SEPTENI HOLDINGS (4293) · 2015-10-16 · Q3 FY09/2014 13,580 410 399 398 - - - Q4 FY09/2014CoE...
14
1 URL: www.walden.co.jp Written by Yoshiyuki Muroya E-mail: [email protected] Phone:+81 3 3553 3769 SEPTENI HOLDINGS (4293) Consolidated Fiscal Year Sales OP RP NP EPS DPS BPS (Million Yen) (Yen) (Yen) (Yen) FY09/2012 41,358 1,527 1,638 677 26.9 5.0 256.9 FY09/2013 45,982 1,593 1,752 1,207 47.9 7.0 300.3 FY09/2014CoE 54,160 2,253 2,329 1,517 60.0 9.0 - FY09/2013 YoY 11.2% 4.3% 7.0% 78.3% - - - FY09/2014CoE YoY 17.8% 41.4% 32.9% 25.7% - - - Consolidated Quarter Sales OP RP NP EPS DPS BPS (Million Yen) (Yen) (Yen) (Yen) Q1 FY09/2014 12,532 682 737 413 - - - Q2 FY09/2014 14,246 611 642 375 - - - Q3 FY09/2014 13,580 410 399 398 - - - Q4 FY09/2014CoE 13,800 550 550 330 - - - Q1 FY09/2014 YoY 15.1% 134.9% 118.2% 121.4% - - - Q2 FY09/2014 YoY 23.2% 27.4% 18.5% (31.6%) - - - Q3 FY09/2014 YoY 17.6% 26.7% 16.7% 129.1% - - - Q4 FY09/2014CoE YoY 15.3% 10.2% 3.8% 11.3% - - - Source: Company Data, WRJ Calculation 1.0 Executive Summary (8 September 2014) Incorporating Growth Domains SEPTENI HOLDINGS, being involved with sales of Internet advertising as the key earnings pillar, is seeing steady earnings growth. Increasing penetrations of Smartphones and social media are driving demand in the market for Internet advertising associated with those domains. That is to say, advertisers or the Company’s customers are aggressively increasing advertising in those domains, while the Company has been well incorporating increasing demand from here. At the same time, sales associated with overseas advertisers who would like to enhance advertising in Japan are starting to take off on a full-fledged basis, in line with ongoing own cultivations of overseas markets. All those trends in recent trading are to persist in the foreseeable future, while the Company is trying to get at accelerating earnings growth, in a long-term view, by means of fostering contents businesses, e.g., manga (comics) and games as the second earnings pillars to additionally drive earnings with the Company. In Q3 (April to June) FY09/2014, sales came in at ¥13,580m (up 17.6% YoY), operating profit ¥410m (up 26.7%) and operating profit margin 3.0% (up 0.2% points). In regards to Internet Marketing Business, being basically involved with sales of Internet advertising, sales came in at ¥12,048m (up 20.7%), operating profit ¥554m (up 24.9%) and operating profit margin 4.6% (up 0.2% points). Operating profit of this business segment accounted for no less than 110.7% of operating profit ¥500m (before elimination negative ¥90m) with the Company. The key contributor for this was that sales of Smartphone advertising increased no less than 2.1 times over the year up to ¥6,146m and accounted for more than 50% of sales in this business segment. Operators of Internet services and other advertisers appear substantially increasing advertising to
Transcript of SEPTENI HOLDINGS (4293) · 2015-10-16 · Q3 FY09/2014 13,580 410 399 398 - - - Q4 FY09/2014CoE...

1
URL: www.walden.co.jp
Written by Yoshiyuki Muroya
E-mail: [email protected]
Phone:+81 3 3553 3769
SEPTENI HOLDINGS (4293)Consolidated Fiscal Year Sales OP RP NP EPS DPS BPS
(Million Yen) (Yen) (Yen) (Yen)
FY09/2012 41,358 1,527 1,638 677 26.9 5.0 256.9
FY09/2013 45,982 1,593 1,752 1,207 47.9 7.0 300.3
FY09/2014CoE 54,160 2,253 2,329 1,517 60.0 9.0 -
FY09/2013 YoY 11.2% 4.3% 7.0% 78.3% - - -
FY09/2014CoE YoY 17.8% 41.4% 32.9% 25.7% - - -
Consolidated Quarter Sales OP RP NP EPS DPS BPS
(Million Yen) (Yen) (Yen) (Yen)
Q1 FY09/2014 12,532 682 737 413 - - -
Q2 FY09/2014 14,246 611 642 375 - - -
Q3 FY09/2014 13,580 410 399 398 - - -
Q4 FY09/2014CoE 13,800 550 550 330 - - -
Q1 FY09/2014 YoY 15.1% 134.9% 118.2% 121.4% - - -
Q2 FY09/2014 YoY 23.2% 27.4% 18.5% (31.6%) - - -
Q3 FY09/2014 YoY 17.6% 26.7% 16.7% 129.1% - - -
Q4 FY09/2014CoE YoY 15.3% 10.2% 3.8% 11.3% - - -
Source: Company Data, WRJ Calculation
1.0 Executive Summary (8 September 2014)
Incorporating Growth Domains
SEPTENI HOLDINGS, being involved with sales of Internet advertising as the key earnings pillar, is seeing
steady earnings growth. Increasing penetrations of Smartphones and social media are driving demand in
the market for Internet advertising associated with those domains. That is to say, advertisers or the
Company’s customers are aggressively increasing advertising in those domains, while the Company has
been well incorporating increasing demand from here. At the same time, sales associated with overseas
advertisers who would like to enhance advertising in Japan are starting to take off on a full-fledged basis, in
line with ongoing own cultivations of overseas markets. All those trends in recent trading are to persist in
the foreseeable future, while the Company is trying to get at accelerating earnings growth, in a long-term
view, by means of fostering contents businesses, e.g., manga (comics) and games as the second earnings
pillars to additionally drive earnings with the Company.
In Q3 (April to June) FY09/2014, sales came in at ¥13,580m (up 17.6% YoY), operating profit ¥410m (up
26.7%) and operating profit margin 3.0% (up 0.2% points). In regards to Internet Marketing Business, being
basically involved with sales of Internet advertising, sales came in at ¥12,048m (up 20.7%), operating profit
¥554m (up 24.9%) and operating profit margin 4.6% (up 0.2% points). Operating profit of this business
segment accounted for no less than 110.7% of operating profit ¥500m (before elimination negative ¥90m)
with the Company. The key contributor for this was that sales of Smartphone advertising increased no less
than 2.1 times over the year up to ¥6,146m and accounted for more than 50% of sales in this business
segment. Operators of Internet services and other advertisers appear substantially increasing advertising to
2
be browsed through Smartphones. In particular, sales associated with advertising on social media,
represented by “Facebook”, “Twitter” and “Line”, increased as much as 3.3 times over the year up to
¥1,493m. On top of this, incoming demand from overseas advertisers is increasing even more rapidly.
Although absolute sales amounts are not disclosed, sales in here increased 7.2 times over the year and
appear to have reached an impactful level in terms of amounts. On the other hand, rest of the businesses,
collectively, saw operating loss equating to 10.7% of operating profit with the Company. Expenses for all
those frontloaded investments were key negative factors for this, including those to develop mobile games to
be launched in the near future and those to make manga (comics) contents business commercially viable in
the foreseeable future.
FY09/2014 Company forecasts are going for prospective sales ¥54,160m (up 17.8% YoY), operating profit
¥2,253m (up 41.4%) and operating profit margin 4.2% (up 0.7% points). As mentioned above, the Company
is suffering from expenses to carry out frontloaded investments in developments of mobile games and manga
(comics) contents business, but substantial increases of sales and earnings as a whole are to be achieved and
marginal increases for operating profit margin. As far as we could see, the Company is meaningfully
competitive in the mainstay operations of Internet advertising sales, while developments of new businesses
to be followed as new sources for earnings are steadily progressed. By means of steadily incorporating
increasing demand in the three domains of “mobile”, “social” and “global”, the Company is calling for
“doubled earnings” to be achieved as early as possible in its midterm management policy. Assuming
operating profit in FY09/2013 as the basis for prospective “doubled earnings”, the Company is to achieve “1.4
times earnings” in FY09/2014, which is the first year of the periods for the midterm management policy,
literally implying early achievement of the target, i.e., “doubled earnings” in the near future.
IR Representative: PR & IR Division (+81 3 6857 7258 [email protected])
3
2.0 Company Profile
Independent Internet Advertising Company
Company Name SEPTENI HOLDINGS CO., LTD.
Company Website
IR Information
Share Price
Established 29 October 1990
Listing 9 August 2001: Tokyo Stock Exchange JASDAQ Standard (Ticker:4293)
Capital ¥2,046m (as of the end of June 2014)
No. of Shares 27,123,400 shares, including 1,784,600 treasury (as of the end of June 2014)
Main Features Sales of Internet advertising, the mainstay earnings source
Successful developments in “mobile (Smartphones)”, “social (“Facebook”, etc.)
and “global (overseas markets)
In manga (comics) contents business, starting to foster and promote artists while
running specialty website
Businesses Ⅰ. Internet Marketing Business
Ⅱ. Media Content Business
Ⅲ. Other
Top Management President and Representative Director: Koki Sato
Chairman of the Board and Representative Director: Mamoru Nanamura
Shareholders Village Seven Co., Ltd. 13.0%, Japan Trustee Services Bank, Ltd. (trust account)
11.0%, Mamoru Nanamura 10.8% (as of the end of March 2014)
Headquarters Shinjuku -ku, Tokyo JAPAN
No. of Employees Consolidated full-time headcounts 798 and overall headcounts 948 (as of the end of
June 2014)
Source: Company Data

4
3.0 Recent Trading & Prospects
Q3 FY09/2014 Results
In Q3 FY09/2014 (April to June), sales came in at ¥13,580m (up 17.6% YoY), operating profit ¥410m (up
26.7%), recurring profit ¥399m (up 16.7%) and net profit ¥398m (up 129.1%). Compared with Company
forecasts, released on 1 May 2014, sales were exceeded ¥81m (0.6%), operating profit ¥60m (17.2%),
recurring profit ¥40m (11.1%) and net profit ¥179m (81.3%).
Quarterly Performance by Business Segment
Sales
0
4,000
8,000
12,000
Q1
FY09
/20
11
Q2
FY09
/20
11
Q3
FY09
/20
11
Q4
FY09
/20
11
Q1
FY09
/20
12
Q2
FY09
/20
12
Q3
FY09
/20
12
Q4
FY09
/20
12
Q1
FY09
/20
13
Q2
FY09
/20
13
Q3
FY09
/20
13
Q4
FY09
/20
13
Q1
FY09
/20
14
Q2
FY09
/20
14
Q3
FY09
/20
14
Q4
FY09
/20
14
Internet Marketing Business Media Contents Business Other(Million Yen)
Operating Profit
(200)
0
200
400
600
800
Q1
FY0
9/2
01
1
Q2
FY0
9/2
01
1
Q3
FY0
9/2
01
1
Q4
FY0
9/2
01
1
Q1
FY0
9/2
01
2
Q2
FY0
9/2
01
2
Q3
FY0
9/2
01
2
Q4
FY0
9/2
01
2
Q1
FY0
9/2
01
3
Q2
FY0
9/2
01
3
Q3
FY0
9/2
01
3
Q4
FY0
9/2
01
3
Q1
FY0
9/2
01
4
Q2
FY0
9/2
01
4
Q3
FY0
9/2
01
4
Q4
FY0
9/2
01
4
Internet Marketing Business Media Contents Business Other Elimination(Million Yen)
Source: Company Data, WRJ Calculation
The Company makes it a rule to disclose Company forecasts for the subsequent quarter when releasing
every quarterly result, where upcoming business performance based on projects to have been confirmed to
book sales in the subsequent quarter only are effectively incorporated and thus newly-added projects are
supposed to make some add-ons. In fact, this was the case in Q3. Meanwhile, Company forecasts in Q3 were
far exceed in net profit that has increased substantially over the year at the same time. This was due to
unexpected reductions of tax charges, stemming from application to adopt consolidated taxation system to
start up in FY09/2015.
5
At the moment, earnings with the Company heavily hinge on the performance of Internet Marketing
Business. More importantly, the Company has been seeing earnings keeping on increasing quarter on
quarter as an underlying trend in line with business performance of Internet Marketing Business.
Meanwhile, sales of Internet Marketing Business in Q3 (April to June) did adjust over Q2 (January to
March) just before. This had a lot to do with one-off factor on top of seasonal adjustments and thus
quarter-on-quarter growth as an underlying trend is effectively persisting in our view. In the first place,
sales are meaningfully concentrated in Q2 every year, as demand for advertising is concentrated in Q2 out of
all the four quarters in a year, resulting in adjustments of sales in Q3 (April to June) over Q2 (January to
March) on a regular basis. In regards to FY09/2014, there were adjustments in Q3 (April to June) over Q2
(January to March), also from elsewhere, i.e., large-sized projects were concentrated in Q2 (January to
March).
In terms of operating profit, an underlying trend of quarter-on-quarter growth is also persisting, when
irregularities quarter to quarter are excluded. For example, adjustments in Q3 (April to June) over Q2
(January to March) are supposed to take place every year, affected by increasing number of headcounts
(from 831 to 948 in terms of FY09/2014 results) over the same period, due mainly to hiring of new graduates.
Meanwhile, there are some swing factors, as in Q1 (October to December) FY09/2014, where the Company
saw a one-off issue to have massively driven gross profit and thus operating profit.
In Internet Marketing Business, SEPTENI CO., LTD., which is the key company of the SEPTENI
HOLDINGS (the Company) group, runs sales of Internet advertising and this accounts for the bulk of sales
in this business segment while earnings as well. Being an independent Internet advertising company,
SEPTENI CO., LTD. offers services for some 1,500 corporate customers or advertisers, mainly comprising
financials, real estate, cosmetics, E-Commerce, Internet services (media, telecom, games, etc.) by sector.
Most recently, the number of customers is rather on the decreases, but this is far more than compensated for
by increasing sales per customer. Meanwhile, by sector, the Company sees increasing demand associated
with Internet services including games in particular, as far as we could gather.
The Company entered the market for Internet advertising in 2000 and the market size increased some 16
times by 2013 to ¥938.1bn from ¥59.0bn, according to “Advertising in Japan” by DENTSU INC. The market
has been surging on the expense of markets for all those existing media, comprising televisions, newspapers,
magazines, radios, etc., while the Company well incorporated demand increasing in the market.
Most recently, the Company allocates own management resources quickly and flexibly to growth domains,
i.e., Smartphones and social media, being an independent player as own strengths, in line with increasing
penetrations by them. As a result, the Company well succeeds in incorporating increasing demand in there,
while having reasonably cultivated overseas markets to date.
For cultivations of overseas markets, the Company claims for establishment of cross-border transaction
scheme among own marketing bases on a global basis, currently comprising those in Seoul, Singapore, San
Francisco and London, i.e., across Asia, U.S.A. and Europe, on top of ones in Japan.

6
Currently, the Company is mainly coping with increasing needs for advertisers based in U.S.A. and Europe
to run advertising in Japan, mainly driving overseas sales with the Company. Having set up aforementioned
collective four overseas marketing bases, the Company also implements capital injections in local companies
to eventually establish the cross-border transaction scheme. Most recent issue is that the Company injected
capital in JNJ INTERACTIVE INC. in July 2014, while having made this own consolidated subsidiary at
the same time. This is a Korea-based Internet advertising company, known as a player with cutting edge
technology in “Facebook” advertising. This operation is expected to be included in the Company’s
consolidated accounts, staring in FY09/2015, generating meaningful add-ons to sales with the Company,
even short-term, but not much to earnings due to goodwill write-offs, etc. for the time being.
Meanwhile, in Media Contents Business, where the bulk of sales is accounted for by those of AXEL MARK
INC. (a consolidated subsidiary 54.9% held by the Company) basically in charge of developing mobile game
contents, sales came in at ¥879m (down 1.1%), operating loss ¥104m (operating loss ¥60m over the year)
and operating profit margin negative 11.9% (down 5.1% points). This business segment continues making
operating loss, as the businesses in here are basically in the processes of frontloaded investments, including
another constituent of manga (comics) contents business in this business segment.
7
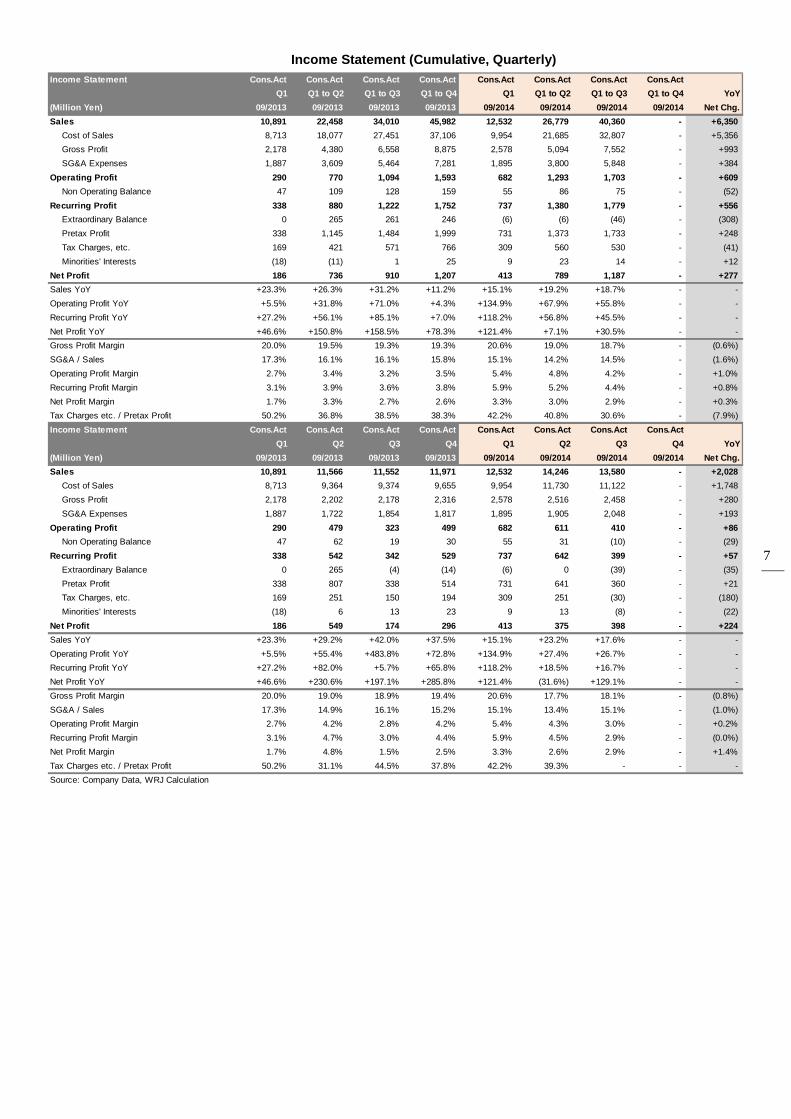
Income Statement (Cumulative, Quarterly)
Income Statement Cons.Act Cons.Act Cons.Act Cons.Act Cons.Act Cons.Act Cons.Act Cons.Act
Q1 Q1 to Q2 Q1 to Q3 Q1 to Q4 Q1 Q1 to Q2 Q1 to Q3 Q1 to Q4 YoY
(Million Yen) 09/2013 09/2013 09/2013 09/2013 09/2014 09/2014 09/2014 09/2014 Net Chg.
Sales 10,891 22,458 34,010 45,982 12,532 26,779 40,360 - +6,350
Cost of Sales 8,713 18,077 27,451 37,106 9,954 21,685 32,807 - +5,356
Gross Profit 2,178 4,380 6,558 8,875 2,578 5,094 7,552 - +993
SG&A Expenses 1,887 3,609 5,464 7,281 1,895 3,800 5,848 - +384
Operating Profit 290 770 1,094 1,593 682 1,293 1,703 - +609
Non Operating Balance 47 109 128 159 55 86 75 - (52)
Recurring Profit 338 880 1,222 1,752 737 1,380 1,779 - +556
Extraordinary Balance 0 265 261 246 (6) (6) (46) - (308)
Pretax Profit 338 1,145 1,484 1,999 731 1,373 1,733 - +248
Tax Charges, etc. 169 421 571 766 309 560 530 - (41)
Minorities' Interests (18) (11) 1 25 9 23 14 - +12
Net Profit 186 736 910 1,207 413 789 1,187 - +277
Sales YoY +23.3% +26.3% +31.2% +11.2% +15.1% +19.2% +18.7% - -
Operating Profit YoY +5.5% +31.8% +71.0% +4.3% +134.9% +67.9% +55.8% - -
Recurring Profit YoY +27.2% +56.1% +85.1% +7.0% +118.2% +56.8% +45.5% - -
Net Profit YoY +46.6% +150.8% +158.5% +78.3% +121.4% +7.1% +30.5% - -
Gross Profit Margin 20.0% 19.5% 19.3% 19.3% 20.6% 19.0% 18.7% - (0.6%)
SG&A / Sales 17.3% 16.1% 16.1% 15.8% 15.1% 14.2% 14.5% - (1.6%)
Operating Profit Margin 2.7% 3.4% 3.2% 3.5% 5.4% 4.8% 4.2% - +1.0%
Recurring Profit Margin 3.1% 3.9% 3.6% 3.8% 5.9% 5.2% 4.4% - +0.8%
Net Profit Margin 1.7% 3.3% 2.7% 2.6% 3.3% 3.0% 2.9% - +0.3%
Tax Charges etc. / Pretax Profit 50.2% 36.8% 38.5% 38.3% 42.2% 40.8% 30.6% - (7.9%)
Income Statement Cons.Act Cons.Act Cons.Act Cons.Act Cons.Act Cons.Act Cons.Act Cons.Act
Q1 Q2 Q3 Q4 Q1 Q2 Q3 Q4 YoY
(Million Yen) 09/2013 09/2013 09/2013 09/2013 09/2014 09/2014 09/2014 09/2014 Net Chg.
Sales 10,891 11,566 11,552 11,971 12,532 14,246 13,580 - +2,028
Cost of Sales 8,713 9,364 9,374 9,655 9,954 11,730 11,122 - +1,748
Gross Profit 2,178 2,202 2,178 2,316 2,578 2,516 2,458 - +280
SG&A Expenses 1,887 1,722 1,854 1,817 1,895 1,905 2,048 - +193
Operating Profit 290 479 323 499 682 611 410 - +86
Non Operating Balance 47 62 19 30 55 31 (10) - (29)
Recurring Profit 338 542 342 529 737 642 399 - +57
Extraordinary Balance 0 265 (4) (14) (6) 0 (39) - (35)
Pretax Profit 338 807 338 514 731 641 360 - +21
Tax Charges, etc. 169 251 150 194 309 251 (30) - (180)
Minorities' Interests (18) 6 13 23 9 13 (8) - (22)
Net Profit 186 549 174 296 413 375 398 - +224
Sales YoY +23.3% +29.2% +42.0% +37.5% +15.1% +23.2% +17.6% - -
Operating Profit YoY +5.5% +55.4% +483.8% +72.8% +134.9% +27.4% +26.7% - -
Recurring Profit YoY +27.2% +82.0% +5.7% +65.8% +118.2% +18.5% +16.7% - -
Net Profit YoY +46.6% +230.6% +197.1% +285.8% +121.4% (31.6%) +129.1% - -
Gross Profit Margin 20.0% 19.0% 18.9% 19.4% 20.6% 17.7% 18.1% - (0.8%)
SG&A / Sales 17.3% 14.9% 16.1% 15.2% 15.1% 13.4% 15.1% - (1.0%)
Operating Profit Margin 2.7% 4.2% 2.8% 4.2% 5.4% 4.3% 3.0% - +0.2%
Recurring Profit Margin 3.1% 4.7% 3.0% 4.4% 5.9% 4.5% 2.9% - (0.0%)
Net Profit Margin 1.7% 4.8% 1.5% 2.5% 3.3% 2.6% 2.9% - +1.4%
Tax Charges etc. / Pretax Profit 50.2% 31.1% 44.5% 37.8% 42.2% 39.3% - - -
Source: Company Data, WRJ Calculation
8
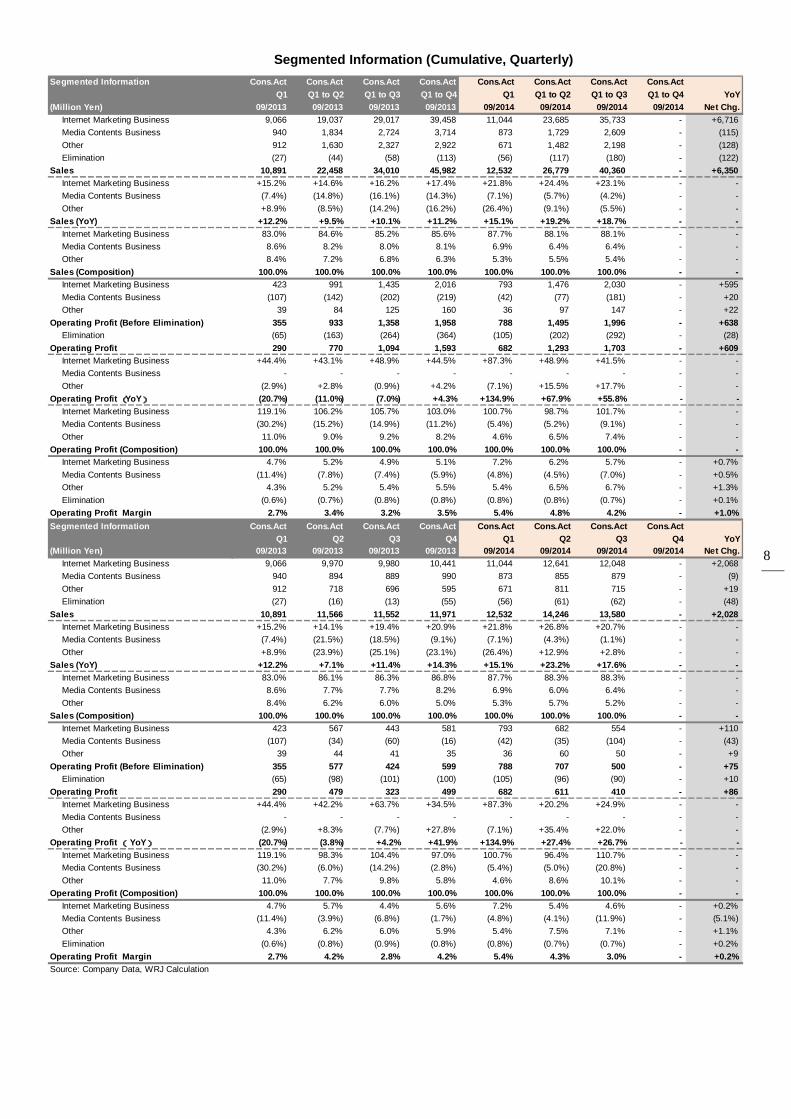
Segmented Information (Cumulative, Quarterly)
Segmented Information Cons.Act Cons.Act Cons.Act Cons.Act Cons.Act Cons.Act Cons.Act Cons.Act
Q1 Q1 to Q2 Q1 to Q3 Q1 to Q4 Q1 Q1 to Q2 Q1 to Q3 Q1 to Q4 YoY
(Million Yen) 09/2013 09/2013 09/2013 09/2013 09/2014 09/2014 09/2014 09/2014 Net Chg.
Internet Marketing Business 9,066 19,037 29,017 39,458 11,044 23,685 35,733 - +6,716
Media Contents Business 940 1,834 2,724 3,714 873 1,729 2,609 - (115)
Other 912 1,630 2,327 2,922 671 1,482 2,198 - (128)
Elimination (27) (44) (58) (113) (56) (117) (180) - (122)
Sales 10,891 22,458 34,010 45,982 12,532 26,779 40,360 - +6,350
Internet Marketing Business +15.2% +14.6% +16.2% +17.4% +21.8% +24.4% +23.1% - -
Media Contents Business (7.4%) (14.8%) (16.1%) (14.3%) (7.1%) (5.7%) (4.2%) - -
Other +8.9% (8.5%) (14.2%) (16.2%) (26.4%) (9.1%) (5.5%) - -
Sales (YoY) +12.2% +9.5% +10.1% +11.2% +15.1% +19.2% +18.7% - -
Internet Marketing Business 83.0% 84.6% 85.2% 85.6% 87.7% 88.1% 88.1% - -
Media Contents Business 8.6% 8.2% 8.0% 8.1% 6.9% 6.4% 6.4% - -
Other 8.4% 7.2% 6.8% 6.3% 5.3% 5.5% 5.4% - -
Sales (Composition) 100.0% 100.0% 100.0% 100.0% 100.0% 100.0% 100.0% - -
Internet Marketing Business 423 991 1,435 2,016 793 1,476 2,030 - +595
Media Contents Business (107) (142) (202) (219) (42) (77) (181) - +20
Other 39 84 125 160 36 97 147 - +22
Operating Profit (Before Elimination) 355 933 1,358 1,958 788 1,495 1,996 - +638
Elimination (65) (163) (264) (364) (105) (202) (292) - (28)
Operating Profit 290 770 1,094 1,593 682 1,293 1,703 - +609
Internet Marketing Business +44.4% +43.1% +48.9% +44.5% +87.3% +48.9% +41.5% - -
Media Contents Business - - - - - - - - -
Other (2.9%) +2.8% (0.9%) +4.2% (7.1%) +15.5% +17.7% - -
Operating Profit (YoY) (20.7%) (11.0%) (7.0%) +4.3% +134.9% +67.9% +55.8% - -
Internet Marketing Business 119.1% 106.2% 105.7% 103.0% 100.7% 98.7% 101.7% - -
Media Contents Business (30.2%) (15.2%) (14.9%) (11.2%) (5.4%) (5.2%) (9.1%) - -
Other 11.0% 9.0% 9.2% 8.2% 4.6% 6.5% 7.4% - -
Operating Profit (Composition) 100.0% 100.0% 100.0% 100.0% 100.0% 100.0% 100.0% - -
Internet Marketing Business 4.7% 5.2% 4.9% 5.1% 7.2% 6.2% 5.7% - +0.7%
Media Contents Business (11.4%) (7.8%) (7.4%) (5.9%) (4.8%) (4.5%) (7.0%) - +0.5%
Other 4.3% 5.2% 5.4% 5.5% 5.4% 6.5% 6.7% - +1.3%
Elimination (0.6%) (0.7%) (0.8%) (0.8%) (0.8%) (0.8%) (0.7%) - +0.1%
Operating Profit Margin 2.7% 3.4% 3.2% 3.5% 5.4% 4.8% 4.2% - +1.0%
Segmented Information Cons.Act Cons.Act Cons.Act Cons.Act Cons.Act Cons.Act Cons.Act Cons.Act
Q1 Q2 Q3 Q4 Q1 Q2 Q3 Q4 YoY
(Million Yen) 09/2013 09/2013 09/2013 09/2013 09/2014 09/2014 09/2014 09/2014 Net Chg.
Internet Marketing Business 9,066 9,970 9,980 10,441 11,044 12,641 12,048 - +2,068
Media Contents Business 940 894 889 990 873 855 879 - (9)
Other 912 718 696 595 671 811 715 - +19
Elimination (27) (16) (13) (55) (56) (61) (62) - (48)
Sales 10,891 11,566 11,552 11,971 12,532 14,246 13,580 - +2,028
Internet Marketing Business +15.2% +14.1% +19.4% +20.9% +21.8% +26.8% +20.7% - -
Media Contents Business (7.4%) (21.5%) (18.5%) (9.1%) (7.1%) (4.3%) (1.1%) - -
Other +8.9% (23.9%) (25.1%) (23.1%) (26.4%) +12.9% +2.8% - -
Sales (YoY) +12.2% +7.1% +11.4% +14.3% +15.1% +23.2% +17.6% - -
Internet Marketing Business 83.0% 86.1% 86.3% 86.8% 87.7% 88.3% 88.3% - -
Media Contents Business 8.6% 7.7% 7.7% 8.2% 6.9% 6.0% 6.4% - -
Other 8.4% 6.2% 6.0% 5.0% 5.3% 5.7% 5.2% - -
Sales (Composition) 100.0% 100.0% 100.0% 100.0% 100.0% 100.0% 100.0% - -
Internet Marketing Business 423 567 443 581 793 682 554 - +110
Media Contents Business (107) (34) (60) (16) (42) (35) (104) - (43)
Other 39 44 41 35 36 60 50 - +9
Operating Profit (Before Elimination) 355 577 424 599 788 707 500 - +75
Elimination (65) (98) (101) (100) (105) (96) (90) - +10
Operating Profit 290 479 323 499 682 611 410 - +86
Internet Marketing Business +44.4% +42.2% +63.7% +34.5% +87.3% +20.2% +24.9% - -
Media Contents Business - - - - - - - - -
Other (2.9%) +8.3% (7.7%) +27.8% (7.1%) +35.4% +22.0% - -
Operating Profit (YoY) (20.7%) (3.8%) +4.2% +41.9% +134.9% +27.4% +26.7% - -
Internet Marketing Business 119.1% 98.3% 104.4% 97.0% 100.7% 96.4% 110.7% - -
Media Contents Business (30.2%) (6.0%) (14.2%) (2.8%) (5.4%) (5.0%) (20.8%) - -
Other 11.0% 7.7% 9.8% 5.8% 4.6% 8.6% 10.1% - -
Operating Profit (Composition) 100.0% 100.0% 100.0% 100.0% 100.0% 100.0% 100.0% - -
Internet Marketing Business 4.7% 5.7% 4.4% 5.6% 7.2% 5.4% 4.6% - +0.2%
Media Contents Business (11.4%) (3.9%) (6.8%) (1.7%) (4.8%) (4.1%) (11.9%) - (5.1%)
Other 4.3% 6.2% 6.0% 5.9% 5.4% 7.5% 7.1% - +1.1%
Elimination (0.6%) (0.8%) (0.9%) (0.8%) (0.8%) (0.7%) (0.7%) - +0.2%
Operating Profit Margin 2.7% 4.2% 2.8% 4.2% 5.4% 4.3% 3.0% - +0.2%
Source: Company Data, WRJ Calculation
9
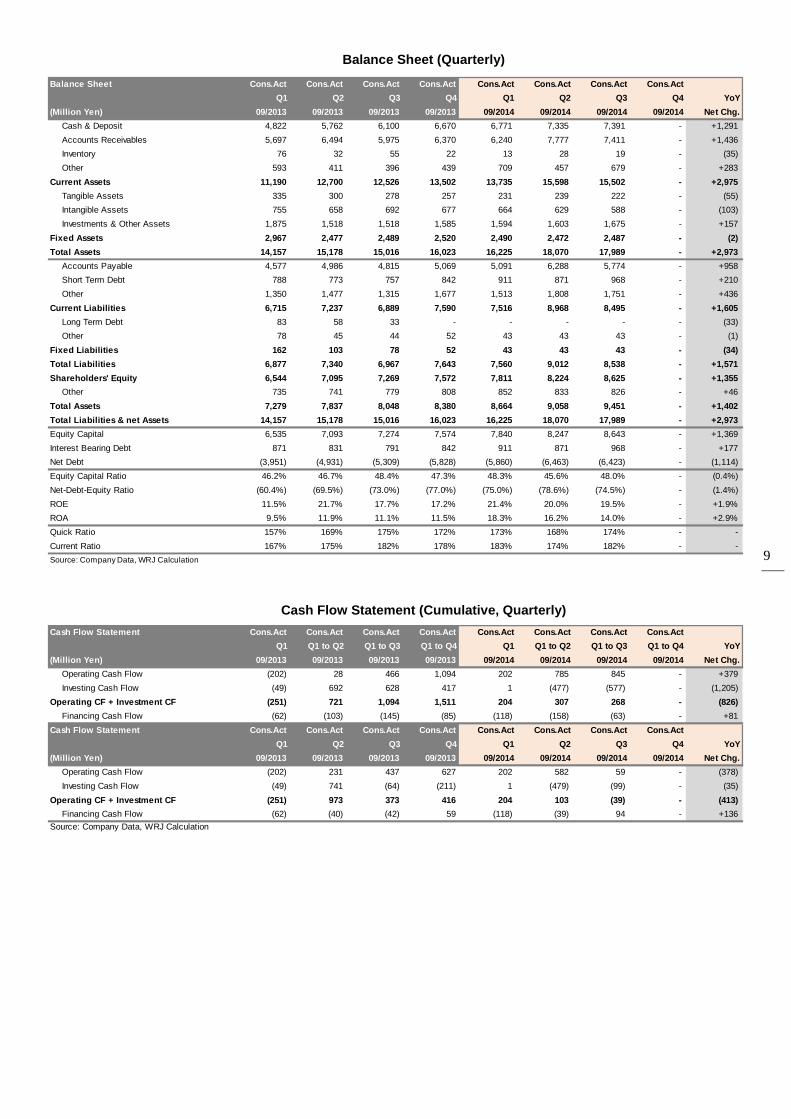
Balance Sheet (Quarterly)
Balance Sheet Cons.Act Cons.Act Cons.Act Cons.Act Cons.Act Cons.Act Cons.Act Cons.Act
Q1 Q2 Q3 Q4 Q1 Q2 Q3 Q4 YoY
(Million Yen) 09/2013 09/2013 09/2013 09/2013 09/2014 09/2014 09/2014 09/2014 Net Chg.
Cash & Deposit 4,822 5,762 6,100 6,670 6,771 7,335 7,391 - +1,291
Accounts Receivables 5,697 6,494 5,975 6,370 6,240 7,777 7,411 - +1,436
Inventory 76 32 55 22 13 28 19 - (35)
Other 593 411 396 439 709 457 679 - +283
Current Assets 11,190 12,700 12,526 13,502 13,735 15,598 15,502 - +2,975
Tangible Assets 335 300 278 257 231 239 222 - (55)
Intangible Assets 755 658 692 677 664 629 588 - (103)
Investments & Other Assets 1,875 1,518 1,518 1,585 1,594 1,603 1,675 - +157
Fixed Assets 2,967 2,477 2,489 2,520 2,490 2,472 2,487 - (2)
Total Assets 14,157 15,178 15,016 16,023 16,225 18,070 17,989 - +2,973
Accounts Payable 4,577 4,986 4,815 5,069 5,091 6,288 5,774 - +958
Short Term Debt 788 773 757 842 911 871 968 - +210
Other 1,350 1,477 1,315 1,677 1,513 1,808 1,751 - +436
Current Liabilities 6,715 7,237 6,889 7,590 7,516 8,968 8,495 - +1,605
Long Term Debt 83 58 33 - - - - - (33)
Other 78 45 44 52 43 43 43 - (1)
Fixed Liabilities 162 103 78 52 43 43 43 - (34)
Total Liabilities 6,877 7,340 6,967 7,643 7,560 9,012 8,538 - +1,571
Shareholders' Equity 6,544 7,095 7,269 7,572 7,811 8,224 8,625 - +1,355
Other 735 741 779 808 852 833 826 - +46
Total Assets 7,279 7,837 8,048 8,380 8,664 9,058 9,451 - +1,402
Total Liabilities & net Assets 14,157 15,178 15,016 16,023 16,225 18,070 17,989 - +2,973
Equity Capital 6,535 7,093 7,274 7,574 7,840 8,247 8,643 - +1,369
Interest Bearing Debt 871 831 791 842 911 871 968 - +177
Net Debt (3,951) (4,931) (5,309) (5,828) (5,860) (6,463) (6,423) - (1,114)
Equity Capital Ratio 46.2% 46.7% 48.4% 47.3% 48.3% 45.6% 48.0% - (0.4%)
Net-Debt-Equity Ratio (60.4%) (69.5%) (73.0%) (77.0%) (75.0%) (78.6%) (74.5%) - (1.4%)
ROE 11.5% 21.7% 17.7% 17.2% 21.4% 20.0% 19.5% - +1.9%
ROA 9.5% 11.9% 11.1% 11.5% 18.3% 16.2% 14.0% - +2.9%
Quick Ratio 157% 169% 175% 172% 173% 168% 174% - -
Current Ratio 167% 175% 182% 178% 183% 174% 182% - -
Source: Company Data, WRJ Calculation
Cash Flow Statement (Cumulative, Quarterly)
Cash Flow Statement Cons.Act Cons.Act Cons.Act Cons.Act Cons.Act Cons.Act Cons.Act Cons.Act
Q1 Q1 to Q2 Q1 to Q3 Q1 to Q4 Q1 Q1 to Q2 Q1 to Q3 Q1 to Q4 YoY
(Million Yen) 09/2013 09/2013 09/2013 09/2013 09/2014 09/2014 09/2014 09/2014 Net Chg.
Operating Cash Flow (202) 28 466 1,094 202 785 845 - +379
Investing Cash Flow (49) 692 628 417 1 (477) (577) - (1,205)
Operating CF + Investment CF (251) 721 1,094 1,511 204 307 268 - (826)
Financing Cash Flow (62) (103) (145) (85) (118) (158) (63) - +81
Cash Flow Statement Cons.Act Cons.Act Cons.Act Cons.Act Cons.Act Cons.Act Cons.Act Cons.Act
Q1 Q2 Q3 Q4 Q1 Q2 Q3 Q4 YoY
(Million Yen) 09/2013 09/2013 09/2013 09/2013 09/2014 09/2014 09/2014 09/2014 Net Chg.
Operating Cash Flow (202) 231 437 627 202 582 59 - (378)
Investing Cash Flow (49) 741 (64) (211) 1 (479) (99) - (35)
Operating CF + Investment CF (251) 973 373 416 204 103 (39) - (413)
Financing Cash Flow (62) (40) (42) 59 (118) (39) 94 - +136
Source: Company Data, WRJ Calculation

10
FY09/2014 Company Forecasts
FY09/2014 Company forecasts, released in line with the release of Q3 FY09/2014 results, are going for
prospective sales ¥54,160m (up 17.8% YoY), operating profit ¥2,253m (up 41.4%), recurring profit ¥2,329m
(up 32.9%) and net profit ¥1,517m (up 25.7%). Operating profit margin is expected to be 4.2% (up 0.7%
points). At the same time, the Company has revealed that it is to deliver ¥9.0 per share as divided, implying
payout ratio 15.0%, in FY09/2014. Compared with ¥7.0, implying payout ratio 14.6%, in FY09/2013, the
Company is going to increase dividend per share ¥2.0, while payout ratio edging up over the year. Thus, the
Company is to increase dividend per share two years in a row.
Quarterly Sales and Operating Profit Margin
9,7
10
10
,80
3
10
,36
5
10
,47
8
10
,89
1
11
,56
6
11
,55
2
11
,97
1
12
,53
2
14
,24
6
13
,58
0
13
,80
0
3.8%4.6%
3.0% 3.4% 2.7%4.1%
2.8%4.2%
5.4%4.3%
3.0%4.0%
(6.0%)
(4.0%)
(2.0%)
0.0%
2.0%
4.0%
6.0%
0
5,000
10,000
15,000
Q1
FY0
9/2
01
2
Q2
FY0
9/2
01
2
Q3
FY0
9/2
01
2
Q4
FY0
9/2
01
2
Q1
FY0
9/2
01
3
Q2
FY0
9/2
01
3
Q3
FY0
9/2
01
3
Q4
FY0
9/2
01
3
Q1
FY0
9/2
01
4
Q2
FY0
9/2
01
4
Q3
FY0
9/2
01
4
Q4
FY0
9/2
01
4
Sales (Million Yen) Operating Profit Margin (%)
Source: Company Data, WRJ Calculation
Meanwhile, in regards to Q4 (July to September), Company forecasts are going for prospective sales
¥13,800m (up 15.3% YoY) and operating profit ¥550m (up 10.2%). However, projects to have been already
confirmed only have been incorporated in here, as suggested earlier. Thus, Company forecasts are likely to
be exceeded due to contributions from new projects to occur towards the end of Q4.
In regards to Internet Marketing Business where the main operations are represented by sales of Internet
advertising, recent trading has remained buoyant and this trend is expected to persist, leading to increases
of sales and earnings over the year. On the Media Contents Business side, the Company forecasts assume
increasing operating loss over the year, due to ongoing frontloaded investments in mobile games and manga
(comics) contents. In regards to mobile games, collective 5 titles are currently under developments, mainly
comprising those based on full-spec native apps scheme, but all of them will be launched later than the
beginning of FY09/2015. “Dragon Parade (provisional)” will be the first title based on full-spec native apps
scheme and is to be launched in Q1 FY09/2015, which has been co-developed with SEGA Networks Co., Ltd.
11
In regards to manga (comics) contents business, the Company released new manga delivering services,
called “GANMA!”, in December 2013, while the number of downloads of apps stood at more than half million
as of the end of July 2014. To date, however, billing revenues have remained insignificant and this just
cannot compensate for expenses to run “Route M” which is a program to foster and support new manga
artists and those to enrich the delivering services. On the other hand, going forwards, the Company plans to
release the titles by manga artists on “GANMA!” as Tankobon Hardcover, while entering extensive IP
(Intellectual Property) businesses based on future hit titles. Thus, all those businesses could be major
sources of earnings with the Company. Meanwhile, “GANMA!” is expected to get increasingly valuable as
advertising media in line with increasing number of users and that of titles available, going forwards,
suggesting future advertising income generation as an operator of media for the Company.
12
Long-Term Prospects
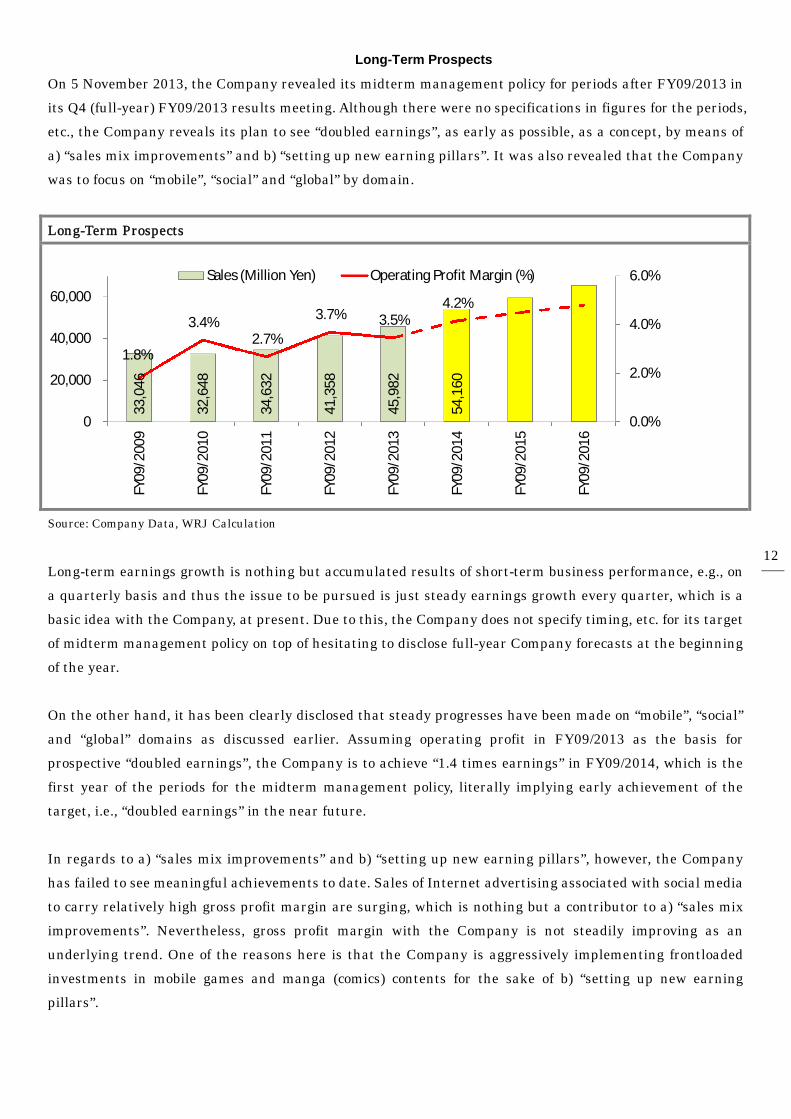
On 5 November 2013, the Company revealed its midterm management policy for periods after FY09/2013 in
its Q4 (full-year) FY09/2013 results meeting. Although there were no specifications in figures for the periods,
etc., the Company reveals its plan to see “doubled earnings”, as early as possible, as a concept, by means of
a) “sales mix improvements” and b) “setting up new earning pillars”. It was also revealed that the Company
was to focus on “mobile”, “social” and “global” by domain.
Long-Term Prospects
33
,04
6
32
,64
8
34
,63
2
41
,35
8
45
,98
2
54
,16
0
1.8%
3.4%2.7%
3.7% 3.5%4.2%
0.0%
2.0%
4.0%
6.0%
0
20,000
40,000
60,000
FY0
9/2
00
9
FY0
9/2
01
0
FY0
9/2
01
1
FY0
9/2
01
2
FY0
9/2
01
3
FY0
9/2
01
4
FY0
9/2
01
5
FY0
9/2
01
6
Sales (Million Yen) Operating Profit Margin (%)
Source: Company Data, WRJ Calculation
Long-term earnings growth is nothing but accumulated results of short-term business performance, e.g., on
a quarterly basis and thus the issue to be pursued is just steady earnings growth every quarter, which is a
basic idea with the Company, at present. Due to this, the Company does not specify timing, etc. for its target
of midterm management policy on top of hesitating to disclose full-year Company forecasts at the beginning
of the year.
On the other hand, it has been clearly disclosed that steady progresses have been made on “mobile”, “social”
and “global” domains as discussed earlier. Assuming operating profit in FY09/2013 as the basis for
prospective “doubled earnings”, the Company is to achieve “1.4 times earnings” in FY09/2014, which is the
first year of the periods for the midterm management policy, literally implying early achievement of the
target, i.e., “doubled earnings” in the near future.
In regards to a) “sales mix improvements” and b) “setting up new earning pillars”, however, the Company
has failed to see meaningful achievements to date. Sales of Internet advertising associated with social media
to carry relatively high gross profit margin are surging, which is nothing but a contributor to a) “sales mix
improvements”. Nevertheless, gross profit margin with the Company is not steadily improving as an
underlying trend. One of the reasons here is that the Company is aggressively implementing frontloaded
investments in mobile games and manga (comics) contents for the sake of b) “setting up new earning
pillars”.
13
4.0 Business Model
Sales of Internet Advertising
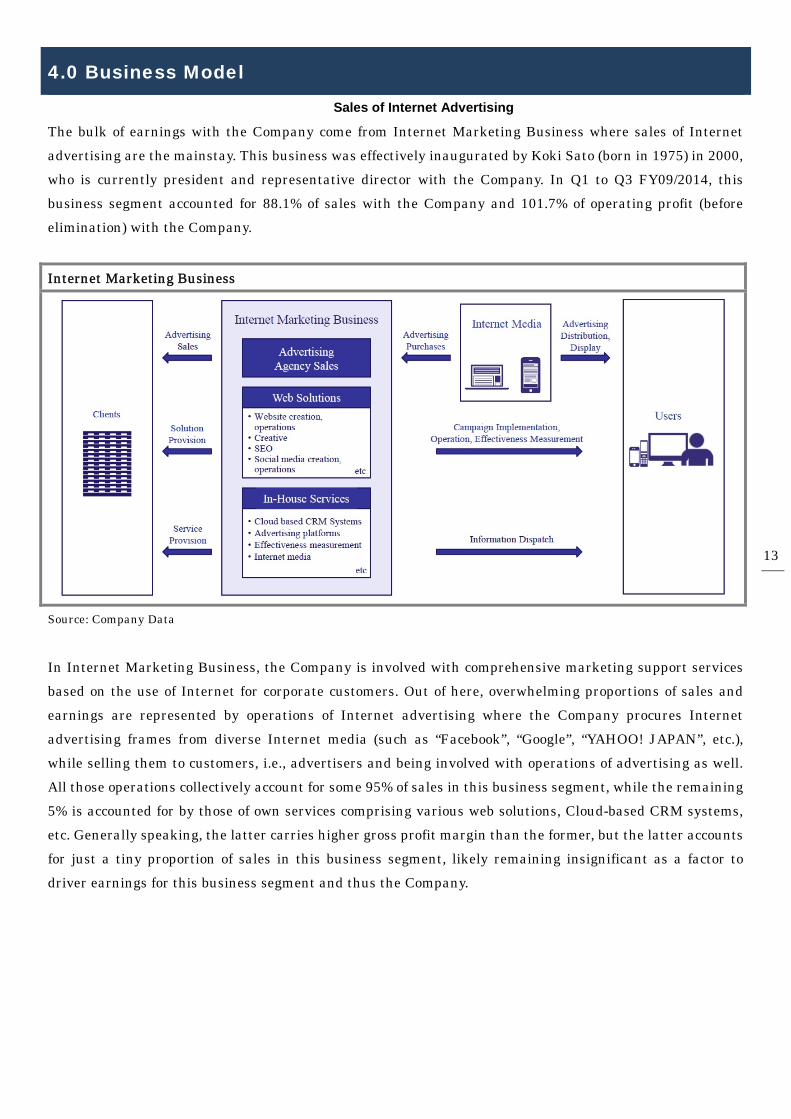
The bulk of earnings with the Company come from Internet Marketing Business where sales of Internet
advertising are the mainstay. This business was effectively inaugurated by Koki Sato (born in 1975) in 2000,
who is currently president and representative director with the Company. In Q1 to Q3 FY09/2014, this
business segment accounted for 88.1% of sales with the Company and 101.7% of operating profit (before
elimination) with the Company.
Internet Marketing Business
Source: Company Data
In Internet Marketing Business, the Company is involved with comprehensive marketing support services
based on the use of Internet for corporate customers. Out of here, overwhelming proportions of sales and
earnings are represented by operations of Internet advertising where the Company procures Internet
advertising frames from diverse Internet media (such as “Facebook”, “Google”, “YAHOO! JAPAN”, etc.),
while selling them to customers, i.e., advertisers and being involved with operations of advertising as well.
All those operations collectively account for some 95% of sales in this business segment, while the remaining
5% is accounted for by those of own services comprising various web solutions, Cloud-based CRM systems,
etc. Generally speaking, the latter carries higher gross profit margin than the former, but the latter accounts
for just a tiny proportion of sales in this business segment, likely remaining insignificant as a factor to
driver earnings for this business segment and thus the Company.
14
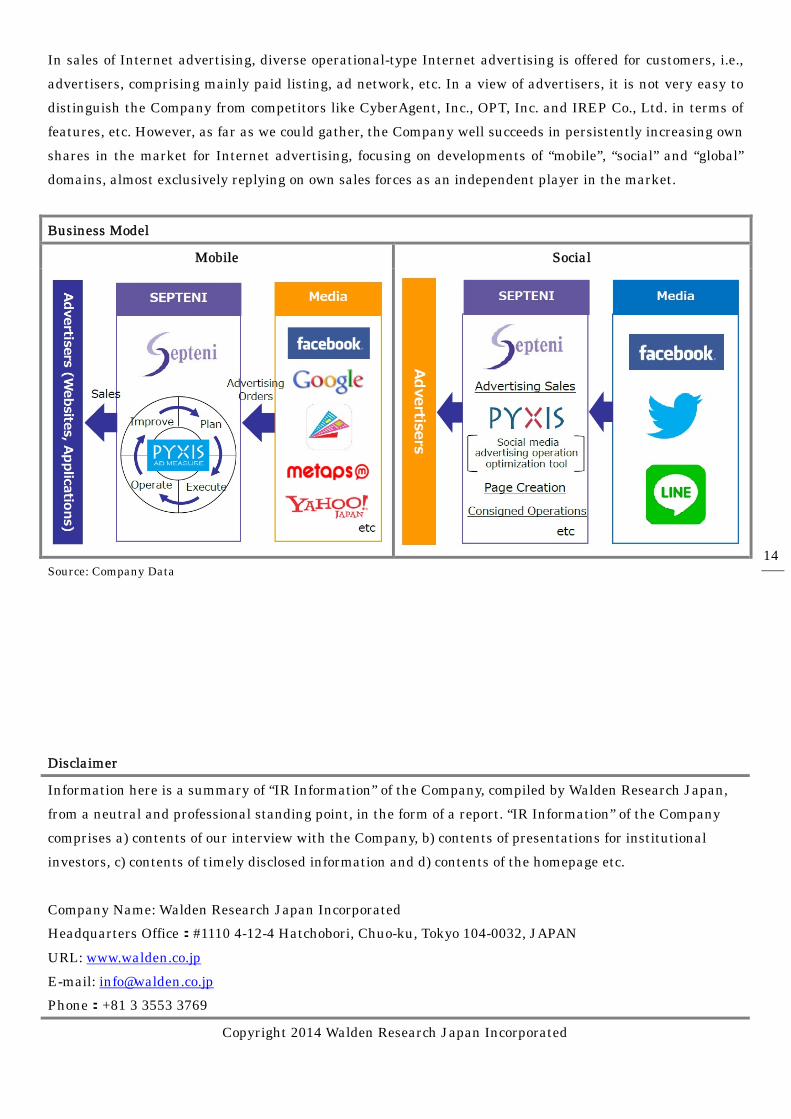
In sales of Internet advertising, diverse operational-type Internet advertising is offered for customers, i.e.,
advertisers, comprising mainly paid listing, ad network, etc. In a view of advertisers, it is not very easy to
distinguish the Company from competitors like CyberAgent, Inc., OPT, Inc. and IREP Co., Ltd. in terms of
features, etc. However, as far as we could gather, the Company well succeeds in persistently increasing own
shares in the market for Internet advertising, focusing on developments of “mobile”, “social” and “global”
domains, almost exclusively replying on own sales forces as an independent player in the market.
Business Model
Mobile Social
Source: Company Data
Disclaimer
Information here is a summary of “IR Information” of the Company, compiled by Walden Research Japan,
from a neutral and professional standing point, in the form of a report. “IR Information” of the Company
comprises a) contents of our interview with the Company, b) contents of presentations for institutional
investors, c) contents of timely disclosed information and d) contents of the homepage etc.
Company Name: Walden Research Japan Incorporated
Headquarters Office:#1110 4-12-4 Hatchobori, Chuo-ku, Tokyo 104-0032, JAPAN
URL: www.walden.co.jp
E-mail: [email protected]
Phone:+81 3 3553 3769
Copyright 2014 Walden Research Japan Incorporated