Public transport service and use in Brussels from 1950 to 2017
32
Brussels Studies La revue scientifique électronique pour les recherches sur Bruxelles / Het elektronisch wetenschappelijk tijdschrift voor onderzoek over Brussel / The e-journal for academic research on Brussels Collection générale | 2018 Public transport service and use in Brussels from 1950 to 2017 Offre et fréquentation des transports publics bruxellois de 1950 à 2017 Aanbod en gebruik van het openbaar vervoer in Brussel van 1950 tot 2017 Vincent Carton Translator: Jane Corrigan Electronic version URL: http://journals.openedition.org/brussels/1769 DOI: 10.4000/brussels.1769 ISSN: 2031-0293 Publisher Université Saint-Louis Bruxelles Electronic reference Vincent Carton, « Public transport service and use in Brussels from 1950 to 2017 », Brussels Studies [Online], General collection, no 127, Online since 17 September 2018, connection on 21 April 2019. URL : http://journals.openedition.org/brussels/1769 ; DOI : 10.4000/brussels.1769 This text was automatically generated on 21 April 2019. Licence CC BY brought to you by CORE View metadata, citation and similar papers at core.ac.uk provided by OpenEdition
Transcript of Public transport service and use in Brussels from 1950 to 2017
Brussels Studies
La revue scientifique électronique pour les recherches
sur Bruxelles / Het elektronisch wetenschappelijk
tijdschrift voor onderzoek over Brussel / The e-journal
for academic research on Brussels Collection générale | 2018
Public transport service and use in Brussels from1950 to 2017Offre et fréquentation des transports publics bruxellois de 1950 à 2017
Aanbod en gebruik van het openbaar vervoer in Brussel van 1950 tot 2017
Vincent Carton
Translator: Jane Corrigan
Electronic versionURL: http://journals.openedition.org/brussels/1769DOI: 10.4000/brussels.1769ISSN: 2031-0293
PublisherUniversité Saint-Louis Bruxelles
Electronic referenceVincent Carton, « Public transport service and use in Brussels from 1950 to 2017 », Brussels Studies
[Online], General collection, no 127, Online since 17 September 2018, connection on 21 April 2019.URL : http://journals.openedition.org/brussels/1769 ; DOI : 10.4000/brussels.1769
This text was automatically generated on 21 April 2019.
Licence CC BY
brought to you by COREView metadata, citation and similar papers at core.ac.uk
provided by OpenEdition
Public transport service and use inBrussels from 1950 to 2017Offre et fréquentation des transports publics bruxellois de 1950 à 2017
Aanbod en gebruik van het openbaar vervoer in Brussel van 1950 tot 2017
Vincent Carton
Translation : Jane Corrigan
Introduction
1 Based on data related to STIB since 1954 and Tramways Bruxellois since 1950, this article
analyses the changes in the public transport service in terms of the different modes
(tram, bus and underground) and quantity (measured in km-convoys covered by the
vehicles or according to the length of the network in particular). It seeks to establish the
relationship between these changes as well as the variation in the number of passengers
in the network, even if this relationship is neither direct nor immediate, as many factors
intervene in the decision to travel and in the choice of mode of transport [for a summary,
see De Witte et al., 2013 and Lebrun et al., 2013]. We shall show, however, that the upward
and downward trends in the use of the Brussels network correspond with some delay to
the major trends in the service.
2 Research helps to clarify this question. In his study on urban travel habits, Vincent
Kaufmann [2003] pointed out three rationales which explain the choice of mode: the
comparative travel times, the cultural predispositions to the use of different means of
transport and the rooting of modal habits in lifestyles. Concerning the gain in time
provided by public transport, he observed that there was no automatic carryover given
the existence of different external factors such as the availability of parking spaces at the
place of work or even the perception of travel times. He also pointed out an overall
preference for the car linked to the social representations of the two modes and the
increased status of the car; the choice of public transport is in this case the result of
difficulties related to the use of the car due to parking issues or traffic congestion. Finally,
Public transport service and use in Brussels from 1950 to 2017
Brussels Studies , Collection générale
1

daily activities influence modal choices; it is difficult to reorientate them. For certain
journeys, the use of public transport is self-evident; for others, cars are always used.
Based on a typology related to a combination of specific reasons for action, Kaufmann
came to the conclusion that if there is high-quality service, the choice of public transport
constitutes a true possibility for those who have a car, but at the time of the survey (2000)
it concerned only one third of the car-owning population (those who are “receptive to the
service”). For those who do not own cars, the question of modal choice is raised in
different terms. They are forced to examine all possibilities (public transport, cycling,
walking, car sharing, etc.) for their necessary journeys and to give up certain non-
essential journeys.
3 In his study comparing the use of modes in medium-sized urban areas in France, Florian
Vanco [2013: 8] showed that “there is a correlation between the number of network
kilometres per inhabitant and the use of public transport. For example, the networks
which have implemented a number of network kilometres per inhabitant which exceeds
the median are used frequently. Other criteria such as urban form, policies to restrict car
use and service quality may also favour the frequent use of an urban public transport
network”. Vanco also shows that there is a correlation between the theoretical interval of
frequency and the use of public transport. According to Georges Bresson [2004], the
decrease in the use of public transport is above all related to the increase in car
ownership, whereas the use of public transport is quite sensitive to the volume of service
and its price.
4 We may conclude from this that the improvement of the public transport service
contributes to the use of a network, but that it constitutes only part of an urban mobility
policy.
5 The analyses of the Brussels network published until now usually cover periods of 10 to
15 years [Thiry, 1988; Delepierre-Dramais, 1990]. This article takes a step back and aims at
identifying the more long-term effects of the choices made. There is a strong inherent
inertia in this domain, related to the length of time involved in the design and realisation
of infrastructures, the requirement to take into account the works carried out to define
the network, and the amortisation period for the rolling stock. A long-term analysis is
therefore fully relevant. We shall show that, despite the inertia of the system, several
changes in direction have taken place since 1950. These decisions are considered in the
political, economic and social context of the different periods studied.
6 The following analysis opens up prospects regarding the current scope of action. Between
investments in heavy infrastructure, extension of the network, separation of trams and
buses from the traffic, increase in the size of the rolling stock and improvement of
frequencies, choices must be made. This retrospective analysis allows us to shed light on
them.
1. Method, data and indicators
7 The statistical analysis carried out here covers the period from 1950-2017 and concerns
the regional public transport operator in Brussels (and therefore not the Flemish and
Walloon operators, De Lijn and Tec, which are also active in Brussels). It covers 4 years of
network operation by Les Tramways Bruxellois and 64 by the current Société des Transports
Intercommunaux de Bruxelles (STIB).
Public transport service and use in Brussels from 1950 to 2017
Brussels Studies , Collection générale
2
8 The quantitative data used concern different facets of the transport service as well as the
evolution in the number of passengers recorded in the network. The qualitative
indicators for the transport service are not considered here (comfort, information,
availability of escalators, etc.). All of the data related to the service and its use come from
STIB annual activity reports. These are the official reports of a public limited company;
they may be consulted at the head office and on its website for the last years.
9 More precisely, the data used concern:
• the network and its geographical scope: length of route for streets covered by STIB (figure 1)
and total length of these lines (figure 2);
• the service in relation to the circulation of vehicles and their respective capacity: km-
convoys in one year (figure 3) and spaces-km provided by these vehicles (figure 4);
• the waiting time (figure 5), thanks to a calculation of the average annual frequency of
vehicles, including wide variations in time and according to the neighbourhoods [Lebrun,
2018].
10 These service indicators are used for each of the three modes (tram, bus and
underground), as well as for the entire network. They are described in the legends for the
figures; the methodological changes in 1995, 2000, 2005 and 2010 adopted by STIB in the
establishment of these series are also described. Indicators 1 to 4 and 6 are from data
collated between 1950 and 2017 for the different modes (tram, bus – including trolley
bus – underground); the other indicators (figures 5, 7, 10 and 13) are the result of a
calculation based on these data and statistics from Institut Bruxellois de Statistiques et
d’Analyse (IBSA).
Public transport service and use in Brussels from 1950 to 2017
Brussels Studies , Collection générale
3
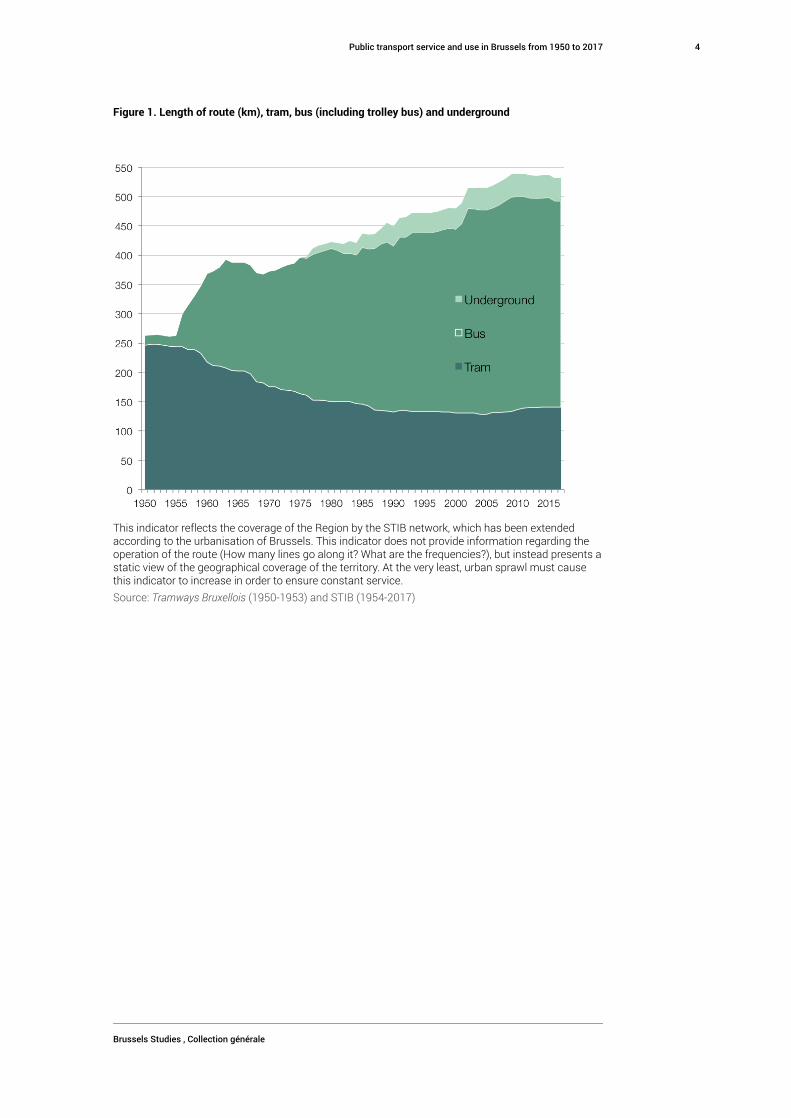
Figure 1. Length of route (km), tram, bus (including trolley bus) and underground
This indicator reflects the coverage of the Region by the STIB network, which has been extendedaccording to the urbanisation of Brussels. This indicator does not provide information regarding theoperation of the route (How many lines go along it? What are the frequencies?), but instead presents astatic view of the geographical coverage of the territory. At the very least, urban sprawl must causethis indicator to increase in order to ensure constant service.
Source: Tramways Bruxellois (1950-1953) and STIB (1954-2017)
Public transport service and use in Brussels from 1950 to 2017
Brussels Studies , Collection générale
4
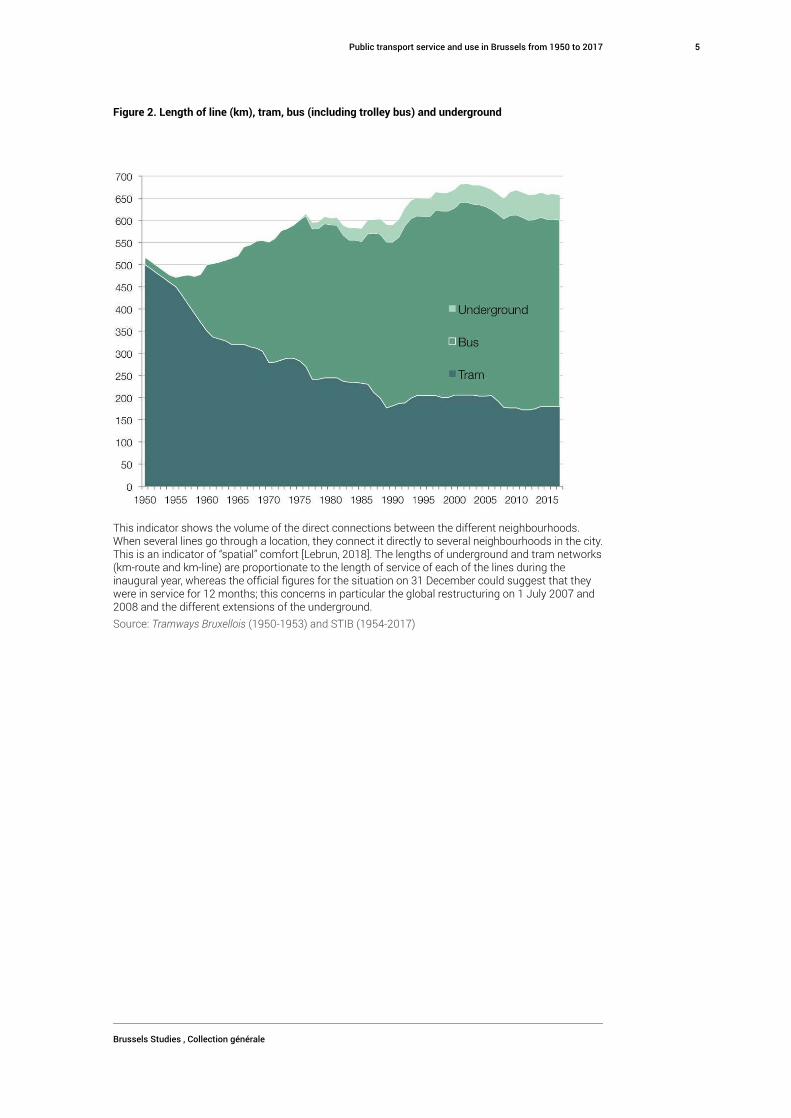
Figure 2. Length of line (km), tram, bus (including trolley bus) and underground
This indicator shows the volume of the direct connections between the different neighbourhoods.When several lines go through a location, they connect it directly to several neighbourhoods in the city.This is an indicator of “spatial” comfort [Lebrun, 2018]. The lengths of underground and tram networks(km-route and km-line) are proportionate to the length of service of each of the lines during theinaugural year, whereas the official figures for the situation on 31 December could suggest that theywere in service for 12 months; this concerns in particular the global restructuring on 1 July 2007 and2008 and the different extensions of the underground.
Source: Tramways Bruxellois (1950-1953) and STIB (1954-2017)
Public transport service and use in Brussels from 1950 to 2017
Brussels Studies , Collection générale
5
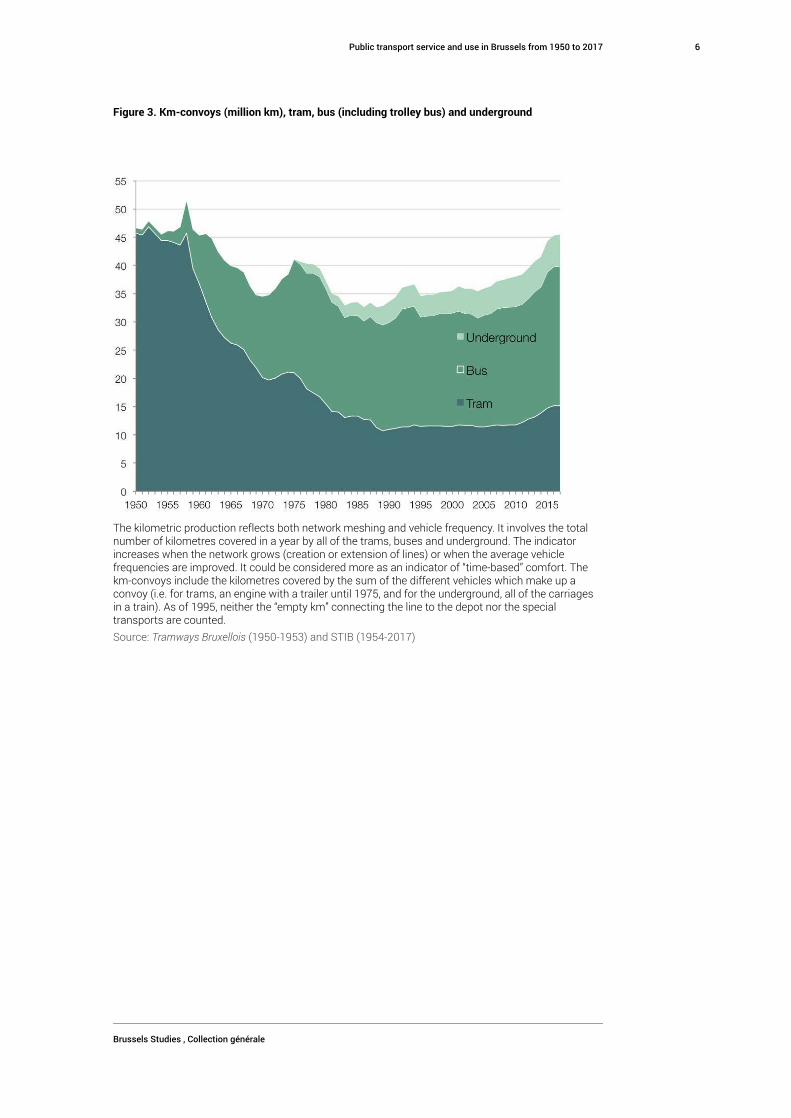
Figure 3. Km-convoys (million km), tram, bus (including trolley bus) and underground
The kilometric production reflects both network meshing and vehicle frequency. It involves the totalnumber of kilometres covered in a year by all of the trams, buses and underground. The indicatorincreases when the network grows (creation or extension of lines) or when the average vehiclefrequencies are improved. It could be considered more as an indicator of “time-based” comfort. Thekm-convoys include the kilometres covered by the sum of the different vehicles which make up aconvoy (i.e. for trams, an engine with a trailer until 1975, and for the underground, all of the carriagesin a train). As of 1995, neither the “empty km” connecting the line to the depot nor the specialtransports are counted.
Source: Tramways Bruxellois (1950-1953) and STIB (1954-2017)
Public transport service and use in Brussels from 1950 to 2017
Brussels Studies , Collection générale
6
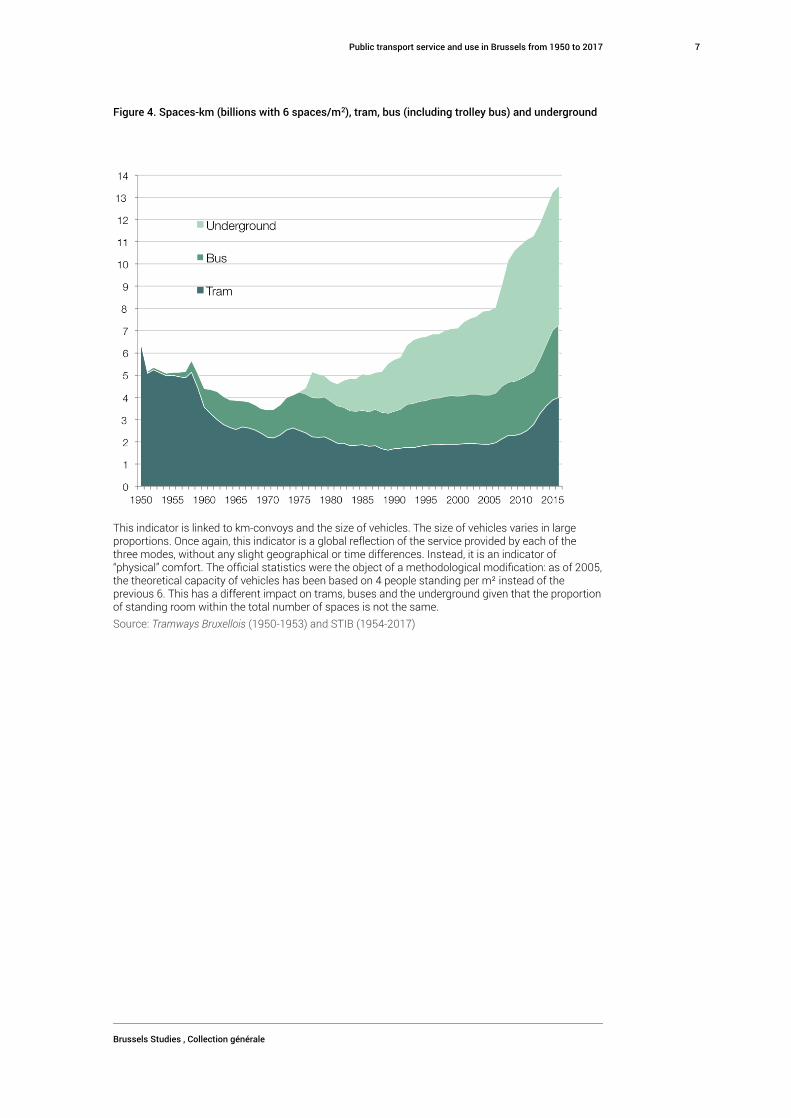
Figure 4. Spaces-km (billions with 6 spaces/m2), tram, bus (including trolley bus) and underground
This indicator is linked to km-convoys and the size of vehicles. The size of vehicles varies in largeproportions. Once again, this indicator is a global reflection of the service provided by each of thethree modes, without any slight geographical or time differences. Instead, it is an indicator of“physical” comfort. The official statistics were the object of a methodological modification: as of 2005,the theoretical capacity of vehicles has been based on 4 people standing per m² instead of theprevious 6. This has a different impact on trams, buses and the underground given that the proportionof standing room within the total number of spaces is not the same.
Source: Tramways Bruxellois (1950-1953) and STIB (1954-2017)
Public transport service and use in Brussels from 1950 to 2017
Brussels Studies , Collection générale
7
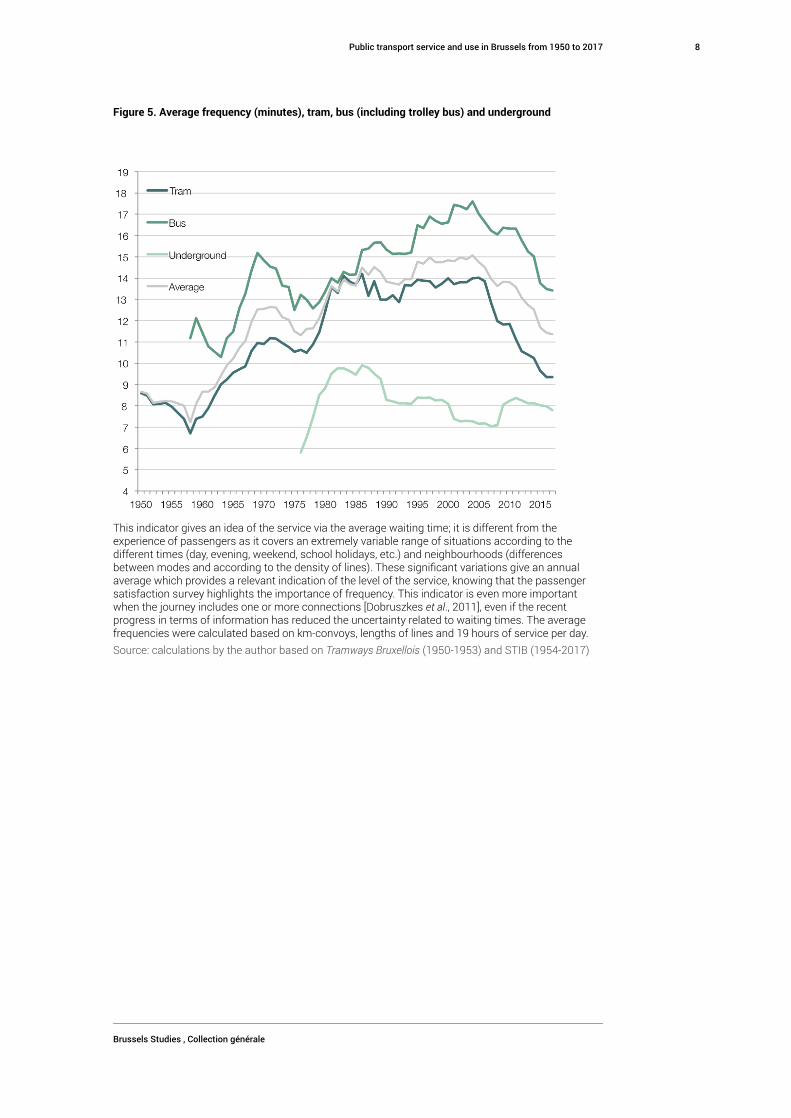
Figure 5. Average frequency (minutes), tram, bus (including trolley bus) and underground
This indicator gives an idea of the service via the average waiting time; it is different from theexperience of passengers as it covers an extremely variable range of situations according to thedifferent times (day, evening, weekend, school holidays, etc.) and neighbourhoods (differencesbetween modes and according to the density of lines). These significant variations give an annualaverage which provides a relevant indication of the level of the service, knowing that the passengersatisfaction survey highlights the importance of frequency. This indicator is even more importantwhen the journey includes one or more connections [Dobruszkes et al., 2011], even if the recentprogress in terms of information has reduced the uncertainty related to waiting times. The averagefrequencies were calculated based on km-convoys, lengths of lines and 19 hours of service per day.
Source: calculations by the author based on Tramways Bruxellois (1950-1953) and STIB (1954-2017)
Public transport service and use in Brussels from 1950 to 2017
Brussels Studies , Collection générale
8
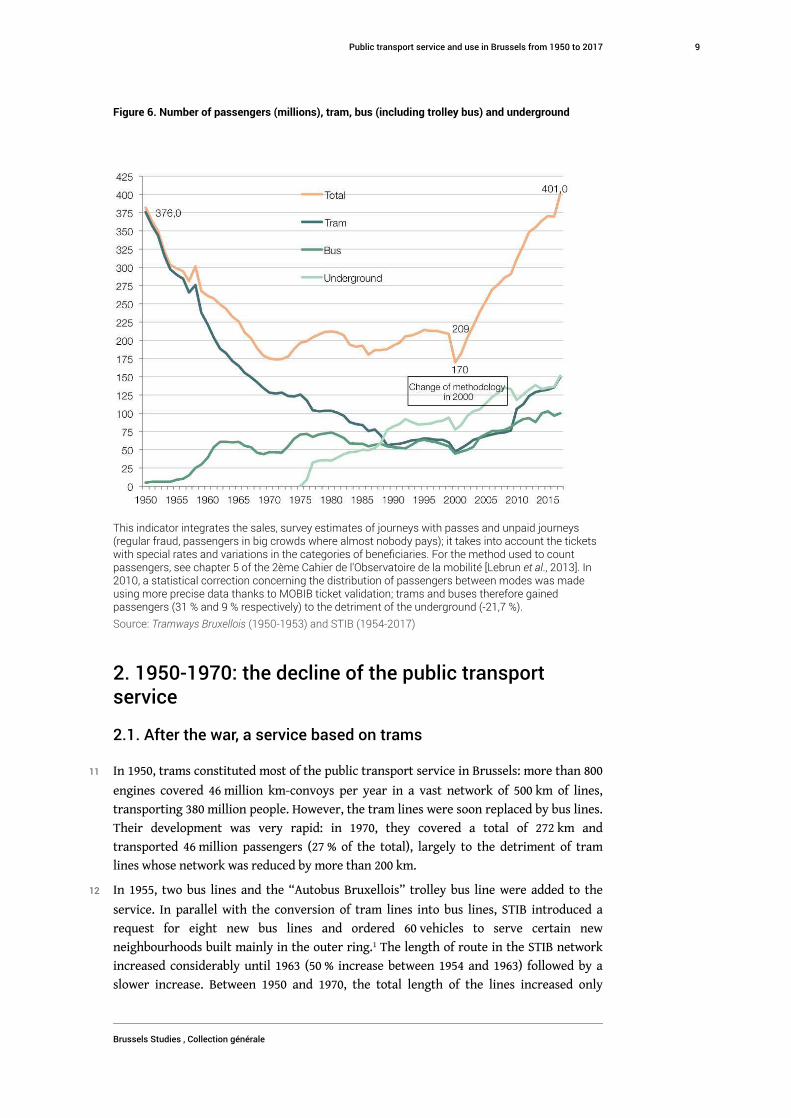
Figure 6. Number of passengers (millions), tram, bus (including trolley bus) and underground
This indicator integrates the sales, survey estimates of journeys with passes and unpaid journeys(regular fraud, passengers in big crowds where almost nobody pays); it takes into account the ticketswith special rates and variations in the categories of beneficiaries. For the method used to countpassengers, see chapter 5 of the 2ème Cahier de l'Observatoire de la mobilité [Lebrun et al., 2013]. In2010, a statistical correction concerning the distribution of passengers between modes was madeusing more precise data thanks to MOBIB ticket validation; trams and buses therefore gainedpassengers (31 % and 9 % respectively) to the detriment of the underground (-21,7 %).
Source: Tramways Bruxellois (1950-1953) and STIB (1954-2017)
2. 1950-1970: the decline of the public transportservice
2.1. After the war, a service based on trams
11 In 1950, trams constituted most of the public transport service in Brussels: more than 800
engines covered 46 million km-convoys per year in a vast network of 500 km of lines,
transporting 380 million people. However, the tram lines were soon replaced by bus lines.
Their development was very rapid: in 1970, they covered a total of 272 km and
transported 46 million passengers (27 % of the total), largely to the detriment of tram
lines whose network was reduced by more than 200 km.
12 In 1955, two bus lines and the “Autobus Bruxellois” trolley bus line were added to the
service. In parallel with the conversion of tram lines into bus lines, STIB introduced a
request for eight new bus lines and ordered 60 vehicles to serve certain new
neighbourhoods built mainly in the outer ring.1 The length of route in the STIB network
increased considerably until 1963 (50 % increase between 1954 and 1963) followed by a
slower increase. Between 1950 and 1970, the total length of the lines increased only
Public transport service and use in Brussels from 1950 to 2017
Brussels Studies , Collection générale
9
slightly (by 7 %). The network therefore expanded geographically but decreased in terms
of density, in particular in the central part of the city. Even though it is considered as
“indispensable to urban prosperity”2 given that private means of transportation cannot
be used for all journeys, the disinvestment in the tram was a reality.
13 Overall, the quality of the service worsened during this period (with the exception of the
efforts made for the 1958 World's Fair, the only true anticipated development): the
average frequencies of the buses were far lower than those of the trams which they
replaced (approximately a twelve- and eight-minute wait respectively). The service
expressed in km-convoys (-36 %) and above all in spaces-km (-47 %) worsened steadily
until 1970, despite the rapid expansion of the bus network. While the buses produced
1,3 billion spaces-km, the tram service was reduced to 4,2 billion spaces-km, i.e. a 65 %
decrease. The decrease in the average frequencies was clear in this respect: the waiting
time increased from one vehicle every six or seven minutes on average to one vehicle
every twelve minutes.
14 In Belgium and even more so in the big cities, most journeys at the time were made by
public transport.3 But the rising standard of living, the decrease in the cost of fuel in
inflation-adjusted francs, and the marketing of cheaper cars4 prompted more and more
households to buy a car. Due to this evolution, those responsible were convinced that the
future belonged to the car. The decisions were all pointed in the same direction: the
public transport service was reduced in order to adapt to the demand, and in reality as a
cost-saving measure, whereas impressive road infrastructures were built throughout the
entire country and in Brussels in particular (tunnels in the inner ring, Leopold II viaduct,
etc.). The first signs of road congestion alarmed those responsible, who decided to
earmark significant resources to increasing road capacity in view of “making the Belgian
road network one of the foremost in Europe” [Ministère des Travaux Publics, 1956: 1].
15 All of this took place within the framework of a certain consensus: “the urban middle
class belonged to the model of periurbanisation, car ownership and indifference towards
– and even disregard for – urban public transport” [Vandermotten, 2014: 181]. Society is
experiencing a true change in culture and practices involving a heightened use of cars:
Americanisation of lifestyles, emergence of a “desire for cars” [Ansay, 1997], beginning of
the middle class exodus towards the outskirts of Brussels via a disconnection between
places of work and residence, and the reinvestment in higher speeds for greater
distances.
16 Having observed the same process in the United States, Jane Jacobs [1960: 360] had
already recommended a “development of the public transport system in order to meet
the increasing demand, and anticipate this demand, in the same way that the decline of
this system was caused by a drop in demand and an anticipation of this drop”.
2.2. The unpopular tram and the global service in free fall
17 The (car-owning) population as well as political decision-makers at the time had lost faith
in trams: they blocked cars at stops, they were often blocked due to their rigid structure,
they were difficult to access with their floors 90 cm off the ground, and they were an
image of the past. Buses, on the other hand, were flexible, modern and above all cheaper
to operate and invest in as they did not require their own infrastructure. They
constituted the ideal means to serve the new neighbourhoods in the outer ring of
Brussels where single-family dwellings were being built as well as “groups of high-rise
Public transport service and use in Brussels from 1950 to 2017
Brussels Studies , Collection générale
10
blocks of luxury flats in co-ownership intended for the more or less well-off middle class”
[Vandermotten, 2014: 168].
18 The bus network also developed in parallel with the resumption of many tram lines. At
the same time, many European cities were more radical, by simply removing their tram
networks altogether. In Brussels, the reorganisation of the tram network is pronounced
in the centre and the inner ring.
19 In “Le retour de la bicyclette”, Frédéric Hérant [2014: 50] provides a comparative
explanation of the disappearance of trams in European countries. He noticed that this
widespread disappearance in France5 and the United Kingdom – unlike Germany and
Belgium for example – is related to several phenomena: “the tidal wave of cars
everywhere constitutes the main explanation”, but it is not enough: France and the
United Kingdom have a very liberal design of urban transport according to which
operators are responsible for their own profitability and users must pay for the service.
The modernisation investment is therefore reduced to a minimum, and buses are a much
more profitable solution.
20 The need for extensive service for Expo '58 also explains the preservation of a tram
network in Brussels [Hubert, 2008]. In order to guarantee the accessibility of the Heysel
site, a huge effort was made: separate lanes for trams in the large avenues and an
increased service thanks to the purchase of one hundred trams from the 7000 series. But,
the following year, there was a sharp decline in the service due to economic reasons.
21 Despite Expo '58, the entire period between 1950 and 1970 was characterised by a
significant reduction in the attractiveness of public transport, which was often crowded
during rush hour. This led to a huge loss of close to 100 million passengers during both
decades. During this period, there was a 46 % reduction in the spaces-km, whereas the
population increased by 10 %, mainly in the outer ring. This significant reduction in the
service took the inhabitants of Brussels by surprise: 1965 was characterised by a record
occupancy rate in public transport vehicles (9,5 % more in trams than in 1950, when
trams were already full) (figure 7). Passengers did not abandon trams as soon as there was
a reduction in the service. The decision to decrease the service was therefore in all
likelihood accelerated by car ownership by households and resulted in a decrease in the
use of public transport, whose service was then adapted to meet the lower demand.
Public transport service and use in Brussels from 1950 to 2017
Brussels Studies , Collection générale
11
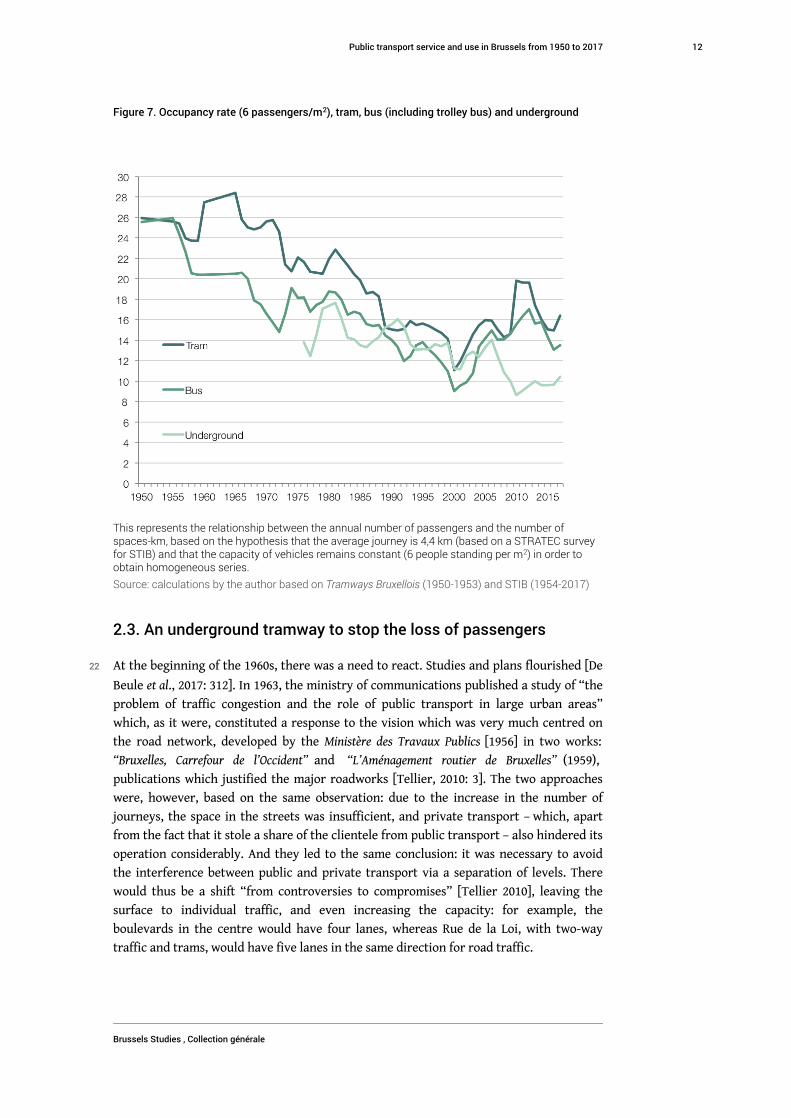
Figure 7. Occupancy rate (6 passengers/m2), tram, bus (including trolley bus) and underground
This represents the relationship between the annual number of passengers and the number ofspaces-km, based on the hypothesis that the average journey is 4,4 km (based on a STRATEC surveyfor STIB) and that the capacity of vehicles remains constant (6 people standing per m2) in order toobtain homogeneous series.
Source: calculations by the author based on Tramways Bruxellois (1950-1953) and STIB (1954-2017)
2.3. An underground tramway to stop the loss of passengers
22 At the beginning of the 1960s, there was a need to react. Studies and plans flourished [De
Beule et al., 2017: 312]. In 1963, the ministry of communications published a study of “the
problem of traffic congestion and the role of public transport in large urban areas”
which, as it were, constituted a response to the vision which was very much centred on
the road network, developed by the Ministère des Travaux Publics [1956] in two works:
“Bruxelles, Carrefour de l’Occident” and “L’Aménagement routier de Bruxelles” (1959),
publications which justified the major roadworks [Tellier, 2010: 3]. The two approaches
were, however, based on the same observation: due to the increase in the number of
journeys, the space in the streets was insufficient, and private transport – which, apart
from the fact that it stole a share of the clientele from public transport – also hindered its
operation considerably. And they led to the same conclusion: it was necessary to avoid
the interference between public and private transport via a separation of levels. There
would thus be a shift “from controversies to compromises” [Tellier 2010], leaving the
surface to individual traffic, and even increasing the capacity: for example, the
boulevards in the centre would have four lanes, whereas Rue de la Loi, with two-way
traffic and trams, would have five lanes in the same direction for road traffic.
Public transport service and use in Brussels from 1950 to 2017
Brussels Studies , Collection générale
12
23 At the time, the compromise consisted officially in promoting the creation of an
underground tramway in the most congested parts of the city. The ministry of
communications [1963: 42] considered that “the biggest concentrations of tram lines in
the boulevards of the centre and the east inner ring do not exceed 10 000 spaces per
hour”, which is too low considering the 25 to 50 000 spaces which could be provided by
the underground. Thus, “rather than creating a metropolitan railway or a monorail, the
creation of an underground tramway which would be limited to the areas where the
general traffic reaches a critical level of congestion, appeared to be a solution which was
more in keeping with the true needs in terms of traffic, and which would cut investment
costs”. The report added: “The beginnings of the underground networks (…) could be
transformed into a true metropolitan railway when all of the conditions which justify
economically the application of this mode of transport are created”. But soon after the
start of works in 1965, there was a call for a true underground. Public Works were in
favour of a more radical solution: a true underground without further delay [Delmelle,
1986: 56]. This position was also backed by the representatives of Tramways Bruxellois who
held the management positions at STIB [Laconte et al., 2016: 11].
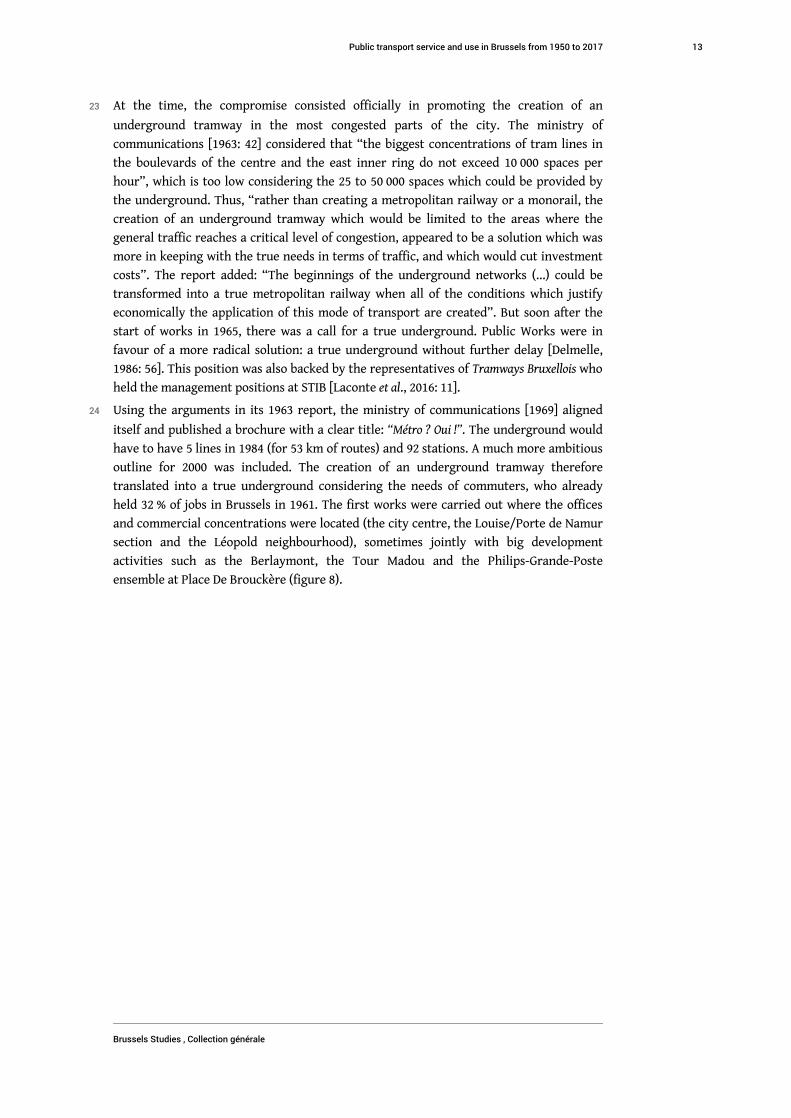
24 Using the arguments in its 1963 report, the ministry of communications [1969] aligned
itself and published a brochure with a clear title: “Métro ? Oui !”. The underground would
have to have 5 lines in 1984 (for 53 km of routes) and 92 stations. A much more ambitious
outline for 2000 was included. The creation of an underground tramway therefore
translated into a true underground considering the needs of commuters, who already
held 32 % of jobs in Brussels in 1961. The first works were carried out where the offices
and commercial concentrations were located (the city centre, the Louise/Porte de Namur
section and the Léopold neighbourhood), sometimes jointly with big development
activities such as the Berlaymont, the Tour Madou and the Philips-Grande-Poste
ensemble at Place De Brouckère (figure 8).
Public transport service and use in Brussels from 1950 to 2017
Brussels Studies , Collection générale
13
Figure 8. Excerpt from brochure N°4 of the Brussels underground for De Brouckère station (1969)
Source: collection V. Carton
25 During these years and until the creation of the Brussels-Capital Region in 1989, the
decisions in the area of road and underground infrastructures were taken by national
ministers and not Brussels ministers,6 with no resistance from the municipalities which
would have to endure these major works. Technical choices were made without
necessarily considering the urbanistic impacts or the needs of users, captive for the most
part.
26 In order to calibrate the road and public transport infrastructures scientifically, the
technicians made use of American traffic engineering methods [Lannoy, 2003]. One must
be aware that the more the schematisation of networks necessary for modelling
concentrates the flow of passengers on certain routes, the easier it is to justify high-
volume infrastructures (viaducts, road tunnels or underground). An example is given by
the simulation carried out for the SOBEMAP study in 1983: “with a scattered network of
lines beginning at Rue du Progrès, the results were not in favour of the extension of the
tunnels beyond the North Station”, contrary to the South Station-Albert branch [van den
Hove, 2007: 26]. In this perspective, the network was restructured in 1967 by removing
the small lines to the benefit of the two central routes (boulevards in the centre and the
east/west route) in preparation for their move underground. It was the beginning of the
shift from a meshed network towards a hierarchical network.
27 To sum up, based on the triple observation of the loss of passengers, the decrease in
network efficiency due to an increase in road traffic, and the deterioration of STIB
accounts, the decision was taken to make large investments in the creation of an
underground tram network, and thus make room on the surface for car traffic.
Public transport service and use in Brussels from 1950 to 2017
Brussels Studies , Collection générale
14
3. 1970-1975: the interlude
28 The beginning of the 1970s was marked by the awareness of environmental challenges,
pollution caused by car traffic and the energy question on the occasion of the first oil
crisis in 1973. From then on, for the first time since the war and therefore after a long
period of deterioration of the public transport service, it was improved over a few years:
+14 % of km-convoys between 1970 and 1975 and almost the same service maintained
until 1979. This result was obtained thanks to better frequencies in the tram and bus
networks, as well as an extension of the latter. The number of spaces-km increased. To
achieve this, the means were reinforced by the purchase of rolling stock and the massive
recruitment of staff, whose numbers rose from 5 118 in 1970 to 5 769 in 1975 (and even
6 784 in 1981). This was made possible thanks to a (temporary) increase in the STIB
allocation, although the very high inflation at the time (12,8 % in 1975) puts this into
perspective.
29 Amid this questioning of the future role of cars, there was unanimity regarding the
realisation of the project for the underground: politicians, unions, associations and public
opinion. This is testified by the fact that in 1972, in view of accelerating the works under
the boulevards in the centre, the City of Brussels borrowed € 255 million (in inflation-
adjusted francs, 2018) and the Greater Brussels Council attempted to do the same, before
it was blocked by its administrative power.
30 This reinforcement of the service soon coincided with an increase in the number of
passengers. The fares were part of the explanation: they were slightly raised at a time
when inflation was high, which means that in inflation-adjusted francs, they decreased by
41 % between 1970 and 1975 [Thiry, 1988: 64]. Due to inertia in the system, this increase
was observed for three more years despite the deterioration in the frequency of trams
and buses and even that of the new underground, but at the cost of a 15 % increase in the
average occupancy rate (figure 7). The individual choices of travel mode did not change
overnight.
4. From 1976 to 1989, austerity and controversy withrespect to the underground
4.1. Contrasted evolution of the service for 13 years
31 With the implementation of the underground on 20 September 1976, the network
configuration and the nature of the service evolved. The common core of the east-west
route operated via underground was replaced by longer tram lines which went through
as a prémétro, causing a change towards a more hierarchical network and operating as
feeders in the direction of underground stations. Two indicators increased during these
13 years: the length of the route increased by 15 % (33 km of underground and 57 km of
buses greatly compensated for the 22 km loss for the tramway, but not the removal of
94 km of tram lines) and the number of spaces-km increased by 25 %, mainly thanks to
the large capacity of underground trains which allowed an improvement in productivity.
However, in order to reduce operational costs, the average frequencies were decreased by
26 % during this period and the km-convoys by 19 %,7 reaching their historical low of
33 million (compared to 45 million in 2017) from 1983 to 1989. This drop in frequencies
Public transport service and use in Brussels from 1950 to 2017
Brussels Studies , Collection générale
15
was sudden: for example, from the winter of 1979-80 and the spring of 1981, surface
network frequencies decreased by 28,3 % (32,6 % for trams and 27,7 % for buses).8 Soon
after its inauguration, the underground was also a victim of economies: the average
interval between two trains was almost doubled.
32 This contrasted evolution after the implementation of the underground service
corresponded to a concentration in the global service: more spaces-km but longer waiting
time and additional connections. In other words, the upturn at the beginning of the 1970s
was followed by a significant transformation of the service. In addition, the increase in
the number of passengers during the 1970s levelled out. The number of passengers
decreased again in 1980 when the km-convoys for buses were also starting to decrease.
This highlights the fact that underground public transport and the operation of
underground trains were not enough to make up for the decrease in the number of
passengers. High frequencies throughout the entire network is a determining factor.
4.2. The budget restrictions at the end of the 1970s and the 1980s
33 At the head of the ministry of communications from 1974 to 1980, Minister Chabert
imposed a reduction of the operating deficit (reorganisation, increased fares, etc.).
Contrary to the preceding period, the fares increased more than inflation beginning in
1976, and in 1975, the credit for covering the operating deficit was capped [Thiry, 1988:
44].
34 Even if the wearing away of the tram network was ongoing (among others during the
conversions of the prémétro into an underground), these economies – reinforced in 1982 –
caused a decrease in the service as a whole beginning in 1978, for more than 10 years: the
budgets earmarked for the operation of public transport were reduced for the entire
country. The liberal/social Christian government in 1981 implemented stricter austerity
measures. Despite the new underground, there was another decline in the number of
passengers which, from 1986 to 1989, reached the historic low seen at the beginning of
the 1970s. The remedy for this did not have the expected results, but no one spoke of it. In
1982, Minister Herman De Croo implemented royal decrees for the improvement in the
rate of coverage of operating costs through traffic revenue which was 28,4 % at the time.9
In concrete terms, this decision led to hiring freezes, reduced maintenance, a delay in the
purchase of buses, an increase in fares, etc. The proposal to reduce the network
drastically after 8 pm was soon abandoned following the fierce protests of associations of
users. Between 1981 and 1990, STIB lost one quarter of its staff. The budget policy
prevailed over mobility challenges, even if, thanks to the increase in productivity, the
service was not reduced in the same proportions: the number of km-convoys produced
per employee increased by 16 % between 1981 and 1986, but given the drop in use, the
number of passengers transported did not change and the occupancy rate of vehicles
dropped by 20,6 % [Thiry, 1988: 68].
4.3. New stakeholders open the debate on the underground
35 Created in 1973, the Greater Brussels Council resumed the rightful place of the
municipalities in the managing bodies of STIB. In its search for legitimacy, it promoted a
more Brussels-based approach advocated among others by deputy burgomaster Serge
Moureaux. In the 1980s, he began to question the national policies centred on commuting
Public transport service and use in Brussels from 1950 to 2017
Brussels Studies , Collection générale
16
and the development of heavy and traumatising road and public transport
infrastructures. The options were debated: round tables, public surveys, etc.
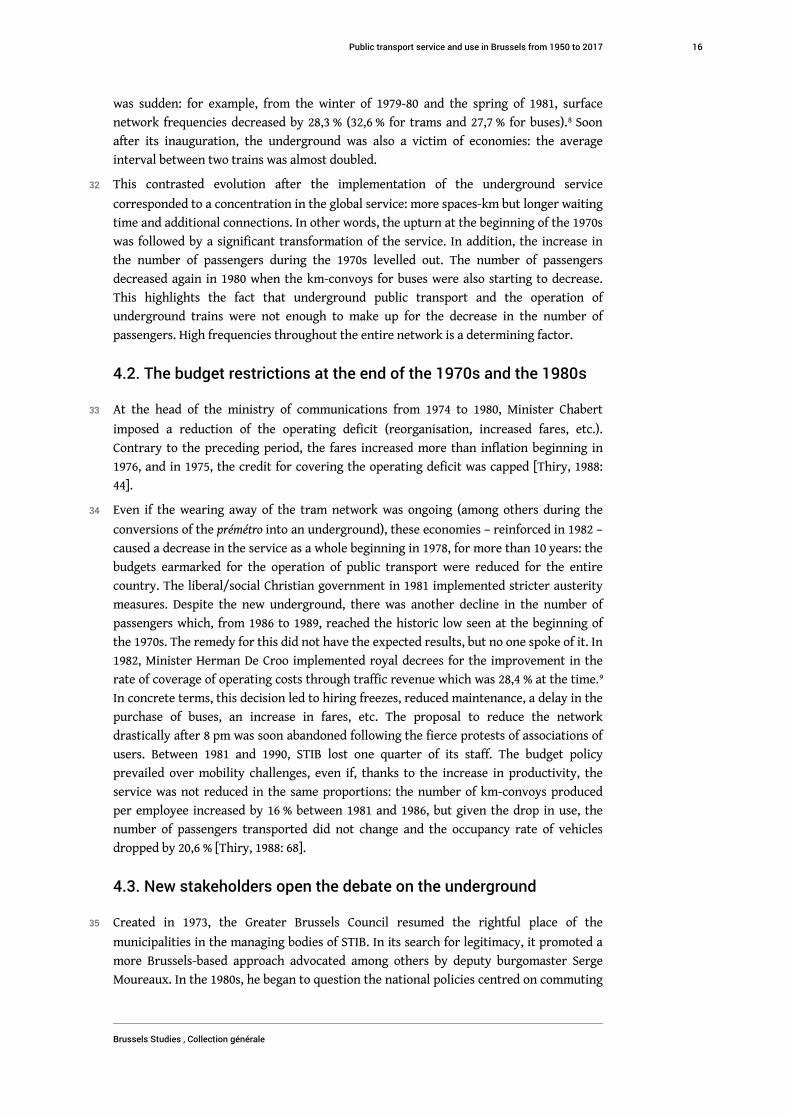
[Schoonbrodt, 2007: 187]. In order to defend its position, the Greater Council organised an
international conference on “The Future of Urban Transport” [Greater Brussels Council,
1985] and published several studies [Carton et al., 1986 and Carton, 1986] (figure 9).
Figure 9. Coverage of the proceedings from the conference “The Future of Urban Transport”organised by the Greater Brussels Council (1985)
Source: collection V. Carton, illustration: François Schuiten
36 Other stakeholders which were increasingly present in the debate on the city were the
citizen groups (neighbourhood or theme-based) such as ARAU, Ligue des Familles and the
federations Inter-Environnement-Bruxelles (IEB) and Brusselse Raad voor het Leefmilieu (BRAL).
The threats to the public transport service prompted them to unite in 1980 in the
creation of Rassemblement pour une Autre Politique de Déplacement (RAPD). It was opposed to
the light rail project promoted by some and to the withdrawal of tram lines (58 and 62,
for example). ARAU [1980] organised its annual Ecole Urbaine on the promotion of a high-
frequency meshed network in opposition to the hierarchical and concentrated network
promoted by STIB and the Minister.
37 This period therefore saw a renewal of discussions regarding the choices in terms of
short-term (operation) and long-term (infrastructures) service.
38 For his part, with his drastic approach to the operating budget, the Minister had no
problem undertaking significant investment expenditure (via loans) in order to continue
the extension of the underground network and reduce the surface network. His objective
was to improve the rate of coverage of costs through revenue; with the increase in
productivity, this rate increased from 28,4 to 32 % in 1986, but of course did not take into
consideration the depreciation of investments.
Public transport service and use in Brussels from 1950 to 2017
Brussels Studies , Collection générale
17
39 At the Minister’s request, in 1983 SOBEMAP studied restructuring scenarios for the STIB
network focusing more on the development of the underground and buses and reducing
the tram network to a minimum, as it was considered to be the most expensive. The
“neighbourhood” trams such as lines 81 (through Saint-Gilles), 93 (Place Brugmann) and
22 (Porte de Namur) were targeted. However, due to their location, their clientele were
not influenced by rush hour and therefore they had a global occupancy rate which was
higher despite the traffic difficulties they encountered.
40 This approach and the abovementioned royal decrees brought together the Secretary of
State of the Brussels-Capital Region, the Conference of Bourgomasters, the Greater
Brussels Council and the citizen groups. For them, the tram network also had to be
developed and priority had to be given to the improvement of the commercial speed of
trams and buses, a policy referred to as VICOM, which is now called AVANTI.
41 The 1970s unanimity in favour of the underground was broken. This strong mobilisation
did not prevent the major change in terms of the service on 2 October 1988 with the
conversion of the prémétro in the eastern part of the inner ring into heavy rail, 10 thus
removing many direct connections made with six tram lines between the “upper city”
and many neighbourhoods.11 A 7 km underground line from the South Station to Simonis
replaced these six lines which each covered an average distance of 11,6 km, involving
many additional connections [see Dobruszkes et al., 2011 regarding the arduousness
represented by this]. These debates and the scarcity of financial means led to certain
projects being given up12 and to a spacing out of worksites over time.
5. The 1990s: the Brussels-Capital Region makes itschoices
5.1. The new Region promotes the surface network
42 When the Brussels-Capital Region was created in 1989,13 the inhabitants of Brussels had
the power to decide on the future of their transport, but in a limited budgetary context
and alongside a federal state in charge of the RER and, a little while later, Beliris.14 The
Region became the organising authority for STIB, took over for the Greater Brussels
Council within STIB and, at the initiative of Minister Jean-Louis Thys, launched a
reorientation of the mobility policy: elaboration of a mobility plan (IRIS plan), withdrawal
of the STIB Service Spécial d’Etude,15 and adoption of the first management contract with
the transport operator in 1991.16 Through this contract, the Region committed itself to
earmarking a guaranteed allocation to STIB which had to ensure a determined level of
transport service. The Region also began a gradual reorganisation of public spaces in
favour of active modes and public transport [Brandeleer et al., 2016]. Of course, this
evolution has been slow and is far from over.
43 Aware of the fundamental challenge of an alternative to cars in a context of a steady
increase in traffic, the Region decided to boost the STIB service, beginning with the most
flexible mode – the bus – whose service had decreased by 18 % from 1979 to 1986. At this
time, the tram network was no longer considered as a network waiting to be replaced by
the underground, with the exception of the lines located in the area of influence of the
future underground. On the contrary, a line was soon restored (Rue de Stalle in 1991),
another was extended (the 55 to Bordet in 1993), the rolling stock was renewed (the 2000
Public transport service and use in Brussels from 1950 to 2017
Brussels Studies , Collection générale
18
series trams: first trams with a low floor in Brussels) and the underground works which
were ending allowed a 2 km extension (Bizet and Clémenceau). For the first time since
1950, the rail network was not reduced. Even if the infrastructure policy did not break
with the past completely given the worksites and the weight of technical bodies [Tellier et
al., 2013], it nevertheless constituted the beginning of a true change in terms of the
allocation of available means, which had decreased significantly following the
regionalisation. Overall, the public transport service was beginning to improve. For the
first time in 1990, the tram won back some passengers, in parallel with the underground
and the bus.
5.2. 1995, a mixed political reorientation
44 As part of the governmental declaration of 1989, the extension of the underground to
“Erasme” university hospital illustrated the desire to reach the development poles on the
outskirts, but without any anticipation, as the decision for the establishment at this
location dated back to 1969. For ULB, this extension “was an obvious fact, just like the
underground to the Louvain-en-Woluwe site, which was inaugurated in 1982” [Telex
1992]. The studies were begun in 1990, but it was not until the arrival in the government
in 1995 of Minister Hervé Hasquin, former chancellor and chairman of the board at ULB,
that the project was launched and ended with its inauguration on 15 September 2003. As
the budgets were not huge, the Minister was able to impose the pertinent choice to build
the line economically (not very deep and single central platform).
45 After an excellent annual increase of 2,1 % of km-convoys covered between 1989 and
1994, there was a return to a low increase of 0,4 % between 199517 and 2005. During this
entire period, the frequencies of trams and buses stagnated: the average frequency was
close to 17 minutes for buses and 14 minutes for trams, i.e. twice that of the 1950s. Only
the underground frequencies had improved slightly. Network use slowed down (-2 % from
1995 to 1999), but remained at a high level.
6. The 2000s: almost double the level of service
6.1. Rapidly evolving context and mobility
46 Brussels has been changing: there has been a trend reversal in terms of population, with
an increase of 232 000 inhabitants from 2000 to 2017;18 the number of jobs, just under
50 % of which are held by commuters, increased by 92 000 between 2002 and 2016, as well
as the number of students. Compared to 1950, employment in 2016 increased by 58 %, the
population by 24 % and STIB clientele by 5 % (figure 10).
Public transport service and use in Brussels from 1950 to 2017
Brussels Studies , Collection générale
19
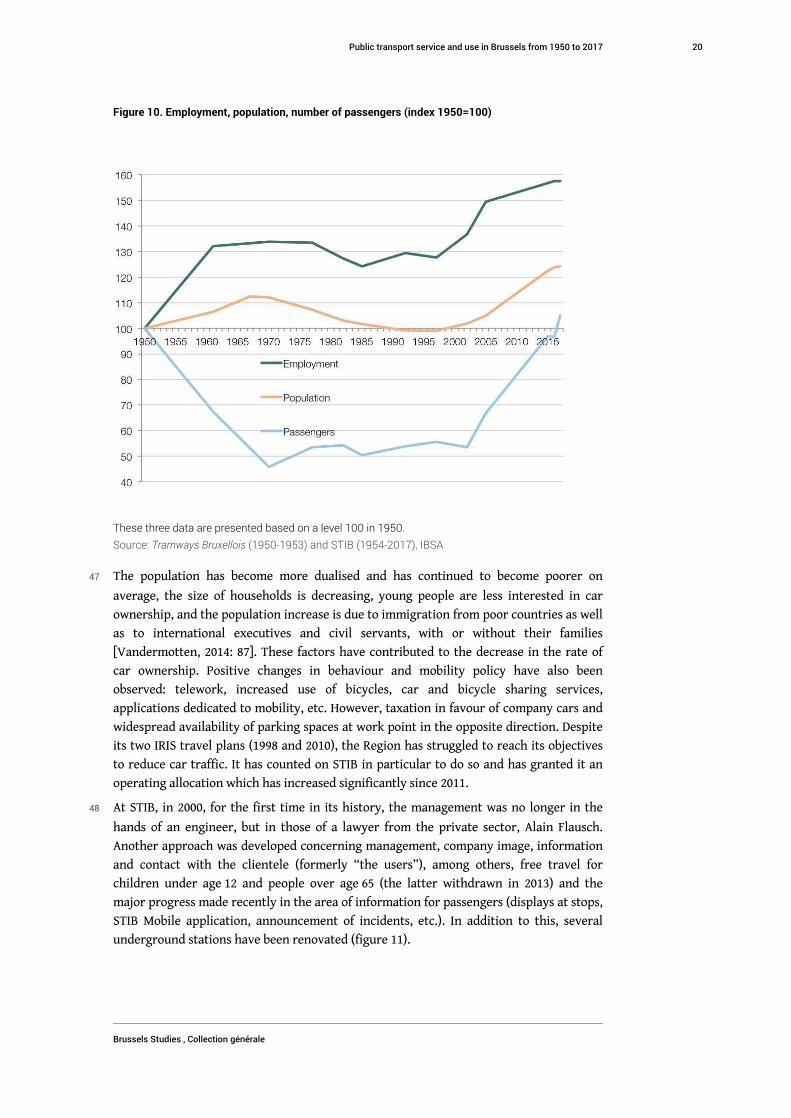
Figure 10. Employment, population, number of passengers (index 1950=100)
These three data are presented based on a level 100 in 1950.
Source: Tramways Bruxellois (1950-1953) and STIB (1954-2017), IBSA
47 The population has become more dualised and has continued to become poorer on
average, the size of households is decreasing, young people are less interested in car
ownership, and the population increase is due to immigration from poor countries as well
as to international executives and civil servants, with or without their families
[Vandermotten, 2014: 87]. These factors have contributed to the decrease in the rate of
car ownership. Positive changes in behaviour and mobility policy have also been
observed: telework, increased use of bicycles, car and bicycle sharing services,
applications dedicated to mobility, etc. However, taxation in favour of company cars and
widespread availability of parking spaces at work point in the opposite direction. Despite
its two IRIS travel plans (1998 and 2010), the Region has struggled to reach its objectives
to reduce car traffic. It has counted on STIB in particular to do so and has granted it an
operating allocation which has increased significantly since 2011.
48 At STIB, in 2000, for the first time in its history, the management was no longer in the
hands of an engineer, but in those of a lawyer from the private sector, Alain Flausch.
Another approach was developed concerning management, company image, information
and contact with the clientele (formerly “the users”), among others, free travel for
children under age 12 and people over age 65 (the latter withdrawn in 2013) and the
major progress made recently in the area of information for passengers (displays at stops,
STIB Mobile application, announcement of incidents, etc.). In addition to this, several
underground stations have been renovated (figure 11).
Public transport service and use in Brussels from 1950 to 2017
Brussels Studies , Collection générale
20
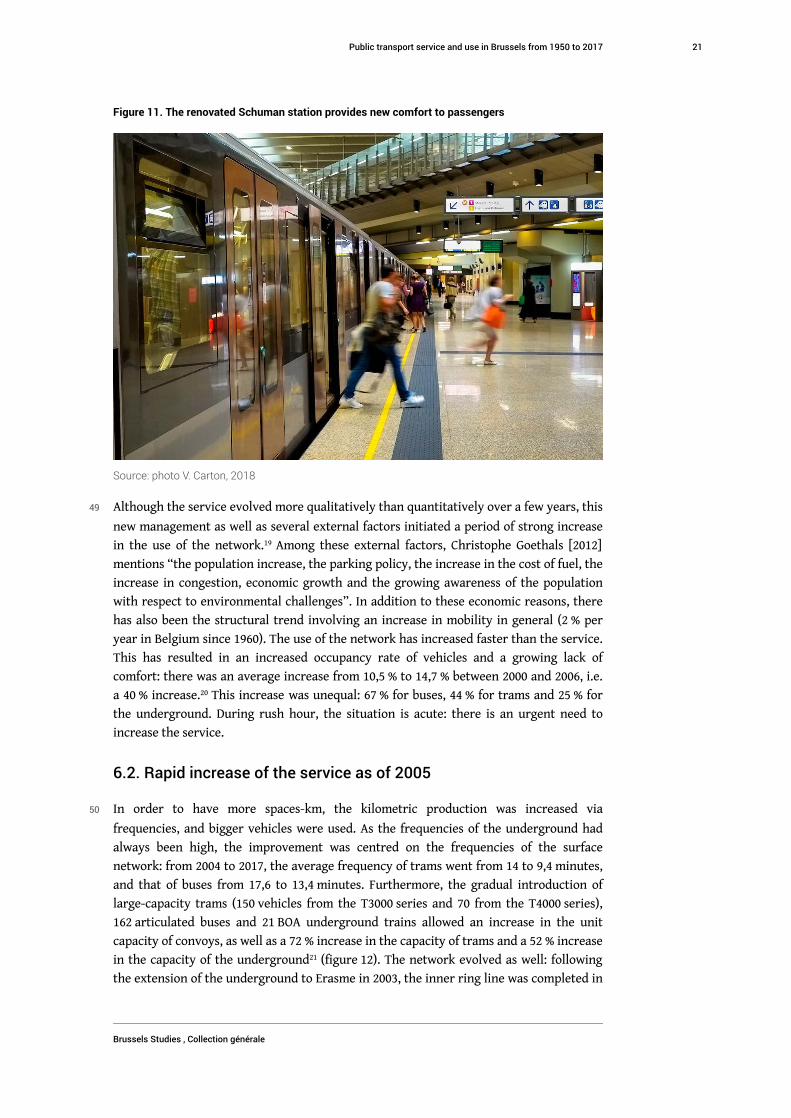
Figure 11. The renovated Schuman station provides new comfort to passengers
Source: photo V. Carton, 2018
49 Although the service evolved more qualitatively than quantitatively over a few years, this
new management as well as several external factors initiated a period of strong increase
in the use of the network.19 Among these external factors, Christophe Goethals [2012]
mentions “the population increase, the parking policy, the increase in the cost of fuel, the
increase in congestion, economic growth and the growing awareness of the population
with respect to environmental challenges”. In addition to these economic reasons, there
has also been the structural trend involving an increase in mobility in general (2 % per
year in Belgium since 1960). The use of the network has increased faster than the service.
This has resulted in an increased occupancy rate of vehicles and a growing lack of
comfort: there was an average increase from 10,5 % to 14,7 % between 2000 and 2006, i.e.
a 40 % increase.20 This increase was unequal: 67 % for buses, 44 % for trams and 25 % for
the underground. During rush hour, the situation is acute: there is an urgent need to
increase the service.
6.2. Rapid increase of the service as of 2005
50 In order to have more spaces-km, the kilometric production was increased via
frequencies, and bigger vehicles were used. As the frequencies of the underground had
always been high, the improvement was centred on the frequencies of the surface
network: from 2004 to 2017, the average frequency of trams went from 14 to 9,4 minutes,
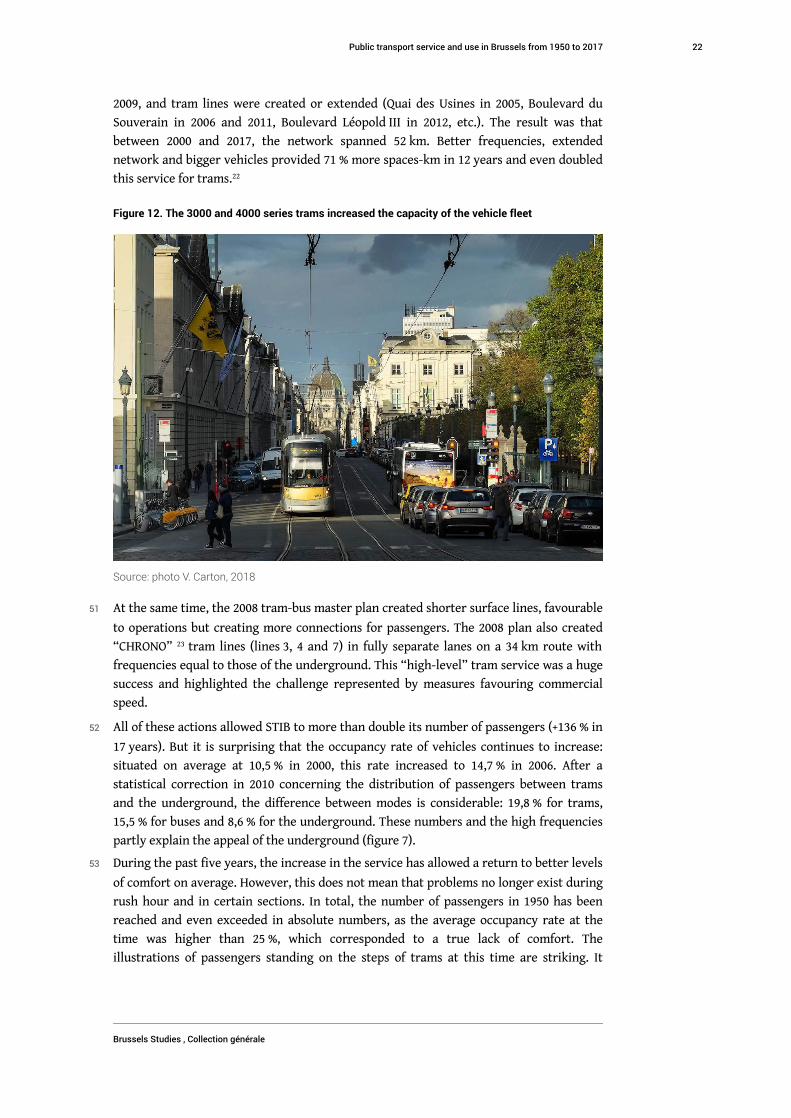
and that of buses from 17,6 to 13,4 minutes. Furthermore, the gradual introduction of
large-capacity trams (150 vehicles from the T3000 series and 70 from the T4000 series),
162 articulated buses and 21 BOA underground trains allowed an increase in the unit
capacity of convoys, as well as a 72 % increase in the capacity of trams and a 52 % increase
in the capacity of the underground21 (figure 12). The network evolved as well: following
the extension of the underground to Erasme in 2003, the inner ring line was completed in
Public transport service and use in Brussels from 1950 to 2017
Brussels Studies , Collection générale
21
2009, and tram lines were created or extended (Quai des Usines in 2005, Boulevard du
Souverain in 2006 and 2011, Boulevard Léopold III in 2012, etc.). The result was that
between 2000 and 2017, the network spanned 52 km. Better frequencies, extended
network and bigger vehicles provided 71 % more spaces-km in 12 years and even doubled
this service for trams.22
Figure 12. The 3000 and 4000 series trams increased the capacity of the vehicle fleet
Source: photo V. Carton, 2018
51 At the same time, the 2008 tram-bus master plan created shorter surface lines, favourable
to operations but creating more connections for passengers. The 2008 plan also created
“CHRONO” 23 tram lines (lines 3, 4 and 7) in fully separate lanes on a 34 km route with
frequencies equal to those of the underground. This “high-level” tram service was a huge
success and highlighted the challenge represented by measures favouring commercial
speed.
52 All of these actions allowed STIB to more than double its number of passengers (+136 % in
17 years). But it is surprising that the occupancy rate of vehicles continues to increase:
situated on average at 10,5 % in 2000, this rate increased to 14,7 % in 2006. After a
statistical correction in 2010 concerning the distribution of passengers between trams
and the underground, the difference between modes is considerable: 19,8 % for trams,
15,5 % for buses and 8,6 % for the underground. These numbers and the high frequencies
partly explain the appeal of the underground (figure 7).
53 During the past five years, the increase in the service has allowed a return to better levels
of comfort on average. However, this does not mean that problems no longer exist during
rush hour and in certain sections. In total, the number of passengers in 1950 has been
reached and even exceeded in absolute numbers, as the average occupancy rate at the
time was higher than 25 %, which corresponded to a true lack of comfort. The
illustrations of passengers standing on the steps of trams at this time are striking. It
Public transport service and use in Brussels from 1950 to 2017
Brussels Studies , Collection générale
22
should be noted that the average rate includes the off-peak hours in the evenings and on
Sundays.
54 The three modes contribute to this new service, but not in the same way: by focusing only
on the evolution between 2010 and 2017 in order to use the same counting method, there
was a 40 % increase in the use of trams, 28 % for the underground and 15 % for buses. As
of 2000, there was a rebalancing between trams, buses and the underground. STIB had
become aware of the need to develop an integrated network based on the three modes by
improving efficiency via the CHRONO lines and by reducing density via vehicles with a
greater capacity.
7. The future service under discussion
55 There are plans to continue reinforcing the service in the years to come. The decision was
taken to reorganise the bus network and deliveries of electric and electric-diesel (hybrid)
rolling stock will replace part of the fleet. The tram network will be extended in the west
with the new line 9 beyond VUB university hospital in Jette until Heysel, and in the east
with the 94 up to the Roodebeek underground. An underground passage is being
considered for Place Meiser. Sixty trams will be delivered as of 2020. As regards the
underground, in addition to a delivery of 43 trains as of 2020, there are plans for a
driverless line from Albert to Bordet in 2028, as well as the renewal of the signals for
lines 1 and 5 in view of their automation and the reinforcement of frequencies along this
route. An investment of approximately 5 billion euros over 10 years has been announced.
This is nevertheless typical of the lack of anticipation often seen in Brussels, where sites
such as Tour & Taxis and the new Tivoli ensemble in Laeken remain forgotten, while the
urban densification of the surroundings of the West Station have been delayed.
56 While the principle of reinforcing the service is not controversial, the underground
conversion of the north-south route (Albert-Bordet or Underground 3) for close to
2 billion euros has opened a debate similar to the one which took place in the 1980s
concerning the underground conversion of the east inner ring: it involves the
replacement of several prémétro lines (3, 4, 51) with a central high-capacity section fed by
connections with the ends of the split tram lines. Aware of the ordeal caused by the major
open trench works, the technicians remembered the request by committees in Saint-
Gilles to make the underground using a tunnel boring machine. This option for very deep
works was accepted quickly by the political decision-makers, exempt from having to take
measures to limit the space for cars, which were necessary for the smooth operation of
tram line 55. In addition, there was the illusion of an invisible worksite.
57 Another approach entitled Cityvision [Lebrun et al., 2009] was developed. It received the
support of citizen groups and unions, but did not interest the political world. It was based
on the principle of a surface network operated as a prémétro in the existing works.
58 In her analysis of public action, Elodie Goffinet came to the conclusion that the rationale
for the prémétro in the 1960s was the same as that for the Underground 3: “The common
conceptions which resulted from this (avoid interference between public and private
transport; the underground belongs to public transport and it is not conceivable to have
roads without private vehicles) have persisted, and are evident in the current decision
concerning the Underground 3. The project is seen as a solution as it is separated from
friction on the surface”. She added that “another vision of mobility in Brussels and the
Public transport service and use in Brussels from 1950 to 2017
Brussels Studies , Collection générale
23

implementation of alternatives would therefore cost too much politically for politicians”
[Goffinet, 2018: 16].
59 Currently, several positions are advocated by the citizen groups which are part of the
debate: some of them contest the encroachment on quality green space (Square Riga),
others do not want a connection with the centre (ACQU in Uccle), others support the
improvement of tram line 55 instead of an underground located at a depth of almost 30 m
(“mobi55”), and others contest the project as a whole and advocate the reinforcement of
the surface service in Schaerbeek and Evere, even if it means taking space away from cars
(ARAU, IEB, BRAL, etc.).
60 The future structure of the network and the allocation of 40 % of the investment budget,
either for a major project in the medium term (2028 at the earliest), or for the extension
and gradual improvement of the entire network, are therefore at stake.
Conclusions
61 Since the creation of the Brussels-Capital Region, the service in terms of spaces-km has
been revived (+150 % 24 in 28 years). The increase has even been spectacular since 2011.
The use of the network follows. This policy highlights the challenge of a vast meshed
network with high frequencies, whose capacity is adapted to the demand, the only
approach which is able to gain favour with the inhabitants of Brussels, despite poor
performance in the area of the commercial speed of one part of the surface network
[Courtois and Dobruszkes, 2008]. The decrease in the commercial speed and irregularity
are the result of the regional and municipal decision makers' fear to take measures to
limit the number of cars in the public space. Fifty years after its inauguration, the
underground accounts for less than 10 % of the length of the network, and due to its
strategic location and thanks to the feeding by trams and buses, it transports more than
one third of passengers. But it is mainly the overall increase in frequencies which has
caused the use of public transport to double over the past 15 years, fuelled in particular
by the population boom and the increase in the number of working-class Brussels
households with a low level of car ownership. The spectacular rise in the number of
annual journeys per inhabitant (figure 13) is evidence of this change, even if the score of
337 is still far from that of cities such as Zurich, which greatly exceeds the score of 500
obtained with a surface network of trams, trolley buses and buses. In contrast, the bus
network of the urban community of Dunkirk, for example, scarcely obtains 80 journeys
per year per inhabitant.
Public transport service and use in Brussels from 1950 to 2017
Brussels Studies , Collection générale
24
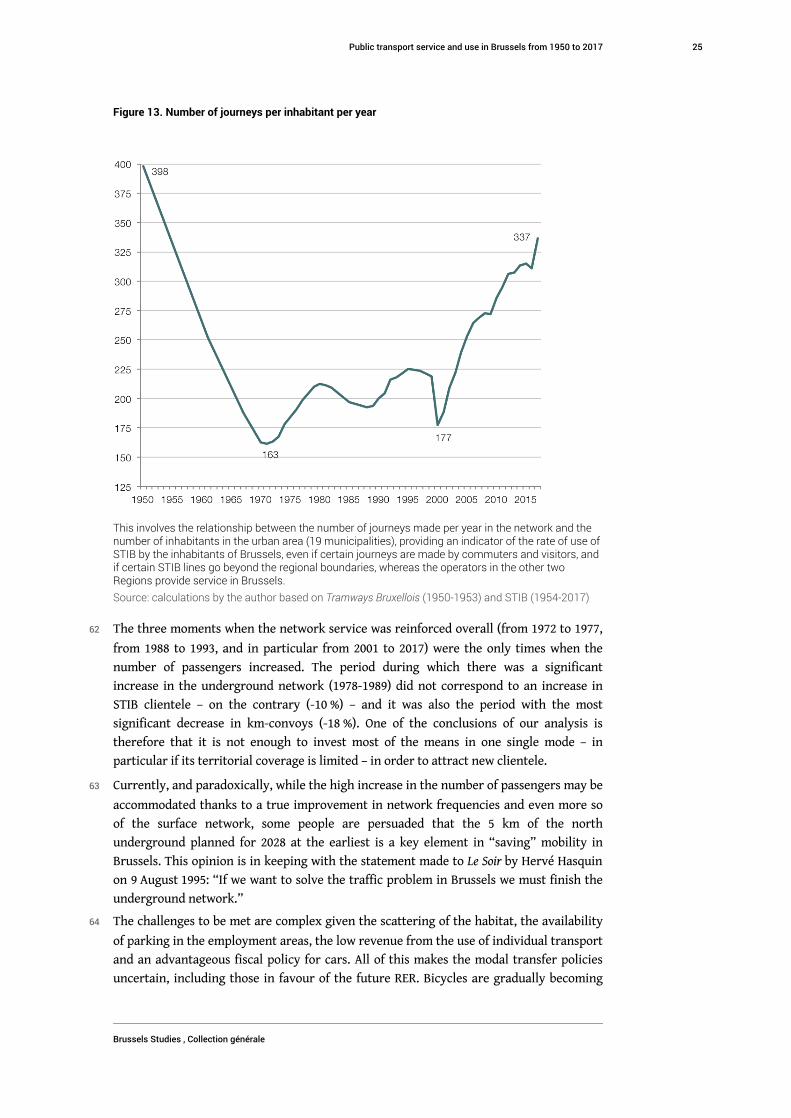
Figure 13. Number of journeys per inhabitant per year
This involves the relationship between the number of journeys made per year in the network and thenumber of inhabitants in the urban area (19 municipalities), providing an indicator of the rate of use ofSTIB by the inhabitants of Brussels, even if certain journeys are made by commuters and visitors, andif certain STIB lines go beyond the regional boundaries, whereas the operators in the other twoRegions provide service in Brussels.
Source: calculations by the author based on Tramways Bruxellois (1950-1953) and STIB (1954-2017)
62 The three moments when the network service was reinforced overall (from 1972 to 1977,
from 1988 to 1993, and in particular from 2001 to 2017) were the only times when the
number of passengers increased. The period during which there was a significant
increase in the underground network (1978-1989) did not correspond to an increase in
STIB clientele – on the contrary (-10 %) – and it was also the period with the most
significant decrease in km-convoys (-18 %). One of the conclusions of our analysis is
therefore that it is not enough to invest most of the means in one single mode – in
particular if its territorial coverage is limited – in order to attract new clientele.
63 Currently, and paradoxically, while the high increase in the number of passengers may be
accommodated thanks to a true improvement in network frequencies and even more so
of the surface network, some people are persuaded that the 5 km of the north
underground planned for 2028 at the earliest is a key element in “saving” mobility in
Brussels. This opinion is in keeping with the statement made to Le Soir by Hervé Hasquin
on 9 August 1995: “If we want to solve the traffic problem in Brussels we must finish the
underground network.”
64 The challenges to be met are complex given the scattering of the habitat, the availability
of parking in the employment areas, the low revenue from the use of individual transport
and an advantageous fiscal policy for cars. All of this makes the modal transfer policies
uncertain, including those in favour of the future RER. Bicycles are gradually becoming
Public transport service and use in Brussels from 1950 to 2017
Brussels Studies , Collection générale
25
more important in the area of mobility and, within certain limits, car sharing allows a
reduction in space requirements for private transport. Part of the increase in the mobility
demand may be met by these. But for the rest, in the short term, this increase cannot be
dealt with by private cars in the congested roads during rush hours, or by the trams and
buses in the roads which face traffic constraints and operate at full capacity, or by the
underground, whose extension is taking a huge amount of time (6 kilometres in the past
20 years) and is expensive (150 to 200 million euros per kilometre). In the medium term,
along with better urban service possible thanks to 46 stations in Brussels,25 a meshed
network, with exclusive lanes, could meet the growing demand in a city with the density
of Brussels. The development of high-capacity infrastructures (5 000 to 25 000
passengers/hour/direction) could only be justified if it was not possible to operate this
meshed network. This involves finding a balance between public transport and individual
transport, collective interest and private interest, and even between general interest and
local interest [Dobruszkes and Fourneau, 2007]. The challenges are not only mobility
challenges: air quality, noise level, security and, more generally, the quality of life in the
city in a calm atmosphere have become essential today.
The author would like to thank Benjamin Wayens, Michel Hubert, Marie Nagy, Isabelle Pauthier,
Thierry Duquenne and Yves Fourneau for their wise advice.
BIBLIOGRAPHY
ANSAY, Pierre, 1997. Le désir automobile. Brussels: CFC Editions.
ARAU, Atelier de Recherche et d’Action Urbaines, 1980. Pour une nouvelle politique de la circulation à
Bruxelles, des petits trams partout et tout le temps.
BRANDELEER, Céline, ERMANS, Thomas, HUBERT, Michel, JANSSENS, Isabelle, LANNOY, Pierre,
LOIR, Christophe and VANDERSTRAETEN, Pierre, 2016. Le partage de l’espace public en Région de
Bruxelles-Capitale. In: Cahier de l’Observatoire de la Mobilité. No 5. Brussels: Bruxelles Mobilité.
BRESSON, Georges, 2004. Economic and structural determinants of the demand for public
transport: an analysis on a panel of French urban areas using shrinkage estimators. In:
Transportation Research. Policy and practice. Vol 8, No 4, pp. 249-328.
CARTON, Vincent, DEWINT, André and VANDEMAELE, Paul, 1986. Quels transports en commun pour
Bruxelles ? Brussels: Greater Brussels Council.
CARTON, Vincent, 1986. Modèle de simulation d’un réseau de transport urbain – application à
Bruxelles. In: Revue TEC, No 77. 07-08/1986. pp. 17-21.
COURTOIS, Xavier and DOBRUSZKES, Frédéric, 2008. The (in)efficiency of trams and buses in
Brussels: a fine geographical analysis. In: Brussels Studies. 27/06/2008. No 20. Available from:
https://journals.openedition.org/brussels/608
DE BEULE, Michel et al., 2017. Bruxelles, histoire de planifier? Liège: Mardaga.
DELMELLE, Joseph, 1986. Le métro de Bruxelles. In: Brabant Tourisme. 09/1986. pp. 54-64.
Public transport service and use in Brussels from 1950 to 2017
Brussels Studies , Collection générale
26

DELEPIERRE-DRAMAIS, Christiane, 1990. Situations comparatives du transport en commun en
surface et de métro à Bruxelles. In: Les dossiers bruxellois. No 15.
DE WITTE, Astrid, HOLLEVOET, Joachim, HUBERT, Michel, DOBRUSZKES, Frédéric and MACHARIS,
Cathy, 2013, Linking modal choice to motility: a comprehensive review. In: Transportation Research
Part A: Policy and practice. Vol. 49, pp. 329-341.
DOBRUSZKES, Frédéric, FOURNEAU, Yves, 2007. The direct cost and geography of Brussels mass
transport’s operating delays. In: Brussels Studies. 24/05/2007. No 7. Available from: https://
journals.openedition.org/brussels/423
DOBRUSZKES, Frédéric, HUBERT, Michel, LAPORTE, François and VEIDERS, Caroline, 2011.
Réorganisation d’un réseau de transport collectif urbain, ruptures de charges et mobilités
éprouvantes à Bruxelles. In: Articulo. Journal of Urban Research. Vol. 7, pp 1-15. Available from:
https://journals.openedition.org/articulo/1844
GOETHALS, Christophe, 2012. Les enjeux du financement des transports en commun à Bruxelles.
In: Les analyses du CRISP online. 20/12/2012. Available from: http://www.crisp.be/2012/12/les-
enjeux-du-financement-des-transports-en-commun-à-bruxelles/
GOFFINET, Elodie, 2018. Le métro 3 : une dépendance au sentier tracé par le prémétro en matière de
mobilité à Bruxelles. Final Assignment in Analyse de l’action publique. Brussels: Université Saint-Louis
– Bruxelles.
GREATER BRUSSELS COUNCIL, 1985. The Future of urban Transport. Proceedings from the
international symposium. Bruxelles. 21-22/05/1985.
HERAN, Frédéric, 2014. Le retour de la bicyclette. Une histoire des déplacements urbains en Europe, de
1817 à 2050. Paris: Editions La Découverte.
HUBERT, Michel, 2008. Expo ’58 and “the car as king” What future for Brussels’s major urban
road infrastructure? In: Brussels Studies. 20/10/2008. No 22. Available from: https://
journals.openedition.org/brussels/627
JACOBS, Jane, 1961 (French edition 1991). Déclin et survie des grandes villes américaines. Liège:
Mardaga.
KAUFMANN, Vincent, 2003. Pratiques modales des déplacements de personnes en milieu urbain :
des rationalités d’usage à la cohérence de l’action publique. In: Revue d’Economie Régionale et
Urbaine. 02/2003. Vol. 1, pp. 39-58.
LACONTE, Pierre and VAN DEN HOVE, Claude, 2016. Le rail, clé de la mobilité. Bruxelles: Editions
Aliter.
LANNOY, Pierre, 2003, L’automobile comme objet de recherche, Chicago, 1915-1940. In: Revue
française de sociologie. Vol. 44, no 3, pp. 497-529.
LEBRUN, Kevin and DOBRUSZKES, Frédéric 2012. New RER stations for Brussels? Challenges,
methods and constraints. In: Brussels Studies. 09/01/2012. No 56. Available from: https://
journals.openedition.org/brussels/1076
LEBRUN, Kevin, HUBERT, Michel, HUYNEN, Philippe, DE WITTE, Astrid and MACHARIS, Cathy,
2013. Les pratiques de déplacement à Bruxelles. In: Cahiers de l’Observatoire de la Mobilité, No 2.
Brussels: Bruxelles Mobilité.
LEBRUN, Kevin, 2018. Travel time by public transport in Brussels: the accessibility of poles of
activity. In: Brussels Studies. 07/05/2018. No 123. Available from: https://
journals.openedition.org/brussels/1661
Public transport service and use in Brussels from 1950 to 2017
Brussels Studies , Collection générale
27

LEBRUN, Luc, HUBERT, Michel and CARTON, Vincent, 2009. La Cityvision, ou comment faire beaucoup
mieux que la Métrovision avec moins de moyens. Available from: http://www.ieb.be/La-Cityvision-ou-
comment-faire
LOMBARD, Aril, 1969, Le métro de Bruxelles, Conception générale et procédés d’exécution. CERES thesis.
Liège: Université de Liège.
MAUFROY, William et al., 2017. A pied, à cheval ou en voiture ? Exhibition. 16/09/2017 – 28/10/2017.
Dunkerque: Centre de la Mémoire Urbaine d’Agglomération, Archives de Dunkerque.
MINISTÈRE DES COMMUNICATIONS, 1963, Le problème de l’encombrement du trafic et le rôle des
transports en commun dans les grandes agglomérations. Administration des Transports.
MINISTÈRE DES COMMUNICATIONS, 1969. Métro ? Oui ! Administration des Transports, 3rd edition.
MINISTÈRE DES TRAVAUX PUBLICS ET DE LA RECONSTRUCTION, 1956. Bruxelles Carrefour de
l’Occident.
SCHOONBRODT, René, 2007. Vouloir et dire la ville, ARAU. Brussels: AAM Editions.
TELEX, 1992. Le métro et les transports publics vers le campus Erasme. In: Magazine de l’ULB-UAE.
01/1992. No 73.
TELLIER, Céline, 2010, Des controverses aux compromis. Les lignes de front du métro bruxellois.
In: Belgeo. Revue belge de géographie. Vol. 1-2. Available from: http://belgeo.revues.org/6796
TELLIER, Céline and ZITOUNI, Benedikte, 2013. How the technical bodies build the city. In:
Brussels Studies. 04/02/2013. No 64. Available from: https://journals.openedition.org/
brussels/1128
THIRY, Bernard, 1988. Evolution institutionnelle et description de l’activité des sociétés belges de
transports urbains. In: La performance économique des sociétés belges de transports urbains. Working
paper. Liège: CIRIEC, pp 41-80.
VANCO, Florian, 2013. Quels indicateurs de suivi de l’efficience des services de transports ? Focus sur les
agglomérations de 100 à 250 000 habitants - Situation 2011. Paris: CERTU.
VAN DEN HOVE, Claude, 2007. Futures étapes des transports urbains, Schaerbeek et la desserte Nord et
Nord-Est de la Région. 21/06/2007. Bruxelles: Commission Régionale de la Mobilité.
VANDERMOTTEN, Christian, 2014. Bruxelles, une lecture de la ville. Bruxelles: Editions de l’ULB.
NOTES
1. From 1950 to 1970, territorial growth reached 11 % and there was a population increase of
100 000 inhabitants.
2. Jean-Pierre Hirsch, honorary president of the Chamber of Commerce, cited by [Ministère des
Communications, 1963: 39].
3. 56,5 % for an average weekday according to the 1964 SOBEMAP study [Lombard, 1969]
4. Citroën 2CV, Renault 4CV, VW Coccinelle, Fiat 500, etc.
5. The Parisian network was dismantled in 12 years from 1925 to 1937, that of La Rochelle
disappeared in 1931 and the major networks outside the Paris area were removed between 1950
and 1964. In Dunkirk, the first bus line was operated in 1931 and the tram network which was
damaged during World War II was removed in 1952 [Maufroy et al., 2017].
Public transport service and use in Brussels from 1950 to 2017
Brussels Studies , Collection générale
28
6. Until 1989, Jos Chabert from Brussels – who had begun his political career in the outskirts of
the city (Meise) – was the only one to hold the post of communications minister for a few years
(and of public works minister for 8 months).
7. And 27 % for the surface network alone.
8. Source: Greater Brussels Area, internal report.
9. For 1981 as well, the rate of coverage was 36 % in Antwerp, 41 % in Liège, 43 % in Ghent and
33 % in Charleroi.
10. The inner ring was only completed 21 years later (West Station-Delacroix).
11. The terminuses of these direct lines were located in Groot Bijgaarden, Erasme, St Denis, South
Station, Fort Jaco, Wiener, Houba de Strooper, Heysel.
12. For example, giving up the East-West bis underground, prémétro under the Louise bottleneck
and Rue Royale, as well as under Bois de la Cambre, which were all included in the 1979 Plan de
Secteur.
13. Nine years after the Walloon and Flemish Regions, Brussels became a full region and obtained
legislative authority, executive authority and its own administration.
14. Cooperation agreement of 1993 between the state and the Region stipulating yearly financing
of 125 million euros for investments related to the role of capital.
15. This measure was intended to move the STIB expertise in infrastructures to the regional
administration, and was delayed until a few years later.
16. The following four management contracts were adopted in 1996, 2001, 2007 and 2013.
17. The figures show a decrease in production in 1995. This was due to the exclusion of “empty”
km to the depots and the special transports as of this date. This change also had the effect of
breaking down the calculation of average frequencies.
18. Brussels nevertheless continues to lose nearly 10 000 inhabitants per year to the other two
Regions, but beginning in 2000, a natural positive balance and positive balance of exchanges with
foreign countries have compensated greatly for the departure of a proportion of the Brussels
middle class.
19. In 2000, the number of passengers was adjusted downwards following the observation after
the survey of an over-estimation of the number of journeys counted per pass.
20. The occupancy rate is calculated here based on 6 people standing/m2 in order to allow a
comparison, although as of 2005, the statistics were based on 4 people. Let us also point out that
the occupancy rate used here is an average which includes the off-peak hours.
21. From 2005 to 2017, the number of spaces in trams increased from 41 675 to 71 511 and in the
underground, from 30 025 to 45 775 (standard of 4 people standing per m2).
22. There was a 67 % increase for the underground and a 46 % increase for the bus (4 people per
m2).
23. CHRONO is the new label given by STIB to its fastest lines. It guarantees quality service, close
to that of the underground, and is characterised by “separate lanes, quick service, high
frequencies, excellent punctuality and new spacious vehicles with a high level of comfort”.
24. Calculated with a constant theoretical capacity of 6 spaces/m² in order to allow a comparison;
the official statistics count 4 people standing/m² as of 2005.
25. In addition to the 31 stations in Brussels, 15 stations are being considered in the different
studies for the RER network [Lebrun & Dobruszkes, 2012].
Public transport service and use in Brussels from 1950 to 2017
Brussels Studies , Collection générale
29
ABSTRACTS
Based on STIB statistics since 1950, this article analyses the choices made in the area of public
transport service. A network based almost exclusively on trams gradually became an
underground-tram-bus service, which has once again reached the same coverage as in 1950 in
terms of kilometres. Although there was soon a consensus regarding the underground, it did not
compensate for the decrease in the service due to network operation economies in the 1980s. It is
not enough to invest most of the means in one single mode, in particular if its territorial
coverage is limited. Although the relationship between the improvement in service and an
increase in clientele is not automatic, a conclusion emerges: in 68 years, STIB attracted more
users on three occasions when it improved its service throughout the network, especially the
frequencies of trams and buses, as the underground frequencies have always been high. The
study sheds light on the debate regarding the possible choices: should there be an investment in
an underground line between Albert and Bordet or in the surface network (extension via lines
with “high-level service”, protection of trams and buses from traffic and increase in
frequencies)?
S’appuyant sur les statistiques de la STIB depuis 1950, cet article analyse les choix faits en
matière d’offre de transport en commun. D’un réseau basé quasi exclusivement sur le tram, on
est passé progressivement à une offre métro-tram-bus retrouvant aujourd’hui son intensité en
Km parcourus de 1950. Si le métro a rapidement fait consensus, il n’a pas permis de compenser
les réductions de l’offre engendrées par les économies sur l’exploitation du réseau dans les
années 1980. Mettre l’essentiel des moyens sur un seul mode, en particulier si sa couverture
territoriale est limitée, n’est pas suffisant. Même si la relation entre l’amélioration de l’offre et le
gain de clientèle n’est pas automatique, une conclusion apparaît : en 68 ans, la STIB a attiré plus
d’usagers à trois reprises lorsqu’elle a amélioré l’offre sur l’ensemble du réseau, surtout les
fréquences des trams et des bus, les fréquences du métro ayant toujours été élevées. L’étude
éclaire le débat sur les choix possibles : faut-il investir dans une ligne de métro entre Albert et
Bordet ou investir dans le réseau de surface (extension au moyen de lignes à « haut niveau de
service », protection des trams et bus vis-à-vis du trafic et amélioration des fréquences) ?
Aan de hand van de statistieken van de MIVB sinds 1950 analyseert dit artikel de gemaakte
keuzes op het vlak van het openbaar vervoersaanbod. Van een net dat bijna uitsluitend gericht
was op de tram gingen we geleidelijk over naar een metro-, tram- en busaanbod, waarvan de
intensiteit in afgelegde km inmiddels weer het niveau van 1950 bereikt. Hoewel er over de metro
gauw consensus heerste, kon die de inkrimpingen van het aanbod als gevolg van besparingen op
de exploitatie van het net in de jaren 1980 niet compenseren. Het volstaat niet om het merendeel
van de middelen op één vervoermiddel in te zetten wanneer dat vervoermiddel een beperkt
grondgebied dekt. Ook al is er geen automatisch verband tussen de verbetering van het aanbod
en een toename van het cliënteel, toch kunnen we het volgende besluiten: in 68 jaar tijd is het
aantal gebruikers van de MIVB tot drie keer toe gestegen nadat het aanbod op het hele net
verbeterd was, en dan vooral de frequenties van tram en bus; de frequenties van de metro zijn
altijd hoog geweest. De studie geeft meer inzicht in het debat over de mogelijke keuzes: moet er
worden geïnvesteerd in een metrolijn tussen Albert en Bordet of in het bovengrondse net
Public transport service and use in Brussels from 1950 to 2017
Brussels Studies , Collection générale
30
(uitbreiding door middel van lijnen met een hoog serviceniveau, afscherming van tram en bus
tegen het overige verkeer en verbetering van de frequenties)?
INDEX
Keywords: public transport, mobility, public action, regional policy, public space, urban
infrastructures
Subjects: 7. aménagement du territoire – logement – mobilité
Mots-clés: transports publics, mobilité, action publique, politique régionale, espace public,
infrastructures urbaines
Trefwoorden openbaar vervoer, mobiliteit, overheidsoptreden, gewestelijk beleid, openbare
ruimte, stedelijke infrastructuur
AUTHORS
VINCENT CARTON
Civil engineer and town planner, professor of town planning at EFP, member of the Management
Committee of the Atomium, former director of Bruxelles-Environnement IBGE and former deputy
head of cabinet of the Ministre fédérale de la Mobilité. Member of the Management Committee of
STIB from 2001 to 2014 and of the Port of Brussels. In 1995, he launched the Délégation au
Développement du Pentagone, which was in charge of the revitalisation of the historical centre of
Brussels. He taught urbanism at La Cambre school of architecture. vincentcarton1[at]gmail.com
Public transport service and use in Brussels from 1950 to 2017
Brussels Studies , Collection générale
31