MINERAL COMMODITY SUMMARIES 2019
204
MINERAL COMMODITY SUMMARIES 2019 Silicon Silver Soda Ash Stone Strontium Sulfur Talc Tantalum Tellurium Thallium Thorium Tin Titanium Tungsten Vanadium Vermiculite Wollastonite Yttrium Zeolites Zinc Zirconium Mercury Mica Molybdenum Nickel Niobium Nitrogen Palladium Peat Perlite Phosphate Rock Platinum Potash Pumice Quartz Crystal Rare Earths Rhenium Rubidium Salt Sand and Gravel Scandium Selenium Fluorspar Gallium Garnet Gemstones Germanium Gold Graphite Gypsum Hafnium Helium Indium Iodine Iron and Steel Iron Ore Iron Oxide Pigments Kyanite Lead Lime Lithium Magnesium Manganese Abrasives Aluminum Antimony Arsenic Asbestos Barite Bauxite Beryllium Bismuth Boron Bromine Cadmium Cement Cesium Chromium Clays Cobalt Copper Diamond Diatomite Feldspar
Transcript of MINERAL COMMODITY SUMMARIES 2019
MINERAL COMMODITY SUMMARIES 2019
SiliconSilverSoda AshStoneStrontiumSulfurTalcTantalumTelluriumThalliumThoriumTinTitaniumTungstenVanadiumVermiculiteWollastoniteYttriumZeolitesZincZirconium
MercuryMicaMolybdenumNickelNiobiumNitrogenPalladiumPeatPerlitePhosphate RockPlatinumPotashPumiceQuartz CrystalRare EarthsRheniumRubidiumSaltSand and GravelScandiumSelenium
FluorsparGalliumGarnetGemstonesGermaniumGoldGraphiteGypsumHafniumHeliumIndiumIodineIron and SteelIron OreIron Oxide PigmentsKyaniteLeadLimeLithiumMagnesiumManganese
AbrasivesAluminumAntimonyArsenicAsbestosBariteBauxiteBerylliumBismuthBoronBromineCadmiumCementCesiumChromiumClaysCobaltCopperDiamondDiatomiteFeldspar

Cover: A solar evaporation pond at Albemarle Corp.’s lithium production site in Silver Peak,
Nevada. Lithium compounds are used to manufacture many products. Lithium carbonate and lithium
hydroxide are needed for lithium-ion-batteries in mobile devices such as smartphones, tablet
computers, and laptops, or in electric or hybrid vehicles. Butyllithium is needed for the production of
synthetic rubber for tires. Lithium organics are versatile tools for the synthesis of pharmaceuticals,
agrochemicals, or flavors and fragrances. The glass industry requires lithium carbonate or spodumene to
improve the properties of glass. Lithium bromide is used in industrial absorption refrigeration systems
that are installed in large buildings and industrial plants for air-conditioning or process
cooling. (Photograph courtesy of Albemarle Corp., copyright 2016 Albemarle Corp.)
U.S. Department of the Interior U.S. Geological Survey
MINERAL COMMODITY SUMMARIES 2019 Abrasives Fluorspar Mercury Silicon Aluminum Gallium Mica Silver Antimony Garnet Molybdenum Soda Ash Arsenic Gemstones Nickel Stone Asbestos Germanium Niobium Strontium Barite Gold Nitrogen Sulfur Bauxite Graphite Palladium Talc Beryllium Gypsum Peat Tantalum Bismuth Hafnium Perlite Tellurium Boron Helium Phosphate Rock Thallium Bromine Indium Platinum Thorium Cadmium Iodine Potash Tin Cement Iron and Steel Pumice Titanium Cesium Iron Ore Quartz Crystal Tungsten Chromium Iron Oxide Pigments Rare Earths Vanadium Clays Kyanite Rhenium Vermiculite Cobalt Lead Rubidium Wollastonite Copper Lime Salt Yttrium Diamond Lithium Sand and Gravel Zeolites Diatomite Magnesium Scandium Zinc Feldspar Manganese Selenium Zirconium
U.S. Department of the Interior DAVID BERNHARDT, Acting Secretary
U.S. Geological Survey James F. Reilly II, Director
U.S. Geological Survey, Reston, Virginia: 2019
Manuscript approved for publication February 28, 2019.
For more information on the USGS—the Federal source for science about the Earth, its natural and living resources, natural hazards, and the environment— visit https://www.usgs.gov or call 1–888–ASK–USGS.
For an overview of USGS information products, including maps, imagery, and publications, visit https://store.usgs.gov/. For sale by the Superintendent of Documents, U.S. Government Publishing Office Mail: Stop IDCC; Washington, DC 20402–0001 Phone: (866) 512–1800 (toll-free); (202) 512–1800 (Washington, DC area) Fax: (202) 512–2104 Internet: bookstore.gpo.gov
Any use of trade, product, or firm names is for descriptive purposes only and does not imply endorsement by the U.S. Government.
Although this report is in the public domain, permission must be secured from the individual copyright owners to reproduce any copyrighted material contained within this report.
Suggested citation: U.S. Geological Survey, 2019, Mineral commodity summaries 2019: U.S. Geological Survey, 200 p., https://doi.org/10.3133/70202434.
ISBN 978-1-4113-4283-5
1
CONTENTS Page Page General: Introduction .................................................................... 3 Growth Rates of Leading and Coincident Indexes for
Mineral Products ......................................................... 4 The Role of Nonfuel Minerals in the U.S. Economy ...... 5 2018 U.S. Net Import Reliance for Selected Nonfuel
Mineral Materials ........................................................ 6
Significant Events, Trends, and Issues .......................... 7 Appendix A—Abbreviations and Units of Measure .... 194 Appendix B—Definitions of Selected Terms Used in This Report .............................................................. 194 Appendix C—Reserves and Resources ..................... 195 Appendix D—Country Specialists Directory ............... 199
Mineral Commodities:
Abrasives (Manufactured) ............................................ 18 Aluminum ..................................................................... 20 Antimony ...................................................................... 22 Arsenic ......................................................................... 24 Asbestos ...................................................................... 26 Barite ............................................................................ 28 Bauxite and Alumina .................................................... 30 Beryllium ...................................................................... 32 Bismuth ........................................................................ 34 Boron ............................................................................ 36 Bromine ........................................................................ 38 Cadmium ...................................................................... 40 Cement......................................................................... 42 Cesium ......................................................................... 44 Chromium..................................................................... 46 Clays ............................................................................ 48 Cobalt ........................................................................... 50 Copper ......................................................................... 52 Diamond (Industrial) ..................................................... 54 Diatomite ...................................................................... 56 Feldspar and Nepheline Syenite .................................. 58 Fluorspar ...................................................................... 60 Gallium ......................................................................... 62 Garnet (Industrial) ........................................................ 64 Gemstones ................................................................... 66 Germanium .................................................................. 68 Gold .............................................................................. 70 Graphite (Natural) ........................................................ 72 Gypsum ........................................................................ 74 Helium .......................................................................... 76 Indium .......................................................................... 78 Iodine ........................................................................... 80 Iron and Steel ............................................................... 82 Iron and Steel Scrap .................................................... 84 Iron and Steel Slag ...................................................... 86 Iron Ore ........................................................................ 88 Iron Oxide Pigments .................................................... 90 Kyanite and Related Minerals ...................................... 92 Lead ............................................................................. 94 Lime ............................................................................. 96 Lithium.......................................................................... 98 Magnesium Compounds ............................................ 100 Magnesium Metal ....................................................... 102 Manganese ................................................................ 104
Mercury ....................................................................... 106 Mica (Natural) ............................................................. 108 Molybdenum ............................................................... 110 Nickel .......................................................................... 112 Niobium (Columbium) ................................................. 114 Nitrogen (Fixed)—Ammonia ....................................... 116 Peat ............................................................................ 118 Perlite ......................................................................... 120 Phosphate Rock ......................................................... 122 Platinum-Group Metals ............................................... 124 Potash ........................................................................ 126 Pumice and Pumicite .................................................. 128 Quartz Crystal (Industrial) .......................................... 130 Rare Earths ................................................................ 132 Rhenium ..................................................................... 134 Rubidium .................................................................... 136 Salt ............................................................................. 138 Sand and Gravel (Construction) ................................. 140 Sand and Gravel (Industrial) ...................................... 142 Scandium .................................................................... 144 Selenium ..................................................................... 146 Silicon ......................................................................... 148 Silver ........................................................................... 150 Soda Ash .................................................................... 152 Stone (Crushed) ......................................................... 154 Stone (Dimension) ...................................................... 156 Strontium .................................................................... 158 Sulfur .......................................................................... 160 Talc and Pyrophyllite .................................................. 162 Tantalum ..................................................................... 164 Tellurium ..................................................................... 166 Thallium ...................................................................... 168 Thorium ...................................................................... 170 Tin ............................................................................... 172 Titanium and Titanium Dioxide ................................... 174 Titanium Mineral Concentrates .................................. 176 Tungsten ..................................................................... 178 Vanadium ................................................................... 180 Vermiculite .................................................................. 182 Wollastonite ................................................................ 184 Yttrium ........................................................................ 186 Zeolites (Natural) ........................................................ 188 Zinc ............................................................................. 190 Zirconium and Hafnium .............................................. 192
2
INSTANT INFORMATION Information about the U.S. Geological Survey, its programs, staff, and products is available from the internet at https://www.usgs.gov or by calling (888) ASK–USGS [(888) 275–8747]. This publication has been prepared by the National Minerals Information Center. Information about the Center and its products is available from the internet at https://minerals.usgs.gov/minerals or by writing to Director, National Minerals Information Center, 988 National Center, Reston, VA 20192.
KEY PUBLICATIONS Minerals Yearbook—These annual publications review the mineral industries of the United States and of more than 180 other countries. They contain statistical data on minerals and materials and include information on economic and technical trends and developments and are available at https://minerals.usgs.gov/minerals/pubs/myb.html. The three volumes that make up the Minerals Yearbook are Volume I, Metals and Minerals; Volume II, Area Reports, Domestic; and Volume III, Area Reports, International. Mineral Commodity Summaries—Published on an annual basis, this report is the earliest Government publication to furnish estimates covering nonfuel mineral industry data and is available at https://minerals.usgs.gov/minerals/pubs/mcs/. Data sheets contain information on the domestic industry structure, Government programs, tariffs, and 5-year salient statistics for more than 90 individual minerals and materials. Mineral Industry Surveys—These periodic statistical and economic reports are designed to provide timely statistical data on production, shipments, stocks, and consumption of significant mineral commodities and are available at https://minerals.usgs.gov/minerals/pubs/commodity/mis.html. The surveys are issued monthly, quarterly, or at other regular intervals. Metal Industry Indicators—This monthly publication analyzes and forecasts the economic health of three metal industries (primary metals, steel, and copper) using leading and coincident indexes and is available at https://minerals.usgs.gov/minerals/pubs/mii/. Nonmetallic Mineral Products Industry Indexes—This monthly publication analyzes the leading and coincident indexes for the nonmetallic mineral products industry (NAICS 327) and is available at https://minerals.usgs.gov/minerals/pubs/imii/. Materials Flow Studies—These publications describe the flow of minerals and materials from extraction to ultimate disposition to help better understand the economy, manage the use of natural resources, and protect the environment and are available at https://minerals.usgs.gov/minerals/mflow/. Recycling Reports—These studies illustrate the recycling of metal commodities and identify recycling trends and are available at https://minerals.usgs.gov/minerals/pubs/commodity/recycle/. Historical Statistics for Mineral and Material Commodities in the United States (Data Series 140)—This report provides a compilation of statistics on production, trade, and use of approximately 90 mineral commodities since as far back as 1900 and is available at https://minerals.usgs.gov/minerals/pubs/historical-statistics/.
WHERE TO OBTAIN PUBLICATIONS • Mineral Commodity Summaries and the Minerals Yearbook are sold by the U.S. Government Publishing Office.
Orders are accepted over the internet at https://bookstore.gpo.gov, by telephone toll free (866) 512–1800; Washington, DC area (202) 512–1800, by fax (202) 512–2104, or through the mail (P.O. Box 979050, St. Louis, MO 63197–9000).
• All current and many past publications are available in PDF format (and some are available in XLS format)
through https://minerals.usgs.gov/minerals.
3
INTRODUCTION Each chapter of the 2019 edition of the U.S. Geological Survey (USGS) Mineral Commodity Summaries (MCS) includes information on events, trends, and issues for each mineral commodity as well as discussions and tabular presentations on domestic industry structure, Government programs, tariffs, 5-year salient statistics, and world production and resources. The MCS is the earliest comprehensive source of 2018 mineral production data for the world. More than 90 individual minerals and materials are covered by two-page synopses. For mineral commodities for which there is a Government stockpile, detailed information concerning the stockpile status is included in the two-page synopsis. Abbreviations and units of measure, and definitions of selected terms used in the report, are in Appendix A and Appendix B, respectively. “Appendix C—Reserves and Resources” includes “Part A—Resource/Reserve Classification for Minerals” and “Part B—Sources of Reserves Data.” A directory of USGS minerals information country specialists and their responsibilities is Appendix D. The USGS continually strives to improve the value of its publications to users. Constructive comments and suggestions by readers of the MCS 2019 are welcomed.
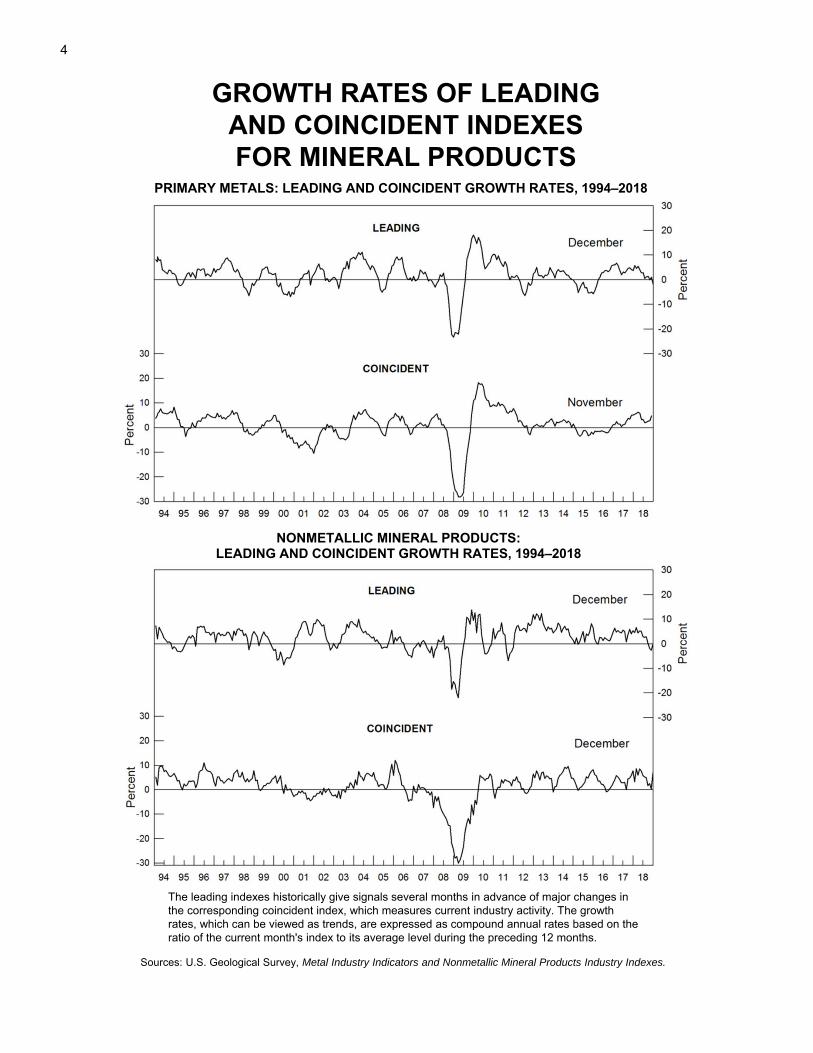
Sources: U.S. Geological Survey, Metal Industry Indicators and Nonmetallic Mineral Products Industry Indexes.
The leading indexes historically give signals several months in advance of major changes in the corresponding coincident index, which measures current industry activity. The growth rates, which can be viewed as trends, are expressed as compound annual rates based on the ratio of the current month's index to its average level during the preceding 12 months.
GROWTH RATES OF LEADING AND COINCIDENT INDEXES FOR MINERAL PRODUCTS
PRIMARY METALS: LEADING AND COINCIDENT GROWTH RATES, 1994–2018
NONMETALLIC MINERAL PRODUCTS:LEADING AND COINCIDENT GROWTH RATES, 1994–2018
4
THE
RO
LE O
F N
ON
FUEL
MIN
ERA
LS IN
TH
E U
.S. E
CO
NO
MY
(ES
TIM
ATE
D V
ALU
ES
IN 2
018)
NET
EXP
OR
TS O
F M
INER
ALR
AW M
ATER
IALS
GO
LD
, S
OD
A A
SH
, Z
INC
CO
NC
EN
TR
AT
ES
, E
TC
.
Exp
orts
: $8
.9 b
illion
Impo
rts:
$6.1
billi
onN
et e
xpor
ts:
$2.8
billi
on
DO
MES
TIC
MIN
ERAL
RAW
M
ATER
IALS
FR
OM
MIN
ING
CO
PP
ER
OR
ES
, IR
ON
OR
E,
SA
ND
AN
D G
RA
VE
L,
ST
ON
E, E
TC
.
Val
ue:
$82.
2 bi
llion
MET
ALS
AND
MIN
ERAL
PR
OD
UC
TS R
ECYC
LED
D
OM
ESTI
CAL
LY
ALU
MIN
UM
, G
LA
SS
, S
TE
EL,
ET
C.
Val
ue o
f old
scr
ap:
$24.
1 bi
llion
NET
EXP
OR
TS O
F O
LD
SCR
AP
GO
LD
, S
TE
EL,
ET
C.
Exp
orts
: $1
7.3
billio
nIm
ports
: $7
.1 b
illion
Net
exp
orts
: $1
0.2
billio
n
MIN
ERAL
MAT
ERIA
LS
PRO
CES
SED
D
OM
ESTI
CAL
LY
ALU
MIN
UM
, B
RIC
K,
CE
ME
NT
,
CO
PP
ER
, F
ER
TIL
IZE
RS
,
ST
EE
L, E
TC
.
Val
ue o
f shi
pmen
ts:
$766
billi
on
NET
IMPO
RTS
OF
PRO
CES
SED
MIN
ERAL
M
ATER
IALS
ME
TA
LS
, C
HE
MIC
ALS
, E
TC
.
Impo
rts:
$152
billi
onE
xpor
ts:
$95
billio
nN
et im
ports
: $5
7 bi
llion
Sou
rces
: U
.S. G
eo
logi
cal S
urv
ey
and
th
e U
.S. D
epar
tmen
t o
f C
om
me
rce.
1M
ajo
r co
nsu
min
g in
du
stri
es o
f p
roce
sse
d m
iner
al m
ater
ials
are
co
nst
ruct
ion
, du
rab
le g
oo
ds
man
ufa
ctu
rers
, an
d s
om
e n
on
du
rab
le g
oo
ds
man
ufa
ctu
rers
. Th
e va
lue
of
ship
men
ts f
or
pro
cess
ed
min
eral
mat
eria
ls c
ann
ot
be
dir
ectl
y re
late
d t
o
gro
ss d
om
est
ic p
rod
uct
.
U.S
. EC
ON
OM
Y
Gro
ss D
omes
tic P
rodu
ct:
$20,
500
billio
n
VALU
E AD
DED
TO
G
RO
SS D
OM
ESTI
C
PRO
DU
CT
BY
MAJ
OR
IN
DU
STR
IES
THAT
C
ON
SUM
E PR
OC
ESSE
D
MIN
ERAL
MAT
ERIA
LS1
Val
ue:
$3,0
20 b
illion
5
Commodity Percent Major import sources (2014–17)2
ARSENIC (trioxide) 100 Morocco, China, BelgiumASBESTOS 100 Brazil, RussiaCESIUM 100 CanadaFLUORSPAR 100 Mexico, Vietnam, South Africa, ChinaGALLIUM 100 China, United Kingdom, Germany, UkraineGRAPHITE (natural) 100 China, Mexico, Canada, BrazilINDIUM 100 China, Canada, Republic of Korea, TaiwanMANGANESE 100 South Africa, Gabon, Australia, GeorgiaMICA (sheet, natural) 100 China, Brazil, Belgium, AustriaNEPHELINE SYENITE 100 CanadaNIOBIUM (columbium) 100 Brazil, Canada, Russia, GermanyRARE EARTHS (compounds and metals)3 100 China, Estonia, France, JapanRUBIDIUM 100 CanadaSCANDIUM 100 Europe, China, Japan, RussiaSTRONTIUM 100 Mexico, Germany, ChinaTANTALUM 100 Brazil, Rwanda, Australia, Congo (Kinshasa)THORIUM 100 India, United KingdomVANADIUM 100 Austria, Canada, Republic of Korea, RussiaGEMSTONES 99 India, Israel, Belgium, South AfricaBISMUTH 96 China, Belgium, Mexico, Republic of KoreaYTTRIUM >95 China, Estonia, Japan, Republic of KoreaPOTASH 92 Canada, Russia, Belarus, IsraelTITANIUM MINERAL CONCENTRATES 91 South Africa, Australia, Canada, MozambiqueDIAMOND (dust, grit, and powder) 89 China, Ireland, Republic of Korea, RomaniaANTIMONY (oxide) 85 China, Thailand, Belgium, BoliviaZINC 85 Canada, Mexico, Peru, AustraliaBARITE 84 China, India, Mexico, MoroccoRHENIUM 84 Chile, Germany, Belgium, PolandSTONE (dimension) 82 Brazil, China, Italy, TurkeyTIN 78 Indonesia, Malaysia, Peru, BoliviaABRASIVES, fused Al oxide (crude) >75 China, France, Hong Kong, CanadaABRASIVES, silicon carbide (crude) >75 China, Netherlands, South Africa, RomaniaBAUXITE >75 Jamaica, Brazil, Guinea, GuyanaTELLURIUM >75 Canada, China, GermanyTITANIUM (sponge) 75 Japan, Kazakhstan, Ukraine, ChinaPLATINUM 73 South Africa, Germany, United Kingdom, ItalyCHROMIUM 71 South Africa, Kazakhstan, RussiaPEAT 70 CanadaGARNET (industrial) 68 Australia, India, South Africa, ChinaSILVER 65 Mexico, Canada, Peru, Republic of KoreaCOBALT 61 Norway, China, Japan, FinlandNICKEL 52 Canada, Norway, Australia, RussiaGERMANIUM >50 China, Belgium, Germany, RussiaIODINE >50 Chile, JapanIRON OXIDE PIGMENTS (natural) >50 Cyprus, Spain, France, AustriaIRON OXIDE PIGMENTS (synthetic) >50 China, Germany, Brazil, CanadaLITHIUM >50 Argentina, Chile, China, RussiaTUNGSTEN >50 China, Bolivia, Germany, CanadaALUMINUM 50 Canada, Russia, United Arab Emirates, ChinaMAGNESIUM COMPOUNDS 48 China, Canada, Australia, BrazilALUMINA 45 Australia, Brazil, Suriname, JamaicaSILICON 34 Russia, Brazil, Canada, ChinaPALLADIUM 33 South Africa, Russia, Italy, United KingdomCOPPER 32 Chile, Canada, MexicoVERMICULITE 30 South Africa, Brazil, China, ZimbabweLEAD 29 Canada, Mexico, Republic of Korea, IndiaPUMICE 29 Greece, Iceland, MexicoSALT 28 Chile, Canada, Mexico, EgyptMICA (scrap and flake, natural) 26 Canada, China, India, JapanPERLITE 25 Greece, Mexico, TurkeyBROMINE <25 Israel, Jordan, ChinaCADMIUM <25 Canada, Australia, China, BelgiumMAGNESIUM METAL <25 Israel, Canada, United Kingdom, MexicoIRON and STEEL 24 Canada, Brazil, Republic of Korea
2018 U.S. NET IMPORT RELIANCE1
1Not all mineral commodities covered in this publication are listed here. Those not shown include mineral commodities for which the United States is a net exporter (abrasives, metallic; boron; clays; diatomite; gold; helium; iron and steel scrap; iron ore; kyanite; molybdenum concentrates; sand and gravel, industrial; selenium; soda ash; titanium dioxide pigment; wollastonite; zeolites; and zirconium) or less than 24% import reliant (beryllium; cement; diamond, industrial stones; feldspar; gypsum; iron and steel slag; lime; nitrogen (fixed)–ammonia; phosphate rock; sand and gravel, construction; stone, crushed; sulfur; and talc and pyrophyllite). For some mineral commodities (hafnium; mercury; quartz crystal, industrial; and thallium), not enough information is available to calculate the exact percentage of import reliance.2In descending order of import share.3Data include lanthanides.
6
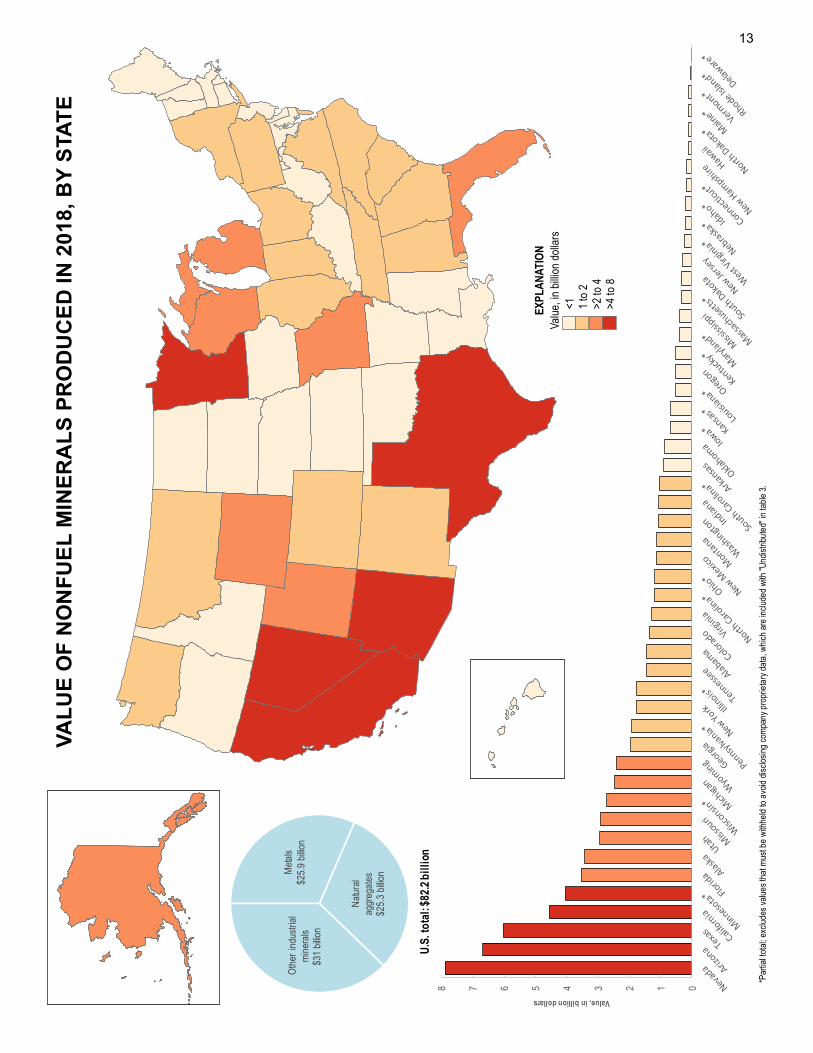
SIGNIFICANT EVENTS, TRENDS, AND ISSUES In 2018, the estimated value of total nonfuel mineral production in the United States was $82.2 billion, a 3% increase from the revised total of $79.7 billion in 2017. The estimated value of metals production decreased by 4% to $25.9 billion. Lower average prices and lower production of many metals contributed to the reduced value. A zinc mine reopened in New York, having last been operational in 2008. The total value of industrial minerals production was $56.3 billion, a 7% increase from that of 2017. Of this total, $25.3 billion was construction aggregates production (construction sand and gravel and crushed stone). Increased construction activity resulted in the increased prices and production of some industrial minerals, especially those used in infrastructure, oil and gas drilling operations, and residential construction. In March 2018, as a result of Department of Commerce findings of harm to national security under Section 232 of the Trade Expansion Act of 1962, as amended (19 U.S.C. 1862), additional import duties of 10% for aluminum articles from all countries of origin, except Canada and Mexico, and additional import duties of 25% for steel articles from all countries of origin, except Canada and Mexico, were implemented under Presidential Proclamations 9704 and 9705, respectively. Throughout the year, modifications and changes were made to the list of countries subject to the tariffs; for some countries, quotas were established in place of the additional duties, and exemptions for certain products were granted. Many countries responded to the increased import duties by increasing the duties for imports of aluminum and steel articles of United States origin, including European Union countries, Canada, China, India, Japan, Mexico, Russia, and Turkey. As of December 2018, the additional import duty for aluminum articles remained at 10% for most countries of origin and 20% for Turkey. The only countries that did not have the increased import duty for aluminum were Argentina, on which import quotas were in place, and Australia. The additional import duty for steel articles remained at 25% for most countries of origin and was 50% for Turkey. The only countries that did not have the increased import duty for steel were Argentina, Brazil, and the Republic of Korea, all of which had import quotas in place, and Australia. As a result, U.S. aluminum imports were estimated to have decreased by 11% and steel mill product imports were estimated to have decreased by 8% in 2018. Under Section 301 (b) of the Trade Act of 1974, as amended, the Office of the United States Trade Representative (USTR) determined that acts, policies and practices of China related to technology transfer, intellectual property, and innovation were discriminatory or unreasonable and those actions burdened or restricted United States commerce (83 FR 14906). An initial list of 818 tariff lines became subject to an additional import duty of 25% in July 2018. In response to this action, China imposed additional import duties for certain items originating in the United States. In August,
the USTR imposed an additional 25% import duty on a second list of 279 tariff lines. China responded in kind and added more products of United States origin to its list of higher import duties. A third list of 5,745 full and partial tariff lines, including nonfuel mineral ores and concentrates and forms, became subject to an additional 10% import duty in late September. The duty rate for this third list was initially scheduled to increase to 25% on January 1, 2019, but that action was delayed. Most mineral commodities were subject to the Section 301 actions; however, a few commodities were removed from proposed lists, including some of those considered critical minerals. Executive Order 13817, A Federal Strategy to Ensure Secure and Reliable Supplies of Critical Minerals (EO), was issued on December 20, 2017. Pursuant to the EO, the Secretary of the Interior, in coordination with the Secretary of Defense, and in consultation with the heads of other relevant executive departments and agencies, was tasked with developing and submitting to the Federal Register a list of minerals defined as critical minerals. The U.S. Geological Survey (USGS), in coordination with the Bureau of Land Management (BLM), developed the unranked list in cooperation with the U.S. Departments of Defense, Energy, State, Commerce, and other members of the National Science and Technology Council Subcommittee on Critical and Strategic Mineral Supply Chains. The final list of critical minerals was published in the Federal Register on May 18, 2018 (83 FR 23295). A critical mineral, as defined by the EO, is a mineral identified to be (i) a nonfuel mineral or mineral material essential to the economic and national security of the United States, (ii) the supply chain of which is vulnerable to disruption, and (iii) that serves an essential function in the manufacturing of a product, the absence of which would have significant consequences for the U.S. economy or national security. Disruptions in supply may arise for any number of reasons, including natural disasters, labor strife, trade disputes, resource nationalism, conflict, and so forth. The assured supply of critical minerals and the resiliency of their supply chains are essential to the economic security and national defense of the United States. Based on analysis and modeling using multiple factors, 35 minerals or mineral material groups were identified on the list of critical minerals. These were aluminum (bauxite), antimony, arsenic, barite, beryllium, bismuth, cesium, chromium, cobalt, fluorspar, gallium, germanium, graphite (natural), hafnium, helium, indium, lithium, magnesium, manganese, niobium, platinum group metals, potash, the rare earth elements group, rhenium, rubidium, scandium, strontium, tantalum, tellurium, tin, titanium, tungsten, uranium, vanadium, and zirconium. One of the principle metrics used in the analysis and modeling of critical minerals was the Herfindahl- Hirschman index (HHI). The HHI is used by the
7
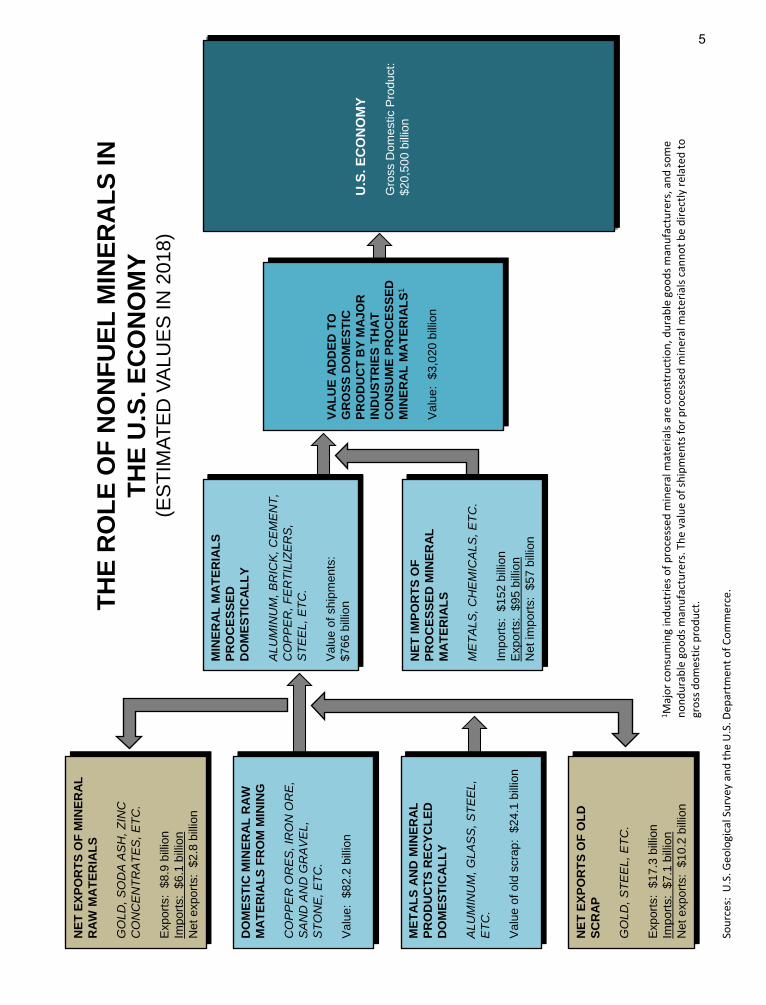
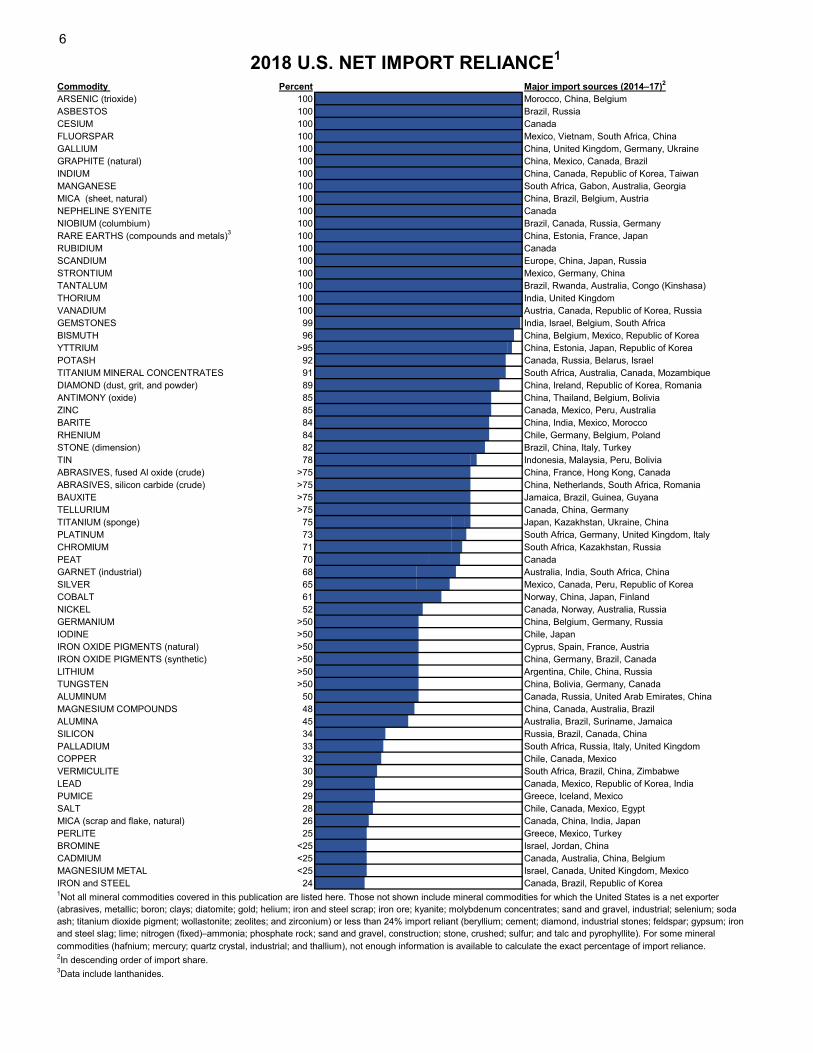
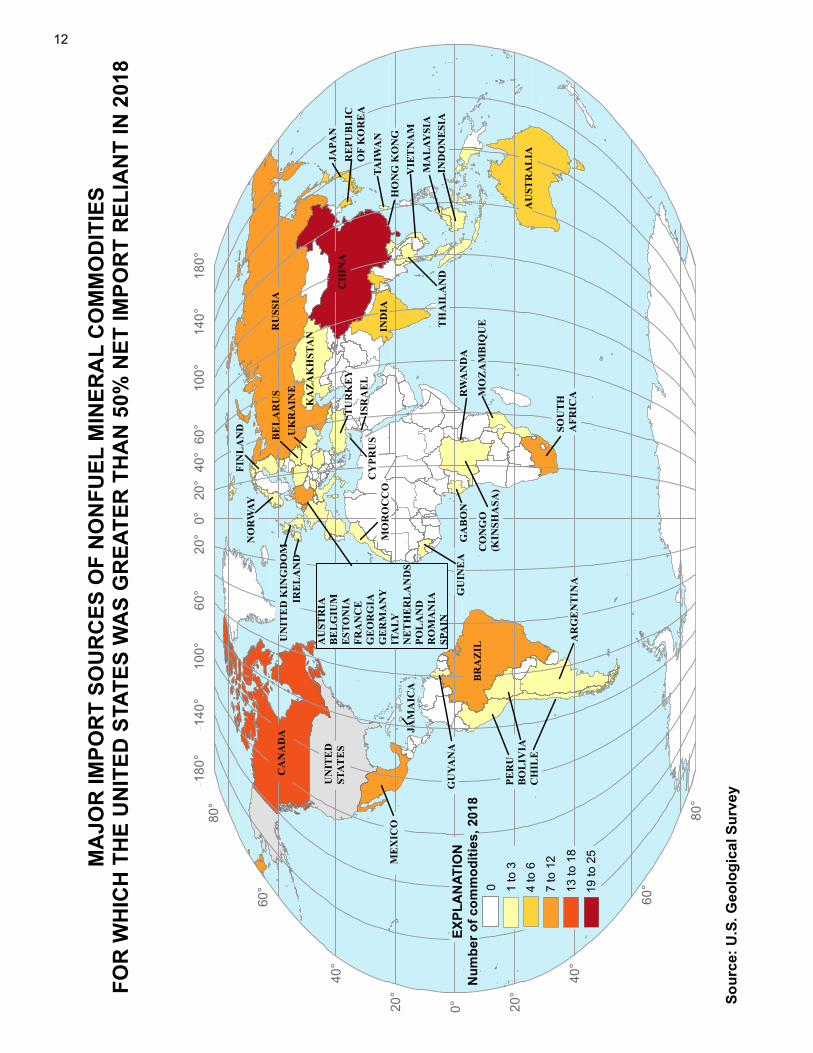
Department of Justice and the Federal Trade Commission to identify highly concentrated markets where a company may control market share above an established threshold of 2,500 on a scale that ranges from 0 to 10,000. Additional tools and sources of information used to produce the list were as follows: (i) U.S. net import reliance (NIR) statistics as published annually in the USGS Mineral Commodity Summaries; (ii) USGS Professional Paper 1802 “Critical Mineral Resources of the United States”; (iii) U.S. Defense Logistics Agency (DLA) reports produced in support of the management of the National Defense Stockpile; (iv) the National Defense Authorization Act for fiscal year 2018; (v) U.S. Energy Information Administration (EIA) uranium statistics in the 2016 Uranium Marketing Annual Report; and (vi) the judgment of subject matter experts. The methodology is summarized in a USGS publication released concurrently with the posting of the draft list in the Federal Register (Fortier and others, 2018). The U.S. Geological Survey (USGS) generates composite leading and coincident indexes to track economic activity in the primary metals and the nonmetallic minerals industries. As shown in the charts on page 4, for each of the indexes, a growth rate is calculated to measure its change relative to the previous 12 months. The indexes’ growth rate is a 6-month smoothed compound annual rate, which measures near-term trend. Usually, a growth rate above +1.0% signals an increase in primary metals or nonmetallic minerals industry activity, and a growth rate below -1.0% indicates a downturn in activity. The primary metals leading index growth rate had been well above +1.0% from January through June 2018 and had been above +1.0% since April 2016; the July growth rate was below the +1.0% threshold; August and September growth rates increased barely above the +1.0% threshold; October turned slightly negative; November returned to +1.0% threshold growth; and December turned negative again. The nonmetallic mineral products industry’s leading index growth rate had been above the +1.0% growth rate threshold January through August; the September growth rate was below the +1.0% threshold but remained positive; and October, November, and December growth rates were negative. As shown in the figure on page 5, minerals remained fundamental to the U.S. economy, contributing to the real gross domestic product at several levels, including mining, processing, and manufacturing finished products. The estimated value of nonfuel minerals produced at mines in the United States in 2018 was $82.2 billion. Domestic raw materials and domestically recycled materials were used to produce mineral materials worth $766 billion. These mineral materials were, in turn, consumed by downstream industries with an estimated value of $3.02 trillion in 2018, a 6% increase from the revised figure of $2.85 trillion in 2017. The figure on page 6 illustrates the reliance of the United States on foreign sources for raw and processed mineral materials. In 2018, imports made up more than one-half of the U.S. apparent consumption for 48 nonfuel mineral commodities, and the United States was 100% net import reliant for 18 of those. Critical minerals comprised
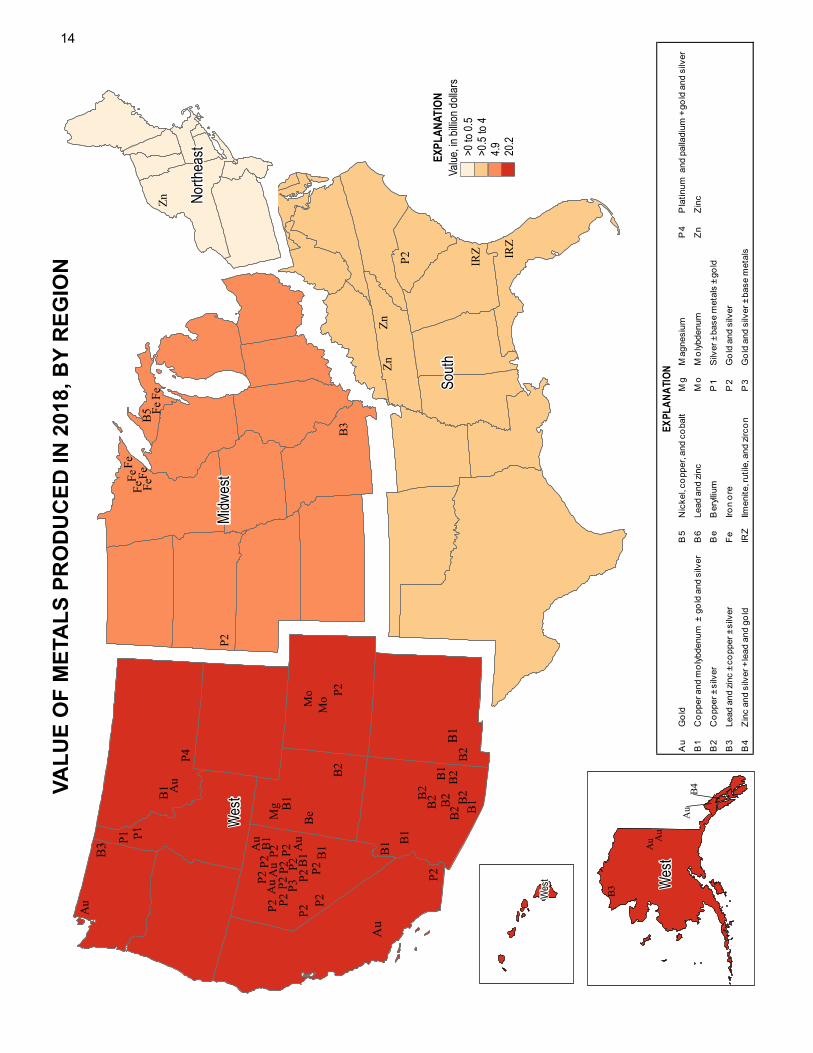
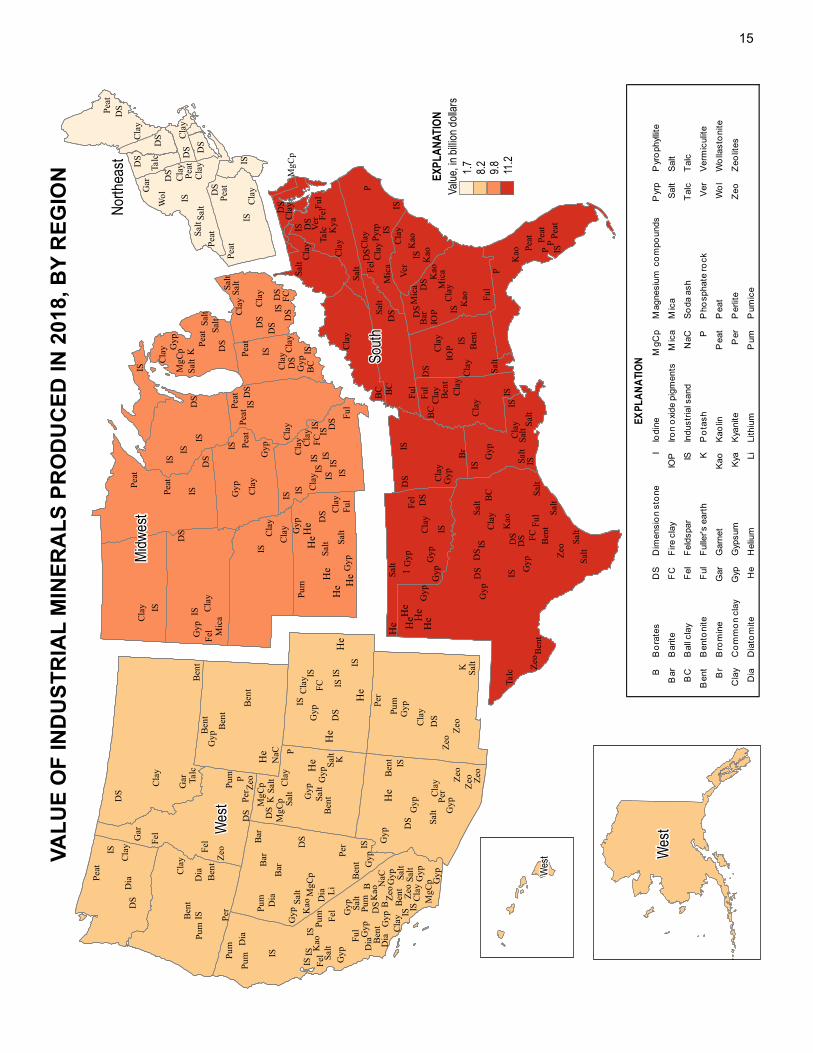
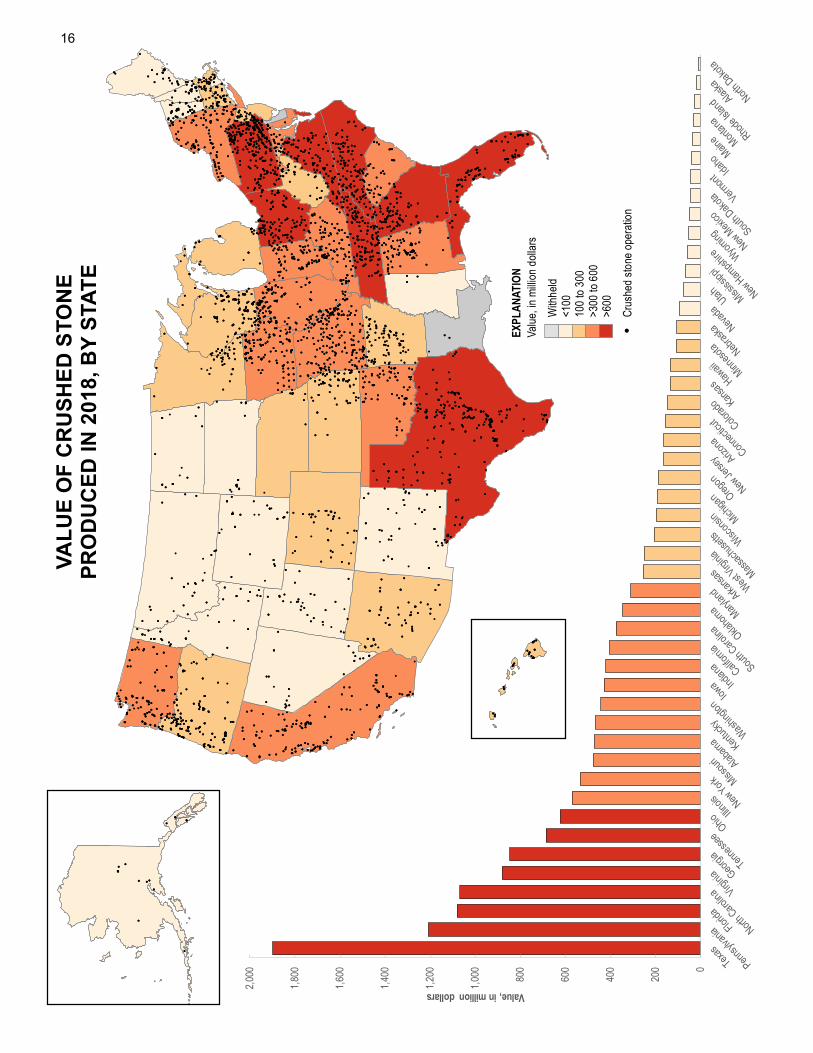
14 of the 18 mineral commodities with 100% net import reliance, and comprised 15 of the 30 remaining mineral commodities with imports greater than 50 percent of annual consumption. The figure on page 12 shows the countries from which the majority of these mineral commodities were imported and the number of mineral commodities for which each highlighted country was a leading supplier. China, followed by Canada, supplied the largest number of nonfuel mineral commodities. The United States was import reliant for an additional 29 commodities and was a net exporter of 18 nonfuel mineral commodities. The estimated value of U.S. metal mine production in 2018 was $25.9 billion (table 1), 4% less than that of 2017. Principal contributors to the total value of metal mine production in 2018 were gold (33%), copper (31%), iron ore (16%), and zinc (9%). The estimated value of U.S. industrial minerals production in 2018, including construction aggregates, was $56.3 billion, about 7% more than the revised value of 2017. The value of industrial minerals production in 2018 was dominated by crushed stone (30%), cement (20%), and construction sand and gravel (15%). In 2018, U.S. production of 13 mineral commodities was valued at more than $1 billion each. These were, in decreasing order of value, crushed stone, cement, construction sand and gravel, gold, copper, industrial sand and gravel, iron ore, zinc, lime, salt, phosphate rock, soda ash, and clays (all types). In 2018, 12 States each produced more than $2 billion worth of nonfuel mineral commodities. These States were, in descending order of production value, Nevada, Arizona, Texas, California, Minnesota, Florida, Alaska, Utah, Missouri, Wisconsin, Michigan, and Wyoming (table 3). The Defense Logistics Agency (DLA) Strategic Materials is responsible for providing safe, secure, and environmentally sound stewardship for strategic and critical materials in the U.S. National Defense Stockpile (NDS). DLA Strategic Materials stores 44 commodities at 10 locations in the United States. In fiscal year 2018, DLA Strategic Materials acquired approximately $11.6 million of new stock and sold $69.9 million of excess materials from the NDS. At the end of fiscal year 2018, materials valued at $1.2 billion remained in the NDS. Of the remaining material, portions are held in reserve, offered for sale, or sales were suspended. Additional detailed information can be found in the “Government Stockpile” sections in the mineral commodity chapters that follow. Under the authority of the Defense Production Act of 1950, the U.S. Geological Survey advises the DLA on acquisition and disposals of NDS mineral materials. Reference Cited Fortier, S.M., Nassar, N.T., Lederer, G.W., Brainard, Jamie, Gambogi,
Joseph, and McCullough, E.A., 2018, Draft critical mineral list—Summary of methodology and background information: U.S. Geological Survey Open-File Report 2018–1021, 15 p.
8
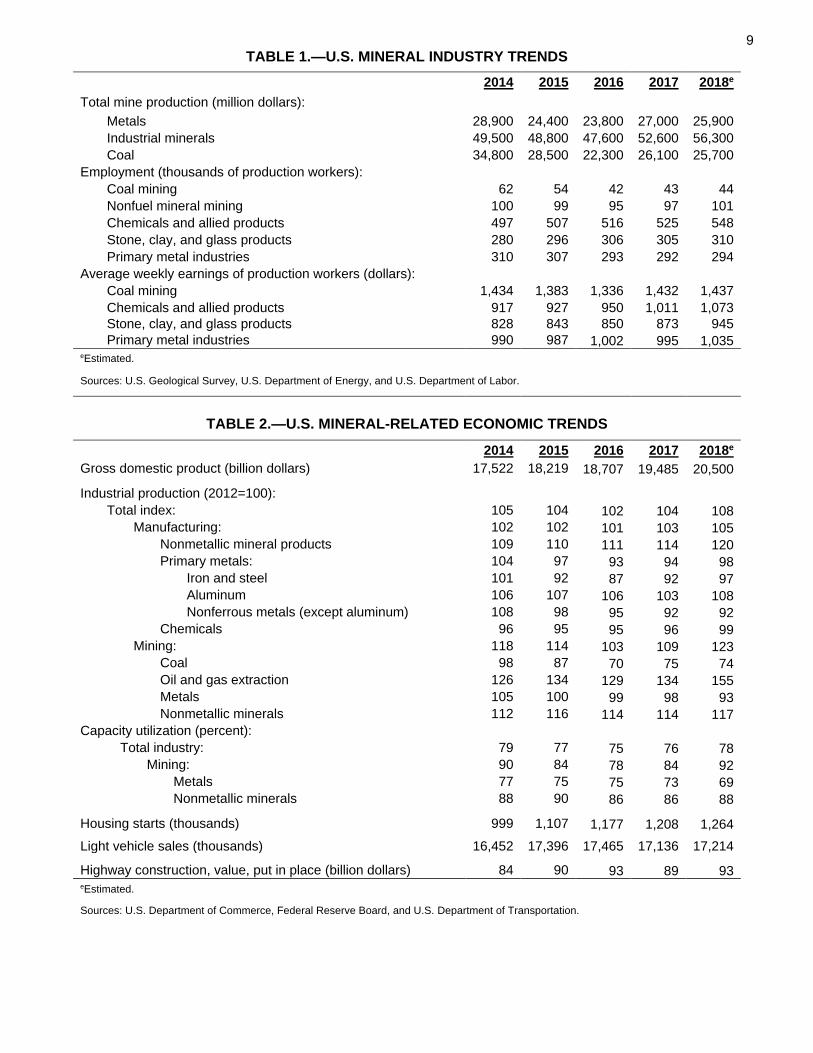
TABLE 1.—U.S. MINERAL INDUSTRY TRENDS 2014 2015 2016 2017 2018e Total mine production (million dollars):
Metals 28,900 24,400 23,800 27,000 25,900 Industrial minerals 49,500 48,800 47,600 52,600 56,300 Coal 34,800 28,500 22,300 26,100 25,700
Employment (thousands of production workers): Coal mining 62 54 42 43 44 Nonfuel mineral mining 100 99 95 97 101 Chemicals and allied products 497 507 516 525 548 Stone, clay, and glass products 280 296 306 305 310 Primary metal industries 310 307 293 292 294
Average weekly earnings of production workers (dollars): Coal mining 1,434 1,383 1,336 1,432 1,437 Chemicals and allied products 917 927 950 1,011 1,073 Stone, clay, and glass products 828 843 850 873 945 Primary metal industries 990 987 1,002 995 1,035
eEstimated.
Sources: U.S. Geological Survey, U.S. Department of Energy, and U.S. Department of Labor.
TABLE 2.—U.S. MINERAL-RELATED ECONOMIC TRENDS 2014 2015 2016 2017 2018e Gross domestic product (billion dollars) 17,522 18,219 18,707 19,485 20,500 Industrial production (2012=100):
Total index: 105 104 102 104 108 Manufacturing: 102 102 101 103 105
Nonmetallic mineral products 109 110 111 114 120 Primary metals: 104 97 93 94 98
Iron and steel 101 92 87 92 97 Aluminum 106 107 106 103 108 Nonferrous metals (except aluminum) 108 98 95 92 92
Chemicals 96 95 95 96 99 Mining: 118 114 103 109 123
Coal 98 87 70 75 74 Oil and gas extraction 126 134 129 134 155 Metals 105 100 99 98 93 Nonmetallic minerals 112 116 114 114 117
Capacity utilization (percent): Total industry: 79 77 75 76 78
Mining: 90 84 78 84 92 Metals 77 75 75 73 69 Nonmetallic minerals 88 90 86 86 88
Housing starts (thousands) 999 1,107 1,177 1,208 1,264 Light vehicle sales (thousands) 16,452 17,396 17,465 17,136 17,214 Highway construction, value, put in place (billion dollars) 84 90 93 89 93 eEstimated.
Sources: U.S. Department of Commerce, Federal Reserve Board, and U.S. Department of Transportation.
9
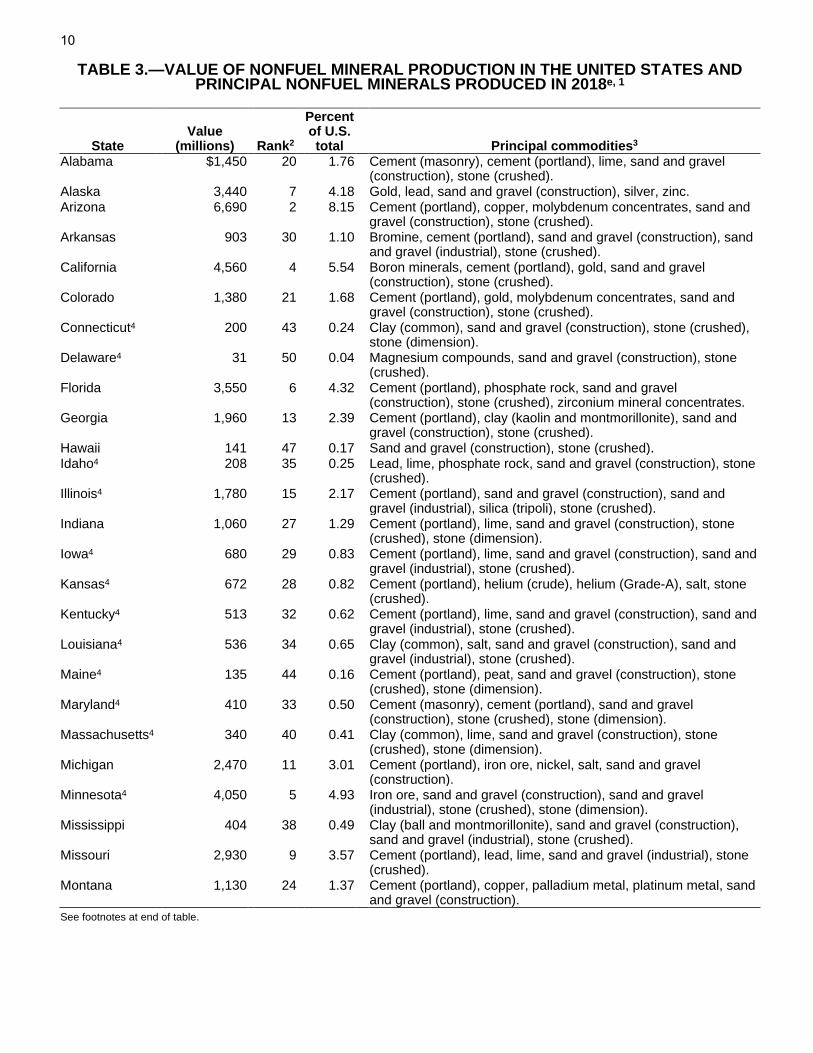
TABLE 3.—VALUE OF NONFUEL MINERAL PRODUCTION IN THE UNITED STATES AND PRINCIPAL NONFUEL MINERALS PRODUCED IN 2018e, 1
State Value
(millions) Rank2
Percent of U.S. total Principal commodities3
Alabama $1,450 20 1.76 Cement (masonry), cement (portland), lime, sand and gravel (construction), stone (crushed).
Alaska 3,440 7 4.18 Gold, lead, sand and gravel (construction), silver, zinc. Arizona 6,690 2 8.15 Cement (portland), copper, molybdenum concentrates, sand and
gravel (construction), stone (crushed). Arkansas 903 30 1.10 Bromine, cement (portland), sand and gravel (construction), sand
and gravel (industrial), stone (crushed). California 4,560 4 5.54 Boron minerals, cement (portland), gold, sand and gravel
(construction), stone (crushed). Colorado 1,380 21 1.68 Cement (portland), gold, molybdenum concentrates, sand and
gravel (construction), stone (crushed). Connecticut4 200 43 0.24 Clay (common), sand and gravel (construction), stone (crushed),
stone (dimension). Delaware4 31 50 0.04 Magnesium compounds, sand and gravel (construction), stone
(crushed). Florida 3,550 6 4.32 Cement (portland), phosphate rock, sand and gravel
(construction), stone (crushed), zirconium mineral concentrates. Georgia 1,960 13 2.39 Cement (portland), clay (kaolin and montmorillonite), sand and
gravel (construction), stone (crushed). Hawaii 141 47 0.17 Sand and gravel (construction), stone (crushed). Idaho4 208 35 0.25 Lead, lime, phosphate rock, sand and gravel (construction), stone
(crushed). Illinois4 1,780 15 2.17 Cement (portland), sand and gravel (construction), sand and
gravel (industrial), silica (tripoli), stone (crushed). Indiana 1,060 27 1.29 Cement (portland), lime, sand and gravel (construction), stone
(crushed), stone (dimension). Iowa4 680 29 0.83 Cement (portland), lime, sand and gravel (construction), sand and
gravel (industrial), stone (crushed). Kansas4 672 28 0.82 Cement (portland), helium (crude), helium (Grade-A), salt, stone
(crushed). Kentucky4 513 32 0.62 Cement (portland), lime, sand and gravel (construction), sand and
gravel (industrial), stone (crushed). Louisiana4 536 34 0.65 Clay (common), salt, sand and gravel (construction), sand and
gravel (industrial), stone (crushed). Maine4 135 44 0.16 Cement (portland), peat, sand and gravel (construction), stone
(crushed), stone (dimension). Maryland4 410 33 0.50 Cement (masonry), cement (portland), sand and gravel
(construction), stone (crushed), stone (dimension). Massachusetts4 340
40
0.41
Clay (common), lime, sand and gravel (construction), stone (crushed), stone (dimension).
Michigan 2,470 11 3.01 Cement (portland), iron ore, nickel, salt, sand and gravel (construction).
Minnesota4 4,050 5 4.93 Iron ore, sand and gravel (construction), sand and gravel (industrial), stone (crushed), stone (dimension).
Mississippi 404 38 0.49 Clay (ball and montmorillonite), sand and gravel (construction), sand and gravel (industrial), stone (crushed).
Missouri 2,930 9 3.57 Cement (portland), lead, lime, sand and gravel (industrial), stone (crushed).
Montana 1,130 24 1.37 Cement (portland), copper, palladium metal, platinum metal, sand and gravel (construction).
See footnotes at end of table.
10
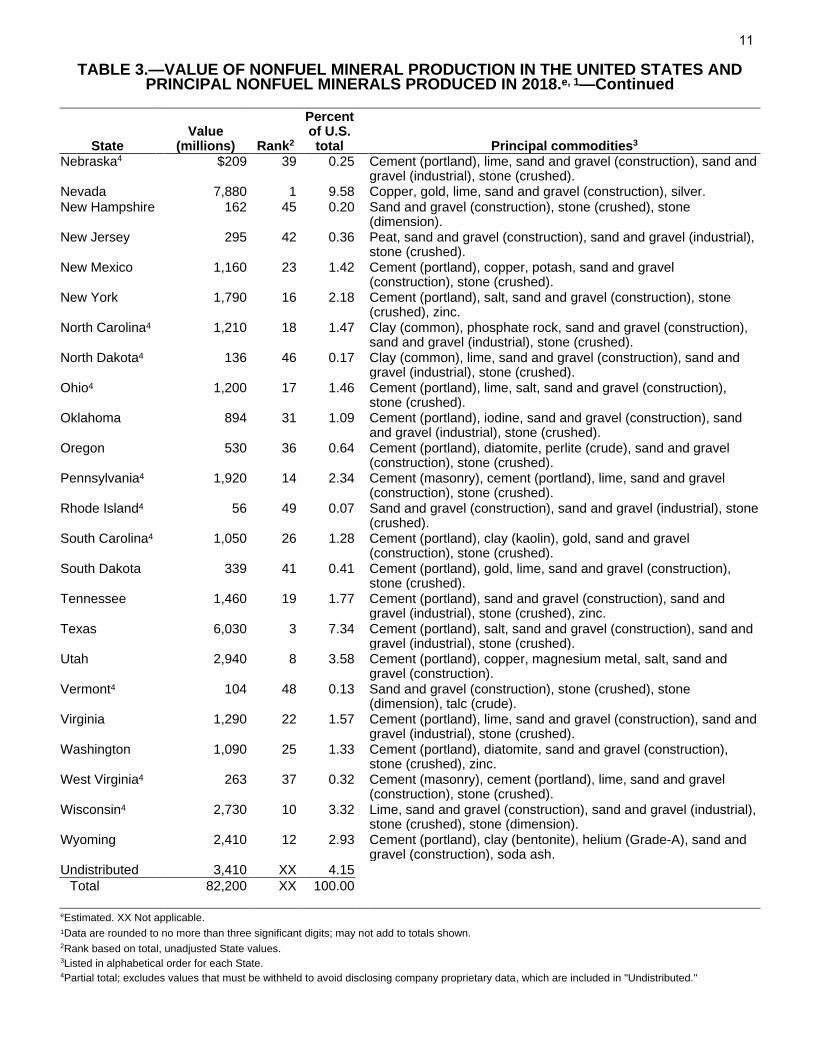
TABLE 3.—VALUE OF NONFUEL MINERAL PRODUCTION IN THE UNITED STATES AND PRINCIPAL NONFUEL MINERALS PRODUCED IN 2018.e, 1—Continued
State Value
(millions) Rank2
Percent of U.S. total Principal commodities3
Nebraska4 $209 39 0.25 Cement (portland), lime, sand and gravel (construction), sand and gravel (industrial), stone (crushed).
Nevada 7,880 1 9.58 Copper, gold, lime, sand and gravel (construction), silver. New Hampshire 162 45 0.20 Sand and gravel (construction), stone (crushed), stone
(dimension). New Jersey 295 42 0.36 Peat, sand and gravel (construction), sand and gravel (industrial),
stone (crushed). New Mexico 1,160 23 1.42 Cement (portland), copper, potash, sand and gravel
(construction), stone (crushed). New York 1,790 16 2.18 Cement (portland), salt, sand and gravel (construction), stone
(crushed), zinc. North Carolina4 1,210 18 1.47 Clay (common), phosphate rock, sand and gravel (construction),
sand and gravel (industrial), stone (crushed). North Dakota4 136 46 0.17 Clay (common), lime, sand and gravel (construction), sand and
gravel (industrial), stone (crushed). Ohio4 1,200 17 1.46 Cement (portland), lime, salt, sand and gravel (construction),
stone (crushed). Oklahoma 894 31 1.09 Cement (portland), iodine, sand and gravel (construction), sand
and gravel (industrial), stone (crushed). Oregon 530 36 0.64 Cement (portland), diatomite, perlite (crude), sand and gravel
(construction), stone (crushed). Pennsylvania4 1,920 14 2.34 Cement (masonry), cement (portland), lime, sand and gravel
(construction), stone (crushed). Rhode Island4 56 49 0.07 Sand and gravel (construction), sand and gravel (industrial), stone
(crushed). South Carolina4 1,050 26 1.28 Cement (portland), clay (kaolin), gold, sand and gravel
(construction), stone (crushed). South Dakota 339 41 0.41 Cement (portland), gold, lime, sand and gravel (construction),
stone (crushed). Tennessee 1,460 19 1.77 Cement (portland), sand and gravel (construction), sand and
gravel (industrial), stone (crushed), zinc. Texas 6,030 3 7.34 Cement (portland), salt, sand and gravel (construction), sand and
gravel (industrial), stone (crushed). Utah 2,940 8 3.58 Cement (portland), copper, magnesium metal, salt, sand and
gravel (construction). Vermont4 104 48 0.13 Sand and gravel (construction), stone (crushed), stone
(dimension), talc (crude). Virginia 1,290 22 1.57 Cement (portland), lime, sand and gravel (construction), sand and
gravel (industrial), stone (crushed). Washington 1,090 25 1.33 Cement (portland), diatomite, sand and gravel (construction),
stone (crushed), zinc. West Virginia4 263 37 0.32 Cement (masonry), cement (portland), lime, sand and gravel
(construction), stone (crushed). Wisconsin4 2,730 10 3.32 Lime, sand and gravel (construction), sand and gravel (industrial),
stone (crushed), stone (dimension). Wyoming 2,410 12 2.93 Cement (portland), clay (bentonite), helium (Grade-A), sand and
gravel (construction), soda ash. Undistributed 3,410 XX 4.15
Total 82,200 XX 100.00
eEstimated. XX Not applicable. 1Data are rounded to no more than three significant digits; may not add to totals shown. 2Rank based on total, unadjusted State values. 3Listed in alphabetical order for each State.4Partial total; excludes values that must be withheld to avoid disclosing company proprietary data, which are included in "Undistributed."
11
180°
180°
140°
140°
100°
100°
60°
60°
40°
40°
20°
20°
0°0°
-20°
-20°
-60°
-60°
-100
°
-100
°
-140
°
-140
°
-180
°
-180
°
40°
40°
20°
20°
0°0°
-20°
-20°
-40°
-40°
80°
80°
60°
60°
-60°
-60°
-80°
-80°
MA
JOR
IMPO
RT
SOU
RC
ES O
F N
ON
FUEL
MIN
ERA
L C
OM
MO
DIT
IES
FOR
WH
ICH
TH
E U
NIT
ED S
TATE
S W
AS
GR
EATE
R T
HA
N 5
0% N
ET IM
POR
T R
ELIA
NT
IN 2
018
Sour
ce: U
.S. G
eolo
gica
l Sur
veyU
NIT
ED
ST
ATES
CA
NA
DA
BRA
ZIL
ME
XIC
O
SOU
THA
FRIC
A
AU
STR
AL
IA
IND
IA
RU
SSIA
JAPA
NR
EPU
BL
IC
OF
KO
REA
PER
UBO
LIV
IAC
HIL
E
AR
GE
NTI
NA
CH
INA
UN
ITE
D K
ING
DO
MIR
ELA
ND
ISR
AEL
GA
BO
N
MO
ZA
MB
IQU
E
KA
ZA
KH
STA
N
UK
RA
INE
NO
RW
AY
BELA
RU
S
CY
PRU
S
GU
INE
A
IND
ON
ESI
AM
AL
AYSI
AV
IET
NA
M
THA
ILA
ND
TAIW
AN
MO
RO
CC
O
JAM
AIC
A
AU
STR
IABE
LGIU
MES
TON
IAFR
AN
CE
GE
OR
GIA
GE
RM
AN
YIT
ALY
NET
HE
RL
AN
DS
POL
AN
DR
OM
AN
IASP
AIN
HO
NG
KO
NG
RW
AN
DA
1 - 3
4 - 6
7 - 1
2
13 -
18
19 -
23
0 1 to
34
to 6
7 to
12
13 to
18
19 to
25
EXPL
AN
ATIO
NN
umbe
r of c
omm
oditi
es, 2
018
CO
NG
O
(KIN
SHA
SA)
FIN
LA
ND
GU
YAN
A
TUR
KEY
12
EXPL
ANAT
IONVal
ue, in
billion
dollar
s<1 1 to
2>2
to 4>4
to 8
*Partia
l total;
exclu
des va
lues th
at must
be wi
thheld
to avo
id disc
losing
comp
any pr
oprieta
ry data
, whic
h are
includ
ed wit
h "Un
distrib
uted"
in tabl
e 3.
VALU
E OF N
ONFU
EL M
INER
ALS P
RODU
CED
IN 20
18, B
Y STA
TE
012345678
Value, in billion dollars
Metals
$25
.9billio
n
Natura
l agg
regate
s$25
.3billio
n
Other
indust
rial
minera
ls$31
billion
U.S.to
tal: $8
2.2 bil
lion
13
B6
B3
B4Au
Au AuWe
st
West
Be
B2 B2B2B1
B1
B2B2 B1B2
B1
B1
P3
B1
B2
B1
B2
P2
Au
B1P2
P2P2
P2P2
P2P2
Au P2P2
P2P2Au
Au
Au AuMg
P4
P1 P1
P2 P2B3
B1
AuP2
FeFe
FeFeFe FeFe
B5
ZnZn
P2Zn
Zn
West
Midwe
stNo
rtheast
South
EXPL
ANAT
IONVal
ue, in
billion
dollar
s>0
to 0.5
>0.5 to
44.9 20.
2
Zn
Mo MoP2
AuGo
ldB5
Nick
el, co
pper,
and c
obalt
Mg
Mag
nesiu
mP4
Plati
num
and p
allad
ium + g
old an
d silv
erB1
Copp
er an
d moly
bden
um ±
gold
and s
ilver
B6Le
ad an
d zinc
Mo
Moly
bden
umZn
Zinc
B2Co
pper
± silv
erBe
Beryl
lium
P1Sil
ver ±
base
meta
ls ± g
oldB3
Lead
and z
inc ± c
oppe
r ± si
lver
FeIro
n ore
P2Go
ld an
d silv
erB4
Zinc a
nd si
lver +
lead
and g
oldIR
ZIlm
enite
, rutile
, and
zirco
nP3
Gold
and s
ilver
± bas
e meta
ls
EXPL
ANAT
ION
IRZ
IRZ
VALU
E OF M
ETAL
S PRO
DUCE
D IN
2018
, BY R
EGIO
N
P2
B3
B1
14
Bar
Bar
Bar
Bar
BB
Br
Dia DiaDia
Dia
Dia
Dia
Dia
DS
I
Kya
Mica Mi
caMica
Mica
P
PP
P
P
P
K
K
K
Pyrp
Salt
Salt
Salt
Salt
Salt
Salt Sa
lt
Salt
Salt
Salt
Salt
Salt
Salt
Salt S
alt
Salt
Salt
Salt
Salt
Salt
Salt
Salt
Salt
Salt
Salt Sa
lt
SaltSa
lt
NaC
Clay
DS
Bent
Bent
ISIS
ISIS
ISIS Kao
Kao
Zeo Zeo
Ful
Fel
Fel
Zeo
Zeo
Kao
Clay
Zeo Ze
oZe
o
ISIS
IS
ISIS
Zeo
Zeo
ISCl
ay
FelGy
pIS Cl
ay
ClayCl
ay
Pum
Peat
IS IS Clay
Clay Cl
ay IS ISIS
IS
Talc
Talc
Talc
Ver
Ver
Gyp
Gyp
Gyp
Gyp
Gyp
Gyp
Gyp
Gyp
Gyp
Gyp
Gyp
Gyp
Gyp
Gyp
Gyp
Gyp
Gyp
Gyp
Gyp
GypGy
p Gyp
Gyp
Gyp
Gyp
Gyp Gy
p
Gyp
Peat
PeatPe
atPe
at
Peat
Peat
Peat
Peat
Peat
Peat
Peat
Peat
Peat
K
Salt
Salt
Salt
Salt
Salt
NaC
ISISIS
ISISIS
DSDS
DSDS
ISCl
ay
Clay
ClayDS
IS
FelDS
ISIS
KaoKa
o
IOP IS
Clay
Clay
Clay
ISIS
IS
Zeo
Zeo
Ful
Clay
Bent
FC
FC
Ful
IS
Talc
Gyp
Gyp
Gyp
Peat Peat
MgCp
MgCp
MgCp
MgCp
MgCpMg
Cp
Fel
Fel
Fel
Fel
Gar
Gar
Gar
IOP
Li
Per
Per
Per
Per
Per Pu
m
PumPu
m
Pum
Pum
Pum
Pum
Pum
Wol
DS
DS
DS
DS
DS
DS
DS
DS
DS
DSDS
DSDS
DS
DS
DS
DS
DS
DS
DS
DSDS
DS
DS
DS
DS
DSDS
DS
DS
DS
DS
DSBC
BC
BC
BC
BCBe
nt
Clay
Bent
Bent
Bent
Bent
Bent
Bent
Bent
Bent
Bent
Bent
Bent
Clay
Clay
Clay
Clay
Clay
Clay
Clay
Clay
Clay
ClayCl
ay
Clay
Clay
Clay Clay
Clay
Clay
Clay
Clay
Clay
Clay
Clay
Clay
Clay
Clay
Clay
Clay
Clay
Clay
FC
FC
Ful
Ful
Ful
Ful
Ful
Kao
Kao
Kao
Kao
IS
IS
IS
ISIS
IS
IS
ISIS
IS
IS
IS
IS
IS
IS
IS
IS
IS
IS
IS
IS
IS
HeHe
He
He
He
He
He He
HeHe
He
He
He
HeHe
He
EXPL
ANAT
IONVal
ue, in
billion
dollar
s1.7 8.2 9.8 11.
2
West
Midwe
stNo
rtheast
South
West
WestVA
LUE O
F IND
USTR
IAL M
INER
ALS P
RODU
CED
IN 20
18, B
Y REG
ION
BBo
rates
DSDi
mens
ion st
one
IIod
ineM
gCp
Mag
nesiu
m co
mpou
nds
Pyrp
Pyro
phylli
teBa
rBa
riteFC
Fire c
layIO
PIro
n oxid
e pigm
ents
Mica
Mica
Salt
Salt
BCBa
ll clay
Fel
Felds
par
ISInd
ustria
l san
dNa
CSo
da as
hTa
lcTa
lcBe
ntBe
ntonit
eFu
lFu
ller's
earth
KPo
tash
PPh
osph
ate ro
ckVe
rVe
rmicu
liteBr
Brom
ineGa
rGa
rnet
Kao
Kaoli
nPe
atPe
atWo
lWo
llasto
nite
Clay
Comm
on cl
ayGy
pGy
psum
Kya
Kyan
itePe
rPe
rlite
Zeo
Zeoli
tesDi
aDi
atomi
teHe
Heliu
mLi
Lithiu
mPu
mPu
mice
EXPL
ANAT
ION
15
!!!!
!!
!!!!!!!!!!!!!!!
!!
!!
!!!!!!!!!!!!!!
!!
!!!!!!!!!!!!!!!!
!!!!!!
!!!!!!
!!!!!!!!!!!!!!!!!!
!!
!!
!!!!!!
!!
!!
!!
!!!!
!!!!
!!
!!
!!!!!!
!
!!!!
!!!!
!!!!
!!!!
!!
!!
!!
!!!!!!
!!!
!!
!!
!!
!!
!!
!!!!
!!
!!!!
!!!!
!!
!!!!
!!!
!!!!!!!!!!
!!!!!!
!!!
!!
!
!!
!
!!
!!!!!
!!!!
!
!!
!!
!!!!
!!!!!!
!!
!!!!!!!!
!!!
!!
!
!!
!!!!!!!!
!!!!!!
!!!!!!!!!!
!!
!!!!
!!
!!
!!!!!!
!!
!!
!!!!
!!
!!!!
!!!
!!!!
!!!!!!!!!!!
!!!!!!
!!
!!!!
!!!!!!
!!!!
!!
!!
!!!!
!!
!!!!!!
!!
!!
!!
!!
!!
!!!!
!!!!!!!!!!!
!!
!!!!!!
!!
!!
!!!!!!
!!
!!
!!!
!!!!
!!!!
!!!!
!!!!!!!
!!!!!!!
!!!
!!!
!!!!
!!
!!
!!
!!!!
!!!!
!!!!
!!!!
!!
!!!!
!!!!
!!!!
!!!
!!!!
!!!!!!!
!!!
!!!!
!!!!!!!!!!
!!
!!!!
!!!!
!!
!!
!!!!
!!
!
!!
!!
!!!!
!!!
!!!!
!!
!!!!
!!!
!!!!!!
!
!!
!!!!
!!!
!!
!!
!!!!!!
!!!
!!!!!!
!!
!!
!!
!!!!
!!
!!
!!
!!!!
!!
!!!!
!!!!!!
!!
!!!!
!!
!!
!!!!!
!!!
!!
!!
!!!!
!
!
!!
!
!!
!!
!!!!
!
!!
!!
!!!!
!!!!
!!
!!!!
!!
!!
!!!
!!!!
!!
!!
!!
!!!!
!!
!!
!!
!!
!!!!
!!
!!
!!!!
!!!!
!!!!
!!!!
!!
!!
!!
!!
!!
!!
!!
!!
!!!!
!!
!!!!!
!!
!!
!!
!!!!
!!
!!
!!
!!!!!
!!
!!
!!
!!
!!
!!!!
!!
!!!!
!!!!
!!
!!!!
!!
!!
!!
!!
!!!!
!!!
!!
!!
!!
!!
!!
!!!!!!!!
!!!!
!!
!!
!!!!
!!
!!
!!!!
!!!!
!!
!!
!!
!!
!!
!
!!
!
!!
!!!!!!
!!
!!
!!
!!
!!!!
!!
!!
!!!!
!!
!!
!!
!!
!!
!!
!
!!
!!
!!
!!
!!
!!
!!
!!
!!
!!
!!
!!!!
!!
!!!!
!!
!!
!!
!!
!
!!
!!!!
!
!
!!
!!
!!
!
!!
!!
!!
!!
!!
!!
!!
!!
!!
!!
!!
!!
!!
!!
!!
!!!!
!!!!
!!
!!
!!
!!!!
!!!!
!!
!!
!!
!!
!!
!!!!
!!
!!!!
!!
!!
!!
!!!!
!!!!
!!
!!
!!!!!!
!!
!!
!!!!
!!
!!
!!
!!
!!
!!!!
!!
!!
!!
!!!!!!
!!
!!
!!!!
!!
!!
!!
!!!
!!!!
!!
!!
!!
!!!
!!
!
!!!!!!
!!!!
!!
!!
!!
!!!!
!!!
!!
!!
!!
!!!!!
!!
!!!!
!!
!!
!!
!!
!!
!!
!!
!!
!!!!
!!
!!
!!
!!
!!
!!
!!
!!
!!
!!
!!!!
!!!!
!!!!
!!
!!
!!
!!!!
!!
!
!!
!!
!!
!!
!!!!!
!!
!!
!!
!!
!!!
!!
!!
!!
!!
!!!!
!!
!!!
!!!!!!!
!!!!
!!!
!!
!!!!
!!
!!
!!!!
!!
!!
!!!!
!!
!!
!!
!!
!
!!
!!
!!
!!
!
!!
!!
!!
!!
!!!!!!
!!
!!
!
!!
!
!!
!!
!!!!
!!
!!
!!
!!!
!!!!
!!
!!!!!!
!!!!!!
!!
!!
!!
!!
!!
!!
!!
!
!
!!
!!
!!!!
!!
!!
!!!!
!!
!!
!!
!!
!!
!!!!
!!
!!
!!
!!
!!
!!
!!!
!!
!!
!!!!
!!
!!
!!
!!
!!
!!
!!
!!
!
!
!!
!!
!!
!!
!!
!!
!!!!
!!
!!
!
!!
!!
!!
!!
!!
!!
!!!
!!
!!!!
!
!!
!!!!!!
!!!!!!
!!
!!
!
!!
!!
!!!!
!!!!
!!
!!
!!!!
!!
!!
!!!!
!!
!!
!!
!!
!!
!
!
!!
!!
!!!!!!
!!!!
!!
!!
!!
!!
!!
!!
!!
!!
!!
!!
!!!!
!!
!!
!!
!!
!!
!!
!!
!!
!!!!
!!
!!
!!
!!
!!
!!
!!
!
!
!!
!!
!!!!
!!
!!!!
!!
!!
!!
!!
!!
!!
!!
!!
!!
!!!!
!!
!!
!!
!!
!!
!
!!
!!
!!
!!!!
!!
!!!!
!!
!!
!!
!!
!!
!!
!!
!!
!!
!!
!!
!!
!!
!!
!!
!!
!
!!
!!
!!
!!!
!!!!
!!
!!
!!
!!!!
!!
!!!!
!!
!!
!!
!!
!!!!
!!!!
!!
!!
!!
!!
!!
!!
!!
!!
!!!!
!!
!!
!!
!!
!!
!!
!!
!!
!!!!
!!
!!!!!!
!!
!
!!!!
!!
!!
!!!!
!!
!!!!
!!
!!
!!
!!
!!!!!!!!
!!
!!
!!
!!
!!
!!!
!!
!!
!!
!!
!!!!
!!
!!
!!!!
!!
!!
!!
!!
!!
!!
!!
!!
!!
!!
!!
!!
!!
!!!!
!!
!!
!!
!!
!!!
!!!!
!!
!!
!!
!!
!!
!!
!!!
!!!!
!!
!!
!!
!!
!!
!!
!!
!!
!!
!!
!!
!!
!!
!!
!!
!!
!!
!!
!!
!!
!!!!
!!!!
!!!!
!!!!
!!
!!
!!!!
!!
!!
!!
!!
!!
!!
!!!!!!
!!
!!!!
!!
!!!
!!
!!
!!
!!!!
!
!!
!!
!!!!
!!!!
!!
!!!!!!!!
!!!!
!!
!!
!!
!!
!!
!!!!
!!
!!
!!
!!
!!
!!
!
!!
!!
!!
!!
!!!!
!!
!!
!!
!!
!!
!!
!!
!!!!
!!
!!
!!!!
!!!!
!!!!
!!
!!
!!
!!!!
!!
!!!!!!
!!
!!
!!
!!
!!
!!
!!!
!!
!!
!
!!
!!
!!
!!
!!
!!
!!
!!!!
!!!!
!
!!
!!!!
!!!!
!!
!!
!!!
!
!!
!!
!!
!!
!!
!!
!!
!!!
!!!!
!!
!!
!!
!!!!
!!!!
!!
!!!!
!!
!!!!
!!
!!
!!
!!
!!
!!
!!
!!
!!
!!
!!
!!
!!
!!
!!
!!
!!
!!!!
!!
!
!!!!!
!!
!!
!!
!!!!
!!
!!
!
!!
!!
!!
!!
!!
!!
!!
!!!!
!
!
!!
!!
!!
!!
!!!!
!!
!!
!
!!
!!!!
!!
!!
!!
!!
!!
!!
!!
!!
!!
!!
!
!!
!!
!!
!!
!!!!!!!!!!
!!!!
!!!
!!
!!
!!
!
!!!!!!
!!
!!
!!
!!
!!
!!
!!
!!
!!!!
!
!!
!!
!!
!!
!!
!!
!!
!!!
!!
!!!!
!!
!!
!
!!
!!
!!
!!
!!
!!
!!
!!!!
!!!!
!!
!!!!
!!
!!!!!!
!!
!!!!
!!
!!
!!
!
!!
!!
!!!!
!!
!!
!!
!!
!!
!!
!!!!
!!
!!!!
!!
!!
!!
!!
!!
!!!!
!!
!!
!!
!!
!!
!!
!!!!
!!
!!
!
!!
!!
!!
!!
!!!!!!!
!!
!!!!
!!
!!
!!
!!
!!!!!!
!!
!!
!!!!
!!
!!
!!
!!!!
!!!!
!!
!
!!
!!
!!
!!
!!!!
!!
!!
!!!!
!!!!
!!
!!
!!
!!!!
!!
!!!!
!!
!!
!!!!
!!
!!
!!
!!!!!!
!!
!!!
!!
!!
!!
!!
!!
!
!!!!!!
!!
!!
!!!!!!
!!
!!
!!!!!!
!
!!
!!
!!!!
!!!!!!
!!
!!
!!
!!
!!
!!!!
!!!!
!!!
!!
!!
!!!
!!!
!!!!
!!
!!
!!
!!
!!
!!!!
!!
!
!!
!!
!!!!
!!
!!
!!
!!!!
!!
!!
!!
!!
!!!!
!!
!!!!
!!
!!
!!!!
!!
!!
!
!!
!!
!!
!!
!!
!!
!!
!!!!
!!!!
!!!!
!!
!
!!!!
!!
!!!!
!!
!!
!!!!
!!
!!
!!
!!!!
!!
!!
!!
!!
!!
!
!!
!!
!
!!
!!
!!
!!
!!!!
!!!!
!!!!
!!
!!
!!!!
!!
!!
!!
!!
!!
!!!!
!!
!!
!!
!!
!!
!!
!
!!!!
!!
!!!!
!!
!!
!!
!!
!!
!!
!!
!!!!
!!
!!
!!
!!
!!!!
!!!
!!
!!
!!
!!
!!!!
!!
!
!!
!!
!!
!!
!!
!!
!!
!!
!!
!!
!!
!!!!
!!
!!
!!
!!!
!!
!!
!!
!!
!!
!!
!!
!!!!
!!!!
!!
!!
!!
!!
!!
!!
!!
!
!!
!!
!!
!!
!!
!!
!!
!!
!
!!
!
!!!
!!
!!!!
!!
!!
!!
!!
!!
!!
!!
!!!!
!!
!!
!!
!!!!
!!
!!
!!
!!
!!!!
!!
!!
!!
!!
!!!!
!!
!!!!
!!!!
!!
!!
!!
!!
!!
!!!!
!!
!!
!!!!
!!
!!
!!
!!
!!
!!!!
!!
!!
!!
!!
!!
!!!!
!!
!!!!
!!
!!
!!
!!
!!!
!!
!!
!!
!!
!!
!!
!
!!!!
!!
!!
!!
!!
!!
!!
!!
!!
!!!!
!!!!
!!
!!
!!!!
!!
!!
!!!!!!
!!!
!!!!
!!
!!
!!
!!
!!!!
!!
!!
!!
!!
!!
!!!
!!
!!
!!
!!!!
!!
!!
!!
!!
!!
!!
!!
!!
!!
!!
!!!!
!!
!
!!
!!
!!
!!
!!
!!
!!
!
!!
!!
!!
!!
!!
!!
!!!!
!!!!
!!
!!!
!!
!!
!
!!
!!
!!
!
!!
!!
!!
!!
!!
!!
!!
!!
!!
!
!!
!!
!!
!!
!!
!!
!!!!
!!
!!!!
!!
!!
!!
!!
!!
!!
!!
!!
!!
!!!!
!!
!!
!!
!!
!
!!
!!
!!
!!
!!
!!
!!
!!
!!
!!
!!
!!
!!
!!
!!!!
!!!
!!!!
!!!!
!!!!
!!
!
!!!!
!!
!!
!!
!!!!
!!
!!
!!
!!
!!
!!
!!
!
!!
!!
!!
!!
!!
!!
!!
!!
!!
!!!!
!!!!
!!
!!
!!
!!
!!
!!
!!
!!
!!!!
!!
!!
!!!!
!!
!!!!
!!
!!
!
!!!!
!!
!!
!!
!!
!!!!
!!
!!
!!
!!
!!
!!
!!
!
!!
!!
!!
!!
!!!!
!!
!!
!!
!!
!!
!!
!!
!!
!!!!
!!
!!
!!!!!!
!!!!
!!
!!
!!
!!
!!
!!!!
!!
!!!!
!!
!!!!
!!
!!!!
!!
!!
!!!!
!!
!
!!!
!!!!
!!
!!
!!
!!!!
!
!!
!!
!!!!
!!
!!
!!
!!
!!
!!
!!
!!
!!
!!
!!
!
!!
!!!!
!!
!!!!
!!
!!
!!
!!
!!
!!
!!
!!
!!
!
!!
!!
!!
!!
!!
!!
!!
!!
!!
!!!
!!
!!
!!
!!!!
!!
!!
!!
!!
!!
!!
!
!!
!!
!!
!!!!
!!
!!
!!
!!
!!
!!
!!
!!
!!
!!!!
!!
!!
!!
!!
!!
!!
!!
!!
!!
!!!!
!!
!!!!
!!
!!
!!
!!!!!!!!!!
!!!!
!!
!!
!!!!!!
!!
!!
!!
!!
!!
!!
!
!!
!!
!!
!!
!!
!!
!!
!
!
!!
!!!!
!!
!!!!
!!
!!!!
!!
!!
!!!!
!
!!
!!
!!
!!
!!!!
!
!!
!!
!!
!!
!!
!!
!!!!
!!
!!!!
!!
!!
!!
!!
!!
!!
!!
!!
!!
!!!!
!!!!!!!
!!!
!!
!!
!!
!!
!!!!
!!
!
!!
!!
!!!!!!
!!
!!
!!!!
!!!!
!!
!!
!!
!!
!!
!!
!!
!!
!!
!!
!!
!!
!!
!!
!
!!
!!
!!
!!
!!
!!!
!!
!!
!!
!!!
!!
!!
!!
!!!!
!!!!
!!
!!!!!!
!!!!
!!
!!
!!
!!
!!
!!!!
!!
!
!!!!
!!
!!
!!
!!
!!
!!
!!
!!
!!
!!
!!
!!
!
!!
!!
!!
!!
!!!
!!
!!!!
!!
!!
!
!!
!!
!!
!!!!
!!
!!
!!
!!
!!
!!!!
!!
!!
!!
!!
!!
!!
!!
!!!!
!!
!!
!!
!!
!!
!!!!
!!
!!
!!
!!
!!
!!!
!!
!!
!!!!!!!!
!!
!!
!!!!!
!!!!
!!!!!!
!!!!
!!
!!
!!
!!
!!
!!
!!
!!
!!
!!
!!
!
!!
!!
!!!!
!!
!!!!
!!
!!
!!
!!!!!!!!
!!
!!
!!
!!!!
!!!!!!!!!!
!!
!!!!!!
!!
!!
!!
!!
!!
!!
!!
!!
!!!!
!!
!!!
!!!!!
!!
!!
!!!!
!
!!!!
!!
!!
!!
!!
!!
!!
!!
!!
!!
!!
!!
!!
!!!!
!!
!!!!!!
!!
!!
!!
!!
!
!!
!!!!!!
!!
!!
!!!
!
!!
!!!!
!!
!!
!!
!!
!!
!
!!
!!
!!
!!
!!
!!
!!
!!
!!
!!
!!
!
!!
!!!!
!!!!
!!
!!
!!
!!!!
!!
!!
!
!!
!!
!!
!!
!!
!!
!
!!
!!
!!
!!
!!!!
!!!!
!!
!!
!!
!!
!!!!
!!!!
!
!!
!!!!!
!!!!
!!
!!!!!!!!!!!!!!!!
!!
!
!!
!!
!!
!!!!!!
!
!!!!!!
!!
!!
!!
!!
!!
!!
!!
!!
!!
!!
!!!!
!!
!!
!!
!!
!
!!
!!
!!
!!
!!
!
!!
!!
!!
!!
!!
!!
!
!!!!
!!!!
!!
!!
!!
!!
!!!
!!!!
!!
!!
!
!!!!!
!!
!!!!
!
!!
!!
!!
!!
!!!!
!!
!!
!!
!!
!!
!!!!
!!!!
!
!!!!
!!
!!
!!!!
!!!!!!
!!
!!
!!
!!
!!
!!
!!
!!!!
!!
!!!!
!!!!
!!
!!
!!
!!
!!!!
!!
!
!!
!!
!!
!!
!!
!!
!!
!!!!
!!
!!!!!!
!!!!
!!!!
!!
!!
!!
!!
!!
!!!!
!!
!!!
!!
!
!!
!!
!!
!!
!!!!!! !!
!!
!!
!!!!!!!
!
!!
!!
!!
!!!!!!
!!
!!
!!!!!!!!
!!!
!!
!!
!!
!
!!!
!!
!!
!!
!!
!!!!
!!
!!!!!!
!!
!!
!!
!!
!!
!!
!!
!!
!!
!!
!!
!!
!!!!!!
!!!!!!
!
!!
!!!!
!!!!
!!!!
!!!!
!!
!!!
!! !
!!
!!
!!!
!!!
!
!!!!
!!!!!!
!!
!!
!!!!!!
!
!!
!!!!
!!
!!!!
!!
!!
!!!!!!
!!
!!!!
!!!!
!!
!!!
!!
!!
!!
!!
!!
!!
!!
!!
!!!!!!
!!
!
!!
!!
!!!!
!!!!
!!
!!!!
!!
!
!!
!!
!!
!!
!!
!!
!!
!!!!
!!
!!
!!
!!
!!!!
!!
!!
!!
!!
!!!!
!!!!
!!
!!
!!!!!!!!
!!
!
!!
!!
!!
!!
!!!!
!!
!!
!!!!
!!
!!
!!
!!
!!
!!
!!
!!
!!
!!
!!
!!!!!
!!
!!!!!!
!!
!!
!!
!
!!!!
!!!!
!!!!
!!
!!
!!
!!!!!!!!!!!!!!
!!!!
!!
!!
!!
!!!!
!!!!!!!!!!!!!!!!!!!!!!!!!!!!!
!!!!!!!!!!!!
!!!!!!
!!!!
!!!!
!!
!!
!!!!
!!!!!!!!!!!!!!
!!
!!
!!
!!
!!
!!!!
!
!!!!!!!!
!!
!!
!
!!!
!!
!!
!!
!!
!!
!!!!
!!!!!!
!
!!
!!!!
!!
!!
!!!!
!!!!
!!
!!!!
!!!
!!
!!
!!
!!
!!!
!!!!!!!!!!!!
!!
!!
!!!!
!!
!!
!!
!!
!!!!!!
!!
!!
!!
!!!!
!!
!!!!
!!
!!
!!!!!
!!!!
!!!!!!
!!
!!
!!!!
!!
!!
!!!!!!!!!!
!!
!!
!!
!!
!!
!!!!
!!
!!!!
!!
!!
!!!!
!!!
!!
!!!
!!
!!!!
!!
!!
!!!!
!!
!!!
!!!!
!!
!!
!!
!
!!
!!!!!
!!
!!
!!
!!
!!
!!
!!
!!
!!
!!
!!
!!!!
!!
!!
!!
!!
!!
!!
!!
!!!!
!!!!!!
!!
!!
!!
!!
!!
!!
!!!
!!!!
!!!!!!
!!
!
!!!
!!
!!
!!
!!
!!!
!!!!!!!!!!!!
!!!!
!!
!!
!!!!!!
!!
!!!!
!!
!!!!
!!
!!
!!
!!
!!!
!!
!!
!!
!!
!!
!!
!!
!
!!
!!
!!
!!
!!
!!
!!!!!!!!!!!
!!!!!!
!!
!!
!!
!!
!!
!
!!
!!!!!!!
!!!
!!!!
!!
!!
!!!!!!
!!!!!!!!!!
!!
!!
!!
!!!!!
!!
!!
!!
!!
!!!
!!
!!
!!
!!
!!
!!
!
!!
!!
!!
!!!!!!!!!!
!!
!!!!
!!
!!
!!
!!
!!
!!
!!
!
!!
!!
!!!!
!!
!!
!!
!!
!!
!!
!!
!!
!!
!!!!
!!!!
!!
!!!!
!!
!
!!
!!
!
!!
!!!
!!!!
!!
!!
!!
!!!!
!!
!!
!!!!
!!
!!
!!
!!
!!!
!!!
!!
!!!!!
!!
!!
!!!!!!
!!
!!!!!!
!!
!!
!!
!
!!
!
!!!!!!
!!
!!
!!
!
!!!!
!!!!
!
!!
!!
!!!!
!!
!!
!!
!!
!!
!!
!!
!!
!!
!
!
!!!!
!!
!!!!
!!!
!!
!!
!
!!
!!
!!
!!
!!
!!
!!!!!!
!!!
!!
!!
!!
!!!
!
!!!!
!!
!
!!
!!
!!
!!
!!!!
!!
!!!!!!!!!
!!
!!
!!
!
!!
!!
!!
!!
!!
!!
!!!!!!!!!!
!!!!
!!!!
!!
!!
!!
!!
!
!!
!!
!!
!!!!
!!
!!
!!
!
!!!!
!!
!!
!!
!!
!!!
!!
!!
!!
!!!!
!!!!
!!
!!!
!!
!!
!!!!!!
!!
!!
!!
!!
!
!
!!
!!
!!
!
!!
!!!!!!
!
!!!!
!!
!!!!!!!!!!!!!!
!!!!!
!!!!
!
!!
!
!!
!!
!
!!
!!
!!
!!!!
!!
!!
!!
!!
!!
!!!!!
!!
!!
!!
!!
!
!!
!!
!!!!
!!
!!!
!!
!!
!
!!
!!
!!!
!!
!!
!!
!!
!!
!!
!!
!!
!!
!!
!!
!!!!
!!
!!
!!!
!!
!!
!!!!!
!!!
!!
!!
!!
!!
!!!!
!!
!!!!!!!
!!!!!
!!!!!!!!
!!!!!!!!
!!!!!!
!!
!!!!!!
!!!!
!!!!!
EXPL
ANAT
IONVal
ue, in
million
dollar
sWi
thheld
<100
100 to
300>30
0 to 60
0>60
0!
Crushe
d ston
e oper
ation
02004006008001,000
1,200
1,400
1,600
1,800
2,000
Value, in million dollarsVA
LUE O
F CRU
SHED
STON
EPR
ODUC
ED IN
2018
, BY S
TATE
16
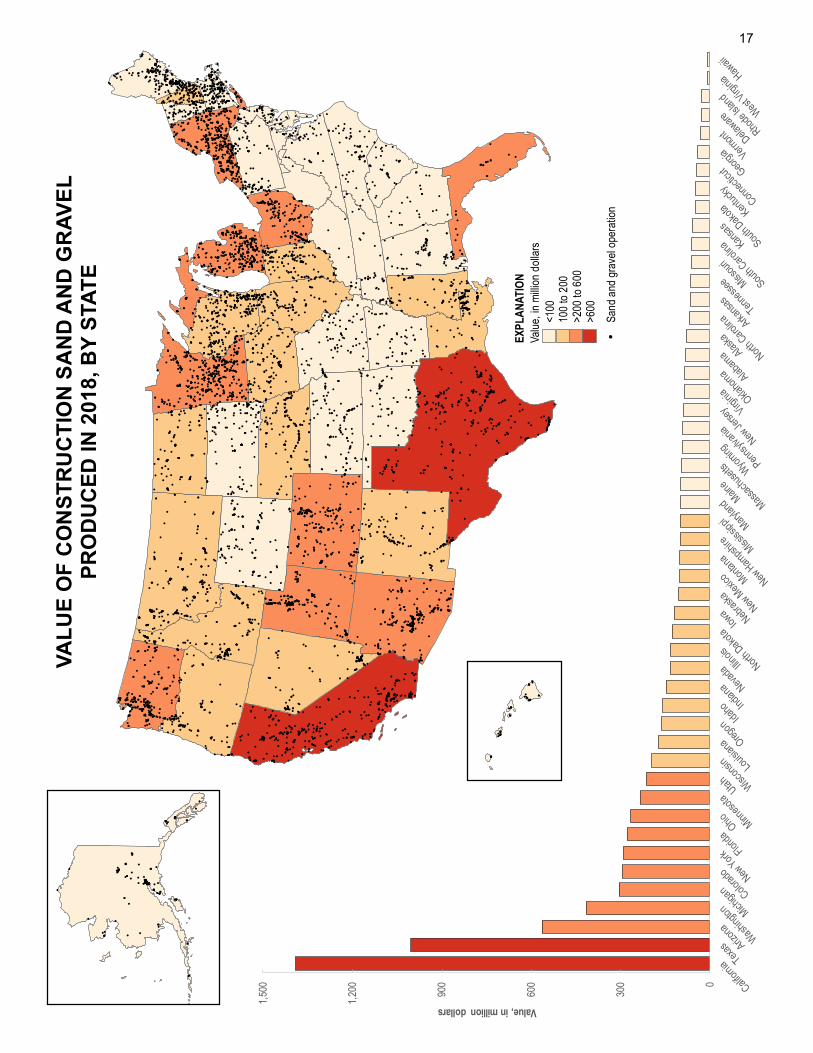
!
!!
! !!!!!!
!
!
! !! !
!
!
!!
!! !
!
!
!!! !
!
!
!
!
!
!
!
!
! !
!
!
!
!
!
!
!!
!
!!
!
!!
!
!
!
!
!
!
!
!
!
!
!
!
!
!
!
!!
!
!
!
!
!
!
!
!
!
!!
!
!
!!
!
!
!
!
!
!
!
!!
!
! !
!
!!
! ! !
!!
!
!!
!
!!
!!
!
!
!!
!
!
!
!
!
!
!
!
!
!
!
!
!
!
!
!
!
!
!
!
!
!
!
!
!
!
!! !
!
!
!
!
!
!
!
!
!
!
!
!
!
!
!
!
!
!
!
!!
!
!
!
!!
!!! !
!
!
!
!
!
!
!
!
!
! !
!
!
!
!
!!
!
!!
!
!
!
!
!
!
!
!
!
!
!!
!
!
!
!
!
!
!
!
!!
!
!
!
!
!!
!
!
!
!
!
!
!
!
!
!!
!
!
!
!
!!
!
!!
!
!
!
!
!
!
!
!
! !
!
!
!
!
!
!
!
!
!
!
!
!
!
!
!
!
!
!
!
!! !
!
!
!!
!
!
!
!
!
!!!
!!
!
!!
!
!
!
!
!
!
!
!!
!
!
!
!
!
!
!
!
! !!
!
!
!
! !
!
!
!
!
!
!
!
! !!
!
!! !!
!
!!
!
!
!
!
!
!
!
!
!
!
!
!
!
!
!
!
!
!
!
!
!
!
!
!
!
!!
!
!!
!
!
!
!
!
!
!
!
!
!
!
!
!
!
!
!
!
!
!
!
!
!
!!
!
!
!
!
!
!
!
!
!
!!
!
!
!
!!!!
!
!
!
!
!!
!
!
!
!!
! !
!
!
!
!
!
!
!
!
!
!!!!
!
!
!!
!
!
!
!
!
!!
!
!
!
!
!
!
!
!
!
!
!! !!!
!
!
!
!
!
!
!
!
!
!
!
!!
!
!
!
!
!
!
!
!
!
!
!
!
!
!
!
!
!
! !
!
!
!!
!
!
!
!
! !
!
!
!
!
!! !
!
!
!
!!
!
!!
! !
!
!
!
!
!
!
!
!!
! !
!
!
!
!
!
! !
!
!
!
!
! !
!
!!
!
!!
!
!!
!
!
!
!
!
!
!
!!
!!
!
! !!
!
!
!
!
!
!
!
!
! !!
!!
!!
!!
!
!
!
! ! ! !
! !
!
!
!
!!
!!
!
!
!!! !!!
!! !
!
!
!!
!
!!
!
! !! !
! ! !! !
!!
!!!!
! !
!
!
!
!
!
!
!
! !
!! !
! !
!!
!!
!
!
!
!
!
!
!
!
!
!
!
!! ! !!! !
! !
!
!
!!
! !
!
!
!
!!!!!!!!
!
!
!
!
!
!
!
!
! !
!
!
!
!
! !
!
!
!
! !!
!
!
!
!
!
!
!
!
!
!
!!! !!
!
!
!
!
!
!! !
!
!
!
!! !
!
!
!
!
!
!
!!! !
!
!
!
!
!
!!!!!!
!! ! !
!
!!
!
!
! !!
! !
!
!
!
!
!! !!!
!
!
!!!!!
!
! !!
!
!
!!
! !!
!
!
!
!
!
!
!!!
!
! !
!
!!
!
!
!
!!
!
!
!
!
!
!
!!
! ! !!
!
!!
!
!
!
!
!!!
!!!
!!
!!!
!
! !
!
!
!!!! !!! ! !! !!! !!
!
! ! !!!!! !! !
!!! !!
!!!
!
!
!
!
!
!
! !
!
!
!
!
!
!
!!
!
!
!
!
!
!
!
!! !
!
!
!
!
!
!
!
!
!
!
!!
!
!
!
!
!
!
!!
!!! !
!
!
!!
!
!
!
!
!
!
!!!
!
!
!
!
!
!
!!!!! !! !
!
!
!
!!!!
!
!
!
!
!
!!!
!!!
!
! !
!!
!
!!
!
!
! !!
!!
!
!
!!
!!
!
!
!
!
!!! !
!
!!
!
!
!!
!
!
!!!
!
!
!!
!! !!! !
!!
!
!
!
!!
!
!
!
!
!!
!
!
!! !!!!!! !!
!
!!!!!
!
!
!
!
!
!
!
! !
!
!!
!
!
! !!!
!!
!
!
!
!
!
! !
!
!
!
!
!!
!
!
!!
!
!!
!
!
!
!
!
!
! !!
!
!
!
!!!!
!!
! !
!
!
!
!
!! !
!!!
!
!
!
!!
!
!
!
!
!
!
!
!
!!
!!
!
!
! !! !!!! !!! !!! !!
!
! !!
!
!!
!
! !!!
!
!
!
!
!!
! !
!!!
!
!!
!!
!!
!
!
!
!
!
!
!!!
!
!
!
!
!
!
!
!!!
!!!
!
!
! !!
!
!
!
!
!!
!
!
!
!!
!
!
!
! !!
!
!!
!
!
! !
!
!
!!!! ! !
!!! !
!
!
!!
!!
!
!!!
!
!! !!
!
!
! !! !
!
!!
!
! !! !
!
!
!
!
!
!
!
!
!
! !
!
!
!
!
!
!
!
!
!
!
!! !
!!!
!!
!
!!
!!
!
!
!
!!
!
!
!!
!
!
!
!
!!!!!
!!
!
!
!!!
!!
!
!
!!
!
!
!
!!
!
!
!!!
!
!!
!
!
!!
!!
!
!!!!
!
!
!!! !
!
!
!
!
!
!
!
! !!!!! !
!
!
!!!!
!
!
!
!!
!!
!
!
!!
!!!
!!
!! !
!!!
!
!
!
!
! !
!! !
!
!
!
!
!
!
!
!
!!
!
!
!
!
!
! !!
!! !
! !!!
!
!!
!!
!!!!!!!!!
!!!!!!!!!!!!!!!!!!!!!!!!!!!!!!!!!!!!!!!!!!
!
!!
!
!
!!
!
!
!
!!!!!
! !!!!!
!
!!!!!!
!
!
!
!
!! !
! ! !
!
! !
!
!
!
!
!!
!
! !
!!
!
!
!
!
!
!
!
!
!!!!!!!!!!!!!!!!!
!! ! ! ! !
!
!!
!
! !
!
!
!
!
!!
!
! !
!!
!!!!!
! ! !
! !!
!
!
!!!
!
!!
!
!!
!
!
!
!! !
!
!
!
!
!
!
!
!
!
!!!
!
!
!
!
!!
!
!!
!!
!!
!!!
!
!
!!
!
!!
!
!
!
! !
!
!
!
!
!!
!
!
!
!!
! !
!
!
! !
!
!
!
!
!
!
!
!
!
!
!
!
!
!
!
!!!!!!!!!!!!!
!!
!
!
!!!!
!
!!!!
!!
!
!
!
!
!
!
! !!!
!
!!
!
!
!
!
!! !
!
!
!
!
!
!
!!!
!!!
!!
!
!
!
!
!
!
!
!
!
!
!
! !
!!!
!
!
!
!!!
!
!
!!
!
!
! !!!!!
!
!
!
!
!!
! !
!
!!
!
!!
!
!
!
! !!!
!
!!!!! !!!
!!
!
!!
!!
!
!
!!
!
!!!!!!!!!!!!!!!!!!!!!
!
!
!
!
!
!
!
!! !
!
!
!!
!
!
!
!
!
!
!
! !
!
!
!!!
!
!
!
!!
!
!
! !
!!!!!
!
!!
!
!
!
!
! !!
!
!!
!
!
!!
!
!
!
! !
!
!!
!
! !
!
!
!
!
!
!!
!!!
!
!!
!!!!!
!
!
!
!
!
!
!!
!!
!
!!
!
!
!!
!!
!
!
!
!
!!! !
!
!
!
!!! !
!!
!
!!!
! !
! !!
!
!! !!
!
!!
!
!!
!
!
!
!
! !
! !
!
!!!!!
!
!
!! !!!!!!!!!!!!!!!!!!!!!!!!!!!!!!!!!!
!
!
! !
!
! !! !!
!
!
!
!
!
!
!
!
!!!!
!
!
!
!
!
!! !!
!
!
!!
!
! !!
! !
!!
!!
!
!! !!
!
!
!
!
!
!!
!!!!!!!!!
! !
!!!
!
! !
!! !!
!!!!!!!!!!!!!
!
!
!!!!!! !
!
!! !!!!!!
!
!
!
!
!
! !! !
! !! !!!!!!
!
!! !! ! !! !!! !!!
!!!! !
!!
!
! !
!
!!
!!!
!!!
!!!!
!!
!! !
!
!!
!!
! !
!! ! ! !
! !
! !
! !
!!!
!!
!
!
!
!
!
!
!
!
!
!
!
!
!!!
!
!
!
!!
!
!
!!
!!
!
!
!
!
!
!
!
!
!
!
! !!!
!
!
!
! ! !
!
!
!
!
!
!!!
!
! !
! !!
!
!!!!!
!!
!
!
!
!
! !!!!!!!!!!!!!!!!!!!!!!!!!!!!!!
!!!!!!!!!
!
!
! !
!
!
!
!!
!
!
!
!
!
!
! ! !
!
!
!
! !
! ! ! !
!
!
!
!!
! ! !!!!!
! !!! !
!
!
!
!
!!
! ! !
! ! !
!
!! ! ! !!!!
! ! !
!
! ! !!!
!!!! !!!!!!!
!!
!
!
!!!
!
!!!!
!! !
! !!
!!!!!!!!!!!!!!!!!!
!!!! !
!
! ! !
!! !! !!! !
!!! !
!!! !! !
! ! !
! ! !!!
!
!
! ! !!!! ! !! ! !!!!!! !! !!
! !! !!! !!!! ! !!!!!!!! !!! !!!!!!!!!!!!!!!!!!!!!!!!!!!!!!!!!!!!!!!!! !!!!!!!!!!!!!!!!!!!!!! !!!!!!!!! ! !!!!! ! ! !!! !!
!
!
!
! !
!
!
! ! !!
! !!! !!! ! !!!!!! !!! ! ! ! !
!
!
!! ! !!! !
!
!
!! ! !! !!!!
!
!
!
! !!
! !
!!!!! !!!!!!
!
!!
!
!!
!
!
!
!
!
!
!!
!!
!! !
!
! ! !
! ! !!
!
!
!!
!!
!
!!
!
!
!!!
! ! !
!
!
!
!!
!
!
!
! !!!
!
!
! !!
!!!!
!!!!!
!
!
!
!!
!
!
!
!
!!
!
!
!! !
!
!
! !
!!
!
!
!
!!!
!
!
!
!
!
!
!!
! !
!!
!
! ! !
!
!
!!
!
!
!
!
!
! !
!
!
!
!
!
!!
!! !!
!
!!
!!!
!!!!
!!
! !
!
! !
!
!
!!
!
!
!!
!
!
!
!
!! !
!
!
! ! ! !!
!
!
!
!
!
!
!
!
! !
!
!!
!! !
!!
!
!
!
!! !
!
!
!
!
!
!
!
!
!
!
!
!
!
!! !
!
! ! !!
!
! !!
!!
!
!
!
!
!! !
!!
!
!
!!
!
!!
!!
!
!
! !
!
!
!
!
!
!
!
!
!!!
!!
!
! !
!
!
!
!
!
!!! !
!
!
! !
!
!
!!
!
!
!!
! !
!
!
!!
!
!
!
!
! !
!
!!
!
!!
!!!!!
!
!
!
!
! !
!
!
!
!
!
!
!
!
!!!!
! !!
!!
!!
!
!
!!
!
!! !
!
!
!
!
!!
!
!
!
!
!
!
!!
!
!!!!!
!!!!!!!!!
!
!
!
!
!!
!
!!
!
!!
!
!
!!!!!
!
!
!
!
!!
!
!
!
!
!!
!
!
!
!
!
!!! !!!
!!!
!
!
!!!
!
!
!
!
!
!
!
!
!!
!!
!! !
!!
!
!
! !
!!
!
!!
!
!
!! !
!
!
!
!
!
!
!
!
!
!
!
!!
!!
!!!!!!
!
!
!
!
!!!
!
!! !
!
! !
!
!
!
!!
!
!
!
!
!
!
!
!
!
!
!
!! !
!
!
!
!
!
!
!!!
!!
!
!
!
!!!!!!
!
!
!
!
!
!
!
!
!
!
!
! !
!!
!!
!!!
!
!
!
!
!
! !
!!
!!
!!! !!
!
!!
!
!
!
!!!
!
!
!
!
!!
!
!
!
!
!
!
!!
!
!
!
!
!!!!!!
!
! !!
!
!
!!
!
!!!
!!
!
!!!
!!
!!
!!
!
! !
!!
!
!
!
!
!
!!
!
!! !!
!!!!!!!
!
!
! !
!
!
!
! ! ! !!!! !
!
!!
!
!
!!!!
!
! !!!!!!!!!!!!!!!
!
!
!
!
!
!
!
!
!
!
!!
!
!
!
!
!
!!
! !
!
!!
!
!!
!
!
!
!!!!
!
!!!!
!!!
!
! !!!
!
!
!
!
!
!
!
!
!!
!
!!!!!!!!!!!!! !!!
!
!
!
!!
!
!
!
!!
!
!
!
!
!
!
!
!!!
!!!!
!
!!
!
!!!!!!!!!!!!
!
!
!
!
!
!
!!
!
!!!
!!
!
!
!
!
!
!!
!
!
!
!!!!!!!
!
!
!
! ! ! !! !!
!!
!!
!!!!!!!
!
!
!
!
!
!!!!!!
!
!
!
!
!!!!!
!
!
!
!
!!!!!!!!!!!!!!!!
!
!
! !
!!
!!!!
!
!
!
! !!!
!
!
! !
!
!
!!!!!!!
!
!
!
!
!
!!!!
!
!
! !!
!!
!
!!
!
!
!
!
!
!!!!!! !
!!
!
!
!
!
!
!
!
!
!
!
!
!
!
!
!
!
! !
!!
!
!!
!!!!! !
!
!
!
!
!
!
!
!
!!
!
!!!!!!!!!
!
!!! !!!!
!
!
!
!
!
!
!
!!
!
!
!
!
!
!
!!
!!!!
!
!
!
!
!!!!!!!
!
!!
!
!!
! !
!!
!
!
!!
!
!!!! !
!
!
!
!
!
!
!!
!
!
! !
!
!!
!
!
!
!! !!!
!
!
!
! !
!
!
!
!! !
!
!
!
!!!
!
!
!
!!!!!!!!!!!!!
!
!
!
!! !
!
!!!
!
! ! !
!
!
!
!
!
!!!!!!!
!
!!
!! !
!
!
!
!
!
!
!
!
!!
!
!
!
!
!
!
!
!
!
!!
!
!
!
!
!
! !
!
!
!
!
!
!
!
!
!
!!
!
!!
!
!
!!!
!
!
!
!
!
!
!!
!
!
!
!!
!
!
!
! !
!
! !
!
!
! !
!
!
!
!
!!
! !
!
!
!
!
!!
!!
! !
!
!
!
!
!
!
!!!!!!
!
!
! !!!
!!
!
!!
!
!
!
!
!
!
!
!
!
!
!
!
!
!!
!!
!!!
!
!!
!
!!
!
!
!
!
!
!!!!
!
!!
!
!
!
!
!
!
!
!
!!
!
!
!
!!
!
!
!!!
!
!!!!!!!!!!!!
!
!
!
!
!!!
!
!!
!
! !
!
!!!!
!!!!!
!
!
!! !
!
!!!!
!
!
! !!!
!
!!
!
!
!
!
!!
!!!
!
!
!
! !!
!
!
!
!
!!
!
!
!
!
!
!
!
!!!
!
!
!
!
!
!
!
!!!!!!!!!!!!!!!!!!!!!!!!!!!
! !
!!
!!
!
!!!!
!
!!
!
!!
!
!
!
! !!
!
!!
!
!
!
!!
!!!! !!
!
!
!
!
! !
!
!!!!! !!! !
!
! !
!
! !
!
!! !!!
!
!
!
!
!!
!
!!!
!
!!! !
!
!
!
!
!!
!
!!
!
!
!
!
!
!
!!!
!
!
!!!!!!
!
!
! ! !!
!
!
!
!
!
!! !
!
! ! !! !
!
! !! ! !
!
!
!
!
!!
!
!
!
!
!
!
!!
!
!
!
!
!
!
!
!
!
!
!
!
!
!
!
! !
!!
!!!
!
! !
!
!
!!
!
!
!
!
!
!
!
!
!
!
!
!!!!!!!!!!!!
!!
!
!
!
! !
!
!
!
!! !
!
!
! !
!
!
!
!
!
!
!
!
!
!
!
!
!
!
!
!
!
! !!
!
!
!
!!
!
!
!
!!
!
!
!
!
!
!
!
!
!
!
!
!
!
!
!
!
!
!
!!!!
!
!
!!!
!
!!
!
!!
!
!
!
!
!
!
!
! !
!
!!
!
!
!
!
!
!!
!
!
!!
!!
!
!
!! !
! !
!
!
!
!
!
!!!
!
!!!!!! !!
!
!!
!
!
!
!
!
!
!!
!
!
!
!
!
!
!!!
!
!
!
!
!
!
!
!
!!
!
!
!
!
!
!!
!!!
! !
! !
!!
!
!
!!
!!!
!
!!!!!!!
!
!
!
!!
!
!
!
!
!
!
!!
!!!!!
!
!
!
!
!! ! !
!
!
!
! !
!
!!!
!
!
!
!
!
!
!!!
!!
!
!
!
!
!
! !
!
!
!!
!
!
!
!
!
!
!
!
!
!
!!!!!!!!!!!!!!!!!!!!!!!!!!!!!!!!!!!!!!!!!!!!!!!!!!!!!!!!!
!
!!
!
!
!
!!
!
!
!
!
!
!
!!!
!!!
!! !
!! !
!
!!
!
!
!!!
!!
!
!!!!!!!!!!!!
!
!
!
!
!
!
!
!!
!
!!
!
!!
!
!!
!!
!!
!
!
!!
!
!
!
!
!
!
!
!
!!
!
!!!!!
!
!
!
!
!
!
!
!
!!!!! !
!
!
!!
!! ! !
!
!
!
!!
!
!
!
!
!
!
!
!!!
!
!
!
!
!
!
!
!!!!!!!!!!!!
!!
!
!
!
!
!! !!
!!
!
!!
!
!!
!!!!!
!
!
!
!! !
!
!
!
!
!
!!!
!!
!
!
!
!
!
!
!
!
!
!
!
!
! !
!
!! !
!
!
!
!!
!
!
!
!
!
!
!
!
!!
!
!
!
!!
!
!
!!
!
!
!
!
!
!
!!!!
!
!
!
!!!!!
!!
!
!
!
!!
!
!
!
!
!
!
!!
!
!
!
!
!!!
!
!
!
!
!
!
!
!
!!
!
!
!
!
!
!
!
!
!
!
!
!!
!!
!!
!
!!!!
!!!!
!
!
!
!
!
!
!
!
!!
!
!
!
!
!
!
!
!
!!
!!
!
!!
!
!
!
!
! !
!
!! !
!
!
!
!!
!
!
!
!
!
!
! !
!
!
!
!
!
!
!
!
!
!
!
!
!
!
!
!!
!!!
!
!
! !
!! !!
!
!!
!
!
!
!
!
!
!
!
!
!
!
!
!
!!
!
!
!
!
!!
!
!
!
!
!!
!
!
! !
!
!
!
!
!
!
!
!
!
!!
! !
!
!
!
!
!
!
! !
!
!
!
!
!
!
!
!
!!
!
!
!
!
!
!
!
!
!
!
!!
!
!
!
!
!!
!!!!
!
!
!
!
!
!!
!
!
!
!!
!
!
!
!
!
! ! !!
!!!!!!
!
!!
!
!!
!!
!!
!
!!!!!
!!!!!!!!!!!!!!!!!!!!!!!!!!!!!!!!!!!!!!!!!!!!!!!!!!!!!!!!!!!!!!!!!!!!!!!!!!!!!!!!!!
!
!
!
!
!!
!
!
!
! !
!!!!
!
!
!
!
!!
!
!
!
!
!
!
!
!!
!
!
!
!
!
!
!
!
!
!
!
!
!
!
!
! !
!
!!
!!!
!
!
!
!
! !
!
!
!
!
!
!
!
!
!
!!!!
!
! !
!
!!
!
!
!
! ! !
!
!!
! !
!!
!!
!
!
!
!
!
!
!!
!
!!
!
!
!!
!
!
!
!!
!
!!
!
!
!
!!
! ! !!!
!
! !
!
!
!
!!
!
!
!!!!!!!!!
!
!!
!!
!
!
!
!
!
!
!!!
!
!
!
!
!
!
! !
!
!
! !
!
!!
! !
!
!!! !
!!
!
!!
!
!
!
!
! !!
!
!
!
!
!
!
!!
!
!
!!
!
!
!
!
!
!!!
!
!
!
!
!!
!!
!
!
!!!
!!
!
!
!
!
!
!
!
!
!
!
!!
!
!!
!
!
!
!
!
!
!
! !
!
!
!
!
!
!
!
!
!
!
!!
!
!
! !!
!
!
!
!
!
!
!
!
!
!
!
! !
! !!! !
!
!!!
!
!
!
!
!
!
!
!
!!
!
!!
!
!
!
!
!
!
!
!
! !
!
!
!!
!
!
!
!!
! !!
!
!
!
!
!
!
!
!!!!
!
!
!
!
!!!!!!! !
!!!!!! !!
!
!
!! !
!
!
!
!
!
! !
!
!
! !
!
!
!
!
!
!
!
!
!
!
! !
!
!
!
!
!
!!
!
!
!
!
!
!
!!!
!!
! ! !
!!
!
!!
!
!
!
!
!
!
!
!
!
!
!
!
!!
!!!!!
!!!!!!!!!!!!!!!!!!!!!!!!!!!
!
! !
!
!
!!
!
!
!
!
!
!
!
!
!
!
!
!
!
!
!
!!!
!
! !
!!
! !
! !
!
!
!
!
!
!
!
!!
!
!
!
!
!
!
!!!
!!
!
!
!
!
!! !!
!!
!
!
!
!
!
!
!
!
!
!
!
!! !
!
!!
!
!
!
!
! !
!
!!
!!! ! ! !!!
!
!
!
! !
!
!
!
!!
!
!
!!
!
!
!!
!
!
! !
!
!
!
!
! !!! !! !!
!!
!
!!
!
!
!
!! !
!
!
! !
!
!
!
!!
!
!!
!!!
!
!
!
!
!
!!
!!
!
!
!
!
!
!
! !
!
!
!
!
!
!
!
!!! !
!
!!
!!! !
!!
!
!
!
! !
!
!!
!
!!
! !
!
!
! !
! !!
!
! !
!!
!
!
!!
!!!
!
!
! ! !!!!
!
!
!
!
!
!! !
!
!
!
!
!
!
!
!
!!
!
!!
!
!
!
!
!!
!
!
!
!!
!
!
!
!
!
! !
!
!
! !!
!
!
!
!!
!
!
!
!!
!!!!!
!
!
!
!
!!!
!
! !!! ! !
!
!
! !!!
!
!
!!
!
!
!
!
!
!!
!
!
!
!
! !!!
!
!!
!
!
!
!!!
!
!
!
!
!
!
!
!!
!
!
!
!
!! !!
!!
!
!
!! !
!
!
!
!
! !
!
!
! !!
!
!
! !
!
!
!!
!!
! !
!
!
!
!
!
!
!
!
!!!! !
!
!!
!
!
!
!
!
!
!!
!
! !
!!!!!!!!
!
!!
!
! !
!
!
!
!!
!
!!!
!
!
!
!
!
! !
!
!
!
!! !
!
!
!
!
! !
!
!
!
!
! !
!
!
!
! !
!
!
!
!
!
!
!
!
!
!
! !
!! !
!
!
!!!!
!!
!
!
!
!
!
!
!! !!
!
!
!
!
!
!
!
!
!
!!!!!!!
!!
!
!
!
!
!
! !
!
!
!
!!!
!!!!!!
!
!
!
!
!
!
!
!!
!
!!
!
! ! !
!
!
!
!
!
!!
!
!
!
!
!
!
!!
!
!
!!
!
!
!!
!
!
!!
!
!
!
!!
!
!
!
! !
!
!
!
!!
! !!
!
!
!
! !
!
!
!
!
!
!!
!
!
!
!
!
!
!
!
!
!
!
!
!!
!
!
!
!
!
!
!
!
!! !
!
!
!
!
!
!
!
!
!
!
!
!
!!
!!
!
!!
! !
!!
!
! !!
!
!
!
!
!
!
!
!
!
!
!
!
!
!
!
!
!
!
!
!
!
!
!
!
!
!!!
!
!
!
!
!
!
!
!!!!
!
!
!
!
!
!
!!!
!
!
!
!!! !
!
!
!
!
!
!
!
!
!
!!!!
!
!!!
!
!
!
!
!
!
!
! !!
! !
!
!
!
!
!
!
!
! !!
!
!
!
!
! ! !
!
!
!
!
!!
!
!
!!
!!
!
!!!!!!!!
!
!
!
!
!!
!
!
!
!!
! !!
!
!
!
!!
!
!
!
!
!
!!
!
!
!
!
!
!
! ! !
!
!
!
!
!!!!!!!!!!!!!!!!!!!!!!!!!!!!!!!!!!
!
!
! !!!
!
!!
!
!!
!
!
! !
!
!!
!
!
!
!
!! !!
!
!!!
!
!
!
!
!
! !
!!
!!
!
!
!
!
!
!
!
!
!!
!
!!
!
!
! !
!
!
!
!!
!
!
!
!
!
!
!
!
!
!!
!
!
!!!
!
!
!
!
! !! !
!
!
!
!
!
!!
!
!
!
!!
!
!
!
!
!
!!!!!
!
!
! !
! !!!!!!
!
!
!
!
!
! !
! !!
!
!
!
!!
!
!!
!! !
!
!
!
!
!
!
!
!!
!
!
!
!
!
!
!!
!
!!
!
!!
!
!!!
!
!
!
!
!
!
!
!
!
!
!
!!!!!!!!!!!!!!!!!!!!!!!!!!
!
!!
!
!
!
!!
!
!
!
!!
!
!
!
!
!!
!!
!
!
!
!! !
!
!!
!
!
!
!!
!!
!
!
!
!
!!
!
!
!!!!
!
! !
! !
!
!
!
!
!!! !
!!
!
!
!
!
!
!
!
!
!
!
!
!!
!
!
!
!
!
!
!
!
!!
!
!
!
!
!!
!
!
!
!
! !
!
!!
!
!
!
!!
!
!
!
!
!
!!
!
!
!
!
!
!
!
!
!!
!!
!
!
!
!
!!
!!
!
!
!
!!
!
!
!
!
!
!!
!
!!!
!
!!
!
!
!
!
! !
!
!
!!!!
!!
!
!
!! !
!
!!
!
!
!
!
!
!
!!
!!
!
!
!
!!
!
!
!
!
!!
!
! !
!
!
!
! ! !
!
! !
!
!!
!
!
!!
!
!! !
!
!
!
!
!
!
! !
!
!
!!
! !!
!
!
!
!
!
!
!
!!
!
!!!!
!
! !
!
!
!
!
!
!!
!
!
!!
!
!
!
!
!
!
!
!
!
!
!
!
!
!
!
!
!!!!
!
!!
!
!
!!
!
!
!
!
!
!!
!
!
!
!
!
!
!
!!!
!
!!
!
!!!!!!!
!
!!
!
!
!
!!
!
!!
!
!
!!!
!
!
!
!
! !
!
!! !!!!!! !
!
!
!
!!
! !! !!!!!
!
!
!
!
! !!!
!
!!
!
! ! !
!
!
!
!!
!!!!
!
!
!
!!!
!
!
!
!
!
! !!
!
!
!
!
!!
!!!!!!!!!!
!
!
!
!!
!
!
!
!
!
!
!
!
!
!
! !!
!
!
!
!
!
!!
!
!
!
!!
!! !
!!!!
!
!
! !!!! !!
!
!
!
!!
!
!!!!!!
!
!
!
!
!
!!
!!
!
!
!
!
!
!
!
!
!
!
!
!!! !!! !!
!
!
!
!
!
!
!
!
!!
!!
!!
!
! !!!!!
!
!!
!!
!!!!! !! !
!
!
! !!! !!!!!
!
! !
!!!!! !
!
!
!
!
!
!! !
!
!
!!
!!!!! !
!!!! !!
!!! !!
!
!!!! ! ! !!! !! !!!!! !! !
! !!!!! !! !! ! ! !! !!!! ! !
!! !!
!
!!! !! !! !
!
!
!
!! !
! !!!! !!!
!
!! ! !!!!!! !!
!! !
!
!!! ! !
! !!!
!!
! !!!!!!
! !! !!!
!
!
!
!
!! !!
! !!!! !!!
!!! !!!!
!!!!!!! ! !!!!!!!!
!!
!
!!!
!!
EXPL
ANAT
IONVal
ue, in
million
dollar
s<10
0100
to 200
>200 to
600
>600
!
Sand
and gr
avel op
eration
03006009001,200
1,500
Value, in million dollars
VALU
E OF C
ONST
RUCT
ION
SAND
AND
GRA
VEL
PROD
UCED
IN 20
18, B
Y STA
TE
17
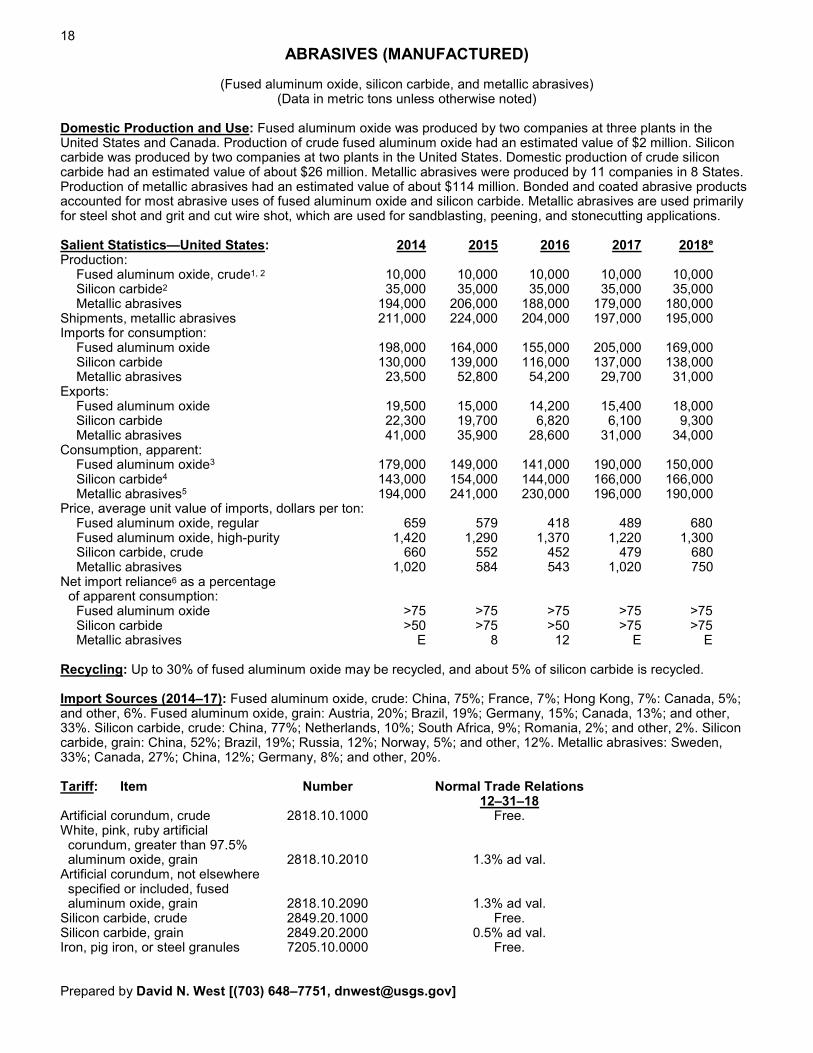
18 ABRASIVES (MANUFACTURED)
(Fused aluminum oxide, silicon carbide, and metallic abrasives) (Data in metric tons unless otherwise noted)
Domestic Production and Use: Fused aluminum oxide was produced by two companies at three plants in the United States and Canada. Production of crude fused aluminum oxide had an estimated value of $2 million. Silicon carbide was produced by two companies at two plants in the United States. Domestic production of crude silicon carbide had an estimated value of about $26 million. Metallic abrasives were produced by 11 companies in 8 States. Production of metallic abrasives had an estimated value of about $114 million. Bonded and coated abrasive products accounted for most abrasive uses of fused aluminum oxide and silicon carbide. Metallic abrasives are used primarily for steel shot and grit and cut wire shot, which are used for sandblasting, peening, and stonecutting applications.
Salient Statistics—United States: 2014 2015 2016 2017 2018e Production:
Fused aluminum oxide, crude1, 2 10,000 10,000 10,000 10,000 10,000 Silicon carbide2 35,000 35,000 35,000 35,000 35,000 Metallic abrasives 194,000 206,000 188,000 179,000 180,000
Shipments, metallic abrasives 211,000 224,000 204,000 197,000 195,000 Imports for consumption:
Fused aluminum oxide 198,000 164,000 155,000 205,000 169,000 Silicon carbide 130,000 139,000 116,000 137,000 138,000 Metallic abrasives 23,500 52,800 54,200 29,700 31,000
Exports: Fused aluminum oxide 19,500 15,000 14,200 15,400 18,000 Silicon carbide 22,300 19,700 6,820 6,100 9,300 Metallic abrasives 41,000 35,900 28,600 31,000 34,000
Consumption, apparent: Fused aluminum oxide3 179,000 149,000 141,000 190,000 150,000 Silicon carbide4 143,000 154,000 144,000 166,000 166,000 Metallic abrasives5 194,000 241,000 230,000 196,000 190,000
Price, average unit value of imports, dollars per ton: Fused aluminum oxide, regular 659 579 418 489 680 Fused aluminum oxide, high-purity 1,420 1,290 1,370 1,220 1,300 Silicon carbide, crude 660 552 452 479 680 Metallic abrasives 1,020 584 543 1,020 750
Net import reliance6 as a percentage of apparent consumption:
Fused aluminum oxide >75 >75 >75 >75 >75Silicon carbide >50 >75 >50 >75 >75Metallic abrasives E 8 12 E E
Recycling: Up to 30% of fused aluminum oxide may be recycled, and about 5% of silicon carbide is recycled.
Import Sources (2014–17): Fused aluminum oxide, crude: China, 75%; France, 7%; Hong Kong, 7%: Canada, 5%; and other, 6%. Fused aluminum oxide, grain: Austria, 20%; Brazil, 19%; Germany, 15%; Canada, 13%; and other, 33%. Silicon carbide, crude: China, 77%; Netherlands, 10%; South Africa, 9%; Romania, 2%; and other, 2%. Silicon carbide, grain: China, 52%; Brazil, 19%; Russia, 12%; Norway, 5%; and other, 12%. Metallic abrasives: Sweden, 33%; Canada, 27%; China, 12%; Germany, 8%; and other, 20%.
Tariff: Item Number Normal Trade Relations 12–31–18
Artificial corundum, crude 2818.10.1000 Free. White, pink, ruby artificial
corundum, greater than 97.5% aluminum oxide, grain 2818.10.2010 1.3% ad val. Artificial corundum, not elsewhere
specified or included, fused aluminum oxide, grain 2818.10.2090 1.3% ad val.
Silicon carbide, crude 2849.20.1000 Free. Silicon carbide, grain 2849.20.2000 0.5% ad val. Iron, pig iron, or steel granules 7205.10.0000 Free.
Prepared by David N. West [(703) 648–7751, [email protected]]
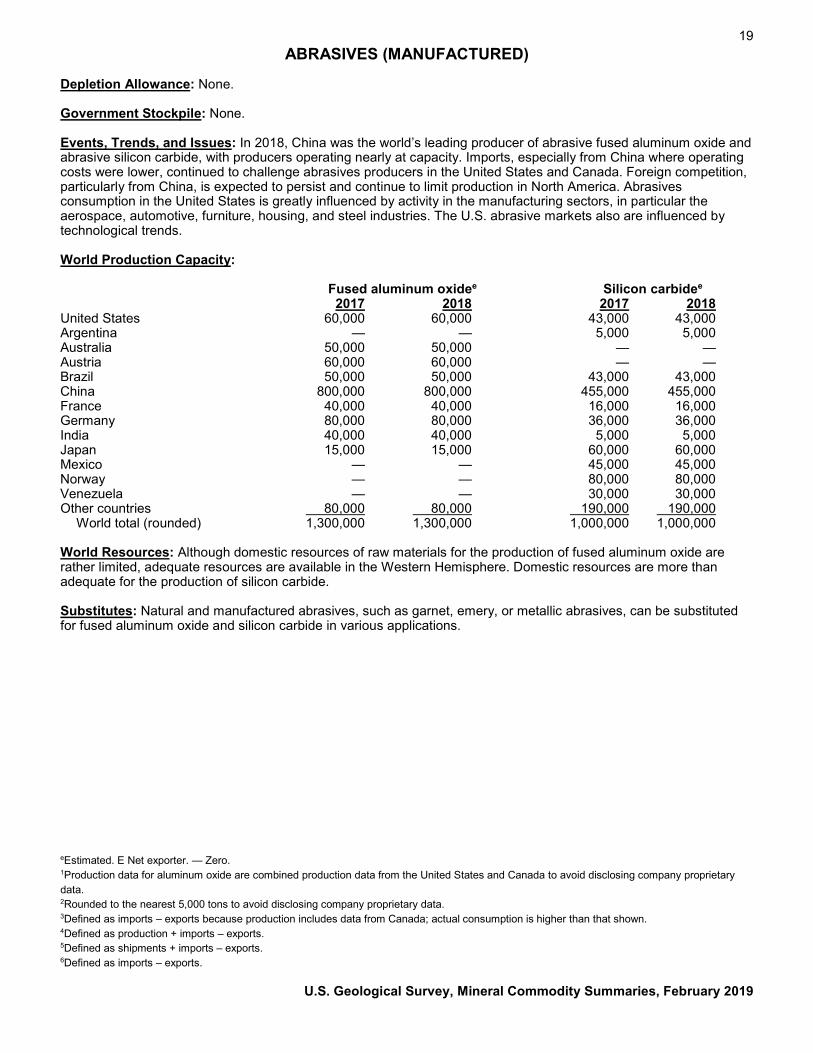
19 ABRASIVES (MANUFACTURED)
Depletion Allowance: None.
Government Stockpile: None.
Events, Trends, and Issues: In 2018, China was the world’s leading producer of abrasive fused aluminum oxide and abrasive silicon carbide, with producers operating nearly at capacity. Imports, especially from China where operating costs were lower, continued to challenge abrasives producers in the United States and Canada. Foreign competition, particularly from China, is expected to persist and continue to limit production in North America. Abrasives consumption in the United States is greatly influenced by activity in the manufacturing sectors, in particular the aerospace, automotive, furniture, housing, and steel industries. The U.S. abrasive markets also are influenced by technological trends.
World Production Capacity:
Fused aluminum oxidee Silicon carbidee 2017 2018 2017 2018
United States 60,000 60,000 43,000 43,000 Argentina — — 5,000 5,000 Australia 50,000 50,000 — — Austria 60,000 60,000 — — Brazil 50,000 50,000 43,000 43,000 China 800,000 800,000 455,000 455,000 France 40,000 40,000 16,000 16,000 Germany 80,000 80,000 36,000 36,000 India 40,000 40,000 5,000 5,000 Japan 15,000 15,000 60,000 60,000 Mexico — — 45,000 45,000 Norway — — 80,000 80,000 Venezuela — — 30,000 30,000 Other countries 80,000 80,000 190,000 190,000
World total (rounded) 1,300,000 1,300,000 1,000,000 1,000,000
World Resources: Although domestic resources of raw materials for the production of fused aluminum oxide are rather limited, adequate resources are available in the Western Hemisphere. Domestic resources are more than adequate for the production of silicon carbide.
Substitutes: Natural and manufactured abrasives, such as garnet, emery, or metallic abrasives, can be substituted for fused aluminum oxide and silicon carbide in various applications.
eEstimated. E Net exporter. — Zero. 1Production data for aluminum oxide are combined production data from the United States and Canada to avoid disclosing company proprietary data. 2Rounded to the nearest 5,000 tons to avoid disclosing company proprietary data. 3Defined as imports – exports because production includes data from Canada; actual consumption is higher than that shown. 4Defined as production + imports – exports. 5Defined as shipments + imports – exports. 6Defined as imports – exports.
U.S. Geological Survey, Mineral Commodity Summaries, February 2019
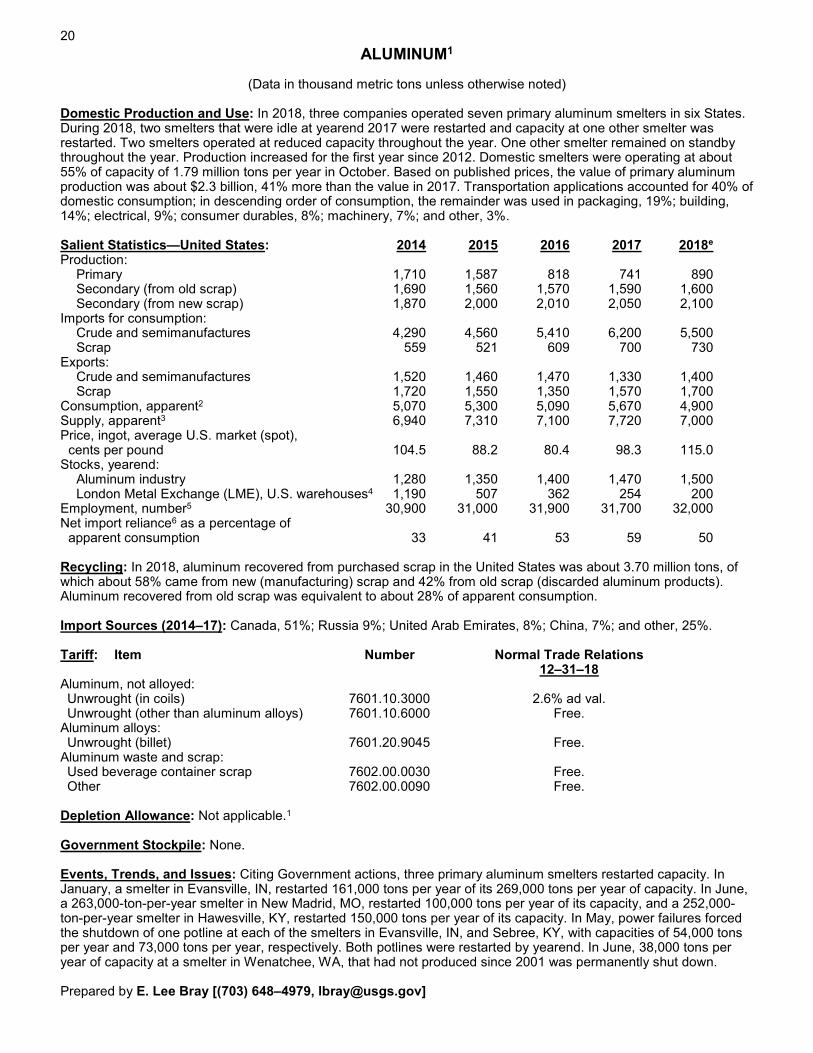
20 ALUMINUM1
(Data in thousand metric tons unless otherwise noted)
Domestic Production and Use: In 2018, three companies operated seven primary aluminum smelters in six States. During 2018, two smelters that were idle at yearend 2017 were restarted and capacity at one other smelter was restarted. Two smelters operated at reduced capacity throughout the year. One other smelter remained on standby throughout the year. Production increased for the first year since 2012. Domestic smelters were operating at about 55% of capacity of 1.79 million tons per year in October. Based on published prices, the value of primary aluminum production was about $2.3 billion, 41% more than the value in 2017. Transportation applications accounted for 40% of domestic consumption; in descending order of consumption, the remainder was used in packaging, 19%; building, 14%; electrical, 9%; consumer durables, 8%; machinery, 7%; and other, 3%.
Salient Statistics—United States: 2014 2015 2016 2017 2018e Production:
Primary 1,710 1,587 818 741 890 Secondary (from old scrap) 1,690 1,560 1,570 1,590 1,600 Secondary (from new scrap) 1,870 2,000 2,010 2,050 2,100
Imports for consumption: Crude and semimanufactures 4,290 4,560 5,410 6,200 5,500 Scrap 559 521 609 700 730
Exports: Crude and semimanufactures 1,520 1,460 1,470 1,330 1,400 Scrap 1,720 1,550 1,350 1,570 1,700
Consumption, apparent2 5,070 5,300 5,090 5,670 4,900 Supply, apparent3 6,940 7,310 7,100 7,720 7,000 Price, ingot, average U.S. market (spot), cents per pound 104.5 88.2 80.4 98.3 115.0 Stocks, yearend:
Aluminum industry 1,280 1,350 1,400 1,470 1,500 London Metal Exchange (LME), U.S. warehouses4 1,190 507 362 254 200 Employment, number5 30,900 31,000 31,900 31,700 32,000 Net import reliance6 as a percentage of
apparent consumption 33 41 53 59 50
Recycling: In 2018, aluminum recovered from purchased scrap in the United States was about 3.70 million tons, of which about 58% came from new (manufacturing) scrap and 42% from old scrap (discarded aluminum products). Aluminum recovered from old scrap was equivalent to about 28% of apparent consumption.
Import Sources (2014–17): Canada, 51%; Russia 9%; United Arab Emirates, 8%; China, 7%; and other, 25%.
Tariff: Item Number Normal Trade Relations 12–31–18
Aluminum, not alloyed: Unwrought (in coils) 7601.10.3000 2.6% ad val.
Unwrought (other than aluminum alloys) 7601.10.6000 Free. Aluminum alloys: Unwrought (billet) 7601.20.9045 Free.
Aluminum waste and scrap: Used beverage container scrap 7602.00.0030 Free. Other 7602.00.0090 Free.
Depletion Allowance: Not applicable.1
Government Stockpile: None.
Events, Trends, and Issues: Citing Government actions, three primary aluminum smelters restarted capacity. In January, a smelter in Evansville, IN, restarted 161,000 tons per year of its 269,000 tons per year of capacity. In June, a 263,000-ton-per-year smelter in New Madrid, MO, restarted 100,000 tons per year of its capacity, and a 252,000-ton-per-year smelter in Hawesville, KY, restarted 150,000 tons per year of its capacity. In May, power failures forced the shutdown of one potline at each of the smelters in Evansville, IN, and Sebree, KY, with capacities of 54,000 tons per year and 73,000 tons per year, respectively. Both potlines were restarted by yearend. In June, 38,000 tons per year of capacity at a smelter in Wenatchee, WA, that had not produced since 2001 was permanently shut down.
Prepared by E. Lee Bray [(703) 648–4979, [email protected]]
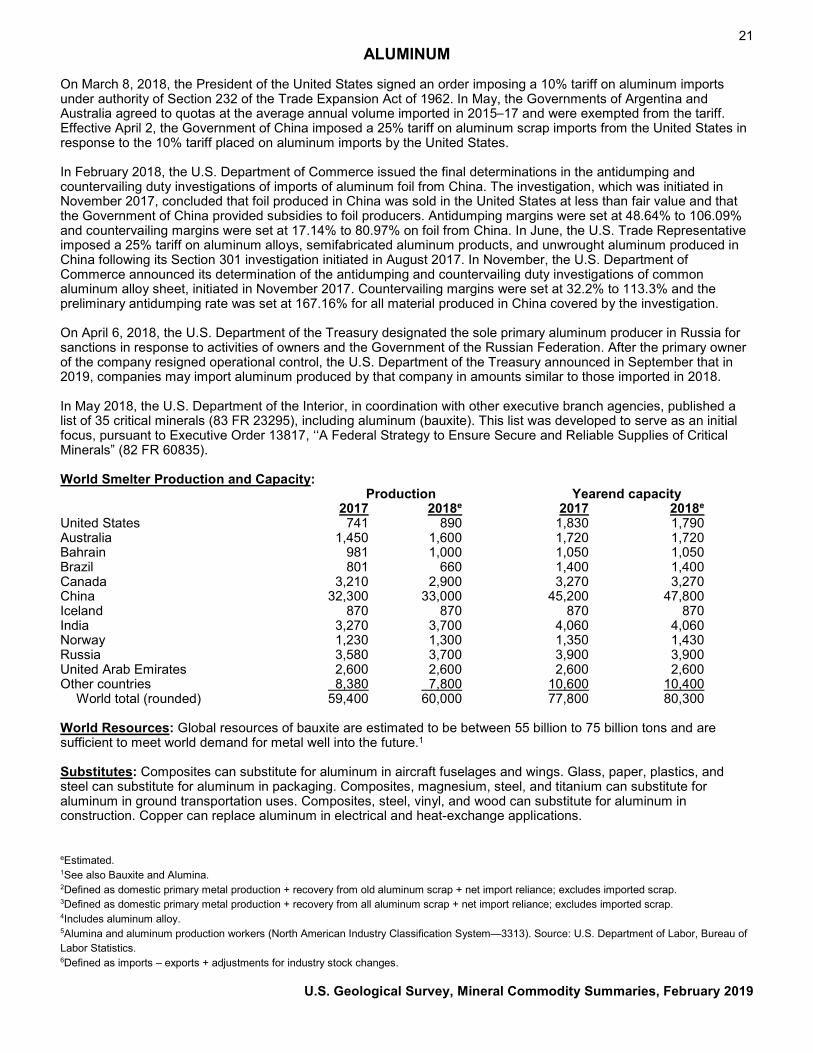
21 ALUMINUM
On March 8, 2018, the President of the United States signed an order imposing a 10% tariff on aluminum imports under authority of Section 232 of the Trade Expansion Act of 1962. In May, the Governments of Argentina and Australia agreed to quotas at the average annual volume imported in 2015–17 and were exempted from the tariff. Effective April 2, the Government of China imposed a 25% tariff on aluminum scrap imports from the United States in response to the 10% tariff placed on aluminum imports by the United States.
In February 2018, the U.S. Department of Commerce issued the final determinations in the antidumping and countervailing duty investigations of imports of aluminum foil from China. The investigation, which was initiated in November 2017, concluded that foil produced in China was sold in the United States at less than fair value and that the Government of China provided subsidies to foil producers. Antidumping margins were set at 48.64% to 106.09% and countervailing margins were set at 17.14% to 80.97% on foil from China. In June, the U.S. Trade Representative imposed a 25% tariff on aluminum alloys, semifabricated aluminum products, and unwrought aluminum produced in China following its Section 301 investigation initiated in August 2017. In November, the U.S. Department of Commerce announced its determination of the antidumping and countervailing duty investigations of common aluminum alloy sheet, initiated in November 2017. Countervailing margins were set at 32.2% to 113.3% and the preliminary antidumping rate was set at 167.16% for all material produced in China covered by the investigation.
On April 6, 2018, the U.S. Department of the Treasury designated the sole primary aluminum producer in Russia for sanctions in response to activities of owners and the Government of the Russian Federation. After the primary owner of the company resigned operational control, the U.S. Department of the Treasury announced in September that in 2019, companies may import aluminum produced by that company in amounts similar to those imported in 2018.
In May 2018, the U.S. Department of the Interior, in coordination with other executive branch agencies, published a list of 35 critical minerals (83 FR 23295), including aluminum (bauxite). This list was developed to serve as an initial focus, pursuant to Executive Order 13817, ‘‘A Federal Strategy to Ensure Secure and Reliable Supplies of Critical Minerals” (82 FR 60835).
World Smelter Production and Capacity: Production Yearend capacity
2017 2018e 2017 2018e United States 741 890 1,830 1,790 Australia 1,450 1,600 1,720 1,720 Bahrain 981 1,000 1,050 1,050 Brazil 801 660 1,400 1,400 Canada 3,210 2,900 3,270 3,270 China 32,300 33,000 45,200 47,800 Iceland 870 870 870 870 India 3,270 3,700 4,060 4,060 Norway 1,230 1,300 1,350 1,430 Russia 3,580 3,700 3,900 3,900 United Arab Emirates 2,600 2,600 2,600 2,600 Other countries 8,380 7,800 10,600 10,400
World total (rounded) 59,400 60,000 77,800 80,300
World Resources: Global resources of bauxite are estimated to be between 55 billion to 75 billion tons and are sufficient to meet world demand for metal well into the future.1
Substitutes: Composites can substitute for aluminum in aircraft fuselages and wings. Glass, paper, plastics, and steel can substitute for aluminum in packaging. Composites, magnesium, steel, and titanium can substitute for aluminum in ground transportation uses. Composites, steel, vinyl, and wood can substitute for aluminum in construction. Copper can replace aluminum in electrical and heat-exchange applications.
eEstimated. 1See also Bauxite and Alumina. 2Defined as domestic primary metal production + recovery from old aluminum scrap + net import reliance; excludes imported scrap. 3Defined as domestic primary metal production + recovery from all aluminum scrap + net import reliance; excludes imported scrap. 4Includes aluminum alloy. 5Alumina and aluminum production workers (North American Industry Classification System—3313). Source: U.S. Department of Labor, Bureau of Labor Statistics. 6Defined as imports – exports + adjustments for industry stock changes.
U.S. Geological Survey, Mineral Commodity Summaries, February 2019
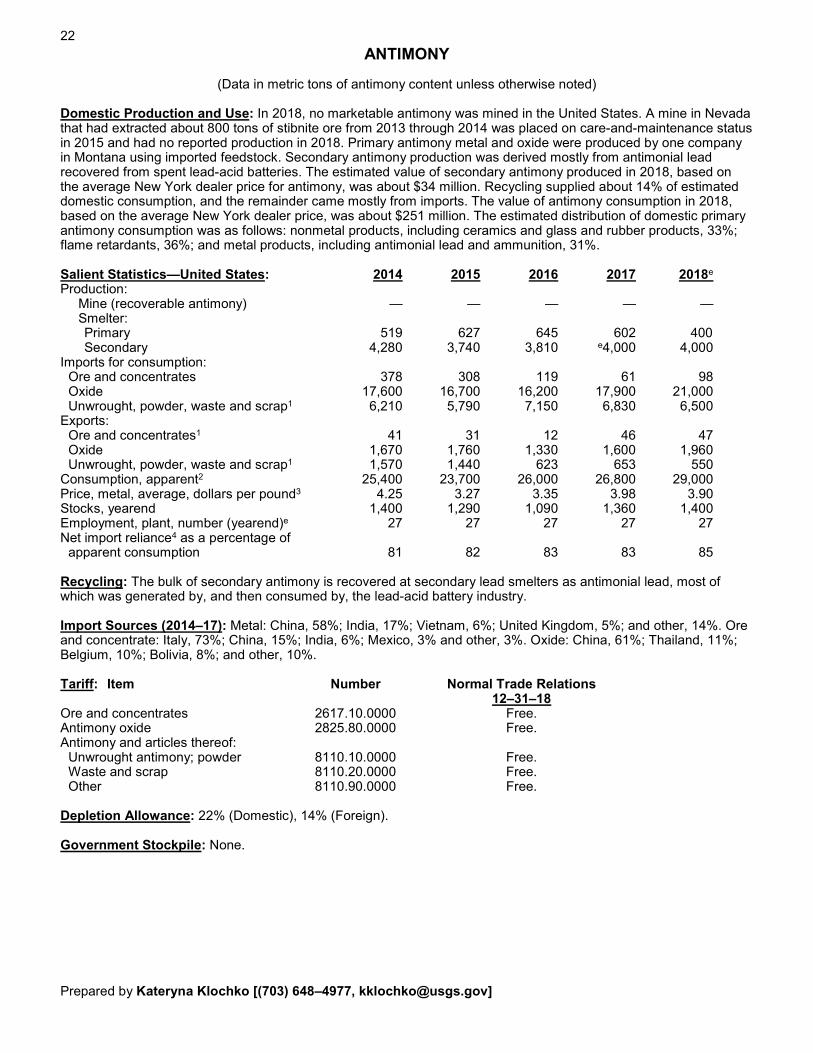
22 ANTIMONY
(Data in metric tons of antimony content unless otherwise noted)
Domestic Production and Use: In 2018, no marketable antimony was mined in the United States. A mine in Nevada that had extracted about 800 tons of stibnite ore from 2013 through 2014 was placed on care-and-maintenance status in 2015 and had no reported production in 2018. Primary antimony metal and oxide were produced by one company in Montana using imported feedstock. Secondary antimony production was derived mostly from antimonial lead recovered from spent lead-acid batteries. The estimated value of secondary antimony produced in 2018, based on the average New York dealer price for antimony, was about $34 million. Recycling supplied about 14% of estimated domestic consumption, and the remainder came mostly from imports. The value of antimony consumption in 2018, based on the average New York dealer price, was about $251 million. The estimated distribution of domestic primary antimony consumption was as follows: nonmetal products, including ceramics and glass and rubber products, 33%; flame retardants, 36%; and metal products, including antimonial lead and ammunition, 31%.
Salient Statistics—United States: 2014 2015 2016 2017 2018e Production:
Mine (recoverable antimony) — — — — — Smelter: Primary 519 627 645 602 400
Secondary 4,280 3,740 3,810 e4,000 4,000 Imports for consumption:
Ore and concentrates 378 308 119 61 98 Oxide 17,600 16,700 16,200 17,900 21,000
Unwrought, powder, waste and scrap1 6,210 5,790 7,150 6,830 6,500 Exports:
Ore and concentrates1 41 31 12 46 47 Oxide 1,670 1,760 1,330 1,600 1,960 Unwrought, powder, waste and scrap1 1,570 1,440 623 653 550
Consumption, apparent2 25,400 23,700 26,000 26,800 29,000 Price, metal, average, dollars per pound3 4.25 3.27 3.35 3.98 3.90 Stocks, yearend 1,400 1,290 1,090 1,360 1,400 Employment, plant, number (yearend)e 27 27 27 27 27 Net import reliance4 as a percentage of
apparent consumption 81 82 83 83 85
Recycling: The bulk of secondary antimony is recovered at secondary lead smelters as antimonial lead, most of which was generated by, and then consumed by, the lead-acid battery industry.
Import Sources (2014–17): Metal: China, 58%; India, 17%; Vietnam, 6%; United Kingdom, 5%; and other, 14%. Ore and concentrate: Italy, 73%; China, 15%; India, 6%; Mexico, 3% and other, 3%. Oxide: China, 61%; Thailand, 11%; Belgium, 10%; Bolivia, 8%; and other, 10%.
Tariff: Item Number Normal Trade Relations 12–31–18
Ore and concentrates 2617.10.0000 Free. Antimony oxide 2825.80.0000 Free. Antimony and articles thereof:
Unwrought antimony; powder 8110.10.0000 Free. Waste and scrap 8110.20.0000 Free. Other 8110.90.0000 Free.
Depletion Allowance: 22% (Domestic), 14% (Foreign).
Government Stockpile: None.
Prepared by Kateryna Klochko [(703) 648–4977, [email protected]]
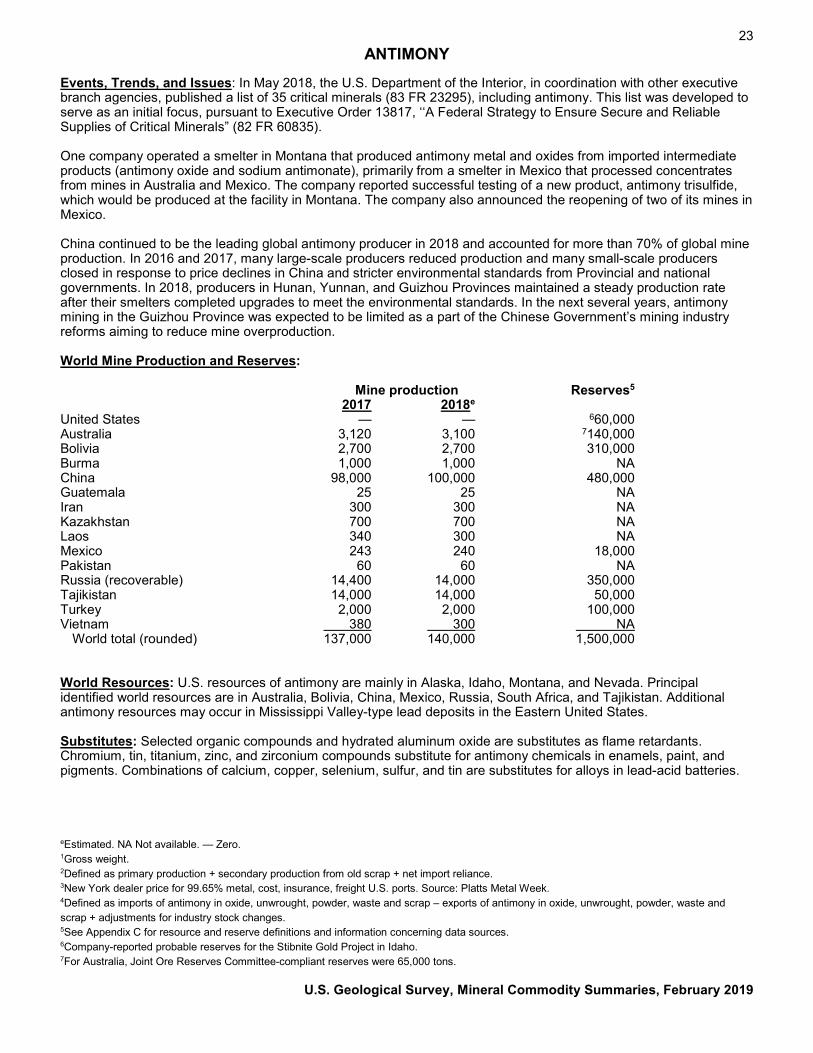
23 ANTIMONY
Events, Trends, and Issues: In May 2018, the U.S. Department of the Interior, in coordination with other executive branch agencies, published a list of 35 critical minerals (83 FR 23295), including antimony. This list was developed to serve as an initial focus, pursuant to Executive Order 13817, ‘‘A Federal Strategy to Ensure Secure and Reliable Supplies of Critical Minerals” (82 FR 60835).
One company operated a smelter in Montana that produced antimony metal and oxides from imported intermediate products (antimony oxide and sodium antimonate), primarily from a smelter in Mexico that processed concentrates from mines in Australia and Mexico. The company reported successful testing of a new product, antimony trisulfide, which would be produced at the facility in Montana. The company also announced the reopening of two of its mines in Mexico.
China continued to be the leading global antimony producer in 2018 and accounted for more than 70% of global mine production. In 2016 and 2017, many large-scale producers reduced production and many small-scale producers closed in response to price declines in China and stricter environmental standards from Provincial and national governments. In 2018, producers in Hunan, Yunnan, and Guizhou Provinces maintained a steady production rate after their smelters completed upgrades to meet the environmental standards. In the next several years, antimony mining in the Guizhou Province was expected to be limited as a part of the Chinese Government’s mining industry reforms aiming to reduce mine overproduction.
World Mine Production and Reserves:
Mine production Reserves5 2017 2018e
United States — — 660,000 Australia 3,120 3,100 7140,000 Bolivia 2,700 2,700 310,000 Burma 1,000 1,000 NA China 98,000 100,000 480,000 Guatemala 25 25 NA Iran 300 300 NA Kazakhstan 700 700 NA Laos 340 300 NA Mexico 243 240 18,000 Pakistan 60 60 NA Russia (recoverable) 14,400 14,000 350,000 Tajikistan 14,000 14,000 50,000 Turkey 2,000 2,000 100,000 Vietnam 380 300 NA
World total (rounded) 137,000 140,000 1,500,000
World Resources: U.S. resources of antimony are mainly in Alaska, Idaho, Montana, and Nevada. Principal identified world resources are in Australia, Bolivia, China, Mexico, Russia, South Africa, and Tajikistan. Additional antimony resources may occur in Mississippi Valley-type lead deposits in the Eastern United States.
Substitutes: Selected organic compounds and hydrated aluminum oxide are substitutes as flame retardants. Chromium, tin, titanium, zinc, and zirconium compounds substitute for antimony chemicals in enamels, paint, and pigments. Combinations of calcium, copper, selenium, sulfur, and tin are substitutes for alloys in lead-acid batteries.
eEstimated. NA Not available. — Zero. 1Gross weight. 2Defined as primary production + secondary production from old scrap + net import reliance. 3New York dealer price for 99.65% metal, cost, insurance, freight U.S. ports. Source: Platts Metal Week. 4Defined as imports of antimony in oxide, unwrought, powder, waste and scrap – exports of antimony in oxide, unwrought, powder, waste and scrap + adjustments for industry stock changes. 5See Appendix C for resource and reserve definitions and information concerning data sources. 6Company-reported probable reserves for the Stibnite Gold Project in Idaho. 7For Australia, Joint Ore Reserves Committee-compliant reserves were 65,000 tons.
U.S. Geological Survey, Mineral Commodity Summaries, February 2019
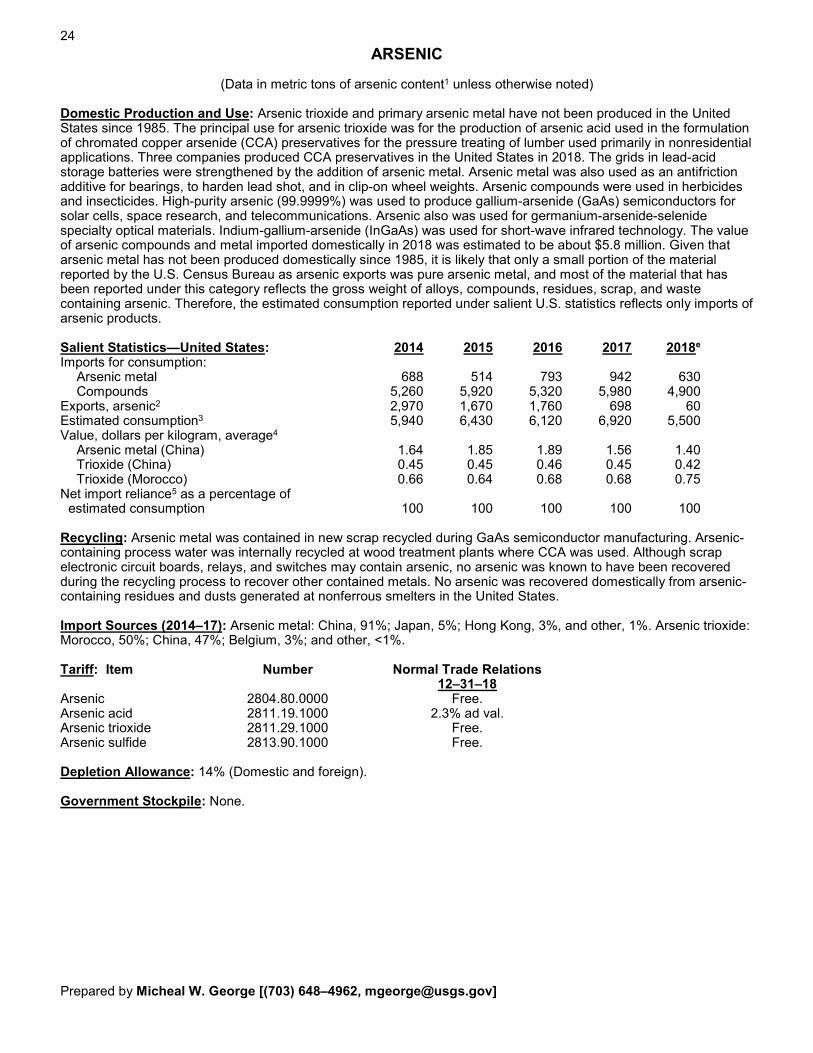
24 ARSENIC
(Data in metric tons of arsenic content1 unless otherwise noted)
Domestic Production and Use: Arsenic trioxide and primary arsenic metal have not been produced in the United States since 1985. The principal use for arsenic trioxide was for the production of arsenic acid used in the formulation of chromated copper arsenide (CCA) preservatives for the pressure treating of lumber used primarily in nonresidential applications. Three companies produced CCA preservatives in the United States in 2018. The grids in lead-acid storage batteries were strengthened by the addition of arsenic metal. Arsenic metal was also used as an antifriction additive for bearings, to harden lead shot, and in clip-on wheel weights. Arsenic compounds were used in herbicides and insecticides. High-purity arsenic (99.9999%) was used to produce gallium-arsenide (GaAs) semiconductors for solar cells, space research, and telecommunications. Arsenic also was used for germanium-arsenide-selenide specialty optical materials. Indium-gallium-arsenide (InGaAs) was used for short-wave infrared technology. The value of arsenic compounds and metal imported domestically in 2018 was estimated to be about $5.8 million. Given that arsenic metal has not been produced domestically since 1985, it is likely that only a small portion of the material reported by the U.S. Census Bureau as arsenic exports was pure arsenic metal, and most of the material that has been reported under this category reflects the gross weight of alloys, compounds, residues, scrap, and waste containing arsenic. Therefore, the estimated consumption reported under salient U.S. statistics reflects only imports of arsenic products.
Salient Statistics—United States: 2014 2015 2016 2017 2018e Imports for consumption:
Arsenic metal 688 514 793 942 630 Compounds 5,260 5,920 5,320 5,980 4,900 Exports, arsenic2 2,970 1,670 1,760 698 60 Estimated consumption3 5,940 6,430 6,120 6,920 5,500 Value, dollars per kilogram, average4
Arsenic metal (China) 1.64 1.85 1.89 1.56 1.40 Trioxide (China) 0.45 0.45 0.46 0.45 0.42 Trioxide (Morocco) 0.66 0.64 0.68 0.68 0.75
Net import reliance5 as a percentage of estimated consumption 100 100 100 100 100
Recycling: Arsenic metal was contained in new scrap recycled during GaAs semiconductor manufacturing. Arsenic-containing process water was internally recycled at wood treatment plants where CCA was used. Although scrap electronic circuit boards, relays, and switches may contain arsenic, no arsenic was known to have been recovered during the recycling process to recover other contained metals. No arsenic was recovered domestically from arsenic-containing residues and dusts generated at nonferrous smelters in the United States.
Import Sources (2014–17): Arsenic metal: China, 91%; Japan, 5%; Hong Kong, 3%, and other, 1%. Arsenic trioxide: Morocco, 50%; China, 47%; Belgium, 3%; and other, <1%.
Tariff: Item Number Normal Trade Relations 12–31–18
Arsenic 2804.80.0000 Free. Arsenic acid 2811.19.1000 2.3% ad val. Arsenic trioxide 2811.29.1000 Free. Arsenic sulfide 2813.90.1000 Free.
Depletion Allowance: 14% (Domestic and foreign).
Government Stockpile: None.
Prepared by Micheal W. George [(703) 648–4962, [email protected]]
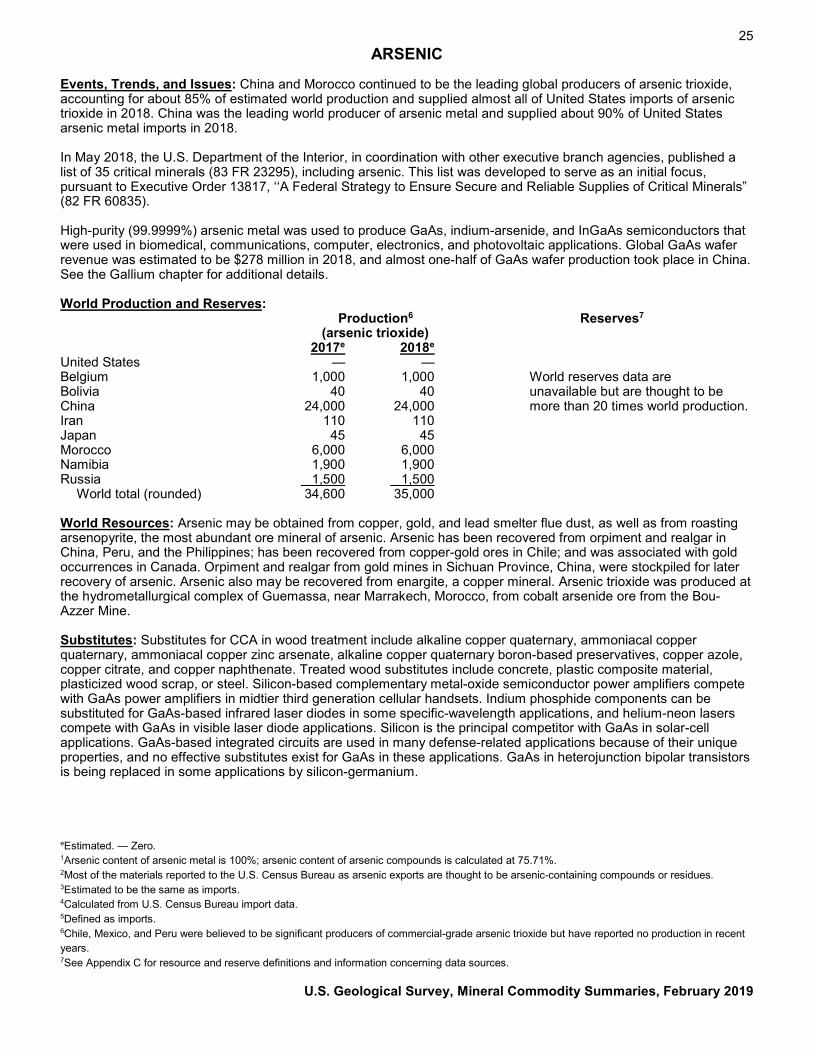
25 ARSENIC
Events, Trends, and Issues: China and Morocco continued to be the leading global producers of arsenic trioxide, accounting for about 85% of estimated world production and supplied almost all of United States imports of arsenic trioxide in 2018. China was the leading world producer of arsenic metal and supplied about 90% of United States arsenic metal imports in 2018.
In May 2018, the U.S. Department of the Interior, in coordination with other executive branch agencies, published a list of 35 critical minerals (83 FR 23295), including arsenic. This list was developed to serve as an initial focus, pursuant to Executive Order 13817, ‘‘A Federal Strategy to Ensure Secure and Reliable Supplies of Critical Minerals” (82 FR 60835).
High-purity (99.9999%) arsenic metal was used to produce GaAs, indium-arsenide, and InGaAs semiconductors that were used in biomedical, communications, computer, electronics, and photovoltaic applications. Global GaAs wafer revenue was estimated to be $278 million in 2018, and almost one-half of GaAs wafer production took place in China. See the Gallium chapter for additional details.
World Production and Reserves: Production6 Reserves7
(arsenic trioxide) 2017e 2018e
United States — — Belgium 1,000 1,000 World reserves data are Bolivia 40 40 unavailable but are thought to be China 24,000 24,000 more than 20 times world production. Iran 110 110 Japan 45 45 Morocco 6,000 6,000 Namibia 1,900 1,900 Russia 1,500 1,500
World total (rounded) 34,600 35,000
World Resources: Arsenic may be obtained from copper, gold, and lead smelter flue dust, as well as from roasting arsenopyrite, the most abundant ore mineral of arsenic. Arsenic has been recovered from orpiment and realgar in China, Peru, and the Philippines; has been recovered from copper-gold ores in Chile; and was associated with gold occurrences in Canada. Orpiment and realgar from gold mines in Sichuan Province, China, were stockpiled for later recovery of arsenic. Arsenic also may be recovered from enargite, a copper mineral. Arsenic trioxide was produced at the hydrometallurgical complex of Guemassa, near Marrakech, Morocco, from cobalt arsenide ore from the Bou-Azzer Mine.
Substitutes: Substitutes for CCA in wood treatment include alkaline copper quaternary, ammoniacal copper quaternary, ammoniacal copper zinc arsenate, alkaline copper quaternary boron-based preservatives, copper azole, copper citrate, and copper naphthenate. Treated wood substitutes include concrete, plastic composite material, plasticized wood scrap, or steel. Silicon-based complementary metal-oxide semiconductor power amplifiers compete with GaAs power amplifiers in midtier third generation cellular handsets. Indium phosphide components can be substituted for GaAs-based infrared laser diodes in some specific-wavelength applications, and helium-neon lasers compete with GaAs in visible laser diode applications. Silicon is the principal competitor with GaAs in solar-cell applications. GaAs-based integrated circuits are used in many defense-related applications because of their unique properties, and no effective substitutes exist for GaAs in these applications. GaAs in heterojunction bipolar transistors is being replaced in some applications by silicon-germanium.
eEstimated. — Zero. 1Arsenic content of arsenic metal is 100%; arsenic content of arsenic compounds is calculated at 75.71%. 2Most of the materials reported to the U.S. Census Bureau as arsenic exports are thought to be arsenic-containing compounds or residues. 3Estimated to be the same as imports. 4Calculated from U.S. Census Bureau import data. 5Defined as imports. 6Chile, Mexico, and Peru were believed to be significant producers of commercial-grade arsenic trioxide but have reported no production in recent years. 7See Appendix C for resource and reserve definitions and information concerning data sources.
U.S. Geological Survey, Mineral Commodity Summaries, February 2019
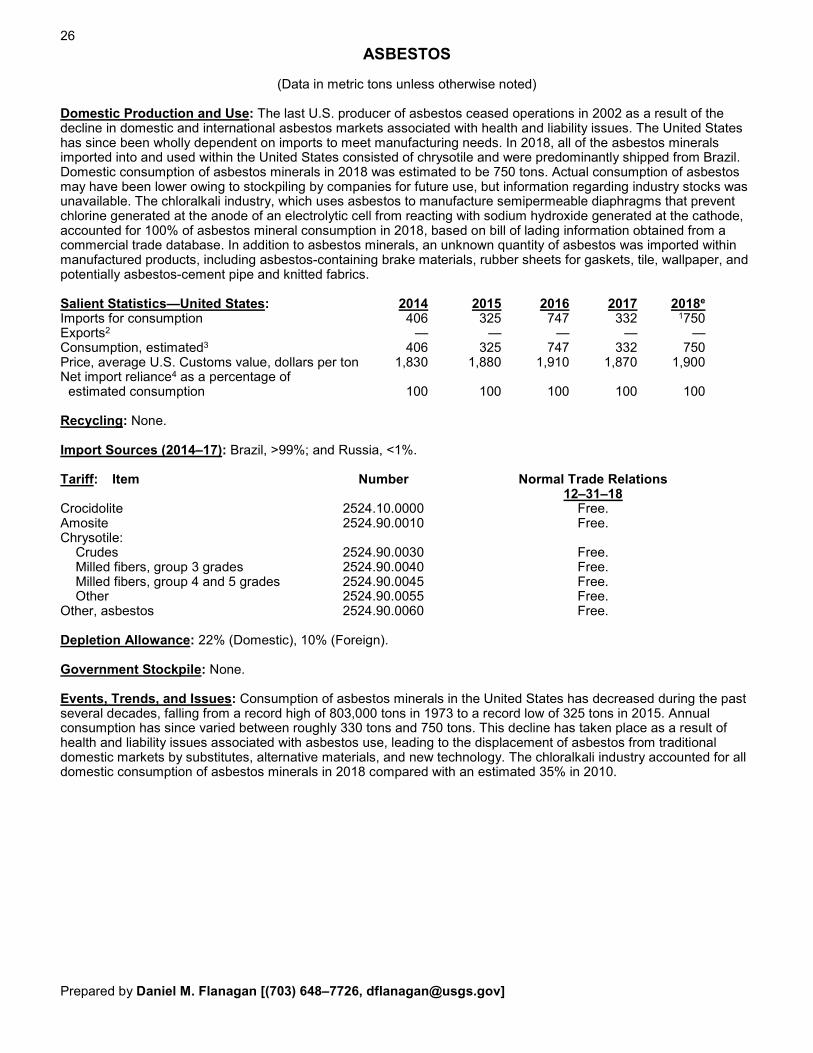
26 ASBESTOS
(Data in metric tons unless otherwise noted)
Domestic Production and Use: The last U.S. producer of asbestos ceased operations in 2002 as a result of the decline in domestic and international asbestos markets associated with health and liability issues. The United States has since been wholly dependent on imports to meet manufacturing needs. In 2018, all of the asbestos minerals imported into and used within the United States consisted of chrysotile and were predominantly shipped from Brazil. Domestic consumption of asbestos minerals in 2018 was estimated to be 750 tons. Actual consumption of asbestos may have been lower owing to stockpiling by companies for future use, but information regarding industry stocks was unavailable. The chloralkali industry, which uses asbestos to manufacture semipermeable diaphragms that prevent chlorine generated at the anode of an electrolytic cell from reacting with sodium hydroxide generated at the cathode, accounted for 100% of asbestos mineral consumption in 2018, based on bill of lading information obtained from a commercial trade database. In addition to asbestos minerals, an unknown quantity of asbestos was imported within manufactured products, including asbestos-containing brake materials, rubber sheets for gaskets, tile, wallpaper, and potentially asbestos-cement pipe and knitted fabrics.
Salient Statistics—United States: 2014 2015 2016 2017 2018e Imports for consumption 406 325 747 332 1750 Exports2 — — — — — Consumption, estimated3 406 325 747 332 750 Price, average U.S. Customs value, dollars per ton 1,830 1,880 1,910 1,870 1,900 Net import reliance4 as a percentage of
estimated consumption 100 100 100 100 100
Recycling: None.
Import Sources (2014–17): Brazil, >99%; and Russia, <1%.
Tariff: Item Number Normal Trade Relations 12–31–18
Crocidolite 2524.10.0000 Free. Amosite 2524.90.0010 Free. Chrysotile:
Crudes 2524.90.0030 Free. Milled fibers, group 3 grades 2524.90.0040 Free. Milled fibers, group 4 and 5 grades 2524.90.0045 Free. Other 2524.90.0055 Free.
Other, asbestos 2524.90.0060 Free.
Depletion Allowance: 22% (Domestic), 10% (Foreign).
Government Stockpile: None.
Events, Trends, and Issues: Consumption of asbestos minerals in the United States has decreased during the past several decades, falling from a record high of 803,000 tons in 1973 to a record low of 325 tons in 2015. Annual consumption has since varied between roughly 330 tons and 750 tons. This decline has taken place as a result of health and liability issues associated with asbestos use, leading to the displacement of asbestos from traditional domestic markets by substitutes, alternative materials, and new technology. The chloralkali industry accounted for all domestic consumption of asbestos minerals in 2018 compared with an estimated 35% in 2010.
Prepared by Daniel M. Flanagan [(703) 648–7726, [email protected]]
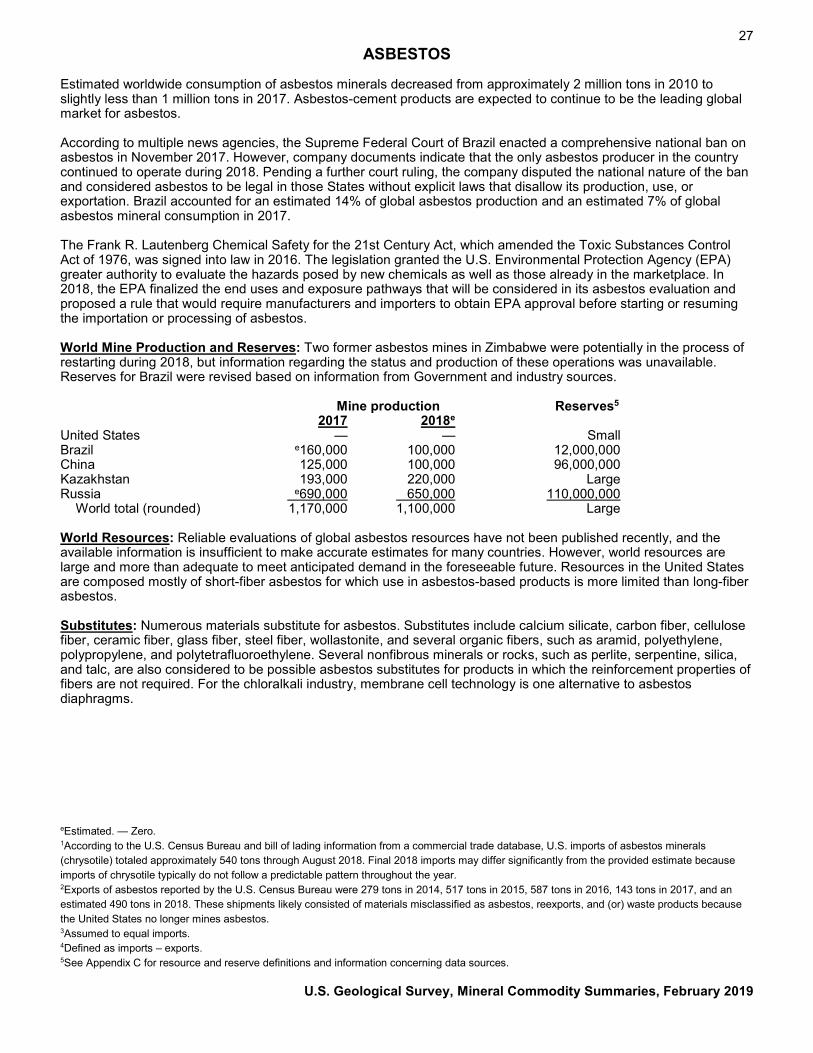
27 ASBESTOS
Estimated worldwide consumption of asbestos minerals decreased from approximately 2 million tons in 2010 to slightly less than 1 million tons in 2017. Asbestos-cement products are expected to continue to be the leading global market for asbestos.
According to multiple news agencies, the Supreme Federal Court of Brazil enacted a comprehensive national ban on asbestos in November 2017. However, company documents indicate that the only asbestos producer in the country continued to operate during 2018. Pending a further court ruling, the company disputed the national nature of the ban and considered asbestos to be legal in those States without explicit laws that disallow its production, use, or exportation. Brazil accounted for an estimated 14% of global asbestos production and an estimated 7% of global asbestos mineral consumption in 2017.
The Frank R. Lautenberg Chemical Safety for the 21st Century Act, which amended the Toxic Substances Control Act of 1976, was signed into law in 2016. The legislation granted the U.S. Environmental Protection Agency (EPA) greater authority to evaluate the hazards posed by new chemicals as well as those already in the marketplace. In 2018, the EPA finalized the end uses and exposure pathways that will be considered in its asbestos evaluation and proposed a rule that would require manufacturers and importers to obtain EPA approval before starting or resuming the importation or processing of asbestos.
World Mine Production and Reserves: Two former asbestos mines in Zimbabwe were potentially in the process of restarting during 2018, but information regarding the status and production of these operations was unavailable. Reserves for Brazil were revised based on information from Government and industry sources.
Mine production Reserves5 2017 2018e
United States — — Small Brazil e160,000 100,000 12,000,000 China 125,000 100,000 96,000,000 Kazakhstan 193,000 220,000 Large Russia e690,000 650,000 110,000,000
World total (rounded) 1,170,000 1,100,000 Large
World Resources: Reliable evaluations of global asbestos resources have not been published recently, and the available information is insufficient to make accurate estimates for many countries. However, world resources are large and more than adequate to meet anticipated demand in the foreseeable future. Resources in the United States are composed mostly of short-fiber asbestos for which use in asbestos-based products is more limited than long-fiber asbestos.
Substitutes: Numerous materials substitute for asbestos. Substitutes include calcium silicate, carbon fiber, cellulose fiber, ceramic fiber, glass fiber, steel fiber, wollastonite, and several organic fibers, such as aramid, polyethylene, polypropylene, and polytetrafluoroethylene. Several nonfibrous minerals or rocks, such as perlite, serpentine, silica, and talc, are also considered to be possible asbestos substitutes for products in which the reinforcement properties of fibers are not required. For the chloralkali industry, membrane cell technology is one alternative to asbestos diaphragms.
eEstimated. — Zero. 1According to the U.S. Census Bureau and bill of lading information from a commercial trade database, U.S. imports of asbestos minerals (chrysotile) totaled approximately 540 tons through August 2018. Final 2018 imports may differ significantly from the provided estimate because imports of chrysotile typically do not follow a predictable pattern throughout the year. 2Exports of asbestos reported by the U.S. Census Bureau were 279 tons in 2014, 517 tons in 2015, 587 tons in 2016, 143 tons in 2017, and an estimated 490 tons in 2018. These shipments likely consisted of materials misclassified as asbestos, reexports, and (or) waste products because the United States no longer mines asbestos. 3Assumed to equal imports. 4Defined as imports – exports. 5See Appendix C for resource and reserve definitions and information concerning data sources.
U.S. Geological Survey, Mineral Commodity Summaries, February 2019
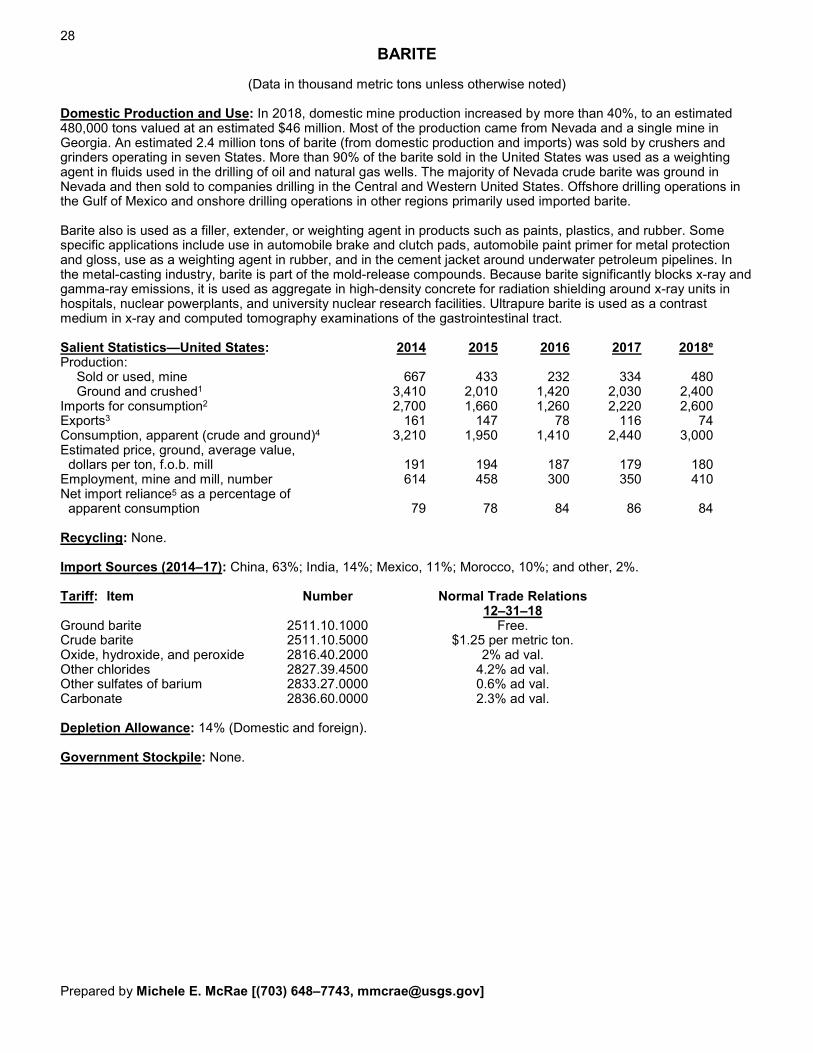
28 BARITE
(Data in thousand metric tons unless otherwise noted)
Domestic Production and Use: In 2018, domestic mine production increased by more than 40%, to an estimated 480,000 tons valued at an estimated $46 million. Most of the production came from Nevada and a single mine in Georgia. An estimated 2.4 million tons of barite (from domestic production and imports) was sold by crushers and grinders operating in seven States. More than 90% of the barite sold in the United States was used as a weighting agent in fluids used in the drilling of oil and natural gas wells. The majority of Nevada crude barite was ground in Nevada and then sold to companies drilling in the Central and Western United States. Offshore drilling operations in the Gulf of Mexico and onshore drilling operations in other regions primarily used imported barite.
Barite also is used as a filler, extender, or weighting agent in products such as paints, plastics, and rubber. Some specific applications include use in automobile brake and clutch pads, automobile paint primer for metal protection and gloss, use as a weighting agent in rubber, and in the cement jacket around underwater petroleum pipelines. In the metal-casting industry, barite is part of the mold-release compounds. Because barite significantly blocks x-ray and gamma-ray emissions, it is used as aggregate in high-density concrete for radiation shielding around x-ray units in hospitals, nuclear powerplants, and university nuclear research facilities. Ultrapure barite is used as a contrast medium in x-ray and computed tomography examinations of the gastrointestinal tract.
Salient Statistics—United States: 2014 2015 2016 2017 2018e Production:
Sold or used, mine 667 433 232 334 480 Ground and crushed1 3,410 2,010 1,420 2,030 2,400 Imports for consumption2 2,700 1,660 1,260 2,220 2,600 Exports3 161 147 78 116 74 Consumption, apparent (crude and ground)4 3,210 1,950 1,410 2,440 3,000 Estimated price, ground, average value, dollars per ton, f.o.b. mill 191 194 187 179 180 Employment, mine and mill, number 614 458 300 350 410 Net import reliance5 as a percentage of
apparent consumption 79 78 84 86 84
Recycling: None.
Import Sources (2014–17): China, 63%; India, 14%; Mexico, 11%; Morocco, 10%; and other, 2%.
Tariff: Item Number Normal Trade Relations 12–31–18
Ground barite 2511.10.1000 Free. Crude barite 2511.10.5000 $1.25 per metric ton. Oxide, hydroxide, and peroxide 2816.40.2000 2% ad val. Other chlorides 2827.39.4500 4.2% ad val. Other sulfates of barium 2833.27.0000 0.6% ad val. Carbonate 2836.60.0000 2.3% ad val.
Depletion Allowance: 14% (Domestic and foreign).
Government Stockpile: None.
Prepared by Michele E. McRae [(703) 648–7743, [email protected]]
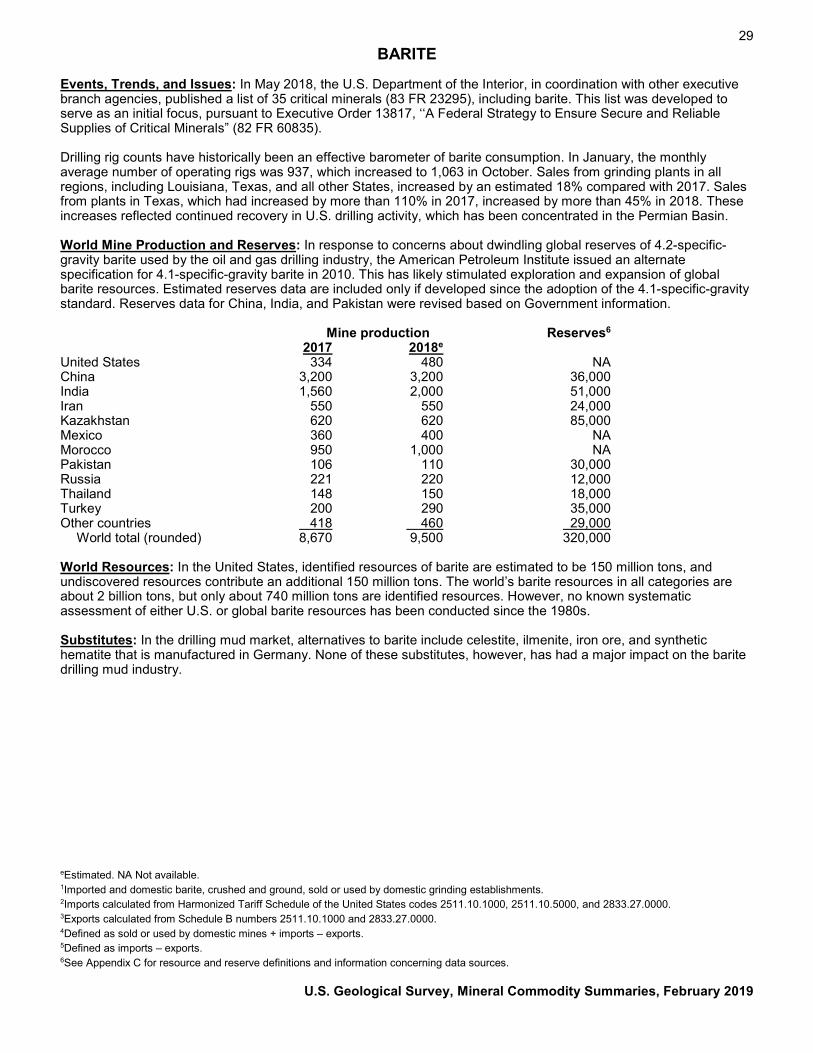
29 BARITE
Events, Trends, and Issues: In May 2018, the U.S. Department of the Interior, in coordination with other executive branch agencies, published a list of 35 critical minerals (83 FR 23295), including barite. This list was developed to serve as an initial focus, pursuant to Executive Order 13817, ‘‘A Federal Strategy to Ensure Secure and Reliable Supplies of Critical Minerals” (82 FR 60835).
Drilling rig counts have historically been an effective barometer of barite consumption. In January, the monthly average number of operating rigs was 937, which increased to 1,063 in October. Sales from grinding plants in all regions, including Louisiana, Texas, and all other States, increased by an estimated 18% compared with 2017. Sales from plants in Texas, which had increased by more than 110% in 2017, increased by more than 45% in 2018. These increases reflected continued recovery in U.S. drilling activity, which has been concentrated in the Permian Basin.
World Mine Production and Reserves: In response to concerns about dwindling global reserves of 4.2-specific-gravity barite used by the oil and gas drilling industry, the American Petroleum Institute issued an alternate specification for 4.1-specific-gravity barite in 2010. This has likely stimulated exploration and expansion of global barite resources. Estimated reserves data are included only if developed since the adoption of the 4.1-specific-gravity standard. Reserves data for China, India, and Pakistan were revised based on Government information.
Mine production Reserves6 2017 2018e
United States 334 480 NA China 3,200 3,200 36,000 India 1,560 2,000 51,000 Iran 550 550 24,000 Kazakhstan 620 620 85,000 Mexico 360 400 NA Morocco 950 1,000 NA Pakistan 106 110 30,000 Russia 221 220 12,000 Thailand 148 150 18,000 Turkey 200 290 35,000 Other countries 418 460 29,000
World total (rounded) 8,670 9,500 320,000
World Resources: In the United States, identified resources of barite are estimated to be 150 million tons, and undiscovered resources contribute an additional 150 million tons. The world’s barite resources in all categories are about 2 billion tons, but only about 740 million tons are identified resources. However, no known systematic assessment of either U.S. or global barite resources has been conducted since the 1980s.
Substitutes: In the drilling mud market, alternatives to barite include celestite, ilmenite, iron ore, and synthetic hematite that is manufactured in Germany. None of these substitutes, however, has had a major impact on the barite drilling mud industry.
eEstimated. NA Not available. 1Imported and domestic barite, crushed and ground, sold or used by domestic grinding establishments. 2Imports calculated from Harmonized Tariff Schedule of the United States codes 2511.10.1000, 2511.10.5000, and 2833.27.0000. 3Exports calculated from Schedule B numbers 2511.10.1000 and 2833.27.0000. 4Defined as sold or used by domestic mines + imports – exports. 5Defined as imports – exports. 6See Appendix C for resource and reserve definitions and information concerning data sources.
U.S. Geological Survey, Mineral Commodity Summaries, February 2019
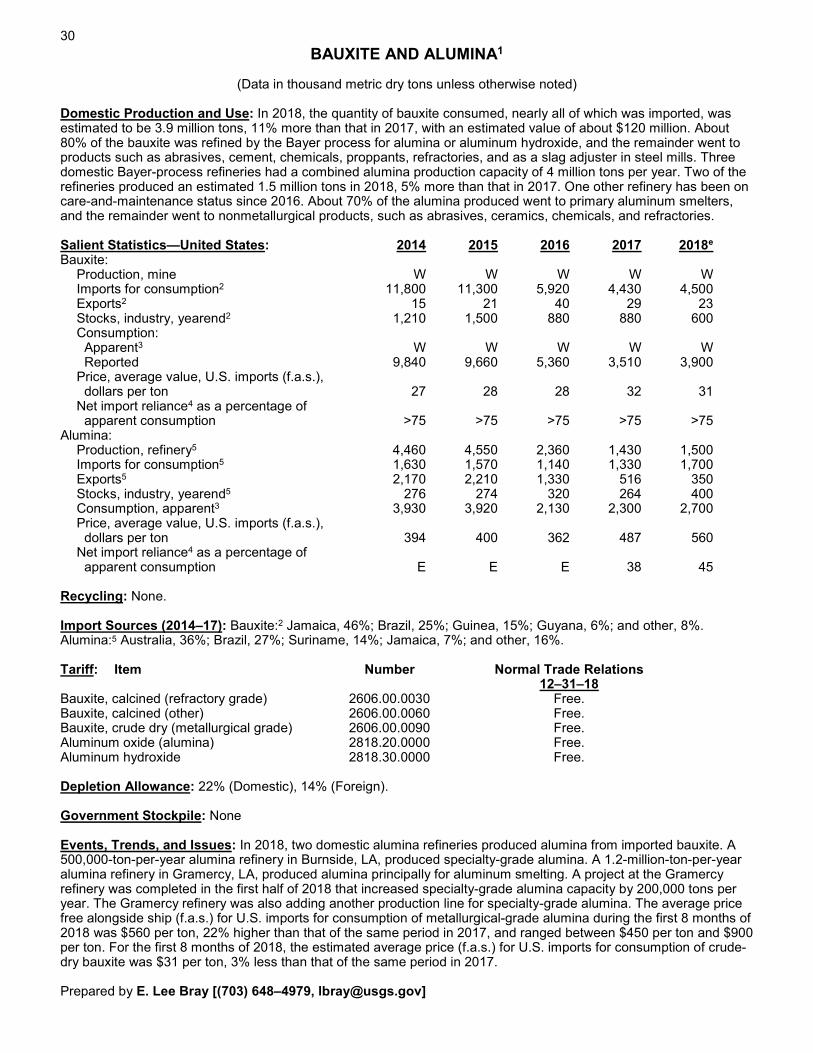
30 BAUXITE AND ALUMINA1
(Data in thousand metric dry tons unless otherwise noted)
Domestic Production and Use: In 2018, the quantity of bauxite consumed, nearly all of which was imported, was estimated to be 3.9 million tons, 11% more than that in 2017, with an estimated value of about $120 million. About 80% of the bauxite was refined by the Bayer process for alumina or aluminum hydroxide, and the remainder went to products such as abrasives, cement, chemicals, proppants, refractories, and as a slag adjuster in steel mills. Three domestic Bayer-process refineries had a combined alumina production capacity of 4 million tons per year. Two of the refineries produced an estimated 1.5 million tons in 2018, 5% more than that in 2017. One other refinery has been on care-and-maintenance status since 2016. About 70% of the alumina produced went to primary aluminum smelters, and the remainder went to nonmetallurgical products, such as abrasives, ceramics, chemicals, and refractories.
Salient Statistics—United States: 2014 2015 2016 2017 2018e Bauxite:
Production, mine W W W W W Imports for consumption2 11,800 11,300 5,920 4,430 4,500 Exports2 15 21 40 29 23 Stocks, industry, yearend2 1,210 1,500 880 880 600 Consumption:
Apparent3 W W W W W Reported 9,840 9,660 5,360 3,510 3,900
Price, average value, U.S. imports (f.a.s.), dollars per ton 27 28 28 32 31
Net import reliance4 as a percentage of apparent consumption >75 >75 >75 >75 >75Alumina:
Production, refinery5 4,460 4,550 2,360 1,430 1,500 Imports for consumption5 1,630 1,570 1,140 1,330 1,700 Exports5 2,170 2,210 1,330 516 350 Stocks, industry, yearend5 276 274 320 264 400 Consumption, apparent3 3,930 3,920 2,130 2,300 2,700 Price, average value, U.S. imports (f.a.s.), dollars per ton 394 400 362 487 560 Net import reliance4 as a percentage of
apparent consumption E E E 38 45
Recycling: None.
Import Sources (2014–17): Bauxite:2 Jamaica, 46%; Brazil, 25%; Guinea, 15%; Guyana, 6%; and other, 8%. Alumina:5 Australia, 36%; Brazil, 27%; Suriname, 14%; Jamaica, 7%; and other, 16%.
Tariff: Item Number Normal Trade Relations 12–31–18
Bauxite, calcined (refractory grade) 2606.00.0030 Free. Bauxite, calcined (other) 2606.00.0060 Free. Bauxite, crude dry (metallurgical grade) 2606.00.0090 Free. Aluminum oxide (alumina) 2818.20.0000 Free. Aluminum hydroxide 2818.30.0000 Free.
Depletion Allowance: 22% (Domestic), 14% (Foreign).
Government Stockpile: None
Events, Trends, and Issues: In 2018, two domestic alumina refineries produced alumina from imported bauxite. A 500,000-ton-per-year alumina refinery in Burnside, LA, produced specialty-grade alumina. A 1.2-million-ton-per-year alumina refinery in Gramercy, LA, produced alumina principally for aluminum smelting. A project at the Gramercy refinery was completed in the first half of 2018 that increased specialty-grade alumina capacity by 200,000 tons per year. The Gramercy refinery was also adding another production line for specialty-grade alumina. The average price free alongside ship (f.a.s.) for U.S. imports for consumption of metallurgical-grade alumina during the first 8 months of 2018 was $560 per ton, 22% higher than that of the same period in 2017, and ranged between $450 per ton and $900 per ton. For the first 8 months of 2018, the estimated average price (f.a.s.) for U.S. imports for consumption of crude-dry bauxite was $31 per ton, 3% less than that of the same period in 2017.
Prepared by E. Lee Bray [(703) 648–4979, [email protected]]
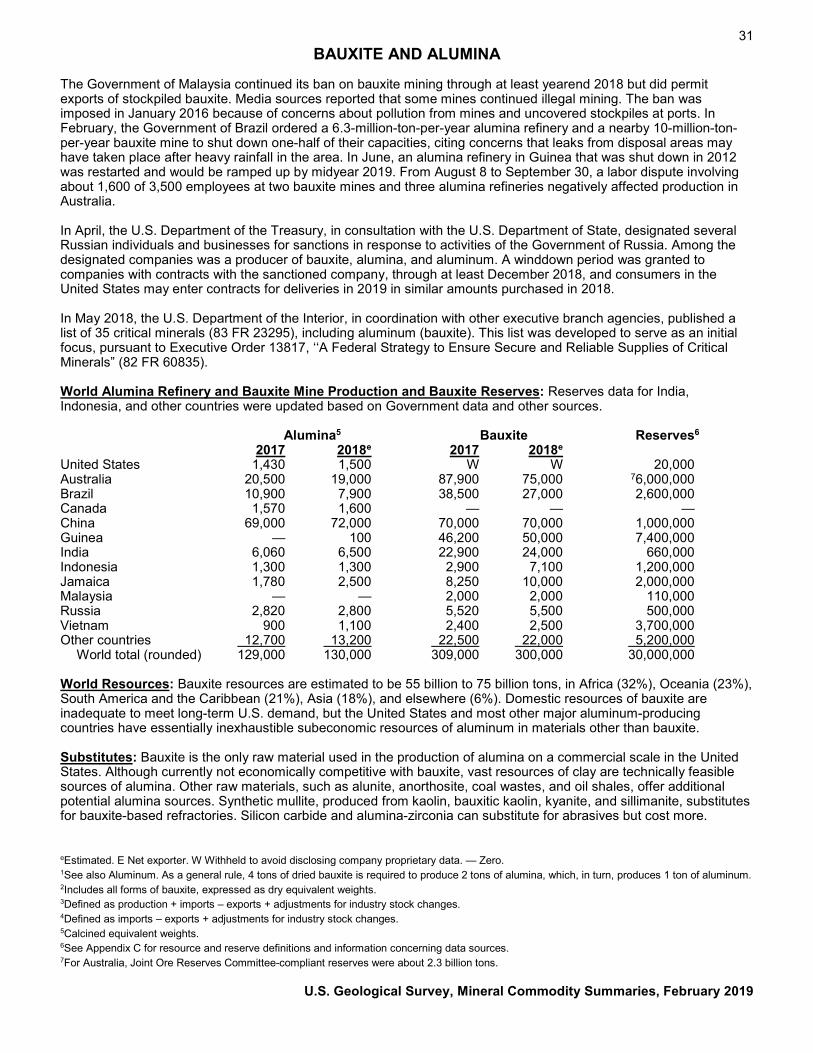
31 BAUXITE AND ALUMINA
The Government of Malaysia continued its ban on bauxite mining through at least yearend 2018 but did permit exports of stockpiled bauxite. Media sources reported that some mines continued illegal mining. The ban was imposed in January 2016 because of concerns about pollution from mines and uncovered stockpiles at ports. In February, the Government of Brazil ordered a 6.3-million-ton-per-year alumina refinery and a nearby 10-million-ton-per-year bauxite mine to shut down one-half of their capacities, citing concerns that leaks from disposal areas may have taken place after heavy rainfall in the area. In June, an alumina refinery in Guinea that was shut down in 2012 was restarted and would be ramped up by midyear 2019. From August 8 to September 30, a labor dispute involving about 1,600 of 3,500 employees at two bauxite mines and three alumina refineries negatively affected production in Australia.
In April, the U.S. Department of the Treasury, in consultation with the U.S. Department of State, designated several Russian individuals and businesses for sanctions in response to activities of the Government of Russia. Among the designated companies was a producer of bauxite, alumina, and aluminum. A winddown period was granted to companies with contracts with the sanctioned company, through at least December 2018, and consumers in the United States may enter contracts for deliveries in 2019 in similar amounts purchased in 2018.
In May 2018, the U.S. Department of the Interior, in coordination with other executive branch agencies, published a list of 35 critical minerals (83 FR 23295), including aluminum (bauxite). This list was developed to serve as an initial focus, pursuant to Executive Order 13817, ‘‘A Federal Strategy to Ensure Secure and Reliable Supplies of Critical Minerals” (82 FR 60835).
World Alumina Refinery and Bauxite Mine Production and Bauxite Reserves: Reserves data for India, Indonesia, and other countries were updated based on Government data and other sources.
Alumina5 Bauxite Reserves6 2017 2018e 2017 2018e
United States 1,430 1,500 W W 20,000 Australia 20,500 19,000 87,900 75,000 76,000,000 Brazil 10,900 7,900 38,500 27,000 2,600,000 Canada 1,570 1,600 — — — China 69,000 72,000 70,000 70,000 1,000,000 Guinea — 100 46,200 50,000 7,400,000 India 6,060 6,500 22,900 24,000 660,000 Indonesia 1,300 1,300 2,900 7,100 1,200,000 Jamaica 1,780 2,500 8,250 10,000 2,000,000 Malaysia — — 2,000 2,000 110,000 Russia 2,820 2,800 5,520 5,500 500,000 Vietnam 900 1,100 2,400 2,500 3,700,000 Other countries 12,700 13,200 22,500 22,000 5,200,000
World total (rounded) 129,000 130,000 309,000 300,000 30,000,000
World Resources: Bauxite resources are estimated to be 55 billion to 75 billion tons, in Africa (32%), Oceania (23%), South America and the Caribbean (21%), Asia (18%), and elsewhere (6%). Domestic resources of bauxite are inadequate to meet long-term U.S. demand, but the United States and most other major aluminum-producing countries have essentially inexhaustible subeconomic resources of aluminum in materials other than bauxite.
Substitutes: Bauxite is the only raw material used in the production of alumina on a commercial scale in the United States. Although currently not economically competitive with bauxite, vast resources of clay are technically feasible sources of alumina. Other raw materials, such as alunite, anorthosite, coal wastes, and oil shales, offer additional potential alumina sources. Synthetic mullite, produced from kaolin, bauxitic kaolin, kyanite, and sillimanite, substitutes for bauxite-based refractories. Silicon carbide and alumina-zirconia can substitute for abrasives but cost more.
eEstimated. E Net exporter. W Withheld to avoid disclosing company proprietary data. — Zero. 1See also Aluminum. As a general rule, 4 tons of dried bauxite is required to produce 2 tons of alumina, which, in turn, produces 1 ton of aluminum. 2Includes all forms of bauxite, expressed as dry equivalent weights. 3Defined as production + imports – exports + adjustments for industry stock changes. 4Defined as imports – exports + adjustments for industry stock changes. 5Calcined equivalent weights. 6See Appendix C for resource and reserve definitions and information concerning data sources. 7For Australia, Joint Ore Reserves Committee-compliant reserves were about 2.3 billion tons.
U.S. Geological Survey, Mineral Commodity Summaries, February 2019
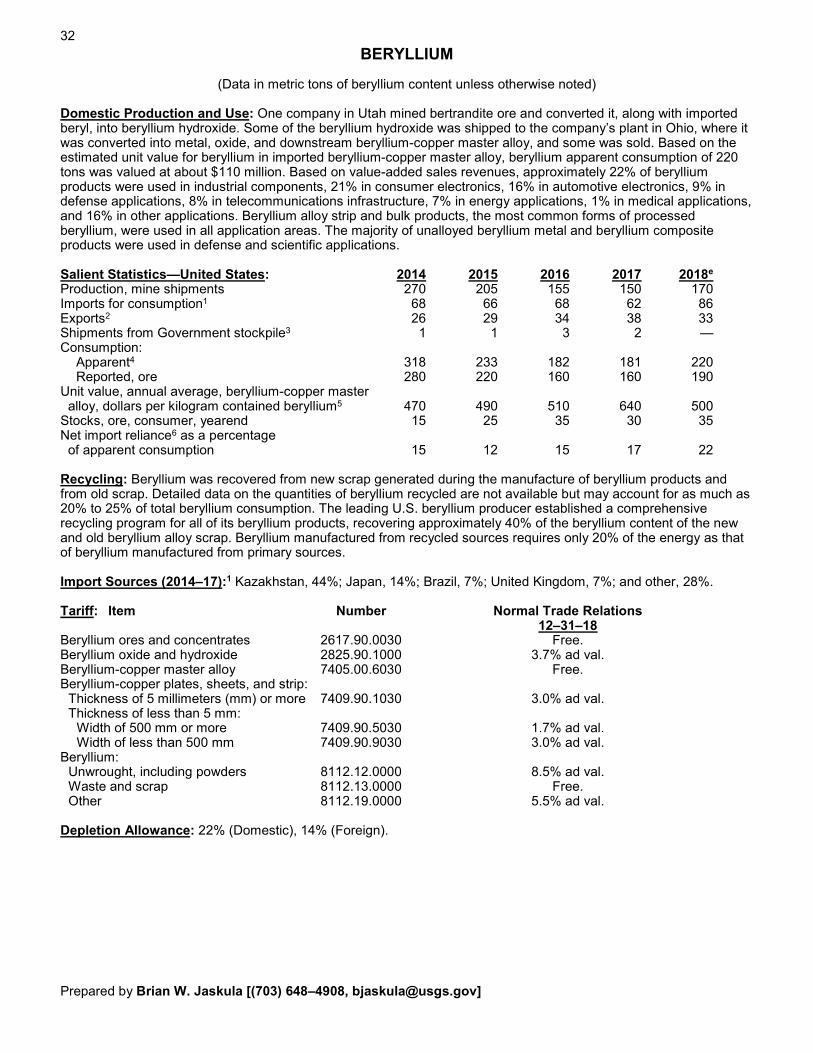
32 BERYLLIUM
(Data in metric tons of beryllium content unless otherwise noted)
Domestic Production and Use: One company in Utah mined bertrandite ore and converted it, along with imported beryl, into beryllium hydroxide. Some of the beryllium hydroxide was shipped to the company’s plant in Ohio, where it was converted into metal, oxide, and downstream beryllium-copper master alloy, and some was sold. Based on the estimated unit value for beryllium in imported beryllium-copper master alloy, beryllium apparent consumption of 220 tons was valued at about $110 million. Based on value-added sales revenues, approximately 22% of beryllium products were used in industrial components, 21% in consumer electronics, 16% in automotive electronics, 9% in defense applications, 8% in telecommunications infrastructure, 7% in energy applications, 1% in medical applications, and 16% in other applications. Beryllium alloy strip and bulk products, the most common forms of processed beryllium, were used in all application areas. The majority of unalloyed beryllium metal and beryllium composite products were used in defense and scientific applications.
Salient Statistics—United States: 2014 2015 2016 2017 2018e Production, mine shipments 270 205 155 150 170 Imports for consumption1 68 66 68 62 86 Exports2 26 29 34 38 33 Shipments from Government stockpile3 1 1 3 2 — Consumption:
Apparent4 318 233 182 181 220 Reported, ore 280 220 160 160 190 Unit value, annual average, beryllium-copper master alloy, dollars per kilogram contained beryllium5 470 490 510 640 500 Stocks, ore, consumer, yearend 15 25 35 30 35 Net import reliance6 as a percentage
of apparent consumption 15 12 15 17 22
Recycling: Beryllium was recovered from new scrap generated during the manufacture of beryllium products and from old scrap. Detailed data on the quantities of beryllium recycled are not available but may account for as much as 20% to 25% of total beryllium consumption. The leading U.S. beryllium producer established a comprehensive recycling program for all of its beryllium products, recovering approximately 40% of the beryllium content of the new and old beryllium alloy scrap. Beryllium manufactured from recycled sources requires only 20% of the energy as that of beryllium manufactured from primary sources.
Import Sources (2014–17):1 Kazakhstan, 44%; Japan, 14%; Brazil, 7%; United Kingdom, 7%; and other, 28%.
Tariff: Item Number Normal Trade Relations 12–31–18
Beryllium ores and concentrates 2617.90.0030 Free. Beryllium oxide and hydroxide 2825.90.1000 3.7% ad val. Beryllium-copper master alloy 7405.00.6030 Free. Beryllium-copper plates, sheets, and strip:
Thickness of 5 millimeters (mm) or more 7409.90.1030 3.0% ad val. Thickness of less than 5 mm:
Width of 500 mm or more 7409.90.5030 1.7% ad val. Width of less than 500 mm 7409.90.9030 3.0% ad val. Beryllium:
Unwrought, including powders 8112.12.0000 8.5% ad val. Waste and scrap 8112.13.0000 Free. Other 8112.19.0000 5.5% ad val.
Depletion Allowance: 22% (Domestic), 14% (Foreign).
Prepared by Brian W. Jaskula [(703) 648–4908, [email protected]]
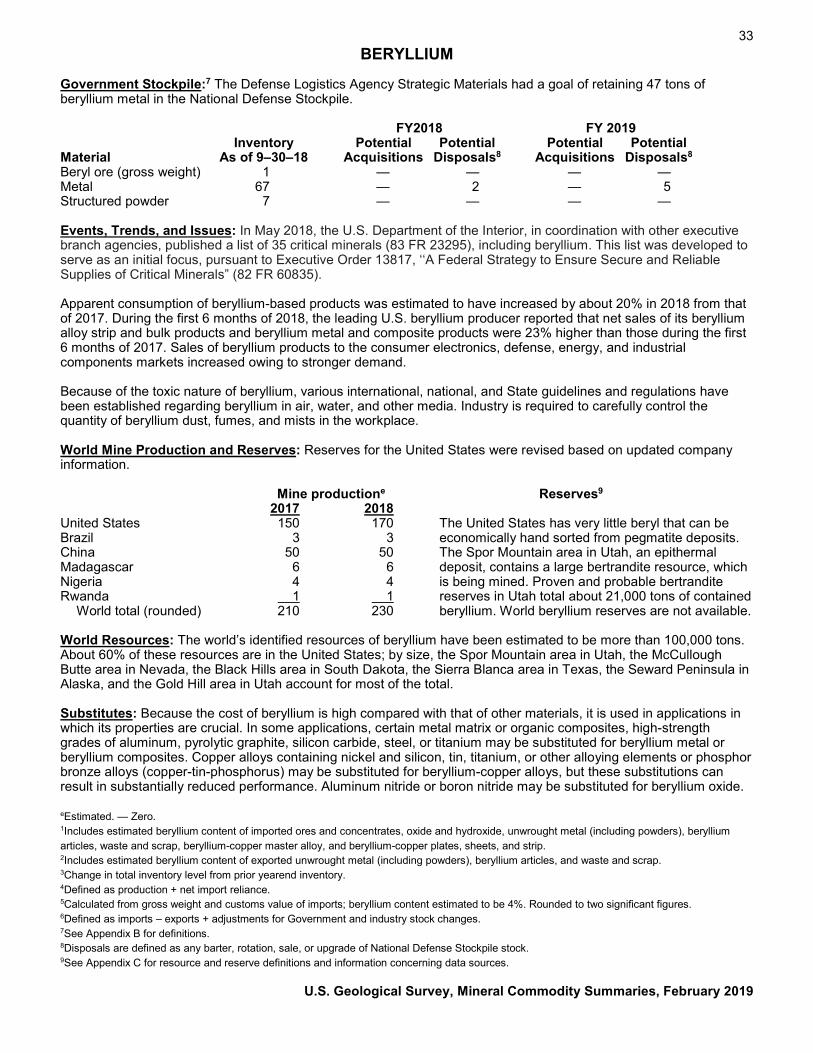
33 BERYLLIUM
Government Stockpile:7 The Defense Logistics Agency Strategic Materials had a goal of retaining 47 tons of beryllium metal in the National Defense Stockpile.
FY2018 FY 2019 Inventory Potential Potential Potential Potential
Material As of 9–30–18 Acquisitions Disposals8 Acquisitions Disposals8
Beryl ore (gross weight) 1 — — — — Metal 67 — 2 — 5 Structured powder 7 — — — —
Events, Trends, and Issues: In May 2018, the U.S. Department of the Interior, in coordination with other executive branch agencies, published a list of 35 critical minerals (83 FR 23295), including beryllium. This list was developed to serve as an initial focus, pursuant to Executive Order 13817, ‘‘A Federal Strategy to Ensure Secure and Reliable Supplies of Critical Minerals” (82 FR 60835).
Apparent consumption of beryllium-based products was estimated to have increased by about 20% in 2018 from that of 2017. During the first 6 months of 2018, the leading U.S. beryllium producer reported that net sales of its beryllium alloy strip and bulk products and beryllium metal and composite products were 23% higher than those during the first 6 months of 2017. Sales of beryllium products to the consumer electronics, defense, energy, and industrial components markets increased owing to stronger demand.
Because of the toxic nature of beryllium, various international, national, and State guidelines and regulations have been established regarding beryllium in air, water, and other media. Industry is required to carefully control the quantity of beryllium dust, fumes, and mists in the workplace.
World Mine Production and Reserves: Reserves for the United States were revised based on updated company information.
Mine productione Reserves9 2017 2018
United States 150 170 The United States has very little beryl that can be Brazil 3 3 economically hand sorted from pegmatite deposits. China 50 50 The Spor Mountain area in Utah, an epithermal Madagascar 6 6 deposit, contains a large bertrandite resource, which Nigeria 4 4 is being mined. Proven and probable bertrandite Rwanda 1 1 reserves in Utah total about 21,000 tons of contained
World total (rounded) 210 230 beryllium. World beryllium reserves are not available.
World Resources: The world’s identified resources of beryllium have been estimated to be more than 100,000 tons. About 60% of these resources are in the United States; by size, the Spor Mountain area in Utah, the McCullough Butte area in Nevada, the Black Hills area in South Dakota, the Sierra Blanca area in Texas, the Seward Peninsula in Alaska, and the Gold Hill area in Utah account for most of the total.
Substitutes: Because the cost of beryllium is high compared with that of other materials, it is used in applications in which its properties are crucial. In some applications, certain metal matrix or organic composites, high-strength grades of aluminum, pyrolytic graphite, silicon carbide, steel, or titanium may be substituted for beryllium metal or beryllium composites. Copper alloys containing nickel and silicon, tin, titanium, or other alloying elements or phosphor bronze alloys (copper-tin-phosphorus) may be substituted for beryllium-copper alloys, but these substitutions can result in substantially reduced performance. Aluminum nitride or boron nitride may be substituted for beryllium oxide.
eEstimated. — Zero. 1Includes estimated beryllium content of imported ores and concentrates, oxide and hydroxide, unwrought metal (including powders), beryllium articles, waste and scrap, beryllium-copper master alloy, and beryllium-copper plates, sheets, and strip. 2Includes estimated beryllium content of exported unwrought metal (including powders), beryllium articles, and waste and scrap. 3Change in total inventory level from prior yearend inventory. 4Defined as production + net import reliance. 5Calculated from gross weight and customs value of imports; beryllium content estimated to be 4%. Rounded to two significant figures. 6Defined as imports – exports + adjustments for Government and industry stock changes. 7See Appendix B for definitions. 8Disposals are defined as any barter, rotation, sale, or upgrade of National Defense Stockpile stock. 9See Appendix C for resource and reserve definitions and information concerning data sources.
U.S. Geological Survey, Mineral Commodity Summaries, February 2019
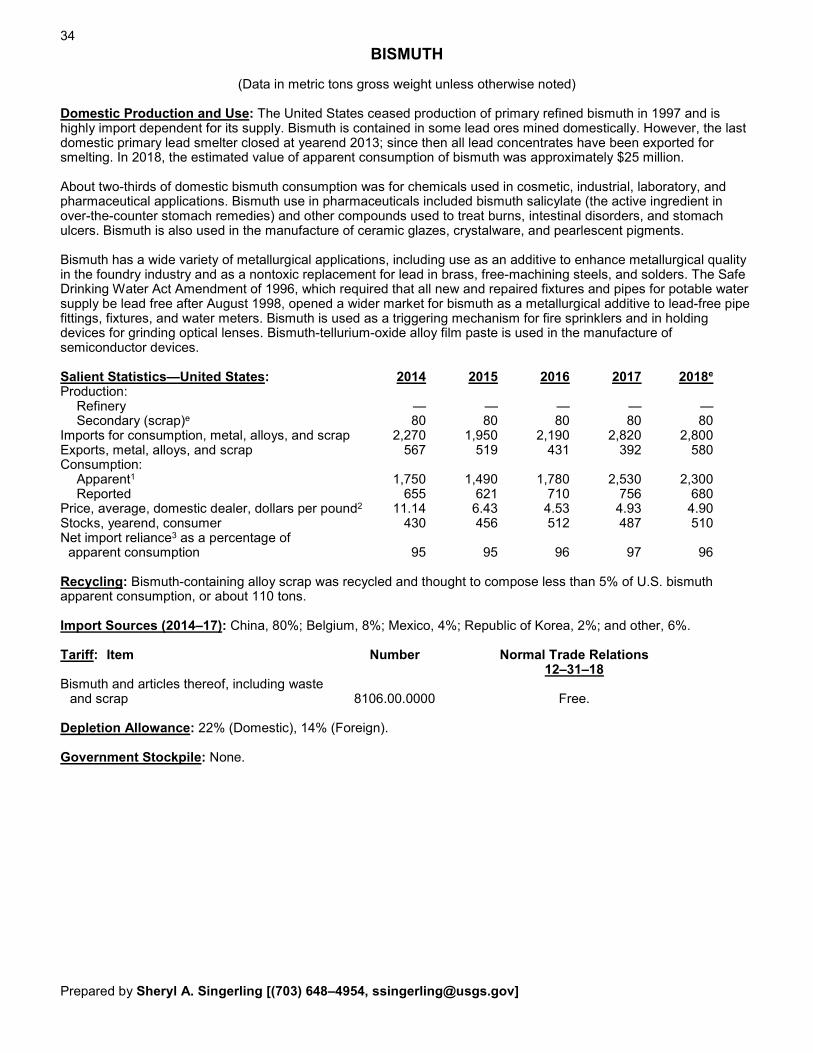
34 BISMUTH
(Data in metric tons gross weight unless otherwise noted)
Domestic Production and Use: The United States ceased production of primary refined bismuth in 1997 and is highly import dependent for its supply. Bismuth is contained in some lead ores mined domestically. However, the last domestic primary lead smelter closed at yearend 2013; since then all lead concentrates have been exported for smelting. In 2018, the estimated value of apparent consumption of bismuth was approximately $25 million.
About two-thirds of domestic bismuth consumption was for chemicals used in cosmetic, industrial, laboratory, and pharmaceutical applications. Bismuth use in pharmaceuticals included bismuth salicylate (the active ingredient in over-the-counter stomach remedies) and other compounds used to treat burns, intestinal disorders, and stomach ulcers. Bismuth is also used in the manufacture of ceramic glazes, crystalware, and pearlescent pigments.
Bismuth has a wide variety of metallurgical applications, including use as an additive to enhance metallurgical quality in the foundry industry and as a nontoxic replacement for lead in brass, free-machining steels, and solders. The Safe Drinking Water Act Amendment of 1996, which required that all new and repaired fixtures and pipes for potable water supply be lead free after August 1998, opened a wider market for bismuth as a metallurgical additive to lead-free pipe fittings, fixtures, and water meters. Bismuth is used as a triggering mechanism for fire sprinklers and in holding devices for grinding optical lenses. Bismuth-tellurium-oxide alloy film paste is used in the manufacture of semiconductor devices.
Salient Statistics—United States: 2014 2015 2016 2017 2018e Production:
Refinery — — — — — Secondary (scrap)e 80 80 80 80 80 Imports for consumption, metal, alloys, and scrap 2,270 1,950 2,190 2,820 2,800 Exports, metal, alloys, and scrap 567 519 431 392 580 Consumption:
Apparent1 1,750 1,490 1,780 2,530 2,300 Reported 655 621 710 756 680
Price, average, domestic dealer, dollars per pound2 11.14 6.43 4.53 4.93 4.90 Stocks, yearend, consumer 430 456 512 487 510 Net import reliance3 as a percentage of
apparent consumption 95 95 96 97 96
Recycling: Bismuth-containing alloy scrap was recycled and thought to compose less than 5% of U.S. bismuth apparent consumption, or about 110 tons.
Import Sources (2014–17): China, 80%; Belgium, 8%; Mexico, 4%; Republic of Korea, 2%; and other, 6%.
Tariff: Item Number Normal Trade Relations 12–31–18
Bismuth and articles thereof, including waste and scrap 8106.00.0000 Free.
Depletion Allowance: 22% (Domestic), 14% (Foreign).
Government Stockpile: None.
Prepared by Sheryl A. Singerling [(703) 648–4954, [email protected]]
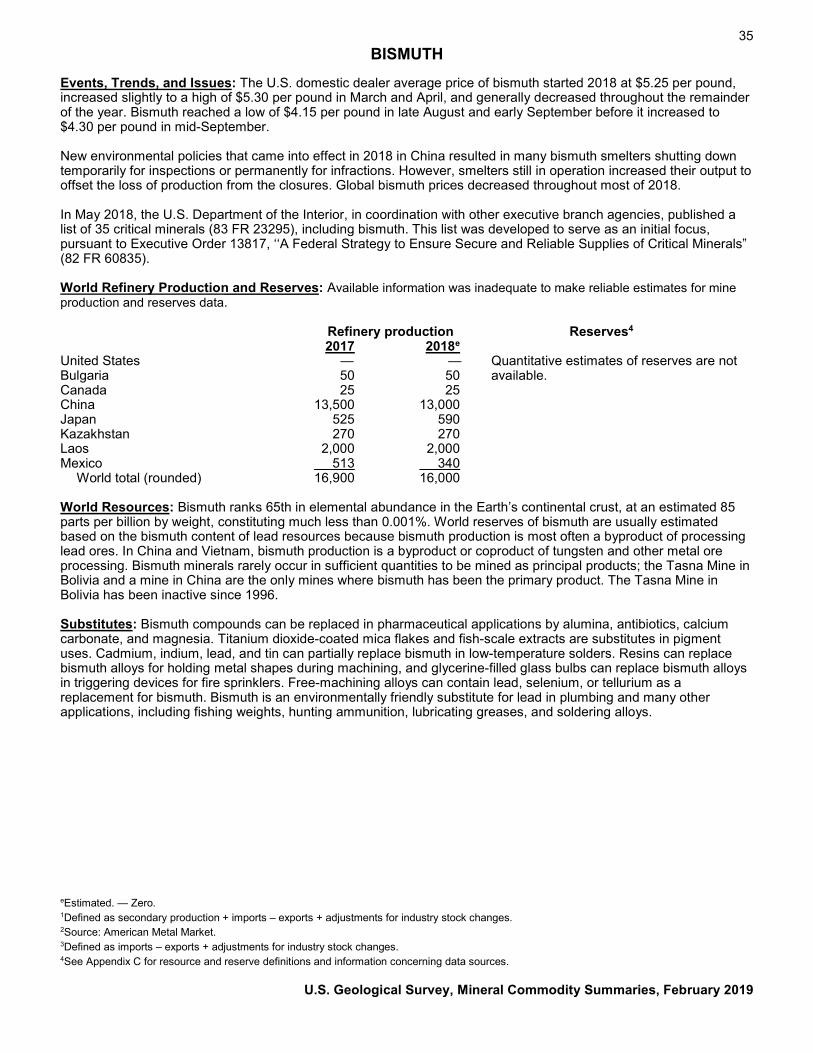
35 BISMUTH
Events, Trends, and Issues: The U.S. domestic dealer average price of bismuth started 2018 at $5.25 per pound, increased slightly to a high of $5.30 per pound in March and April, and generally decreased throughout the remainder of the year. Bismuth reached a low of $4.15 per pound in late August and early September before it increased to $4.30 per pound in mid-September.
New environmental policies that came into effect in 2018 in China resulted in many bismuth smelters shutting down temporarily for inspections or permanently for infractions. However, smelters still in operation increased their output to offset the loss of production from the closures. Global bismuth prices decreased throughout most of 2018.
In May 2018, the U.S. Department of the Interior, in coordination with other executive branch agencies, published a list of 35 critical minerals (83 FR 23295), including bismuth. This list was developed to serve as an initial focus, pursuant to Executive Order 13817, ‘‘A Federal Strategy to Ensure Secure and Reliable Supplies of Critical Minerals” (82 FR 60835).
World Refinery Production and Reserves: Available information was inadequate to make reliable estimates for mine production and reserves data.
Refinery production Reserves4
2017 2018e United States — — Quantitative estimates of reserves are not Bulgaria 50 50 available. Canada 25 25 China 13,500 13,000 Japan 525 590 Kazakhstan 270 270 Laos 2,000 2,000 Mexico 513 340
World total (rounded) 16,900 16,000
World Resources: Bismuth ranks 65th in elemental abundance in the Earth’s continental crust, at an estimated 85 parts per billion by weight, constituting much less than 0.001%. World reserves of bismuth are usually estimated based on the bismuth content of lead resources because bismuth production is most often a byproduct of processing lead ores. In China and Vietnam, bismuth production is a byproduct or coproduct of tungsten and other metal ore processing. Bismuth minerals rarely occur in sufficient quantities to be mined as principal products; the Tasna Mine in Bolivia and a mine in China are the only mines where bismuth has been the primary product. The Tasna Mine in Bolivia has been inactive since 1996.
Substitutes: Bismuth compounds can be replaced in pharmaceutical applications by alumina, antibiotics, calcium carbonate, and magnesia. Titanium dioxide-coated mica flakes and fish-scale extracts are substitutes in pigment uses. Cadmium, indium, lead, and tin can partially replace bismuth in low-temperature solders. Resins can replace bismuth alloys for holding metal shapes during machining, and glycerine-filled glass bulbs can replace bismuth alloys in triggering devices for fire sprinklers. Free-machining alloys can contain lead, selenium, or tellurium as a replacement for bismuth. Bismuth is an environmentally friendly substitute for lead in plumbing and many other applications, including fishing weights, hunting ammunition, lubricating greases, and soldering alloys.
eEstimated. — Zero. 1Defined as secondary production + imports – exports + adjustments for industry stock changes. 2Source: American Metal Market. 3Defined as imports – exports + adjustments for industry stock changes. 4See Appendix C for resource and reserve definitions and information concerning data sources.
U.S. Geological Survey, Mineral Commodity Summaries, February 2019
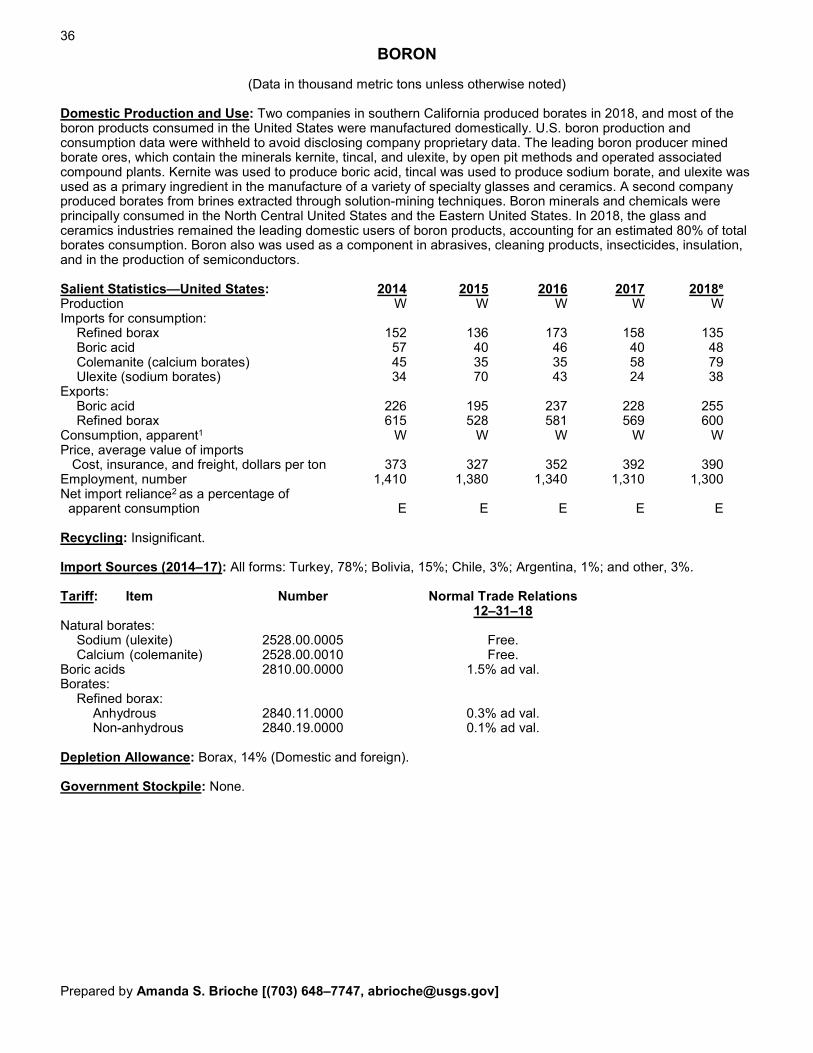
36 BORON
(Data in thousand metric tons unless otherwise noted)
Domestic Production and Use: Two companies in southern California produced borates in 2018, and most of the boron products consumed in the United States were manufactured domestically. U.S. boron production and consumption data were withheld to avoid disclosing company proprietary data. The leading boron producer mined borate ores, which contain the minerals kernite, tincal, and ulexite, by open pit methods and operated associated compound plants. Kernite was used to produce boric acid, tincal was used to produce sodium borate, and ulexite was used as a primary ingredient in the manufacture of a variety of specialty glasses and ceramics. A second company produced borates from brines extracted through solution-mining techniques. Boron minerals and chemicals were principally consumed in the North Central United States and the Eastern United States. In 2018, the glass and ceramics industries remained the leading domestic users of boron products, accounting for an estimated 80% of total borates consumption. Boron also was used as a component in abrasives, cleaning products, insecticides, insulation, and in the production of semiconductors.
Salient Statistics—United States: 2014 2015 2016 2017 2018e Production W W W W W Imports for consumption:
Refined borax 152 136 173 158 135 Boric acid 57 40 46 40 48 Colemanite (calcium borates) 45 35 35 58 79 Ulexite (sodium borates) 34 70 43 24 38
Exports: Boric acid 226 195 237 228 255
Refined borax 615 528 581 569 600 Consumption, apparent1 W W W W W Price, average value of imports Cost, insurance, and freight, dollars per ton 373 327 352 392 390 Employment, number 1,410 1,380 1,340 1,310 1,300 Net import reliance2 as a percentage of
apparent consumption E E E E E
Recycling: Insignificant.
Import Sources (2014–17): All forms: Turkey, 78%; Bolivia, 15%; Chile, 3%; Argentina, 1%; and other, 3%.
Tariff: Item Number Normal Trade Relations 12–31–18
Natural borates: Sodium (ulexite) 2528.00.0005 Free.
Calcium (colemanite) 2528.00.0010 Free. Boric acids 2810.00.0000 1.5% ad val. Borates:
Refined borax: Anhydrous 2840.11.0000 0.3% ad val. Non-anhydrous 2840.19.0000 0.1% ad val.
Depletion Allowance: Borax, 14% (Domestic and foreign).
Government Stockpile: None.
Prepared by Amanda S. Brioche [(703) 648–7747, [email protected]]
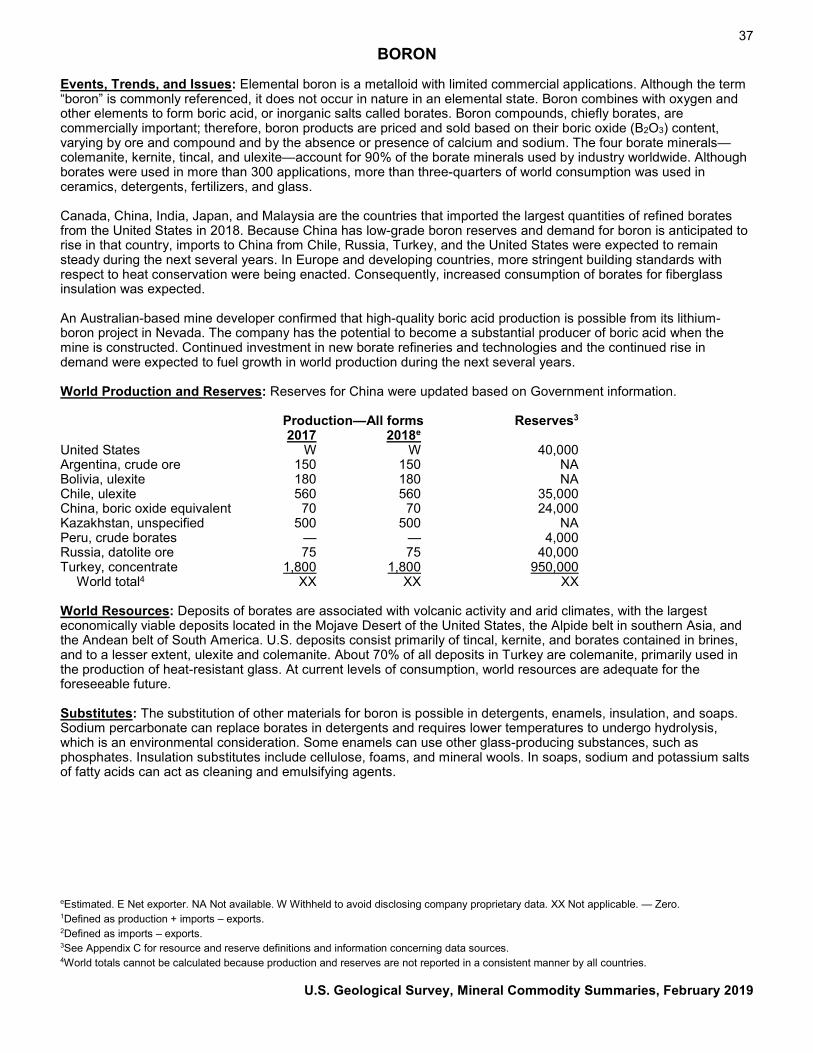
37 BORON
Events, Trends, and Issues: Elemental boron is a metalloid with limited commercial applications. Although the term “boron” is commonly referenced, it does not occur in nature in an elemental state. Boron combines with oxygen and other elements to form boric acid, or inorganic salts called borates. Boron compounds, chiefly borates, are commercially important; therefore, boron products are priced and sold based on their boric oxide (B2O3) content, varying by ore and compound and by the absence or presence of calcium and sodium. The four borate minerals—colemanite, kernite, tincal, and ulexite—account for 90% of the borate minerals used by industry worldwide. Although borates were used in more than 300 applications, more than three-quarters of world consumption was used in ceramics, detergents, fertilizers, and glass. Canada, China, India, Japan, and Malaysia are the countries that imported the largest quantities of refined borates from the United States in 2018. Because China has low-grade boron reserves and demand for boron is anticipated to rise in that country, imports to China from Chile, Russia, Turkey, and the United States were expected to remain steady during the next several years. In Europe and developing countries, more stringent building standards with respect to heat conservation were being enacted. Consequently, increased consumption of borates for fiberglass insulation was expected. An Australian-based mine developer confirmed that high-quality boric acid production is possible from its lithium-boron project in Nevada. The company has the potential to become a substantial producer of boric acid when the mine is constructed. Continued investment in new borate refineries and technologies and the continued rise in demand were expected to fuel growth in world production during the next several years. World Production and Reserves: Reserves for China were updated based on Government information. Production—All forms Reserves3
2017 2018e United States W W 40,000 Argentina, crude ore 150 150 NA Bolivia, ulexite 180 180 NA Chile, ulexite 560 560 35,000 China, boric oxide equivalent 70 70 24,000 Kazakhstan, unspecified 500 500 NA Peru, crude borates — — 4,000 Russia, datolite ore 75 75 40,000 Turkey, concentrate 1,800 1,800 950,000 World total4 XX XX XX World Resources: Deposits of borates are associated with volcanic activity and arid climates, with the largest economically viable deposits located in the Mojave Desert of the United States, the Alpide belt in southern Asia, and the Andean belt of South America. U.S. deposits consist primarily of tincal, kernite, and borates contained in brines, and to a lesser extent, ulexite and colemanite. About 70% of all deposits in Turkey are colemanite, primarily used in the production of heat-resistant glass. At current levels of consumption, world resources are adequate for the foreseeable future. Substitutes: The substitution of other materials for boron is possible in detergents, enamels, insulation, and soaps. Sodium percarbonate can replace borates in detergents and requires lower temperatures to undergo hydrolysis, which is an environmental consideration. Some enamels can use other glass-producing substances, such as phosphates. Insulation substitutes include cellulose, foams, and mineral wools. In soaps, sodium and potassium salts of fatty acids can act as cleaning and emulsifying agents. eEstimated. E Net exporter. NA Not available. W Withheld to avoid disclosing company proprietary data. XX Not applicable. — Zero. 1Defined as production + imports – exports. 2Defined as imports – exports. 3See Appendix C for resource and reserve definitions and information concerning data sources. 4World totals cannot be calculated because production and reserves are not reported in a consistent manner by all countries.
U.S. Geological Survey, Mineral Commodity Summaries, February 2019
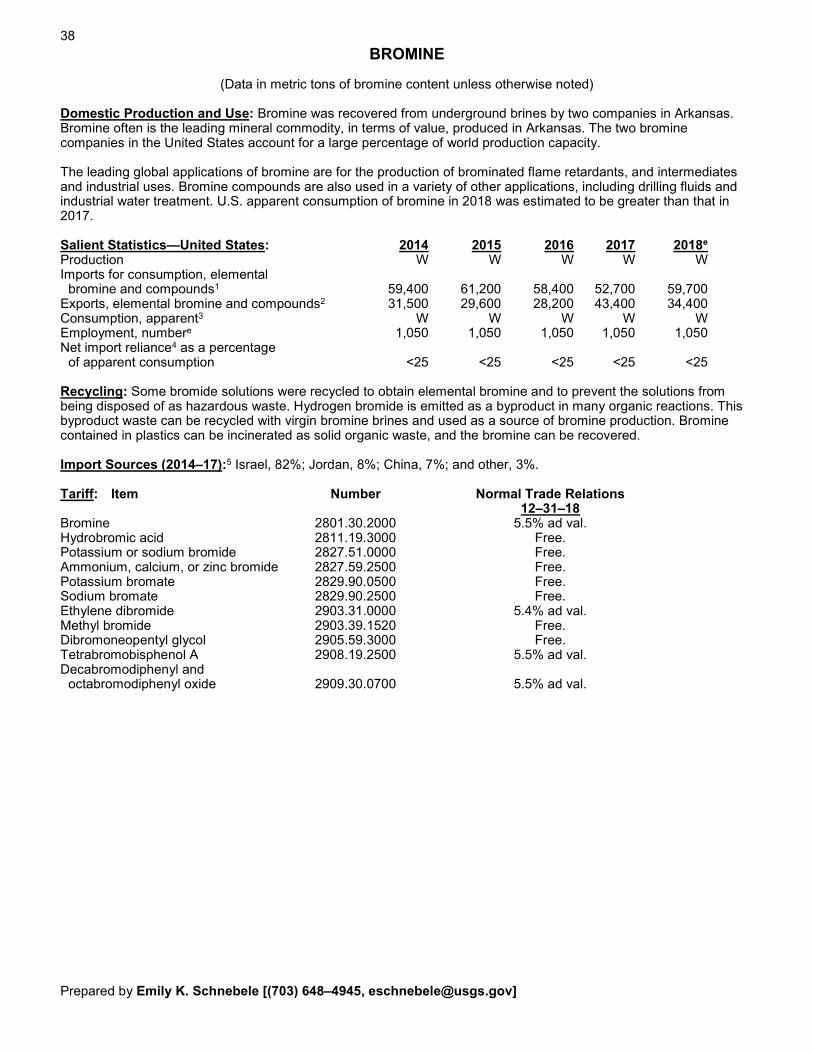
38
BROMINE
(Data in metric tons of bromine content unless otherwise noted) Domestic Production and Use: Bromine was recovered from underground brines by two companies in Arkansas. Bromine often is the leading mineral commodity, in terms of value, produced in Arkansas. The two bromine companies in the United States account for a large percentage of world production capacity. The leading global applications of bromine are for the production of brominated flame retardants, and intermediates and industrial uses. Bromine compounds are also used in a variety of other applications, including drilling fluids and industrial water treatment. U.S. apparent consumption of bromine in 2018 was estimated to be greater than that in 2017. Salient Statistics—United States: 2014 2015 2016 2017 2018e Production W W W W W Imports for consumption, elemental bromine and compounds1 59,400 61,200 58,400 52,700 59,700 Exports, elemental bromine and compounds2 31,500 29,600 28,200 43,400 34,400 Consumption, apparent3 W W W W W Employment, numbere 1,050 1,050 1,050 1,050 1,050 Net import reliance4 as a percentage of apparent consumption <25 <25 <25 <25 <25 Recycling: Some bromide solutions were recycled to obtain elemental bromine and to prevent the solutions from being disposed of as hazardous waste. Hydrogen bromide is emitted as a byproduct in many organic reactions. This byproduct waste can be recycled with virgin bromine brines and used as a source of bromine production. Bromine contained in plastics can be incinerated as solid organic waste, and the bromine can be recovered. Import Sources (2014–17):5 Israel, 82%; Jordan, 8%; China, 7%; and other, 3%. Tariff: Item Number Normal Trade Relations 12–31–18 Bromine 2801.30.2000 5.5% ad val. Hydrobromic acid 2811.19.3000 Free. Potassium or sodium bromide 2827.51.0000 Free. Ammonium, calcium, or zinc bromide 2827.59.2500 Free. Potassium bromate 2829.90.0500 Free. Sodium bromate 2829.90.2500 Free. Ethylene dibromide 2903.31.0000 5.4% ad val. Methyl bromide 2903.39.1520 Free. Dibromoneopentyl glycol 2905.59.3000 Free. Tetrabromobisphenol A 2908.19.2500 5.5% ad val. Decabromodiphenyl and octabromodiphenyl oxide 2909.30.0700 5.5% ad val. Prepared by Emily K. Schnebele [(703) 648–4945, [email protected]]
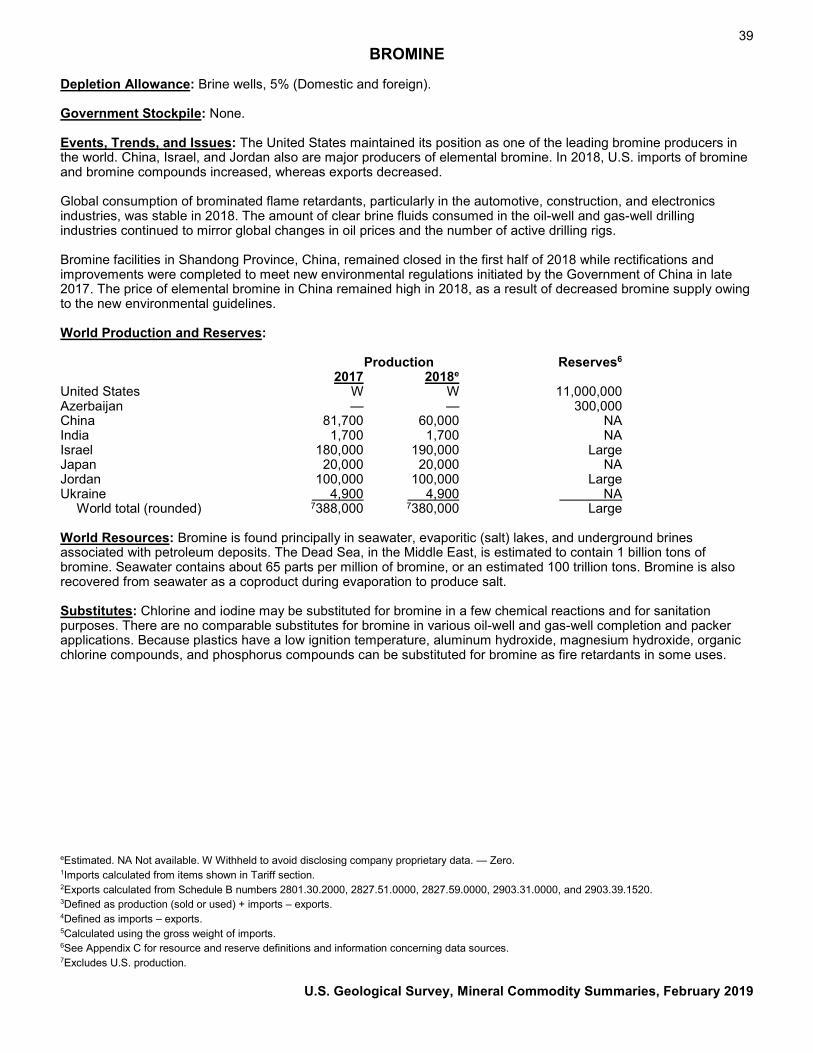
39 BROMINE
Depletion Allowance: Brine wells, 5% (Domestic and foreign). Government Stockpile: None. Events, Trends, and Issues: The United States maintained its position as one of the leading bromine producers in the world. China, Israel, and Jordan also are major producers of elemental bromine. In 2018, U.S. imports of bromine and bromine compounds increased, whereas exports decreased. Global consumption of brominated flame retardants, particularly in the automotive, construction, and electronics industries, was stable in 2018. The amount of clear brine fluids consumed in the oil-well and gas-well drilling industries continued to mirror global changes in oil prices and the number of active drilling rigs. Bromine facilities in Shandong Province, China, remained closed in the first half of 2018 while rectifications and improvements were completed to meet new environmental regulations initiated by the Government of China in late 2017. The price of elemental bromine in China remained high in 2018, as a result of decreased bromine supply owing to the new environmental guidelines. World Production and Reserves: Production Reserves6 2017 2018e United States W W 11,000,000 Azerbaijan — — 300,000 China 81,700 60,000 NA India 1,700 1,700 NA Israel 180,000 190,000 Large Japan 20,000 20,000 NA Jordan 100,000 100,000 Large Ukraine 4,900 4,900 NA World total (rounded) 7388,000 7380,000 Large World Resources: Bromine is found principally in seawater, evaporitic (salt) lakes, and underground brines associated with petroleum deposits. The Dead Sea, in the Middle East, is estimated to contain 1 billion tons of bromine. Seawater contains about 65 parts per million of bromine, or an estimated 100 trillion tons. Bromine is also recovered from seawater as a coproduct during evaporation to produce salt. Substitutes: Chlorine and iodine may be substituted for bromine in a few chemical reactions and for sanitation purposes. There are no comparable substitutes for bromine in various oil-well and gas-well completion and packer applications. Because plastics have a low ignition temperature, aluminum hydroxide, magnesium hydroxide, organic chlorine compounds, and phosphorus compounds can be substituted for bromine as fire retardants in some uses. eEstimated. NA Not available. W Withheld to avoid disclosing company proprietary data. — Zero. 1Imports calculated from items shown in Tariff section. 2Exports calculated from Schedule B numbers 2801.30.2000, 2827.51.0000, 2827.59.0000, 2903.31.0000, and 2903.39.1520. 3Defined as production (sold or used) + imports – exports. 4Defined as imports – exports. 5Calculated using the gross weight of imports. 6See Appendix C for resource and reserve definitions and information concerning data sources. 7Excludes U.S. production.
U.S. Geological Survey, Mineral Commodity Summaries, February 2019
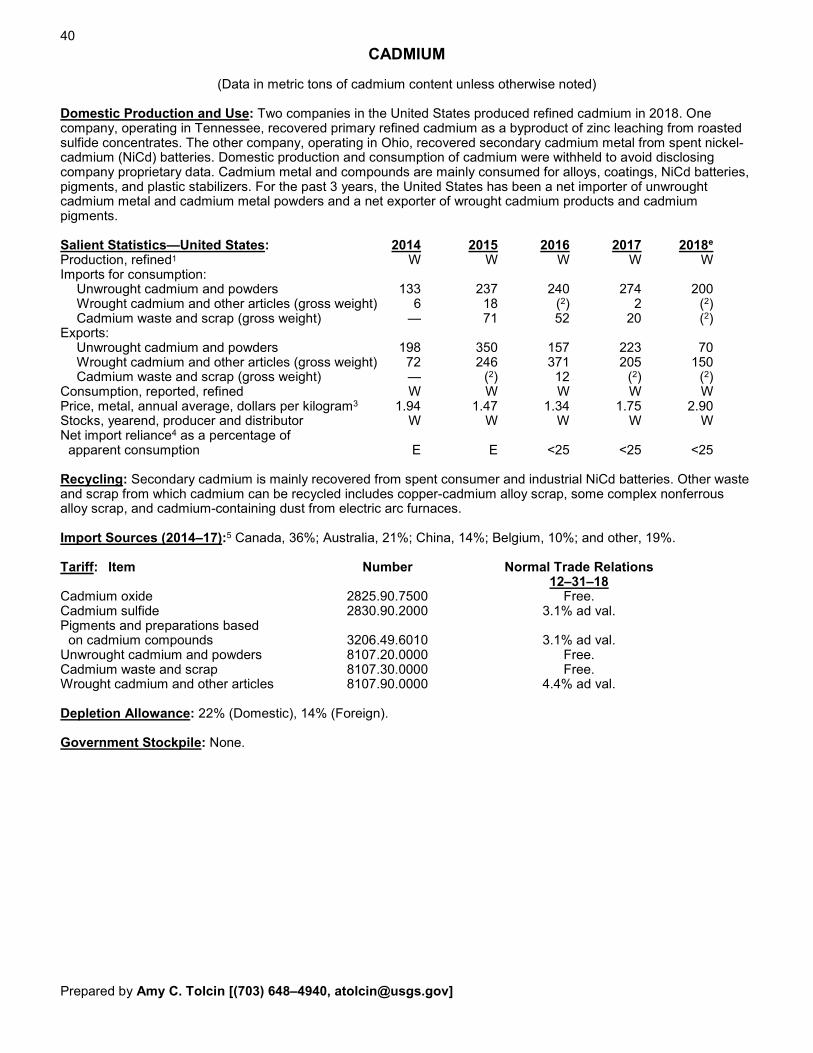
40
CADMIUM
(Data in metric tons of cadmium content unless otherwise noted) Domestic Production and Use: Two companies in the United States produced refined cadmium in 2018. One company, operating in Tennessee, recovered primary refined cadmium as a byproduct of zinc leaching from roasted sulfide concentrates. The other company, operating in Ohio, recovered secondary cadmium metal from spent nickel-cadmium (NiCd) batteries. Domestic production and consumption of cadmium were withheld to avoid disclosing company proprietary data. Cadmium metal and compounds are mainly consumed for alloys, coatings, NiCd batteries, pigments, and plastic stabilizers. For the past 3 years, the United States has been a net importer of unwrought cadmium metal and cadmium metal powders and a net exporter of wrought cadmium products and cadmium pigments. Salient Statistics—United States: 2014 2015 2016 2017 2018e Production, refined1 W W W W W Imports for consumption: Unwrought cadmium and powders 133 237 240 274 200 Wrought cadmium and other articles (gross weight) 6 18 (2) 2 (2) Cadmium waste and scrap (gross weight) — 71 52 20 (2) Exports: Unwrought cadmium and powders 198 350 157 223 70 Wrought cadmium and other articles (gross weight) 72 246 371 205 150 Cadmium waste and scrap (gross weight) — (2) 12 (2) (2) Consumption, reported, refined W W W W W Price, metal, annual average, dollars per kilogram3 1.94 1.47 1.34 1.75 2.90 Stocks, yearend, producer and distributor W W W W W Net import reliance4 as a percentage of apparent consumption E E <25 <25 <25 Recycling: Secondary cadmium is mainly recovered from spent consumer and industrial NiCd batteries. Other waste and scrap from which cadmium can be recycled includes copper-cadmium alloy scrap, some complex nonferrous alloy scrap, and cadmium-containing dust from electric arc furnaces. Import Sources (2014–17):5 Canada, 36%; Australia, 21%; China, 14%; Belgium, 10%; and other, 19%. Tariff: Item Number Normal Trade Relations 12–31–18 Cadmium oxide 2825.90.7500 Free. Cadmium sulfide 2830.90.2000 3.1% ad val. Pigments and preparations based on cadmium compounds 3206.49.6010 3.1% ad val. Unwrought cadmium and powders 8107.20.0000 Free. Cadmium waste and scrap 8107.30.0000 Free. Wrought cadmium and other articles 8107.90.0000 4.4% ad val. Depletion Allowance: 22% (Domestic), 14% (Foreign). Government Stockpile: None. Prepared by Amy C. Tolcin [(703) 648–4940, [email protected]]
41 CADMIUM
Events, Trends, and Issues: Most of the world’s primary cadmium metal was produced in Asia, and leading global producers were China, the Republic of Korea, and Japan. A smaller amount of secondary cadmium metal was recovered from recycling NiCd batteries. Although detailed data on the global consumption of primary cadmium were not available, NiCd battery production was thought to have continued to account for the majority of global cadmium consumption. Other end uses for cadmium and cadmium compounds included alloys, anticorrosive coatings, pigments, polyvinyl chloride (PVC) stabilizers, and semiconductors for solar cells. The average monthly cadmium price began 2018 at $2.23 per kilogram in January 2018 and trended upward to $3.42 per kilogram in April. Prices then decreased during the next 4 months, falling to an average of $2.81 per kilogram in August. In April 2018, a U.S.-based cadmium telluride thin-film solar-cell producer announced plans to build a second manufacturing plant in Ohio owing to strong domestic demand for solar technology and recent changes in U.S. corporate tax policy. Construction began in mid-2018, and the facility was expected to reach its full production rate by late 2019. World Refinery Production and Reserves: Refinery production Reserves6
2017 2018e United States1 W W Quantitative estimates of reserves are Canada 1,800 1,800 not available. The cadmium content of China 8,200 8,200 typical zinc ores averages about 0.03%. Japan 2,140 2,100 See the Zinc chapter for zinc reserves. Kazakhstan 1,500 1,500 Korea, Republic of 5,600 5,600 Mexico 1,160 1,200 Netherlands 600 900 Peru 797 800 Russia 1,200 1,200 Other countries 2,370 2,400 World total (rounded) 725,400 726,000 World Resources: Cadmium is generally recovered from zinc ores and concentrates. Sphalerite, the most economically significant zinc ore mineral, commonly contains minor amounts of cadmium, which shares certain similar chemical properties with zinc and often substitutes for zinc in the sphalerite crystal lattice. The cadmium mineral greenockite is frequently associated with weathered sphalerite and wurtzite. Zinc-bearing coals of the Central United States and Carboniferous age coals of other countries also contain large subeconomic resources of cadmium. Substitutes: Lithium-ion and nickel-metal hydride batteries can replace NiCd batteries in many applications. Except where the surface characteristics of a coating are critical (for example, fasteners for aircraft), coatings of zinc, zinc-nickel, aluminum, or tin can be substituted for cadmium in many plating applications. Cerium sulfide is used as a replacement for cadmium pigments, mostly in plastics. Barium-zinc or calcium-zinc stabilizers can replace barium-cadmium stabilizers in flexible PVC applications. Amorphous silicon and copper-indium-gallium-selenide photovoltaic cells compete with cadmium telluride in the thin-film solar-cell market. eEstimated. E Net exporter. W Withheld to avoid disclosing company proprietary data. — Zero. 1Cadmium metal produced as a byproduct of zinc refining plus metal from recycling. 2Less than ½ unit. 3Average New York dealer price for 99.95% purity in 5-short-ton lots (2014–15). Source: Platts Metals Week. Average free market price for 99.95% purity in 10-ton lots; cost, insurance, and freight; global ports (2016–17). Source: Metal Bulletin. 4Defined as imports of unwrought metal and metal powders – exports of unwrought metal and metal powders + adjustments for industry stock changes. 5Imports for consumption of unwrought metal and metal powders (Harmonized Tariff Schedule of the United States code 8107.20.0000). 6See Appendix C for resource and reserve definitions and information concerning data sources. 7Excludes U.S. production.
U.S. Geological Survey, Mineral Commodity Summaries, February 2019
42
CEMENT
(Data in thousand metric tons unless otherwise noted) Domestic Production and Use: Production of portland cement in 2018 in the United States increased slightly to about 85.4 million tons, and output of masonry cement continued to be stagnant at 2.4 million tons. Cement was produced at 98 plants in 34 States, and at 2 plants in Puerto Rico. Overall U.S. cement production continued to be well below the record level of 99 million tons reported in 2005, indicating continued full-time idle status at a few plants, underutilized capacity at many others, production disruptions from plant upgrades, plant closures over the interim, and relatively inexpensive imports in some recent years. Sales of cement increased by nearly 3% in 2018. Overall, shipments were 27.8 million tons lower than the record volume set in 2005. The overall value of shipments was nearly $12.7 billion. Most of the sales of cement were to make concrete, worth at least $66 billion. In recent years, about 70% to 75% of cement sales have been to ready-mixed concrete producers, 8% to 10% to contractors (mainly road paving; much contractor work also involves ready-mixed concrete), about 10% to concrete product manufacturers, and 7% to 10% to other customer types. Texas, California, Missouri, Florida, and Alabama were, in descending order of production, the five leading cement-producing States and accounted for nearly 50% of U.S. production. Salient Statistics—United States:1 2014 2015 2016 2017 2018e Production: Portland and masonry cement2 82,535 84,405 84,695 e86,100 87,800 Clinker 74,372 76,043 75,633 76,542 77,700 Shipments to final customers, includes exports 90,204 93,338 95,373 97,359 100,000 Imports of hydraulic cement for consumption 7,584 10,376 11,742 12,288 14,000 Imports of clinker for consumption 720 942 1,496 1,209 910 Exports of hydraulic cement and clinker 1,404 1,288 1,283 1,035 1,000 Consumption, apparent3 89,145 92,403 94,964 e97,400 100,200 Price, average mill value, dollars per ton 100.50 106.50 111.00 e121.00 126.50 Stocks, cement, yearend 6,140 7,230 7,420 e7,400 8,050 Employment, mine and mill, numbere 11,500 11,300 11,000 10,500 10,000 Net import reliance4 as a percentage of apparent consumption 8 11 13 13 14 Recycling: Cement kiln dust is routinely recycled to the kilns, which also can make use of a variety of waste fuels and recycled raw materials such as slags and fly ash. Various secondary materials can be incorporated as supplementary cementitious materials (SCMs) in blended cements and in the cement paste in concrete. Cement is not directly recycled, but significant quantities of concrete are recycled for use as construction aggregate. Import Sources (2014–17):5 Canada, 33%; Greece, 15%; China, 13%; Republic of Korea, 8%; and other, 31%. Tariff: Item Number Normal Trade Relations 12–31–18 Cement clinker 2523.10.0000 Free. White portland cement 2523.21.0000 Free. Other portland cement 2523.29.0000 Free. Aluminous cement 2523.30.0000 Free. Other hydraulic cement 2523.90.0000 Free. Depletion Allowance: Not applicable. Certain raw materials for cement production have depletion allowances. Government Stockpile: None. Events, Trends, and Issues: Shipments of cement increased by nearly 3% overall in 2018, tempered by stagnant sales of masonry cement. Construction spending increased modestly during the year, largely owing to somewhat higher spending in the residential and public construction sectors; the nonresidential private building sector, however, declined slightly. Cement shipments into parts of the southeast and in Florida were lower than originally expected because of damage from hurricanes in 2017. In contrast, shipments into Puerto Rico were relatively strong because of reconstruction following devastating hurricanes in 2017. The leading cement-consuming States continued to be Texas, California, and Florida, in descending order by tonnage. Production of cement remained well below capacity, in part reflecting both the technical and environmental issues in returning long-idle kilns to full production at some plants, and the ready availability of imported cement in coastal markets. Prepared by Hendrik G. van Oss [Contact Kenneth C. Curry (703) 648–7793, [email protected]]
43 CEMENT
Company mergers continued in 2018, with the final approval of the sale of a major U.S. cement company to a European cement company (the sales agreement had been announced in 2017). Completion of the sale required the consolidation of the European company’s holdings (two cement plants) in Florida, and the sale by the European company of its newly acquired plant in Montana to a Mexican cement company. A major upgrade to a cement plant in Michigan was completed during the year; minor upgrades were ongoing at a number of other plants in the country. Apart from increasing production efficiency, these upgrades were expected to improve the ability of individual plants to comply with the stringent emissions limits of the 2010 National Emissions Standards for Hazardous Air Pollutants (NESHAP) protocol for cement plants, which went into effect in September 2015. Many plants have installed emissions-reduction technologies to comply with the NESHAP protocol, but it remained unclear if such modifications would be economic for all individual kilns (some being of older technology) at multikiln plants. It remained possible that some kilns would be shut down, or used only sparingly, because of the NESHAP limits, and thus constrain U.S. clinker production capacity. Despite environmental permitting difficulties in recent years reducing the attractiveness of constructing new (greenfields) plants in the United States, a project to construct a greenfields white cement plant in Texas was announced during the year; currently, the United States has only two white cement plants. World Production and Capacity: Cement productione Clinker capacitye 2017 2018 2017 2018 United States (includes Puerto Rico) 86,600 88,500 107,000 108,000 Brazil 53,000 52,000 60,000 60,000 China 2,320,000 2,370,000 2,000,000 2,000,000 Egypt 53,000 55,000 48,000 48,000 India 290,000 290,000 280,000 280,000 Indonesia 65,000 67,000 78,000 78,000 Iran 54,000 53,000 80,000 80,000 Japan 55,200 55,500 53,000 53,000 Korea, Republic of 56,500 56,000 50,000 50,000 Russia 54,700 55,000 80,000 80,000 Saudi Arabia 47,100 45,000 75,000 75,000 Turkey 80,600 84,000 80,000 82,000 Vietnam 78,800 80,000 90,000 90,000 Other countries (rounded) 756,000 759,000 717,000 716,000 World total (rounded) 4,050,000 4,100,000 3,800,000 3,800,000 World Resources: Although reserves at individual plants are subject to exhaustion, limestone and other cement raw materials are geologically widespread and abundant, and overall shortages are unlikely in the future. Substitutes: Most portland cement is used to make concrete, mortars, or stuccos, and competes in the construction sector with concrete substitutes, such as aluminum, asphalt, clay brick, fiberglass, glass, gypsum (plaster), steel, stone, and wood. Certain materials, especially fly ash and ground granulated blast furnace slag, develop good hydraulic cementitious properties by reacting with lime, such as that released by the hydration of portland cement. Where readily available (including as imports), these SCMs are increasingly being used as partial substitutes for portland cement in many concrete applications and are components of finished blended cements. eEstimated. 1Portland plus masonry cement unless otherwise noted; excludes Puerto Rico unless otherwise noted. 2Includes cement made from imported clinker. 3Defined as production of cement (including from imported clinker) + imports (excluding clinker) – exports + adjustments for stock changes. 4Defined as imports (cement and clinker) – exports. 5Hydraulic cement and clinker; includes imports into Puerto Rico.
U.S. Geological Survey, Mineral Commodity Summaries, February 2019
44
CESIUM
(Data in metric tons of cesium oxide unless otherwise noted) Domestic Production and Use: In 2018, no cesium was mined domestically, and the United States was 100% import reliant for cesium minerals. The United States sourced the majority of its pollucite, the principal cesium mineral, from the largest known deposit in North America at Bernic Lake, Manitoba, Canada; however, that operation ceased mining at the end of 2015 and continued to supply cesium products from stocks. Cesium minerals are used as feedstocks to produce a variety of cesium compounds and cesium metal. The primary application for cesium, by gross weight, is in cesium formate brines used for high-pressure, high-temperature well drilling for oil and gas production and exploration. Cesium nitrate is used as a colorant and oxidizer in the pyrotechnic industry, in petroleum cracking, in scintillation counters, and in x-ray phosphors. Cesium chloride is used in analytical chemistry applications as a reagent, in high-temperature solders, as an intermediate in cesium metal production, in isopycnic centrifugation, as a radioisotope in nuclear medicine, as an insect repellent in agricultural applications, and in specialty glasses. Cesium metal is used in the production of cesium compounds and in photoelectric cells. Cesium carbonate is used in the alkylation of organic compounds and in energy conversion devices, such as fuel cells, magneto-hydrodynamic generators, and polymer solar cells. Cesium bromide is used in infrared detectors, optics, photoelectric cells, scintillation counters, and spectrophotometers. Cesium hydroxide is used as an electrolyte in alkaline storage batteries. Cesium iodide is used in fluoroscopy equipment—Fourier-transform infrared spectrometers—as the input phosphor of x-ray image intensifier tubes, and in scintillators. Cesium isotopes, which are obtained as a byproduct in nuclear fission or formed from other isotopes, such as barium-131, are used in electronic, medical, and research applications. Cesium isotopes are used as an atomic resonance frequency standard in atomic clocks, playing a vital role in aircraft guidance systems, global positioning satellites, and internet and cellular telephone transmissions. Cesium clocks monitor the cycles of microwave radiation emitted by cesium’s electrons and use these cycles as a time reference. Owing to the high accuracy of the cesium atomic clock, the international definition of 1 second is based on the cesium atom. The U.S. civilian time and frequency standard is based on a cesium fountain clock at the National Institute of Standards and Technology in Boulder, CO. The U.S. military frequency standard, the United States Naval Observatory Time Scale, is based on 48 weighted atomic clocks, including 25 cesium fountain clocks. A company in Richland, WA, produced a range of cesium-131 medical products for treatment of various cancers. Cesium-137 is widely used in industrial gauges, in mining and geophysical instruments, and for sterilization of food, sewage, and surgical equipment. Cesium isotopes can be used in metallurgy to remove gases and other impurities and in vacuum tubes. Salient Statistics—United States: Consumption, import, and export data for cesium have not been available since the late 1980s. Because cesium metal is not traded in commercial quantities, a market price is unavailable. Only a few thousand kilograms of cesium are consumed in the United States every year. The United States was 100% import reliant for its cesium needs. In 2018, one company offered 1-gram ampoules of 99.8% (metal basis) cesium for $61.80, unchanged from that in 2017, and 99.98% (metal basis) cesium for $78.70, a slight increase from that in 2017. In 2018, the prices for 50 grams of 99.9% (metal basis) cesium acetate, cesium bromide, cesium carbonate, and cesium chloride were $114.80, $69.80, $98.80, and $100.60, respectively. The price for a cesium-plasma standard solution (10,000 micrograms per milliliter) was $79.80 for 50 milliliters and $122.00 for 100 milliliters, and the price for 25 grams of cesium formate, 98% basis, was $38.70—the same prices as in 2017. Recycling: Cesium formate brines are typically rented by oil and gas exploration clients. After completion of the well, the used cesium formate brine is returned and reprocessed for subsequent drilling operations. The formate brines are recycled with an estimated recovery rate of 85%, which can be reprocessed for further use. Import Sources (2014–17): No reliable data has been available to determine the source of cesium ore imported by the United States since 1988. Previously, Canada was thought to be the primary supplier of cesium ore. Prepared by Christopher A. Tuck [(703) 648–4912, [email protected]]
45 CESIUM
Tariff: Item Number Normal Trade Relations 12–31–18 Alkali metals, other 2805.19.9000 5.5% ad val. Chlorides, other 2827.39.9000 3.7% ad val. Bromides, other 2827.59.5100 3.6% ad val. Nitrates, other 2834.29.5100 3.5% ad val. Carbonates, other 2836.99.5000 3.7% ad val. Cesium-137, other 2844.40.0021 Free Depletion Allowance: 14% (Domestic and foreign). Government Stockpile: None. Events, Trends, and Issues: Domestic cesium occurrences will likely remain uneconomic unless market conditions change. No known human health issues are associated with naturally occurring cesium, and its use has minimal environmental impact. Radioactive isotopes of cesium have been known to cause adverse health effects. In May 2018, the U.S. Department of the Interior, in coordination with other executive branch agencies, published a list of 35 critical minerals (83 FR 23295), including cesium. This list was developed to serve as an initial focus, pursuant to Executive Order 13817, ‘‘A Federal Strategy to Ensure Secure and Reliable Supplies of Critical Minerals” (82 FR 60835). During 2018, projects that were primarily aimed at developing lithium resources with cesium content were at various stages of development, including eight subprojects at the King Col project in Australia, the Jubilee Lake lithium prospect in Canada, the Soris lithium project in Namibia, and the Winnipeg River pegmatite field in Canada. The status of these projects ranged from early feasibility studies to active exploration and drilling. No production has been reported at any sites. The projects focused on pegmatites containing pollucite and spodumene, which primarily contain lithium, tantalum, or both, but may also contain minor quantities of cesium and rubidium. World Mine Production and Reserves: There were no official sources for cesium production data. Zimbabwe and Namibia were thought to have produced cesium in small quantities as a byproduct of lithium mining operations. Pollucite, mainly found in association with lithium-rich, lepidolite-bearing or petalite-bearing zoned granite pegmatites, is the principal cesium ore mineral. Cesium reserves are, therefore, estimated based on the occurrence of pollucite, which is mined as a byproduct of the lithium mineral lepidolite. Most pollucite contains 5% to 32% cesium oxide (Cs2O). The main pollucite zone at Bernic Lake in Canada contains approximately 120,000 tons of contained cesium oxide in pollucite ore, with average ore grades of 23.3% Cs2O. Cesium at the Manitoba, Canada, operation no longer was considered economically recoverable following a mine collapse in 2015. Reserves1 Namibia 30,000 Zimbabwe 60,000 Other countries NA World total (rounded) 90,000 World Resources: U.S. and world resources of cesium have not been estimated. Cesium is associated with lithium-bearing pegmatites worldwide, and cesium resources have been identified in Australia, Canada, Namibia, the United States, and Zimbabwe. In the United States, pollucite occurs in pegmatites in Alaska, Maine, and South Dakota. Lower concentrations occur in brines in Chile and China and in geothermal systems in Germany, India, and Tibet. China was believed to have cesium-rich deposits of geyserite, lepidolite, and pollucite, with concentrations highest in Yichun, Jiangxi Province, China, although no resource or production estimates were available. Substitutes: Cesium and rubidium can be used interchangeably in many applications because they have similar physical properties and atomic radii. Cesium, however, is more electropositive than rubidium, making it a preferred material for some applications. However, rubidium is mined from similar deposits, in relatively smaller quantities, as a byproduct of cesium production in pegmatites and as a byproduct of lithium production from lepidolite (hard-rock) mining and processing, making it no more readily available than cesium. NA Not available. 1See Appendix C for resource and reserve definitions and information concerning data sources.
U.S. Geological Survey, Mineral Commodity Summaries, February 2019
46
CHROMIUM
(Data in thousand metric tons of chromium content unless otherwise noted) Domestic Production and Use: In 2018, the United States was expected to consume about 6% of world chromite ore production in various forms of imported materials, such as chromite ore, chromium chemicals, chromium ferroalloys, chromium metal, and stainless steel. Imported chromite ore was consumed by one chemical firm to produce chromium chemicals. One company produced chromium metal. Stainless-steel and heat-resisting-steel producers were the leading consumers of ferrochromium. Stainless steels and superalloys require chromium. The value of chromium material consumption in 2017 was $1.0 billion as measured by the value of net imports, excluding stainless steel, and was expected to be about $1.1 billion in 2018. Salient Statistics—United States: 2014 2015 2016 2017 2018e Production: Mine — — — — — Recycling1 157 154 152 158 160 Imports for consumption 708 535 547 633 650 Exports 257 238 253 256 260 Shipments from Government stockpile 15 9 5 8 3 Consumption: Reported (includes recycling) 417 406 393 412 400 Apparent (includes recycling)2 622 461 451 542 550 Unit value, average annual import (dollars per ton): Chromite ore (gross weight) 243 216 198 259 280 Ferrochromium (chromium content)3 2,514 2,593 2,227 3,212 2,600 Chromium metal (gross weight) 11,048 11,386 9,827 9,682 9,000 Stocks, yearend, held by U.S. consumers 8 8 8 8 8 Net import reliance4 as a percentage of apparent consumption 75 67 66 71 71 Recycling: In 2018, recycled chromium (contained in reported stainless steel scrap receipts) accounted for 29% of apparent consumption. Import Sources (2014–17): Chromite (mineral): South Africa, 97%; Canada, 3%; and other, <1%. Chromium-containing scrap:5 Canada, 51%; Mexico, 41%; and other, 8%. Chromium (primary metal):6 South Africa, 36%; Kazakhstan, 10%; Russia, 7%; and other, 47%. Total imports: South Africa, 38%; Kazakhstan, 8%; Russia, 6%; and other, 48%. Tariff:7 Item Number Normal Trade Relations 12–31–18 Chromium ores and concentrates: Cr2O3 not more than 40% 2610.00.0020 Free. Cr2O3 more than 40% and less than 46% 2610.00.0040 Free. Cr2O3 more than or equal to 46% 2610.00.0060 Free. Chromium oxides and hydroxides: Chromium trioxide 2819.10.0000 3.7% ad val. Other 2819.90.0000 3.7% ad val. Sodium dichromate 2841.30.0000 2.4% ad val. Potassium dichromate 2841.50.1000 1.5% ad val. Other chromates and dichromates 2841.50.9100 3.1% ad val. Carbides of chromium 2849.90.2000 4.2% ad val. Ferrochromium: Carbon more than 4% 7202.41.0000 1.9% ad val. Carbon more than 3% 7202.49.1000 1.9% ad val. Carbon more than 0.5% 7202.49.5010 3.1% ad val. Other 7202.49.5090 3.1% ad val. Ferrosilicon chromium 7202.50.0000 10% ad val. Chromium metal: Unwrought, powder 8112.21.0000 3% ad val. Waste and scrap 8112.22.0000 Free. Other 8112.29.0000 3% ad val. Depletion Allowance: 22% (Domestic), 14% (Foreign). Prepared by Ruth F. Schulte [(703) 648–4963, [email protected]]
47 CHROMIUM
Government Stockpile:8 FY2018 FY 2019 Inventory Potential Potential Potential Potential Material9 As of 9–30–18 Acquisitions Disposals10 Acquisitions Disposals10
Ferrochromium: High-carbon 44.5 — 1121.3 — 1121.3 Low carbon 27.6 — — — — Chromium metal 3.85 — 0.181 — 0.181 Events, Trends, and Issues: Chromium is consumed in the form of ferrochromium to produce stainless steel. China was the leading chromium-consuming country. China was also the leading stainless-steel- and ferrochromium-producing country. South Africa was the leading chromite ore producer. World stainless steel producers depend directly or indirectly on chromium supply. Ferrochromium production is electrical-energy intensive, so constrained electrical power supply results in constrained ferrochromium production. In May 2018, the U.S. Department of the Interior, in coordination with other executive branch agencies, published a list of 35 critical minerals (83 FR 23295), including chromium. This list was developed to serve as an initial focus, pursuant to Executive Order 13817, ‘‘A Federal Strategy to Ensure Secure and Reliable Supplies of Critical Minerals” (82 FR 60835). From August 2017 to August 2018, ferrochromium prices did not change for charge grade and increased slightly for high carbon. Prices have remained relatively high compared with those prior to October 2016. World Mine Production and Reserves: Reserves for India were revised based on Government reports. Mine production12 Reserves13 2017 2018e (shipping grade)14 United States — — 620 India 3,500 3,500 100,000 Kazakhstan 4,580 4,600 230,000 South Africa 16,500 16,000 200,000 Turkey 6,500 6,500 26,000 Other countries 4,580 4,500 NA World total (rounded) 35,700 36,000 560,000 World Resources: World resources are greater than 12 billion tons of shipping-grade chromite, sufficient to meet conceivable demand for centuries. The world’s chromium resources are heavily geographically concentrated (95%) in Kazakhstan and southern Africa; United States chromium resources are mostly in the Stillwater Complex in Montana. Substitutes: Chromium has no substitute in stainless steel, the leading end use, or in superalloys, the major strategic end use. Chromium-containing scrap can substitute for ferrochromium in some metallurgical uses.
eEstimated. NA Not available. — Zero. 1Recycling production is based on reported receipts of all types of stainless steel scrap. 2Defined as production (from mines and recycling) + imports – exports + adjustments for Government and industry stock changes. 3Excludes ferrochromium silicon. 4Defined as imports – exports + adjustments for Government and industry stock changes. 5Includes chromium metal scrap and stainless steel scrap. 6Includes chromium metal, ferrochromium, and stainless steel. 7In addition to the tariff items listed, certain imported chromium materials (see 26 U.S.C. sec. 4661, 4662, and 4672) are subject to excise tax. 8See Appendix B for definitions. 9Units are thousand tons of material by gross weight. 10Disposals are defined as any barter, rotation, sale, or upgrade of National Defense Stockpile stock. 11High-carbon and low-carbon ferrochromium, combined. 12Mine production units are thousand tons, gross weight, of marketable chromite ore. 13See Appendix C for resource and reserve definitions and information concerning data sources. 14Reserves units are thousand tons of shipping-grade chromite ore, which is deposit quantity and grade normalized to 45% Cr2O3, except for the United States where grade is normalized to 7% Cr2O3.
U.S. Geological Survey, Mineral Commodity Summaries, February 2019
48
CLAYS
(Data in thousand metric tons unless otherwise noted) Domestic Production and Use: Production of clays (sold or used) in the United States was estimated to be 27 million tons valued at $1.6 billion in 2018, with about 145 companies operating clay and shale mines in 40 States. The leading 20 firms produced approximately 50% of the U.S. tonnage and 85% of the value for all types of clay. Principal uses for specific clays were estimated, in descending order, to be as follows: ball clay—50% floor and wall tile and 15% sanitaryware; bentonite—52% pet waste absorbents and 31% drilling mud; common clay—34% brick, 29% lightweight aggregate, and 24% cement; fire clay—70% heavy clay products (for example, brick and cement) and 30% refractory products and miscellaneous uses; fuller’s earth—98% pet waste absorbents; and kaolin—60% paper coating and filling, 12% paint, and 9% catalysts. Lightweight ceramic proppants for use in hydraulic fracturing are also a significant market for kaolin, but available data were insufficient for a reliable estimate of the market size. The United States accounted for 15% to 25% of the global production of refined clays, excluding common clay and shale. U.S. exports of bentonite decreased by an estimated 3% in 2018 relative to the prior year. Canada, Japan, and Mexico were, in decreasing order by tonnage, the leading destinations for United States bentonite and accounted for 67% of exports. Kaolin exports increased by an estimated 17% in 2018 relative to the prior year. Exports of kaolin went primarily to China, Mexico, Japan, Finland, and Canada, in decreasing order by tonnage. Salient Statistics—United States: 2014 2015 2016 2017 2018e Production (sold or used): Ball clay 980 1,030 975 e900 1,000 Bentonite 4,580 4,050 3,600 e4,300 3,700 Common clay 10,900 11,300 11,700 e13,000 13,000 Fire clay 210 393 528 e440 460 Fuller’s earth1 1,890 1,960 1,860 e1,700 1,600 Kaolin 5,960 5,810 5,320 e7,300 7,300 Total1, 2 24,500 24,500 23,900 e28,000 27,000 Imports for consumption: Artificially activated clays and earths 26 24 26 28 21 Kaolin 518 426 389 480 326 Other 47 70 58 86 63 Total2 591 520 473 594 410 Exports: Artificially activated clays and earths 175 173 143 147 170 Ball clay 33 48 41 83 100 Bentonite 901 938 801 961 930 Clays, not elsewhere classified 282 268 256 243 280 Fire clay3 237 217 184 225 280 Fuller’s earth 92 77 86 78 82 Kaolin 2,640 2,420 2,290 2,310 2,700 Total2 4,360 4,140 3,800 4,050 4,500 Consumption, apparent4 21,900 21,000 20,700 e25,000 23,000 Price, ex-works, average, dollars per ton: Ball clay 44 46 45 46 46 Bentonite 67 74 75 75 77 Common clay 11 15 15 13 13 Fire clay 17 13 13 13 11 Fuller’s earth1 86 86 89 96 83 Kaolin 144 151 157 160 140 Employment (excludes office workers): Mine (may not include contract workers) 1,150 1,130 1,120 1,220 1,110 Mill 4,930 4,730 4,440 4,370 4,360 Net import reliance5 as a percentage of apparent consumption E E E E E Recycling: Insignificant. Import Sources (2014–17): All clay types combined: Brazil, 78%; Mexico, 7%; United Kingdom, 2%; and other, 13%. Prepared by David N. West [(703) 648–7751, [email protected]]
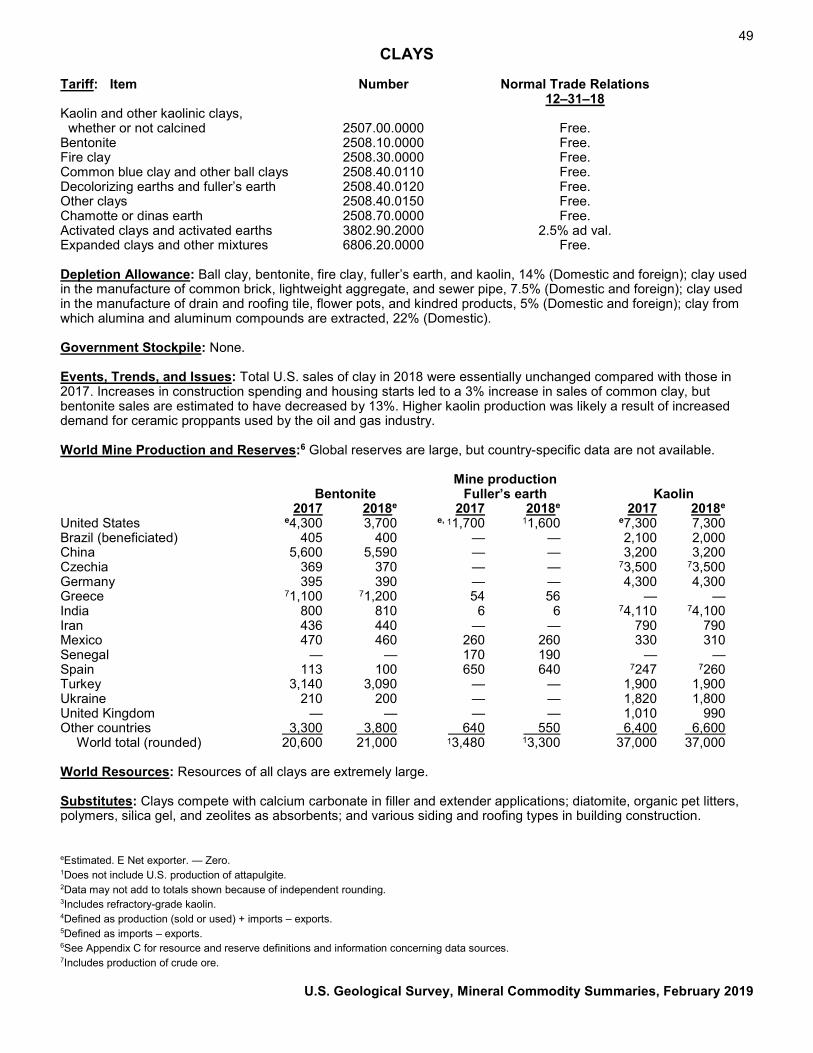
49 CLAYS
Tariff: Item Number Normal Trade Relations 12–31–18 Kaolin and other kaolinic clays, whether or not calcined 2507.00.0000 Free. Bentonite 2508.10.0000 Free. Fire clay 2508.30.0000 Free. Common blue clay and other ball clays 2508.40.0110 Free. Decolorizing earths and fuller’s earth 2508.40.0120 Free. Other clays 2508.40.0150 Free. Chamotte or dinas earth 2508.70.0000 Free. Activated clays and activated earths 3802.90.2000 2.5% ad val. Expanded clays and other mixtures 6806.20.0000 Free. Depletion Allowance: Ball clay, bentonite, fire clay, fuller’s earth, and kaolin, 14% (Domestic and foreign); clay used in the manufacture of common brick, lightweight aggregate, and sewer pipe, 7.5% (Domestic and foreign); clay used in the manufacture of drain and roofing tile, flower pots, and kindred products, 5% (Domestic and foreign); clay from which alumina and aluminum compounds are extracted, 22% (Domestic). Government Stockpile: None. Events, Trends, and Issues: Total U.S. sales of clay in 2018 were essentially unchanged compared with those in 2017. Increases in construction spending and housing starts led to a 3% increase in sales of common clay, but bentonite sales are estimated to have decreased by 13%. Higher kaolin production was likely a result of increased demand for ceramic proppants used by the oil and gas industry. World Mine Production and Reserves:6 Global reserves are large, but country-specific data are not available. Mine production Bentonite Fuller’s earth Kaolin 2017 2018e 2017 2018e 2017 2018e United States e4,300 3,700 e, 11,700 11,600 e7,300 7,300 Brazil (beneficiated) 405 400 — — 2,100 2,000 China 5,600 5,590 — — 3,200 3,200 Czechia 369 370 — — 73,500 73,500 Germany 395 390 — — 4,300 4,300 Greece 71,100 71,200 54 56 — — India 800 810 6 6 74,110 74,100 Iran 436 440 — — 790 790 Mexico 470 460 260 260 330 310 Senegal — — 170 190 — — Spain 113 100 650 640 7247 7260 Turkey 3,140 3,090 — — 1,900 1,900 Ukraine 210 200 — — 1,820 1,800 United Kingdom — — — — 1,010 990 Other countries 3,300 3,800 640 550 6,400 6,600 World total (rounded) 20,600 21,000 13,480 13,300 37,000 37,000 World Resources: Resources of all clays are extremely large. Substitutes: Clays compete with calcium carbonate in filler and extender applications; diatomite, organic pet litters, polymers, silica gel, and zeolites as absorbents; and various siding and roofing types in building construction. eEstimated. E Net exporter. — Zero. 1Does not include U.S. production of attapulgite. 2Data may not add to totals shown because of independent rounding. 3Includes refractory-grade kaolin. 4Defined as production (sold or used) + imports – exports. 5Defined as imports – exports. 6See Appendix C for resource and reserve definitions and information concerning data sources. 7Includes production of crude ore.
U.S. Geological Survey, Mineral Commodity Summaries, February 2019
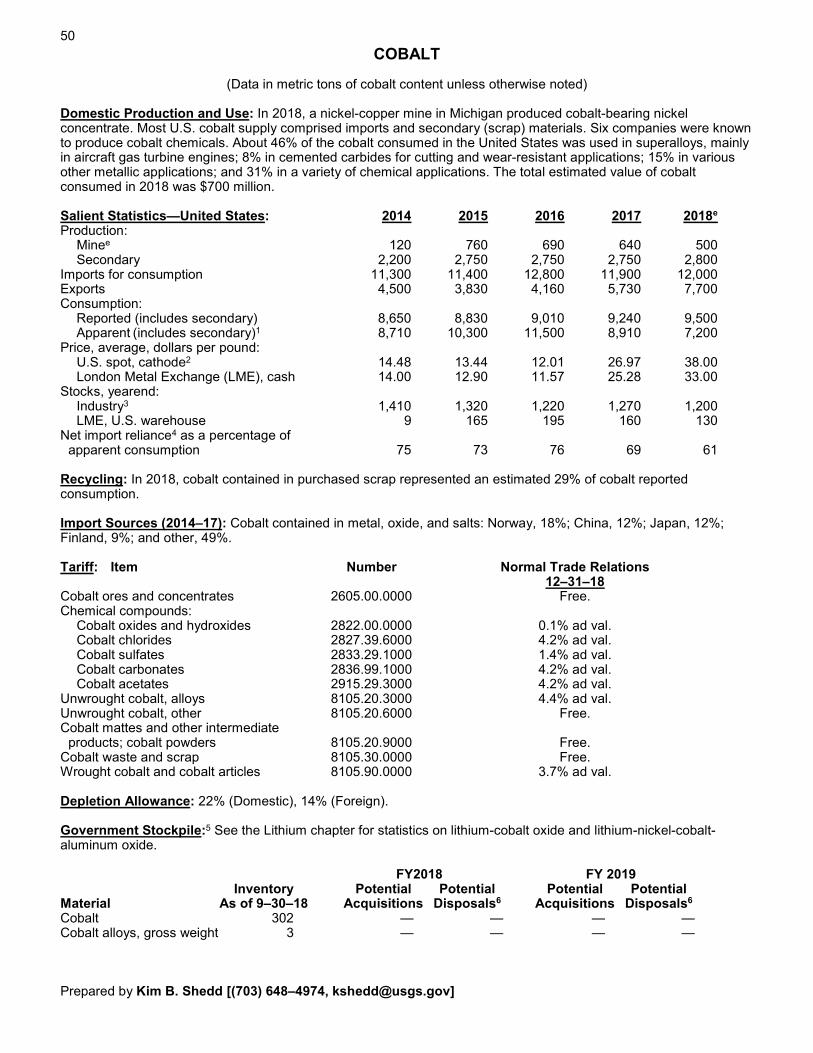
50
COBALT
(Data in metric tons of cobalt content unless otherwise noted) Domestic Production and Use: In 2018, a nickel-copper mine in Michigan produced cobalt-bearing nickel concentrate. Most U.S. cobalt supply comprised imports and secondary (scrap) materials. Six companies were known to produce cobalt chemicals. About 46% of the cobalt consumed in the United States was used in superalloys, mainly in aircraft gas turbine engines; 8% in cemented carbides for cutting and wear-resistant applications; 15% in various other metallic applications; and 31% in a variety of chemical applications. The total estimated value of cobalt consumed in 2018 was $700 million. Salient Statistics—United States: 2014 2015 2016 2017 2018e Production: Minee 120 760 690 640 500 Secondary 2,200 2,750 2,750 2,750 2,800 Imports for consumption 11,300 11,400 12,800 11,900 12,000 Exports 4,500 3,830 4,160 5,730 7,700 Consumption: Reported (includes secondary) 8,650 8,830 9,010 9,240 9,500 Apparent (includes secondary)1 8,710 10,300 11,500 8,910 7,200 Price, average, dollars per pound: U.S. spot, cathode2 14.48 13.44 12.01 26.97 38.00 London Metal Exchange (LME), cash 14.00 12.90 11.57 25.28 33.00 Stocks, yearend: Industry3 1,410 1,320 1,220 1,270 1,200 LME, U.S. warehouse 9 165 195 160 130 Net import reliance4 as a percentage of apparent consumption 75 73 76 69 61 Recycling: In 2018, cobalt contained in purchased scrap represented an estimated 29% of cobalt reported consumption. Import Sources (2014–17): Cobalt contained in metal, oxide, and salts: Norway, 18%; China, 12%; Japan, 12%; Finland, 9%; and other, 49%. Tariff: Item Number Normal Trade Relations 12–31–18 Cobalt ores and concentrates 2605.00.0000 Free. Chemical compounds: Cobalt oxides and hydroxides 2822.00.0000 0.1% ad val. Cobalt chlorides 2827.39.6000 4.2% ad val. Cobalt sulfates 2833.29.1000 1.4% ad val. Cobalt carbonates 2836.99.1000 4.2% ad val. Cobalt acetates 2915.29.3000 4.2% ad val. Unwrought cobalt, alloys 8105.20.3000 4.4% ad val. Unwrought cobalt, other 8105.20.6000 Free. Cobalt mattes and other intermediate products; cobalt powders 8105.20.9000 Free. Cobalt waste and scrap 8105.30.0000 Free. Wrought cobalt and cobalt articles 8105.90.0000 3.7% ad val. Depletion Allowance: 22% (Domestic), 14% (Foreign). Government Stockpile:5 See the Lithium chapter for statistics on lithium-cobalt oxide and lithium-nickel-cobalt-aluminum oxide. FY2018 FY 2019 Inventory Potential Potential Potential Potential Material As of 9–30–18 Acquisitions Disposals6 Acquisitions Disposals6
Cobalt 302 — — — — Cobalt alloys, gross weight 3 — — — — Prepared by Kim B. Shedd [(703) 648–4974, [email protected]]
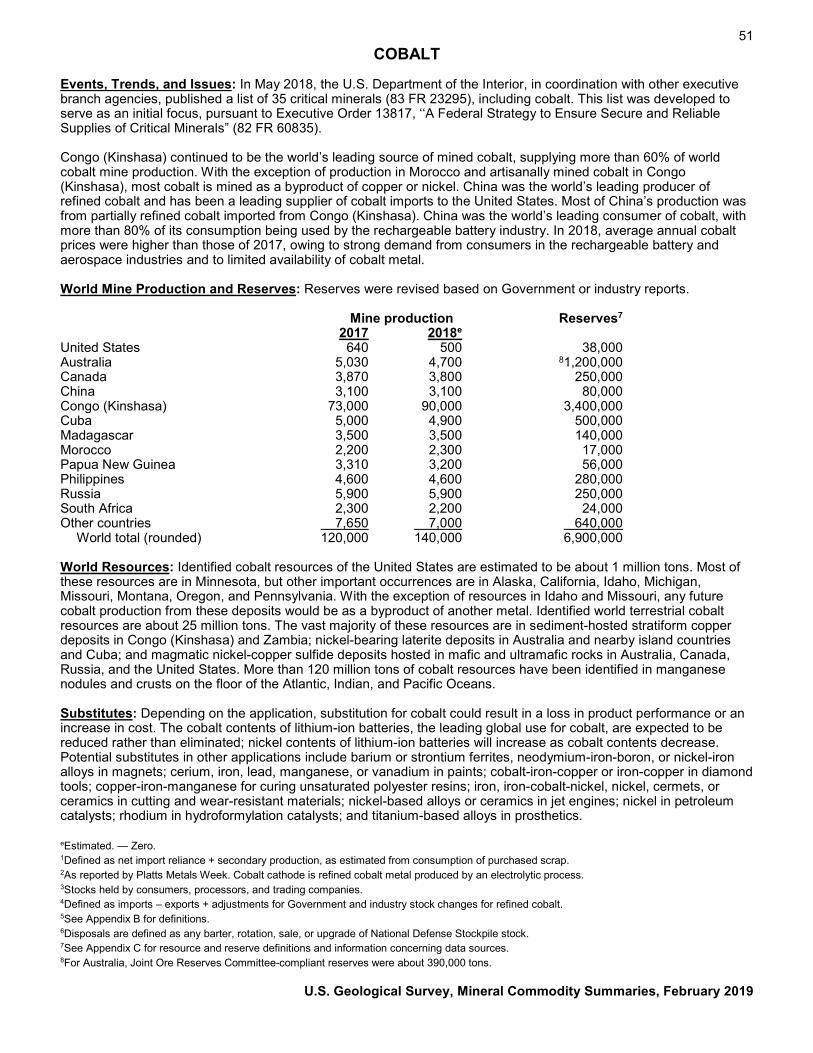
51 COBALT
Events, Trends, and Issues: In May 2018, the U.S. Department of the Interior, in coordination with other executive branch agencies, published a list of 35 critical minerals (83 FR 23295), including cobalt. This list was developed to serve as an initial focus, pursuant to Executive Order 13817, ‘‘A Federal Strategy to Ensure Secure and Reliable Supplies of Critical Minerals” (82 FR 60835). Congo (Kinshasa) continued to be the world’s leading source of mined cobalt, supplying more than 60% of world cobalt mine production. With the exception of production in Morocco and artisanally mined cobalt in Congo (Kinshasa), most cobalt is mined as a byproduct of copper or nickel. China was the world’s leading producer of refined cobalt and has been a leading supplier of cobalt imports to the United States. Most of China’s production was from partially refined cobalt imported from Congo (Kinshasa). China was the world’s leading consumer of cobalt, with more than 80% of its consumption being used by the rechargeable battery industry. In 2018, average annual cobalt prices were higher than those of 2017, owing to strong demand from consumers in the rechargeable battery and aerospace industries and to limited availability of cobalt metal. World Mine Production and Reserves: Reserves were revised based on Government or industry reports. Mine production Reserves7 2017 2018e United States 640 500 38,000 Australia 5,030 4,700 81,200,000 Canada 3,870 3,800 250,000 China 3,100 3,100 80,000 Congo (Kinshasa) 73,000 90,000 3,400,000 Cuba 5,000 4,900 500,000 Madagascar 3,500 3,500 140,000 Morocco 2,200 2,300 17,000 Papua New Guinea 3,310 3,200 56,000 Philippines 4,600 4,600 280,000 Russia 5,900 5,900 250,000 South Africa 2,300 2,200 24,000 Other countries 7,650 7,000 640,000 World total (rounded) 120,000 140,000 6,900,000 World Resources: Identified cobalt resources of the United States are estimated to be about 1 million tons. Most of these resources are in Minnesota, but other important occurrences are in Alaska, California, Idaho, Michigan, Missouri, Montana, Oregon, and Pennsylvania. With the exception of resources in Idaho and Missouri, any future cobalt production from these deposits would be as a byproduct of another metal. Identified world terrestrial cobalt resources are about 25 million tons. The vast majority of these resources are in sediment-hosted stratiform copper deposits in Congo (Kinshasa) and Zambia; nickel-bearing laterite deposits in Australia and nearby island countries and Cuba; and magmatic nickel-copper sulfide deposits hosted in mafic and ultramafic rocks in Australia, Canada, Russia, and the United States. More than 120 million tons of cobalt resources have been identified in manganese nodules and crusts on the floor of the Atlantic, Indian, and Pacific Oceans. Substitutes: Depending on the application, substitution for cobalt could result in a loss in product performance or an increase in cost. The cobalt contents of lithium-ion batteries, the leading global use for cobalt, are expected to be reduced rather than eliminated; nickel contents of lithium-ion batteries will increase as cobalt contents decrease. Potential substitutes in other applications include barium or strontium ferrites, neodymium-iron-boron, or nickel-iron alloys in magnets; cerium, iron, lead, manganese, or vanadium in paints; cobalt-iron-copper or iron-copper in diamond tools; copper-iron-manganese for curing unsaturated polyester resins; iron, iron-cobalt-nickel, nickel, cermets, or ceramics in cutting and wear-resistant materials; nickel-based alloys or ceramics in jet engines; nickel in petroleum catalysts; rhodium in hydroformylation catalysts; and titanium-based alloys in prosthetics. eEstimated. — Zero. 1Defined as net import reliance + secondary production, as estimated from consumption of purchased scrap. 2As reported by Platts Metals Week. Cobalt cathode is refined cobalt metal produced by an electrolytic process. 3Stocks held by consumers, processors, and trading companies. 4Defined as imports – exports + adjustments for Government and industry stock changes for refined cobalt. 5See Appendix B for definitions. 6Disposals are defined as any barter, rotation, sale, or upgrade of National Defense Stockpile stock. 7See Appendix C for resource and reserve definitions and information concerning data sources. 8For Australia, Joint Ore Reserves Committee-compliant reserves were about 390,000 tons.
U.S. Geological Survey, Mineral Commodity Summaries, February 2019
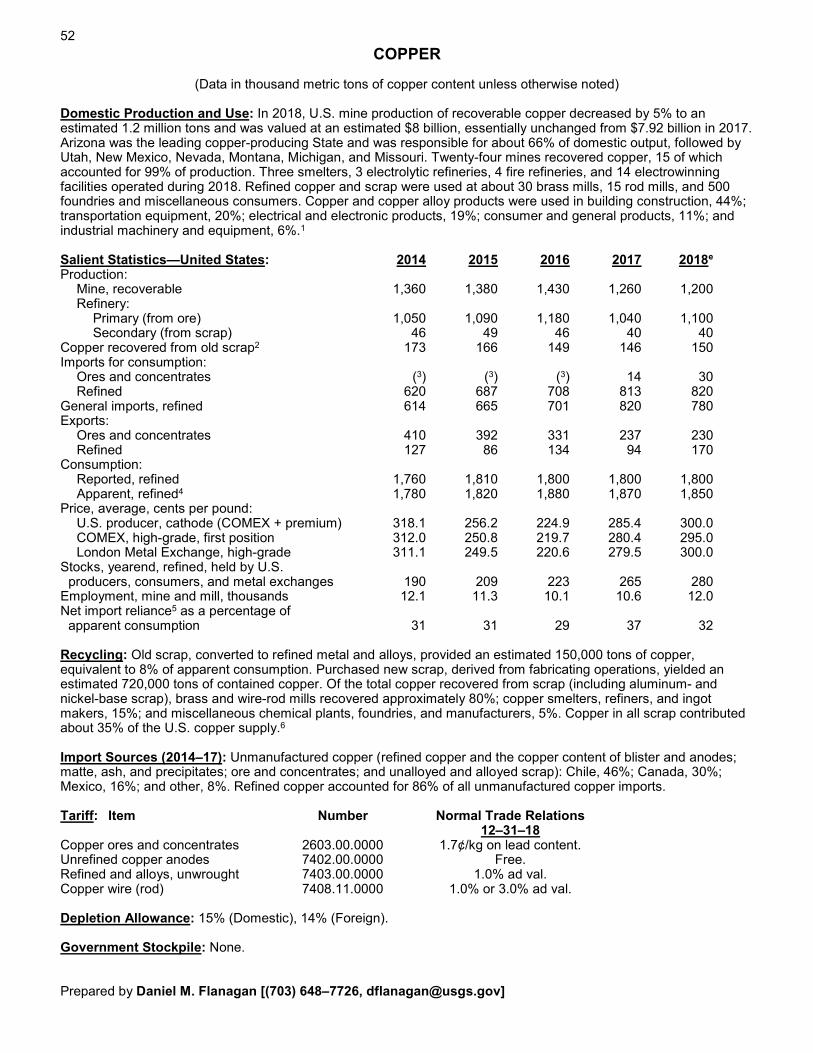
52
COPPER
(Data in thousand metric tons of copper content unless otherwise noted) Domestic Production and Use: In 2018, U.S. mine production of recoverable copper decreased by 5% to an estimated 1.2 million tons and was valued at an estimated $8 billion, essentially unchanged from $7.92 billion in 2017. Arizona was the leading copper-producing State and was responsible for about 66% of domestic output, followed by Utah, New Mexico, Nevada, Montana, Michigan, and Missouri. Twenty-four mines recovered copper, 15 of which accounted for 99% of production. Three smelters, 3 electrolytic refineries, 4 fire refineries, and 14 electrowinning facilities operated during 2018. Refined copper and scrap were used at about 30 brass mills, 15 rod mills, and 500 foundries and miscellaneous consumers. Copper and copper alloy products were used in building construction, 44%; transportation equipment, 20%; electrical and electronic products, 19%; consumer and general products, 11%; and industrial machinery and equipment, 6%.1 Salient Statistics—United States: 2014 2015 2016 2017 2018e Production: Mine, recoverable 1,360 1,380 1,430 1,260 1,200 Refinery: Primary (from ore) 1,050 1,090 1,180 1,040 1,100 Secondary (from scrap) 46 49 46 40 40 Copper recovered from old scrap2 173 166 149 146 150 Imports for consumption: Ores and concentrates (3) (3) (3) 14 30 Refined 620 687 708 813 820 General imports, refined 614 665 701 820 780 Exports: Ores and concentrates 410 392 331 237 230 Refined 127 86 134 94 170 Consumption: Reported, refined 1,760 1,810 1,800 1,800 1,800 Apparent, refined4 1,780 1,820 1,880 1,870 1,850 Price, average, cents per pound: U.S. producer, cathode (COMEX + premium) 318.1 256.2 224.9 285.4 300.0 COMEX, high-grade, first position 312.0 250.8 219.7 280.4 295.0 London Metal Exchange, high-grade 311.1 249.5 220.6 279.5 300.0 Stocks, yearend, refined, held by U.S. producers, consumers, and metal exchanges 190 209 223 265 280 Employment, mine and mill, thousands 12.1 11.3 10.1 10.6 12.0 Net import reliance5 as a percentage of apparent consumption 31 31 29 37 32 Recycling: Old scrap, converted to refined metal and alloys, provided an estimated 150,000 tons of copper, equivalent to 8% of apparent consumption. Purchased new scrap, derived from fabricating operations, yielded an estimated 720,000 tons of contained copper. Of the total copper recovered from scrap (including aluminum- and nickel-base scrap), brass and wire-rod mills recovered approximately 80%; copper smelters, refiners, and ingot makers, 15%; and miscellaneous chemical plants, foundries, and manufacturers, 5%. Copper in all scrap contributed about 35% of the U.S. copper supply.6 Import Sources (2014–17): Unmanufactured copper (refined copper and the copper content of blister and anodes; matte, ash, and precipitates; ore and concentrates; and unalloyed and alloyed scrap): Chile, 46%; Canada, 30%; Mexico, 16%; and other, 8%. Refined copper accounted for 86% of all unmanufactured copper imports. Tariff: Item Number Normal Trade Relations 12–31–18 Copper ores and concentrates 2603.00.0000 1.7¢/kg on lead content. Unrefined copper anodes 7402.00.0000 Free. Refined and alloys, unwrought 7403.00.0000 1.0% ad val. Copper wire (rod) 7408.11.0000 1.0% or 3.0% ad val. Depletion Allowance: 15% (Domestic), 14% (Foreign). Government Stockpile: None. Prepared by Daniel M. Flanagan [(703) 648–7726, [email protected]]
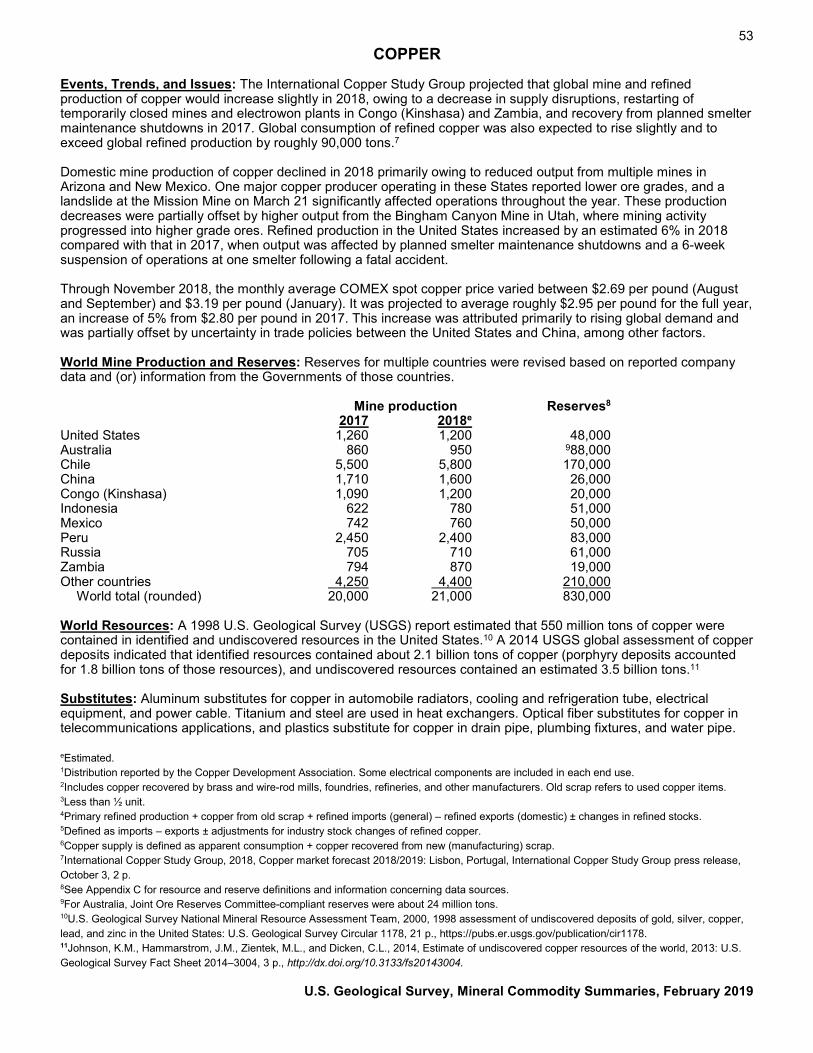
53 COPPER
Events, Trends, and Issues: The International Copper Study Group projected that global mine and refined production of copper would increase slightly in 2018, owing to a decrease in supply disruptions, restarting of temporarily closed mines and electrowon plants in Congo (Kinshasa) and Zambia, and recovery from planned smelter maintenance shutdowns in 2017. Global consumption of refined copper was also expected to rise slightly and to exceed global refined production by roughly 90,000 tons.7
Domestic mine production of copper declined in 2018 primarily owing to reduced output from multiple mines in Arizona and New Mexico. One major copper producer operating in these States reported lower ore grades, and a landslide at the Mission Mine on March 21 significantly affected operations throughout the year. These production decreases were partially offset by higher output from the Bingham Canyon Mine in Utah, where mining activity progressed into higher grade ores. Refined production in the United States increased by an estimated 6% in 2018 compared with that in 2017, when output was affected by planned smelter maintenance shutdowns and a 6-week suspension of operations at one smelter following a fatal accident. Through November 2018, the monthly average COMEX spot copper price varied between $2.69 per pound (August and September) and $3.19 per pound (January). It was projected to average roughly $2.95 per pound for the full year, an increase of 5% from $2.80 per pound in 2017. This increase was attributed primarily to rising global demand and was partially offset by uncertainty in trade policies between the United States and China, among other factors. World Mine Production and Reserves: Reserves for multiple countries were revised based on reported company data and (or) information from the Governments of those countries. Mine production Reserves8 2017 2018e United States 1,260 1,200 48,000 Australia 860 950 988,000 Chile 5,500 5,800 170,000 China 1,710 1,600 26,000 Congo (Kinshasa) 1,090 1,200 20,000 Indonesia 622 780 51,000 Mexico 742 760 50,000 Peru 2,450 2,400 83,000 Russia 705 710 61,000 Zambia 794 870 19,000 Other countries 4,250 4,400 210,000 World total (rounded) 20,000 21,000 830,000 World Resources: A 1998 U.S. Geological Survey (USGS) report estimated that 550 million tons of copper were contained in identified and undiscovered resources in the United States.10 A 2014 USGS global assessment of copper deposits indicated that identified resources contained about 2.1 billion tons of copper (porphyry deposits accounted for 1.8 billion tons of those resources), and undiscovered resources contained an estimated 3.5 billion tons.11 Substitutes: Aluminum substitutes for copper in automobile radiators, cooling and refrigeration tube, electrical equipment, and power cable. Titanium and steel are used in heat exchangers. Optical fiber substitutes for copper in telecommunications applications, and plastics substitute for copper in drain pipe, plumbing fixtures, and water pipe. eEstimated. 1Distribution reported by the Copper Development Association. Some electrical components are included in each end use. 2Includes copper recovered by brass and wire-rod mills, foundries, refineries, and other manufacturers. Old scrap refers to used copper items. 3Less than ½ unit. 4Primary refined production + copper from old scrap + refined imports (general) – refined exports (domestic) ± changes in refined stocks. 5Defined as imports – exports ± adjustments for industry stock changes of refined copper. 6Copper supply is defined as apparent consumption + copper recovered from new (manufacturing) scrap. 7International Copper Study Group, 2018, Copper market forecast 2018/2019: Lisbon, Portugal, International Copper Study Group press release, October 3, 2 p. 8See Appendix C for resource and reserve definitions and information concerning data sources. 9For Australia, Joint Ore Reserves Committee-compliant reserves were about 24 million tons. 10U.S. Geological Survey National Mineral Resource Assessment Team, 2000, 1998 assessment of undiscovered deposits of gold, silver, copper, lead, and zinc in the United States: U.S. Geological Survey Circular 1178, 21 p., https://pubs.er.usgs.gov/publication/cir1178. 11Johnson, K.M., Hammarstrom, J.M., Zientek, M.L., and Dicken, C.L., 2014, Estimate of undiscovered copper resources of the world, 2013: U.S. Geological Survey Fact Sheet 2014–3004, 3 p., http://dx.doi.org/10.3133/fs20143004.
U.S. Geological Survey, Mineral Commodity Summaries, February 2019
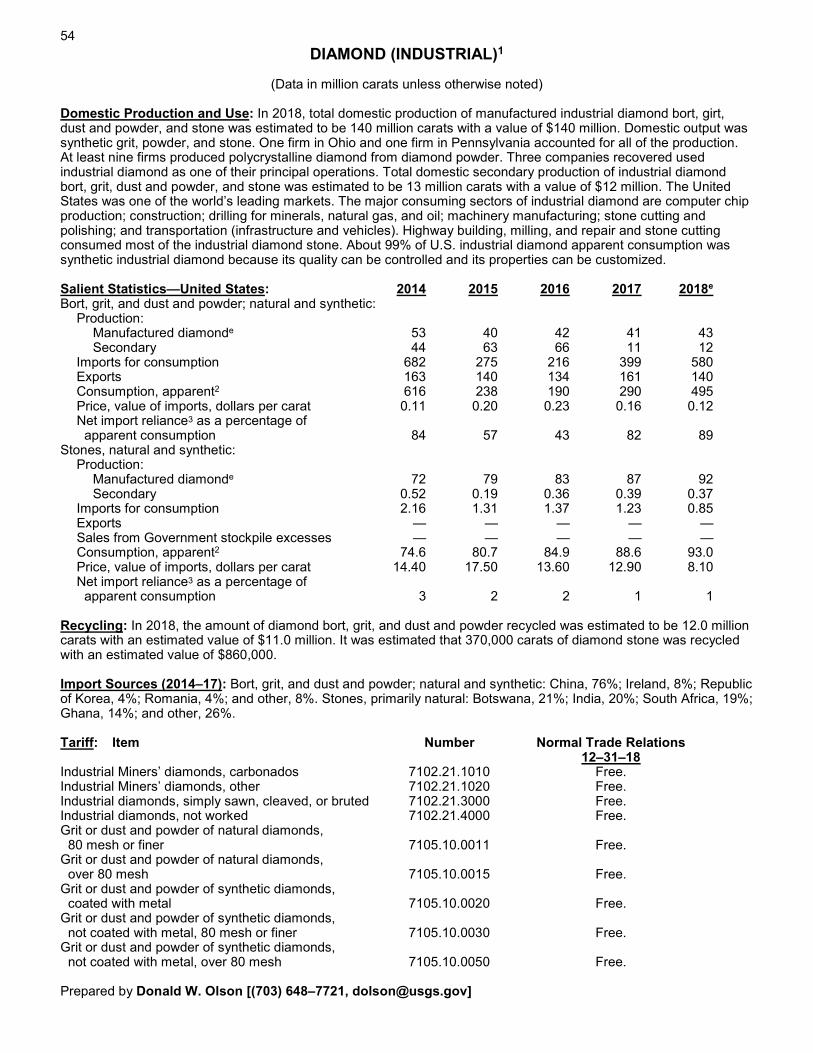
54
DIAMOND (INDUSTRIAL)1
(Data in million carats unless otherwise noted) Domestic Production and Use: In 2018, total domestic production of manufactured industrial diamond bort, girt, dust and powder, and stone was estimated to be 140 million carats with a value of $140 million. Domestic output was synthetic grit, powder, and stone. One firm in Ohio and one firm in Pennsylvania accounted for all of the production. At least nine firms produced polycrystalline diamond from diamond powder. Three companies recovered used industrial diamond as one of their principal operations. Total domestic secondary production of industrial diamond bort, grit, dust and powder, and stone was estimated to be 13 million carats with a value of $12 million. The United States was one of the world’s leading markets. The major consuming sectors of industrial diamond are computer chip production; construction; drilling for minerals, natural gas, and oil; machinery manufacturing; stone cutting and polishing; and transportation (infrastructure and vehicles). Highway building, milling, and repair and stone cutting consumed most of the industrial diamond stone. About 99% of U.S. industrial diamond apparent consumption was synthetic industrial diamond because its quality can be controlled and its properties can be customized. Salient Statistics—United States: 2014 2015 2016 2017 2018e Bort, grit, and dust and powder; natural and synthetic: Production: Manufactured diamonde 53 40 42 41 43 Secondary 44 63 66 11 12 Imports for consumption 682 275 216 399 580 Exports 163 140 134 161 140 Consumption, apparent2 616 238 190 290 495 Price, value of imports, dollars per carat 0.11 0.20 0.23 0.16 0.12 Net import reliance3 as a percentage of apparent consumption 84 57 43 82 89 Stones, natural and synthetic: Production: Manufactured diamonde 72 79 83 87 92 Secondary 0.52 0.19 0.36 0.39 0.37 Imports for consumption 2.16 1.31 1.37 1.23 0.85 Exports — — — — — Sales from Government stockpile excesses — — — — — Consumption, apparent2 74.6 80.7 84.9 88.6 93.0 Price, value of imports, dollars per carat 14.40 17.50 13.60 12.90 8.10 Net import reliance3 as a percentage of apparent consumption 3 2 2 1 1 Recycling: In 2018, the amount of diamond bort, grit, and dust and powder recycled was estimated to be 12.0 million carats with an estimated value of $11.0 million. It was estimated that 370,000 carats of diamond stone was recycled with an estimated value of $860,000. Import Sources (2014–17): Bort, grit, and dust and powder; natural and synthetic: China, 76%; Ireland, 8%; Republic of Korea, 4%; Romania, 4%; and other, 8%. Stones, primarily natural: Botswana, 21%; India, 20%; South Africa, 19%; Ghana, 14%; and other, 26%. Tariff: Item Number Normal Trade Relations 12–31–18 Industrial Miners’ diamonds, carbonados 7102.21.1010 Free. Industrial Miners’ diamonds, other 7102.21.1020 Free. Industrial diamonds, simply sawn, cleaved, or bruted 7102.21.3000 Free. Industrial diamonds, not worked 7102.21.4000 Free. Grit or dust and powder of natural diamonds, 80 mesh or finer 7105.10.0011 Free. Grit or dust and powder of natural diamonds, over 80 mesh 7105.10.0015 Free. Grit or dust and powder of synthetic diamonds, coated with metal 7105.10.0020 Free. Grit or dust and powder of synthetic diamonds, not coated with metal, 80 mesh or finer 7105.10.0030 Free. Grit or dust and powder of synthetic diamonds, not coated with metal, over 80 mesh 7105.10.0050 Free. Prepared by Donald W. Olson [(703) 648–7721, [email protected]]
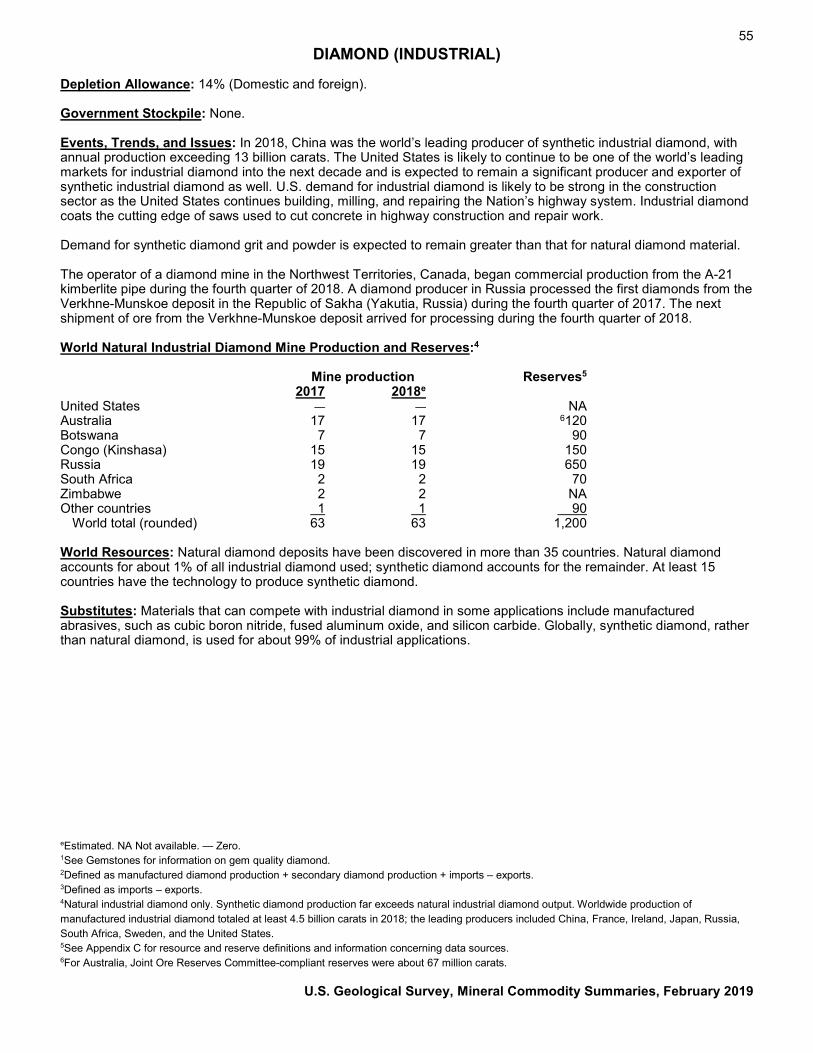
55 DIAMOND (INDUSTRIAL)
Depletion Allowance: 14% (Domestic and foreign). Government Stockpile: None. Events, Trends, and Issues: In 2018, China was the world’s leading producer of synthetic industrial diamond, with annual production exceeding 13 billion carats. The United States is likely to continue to be one of the world’s leading markets for industrial diamond into the next decade and is expected to remain a significant producer and exporter of synthetic industrial diamond as well. U.S. demand for industrial diamond is likely to be strong in the construction sector as the United States continues building, milling, and repairing the Nation’s highway system. Industrial diamond coats the cutting edge of saws used to cut concrete in highway construction and repair work. Demand for synthetic diamond grit and powder is expected to remain greater than that for natural diamond material. The operator of a diamond mine in the Northwest Territories, Canada, began commercial production from the A-21 kimberlite pipe during the fourth quarter of 2018. A diamond producer in Russia processed the first diamonds from the Verkhne-Munskoe deposit in the Republic of Sakha (Yakutia, Russia) during the fourth quarter of 2017. The next shipment of ore from the Verkhne-Munskoe deposit arrived for processing during the fourth quarter of 2018. World Natural Industrial Diamond Mine Production and Reserves:4 Mine production Reserves5 2017 2018e United States — — NA Australia 17 17 6120 Botswana 7 7 90 Congo (Kinshasa) 15 15 150 Russia 19 19 650 South Africa 2 2 70 Zimbabwe 2 2 NA Other countries 1 1 90 World total (rounded) 63 63 1,200 World Resources: Natural diamond deposits have been discovered in more than 35 countries. Natural diamond accounts for about 1% of all industrial diamond used; synthetic diamond accounts for the remainder. At least 15 countries have the technology to produce synthetic diamond. Substitutes: Materials that can compete with industrial diamond in some applications include manufactured abrasives, such as cubic boron nitride, fused aluminum oxide, and silicon carbide. Globally, synthetic diamond, rather than natural diamond, is used for about 99% of industrial applications. eEstimated. NA Not available. — Zero. 1See Gemstones for information on gem quality diamond. 2Defined as manufactured diamond production + secondary diamond production + imports – exports. 3Defined as imports – exports. 4Natural industrial diamond only. Synthetic diamond production far exceeds natural industrial diamond output. Worldwide production of manufactured industrial diamond totaled at least 4.5 billion carats in 2018; the leading producers included China, France, Ireland, Japan, Russia, South Africa, Sweden, and the United States. 5See Appendix C for resource and reserve definitions and information concerning data sources. 6For Australia, Joint Ore Reserves Committee-compliant reserves were about 67 million carats.
U.S. Geological Survey, Mineral Commodity Summaries, February 2019
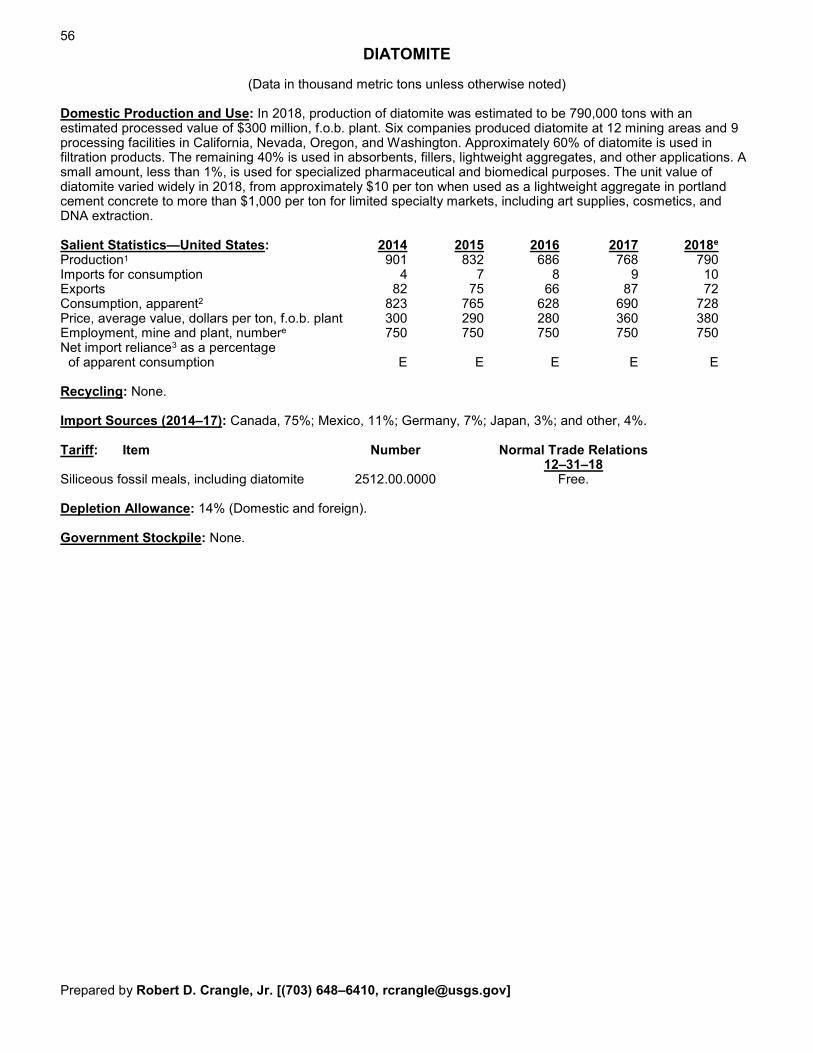
56
DIATOMITE
(Data in thousand metric tons unless otherwise noted) Domestic Production and Use: In 2018, production of diatomite was estimated to be 790,000 tons with an estimated processed value of $300 million, f.o.b. plant. Six companies produced diatomite at 12 mining areas and 9 processing facilities in California, Nevada, Oregon, and Washington. Approximately 60% of diatomite is used in filtration products. The remaining 40% is used in absorbents, fillers, lightweight aggregates, and other applications. A small amount, less than 1%, is used for specialized pharmaceutical and biomedical purposes. The unit value of diatomite varied widely in 2018, from approximately $10 per ton when used as a lightweight aggregate in portland cement concrete to more than $1,000 per ton for limited specialty markets, including art supplies, cosmetics, and DNA extraction. Salient Statistics—United States: 2014 2015 2016 2017 2018e Production1 901 832 686 768 790 Imports for consumption 4 7 8 9 10 Exports 82 75 66 87 72 Consumption, apparent2 823 765 628 690 728 Price, average value, dollars per ton, f.o.b. plant 300 290 280 360 380 Employment, mine and plant, numbere 750 750 750 750 750 Net import reliance3 as a percentage of apparent consumption E E E E E Recycling: None. Import Sources (2014–17): Canada, 75%; Mexico, 11%; Germany, 7%; Japan, 3%; and other, 4%. Tariff: Item Number Normal Trade Relations 12–31–18 Siliceous fossil meals, including diatomite 2512.00.0000 Free. Depletion Allowance: 14% (Domestic and foreign). Government Stockpile: None. Prepared by Robert D. Crangle, Jr. [(703) 648–6410, [email protected]]
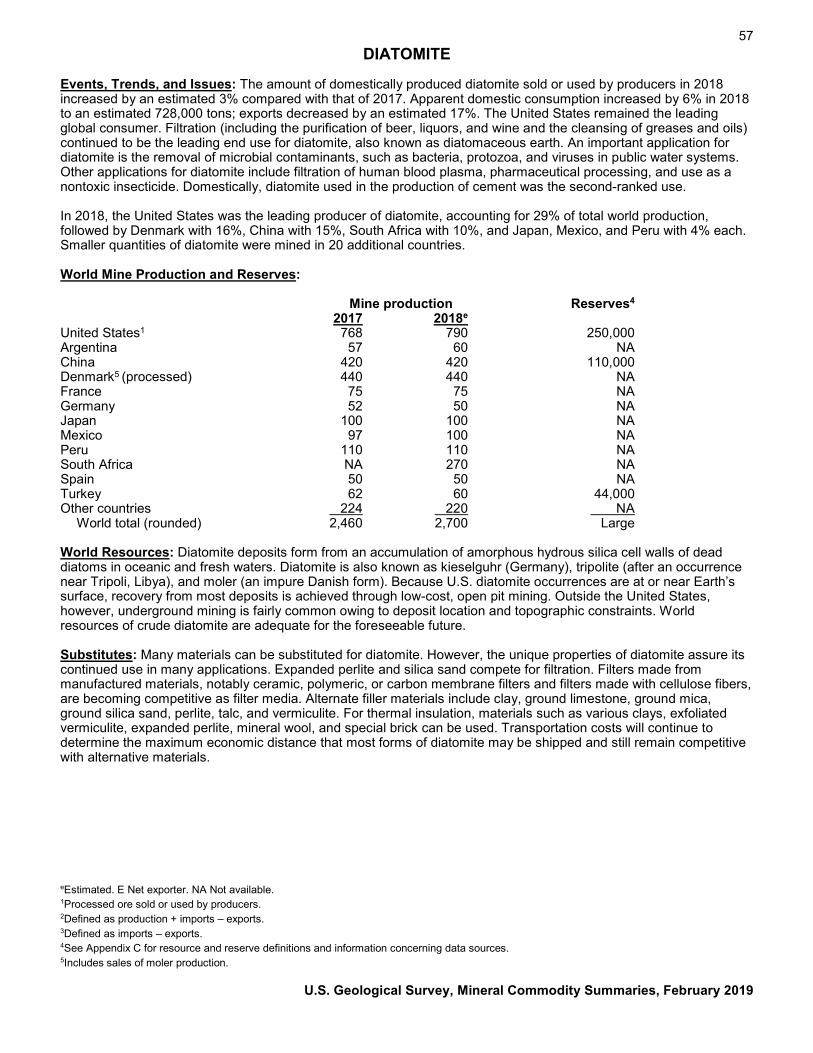
57 DIATOMITE
Events, Trends, and Issues: The amount of domestically produced diatomite sold or used by producers in 2018 increased by an estimated 3% compared with that of 2017. Apparent domestic consumption increased by 6% in 2018 to an estimated 728,000 tons; exports decreased by an estimated 17%. The United States remained the leading global consumer. Filtration (including the purification of beer, liquors, and wine and the cleansing of greases and oils) continued to be the leading end use for diatomite, also known as diatomaceous earth. An important application for diatomite is the removal of microbial contaminants, such as bacteria, protozoa, and viruses in public water systems. Other applications for diatomite include filtration of human blood plasma, pharmaceutical processing, and use as a nontoxic insecticide. Domestically, diatomite used in the production of cement was the second-ranked use. In 2018, the United States was the leading producer of diatomite, accounting for 29% of total world production, followed by Denmark with 16%, China with 15%, South Africa with 10%, and Japan, Mexico, and Peru with 4% each. Smaller quantities of diatomite were mined in 20 additional countries. World Mine Production and Reserves: Mine production Reserves4 2017 2018e United States1 768 790 250,000 Argentina 57 60 NA China 420 420 110,000 Denmark5 (processed) 440 440 NA France 75 75 NA Germany 52 50 NA Japan 100 100 NA Mexico 97 100 NA Peru 110 110 NA South Africa NA 270 NA Spain 50 50 NA Turkey 62 60 44,000 Other countries 224 220 NA World total (rounded) 2,460 2,700 Large World Resources: Diatomite deposits form from an accumulation of amorphous hydrous silica cell walls of dead diatoms in oceanic and fresh waters. Diatomite is also known as kieselguhr (Germany), tripolite (after an occurrence near Tripoli, Libya), and moler (an impure Danish form). Because U.S. diatomite occurrences are at or near Earth’s surface, recovery from most deposits is achieved through low-cost, open pit mining. Outside the United States, however, underground mining is fairly common owing to deposit location and topographic constraints. World resources of crude diatomite are adequate for the foreseeable future. Substitutes: Many materials can be substituted for diatomite. However, the unique properties of diatomite assure its continued use in many applications. Expanded perlite and silica sand compete for filtration. Filters made from manufactured materials, notably ceramic, polymeric, or carbon membrane filters and filters made with cellulose fibers, are becoming competitive as filter media. Alternate filler materials include clay, ground limestone, ground mica, ground silica sand, perlite, talc, and vermiculite. For thermal insulation, materials such as various clays, exfoliated vermiculite, expanded perlite, mineral wool, and special brick can be used. Transportation costs will continue to determine the maximum economic distance that most forms of diatomite may be shipped and still remain competitive with alternative materials. eEstimated. E Net exporter. NA Not available. 1Processed ore sold or used by producers. 2Defined as production + imports – exports. 3Defined as imports – exports. 4See Appendix C for resource and reserve definitions and information concerning data sources. 5Includes sales of moler production.
U.S. Geological Survey, Mineral Commodity Summaries, February 2019
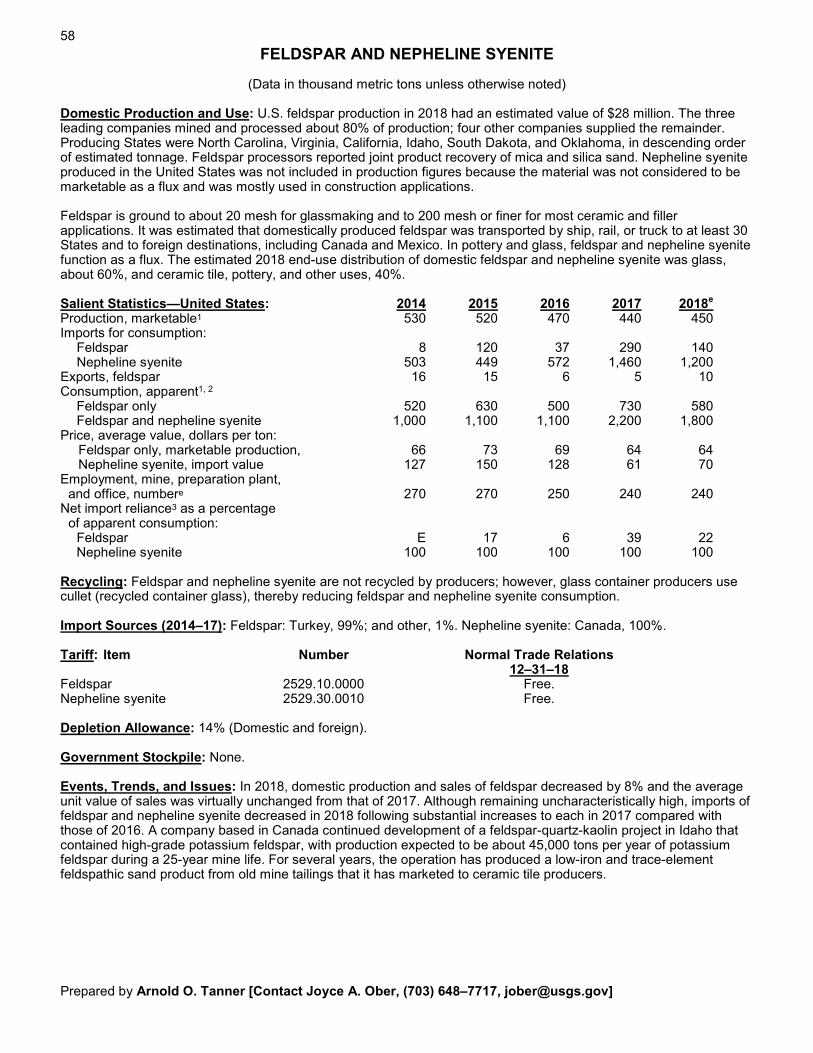
58
FELDSPAR AND NEPHELINE SYENITE
(Data in thousand metric tons unless otherwise noted) Domestic Production and Use: U.S. feldspar production in 2018 had an estimated value of $28 million. The three leading companies mined and processed about 80% of production; four other companies supplied the remainder. Producing States were North Carolina, Virginia, California, Idaho, South Dakota, and Oklahoma, in descending order of estimated tonnage. Feldspar processors reported joint product recovery of mica and silica sand. Nepheline syenite produced in the United States was not included in production figures because the material was not considered to be marketable as a flux and was mostly used in construction applications. Feldspar is ground to about 20 mesh for glassmaking and to 200 mesh or finer for most ceramic and filler applications. It was estimated that domestically produced feldspar was transported by ship, rail, or truck to at least 30 States and to foreign destinations, including Canada and Mexico. In pottery and glass, feldspar and nepheline syenite function as a flux. The estimated 2018 end-use distribution of domestic feldspar and nepheline syenite was glass, about 60%, and ceramic tile, pottery, and other uses, 40%. Salient Statistics—United States: 2014 2015 2016 2017 2018e Production, marketable1 530 520 470 440 450 Imports for consumption: Feldspar 8 120 37 290 140 Nepheline syenite 503 449 572 1,460 1,200 Exports, feldspar 16 15 6 5 10 Consumption, apparent1, 2
Feldspar only 520 630 500 730 580 Feldspar and nepheline syenite 1,000 1,100 1,100 2,200 1,800 Price, average value, dollars per ton: Feldspar only, marketable production, 66 73 69 64 64 Nepheline syenite, import value 127 150 128 61 70 Employment, mine, preparation plant, and office, numbere 270 270 250 240 240 Net import reliance3 as a percentage of apparent consumption: Feldspar E 17 6 39 22 Nepheline syenite 100 100 100 100 100 Recycling: Feldspar and nepheline syenite are not recycled by producers; however, glass container producers use cullet (recycled container glass), thereby reducing feldspar and nepheline syenite consumption. Import Sources (2014–17): Feldspar: Turkey, 99%; and other, 1%. Nepheline syenite: Canada, 100%. Tariff: Item Number Normal Trade Relations 12–31–18 Feldspar 2529.10.0000 Free. Nepheline syenite 2529.30.0010 Free. Depletion Allowance: 14% (Domestic and foreign). Government Stockpile: None. Events, Trends, and Issues: In 2018, domestic production and sales of feldspar decreased by 8% and the average unit value of sales was virtually unchanged from that of 2017. Although remaining uncharacteristically high, imports of feldspar and nepheline syenite decreased in 2018 following substantial increases to each in 2017 compared with those of 2016. A company based in Canada continued development of a feldspar-quartz-kaolin project in Idaho that contained high-grade potassium feldspar, with production expected to be about 45,000 tons per year of potassium feldspar during a 25-year mine life. For several years, the operation has produced a low-iron and trace-element feldspathic sand product from old mine tailings that it has marketed to ceramic tile producers. Prepared by Arnold O. Tanner [Contact Joyce A. Ober, (703) 648–7717, [email protected]]
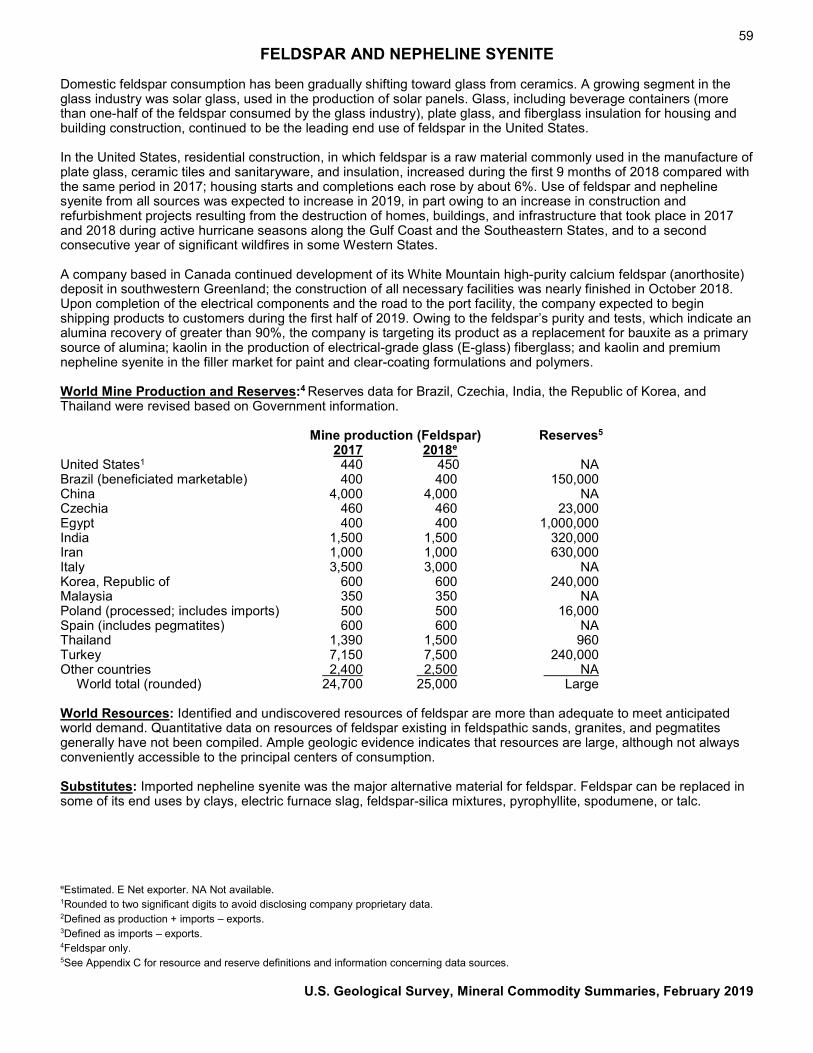
59 FELDSPAR AND NEPHELINE SYENITE
Domestic feldspar consumption has been gradually shifting toward glass from ceramics. A growing segment in the glass industry was solar glass, used in the production of solar panels. Glass, including beverage containers (more than one-half of the feldspar consumed by the glass industry), plate glass, and fiberglass insulation for housing and building construction, continued to be the leading end use of feldspar in the United States. In the United States, residential construction, in which feldspar is a raw material commonly used in the manufacture of plate glass, ceramic tiles and sanitaryware, and insulation, increased during the first 9 months of 2018 compared with the same period in 2017; housing starts and completions each rose by about 6%. Use of feldspar and nepheline syenite from all sources was expected to increase in 2019, in part owing to an increase in construction and refurbishment projects resulting from the destruction of homes, buildings, and infrastructure that took place in 2017 and 2018 during active hurricane seasons along the Gulf Coast and the Southeastern States, and to a second consecutive year of significant wildfires in some Western States. A company based in Canada continued development of its White Mountain high-purity calcium feldspar (anorthosite) deposit in southwestern Greenland; the construction of all necessary facilities was nearly finished in October 2018. Upon completion of the electrical components and the road to the port facility, the company expected to begin shipping products to customers during the first half of 2019. Owing to the feldspar’s purity and tests, which indicate an alumina recovery of greater than 90%, the company is targeting its product as a replacement for bauxite as a primary source of alumina; kaolin in the production of electrical-grade glass (E-glass) fiberglass; and kaolin and premium nepheline syenite in the filler market for paint and clear-coating formulations and polymers. World Mine Production and Reserves:4 Reserves data for Brazil, Czechia, India, the Republic of Korea, and Thailand were revised based on Government information. Mine production (Feldspar) Reserves5 2017 2018e United States1 440 450 NA Brazil (beneficiated marketable) 400 400 150,000 China 4,000 4,000 NA Czechia 460 460 23,000 Egypt 400 400 1,000,000 India 1,500 1,500 320,000 Iran 1,000 1,000 630,000 Italy 3,500 3,000 NA Korea, Republic of 600 600 240,000 Malaysia 350 350 NA Poland (processed; includes imports) 500 500 16,000 Spain (includes pegmatites) 600 600 NA Thailand 1,390 1,500 960 Turkey 7,150 7,500 240,000 Other countries 2,400 2,500 NA World total (rounded) 24,700 25,000 Large World Resources: Identified and undiscovered resources of feldspar are more than adequate to meet anticipated world demand. Quantitative data on resources of feldspar existing in feldspathic sands, granites, and pegmatites generally have not been compiled. Ample geologic evidence indicates that resources are large, although not always conveniently accessible to the principal centers of consumption. Substitutes: Imported nepheline syenite was the major alternative material for feldspar. Feldspar can be replaced in some of its end uses by clays, electric furnace slag, feldspar-silica mixtures, pyrophyllite, spodumene, or talc. eEstimated. E Net exporter. NA Not available. 1Rounded to two significant digits to avoid disclosing company proprietary data. 2Defined as production + imports – exports. 3Defined as imports – exports. 4Feldspar only. 5See Appendix C for resource and reserve definitions and information concerning data sources.
U.S. Geological Survey, Mineral Commodity Summaries, February 2019
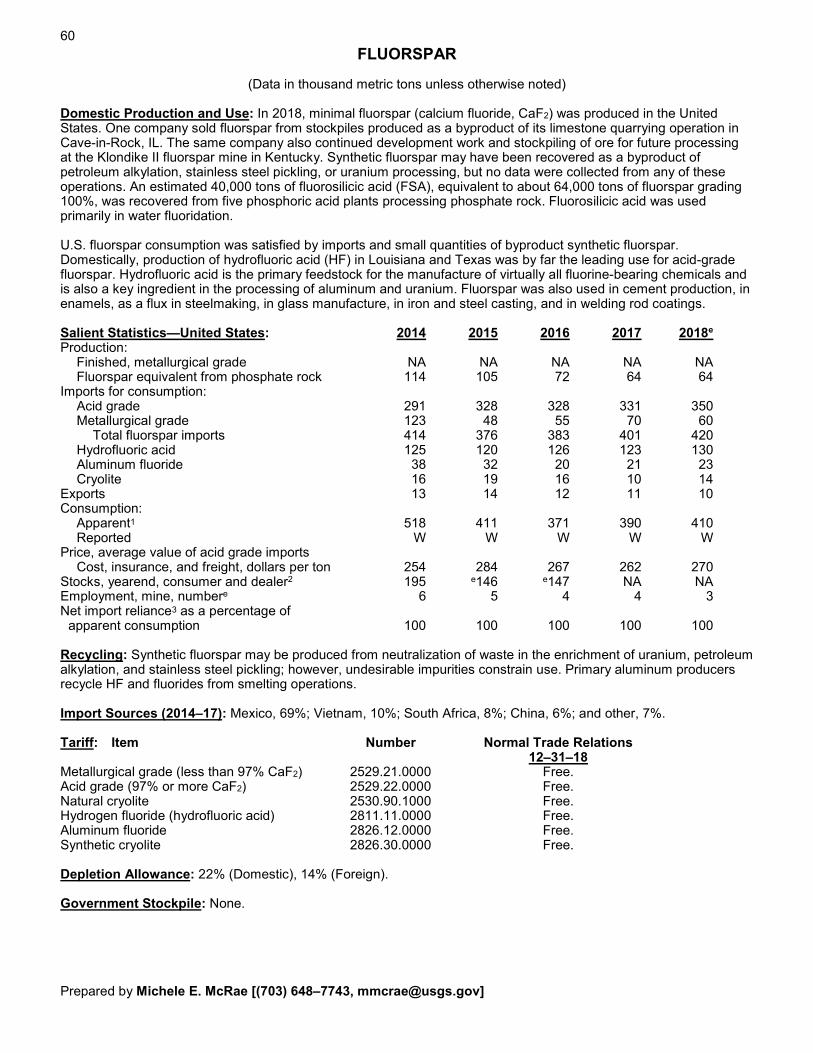
60
FLUORSPAR
(Data in thousand metric tons unless otherwise noted) Domestic Production and Use: In 2018, minimal fluorspar (calcium fluoride, CaF2) was produced in the United States. One company sold fluorspar from stockpiles produced as a byproduct of its limestone quarrying operation in Cave-in-Rock, IL. The same company also continued development work and stockpiling of ore for future processing at the Klondike II fluorspar mine in Kentucky. Synthetic fluorspar may have been recovered as a byproduct of petroleum alkylation, stainless steel pickling, or uranium processing, but no data were collected from any of these operations. An estimated 40,000 tons of fluorosilicic acid (FSA), equivalent to about 64,000 tons of fluorspar grading 100%, was recovered from five phosphoric acid plants processing phosphate rock. Fluorosilicic acid was used primarily in water fluoridation. U.S. fluorspar consumption was satisfied by imports and small quantities of byproduct synthetic fluorspar. Domestically, production of hydrofluoric acid (HF) in Louisiana and Texas was by far the leading use for acid-grade fluorspar. Hydrofluoric acid is the primary feedstock for the manufacture of virtually all fluorine-bearing chemicals and is also a key ingredient in the processing of aluminum and uranium. Fluorspar was also used in cement production, in enamels, as a flux in steelmaking, in glass manufacture, in iron and steel casting, and in welding rod coatings. Salient Statistics—United States: 2014 2015 2016 2017 2018e Production: Finished, metallurgical grade NA NA NA NA NA Fluorspar equivalent from phosphate rock 114 105 72 64 64 Imports for consumption: Acid grade 291 328 328 331 350 Metallurgical grade 123 48 55 70 60 Total fluorspar imports 414 376 383 401 420 Hydrofluoric acid 125 120 126 123 130 Aluminum fluoride 38 32 20 21 23 Cryolite 16 19 16 10 14 Exports 13 14 12 11 10 Consumption: Apparent1 518 411 371 390 410 Reported W W W W W Price, average value of acid grade imports Cost, insurance, and freight, dollars per ton 254 284 267 262 270 Stocks, yearend, consumer and dealer2 195 e146 e147 NA NA Employment, mine, numbere 6 5 4 4 3 Net import reliance3 as a percentage of apparent consumption 100 100 100 100 100 Recycling: Synthetic fluorspar may be produced from neutralization of waste in the enrichment of uranium, petroleum alkylation, and stainless steel pickling; however, undesirable impurities constrain use. Primary aluminum producers recycle HF and fluorides from smelting operations. Import Sources (2014–17): Mexico, 69%; Vietnam, 10%; South Africa, 8%; China, 6%; and other, 7%. Tariff: Item Number Normal Trade Relations 12–31–18 Metallurgical grade (less than 97% CaF2) 2529.21.0000 Free. Acid grade (97% or more CaF2) 2529.22.0000 Free. Natural cryolite 2530.90.1000 Free. Hydrogen fluoride (hydrofluoric acid) 2811.11.0000 Free. Aluminum fluoride 2826.12.0000 Free. Synthetic cryolite 2826.30.0000 Free. Depletion Allowance: 22% (Domestic), 14% (Foreign). Government Stockpile: None. Prepared by Michele E. McRae [(703) 648–7743, [email protected]]
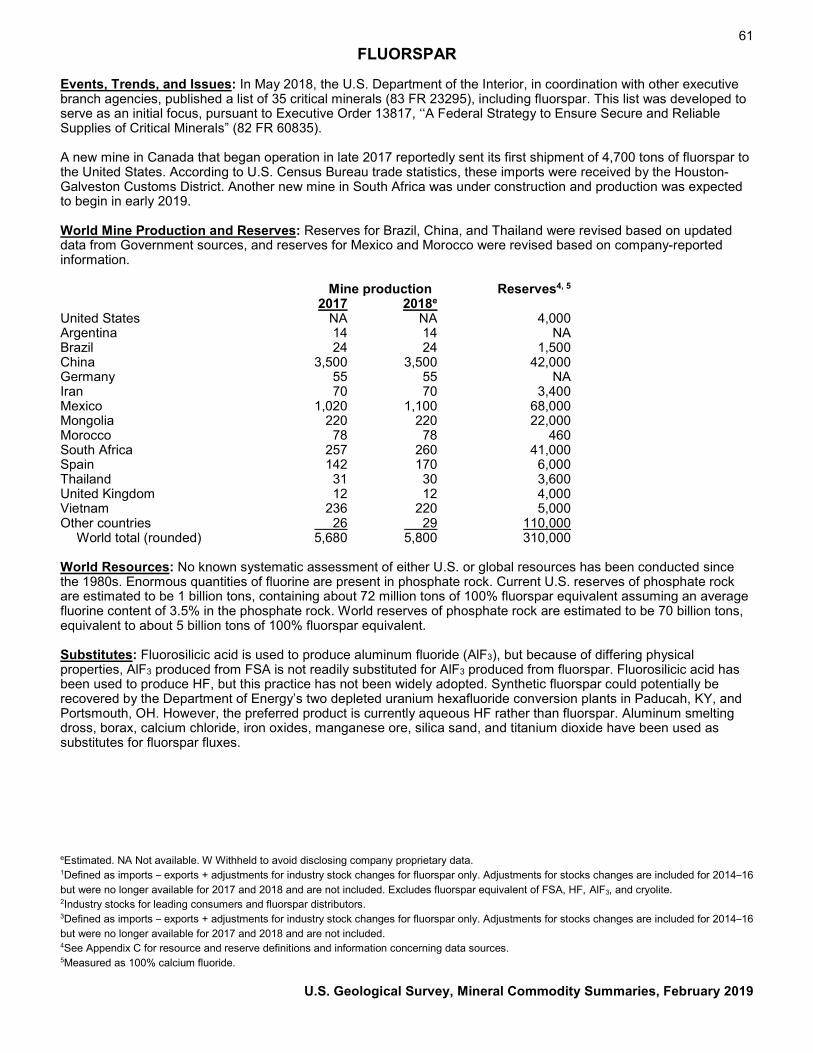
61 FLUORSPAR
Events, Trends, and Issues: In May 2018, the U.S. Department of the Interior, in coordination with other executive branch agencies, published a list of 35 critical minerals (83 FR 23295), including fluorspar. This list was developed to serve as an initial focus, pursuant to Executive Order 13817, ‘‘A Federal Strategy to Ensure Secure and Reliable Supplies of Critical Minerals” (82 FR 60835). A new mine in Canada that began operation in late 2017 reportedly sent its first shipment of 4,700 tons of fluorspar to the United States. According to U.S. Census Bureau trade statistics, these imports were received by the Houston-Galveston Customs District. Another new mine in South Africa was under construction and production was expected to begin in early 2019. World Mine Production and Reserves: Reserves for Brazil, China, and Thailand were revised based on updated data from Government sources, and reserves for Mexico and Morocco were revised based on company-reported information. Mine production Reserves4, 5
2017 2018e United States NA NA 4,000 Argentina 14 14 NA Brazil 24 24 1,500 China 3,500 3,500 42,000 Germany 55 55 NA Iran 70 70 3,400 Mexico 1,020 1,100 68,000 Mongolia 220 220 22,000 Morocco 78 78 460 South Africa 257 260 41,000 Spain 142 170 6,000 Thailand 31 30 3,600 United Kingdom 12 12 4,000 Vietnam 236 220 5,000 Other countries 26 29 110,000 World total (rounded) 5,680 5,800 310,000 World Resources: No known systematic assessment of either U.S. or global resources has been conducted since the 1980s. Enormous quantities of fluorine are present in phosphate rock. Current U.S. reserves of phosphate rock are estimated to be 1 billion tons, containing about 72 million tons of 100% fluorspar equivalent assuming an average fluorine content of 3.5% in the phosphate rock. World reserves of phosphate rock are estimated to be 70 billion tons, equivalent to about 5 billion tons of 100% fluorspar equivalent. Substitutes: Fluorosilicic acid is used to produce aluminum fluoride (AlF3), but because of differing physical properties, AlF3 produced from FSA is not readily substituted for AlF3 produced from fluorspar. Fluorosilicic acid has been used to produce HF, but this practice has not been widely adopted. Synthetic fluorspar could potentially be recovered by the Department of Energy’s two depleted uranium hexafluoride conversion plants in Paducah, KY, and Portsmouth, OH. However, the preferred product is currently aqueous HF rather than fluorspar. Aluminum smelting dross, borax, calcium chloride, iron oxides, manganese ore, silica sand, and titanium dioxide have been used as substitutes for fluorspar fluxes. eEstimated. NA Not available. W Withheld to avoid disclosing company proprietary data. 1Defined as imports – exports + adjustments for industry stock changes for fluorspar only. Adjustments for stocks changes are included for 2014–16 but were no longer available for 2017 and 2018 and are not included. Excludes fluorspar equivalent of FSA, HF, AlF3, and cryolite. 2Industry stocks for leading consumers and fluorspar distributors. 3Defined as imports – exports + adjustments for industry stock changes for fluorspar only. Adjustments for stocks changes are included for 2014–16 but were no longer available for 2017 and 2018 and are not included. 4See Appendix C for resource and reserve definitions and information concerning data sources. 5Measured as 100% calcium fluoride.
U.S. Geological Survey, Mineral Commodity Summaries, February 2019
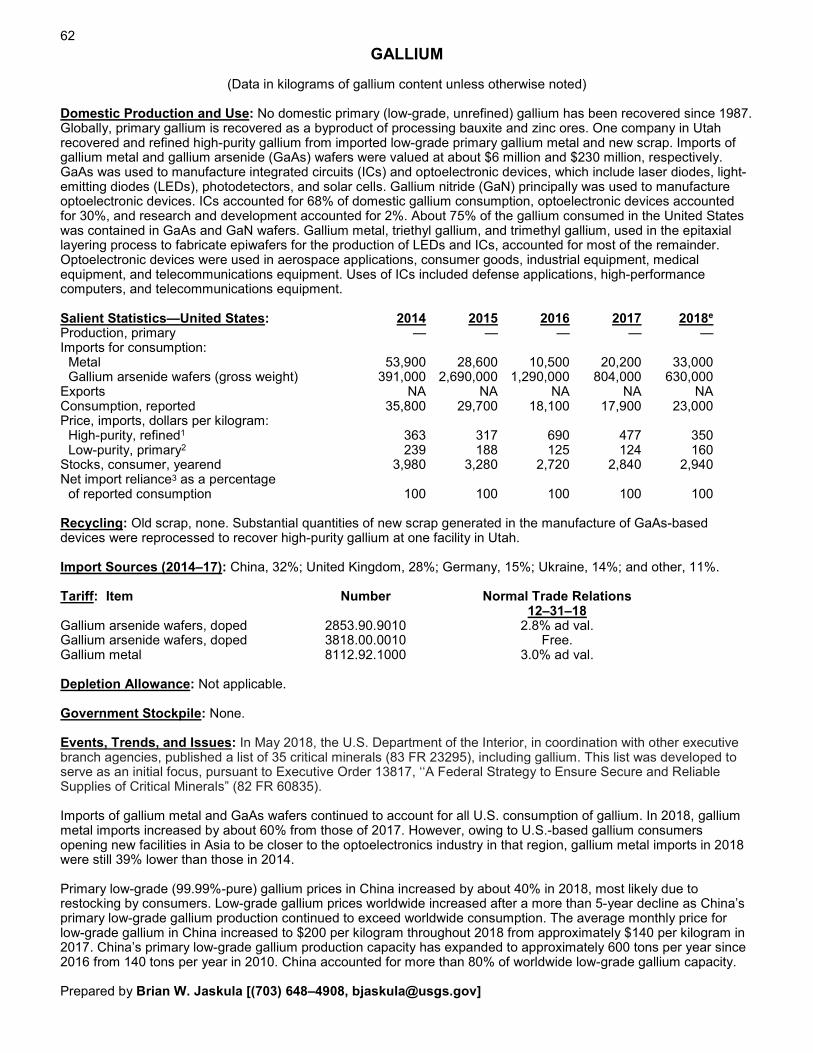
62
GALLIUM
(Data in kilograms of gallium content unless otherwise noted) Domestic Production and Use: No domestic primary (low-grade, unrefined) gallium has been recovered since 1987. Globally, primary gallium is recovered as a byproduct of processing bauxite and zinc ores. One company in Utah recovered and refined high-purity gallium from imported low-grade primary gallium metal and new scrap. Imports of gallium metal and gallium arsenide (GaAs) wafers were valued at about $6 million and $230 million, respectively. GaAs was used to manufacture integrated circuits (ICs) and optoelectronic devices, which include laser diodes, light-emitting diodes (LEDs), photodetectors, and solar cells. Gallium nitride (GaN) principally was used to manufacture optoelectronic devices. ICs accounted for 68% of domestic gallium consumption, optoelectronic devices accounted for 30%, and research and development accounted for 2%. About 75% of the gallium consumed in the United States was contained in GaAs and GaN wafers. Gallium metal, triethyl gallium, and trimethyl gallium, used in the epitaxial layering process to fabricate epiwafers for the production of LEDs and ICs, accounted for most of the remainder. Optoelectronic devices were used in aerospace applications, consumer goods, industrial equipment, medical equipment, and telecommunications equipment. Uses of ICs included defense applications, high-performance computers, and telecommunications equipment. Salient Statistics—United States: 2014 2015 2016 2017 2018e Production, primary — — — — — Imports for consumption: Metal 53,900 28,600 10,500 20,200 33,000 Gallium arsenide wafers (gross weight) 391,000 2,690,000 1,290,000 804,000 630,000 Exports NA NA NA NA NA Consumption, reported 35,800 29,700 18,100 17,900 23,000 Price, imports, dollars per kilogram: High-purity, refined1 363 317 690 477 350 Low-purity, primary2 239 188 125 124 160 Stocks, consumer, yearend 3,980 3,280 2,720 2,840 2,940 Net import reliance3 as a percentage of reported consumption 100 100 100 100 100 Recycling: Old scrap, none. Substantial quantities of new scrap generated in the manufacture of GaAs-based devices were reprocessed to recover high-purity gallium at one facility in Utah. Import Sources (2014–17): China, 32%; United Kingdom, 28%; Germany, 15%; Ukraine, 14%; and other, 11%. Tariff: Item Number Normal Trade Relations 12–31–18 Gallium arsenide wafers, doped 2853.90.9010 2.8% ad val. Gallium arsenide wafers, doped 3818.00.0010 Free. Gallium metal 8112.92.1000 3.0% ad val. Depletion Allowance: Not applicable. Government Stockpile: None. Events, Trends, and Issues: In May 2018, the U.S. Department of the Interior, in coordination with other executive branch agencies, published a list of 35 critical minerals (83 FR 23295), including gallium. This list was developed to serve as an initial focus, pursuant to Executive Order 13817, ‘‘A Federal Strategy to Ensure Secure and Reliable Supplies of Critical Minerals” (82 FR 60835). Imports of gallium metal and GaAs wafers continued to account for all U.S. consumption of gallium. In 2018, gallium metal imports increased by about 60% from those of 2017. However, owing to U.S.-based gallium consumers opening new facilities in Asia to be closer to the optoelectronics industry in that region, gallium metal imports in 2018 were still 39% lower than those in 2014. Primary low-grade (99.99%-pure) gallium prices in China increased by about 40% in 2018, most likely due to restocking by consumers. Low-grade gallium prices worldwide increased after a more than 5-year decline as China’s primary low-grade gallium production continued to exceed worldwide consumption. The average monthly price for low-grade gallium in China increased to $200 per kilogram throughout 2018 from approximately $140 per kilogram in 2017. China’s primary low-grade gallium production capacity has expanded to approximately 600 tons per year since 2016 from 140 tons per year in 2010. China accounted for more than 80% of worldwide low-grade gallium capacity. Prepared by Brian W. Jaskula [(703) 648–4908, [email protected]]
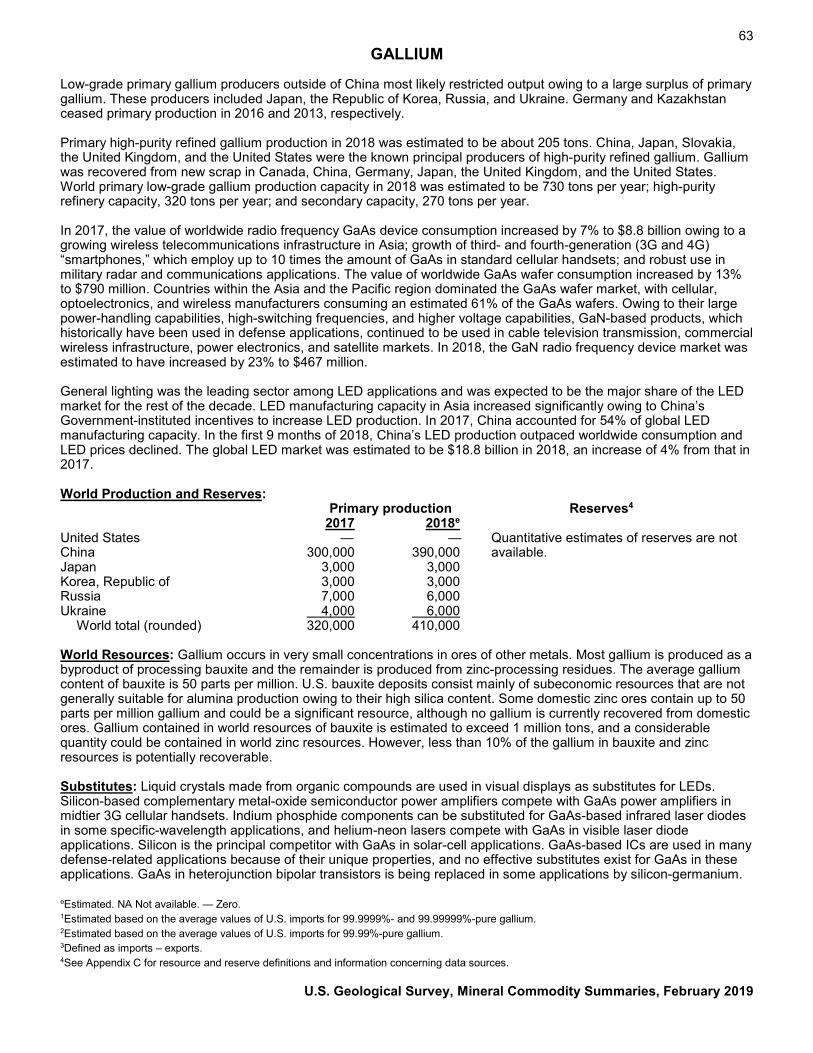
63 GALLIUM
Low-grade primary gallium producers outside of China most likely restricted output owing to a large surplus of primary gallium. These producers included Japan, the Republic of Korea, Russia, and Ukraine. Germany and Kazakhstan ceased primary production in 2016 and 2013, respectively. Primary high-purity refined gallium production in 2018 was estimated to be about 205 tons. China, Japan, Slovakia, the United Kingdom, and the United States were the known principal producers of high-purity refined gallium. Gallium was recovered from new scrap in Canada, China, Germany, Japan, the United Kingdom, and the United States. World primary low-grade gallium production capacity in 2018 was estimated to be 730 tons per year; high-purity refinery capacity, 320 tons per year; and secondary capacity, 270 tons per year. In 2017, the value of worldwide radio frequency GaAs device consumption increased by 7% to $8.8 billion owing to a growing wireless telecommunications infrastructure in Asia; growth of third- and fourth-generation (3G and 4G) “smartphones,” which employ up to 10 times the amount of GaAs in standard cellular handsets; and robust use in military radar and communications applications. The value of worldwide GaAs wafer consumption increased by 13% to $790 million. Countries within the Asia and the Pacific region dominated the GaAs wafer market, with cellular, optoelectronics, and wireless manufacturers consuming an estimated 61% of the GaAs wafers. Owing to their large power-handling capabilities, high-switching frequencies, and higher voltage capabilities, GaN-based products, which historically have been used in defense applications, continued to be used in cable television transmission, commercial wireless infrastructure, power electronics, and satellite markets. In 2018, the GaN radio frequency device market was estimated to have increased by 23% to $467 million. General lighting was the leading sector among LED applications and was expected to be the major share of the LED market for the rest of the decade. LED manufacturing capacity in Asia increased significantly owing to China’s Government-instituted incentives to increase LED production. In 2017, China accounted for 54% of global LED manufacturing capacity. In the first 9 months of 2018, China’s LED production outpaced worldwide consumption and LED prices declined. The global LED market was estimated to be $18.8 billion in 2018, an increase of 4% from that in 2017. World Production and Reserves: Primary production Reserves4
2017 2018e United States — — Quantitative estimates of reserves are not China 300,000 390,000 available. Japan 3,000 3,000 Korea, Republic of 3,000 3,000 Russia 7,000 6,000 Ukraine 4,000 6,000 World total (rounded) 320,000 410,000 World Resources: Gallium occurs in very small concentrations in ores of other metals. Most gallium is produced as a byproduct of processing bauxite and the remainder is produced from zinc-processing residues. The average gallium content of bauxite is 50 parts per million. U.S. bauxite deposits consist mainly of subeconomic resources that are not generally suitable for alumina production owing to their high silica content. Some domestic zinc ores contain up to 50 parts per million gallium and could be a significant resource, although no gallium is currently recovered from domestic ores. Gallium contained in world resources of bauxite is estimated to exceed 1 million tons, and a considerable quantity could be contained in world zinc resources. However, less than 10% of the gallium in bauxite and zinc resources is potentially recoverable. Substitutes: Liquid crystals made from organic compounds are used in visual displays as substitutes for LEDs. Silicon-based complementary metal-oxide semiconductor power amplifiers compete with GaAs power amplifiers in midtier 3G cellular handsets. Indium phosphide components can be substituted for GaAs-based infrared laser diodes in some specific-wavelength applications, and helium-neon lasers compete with GaAs in visible laser diode applications. Silicon is the principal competitor with GaAs in solar-cell applications. GaAs-based ICs are used in many defense-related applications because of their unique properties, and no effective substitutes exist for GaAs in these applications. GaAs in heterojunction bipolar transistors is being replaced in some applications by silicon-germanium.
eEstimated. NA Not available. — Zero. 1Estimated based on the average values of U.S. imports for 99.9999%- and 99.99999%-pure gallium. 2Estimated based on the average values of U.S. imports for 99.99%-pure gallium. 3Defined as imports – exports. 4See Appendix C for resource and reserve definitions and information concerning data sources.
U.S. Geological Survey, Mineral Commodity Summaries, February 2019
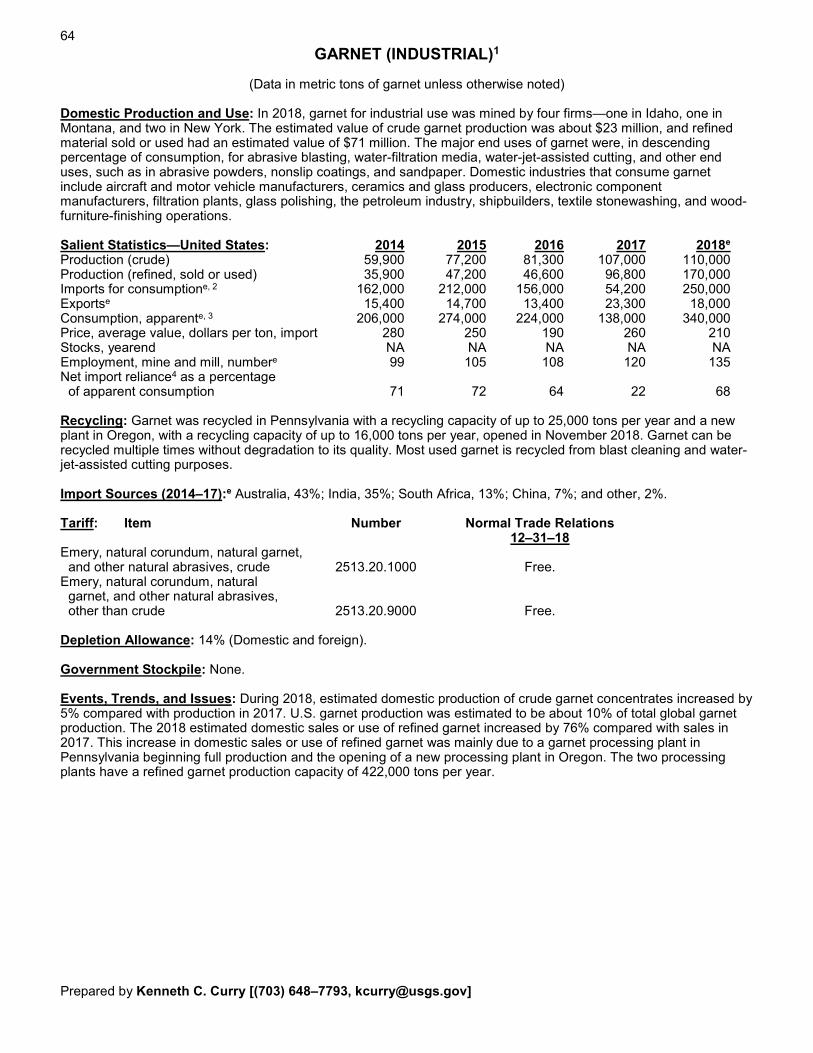
64
GARNET (INDUSTRIAL)1
(Data in metric tons of garnet unless otherwise noted) Domestic Production and Use: In 2018, garnet for industrial use was mined by four firms—one in Idaho, one in Montana, and two in New York. The estimated value of crude garnet production was about $23 million, and refined material sold or used had an estimated value of $71 million. The major end uses of garnet were, in descending percentage of consumption, for abrasive blasting, water-filtration media, water-jet-assisted cutting, and other end uses, such as in abrasive powders, nonslip coatings, and sandpaper. Domestic industries that consume garnet include aircraft and motor vehicle manufacturers, ceramics and glass producers, electronic component manufacturers, filtration plants, glass polishing, the petroleum industry, shipbuilders, textile stonewashing, and wood-furniture-finishing operations. Salient Statistics—United States: 2014 2015 2016 2017 2018e Production (crude) 59,900 77,200 81,300 107,000 110,000 Production (refined, sold or used) 35,900 47,200 46,600 96,800 170,000 Imports for consumptione, 2 162,000 212,000 156,000 54,200 250,000 Exportse 15,400 14,700 13,400 23,300 18,000 Consumption, apparente, 3 206,000 274,000 224,000 138,000 340,000 Price, average value, dollars per ton, import 280 250 190 260 210 Stocks, yearend NA NA NA NA NA Employment, mine and mill, numbere 99 105 108 120 135 Net import reliance4 as a percentage of apparent consumption 71 72 64 22 68 Recycling: Garnet was recycled in Pennsylvania with a recycling capacity of up to 25,000 tons per year and a new plant in Oregon, with a recycling capacity of up to 16,000 tons per year, opened in November 2018. Garnet can be recycled multiple times without degradation to its quality. Most used garnet is recycled from blast cleaning and water-jet-assisted cutting purposes. Import Sources (2014–17):e Australia, 43%; India, 35%; South Africa, 13%; China, 7%; and other, 2%. Tariff: Item Number Normal Trade Relations 12–31–18 Emery, natural corundum, natural garnet, and other natural abrasives, crude 2513.20.1000 Free. Emery, natural corundum, natural garnet, and other natural abrasives, other than crude 2513.20.9000 Free. Depletion Allowance: 14% (Domestic and foreign). Government Stockpile: None. Events, Trends, and Issues: During 2018, estimated domestic production of crude garnet concentrates increased by 5% compared with production in 2017. U.S. garnet production was estimated to be about 10% of total global garnet production. The 2018 estimated domestic sales or use of refined garnet increased by 76% compared with sales in 2017. This increase in domestic sales or use of refined garnet was mainly due to a garnet processing plant in Pennsylvania beginning full production and the opening of a new processing plant in Oregon. The two processing plants have a refined garnet production capacity of 422,000 tons per year. Prepared by Kenneth C. Curry [(703) 648–7793, [email protected]]
65 GARNET (INDUSTRIAL)
Garnet imports in 2018 were estimated to have more than tripled compared with those of 2017. The significant increase in imports of garnet can be attributed to easing of supply restrictions of garnet from India and an increase in garnet required for the processing plants in Pennsylvania and Oregon. Imports from India increased in 2018 but were still significantly lower than in 2016, prior to the export restrictions in 2017. However, there was a substantial increase in imports from South Africa in 2018 to meet consumption requirements. In 2018, the average unit value of garnet imports was $210 per ton, which represents a decrease of 19% compared with the average unit value in 2017. In the United States, most domestically produced crude garnet concentrate was priced at about $205 per ton. Exports in 2018 were estimated to have decreased by 24%. Over the past 5 years, U.S. production has increased steadily while imports have varied widely. It is thought that producer stocks have been able to augment supply to meet consumption requirements. The significant increase in imports in 2018 may be partially attributed to resupplying stocks that were used in 2017. The United States consumed about 31% of global garnet production and world production of garnet increased by 13% in 2018. In India, garnet production continued to be limited. Garnet production in South Africa increased in 2018. The garnet market is very competitive. To increase profitability and remain competitive with imported material, production may be restricted to only high-grade garnet ores or other salable mineral products that occur with garnet, such as kyanite, marble, metallic ores, mica minerals, sillimanite, staurolite, or wollastonite. World Mine Production and Reserves: Reserves for India were revised based on Government reports. Mine production Reserves5 2017 2018e United States 107,000 110,000 5,000,000 Australia 364,000 330,000 Moderate to Large China 100,000 110,000 Moderate to Large India 142,000 180,000 13,000,000 South Africa 211,000 270,000 NA Other countries 50,000 60,000 6,500,000 World total (rounded) 974,000 1,100,000 Moderate to Large World Resources: World resources of garnet are large and occur in a wide variety of rocks, particularly gneisses and schists. Garnet also occurs in contact-metamorphic deposits in crystalline limestones, pegmatites, serpentinites, and vein deposits. In addition, alluvial garnet is present in many heavy-mineral sand and gravel deposits throughout the world. Large domestic resources of garnet also are concentrated in coarsely crystalline gneiss near North Creek, NY; other significant domestic resources of garnet occur in Idaho, Maine, Montana, New Hampshire, North Carolina, and Oregon. In addition to those in the United States, major garnet deposits exist in Australia, Canada, China, India, and South Africa, where they are mined for foreign and domestic markets; deposits in Russia and Turkey also have been mined in recent years, primarily for internal markets. Additional garnet resources are in Chile, Czechia, Pakistan, Spain, Thailand, and Ukraine; small mining operations have been reported in most of these countries. Substitutes: Other natural and manufactured abrasives can substitute to some extent for all major end uses of garnet. In many cases, however, using the substitutes would entail sacrifices in quality or cost. Fused aluminum oxide and staurolite compete with garnet as a sandblasting material. Ilmenite, magnetite, and plastics compete as filtration media. Corundum, diamond, and fused aluminum oxide compete for lens grinding and for many lapping operations. Emery is a substitute in nonskid surfaces. Fused aluminum oxide, quartz sand, and silicon carbide compete for the finishing of plastics, wood furniture, and other products. eEstimated. NA Not Available. 1Excludes gem and synthetic garnet. 2It was assumed that 75% of imports under Harmonized Tariff Schedule codes 2513.20.1000 and 2513.20.9000 were industrial garnet. 3Defined as crude production + imports – exports. 4Defined as imports – exports. 5See Appendix C for resource and reserve definitions and information concerning data sources.
U.S. Geological Survey, Mineral Commodity Summaries, February 2019
66
GEMSTONES1
(Data in million dollars unless otherwise noted) Domestic Production and Use: The combined value of U.S. natural and synthetic gemstone output in 2018 was an estimated $53 million, a 18% decrease compared with that of 2017. Domestic gemstone production included agate, beryl, coral, diamond, garnet, jade, jasper, opal, pearl, quartz, sapphire, shell, topaz, tourmaline, turquoise, and many other gem materials. In decreasing order of production value, Arizona, Oregon, Nevada, California, Montana, Maine, Arkansas, Colorado, Utah, Idaho, Tennessee, North Carolina, and New York produced 95% of U.S. natural gemstones. Synthetic gemstones were manufactured by four firms in North Carolina, California, South Carolina, and Arizona, in decreasing order of production value. Major gemstone uses were carvings, gem and mineral collections, and jewelry. The apparent consumption in the table below is much lower than the actual consumption because the value of exports includes the value of reexports. Salient Statistics—United States: 2014 2015 2016 2017 2018e Production:2 Natural3 9.5 8.5 11.7 9.2 10 Laboratory-created (synthetic) 51.0 55.1 54.9 55.1 43 Imports for consumption 26,400 25,100 25,200 25,100 28,000 Exports, including reexports4 21,300 18,500 19,500 21,100 23,000 Consumption, apparent5 5,160 6,660 5,770 4,060 5,100 Price Variable, depending on size, type, and quality Employment, mine, numbere 1,100 1,100 1,120 1,120 1,120 Net import reliance6 as a percentage of apparent consumption 99 99 99 99 99 Recycling: Gemstones are often recycled by being resold as estate jewelry, reset, or recut, but this report does not account for those stones. Import Sources (2014–17 by value): India, 35%; Israel, 35%; Belgium, 15%; South Africa, 4%; and other, 11%. Diamond imports accounted for 91% of the total value of gem imports. Tariff: Item Number Normal Trade Relations 12–31–18 Coral and similar materials, unworked 0508.00.0000 Free. Imitation gemstones 3926.90.4000 2.8% ad val. Pearls, imitation, not strung 7018.10.1000 4.0% ad val. Pearls, imitation, glass beads 7018.10.2000 Free. Pearls, natural 7101.10.0000 Free. Pearls, cultured 7101.21.0000 Free. Diamonds, unworked or sawn 7102.31.0000 Free. Diamonds, ½ carat or less 7102.39.0010 Free. Diamonds, cut, more than ½ carat 7102.39.0050 Free. Other nondiamond gemstones, unworked 7103.10.2000 Free. Other nondiamond gemstones, uncut 7103.10.4000 10.5% ad val. Rubies, cut 7103.91.0010 Free. Sapphires, cut 7103.91.0020 Free. Emeralds, cut 7103.91.0030 Free. Other nondiamond gemstones, cut 7103.99.1000 Free. Other nondiamond gemstones, worked 7103.99.5000 10.5% ad val. Synthetic gemstones, cut but not set 7104.90.1000 Free. Synthetic gemstones, other 7104.90.5000 6.4% ad val. Depletion Allowance: 14% (Domestic and foreign). Government Stockpile: None. Prepared by Donald W. Olson [(703) 648–7721, [email protected]]
67 GEMSTONES
Events, Trends, and Issues: In 2018, U.S. imports for consumption for gem-quality diamonds were estimated to be about $26 billion, which was a 13% increase compared with $22.7 billion in 2017. U.S. imports for consumption for natural, nondiamond gemstones was estimated to be about $2.0 billion, which was a 14% decrease compared with $2.30 billion in 2017. U.S. synthetic gemstone production decreased by 22% compared with that in 2017. Decreases in U.S. synthetic gemstone production were because the only U.S. cubic zirconia producer stopped producing at its U.S. production facility in November 2017. The United States accounted for more than 35% of the world’s diamond consumption and was once again the fastest-growing market in terms of consumer demand. The United States is expected to continue to dominate global gemstone demand. Demand also increased in China, but growth in the other main markets declined. During the first half of 2018, worldwide rough diamond sales to cutting centers were higher than during the same period in 2017. Total world diamond production during 2018 fell slightly from 2017 levels, owing to a suspension of operations at a mine in Russia and reduced production in Canada. Production is expected to continue to decline, and new projects and expansions will not replace the output lost from closing mines. By 2025, several large mines are expected to reach the end of their mine life, and only a few new projects are in the pipeline. World Gem Diamond Mine Production and Reserves: Mine production7 Reserves8 2017 2018e United States (9) (9) World reserves of diamond-bearing Angola 8,500 8,500 deposits are substantial. No reserves Australia 343 340 data are available for other gemstones. Botswana 16,000 16,000 Brazil 255 250 Canada 23,200 23,000 China 230 230 Congo (Kinshasa) 3,780 3,700 Guinea 145 140 Lesotho 1,130 1,100 Namibia 1,950 1,900 Russia 23,800 23,000 Sierra Leone 231 230 South Africa 7,750 7,700 Tanzania 260 260 Zimbabwe 251 250 Other countries 277 480 World total (rounded) 88,100 87,000 World Resources: Most diamond-bearing ore bodies have a diamond content that ranges from less than 1 carat per ton to about 6 carats per ton of ore. The major gem diamond reserves are in southern Africa, Australia, Canada, and Russia. Substitutes: Glass, plastics, and other materials are substituted for natural gemstones. Synthetic gemstones (manufactured materials that have the same chemical and physical properties as gemstones) are common substitutes. Simulants (materials that appear to be gems but differ in chemical and physical characteristics) also are frequently substituted for natural gemstones. eEstimated. 1Excludes industrial diamond and industrial garnet. See Diamond (Industrial) and Garnet (Industrial). 2Estimated minimum production. 3Includes production of freshwater shell. 4Reexports account for between 67% and 92% of the totals. 5Defined as production (natural and synthetic) + imports – exports (including reexports). 6Defined as imports – exports (including reexports). 7Data in thousands of carats of gem diamond. 8See Appendix C for resource and reserve definitions and information concerning data sources. 9Less than ½ unit.
U.S. Geological Survey, Mineral Commodity Summaries, February 2019
68
GERMANIUM
(Data in kilograms of germanium content unless otherwise noted) Domestic Production and Use: In 2018, zinc concentrates containing germanium were produced at mines in Alaska, Tennessee, and Washington. Germanium-containing concentrates in Alaska and Washington were exported to a refinery in Canada for processing and germanium recovery. A zinc smelter in Clarksville, TN, produced and exported germanium leach concentrates recovered from processing zinc concentrates from the Middle Tennessee Mines. Germanium in the form of compounds and metal was imported into the United States for further processing by industry. A company in Utah produced germanium wafers for solar cells used in satellites from imported and recycled germanium. A refinery in Oklahoma recovered germanium from industry-generated scrap and produced germanium tetrachloride for the production of fiber optics. The estimated value of germanium consumed in 2018, based on the annual average price, was about $35 million, about 8% more than that in 2017. Salient Statistics—United States: 2014 2015 2016 2017 2018e Production: Primary refinery — — — — — Secondary refinery W W W W W Imports for consumption: Germanium metal 23,700 20,100 11,000 11,100 8,000 Germanium dioxide1 12,500 14,300 15,200 12,000 13,000 Total exports2 12,000 5,000 4,780 3,670 4,900 Shipments from Government stockpile 33,000 — — — — Consumption, estimated 32,000 34,000 30,000 30,000 27,000 Price, annual average, dollars per kilogram:4 Germanium metal 1,918 1,792 1,087 1,082 1,300 Germanium dioxide 1,291 1,211 830 731 1,100 Net import reliance5 as a percentage of estimated consumption >75% >75% >50% >50% >50% Recycling: Worldwide, about 30% of the total germanium consumed is produced from recycled materials. During the manufacture of most optical devices, more than 60% of the germanium metal used is routinely recycled as new scrap. Germanium scrap is also recovered from the windows in decommissioned tanks and other military vehicles. The United States has the capability to recycle new and old scrap. Import Sources (2014–17):6 Germanium metal: China, 58%; Belgium, 26%; Germany, 7%; Russia, 6%; and other, 3%. Tariff: Item Number Normal Trade Relations 12–31–18 Germanium oxides and zirconium dioxide 2825.60.0000 3.7% ad val. Metal, unwrought 8112.92.6000 2.6% ad val. Metal, powder 8112.92.6500 4.4% ad val. Metal, wrought 8112.99.1000 4.4% ad val. Depletion Allowance: 14% (Domestic and foreign). Government Stockpile:7 FY2018 FY 2019 Inventory Potential Potential Potential Potential Material As of 9–30–18 Acquisitions Disposals8 Acquisitions Disposals8
Germanium metal 14,004 1,000 — — — Germanium scrap (gross weight) 2,806 — 5,000 — 5,000 Germanium wafers (each) 76,454 — — — — Events, Trends, and Issues: The major global end uses for germanium were electronics and solar applications, fiber-optic systems, infrared optics, polymerization catalysts, and other uses (such as chemotherapy, metallurgy, and phosphors). Germanium-containing infrared optics were primarily for military use, but the commercial applications for thermal-imaging devices that use germanium lenses have increased during the past few years. Prepared by Christine L. Thomas [(703) 648–7713, [email protected]]
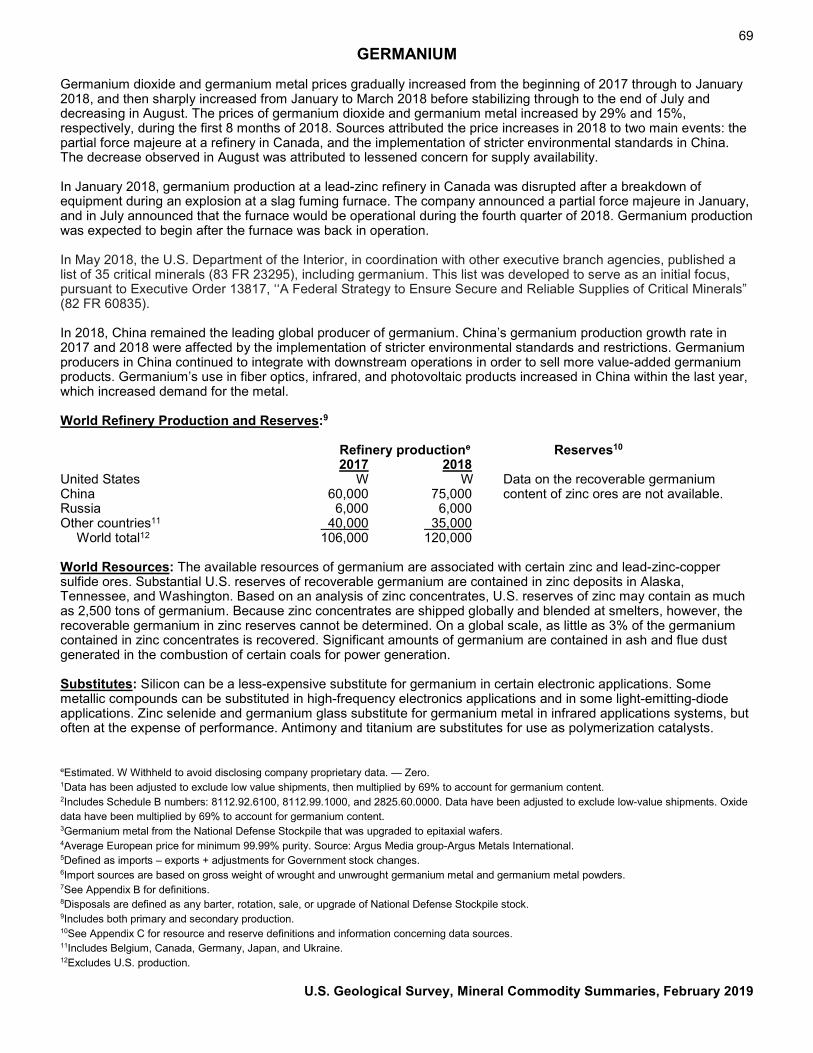
69 GERMANIUM
Germanium dioxide and germanium metal prices gradually increased from the beginning of 2017 through to January 2018, and then sharply increased from January to March 2018 before stabilizing through to the end of July and decreasing in August. The prices of germanium dioxide and germanium metal increased by 29% and 15%, respectively, during the first 8 months of 2018. Sources attributed the price increases in 2018 to two main events: the partial force majeure at a refinery in Canada, and the implementation of stricter environmental standards in China. The decrease observed in August was attributed to lessened concern for supply availability. In January 2018, germanium production at a lead-zinc refinery in Canada was disrupted after a breakdown of equipment during an explosion at a slag fuming furnace. The company announced a partial force majeure in January, and in July announced that the furnace would be operational during the fourth quarter of 2018. Germanium production was expected to begin after the furnace was back in operation. In May 2018, the U.S. Department of the Interior, in coordination with other executive branch agencies, published a list of 35 critical minerals (83 FR 23295), including germanium. This list was developed to serve as an initial focus, pursuant to Executive Order 13817, ‘‘A Federal Strategy to Ensure Secure and Reliable Supplies of Critical Minerals” (82 FR 60835). In 2018, China remained the leading global producer of germanium. China’s germanium production growth rate in 2017 and 2018 were affected by the implementation of stricter environmental standards and restrictions. Germanium producers in China continued to integrate with downstream operations in order to sell more value-added germanium products. Germanium’s use in fiber optics, infrared, and photovoltaic products increased in China within the last year, which increased demand for the metal. World Refinery Production and Reserves:9
Refinery productione Reserves10 2017 2018 United States W W Data on the recoverable germanium China 60,000 75,000 content of zinc ores are not available. Russia 6,000 6,000 Other countries11 40,000 35,000 World total12 106,000 120,000 World Resources: The available resources of germanium are associated with certain zinc and lead-zinc-copper sulfide ores. Substantial U.S. reserves of recoverable germanium are contained in zinc deposits in Alaska, Tennessee, and Washington. Based on an analysis of zinc concentrates, U.S. reserves of zinc may contain as much as 2,500 tons of germanium. Because zinc concentrates are shipped globally and blended at smelters, however, the recoverable germanium in zinc reserves cannot be determined. On a global scale, as little as 3% of the germanium contained in zinc concentrates is recovered. Significant amounts of germanium are contained in ash and flue dust generated in the combustion of certain coals for power generation. Substitutes: Silicon can be a less-expensive substitute for germanium in certain electronic applications. Some metallic compounds can be substituted in high-frequency electronics applications and in some light-emitting-diode applications. Zinc selenide and germanium glass substitute for germanium metal in infrared applications systems, but often at the expense of performance. Antimony and titanium are substitutes for use as polymerization catalysts. eEstimated. W Withheld to avoid disclosing company proprietary data. — Zero. 1Data has been adjusted to exclude low value shipments, then multiplied by 69% to account for germanium content. 2Includes Schedule B numbers: 8112.92.6100, 8112.99.1000, and 2825.60.0000. Data have been adjusted to exclude low-value shipments. Oxide data have been multiplied by 69% to account for germanium content. 3Germanium metal from the National Defense Stockpile that was upgraded to epitaxial wafers. 4Average European price for minimum 99.99% purity. Source: Argus Media group-Argus Metals International. 5Defined as imports – exports + adjustments for Government stock changes. 6Import sources are based on gross weight of wrought and unwrought germanium metal and germanium metal powders. 7See Appendix B for definitions. 8Disposals are defined as any barter, rotation, sale, or upgrade of National Defense Stockpile stock. 9Includes both primary and secondary production. 10See Appendix C for resource and reserve definitions and information concerning data sources. 11Includes Belgium, Canada, Germany, Japan, and Ukraine. 12Excludes U.S. production.
U.S. Geological Survey, Mineral Commodity Summaries, February 2019
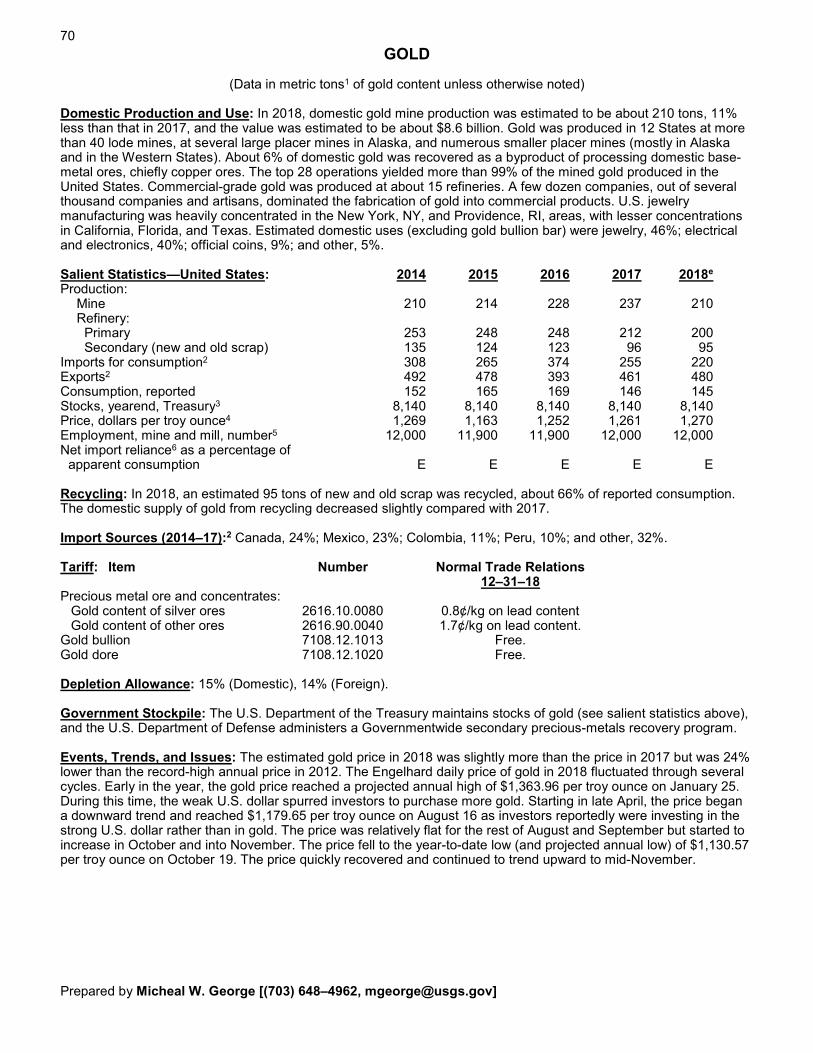
70
GOLD
(Data in metric tons1 of gold content unless otherwise noted) Domestic Production and Use: In 2018, domestic gold mine production was estimated to be about 210 tons, 11% less than that in 2017, and the value was estimated to be about $8.6 billion. Gold was produced in 12 States at more than 40 lode mines, at several large placer mines in Alaska, and numerous smaller placer mines (mostly in Alaska and in the Western States). About 6% of domestic gold was recovered as a byproduct of processing domestic base-metal ores, chiefly copper ores. The top 28 operations yielded more than 99% of the mined gold produced in the United States. Commercial-grade gold was produced at about 15 refineries. A few dozen companies, out of several thousand companies and artisans, dominated the fabrication of gold into commercial products. U.S. jewelry manufacturing was heavily concentrated in the New York, NY, and Providence, RI, areas, with lesser concentrations in California, Florida, and Texas. Estimated domestic uses (excluding gold bullion bar) were jewelry, 46%; electrical and electronics, 40%; official coins, 9%; and other, 5%. Salient Statistics—United States: 2014 2015 2016 2017 2018e Production: Mine 210 214 228 237 210 Refinery: Primary 253 248 248 212 200 Secondary (new and old scrap) 135 124 123 96 95 Imports for consumption2 308 265 374 255 220 Exports2 492 478 393 461 480 Consumption, reported 152 165 169 146 145 Stocks, yearend, Treasury3 8,140 8,140 8,140 8,140 8,140 Price, dollars per troy ounce4 1,269 1,163 1,252 1,261 1,270 Employment, mine and mill, number5 12,000 11,900 11,900 12,000 12,000 Net import reliance6 as a percentage of apparent consumption E E E E E Recycling: In 2018, an estimated 95 tons of new and old scrap was recycled, about 66% of reported consumption. The domestic supply of gold from recycling decreased slightly compared with 2017. Import Sources (2014–17):2 Canada, 24%; Mexico, 23%; Colombia, 11%; Peru, 10%; and other, 32%. Tariff: Item Number Normal Trade Relations 12–31–18 Precious metal ore and concentrates: Gold content of silver ores 2616.10.0080 0.8¢/kg on lead content Gold content of other ores 2616.90.0040 1.7¢/kg on lead content. Gold bullion 7108.12.1013 Free. Gold dore 7108.12.1020 Free. Depletion Allowance: 15% (Domestic), 14% (Foreign). Government Stockpile: The U.S. Department of the Treasury maintains stocks of gold (see salient statistics above), and the U.S. Department of Defense administers a Governmentwide secondary precious-metals recovery program. Events, Trends, and Issues: The estimated gold price in 2018 was slightly more than the price in 2017 but was 24% lower than the record-high annual price in 2012. The Engelhard daily price of gold in 2018 fluctuated through several cycles. Early in the year, the gold price reached a projected annual high of $1,363.96 per troy ounce on January 25. During this time, the weak U.S. dollar spurred investors to purchase more gold. Starting in late April, the price began a downward trend and reached $1,179.65 per troy ounce on August 16 as investors reportedly were investing in the strong U.S. dollar rather than in gold. The price was relatively flat for the rest of August and September but started to increase in October and into November. The price fell to the year-to-date low (and projected annual low) of $1,130.57 per troy ounce on October 19. The price quickly recovered and continued to trend upward to mid-November. Prepared by Micheal W. George [(703) 648–4962, [email protected]]
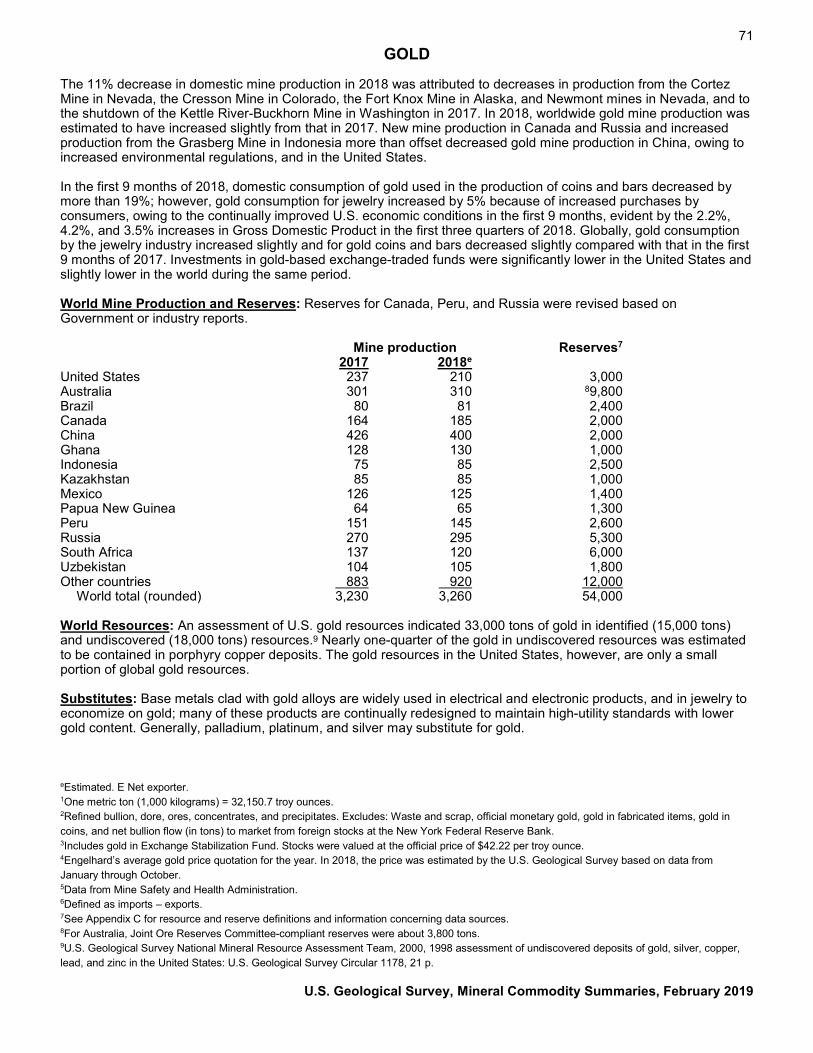
71 GOLD
The 11% decrease in domestic mine production in 2018 was attributed to decreases in production from the Cortez Mine in Nevada, the Cresson Mine in Colorado, the Fort Knox Mine in Alaska, and Newmont mines in Nevada, and to the shutdown of the Kettle River-Buckhorn Mine in Washington in 2017. In 2018, worldwide gold mine production was estimated to have increased slightly from that in 2017. New mine production in Canada and Russia and increased production from the Grasberg Mine in Indonesia more than offset decreased gold mine production in China, owing to increased environmental regulations, and in the United States. In the first 9 months of 2018, domestic consumption of gold used in the production of coins and bars decreased by more than 19%; however, gold consumption for jewelry increased by 5% because of increased purchases by consumers, owing to the continually improved U.S. economic conditions in the first 9 months, evident by the 2.2%, 4.2%, and 3.5% increases in Gross Domestic Product in the first three quarters of 2018. Globally, gold consumption by the jewelry industry increased slightly and for gold coins and bars decreased slightly compared with that in the first 9 months of 2017. Investments in gold-based exchange-traded funds were significantly lower in the United States and slightly lower in the world during the same period. World Mine Production and Reserves: Reserves for Canada, Peru, and Russia were revised based on Government or industry reports. Mine production Reserves7 2017 2018e United States 237 210 3,000 Australia 301 310 89,800 Brazil 80 81 2,400 Canada 164 185 2,000 China 426 400 2,000 Ghana 128 130 1,000 Indonesia 75 85 2,500 Kazakhstan 85 85 1,000 Mexico 126 125 1,400 Papua New Guinea 64 65 1,300 Peru 151 145 2,600 Russia 270 295 5,300 South Africa 137 120 6,000 Uzbekistan 104 105 1,800 Other countries 883 920 12,000 World total (rounded) 3,230 3,260 54,000 World Resources: An assessment of U.S. gold resources indicated 33,000 tons of gold in identified (15,000 tons) and undiscovered (18,000 tons) resources.9 Nearly one-quarter of the gold in undiscovered resources was estimated to be contained in porphyry copper deposits. The gold resources in the United States, however, are only a small portion of global gold resources. Substitutes: Base metals clad with gold alloys are widely used in electrical and electronic products, and in jewelry to economize on gold; many of these products are continually redesigned to maintain high-utility standards with lower gold content. Generally, palladium, platinum, and silver may substitute for gold. eEstimated. E Net exporter. 1One metric ton (1,000 kilograms) = 32,150.7 troy ounces. 2Refined bullion, dore, ores, concentrates, and precipitates. Excludes: Waste and scrap, official monetary gold, gold in fabricated items, gold in coins, and net bullion flow (in tons) to market from foreign stocks at the New York Federal Reserve Bank. 3Includes gold in Exchange Stabilization Fund. Stocks were valued at the official price of $42.22 per troy ounce. 4Engelhard’s average gold price quotation for the year. In 2018, the price was estimated by the U.S. Geological Survey based on data from January through October. 5Data from Mine Safety and Health Administration. 6Defined as imports – exports. 7See Appendix C for resource and reserve definitions and information concerning data sources. 8For Australia, Joint Ore Reserves Committee-compliant reserves were about 3,800 tons. 9U.S. Geological Survey National Mineral Resource Assessment Team, 2000, 1998 assessment of undiscovered deposits of gold, silver, copper, lead, and zinc in the United States: U.S. Geological Survey Circular 1178, 21 p.
U.S. Geological Survey, Mineral Commodity Summaries, February 2019
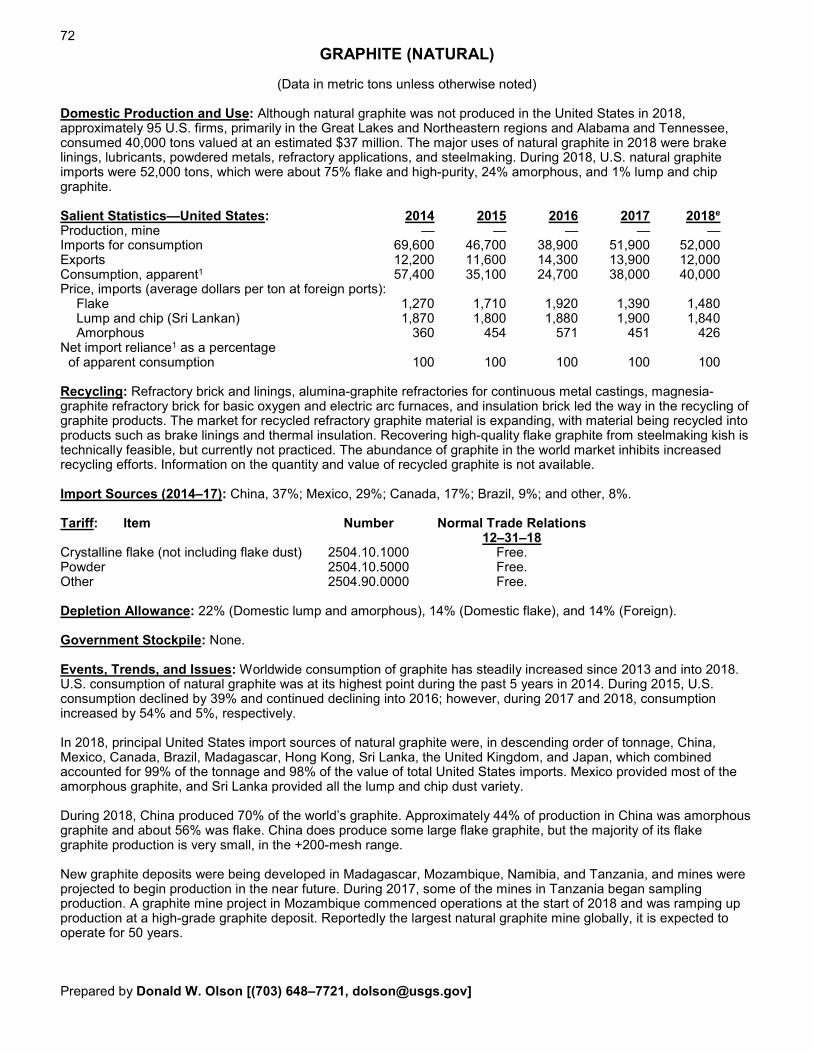
72
GRAPHITE (NATURAL)
(Data in metric tons unless otherwise noted) Domestic Production and Use: Although natural graphite was not produced in the United States in 2018, approximately 95 U.S. firms, primarily in the Great Lakes and Northeastern regions and Alabama and Tennessee, consumed 40,000 tons valued at an estimated $37 million. The major uses of natural graphite in 2018 were brake linings, lubricants, powdered metals, refractory applications, and steelmaking. During 2018, U.S. natural graphite imports were 52,000 tons, which were about 75% flake and high-purity, 24% amorphous, and 1% lump and chip graphite. Salient Statistics—United States: 2014 2015 2016 2017 2018e Production, mine — — — — — Imports for consumption 69,600 46,700 38,900 51,900 52,000 Exports 12,200 11,600 14,300 13,900 12,000 Consumption, apparent1 57,400 35,100 24,700 38,000 40,000 Price, imports (average dollars per ton at foreign ports): Flake 1,270 1,710 1,920 1,390 1,480 Lump and chip (Sri Lankan) 1,870 1,800 1,880 1,900 1,840 Amorphous 360 454 571 451 426 Net import reliance1 as a percentage of apparent consumption 100 100 100 100 100 Recycling: Refractory brick and linings, alumina-graphite refractories for continuous metal castings, magnesia-graphite refractory brick for basic oxygen and electric arc furnaces, and insulation brick led the way in the recycling of graphite products. The market for recycled refractory graphite material is expanding, with material being recycled into products such as brake linings and thermal insulation. Recovering high-quality flake graphite from steelmaking kish is technically feasible, but currently not practiced. The abundance of graphite in the world market inhibits increased recycling efforts. Information on the quantity and value of recycled graphite is not available. Import Sources (2014–17): China, 37%; Mexico, 29%; Canada, 17%; Brazil, 9%; and other, 8%. Tariff: Item Number Normal Trade Relations 12–31–18 Crystalline flake (not including flake dust) 2504.10.1000 Free. Powder 2504.10.5000 Free. Other 2504.90.0000 Free. Depletion Allowance: 22% (Domestic lump and amorphous), 14% (Domestic flake), and 14% (Foreign). Government Stockpile: None. Events, Trends, and Issues: Worldwide consumption of graphite has steadily increased since 2013 and into 2018. U.S. consumption of natural graphite was at its highest point during the past 5 years in 2014. During 2015, U.S. consumption declined by 39% and continued declining into 2016; however, during 2017 and 2018, consumption increased by 54% and 5%, respectively. In 2018, principal United States import sources of natural graphite were, in descending order of tonnage, China, Mexico, Canada, Brazil, Madagascar, Hong Kong, Sri Lanka, the United Kingdom, and Japan, which combined accounted for 99% of the tonnage and 98% of the value of total United States imports. Mexico provided most of the amorphous graphite, and Sri Lanka provided all the lump and chip dust variety. During 2018, China produced 70% of the world’s graphite. Approximately 44% of production in China was amorphous graphite and about 56% was flake. China does produce some large flake graphite, but the majority of its flake graphite production is very small, in the +200-mesh range. New graphite deposits were being developed in Madagascar, Mozambique, Namibia, and Tanzania, and mines were projected to begin production in the near future. During 2017, some of the mines in Tanzania began sampling production. A graphite mine project in Mozambique commenced operations at the start of 2018 and was ramping up production at a high-grade graphite deposit. Reportedly the largest natural graphite mine globally, it is expected to operate for 50 years. Prepared by Donald W. Olson [(703) 648–7721, [email protected]]
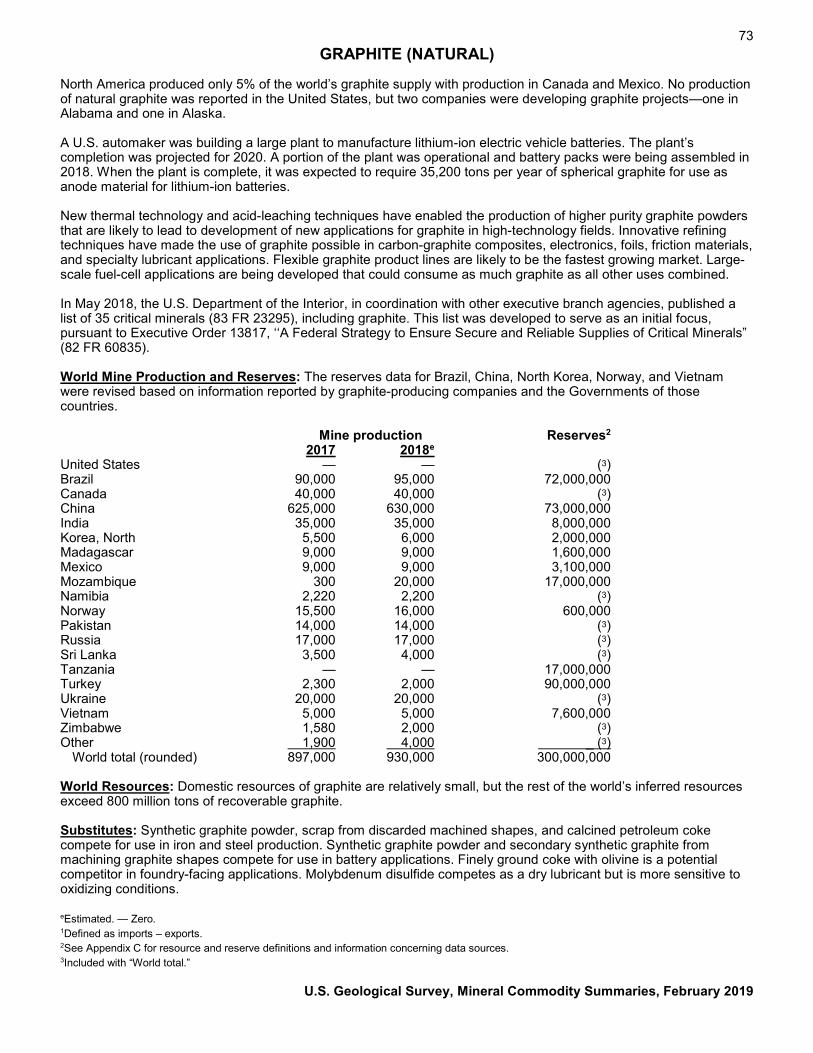
73 GRAPHITE (NATURAL)
North America produced only 5% of the world’s graphite supply with production in Canada and Mexico. No production of natural graphite was reported in the United States, but two companies were developing graphite projects—one in Alabama and one in Alaska. A U.S. automaker was building a large plant to manufacture lithium-ion electric vehicle batteries. The plant’s completion was projected for 2020. A portion of the plant was operational and battery packs were being assembled in 2018. When the plant is complete, it was expected to require 35,200 tons per year of spherical graphite for use as anode material for lithium-ion batteries. New thermal technology and acid-leaching techniques have enabled the production of higher purity graphite powders that are likely to lead to development of new applications for graphite in high-technology fields. Innovative refining techniques have made the use of graphite possible in carbon-graphite composites, electronics, foils, friction materials, and specialty lubricant applications. Flexible graphite product lines are likely to be the fastest growing market. Large-scale fuel-cell applications are being developed that could consume as much graphite as all other uses combined. In May 2018, the U.S. Department of the Interior, in coordination with other executive branch agencies, published a list of 35 critical minerals (83 FR 23295), including graphite. This list was developed to serve as an initial focus, pursuant to Executive Order 13817, ‘‘A Federal Strategy to Ensure Secure and Reliable Supplies of Critical Minerals” (82 FR 60835). World Mine Production and Reserves: The reserves data for Brazil, China, North Korea, Norway, and Vietnam were revised based on information reported by graphite-producing companies and the Governments of those countries. Mine production Reserves2 2017 2018e United States — — (3) Brazil 90,000 95,000 72,000,000 Canada 40,000 40,000 (3) China 625,000 630,000 73,000,000 India 35,000 35,000 8,000,000 Korea, North 5,500 6,000 2,000,000 Madagascar 9,000 9,000 1,600,000 Mexico 9,000 9,000 3,100,000 Mozambique 300 20,000 17,000,000 Namibia 2,220 2,200 (3) Norway 15,500 16,000 600,000 Pakistan 14,000 14,000 (3) Russia 17,000 17,000 (3) Sri Lanka 3,500 4,000 (3) Tanzania — — 17,000,000 Turkey 2,300 2,000 90,000,000 Ukraine 20,000 20,000 (3) Vietnam 5,000 5,000 7,600,000 Zimbabwe 1,580 2,000 (3) Other 1,900 4,000 _ (3) World total (rounded) 897,000 930,000 300,000,000 World Resources: Domestic resources of graphite are relatively small, but the rest of the world’s inferred resources exceed 800 million tons of recoverable graphite. Substitutes: Synthetic graphite powder, scrap from discarded machined shapes, and calcined petroleum coke compete for use in iron and steel production. Synthetic graphite powder and secondary synthetic graphite from machining graphite shapes compete for use in battery applications. Finely ground coke with olivine is a potential competitor in foundry-facing applications. Molybdenum disulfide competes as a dry lubricant but is more sensitive to oxidizing conditions. eEstimated. — Zero. 1Defined as imports – exports. 2See Appendix C for resource and reserve definitions and information concerning data sources. 3Included with “World total.”
U.S. Geological Survey, Mineral Commodity Summaries, February 2019
74 GYPSUM
(Data in thousand metric tons unless otherwise noted)
Domestic Production and Use: In 2018, domestic production of crude gypsum was estimated to be 21 million tons with a value of about $168 million. The leading crude gypsum-producing States were Colorado, Iowa, Kansas, Nevada, Oklahoma, and Texas, which together accounted for an estimated 67% of total output. Overall, 47 companies produced or processed gypsum in the United States at 50 mines in 16 States. The majority of domestic consumption, which totaled approximately 48 million tons, was used by agriculture, cement production, and manufacturers of wallboard and plaster products. Small quantities of high-purity gypsum, used in a wide range of industrial processes, accounted for the remaining tonnage. At the beginning of 2018, the production capacity of operating wallboard plants in the United States was about 33.4 billion square feet1 per year. Total wallboard sales were estimated to be 25.5 billion square feet.
Salient Statistics—United States: 2014 2015 2016 2017 2018e Production:
Crude 18,300 18,800 19,800 20,700 21,000 Synthetic2 15,200 15,500 16,700 20,700 22,000 Calcined3 16,100 16,500 17,900 17,800 18,000
Wallboard products sold (million square feet1) 21,500 22,100 24,400 25,000 25,500 Imports, crude, including anhydrite 3,720 4,030 4,340 4,890 5,400 Exports, crude, not ground or calcined 67 63 43 36 34 Consumption, apparent4 37,100 38,200 40,700 46,300 48,000 Price:
Average crude, free on board (f.o.b.) mine, dollars per metric ton 8.00 7.80 8.00 7.50 7.80
Average calcined, f.o.b. plant, dollars per metric ton 27.00 28.00 30.00 30.00 31.00 Employment, mine and calcining plant, numbere 4,500 4,500 4,500 4,500 4,500 Net import reliance5 as a percentage
of apparent consumption 10 10 11 10 11
Recycling: Approximately 700,000 tons of gypsum scrap that was generated by wallboard manufacturing was recycled onsite. The recycling of wallboard from new construction and demolition sources also took place, although those amounts are unknown. Recycled gypsum was used primarily for agricultural purposes and feedstock for the manufacture of new wallboard. Other potential markets for recycled gypsum include athletic field marking, cement production as a stucco additive, grease absorption, sludge drying, and water treatment.
Import Sources (2014–17): Mexico, 41%; Canada, 30%; Spain, 27%; and other, 2%.
Tariff: Item Number Normal Trade Relations 12–31–18
Gypsum; anhydrite 2520.10.0000 Free.
Depletion Allowance: 14% (Domestic and foreign).
Government Stockpile: None.
Events, Trends, and Issues: U.S. gypsum production increased slightly compared with that of 2017. Apparent consumption increased by 4% compared with that of 2017. The world’s leading crude gypsum producer, the United States, produced an estimated 21 million tons. Iran, tied for second with China in world production, supplied much of the gypsum needed for construction in the Middle East. China and Iran each produced an estimated 16 million tons. Spain, the leading European producer, ranked seventh in the world and supplied crude gypsum and gypsum products to much of Western Europe. Increased use of wallboard in Asia, coupled with new gypsum product plants, spurred increased production in that region. As wallboard becomes more widely used in other regions, worldwide production of gypsum is expected to increase.
Prior year chapters of this commodity included gypsum production for China that totaled as much as 130 million tons. However, recently acquired information revealed that the vast majority of that amount was likely synthetic gypsum, which is not “mine production.” Hence, the large decrease in reported gypsum in China reflects a recategorization of gypsum material and should not be interpreted as a large decrease in the overall total world production of gypsum nor the production of gypsum in China.
Prepared by Robert D. Crangle, Jr. [(703) 648–6410, [email protected]]
75 GYPSUM
Demand for gypsum depends principally on construction industry activity, particularly in the United States, where the majority of gypsum consumed is used for building plasters, the manufacture of portland cement, and wallboard products. If the construction of wallboard manufacturing plants designed to use synthetic gypsum from coal flue gas desulfurization (FGD) units as feedstock continues, this could result in less mining of natural gypsum. The availability of inexpensive natural gas, however, may limit the additional construction of FGD units and, therefore, the use of synthetic gypsum in wallboard. U.S. gypsum imports increased by 10% compared with those of 2017. Exports, although very low compared with imports and often subject to wide fluctuations, decreased by 6%.
World Mine Production and Reserves: Reserves for Brazil, India, and Turkey were revised based on Government and other public data.
Mine production Reserves6 2017 2018e
United States 21,000 700,000 Algeria 2,200 NA Argentina 1,500 NA Australia 1,400 NA Brazil 3,400 340,000 Canada 1,700 450,000 China 16,000 NA Egypt 2,200 NA France 4,200 NA Germany 3,100 NA India 2,700 36,000 Iran 16,000 1,600 Japan 4,700 NA Mexico 5,400 NA Oman 5,500 4,900 Pakistan 2,000 NA Russia 4,000 NA Saudi Arabia 3,200 NA Spain 7,000 NA Thailand 9,300 NA Turkey 9,000 200,000 Other countries 21,000 NA
World total (rounded)
20,700 2,200 1,500 1,400 3,400 1,700
15,500 2,200 4,200 3,100 2,700
16,000 4,700 5,400 5,500 2,000 4,000 3,150 7,000 9,250 9,000
16,100 141,000 150,000 Large
World Resources: Reserves are large in major producing countries, but data for most are not available. Domestic gypsum resources are adequate but unevenly distributed. Large imports from Canada augment domestic supplies for wallboard manufacturing in the United States, particularly in the eastern and southern coastal regions. Imports from Mexico supplement domestic supplies for wallboard manufacturing along portions of the U.S. western seaboard. Large gypsum deposits occur in the Great Lakes region, the midcontinent region, and several Western States. Foreign resources are large and widely distributed; 82 countries were thought to produce gypsum in 2018.
Substitutes: In such applications as stucco and plaster, cement and lime may be substituted for gypsum; brick, glass, metallic or plastic panels, and wood may be substituted for wallboard. Gypsum has no practical substitute in the manufacturing of portland cement. Synthetic gypsum generated by various industrial processes, including FGD of smokestack emissions, is very important as a substitute for mined gypsum in wallboard manufacturing, cement production, and agricultural applications (in descending order by tonnage). In 2018, synthetic gypsum accounted for more than 50% of the total domestic gypsum supply.
eEstimated. NA Not available. 1The standard unit used in the U.S. wallboard industry is square feet; multiply square feet by 9.29 x 10⁻² to convert to square meters. Source: The Gypsum Association. 2Data refer to the amount sold or used, not produced. Source: American Coal Ash Association. 3From domestic crude and synthetic. 4Defined as crude production + total synthetic reported used + imports – exports. 5Defined as imports – exports. 6See Appendix C for resource and reserve definitions and information concerning data sources.
U.S. Geological Survey, Mineral Commodity Summaries, February 2019
76
HELIUM
(Data in million cubic meters of contained helium gas1 unless otherwise noted) Domestic Production and Use: The estimated value of Grade-A helium (99.997% or greater) extracted during 2018 by private industry was about $682 million. Fourteen plants (one in Arizona, two in Colorado, five in Kansas, one in Oklahoma, four in Texas, and one in Utah) extracted helium from natural gas and produced crude helium that ranged from 50% to 99% helium. One plant in Colorado and another in Wyoming extracted helium from natural gas and produced Grade-A helium. Three plants in Kansas and one in Oklahoma accepted crude helium from other producers and the Bureau of Land Management (BLM) pipeline and purified it to Grade-A helium. In 2018, estimated domestic consumption of Grade-A helium was 39 million cubic meters (1.4 billion cubic feet), and it was used for magnetic resonance imaging, 30%; lifting gas, 17%; analytical and laboratory applications, 14%; welding, 9%; engineering and scientific applications, 6%; leak detection and semiconductor manufacturing, 5% each; and various other minor applications, 14%. Salient Statistics—United States: 2014 2015 2016 2017 2018e Helium extracted from natural gas2 75 71 66 63 64 Withdrawn from storage3 27 20 23 28 26 Grade-A helium sales 102 91 89 91 90 Imports for consumption 7 16 24 21 22 Exports 67 65 61 69 73 Consumption, apparent4 42 42 52 43 39 Net import reliance5 as a percentage of apparent consumption E E E E E In fiscal year (FY) 2018, the price for crude helium to Government users was $3.10 per cubic meter ($86.00 per thousand cubic feet) and to nongovernment users was $4.29 per cubic meter ($119.00 per thousand cubic feet). The price for the Government-owned helium is mandated by the Helium Stewardship Act of 2013 (Public Law 113–40) and determined through public auctions and industry surveys. The estimated price for private industry’s Grade-A helium was about $7.57 per cubic meter ($210 per thousand cubic feet), with some producers posting surcharges to this price. Recycling: In the United States, helium used in large-volume applications is seldom recycled. Some low-volume or liquid boil-off recovery systems are used. In the rest of the world, helium recycling is practiced more often. Import Sources (2014–17): Qatar, 79%; and other, 21%. Tariff: Item Number Normal Trade Relations 12–31–18 Helium 2804.29.0010 3.7% ad val. Depletion Allowance: Allowances are applicable to natural gas from which helium is extracted, but no allowance is granted directly to helium. Government Stockpile: Under the Helium Stewardship Act of 2013, the BLM manages the Federal Helium Program, which includes all operations of the Cliffside Field helium storage reservoir, in Potter County, TX, and the Government’s crude helium pipeline system. Private firms that sell Grade-A helium to Federal agencies are required to purchase a like amount of (in-kind) crude helium from the BLM. The law mandated that the BLM annually sell at auction Federal Conservation helium stored in Bush Dome at the Cliffside Field. The amounts sold are approximately equal to the amount that the Federal helium system can produce each year. The BLM will dispose of all helium- related assets when the remaining conservation helium falls below 83.2 million cubic meters or no later than 2021. In FY 2018, privately owned companies purchased about 4.4 million cubic meters (158 million cubic feet) of in-kind crude helium. Privately owned companies also purchased 8.3 million cubic meters (300 million cubic feet) of open market sales helium. During FY 2018, the BLM’s Amarillo Field Office, Helium Operations, accepted about 3.3 million cubic meters (119 million cubic feet) of private helium for storage and redelivered nearly 30.5 million cubic meters (1.1 billion cubic feet). As of September 30, 2018, about 85.9 million cubic meters (3.1 billion cubic feet) of privately owned helium remained in storage at Cliffside Field.
Stockpile Status—9–30–186
Authorized Disposal plan Disposals Material Inventory for disposal FY 2018 FY 2018 Helium 83.1 74.8 8.3 8.3 Prepared by Joseph B. Peterson7 [(806) 356–1030, [email protected]]
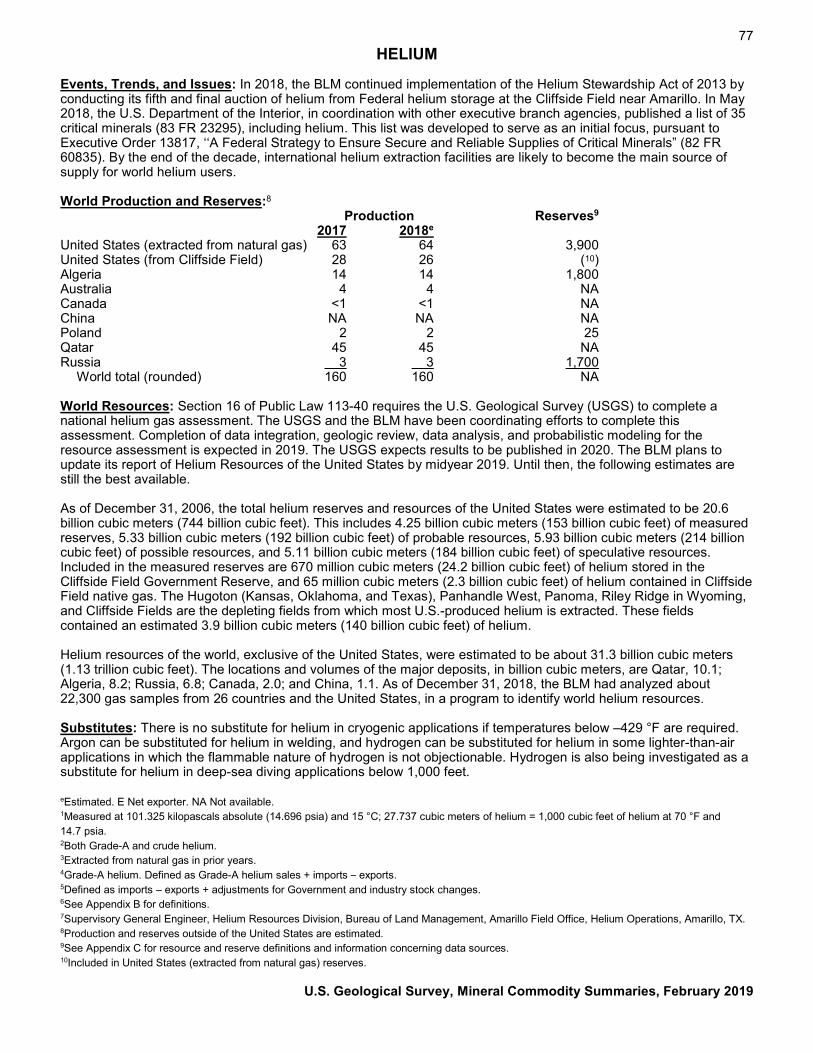
77 HELIUM
Events, Trends, and Issues: In 2018, the BLM continued implementation of the Helium Stewardship Act of 2013 by conducting its fifth and final auction of helium from Federal helium storage at the Cliffside Field near Amarillo. In May 2018, the U.S. Department of the Interior, in coordination with other executive branch agencies, published a list of 35 critical minerals (83 FR 23295), including helium. This list was developed to serve as an initial focus, pursuant to Executive Order 13817, ‘‘A Federal Strategy to Ensure Secure and Reliable Supplies of Critical Minerals” (82 FR 60835). By the end of the decade, international helium extraction facilities are likely to become the main source of supply for world helium users. World Production and Reserves:8
Production Reserves9 2017 2018e United States (extracted from natural gas) 63 64 3,900 United States (from Cliffside Field) 28 26 (10) Algeria 14 14 1,800 Australia 4 4 NA Canada <1 <1 NA China NA NA NA Poland 2 2 25 Qatar 45 45 NA Russia 3 3 1,700 World total (rounded) 160 160 NA World Resources: Section 16 of Public Law 113-40 requires the U.S. Geological Survey (USGS) to complete a national helium gas assessment. The USGS and the BLM have been coordinating efforts to complete this assessment. Completion of data integration, geologic review, data analysis, and probabilistic modeling for the resource assessment is expected in 2019. The USGS expects results to be published in 2020. The BLM plans to update its report of Helium Resources of the United States by midyear 2019. Until then, the following estimates are still the best available. As of December 31, 2006, the total helium reserves and resources of the United States were estimated to be 20.6 billion cubic meters (744 billion cubic feet). This includes 4.25 billion cubic meters (153 billion cubic feet) of measured reserves, 5.33 billion cubic meters (192 billion cubic feet) of probable resources, 5.93 billion cubic meters (214 billion cubic feet) of possible resources, and 5.11 billion cubic meters (184 billion cubic feet) of speculative resources. Included in the measured reserves are 670 million cubic meters (24.2 billion cubic feet) of helium stored in the Cliffside Field Government Reserve, and 65 million cubic meters (2.3 billion cubic feet) of helium contained in Cliffside Field native gas. The Hugoton (Kansas, Oklahoma, and Texas), Panhandle West, Panoma, Riley Ridge in Wyoming, and Cliffside Fields are the depleting fields from which most U.S.-produced helium is extracted. These fields contained an estimated 3.9 billion cubic meters (140 billion cubic feet) of helium. Helium resources of the world, exclusive of the United States, were estimated to be about 31.3 billion cubic meters (1.13 trillion cubic feet). The locations and volumes of the major deposits, in billion cubic meters, are Qatar, 10.1; Algeria, 8.2; Russia, 6.8; Canada, 2.0; and China, 1.1. As of December 31, 2018, the BLM had analyzed about 22,300 gas samples from 26 countries and the United States, in a program to identify world helium resources. Substitutes: There is no substitute for helium in cryogenic applications if temperatures below –429 °F are required. Argon can be substituted for helium in welding, and hydrogen can be substituted for helium in some lighter-than-air applications in which the flammable nature of hydrogen is not objectionable. Hydrogen is also being investigated as a substitute for helium in deep-sea diving applications below 1,000 feet. eEstimated. E Net exporter. NA Not available. 1Measured at 101.325 kilopascals absolute (14.696 psia) and 15 °C; 27.737 cubic meters of helium = 1,000 cubic feet of helium at 70 °F and 14.7 psia. 2Both Grade-A and crude helium. 3Extracted from natural gas in prior years. 4Grade-A helium. Defined as Grade-A helium sales + imports – exports. 5Defined as imports – exports + adjustments for Government and industry stock changes. 6See Appendix B for definitions. 7Supervisory General Engineer, Helium Resources Division, Bureau of Land Management, Amarillo Field Office, Helium Operations, Amarillo, TX. 8Production and reserves outside of the United States are estimated. 9See Appendix C for resource and reserve definitions and information concerning data sources. 10Included in United States (extracted from natural gas) reserves.
U.S. Geological Survey, Mineral Commodity Summaries, February 2019
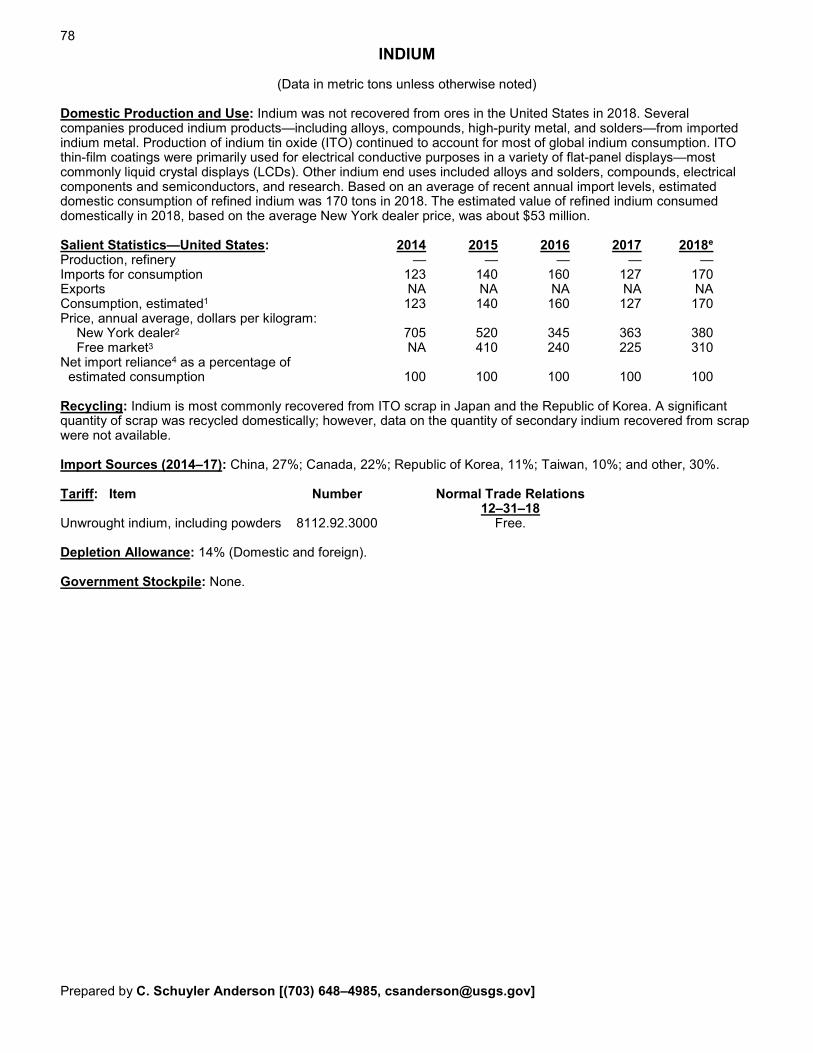
78
INDIUM
(Data in metric tons unless otherwise noted) Domestic Production and Use: Indium was not recovered from ores in the United States in 2018. Several companies produced indium products—including alloys, compounds, high-purity metal, and solders—from imported indium metal. Production of indium tin oxide (ITO) continued to account for most of global indium consumption. ITO thin-film coatings were primarily used for electrical conductive purposes in a variety of flat-panel displays—most commonly liquid crystal displays (LCDs). Other indium end uses included alloys and solders, compounds, electrical components and semiconductors, and research. Based on an average of recent annual import levels, estimated domestic consumption of refined indium was 170 tons in 2018. The estimated value of refined indium consumed domestically in 2018, based on the average New York dealer price, was about $53 million. Salient Statistics—United States: 2014 2015 2016 2017 2018e Production, refinery — — — — — Imports for consumption 123 140 160 127 170 Exports NA NA NA NA NA Consumption, estimated1 123 140 160 127 170 Price, annual average, dollars per kilogram: New York dealer2 705 520 345 363 380 Free market3 NA 410 240 225 310 Net import reliance4 as a percentage of estimated consumption 100 100 100 100 100 Recycling: Indium is most commonly recovered from ITO scrap in Japan and the Republic of Korea. A significant quantity of scrap was recycled domestically; however, data on the quantity of secondary indium recovered from scrap were not available. Import Sources (2014–17): China, 27%; Canada, 22%; Republic of Korea, 11%; Taiwan, 10%; and other, 30%. Tariff: Item Number Normal Trade Relations 12–31–18 Unwrought indium, including powders 8112.92.3000 Free. Depletion Allowance: 14% (Domestic and foreign). Government Stockpile: None. Prepared by C. Schuyler Anderson [(703) 648–4985, [email protected]]
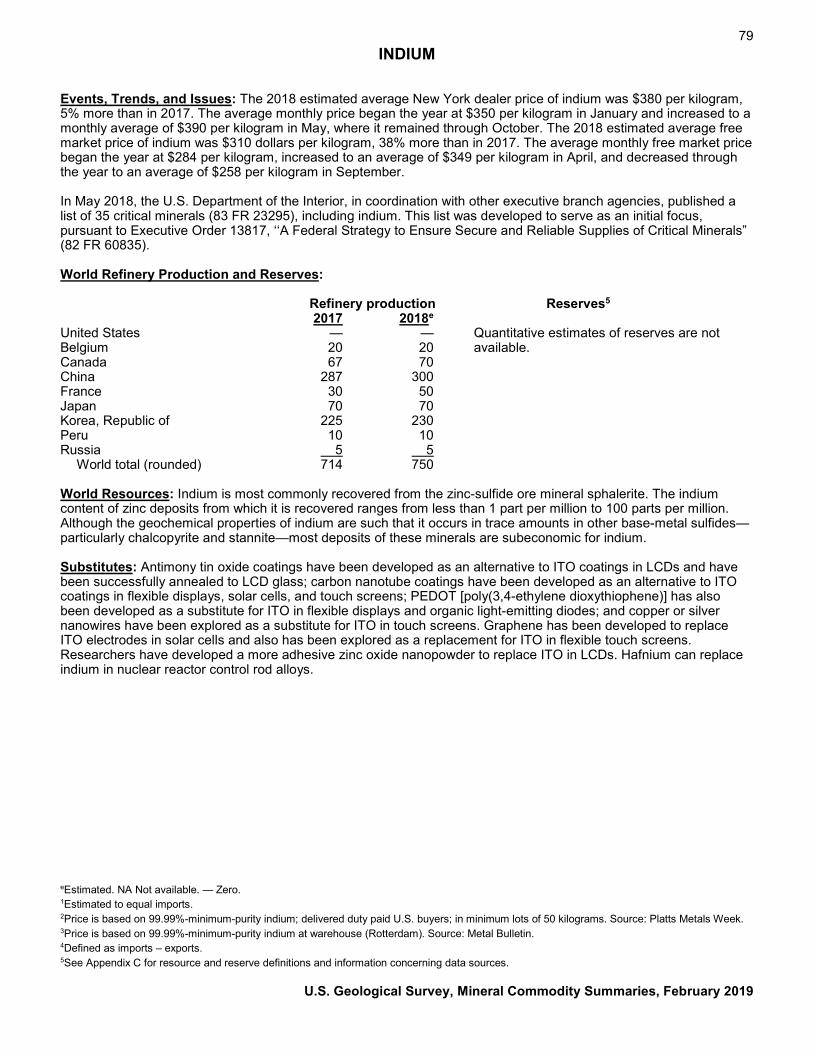
79 INDIUM
Events, Trends, and Issues: The 2018 estimated average New York dealer price of indium was $380 per kilogram, 5% more than in 2017. The average monthly price began the year at $350 per kilogram in January and increased to a monthly average of $390 per kilogram in May, where it remained through October. The 2018 estimated average free market price of indium was $310 dollars per kilogram, 38% more than in 2017. The average monthly free market price began the year at $284 per kilogram, increased to an average of $349 per kilogram in April, and decreased through the year to an average of $258 per kilogram in September. In May 2018, the U.S. Department of the Interior, in coordination with other executive branch agencies, published a list of 35 critical minerals (83 FR 23295), including indium. This list was developed to serve as an initial focus, pursuant to Executive Order 13817, ‘‘A Federal Strategy to Ensure Secure and Reliable Supplies of Critical Minerals” (82 FR 60835). World Refinery Production and Reserves: Refinery production Reserves5 2017 2018e United States — — Quantitative estimates of reserves are not Belgium 20 20 available. Canada 67 70 China 287 300 France 30 50 Japan 70 70 Korea, Republic of 225 230 Peru 10 10 Russia 5 5 World total (rounded) 714 750 World Resources: Indium is most commonly recovered from the zinc-sulfide ore mineral sphalerite. The indium content of zinc deposits from which it is recovered ranges from less than 1 part per million to 100 parts per million. Although the geochemical properties of indium are such that it occurs in trace amounts in other base-metal sulfides—particularly chalcopyrite and stannite—most deposits of these minerals are subeconomic for indium. Substitutes: Antimony tin oxide coatings have been developed as an alternative to ITO coatings in LCDs and have been successfully annealed to LCD glass; carbon nanotube coatings have been developed as an alternative to ITO coatings in flexible displays, solar cells, and touch screens; PEDOT [poly(3,4-ethylene dioxythiophene)] has also been developed as a substitute for ITO in flexible displays and organic light-emitting diodes; and copper or silver nanowires have been explored as a substitute for ITO in touch screens. Graphene has been developed to replace ITO electrodes in solar cells and also has been explored as a replacement for ITO in flexible touch screens. Researchers have developed a more adhesive zinc oxide nanopowder to replace ITO in LCDs. Hafnium can replace indium in nuclear reactor control rod alloys. eEstimated. NA Not available. — Zero. 1Estimated to equal imports. 2Price is based on 99.99%-minimum-purity indium; delivered duty paid U.S. buyers; in minimum lots of 50 kilograms. Source: Platts Metals Week. 3Price is based on 99.99%-minimum-purity indium at warehouse (Rotterdam). Source: Metal Bulletin. 4Defined as imports – exports. 5See Appendix C for resource and reserve definitions and information concerning data sources.
U.S. Geological Survey, Mineral Commodity Summaries, February 2019
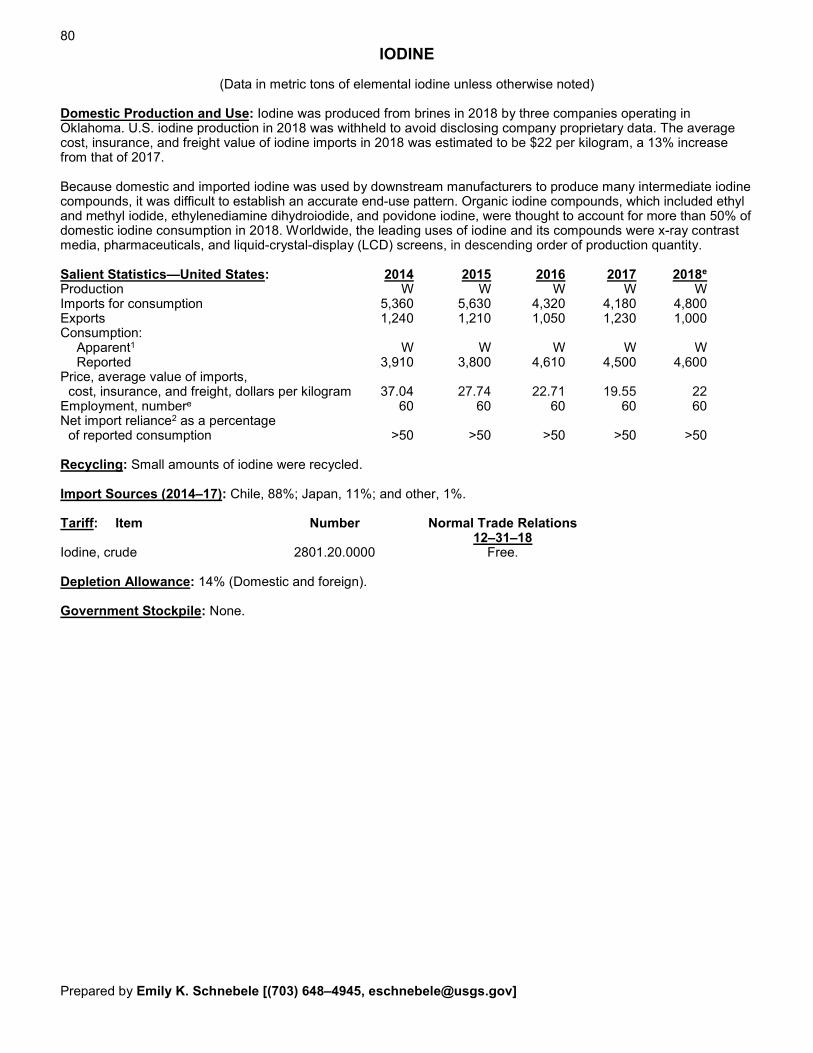
80 IODINE
(Data in metric tons of elemental iodine unless otherwise noted)
Domestic Production and Use: Iodine was produced from brines in 2018 by three companies operating in Oklahoma. U.S. iodine production in 2018 was withheld to avoid disclosing company proprietary data. The average cost, insurance, and freight value of iodine imports in 2018 was estimated to be $22 per kilogram, a 13% increase from that of 2017.
Because domestic and imported iodine was used by downstream manufacturers to produce many intermediate iodine compounds, it was difficult to establish an accurate end-use pattern. Organic iodine compounds, which included ethyl and methyl iodide, ethylenediamine dihydroiodide, and povidone iodine, were thought to account for more than 50% of domestic iodine consumption in 2018. Worldwide, the leading uses of iodine and its compounds were x-ray contrast media, pharmaceuticals, and liquid-crystal-display (LCD) screens, in descending order of production quantity.
Salient Statistics—United States: 2014 2015 2016 2017 2018e Production W W W W W Imports for consumption 5,360 5,630 4,320 4,180 4,800 Exports 1,240 1,210 1,050 1,230 1,000 Consumption:
Apparent1 W W W W W Reported 3,910 3,800 4,610 4,500 4,600 Price, average value of imports, cost, insurance, and freight, dollars per kilogram 37.04 27.74 22.71 19.55 22 Employment, numbere 60 60 60 60 60 Net import reliance2 as a percentage
of reported consumption >50 >50 >50 >50 >50
Recycling: Small amounts of iodine were recycled.
Import Sources (2014–17): Chile, 88%; Japan, 11%; and other, 1%.
Tariff: Item Number Normal Trade Relations 12–31–18
Iodine, crude 2801.20.0000 Free.
Depletion Allowance: 14% (Domestic and foreign).
Government Stockpile: None.
Prepared by Emily K. Schnebele [(703) 648–4945, [email protected]]
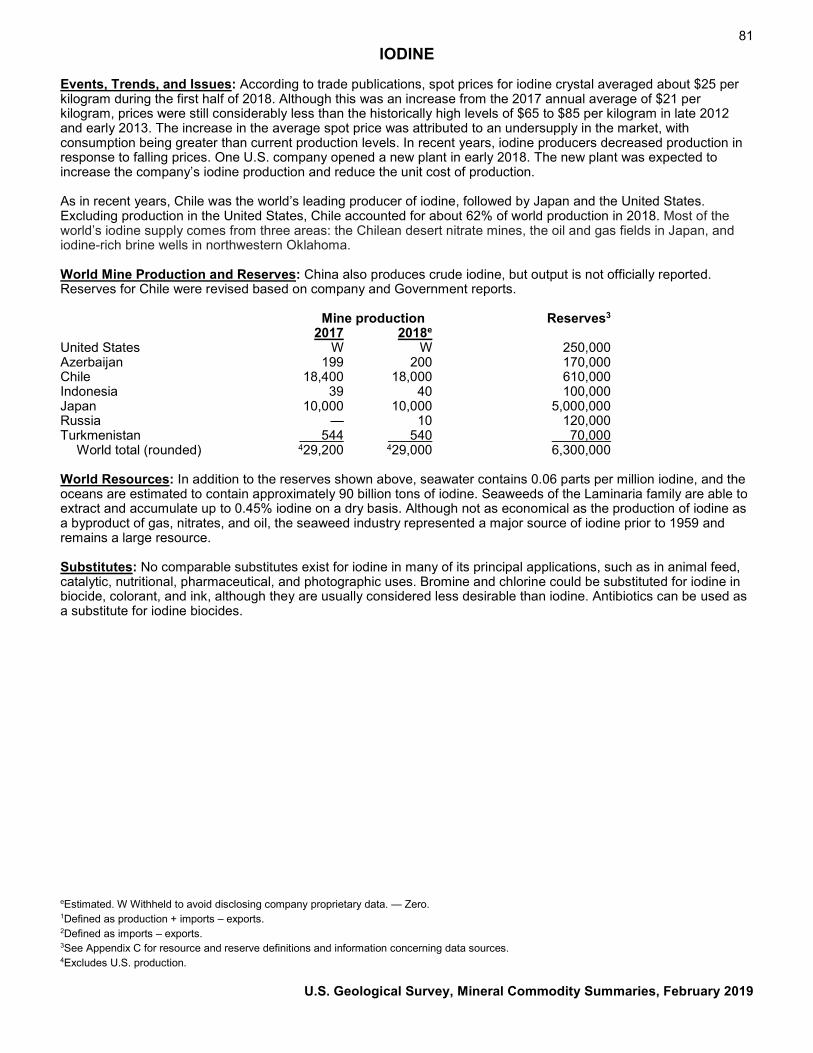
81 IODINE
Events, Trends, and Issues: According to trade publications, spot prices for iodine crystal averaged about $25 per kilogram during the first half of 2018. Although this was an increase from the 2017 annual average of $21 per kilogram, prices were still considerably less than the historically high levels of $65 to $85 per kilogram in late 2012 and early 2013. The increase in the average spot price was attributed to an undersupply in the market, with consumption being greater than current production levels. In recent years, iodine producers decreased production in response to falling prices. One U.S. company opened a new plant in early 2018. The new plant was expected to increase the company’s iodine production and reduce the unit cost of production. As in recent years, Chile was the world’s leading producer of iodine, followed by Japan and the United States. Excluding production in the United States, Chile accounted for about 62% of world production in 2018. Most of the world’s iodine supply comes from three areas: the Chilean desert nitrate mines, the oil and gas fields in Japan, and iodine-rich brine wells in northwestern Oklahoma. World Mine Production and Reserves: China also produces crude iodine, but output is not officially reported. Reserves for Chile were revised based on company and Government reports. Mine production Reserves3 2017 2018e United States W W 250,000 Azerbaijan 199 200 170,000 Chile 18,400 18,000 610,000 Indonesia 39 40 100,000 Japan 10,000 10,000 5,000,000 Russia — 10 120,000 Turkmenistan 544 540 70,000 World total (rounded) 429,200 429,000 6,300,000 World Resources: In addition to the reserves shown above, seawater contains 0.06 parts per million iodine, and the oceans are estimated to contain approximately 90 billion tons of iodine. Seaweeds of the Laminaria family are able to extract and accumulate up to 0.45% iodine on a dry basis. Although not as economical as the production of iodine as a byproduct of gas, nitrates, and oil, the seaweed industry represented a major source of iodine prior to 1959 and remains a large resource. Substitutes: No comparable substitutes exist for iodine in many of its principal applications, such as in animal feed, catalytic, nutritional, pharmaceutical, and photographic uses. Bromine and chlorine could be substituted for iodine in biocide, colorant, and ink, although they are usually considered less desirable than iodine. Antibiotics can be used as a substitute for iodine biocides. eEstimated. W Withheld to avoid disclosing company proprietary data. — Zero. 1Defined as production + imports – exports. 2Defined as imports – exports. 3See Appendix C for resource and reserve definitions and information concerning data sources. 4Excludes U.S. production.
U.S. Geological Survey, Mineral Commodity Summaries, February 2019
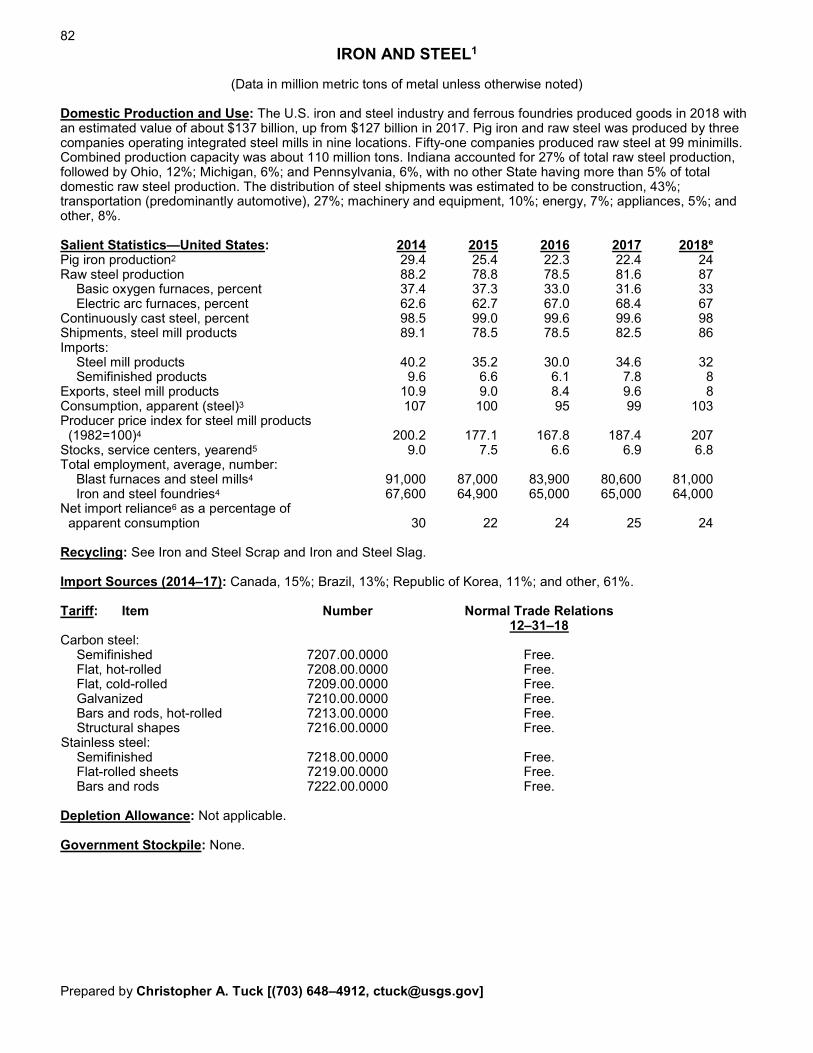
82
IRON AND STEEL1
(Data in million metric tons of metal unless otherwise noted) Domestic Production and Use: The U.S. iron and steel industry and ferrous foundries produced goods in 2018 with an estimated value of about $137 billion, up from $127 billion in 2017. Pig iron and raw steel was produced by three companies operating integrated steel mills in nine locations. Fifty-one companies produced raw steel at 99 minimills. Combined production capacity was about 110 million tons. Indiana accounted for 27% of total raw steel production, followed by Ohio, 12%; Michigan, 6%; and Pennsylvania, 6%, with no other State having more than 5% of total domestic raw steel production. The distribution of steel shipments was estimated to be construction, 43%; transportation (predominantly automotive), 27%; machinery and equipment, 10%; energy, 7%; appliances, 5%; and other, 8%. Salient Statistics—United States: 2014 2015 2016 2017 2018e
Pig iron production2 29.4 25.4 22.3 22.4 24 Raw steel production 88.2 78.8 78.5 81.6 87 Basic oxygen furnaces, percent 37.4 37.3 33.0 31.6 33 Electric arc furnaces, percent 62.6 62.7 67.0 68.4 67 Continuously cast steel, percent 98.5 99.0 99.6 99.6 98 Shipments, steel mill products 89.1 78.5 78.5 82.5 86 Imports: Steel mill products 40.2 35.2 30.0 34.6 32 Semifinished products 9.6 6.6 6.1 7.8 8 Exports, steel mill products 10.9 9.0 8.4 9.6 8 Consumption, apparent (steel)3 107 100 95 99 103 Producer price index for steel mill products (1982=100)4 200.2 177.1 167.8 187.4 207 Stocks, service centers, yearend5 9.0 7.5 6.6 6.9 6.8 Total employment, average, number: Blast furnaces and steel mills4 91,000 87,000 83,900 80,600 81,000 Iron and steel foundries4 67,600 64,900 65,000 65,000 64,000 Net import reliance6 as a percentage of apparent consumption 30 22 24 25 24 Recycling: See Iron and Steel Scrap and Iron and Steel Slag. Import Sources (2014–17): Canada, 15%; Brazil, 13%; Republic of Korea, 11%; and other, 61%. Tariff: Item Number Normal Trade Relations 12–31–18 Carbon steel: Semifinished 7207.00.0000 Free. Flat, hot-rolled 7208.00.0000 Free. Flat, cold-rolled 7209.00.0000 Free. Galvanized 7210.00.0000 Free. Bars and rods, hot-rolled 7213.00.0000 Free. Structural shapes 7216.00.0000 Free. Stainless steel: Semifinished 7218.00.0000 Free. Flat-rolled sheets 7219.00.0000 Free. Bars and rods 7222.00.0000 Free. Depletion Allowance: Not applicable. Government Stockpile: None. Prepared by Christopher A. Tuck [(703) 648–4912, [email protected]]
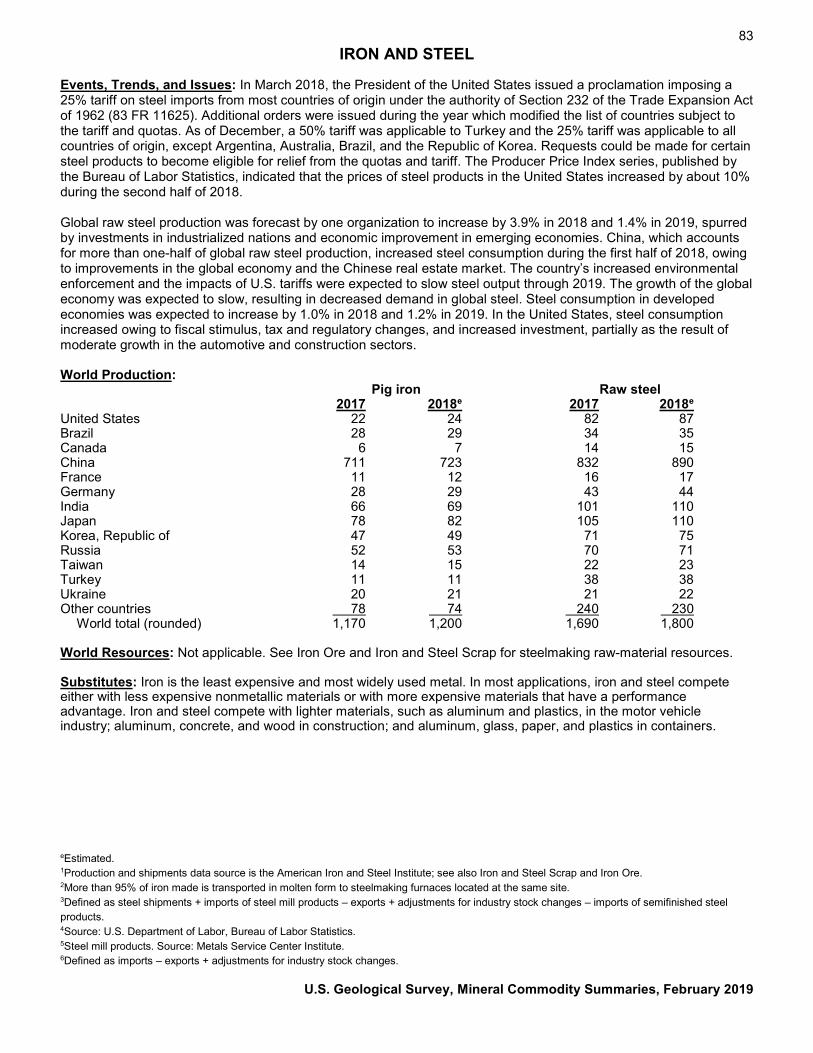
83 IRON AND STEEL
Events, Trends, and Issues: In March 2018, the President of the United States issued a proclamation imposing a 25% tariff on steel imports from most countries of origin under the authority of Section 232 of the Trade Expansion Act of 1962 (83 FR 11625). Additional orders were issued during the year which modified the list of countries subject to the tariff and quotas. As of December, a 50% tariff was applicable to Turkey and the 25% tariff was applicable to all countries of origin, except Argentina, Australia, Brazil, and the Republic of Korea. Requests could be made for certain steel products to become eligible for relief from the quotas and tariff. The Producer Price Index series, published by the Bureau of Labor Statistics, indicated that the prices of steel products in the United States increased by about 10% during the second half of 2018. Global raw steel production was forecast by one organization to increase by 3.9% in 2018 and 1.4% in 2019, spurred by investments in industrialized nations and economic improvement in emerging economies. China, which accounts for more than one-half of global raw steel production, increased steel consumption during the first half of 2018, owing to improvements in the global economy and the Chinese real estate market. The country’s increased environmental enforcement and the impacts of U.S. tariffs were expected to slow steel output through 2019. The growth of the global economy was expected to slow, resulting in decreased demand in global steel. Steel consumption in developed economies was expected to increase by 1.0% in 2018 and 1.2% in 2019. In the United States, steel consumption increased owing to fiscal stimulus, tax and regulatory changes, and increased investment, partially as the result of moderate growth in the automotive and construction sectors. World Production: Pig iron Raw steel 2017 2018e 2017 2018e United States 22 24 82 87 Brazil 28 29 34 35 Canada 6 7 14 15 China 711 723 832 890 France 11 12 16 17 Germany 28 29 43 44 India 66 69 101 110 Japan 78 82 105 110 Korea, Republic of 47 49 71 75 Russia 52 53 70 71 Taiwan 14 15 22 23 Turkey 11 11 38 38 Ukraine 20 21 21 22 Other countries 78 74 240 230 World total (rounded) 1,170 1,200 1,690 1,800 World Resources: Not applicable. See Iron Ore and Iron and Steel Scrap for steelmaking raw-material resources. Substitutes: Iron is the least expensive and most widely used metal. In most applications, iron and steel compete either with less expensive nonmetallic materials or with more expensive materials that have a performance advantage. Iron and steel compete with lighter materials, such as aluminum and plastics, in the motor vehicle industry; aluminum, concrete, and wood in construction; and aluminum, glass, paper, and plastics in containers. eEstimated. 1Production and shipments data source is the American Iron and Steel Institute; see also Iron and Steel Scrap and Iron Ore. 2More than 95% of iron made is transported in molten form to steelmaking furnaces located at the same site. 3Defined as steel shipments + imports of steel mill products – exports + adjustments for industry stock changes – imports of semifinished steel products. 4Source: U.S. Department of Labor, Bureau of Labor Statistics. 5Steel mill products. Source: Metals Service Center Institute. 6Defined as imports – exports + adjustments for industry stock changes.
U.S. Geological Survey, Mineral Commodity Summaries, February 2019
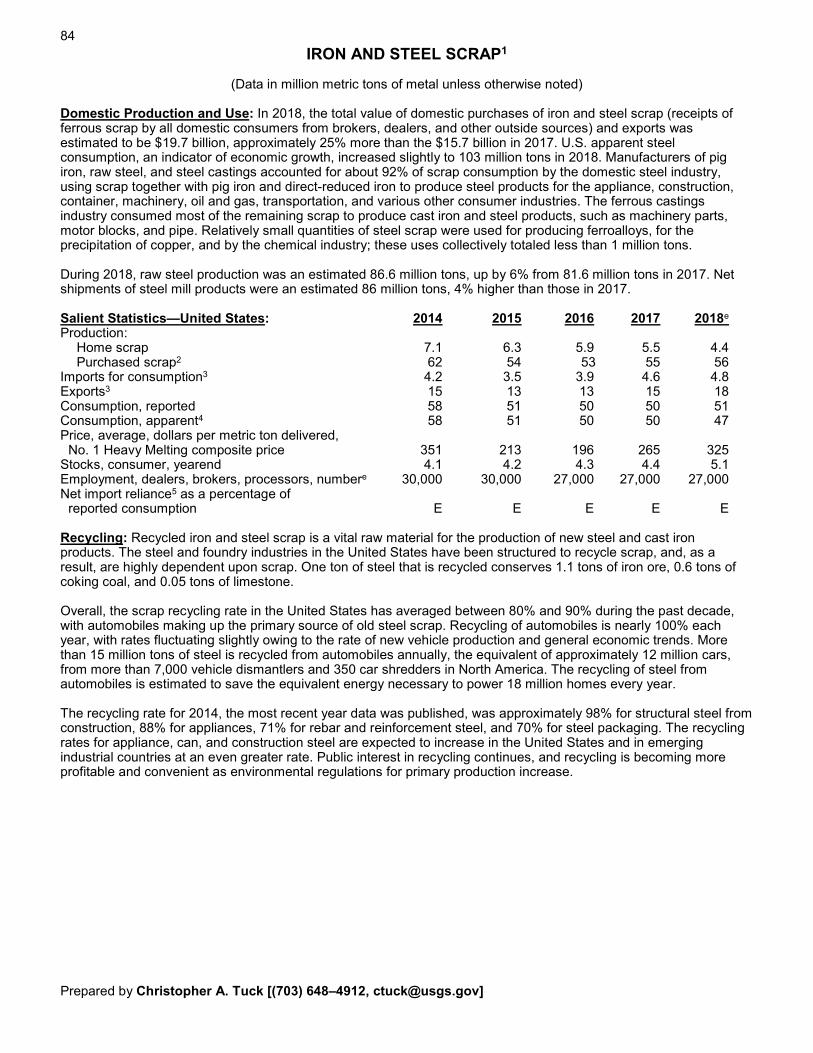
84
IRON AND STEEL SCRAP1
(Data in million metric tons of metal unless otherwise noted) Domestic Production and Use: In 2018, the total value of domestic purchases of iron and steel scrap (receipts of ferrous scrap by all domestic consumers from brokers, dealers, and other outside sources) and exports was estimated to be $19.7 billion, approximately 25% more than the $15.7 billion in 2017. U.S. apparent steel consumption, an indicator of economic growth, increased slightly to 103 million tons in 2018. Manufacturers of pig iron, raw steel, and steel castings accounted for about 92% of scrap consumption by the domestic steel industry, using scrap together with pig iron and direct-reduced iron to produce steel products for the appliance, construction, container, machinery, oil and gas, transportation, and various other consumer industries. The ferrous castings industry consumed most of the remaining scrap to produce cast iron and steel products, such as machinery parts, motor blocks, and pipe. Relatively small quantities of steel scrap were used for producing ferroalloys, for the precipitation of copper, and by the chemical industry; these uses collectively totaled less than 1 million tons. During 2018, raw steel production was an estimated 86.6 million tons, up by 6% from 81.6 million tons in 2017. Net shipments of steel mill products were an estimated 86 million tons, 4% higher than those in 2017. Salient Statistics—United States: 2014 2015 2016 2017 2018e Production: Home scrap 7.1 6.3 5.9 5.5 4.4 Purchased scrap2 62 54 53 55 56 Imports for consumption3 4.2 3.5 3.9 4.6 4.8 Exports3 15 13 13 15 18 Consumption, reported 58 51 50 50 51 Consumption, apparent4 58 51 50 50 47 Price, average, dollars per metric ton delivered, No. 1 Heavy Melting composite price 351 213 196 265 325 Stocks, consumer, yearend 4.1 4.2 4.3 4.4 5.1 Employment, dealers, brokers, processors, numbere 30,000 30,000 27,000 27,000 27,000 Net import reliance5 as a percentage of reported consumption E E E E E Recycling: Recycled iron and steel scrap is a vital raw material for the production of new steel and cast iron products. The steel and foundry industries in the United States have been structured to recycle scrap, and, as a result, are highly dependent upon scrap. One ton of steel that is recycled conserves 1.1 tons of iron ore, 0.6 tons of coking coal, and 0.05 tons of limestone. Overall, the scrap recycling rate in the United States has averaged between 80% and 90% during the past decade, with automobiles making up the primary source of old steel scrap. Recycling of automobiles is nearly 100% each year, with rates fluctuating slightly owing to the rate of new vehicle production and general economic trends. More than 15 million tons of steel is recycled from automobiles annually, the equivalent of approximately 12 million cars, from more than 7,000 vehicle dismantlers and 350 car shredders in North America. The recycling of steel from automobiles is estimated to save the equivalent energy necessary to power 18 million homes every year. The recycling rate for 2014, the most recent year data was published, was approximately 98% for structural steel from construction, 88% for appliances, 71% for rebar and reinforcement steel, and 70% for steel packaging. The recycling rates for appliance, can, and construction steel are expected to increase in the United States and in emerging industrial countries at an even greater rate. Public interest in recycling continues, and recycling is becoming more profitable and convenient as environmental regulations for primary production increase. Prepared by Christopher A. Tuck [(703) 648–4912, [email protected]]
85 IRON AND STEEL SCRAP
Recycling of scrap plays an important role in the conservation of energy because the remelting of scrap requires much less energy than the production of iron or steel products from iron ore. Also, consumption of iron and steel scrap by remelting reduces the burden on landfill disposal facilities and prevents the accumulation of abandoned steel products in the environment. Recycled scrap consists of approximately 58% post-consumer (old, obsolete) scrap, 24% prompt scrap (produced in steel-product manufacturing plants), and 18% home scrap (recirculating scrap from current operations). Import Sources (2014–17): Canada, 75%; Mexico, 7%; United Kingdom, 7%; Sweden, 5%; and other, 6%. Tariff: Item Number Normal Trade Relations 12–31–18 Iron and steel waste and scrap: No. 1 Bundles 7204.41.0020 Free. No. 1 Heavy Melting 7204.49.0020 Free. No. 2 Heavy Melting 7204.49.0040 Free. Shredded 7204.49.0070 Free. Depletion Allowance: Not applicable. Government Stockpile: None. Events, Trends, and Issues: Steel mill production capacity utilization last peaked at 80.9% in April 2012; however, that utilization rate was surpassed in November 2018 when the rate reached 81.2%. Scrap prices fluctuated during 2018, with a high of about $378 per ton in May and a low of about $299 per ton in September. Composite prices published by Scrap Price Bulletin for No. 1 Heavy Melting steel scrap delivered to purchasers in Chicago, IL, Philadelphia, PA, and Pittsburgh, PA, averaged about $329 per ton during the first 9 months of 2018. Exports of ferrous scrap increased in 2018 and primarily went to Turkey, Mexico, and Taiwan, in descending order of export tonnage. The value of exported scrap increased to an estimated $5.9 billion in 2018 from $4.0 billion in 2017. Global raw steel production was forecast by one organization to increase by 3.9% in 2018 and by 1.4% in 2019, spurred by investments in industrialized nations and economic improvement in emerging economies. Steel demand in developed economies was expected to increase by only 1.0% in 2018 and 1.2% in 2019. In the United States, demand increased owing to tax and regulatory changes and increased investment. The automotive and construction sectors were expected to experience overall moderate growth. World Mine Production and Reserves: Not applicable. World Resources: Not applicable. Substitutes: An estimated 2.0 million tons of direct-reduced iron was used in the United States in 2018 as a substitute for iron and steel scrap, up from 1.9 million tons in 2017. eEstimated. E Net exporter. 1See also Iron and Steel and Iron Ore. 2Defined as receipts – shipments by consumers + exports – imports. 3Excludes used rails for rerolling and other uses, and ships, boats, and other vessels for scrapping. 4Defined as home scrap + purchased scrap + imports – exports + adjustments for industry stock changes. 5Defined as imports – exports + adjustments for industry stock changes.
U.S. Geological Survey, Mineral Commodity Summaries, February 2019
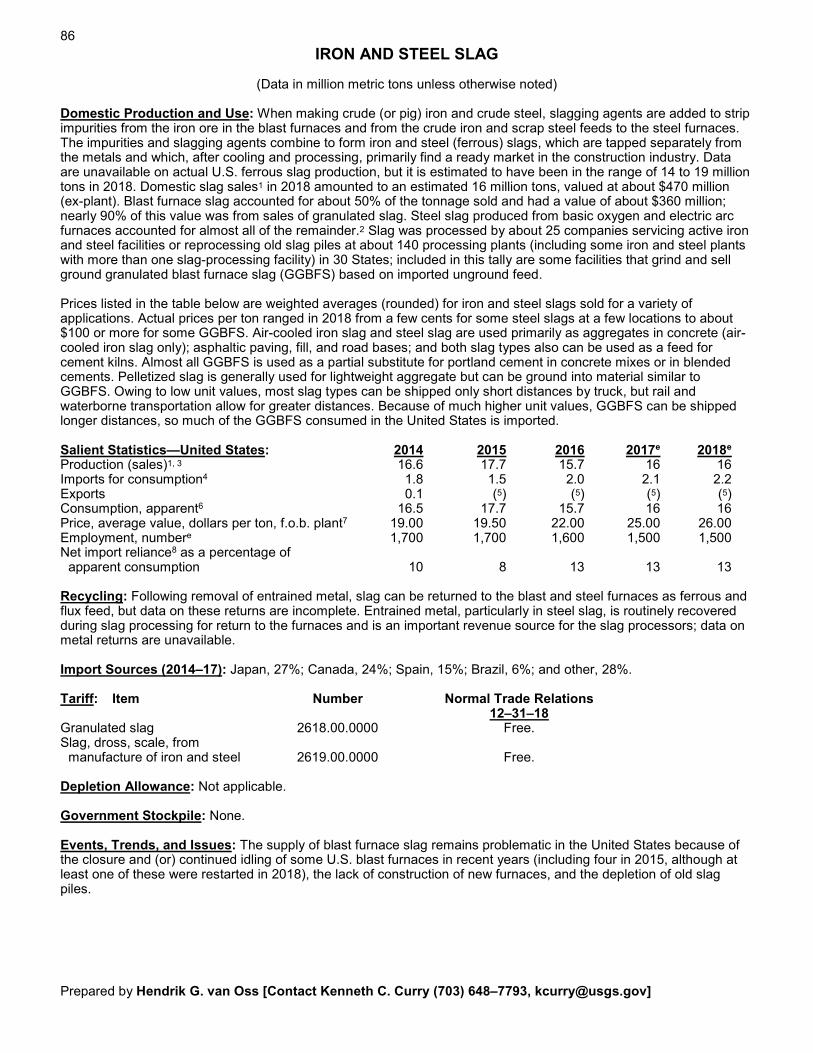
86
IRON AND STEEL SLAG
(Data in million metric tons unless otherwise noted) Domestic Production and Use: When making crude (or pig) iron and crude steel, slagging agents are added to strip impurities from the iron ore in the blast furnaces and from the crude iron and scrap steel feeds to the steel furnaces. The impurities and slagging agents combine to form iron and steel (ferrous) slags, which are tapped separately from the metals and which, after cooling and processing, primarily find a ready market in the construction industry. Data are unavailable on actual U.S. ferrous slag production, but it is estimated to have been in the range of 14 to 19 million tons in 2018. Domestic slag sales1 in 2018 amounted to an estimated 16 million tons, valued at about $470 million (ex-plant). Blast furnace slag accounted for about 50% of the tonnage sold and had a value of about $360 million; nearly 90% of this value was from sales of granulated slag. Steel slag produced from basic oxygen and electric arc furnaces accounted for almost all of the remainder.2 Slag was processed by about 25 companies servicing active iron and steel facilities or reprocessing old slag piles at about 140 processing plants (including some iron and steel plants with more than one slag-processing facility) in 30 States; included in this tally are some facilities that grind and sell ground granulated blast furnace slag (GGBFS) based on imported unground feed. Prices listed in the table below are weighted averages (rounded) for iron and steel slags sold for a variety of applications. Actual prices per ton ranged in 2018 from a few cents for some steel slags at a few locations to about $100 or more for some GGBFS. Air-cooled iron slag and steel slag are used primarily as aggregates in concrete (air-cooled iron slag only); asphaltic paving, fill, and road bases; and both slag types also can be used as a feed for cement kilns. Almost all GGBFS is used as a partial substitute for portland cement in concrete mixes or in blended cements. Pelletized slag is generally used for lightweight aggregate but can be ground into material similar to GGBFS. Owing to low unit values, most slag types can be shipped only short distances by truck, but rail and waterborne transportation allow for greater distances. Because of much higher unit values, GGBFS can be shipped longer distances, so much of the GGBFS consumed in the United States is imported. Salient Statistics—United States: 2014 2015 2016 2017e 2018e Production (sales)1, 3 16.6 17.7 15.7 16 16 Imports for consumption4 1.8 1.5 2.0 2.1 2.2 Exports 0.1 (5) (5) (5) (5) Consumption, apparent6 16.5 17.7 15.7 16 16 Price, average value, dollars per ton, f.o.b. plant7 19.00 19.50 22.00 25.00 26.00 Employment, numbere 1,700 1,700 1,600 1,500 1,500 Net import reliance8 as a percentage of apparent consumption 10 8 13 13 13 Recycling: Following removal of entrained metal, slag can be returned to the blast and steel furnaces as ferrous and flux feed, but data on these returns are incomplete. Entrained metal, particularly in steel slag, is routinely recovered during slag processing for return to the furnaces and is an important revenue source for the slag processors; data on metal returns are unavailable. Import Sources (2014–17): Japan, 27%; Canada, 24%; Spain, 15%; Brazil, 6%; and other, 28%. Tariff: Item Number Normal Trade Relations 12–31–18 Granulated slag 2618.00.0000 Free. Slag, dross, scale, from manufacture of iron and steel 2619.00.0000 Free. Depletion Allowance: Not applicable. Government Stockpile: None. Events, Trends, and Issues: The supply of blast furnace slag remains problematic in the United States because of the closure and (or) continued idling of some U.S. blast furnaces in recent years (including four in 2015, although at least one of these were restarted in 2018), the lack of construction of new furnaces, and the depletion of old slag piles. Prepared by Hendrik G. van Oss [Contact Kenneth C. Curry (703) 648–7793, [email protected]]
87 IRON AND STEEL SLAG
Locally produced granulated blast furnace slag remained in limited supply because, at yearend 2018, granulation cooling was available at only two active U.S. blast furnaces. Installation of granulation cooling continued to be evaluated at a few blast furnaces, but it remained unclear if this would be cost-effective given the economic uncertainties in operating blast furnaces. Pelletized blast furnace slag was in very limited supply (one site only), and it was uncertain if any additional pelletizing capacity was planned. Domestic grinding of granulated blast furnace slag was only done by cement companies. Basic oxygen furnace steel slag from domestic furnaces also has become less available recently because of the closure or idling of several integrated iron and steel complexes, although the existence at many sites of large slag stockpiles can allow for slag processing to continue even several years after the cessation of furnace operations. Nonetheless, the long-term supply of steel slag will increasingly rely on electric arc furnaces, which now contribute the majority of U.S. steel production. Domestic- and import-supply constraints appear to have limited domestic consumption of GGBFS in recent years. Although prices have increased, sales volumes for GGBFS have not matched the relative increases that have characterized the overall U.S. cement market since 2010. Long-term demand for GGBFS likely will increase because its use in concrete yields a superior product in many applications and reduces the unit carbon dioxide (CO2) emissions footprint of the concrete related to the portland cement (clinker) content. Recent regulations to restrict emissions of CO2 and mercury by coal-fired powerplants, together with powerplant closures or conversion of others to natural gas, have led to a reduction in the supply of fly ash in some areas, including that of material for use as cementitious additive for concrete, with the result that fly ash imports have increased. Fly ash shortages have the potential to increase future demand for GGBFS, but the availability of granulated slag will increasingly depend on imports, either of ground or unground material. Imported slag availability may be constrained by increasing international demand for the same material and because not all granulated slag produced overseas is of high quality. Restrictions on mercury emissions by cement plants enacted in 2015 may reduce demand for fly ash as a raw material for clinker manufacture, and this could lead to use of air-cooled and steel slags as replacement raw materials. World Mine Production and Reserves: Slag is not a mined material and thus the concept of reserves does not apply to this mineral commodity. Slag production data for the world are unavailable, but may be estimated as equivalent to 25% to 30% of crude (pig) iron production and steel furnace slag as about 10% to 15% of crude steel output. On this basis, it is estimated that global iron slag output in 2018 was on the order of 300 million to 360 million tons, and steel slag about 190 million to 290 million tons. World Resources: Not applicable. Substitutes: In the construction sector, ferrous slags compete with natural aggregates (crushed stone and sand and gravel) but are far less widely available than the natural materials. As a cementitious additive in blended cements and concrete, GGBFS mainly competes with fly ash, metakaolin, and volcanic ash pozzolans. In this respect, GGBFS reduces the amount of portland cement per ton of concrete, thus allowing more concrete to be made per ton of portland cement. Slags (especially steel slag) can be used as a partial substitute for limestone and some other natural raw materials for clinker (cement) manufacture and compete in this use with fly ash and bottom ash. Some other metallurgical slags, such as copper slag, can compete with ferrous slags in some specialty markets, such as a ferrous feed in clinker manufacture, but are generally in much more restricted supply than ferrous slags. eEstimated. 1Processed slag sold rather than that processed or produced during the year. Excludes any entrained metal that may be recovered during slag processing and then sold separately or returned to iron and, especially, steel furnaces. Data are incomplete regarding slag returns to the furnaces. 2There were very minor sales of open hearth furnace steel slag from stockpiles but no domestic production of this slag type in 2014–18. 3Data include sales of imported granulated blast furnace slag, either after domestic grinding or still unground, and exclude sales of pelletized slag (proprietary but very small). 4Official (U.S. Census Bureau) data adjusted by the U.S. Geological Survey. In some years, the official data, which are reported as granulated blast furnace slag only, appear to have understated the true imports of this material by as much as 0.4‒0.5 million tons annually for the period shown, and have included significant tonnages of nonslag materials (such as cenospheres, fly ash, and silica fume), and slags or other residues of other metallurgical industries (especially copper slag), whose unit values are outside the range expected for granulated slag. 5Less than 0.05 million tons. 6Defined as total sales of slag (including those from imported feed) − exports but does not significantly differ from total sales owing to the very small export tonnages. 7Rounded to the nearest $0.50 per ton. 8Defined as imports ‒ exports.
U.S. Geological Survey, Mineral Commodity Summaries, February 2019
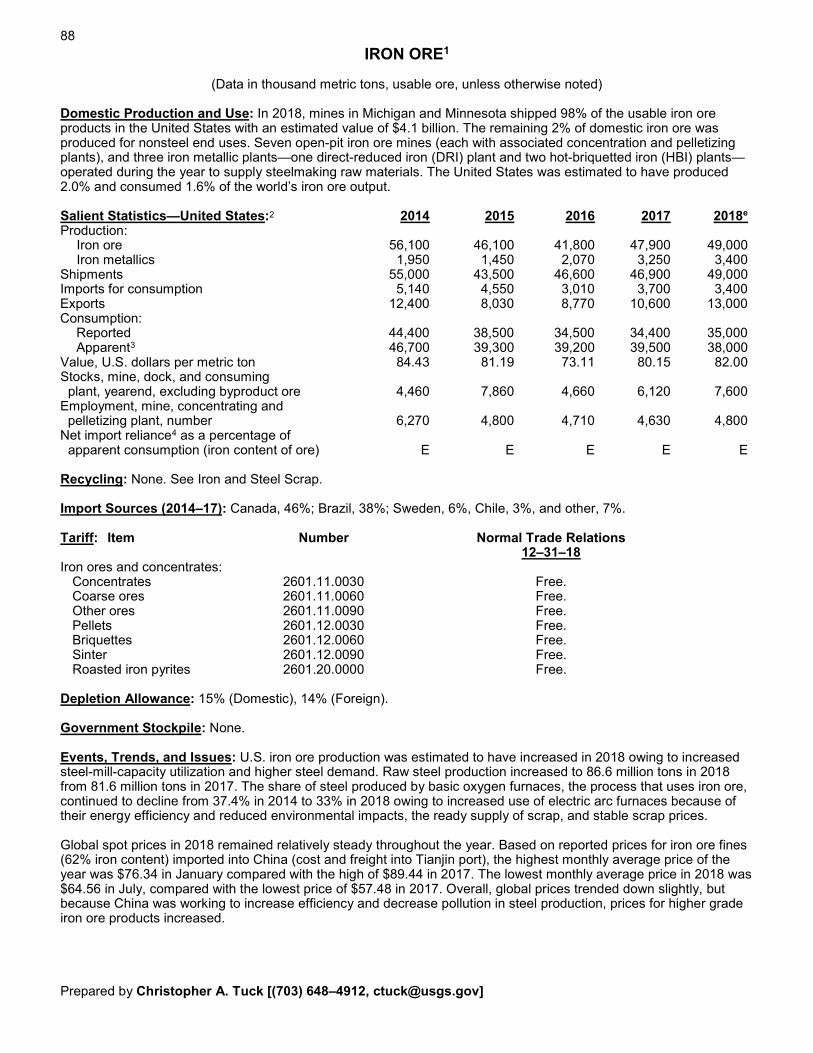
88
IRON ORE1
(Data in thousand metric tons, usable ore, unless otherwise noted) Domestic Production and Use: In 2018, mines in Michigan and Minnesota shipped 98% of the usable iron ore products in the United States with an estimated value of $4.1 billion. The remaining 2% of domestic iron ore was produced for nonsteel end uses. Seven open-pit iron ore mines (each with associated concentration and pelletizing plants), and three iron metallic plants—one direct-reduced iron (DRI) plant and two hot-briquetted iron (HBI) plants—operated during the year to supply steelmaking raw materials. The United States was estimated to have produced 2.0% and consumed 1.6% of the world’s iron ore output. Salient Statistics—United States:2 2014 2015 2016 2017 2018e Production: Iron ore 56,100 46,100 41,800 47,900 49,000 Iron metallics 1,950 1,450 2,070 3,250 3,400 Shipments 55,000 43,500 46,600 46,900 49,000 Imports for consumption 5,140 4,550 3,010 3,700 3,400 Exports 12,400 8,030 8,770 10,600 13,000 Consumption: Reported 44,400 38,500 34,500 34,400 35,000 Apparent3 46,700 39,300 39,200 39,500 38,000 Value, U.S. dollars per metric ton 84.43 81.19 73.11 80.15 82.00 Stocks, mine, dock, and consuming plant, yearend, excluding byproduct ore 4,460 7,860 4,660 6,120 7,600 Employment, mine, concentrating and pelletizing plant, number 6,270 4,800 4,710 4,630 4,800 Net import reliance4 as a percentage of apparent consumption (iron content of ore) E E E E E Recycling: None. See Iron and Steel Scrap. Import Sources (2014–17): Canada, 46%; Brazil, 38%; Sweden, 6%, Chile, 3%, and other, 7%. Tariff: Item Number Normal Trade Relations 12–31–18 Iron ores and concentrates: Concentrates 2601.11.0030 Free. Coarse ores 2601.11.0060 Free. Other ores 2601.11.0090 Free. Pellets 2601.12.0030 Free. Briquettes 2601.12.0060 Free. Sinter 2601.12.0090 Free. Roasted iron pyrites 2601.20.0000 Free. Depletion Allowance: 15% (Domestic), 14% (Foreign). Government Stockpile: None. Events, Trends, and Issues: U.S. iron ore production was estimated to have increased in 2018 owing to increased steel-mill-capacity utilization and higher steel demand. Raw steel production increased to 86.6 million tons in 2018 from 81.6 million tons in 2017. The share of steel produced by basic oxygen furnaces, the process that uses iron ore, continued to decline from 37.4% in 2014 to 33% in 2018 owing to increased use of electric arc furnaces because of their energy efficiency and reduced environmental impacts, the ready supply of scrap, and stable scrap prices. Global spot prices in 2018 remained relatively steady throughout the year. Based on reported prices for iron ore fines (62% iron content) imported into China (cost and freight into Tianjin port), the highest monthly average price of the year was $76.34 in January compared with the high of $89.44 in 2017. The lowest monthly average price in 2018 was $64.56 in July, compared with the lowest price of $57.48 in 2017. Overall, global prices trended down slightly, but because China was working to increase efficiency and decrease pollution in steel production, prices for higher grade iron ore products increased. Prepared by Christopher A. Tuck [(703) 648–4912, [email protected]]
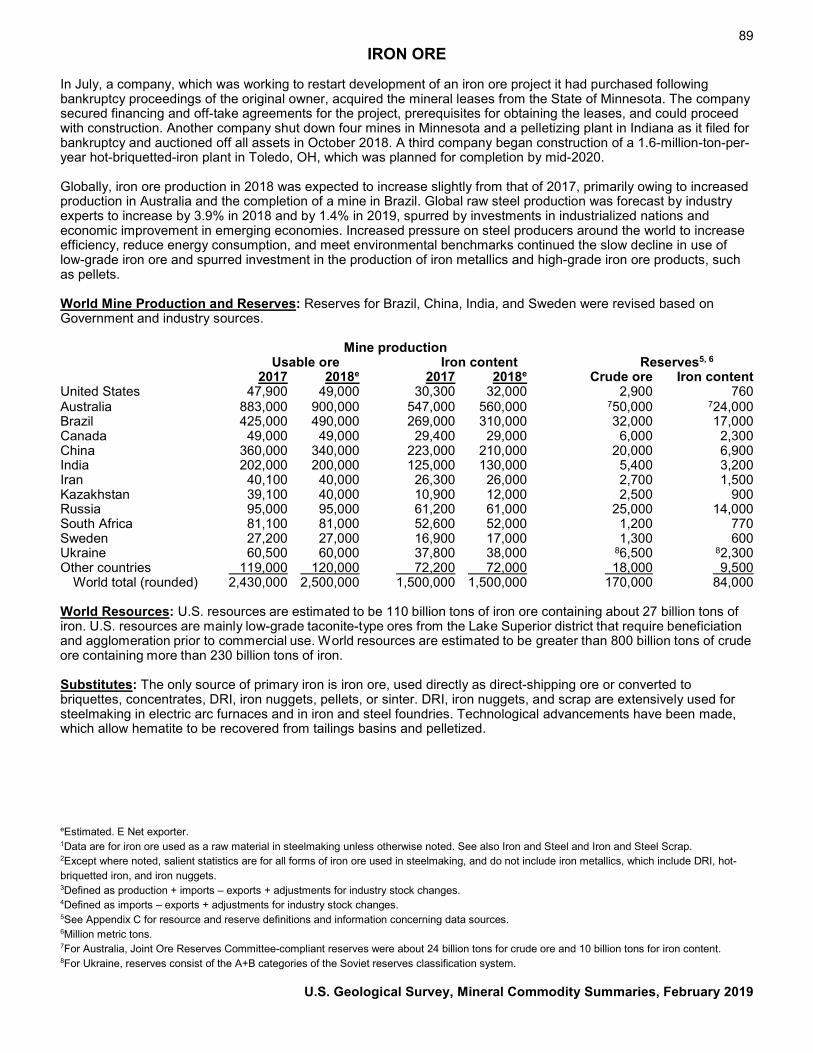
89 IRON ORE
In July, a company, which was working to restart development of an iron ore project it had purchased following bankruptcy proceedings of the original owner, acquired the mineral leases from the State of Minnesota. The company secured financing and off-take agreements for the project, prerequisites for obtaining the leases, and could proceed with construction. Another company shut down four mines in Minnesota and a pelletizing plant in Indiana as it filed for bankruptcy and auctioned off all assets in October 2018. A third company began construction of a 1.6-million-ton-per-year hot-briquetted-iron plant in Toledo, OH, which was planned for completion by mid-2020. Globally, iron ore production in 2018 was expected to increase slightly from that of 2017, primarily owing to increased production in Australia and the completion of a mine in Brazil. Global raw steel production was forecast by industry experts to increase by 3.9% in 2018 and by 1.4% in 2019, spurred by investments in industrialized nations and economic improvement in emerging economies. Increased pressure on steel producers around the world to increase efficiency, reduce energy consumption, and meet environmental benchmarks continued the slow decline in use of low-grade iron ore and spurred investment in the production of iron metallics and high-grade iron ore products, such as pellets. World Mine Production and Reserves: Reserves for Brazil, China, India, and Sweden were revised based on Government and industry sources. Mine production Usable ore Iron content Reserves5, 6 2017 2018e 2017 2018e Crude ore Iron content United States 47,900 49,000 30,300 32,000 2,900 760 Australia 883,000 900,000 547,000 560,000 750,000 724,000 Brazil 425,000 490,000 269,000 310,000 32,000 17,000 Canada 49,000 49,000 29,400 29,000 6,000 2,300 China 360,000 340,000 223,000 210,000 20,000 6,900 India 202,000 200,000 125,000 130,000 5,400 3,200 Iran 40,100 40,000 26,300 26,000 2,700 1,500 Kazakhstan 39,100 40,000 10,900 12,000 2,500 900 Russia 95,000 95,000 61,200 61,000 25,000 14,000 South Africa 81,100 81,000 52,600 52,000 1,200 770 Sweden 27,200 27,000 16,900 17,000 1,300 600 Ukraine 60,500 60,000 37,800 38,000 86,500 82,300 Other countries 119,000 120,000 72,200 72,000 18,000 9,500 World total (rounded) 2,430,000 2,500,000 1,500,000 1,500,000 170,000 84,000 World Resources: U.S. resources are estimated to be 110 billion tons of iron ore containing about 27 billion tons of iron. U.S. resources are mainly low-grade taconite-type ores from the Lake Superior district that require beneficiation and agglomeration prior to commercial use. World resources are estimated to be greater than 800 billion tons of crude ore containing more than 230 billion tons of iron. Substitutes: The only source of primary iron is iron ore, used directly as direct-shipping ore or converted to briquettes, concentrates, DRI, iron nuggets, pellets, or sinter. DRI, iron nuggets, and scrap are extensively used for steelmaking in electric arc furnaces and in iron and steel foundries. Technological advancements have been made, which allow hematite to be recovered from tailings basins and pelletized. eEstimated. E Net exporter. 1Data are for iron ore used as a raw material in steelmaking unless otherwise noted. See also Iron and Steel and Iron and Steel Scrap. 2Except where noted, salient statistics are for all forms of iron ore used in steelmaking, and do not include iron metallics, which include DRI, hot-briquetted iron, and iron nuggets. 3Defined as production + imports – exports + adjustments for industry stock changes. 4Defined as imports – exports + adjustments for industry stock changes. 5See Appendix C for resource and reserve definitions and information concerning data sources. 6Million metric tons. 7For Australia, Joint Ore Reserves Committee-compliant reserves were about 24 billion tons for crude ore and 10 billion tons for iron content. 8For Ukraine, reserves consist of the A+B categories of the Soviet reserves classification system.
U.S. Geological Survey, Mineral Commodity Summaries, February 2019
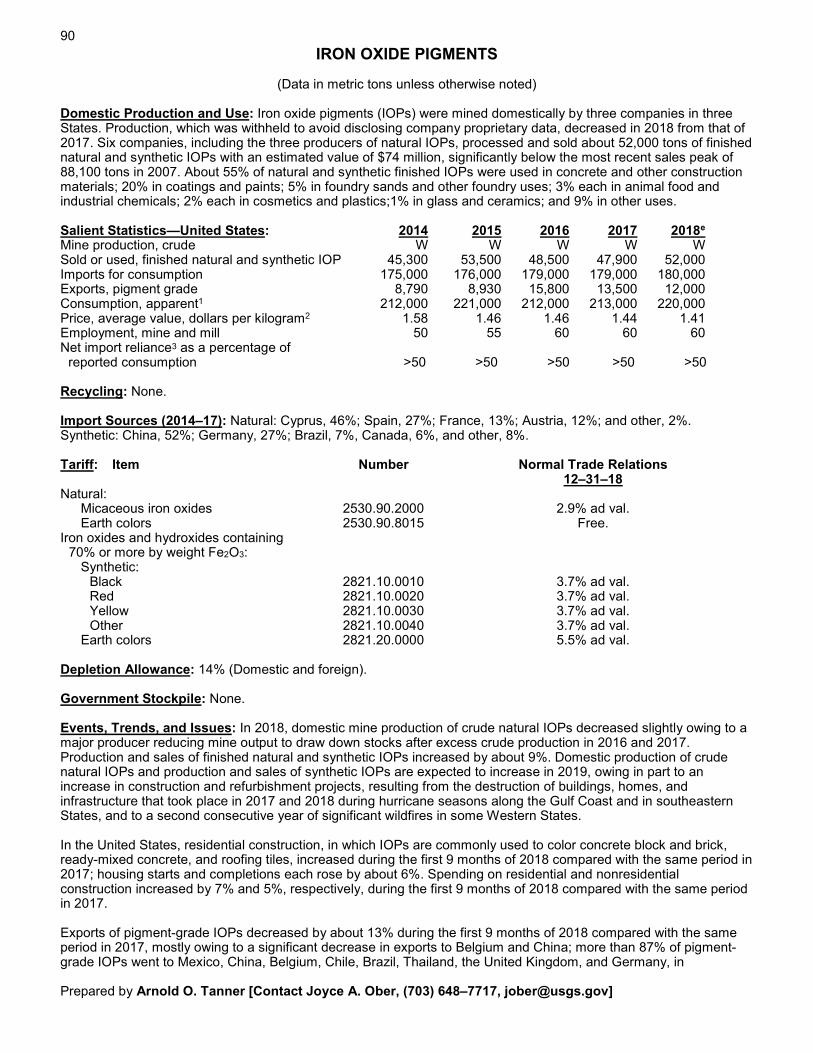
90
IRON OXIDE PIGMENTS
(Data in metric tons unless otherwise noted) Domestic Production and Use: Iron oxide pigments (IOPs) were mined domestically by three companies in three States. Production, which was withheld to avoid disclosing company proprietary data, decreased in 2018 from that of 2017. Six companies, including the three producers of natural IOPs, processed and sold about 52,000 tons of finished natural and synthetic IOPs with an estimated value of $74 million, significantly below the most recent sales peak of 88,100 tons in 2007. About 55% of natural and synthetic finished IOPs were used in concrete and other construction materials; 20% in coatings and paints; 5% in foundry sands and other foundry uses; 3% each in animal food and industrial chemicals; 2% each in cosmetics and plastics;1% in glass and ceramics; and 9% in other uses. Salient Statistics—United States: 2014 2015 2016 2017 2018e Mine production, crude W W W W W Sold or used, finished natural and synthetic IOP 45,300 53,500 48,500 47,900 52,000 Imports for consumption 175,000 176,000 179,000 179,000 180,000 Exports, pigment grade 8,790 8,930 15,800 13,500 12,000 Consumption, apparent1 212,000 221,000 212,000 213,000 220,000 Price, average value, dollars per kilogram2 1.58 1.46 1.46 1.44 1.41 Employment, mine and mill 50 55 60 60 60 Net import reliance3 as a percentage of reported consumption >50 >50 >50 >50 >50 Recycling: None. Import Sources (2014–17): Natural: Cyprus, 46%; Spain, 27%; France, 13%; Austria, 12%; and other, 2%. Synthetic: China, 52%; Germany, 27%; Brazil, 7%, Canada, 6%, and other, 8%. Tariff: Item Number Normal Trade Relations 12–31–18 Natural: Micaceous iron oxides 2530.90.2000 2.9% ad val. Earth colors 2530.90.8015 Free. Iron oxides and hydroxides containing 70% or more by weight Fe2O3: Synthetic: Black 2821.10.0010 3.7% ad val. Red 2821.10.0020 3.7% ad val. Yellow 2821.10.0030 3.7% ad val. Other 2821.10.0040 3.7% ad val. Earth colors 2821.20.0000 5.5% ad val. Depletion Allowance: 14% (Domestic and foreign). Government Stockpile: None. Events, Trends, and Issues: In 2018, domestic mine production of crude natural IOPs decreased slightly owing to a major producer reducing mine output to draw down stocks after excess crude production in 2016 and 2017. Production and sales of finished natural and synthetic IOPs increased by about 9%. Domestic production of crude natural IOPs and production and sales of synthetic IOPs are expected to increase in 2019, owing in part to an increase in construction and refurbishment projects, resulting from the destruction of buildings, homes, and infrastructure that took place in 2017 and 2018 during hurricane seasons along the Gulf Coast and in southeastern States, and to a second consecutive year of significant wildfires in some Western States. In the United States, residential construction, in which IOPs are commonly used to color concrete block and brick, ready-mixed concrete, and roofing tiles, increased during the first 9 months of 2018 compared with the same period in 2017; housing starts and completions each rose by about 6%. Spending on residential and nonresidential construction increased by 7% and 5%, respectively, during the first 9 months of 2018 compared with the same period in 2017. Exports of pigment-grade IOPs decreased by about 13% during the first 9 months of 2018 compared with the same period in 2017, mostly owing to a significant decrease in exports to Belgium and China; more than 87% of pigment-grade IOPs went to Mexico, China, Belgium, Chile, Brazil, Thailand, the United Kingdom, and Germany, in Prepared by Arnold O. Tanner [Contact Joyce A. Ober, (703) 648–7717, [email protected]]
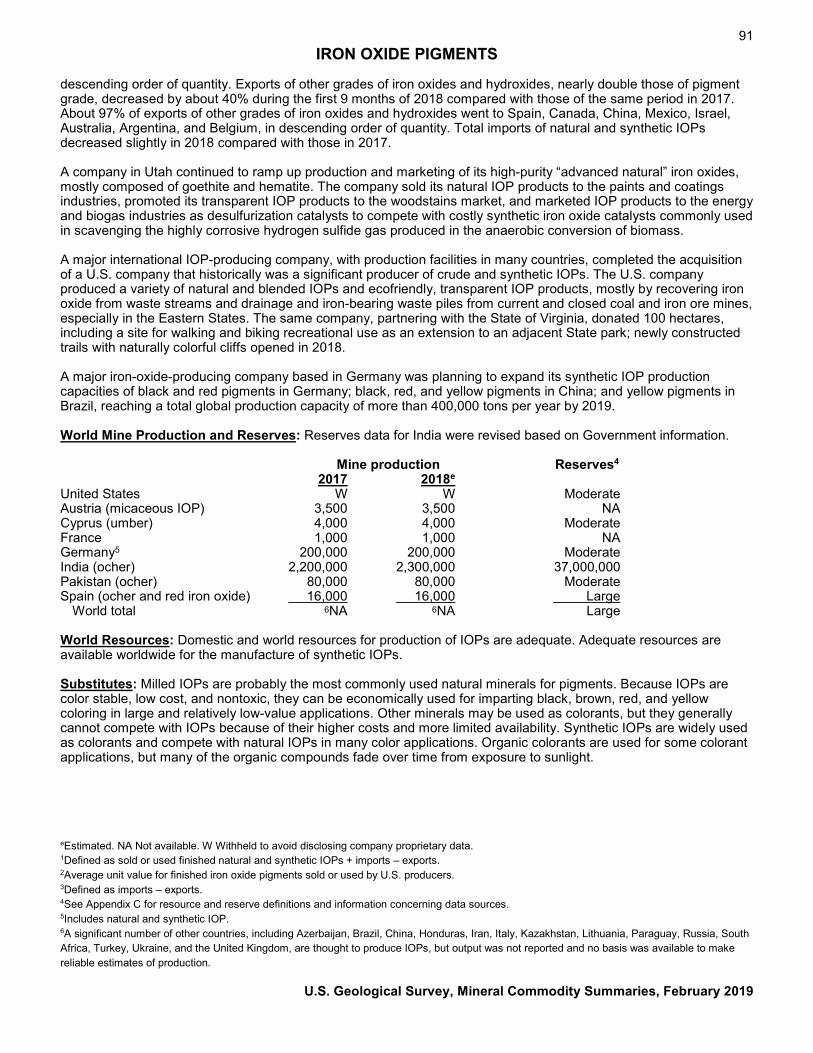
91 IRON OXIDE PIGMENTS
descending order of quantity. Exports of other grades of iron oxides and hydroxides, nearly double those of pigment grade, decreased by about 40% during the first 9 months of 2018 compared with those of the same period in 2017. About 97% of exports of other grades of iron oxides and hydroxides went to Spain, Canada, China, Mexico, Israel, Australia, Argentina, and Belgium, in descending order of quantity. Total imports of natural and synthetic IOPs decreased slightly in 2018 compared with those in 2017. A company in Utah continued to ramp up production and marketing of its high-purity “advanced natural” iron oxides, mostly composed of goethite and hematite. The company sold its natural IOP products to the paints and coatings industries, promoted its transparent IOP products to the woodstains market, and marketed IOP products to the energy and biogas industries as desulfurization catalysts to compete with costly synthetic iron oxide catalysts commonly used in scavenging the highly corrosive hydrogen sulfide gas produced in the anaerobic conversion of biomass. A major international IOP-producing company, with production facilities in many countries, completed the acquisition of a U.S. company that historically was a significant producer of crude and synthetic IOPs. The U.S. company produced a variety of natural and blended IOPs and ecofriendly, transparent IOP products, mostly by recovering iron oxide from waste streams and drainage and iron-bearing waste piles from current and closed coal and iron ore mines, especially in the Eastern States. The same company, partnering with the State of Virginia, donated 100 hectares, including a site for walking and biking recreational use as an extension to an adjacent State park; newly constructed trails with naturally colorful cliffs opened in 2018. A major iron-oxide-producing company based in Germany was planning to expand its synthetic IOP production capacities of black and red pigments in Germany; black, red, and yellow pigments in China; and yellow pigments in Brazil, reaching a total global production capacity of more than 400,000 tons per year by 2019. World Mine Production and Reserves: Reserves data for India were revised based on Government information. Mine production Reserves4 2017 2018e United States W W Moderate Austria (micaceous IOP) 3,500 3,500 NA Cyprus (umber) 4,000 4,000 Moderate France 1,000 1,000 NA Germany5 200,000 200,000 Moderate India (ocher) 2,200,000 2,300,000 37,000,000 Pakistan (ocher) 80,000 80,000 Moderate Spain (ocher and red iron oxide) 16,000 16,000 Large World total 6NA 6NA Large World Resources: Domestic and world resources for production of IOPs are adequate. Adequate resources are available worldwide for the manufacture of synthetic IOPs. Substitutes: Milled IOPs are probably the most commonly used natural minerals for pigments. Because IOPs are color stable, low cost, and nontoxic, they can be economically used for imparting black, brown, red, and yellow coloring in large and relatively low-value applications. Other minerals may be used as colorants, but they generally cannot compete with IOPs because of their higher costs and more limited availability. Synthetic IOPs are widely used as colorants and compete with natural IOPs in many color applications. Organic colorants are used for some colorant applications, but many of the organic compounds fade over time from exposure to sunlight. eEstimated. NA Not available. W Withheld to avoid disclosing company proprietary data. 1Defined as sold or used finished natural and synthetic IOPs + imports – exports. 2Average unit value for finished iron oxide pigments sold or used by U.S. producers. 3Defined as imports – exports. 4See Appendix C for resource and reserve definitions and information concerning data sources. 5Includes natural and synthetic IOP. 6A significant number of other countries, including Azerbaijan, Brazil, China, Honduras, Iran, Italy, Kazakhstan, Lithuania, Paraguay, Russia, South Africa, Turkey, Ukraine, and the United Kingdom, are thought to produce IOPs, but output was not reported and no basis was available to make reliable estimates of production.
U.S. Geological Survey, Mineral Commodity Summaries, February 2019
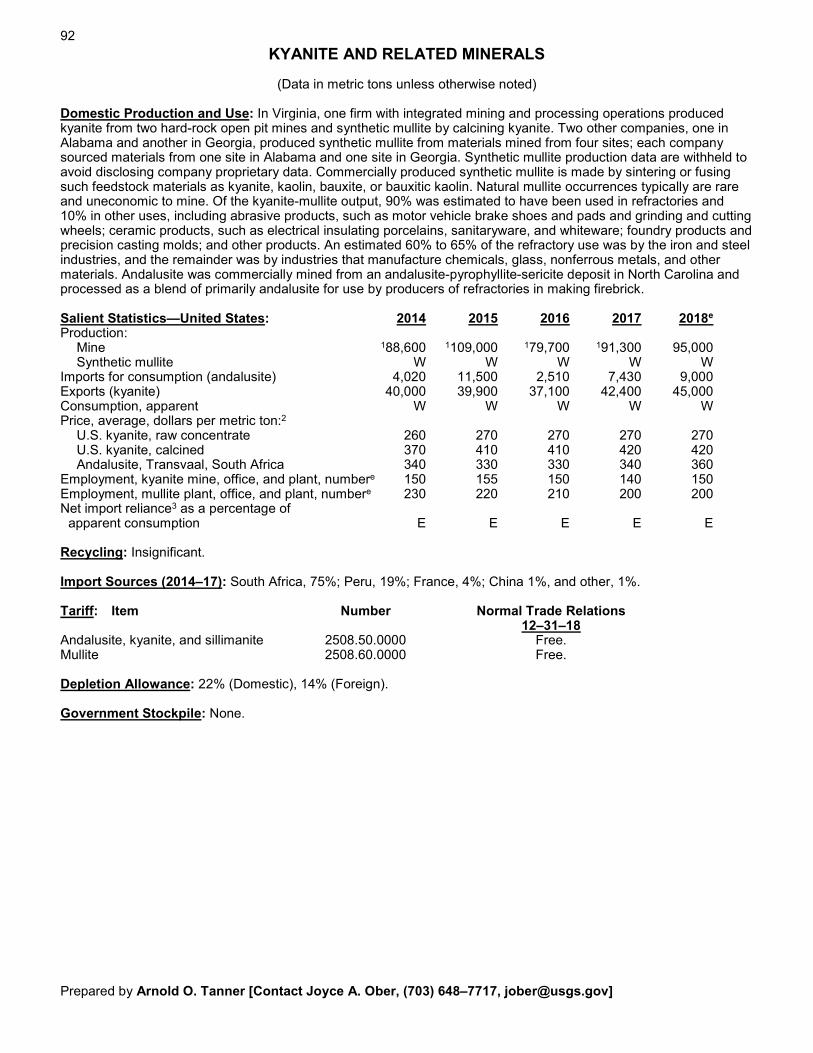
92
KYANITE AND RELATED MINERALS
(Data in metric tons unless otherwise noted) Domestic Production and Use: In Virginia, one firm with integrated mining and processing operations produced kyanite from two hard-rock open pit mines and synthetic mullite by calcining kyanite. Two other companies, one in Alabama and another in Georgia, produced synthetic mullite from materials mined from four sites; each company sourced materials from one site in Alabama and one site in Georgia. Synthetic mullite production data are withheld to avoid disclosing company proprietary data. Commercially produced synthetic mullite is made by sintering or fusing such feedstock materials as kyanite, kaolin, bauxite, or bauxitic kaolin. Natural mullite occurrences typically are rare and uneconomic to mine. Of the kyanite-mullite output, 90% was estimated to have been used in refractories and 10% in other uses, including abrasive products, such as motor vehicle brake shoes and pads and grinding and cutting wheels; ceramic products, such as electrical insulating porcelains, sanitaryware, and whiteware; foundry products and precision casting molds; and other products. An estimated 60% to 65% of the refractory use was by the iron and steel industries, and the remainder was by industries that manufacture chemicals, glass, nonferrous metals, and other materials. Andalusite was commercially mined from an andalusite-pyrophyllite-sericite deposit in North Carolina and processed as a blend of primarily andalusite for use by producers of refractories in making firebrick. Salient Statistics—United States: 2014 2015 2016 2017 2018e Production: Mine 188,600 1109,000 179,700 191,300 95,000 Synthetic mullite W W W W W Imports for consumption (andalusite) 4,020 11,500 2,510 7,430 9,000 Exports (kyanite) 40,000 39,900 37,100 42,400 45,000 Consumption, apparent W W W W W Price, average, dollars per metric ton:2 U.S. kyanite, raw concentrate 260 270 270 270 270 U.S. kyanite, calcined 370 410 410 420 420 Andalusite, Transvaal, South Africa 340 330 330 340 360 Employment, kyanite mine, office, and plant, numbere 150 155 150 140 150 Employment, mullite plant, office, and plant, numbere 230 220 210 200 200 Net import reliance3 as a percentage of apparent consumption E E E E E Recycling: Insignificant. Import Sources (2014–17): South Africa, 75%; Peru, 19%; France, 4%; China 1%, and other, 1%. Tariff: Item Number Normal Trade Relations 12–31–18 Andalusite, kyanite, and sillimanite 2508.50.0000 Free. Mullite 2508.60.0000 Free. Depletion Allowance: 22% (Domestic), 14% (Foreign). Government Stockpile: None. Prepared by Arnold O. Tanner [Contact Joyce A. Ober, (703) 648–7717, [email protected]]
93 KYANITE AND RELATED MINERALS
Events, Trends, and Issues: Crude steel production in the United States, which ranked fourth in the world, increased by about 4% in the first 8 months of 2018 compared with that of the same period in 2017, indicating a similar change in consumption of kyanite-mullite refractories. Total world steel production increased by nearly 5% during the first 8 months of 2018 compared with that of the same period in 2017. The increase in world steel production during the first 8 months of 2018 was the result of incremental to small increases in production in developed and developing countries, especially in Asia. Despite a continuing deceleration in growth, China still led with the largest increase in steel production and continued to be the largest market for refractories. Of the total world refractories market, which was estimated to be approximately 40 million tons, crude steel manufacturing consumed more than 70% of refractories production. The availability of inexpensive refractory-grade bauxite from China, which accounted for about three-quarters of the refractories market share worldwide, continued to decrease, in part owing to inspections by the Government of China and the shutdown of some operations during the past few years because of environmental problems. Andalusite and mullite could receive increased consideration as alternative aluminosilicate refractory minerals to refractory bauxite, if the availability of andalusite in 2019 can meet the rising demand for the mineral. The mine disruptions caused by heavy rain during 2017 at major andalusite operations in South Africa and Peru followed prolonged rampup to full capacity and resulted in shortages of andalusite to supply existing and future orders. Contracts for orders for andalusite of shorter than traditional duration, typically with an increase in prices, began in 2018 and were expected to continue in 2019. Higher consumption of refractories in iron and steel production is expected in countries with higher rates of growth in steel production. Although still recovering from the adverse weather conditions of 2017, andalusite projects in Peru continued to progress. At one andalusite project, the company continued exploration and construction of a processing facility as it sought a joint-venture investment partner, which was deemed necessary to proceed with production. World Mine Production and Reserves: Reserves data for India were revised based on Government information. Mine production Reserves4 2017 2018e United States (kyanite) 91,300 95,000 Large India (kyanite and sillimanite) 68,000 70,000 7,190,000 Peru (andalusite) 35,000 40,000 NA South Africa (andalusite) 200,000 200,000 NA World total (rounded) 5NA 5NA NA World Resources: Large resources of kyanite and related minerals are known to exist in the United States. The chief resources are in deposits of micaceous schist and gneiss, mostly in the Appalachian Mountains and in Idaho. Other resources are in aluminous gneiss in southern California. These resources are not economic to mine at present. The characteristics of kyanite resources in the rest of the world are thought to be similar to those in the United States. Significant resources of andalusite are known to exist in China, France, Peru, and South Africa; kyanite resources have been identified in Brazil, India, and Russia; and sillimanite has been identified in India. Substitutes: Two types of synthetic mullite (fused and sintered), superduty fire clays, and high-alumina materials are substitutes for kyanite in refractories. Principal raw materials for synthetic mullite are bauxite, kaolin and other clays, and silica sand. eEstimated. E Net exporter. NA Not available. W Withheld to avoid disclosing company proprietary data. 1Source: Virginia Department of Mines, Minerals and Energy. 2Source: Average of prices reported in Industrial Minerals. 3Defined as imports – exports. 4See Appendix C for resource and reserve definitions and information concerning data sources. 5In addition to the countries listed, France continued production of andalusite and Cameroon and China produced kyanite and related minerals. Output is not reported quantitatively, and no reliable basis is available for estimation of output levels.
U.S. Geological Survey, Mineral Commodity Summaries, February 2019
94 LEAD
(Data in thousand metric tons of lead content unless otherwise noted)
Domestic Production and Use: Five lead mines in Missouri, plus five mines in Alaska, Idaho, and Washington that produced lead as a principal product or byproduct, accounted for all domestic lead mine production. The value of the lead in concentrates mined in 2018, based on the average North American Market price for refined lead, was about $660 million. It was estimated that the lead-acid battery industry accounted for more than 85% of reported U.S. lead consumption during 2018. Lead-acid batteries were primarily used as starting-lighting-ignition (SLI) batteries for automobiles, as industrial-type batteries for standby power for computer and telecommunications networks, and for motive power. During the first 10 months of 2018, 116 million lead-acid automotive batteries were shipped by North American producers, a 3% increase from those shipped in the same period of 2017.
Salient Statistics—United States: 2014 2015 2016 2017 2018e Production:
Mine, lead in concentrates 378 370 346 310 260 Primary refinery — — — — — Secondary refinery, old scrap 1,020 1,050 986 1,130 1,300
Imports for consumption: Lead in concentrates — — (1) — —
Refined metal, unwrought 593 521 533 658 580 Exports:
Lead in concentrates 357 350 341 269 270 Refined metal, unwrought (gross weight) 55 56 43 24 54
Consumption: Reported 1,510 1,630 1,470 NA NA
Apparent2 1,560 1,520 1,480 1,760 1,800 Price, average, cents per pound:3
North American market 106.2 91.2 94.4 114.5 115.0 London Metal Exchange (LME), cash 95.0 81.0 84.8 105.1 104.0
Stocks, metal, producers, consumers, yearend 66 64 101 NA NA Employment, number:
Mine and mill (average)4 1,890 1,970 1,970 1,890 1,870 Primary smelter, refineries — — — — — Secondary smelters, refineries 1,800 1,800 1,850 1,850 1,850
Net import reliance5 as a percentage of apparent consumption, refined lead 35 31 33 36 29
Recycling: In 2018, about 1.3 million tons of secondary lead was produced, an amount equivalent to 71% of apparent domestic consumption. Nearly all secondary lead was recovered from old scrap, mostly lead-acid batteries.
Import Sources (2014–17): Refined metal: Canada, 45%; Mexico, 18%; Republic of Korea, 14%; India, 5%; and other, 18%.
Tariff: Item Number Normal Trade Relations 12–31–18
Lead ores and concentrates, lead content 2607.00.0020 1.1¢/kg on lead content. Refined lead 7801.10.0000 2.5% on the value of the lead content. Antimonial lead 7801.91.0000 2.5% on the value of the lead content. Alloys of lead 7801.99.9030 2.5% on the value of the lead content. Other unwrought lead 7801.99.9050 2.5% on the value of the lead content.
Depletion Allowance: 22% (Domestic), 14% (Foreign).
Government Stockpile: None.
Prepared by Kateryna Klochko [(703) 648–4977, [email protected]]
95 LEAD
Events, Trends, and Issues: During the first 10 months of 2018, the average LME cash price for lead was $1.04 per pound, essentially unchanged from that in the same period of 2017. In the second half of 2017, prices reached a 6-year high owing to a tight supply of concentrate and increased demand for refined lead. During the first 10 months of 2018, prices decreased by 23%, bringing down the year average. Global stocks of lead in LME-approved warehouses were 106,950 tons in mid-December, which was 25% less than those at yearend 2017.
In 2018, domestic mine production was estimated to have decreased from that in the previous year in all four lead-producing States. Production at one mine in Idaho continued to be relatively low owing to an employee strike, which began in March 2017. The United States has become more reliant on imported refined lead in recent years owing to the closure of the last primary lead smelter in 2013. Exports of spent SLI batteries had been decreasing since 2014. During the first 10 months of 2018, however, 22.9 million spent SLI lead-acid batteries were exported, which was 44% more than exports in 2017.
In November 2018, an industrial conglomerate, which was a leading lead-acid automotive battery manufacturer and secondary lead producer in the United States, announced the sale of its battery-making component.
According to the International Lead and Zinc Study Group,6 global refined lead production in 2018 increased by 0.4% to 11.59 million tons, and metal consumption increased by 0.2% to 11.71 million tons, resulting in a production-to-consumption deficit of about 120,000 tons of refined lead.
World Mine Production and Reserves: Reserves estimates for Australia, China, India, and Turkey were revised based on new information from company or Government reports.
Mine production Reserves7 2017 2018e
United States 310 260 5,000 Australia 459 450 824,000Bolivia 110 100 1,600 China 2,150 2,100 18,000 India 170 170 2,500 Kazakhstan 112 100 2,000 Mexico 243 240 5,600 Peru 307 300 6,000 Russia 200 200 6,400 Sweden 74 70 1,100 Turkey 68 60 6,100 Other countries 379 380 5,000
World total (rounded) 4,580 4,400 83,000
World Resources: Identified world lead resources total more than 2 billion tons. In recent years, significant lead resources have been identified in association with zinc and (or) silver or copper deposits in Australia, China, Ireland, Mexico, Peru, Portugal, Russia, and the United States (Alaska).
Substitutes: Substitution by plastics has reduced the use of lead in cable covering and cans. Tin has replaced lead in solder for potable water systems. The electronics industry has moved toward lead-free solders and flat-panel displays that do not require lead shielding. Steel and zinc are common substitutes for lead in wheel weights.
eEstimated. NA Not available. — Zero. 1Less than ½ unit. 2Defined as primary refined production + secondary refined production (old scrap) + refined imports – refined exports. 3Source: Platts Metal Week. 4Includes lead and zinc-lead mines for which lead was either a principal product or significant byproduct. 5Defined as imports – exports. 6International Lead and Zinc Study Group, 2018, ILZSG session/forecasts: Lisbon, Portugal, International Lead and Zinc Study Group news release, October 8, 5 p. 7See Appendix C for resource and reserve definitions and information concerning data sources. 8For Australia, Joint Ore Reserves Committee-compliant reserves were about 12 million tons.
U.S. Geological Survey, Mineral Commodity Summaries, February 2019
96
LIME1
(Data in thousand metric tons unless otherwise noted) Domestic Production and Use: In 2018, an estimated 19 million tons of quicklime and hydrate was produced (excluding independent commercial hydrators2), valued at about $2.4 billion. At yearend, 29 companies were producing lime, which included 18 companies with commercial sales and 10 companies that produced lime strictly for internal use (for example, sugar companies). These companies had 74 primary lime plants (plants operating quicklime kilns) in 28 States and Puerto Rico. Six of these 29 companies operated only hydrating plants in 11 States. In 2018, the five leading U.S. lime companies produced quicklime or hydrate in 20 States and accounted for 79% of U.S. lime production. Principal producing States were, in alphabetical order, Alabama, Kentucky, Missouri, Ohio, and Texas. Major markets for lime were, in descending order of consumption, steelmaking, chemical and industrial applications (such as the manufacture of fertilizer, glass, paper and pulp, and precipitated calcium carbonate, and in sugar refining), flue gas treatment, construction, water treatment, and nonferrous mining. Salient Statistics—United States: 2014 2015 2016 2017 2018e Production3 19,500 18,300 17,700 17,800 19,000 Imports for consumption 414 391 376 367 330 Exports 320 346 329 391 350 Consumption, apparent4 19,600 18,300 17,700 17,800 19,000 Quicklime average value, dollars per ton at plant 119.10 121.50 121.00 121.80 120.00 Hydrate average value, dollars per ton at plant 142.20 146.40 145.50 146.70 150.00 Employment, mine and plant, number 5,100 NA NA NA NA Net import reliance5 as a percentage of apparent consumption 1 <1 <1 <1 <1 Recycling: Large quantities of lime are regenerated by paper mills. Some municipal water-treatment plants regenerate lime from softening sludge. Quicklime is regenerated from waste hydrated lime in the carbide industry. Data for these sources were not included as production in order to avoid duplication. Import Sources (2014–17): Canada, 94%; Mexico, 5%; and other, 1%. Tariff: Item Number Normal Trade Relations 12–31–18 Calcined dolomite 2518.20.0000 3% ad val. Quicklime 2522.10.0000 Free. Slaked lime 2522.20.0000 Free. Hydraulic lime 2522.30.0000 Free. Depletion Allowance: Limestone produced and used for lime production, 14% (Domestic and foreign). Government Stockpile: None. Events, Trends, and Issues: In 2018, domestic lime production was estimated to increase by 7% from that of 2017, owing primarily to an increase in hydrated lime output. This also led to the slight increase in estimated value of production year over year. In 2017, one sugar cooperative reversed an earlier decision made in 2016 to close its sugar beet facility in Torrington, WY, thereby keeping one quicklime kiln in production. Another company shut down quicklime production at one plant in Green Bay, WI; since then, only hydrated lime has been produced at this location. As a result, the total number of operating quicklime plants stayed at 74 in 2018. Hydrated lime is a dry calcium hydroxide powder made from reacting quicklime with a controlled amount of water in a hydrator. It is used in chemical and industrial, construction, and environmental applications. In 2018, the leading uses of hydrated lime were chemical and industrial, and construction applications; flue gas desulfurization; and water treatment. Prepared by Lisa A. Corathers [(703) 648–4973, [email protected]]
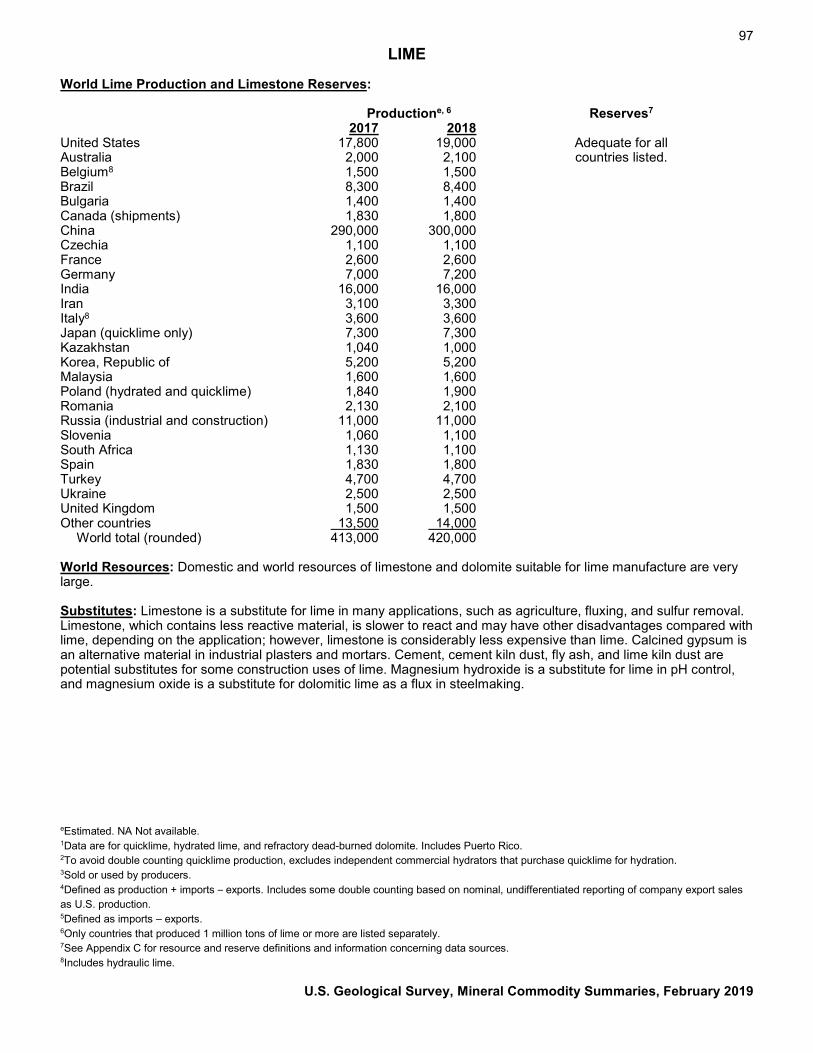
97 LIME
World Lime Production and Limestone Reserves: Productione, 6 Reserves7 2017 2018 United States 17,800 19,000 Adequate for all Australia 2,000 2,100 countries listed. Belgium8 1,500 1,500 Brazil 8,300 8,400 Bulgaria 1,400 1,400 Canada (shipments) 1,830 1,800 China 290,000 300,000 Czechia 1,100 1,100 France 2,600 2,600 Germany 7,000 7,200 India 16,000 16,000 Iran 3,100 3,300 Italy8 3,600 3,600 Japan (quicklime only) 7,300 7,300 Kazakhstan 1,040 1,000 Korea, Republic of 5,200 5,200 Malaysia 1,600 1,600 Poland (hydrated and quicklime) 1,840 1,900 Romania 2,130 2,100 Russia (industrial and construction) 11,000 11,000 Slovenia 1,060 1,100 South Africa 1,130 1,100 Spain 1,830 1,800 Turkey 4,700 4,700 Ukraine 2,500 2,500 United Kingdom 1,500 1,500 Other countries 13,500 14,000 World total (rounded) 413,000 420,000 World Resources: Domestic and world resources of limestone and dolomite suitable for lime manufacture are very large. Substitutes: Limestone is a substitute for lime in many applications, such as agriculture, fluxing, and sulfur removal. Limestone, which contains less reactive material, is slower to react and may have other disadvantages compared with lime, depending on the application; however, limestone is considerably less expensive than lime. Calcined gypsum is an alternative material in industrial plasters and mortars. Cement, cement kiln dust, fly ash, and lime kiln dust are potential substitutes for some construction uses of lime. Magnesium hydroxide is a substitute for lime in pH control, and magnesium oxide is a substitute for dolomitic lime as a flux in steelmaking. eEstimated. NA Not available. 1Data are for quicklime, hydrated lime, and refractory dead-burned dolomite. Includes Puerto Rico. 2To avoid double counting quicklime production, excludes independent commercial hydrators that purchase quicklime for hydration. 3Sold or used by producers. 4Defined as production + imports – exports. Includes some double counting based on nominal, undifferentiated reporting of company export sales as U.S. production. 5Defined as imports – exports. 6Only countries that produced 1 million tons of lime or more are listed separately. 7See Appendix C for resource and reserve definitions and information concerning data sources. 8Includes hydraulic lime.
U.S. Geological Survey, Mineral Commodity Summaries, February 2019
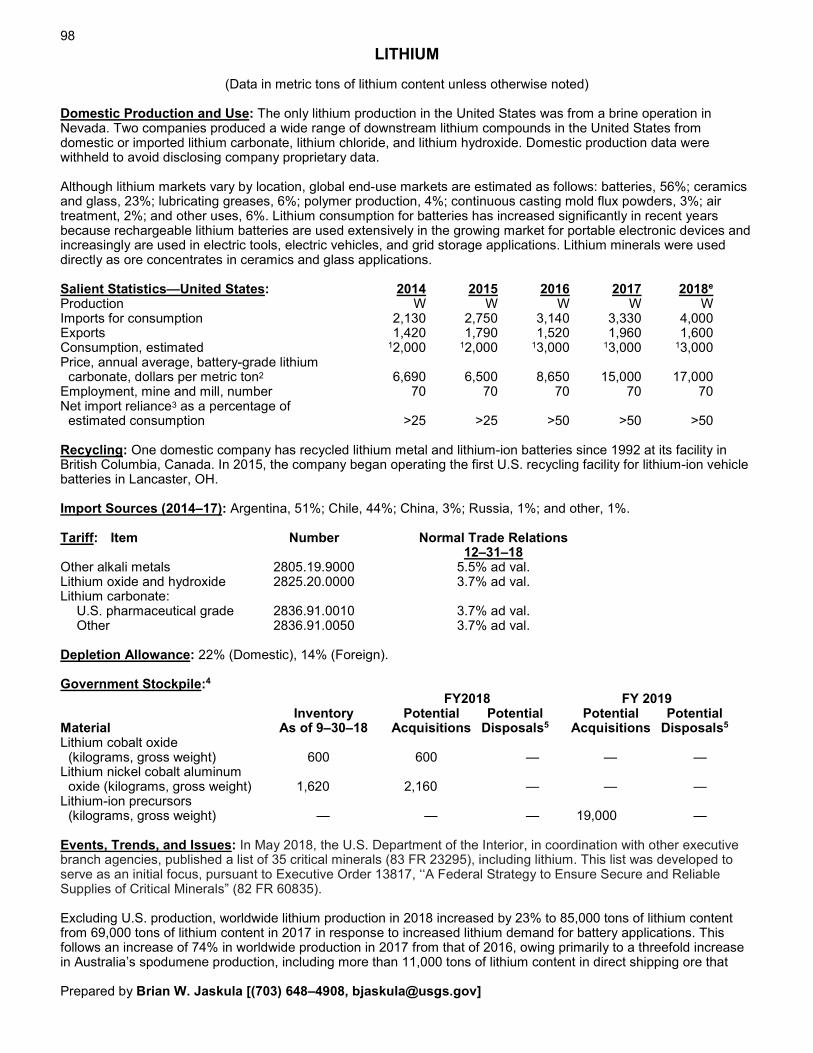
98 LITHIUM
(Data in metric tons of lithium content unless otherwise noted)
Domestic Production and Use: The only lithium production in the United States was from a brine operation in Nevada. Two companies produced a wide range of downstream lithium compounds in the United States from domestic or imported lithium carbonate, lithium chloride, and lithium hydroxide. Domestic production data were withheld to avoid disclosing company proprietary data.
Although lithium markets vary by location, global end-use markets are estimated as follows: batteries, 56%; ceramics and glass, 23%; lubricating greases, 6%; polymer production, 4%; continuous casting mold flux powders, 3%; air treatment, 2%; and other uses, 6%. Lithium consumption for batteries has increased significantly in recent years because rechargeable lithium batteries are used extensively in the growing market for portable electronic devices and increasingly are used in electric tools, electric vehicles, and grid storage applications. Lithium minerals were used directly as ore concentrates in ceramics and glass applications.
Salient Statistics—United States: 2014 2015 2016 2017 2018e Production W W W W W Imports for consumption 2,130 2,750 3,140 3,330 4,000 Exports 1,420 1,790 1,520 1,960 1,600 Consumption, estimated 12,000 12,000 13,000 13,000 13,000 Price, annual average, battery-grade lithium carbonate, dollars per metric ton2 6,690 6,500 8,650 15,000 17,000 Employment, mine and mill, number 70 70 70 70 70 Net import reliance3 as a percentage of
estimated consumption >25 >25 >50 >50 >50
Recycling: One domestic company has recycled lithium metal and lithium-ion batteries since 1992 at its facility in British Columbia, Canada. In 2015, the company began operating the first U.S. recycling facility for lithium-ion vehicle batteries in Lancaster, OH.
Import Sources (2014–17): Argentina, 51%; Chile, 44%; China, 3%; Russia, 1%; and other, 1%.
Tariff: Item Number Normal Trade Relations 12–31–18
Other alkali metals 2805.19.9000 5.5% ad val. Lithium oxide and hydroxide 2825.20.0000 3.7% ad val. Lithium carbonate:
U.S. pharmaceutical grade 2836.91.0010 3.7% ad val. Other 2836.91.0050 3.7% ad val.
Depletion Allowance: 22% (Domestic), 14% (Foreign).
Government Stockpile:4
FY2018 FY 2019 Inventory Potential Potential Potential Potential
Material As of 9–30–18 Acquisitions Disposals5 Acquisitions Disposals5
Lithium cobalt oxide (kilograms, gross weight) 600 600 — — — Lithium nickel cobalt aluminum oxide (kilograms, gross weight) 1,620 2,160 — — — Lithium-ion precursors
(kilograms, gross weight) — — — 19,000 —
Events, Trends, and Issues: In May 2018, the U.S. Department of the Interior, in coordination with other executive branch agencies, published a list of 35 critical minerals (83 FR 23295), including lithium. This list was developed to serve as an initial focus, pursuant to Executive Order 13817, ‘‘A Federal Strategy to Ensure Secure and Reliable Supplies of Critical Minerals” (82 FR 60835).
Excluding U.S. production, worldwide lithium production in 2018 increased by 23% to 85,000 tons of lithium content from 69,000 tons of lithium content in 2017 in response to increased lithium demand for battery applications. This follows an increase of 74% in worldwide production in 2017 from that of 2016, owing primarily to a threefold increase in Australia’s spodumene production, including more than 11,000 tons of lithium content in direct shipping ore that
Prepared by Brian W. Jaskula [(703) 648–4908, [email protected]]
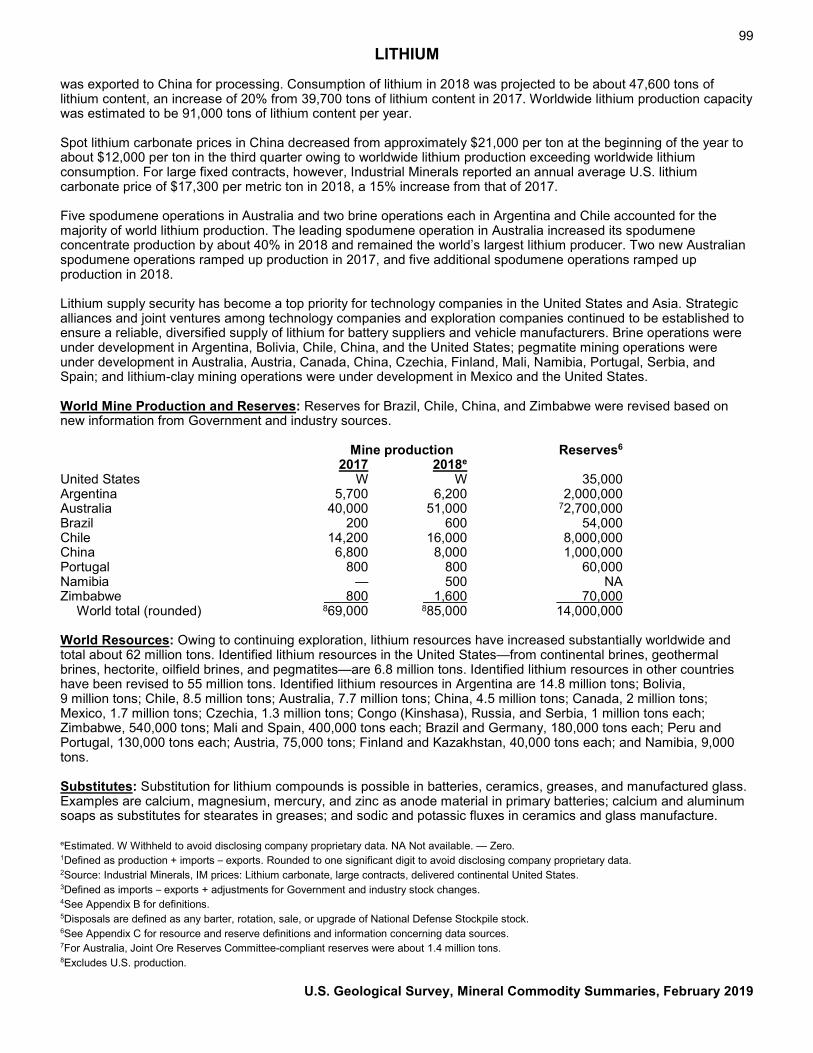
99 LITHIUM
was exported to China for processing. Consumption of lithium in 2018 was projected to be about 47,600 tons of lithium content, an increase of 20% from 39,700 tons of lithium content in 2017. Worldwide lithium production capacity was estimated to be 91,000 tons of lithium content per year. Spot lithium carbonate prices in China decreased from approximately $21,000 per ton at the beginning of the year to about $12,000 per ton in the third quarter owing to worldwide lithium production exceeding worldwide lithium consumption. For large fixed contracts, however, Industrial Minerals reported an annual average U.S. lithium carbonate price of $17,300 per metric ton in 2018, a 15% increase from that of 2017. Five spodumene operations in Australia and two brine operations each in Argentina and Chile accounted for the majority of world lithium production. The leading spodumene operation in Australia increased its spodumene concentrate production by about 40% in 2018 and remained the world’s largest lithium producer. Two new Australian spodumene operations ramped up production in 2017, and five additional spodumene operations ramped up production in 2018. Lithium supply security has become a top priority for technology companies in the United States and Asia. Strategic alliances and joint ventures among technology companies and exploration companies continued to be established to ensure a reliable, diversified supply of lithium for battery suppliers and vehicle manufacturers. Brine operations were under development in Argentina, Bolivia, Chile, China, and the United States; pegmatite mining operations were under development in Australia, Austria, Canada, China, Czechia, Finland, Mali, Namibia, Portugal, Serbia, and Spain; and lithium-clay mining operations were under development in Mexico and the United States. World Mine Production and Reserves: Reserves for Brazil, Chile, China, and Zimbabwe were revised based on new information from Government and industry sources. Mine production Reserves6 2017 2018e United States W W 35,000 Argentina 5,700 6,200 2,000,000 Australia 40,000 51,000 72,700,000 Brazil 200 600 54,000 Chile 14,200 16,000 8,000,000 China 6,800 8,000 1,000,000 Portugal 800 800 60,000 Namibia — 500 NA Zimbabwe 800 1,600 70,000 World total (rounded) 869,000 885,000 14,000,000 World Resources: Owing to continuing exploration, lithium resources have increased substantially worldwide and total about 62 million tons. Identified lithium resources in the United States—from continental brines, geothermal brines, hectorite, oilfield brines, and pegmatites—are 6.8 million tons. Identified lithium resources in other countries have been revised to 55 million tons. Identified lithium resources in Argentina are 14.8 million tons; Bolivia, 9 million tons; Chile, 8.5 million tons; Australia, 7.7 million tons; China, 4.5 million tons; Canada, 2 million tons; Mexico, 1.7 million tons; Czechia, 1.3 million tons; Congo (Kinshasa), Russia, and Serbia, 1 million tons each; Zimbabwe, 540,000 tons; Mali and Spain, 400,000 tons each; Brazil and Germany, 180,000 tons each; Peru and Portugal, 130,000 tons each; Austria, 75,000 tons; Finland and Kazakhstan, 40,000 tons each; and Namibia, 9,000 tons. Substitutes: Substitution for lithium compounds is possible in batteries, ceramics, greases, and manufactured glass. Examples are calcium, magnesium, mercury, and zinc as anode material in primary batteries; calcium and aluminum soaps as substitutes for stearates in greases; and sodic and potassic fluxes in ceramics and glass manufacture. eEstimated. W Withheld to avoid disclosing company proprietary data. NA Not available. — Zero. 1Defined as production + imports – exports. Rounded to one significant digit to avoid disclosing company proprietary data. 2Source: Industrial Minerals, IM prices: Lithium carbonate, large contracts, delivered continental United States. 3Defined as imports – exports + adjustments for Government and industry stock changes. 4See Appendix B for definitions. 5Disposals are defined as any barter, rotation, sale, or upgrade of National Defense Stockpile stock. 6See Appendix C for resource and reserve definitions and information concerning data sources. 7For Australia, Joint Ore Reserves Committee-compliant reserves were about 1.4 million tons. 8Excludes U.S. production.
U.S. Geological Survey, Mineral Commodity Summaries, February 2019
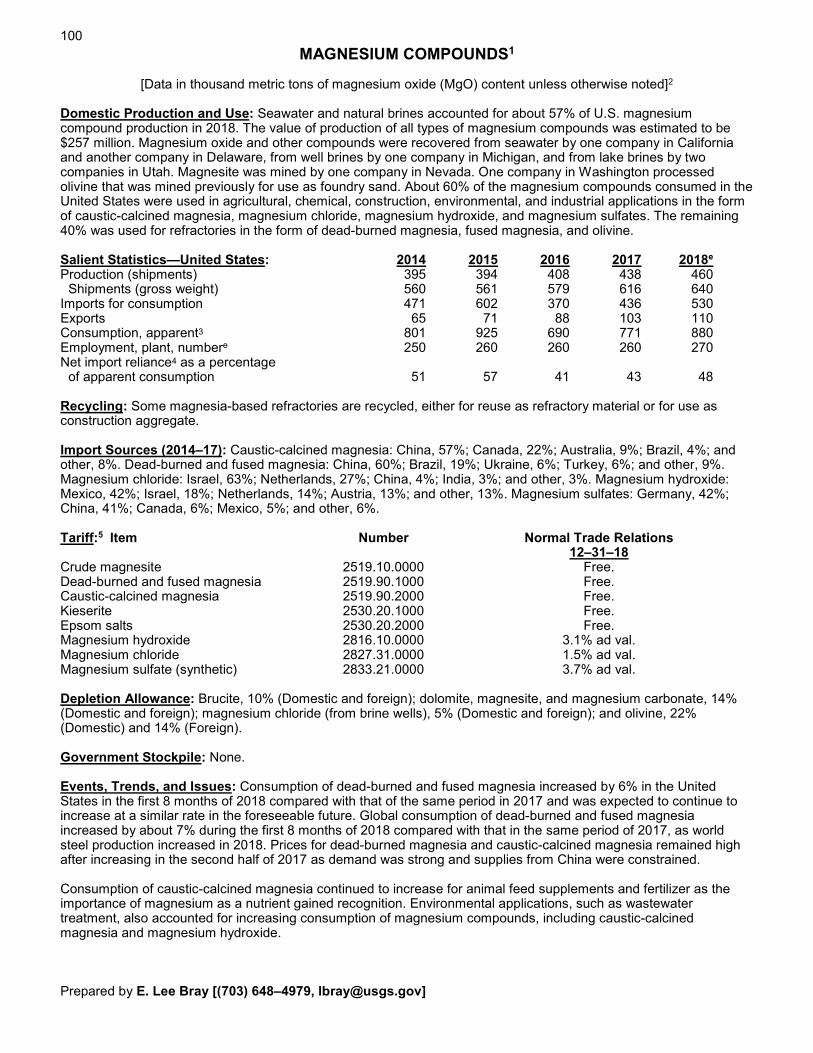
100
MAGNESIUM COMPOUNDS1
[Data in thousand metric tons of magnesium oxide (MgO) content unless otherwise noted]2 Domestic Production and Use: Seawater and natural brines accounted for about 57% of U.S. magnesium compound production in 2018. The value of production of all types of magnesium compounds was estimated to be $257 million. Magnesium oxide and other compounds were recovered from seawater by one company in California and another company in Delaware, from well brines by one company in Michigan, and from lake brines by two companies in Utah. Magnesite was mined by one company in Nevada. One company in Washington processed olivine that was mined previously for use as foundry sand. About 60% of the magnesium compounds consumed in the United States were used in agricultural, chemical, construction, environmental, and industrial applications in the form of caustic-calcined magnesia, magnesium chloride, magnesium hydroxide, and magnesium sulfates. The remaining 40% was used for refractories in the form of dead-burned magnesia, fused magnesia, and olivine. Salient Statistics—United States: 2014 2015 2016 2017 2018e Production (shipments) 395 394 408 438 460 Shipments (gross weight) 560 561 579 616 640 Imports for consumption 471 602 370 436 530 Exports 65 71 88 103 110 Consumption, apparent3 801 925 690 771 880 Employment, plant, numbere 250 260 260 260 270 Net import reliance4 as a percentage of apparent consumption 51 57 41 43 48 Recycling: Some magnesia-based refractories are recycled, either for reuse as refractory material or for use as construction aggregate. Import Sources (2014–17): Caustic-calcined magnesia: China, 57%; Canada, 22%; Australia, 9%; Brazil, 4%; and other, 8%. Dead-burned and fused magnesia: China, 60%; Brazil, 19%; Ukraine, 6%; Turkey, 6%; and other, 9%. Magnesium chloride: Israel, 63%; Netherlands, 27%; China, 4%; India, 3%; and other, 3%. Magnesium hydroxide: Mexico, 42%; Israel, 18%; Netherlands, 14%; Austria, 13%; and other, 13%. Magnesium sulfates: Germany, 42%; China, 41%; Canada, 6%; Mexico, 5%; and other, 6%. Tariff:5 Item Number Normal Trade Relations 12–31–18 Crude magnesite 2519.10.0000 Free. Dead-burned and fused magnesia 2519.90.1000 Free. Caustic-calcined magnesia 2519.90.2000 Free. Kieserite 2530.20.1000 Free. Epsom salts 2530.20.2000 Free. Magnesium hydroxide 2816.10.0000 3.1% ad val. Magnesium chloride 2827.31.0000 1.5% ad val. Magnesium sulfate (synthetic) 2833.21.0000 3.7% ad val. Depletion Allowance: Brucite, 10% (Domestic and foreign); dolomite, magnesite, and magnesium carbonate, 14% (Domestic and foreign); magnesium chloride (from brine wells), 5% (Domestic and foreign); and olivine, 22% (Domestic) and 14% (Foreign). Government Stockpile: None. Events, Trends, and Issues: Consumption of dead-burned and fused magnesia increased by 6% in the United States in the first 8 months of 2018 compared with that of the same period in 2017 and was expected to continue to increase at a similar rate in the foreseeable future. Global consumption of dead-burned and fused magnesia increased by about 7% during the first 8 months of 2018 compared with that in the same period of 2017, as world steel production increased in 2018. Prices for dead-burned magnesia and caustic-calcined magnesia remained high after increasing in the second half of 2017 as demand was strong and supplies from China were constrained. Consumption of caustic-calcined magnesia continued to increase for animal feed supplements and fertilizer as the importance of magnesium as a nutrient gained recognition. Environmental applications, such as wastewater treatment, also accounted for increasing consumption of magnesium compounds, including caustic-calcined magnesia and magnesium hydroxide. Prepared by E. Lee Bray [(703) 648–4979, [email protected]]
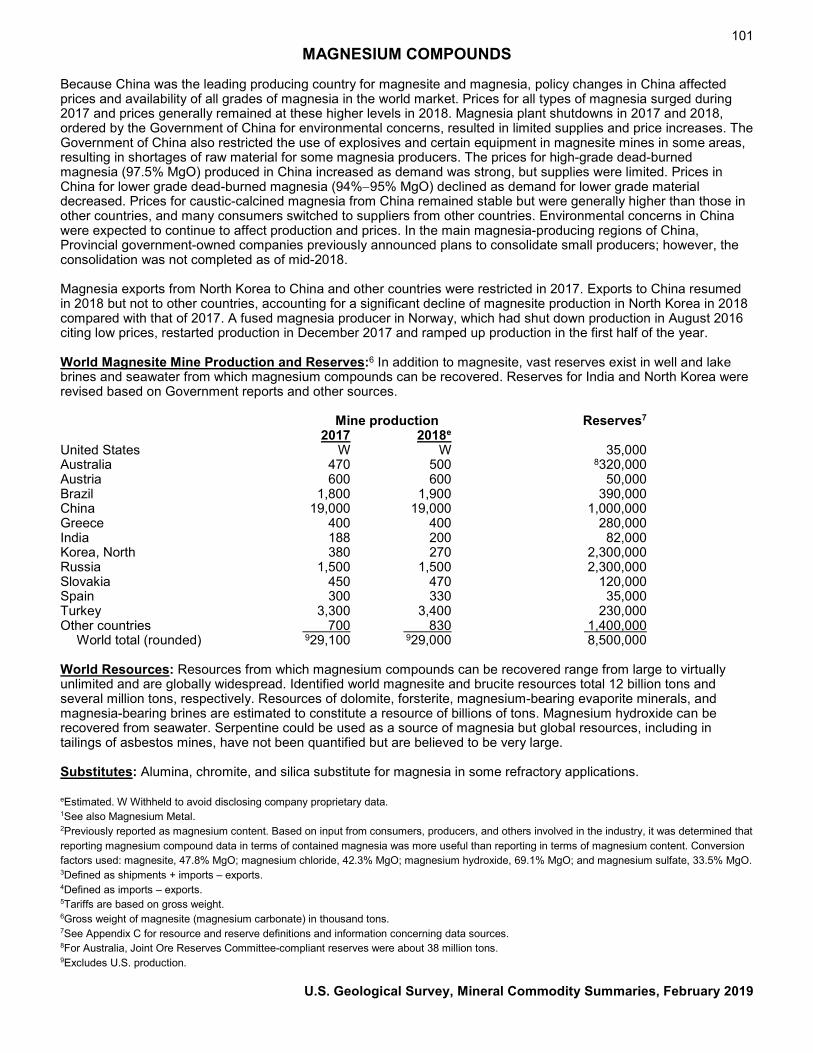
101 MAGNESIUM COMPOUNDS
Because China was the leading producing country for magnesite and magnesia, policy changes in China affected prices and availability of all grades of magnesia in the world market. Prices for all types of magnesia surged during 2017 and prices generally remained at these higher levels in 2018. Magnesia plant shutdowns in 2017 and 2018, ordered by the Government of China for environmental concerns, resulted in limited supplies and price increases. The Government of China also restricted the use of explosives and certain equipment in magnesite mines in some areas, resulting in shortages of raw material for some magnesia producers. The prices for high-grade dead-burned magnesia (97.5% MgO) produced in China increased as demand was strong, but supplies were limited. Prices in China for lower grade dead-burned magnesia (94%−95% MgO) declined as demand for lower grade material decreased. Prices for caustic-calcined magnesia from China remained stable but were generally higher than those in other countries, and many consumers switched to suppliers from other countries. Environmental concerns in China were expected to continue to affect production and prices. In the main magnesia-producing regions of China, Provincial government-owned companies previously announced plans to consolidate small producers; however, the consolidation was not completed as of mid-2018. Magnesia exports from North Korea to China and other countries were restricted in 2017. Exports to China resumed in 2018 but not to other countries, accounting for a significant decline of magnesite production in North Korea in 2018 compared with that of 2017. A fused magnesia producer in Norway, which had shut down production in August 2016 citing low prices, restarted production in December 2017 and ramped up production in the first half of the year. World Magnesite Mine Production and Reserves:6 In addition to magnesite, vast reserves exist in well and lake brines and seawater from which magnesium compounds can be recovered. Reserves for India and North Korea were revised based on Government reports and other sources. Mine production Reserves7 2017 2018e United States W W 35,000 Australia 470 500 8320,000 Austria 600 600 50,000 Brazil 1,800 1,900 390,000 China 19,000 19,000 1,000,000 Greece 400 400 280,000 India 188 200 82,000 Korea, North 380 270 2,300,000 Russia 1,500 1,500 2,300,000 Slovakia 450 470 120,000 Spain 300 330 35,000 Turkey 3,300 3,400 230,000 Other countries 700 830 1,400,000 World total (rounded) 929,100 929,000 8,500,000 World Resources: Resources from which magnesium compounds can be recovered range from large to virtually unlimited and are globally widespread. Identified world magnesite and brucite resources total 12 billion tons and several million tons, respectively. Resources of dolomite, forsterite, magnesium-bearing evaporite minerals, and magnesia-bearing brines are estimated to constitute a resource of billions of tons. Magnesium hydroxide can be recovered from seawater. Serpentine could be used as a source of magnesia but global resources, including in tailings of asbestos mines, have not been quantified but are believed to be very large. Substitutes: Alumina, chromite, and silica substitute for magnesia in some refractory applications. eEstimated. W Withheld to avoid disclosing company proprietary data. 1See also Magnesium Metal. 2Previously reported as magnesium content. Based on input from consumers, producers, and others involved in the industry, it was determined that reporting magnesium compound data in terms of contained magnesia was more useful than reporting in terms of magnesium content. Conversion factors used: magnesite, 47.8% MgO; magnesium chloride, 42.3% MgO; magnesium hydroxide, 69.1% MgO; and magnesium sulfate, 33.5% MgO. 3Defined as shipments + imports – exports. 4Defined as imports – exports. 5Tariffs are based on gross weight. 6Gross weight of magnesite (magnesium carbonate) in thousand tons. 7See Appendix C for resource and reserve definitions and information concerning data sources. 8For Australia, Joint Ore Reserves Committee-compliant reserves were about 38 million tons. 9Excludes U.S. production.
U.S. Geological Survey, Mineral Commodity Summaries, February 2019
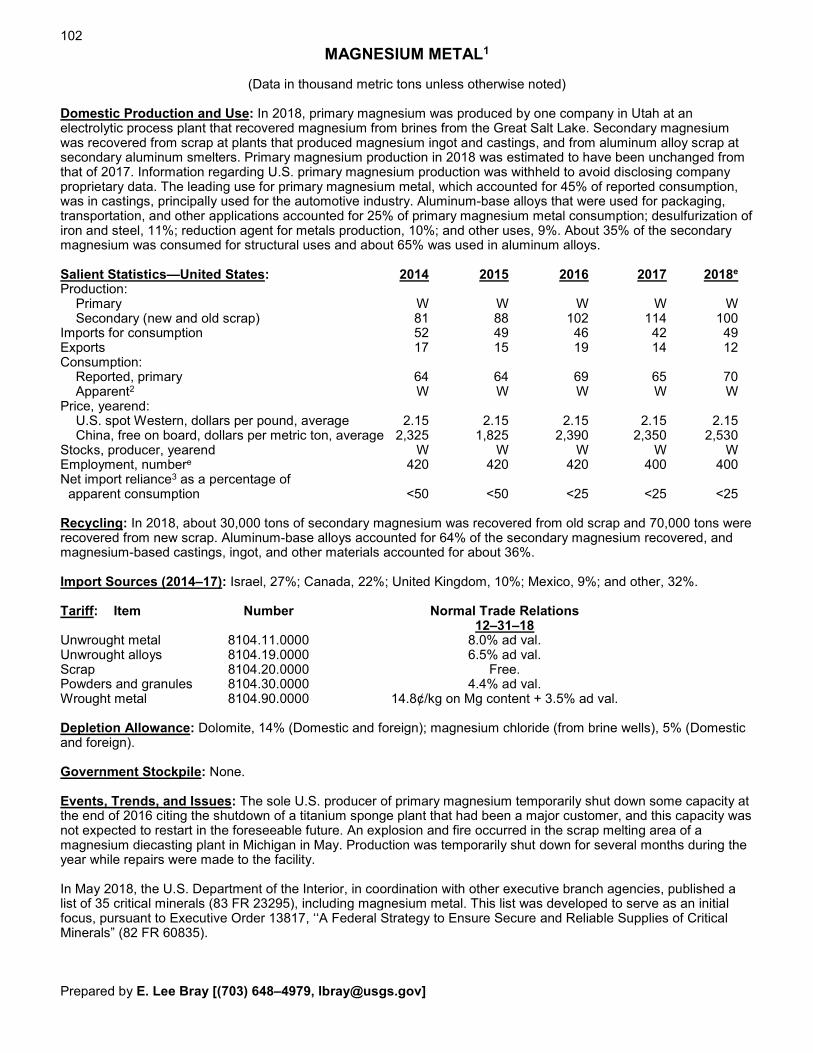
102
MAGNESIUM METAL1
(Data in thousand metric tons unless otherwise noted) Domestic Production and Use: In 2018, primary magnesium was produced by one company in Utah at an electrolytic process plant that recovered magnesium from brines from the Great Salt Lake. Secondary magnesium was recovered from scrap at plants that produced magnesium ingot and castings, and from aluminum alloy scrap at secondary aluminum smelters. Primary magnesium production in 2018 was estimated to have been unchanged from that of 2017. Information regarding U.S. primary magnesium production was withheld to avoid disclosing company proprietary data. The leading use for primary magnesium metal, which accounted for 45% of reported consumption, was in castings, principally used for the automotive industry. Aluminum-base alloys that were used for packaging, transportation, and other applications accounted for 25% of primary magnesium metal consumption; desulfurization of iron and steel, 11%; reduction agent for metals production, 10%; and other uses, 9%. About 35% of the secondary magnesium was consumed for structural uses and about 65% was used in aluminum alloys. Salient Statistics—United States: 2014 2015 2016 2017 2018e Production: Primary W W W W W Secondary (new and old scrap) 81 88 102 114 100 Imports for consumption 52 49 46 42 49 Exports 17 15 19 14 12 Consumption: Reported, primary 64 64 69 65 70 Apparent2 W W W W W Price, yearend: U.S. spot Western, dollars per pound, average 2.15 2.15 2.15 2.15 2.15 China, free on board, dollars per metric ton, average 2,325 1,825 2,390 2,350 2,530 Stocks, producer, yearend W W W W W Employment, numbere 420 420 420 400 400 Net import reliance3 as a percentage of apparent consumption <50 <50 <25 <25 <25 Recycling: In 2018, about 30,000 tons of secondary magnesium was recovered from old scrap and 70,000 tons were recovered from new scrap. Aluminum-base alloys accounted for 64% of the secondary magnesium recovered, and magnesium-based castings, ingot, and other materials accounted for about 36%. Import Sources (2014–17): Israel, 27%; Canada, 22%; United Kingdom, 10%; Mexico, 9%; and other, 32%. Tariff: Item Number Normal Trade Relations 12–31–18 Unwrought metal 8104.11.0000 8.0% ad val. Unwrought alloys 8104.19.0000 6.5% ad val. Scrap 8104.20.0000 Free. Powders and granules 8104.30.0000 4.4% ad val. Wrought metal 8104.90.0000 14.8¢/kg on Mg content + 3.5% ad val. Depletion Allowance: Dolomite, 14% (Domestic and foreign); magnesium chloride (from brine wells), 5% (Domestic and foreign). Government Stockpile: None. Events, Trends, and Issues: The sole U.S. producer of primary magnesium temporarily shut down some capacity at the end of 2016 citing the shutdown of a titanium sponge plant that had been a major customer, and this capacity was not expected to restart in the foreseeable future. An explosion and fire occurred in the scrap melting area of a magnesium diecasting plant in Michigan in May. Production was temporarily shut down for several months during the year while repairs were made to the facility. In May 2018, the U.S. Department of the Interior, in coordination with other executive branch agencies, published a list of 35 critical minerals (83 FR 23295), including magnesium metal. This list was developed to serve as an initial focus, pursuant to Executive Order 13817, ‘‘A Federal Strategy to Ensure Secure and Reliable Supplies of Critical Minerals” (82 FR 60835). Prepared by E. Lee Bray [(703) 648–4979, [email protected]]
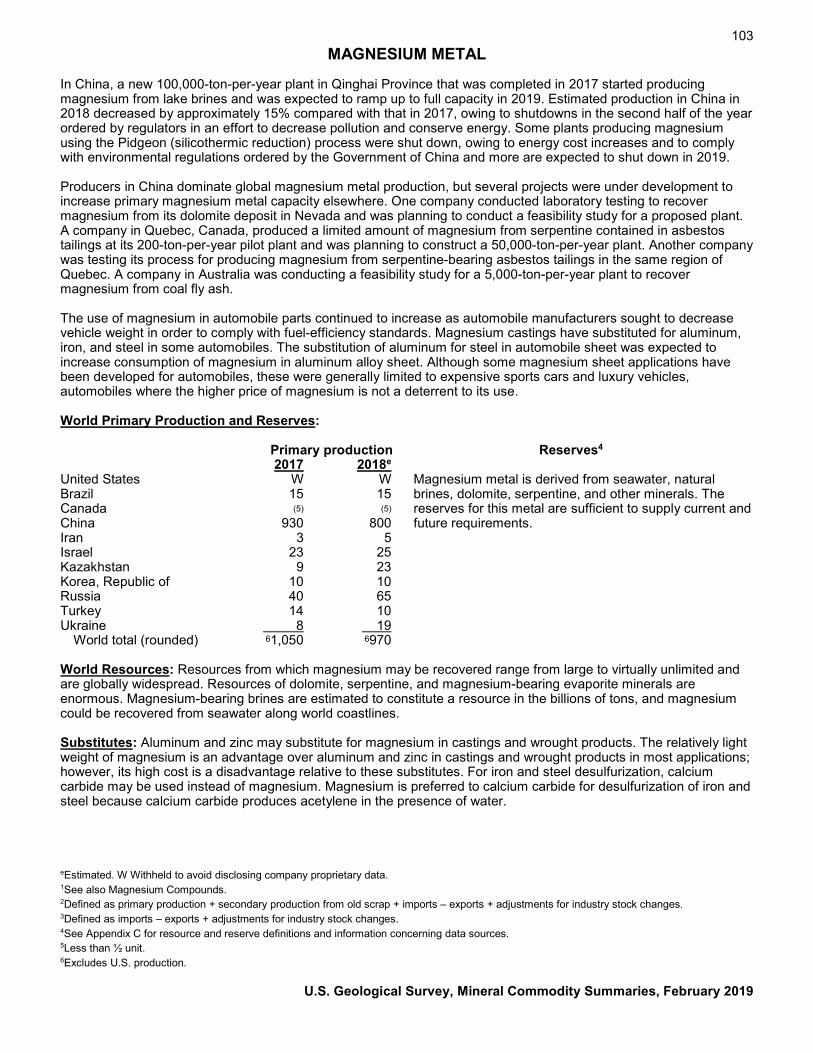
103 MAGNESIUM METAL
In China, a new 100,000-ton-per-year plant in Qinghai Province that was completed in 2017 started producing magnesium from lake brines and was expected to ramp up to full capacity in 2019. Estimated production in China in 2018 decreased by approximately 15% compared with that in 2017, owing to shutdowns in the second half of the year ordered by regulators in an effort to decrease pollution and conserve energy. Some plants producing magnesium using the Pidgeon (silicothermic reduction) process were shut down, owing to energy cost increases and to comply with environmental regulations ordered by the Government of China and more are expected to shut down in 2019. Producers in China dominate global magnesium metal production, but several projects were under development to increase primary magnesium metal capacity elsewhere. One company conducted laboratory testing to recover magnesium from its dolomite deposit in Nevada and was planning to conduct a feasibility study for a proposed plant. A company in Quebec, Canada, produced a limited amount of magnesium from serpentine contained in asbestos tailings at its 200-ton-per-year pilot plant and was planning to construct a 50,000-ton-per-year plant. Another company was testing its process for producing magnesium from serpentine-bearing asbestos tailings in the same region of Quebec. A company in Australia was conducting a feasibility study for a 5,000-ton-per-year plant to recover magnesium from coal fly ash. The use of magnesium in automobile parts continued to increase as automobile manufacturers sought to decrease vehicle weight in order to comply with fuel-efficiency standards. Magnesium castings have substituted for aluminum, iron, and steel in some automobiles. The substitution of aluminum for steel in automobile sheet was expected to increase consumption of magnesium in aluminum alloy sheet. Although some magnesium sheet applications have been developed for automobiles, these were generally limited to expensive sports cars and luxury vehicles, automobiles where the higher price of magnesium is not a deterrent to its use. World Primary Production and Reserves: Primary production Reserves4 2017 2018e United States W W Magnesium metal is derived from seawater, natural Brazil 15 15 brines, dolomite, serpentine, and other minerals. The Canada (5) (5) reserves for this metal are sufficient to supply current and China 930 800 future requirements. Iran 3 5 Israel 23 25 Kazakhstan 9 23 Korea, Republic of 10 10 Russia 40 65 Turkey 14 10 Ukraine 8 19 World total (rounded) 61,050 6970 World Resources: Resources from which magnesium may be recovered range from large to virtually unlimited and are globally widespread. Resources of dolomite, serpentine, and magnesium-bearing evaporite minerals are enormous. Magnesium-bearing brines are estimated to constitute a resource in the billions of tons, and magnesium could be recovered from seawater along world coastlines. Substitutes: Aluminum and zinc may substitute for magnesium in castings and wrought products. The relatively light weight of magnesium is an advantage over aluminum and zinc in castings and wrought products in most applications; however, its high cost is a disadvantage relative to these substitutes. For iron and steel desulfurization, calcium carbide may be used instead of magnesium. Magnesium is preferred to calcium carbide for desulfurization of iron and steel because calcium carbide produces acetylene in the presence of water. eEstimated. W Withheld to avoid disclosing company proprietary data. 1See also Magnesium Compounds. 2Defined as primary production + secondary production from old scrap + imports – exports + adjustments for industry stock changes. 3Defined as imports – exports + adjustments for industry stock changes. 4See Appendix C for resource and reserve definitions and information concerning data sources. 5Less than ½ unit. 6Excludes U.S. production.
U.S. Geological Survey, Mineral Commodity Summaries, February 2019
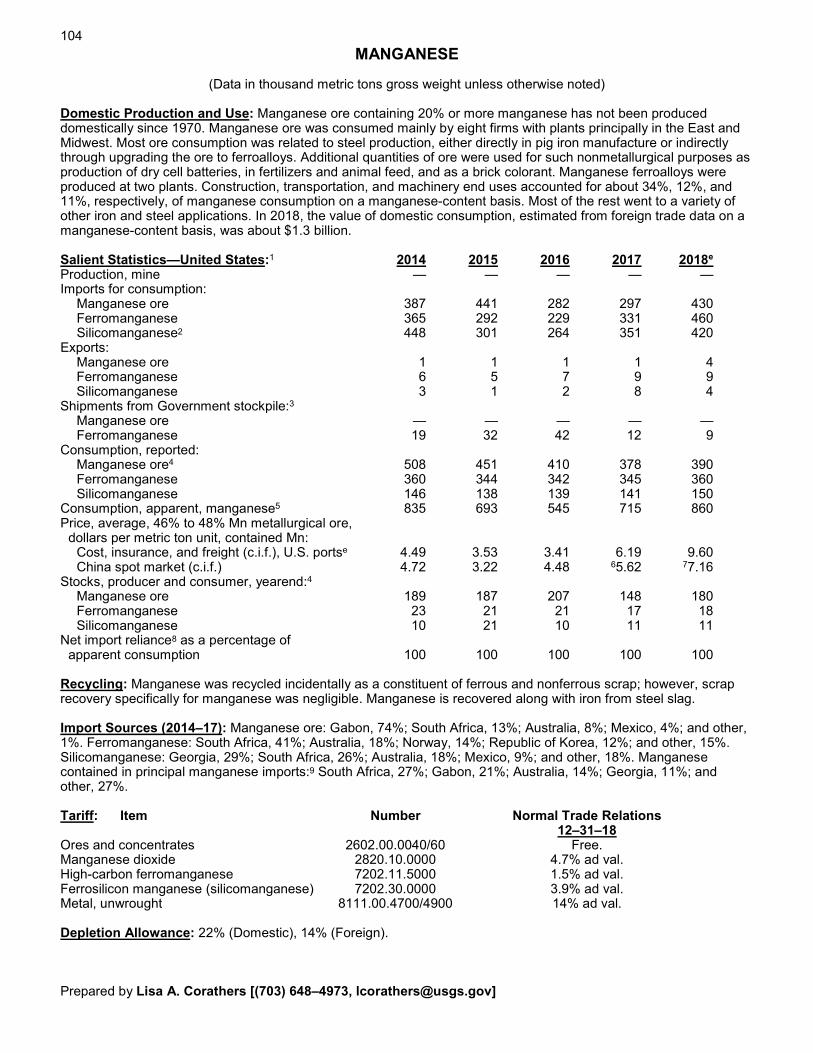
104
MANGANESE
(Data in thousand metric tons gross weight unless otherwise noted) Domestic Production and Use: Manganese ore containing 20% or more manganese has not been produced domestically since 1970. Manganese ore was consumed mainly by eight firms with plants principally in the East and Midwest. Most ore consumption was related to steel production, either directly in pig iron manufacture or indirectly through upgrading the ore to ferroalloys. Additional quantities of ore were used for such nonmetallurgical purposes as production of dry cell batteries, in fertilizers and animal feed, and as a brick colorant. Manganese ferroalloys were produced at two plants. Construction, transportation, and machinery end uses accounted for about 34%, 12%, and 11%, respectively, of manganese consumption on a manganese-content basis. Most of the rest went to a variety of other iron and steel applications. In 2018, the value of domestic consumption, estimated from foreign trade data on a manganese-content basis, was about $1.3 billion. Salient Statistics—United States:1 2014 2015 2016 2017 2018e Production, mine — — — — — Imports for consumption: Manganese ore 387 441 282 297 430 Ferromanganese 365 292 229 331 460 Silicomanganese2 448 301 264 351 420 Exports: Manganese ore 1 1 1 1 4 Ferromanganese 6 5 7 9 9 Silicomanganese 3 1 2 8 4 Shipments from Government stockpile:3 Manganese ore — — — — — Ferromanganese 19 32 42 12 9 Consumption, reported: Manganese ore4 508 451 410 378 390 Ferromanganese 360 344 342 345 360 Silicomanganese 146 138 139 141 150 Consumption, apparent, manganese5 835 693 545 715 860 Price, average, 46% to 48% Mn metallurgical ore, dollars per metric ton unit, contained Mn: Cost, insurance, and freight (c.i.f.), U.S. portse 4.49 3.53 3.41 6.19 9.60 China spot market (c.i.f.) 4.72 3.22 4.48 65.62 77.16 Stocks, producer and consumer, yearend:4
Manganese ore 189 187 207 148 180 Ferromanganese 23 21 21 17 18 Silicomanganese 10 21 10 11 11 Net import reliance8 as a percentage of apparent consumption 100 100 100 100 100 Recycling: Manganese was recycled incidentally as a constituent of ferrous and nonferrous scrap; however, scrap recovery specifically for manganese was negligible. Manganese is recovered along with iron from steel slag. Import Sources (2014–17): Manganese ore: Gabon, 74%; South Africa, 13%; Australia, 8%; Mexico, 4%; and other, 1%. Ferromanganese: South Africa, 41%; Australia, 18%; Norway, 14%; Republic of Korea, 12%; and other, 15%. Silicomanganese: Georgia, 29%; South Africa, 26%; Australia, 18%; Mexico, 9%; and other, 18%. Manganese contained in principal manganese imports:9 South Africa, 27%; Gabon, 21%; Australia, 14%; Georgia, 11%; and other, 27%. Tariff: Item Number Normal Trade Relations 12–31–18 Ores and concentrates 2602.00.0040/60 Free. Manganese dioxide 2820.10.0000 4.7% ad val. High-carbon ferromanganese 7202.11.5000 1.5% ad val. Ferrosilicon manganese (silicomanganese) 7202.30.0000 3.9% ad val. Metal, unwrought 8111.00.4700/4900 14% ad val. Depletion Allowance: 22% (Domestic), 14% (Foreign). Prepared by Lisa A. Corathers [(703) 648–4973, [email protected]]
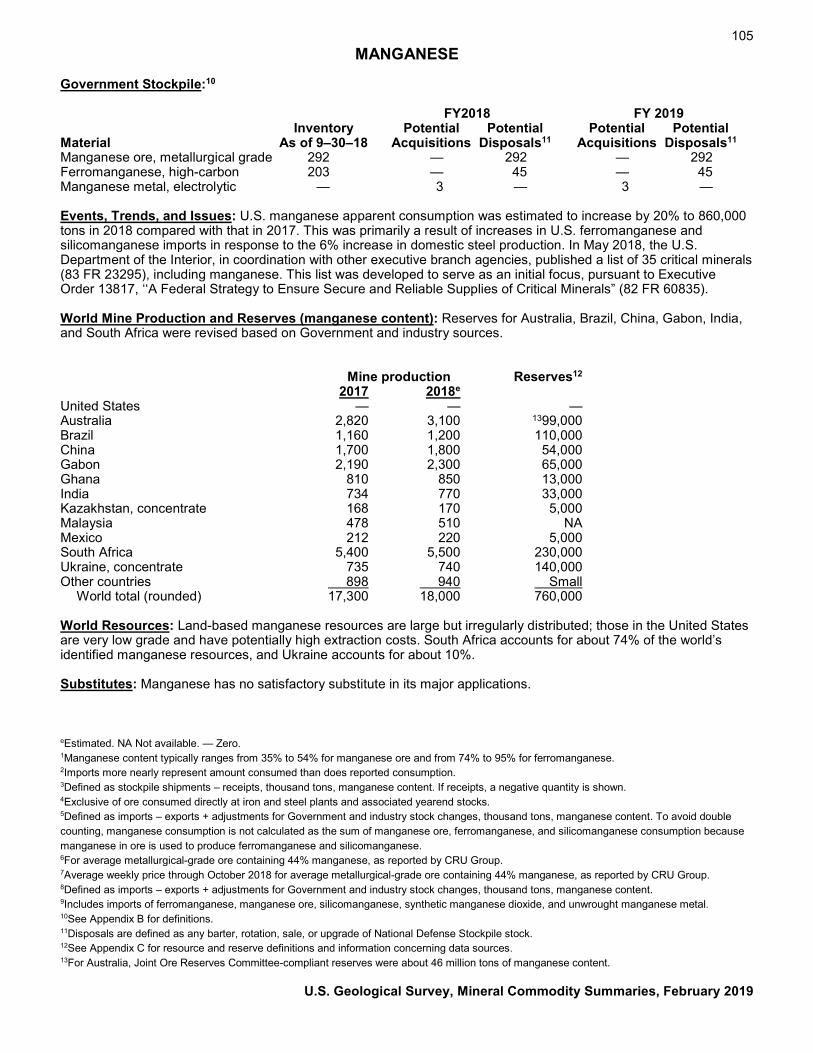
105 MANGANESE
Government Stockpile:10 FY2018 FY 2019 Inventory Potential Potential Potential Potential Material As of 9–30–18 Acquisitions Disposals11 Acquisitions Disposals11
Manganese ore, metallurgical grade 292 — 292 — 292 Ferromanganese, high-carbon 203 — 45 — 45 Manganese metal, electrolytic — 3 — 3 — Events, Trends, and Issues: U.S. manganese apparent consumption was estimated to increase by 20% to 860,000 tons in 2018 compared with that in 2017. This was primarily a result of increases in U.S. ferromanganese and silicomanganese imports in response to the 6% increase in domestic steel production. In May 2018, the U.S. Department of the Interior, in coordination with other executive branch agencies, published a list of 35 critical minerals (83 FR 23295), including manganese. This list was developed to serve as an initial focus, pursuant to Executive Order 13817, ‘‘A Federal Strategy to Ensure Secure and Reliable Supplies of Critical Minerals” (82 FR 60835). World Mine Production and Reserves (manganese content): Reserves for Australia, Brazil, China, Gabon, India, and South Africa were revised based on Government and industry sources. Mine production Reserves12 2017 2018e United States — — — Australia 2,820 3,100 1399,000 Brazil 1,160 1,200 110,000 China 1,700 1,800 54,000 Gabon 2,190 2,300 65,000 Ghana 810 850 13,000 India 734 770 33,000 Kazakhstan, concentrate 168 170 5,000 Malaysia 478 510 NA Mexico 212 220 5,000 South Africa 5,400 5,500 230,000 Ukraine, concentrate 735 740 140,000 Other countries 898 940 Small World total (rounded) 17,300 18,000 760,000 World Resources: Land-based manganese resources are large but irregularly distributed; those in the United States are very low grade and have potentially high extraction costs. South Africa accounts for about 74% of the world’s identified manganese resources, and Ukraine accounts for about 10%. Substitutes: Manganese has no satisfactory substitute in its major applications. eEstimated. NA Not available. — Zero. 1Manganese content typically ranges from 35% to 54% for manganese ore and from 74% to 95% for ferromanganese. 2Imports more nearly represent amount consumed than does reported consumption. 3Defined as stockpile shipments – receipts, thousand tons, manganese content. If receipts, a negative quantity is shown. 4Exclusive of ore consumed directly at iron and steel plants and associated yearend stocks. 5Defined as imports – exports + adjustments for Government and industry stock changes, thousand tons, manganese content. To avoid double counting, manganese consumption is not calculated as the sum of manganese ore, ferromanganese, and silicomanganese consumption because manganese in ore is used to produce ferromanganese and silicomanganese. 6For average metallurgical-grade ore containing 44% manganese, as reported by CRU Group. 7Average weekly price through October 2018 for average metallurgical-grade ore containing 44% manganese, as reported by CRU Group. 8Defined as imports – exports + adjustments for Government and industry stock changes, thousand tons, manganese content. 9Includes imports of ferromanganese, manganese ore, silicomanganese, synthetic manganese dioxide, and unwrought manganese metal. 10See Appendix B for definitions. 11Disposals are defined as any barter, rotation, sale, or upgrade of National Defense Stockpile stock. 12See Appendix C for resource and reserve definitions and information concerning data sources. 13For Australia, Joint Ore Reserves Committee-compliant reserves were about 46 million tons of manganese content.
U.S. Geological Survey, Mineral Commodity Summaries, February 2019
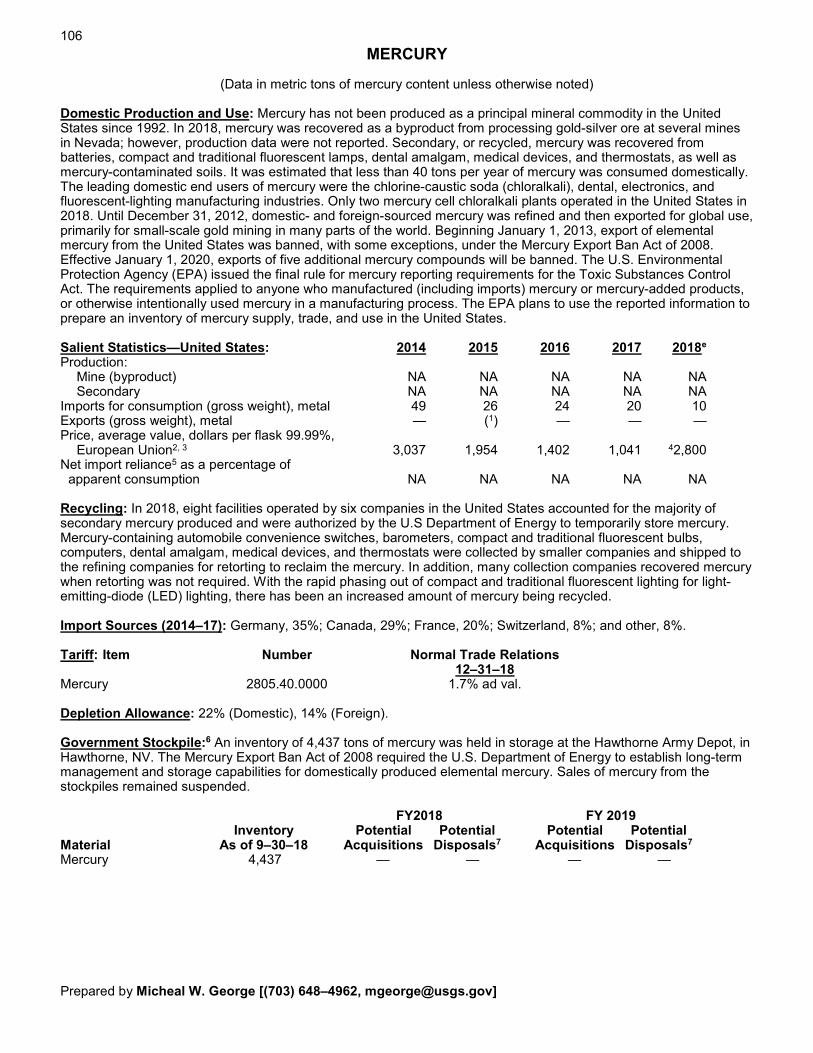
106
MERCURY
(Data in metric tons of mercury content unless otherwise noted) Domestic Production and Use: Mercury has not been produced as a principal mineral commodity in the United States since 1992. In 2018, mercury was recovered as a byproduct from processing gold-silver ore at several mines in Nevada; however, production data were not reported. Secondary, or recycled, mercury was recovered from batteries, compact and traditional fluorescent lamps, dental amalgam, medical devices, and thermostats, as well as mercury-contaminated soils. It was estimated that less than 40 tons per year of mercury was consumed domestically. The leading domestic end users of mercury were the chlorine-caustic soda (chloralkali), dental, electronics, and fluorescent-lighting manufacturing industries. Only two mercury cell chloralkali plants operated in the United States in 2018. Until December 31, 2012, domestic- and foreign-sourced mercury was refined and then exported for global use, primarily for small-scale gold mining in many parts of the world. Beginning January 1, 2013, export of elemental mercury from the United States was banned, with some exceptions, under the Mercury Export Ban Act of 2008. Effective January 1, 2020, exports of five additional mercury compounds will be banned. The U.S. Environmental Protection Agency (EPA) issued the final rule for mercury reporting requirements for the Toxic Substances Control Act. The requirements applied to anyone who manufactured (including imports) mercury or mercury-added products, or otherwise intentionally used mercury in a manufacturing process. The EPA plans to use the reported information to prepare an inventory of mercury supply, trade, and use in the United States. Salient Statistics—United States: 2014 2015 2016 2017 2018e Production: Mine (byproduct) NA NA NA NA NA Secondary NA NA NA NA NA Imports for consumption (gross weight), metal 49 26 24 20 10 Exports (gross weight), metal — (1) — — — Price, average value, dollars per flask 99.99%, European Union2, 3 3,037 1,954 1,402 1,041 42,800 Net import reliance5 as a percentage of apparent consumption NA NA NA NA NA Recycling: In 2018, eight facilities operated by six companies in the United States accounted for the majority of secondary mercury produced and were authorized by the U.S Department of Energy to temporarily store mercury. Mercury-containing automobile convenience switches, barometers, compact and traditional fluorescent bulbs, computers, dental amalgam, medical devices, and thermostats were collected by smaller companies and shipped to the refining companies for retorting to reclaim the mercury. In addition, many collection companies recovered mercury when retorting was not required. With the rapid phasing out of compact and traditional fluorescent lighting for light-emitting-diode (LED) lighting, there has been an increased amount of mercury being recycled. Import Sources (2014–17): Germany, 35%; Canada, 29%; France, 20%; Switzerland, 8%; and other, 8%. Tariff: Item Number Normal Trade Relations 12–31–18 Mercury 2805.40.0000 1.7% ad val. Depletion Allowance: 22% (Domestic), 14% (Foreign). Government Stockpile:6 An inventory of 4,437 tons of mercury was held in storage at the Hawthorne Army Depot, in Hawthorne, NV. The Mercury Export Ban Act of 2008 required the U.S. Department of Energy to establish long-term management and storage capabilities for domestically produced elemental mercury. Sales of mercury from the stockpiles remained suspended. FY2018 FY 2019 Inventory Potential Potential Potential Potential Material As of 9–30–18 Acquisitions Disposals7 Acquisitions Disposals7
Mercury 4,437 — — — — Prepared by Micheal W. George [(703) 648–4962, [email protected]]
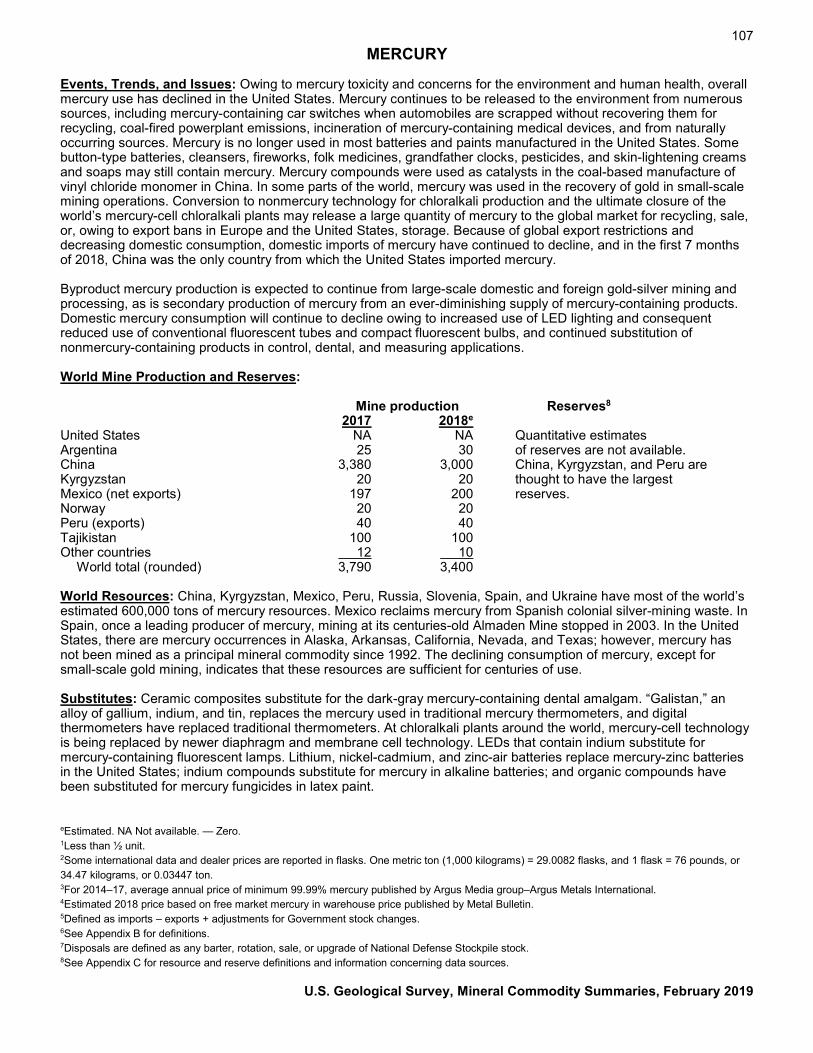
107 MERCURY
Events, Trends, and Issues: Owing to mercury toxicity and concerns for the environment and human health, overall mercury use has declined in the United States. Mercury continues to be released to the environment from numerous sources, including mercury-containing car switches when automobiles are scrapped without recovering them for recycling, coal-fired powerplant emissions, incineration of mercury-containing medical devices, and from naturally occurring sources. Mercury is no longer used in most batteries and paints manufactured in the United States. Some button-type batteries, cleansers, fireworks, folk medicines, grandfather clocks, pesticides, and skin-lightening creams and soaps may still contain mercury. Mercury compounds were used as catalysts in the coal-based manufacture of vinyl chloride monomer in China. In some parts of the world, mercury was used in the recovery of gold in small-scale mining operations. Conversion to nonmercury technology for chloralkali production and the ultimate closure of the world’s mercury-cell chloralkali plants may release a large quantity of mercury to the global market for recycling, sale, or, owing to export bans in Europe and the United States, storage. Because of global export restrictions and decreasing domestic consumption, domestic imports of mercury have continued to decline, and in the first 7 months of 2018, China was the only country from which the United States imported mercury. Byproduct mercury production is expected to continue from large-scale domestic and foreign gold-silver mining and processing, as is secondary production of mercury from an ever-diminishing supply of mercury-containing products. Domestic mercury consumption will continue to decline owing to increased use of LED lighting and consequent reduced use of conventional fluorescent tubes and compact fluorescent bulbs, and continued substitution of nonmercury-containing products in control, dental, and measuring applications. World Mine Production and Reserves: Mine production Reserves8 2017 2018e United States NA NA Quantitative estimates Argentina 25 30 of reserves are not available. China 3,380 3,000 China, Kyrgyzstan, and Peru are Kyrgyzstan 20 20 thought to have the largest Mexico (net exports) 197 200 reserves. Norway 20 20 Peru (exports) 40 40 Tajikistan 100 100 Other countries 12 10 World total (rounded) 3,790 3,400 World Resources: China, Kyrgyzstan, Mexico, Peru, Russia, Slovenia, Spain, and Ukraine have most of the world’s estimated 600,000 tons of mercury resources. Mexico reclaims mercury from Spanish colonial silver-mining waste. In Spain, once a leading producer of mercury, mining at its centuries-old Almaden Mine stopped in 2003. In the United States, there are mercury occurrences in Alaska, Arkansas, California, Nevada, and Texas; however, mercury has not been mined as a principal mineral commodity since 1992. The declining consumption of mercury, except for small-scale gold mining, indicates that these resources are sufficient for centuries of use. Substitutes: Ceramic composites substitute for the dark-gray mercury-containing dental amalgam. “Galistan,” an alloy of gallium, indium, and tin, replaces the mercury used in traditional mercury thermometers, and digital thermometers have replaced traditional thermometers. At chloralkali plants around the world, mercury-cell technology is being replaced by newer diaphragm and membrane cell technology. LEDs that contain indium substitute for mercury-containing fluorescent lamps. Lithium, nickel-cadmium, and zinc-air batteries replace mercury-zinc batteries in the United States; indium compounds substitute for mercury in alkaline batteries; and organic compounds have been substituted for mercury fungicides in latex paint.
eEstimated. NA Not available. — Zero. 1Less than ½ unit. 2Some international data and dealer prices are reported in flasks. One metric ton (1,000 kilograms) = 29.0082 flasks, and 1 flask = 76 pounds, or 34.47 kilograms, or 0.03447 ton. 3For 2014–17, average annual price of minimum 99.99% mercury published by Argus Media group–Argus Metals International. 4Estimated 2018 price based on free market mercury in warehouse price published by Metal Bulletin. 5Defined as imports – exports + adjustments for Government stock changes. 6See Appendix B for definitions. 7Disposals are defined as any barter, rotation, sale, or upgrade of National Defense Stockpile stock. 8See Appendix C for resource and reserve definitions and information concerning data sources.
U.S. Geological Survey, Mineral Commodity Summaries, February 2019
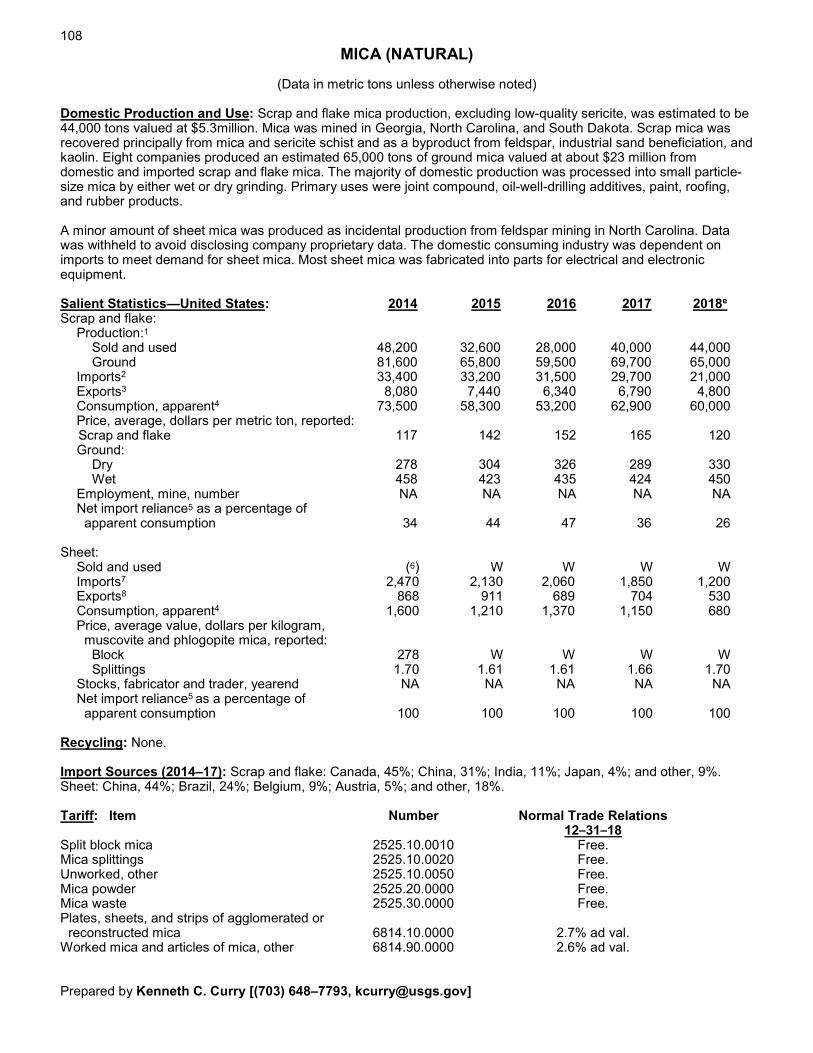
108
MICA (NATURAL)
(Data in metric tons unless otherwise noted) Domestic Production and Use: Scrap and flake mica production, excluding low-quality sericite, was estimated to be 44,000 tons valued at $5.3million. Mica was mined in Georgia, North Carolina, and South Dakota. Scrap mica was recovered principally from mica and sericite schist and as a byproduct from feldspar, industrial sand beneficiation, and kaolin. Eight companies produced an estimated 65,000 tons of ground mica valued at about $23 million from domestic and imported scrap and flake mica. The majority of domestic production was processed into small particle-size mica by either wet or dry grinding. Primary uses were joint compound, oil-well-drilling additives, paint, roofing, and rubber products. A minor amount of sheet mica was produced as incidental production from feldspar mining in North Carolina. Data was withheld to avoid disclosing company proprietary data. The domestic consuming industry was dependent on imports to meet demand for sheet mica. Most sheet mica was fabricated into parts for electrical and electronic equipment. Salient Statistics—United States: 2014 2015 2016 2017 2018e Scrap and flake: Production:1 Sold and used 48,200 32,600 28,000 40,000 44,000 Ground 81,600 65,800 59,500 69,700 65,000 Imports2 33,400 33,200 31,500 29,700 21,000 Exports3 8,080 7,440 6,340 6,790 4,800 Consumption, apparent4 73,500 58,300 53,200 62,900 60,000 Price, average, dollars per metric ton, reported: Scrap and flake 117 142 152 165 120 Ground: Dry 278 304 326 289 330 Wet 458 423 435 424 450 Employment, mine, number NA NA NA NA NA Net import reliance5 as a percentage of apparent consumption 34 44 47 36 26 Sheet: Sold and used (6) W W W W Imports7 2,470 2,130 2,060 1,850 1,200 Exports8 868 911 689 704 530 Consumption, apparent4 1,600 1,210 1,370 1,150 680 Price, average value, dollars per kilogram, muscovite and phlogopite mica, reported: Block 278 W W W W Splittings 1.70 1.61 1.61 1.66 1.70 Stocks, fabricator and trader, yearend NA NA NA NA NA Net import reliance5 as a percentage of apparent consumption 100 100 100 100 100 Recycling: None. Import Sources (2014–17): Scrap and flake: Canada, 45%; China, 31%; India, 11%; Japan, 4%; and other, 9%. Sheet: China, 44%; Brazil, 24%; Belgium, 9%; Austria, 5%; and other, 18%. Tariff: Item Number Normal Trade Relations 12–31–18 Split block mica 2525.10.0010 Free. Mica splittings 2525.10.0020 Free. Unworked, other 2525.10.0050 Free. Mica powder 2525.20.0000 Free. Mica waste 2525.30.0000 Free. Plates, sheets, and strips of agglomerated or reconstructed mica 6814.10.0000 2.7% ad val. Worked mica and articles of mica, other 6814.90.0000 2.6% ad val. Prepared by Kenneth C. Curry [(703) 648–7793, [email protected]]
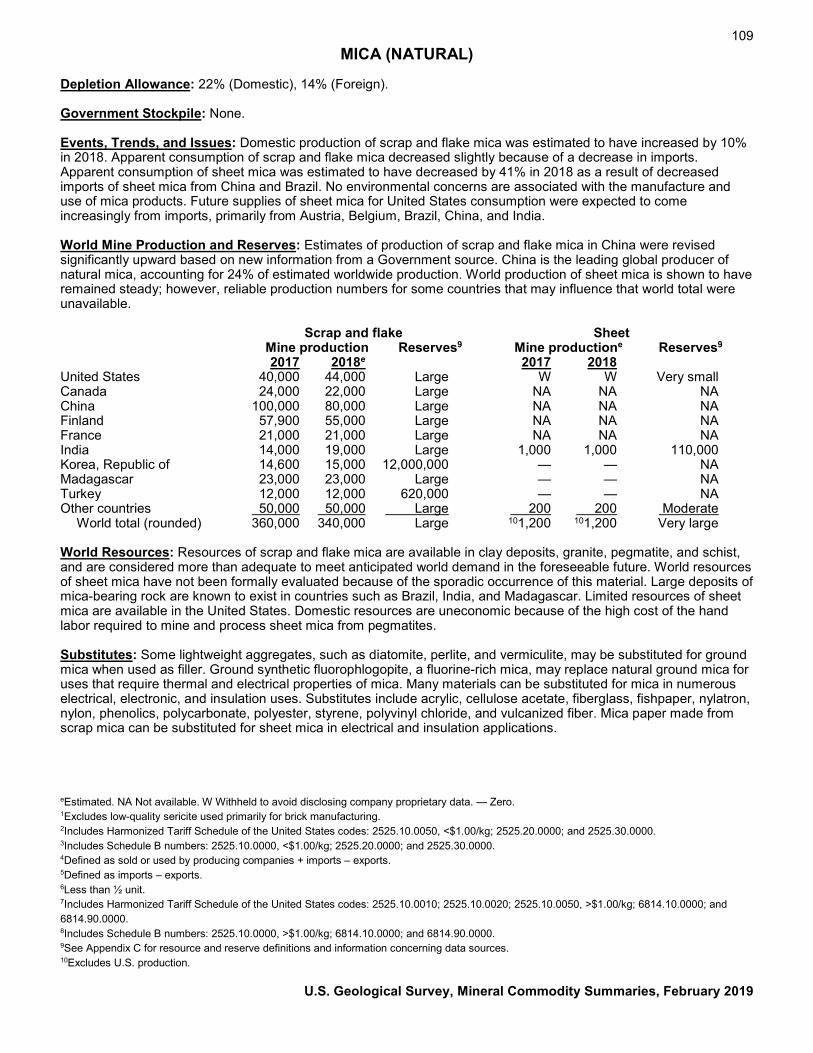
109 MICA (NATURAL)
Depletion Allowance: 22% (Domestic), 14% (Foreign). Government Stockpile: None. Events, Trends, and Issues: Domestic production of scrap and flake mica was estimated to have increased by 10% in 2018. Apparent consumption of scrap and flake mica decreased slightly because of a decrease in imports. Apparent consumption of sheet mica was estimated to have decreased by 41% in 2018 as a result of decreased imports of sheet mica from China and Brazil. No environmental concerns are associated with the manufacture and use of mica products. Future supplies of sheet mica for United States consumption were expected to come increasingly from imports, primarily from Austria, Belgium, Brazil, China, and India. World Mine Production and Reserves: Estimates of production of scrap and flake mica in China were revised significantly upward based on new information from a Government source. China is the leading global producer of natural mica, accounting for 24% of estimated worldwide production. World production of sheet mica is shown to have remained steady; however, reliable production numbers for some countries that may influence that world total were unavailable. Scrap and flake Sheet Mine production Reserves9 Mine productione Reserves9 2017 2018e 2017 2018 United States 40,000 44,000 Large W W Very small Canada 24,000 22,000 Large NA NA NA China 100,000 80,000 Large NA NA NA Finland 57,900 55,000 Large NA NA NA France 21,000 21,000 Large NA NA NA India 14,000 19,000 Large 1,000 1,000 110,000 Korea, Republic of 14,600 15,000 12,000,000 — — NA Madagascar 23,000 23,000 Large — — NA Turkey 12,000 12,000 620,000 — — NA Other countries 50,000 50,000 Large 200 200 Moderate World total (rounded) 360,000 340,000 Large 101,200 101,200 Very large World Resources: Resources of scrap and flake mica are available in clay deposits, granite, pegmatite, and schist, and are considered more than adequate to meet anticipated world demand in the foreseeable future. World resources of sheet mica have not been formally evaluated because of the sporadic occurrence of this material. Large deposits of mica-bearing rock are known to exist in countries such as Brazil, India, and Madagascar. Limited resources of sheet mica are available in the United States. Domestic resources are uneconomic because of the high cost of the hand labor required to mine and process sheet mica from pegmatites. Substitutes: Some lightweight aggregates, such as diatomite, perlite, and vermiculite, may be substituted for ground mica when used as filler. Ground synthetic fluorophlogopite, a fluorine-rich mica, may replace natural ground mica for uses that require thermal and electrical properties of mica. Many materials can be substituted for mica in numerous electrical, electronic, and insulation uses. Substitutes include acrylic, cellulose acetate, fiberglass, fishpaper, nylatron, nylon, phenolics, polycarbonate, polyester, styrene, polyvinyl chloride, and vulcanized fiber. Mica paper made from scrap mica can be substituted for sheet mica in electrical and insulation applications.
eEstimated. NA Not available. W Withheld to avoid disclosing company proprietary data. — Zero. 1Excludes low-quality sericite used primarily for brick manufacturing. 2Includes Harmonized Tariff Schedule of the United States codes: 2525.10.0050, <$1.00/kg; 2525.20.0000; and 2525.30.0000. 3Includes Schedule B numbers: 2525.10.0000, <$1.00/kg; 2525.20.0000; and 2525.30.0000. 4Defined as sold or used by producing companies + imports – exports. 5Defined as imports – exports. 6Less than ½ unit. 7Includes Harmonized Tariff Schedule of the United States codes: 2525.10.0010; 2525.10.0020; 2525.10.0050, >$1.00/kg; 6814.10.0000; and 6814.90.0000. 8Includes Schedule B numbers: 2525.10.0000, >$1.00/kg; 6814.10.0000; and 6814.90.0000. 9See Appendix C for resource and reserve definitions and information concerning data sources. 10Excludes U.S. production.
U.S. Geological Survey, Mineral Commodity Summaries, February 2019
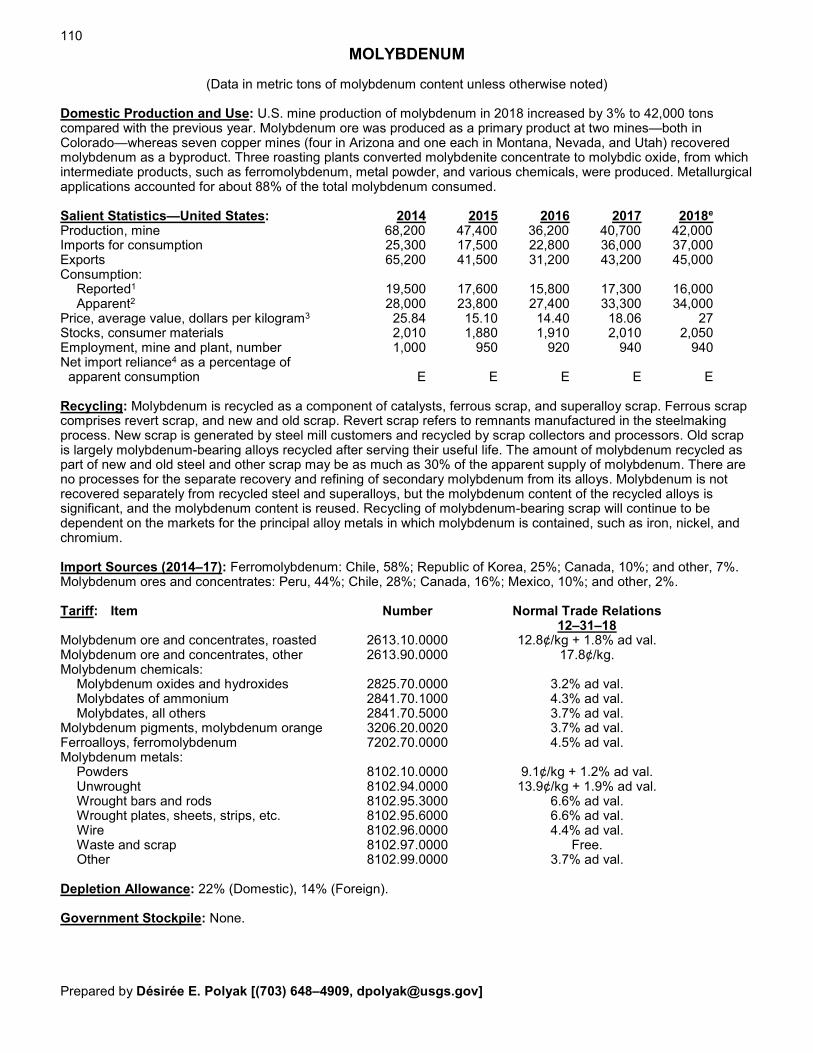
110
MOLYBDENUM
(Data in metric tons of molybdenum content unless otherwise noted) Domestic Production and Use: U.S. mine production of molybdenum in 2018 increased by 3% to 42,000 tons compared with the previous year. Molybdenum ore was produced as a primary product at two mines—both in Colorado—whereas seven copper mines (four in Arizona and one each in Montana, Nevada, and Utah) recovered molybdenum as a byproduct. Three roasting plants converted molybdenite concentrate to molybdic oxide, from which intermediate products, such as ferromolybdenum, metal powder, and various chemicals, were produced. Metallurgical applications accounted for about 88% of the total molybdenum consumed. Salient Statistics—United States: 2014 2015 2016 2017 2018e Production, mine 68,200 47,400 36,200 40,700 42,000 Imports for consumption 25,300 17,500 22,800 36,000 37,000 Exports 65,200 41,500 31,200 43,200 45,000 Consumption: Reported1 19,500 17,600 15,800 17,300 16,000 Apparent2 28,000 23,800 27,400 33,300 34,000 Price, average value, dollars per kilogram3 25.84 15.10 14.40 18.06 27 Stocks, consumer materials 2,010 1,880 1,910 2,010 2,050 Employment, mine and plant, number 1,000 950 920 940 940 Net import reliance4 as a percentage of apparent consumption E E E E E Recycling: Molybdenum is recycled as a component of catalysts, ferrous scrap, and superalloy scrap. Ferrous scrap comprises revert scrap, and new and old scrap. Revert scrap refers to remnants manufactured in the steelmaking process. New scrap is generated by steel mill customers and recycled by scrap collectors and processors. Old scrap is largely molybdenum-bearing alloys recycled after serving their useful life. The amount of molybdenum recycled as part of new and old steel and other scrap may be as much as 30% of the apparent supply of molybdenum. There are no processes for the separate recovery and refining of secondary molybdenum from its alloys. Molybdenum is not recovered separately from recycled steel and superalloys, but the molybdenum content of the recycled alloys is significant, and the molybdenum content is reused. Recycling of molybdenum-bearing scrap will continue to be dependent on the markets for the principal alloy metals in which molybdenum is contained, such as iron, nickel, and chromium. Import Sources (2014–17): Ferromolybdenum: Chile, 58%; Republic of Korea, 25%; Canada, 10%; and other, 7%. Molybdenum ores and concentrates: Peru, 44%; Chile, 28%; Canada, 16%; Mexico, 10%; and other, 2%. Tariff: Item Number Normal Trade Relations 12–31–18 Molybdenum ore and concentrates, roasted 2613.10.0000 12.8¢/kg + 1.8% ad val. Molybdenum ore and concentrates, other 2613.90.0000 17.8¢/kg. Molybdenum chemicals: Molybdenum oxides and hydroxides 2825.70.0000 3.2% ad val. Molybdates of ammonium 2841.70.1000 4.3% ad val. Molybdates, all others 2841.70.5000 3.7% ad val. Molybdenum pigments, molybdenum orange 3206.20.0020 3.7% ad val. Ferroalloys, ferromolybdenum 7202.70.0000 4.5% ad val. Molybdenum metals: Powders 8102.10.0000 9.1¢/kg + 1.2% ad val. Unwrought 8102.94.0000 13.9¢/kg + 1.9% ad val. Wrought bars and rods 8102.95.3000 6.6% ad val. Wrought plates, sheets, strips, etc. 8102.95.6000 6.6% ad val. Wire 8102.96.0000 4.4% ad val. Waste and scrap 8102.97.0000 Free. Other 8102.99.0000 3.7% ad val. Depletion Allowance: 22% (Domestic), 14% (Foreign). Government Stockpile: None. Prepared by Désirée E. Polyak [(703) 648–4909, [email protected]]
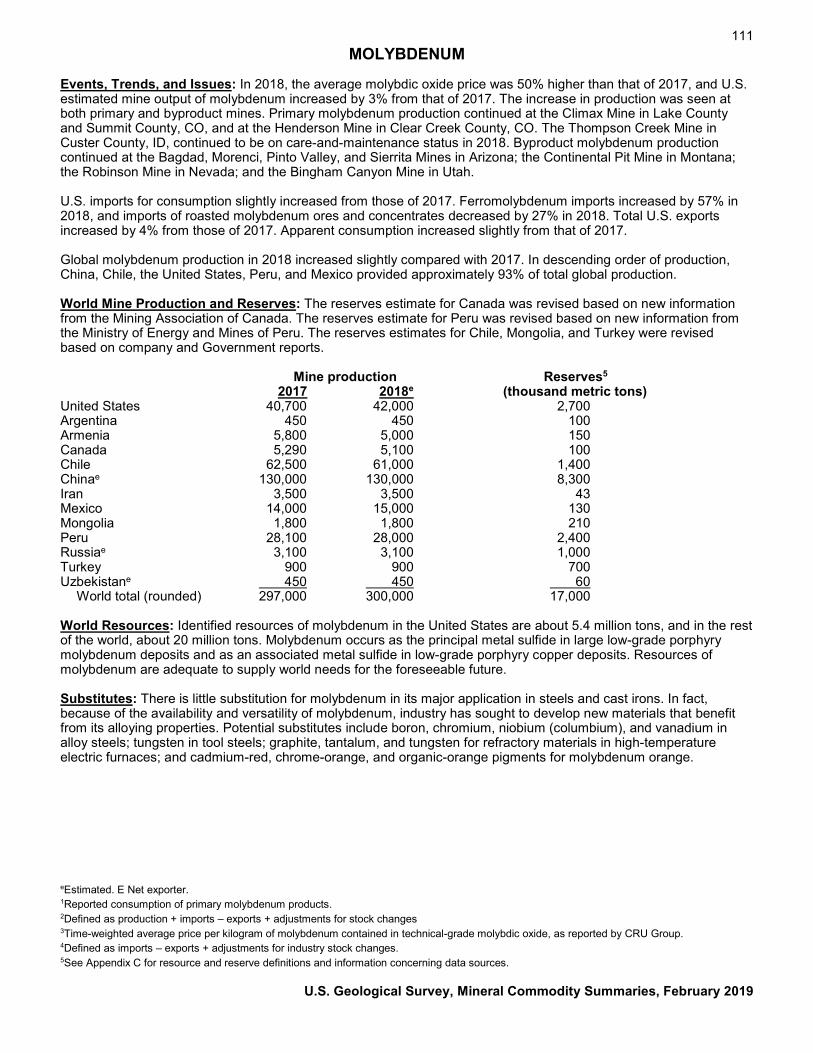
111 MOLYBDENUM
Events, Trends, and Issues: In 2018, the average molybdic oxide price was 50% higher than that of 2017, and U.S. estimated mine output of molybdenum increased by 3% from that of 2017. The increase in production was seen at both primary and byproduct mines. Primary molybdenum production continued at the Climax Mine in Lake County and Summit County, CO, and at the Henderson Mine in Clear Creek County, CO. The Thompson Creek Mine in Custer County, ID, continued to be on care-and-maintenance status in 2018. Byproduct molybdenum production continued at the Bagdad, Morenci, Pinto Valley, and Sierrita Mines in Arizona; the Continental Pit Mine in Montana; the Robinson Mine in Nevada; and the Bingham Canyon Mine in Utah. U.S. imports for consumption slightly increased from those of 2017. Ferromolybdenum imports increased by 57% in 2018, and imports of roasted molybdenum ores and concentrates decreased by 27% in 2018. Total U.S. exports increased by 4% from those of 2017. Apparent consumption increased slightly from that of 2017. Global molybdenum production in 2018 increased slightly compared with 2017. In descending order of production, China, Chile, the United States, Peru, and Mexico provided approximately 93% of total global production. World Mine Production and Reserves: The reserves estimate for Canada was revised based on new information from the Mining Association of Canada. The reserves estimate for Peru was revised based on new information from the Ministry of Energy and Mines of Peru. The reserves estimates for Chile, Mongolia, and Turkey were revised based on company and Government reports. Mine production Reserves5 2017 2018e (thousand metric tons) United States 40,700 42,000 2,700 Argentina 450 450 100 Armenia 5,800 5,000 150 Canada 5,290 5,100 100 Chile 62,500 61,000 1,400 Chinae 130,000 130,000 8,300 Iran 3,500 3,500 43 Mexico 14,000 15,000 130 Mongolia 1,800 1,800 210 Peru 28,100 28,000 2,400 Russiae 3,100 3,100 1,000 Turkey 900 900 700 Uzbekistane 450 450 60 World total (rounded) 297,000 300,000 17,000 World Resources: Identified resources of molybdenum in the United States are about 5.4 million tons, and in the rest of the world, about 20 million tons. Molybdenum occurs as the principal metal sulfide in large low-grade porphyry molybdenum deposits and as an associated metal sulfide in low-grade porphyry copper deposits. Resources of molybdenum are adequate to supply world needs for the foreseeable future. Substitutes: There is little substitution for molybdenum in its major application in steels and cast irons. In fact, because of the availability and versatility of molybdenum, industry has sought to develop new materials that benefit from its alloying properties. Potential substitutes include boron, chromium, niobium (columbium), and vanadium in alloy steels; tungsten in tool steels; graphite, tantalum, and tungsten for refractory materials in high-temperature electric furnaces; and cadmium-red, chrome-orange, and organic-orange pigments for molybdenum orange. eEstimated. E Net exporter. 1Reported consumption of primary molybdenum products. 2Defined as production + imports – exports + adjustments for stock changes 3Time-weighted average price per kilogram of molybdenum contained in technical-grade molybdic oxide, as reported by CRU Group. 4Defined as imports – exports + adjustments for industry stock changes. 5See Appendix C for resource and reserve definitions and information concerning data sources.
U.S. Geological Survey, Mineral Commodity Summaries, February 2019
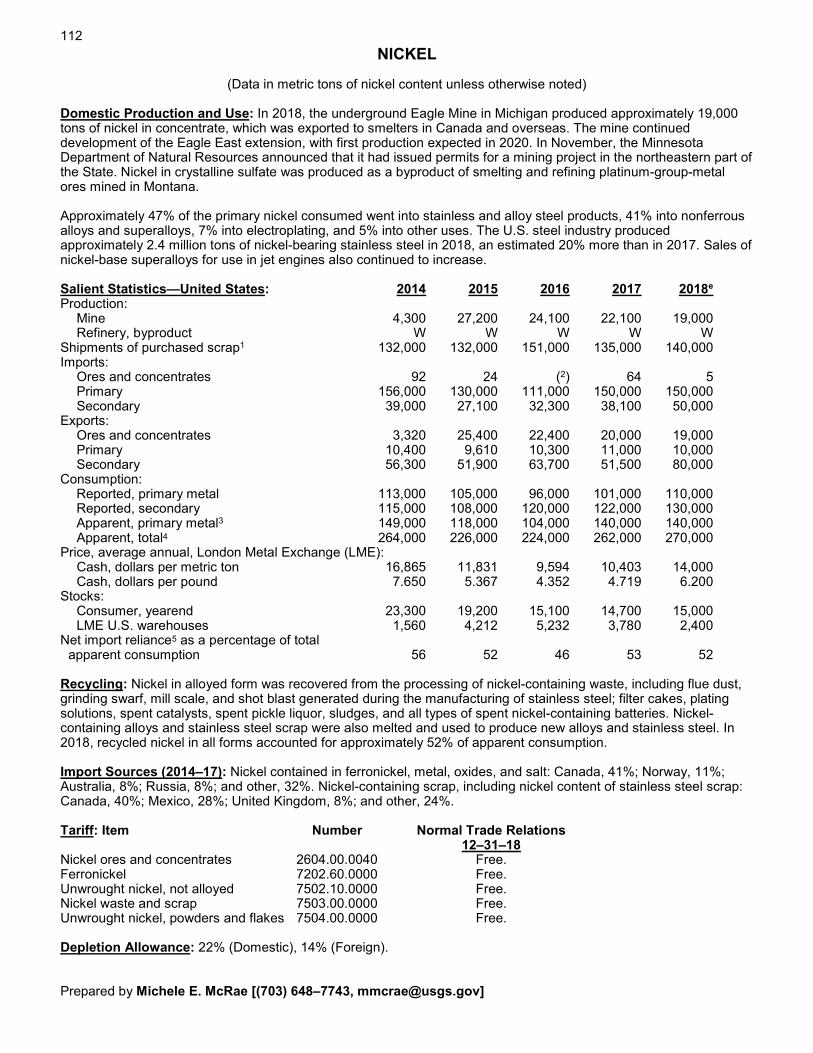
112
NICKEL
(Data in metric tons of nickel content unless otherwise noted) Domestic Production and Use: In 2018, the underground Eagle Mine in Michigan produced approximately 19,000 tons of nickel in concentrate, which was exported to smelters in Canada and overseas. The mine continued development of the Eagle East extension, with first production expected in 2020. In November, the Minnesota Department of Natural Resources announced that it had issued permits for a mining project in the northeastern part of the State. Nickel in crystalline sulfate was produced as a byproduct of smelting and refining platinum-group-metal ores mined in Montana. Approximately 47% of the primary nickel consumed went into stainless and alloy steel products, 41% into nonferrous alloys and superalloys, 7% into electroplating, and 5% into other uses. The U.S. steel industry produced approximately 2.4 million tons of nickel-bearing stainless steel in 2018, an estimated 20% more than in 2017. Sales of nickel-base superalloys for use in jet engines also continued to increase. Salient Statistics—United States: 2014 2015 2016 2017 2018e Production: Mine 4,300 27,200 24,100 22,100 19,000 Refinery, byproduct W W W W W Shipments of purchased scrap1 132,000 132,000 151,000 135,000 140,000 Imports: Ores and concentrates 92 24 (2) 64 5 Primary 156,000 130,000 111,000 150,000 150,000 Secondary 39,000 27,100 32,300 38,100 50,000 Exports: Ores and concentrates 3,320 25,400 22,400 20,000 19,000 Primary 10,400 9,610 10,300 11,000 10,000 Secondary 56,300 51,900 63,700 51,500 80,000 Consumption: Reported, primary metal 113,000 105,000 96,000 101,000 110,000 Reported, secondary 115,000 108,000 120,000 122,000 130,000 Apparent, primary metal3 149,000 118,000 104,000 140,000 140,000 Apparent, total4 264,000 226,000 224,000 262,000 270,000 Price, average annual, London Metal Exchange (LME): Cash, dollars per metric ton 16,865 11,831 9,594 10,403 14,000 Cash, dollars per pound 7.650 5.367 4.352 4.719 6.200 Stocks: Consumer, yearend 23,300 19,200 15,100 14,700 15,000 LME U.S. warehouses 1,560 4,212 5,232 3,780 2,400 Net import reliance5 as a percentage of total apparent consumption 56 52 46 53 52 Recycling: Nickel in alloyed form was recovered from the processing of nickel-containing waste, including flue dust, grinding swarf, mill scale, and shot blast generated during the manufacturing of stainless steel; filter cakes, plating solutions, spent catalysts, spent pickle liquor, sludges, and all types of spent nickel-containing batteries. Nickel-containing alloys and stainless steel scrap were also melted and used to produce new alloys and stainless steel. In 2018, recycled nickel in all forms accounted for approximately 52% of apparent consumption. Import Sources (2014–17): Nickel contained in ferronickel, metal, oxides, and salt: Canada, 41%; Norway, 11%; Australia, 8%; Russia, 8%; and other, 32%. Nickel-containing scrap, including nickel content of stainless steel scrap: Canada, 40%; Mexico, 28%; United Kingdom, 8%; and other, 24%. Tariff: Item Number Normal Trade Relations 12–31–18 Nickel ores and concentrates 2604.00.0040 Free. Ferronickel 7202.60.0000 Free. Unwrought nickel, not alloyed 7502.10.0000 Free. Nickel waste and scrap 7503.00.0000 Free. Unwrought nickel, powders and flakes 7504.00.0000 Free. Depletion Allowance: 22% (Domestic), 14% (Foreign). Prepared by Michele E. McRae [(703) 648–7743, [email protected]]
113 NICKEL
Government Stockpile:6 The U.S. Department of Energy is holding nickel ingot contaminated by low-level radioactivity at Paducah, KY, and shredded nickel scrap at Oak Ridge, TN. Ongoing decommissioning activities at former nuclear defense sites were expected to generate additional nickel in scrap. See the Lithium chapter for statistics on lithium-nickel-cobalt-aluminum oxide. FY2018 FY 2019 Inventory Potential Potential Potential Potential Material As of 9–30–18 Acquisitions Disposals7 Acquisitions Disposals7
Nickel alloys, gross weight 307 — 68 — 68 Events, Trends, and Issues: In recent years, production of refined nickel decreased as stainless steel producers, primarily in Asia, preferred lower cost nickel pig iron. Mine production in countries that supply direct shipping ore to nickel pig iron operations increased, while mine production supplying refineries tended to decrease. Production of nickel chemicals, however, has increased, particularly nickel sulfate used in the production of batteries. Industry analysts project a significant increase in global nickel consumption in batteries for energy storage and electric vehicles. World Mine Production and Reserves: Reserves for Brazil, China, Colombia, Indonesia, and the United States were revised based on new information from company or Government reports. Mine production Reserves8 2017 2018e United States 22,100 19,000 110,000 Australia 179,000 170,000 919,000,000 Brazil 78,600 80,000 11,000,000 Canada 214,000 160,000 2,700,000 China 103,000 110,000 2,800,000 Colombia 45,500 43,000 440,000 Cuba 52,800 53,000 5,500,000 Finland 34,600 46,000 NA Guatemala 53,700 49,000 1,800,000 Indonesia 345,000 560,000 21,000,000 Madagascar 41,700 39,000 1,600,000 New Caledonia10 215,000 210,000 — Philippines 366,000 340,000 4,800,000 Russia 214,000 210,000 7,600,000 South Africa 48,400 44,000 3,700,000 Other countries 146,000 180,000 6,500,000 World total (rounded) 2,160,000 2,300,000 89,000,000 World Resources: Identified land-based resources averaging 1% nickel or greater contain at least 130 million tons of nickel, with about 60% in laterites and 40% in sulfide deposits. Extensive nickel resources also are found in manganese crusts and nodules on the ocean floor. The decline in discovery of new sulfide deposits in traditional mining districts has led to exploration in more challenging locations such as east-central Africa and the subarctic. Substitutes: Low-nickel, duplex, or ultrahigh-chromium stainless steels are being substituted for austenitic grades in construction. Nickel-free specialty steels are sometimes used in place of stainless steel in the power-generating and petrochemical industries. Titanium alloys can substitute for nickel metal or nickel-base alloys in corrosive chemical environments. Lithium-ion batteries may be used instead of nickel metal hydride batteries in certain applications.
eEstimated. NA Not available. W Withheld to avoid disclosing company proprietary data. — Zero. 1Scrap receipts – shipments by consumers + exports – imports + adjustments for consumer stock changes. 2Less than ½ unit. 3Defined as primary imports – primary exports + adjustments for industry stock changes, excluding secondary consumer stocks. 4Defined as apparent primary metal consumption + reported secondary consumption. 5Defined as imports – exports + adjustments for consumer stock changes. 6See Appendix B for definitions. 7Disposals are defined as any barter, rotation, sale, or upgrade of National Defense Stockpile stock. 8See Appendix C for resource and reserve definitions and information concerning data sources. 9For Australia, Joint Ore Reserves Committee-compliant reserves were about 6.0 million tons. 10Overseas territory of France. Although nickel-cobalt mining and processing continued, the leading producing company reported zero reserves owing to recent nickel prices.
U.S. Geological Survey, Mineral Commodity Summaries, February 2019
114
NIOBIUM (COLUMBIUM)
(Data in metric tons of niobium content unless otherwise noted) Domestic Production and Use: Significant U.S. niobium mine production has not been reported since 1959. Domestic niobium resources are of low grade, some are mineralogically complex, and most are not commercially recoverable. Companies in the United States produced niobium-containing materials from imported niobium minerals, oxides, and ferroniobium. Niobium was consumed mostly in the form of ferroniobium by the steel industry and as niobium alloys and metal by the aerospace industry. Major end-use distribution of reported niobium consumption was as follows: steels, about 75%, and superalloys, about 25%. In 2018, the estimated value of niobium consumption was $310 million, as measured by the value of imports. Salient Statistics—United States: 2014 2015 2016 2017 2018e Production, mine — — — — — Imports for consumption1 11,100 8,520 8,250 9,370 11,000 Exports1 1,110 1,430 1,480 1,490 1,000 Shipments from Government stockpile — — — — — Consumption:e Apparent2 10,000 7,080 6,730 7,820 10,000 Reported3 8,210 7,510 7,370 7,510 9,000 Unit value, ferroniobium, dollars per kilogram4 26 24 21 20 21 Net import reliance2 as a percentage of apparent consumption 100 100 100 100 100 Recycling: Niobium was recycled when niobium-bearing steels and superalloys were recycled; scrap recovery, specifically for niobium content, was negligible. The amount of niobium recycled is not available, but it may be as much as 20% of apparent consumption. Import Sources (2014–17): Niobium ore and concentrate: Brazil, 35%; Rwanda, 31%; Australia, 15%; Congo (Kinshasa), 8%; and other, 11%. Niobium oxide: Brazil, 44%; Russia, 30%; Thailand, 9%; Estonia, 7%; and other, 10%. Ferroniobium and niobium metal: Brazil, 76%; Canada, 21%; Germany, 2%; and other, 1%. Total imports: Brazil, 72%; Canada, 18%; Russia, 3%; Germany, 2%; and other, 5%. Of the U.S. niobium material imports, 99% (by gross weight) was ferroniobium, niobium metal, and niobium oxide. Tariff: Item Number Normal Trade Relations 12–31–18 Synthetic tantalum-niobium concentrates 2615.90.3000 Free. Niobium ores and concentrates 2615.90.6030 Free. Niobium oxide 2825.90.1500 3.7% ad val. Ferroniobium: Less than 0.02% P or S, or less than 0.4% Si 7202.93.4000 5% ad val. Other 7202.93.8000 5% ad val. Niobium: Waste and scrap5 8112.92.0600 Free. Powders and unwrought metal 8112.92.4000 4.9% ad val. Niobium, other5 8112.99.9000 4% ad val. Depletion Allowance: 22% (Domestic), 14% (Foreign). Government Stockpile:6
FY2018 FY 2019 Inventory Potential Potential Potential Potential Material As of 9–30–18 Acquisitions Disposals7 Acquisitions Disposals7
Ferroniobium (gross weight) 278 209 — 209 — Niobium metal (gross weight) 10 — — — — Prepared by Abraham J. Padilla [(703) 648–4965, [email protected]]
115 NIOBIUM (COLUMBIUM)
Events, Trends, and Issues: Niobium principally was imported in the form of ferroniobium. Based on data through July 2018, U.S. niobium apparent consumption (measured in contained niobium) was estimated to be 10,000 metric tons, 27% more than that of 2017. Brazil continued to be the world’s leading niobium producer with 88% of global production, followed by Canada with 10%. In May 2018, the U.S. Department of the Interior, in coordination with other executive branch agencies, published a list of 35 critical minerals (83 FR 23295), including niobium. This list was developed to serve as an initial focus, pursuant to Executive Order 13817, ‘‘A Federal Strategy to Ensure Secure and Reliable Supplies of Critical Minerals” (82 FR 60835). One domestic company continued to make progress developing its Elk Creek project in Nebraska by securing all major Federal permits and completing a proposed engineering design for its underground mine. The project would be the only niobium mine and primary niobium processing facility in the United States. It was expected to begin production after 2019. In July 2018, a company from Japan acquired all shares of the niobium-tantalum business of a company from Germany. The business was headquartered in Munich, Germany, and included niobium processing and manufacturing facilities in Baden-Wurttemberg and Lower Saxony States, Germany, as well as Ibaraki Prefecture, Japan, and Rayong Province, Thailand. World Mine Production and Reserves: The reserves data for the United States, Brazil, and Canada were revised based on information reported by niobium-producing companies and the Governments of those countries. Mine production Reserves8 2017 2018e United States — — 180,000 Brazil 60,700 60,000 7,300,000 Canada 6,980 7,000 1,600,000 Other countries 1,410 1,000 NA World total (rounded) 69,100 68,000 >9,100,000 World Resources: World resources of niobium are more than adequate to supply projected needs. Most of the world’s identified resources of niobium occur as pyrochlore in carbonatite (igneous rocks that contain more than 50%- by-volume carbonate minerals) deposits and are outside the United States. The United States has approximately 868,000 tons of niobium in identified resources, most of which were considered subeconomic at 2018 prices for niobium. Substitutes: The following materials can be substituted for niobium, but a performance loss or higher cost may ensue: ceramic matrix composites, molybdenum, tantalum, and tungsten in high-temperature (superalloy) applications; molybdenum, tantalum, and titanium as alloying elements in stainless and high-strength steels; and molybdenum and vanadium as alloying elements in high-strength low-alloy steels. eEstimated. NA Not available. — Zero. 1Imports and exports include the estimated niobium content of ferroniobium, niobium and tantalum ores and concentrates, niobium oxide, and niobium powders and unwrought metal. 2Defined as imports – exports + adjustments for Government stock changes. 3Only includes ferroniobium and nickel niobium. 4Unit value is weighted average unit value of gross weight of U.S. ferroniobium trade. (Trade is imports plus exports.) 5This category includes niobium-containing material and other material. 6See Appendix B for definitions. 7Disposals are defined as any barter, rotation, sale, or upgrade of National Defense Stockpile stock. 8See Appendix C for resource and reserve definitions and information concerning data sources.
U.S. Geological Survey, Mineral Commodity Summaries, February 2019
116
NITROGEN (FIXED)—AMMONIA
(Data in thousand metric tons of contained nitrogen unless otherwise noted) Domestic Production and Use: Ammonia was produced by 15 companies at 34 plants in 16 States in the United States during 2018; 2 additional plants were idle for the entire year. About 50% of total U.S. ammonia production capacity was located in Louisiana, Oklahoma, and Texas because of their large reserves of natural gas, the dominant domestic feedstock for ammonia. In 2018, U.S. producers operated at about 75% of rated capacity. The United States was one of the world’s leading producers and consumers of ammonia. Urea, ammonium nitrate, ammonium phosphates, nitric acid, and ammonium sulfate were, in descending order of importance, the major derivatives of ammonia produced in the United States. Approximately 88% of apparent domestic ammonia consumption was for fertilizer use, including anhydrous ammonia for direct application, urea, ammonium nitrates, ammonium phosphates, and other nitrogen compounds. Ammonia also was used to produce explosives, plastics, synthetic fibers and resins, and numerous other chemical compounds. Salient Statistics—United States: 2014 2015 2016 2017 2018e Production 19,330 19,590 110,200 111,600 12,500 Imports for consumption 4,150 4,320 3,840 3,090 2,600 Exports 111 93 183 612 430 Consumption, apparent2 13,300 13,700 13,800 14,100 14,600 Stocks, producer, yearend 280 420 400 320 400 Price, dollars per short ton, average, f.o.b. Gulf Coast3 531 481 267 247 280 Employment, plant, numbere 1,200 1,200 1,300 1,500 1,600 Net import reliance4 as a percentage of apparent consumption 30 30 26 18 14 Recycling: None. Import Sources (2014–17): Trinidad and Tobago, 66%; Canada, 23%; Russia, 4%; Venezuela, 4%; and other, 3%. Tariff: Item Number Normal Trade Relations 12–31–18 Ammonia, anhydrous 2814.10.0000 Free. Urea 3102.10.0000 Free. Ammonium sulfate 3102.21.0000 Free. Ammonium nitrate 3102.30.0000 Free. Depletion Allowance: Not applicable. Government Stockpile: None. Events, Trends, and Issues: The Henry Hub spot natural gas price ranged between $2.48 and $6.88 per million British thermal units for most of the year, with an average of about $3.00 per million British thermal units. Natural gas prices in 2018 were relatively stable; slightly higher prices were a result of increased demand for natural gas owing to cold temperatures and associated increased demand for power generation. The U.S. Department of Energy, Energy Information Administration, projected that Henry Hub natural gas spot prices would average $3.12 per million British thermal units in 2019. The weekly average Gulf Coast ammonia price was $290 per short ton at the beginning of 2018, decreased to $210 per short ton in early June, and then increased to $322 per short ton in October. The average ammonia price for 2018 was estimated to be $280 per short ton. Increased ammonia prices were a result of an improved urea market and rising production costs in Europe. A long period of stable and low natural gas prices in the United States has made it economical for companies to upgrade existing ammonia plants and plan for the construction of new nitrogen projects. The additional capacity has reduced ammonia imports. In 2017, ammonia facilities in Iowa, Louisiana, and Texas became operational. In 2018, one new ammonia facility in Texas became operational. No other ammonia plants are expected to be commissioned before 2022. Two U.S. ammonia producers completed their merger in January 2018. The new company accounted for 18% of the U.S. ammonia production capacity. Prepared by Lori E. Apodaca [(703) 648–7724, [email protected]]
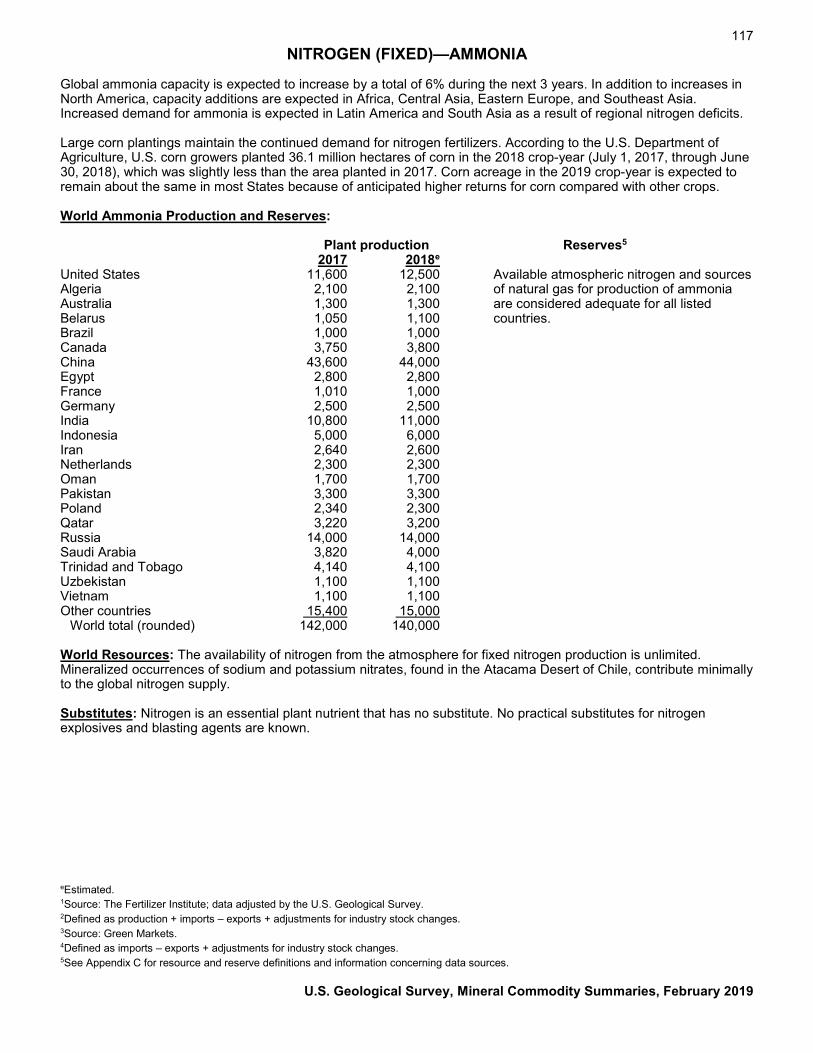
117 NITROGEN (FIXED)—AMMONIA
Global ammonia capacity is expected to increase by a total of 6% during the next 3 years. In addition to increases in North America, capacity additions are expected in Africa, Central Asia, Eastern Europe, and Southeast Asia. Increased demand for ammonia is expected in Latin America and South Asia as a result of regional nitrogen deficits. Large corn plantings maintain the continued demand for nitrogen fertilizers. According to the U.S. Department of Agriculture, U.S. corn growers planted 36.1 million hectares of corn in the 2018 crop-year (July 1, 2017, through June 30, 2018), which was slightly less than the area planted in 2017. Corn acreage in the 2019 crop-year is expected to remain about the same in most States because of anticipated higher returns for corn compared with other crops. World Ammonia Production and Reserves: Plant production Reserves5 2017 2018e United States 11,600 12,500 Available atmospheric nitrogen and sources Algeria 2,100 2,100 of natural gas for production of ammonia Australia 1,300 1,300 are considered adequate for all listed Belarus 1,050 1,100 countries. Brazil 1,000 1,000 Canada 3,750 3,800 China 43,600 44,000 Egypt 2,800 2,800 France 1,010 1,000 Germany 2,500 2,500 India 10,800 11,000 Indonesia 5,000 6,000 Iran 2,640 2,600 Netherlands 2,300 2,300 Oman 1,700 1,700 Pakistan 3,300 3,300 Poland 2,340 2,300 Qatar 3,220 3,200 Russia 14,000 14,000 Saudi Arabia 3,820 4,000 Trinidad and Tobago 4,140 4,100 Uzbekistan 1,100 1,100 Vietnam 1,100 1,100 Other countries 15,400 15,000 World total (rounded) 142,000 140,000 World Resources: The availability of nitrogen from the atmosphere for fixed nitrogen production is unlimited. Mineralized occurrences of sodium and potassium nitrates, found in the Atacama Desert of Chile, contribute minimally to the global nitrogen supply. Substitutes: Nitrogen is an essential plant nutrient that has no substitute. No practical substitutes for nitrogen explosives and blasting agents are known. eEstimated. 1Source: The Fertilizer Institute; data adjusted by the U.S. Geological Survey. 2Defined as production + imports – exports + adjustments for industry stock changes. 3Source: Green Markets. 4Defined as imports – exports + adjustments for industry stock changes. 5See Appendix C for resource and reserve definitions and information concerning data sources.
U.S. Geological Survey, Mineral Commodity Summaries, February 2019
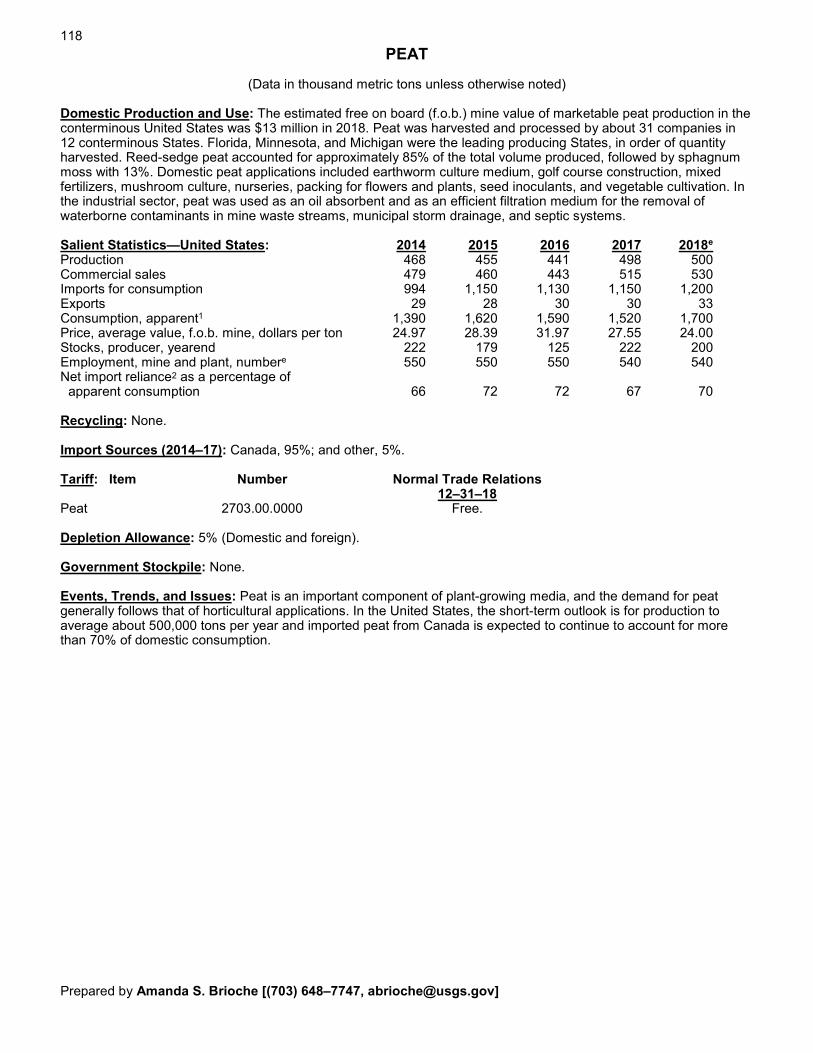
118
PEAT
(Data in thousand metric tons unless otherwise noted) Domestic Production and Use: The estimated free on board (f.o.b.) mine value of marketable peat production in the conterminous United States was $13 million in 2018. Peat was harvested and processed by about 31 companies in 12 conterminous States. Florida, Minnesota, and Michigan were the leading producing States, in order of quantity harvested. Reed-sedge peat accounted for approximately 85% of the total volume produced, followed by sphagnum moss with 13%. Domestic peat applications included earthworm culture medium, golf course construction, mixed fertilizers, mushroom culture, nurseries, packing for flowers and plants, seed inoculants, and vegetable cultivation. In the industrial sector, peat was used as an oil absorbent and as an efficient filtration medium for the removal of waterborne contaminants in mine waste streams, municipal storm drainage, and septic systems. Salient Statistics—United States: 2014 2015 2016 2017 2018e Production 468 455 441 498 500 Commercial sales 479 460 443 515 530 Imports for consumption 994 1,150 1,130 1,150 1,200 Exports 29 28 30 30 33 Consumption, apparent1 1,390 1,620 1,590 1,520 1,700 Price, average value, f.o.b. mine, dollars per ton 24.97 28.39 31.97 27.55 24.00 Stocks, producer, yearend 222 179 125 222 200 Employment, mine and plant, numbere 550 550 550 540 540 Net import reliance2 as a percentage of apparent consumption 66 72 72 67 70 Recycling: None. Import Sources (2014–17): Canada, 95%; and other, 5%. Tariff: Item Number Normal Trade Relations 12–31–18 Peat 2703.00.0000 Free. Depletion Allowance: 5% (Domestic and foreign). Government Stockpile: None. Events, Trends, and Issues: Peat is an important component of plant-growing media, and the demand for peat generally follows that of horticultural applications. In the United States, the short-term outlook is for production to average about 500,000 tons per year and imported peat from Canada is expected to continue to account for more than 70% of domestic consumption. Prepared by Amanda S. Brioche [(703) 648–7747, [email protected]]
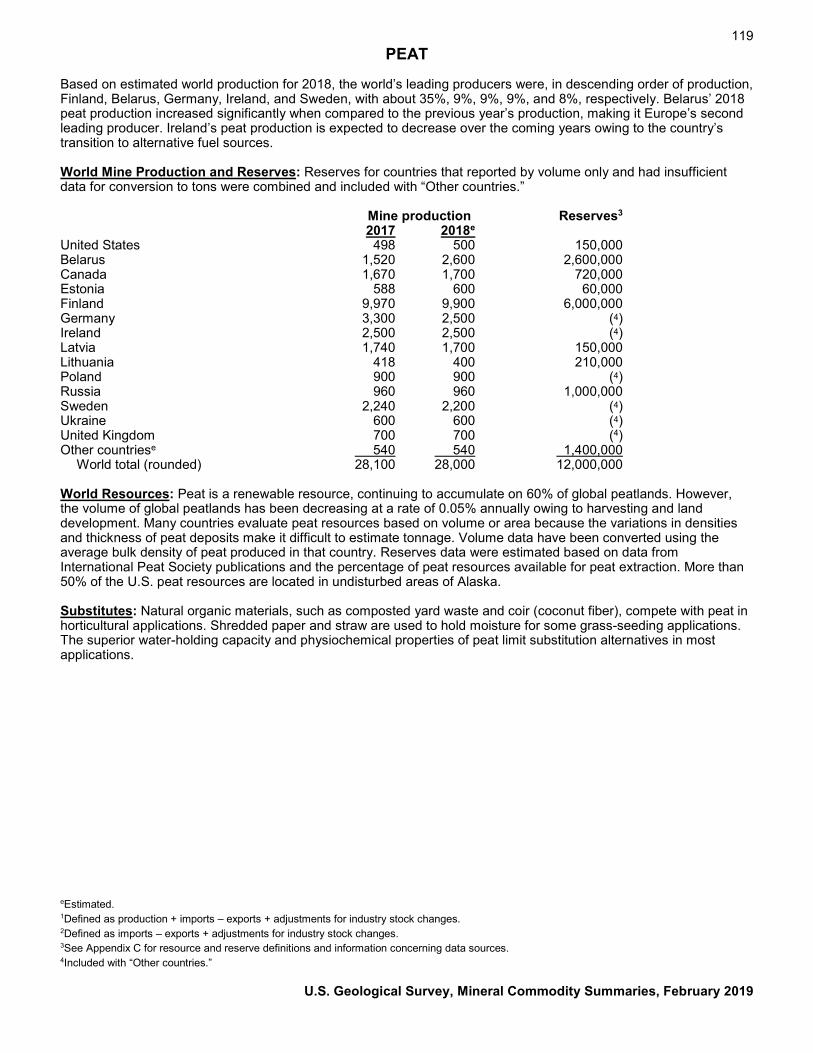
119 PEAT
Based on estimated world production for 2018, the world’s leading producers were, in descending order of production, Finland, Belarus, Germany, Ireland, and Sweden, with about 35%, 9%, 9%, 9%, and 8%, respectively. Belarus’ 2018 peat production increased significantly when compared to the previous year’s production, making it Europe’s second leading producer. Ireland’s peat production is expected to decrease over the coming years owing to the country’s transition to alternative fuel sources. World Mine Production and Reserves: Reserves for countries that reported by volume only and had insufficient data for conversion to tons were combined and included with “Other countries.” Mine production Reserves3 2017 2018e United States 498 500 150,000 Belarus 1,520 2,600 2,600,000 Canada 1,670 1,700 720,000 Estonia 588 600 60,000 Finland 9,970 9,900 6,000,000 Germany 3,300 2,500 (4) Ireland 2,500 2,500 (4) Latvia 1,740 1,700 150,000 Lithuania 418 400 210,000 Poland 900 900 (4) Russia 960 960 1,000,000 Sweden 2,240 2,200 (4) Ukraine 600 600 (4) United Kingdom 700 700 (4) Other countriese 540 540 1,400,000 World total (rounded) 28,100 28,000 12,000,000 World Resources: Peat is a renewable resource, continuing to accumulate on 60% of global peatlands. However, the volume of global peatlands has been decreasing at a rate of 0.05% annually owing to harvesting and land development. Many countries evaluate peat resources based on volume or area because the variations in densities and thickness of peat deposits make it difficult to estimate tonnage. Volume data have been converted using the average bulk density of peat produced in that country. Reserves data were estimated based on data from International Peat Society publications and the percentage of peat resources available for peat extraction. More than 50% of the U.S. peat resources are located in undisturbed areas of Alaska. Substitutes: Natural organic materials, such as composted yard waste and coir (coconut fiber), compete with peat in horticultural applications. Shredded paper and straw are used to hold moisture for some grass-seeding applications. The superior water-holding capacity and physiochemical properties of peat limit substitution alternatives in most applications.
eEstimated. 1Defined as production + imports – exports + adjustments for industry stock changes. 2Defined as imports – exports + adjustments for industry stock changes. 3See Appendix C for resource and reserve definitions and information concerning data sources. 4Included with “Other countries.”
U.S. Geological Survey, Mineral Commodity Summaries, February 2019
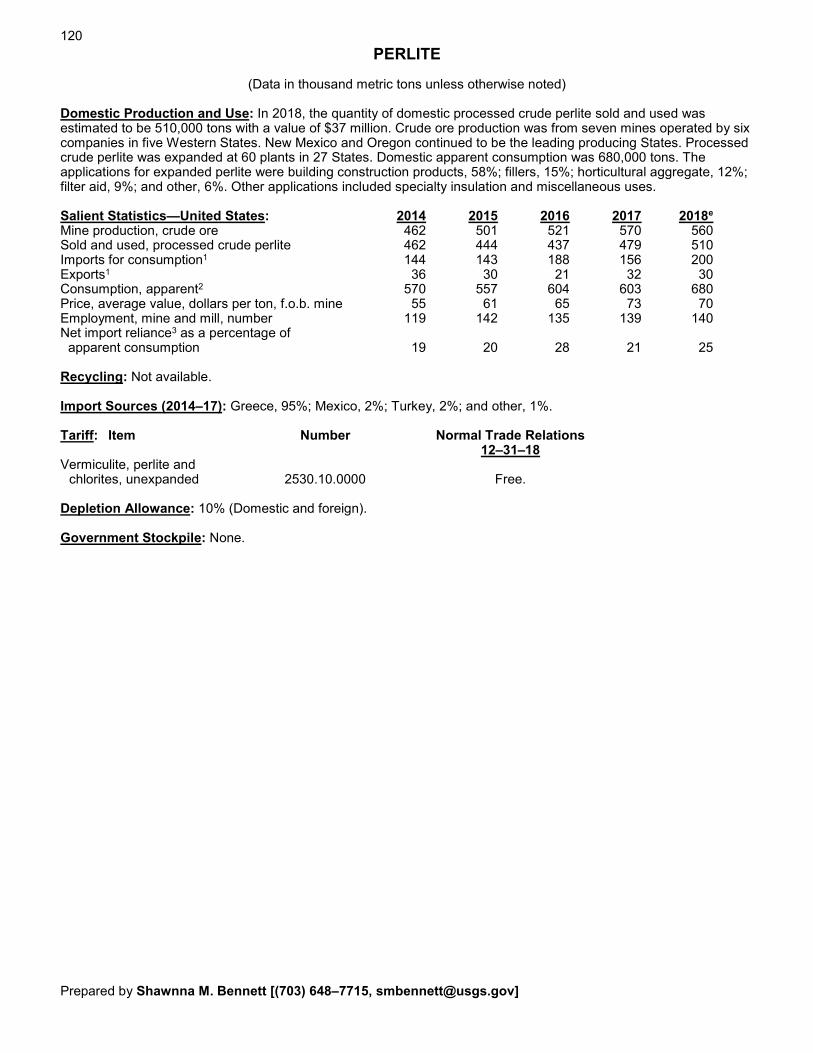
120
PERLITE
(Data in thousand metric tons unless otherwise noted)
Domestic Production and Use: In 2018, the quantity of domestic processed crude perlite sold and used was estimated to be 510,000 tons with a value of $37 million. Crude ore production was from seven mines operated by six companies in five Western States. New Mexico and Oregon continued to be the leading producing States. Processed crude perlite was expanded at 60 plants in 27 States. Domestic apparent consumption was 680,000 tons. The applications for expanded perlite were building construction products, 58%; fillers, 15%; horticultural aggregate, 12%; filter aid, 9%; and other, 6%. Other applications included specialty insulation and miscellaneous uses. Salient Statistics—United States: 2014 2015 2016 2017 2018e Mine production, crude ore 462 501 521 570 560 Sold and used, processed crude perlite 462 444 437 479 510 Imports for consumption1 144 143 188 156 200 Exports1 36 30 21 32 30 Consumption, apparent2 570 557 604 603 680 Price, average value, dollars per ton, f.o.b. mine 55 61 65 73 70 Employment, mine and mill, number 119 142 135 139 140 Net import reliance3 as a percentage of apparent consumption 19 20 28 21 25 Recycling: Not available. Import Sources (2014–17): Greece, 95%; Mexico, 2%; Turkey, 2%; and other, 1%. Tariff: Item Number Normal Trade Relations 12–31–18 Vermiculite, perlite and chlorites, unexpanded 2530.10.0000 Free. Depletion Allowance: 10% (Domestic and foreign). Government Stockpile: None. Prepared by Shawnna M. Bennett [(703) 648–7715, [email protected]]
121 PERLITE
Events, Trends, and Issues: Perlite is a siliceous volcanic glass that expands up to 20 times its original volume when rapidly heated. In horticultural uses, expanded perlite is used to provide moisture retention and aeration without compaction when added to soil. Owing primarily to cost, some commercial greenhouse growers in the United States have recently switched to a wood fiber material over perlite. Perlite, however, remained a preferred soil amendment for segments of the greenhouse growers because it does not degrade or compact over lengthy growing times and is inert. Construction applications for expanded perlite are numerous because it is lightweight, fire resistant, and an excellent insulator. Novel and small markets for perlite have increased during the past 10 years; cosmetics, environmental remediation, and personal care products have become increasing markets for perlite. Throughout 2017 and 2018, a new perlite deposit in Nevada was being actively explored and developed as a potential supplier of crude perlite ore for industrial and household applications. The estimated amount of processed crude perlite sold or used from U.S. mines increased to the highest level since 2005. Domestic perlite mining generally takes place in remote areas, and its environmental impact is not severe. The mineral fines, overburden, and reject ore produced during ore mining and processing are used to reclaim the mined-out areas, and, therefore, little waste remains. Airborne dust is captured by baghouses, and virtually no runoff contributes to water pollution. Based on estimated world production for 2018, the world’s leading producers were, in descending order of production, China, Turkey, Greece, and the United States, with about 41%, 22%, 21%, and 12%, respectively, of world production. Although China was the leading producer, most of its perlite production was thought to be consumed internally. Greece and Turkey remained the leading exporters of perlite. World Perlite Production and Reserves: Reserves for Hungary were revised based on Government reports. Production Reserves4 2017 2018e United States 5570 5560 50,000 Armenia 45 45 NA China 1,930 1,900 NA Greece 930 950 120,000 Hungary 35 35 49,000 Iran 20 20 NA Mexico 20 20 NA New Zealand 25 25 NA Turkey 1,000 1,000 57,000 Other countries 78 60 NA World total (rounded) 4,650 4,600 NA World Resources: Perlite occurrences in Arizona, Idaho, Nevada, New Mexico, and Oregon contain estimated large resources. Significant deposits have been reported in China, Greece, and Turkey, and some other countries. Insufficient information is available to make reliable estimates of resources in many perlite-producing countries. Substitutes: In construction applications, diatomite, expanded clay and shale, pumice, and slag can be substituted for perlite. For horticultural uses, vermiculite, coco coir, wood pulp, and pumice are alternative soil additives and are sometimes used in conjunction with perlite. eEstimated. NA Not available. 1Exports and imports were estimated by the U.S. Geological Survey from U.S. Census Bureau combined data for vermiculite, perlite, and chlorites, unexpanded. 2Defined as sold or used processed perlite + imports – exports. 3Defined as imports − exports. 4See Appendix C for resource and reserve definitions and information concerning data sources. 5Mine production of crude ore.
U.S. Geological Survey, Mineral Commodity Summaries, February 2019
122
PHOSPHATE ROCK
(Data in thousand metric tons unless otherwise noted) Domestic Production and Use: In 2018, phosphate rock ore was mined by five firms at 10 mines in four States and processed into an estimated 27 million tons of marketable product, valued at $1.8 billion, free on board (f.o.b.) mine. Florida and North Carolina accounted for more than 75% of total domestic output; the remainder was produced in Idaho and Utah. Marketable product refers to beneficiated phosphate rock with phosphorus pentoxide (P2O5) content suitable for phosphoric acid or elemental phosphorus production. More than 95% of the phosphate rock mined in the United States was used to manufacture wet-process phosphoric acid and superphosphoric acid, which were used as intermediate feedstocks in the manufacture of granular and liquid ammonium phosphate fertilizers and animal feed supplements. Approximately 50% of the wet-process phosphoric acid produced was exported in the form of upgraded granular diammonium (DAP) and monoammonium phosphate (MAP) fertilizer, and merchant-grade phosphoric acid. The balance of the phosphate rock mined was for the manufacture of elemental phosphorus, which was used to produce phosphorus compounds for industrial applications, primarily glyphosate herbicide. Salient Statistics—United States: 2014 2015 2016 2017 2018e Production, marketable 25,300 27,400 27,100 27,900 27,000 Used by producers 26,700 26,200 26,700 26,300 23,000 Imports for consumption 2,380 1,960 1,590 2,520 3,000 Consumption, apparent1 29,100 28,100 28,200 28,800 27,000 Price, average value, dollars per ton, f.o.b. mine2 78.59 72.41 76.90 73.67 68.00 Stocks, producer, yearend 5,880 6,730 7,450 8,440 11,000 Employment, mine and beneficiation plant, numbere 2,100 2,000 2,000 2,000 2,000 Net import reliance3 as a percentage of apparent consumption 18 4 4 5 5 Recycling: None. Import Sources (2014–17): Peru, 68%; Morocco, 31%; and other, 1%. Tariff: Item Number Normal Trade Relations 12–31–18 Natural calcium phosphates: Unground 2510.10.0000 Free. Ground 2510.20.0000 Free. Depletion Allowance: 14% (Domestic and foreign). Government Stockpile: None. Events, Trends, and Issues: Domestic phosphate rock production and consumption in 2018 were estimated to be lower than those in 2017, owing to a decrease in phosphoric acid production caused in part by the temporary closure of a phosphate plant in Florida. Production of DAP and MAP were lower in 2018 because of lower export sales. In early 2018, the leading United States phosphate rock producer completed its purchase of the phosphate and potash assets of the leading fertilizer producer in Brazil. The acquisition included five phosphate rock mines, one potash mine, and four phosphate fertilizer plants in Brazil, and potash mine projects in Argentina and Canada. The company also acquired the Brazilian company’s 40% stake in their joint-venture mine in Peru, which increased its stake to 75%. U.S. annual mine production capacity was expected to remain steady at 32.5 million tons during the next 5 years. All three producers in Idaho were developing new mines to replace existing mines as they become exhausted over the next decade. According to industry analysts, world mine production rated capacity was projected to increase to 169 million tons in 2022 from 148 million tons in 2018, excluding official capacity data for China. Production of marketable phosphate rock in China was believed to be between 80 to 85 million tons per year, compared with official production statistics that included some crude ore production, according to industry analysts. Most of the increases are planned for Africa and the Middle East, where expansion projects were in progress in Egypt, Jordan, Morocco, Saudi Arabia, and South Africa. Prepared by Stephen M. Jasinski [(703) 648–7711, [email protected]]
123 PHOSPHATE ROCK
World consumption of P2O5, contained in phosphoric acid, fertilizers, and other uses, was projected to increase to 50.5 million tons in 2022 from 47.0 million tons in 2018. Africa, India, and South America would account for about 75% of the projected growth. U.S. consumption of P2O5 was expected to remain at nearly 5 million tons per year. World Mine Production and Reserves: Reserves for China, India, and Russia were updated with official Government data. Reserves for Israel and Jordan were updated with information from company reports. Mine production Reserves4 2017 2018e United States 27,900 27,000 1,000,000 Algeria 1,300 1,300 2,200,000 Australia 3,000 3,000 51,100,000 Brazil 5,200 5,400 1,700,000 China6 144,000 140,000 3,200,000 Egypt 4,400 4,600 1,300,000 Finland 980 1,000 1,000,000 India 1,590 1,600 46,000 Israel 3,850 3,900 67,000 Jordan 8,690 8,800 1,000,000 Kazakhstan 1,500 1,600 260,000 Mexico 1,930 2,000 30,000 Morocco and Western Sahara 30,000 33,000 50,000,000 Peru 3,040 3,100 400,000 Russia 13,300 13,000 600,000 Saudi Arabia 5,000 5,200 1,400,000 Senegal 1,390 1,500 50,000 South Africa 2,080 2,100 1,500,000 Syria 100 100 1,800,000 Togo 825 850 30,000 Tunisia 4,420 3,300 100,000 Uzbekistan 900 900 100,000 Vietnam 3,000 3,300 30,000 Other countries 1,100 1,300 770,000 World total (rounded) 269,000 270,000 70,000,000 World Resources: Some world reserves were reported only in terms of ore tonnage and grade. Phosphate rock resources occur principally as sedimentary marine phosphorites. The largest sedimentary deposits are found in northern Africa, China, the Middle East, and the United States. Significant igneous occurrences are found in Brazil, Canada, Finland, Russia, and South Africa. Large phosphate resources have been identified on the continental shelves and on seamounts in the Atlantic Ocean and the Pacific Ocean. World resources of phosphate rock are more than 300 billion tons. There are no imminent shortages of phosphate rock. Substitutes: There are no substitutes for phosphorus in agriculture. eEstimated. 1Defined as phosphate rock used by producers + imports - exports. U.S. producers stopped exporting phosphate rock in 2003. 2Marketable phosphate rock, weighted value, all grades. 3Defined as imports – exports + adjustments for industry stock changes. U.S. producers stopped exporting phosphate rock in 2003. 4See Appendix C for resource and reserve definitions and information concerning data sources. 5For Australia, Joint Ore Reserves Committee-compliant reserves were about 290 million tons. 6Production data for large mines only, as reported by National Bureau of Statistics of China.
U.S. Geological Survey, Mineral Commodity Summaries, February 2019
124
PLATINUM-GROUP METALS
(Palladium, platinum, iridium, osmium, rhodium, and ruthenium) (Data in kilograms of platinum-group-metal content unless otherwise noted)
Domestic Production and Use: One company in Montana produced about 18,100 kilograms of platinum-group metals (PGMs) with an estimated value of about $570 million. Small quantities of primary PGMs also were recovered as byproducts of copper-nickel mining in Minnesota; however, this material was sold to foreign companies for refining. The leading domestic use for PGMs was in catalytic converters to decrease harmful emissions from automobiles. Platinum-group metals are also used in catalysts for bulk-chemical production and petroleum refining; dental and medical devices; electronic applications, such as in computer hard disks, hybridized integrated circuits, and multilayer ceramic capacitors; glass manufacturing; investment; jewelry; and laboratory equipment. Salient Statistics—United States: 2014 2015 2016 2017 2018e Mine production:1 Palladium 12,400 12,500 13,100 13,600 14,000 Platinum 3,660 3,670 3,890 3,980 4,100 Imports for consumption:2 Palladium 92,900 85,300 80,400 86,000 89,000 Platinum 45,400 42,700 42,300 53,200 59,000 PGM waste and scrap 112,000 123,000 159,000 363,000 43,000 Iridium 1,960 1,010 1,300 1,420 940 Osmium 322 8 27 856 38 Rhodium 11,100 10,600 10,700 11,600 14,000 Ruthenium 11,000 8,230 8,410 14,500 17,000 Exports:3 Palladium 22,100 23,000 17,500 52,300 61,000 Platinum 14,800 14,400 14,000 16,700 18,000 PGM waste and scrap 254,000 246,000 273,000 195,000 34,000 Rhodium 433 759 794 844 4,000 Other PGMs 887 781 736 939 2,500 Price, dollars per troy ounce:4 Palladium 809.89 694.99 617.39 874.30 990.00 Platinum 1,387.89 1,056.09 989.52 951.23 900.00 Iridium 556.19 544.19 586.90 908.35 1,200.00 Rhodium 1,174.23 954.90 696.84 1,112.59 2,100.00 Ruthenium 65.13 47.63 42.00 76.86 240.00 Employment, mine, number1 1,622 1,439 1,432 1,513 1,500 Net import reliance5, 6 as a percentage of apparent consumption: Palladium 57 53 53 38 33 Platinum 69 66 66 71 73 Recycling: About 120,000 kilograms of palladium and platinum was recovered globally from new and old scrap in 2018, including about 51,000 kilograms recovered from automobile catalytic converters in the United States. Import Sources (2014–17):6 Palladium: South Africa, 31%; Russia, 28%; Italy, 12%; United Kingdom, 6%; and other, 23%. Platinum: South Africa, 44%; Germany, 15%; United Kingdom, 10%; Italy, 7%; and other, 24%. Tariff: All unwrought and semimanufactured forms of PGMs are imported duty free. Depletion Allowance: 22% (Domestic), 14% (Foreign). Government Stockpile:7
FY 2018 FY 2019 Inventory Potential Potential Potential Potential Material As of 9–30–18 Acquisitions Disposals8 Acquisitions Disposals8
Iridium 15 — 15 — 15 Platinum 261 — 261 — 261 Prepared by Sheryl A. Singerling [(703) 648–4954, [email protected]]
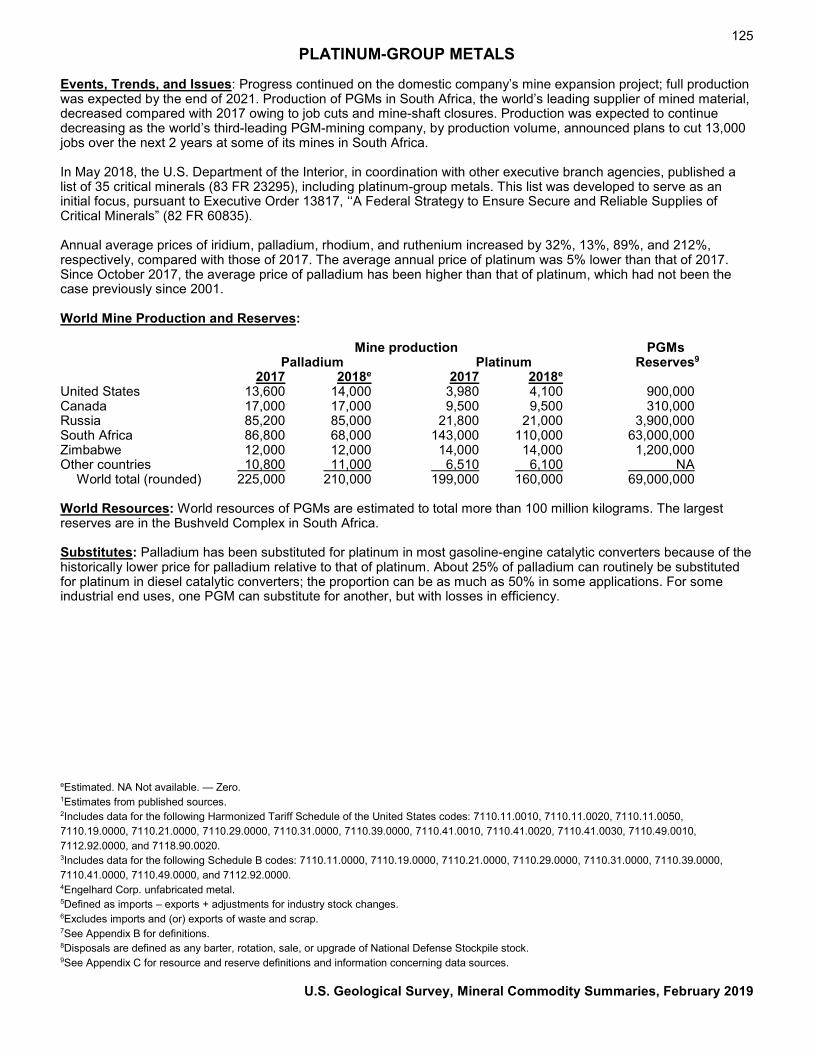
125 PLATINUM-GROUP METALS
Events, Trends, and Issues: Progress continued on the domestic company’s mine expansion project; full production was expected by the end of 2021. Production of PGMs in South Africa, the world’s leading supplier of mined material, decreased compared with 2017 owing to job cuts and mine-shaft closures. Production was expected to continue decreasing as the world’s third-leading PGM-mining company, by production volume, announced plans to cut 13,000 jobs over the next 2 years at some of its mines in South Africa. In May 2018, the U.S. Department of the Interior, in coordination with other executive branch agencies, published a list of 35 critical minerals (83 FR 23295), including platinum-group metals. This list was developed to serve as an initial focus, pursuant to Executive Order 13817, ‘‘A Federal Strategy to Ensure Secure and Reliable Supplies of Critical Minerals” (82 FR 60835). Annual average prices of iridium, palladium, rhodium, and ruthenium increased by 32%, 13%, 89%, and 212%, respectively, compared with those of 2017. The average annual price of platinum was 5% lower than that of 2017. Since October 2017, the average price of palladium has been higher than that of platinum, which had not been the case previously since 2001. World Mine Production and Reserves: Mine production PGMs Palladium Platinum Reserves9 2017 2018e 2017 2018e United States 13,600 14,000 3,980 4,100 900,000 Canada 17,000 17,000 9,500 9,500 310,000 Russia 85,200 85,000 21,800 21,000 3,900,000 South Africa 86,800 68,000 143,000 110,000 63,000,000 Zimbabwe 12,000 12,000 14,000 14,000 1,200,000 Other countries 10,800 11,000 6,510 6,100 NA World total (rounded) 225,000 210,000 199,000 160,000 69,000,000 World Resources: World resources of PGMs are estimated to total more than 100 million kilograms. The largest reserves are in the Bushveld Complex in South Africa. Substitutes: Palladium has been substituted for platinum in most gasoline-engine catalytic converters because of the historically lower price for palladium relative to that of platinum. About 25% of palladium can routinely be substituted for platinum in diesel catalytic converters; the proportion can be as much as 50% in some applications. For some industrial end uses, one PGM can substitute for another, but with losses in efficiency. eEstimated. NA Not available. — Zero. 1Estimates from published sources. 2Includes data for the following Harmonized Tariff Schedule of the United States codes: 7110.11.0010, 7110.11.0020, 7110.11.0050, 7110.19.0000, 7110.21.0000, 7110.29.0000, 7110.31.0000, 7110.39.0000, 7110.41.0010, 7110.41.0020, 7110.41.0030, 7110.49.0010, 7112.92.0000, and 7118.90.0020. 3Includes data for the following Schedule B codes: 7110.11.0000, 7110.19.0000, 7110.21.0000, 7110.29.0000, 7110.31.0000, 7110.39.0000, 7110.41.0000, 7110.49.0000, and 7112.92.0000. 4Engelhard Corp. unfabricated metal. 5Defined as imports – exports + adjustments for industry stock changes. 6Excludes imports and (or) exports of waste and scrap. 7See Appendix B for definitions. 8Disposals are defined as any barter, rotation, sale, or upgrade of National Defense Stockpile stock. 9See Appendix C for resource and reserve definitions and information concerning data sources.
U.S. Geological Survey, Mineral Commodity Summaries, February 2019
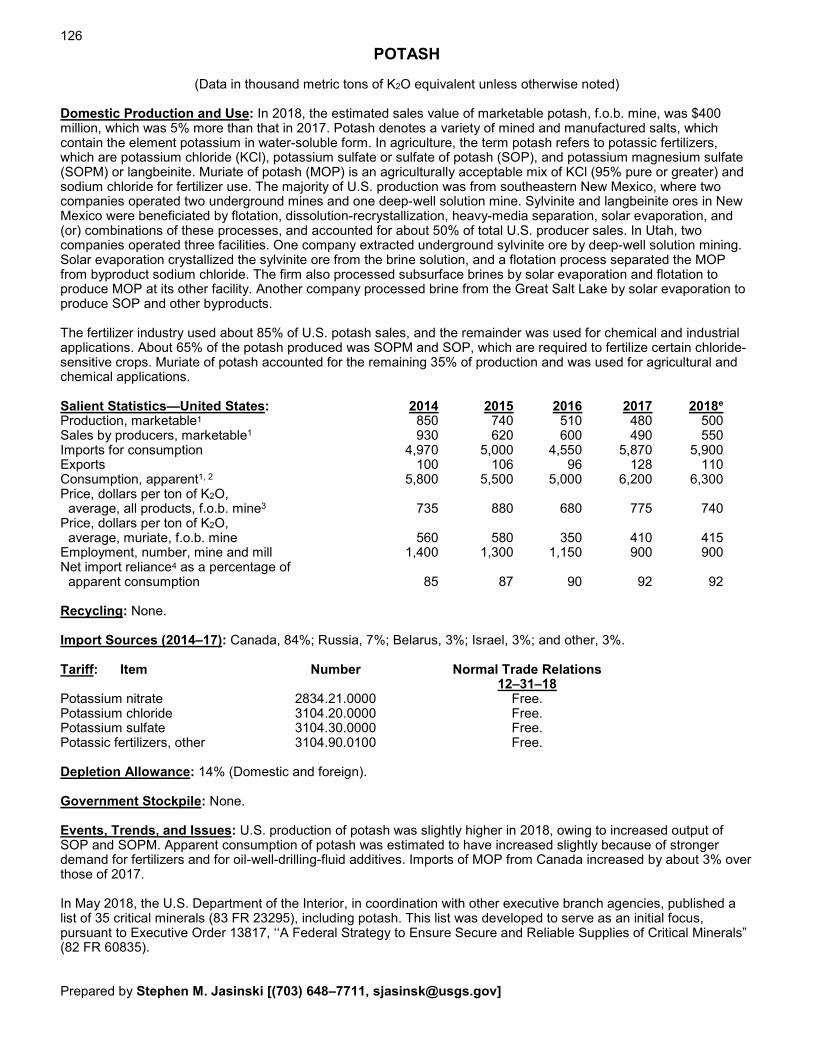
126
POTASH
(Data in thousand metric tons of K2O equivalent unless otherwise noted) Domestic Production and Use: In 2018, the estimated sales value of marketable potash, f.o.b. mine, was $400 million, which was 5% more than that in 2017. Potash denotes a variety of mined and manufactured salts, which contain the element potassium in water-soluble form. In agriculture, the term potash refers to potassic fertilizers, which are potassium chloride (KCl), potassium sulfate or sulfate of potash (SOP), and potassium magnesium sulfate (SOPM) or langbeinite. Muriate of potash (MOP) is an agriculturally acceptable mix of KCl (95% pure or greater) and sodium chloride for fertilizer use. The majority of U.S. production was from southeastern New Mexico, where two companies operated two underground mines and one deep-well solution mine. Sylvinite and langbeinite ores in New Mexico were beneficiated by flotation, dissolution-recrystallization, heavy-media separation, solar evaporation, and (or) combinations of these processes, and accounted for about 50% of total U.S. producer sales. In Utah, two companies operated three facilities. One company extracted underground sylvinite ore by deep-well solution mining. Solar evaporation crystallized the sylvinite ore from the brine solution, and a flotation process separated the MOP from byproduct sodium chloride. The firm also processed subsurface brines by solar evaporation and flotation to produce MOP at its other facility. Another company processed brine from the Great Salt Lake by solar evaporation to produce SOP and other byproducts. The fertilizer industry used about 85% of U.S. potash sales, and the remainder was used for chemical and industrial applications. About 65% of the potash produced was SOPM and SOP, which are required to fertilize certain chloride-sensitive crops. Muriate of potash accounted for the remaining 35% of production and was used for agricultural and chemical applications. Salient Statistics—United States: 2014 2015 2016 2017 2018e Production, marketable1 850 740 510 480 500 Sales by producers, marketable1 930 620 600 490 550 Imports for consumption 4,970 5,000 4,550 5,870 5,900 Exports 100 106 96 128 110 Consumption, apparent1, 2 5,800 5,500 5,000 6,200 6,300 Price, dollars per ton of K2O, average, all products, f.o.b. mine3 735 880 680 775 740
Price, dollars per ton of K2O, average, muriate, f.o.b. mine 560 580 350 410 415 Employment, number, mine and mill 1,400 1,300 1,150 900 900 Net import reliance4 as a percentage of apparent consumption 85 87 90 92 92 Recycling: None. Import Sources (2014–17): Canada, 84%; Russia, 7%; Belarus, 3%; Israel, 3%; and other, 3%. Tariff: Item Number Normal Trade Relations 12–31–18 Potassium nitrate 2834.21.0000 Free. Potassium chloride 3104.20.0000 Free. Potassium sulfate 3104.30.0000 Free. Potassic fertilizers, other 3104.90.0100 Free. Depletion Allowance: 14% (Domestic and foreign). Government Stockpile: None. Events, Trends, and Issues: U.S. production of potash was slightly higher in 2018, owing to increased output of SOP and SOPM. Apparent consumption of potash was estimated to have increased slightly because of stronger demand for fertilizers and for oil-well-drilling-fluid additives. Imports of MOP from Canada increased by about 3% over those of 2017. In May 2018, the U.S. Department of the Interior, in coordination with other executive branch agencies, published a list of 35 critical minerals (83 FR 23295), including potash. This list was developed to serve as an initial focus, pursuant to Executive Order 13817, ‘‘A Federal Strategy to Ensure Secure and Reliable Supplies of Critical Minerals” (82 FR 60835). Prepared by Stephen M. Jasinski [(703) 648–7711, [email protected]]
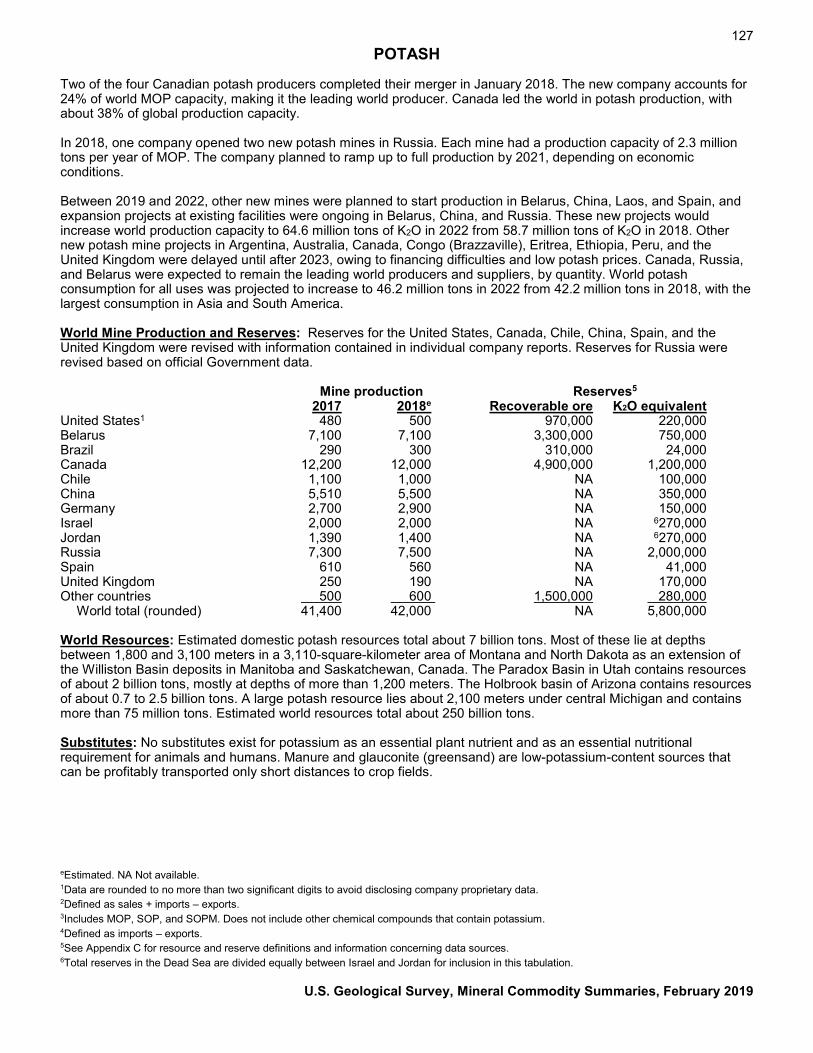
127 POTASH
Two of the four Canadian potash producers completed their merger in January 2018. The new company accounts for 24% of world MOP capacity, making it the leading world producer. Canada led the world in potash production, with about 38% of global production capacity. In 2018, one company opened two new potash mines in Russia. Each mine had a production capacity of 2.3 million tons per year of MOP. The company planned to ramp up to full production by 2021, depending on economic conditions. Between 2019 and 2022, other new mines were planned to start production in Belarus, China, Laos, and Spain, and expansion projects at existing facilities were ongoing in Belarus, China, and Russia. These new projects would increase world production capacity to 64.6 million tons of K2O in 2022 from 58.7 million tons of K2O in 2018. Other new potash mine projects in Argentina, Australia, Canada, Congo (Brazzaville), Eritrea, Ethiopia, Peru, and the United Kingdom were delayed until after 2023, owing to financing difficulties and low potash prices. Canada, Russia, and Belarus were expected to remain the leading world producers and suppliers, by quantity. World potash consumption for all uses was projected to increase to 46.2 million tons in 2022 from 42.2 million tons in 2018, with the largest consumption in Asia and South America. World Mine Production and Reserves: Reserves for the United States, Canada, Chile, China, Spain, and the United Kingdom were revised with information contained in individual company reports. Reserves for Russia were revised based on official Government data. Mine production Reserves5 2017 2018e Recoverable ore K2O equivalent United States1 480 500 970,000 220,000 Belarus 7,100 7,100 3,300,000 750,000 Brazil 290 300 310,000 24,000 Canada 12,200 12,000 4,900,000 1,200,000 Chile 1,100 1,000 NA 100,000 China 5,510 5,500 NA 350,000 Germany 2,700 2,900 NA 150,000 Israel 2,000 2,000 NA 6270,000 Jordan 1,390 1,400 NA 6270,000 Russia 7,300 7,500 NA 2,000,000 Spain 610 560 NA 41,000 United Kingdom 250 190 NA 170,000 Other countries 500 600 1,500,000 280,000 World total (rounded) 41,400 42,000 NA 5,800,000 World Resources: Estimated domestic potash resources total about 7 billion tons. Most of these lie at depths between 1,800 and 3,100 meters in a 3,110-square-kilometer area of Montana and North Dakota as an extension of the Williston Basin deposits in Manitoba and Saskatchewan, Canada. The Paradox Basin in Utah contains resources of about 2 billion tons, mostly at depths of more than 1,200 meters. The Holbrook basin of Arizona contains resources of about 0.7 to 2.5 billion tons. A large potash resource lies about 2,100 meters under central Michigan and contains more than 75 million tons. Estimated world resources total about 250 billion tons. Substitutes: No substitutes exist for potassium as an essential plant nutrient and as an essential nutritional requirement for animals and humans. Manure and glauconite (greensand) are low-potassium-content sources that can be profitably transported only short distances to crop fields. eEstimated. NA Not available. 1Data are rounded to no more than two significant digits to avoid disclosing company proprietary data. 2Defined as sales + imports – exports. 3Includes MOP, SOP, and SOPM. Does not include other chemical compounds that contain potassium. 4Defined as imports – exports. 5See Appendix C for resource and reserve definitions and information concerning data sources. 6Total reserves in the Dead Sea are divided equally between Israel and Jordan for inclusion in this tabulation.
U.S. Geological Survey, Mineral Commodity Summaries, February 2019
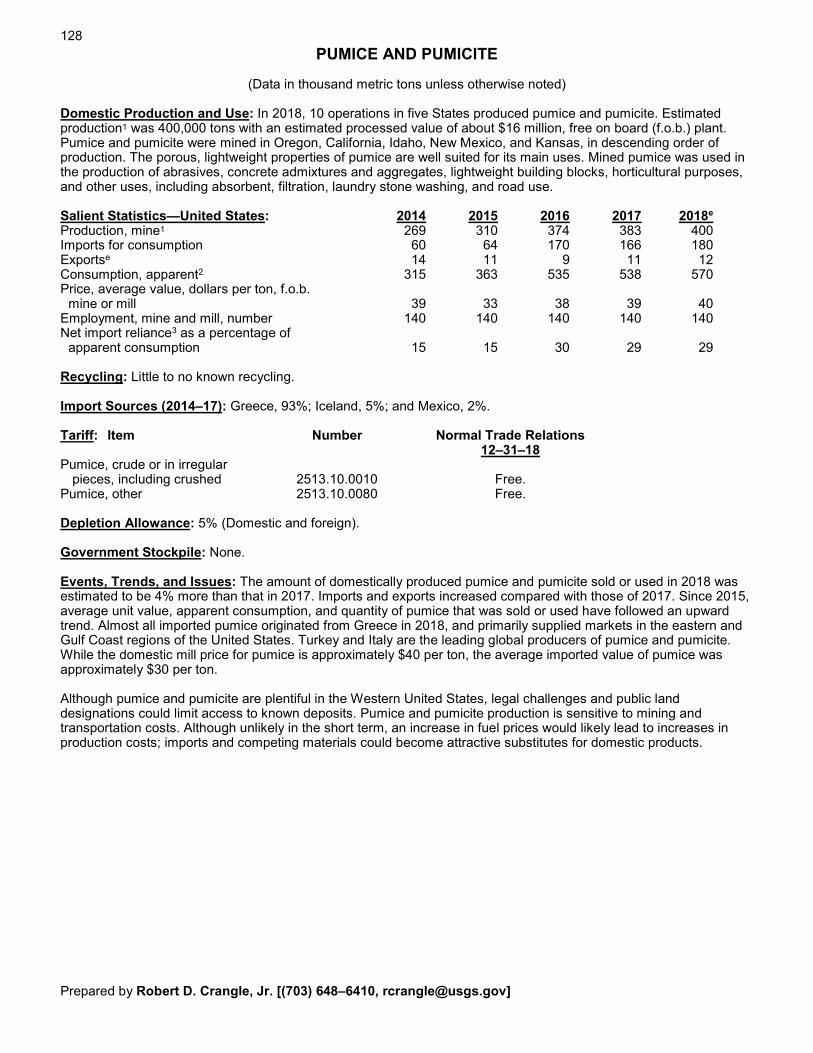
128
PUMICE AND PUMICITE
(Data in thousand metric tons unless otherwise noted) Domestic Production and Use: In 2018, 10 operations in five States produced pumice and pumicite. Estimated production1 was 400,000 tons with an estimated processed value of about $16 million, free on board (f.o.b.) plant. Pumice and pumicite were mined in Oregon, California, Idaho, New Mexico, and Kansas, in descending order of production. The porous, lightweight properties of pumice are well suited for its main uses. Mined pumice was used in the production of abrasives, concrete admixtures and aggregates, lightweight building blocks, horticultural purposes, and other uses, including absorbent, filtration, laundry stone washing, and road use. Salient Statistics—United States: 2014 2015 2016 2017 2018e Production, mine1 269 310 374 383 400 Imports for consumption 60 64 170 166 180 Exportse 14 11 9 11 12 Consumption, apparent2 315 363 535 538 570 Price, average value, dollars per ton, f.o.b. mine or mill 39 33 38 39 40 Employment, mine and mill, number 140 140 140 140 140 Net import reliance3 as a percentage of apparent consumption 15 15 30 29 29 Recycling: Little to no known recycling. Import Sources (2014–17): Greece, 93%; Iceland, 5%; and Mexico, 2%. Tariff: Item Number Normal Trade Relations 12–31–18 Pumice, crude or in irregular pieces, including crushed 2513.10.0010 Free. Pumice, other 2513.10.0080 Free. Depletion Allowance: 5% (Domestic and foreign). Government Stockpile: None. Events, Trends, and Issues: The amount of domestically produced pumice and pumicite sold or used in 2018 was estimated to be 4% more than that in 2017. Imports and exports increased compared with those of 2017. Since 2015, average unit value, apparent consumption, and quantity of pumice that was sold or used have followed an upward trend. Almost all imported pumice originated from Greece in 2018, and primarily supplied markets in the eastern and Gulf Coast regions of the United States. Turkey and Italy are the leading global producers of pumice and pumicite. While the domestic mill price for pumice is approximately $40 per ton, the average imported value of pumice was approximately $30 per ton. Although pumice and pumicite are plentiful in the Western United States, legal challenges and public land designations could limit access to known deposits. Pumice and pumicite production is sensitive to mining and transportation costs. Although unlikely in the short term, an increase in fuel prices would likely lead to increases in production costs; imports and competing materials could become attractive substitutes for domestic products. Prepared by Robert D. Crangle, Jr. [(703) 648–6410, [email protected]]
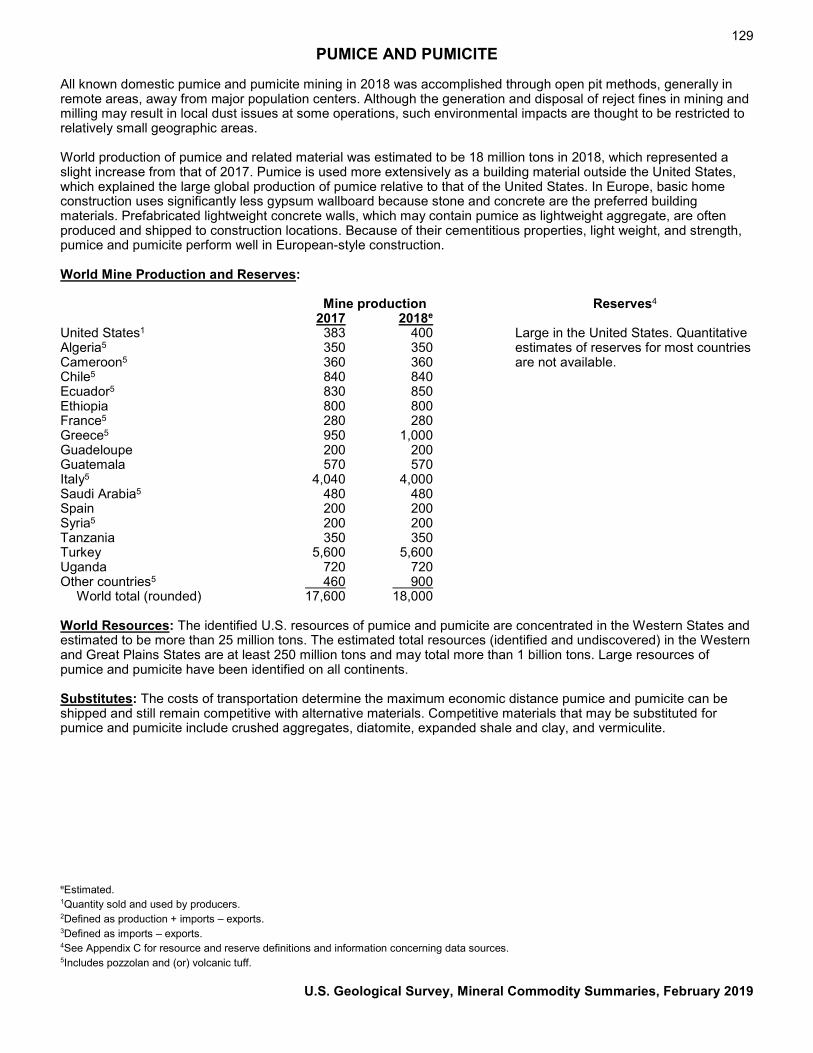
129 PUMICE AND PUMICITE
All known domestic pumice and pumicite mining in 2018 was accomplished through open pit methods, generally in remote areas, away from major population centers. Although the generation and disposal of reject fines in mining and milling may result in local dust issues at some operations, such environmental impacts are thought to be restricted to relatively small geographic areas. World production of pumice and related material was estimated to be 18 million tons in 2018, which represented a slight increase from that of 2017. Pumice is used more extensively as a building material outside the United States, which explained the large global production of pumice relative to that of the United States. In Europe, basic home construction uses significantly less gypsum wallboard because stone and concrete are the preferred building materials. Prefabricated lightweight concrete walls, which may contain pumice as lightweight aggregate, are often produced and shipped to construction locations. Because of their cementitious properties, light weight, and strength, pumice and pumicite perform well in European-style construction. World Mine Production and Reserves: Mine production Reserves4 2017 2018e United States1 383 400 Large in the United States. Quantitative Algeria5 350 350 estimates of reserves for most countries Cameroon5 360 360 are not available. Chile5 840 840 Ecuador5 830 850 Ethiopia 800 800 France5 280 280 Greece5 950 1,000 Guadeloupe 200 200 Guatemala 570 570 Italy5 4,040 4,000 Saudi Arabia5 480 480 Spain 200 200 Syria5 200 200 Tanzania 350 350 Turkey 5,600 5,600 Uganda 720 720 Other countries5 460 900 World total (rounded) 17,600 18,000 World Resources: The identified U.S. resources of pumice and pumicite are concentrated in the Western States and estimated to be more than 25 million tons. The estimated total resources (identified and undiscovered) in the Western and Great Plains States are at least 250 million tons and may total more than 1 billion tons. Large resources of pumice and pumicite have been identified on all continents. Substitutes: The costs of transportation determine the maximum economic distance pumice and pumicite can be shipped and still remain competitive with alternative materials. Competitive materials that may be substituted for pumice and pumicite include crushed aggregates, diatomite, expanded shale and clay, and vermiculite. eEstimated. 1Quantity sold and used by producers. 2Defined as production + imports – exports. 3Defined as imports – exports. 4See Appendix C for resource and reserve definitions and information concerning data sources. 5Includes pozzolan and (or) volcanic tuff.
U.S. Geological Survey, Mineral Commodity Summaries, February 2019
130
QUARTZ CRYSTAL (INDUSTRIAL)
(Data in kilograms unless otherwise noted) Domestic Production and Use: Industrial cultured quartz crystal is electronic-grade quartz crystal that is manufactured, not mined. In the past, cultured quartz crystal was primarily produced using lascas1 as raw quartz feed material. Lascas mining and processing in Arkansas ended in 1997. Cultured quartz crystal is produced in the United States, but production statistics were not available. In addition to lascas, these companies may use cultured quartz crystal that has been rejected during the manufacturing process, owing to crystallographic imperfections, as feed material. The companies may use a mix of cultured quartz and imported lascas as feed material. In the past several years, cultured quartz crystal has been increasingly produced overseas, primarily in Asia. Electronic applications accounted for most industrial uses of quartz crystal; other uses included special optical applications. Virtually all quartz crystal used for electronics was cultured, rather than natural, crystal. Electronic-grade quartz crystal is used to make frequency filters, frequency controls, and timers in electronic circuits employed for a wide range of products, such as communications equipment, computers, and many consumer goods, such as electronic games and television receivers. Salient Statistics—United States: 2014 2015 2016 2017 2018e Production: Mine (lascas) — — — — — Cultured quartz crystal NA NA NA NA NA Imports for consumption: Quartz (lascas) NA NA NA NA NA Piezoelectric quartz, unmounted 4,180 3,400 6,280 7,210 4,860 Exports: Quartz (lascas) NA NA NA NA NA Piezoelectric quartz, unmounted 46,800 43,600 60,500 57,900 50,000 Price, dollars per kilogram: As-grown cultured quartz 280 280 280 280 280 Lumbered quartz2 400 160 890 300 300 Net import reliance3 as a percentage of apparent consumption NA NA NA NA NA Recycling: An unspecified amount of rejected cultured quartz crystal was used as feed material for the production of cultured quartz crystal. Import Sources (2014–17): Import statistics specific to lascas are not available because they are combined with other types of quartz. Cultured quartz crystal is thought to be mostly imported from China, Italy, Japan, and Taiwan. Tariff: Item Number Normal Trade Relations 12–31–18 Quartz (including lascas) 2506.10.0050 Free. Piezoelectric quartz, unmounted 7104.10.0000 3% ad val. Depletion Allowance: 22% (Domestic), 14% (Foreign). Prepared by Thomas P. Dolley [(703) 648–7710, [email protected]]
131 QUARTZ CRYSTAL (INDUSTRIAL)
Government Stockpile:4 As of September 30, 2018, the National Defense Stockpile (NDS) contained 7,148 kilograms of natural quartz crystal. The stockpile has 11 weight classes for natural quartz crystal that range from 0.2 kilogram to more than 10 kilograms. The stockpiled crystals, however, are primarily in the larger weight classes. The larger pieces are suitable as seed crystals, which are very thin crystals cut to exact dimensions, to produce cultured quartz crystal. In addition, many of the stockpiled crystals could be of interest to the specimen and gemstone industry. Little, if any, of the stockpiled material is likely to be used in the same applications as cultured quartz crystal. No natural quartz crystal was sold from the NDS in 2018. Previously, the only individual crystals from the stockpile that were sold were those that weighed 10 kilograms or more and that could be used as seed material. FY2018 FY 2019 Inventory Potential Potential Potential Potential Material As of 9–30–18 Acquisitions Disposals5 Acquisitions Disposals5
Quartz crystal 7,148 — — — — Events, Trends, and Issues: Demand for cultured quartz crystal for frequency-control oscillators and frequency filters in a variety of electronic devices is expected to remain stable. However, silicon has replaced quartz crystal in two very important markets—cellular telephones and other mobile devices and automotive stability control applications. Growth of the consumer electronics market, for products such as personal computers, electronic games, and tablet computers, is likely to continue to sustain global production of cultured quartz crystal. World Mine Production and Reserves:6 This information is unavailable, but the global reserves for lascas are thought to be large. World Resources: Limited resources of natural quartz crystal suitable for direct electronic or optical use are available throughout the world. World dependence on these resources will continue to decline because of the increased acceptance of cultured quartz crystal as an alternative material. Additionally, techniques using rejected cultured quartz crystal as feed material could mean a decreased dependence on lascas for growing cultured quartz. Substitutes: Silicon is increasingly being used as a substitute for quartz crystal for frequency-control oscillators in electronic circuits. Other materials, such as aluminum orthophosphate (the very rare mineral berlinite), langasite, lithium niobate, and lithium tantalate, which have larger piezoelectric coupling constants, have been studied and used. The cost competitiveness of these materials, as opposed to cultured quartz crystal, is dependent on the type of application that the material is used for and the processing required. eEstimated. NA Not available. — Zero. 1Lascas is a nonelectronic-grade quartz used as a feedstock for growing cultured quartz crystal and for production of fused quartz. 2As-grown cultured quartz that has been processed by sawing and grinding. 3Defined as imports - exports. 4See Appendix B for definitions. 5Disposals are defined as any barter, rotation, sale, or upgrade of National Defense Stockpile stock. 6See Appendix C for resource and reserve definitions and information concerning data sources.
U.S. Geological Survey, Mineral Commodity Summaries, February 2019
132
RARE EARTHS1
[Data in metric tons of rare-earth oxide (REO) equivalent content unless otherwise noted]
Domestic Production and Use: Rare earths were mined domestically in 2018. Bastnaesite (or bastnäsite), a rare-earth fluorocarbonate mineral, was mined as a primary product at a mine in Mountain Pass, CA, which was restarted in the first quarter of 2018 after being put on care-and-maintenance status in the fourth quarter of 2015. Monazite, a phosphate mineral, also may have been produced as a separated concentrate or included as an accessory mineral in heavy-mineral concentrates. The estimated value of rare-earth compounds and metals imported by the United States in 2018 was $160 million, an increase from $137 million in 2017. The estimated distribution of rare earths by end use was as follows: catalysts, 60%; ceramics and glass, 15%; metallurgical applications and alloys, 10%; polishing, 10%; and other, 5%. Salient Statistics—United States: 2014 2015 2016 2017 2018e Production, bastnaesite concentrates 5,400 5,900 — — 15,000 Imports:2
Compounds 12,300 9,160 11,500 11,000 9,800 Metals: Ferrocerium, alloys 371 356 268 309 330 Rare-earth metals, scandium, and yttrium 348 385 404 524 1,000 Exports:2
Compounds 4,390 4,980 590 1,740 15,000 Metals: Ferrocerium, alloys 1,640 1,220 943 982 1,300 Rare-earth metals, scandium, and yttrium 140 60 103 55 30 Consumption, apparent3 12,200 9,550 10,500 9,060 9,500 Price, dollars per kilogram, average:4 Cerium oxide, 99.5% minimum 5 3 2 2 2 Dysprosium oxide, 99.5% minimum 395 279 198 187 180 Europium oxide, 99.99% minimum 822 344 74 77 56 Lanthanum oxide, 99.5% minimum 5 3 2 2 2 Mischmetal, 65% cerium, 35% lanthanum 10 7 5 6 6 Neodymium oxide, 99.5% minimum 63 48 40 50 51 Terbium oxide, 99.99% minimum 713 564 415 501 461 Employment, mine and mill, annual average 391 351 — 24 150 Net import reliance5 as a percentage of apparent consumption:6 Compounds and metals 56 38 100 100 100 Mineral concentrates NA NA NA NA E Recycling: Limited quantities, from batteries, permanent magnets, and fluorescent lamps. Import Sources (2014–17): Rare-earth compounds and metals: China, 80%; Estonia, 6%; France and Japan, 3% each; and other, 8%. Imports of compounds and metals from Estonia, France, and Japan were derived from mineral concentrates and chemical intermediates produced in China and elsewhere. Tariff: Item Number Normal Trade Relations 12–31–18 Rare-earth metals, scandium, and yttrium, whether or not intermixed or interalloyed 2805.30.0000 5.0% ad val. Cerium compounds: Oxides 2846.10.0010 5.5% ad val. Other 2846.10.0050 5.5% ad val. Other rare-earth compounds: Lanthanum oxides 2846.90.2005 Free. Other oxides 2846.90.2040 Free. Lanthanum carbonates 2846.90.8070 3.7% ad val. Other carbonates 2846.90.8075 3.7% ad val. Other rare-earth compounds 2846.90.8090 3.7% ad val. Ferrocerium and other pyrophoric alloys 3606.90.3000 5.9% ad val. Depletion Allowance: Monazite, 22% on thorium content and 14% on rare-earth content (Domestic), 14% (Foreign); bastnäsite and xenotime, 14% (Domestic and foreign). Prepared by Joseph Gambogi [(703) 648–7718, [email protected]]
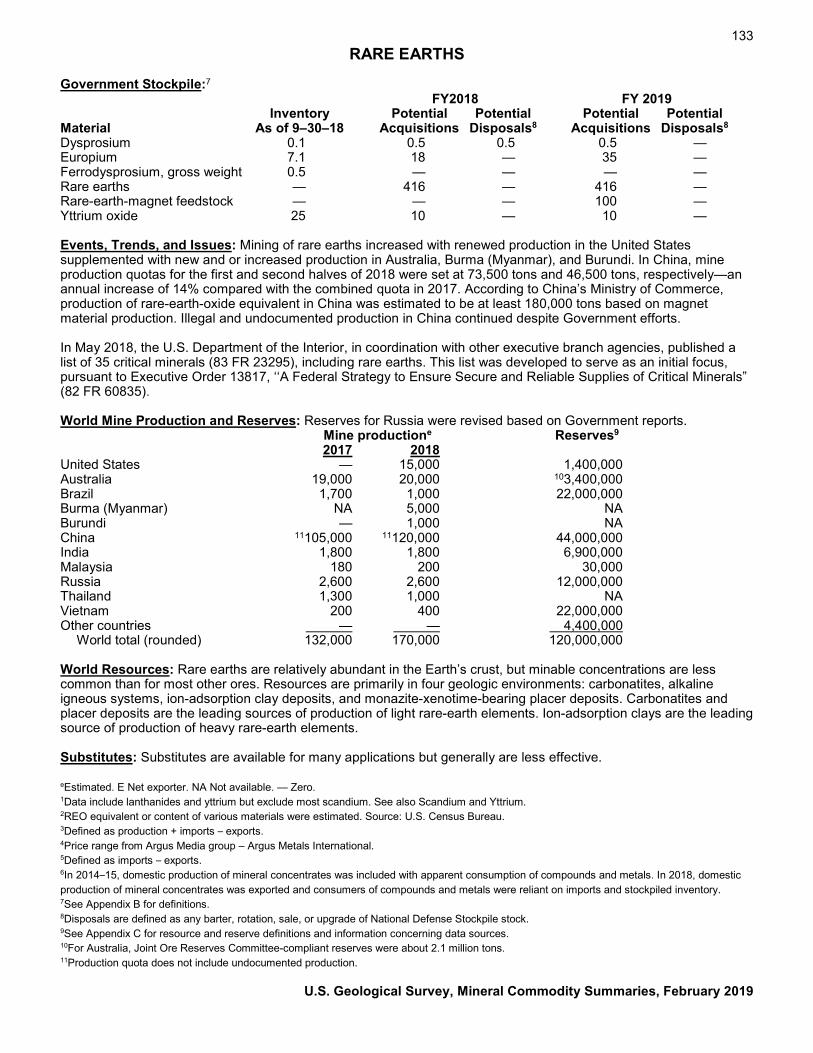
133 RARE EARTHS
Government Stockpile:7
FY2018 FY 2019 Inventory Potential Potential Potential Potential Material As of 9–30–18 Acquisitions Disposals8 Acquisitions Disposals8
Dysprosium 0.1 0.5 0.5 0.5 — Europium 7.1 18 — 35 — Ferrodysprosium, gross weight 0.5 — — — — Rare earths — 416 — 416 — Rare-earth-magnet feedstock — — — 100 — Yttrium oxide 25 10 — 10 — Events, Trends, and Issues: Mining of rare earths increased with renewed production in the United States supplemented with new and or increased production in Australia, Burma (Myanmar), and Burundi. In China, mine production quotas for the first and second halves of 2018 were set at 73,500 tons and 46,500 tons, respectively—an annual increase of 14% compared with the combined quota in 2017. According to China’s Ministry of Commerce, production of rare-earth-oxide equivalent in China was estimated to be at least 180,000 tons based on magnet material production. Illegal and undocumented production in China continued despite Government efforts. In May 2018, the U.S. Department of the Interior, in coordination with other executive branch agencies, published a list of 35 critical minerals (83 FR 23295), including rare earths. This list was developed to serve as an initial focus, pursuant to Executive Order 13817, ‘‘A Federal Strategy to Ensure Secure and Reliable Supplies of Critical Minerals” (82 FR 60835). World Mine Production and Reserves: Reserves for Russia were revised based on Government reports. Mine productione Reserves9 2017 2018 United States — 15,000 1,400,000 Australia 19,000 20,000 103,400,000 Brazil 1,700 1,000 22,000,000 Burma (Myanmar) NA 5,000 NA Burundi — 1,000 NA China 11105,000 11120,000 44,000,000 India 1,800 1,800 6,900,000 Malaysia 180 200 30,000 Russia 2,600 2,600 12,000,000 Thailand 1,300 1,000 NA Vietnam 200 400 22,000,000 Other countries — — 4,400,000 World total (rounded) 132,000 170,000 120,000,000 World Resources: Rare earths are relatively abundant in the Earth’s crust, but minable concentrations are less common than for most other ores. Resources are primarily in four geologic environments: carbonatites, alkaline igneous systems, ion-adsorption clay deposits, and monazite-xenotime-bearing placer deposits. Carbonatites and placer deposits are the leading sources of production of light rare-earth elements. Ion-adsorption clays are the leading source of production of heavy rare-earth elements. Substitutes: Substitutes are available for many applications but generally are less effective. eEstimated. E Net exporter. NA Not available. — Zero. 1Data include lanthanides and yttrium but exclude most scandium. See also Scandium and Yttrium. 2REO equivalent or content of various materials were estimated. Source: U.S. Census Bureau. 3Defined as production + imports – exports. 4Price range from Argus Media group – Argus Metals International. 5Defined as imports – exports. 6In 2014–15, domestic production of mineral concentrates was included with apparent consumption of compounds and metals. In 2018, domestic production of mineral concentrates was exported and consumers of compounds and metals were reliant on imports and stockpiled inventory. 7See Appendix B for definitions. 8Disposals are defined as any barter, rotation, sale, or upgrade of National Defense Stockpile stock. 9See Appendix C for resource and reserve definitions and information concerning data sources. 10For Australia, Joint Ore Reserves Committee-compliant reserves were about 2.1 million tons. 11Production quota does not include undocumented production.
U.S. Geological Survey, Mineral Commodity Summaries, February 2019
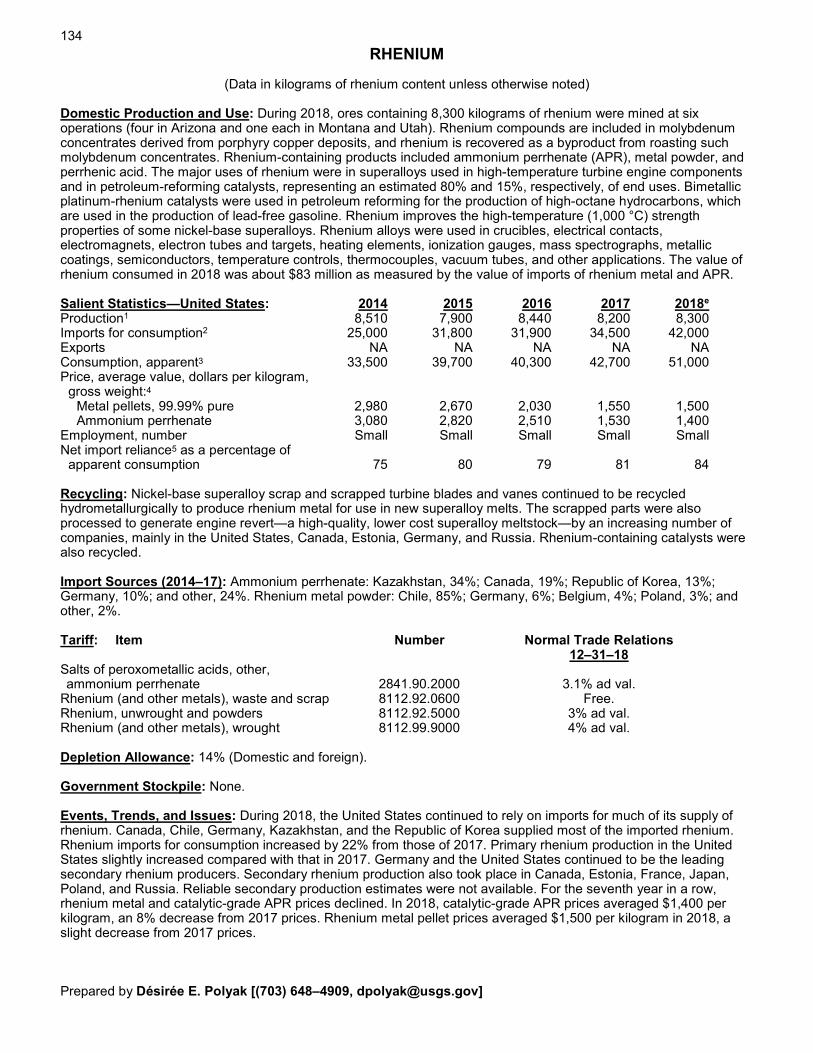
134
RHENIUM
(Data in kilograms of rhenium content unless otherwise noted) Domestic Production and Use: During 2018, ores containing 8,300 kilograms of rhenium were mined at six operations (four in Arizona and one each in Montana and Utah). Rhenium compounds are included in molybdenum concentrates derived from porphyry copper deposits, and rhenium is recovered as a byproduct from roasting such molybdenum concentrates. Rhenium-containing products included ammonium perrhenate (APR), metal powder, and perrhenic acid. The major uses of rhenium were in superalloys used in high-temperature turbine engine components and in petroleum-reforming catalysts, representing an estimated 80% and 15%, respectively, of end uses. Bimetallic platinum-rhenium catalysts were used in petroleum reforming for the production of high-octane hydrocarbons, which are used in the production of lead-free gasoline. Rhenium improves the high-temperature (1,000 °C) strength properties of some nickel-base superalloys. Rhenium alloys were used in crucibles, electrical contacts, electromagnets, electron tubes and targets, heating elements, ionization gauges, mass spectrographs, metallic coatings, semiconductors, temperature controls, thermocouples, vacuum tubes, and other applications. The value of rhenium consumed in 2018 was about $83 million as measured by the value of imports of rhenium metal and APR. Salient Statistics—United States: 2014 2015 2016 2017 2018e Production1 8,510 7,900 8,440 8,200 8,300 Imports for consumption2 25,000 31,800 31,900 34,500 42,000 Exports NA NA NA NA NA Consumption, apparent3 33,500 39,700 40,300 42,700 51,000 Price, average value, dollars per kilogram, gross weight:4 Metal pellets, 99.99% pure 2,980 2,670 2,030 1,550 1,500 Ammonium perrhenate 3,080 2,820 2,510 1,530 1,400 Employment, number Small Small Small Small Small Net import reliance5 as a percentage of apparent consumption 75 80 79 81 84 Recycling: Nickel-base superalloy scrap and scrapped turbine blades and vanes continued to be recycled hydrometallurgically to produce rhenium metal for use in new superalloy melts. The scrapped parts were also processed to generate engine revert—a high-quality, lower cost superalloy meltstock—by an increasing number of companies, mainly in the United States, Canada, Estonia, Germany, and Russia. Rhenium-containing catalysts were also recycled. Import Sources (2014–17): Ammonium perrhenate: Kazakhstan, 34%; Canada, 19%; Republic of Korea, 13%; Germany, 10%; and other, 24%. Rhenium metal powder: Chile, 85%; Germany, 6%; Belgium, 4%; Poland, 3%; and other, 2%. Tariff: Item Number Normal Trade Relations 12–31–18 Salts of peroxometallic acids, other, ammonium perrhenate 2841.90.2000 3.1% ad val. Rhenium (and other metals), waste and scrap 8112.92.0600 Free. Rhenium, unwrought and powders 8112.92.5000 3% ad val. Rhenium (and other metals), wrought 8112.99.9000 4% ad val. Depletion Allowance: 14% (Domestic and foreign). Government Stockpile: None. Events, Trends, and Issues: During 2018, the United States continued to rely on imports for much of its supply of rhenium. Canada, Chile, Germany, Kazakhstan, and the Republic of Korea supplied most of the imported rhenium. Rhenium imports for consumption increased by 22% from those of 2017. Primary rhenium production in the United States slightly increased compared with that in 2017. Germany and the United States continued to be the leading secondary rhenium producers. Secondary rhenium production also took place in Canada, Estonia, France, Japan, Poland, and Russia. Reliable secondary production estimates were not available. For the seventh year in a row, rhenium metal and catalytic-grade APR prices declined. In 2018, catalytic-grade APR prices averaged $1,400 per kilogram, an 8% decrease from 2017 prices. Rhenium metal pellet prices averaged $1,500 per kilogram in 2018, a slight decrease from 2017 prices. Prepared by Désirée E. Polyak [(703) 648–4909, [email protected]]
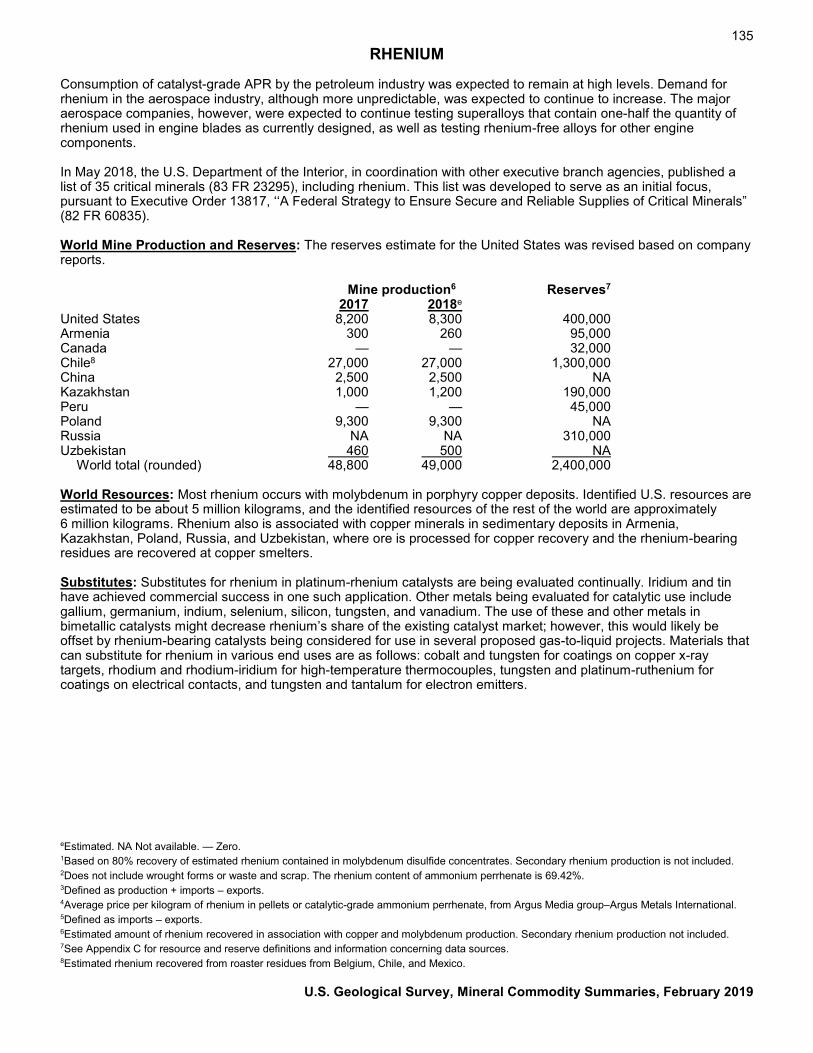
135 RHENIUM
Consumption of catalyst-grade APR by the petroleum industry was expected to remain at high levels. Demand for rhenium in the aerospace industry, although more unpredictable, was expected to continue to increase. The major aerospace companies, however, were expected to continue testing superalloys that contain one-half the quantity of rhenium used in engine blades as currently designed, as well as testing rhenium-free alloys for other engine components. In May 2018, the U.S. Department of the Interior, in coordination with other executive branch agencies, published a list of 35 critical minerals (83 FR 23295), including rhenium. This list was developed to serve as an initial focus, pursuant to Executive Order 13817, ‘‘A Federal Strategy to Ensure Secure and Reliable Supplies of Critical Minerals” (82 FR 60835). World Mine Production and Reserves: The reserves estimate for the United States was revised based on company reports. Mine production6 Reserves7 2017 2018e United States 8,200 8,300 400,000 Armenia 300 260 95,000 Canada — — 32,000 Chile8 27,000 27,000 1,300,000 China 2,500 2,500 NA Kazakhstan 1,000 1,200 190,000 Peru — — 45,000 Poland 9,300 9,300 NA Russia NA NA 310,000 Uzbekistan 460 500 NA World total (rounded) 48,800 49,000 2,400,000 World Resources: Most rhenium occurs with molybdenum in porphyry copper deposits. Identified U.S. resources are estimated to be about 5 million kilograms, and the identified resources of the rest of the world are approximately 6 million kilograms. Rhenium also is associated with copper minerals in sedimentary deposits in Armenia, Kazakhstan, Poland, Russia, and Uzbekistan, where ore is processed for copper recovery and the rhenium-bearing residues are recovered at copper smelters. Substitutes: Substitutes for rhenium in platinum-rhenium catalysts are being evaluated continually. Iridium and tin have achieved commercial success in one such application. Other metals being evaluated for catalytic use include gallium, germanium, indium, selenium, silicon, tungsten, and vanadium. The use of these and other metals in bimetallic catalysts might decrease rhenium’s share of the existing catalyst market; however, this would likely be offset by rhenium-bearing catalysts being considered for use in several proposed gas-to-liquid projects. Materials that can substitute for rhenium in various end uses are as follows: cobalt and tungsten for coatings on copper x-ray targets, rhodium and rhodium-iridium for high-temperature thermocouples, tungsten and platinum-ruthenium for coatings on electrical contacts, and tungsten and tantalum for electron emitters. eEstimated. NA Not available. — Zero. 1Based on 80% recovery of estimated rhenium contained in molybdenum disulfide concentrates. Secondary rhenium production is not included. 2Does not include wrought forms or waste and scrap. The rhenium content of ammonium perrhenate is 69.42%. 3Defined as production + imports – exports. 4Average price per kilogram of rhenium in pellets or catalytic-grade ammonium perrhenate, from Argus Media group–Argus Metals International. 5Defined as imports – exports. 6Estimated amount of rhenium recovered in association with copper and molybdenum production. Secondary rhenium production not included. 7See Appendix C for resource and reserve definitions and information concerning data sources. 8Estimated rhenium recovered from roaster residues from Belgium, Chile, and Mexico.
U.S. Geological Survey, Mineral Commodity Summaries, February 2019
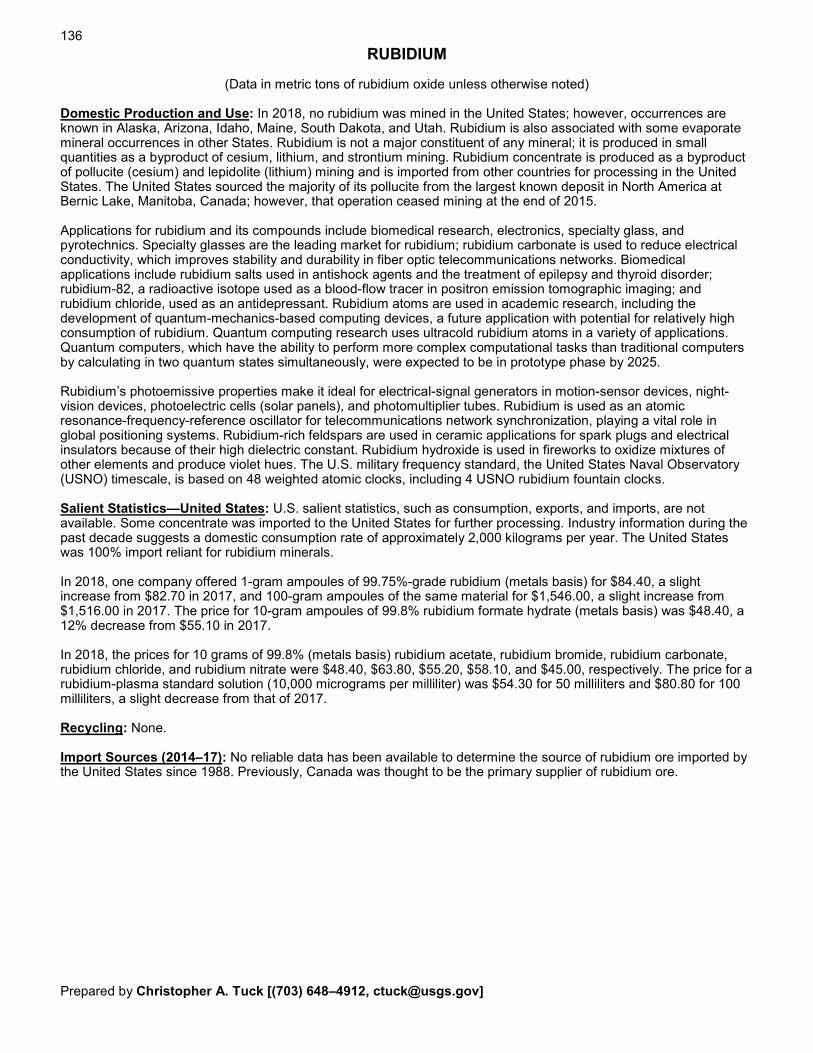
136
RUBIDIUM
(Data in metric tons of rubidium oxide unless otherwise noted) Domestic Production and Use: In 2018, no rubidium was mined in the United States; however, occurrences are known in Alaska, Arizona, Idaho, Maine, South Dakota, and Utah. Rubidium is also associated with some evaporate mineral occurrences in other States. Rubidium is not a major constituent of any mineral; it is produced in small quantities as a byproduct of cesium, lithium, and strontium mining. Rubidium concentrate is produced as a byproduct of pollucite (cesium) and lepidolite (lithium) mining and is imported from other countries for processing in the United States. The United States sourced the majority of its pollucite from the largest known deposit in North America at Bernic Lake, Manitoba, Canada; however, that operation ceased mining at the end of 2015. Applications for rubidium and its compounds include biomedical research, electronics, specialty glass, and pyrotechnics. Specialty glasses are the leading market for rubidium; rubidium carbonate is used to reduce electrical conductivity, which improves stability and durability in fiber optic telecommunications networks. Biomedical applications include rubidium salts used in antishock agents and the treatment of epilepsy and thyroid disorder; rubidium-82, a radioactive isotope used as a blood-flow tracer in positron emission tomographic imaging; and rubidium chloride, used as an antidepressant. Rubidium atoms are used in academic research, including the development of quantum-mechanics-based computing devices, a future application with potential for relatively high consumption of rubidium. Quantum computing research uses ultracold rubidium atoms in a variety of applications. Quantum computers, which have the ability to perform more complex computational tasks than traditional computers by calculating in two quantum states simultaneously, were expected to be in prototype phase by 2025. Rubidium’s photoemissive properties make it ideal for electrical-signal generators in motion-sensor devices, night-vision devices, photoelectric cells (solar panels), and photomultiplier tubes. Rubidium is used as an atomic resonance-frequency-reference oscillator for telecommunications network synchronization, playing a vital role in global positioning systems. Rubidium-rich feldspars are used in ceramic applications for spark plugs and electrical insulators because of their high dielectric constant. Rubidium hydroxide is used in fireworks to oxidize mixtures of other elements and produce violet hues. The U.S. military frequency standard, the United States Naval Observatory (USNO) timescale, is based on 48 weighted atomic clocks, including 4 USNO rubidium fountain clocks. Salient Statistics—United States: U.S. salient statistics, such as consumption, exports, and imports, are not available. Some concentrate was imported to the United States for further processing. Industry information during the past decade suggests a domestic consumption rate of approximately 2,000 kilograms per year. The United States was 100% import reliant for rubidium minerals.
In 2018, one company offered 1-gram ampoules of 99.75%-grade rubidium (metals basis) for $84.40, a slight increase from $82.70 in 2017, and 100-gram ampoules of the same material for $1,546.00, a slight increase from $1,516.00 in 2017. The price for 10-gram ampoules of 99.8% rubidium formate hydrate (metals basis) was $48.40, a 12% decrease from $55.10 in 2017. In 2018, the prices for 10 grams of 99.8% (metals basis) rubidium acetate, rubidium bromide, rubidium carbonate, rubidium chloride, and rubidium nitrate were $48.40, $63.80, $55.20, $58.10, and $45.00, respectively. The price for a rubidium-plasma standard solution (10,000 micrograms per milliliter) was $54.30 for 50 milliliters and $80.80 for 100 milliliters, a slight decrease from that of 2017. Recycling: None. Import Sources (2014–17): No reliable data has been available to determine the source of rubidium ore imported by the United States since 1988. Previously, Canada was thought to be the primary supplier of rubidium ore. Prepared by Christopher A. Tuck [(703) 648–4912, [email protected]]
137 RUBIDIUM
Tariff: Item Number Normal Trade Relations 12–31–18 Alkali metals, other 2805.19.9000 5.5% ad val. Chlorides, other 2827.39.9000 3.7% ad val. Bromides, other 2827.59.5100 3.6% ad val. Nitrates, other 2834.29.5100 3.5% ad val. Carbonates, other 2836.99.5000 3.7% ad val. Depletion Allowance: 14% (Domestic and foreign). Government Stockpile: None. Events, Trends, and Issues: Domestic rubidium occurrences will remain uneconomic unless market conditions change, such as the development of new end uses or increased consumption for existing end uses, which in turn could lead to increased prices. No known human health issues are associated with exposure to naturally occurring rubidium, and its use has minimal environmental impact. In May 2018, the U.S. Department of the Interior, in coordination with other executive branch agencies, published a list of 35 critical minerals (83 FR 23295), including rubidium. This list was developed to serve as an initial focus, pursuant to Executive Order 13817, ‘‘A Federal Strategy to Ensure Secure and Reliable Supplies of Critical Minerals” (82 FR 60835). During 2018, projects that were primarily aimed at developing lithium resources were at various stages of development, including eight subprojects at the King Col project in Australia, the Jubilee Lake lithium prospect in Canada, the Soris lithium project in Namibia, and the Winnipeg River pegmatite field in Canada. The status of these projects ranged from early feasibility studies to active exploration and drilling. No production has been reported at any sites. The projects focused on pegmatites containing pollucite and spodumene, which primarily contain lithium, tantalum, or both, but may also contain minor quantities of cesium and rubidium. World Mine Production and Reserves: There were no official sources for rubidium production data. Production is known to take place periodically in Namibia and Zimbabwe, but production data are not available. Production of pollucite ceased at the Bernic Lake operation in Manitoba, Canada, at the end of 2015; however, it was expected that rubidium concentrate would continue to be produced as a byproduct of processing from pollucite stocks. Rubidium is thought to be mined in China, but information regarding reserves and production is unavailable. Lepidolite and pollucite, the principal rubidium-containing minerals in global rubidium reserves, can contain up to 3.5% and 1.5% rubidium oxide, respectively. Rubidium-bearing mineral resources are found in zoned pegmatites. Mineral resources exist globally, but extraction and concentration are cost prohibitive. Rubidium at the Manitoba, Canada, operation no longer was considered economically recoverable following a mine collapse in 2015. Reserves1 Namibia 50,000 Zimbabwe 30,000 Other countries 10,000 World total 90,000 World Resources: Significant rubidium-bearing pegmatite occurrences have been identified in the United States, Afghanistan, Australia, Canada, China, Denmark, Germany, Japan, Kazakhstan, Namibia, Peru, Russia, the United Kingdom, and Zambia. Minor quantities of rubidium are reported in brines in northern Chile and China and in evaporites in the United States (New Mexico and Utah), France, and Germany. Substitutes: Rubidium and cesium can be used interchangeably in many applications because they have similar physical properties and atomic radii. Cesium, however, is more electropositive than rubidium, making it a preferred material for some applications. 1See Appendix C for resource and reserve definitions and information concerning data sources.
U.S. Geological Survey, Mineral Commodity Summaries, February 2019
138
SALT
(Data in thousand metric tons unless otherwise noted) Domestic Production and Use: Domestic production of salt was estimated to have increased by 5% in 2018 to 42 million tons. The total value of salt sold or used was estimated to be about $2.3 billion. Twenty-six companies operated 62 plants in 16 States. The top producing States were, in alphabetical order, Kansas, Louisiana, Michigan, New York, Ohio, Texas, and Utah. These seven States produced about 92% of the salt in the United States in 2018. The estimated percentage of salt sold or used was, by type, rock salt, 43%; salt in brine, 40%; vacuum pan salt, 10%; and solar salt, 7%. Highway deicing accounted for about 43% of total salt consumed. The chemical industry accounted for about 39% of total salt sales, with salt in brine accounting for 87% of the salt used for chemical feedstock. Chlorine and caustic soda manufacturers were the main consumers within the chemical industry. The remaining markets for salt were, in declining order of use, distributors, 7%; agricultural and food processing, 3% each; other uses combined with exports and general industrial, 2% each; and primary water treatment, 1%. Salient Statistics—United States:1 2014 2015 2016 2017 2018e Production 45,300 45,100 41,700 e40,000 42,000 Sold or used by producers 46,000 42,800 40,200 e38,000 41,000 Imports for consumption 20,200 21,600 12,100 12,600 17,000 Exports 935 830 716 1,120 950 Consumption: Apparent2 65,300 63,600 51,600 e49,000 57,000 Reported 55,600 52,300 48,400 e48,000 51,000 Price, average value of bulk, pellets and packaged salt, dollars per ton, f.o.b. mine and plant: Vacuum and open pan salt 180.61 188.87 197.78 e200.00 200.00 Solar salt 75.35 102.04 99.69 e100.00 100.00 Rock salt 48.11 56.32 56.74 e55.00 58.00 Salt in brine 9.08 10.27 8.29 e10.00 10.00 Employment, mine and plant, numbere 4,200 4,200 4,000 4,100 4,100 Net import reliance3 as a percentage of apparent consumption 29 33 22 23 28 Recycling: None. Import Sources (2014–17): Chile, 38%; Canada, 28%; Mexico, 11%; Egypt, 4%; and other, 19%. Tariff: Item Number Normal Trade Relations 12–31–18 Salt (sodium chloride) 2501.00.0000 Free. Depletion Allowance: 10% (Domestic and foreign). Government Stockpile: None. Events, Trends, and Issues: The winter was slightly colder than average in 2017–18 after several warmer than average winters. The total amount of frozen precipitation was about average, but the number of winter weather events was greater than the last few years in many parts of the United States, requiring more salt for highway deicing. Rock salt production and imports in 2018 increased from the levels in 2017 because demand from many local and State transportation departments increased. The majority of local and State governments in cold regions reportedly had depleted stockpiles and had to replenish supplies of rock salt for the winter of 2018–19. Because winter weather started relatively early in November 2018, many consumers of rock salt had already begun to use stockpiles of salt and considered increasing salt purchases for the remainder of the winter season. Owing to the increased demand for deicing salt, coupled with production interruptions at mines in the United States and Canada, many buyers were experiencing increased unit prices for rock salt. Prepared by Wallace P. Bolen [(703) 648–7727, [email protected]]
139 SALT
For the winter of 2018–19, the National Oceanic and Atmospheric Administration predicted a weak El Niño weather pattern. This pattern normally leads to cooler weather in the Southeast with more precipitation in the Southern United States and drier and warmer conditions in the northern States, particularly in the Great Plains and Great Lakes region. Weather conditions in the northeastern United States were predicted to be near average. Because the effects of a weak El Niño are less predictable, forecasting is more difficult for 2018–19. The early part of the ongoing season was noticeably cooler and wetter than normal, and if this were to continue, as some meteorologists were predicting, salt demand could continue to increase throughout the winter. Demand for salt brine used in the chloralkali industry was expected to increase as demand for caustic soda increased globally, especially in Asia. Exports from Australia and especially India increased to supply the increasing demand for caustic soda in China. World Production and Reserves: Mine Productione Reserves4 2017 2018 United States1 40,000 42,000 Large. Economic and subeconomic Australia 11,000 12,000 deposits of salt are substantial in Austria 4,600 4,600 principal salt-producing countries. Brazil 7,400 7,500 The oceans contain a virtually Canada 12,000 13,000 inexhaustible supply of salt. Chile 8,500 9,500 China 67,000 68,000 France 4,500 4,500 Germany 13,000 13,000 India 28,000 29,000 Mexico 9,000 9,000 Netherlands 6,940 7,000 Pakistan 3,600 3,600 Poland 4,450 4,500 Russia 5,800 5,800 Spain 4,500 4,500 Turkey 5,500 5,500 United Kingdom 5,100 5,100 Other countries 47,200 47,000 World total (rounded) 288,000 300,000 World Resources: World continental resources of salt are vast, and the salt content in the oceans is nearly unlimited. Domestic resources of rock salt and salt from brine are primarily in Kansas, Louisiana, Michigan, New York, Ohio, and Texas. Saline lakes and solar evaporation salt facilities are in Arizona, California, Nevada, New Mexico, Oklahoma, and Utah. Almost every country in the world has salt deposits or solar evaporation operations of various sizes. Substitutes: No economic substitutes or alternatives for salt exist in most applications. Calcium chloride and calcium magnesium acetate, hydrochloric acid, and potassium chloride can be substituted for salt in deicing, certain chemical processes, and food flavoring, but at a higher cost. eEstimated. 1Excludes production from Puerto Rico. 2Defined as sold or used by producers + imports – exports. 3Defined as imports – exports. 4See Appendix C for resource and reserve definitions and information concerning data sources.
U.S. Geological Survey, Mineral Commodity Summaries, February 2019
140
SAND AND GRAVEL (CONSTRUCTION)1
(Data in million metric tons unless otherwise noted)
Domestic Production and Use: In 2018, 970 million tons of construction sand and gravel valued at $8.7 billion was produced by an estimated 3,800 companies operating 9,350 pits and 340 sales and distribution yards in 50 States. Leading producing States were California, Texas, Arizona, Washington, Michigan, Minnesota, Colorado, Ohio, Wisconsin, and Utah, in order of decreasing tonnage, which together accounted for about 55% of total output. It is estimated that about 44% of construction sand and gravel was used as concrete aggregates; 24%, for road base and coverings and road stabilization; 12%, as asphaltic concrete aggregates and other bituminous mixtures; 12%, as construction fill; and 4%, for other miscellaneous uses. The remaining 4% was used for concrete products, filtration, golf course maintenance, plaster and gunite sands, railroad ballast, road stabilization, roofing granules, and snow and ice control. The estimated output of construction sand and gravel in the United States shipped for consumption in the first 9 months of 2018 was 720 million tons, an increase of 7% compared with that of the same period of 2017. Third quarter shipments for consumption increased by 8% compared with those of the same period of 2017. Additional production information by quarter for each State, geographic region, and the United States is published by the U.S. Geological Survey (USGS) in its quarterly Mineral Industry Surveys for Crushed Stone and Sand and Gravel. Salient Statistics—United States: 2014 2015 2016 2017e 2018e Production 830 881 888 900 970 Imports for consumption 4 4 3 7 6 Exports (2) (2) (2) (2) (2) Consumption, apparent3 833 885 892 910 980 Price, average value, dollars per metric ton 8.04 8.28 8.40 8.64 8.94 Employment, mine and mill, number4 34,600 34,800 35,300 36,500 36,200 Net import reliance5 as a percentage of apparent consumption (2) (2) (2) 1 1 Import Sources (2014–17): Canada, 94%; Mexico, 3%; China, 1%; Norway, 1%; and other, 1%. Tariff: Item Number Normal Trade Relations 12–31–18 Sand, other 2505.90.0000 Free. Pebbles and gravel 2517.10.0015 Free. Depletion Allowance: Common varieties, 5% (Domestic and foreign). Government Stockpile: None. Prepared by Jason Christopher Willett [(703) 648–6473, [email protected]]
141 SAND AND GRAVEL (CONSTRUCTION)
Events, Trends, and Issues: Construction sand and gravel production was about 970 million tons in 2018, an increase of 8% compared with that of 2017. Apparent consumption also increased by 7% to 980 million tons. Demand for construction sand and gravel increased in 2018 because of growth in the private and public construction markets, especially after this segment being flat during the past 2 years. Commercial and heavy-industrial construction activity, infrastructure funding, new single-family housing unit starts, and weather affect growth in sand and gravel production and consumption. Long-term increases in construction aggregates demand will be influenced by activity in the public and private construction sectors, as well as by construction work related to security measures being implemented around the Nation. The underlying factors that would support a rise in prices of construction sand and gravel are expected to be present in 2019, especially in and near metropolitan areas. The construction sand and gravel industry remained concerned with environmental, health, permitting, safety, and zoning regulations. Movement of sand and gravel operations away from densely populated regions was expected to continue where regulations and local sentiment discouraged them. Resultant regional shortages of construction sand and gravel would likely result in higher-than-average price increases in industrialized and urban areas. World Mine Production and Reserves: Mine productione Reserves6 2017 2018 United States 900 970 Reserves are controlled largely by land Other countries7 NA NA use and (or) environmental concerns. World total NA NA World Resources: Sand and gravel resources are plentiful throughout the world. However, because of environmental regulations, geographic distribution, and quality requirements for some uses, sand and gravel extraction is uneconomic in some cases. The most important commercial sources of sand and gravel have been glacial deposits, river channels, and river flood plains. Use of offshore deposits in the United States is mostly restricted to beach erosion control and replenishment. Other countries routinely mine offshore deposits of aggregates for onshore construction projects. Substitutes: Crushed stone, the other major construction aggregate, is often substituted for natural sand and gravel, especially in more densely populated areas of the Eastern United States. Crushed stone remains the dominant choice for construction aggregate use. Increasingly, recycled asphalt and portland cement concretes are being substituted for virgin aggregate, although the percentage of total aggregate supplied by recycled materials remained very small in 2018. eEstimated. NA Not available. 1See also Sand and Gravel (Industrial) and Stone (Crushed). 2Less than ½ unit. 3Defined as production + imports – exports. 4Including office staff. Source: Mine Safety and Health Administration. 5Defined as imports – exports. 6See Appendix C for resource and reserve definitions and information concerning data sources. 7No reliable production information is available for most countries owing to the wide variety of ways in which countries report their sand and gravel production. Some countries do not report production for this mineral commodity. Production information for some countries is available in the USGS Minerals Yearbook, Volume III, Area Reports: International.
U.S. Geological Survey, Mineral Commodity Summaries, February 2019
142
SAND AND GRAVEL (INDUSTRIAL)1
(Data in thousand metric tons unless otherwise noted) Domestic Production and Use: In 2018, industrial sand and gravel valued at about $6.2 billion was produced by about 191 companies from 321 operations in 35 States. The value of production of industrial sand and gravel in 2018 increased by 22% compared with that of the previous year, and by 130% compared with 2016, owing primarily to increased demand for hydraulic-fracturing sand for the oil and gas sector. Leading States were Wisconsin, Texas, Illinois, Missouri, Minnesota, Oklahoma, North Carolina, Mississippi, Iowa, and Arkansas, in order of tonnage produced. Combined production from these States accounted for 87% of the domestic total. About 73% of the U.S. tonnage was used as hydraulic-fracturing sand and well-packing and cementing sand; as glassmaking sand and other whole-grain silica, 7% each; as foundry sand, 4%; as other ground silica, and whole-grain fillers and building products, 2% each; as ground and unground sand for chemicals, filtration sand, and recreational sand, 1% each; and for other uses, 2%. Salient Statistics—United States: 2014 2015 2016 2017 2018e Sold or used 110,000 102,000 79,400 102,000 120,000 Imports for consumption 245 289 281 365 370 Exports 4,470 3,910 2,780 4,680 7,000 Consumption, apparent2 106,000 98,400 76,900 97,700 110,000 Price, average value, dollars per ton 74.80 47.30 35.40 52.60 53.10 Employment, quarry and mill, numbere 4,000 3,500 3,500 4,000 4,000 Net import reliance3 as a percentage of apparent consumption E E E E E Recycling: Some foundry sand is recycled, and recycled cullet (pieces of glass) represents a significant proportion of reused silica. About 34% of glass containers are recycled. Import Sources (2014–17): Canada, 86%; Mexico, 1%; and other, 13%. Tariff: Item Number Normal Trade Relations 12–31–18 Sand containing 95% or more silica and not more than 0.6% iron oxide 2505.10.1000 Free. Depletion Allowance: Industrial sand or pebbles, 14% (Domestic and foreign). Government Stockpile: None. Events, Trends, and Issues: U.S. apparent consumption of industrial sand and gravel was an estimated 110 million tons in 2018, a 13% increase from that of the previous year, owing primarily to increased activity in the oil and gas sector. Mine output was sufficient to accommodate many uses, which included abrasives, ceramics, chemicals, fillers (ground and whole-grain), glassmaking sand, filtration sand for swimming pools, foundry sand, other ground silica, recreational sand, roofing granules and fillers, and sand for well packing and cementing. Increased oil and gas drilling in North America and oil well completion activity triggered a corresponding increase in the production of hydraulic-fracturing sand in 2018 compared with that of the previous year. More efficient hydraulic-fracturing techniques, which require more silica sand use per well (mostly for secondary recovery at mature wells) also led to increased demand for hydraulic-fracturing sand. Imports of industrial sand and gravel in 2018 were about 370,000 tons—essentially unchanged from those of 2017. Imports of silica are generally of two types—small shipments of very high-purity silica or a few large shipments of lower grade silica shipped only under special circumstances (for example, very low freight rates). The United States remains a net exporter of industrial sand and gravel; U.S. exports of industrial sand and gravel increased by 50% in 2018 compared with those of 2017. The United States was the world’s leading producer and consumer of industrial sand and gravel based on estimated world production figures. It is difficult to collect definitive data on silica sand and gravel production in most nations because of the wide range of terminology and specifications found among different countries. The United States remained a major exporter of silica sand and gravel, shipping it to almost every region of the world. The high level of exports was attributed to the high quality and advanced processing techniques used in the United States for many grades of silica sand and gravel, meeting virtually every specification. Prepared by Thomas P. Dolley [(703) 648–7710, [email protected]]
143 SAND AND GRAVEL (INDUSTRIAL)
The industrial sand and gravel industry continued to be concerned with safety and health regulations and environmental restrictions in 2018, especially those concerning crystalline silica exposure. The Occupational Safety and Health Administration finalized new regulations to further restrict exposure to crystalline silica at mine sites and other industries that use it. Phased implementation of the new regulations is scheduled to take effect through 2021. Most provisions of the new regulations became enforceable on June 23, 2018, for general industry and maritime operations. Local shortages of industrial sand and gravel were expected to continue to increase owing to land development priorities, local zoning regulations, and logistical issues, including ongoing development and permitting of operations producing hydraulic-fracturing sand. Natural gas and petroleum operations that use hydraulic fracturing may also undergo increased scrutiny. These factors may result in future sand and gravel operations being located farther from high-population centers. World Mine Production and Reserves: Mine productione Reserves4 2017 2018 United States 102,000 120,000 Large. Industrial sand and gravel deposits Australia 3,000 3,000 are widespread. Bulgaria 7,250 7,300 Canada 2,300 2,300 France 9,310 9,300 Germany 7,500 7,500 India 8,500 8,500 Italy 14,000 14,000 Japan 2,700 2,700 Korea, Republic of 4,480 4,500 Malaysia 10,000 10,000 Mexico 2,400 2,400 Netherlands 54,000 54,000 New Zealand 2,320 2,300 Poland 4,800 4,800 South Africa 1,900 2,200 Spain 6,300 6,300 Turkey 10,500 15,000 United Kingdom 4,000 4,000 Other countries 15,700 16,000 World total (rounded) 273,000 300,000 World Resources: Sand and gravel resources of the world are large. However, because of their geographic distribution, environmental restrictions, and quality requirements for some uses, extraction of these resources is sometimes uneconomic. Quartz-rich sand and sandstone, the main sources of industrial silica sand, occur throughout the world. Substitutes: Alternative materials that can be used for glassmaking and for foundry and molding sands are chromite, olivine, staurolite, and zircon sands. Although costlier and mostly used in deeper wells, alternative materials that can be used as proppants are sintered bauxite and kaolin-based ceramic proppants. eEstimated. E Net exporter. 1See also Sand and Gravel (Construction). 2Defined as production + imports – exports. 3Defined as imports – exports. 4See Appendix C for resource and reserve definitions and information concerning data sources.
U.S. Geological Survey, Mineral Commodity Summaries, February 2019
144
SCANDIUM1
(Data in metric tons of scandium oxide equivalent unless otherwise noted)
Domestic Production and Use: Domestically, scandium-bearing minerals were neither mined nor recovered from mine tailings in 2018. Previously, scandium was produced domestically primarily from the scandium-yttrium silicate mineral thortveitite and from byproduct leach solutions from uranium operations. Limited capacity to produce ingot and distilled scandium metal existed at facilities in Ames, IA; Tolleson, AZ; and Urbana, IL. The principal source for scandium metal and scandium compounds was imports from China. The principal uses for scandium in 2018 were in aluminum-scandium alloys and solid oxide fuel cells (SOFCs). Other uses for scandium included ceramics, electronics, lasers, lighting, and radioactive isotopes. In SOFCs, electricity is generated directly from oxidizing a fuel. For metal applications, scandium metal is typically produced by reducing scandium fluoride with calcium metal. Aluminum-scandium alloys are produced for sporting goods, aerospace, and other high-performance applications. Aluminum-magnesium-scandium alloys have been developed for use in additive manufacturing. Scandium is added to a zirconia-base electrolyte to improve the power density and to lower the reaction temperature of the SOFC. Scandium is used in small quantities in a number of electronic applications. Some lasers that contain scandium are used in defense applications and in medical treatments. In lighting, scandium iodide is used in high-intensity lights to simulate natural light. Scandium isotopes are used as a tracing agent in oil refining. Salient Statistics—United States: 2014 2015 2016 2017 2018e Price, yearend, dollars: Compounds, per gram: Acetate, 99.9% purity, 5-gram sample size2 43.00 43.00 44.00 44.00 44.00 Chloride, 99.9% purity, 5-gram sample size2 123.00 123.00 126.00 124.00 125.00 Fluoride, 99.9% purity, 1-to-5-gram sample size 2263.00 2263.00 3270.00 3277.00 3206.00 Iodide, 99.999% purity, 5-gram sample size2 187.00 187.00 149.00 183.00 165.00 Oxide, 99.99% purity, 5-kilogram lot size4 5.00 5.10 4.60 4.60 4.60 Metal: Scandium, distilled dendritic, per gram, 2-gram sample size2 221.00 221.00 228.00 226.00 226.00 Scandium, ingot, per gram, 5-gram sample size2 134.00 134.00 107.00 132.00 132.00 Scandium-aluminum alloy, per kilogram, metric-ton lot size4 386.00 220.00 340.00 350.00 360.00 Net import reliance5 as a percentage of apparent consumption 100 100 100 100 100 Recycling: None. Import Sources (2014–17): Although no definitive data exist listing import sources, imported material is mostly from Europe, China, Japan, and Russia. Tariff: Item Number Normal Trade Relations 12–31–18 Rare-earth metals, unspecified, whether or not intermixed or interalloyed 2805.30.0090 5.0% ad val. Compounds of rare-earth metals: Mixtures of oxides of yttrium or scandium as the predominant metal 2846.90.2015 Free. Mixtures of chlorides of yttrium or scandium as the predominant metal 2846.90.2082 Free. Mixtures of other rare-earth carbonates, including scandium 2846.90.8075 3.7% ad val. Mixtures of other rare-earth compounds, including scandium 2846.90.8090 3.7% ad val. Depletion Allowance: 14% (Domestic and foreign). Government Stockpile: None. Prepared by Joseph Gambogi [(703) 648–7718, [email protected]]
145 SCANDIUM
Events, Trends, and Issues: The global supply and consumption of scandium was estimated to be about 10 tons to 15 tons per year. Consumption of scandium contained in SOFCs and nonferrous alloys was reported to be within this same range. Prices quoted for most scandium products in the United States were generally unchanged or decreased compared with those in 2017. In China, ex-works prices for scandium oxide were significantly less than domestic quoted prices. Although global exploration and development projects continued in anticipation of increased demand, the global scandium market remained small relative to most other metals. In the United States, following the completion of a feasibility study in 2017 for the polymetallic Elk Creek project in Nebraska, permitting and engineering studies were ongoing. Other domestic projects that included scandium recovery in their process plans were the Bokan project in Alaska and the Round Top project in Texas. The U.S. Department of Energy was funding the development of methods to separate scandium from coal and coal byproducts. In Australia, the Nyngan project and Syerston project in New South Wales were under development while seeking project financing and offtake agreements. Reserves at Nyngan were estimated to be 1.44 million tons containing about 590 tons of scandium using an effective cutoff grade of 155 parts per million scandium. Subject to financing, the developer expected to begin production in 2020 and was expected to produce as much as 38.5 tons per year of scandium oxide. The Syerston project’s measured and indicated scandium resources increased 63% to 45.7 million tons containing 19,200 tons of scandium oxide equivalent using a 300-parts-per-million scandium cutoff grade. In Queensland, the Scandium-Cobalt-Nickel (SCONI) Project was nearing completion of a bankable feasibility study and updated resource estimate at yearend. The prior measured and indicated resources of the SCONI Project were estimated at 12 million tons containing about 3,000 tons of scandium oxide using a 162-parts-per-million scandium cutoff grade. In India, a project to construct a 2.4-ton-per-year scandium oxide plant awaited environmental approval. In the Philippines, a plant to recover 7.5 tons per year of scandium oxide equivalent was being commissioned at the Taganito high-pressure acid-leach nickel operation. Production of an intermediate concentrate was expected to increase in 2019. In Russia, an aluminum producer was commercializing a hybrid technology for producing scandium-aluminum master alloy and developing new aluminum alloy formulations for additive manufacturing. Feasibility studies for making scandium oxide as a byproduct of alumina refining in the Ural Mountains were ongoing. The pilot plant was reported to have produced scandium oxide with purity greater than 99%. Based on pilot test results, plans were in place for a 3-ton-per-year scandium oxide plant. In Dalur, Kurgan region, development of scandium recovery as a byproduct of uranium production continued, and a 1.5-ton-per-year plant produced finished scandium oxide in 2018. In the European Union, recovery methods were being developed to produce scandium compounds and aluminum alloys from ores and byproducts. Globally, several projects were underway to commercialize new aluminum-scandium alloys for casting and additive manufacturing. In May 2018, the U.S. Department of the Interior, in coordination with other executive branch agencies, published a list of 35 critical minerals (83 FR 23295), including scandium. This list was developed to serve as an initial focus, pursuant to Executive Order 13817, ‘‘A Federal Strategy to Ensure Secure and Reliable Supplies of Critical Minerals” (82 FR 60835). World Mine Production and Reserves:6 No scandium was mined in the United States. As a result of its low concentration, scandium is produced exclusively as a byproduct during processing of various ores or recovered from previously processed tailings or residues. In recent years, scandium was produced as byproduct material in China (iron ore, rare earths, titanium, and zirconium), Kazakhstan (uranium), Russia (apatite and uranium), and Ukraine (uranium). Foreign mine production data for 2018 were not available. World Resources: Resources of scandium are abundant. Scandium’s crustal abundance is greater than that of lead. Scandium lacks affinity for the common ore-forming anions; therefore, it is widely dispersed in the lithosphere and forms solid solutions with low concentrations in more than 100 minerals. There are identified scandium resources in Australia, Canada, China, Kazakhstan, Madagascar, Norway, the Philippines, Russia, Ukraine, and the United States. Substitutes: Titanium and aluminum high-strength alloys, as well as carbon-fiber materials, may substitute in high-performance scandium-alloy applications. Light-emitting diodes displace mercury-vapor high-intensity lights in some industrial and residential applications. In some applications that rely on scandium’s unique properties, substitution is not possible. eEstimated. 1See also Rare Earths. Scandium is one of the 17 rare-earth elements. 2Prices from Alfa Aesar, a Johnson Matthey company. 3Prices from Sigma-Aldrich, a part of Millipore Sigma. 4Prices from Stanford Materials Corp. 5Defined as imports – exports. Quantitative data are not available. 6See Appendix C for resource and reserve definitions and information concerning data sources.
U.S. Geological Survey, Mineral Commodity Summaries, February 2019
146
SELENIUM
(Data in metric tons of selenium content unless otherwise noted) Domestic Production and Use: Primary selenium was refined from anode slimes recovered from the electrolytic refining of copper. Of the two electrolytic copper refineries operating in the United States, only one in Texas reported production of primary selenium. In glass manufacturing, selenium is used to decolorize the green tint caused by iron impurities in container glass and other soda-lime silica glass and is used in architectural plate glass to reduce solar heat transmission. Cadmium sulfoselenide pigments are used in ceramics, glass, and plastics to produce a ruby-red color. Selenium is used in blasting caps; in catalysts to enhance selective oxidation; in copper, lead, and steel alloys to improve machinability; in the electrolytic production of manganese to increase yields; in gun bluing to improve cosmetic appearance and provide corrosion resistance; in plating solutions, where it improves appearance and durability; in rubber compounding chemicals to act as a vulcanizing agent; and in thin-film photovoltaic copper-indium-gallium-diselenide (CIGS) solar cells. Selenium is an essential micronutrient and is used as a human dietary supplement, a dietary supplement for livestock, and as a fertilizer additive to enrich selenium-poor soils. Selenium is also used as an active ingredient in antidandruff shampoos. Estimates for world consumption are as follows: metallurgy (including manganese production), 40%; glass manufacturing, 25%; agriculture, 10%; chemicals and pigments, 10%; electronics, 10%; and other uses, 5%. Salient Statistics—United States: 2014 2015 2016 2017 2018e Production, refinery W W W W W Imports for consumption: Selenium metal 467 444 411 450 390 Selenium dioxide 8 14 21 19 13 Exports,1 metal 521 468 150 268 160 Consumption, apparent2 W W W W W Price, average, dollars per pound3 26.78 22.09 23.69 10.78 20.00 Stocks, producer, refined, yearend W W W W W Net import reliance4 as a percentage of apparent consumption E E E E E Recycling: Domestic production of secondary selenium was estimated to be very small because most scrap from older plain paper photocopiers and electronic materials was exported for recovery of the contained selenium. Import Sources (2014–17): China, 19%; Philippines 13%; Germany, 13%; Japan, 12%; and other, 43%. Tariff: Item Number Normal Trade Relations 12–31–18 Selenium metal 2804.90.0000 Free. Selenium dioxide 2811.29.2000 Free. Depletion Allowance: 14% (Domestic and foreign). Government Stockpile: None. Events, Trends, and Issues: The supply of selenium is directly affected by the supply of the materials from which it is a byproduct—copper and, to a lesser extent, nickel—and it is directly affected by the number of facilities that recover selenium. The estimated annual average price for selenium was $20.00 per pound in 2018, about 86% more than the annual average price in 2017. In the first quarter of 2018, average monthly prices increased from $12.50 per pound to $20.00 per pound. Prices then increased slightly to $20.50 per pound in June and remained level through September. Prepared by C. Schuyler Anderson [(703) 648–4985, [email protected]]
147 SELENIUM
Electrolytic manganese production was the main metallurgical end use for selenium in China, where selenium dioxide was used in the electrolytic process to increase current efficiency and the metal deposition rate. Selenium consumption in China was thought to have increased in recent years; 51 electrolytic manganese producers were reported to have been operating and consuming selenium in 2017 (latest information available), up from 47 reported in 2016. World Refinery Production and Reserves: Refinery production5 Reserves6 2017 2018e United States W W 10,000 Belgium 200 200 — Canada 49 50 6,000 China 930 950 26,000 Finland 105 100 — Germany 300 300 — Japan 729 750 — Peru 45 45 13,000 Poland 88 90 3,000 Russia 150 150 20,000 Sweden 20 20 — Turkey 50 50 — Other countries 47 50 21,000 World total (rounded) 72,710 72,800 99,000 World Resources: Reserves for selenium are based on identified copper deposits and average selenium content. Coal generally contains between 0.5 and 12 parts per million of selenium, or about 80 to 90 times the average for copper deposits. The recovery of selenium from coal fly ash, although technically feasible, does not appear likely to be economical in the foreseeable future. Substitutes: Silicon is the major substitute for selenium in low- and medium-voltage rectifiers. Organic pigments have been developed as substitutes for cadmium sulfoselenide pigments. Other substitutes include cerium oxide as either a colorant or decolorant in glass; tellurium in pigments and rubber; bismuth, lead, and tellurium in free-machining alloys; and bismuth and tellurium in lead-free brasses. Sulfur dioxide can be used as a replacement for selenium dioxide in the production of electrolytic manganese metal, but it is not as energy efficient. The selenium-tellurium photoreceptors used in some plain paper copiers and laser printers have been replaced by organic photoreceptors in newer machines. Amorphous silicon and cadmium telluride are the two principal competitors with CIGS in thin-film photovoltaic solar cells. eEstimated. E Net exporter. W Withheld to avoid disclosing company proprietary data. — Zero. 1There was no exclusive domestic export classification code for selenium dioxide. 2Defined as production + imports – exports + adjustments for industry stock changes. 3U.S. spot market price for selenium metal powder, minimum 99.5% purity, in 5-ton lots. Source: Platts Metals Week. 4Defined as imports – exports + adjustments for industry stock changes; export data incomplete for common forms of selenium, and may be exported under unexpected or misidentified forms, such as copper selenide or zinc selenide. 5Insofar as possible, data relate to refinery output only; thus, countries that produced selenium contained in blister copper, copper concentrates, copper ores, and (or) refinery residues, but did not recover refined selenium from these materials indigenously, were excluded to avoid double counting. 6See Appendix C for resource and reserve definitions and information concerning data sources. 7Excludes U.S. production. Australia, Iran, Kazakhstan, Mexico, the Philippines, and Uzbekistan are known to produce refined selenium, but output was not reported, and information was inadequate to make reliable production estimates.
U.S. Geological Survey, Mineral Commodity Summaries, February 2019
148
SILICON
(Data in thousand metric tons of silicon content unless otherwise noted) Domestic Production and Use: Six companies produced silicon materials at eight plants, all east of the Mississippi River. Most ferrosilicon was consumed in the ferrous foundry and steel industries, predominantly in the Eastern United States, and was sourced primarily from domestic quartzite (silica). The main consumers of silicon metal were producers of aluminum alloys and the chemical industry. The semiconductor and solar energy industries, which manufacture chips for computers and photovoltaic cells from high-purity silicon, respectively, accounted for only a small percentage of silicon demand. Salient Statistics—United States: 2014 2015 2016 2017 2018e Production: Ferrosilicon and silicon metal1, 2 401 411 384 415 430 Imports for consumption: Ferrosilicon, all grades1 186 162 155 147 158 Silicon metal 139 140 122 136 118 Exports: Ferrosilicon, all grades1 9 9 7 11 12 Silicon metal 45 37 60 71 41 Consumption, apparent:3 Ferrosilicon, all grades1 W W W W W Silicon metal2 W W W W W Total 670 661 601 616 660 Price, average, cents per pound of silicon: Ferrosilicon, 50% Si4 108 101 83 94 104 Ferrosilicon, 75% Si5 98 88 71 87 108 Silicon metal2, 5 140 127 91 117 138 Stocks, producer, yearend: Ferrosilicon and metal1, 2 27 33 26 26 25 Net import reliance6 as a percentage of apparent consumption: Ferrosilicon, all grades1 <50 >50 >50 <50 <50 Silicon metal2 <50 <50 <50 <50 <50 Total 42 38 36 33 34 Recycling: Insignificant. Import Sources (2014–17): Ferrosilicon: Russia, 35%; China, 20%; Canada, 12%; Iceland, 7%; and other, 26%. Silicon metal: Brazil, 28%; South Africa, 18%; Canada, 15%; Australia, 14%; and other, 25%. Total: Russia, 19%; Brazil, 16%; Canada, 14%; China, 11%; and other, 40%. Tariff: Item Number Normal Trade Relations 12–31–18 Silicon, more than 99.99% Si 2804.61.0000 Free. Silicon, 99.00%−99.99% Si 2804.69.1000 5.3% ad val. Silicon, other 2804.69.5000 5.5% ad val. Ferrosilicon, 55%−80% Si: More than 3% Ca 7202.21.1000 1.1% ad val. Other 7202.21.5000 1.5% ad val. Ferrosilicon, 80%−90% Si 7202.21.7500 1.9% ad val. Ferrosilicon, more than 90% Si 7202.21.9000 5.8% ad val. Ferrosilicon, other: More than 2% Mg 7202.29.0010 Free. Other 7202.29.0050 Free. Prepared by Emily K. Schnebele [(703) 648–4945, [email protected]]
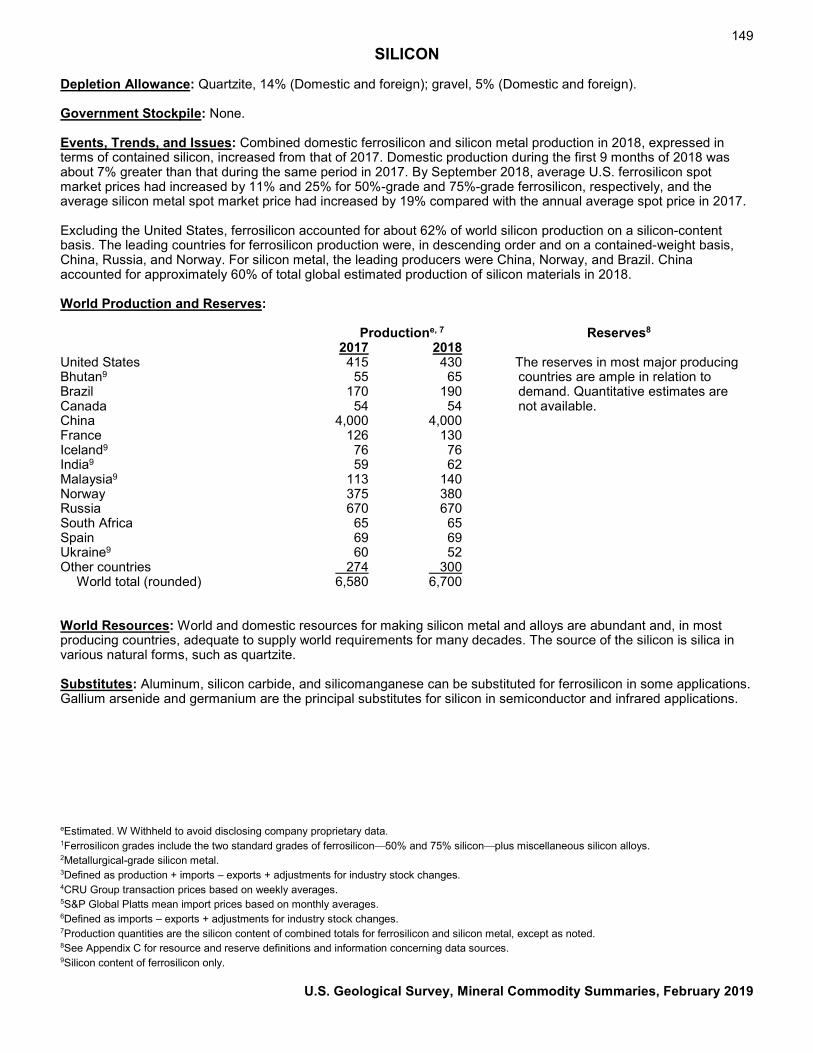
149 SILICON
Depletion Allowance: Quartzite, 14% (Domestic and foreign); gravel, 5% (Domestic and foreign). Government Stockpile: None. Events, Trends, and Issues: Combined domestic ferrosilicon and silicon metal production in 2018, expressed in terms of contained silicon, increased from that of 2017. Domestic production during the first 9 months of 2018 was about 7% greater than that during the same period in 2017. By September 2018, average U.S. ferrosilicon spot market prices had increased by 11% and 25% for 50%-grade and 75%-grade ferrosilicon, respectively, and the average silicon metal spot market price had increased by 19% compared with the annual average spot price in 2017. Excluding the United States, ferrosilicon accounted for about 62% of world silicon production on a silicon-content basis. The leading countries for ferrosilicon production were, in descending order and on a contained-weight basis, China, Russia, and Norway. For silicon metal, the leading producers were China, Norway, and Brazil. China accounted for approximately 60% of total global estimated production of silicon materials in 2018. World Production and Reserves: Productione, 7 Reserves8 2017 2018 United States 415 430 The reserves in most major producing Bhutan9 55 65 countries are ample in relation to Brazil 170 190 demand. Quantitative estimates are Canada 54 54 not available. China 4,000 4,000 France 126 130 Iceland9 76 76 India9 59 62 Malaysia9 113 140 Norway 375 380 Russia 670 670 South Africa 65 65 Spain 69 69 Ukraine9 60 52 Other countries 274 300 World total (rounded) 6,580 6,700 World Resources: World and domestic resources for making silicon metal and alloys are abundant and, in most producing countries, adequate to supply world requirements for many decades. The source of the silicon is silica in various natural forms, such as quartzite. Substitutes: Aluminum, silicon carbide, and silicomanganese can be substituted for ferrosilicon in some applications. Gallium arsenide and germanium are the principal substitutes for silicon in semiconductor and infrared applications. eEstimated. W Withheld to avoid disclosing company proprietary data. 1Ferrosilicon grades include the two standard grades of ferrosilicon50% and 75% siliconplus miscellaneous silicon alloys. 2Metallurgical-grade silicon metal. 3Defined as production + imports – exports + adjustments for industry stock changes. 4CRU Group transaction prices based on weekly averages. 5S&P Global Platts mean import prices based on monthly averages. 6Defined as imports – exports + adjustments for industry stock changes. 7Production quantities are the silicon content of combined totals for ferrosilicon and silicon metal, except as noted. 8See Appendix C for resource and reserve definitions and information concerning data sources. 9Silicon content of ferrosilicon only.
U.S. Geological Survey, Mineral Commodity Summaries, February 2019
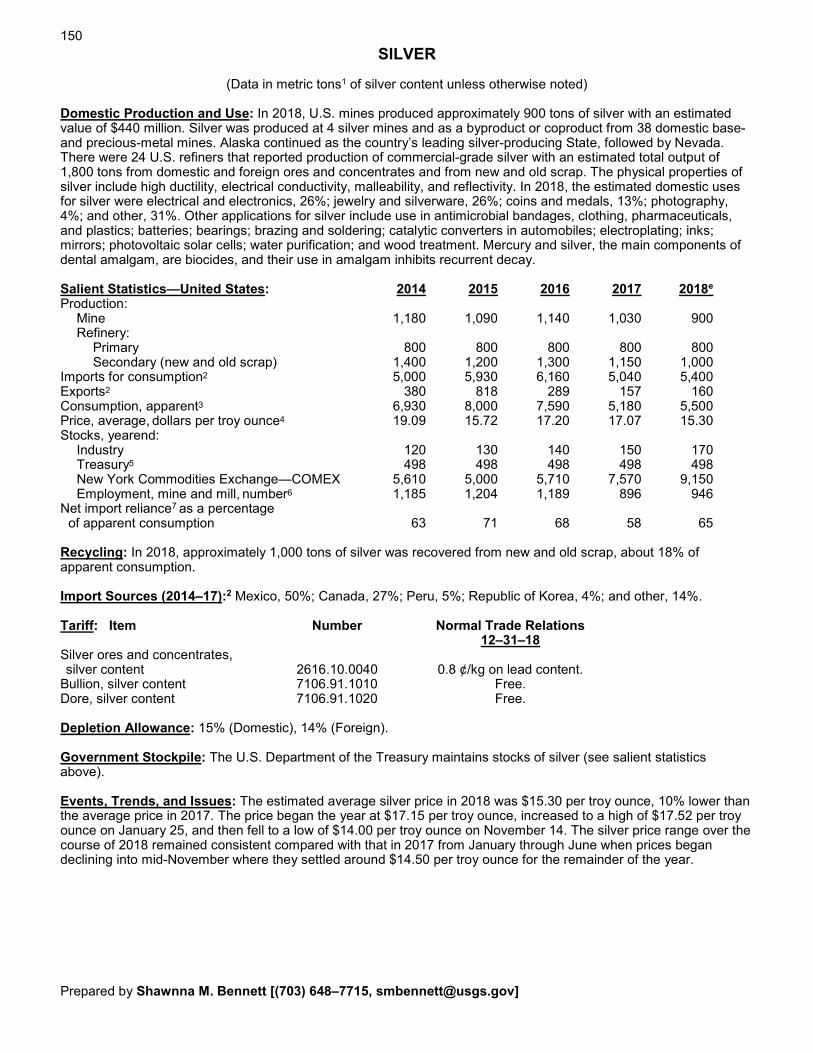
150
SILVER
(Data in metric tons1 of silver content unless otherwise noted) Domestic Production and Use: In 2018, U.S. mines produced approximately 900 tons of silver with an estimated value of $440 million. Silver was produced at 4 silver mines and as a byproduct or coproduct from 38 domestic base- and precious-metal mines. Alaska continued as the country’s leading silver-producing State, followed by Nevada. There were 24 U.S. refiners that reported production of commercial-grade silver with an estimated total output of 1,800 tons from domestic and foreign ores and concentrates and from new and old scrap. The physical properties of silver include high ductility, electrical conductivity, malleability, and reflectivity. In 2018, the estimated domestic uses for silver were electrical and electronics, 26%; jewelry and silverware, 26%; coins and medals, 13%; photography, 4%; and other, 31%. Other applications for silver include use in antimicrobial bandages, clothing, pharmaceuticals, and plastics; batteries; bearings; brazing and soldering; catalytic converters in automobiles; electroplating; inks; mirrors; photovoltaic solar cells; water purification; and wood treatment. Mercury and silver, the main components of dental amalgam, are biocides, and their use in amalgam inhibits recurrent decay. Salient Statistics—United States: 2014 2015 2016 2017 2018e Production: Mine 1,180 1,090 1,140 1,030 900 Refinery: Primary 800 800 800 800 800 Secondary (new and old scrap) 1,400 1,200 1,300 1,150 1,000 Imports for consumption2 5,000 5,930 6,160 5,040 5,400 Exports2 380 818 289 157 160 Consumption, apparent3 6,930 8,000 7,590 5,180 5,500 Price, average, dollars per troy ounce4 19.09 15.72 17.20 17.07 15.30 Stocks, yearend: Industry 120 130 140 150 170 Treasury5 498 498 498 498 498 New York Commodities Exchange—COMEX 5,610 5,000 5,710 7,570 9,150 Employment, mine and mill, number6 1,185 1,204 1,189 896 946 Net import reliance7 as a percentage of apparent consumption 63 71 68 58 65 Recycling: In 2018, approximately 1,000 tons of silver was recovered from new and old scrap, about 18% of apparent consumption. Import Sources (2014–17):2 Mexico, 50%; Canada, 27%; Peru, 5%; Republic of Korea, 4%; and other, 14%. Tariff: Item Number Normal Trade Relations 12–31–18 Silver ores and concentrates, silver content 2616.10.0040 0.8 ¢/kg on lead content. Bullion, silver content 7106.91.1010 Free. Dore, silver content 7106.91.1020 Free. Depletion Allowance: 15% (Domestic), 14% (Foreign). Government Stockpile: The U.S. Department of the Treasury maintains stocks of silver (see salient statistics above). Events, Trends, and Issues: The estimated average silver price in 2018 was $15.30 per troy ounce, 10% lower than the average price in 2017. The price began the year at $17.15 per troy ounce, increased to a high of $17.52 per troy ounce on January 25, and then fell to a low of $14.00 per troy ounce on November 14. The silver price range over the course of 2018 remained consistent compared with that in 2017 from January through June when prices began declining into mid-November where they settled around $14.50 per troy ounce for the remainder of the year. Prepared by Shawnna M. Bennett [(703) 648–7715, [email protected]]
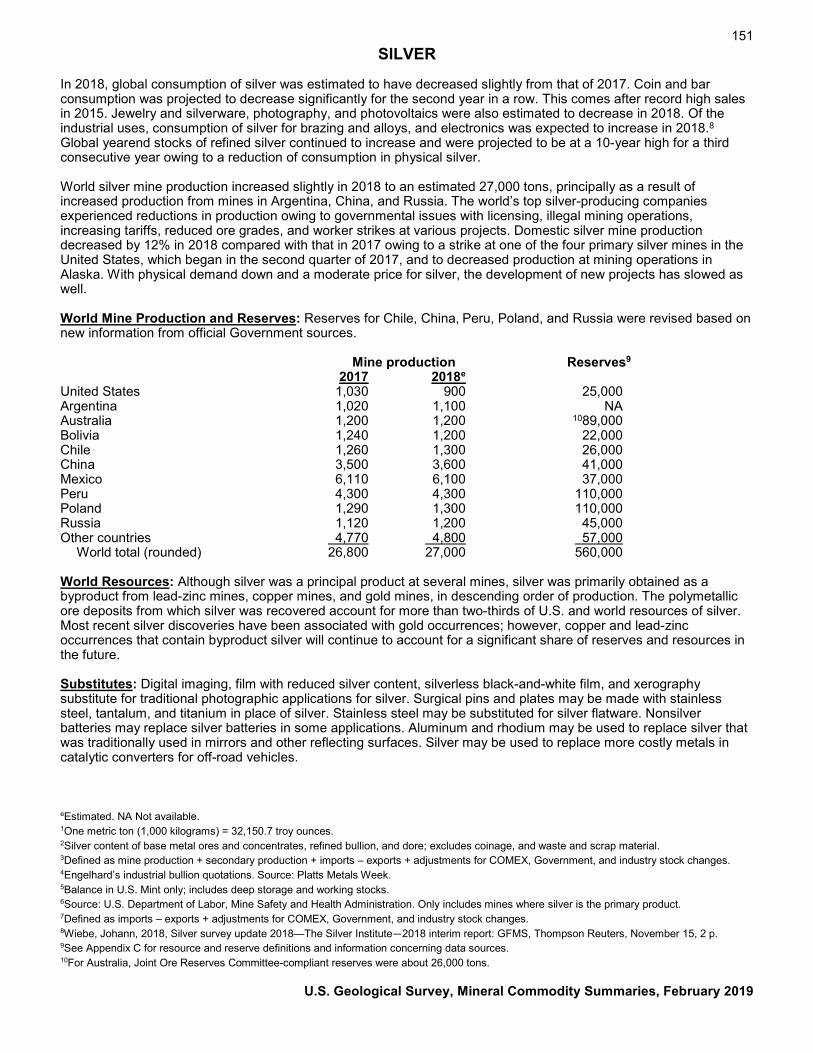
151 SILVER
In 2018, global consumption of silver was estimated to have decreased slightly from that of 2017. Coin and bar consumption was projected to decrease significantly for the second year in a row. This comes after record high sales in 2015. Jewelry and silverware, photography, and photovoltaics were also estimated to decrease in 2018. Of the industrial uses, consumption of silver for brazing and alloys, and electronics was expected to increase in 2018.8 Global yearend stocks of refined silver continued to increase and were projected to be at a 10-year high for a third consecutive year owing to a reduction of consumption in physical silver. World silver mine production increased slightly in 2018 to an estimated 27,000 tons, principally as a result of increased production from mines in Argentina, China, and Russia. The world’s top silver-producing companies experienced reductions in production owing to governmental issues with licensing, illegal mining operations, increasing tariffs, reduced ore grades, and worker strikes at various projects. Domestic silver mine production decreased by 12% in 2018 compared with that in 2017 owing to a strike at one of the four primary silver mines in the United States, which began in the second quarter of 2017, and to decreased production at mining operations in Alaska. With physical demand down and a moderate price for silver, the development of new projects has slowed as well. World Mine Production and Reserves: Reserves for Chile, China, Peru, Poland, and Russia were revised based on new information from official Government sources. Mine production Reserves9 2017 2018e United States 1,030 900 25,000 Argentina 1,020 1,100 NA Australia 1,200 1,200 1089,000 Bolivia 1,240 1,200 22,000 Chile 1,260 1,300 26,000 China 3,500 3,600 41,000 Mexico 6,110 6,100 37,000 Peru 4,300 4,300 110,000 Poland 1,290 1,300 110,000 Russia 1,120 1,200 45,000 Other countries 4,770 4,800 57,000 World total (rounded) 26,800 27,000 560,000 World Resources: Although silver was a principal product at several mines, silver was primarily obtained as a byproduct from lead-zinc mines, copper mines, and gold mines, in descending order of production. The polymetallic ore deposits from which silver was recovered account for more than two-thirds of U.S. and world resources of silver. Most recent silver discoveries have been associated with gold occurrences; however, copper and lead-zinc occurrences that contain byproduct silver will continue to account for a significant share of reserves and resources in the future. Substitutes: Digital imaging, film with reduced silver content, silverless black-and-white film, and xerography substitute for traditional photographic applications for silver. Surgical pins and plates may be made with stainless steel, tantalum, and titanium in place of silver. Stainless steel may be substituted for silver flatware. Nonsilver batteries may replace silver batteries in some applications. Aluminum and rhodium may be used to replace silver that was traditionally used in mirrors and other reflecting surfaces. Silver may be used to replace more costly metals in catalytic converters for off-road vehicles. eEstimated. NA Not available. 1One metric ton (1,000 kilograms) = 32,150.7 troy ounces. 2Silver content of base metal ores and concentrates, refined bullion, and dore; excludes coinage, and waste and scrap material. 3Defined as mine production + secondary production + imports – exports + adjustments for COMEX, Government, and industry stock changes. 4Engelhard’s industrial bullion quotations. Source: Platts Metals Week. 5Balance in U.S. Mint only; includes deep storage and working stocks. 6Source: U.S. Department of Labor, Mine Safety and Health Administration. Only includes mines where silver is the primary product. 7Defined as imports – exports + adjustments for COMEX, Government, and industry stock changes. 8Wiebe, Johann, 2018, Silver survey update 2018—The Silver Institute—2018 interim report: GFMS, Thompson Reuters, November 15, 2 p. 9See Appendix C for resource and reserve definitions and information concerning data sources. 10For Australia, Joint Ore Reserves Committee-compliant reserves were about 26,000 tons.
U.S. Geological Survey, Mineral Commodity Summaries, February 2019
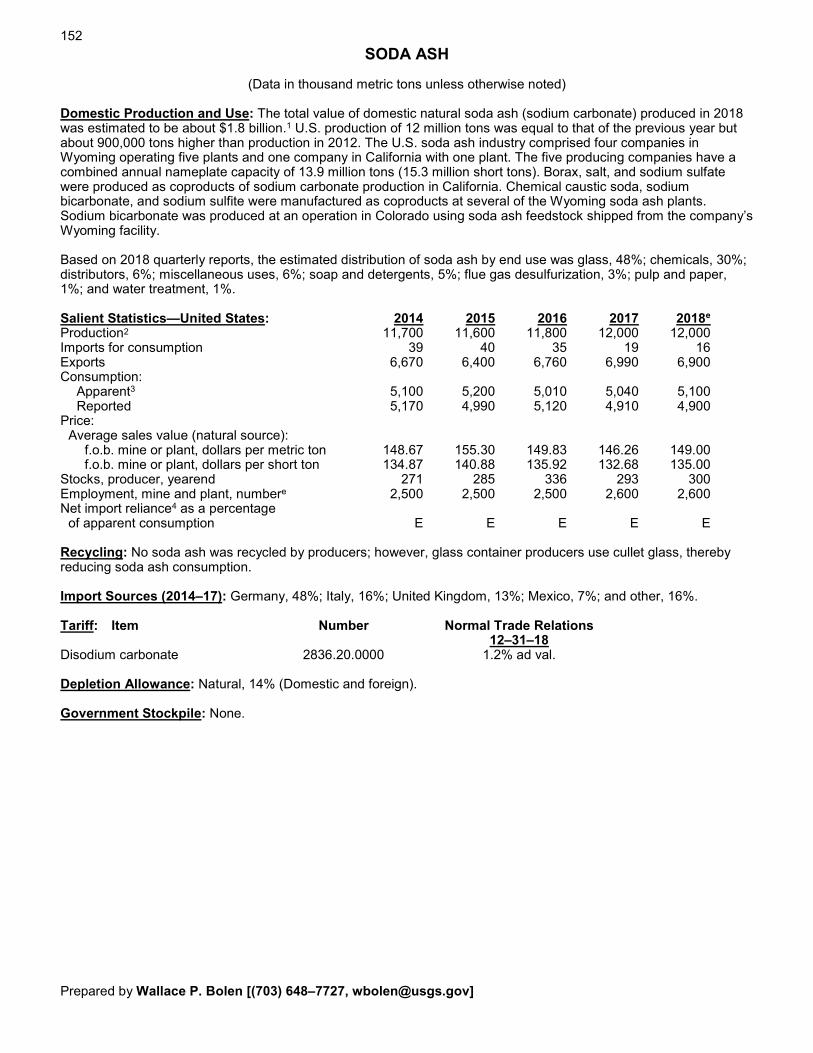
152
SODA ASH
(Data in thousand metric tons unless otherwise noted) Domestic Production and Use: The total value of domestic natural soda ash (sodium carbonate) produced in 2018 was estimated to be about $1.8 billion.1 U.S. production of 12 million tons was equal to that of the previous year but about 900,000 tons higher than production in 2012. The U.S. soda ash industry comprised four companies in Wyoming operating five plants and one company in California with one plant. The five producing companies have a combined annual nameplate capacity of 13.9 million tons (15.3 million short tons). Borax, salt, and sodium sulfate were produced as coproducts of sodium carbonate production in California. Chemical caustic soda, sodium bicarbonate, and sodium sulfite were manufactured as coproducts at several of the Wyoming soda ash plants. Sodium bicarbonate was produced at an operation in Colorado using soda ash feedstock shipped from the company’s Wyoming facility. Based on 2018 quarterly reports, the estimated distribution of soda ash by end use was glass, 48%; chemicals, 30%; distributors, 6%; miscellaneous uses, 6%; soap and detergents, 5%; flue gas desulfurization, 3%; pulp and paper, 1%; and water treatment, 1%. Salient Statistics—United States: 2014 2015 2016 2017 2018e Production2 11,700 11,600 11,800 12,000 12,000 Imports for consumption 39 40 35 19 16 Exports 6,670 6,400 6,760 6,990 6,900 Consumption: Apparent3 5,100 5,200 5,010 5,040 5,100 Reported 5,170 4,990 5,120 4,910 4,900 Price: Average sales value (natural source): f.o.b. mine or plant, dollars per metric ton 148.67 155.30 149.83 146.26 149.00 f.o.b. mine or plant, dollars per short ton 134.87 140.88 135.92 132.68 135.00 Stocks, producer, yearend 271 285 336 293 300 Employment, mine and plant, numbere 2,500 2,500 2,500 2,600 2,600 Net import reliance4 as a percentage of apparent consumption E E E E E Recycling: No soda ash was recycled by producers; however, glass container producers use cullet glass, thereby reducing soda ash consumption. Import Sources (2014–17): Germany, 48%; Italy, 16%; United Kingdom, 13%; Mexico, 7%; and other, 16%. Tariff: Item Number Normal Trade Relations 12–31–18 Disodium carbonate 2836.20.0000 1.2% ad val. Depletion Allowance: Natural, 14% (Domestic and foreign). Government Stockpile: None. Prepared by Wallace P. Bolen [(703) 648–7727, [email protected]]
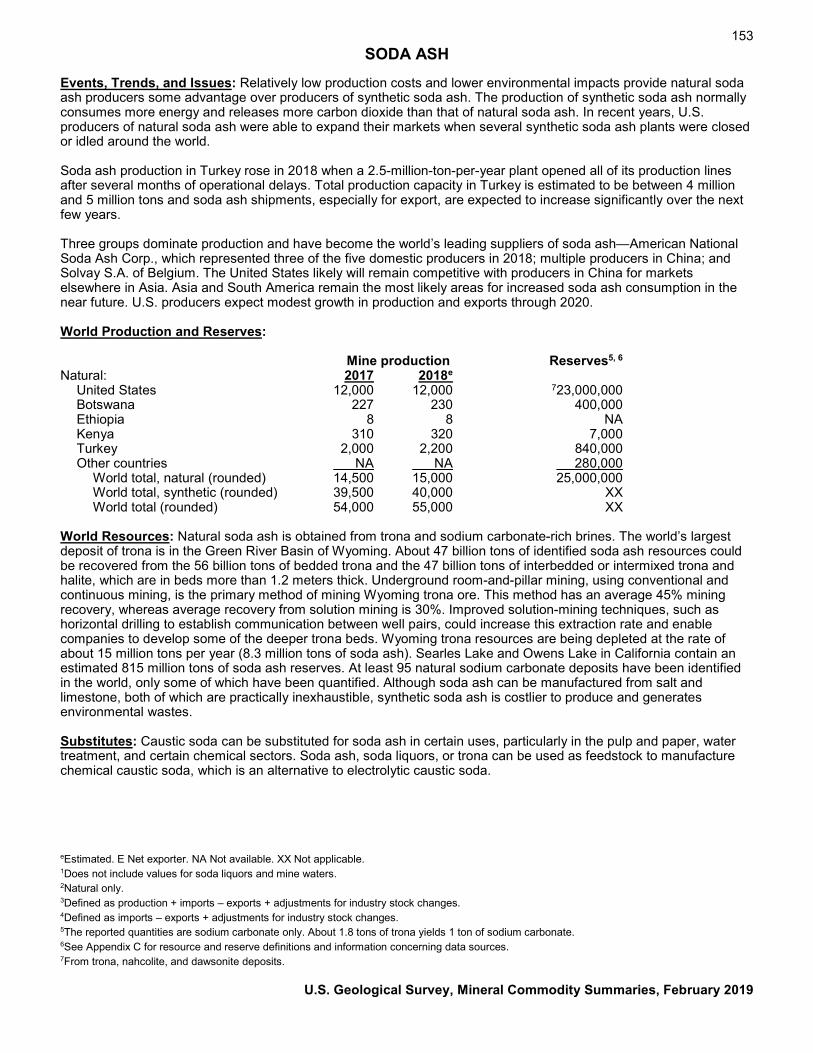
153 SODA ASH
Events, Trends, and Issues: Relatively low production costs and lower environmental impacts provide natural soda ash producers some advantage over producers of synthetic soda ash. The production of synthetic soda ash normally consumes more energy and releases more carbon dioxide than that of natural soda ash. In recent years, U.S. producers of natural soda ash were able to expand their markets when several synthetic soda ash plants were closed or idled around the world. Soda ash production in Turkey rose in 2018 when a 2.5-million-ton-per-year plant opened all of its production lines after several months of operational delays. Total production capacity in Turkey is estimated to be between 4 million and 5 million tons and soda ash shipments, especially for export, are expected to increase significantly over the next few years. Three groups dominate production and have become the world’s leading suppliers of soda ash—American National Soda Ash Corp., which represented three of the five domestic producers in 2018; multiple producers in China; and Solvay S.A. of Belgium. The United States likely will remain competitive with producers in China for markets elsewhere in Asia. Asia and South America remain the most likely areas for increased soda ash consumption in the near future. U.S. producers expect modest growth in production and exports through 2020. World Production and Reserves: Mine production Reserves5, 6 Natural: 2017 2018e United States 12,000 12,000 723,000,000 Botswana 227 230 400,000 Ethiopia 8 8 NA Kenya 310 320 7,000 Turkey 2,000 2,200 840,000 Other countries NA NA 280,000 World total, natural (rounded) 14,500 15,000 25,000,000 World total, synthetic (rounded) 39,500 40,000 XX World total (rounded) 54,000 55,000 XX World Resources: Natural soda ash is obtained from trona and sodium carbonate-rich brines. The world’s largest deposit of trona is in the Green River Basin of Wyoming. About 47 billion tons of identified soda ash resources could be recovered from the 56 billion tons of bedded trona and the 47 billion tons of interbedded or intermixed trona and halite, which are in beds more than 1.2 meters thick. Underground room-and-pillar mining, using conventional and continuous mining, is the primary method of mining Wyoming trona ore. This method has an average 45% mining recovery, whereas average recovery from solution mining is 30%. Improved solution-mining techniques, such as horizontal drilling to establish communication between well pairs, could increase this extraction rate and enable companies to develop some of the deeper trona beds. Wyoming trona resources are being depleted at the rate of about 15 million tons per year (8.3 million tons of soda ash). Searles Lake and Owens Lake in California contain an estimated 815 million tons of soda ash reserves. At least 95 natural sodium carbonate deposits have been identified in the world, only some of which have been quantified. Although soda ash can be manufactured from salt and limestone, both of which are practically inexhaustible, synthetic soda ash is costlier to produce and generates environmental wastes. Substitutes: Caustic soda can be substituted for soda ash in certain uses, particularly in the pulp and paper, water treatment, and certain chemical sectors. Soda ash, soda liquors, or trona can be used as feedstock to manufacture chemical caustic soda, which is an alternative to electrolytic caustic soda. eEstimated. E Net exporter. NA Not available. XX Not applicable. 1Does not include values for soda liquors and mine waters. 2Natural only. 3Defined as production + imports – exports + adjustments for industry stock changes. 4Defined as imports – exports + adjustments for industry stock changes. 5The reported quantities are sodium carbonate only. About 1.8 tons of trona yields 1 ton of sodium carbonate. 6See Appendix C for resource and reserve definitions and information concerning data sources. 7From trona, nahcolite, and dawsonite deposits.
U.S. Geological Survey, Mineral Commodity Summaries, February 2019
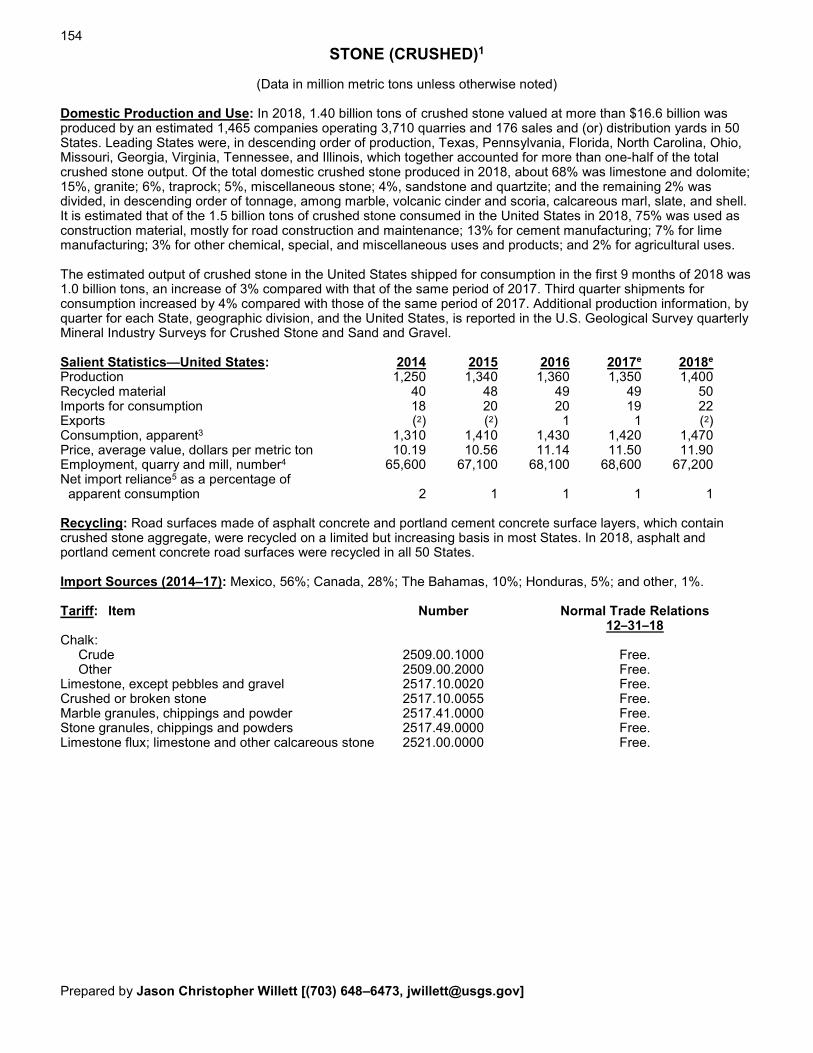
154
STONE (CRUSHED)1
(Data in million metric tons unless otherwise noted) Domestic Production and Use: In 2018, 1.40 billion tons of crushed stone valued at more than $16.6 billion was produced by an estimated 1,465 companies operating 3,710 quarries and 176 sales and (or) distribution yards in 50 States. Leading States were, in descending order of production, Texas, Pennsylvania, Florida, North Carolina, Ohio, Missouri, Georgia, Virginia, Tennessee, and Illinois, which together accounted for more than one-half of the total crushed stone output. Of the total domestic crushed stone produced in 2018, about 68% was limestone and dolomite; 15%, granite; 6%, traprock; 5%, miscellaneous stone; 4%, sandstone and quartzite; and the remaining 2% was divided, in descending order of tonnage, among marble, volcanic cinder and scoria, calcareous marl, slate, and shell. It is estimated that of the 1.5 billion tons of crushed stone consumed in the United States in 2018, 75% was used as construction material, mostly for road construction and maintenance; 13% for cement manufacturing; 7% for lime manufacturing; 3% for other chemical, special, and miscellaneous uses and products; and 2% for agricultural uses. The estimated output of crushed stone in the United States shipped for consumption in the first 9 months of 2018 was 1.0 billion tons, an increase of 3% compared with that of the same period of 2017. Third quarter shipments for consumption increased by 4% compared with those of the same period of 2017. Additional production information, by quarter for each State, geographic division, and the United States, is reported in the U.S. Geological Survey quarterly Mineral Industry Surveys for Crushed Stone and Sand and Gravel. Salient Statistics—United States: 2014 2015 2016 2017e 2018e Production 1,250 1,340 1,360 1,350 1,400 Recycled material 40 48 49 49 50 Imports for consumption 18 20 20 19 22 Exports (2) (2) 1 1 (2) Consumption, apparent3 1,310 1,410 1,430 1,420 1,470 Price, average value, dollars per metric ton 10.19 10.56 11.14 11.50 11.90 Employment, quarry and mill, number4 65,600 67,100 68,100 68,600 67,200 Net import reliance5 as a percentage of apparent consumption 2 1 1 1 1 Recycling: Road surfaces made of asphalt concrete and portland cement concrete surface layers, which contain crushed stone aggregate, were recycled on a limited but increasing basis in most States. In 2018, asphalt and portland cement concrete road surfaces were recycled in all 50 States. Import Sources (2014–17): Mexico, 56%; Canada, 28%; The Bahamas, 10%; Honduras, 5%; and other, 1%. Tariff: Item Number Normal Trade Relations 12–31–18 Chalk: Crude 2509.00.1000 Free. Other 2509.00.2000 Free. Limestone, except pebbles and gravel 2517.10.0020 Free. Crushed or broken stone 2517.10.0055 Free. Marble granules, chippings and powder 2517.41.0000 Free. Stone granules, chippings and powders 2517.49.0000 Free. Limestone flux; limestone and other calcareous stone 2521.00.0000 Free. Prepared by Jason Christopher Willett [(703) 648–6473, [email protected]]
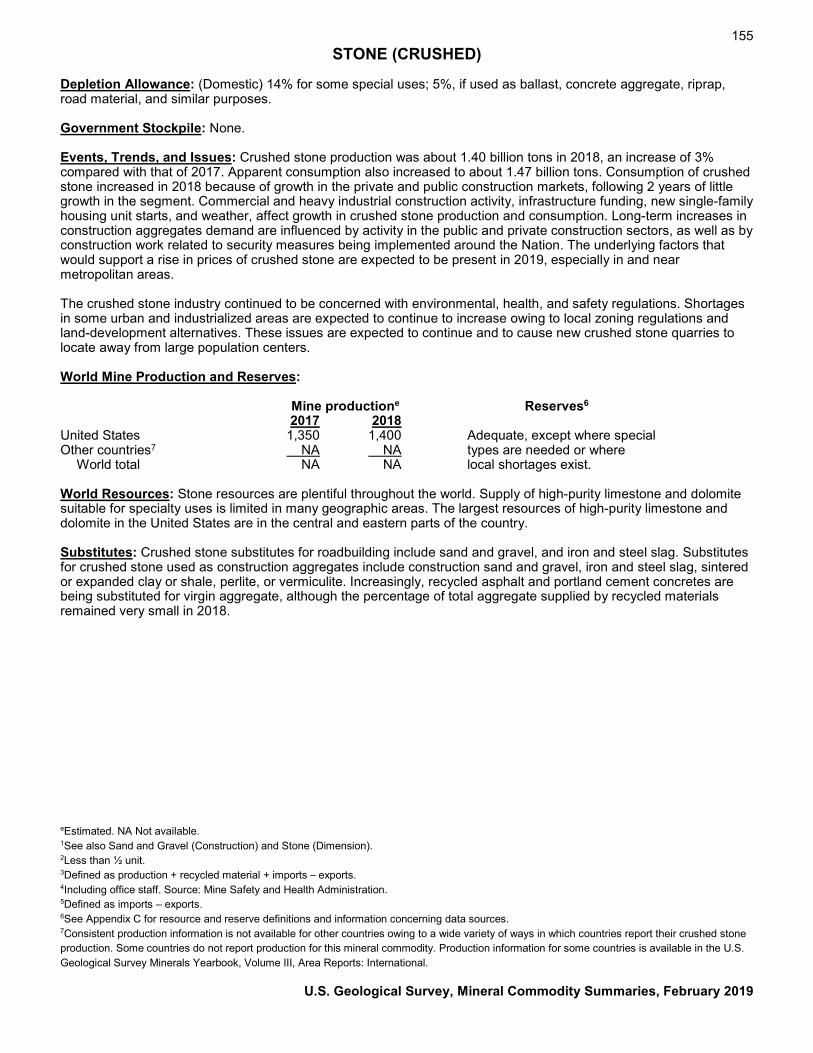
155 STONE (CRUSHED)
Depletion Allowance: (Domestic) 14% for some special uses; 5%, if used as ballast, concrete aggregate, riprap, road material, and similar purposes. Government Stockpile: None. Events, Trends, and Issues: Crushed stone production was about 1.40 billion tons in 2018, an increase of 3% compared with that of 2017. Apparent consumption also increased to about 1.47 billion tons. Consumption of crushed stone increased in 2018 because of growth in the private and public construction markets, following 2 years of little growth in the segment. Commercial and heavy industrial construction activity, infrastructure funding, new single-family housing unit starts, and weather, affect growth in crushed stone production and consumption. Long-term increases in construction aggregates demand are influenced by activity in the public and private construction sectors, as well as by construction work related to security measures being implemented around the Nation. The underlying factors that would support a rise in prices of crushed stone are expected to be present in 2019, especially in and near metropolitan areas. The crushed stone industry continued to be concerned with environmental, health, and safety regulations. Shortages in some urban and industrialized areas are expected to continue to increase owing to local zoning regulations and land-development alternatives. These issues are expected to continue and to cause new crushed stone quarries to locate away from large population centers. World Mine Production and Reserves: Mine productione Reserves6 2017 2018 United States 1,350 1,400 Adequate, except where special Other countries7 NA NA types are needed or where World total NA NA local shortages exist. World Resources: Stone resources are plentiful throughout the world. Supply of high-purity limestone and dolomite suitable for specialty uses is limited in many geographic areas. The largest resources of high-purity limestone and dolomite in the United States are in the central and eastern parts of the country. Substitutes: Crushed stone substitutes for roadbuilding include sand and gravel, and iron and steel slag. Substitutes for crushed stone used as construction aggregates include construction sand and gravel, iron and steel slag, sintered or expanded clay or shale, perlite, or vermiculite. Increasingly, recycled asphalt and portland cement concretes are being substituted for virgin aggregate, although the percentage of total aggregate supplied by recycled materials remained very small in 2018. eEstimated. NA Not available. 1See also Sand and Gravel (Construction) and Stone (Dimension). 2Less than ½ unit. 3Defined as production + recycled material + imports – exports. 4Including office staff. Source: Mine Safety and Health Administration. 5Defined as imports – exports. 6See Appendix C for resource and reserve definitions and information concerning data sources. 7Consistent production information is not available for other countries owing to a wide variety of ways in which countries report their crushed stone production. Some countries do not report production for this mineral commodity. Production information for some countries is available in the U.S. Geological Survey Minerals Yearbook, Volume III, Area Reports: International.
U.S. Geological Survey, Mineral Commodity Summaries, February 2019
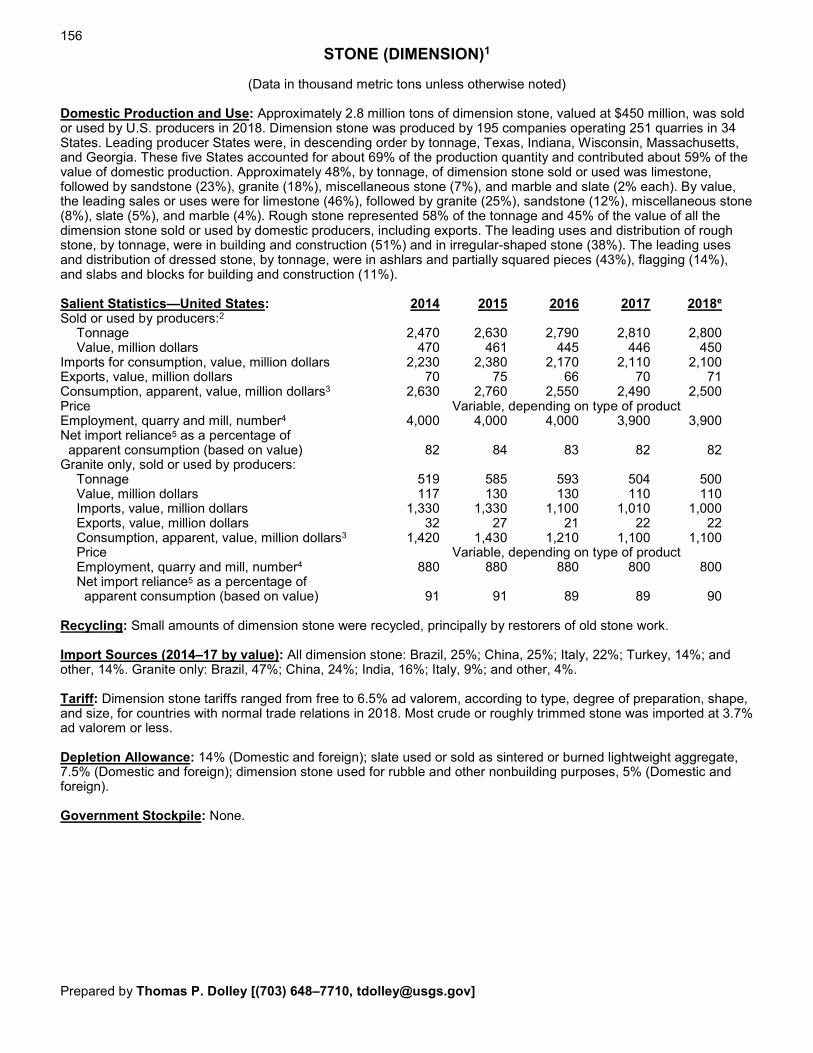
156
STONE (DIMENSION)1
(Data in thousand metric tons unless otherwise noted) Domestic Production and Use: Approximately 2.8 million tons of dimension stone, valued at $450 million, was sold or used by U.S. producers in 2018. Dimension stone was produced by 195 companies operating 251 quarries in 34 States. Leading producer States were, in descending order by tonnage, Texas, Indiana, Wisconsin, Massachusetts, and Georgia. These five States accounted for about 69% of the production quantity and contributed about 59% of the value of domestic production. Approximately 48%, by tonnage, of dimension stone sold or used was limestone, followed by sandstone (23%), granite (18%), miscellaneous stone (7%), and marble and slate (2% each). By value, the leading sales or uses were for limestone (46%), followed by granite (25%), sandstone (12%), miscellaneous stone (8%), slate (5%), and marble (4%). Rough stone represented 58% of the tonnage and 45% of the value of all the dimension stone sold or used by domestic producers, including exports. The leading uses and distribution of rough stone, by tonnage, were in building and construction (51%) and in irregular-shaped stone (38%). The leading uses and distribution of dressed stone, by tonnage, were in ashlars and partially squared pieces (43%), flagging (14%), and slabs and blocks for building and construction (11%). Salient Statistics—United States: 2014 2015 2016 2017 2018e Sold or used by producers:2
Tonnage 2,470 2,630 2,790 2,810 2,800 Value, million dollars 470 461 445 446 450 Imports for consumption, value, million dollars 2,230 2,380 2,170 2,110 2,100 Exports, value, million dollars 70 75 66 70 71 Consumption, apparent, value, million dollars3 2,630 2,760 2,550 2,490 2,500 Price Variable, depending on type of product Employment, quarry and mill, number4 4,000 4,000 4,000 3,900 3,900 Net import reliance5 as a percentage of apparent consumption (based on value) 82 84 83 82 82 Granite only, sold or used by producers: Tonnage 519 585 593 504 500 Value, million dollars 117 130 130 110 110 Imports, value, million dollars 1,330 1,330 1,100 1,010 1,000 Exports, value, million dollars 32 27 21 22 22 Consumption, apparent, value, million dollars3 1,420 1,430 1,210 1,100 1,100 Price Variable, depending on type of product Employment, quarry and mill, number4 880 880 880 800 800 Net import reliance5 as a percentage of apparent consumption (based on value) 91 91 89 89 90 Recycling: Small amounts of dimension stone were recycled, principally by restorers of old stone work. Import Sources (2014–17 by value): All dimension stone: Brazil, 25%; China, 25%; Italy, 22%; Turkey, 14%; and other, 14%. Granite only: Brazil, 47%; China, 24%; India, 16%; Italy, 9%; and other, 4%. Tariff: Dimension stone tariffs ranged from free to 6.5% ad valorem, according to type, degree of preparation, shape, and size, for countries with normal trade relations in 2018. Most crude or roughly trimmed stone was imported at 3.7% ad valorem or less. Depletion Allowance: 14% (Domestic and foreign); slate used or sold as sintered or burned lightweight aggregate, 7.5% (Domestic and foreign); dimension stone used for rubble and other nonbuilding purposes, 5% (Domestic and foreign). Government Stockpile: None. Prepared by Thomas P. Dolley [(703) 648–7710, [email protected]]
157 STONE (DIMENSION)
Events, Trends, and Issues: The United States remained one of the world’s leading markets for dimension stone. In 2018, total imports of dimension stone were unchanged in value compared with those in 2017. In 2018, mixed to steady activity in new residential construction resulted in essentially unchanged domestic production of dimension stone compared with the previous year. Dimension stone for construction and refurbishment was used in commercial and residential markets; in 2018, the renovation market for existing homes remained steady and unchanged compared with that in the previous year. These factors contributed to a slight decline in dimension stone imports. Dimension stone exports increased to about $71 million. Apparent consumption, by value, was estimated to be $2.5 billion in 2018—about the same as that of 2017. The dimension stone industry continued to be concerned with safety and health regulations and environmental restrictions in 2018, especially those concerning crystalline silica exposure. In 2016, the Occupational Safety and Health Administration finalized new regulations to further restrict exposure to crystalline silica at quarry sites and other industries that use materials containing it. Phased implementation of the new regulations was scheduled to take effect through 2021, affecting various industries that use materials containing silica. Most provisions of the new regulations became enforceable on June 23, 2018, for general industry and maritime operations. Although some small-scale production was likely in many nations, dimension granite and marble was produced and officially reported in 27 countries. The leading five producing countries, in descending order by tonnage, were thought to be China, India, Turkey, Iran, and Italy. World Mine Production and Reserves: Mine production Reserves6 2017 2018e United States 2,810 2,800 Adequate, except for certain Other countries NA NA special types and local World total NA NA shortages. World Resources: Dimension stone resources of the world are sufficient. Resources can be limited on a local level or occasionally on a regional level by the lack of a particular kind of stone that is suitable for dimension purposes. Substitutes: Substitutes for dimension stone include aluminum, brick, ceramic tile, concrete, glass, plastics, resin-agglomerated stone, and steel. eEstimated. NA Not available. 1See also Stone (Crushed). 2Includes granite, limestone, and other types of dimension stone. 3Defined as sold or used (value) + imports (value) – exports (value). 4Excludes office staff. 5Defined as imports – exports. 6See Appendix C for resource and reserve definitions and information concerning data sources.
U.S. Geological Survey, Mineral Commodity Summaries, February 2019
158
STRONTIUM
(Data in metric tons of strontium content unless otherwise noted) Domestic Production and Use: Although deposits of strontium minerals occur widely throughout the United States, none have been mined in the United States since 1959. Domestic production of strontium carbonate, the principal strontium compound, ceased in 2006. It is thought that virtually all of the strontium mineral celestite consumed in the United States since 2006 has been used as an additive in drilling fluids for oil and natural gas wells. A few domestic companies produced small quantities of downstream strontium chemicals from imported strontium carbonate. Based on import data, the estimated end-use distribution in the United States for strontium, including celestite and strontium compounds, was, in descending order, drilling fluids, 70%; ceramic ferrite magnets, and pyrotechnics and signals, 9% each; electrolytic production of zinc, master alloys, pigments and fillers, and other applications, including glass, 3% each. Salient Statistics—United States: 2014 2015 2016 2017 2018e Production — — — — — Imports for consumption: Celestite1 24,200 24,500 4,420 11,300 21,000 Strontium compounds2 7,600 7,100 6,420 6,660 6,800 Exports, strontium compounds 104 86 91 36 37 Consumption, apparent: Celestite 24,200 24,500 4,420 11,300 21,000 Strontium compounds 7,500 7,020 6,330 6,620 6,800 Total 31,700 31,500 10,700 17,900 28,000 Price, average value of celestite imports at port of exportation, dollars per ton 50 51 78 74 75 Net import reliance3 as a percentage of apparent consumption 100 100 100 100 100 Recycling: None. Import Sources (2014–17): Celestite: Mexico, 100%. Strontium compounds: Mexico, 52%; Germany, 39%; China, 6%; and other, 3%. Total imports: Mexico, 86%; Germany, 12%; and China, 2%. Tariff: Item Number Normal Trade Relations 12–31–18 Celestite 2530.90.8010 Free. Strontium compounds: Strontium metal 2805.19.1000 3.7% ad val. Strontium oxide, hydroxide, peroxide 2816.40.1000 4.2% ad val. Strontium nitrate 2834.29.2000 4.2% ad val. Strontium carbonate 2836.92.0000 4.2% ad val. Depletion Allowance: 22% (Domestic), 14% (Foreign). Government Stockpile: None. Prepared by Sheryl A. Singerling [(703) 648–4954, [email protected]]
159 STRONTIUM
Events, Trends, and Issues: For the second year in a row, imports of celestite, the most commonly used strontium mineral, increased significantly. Imports increased by an estimated 88% in 2018 from those in 2017 and by 155% from those in 2016. The decrease in 2016 was likely the result of decreased natural gas- and oil-drilling activity owing to low gas and oil prices in 2014 and 2015. The imports of celestite correlated with the number of active drilling rigs in 2016 through 2018. Nearly all of the celestite is imported from Mexico, with the exception of a small amount of specimen samples, and is thought to be used exclusively as an additive in drilling fluids for oil and natural gas exploration and production. For these applications, celestite is ground but undergoes no chemical processing. Outside the United States, celestite is the raw material used for production of strontium compounds. Strontium compounds include strontium carbonate, which is sintered with iron oxide to produce permanent ceramic ferrite magnets, and strontium nitrate, which contributes a brilliant red color to fireworks and signal flares. Smaller quantities of these and other strontium compounds were consumed in several other applications, including electrolytic production of zinc, glass production, master alloys, and pigments and fillers. In May 2018, the U.S. Department of the Interior, in coordination with other executive branch agencies, published a list of 35 critical minerals (83 FR 23295), including strontium. This list was developed to serve as an initial focus, pursuant to Executive Order 13817, ‘‘A Federal Strategy to Ensure Secure and Reliable Supplies of Critical Minerals” (82 FR 60835). World Mine Production and Reserves:4 Production data for celestite in Iran was added owing to a new source of Government data. Output from Iran was previously not estimated and not included in world totals. Mine production Reserves5 2017 2018e United States — — — Argentina 5,000 5,000 All other: China 50,000 50,000 6,800,000 Iran 40,000 37,000 Mexico 70,000 70,000 Spain 90,000 100,000 1 World total (rounded) 255,000 260,000 6,800,000 World Resources: World resources of strontium are thought to exceed 1 billion tons. Substitutes: Barium can be substituted for strontium in ferrite ceramic magnets; however, the resulting barium composite will have reduced maximum operating temperature when compared with that of strontium composites. Substituting for strontium in pyrotechnics is hindered by difficulty in obtaining the desired brilliance and visibility imparted by strontium and its compounds. In drilling mud, barite is the preferred material, but celestite may substitute for some barite, especially when barite prices are high. eEstimated. — Zero. 1The strontium content of celestite is 43.88%, assuming an ore grade of 92%, which was used to convert units of celestite to strontium content. 2Strontium compounds, with their respective strontium contents, in descending order, include metal (100.00%); oxide, hydroxide, and peroxide (70.00%); carbonate (59.35%); and nitrate (41.40%). These factors were used to convert gross weight of strontium compounds to strontium content. 3Defined as imports − exports. 4Gross weight of celestite in tons. 5See Appendix C for resource and reserve definitions and information concerning data sources.
U.S. Geological Survey, Mineral Commodity Summaries, February 2019
160
SULFUR
(Data in thousand metric tons of sulfur unless otherwise noted) Domestic Production and Use: In 2018, recovered elemental sulfur and byproduct sulfuric acid were produced at 95 operations in 27 States. Total shipments were valued at about $670 million. Elemental sulfur production was 9.0 million tons; Louisiana and Texas accounted for about 55% of domestic production. Elemental sulfur was recovered, in descending order of tonnage, at petroleum refineries, natural-gas-processing plants, and coking plants by 35 companies at 90 plants in 26 States. Byproduct sulfuric acid, representing about 7% of production of sulfur in all forms, was recovered at five nonferrous smelters in four States by four companies. Domestic elemental sulfur provided 67% of domestic consumption, and byproduct acid accounted for about 5%. The remaining 28% of sulfur consumed was provided by imported sulfur and sulfuric acid. About 90% of sulfur consumed was in the form of sulfuric acid. Salient Statistics—United States: 2014 2015 2016 2017 2018e Production: Recovered elemental 9,050 8,890 9,070 9,070 9,000 Other forms 587 646 673 575 670 Total (rounded) 9,630 9,540 9,740 9,640 9,700 Shipments, all forms 9,670 9,560 9,750 9,700 9,700 Imports for consumption: Recovered, elementale 2,370 2,240 1,820 1,860 1,900 Sulfuric acid, sulfur content 1,000 1,160 1,050 954 1,000 Exports: Recovered, elemental 2,010 1,840 2,060 2,340 2,300 Sulfuric acid, sulfur content 53 58 59 83 100 Consumption, apparent, all forms1 11,000 11,000 10,500 10,000 10,000 Price, reported average value, dollars per ton of elemental sulfur, f.o.b., mine and (or) plant 80.07 87.62 37.88 46.40 70.00 Stocks, producer, yearend 141 138 144 124 110 Employment, mine and (or) plant, number 2,600 2,600 2,500 2,400 2,400 Net import reliance2 as a percentage of apparent consumption 12 14 7 4 5 Recycling: Typically, between 2.5 million and 5 million tons of spent sulfuric acid is reclaimed from petroleum refining and chemical processes during any given year. Import Sources (2014–17): Elemental: Canada, 78%; Mexico, 8%; Kazakhstan, 4%; Russia, 4%; and other, 6%. Sulfuric acid: Canada, 62%; Mexico, 20%; and other, 18%. Total sulfur imports: Canada, 73%; Mexico 12%; Kazakhstan, 3%; Russia, 3%; and other, 9%. Tariff: Item Number Normal Trade Relations 12–31–18 Sulfur, crude or unrefined 2503.00.0010 Free. Sulfur, all kinds, other 2503.00.0090 Free. Sulfur, sublimed or precipitated 2802.00.0000 Free. Sulfuric acid 2807.00.0000 Free. Depletion Allowance: 22% (Domestic and foreign). Government Stockpile: None. Events, Trends, and Issues: Total U.S. sulfur production in 2018 was estimated to have increased slightly from that of 2017 and shipments were slightly less than those of 2017. Domestic production of elemental sulfur from petroleum refineries and recovery from natural gas operations decreased slightly. Domestically, refinery sulfur production is expected to remain relatively constant as well as byproduct sulfuric acid, unless one or more of the remaining nonferrous-metal smelters close. Domestic phosphate rock consumption in 2018 was estimated to be 9% lower than that in 2017, which resulted in decreased demand for sulfur to process the phosphate rock into phosphate fertilizers. Prepared by Lori E. Apodaca [(703) 648–7724, [email protected]]
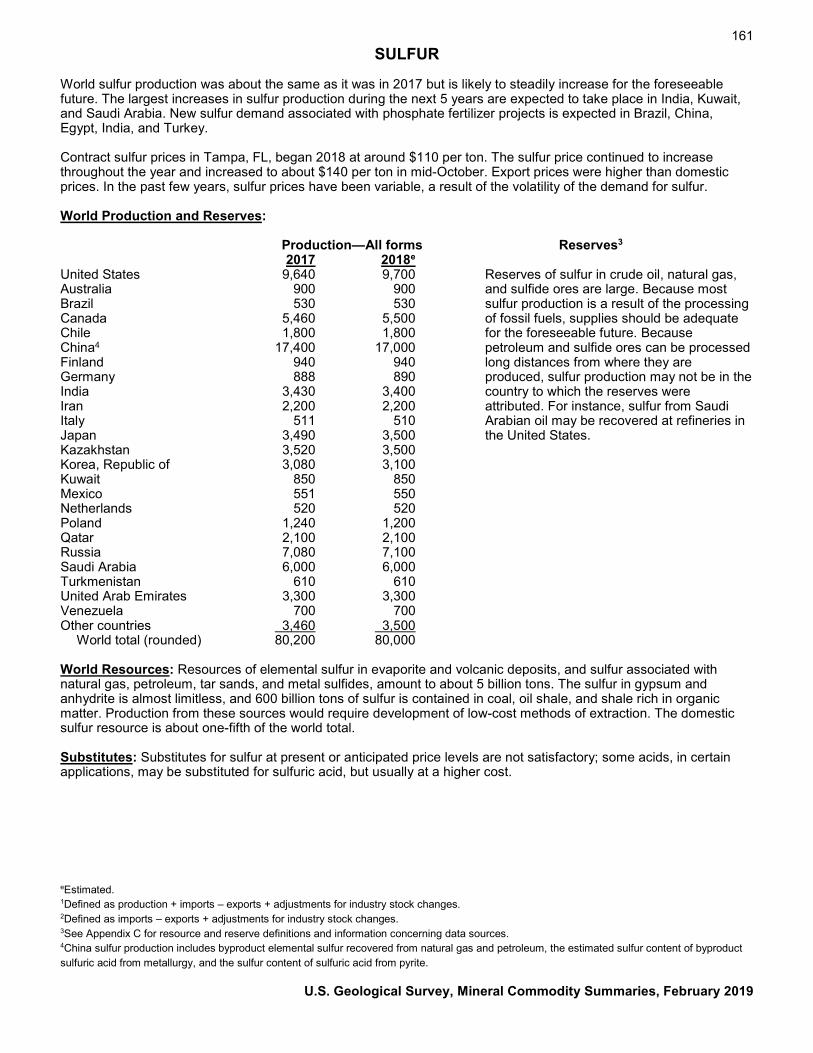
161 SULFUR
World sulfur production was about the same as it was in 2017 but is likely to steadily increase for the foreseeable future. The largest increases in sulfur production during the next 5 years are expected to take place in India, Kuwait, and Saudi Arabia. New sulfur demand associated with phosphate fertilizer projects is expected in Brazil, China, Egypt, India, and Turkey. Contract sulfur prices in Tampa, FL, began 2018 at around $110 per ton. The sulfur price continued to increase throughout the year and increased to about $140 per ton in mid-October. Export prices were higher than domestic prices. In the past few years, sulfur prices have been variable, a result of the volatility of the demand for sulfur. World Production and Reserves: Production—All forms Reserves3 2017 2018e United States 9,640 9,700 Reserves of sulfur in crude oil, natural gas, Australia 900 900 and sulfide ores are large. Because most Brazil 530 530 sulfur production is a result of the processing Canada 5,460 5,500 of fossil fuels, supplies should be adequate Chile 1,800 1,800 for the foreseeable future. Because China4 17,400 17,000 petroleum and sulfide ores can be processed Finland 940 940 long distances from where they are Germany 888 890 produced, sulfur production may not be in the India 3,430 3,400 country to which the reserves were Iran 2,200 2,200 attributed. For instance, sulfur from Saudi Italy 511 510 Arabian oil may be recovered at refineries in Japan 3,490 3,500 the United States. Kazakhstan 3,520 3,500 Korea, Republic of 3,080 3,100 Kuwait 850 850 Mexico 551 550 Netherlands 520 520 Poland 1,240 1,200 Qatar 2,100 2,100 Russia 7,080 7,100 Saudi Arabia 6,000 6,000 Turkmenistan 610 610 United Arab Emirates 3,300 3,300 Venezuela 700 700 Other countries 3,460 3,500 World total (rounded) 80,200 80,000 World Resources: Resources of elemental sulfur in evaporite and volcanic deposits, and sulfur associated with natural gas, petroleum, tar sands, and metal sulfides, amount to about 5 billion tons. The sulfur in gypsum and anhydrite is almost limitless, and 600 billion tons of sulfur is contained in coal, oil shale, and shale rich in organic matter. Production from these sources would require development of low-cost methods of extraction. The domestic sulfur resource is about one-fifth of the world total. Substitutes: Substitutes for sulfur at present or anticipated price levels are not satisfactory; some acids, in certain applications, may be substituted for sulfuric acid, but usually at a higher cost.
eEstimated. 1Defined as production + imports – exports + adjustments for industry stock changes. 2Defined as imports – exports + adjustments for industry stock changes. 3See Appendix C for resource and reserve definitions and information concerning data sources. 4China sulfur production includes byproduct elemental sulfur recovered from natural gas and petroleum, the estimated sulfur content of byproduct sulfuric acid from metallurgy, and the sulfur content of sulfuric acid from pyrite.
U.S. Geological Survey, Mineral Commodity Summaries, February 2019
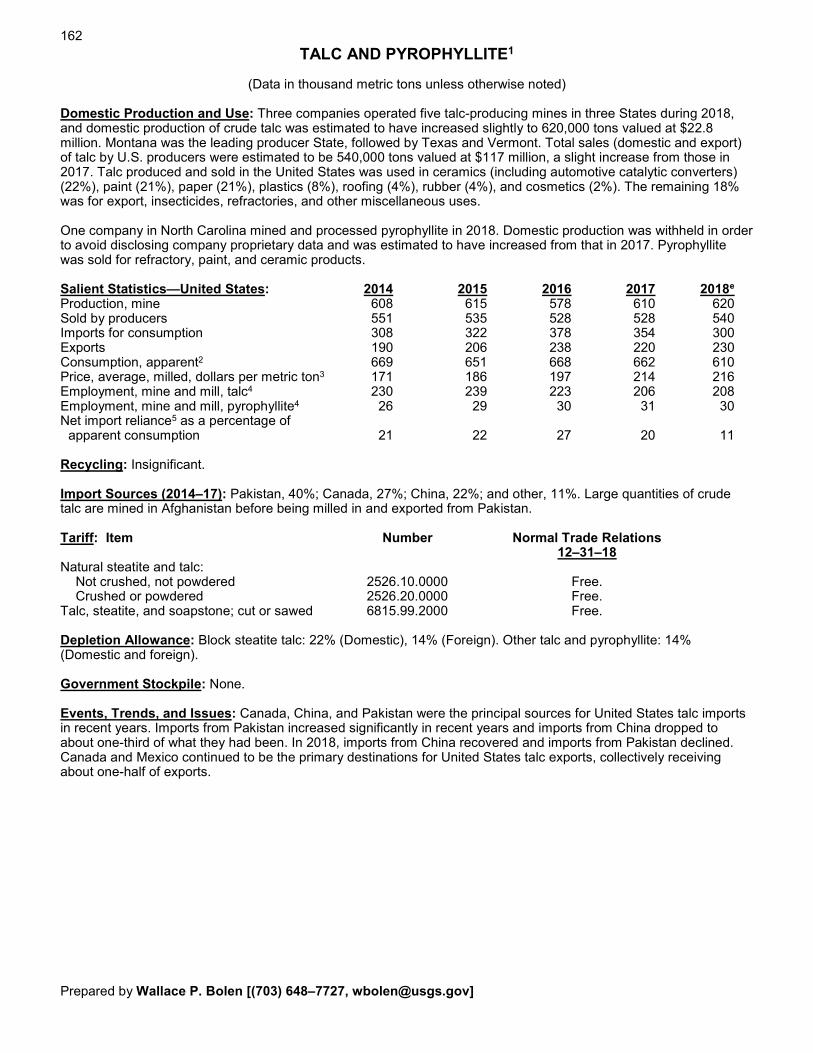
162
TALC AND PYROPHYLLITE1
(Data in thousand metric tons unless otherwise noted) Domestic Production and Use: Three companies operated five talc-producing mines in three States during 2018, and domestic production of crude talc was estimated to have increased slightly to 620,000 tons valued at $22.8 million. Montana was the leading producer State, followed by Texas and Vermont. Total sales (domestic and export) of talc by U.S. producers were estimated to be 540,000 tons valued at $117 million, a slight increase from those in 2017. Talc produced and sold in the United States was used in ceramics (including automotive catalytic converters) (22%), paint (21%), paper (21%), plastics (8%), roofing (4%), rubber (4%), and cosmetics (2%). The remaining 18% was for export, insecticides, refractories, and other miscellaneous uses. One company in North Carolina mined and processed pyrophyllite in 2018. Domestic production was withheld in order to avoid disclosing company proprietary data and was estimated to have increased from that in 2017. Pyrophyllite was sold for refractory, paint, and ceramic products. Salient Statistics—United States: 2014 2015 2016 2017 2018e Production, mine 608 615 578 610 620 Sold by producers 551 535 528 528 540 Imports for consumption 308 322 378 354 300 Exports 190 206 238 220 230 Consumption, apparent2 669 651 668 662 610 Price, average, milled, dollars per metric ton3 171 186 197 214 216 Employment, mine and mill, talc4 230 239 223 206 208 Employment, mine and mill, pyrophyllite4 26 29 30 31 30 Net import reliance5 as a percentage of apparent consumption 21 22 27 20 11 Recycling: Insignificant. Import Sources (2014–17): Pakistan, 40%; Canada, 27%; China, 22%; and other, 11%. Large quantities of crude talc are mined in Afghanistan before being milled in and exported from Pakistan. Tariff: Item Number Normal Trade Relations 12–31–18 Natural steatite and talc: Not crushed, not powdered 2526.10.0000 Free. Crushed or powdered 2526.20.0000 Free. Talc, steatite, and soapstone; cut or sawed 6815.99.2000 Free. Depletion Allowance: Block steatite talc: 22% (Domestic), 14% (Foreign). Other talc and pyrophyllite: 14% (Domestic and foreign). Government Stockpile: None. Events, Trends, and Issues: Canada, China, and Pakistan were the principal sources for United States talc imports in recent years. Imports from Pakistan increased significantly in recent years and imports from China dropped to about one-third of what they had been. In 2018, imports from China recovered and imports from Pakistan declined. Canada and Mexico continued to be the primary destinations for United States talc exports, collectively receiving about one-half of exports. Prepared by Wallace P. Bolen [(703) 648–7727, [email protected]]
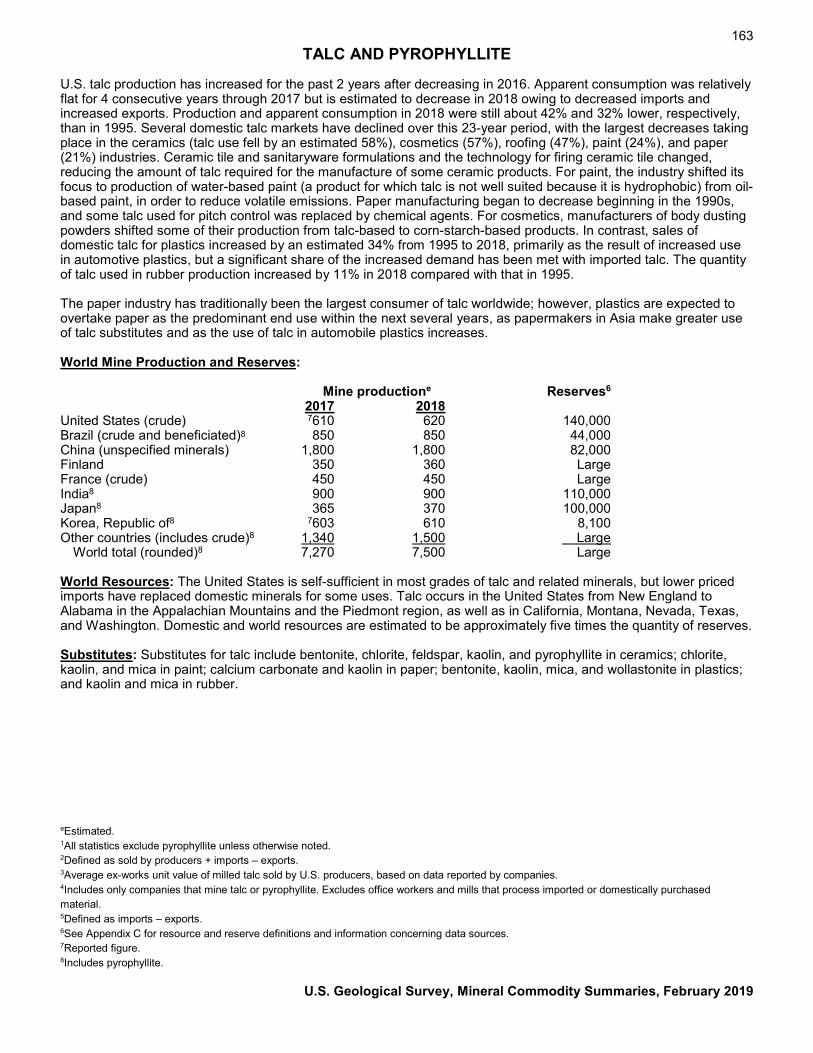
163 TALC AND PYROPHYLLITE
U.S. talc production has increased for the past 2 years after decreasing in 2016. Apparent consumption was relatively flat for 4 consecutive years through 2017 but is estimated to decrease in 2018 owing to decreased imports and increased exports. Production and apparent consumption in 2018 were still about 42% and 32% lower, respectively, than in 1995. Several domestic talc markets have declined over this 23-year period, with the largest decreases taking place in the ceramics (talc use fell by an estimated 58%), cosmetics (57%), roofing (47%), paint (24%), and paper (21%) industries. Ceramic tile and sanitaryware formulations and the technology for firing ceramic tile changed, reducing the amount of talc required for the manufacture of some ceramic products. For paint, the industry shifted its focus to production of water-based paint (a product for which talc is not well suited because it is hydrophobic) from oil-based paint, in order to reduce volatile emissions. Paper manufacturing began to decrease beginning in the 1990s, and some talc used for pitch control was replaced by chemical agents. For cosmetics, manufacturers of body dusting powders shifted some of their production from talc-based to corn-starch-based products. In contrast, sales of domestic talc for plastics increased by an estimated 34% from 1995 to 2018, primarily as the result of increased use in automotive plastics, but a significant share of the increased demand has been met with imported talc. The quantity of talc used in rubber production increased by 11% in 2018 compared with that in 1995. The paper industry has traditionally been the largest consumer of talc worldwide; however, plastics are expected to overtake paper as the predominant end use within the next several years, as papermakers in Asia make greater use of talc substitutes and as the use of talc in automobile plastics increases. World Mine Production and Reserves: Mine productione Reserves6 2017 2018 United States (crude) 7610 620 140,000 Brazil (crude and beneficiated)8 850 850 44,000 China (unspecified minerals) 1,800 1,800 82,000 Finland 350 360 Large France (crude) 450 450 Large India8 900 900 110,000 Japan8 365 370 100,000 Korea, Republic of8 7603 610 8,100 Other countries (includes crude)8 1,340 1,500 Large World total (rounded)8 7,270 7,500 Large World Resources: The United States is self-sufficient in most grades of talc and related minerals, but lower priced imports have replaced domestic minerals for some uses. Talc occurs in the United States from New England to Alabama in the Appalachian Mountains and the Piedmont region, as well as in California, Montana, Nevada, Texas, and Washington. Domestic and world resources are estimated to be approximately five times the quantity of reserves. Substitutes: Substitutes for talc include bentonite, chlorite, feldspar, kaolin, and pyrophyllite in ceramics; chlorite, kaolin, and mica in paint; calcium carbonate and kaolin in paper; bentonite, kaolin, mica, and wollastonite in plastics; and kaolin and mica in rubber. eEstimated. 1All statistics exclude pyrophyllite unless otherwise noted. 2Defined as sold by producers + imports – exports. 3Average ex-works unit value of milled talc sold by U.S. producers, based on data reported by companies. 4Includes only companies that mine talc or pyrophyllite. Excludes office workers and mills that process imported or domestically purchased material. 5Defined as imports – exports. 6See Appendix C for resource and reserve definitions and information concerning data sources. 7Reported figure. 8Includes pyrophyllite.
U.S. Geological Survey, Mineral Commodity Summaries, February 2019
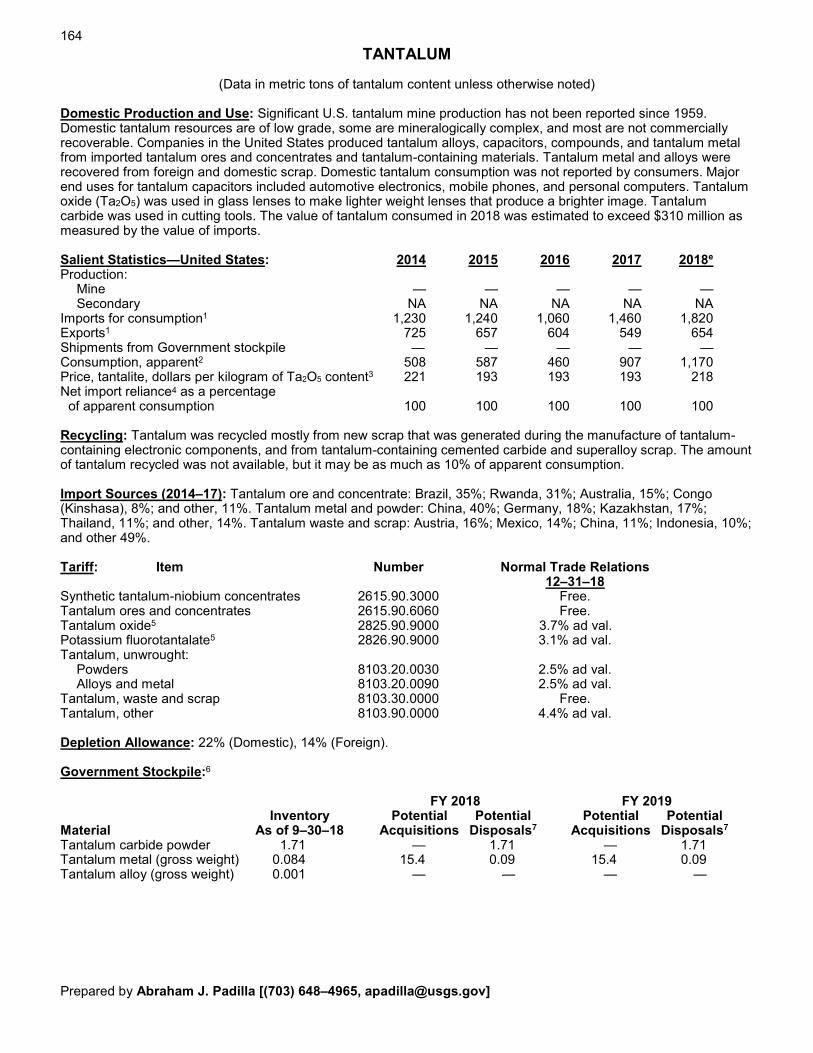
164
TANTALUM
(Data in metric tons of tantalum content unless otherwise noted) Domestic Production and Use: Significant U.S. tantalum mine production has not been reported since 1959. Domestic tantalum resources are of low grade, some are mineralogically complex, and most are not commercially recoverable. Companies in the United States produced tantalum alloys, capacitors, compounds, and tantalum metal from imported tantalum ores and concentrates and tantalum-containing materials. Tantalum metal and alloys were recovered from foreign and domestic scrap. Domestic tantalum consumption was not reported by consumers. Major end uses for tantalum capacitors included automotive electronics, mobile phones, and personal computers. Tantalum oxide (Ta2O5) was used in glass lenses to make lighter weight lenses that produce a brighter image. Tantalum carbide was used in cutting tools. The value of tantalum consumed in 2018 was estimated to exceed $310 million as measured by the value of imports. Salient Statistics—United States: 2014 2015 2016 2017 2018e Production: Mine — — — — — Secondary NA NA NA NA NA Imports for consumption1 1,230 1,240 1,060 1,460 1,820 Exports1 725 657 604 549 654 Shipments from Government stockpile — — — — — Consumption, apparent2 508 587 460 907 1,170 Price, tantalite, dollars per kilogram of Ta2O5 content3 221 193 193 193 218 Net import reliance4 as a percentage of apparent consumption 100 100 100 100 100 Recycling: Tantalum was recycled mostly from new scrap that was generated during the manufacture of tantalum-containing electronic components, and from tantalum-containing cemented carbide and superalloy scrap. The amount of tantalum recycled was not available, but it may be as much as 10% of apparent consumption. Import Sources (2014–17): Tantalum ore and concentrate: Brazil, 35%; Rwanda, 31%; Australia, 15%; Congo (Kinshasa), 8%; and other, 11%. Tantalum metal and powder: China, 40%; Germany, 18%; Kazakhstan, 17%; Thailand, 11%; and other, 14%. Tantalum waste and scrap: Austria, 16%; Mexico, 14%; China, 11%; Indonesia, 10%; and other 49%. Tariff: Item Number Normal Trade Relations 12–31–18 Synthetic tantalum-niobium concentrates 2615.90.3000 Free. Tantalum ores and concentrates 2615.90.6060 Free. Tantalum oxide5 2825.90.9000 3.7% ad val. Potassium fluorotantalate5 2826.90.9000 3.1% ad val. Tantalum, unwrought: Powders 8103.20.0030 2.5% ad val. Alloys and metal 8103.20.0090 2.5% ad val. Tantalum, waste and scrap 8103.30.0000 Free. Tantalum, other 8103.90.0000 4.4% ad val. Depletion Allowance: 22% (Domestic), 14% (Foreign). Government Stockpile:6
FY 2018 FY 2019 Inventory Potential Potential Potential Potential Material As of 9–30–18 Acquisitions Disposals7 Acquisitions Disposals7
Tantalum carbide powder 1.71 — 1.71 — 1.71 Tantalum metal (gross weight) 0.084 15.4 0.09 15.4 0.09 Tantalum alloy (gross weight) 0.001 — — — — Prepared by Abraham J. Padilla [(703) 648–4965, [email protected]]
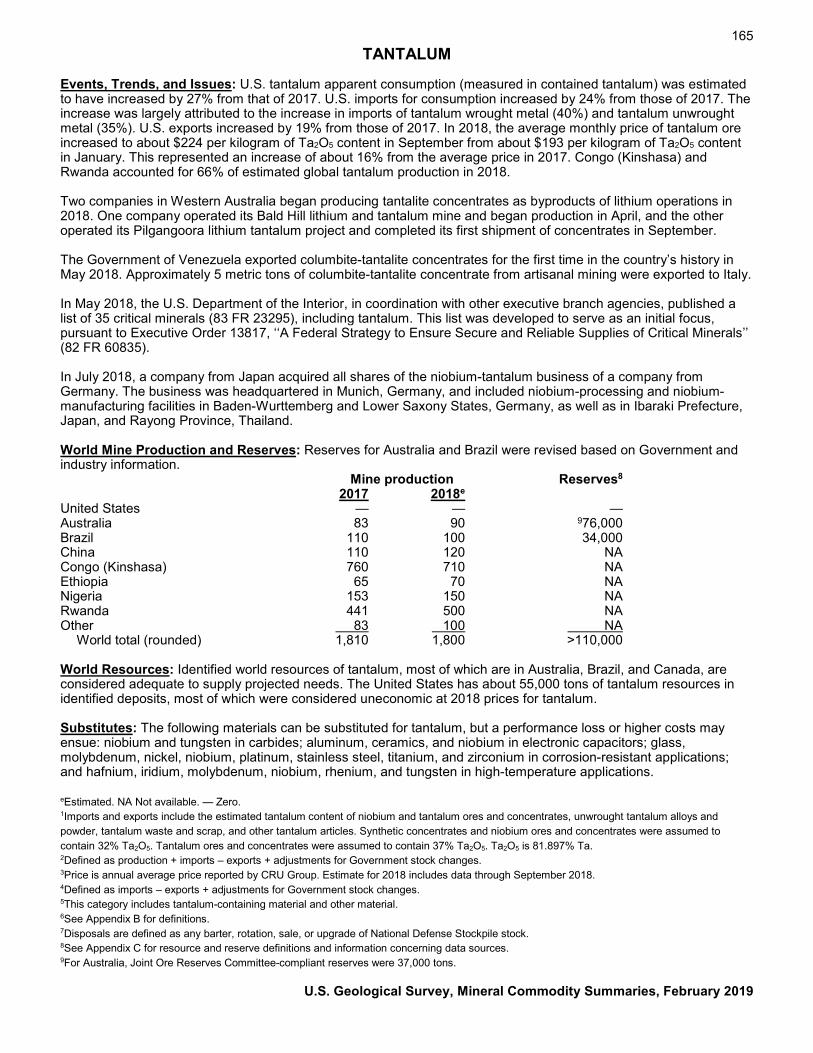
165 TANTALUM
Events, Trends, and Issues: U.S. tantalum apparent consumption (measured in contained tantalum) was estimated to have increased by 27% from that of 2017. U.S. imports for consumption increased by 24% from those of 2017. The increase was largely attributed to the increase in imports of tantalum wrought metal (40%) and tantalum unwrought metal (35%). U.S. exports increased by 19% from those of 2017. In 2018, the average monthly price of tantalum ore increased to about $224 per kilogram of Ta2O5 content in September from about $193 per kilogram of Ta2O5 content in January. This represented an increase of about 16% from the average price in 2017. Congo (Kinshasa) and Rwanda accounted for 66% of estimated global tantalum production in 2018. Two companies in Western Australia began producing tantalite concentrates as byproducts of lithium operations in 2018. One company operated its Bald Hill lithium and tantalum mine and began production in April, and the other operated its Pilgangoora lithium tantalum project and completed its first shipment of concentrates in September. The Government of Venezuela exported columbite-tantalite concentrates for the first time in the country’s history in May 2018. Approximately 5 metric tons of columbite-tantalite concentrate from artisanal mining were exported to Italy. In May 2018, the U.S. Department of the Interior, in coordination with other executive branch agencies, published a list of 35 critical minerals (83 FR 23295), including tantalum. This list was developed to serve as an initial focus, pursuant to Executive Order 13817, ‘‘A Federal Strategy to Ensure Secure and Reliable Supplies of Critical Minerals’’ (82 FR 60835). In July 2018, a company from Japan acquired all shares of the niobium-tantalum business of a company from Germany. The business was headquartered in Munich, Germany, and included niobium-processing and niobium-manufacturing facilities in Baden-Wurttemberg and Lower Saxony States, Germany, as well as in Ibaraki Prefecture, Japan, and Rayong Province, Thailand. World Mine Production and Reserves: Reserves for Australia and Brazil were revised based on Government and industry information. Mine production Reserves8 2017 2018e United States — — — Australia 83 90 976,000 Brazil 110 100 34,000 China 110 120 NA Congo (Kinshasa) 760 710 NA Ethiopia 65 70 NA Nigeria 153 150 NA Rwanda 441 500 NA Other 83 100 NA World total (rounded) 1,810 1,800 >110,000 World Resources: Identified world resources of tantalum, most of which are in Australia, Brazil, and Canada, are considered adequate to supply projected needs. The United States has about 55,000 tons of tantalum resources in identified deposits, most of which were considered uneconomic at 2018 prices for tantalum. Substitutes: The following materials can be substituted for tantalum, but a performance loss or higher costs may ensue: niobium and tungsten in carbides; aluminum, ceramics, and niobium in electronic capacitors; glass, molybdenum, nickel, niobium, platinum, stainless steel, titanium, and zirconium in corrosion-resistant applications; and hafnium, iridium, molybdenum, niobium, rhenium, and tungsten in high-temperature applications. eEstimated. NA Not available. — Zero. 1Imports and exports include the estimated tantalum content of niobium and tantalum ores and concentrates, unwrought tantalum alloys and powder, tantalum waste and scrap, and other tantalum articles. Synthetic concentrates and niobium ores and concentrates were assumed to contain 32% Ta2O5. Tantalum ores and concentrates were assumed to contain 37% Ta2O5. Ta2O5 is 81.897% Ta. 2Defined as production + imports – exports + adjustments for Government stock changes. 3Price is annual average price reported by CRU Group. Estimate for 2018 includes data through September 2018. 4Defined as imports – exports + adjustments for Government stock changes. 5This category includes tantalum-containing material and other material. 6See Appendix B for definitions. 7Disposals are defined as any barter, rotation, sale, or upgrade of National Defense Stockpile stock. 8See Appendix C for resource and reserve definitions and information concerning data sources. 9For Australia, Joint Ore Reserves Committee-compliant reserves were 37,000 tons.
U.S. Geological Survey, Mineral Commodity Summaries, February 2019
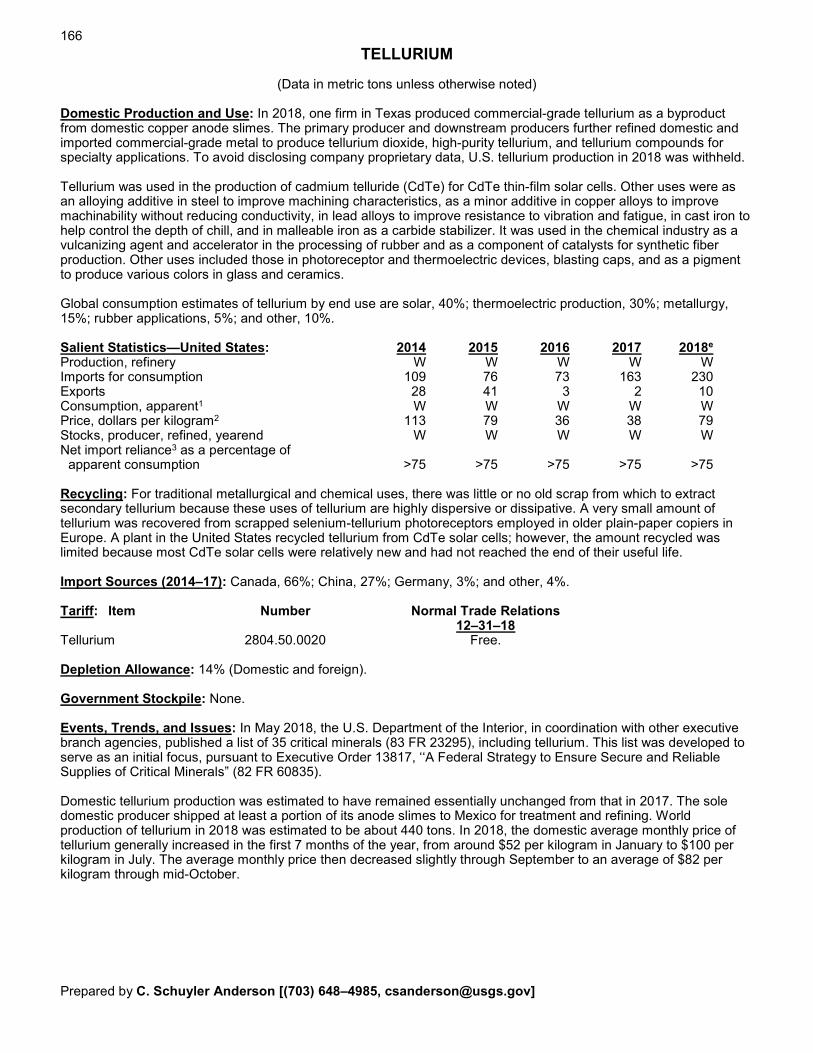
166
TELLURIUM
(Data in metric tons unless otherwise noted) Domestic Production and Use: In 2018, one firm in Texas produced commercial-grade tellurium as a byproduct from domestic copper anode slimes. The primary producer and downstream producers further refined domestic and imported commercial-grade metal to produce tellurium dioxide, high-purity tellurium, and tellurium compounds for specialty applications. To avoid disclosing company proprietary data, U.S. tellurium production in 2018 was withheld. Tellurium was used in the production of cadmium telluride (CdTe) for CdTe thin-film solar cells. Other uses were as an alloying additive in steel to improve machining characteristics, as a minor additive in copper alloys to improve machinability without reducing conductivity, in lead alloys to improve resistance to vibration and fatigue, in cast iron to help control the depth of chill, and in malleable iron as a carbide stabilizer. It was used in the chemical industry as a vulcanizing agent and accelerator in the processing of rubber and as a component of catalysts for synthetic fiber production. Other uses included those in photoreceptor and thermoelectric devices, blasting caps, and as a pigment to produce various colors in glass and ceramics. Global consumption estimates of tellurium by end use are solar, 40%; thermoelectric production, 30%; metallurgy, 15%; rubber applications, 5%; and other, 10%. Salient Statistics—United States: 2014 2015 2016 2017 2018e Production, refinery W W W W W Imports for consumption 109 76 73 163 230 Exports 28 41 3 2 10 Consumption, apparent1 W W W W W Price, dollars per kilogram2 113 79 36 38 79 Stocks, producer, refined, yearend W W W W W Net import reliance3 as a percentage of apparent consumption >75 >75 >75 >75 >75 Recycling: For traditional metallurgical and chemical uses, there was little or no old scrap from which to extract secondary tellurium because these uses of tellurium are highly dispersive or dissipative. A very small amount of tellurium was recovered from scrapped selenium-tellurium photoreceptors employed in older plain-paper copiers in Europe. A plant in the United States recycled tellurium from CdTe solar cells; however, the amount recycled was limited because most CdTe solar cells were relatively new and had not reached the end of their useful life. Import Sources (2014–17): Canada, 66%; China, 27%; Germany, 3%; and other, 4%. Tariff: Item Number Normal Trade Relations 12–31–18 Tellurium 2804.50.0020 Free. Depletion Allowance: 14% (Domestic and foreign). Government Stockpile: None. Events, Trends, and Issues: In May 2018, the U.S. Department of the Interior, in coordination with other executive branch agencies, published a list of 35 critical minerals (83 FR 23295), including tellurium. This list was developed to serve as an initial focus, pursuant to Executive Order 13817, ‘‘A Federal Strategy to Ensure Secure and Reliable Supplies of Critical Minerals” (82 FR 60835). Domestic tellurium production was estimated to have remained essentially unchanged from that in 2017. The sole domestic producer shipped at least a portion of its anode slimes to Mexico for treatment and refining. World production of tellurium in 2018 was estimated to be about 440 tons. In 2018, the domestic average monthly price of tellurium generally increased in the first 7 months of the year, from around $52 per kilogram in January to $100 per kilogram in July. The average monthly price then decreased slightly through September to an average of $82 per kilogram through mid-October. Prepared by C. Schuyler Anderson [(703) 648–4985, [email protected]]
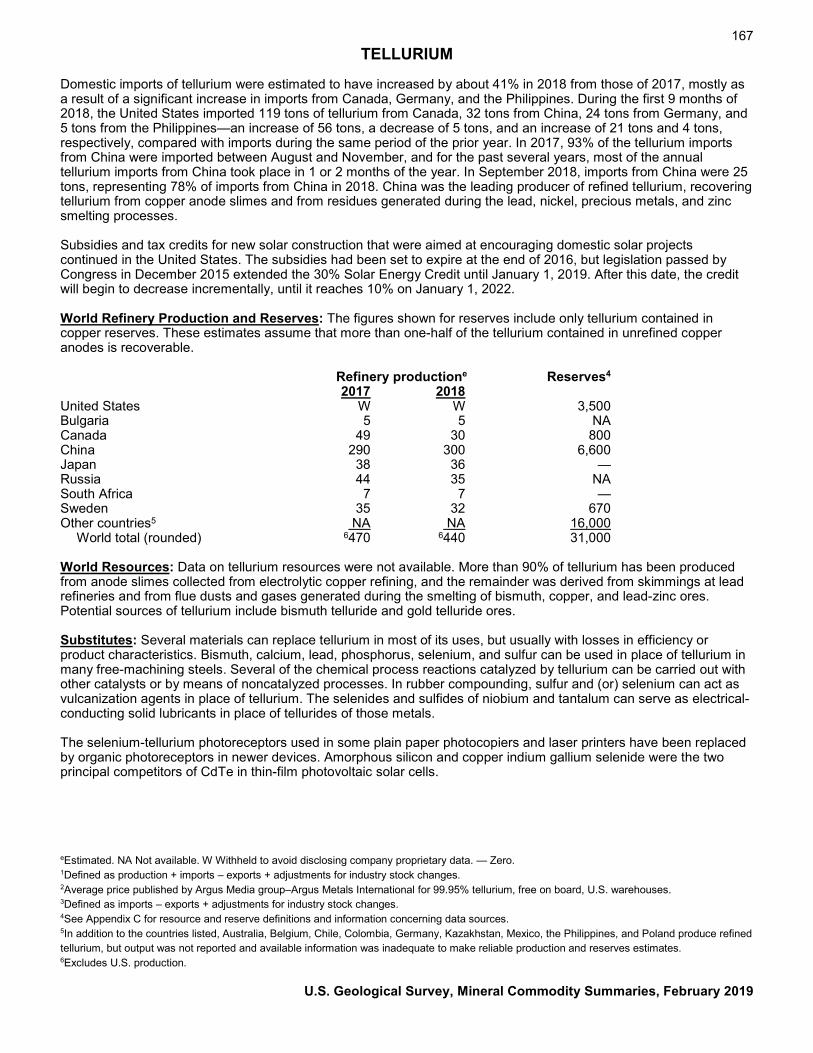
167 TELLURIUM
Domestic imports of tellurium were estimated to have increased by about 41% in 2018 from those of 2017, mostly as a result of a significant increase in imports from Canada, Germany, and the Philippines. During the first 9 months of 2018, the United States imported 119 tons of tellurium from Canada, 32 tons from China, 24 tons from Germany, and 5 tons from the Philippines—an increase of 56 tons, a decrease of 5 tons, and an increase of 21 tons and 4 tons, respectively, compared with imports during the same period of the prior year. In 2017, 93% of the tellurium imports from China were imported between August and November, and for the past several years, most of the annual tellurium imports from China took place in 1 or 2 months of the year. In September 2018, imports from China were 25 tons, representing 78% of imports from China in 2018. China was the leading producer of refined tellurium, recovering tellurium from copper anode slimes and from residues generated during the lead, nickel, precious metals, and zinc smelting processes. Subsidies and tax credits for new solar construction that were aimed at encouraging domestic solar projects continued in the United States. The subsidies had been set to expire at the end of 2016, but legislation passed by Congress in December 2015 extended the 30% Solar Energy Credit until January 1, 2019. After this date, the credit will begin to decrease incrementally, until it reaches 10% on January 1, 2022. World Refinery Production and Reserves: The figures shown for reserves include only tellurium contained in copper reserves. These estimates assume that more than one-half of the tellurium contained in unrefined copper anodes is recoverable. Refinery productione Reserves4 2017 2018 United States W W 3,500 Bulgaria 5 5 NA Canada 49 30 800 China 290 300 6,600 Japan 38 36 — Russia 44 35 NA South Africa 7 7 — Sweden 35 32 670 Other countries5 NA NA 16,000 World total (rounded) 6470 6440 31,000 World Resources: Data on tellurium resources were not available. More than 90% of tellurium has been produced from anode slimes collected from electrolytic copper refining, and the remainder was derived from skimmings at lead refineries and from flue dusts and gases generated during the smelting of bismuth, copper, and lead-zinc ores. Potential sources of tellurium include bismuth telluride and gold telluride ores. Substitutes: Several materials can replace tellurium in most of its uses, but usually with losses in efficiency or product characteristics. Bismuth, calcium, lead, phosphorus, selenium, and sulfur can be used in place of tellurium in many free-machining steels. Several of the chemical process reactions catalyzed by tellurium can be carried out with other catalysts or by means of noncatalyzed processes. In rubber compounding, sulfur and (or) selenium can act as vulcanization agents in place of tellurium. The selenides and sulfides of niobium and tantalum can serve as electrical-conducting solid lubricants in place of tellurides of those metals. The selenium-tellurium photoreceptors used in some plain paper photocopiers and laser printers have been replaced by organic photoreceptors in newer devices. Amorphous silicon and copper indium gallium selenide were the two principal competitors of CdTe in thin-film photovoltaic solar cells.
eEstimated. NA Not available. W Withheld to avoid disclosing company proprietary data. — Zero. 1Defined as production + imports – exports + adjustments for industry stock changes. 2Average price published by Argus Media group–Argus Metals International for 99.95% tellurium, free on board, U.S. warehouses. 3Defined as imports – exports + adjustments for industry stock changes. 4See Appendix C for resource and reserve definitions and information concerning data sources. 5In addition to the countries listed, Australia, Belgium, Chile, Colombia, Germany, Kazakhstan, Mexico, the Philippines, and Poland produce refined tellurium, but output was not reported and available information was inadequate to make reliable production and reserves estimates. 6Excludes U.S. production.
U.S. Geological Survey, Mineral Commodity Summaries, February 2019
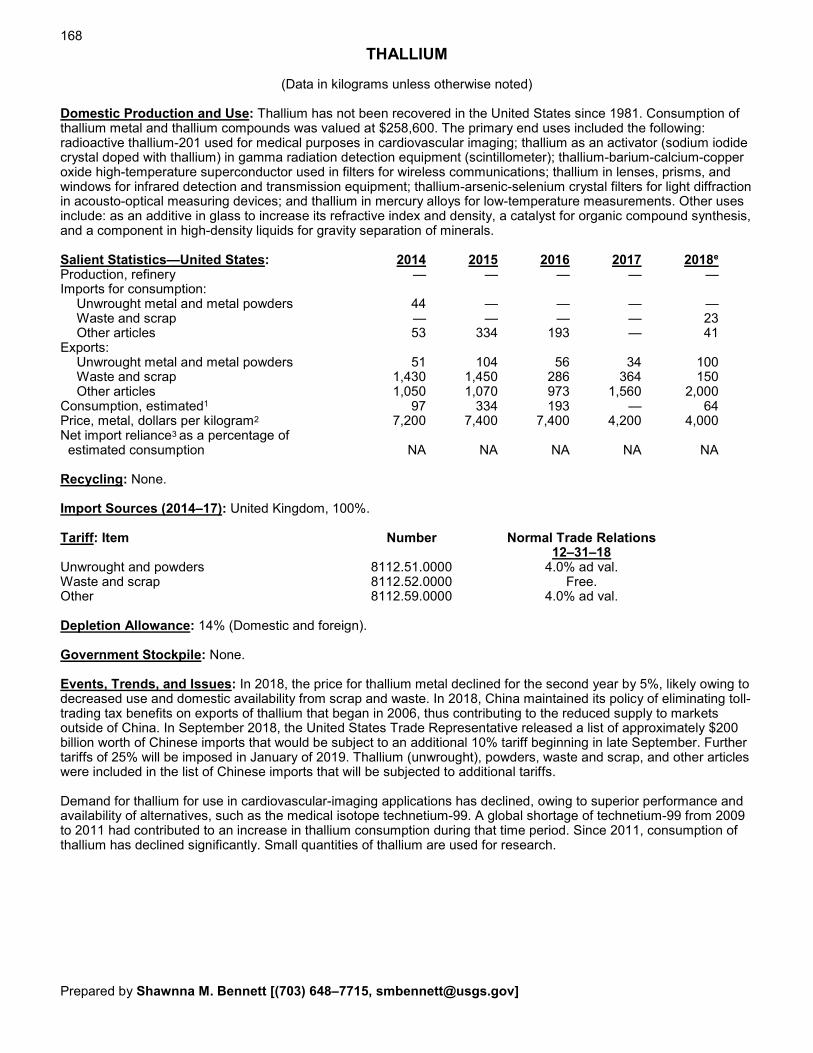
168
THALLIUM
(Data in kilograms unless otherwise noted) Domestic Production and Use: Thallium has not been recovered in the United States since 1981. Consumption of thallium metal and thallium compounds was valued at $258,600. The primary end uses included the following: radioactive thallium-201 used for medical purposes in cardiovascular imaging; thallium as an activator (sodium iodide crystal doped with thallium) in gamma radiation detection equipment (scintillometer); thallium-barium-calcium-copper oxide high-temperature superconductor used in filters for wireless communications; thallium in lenses, prisms, and windows for infrared detection and transmission equipment; thallium-arsenic-selenium crystal filters for light diffraction in acousto-optical measuring devices; and thallium in mercury alloys for low-temperature measurements. Other uses include: as an additive in glass to increase its refractive index and density, a catalyst for organic compound synthesis, and a component in high-density liquids for gravity separation of minerals. Salient Statistics—United States: 2014 2015 2016 2017 2018e Production, refinery — — — — — Imports for consumption: Unwrought metal and metal powders 44 — — — — Waste and scrap — — — — 23 Other articles 53 334 193 — 41 Exports: Unwrought metal and metal powders 51 104 56 34 100 Waste and scrap 1,430 1,450 286 364 150 Other articles 1,050 1,070 973 1,560 2,000 Consumption, estimated1 97 334 193 — 64 Price, metal, dollars per kilogram2 7,200 7,400 7,400 4,200 4,000 Net import reliance3 as a percentage of estimated consumption NA NA NA NA NA Recycling: None. Import Sources (2014–17): United Kingdom, 100%. Tariff: Item Number Normal Trade Relations 12–31–18 Unwrought and powders 8112.51.0000 4.0% ad val. Waste and scrap 8112.52.0000 Free. Other 8112.59.0000 4.0% ad val. Depletion Allowance: 14% (Domestic and foreign). Government Stockpile: None. Events, Trends, and Issues: In 2018, the price for thallium metal declined for the second year by 5%, likely owing to decreased use and domestic availability from scrap and waste. In 2018, China maintained its policy of eliminating toll-trading tax benefits on exports of thallium that began in 2006, thus contributing to the reduced supply to markets outside of China. In September 2018, the United States Trade Representative released a list of approximately $200 billion worth of Chinese imports that would be subject to an additional 10% tariff beginning in late September. Further tariffs of 25% will be imposed in January of 2019. Thallium (unwrought), powders, waste and scrap, and other articles were included in the list of Chinese imports that will be subjected to additional tariffs. Demand for thallium for use in cardiovascular-imaging applications has declined, owing to superior performance and availability of alternatives, such as the medical isotope technetium-99. A global shortage of technetium-99 from 2009 to 2011 had contributed to an increase in thallium consumption during that time period. Since 2011, consumption of thallium has declined significantly. Small quantities of thallium are used for research. Prepared by Shawnna M. Bennett [(703) 648–7715, [email protected]]
169 THALLIUM
Two of the leading global markets for thallium were glass lenses, prisms, and windows for fiber optics, and optics for digital cameras. The majority of producers of these products were in China, Japan, and the Republic of Korea. A search of the U.S. Patent and Trademark office shows that patents were filed in 2018 to use thallium as a metal plating enhancer in batteries and as a variable resistance layer in memory devices to increase thermal and electrical conductivity. Other applications were for antibody detection labels with radioactive isotopes for research, and for quantum dots and solder. Thallium metal and its compounds are highly toxic materials and are strictly controlled to prevent harm to humans and the environment. Thallium and its compounds can be absorbed into the human body by skin contact, ingestion, or inhalation of dust or fumes. The leading sources of thallium released into the environment are coal-burning powerplants and smelters of copper, lead, and zinc ores. The major sources of thallium in drinking water are ore-processing sites and discharges from drugs, electronics, and glass factories. Under its national primary drinking water regulations for public water supplies, the U.S. Environmental Protection Agency has set an enforceable Maximum Contaminant Level of 2 parts per billion of thallium in drinking water. World Refinery Production and Reserves:4 Thallium is produced commercially in only a few countries as a byproduct in the roasting of copper, lead, and zinc ores and is recovered from flue dust. Because most producers withhold thallium production data, global production data are limited. In 2018, global production of thallium was estimated to be less than 8,000 kilograms. China, Kazakhstan, and Russia were believed to be leading producers of primary thallium. Since 2005, substantial thallium-rich deposits have been identified in Brazil, China, Macedonia, and Russia. World Resources: Although thallium is reasonably abundant in the Earth's crust, estimated at about 0.7 part per million, it exists mostly in association with potassium minerals in clays, granites, and soils, and it is not generally considered to be commercially recoverable from those materials. The major source of recoverable thallium is the trace amounts found in copper, lead, zinc, and other sulfide ores. Quantitative estimates of reserves are not available, owing to the difficulty in identifying deposits where thallium can be extracted economically. Previous estimates of reserves were based on the thallium content of zinc ores. World resources of thallium contained in zinc resources could be as much as 17 million kilograms; most are in Canada, Europe, and the United States. Global resources of coal contain an estimated 630 million kilograms of thallium. Substitutes: Although other materials and formulations can substitute for thallium in gamma radiation detection equipment and optics used for infrared detection and transmission, thallium materials are presently superior and more cost effective for these very specialized uses. The medical isotope technetium-99 can be used in cardiovascular-imaging applications instead of thallium. Nonpoisonous substitutes, such as tungsten compounds, are being marketed as substitutes for thallium in high-density liquids for gravity separation of minerals. eEstimated. NA Not available. — Zero. 1Estimated to be equal to imports. 2Estimated price of 99.99%-pure granules or rods in 100- to 250-gram or larger lots. 3Defined as imports – exports. Consumption and exports of unwrought thallium were from imported material or from a drawdown in unreported inventories. 4See Appendix C for resource and reserve definitions and information concerning data sources.
U.S. Geological Survey, Mineral Commodity Summaries, February 2019
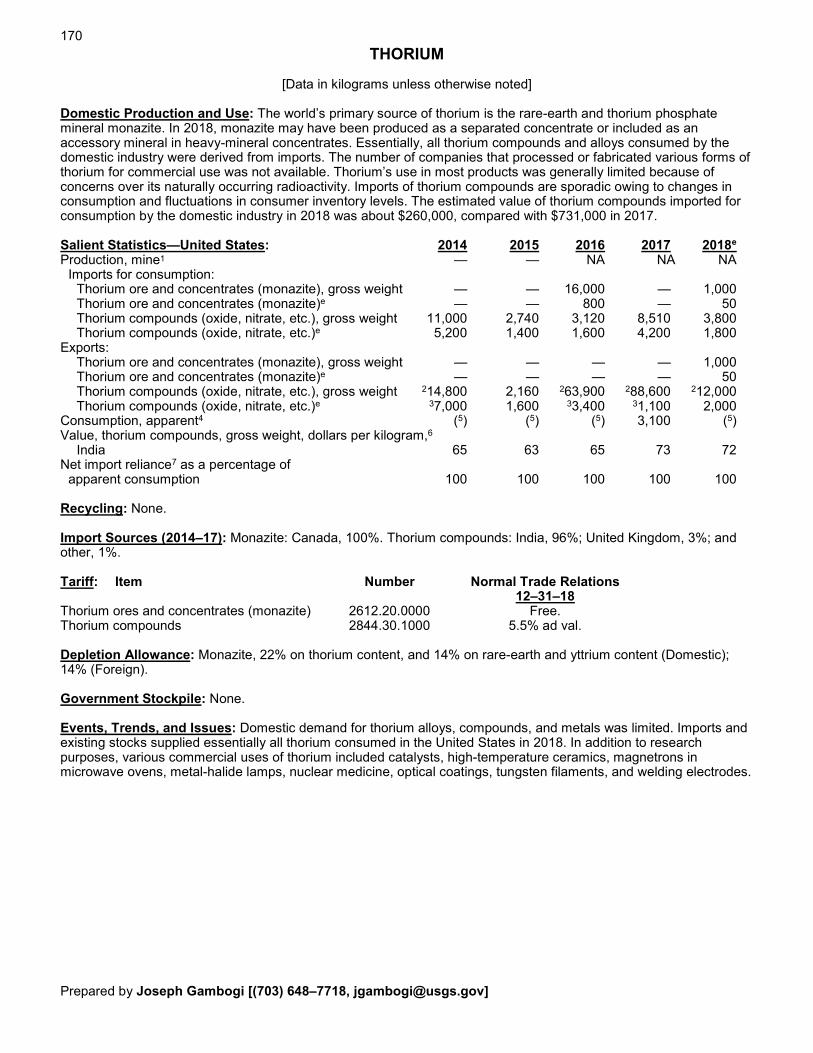
170
THORIUM
[Data in kilograms unless otherwise noted] Domestic Production and Use: The world’s primary source of thorium is the rare-earth and thorium phosphate mineral monazite. In 2018, monazite may have been produced as a separated concentrate or included as an accessory mineral in heavy-mineral concentrates. Essentially, all thorium compounds and alloys consumed by the domestic industry were derived from imports. The number of companies that processed or fabricated various forms of thorium for commercial use was not available. Thorium’s use in most products was generally limited because of concerns over its naturally occurring radioactivity. Imports of thorium compounds are sporadic owing to changes in consumption and fluctuations in consumer inventory levels. The estimated value of thorium compounds imported for consumption by the domestic industry in 2018 was about $260,000, compared with $731,000 in 2017. Salient Statistics—United States: 2014 2015 2016 2017 2018e Production, mine1 — — NA NA NA Imports for consumption: Thorium ore and concentrates (monazite), gross weight — — 16,000 — 1,000 Thorium ore and concentrates (monazite)e — — 800 — 50 Thorium compounds (oxide, nitrate, etc.), gross weight 11,000 2,740 3,120 8,510 3,800 Thorium compounds (oxide, nitrate, etc.)e 5,200 1,400 1,600 4,200 1,800 Exports: Thorium ore and concentrates (monazite), gross weight — — — — 1,000 Thorium ore and concentrates (monazite)e — — — — 50 Thorium compounds (oxide, nitrate, etc.), gross weight 214,800 2,160 263,900 288,600 212,000 Thorium compounds (oxide, nitrate, etc.)e 37,000 1,600 33,400 31,100 2,000 Consumption, apparent4 (5) (5) (5) 3,100 (5) Value, thorium compounds, gross weight, dollars per kilogram,6 India 65 63 65 73 72 Net import reliance7 as a percentage of apparent consumption 100 100 100 100 100 Recycling: None. Import Sources (2014–17): Monazite: Canada, 100%. Thorium compounds: India, 96%; United Kingdom, 3%; and other, 1%. Tariff: Item Number Normal Trade Relations 12–31–18 Thorium ores and concentrates (monazite) 2612.20.0000 Free. Thorium compounds 2844.30.1000 5.5% ad val. Depletion Allowance: Monazite, 22% on thorium content, and 14% on rare-earth and yttrium content (Domestic); 14% (Foreign). Government Stockpile: None. Events, Trends, and Issues: Domestic demand for thorium alloys, compounds, and metals was limited. Imports and existing stocks supplied essentially all thorium consumed in the United States in 2018. In addition to research purposes, various commercial uses of thorium included catalysts, high-temperature ceramics, magnetrons in microwave ovens, metal-halide lamps, nuclear medicine, optical coatings, tungsten filaments, and welding electrodes. Prepared by Joseph Gambogi [(703) 648–7718, [email protected]]
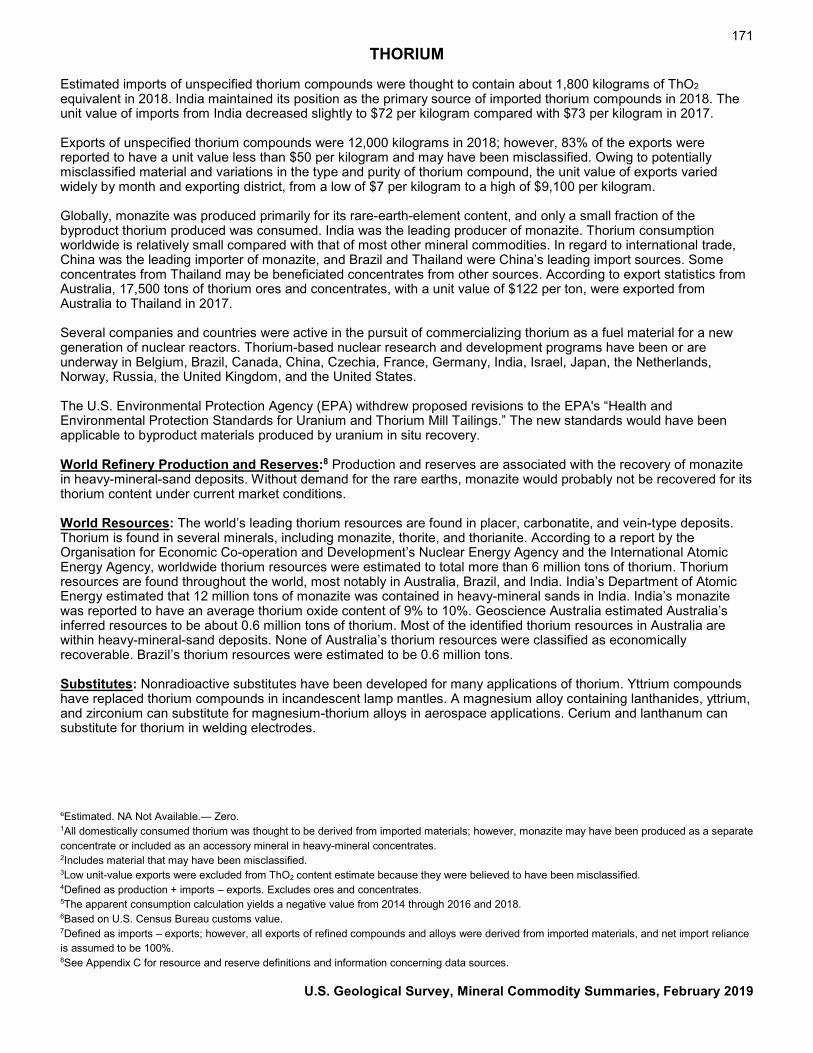
171 THORIUM
Estimated imports of unspecified thorium compounds were thought to contain about 1,800 kilograms of ThO2 equivalent in 2018. India maintained its position as the primary source of imported thorium compounds in 2018. The unit value of imports from India decreased slightly to $72 per kilogram compared with $73 per kilogram in 2017. Exports of unspecified thorium compounds were 12,000 kilograms in 2018; however, 83% of the exports were reported to have a unit value less than $50 per kilogram and may have been misclassified. Owing to potentially misclassified material and variations in the type and purity of thorium compound, the unit value of exports varied widely by month and exporting district, from a low of $7 per kilogram to a high of $9,100 per kilogram. Globally, monazite was produced primarily for its rare-earth-element content, and only a small fraction of the byproduct thorium produced was consumed. India was the leading producer of monazite. Thorium consumption worldwide is relatively small compared with that of most other mineral commodities. In regard to international trade, China was the leading importer of monazite, and Brazil and Thailand were China’s leading import sources. Some concentrates from Thailand may be beneficiated concentrates from other sources. According to export statistics from Australia, 17,500 tons of thorium ores and concentrates, with a unit value of $122 per ton, were exported from Australia to Thailand in 2017. Several companies and countries were active in the pursuit of commercializing thorium as a fuel material for a new generation of nuclear reactors. Thorium-based nuclear research and development programs have been or are underway in Belgium, Brazil, Canada, China, Czechia, France, Germany, India, Israel, Japan, the Netherlands, Norway, Russia, the United Kingdom, and the United States. The U.S. Environmental Protection Agency (EPA) withdrew proposed revisions to the EPA's “Health and Environmental Protection Standards for Uranium and Thorium Mill Tailings.” The new standards would have been applicable to byproduct materials produced by uranium in situ recovery. World Refinery Production and Reserves:8 Production and reserves are associated with the recovery of monazite in heavy-mineral-sand deposits. Without demand for the rare earths, monazite would probably not be recovered for its thorium content under current market conditions. World Resources: The world’s leading thorium resources are found in placer, carbonatite, and vein-type deposits. Thorium is found in several minerals, including monazite, thorite, and thorianite. According to a report by the Organisation for Economic Co-operation and Development’s Nuclear Energy Agency and the International Atomic Energy Agency, worldwide thorium resources were estimated to total more than 6 million tons of thorium. Thorium resources are found throughout the world, most notably in Australia, Brazil, and India. India’s Department of Atomic Energy estimated that 12 million tons of monazite was contained in heavy-mineral sands in India. India’s monazite was reported to have an average thorium oxide content of 9% to 10%. Geoscience Australia estimated Australia’s inferred resources to be about 0.6 million tons of thorium. Most of the identified thorium resources in Australia are within heavy-mineral-sand deposits. None of Australia’s thorium resources were classified as economically recoverable. Brazil’s thorium resources were estimated to be 0.6 million tons. Substitutes: Nonradioactive substitutes have been developed for many applications of thorium. Yttrium compounds have replaced thorium compounds in incandescent lamp mantles. A magnesium alloy containing lanthanides, yttrium, and zirconium can substitute for magnesium-thorium alloys in aerospace applications. Cerium and lanthanum can substitute for thorium in welding electrodes. eEstimated. NA Not Available.— Zero. 1All domestically consumed thorium was thought to be derived from imported materials; however, monazite may have been produced as a separate concentrate or included as an accessory mineral in heavy-mineral concentrates. 2Includes material that may have been misclassified. 3Low unit-value exports were excluded from ThO2 content estimate because they were believed to have been misclassified. 4Defined as production + imports – exports. Excludes ores and concentrates. 5The apparent consumption calculation yields a negative value from 2014 through 2016 and 2018. 6Based on U.S. Census Bureau customs value. 7Defined as imports – exports; however, all exports of refined compounds and alloys were derived from imported materials, and net import reliance is assumed to be 100%. 8See Appendix C for resource and reserve definitions and information concerning data sources.
U.S. Geological Survey, Mineral Commodity Summaries, February 2019
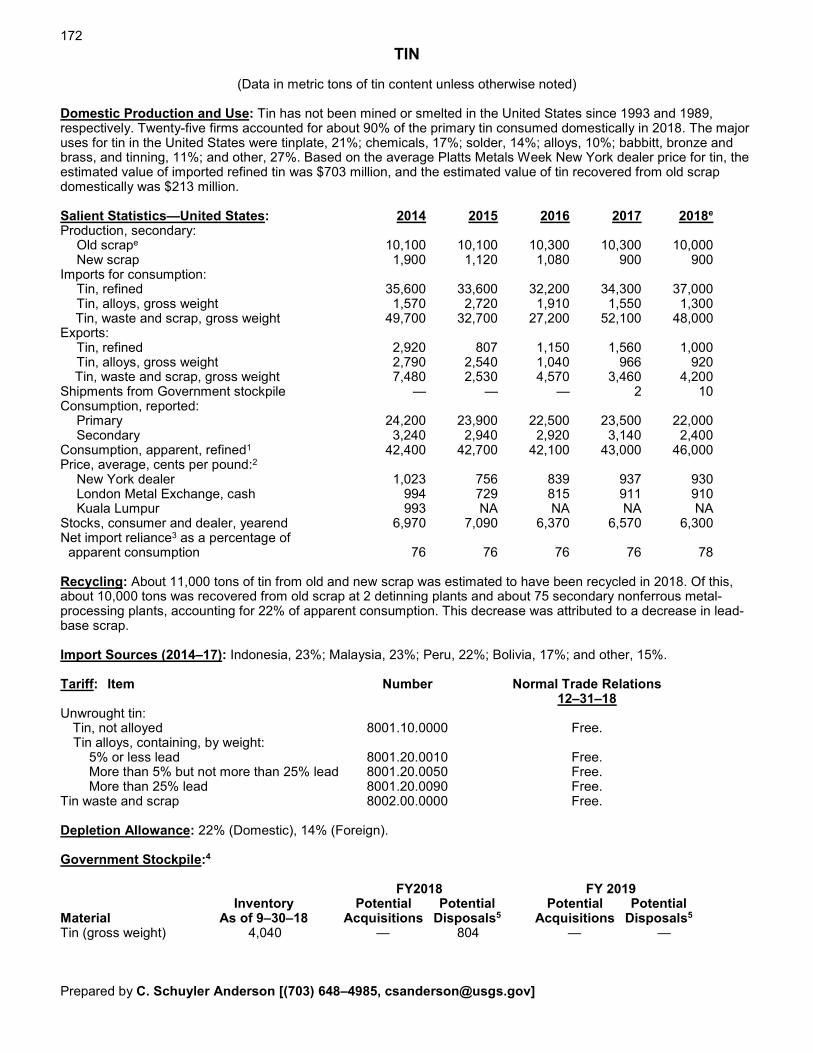
172
TIN
(Data in metric tons of tin content unless otherwise noted) Domestic Production and Use: Tin has not been mined or smelted in the United States since 1993 and 1989, respectively. Twenty-five firms accounted for about 90% of the primary tin consumed domestically in 2018. The major uses for tin in the United States were tinplate, 21%; chemicals, 17%; solder, 14%; alloys, 10%; babbitt, bronze and brass, and tinning, 11%; and other, 27%. Based on the average Platts Metals Week New York dealer price for tin, the estimated value of imported refined tin was $703 million, and the estimated value of tin recovered from old scrap domestically was $213 million. Salient Statistics—United States: 2014 2015 2016 2017 2018e Production, secondary: Old scrape 10,100 10,100 10,300 10,300 10,000 New scrap 1,900 1,120 1,080 900 900 Imports for consumption: Tin, refined 35,600 33,600 32,200 34,300 37,000 Tin, alloys, gross weight 1,570 2,720 1,910 1,550 1,300 Tin, waste and scrap, gross weight 49,700 32,700 27,200 52,100 48,000 Exports: Tin, refined 2,920 807 1,150 1,560 1,000 Tin, alloys, gross weight 2,790 2,540 1,040 966 920 Tin, waste and scrap, gross weight 7,480 2,530 4,570 3,460 4,200 Shipments from Government stockpile — — — 2 10 Consumption, reported: Primary 24,200 23,900 22,500 23,500 22,000 Secondary 3,240 2,940 2,920 3,140 2,400 Consumption, apparent, refined1 42,400 42,700 42,100 43,000 46,000 Price, average, cents per pound:2 New York dealer 1,023 756 839 937 930 London Metal Exchange, cash 994 729 815 911 910 Kuala Lumpur 993 NA NA NA NA Stocks, consumer and dealer, yearend 6,970 7,090 6,370 6,570 6,300 Net import reliance3 as a percentage of apparent consumption 76 76 76 76 78 Recycling: About 11,000 tons of tin from old and new scrap was estimated to have been recycled in 2018. Of this, about 10,000 tons was recovered from old scrap at 2 detinning plants and about 75 secondary nonferrous metal-processing plants, accounting for 22% of apparent consumption. This decrease was attributed to a decrease in lead-base scrap. Import Sources (2014–17): Indonesia, 23%; Malaysia, 23%; Peru, 22%; Bolivia, 17%; and other, 15%. Tariff: Item Number Normal Trade Relations 12–31–18 Unwrought tin: Tin, not alloyed 8001.10.0000 Free. Tin alloys, containing, by weight:
5% or less lead 8001.20.0010 Free. More than 5% but not more than 25% lead 8001.20.0050 Free. More than 25% lead 8001.20.0090 Free.
Tin waste and scrap 8002.00.0000 Free. Depletion Allowance: 22% (Domestic), 14% (Foreign). Government Stockpile:4 FY2018 FY 2019 Inventory Potential Potential Potential Potential Material As of 9–30–18 Acquisitions Disposals5 Acquisitions Disposals5
Tin (gross weight) 4,040 — 804 — — Prepared by C. Schuyler Anderson [(703) 648–4985, [email protected]]
173 TIN
Events, Trends, and Issues: Apparent consumption of tin in the United States was estimated to have increased slightly in 2018 compared with consumption in 2017. Indonesia was the primary supplier of tin to the United States, and the estimated amount of tin recycled in 2018 decreased slightly from that in 2017. Estimated average tin prices for the first 10 months in 2018 were 945 and 923 cents per pound for the New York dealer price and London Metal Exchange price, respectively—a slight increase from both of the average prices in 2017.The monthly average New York dealer tin price in 2018 peaked in February at 1,004 cents per pound, then steadily decreased through September to a monthly average price of 882 cents per pound, before recovering slightly to a monthly average price of 889 cents per pound in October. In May 2018, the U.S. Department of the Interior, in coordination with other executive branch agencies, published a list of 35 critical minerals (83 FR 23295), including tin. This list was developed to serve as an initial focus, pursuant to Executive Order 13817, ‘‘A Federal Strategy to Ensure Secure and Reliable Supplies of Critical Minerals” (82 FR 60835). World Mine Production and Reserves: Reserves for Australia were revised based on new information from Government sources. Mine production Reserves6 2017 2018e United States — — — Australia 7,200 7,000 7370,000 Bolivia 18,500 18,000 400,000 Brazil 18,000 18,000 700,000 Burma 47,000 45,000 110,000 China 93,000 90,000 1,100,000 Congo (Kinshasa) 9,500 9,000 150,000 Indonesia 83,000 83,000 800,000 Malaysia 3,810 4,000 250,000 Nigeria 5,960 6,000 NA Peru 17,800 18,000 110,000 Russia 1,300 1,300 350,000 Rwanda 2,860 2,900 NA Thailand 100 100 170,000 Vietnam 4,560 5,000 11,000 Other countries 200 300 180,000 World total (rounded) 313,000 310,000 4,700,000 World Resources: Identified resources of tin in the United States, primarily in Alaska, were insignificant compared with those of the rest of the world. World resources, principally in western Africa, southeastern Asia, Australia, Bolivia, Brazil, Indonesia, and Russia, are extensive and, if developed, could sustain recent annual production rates well into the future. Substitutes: Aluminum, glass, paper, plastic, or tin-free steel substitute for tin content in cans and containers. Other materials that substitute for tin are epoxy resins for solder; aluminum alloys, alternative copper-base alloys, and plastics for bronze; plastics for bearing metals that contain tin; and compounds of lead and sodium for some tin chemicals. eEstimated. NA Not available. — Zero. 1Defined as production (old scrap) + refined tin imports – refined tin exports + adjustments for Government and industry stock changes. Excludes imports and exports of alloys, and waste and scrap. 2Source: Platts Metals Week. 3Defined as imports – exports + adjustments for Government and industry stock changes, excluding imports and exports of waste and scrap. 4See Appendix B for definitions. 5Disposals are defined as any barter, rotation, sale, or upgrade of National Defense Stockpile stock. 6See Appendix C for resource and reserve definitions and information concerning data sources. 7For Australia, Joint Ore Reserves Committee-compliant reserves were about 260,000 tons.
U.S. Geological Survey, Mineral Commodity Summaries, February 2019
174
TITANIUM AND TITANIUM DIOXIDE1
(Data in metric tons unless otherwise noted) Domestic Production and Use: Titanium sponge metal was produced by two operations in Nevada and Utah. Production data were withheld to avoid disclosing company proprietary data. The facility in Salt Lake City, UT, with an estimated capacity of 500 tons per year, used the Armstrong method to produce high-purity titanium for use in electronics. The operations in Nevada, with an estimated capacity of 12,600 tons per year, used the Kroll method, the dominant process of titanium sponge production for use in aerospace, industrial, and all other applications. A third facility, in Rowley, UT, which produced titanium sponge using the Kroll method, was idled and placed on care-and-maintenance status in 2016 owing to low titanium sponge prices. In 2018, an estimated 80% of titanium metal was used in aerospace applications; the remaining 20% was used in armor, chemical processing, marine hardware, medical implants, power generation, and consumer and other applications. Assuming an average purchase price of $9.10 per kilogram, the value of sponge metal consumed was about $309 million. In 2018, titanium dioxide (TiO2) pigment production, by four companies operating five facilities in four States, was valued at about $3.0 billion. The estimated end-use distribution of TiO2 pigment consumption was paints (including lacquers and varnishes), 69%; plastics, 25%; paper, 5%; and other, 1%. Other uses of TiO2 included catalysts, ceramics, coated fabrics and textiles, floor coverings, printing ink, and roofing granules. Salient Statistics—United States: 2014 2015 2016 2017 2018e Titanium sponge metal: Production W W W W W Imports for consumption 17,700 20,700 16,200 24,100 23,000 Exports 2,590 1,700 724 3,130 600 Consumption, reported 26,400 31,200 34,100 37,400 34,000 Price, dollars per kilogram, yearend 10.00 9.40 9.50 9.70 9.10 Stocks, industry, yearende 22,900 25,000 25,100 13,200 10,000 Employment, numbere 300 300 150 150 150 Net import reliance2 as a percentage of reported consumption 57 61 45 88 75 Titanium dioxide pigment: Production 1,260,000 1,220,000 1,240,000 1,260,000 1,200,000 Imports for consumption 224,000 221,000 247,000 239,000 270,000 Exports 685,000 649,000 651,000 634,000 550,000 Consumption, apparent3 802,000 792,000 840,000 870,000 920,000 Producer price index (1982=100), yearend4 224 176 175 205 217 Employment, numbere 3,400 3,110 3,110 3,110 3,050 Net import reliance2 as a percentage of apparent consumption E E E E E Recycling: About 61,500 tons of titanium scrap metal was consumed in 2018—50,000 tons by the titanium industry, 9,800 tons by the steel industry, 600 tons by the superalloy industry, and 1,100 tons by other industries. Import Sources (2014–17): Sponge metal: Japan, 81%; Kazakhstan, 7%; Ukraine, 7%; China, 3%; and other, 2%. Titanium dioxide pigment: Canada, 34%; China, 24%; Germany, 10%; Mexico, 4%; and other, 28%. Tariff: Item Number Normal Trade Relations 12–31–18 Titanium oxides (unfinished TiO2 pigments) 2823.00.0000 5.5% ad val. TiO2 pigments, 80% or more TiO2 3206.11.0000 6.0% ad val. TiO2 pigments, other 3206.19.0000 6.0% ad val. Ferrotitanium and ferrosilicon titanium 7202.91.0000 3.7% ad val. Unwrought titanium metal 8108.20.0010 15.0% ad val. Titanium waste and scrap metal 8108.30.0000 Free. Other titanium metal articles 8108.90.3000 5.5% ad val. Wrought titanium metal 8108.90.6000 15.0% ad val. Prepared by George M. Bedinger [(703) 648–6183, [email protected]]
175 TITANIUM AND TITANIUM DIOXIDE
Depletion Allowance: Not applicable. Government Stockpile: None. Events, Trends, and Issues: Domestic consumption of titanium sponge in 2018 was estimated to have decreased by about 9% from that of 2017, owing to continued demand from the aerospace industry. Additive manufacturing (3D printing) techniques for aerospace applications continued to progress. In May 2018, the U.S. Department of the Interior, in coordination with other executive branch agencies, published a list of 35 critical minerals (83 FR 23295), including titanium. This list was developed to serve as an initial focus, pursuant to Executive Order 13817, ‘‘A Federal Strategy to Ensure Secure and Reliable Supplies of Critical Minerals” (82 FR 60835). In Yanbu, Saudi Arabia, the first batch of titanium sponge was produced in August. The Yanbu facility was jointly owned by a Saudi Arabian industrial company and a Japanese titanium producer. The plant was expected to have a capacity of 15,600 tons per year. Domestic production of TiO2 pigment in 2018 was estimated to be about 1.2 million tons, a decrease from that of 2017. A proposed merger between two major TiO2 pigment producers was delayed pending approval from U.S. regulators. If approved, the combined company operations would have a capacity of 1.3 million tons per year and would be the largest global producer of TiO2 pigments. In Pori, Finland, a 130,000-ton-per-year pigment plant was shut down after experiencing fire damage in 2017. In 2018, the plant resumed operations and was producing at a rate of approximately 25,000 tons per year. In September, the owner announced its intention to close the facility by yearend 2021. World Sponge Metal Production and Sponge and Pigment Capacity: Sponge production Capacity 20185 2017 2018e Sponge Pigment United States W W 13,100 1,370,000 Australia — — — 260,000 Canada — — — 104,000 Chinae 72,000 70,000 110,000 3,250,000 Germany — — 472,000 India 500 500 500 108,000 Japane 51,000 52,000 68,800 314,000 Kazakhstane 9,000 9,000 26,000 1,000 Mexico — — — 300,000 Russiae 40,000 40,000 46,500 55,000 Saudi Arabia — 500 15,600 210,000 Ukrainee 8,000 8,000 12,000 120,000 United Kingdom — — — 315,000 Other countries — — — 784,000 World total (rounded) 6181,000 6180,000 293,000 7,660,000 World Resources: Reserves and resources of titanium minerals are discussed in the Titanium Mineral Concentrates chapter. Substitutes: Few materials possess titanium metal’s strength-to-weight ratio and corrosion resistance. In high-strength applications, titanium competes with aluminum, composites, intermetallics, steel, and superalloys. Aluminum, nickel, specialty steels, and zirconium alloys may be substituted for titanium for applications that require corrosion resistance. Ground calcium carbonate, precipitated calcium carbonate, kaolin, and talc compete with titanium dioxide as a white pigment. eEstimated. E Net exporter. W Withheld to avoid disclosing company proprietary data. — Zero. 1See also Titanium Mineral Concentrates. 2Defined as imports – exports. 3Defined as production + imports – exports. 4U.S. Department of Labor, Bureau of Labor Statistics. 5Yearend operating capacity. 6Excludes U.S. production.
U.S. Geological Survey, Mineral Commodity Summaries, February 2019
176
TITANIUM MINERAL CONCENTRATES1
(Data in thousand metric tons of TiO2 content unless otherwise noted) Domestic Production and Use: In 2018, two companies recovered ilmenite and rutile concentrates from surface-mining operations near Nahunta, GA, and Starke, FL, and a third company processed existing mineral sands tailings in Florida. Based on reported data through August 2018, the estimated value of titanium mineral concentrates imported in the United States in 2018 was $654 million. Zircon was a coproduct of mining from ilmenite and rutile deposits. About 90% of titanium mineral concentrates were consumed by domestic titanium dioxide (TiO2) pigment producers. The remaining 10% was used in welding-rod coatings and for manufacturing carbides, chemicals, and metal. Salient Statistics—United States: 2014 2015 2016 2017 2018e Production2 100 200 100 100 100 Imports for consumption 1,110 1,100 1,020 1,180 1,100 Exports, all formse 1 2 5 6 30 Consumption, apparent3 1,210 1,300 1,120 1,270 1,100 Price, dollars per metric ton: Rutile, bulk, minimum 95% TiO2, f.o.b. Australia4 950 840 740 740 990 Ilmenite, bulk, minimum 54% TiO2, f.o.b. Australia4 155 110 105 173 NA Ilmenite, import, dollars per ton 172 215 142 172 220 Slag, 80%–95% TiO25 679–761 687–742 612–682 621–700 690–720 Employment, mine and mill, number 234 285 156 264 270 Net import reliance6 as a percentage of apparent consumption 92 85 91 92 91 Recycling: None. Import Sources (2014–17): South Africa, 35%; Australia, 27%; Canada, 12%; Mozambique, 11%; and other, 15%. Tariff: Item Number Normal Trade Relations 12–31–18 Synthetic rutile 2614.00.3000 Free. Ilmenite and ilmenite sand 2614.00.6020 Free. Rutile concentrate 2614.00.6040 Free. Titanium slag 2620.99.5000 Free. Depletion Allowance: Ilmenite and rutile; 22% (Domestic), 14% (Foreign). Government Stockpile: None. Events, Trends, and Issues: Consumption of titanium mineral concentrates is tied to production of TiO2 pigments that are primarily used in paint, paper, and plastics. Domestic apparent consumption of titanium mineral concentrates in 2018 was estimated to have decreased by about 13 percent from that of 2017. Although exports were estimated to have increased fivefold in 2018, they were a result of an intracompany transfer that moved 27,000 tons of stockpiled ilmenite from its former operations in Virginia to its synthetic rutile kiln in Western Australia in February. Prices for ilmenite, rutile, and titanium slag all increased through 2018. A company was conducting a feasibility study of the Dundas ilmenite project on the northwest coast of Greenland. Large-scale production was expected to begin in 2019 contingent upon obtaining customer offtake agreements. A major producer of titanium minerals was restarting its Jacinth-Ambrosia Mine in South Australia and was further developing its operations in Sierra Leone in order to increase its production of natural rutile. Other projects were being developed in Australia, Mozambique, and Tanzania. Prepared by George M. Bedinger [(703) 648–6183, [email protected]]
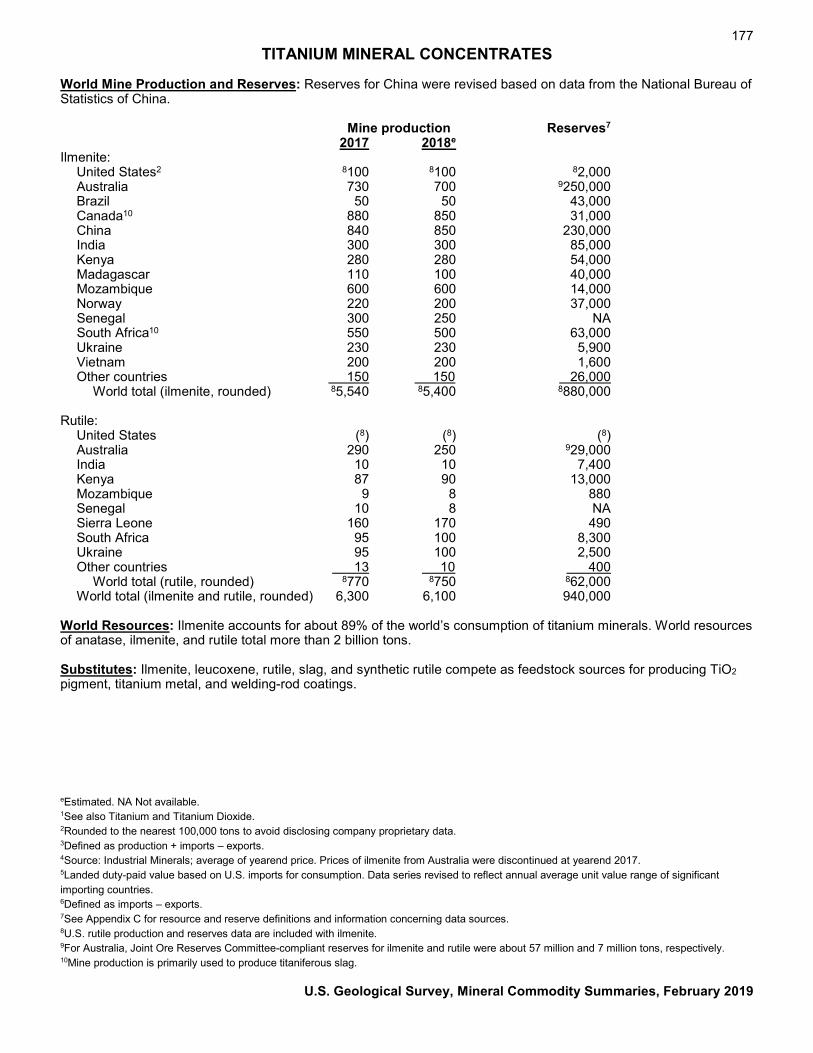
177 TITANIUM MINERAL CONCENTRATES
World Mine Production and Reserves: Reserves for China were revised based on data from the National Bureau of Statistics of China. Mine production Reserves7 2017 2018e Ilmenite: United States2 8100 8100 82,000 Australia 730 700 9250,000 Brazil 50 50 43,000 Canada10 880 850 31,000 China 840 850 230,000 India 300 300 85,000 Kenya 280 280 54,000 Madagascar 110 100 40,000 Mozambique 600 600 14,000 Norway 220 200 37,000 Senegal 300 250 NA South Africa10 550 500 63,000 Ukraine 230 230 5,900 Vietnam 200 200 1,600 Other countries 150 150 26,000 World total (ilmenite, rounded) 85,540 85,400 8880,000 Rutile: United States (8) (8) (8) Australia 290 250 929,000 India 10 10 7,400 Kenya 87 90 13,000 Mozambique 9 8 880 Senegal 10 8 NA Sierra Leone 160 170 490 South Africa 95 100 8,300 Ukraine 95 100 2,500 Other countries 13 10 400 World total (rutile, rounded) 8770 8750 862,000 World total (ilmenite and rutile, rounded) 6,300 6,100 940,000 World Resources: Ilmenite accounts for about 89% of the world’s consumption of titanium minerals. World resources of anatase, ilmenite, and rutile total more than 2 billion tons. Substitutes: Ilmenite, leucoxene, rutile, slag, and synthetic rutile compete as feedstock sources for producing TiO2 pigment, titanium metal, and welding-rod coatings. eEstimated. NA Not available. 1See also Titanium and Titanium Dioxide. 2Rounded to the nearest 100,000 tons to avoid disclosing company proprietary data. 3Defined as production + imports – exports. 4Source: Industrial Minerals; average of yearend price. Prices of ilmenite from Australia were discontinued at yearend 2017. 5Landed duty-paid value based on U.S. imports for consumption. Data series revised to reflect annual average unit value range of significant importing countries. 6Defined as imports – exports. 7See Appendix C for resource and reserve definitions and information concerning data sources. 8U.S. rutile production and reserves data are included with ilmenite. 9For Australia, Joint Ore Reserves Committee-compliant reserves for ilmenite and rutile were about 57 million and 7 million tons, respectively. 10Mine production is primarily used to produce titaniferous slag.
U.S. Geological Survey, Mineral Commodity Summaries, February 2019
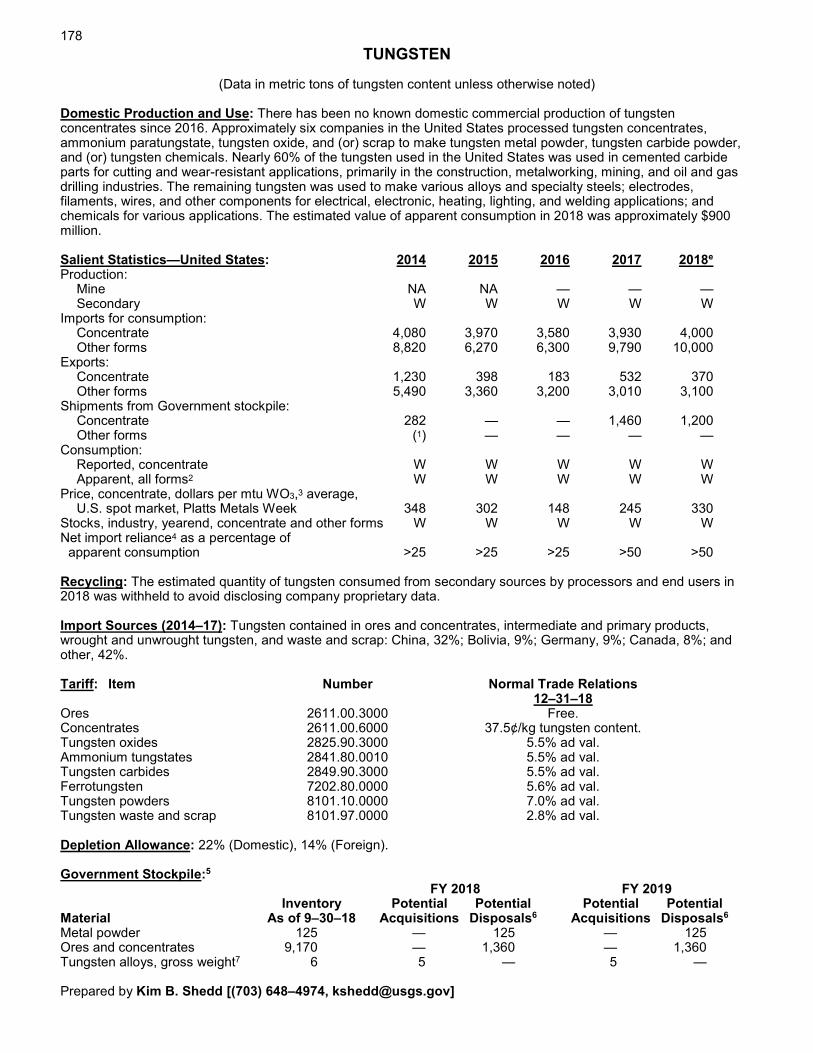
178
TUNGSTEN
(Data in metric tons of tungsten content unless otherwise noted) Domestic Production and Use: There has been no known domestic commercial production of tungsten concentrates since 2016. Approximately six companies in the United States processed tungsten concentrates, ammonium paratungstate, tungsten oxide, and (or) scrap to make tungsten metal powder, tungsten carbide powder, and (or) tungsten chemicals. Nearly 60% of the tungsten used in the United States was used in cemented carbide parts for cutting and wear-resistant applications, primarily in the construction, metalworking, mining, and oil and gas drilling industries. The remaining tungsten was used to make various alloys and specialty steels; electrodes, filaments, wires, and other components for electrical, electronic, heating, lighting, and welding applications; and chemicals for various applications. The estimated value of apparent consumption in 2018 was approximately $900 million. Salient Statistics—United States: 2014 2015 2016 2017 2018e Production: Mine NA NA — — — Secondary W W W W W Imports for consumption: Concentrate 4,080 3,970 3,580 3,930 4,000 Other forms 8,820 6,270 6,300 9,790 10,000 Exports: Concentrate 1,230 398 183 532 370 Other forms 5,490 3,360 3,200 3,010 3,100 Shipments from Government stockpile: Concentrate 282 — — 1,460 1,200 Other forms (1) — — — — Consumption: Reported, concentrate W W W W W Apparent, all forms2 W W W W W Price, concentrate, dollars per mtu WO3,3 average, U.S. spot market, Platts Metals Week 348 302 148 245 330 Stocks, industry, yearend, concentrate and other forms W W W W W Net import reliance4 as a percentage of apparent consumption >25 >25 >25 >50 >50 Recycling: The estimated quantity of tungsten consumed from secondary sources by processors and end users in 2018 was withheld to avoid disclosing company proprietary data. Import Sources (2014–17): Tungsten contained in ores and concentrates, intermediate and primary products, wrought and unwrought tungsten, and waste and scrap: China, 32%; Bolivia, 9%; Germany, 9%; Canada, 8%; and other, 42%. Tariff: Item Number Normal Trade Relations 12–31–18 Ores 2611.00.3000 Free. Concentrates 2611.00.6000 37.5¢/kg tungsten content. Tungsten oxides 2825.90.3000 5.5% ad val. Ammonium tungstates 2841.80.0010 5.5% ad val. Tungsten carbides 2849.90.3000 5.5% ad val. Ferrotungsten 7202.80.0000 5.6% ad val. Tungsten powders 8101.10.0000 7.0% ad val. Tungsten waste and scrap 8101.97.0000 2.8% ad val. Depletion Allowance: 22% (Domestic), 14% (Foreign). Government Stockpile:5
FY 2018 FY 2019 Inventory Potential Potential Potential Potential Material As of 9–30–18 Acquisitions Disposals6 Acquisitions Disposals6
Metal powder 125 — 125 — 125 Ores and concentrates 9,170 — 1,360 — 1,360 Tungsten alloys, gross weight7 6 5 — 5 — Prepared by Kim B. Shedd [(703) 648–4974, [email protected]]
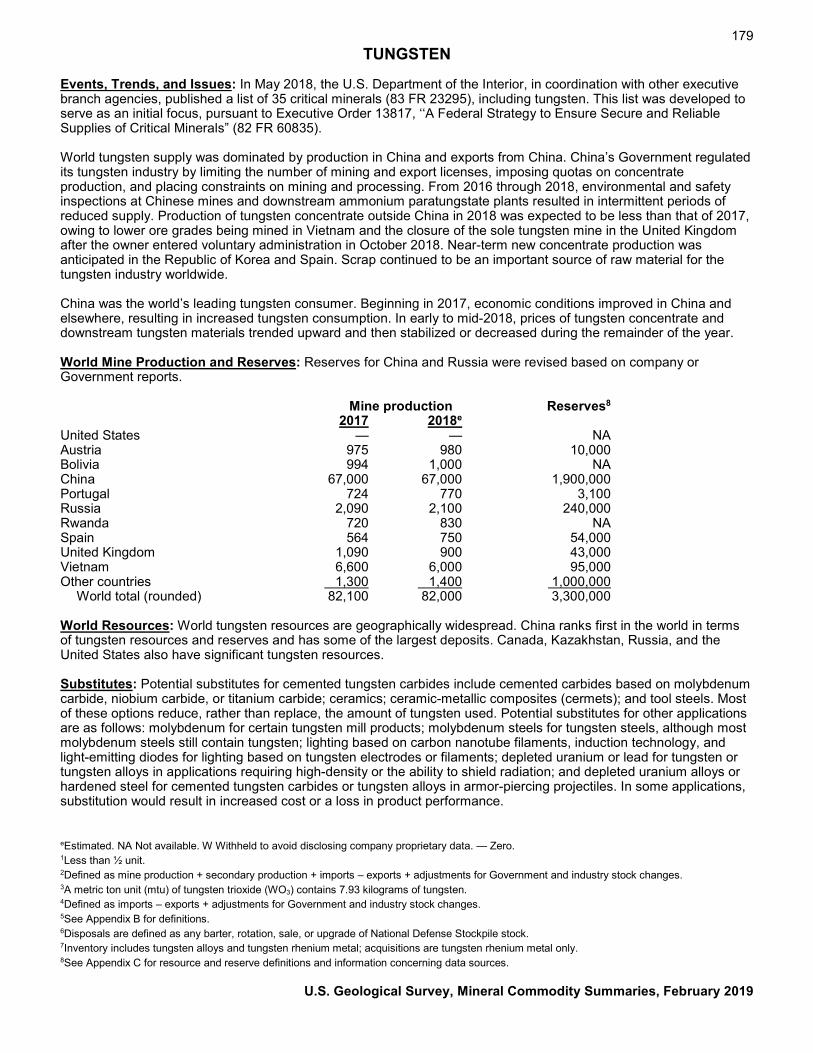
179 TUNGSTEN
Events, Trends, and Issues: In May 2018, the U.S. Department of the Interior, in coordination with other executive branch agencies, published a list of 35 critical minerals (83 FR 23295), including tungsten. This list was developed to serve as an initial focus, pursuant to Executive Order 13817, ‘‘A Federal Strategy to Ensure Secure and Reliable Supplies of Critical Minerals” (82 FR 60835). World tungsten supply was dominated by production in China and exports from China. China’s Government regulated its tungsten industry by limiting the number of mining and export licenses, imposing quotas on concentrate production, and placing constraints on mining and processing. From 2016 through 2018, environmental and safety inspections at Chinese mines and downstream ammonium paratungstate plants resulted in intermittent periods of reduced supply. Production of tungsten concentrate outside China in 2018 was expected to be less than that of 2017, owing to lower ore grades being mined in Vietnam and the closure of the sole tungsten mine in the United Kingdom after the owner entered voluntary administration in October 2018. Near-term new concentrate production was anticipated in the Republic of Korea and Spain. Scrap continued to be an important source of raw material for the tungsten industry worldwide. China was the world’s leading tungsten consumer. Beginning in 2017, economic conditions improved in China and elsewhere, resulting in increased tungsten consumption. In early to mid-2018, prices of tungsten concentrate and downstream tungsten materials trended upward and then stabilized or decreased during the remainder of the year. World Mine Production and Reserves: Reserves for China and Russia were revised based on company or Government reports. Mine production Reserves8 2017 2018e United States — — NA Austria 975 980 10,000 Bolivia 994 1,000 NA China 67,000 67,000 1,900,000 Portugal 724 770 3,100 Russia 2,090 2,100 240,000 Rwanda 720 830 NA Spain 564 750 54,000 United Kingdom 1,090 900 43,000 Vietnam 6,600 6,000 95,000 Other countries 1,300 1,400 1,000,000 World total (rounded) 82,100 82,000 3,300,000 World Resources: World tungsten resources are geographically widespread. China ranks first in the world in terms of tungsten resources and reserves and has some of the largest deposits. Canada, Kazakhstan, Russia, and the United States also have significant tungsten resources. Substitutes: Potential substitutes for cemented tungsten carbides include cemented carbides based on molybdenum carbide, niobium carbide, or titanium carbide; ceramics; ceramic-metallic composites (cermets); and tool steels. Most of these options reduce, rather than replace, the amount of tungsten used. Potential substitutes for other applications are as follows: molybdenum for certain tungsten mill products; molybdenum steels for tungsten steels, although most molybdenum steels still contain tungsten; lighting based on carbon nanotube filaments, induction technology, and light-emitting diodes for lighting based on tungsten electrodes or filaments; depleted uranium or lead for tungsten or tungsten alloys in applications requiring high-density or the ability to shield radiation; and depleted uranium alloys or hardened steel for cemented tungsten carbides or tungsten alloys in armor-piercing projectiles. In some applications, substitution would result in increased cost or a loss in product performance. eEstimated. NA Not available. W Withheld to avoid disclosing company proprietary data. — Zero. 1Less than ½ unit. 2Defined as mine production + secondary production + imports – exports + adjustments for Government and industry stock changes. 3A metric ton unit (mtu) of tungsten trioxide (WO3) contains 7.93 kilograms of tungsten. 4Defined as imports – exports + adjustments for Government and industry stock changes. 5See Appendix B for definitions. 6Disposals are defined as any barter, rotation, sale, or upgrade of National Defense Stockpile stock. 7Inventory includes tungsten alloys and tungsten rhenium metal; acquisitions are tungsten rhenium metal only. 8See Appendix C for resource and reserve definitions and information concerning data sources.
U.S. Geological Survey, Mineral Commodity Summaries, February 2019
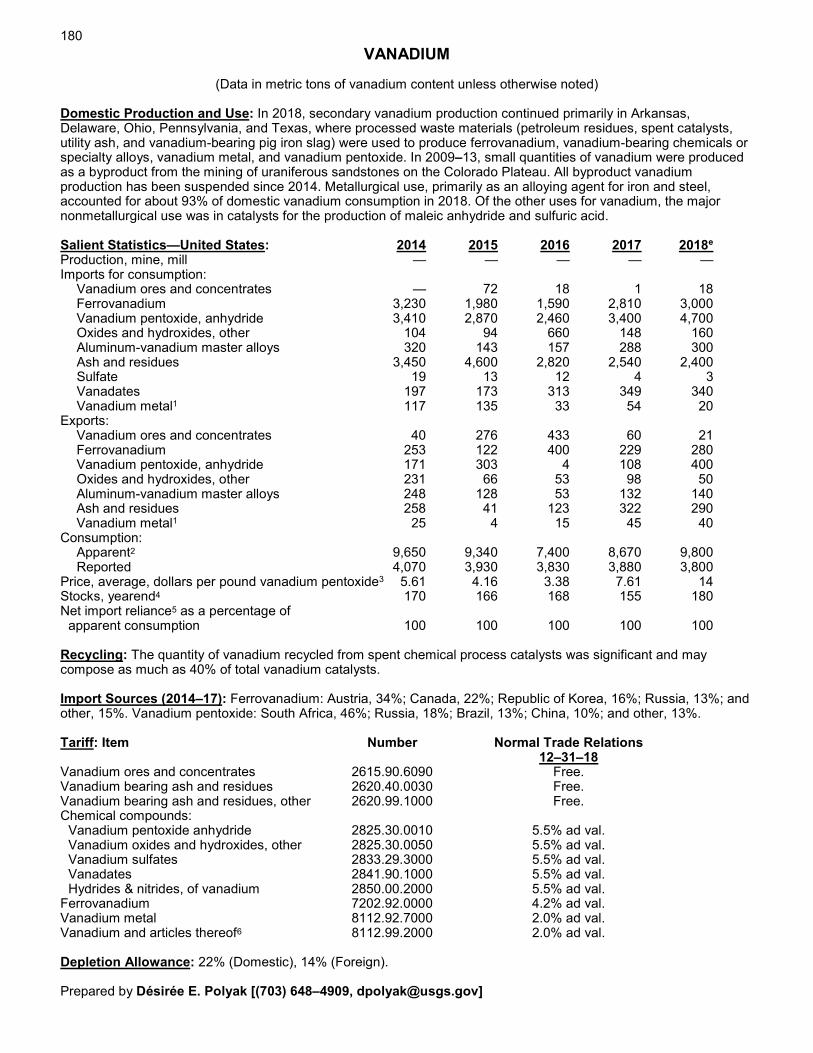
180
VANADIUM
(Data in metric tons of vanadium content unless otherwise noted) Domestic Production and Use: In 2018, secondary vanadium production continued primarily in Arkansas, Delaware, Ohio, Pennsylvania, and Texas, where processed waste materials (petroleum residues, spent catalysts, utility ash, and vanadium-bearing pig iron slag) were used to produce ferrovanadium, vanadium-bearing chemicals or specialty alloys, vanadium metal, and vanadium pentoxide. In 2009–13, small quantities of vanadium were produced as a byproduct from the mining of uraniferous sandstones on the Colorado Plateau. All byproduct vanadium production has been suspended since 2014. Metallurgical use, primarily as an alloying agent for iron and steel, accounted for about 93% of domestic vanadium consumption in 2018. Of the other uses for vanadium, the major nonmetallurgical use was in catalysts for the production of maleic anhydride and sulfuric acid. Salient Statistics—United States: 2014 2015 2016 2017 2018e Production, mine, mill — — — — — Imports for consumption: Vanadium ores and concentrates — 72 18 1 18 Ferrovanadium 3,230 1,980 1,590 2,810 3,000 Vanadium pentoxide, anhydride 3,410 2,870 2,460 3,400 4,700 Oxides and hydroxides, other 104 94 660 148 160 Aluminum-vanadium master alloys 320 143 157 288 300 Ash and residues 3,450 4,600 2,820 2,540 2,400 Sulfate 19 13 12 4 3 Vanadates 197 173 313 349 340 Vanadium metal1 117 135 33 54 20 Exports: Vanadium ores and concentrates 40 276 433 60 21 Ferrovanadium 253 122 400 229 280 Vanadium pentoxide, anhydride 171 303 4 108 400 Oxides and hydroxides, other 231 66 53 98 50 Aluminum-vanadium master alloys 248 128 53 132 140 Ash and residues 258 41 123 322 290 Vanadium metal1 25 4 15 45 40 Consumption: Apparent2 9,650 9,340 7,400 8,670 9,800 Reported 4,070 3,930 3,830 3,880 3,800 Price, average, dollars per pound vanadium pentoxide3 5.61 4.16 3.38 7.61 14 Stocks, yearend4 170 166 168 155 180 Net import reliance5 as a percentage of apparent consumption 100 100 100 100 100 Recycling: The quantity of vanadium recycled from spent chemical process catalysts was significant and may compose as much as 40% of total vanadium catalysts. Import Sources (2014–17): Ferrovanadium: Austria, 34%; Canada, 22%; Republic of Korea, 16%; Russia, 13%; and other, 15%. Vanadium pentoxide: South Africa, 46%; Russia, 18%; Brazil, 13%; China, 10%; and other, 13%. Tariff: Item Number Normal Trade Relations 12–31–18 Vanadium ores and concentrates 2615.90.6090 Free. Vanadium bearing ash and residues 2620.40.0030 Free. Vanadium bearing ash and residues, other 2620.99.1000 Free. Chemical compounds: Vanadium pentoxide anhydride 2825.30.0010 5.5% ad val. Vanadium oxides and hydroxides, other 2825.30.0050 5.5% ad val. Vanadium sulfates 2833.29.3000 5.5% ad val. Vanadates 2841.90.1000 5.5% ad val. Hydrides & nitrides, of vanadium 2850.00.2000 5.5% ad val. Ferrovanadium 7202.92.0000 4.2% ad val. Vanadium metal 8112.92.7000 2.0% ad val. Vanadium and articles thereof6 8112.99.2000 2.0% ad val. Depletion Allowance: 22% (Domestic), 14% (Foreign). Prepared by Désirée E. Polyak [(703) 648–4909, [email protected]]
181 VANADIUM
Government Stockpile: None. Events, Trends, and Issues: U.S. apparent consumption of vanadium in 2018 increased by 13% from that of 2017. Among the major uses for vanadium, production of carbon, full-alloy, and high-strength low-alloy steels accounted for 18%, 44%, and 33%, respectively, of domestic consumption. Average 2018 vanadium pentoxide prices almost doubled compared with 2017 prices, and ferrovanadium prices more than doubled to $33 per pound in 2018 compared with 2017. In September 2018, ferrovanadium prices averaged $39.60 per pound. Prices had not been this high since March 2008. Byproduct vanadium production in the United States was expected to resume by early 2019 at the White Mesa mill in Utah. An iron and vanadium mine in South Africa remained closed and left South Africa with only two major producers of vanadium. Few new vanadium operations have been commissioned in recent years, with the exception of a producer in Brazil that started production in 2014. The producer began construction on an expansion plan in June 2018 that would further increase capacity. In February 2018, the Standardization Administration of China released a new high-strength rebar standard that would decrease the use of substandard steels in construction. The implementation date was expected to be November 1, 2018. The increase of vanadium in rebar was expected to increase overall consumption of vanadium in China by approximately 10,000 tons per year, depending on the degree of enforcement. In May 2018, the U.S. Department of the Interior, in coordination with other executive branch agencies, published a list of 35 critical minerals (83 FR 23295), including vanadium. This list was developed to serve as an initial focus, pursuant to Executive Order 13817, ‘‘A Federal Strategy to Ensure Secure and Reliable Supplies of Critical Minerals” (82 FR 60835). World Mine Production and Reserves: Reserves for Brazil and China were revised based on Government reports. Mine production Reserves7 2017 2018e (thousand metric tons) United States — — 45 Australia — — 82,100 Brazil 5,210 6,300 130 China 40,000 40,000 9,500 Russia 18,000 18,000 5,000 South Africa 7,960 9,100 3,500 World total (rounded) 71,200 73,000 20,000 World Resources: World resources of vanadium exceed 63 million tons. Vanadium occurs in deposits of phosphate rock, titaniferous magnetite, and uraniferous sandstone and siltstone, in which it constitutes less than 2% of the host rock. Significant quantities are also present in bauxite and carboniferous materials, such as coal, crude oil, oil shale, and tar sands. Because vanadium is typically recovered as a byproduct or coproduct, demonstrated world resources of the element are not fully indicative of available supplies. Although domestic resources and secondary recovery are adequate to supply a large portion of domestic needs, all of U.S. demand is currently met by foreign sources. Substitutes: Steels containing various combinations of other alloying elements can be substituted for steels containing vanadium. Certain metals, such as manganese, molybdenum, niobium (columbium), titanium, and tungsten, are to some degree interchangeable with vanadium as alloying elements in steel. Platinum and nickel can replace vanadium compounds as catalysts in some chemical processes. Currently, no acceptable substitute for vanadium is available for use in aerospace titanium alloys. eEstimated. — Zero. 1Vanadium metal includes waste and scrap. 2Defined as production + net import reliance. 3Prices for 2014–2016 are U.S. annual average vanadium pentoxide prices. The 2017 annual average vanadium pentoxide price includes U.S. monthly averages for January 2017–June 2017 and Chinese monthly average prices for July 2017–December 2017. The price for 2018 is the Chinese annual average vanadium pentoxide price. 4Includes chlorides, ferrovanadium, vanadates, vanadium-aluminum alloy, other vanadium alloys, vanadium metal, vanadium pentoxide, and other specialty chemicals. 5Defined as imports – exports + adjustments for industry stock changes. 6Aluminum-vanadium master alloy consisting of 35% aluminum and 64.5% vanadium. 7See Appendix C for resource and reserve definitions and information concerning data sources. 8For Australia, Joint Ore Reserves Committee-compliant reserves were about 1.3 million tons.
U.S. Geological Survey, Mineral Commodity Summaries, February 2019
182
VERMICULITE
(Data in thousand metric tons unless otherwise noted) Domestic Production and Use: Two companies with mining and processing facilities in South Carolina and Virginia produced vermiculite concentrate and reported production of approximately 100,000 tons. Flakes of raw vermiculite concentrate are micaceous in appearance and contain interlayer water in their structure. When the flakes are heated rapidly at a temperature above 870 °C, the water flashes into steam, and the flakes expand into accordionlike particles. This process is called exfoliation or expansion, and the resulting lightweight material is chemically inert, fire resistant, and odorless. Most of the vermiculite concentrate produced in the United States was shipped to 17 exfoliating plants in 11 States. The end uses for exfoliated vermiculite were estimated to be agriculture and horticulture, 46%; lightweight concrete aggregates (including cement premixes, concrete, and plaster), 19%; insulation, 8%; and other, 27%. Salient Statistics—United States: 2014 2015 2016 2017 2018e Productione, 1 100 100 100 100 100 Imports for consumptione, 2 52 33 46 53 50 Exportse 3 2 2 2 2 Consumption, apparent, concentrate3 150 130 140 150 150 Consumption, reported, exfoliated 63 65 68 72 70 Price, range of value, concentrate, dollars per ton, ex-plant 145–565 140–575 140–575 140–575 140–575 Employment, numbere 68 69 69 70 70 Net import reliance4 as a percentage of apparent consumption 30 20 30 30 30 Recycling: Insignificant. Import Sources (2014–17): South Africa, 36%; Brazil, 34%; China, 24%; Zimbabwe, 4%; and other, 2%. Tariff: Item Number Normal Trade Relations 12–31–18 Vermiculite, perlite and chlorites, unexpanded 2530.10.0000 Free. Exfoliated vermiculite, expanded clays, foamed slag, and similar expanded materials 6806.20.0000 Free. Depletion Allowance: 14% (Domestic and foreign). Government Stockpile: None. Events, Trends, and Issues: U.S. exports and imports of vermiculite are not collected as a separate category by the U.S. Census Bureau. However, according to an independent industry trade information source, United States imports, excluding any material from Canada and Mexico, were estimated to be about 50,000 tons in 2018, slightly less than those of 2017. Coarse-grade vermiculite remained in short supply; however, prices were unchanged in 2018. Most imports, excluding any material from Canada and Mexico, came from China, South Africa, and Zimbabwe in 2018. A company based in Australia withdrew from its joint venture in developing the Namekara vermiculite mine in Uganda, citing inconsistent sales of vermiculite that resulted in reduced cash flow and the company’s inability to service its debt obligations. A local mining company, which became the 100% owner of the project, continued mining operations and honored existing contracts to supply vermiculite concentrate to customers in Japan, the United Kingdom, and other countries in Europe. The deposit was considered to be one of the world’s largest vermiculite deposits with significant portions of medium- and coarse-grade material. Capacity at the 30,000-ton-per-year mine may be expanded to 80,000 tons per year during the next several years. The Namekara deposit has sufficient resources for more than 50 years of production at previously announced rates. Prepared by Arnold O. Tanner [Contact Joyce A. Ober, (703) 648–7717, [email protected]]
183 VERMICULITE
A company based in France, in cooperation with the Government of Zimbabwe and local governments, produced vermiculite concentrate, including a significant portion of coarse-grade vermiculite, at the Shawa deposit in Zimbabwe. The mine had an expected life of more than 30 years. The deposit also was considered to be one of the world’s largest vermiculite deposits with significant portions of medium- and coarse-grade material. A company in Brazil expanded production capacity at its vermiculite mine in central Brazil and continued with the development of another deposit near Brasilia with the goal of bringing the company’s total production capacity to 200,000 tons per year. Companies in China with significant vermiculite resources also were ramping up production, although processing operations continued to be somewhat constrained by increased enforcement of environmental regulations. Specific production data were not available for China. World Mine Production and Reserves: Reserves data for Brazil and India were revised based on Government information. Mine production Reserves5 2017 2018e United Statese 1100 1100 25,000 Brazil 55 50 6,200 Bulgaria 10 10 NA China NA NA NA Egypt 8 8 NA India 5 10 1,600 Russia 13 10 NA South Africa 176 180 14,000 Uganda 5 20 NA Zimbabwe 30 30 NA Other countries 2 12 NA World total 400 430 NA World Resources: Vermiculite occurrences in Colorado, Nevada, North Carolina, Texas, and Wyoming contain estimated resources of 2 million to 3 million tons. Significant deposits have been reported in Australia, China, Russia, Uganda, and some other countries, but reserves and resource information comes from many sources and, in most cases, it is not clear whether the numbers refer to vermiculite alone or vermiculite plus other minerals and host rock and overburden. Substitutes: Expanded perlite is a substitute for exfoliated vermiculite in lightweight concrete and plaster. Other denser but less costly substitutes in these applications are expanded clay, shale, slag, and slate. Alternate materials for loose-fill fireproofing insulation include fiberglass, perlite, and slag wool. In agriculture, substitutes include bark and other plant materials, peat, perlite, sawdust, and synthetic soil conditioners. eEstimated. NA Not available. 1Concentrate sold or used by producers. Data are rounded to one significant digit to avoid disclosing company proprietary data. 2Excludes Canada and Mexico. 3Defined as concentrate sold or used by producers + imports – exports. 4Defined as imports – exports. Data are rounded to one significant digit to avoid disclosing company proprietary data. 5See Appendix C for resource and reserve definitions and information concerning data sources.
U.S. Geological Survey, Mineral Commodity Summaries, February 2019
184
WOLLASTONITE
(Data in metric tons unless otherwise noted) Domestic Production and Use: Wollastonite was mined by two companies in New York during 2018. U.S. production of wollastonite (sold or used by producers) was withheld to avoid disclosing company proprietary data but was estimated to have increased from that of 2017. Economic resources of wollastonite typically form as a result of thermal metamorphism of siliceous limestone during regional deformation or chemical alteration of limestone by siliceous hydrothermal fluids along faults or contacts with magmatic intrusions. Deposits of wollastonite have been identified in Arizona, California, Idaho, Nevada, New Mexico, New York, and Utah; however, New York is the only State where long-term continuous mining has taken place. The U.S. Geological Survey does not collect consumption statistics for wollastonite, but consumption was estimated to have increased in 2018 as compared with that of the previous year. Ceramics (frits, sanitaryware, and tile), friction products (primarily brake linings), metallurgical applications (flux and conditioner), paint (architectural and industrial paints), plastics and rubber markets (thermoplastic and thermoset resins and elastomer compounds), and miscellaneous uses (including adhesives, concrete, glass, and sealants) accounted for wollastonite sales in the United States. In ceramics, wollastonite decreases shrinkage and gas evolution during firing; increases green and fired strength; maintains brightness during firing; permits fast firing; and reduces crazing, cracking, and glaze defects. In metallurgical applications, wollastonite serves as a flux for welding, a source for calcium oxide, a slag conditioner, and protects the surface of molten metal during the continuous casting of steel. As an additive in paint, it improves the durability of the paint film, acts as a pH buffer, improves resistance to weathering, reduces gloss and pigment consumption, and acts as a flatting and suspending agent. In plastics, wollastonite improves tensile and flexural strength, reduces resin consumption, and improves thermal and dimensional stability at elevated temperatures. Surface treatments are used to improve the adhesion between wollastonite and the polymers to which it is added. As a substitute for asbestos in floor tiles, friction products, insulating board and panels, paint, plastics, and roofing products, wollastonite is resistant to chemical attack, stable at high temperatures, and improves flexural and tensile strength. Salient Statistics—United States: The United States was thought to be a net exporter of wollastonite in 2018. Comprehensive trade data were not available for wollastonite because it is imported and exported under a generic Harmonized Tariff Schedule of the United States code that includes multiple mineral commodities. Ex-works prices for domestic wollastonite were reported in trade literature to range from approximately $210 to $445 per ton, and free-on-board prices for wollastonite from China, which tends to be minimally refined, ranged from $80 to $105 per ton. Products with finer grain sizes and acicular (highly elongated) particles sold for higher prices. Surface treatment, when necessary, also increased the selling price. Approximately 82 people were employed at wollastonite mines and mills in 2018 (excluding office workers). Recycling: None. Import Sources (2014–17): Comprehensive trade data were not available, but wollastonite was primarily imported from China, Finland, India, and Mexico. Tariff: Item Number Normal Trade Relations 12–31–18 Mineral substances not elsewhere specified or included 2530.90.8050 Free. Depletion Allowance: 10% (Domestic and foreign). Government Stockpile: None. Prepared by Kenneth C. Curry [(703) 648–7793, [email protected]]
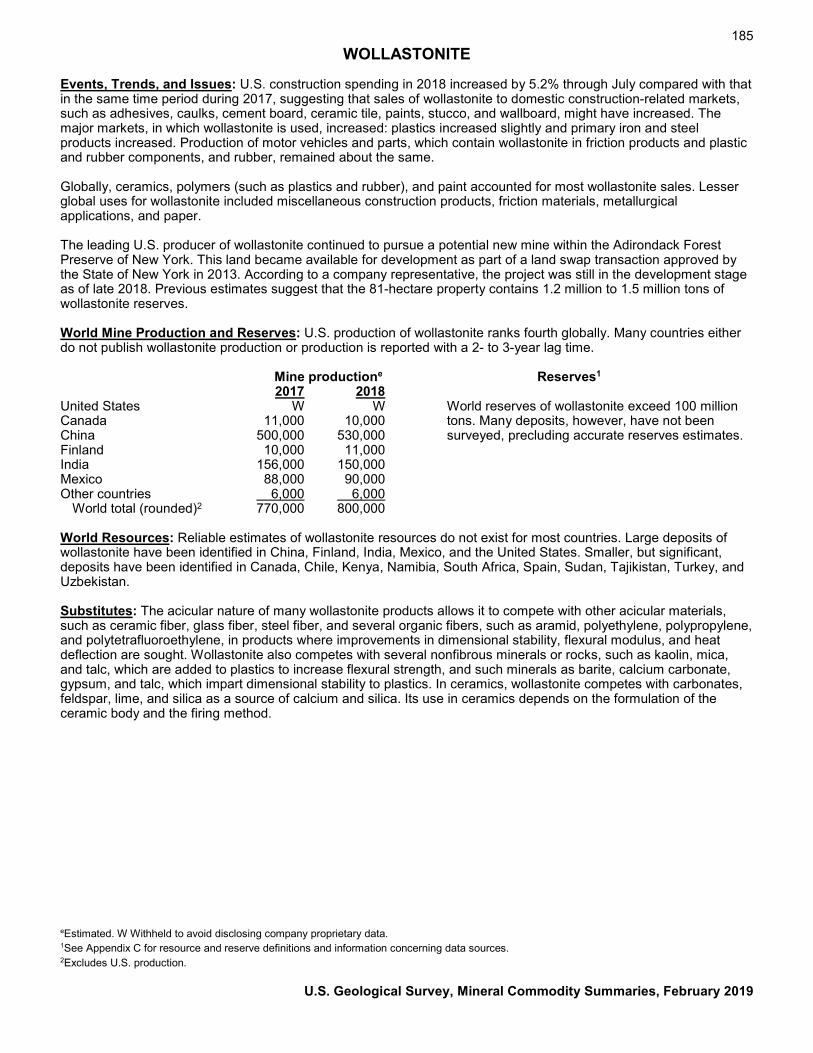
185 WOLLASTONITE
Events, Trends, and Issues: U.S. construction spending in 2018 increased by 5.2% through July compared with that in the same time period during 2017, suggesting that sales of wollastonite to domestic construction-related markets, such as adhesives, caulks, cement board, ceramic tile, paints, stucco, and wallboard, might have increased. The major markets, in which wollastonite is used, increased: plastics increased slightly and primary iron and steel products increased. Production of motor vehicles and parts, which contain wollastonite in friction products and plastic and rubber components, and rubber, remained about the same. Globally, ceramics, polymers (such as plastics and rubber), and paint accounted for most wollastonite sales. Lesser global uses for wollastonite included miscellaneous construction products, friction materials, metallurgical applications, and paper. The leading U.S. producer of wollastonite continued to pursue a potential new mine within the Adirondack Forest Preserve of New York. This land became available for development as part of a land swap transaction approved by the State of New York in 2013. According to a company representative, the project was still in the development stage as of late 2018. Previous estimates suggest that the 81-hectare property contains 1.2 million to 1.5 million tons of wollastonite reserves. World Mine Production and Reserves: U.S. production of wollastonite ranks fourth globally. Many countries either do not publish wollastonite production or production is reported with a 2- to 3-year lag time. Mine productione Reserves1 2017 2018 United States W W World reserves of wollastonite exceed 100 million Canada 11,000 10,000 tons. Many deposits, however, have not been China 500,000 530,000 surveyed, precluding accurate reserves estimates. Finland 10,000 11,000 India 156,000 150,000 Mexico 88,000 90,000 Other countries 6,000 6,000 World total (rounded)2 770,000 800,000 World Resources: Reliable estimates of wollastonite resources do not exist for most countries. Large deposits of wollastonite have been identified in China, Finland, India, Mexico, and the United States. Smaller, but significant, deposits have been identified in Canada, Chile, Kenya, Namibia, South Africa, Spain, Sudan, Tajikistan, Turkey, and Uzbekistan. Substitutes: The acicular nature of many wollastonite products allows it to compete with other acicular materials, such as ceramic fiber, glass fiber, steel fiber, and several organic fibers, such as aramid, polyethylene, polypropylene, and polytetrafluoroethylene, in products where improvements in dimensional stability, flexural modulus, and heat deflection are sought. Wollastonite also competes with several nonfibrous minerals or rocks, such as kaolin, mica, and talc, which are added to plastics to increase flexural strength, and such minerals as barite, calcium carbonate, gypsum, and talc, which impart dimensional stability to plastics. In ceramics, wollastonite competes with carbonates, feldspar, lime, and silica as a source of calcium and silica. Its use in ceramics depends on the formulation of the ceramic body and the firing method.
eEstimated. W Withheld to avoid disclosing company proprietary data. 1See Appendix C for resource and reserve definitions and information concerning data sources. 2Excludes U.S. production.
U.S. Geological Survey, Mineral Commodity Summaries, February 2019
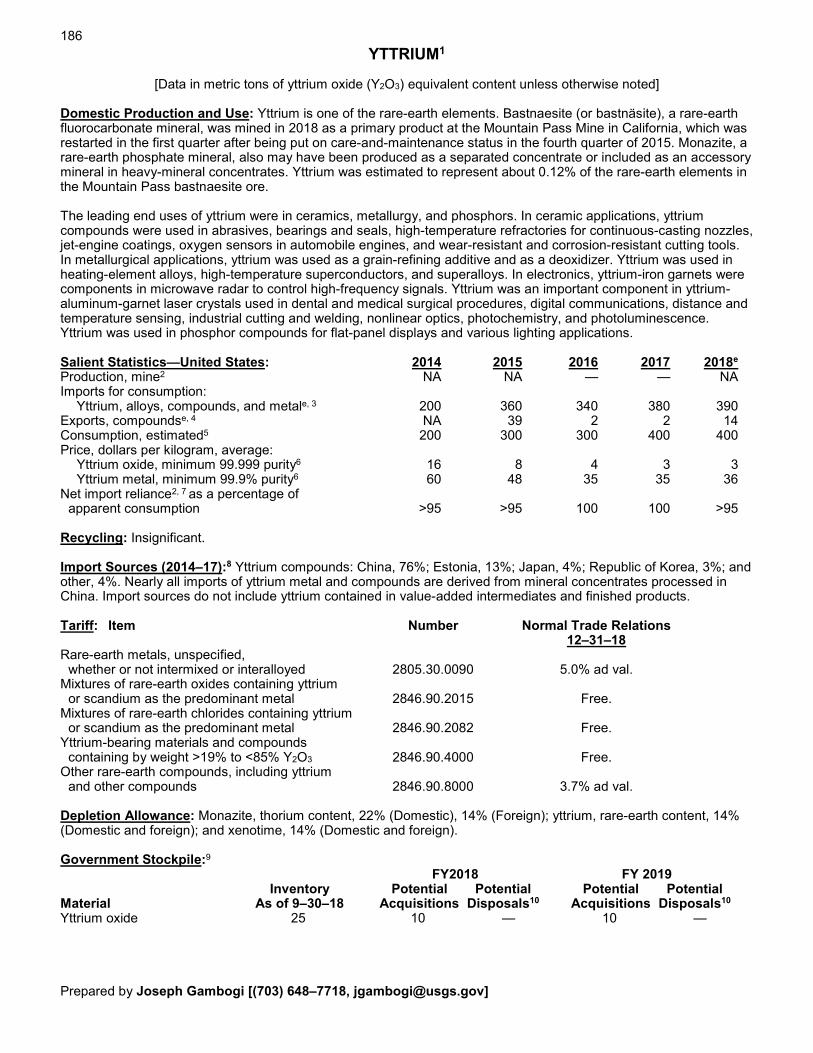
186
YTTRIUM1
[Data in metric tons of yttrium oxide (Y2O3) equivalent content unless otherwise noted] Domestic Production and Use: Yttrium is one of the rare-earth elements. Bastnaesite (or bastnäsite), a rare-earth fluorocarbonate mineral, was mined in 2018 as a primary product at the Mountain Pass Mine in California, which was restarted in the first quarter after being put on care-and-maintenance status in the fourth quarter of 2015. Monazite, a rare-earth phosphate mineral, also may have been produced as a separated concentrate or included as an accessory mineral in heavy-mineral concentrates. Yttrium was estimated to represent about 0.12% of the rare-earth elements in the Mountain Pass bastnaesite ore. The leading end uses of yttrium were in ceramics, metallurgy, and phosphors. In ceramic applications, yttrium compounds were used in abrasives, bearings and seals, high-temperature refractories for continuous-casting nozzles, jet-engine coatings, oxygen sensors in automobile engines, and wear-resistant and corrosion-resistant cutting tools. In metallurgical applications, yttrium was used as a grain-refining additive and as a deoxidizer. Yttrium was used in heating-element alloys, high-temperature superconductors, and superalloys. In electronics, yttrium-iron garnets were components in microwave radar to control high-frequency signals. Yttrium was an important component in yttrium-aluminum-garnet laser crystals used in dental and medical surgical procedures, digital communications, distance and temperature sensing, industrial cutting and welding, nonlinear optics, photochemistry, and photoluminescence. Yttrium was used in phosphor compounds for flat-panel displays and various lighting applications. Salient Statistics—United States: 2014 2015 2016 2017 2018e Production, mine2 NA NA — — NA Imports for consumption: Yttrium, alloys, compounds, and metale, 3 200 360 340 380 390 Exports, compoundse, 4 NA 39 2 2 14 Consumption, estimated5 200 300 300 400 400 Price, dollars per kilogram, average: Yttrium oxide, minimum 99.999 purity6 16 8 4 3 3 Yttrium metal, minimum 99.9% purity6 60 48 35 35 36 Net import reliance2, 7 as a percentage of apparent consumption >95 >95 100 100 >95 Recycling: Insignificant. Import Sources (2014–17):8 Yttrium compounds: China, 76%; Estonia, 13%; Japan, 4%; Republic of Korea, 3%; and other, 4%. Nearly all imports of yttrium metal and compounds are derived from mineral concentrates processed in China. Import sources do not include yttrium contained in value-added intermediates and finished products. Tariff: Item Number Normal Trade Relations 12–31–18 Rare-earth metals, unspecified, whether or not intermixed or interalloyed 2805.30.0090 5.0% ad val. Mixtures of rare-earth oxides containing yttrium or scandium as the predominant metal 2846.90.2015 Free. Mixtures of rare-earth chlorides containing yttrium or scandium as the predominant metal 2846.90.2082 Free. Yttrium-bearing materials and compounds containing by weight >19% to <85% Y2O3 2846.90.4000 Free. Other rare-earth compounds, including yttrium and other compounds 2846.90.8000 3.7% ad val. Depletion Allowance: Monazite, thorium content, 22% (Domestic), 14% (Foreign); yttrium, rare-earth content, 14% (Domestic and foreign); and xenotime, 14% (Domestic and foreign). Government Stockpile:9
FY2018 FY 2019 Inventory Potential Potential Potential Potential Material As of 9–30–18 Acquisitions Disposals10 Acquisitions Disposals10 Yttrium oxide 25 10 — 10 — Prepared by Joseph Gambogi [(703) 648–7718, [email protected]]
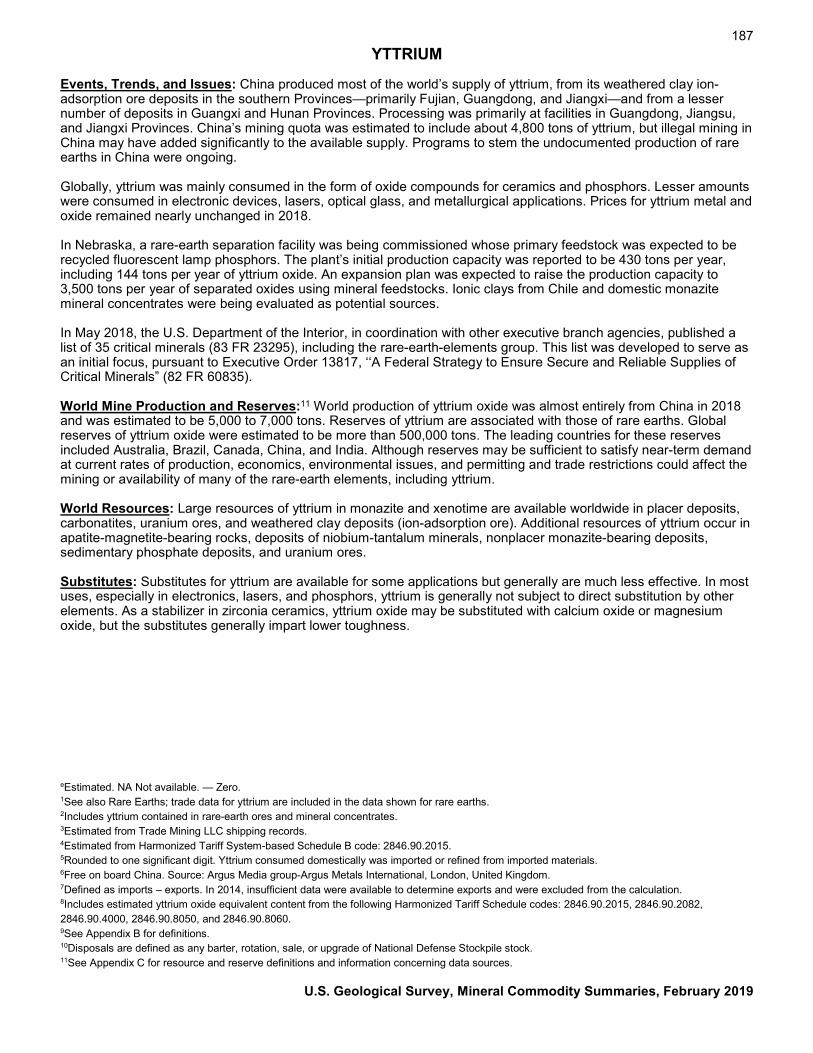
187 YTTRIUM
Events, Trends, and Issues: China produced most of the world’s supply of yttrium, from its weathered clay ion-adsorption ore deposits in the southern Provinces—primarily Fujian, Guangdong, and Jiangxi—and from a lesser number of deposits in Guangxi and Hunan Provinces. Processing was primarily at facilities in Guangdong, Jiangsu, and Jiangxi Provinces. China’s mining quota was estimated to include about 4,800 tons of yttrium, but illegal mining in China may have added significantly to the available supply. Programs to stem the undocumented production of rare earths in China were ongoing. Globally, yttrium was mainly consumed in the form of oxide compounds for ceramics and phosphors. Lesser amounts were consumed in electronic devices, lasers, optical glass, and metallurgical applications. Prices for yttrium metal and oxide remained nearly unchanged in 2018. In Nebraska, a rare-earth separation facility was being commissioned whose primary feedstock was expected to be recycled fluorescent lamp phosphors. The plant’s initial production capacity was reported to be 430 tons per year, including 144 tons per year of yttrium oxide. An expansion plan was expected to raise the production capacity to 3,500 tons per year of separated oxides using mineral feedstocks. Ionic clays from Chile and domestic monazite mineral concentrates were being evaluated as potential sources. In May 2018, the U.S. Department of the Interior, in coordination with other executive branch agencies, published a list of 35 critical minerals (83 FR 23295), including the rare-earth-elements group. This list was developed to serve as an initial focus, pursuant to Executive Order 13817, ‘‘A Federal Strategy to Ensure Secure and Reliable Supplies of Critical Minerals” (82 FR 60835). World Mine Production and Reserves:11 World production of yttrium oxide was almost entirely from China in 2018 and was estimated to be 5,000 to 7,000 tons. Reserves of yttrium are associated with those of rare earths. Global reserves of yttrium oxide were estimated to be more than 500,000 tons. The leading countries for these reserves included Australia, Brazil, Canada, China, and India. Although reserves may be sufficient to satisfy near-term demand at current rates of production, economics, environmental issues, and permitting and trade restrictions could affect the mining or availability of many of the rare-earth elements, including yttrium. World Resources: Large resources of yttrium in monazite and xenotime are available worldwide in placer deposits, carbonatites, uranium ores, and weathered clay deposits (ion-adsorption ore). Additional resources of yttrium occur in apatite-magnetite-bearing rocks, deposits of niobium-tantalum minerals, nonplacer monazite-bearing deposits, sedimentary phosphate deposits, and uranium ores. Substitutes: Substitutes for yttrium are available for some applications but generally are much less effective. In most uses, especially in electronics, lasers, and phosphors, yttrium is generally not subject to direct substitution by other elements. As a stabilizer in zirconia ceramics, yttrium oxide may be substituted with calcium oxide or magnesium oxide, but the substitutes generally impart lower toughness. eEstimated. NA Not available. — Zero. 1See also Rare Earths; trade data for yttrium are included in the data shown for rare earths. 2Includes yttrium contained in rare-earth ores and mineral concentrates. 3Estimated from Trade Mining LLC shipping records. 4Estimated from Harmonized Tariff System-based Schedule B code: 2846.90.2015. 5Rounded to one significant digit. Yttrium consumed domestically was imported or refined from imported materials. 6Free on board China. Source: Argus Media group-Argus Metals International, London, United Kingdom. 7Defined as imports – exports. In 2014, insufficient data were available to determine exports and were excluded from the calculation. 8Includes estimated yttrium oxide equivalent content from the following Harmonized Tariff Schedule codes: 2846.90.2015, 2846.90.2082, 2846.90.4000, 2846.90.8050, and 2846.90.8060. 9See Appendix B for definitions. 10Disposals are defined as any barter, rotation, sale, or upgrade of National Defense Stockpile stock. 11See Appendix C for resource and reserve definitions and information concerning data sources.
U.S. Geological Survey, Mineral Commodity Summaries, February 2019
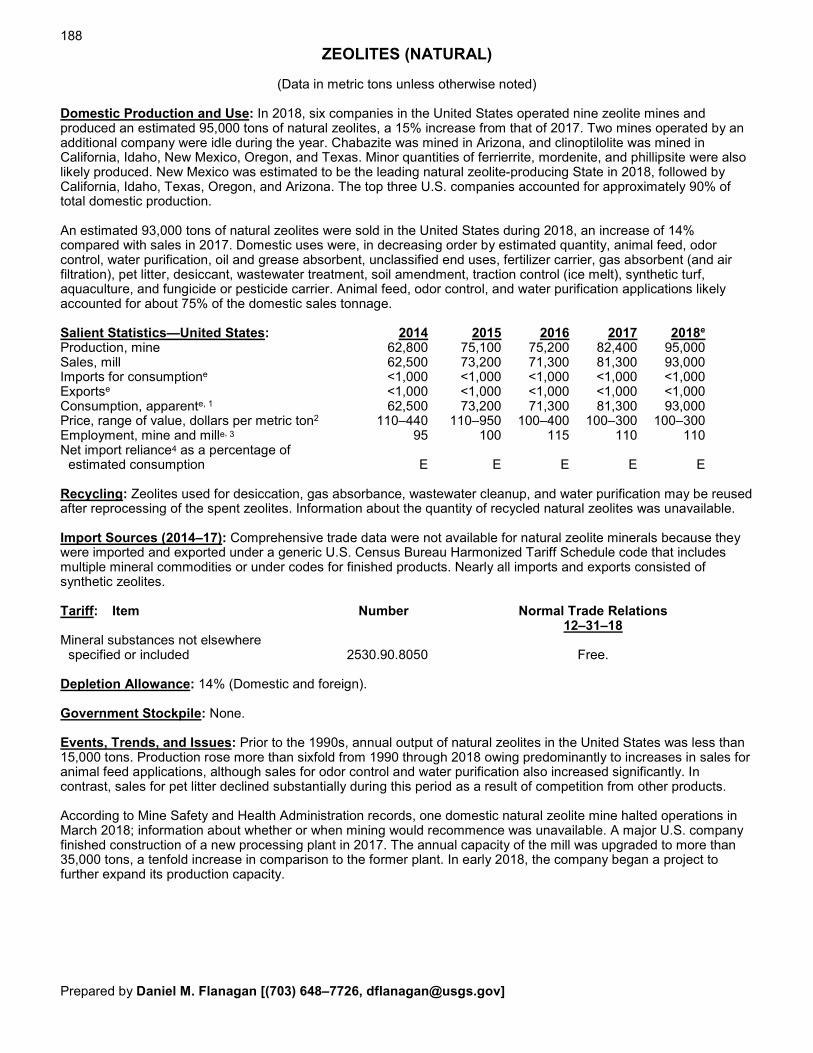
188
ZEOLITES (NATURAL)
(Data in metric tons unless otherwise noted) Domestic Production and Use: In 2018, six companies in the United States operated nine zeolite mines and produced an estimated 95,000 tons of natural zeolites, a 15% increase from that of 2017. Two mines operated by an additional company were idle during the year. Chabazite was mined in Arizona, and clinoptilolite was mined in California, Idaho, New Mexico, Oregon, and Texas. Minor quantities of ferrierrite, mordenite, and phillipsite were also likely produced. New Mexico was estimated to be the leading natural zeolite-producing State in 2018, followed by California, Idaho, Texas, Oregon, and Arizona. The top three U.S. companies accounted for approximately 90% of total domestic production. An estimated 93,000 tons of natural zeolites were sold in the United States during 2018, an increase of 14% compared with sales in 2017. Domestic uses were, in decreasing order by estimated quantity, animal feed, odor control, water purification, oil and grease absorbent, unclassified end uses, fertilizer carrier, gas absorbent (and air filtration), pet litter, desiccant, wastewater treatment, soil amendment, traction control (ice melt), synthetic turf, aquaculture, and fungicide or pesticide carrier. Animal feed, odor control, and water purification applications likely accounted for about 75% of the domestic sales tonnage. Salient Statistics—United States: 2014 2015 2016 2017 2018e Production, mine 62,800 75,100 75,200 82,400 95,000 Sales, mill 62,500 73,200 71,300 81,300 93,000 Imports for consumptione <1,000 <1,000 <1,000 <1,000 <1,000 Exportse <1,000 <1,000 <1,000 <1,000 <1,000 Consumption, apparente, 1 62,500 73,200 71,300 81,300 93,000 Price, range of value, dollars per metric ton2 110–440 110–950 100–400 100–300 100–300 Employment, mine and mille, 3 95 100 115 110 110 Net import reliance4 as a percentage of estimated consumption E E E E E Recycling: Zeolites used for desiccation, gas absorbance, wastewater cleanup, and water purification may be reused after reprocessing of the spent zeolites. Information about the quantity of recycled natural zeolites was unavailable. Import Sources (2014–17): Comprehensive trade data were not available for natural zeolite minerals because they were imported and exported under a generic U.S. Census Bureau Harmonized Tariff Schedule code that includes multiple mineral commodities or under codes for finished products. Nearly all imports and exports consisted of synthetic zeolites. Tariff: Item Number Normal Trade Relations 12–31–18 Mineral substances not elsewhere specified or included 2530.90.8050 Free. Depletion Allowance: 14% (Domestic and foreign). Government Stockpile: None. Events, Trends, and Issues: Prior to the 1990s, annual output of natural zeolites in the United States was less than 15,000 tons. Production rose more than sixfold from 1990 through 2018 owing predominantly to increases in sales for animal feed applications, although sales for odor control and water purification also increased significantly. In contrast, sales for pet litter declined substantially during this period as a result of competition from other products. According to Mine Safety and Health Administration records, one domestic natural zeolite mine halted operations in March 2018; information about whether or when mining would recommence was unavailable. A major U.S. company finished construction of a new processing plant in 2017. The annual capacity of the mill was upgraded to more than 35,000 tons, a tenfold increase in comparison to the former plant. In early 2018, the company began a project to further expand its production capacity. Prepared by Daniel M. Flanagan [(703) 648–7726, [email protected]]
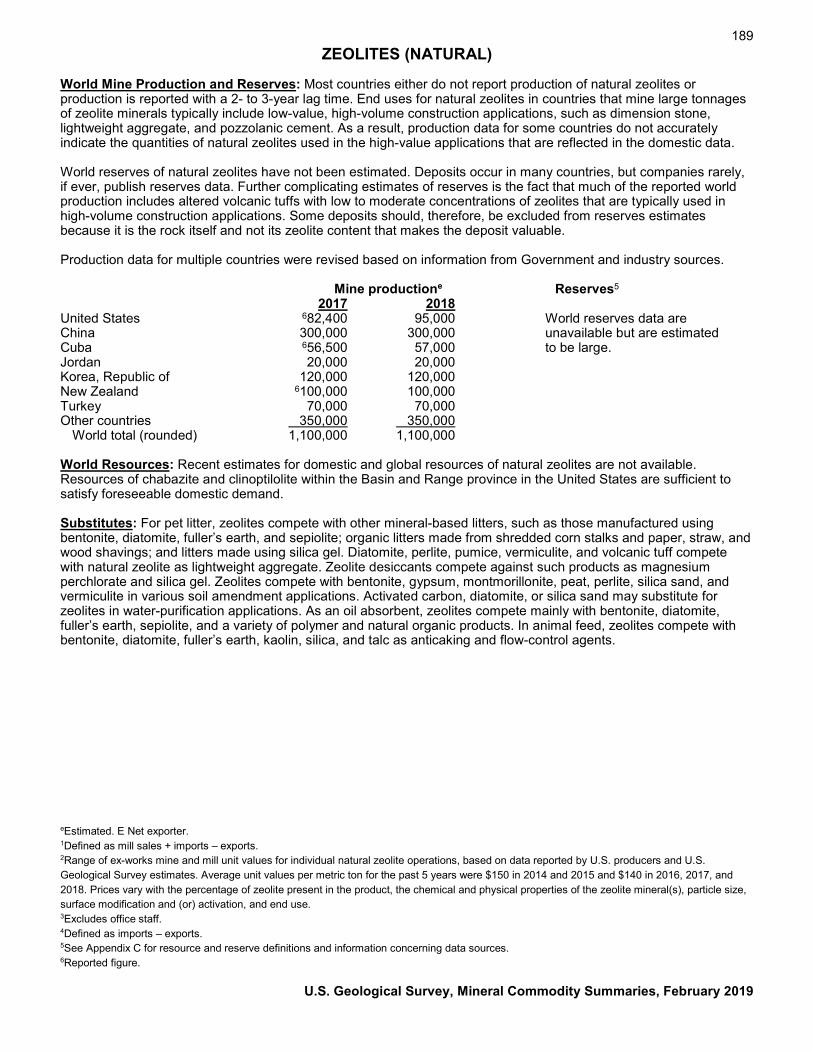
189 ZEOLITES (NATURAL)
World Mine Production and Reserves: Most countries either do not report production of natural zeolites or production is reported with a 2- to 3-year lag time. End uses for natural zeolites in countries that mine large tonnages of zeolite minerals typically include low-value, high-volume construction applications, such as dimension stone, lightweight aggregate, and pozzolanic cement. As a result, production data for some countries do not accurately indicate the quantities of natural zeolites used in the high-value applications that are reflected in the domestic data. World reserves of natural zeolites have not been estimated. Deposits occur in many countries, but companies rarely, if ever, publish reserves data. Further complicating estimates of reserves is the fact that much of the reported world production includes altered volcanic tuffs with low to moderate concentrations of zeolites that are typically used in high-volume construction applications. Some deposits should, therefore, be excluded from reserves estimates because it is the rock itself and not its zeolite content that makes the deposit valuable. Production data for multiple countries were revised based on information from Government and industry sources. Mine productione Reserves5 2017 2018 United States 682,400 95,000 World reserves data are China 300,000 300,000 unavailable but are estimated Cuba 656,500 57,000 to be large. Jordan 20,000 20,000 Korea, Republic of 120,000 120,000 New Zealand 6100,000 100,000 Turkey 70,000 70,000 Other countries 350,000 350,000 World total (rounded) 1,100,000 1,100,000 World Resources: Recent estimates for domestic and global resources of natural zeolites are not available. Resources of chabazite and clinoptilolite within the Basin and Range province in the United States are sufficient to satisfy foreseeable domestic demand. Substitutes: For pet litter, zeolites compete with other mineral-based litters, such as those manufactured using bentonite, diatomite, fuller’s earth, and sepiolite; organic litters made from shredded corn stalks and paper, straw, and wood shavings; and litters made using silica gel. Diatomite, perlite, pumice, vermiculite, and volcanic tuff compete with natural zeolite as lightweight aggregate. Zeolite desiccants compete against such products as magnesium perchlorate and silica gel. Zeolites compete with bentonite, gypsum, montmorillonite, peat, perlite, silica sand, and vermiculite in various soil amendment applications. Activated carbon, diatomite, or silica sand may substitute for zeolites in water-purification applications. As an oil absorbent, zeolites compete mainly with bentonite, diatomite, fuller’s earth, sepiolite, and a variety of polymer and natural organic products. In animal feed, zeolites compete with bentonite, diatomite, fuller’s earth, kaolin, silica, and talc as anticaking and flow-control agents. eEstimated. E Net exporter. 1Defined as mill sales + imports – exports. 2Range of ex-works mine and mill unit values for individual natural zeolite operations, based on data reported by U.S. producers and U.S. Geological Survey estimates. Average unit values per metric ton for the past 5 years were $150 in 2014 and 2015 and $140 in 2016, 2017, and 2018. Prices vary with the percentage of zeolite present in the product, the chemical and physical properties of the zeolite mineral(s), particle size, surface modification and (or) activation, and end use. 3Excludes office staff. 4Defined as imports – exports. 5See Appendix C for resource and reserve definitions and information concerning data sources. 6Reported figure.
U.S. Geological Survey, Mineral Commodity Summaries, February 2019
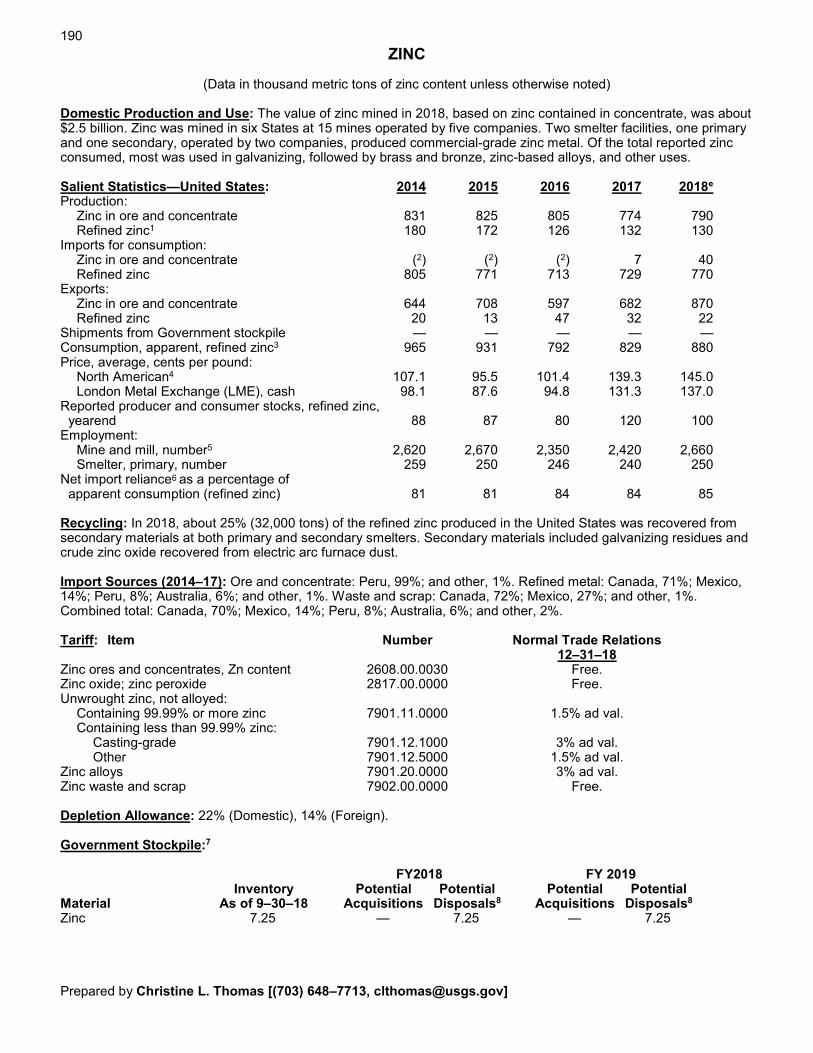
190
ZINC
(Data in thousand metric tons of zinc content unless otherwise noted) Domestic Production and Use: The value of zinc mined in 2018, based on zinc contained in concentrate, was about $2.5 billion. Zinc was mined in six States at 15 mines operated by five companies. Two smelter facilities, one primary and one secondary, operated by two companies, produced commercial-grade zinc metal. Of the total reported zinc consumed, most was used in galvanizing, followed by brass and bronze, zinc-based alloys, and other uses. Salient Statistics—United States: 2014 2015 2016 2017 2018e
Production: Zinc in ore and concentrate 831 825 805 774 790 Refined zinc1 180 172 126 132 130 Imports for consumption: Zinc in ore and concentrate (2) (2) (2) 7 40 Refined zinc 805 771 713 729 770 Exports: Zinc in ore and concentrate 644 708 597 682 870 Refined zinc 20 13 47 32 22 Shipments from Government stockpile — — — — — Consumption, apparent, refined zinc3 965 931 792 829 880 Price, average, cents per pound: North American4 107.1 95.5 101.4 139.3 145.0 London Metal Exchange (LME), cash 98.1 87.6 94.8 131.3 137.0 Reported producer and consumer stocks, refined zinc, yearend 88 87 80 120 100 Employment: Mine and mill, number5 2,620 2,670 2,350 2,420 2,660 Smelter, primary, number 259 250 246 240 250 Net import reliance6 as a percentage of apparent consumption (refined zinc) 81 81 84 84 85 Recycling: In 2018, about 25% (32,000 tons) of the refined zinc produced in the United States was recovered from secondary materials at both primary and secondary smelters. Secondary materials included galvanizing residues and crude zinc oxide recovered from electric arc furnace dust. Import Sources (2014–17): Ore and concentrate: Peru, 99%; and other, 1%. Refined metal: Canada, 71%; Mexico, 14%; Peru, 8%; Australia, 6%; and other, 1%. Waste and scrap: Canada, 72%; Mexico, 27%; and other, 1%. Combined total: Canada, 70%; Mexico, 14%; Peru, 8%; Australia, 6%; and other, 2%. Tariff: Item Number Normal Trade Relations 12–31–18 Zinc ores and concentrates, Zn content 2608.00.0030 Free. Zinc oxide; zinc peroxide 2817.00.0000 Free. Unwrought zinc, not alloyed: Containing 99.99% or more zinc 7901.11.0000 1.5% ad val. Containing less than 99.99% zinc: Casting-grade 7901.12.1000 3% ad val. Other 7901.12.5000 1.5% ad val. Zinc alloys 7901.20.0000 3% ad val. Zinc waste and scrap 7902.00.0000 Free. Depletion Allowance: 22% (Domestic), 14% (Foreign). Government Stockpile:7
FY2018 FY 2019 Inventory Potential Potential Potential Potential Material As of 9–30–18 Acquisitions Disposals8 Acquisitions Disposals8
Zinc 7.25 — 7.25 — 7.25 Prepared by Christine L. Thomas [(703) 648–7713, [email protected]]
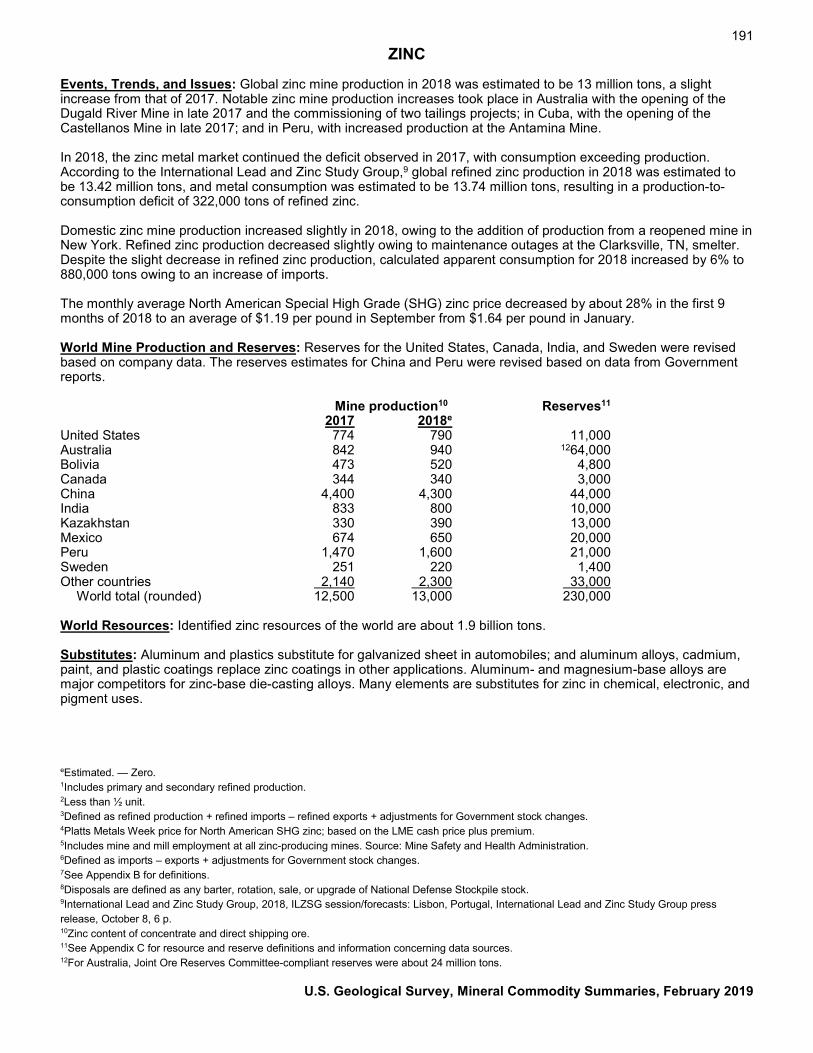
191 ZINC
Events, Trends, and Issues: Global zinc mine production in 2018 was estimated to be 13 million tons, a slight increase from that of 2017. Notable zinc mine production increases took place in Australia with the opening of the Dugald River Mine in late 2017 and the commissioning of two tailings projects; in Cuba, with the opening of the Castellanos Mine in late 2017; and in Peru, with increased production at the Antamina Mine. In 2018, the zinc metal market continued the deficit observed in 2017, with consumption exceeding production. According to the International Lead and Zinc Study Group,9 global refined zinc production in 2018 was estimated to be 13.42 million tons, and metal consumption was estimated to be 13.74 million tons, resulting in a production-to-consumption deficit of 322,000 tons of refined zinc. Domestic zinc mine production increased slightly in 2018, owing to the addition of production from a reopened mine in New York. Refined zinc production decreased slightly owing to maintenance outages at the Clarksville, TN, smelter. Despite the slight decrease in refined zinc production, calculated apparent consumption for 2018 increased by 6% to 880,000 tons owing to an increase of imports. The monthly average North American Special High Grade (SHG) zinc price decreased by about 28% in the first 9 months of 2018 to an average of $1.19 per pound in September from $1.64 per pound in January. World Mine Production and Reserves: Reserves for the United States, Canada, India, and Sweden were revised based on company data. The reserves estimates for China and Peru were revised based on data from Government reports. Mine production10 Reserves11 2017 2018e United States 774 790 11,000 Australia 842 940 1264,000 Bolivia 473 520 4,800 Canada 344 340 3,000 China 4,400 4,300 44,000 India 833 800 10,000 Kazakhstan 330 390 13,000 Mexico 674 650 20,000 Peru 1,470 1,600 21,000 Sweden 251 220 1,400 Other countries 2,140 2,300 33,000 World total (rounded) 12,500 13,000 230,000 World Resources: Identified zinc resources of the world are about 1.9 billion tons. Substitutes: Aluminum and plastics substitute for galvanized sheet in automobiles; and aluminum alloys, cadmium, paint, and plastic coatings replace zinc coatings in other applications. Aluminum- and magnesium-base alloys are major competitors for zinc-base die-casting alloys. Many elements are substitutes for zinc in chemical, electronic, and pigment uses. eEstimated. — Zero. 1Includes primary and secondary refined production. 2Less than ½ unit. 3Defined as refined production + refined imports – refined exports + adjustments for Government stock changes. 4Platts Metals Week price for North American SHG zinc; based on the LME cash price plus premium. 5Includes mine and mill employment at all zinc-producing mines. Source: Mine Safety and Health Administration. 6Defined as imports – exports + adjustments for Government stock changes. 7See Appendix B for definitions. 8Disposals are defined as any barter, rotation, sale, or upgrade of National Defense Stockpile stock. 9International Lead and Zinc Study Group, 2018, ILZSG session/forecasts: Lisbon, Portugal, International Lead and Zinc Study Group press release, October 8, 6 p. 10Zinc content of concentrate and direct shipping ore. 11See Appendix C for resource and reserve definitions and information concerning data sources. 12For Australia, Joint Ore Reserves Committee-compliant reserves were about 24 million tons.
U.S. Geological Survey, Mineral Commodity Summaries, February 2019
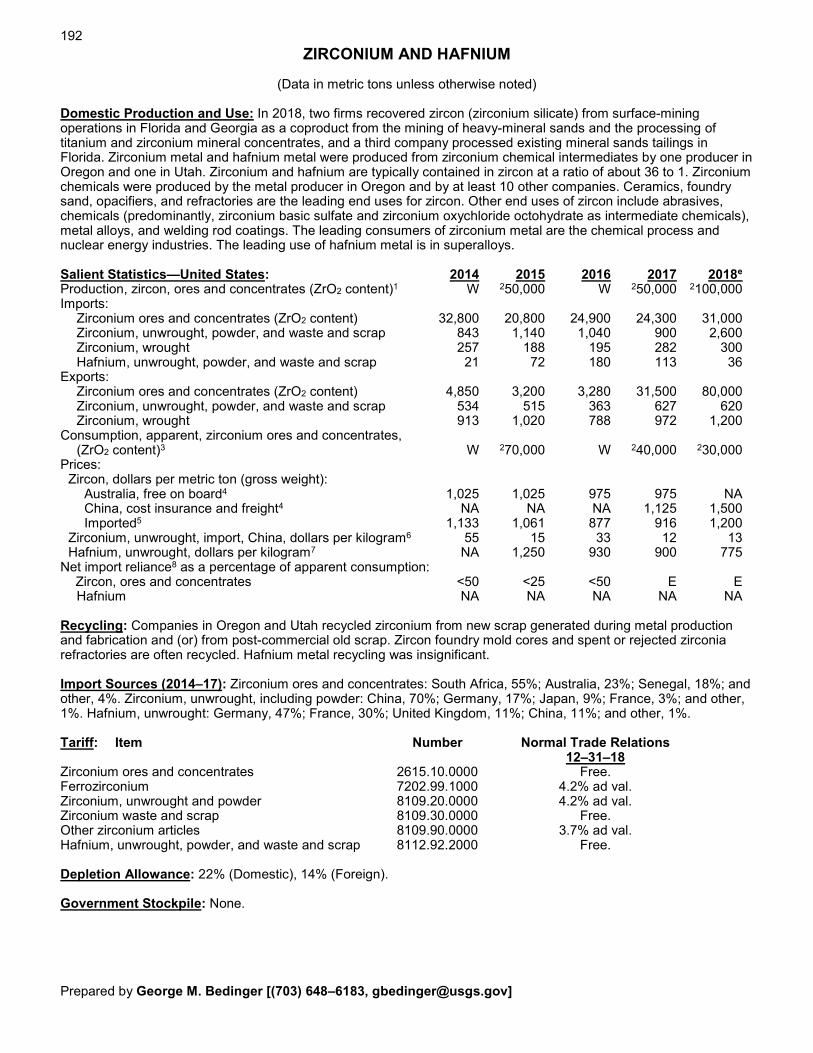
192
ZIRCONIUM AND HAFNIUM
(Data in metric tons unless otherwise noted) Domestic Production and Use: In 2018, two firms recovered zircon (zirconium silicate) from surface-mining operations in Florida and Georgia as a coproduct from the mining of heavy-mineral sands and the processing of titanium and zirconium mineral concentrates, and a third company processed existing mineral sands tailings in Florida. Zirconium metal and hafnium metal were produced from zirconium chemical intermediates by one producer in Oregon and one in Utah. Zirconium and hafnium are typically contained in zircon at a ratio of about 36 to 1. Zirconium chemicals were produced by the metal producer in Oregon and by at least 10 other companies. Ceramics, foundry sand, opacifiers, and refractories are the leading end uses for zircon. Other end uses of zircon include abrasives, chemicals (predominantly, zirconium basic sulfate and zirconium oxychloride octohydrate as intermediate chemicals), metal alloys, and welding rod coatings. The leading consumers of zirconium metal are the chemical process and nuclear energy industries. The leading use of hafnium metal is in superalloys. Salient Statistics—United States: 2014 2015 2016 2017 2018e Production, zircon, ores and concentrates (ZrO2 content)1 W 250,000 W 250,000 2100,000 Imports: Zirconium ores and concentrates (ZrO2 content) 32,800 20,800 24,900 24,300 31,000 Zirconium, unwrought, powder, and waste and scrap 843 1,140 1,040 900 2,600 Zirconium, wrought 257 188 195 282 300 Hafnium, unwrought, powder, and waste and scrap 21 72 180 113 36 Exports: Zirconium ores and concentrates (ZrO2 content) 4,850 3,200 3,280 31,500 80,000 Zirconium, unwrought, powder, and waste and scrap 534 515 363 627 620 Zirconium, wrought 913 1,020 788 972 1,200 Consumption, apparent, zirconium ores and concentrates, (ZrO2 content)3 W 270,000 W 240,000 230,000 Prices: Zircon, dollars per metric ton (gross weight): Australia, free on board4 1,025 1,025 975 975 NA China, cost insurance and freight4 NA NA NA 1,125 1,500 Imported5 1,133 1,061 877 916 1,200 Zirconium, unwrought, import, China, dollars per kilogram6 55 15 33 12 13 Hafnium, unwrought, dollars per kilogram7 NA 1,250 930 900 775 Net import reliance8 as a percentage of apparent consumption: Zircon, ores and concentrates <50 <25 <50 E E Hafnium NA NA NA NA NA Recycling: Companies in Oregon and Utah recycled zirconium from new scrap generated during metal production and fabrication and (or) from post-commercial old scrap. Zircon foundry mold cores and spent or rejected zirconia refractories are often recycled. Hafnium metal recycling was insignificant. Import Sources (2014–17): Zirconium ores and concentrates: South Africa, 55%; Australia, 23%; Senegal, 18%; and other, 4%. Zirconium, unwrought, including powder: China, 70%; Germany, 17%; Japan, 9%; France, 3%; and other, 1%. Hafnium, unwrought: Germany, 47%; France, 30%; United Kingdom, 11%; China, 11%; and other, 1%. Tariff: Item Number Normal Trade Relations 12–31–18 Zirconium ores and concentrates 2615.10.0000 Free. Ferrozirconium 7202.99.1000 4.2% ad val. Zirconium, unwrought and powder 8109.20.0000 4.2% ad val. Zirconium waste and scrap 8109.30.0000 Free. Other zirconium articles 8109.90.0000 3.7% ad val. Hafnium, unwrought, powder, and waste and scrap 8112.92.2000 Free. Depletion Allowance: 22% (Domestic), 14% (Foreign). Government Stockpile: None. Prepared by George M. Bedinger [(703) 648–6183, [email protected]]
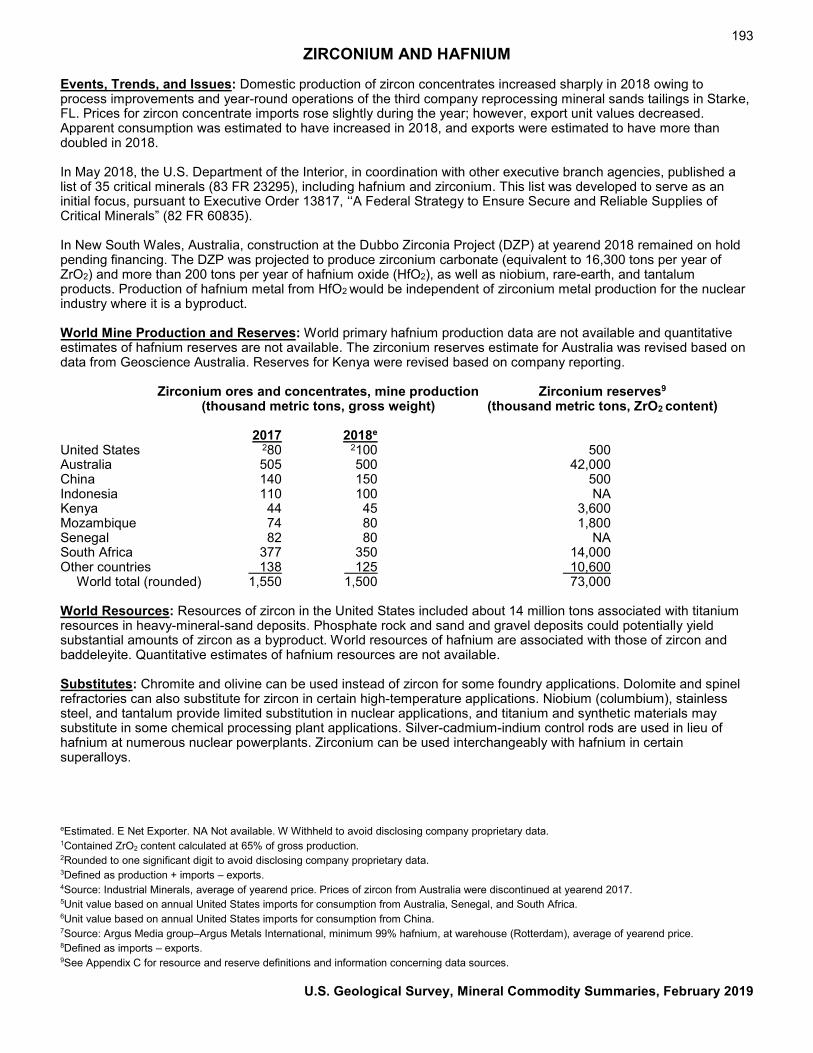
193 ZIRCONIUM AND HAFNIUM
Events, Trends, and Issues: Domestic production of zircon concentrates increased sharply in 2018 owing to process improvements and year-round operations of the third company reprocessing mineral sands tailings in Starke, FL. Prices for zircon concentrate imports rose slightly during the year; however, export unit values decreased. Apparent consumption was estimated to have increased in 2018, and exports were estimated to have more than doubled in 2018.
In May 2018, the U.S. Department of the Interior, in coordination with other executive branch agencies, published a list of 35 critical minerals (83 FR 23295), including hafnium and zirconium. This list was developed to serve as an initial focus, pursuant to Executive Order 13817, ‘‘A Federal Strategy to Ensure Secure and Reliable Supplies of Critical Minerals” (82 FR 60835).
In New South Wales, Australia, construction at the Dubbo Zirconia Project (DZP) at yearend 2018 remained on hold pending financing. The DZP was projected to produce zirconium carbonate (equivalent to 16,300 tons per year of ZrO2) and more than 200 tons per year of hafnium oxide (HfO2), as well as niobium, rare-earth, and tantalum products. Production of hafnium metal from HfO2 would be independent of zirconium metal production for the nuclear industry where it is a byproduct.
World Mine Production and Reserves: World primary hafnium production data are not available and quantitative estimates of hafnium reserves are not available. The zirconium reserves estimate for Australia was revised based on data from Geoscience Australia. Reserves for Kenya were revised based on company reporting.
Zirconium ores and concentrates, mine production Zirconium reserves9 (thousand metric tons, gross weight) (thousand metric tons, ZrO2 content)
2017 2018e United States 280 2100 500 Australia 505 500 42,000 China 140 150 500 Indonesia 110 100 NA Kenya 44 45 3,600 Mozambique 74 80 1,800 Senegal 82 80 NA South Africa 377 350 14,000 Other countries 138 125 10,600
World total (rounded) 1,550 1,500 73,000
World Resources: Resources of zircon in the United States included about 14 million tons associated with titanium resources in heavy-mineral-sand deposits. Phosphate rock and sand and gravel deposits could potentially yield substantial amounts of zircon as a byproduct. World resources of hafnium are associated with those of zircon and baddeleyite. Quantitative estimates of hafnium resources are not available.
Substitutes: Chromite and olivine can be used instead of zircon for some foundry applications. Dolomite and spinel refractories can also substitute for zircon in certain high-temperature applications. Niobium (columbium), stainless steel, and tantalum provide limited substitution in nuclear applications, and titanium and synthetic materials may substitute in some chemical processing plant applications. Silver-cadmium-indium control rods are used in lieu of hafnium at numerous nuclear powerplants. Zirconium can be used interchangeably with hafnium in certain superalloys.
eEstimated. E Net Exporter. NA Not available. W Withheld to avoid disclosing company proprietary data. 1Contained ZrO2 content calculated at 65% of gross production. 2Rounded to one significant digit to avoid disclosing company proprietary data. 3Defined as production + imports – exports. 4Source: Industrial Minerals, average of yearend price. Prices of zircon from Australia were discontinued at yearend 2017. 5Unit value based on annual United States imports for consumption from Australia, Senegal, and South Africa. 6Unit value based on annual United States imports for consumption from China. 7Source: Argus Media group–Argus Metals International, minimum 99% hafnium, at warehouse (Rotterdam), average of yearend price. 8Defined as imports – exports. 9See Appendix C for resource and reserve definitions and information concerning data sources.
U.S. Geological Survey, Mineral Commodity Summaries, February 2019
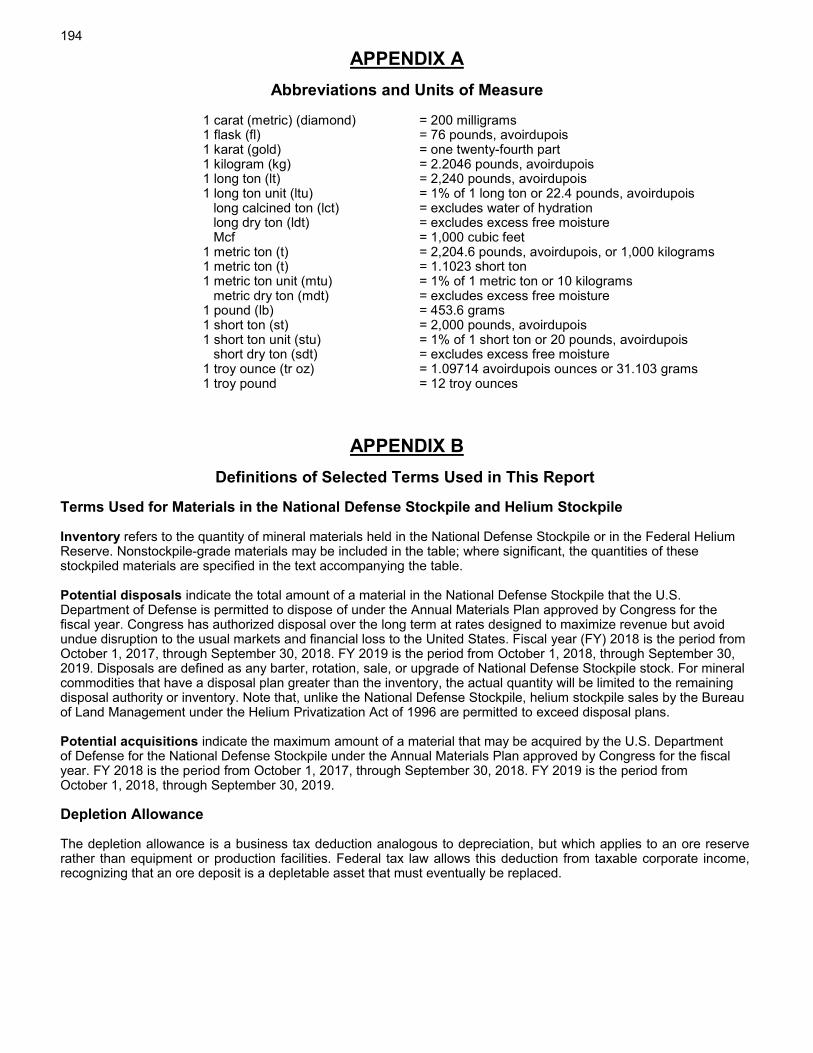
194
APPENDIX A Abbreviations and Units of Measure
1 carat (metric) (diamond) = 200 milligrams 1 flask (fl) = 76 pounds, avoirdupois 1 karat (gold) = one twenty-fourth part 1 kilogram (kg) = 2.2046 pounds, avoirdupois 1 long ton (lt) = 2,240 pounds, avoirdupois 1 long ton unit (ltu) = 1% of 1 long ton or 22.4 pounds, avoirdupois
long calcined ton (lct) = excludes water of hydration long dry ton (ldt) = excludes excess free moisture Mcf = 1,000 cubic feet
1 metric ton (t) = 2,204.6 pounds, avoirdupois, or 1,000 kilograms 1 metric ton (t) = 1.1023 short ton 1 metric ton unit (mtu) = 1% of 1 metric ton or 10 kilograms metric dry ton (mdt) = excludes excess free moisture 1 pound (lb) = 453.6 grams 1 short ton (st) = 2,000 pounds, avoirdupois 1 short ton unit (stu) = 1% of 1 short ton or 20 pounds, avoirdupois short dry ton (sdt) = excludes excess free moisture 1 troy ounce (tr oz) = 1.09714 avoirdupois ounces or 31.103 grams 1 troy pound = 12 troy ounces
APPENDIX B Definitions of Selected Terms Used in This Report
Terms Used for Materials in the National Defense Stockpile and Helium Stockpile
Inventory refers to the quantity of mineral materials held in the National Defense Stockpile or in the Federal Helium Reserve. Nonstockpile-grade materials may be included in the table; where significant, the quantities of these stockpiled materials are specified in the text accompanying the table.
Potential disposals indicate the total amount of a material in the National Defense Stockpile that the U.S. Department of Defense is permitted to dispose of under the Annual Materials Plan approved by Congress for the fiscal year. Congress has authorized disposal over the long term at rates designed to maximize revenue but avoid undue disruption to the usual markets and financial loss to the United States. Fiscal year (FY) 2018 is the period from October 1, 2017, through September 30, 2018. FY 2019 is the period from October 1, 2018, through September 30, 2019. Disposals are defined as any barter, rotation, sale, or upgrade of National Defense Stockpile stock. For mineral commodities that have a disposal plan greater than the inventory, the actual quantity will be limited to the remaining disposal authority or inventory. Note that, unlike the National Defense Stockpile, helium stockpile sales by the Bureau of Land Management under the Helium Privatization Act of 1996 are permitted to exceed disposal plans.
Potential acquisitions indicate the maximum amount of a material that may be acquired by the U.S. Department of Defense for the National Defense Stockpile under the Annual Materials Plan approved by Congress for the fiscal year. FY 2018 is the period from October 1, 2017, through September 30, 2018. FY 2019 is the period from October 1, 2018, through September 30, 2019.
Depletion Allowance
The depletion allowance is a business tax deduction analogous to depreciation, but which applies to an ore reserve rather than equipment or production facilities. Federal tax law allows this deduction from taxable corporate income, recognizing that an ore deposit is a depletable asset that must eventually be replaced.
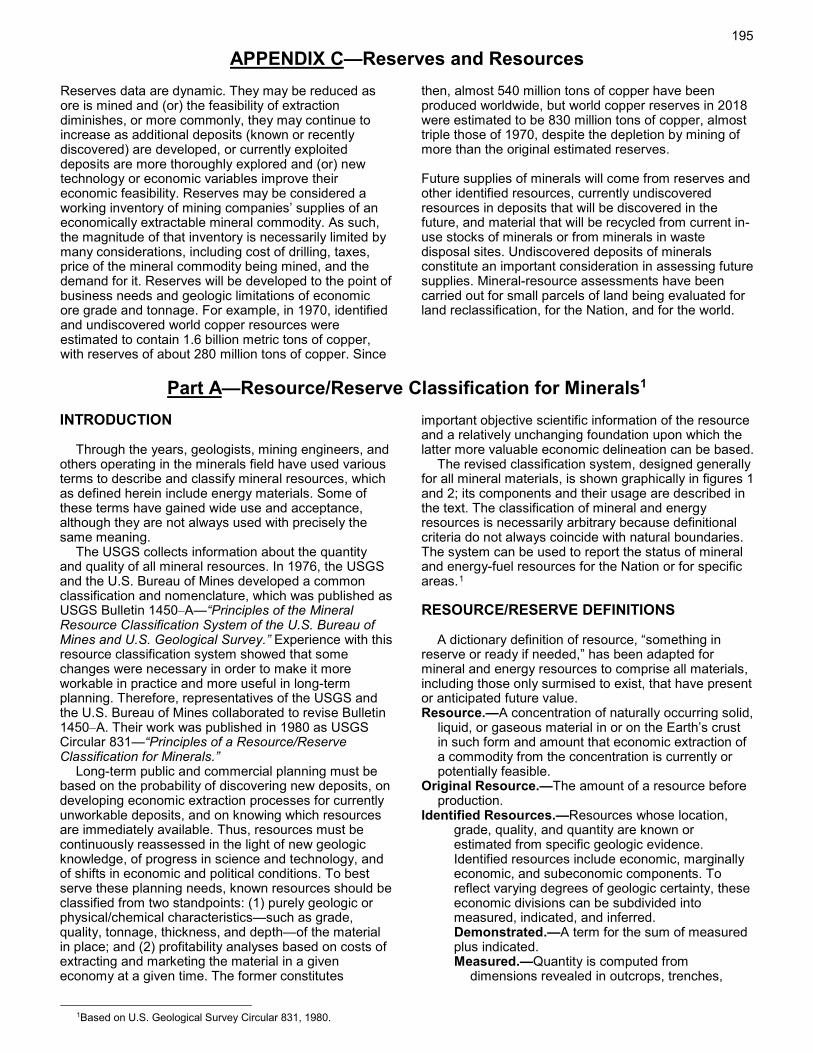
195
APPENDIX C—Reserves and Resources Reserves data are dynamic. They may be reduced as ore is mined and (or) the feasibility of extraction diminishes, or more commonly, they may continue to increase as additional deposits (known or recently discovered) are developed, or currently exploited deposits are more thoroughly explored and (or) new technology or economic variables improve their economic feasibility. Reserves may be considered a working inventory of mining companies’ supplies of an economically extractable mineral commodity. As such, the magnitude of that inventory is necessarily limited by many considerations, including cost of drilling, taxes, price of the mineral commodity being mined, and the demand for it. Reserves will be developed to the point of business needs and geologic limitations of economic ore grade and tonnage. For example, in 1970, identified and undiscovered world copper resources were estimated to contain 1.6 billion metric tons of copper, with reserves of about 280 million tons of copper. Since
then, almost 540 million tons of copper have been produced worldwide, but world copper reserves in 2018 were estimated to be 830 million tons of copper, almost triple those of 1970, despite the depletion by mining of more than the original estimated reserves. Future supplies of minerals will come from reserves and other identified resources, currently undiscovered resources in deposits that will be discovered in the future, and material that will be recycled from current in-use stocks of minerals or from minerals in waste disposal sites. Undiscovered deposits of minerals constitute an important consideration in assessing future supplies. Mineral-resource assessments have been carried out for small parcels of land being evaluated for land reclassification, for the Nation, and for the world.
Part A—Resource/Reserve Classification for Minerals1
INTRODUCTION Through the years, geologists, mining engineers, and others operating in the minerals field have used various terms to describe and classify mineral resources, which as defined herein include energy materials. Some of these terms have gained wide use and acceptance, although they are not always used with precisely the same meaning. The USGS collects information about the quantity and quality of all mineral resources. In 1976, the USGS and the U.S. Bureau of Mines developed a common classification and nomenclature, which was published as USGS Bulletin 1450–A—“Principles of the Mineral Resource Classification System of the U.S. Bureau of Mines and U.S. Geological Survey.” Experience with this resource classification system showed that some changes were necessary in order to make it more workable in practice and more useful in long-term planning. Therefore, representatives of the USGS and the U.S. Bureau of Mines collaborated to revise Bulletin 1450–A. Their work was published in 1980 as USGS Circular 831—“Principles of a Resource/Reserve Classification for Minerals.” Long-term public and commercial planning must be based on the probability of discovering new deposits, on developing economic extraction processes for currently unworkable deposits, and on knowing which resources are immediately available. Thus, resources must be continuously reassessed in the light of new geologic knowledge, of progress in science and technology, and of shifts in economic and political conditions. To best serve these planning needs, known resources should be classified from two standpoints: (1) purely geologic or physical/chemical characteristics—such as grade, quality, tonnage, thickness, and depth—of the material in place; and (2) profitability analyses based on costs of extracting and marketing the material in a given economy at a given time. The former constitutes
1Based on U.S. Geological Survey Circular 831, 1980.
important objective scientific information of the resource and a relatively unchanging foundation upon which the latter more valuable economic delineation can be based. The revised classification system, designed generally for all mineral materials, is shown graphically in figures 1 and 2; its components and their usage are described in the text. The classification of mineral and energy resources is necessarily arbitrary because definitional criteria do not always coincide with natural boundaries. The system can be used to report the status of mineral and energy-fuel resources for the Nation or for specific areas.1 RESOURCE/RESERVE DEFINITIONS A dictionary definition of resource, “something in reserve or ready if needed,” has been adapted for mineral and energy resources to comprise all materials, including those only surmised to exist, that have present or anticipated future value. Resource.—A concentration of naturally occurring solid,
liquid, or gaseous material in or on the Earth’s crust in such form and amount that economic extraction of a commodity from the concentration is currently or potentially feasible.
Original Resource.—The amount of a resource before production.
Identified Resources.—Resources whose location, grade, quality, and quantity are known or estimated from specific geologic evidence. Identified resources include economic, marginally economic, and subeconomic components. To reflect varying degrees of geologic certainty, these economic divisions can be subdivided into measured, indicated, and inferred. Demonstrated.—A term for the sum of measured plus indicated.
Measured.—Quantity is computed from dimensions revealed in outcrops, trenches,
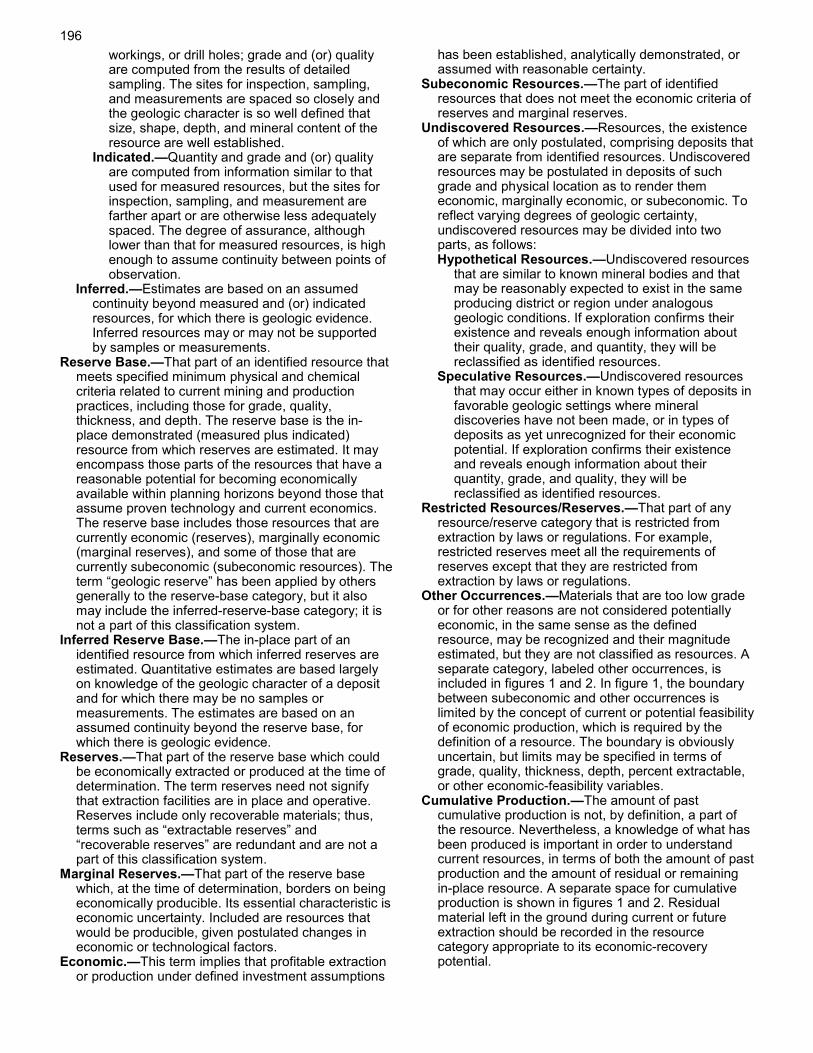
196
workings, or drill holes; grade and (or) quality are computed from the results of detailed sampling. The sites for inspection, sampling, and measurements are spaced so closely and the geologic character is so well defined that size, shape, depth, and mineral content of the resource are well established.
Indicated.—Quantity and grade and (or) quality are computed from information similar to that used for measured resources, but the sites for inspection, sampling, and measurement are farther apart or are otherwise less adequately spaced. The degree of assurance, although lower than that for measured resources, is high enough to assume continuity between points of observation.
Inferred.—Estimates are based on an assumed continuity beyond measured and (or) indicated resources, for which there is geologic evidence. Inferred resources may or may not be supported by samples or measurements.
Reserve Base.—That part of an identified resource that meets specified minimum physical and chemical criteria related to current mining and production practices, including those for grade, quality, thickness, and depth. The reserve base is the in-place demonstrated (measured plus indicated) resource from which reserves are estimated. It may encompass those parts of the resources that have a reasonable potential for becoming economically available within planning horizons beyond those that assume proven technology and current economics. The reserve base includes those resources that are currently economic (reserves), marginally economic (marginal reserves), and some of those that are currently subeconomic (subeconomic resources). The term “geologic reserve” has been applied by others generally to the reserve-base category, but it also may include the inferred-reserve-base category; it is not a part of this classification system.
Inferred Reserve Base.—The in-place part of an identified resource from which inferred reserves are estimated. Quantitative estimates are based largely on knowledge of the geologic character of a deposit and for which there may be no samples or measurements. The estimates are based on an assumed continuity beyond the reserve base, for which there is geologic evidence.
Reserves.—That part of the reserve base which could be economically extracted or produced at the time of determination. The term reserves need not signify that extraction facilities are in place and operative. Reserves include only recoverable materials; thus, terms such as “extractable reserves” and “recoverable reserves” are redundant and are not a part of this classification system.
Marginal Reserves.—That part of the reserve base which, at the time of determination, borders on being economically producible. Its essential characteristic is economic uncertainty. Included are resources that would be producible, given postulated changes in economic or technological factors.
Economic.—This term implies that profitable extraction or production under defined investment assumptions
has been established, analytically demonstrated, or assumed with reasonable certainty.
Subeconomic Resources.—The part of identified resources that does not meet the economic criteria of reserves and marginal reserves.
Undiscovered Resources.—Resources, the existence of which are only postulated, comprising deposits that are separate from identified resources. Undiscovered resources may be postulated in deposits of such grade and physical location as to render them economic, marginally economic, or subeconomic. To reflect varying degrees of geologic certainty, undiscovered resources may be divided into two parts, as follows:
Hypothetical Resources.—Undiscovered resources that are similar to known mineral bodies and that may be reasonably expected to exist in the same producing district or region under analogous geologic conditions. If exploration confirms their existence and reveals enough information about their quality, grade, and quantity, they will be reclassified as identified resources.
Speculative Resources.—Undiscovered resources that may occur either in known types of deposits in favorable geologic settings where mineral discoveries have not been made, or in types of deposits as yet unrecognized for their economic potential. If exploration confirms their existence and reveals enough information about their quantity, grade, and quality, they will be reclassified as identified resources.
Restricted Resources/Reserves.—That part of any resource/reserve category that is restricted from extraction by laws or regulations. For example, restricted reserves meet all the requirements of reserves except that they are restricted from extraction by laws or regulations.
Other Occurrences.—Materials that are too low grade or for other reasons are not considered potentially economic, in the same sense as the defined resource, may be recognized and their magnitude estimated, but they are not classified as resources. A separate category, labeled other occurrences, is included in figures 1 and 2. In figure 1, the boundary between subeconomic and other occurrences is limited by the concept of current or potential feasibility of economic production, which is required by the definition of a resource. The boundary is obviously uncertain, but limits may be specified in terms of grade, quality, thickness, depth, percent extractable, or other economic-feasibility variables.
Cumulative Production.—The amount of past cumulative production is not, by definition, a part of the resource. Nevertheless, a knowledge of what has been produced is important in order to understand current resources, in terms of both the amount of past production and the amount of residual or remaining in-place resource. A separate space for cumulative production is shown in figures 1 and 2. Residual material left in the ground during current or future extraction should be recorded in the resource category appropriate to its economic-recovery potential.
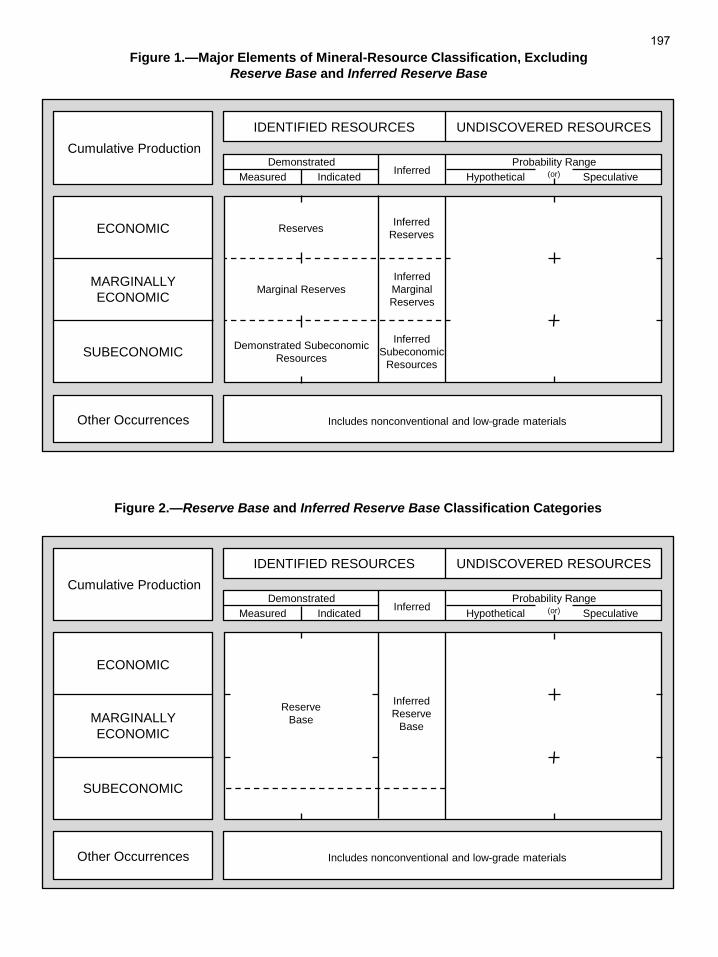
Figure 1.—Major Elements of Mineral-Resource Classification, Excluding Reserve Base and Inferred Reserve Base
Cumulative Production IDENTIFIED RESOURCES UNDISCOVERED RESOURCES
Demonstrated Measured Indicated Inferred
Probability Range (or) Speculative Hypothetical
SUBECONOMIC
MARGINALLY ECONOMIC
ECONOMIC Reserves
Marginal Reserves
Demonstrated Subeconomic Resources
Inferred Reserves
Inferred Marginal Reserves
Inferred Subeconomic
Resources
Other Occurrences Includes nonconventional and low-grade materials
Figure 2.—Reserve Base and Inferred Reserve Base Classification Categories
Cumulative Production IDENTIFIED RESOURCES UNDISCOVERED RESOURCES
Demonstrated Measured Indicated Inferred
Probability Range (or) Speculative Hypothetical
SUBECONOMIC
MARGINALLY ECONOMIC
ECONOMIC
Reserve Base
Inferred Reserve
Base
Other Occurrences Includes nonconventional and low-grade materials
197
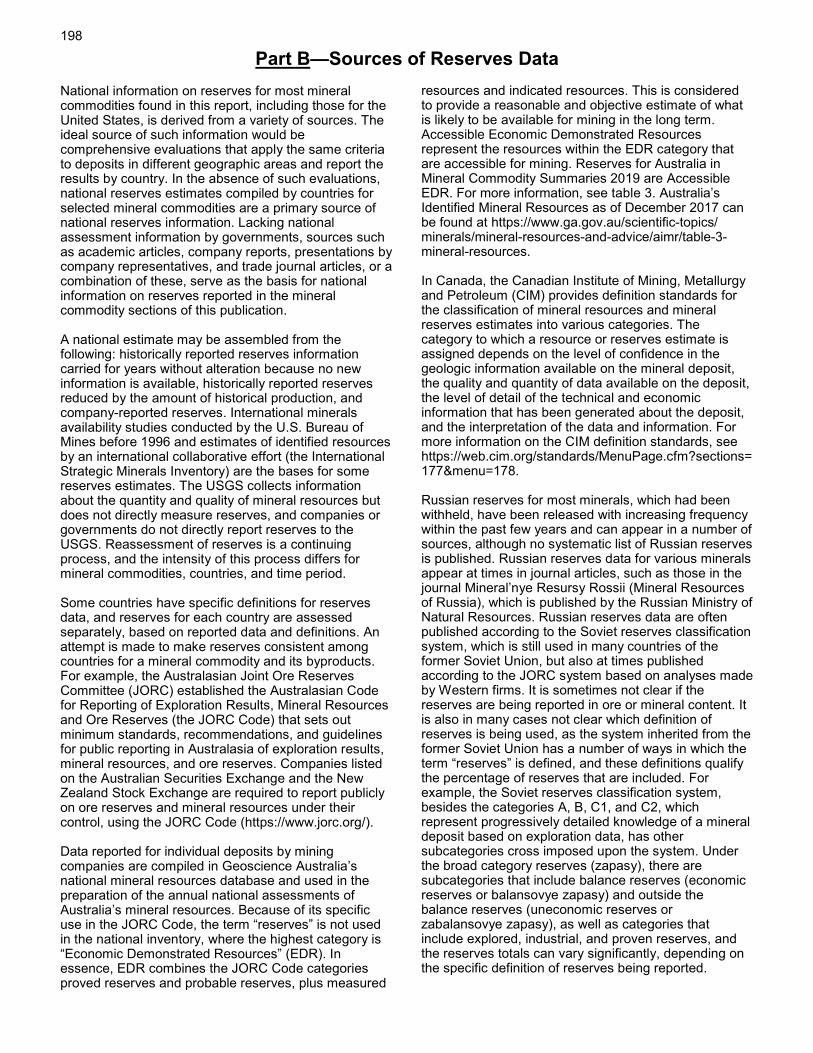
198
Part B—Sources of Reserves Data National information on reserves for most mineral commodities found in this report, including those for the United States, is derived from a variety of sources. The ideal source of such information would be comprehensive evaluations that apply the same criteria to deposits in different geographic areas and report the results by country. In the absence of such evaluations, national reserves estimates compiled by countries for selected mineral commodities are a primary source of national reserves information. Lacking national assessment information by governments, sources such as academic articles, company reports, presentations by company representatives, and trade journal articles, or a combination of these, serve as the basis for national information on reserves reported in the mineral commodity sections of this publication.
A national estimate may be assembled from the following: historically reported reserves information carried for years without alteration because no new information is available, historically reported reserves reduced by the amount of historical production, and company-reported reserves. International minerals availability studies conducted by the U.S. Bureau of Mines before 1996 and estimates of identified resources by an international collaborative effort (the International Strategic Minerals Inventory) are the bases for some reserves estimates. The USGS collects information about the quantity and quality of mineral resources but does not directly measure reserves, and companies or governments do not directly report reserves to the USGS. Reassessment of reserves is a continuing process, and the intensity of this process differs for mineral commodities, countries, and time period.
Some countries have specific definitions for reserves data, and reserves for each country are assessed separately, based on reported data and definitions. An attempt is made to make reserves consistent among countries for a mineral commodity and its byproducts. For example, the Australasian Joint Ore Reserves Committee (JORC) established the Australasian Code for Reporting of Exploration Results, Mineral Resources and Ore Reserves (the JORC Code) that sets out minimum standards, recommendations, and guidelines for public reporting in Australasia of exploration results, mineral resources, and ore reserves. Companies listed on the Australian Securities Exchange and the New Zealand Stock Exchange are required to report publicly on ore reserves and mineral resources under their control, using the JORC Code (https://www.jorc.org/).
Data reported for individual deposits by mining companies are compiled in Geoscience Australia’s national mineral resources database and used in the preparation of the annual national assessments of Australia’s mineral resources. Because of its specific use in the JORC Code, the term “reserves” is not used in the national inventory, where the highest category is “Economic Demonstrated Resources” (EDR). In essence, EDR combines the JORC Code categories proved reserves and probable reserves, plus measured
resources and indicated resources. This is considered to provide a reasonable and objective estimate of what is likely to be available for mining in the long term. Accessible Economic Demonstrated Resources represent the resources within the EDR category that are accessible for mining. Reserves for Australia in Mineral Commodity Summaries 2019 are Accessible EDR. For more information, see table 3. Australia’s Identified Mineral Resources as of December 2017 can be found at https://www.ga.gov.au/scientific-topics/minerals/mineral-resources-and-advice/aimr/table-3-mineral-resources.
In Canada, the Canadian Institute of Mining, Metallurgy and Petroleum (CIM) provides definition standards for the classification of mineral resources and mineral reserves estimates into various categories. The category to which a resource or reserves estimate is assigned depends on the level of confidence in the geologic information available on the mineral deposit, the quality and quantity of data available on the deposit, the level of detail of the technical and economic information that has been generated about the deposit, and the interpretation of the data and information. For more information on the CIM definition standards, see https://web.cim.org/standards/MenuPage.cfm?sections= 177&menu=178.
Russian reserves for most minerals, which had been withheld, have been released with increasing frequency within the past few years and can appear in a number of sources, although no systematic list of Russian reserves is published. Russian reserves data for various minerals appear at times in journal articles, such as those in the journal Mineral’nye Resursy Rossii (Mineral Resources of Russia), which is published by the Russian Ministry of Natural Resources. Russian reserves data are often published according to the Soviet reserves classification system, which is still used in many countries of the former Soviet Union, but also at times published according to the JORC system based on analyses made by Western firms. It is sometimes not clear if the reserves are being reported in ore or mineral content. It is also in many cases not clear which definition of reserves is being used, as the system inherited from the former Soviet Union has a number of ways in which the term “reserves” is defined, and these definitions qualify the percentage of reserves that are included. For example, the Soviet reserves classification system, besides the categories A, B, C1, and C2, which represent progressively detailed knowledge of a mineral deposit based on exploration data, has other subcategories cross imposed upon the system. Under the broad category reserves (zapasy), there are subcategories that include balance reserves (economic reserves or balansovye zapasy) and outside the balance reserves (uneconomic reserves or zabalansovye zapasy), as well as categories that include explored, industrial, and proven reserves, and the reserves totals can vary significantly, depending on the specific definition of reserves being reported.
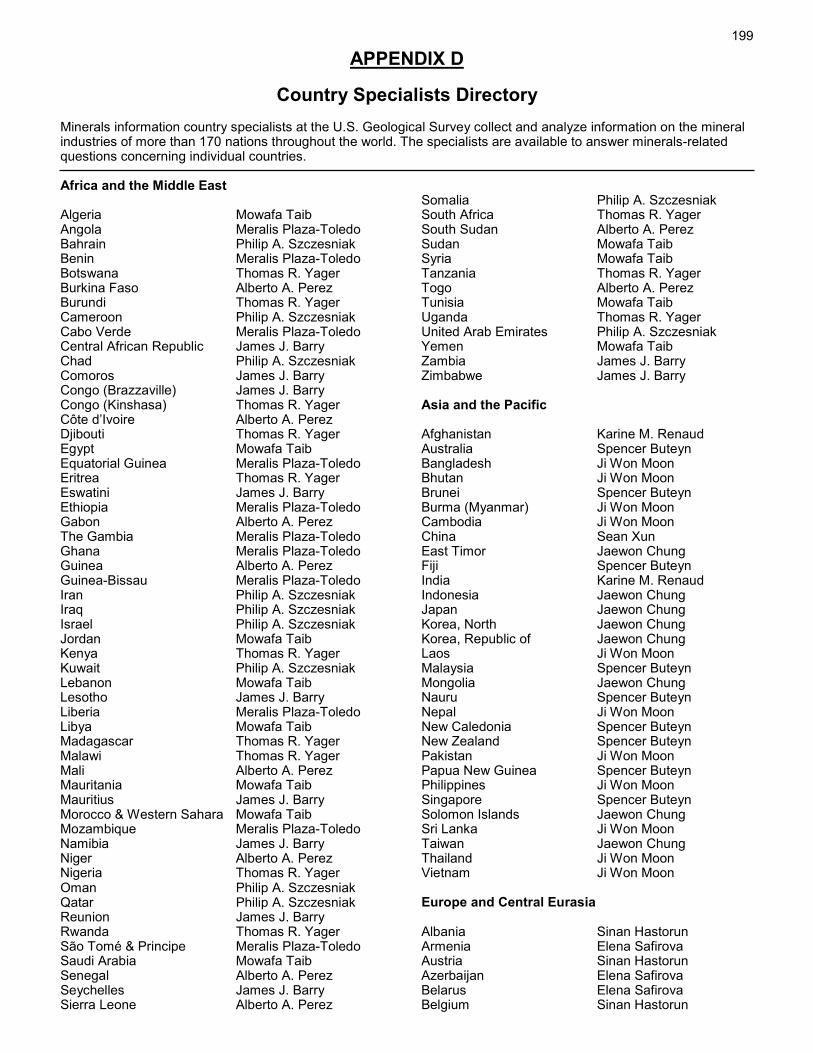
199
APPENDIX D
Country Specialists Directory Minerals information country specialists at the U.S. Geological Survey collect and analyze information on the mineral industries of more than 170 nations throughout the world. The specialists are available to answer minerals-related questions concerning individual countries. Africa and the Middle East Algeria Mowafa Taib Angola Meralis Plaza-Toledo Bahrain Philip A. Szczesniak Benin Meralis Plaza-Toledo Botswana Thomas R. Yager Burkina Faso Alberto A. Perez Burundi Thomas R. Yager Cameroon Philip A. Szczesniak Cabo Verde Meralis Plaza-Toledo Central African Republic James J. Barry Chad Philip A. Szczesniak Comoros James J. Barry Congo (Brazzaville) James J. Barry Congo (Kinshasa) Thomas R. Yager Côte d’Ivoire Alberto A. Perez Djibouti Thomas R. Yager Egypt Mowafa Taib Equatorial Guinea Meralis Plaza-Toledo Eritrea Thomas R. Yager Eswatini James J. Barry Ethiopia Meralis Plaza-Toledo Gabon Alberto A. Perez The Gambia Meralis Plaza-Toledo Ghana Meralis Plaza-Toledo Guinea Alberto A. Perez Guinea-Bissau Meralis Plaza-Toledo Iran Philip A. Szczesniak Iraq Philip A. Szczesniak Israel Philip A. Szczesniak Jordan Mowafa Taib Kenya Thomas R. Yager Kuwait Philip A. Szczesniak Lebanon Mowafa Taib Lesotho James J. Barry Liberia Meralis Plaza-Toledo Libya Mowafa Taib Madagascar Thomas R. Yager Malawi Thomas R. Yager Mali Alberto A. Perez Mauritania Mowafa Taib Mauritius James J. Barry Morocco & Western Sahara Mowafa Taib Mozambique Meralis Plaza-Toledo Namibia James J. Barry Niger Alberto A. Perez Nigeria Thomas R. Yager Oman Philip A. Szczesniak Qatar Philip A. Szczesniak Reunion James J. Barry Rwanda Thomas R. Yager São Tomé & Principe Meralis Plaza-Toledo Saudi Arabia Mowafa Taib Senegal Alberto A. Perez Seychelles James J. Barry Sierra Leone Alberto A. Perez
Somalia Philip A. Szczesniak South Africa Thomas R. Yager South Sudan Alberto A. Perez Sudan Mowafa Taib Syria Mowafa Taib Tanzania Thomas R. Yager Togo Alberto A. Perez Tunisia Mowafa Taib Uganda Thomas R. Yager United Arab Emirates Philip A. Szczesniak Yemen Mowafa Taib Zambia James J. Barry Zimbabwe James J. Barry Asia and the Pacific Afghanistan Karine M. Renaud Australia Spencer Buteyn Bangladesh Ji Won Moon Bhutan Ji Won Moon Brunei Spencer Buteyn Burma (Myanmar) Ji Won Moon Cambodia Ji Won Moon China Sean Xun East Timor Jaewon Chung Fiji Spencer Buteyn India Karine M. Renaud Indonesia Jaewon Chung Japan Jaewon Chung Korea, North Jaewon Chung Korea, Republic of Jaewon Chung Laos Ji Won Moon Malaysia Spencer Buteyn Mongolia Jaewon Chung Nauru Spencer Buteyn Nepal Ji Won Moon New Caledonia Spencer Buteyn New Zealand Spencer Buteyn Pakistan Ji Won Moon Papua New Guinea Spencer Buteyn Philippines Ji Won Moon Singapore Spencer Buteyn Solomon Islands Jaewon Chung Sri Lanka Ji Won Moon Taiwan Jaewon Chung Thailand Ji Won Moon Vietnam Ji Won Moon Europe and Central Eurasia Albania Sinan Hastorun Armenia Elena Safirova Austria Sinan Hastorun Azerbaijan Elena Safirova Belarus Elena Safirova Belgium Sinan Hastorun
200
Europe and Central Eurasia—Continued Bosnia and Herzegovina Lindsey Abdale Bulgaria Karine M. Renaud Croatia Lindsey Abdale Cyprus Sinan Hastorun Czechia Lindsey Abdale Denmark, Faroe Islands, and Greenland Joanna Goclawska Estonia Lindsey Abdale Finland Joanna Goclawska France Lindsey Abdale Georgia Elena Safirova Germany Elena Safirova Greece Sinan Hastorun Hungary Sinan Hastorun Iceland Joanna Goclawska Ireland Joanna Goclawska Italy Lindsey Abdale Kazakhstan Elena Safirova Kosovo Sinan Hastorun Kyrgyzstan Karine M. Renaud Latvia Lindsey Abdale Lithuania Lindsey Abdale Luxembourg Sinan Hastorun Macedonia Lindsey Abdale Malta Sinan Hastorun Moldova Elena Safirova Montenegro Sinan Hastorun Netherlands Sinan Hastorun Norway Joanna Goclawska Poland Joanna Goclawska Portugal Joanna Goclawska Romania Lindsey Abdale Russia Elena Safirova Serbia Karine M. Renaud Slovakia Lindsey Abdale Slovenia Lindsey Abdale Spain Lindsey Abdale Sweden Joanna Goclawska Switzerland Sinan Hastorun Tajikistan Karine M. Renaud
Turkey Sinan Hastorun Turkmenistan Karine M. Renaud Ukraine Elena Safirova United Kingdom Lindsey Abdale Uzbekistan Elena Safirova North America, Central America, and the Caribbean Aruba Yadira Soto-Viruet The Bahamas Yadira Soto-Viruet Belize Jesse J. Inestroza Canada James J. Barry Costa Rica Jesse J. Inestroza Cuba Yadira Soto-Viruet Dominican Republic Yadira Soto-Viruet El Salvador Jesse J. Inestroza Guatemala Jesse J. Inestroza Haiti Yadira Soto-Viruet Honduras Jesse J. Inestroza Jamaica Yadira Soto-Viruet Mexico Alberto A. Perez Nicaragua Jesse J. Inestroza Panama Jesse J. Inestroza Trinidad and Tobago Yadira Soto-Viruet South America Argentina Jesse J. Inestroza Bolivia Yolanda Fong-Sam Brazil Yolanda Fong-Sam Chile Yadira Soto-Viruet Colombia Jesse J. Inestroza Ecuador Jesse J. Inestroza French Guiana Yolanda Fong-Sam Guyana Yolanda Fong-Sam Paraguay Yadira Soto-Viruet Peru Yadira Soto-Viruet Suriname Yolanda Fong-Sam Uruguay Yadira Soto-Viruet Venezuela Yolanda Fong-Sam
Country specialist Telephone E-mail Lindsey Abdale (703) 648–7716 [email protected] James J. Barry (703) 648–7752 [email protected] Spencer Buteyn (703) 648–7738 [email protected] Jaewon Chung (703) 648–4793 [email protected] Yolanda Fong-Sam (703) 648–7756 [email protected] Joanna Goclawska (703) 648–7973 [email protected] Sinan Hastorun (703) 648–7744 [email protected] Jesse J. Inestroza (703) 648–7779 [email protected] Ji Won Moon (703) 648–7791 [email protected] Alberto A. Perez (703) 648–7749 [email protected] Meralis Plaza-Toledo (703) 648–7759 [email protected] Karine M. Renaud (703) 648–7748 [email protected] Elena Safirova (703) 648–7731 [email protected] Yadira Soto-Viruet (703) 648–4957 [email protected] Philip A. Szczesniak (703) 648–7728 [email protected] Mowafa Taib (703) 648–4986 [email protected] Sean Xun (703) 648–7746 [email protected] Thomas R. Yager (703) 648–7739 [email protected]