
External acquisition of Technology - TU/e
158
External acquisition of Technology Exploration and exploitation in international innovation networks Bonnie Beerkens
Transcript of External acquisition of Technology - TU/e

External acquisition of Technology
Exploration and exploitation in international innovation networks
Bonnie Beerkens

2
CIP-DATA LIBRARY TECHNISCHE UNIVERSITEIT EINDHOVEN Beerkens, Bonnie Elisabeth External acquisition of technology: exploration and exploitation in international innovation networks / by Bonnie Elisabeth Beerkens. � Eindhoven: Technische Universiteit Eindhoven, 2004. � Proefschrift. ISBN 90-386-2087-X NUR 800 Keywords: Technological innovation / exploration and exploitation / innovation networks / alliance networks / network closure and structural holes / alliance portfolio Cover design: Paul Verspaget Printing: Eindhoven University Press

3
External acquisition of Technology
Exploration and exploitation in international innovation networks
PROEFSCHRIFT
ter verkrijging van de graad van doctor aan de Technische Universiteit Eindhoven, op gezag van de
Rector Magnificus, prof.dr. R.A. van Santen, voor een commissie aangewezen door het College voor
Promoties in het openbaar te verdedigen op woensdag 15 september 2004 om 16.00 uur
door
Bonnie Elisabeth Beerkens
geboren te Wessem

4
Dit proefschrift is goedgekeurd door de promotoren: prof.dr. G.M. Duijsters en prof.dr. A.P. de Man Copromotor: dr. W.P.M. Vanhaverbeke

5
CONTENTS
PREFACE 9 Chapter 1 INTRODUCTION 11 Internal learning / external learning 13 Explorative and exploitative technological performance 14 Local action 15 Empirical testing 16 Chapter 2 TECHNOLOGICAL CAPABILITY BUILDING THROUGH NETWORKING STRATEGIES WITHIN HIGH-TECH INDUSTRIES 19 Abstract 19 Introduction 20 Theoretical background and hypotheses 21 Technological and social capital 21 Exploring new technologies 25 Empirical setting 27 Definition and characteristics 27 Data, variables and modeling 29 Data 29 Variable definitions and operationalization 32 Dependent variable 32 Independent variables 32 Control variables 36 Model specification and econometric issues 37 Results 38 Discussion and conclusions 45 Chapter 3 EXPLORATIVE AND EXPLOITATIVE LEARNING STRATEGIES IN TECHNOLOGY-BASED ALLIANCE NETWORKS 49 Abstract 49 Introduction 50 Theoretical background and hypotheses 52 Strategic alliances and their role in exploitative and explorative learning 52 Direct ties 53 Indirect ties 55 Network structure of social capital 57 Data, variables and methods 59 Data 59 Variables 61 Dependent variables 61 Independent variables 62 Model estimation 68 Results 70 Conclusion 82
6
Chapter 4 LOCAL ACTION IN TECHNOLOGY ALLIANCE NETWORKS: AN EMPIRICAL INVESTIGATION 89 Abstract 89 Introduction 90 Theoretical background and hypotheses 91 Hypotheses 92 Data, variables and modeling 99 Data 99 Variable definition and operationalization 100 Dependent variable 100 Independent variables 101 Control variables 103 Model specification 105 Results 105 Basic models 105 Discussion and conclusion 115 Chapter 5 CONCLUSION 119 Optimal alliance portfolios 120 Balancing internal and external learning 120 �Optimal� portfolio size 121 Indirect ties 123 Redundancy 123 Technological capabilities partners 125 Limitations and avenues for future research 127 Methodological issues 127 Conceptual issues 128 REFERENCES 133 SAMENVATTING 149 ABOUT THE AUTHOR 155 ECIS DISSERTATION SERIES 157

7
TABLES
Table 2.1 ASIC definitions 28 Table 2.2 Definitions of dependent and independent variables 33 Table 2.3 Descriptive statistics and correlation matrix 40 Table 2.4 Determinants of the patent rate of ASIC producers, 1988-1996 42 Table 3.1 Definitions of dependent and independent variables 71 Table 3.2 Descriptive statistics and correlation matrix 72, 73 Table 3.3a Determinants of the patent rate of firms � strengthening the technology base, 1986-1997 76, 77 Table 3b Determinants of the patent rate of firms � broadening of the technology base, 1986-1997 80, 81 Table 4.1 Definitions of dependent and independent variables 106 Table 4.2 Descriptive statistics and correlation matrix 107 Table 4.3a Determinants of the patent intensity of firms, 1986-1997 109 Table 4.3b Determinants of the exploitative patent intensity of firms, 1986-1997 112 Table 4.3c Determinants of the explorative patent intensity of firms, 1986-1997 113
FIGURES
Figure 2.1 ASIC diagram 28 Figure 2.2 The ASIC technology field 29 Figure 2.3 Number of technology based SAs in the ASIC industry 30 Figure 2.4 Different types of SAs in the ASIC industry 30 Figure 2.5 Impact of social and technical capital on the patent rate 43 Figure 4.1 An ego-network perspective 93 Figure 4.2a Ego-network 101 Figure 4.2b Direct ties 101 Figure 4.2c Weak component cliques 102 Figure 4.2d Minimum Indirect ties needed 102 Figure 4.2e Within-clique ties 102

8
Voor Pap en Mam

9
PREFACE
Five years of academic research at the Technische Universiteit Eindhoven have resulted in this PhD
thesis. These years were the most challenging of my life so far, both professionally and personally.
My personal struggles made my academic work difficult at moments, yet the ongoing confidence of
my promotors in my abilities and qualities stimulated me to bring this thesis to an end. Therefore,
first of all, I�d like to express my gratitude to Geert Duysters, my first promotor, for all his
encouragement and understanding at times when I lacked both motivation and energy. The
irresistible relaxing chair in my office seduced Geert into long conversations in which Geert shared
with me his ongoing positive look on life. Another source of great inspiration has been Wim
Vanhaverbeke, my daily supervisor. Wim, thank you for understanding and stimulating my passion
for empirical work. Wim helped me regain and sustain my motivation. I have always enjoyed our
discussions and Wim�s detailed and precise style of working. I look forward to working on research
with both Wim and Geert in the future.
Also I would like to thank the other members of my PhD committee. Ard-Pieter de Man, my
second supervisor, I would like to thank for his comments which helped me to position my thesis in
a strategic context. René Belderbos provided extremely detailed and valuable comments, which not
only helped me in organizing my thoughts, but will also improve my future research. Finally, Niels
Noorderhaven I would like to thank for his willingness to join my committee and to read my thesis
on such short notice.
Martin Schuurmans gave me the opportunity to do a project in Philips, CFT (Center for
Industrial Technology), which gave me a taste of the complexity of alliance portfolio planning for
technology management within companies. John Bell, senior director corporate alliances at Royal
Philips Electronics and professor Strategic Alliances at the University of Nijmegen, helped me to
position my work in an early stage.
Victor Gilsing must be the person who has read my articles most often and in great detail.
His thorough questions helped me work through the complexity of my empirical work. Mathieu
Weggeman and Joan van Aken provided insights in academic fields related to the topic of my thesis
in an early stage. I have also enjoyed discussing work and other topics with the rest of my
colleagues at the department Organisation and Strategy and my colleagues within the TAG project.
Apart from all the professional support I received, I am tremendously grateful for the help of people
who are related to me in other ways.

10
Ad, you have become my true soul mate. Thank you for our valuable discussions and all
your help on my thesis, but even more I�d like to thank you for all of your emotional support. This
is what I have always imagined pure friendship to be like.
Marjan, thank you for listening at me. I will never forget our conversations, sitting across
from your desk, sharing our inner thoughts and emotions. In my emotional and spiritual search you
have been a pillar, and added tremendously to the understanding of my being. You have become a
wonderful friend in the past five years.
Otto, you made a difference in my life, giving me the courage to continue with my thesis
when I needed someone�s support most. You hardly knew me, but you cared. Thank you for being
you.
Vivian, through hours and hours spend on the telephone I have gotten to know you so well.
Thank you for understanding me, and thank you for being my friend.
Dr. Coumans, thank you for taking me by the hand on my inner journey. I strongly feel you
gave me the energy that I would otherwise have lacked. You also helped me put my thesis in
perspective, giving it a place in my life, which I needed to get it finished.
Paul, thank you for being my �paranimf� at my defense. It will be good to have you near me.
Wilko, thank you for your immaculate patience. I didn�t make things easy for you. Ton, thanks for
walking into my office regularly, and joking around. Patrick, whoopsieflipperflapperdieflop (need I
say more?).
And last, but definitely not least, Pap en Mam. I don�t know where to begin thanking you. You
have always been there for me with your love and support, believing in me, encouraging me,
sharing the worst moments of my thesis, and feeling as happy as I did when things turned out well.
I couldn�t have wished for more caring and involved parents. I love you.

11
CHAPTER 1
INTRODUCTION
12
Technology has become extremely important in determining the competitive advantage of
companies in a growing number of industries. Products are becoming increasingly complex and
require more and more sophisticated technologies. Emerging technologies challenge the
competitive positions of incumbents more than ever and have opened up new windows of
opportunities for innovative firms. In an attempt to deal with these forces of �creative destruction�
firms are increasingly forced to combine internal technological strengths with those of other firms
as R&D costs soar rapidly and technological dynamics speed up.
The ongoing increase in the number of newly established strategic technology alliances
among companies has led to the emergence of dense inter-organizational networks in which
companies position themselves in order to benefit from the specific know-how of competent
partners. A number of recent studies have investigated the relationship between a portfolio of
technology alliances and (technological) firm performance (Hagedoorn and Schakenraad, 1994;
Shan et al., 1994; Powell et al., 1996; Mitchell and Singh, 1996; Stuart, 2000). In similar vein,
many publications have argued that a centrally positioned firm may have access to a larger and
wider base of knowledge than a company in the periphery of an alliance network (Duysters and de
Man, 2003). Others (Stuart, 2000) find evidence that alliances with partners that are technologically
well endowed have a larger positive impact on post-alliance performance of the focal firm than
those with partners that are less well endowed. Companies with a large stock of technological
resources are often considered to be highly attractive potential alliance partners. Similarly, we
could argue that the alliances of a focal firm�s partners matter, since these indirect contacts provide
access to an even broader range of information. These and other arguments which will be put
forward in the thesis lead us to believe that not only the dyadic level of alliances matter, but
increasingly aspects of ego-networks or the entire network play a major role in determining the
technological performance of a firm. Whereas most previous studies have taken on a dyadic
perspective on alliances we take on a network approach to firm�s innovative performance. In
particular we will focus on the effect of specific networking strategies on the degree of
technological performance of firms. Therefore, we derive the following research question:
What is the effect of particular alliance networking strategies on
the degree of technological performance of firms?
In order to come up with an answer to this research question three aspects will be studied in
this thesis. First, it is important for firms to make a distinction between the internal development of
technological knowledge and the external acquisition of technological know-how.
13
INTERNAL LEARNING / EXTERNAL LEARNING
In large companies, management is gradually replacing the traditional inward focus of its
technological competence building by a more outward-looking approach that draws heavily on
technologies from networks of universities, startups, suppliers, and competitors. Hence,
technological performance is increasingly based on a combination of internal and external learning:
internal learning based on a firm�s own R&D efforts, external learning on the technology acquired
from alliance partners. Both types of learning are considered to be complements reinforcing each
other�s productivity (Cohen and Levinthal, 1990; Duysters and Hagedoorn, 2000). However, little
is known about the interaction between and the mutual reinforcing effect of internal learning and
external learning. Thus, chapter two of this thesis is devoted to finding an answer to the following
question:
How do internal learning and external learning mutually affect a
firm�s technological performance?
For firms with low degrees of technological competences and social capital � in terms of the
number of alliances they have � entering new alliances can be greatly beneficial since they provide
access to new and valuable technological knowledge. However, these firms may be less attractive
to other firms to cooperate with, because of their low technological know-how. Firms with unique
internal knowledge resources, on the other hand, are likely to be attractive to other firms that expect
to benefit from getting access to these unique resources (Baum et al., 2000). However, as these
firms are already well endowed with technological capital, they have fewer incentives to cooperate
in order to improve their own rate of innovation (Ahuja, 2000). As a result, a company that is well
endowed with technological competences is likely to benefit only marginally from extending its
alliance network beyond a critical threshold.
Hence, both types of firms need to find a balance between internal and external
development of technological know-how, and the optimal mix will be different for both types.
Although it is very unlikely that companies can develop their technological resources completely
in-house, those that have unique technological resources need only a relatively small alliance
network to ensure high rates of innovation. On the other hand, companies with moderate levels of
14
technological knowledge may opt for investing in much larger alliance networks. Whether internal
and external learning have mutually reinforcing effects under all circumstances is still open for
debate. We believe that beyond a critical threshold both types of capital substitute each other and
extending social capital may become a liability. This will be addressed in chapter two.
After discussing this first aspect of the central research question, we can further explore how
companies can optimally use this externally acquired knowledge. This leads us to the second aspect
that will be studied in this thesis, i.e. the optimal positioning of a company in an innovation
network in order to deepen the existing knowledge base (exploitation) or to widen the existing
knowledge base (exploration).
EXPLORATIVE AND EXPLOITATIVE TECHNOLOGICAL PERFORMANCE
Teaming up with competent partners allows firms to share the costs and risks involved in Research
and Development and enables them to increase their speed-to-market considerably. Many of these
technology based alliances are referred to as �learning alliances� through which companies can
speed up their capability development and exploit knowledge developed by others (Grant and
Baden-Fuller, 1995).
However, considering inter-organizational networks of technology-based alliances as a set
of �learning alliances� is clearly a simplification. We therefore follow March (1991) in
distinguishing between exploitative and explorative learning, and argue that the value of a firm�s
alliance network is contingent on the type of learning. Exploitation is associated with the
refinement and extension of existing technologies, whereas exploration can be seen as the
experimentation with new alternatives. There are considerable differences between both types of
learning (March, 1991; Chesbrough, 2003), which, in turn, have important implications in the way
a company can tap into the technological capabilities of its alliance partners. Because there are
marked differences between exploitative and explorative learning, we assume that the role of
alliances and the structure of the alliance network is contingent on the type of learning.
How do networking strategies affect explorative and exploitative
learning?

15
In chapter three we suggest, in line with Ahuja�s (2000a) study, that three more aspects of a
company�s technology-based alliance network should be analyzed in detail. We will argue that (1)
the number of direct ties, (2) the indirect ties maintained by the firm, and (3) the degree of
redundancy among the firm�s partners all have a differential impact on explorative and exploitative
learning.
We argue that the distinction between explorative and exploitative learning may be an
important contingency factor in explaining the value of (non-)redundant ties. Companies have to
make choices between bridging structural holes between the dense areas of an alliance network on
the one hand and creating cohesive ties to benefit from its social capital in the network on the other
hand. In other words, firms should make decisions about how and when to make use of redundant
and non-redundant ties in their external acquisition of technology. In particular we argue that, since
companies have to find a balance between explorative and exploitative learning (March, 1991),
redundant and non-redundant links play a complementary role in inter-organizational learning
processes: redundant information improves exploitative learning, non-redundant information
enhances a firm�s explorative learning.
Network positioning is often studied from a deterministic point of view. In the existing literature
we find that firms can exert little influence on the entire network. However, as opposed to the small
influence firms have on the network as a whole, firms can actually play a part in their direct
surroundings. Therefore the third aspect studied in this thesis is network positioning from the
perspective of the ego-network. This implies that no longer the entire network with all the indirect
contacts (i.e., contacts of partners, thus the partner�s partners) are taken into consideration, but the
effectiveness of network strategies at the level of the direct contacts (that can be influenced) are the
focus of this study.
LOCAL ACTION
Inspired by seminal work of Granovetter (1985), Coleman (1988) and Burt (1992a, b) many authors
have subsequently dealt with the question of which specific structural network positions enable
firms to achieve the highest level of performance. The existing literature seems to take on a rather
deterministic approach to network structure and positioning where firms are primarily influenced
16
by the exogenous network structure they are part of. Most of the work in this area thus neglects the
endogenous micro-level dynamics of organizational action (Bae and Gargiulo, 2003). In this thesis
we argue that these endogenous micro-level dynamics prove to be instrumental in building the
overall network structure. In order to fill this gap in the existing academic literature we follow Bae
and Gargiulo (2003) by arguing that networks are basically the outcome of the combined local
alliance actions of all individual players in the network. In order to assess the role of these micro-
level dynamics on technological performance we decided to focus on the outcomes of local alliance
action on the innovative performance in chapter four. The main question we seek to answer in the
fourth chapter is:
What is the role of local alliance action on technological
performance?
In this part of the thesis we argue that the efficiency of alliance strategies is primarily
dependent on two major factors, i.e. the local actions of a focal firm (ego) and the local actions of
its alliance partners (alters). Local actions can be associated with the establishment (or dissolution)
of direct ties (ego-alter) whereas the local actions of the alliance partners are associated with
indirect ties (alter-alter). Of course, direct and indirect ties are interrelated. Some of the actions of a
focal firm�s alliance partners might be beneficial to the focal company and some of the actions
might have a negative effect on the focal firm�s network position.
Rowley et al. (2000) argue that local density rather than global (network wide) density
influences the performance of the focal firm. Ego-network measures are consistent with this view.
We therefore leave behind the network level, and descend to the level of the ego-network, which
provides a micro-level analysis of local actions and their impact on the innovative performance of
companies.
EMPIRICAL TESTING
The various issues as described above are empirically studied by using two main longitudinal
datasets. Both these datasets contain information on the alliance activity and patent activity of the
companies under study.
17
The first part of the research in this thesis (aspect one as mentioned above) is performed in
the ASIC-industry (application-specific integrated circuits), a branch of the micro-electronics
industry that develops and produces custom-made chips for customers. The data that is used
consists of observations for 99 ASIC-related firms in the period 1988 until 1996. ASIC-related
patents were used exclusively since we wanted to compare the effectiveness of R&D cooperation
within the ASIC-field on the technological performance of firms as well as the effect of internal
development on technological performance.
The second part of the empirical research (the above mentioned aspects two and three) in
this thesis was performed on a dataset with 116 firms in the chemicals, automotive and
pharmaceutical industries. The firms were observed over a period of twelve years, from 1986 until
1997. The patent and alliance activity data were complemented with company data such as
financial data (from Worldscope, COMPUSTAT and data published on the companies� websites)
and the country of origin. In this instance both patent-activity and alliance-activity were measured
broader than the industries under study to be able to measure explorative technological
performance.
In the final chapter, we will summarize the most interesting findings of the next three chapters. The
three research questions will be put together and commented starting from a unifying framework
about optimal alliance portfolios. We will explore issues like the balancing between internal and
external (technological) learning, portfolio size, indirect ties, redundancy in the alliance network
and the capabilities of the alliance partners. Finally, a number of avenues for future research will be
explored: the current thesis has its limitations and it seems that empirical research about the effect
of particular alliance networking strategies on the degree of technological learning is still in its
infancy. We will provide a number of directions in which future research may evolve.

18
19
CHAPTER 2
TECHNOLOGICAL CAPABILITY BUILDING THROUGH NETWORKING
STRATEGIES WITHIN HIGH-TECH INDUSTRIES 1
Abstract
Learning through networks has been a research topic for several years now. Technological
learning is more and more based on a combination of internal and external learning and firms
need to develop both technological and social capital for that purpose. This chapter analyses the
relationship between both types of capital and their impact on the technological performance of
companies in high-tech industries. We claim and find strong empirical evidence that technological
capital and social capital mutually reinforce each other�s effect on the rate of innovation for
companies with small patent and alliance portfolios. However, when companies have a strong
patent portfolio and an extensive network of alliances then both types of capital become substitutes.
We also found that there are two possible equilibria: the first one emphasizes the development of
strong internal technological capabilities supported by a small alliance portfolio. The second is the
mirror image of the first one: these firms focus mainly on technology acquisition through alliance
partners supported by a minimum of internal technological capabilities. Both strategies can co-
exist in an industry. Finally, we find empirical evidence that companies who explore novel and
pioneering technologies have a higher rate of innovation in subsequent years.
1 This chapter is based on a paper written with Wim Vanhaverbeke and Geert Duysters
20
INTRODUCTION
This study aims to relate technological performance of companies in high-tech industries to their
degree of technological and social capital. More specifically, we focus on three main research
topics. First, we consider whether a firm�s technological and social capital are mutually enforcing
factors that together determine the rate of innovation, or whether they can be considered as
substitutes. We also address the question of whether there is an optimal mix of resources, which
produces above average results. Second, following Stuart (2000) we argue that not so much the size
of the alliance portfolio, but the technological performance of the partnering firms to whom a focal
firm is connected determines the rate of innovation of the latter. Finally, we aim to find out whether
companies that explore new technologies have higher rates of innovation than companies that are
primarily engaged in exploiting and strengthening their existing technology base.
The apparent importance of knowledge, especially in high tech industries, has given rise to a
stream of research focusing on knowledge as the single most important resource within an
organization (Kogut and Zander, 1996; Conner and Prahalad, 1996) and has led to the emergence of
the knowledge based theory of the firm (Grant, 1997). In a similar vein, a number of recent studies
have investigated the relationship between a portfolio of technology alliances and (technological)
firm performance (Hagedoorn and Schakenraad, 1994; Shan et al., 1994; Powell et al., 1996;
Mitchell and Singh, 1996; Stuart, 2000). Firms are increasingly forced to combine internal
technological strengths with those of other firms as R&D costs soar rapidly and technological
dynamics speed up. Products require more and more sophisticated technologies and emerging
technologies have the potential to undermine the competitive positions of incumbents. Many of
these alliances are �learning alliances� through which companies can speed up their capability
development and exploit knowledge developed by others (Grant and Baden-Fuller, 1995). Because
in today�s turbulent technological environment no single firm is able to come up with all the
required technological capabilities themselves, firms are increasingly induced to form these
�learning alliances�. In order to overcome the lack of specific technological capabilities they try to
tap into other companies� technological assets. Market transactions are generally considered to be
only a weak alternative to alliances because most valuable knowledge is cumulative and tacit in
nature. This specific nature makes it hard to transfer between organizations through market
transactions (Mowery, 1988; Mowery et al., 1995; Osborn and Baughn, 1990).
21
Technological performance is more and more based on a combination of internal and
external learning: internal learning by the internal development of new products and processes as a
result of internal R&D, external learning from the technology acquired through technology
alliances. Both types of learning are considered complements reinforcing each other�s productivity
(Cohen and Levinthal, 1990; Duysters and Hagedoorn, 2000). Moreover, companies can only tap
into other companies� technology base successfully if they have sufficient absorptive capacity
(Lane and Lubatkin, 1998). In its turn, absorptive capacity results from investments in internal
technological know-how. Hence, internal technological knowledge and external technology
acquisition via alliances are considered complements. But surprisingly, there are to our knowledge
no large-sample empirical studies that focus on the combined effect of internal and (quasi) external
knowledge acquisition on the technological innovative performance2.
THEORETICAL BACKGROUND AND HYPOTHESES
Technological and social capital
This chapter builds on the knowledge-based view of the firm. Over time accumulated knowledge
assets constitute the source of a firm�s sustainable competitive advantage in the marketplace (Kogut
and Zander, 1996; Spender, 1996). Firm specific knowledge assets are of strategic interest � they
are distinctive competences � because they are rare, imperfectly tradable and hard to imitate and
must be build within the organization internally as long as part of the technological know-how is
not articulated or tacit in nature. The development of knowledge assets (or technological capital) is
difficult, time consuming and expensive. Moreover, developing technological capabilities is a risky
venture because R&D up-front costs may be huge and the technological and commercial outcomes
may be highly uncertain (Mitchell and Singh, 1992).
2 Ahuja (2000) focuses on the impact of technical, commercial and social capital of companies on the formation of new
alliances. Commercial resources are those required to convert technical innovations to products and services. They
consist of manufacturing and marketing capabilities and entail manufacturing facilities and service and distribution
networks (Mitchell, 1989; Teece, 1986). In what follows we focus on the relationship between technical and social
capital and neglect the linkages with commercial capital.
22
Because of the cumulative character of technology, the current technological position of a
company is shaped by the path it has traveled (Teece et al., 1997). Hence, path dependency is
crucial: previous investments in and strategic choices about technology development not only
explain the current position of a company, but they also constrain the future options of companies.
Therefore, companies that failed to build up a technological capability in the past may find it
difficult to catch up later by internal development (Shan, 1990). Furthermore, existing
technological capabilities may reduce a firm�s capacity to adapt to new commercial challenges or to
rejuvenate its capabilities in the face of new, �competence destroying� technologies (Abernathy and
Clark, 1985).
Accumulated technological competence can therefore be seen as the result of past
innovative activities of a firm (Podolny and Stuart, 1995; Stuart et al., 1999). As a result, we can
expect that firms with well developed technological assets will be more innovative than other firms
under conditions of relative technological stability � i.e. when companies can build on their
previously developed knowledge. This argument suggests the following hypothesis.
Hypothesis 1: The greater the technological capabilities of a firm at t-1 the higher
its rate of innovation at t.
Being centrally positioned in a network of technology alliances has been recognized as a
distinctive and important form of capital � social capital � of innovative companies (Gulati, 1995,
1999). Especially in fast changing technological fields internal R&D efforts need to be
complemented by external means of technology acquisition. The creation of a strategic alliance
network can facilitate the access to technological resources across industries or technological field.
Alliances are often used by companies as instruments to acquire technological knowledge and to
develop new skills that reside within the partnering companies (Hamel, 1991; Hagedoorn and
Schakenraad, 1994; Powell et al., 1996). Previous research established that alliances often have a
positive impact on the performance of companies (Baum and Oliver, 1991; Mitchell and Singh,
1996; Uzzi, 1996; Powell et al., 1996; Hagedoorn and Schakenraad, 1994). These authors found in
different research settings a positive relationship between technological alliances and rates of
innovation. A notable exception is the work of Stuart (2000) who found no significant relationship
between the number of alliances and the growth rate or rate of innovation of semiconductor firms.
A portfolio with too many alliances may lead to saturation and overembeddedness (Kogut et
al., 1992; Uzzi, 1997). Therefore, at high levels of embeddedness marginal benefits of forming new
linkages will be low and marginal costs of additional links will be relatively high (Ahuja, 2000).
23
Nahapiet and Ghoshal (1998: 245) argue that the collective social capital resulting from dense
networks can limit a firm�s �openness to information and to alternative ways of doing things,
producing forms of collective blindness that sometimes have disastrous effects�. At the same time
managerial costs increase significantly because not only individual alliances need management
attention, but management also has to coordinate across linkages (Harrigan, 1985). Gomes-
Casseres (1996) has shown that there is a natural limit to the number of alliances that a company
can manage successfully. Therefore, we argue that there is a non-linear relationship between the
social capital of a company and its rate of innovation. Highly embedded companies or firms with
poorly developed social capital will have the lowest rates of innovation. In particular firms at
intermediate levels of embeddedness will show the highest rates of innovation. This argument
suggests the following hypothesis:
Hypothesis 2: The involvement of a company in technology-based alliances at t-1
is related in a curvilinear way (inverted-U shaped) to its rate of
innovation at t.
As discussed above, technological performance is increasingly based on a combination of
internal and external learning. Both types of learning have been described in the literature as
complements reinforcing each other�s productivity (Cohen and Levinthal, 1990; Duysters and
Hagedoorn, 2000).
Whether social and technological capital would have mutually reinforcing effects under all
circumstances is however open for debate. Firms with low degrees of technological competences
and social capital, in terms of the number of alliances they have, will benefit considerably from
entering new alliances since they provide access to new and valuable technological knowledge.
Firms with poorly developed technological capital have strong incentives to get access to the
technological capital of other firms through interorganizational alliances (Mitchell and Singh,
1996). These companies will also profit from strengthening the internal knowledge base as this
increases their absorptive capacity so that its partners� knowledge can better be valued and
assimilated (Lane and Lubatkin, 1998).
Firms with unique internal knowledge resources are likely to be attractive to other firms that
expect to benefit from getting access to these resources through means of alliances (Baum et al.,
2000). As a result, firms with unique technological resources have more opportunities to
collaborate than firms with poorly developed resources. However, firms that are already well
endowed with technological capital have fewer incentives to cooperate in order to improve their
24
own rate of innovation (Ahuja, 2000). Because these companies have already developed leading
edge technological competences they are likely to learn to a lesser extent from their partners than
vice versa (Hamel et al., 1989; Kale et al., 2000; Khanna et al., 1998).
As a result, a company that is well endowed with technological competences is likely to
benefit only marginally from extending its alliance network beyond a critical threshold because it
increases the chance that internally developed and externally acquired technology may overlap or
that the marginal value of getting access to another company�s knowledge base is smaller than the
cost to set up and manage the alliance (Harrigan, 1985). Hence, although it is very unlikely that
companies can develop their technological resources completely in-house those that have unique
technological resources need only a relatively small alliance network to ensure high rates of
innovation. Beyond a critical threshold both types of capital substitute each other and extending
social capital may become a liability. This argument suggests the following hypothesis:
Hypothesis 3: At low levels, internal technological capabilities (technological
capital) and external acquisition of technology through
technological alliances (social capital) reinforce each other�s effect
on the rate of innovation. At high levels, they weaken each other�s
effect.
Combining hypotheses 2 and 3, we expect that companies can realize the highest rates of
innovation by two different types of strategies that can coexist in the same industry. The first
strategy is based on a considerable alliance network and small (potentially specialized)
technological capital. This provides the company with ample opportunities to tap into its partners�
technology resources or to co-develop innovations by combining (complementary) skills. The
second strategy emphasizes the internal development of innovations in the company. The company
has an extensive patent portfolio and needs only a few alliances to ensure that it has the required
technology to strengthen or to continue its strong technological performance. Companies with
moderate values for both types of capital, failing to stick to one of these two strategies, are �stuck in
the middle�. Thus:
Hypothesis 4: Companies with extensive (small) internal technological
capabilities and a small (extensive) alliance network have the
highest rates of innovation. Both profiles may successfully coexist
in an industry.
25
Stuart (2000) argues that the technological (and economic) performance of companies is not
so much determined by the size of the alliance network but rather by the characteristics of the focal
company�s alliance partners3. If companies enter alliances to get access to other firms� technology,
then those with a large stock of technological resources are highly attractive as potential alliance
partners. Stuart finds evidence that alliances with partners that are technologically well endowed
have a larger positive impact on post-alliance performance of the focal firm. In high-tech industries
the technological competencies of alliance partners determine in part the focal company�s potential
to learn. Teaming up with skilled innovative companies with unique technological assets offers a
company the best opportunities to learn and thus to invigorate its competitive position.
Hypothesis 5: The stronger the technological capabilities of a company�s alliance
partners at t-1, the higher its rate of innovation at t.
EXPLORING NEW TECHNOLOGIES
We have already argued that a mutual positive feedback between experience and competence
exists. This virtuous cycle enables companies to build up unique technological skills, which
potentially lead to competitive advantages in the marketplace. The increased ease of learning within
particular technologies facilitates the exploitation of these technologies compared to the exploration
of new technologies (Levinthal and March, 1993; March, 1991).
The downside of this path dependency is that it increases the likelihood of a company
falling in the so-called familiarity trap (Ahuja and Lampert, 2001). It is argued that experience and
competence in a specific set of technologies lead to the emergence of a dominant and increasingly
rigid technological paradigm. This, in turn, reduces the probability of a company�s willingness to
experiment with other problem solving approaches. This absence of experimentation reduces the
chance that a company will discover new technological opportunities that are assumed to be large
in high tech industries (Jaffe, 1986; Lunn and Martin, 1986; Levin et al., 1985).
3 Similarly, Baum et al. (2000) argue that the performance of biotechnology start-ups is positively influenced by the
technological capabilities of the partnering companies.
26
To avoid familiarity traps companies can explore novel technologies, i.e. technologies that
are new to the organization even though they may have been in existence earlier (Ahuja and
Lampert, 2001). Experimenting with novel technologies allows a company to value the potential of
these technologies in a more accurate way (Cohen and Levinthal, 1990). Explorative companies are
better positioned to discover the technological and commercial potentials of novel technologies.
They may also be better prepared to value the potential competitive threat of disruptive
technologies (Bower and Christensen, 1995; Christensen and Overdorf, 2000) or competence
destroying technologies early on (Abernathy and Clark, 1985; Tushman and Anderson, 1986).
Exploring novel technologies challenges the dominant problem-solving paradigm in companies
(Lei et al., 1996). Unfamiliar technologies may force a firm to search for new cognitive maps that
open up new avenues for research. Hence, we may expect that companies that experiment with
novel technologies are better positioned to have a higher rate of innovation than firms that invest all
their efforts in exploiting existing, familiar technologies.
Exploring novel technologies, however, is only advantageous up to a point. Investing
excessively in exploration of novel technologies may lead to confusion: exploration of unfamiliar
technologies and exploitation of familiar ones have to be balanced to be productive. As argued by
March (1991) and Levinthal and March (1993) firms engaging in exploration exclusively, only
suffer from the costs associated with experimentation without exploiting its benefits. Moreover,
there will always be a trade-off between investing in deepening and upgrading the existing
technologies to safeguard profits today and exploring new technologies to secure future profits
(Rowley et al., 2000; Levinthal and March, 1981). Finally, scattering R&D resources on many
novel technologies may eventually lead to diseconomies of scale within the individual technologies
(Ahuja and Lampert, 2001). Therefore, we argue that:
Hypothesis 6: A firm�s rate of innovation at t is related in a curvilinear way
(inverted-U shaped) to its exploration of novel technologies at t-1.
Innovative firms generally search for technological solutions within the scope of what has
been invented before. They tend to build on their own technological successes and on those of
others4. Previous solutions offer technologists or scientists an anchor to move forward. As a result,
building on technological antecedents is less risky than working on a de novo innovation
(Hoskisson et al., 1993; Hoskisson et al., 1994).
4 An average of 18 patent citations for the 1850 patents in the sample of ASIC related patents.
27
Ahuja and Lampert (2001) refer to the tendency of firms to search near to old solutions as
the propinquity or nearness trap. Often interesting technological fields remain unexplored when
companies rely too much on old solutions. The literature however suggests that important
inventions emerge, in particular, from these unexplored areas (Utterback, 1994). Experimenting
with pioneering technologies � i.e. technologies that do not build on existing technologies (Ahuja
and Lampert, 2001) � is one possible way to circumvent the dangers of the propinquity trap.
Experimenting with pioneering technologies is an attempt to jump to different technological
trajectories (Dosi, 1988; Foster, 1986; Sahal, 1985). Since pioneering technologies offer
fundamentally new solutions they may generate large future profit streams for the innovative
company. At the same time, they entail large risks typical for radical innovations: However, when a
company increases the number of experiments it also inflates the probability that a major,
successful innovation will pop up sooner or later. We expect that a company having successfully
patented a �pioneering technology�-innovation will increase its rate of innovation in the subsequent
years.
Hypothesis 7: A firm�s rate of innovation at t is positively related to its success in
pioneering new technologies at t-1.
EMPIRICAL SETTING
Definition and characteristics
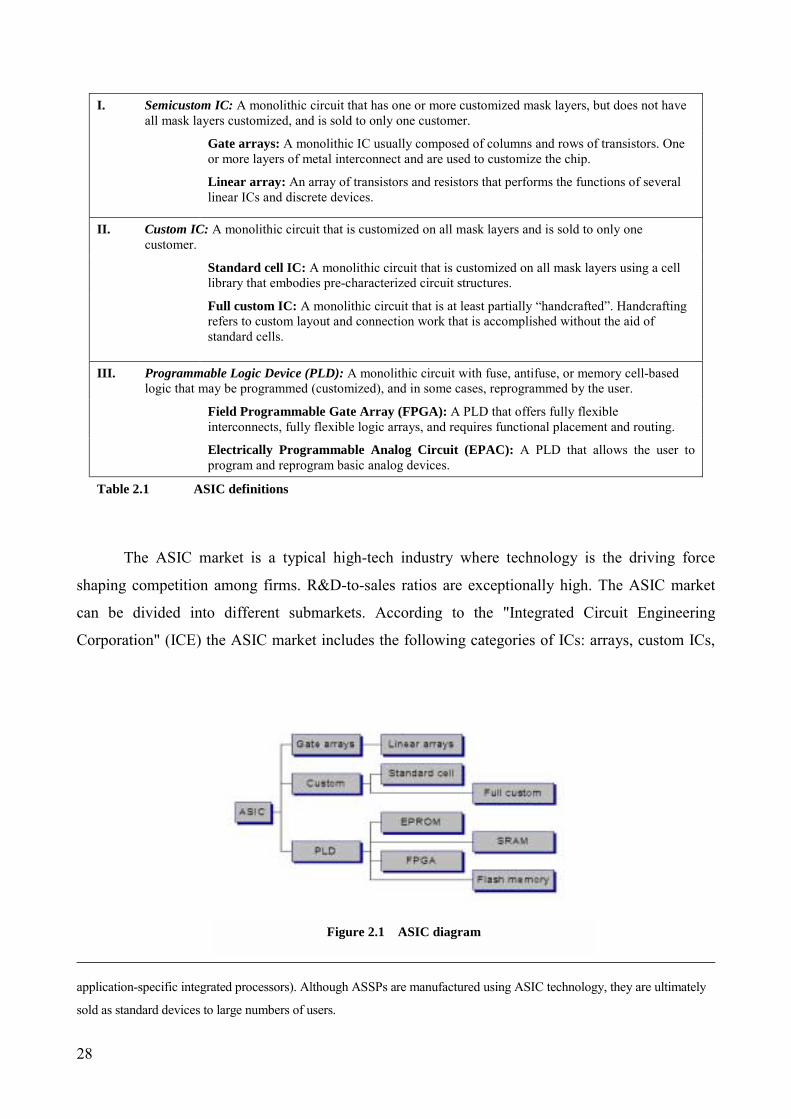
The hypotheses were tested on the population of ASIC-producers that were active in the period
1988-1996. ASICs � i.e. application-specific integrated circuits � are a special type of ICs
(integrated circuits) accounting for about 12 % of worldwide IC sales in 1995. The term 'ASIC', as
now in use in the industry, is a misnomer. In reality these ICs are customer-specific rather than
application-specific since an ASIC is a device made for a specific customer5.
5 A device which is made for one particular type of system function (e.g. disk-drives, CD-players, video compressing) but is
sold to more than one customer, is called an ASSP (application-specific standard product, sometimes also called ASIPs -
28
The ASIC market is a typical high-tech industry where technology is the driving force
shaping competition among firms. R&D-to-sales ratios are exceptionally high. The ASIC market
can be divided into different submarkets. According to the "Integrated Circuit Engineering
Corporation" (ICE) the ASIC market includes the following categories of ICs: arrays, custom ICs,
application-specific integrated processors). Although ASSPs are manufactured using ASIC technology, they are ultimately
sold as standard devices to large numbers of users.
I. Semicustom IC: A monolithic circuit that has one or more customized mask layers, but does not have all mask layers customized, and is sold to only one customer.
Gate arrays: A monolithic IC usually composed of columns and rows of transistors. One or more layers of metal interconnect and are used to customize the chip.
Linear array: An array of transistors and resistors that performs the functions of several linear ICs and discrete devices.
II. Custom IC: A monolithic circuit that is customized on all mask layers and is sold to only one customer.
Standard cell IC: A monolithic circuit that is customized on all mask layers using a cell library that embodies pre-characterized circuit structures.
Full custom IC: A monolithic circuit that is at least partially �handcrafted�. Handcrafting refers to custom layout and connection work that is accomplished without the aid of standard cells.
III. Programmable Logic Device (PLD): A monolithic circuit with fuse, antifuse, or memory cell-based logic that may be programmed (customized), and in some cases, reprogrammed by the user.
Field Programmable Gate Array (FPGA): A PLD that offers fully flexible interconnects, fully flexible logic arrays, and requires functional placement and routing.
Electrically Programmable Analog Circuit (EPAC): A PLD that allows the user to program and reprogram basic analog devices.
Table 2.1 ASIC definitions
Figure 2.1 ASIC diagram
29
and programmable logic devices (PLDs). Formal definitions are given in Table 2.1 and
diagrammed in Figure 2.1.
The development and production of ASICs requires the interplay between different
economic agents. The most important participants are the ASIC design houses, IC manufacturing
facilities, electronic system houses and CAD-tool vendors. This list can be enlarged by a number of
auxiliary and/or intermediate players, such as companies offering services in the microelectronics
field, firms that translate customers' needs into the specifications for the design of ASICs, and
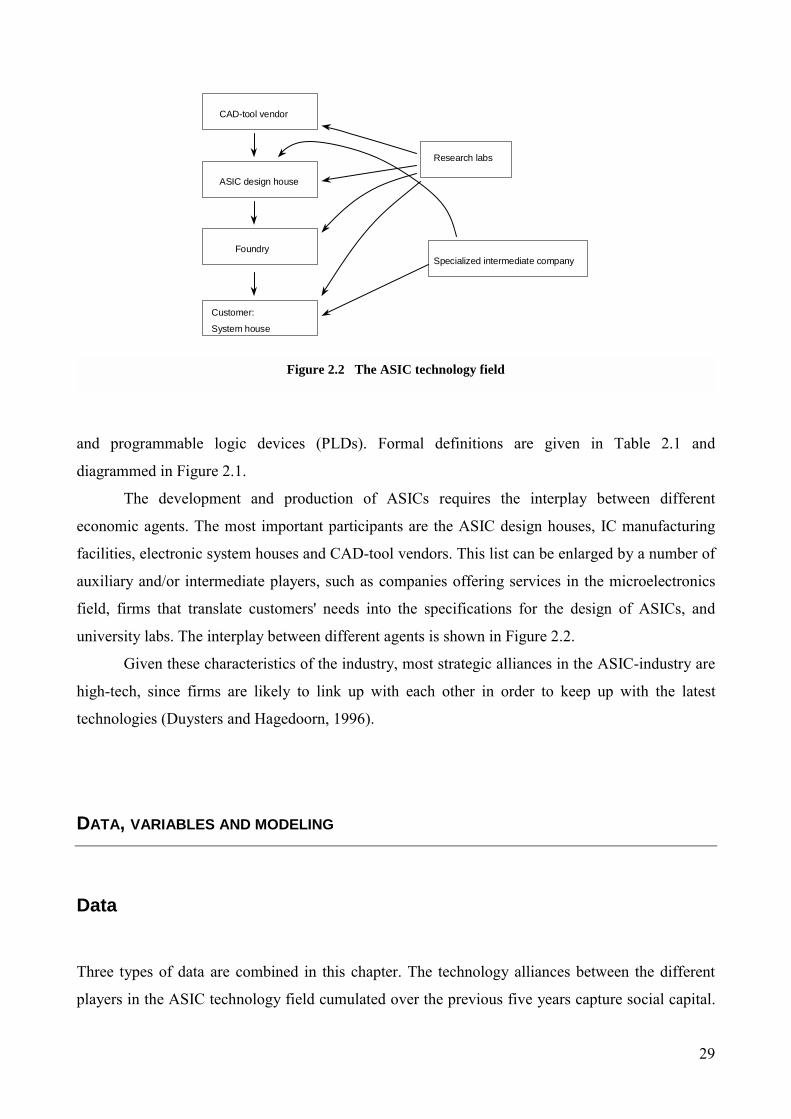
university labs. The interplay between different agents is shown in Figure 2.2.
Given these characteristics of the industry, most strategic alliances in the ASIC-industry are
high-tech, since firms are likely to link up with each other in order to keep up with the latest
technologies (Duysters and Hagedoorn, 1996).
DATA, VARIABLES AND MODELING
Data
Three types of data are combined in this chapter. The technology alliances between the different
players in the ASIC technology field cumulated over the previous five years capture social capital.
CAD-tool vendor
Foundry
Customer:
System house
ASIC design house
Research labs
Specialized intermediate company
Figure 2.2 The ASIC technology field

30
Technological capital is measured by means of the cumulated US patents related to ASIC
technologies of each company. Finally, a set of financial data is gathered for each ASIC producer.
The data on strategic alliances were selected from the MERIT-CATI databank on strategic
0
5
10
15
20
25
30
35
1975 1977 1979 1981 1982 1983 1984 1985 1986 1987 1988 1989 1990 1991 1992 1993 1994 1995 1996
# of
alli
ance
s
Figure 2.3 Number of technology based SAs in the ASIC industry
164
37
2315 15
11 136
2 10
20
40
60
80
100
120
140
160
180
JDA JV MH JRP XL MSSA TS SSA SIRD RCD
# of
alia
nces
JDA = Joint development agreementJV = Joint ventureMH = Minority holdingXL = Cross licensingMSSA = Mutual second source agreementTS = Technology sharingSSA = Second source agreementSIRD = State intervention R&DRC = Research orporationRDC = R&D contract
Source: Merit - CATI Database
Figure 2.4 Different types of SAs in the ASIC industry
31
technology alliances (Duysters and Hagedoorn; 1993)6. The selection included strategic alliances
(SAs) which major focus was on (technological developments in) the ASIC-industry. The MERIT-
CATI databank covers the period between 1975 and 1996: For that period 288 ASIC related
strategic technology alliances were detected. There were 130 different firms involved in these SAs.
A sharp increase in SAs occurred in the early and mid-eighties (see figure 2.3). Their
popularity diminished in the late eighties and the early nineties. SAs in the ASIC industry are
mainly non-equity agreements (79.2%) of which the majority is joint development agreements
(56.9% of all SAs). Joint ventures, which account for 12.8% in the ASIC industry, are the most
important form of equity SAs. The distribution of different types of SAs is presented in figure 2.4.
To measure technological capital, we used patent data from the U.S. Patents Database for all
companies involved in the design and production of ASICs, also those based outside the US7.
Working with U.S. patents � the largest patent market � is preferable to the use of several national
patent systems. Nations differ in their application of standards, systems to grant patents and value
of the protection granted (Basberg, 1987; Griliches, 1990). Especially in industries where
companies operate on a global scale, such as the ASIC-industry, U.S. patents may be a good proxy
for companies� worldwide innovative performance8.
Financial data of ASIC producers have been gathered from different sources among which
the annual ICE reports (McClean, 1985-1998). The data contain the ASIC-sales of these
companies, their total IC-sales, the distribution of the ASIC-sales across the three segments, and
total sales. We furthermore included the nationality of each company.
6 Strategic technology alliances include joint research projects, joint development agreements, cross licensing, (mutual)
second source agreements, technology sharing, R&D consortia, minority holdings and joint ventures, but no licensing
agreements or production and marketing agreements. 7 The patents were selected by means of a query on �ASIC� and related concepts/definitions such as �gate array�, �linear
array�, �FPGA�, �PLD�, �full custom�, �SPGA� and �EPAC�. 8 Patents can be categorized by means of the International Patent Classification, an internationally recognized
hierarchical classification system comprising 118 broad sections and 624 subclasses nested within the classes. It is
furthermore possible to subdivide the subclasses into 67.000 groups. ASIC-related patents are classified in a relatively
small set of subclasses (75 in total).
32
Variable definitions and operationalization
To test the hypotheses we constructed a number of variables. Table 2.2 summarizes them.
Dependent variable
Explaining the technological performance capacity of different ASIC producers requires an
operationalization of the change in size of a company�s technological capital. Changes in
technological capital are operationalized by patents granted to an innovating company. However,
the patent is recorded in the database at the time the company applied for the patent (rather than the
year when it was granted to the firm) because a patent application is a signal that a company has
successfully developed a technological innovation. The dependent variable is a count variable
measured by the number of patents that a company applied for in a particular year9.
Independent variables
The first 5 hypotheses suggest a relationship between a firm�s prior technological capital past, its
social capital and the technological characteristics of its alliance partners on the one hand and its ex
post technological performance on the other hand.
Cumulative technological capital is calculated as the number of ASIC-related patents that an
ASIC-producer obtained in the previous 4 years. Patents granted to a company are used to measure,
in an indirect way, the technological competence of a company (Narin et al., 1987). A moving
window of 4 to 5 years is the appropriate time frame for assessing the technological impact in high-
tech industries (Podolny and Stuart, 1995; Stuart and Podolny, 1996; Henderson and Cockburn,
1996; Ahuja, 2000). Studies about R&D depreciation (Griliches, 1979, 1984) suggests that
knowledge capital depreciates sharply, losing most of its economic value within 5 years. As a
result, a 4 or 5-year period is appropriate to assess technological relevance. In this chapter we use
the cumulated patents obtained by a firm during the last 4 years as a measure for the technological
9 Of course, we only keep track of patents that have been granted by the U.S. Patent Office before the end of 2000. The
observation period is 1988-1996. We do not expect to have a significant bias at the end of that period, because most
patents are granted within a period of 2 to 3 years (average time for all patents in the sample is 26 months). Of the 1381
patents that were filed between 1/1/1988 and 31/12/1996 only 50 (or 3.6%) were granted after 4 years.
33
Table 2.2 Definitions of dependent and independent variables Variable name Variable description Expected effect Number of patents Count of the number of patents related to the ASIC-industry a firm filed for in the current year (t).
Only patents that were granted to the company are taken into consideration --------
Cumulative patentst-1 Count of the number of ASIC-related patents that a firm filed for during the previous four years (t-4 to t-1)
Positive
Cumulative technology alliancest-1 Count of the number of ASIC-related technology alliances a firm established in the five previous years (t-5 to t-1)
Positive
(Cumulative technology alliancest-1)2 Squared term of the previous variable Negative (Cum. technology alliances t-1) * (cum. patents t-1)
Interaction between the number of ASIC-related patents a firm files for during the last 4 years and the number of alliances it formed in the previous 5 years
Negative
Innovative performance of alliance partners
Sum of the patent citations received by the firm�s alliance partners Positive
Novel technologiest-1 Number of patents filed during the last 3 years in patent classes in which the company had not patented in the previous 4 years
Positive
(Novel technologiest-1)2 Squared term of the previous variable Negative Pioneering technologiest-1 Number of a firm�s patents that cite no other patents Positive Log ASIC salest-1 Natural logarithm of the ASIC sales of the firm Positive Firm size (log sales)t-1 Natural logarithm of the total sales of the firm Positive ASIC market growtht-1 Annual growth rate of the ASIC market Positive Firm is a captive producer Dummy variable denoting that the firm is not selling ASICs on the market Negative Firm is Asian Dummy variable denoting that the firm is headquartered in Asia Firm is European Dummy variable denoting that the firm is headquartered in Europe Firm is GA-producer Dummy variable denoting that the firm is producing only gate arrays Firm is SC-producer Dummy variable denoting that the firm is producing only standard cells Firm is PLD-producer Dummy variable denoting that the firm is producing only PLDs Firm is GA and SC producer Dummy variable denoting that the firm is producing gate arrays and standard cells Firm is GA and PLD producer Dummy variable denoting that the firm is producing gate arrays and PLDs

34
competence of an ASIC producer. Variables using a 3 and 5-year time window were also calculated
to check for the sensitivity of this variable to the length of the time period. These variables are
highly correlated with the 4-year time window (r = 0.94 for the 3 year window and 0.96 for the 5
year window), suggesting that the measurement of technological capital is not sensitive to the
choice of a particular time window.
Following Gulati (1995), we computed social capital from matrices including all alliance
activities of the ASIC-producers prior to a given year. In constructing measures of social capital
based on past alliances, a number of choices have been made. First, we do not consider different
types of alliances separately10. Second, some authors weigh each type of SA according to the
�strength� of their relationship (see Contractor and Lorange, 1988; Nohria and Garcia-Pont, 1991;
Gulati 1995). As some technology alliances are more important than others in creating and
transferring technological know-how we followed this weighting procedure to construct the social
capital variable11. The third choice relates to the length of the period during which the existing
alliance portfolio is likely to have an influence on the current technological performance of a
company. All past alliances can be included into the calculation of social capital assuming that all
prior ties, no matter how long ago they were established, have an impact on current firm behavior.
However, we chose for a moving window approach, assuming that only �ongoing� alliances have an
impact on the technological performance of the focal firm. For the alliance activities of the ASIC
producers we have an indication about the termination of 62 (21.5%) alliances in the observation
period 1988-1996. We assumed they have an impact on the rate of innovation as long as they were
not terminated. For the other alliances we assume that the lifespan of alliances is usually no more
than five years (Kogut, 1988, 1989).
The innovative performance of a company�s partners can be modeled in different ways.
Basically, we follow the method developed by Stuart (2000). The innovative performance of a firm
i at time t is denoted as dit. For each year in the observation period 1988-1996, an Nx1 vector dt
10 Figure 5 gives an overview of the different alliance types: alliances vary from equity joint-ventures and minority holdings
with a strong organizational commitment and interdependence between allies to non-equity alliances which imply only
moderate levels of organizational commitment (although stronger than arms' length licensing agreements). 11 Type Weight Type Weight
Cross licensing 1 R&D contract 4
Technology sharing 2 Joint development agreement 4
(Mutual) second source agreement 3 Minority holding 5
State intervention R&D 3 Joint venture 6
Research corporation 3
35
represents the innovation scores of the N firms in the sample. Combining these innovation scores
with alliance activity in the ASIC-industry allows the construction of compact, time-varying
innovation measures of the alliance partners of each company. These measures are computed by
creating first a NxN (firm-by-firm) time changing symmetrical alliance matrices, labeled Wt=[wijt].
The innovative performance of the alliance partners of each ASIC-producer at time t (pt) is
the product of the alliance matrix with the corresponding vector of innovative performance scores.
As a result pt is a time-changing vector containing the summed innovative performance scores for
the allies of each ASIC producer.
The innovative performance of the partners can be measured in different ways. One possible
way is to count the patents received by each of the companies during the previous 4 or 5 years
(Stuart and Podolny, 1996; Ahuja, 2000; Baum et al., 2000). An alternative is to weight these
patents by the number of times they have been cited by more recent patents. Patent citation counts
are important indicators of the technological importance of an innovation (Narin et al., 1987; Albert
et al., 1991). A small inconvenience of patent citations is that the patents applied for in the last
years of the observation period 1988-1996 have a shorter �citation-period� than those that have been
filed for in the beginning of that period. The majority of citations appear in the first five years after
the patent was granted: as a result, although we cannot exclude a potential bias we expect that this
will not have a major impact on the results.
Novel technologies measure the degree to which a company experiments with technologies
that were not used previously (Ahuja and Lampert, 2001). To construct this variable we used the
International Patent Classification (IPC), which is an internationally recognized hierarchical
classification system. We computed this variable using the subclass level of the IPC. Novel
technologies were calculated as the number of new technology �subclasses� that were entered in the
previous 3 years and a company was assumed ��to have entered a new subclass when it first
applies for a patent in a subclass in which it had not patented in the previous 4 years� (Ahuja and
Lampert, 2001: 533). This four-year time window results from the fact that technological
knowledge depreciates rapidly: not being active in a technology subclass for a considerable period
of time will significantly shrink a company�s viable knowledge in that technological field. A time
window of 4 to 5 years is considered an appropriate time span over which the technology is
valuable for a company in high-tech industries (Stuart and Podolny, 1996; Ahuja, 2000).
Ahuja and Lampert (2001) define pioneering technologies as technologies that do not build
on prior technologies. Patent regulations require companies to indicate how much they are indebted
to the technological heritage by citing the patents they build on. Companies that apply for a patent
36
that cite no other patents are exploring technological fields that have been left untouched so far.
Therefore this variable is computed as the number of a company�s patents that cite no other patents.
Control variables
We included four types of dummy variables. A first variable indicates in which economic region
the company is headquartered. Following the Triad-concept of the world economy, a company can
be headquartered in North America, Asia or Europe � the default is North America. Firms from a
different home country may differ in their propensity to patent. Next to that, Asian and European
firms may be less inclined to patent in the USA even when the semiconductor industry is widely
recognized as a global industry.
Annual dummy variables were included to capture changes over time in the propensity of
companies to patent their innovations. The number of ASIC-technology related patents increased
from 50 patents in 1988 up to 342 in 1995. In 1996 the number dropped again to 289 patents. Part
of this growth is the result of the growing importance of ASIC-products and the accelerating
changes in this technological field. Moreover, firms are increasingly aware of the earnings they can
reap from by improving intellectual property management (Grindley and Teece, 1997; Teece, 1998;
Rivette and Kline, 2000).
Next, dummy variables were used to indicate which type of ASIC-producer a company is.
Firms can be involved exclusively in the production of gate arrays, standard cells or PLDs, or they
can be involved in more segments at the same time. Segments are important in the sense that firms
in each segment face different technologies, different competitors and different competitive or
technological dynamics. Therefore, firms can vary in their propensity to patent simply because they
are active in other segments.
A last dummy variable is included to control for possible biases due to the fact that some
large companies produce ASICs only for their internal needs (captive market), i.e. for internal
supply as parts in their electronic systems. These captive producers are a small minority of ASIC-
producing companies but are nonetheless important in terms of technological capabilities (e.g. IBM
and DEC). They establish technological alliances for the same reasons as ASIC-vendors.
We furthermore included two organizational variables. First, the natural logarithm of
�corporate sales� was included as a control variable. Large companies have the possibility to invest
large amounts of money in R&D. Assuming that there exists a positive correlation between
technological input and output (Pakes and Griliches, 1984) large firms will have a higher rate of
37
innovation than small firms12. The second control variable is the natural logarithm of the ASIC-
sales of a company. Firms with a considerable stake in the ASIC-market can defend or improve
their market position by rejuvenating or reinforcing their technological capital. This, in turn,
requires a high rate of innovation.
Finally, we introduced the annual growth rate of the ASIC market. High growth rates offer
companies new economic opportunities stimulating them to invest more in R&D, which in turn
should lead to more patents granted to the firm. As a result, we expect a positive coefficient for this
variable.
Model specification and econometric issues
The dependent variable is a count variable and takes only nonnegative integer values � i.e. the
number of patents a firm filed for in a particular year. A Poisson regression approach provides a
natural baseline model for such data (Hausman et al., 1984; Henderson and Cockburn, 1996). Since
we use pooled cross-section data with several observations on the same firms at different points in
time, we modeled the data using a random effects Poisson estimator with a robust variance
estimator.
The basic Poisson model for event count data can be written as follows:
!)exp(
)Pr(it
yitit
itity
yYitλλ−
== (1)
where the parameter λit represents the mean and the variance of the event count and yit the observed
count variable. It is furthermore assumed that:
λit = β�xit (2)
with xit being a vector of independent variables.
12 No R&D figures were available for the few privately owned companies in the sample. However, corporate sales are a
good proxy for R&D expenditures: for the companies of whom figures where available the correlation between sales en
R&D expenditure was 0.91.
38
The above specification assumes that the mean and variance of the event count are equal.
However, for pooled cross-section count data the variance often exceeds the mean. This
overdispersion is particularly relevant in the case of unobserved heterogeneity13. Therefore, a
random effects Poisson estimator with robust variance estimator is used: it does not assume within-
firm observational independence for the purpose of computing standard errors. For the random
effects Poisson estimator equation (2) is changed into:
λit = β�xit + ui (3)
where ui is a random effect for the ith firm.
Unobserved heterogeneity may be the result of differences between companies in their innovation
generating capabilities, and as a consequence, also in their propensity or ability to patent. Such
unobserved heterogeneity, if present and not controlled for, can lead to overdispersion in the data or
serial correlation. Including the sum of alliances that a firm entered in the last four years (moving
window approach) as an additional variable is a common method of controlling for unobserved
heterogeneity (Heckman and Borjas, 1980).
Part of the differences between companies or between different years can be captured by
including dummy variables in the model. First, the propensity to patent may be partly determined
by the nationality of ASIC-producing companies. It is for instance reasonable to assume that Asian
or European companies are less inclined to file for patent in the USA. Similarly, we introduced
annual dummy variables to account for changes over time: they may capture the ever growing
importance of intellectual capital forcing companies to file more patents over the years, or
macroeconomic conditions that may affect the ASIC industry as a whole.
RESULTS
Table 2.3 presents a correlation matrix and descriptive statistics for the different variables. Table
2.4 shows the results from the random effects Poisson regressions testing the different hypotheses. 13 The presence of overdispersion does not bias the regression coefficients but the computed standard errors in the
Poisson regression are understated, so that the statistical significance is overestimated.
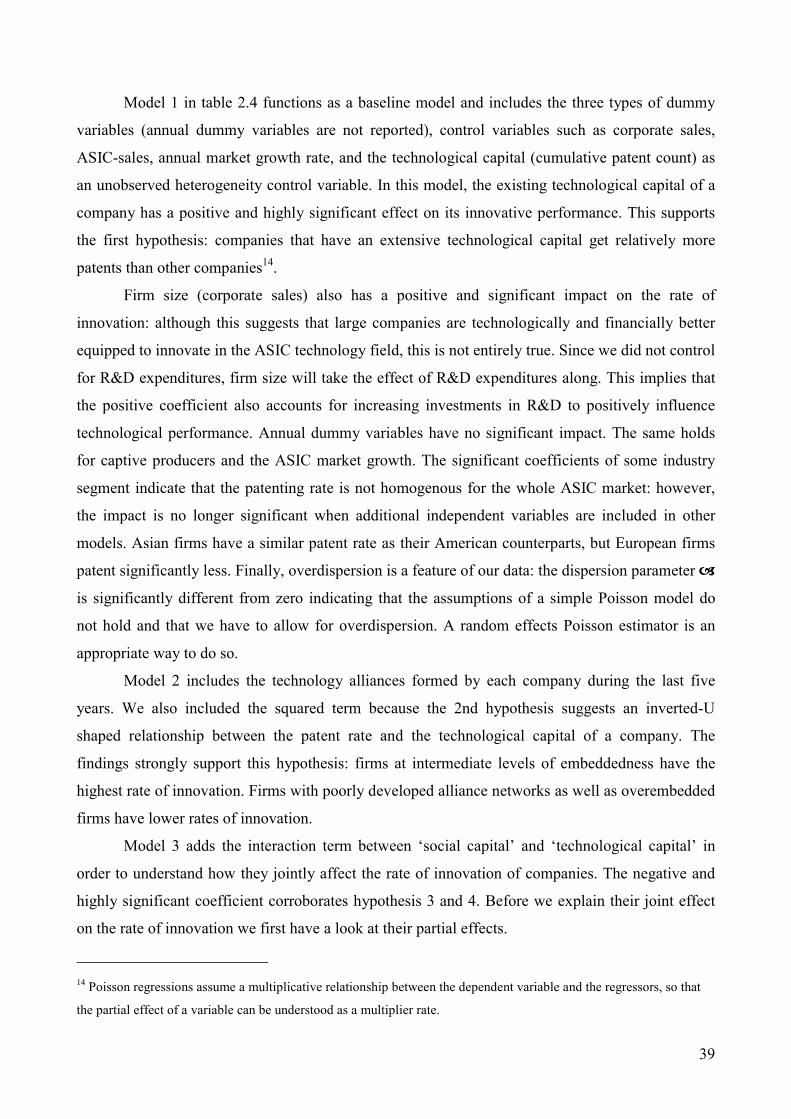
39
Model 1 in table 2.4 functions as a baseline model and includes the three types of dummy
variables (annual dummy variables are not reported), control variables such as corporate sales,
ASIC-sales, annual market growth rate, and the technological capital (cumulative patent count) as
an unobserved heterogeneity control variable. In this model, the existing technological capital of a
company has a positive and highly significant effect on its innovative performance. This supports
the first hypothesis: companies that have an extensive technological capital get relatively more
patents than other companies14.
Firm size (corporate sales) also has a positive and significant impact on the rate of
innovation: although this suggests that large companies are technologically and financially better
equipped to innovate in the ASIC technology field, this is not entirely true. Since we did not control
for R&D expenditures, firm size will take the effect of R&D expenditures along. This implies that
the positive coefficient also accounts for increasing investments in R&D to positively influence
technological performance. Annual dummy variables have no significant impact. The same holds
for captive producers and the ASIC market growth. The significant coefficients of some industry
segment indicate that the patenting rate is not homogenous for the whole ASIC market: however,
the impact is no longer significant when additional independent variables are included in other
models. Asian firms have a similar patent rate as their American counterparts, but European firms
patent significantly less. Finally, overdispersion is a feature of our data: the dispersion parameter !
is significantly different from zero indicating that the assumptions of a simple Poisson model do
not hold and that we have to allow for overdispersion. A random effects Poisson estimator is an
appropriate way to do so.
Model 2 includes the technology alliances formed by each company during the last five
years. We also included the squared term because the 2nd hypothesis suggests an inverted-U
shaped relationship between the patent rate and the technological capital of a company. The
findings strongly support this hypothesis: firms at intermediate levels of embeddedness have the
highest rate of innovation. Firms with poorly developed alliance networks as well as overembedded
firms have lower rates of innovation.
Model 3 adds the interaction term between �social capital� and �technological capital� in
order to understand how they jointly affect the rate of innovation of companies. The negative and
highly significant coefficient corroborates hypothesis 3 and 4. Before we explain their joint effect
on the rate of innovation we first have a look at their partial effects.
14 Poisson regressions assume a multiplicative relationship between the dependent variable and the regressors, so that
the partial effect of a variable can be understood as a multiplier rate.
40
Table 2.3 Descriptive statistics and correlation matrix
Variable Mean S.D. Min. Max. 1 2 3 4 5 6 7 8 9 10 11 12 13 14 15 16
1 Number of patents 1.22 3.40 0 42 2 Cumulative technology alliancest-1 4.05 6.90 0 38 0.25
3 Cumulative patentst-1 3.93 8.15 0 72 0.67 0.33 4 Log ASIC salest-1 2.95 2.03 -0.65 7.43 0.38 0.43 0.49 5 ASIC market growtht-1 0.14 0.03 0.10 0.21 -0.16 0.09 -0.02 -0.06 6 Firm size (log sales)t-1 6.20 3.30 -0.65 12.60 0.19 0.40 0.37 0.52 -0.02 7 Novel technologiest-1 0.86 1.31 0 11 0.48 0.39 0.61 0.41 -0.05 0.36 8 Pioneering technologiest-1 0.08 0.10 0 2 0.12 0.01 0.11 0.11 0.12 0.12 0.12 9 Firm is a captive producer 0.12 0.32 0 1 -0.01 -0.01 0.01 -0.31 -0.01 0.21 -0.00 0.01 10 Innovative performance of alliance partners 46.91 129.48 0 1251 0.26 0.48 0.36 0.28 0.01 0.26 0.37 0.01 -0.01
11 Firm is Asian 0.22 0.42 0 1 0.02 0.00 0.17 0.14 0.00 0.40 0.10 0.12 -0.04 -0.01 12 Firm is European 0.17 0.38 0 1 -0.11 0.15 -0.12 -0.01 0.01 0.10 -0.12 -0.04 0.10 0.04 -0.25 13 Firm is GA-producer 0.12 0.32 0 1 -0.10 -0.16 -0.14 -0.07 0.00 -0.13 -0.13 0.01 -0.03 -0.12 -0.12 -0.14 14 Firm is SC-producer 0.18 0.39 0 1 -0.13 -0.15 -0.16 -0.12 -0.03 -0.20 -0.19 -0.04 -0.01 -0.12 -0.21 0.14 -0.17 15 Firm is PLD-producer 0.07 0.25 0 1 0.31 -0.01 0.17 0.16 -0.02 -0.13 0.13 -0.02 -0.10 0.09 -0.14 -0.12 -0.10 -0.13 16 Firm is GA and SC producer 0.30 0.46 0 1 0.06 0.07 0.17 0.44 -0.00 0.38 0.24 0.10 -0.13 0.09 0.35 -0.04 -0.23 -0.31 -0.17 17 Firm is GA and PLD producer 0.08 0.09 0 1 0.04 0.09 0.00 0.07 0.04 0.00 0.03 -0.01 -0.03 0.02 -0.05 -0.04 -0.03 -0.04 -0.02 -0.06
N = 830 observations
All correlations with magnitude > |0.077| are significant at the 0.05 level
41
To demonstrate the impact of both types of capital we first focus on their partial effects on
the rate of innovation (i.e. multiplier of the patent rate)15. Technological capital moderates the
relationship between social capital and the rate of innovation of the firm. This basically has two
consequences. First, a larger technological capital decreases the positive impact of social capital on
the rate of innovation. In other words, companies with small internal technological capabilities �
e.g. start-ups, technological laggards or incumbents that want to get access to a new technology
developed by other companies � profit most from their network of technological alliances. Second,
higher technological capital requires lower social capital to �maximize� the rate of innovation.
Similarly, social capital moderates the impact of prior technological capital on the rate of
innovation of a company. The relationship is positive for companies that did not establish a
network of alliances. It gradually drops the stronger the company is embedded in its alliances
network. The relationship becomes negative for companies that are highly embedded � according to
model 3 the relationship becomes negative when the company has more than 16 �weighted�
technology alliances. Companies that are moderately embedded in an alliance network can tap from
the internal technological resources as well as from the knowledge of their partners: their social
capital weakens the relation between prior technological capital and the current rate of innovation.
The total impact of both types of capital on the rate of innovation is visualized in figure 2.5.
The graph compares the patenting rate of companies with no technological and social capital � the
benchmark � to patenting rates of companies that have invested previously in one or both types of
capital. A positive (negative) patenting rate indicates that the rate of innovation of a company is
higher (lower) than that of the benchmark.
The figure shows a number of interesting points. First, there is a �curve of optimal solutions�
maximizing the rate of innovation for each ratio of technological and social capital: left (right) of
that curve companies can improve their rate of innovation by increasing (decreasing) their
technological or/and social capital. Moreover, the �optimal� size of the alliance network decreases
with an increase of technological capital. If a company has no patents the optimal number of
�weighted� alliances is 29. This number is reduced to 6 alliances when the company has a
technological capital of 50 patents. Companies can improve their rate of innovation by investing in
social or/and technological capital when the size of their existing internal technological capabilities
and social network is small. Hence, technological capital and social capital have mutually
reinforcing effects on the rate of innovation. On the contrary, when a company has strong internal
15 The partial effect of the prior technical capital (TC) in Table 4, Model 3 is exp[TC(0.0262-0.0016SC)], where SC is
the social capital. The partial effect of social capital is exp[SC(0.0994-0.0017SC-0.0016TC)].

42
Table 2.4 Determinants of the patent rate of ASIC producers, 1988-1996 Variable Model 1 Model 2 Model 3 Model 4 Model 5 Cumulative patentst-1 0.0162*** 0.0153*** 0.0262*** 0.0292*** 0.0309*** (0.0048) (0.0052) (0.0053) (0.0054) (0.0073) Cumulative technology 0.0786*** 0.0994*** 0.0965*** 0.0872*** alliancest-1 (0.0172) (0.0201) (0.0246) (0.0302) (Cumulative technology -0.0018*** -0.0017** -0.0017** -0.0012* alliancest-1)2 (0.0006) (0.0007) (0.0008) (0.0007) (Cum. technology alliances t-1) -0.0016*** -0.0019*** -0.0020*** * (cum. patents t-1) (0.0003) (0.0003) (0.0003) Innovative performance of 0.00061* alliance partners (0.00033) Novel 0.2229** technologiest-1 (0.0888) (Novel -0.0230* technologiest-1)2 (0.0135) Pioneering 1.3429** technologiest-1 (0.5546) Log ASIC salest-1 0.1269** 0.1087*** 0.1212** 0.1319** 0.1281* (0.0541) (0.0575) (0.5874) (0.0584) (0.0658) Firm size 0.2936*** 0.2381*** 0.1935*** 0.1841*** 0.1554*** (log sales)t-1 (0.0569) (0.0535) (0.0553) (0.0552) (0.0568) ASIC market growtht-1 8.3684 6.9522 5.294 7.3250 3.6514 (60.7947) (66.9714) (76.8344) (63.1954) (93.0791) Firm is a captive -0.5178 -0.3482 -0.1770 -0.1305 -0.0460 producer (1.0519) (0.9906) (0.3082) (0.9108) (0.8288) Firm is Asian 0.9609 -0.6905 -0.4957 -0.4454 -0.3269 (0.8214) (0.7896) (0.8021) (0.7879) (0.6925) Firm is European -1.7333*** -1.6781*** -1.6275** -1.6088** -1.4219** (0.6326) (0.6643) (0.7011) (0.6874) (0.6314) Firm is GA-producer 0.5137* 0.5375* 0.4132 0.3429 0.0813 (0.2772) (0.2990) (0.3447) (0.3438) (0.3250) Firm is SC-producer -0.5131** -0.4198* -0.4573* -0.4677** -0.3706 (0.2343) (0.2248) (0.2425) (0.2341) (0.2976) Firm is PLD-producer 0.8335 0.8496* 0.7167 0.6707 0.6608 (0.5972) (0.4697) (0.4776) (0.4778) (0.4762) Firm is GA and SC -0.1456 -0.0250 -0.1116 -0.1777 -0.2186 producer (0.1541) (0.1544) (0.1608) (0.1697) (0.1915) Firm is GA and PLD 0.8286 0.3909 0.3623 0.3272 0.4156 producer (1.4550) (2.4542) (2.7874) (2.7063) (2.8703) Constant -4.3035 -4.1684 -3.8625 -4.1907 -3.5583 (11.5597) (12.7302) (14.6083) (12.0047) (17.6953) α 1.7460*** 1.4786*** 1.3206*** 1.2837*** 0.9574*** (0.3759) (0.3376) (0.3082) (0.3025) (0.2508) Number of firms 99 99 99 99 99 Number of firms-years 830 830 830 830 830 Log-likelihood 370.87 382.50 392.20 394.51 410.38 Chi-squared 741.74 765.00 784.40 789.02 820.75 Notes: *** p < 0.01; ** p < 0.05; * p < 0.10
�Year dummy variable�-coefficients are not statistically significant. They are not reported in the table. The models use a random effects Poisson estimator. The sample is an unbalanced panel with 99 ASIC producers and 830 firm-years (units of observation).
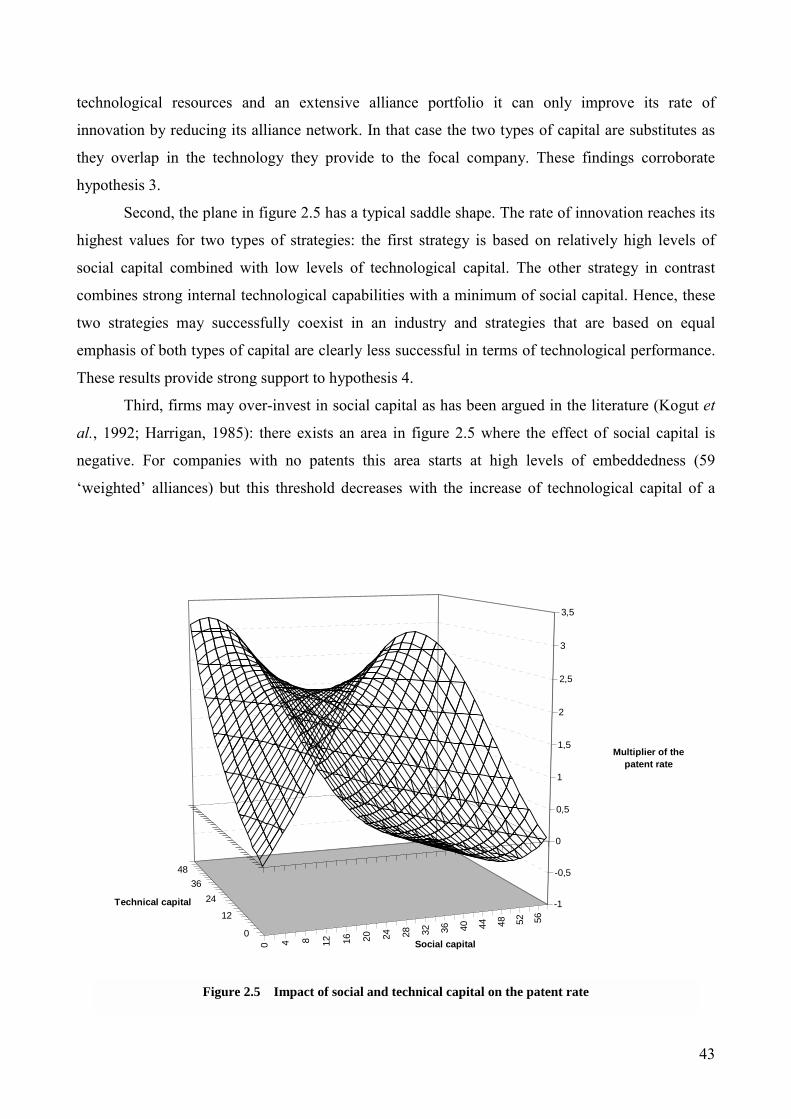
43
technological resources and an extensive alliance portfolio it can only improve its rate of
innovation by reducing its alliance network. In that case the two types of capital are substitutes as
they overlap in the technology they provide to the focal company. These findings corroborate
hypothesis 3.
Second, the plane in figure 2.5 has a typical saddle shape. The rate of innovation reaches its
highest values for two types of strategies: the first strategy is based on relatively high levels of
social capital combined with low levels of technological capital. The other strategy in contrast
combines strong internal technological capabilities with a minimum of social capital. Hence, these
two strategies may successfully coexist in an industry and strategies that are based on equal
emphasis of both types of capital are clearly less successful in terms of technological performance.
These results provide strong support to hypothesis 4.
Third, firms may over-invest in social capital as has been argued in the literature (Kogut et
al., 1992; Harrigan, 1985): there exists an area in figure 2.5 where the effect of social capital is
negative. For companies with no patents this area starts at high levels of embeddedness (59
�weighted� alliances) but this threshold decreases with the increase of technological capital of a
0
12
2436
48
0 4 8 12 16 20 24 28 32 36 40 44 48 52 56
-1
-0,5
0
0,5
1
1,5
2
2,5
3
3,5
Multiplier of thepatent rate
Technical capital
Social capital
Figure 2.5 Impact of social and technical capital on the patent rate
44
company.
Model 4 introduces the innovative performance of the alliance partners. The positive but
only weakly significant coefficient indicates that we have some support � although not very
convincing � that a company benefits from the technological strengths of its alliance partners.
Other variables held constant a one-standard deviation increase in the innovative performance of a
firm�s alliance partners results in an 8.2 percent increase in the rate of innovation (=
exp(0.00061*129.48) = 1.08219).
As a result we could state that companies connected to technologically advanced partners
seem to innovate at a higher rate than those connected to less prominent companies. However, we
need to be cautious about these outcomes. There is a high bi-variate correlation between the total
number of alliances a company established during the previous five years and the accumulated
innovative performance scores of its partners over that same period. Therefore we executed the
same two additional steps as Stuart (2000) to test whether or not this result is driven by collinearity.
First, we omitted the variables based on the cumulative technological alliances (social capital). In
that case, the coefficient of the �innovative performance of the partners�- variable remains positive
but is no longer significant (not reported). Second, we replaced the variable �innovative
performance-of-partners� in Model 4 with the �average innovative performance score computed
over the set of partners in each firm�s alliance portfolio� (Stuart, 2000: 803). The advantage of this
variable is that even though it is not correlated with the total count of alliances (r = 0.02), it still
gives a flavor of the innovative performance of the alliance partners. Again, the coefficient is
positive but not significant. As a result, it is not safe to claim any support for hypothesis 5.
Model 5 tests the two final hypotheses. We have argued that firms experimenting with novel
technologies are more likely to have a higher rate of innovation. These firms are able to value the
potential of novel technologies in a more accurate way. They perceive the potential threats of
disruptive technologies more easily, and they are more open to new avenues for research. However,
too much experimentation with unfamiliar technologies is counterproductive: it should be in
balance with the exploitation of familiar technologies. In line with this argument we expect a
positive sign for the coefficient of the �novel technologies�-variable and a negative sign for the
squared term. Model 5 indicates strong support for hypothesis 6. Moreover, the magnitude of the
effect is substantial: other variables held constant, one-standard deviation increase above the mean
45
in the experimentation with novel technologies results in a 26.5 percent increase in a company�s
rate of innovation16.
Finally, hypothesis 7 suggests that experimenting with pioneering technologies increases the
rate of innovation of a company. The results in Model 5 support this hypothesis. A one-standard
deviation increase in the experimentation of pioneering technologies leads to a 14.4 percent
(=exp[1.3429*0.10]) increase in the rate of innovation. Hence, companies that successfully
patented a �pioneering technology�-innovation increase their rate of innovation in the subsequent
years.
DISCUSSION AND CONCLUSIONS
The increasing requirements of the organizational environment have forced companies in high tech
industries to establish networks of technology alliances. The internal development of technological
resources is interwoven with the external acquisition of technologies through alliances. Both
technological and social capital determine the rate of innovation of companies. In the literature,
both types of capital have been conceived as complements: they are mutually reinforcing each
other�s effect on the rate of innovation of a company (Cohen and Levinthal, 1990; Lane and
Lubatkin, 1998; Duysters and Hagedoorn, 2000).
In this chapter we claim that the effect of an increase in the internal technology capabilities
of a company or an extension of the alliance portfolio on its rate of innovation depends on the size
of its existing technological and social capital. For low degrees of internal technological
capabilities and/or small alliance portfolios increases in either one of both types of capital will
increase a company�s rate of innovation. Technological and social capital are found to mutually
reinforce each other�s impact on the technological performance of a company. However, we also
found strong empirical support for the change in interaction between both types of capital in the
16 The partial effect of the novel technologies (NT) in Table 4, Model 5 is exp[NT(0.2229 -0.023.NT)]. For an average
company this implies a rate of innovation increase of 19.1 percent (exp[0.86(0.2229-0.0230*0.86)]). For a company
that is highly involved in experimenting with novel technologies (one-standard deviation above the mean) this increase
is 45,6 percent (exp[2.17(0.2229-0.0230*2.17]). The highest possible value for the partial effect (71.6 percent) is
reached for companies having experimented with 4.85 novel technologies.
46
case technological capabilities and the alliance network of a company increase. At high levels,
technological and social capital are substitutes: the company with strong technological resources
does not need an extensive portfolio of alliances to come up with a strong technological
performance. Similarly, companies that learned how to acquire technology from their allies can
curtail their internal research and development efforts compared to companies with a small alliance
network.
We also found strong support for the possibility of local equilibria. Two main strategies are
found to provide an optimal rate of innovation. The first emphasizes the development of strong
internal technological resources in combination with a small alliance portfolio. The other
emphasizes the establishment of an extensive alliance network supported by a minimal amount of
technological capital.
Stuart (2000) argued that the technological performance of a company is not so much
determined by the size of the alliance network but rather by the characteristics of the focal firm�s
alliance partners. Contrary to his findings we find no credible support for this claim. It is possible
that in the specific context of the ASIC industry the technological prominence of the partners are
less important because of the continuous stream of �competence destroying� innovations by new
entrants. Another possibility is that slightly different variables will confirm the importance of
technological characteristics of the partners. One possible alternative is to calculate differences
between the technological capital of the focal firm and that of its partners.
Finally, companies that experiment with novel and pioneering technologies are found to
have a higher rate of innovation in subsequent years. This is an interesting finding because it
indicates that companies, which almost exclusively focus on the exploitation of their existing
technologies, are likely to get trapped in their own technological competences. This supports the
idea of Leonard-Barton (1992) that core competencies can turn into core rigidities if companies are
not rejuvenating their existing capabilities by exploring new technological fields.
This chapter clearly contains a number of limitations. One important limitation is that we did not
model the �interorganizational absorptive capacity� of companies explicitly. We assumed (and
found empirical evidence) that the technological capital in a company has a moderating effect on
the relationship between its social capital and its rate of innovation. Modeling explicitly the
industry and organizational factors that have an impact on the absorptive capacity of a company
could improve our understanding of the interaction between technological capital and alliance
portfolios.

47
Future research on the dyadic level (dyad-year as unit of observation) could also
complement the firm level analysis about the relationship between technological resources and
alliance networks. An analysis on the dyadic level allows us to focus on the question how the
probability of the formation of new alliances is affected by (the difference between) the existing
technological capital of the allying companies.

48

49
CHAPTER 3
EXPLORATIVE AND EXPLOITATIVE LEARNING STRATEGIES IN
TECHNOLOGY-BASED ALLIANCE NETWORKS 17
Abstract
This chapter aims to improve our understanding of how exploitative and explorative learning of
firms is enhanced through their social capital. Both types of learning differ considerably from each
other and we argue that the distinction between them may be an important contingency factor in
explaining the value of direct, indirect and (non-)redundant technology-based alliances. In
particular we argue that, since companies have to find a balance between explorative and
exploitative learning (March, 1991), redundant and non-redundant links play a complementary
role in inter-organizational learning processes: redundant information improves exploitative
learning, non-redundant information enhances a firm�s explorative learning. The empirical results
support the predictions about the contingency of the value of redundant information for both types
of learning. Direct and indirect ties improve both types of learning but the impact on explorative
learning is much higher. We find that direct ties have a moderating effect on indirect ties only in
the case of exploitative learning. However, the empirical results indicate that the relationship
between (non)-redundancy and explorative and exploitative learning are more complicated than a
simple one-to-one relationship. Redundancy in alliance networks is a multi-dimensional concept:
network density negatively affects exploitative learning and dependence on one or few alliance
partners reduces both exploitative and explorative learning.
17 This chapter is based on a paper written with Wim Vanhaverbeke and Geert Duysters
50
INTRODUCTION
As competition becomes increasingly knowledge-based and companies get involved in accelerating
technology races reducing time to market, they face considerable problems to develop all the
required knowledge and capabilities internally (Mowery, 1988; Mytelka, 1991; Teece, 1992;
Gomes-Casseres, 1996; Hagedoorn and Duysters, 2002). Chesbrough (2003) coined the term �open
innovation� to indicate that companies � even the largest and most technologically advanced ones �
must complement their in-house R&D with technologies that are developed externally. In large
companies, management is gradually replacing the traditional inward focus of its technological
competence building by a more outward-looking approach that draws heavily on technologies from
networks of universities, startups, suppliers, and competitors. Hence, technological learning is
increasingly based on a combination of internal and external learning: internal learning based on a
firm�s own R&D efforts, external learning on the technology acquired from alliance partners. Both
types of learning are complements reinforcing each other�s productivity (Cohen and Levinthal,
1990).
Technology based alliances between companies are one way to tap into these networks. A
growing number of firms are realizing that alliances can be employed as effective learning
mechanisms (Hagedoorn, 1996; Powell et al., 1996; Hagedoorn and Duysters, 2002). However,
considering inter-organizational networks of technology-based alliances as a set of �learning
alliances� is clearly a simplification. In this study we focus on March�s (1991) distinction between
exploitative and explorative learning. Exploitation is associated with the refinement and extension
of existing technologies, whereas exploration is concerned with the experimentation with new
alternatives. There are considerable differences between both types of learning (March, 1991;
Chesbrough, 2003), which, in turn, have important implications in the way a company can tap into
the technological capabilities of its alliance partners. Although there are numerous studies that have
investigated the relationship between a firm�s portfolio of technology alliances and its
(technological) performance (Hagedoorn and Schakenraad, 1994; Shan et al., 1994; Mitchell and
Singh, 1996; Powell et al., 1996; Stuart, 2000), only few of them pay particular attention to the
exploitative or explorative nature of the inter-organizational learning in alliance networks (e.g.
Rowley et al., 2000; Ahuja and Lampert, 2001; Hagedoorn and Duysters, 2002).
51
The main aim of this chapter is to improve our current understanding of how exploitative
and explorative learning of firms is enhanced (or hampered) by the use of technology-based
alliances and the social structure of the alliance network. In this chapter we argue that the value of a
firm�s alliance network is contingent on the type of learning (Burt, 1997, 2000; Gabbay and
Zuckerman, 1998; Hansen et al., 2001). Since exploitative and explorative learning are quite
different in nature, alliances (both direct and indirect ones) are expected to have a different impact
on both types of learning.
Moreover, we will also focus on the effect of redundant ties in alliance networks. In the
literature on social networks there are two opposing views on the benefits of redundant ties. On the
one hand, there is the structural hole theory of Burt (1992a) where firms can reap rents because of
the absence of ties among its contacts. As a result, companies benefit from non-redundant ties in
their networks. This view is at odds with the social capital theory of Coleman (1988, 1990) where
firms benefit from cohesive (redundant) ties with their alliance partners. However, a number of
scholars (Burt 1998, 2000; Ahuja 2000a; Hansen et al., 2001) suggest that the two forms of social
capital are not necessarily contradictory, but they rather play different roles in different settings or
have different purposes. We argue that the distinction between explorative and exploitative learning
may be an important contingency factor in explaining the value of (non-)redundant ties. Companies
have to make choices between bridging structural holes between the dense areas of an alliance
network on the one hand and creating cohesive ties to benefit from its social capital in the network
on the other hand. In other words, firms should make decisions about how and when to make use of
redundant and non-redundant ties in their external acquisition of technology.
In the next part, we will derive some basic hypotheses on the effect of firms� alliance
network structure on their innovative performance. In the empirical part of the study we will test
these hypotheses using strategic technology alliance data and patent data of companies in three
different industries over a time-span of 12 years.

52
THEORETICAL BACKGROUND AND HYPOTHESES
Strategic alliances and their role in exploitative and explorative learning
Several studies indicate that interfirm linkages are efficient means to develop and absorb new
technological capabilities (Harianto and Pennings, 1990; Powell et al., 1996; Ahuja, 2000b). The
growing importance of external knowledge acquisition poses a number of important challenges to
companies. One of the most prominent questions relates to the degree in which firms are able to
absorb their newly acquired knowledge, i.e. the degree of their absorptive capacity (Cohen and
Levinthal, 1990). Lane and Lubatkin (1998) and Cockburn and Henderson (1998) argue that
external networks enhance an organization�s absorptive capacity. In fact, experience in transferring
knowledge through technology-based alliances can increase the absorptive capacity of the firms
involved in two ways. First, by increasing the knowledge base communication between partners
becomes easier. Second, experience with alliances results in the development of specific routines
that support knowledge transfer (Simonin, 1999).
In the case of exploitative learning, companies team up with partners to share R&D costs
and risks, to obtain existing, complementary know-how (Teece, 1986), or to speed up the R&D-
process in industries where time-to market is crucial. If a company establishes alliances with
partners to strengthen its existing technology base (i.e. exploitative learning), it already owns much
of the required expertise and know-how. The in-house technological capabilities guarantee that the
problem the alliance partners wish to focus on is clearly defined, possible solutions are known and
that the partners have a fairly good understanding of the tasks at hand (Hansen et al., 2001).
Acquaintance with the technology implies that the knowledge involved is to a large extent explicit
and codified (Nonaka, 1994). The inter-organizational learning process can be planned and
controlled to a large extent and targets can be set at the start.
Explorative learning is different. This type of learning is not about improving the efficiency
of the current businesses, but it is a search for new, technology based business opportunities.
Exploring new technology entails problems that are novel to the company and because of that
particular characteristic knowledge is usually contested, tacit and hard to articulate. In explorative
learning the outcome cannot be predicted at the start, but it is an entrepreneurial search process for
business opportunities in technological areas that are relatively new to the company. Besides, the
tacit and contested knowledge involved in the process also implies that the contact between the
53
partners will often be iterative and informal (discussing ideas, exchanging views, reformulation of
the strategy when unforeseen problems emerge, etc.).
So far, we argued that an organization has to find a balance between explorative and
exploitative learning, that these two learning types are different in nature, returns and
organizational requirements, and that technology-based alliances are increasingly important to
absorb external technological knowledge. Because there are marked differences between
exploitative and explorative learning, we assume that the role of alliances and the structure of the
alliance network is contingent on the type of learning. In line with Ahuja�s (2000a) study, we
suggest that three aspects of a company�s technology-based alliance network should be analyzed in
detail. We will argue that (1) the number of direct ties and (2) indirect ties maintained by the firm
and (3) the degree of redundancy among the firm�s partners have a differential impact on
explorative and exploitative learning.
Direct ties
By means of strategic technology alliances, firms are able to generate scale and scope advantages
by internal development of core technologies, while increasing their strategic flexibility by means
of learning through alliances. External knowledge acquisition might be even more important in the
case of developing technological capabilities that are new to the company � i.e. explorative
learning. Different arguments point in that direction. First, organization theorists (Levinthal and
March, 1993; Cohen and Levinthal, 1990) have argued that there is a positive feedback loop
between experience and competence. Experience in a particular knowledge domain leads to
increased absorptive capacity and enhanced competencies in this specific domain. A higher level of
competence, in its turn, will lead to increased usage of the specific knowledge and therefore
increases the level of experience. In spite of the positive effect of this cycle on the specific
technological competences of companies, firms may fall into the so-called familiarity trap (Ahuja
and Lampert, 2001): this cycle favors specialization and inhibits experimentation with unfamiliar
technologies. Hence, strong technological capabilities tend to facilitate cognitive inertia, path
dependency and low levels of experimentation (Stuart and Podolny, 1996). In this way, local search
and organizational routines may eventually lead firms to miss out on new windows of opportunities
related to experimenting with technologies beyond their core technologies. Teaming up with
competent partners might then prove the only way to go beyond the current knowledge base.
Second, exploitative knowledge creation can be based primarily on internal technology
54
competencies. Companies involved in exploitative knowledge creation have much of the required
knowledge in-house and teaming up with partners is only one (although maybe an important) of
many alternative ways of strengthening their technological capabilities. Third, companies are often
found to be very careful in sharing core technologies because of the dangers of partners �stealing�
the specific know-how in which a company has a competitive advantage. This problem is expected
to be important in exploitative learning because in that case partners are likely to have similar
technology profiles. This problem is furthermore aggravated because the cooperating companies
are frequently (potential) competitors. Therefore, we expect that in teaming up with companies in
non-core technologies sharing of technology will pose fewer problems than in the case of core
technologies. Next, knowledge resulting from exploitative and explorative learning is different in
nature. Exploring realms of knowledge that a company has not yet explored often generates new,
breakthrough innovations. Finally, the nature of explorative learning implies that partnering
companies usually get involved in a long-lasting and informal relationship. Exploration involves
tacit knowledge, high uncertainty, and problems that are novel to the focal firm; this implies that
successfully broadening the technology base of a company depends on the �quality� of the
relationship with its alliance partners (much more than in the case of exploitative learning). Over
time and through prior experience with alliances firms develop capabilities or routines to manage
alliances. As a result, companies that established many alliances in the past develop routines and
alliance management skills which in turn lead to higher innovative output for the partnering
company. We expect that these skills have a stronger impact on explorative learning because of its
tacit and experimental nature.
Therefore, we hypothesize:
Hypothesis 1a: The past involvement of a firm in technology-based alliances (its
social capital) has a stronger positive impact on the broadening of
its knowledge base than on the strengthening of its core
technologies.
However, once firms are involved in an excessive number of technology alliances firms can
start to suffer from information overload and diseconomies of scale. This occurs in particular when
a firm tries to deal with too many unfamiliar streams of knowledge (Ahuja and Lampert, 2001).
Management attention and integration costs also seem to grow exponentially once a certain optimal
level of alliances has been established (Duysters and de Man, 2003). An alliance portfolio with too
many alliances may lead to saturation and overembeddedness (Kogut et al., 1992; Uzzi, 1997).
55
Therefore, at high levels of embeddedness marginal benefits of forming new linkages will be low
and marginal costs of additional links will be relatively high (Ahuja, 2000a). As a result, we expect
an inverted-U shape relationship between the social capital of companies and their exploitative and
explorative learning.
Hypothesis 1b: The past involvement of a firm in technology-based alliances (its
social capital) is related in a curvilinear way (inverted-U shape) to
the strengthening of its knowledge base.
Indirect ties
Not only direct ties have an impact on the technological performance of partnering companies.
Indirect ties also play a role because alliances can be a channel of communication between a focal
firm and many indirect contacts, i.e. the partners of its partners, and so forth (Mizruchi, 1989;
Haunschild, 1993; Gulati, 1995a). The distinction between direct and indirect ties is important
because two companies that have the same number of direct contacts might still differ in the
number of companies they can reach indirectly depending on the size and scope of their partners�
alliance networks (Gulati, 1999). A firm may have numerous alliances with partners that are not
well connected to other companies. In contrast, a company may have a limited number of alliance
partners, linking the focal company to a wide range a companies that have themselves alliances to
other companies, and so forth. As a result, the social capital of a company is not only determined
by its direct ties but also by the number of companies it can reach in the network through indirect
ties.
Indirect ties are important for both exploitative and explorative learning, but the impact on
the latter is expected to be larger. First, if a company can reach many other companies through
indirect ties it can often receive information about the findings of a broad set of research projects in
the network (Ahuja, 2000a). Their indirect ties may also serve as a �radar� function for companies
in the sense that relevant technological developments are brought to the attention of the focal firm.
Next, the tacit and experimental nature of explorative learning implies that companies in search for
opportunities beyond their existing technology base will have a difficult time recognizing and
valuing the technology of potential partners as long as they are not connected through a common
alliance partner. As a result, since indirect ties seem to play an essential role in the process of
explorative learning, we hypothesize:

56
Hypothesis 2a: The larger the number of indirect ties of a firm the higher their
effect on the strengthening of its knowledge base.
Hypothesis 2b: The larger the number of indirect ties of a firm the higher their
effect on the broadening of its knowledge base.
Hypothesis 2c: The number of indirect ties is more positively related to the
broadening of a firm�s knowledge base than to the strengthening of
its knowledge base.
As argued by Ahuja (2000a), firms that are involved in many direct ties are likely to benefit less
from their indirect ties than firms characterized by a more limited number of direct ties. The
argumentation is twofold: First, firms that have many direct ties are likely to gain less new or
additional information from their indirect ties. For firms establishing many direct ties, the
information that can be obtained from indirect ties may be very similar to the knowledge already
obtained by its direct contacts and is therefore more likely to be redundant. Second, firms with
many direct ties may be more constrained in their ability to profit from new information through
their indirect ties. When a company has many direct connections, the information that reaches the
company through the network also reaches the partners of the focal firm�s allies, who may be
potential competitors.
We argue that the impact of direct ties on indirect ones is likely to depend on the context of
exploitative or explorative learning. The contingency may result from the different mix of targets a
company wants to reach through its alliance network. When a company intends to broaden its
technology base, it is primarily interested in finding and getting access to new information and
technologies. If a company explores new technologies through its alliance network, problems are
novel to the firm and technological benefits might not be straightforward (Hansen et al., 2001).
There is a high degree of exploration as the company departs from its existing knowledge base, and
much of the knowledge involved in exploratory tasks is tacit, hard to articulate and can only be
acquired through experience (Nelson and Winter, 1982; Von Hippel, 1994; Hansen, 1999; Hansen
et al., 2001). A company will typically have many contacts with its alliance partners before an idea
evolves into a valuable innovation. This, in turn, implies that having many direct contacts does not
necessarily constrain the information stemming from indirect contacts. On the contrary, several
direct ties provide different ways of exploring tacit and uncertain technological knowledge.

57
Moreover, when a company explores new technological areas, it establishes in many cases alliances
with companies that are not competitors: it is therefore unlikely that competitors will capture the
knowledge involved. Moreover, the sticky nature of the knowledge prevents an easy diffusion
among partners.
In contrast, when a company deepens its existing technology base much of the knowledge
involved is likely not to be tacit, ��because the focal actor has much of the expertise required and
hence is likely to understand the problem, possible solutions, and the causal mechanisms among the
parameters involved in the task� (Hansen et al., 2001: 26) . In this case, the information gained
from many direct ties will substitute for information from indirect ties. Moreover, as the knowledge
is explicit in nature it is also easily diffused among partners. Finally, the competitive threat is real
since the focal company is partnering with companies that are likely to have a similar technology
profile. This leads to Hypothesis 3:
Hypothesis 3a: The impact of the number of indirect ties of a firm on strengthening
a firm�s knowledge base is weakened by the number of direct ties.
Hypothesis 3b: The impact of the number of indirect ties of a firm on broadening a
firm�s knowledge base is not weakened by the number of direct
ties.
Network structure of social capital
There is an ongoing debate in the academic literature about the impact of redundant and non-
redundant network ties. Burt (1992a, 1992b, 2000) argues that a tie will provide access to new
information and entrepreneurial opportunities to the extent that it offers non-redundant sources of
information. In other words, Burt suggests that firms benefit from their alliances when they are
connected to companies that are themselves not connected to the same network, i.e. that the alliance
spans a structural hole. On the contrary, Coleman (1988, 1990) and Bourdieu and Wacquant (1992)
argue that companies can benefit from establishing alliances with companies that are densely tied to
each other. The structural hole theory of Burt (1992a, 2000) where firms can reap �entrepreneurial�
rents because of the absence of ties among its contacts is apparently at odds with the network
closure theory of Coleman (1988, 1990) where firms benefit from cohesive (redundant) ties with
their partners. However, a number of scholars (Burt 1998, 2000; Hansen, 1999; Ahuja, 2000a;
58
Hansen et al., 2001) suggest that the two theories about the network structure of social capital are
not necessarily contradictory, but they rather play different roles that may be valuable in different
settings or for different purposes.
In a similar vein, we argue that the distinction between explorative and exploitative learning
may be one of these contingency factors determining the value of the network structure of a firm�s
alliance portfolio. In particular we argue that the value of redundant and non-redundant ties is
contingent on the type of inter-organizational learning in which the company is interested. In other
words, firms should make decisions about how and when to make use of redundant and non-
redundant ties in their external technology acquisition, depending on the type of learning.
In exploration, companies try to get a first, quick understanding on many different
alternatives. �Information is relatively broad and general in nature, because the emphasis is on
identifying alternatives rather than fully understanding how to develop any one innovation. This
task does not have a well-defined solution space so firms perform broad searches of their
environments in order to identify a variety of future options.� (Rowley et al., 2000: 373-374). Since
explorers want to cover a relatively broad range of technologies, it can be argued that non-
redundant ties are advantageous in explorative learning. First, following the arguments advanced by
Granovetter (1973) and Burt (1992a, 2000), companies in search for new knowledge � explorative
learning � will benefit more from non-redundant ties spanning structural holes than from dense
network ties because the latter are less likely to provide new, non-redundant information or
knowledge. Second, when firms are only exploring technological realms and do not need a full
understanding of the technology, they may tolerate some information noise and do not need
redundant sources to evaluate the information (Rowley et al., 2000). Network inertia is a third
reason why ties bridging structural holes may be advantageous in explorative learning: benefits of
explorative learning will be larger the more the focal learning firm can search for knowledge
outside its existing network relations. Risk hedging might be considered a last reason why firms
engage in non-redundant relationships: by employing several technology alliances at the same time
firms hedge the risks associated with missing out on important new technological developments
(Nicholls-Nixon and Woo, 2003).
In contrast, we argue that redundant ties offer considerable advantages when a company is
primarily interested in the refinement and the extension of its existing technologies and
competencies. Exploitative learning implies that companies refine and strengthen their existing
technology base and for that purpose they need specific and fine-grained information that will
provide a deeper knowledge of this particular technology. In contrast with explorative learning,
exploitative learning ��requires a deeper understanding of specific information rather than a wider
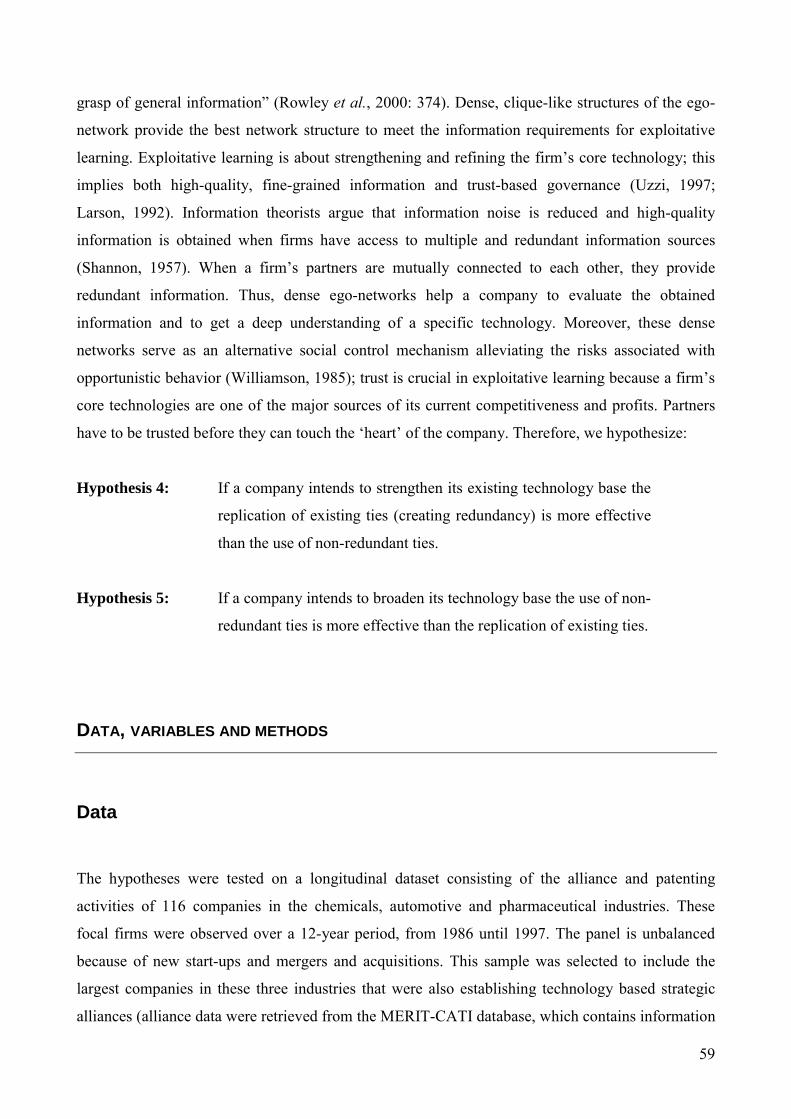
59
grasp of general information� (Rowley et al., 2000: 374). Dense, clique-like structures of the ego-
network provide the best network structure to meet the information requirements for exploitative
learning. Exploitative learning is about strengthening and refining the firm�s core technology; this
implies both high-quality, fine-grained information and trust-based governance (Uzzi, 1997;
Larson, 1992). Information theorists argue that information noise is reduced and high-quality
information is obtained when firms have access to multiple and redundant information sources
(Shannon, 1957). When a firm�s partners are mutually connected to each other, they provide
redundant information. Thus, dense ego-networks help a company to evaluate the obtained
information and to get a deep understanding of a specific technology. Moreover, these dense
networks serve as an alternative social control mechanism alleviating the risks associated with
opportunistic behavior (Williamson, 1985); trust is crucial in exploitative learning because a firm�s
core technologies are one of the major sources of its current competitiveness and profits. Partners
have to be trusted before they can touch the �heart� of the company. Therefore, we hypothesize:
Hypothesis 4: If a company intends to strengthen its existing technology base the
replication of existing ties (creating redundancy) is more effective
than the use of non-redundant ties.
Hypothesis 5: If a company intends to broaden its technology base the use of non-
redundant ties is more effective than the replication of existing ties.
DATA, VARIABLES AND METHODS
Data
The hypotheses were tested on a longitudinal dataset consisting of the alliance and patenting
activities of 116 companies in the chemicals, automotive and pharmaceutical industries. These
focal firms were observed over a 12-year period, from 1986 until 1997. The panel is unbalanced
because of new start-ups and mergers and acquisitions. This sample was selected to include the
largest companies in these three industries that were also establishing technology based strategic
alliances (alliance data were retrieved from the MERIT-CATI database, which contains information
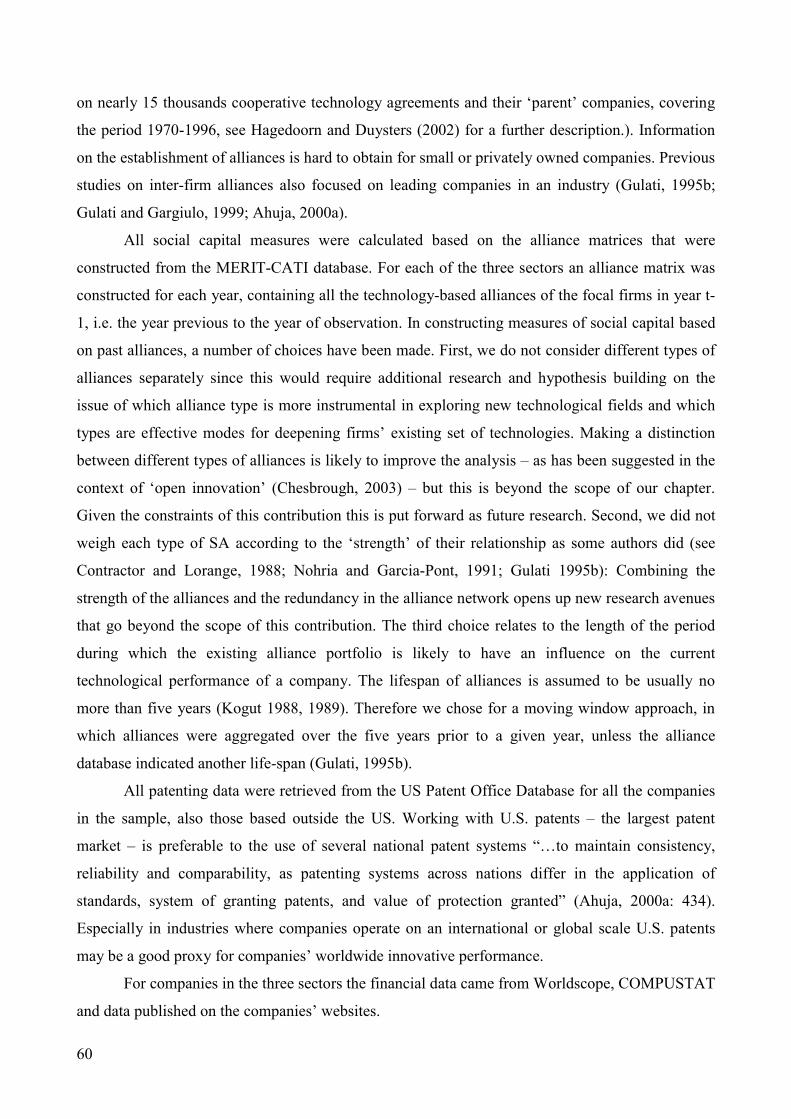
60
on nearly 15 thousands cooperative technology agreements and their �parent� companies, covering
the period 1970-1996, see Hagedoorn and Duysters (2002) for a further description.). Information
on the establishment of alliances is hard to obtain for small or privately owned companies. Previous
studies on inter-firm alliances also focused on leading companies in an industry (Gulati, 1995b;
Gulati and Gargiulo, 1999; Ahuja, 2000a).
All social capital measures were calculated based on the alliance matrices that were
constructed from the MERIT-CATI database. For each of the three sectors an alliance matrix was
constructed for each year, containing all the technology-based alliances of the focal firms in year t-
1, i.e. the year previous to the year of observation. In constructing measures of social capital based
on past alliances, a number of choices have been made. First, we do not consider different types of
alliances separately since this would require additional research and hypothesis building on the
issue of which alliance type is more instrumental in exploring new technological fields and which
types are effective modes for deepening firms� existing set of technologies. Making a distinction
between different types of alliances is likely to improve the analysis � as has been suggested in the
context of �open innovation� (Chesbrough, 2003) � but this is beyond the scope of our chapter.
Given the constraints of this contribution this is put forward as future research. Second, we did not
weigh each type of SA according to the �strength� of their relationship as some authors did (see
Contractor and Lorange, 1988; Nohria and Garcia-Pont, 1991; Gulati 1995b): Combining the
strength of the alliances and the redundancy in the alliance network opens up new research avenues
that go beyond the scope of this contribution. The third choice relates to the length of the period
during which the existing alliance portfolio is likely to have an influence on the current
technological performance of a company. The lifespan of alliances is assumed to be usually no
more than five years (Kogut 1988, 1989). Therefore we chose for a moving window approach, in
which alliances were aggregated over the five years prior to a given year, unless the alliance
database indicated another life-span (Gulati, 1995b).
All patenting data were retrieved from the US Patent Office Database for all the companies
in the sample, also those based outside the US. Working with U.S. patents � the largest patent
market � is preferable to the use of several national patent systems ��to maintain consistency,
reliability and comparability, as patenting systems across nations differ in the application of
standards, system of granting patents, and value of protection granted� (Ahuja, 2000a: 434).
Especially in industries where companies operate on an international or global scale U.S. patents
may be a good proxy for companies� worldwide innovative performance.
For companies in the three sectors the financial data came from Worldscope, COMPUSTAT
and data published on the companies� websites.
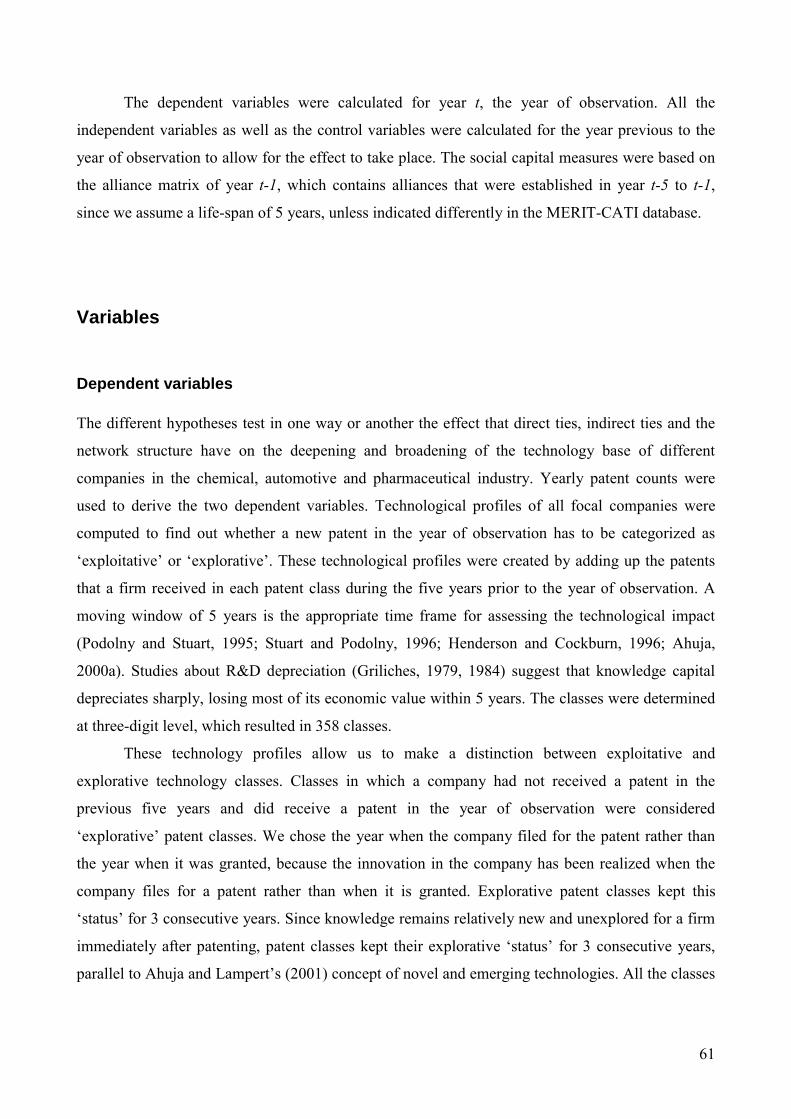
61
The dependent variables were calculated for year t, the year of observation. All the
independent variables as well as the control variables were calculated for the year previous to the
year of observation to allow for the effect to take place. The social capital measures were based on
the alliance matrix of year t-1, which contains alliances that were established in year t-5 to t-1,
since we assume a life-span of 5 years, unless indicated differently in the MERIT-CATI database.
Variables
Dependent variables
The different hypotheses test in one way or another the effect that direct ties, indirect ties and the
network structure have on the deepening and broadening of the technology base of different
companies in the chemical, automotive and pharmaceutical industry. Yearly patent counts were
used to derive the two dependent variables. Technological profiles of all focal companies were
computed to find out whether a new patent in the year of observation has to be categorized as
�exploitative� or �explorative�. These technological profiles were created by adding up the patents
that a firm received in each patent class during the five years prior to the year of observation. A
moving window of 5 years is the appropriate time frame for assessing the technological impact
(Podolny and Stuart, 1995; Stuart and Podolny, 1996; Henderson and Cockburn, 1996; Ahuja,
2000a). Studies about R&D depreciation (Griliches, 1979, 1984) suggest that knowledge capital
depreciates sharply, losing most of its economic value within 5 years. The classes were determined
at three-digit level, which resulted in 358 classes.
These technology profiles allow us to make a distinction between exploitative and
explorative technology classes. Classes in which a company had not received a patent in the
previous five years and did receive a patent in the year of observation were considered
�explorative� patent classes. We chose the year when the company filed for the patent rather than
the year when it was granted, because the innovation in the company has been realized when the
company files for a patent rather than when it is granted. Explorative patent classes kept this
�status� for 3 consecutive years. Since knowledge remains relatively new and unexplored for a firm
immediately after patenting, patent classes kept their explorative �status� for 3 consecutive years,
parallel to Ahuja and Lampert�s (2001) concept of novel and emerging technologies. All the classes
62
in which a company had successfully applied for a patent the previous five years and successfully
applied for a patent in the year of observation were considered �exploitative� patent classes.
The dependent variables �broadening of technology base� and �deepening of technology
base� were then made up by adding up all the patents applied for in the year of observation in the
explorative and exploitative patent classes respectively.
Although the use of patent as an indicator of learning and innovative output has been
criticized on many different ground (for an overview see Griliches, 1990) they are generally viewed
as the single most appropriate measure of innovative performance at the company level (Ahuja and
Katila, 2001; Hagedoorn and Duysters, 2002) in particular in a single industrial sector context
(Basberg, 1987; Cohen and Levin, 1989; Ahuja and Katila, 2001). We must acknowledge that
although patents are increasingly used as a proxy for learning it does not equate learning. In our
view it is a proxy for the output of learning (knowledge stock increase).
Independent variables
The impact of social capital on innovative output of companies has been explored among others by
Ahuja (2000a) and Ahuja and Lampert (2001). In this chapter, innovative output of a company is
split up into the deepening or strengthening of the existing technology base and the exploration of
new technological fields. We have argued that the former should benefit from a dense ego-network,
while the latter is will be spurred by the presence of the structural holes. For an accurate
understanding of the impact of redundant and structural hole spanning alliances on both dimensions
of innovative firm behavior, the firm�s ego network should be decomposed into distinct and
separate elements. Following Ahuja (2000a), we make a distinction between direct ties, indirect ties
and the redundancy of ties in the technology based alliances network. All measures are calculated
on the alliance matrices of year t-1.
Direct ties
The first dimension of social capital is �direct ties�. We prefer to use the number of allies that the
focal firm is directly connected to (i.e., the size of the ego-network) as a measure for direct ties,
above the use of the degree centrality (number of alliances between the focal firm and its allies).
We also introduce the squared term of the number of allies since hypothesis 1b suggests an inverted
U-shaped relationship between innovative performance and the number of direct ties.
63
Indirect ties
A second dimension of the social capital of a company consists of firms it can reach indirectly in
the alliance network through its alliance partners and their partners. There are different possibilities
to operationalize the breadth of coverage of indirect ties. We chose for a variable that measures the
impact of indirect ties while taking into account the decline in tie strength across more distant ties.
We only report the findings for the distance-weighted centrality (see tables 3a and 3b). We tested
the robustness of the findings with other centrality measures that do ��not account for the
weakening or decay in tie strength between firms that are connected by increasingly large path
distances.� (Ahuja, 2000a: 438) and obtained similar results. The measure, which we call �distance
weighted centrality�, is provided by Burt (1991). The variable �� attaches weights of the form 1 �
(fi/(N+1)) to each tie, where fi is the total number of nodes that can be reached up to and including
the path distance i, and N is the total number of firms that can be reached by the focal firm in any
number of steps� (Ahuja 2000a: 438). The result is that alliance partners receive smaller weights
the longer the path distance to the focal firm. The �distance weighted centrality� can be calculated
by adding up all alliances at several distances weighted by their path distances (Ahuja, 2000a).
Social capital: network closure versus structural holes
The literature offers several possibilities to operationalize the (non-)redundancy of alliances. Most
� if not all � researchers that have been involved in empirical studies on inter-organizational
networking and social capital have chosen for a single measure of social capital (Burt, 1992a;
McEvily and Zaheer, 1999; Gulati, 1999; Ahuja, 2000a; Baum et al., 2000). In this chapter, we
develop different (non-)redundancy measures to formalize the notion of social capital. We refer to
Borgatti et al. (1998) for an extensive analysis of network measures that can be used to formalize
the notion of social capital.
Burt (1992a, 1992b) argues that the two empirical conditions that indicate a structural hole
(or non-redundancy) are cohesion and structural equivalence. Both conditions reveal that there are
structural holes by indicating where they are absent. The cohesion criterion indicates that two
partners of the focal firm ��are redundant to the extent that they are connected [to each other] by a
strong relationship. A strong relationship indicates the absence of a structural hole.� (Burt, 1992b:
66). Structurally equivalent partners of the focal firm on the other hand have the same alliance
connections to every other company in the network. Even in absence of an alliance between these
two firms they will provide similar information to the focal firm because they are linked (directly
and indirectly) to the same other companies in the overall alliance network. Thus cohesion focuses
64
on the direct ties between a focal firm�s partners, structural equivalence concerns the indirect ties of
a focal firm�s partners with more distant companies in the alliance network.
The first measure of social capital, proportion density (Burt, 1983; Hansen, 1999), captures
redundancy by cohesion indicating the presence of alliances between a focal firm�s allies. Alliance
partners are redundant to the focal firm when alliances have been established between them.
Proportion density is calculated as the number of ties (not counting ties involving the focal
company) divided by the number of pairs where �pairs� are potential ties. The values for this
variable range from 0 to 1, where 1 indicates that all allies are directly linked to each other.
Another variable to measure social capital in terms of cohesion is �network efficiency� of a
firm�s network (Burt, 1992a). This is calculated by dividing the �effective size� (a variable
measuring the number of non-redundant ties in a firm�s ego-network by subtracting the redundancy
in the network from the number of partners the focal firm is connected to) by the number of
partners in the firm�s ego-network. This efficiency ratio ranges ��from a maximum of one,
indicating that every contact in the network is non-redundant, down to a minimum approaching
zero, indicating high contact redundancy and therefore low efficiency� (Burt, 1992a: 53).
Burt (1992a) offers two variables that capture different aspects from redundancy. The first
one is network constraint: this variable describes the extent to which a network is concentrated in
redundant contacts. More constrained networks span fewer structural holes and, thus, we expect a
positive impact of the �network constraint�-variable on the strengthening of a technology base and a
negative effect on the broadening of technology base. The other variable is �network hierarchy�. It
measures the extent to which the redundancy can be traced to a single contact in the network: high
values indicate that redundancy is concentrated around one or a few alliance partners. We expect
that network hierarchy should be positively related to the strengthening of a technology portfolio
(hypothesis 4) and negatively to its broadening (hypothesis).
Another variable measuring redundancy by cohesion, �Clique overlap centrality�, is a
variable that measures the information available to firms from their position in the network (Everett
and Borgatti, 1998; Gulati, 1999). It measures the extent to which the actor is a member of
overlapping cliques in the network. The idea is that a firm that belongs to many cliques is one that
is located in the midst of dense clusters of firms that have ties with each other. Thus, clique overlap
centrality indicates embeddedness in dense regions of a network. In this sense �clique overlap
centrality� measures redundancy � network closure argument. Hence, firms with a high value for
clique centrality overlap have access to redundant information and, therefore, we expect a positive
(negative) relationship with exploitative (explorative) learning. �Clique overlap centrality� is
calculated using UCINET VI identifying the Luce and Perry (1949) cliques. Those cliques identify

65
groups of firms that are linked to each other by alliances. The minimum clique size we specified
was three. The scores for the clique centrality of each firm were expressed as a ratio to the score of
the most central firm in the network.
Apart from redundancy based on cohesion, redundancy can also be based on structural
equivalence as argued by Burt (1992a, 1992b). We provide two redundancy measures based on
structural equivalence. The first variable that captures redundancy by structural equivalence is
provided by Hansen (1999). Applied to an inter-organizational setting, we can calculate the
correlations for all firms in the alliance network. Thereby we exclude the alliances between the
focal firm and its partners because we intend to measure the extent to which the alliance partners of
the focal firm are connected to other firms in the overall network. Correlations can be converted
into a redundancy measure by taking the average of the correlations between pairs of direct partners
(allies) of the focal company. The values for this variable range from +1 (high redundancy) to �1
(non-redundancy). Consequently, opposite signs should be expected when the redundancy measure
is based on correlations instead of Euclidean distances. Thus we expect a negative sign when a
company explores new technological fields and a positive sign when it depends on its existing
technological capabilities.
Walker et al. (1997) have developed a variable that also measures social capital based on
structural equivalence albeit in a completely different way. Their structural equivalence measure
refers to the pattern of partner sharing: structural equivalent firms have relationships with the same
other firms in the network. �Therefore, measuring structural equivalence in practice almost always
depends on the assessment of relative partner overlap� (Walker et al., 1997: 115). To measure in
how far firms in a group share partners requires one can examine the dispersion of inter-group
densities (Gi) around the network average. An equation that calculates density dispersion is:
∑ −=
jijjii ddmnG 2*)(
where i γ j (1)
�In this equation, Gi is the measure of the dispersion of intergroup densities for the ith group
in the network, ni is the number of firms in the ith group, mj is the number of partners in the jth
partner group , dij is the density of the intersection of the ith and the jth groups, and d* is the overall
density of the network� (Walker et al., 1997: p. 115). Summing Gi over all groups produces a
measure of network structure:
66
∑∑ −=j
ijjii
ddmnG 2*)( (2)
Dividing equation (1) by equation (2) produces a measure of each group�s percentage
contribution to network structure. This variable varies between 0 and 1, and represents the
dispersion of group densities normalized by the way in which a network is structured in a particular
industry and year (Walker et al., 1997: 116). For further explanation of this measure we refer to
Walker et al. (1997).
For our purpose, this variable represents the dispersion of alliances across different
structurally equivalent (SE) groups of partners. All else equal, the more the SE group of the focal
firm has alliances to all different SE groups of partners, the lower the value for this variable. High
densities that are concentrated into one or a few partner groups (i.e., high values for this variable)
mean that the focal firm (and its structurally equivalent group of partners) has established many
alliances with selected structurally equivalent groups of partners.
We have to be cautious with this variable however, for several reasons. First, it does not
measure social capital of an individual (focal) firm but it indicates how the relations of the SE
group to which it belongs are distributed among partner groups. Second, this variable ��penalizes
small groups of firms with small partner groups� (Walker et al., 1997: 115). This variable tends to
zero for SE groups that only establish alliances among themselves because we excluded diagonal
values in the density matrix. The value for this variable increases (to a maximum of one) the larger
the size of the focal group of SE and the more it has dense ties with a single but large group of SE
firms.
Control variables
While the primary focus of this study is to analyze the effect of social capital and its network
structure on exploitative and explorative learning, there may also be other factors that could affect
these two types of learning. We included three types of dummy variables. A first dummy variable
indicates in which economic region the company is headquartered. Following the Triad-concept of
the world economy, a company can be headquartered in North America, Asia or Europe � the
default is Asia. Firms from a different economic region may differ in their propensity to patent.
Annual dummy variables were included to capture changes over time in the propensity of
companies to patent their innovations. Finally, we included a dummy variable to indicate whether a
company is a car manufacturer or chemical firm (default is the pharmaceutical industry).

67
Furthermore, we included a number of correlating organizational variables in one factor.
First, the natural logarithm of �corporate revenues� � a proxy for firm size - was included in the
factor. Firm size is expected to enhance exploitative learning (Acs and Audretsch, 1991). Large
firms have the financial means and vast technological and other resources to invest heavily in
R&D. However, they usually experience problems in diversifying into new technological areas
inhibiting experimentation and favoring specialization along existing technological trajectories
(March, 1991; Levinthal and March, 1993; Ahuja and Lampert, 2001). As a result we expect that
large firms have an advantage over small ones in exploiting technological dynamics with a
cumulative nature, but they may be at a disadvantage with respect to experimenting and exploring
new technological fields.
The second organizational variable included in the factor is the natural logarithm of R&D
expenditures of year t-1. Assuming that there exists a positive correlation between technological
input and output (Pakes and Griliches, 1984) we expect that firms that invest heavily in R&D will
have a higher rate of innovation. Also R&D investments play a role in the ability of companies to
recognize, value and assimilate external knowledge. This absorptive capacity of companies is
crucial to acquire and integrate external knowledge, especially when the knowledge is tacit. Firms
conduct R&D to be more able to use the technology of other companies (Cohen and Levinthal,
1990; Kim, 1998; Mowery and Oxley, 1995). This absorptive capacity argument is particularly
relevant in the case of explorative learning because the knowledge to transfer is tacit and the focal
firm has not yet built any capabilities in these technological areas. Therefore we also included
previous technical capital, i.e. the number of patents received in the previous five years, as an
indicator of absorptive capacity.
Technological diversity between the firm�s partners in the alliance network has to be
introduced as another control variable according to Ahuja (2000a). His argument is twofold. First,
if a firm�s allies are active in widely different technological fields, they may remain unconnected,
generating structural holes in a focal firm�s alliance network. Next, if partners are highly
heterogeneous in their technology base, collaboration is unlikely because they do not have the
required absorptive capacity to learn from each other (Cohen and Levinthal, 1989; Lane and
Lubatkin, 1998; Stuart, 1998). As a result, structural hole measures might reflect the negative
impact of technological distance between its allies rather than social structural effects as postulated
in hypotheses 4 and 5.
Yao (2003) provides an interesting way to calculate the technological distance between a
focal firm�s partners. �The knowledge distance among a firm�s direct alliances (excluding the firm
itself) is the average distance among those firms. We take the sum of each dyadic distance between

68
a firm�s direct contacts and divide the value by the total number of direct alliances of the firm.
Since each pair of firms is counted twice, we also divide the value by 2 to get the final technology
distance among a firm�s alliance� (Yao, 2003: 12). The technological distance between companies
can be calculated as follows:
= ( )
∑∑
==jkt
P
k
P
jit
DISTANCEP
itit
11
**21
=
−∑∑∑
∑∑=
==
==
t
tt
itit C
cC
ckct
kctC
cjct
jct
t
P
k
P
jit N
N
N
NCP 1
2
11
11
1**21
(4)
Where j and k represent the jth and kth partner (j γ k) of the focal firm i. Pit is the number of
partners the focal firm year t. Ct is number of patent classes issued to the set of all sample firms in
year t. Njct and Nkct represent the number of patents in the cth patent class filed for respectively by
the jth and kth partner in year t.
Model estimation
The two dependent variables are count variables and take only nonnegative integer values � i.e. the
number of patents a firm filed for in a particular year in patent classes in which it has issued patents
during the past 5 years (exploitative learning) and the other ones (explorative learning). A Poisson
regression approach provides a natural baseline model for such data (Hausman et al., 1984;
Henderson and Cockburn, 1996). Since we use pooled cross-section data with several observations
on the same firms at different points in time, we modeled the data using a random effects Poisson
estimator with a robust variance estimator.
The basic Poisson model for event count data can be written as follows:

69
!)exp(
)Pr(it
yitit
itity
yYitλλ−
== (1)
Where the parameter λit represents the mean and the variance of the event count and yit the
observed count variable. It is furthermore assumed that:
λit = β�xit (2)
with xit being a vector of independent variables.
The above specification assumes that the mean and variance of the event count are equal.
However, for pooled cross-section count data the variance often exceeds the mean. This
overdispersion is particularly relevant in the case of unobserved heterogeneity. The presence of
overdispersion does not bias the regression coefficients. Rather the computed standard errors in the
Poisson regression are understated, so that the statistical significance is overestimated. Therefore, a
random effects Poisson estimator with robust variance estimator is used: it does not assume within-
firm observational independence for the purpose of computing standard errors. For the random
effects Poisson estimator equation (2) is changed into:
λit = β�xit + ui (3)
where ui is a random effect for the ith firm and reflects the firm-specific heterogeneity.
Unobserved heterogeneity may be the result of differences between companies in their
innovation generating capabilities, and as a consequence, also in their propensity or ability to
patent. Such unobserved heterogeneity, if present and not controlled for, can lead to overdispersion
in the data or serial correlation. Including the sum of alliances that a firm entered in the last five
years (moving window approach) as an additional variable is a common method of controlling for
unobserved heterogeneity (Heckman and Borjas, 1980).
Differences in patenting behavior between companies or between different years are
captured by including dummy variables in the model. First, the propensity to patent may be partly
determined by the nationality of the companies or the industry to which they belong. Similarly, we
introduced annual dummy variables to account for changes over time: they may capture the ever-
growing importance of intellectual capital or changing macroeconomic conditions.
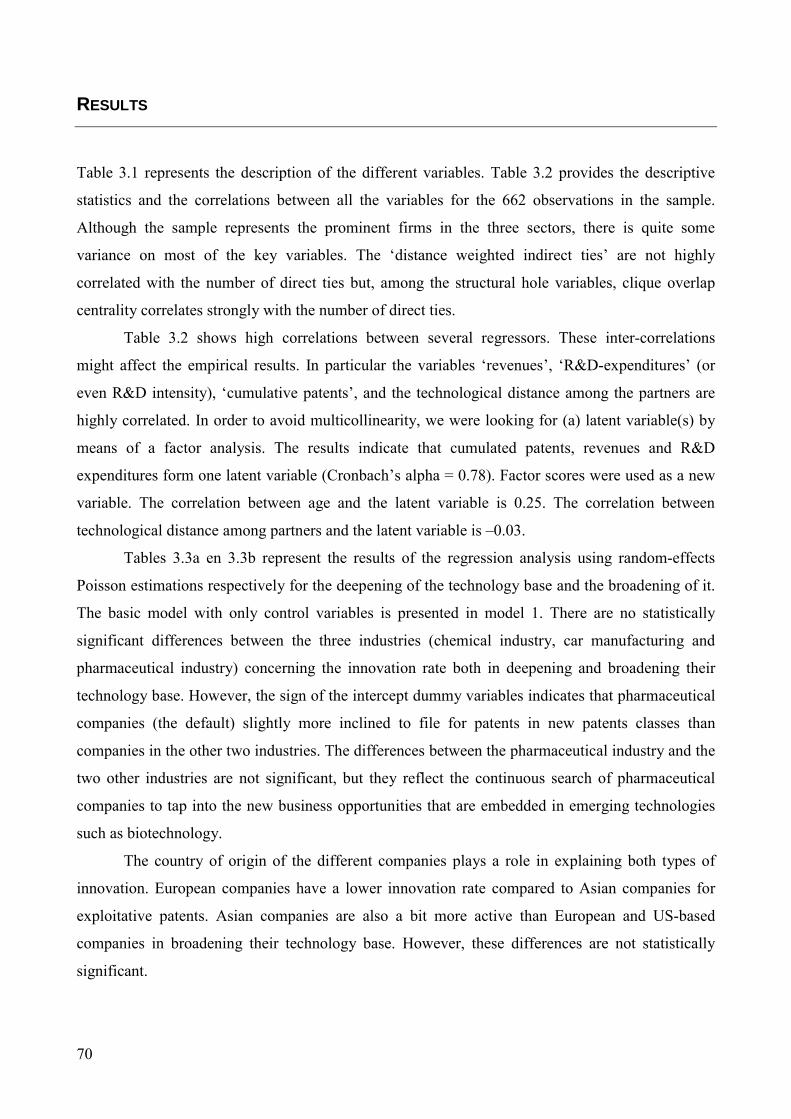
70
RESULTS
Table 3.1 represents the description of the different variables. Table 3.2 provides the descriptive
statistics and the correlations between all the variables for the 662 observations in the sample.
Although the sample represents the prominent firms in the three sectors, there is quite some
variance on most of the key variables. The �distance weighted indirect ties� are not highly
correlated with the number of direct ties but, among the structural hole variables, clique overlap
centrality correlates strongly with the number of direct ties.
Table 3.2 shows high correlations between several regressors. These inter-correlations
might affect the empirical results. In particular the variables �revenues�, �R&D-expenditures� (or
even R&D intensity), �cumulative patents�, and the technological distance among the partners are
highly correlated. In order to avoid multicollinearity, we were looking for (a) latent variable(s) by
means of a factor analysis. The results indicate that cumulated patents, revenues and R&D
expenditures form one latent variable (Cronbach�s alpha = 0.78). Factor scores were used as a new
variable. The correlation between age and the latent variable is 0.25. The correlation between
technological distance among partners and the latent variable is �0.03.
Tables 3.3a en 3.3b represent the results of the regression analysis using random-effects
Poisson estimations respectively for the deepening of the technology base and the broadening of it.
The basic model with only control variables is presented in model 1. There are no statistically
significant differences between the three industries (chemical industry, car manufacturing and
pharmaceutical industry) concerning the innovation rate both in deepening and broadening their
technology base. However, the sign of the intercept dummy variables indicates that pharmaceutical
companies (the default) slightly more inclined to file for patents in new patents classes than
companies in the other two industries. The differences between the pharmaceutical industry and the
two other industries are not significant, but they reflect the continuous search of pharmaceutical
companies to tap into the new business opportunities that are embedded in emerging technologies
such as biotechnology.
The country of origin of the different companies plays a role in explaining both types of
innovation. European companies have a lower innovation rate compared to Asian companies for
exploitative patents. Asian companies are also a bit more active than European and US-based
companies in broadening their technology base. However, these differences are not statistically
significant.
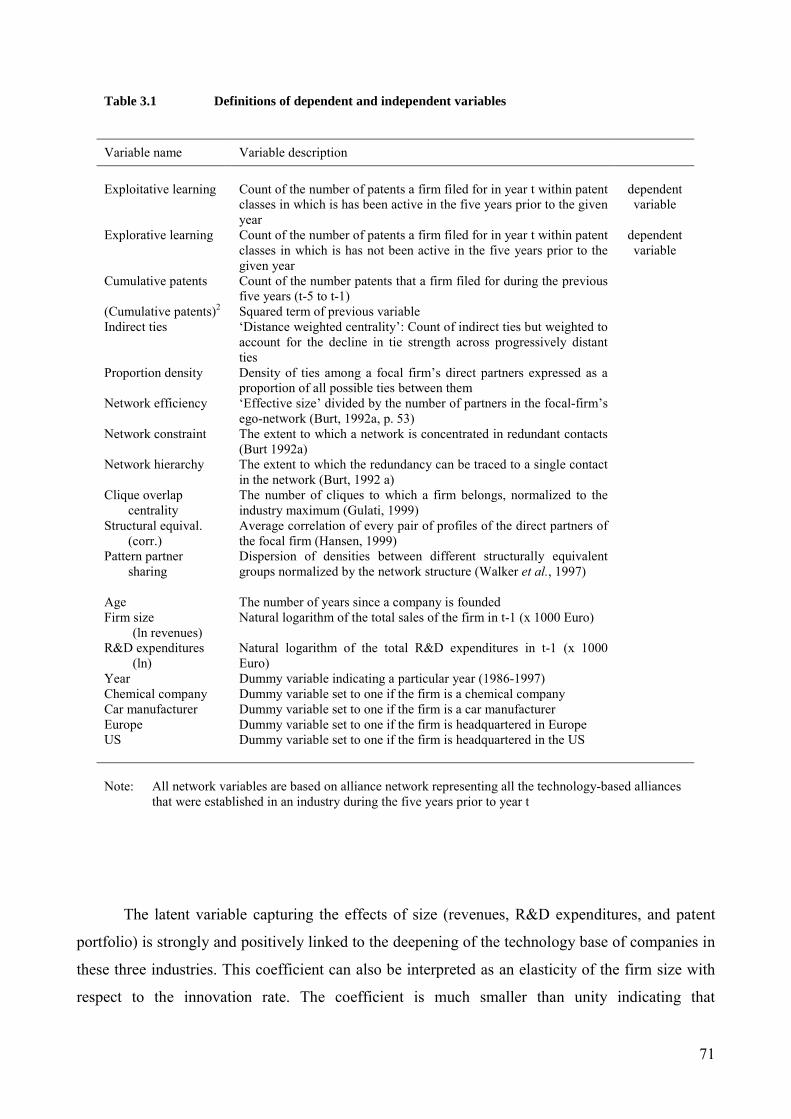
71
The latent variable capturing the effects of size (revenues, R&D expenditures, and patent
portfolio) is strongly and positively linked to the deepening of the technology base of companies in
these three industries. This coefficient can also be interpreted as an elasticity of the firm size with
respect to the innovation rate. The coefficient is much smaller than unity indicating that
Table 3.1 Definitions of dependent and independent variables Variable name Variable description
Exploitative learning Count of the number of patents a firm filed for in year t within patent
classes in which is has been active in the five years prior to the given year
dependent variable
Explorative learning Count of the number of patents a firm filed for in year t within patent classes in which is has not been active in the five years prior to the given year
dependent variable
Cumulative patents Count of the number patents that a firm filed for during the previous five years (t-5 to t-1)
(Cumulative patents)2 Squared term of previous variable Indirect ties �Distance weighted centrality�: Count of indirect ties but weighted to
account for the decline in tie strength across progressively distant ties
Proportion density Density of ties among a focal firm�s direct partners expressed as a proportion of all possible ties between them
Network efficiency �Effective size� divided by the number of partners in the focal-firm�s ego-network (Burt, 1992a, p. 53)
Network constraint The extent to which a network is concentrated in redundant contacts (Burt 1992a)
Network hierarchy The extent to which the redundancy can be traced to a single contact in the network (Burt, 1992 a)
Clique overlap centrality
The number of cliques to which a firm belongs, normalized to the industry maximum (Gulati, 1999)
Structural equival. (corr.)
Average correlation of every pair of profiles of the direct partners of the focal firm (Hansen, 1999)
Pattern partner sharing
Dispersion of densities between different structurally equivalent groups normalized by the network structure (Walker et al., 1997)
Age The number of years since a company is founded Firm size (ln revenues)
Natural logarithm of the total sales of the firm in t-1 (x 1000 Euro)
R&D expenditures (ln)
Natural logarithm of the total R&D expenditures in t-1 (x 1000 Euro)
Year Dummy variable indicating a particular year (1986-1997) Chemical company Dummy variable set to one if the firm is a chemical company Car manufacturer Dummy variable set to one if the firm is a car manufacturer Europe Dummy variable set to one if the firm is headquartered in Europe US Dummy variable set to one if the firm is headquartered in the US Note: All network variables are based on alliance network representing all the technology-based alliances
that were established in an industry during the five years prior to year t
72
Table 3.2 Descriptive statistics and correlation matrix Variable Mean S.D. Min. Max. 1 2 3 4 5 6 7 8 9 10 11 12 13 1 # of exploitative patents 102.23 156.81 0 1136 2 # of explorative patents 9.19 14.92 0 125 0.24 3 Direct ties 14.16 13.42 2 113 0.51 0.25 4 Indirect ties 68.31 32.01 0 177 -0.12 0.03 -0.17 5 Proportion density 14.60 23.10 0 100 -0.16 -0.09 -0.11 -0.15 6 Network efficiency 0.884 0.167 0.1 1 0.15 0.08 0.05 0.16 -0.96 7 Network constraint 0.224 0.181 0 1.125 -0.33 -0.19 -0.56 -0.11 0.51 -0.34 8 Network hierarchy 0.022 0.057 0 1 0.14 0.06 0.38 -0.08 0.27 -0.27 -0.08 9 Clique overlap centrality 2.85 4.49 0 28 0.43 0.20 0.87 -0.25 -0.01 -0.04 -040 0.19 10 Structural equival. (corr.) 0.152 0.193 -0.012 1 -0.12 -0.06 0.05 -0.22 0.92 -0.92 0.38 0.26 0.15 11 Pattern partner sharing 0.314 0.143 0.003 0.5 0.07 0.08 0.18 0.30 -0.04 0.00 -0.22 -0.09 0.17 -0.05 12 Age 79.75 45.82 0 236 0.13 -0.06 0.12 0.01 0.02 -0.03 -0.05 -0.02 0.09 0.05 0.04 13 Factor (Firm size, # patents, R&D int) -7.32e-10 1 -10.077 3.317 0.66 0.26 0.50 -0.21 -0.10 0.08 -0.28 0.23 0.40 -0.02 0.04 0.31 14 Techn. distance partners 0.022 0.009 0 0.063 0.02 0.04 -0.11 0.27 -0.13 0.18 -0.01 -0.01 -0.20 -0.21 -0.06 0.05 -0.11 15 Chemical company 0.376 0.458 0 1 0.03 -0.02 -0.05 -0.11 0.07 -0.07 -0.08 -0.31 0.04 0.08 -0.10 0.16 0.10 16 Car manufacturer 0.270 0.444 0 1 0.05 0.03 0.25 -0.33 0.13 -0.20 0.11 0.27 0.36 0.20 0.07 0.04 0.33 17 Firm is European 0.233 0.423 0 1 -0.26 -0.02 0.01 -0.11 0.13 -0.18 -0.07 0.10 0.02 0.18 -0.05 -0.07 -0.03 18 Firm is US-based 0.429 0.495 0 1 0.04 0.01 -0.02 0.17 -0.18 0.20 -0.06 -0.12 -0.11 -0.23 0.01 -0.05 -0.14 19 Year 1986 0.081 0.273 0 1 -0.03 -0.02 -0.08 -0.27 0.05 -0.04 0.10 0.32 -0.08 0.08 -0.26 -0.05 -0.06 20 Year 1987 0.087 0.282 0 1 -0.03 -0.02 -0.06 -0.26 0.04 -0.04 0.07 0.29 -0.03 0.06 -0.04 -0.04 -0.03 21 Year 1988 0.081 0.273 0 1 0.00 0.01 -0.03 -0.09 0.07 -0.06 0.03 0.17 -0.01 0.05 0.05 -0.03 -0.05 22 Year 1989 0.081 0.273 0 1 0.01 0.02 -0.00 -0.03 0.05 -0.04 -0.01 0.09 0.03 0.02 0.07 -0.02 -0.05 23 Year 1990 0.087 0.282 0 1 -0.01 -0.03 0.02 -0.01 0.03 -0.02 0.01 0.03 0.09 0.03 0.01 0.01 -0.02 24 Year 1991 0.087 0.282 0 1 -0.01 -0.04 0.00 -0.00 -0.05 0.05 -0.00 -0.01 0.04 -0.05 0.02 0.03 0.00 25 Year 1992 0.082 0.275 0 1 0.01 -0.07 -0.00 0.02 -0.07 0.06 -0.02 -0.07 -0.02 -0.06 0.14 0.04 0.03 26 Year 1993 0.084 0.277 0 1 0.00 -0.07 0.00 0.01 -0.05 0.05 -0.02 -0.11 -0.00 -0.04 -0.17 0.04 0.02 27 Year 1994 0.081 0.273 0 1 0.01 0.01 0.01 0.10 -0.05 0.05 -0.03 -0.13 -0.01 -0.04 -0.20 0.02 0.02 28 Year 1995 0.082 0.275 0 1 0.05 0.15 0.02 0.09 -0.01 0.01 -0.03 -0.06 -0.04 -0.03 0.10 -0.00 0.04 29 Year 1996 0.082 0.275 0 1 -0.00 0.07 0.05 0.17 -0.00 -0.00 -0.06 -0.23 -0.01 -0.02 0.04 -0.00 0.04

73
Table 3.2 Descriptive statistics and correlation matrix (continued)
Variable 14 15 16 17 18 19 20 21 22 23 24 25 26 27 28 15 Chemical company -0.17 16 Car manufacturer -0.15 -0.47 17 Firm is European -0.14 0.11 0.13 18 Firm is US-based 0.17 -0.14 -0.18 -0.48 19 Year 1986 0.00 0.01 -0.00 0.03 -0.02 20 Year 1987 -0.02 -0.00 0.03 0.01 -0.02 -0.09 21 Year 1988 -0.00 -0.02 0.01 -0.02 0.01 -0.08 -0.09 22 Year 1989 -0.10 -0.01 -0.00 -0.01 0.00 -0.08 -0.09 -0.08 23 Year 1990 -0.09 -0.00 0.01 -0.00 -0.01 -0.09 -0.10 -0.09 -0.09 24 Year 1991 0.01 -0.00 0.01 -0.02 0.01 -0.09 -0.10 -0.09 -0.09 -0.10 25 Year 1992 -0.02 -0.00 0.01 -0.01 -0.00 -0.09 -0.09 -0.09 -0.09 -0.09 -0.09 26 Year 1993 0.02 -0.01 0.01 -0.02 0.00 -0.09 -0.09 -0.09 -0.09 -0.09 -0.09 -0.09 27 Year 1994 0.06 0.00 -0.00 -0.02 0.01 -0.09 -0.09 -0.09 -0.09 -0.09 -0.09 -0.09 -0.09 28 Year 1995 0.04 0.01 -0.02 0.02 -0.00 -0.09 -0.09 -0.09 -0.09 -0.09 -0.09 -0.09 -0.09 -0.09 29 Year 1996 0.04 0.02 -0.02 0.02 0.01 -0.09 -0.09 -0.09 -0.09 -0.09 -0.09 -0.09 -0.09 -0.09 -0.09

74
�exploitative� patenting is less than proportionately growing with firm size. This is in line with
previous research (Acs and Audretsch, 1991). On the contrary, the size of a company is not related
to the patenting frequency in new patent classes (see table 3.3b). This finding is in line with the
organizational learning literature: established organizations have difficulties in diversifying into
new technological areas, inhibiting experimentation and favoring specialization along existing
technological trajectories (Levinthal and March, 1993; March, 1991; Ahuja and Lampert, 2001).
According to our results, small and large companies have the same probability of patenting in new
technology classes. Small firms can be as successful as large ones with respect to experimenting
and exploring new technological fields.
The age of companies has no impact on deepening the technology base, but it is negatively
related to the broadening of the technology base. Hence, older companies have more problems than
younger ones to look beyond the existing technological portfolio. A last control variable is the
technological distance between partners. Its effect on deepening the technology base of companies
is negative and significant, suggesting that absorptive capacity is likely to play an important role in
external technology acquisition within technological areas in which the company already has some
expertise. However, the same regressor has no impact at all on the broadening of companies�
technology base. As a result, it is advantageous to carefully select alliance partners who have a
similar technology profile when a company intends to deepen its technology base. This is no longer
true for companies that intend to experiment with technological areas beyond their technology
base: allying with partners with quite different or similar technology profiles will not influence the
success of the company�s technological diversification strategy.
The estimated alpha coefficient is positive and significant for both exploitative and
explorative learning. This indicates that important firm-level unobserved effects are present in the
data and that a panel estimator is preferred above a pooled Poisson estimator.
Model 2 introduces direct ties (the social capital of a company) and indirect ties as
regressors. Social capital is measured as the number of alliances a company established in the five
previous years. Besides the linear term we also inserted the quadratic term to measure the impact of
overembeddedness (Kogut et al., 1992; Uzzi, 1997). The coefficients for these variables are
significant in both tables: More ties help companies to both deepen and broaden their technology
base up to a certain point, beyond which the effect of overembeddedness dominates.
The coefficients for the �indirect ties� as an explanatory variable are positive and significant
in both tables. Hypotheses 2a and 2b are empirically supported: The impact is significantly larger
on the broadening compared to the strengthening of the technology base. As a result, also
hypothesis 2c is corroborated. Hence, social capital of a company is not only determined by its
75
direct ties but also by the number of firms it can reach in the alliance network. Moreover, the
impact of indirect ties is significantly larger in case a company is involved in exploring new
technological fields. The uncertainty involved in explorative research and its tacit nature pushes the
focal firm to search for solutions among the partners of its partners. Hence, partners of a focal firm
are not only valuable because of their technological know-how but also because of their social
capital especially when the focal company is exploring new technologies.
Model 2 also introduces an interaction term between direct and indirect ties and is an
empirical test for hypothesis 3. We have argued � following Ahuja (2000a) � that the number of
direct ties moderates the impact of indirect ties, at least in the case of exploitative learning
(hypothesis 3a). This is supported by model 4 in table 3.3a. Because a focal firm has a good
understanding of what type of knowledge is required and since the information involved is fairly
explicit in exploitative learning, direct ties may easily overlap the knowledge that could be acquired
from indirect contacts. However, the coefficient of this interaction term in table 3.3b is also
negative and significant. This is not in line with our expectations of hypothesis 3b. In the case of
broadening the technology base, implying tacit knowledge and high levels of uncertainty, direct
contacts are also moderating the need to have alliance partners with extensive networks of partners.
In other words, there are different possible strategies for companies: they can choose to establish
few alliances with partners that have extensive alliance networks with other companies, or they
may establish more alliances with partners whom themselves are only connected to few other
companies. This is the case for both the strengthening of the existing technology base as for the
broadening of it.
Returning to the direct ties, the maximums are reached at medium levels of social capital �
i.e. 15 alliances for strengthening and 27 alliances for broadening the technology portfolio,
calculated at the average level of indirect ties � indicating that overembeddedness may play a role
at higher levels of social capital, especially when the company intends to strengthen its existing
technology base. However, these maximums increase significantly if the level of indirect ties drops:
if the �distance weighted centrality drops to �10�, maximums are reached at 41 and 62 alliances
respectively. Hence, when companies are not situated in the dense pack of the alliance network,
they need more direct ties to reach the maximal innovation rate.
The impact of social capital (only direct ties) on both types of learning differs considerably:
according to model 2 companies can at best increase the patenting rate with 3.1% (calculated at the
average level of indirect ties) in case they intend to strengthen their knowledge base. In contrast,
companies can broaden their technology base through a network of technology alliances � with a
maximum increase of 9.0%. The level of indirect ties plays a crucial role here: when the �distance

76
Table 3.3a Determinants of the patent rate of firms – strengthening the technology base, 1986-1997 Variable Model 1 Model 2 Model 3 Model 4 Model 5 Model 6 Model 7 Model 8 Model 9 Direct ties Cumulative alliances /1000 12.1445*** 11.8128*** 12.3351*** 12.3503*** 12.7228*** 11.2050*** (1.2178) (1.2183) (1.2209) (1.2186) (1.2274) (1.2422) (Cumulative alliances/1000)2 -0.1339*** -0.1312*** -0.1349*** -0.1339*** -0.1362*** -0.1263*** (0.0097) (0.0097) (0.0097) (0.0097) (0.0097) (0.0099) Indirect ties Distance weighted centrality 0.0020*** 0.0018*** 0.0020*** 0.0020*** 0.0020*** 0.0018*** (0.0003) (0.0003) (0.0003) (0.0003) (0.0003) (0.0003) ((Distance weighted centrality) -0.1184*** -0.1131*** -0.1185*** -0.1153*** -0.1183*** -0.1156*** * (cumulative alliances))/1000 (0.0093) (0.0093) (0.0093) (0.0093) (0.0093) (0.0093) Redundancy Via cohesion Proportion density -0.1175*** (0.0385) Network efficiency 0.1171** (0.0558) Network constraint -0.5524*** (0.0506) Network hierarchy -0.5635*** (0.1313) Clique overlap centrality -0.0028* (0.0015) Via structural equivalence Correlation (Hansen) -0.1585*** (0.0412) Pattern of partner sharing 0.1457*** (0.0371)
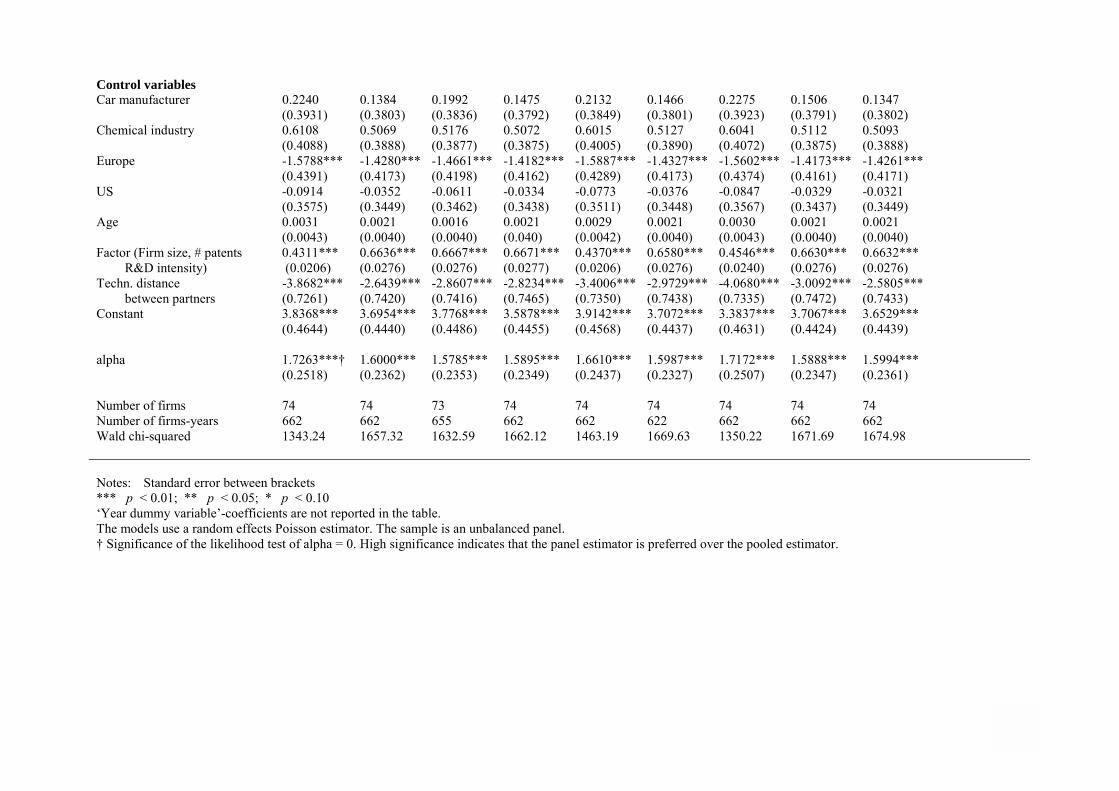
77
Control variables Car manufacturer 0.2240 0.1384 0.1992 0.1475 0.2132 0.1466 0.2275 0.1506 0.1347 (0.3931) (0.3803) (0.3836) (0.3792) (0.3849) (0.3801) (0.3923) (0.3791) (0.3802) Chemical industry 0.6108 0.5069 0.5176 0.5072 0.6015 0.5127 0.6041 0.5112 0.5093 (0.4088) (0.3888) (0.3877) (0.3875) (0.4005) (0.3890) (0.4072) (0.3875) (0.3888) Europe -1.5788*** -1.4280*** -1.4661*** -1.4182*** -1.5887*** -1.4327*** -1.5602*** -1.4173*** -1.4261*** (0.4391) (0.4173) (0.4198) (0.4162) (0.4289) (0.4173) (0.4374) (0.4161) (0.4171) US -0.0914 -0.0352 -0.0611 -0.0334 -0.0773 -0.0376 -0.0847 -0.0329 -0.0321 (0.3575) (0.3449) (0.3462) (0.3438) (0.3511) (0.3448) (0.3567) (0.3437) (0.3449) Age 0.0031 0.0021 0.0016 0.0021 0.0029 0.0021 0.0030 0.0021 0.0021 (0.0043) (0.0040) (0.0040) (0.040) (0.0042) (0.0040) (0.0043) (0.0040) (0.0040) Factor (Firm size, # patents 0.4311*** 0.6636*** 0.6667*** 0.6671*** 0.4370*** 0.6580*** 0.4546*** 0.6630*** 0.6632*** R&D intensity) (0.0206) (0.0276) (0.0276) (0.0277) (0.0206) (0.0276) (0.0240) (0.0276) (0.0276) Techn. distance -3.8682*** -2.6439*** -2.8607*** -2.8234*** -3.4006*** -2.9729*** -4.0680*** -3.0092*** -2.5805*** between partners (0.7261) (0.7420) (0.7416) (0.7465) (0.7350) (0.7438) (0.7335) (0.7472) (0.7433) Constant 3.8368*** 3.6954*** 3.7768*** 3.5878*** 3.9142*** 3.7072*** 3.3837*** 3.7067*** 3.6529*** (0.4644) (0.4440) (0.4486) (0.4455) (0.4568) (0.4437) (0.4631) (0.4424) (0.4439) alpha 1.7263***� 1.6000*** 1.5785*** 1.5895*** 1.6610*** 1.5987*** 1.7172*** 1.5888*** 1.5994*** (0.2518) (0.2362) (0.2353) (0.2349) (0.2437) (0.2327) (0.2507) (0.2347) (0.2361) Number of firms 74 74 73 74 74 74 74 74 74 Number of firms-years 662 662 655 662 662 622 662 662 662 Wald chi-squared 1343.24 1657.32 1632.59 1662.12 1463.19 1669.63 1350.22 1671.69 1674.98 Notes: Standard error between brackets *** p < 0.01; ** p < 0.05; * p < 0.10 �Year dummy variable�-coefficients are not reported in the table. The models use a random effects Poisson estimator. The sample is an unbalanced panel. � Significance of the likelihood test of alpha = 0. High significance indicates that the panel estimator is preferred over the pooled estimator.
78
weighted centrality drops to �10�, companies can improve performance with 25% (55%) when they
intend to strengthen (broaden) their technology base. Because of the interaction term between direct
and indirect terms, it is important to consider their joint effect: at an average level of indirect ties,
this total effect of �social capital� (indirect ties included) amounts to 25.1% for the strengthening
and 39.4% for the broadening of the technology base.
These results support hypothesis 1a, which predicted a stronger effect of social capital on
explorative learning compared to exploitative learning. The difference is considerable indicating
that the impact of external acquisition of technological know-how through alliances is larger when
companies are experimenting in new technological areas compared to the strengthening of their
existing technological capabilities.
Models 3 to 9 allow us to test hypotheses 4 and 5. We have seven variables that measure the
network structure of social capital in different ways; five of them are based on cohesion and two on
structural equivalence. �Proportion density� gives an idea of the density of ties among a focal firm�s
alliance partners. From hypothesis 4, we expect a positive and significant relation between a dense
network of ties among a focal firm�s partners and its ability to strengthen its existing technology
base. The opposite should be true when a company intends to broaden its technology base. We find
a negative and significant coefficient in model 3 in table 3.3a. The coefficient in model 3 of table
3.3b has a positive sign but is not statistically significant. Hence, the results of model 3 in both
tables are not corroborating hypotheses 4 and 5. The opposite seems to be true: when a firm�s
partners are connected to each other a company becomes less successful in strengthening but not in
broadening its technology base. Connections between partners even seem to foster the process of
broadening the technology base, but the relationship is weak and hence, no hard conclusions, can
be drawn.
�Network efficiency� is another variable measuring the non-redundancy within a firm�s ego-
network. High values for this variable indicate that a firm�s direct contacts provide non-redundant
information. We expect a negative and significant coefficient in table 3.3a according to hypothesis
4. Again, the empirical results are not supporting the hypothesis: the coefficient is positive and
significant. The coefficient in table 3.3b is expected to be positive: also here we find the opposite
sign although the coefficient is not significant. Hence, both regressors � proportion density and
network efficiency � indicate (contrary to the hypotheses) that non-redundancy among a firm�s
partners improves the strengthening of a firm�s technology base. Broadening the technology base is
not enhanced by non-redundancy � as was expected by hypothesis 5. Rather the opposite seems to
be true but the evidence is not conclusive.
79
The direct and indirect ties are eliminated in Model 5 because of the strong correlation
between �network constraint� and these variables. The coefficients for �network constraint� are in
both tables negative and significant and the absolute value of the coefficient in table 3.3a is
(significantly) larger than the one in the other table. The negative sign is expected for the
broadening of the technology portfolio, but not for the strengthening of it. Moreover, based on
hypotheses 4 and 5 we expect that the negative impact should be stronger in the case of the
broadening of the technology base. Before we try to explain these results we move to the results of
model 6.
The results for �network hierarchy� (model 6) are closely related to those of the �network
constraint�-variable. The coefficients have a negative sign and are significant. The absolute values
of both coefficients are not significantly different from each other. These results indicate that
innovation performance always suffers from a strong dependence on one or a few alliance partners.
Hence, companies should try to avoid to become too dependent on one alliance partner: redundancy
seems to be fine in a number of �explorative strategies� as long as the focal firm can avoid
dependence on one or a few dominant partners.
Now we can come back to the explanation of the results for the �network constraint
variable�. Network constraint varies with three qualities of the alliance network: size, density and
hierarchy. Size is captured by the direct ties and density is related to proportion density and
network efficiency. Hence, the negative sign for network constraint in table 3.3a is in line with the
negative impact of both density and hierarchy on the strengthening of the alliance portfolio. In table
3.3b density and hierarchy have an opposite impact on the broadening of the technology portfolio;
the negative sign of the �network constraint�-variable indicates that the hierarchy effect is
dominant.
The direct and indirect ties are eliminated in model 7 because of the strong correlation
between clique overlap centrality and these variables. A high value for the variable �clique overlap
centrality� indicates that a company is in the midst of dense clusters of ties and is confronted with a
lot of redundant information. Consequently, according to hypothesis 4 we expect a positive and
significant relation between high clique overlap centrality and the strengthening of the technology
portfolio. Again, this is not corroborated by the result in table 3.3a. We also find a negative effect
on the broadening of a firm�s technology portfolio, as expected by hypothesis 5. However, this
coefficient is not statistically significant.
Model 8 measures the effect of the first of two variables that captures redundancy based on
structural equivalence. The calculation of structural equivalence is based on the correlation
coefficient of every pair of profiles of the direct partners of the focal firm: high (low) values
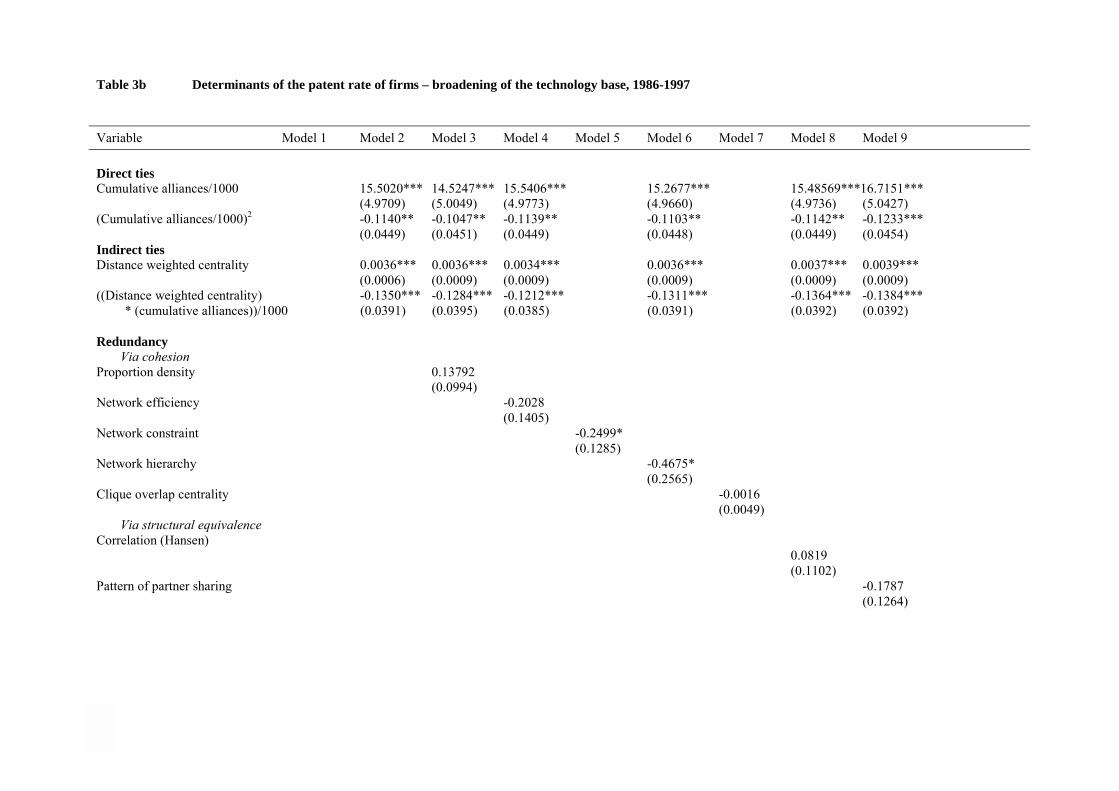
80
Table 3b Determinants of the patent rate of firms – broadening of the technology base, 1986-1997 Variable Model 1 Model 2 Model 3 Model 4 Model 5 Model 6 Model 7 Model 8 Model 9 Direct ties Cumulative alliances/1000 15.5020*** 14.5247*** 15.5406*** 15.2677*** 15.48569***16.7151*** (4.9709) (5.0049) (4.9773) (4.9660) (4.9736) (5.0427) (Cumulative alliances/1000)2 -0.1140** -0.1047** -0.1139** -0.1103** -0.1142** -0.1233*** (0.0449) (0.0451) (0.0449) (0.0448) (0.0449) (0.0454) Indirect ties Distance weighted centrality 0.0036*** 0.0036*** 0.0034*** 0.0036*** 0.0037*** 0.0039*** (0.0006) (0.0009) (0.0009) (0.0009) (0.0009) (0.0009) ((Distance weighted centrality) -0.1350*** -0.1284*** -0.1212*** -0.1311*** -0.1364*** -0.1384*** * (cumulative alliances))/1000 (0.0391) (0.0395) (0.0385) (0.0391) (0.0392) (0.0392) Redundancy Via cohesion Proportion density 0.13792 (0.0994) Network efficiency -0.2028 (0.1405) Network constraint -0.2499* (0.1285) Network hierarchy -0.4675* (0.2565) Clique overlap centrality -0.0016 (0.0049) Via structural equivalence Correlation (Hansen) 0.0819 (0.1102) Pattern of partner sharing -0.1787 (0.1264)
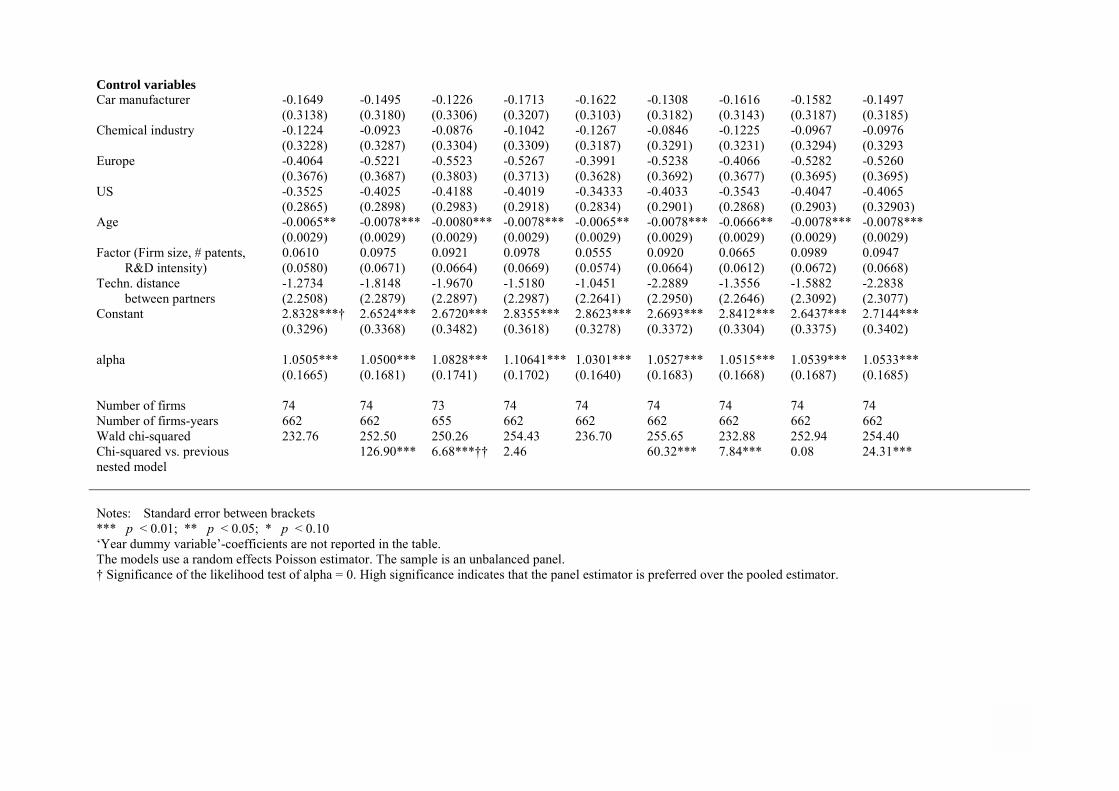
81
Control variables Car manufacturer -0.1649 -0.1495 -0.1226 -0.1713 -0.1622 -0.1308 -0.1616 -0.1582 -0.1497 (0.3138) (0.3180) (0.3306) (0.3207) (0.3103) (0.3182) (0.3143) (0.3187) (0.3185) Chemical industry -0.1224 -0.0923 -0.0876 -0.1042 -0.1267 -0.0846 -0.1225 -0.0967 -0.0976 (0.3228) (0.3287) (0.3304) (0.3309) (0.3187) (0.3291) (0.3231) (0.3294) (0.3293 Europe -0.4064 -0.5221 -0.5523 -0.5267 -0.3991 -0.5238 -0.4066 -0.5282 -0.5260 (0.3676) (0.3687) (0.3803) (0.3713) (0.3628) (0.3692) (0.3677) (0.3695) (0.3695) US -0.3525 -0.4025 -0.4188 -0.4019 -0.34333 -0.4033 -0.3543 -0.4047 -0.4065 (0.2865) (0.2898) (0.2983) (0.2918) (0.2834) (0.2901) (0.2868) (0.2903) (0.32903) Age -0.0065** -0.0078*** -0.0080*** -0.0078*** -0.0065** -0.0078*** -0.0666** -0.0078*** -0.0078*** (0.0029) (0.0029) (0.0029) (0.0029) (0.0029) (0.0029) (0.0029) (0.0029) (0.0029) Factor (Firm size, # patents, 0.0610 0.0975 0.0921 0.0978 0.0555 0.0920 0.0665 0.0989 0.0947 R&D intensity) (0.0580) (0.0671) (0.0664) (0.0669) (0.0574) (0.0664) (0.0612) (0.0672) (0.0668) Techn. distance -1.2734 -1.8148 -1.9670 -1.5180 -1.0451 -2.2889 -1.3556 -1.5882 -2.2838 between partners (2.2508) (2.2879) (2.2897) (2.2987) (2.2641) (2.2950) (2.2646) (2.3092) (2.3077) Constant 2.8328***� 2.6524*** 2.6720*** 2.8355*** 2.8623*** 2.6693*** 2.8412*** 2.6437*** 2.7144*** (0.3296) (0.3368) (0.3482) (0.3618) (0.3278) (0.3372) (0.3304) (0.3375) (0.3402) alpha 1.0505*** 1.0500*** 1.0828*** 1.10641*** 1.0301*** 1.0527*** 1.0515*** 1.0539*** 1.0533*** (0.1665) (0.1681) (0.1741) (0.1702) (0.1640) (0.1683) (0.1668) (0.1687) (0.1685) Number of firms 74 74 73 74 74 74 74 74 74 Number of firms-years 662 662 655 662 662 662 662 662 662 Wald chi-squared 232.76 252.50 250.26 254.43 236.70 255.65 232.88 252.94 254.40 Chi-squared vs. previous 126.90*** 6.68***�� 2.46 60.32*** 7.84*** 0.08 24.31*** nested model Notes: Standard error between brackets *** p < 0.01; ** p < 0.05; * p < 0.10 �Year dummy variable�-coefficients are not reported in the table. The models use a random effects Poisson estimator. The sample is an unbalanced panel. � Significance of the likelihood test of alpha = 0. High significance indicates that the panel estimator is preferred over the pooled estimator.

82
represent (non-)redundancy. Contrary to hypothesis 4, the impact of this variable on the
strengthening of the technology portfolio is negative and significant. The coefficient is positive but
not statistically significant in table 3.3b. Again, the results are pointing in the opposite direction of
the hypotheses.
The last model shows the effect of �the pattern of partner sharing� on exploitative and
explorative learning. This variable is different from the other network structure variables because it
does not measure social capital of an individual (focal) firm but how relations of the structurally
equivalent group to which it belongs are distributed among different partner groups. We have
argued that high values of this variable indicate the presence of a �learning highway� between two
important groups of firms with different technological capabilities. Since firms of both ends of the
�highway� are structurally equivalent, they can easily learn from each other through spillover
effects. We have mentioned before that this is an advantageous situation for improving technology
performance � and especially for broadening the technology base. The coefficients in table 3.3a
indicate that being part of the �learning highway� fosters the strengthening of a firm�s technology
base, but not the broadening of it. The coefficient in table 3.3b is negative but not significant.
We can conclude that redundant information from alliance partners does not spur the strengthening
of a focal firm�s technology portfolio. On the contrary, there is evidence that non-redundancy
improves the innovativeness of the company. This requires some more explanation in the next
section. We found no hard evidence for a relation between (non)-redundancy and the broadening of
the technology base. The coefficients in table 3.3b have the wrong signs and suggest that � contrary
to hypothesis 5 � exploring new technologies might benefit from redundant ties. However, these
coefficients are not significant and we have to be cautious in drawing any conclusions. The results
for network hierarchy indicate that being tied up to a few dominant alliance partners has a negative
impact on the innovation performance of a company.
CONCLUSION
This chapter focuses on the impact of firms� social capital on the strengthening and broadening of
their technology portfolio. March (1991) argues that each company needs to balance both the
exploitation of its current capabilities and the exploration of new ones to stay competitive in the
83
short and the long run. There are considerable differences between both types of �learning� (March,
1991; Chesbrough, 2003), which, in turn, have important implications for the way in which a
company has to get access to and profit from the technological capabilities of its alliance partners.
We argued that the value of a firm�s alliance network is contingent on the type of learning. Since
broadening and strengthening of the technology base are different in nature, we assume that the role
of alliances and the structure of the alliance network are contingent on the type of learning: we
argued that redundant information coming from alliance partners that are mutually linked to each
other in dense networks improves the strengthening or deepening of the existing technological
capabilities within a firm. On the contrary, non-redundant information enhances the exploration of
new technological areas and requires that the firm�s ego-network spans structural holes.
We formulated several hypotheses about the impact of direct ties, indirect ties, and the
alliance network structure on the success of firms� explorative an exploitative learning. We found
empirical evidence that direct ties spur both types of learning although there is an optimal level of
social capital beyond which the effect of overembeddedness dominates. For companies this means
that one has to weight the benefits of adding another alliance to the costs of creating and managing
this alliance. Gomes-Casseres (1996) has shown that there is a natural limit to the number of
alliances that a company can manage successfully. We also found evidence that the optimal number
of direct ties depends on the number of indirect ties (centrality in the alliance network): central
players need less direct ties to get access to a broad range of actors and technologies. Furthermore,
there is strong evidence that social capital has a much larger impact on the exploration of new
technological fields than on the strengthening of a firm�s existing technological portfolio. We can
conclude that external acquisition of technological know-how through alliances is more important
when companies are experimenting in new technological areas than when they intend to strengthen
their existing technological capabilities. Many companies have already adapted a strategy of
constructing a �radar-screen� which consists of multiple strategic alliances. Alliances allow firms
to �scan� their environment for new windows of opportunities. At relatively low costs they can get
a �sneak preview� of a broad array of new technologies without investing large amounts of money.
Furthermore, it allows them to tap into the technological resources of other companies in areas in
which they themselves do not have an established core competency. Complementary knowledge
from partners can allow companies to combine their knowledge into new technologies or products
that each partner individually would not have been able to produce to create.
Indirect ties also have a beneficial effect on both types of �learning� but the impact on the
exploration of new technological fields is significantly larger. Interestingly, the empirical results
show that direct ties also have a moderating effect on the impact of indirect ties (which resembles
84
the results of Ahuja (2000a)). This suggests that companies that establish alliances with partners
that are at the center of the alliance network need fewer ties than those that have ties with
companies that in turn have no other alliances.
Finally, we did not find empirical evidence that firms profit from redundant ties when they
are primarily interested in the refinement and strengthening of its existing technology base and
competencies, while non-redundant ties are advantageous in explorative learning. On the contrary,
non-redundancy improves the technological performance of the companies when they intend to
strengthen their existing technological competencies. There is some evidence (but not conclusive)
that redundancy spurs exploration of new technological fields. Consequently, we can conclude that
the value of the network closure (Coleman, 1988, 1990) and the structural hole theory of social
capital (Burt, 1992a, 2000) is contingent on the type of organizational learning, but the empirical
results go in the opposite direction of the argumentation in hypotheses 4 and 5. We suggested that
that the exploration of new technologies requires boundary-spanning alliances. In line with Burt�s
(1992a, 2000) suggestion that firms can reap �entrepreneurial� rents because of the absence of ties
among their contacts, innovative firms that would like to explore new technological opportunities
should therefore be engaged in non-redundant ties.
We found no support for this argument. On the contrary, non-redundant ties are beneficial
for companies that aim at strengthening their technologies. So, why non-redundancy is not
favorable for companies exploring new technological areas? Part of the answer has been provided
by the literature: Cohen and Levinthal (1990) mentioned already that absorptive capacity is not
only a question of getting access to new technologies, but also of evaluating and incorporating
externally generated technical knowledge. Detecting new technologies and getting access to them is
different from the evaluation and assimilation process. The question here is what firms do when
they want a fuller understanding and want to move beyond �detection phase� towards evaluation
and assimilation of new technologies. In an �explorative� setting knowledge is new and highly tacit.
This requires triangulation in order to be able to understand and value the new knowledge. Such
triangulation can only be obtained from redundant, multiple sources (Duysters and Hagedoorn,
2003; Gilsing, 2003; Nooteboom and Gilsing, 2004). In exploitation on the other hand, knowledge
is (more) codified, there is more stability through a dominant design and contingencies can be
better foreseen. More importantly, there are industry-standards, selected technical norms and so on,
which decrease the need for continuous checks with existing ties. Because of this, redundancy can
be reduced and must be reduced, in view of the need for efficiency and competition. These
arguments are in line with our empirical results. As a result, further research should have a closer
look at technological exploration in its different phases.
85
In contrast with most studies we calculated several variables that measure (non)-redundancy
in alliance networks in different ways. The results show that redundancy can have different
meanings. We draw two conclusions from this: First, these variables measure redundancy in
different ways, and it is not a priori clear that these different �dimensions� of redundancy should
have the same effect on exploitative or explorative learning. Redundancy by cohesion or by
structural equivalence represents one of these differences that are worth probing further. Second,
the empirical results in prior studies may be influenced by the choice of the variable.
That �redundancy� is a multi-dimensional concept is illustrated by the variables �network
hierarchy� and �pattern of partner sharing�. The negative impact of network hierarchy on both types
of learning indicates that companies should avoid to be allied to one or a few dominant partners.
Walker et al. (1997) use �pattern of partner sharing� to detect partner overlap. The concept does not
measure social capital of an individual (focal) firm but it indicates how the relations of the
structural equivalent group to which the firm belongs are distributed among partner groups.
Applied to inter-organizational learning, we argue that this variable measures a particular network
structure that is quite different from the other redundancy measures. High values for this variable
represent a type of �learning highway� between two groups of firms with different technological
capabilities. Firms not only learn from their direct and indirect partners, but they can also take
advantage from the knowledge spillovers from structurally equivalent partners who have dense
contacts with other structurally equivalent partner groups. The empirical evidence shows that high
values for the �pattern of partner sharing�-variable stimulate the two types of learning but the
impact is significantly larger on explorative learning.
This study has of course its limitations. First, we focused only the redundancy of the information in
a firm�s alliance network. We did not pay attention to the strength of the ties: there is empirical
evidence that the value of strong and weak ties depends on the type of learning (Hansen et al.,
2001, Rowley et al., 2000). Combining the strength of the alliances and the redundancy in the
alliance network opens up new research avenues that go beyond the scope of this contribution.
Rowley et al. (2000) made a first attempt in this direction: they suggest and find evidence that
strong ties are especially important for the purpose of exploitation. The situation is different in the
case a company intends to explore new technologies: the time and resources invested in strong ties
(compared to weak ties) �would decrease the number of alternative contacts a firm can realistically
maintain and therefore limits its reach into divergent sectors of the environment.� (Rowley et al.,
2000: 375). The need for weak ties has been observed in industries that are characterized by rapid
technological changes (Afuah, 2000). However, their analysis is hardly comparable with the one we
86
presented here: future research might make use of the combination of the strength of ties and their
degree of redundancy in order to explain their value in strengthening and broadening a company�s
technology base.
Furthermore, we have made a distinction between �explorative� and �exploitative� patents.
However, exploration may cover many different issues. First, we have no indication whether or not
the �explorative� patent class in which a company was granted a patent, is in technological terms
closely related to the other classes in which the company is already active. The �proximity� of
patent classes can be measured (Jaffe, 1986, 1989; Verspagen, 1997) and, as a result, one can
calculate the level of exploration of a company�s patents in a particular year compared to its current
patent portfolio. Instead of having separate regressions for exploitative and explorative patents, one
could simply measure the impact of different regressors on the �level of exploration�. Second, we
made no distinction between technologies that are new to a firm but may have been in existence
earlier and those that have never been explored before by any other firm � i.e. the difference
between novel technologies and nascent or emerging technologies (Ahuja and Lampert, 2001).
Exploration means something different in both situations and successful alliance strategies will
obviously differ. Hence, there is a need to further differentiate the notion of technological
exploration.
Moreover, we did not consider different types of alliances separately and their specific
effect on exploring new technological fields and on the deepening of a firms� existing set of
technologies. Making a distinction between different types of alliances is likely to improve the
analysis � as has been suggested in the context of �open innovation� (Chesbrough, 2003) � but this
requires the use of a different data-set.
Another possible area that deserves attention is that a firm�s experience in the past with the
creation of explorative patents (and not only exploitative ones) is likely to generate expertise in
exploring new technological fields � compared to companies that stick to their existing
technological competencies. This routine-based argument suggests that splitting up the number of
patents in the past into an explorative and an exploitative part should allow us to analyze the impact
of the experience of companies with �explorative strategies� on their efficiency in exploring new
technological fields. The same argument may, of course, hold for companies specializing in the
strengthening of the existing technological base.
Finally, we have paid no attention to the cognitive distance between a company and its
partners although it is beyond doubt that, compared to exploitative learning, partners should have a
different technology profile than the focal-firm in explorative learning. This raises the question

87
what the optimal �cognitive distance� should be between alliance partners, when they or involved in
exploitative or explorative learning (Nooteboom 1999, 2000).

88
89
CHAPTER 4
LOCAL ACTION IN TECHNOLOGY ALLIANCE NETWORKS: AN EMPIRICAL
INVESTIGATION 18
Abstract
This chapter studies the effect of local alliance action on the technological performance of
companies. We go beyond the commonly used network level of analysis and focus on the ego-level
aspects of strategic technology alliances. Our main focus is on the empirical outcomes of local
actions with respect to technology alliances. In this chapter we aim to discern efficient strategies of
local action that allow firms to become more innovative in three different industry settings;
chemicals, motor vehicles and pharmaceuticals. The results of our analysis show that redundancy
in an ego-network is related in a curvilinear way to innovative performance but density of networks
between alliance partners negatively affects the innovative performance. Exploitative and
explorative learning also seem to require a different ego-network structure.
18 This chapter is based on a paper written with Wim Vanhaverbeke and Geert Duysters
90
INTRODUCTION
Over the past decades we have witnessed a rapid proliferation of strategic technology alliances. The
unprecedented increase in the number of newly established alliances has led to the creation of
dense alliance networks in which virtually all firms are linked to each-other by means of direct or
indirect relationships. Traditionally, alliance research has been pre-occupied with the study of why
and when alliances are formed (Duysters et al., 2001). More recently, researchers have engaged in
the analysis of with �whom� firms are likely to form alliances (Gulati, 1995; Walker et al., 1997;
Gulati and Gargiulo, 1999; Bae and Gargiulo, 2003). Most scholars in this tradition have taken on
an overall social network perspective in dealing with alliance formation patterns. Despite a growing
number of empirical studies on network positioning strategies (e.g. Uzzi, 1996, 1997; Gulati, 1999;
Hite and Hesterly, 2001) only a few of these studies actually connect network strategies and
network positions to technological performance measures.
In this chapter we will fill this void by focusing on the effects of alliance formation patterns
from an ego-network perspective. More in particular, we will focus on the outcomes of local
alliance action on the innovative performance of the companies under study. This study will also
contribute to the ongoing debate in the academic literature on the efficiency of networking
strategies. The debate focuses on the discussion of whether firms should concentrate on building
strong ties with preferential partners or should opt for relationships that overarch structural holes.
Scholars in the first tradition often make use of �network closure� arguments (Coleman, 1988) that
argue that through the replication of existing ties highly cohesive groups of firms emerge that work
together under conditions of trust, commitment and free sharing of knowledge. On the other hand,
scholars taking on a �structural holes� perspective (Burt, 1992) suggest that firms may enjoy
brokerage advantages by taking advantage of opportunities that arise from bridging disconnected
parts of the network (Duysters et al., 2003). This allows firms to obtain non-redundant, high-yield
information and facilitates information access, timing, referrals and control benefits (Burt, 1992).
Empirical contributions in this debate have generated a mixed bag of findings. There is, however,
increasing consensus that a �contingency approach� might be most effective. This implies that the
efficiency of network strategies is dependent on the environmental conditions in which firms
operate. In order to account for these different environmental conditions we will focus our study on
three different industry settings, i.e. chemicals, motor vehicles and pharmaceuticals. In contrast to
91
most work in this area, which takes on an overall network perspective, we will focus on the
particular set of actions of the network that surrounds focal organizations, the so-called ego-
network (Garcia Pont and Nohria, 1999; Rowley et al., 2000; Bae and Gargiulo, 2003).
In this chapter we will first derive some basic hypotheses on the effects of local action in
technology alliance networks. We will then provide the empirical results followed by a discussion
of the main findings and conclusions.
THEORETICAL BACKGROUND AND HYPOTHESES
The growing importance of alliance networks has induced many scholars in the field of
organization science, strategic management and sociology to study the structure of these networks
and their implications for firm performance. The structural and relational position of firms in
alliance networks has been the focus in the majority of studies in this particular field. Inspired by
seminal work of Coleman (1988), Granovetter (1985) and Burt (1992) many authors have
subsequently dealt with the question of which specific structural network positions enable firms to
achieve the highest level of performance. Most of the work in this area has taken on an overall
network perspective that tends to neglect the endogenous micro-level dynamics of organizational
action (Bae and Gargiulo, 2003). In this chapter we argue that these endogenous micro-level
dynamics prove to be instrumental in building the overall network structure. In order to fill this gap
in the existing academic literature we follow Bae and Gargiulo (2003) by arguing that networks are
basically the outcome of the combined local alliance actions of all individual players in the
network. This at first sight obvious aspect of alliance networks has received relatively little
attention in the dominant network literature. The existing literature seems to take on a rather
deterministic approach to network structure and positioning where firms are primarily influenced
by the exogenous network structure they are part of.
In this chapter we argue that the efficiency of alliance strategies is primarily dependent on
two major factors, i.e. the local actions of a focal firm (ego) and the local actions of its alliance
partners (alters). Local actions can be associated with the establishment (or dissolution) of direct
ties (ego-alter) whereas the local actions of the alliance partners are associated with indirect ties
(alter-alter). Of course, direct and indirect ties are interrelated. If, for example, the focal firm
undertakes a direct link with another company that has many direct links with firms with which the
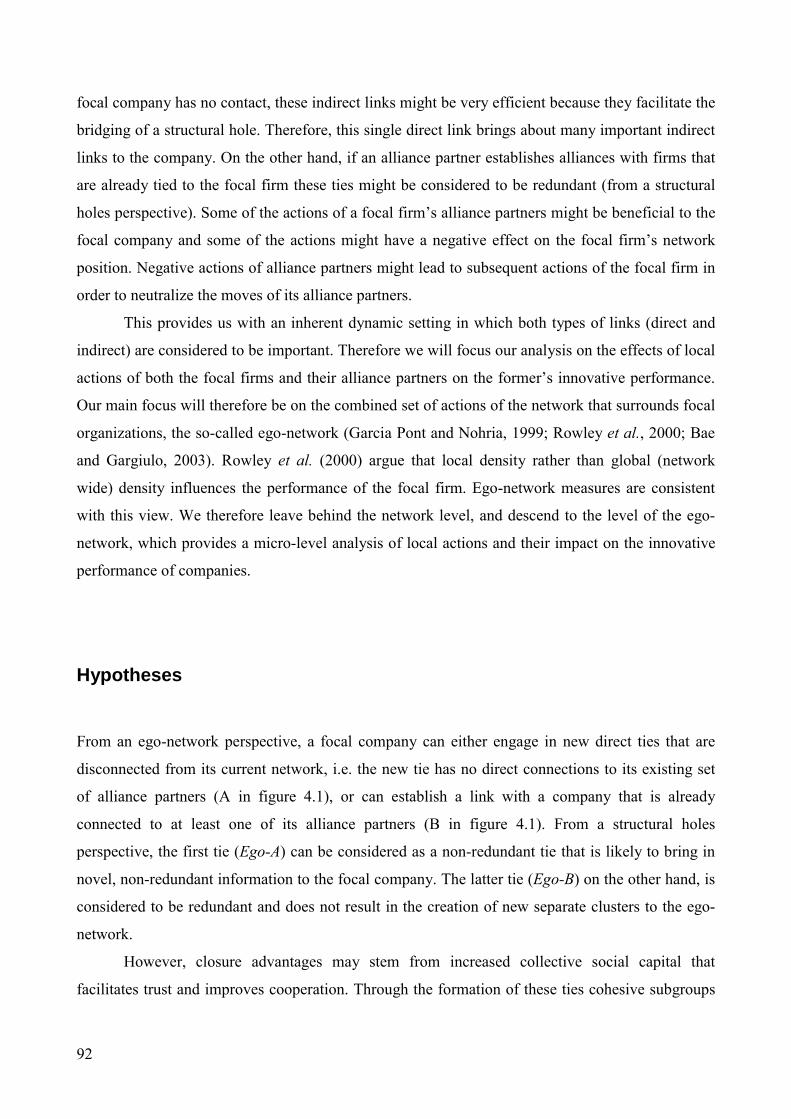
92
focal company has no contact, these indirect links might be very efficient because they facilitate the
bridging of a structural hole. Therefore, this single direct link brings about many important indirect
links to the company. On the other hand, if an alliance partner establishes alliances with firms that
are already tied to the focal firm these ties might be considered to be redundant (from a structural
holes perspective). Some of the actions of a focal firm�s alliance partners might be beneficial to the
focal company and some of the actions might have a negative effect on the focal firm�s network
position. Negative actions of alliance partners might lead to subsequent actions of the focal firm in
order to neutralize the moves of its alliance partners.
This provides us with an inherent dynamic setting in which both types of links (direct and
indirect) are considered to be important. Therefore we will focus our analysis on the effects of local
actions of both the focal firms and their alliance partners on the former�s innovative performance.
Our main focus will therefore be on the combined set of actions of the network that surrounds focal
organizations, the so-called ego-network (Garcia Pont and Nohria, 1999; Rowley et al., 2000; Bae
and Gargiulo, 2003). Rowley et al. (2000) argue that local density rather than global (network
wide) density influences the performance of the focal firm. Ego-network measures are consistent
with this view. We therefore leave behind the network level, and descend to the level of the ego-
network, which provides a micro-level analysis of local actions and their impact on the innovative
performance of companies.
Hypotheses
From an ego-network perspective, a focal company can either engage in new direct ties that are
disconnected from its current network, i.e. the new tie has no direct connections to its existing set
of alliance partners (A in figure 4.1), or can establish a link with a company that is already
connected to at least one of its alliance partners (B in figure 4.1). From a structural holes
perspective, the first tie (Ego-A) can be considered as a non-redundant tie that is likely to bring in
novel, non-redundant information to the focal company. The latter tie (Ego-B) on the other hand, is
considered to be redundant and does not result in the creation of new separate clusters to the ego-
network.
However, closure advantages may stem from increased collective social capital that
facilitates trust and improves cooperation. Through the formation of these ties cohesive subgroups

93
emerge that maintain strongly cohesive ties
among themselves. The firms involved in those
strong ties relationships are more likely to share
information or to act in concert (Knoke and
Kuklinsky, 1982). As argued by Krackhardt
(1992: 218) these ��. strong ties constitute a
base of trust that can reduce resistance and
provide comfort in the face of uncertainty�. Trust
and comfort tend to facilitate information sharing
and therefore can be seen as a stimulus for
successful alliances.
On the other hand, scholars taking on a
�structural holes� perspective (Burt, 1992) suggest that firms may enjoy brokerage advantages
because of their access to non-redundant information (Duysters et al., 2003). This non-redundant or
high-yield information is said to facilitate information access, timing, referrals and control benefits
(Burt, 1992). In high-tech environments most new business opportunities come about as a result of
new combinations of knowledge. It therefore seems to be important to link up with other clusters in
the network. Firms may decide to act as a local bridge between different clusters of the network. By
teaming up with a competent partner from another cluster, firms can benefit from the know-how of
the complete cluster. The lack of �social capital� might fuel opportunism though, as well as a lack
of commitment among alliance partners. Liberal exchange of technological know-how is simply
too difficult to facilitate in those relationships characterized by only small amounts of trust. The
potential benefits of �weak ties� might also be restricted because of resource limitations in terms of
the managerial resources that firms can deploy in the search process for new partners. Matching,
complementary (non-redundant) partners might be very hard to find and may easily exhaust
available managerial resources.
Many of these problems are caused because information about relevant technological assets
is often tacit and not readily available, and because the information provided by the potential
alliance partner may be opportunistically biased. The more information asymmetry problems are
faced, the more difficult the process of partner valuation will be. It is clear that in a setting where
firms aim to overarch structural holes by teaming up with partners to whom the firm is unfamiliar
problems associated with information asymmetry are considerably higher.
Furthermore, it is often argued that strong ties lead to increased similarity among partners.
This might be a disadvantage in terms of the novelty of information exchanged. However, it might
Ego
B
A
Figure 4.1 An ego-network perspective
94
prove to be a significant advantage to the firms involved because of the potential lack of absorptive
capacity among companies. In order to reap the full benefits of alliances firms need to have a
sufficient degree of absorptive capacity (Cohen and Levinthal, 1990). Close contact between
partners often leads to increased absorptive capacity because densely connected firms act similarly
and develop similar preferences (Knoke and Kuklinski, 1982). Similarity leads to some degree of
knowledge overlap between alliance partners and is therefore positively related to the absorptive
capacity of partners. Structural hole networking strategies seem to be less effective because of the
often too wide gap in absorptive capacity among alliance partners.
Too much overlap between alliance partners might, however, result into patterns of
�overembeddedness� in which firms face a lack of learning opportunities. In spite of the high levels
of trust and commitment in these alliances too much knowledge overlap may hamper the efficient
transfer of new ideas and technologies. The low informational value of the ties in a redundant ego-
network is likely to have a detrimental effect on the overall learning efficiency in these networks.
In other words, the information yield of the ties is likely to be low. Therefore we argue that
although redundancy can be very helpful in raising the overall level of trust, commitment and
absorptive capacity, the value of redundancy is likely to decrease once a certain threshold level is
passed. Above this specific level, we expect that the ego-network is likely to become
�overembedded� and that the informational value of ties starts to decrease. Therefore, we expect a
curvilinear relationship between the creation of redundancy in an ego-network and the innovative
performance of ego. Thus:
Hypothesis 1: The creation of redundancy in an ego-network has a positive
curvilinear effect (inverted-U shape) on the innovative performance
of the focal company.
Whereas most of the alliance literature has traditionally focused on the effect of direct ties
on company performance, there is increasing consensus among authors that indirect ties play an
equally important role in determining the effects of network positioning of companies (Mizruchi,
1989; Haunschild, 1993; Gulati, 1995). In similar vein, we might argue that a firm�s local action
has only a partial effect on its ego-network. Although a focal company can control its own direct
ties, it is often unable to control all of the alliance actions of its partners. In fact, some actions by
other players might even neutralize specific moves that are made by the focal organization (Bae
and Gargiulo, 2003).
95
Granovetter (1992) was among the first to go beyond the relational embeddedness level in
which firms are characterized in terms of their direct links with other companies. Granovetter
emphasized that apart from relational embeddedness firm�s effectiveness in a network is also
dependent on two other mechanisms; structural embeddedness and positional embeddedness.
Whereas positional embeddedness focuses on the impact of particular network positions that
organizations occupy in the overall structure of the network, structural embeddedness is concerned
with the effects of indirect ties, or the tendency of actors around the focal firm to cooperate with
each other (Granovetter, 1992; Duysters et al., 2003). Those particular ties among alliance partners
can either strengthen the position of ego, or can have a diminishing effect on the local action of the
focal company.
Ties among alliance partners tend to increase the density of the network surrounding the
focal organization. This may result in the formation of strong, densely connected cliques consisting
of firms that are all mutually connected. From a closure perspective increased density often leads to
the accumulation of shared social capital (Burt, 1997). Social capital encompasses many aspects of
a social context, such as social ties, trusting relations, and value systems that facilitate actions of
individuals located within that context (Tsai, 1998). Increased social capital decreases the chances
of opportunistic behavior and facilitates trust among partners (Chung et al., 2000). Structural
embeddedness therefore facilitates norm creation at the network level, whereas relational
embeddedness facilitates trust at the dyadic level (Rowley et al., 2000). Especially in dynamic
industry environments companies tend to learn as much as possible from a number of �trusted�
sources instead of optimizing their non-redundant ties (Hagedoorn and Duysters, 2002).
In spite of the noted advantages of ties among alters, authors in the structural holes tradition
(e.g. Burt, 1997) have, however, pointed at the dangers of increased redundancy of information and
to the effects of decreasing opportunities for information brokerage due to the establishment of ties
among alters. Dense networks created by multiple ties among alters are often characterized as being
redundant and inefficient (Hagedoorn and Duysters, 2002).
In high-tech environments firms might become locked-in in their own closed social system
and start to suffer from �over-embeddedness�, rigidity and collective blindness (Uzzi, 1997;
Duysters and Lemmens, 2003). Over-embeddedness often leads to the development of core
rigidities (Leonard-Barton, 1995) and drives firms into so-called competency traps (Levitt and
March, 1988). This leads to decreasing opportunities for learning and innovation (Duysters and
Lemmens, 2003).
96
We make a distinction between two types of indirect ties in an ego network19; an indirect tie
can be the bridge between otherwise separate clusters of alliance partners, but it can also take place
within a cluster of alliance partners that would remain a cluster even when that tie was removed
from the ego network20. The two types of indirect ties do not have the same effect on the position of
the focal firm in the ego-network. When an alliance is the single bridge between two individual
partners or clusters of partners, it increases redundancy in the ego-network. That effect is already
analyzed in hypothesis 1. When an alliance is just reinforcing the cohesiveness within a cluster, i.e.
when there are other alliances that hold the cluster together as a whole, then redundancy is not
increased but the ties between partners belonging to the same cluster are strengthened.
The former forecloses possible brokerage advantages for ego; the latter increases the density
within a cluster and therefore decreases the potential yield of information that can be obtained from
the network. From a structural holes perspective, increasing density among the alliance partners can
have a negative effect on the focal company�s innovative performance. The network closure theory
predicts that there should be a positive relationship between both types of indirect ties and the
innovative performance of companies.
The relationship between indirect ties and innovative performance might be a bit more
complex than as predicted by these opposing theories. To some extent density within a component
of alliance partners can be beneficial for the innovative performance of the focal firm. Redundancy
might be necessary as argued by the network closure theory. However, too much redundancy leads
to �overembeddedness� which is detrimental for the innovative performance of partnering firms
(Kogut et al., 1992; Uzzi, 1997). Very dense components are thus likely to suffer from marginal
informational benefits. Therefore, we hypothesize:
Hypothesis 2a: Increasing cohesiveness between alliance partners in the same
cluster has a negative impact on the focal firm�s technological
innovative performance.
19 This distinction is similar, but not identical, to the distinction Bae and Gargiulo (2003) make between between-
cluster indirect ties and within-cluster indirect ties. 20 A cluster of alliance partners can be formalized as a �weak component clique�, i.e. a subgroup in which all members
can reach each other at least indirectly without passing through the focal firm (Bae and Gargiulo, 2003, p. 11).
97
Hypothesis 2b: Increasing cohesiveness among alliance partners in the same
cluster has a curvilinear effect (inverted-U shape) on the
technological innovative performance of the focal firm.
As discussed above, empirical contributions in the Coleman/Burt debate have generated a mixed
bag of findings. There is, however, increasing consensus that a �contingency approach� might be
most effective. This implies that the efficiency of network strategies is dependent on the
environmental conditions in which firms operate. We would like to extent this argument by
reasoning that the effects of local action are also, for a large part, dependent on the innovation
strategies that firms undertake. In particular, we would like to introduce the discussion on
explorative and exploitative learning (March, 1991). Whereas explorative learning is associated
with experimentation and novel technologies, exploitation is concerned with the refinement and
extension of existing technologies. Under conditions of explorative learning companies tend to
depart from their existing knowledge base and move into resource areas where they can find tacit
and novel knowledge (Levinthal and March, 1993). Exploitative learning, on the other hand, is
characterized by an extension of existing know-how that entails less uncertainty and a lower degree
of �tacitness� (Hansen et al., 2001). The important differences in the specific nature of both types of
learning (March, 1991; Chesbrough, 2003) significantly influence the way in which a company can
tap into the technological capabilities of its alliances partners (Rowley et al., 2000; Ahuja and
Lampert, 2001; Hagedoorn and Duysters, 2002; Vanhaverbeke et al., 2003). More in particular, we
argue that this contingency is reflected in differences in the value of indirect ties (Vanhaverbeke et
al., 2003).
In the case of explorative learning firms need to team-up with companies that are
knowledgeable in those technological areas in which the focal firm has little or no expertise. When
companies get involved in explorative learning they try to get a first, quick understanding on many
different alternatives. �Information is relatively broad and general in nature, because the emphasis
is on identifying alternatives rather than fully understanding how to develop any one innovation. �
This task does not have a well-defined solution space so firms perform broad searches of their
environments in order to identify a variety of future options.� (Rowley et al., 2000: 373-374). Non-
redundant ties are advantageous in these broad scanning activities in order to cover a broad
technological field with a minimum of alliances. As a result, companies in search for new
knowledge will benefit more from non-redundant ties spanning structural holes than from dense
network ties (Granovetter, 1973; Burt, 1992, 2000). Hence, redundancy is not expected to be
valuable in explorative learning. Increasing density between alliance partners (without increasing
98
redundancy) is also of no value to the focal company. The latter does not need to team up with
partners that are already familiar with each other through established alliances.
In contrast, redundant ties may be beneficial for the focal company when it is primarily
interested in deepening existing technological knowledge. Contrary to explorative learning,
exploitative learning ��requires a deeper understanding of specific information rather than a wider
grasp of general information� (Rowley et al., 2000). Exploitative learning entails strengthening and
refining the firm�s existing core technology, which implies both high-quality, fine-grained
information and trust-based governance (Uzzi, 1997; Larson, 1992). High density among the
alliance partners in the ego-network provides an efficient network structure to meet these
information requirements. Information theorists argue that information noise is reduced and high-
quality information is obtained when firms have access to multiple and redundant information
sources (Shannon, 1957). Dense ego-networks help a company to evaluate the obtained information
and to get a deeper understanding of a specific technology. Furthermore, dense ego-networks serve
as a trust creating mechanism alleviating the risks associated with opportunistic behavior
(Williamson, 1985); trust is crucial in exploitative learning as partners exchange highly sensitive
technological knowledge. Redundancy and density in the ego network are expected to have a
positive impact on exploitative learning. However, as argued before, redundancy might only be
valuable up to a particular level since �overembeddedness� reduces the marginal value of additional
indirect ties. Therefore, we hypothesize:
Hypothesis 3a: Redundancy in the ego-network of the focal firm is related in a
curvilinear way (inverted U-shape) to exploitative learning.
Increasing redundancy has a negative effect when a focal firm is
involved in explorative learning strategies.
Hypothesis 3b: Increasing density among alliance partners (without increasing the
redundancy level) has a positive impact on exploitative learning.
Increasing density among alliance partners has a negative effect on
explorative learning.

99
DATA, VARIABLES AND MODELING
Data
In order to test our main hypotheses we constructed a longitudinal dataset which consists of
alliance and patenting activities of 116 companies in the chemicals, automotive and pharmaceutical
industries. These focal companies were observed over a 12-year period, from 1986 until 1997.
However, due to new start-ups, mergers and acquisitions the panel is unbalanced. This specific
sample was selected to include the largest companies that were establishing technology based
strategic alliances in the three industries mentioned (alliance data were retrieved from the MERIT-
CATI database21). For small or privately owned companies it is hard to obtain information on the
establishment of a sufficient number of alliances. This is one of the reasons why other studies on
inter-firm alliances also focus on leading companies in an industry (Gulati, 1995; Gulati and
Gargiulo, 1999; Ahuja, 2000).
All network measures were calculated on the basis of the alliance matrices that were
constructed from the MERIT-CATI database. For each of the three sectors an alliance matrix was
constructed for each year, containing the technology-based alliances that were established by the
focal firms prior to a given year as well as the alliances established by other companies that belong
to the industry. In constructing network measures, a number of choices have been made. First,
different types of alliances were not considered separately. Second, the �strength� of the
relationships of strategic alliances was not weighted as some authors did (see Contractor and
Lorange, 1988; Nohria and Garcia-Pont, 1991; Gulati, 1995). The third choice relates to the length
of the period during which the existing alliance portfolio is likely to have an influence on the
current technological performance of a company. We chose for a moving window approach in
which alliances were aggregated over the five years prior to a given year, unless the alliance
database indicated another life-span (Gulati, 1995). The lifespan of alliances is assumed to be
usually no more than five years (Kogut 1988, 1989).
21 The data on alliances are taken from the MERIT-CATI database which contains worldwide information on nearly 15
thousands cooperative technology agreements and their �parent� companies, covering the period 1970-1996. The
alliances in the database are primarily related to technology cooperation. See Hagedoorn and Duysters (2002) for a
further description.
100
All patenting data were retrieved from the US Patent Office Database for all the companies
in the sample, also those based outside the US. Working with U.S. patents � the largest patent
market � is preferable to the use of several national patent systems ��to maintain consistency,
reliability and comparability, as patenting systems across nations differ in the application of
standards, system of granting patents, and value of protection granted� (Ahuja, 2000: 434)22.
Especially in industries where companies operate on an international or global scale U.S. patents
are a good proxy for companies� worldwide innovative performance.
For companies in the three sectors the financial data are gathered from Worldscope,
COMPUSTAT and from company websites. The data contain yearly revenues, converted to the
European Euro in order to standardize. Furthermore the nationality of each company and its age are
included.
Variable definition and operationalization
Dependent variable
Technological innovative performance is measured by the patent intensity of a firm. This measure
was chosen because it controls for firm size. Small firms generate a smaller amount of patents than
larger firms. Therefore the impact of the alliance portfolio of small firms can not be compared to
the impact of the alliance portfolio of large firms. Thus we need to control for firm size to
standardize innovative outcome. Patent intensity enables the comparison of technological
performance and technological learning of companies (Aspden, 1983; Pavitt, 1988; Acs and
Audretsch, 1989; Napolitano and Sirilli, 1990; Cantwell and Hodson, 1991; Patel and Pavitt, 1991,
1995). Patent intensity is calculated by means of dividing the innovative performance of a firm, i.e.
the patents that were granted in a given year, by the size of the firm, i.e. the revenues generated by
that firm in the same year. In other words, the patent intensity is innovative performance controlled
by firm size.
22 See also Basberg (1987) and Griliches (1990).

101
For exploitative technological performance the measure exploitative patent intensity is
calculated. The number of patents a firm filed for in year t within patent classes in which it had
been active in the five years prior to the given year is divided by the revenues generated by the firm
in that same year to make the measure comparable to patent intensity. For explorative technological
performance the number of patents a firm filed for in year t within patent classes in which it had not
been active in the five years prior to the given year is divided by the revenues generated by the firm
in that same year.
Independent variables
The first independent measure estimates the extent to which the direct ties of a focal firm�s ego
network are redundant. Since we observe ego-networks with only first-level alters (its alliance
partners) traditional measures of redundancy do not apply. Traditional measures take into account
larger parts of the network or the entire network itself. Therefore a redundancy-measure applying to
ego-networks only was developed, i.e. egonet redundancy. This measure calculates the proportion
of direct ties that are redundant given the ego-network. It considers only one tie to a weak
component clique, i.e. a group of alliance partners that are themselves connected, as non-redundant.
The other ties are considered to be redundant. Consider the ego-network in figure 4.2a. This ego-
network contains two weak component cliques, i.e. Ego-A-B-C-D and Ego-E-F. E can be reached
through F in weak component clique Ego-E-F, and F can be reached through E. Therefore one of
these contacts is considered redundant.
To calculate the egonet redundancy measure, first we need to measure the number of direct
ties linking the focal firm to its alliance partners in the ego network. This is the degree centrality of
Ego
A B
C
D E
F
Figure 4.2a Ego-network
Ego
A B
C
DE
F
Figure 4.2b Direct ties

102
ego (Freeman, 1979)23. Figure 4.2b represents direct ties in solid lines. Next, we need to calculate
the number of non-overlapping weak component cliques in the focal firm�s ego-network. A weak
component clique is a group of alters (here the alliance partners) that are all connected to the ego
(focal firm) under study, and every alter can reach the other alter in a number of steps without
going through ego (Wasserman and Faust, 1994). Ego can thus reach all actors in such a weak
component clique through any partner, making all other partners �redundant�. The solid lines of
figure 4.2c show the 2 weak component cliques in our example. Thus all ties to the alters in a weak
component clique are redundant except for one. In other words, one weak component clique stands
for one non-redundant direct tie, all other direct ties being redundant. To calculate how many direct
ties are redundant we subtract the number of weak
component cliques from the total number of direct
ties of the ego network (since only one tie per weak
component clique is non-redundant). However, the
number of redundant direct ties only makes sense
when related to the network size. Therefore, we
divide the number of redundant direct ties by the
total number of direct ties. This results in a measure
with values ranging from zero to one. A low value
implies there is no or little redundancy, increasing
values indicate increasing redundancy.
23 This and other network variables can be calculated with the network analysis software package Ucinet 6 (Borgatti et
al., 2002).
Ego
A B
C
D E
F
Figure 4.2c Weak
component cliques
CEgo
A B
DE
F
Figure 4.2d Minimum
Indirect ties needed
Ego
A B
C
DE
F
Figure 4.2e Within-clique ties

103
The second independent variable, component-density, measures the �density� of the weak
component cliques of an ego�s ego-network. First, we need to understand how a weak component
clique is composed. The minimum number of ties necessary to form a weak component clique
always equals the number of alters minus one. Consider figure 4.2a again. In order for ego-A-B-C-
D to form a weak component clique, we need at least three ties connecting A, B, C and D (we do
not involve ego in this calculation). Thus, in the weak component clique ego-A-B-C-D there are
four alters, and therefore three (4-1) ties are necessary to form a weak component clique. These are
shown by the solid lines in figure 4.2d. All the ties beyond this minimum number of ties needed to
connect the alters within a clique are referred to as �within-clique ties�. Thus, if a weak component
clique contains g alters and h ties, there are h-(g-1) within-clique ties. In figure 4.2a there is one
within-clique tie, i.e. tie A-C represented by a solid line. This is the real number of within-clique
ties. However, the maximum possible number of within-clique ties in one weak-component clique
is (g-2)!. In order to calculate the �density� of the weak component cliques of an ego-network we
add up all the real within-clique ties, and divide this by the sum of the maximum possible number
of within-clique ties of all the weak-component cliques of the ego-network. The formula for
component-density is:
( )
∑=
−
+−= c
nci
iiii
s
cdincompdens
1)!2(
where i is the ego firm, ini is the number of indirect ties in the ego-network of ego firm i, di
is the number of direct ties in the ego-network of ego firm i, ci is the number of components of the
ego-network of ego firm i, and sci is the size of each component in the ego-network of ego firm i.
The values for component-density again range from 0 to 1. High values imply that the
weak-component cliques of the focal firm are characterized by high density. A value of one
indicates that maximum density is reached.
Control variables
To control for differences between industries intercept dummy variables were included to indicate
whether a company is a car manufacturer or chemical firm (default is the pharmaceutical industry)
and to control for differences in the strategic value of innovation and patenting propensity among
the three industries.
104
Two other types of dummy variables were used. A dummy variable indicating in which
economic region the company is headquartered was used to control for regional differences.
Following the Triad-concept of the world economy, a company can be headquartered in North
America, Asia or Europe � the default here is Asia. Firms from a different economic region may
differ in their propensity to patent. Also annual dummy variables were included to capture changes
over time in the propensity of companies to patent their innovations.
Furthermore, we included an organizational variable, the natural logarithm of �corporate
sales�, as a proxy for firm size. Larger firms have more financial means and vast technological and
other resources to invest in R&D than smaller firms. Therefore, assuming that there exists a
positive correlation between technological input and output (Pakes and Griliches, 1984) large firms
will have a higher rate of innovation than small firms. However, returns diminish when investment
increases. Thus, as the dependent variable patent intensity is already controlled for by firm size, we
expect a negative relation between firm size and patent intensity.
Also technological capital, i.e. patents received in the five years previous to the year of
observation, was used as a control variable. Technological capital measures the technological
competence of a company (Narin et al., 1987). Studies about R&D depreciation (Griliches, 1979,
1984) suggest that knowledge capital depreciates sharply, losing most of its economic value within
5 years. Thus, a moving window of 4 to 5 years is the appropriate time frame for assessing the
technological impact in high-tech industries (Podolny and Stuart, 1995; Stuart and Podolny, 1996;
Henderson and Cockburn, 1996; Ahuja, 2000). Because of the cumulative character of technology,
the current technological position of a company is often dependent on its previous level of
technological know-how (Teece et al., 1997). A positive relation between previous technical capital
and technological learning is expected. The last control variable to be included is related to the age
of a company. Ever since Schumpeter Mark I and Mark II there is an unresolved and ongoing
debate in the literature about the relationship between age and innovative performance. Some
authors have addressed the important role of young entrepreneurial companies in the innovation
process, whereas others have appraised the important role of older, large, efficient companies in
this same process.
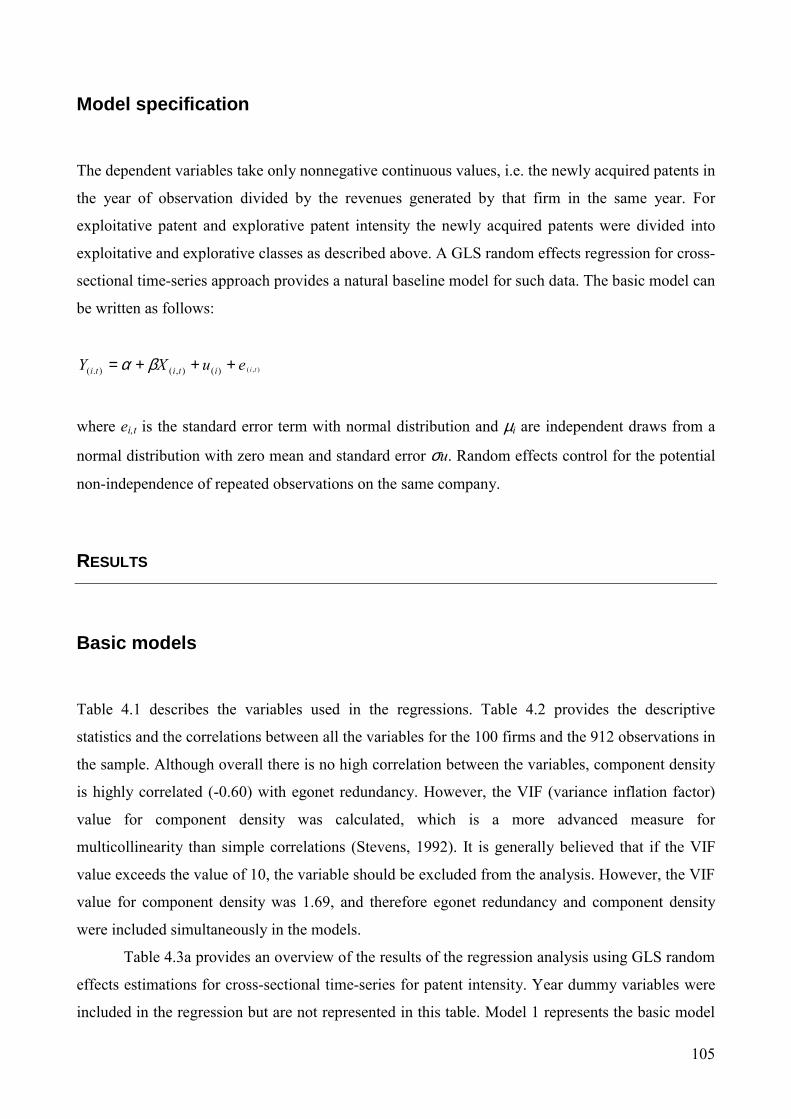
105
Model specification
The dependent variables take only nonnegative continuous values, i.e. the newly acquired patents in
the year of observation divided by the revenues generated by that firm in the same year. For
exploitative patent and explorative patent intensity the newly acquired patents were divided into
exploitative and explorative classes as described above. A GLS random effects regression for cross-
sectional time-series approach provides a natural baseline model for such data. The basic model can
be written as follows:
),()(),().( tieuXY ititi +++= βα
where ei,t is the standard error term with normal distribution and µi are independent draws from a
normal distribution with zero mean and standard error σu. Random effects control for the potential
non-independence of repeated observations on the same company.
RESULTS
Basic models
Table 4.1 describes the variables used in the regressions. Table 4.2 provides the descriptive
statistics and the correlations between all the variables for the 100 firms and the 912 observations in
the sample. Although overall there is no high correlation between the variables, component density
is highly correlated (-0.60) with egonet redundancy. However, the VIF (variance inflation factor)
value for component density was calculated, which is a more advanced measure for
multicollinearity than simple correlations (Stevens, 1992). It is generally believed that if the VIF
value exceeds the value of 10, the variable should be excluded from the analysis. However, the VIF
value for component density was 1.69, and therefore egonet redundancy and component density
were included simultaneously in the models.
Table 4.3a provides an overview of the results of the regression analysis using GLS random
effects estimations for cross-sectional time-series for patent intensity. Year dummy variables were
included in the regression but are not represented in this table. Model 1 represents the basic model

106
Table 4.1 Definitions of dependent and independent variables Variable name Variable description Technical learning Count of the number of patents a firm filed for in year t within all patent classes dependent variable Exploitative learning Count of the number of patents a firm filed for in year t within patent classes in which it dependent variable was active in the five years prior to year t Explorative learning Count of the number of patents a firm filed for in year t within patent classes in which it dependent variable was active in the five years prior to year t Egonet redundancy Share of the direct contacts that are redundant in year t-1 (Egonet redundancy)2 Squared term of previous variable Component density Average relative density within the components of a focal firm, i.e. the actual number of ties within a component divided by the potential number of ties, averaged over all components of the focal firm (Component density)2 Squared term of previous variable Cumulative patents Count of the number of patents that a firm filed for during the previous five years (t-5 to t-1) Age The number of years since a company is founded Firm size (ln revenues) Natural logarithm of the total sales (x 1000 Euro) of the firm in t-1 R&D expenditures (ln) Natural logarithm of the total R&D expenditures (x 1000 Euro) of the firm in t-1 Year Dummy variable indicating a particular year (1986-1997) Chemical company Dummy variable set to one if the firm is a chemical company Car manufacturer Dummy variable set to one if the firm is a car manufacturer Europe Dummy variable set to one if the firm is headquartered in Europe US Dummy variable set to one if the firm is headquartered in the US Note: All network variables are based on alliance network representing all the technology-based alliances that were established in an industry during the five years prior to year t
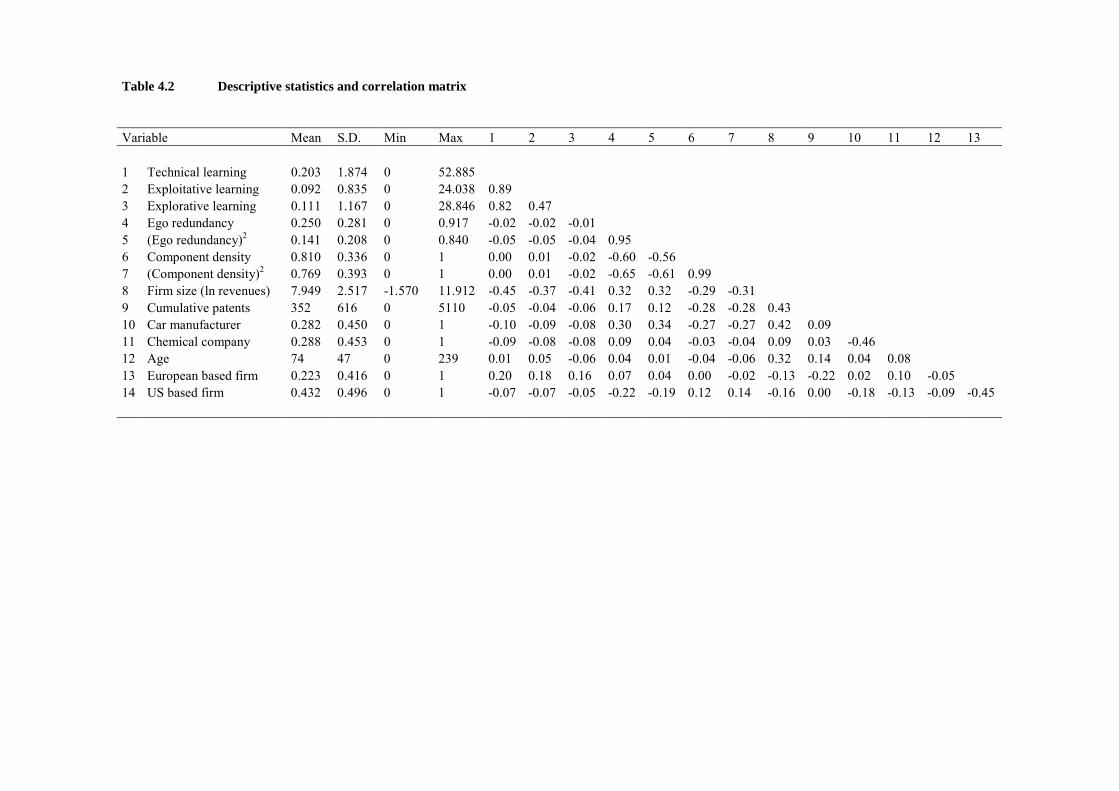
107
Table 4.2 Descriptive statistics and correlation matrix Variable Mean S.D. Min Max 1 2 3 4 5 6 7 8 9 10 11 12 13 1 Technical learning 0.203 1.874 0 52.885 2 Exploitative learning 0.092 0.835 0 24.038 0.89 3 Explorative learning 0.111 1.167 0 28.846 0.82 0.47 4 Ego redundancy 0.250 0.281 0 0.917 -0.02 -0.02 -0.01 5 (Ego redundancy)2 0.141 0.208 0 0.840 -0.05 -0.05 -0.04 0.95 6 Component density 0.810 0.336 0 1 0.00 0.01 -0.02 -0.60 -0.56 7 (Component density)2 0.769 0.393 0 1 0.00 0.01 -0.02 -0.65 -0.61 0.99 8 Firm size (ln revenues) 7.949 2.517 -1.570 11.912 -0.45 -0.37 -0.41 0.32 0.32 -0.29 -0.31 9 Cumulative patents 352 616 0 5110 -0.05 -0.04 -0.06 0.17 0.12 -0.28 -0.28 0.43 10 Car manufacturer 0.282 0.450 0 1 -0.10 -0.09 -0.08 0.30 0.34 -0.27 -0.27 0.42 0.09 11 Chemical company 0.288 0.453 0 1 -0.09 -0.08 -0.08 0.09 0.04 -0.03 -0.04 0.09 0.03 -0.46 12 Age 74 47 0 239 0.01 0.05 -0.06 0.04 0.01 -0.04 -0.06 0.32 0.14 0.04 0.08 13 European based firm 0.223 0.416 0 1 0.20 0.18 0.16 0.07 0.04 0.00 -0.02 -0.13 -0.22 0.02 0.10 -0.05 14 US based firm 0.432 0.496 0 1 -0.07 -0.07 -0.05 -0.22 -0.19 0.12 0.14 -0.16 0.00 -0.18 -0.13 -0.09 -0.45
108
in which only the control variables are introduced. Some results are worth mentioning. The
coefficient of firm size is negative and significantly related to patent intensity as expected. Thus
increasing firm size results in decreasing innovative output. This confirms the idea that smaller
firms are usually more innovative than large companies (Ahuja and Lampert, 2001). Next, we find
a positive and significant relation between previous technical capital and the patent intensity of a
firm. Thus previous knowledge stimulates the technological innovative performance of a firm.
Knowledge accumulation building on previous knowledge is the basis for technological
development. Because of the cumulative character of technology, the current technological position
of a company is shaped by the path it has traveled (Teece et al., 1997). When companies can build
on their previously developed knowledge investments in the past should lead to a higher innovation
rate in the present.
Model 2 introduces the linear term for the �egonet redundancy� variable. The results show a
positive and significant relation between egonet redundancy and patent intensity implying that
redundancy in the direct ties of an ego network stimulates the technological innovative
performance of a company.
In hypothesis 1 we predict a positive though curvilinear relation between the creation of
redundancy in an ego-network and the innovative performance of the focal company. In model 3
we included both the linear and the squared term of egonet redundancy in the regression in order to
account for the curvilinear effect. We find there is a positive and significant relation between
egonet redundancy and patent intensity. This corroborates hypothesis 1. Thus redundancy in the
direct ties of an ego network stimulates patent intensity. However, the significance of the squared
term of egonet redundancy implies that redundancy in the direct contacts is only beneficial up to a
maximum point. This point is reached when approximately 52% of the direct ties are redundant24.
Model 4 returns to the linear model and adds �component density� as a regressor25.
Although egonet redundancy keeps its positive coefficient, its significance decreases and becomes
weak. For component density we find a negative and weakly significant relation. Thus increasing
density in the components of an ego network is not beneficial for the patent intensity of a focal
24 52% = 0.4500 / 2*0.4314. 25 In table II the correlation between component density and egonet redundancy is -0.60. This would plead against
inclusion of component density in the same regression analysis as egonet redundancy. However, the VIF (variance
inflation factor) value for component density was calculated, which is a more advanced measure for multicollinearity
than simple correlations (Stevens, 1992). It is generally believed that if VIF exceeds the value of 10, the variable should
be excluded from the analysis. However, the VIF value for component density was 1.69, and therefore component
density was included in the regression.
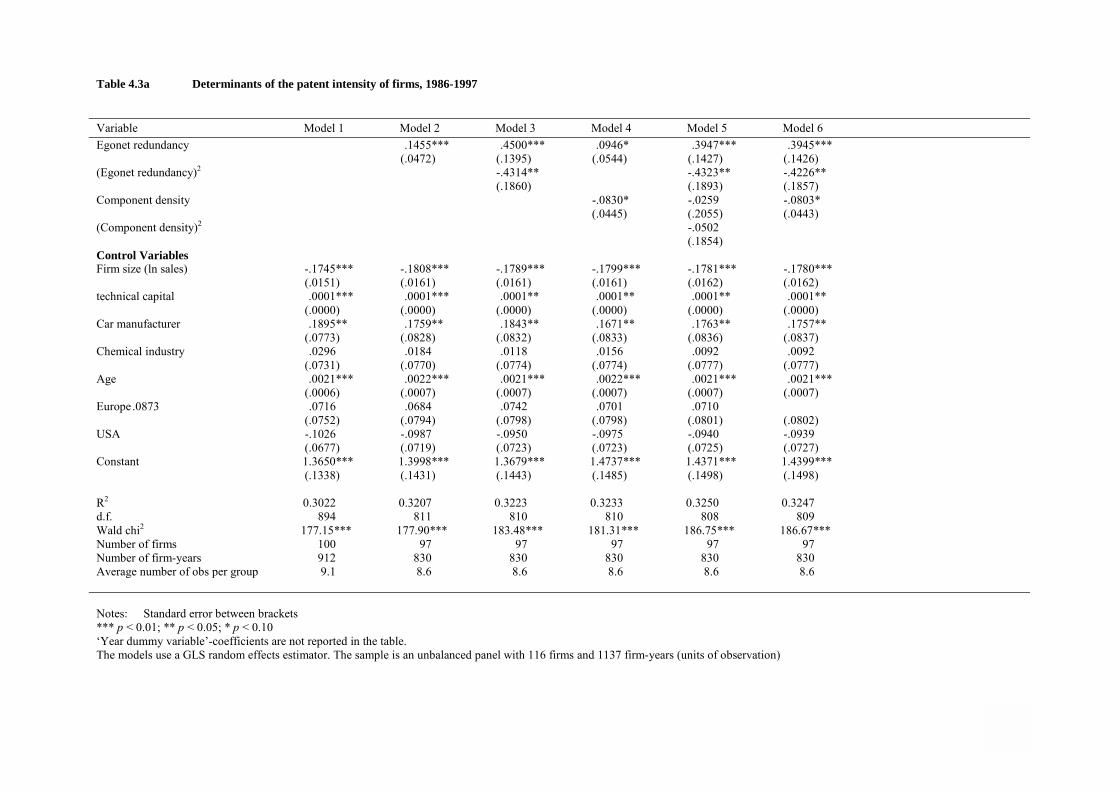
109
Table 4.3a Determinants of the patent intensity of firms, 1986-1997 Variable Model 1 Model 2 Model 3 Model 4 Model 5 Model 6 Egonet redundancy .1455*** .4500*** .0946* .3947*** .3945*** (.0472) (.1395) (.0544) (.1427) (.1426) (Egonet redundancy)2 -.4314** -.4323** -.4226** (.1860) (.1893) (.1857) Component density -.0830* -.0259 -.0803* (.0445) (.2055) (.0443) (Component density)2 -.0502 (.1854) Control Variables Firm size (ln sales) -.1745*** -.1808*** -.1789*** -.1799*** -.1781*** -.1780*** (.0151) (.0161) (.0161) (.0161) (.0162) (.0162) technical capital .0001*** .0001*** .0001** .0001** .0001** .0001** (.0000) (.0000) (.0000) (.0000) (.0000) (.0000) Car manufacturer .1895** .1759** .1843** .1671** .1763** .1757** (.0773) (.0828) (.0832) (.0833) (.0836) (.0837) Chemical industry .0296 .0184 .0118 .0156 .0092 .0092 (.0731) (.0770) (.0774) (.0774) (.0777) (.0777) Age .0021*** .0022*** .0021*** .0022*** .0021*** .0021*** (.0006) (.0007) (.0007) (.0007) (.0007) (.0007) Europe .0873 .0716 .0684 .0742 .0701 .0710 (.0752) (.0794) (.0798) (.0798) (.0801) (.0802) USA -.1026 -.0987 -.0950 -.0975 -.0940 -.0939 (.0677) (.0719) (.0723) (.0723) (.0725) (.0727) Constant 1.3650*** 1.3998*** 1.3679*** 1.4737*** 1.4371*** 1.4399*** (.1338) (.1431) (.1443) (.1485) (.1498) (.1498) R2 0.3022 0.3207 0.3223 0.3233 0.3250 0.3247 d.f. 894 811 810 810 808 809 Wald chi2 177.15*** 177.90*** 183.48*** 181.31*** 186.75*** 186.67*** Number of firms 100 97 97 97 97 97 Number of firm-years 912 830 830 830 830 830 Average number of obs per group 9.1 8.6 8.6 8.6 8.6 8.6 Notes: Standard error between brackets *** p < 0.01; ** p < 0.05; * p < 0.10 �Year dummy variable�-coefficients are not reported in the table. The models use a GLS random effects estimator. The sample is an unbalanced panel with 116 firms and 1137 firm-years (units of observation)
110
firm. In other words, the more alliance partners cooperate among each other within the same
component (beyond the level that is strictly necessary to create a component) the less
technologically innovative the focal firm becomes.
Model 5 introduces the squared term for both egonet redundancy and component density.
Again the curvilinear relation for egonet redundancy is significant. However, the significance for
component density disappears. Therefore, model 6 omits the squared term for component density
assuming a linear relationship between component density and the innovative performance of the
focal companies. In model 6 the significance for component density increases although it remains
weak.
In short, hypothesis 1b is corroborated by the data. Redundancy in an ego network of a focal
firm�s alliance portfolio improves the innovative performance of the company up to a point, where
after redundancy becomes a liability. Component density negatively affects the innovative
performance of companies � although the relationship is only weakly significant. This implies that
a focal company is better off to be linked to groups of alliance partners that are not or only poorly
connected to each other by means of alliances. This empirical result confirms the arguments in
favor of the structural holes theory as argued in hypothesis 2a (Burt, 1992).
Table 4.3b and 4.3c provide the results for the analysis of respectively exploitative and explorative
learning (hypothesis 3). Again we make use of GLS random effects estimations for cross-sectional
time-series. Model 1 represents the basic model including only the control variables.
It is useful to mention some of the differences between the analyses for exploitative learning and
explorative learning. First, for explorative learning (see table 4.3c) the coefficient of the �car
manufacturer� dummy variable is positive and significant, while not significant for exploitative
learning (table 4.3b). Therefore, car manufacturers seem to be inclined to explore more new
technical domains than their counterparts in the pharmaceutical and the chemical industry, all else
equal. Consequently, the stronger inclination of the car manufacturers to explore new technical
domains is also the reason why we find a significant coefficient for this dummy variable in table
4.3a where all patents are taken into account.
For both explorative and exploitative learning the coefficient of the control variable �age� is
positive and significant. However, the coefficient for explorative learning is smaller than for
exploitative learning. Hence, age seems to be advantageous for both exploitative and explorative
technological learning but its impact is larger for exploitative learning compared to explorative
learning. A possible explanation is that start-ups or young companies usually stick to their knitting
in one particular technical field because they do not have the technical know-how and financial
111
resources to diversify into other, new, technological fields. This implies that older companies profit
from economies of scope and scale in R&D.
As for regional dummy variables there are no significant differences between the three economic
regions for exploitative learning. However, for explorative learning European firms are doing better
than Far-East and US based companies, while the latter still have a lower level of explorative
learning than Far-East based companies. This is a bit surprising given the technological lead and
entrepreneurial resilience of the US economy: another possible explanation for this empirical result
is that companies in these three industries in Europe and the Far East had to diversify their
innovation efforts into technical fields in the period 1986-1997 whereas their American
counterparts had already done that before.
Model 2 in table 4.3b adds �egonet redundancy� as a regressor to the analysis. The coefficient is
positive and significant implying that some redundancy in the direct contacts of a focal�s ego
network stimulates the deepening of firms� current technological portfolio. We also introduced
component density as a single regressor. The sign is negative, which means that increased
cooperation between a focal firm�s alliance partners is detrimental for the deepening of its current
knowledge base. However, the negative coefficient was not significant and the Wald chi2
decreased to a level below that of the basic model. Therefore we decided not to include this model
in table 4.3b.
When both variables are introduced in model 326 �egonet redundancy� keeps its positive sign and
the value of the coefficient does not change drastically. �Component density� has a negative sign
but is not significant at all. Therefore, we omit this variable again in model 4.
Model 4 introduces the squared term for egonet redundancy. The linear term is positive and
significant, whereas the squared term is negative and significant. Thus there exists a curvilinear
relation between the redundancy in the direct ties of a focal firm and exploitative learning. These
results corroborate hypothesis 3a. The optimal point is at approximately 49%27. The same was done
for component density. The linear and squared term were introduced in a separate regression (not
displayed in table 4.3b). However, no significant results were found, and the Wald chi2 decreased
compared to models 2 and 3. Model 5 adds both the linear term and the squared term for
component density but both coefficients are not significant. As a result, we stick to model 4.
Model 2 in table 4.3c introduces �egonet redundancy� into the regression with explorative learning
as the dependent variable. The coefficient is positive and highly significant. We also introduced the
26 For the inclusion of component density with a high correlation with egonet redundancy see note 22. 27 From model 4: 49% = 0.2622/ (2*0.2692).

112
Table 4.3b Determinants of the exploitative patent intensity of firms, 1986-1997 Variable Model 1 Model 2 Model 3 Model 4 Model 5 Egonet redundancy .0723** .0696** .2622*** .2614*** (.0299) (.0345) (.0881) (.0902) (Egonet redundancy)2 -.2692** -.3035** (.1176) (.1198) Component density -.0044 .1842 (.0282) (.1296) (Component density)2 -.1729 (.1169) Control Variables Firm size (ln sales) -.0778*** -.0828*** -.0827*** -.0811*** -.0819*** (.0104) (.0112) (.0112) (.0112) (.0112) technical capital .0001** .0001** .0001* .0001* .0000* (.0000) (.0000) (.0000) (.0000) (.0000) Car manufacturer .0625 .0573 .0568 .0614 .0645 (.0569) (.0607) (.0612) (.0610) (.0614) Chemical industry -.0090 -.0126 -.0127 -.0175 -.0171 (.0542) (.0569) (.0573) (.0573) (.0575) Age .0014*** .0014*** .0014*** .0014*** .0014*** (.0005) (.0005) (.0005) (.0005) (.0005) Europe .0696 .0634 .0634 .0624 .0585 (.0558) (.0588) (.0591) (.0591) (.0594) USA -.0487 -.0456 -.0456 -.0428 -.0435 (.0505) (.0535) (.0538) (.0538) (.0540) Constant .6346*** .6649*** .6688*** .6411*** .6376*** (.0952) (.1018) (.1048) (.1027) (.1056) R2 0.2273 0.2454 0.2455 0.2456 0.2484 Wald chi2 92.01*** 95.83*** 95.40*** 101.06*** 103.04*** Number of firms 100 97 97 97 97 Number of firm-years 912 830 830 830 830 Average number of 9.1 8.6 8.6 8.6 8.6 obs. per group Notes: Standard error between brackets *** p < 0.01; ** p < 0.05; * p < 0.10 �Year dummy variable�-coefficients are not reported in the table. The models use a GLS random effects estimator.

113
Table 4.3c Determinants of the explorative patent intensity of firms, 1986-1997 Variable Model 1 Model 2 Model 3 Model 4 Egonet redundancy .0777*** .0362 (.0287) (.0333) Component density -.0816*** -.0661** (.0235) (.0273) Control Variables Firm size (ln sales) -.0718*** -.0730*** -.0729*** -.0730*** (.0059) (.0060) (.0061) (.0061) technical capital .0001*** .0001*** .0000*** .0000*** (.0000) (.0000) (.0000) (.0000) Car manufacturer .0735*** .0586** .0580** .0534** (.0250) (.0265) (.0268) (.0267) Chemical industry .0072 -.0038 -.0016 -.0052 (.0230) (.0238) (.0241) (.0239) Age .0005** .0005** .0005** .0005** (.0002) (.0002) (.0002) (.0002) Europe .0489** .0429* .0433* .0430* (.0238) (.0245) (.0250) (.0246) USA -.0378* -.0352* -.0379* -.0359* (.0206) (.0214) (.0218) (.0215) Constant .5492*** .5496*** .6341*** .6156*** (.0504) (.0526) (.0579) (.0591) R2 0.2438 0.2541 0.2569 0.2586 Wald chi2 211.50*** 212.17*** 213.28*** 217.79*** Number of firms 100 97 97 97 Number of firm-years 912 830 830 830 Average number of obs per group 9.1 8.6 8.6 8.6 Notes: Standard error between brackets *** p < 0.01; ** p < 0.05; * p < 0.10 �Year dummy variable�-coefficients are not reported in the table. The models use a GLS random effects estimator.
114
squared term of egonet redundancy as a second regressor (not displayed in table 4.3c) but this
hardly improved the model as the squared term was not significant.
Model 3 introduces component density as a single regressor. The coefficient for this variable is
negative and highly significant. Again, we introduce the squared term of component density in a
separate regression, but the variable has no significant coefficient and therefore this model is not
included in table 4.3c. Thus, while we do not find a significant impact of component density in the
case of exploitative learning, this variable has clearly negative impact on explorative learning.
Having partners that are densely connected to each other hampers explorative learning. Hence, this
type of learning is improved when allies are only loosely coupled to each other.
Next, the egonet redundancy variable and the component density variable were introduced
simultaneously into model 428. The significance of egonet redundancy disappears, while the
negative coefficient for the component density variable remains significant. Hence, for explorative
learning we only find a positive and significant effect for egonet redundancy when we do not
account for component density. However, model 4 performs better than model 2, thus we believe
that redundancy on the ego-network level has no effect on the exploration of new fields.
The differences in the optimal network structures between explorative and exploitative
learning are clear. Redundancy in the direct ties of a focal company�s network stimulates
exploitative learning up to a maximum point. Beyond that threshold increasing redundancy has a
negative impact on exploitative learning. This corroborates hypothesis 3a for exploitative learning.
This is not the case for explorative learning: Redundancy has no effect on explorative learning.
Increasing density or cohesion between the allies of the focal firm has no significant effect on
exploitative learning, while this does have a significant negative effect on explorative learning.
Hence, hypothesis 3b is corroborated for explorative but not for exploitative learning.
Finally, we should explain why there is no support for the hypothesized negative impact of
redundancy on explorative learning. Most likely the answer has to be sought in the very nature of
explorative learning. Redundant ties are likely to be detrimental for firms that intend to discover
new and promising new technological areas with a minimum of alliances. However, is exploration
merely discovering new technological areas? In order to apply for a patent in a new patent class (=
explorative patent) companies not only have to detect and evaluate new technologies but they also
have to absorb it and turn it into new innovations (patents). The question here is what firms do
when they want a fuller understanding and want to move beyond �light exploration�. In such a
setting knowledge is new and highly tacit. This requires triangulation in order to be able to
28 For the inclusion of component density with a high correlation with egonet-redundancy see note 22.
115
understand and value the new knowledge (Gilsing, 2003). Such triangulation can only be obtained
from redundant, multiple sources. Moreover, given the tacitness of knowledge, it is difficult if not
impossible to use contracts as governance instruments, creating a need for trust-based governance.
Hence, the need for triangulation in exploration is crucial and requires multiple, redundant contacts
in order to reduce information noise. Therefore, redundancy might be beneficial for companies that
search for innovations in new technological areas.
DISCUSSION AND CONCLUSION
In this chapter we have investigated the effects of local action in technology alliance networks on
the innovative performance of focal companies. The overall results show that local action does
indeed have a significant effect on the level of technological innovative performance of companies.
This seemingly obvious result has, however, been largely neglected in the existing academic
literature. The majority of the existing alliance literature has focused on network positions as
positions that are primarily influenced by the overall network structure as opposed to being shaped
by local action. The first approach is to a large extent deterministic, the second one is more
voluntaristic in nature. The outcome of the empirical analysis in this chapter is an important finding
because it shows that individual firms can decide, for a large part, on their position in an alliance
network.
We focus on two types of indirect ties in the ego-network of innovating firms. The first type
increases ego-redundancy: these alliances connect two partners or groups of partners of the focal
firm that were not linked otherwise. The other type increases component density: these alliances
between partners do not increase the redundancy in the ego network, but increase the density within
a group of partners. The results (table 4.3a) indicate that the distinction between the two types of
indirect alliances is important to understand the effect of alliance networks on the technological
innovative performance of companies. With respect to the closure versus structural hole debate
about efficient networking strategies the results for the ego-redundancy measure indicate that firms
pursuing an alliance strategy based on redundant ties seem to outperform firms that take on a
structural holes-related strategy. This result can be explained by the fact that the tacit nature of
technology requires firms to have a sufficient degree of absorptive capacity (Cohen and Levinthal,
1990) in order to benefit from the know-how of alliance partners. Close contact between partners
116
often leads to increased absorptive capacity because densely connected firms act similarly and
develop similar preferences (Knoke and Kuklinski, 1982). Similarity leads to some degree of
knowledge overlap between alliance partners and is therefore positively related to the absorptive
capacity of partners. Structural hole networking strategies seem to be less effective because of the
often too wide gap in absorptive capacity among alliance partners.
The relationship between ego-redundancy and the innovative performance of companies is
not linear but curvilinear. After a certain threshold the impact of redundancy on innovation
performance becomes negative; the marginal value of an additional alliance between alliance
partners is lower than the additional cost of setting up the alliance. Thus, after a certain threshold
level is reached firms start to suffer from overembeddedness and the informational value of ties
starts to decrease. Firms that are too similar tend to suffer from decreased strategic opportunities
through the lack of information access, timing, referrals and control (Burt, 1992: 62)
The results (table 4.3a) furthermore show that growing density levels within groups of
alliance partners has a negative effect on the innovative performance of the focal firm. Redundancy
in the direct ties plays a role but how dense partners are linked to each other plays no role at all.
This is an interesting finding, because it is frequently argued, in line with the network closure
theory (Coleman, 1988; Bourdieu and Wacquant, 1992) that dense, clique like networks of partners
stimulates the innovative performance. We find, however, that increasing density levels within
groups of partners has no beneficial effect.
Finally, we examined the effect of ego-redundancy and component-density on explorative
and exploitative learning. The two types of learning differ considerably from each other and the
optimal network structure to spur exploitative learning is clearly not optimal in the case of
explorative learning. We hypothesize a curvilinear relation (inverted U-shape) between redundancy
in the ego-network of the focal firm and its exploitative learning, but increasing redundancy is
expected to have a negative effect in the case of explorative learning. Similarly, increasing density
within groups of alliance partners is hypothesized to have a positive impact on exploitative learning
and a negative effect for explorative learning. The results indicate that exploitative and explorative
learning require different network structures. However, the expected effects are not always
corroborated by the results: exploitative learning benefits from increasing redundancy up to a
certain level (curvilinear effect) whereas component density has no effect at all. On the contrary,
explorative learning is not affected by network redundancy but increasing density between partners
is detrimental for its success.
We suggested in hypothesis 3a that ego redundancy should have a negative effect on
explorative learning. The fact that the empirical analysis shows a positive (but not always
117
significant) sign indicates that explorative learning is not confined to the detection and evaluation
of new technologies only. Firms can apply for explorative patents, as defined in this chapter, if they
discovered and evaluated new technological areas. However, since we defined explorative learning
in such a way that a technological field remains its explorative status for an extended period of
time, the generated new insights based on the understanding of the newly acquired technology also
serves as explorative learning. In such setting, when companies move beyond �light exploration�
and desire a fuller understanding of a new technological area, knowledge is new to the firm and
usually highly tacit. This requires triangulation in order to understand and value the new
knowledge. Such triangulation and possibly hedging can only be obtained from redundant, multiple
sources. This explains the unpredicted positive, though not always significant, sign for the effect of
egonet redundancy on explorative learning.
Naturally this study has its limitations. First, we focused on the redundancy of the
information in the ego-network of firms� alliance networks only. We did not pay attention to the
strength of the ties: there is empirical evidence that the value of strong and weak ties depends on
the type of learning (Rowley et al., 2000). Next, we paid no attention to the cognitive distance
between a company and its partners although it is beyond doubt that, opposite to the case of
exploitative learning, partners should differ in technology profile in explorative learning. This
raises the question of what the optimal �cognitive distance� should be between alliance partners
when involved in exploitative or explorative learning (Nooteboom 1999, 2000). Finally, benefits
stemming from alliances might be limited through resource limitations in terms of the managerial
and financial resources that firms can deploy in the search process for new partners. Matching,
complementary partners might be very hard to find and may soon exhaust available resources.
Many of these problems are caused because information about relevant technological assets is often
tacit and not readily available. Also the information provided by the potential alliance partners may
be opportunistically biased. The more information asymmetry problems are faced, the more
difficult the process of partner valuation will be. This is clearly the case when companies enter new
technological areas: problems associated with information asymmetry are considerably higher
when a company is teaming up with partners that have a complete different knowledge base.

118

119
CHAPTER 5
CONCLUSION

120
The three previous chapters provide different analyses of the effect of alliance network structure
positions on the technological learning of firms. More in particular, we intended to give an answer
on the following research question:
What is the effect of particular alliance networking strategies on
the degree of technological learning of firms?
This research question was split up into three sub-questions. Each of the preceding chapters
dealt with one of the sub-questions. Chapter two analyzed how internal learning and external
learning mutually affect a firm�s technological performance. In chapter three we tried to find the
effect of networking strategies on explorative and exploitative learning. The role of local alliance
action on the technological performance of a company was discussed in the fourth chapter.
Instead of dealing with these research questions one by one, we will put the findings of the analyses
in a portfolio perspective.
OPTIMAL ALLIANCE PORTFOLIOS
As mentioned before, firms can no longer rely on their internal development of technological
capabilities. Rather, firms need to complement their internal R&D with an alliance portfolio to keep
up with the rapid pace of technological change. The results of the empirical research of the three
previous chapters provide some preliminary guidelines for firms on how to build an optimal
alliance portfolio. Next, we will try to translate the findings of the empirical analyses into a number
of dimensions that are crucial for the management of an alliance portfolio.
Balancing internal and external learning
The first step towards building an alliance portfolio is determining in how far a particular company
needs external resources for learning. The results from the analysis in chapter two show that there
are two optimal strategies for combining internal and external learning. The first strategy
emphasizes the internal development of strong technological resources combined with a small
121
alliance portfolio; the other strategy focuses on the establishment of an extensive alliance network
supported by a minimal internal development of technological knowledge. Hence, there is no single
optimal strategy to follow. Different optimal strategies exist that can co-exist in one and the same
industry.
However, we also found support for differences in the effect between internal and external
learning for different sizes of the existing technological and social capital. For low degrees of
internal technological capabilities and/or small alliance portfolios an increase in either one of both
types of capital will increase a company�s rate of innovation. Therefore, at low levels technological
and social capital are found to mutually reinforce each other�s impact on the technological
performance of a company. With increasing levels of both types of capital on the other hand, we
found strong empirical support for the change in interaction between both types of capital. At high
levels, technological and social capital become substitutes: companies can rely on a focus on either
type of capital to come up with a strong technological performance. Furthermore, there is evidence
that companies can overextend their alliance portfolio: the innovative performance rapidly
decreases when the portfolio is becoming too large.
As a result, firms need to make an inventory of their existing technological knowledge as
well as the existing set of alliances, and explore the possibilities of extending (or shrinking) the
alliance portfolio up to an optimal level.
“Optimal” portfolio size
The empirical analyses in the previous chapters indicate that companies that established many
alliances in the past develop routines and alliance management skills which in turn lead to higher
innovative output. However, since overembeddedness is a potential problem companies need to
build an alliance portfolio up to an optimal level. We find strong evidence, both in chapter two and
three, that portfolio size matters indeed. However, parallel to the findings of Gomes-Casseres
(1996) we find there is an optimum of alliances a firm can manage successfully, after which the
added value of an extra alliance diminishes and decreases the effectiveness of the portfolio as a
whole. Furthermore, we make a distinction between optimum size of the alliance portfolio for firms
that prefer to concentrate on exploitative learning, i.e. strengthening the existing knowledge base,
and firms that wish to focus on explorative learning, i.e. broadening the existing knowledge base.
122
The analyses indicate that the optimum level of the alliance portfolio is smaller for exploitative
learning than for explorative learning. Since companies depend to a larger extent on partners for
explorative learning � companies have less developed internal technological know-how about these
explorative technological areas and exploration is usually related to tacit knowledge that can only
be transferred by means of a close interaction with partners � more ties are necessary in the case of
explorative learning. Moreover, we found that the impact of social capital on explorative learning is
larger than on exploitative learning.
However, this optimum size is also dependent on the number of indirect ties. In chapter
three we find evidence that indirect ties have a positive impact on both exploitative and explorative
learning. This implies that information can be acquired through partners from players with whom a
firm is not connected. However, we also find that the number of direct partners has a moderating
effect on the effectiveness of the number of indirect partners. Therefore direct ties may substitute
indirect ties, and vice versa. Thus, firms with partners that are well-connected to the rest of the
network may be equally successful to firms with a larger set of partners that are less well-connected
to the rest of the network. This implies that the optimum portfolio size grows as the number of
indirect partners diminishes. As a result, innovating companies have the possibility to choose
between many ties to companies that are not central in the alliance network themselves and a small
number of ties with companies that are in the �pack� of it.
Hence, the optimum portfolio size is dependent on a number of factors. First, the chosen
learning strategy determines to a large extent what the optimum is. Exploitative learning requires a
smaller number of alliances than explorative learning. Second, the connectedness of the partners
determining the centrality of the focal firm in the overall alliance network influences the optimum
size as well. Well connected partners lower the optimal number of alliances for both explorative
and exploitative learning.
The results of the previous chapters only show some stylized facts about the optimum size
of the alliance portfolio for an �average� company. In reality this optimum size depends on a whole
range of parameters. For example, the size of the firm itself matters to a great extent, putting limits
on the resources available, both financial and managerial, to build an alliance portfolio as well as
on the capabilities to internalize the knowledge that is received through the alliances. The optimum
size also depends on the industry and the economic region in which the companies are located
(different national systems of innovation). Firms may have different management styles through
which they are inclined to establish alliances or opt for licensing or M&As. Hence, a direct
translation of the empirical results into management prescriptions is not possible, but they
nevertheless give valuable information on how management should take optimum size of the
123
portfolio into account, how exploration and exploitation ask for a different approach, and how
direct ties always have to be considered jointly with indirect ties.
Indirect ties
The analysis in chapter three shows that indirect alliances are a good tool for companies to scan the
environment for new ideas and technologies. The observed impact of indirect ties is significantly
larger in case a company is involved in exploring new technological fields than when a firm
deepens its existing technology base. Hence we may conclude that firms focusing on explorative
learning should find partners that have themselves an extensive network of partners. These �highly
connected� partners are vital in providing information about other companies that might possess
relevant technologies for the focal firms. This is particularly interesting in explorative learning
since the focal firm does � in comparison with exploitative learning � not know much about the
interesting and relevant technological competencies and the companies that have expertise in these
areas.
However, the results of the previous chapters also indicate that it is advantageous when a
focal firm�s partners are mutually connected to each other to some extent compared to a situation
where its partners are exclusively connected to other firms in the network that have no direct
connection with the focal firm.
Redundancy
A next question in the formation of an alliance portfolio is the degree to which partners, both direct
partners and indirect partners, should be redundant in the information provided. This is again
dependent on the learning strategy a firm wishes to pursue as well as on the type of redundancy.
Redundancy can be considered on different levels. We can distinguish between redundancy
based on cohesion and redundancy based on structural equivalence. Redundancy based on cohesion
occurs between two actors, i.e. when they are themselves connected to each other, whereas
124
redundancy by structural equivalence occurs when two actors are connected to the same others,
thus providing the same information to the focal firm.
In chapter three we test with different measures for the effectiveness of both types of
redundancy and non-redundancy on exploitative and explorative learning. Contrary to our
expectations, most measures point to non-redundancy enhancing exploitative learning. For
explorative learning we did not find conclusive results, although the results point tentatively
towards redundancy spurring the broadening of the knowledge base. It is also important to mention
that some variables show divergent results for the two types of learning while other variables � like
network hierarchy � indicate that the effect goes in the same direction for both of them. A variable
like �pattern of partner sharing� indicates (contrary to most other results) that redundancy fosters
exploitative learning, not explorative learning. In chapter four we introduce yet another measure of
redundancy, which is also based on cohesion. However, this redundancy measure differs from the
others in that it adds the components of the ego-network as a new dimension of redundancy The
analysis in chapter four finds that redundancy is positively and curvilinearly related to a firm�s
exploitative patent intensity. Some redundancy in the partners of the ego-network therefore
stimulates the deepening of the technology base, but only up to a maximum. We did not find a
significant result for the effect of redundancy between direct partners and explorative learning.
In short, we have mixed results for the impact of redundancy on both exploitative and
explorative learning. There are significant differences between exploitative and explorative
learning, but the signs of the coefficients are not always as expected. From these different findings
we may conclude though that redundancy is a subtle concept that has many dimensions as explored
by the different �redundancy� variables in chapters three and four. There are more dimensions to
redundancy which need to be considered in the measurement of its effects than was assumed so far
in the hypotheses. The question why non-redundancy is not favorable for companies exploring new
technological areas as was suggested by the hypotheses in chapter three could be raised. One
possible explanation is that detecting new technologies and getting access to them is different from
the evaluation and assimilation process. The question here is what firms do when they want a fuller
understanding and want to move beyond �detection phase� towards evaluation and assimilation of
new technologies. In an �explorative� setting knowledge is new and highly tacit. This requires
triangulation which can only be obtained from redundant, multiple sources (Duysters and
Hagedoorn, 2003; Gilsing, 2003; Nooteboom and Gilsing, 2004). In exploitation on the other hand,
knowledge is (more) codified, there is more stability through a dominant design and contingencies
can be better foreseen. Because of this redundancy can be reduced. These arguments are in line
with our empirical results. As a result, further research should have a closer look at technological
125
exploration in its different phases. We probably have looked too narrowly at the first phases where
companies detect and get access to new technologies. Assimilation and integration of new
technologies most likely require more redundant network structures. This is clearly an interesting
area for future research.
Technological capabilities partners
So far, we explained different aspects of the alliance network structure which are important in
explaining an optimal alliance portfolio. Stuart (2000) suggests that not only the network structure
but also the characteristics of the focal firm�s alliance partners matter.
In the second chapter we tested for one such characteristic, i.e. the previous technological
capabilities of the partners. We used the patent portfolio of the partnering companies and tested for
its effect on the innovative performance of the focal companies. The measured effect was not
significant. However, this may be caused due to the fact that we used a measure that averages the
innovative performance of all the partners in the network. A more refined measure will probably be
more effective in order to test for a relation between the success of the alliance partner�s innovative
performance and the focal firm�s performance.
In the third chapter we used the average technological distance between the partners of the
focal firm as a control variable. Ahuja (2000a) argues that larger technological diversity between
the firm�s partners generates structural holes in a focal firm�s alliance network. Moreover, if
partners are highly heterogeneous in their technology base, collaboration is unlikely because they
do not have the required absorptive capacity to learn from each other (Cohen and Levinthal, 1989;
Lane and Lubatkin, 1998; Stuart, 1998). In this way, structural hole measures might reflect the
negative impact of technological distance between its allies rather than social structural effects. The
results suggest that partnering with companies that have a similar technological profile is likely to
play a stimulating role in external technology acquisition within technological areas in which the
company already has some expertise. When a company intends to strengthen its existing
technology base it should carefully choose partners with similar technology profiles. However, we
did not find that technological distance has an impact on the broadening of companies� technology
base. Explorative learning is almost by definition more experimental and uncorrelated technology
profiles of a company�s partners will not harm the innovative performance of the focal firm. We
126
may conclude that it is advantageous to carefully select alliance partners who have a similar
technology profile when a company intends to strengthen its technology base. This is no longer true
for companies that intend to experiment with technological areas beyond their technology base:
allying with partners with quite different or similar technology profiles will not influence the
success of the company�s technological diversification strategy.
In short, we discussed that internal learning and external learning should be matched. At low levels,
they mutually reinforce each other, at higher levels they become substitutes. Next, we discussed
four dimensions of an alliance portfolio. The portfolio size is, irrespective of the available resources
within the company, dependent on the chosen learning strategy as well as on the extent to which the
partners are connected. Indirect ties are a useful means to scan the environment for new ideas and
technologies, thus enhancing explorative learning. As for redundancy we can conclude that it is a
multi-dimensional concept. There exists no simple one-to-one relationship between (non)
redundancy and the strengthening or broadening of the technology base. The relationship seems to
be more complex and it should be unraveled into different sub-concepts. We distinguished �
parallel with Burt�s (1992) concept of network constraint � two dimensions, i.e. density and
hierarchy. They clearly have a different effect on technological performance. Group membership
(operationalized by �pattern of group membership�, Walker et al. (1997)) also seems to play a role
in determining the technological innovative performance of companies. This is in line with recent
research about the impact of block membership on companies� technological performance
(Lemmens, 2003). Increasing technological distance is detrimental for exploitative learning, while
the difference in technology base between partners is not important in explorative learning.
The results of the analyses cannot directly be translated into management lessons about the
optimum composition of an alliance portfolio. Portfolio composition, scale and scope economies in
building an alliance portfolio, the renewal of a portfolio that gradually becomes obsolete through
external technological trends or disruptive technologies: they are all topics that are extremely
interesting. However, we did not spend attention to it because we had to restrict our attention to a
few narrow research topics. In the next section we will discuss some limitations of this thesis.

127
LIMITATIONS AND AVENUES FOR FUTURE RESEARCH
Methodological issues
We use panel data in the three chapters and the unit of observation is the �firm-year� in each one of
them. This has a number of consequences. First, we used rough measures for the overall
technological innovative performance as dependent variables in the tests. The number of new
patents (exploitative or explorative) and the patent intensity give us an indication of how alliance
portfolios enhance the technological learning of companies. However, these measures did not
provide us with an idea of the distribution or internal composition of the alliance portfolios. Some
groups of alliances might be much more important than others for the competitive advantage of a
firm. So far, we did not differentiate different groups of alliances from each other which may be
necessary to have a full understanding of alliance portfolio management.
Whereas we used patents extensively in our study, both in the dependent variables and in
the independent variables, we did not put weights to the importance of these patents. This would,
however, be more accurate, since not every patent contributes to learning in the same way. With the
use of patent citations, i.e. the citation of one patent to the other to indicate on what knowledge the
new patent is based, we could measure the �importance� of a patent. A company in the possession
of an often cited patent will have highly relevant technological knowledge in-house. Therefore this
firm may be more attractive as a potential alliance partner than other firms. Thus, dependent
variables based on the quantity of patents can be refined by weighting the patents.
Next, we only could take care of averaged independent variables. Take technological
distances between partners as an example. Although the average of technological distances between
partners may be the same for two focal companies, the distribution (or variance) of these
technological distances may be very different. Our study draws conclusions based on the average of
technological distances but it is clear that also other characteristics of the partners and their
technological profiles might be interesting dimensions to study.
As for the measures we used, there are some more possibilities to improve our current
study. First of all, the dichotomous nature of our exploitative learning/explorative learning
dependent variable confines our methods of analysis. A continuous variable measuring the extent to
which knowledge accumulation is exploitative or explorative would allow for more types of
regression methods. So far, we had no indication whether or not the �explorative� patent class in
128
which a company was granted a patent, is in technological terms closely related to the other classes
in which the company is already active. The �proximity� of patent classes can be measured (Jaffe,
1986, 1989; Verspagen, 1997) and one can calculate the level of exploration of a company�s
patents in a particular year compared to its current patent portfolio. Instead of having separate
regressions for exploitative and explorative patents, one could simply measure the impact of
different regressors on the �level of exploration�. Furthermore, we made no distinction between
technologies that are new to a firm but may have been in existence earlier and those that have never
been explored before by any other firm � i.e. the difference between novel technologies and nascent
or emerging technologies (Ahuja and Lampert, 2001). Exploration means something different in
both situations and successful alliance strategies will obviously differ. Another possible area that
deserves attention is that a firm�s experience in the past with the creation of explorative patents
(and not only the total number of patents) is likely to generate expertise in exploring new
technological fields � compared to companies that stick to their existing technological
competencies. This routine-based argument suggests that splitting up the number of patents in the
past into an explorative and an exploitative part should allow us to analyze the impact of the
experience of companies with �explorative strategies� on their efficiency in exploring new
technological fields. The same argument may, of course, hold for companies specializing in the
strengthening of the existing technological base.
Conceptual issues
Central to the topic of discussion in this thesis is external learning. In chapter two the reinforcing
and moderating effect between internal and external learning on technological performance is
studied. Chapters three and four build further on this argument by examining how network
positions resulting from the external learning of a set of companies influence the learning process
of these firms. Therefore, external learning is a common theme in the three chapters of this thesis.
However, we limited the study to the effects of alliances exclusively. There are more ways of
external technological knowledge acquisition, however. Traditionally, mergers and acquisitions
were regarded another potential way of acquiring knowledge externally. Research has shown,
though, that mergers and acquisitions did not always result in the efficient knowledge transfer
(Vanhaverbeke et al., 2002; Hennart and Reddy, 1997). Recently attention has been drawn to new
129
forms of corporate external venturing. This implies companies set op a venture capital fund to
stimulate employees to take up internally developed ideas and develop them further in a new
venture. However, the VC-financing is also used increasingly for small investment in emerging
technologies (educational investments in research labs, explorative research at universities, or start-
ups). This allows companies to have an early view on new, emerging technologies that may be
relevant for the firm. These small investments create options for the firm to spin in the external
venture when the idea proves to be successful. It is considered an excellent way to overcome
rigidness of large companies to depart from �common practice�. Next, companies do not need to
take the risk of changing their strategy as long as the success of a new idea is uncertain. Hence,
companies profit more and more from the choice between different modes to explore and absorb
externally developed technologies. Alliances are only one mode to acquire externally developed
technologies and the choice is certainly no longer one between strategic alliances and M&As
(Chesbrough, 2003; Van de Vrande et al., 2004)
Next, we made no distinction between the different types of alliances. We do not distinguish
between equity and non-equity alliances, or any other typology that might have refined the analysis.
We do believe though that such a classification would be useful when studying firm�s learning
strategies. Exploitative learning will require a different composition of alliance portfolios with
respect to alliance types than does explorative learning. We focused only on the redundancy of the
information in a firm�s alliance network. We did not pay attention to the strength of the ties: there
is empirical evidence that the value of strong and weak ties depends on the type of learning
(Hansen et al., 2001; Rowley et al., 2000). Combining the strength of the alliances and the
redundancy in the alliance network opens up new research avenues that go beyond the scope of this
thesis. Rowley et al. (2000) suggest and find evidence that strong ties are especially important for
the purpose of exploitation. They argue that weak ties are advantageous in case a company intends
to explore new technologies. The need for weak ties has been observed in industries that are
characterized by rapid technological changes (Afuah, 2000). Future research might make use of the
combination of the strength of ties and their degree of redundancy in order to explain their value in
strengthening and broadening a company�s technology base.
Relative network positions of the focal firm and its partners may result in an interesting
study as well. Again we believe that both types of learning require different sets of relative network
positions. The relative positions of the focal firm and the partnering firms may have an effect on the
technological learning of the focal firm. A centrally positioned firm has different opportunities as
well as different requirements for an alliance portfolio, compared to a firm which operates in the
periphery of the same alliance network. Also, the strategy a firm wishes to pursue determines to a
130
great extent the requirements of a portfolio. Two equally positioned firms will have different results
if their alliance portfolio differs in network positions of partners. When the focal firm is centrally
positioned and has alliance partners that are also centrally positioned this might lead to different
results than when an equally centrally positioned firm chooses to team up with peripheral players.
Similarly, focusing on the technology profiles of both the focal firm and the partners may be
considered as a natural extension of our research (see also Yao, 2003)
Another issue we neglected to take into account in our study is the stages of the technology
life cycle in which companies under study operate. Neither did we take into account the
development stage (embryonic, growth, mature, aging) of the industries at study. We believe,
however, that different stages of the technology life cycle put different demands on the portfolio
structure of a company as well as influence the network structure in which the company operates.
The neglect of the development or evolution of industries brings along another issue,
namely disruptive technologies. These have an effect on the evolution of alliance networks (Gulati
and Gargiulo, 1999). As such, disruptive technologies play a role in the technological capability
process as well. Firms need to react to technological continuities in order to maintain or possibly
build a competitive position. Various authors picked up the topic of corporate strategies related to
disruptive technologies (Tushman and Andersen, 1986; Bower and Christensen, 1995; Christensen
and Overdorf, 2000; Christensen et al., 2000). Also, a number of authors dealt with the evolution of
networks (Gulati and Gargiulo, 1999; Baum et al., 2002). However, both groups of authors
neglected the effect of technological discontinuities on alliance networks.
Future research on the dyadic level (dyad-year as unit of observation) could also
complement the firm level analysis about the relationship between technological resources and
alliance networks. An analysis on the dyadic level allows us to focus on the question how the
probability of the formation of new alliances is affected by (the difference between) the existing
technological capital of the allying companies. Hence, this opens up the possibility to explore the
opposite causality � from technology performance to alliance network structuring � as has been
suggested in the introduction of this thesis.
We have already mentioned that technological distance among partners as well as between
the partners and the focal firm are likely to play a role in the structuring of the alliance network
(Yao, 2003). It might be interesting to observe in how far technology and the technological profiles
of players determine the network structure of an industry. Next, do technology profiles determine
network positions? Companies with a large stock of technological resources are highly attractive as
potential alliance partners if companies enter alliances to get access to other firms� technology.
Also, a company with specialized technological know-how may become interesting as this know-
131
how becomes increasingly important in a sector, thus moving a peripheral player to a more central
network position. This is in particular true in situations where new, disruptive technologies emerge
and force companies to reshape their alliance portfolio. And can a firm obtain a desired network
position by reshaping its technology profile? This view is based more on the attractiveness of
players within an industry than on the conscious partner selection of the focal firm itself though.
This is part of ongoing research about disruptive technologies and the evolution of network
structure as has been explored by Vanhaverbeke et al. (2003).
The above presumed effect of the technological profile of a company on network structure
combined with the findings of this thesis that network structure has an effect on learning implies
technological learning, technology profiles and network structure should be modeled dynamically.
Simple one-directional models are no longer sufficient in such settings. This also means that the
modeling of the empirical research will take a different shape, where structural equation modeling
(e.g., LISREL) may be one way to explore these multiple interactions between companies.

132
133
REFERENCES
Abernathy, W. and K. Clark, 1985, �Innovation: mapping the winds of creative destruction�,
Research Policy, 14, pp. 3-22.
Acs, Z. and D.B. Audretsch, �Patents as a measure of innovative activity�, Kyklos, 4, pp.171-180.
Acs, Z. and D.B. Audretsch, 1991, �Innovation in large small firms: An empirical analysis�,
American Economic Review, 78, pp. 678-690.
Afuah, A., 2000, �How much do your co-opetitors� capabilities matter in the face of technological
change?�, Strategic Management Journal, Special Issue, 21, pp. 387�404.
Ahuja, G., 2000a., �Collaboration Networks, structural holes, and innovation: A longitudinal
study�, Administrative Science Quarterly, 45, pp. 425-455.
Ahuja, G., 2000b, �The duality of collaboration: inducements and opportunities in the formation of
interfirm linkages�, Strategic Management Journal, 21, pp. 317-343.
Ahuja, G. and C.M. Lampert, 2001, �Entrepreneurship in the large corporation: A longitudinal
study of how established firms create breakthrough inventions�, Strategic Management Journal,
22, pp. 521-543.
Ahuja, G., and R. Katila, 2001, �Technological Acquisitions and the Innovation Performance of
Acquiring Firms: a Longitudinal Study�, Strategic Management Journal, 22, pp. 197-220.
Albert M., D. Avery, F. Narin and P. McAllister, 1991, �Direct validation of citation count as
indicators of industrially important patents�, Research Policy, 20, pp. 251-259.
Aspden, H., 1983, �Patent Statistics as a measure of technological vitality�, World Patent
Information, 5, pp. 170-173.
134
Bae, J. and M. Gargiulo, 2003, �Local action and efficient alliance strategies in the
Telecommunications Industry�, INSEAD working paper.
Basberg, B.L., 1987, �Patents and measurement of technological change: A survey of the
literature�, Research Policy, 16, pp. 131-141.
Baum, J.A.C. and C. Oliver, 1991, �Institutional linkages and organizational mortality�,
Administrative Science Quarterly, 63, pp. 187-218.
Baum, J.A.C., T. Calabrese and B. Silverman, 2000, �Don�t go it alone: Alliance network
composition and start ups� performance in Canadian biotechnology�, Strategic Management
Journal, 20, pp. 267-294.
Basberg, B.L., 1987, �Patents and measurement of technical change: A survey of the literature�,
Research Policy, 16, pp. 131-141.
Borgatti, S. P., M..G. Everett and L.C. Freeman, 2002, Ucinet 6 for Windows, Harvard: Analytic
Technologies.
Borgatti, S. P., C. Jones and M.G. Everett, 1998, �Network measures of social capital�,
Connections, 21, pp. 20-36.
Bourdieu, P. and L.J.D. Wacquant, 1992, An invitation to reflexive sociology, Chicago, IL:
University of Chicago Press.
Bower, J.L. and C.M. Christensen, 1995, "Disruptive technologies: Catching the wave", Harvard
Business Review, January-February, pp. 43-53.
Burt, R. S., 1983, Range. In: Applied Network Analysis, R.S. Burt and M.J. Minor (eds.), Beverly
Hills: Sage Publications: pp. 176-194.
Burt, R.S., 1991, Structure. Version 4.2. New York: Center for the Social Sciences, Columbia
University.

135
Burt, S., 1992a, Structural holes: The social structure of competition, Harvard University Press,
Cambridge, MA.
Burt, R. S., 1992b, �The social structure of competition�, in: Networks and organizations:
Structure, form and action, N. Nohria and R. Eccles (eds.), Boston: Harvard Business School Press:
57-91.
Burt, R.S., 1997, �The contingent value of social capital�, Administrative Science Quarterly, 42,
pp. 339-365.
Burt, R. S., 1998, �The network structure of social capital�, Paper presented at the Social Network
and Social Capital Conference, Duke University, Durham, NC.
Burt, R. S., 2000, �The network structure of social capital�, in: Research in Organizational
Behavior, R. I. Sutton and B. M. Straw (eds.), Greenwich, CT: JAI Press, 22, pp. 345-423.
Cantwell, J. and C. Hodson, 1991, �Global R&D and UK competitiveness�, in: Global Research
Strategy and International Competitiveness, M. Casson (ed.), Oxford, Blackwell, pp. 133-182.
Chesbrough, H., 2003, Open innovation: The new imperative for creating and profiting from
technology, Harvard Business School Press, Harvard:MA.
Christensen, C.M. and M. Overdorf, 2000, �Meeting the challenge of disruptive change�, Harvard
Business Review, March-April, pp. 66-76.
Christensen, C.M., R.M.J. Bohmer, and J. Kenagy, 2000, "Will Disruptive Innovations Cure Health
Care?", Harvard Business Review, September-October 2000, pp. 102-117.
Chung, S., H. Singh and K. Lee, 2000, �Complementarity, status similarity, and social capital as
drivers of alliance formation�, Strategic Management Journal, 21, pp. 1-22.
Cockburn, I.M. and R.M. Henderson, 1998, �Absorptive capacity, co-authoring behavior, and the
organization of research in drug discovery�, Journal of Industrial Economics, 64, pp. 157-162.
136
Cohen, W.M. and R. Levin, 1989, �Empirical Studies of Innovation and Market Structure�, in:
Handbook of Industrial Organization (II), R. Schmalensee and R.D. Willig (eds.) , Elsevier,
Amsterdam, pp. 1059-1107
Cohen, W.M. and D.A. Levinthal, 1989, �Innovation and learning: The two faces of R&D�,
Economic Journal, 99, pp. 569-596.
Cohen, W.M. and D.A. Levinthal, 1990, "Absorptive capacity: A new perspective on learning and
innovation", Administrative Science Quarterly, 35, pp.128-152.
Coleman, J.S., 1988, �Social capital in the creation of human capital�, American Journal of
Sociology, 94, pp. S95-S120.
Coleman, J.S., 1990, Foundations of social theory, Cambridge, MA :Harvard University Press.
Conner, K., and C.K. Prahalad, 1996, �A resource-based theory of the firm: Knowledge versus
opportunism�, Organization Science, 7, pp. 477-501.
Contractor, F. and P. Lorange (eds.), 1988, Cooperative Strategies in International Business,
Lexington, MA: Lexington Books.
Dosi, G., (1988), �Sources, procedures, and microeconomic effects of innovation�, Journal of
Economic Literature, 26, pp. 1120-1171.
Duysters, G.M. and J. Hagedoorn, 1993, The Cooperative Agreements and Technology Indicators
(CATI) Information System, MERIT: Maastricht, 19 p.
Duysters, G.M. and J. Hagedoorn, 1996, �External appropriation of innovative capabilities: The
choice between strategic partnering and mergers and acquisitions�, MERIT working paper, 2/96-
021, 36 p.
Duysters, G.M. and J. Hagedoorn, 2000, �Core competencies and company performance in the
world-wide computer industry�, Journal of High Technology Management Research, 11.
137
Duysters, G.M., J. Hagedoorn and C.E.A.V. Lemmens, 2003, �The Effect of Alliance Block
Membership on Innovative Performance�, Revue d�Économie Industrielle, Special Issue on �La
Morphogénèse des Réseaux�, 103, 2nd and 3rd trimester 2003.
Duysters, G.M. and C.E.A.V. Lemmens, 2003, �Cohesive subgroup formation: enabling and
enforcing factors in strategic technology alliance networks�, International Studies on Management
and Organisation, 33, pp. 49-68 .
Duysters, G.M. and A.P. de Man, 2003, �Transitory Alliances: an Instrument for Surviving
Turbulent Industries�, R&D Management, 33, pp. 49-58.
Duysters, G.M., R. Guidice, B. Sadowski, and A. Vasudevan, 2001, �Inter Alliance Rivalry,
Theory and Application to the Global Telecommunications Industry�, in: International Business
and its European Dimensions, M. Hughes (ed.), MacMillan, London.
Everett, M.G. and S.P. Borgatti, 1998, �Analyzing clique overlap�, Connections, 21, pp. 49-61.
Foster, R., 1986, Innovation: The attackers advantage, Summit Books: New York.
Freeman, L.C., 1979, �Centrality in Networks: I. Conceptual Clarification�, Social Networks, 1, pp.
215-239.
Gabbay, S.M. and E.W. Zuckerman, 1998, �Social capital and opportunity in corporate R&D: The
contingent effect of contact density on mobility expectations�, Social science Research, 27, pp.
189-217.
Garcia-Pont, C. and N. Nohria, 1999, �Global versus local mimetism: How strategic networks get
built�, paper presented at the Strategic Management Society�s Special Issue Conference on
Strategic Networks.
Gilsing, V.A., 2003, Exploration, Exploitatation and Co-evolution in Innovation networks, PhD-
thesis, ERIM, Rotterdam School of Management, Erasmus University, Rotterdam.

138
Gomes-Casseres, B., 1996, The alliance revolution: The new shape of business rivalry, Harvard
university Press, Cambridge, MA.
Granovetter, M., 1973, �The strength of weak ties�, American Journal of Sociology, 78, pp. 1360-
1380.
Granovetter, M., 1985, �Economic Action and Social Structure: The Problem of Embeddedness�,
American Journal of Sociology, 91, pp. 481-510.
Granovetter, M., 1992, �Problems of explanation in economic sociology�, in: Networks and
Organizations: Structure, Form and Action, N. Nohria and R.G. Eccles (eds.), Boston: Harvard
Business School Press
Grant, R. A., 1997, �Toward a knowledge-based theory of the firm�, Strategic Management
Journal, 17, Winter Special Issue, pp. 109-122.
Grant, R.M and C. Baden-Fuller, 1995, �A knowledge-based theory of inter-firm collaboration�,
Academy of management Best Paper Proceedings, pp. 17-21.
Griliches, Z., 1979, �Issues in assessing the contribution of research and development to
productivity growth�, Bell Journal of Economics, 10, pp. 92-116.
Griliches, Z., 1984, Patents and productivity, NBER: Chicago, IL.
Griliches, Z., 1990, �Patent statistics as economic indicators: A survey�, Journal of Economic
Literature, 27, pp. 1661-1707.
Grindley, P.C. and D.J. Teece, 1997, "Managing intellectual capital: Lisensing in semiconductors
and electronics", California Management Review, 39, pp. 8-41.
Gulati, R., 1995a, �Does familiarity breed trust? The implications of repeated ties for contractual
choice in alliances�, Academy of Management Journal, 38, pp. 85-112.
139
Gulati, R., 1995b, �Social structure and alliance formation patterns: A longitudinal analysis�,
Administrative Science Quarterly, 40, pp. 619-652.
Gulati, R., 1999, �Network location and learning: The influence of network resources and firm
capabilities on alliance formation�, Strategic Management Journal, 20, pp. 397-420.
Gulati, R. and M. Gargiulo, 1999, �Where do interorganizational networks come from?�, American
Journal of Sociology, 104, pp. 1439-93.
Hagedoorn, J., 1996, �Trends and patterns in strategic technology partnering since the early
seventies�, Review of Industrial Organization, 1, pp. 601-616.
Hagedoorn, J. and J. Schakenraad, 1994, �The effect of strategic technology alliances on company
performance�, Strategic Management Journal, 15, pp. 291-309.
Hagedoorn, J. and G.M. Duysters, 2002, �Learning in dynamic inter-firm networks � The efficacy
of quasi-redundant contacts�, Organization Studies, 23, pp. 525-548.
Hamel, G.P., 1991, �Competition for competence and interpartner learning within international
strategic alliances�, Strategic Management Journal, Summer Special Issue, 12, pp. 83-103.
Hamel, G.P., Y. Doz, and C.K. Prahalad, 1989, �Collaborate with your competitors and win�,
Harvard Business Review, 67, pp. 133-139.
Hansen, M.T., 1999, �The search-transfer problem: The role of weak ties in sharing knowledge
across organization subunits�, Administrative Science Quarterly, 44, pp. 82-111.
Hansen, M.T., J.M. Podolny, and J. Pfeffer, 2001, �So many ties, so little time: A task contingency
perspective on corporate social capital�, Research in the Sociology of Organizations.
Harianto, F. and J. Pennings, 1990, �Technological innovation through interfirm linkages�, in:
Strategic Management in High Technology Firms, M. Lawless and L. R. Gomez-Mejia (eds.), JAI
Press, Greenwich, CT: 15�41.

140
Harrigan, K.R., 1985, Strategies for joint ventures, Lexington Books, Lexington, MA.
Haunschild, P.R., 1993, �Interorganizational imitation: The impact of interlocks on corporate
acquisition activity�, Administrative Science Quarterly, 38, pp. 564-592.
Hausman J., B. Hall and Z. Griliches, 1984, �Econometric models for count data with an
application to the patents-R&D relationship�, Econometrica, 52, pp. 909-938.
Heckman, J.J. and G.J. Borjas, 1980, �Does unemployment cause future unemployment:
definitions, questions, and answers from a continuous time model of heterogeneity and state
dependence�, Econometrica, 48, pp. 247-283.
Henderson, R. and I. Cockburn, 1996, �Scale, scope and spillovers: the determinants of research
productivity in drug discovery�, Rand Journal of Economics, 27, pp. 32-59.
Hennart, J.F., and S. Reddy, 1997, �The choice between mergers/acquisitions and joint ventures:
the case of Japanese investors in the United States�, Strategic Management Journal, 18, pp. 1-12.
Hite, J.M. and W.S. Hesterly, 2001, �The evolution of firm networks: From emergence to early
growth of the firm�, Strategic Management Journal, 22, pp. 275-287.
Hoskisson, R, M. Hitt and C.L.W. Hill, 1993, �Managerial incentives and investment in R&D in
large multiproduct firms�, Organization Science, 4, pp. 325-341.
Hoskisson, R, M. Hitt, and D. Ireland, 1994, �The effects of acquisitions and restructuring
(strategic refocusing) strategies on innovation�, in: The management of corporate acquisitions:
International perspectives, G. Von Krogh, A. Sinatra, and H. Singh (eds.), MacMillan:
Houndsmills, pp. 144-169.
Jaffe, A.B., 1986, �Technological opportunity and spillovers of R&D: Evidence from firms�
patents�, American Economic Review, 76, pp. 984-1001.
Jaffe, A.B., 1989, �Characterizing the �technological position� of firms, with application to
quantifying technological opportunity and research spillovers�, Research Policy, 18, pp. 87-97.
141
Kale, P., H. Singh, and H. Perlmutter, 2000, �Learning and protection of proprietary assets in
strategic alliances: Building relational capital�, Strategic Management Journal, Special Issue, 21,
pp. 217-237.
Khanna, T., R. Gulati, and N. Nohria, 1998, �The dynamics of learning alliances: Competition,
cooperation and relative scope�, Strategic Management Journal, 19, pp. 193-210.
Kim, L., 1998, �Crisis construction and organizational learning: Capability building in cathing-up
at Hyundai Motor�, Organization Science, 9, pp. 506-521.
Kogut, B., 1988, "A study of the life cycle of joint ventures", in: Cooperative Strategies in
International Business, F. Contractor and P. Lorange (eds.), Lexington, MA: Lexington Books, pp.
169-186.
Kogut, B., 1989, �The stability of joint ventures: reciprocity and competitive rivalry�, Journal of
industrial economics, 38, pp. 183-198.
Kogut, B., W. Shan and G. Walker, 1992, �The make-or-cooperate decision in the context of an
industry network�, in: Networks and organizations: Structure, form and actions, N. Nohria and R.
Eccles (eds.), HBSPress: Bosteon MA, pp. 348-365.
Kogut, B. and U. Zander, 1996, �What firms do? Coordination, identity and learning�,
Organization Science, 7, pp. 502-518.
Knoke, D., and J.H. Kuklinski, 1982, Network Analysis, Series: Quantitative Applications in the
Social Sciences, Beverly Hills and London: Sage Publications.
Krackhardt, D., 1992, �The strength of strong ties: The importance of philos in organizations�, in:
Networks and organizations: Structure, form and actions, N. Nohria, and R. Eccles, (eds.), Boston,
MA: Harvard Business School Press.
Lane, P.J. and M. Lubatkin, 1998, �Relative absorptive capacity and interorganizational learning�,
Strategic Management Journal, 19, pp. 461-477.

142
Larson, A., 1992, �Network dyads in entrepreneurial settings: A study of the governance of
exchange processes�, Administrative Science Quarterly, 37, pp. 76-104.
Lei, D., M.A. Hitt, and R. Bettis, 1996, �Dynamic core competencies through meta-learning and
strategic context�, Journal of Management, 22, pp. 549-569.
Lemmens, C.E.A.V., 2003, Network Dynamics and Innovation: The effects of social embeddedness
in technology alliance blocks, PhD-thesis, Eindhoven Centre for Innovation Studies, Eindhoven
University of Technology
Leonard-Barton, D. 1992, �Core capabilities and core rigidities: A paradox in managing new
product development�, Strategic Management Journal, Summer Special Issue, 13, pp. 111-125.
Leonard-Barton, D., 1995, The Wellsprings of Knowledge, Cambridge, MA: Harvard Business
School Press.
Levin, R.C., W.M. Cohen and D.C. Mowery, 1985, �R&D appropriability, opportunity and market
structure�, American Economic Review, 75, pp. 20-24.
Levinthal, D.A. and J.G. March, 1981, �A model of adaptive organizational search�, Journal of
Economic Behavior and Organization, 2, pp. 207-233.
Levinthal, D.A. and J.G. March, 1993, �The myopia of learning�, Strategic Management Journal,
Winter Special Issue, 14, pp. 95-112.
Levitt, B. and J.G. March, 1988, �Organizational Learning�, Annual Review of Sociology, 14, pp.
319-340.
Lunn, J. and S. Martin, 1986, �Market structure, firm structure, and research and development�,
Quarterly Review of Economics and Business, 26, pp. 31-44.
Luce, R. and A. Perry, 1949, �A method of matrix analysis of group structure�, Psychometrika, 14,
pp. 95-116.
143
March, J.G., 1991, �Exploration and exploitation in organizational learning�, Organization Science,
2, pp. 71-87.
McClean, W.J. (ed.), 1985-1998, Status 1999: A report on the integrated Circuit Industry,
Scottsdale, Arizona: Integrated Circuit Engineering Corporation.
McEvily, B. and A. Zaheer, 1999, �Bridging Ties: A Source of Firm Heterogeneity in Competitive
Capabilities�, Strategic Management Journal, 20, pp. 1133-1156.
Mitchell, W. and K. Singh, 1992, �Incumbents� use of pre-entry alliances befor expansion into new
technological subfields of an industry�, Journal of Economic Behavior and Organization, 18, pp.
347-372.
Mitchell, W. and K. Singh, 1996, �Survival of businesses using collaborative relationships to
commercialize complex goods�, Strategic Management Journal, 17, pp. 169-196.
Mizruchi, M.S., 1989, �Similarity of political behavior among American corporations�, American
Journal of Sociology, 95, pp. 401-424.
Mowery, D.C. (ed.), 1988, International collaborative ventures in the U.S. manufacturing,
Cambridge: Ballinger.
Mowery, D.C. and J.E. Oxley, 1995, �Inward technology transfer and competitiveness: The role of
national innovation systems�, Strategic Management Journal, 17, pp. 77-91.
Mowery, D.C, J.E. Oxley, and B.S. Silverman, 1995, �Firm capabilities, technological
complementarity, and interfirm cooperation�, Paper prepared for the conference on technology and
the theory of the firm, University of Reading, May 14-16.
Mytelka, L., 1991, Strategic Partnerships and the World Economy, Pinter Publishers, London.
Nahapiet, J. and S. Ghoshal, 1998, �Social capital, intellectual capital and organizational
advantage�, Academy of Management Review, 23, pp. 242-266.

144
Napolitano, G. and G. Sirilli, 1990, �The patent system and the exploitation of inventions: results of
a statistical survey conducted in Italy�, Technovation, 10, pp. 5-16
Narin, F., E. Noma, and R. Perry, 1987, �Patents as indicators of corporate technological strength�,
Research Policy, 16, pp. 26-48.
Nelson, R.R. and S.G. Winter, 1982, An Evolutionary Theory of Economic Change, MA:Belknap
Press, Cambridge.
Nicholls-Nixon, C.L. and C.Y. Woo, 2003, �Technology Sourcing and Output of Established Firms
in a Regime of Encompassing technological Change�, Strategic Management Journal, 24, pp. 651-
666.
Nohria, N. and C. Garcia-Pont, 1991, �Global strategic linkages and industry structure�, Strategic
Management Journal, 12, pp. 105-124.
Nonaka, I., 1994, �A dynamic theory of organizational knowledge creation�, Organization Science,
5, pp. 14-47.
Nooteboom, B., 1999, Inter-firm alliances: Analysis and design, Routledge, London.
Nooteboom, B., 2000, Learning and innovation in organizations and economics, Oxford University
Press, Oxford.
Nooteboom, B. and V.A. Gilsing, 2004, Density and strength of ties: a competence and governance
view, Working Paper, ECIS 04.01.
Osborn, R.N. and C.C. Baughn, 1990, �Forms of interorganizational governance for multinational
alliances�, Academy of Management Journal, 33, pp. 503-519.
Pakes, A. and Z. Griliches, 1984a, �Estimating distributed lags in short panels with an application
to the specification of depreciation patterns and capital Stock constructs�, Review of Economic
Studies, 51, pp. 243-62.

145
Pakes, A. and Z. Griliches, 1984b, �Patents and R&D at the Firm Level: A first look�, in: R&D,
patents and Productivity, Z. Griliches (ed.), University of Chicago: Chicago, pp. 55-70.
Patel, P. and K. Pavitt, 1991, �Large firms in the production of the world�s technology: an
important case of non-globalization�, Journal of International Business Studies, 22, pp 1-21.
Patel, P. and K. Pavitt, 1995, �Divergence in technological development among countries and
firms�, in: Technical change and the world economy, J. Hagedoorn (ed.), Aldershot, Edward Elgar,
pp. 147-181.
Pavitt, K., 1988, �Uses and abuses of patent statistics�, in: Handbook of Quantitative Studies of
Science and Technology, A.F.J. van Raan, Amsterdam, Elsevier.
Podolny, J.M. and T.A. Stuart, 1995, �A role-based ecology of technological change�, American
Journal of Sociology, 100, pp. 1224-1260.
Powell, W.W., K.W. Koput and L. Smith-Doerr, 1996, �Interorganizational collaboration and the
locus of control of innovation: Networks of learning in biotechnology�, Administrative Science
Quarterly, 41, pp. 116-145.
Rivette, K. and D. Kline, 2000, �Discovering new value in intellectual property�, Harvard Business
Review, January-February, 2000, pp. 54-66.
Rowley, T., D. Behrens and D. Krackhardt, 2000, �Redundant governance structures: An analysis
of structural and relational embeddedness in the steel and semiconductor industries�, Strategic
Management Journal, Special Issue, 21, pp. 369-386.
Sahal, D., (1985), �Technological guideposts and innovation avenues�, Research Policy, 14, pp.
61-82.
Shan, W., 1990, �An empirical analysis of organizational strategies by entrepreneurial high-
technology firms�, Strategic Management Journal, 11, pp. 129-139.

146
Shan, W., G. Walker and B. Kogut, 1994, �Interfirm cooperation and startup innovation in the
biotechnology industry�, Strategic Management Journal, 15, pp. 387-394.
Shannon, C.E., 1957, �A mathematical theory of communication�, Bell Sytem Technical Journal,
27, pp. 379-423.
Simonin, B. L., 1999, �Ambiguity and the process of knowledge transfer in strategic alliances�,
Strategic Management Journal, 20, pp. 595-623.
Spender, J.C., 1996, �Making knowledge the basis of a dynamic theory of the firm�, Strategic
Management Journal, Winter Special Issue, 17, pp. 45-62.
Stevens, J., 1992, Applied multivariate statistics for the social sciences, Hillsdale, New Jersey:
Lawrence Erlbaum Associates, Publishers.
Stuart, T.E., 1998, �Network positions and propensities to collaborate: An investigation of strategic
alliance formation in a high-technology industry�, Administrative Science Quarterly, 43, pp. 668-
698.
Stuart, T.E., 2000, �Interorganizational alliances and the performance of firms: A study of growth
rates in a high-technology industry�, Strategic Management Journal, 21, pp. 791-811.
Stuart, T.E. and J.M. Podolny, 1996, �Local search and the evolution of technological capabilities�,
Strategic Management Journal, Summer Special Issue, 17, pp. 21-38.
Stuart, T.E., H. Hoang and R. Hybels, 1999, �Interorganizational endorsements and the
performance of entrepreneurial ventures�, Administrative Science Quarterly, 44, pp. 315-349.
Teece, D.J., 1986, �Profiting from technological innovation: Implications for integration,
collaboration, licensing and public policy�, Research Policy, 15, pp. 285-305.
Teece, D.J., 1992, �Competition, cooperation and innovation: Organizational arrangements for
regimes of rapid technological progress�, Journal of Economic Behavior and Organization, 18, pp.
1-25.
147
Teece, D.J., 1998, �Capturing value from knowledge assets: The new economy, markets for know-
how and Intangible assets�, California Management Review, 40, pp. 55-79.
Teece, D.J., G. Pisano, and A. Shuen, 1997, �Dynamic capabilities and strategic management�,
Strategic Management Journal, 18, pp. 509-533.
Tsai, W., 1998, �Strategic linking capability in intra-organizational networks�, Academy of
Management, Best Paper Proceedings.
Tushman, M.L. and P. Anderson, 1986, �Technological discontinuities and organizational
environments�, Administrative Science Quarterly, 31, pp. 439-465.
Utterback, J.M., 1994, Mastering the dynamics of innovation, Harvard Business School Press:
Boston, MA.
Uzzi, B., 1996, �The sources and consequences of embeddedness for economic performance of
organizations: the network effect�, American Sociological Review, 61, pp. 674-698.
Uzzi, B., 1997, �Social structure and competition in interfirm networks: The paradox of
embeddedness�, Administrative Science Quarterly, 42, pp. 35-67.
Vanhaverbeke, W., H. Berends, R. Kirschbaum, and F. De Brabander, 2003, �Knowledge
management challenges in corporate venturing and technological capability building through
radical innovations�, Proceedings of the 10th International product development management
conference, Brussels: 1099-1118.
Vanhaverbeke, W., G. Duysters, J. Hagedoorn, N. Noorderhaven, and B. Nooteboom, 2003,
�Changing technological environments, strategic entrepreneurship and the dynamics of technology
based alliance networks�, Research proposal, Bijzonder Onderzoeksfonds Groot project, Limburg
University Center, Diepenbeek, Belgium
148
Vanhaverbeke, W., G. Duysters, and N. Noorderhaven, 2002, �External technology Sourcing
Through Alliances or Acquisitions: An analysis of the application-specific integrated circuits
industry�, Organizations Science, 13, pp 714-733.
Verspagen, B., 1997, �Measuring Intersectoral Technology Spillovers: Estimates from the
European and US Patent Office Databases�, Economic Systems Research, 9, pp. 47-65.
Von Hippel, E., 1994, �Sticky information and the locus of problem solving: Implications for
innovation�, Management Science, 40, pp. 429-439.
Vrande, V. van de, W. Vanhaverbeke and C. Lemmens , 2004, "Corporate Diversification into
High-Growth Industries: Combining the Role of Internal and External Venturing from A Real
Options Perspective", Paper presented at the EURAM 2nd Preconference for doctoral students
Walker, G., B. Kogut, and W. Shan, 1997, �Social capital, structural holes and the formation of an
industry network�, Organization Science, 8, pp. 109-125.
Wasserman, S. and K. Faust, 1994, Social network analysis: methods and applications, New York:
Cambridge University press.
Williamson, O., 1985, The economic institutions of capitalism: Firms, markets, relational
contracting, Free Press, New York..
Yao, B., 2003, �Assessing the knowledge landscape across firms in alliance networks and its
impact on organizational innovation performance�, Working Paper, Katz Graduate School of
Business - University of Pittsburgh: 30.

149
SAMENVATTING
Technologische innovatie is de laatste decennia steeds belangrijker geworden voor bedrijven. Om
competitief te zijn op de wereldmarkt dienen bedrijven continu te innoveren. Nieuwe technologieën
zijn echter zodanig complex geworden, dat bedrijven steeds vaker samenwerking met partners
zoeken om tot innovatie te komen. Allianties verlagen het risico van innovatie doordat partners
kosten kunnen delen, en vaak het tempo van innovatie verhogen (time-to-market). Daarnaast
hebben bedrijven niet altijd alle benodigde kennis in huis, en het combineren van complementaire
kennis met partners kan leiden tot de beoogde innovatie die anders nooit bereikt zou worden. Ook
kunnen allianties een frisse kijk op zaken bieden, of fungeren als een radarfunctie voor het vinden
van nieuwe ideeën of technologieën. Om een leidende rol te kunnen spelen in de wereldwijde
economie combineren bedrijven derhalve hun technologische kennis.
Dit alles heeft geresulteerd in een sterk groeiend belang van strategische technologie allianties, en
het ontstaan van innovatie netwerken van bedrijven. Samenwerken is echter niet altijd even
gemakkelijk. Voor bedrijven is het vaak moeilijk te bepalen met wie samen te werken.
Partnerkeuze is inherent aan netwerkpositionering, met andere woorden, door zorgvuldig te kiezen
met wie samen te werken kan een bedrijf zelf bepalen welke positie het inneemt in het innovatie
netwerk. De belangrijkste onopgeloste vraag in de literatuur is echter hoe netwerkpositionering het
innovatievermogen in bedrijven beïnvloedt. Hier is tot op heden weinig onderzoek naar gedaan, en
vormt het onderwerp van dit proefschrift. Met andere woorden, in dit proefschrift wordt een
antwoord gezocht op de volgende vraag: wat is het effect van alliantie netwerkstrategieën op de
technologische performantie van bedrijven?
Om te komen tot een antwoord op deze centrale vraag zullen drie aspecten aan de orde komen.
Allereerst is het voor bedrijven belangrijk om de afweging te maken tussen het intern ontwikkelen
van technologische kennis, of het (extern) samenwerken met bedrijven om tot innovatie te komen.
Pas wanneer op deze vraag een antwoord is gegeven kunnen we kijken naar de vraag hoe bedrijven
optimaal gebruik kunnen maken van deze extern geacquireerde technologische kennis. Derhalve zal
als tweede aspect van de centrale vraag worden gekeken naar de optimale positionering van een
bedrijf in een innovatienetwerk met als doel de bestaande kennis te verbreden of te verdiepen.

150
Hierbij wordt vaak een deterministische kijk op zaken genomen. In de literatuur zien we dat
bedrijven relatief weinig invloed kunnen uitoefenen op het netwerk in zijn geheel. Bedrijven
hebben echter wel de mogelijkheid om een bepalende rol in hun directe omgeving te spelen.
Daarom zal als derde en laatste aspect nogmaals worden gekeken naar netwerkpositionering, echter
op een egonetwerk niveau. Dit betekent dat niet meer het netwerk in zijn geheel, met alle indirecte
contacten (contacten van partners), in beschouwing zal worden genomen, maar zal worden gekeken
naar de effectiviteit van netwerkstrategieën op het beïnvloedbare niveau van de directe partners.
Bovengenoemde deelvragen zijn empirisch onderzocht met behulp van twee longitudinale datasets.
Deze datasets bevatten informatie over de alliantieactiviteit en patentactiviteit van de bestudeerde
bedrijven. Het eerste deel van het onderzoek is verricht in de ASIC-industrie (applicatie gerichte
geïntegreerde chips) een tak van de micro-elektronica industrie die zich bezig houdt met het op
maat maken van chips naar klantenwens. De verzamelde data hebben betrekking op 99 ASIC-
gerelateerde bedrijven die geobserveerd werden in de periode tussen 1988 en 1996. Het tweede
deel van het onderzoek is uitgevoerd op een dataset met 116 bedrijven in de chemische industrie,
de auto industrie en de farmaceutische industrie, die geobserveerd werden over een periode van
twaalf jaar, van 1986 tot 1997.
Het eerstgenoemde aspect, de relatie tussen interne R&D en externe acquisitie van technologie, is
in hoofdstuk twee empirisch onderzocht. Hierbij wordt gebouwd op �path-dependency� theorie van
het bedrijf (Teece et al., 1997). Het voortbouwen op bestaande technologische kennis (technisch
kapitaal) werd afgezet tegen het succes van een alliantieportfolio (sociaal kapitaal) in de
internationale ASIC-industrie in de periode 1988-1996. Sterk empirisch bewijs werd gevonden
voor het wederzijds versterkend effect van sociaal en technisch kapitaal bij lage niveaus van
bestaande technologische kennis en alliantie portfolio�s. Bij hogere niveaus van bestaande
technologische kennis en grotere alliantie portfolio�s werken beide vormen van kapitaal als
substituten.
Een andere belangrijke empirische bevinding is het bestaan van twee mogelijke evenwichten die
vertaald kunnen worden als optimale strategieën voor bedrijven om te innoveren: de eerste bestaat
uit een sterke focus op interne ontwikkeling van technologische vaardigheden ondersteund door een
kleine alliantie portfolio. De tweede optimale strategie bestaat uit de opbouw van een sterk alliantie
portfolio ondersteund door een lage mate van interne ontwikkeling van technologische capaciteiten.
Beide strategieën kunnen naast elkaar bestaan in een industrie.

151
Verder werd empirisch bewijs gevonden dat het experimenteren met nieuwe technologieën, zowel
nieuw voor het bedrijf als nieuw voor de industrie, leidt tot verhoogd innovatief succes in de daarop
volgende jaren.
Om een antwoord te vinden op het tweede hoofdaspect van dit proefschrift, hoe bedrijven zich
dienen te positioneren om te komen tot optimale innovatie, wordt technologisch performantie
opgedeeld in het verbreden van technologische kennis (exploratie) en het verdiepen van
technologische kennis (exploitatie). Bij exploitatie zoeken bedrijven naar partners die aanvullende
kennis in huis hebben of R&D kosten willen delen. Daardoor kan er een versnelling plaatsvinden in
termen van time-to-market en kosten (Teece, 1986). Een vereiste om samenwerking succesvol te
laten verlopen is een bepaalde mate van gezamenlijke overlappende kennis, waardoor bedrijven
duidelijk kunnen communiceren en de doelstelling helder gesteld kan worden (Hansen et al., 2001).
Exploratie behelst het zoeken naar nieuwe technologische opportuniteiten. Hier krijgen partners te
maken met kennis die nieuw is, waarbij problemen op voorhand onbekend zijn, en de kennis nog
niet te expliciteren is. Resultaten kunnen niet voorspeld worden, wat het gehele proces (en de
einduitkomst) erg onzeker maakt. In plaats van te concentreren op een van beide strategieën, dienen
bedrijven een balans te vinden tussen exploratie en exploitatie (March, 1991; Chesbrough, 2003).
Dit onderzoek is ingebed in de sociale netwerkliteratuur. Binnen deze academische stroming wordt
al jarenlang een discussie gevoerd tussen aanhangers van twee scholen die beide een verschillend
belang hechten aan de redundantie van contacten. Allereerst zijn er de aanhangers van Burt, die
argumenteert dat contacten die onderling niet verbonden zijn (direct of indirect) unieke informatie
zullen opleveren. Aanhangers van deze theorie vinden dat een bedrijf zich zodanig dient te
positioneren dat het in staat is om door alliantievorming delen van het netwerk met elkaar te
verbinden die op geen andere manier met elkaar verbonden zijn. Dit zou leiden tot een optimale
efficiëntie in de spreiding van relaties.
Coleman�s theorie neemt het tegenovergestelde standpunt in. Aanhangers van deze school beweren
dat onderling verbonden contacten juist leiden tot wederzijds vertrouwen, o.a. door de sociale
controle die hieruit voortvloeit. Er is kortom geen of nauwelijks ruimte voor opportunistisch
gedrag. Daarnaast gaan bedrijven eenzelfde richting uit �denken�, wat meer zekerheid geeft over het
succes van een technologie die nog in de kinderschoenen staat. Immers, wanneer meer bedrijven
aan eenzelfde technologie werken, dan is de kans dat deze technologie steun krijgt groot. De laatste
jaren heeft zich een contingentiestandpunt ontwikkeld dat er voor pleit dat beide theorieën

152
toepasbaar zijn, afhankelijk van de omstandigheden waaronder ze worden toegepast. Ditzelfde
standpunt wordt ook in dit proefschrift ingenomen.
Bovengenoemde discussie impliceert dat bedrijven een keuze dienen te maken tussen het
overbruggen van structurele gaten in het netwerk, of het creëren van sterk samenhangende relaties
om profijt te trekken van sociale controle in het netwerk. Met andere woorden, bedrijven dienen
keuzes te maken over wanneer en hoe gebruik te maken van redundante en niet-redundantie relaties
bij het extern acquireren van technologie.
Het effect van sociaal kapitaal (het gebruik van redundante en niet-redundante contacten) op beide
typen technologisch performantie (kennisverbreding en kennisverdieping) is gemeten met behulp
van een longitudinale dataset die de grootste spelers in de chemische industrie, auto-industrie en
farmaceutische industrie bevat. Er is sterk bewijs gevonden voor het bevorderende effect van zowel
direct als indirecte contacten op technologische performantie van bedrijven. Echter, het effect voor
exploratie is significant hoger.
Ook wordt een matigend effect van directe contacten op indirecte contacten gevonden. Dit
impliceert dat naarmate een bedrijf meer directe contacten heeft, het effect van de indirecte
contacten kleiner wordt. Dit heeft alles te maken met het absorptievermogen van een organisatie. In
feite leidt dit er toe dat een bedrijf kan kiezen tussen twee optimale alliantieportfolio strategieën:
een kleine set van partners die zelf een groot netwerk van allianties hebben, of een grote set van
partners die zelf kleine netwerken hebben.
Het derde aspect dat onderzocht wordt in dit proefschrift is netwerkpositionering op egonetwerk
niveau. Dit niveau is grotendeels genegeerd in de netwerk literatuur en het overige academische
werk. Echter, vanuit bedrijfsstrategisch standpunt is juist dit niveau van groot belang. Het is
namelijk niet vanzelfsprekend dat de partners van een bedrijf de informatie die zij van hun
contacten (dus de indirecte contacten van het bestudeerde bedrijf) binnenkrijgen ook zullen
doorspelen naar het bestudeerde bedrijf. Vooral in multinationals zal de informatie die voortvloeit
uit de ene alliantie een lange tijd nodig hebben tot het terecht komt bij de werknemers die
deelnemen in een andere alliantie. Daarnaast kan een bedrijf niet altijd overzien met welke
contacten een partner samenwerkt, laat staan dat een bedrijf hierop invloed kan uitoefenen. Dit alles
pleit ervoor om netwerkpositionering ook op egonetwerk niveau te bekijken.
Ook bij het bestuderen van dit niveau werd gewerkt met de dataset voor bedrijven in de chemische
industrie, de auto industrie en de farmaceutische industrie. De resultaten van de empirische analyse

153
duiden op een curvilineaire relatie tussen redundantie op het egonetwerk niveau en
innovatievermogen van een bedrijf. Dit betekent dat een toenemende mate van redundantie een
positief effect heeft op innovatieve performantie van bedrijven tot een bepaald niveau. Daarna gaat
toenemende redundantie het innovatievermogen negatief beïnvloeden. Behalve redundantie in de
directe contacten is ook het effect van verbondenheid van partners onderling op de innovatieve
performantie van bedrijven gemeten. Een toenemende mate van verbondenheid beïnvloedt het
innovatievermogen negatief, maar niet altijd significant. Dit gaat in tegen de bovengenoemde leer
van Coleman die claimt dat compacte groepen van goed verbonden partners juist innovatiever
zouden zijn dan andere bedrijven.
Deze resultaten voor de algehele technologische performantie van bedrijven zijn later uitgesplitst
naar het verbreden van technologische kennis en het verdiepen van technologische kennis. Er is
bewijs gevonden dat deze twee typen van technologische ontwikkeling verschillende vormen van
netwerk strategie vereisen. In het geval van het verdiepen van bestaande kennis dient een bedrijf
met name aandacht te schenken aan de redundantie van de directe contacten. Wederom werd een
positieve maar curvilineaire relatie gevonden tussen redundantie en verbreden van kennis, wat
bevestigt dat redundantie een positief effect heeft tot een bepaald maximum. Daarna gaat
redundantie de technologische verdieping nadelig beïnvloeden. De verbondenheid van partners
heeft geen invloed op het verdiepen van kennis. Voor het verbreden van kennis werd een heel ander
verband gevonden. Redundantie in de directe contacten bleek geen significante invloed te hebben,
terwijl verbondenheid van partners het verbreden van kennis nadelig beïnvloed.
In zijn algemeenheid kunnen we concluderen dat door bestudering van de effecten van alliantie
netwerkstrategieën op technologische performantie van bedrijven dit proefschrift zowel een
conceptuele als empirische bijdrage heeft geleverd aan het academische werk en de praktijk van
bedrijven die zoeken naar een optimale balans voor hun innovatiestrategieën.

154
155
ABOUT THE AUTHOR
Bonnie Beerkens was born in Wessem on January 6th, 1975. After completion of the HAVO at
Scholengemeenschap St. Ursula in Horn, she studied Logistic Management at Vervoersacademie,
Fontys Hogeschool in Venlo for one year. Thereafter she started with International Business
Studies at the University of Maastricht, Faculty of Economics and Business Administration where
she specialized in Organization and Strategy. She also studied at Keim Yung University, Daegu,
South-Korea for half a year, as part of an exchange program. In 1998 Bonnie graduated with a final
thesis on �Technology Strategy and Industry Evolution�. In that same year she began working as a
teacher at the University of Maastricht. Bonnie started her PhD at the Eindhoven University of
Technology, Faculty Technology Management, department Organisation Strategy en Marketing in
1999. Currently she is working as a full time academic researcher at the contract center of the
faculty Technology Management at the Eindhoven University of Technology.

156
157
ECIS DISSERTATION SERIES
1. Wynstra, J.Y.F. (10-09-1998). Purchasing involvement in product development. Technische Universiteit Eindhoven, 320 pp.
2. Koops, B.J. (06-01-1999). The crypto controversy. A key conflict in the information
society. SOBU Eindhoven/Tilburg, 301 pp.
3. Timmer, M.P. (18-10-1999). The dynamics of Asian manufacturing. Technische Universiteit Eindhoven, 261 pp.
4. Punt, P.T.I.J. (21-12-2000). Effectieve en robuuste organisatieveranderingen in het
productcreatieproces. Technische Universiteit Eindhoven, 356 pp.
5. Rozemeijer, F.A. (14-09-2000). Creating corporate advantage in purchasing. Technische Universiteit Eindhoven, 251 pp.
6. Wouters, J.P.M. (16-11-2000). Customer service as a competitive marketing instrument: an
industrial supply chain perspective. Technische Universiteit Eindhoven, 264 pp.
7. Bekkers, R.N.A. (15-06-2001). The development of European mobile telecommunication standards. Technische Universiteit Eindhoven, 575 pp.
8. Migchels, N.G. (04-09-2001). The ties that bind. Technische Universiteit Eindhoven, 193
pp.
9. Yamfwa, F.K. (02-10-2001). Improving manufacturing performance in LDC's. Technische Universiteit Eindhoven, 229 pp.
10. Premaratne, S.P. (24-04-2002). Entrepreneurial networks and small business development:
The case of small enterprises in Sri Lanka. Technische Universiteit Eindhoven, 276 pp.
11. Vos, J.P. (18-06-2002). The making of strategic realities: An application of the social systems theory of Niklas Luhmann, Technische Universiteit Eindhoven, 276 pp.
12. Berends, J.J. (07-02-2003). Knowledge sharing in industrial research, Technische
Universiteit Eindhoven, 248 pp.
13. Lemmens, C.E.A.V. (02-12-2003). Network dynamics and innovation: The effects of social embeddedness in technology alliance blocks, Technische Universiteit Eindhoven, 154 pp.
14. Echtelt van, F.E.A. (04-03-2004). New product development: shifting suppliers into gear,
Technische Universiteit Eindhoven, 370 pp.
15. Beerkens, B.E. (15-09-2004). External acquisition of technology. Exploration and exploitation in international innovation networks. Technische Universiteit Eindhoven, 160 pp.

158
16. Nuvolari, A. (23-09-2004). The making of steam power technology: A study of
technological change during the British Industrial Revolution. Technische Universiteit Eindhoven