ENQUIRY INTO SEWAGE PUMP STATION PROBLEMS WITH …€¦ · watervlak, soort ongewenste voorwerpe en...
163
ENQUIRY INTO SEWAGE PUMP STATION PROBLEMS WITH SPECIFIC FOCUS ON REMOVING SOLIDS By Joubert Tulleken Thesis presented in partial fulfilment of the requirements for the degree of Master of Science (Civil Engineering) at Stellenbosch University. Supervisor: Prof HE Jacobs March 2012
Transcript of ENQUIRY INTO SEWAGE PUMP STATION PROBLEMS WITH …€¦ · watervlak, soort ongewenste voorwerpe en...
ENQUIRY INTO SEWAGE PUMP
STATION PROBLEMS WITH
SPECIFIC FOCUS ON REMOVING
SOLIDS
By Joubert Tulleken
Thesis presented in partial fulfilment of the requirements for the degree of Master of
Science (Civil Engineering) at Stellenbosch University.
Supervisor: Prof HE Jacobs
March 2012
i
Declaration
By submitting this thesis electronically, I declare that the entirety of the work contained therein is
my own, original work, that I am the sole author thereof (save to the extent explicitly otherwise
stated), that reproduction and publication thereof by Stellenbosch University will not infringe any
third party rights and that I have not previously in its entirety or in part submitted it for obtaining
any qualification.
Signed:
……………………….. ………………………
Date
Copyright É 2012 Stellenbosch UniversityAll rights reserved
Stellenbosch University http://scholar.sun.ac.za
ii
Abstract
There is a general lack of published research on sewage pump station problems and the removal
of solids in South African sanitary sewers. Research was undertaken to investigate the problems
at sewage pump stations by means of site visits, interviews, literature reviews and laboratory
experiments. An in-depth literature study is presented on sewage pump stations, pump station
problems and solids in sewers. The problems at sewage pump stations were categorised into
identifiable groups with possible generalised solutions. The site visits and literature review
indicated a specific lack of knowledge regarding screening baskets used to remove solids at
sewage pumping stations. This led to the experimental testing of a screening basket on full scale
in a controlled environment to develop an efficiency index for screening baskets. The efficiency
index was determined using fuzzy logic methodology with predetermined solids load, basket
height above the sump level and solids retention time. The fuzzy logic proved that the basket is
best operated halfway submerged, after one hour retention time and with degradable solids in the
system. The literature compiled and problems identified in this study were used as the backbone
for the development of a conceptual Decision Support Tool (DST) for sewage pump stations. The
DST is aimed at requiring limited inputs and providing maximum knowledge output and is
presented as a software tool in MS Excel format. The functionality was added by applying visual
basic applications in MS Excel user forms. The idea of developing a DST is to assist designers,
sewage service providers and operators with understanding the various components and for
problem identification pertaining to sewage pump stations in the future. The DST is relatively
self-explanatory with a user friendly visual interface that is easy to operate. This study sets the
scene for further research into efficiency indices pertaining to different components of sewage
pump stations and their application in comprehensive sewage pump decision support tools.
Stellenbosch University http://scholar.sun.ac.za
Table of Contents iii
J. Tulleken Stellenbosch University
Opsomming
Daar is 'n algemene gebrek aan gepubliseerde navorsing oor probleme met rioolpompstasies en
die verwydering van ongewenste voorwerpe in Suid-Afrikaanse sanitêre rioolsisteme. Navorsing
is gedoen om die probleme by rioolpompstasies te ondersoek deur middel van terreinbesoeke,
onderhoude, literatuurstudie en eksperimente in „n laboratorium. 'n Omvattende literatuurstudie is
op rioolpompstasies, probleme by pompstasies en ongewenste voorwerpe in rioolnetwerke
gedoen. Die probleme by rioolpompstasies is verdeel in identifiseerbare groepe met moontlike
oplossings. Die terreinbesoeke en literatuuroorsig het 'n spesifieke gebrek aan kennis met
betrekking tot skermmandjies, wat gebruik word om ongewenste voorwerpe by rioolpompstasies
te verwyder, aangedui. Dit het gelei tot die eksperimentele toetsing van 'n skermmandjie deur die
volskaalse opstelling in 'n beheerde omgewing om 'n doeltreffendheidsindeks vir skermmandjies
in die praktyk te ontwikkel. Die doeltreffendheidsindeks is bepaal deur gebruik te maak van
“fuzzy logic” metodologie met voorafbepaalde insette naamlik, die mandjie se hoogte bo die
watervlak, soort ongewenste voorwerpe en die tyd wat die voorwerpe aan water blootgestel is.
Die “fuzzy logic” bewys dat die mandjie die beste werking toon, halfpad onder die water, na „n
een uur van blootstelling aan water en met degradeerbare voorwerpe in die stelsel. Die literatuur
wat saamgestel is en probleme wat in hierdie studie geïdentifiseer is, is gebruik as die inhoud vir
die konseptuele “Decision Support Program” (DST) vir rioolpompstasies. Die DST het ten doel
om met beperkte insette die maksimum kennis te verskaf en word aangebied as 'n sagteware
instrument in MS Excel formaat. Die funksionaliteit is bygevoeg deur die toepassing van die
“visual basic applications” in MS Excel gebruikersvorms. Die doel van die ontwikkeling van 'n
DST is om ontwerpers, riooldiensverskaffers en operateurs te help om die verskillende funksies
en probleem-identifikasie met betrekking tot rioolpompstasies te begryp. Die DST is relatief
selfverduidelikend met 'n gebruikers vriendelike visuele koppelvlak wat maklik is om te bedryf.
Hierdie studie bied die basis vir verdere ondersoek na die doeltreffendheidsindekse met
betrekking tot die verskillende komponente van rioolpompstasies en die toepassing daarvan in
omvattende rioolpomp “DSTs”.
Stellenbosch University http://scholar.sun.ac.za

Table of Contents iv
J. Tulleken Stellenbosch University
Acknowledgements
This thesis would not have been possible without the help of my supervisor, Professor
Heinz Jacobs, whose patience and kindness, as well as his academic experience, has been
invaluable to me.
I am extremely grateful to all the Western Cape Municipalities for allowing me to
interview their staff and accompany them on site visits.
I would also like to thank my girlfriend, family and friends for their endless support and
encouragement throughout my postgraduate years, and this thesis would certainly not
have existed without them.
Lastly, I offer my regards and blessings to all of those who supported me in any respect
during the completion of the project.
Stellenbosch University http://scholar.sun.ac.za
Table of Contents v
J. Tulleken Stellenbosch University
Table of Contents
Declaration i
Abstract ii
Opsomming iii
Acknowledgements iv
List of Figures x
List of Tables xiii
Glossary xv
1. Introduction 1
1.1 Background 1
1.2 Objectives 2
1.3 Thesis approach 3
1.4 Definitions 4
2. Literature 6
2.1 Pump station basics 6
2.2 Inlet Works or Preliminary Treatment 9
2.2.1 Screening 9
2.2.2 Grit Removal 10
2.3 Sumps 10
2.3.1 Wet and Dry well (Conventional dry well) 10
2.3.2 Wet well (Self priming pumps) 12
2.3.3 Wet well (Submersible pumps) 12
2.4 Pumps 14
2.4.1 Pump types 14
2.4.1.1 Classification 14
2.4.1.2 Specific speed 14
2.4.1.3 Pump family tree 15
Stellenbosch University http://scholar.sun.ac.za
Table of Contents vi
J. Tulleken Stellenbosch University
2.4.1.4 General features 16
2.4.1.5 Solids handling ability 17
2.4.2 Pump selection 18
2.4.2.1 Pump characteristics 18
2.4.2.2 Pump efficiency 19
2.4.2.3 System characteristics 19
2.4.3 Back-up pumps 21
2.5 Electronics 22
2.5.1 Telemetry and control systems 22
2.5.2 Level meters and wiring 23
2.5.3 Power failure 24
2.6 Structural Elements 25
2.6.1 Layout and Location 25
2.6.2 Equipment 26
2.7 Other Elements 27
2.8 Rising Main 28
2.9 Construction 28
3. Solids in Sewers 29
3.1 Entry points 31
3.2 Flow rates 31
3.3 Composition of Solids in Sewers 33
3.3.1 Rhone-Alpes, France case study 33
3.3.2 Sanitary waste items case study 35
3.3.3 Categories of solids 35
3.4 Screenings Removal Systems (SRSs) 39
3.4.1 Screens 40
3.4.2 Baskets 43
3.4.3 Macerators 43
3.5 Grit removal systems (GRSs) 46
Stellenbosch University http://scholar.sun.ac.za
Table of Contents vii
J. Tulleken Stellenbosch University
3.6 Effects of solids 47
3.7 Small bore systems 47
4. Problems at Pump Stations 49
4.1 Site Visits 50
4.2 Cause of Problems 53
4.2.1 Foreign objects 54
4.2.2 Peak flows and FOG products 56
4.2.3 Design problems 57
4.2.3.1 Sump 57
4.2.3.2 Pump 58
4.2.3.3 Size and layout 58
4.2.4 Maintenance and operation 58
4.2.5 Eskom Power outages 59
4.2.6 Grit accumulation 60
4.2.7 Lack of technology 61
4.2.8 Other 62
4.3 Problem Categories 63
4.3.1 Overflows 64
4.3.2 Odours 65
4.3.3 Operational problems 65
4.3.4 Other problems 67
4.4 Solving the problem 68
4.4.1 Solids 68
4.4.2 Operation and Maintenance 70
4.4.3 Mechanical 70
4.4.4 Safety 72
5. Laboratory Experiment 73
5.1 Methodology and aim 73
5.2 Design 75
Stellenbosch University http://scholar.sun.ac.za
Table of Contents viii
J. Tulleken Stellenbosch University
5.3 Testing phase 81
5.3.1 Solids tested 82
5.3.2 Method 84
5.3.3 Limitations 86
5.4 Results 87
5.4.1 Toilet paper 87
5.4.2 Newspaper and magazine paper 88
5.4.3 Cotton buds 90
5.4.4 Dental floss 92
5.4.5 Stockings 93
5.4.6 Final tests 93
6. Fuzzy logic based efficiency index 97
6.1 Interpretation of results 97
6.2 Fuzzy sets 97
6.3 Degree of membership 98
6.4 Possible applications 99
6.4.1 Developing basic basket efficiency index 99
6.4.2 Extended laboratory experiment application 101
6.4.3 Fuzzy logic applied to the 4 Os of pump stations 103
7. Decision Support Tool Concept 111
7.1 Overview 111
7.2 Development of DST 112
7.2.1 Design aid section 113
7.2.2 Problem aid section 114
7.2.3 Target user 114
7.2.3.1 Main users 114
7.2.3.2 Alternative users 115
7.2.3.3 Future users 116
7.3 Application of DST 116
Stellenbosch University http://scholar.sun.ac.za
Table of Contents ix
J. Tulleken Stellenbosch University
7.3.1 Application of design aid 116
7.3.2 Application of problem aid 120
8. Conclusion 122
8.1 Overview 122
8.2 Main findings 122
8.3 Future research and recommendations 123
8.4 Final conclusion 124
References 125
Appendix A Pumps and Pump Installations I
Appendix B Different Types of Screens IV
Appendix C Field Questionnaire VII
Appendix D Site Visits Data Sheet X
Appendix E Practical Implementation, Lab Experiment Drawings and PhotosI
Appendix F DST Program V
Stellenbosch University http://scholar.sun.ac.za
List of figures x
J. Tulleken Stellenbosch University
List of Figures
Figure 2.1.Pump station categories .................................................................................................. 6
Figure 2.2. Pump station basic components ..................................................................................... 7
Figure 2.3. Different pump stations .................................................................................................. 8
Figure 2.4. Conventional dry well .................................................................................................. 11
Figure 2.5. Installation of conventional dry well pump station ...................................................... 11
Figure 2.6. Self priming pump installation ..................................................................................... 12
Figure 2.7. Submersible pump installation ..................................................................................... 13
Figure 2.8. Pumps Family Tree (Turton, 2002) .............................................................................. 15
Figure 2.9. Pump casing and components (Van Dijk, 2010) .......................................................... 16
Figure 2.10. Screw centrifugal impeller passing a rag (Worthington-Smith, 2011) ...................... 17
Figure 2.11. Definition of the operating point (Haested et al., 2004: 127) .................................... 20
Figure 2.12. Pumps in series and parallel (Vesilind, 2003: 324) .................................................... 20
Figure 2.13. Pumps at Scottsdene (Western Cape) pump station ................................................... 22
Figure 2.14. Control boxes ............................................................................................................. 23
Figure 2.15. Level meter and wiring .............................................................................................. 24
Figure 2.16. Generator and housing unit ........................................................................................ 25
Figure 2.17. Overflow dam ............................................................................................................ 26
Figure 3.1. Hypothetical layout of separate sewer system (Stephenson & Barta, 2005) ................ 29
Figure 3.2 Cotton buds clogging screen (Ashley et al., 2004) ....................................................... 37
Figure 3.3 Types of screens used ................................................................................................... 40
Figure 3.4 Types of screens in practice .......................................................................................... 41
Figure 3.5 Mechanically cleaned screens ....................................................................................... 42
Figure 3.6 Screening baskets .......................................................................................................... 43
Figure 3.7 Macerator at CTIA ........................................................................................................ 44
Figure 3.8 Sand trap and degritter .................................................................................................. 46
Figure 4.1 Object found in sewers .................................................................................................. 53
Figure 4.2 FOG deposits on level probes ....................................................................................... 56
Figure 4.3 Sand used in UDD toilet (Muench, 2008) ..................................................................... 60
Figure 4.4 Debris from baskets just thrown on ground .................................................................. 61
Stellenbosch University http://scholar.sun.ac.za
List of figures xi
J. Tulleken Stellenbosch University
Figure 4.5 Protective gear for working with sewage ...................................................................... 62
Figure 4.6 Summary of sewage pump station problems in Cape Town (Samson, 2011) ............... 63
Figure 4.7 Problems leading to overflows ...................................................................................... 64
Figure 4.8 Problems leading to odours ........................................................................................... 65
Figure 4.9 Problems leading to operational problems .................................................................... 66
Figure 4.10 Other problems at pump stations ................................................................................. 67
Figure 4.11 Think before you flush poster (Ashley et al., 2004: 211) ........................................... 69
Figure 5.1 Screening manhole with screening basket (Strassberger, 2011) ................................... 75
Figure 5.2 Design of screening basket used in experiment ............................................................ 76
Figure 5.3 Top view of lab experiment .......................................................................................... 79
Figure 5.4 Side view of lab experiment .......................................................................................... 79
Figure 5.5 Frot view of lab experiment .......................................................................................... 80
Figure 5.6 Design of laboratory experiment ................................................................................... 80
Figure 5.7 Actual model in laboratory............................................................................................ 81
Figure 5.8 Products tested in experiment ....................................................................................... 83
Figure 5.9 Illustration of different retention times ......................................................................... 85
Figure 5.10 Inlet pipe and basket.................................................................................................... 86
Figure 5.11 Toilet paper caught by basket ..................................................................................... 88
Figure 5.12 Newspaper test results ................................................................................................. 89
Figure 5.13 Magazine paper test results ......................................................................................... 89
Figure 5.14 Newspaper and magazine paper caught by basket ...................................................... 90
Figure 5.15 Results for cotton buds (not a biodegradable product) ............................................... 91
Figure 5.16 Cotton buds ................................................................................................................. 91
Figure 5.17 Results for dental floss ................................................................................................ 92
Figure 5.18 Dental floss caught by basket ...................................................................................... 92
Figure 5.19 Stockings caught by basket ......................................................................................... 93
Figure 5.20 Products for final tests ................................................................................................. 94
Figure 5.21 Results for final test (basket above water) .................................................................. 95
Figure 5.22 Results for final test (basket submerged halfway in water) ........................................ 96
Figure 6.1 Height of basket ............................................................................................................ 98
Figure 6.2 Retention time of solids ................................................................................................ 98
Figure 6.3 Type of solids ................................................................................................................ 99
Stellenbosch University http://scholar.sun.ac.za
List of figures xii
J. Tulleken Stellenbosch University
Figure 7.1 Bodywork of design aid section .................................................................................. 113
Figure 7.2 Target users for DST ................................................................................................... 115
Figure 7.3 DST opening screenshot ............................................................................................. 117
Figure 7.4 Selecting a pump station section ................................................................................. 117
Figure 7.5 Inlet works technologies ............................................................................................. 118
Figure 7.6 Possible screening techniques ..................................................................................... 119
Figure 7.7 Baskets and basket installations .................................................................................. 119
Figure 7.8 Four possible problems for selection .......................................................................... 120
Figure 7.9 Possible causes of overflows ....................................................................................... 121
Figure 7.10 Possible causes of power outages ............................................................................. 121
Figure 8.1 Cost comparison scale ................................................................................................. 123
Stellenbosch University http://scholar.sun.ac.za

List of tables xiii
J. Tulleken Stellenbosch University
List of Tables
Table 2.1. Advantages and disadvantages of centrifugal pumps .................................................... 16
Table 3.1 Advantages and disadvantages of SSS (Stephenson & Barta, 2005) ............................. 30
Table 3.2 Minimum velocities table (Ashley et al., 2004: 253) ..................................................... 32
Table 3.3 Specific gravity of solids ................................................................................................ 33
Table 3.4 Characterization of screenings (Le Hyaric et al., 2009) ................................................. 34
Table 3.5 Disposal habits for most common sanitary items (Ashley & Souter, 1999) .................. 35
Table 3.6 Constituents of screenings (Sidwick, 1984: 29) ............................................................. 36
Table 3.7 Index of solids in sewers ................................................................................................ 38
Table 3.8 Screening device classification (Nozaic & Freese, 2009) .............................................. 41
Table 3.9 Variety of screens and macerators (Vesilind, 2003: 42) ................................................ 45
Table 3.10 Effects of solids in sewers (Ashley et al., 2004: 165) .................................................. 47
Table 3.11 Advantages and disadvantages of SFS‟s ...................................................................... 48
Table 4.1 Lists of pump station visits ............................................................................................. 52
Table 4.2 Effects of solids in sewers .............................................................................................. 54
Table 4.3 Problems with sump design ............................................................................................ 57
Table 4.4 Maintenance problems ................................................................................................... 59
Table 4.5 Problems due to the lack of technology ......................................................................... 61
Table 4.6 Troubleshooting guide (Water Environment Federation, 2008: 8-44) ........................... 70
Table 5.1 Assumptions for laboratory experiment ......................................................................... 74
Table 5.2 Solids tested in experiment ............................................................................................. 82
Table 6.1 Fuzzy sets ....................................................................................................................... 98
Table 6.2 Efficiency index of basket installations ........................................................................ 100
Table 6.3 Assumptions for extended laboratory experiment application ..................................... 101
Table 6.4 Fuzzy sets for extended laboratory experiment ............................................................ 102
Table 6.5 Blockages criteria weights ............................................................................................ 103
Table 6.6 Mechanical failure criteria weights .............................................................................. 104
Table 6.7 Electrical failure criteria weights .................................................................................. 105
Stellenbosch University http://scholar.sun.ac.za

List of tables xiv
J. Tulleken Stellenbosch University
Table 6.8 Peak flow criteria weights ............................................................................................ 106
Table 6.9 Power outages criteria weights ..................................................................................... 107
Table 6.10 Storage failure criteria weights ................................................................................... 107
Table 6.11 Main causes of overflows criteria weights ................................................................. 108
Table 6.12 Fuzzy sets for overflows ............................................................................................. 109
Stellenbosch University http://scholar.sun.ac.za

Glossary xv
J. Tulleken Stellenbosch University
Glossary
BEP Best Efficiency Point
CCP Critical Control Point
CFD Computational Fluid Dynamics
CSIR Council of Scientific and Industrial Research
CSO Combined Sewer Overflow
CSS Combined Sewer System
DST Decision Support Tool
FOG Fats Oils and Grease
NPSHA Net Positive Suction Head Available
NPSHR Net Positive Suction Head Required
SAICE South African Institution of Civil Engineering
SG Specific Gravity
SHD Solids Handling Device
SRS Solids Removal System
SSO Sanitary Sewer Overflow
SSS Separate Sewer System
UDD Urine Diversion Dry
WRC Water Research Commission
WWTP Wastewater Treatment Plant
Stellenbosch University http://scholar.sun.ac.za
Introduction Page 1
J. Tulleken Stellenbosch University
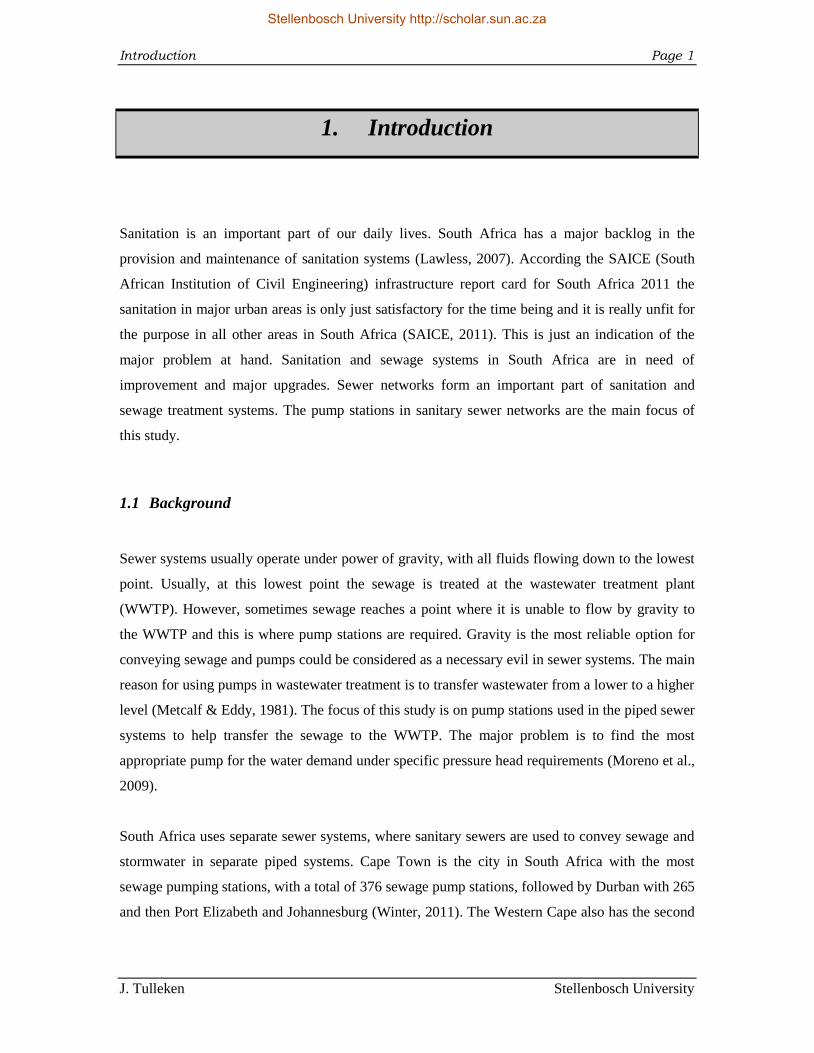
1. Introduction
Sanitation is an important part of our daily lives. South Africa has a major backlog in the
provision and maintenance of sanitation systems (Lawless, 2007). According the SAICE (South
African Institution of Civil Engineering) infrastructure report card for South Africa 2011 the
sanitation in major urban areas is only just satisfactory for the time being and it is really unfit for
the purpose in all other areas in South Africa (SAICE, 2011). This is just an indication of the
major problem at hand. Sanitation and sewage systems in South Africa are in need of
improvement and major upgrades. Sewer networks form an important part of sanitation and
sewage treatment systems. The pump stations in sanitary sewer networks are the main focus of
this study.
1.1 Background
Sewer systems usually operate under power of gravity, with all fluids flowing down to the lowest
point. Usually, at this lowest point the sewage is treated at the wastewater treatment plant
(WWTP). However, sometimes sewage reaches a point where it is unable to flow by gravity to
the WWTP and this is where pump stations are required. Gravity is the most reliable option for
conveying sewage and pumps could be considered as a necessary evil in sewer systems. The main
reason for using pumps in wastewater treatment is to transfer wastewater from a lower to a higher
level (Metcalf & Eddy, 1981). The focus of this study is on pump stations used in the piped sewer
systems to help transfer the sewage to the WWTP. The major problem is to find the most
appropriate pump for the water demand under specific pressure head requirements (Moreno et al.,
2009).
South Africa uses separate sewer systems, where sanitary sewers are used to convey sewage and
stormwater in separate piped systems. Cape Town is the city in South Africa with the most
sewage pumping stations, with a total of 376 sewage pump stations, followed by Durban with 265
and then Port Elizabeth and Johannesburg (Winter, 2011). The Western Cape also has the second
Stellenbosch University http://scholar.sun.ac.za
Introduction Page 2
J. Tulleken Stellenbosch University
most WWTPs with 164 plants, after Kwazulu Natal which has 196 plants. The focus area of the
investigations conducted for this study was the Western Cape.
Population growth and environmental concerns impose increasing demand for pumping sewage.
Pump stations have many challenges and hazards to overcome. This is a very important field and
one that is often neglected by municipalities.
Pump stations are very sensitive when it comes to the handling of solids. This report will address
the problems pump stations have to deal with on a daily basis. A detailed study is presented on
the solids in sewers. Although sewage consists of approximately 98% water, sewage pumps must
be able to pump unpredictable volumes of grit, rags and even plastics (Rayner, 1995). Sewage
pumps must handle all of these objects and pump station operators consider the cleaning of these
stations as an occupational hazard (Elsevier, 1999).
1.2 Objectives
The following are the three main objectives of this research:
Identify and categorise problems that occur at sewage pump stations.
Test the efficiency of a screening basket used to remove solids in the laboratory.
Propose a concept DST (decision support tool) design for sewage pump stations.
Problems at sewage pump stations were identified by means of site visits, interviews and
literature study. Site visits revealed a general lack of knowledge on screening baskets used to
remove solids prior to pumping. This lack of knowledge and limited literature on screening
baskets led to the experimental testing of a screening basket on full scale in a laboratory
experiment. The proposed framework of the DST is presented as a possible solution for
identifying sewage pump station problems and to aid with design guidance in the future.
All additional objectives were minor objectives identified during the period of the research. The
research evolved during the period of the study and the main objectives were be achieved by
starting small and successively adding complexity to the research.
Stellenbosch University http://scholar.sun.ac.za
Introduction Page 3
J. Tulleken Stellenbosch University
1.3 Thesis approach
This study had four contributing factors, namely:
Literature study
Site visits and interviews
Full size laboratory experiment
Prototype design of DST for pump stations.
There are many problems and concerns when it comes to the pumping of sewage. However, in
South Africa there are no guidelines addressing these pumping problems. The lack of published
articles in this field has lead to the compiling of this study. This study sets out to identify the
causes of sanitary sewage pump station problems and possible solutions. The literature review is
focused on pump stations to get a better understanding of how they operate and function. The
literature addresses the different sectors and components of pump stations.
After the literature review was completed, site visits were conducted to gain knowledge of how
pump stations operate in the field. Interviews with operators, engineers and manufacturers helped
to gain a better understanding of where there is a lack of knowledge. The idea of the site visits
was to establish what problems occur most often. Site visits were only conducted in the Western
Cape to get a sense of what is used in practice. Some municipalities do remove solids at their
pump stations and others prefer to remove all solids at the WWTP. There is big debate
surrounding this concept. In this study solids removal technology at pump stations is investigated
and tested to get a better perspective. These visits revealed that the two biggest problems were the
handling of solids and maintenance issues. The obvious solution is to get rid of all sewage pump
stations, this way there will be no problems, but that is not necessarily the most economical or the
best solution in many cases (Jacobs et al., 2011). Solids handling pumps are available, but in this
study the focus is on the potential threat and damage that solids may cause at sewage pump
stations.
With the knowledge gained through the site visits and interviews, another literature study was
done, with specific focus on the solids in sewers. This literature review focuses on what types of
solids are found in sewers and the technologies that are available for removing them.
Stellenbosch University http://scholar.sun.ac.za
Introduction Page 4
J. Tulleken Stellenbosch University
This research addresses sewage pump stations and related problems in the sewage collection
system. There are no categories for labelling problems that occur at pumping stations. This study
provides an index to identify and categorise the problems with pumping stations.
A full size model was designed to test a basket used to remove solids at pump stations. The
screening basket was tested to get data on how it operates and the problems that may arise. The
problem products tested were mainly household products, where the water closet was the main
entry point.
A concept decision support tool (DST) was developed to help in selecting the appropriate parts of
a pump station and to identify possible problems. The aim of the DST developed is to convey
knowledge regarding pump problems to those who might need information on technologies used
at sewage pump stations, and to flag potential problems to the user at an early stage, given certain
inputs. The idea is to develop the framework for a tool that can act as an aid or guideline to
sewage pump station designers and operators in the future. The tool could also be applied to
better understand and analyse problems experienced at existing pump station locations in the
future.
1.4 Definitions
The key definitions are listed below:
Gross solids Gross solids are sewage-derived materials larger than 6mm
(Gouda et al., 2003).
Pump station Wherever a pump station is referred to in the text this refers to a
sewage pump station in a sewer network, unless stated otherwise.
Sanitary sewer A sewer that carries liquid and waterborne wastes from
residences, commercial buildings, industrial plants and
institutions, together with minor quantities of ground, storm and
surface water which are not admitted intentionally (Water
Environment Federation, 2008).
Stellenbosch University http://scholar.sun.ac.za
Introduction Page 5
J. Tulleken Stellenbosch University
Screen A device with openings, generally of uniform size, used to
remove suspended or floating solids in a flow stream, thus
preventing them from passing a given point in conduit.
Screening Screening is interpreted to mean not only the physical removal of
screenings from the crude sewage, but also their side-stream or
in-flow disintegration (Sidwick, 1984).
Screening basket A basket used at pump stations to catch or remove solids from
sewers prior to pumping.
Screening removal system SRS is a device or system used in a sewer system, usually at
sewage pump stations to remove or reduce screenings from the
sewage system.
Screenings Screenings are typically removed by bar screens or bar racks.
These are relatively large debris consisting of rags, plastic, cans,
rocks and similar items (Water Environment Federation, 2008).
Sewage Sewage is waste and excrement which is disposed and conveyed
in sewers.
Solids For the purpose of these study solids are defined as the
constituents in sewers that are not supposed to be in sewers and
therefore have to be removed.
Stellenbosch University http://scholar.sun.ac.za
Literature Page 6
J. Tulleken Stellenbosch University
2. Literature
Wastewater reticulation involves the use of multifarious pipeline networks and pumping stations
to direct and transport sewage to the treatment facilities (Winter, 2011). Along sewer pipelines
there are critical control points (CCP). A CCP is a place along a wastewater collection and
treatment system where there is access to the system to do monitoring or interventions that can
have an effect on the water quality (van der Merwe-Botha & Manus, 2011). A pump station is the
most important CCP in a sewer system. Pump stations very often go unnoticed by the public, but
they are an imperative contributor in the basic sanitation system. South Africa produces
approximately 5800M of wastewater per day, all of which is probably pumped somewhere along
its journey through the sewer system. Pump stations are the most critical elements in ensuring that
a wastewater distribution network operates smoothly (Winter, 2011). This chapter focuses on the
design, operation and maintenance phases of the pump station life cycle. The construction phase
is addressed briefly in some sections. Pump stations are in some cases complicated systems
comprising many parts and sections. All these sections are addressed in a thorough literature
study in this chapter. This chapter also presents many visual aids, which will be used for a
Decision Support Tool (DST) addressed in Chapter 6.
2.1 Pump station basics
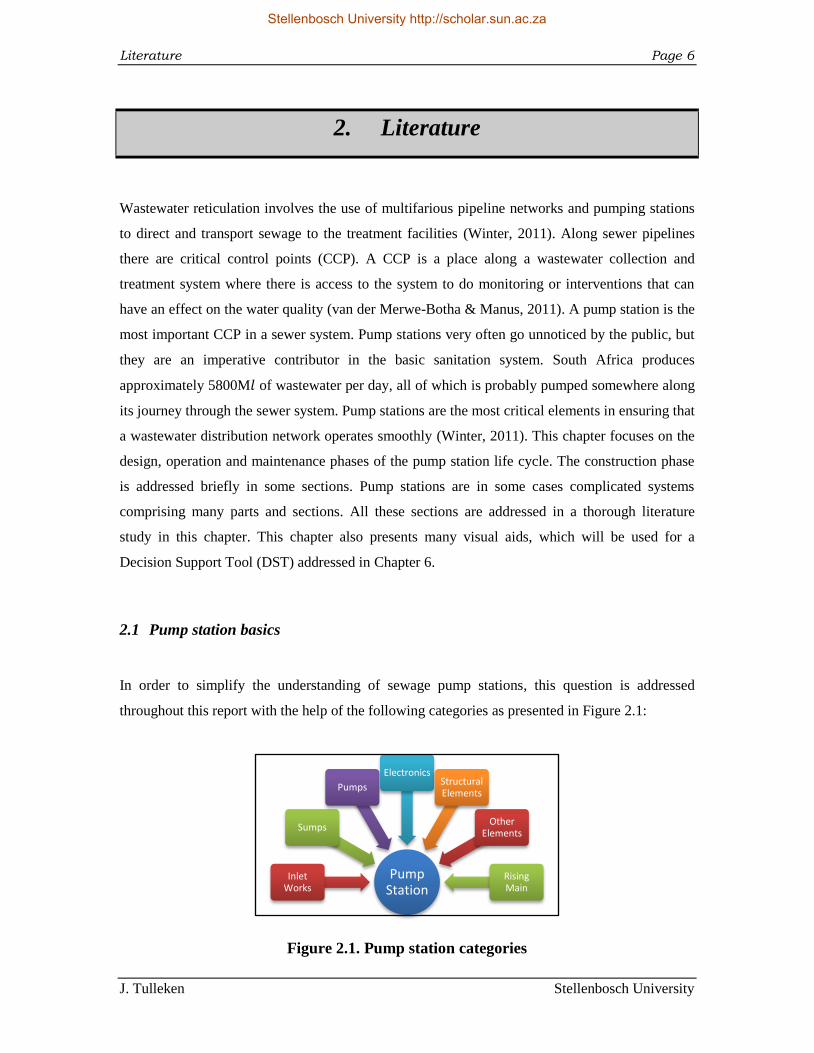
In order to simplify the understanding of sewage pump stations, this question is addressed
throughout this report with the help of the following categories as presented in Figure 2.1:
Figure 2.1. Pump station categories
Pump Station
Inlet Works
Sumps
Pumps
Electronics Structural Elements
Other Elements
Rising Main
Stellenbosch University http://scholar.sun.ac.za
Literature Page 7
J. Tulleken Stellenbosch University
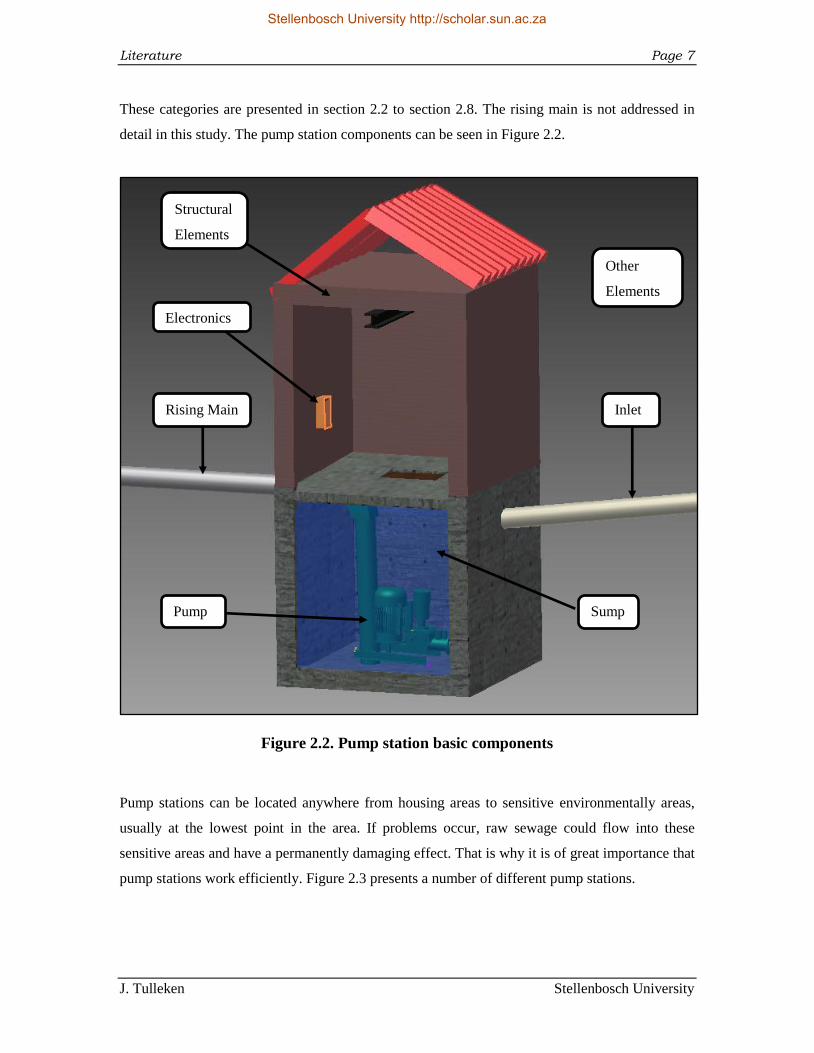
These categories are presented in section 2.2 to section 2.8. The rising main is not addressed in
detail in this study. The pump station components can be seen in Figure 2.2.
Figure 2.2. Pump station basic components
Pump stations can be located anywhere from housing areas to sensitive environmentally areas,
usually at the lowest point in the area. If problems occur, raw sewage could flow into these
sensitive areas and have a permanently damaging effect. That is why it is of great importance that
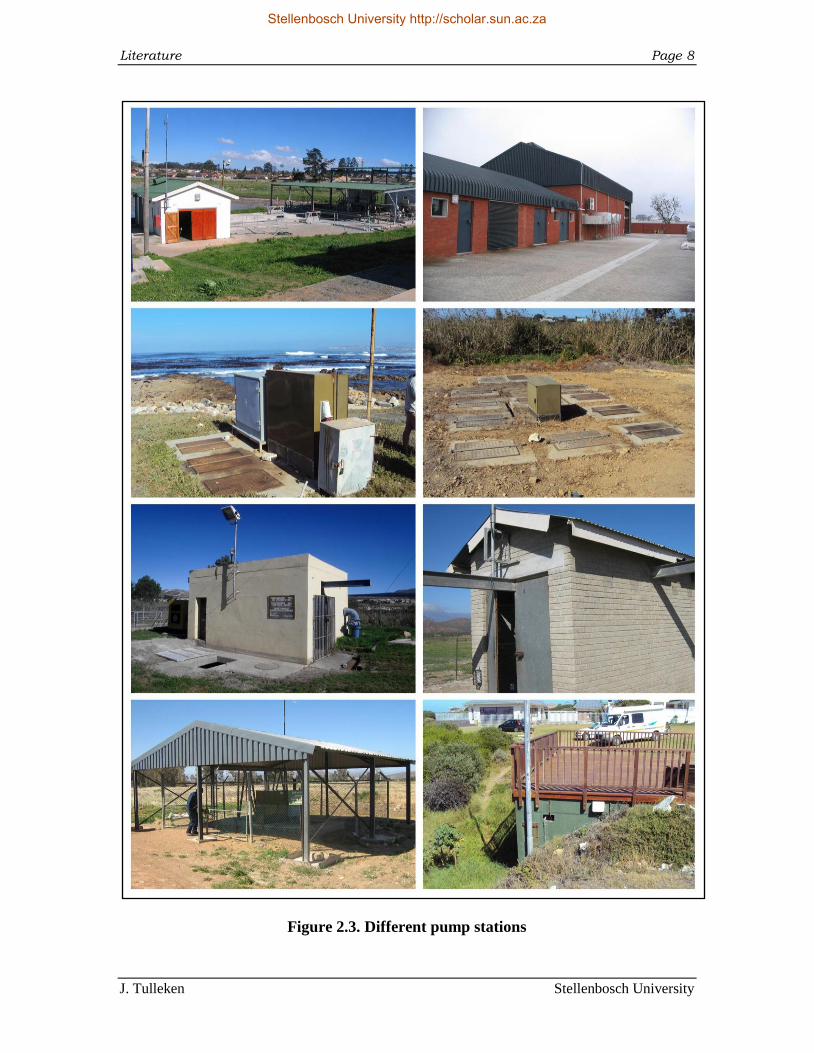
pump stations work efficiently. Figure 2.3 presents a number of different pump stations.
Rising Main
Structural
Elements
Sump
Other
Elements
Pump
Inlet
Electronics
Stellenbosch University http://scholar.sun.ac.za
Literature Page 8
J. Tulleken Stellenbosch University
Figure 2.3. Different pump stations
Stellenbosch University http://scholar.sun.ac.za
Literature Page 9
J. Tulleken Stellenbosch University
Liquids flow from a higher point to the lowest point, which is where a pump station will be
situated. Sewage travels by means of a pipe or channel which is called the inlet. The inlet carries
the sewage into the sump; the sump is a temporary housing unit for the sewage until it is pumped
away. The sewage is then pumped from the sump via the rising main to the next point of interest,
which could be the WWTP or a point from where the water can travel under gravitation to its next
point of interest.
2.2 Inlet Works or Preliminary Treatment
The inlet or preliminary treatment section consists of a pipe or channel conveying the sewage to
the sump. The inlet works is the pump station‟s primary defence and therefore it can have a great
impact on how the pump station functions. The inlet works are addressed in more detail in
Chapter 3 of this report. The inlet can be just a pipe conveying sewage directly into the sump or it
can include structures designed to remove solids. Some pump stations have no primary treatment,
but in cases where there is treatment it normally consists of screening and grit removal.
2.2.1 Screening
“Screening is interpreted to mean not only the physical removal of screenings from the crude
sewage but also their side-stream or in-flow disintegration” (Sidwick, 1984).
Screening can be done with the help of screens and screening baskets to remove the larger solids
and unwanted objects. Screening removes objects such as rags, plastics, metal and paper to
prevent damage to the pump or pipes downstream (Nozaic & Freese, 2009). Screens are usually
placed upstream of delicate equipment, in this case pump stations (Sutherland, 2009). Solids can
be removed by coarse screens to remove gross solids and/or fine screens to remove finer solids.
The implementation of screening decreases the potential for damage of sewage pumps, potentially
thus increasing the lifetime of the sewage pumps.
Stellenbosch University http://scholar.sun.ac.za
Literature Page 10
J. Tulleken Stellenbosch University
2.2.2 Grit Removal
Grit normally composes of small heavy particles or course inorganic matter like sand and gravels
(Water Environment Federation, 2008). Removal of grit is done with sand traps, grit chambers or
degritters, all of which use sedimentation to remove the grit. Sedimentation of grit can occur in
pipes and sumps if infrastructure is not well constructed. The ideal is to keep the grit moving in
sewer networks and then to remove it from the system at pump stations or WWTPs. The nature
and behaviour of grit in sewers is still relatively unknown.
2.3 Sumps
A sump is a well where the sewage accumulates in order that it can be pumped away. Sumps are
usually below ground level. Different designs and construction techniques for sumps are used in
pump stations. According to the Guidelines for Human Settlement Planning and Design a sump
should allow for 4 hours of emergency storage at average flow rate of a station serving less than
250 dwellings (CSIR, 2003).
Pumping stations can consist of many wells. The dry well is generally where the pump, motor and
electronic components are situated. The wet well is where the sewage is located. There are
various combinations of the wet and dry wells (Pollard, 2009).
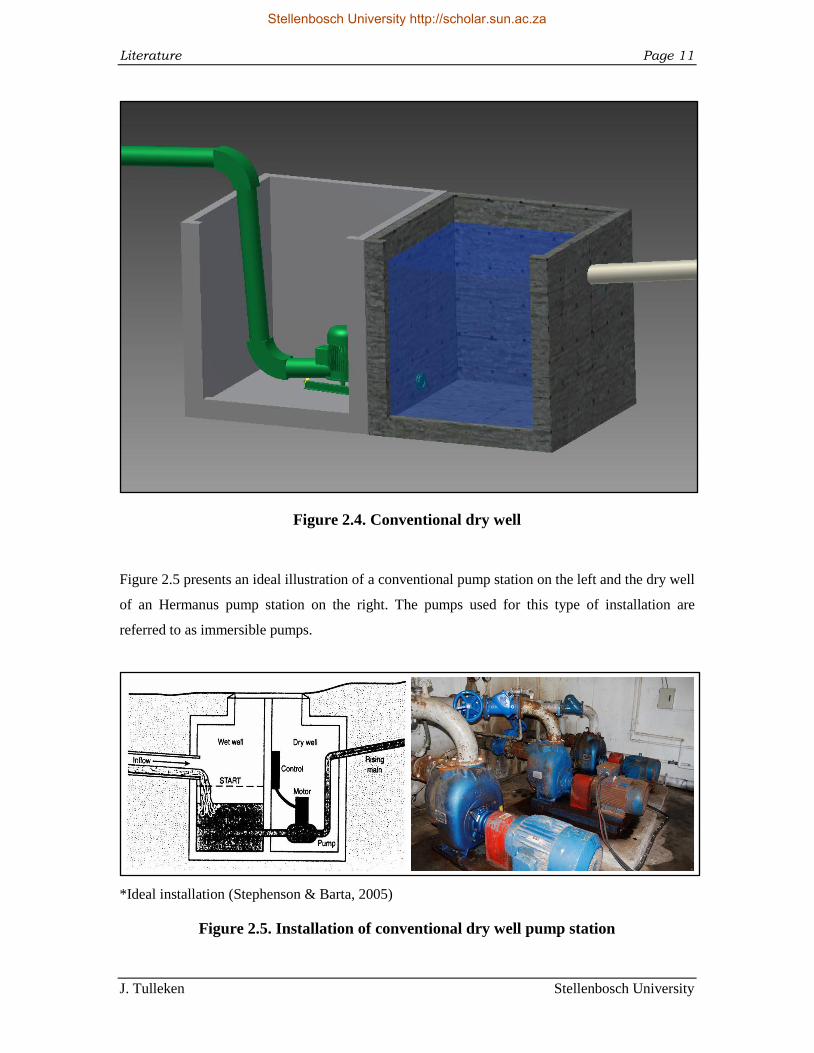
2.3.1 Wet and Dry well (Conventional dry well)
The conventional dry well pumping station comprises two underground wells. One well houses
the pump and the other is the catchment for the sewage. This type of arrangement is usually found
at large pumping stations, where maintenance needs to be a simple operation. It is also found at
old pump stations. The pump pumps the liquid from the wet well to a higher location, as seen in
Figure 2.4.
Stellenbosch University http://scholar.sun.ac.za
Literature Page 11
J. Tulleken Stellenbosch University
Figure 2.4. Conventional dry well
Figure 2.5 presents an ideal illustration of a conventional pump station on the left and the dry well
of an Hermanus pump station on the right. The pumps used for this type of installation are
referred to as immersible pumps.
*Ideal installation (Stephenson & Barta, 2005)
Figure 2.5. Installation of conventional dry well pump station
Stellenbosch University http://scholar.sun.ac.za
Literature Page 12
J. Tulleken Stellenbosch University
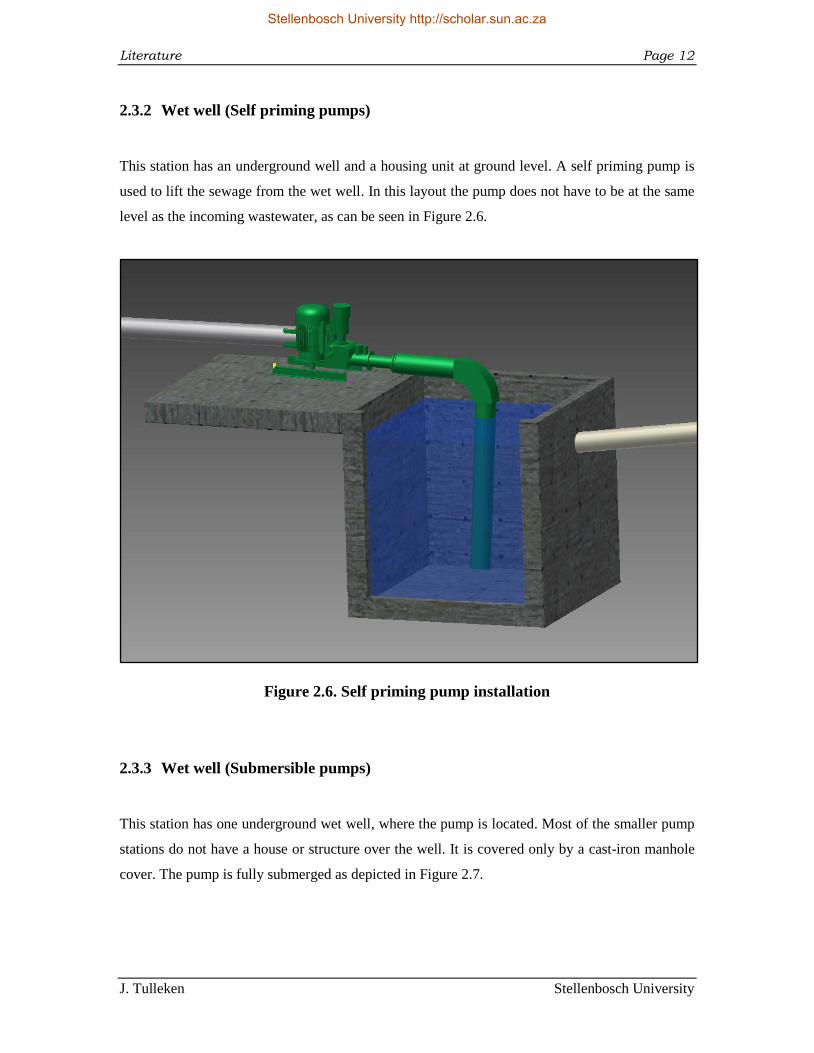
2.3.2 Wet well (Self priming pumps)
This station has an underground well and a housing unit at ground level. A self priming pump is
used to lift the sewage from the wet well. In this layout the pump does not have to be at the same
level as the incoming wastewater, as can be seen in Figure 2.6.
Figure 2.6. Self priming pump installation
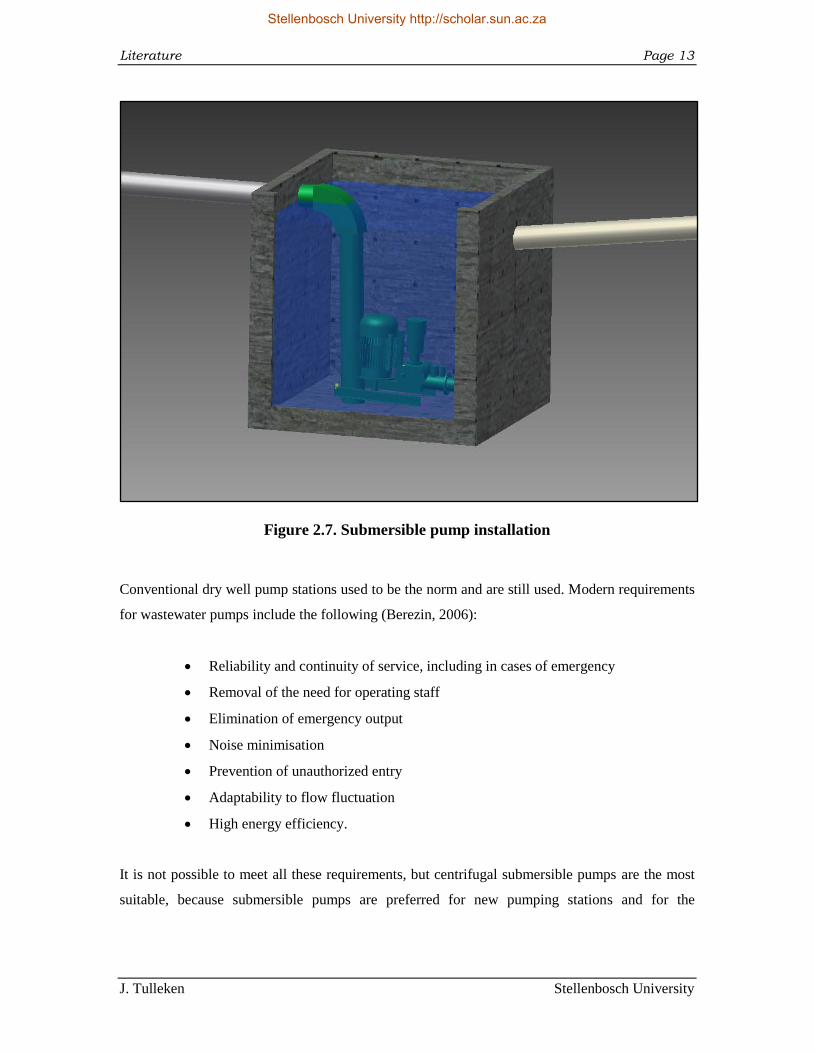
2.3.3 Wet well (Submersible pumps)
This station has one underground wet well, where the pump is located. Most of the smaller pump
stations do not have a house or structure over the well. It is covered only by a cast-iron manhole
cover. The pump is fully submerged as depicted in Figure 2.7.
Stellenbosch University http://scholar.sun.ac.za
Literature Page 13
J. Tulleken Stellenbosch University
Figure 2.7. Submersible pump installation
Conventional dry well pump stations used to be the norm and are still used. Modern requirements
for wastewater pumps include the following (Berezin, 2006):
Reliability and continuity of service, including in cases of emergency
Removal of the need for operating staff
Elimination of emergency output
Noise minimisation
Prevention of unauthorized entry
Adaptability to flow fluctuation
High energy efficiency.
It is not possible to meet all these requirements, but centrifugal submersible pumps are the most
suitable, because submersible pumps are preferred for new pumping stations and for the
Stellenbosch University http://scholar.sun.ac.za
Literature Page 14
J. Tulleken Stellenbosch University
upgrading of old stations (Berezin, 2006). The advantage of submersible pumps is that they don‟t
need a housing unit, because they are submerged under the liquid in the sump.
2.4 Pumps
Pumps used for lifting sewage are usually high capacity, low head installations with low flow and
large openings capable of passing solid materials (Bowers, 1973). This does not mean that pumps
used at sewage pump stations can handle all solids present in sewers. The solids in sewers pose
many threats to all pumps used in sewers. Figures of pumps and different pump installations are
presented in Appendix A.
2.4.1 Pump types
2.4.1.1 Classification
Hydraulic machines (pumps) can be divided into continuous flow (kinetic or dynamic) units and
positive displacement units (Chadwick et al., 2004). The focus of this study will be on continuous
flow units, which are used in sewage pump stations.
In general, the three classifications for kinetic pumps are radial flow, mixed-flow and axial flow.
Radial-flow pumps are used mostly for pumping sewage and storm water (Metcalf & Eddy,
1981). Various radial-flow pumps are available and they can be classified as centrifugal pumps.
Most of the pumps in sewer systems are centrifugal pumps (Pollard, 2009).
2.4.1.2 Specific speed
In order to determine what type of pump should be used the specific speed of the impeller is
required. The specific speed is the number that defines what pump should be used (Chadwick et
al., 2004; Finnemore & Franzini, 2009):
√
⁄
....1
Where
Stellenbosch University http://scholar.sun.ac.za
Literature Page 15
J. Tulleken Stellenbosch University
Ns = pump specific speed
N = Rotational speed (rpm)
Q = flow at optimum efficiency (m3/s or l/s)
Hp = total head (m)
For
10 < Ns < 70 radial flow (centrifugal) units (high head, low discharge)
70 < Ns < 165 mixed flow units (moderate head, moderate discharge)
110 < Ns axial flow units (low head, high discharge)
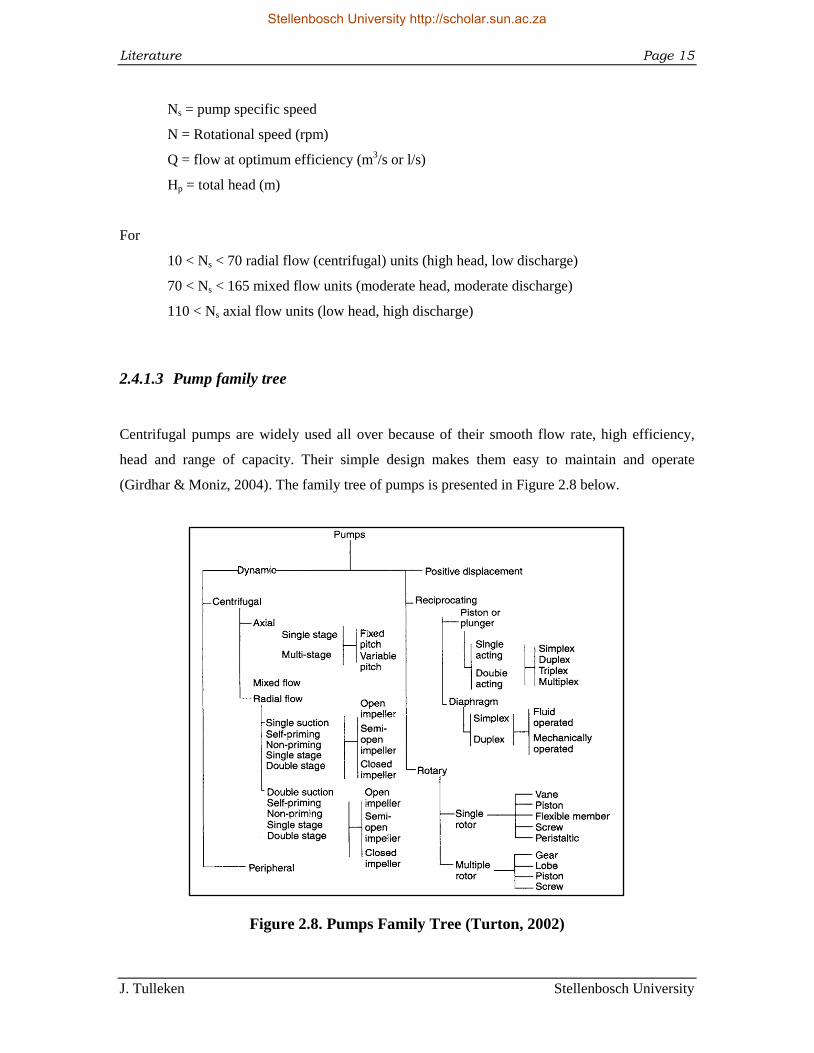
2.4.1.3 Pump family tree
Centrifugal pumps are widely used all over because of their smooth flow rate, high efficiency,
head and range of capacity. Their simple design makes them easy to maintain and operate
(Girdhar & Moniz, 2004). The family tree of pumps is presented in Figure 2.8 below.
Figure 2.8. Pumps Family Tree (Turton, 2002)
Stellenbosch University http://scholar.sun.ac.za
Literature Page 16
J. Tulleken Stellenbosch University
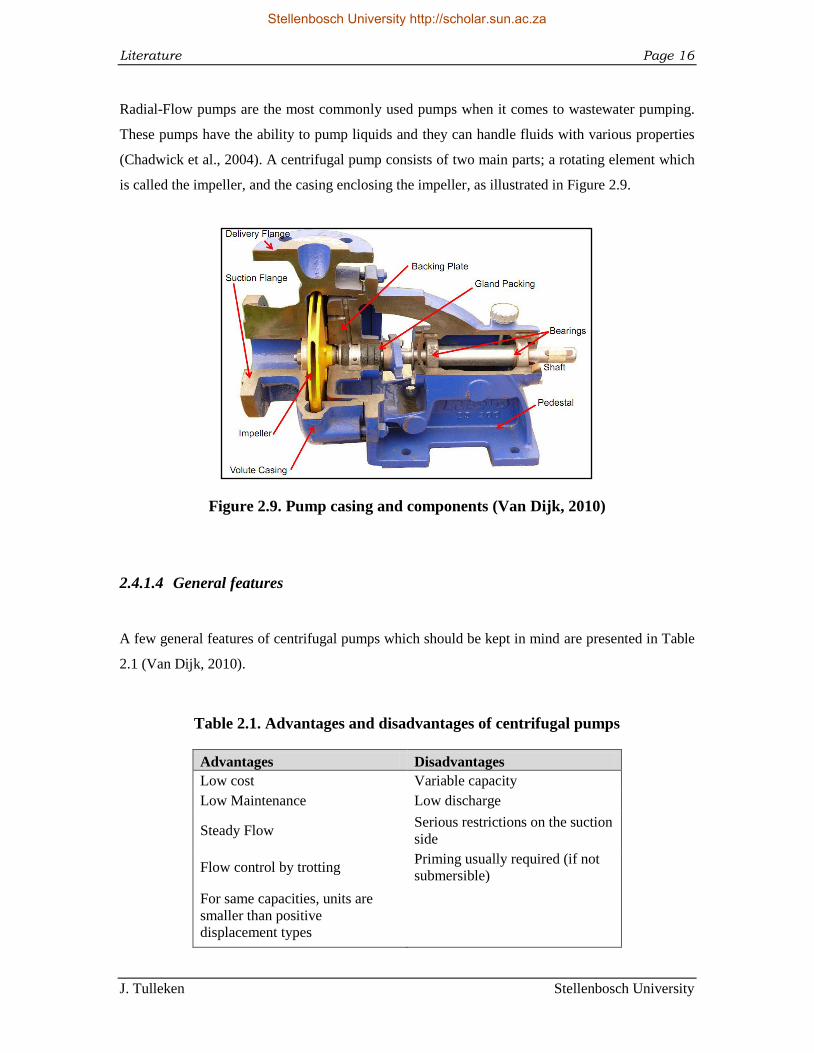
Radial-Flow pumps are the most commonly used pumps when it comes to wastewater pumping.
These pumps have the ability to pump liquids and they can handle fluids with various properties
(Chadwick et al., 2004). A centrifugal pump consists of two main parts; a rotating element which
is called the impeller, and the casing enclosing the impeller, as illustrated in Figure 2.9.
Figure 2.9. Pump casing and components (Van Dijk, 2010)
2.4.1.4 General features
A few general features of centrifugal pumps which should be kept in mind are presented in Table
2.1 (Van Dijk, 2010).
Table 2.1. Advantages and disadvantages of centrifugal pumps
Advantages Disadvantages
Low cost Variable capacity
Low Maintenance Low discharge
Steady Flow Serious restrictions on the suction
side
Flow control by trotting Priming usually required (if not
submersible)
For same capacities, units are
smaller than positive
displacement types
Stellenbosch University http://scholar.sun.ac.za
Literature Page 17
J. Tulleken Stellenbosch University
2.4.1.5 Solids handling ability
Pumps with solids handling ability present a technology that makes a significant contribution to
enhancing the operational reliability and reducing the costs of manpower and electrical
consumption of sewage pump stations. It introduces the concept of a self-cleaning submersible
pump station that is achieved by the installation of special sump geometry which results in all
settled and floating solids, greases and fats being removed every pumping cycle. A benefit of
such a system is that man entry into a sewage wet well is eliminated, as is the need to deploy a
vacuum tanker and its attendant crew delivering a significant cost saving to the user (Jacobs et al.,
2011).
In the case of solids handling pumping it is necessary to provide passage ways through which
entrained solids can pass. Although the basic principles still apply, it becomes necessary to alter
impeller design accordingly. Standard water impellers with double shrouds and multiple vanes
provided a solution, but are in many cases no longer suitable particularly when handling fibrous
materials.
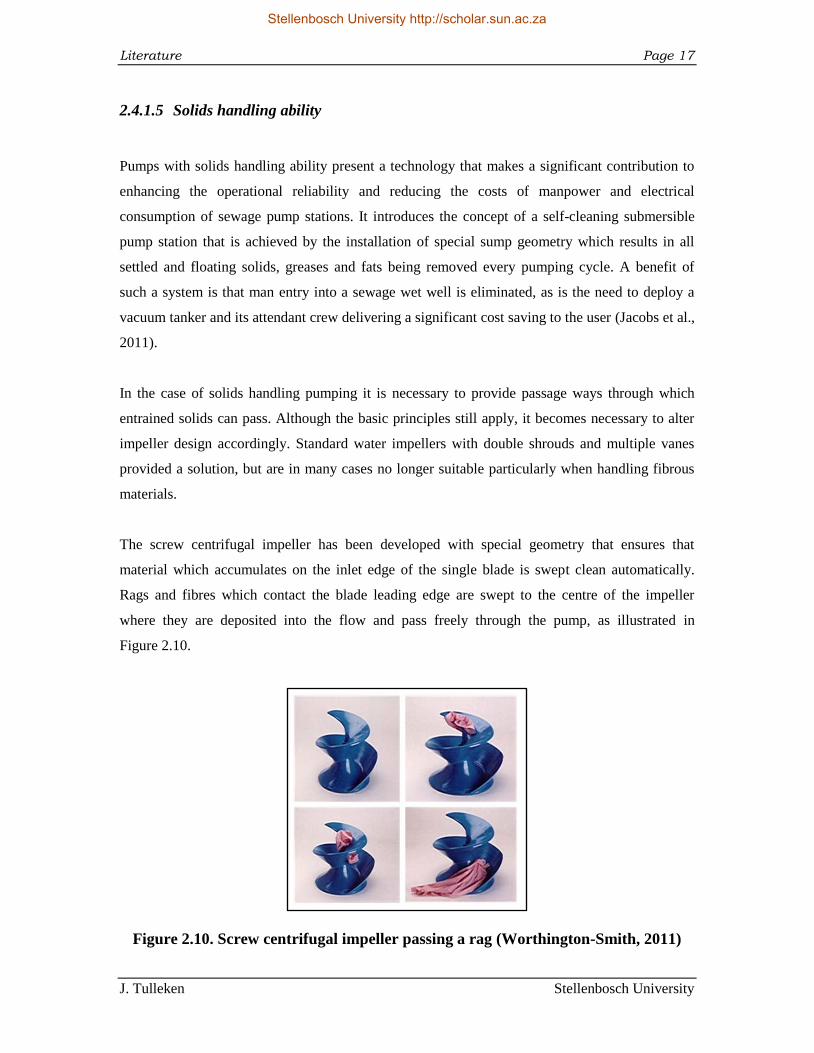
The screw centrifugal impeller has been developed with special geometry that ensures that
material which accumulates on the inlet edge of the single blade is swept clean automatically.
Rags and fibres which contact the blade leading edge are swept to the centre of the impeller
where they are deposited into the flow and pass freely through the pump, as illustrated in
Figure 2.10.
Figure 2.10. Screw centrifugal impeller passing a rag (Worthington-Smith, 2011)
Stellenbosch University http://scholar.sun.ac.za
Literature Page 18
J. Tulleken Stellenbosch University
2.4.2 Pump selection
Problems at sewage pumps may originate from improper design. For this reason it was considered
appropriate to add the basic theory of pump selection to this report. In order to select a pump for a
specific system the following need to be known:
Pump characteristics
Pump efficiency
System characteristics.
2.4.2.1 Pump characteristics
Every pumping system has specific needs and therefore it is important to select the correct pump
for it. Pumps are identified by their efficiency curves, performance curves (pump curves) and net
positive suction head (NPSH) requirements. The pump curves are normally supplied by the pump
manufacturers, with varying conditions being given on the same graph. The curve gives relational
information on variable speed, flow, pressure, efficiency, absorbed power and NPSHR.
The required NPSHR is the minimum head needed to avoid cavitation. The available NPSHA is
calculated as follows (Water Environment Federation, 2008):
....2
Where
Patm = the absolute atmospheric pressure exerted on the free fluid surface on the suction
side of the pump (atmosphere pressure, based on height above sea level)
Pvp = the fluid‟s vapour pressure (based on fluid temperature at suction)
Zw = vertical distance between fluid surface and pump centreline
HL = the sum of all the head losses in the suction piping
To avoid cavitation the following always has to be true:
NPSHA > NPSHR ....3
Stellenbosch University http://scholar.sun.ac.za
Literature Page 19
J. Tulleken Stellenbosch University
2.4.2.2 Pump efficiency
The pump‟s efficiency (η) is the difference between the brake power (Pb) input and the water
power (Pw) output (Finnemore & Franzini, 2009; Water Environment Federation, 2008).
....4
Where
Water power (Pw) is the energy needed to pump fluid from one location to another
Brake power (Pb) is the energy provided to the pump by the motor
2.4.2.3 System characteristics
The system characteristics for a single pipeline between two points can be calculated by the
following (Haested et al., 2004):
∑ ∑ ....5
Where
H = total head (m)
H1 = static lift (m)
Kp = pipe head loss coefficient (sz/m
3z-1)
Q = pipe discharge (m3/s)
Z = coefficient
KM = minor head loss coefficient (s2/m
5)
The system characteristic curve can change if valves upstream from the station are closed, or with
the altering level in the sump.
The system operating point, the intersection of the pump performance curve and the system head
curve at a specific speed, is as illustrated in Figure 2.11. The idea is to get the operating point as
Stellenbosch University http://scholar.sun.ac.za
Literature Page 20
J. Tulleken Stellenbosch University
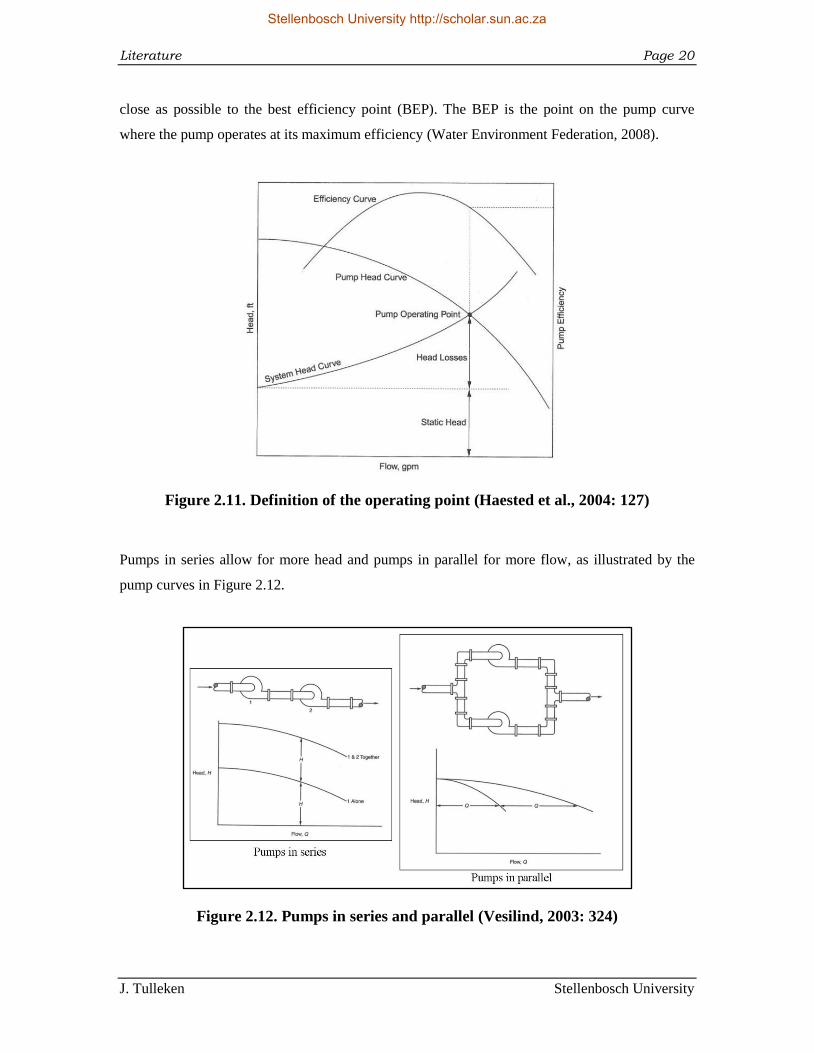
close as possible to the best efficiency point (BEP). The BEP is the point on the pump curve
where the pump operates at its maximum efficiency (Water Environment Federation, 2008).
Figure 2.11. Definition of the operating point (Haested et al., 2004: 127)
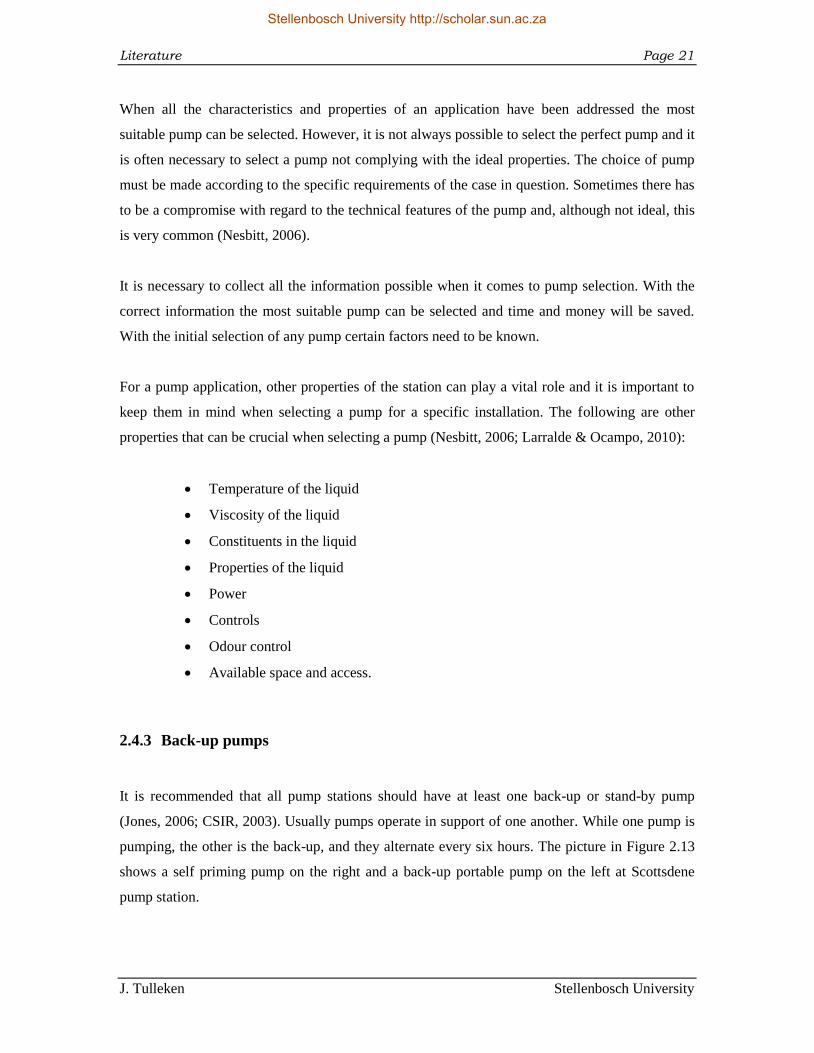
Pumps in series allow for more head and pumps in parallel for more flow, as illustrated by the
pump curves in Figure 2.12.
Figure 2.12. Pumps in series and parallel (Vesilind, 2003: 324)
Stellenbosch University http://scholar.sun.ac.za
Literature Page 21
J. Tulleken Stellenbosch University
When all the characteristics and properties of an application have been addressed the most
suitable pump can be selected. However, it is not always possible to select the perfect pump and it
is often necessary to select a pump not complying with the ideal properties. The choice of pump
must be made according to the specific requirements of the case in question. Sometimes there has
to be a compromise with regard to the technical features of the pump and, although not ideal, this
is very common (Nesbitt, 2006).
It is necessary to collect all the information possible when it comes to pump selection. With the
correct information the most suitable pump can be selected and time and money will be saved.
With the initial selection of any pump certain factors need to be known.
For a pump application, other properties of the station can play a vital role and it is important to
keep them in mind when selecting a pump for a specific installation. The following are other
properties that can be crucial when selecting a pump (Nesbitt, 2006; Larralde & Ocampo, 2010):
Temperature of the liquid
Viscosity of the liquid
Constituents in the liquid
Properties of the liquid
Power
Controls
Odour control
Available space and access.
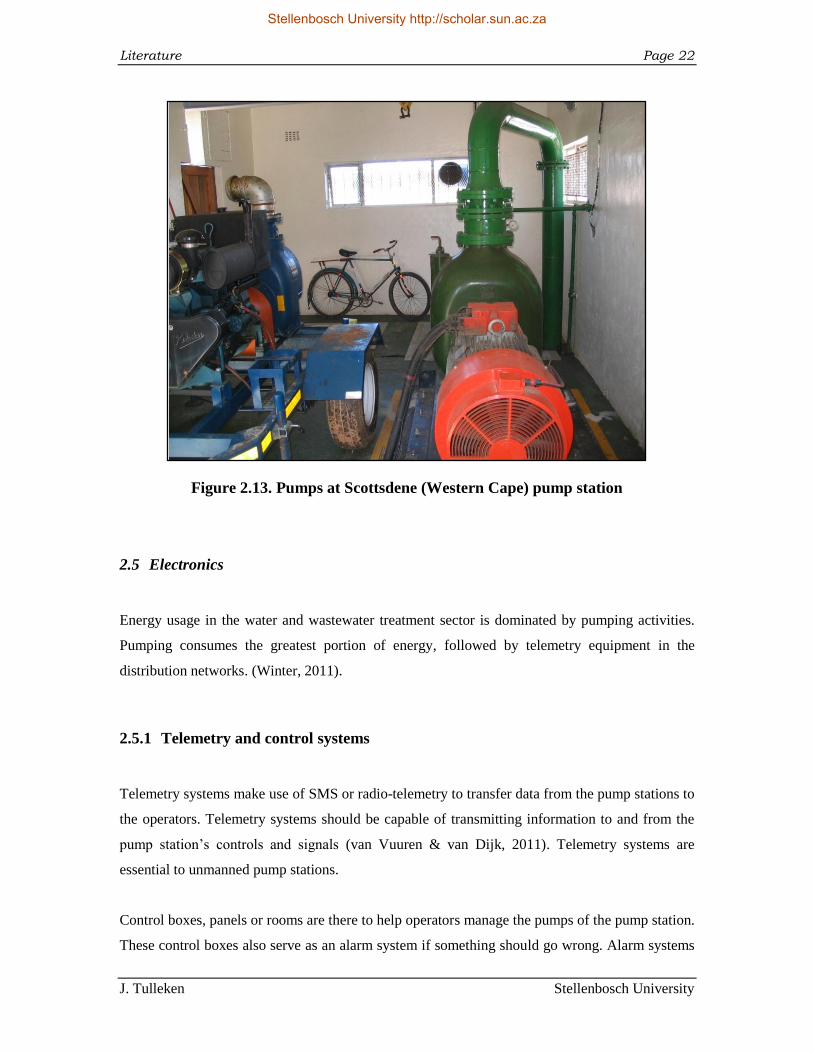
2.4.3 Back-up pumps
It is recommended that all pump stations should have at least one back-up or stand-by pump
(Jones, 2006; CSIR, 2003). Usually pumps operate in support of one another. While one pump is
pumping, the other is the back-up, and they alternate every six hours. The picture in Figure 2.13
shows a self priming pump on the right and a back-up portable pump on the left at Scottsdene
pump station.
Stellenbosch University http://scholar.sun.ac.za
Literature Page 22
J. Tulleken Stellenbosch University
Figure 2.13. Pumps at Scottsdene (Western Cape) pump station
2.5 Electronics
Energy usage in the water and wastewater treatment sector is dominated by pumping activities.
Pumping consumes the greatest portion of energy, followed by telemetry equipment in the
distribution networks. (Winter, 2011).
2.5.1 Telemetry and control systems
Telemetry systems make use of SMS or radio-telemetry to transfer data from the pump stations to
the operators. Telemetry systems should be capable of transmitting information to and from the
pump station‟s controls and signals (van Vuuren & van Dijk, 2011). Telemetry systems are
essential to unmanned pump stations.
Control boxes, panels or rooms are there to help operators manage the pumps of the pump station.
These control boxes also serve as an alarm system if something should go wrong. Alarm systems
Stellenbosch University http://scholar.sun.ac.za
Literature Page 23
J. Tulleken Stellenbosch University
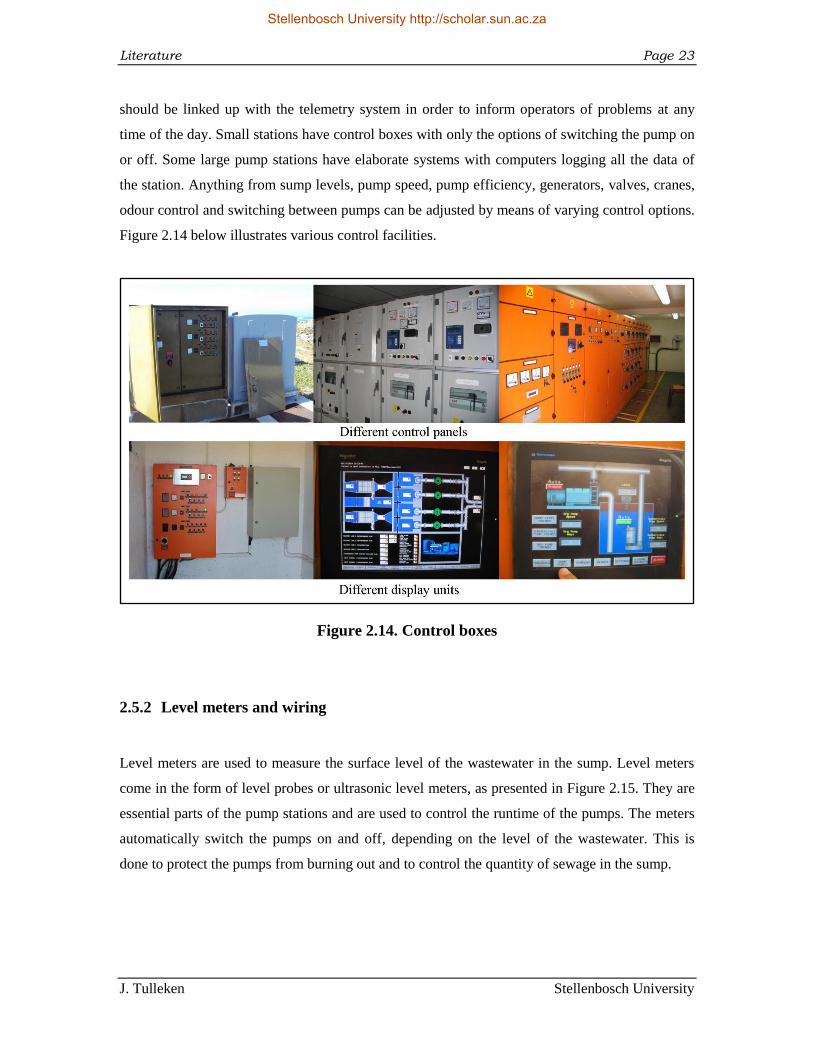
should be linked up with the telemetry system in order to inform operators of problems at any
time of the day. Small stations have control boxes with only the options of switching the pump on
or off. Some large pump stations have elaborate systems with computers logging all the data of
the station. Anything from sump levels, pump speed, pump efficiency, generators, valves, cranes,
odour control and switching between pumps can be adjusted by means of varying control options.
Figure 2.14 below illustrates various control facilities.
Figure 2.14. Control boxes
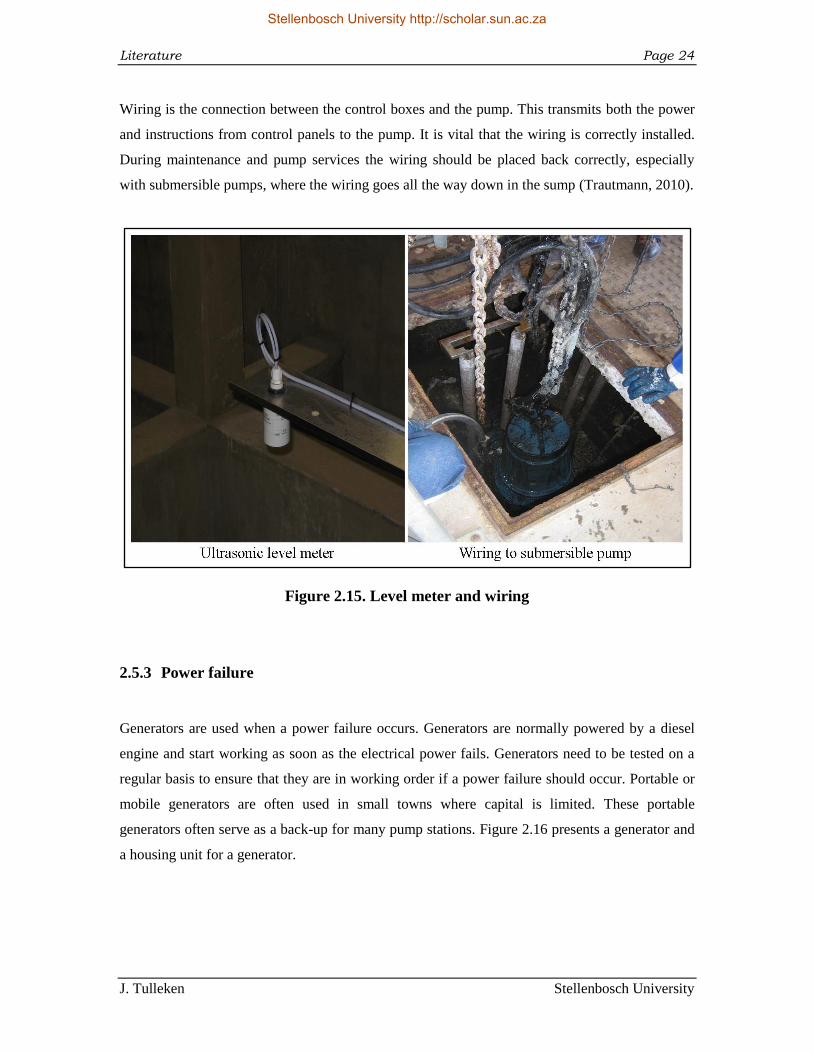
2.5.2 Level meters and wiring
Level meters are used to measure the surface level of the wastewater in the sump. Level meters
come in the form of level probes or ultrasonic level meters, as presented in Figure 2.15. They are
essential parts of the pump stations and are used to control the runtime of the pumps. The meters
automatically switch the pumps on and off, depending on the level of the wastewater. This is
done to protect the pumps from burning out and to control the quantity of sewage in the sump.
Stellenbosch University http://scholar.sun.ac.za
Literature Page 24
J. Tulleken Stellenbosch University
Wiring is the connection between the control boxes and the pump. This transmits both the power
and instructions from control panels to the pump. It is vital that the wiring is correctly installed.
During maintenance and pump services the wiring should be placed back correctly, especially
with submersible pumps, where the wiring goes all the way down in the sump (Trautmann, 2010).
Figure 2.15. Level meter and wiring
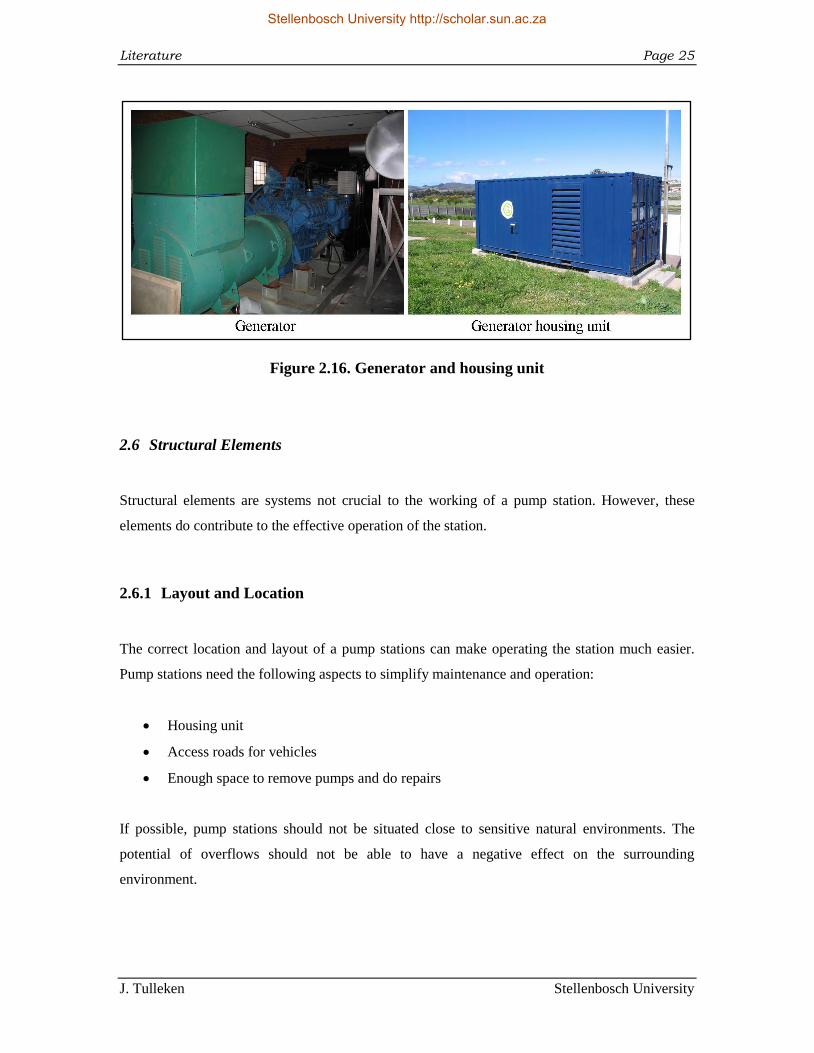
2.5.3 Power failure
Generators are used when a power failure occurs. Generators are normally powered by a diesel
engine and start working as soon as the electrical power fails. Generators need to be tested on a
regular basis to ensure that they are in working order if a power failure should occur. Portable or
mobile generators are often used in small towns where capital is limited. These portable
generators often serve as a back-up for many pump stations. Figure 2.16 presents a generator and
a housing unit for a generator.
Stellenbosch University http://scholar.sun.ac.za
Literature Page 25
J. Tulleken Stellenbosch University
Figure 2.16. Generator and housing unit
2.6 Structural Elements
Structural elements are systems not crucial to the working of a pump station. However, these
elements do contribute to the effective operation of the station.
2.6.1 Layout and Location
The correct location and layout of a pump stations can make operating the station much easier.
Pump stations need the following aspects to simplify maintenance and operation:
Housing unit
Access roads for vehicles
Enough space to remove pumps and do repairs
If possible, pump stations should not be situated close to sensitive natural environments. The
potential of overflows should not be able to have a negative effect on the surrounding
environment.
Stellenbosch University http://scholar.sun.ac.za
Literature Page 26
J. Tulleken Stellenbosch University
2.6.2 Equipment
A pump station should be equipped with the following to ensure effective operation:
Gantry, hoisting equipment or crane for lifting pumps to ground level
Water and electrical supply
Fire protection equipment (fire extinguisher)
Overflow facility (overflow pipes and dams).
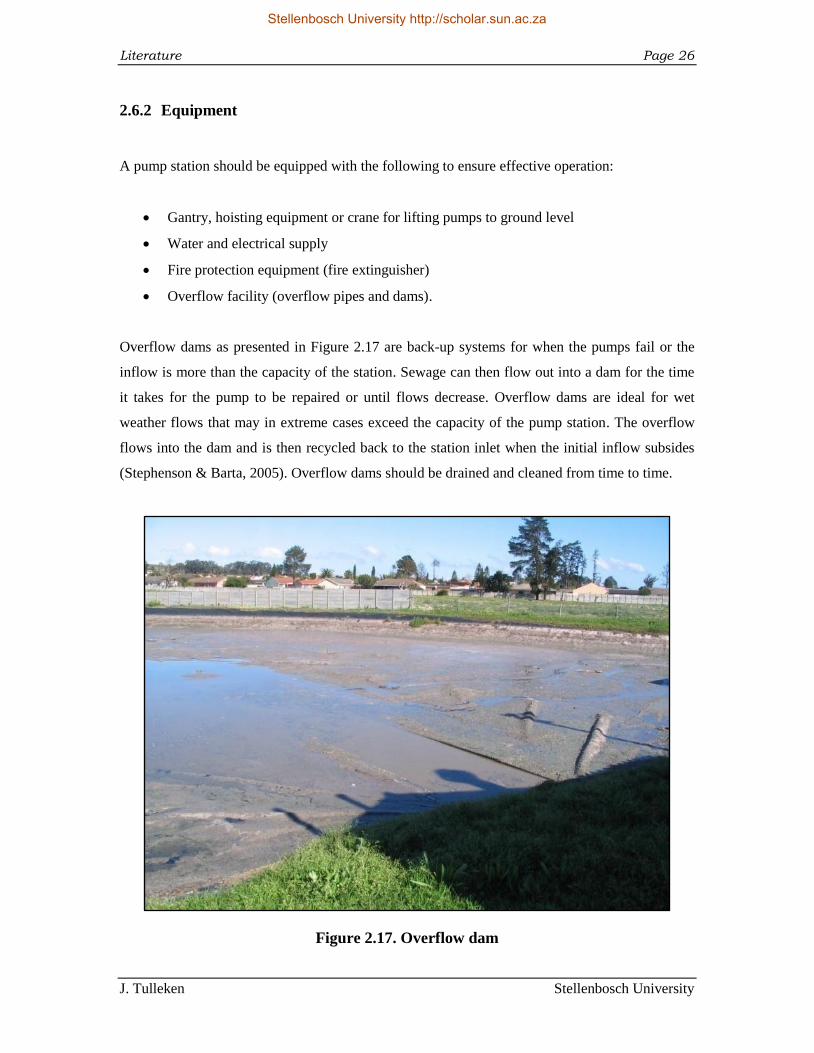
Overflow dams as presented in Figure 2.17 are back-up systems for when the pumps fail or the
inflow is more than the capacity of the station. Sewage can then flow out into a dam for the time
it takes for the pump to be repaired or until flows decrease. Overflow dams are ideal for wet
weather flows that may in extreme cases exceed the capacity of the pump station. The overflow
flows into the dam and is then recycled back to the station inlet when the initial inflow subsides
(Stephenson & Barta, 2005). Overflow dams should be drained and cleaned from time to time.
Figure 2.17. Overflow dam
Stellenbosch University http://scholar.sun.ac.za
Literature Page 27
J. Tulleken Stellenbosch University
2.7 Other Elements
Other elements include aspects that should be kept in mind when designing a pump station. These
aspects can include the following:
Emergency response teams
Environmental impact assessment
Health and safety standards
Maintenance
Noise minimisation
Odour control (photo presented in Appendix A)
Security, fencing and alarm systems
Ventilation in station.
Pump stations require high levels of maintenance. There is electrical, mechanical and control
equipment that need basic maintenance and operators doing this maintenance should be trained
(Butler & Davies, 2004).
The Waterborne Sanitation Operations and Maintenance Guide provides some guidelines for
pump station maintenance and a pump station operation inspection checklist (van Vuuren & van
Dijk, 2011).
A very important factor of maintenance is monitoring the performance of the pumping station. It
is necessary to monitor the following (Butler & Davies, 2004):
Failure in the electricity supply
Pump failure
Unusually high levels in the wet well
Flooding of the dry well
Operation of the overflow
Cleaning of screens and baskets (van Vuuren & van Dijk, 2011).
Stellenbosch University http://scholar.sun.ac.za
Literature Page 28
J. Tulleken Stellenbosch University
2.8 Rising Main
The rising main is the section between the pump station and the next point of interest, usually
upstream from the pump station, but at a higher level as the pump station. For the purpose of this
study the rising main is not addressed in further detail.
2.9 Construction
This study does not address the construction phase of pump stations in detail; however there are
certain aspects that should be kept in mind. There are necessities for construction and they are
addressed throughout this report. If the construction and the preliminary research on the area are
not done properly, problems might occur at the station. It is important to be proactive to avoid
future problems. The following should be kept in mind during the construction phase:
Weather
Environmental impact
Safety
Local community.
Stellenbosch University http://scholar.sun.ac.za
Solids in Sewers Page 29
J. Tulleken Stellenbosch University
3. Solids in Sewers
There are various technologies available for removing solids from sewers. The big debate is
whether some solids should be removed at pump stations or whether all solids should be removed
at the WWTP. This chapter investigates the case where solids are removed at pump stations.
However, this method requires regular maintenance and that poses a new set of problems. The
philosophy is to solve problems as they occur and not wait for problems to increase the intensity
further downstream. This is considered to be the proactive approach. This chapter addresses the
handling, removal and composition of solids at pump stations. It does not address the chemical
compounds of solids found in sewers.
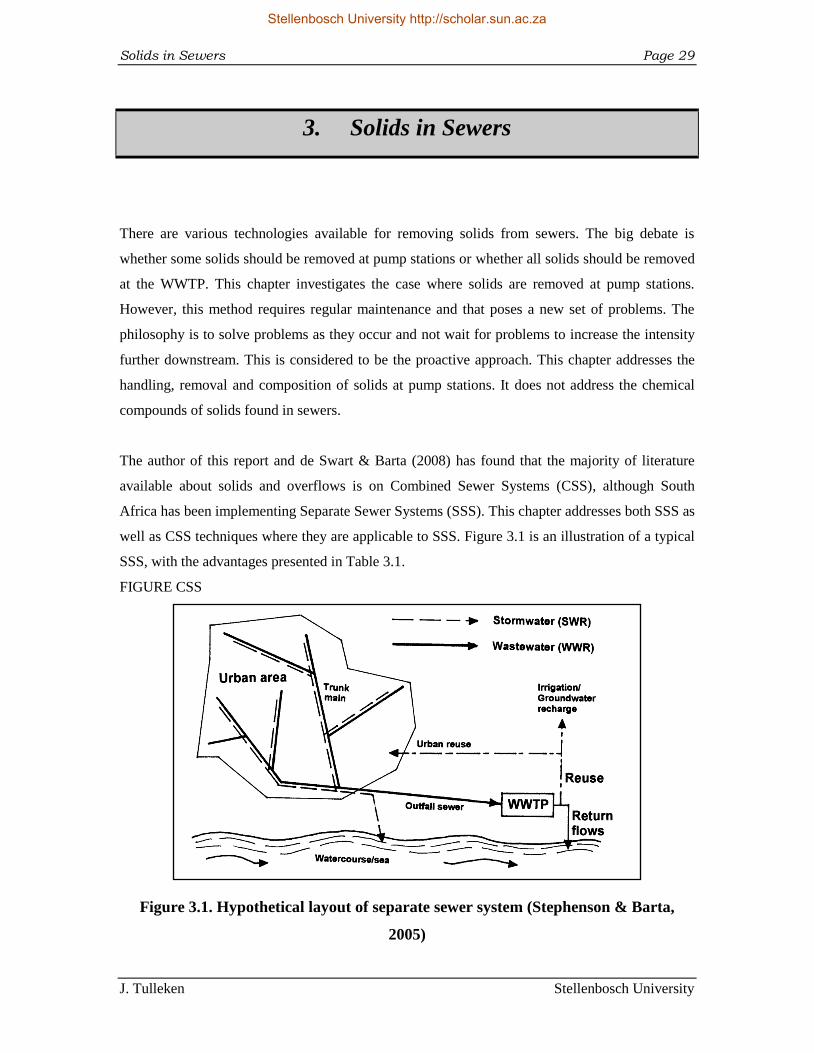
The author of this report and de Swart & Barta (2008) has found that the majority of literature
available about solids and overflows is on Combined Sewer Systems (CSS), although South
Africa has been implementing Separate Sewer Systems (SSS). This chapter addresses both SSS as
well as CSS techniques where they are applicable to SSS. Figure 3.1 is an illustration of a typical
SSS, with the advantages presented in Table 3.1.
FIGURE CSS
Figure 3.1. Hypothetical layout of separate sewer system (Stephenson & Barta,
2005)
Stellenbosch University http://scholar.sun.ac.za
Solids in Sewers Page 30
J. Tulleken Stellenbosch University
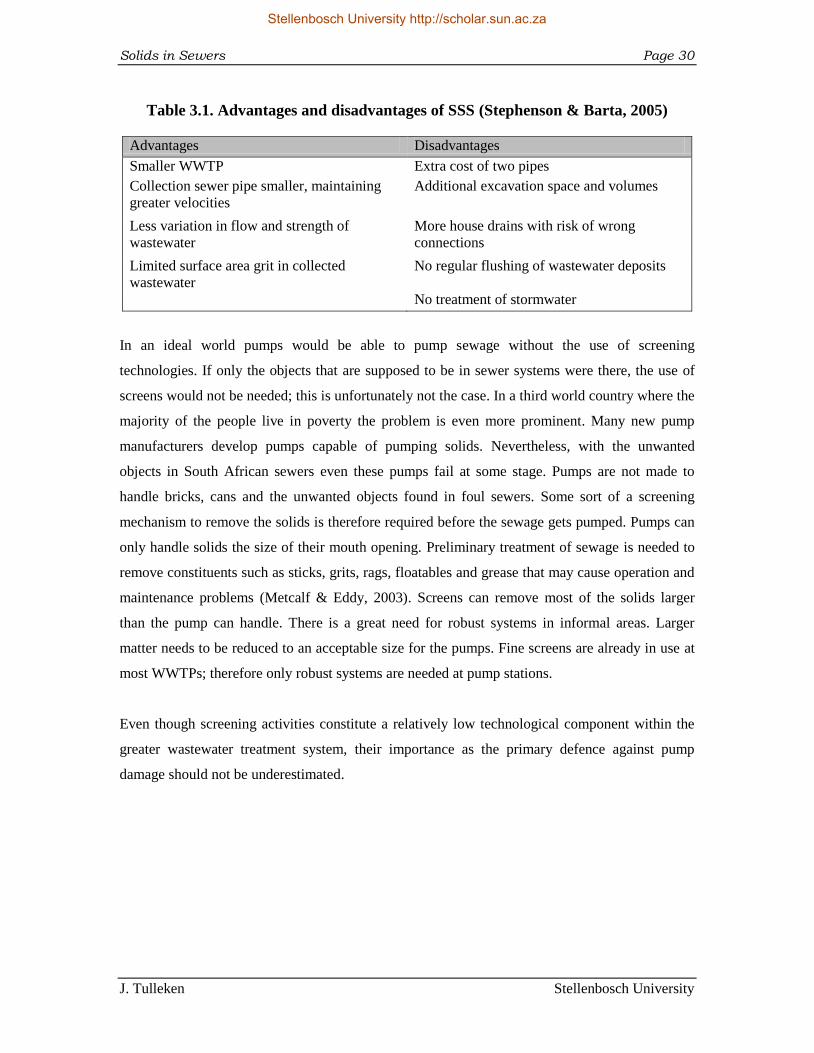
Table 3.1. Advantages and disadvantages of SSS (Stephenson & Barta, 2005)
Advantages Disadvantages
Smaller WWTP Extra cost of two pipes
Collection sewer pipe smaller, maintaining
greater velocities
Additional excavation space and volumes
Less variation in flow and strength of
wastewater
More house drains with risk of wrong
connections
Limited surface area grit in collected
wastewater
No regular flushing of wastewater deposits
No treatment of stormwater
In an ideal world pumps would be able to pump sewage without the use of screening
technologies. If only the objects that are supposed to be in sewer systems were there, the use of
screens would not be needed; this is unfortunately not the case. In a third world country where the
majority of the people live in poverty the problem is even more prominent. Many new pump
manufacturers develop pumps capable of pumping solids. Nevertheless, with the unwanted
objects in South African sewers even these pumps fail at some stage. Pumps are not made to
handle bricks, cans and the unwanted objects found in foul sewers. Some sort of a screening
mechanism to remove the solids is therefore required before the sewage gets pumped. Pumps can
only handle solids the size of their mouth opening. Preliminary treatment of sewage is needed to
remove constituents such as sticks, grits, rags, floatables and grease that may cause operation and
maintenance problems (Metcalf & Eddy, 2003). Screens can remove most of the solids larger
than the pump can handle. There is a great need for robust systems in informal areas. Larger
matter needs to be reduced to an acceptable size for the pumps. Fine screens are already in use at
most WWTPs; therefore only robust systems are needed at pump stations.
Even though screening activities constitute a relatively low technological component within the
greater wastewater treatment system, their importance as the primary defence against pump
damage should not be underestimated.
Stellenbosch University http://scholar.sun.ac.za
Solids in Sewers Page 31
J. Tulleken Stellenbosch University
3.1 Entry points
Solids can enter the sewers at a number of places. Sanitary sewers (SS) have fewer entry points
than combined sewers. In South Africa the following are places where unwanted objects can enter
the sewers:
Toilet
Shower and bath
Bathroom basin
Kitchen sink
Gulley
Manholes
Industrial or commercial facilities (chicken farms, restaurants, factories).
3.2 Flow rates
Flow rates in sewers are dependent on factors such as time of day, time of year, weather, deposits
in sewers, slime, pipe size and pipe slope, to name only a few. The various factors are listed by
Ashley et al. (2004) in the list below:
Dry weather flow rate and concentrations
Period of the day
Rainfall intensity and duration (infiltration)
Antecedent dry weather period
Amount and type of deposits in system
Amount and growth rate of slime (slime growing inside pipes)
Age and condition of sewer fabric (pipe corrosion)
Sewer maintenance and cleaning practices
Sewer geometry, size and slope.
During the wet weather season rain and storm water infiltrate the sewers. The total mass of solids
can be 5 to 10 times more in wet weather than in dry weather periods (Ashley et al., 2004). The
Stellenbosch University http://scholar.sun.ac.za
Solids in Sewers Page 32
J. Tulleken Stellenbosch University
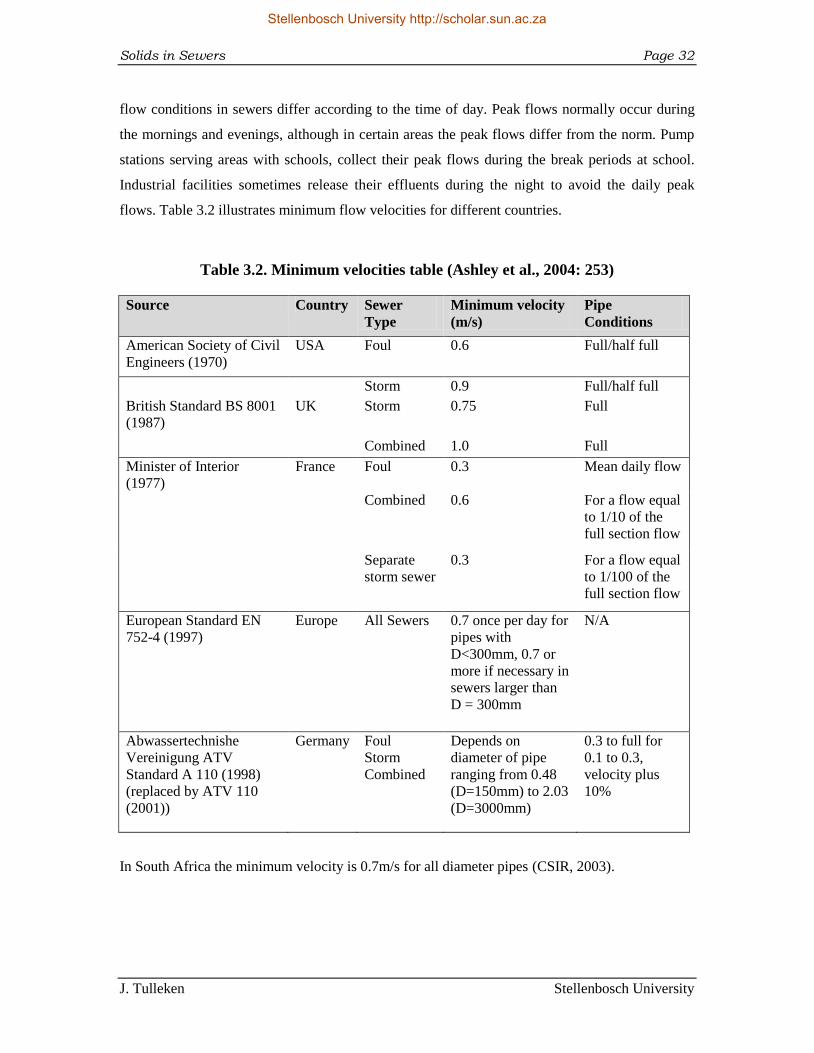
flow conditions in sewers differ according to the time of day. Peak flows normally occur during
the mornings and evenings, although in certain areas the peak flows differ from the norm. Pump
stations serving areas with schools, collect their peak flows during the break periods at school.
Industrial facilities sometimes release their effluents during the night to avoid the daily peak
flows. Table 3.2 illustrates minimum flow velocities for different countries.
Table 3.2. Minimum velocities table (Ashley et al., 2004: 253)
Source Country Sewer
Type
Minimum velocity
(m/s)
Pipe
Conditions
American Society of Civil
Engineers (1970)
USA Foul 0.6 Full/half full
Storm 0.9 Full/half full
British Standard BS 8001
(1987)
UK Storm 0.75 Full
Combined 1.0 Full
Minister of Interior
(1977)
France Foul 0.3 Mean daily flow
Combined 0.6 For a flow equal
to 1/10 of the
full section flow
Separate
storm sewer
0.3 For a flow equal
to 1/100 of the
full section flow
European Standard EN
752-4 (1997)
Europe All Sewers 0.7 once per day for
pipes with
D<300mm, 0.7 or
more if necessary in
sewers larger than
D = 300mm
N/A
Abwassertechnishe
Vereinigung ATV
Standard A 110 (1998)
(replaced by ATV 110
(2001))
Germany Foul
Storm
Combined
Depends on
diameter of pipe
ranging from 0.48
(D=150mm) to 2.03
(D=3000mm)
0.3 to full for
0.1 to 0.3,
velocity plus
10%
In South Africa the minimum velocity is 0.7m/s for all diameter pipes (CSIR, 2003).
Stellenbosch University http://scholar.sun.ac.za
Solids in Sewers Page 33
J. Tulleken Stellenbosch University
3.3 Composition of Solids in Sewers
Due to the variety of flow regimes and operational characteristics, the behaviour of solids cannot
be generalised. It is better to predict the nature of solids by local observations or measurements
than to compare it with published averages (Ashley et al., 2005).
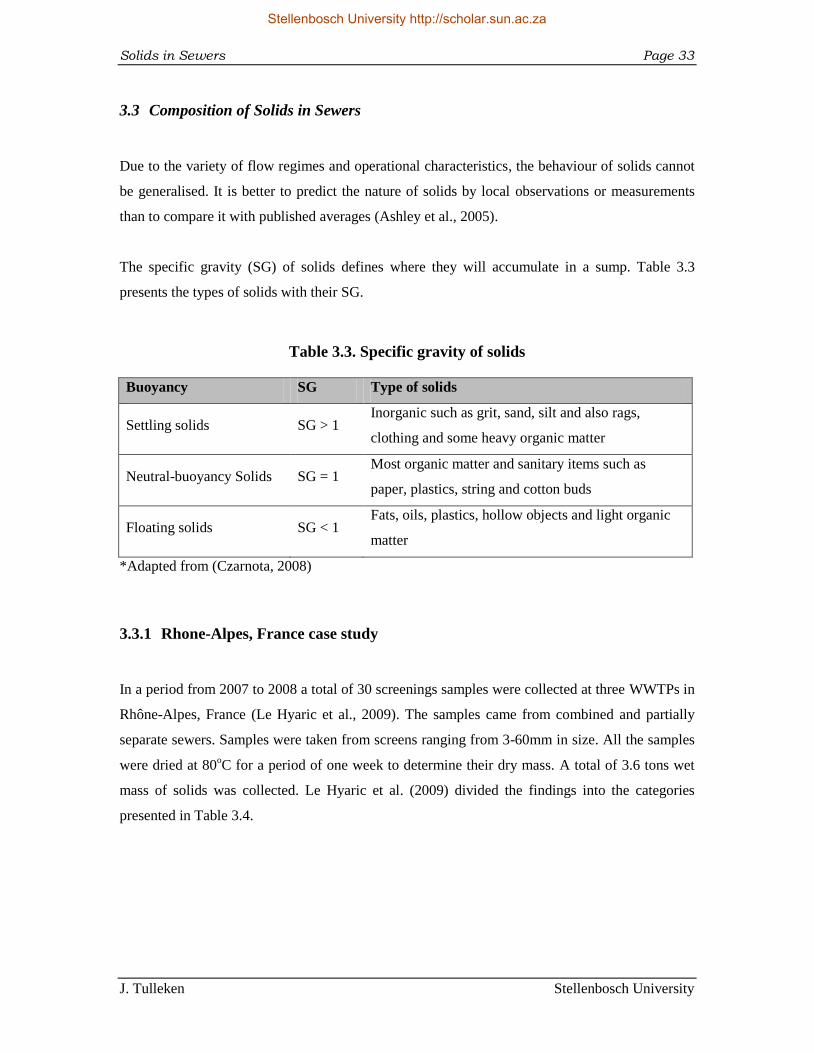
The specific gravity (SG) of solids defines where they will accumulate in a sump. Table 3.3
presents the types of solids with their SG.
Table 3.3. Specific gravity of solids
Buoyancy SG Type of solids
Settling solids SG > 1 Inorganic such as grit, sand, silt and also rags,
clothing and some heavy organic matter
Neutral-buoyancy Solids SG = 1 Most organic matter and sanitary items such as
paper, plastics, string and cotton buds
Floating solids SG < 1 Fats, oils, plastics, hollow objects and light organic
matter
*Adapted from (Czarnota, 2008)
3.3.1 Rhone-Alpes, France case study
In a period from 2007 to 2008 a total of 30 screenings samples were collected at three WWTPs in
Rhône-Alpes, France (Le Hyaric et al., 2009). The samples came from combined and partially
separate sewers. Samples were taken from screens ranging from 3-60mm in size. All the samples
were dried at 80oC for a period of one week to determine their dry mass. A total of 3.6 tons wet
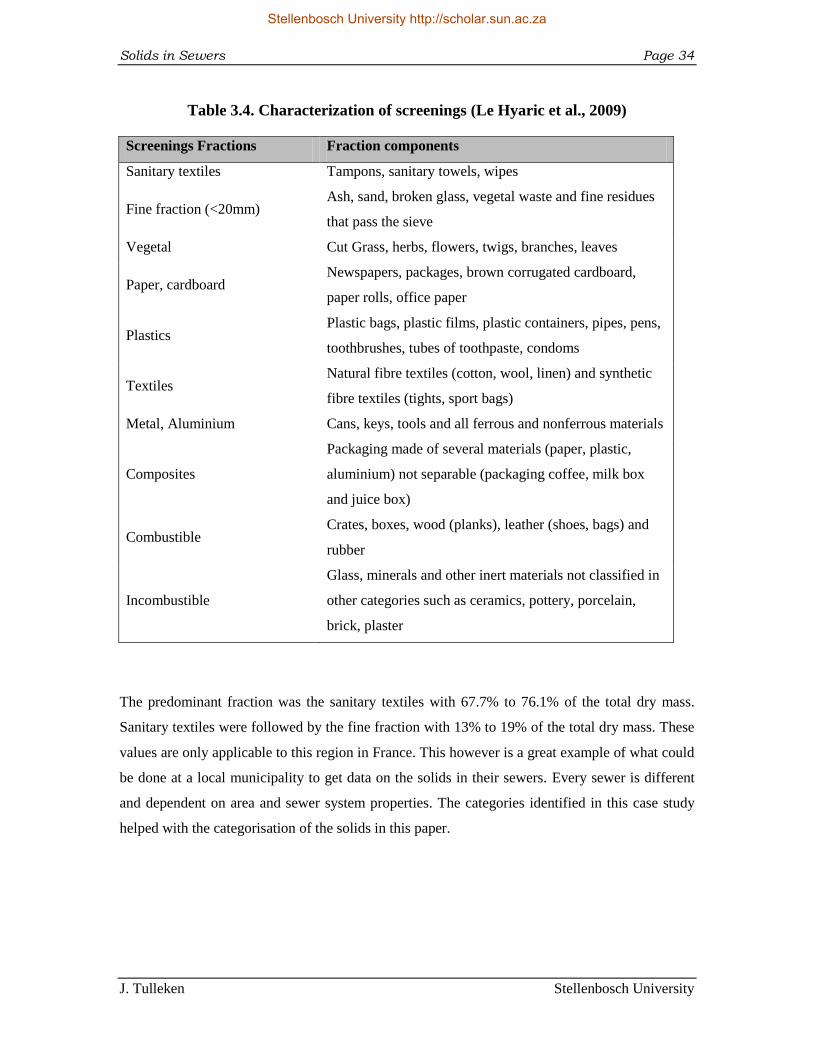
mass of solids was collected. Le Hyaric et al. (2009) divided the findings into the categories
presented in Table 3.4.
Stellenbosch University http://scholar.sun.ac.za
Solids in Sewers Page 34
J. Tulleken Stellenbosch University
Table 3.4. Characterization of screenings (Le Hyaric et al., 2009)
Screenings Fractions Fraction components
Sanitary textiles Tampons, sanitary towels, wipes
Fine fraction (<20mm) Ash, sand, broken glass, vegetal waste and fine residues
that pass the sieve
Vegetal Cut Grass, herbs, flowers, twigs, branches, leaves
Paper, cardboard Newspapers, packages, brown corrugated cardboard,
paper rolls, office paper
Plastics Plastic bags, plastic films, plastic containers, pipes, pens,
toothbrushes, tubes of toothpaste, condoms
Textiles Natural fibre textiles (cotton, wool, linen) and synthetic
fibre textiles (tights, sport bags)
Metal, Aluminium Cans, keys, tools and all ferrous and nonferrous materials
Composites
Packaging made of several materials (paper, plastic,
aluminium) not separable (packaging coffee, milk box
and juice box)
Combustible Crates, boxes, wood (planks), leather (shoes, bags) and
rubber
Incombustible
Glass, minerals and other inert materials not classified in
other categories such as ceramics, pottery, porcelain,
brick, plaster
The predominant fraction was the sanitary textiles with 67.7% to 76.1% of the total dry mass.
Sanitary textiles were followed by the fine fraction with 13% to 19% of the total dry mass. These
values are only applicable to this region in France. This however is a great example of what could
be done at a local municipality to get data on the solids in their sewers. Every sewer is different
and dependent on area and sewer system properties. The categories identified in this case study
helped with the categorisation of the solids in this paper.
Stellenbosch University http://scholar.sun.ac.za
Solids in Sewers Page 35
J. Tulleken Stellenbosch University
3.3.2 Sanitary waste items case study
A questionnaire survey of 44 countries was undertaken by Ashley & Souter (1999) to determine
what sanitary items are flushed and what items are binned. It was found that almost 75% percent
of sanitary waste items found in sewers are flushed by women, and consist of tampons,
applicators, sanitary towels, panty liners, cotton buds, cotton wool, condoms and toilet paper
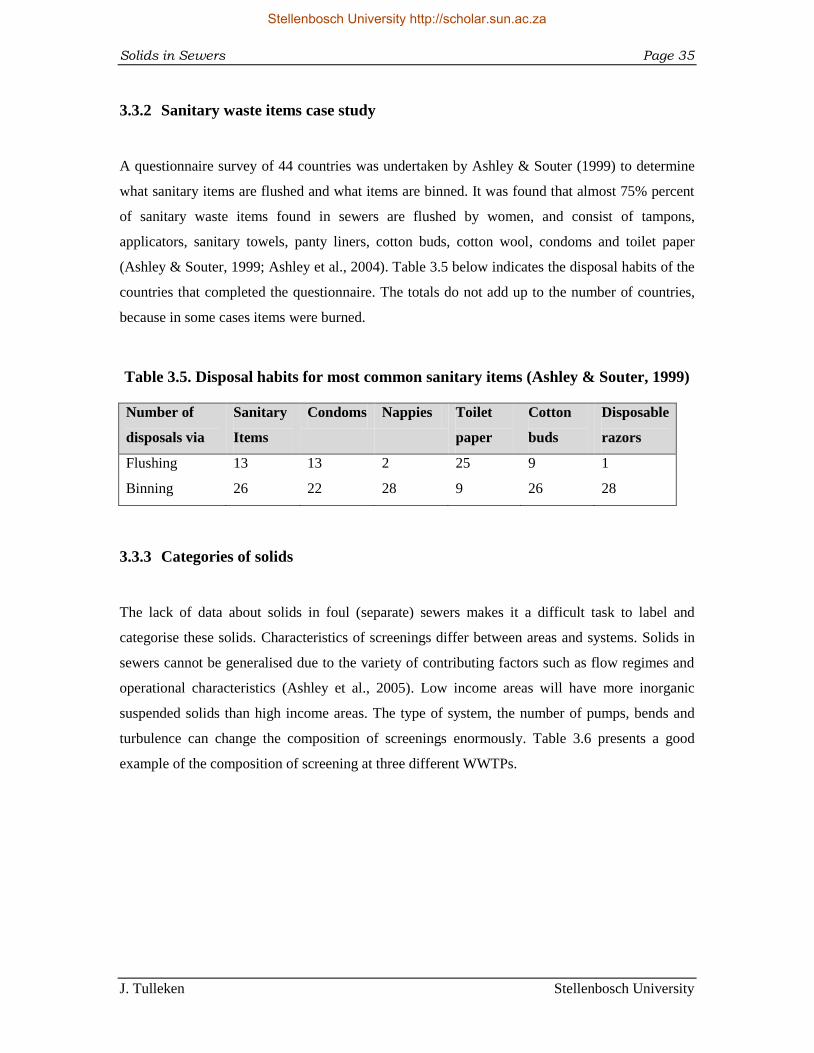
(Ashley & Souter, 1999; Ashley et al., 2004). Table 3.5 below indicates the disposal habits of the
countries that completed the questionnaire. The totals do not add up to the number of countries,
because in some cases items were burned.
Table 3.5. Disposal habits for most common sanitary items (Ashley & Souter, 1999)
Number of
disposals via
Sanitary
Items
Condoms Nappies Toilet
paper
Cotton
buds
Disposable
razors
Flushing 13 13 2 25 9 1
Binning 26 22 28 9 26 28
3.3.3 Categories of solids
The lack of data about solids in foul (separate) sewers makes it a difficult task to label and
categorise these solids. Characteristics of screenings differ between areas and systems. Solids in
sewers cannot be generalised due to the variety of contributing factors such as flow regimes and
operational characteristics (Ashley et al., 2005). Low income areas will have more inorganic
suspended solids than high income areas. The type of system, the number of pumps, bends and
turbulence can change the composition of screenings enormously. Table 3.6 presents a good
example of the composition of screening at three different WWTPs.
Stellenbosch University http://scholar.sun.ac.za
Solids in Sewers Page 36
J. Tulleken Stellenbosch University
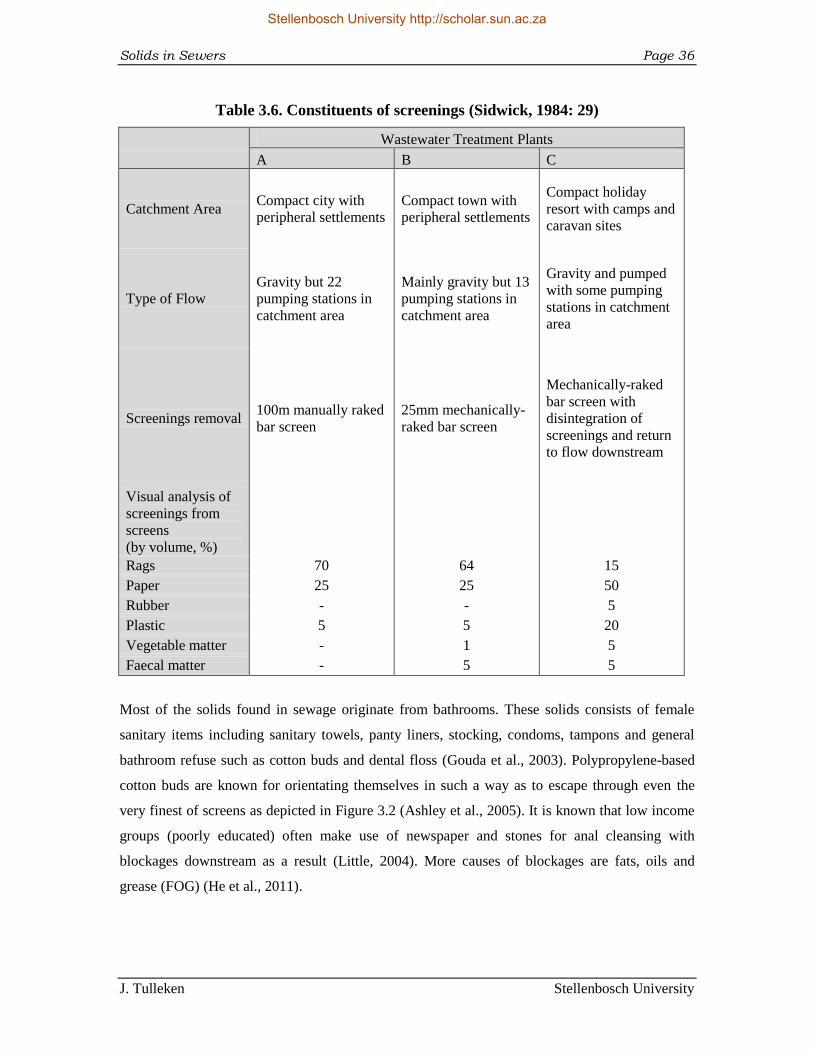
Table 3.6. Constituents of screenings (Sidwick, 1984: 29)
Wastewater Treatment Plants
A B C
Catchment Area Compact city with
peripheral settlements
Compact town with
peripheral settlements
Compact holiday
resort with camps and
caravan sites
Type of Flow
Gravity but 22
pumping stations in
catchment area
Mainly gravity but 13
pumping stations in
catchment area
Gravity and pumped
with some pumping
stations in catchment
area
Screenings removal 100m manually raked
bar screen
25mm mechanically-
raked bar screen
Mechanically-raked
bar screen with
disintegration of
screenings and return
to flow downstream
Visual analysis of
screenings from
screens
(by volume, %)
Rags 70 64 15
Paper 25 25 50
Rubber - - 5
Plastic 5 5 20
Vegetable matter - 1 5
Faecal matter - 5 5
Most of the solids found in sewage originate from bathrooms. These solids consists of female
sanitary items including sanitary towels, panty liners, stocking, condoms, tampons and general
bathroom refuse such as cotton buds and dental floss (Gouda et al., 2003). Polypropylene-based
cotton buds are known for orientating themselves in such a way as to escape through even the
very finest of screens as depicted in Figure 3.2 (Ashley et al., 2005). It is known that low income
groups (poorly educated) often make use of newspaper and stones for anal cleansing with
blockages downstream as a result (Little, 2004). More causes of blockages are fats, oils and
grease (FOG) (He et al., 2011).
Stellenbosch University http://scholar.sun.ac.za
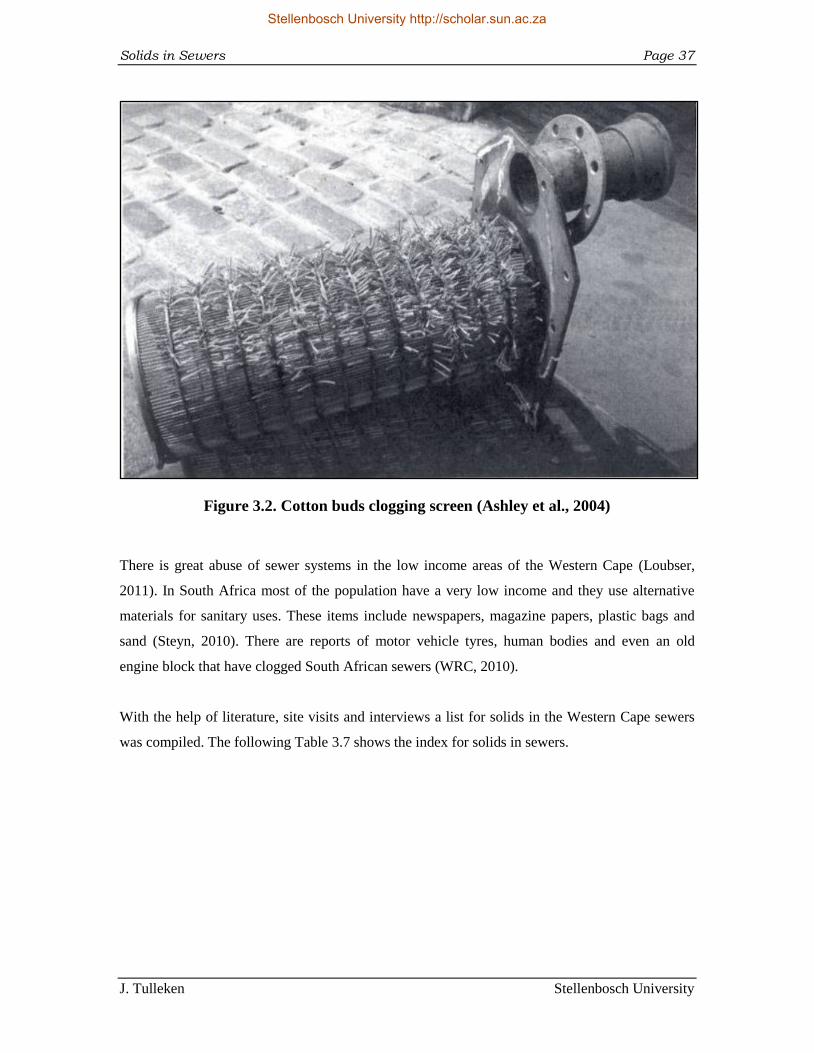
Solids in Sewers Page 37
J. Tulleken Stellenbosch University
Figure 3.2. Cotton buds clogging screen (Ashley et al., 2004)
There is great abuse of sewer systems in the low income areas of the Western Cape (Loubser,
2011). In South Africa most of the population have a very low income and they use alternative
materials for sanitary uses. These items include newspapers, magazine papers, plastic bags and
sand (Steyn, 2010). There are reports of motor vehicle tyres, human bodies and even an old
engine block that have clogged South African sewers (WRC, 2010).
With the help of literature, site visits and interviews a list for solids in the Western Cape sewers
was compiled. The following Table 3.7 shows the index for solids in sewers.
Stellenbosch University http://scholar.sun.ac.za
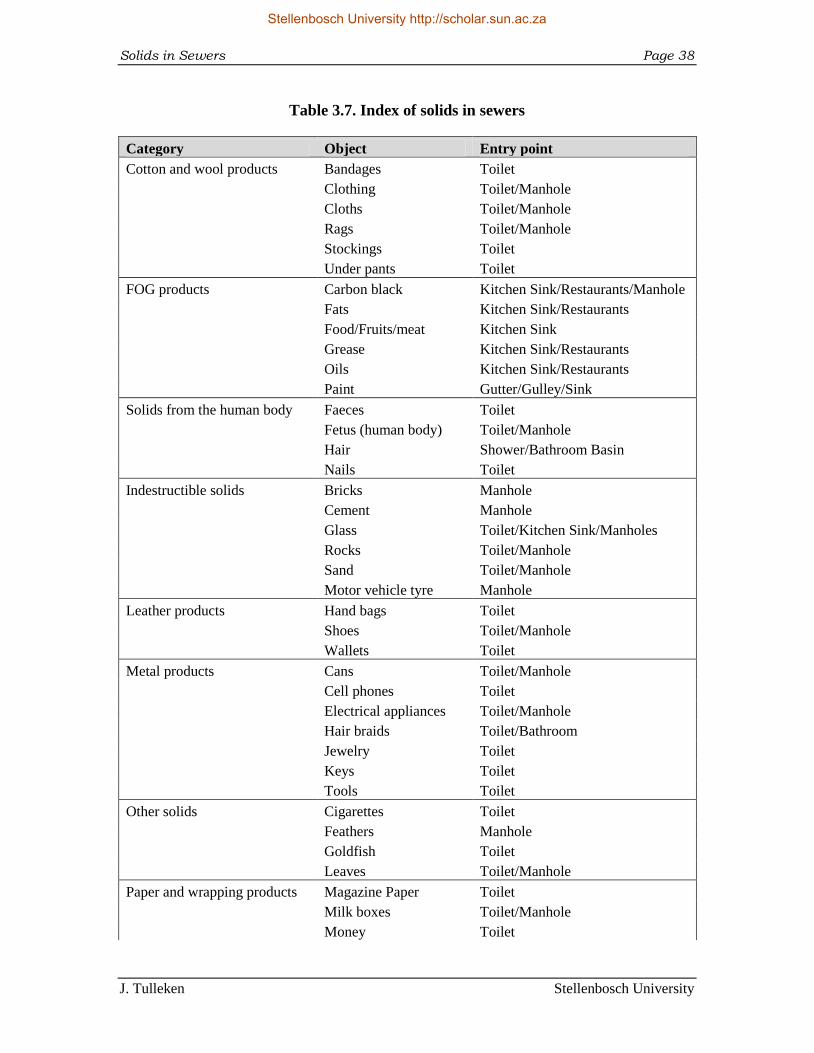
Solids in Sewers Page 38
J. Tulleken Stellenbosch University
Table 3.7. Index of solids in sewers
Category Object Entry point
Cotton and wool products Bandages Toilet
Clothing Toilet/Manhole
Cloths Toilet/Manhole
Rags Toilet/Manhole
Stockings Toilet
Under pants Toilet
FOG products Carbon black Kitchen Sink/Restaurants/Manhole
Fats Kitchen Sink/Restaurants
Food/Fruits/meat Kitchen Sink
Grease Kitchen Sink/Restaurants
Oils Kitchen Sink/Restaurants
Paint Gutter/Gulley/Sink
Solids from the human body Faeces Toilet
Fetus (human body) Toilet/Manhole
Hair Shower/Bathroom Basin
Nails Toilet
Indestructible solids Bricks Manhole
Cement Manhole
Glass Toilet/Kitchen Sink/Manholes
Rocks Toilet/Manhole
Sand Toilet/Manhole
Motor vehicle tyre Manhole
Leather products Hand bags Toilet
Shoes Toilet/Manhole
Wallets Toilet
Metal products Cans Toilet/Manhole
Cell phones Toilet
Electrical appliances Toilet/Manhole
Hair braids Toilet/Bathroom
Jewelry Toilet
Keys Toilet
Tools Toilet
Other solids Cigarettes Toilet
Feathers Manhole
Goldfish Toilet
Leaves Toilet/Manhole
Paper and wrapping products Magazine Paper Toilet
Milk boxes Toilet/Manhole
Money Toilet
Stellenbosch University http://scholar.sun.ac.za
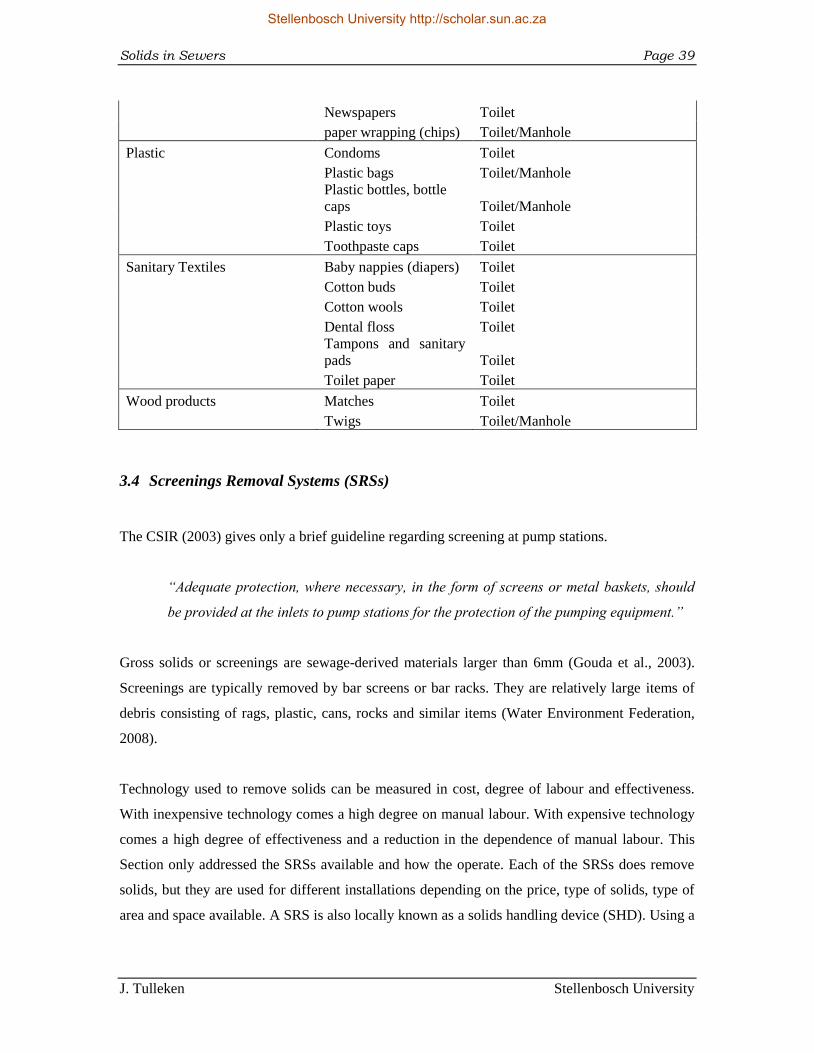
Solids in Sewers Page 39
J. Tulleken Stellenbosch University
Newspapers Toilet
paper wrapping (chips) Toilet/Manhole
Plastic Condoms Toilet
Plastic bags Toilet/Manhole
Plastic bottles, bottle
caps Toilet/Manhole
Plastic toys Toilet
Toothpaste caps Toilet
Sanitary Textiles Baby nappies (diapers) Toilet
Cotton buds Toilet
Cotton wools Toilet
Dental floss Toilet
Tampons and sanitary
pads Toilet
Toilet paper Toilet
Wood products Matches Toilet
Twigs Toilet/Manhole
3.4 Screenings Removal Systems (SRSs)
The CSIR (2003) gives only a brief guideline regarding screening at pump stations.
“Adequate protection, where necessary, in the form of screens or metal baskets, should
be provided at the inlets to pump stations for the protection of the pumping equipment.”
Gross solids or screenings are sewage-derived materials larger than 6mm (Gouda et al., 2003).
Screenings are typically removed by bar screens or bar racks. They are relatively large items of
debris consisting of rags, plastic, cans, rocks and similar items (Water Environment Federation,
2008).
Technology used to remove solids can be measured in cost, degree of labour and effectiveness.
With inexpensive technology comes a high degree on manual labour. With expensive technology
comes a high degree of effectiveness and a reduction in the dependence of manual labour. This
Section only addressed the SRSs available and how the operate. Each of the SRSs does remove
solids, but they are used for different installations depending on the price, type of solids, type of
area and space available. A SRS is also locally known as a solids handling device (SHD). Using a
Stellenbosch University http://scholar.sun.ac.za
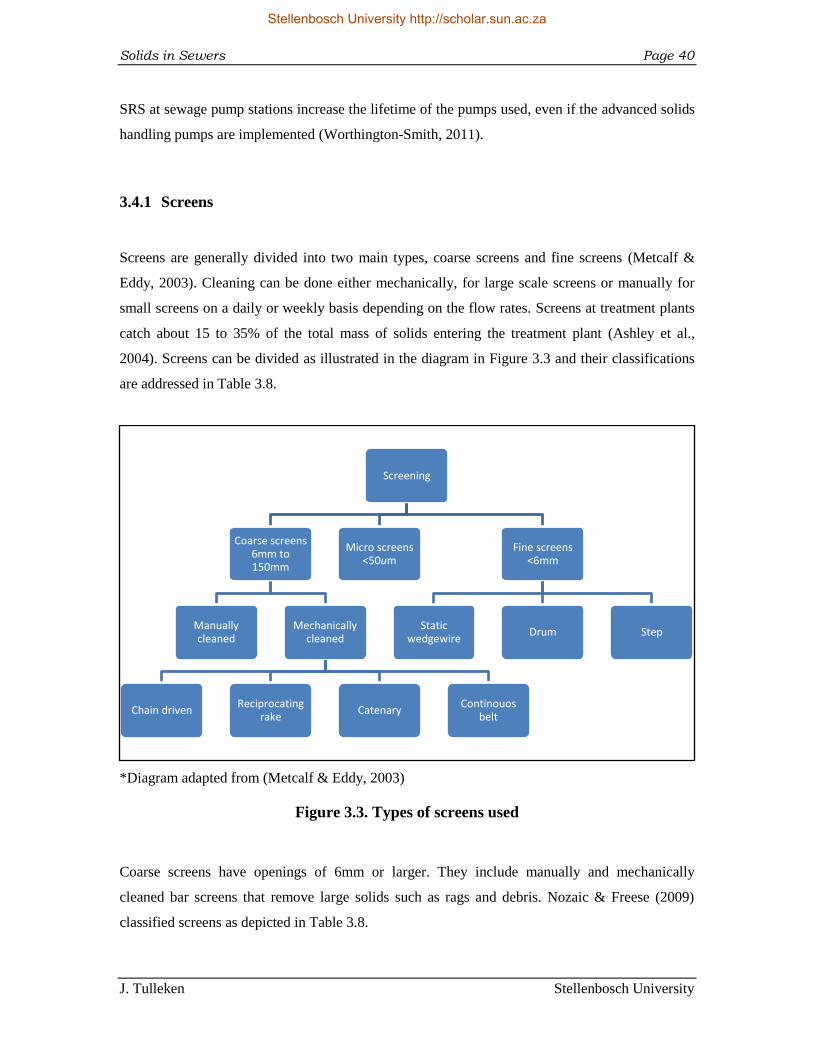
Solids in Sewers Page 40
J. Tulleken Stellenbosch University
SRS at sewage pump stations increase the lifetime of the pumps used, even if the advanced solids
handling pumps are implemented (Worthington-Smith, 2011).
3.4.1 Screens
Screens are generally divided into two main types, coarse screens and fine screens (Metcalf &
Eddy, 2003). Cleaning can be done either mechanically, for large scale screens or manually for
small screens on a daily or weekly basis depending on the flow rates. Screens at treatment plants
catch about 15 to 35% of the total mass of solids entering the treatment plant (Ashley et al.,
2004). Screens can be divided as illustrated in the diagram in Figure 3.3 and their classifications
are addressed in Table 3.8.
*Diagram adapted from (Metcalf & Eddy, 2003)
Figure 3.3. Types of screens used
Coarse screens have openings of 6mm or larger. They include manually and mechanically
cleaned bar screens that remove large solids such as rags and debris. Nozaic & Freese (2009)
classified screens as depicted in Table 3.8.
Screening
Coarse screens 6mm to 150mm
Manually cleaned
Mechanically cleaned
Chain driven Reciprocating
rake Catenary
Continouos belt
Micro screens <50um
Fine screens <6mm
Static wedgewire
Drum Step
Stellenbosch University http://scholar.sun.ac.za
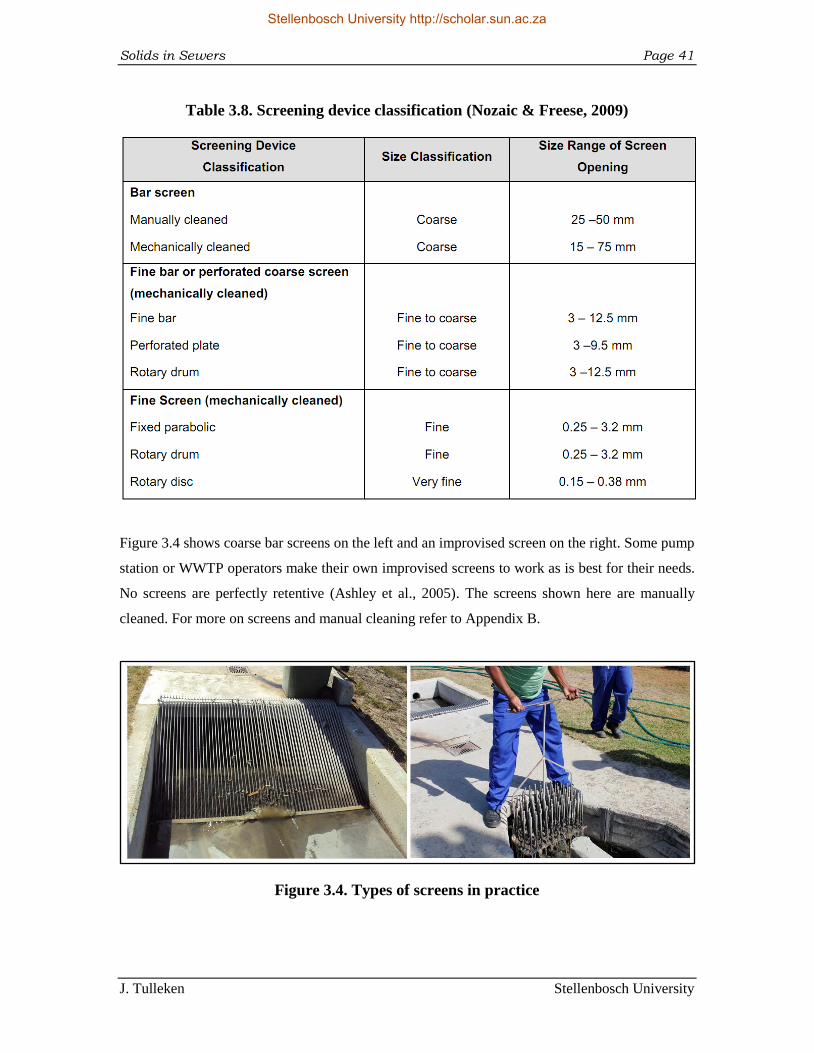
Solids in Sewers Page 41
J. Tulleken Stellenbosch University
Table 3.8. Screening device classification (Nozaic & Freese, 2009)
Figure 3.4 shows coarse bar screens on the left and an improvised screen on the right. Some pump
station or WWTP operators make their own improvised screens to work as is best for their needs.
No screens are perfectly retentive (Ashley et al., 2005). The screens shown here are manually
cleaned. For more on screens and manual cleaning refer to Appendix B.
Figure 3.4. Types of screens in practice
Stellenbosch University http://scholar.sun.ac.za
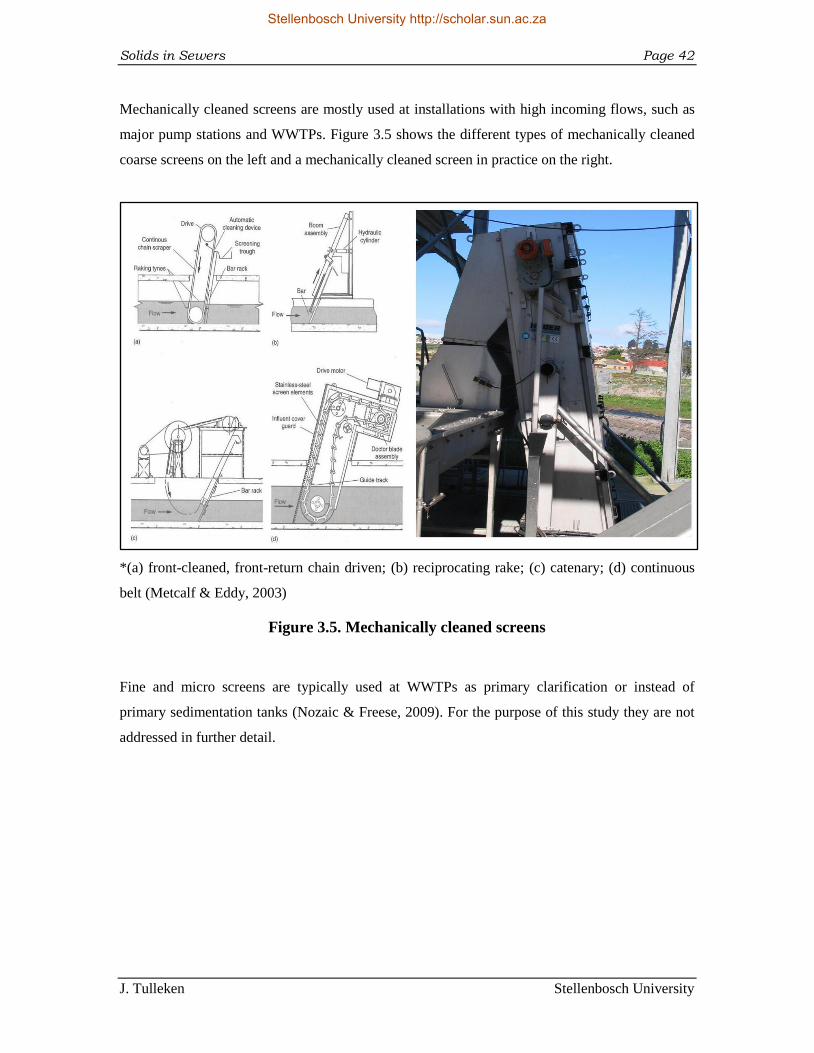
Solids in Sewers Page 42
J. Tulleken Stellenbosch University
Mechanically cleaned screens are mostly used at installations with high incoming flows, such as
major pump stations and WWTPs. Figure 3.5 shows the different types of mechanically cleaned
coarse screens on the left and a mechanically cleaned screen in practice on the right.
*(a) front-cleaned, front-return chain driven; (b) reciprocating rake; (c) catenary; (d) continuous
belt (Metcalf & Eddy, 2003)
Figure 3.5. Mechanically cleaned screens
Fine and micro screens are typically used at WWTPs as primary clarification or instead of
primary sedimentation tanks (Nozaic & Freese, 2009). For the purpose of this study they are not
addressed in further detail.
Stellenbosch University http://scholar.sun.ac.za
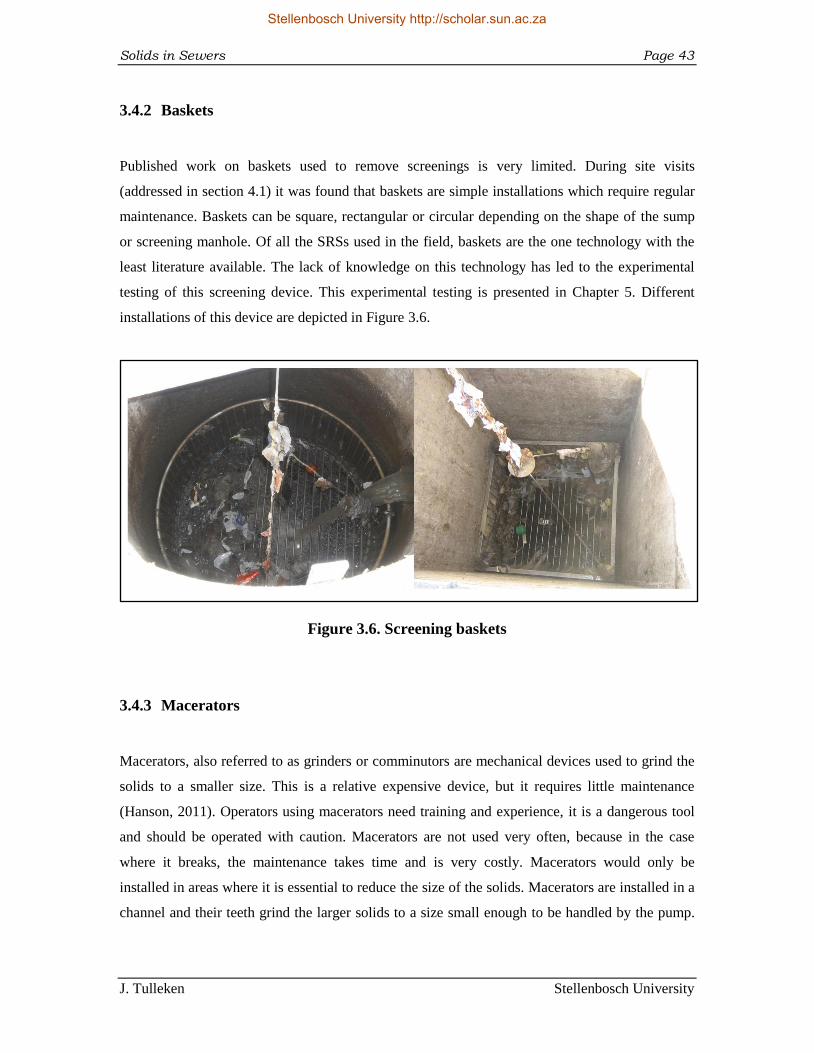
Solids in Sewers Page 43
J. Tulleken Stellenbosch University
3.4.2 Baskets
Published work on baskets used to remove screenings is very limited. During site visits
(addressed in section 4.1) it was found that baskets are simple installations which require regular
maintenance. Baskets can be square, rectangular or circular depending on the shape of the sump
or screening manhole. Of all the SRSs used in the field, baskets are the one technology with the
least literature available. The lack of knowledge on this technology has led to the experimental
testing of this screening device. This experimental testing is presented in Chapter 5. Different
installations of this device are depicted in Figure 3.6.
Figure 3.6. Screening baskets
3.4.3 Macerators
Macerators, also referred to as grinders or comminutors are mechanical devices used to grind the
solids to a smaller size. This is a relative expensive device, but it requires little maintenance
(Hanson, 2011). Operators using macerators need training and experience, it is a dangerous tool
and should be operated with caution. Macerators are not used very often, because in the case
where it breaks, the maintenance takes time and is very costly. Macerators would only be
installed in areas where it is essential to reduce the size of the solids. Macerators are installed in a
channel and their teeth grind the larger solids to a size small enough to be handled by the pump.
Stellenbosch University http://scholar.sun.ac.za
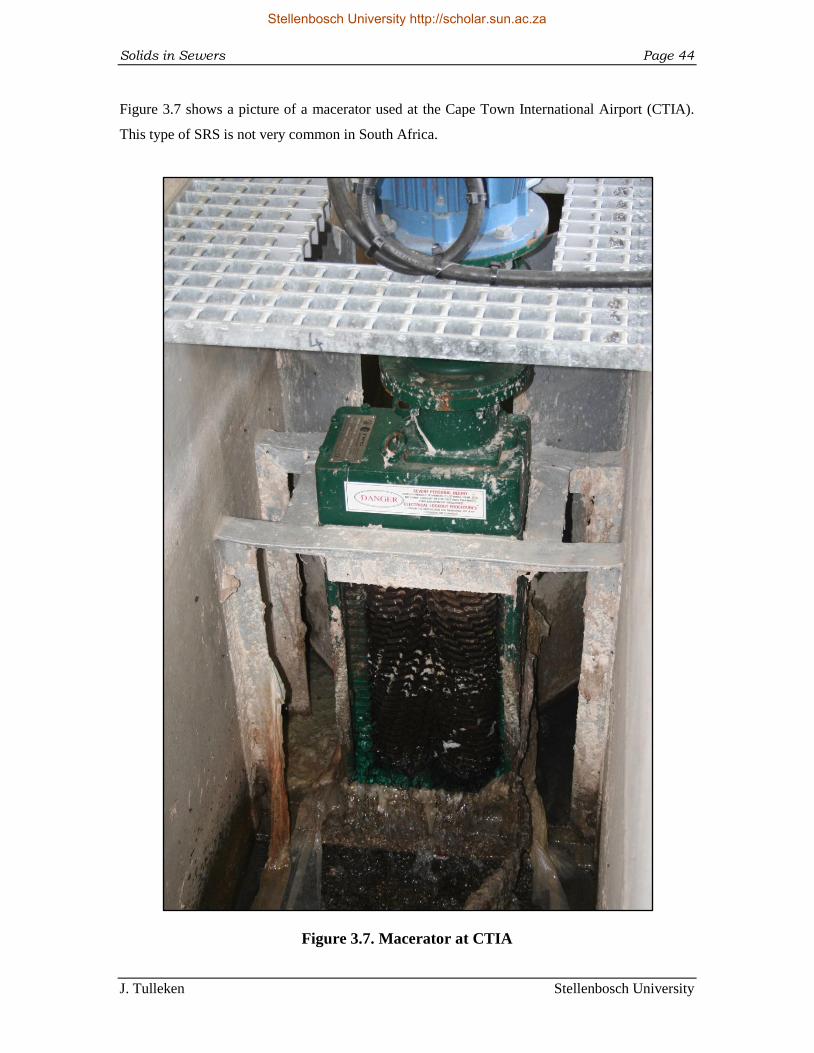
Solids in Sewers Page 44
J. Tulleken Stellenbosch University
Figure 3.7 shows a picture of a macerator used at the Cape Town International Airport (CTIA).
This type of SRS is not very common in South Africa.
Figure 3.7. Macerator at CTIA
Stellenbosch University http://scholar.sun.ac.za
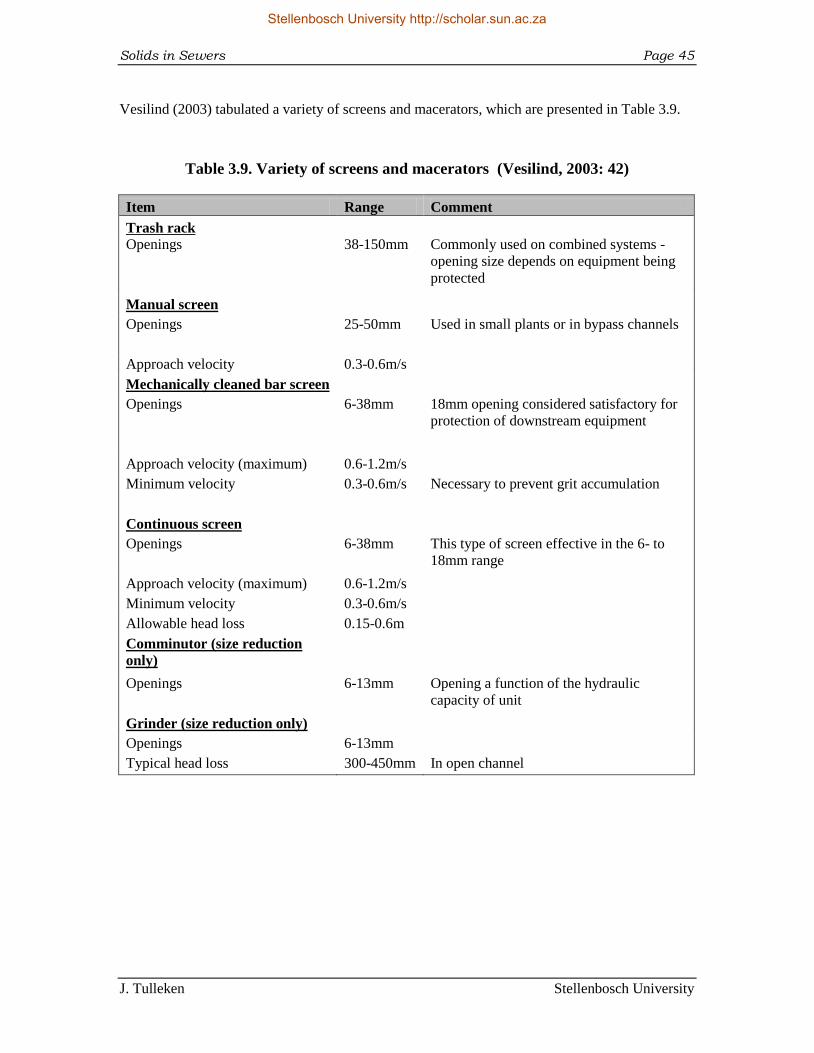
Solids in Sewers Page 45
J. Tulleken Stellenbosch University
Vesilind (2003) tabulated a variety of screens and macerators, which are presented in Table 3.9.
Table 3.9. Variety of screens and macerators (Vesilind, 2003: 42)
Item Range Comment
Trash rack
Openings 38-150mm Commonly used on combined systems -
opening size depends on equipment being
protected
Manual screen
Openings 25-50mm Used in small plants or in bypass channels
Approach velocity 0.3-0.6m/s
Mechanically cleaned bar screen
Openings 6-38mm 18mm opening considered satisfactory for
protection of downstream equipment
Approach velocity (maximum) 0.6-1.2m/s
Minimum velocity 0.3-0.6m/s Necessary to prevent grit accumulation
Continuous screen
Openings 6-38mm This type of screen effective in the 6- to
18mm range
Approach velocity (maximum) 0.6-1.2m/s
Minimum velocity 0.3-0.6m/s
Allowable head loss 0.15-0.6m
Comminutor (size reduction
only)
Openings 6-13mm Opening a function of the hydraulic
capacity of unit
Grinder (size reduction only)
Openings 6-13mm
Typical head loss 300-450mm In open channel
Stellenbosch University http://scholar.sun.ac.za
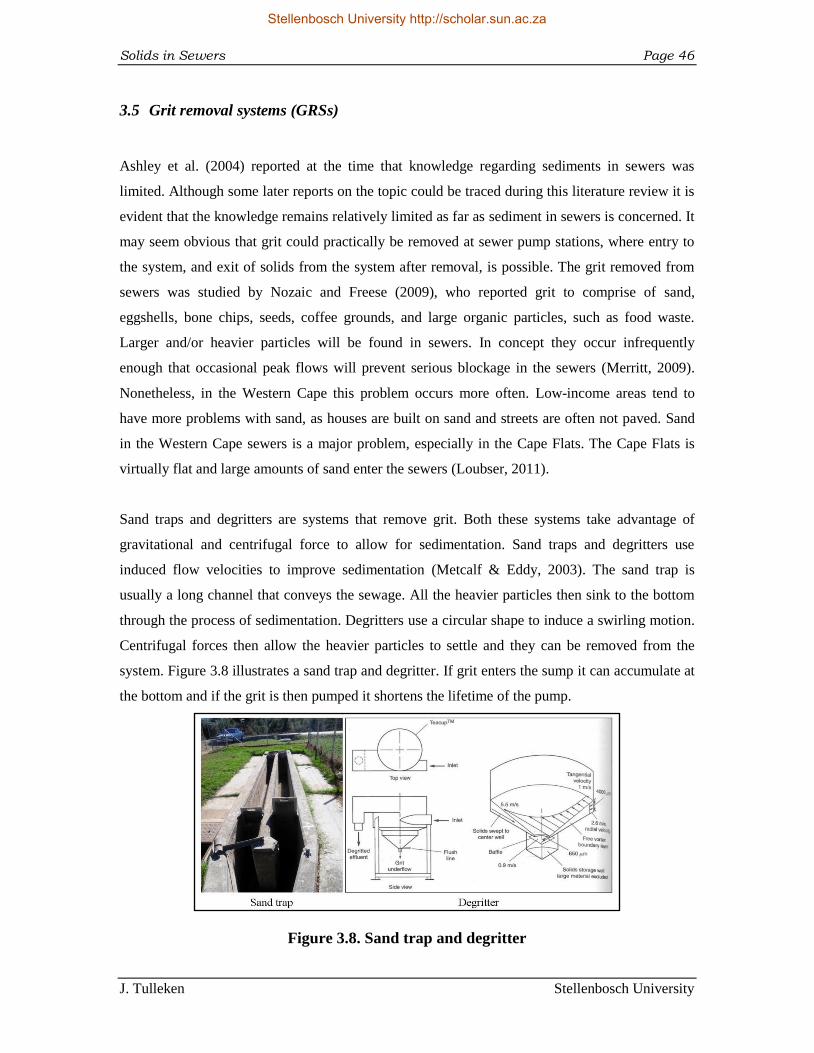
Solids in Sewers Page 46
J. Tulleken Stellenbosch University
3.5 Grit removal systems (GRSs)
Ashley et al. (2004) reported at the time that knowledge regarding sediments in sewers was
limited. Although some later reports on the topic could be traced during this literature review it is
evident that the knowledge remains relatively limited as far as sediment in sewers is concerned. It
may seem obvious that grit could practically be removed at sewer pump stations, where entry to
the system, and exit of solids from the system after removal, is possible. The grit removed from
sewers was studied by Nozaic and Freese (2009), who reported grit to comprise of sand,
eggshells, bone chips, seeds, coffee grounds, and large organic particles, such as food waste.
Larger and/or heavier particles will be found in sewers. In concept they occur infrequently
enough that occasional peak flows will prevent serious blockage in the sewers (Merritt, 2009).
Nonetheless, in the Western Cape this problem occurs more often. Low-income areas tend to
have more problems with sand, as houses are built on sand and streets are often not paved. Sand
in the Western Cape sewers is a major problem, especially in the Cape Flats. The Cape Flats is
virtually flat and large amounts of sand enter the sewers (Loubser, 2011).
Sand traps and degritters are systems that remove grit. Both these systems take advantage of
gravitational and centrifugal force to allow for sedimentation. Sand traps and degritters use
induced flow velocities to improve sedimentation (Metcalf & Eddy, 2003). The sand trap is
usually a long channel that conveys the sewage. All the heavier particles then sink to the bottom
through the process of sedimentation. Degritters use a circular shape to induce a swirling motion.
Centrifugal forces then allow the heavier particles to settle and they can be removed from the
system. Figure 3.8 illustrates a sand trap and degritter. If grit enters the sump it can accumulate at
the bottom and if the grit is then pumped it shortens the lifetime of the pump.
Figure 3.8. Sand trap and degritter
Stellenbosch University http://scholar.sun.ac.za
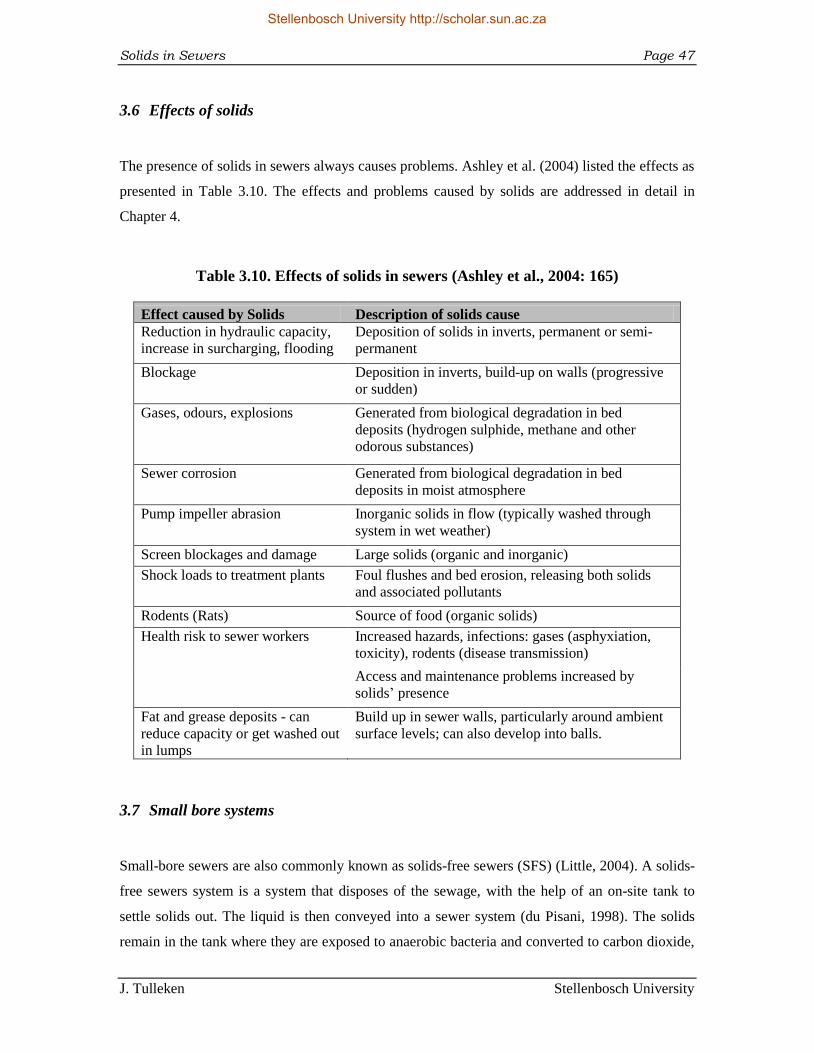
Solids in Sewers Page 47
J. Tulleken Stellenbosch University
3.6 Effects of solids
The presence of solids in sewers always causes problems. Ashley et al. (2004) listed the effects as
presented in Table 3.10. The effects and problems caused by solids are addressed in detail in
Chapter 4.
Table 3.10. Effects of solids in sewers (Ashley et al., 2004: 165)
Effect caused by Solids Description of solids cause
Reduction in hydraulic capacity,
increase in surcharging, flooding
Deposition of solids in inverts, permanent or semi-
permanent
Blockage Deposition in inverts, build-up on walls (progressive
or sudden)
Gases, odours, explosions Generated from biological degradation in bed
deposits (hydrogen sulphide, methane and other
odorous substances)
Sewer corrosion Generated from biological degradation in bed
deposits in moist atmosphere
Pump impeller abrasion Inorganic solids in flow (typically washed through
system in wet weather)
Screen blockages and damage Large solids (organic and inorganic)
Shock loads to treatment plants Foul flushes and bed erosion, releasing both solids
and associated pollutants
Rodents (Rats) Source of food (organic solids)
Health risk to sewer workers Increased hazards, infections: gases (asphyxiation,
toxicity), rodents (disease transmission)
Access and maintenance problems increased by
solids‟ presence
Fat and grease deposits - can
reduce capacity or get washed out
in lumps
Build up in sewer walls, particularly around ambient
surface levels; can also develop into balls.
3.7 Small bore systems
Small-bore sewers are also commonly known as solids-free sewers (SFS) (Little, 2004). A solids-
free sewers system is a system that disposes of the sewage, with the help of an on-site tank to
settle solids out. The liquid is then conveyed into a sewer system (du Pisani, 1998). The solids
remain in the tank where they are exposed to anaerobic bacteria and converted to carbon dioxide,
Stellenbosch University http://scholar.sun.ac.za
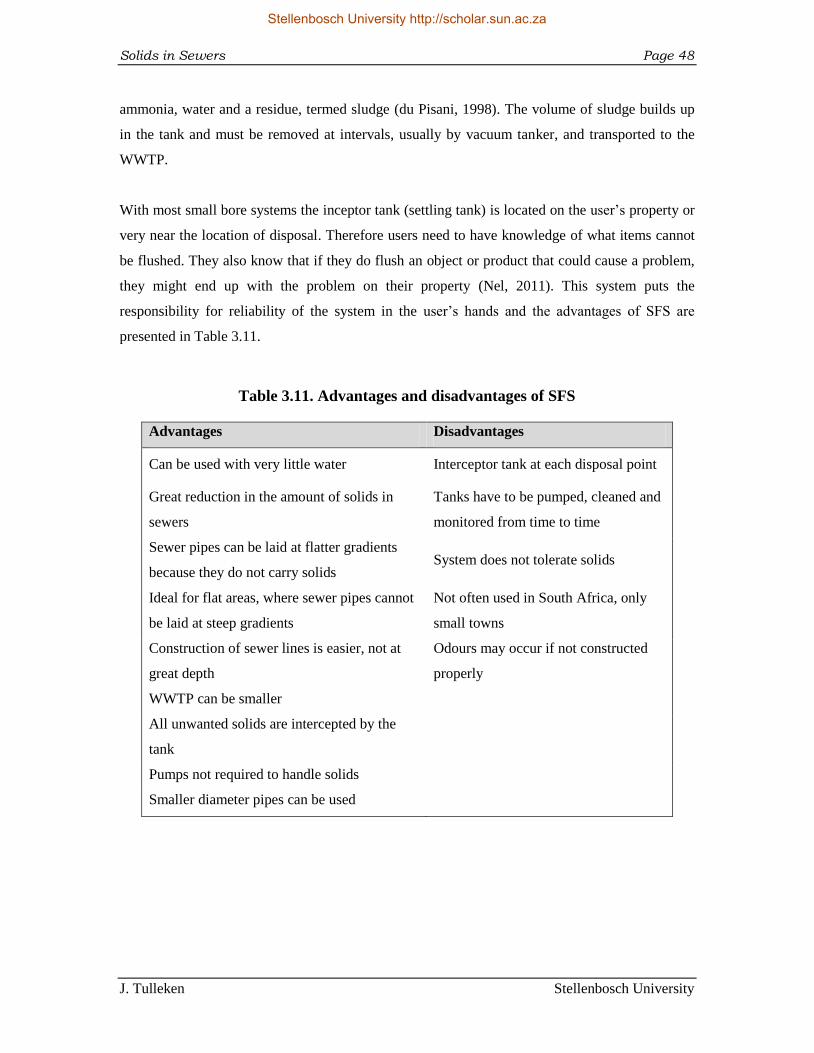
Solids in Sewers Page 48
J. Tulleken Stellenbosch University
ammonia, water and a residue, termed sludge (du Pisani, 1998). The volume of sludge builds up
in the tank and must be removed at intervals, usually by vacuum tanker, and transported to the
WWTP.
With most small bore systems the inceptor tank (settling tank) is located on the user‟s property or
very near the location of disposal. Therefore users need to have knowledge of what items cannot
be flushed. They also know that if they do flush an object or product that could cause a problem,
they might end up with the problem on their property (Nel, 2011). This system puts the
responsibility for reliability of the system in the user‟s hands and the advantages of SFS are
presented in Table 3.11.
Table 3.11. Advantages and disadvantages of SFS
Advantages Disadvantages
Can be used with very little water Interceptor tank at each disposal point
Great reduction in the amount of solids in
sewers
Tanks have to be pumped, cleaned and
monitored from time to time
Sewer pipes can be laid at flatter gradients
because they do not carry solids System does not tolerate solids
Ideal for flat areas, where sewer pipes cannot
be laid at steep gradients
Not often used in South Africa, only
small towns
Construction of sewer lines is easier, not at
great depth
Odours may occur if not constructed
properly
WWTP can be smaller
All unwanted solids are intercepted by the
tank
Pumps not required to handle solids
Smaller diameter pipes can be used
Stellenbosch University http://scholar.sun.ac.za
Problems at Pump Stations Page 49
J. Tulleken Stellenbosch University
4. Problems at Pump Stations
There will always be a need for sewage pump stations, since sewage cannot flow under gravity at
all times. Pump stations have the duty of pumping sewage to maintain flow in sewer networks.
Pumping sewage holds various problems, of which one of the most common is overflows.
Parts of this Chapter were submitted to the WRC in a report (K5-2007-3 Deliverable 3) on sewer
pumps and pressurized flow (Jacobs et al., 2011).
Various common problems have been documented. A list of problems has been compiled from
literature, site visits and interviews. These common problems include (van der Merwe-Botha &
Manus, 2011; Sidwick, 1984):
Baskets and screens are not cleaned
Blockages of pumps and pipelines
Criminal activities (theft, vandalism, sabotage)
Design deficiencies
Electrical failure within the pump station
Excess ingress of stormwater
Failure of alarms and monitoring equipment
Fouling of level probes
Human access or absence of exclusion areas
Human error
Inadequate budgeting
Inadequate inspection
Inadequate overflow facilities
Inadequate redundancy or standby on pumps
Jamming of valves
Lack of maintenance planning
Lack of preventive maintenance
Stellenbosch University http://scholar.sun.ac.za
Problems at Pump Stations Page 50
J. Tulleken Stellenbosch University
Lack of routine inspections and condition analysis
Level switches and controls are out of order
Mechanical failure of duty and standby pump sets
Odour problems
Power outages
Pumps that are unsuitable for sewage – certain types of pumps give chronic problems
Settlement of grit in pipes and sumps
Uncontrolled discharge from tankers along the reticulation system.
In this study problems at sewage pump stations were identified by means of an in depth literature
study in conjunction with a combination of field visits and interviews in the Western Cape. The
causes of sewage pump station problems were investigated in detail. This chapter addresses these
problems and categorizes them into identifiable groups.
4.1 Site Visits
Ashley et al. (2005) confirmed that there is a lack of data on solids in sewers in many countries
and emphasized that more information is needed on the sewer solids of developing countries.
Hydraulics and theory have their place, but a lot of experience has been gained over the years
based on practical experience and considerations (WRC, 2010). Local conditions and problems
unique to certain areas have to be solved “on-site”, sometimes with improvised techniques not
available in text books.
Site visits were conducted to get a better overview of the state and magnitude of the problems at
sewage pump stations. Various municipalities were visited and pump station inspections were
conducted. All the pump stations visited were located in the Western Cape, of which the majority
were unmanned stations.
The places chosen for site visits depended on the type of system used in the area. The goal was to
gain knowledge of as many of the different technologies available as possible and the possible
problems that occur. Different technologies included:
Pump stations (small and large stations)
Stellenbosch University http://scholar.sun.ac.za
Problems at Pump Stations Page 51
J. Tulleken Stellenbosch University
Different solids removal techniques (screens, baskets, macerators and grit
removal)
Gravity only systems (no pump stations required)
Small-bore systems
WWTPs
Different types of pump installations (submersible, immersible, screw and self
priming)
Different catchment areas classified according to income level (low-income,
moderate income and high income).
It is evident that the problem with pump stations lies beyond only the design of the stations.
Problems with maintenance and managing staff were visible at most of the municipalities.
Nonetheless, some municipalities found that with a well designed system and regular
maintenance, the problems could be reduced dramatically. At some municipalities, personnel time
management perceived to be problematic. At other municipalities personnel are monitored and
the pump stations work effectively. With the right attitude success can be achieved, but this is not
always possible, therefore operation and maintenance should be simplified through design.
At the start of the study a field questionnaire or pump station checklist was compiled to capture
relevant data at the pump stations. The field questionnaire that was developed is attached in
Appendix C and can be used in the future, but it is not recommended. It was thought that if data
were collected from site visits a good benchmark could be established. However, it soon became
apparent that this was not a very effective method since the people operating these stations often
did not have the data or knowledge of the station. The operation manual and maintenance list is
often not available on site and with most of the pumps being submersible pumps, the
characteristics of the pump cannot be read or collected.
It was found that the best way to collect data was to take photographs and interrogate staff about
operational problems. The Pump-station standard operation inspection form, which is available in
the Waterborne Sanitation Operations and Maintenance Guide is also a form which can be used.
The problems documented during the site visits are addressed throughout this chapter. Table 4.1
lists the locations that were visited. A more detailed list is attached in Appendix D.
Stellenbosch University http://scholar.sun.ac.za
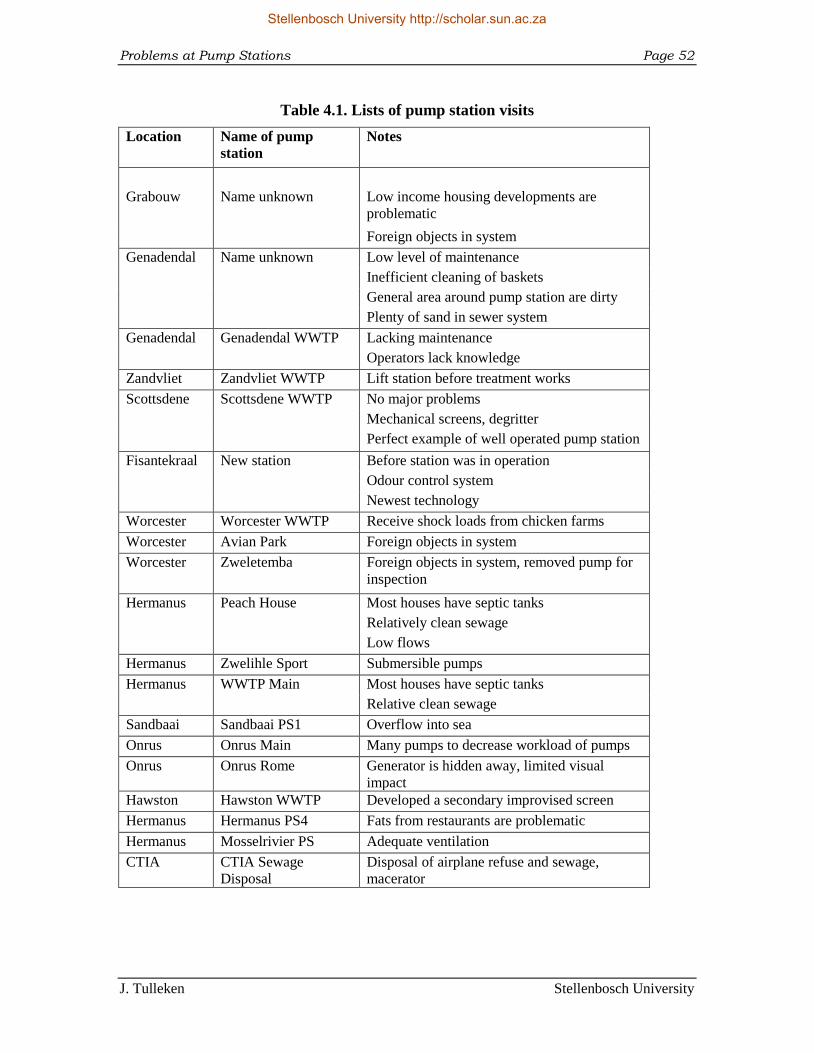
Problems at Pump Stations Page 52
J. Tulleken Stellenbosch University
Table 4.1. Lists of pump station visits
Location Name of pump
station
Notes
Grabouw Name unknown Low income housing developments are
problematic
Foreign objects in system
Genadendal Name unknown Low level of maintenance
Inefficient cleaning of baskets
General area around pump station are dirty
Plenty of sand in sewer system
Genadendal Genadendal WWTP Lacking maintenance
Operators lack knowledge
Zandvliet Zandvliet WWTP Lift station before treatment works
Scottsdene Scottsdene WWTP No major problems
Mechanical screens, degritter
Perfect example of well operated pump station
Fisantekraal New station Before station was in operation
Odour control system
Newest technology
Worcester Worcester WWTP Receive shock loads from chicken farms
Worcester Avian Park Foreign objects in system
Worcester Zweletemba Foreign objects in system, removed pump for
inspection
Hermanus Peach House Most houses have septic tanks
Relatively clean sewage
Low flows
Hermanus Zwelihle Sport Submersible pumps
Hermanus WWTP Main Most houses have septic tanks
Relative clean sewage
Sandbaai Sandbaai PS1 Overflow into sea
Onrus Onrus Main Many pumps to decrease workload of pumps
Onrus Onrus Rome Generator is hidden away, limited visual
impact
Hawston Hawston WWTP Developed a secondary improvised screen
Hermanus Hermanus PS4 Fats from restaurants are problematic
Hermanus Mosselrivier PS Adequate ventilation
CTIA CTIA Sewage
Disposal
Disposal of airplane refuse and sewage,
macerator
Stellenbosch University http://scholar.sun.ac.za
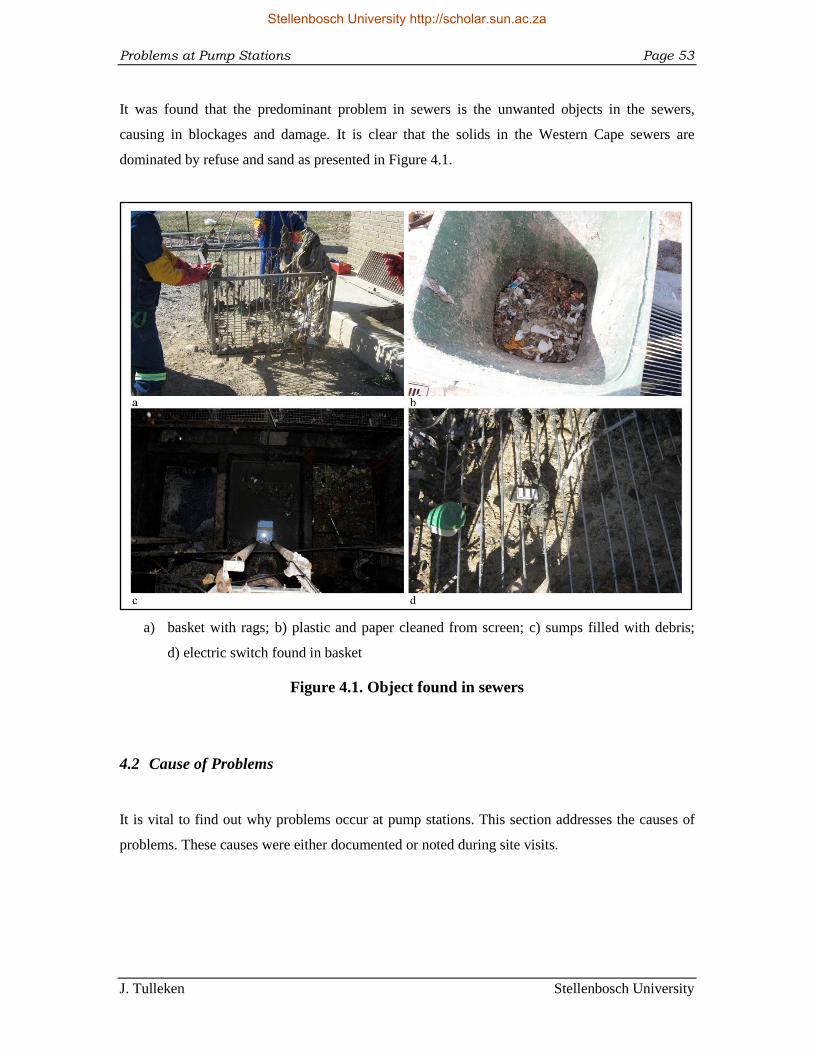
Problems at Pump Stations Page 53
J. Tulleken Stellenbosch University
It was found that the predominant problem in sewers is the unwanted objects in the sewers,
causing in blockages and damage. It is clear that the solids in the Western Cape sewers are
dominated by refuse and sand as presented in Figure 4.1.
a) basket with rags; b) plastic and paper cleaned from screen; c) sumps filled with debris;
d) electric switch found in basket
Figure 4.1. Object found in sewers
4.2 Cause of Problems
It is vital to find out why problems occur at pump stations. This section addresses the causes of
problems. These causes were either documented or noted during site visits.
Stellenbosch University http://scholar.sun.ac.za
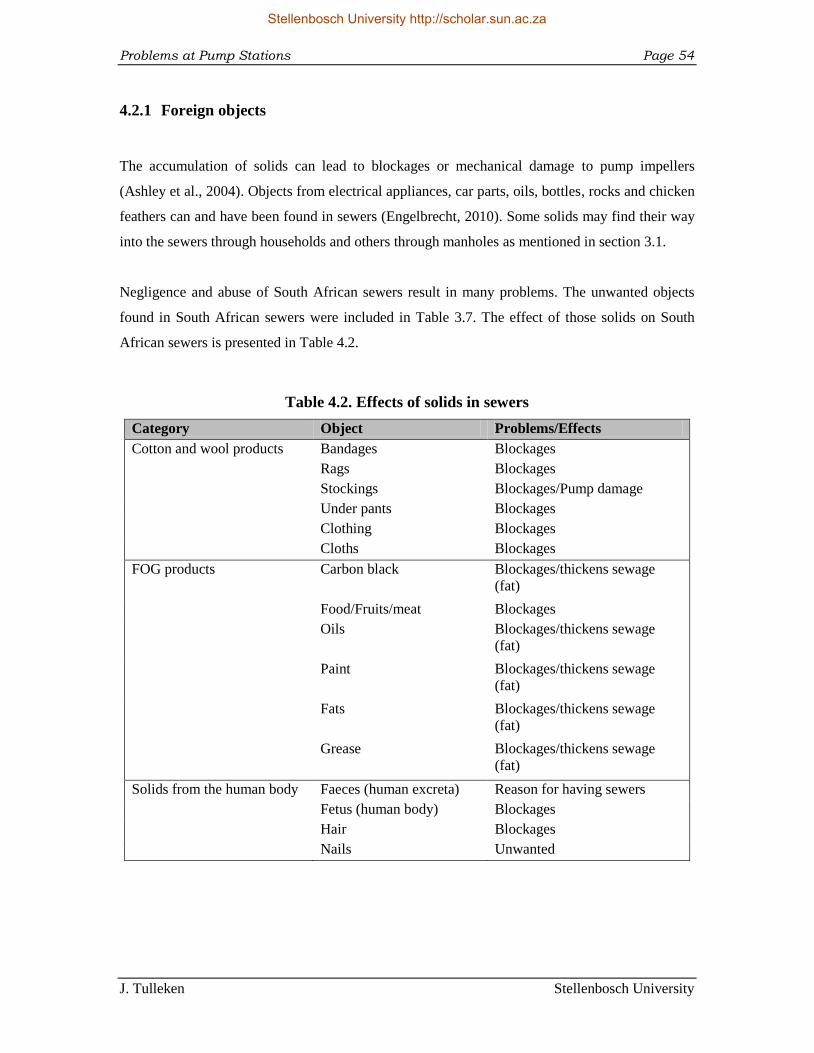
Problems at Pump Stations Page 54
J. Tulleken Stellenbosch University
4.2.1 Foreign objects
The accumulation of solids can lead to blockages or mechanical damage to pump impellers
(Ashley et al., 2004). Objects from electrical appliances, car parts, oils, bottles, rocks and chicken
feathers can and have been found in sewers (Engelbrecht, 2010). Some solids may find their way
into the sewers through households and others through manholes as mentioned in section 3.1.
Negligence and abuse of South African sewers result in many problems. The unwanted objects
found in South African sewers were included in Table 3.7. The effect of those solids on South
African sewers is presented in Table 4.2.
Table 4.2. Effects of solids in sewers
Category Object Problems/Effects
Cotton and wool products Bandages Blockages
Rags Blockages
Stockings Blockages/Pump damage
Under pants Blockages
Clothing Blockages
Cloths Blockages
FOG products Carbon black Blockages/thickens sewage
(fat)
Food/Fruits/meat Blockages
Oils Blockages/thickens sewage
(fat)
Paint Blockages/thickens sewage
(fat)
Fats Blockages/thickens sewage
(fat)
Grease Blockages/thickens sewage
(fat)
Solids from the human body Faeces (human excreta) Reason for having sewers
Fetus (human body) Blockages
Hair Blockages
Nails Unwanted
Stellenbosch University http://scholar.sun.ac.za
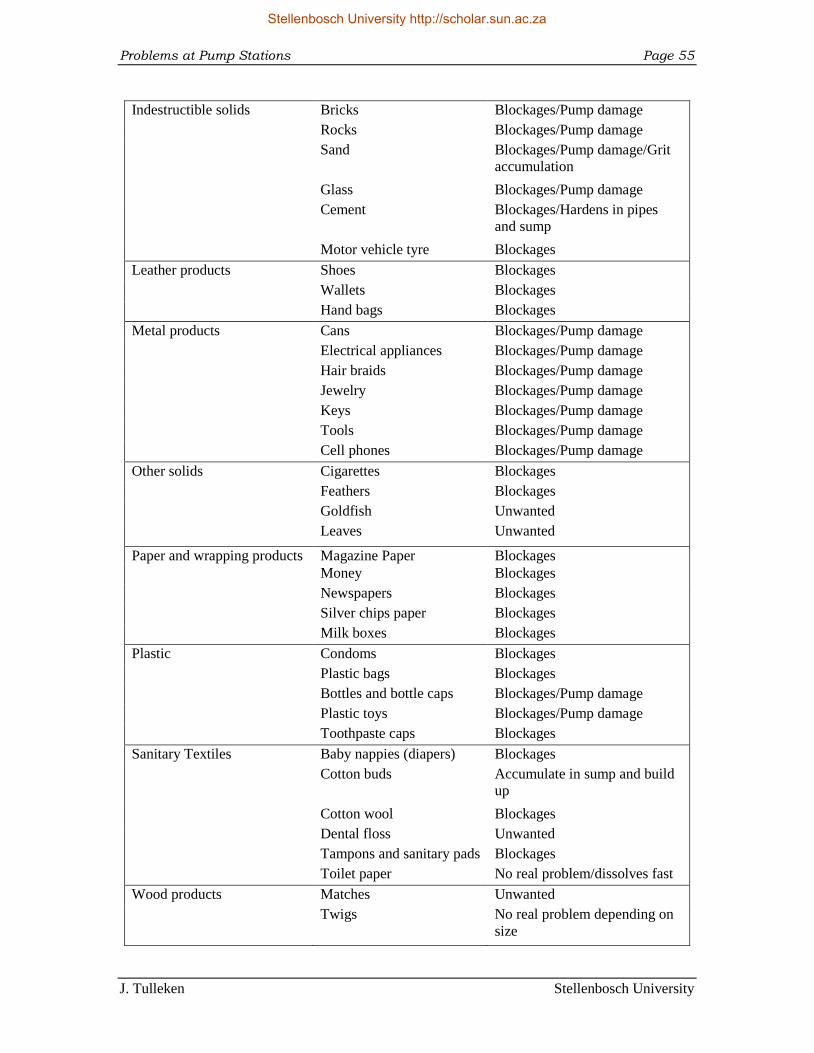
Problems at Pump Stations Page 55
J. Tulleken Stellenbosch University
Indestructible solids Bricks Blockages/Pump damage
Rocks Blockages/Pump damage
Sand Blockages/Pump damage/Grit
accumulation
Glass Blockages/Pump damage
Cement Blockages/Hardens in pipes
and sump
Motor vehicle tyre Blockages
Leather products Shoes Blockages
Wallets Blockages
Hand bags Blockages
Metal products Cans Blockages/Pump damage
Electrical appliances Blockages/Pump damage
Hair braids Blockages/Pump damage
Jewelry Blockages/Pump damage
Keys Blockages/Pump damage
Tools Blockages/Pump damage
Cell phones Blockages/Pump damage
Other solids Cigarettes Blockages
Feathers Blockages
Goldfish Unwanted
Leaves Unwanted
Paper and wrapping products Magazine Paper Blockages
Money Blockages
Newspapers Blockages
Silver chips paper Blockages
Milk boxes Blockages
Plastic Condoms Blockages
Plastic bags Blockages
Bottles and bottle caps Blockages/Pump damage
Plastic toys Blockages/Pump damage
Toothpaste caps Blockages
Sanitary Textiles Baby nappies (diapers) Blockages
Cotton buds Accumulate in sump and build
up
Cotton wool Blockages
Dental floss Unwanted
Tampons and sanitary pads Blockages
Toilet paper No real problem/dissolves fast
Wood products Matches Unwanted
Twigs No real problem depending on
size
Stellenbosch University http://scholar.sun.ac.za
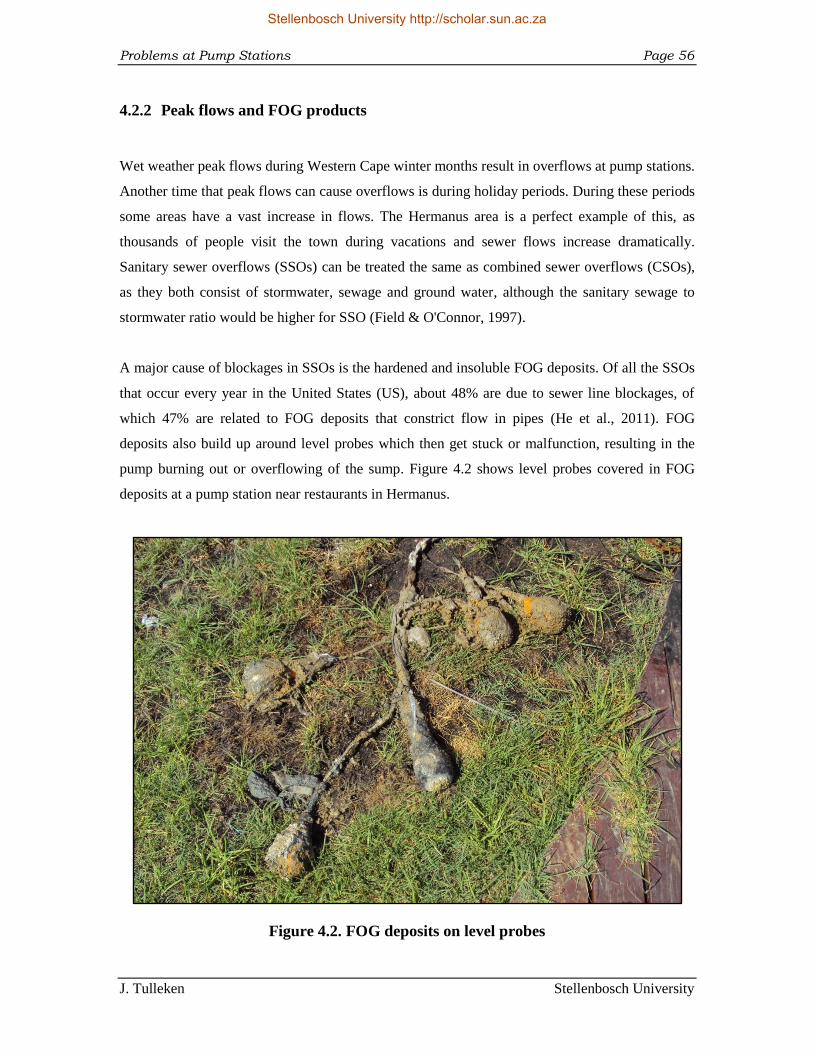
Problems at Pump Stations Page 56
J. Tulleken Stellenbosch University
4.2.2 Peak flows and FOG products
Wet weather peak flows during Western Cape winter months result in overflows at pump stations.
Another time that peak flows can cause overflows is during holiday periods. During these periods
some areas have a vast increase in flows. The Hermanus area is a perfect example of this, as
thousands of people visit the town during vacations and sewer flows increase dramatically.
Sanitary sewer overflows (SSOs) can be treated the same as combined sewer overflows (CSOs),
as they both consist of stormwater, sewage and ground water, although the sanitary sewage to
stormwater ratio would be higher for SSO (Field & O'Connor, 1997).
A major cause of blockages in SSOs is the hardened and insoluble FOG deposits. Of all the SSOs
that occur every year in the United States (US), about 48% are due to sewer line blockages, of
which 47% are related to FOG deposits that constrict flow in pipes (He et al., 2011). FOG
deposits also build up around level probes which then get stuck or malfunction, resulting in the
pump burning out or overflowing of the sump. Figure 4.2 shows level probes covered in FOG
deposits at a pump station near restaurants in Hermanus.
Figure 4.2. FOG deposits on level probes
Stellenbosch University http://scholar.sun.ac.za
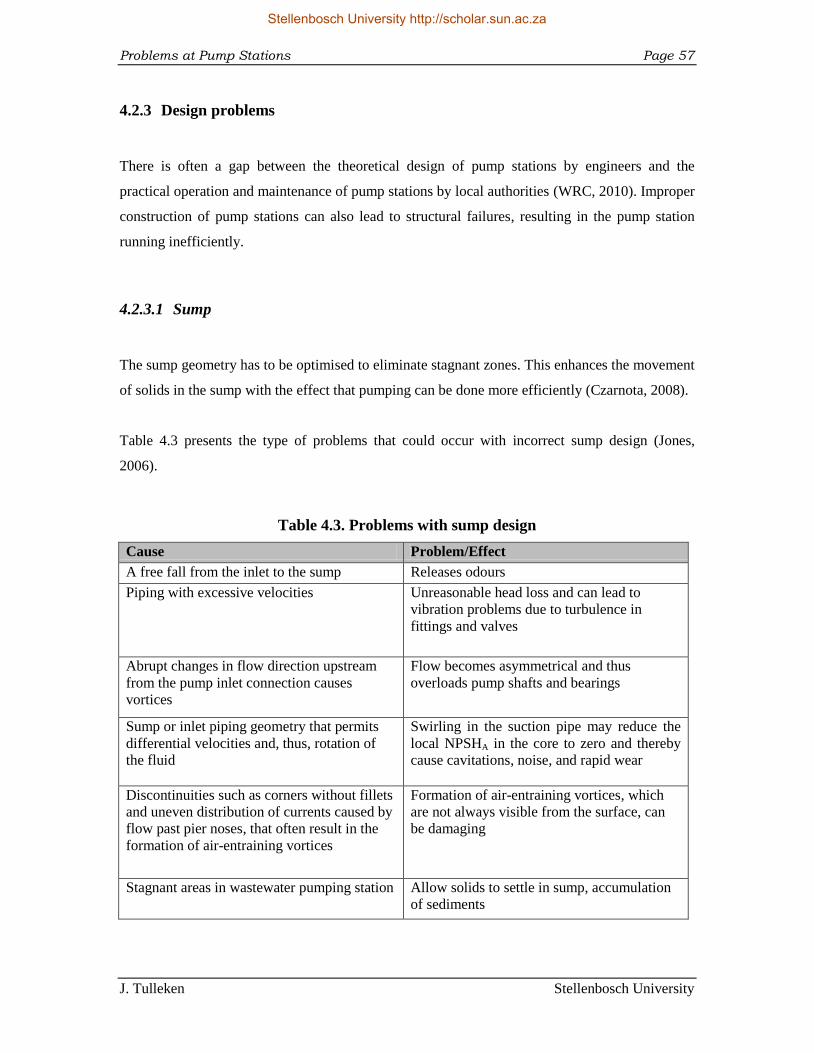
Problems at Pump Stations Page 57
J. Tulleken Stellenbosch University
4.2.3 Design problems
There is often a gap between the theoretical design of pump stations by engineers and the
practical operation and maintenance of pump stations by local authorities (WRC, 2010). Improper
construction of pump stations can also lead to structural failures, resulting in the pump station
running inefficiently.
4.2.3.1 Sump
The sump geometry has to be optimised to eliminate stagnant zones. This enhances the movement
of solids in the sump with the effect that pumping can be done more efficiently (Czarnota, 2008).
Table 4.3 presents the type of problems that could occur with incorrect sump design (Jones,
2006).
Table 4.3. Problems with sump design
Cause Problem/Effect
A free fall from the inlet to the sump Releases odours
Piping with excessive velocities Unreasonable head loss and can lead to
vibration problems due to turbulence in
fittings and valves
Abrupt changes in flow direction upstream
from the pump inlet connection causes
vortices
Flow becomes asymmetrical and thus
overloads pump shafts and bearings
Sump or inlet piping geometry that permits
differential velocities and, thus, rotation of
the fluid
Swirling in the suction pipe may reduce the
local NPSHA in the core to zero and thereby
cause cavitations, noise, and rapid wear
Discontinuities such as corners without fillets
and uneven distribution of currents caused by
flow past pier noses, that often result in the
formation of air-entraining vortices
Formation of air-entraining vortices, which
are not always visible from the surface, can
be damaging
Stagnant areas in wastewater pumping station Allow solids to settle in sump, accumulation
of sediments
Stellenbosch University http://scholar.sun.ac.za
Problems at Pump Stations Page 58
J. Tulleken Stellenbosch University
4.2.3.2 Pump
Mechanical failure of a pump can happen due to many reasons, one of which can be selecting the
wrong pump for a specific installation. The selection process described in Section 2.4.2 should be
followed to select the appropriate pump for a specific installation. Failing to select the appropriate
pump can lead to the problems listed below:
Pump cavitation
Pump under performing
Pump over-pumping (burning out)
Impeller failure
Seal failure.
4.2.3.3 Size and layout
The size of the pump station should not be underestimated. The station should allow for 4 hours
of emergency storage (CSIR, 2003). Allowance should also be made for wet weather peak flows
and future developments. If a pump station is designed too small, the result could be regular
overflows and high maintenance.
The layout of the station is important for ease of maintenance, as emphasized in Section 2.6.1. If
the layout of the pump station is not optimised, maintenance can become complicated and costly.
4.2.4 Maintenance and operation
Screens and baskets need to be cleaned on a regular basis, otherwise they might cause blockages,
resulting in sewage spills in sensitive areas causing damage and odours. Mechanically raked
screens also need to be checked regularly, because their teeth are vulnerable to breakage and
bending (Nozaic & Freese, 2009). The maintenance of sewage pump stations causes many
problems daily throughout the Western Cape.
Stellenbosch University http://scholar.sun.ac.za
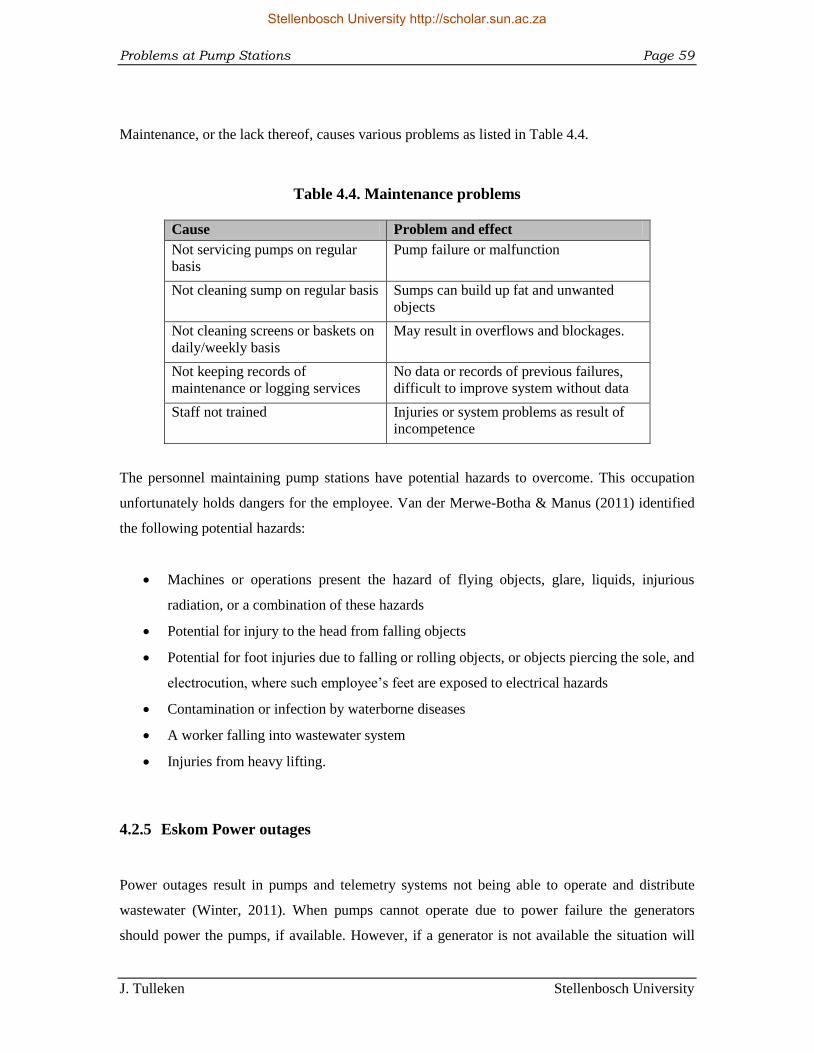
Problems at Pump Stations Page 59
J. Tulleken Stellenbosch University
Maintenance, or the lack thereof, causes various problems as listed in Table 4.4.
Table 4.4. Maintenance problems
Cause Problem and effect
Not servicing pumps on regular
basis
Pump failure or malfunction
Not cleaning sump on regular basis Sumps can build up fat and unwanted
objects
Not cleaning screens or baskets on
daily/weekly basis
May result in overflows and blockages.
Not keeping records of
maintenance or logging services
No data or records of previous failures,
difficult to improve system without data
Staff not trained Injuries or system problems as result of
incompetence
The personnel maintaining pump stations have potential hazards to overcome. This occupation
unfortunately holds dangers for the employee. Van der Merwe-Botha & Manus (2011) identified
the following potential hazards:
Machines or operations present the hazard of flying objects, glare, liquids, injurious
radiation, or a combination of these hazards
Potential for injury to the head from falling objects
Potential for foot injuries due to falling or rolling objects, or objects piercing the sole, and
electrocution, where such employee‟s feet are exposed to electrical hazards
Contamination or infection by waterborne diseases
A worker falling into wastewater system
Injuries from heavy lifting.
4.2.5 Eskom Power outages
Power outages result in pumps and telemetry systems not being able to operate and distribute
wastewater (Winter, 2011). When pumps cannot operate due to power failure the generators
should power the pumps, if available. However, if a generator is not available the situation will
Stellenbosch University http://scholar.sun.ac.za
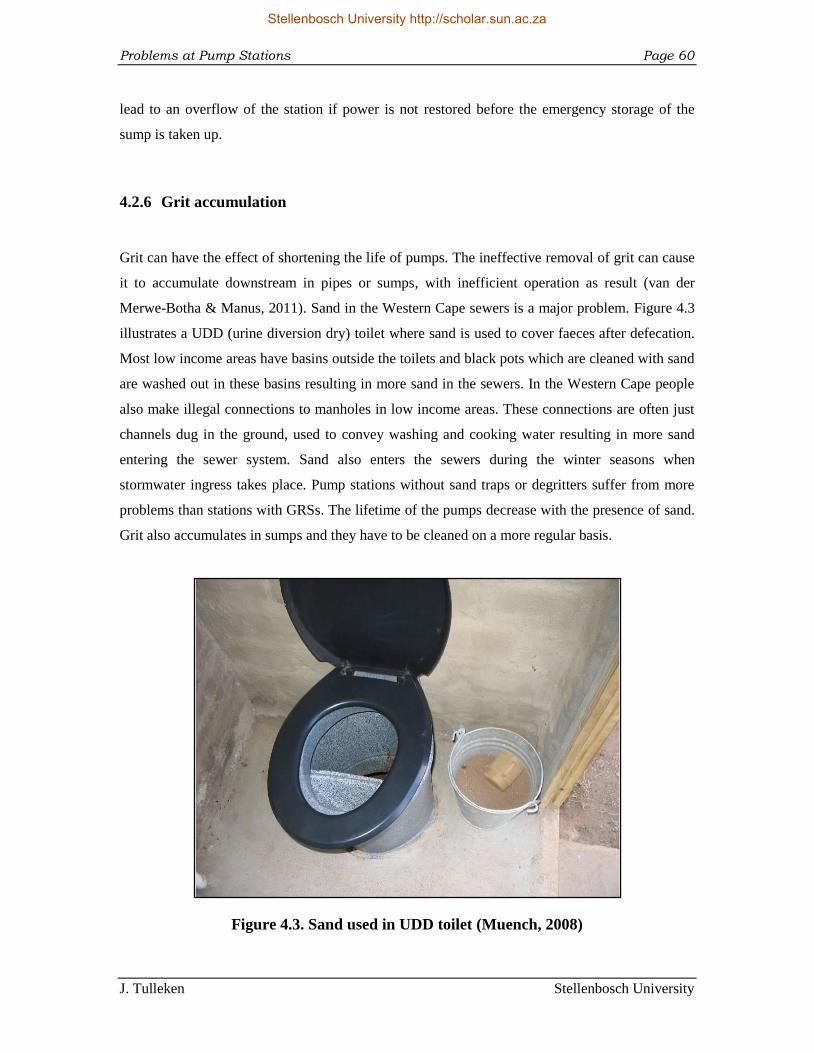
Problems at Pump Stations Page 60
J. Tulleken Stellenbosch University
lead to an overflow of the station if power is not restored before the emergency storage of the
sump is taken up.
4.2.6 Grit accumulation
Grit can have the effect of shortening the life of pumps. The ineffective removal of grit can cause
it to accumulate downstream in pipes or sumps, with inefficient operation as result (van der
Merwe-Botha & Manus, 2011). Sand in the Western Cape sewers is a major problem. Figure 4.3
illustrates a UDD (urine diversion dry) toilet where sand is used to cover faeces after defecation.
Most low income areas have basins outside the toilets and black pots which are cleaned with sand
are washed out in these basins resulting in more sand in the sewers. In the Western Cape people
also make illegal connections to manholes in low income areas. These connections are often just
channels dug in the ground, used to convey washing and cooking water resulting in more sand
entering the sewer system. Sand also enters the sewers during the winter seasons when
stormwater ingress takes place. Pump stations without sand traps or degritters suffer from more
problems than stations with GRSs. The lifetime of the pumps decrease with the presence of sand.
Grit also accumulates in sumps and they have to be cleaned on a more regular basis.
Figure 4.3. Sand used in UDD toilet (Muench, 2008)
Stellenbosch University http://scholar.sun.ac.za
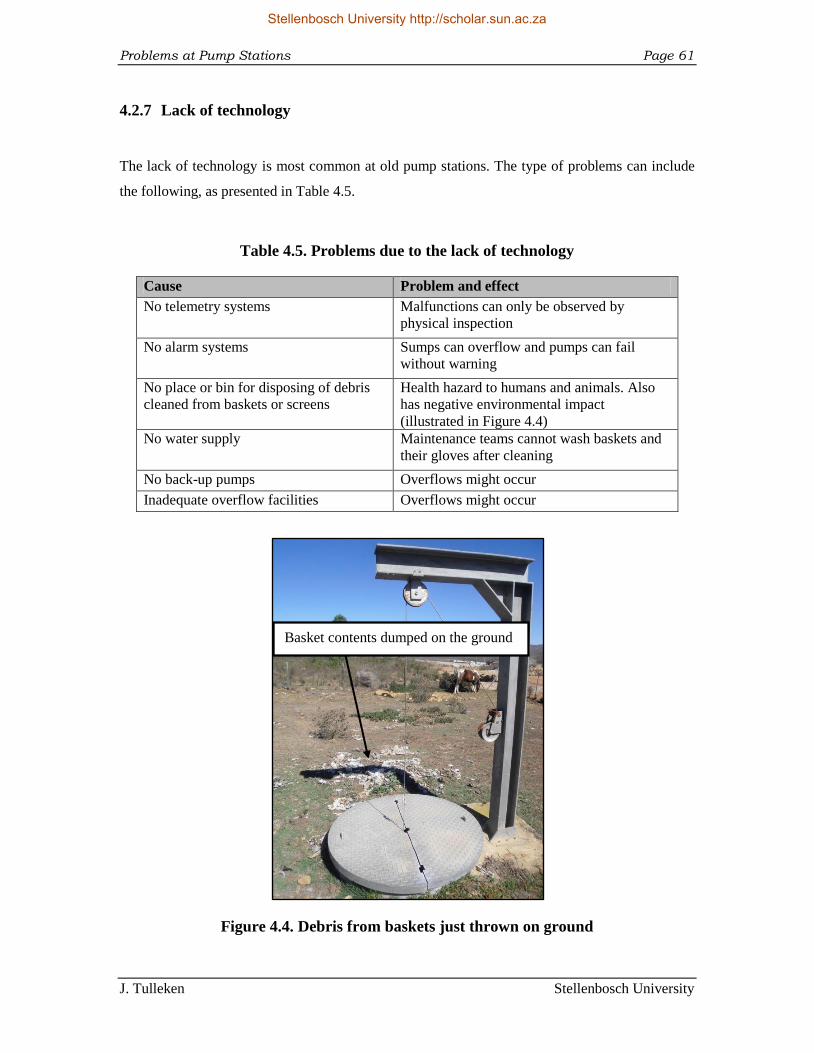
Problems at Pump Stations Page 61
J. Tulleken Stellenbosch University
4.2.7 Lack of technology
The lack of technology is most common at old pump stations. The type of problems can include
the following, as presented in Table 4.5.
Table 4.5. Problems due to the lack of technology
Cause Problem and effect
No telemetry systems Malfunctions can only be observed by
physical inspection
No alarm systems Sumps can overflow and pumps can fail
without warning
No place or bin for disposing of debris
cleaned from baskets or screens
Health hazard to humans and animals. Also
has negative environmental impact
(illustrated in Figure 4.4)
No water supply Maintenance teams cannot wash baskets and
their gloves after cleaning
No back-up pumps Overflows might occur
Inadequate overflow facilities Overflows might occur
Figure 4.4. Debris from baskets just thrown on ground
Basket contents dumped on the ground
Stellenbosch University http://scholar.sun.ac.za
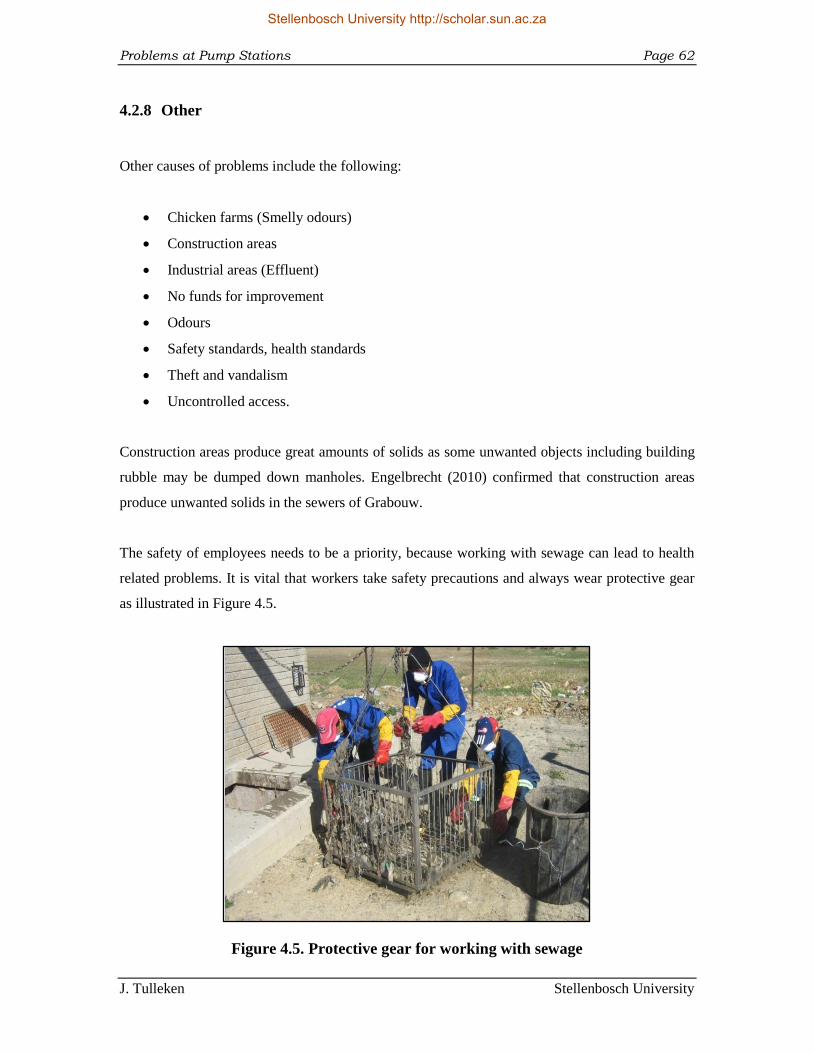
Problems at Pump Stations Page 62
J. Tulleken Stellenbosch University
4.2.8 Other
Other causes of problems include the following:
Chicken farms (Smelly odours)
Construction areas
Industrial areas (Effluent)
No funds for improvement
Odours
Safety standards, health standards
Theft and vandalism
Uncontrolled access.
Construction areas produce great amounts of solids as some unwanted objects including building
rubble may be dumped down manholes. Engelbrecht (2010) confirmed that construction areas
produce unwanted solids in the sewers of Grabouw.
The safety of employees needs to be a priority, because working with sewage can lead to health
related problems. It is vital that workers take safety precautions and always wear protective gear
as illustrated in Figure 4.5.
Figure 4.5. Protective gear for working with sewage
Stellenbosch University http://scholar.sun.ac.za
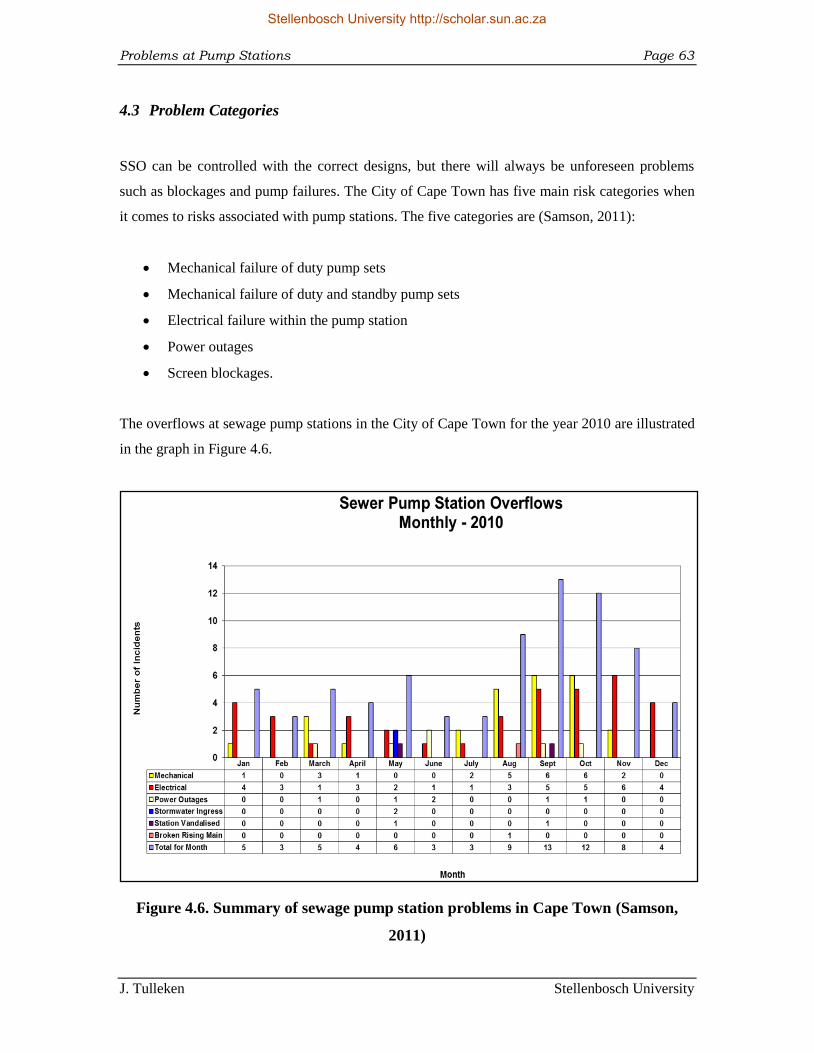
Problems at Pump Stations Page 63
J. Tulleken Stellenbosch University
4.3 Problem Categories
SSO can be controlled with the correct designs, but there will always be unforeseen problems
such as blockages and pump failures. The City of Cape Town has five main risk categories when
it comes to risks associated with pump stations. The five categories are (Samson, 2011):
Mechanical failure of duty pump sets
Mechanical failure of duty and standby pump sets
Electrical failure within the pump station
Power outages
Screen blockages.
The overflows at sewage pump stations in the City of Cape Town for the year 2010 are illustrated
in the graph in Figure 4.6.
Figure 4.6. Summary of sewage pump station problems in Cape Town (Samson,
2011)
Stellenbosch University http://scholar.sun.ac.za
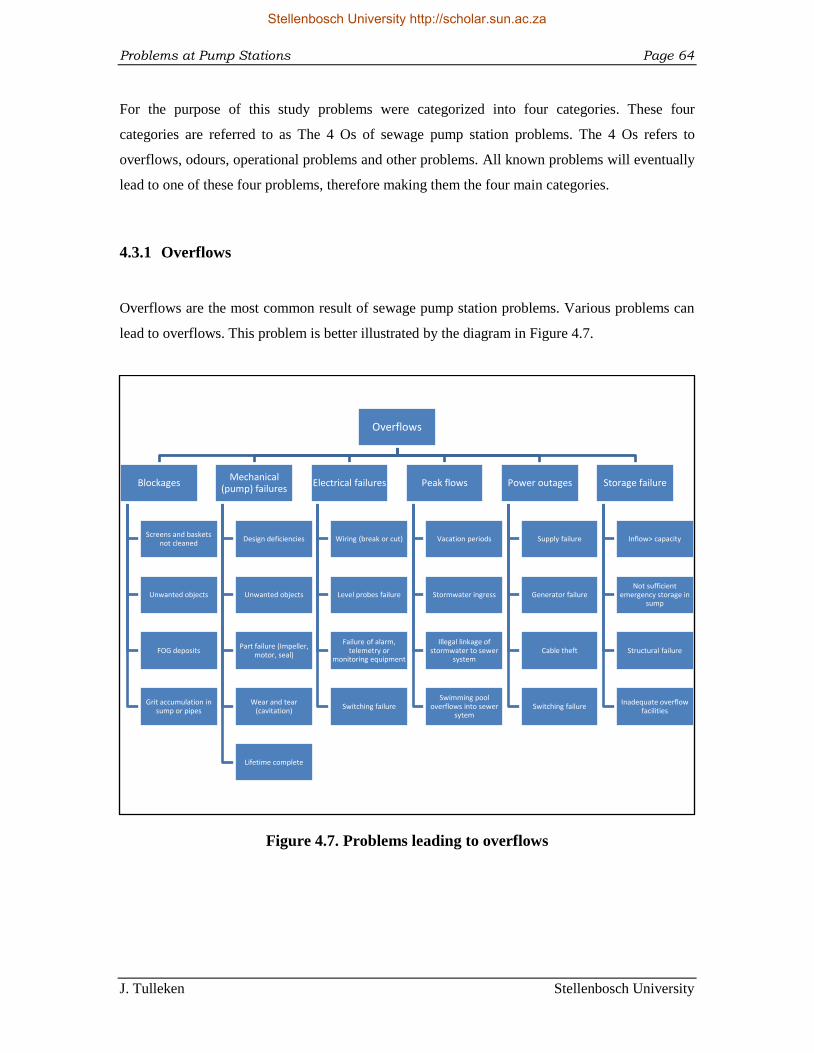
Problems at Pump Stations Page 64
J. Tulleken Stellenbosch University
For the purpose of this study problems were categorized into four categories. These four
categories are referred to as The 4 Os of sewage pump station problems. The 4 Os refers to
overflows, odours, operational problems and other problems. All known problems will eventually
lead to one of these four problems, therefore making them the four main categories.
4.3.1 Overflows
Overflows are the most common result of sewage pump station problems. Various problems can
lead to overflows. This problem is better illustrated by the diagram in Figure 4.7.
Figure 4.7. Problems leading to overflows
Overflows
Blockages
Screens and baskets not cleaned
Unwanted objects
FOG deposits
Grit accumulation in sump or pipes
Mechanical (pump) failures
Design deficiencies
Unwanted objects
Part failure (Impeller, motor, seal)
Wear and tear (cavitation)
Lifetime complete
Electrical failures
Wiring (break or cut)
Level probes failure
Failure of alarm, telemetry or
monitoring equipment
Switching failure
Peak flows
Vacation periods
Stormwater ingress
Illegal linkage of stormwater to sewer
system
Swimming pool overflows into sewer
sytem
Power outages
Supply failure
Generator failure
Cable theft
Switching failure
Storage failure
Inflow> capacity
Not sufficient emergency storage in
sump
Structural failure
Inadequate overflow facilities
Stellenbosch University http://scholar.sun.ac.za
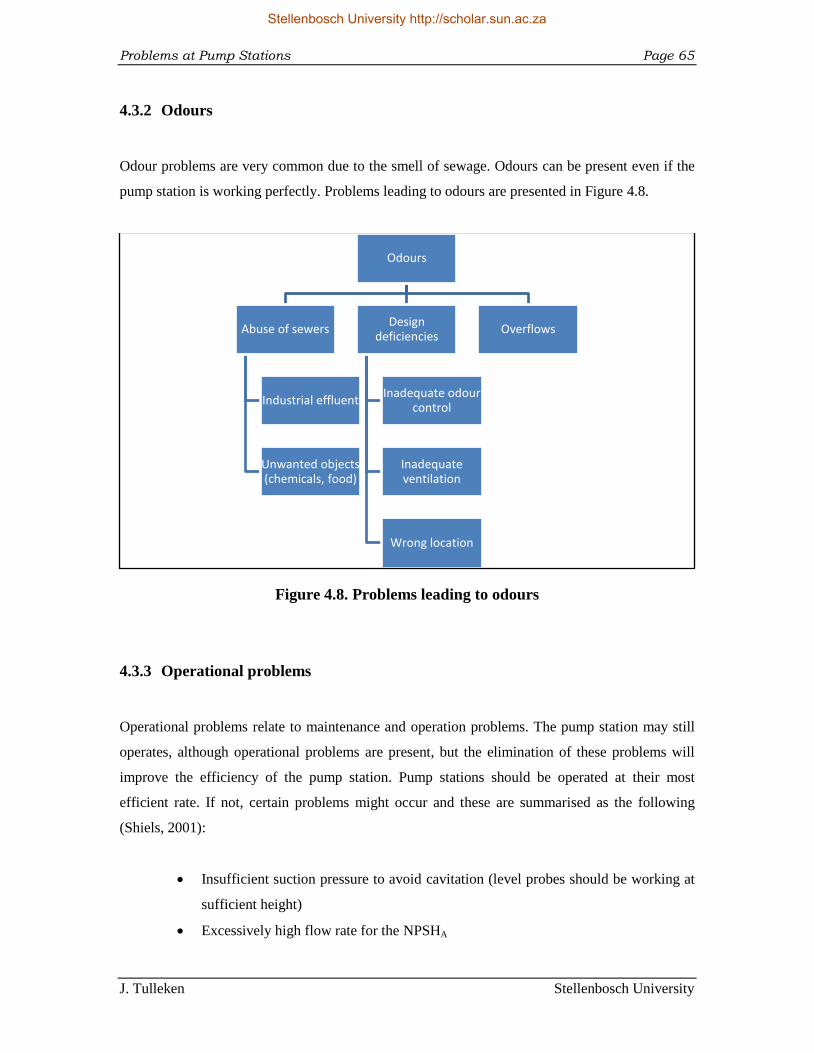
Problems at Pump Stations Page 65
J. Tulleken Stellenbosch University
4.3.2 Odours
Odour problems are very common due to the smell of sewage. Odours can be present even if the
pump station is working perfectly. Problems leading to odours are presented in Figure 4.8.
Figure 4.8. Problems leading to odours
4.3.3 Operational problems
Operational problems relate to maintenance and operation problems. The pump station may still
operates, although operational problems are present, but the elimination of these problems will
improve the efficiency of the pump station. Pump stations should be operated at their most
efficient rate. If not, certain problems might occur and these are summarised as the following
(Shiels, 2001):
Insufficient suction pressure to avoid cavitation (level probes should be working at
sufficient height)
Excessively high flow rate for the NPSHA
Odours
Abuse of sewers
Industrial effluent
Unwanted objects (chemicals, food)
Design deficiencies
Inadequate odour control
Inadequate ventilation
Wrong location
Overflows
Stellenbosch University http://scholar.sun.ac.za
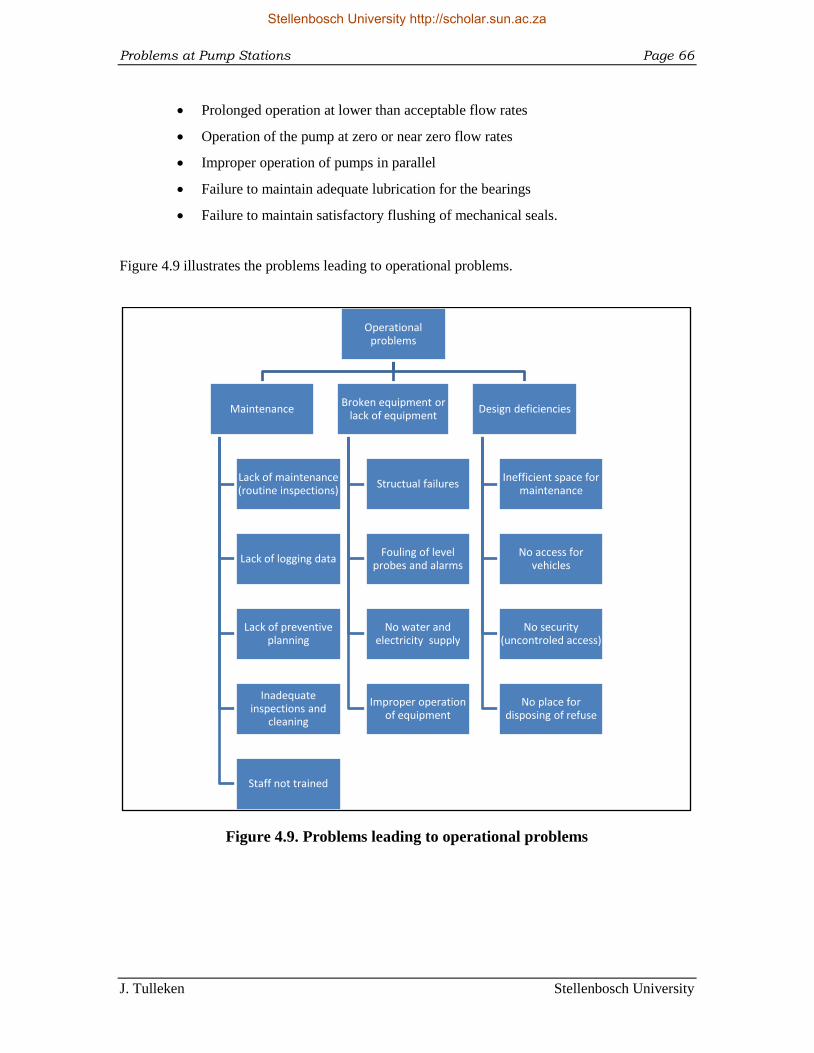
Problems at Pump Stations Page 66
J. Tulleken Stellenbosch University
Prolonged operation at lower than acceptable flow rates
Operation of the pump at zero or near zero flow rates
Improper operation of pumps in parallel
Failure to maintain adequate lubrication for the bearings
Failure to maintain satisfactory flushing of mechanical seals.
Figure 4.9 illustrates the problems leading to operational problems.
Figure 4.9. Problems leading to operational problems
Operational problems
Maintenance
Lack of maintenance (routine inspections)
Lack of logging data
Lack of preventive planning
Inadequate inspections and
cleaning
Staff not trained
Broken equipment or lack of equipment
Structual failures
Fouling of level probes and alarms
No water and electricity supply
Improper operation of equipment
Design deficiencies
Inefficient space for maintenance
No access for vehicles
No security (uncontroled access)
No place for disposing of refuse
Stellenbosch University http://scholar.sun.ac.za
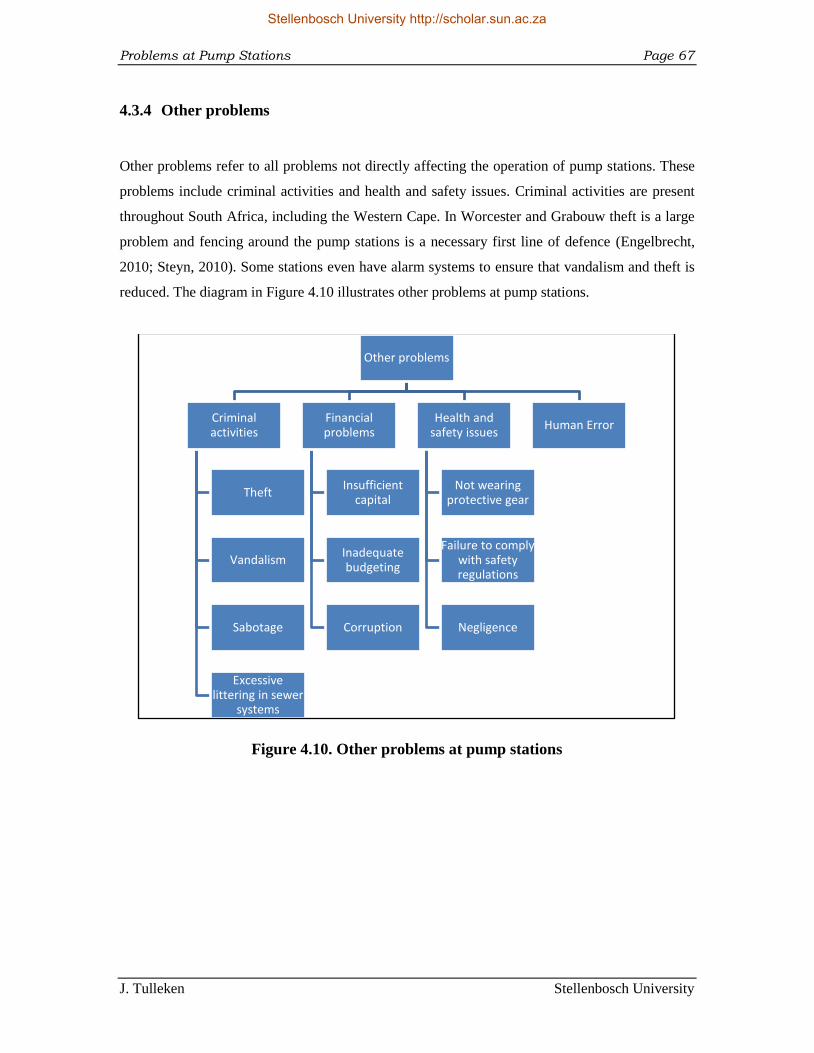
Problems at Pump Stations Page 67
J. Tulleken Stellenbosch University
4.3.4 Other problems
Other problems refer to all problems not directly affecting the operation of pump stations. These
problems include criminal activities and health and safety issues. Criminal activities are present
throughout South Africa, including the Western Cape. In Worcester and Grabouw theft is a large
problem and fencing around the pump stations is a necessary first line of defence (Engelbrecht,
2010; Steyn, 2010). Some stations even have alarm systems to ensure that vandalism and theft is
reduced. The diagram in Figure 4.10 illustrates other problems at pump stations.
Figure 4.10. Other problems at pump stations
Other problems
Criminal activities
Theft
Vandalism
Sabotage
Excessive littering in sewer
systems
Financial problems
Insufficient capital
Inadequate budgeting
Corruption
Health and safety issues
Not wearing protective gear
Failure to comply with safety regulations
Negligence
Human Error
Stellenbosch University http://scholar.sun.ac.za
Problems at Pump Stations Page 68
J. Tulleken Stellenbosch University
4.4 Solving the problem
The lack of knowledge regarding pump stations and how they should be operated and designed is
a major problem. A possible solution for this is to get proper design guidance and to convey the
correct knowledge to the appropriate (operators and designers) people. A concept DST is
proposed in Chapter 6 as a possible solution. A DST could help with identifying, minimising and
eliminating sewage pump station problems in the future. Eliminating or minimising problems
improves the functioning of a pump station. Many authors have compiled precautionary control
measures, guidelines and methods to reduce or eliminate the problems at sewage pump stations.
A number of these measures are presented in this section, but the main focus is on the removing
or reducing of solids. Solids are the cause of the majority of the problems at pump stations.
4.4.1 Solids
There are two ways to approach the problem of solids in sewers. One is to remove the solids at
CCPs along the sewer system, whether at pump stations or at WWTPs. The other is to stop the
problem at the source, by educating the public on what solids sewer systems can handle.
To effectively remove solids at CCPs the correct systems need to be in place. The SRS and GRS
addressed in Section 3.4 and 3.5 have to be incorporated with the design of pump station to work
effectively. These technologies can work effectively with the correct implementation and
operation. Removing solids from sewers is not a pleasant job. Manually cleaning screens and
baskets is considered to be an occupational hazard and a health threat. It is unfortunate that
humans have to work with solids, but with the right systems and precautionary measures cleaning
can be done with more ease. The following list contains some guidelines to more effectively
remove solids at pump stations:
Always wear protective gear
Asset management
Odour control
On site solutions (often works the best)
Operate systems to their optimum potential
Stellenbosch University http://scholar.sun.ac.za

Problems at Pump Stations Page 69
J. Tulleken Stellenbosch University
Provide maintenance manuals and checklists
Regular cleaning of screens and baskets
Regular maintenance of equipment
Staff management (monitoring of personnel)
Stock back-up equipment and spare parts
Training of personnel (straightforward to operate most systems).
To be more proactive, unwanted solids should never enter sewer systems. Public participation and
willingness to participate are required to achieve sustainable developments (Ashley et al., 1999).
Public prosecutions, awareness, knowledge and ownership need dramatic improvement to achieve
sustainable development. Radical changes need to be made in the structure and management of
societies, policies, aid programmes, social habits and educational systems in order to prevent
pollution (Niemczynowicz, 1993). South Africa is in need of educational campaigns teaching the
public the effects of their habits. Scotland has had the Think before you flush campaign and once
the public became aware, they became more responsible users. It is believed that a change of at
least 50% of those flushing sanitary items could be achieved with public awareness campaigns, if
implemented correctly (Ashley et al., 2005). The campaign poster is illustrated in Figure 4.11.
Figure 4.11. Think before you flush poster (Ashley et al., 2004: 211)
Stellenbosch University http://scholar.sun.ac.za

Problems at Pump Stations Page 70
J. Tulleken Stellenbosch University
4.4.2 Operation and Maintenance
Van der Merwe-Botha & Manus (2011) listed control measures to improve the efficiency of
sewage pump stations:
Ensuring contingency plans are in place in case of unforeseen incidents
Ensuring working alarm and failure monitoring equipment
Implementing stormwater reduction activities, e.g. seal off manholes, replace manhole
covers
Availability of mobile or fixed power generating plants
Overflow retention dams
Rapid response to alarm conditions
Removal of grit from sewers
Replacement of old systems and pipes
Routine checks and monitoring
Security from access by animals and criminals
Security to prevent unauthorised access and tampering.
4.4.3 Mechanical
Regular maintenance of pumps is essential. The Water Environmental Federation provides (2008)
a trouble shooting guide for centrifugal pumps, presented in Table 4.6.
Table 4.6. Troubleshooting guide (Water Environment Federation, 2008: 8-44)
Problems Causes Solutions
No liquid delivered Pump not primed. Speed to low Prime pump. Check voltage and
frequency
Air leak in suction or stuffing
box
Repair leak
Suction or discharge line
plugged
Unplug line
Wrong direction of rotation Correct direction of rotation
Discharge valve closed Open discharge valve
Stellenbosch University http://scholar.sun.ac.za
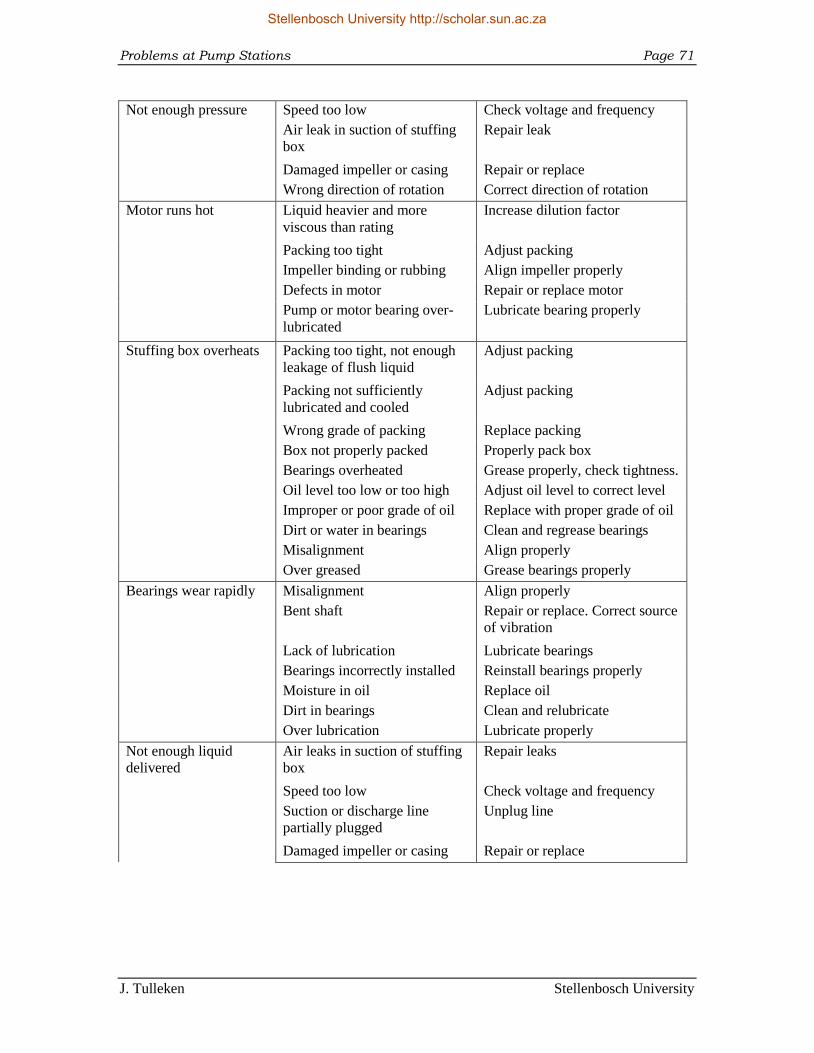
Problems at Pump Stations Page 71
J. Tulleken Stellenbosch University
Not enough pressure Speed too low Check voltage and frequency
Air leak in suction of stuffing
box
Repair leak
Damaged impeller or casing Repair or replace
Wrong direction of rotation Correct direction of rotation
Motor runs hot Liquid heavier and more
viscous than rating
Increase dilution factor
Packing too tight Adjust packing
Impeller binding or rubbing Align impeller properly
Defects in motor Repair or replace motor
Pump or motor bearing over-
lubricated
Lubricate bearing properly
Stuffing box overheats Packing too tight, not enough
leakage of flush liquid
Adjust packing
Packing not sufficiently
lubricated and cooled
Adjust packing
Wrong grade of packing Replace packing
Box not properly packed Properly pack box
Bearings overheated Grease properly, check tightness.
Oil level too low or too high Adjust oil level to correct level
Improper or poor grade of oil Replace with proper grade of oil
Dirt or water in bearings Clean and regrease bearings
Misalignment Align properly
Over greased Grease bearings properly
Bearings wear rapidly Misalignment Align properly
Bent shaft Repair or replace. Correct source
of vibration
Lack of lubrication Lubricate bearings
Bearings incorrectly installed Reinstall bearings properly
Moisture in oil Replace oil
Dirt in bearings Clean and relubricate
Over lubrication Lubricate properly
Not enough liquid
delivered
Air leaks in suction of stuffing
box
Repair leaks
Speed too low Check voltage and frequency
Suction or discharge line
partially plugged
Unplug line
Damaged impeller or casing Repair or replace
Stellenbosch University http://scholar.sun.ac.za
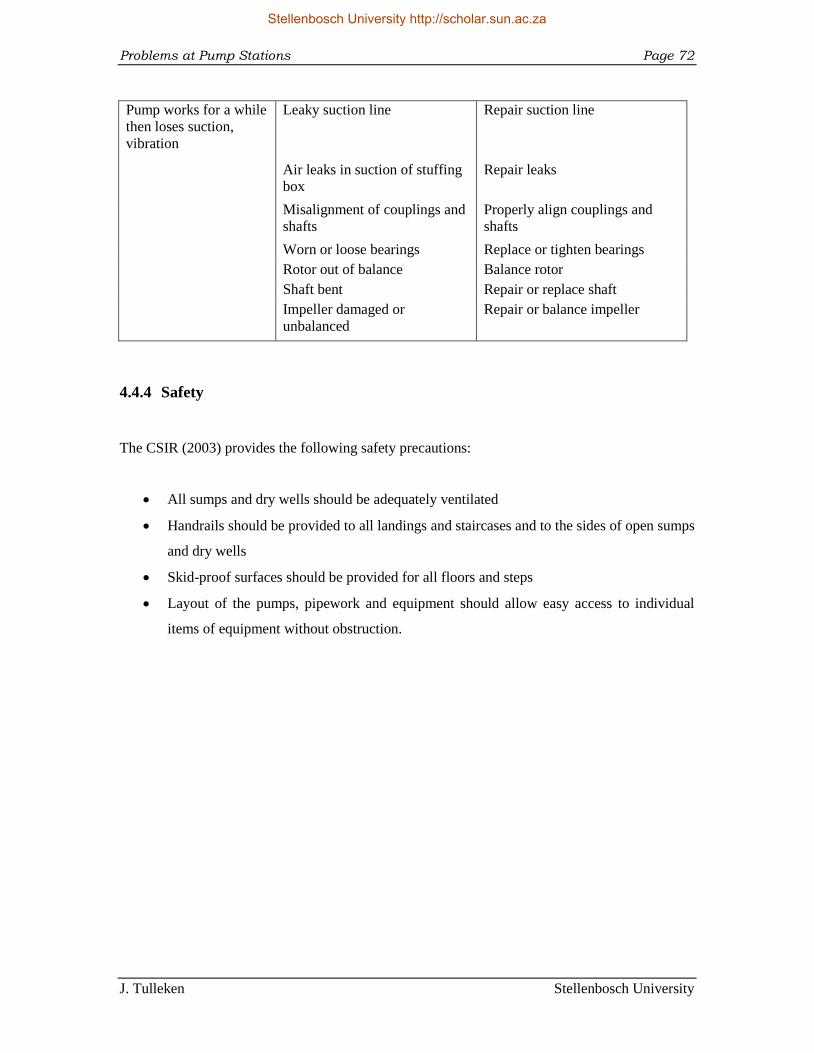
Problems at Pump Stations Page 72
J. Tulleken Stellenbosch University
Pump works for a while
then loses suction,
vibration
Leaky suction line Repair suction line
Air leaks in suction of stuffing
box
Repair leaks
Misalignment of couplings and
shafts
Properly align couplings and
shafts
Worn or loose bearings Replace or tighten bearings
Rotor out of balance Balance rotor
Shaft bent Repair or replace shaft
Impeller damaged or
unbalanced
Repair or balance impeller
4.4.4 Safety
The CSIR (2003) provides the following safety precautions:
All sumps and dry wells should be adequately ventilated
Handrails should be provided to all landings and staircases and to the sides of open sumps
and dry wells
Skid-proof surfaces should be provided for all floors and steps
Layout of the pumps, pipework and equipment should allow easy access to individual
items of equipment without obstruction.
Stellenbosch University http://scholar.sun.ac.za
Laboratory Experiment Page 73
J. Tulleken Stellenbosch University
5. Laboratory Experiment
The laboratory experiment investigates the current use of baskets at pump stations as a solids
removal system (SRS). As far as the author could determine there is no published work on a
similar experiment that has been conducted on screening baskets in South Africa.
Baskets can be operated inside the sump or in a screening manhole (communicator vault). There
is literature available on screens and how they operate, but very little literature was found on
baskets. Baskets are used in practice and Theart (2011) confirmed that they are built frequently
for pump stations by his company, Zwangavho Trading. There is brief reference to baskets in
some local publications by CSIR (2003) and van Vuuren & van Dijk (2011), but no literature
could be found during the literature review on how efficiently baskets work and how they should
be operated. The intention with the laboratory experiment was to gain knowledge of basket
performance and to identify future research needs.
5.1 Methodology and aim
This section outlines the methodology used to approach the experiment. After conducting site
visits it was clear that baskets are often used in practice. However, conditions under which the
baskets should be operated remained unclear. One of the major uncertainties found by the author
was at what level (height) the basket should be operated in relation to the surface of the fluid in
the sump. The heights at which baskets were operated vary at pump stations. At some
installations the basket was beneath the surface and at others above the surface level. This was
one of the main focuses of the laboratory experiments. Two variable factors were chosen to
ensure that tests did not get too complicated. The predetermined factors are the time of the solids
in the water (retention time) and the height of the basket above the liquid in the sump. All other
influencing factors remained consistent throughout the testing.
Stellenbosch University http://scholar.sun.ac.za
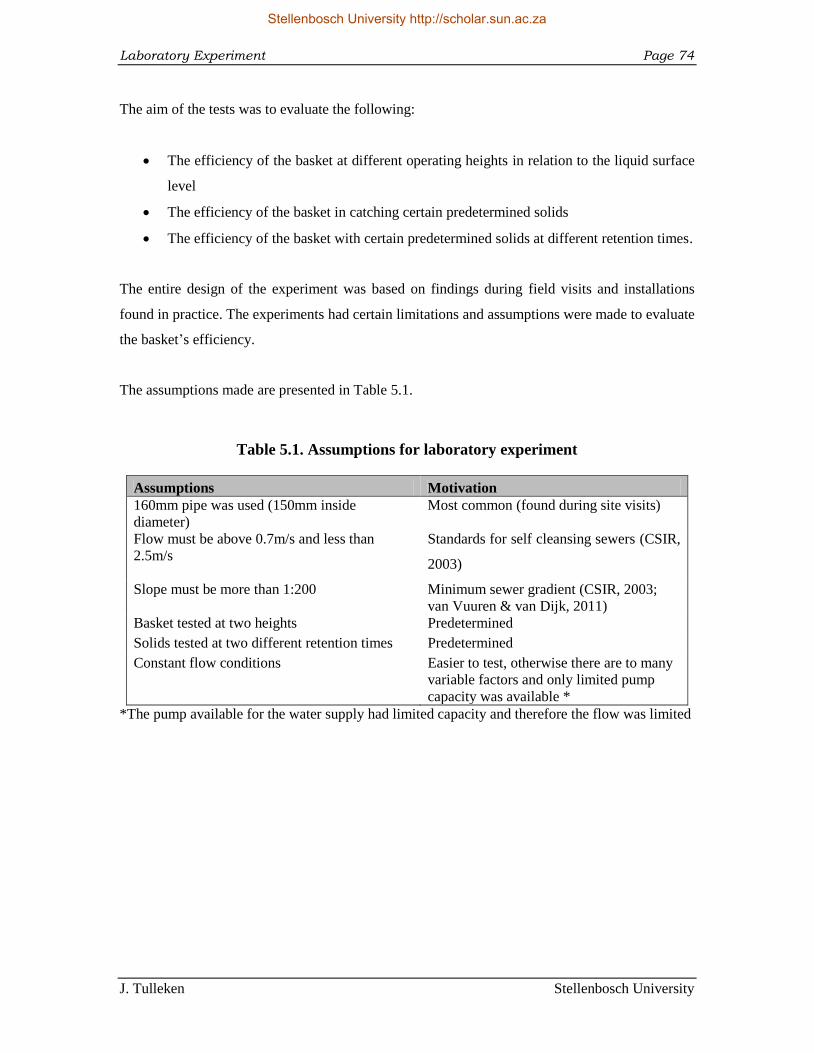
Laboratory Experiment Page 74
J. Tulleken Stellenbosch University
The aim of the tests was to evaluate the following:
The efficiency of the basket at different operating heights in relation to the liquid surface
level
The efficiency of the basket in catching certain predetermined solids
The efficiency of the basket with certain predetermined solids at different retention times.
The entire design of the experiment was based on findings during field visits and installations
found in practice. The experiments had certain limitations and assumptions were made to evaluate
the basket‟s efficiency.
The assumptions made are presented in Table 5.1.
Table 5.1. Assumptions for laboratory experiment
Assumptions Motivation
160mm pipe was used (150mm inside
diameter)
Most common (found during site visits)
Flow must be above 0.7m/s and less than
2.5m/s
Standards for self cleansing sewers (CSIR,
2003)
Slope must be more than 1:200 Minimum sewer gradient (CSIR, 2003;
van Vuuren & van Dijk, 2011)
Basket tested at two heights Predetermined
Solids tested at two different retention times Predetermined
Constant flow conditions Easier to test, otherwise there are to many
variable factors and only limited pump
capacity was available *
*The pump available for the water supply had limited capacity and therefore the flow was limited
Stellenbosch University http://scholar.sun.ac.za
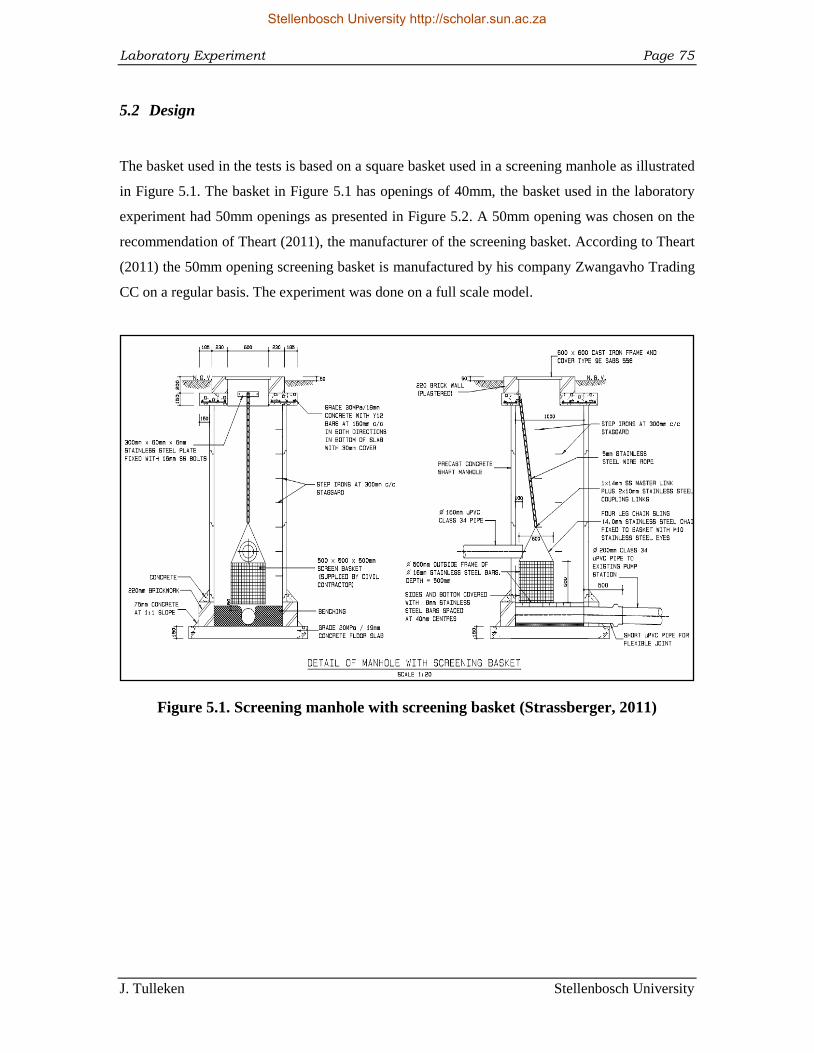
Laboratory Experiment Page 75
J. Tulleken Stellenbosch University
5.2 Design
The basket used in the tests is based on a square basket used in a screening manhole as illustrated
in Figure 5.1. The basket in Figure 5.1 has openings of 40mm, the basket used in the laboratory
experiment had 50mm openings as presented in Figure 5.2. A 50mm opening was chosen on the
recommendation of Theart (2011), the manufacturer of the screening basket. According to Theart
(2011) the 50mm opening screening basket is manufactured by his company Zwangavho Trading
CC on a regular basis. The experiment was done on a full scale model.
Figure 5.1. Screening manhole with screening basket (Strassberger, 2011)
Stellenbosch University http://scholar.sun.ac.za
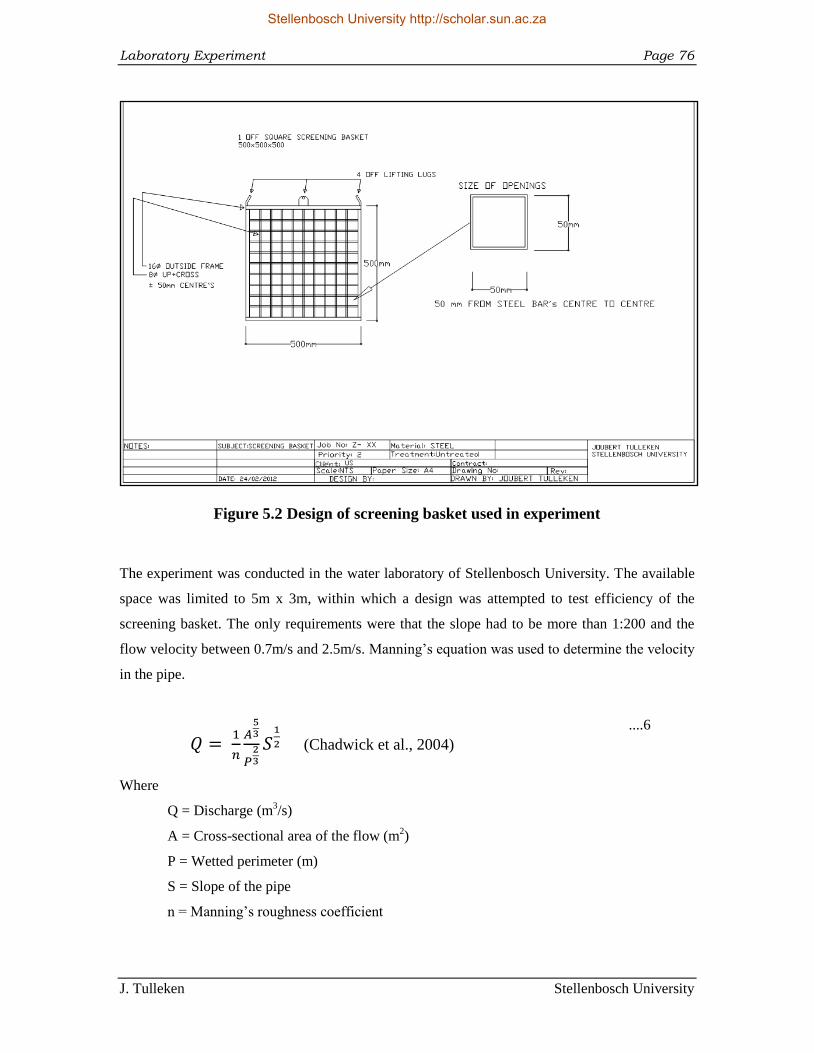
Laboratory Experiment Page 76
J. Tulleken Stellenbosch University
Figure 5.2 Design of screening basket used in experiment
The experiment was conducted in the water laboratory of Stellenbosch University. The available
space was limited to 5m x 3m, within which a design was attempted to test efficiency of the
screening basket. The only requirements were that the slope had to be more than 1:200 and the
flow velocity between 0.7m/s and 2.5m/s. Manning‟s equation was used to determine the velocity
in the pipe.
(Chadwick et al., 2004) ....6
Where
Q = Discharge (m3/s)
A = Cross-sectional area of the flow (m2)
P = Wetted perimeter (m)
S = Slope of the pipe
n = Manning‟s roughness coefficient
Stellenbosch University http://scholar.sun.ac.za
Laboratory Experiment Page 77
J. Tulleken Stellenbosch University
For a circular pipe sections (Haested et al., 2004):
....7
....8
....9
10
Where
D = Diameter of pipe (m)
θ = Angle (radians)
y = depth of flow (m)
v = velocity of flow (m/s)
A Manning roughness coefficient of 0.013 was selected for the plastic pipe (van Vuuren & van
Dijk, 2011). Before construction was done, the angle of the slope was chosen to be 1:40 with the
limited space. For that slope, a velocity of more than 0.7m/s and less than 2.5m/s would be
present for the flow depth used with an inside pipe diameter of 150mm.
However, after construction the slope was 1:43, for which a velocity of more than 0.7m/s and less
than 2.5m/s was present for the flow depth used.
The following values were applied to all the tests in the experiment:
D = 0.15m (inside diameter)
n = 0.013
S = 1:43
y = 0.035m (depth measured during tests)
These values were substituted into the equations as mentioned above and the following was
calculated:
A = 0.0052m2
P = 0.15m
Stellenbosch University http://scholar.sun.ac.za
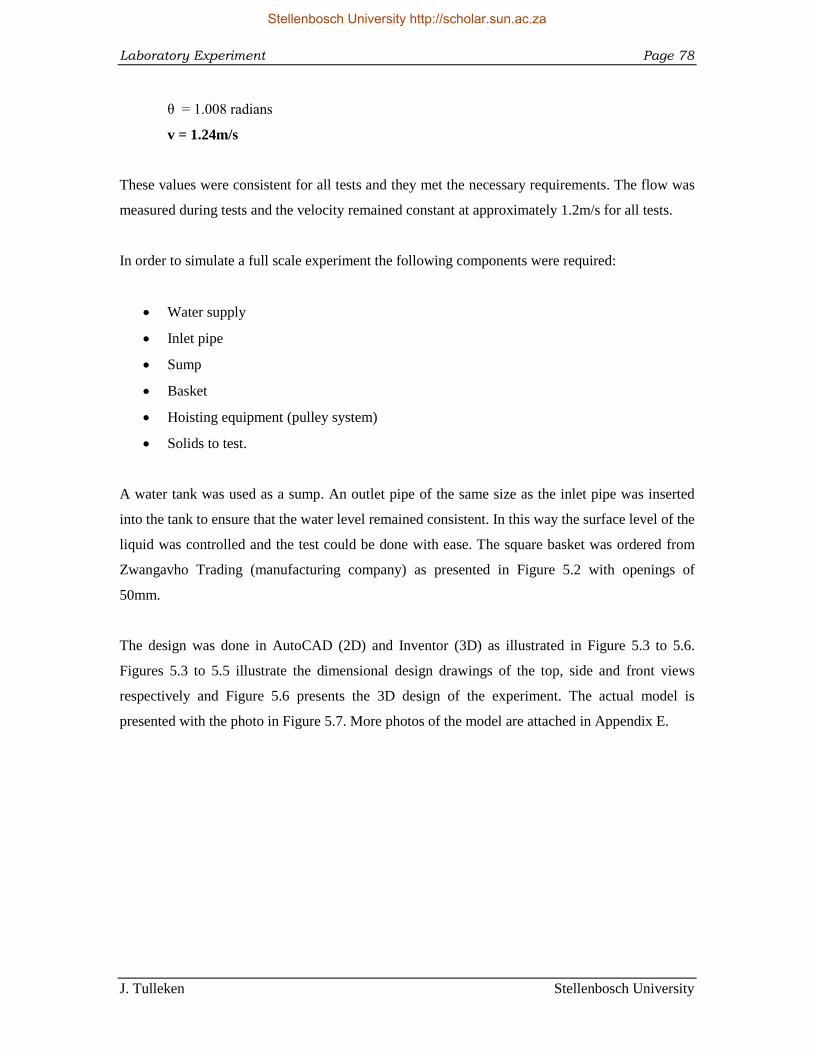
Laboratory Experiment Page 78
J. Tulleken Stellenbosch University
θ = 1.008 radians
v = 1.24m/s
These values were consistent for all tests and they met the necessary requirements. The flow was
measured during tests and the velocity remained constant at approximately 1.2m/s for all tests.
In order to simulate a full scale experiment the following components were required:
Water supply
Inlet pipe
Sump
Basket
Hoisting equipment (pulley system)
Solids to test.
A water tank was used as a sump. An outlet pipe of the same size as the inlet pipe was inserted
into the tank to ensure that the water level remained consistent. In this way the surface level of the
liquid was controlled and the test could be done with ease. The square basket was ordered from
Zwangavho Trading (manufacturing company) as presented in Figure 5.2 with openings of
50mm.
The design was done in AutoCAD (2D) and Inventor (3D) as illustrated in Figure 5.3 to 5.6.
Figures 5.3 to 5.5 illustrate the dimensional design drawings of the top, side and front views
respectively and Figure 5.6 presents the 3D design of the experiment. The actual model is
presented with the photo in Figure 5.7. More photos of the model are attached in Appendix E.
Stellenbosch University http://scholar.sun.ac.za
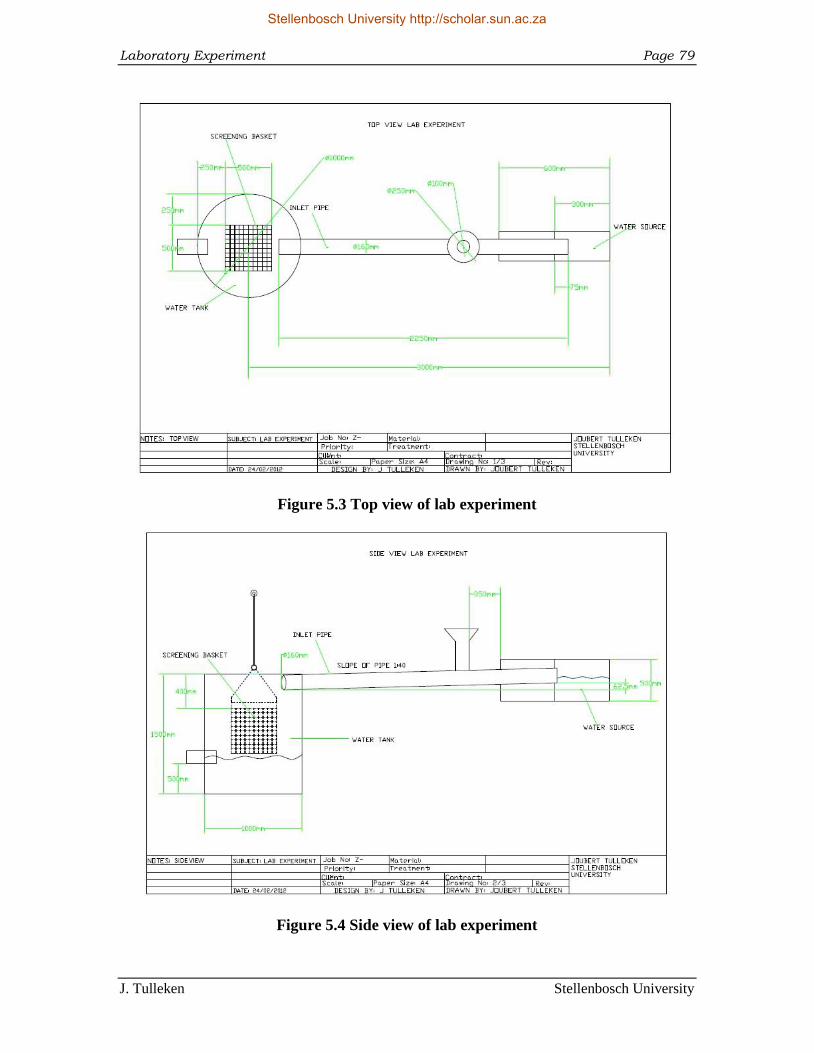
Laboratory Experiment Page 79
J. Tulleken Stellenbosch University
Figure 5.3 Top view of lab experiment
Figure 5.4 Side view of lab experiment
Stellenbosch University http://scholar.sun.ac.za
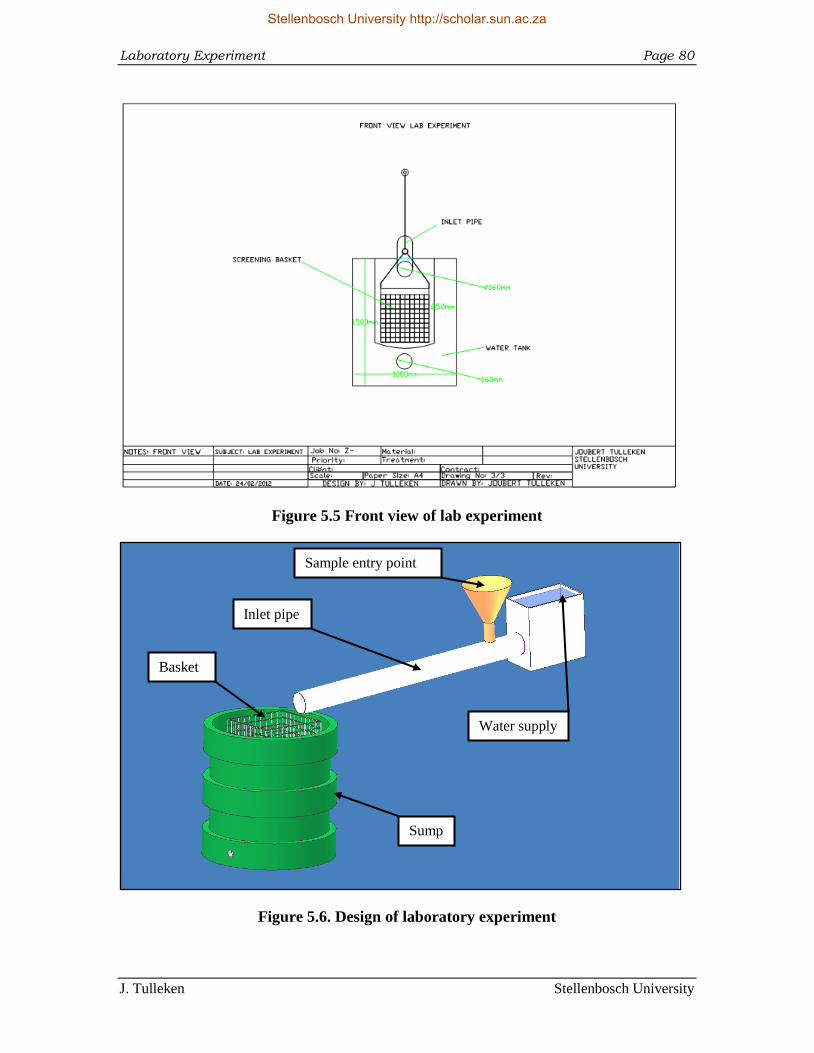
Laboratory Experiment Page 80
J. Tulleken Stellenbosch University
Figure 5.5 Front view of lab experiment
Figure 5.6. Design of laboratory experiment
Inlet pipe
Basket
Sump
Sample entry point
Water supply
Stellenbosch University http://scholar.sun.ac.za
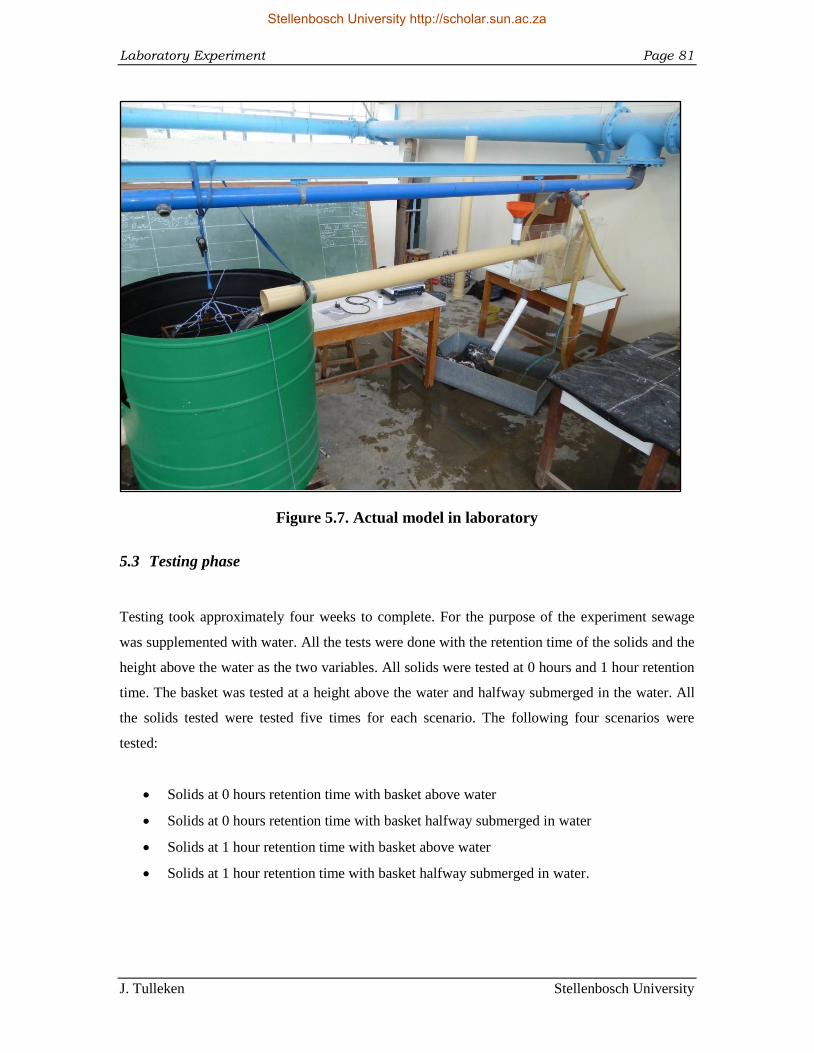
Laboratory Experiment Page 81
J. Tulleken Stellenbosch University
Figure 5.7. Actual model in laboratory
5.3 Testing phase
Testing took approximately four weeks to complete. For the purpose of the experiment sewage
was supplemented with water. All the tests were done with the retention time of the solids and the
height above the water as the two variables. All solids were tested at 0 hours and 1 hour retention
time. The basket was tested at a height above the water and halfway submerged in the water. All
the solids tested were tested five times for each scenario. The following four scenarios were
tested:
Solids at 0 hours retention time with basket above water
Solids at 0 hours retention time with basket halfway submerged in water
Solids at 1 hour retention time with basket above water
Solids at 1 hour retention time with basket halfway submerged in water.
Stellenbosch University http://scholar.sun.ac.za
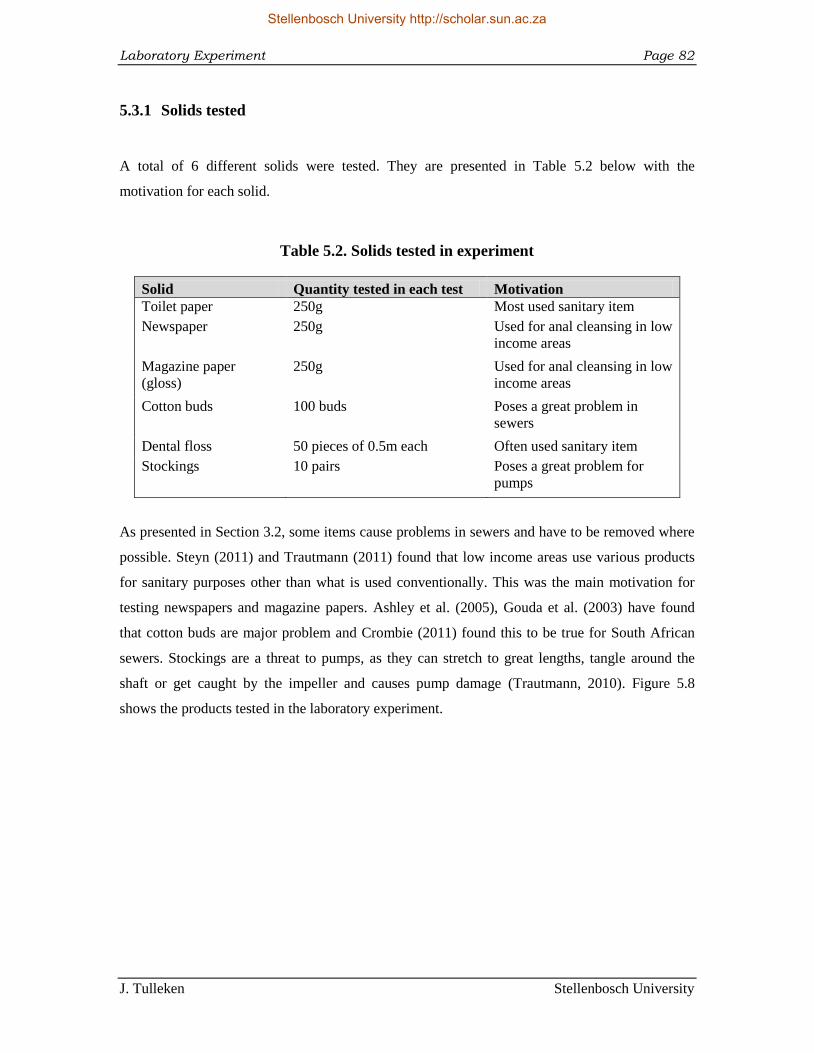
Laboratory Experiment Page 82
J. Tulleken Stellenbosch University
5.3.1 Solids tested
A total of 6 different solids were tested. They are presented in Table 5.2 below with the
motivation for each solid.
Table 5.2. Solids tested in experiment
Solid Quantity tested in each test Motivation
Toilet paper 250g Most used sanitary item
Newspaper 250g Used for anal cleansing in low
income areas
Magazine paper
(gloss)
250g Used for anal cleansing in low
income areas
Cotton buds 100 buds Poses a great problem in
sewers
Dental floss 50 pieces of 0.5m each Often used sanitary item
Stockings 10 pairs Poses a great problem for
pumps
As presented in Section 3.2, some items cause problems in sewers and have to be removed where
possible. Steyn (2011) and Trautmann (2011) found that low income areas use various products
for sanitary purposes other than what is used conventionally. This was the main motivation for
testing newspapers and magazine papers. Ashley et al. (2005), Gouda et al. (2003) have found
that cotton buds are major problem and Crombie (2011) found this to be true for South African
sewers. Stockings are a threat to pumps, as they can stretch to great lengths, tangle around the
shaft or get caught by the impeller and causes pump damage (Trautmann, 2010). Figure 5.8
shows the products tested in the laboratory experiment.
Stellenbosch University http://scholar.sun.ac.za
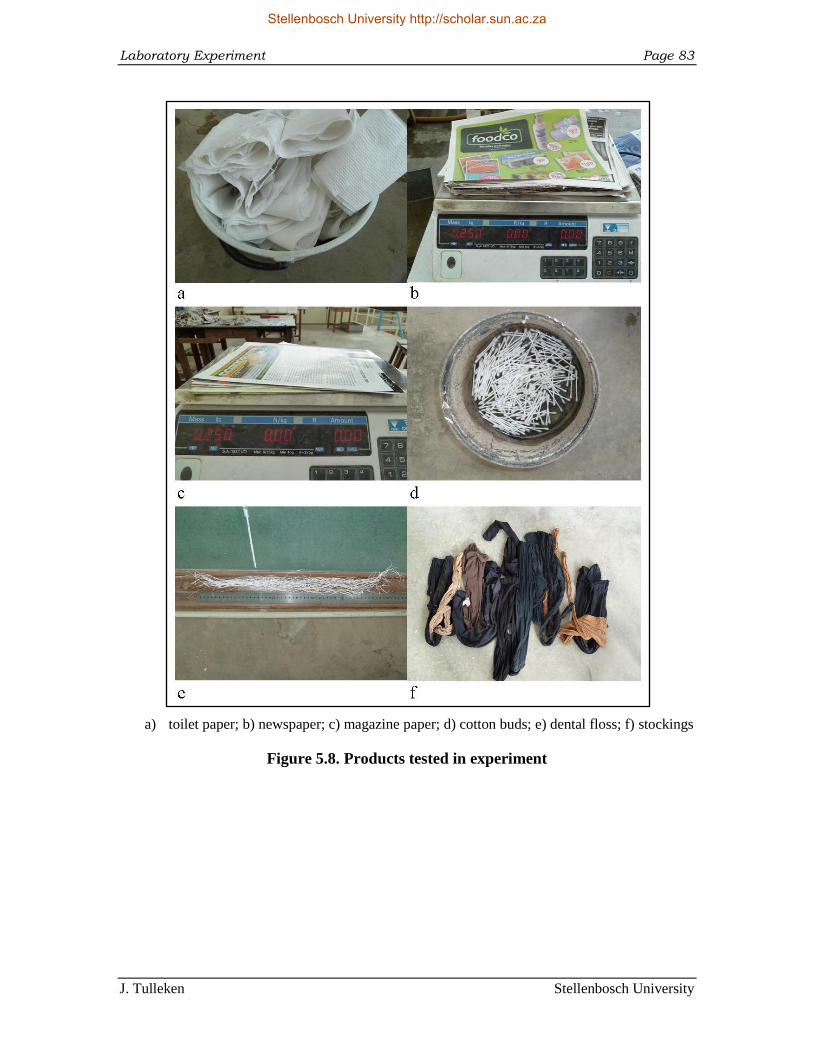
Laboratory Experiment Page 83
J. Tulleken Stellenbosch University
a) toilet paper; b) newspaper; c) magazine paper; d) cotton buds; e) dental floss; f) stockings
Figure 5.8. Products tested in experiment
Stellenbosch University http://scholar.sun.ac.za
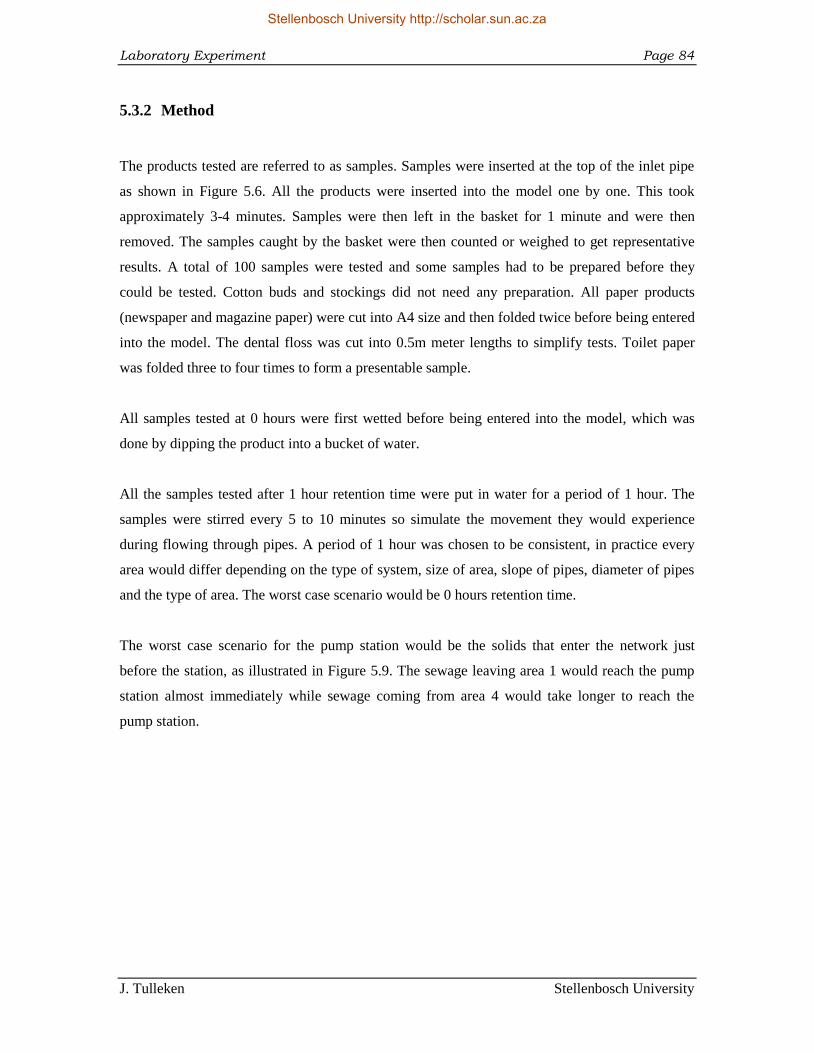
Laboratory Experiment Page 84
J. Tulleken Stellenbosch University
5.3.2 Method
The products tested are referred to as samples. Samples were inserted at the top of the inlet pipe
as shown in Figure 5.6. All the products were inserted into the model one by one. This took
approximately 3-4 minutes. Samples were then left in the basket for 1 minute and were then
removed. The samples caught by the basket were then counted or weighed to get representative
results. A total of 100 samples were tested and some samples had to be prepared before they
could be tested. Cotton buds and stockings did not need any preparation. All paper products
(newspaper and magazine paper) were cut into A4 size and then folded twice before being entered
into the model. The dental floss was cut into 0.5m meter lengths to simplify tests. Toilet paper
was folded three to four times to form a presentable sample.
All samples tested at 0 hours were first wetted before being entered into the model, which was
done by dipping the product into a bucket of water.
All the samples tested after 1 hour retention time were put in water for a period of 1 hour. The
samples were stirred every 5 to 10 minutes so simulate the movement they would experience
during flowing through pipes. A period of 1 hour was chosen to be consistent, in practice every
area would differ depending on the type of system, size of area, slope of pipes, diameter of pipes
and the type of area. The worst case scenario would be 0 hours retention time.
The worst case scenario for the pump station would be the solids that enter the network just
before the station, as illustrated in Figure 5.9. The sewage leaving area 1 would reach the pump
station almost immediately while sewage coming from area 4 would take longer to reach the
pump station.
Stellenbosch University http://scholar.sun.ac.za
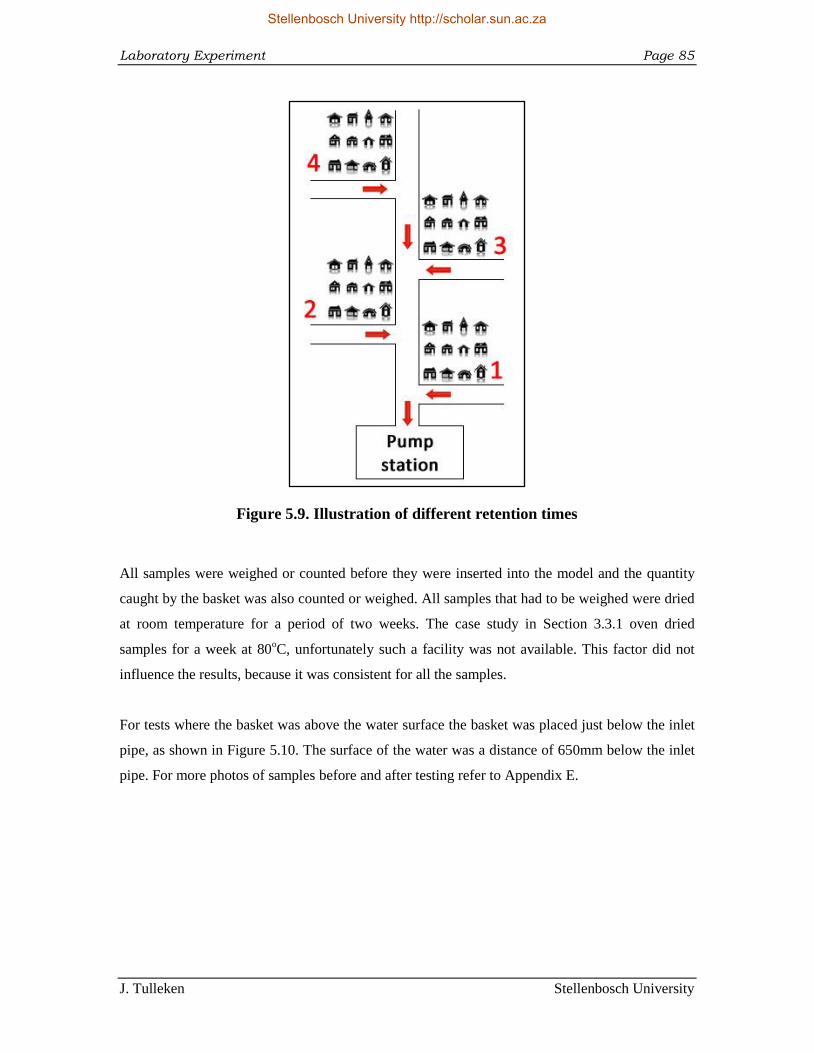
Laboratory Experiment Page 85
J. Tulleken Stellenbosch University
Figure 5.9. Illustration of different retention times
All samples were weighed or counted before they were inserted into the model and the quantity
caught by the basket was also counted or weighed. All samples that had to be weighed were dried
at room temperature for a period of two weeks. The case study in Section 3.3.1 oven dried
samples for a week at 80oC, unfortunately such a facility was not available. This factor did not
influence the results, because it was consistent for all the samples.
For tests where the basket was above the water surface the basket was placed just below the inlet
pipe, as shown in Figure 5.10. The surface of the water was a distance of 650mm below the inlet
pipe. For more photos of samples before and after testing refer to Appendix E.
Stellenbosch University http://scholar.sun.ac.za
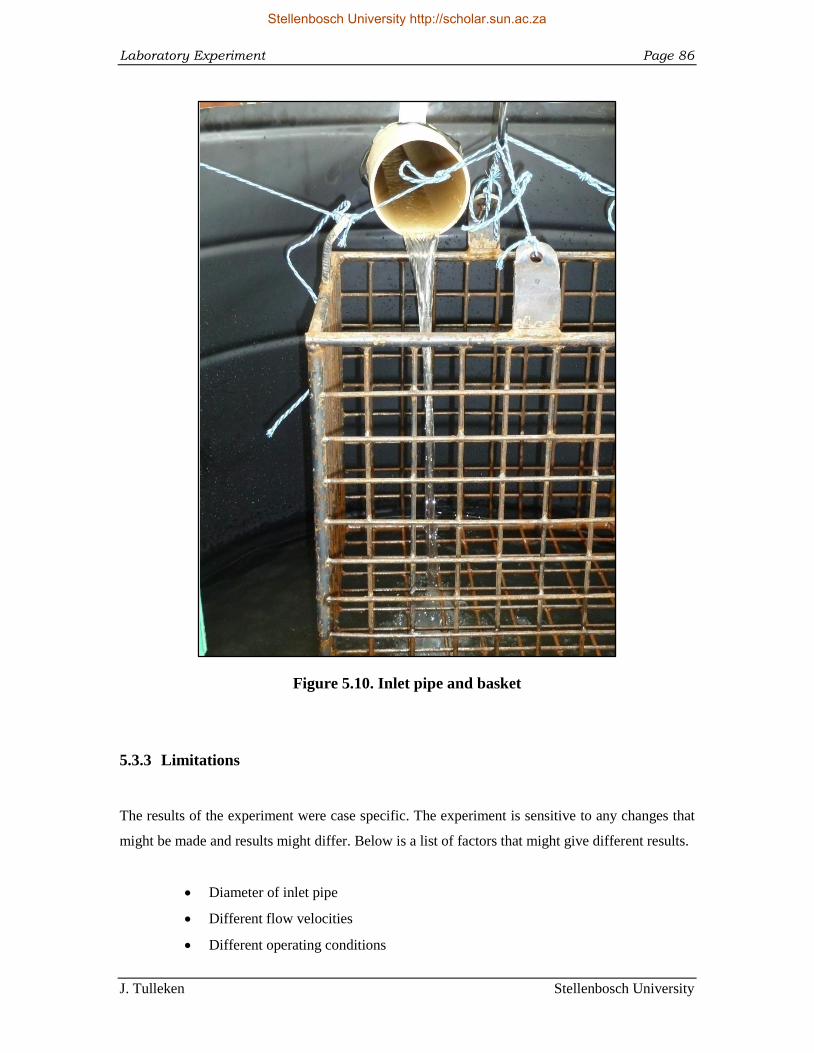
Laboratory Experiment Page 86
J. Tulleken Stellenbosch University
Figure 5.10. Inlet pipe and basket
5.3.3 Limitations
The results of the experiment were case specific. The experiment is sensitive to any changes that
might be made and results might differ. Below is a list of factors that might give different results.
Diameter of inlet pipe
Different flow velocities
Different operating conditions
Stellenbosch University http://scholar.sun.ac.za
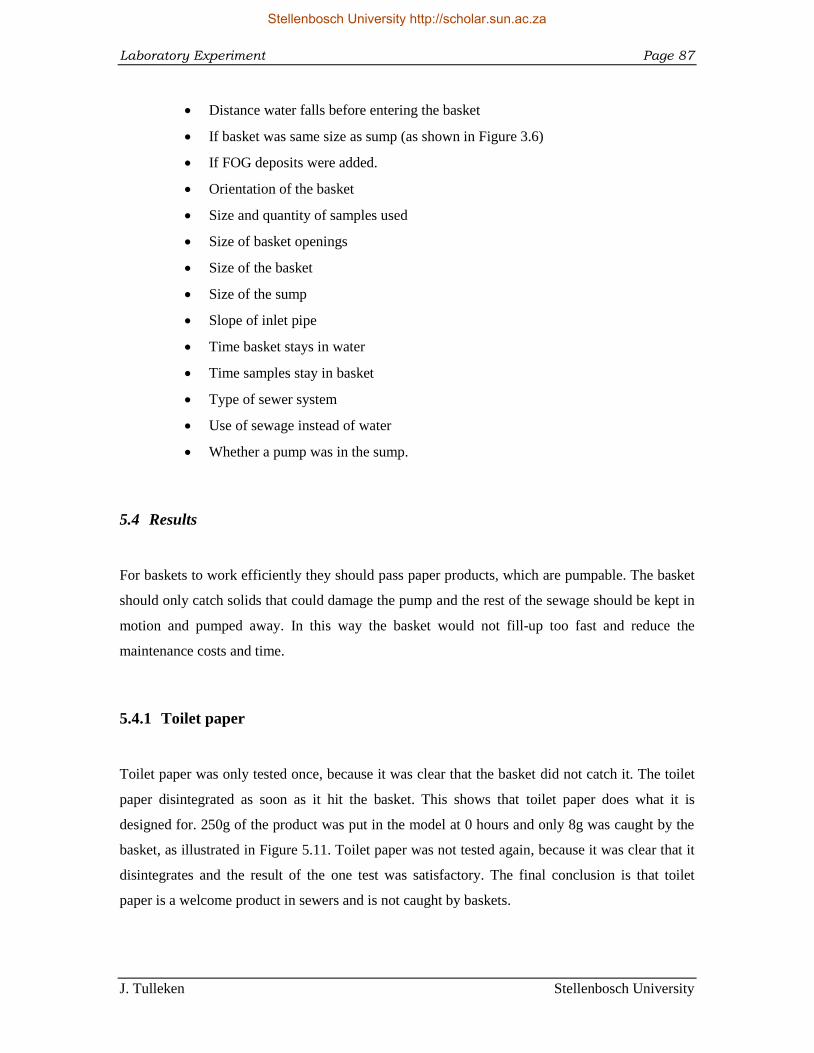
Laboratory Experiment Page 87
J. Tulleken Stellenbosch University
Distance water falls before entering the basket
If basket was same size as sump (as shown in Figure 3.6)
If FOG deposits were added.
Orientation of the basket
Size and quantity of samples used
Size of basket openings
Size of the basket
Size of the sump
Slope of inlet pipe
Time basket stays in water
Time samples stay in basket
Type of sewer system
Use of sewage instead of water
Whether a pump was in the sump.
5.4 Results
For baskets to work efficiently they should pass paper products, which are pumpable. The basket
should only catch solids that could damage the pump and the rest of the sewage should be kept in
motion and pumped away. In this way the basket would not fill-up too fast and reduce the
maintenance costs and time.
5.4.1 Toilet paper
Toilet paper was only tested once, because it was clear that the basket did not catch it. The toilet
paper disintegrated as soon as it hit the basket. This shows that toilet paper does what it is
designed for. 250g of the product was put in the model at 0 hours and only 8g was caught by the
basket, as illustrated in Figure 5.11. Toilet paper was not tested again, because it was clear that it
disintegrates and the result of the one test was satisfactory. The final conclusion is that toilet
paper is a welcome product in sewers and is not caught by baskets.
Stellenbosch University http://scholar.sun.ac.za
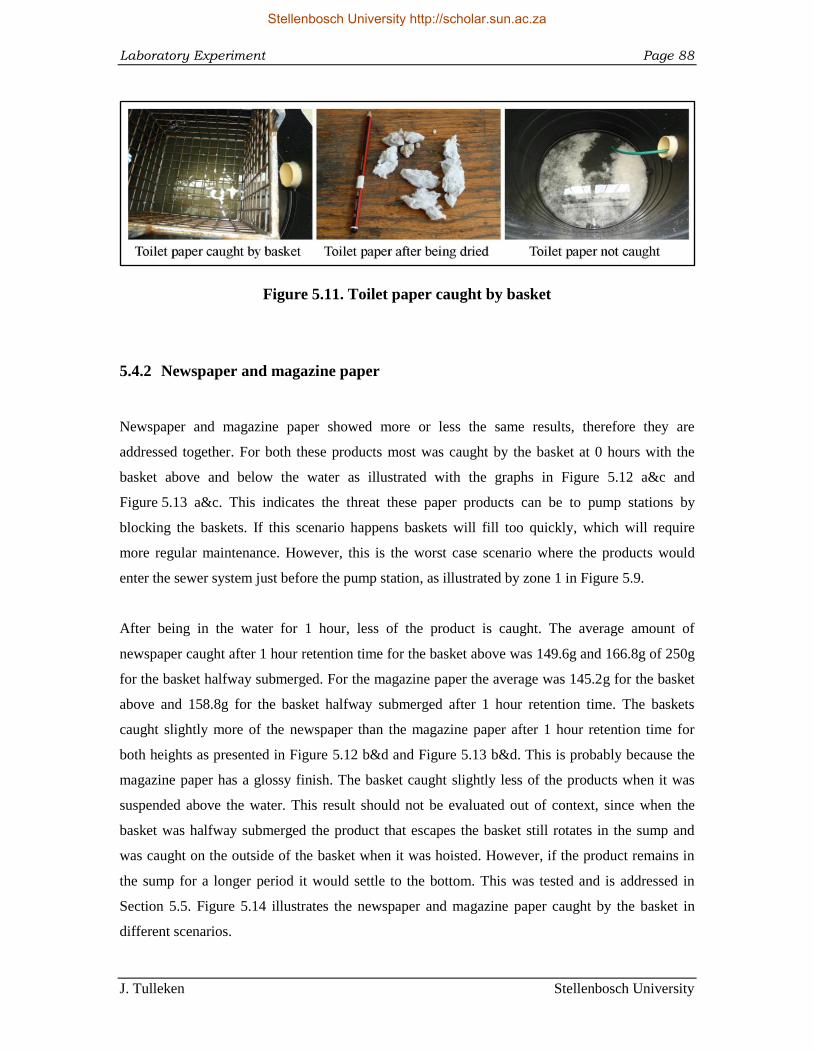
Laboratory Experiment Page 88
J. Tulleken Stellenbosch University
Figure 5.11. Toilet paper caught by basket
5.4.2 Newspaper and magazine paper
Newspaper and magazine paper showed more or less the same results, therefore they are
addressed together. For both these products most was caught by the basket at 0 hours with the
basket above and below the water as illustrated with the graphs in Figure 5.12 a&c and
Figure 5.13 a&c. This indicates the threat these paper products can be to pump stations by
blocking the baskets. If this scenario happens baskets will fill too quickly, which will require
more regular maintenance. However, this is the worst case scenario where the products would
enter the sewer system just before the pump station, as illustrated by zone 1 in Figure 5.9.
After being in the water for 1 hour, less of the product is caught. The average amount of
newspaper caught after 1 hour retention time for the basket above was 149.6g and 166.8g of 250g
for the basket halfway submerged. For the magazine paper the average was 145.2g for the basket
above and 158.8g for the basket halfway submerged after 1 hour retention time. The baskets
caught slightly more of the newspaper than the magazine paper after 1 hour retention time for
both heights as presented in Figure 5.12 b&d and Figure 5.13 b&d. This is probably because the
magazine paper has a glossy finish. The basket caught slightly less of the products when it was
suspended above the water. This result should not be evaluated out of context, since when the
basket was halfway submerged the product that escapes the basket still rotates in the sump and
was caught on the outside of the basket when it was hoisted. However, if the product remains in
the sump for a longer period it would settle to the bottom. This was tested and is addressed in
Section 5.5. Figure 5.14 illustrates the newspaper and magazine paper caught by the basket in
different scenarios.
Stellenbosch University http://scholar.sun.ac.za
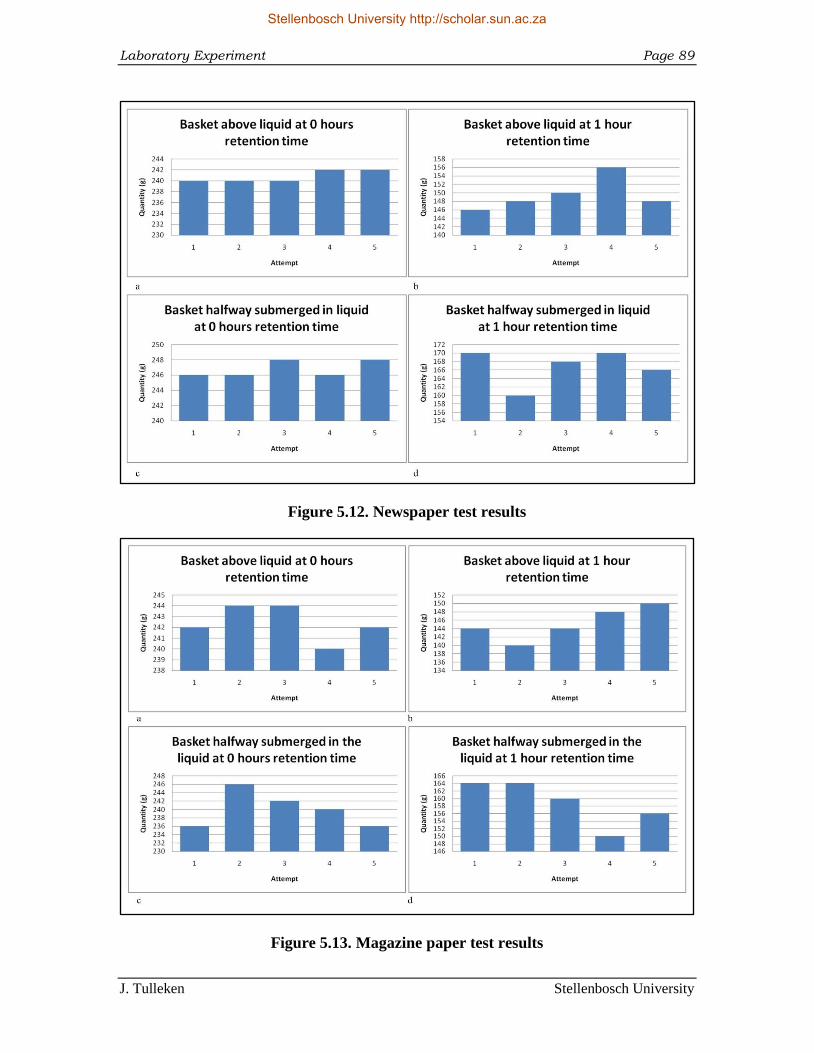
Laboratory Experiment Page 89
J. Tulleken Stellenbosch University
Figure 5.12. Newspaper test results
Figure 5.13. Magazine paper test results
Stellenbosch University http://scholar.sun.ac.za
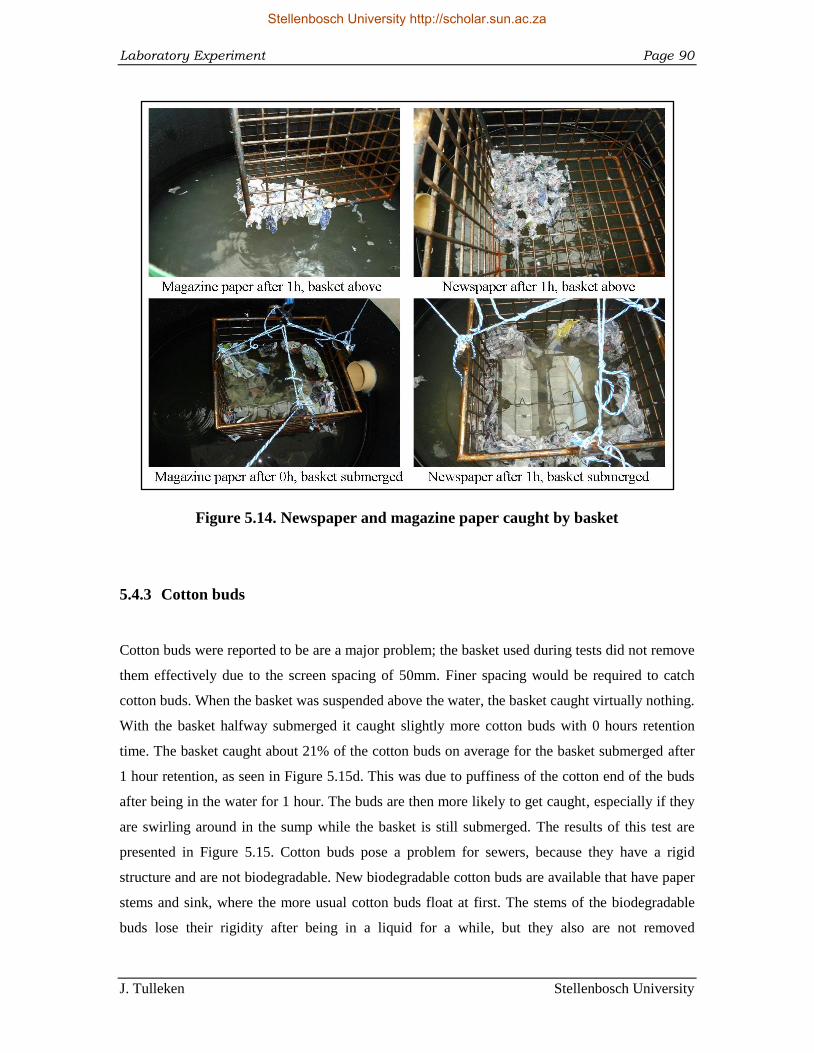
Laboratory Experiment Page 90
J. Tulleken Stellenbosch University
Figure 5.14. Newspaper and magazine paper caught by basket
5.4.3 Cotton buds
Cotton buds were reported to be are a major problem; the basket used during tests did not remove
them effectively due to the screen spacing of 50mm. Finer spacing would be required to catch
cotton buds. When the basket was suspended above the water, the basket caught virtually nothing.
With the basket halfway submerged it caught slightly more cotton buds with 0 hours retention
time. The basket caught about 21% of the cotton buds on average for the basket submerged after
1 hour retention, as seen in Figure 5.15d. This was due to puffiness of the cotton end of the buds
after being in the water for 1 hour. The buds are then more likely to get caught, especially if they
are swirling around in the sump while the basket is still submerged. The results of this test are
presented in Figure 5.15. Cotton buds pose a problem for sewers, because they have a rigid
structure and are not biodegradable. New biodegradable cotton buds are available that have paper
stems and sink, where the more usual cotton buds float at first. The stems of the biodegradable
buds lose their rigidity after being in a liquid for a while, but they also are not removed
Stellenbosch University http://scholar.sun.ac.za
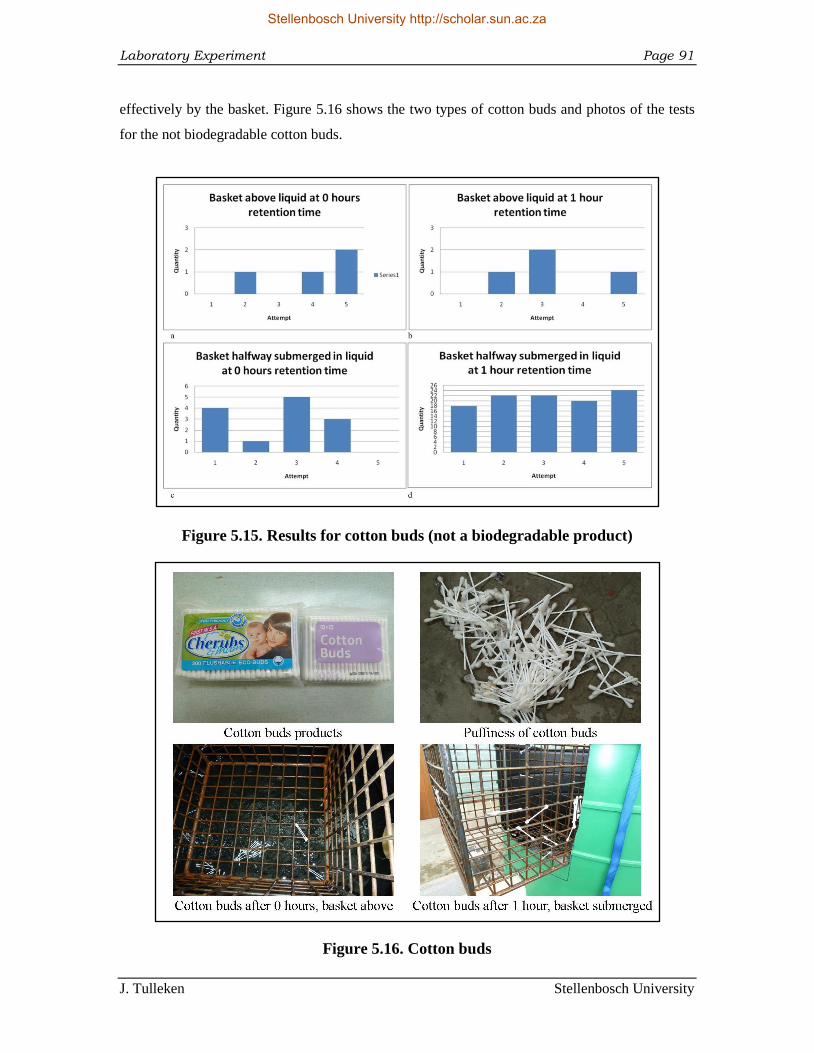
Laboratory Experiment Page 91
J. Tulleken Stellenbosch University
effectively by the basket. Figure 5.16 shows the two types of cotton buds and photos of the tests
for the not biodegradable cotton buds.
Figure 5.15. Results for cotton buds (not a biodegradable product)
Figure 5.16. Cotton buds
Stellenbosch University http://scholar.sun.ac.za
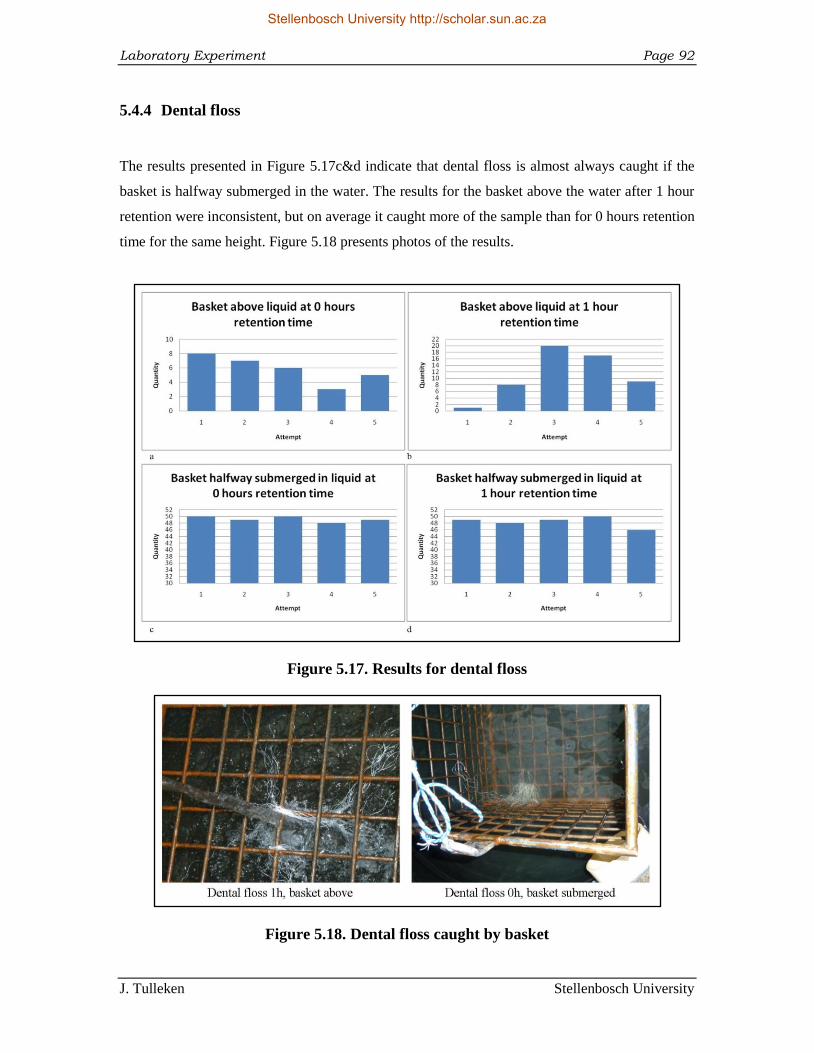
Laboratory Experiment Page 92
J. Tulleken Stellenbosch University
5.4.4 Dental floss
The results presented in Figure 5.17c&d indicate that dental floss is almost always caught if the
basket is halfway submerged in the water. The results for the basket above the water after 1 hour
retention were inconsistent, but on average it caught more of the sample than for 0 hours retention
time for the same height. Figure 5.18 presents photos of the results.
Figure 5.17. Results for dental floss
Figure 5.18. Dental floss caught by basket
Stellenbosch University http://scholar.sun.ac.za
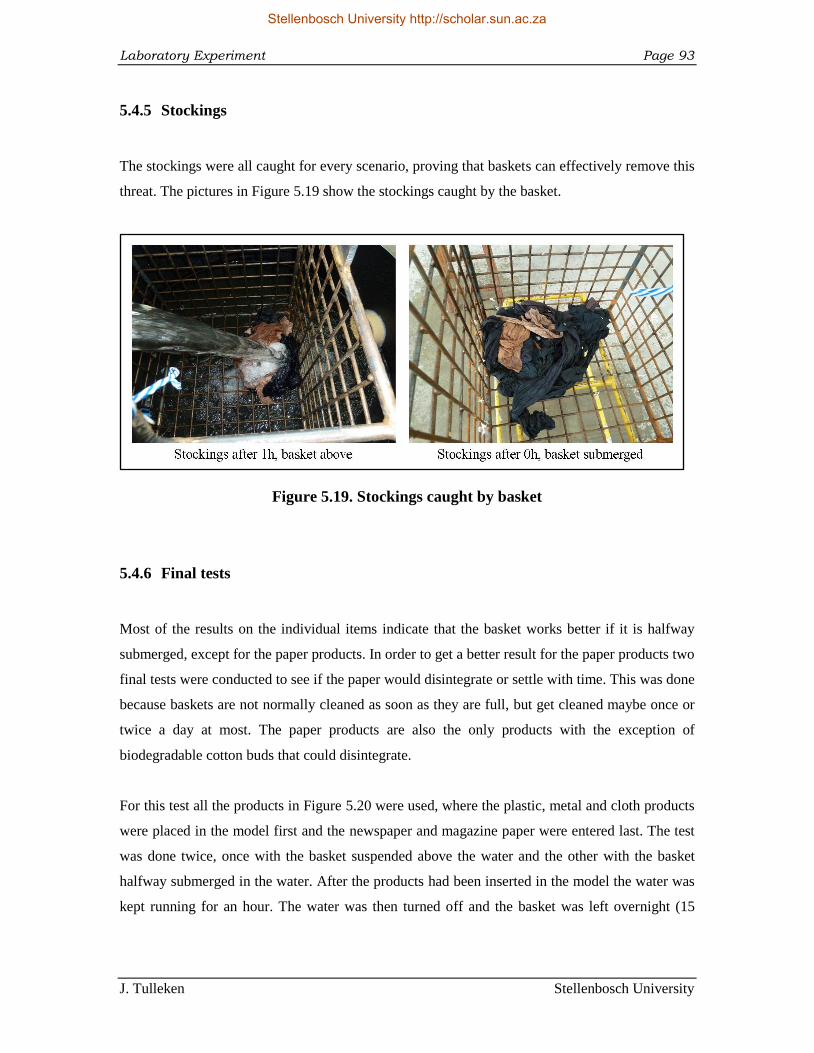
Laboratory Experiment Page 93
J. Tulleken Stellenbosch University
5.4.5 Stockings
The stockings were all caught for every scenario, proving that baskets can effectively remove this
threat. The pictures in Figure 5.19 show the stockings caught by the basket.
Figure 5.19. Stockings caught by basket
5.4.6 Final tests
Most of the results on the individual items indicate that the basket works better if it is halfway
submerged, except for the paper products. In order to get a better result for the paper products two
final tests were conducted to see if the paper would disintegrate or settle with time. This was done
because baskets are not normally cleaned as soon as they are full, but get cleaned maybe once or
twice a day at most. The paper products are also the only products with the exception of
biodegradable cotton buds that could disintegrate.
For this test all the products in Figure 5.20 were used, where the plastic, metal and cloth products
were placed in the model first and the newspaper and magazine paper were entered last. The test
was done twice, once with the basket suspended above the water and the other with the basket
halfway submerged in the water. After the products had been inserted in the model the water was
kept running for an hour. The water was then turned off and the basket was left overnight (15
Stellenbosch University http://scholar.sun.ac.za
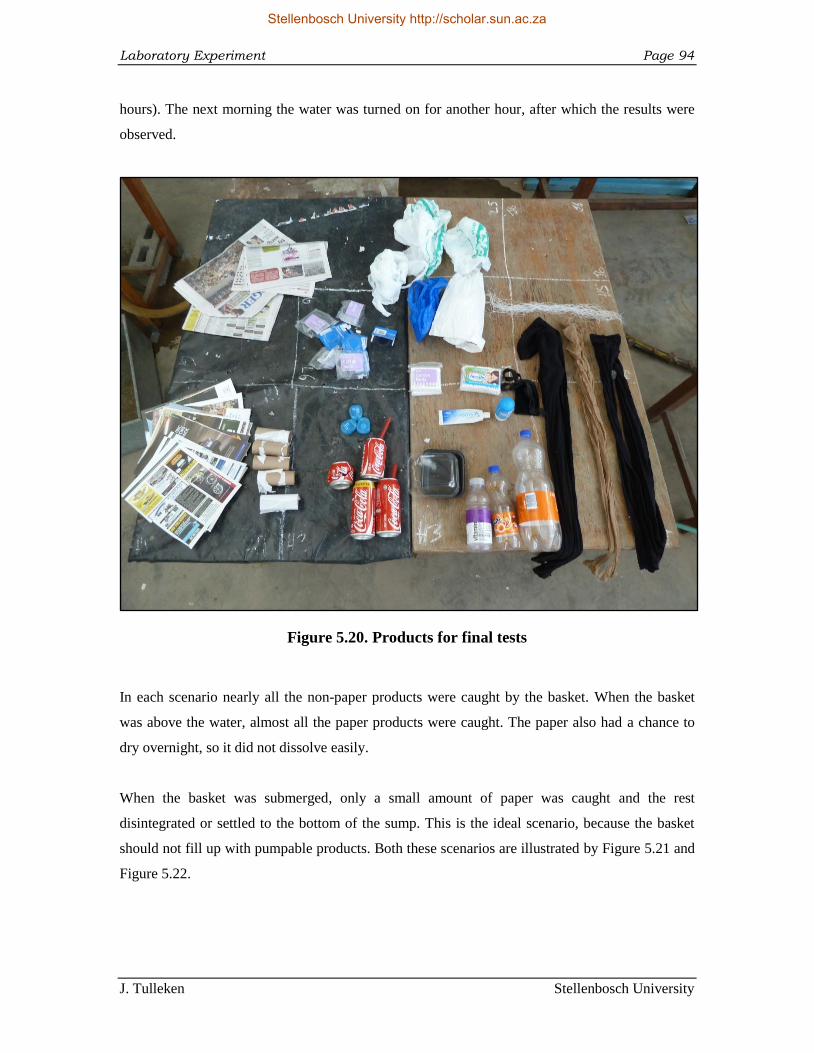
Laboratory Experiment Page 94
J. Tulleken Stellenbosch University
hours). The next morning the water was turned on for another hour, after which the results were
observed.
Figure 5.20. Products for final tests
In each scenario nearly all the non-paper products were caught by the basket. When the basket
was above the water, almost all the paper products were caught. The paper also had a chance to
dry overnight, so it did not dissolve easily.
When the basket was submerged, only a small amount of paper was caught and the rest
disintegrated or settled to the bottom of the sump. This is the ideal scenario, because the basket
should not fill up with pumpable products. Both these scenarios are illustrated by Figure 5.21 and
Figure 5.22.
Stellenbosch University http://scholar.sun.ac.za
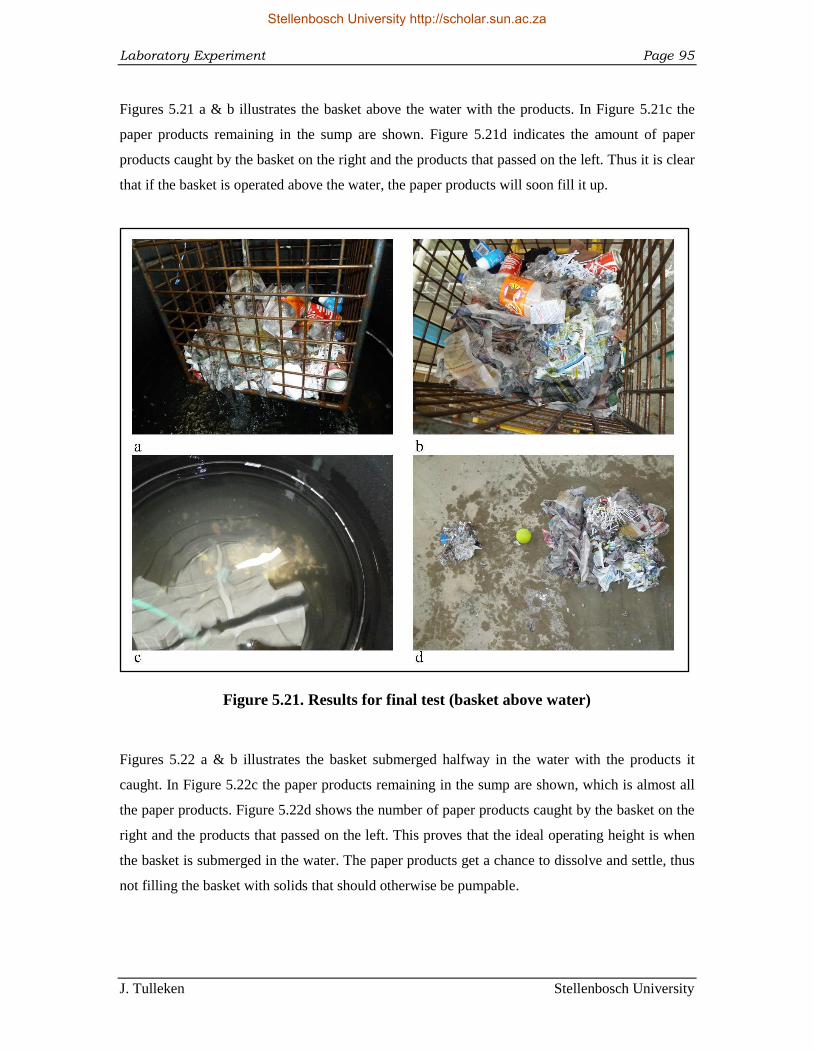
Laboratory Experiment Page 95
J. Tulleken Stellenbosch University
Figures 5.21 a & b illustrates the basket above the water with the products. In Figure 5.21c the
paper products remaining in the sump are shown. Figure 5.21d indicates the amount of paper
products caught by the basket on the right and the products that passed on the left. Thus it is clear
that if the basket is operated above the water, the paper products will soon fill it up.
Figure 5.21. Results for final test (basket above water)
Figures 5.22 a & b illustrates the basket submerged halfway in the water with the products it
caught. In Figure 5.22c the paper products remaining in the sump are shown, which is almost all
the paper products. Figure 5.22d shows the number of paper products caught by the basket on the
right and the products that passed on the left. This proves that the ideal operating height is when
the basket is submerged in the water. The paper products get a chance to dissolve and settle, thus
not filling the basket with solids that should otherwise be pumpable.
Stellenbosch University http://scholar.sun.ac.za
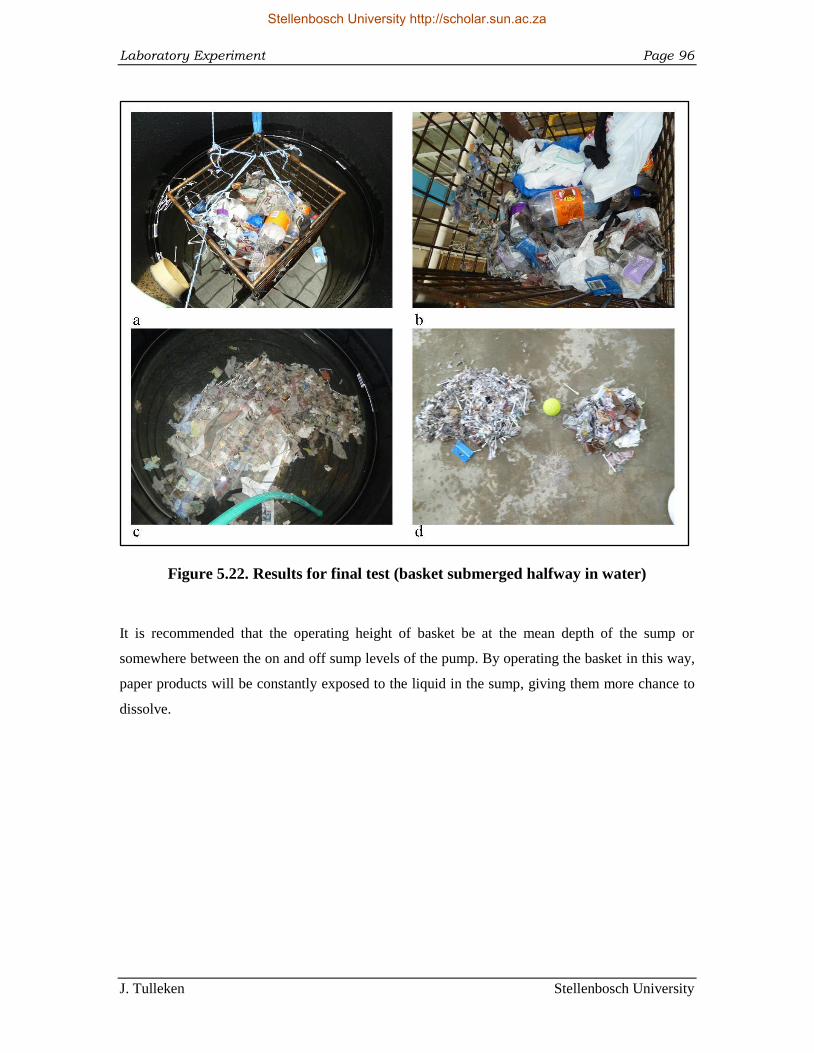
Laboratory Experiment Page 96
J. Tulleken Stellenbosch University
Figure 5.22. Results for final test (basket submerged halfway in water)
It is recommended that the operating height of basket be at the mean depth of the sump or
somewhere between the on and off sump levels of the pump. By operating the basket in this way,
paper products will be constantly exposed to the liquid in the sump, giving them more chance to
dissolve.
Stellenbosch University http://scholar.sun.ac.za
Laboratory Experiment Page 97
J. Tulleken Stellenbosch University
6. Fuzzy logic based efficiency index
6.1 Interpretation of results
The observations made from these experiments and the results obtained are quite simple and can
be used effectively. Therefore an efficiency index was determined to indicate the ideal
implementation of a screening basket. The forecasting of how efficiently the basket will catch
unwanted solids was done with the help of a fuzzy logic concept. The concept of fuzzy logic was
implemented and adjusted to interpret the data of each specific scenario.
Fuzzy logic has been used in many sewer-related control components. Ostojin et al. (2011) used
fuzzy logic to optimise the energy costs savings at sewage pump stations. A fuzzy control system
uses IF-THEN statements and can be created to match any set of input-output data (Murtha,
1995). Fuzzy logic has three components namely the fuzzy sets (system inputs), the IF-THEN
rules and the system outputs.
6.2 Fuzzy sets
Fuzzy sets are described domains of the inputs, each of which is thought to have a definite effect
on the output (Murtha, 1995). The system input parameters can be anything defined by the user;
Ostojin et al. (2011) used the change rate of the sump levels over time and the level of sump as
the inputs to determine the energy costs savings. Chiang et al. (2010) determined the outputs for
an automated control system for sewage pump stations in Taipei city (Taiwan), where the input
parameters were water level, precipitation, status of pumps, status of gates and the predictive
water level (Chiang et al., 2010).
For this research project the system inputs selected to form part of the fuzzy sets are the height of
the basket above the sump water level, the retention time of the solids and the type of solids in the
system. The fuzzy sets are presented in Table 6.1. The domains for the height of the basket are
either above the water or halfway submerged and similarly for the retention time (0 or 1h) and
type of solids (degradable or not).
Stellenbosch University http://scholar.sun.ac.za
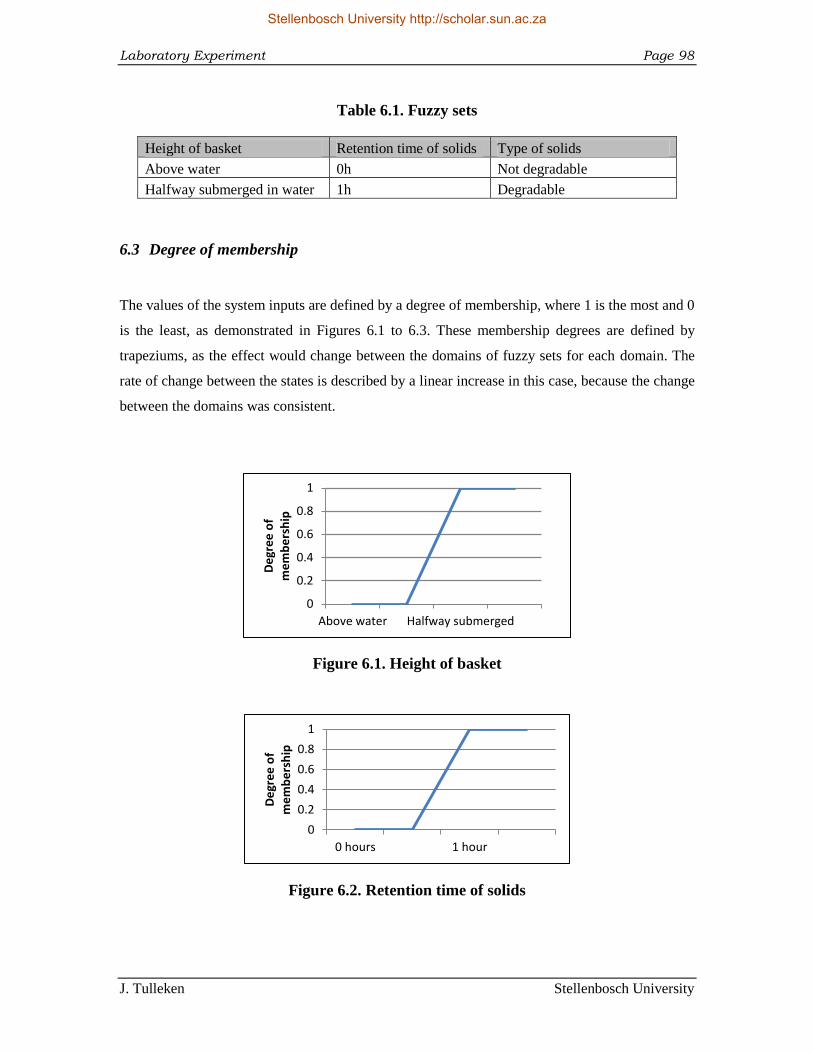
Laboratory Experiment Page 98
J. Tulleken Stellenbosch University
Table 6.1. Fuzzy sets
Height of basket Retention time of solids Type of solids
Above water 0h Not degradable
Halfway submerged in water 1h Degradable
6.3 Degree of membership
The values of the system inputs are defined by a degree of membership, where 1 is the most and 0
is the least, as demonstrated in Figures 6.1 to 6.3. These membership degrees are defined by
trapeziums, as the effect would change between the domains of fuzzy sets for each domain. The
rate of change between the states is described by a linear increase in this case, because the change
between the domains was consistent.
Figure 6.1. Height of basket
Figure 6.2. Retention time of solids
0
0.2
0.4
0.6
0.8
1
Above water Halfway submerged
De
gre
e o
f m
em
be
rsh
ip
0
0.2
0.4
0.6
0.8
1
0 hours 1 hour
De
gre
e o
f m
em
be
rsh
ip
Stellenbosch University http://scholar.sun.ac.za
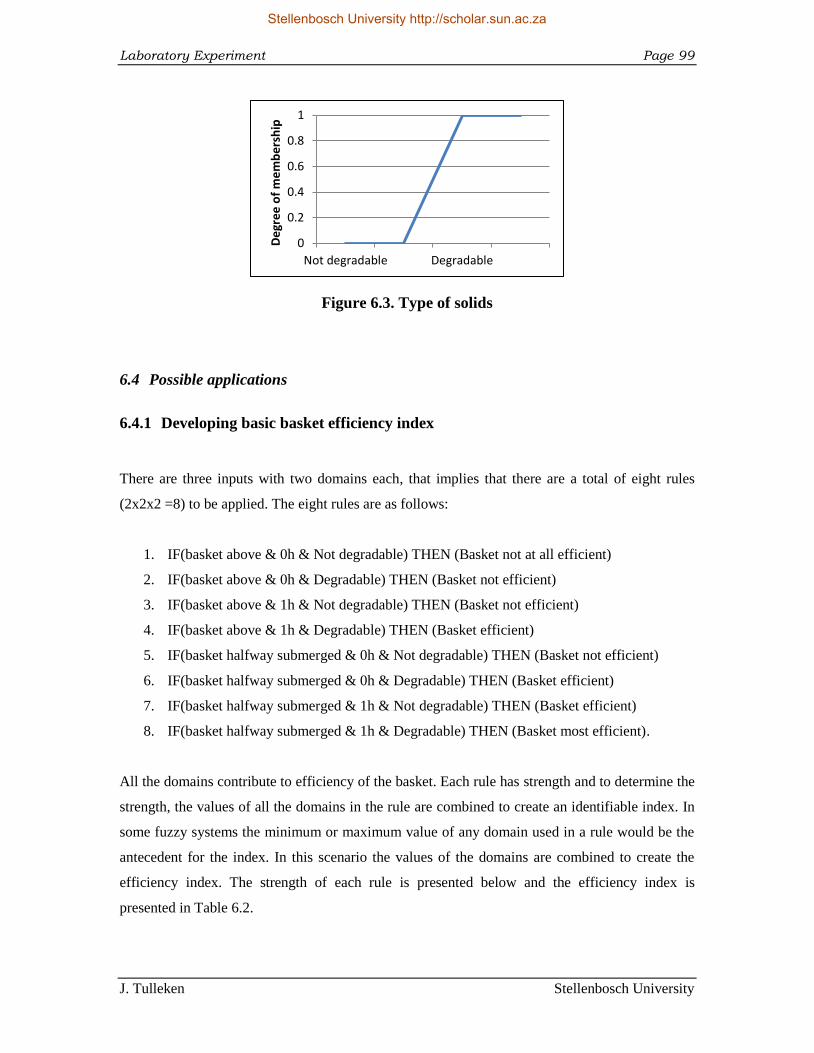
Laboratory Experiment Page 99
J. Tulleken Stellenbosch University
Figure 6.3. Type of solids
6.4 Possible applications
6.4.1 Developing basic basket efficiency index
There are three inputs with two domains each, that implies that there are a total of eight rules
(2x2x2 =8) to be applied. The eight rules are as follows:
1. IF(basket above & 0h & Not degradable) THEN (Basket not at all efficient)
2. IF(basket above & 0h & Degradable) THEN (Basket not efficient)
3. IF(basket above & 1h & Not degradable) THEN (Basket not efficient)
4. IF(basket above & 1h & Degradable) THEN (Basket efficient)
5. IF(basket halfway submerged & 0h & Not degradable) THEN (Basket not efficient)
6. IF(basket halfway submerged & 0h & Degradable) THEN (Basket efficient)
7. IF(basket halfway submerged & 1h & Not degradable) THEN (Basket efficient)
8. IF(basket halfway submerged & 1h & Degradable) THEN (Basket most efficient).
All the domains contribute to efficiency of the basket. Each rule has strength and to determine the
strength, the values of all the domains in the rule are combined to create an identifiable index. In
some fuzzy systems the minimum or maximum value of any domain used in a rule would be the
antecedent for the index. In this scenario the values of the domains are combined to create the
efficiency index. The strength of each rule is presented below and the efficiency index is
presented in Table 6.2.
0
0.2
0.4
0.6
0.8
1
Not degradable DegradableD
egr
ee
of
me
mb
ers
hip
Stellenbosch University http://scholar.sun.ac.za
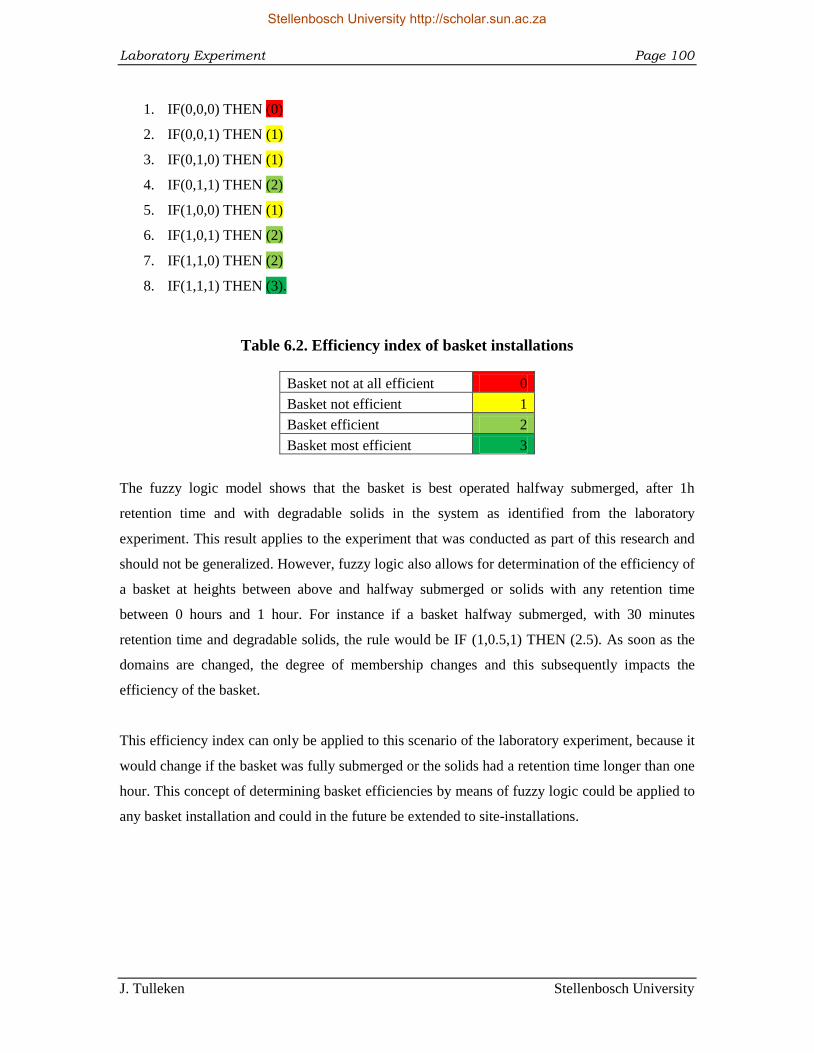
Laboratory Experiment Page 100
J. Tulleken Stellenbosch University
1. IF(0,0,0) THEN (0)
2. IF(0,0,1) THEN (1)
3. IF(0,1,0) THEN (1)
4. IF(0,1,1) THEN (2)
5. IF(1,0,0) THEN (1)
6. IF(1,0,1) THEN (2)
7. IF(1,1,0) THEN (2)
8. IF(1,1,1) THEN (3).
Table 6.2. Efficiency index of basket installations
Basket not at all efficient 0
Basket not efficient 1
Basket efficient 2
Basket most efficient 3
The fuzzy logic model shows that the basket is best operated halfway submerged, after 1h
retention time and with degradable solids in the system as identified from the laboratory
experiment. This result applies to the experiment that was conducted as part of this research and
should not be generalized. However, fuzzy logic also allows for determination of the efficiency of
a basket at heights between above and halfway submerged or solids with any retention time
between 0 hours and 1 hour. For instance if a basket halfway submerged, with 30 minutes
retention time and degradable solids, the rule would be IF (1,0.5,1) THEN (2.5). As soon as the
domains are changed, the degree of membership changes and this subsequently impacts the
efficiency of the basket.
This efficiency index can only be applied to this scenario of the laboratory experiment, because it
would change if the basket was fully submerged or the solids had a retention time longer than one
hour. This concept of determining basket efficiencies by means of fuzzy logic could be applied to
any basket installation and could in the future be extended to site-installations.
Stellenbosch University http://scholar.sun.ac.za
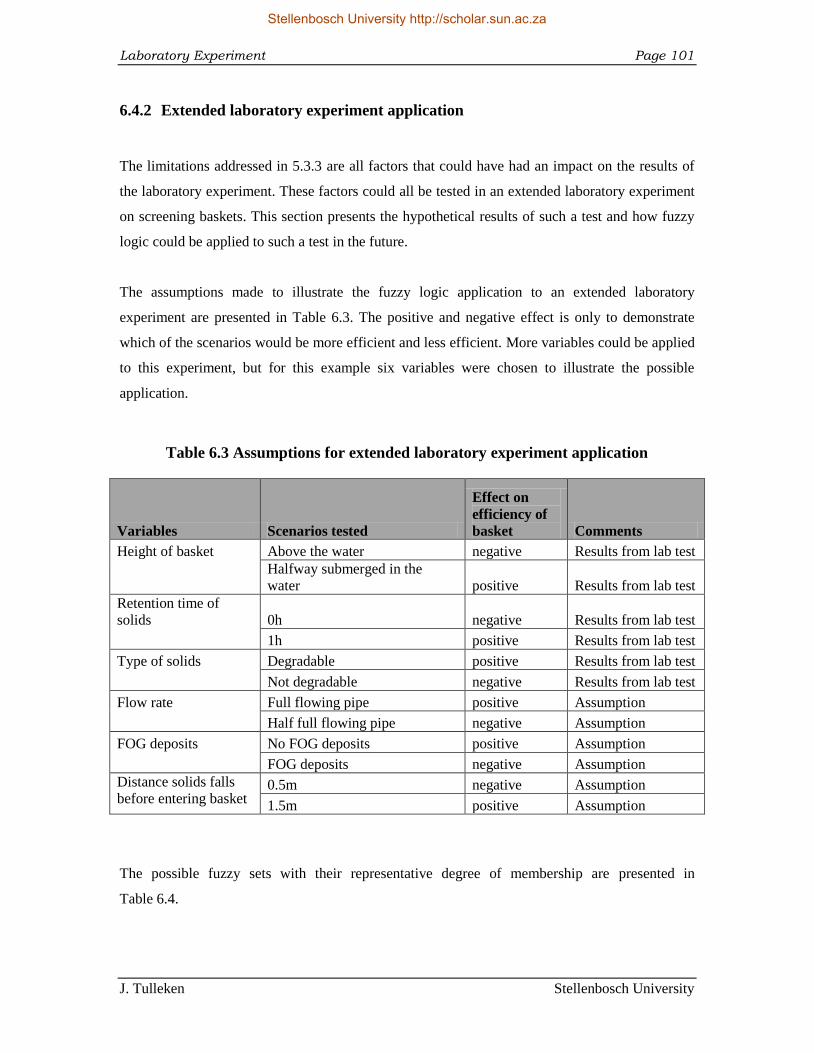
Laboratory Experiment Page 101
J. Tulleken Stellenbosch University
6.4.2 Extended laboratory experiment application
The limitations addressed in 5.3.3 are all factors that could have had an impact on the results of
the laboratory experiment. These factors could all be tested in an extended laboratory experiment
on screening baskets. This section presents the hypothetical results of such a test and how fuzzy
logic could be applied to such a test in the future.
The assumptions made to illustrate the fuzzy logic application to an extended laboratory
experiment are presented in Table 6.3. The positive and negative effect is only to demonstrate
which of the scenarios would be more efficient and less efficient. More variables could be applied
to this experiment, but for this example six variables were chosen to illustrate the possible
application.
Table 6.3 Assumptions for extended laboratory experiment application
Variables Scenarios tested
Effect on
efficiency of
basket Comments
Height of basket Above the water negative Results from lab test
Halfway submerged in the
water positive Results from lab test
Retention time of
solids 0h negative Results from lab test
1h positive Results from lab test
Type of solids Degradable positive Results from lab test
Not degradable negative Results from lab test
Flow rate Full flowing pipe positive Assumption
Half full flowing pipe negative Assumption
FOG deposits No FOG deposits positive Assumption
FOG deposits negative Assumption
Distance solids falls
before entering basket 0.5m negative Assumption
1.5m positive Assumption
The possible fuzzy sets with their representative degree of membership are presented in
Table 6.4.
Stellenbosch University http://scholar.sun.ac.za
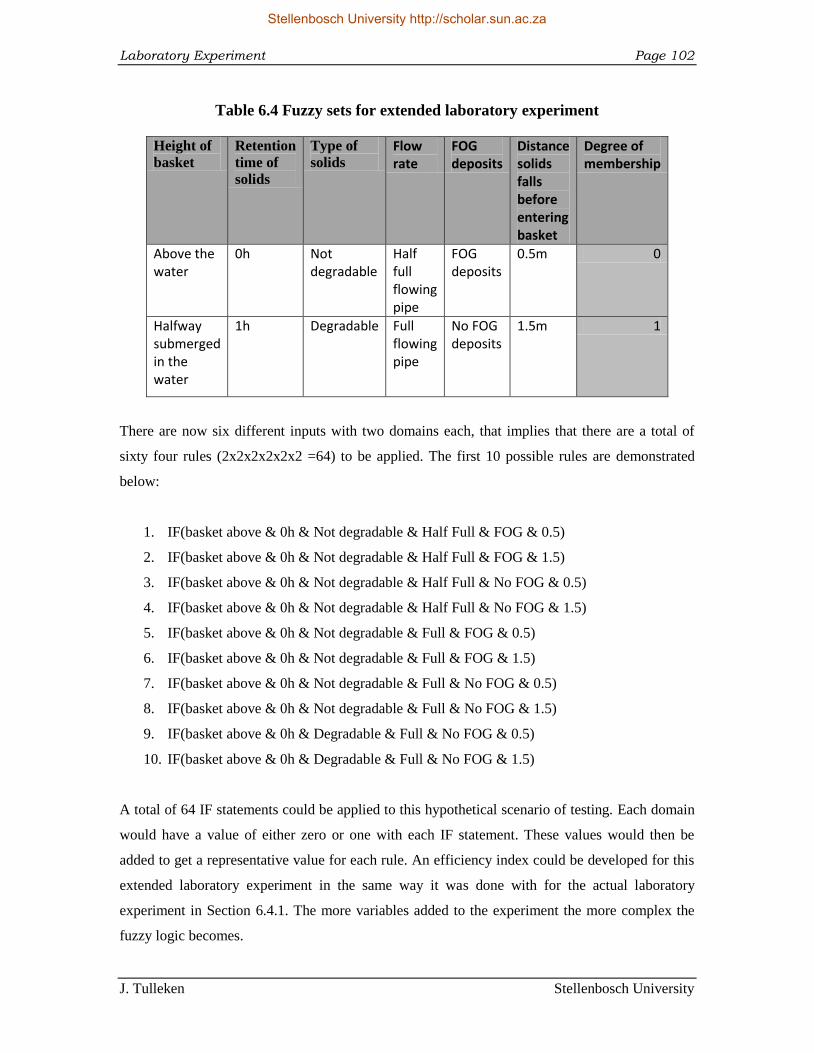
Laboratory Experiment Page 102
J. Tulleken Stellenbosch University
Table 6.4 Fuzzy sets for extended laboratory experiment
Height of
basket
Retention
time of
solids
Type of
solids
Flow rate
FOG deposits
Distance solids falls before entering basket
Degree of membership
Above the water
0h Not degradable
Half full flowing pipe
FOG deposits
0.5m 0
Halfway submerged in the water
1h Degradable Full flowing pipe
No FOG deposits
1.5m 1
There are now six different inputs with two domains each, that implies that there are a total of
sixty four rules (2x2x2x2x2x2 =64) to be applied. The first 10 possible rules are demonstrated
below:
1. IF(basket above & 0h & Not degradable & Half Full & FOG & 0.5)
2. IF(basket above & 0h & Not degradable & Half Full & FOG & 1.5)
3. IF(basket above & 0h & Not degradable & Half Full & No FOG & 0.5)
4. IF(basket above & 0h & Not degradable & Half Full & No FOG & 1.5)
5. IF(basket above & 0h & Not degradable & Full & FOG & 0.5)
6. IF(basket above & 0h & Not degradable & Full & FOG & 1.5)
7. IF(basket above & 0h & Not degradable & Full & No FOG & 0.5)
8. IF(basket above & 0h & Not degradable & Full & No FOG & 1.5)
9. IF(basket above & 0h & Degradable & Full & No FOG & 0.5)
10. IF(basket above & 0h & Degradable & Full & No FOG & 1.5)
A total of 64 IF statements could be applied to this hypothetical scenario of testing. Each domain
would have a value of either zero or one with each IF statement. These values would then be
added to get a representative value for each rule. An efficiency index could be developed for this
extended laboratory experiment in the same way it was done with for the actual laboratory
experiment in Section 6.4.1. The more variables added to the experiment the more complex the
fuzzy logic becomes.
Stellenbosch University http://scholar.sun.ac.za
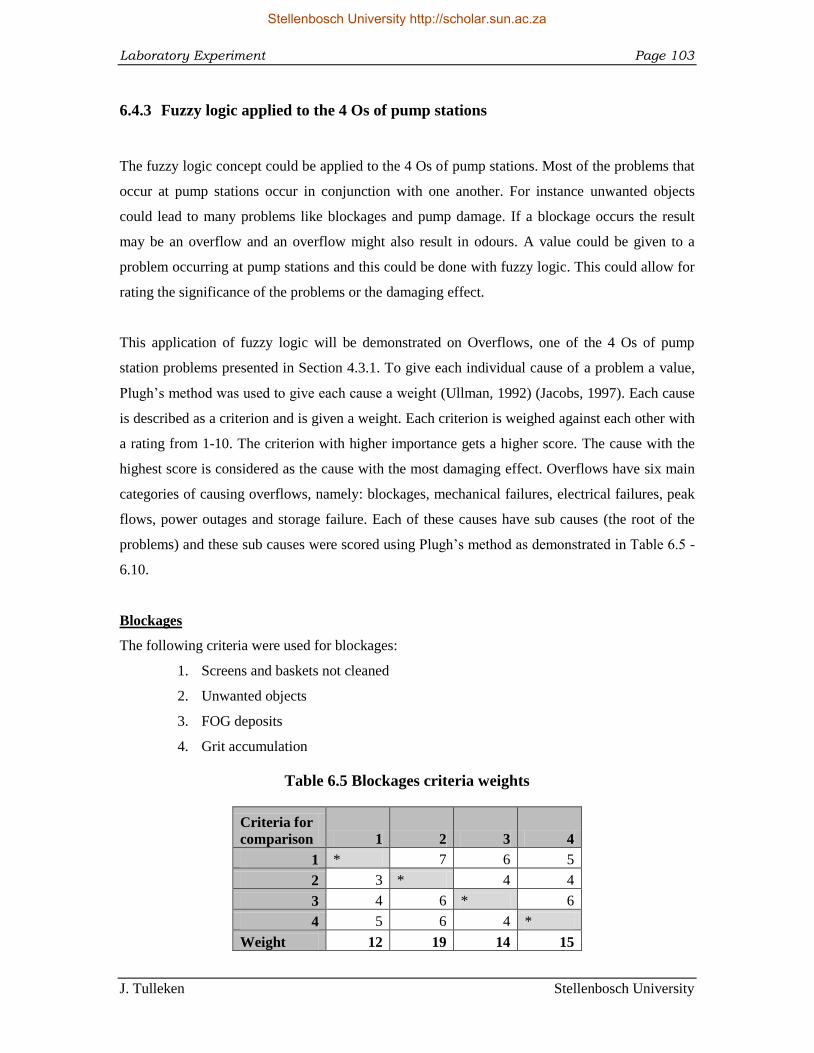
Laboratory Experiment Page 103
J. Tulleken Stellenbosch University
6.4.3 Fuzzy logic applied to the 4 Os of pump stations
The fuzzy logic concept could be applied to the 4 Os of pump stations. Most of the problems that
occur at pump stations occur in conjunction with one another. For instance unwanted objects
could lead to many problems like blockages and pump damage. If a blockage occurs the result
may be an overflow and an overflow might also result in odours. A value could be given to a
problem occurring at pump stations and this could be done with fuzzy logic. This could allow for
rating the significance of the problems or the damaging effect.
This application of fuzzy logic will be demonstrated on Overflows, one of the 4 Os of pump
station problems presented in Section 4.3.1. To give each individual cause of a problem a value,
Plugh‟s method was used to give each cause a weight (Ullman, 1992) (Jacobs, 1997). Each cause
is described as a criterion and is given a weight. Each criterion is weighed against each other with
a rating from 1-10. The criterion with higher importance gets a higher score. The cause with the
highest score is considered as the cause with the most damaging effect. Overflows have six main
categories of causing overflows, namely: blockages, mechanical failures, electrical failures, peak
flows, power outages and storage failure. Each of these causes have sub causes (the root of the
problems) and these sub causes were scored using Plugh‟s method as demonstrated in Table 6.5 -
6.10.
Blockages
The following criteria were used for blockages:
1. Screens and baskets not cleaned
2. Unwanted objects
3. FOG deposits
4. Grit accumulation
Table 6.5 Blockages criteria weights
Criteria for
comparison 1 2 3 4
1 * 7 6 5
2 3 * 4 4
3 4 6 * 6
4 5 6 4 *
Weight 12 19 14 15
Stellenbosch University http://scholar.sun.ac.za
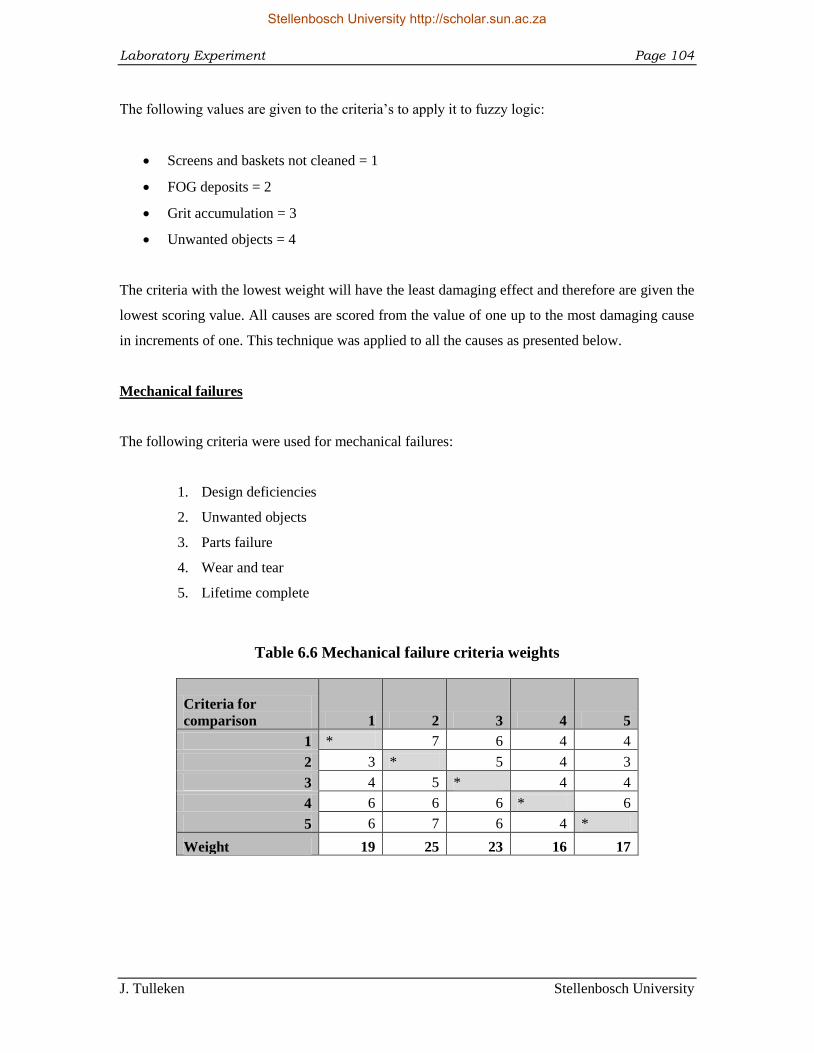
Laboratory Experiment Page 104
J. Tulleken Stellenbosch University
The following values are given to the criteria‟s to apply it to fuzzy logic:
Screens and baskets not cleaned = 1
FOG deposits = 2
Grit accumulation = 3
Unwanted objects = 4
The criteria with the lowest weight will have the least damaging effect and therefore are given the
lowest scoring value. All causes are scored from the value of one up to the most damaging cause
in increments of one. This technique was applied to all the causes as presented below.
Mechanical failures
The following criteria were used for mechanical failures:
1. Design deficiencies
2. Unwanted objects
3. Parts failure
4. Wear and tear
5. Lifetime complete
Table 6.6 Mechanical failure criteria weights
Criteria for
comparison 1 2 3 4 5
1 * 7 6 4 4
2 3 * 5 4 3
3 4 5 * 4 4
4 6 6 6 * 6
5 6 7 6 4 *
Weight 19 25 23 16 17
Stellenbosch University http://scholar.sun.ac.za
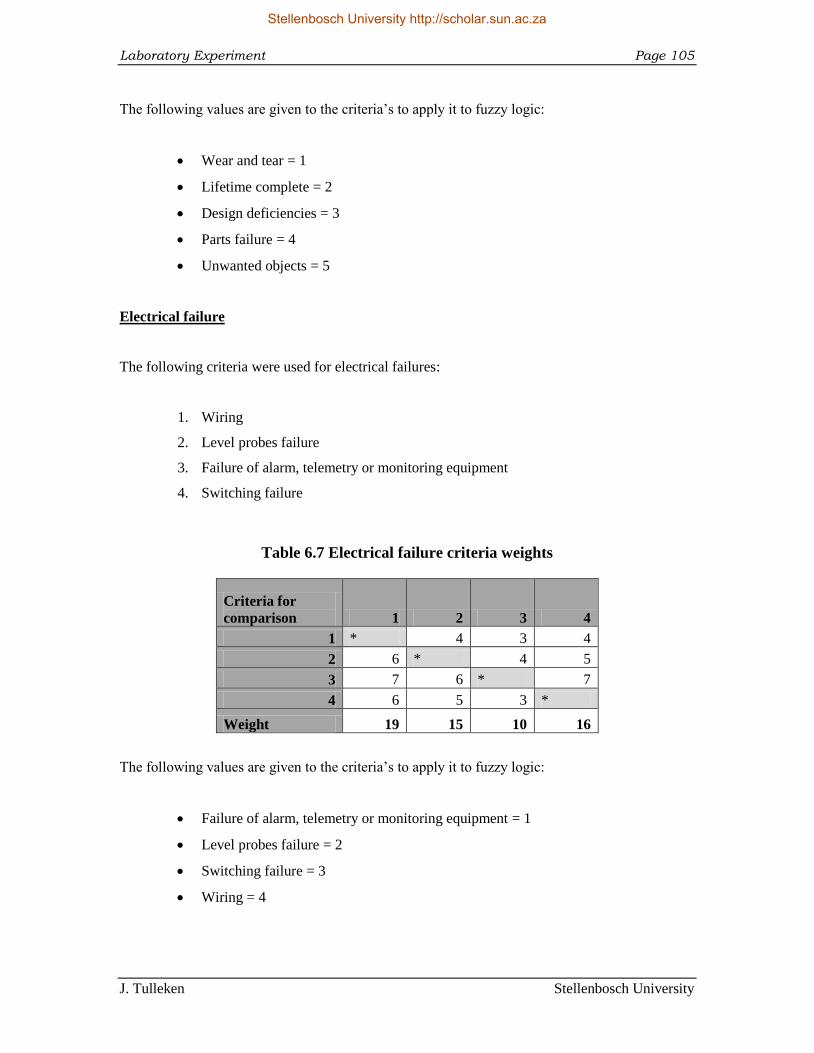
Laboratory Experiment Page 105
J. Tulleken Stellenbosch University
The following values are given to the criteria‟s to apply it to fuzzy logic:
Wear and tear = 1
Lifetime complete = 2
Design deficiencies = 3
Parts failure = 4
Unwanted objects = 5
Electrical failure
The following criteria were used for electrical failures:
1. Wiring
2. Level probes failure
3. Failure of alarm, telemetry or monitoring equipment
4. Switching failure
Table 6.7 Electrical failure criteria weights
Criteria for
comparison 1 2 3 4
1 * 4 3 4
2 6 * 4 5
3 7 6 * 7
4 6 5 3 *
Weight 19 15 10 16
The following values are given to the criteria‟s to apply it to fuzzy logic:
Failure of alarm, telemetry or monitoring equipment = 1
Level probes failure = 2
Switching failure = 3
Wiring = 4
Stellenbosch University http://scholar.sun.ac.za
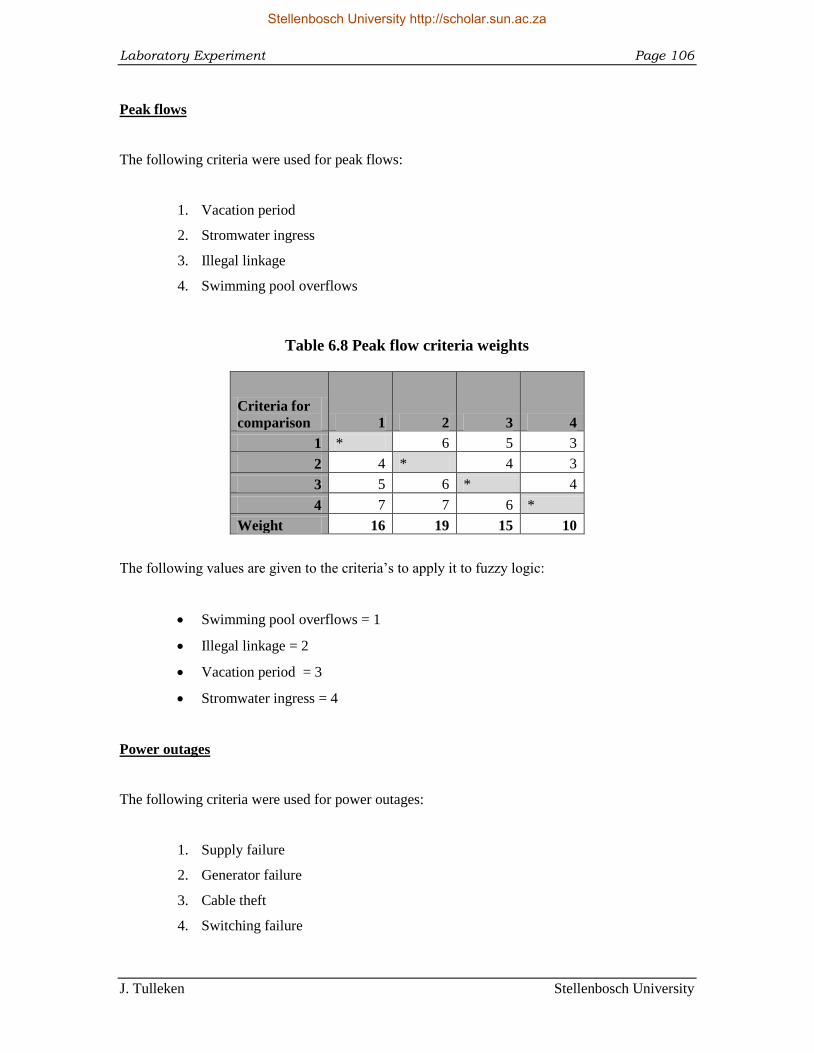
Laboratory Experiment Page 106
J. Tulleken Stellenbosch University
Peak flows
The following criteria were used for peak flows:
1. Vacation period
2. Stromwater ingress
3. Illegal linkage
4. Swimming pool overflows
Table 6.8 Peak flow criteria weights
Criteria for
comparison 1 2 3 4
1 * 6 5 3
2 4 * 4 3
3 5 6 * 4
4 7 7 6 *
Weight 16 19 15 10
The following values are given to the criteria‟s to apply it to fuzzy logic:
Swimming pool overflows = 1
Illegal linkage = 2
Vacation period = 3
Stromwater ingress = 4
Power outages
The following criteria were used for power outages:
1. Supply failure
2. Generator failure
3. Cable theft
4. Switching failure
Stellenbosch University http://scholar.sun.ac.za
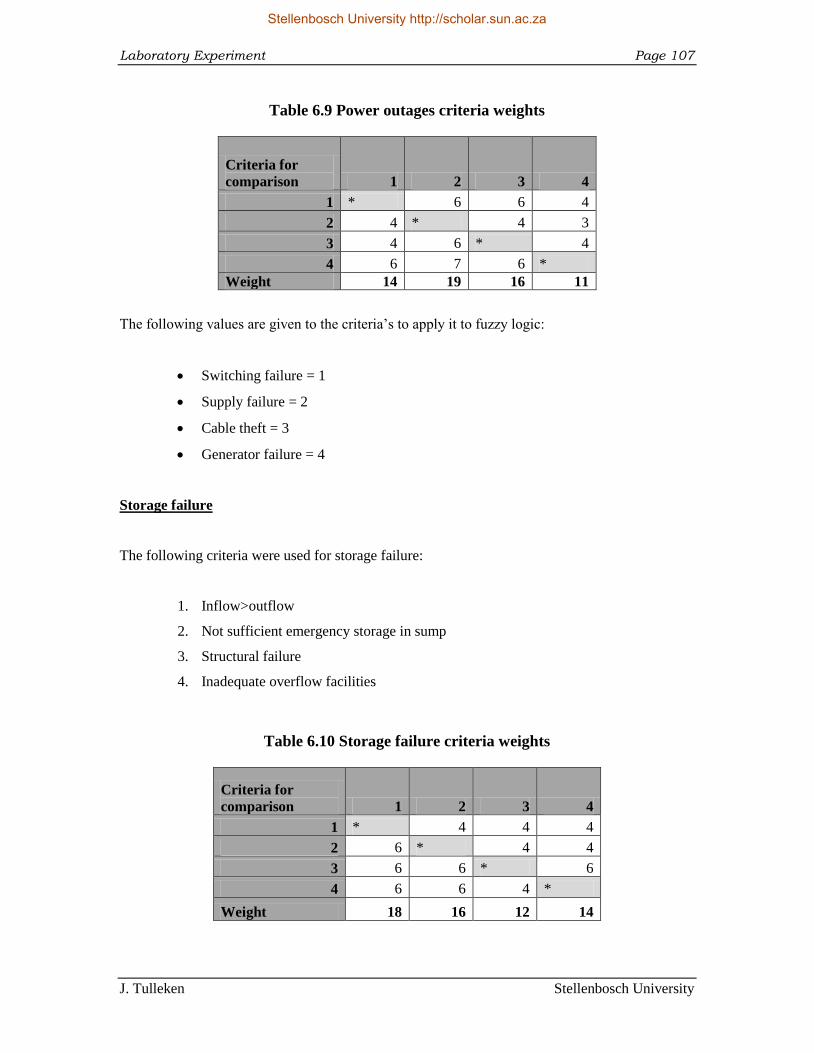
Laboratory Experiment Page 107
J. Tulleken Stellenbosch University
Table 6.9 Power outages criteria weights
Criteria for
comparison 1 2 3 4
1 * 6 6 4
2 4 * 4 3
3 4 6 * 4
4 6 7 6 *
Weight 14 19 16 11
The following values are given to the criteria‟s to apply it to fuzzy logic:
Switching failure = 1
Supply failure = 2
Cable theft = 3
Generator failure = 4
Storage failure
The following criteria were used for storage failure:
1. Inflow>outflow
2. Not sufficient emergency storage in sump
3. Structural failure
4. Inadequate overflow facilities
Table 6.10 Storage failure criteria weights
Criteria for
comparison 1 2 3 4
1 * 4 4 4
2 6 * 4 4
3 6 6 * 6
4 6 6 4 *
Weight 18 16 12 14
Stellenbosch University http://scholar.sun.ac.za
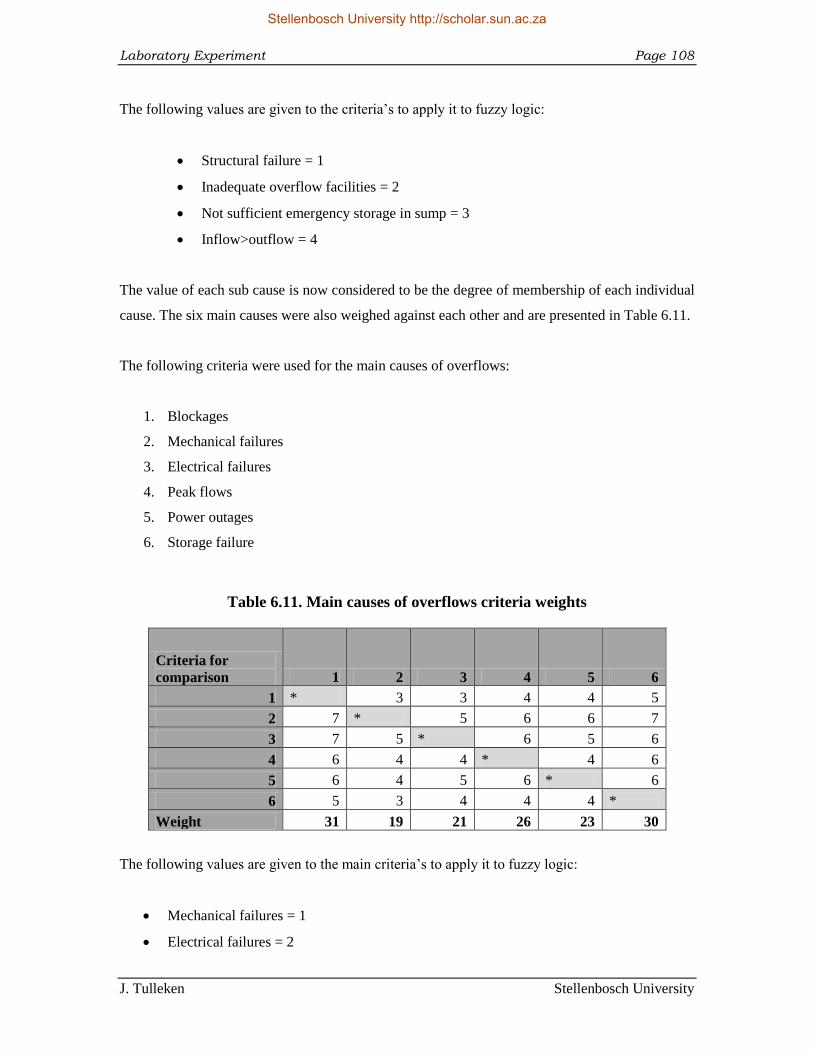
Laboratory Experiment Page 108
J. Tulleken Stellenbosch University
The following values are given to the criteria‟s to apply it to fuzzy logic:
Structural failure = 1
Inadequate overflow facilities = 2
Not sufficient emergency storage in sump = 3
Inflow>outflow = 4
The value of each sub cause is now considered to be the degree of membership of each individual
cause. The six main causes were also weighed against each other and are presented in Table 6.11.
The following criteria were used for the main causes of overflows:
1. Blockages
2. Mechanical failures
3. Electrical failures
4. Peak flows
5. Power outages
6. Storage failure
Table 6.11. Main causes of overflows criteria weights
Criteria for
comparison 1 2 3 4 5 6
1 * 3 3 4 4 5
2 7 * 5 6 6 7
3 7 5 * 6 5 6
4 6 4 4 * 4 6
5 6 4 5 6 * 6
6 5 3 4 4 4 *
Weight 31 19 21 26 23 30
The following values are given to the main criteria‟s to apply it to fuzzy logic:
Mechanical failures = 1
Electrical failures = 2
Stellenbosch University http://scholar.sun.ac.za
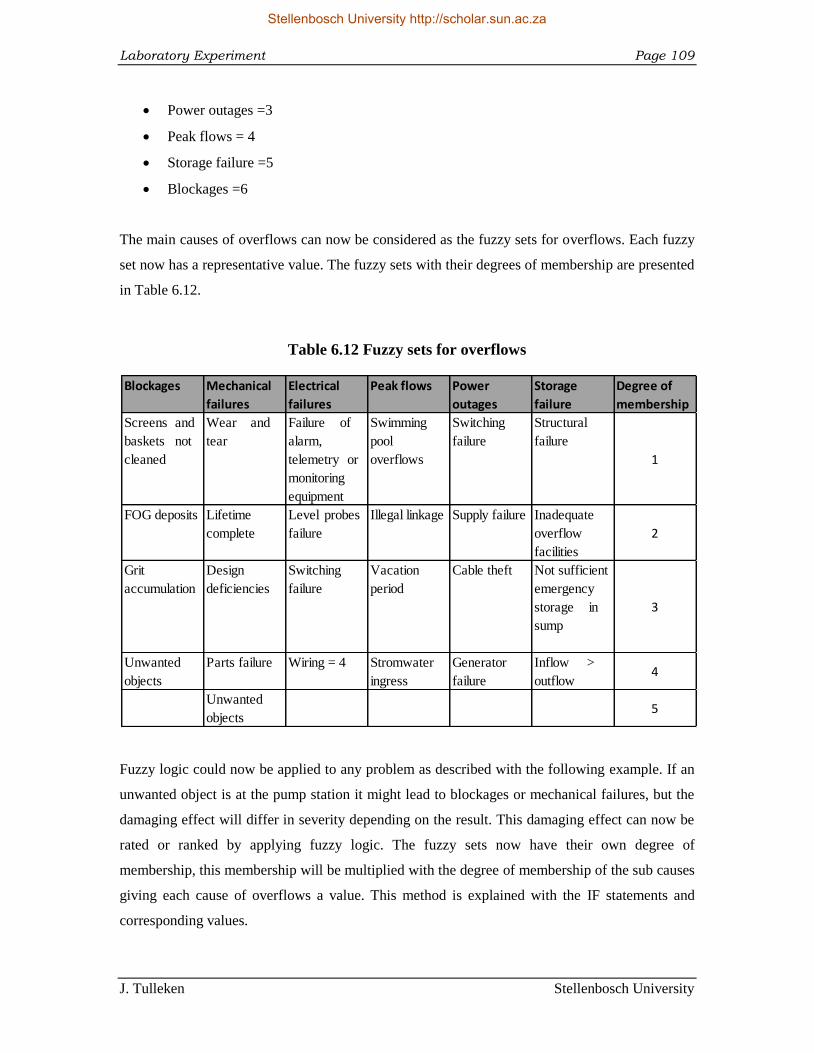
Laboratory Experiment Page 109
J. Tulleken Stellenbosch University
Power outages =3
Peak flows = 4
Storage failure =5
Blockages =6
The main causes of overflows can now be considered as the fuzzy sets for overflows. Each fuzzy
set now has a representative value. The fuzzy sets with their degrees of membership are presented
in Table 6.12.
Table 6.12 Fuzzy sets for overflows
Fuzzy logic could now be applied to any problem as described with the following example. If an
unwanted object is at the pump station it might lead to blockages or mechanical failures, but the
damaging effect will differ in severity depending on the result. This damaging effect can now be
rated or ranked by applying fuzzy logic. The fuzzy sets now have their own degree of
membership, this membership will be multiplied with the degree of membership of the sub causes
giving each cause of overflows a value. This method is explained with the IF statements and
corresponding values.
Blockages Mechanical
failures
Electrical
failures
Peak flows Power
outages
Storage
failure
Degree of
membership
Screens and
baskets not
cleaned
Wear and
tear
Failure of
alarm,
telemetry or
monitoring
equipment
Swimming
pool
overflows
Switching
failure
Structural
failure
1
FOG deposits Lifetime
complete
Level probes
failure
Illegal linkage Supply failure Inadequate
overflow
facilities
2
Grit
accumulation
Design
deficiencies
Switching
failure
Vacation
period
Cable theft Not sufficient
emergency
storage in
sump
3
Unwanted
objects
Parts failure Wiring = 4 Stromwater
ingress
Generator
failure
Inflow >
outflow4
Unwanted
objects5
Stellenbosch University http://scholar.sun.ac.za
Laboratory Experiment Page 110
J. Tulleken Stellenbosch University
IF (blockage due to unwanted object) THEN (6 x 4) = 24
IF (mechanical failure due to unwanted object) THEN (1 x 5) = 5
This indicates that if an unwanted object causes a blockage the effect will be greater than for a
mechanical failure. This could be a true representation of the severity of the problem, because if a
mechanical failure occurs, the back-up pump will most likely be used and the sump should have
emergency storage or overflow facilities could be utilised. However if a blockage occurs in the
inlet to the pump station, an overflow will occur very quickly; therefore it has a higher possibility
of damaging effect, because an overflow could occur almost immediately. Where with the
mechanical failure it might take a while before an overflow will occur. With the mechanical
failure there is still time to fix the problem before a overflow would occur
Another example could be the following:
IF (power outage due to supply failure) THEN (3x2) = 6
This method of applying fuzzy logic could be applied to all 4 Os of pump station problems. This
however is only a hypothetical scenario approach. In practise this approach should be taken with
more detail and specifics.
Stellenbosch University http://scholar.sun.ac.za
Decision Support Tool Concept Page 111
J. Tulleken Stellenbosch University
7. Decision Support Tool Concept
7.1 Overview
The pumping of sewage poses various problems, complicating decision making during the design
as well as the operation and maintenance phases of the pump station life cycle. An interactive
DST concept was developed as part of this research to assist with pump station design and
understanding. Pump stations form critical components in most sewer systems and pose many
challenges and present hazards to municipalities responsible for their operation and maintenance.
The idea of developing a DST was to assist designers, operators and students with understanding
of and problem identification for sewage pump stations in the future. The DST presented in this
research is only the concept tool for such a DST. The DST in this study is should not be used as a
final product for problem identification or design guidance. This DST could only be used as the
basis for a concept DST to be developed further for more proper usage. The DST is only the
formwork for a potential full functioning DST in the future. The idea for this DST for sewage
pump stations was taken from the SewerAID concept (van Vuuren & van Dijk, 2011). The
content for the DST was all taken from the literature presented, the problems identified and the
pictures taken at site visits. The idea was to develop a tool that would act as a visual aid for
sewage pump stations problems and guidance for sewage pump station designs. This study
proposes a concept design of a DST that focuses on sewage pump stations alone. The tool
provides further background information, photos and additional literature to aid with the
understanding of sewage pump stations problems, with a specific focus on removing solids. This
tool would be an indirect solution to some existing problems and would help to avoid future
problems. The DST developed and presented in this chapter was also submitted to the WRC for a
related project (Jacobs et al., 2011).
Stellenbosch University http://scholar.sun.ac.za
Decision Support Tool Concept Page 112
J. Tulleken Stellenbosch University
7.2 Development of DST
The DST comprises two main sections, namely the design aid section and the problem aid
section. The literature on pump stations (Chapter 2) and solids in sewers (Chapter 3) were used as
the backbone of the design aid section. The problems identified in Chapter 4 were the basis of the
problem aid section of the DST.
The DST allows the user to focus on any one particular section of the pump station at a time.
Many different components were integrated with the design of the DST. Pump station
components included in the DST are the inlet works, sump, pumps, electrical equipment and
structural elements, to name but a few. The DST features all the different sections of a pump
station, providing various design options in each case. The DST allows for interactive graphic
illustrations of possible design components, related problems and literature resources, providing
useful information in a structured and convenient way. The tool can also be used as a sewage
pump station problem identification tool. This DST would be of value to engineering consultants,
service providers and educational institutions.
This DST is only a prototype concept version. This prototype concept can be used as the basis for
the design of a fully functioning DST. A program was designed to illustrate the functioning of
this DST. The program was developed in MS Excel with a user friendly visual interface and is
very easy to operate and is self-explanatory. The DST requires no user inputs, apart from clicking
to obtain the required output text and photos, and no mathematical calculations are conducted in
the process.
The focus of the tool is mostly on sewage pump station problems and the inlet works of the pump
station, since that is where solids removal takes place. The other sections of the pump station are
only addressed briefly for the purpose of this prototype DST.
Stellenbosch University http://scholar.sun.ac.za
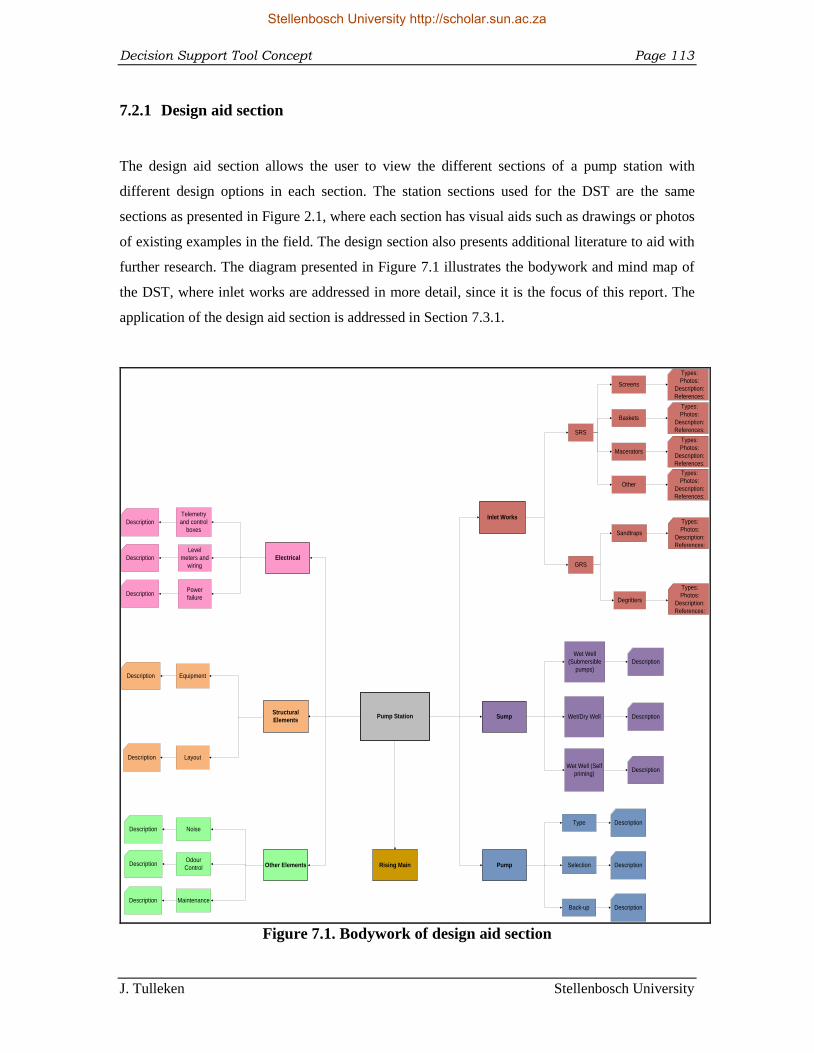
Decision Support Tool Concept Page 113
J. Tulleken Stellenbosch University
7.2.1 Design aid section
The design aid section allows the user to view the different sections of a pump station with
different design options in each section. The station sections used for the DST are the same
sections as presented in Figure 2.1, where each section has visual aids such as drawings or photos
of existing examples in the field. The design section also presents additional literature to aid with
further research. The diagram presented in Figure 7.1 illustrates the bodywork and mind map of
the DST, where inlet works are addressed in more detail, since it is the focus of this report. The
application of the design aid section is addressed in Section 7.3.1.
Pump Station
Inlet Works
Sump
Pump
Electrical
Structural
Elements
Other Elements Rising Main
SRS
GRS
Screens
Baskets
Macerators
Other
Types:
Photos:
Description:
References:
Sandtraps
Degritters
Wet Well (Self
priming)
Wet/Dry Well
Wet Well
(Submersible
pumps)
Description
Description
Selection
Type
Back-up
Description
Odour
Control
Noise
Maintenance
Equipment
Layout
Description
Description
Telemetry
and control
boxes
Level
meters and
wiring
Power
failure
Description
Description
Description
Description
Description
Description
Types:
Photos:
Description:
References:
Types:
Photos:
Description:
References:
Types:
Photos:
Description:
References:
Types:
Photos:
Description:
References:
Types:
Photos:
Description:
References:
Description
Description
Description
Figure 7.1. Bodywork of design aid section
Stellenbosch University http://scholar.sun.ac.za
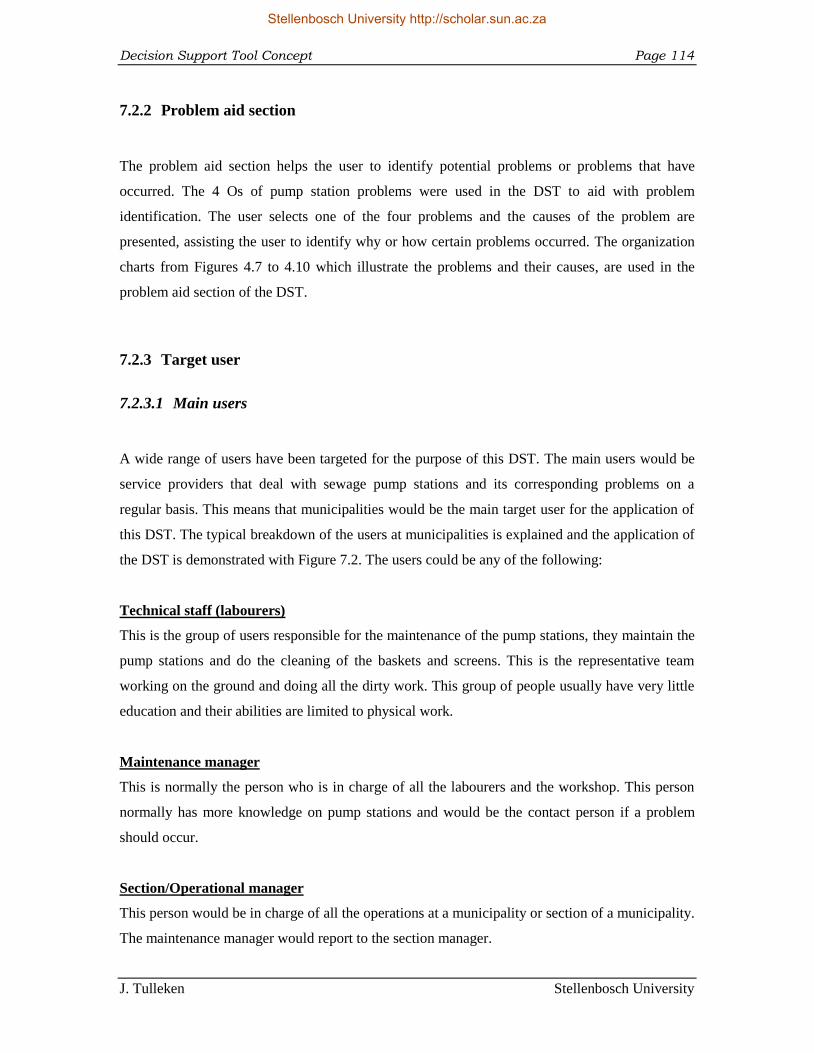
Decision Support Tool Concept Page 114
J. Tulleken Stellenbosch University
7.2.2 Problem aid section
The problem aid section helps the user to identify potential problems or problems that have
occurred. The 4 Os of pump station problems were used in the DST to aid with problem
identification. The user selects one of the four problems and the causes of the problem are
presented, assisting the user to identify why or how certain problems occurred. The organization
charts from Figures 4.7 to 4.10 which illustrate the problems and their causes, are used in the
problem aid section of the DST.
7.2.3 Target user
7.2.3.1 Main users
A wide range of users have been targeted for the purpose of this DST. The main users would be
service providers that deal with sewage pump stations and its corresponding problems on a
regular basis. This means that municipalities would be the main target user for the application of
this DST. The typical breakdown of the users at municipalities is explained and the application of
the DST is demonstrated with Figure 7.2. The users could be any of the following:
Technical staff (labourers)
This is the group of users responsible for the maintenance of the pump stations, they maintain the
pump stations and do the cleaning of the baskets and screens. This is the representative team
working on the ground and doing all the dirty work. This group of people usually have very little
education and their abilities are limited to physical work.
Maintenance manager
This is normally the person who is in charge of all the labourers and the workshop. This person
normally has more knowledge on pump stations and would be the contact person if a problem
should occur.
Section/Operational manager
This person would be in charge of all the operations at a municipality or section of a municipality.
The maintenance manager would report to the section manager.
Stellenbosch University http://scholar.sun.ac.za
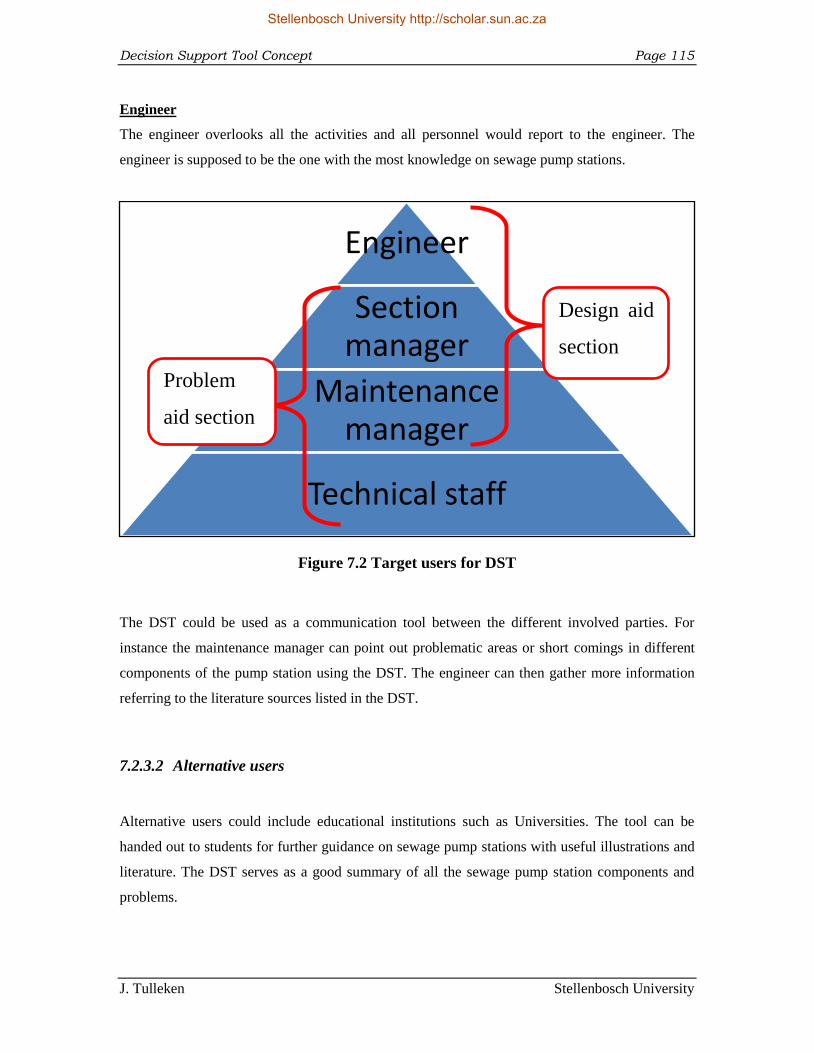
Decision Support Tool Concept Page 115
J. Tulleken Stellenbosch University
Engineer
The engineer overlooks all the activities and all personnel would report to the engineer. The
engineer is supposed to be the one with the most knowledge on sewage pump stations.
Figure 7.2 Target users for DST
The DST could be used as a communication tool between the different involved parties. For
instance the maintenance manager can point out problematic areas or short comings in different
components of the pump station using the DST. The engineer can then gather more information
referring to the literature sources listed in the DST.
7.2.3.2 Alternative users
Alternative users could include educational institutions such as Universities. The tool can be
handed out to students for further guidance on sewage pump stations with useful illustrations and
literature. The DST serves as a good summary of all the sewage pump station components and
problems.
Engineer
Section manager
Maintenance manager
Technical staff
Problem
aid section
Design aid
section
Stellenbosch University http://scholar.sun.ac.za
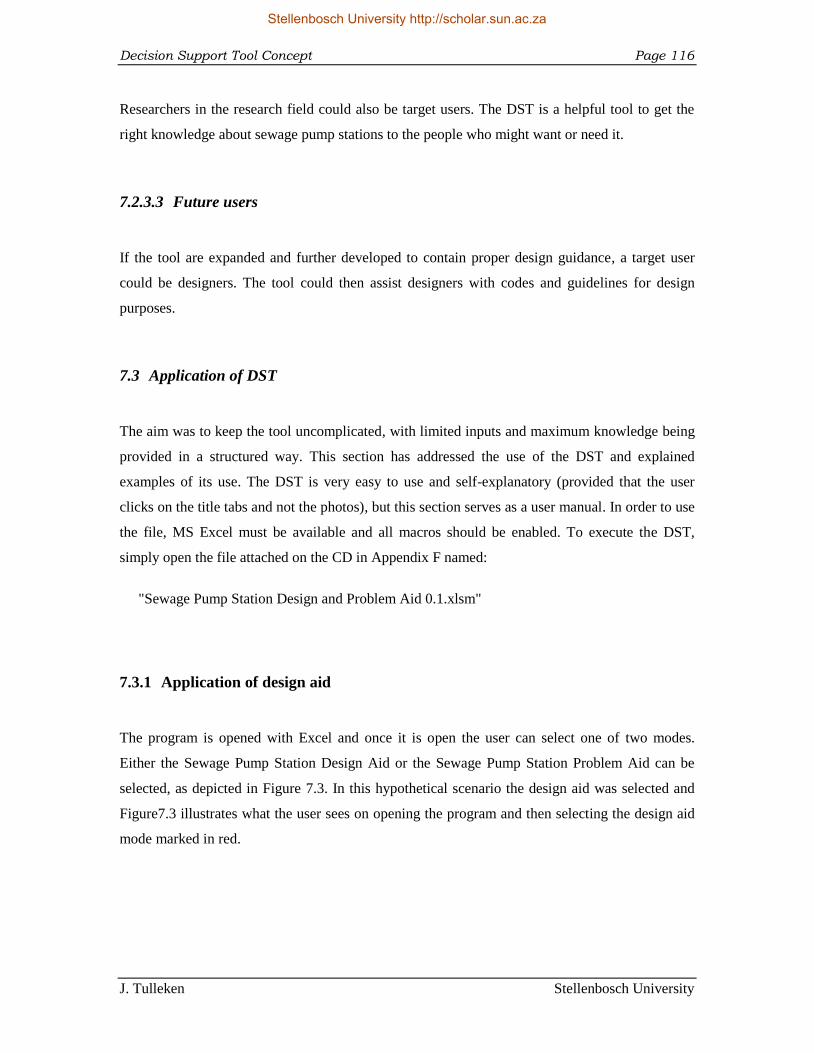
Decision Support Tool Concept Page 116
J. Tulleken Stellenbosch University
Researchers in the research field could also be target users. The DST is a helpful tool to get the
right knowledge about sewage pump stations to the people who might want or need it.
7.2.3.3 Future users
If the tool are expanded and further developed to contain proper design guidance, a target user
could be designers. The tool could then assist designers with codes and guidelines for design
purposes.
7.3 Application of DST
The aim was to keep the tool uncomplicated, with limited inputs and maximum knowledge being
provided in a structured way. This section has addressed the use of the DST and explained
examples of its use. The DST is very easy to use and self-explanatory (provided that the user
clicks on the title tabs and not the photos), but this section serves as a user manual. In order to use
the file, MS Excel must be available and all macros should be enabled. To execute the DST,
simply open the file attached on the CD in Appendix F named:
"Sewage Pump Station Design and Problem Aid 0.1.xlsm"
7.3.1 Application of design aid
The program is opened with Excel and once it is open the user can select one of two modes.
Either the Sewage Pump Station Design Aid or the Sewage Pump Station Problem Aid can be
selected, as depicted in Figure 7.3. In this hypothetical scenario the design aid was selected and
Figure7.3 illustrates what the user sees on opening the program and then selecting the design aid
mode marked in red.
Stellenbosch University http://scholar.sun.ac.za
Decision Support Tool Concept Page 117
J. Tulleken Stellenbosch University
Figure 7.3. DST opening screenshot
Consider the example where the user wants to know more about screening techniques, then Inlet
Works would be selected. Figure 7.4 shows the different sections of the pump station, which the
user is able to select. The user selected the Inlet works as presented in Figure 7.4.
Figure 7.4. Selecting a pump station section
Stellenbosch University http://scholar.sun.ac.za
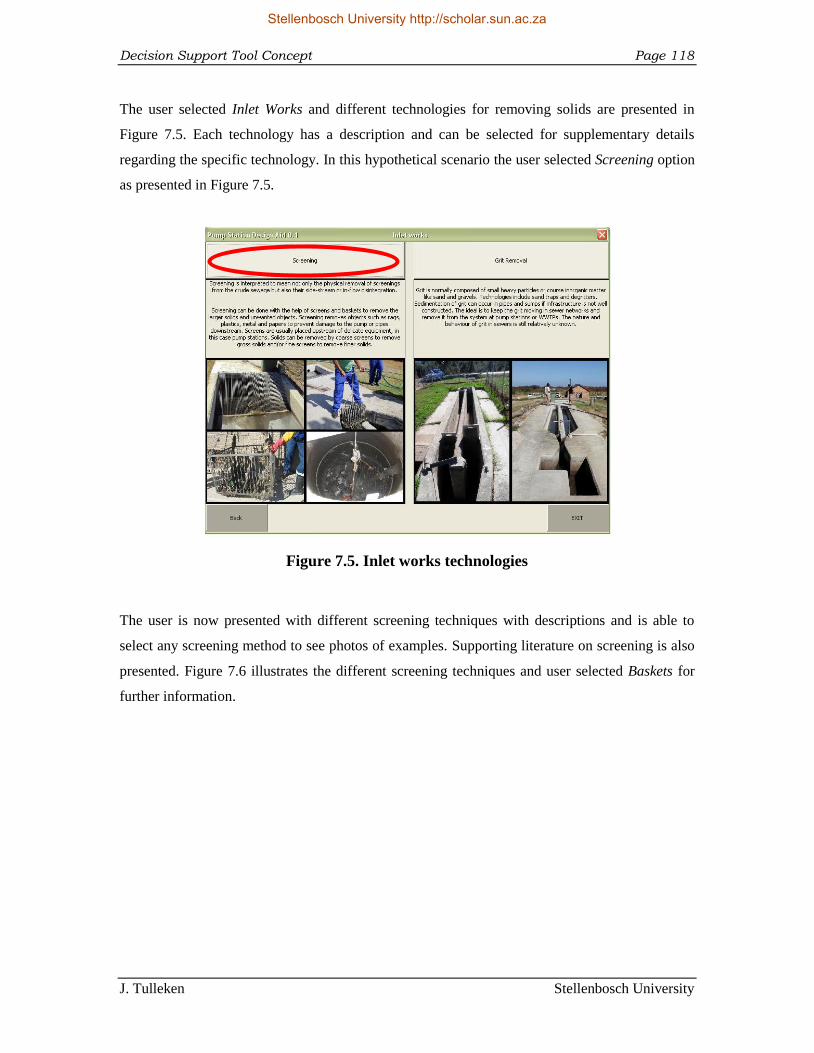
Decision Support Tool Concept Page 118
J. Tulleken Stellenbosch University
The user selected Inlet Works and different technologies for removing solids are presented in
Figure 7.5. Each technology has a description and can be selected for supplementary details
regarding the specific technology. In this hypothetical scenario the user selected Screening option
as presented in Figure 7.5.
Figure 7.5. Inlet works technologies
The user is now presented with different screening techniques with descriptions and is able to
select any screening method to see photos of examples. Supporting literature on screening is also
presented. Figure 7.6 illustrates the different screening techniques and user selected Baskets for
further information.
Stellenbosch University http://scholar.sun.ac.za
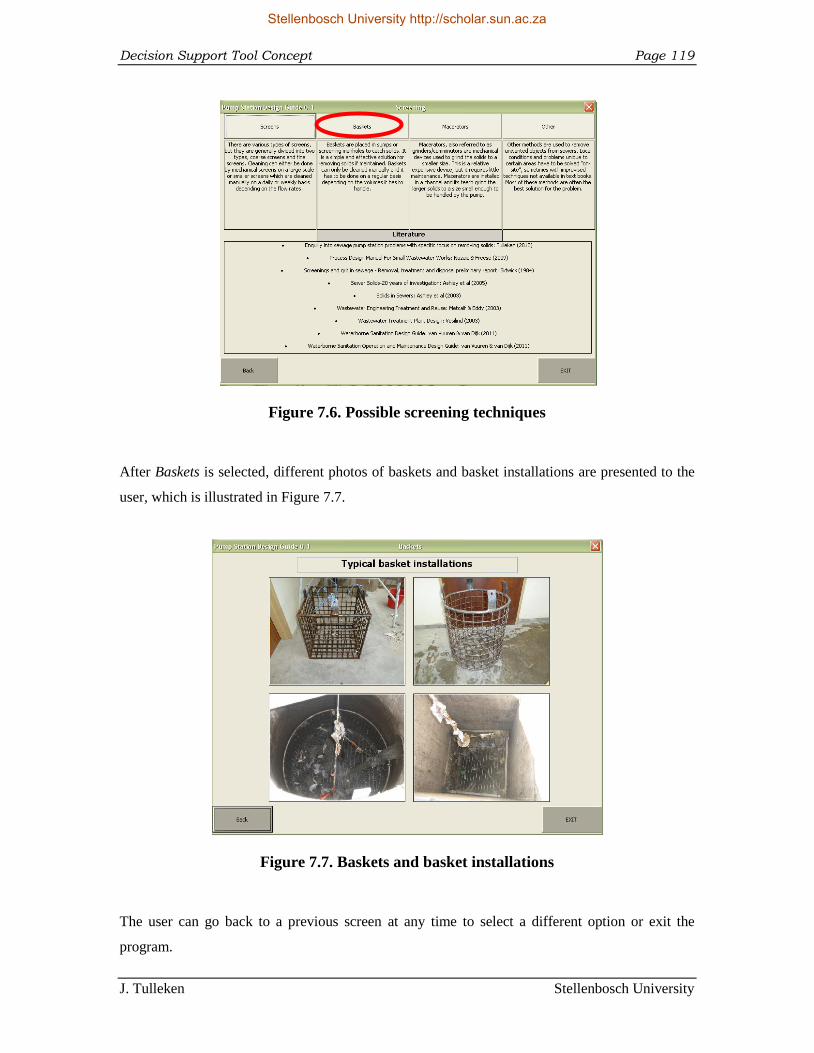
Decision Support Tool Concept Page 119
J. Tulleken Stellenbosch University
Figure 7.6. Possible screening techniques
After Baskets is selected, different photos of baskets and basket installations are presented to the
user, which is illustrated in Figure 7.7.
Figure 7.7. Baskets and basket installations
The user can go back to a previous screen at any time to select a different option or exit the
program.
Stellenbosch University http://scholar.sun.ac.za
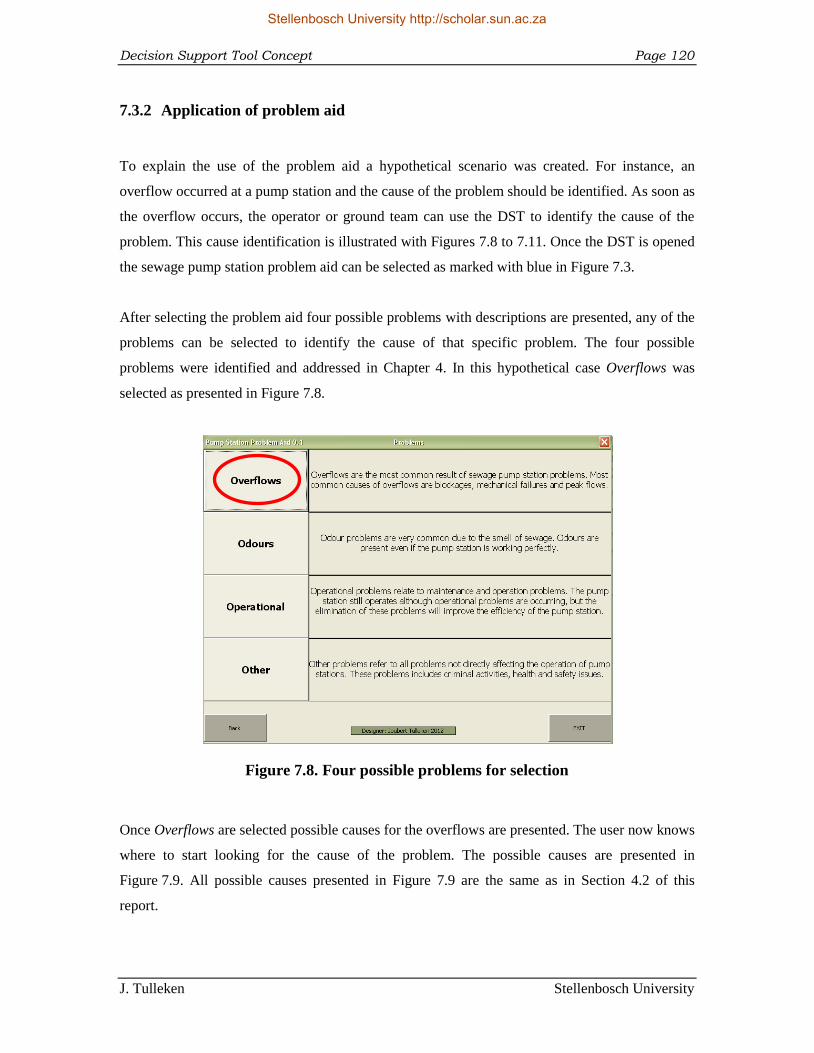
Decision Support Tool Concept Page 120
J. Tulleken Stellenbosch University
7.3.2 Application of problem aid
To explain the use of the problem aid a hypothetical scenario was created. For instance, an
overflow occurred at a pump station and the cause of the problem should be identified. As soon as
the overflow occurs, the operator or ground team can use the DST to identify the cause of the
problem. This cause identification is illustrated with Figures 7.8 to 7.11. Once the DST is opened
the sewage pump station problem aid can be selected as marked with blue in Figure 7.3.
After selecting the problem aid four possible problems with descriptions are presented, any of the
problems can be selected to identify the cause of that specific problem. The four possible
problems were identified and addressed in Chapter 4. In this hypothetical case Overflows was
selected as presented in Figure 7.8.
Figure 7.8. Four possible problems for selection
Once Overflows are selected possible causes for the overflows are presented. The user now knows
where to start looking for the cause of the problem. The possible causes are presented in
Figure 7.9. All possible causes presented in Figure 7.9 are the same as in Section 4.2 of this
report.
Stellenbosch University http://scholar.sun.ac.za
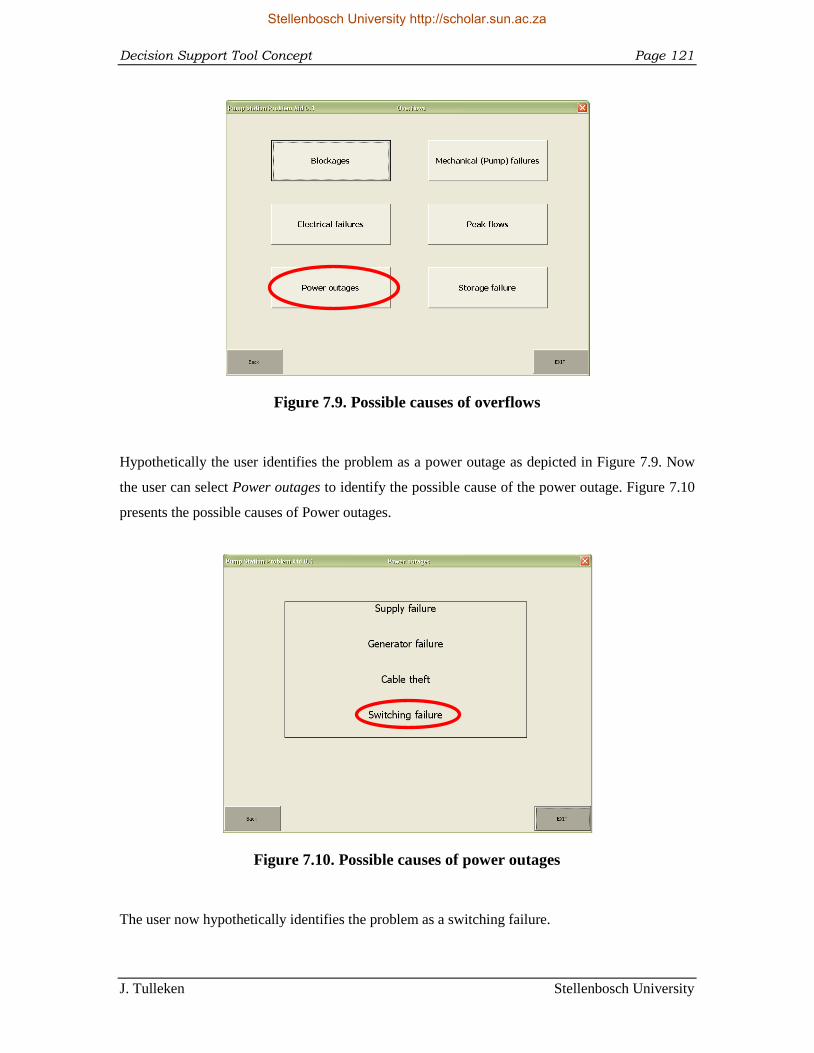
Decision Support Tool Concept Page 121
J. Tulleken Stellenbosch University
Figure 7.9. Possible causes of overflows
Hypothetically the user identifies the problem as a power outage as depicted in Figure 7.9. Now
the user can select Power outages to identify the possible cause of the power outage. Figure 7.10
presents the possible causes of Power outages.
Figure 7.10. Possible causes of power outages
The user now hypothetically identifies the problem as a switching failure.
Stellenbosch University http://scholar.sun.ac.za
Conclusion Page 122
J. Tulleken Stellenbosch University
8. Conclusion
8.1 Overview
Sewage pump stations will always pose problems, with even the newest technologies; that is just
a consequence of working with sewage. The various problems and technologies associated with
sewage pump stations were investigated and the main findings are summarised in this chapter.
8.2 Main findings
Unwanted objects are one of the major problems in the Western Cape sewers, leading to sewage
pump station problems and subsequent overflows.
Maintenance of a pump station is an occupational hazard and all municipalities have problems
with maintaining pump stations, while some handle the problems better than others. There is
room for improvement in many cases regarding the management of employees and municipalities
need to learn from each other to achieve better productivity.
Most problematic solids originate from humans abusing sewers. There is a major need for
educational programmes to teach people how to use sewers and particularly how to use the toilet,
which allows entry to relative large solids of up to about 100mm.
The use of screening devices needs to be encouraged; they are robust, easy to fix and low level
skills are required to operate them. Even if advanced solids handling pumps were to be used, the
pump life would be extended by employing a SRS (Worthington-Smith, 2011). Pump stations
need regular maintenance checks and the cleaning of screens and baskets can be done in
conjunction with this operation since cleaning screens and baskets does not take long.
Baskets can operate efficiently if they are cleaned regularly. The recommended operating height
for baskets is to have the basket halfway submerged in the sump to give degradable products the
chance to disintegrate or dissolve.
Stellenbosch University http://scholar.sun.ac.za
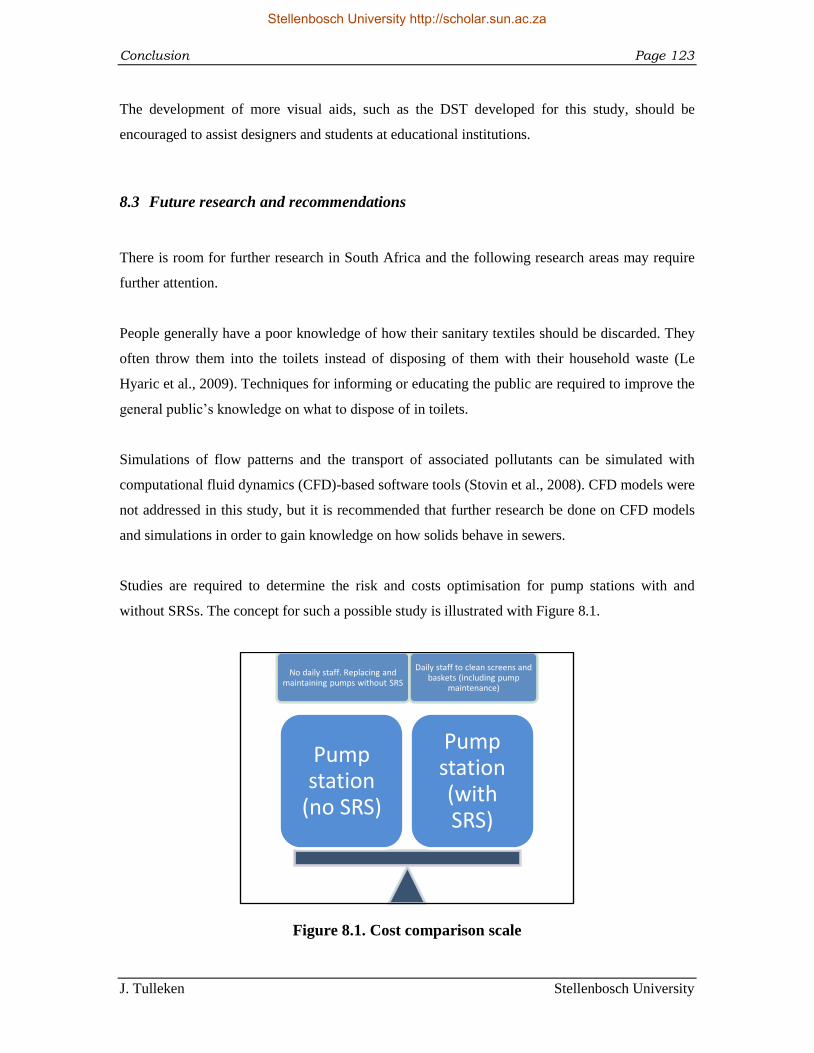
Conclusion Page 123
J. Tulleken Stellenbosch University
The development of more visual aids, such as the DST developed for this study, should be
encouraged to assist designers and students at educational institutions.
8.3 Future research and recommendations
There is room for further research in South Africa and the following research areas may require
further attention.
People generally have a poor knowledge of how their sanitary textiles should be discarded. They
often throw them into the toilets instead of disposing of them with their household waste (Le
Hyaric et al., 2009). Techniques for informing or educating the public are required to improve the
general public‟s knowledge on what to dispose of in toilets.
Simulations of flow patterns and the transport of associated pollutants can be simulated with
computational fluid dynamics (CFD)-based software tools (Stovin et al., 2008). CFD models were
not addressed in this study, but it is recommended that further research be done on CFD models
and simulations in order to gain knowledge on how solids behave in sewers.
Studies are required to determine the risk and costs optimisation for pump stations with and
without SRSs. The concept for such a possible study is illustrated with Figure 8.1.
Figure 8.1. Cost comparison scale
No daily staff. Replacing and maintaining pumps without SRS
Daily staff to clean screens and baskets (including pump
maintenance)
Pump station
(no SRS)
Pump station (with SRS)
Stellenbosch University http://scholar.sun.ac.za
Conclusion Page 124
J. Tulleken Stellenbosch University
The tests conducted in the laboratory indicated that the basket should be operated at a level where
it is submerged in the sump. Unfortunately this study did not allow for this theory to be
implemented on an actual basket in practise. It is recommended that tests are done on a screening
basket in practise to confirm or differ from the results obtained from this laboratory experiment.
The laboratory test could be extended to also address a SRS in combination with solids handling
pumps and the implementation of the combination setup in practice.
8.4 Final conclusion
Problematic areas with shortage in financial backing exist and where municipalities are trying to
supply more people with sanitary services, shortcuts have to be made to reach the goal of basic
sanitation for all. This is unfortunate and the lack of efficient infrastructure is the result. With
more available capital decent pump stations can be constructed with a longer lifetime and better
operating conditions with less maintenance. It is the responsibility of engineers to design efficient
technologies and come up with more innovative ideas to handle solids at pump stations.
Solids can either be removed at pump stations or at the WWTPs, the remaining question is which
of these philosophies is the best. This study focused on removing solids at pump stations and after
investigations and tests were completed it was clear that both these philosophies pose problems
and it comes down to the authority‟s preferences. Every sewer is unique and poses its own
distinctive problems and therefore each scenario has to be evaluated individually. SRSs are easy
to maintain and it is a cheap primary defence against unwanted objects, therefore it is
recommended that SRSs be used to minimise the problems at sewage pump stations.
Stellenbosch University http://scholar.sun.ac.za
References Page 125
J. Tulleken Stellenbosch University
References
Ashley, R.M., Bertrand-Krajewski, J.-L. & Hvited-Jacobsen, T., 2005. Sewer Solids-20 years of
investigation. Water Science & Technology, 52(3), p.73-84.
Ashley, R.M., Bertrand-Krajewski, J.-L., Hvited-Jacobsen, T. & Verbranck, M., 2004. Solids in
Sewers. Joint Committee on Urban Drainage. London: IWA Publishing.
Ashley, R. et al., 2005. Sustainable Disposal of Domestic Sanitary Waste. Journal of
Environmental Engineering, 131(2), p.206–215.
Ashley, R.M. & Souter, N., 1999. Urban Drainage - The Human Dimension. In 8th International
Conference on Urban Drainage. Sydney, Australia, 1999. ICUSD.
Ashley, R.M. et al., 1999. Assessment of the sustainability of alternatives for disposal of domestic
sanitary waste. Water Science Technology, 39(5), p.251-58.
Berezin, S., 2006. Submersible Pumps for Wastewater Applications. World Pumps, 480, p.26-30.
Bowers, V.L., 1973. US Army Field Manual 5-163 on Sewerage. US Goverment Printing Office.
Butler, D. & Davies, J.W., 2004. Urban Drainage. Second Edition. New York: Spon Press.
Chadwick, A., Morfett, J. & Borthwick, M., 2004. Hydraulics in Civil Environmental
Engineering, Fourth Edition. London and New York: Spon Press.
Chiang, Y.M. et al., 2010. Auto-control of pumping operations in sewerage systems by rule-based
fuzzy neural networks. Hydrology and Earth System Sciences, 7, p.6725–6756.
Crombie, D., 2011. Sedimentation in sewers. In Sewer Systems. Stellenbosch, 2011. Institute for
Water and Environmental Engineering.
Stellenbosch University http://scholar.sun.ac.za

References Page 126
J. Tulleken Stellenbosch University
CSIR, 2003. Guidelines for Human settlement planning and design, Volume 2. Pretoria: CSIR
Building and Construction Technology.
Czarnota, Z., 2008. TOP Optimal pump sumps for wastewater. [Online] ITT Water & Wastewater
Available at: http://www.flygt.co.uk/2421173.pdf [Accessed 17 March 2011].
de Swart, B. & Barta, B., 2008. A First order National Audit of Sewarage reticulation issues.
WRC Report No 1671/1/08. Gezina: Water Research Commission.
du Pisani, J., 1998. Operation of Solids-Free Sewer (SFS) Systems in South Africa: Guidelines for
engineers. WRC Report No, TT97/98. Pretoria: Water Reseach Commission.
du Pisani, J.E., 1998. The operation and maintenance of settled sewerage (SS) systems in South
Africa. WRC Report No. 708/1/98. Pretoria: Water Researh Commission.
Elsevier, 1999. The Secrets of Successful Submersible Sewage Pumps. World Pumps, 1999(394),
p.38-42.
Engelbrecht, G. 2010. Personal interview. 15 March 2010, Theewaterskloof Municipality,
Grabouw.
Field, R. & O'Connor, T.P., 1997. Control strategy for storm-generated sanitary-sewer overflows.
Journal of Environmental Engineering, 123(1), p.41-46.
Finnemore, E.J. & Franzini, J.B., 2009. Fluid Mechanics with Engineering Applications. Tenth
Edition. Boston: McGraw-Hill.
Girdhar, P. & Moniz, O., 2004. Practical Centrifugal Pumps. Oxford, UK: Newnes.
Gouda, H., Ashley, R.M., Gilmour, D. & Smith, H., 2003. Life cycle analysis and sewer solids.
Water Science & Technology, 47(4), p.185-92.
Haested, M. et al., 2004. Wastewater Collection System Modeling and Design. First Edition.
Waterbury: Haestad Press.
Stellenbosch University http://scholar.sun.ac.za
References Page 127
J. Tulleken Stellenbosch University
Hanson, N. 2011. Personal interview. 21 April 2011, CTIA Cape Town.
He, X. et al., 2011. Evidence for Fat, Oil, and Grease (FOG) Deposit Formation Mechanisms in
Sewer Lines. Environmental Science & Technology, 45, p.4385–4391.
Jacobs, H.E., 1997. Investigation into the application of just-in-time principles in small South
African frims. Masters Thesis. Johannesburg: Rand Afrikaans University Rand Afrikaans
University.
Jacobs, H., Tulleken, J., Loubser, C. & Griffioen, M., 2011. Sewer Pumps and Pressurised Flow:
Deliverable 3: Decision Support Tool. WRC Project: K5/2007/3. WRC.
Jones, G.M., 2006. Pumping Station Design. Third Edition. Amsterdam: Elsevier.
Larralde, E. & Ocampo, R., 2010. Centrifugal Pump Selection Process. World Pumps, 2010(2),
p.24-28.
Lawless, A., 2007. Numbers & Needs in Local Government. First Edition. Johannesburg: SAICE.
Le Hyaric, R. et al., 2009. Characterization of screenings from three municipal wastewater
treatment plants in the region Rhône-Alpes. Water Science & Technology, 60(2), p.525-31.
Little, C., 2004. A comparison of sewer reticulation system design standards gravity, vacuum and
small bore sewers. Water SA, 30(5), p.137-44.
Loubser, C., 2011. Trapping the Problems. In Sewer System Course. Stellenbosch, 2011. Institute
for Water and Environmental Engineering Stellenbosch University.
Merritt, L.B., 2009. Tractive Force Design for Sanitary Sewer Self-Cleansing. Journal of
Environmental Engineering, 135(12), p.1338–1347.
Metcalf & Eddy, 1981. Wastewater Engineering: Collection and Pumping of Wastewater. New
York: McGraw-Hill.
Stellenbosch University http://scholar.sun.ac.za
References Page 128
J. Tulleken Stellenbosch University
Metcalf & Eddy, 2003. Wastewater Engineering Treatment and Reuse. Fourth Edition. Boston:
McGraw-Hill.
Moreno, M.A. et al., 2009. Development of a new methodology to obtain the characteristic pump
curves that minimize the total cost at pumping stations. Biosystems Engineering, 102(1), p.95-
105.
Muench, E., 2008. UDD Toilet near Durban, South Africa. [Online] Sustainable Sanitation
Alliance. Available at: http://www.flickr.com/photos/gtzecosan/3149832585/ [Accessed 17
November 2011].
Murtha, J., 1995. Applications of Fuzzy Logic in Operational Meteorology. Scientific Services
and Professional Development Newsletter, p.42-54.
Nel, D. 2011. Personal interview. 28 March 2011, Overstrand Municipality, Hermanus.
Nesbitt, B., 2006. Handbook of Pumps and Pumping. Elsevier.
Niemczynowicz, J., 1993. New Aspects of Sewerage and Water Technology. Ambio, 22(7),
p.449-55.
Nozaic, D. & Freese, S., 2009. Process Design Manual For Small Wastewater Works. WRC
Report no. TT 389/09. Gezina: Water Research Commission.
Ostojin, S., Mounce, S.R. & Boxall, J.B., 2011. An Artificial intelligence approach for optimizing
pumping in sewer systems. Journal of Hydroinformatics, 13(3), p.295-306.
Pollard, T., 2009. Pump Station Design and the Selection of Pumps. In Sewer system planning
and design. Stellenbosch, 2009. Stellenbosch University.
Rayner, R., 1995. Pump Users Handbook (Fourth Edition). Amsterdam: Elsevier.
SAICE, 2011. SAICE Infrastructure Report Card for South Africa. Midrand: SAICE.
Stellenbosch University http://scholar.sun.ac.za
References Page 129
J. Tulleken Stellenbosch University
Samson, K., 2011. Wastewater Risk Abatement Plan of City of Cape Town. WRC Report No. SP
22/11. Gezina: Water Research Commission.
Shiels, S., 2001. Optimizing centrifugal pump operation. World Pumps, 2001(412), p.35-39.
Sidwick, J.M., 1984. Screenings and grit in sewage - removal, treatment and disposal
preliminary report. London: Construction Industry Research and Information Association and
Water Research Centre.
Stephenson, D. & Barta, B., 2005. Guidelines on reduction of the impact of water infiltration into
sewers. WRC TT 239/05. Gezina: Water Research Commission.
Steyn, J. 2010. Personal interview. 18 October 2010, Breede River Valley Municipality,
Worcester.
Stovin, V.R., Grimm, J.P. & Lau, S.-T.D., 2008. Solute Transport Modeling for Urban Drainage
Structures. Journal of Environmental Engineering, 134(8), p.640–650.
Strassberger, D. 2011. Correspondence. 13 June 2011, Worley Parsons.
Sutherland, K., 2009. Filtration and separation technology: What‟s new in sedimentation?
Filtration & Separation, 46(1), p.34-36.
Theart, K. 2011. Personal interview. 16 June 2011, Zwangavo Trading 21cc, Brackenfell.
Trautmann, GW. 2010. Personal interview. 10 September 2010, GW TRAUTMANN cc Parow.
Turton, K., 2002. Pumps and Pumping. In D.A. Snow, ed. Plant Engineer's Reference Book.
Second Edition. Elsevier.
Ullman, D.G., 1992. The Mechanical Design Process. New York: McGraw-Hill, Inc.
van der Merwe-Botha, M. & Manus, L., 2011. Wastewater Risk Abatement Plan A W2RAP
GUIDELINE. WRC Report No. TT 489/11. Gezina: Water Research Commission.
Stellenbosch University http://scholar.sun.ac.za
References Page 130
J. Tulleken Stellenbosch University
Van Dijk, M., 2010. Pumps and pump selection. In Water Network Analysis. Stellenbosch, 2010.
Stellenbosch University.
van Vuuren, S.J. & van Dijk, M., 2011. Waterborne Sanitation Design Guide. WRC Report No.
TT 481/11. Gezina: Water Research Commission.
van Vuuren, S.J. & van Dijk, M., 2011. Waterborne Sanitaion Operation and Maintenance
Guide. WRC Report No. TT 482/11. Gezina: Water Research Commission.
van Vuuren, S.J. & van Dijk, M., 2011. SewerAID. WRC Report SP 20/11. Gezina: Water
Research Commission.
Vesilind, P.A., 2003. Wastewater Treatment Plant Design. Alexandria: Water Environment
Federation.
Water Environment Federation, 2008. Operation of Municipal Wastewater Treatment Plants
Volume I. Sixth Edition. New York: McGraw-Hill.
Water Environment Federation, 2008. Operation of Municipal Wastewater Treatment Plants
Volume III. Sixth Edition. New York: McGraw-Hill.
Winter, D., 2011. Power Outages and their Impact on South Africa’s Water and Wastewater
Sectors. WRC Report No. KV 267/11. Gezina: Water Research Commision.
Worthington-Smith, L., 2011. Personal interview. 8 June 2011, Stellenbosch.
Worthington-Smith, L., 2011. Solids Handling Pumping. In Sewer Systems Course. Stellenbosch,
2011. Institute for Water and Environmental Engineering Stellenbosch University.
WRC, 2010. Sewer Pumps and Pressurised flow: Deliverable 1: Knowledge Review Report.
WRC Project: K5/2007/3. Gezina: Stellenbosch University, BKS, University of Johannesburg,
Water Research Commission.
Stellenbosch University http://scholar.sun.ac.za
Appendix A Page I
J. Tulleken Stellenbosch University
Appendix A Pumps and Pump
Installations
Stellenbosch University http://scholar.sun.ac.za

Appendix A Page II
J. Tulleken Stellenbosch University
Submersible pump hoisted for routine maintenance, left, and immersible pumps, on the right
Self priming pump in photo above
Stellenbosch University http://scholar.sun.ac.za
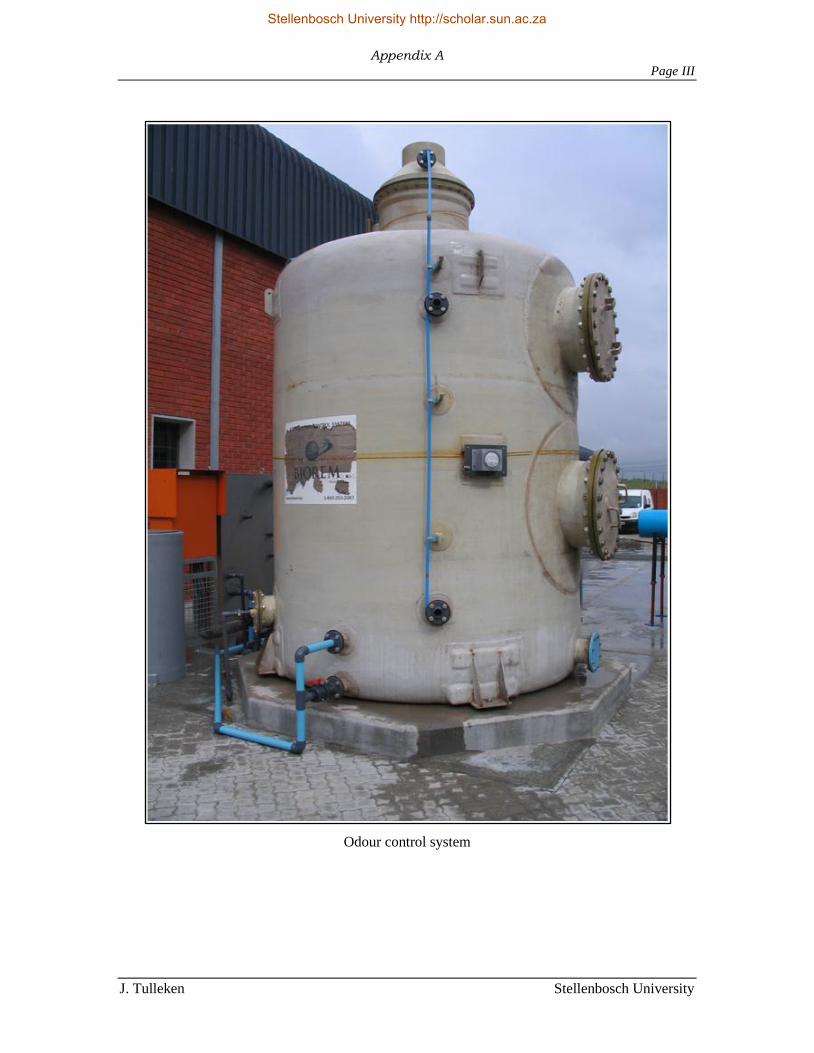
Appendix A Page III
J. Tulleken Stellenbosch University
Odour control system
Stellenbosch University http://scholar.sun.ac.za

Appendix B
Page IV
J. Tulleken Stellenbosch University
Appendix B Different Types of Screens
Stellenbosch University http://scholar.sun.ac.za
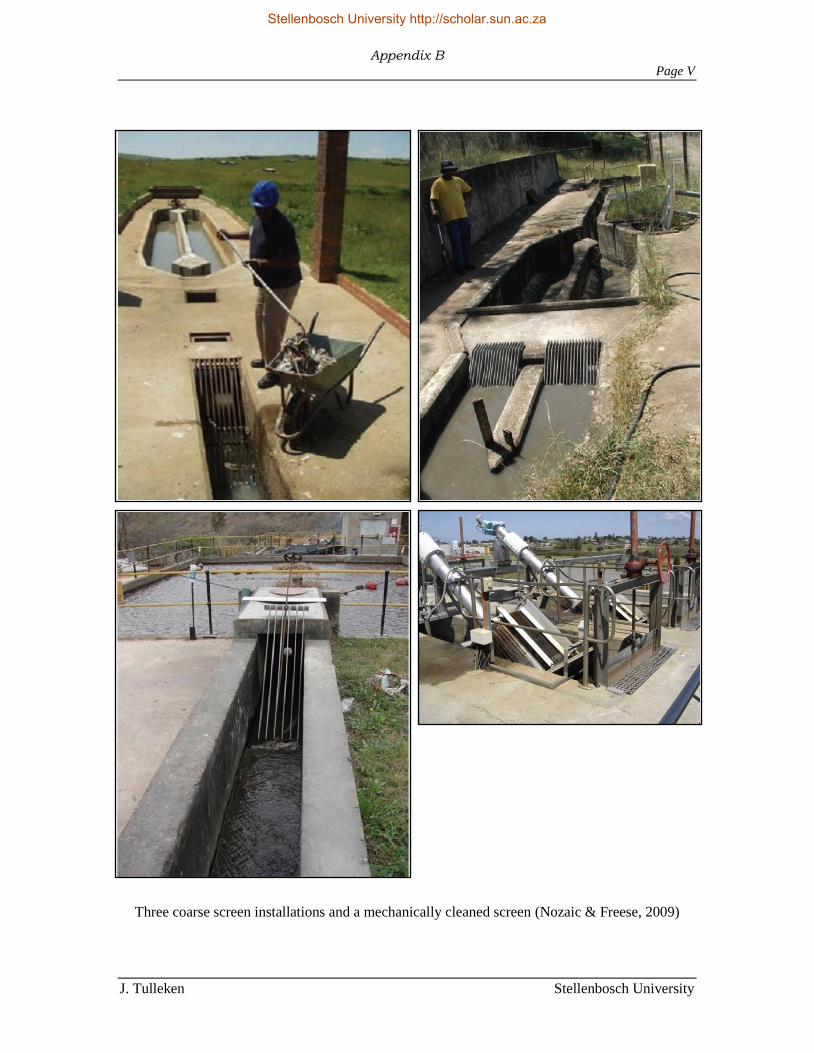
Appendix B Page V
J. Tulleken Stellenbosch University
Three coarse screen installations and a mechanically cleaned screen (Nozaic & Freese, 2009)
Stellenbosch University http://scholar.sun.ac.za
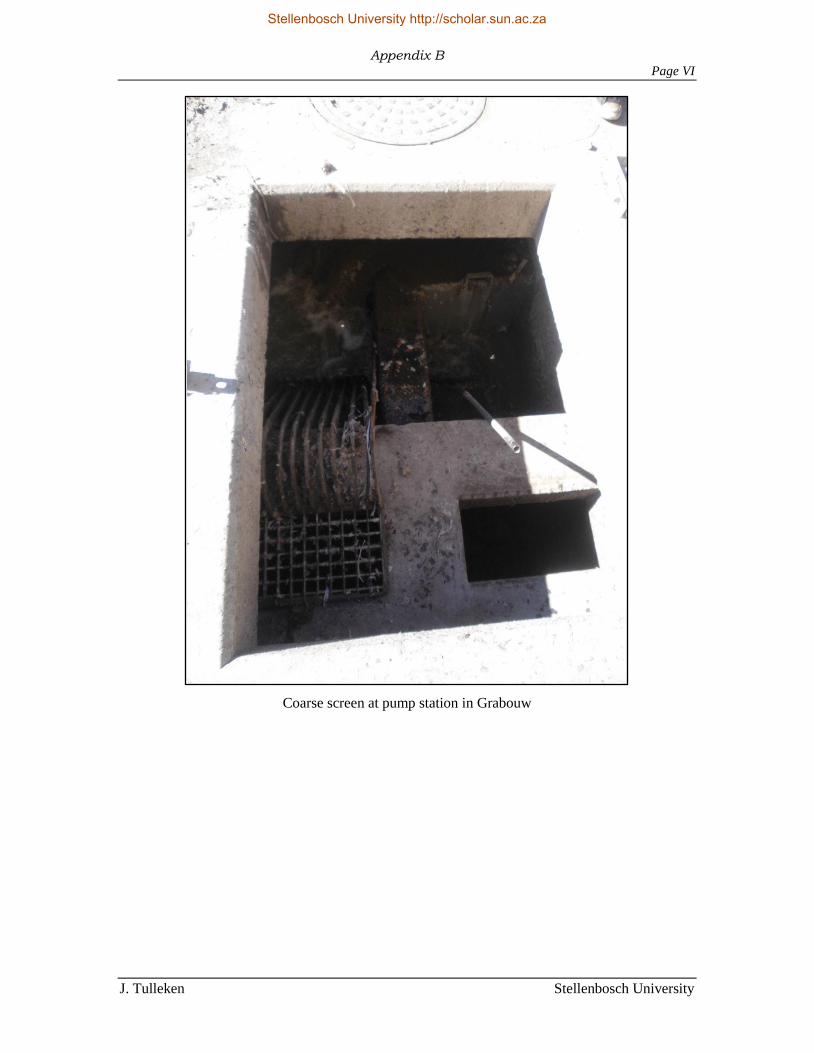
Appendix B Page VI
J. Tulleken Stellenbosch University
Coarse screen at pump station in Grabouw
Stellenbosch University http://scholar.sun.ac.za

Appendix C Page VII
J. Tulleken Stellenbosch University
C
Appendix C Field Questionnaire
Stellenbosch University http://scholar.sun.ac.za

Appendix C Page VIII
J. Tulleken Stellenbosch University
Pump station questionnaire
Date:
Pump Station
Name
Location
GPS coordinates
Pump Operating data:
Type
Capacity (Motor rating)
kW
Flow Capacity (Q)
m3/h or l/s
Discharge head
m
Number of units per station
Series or Parallel pumps
Time in service
Years
Back-up/standby pumps
Number of pumps
Generator
Flow rates
Daily average
m3/h or l/s
Daily peak
m3/h or l/s
Wet weather daily average
m3/h or l/s
Wet weather daily peak
m3/h or l/s
Sump size
Volume
m3
Overflow time
h
Well type
Wet/Dry or Single Wet well
Sand traps/Grit removal
Yes/No
Baskets/Screens
Yes/No
Screens‟ gap size
mm
Maintenance
Pump Station Visit Intervals
(weekly, daily)
Maintenance frequency
(monthly, yearly)
Log Sheets available
Yes/No
Stellenbosch University http://scholar.sun.ac.za

Appendix C Page IX
J. Tulleken Stellenbosch University
Pump failure
Frequency of Breakdown
Constant Problems and Comments
Stellenbosch University http://scholar.sun.ac.za
Appendix D Page X
J. Tulleken Stellenbosch University
D
Appendix D Site Visits Data Sheet
Stellenbosch University http://scholar.sun.ac.za
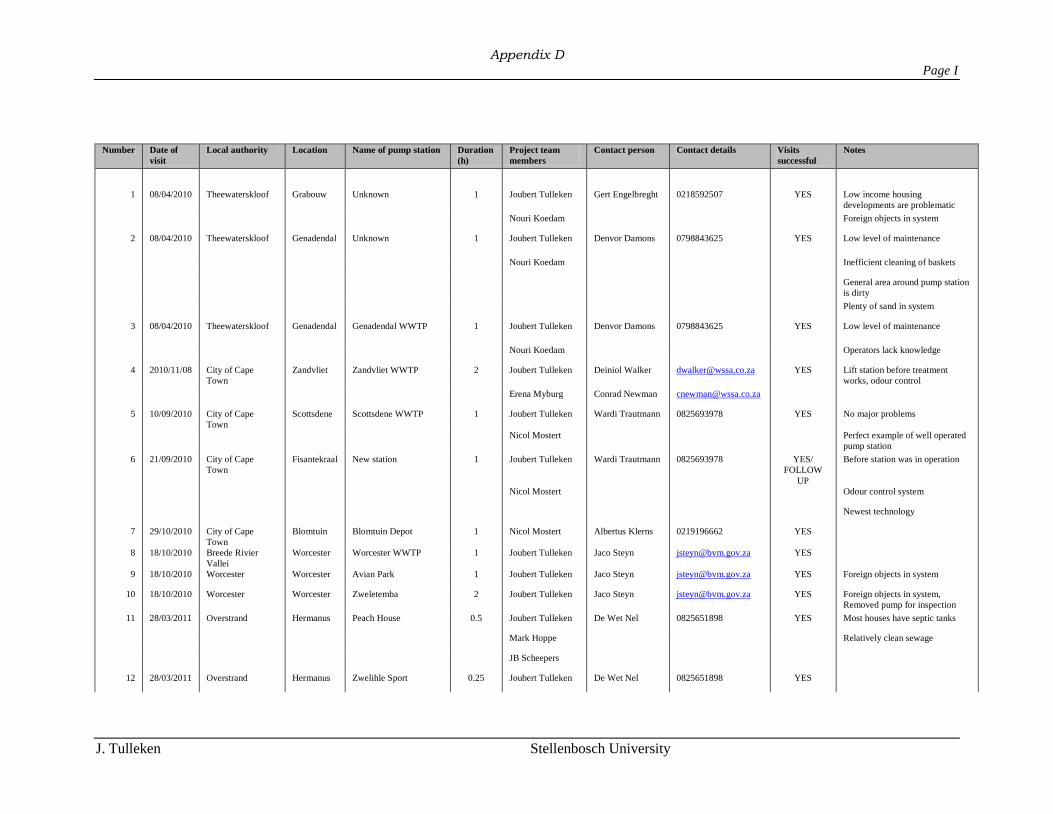
Appendix D Page I
J. Tulleken Stellenbosch University
Number Date of
visit
Local authority Location Name of pump station Duration
(h)
Project team
members
Contact person Contact details Visits
successful
Notes
1 08/04/2010 Theewaterskloof Grabouw Unknown 1 Joubert Tulleken Gert Engelbreght 0218592507 YES Low income housing
developments are problematic
Nouri Koedam Foreign objects in system
2 08/04/2010 Theewaterskloof Genadendal Unknown 1 Joubert Tulleken Denvor Damons 0798843625 YES Low level of maintenance
Nouri Koedam Inefficient cleaning of baskets
General area around pump station
is dirty
Plenty of sand in system
3 08/04/2010 Theewaterskloof Genadendal Genadendal WWTP 1 Joubert Tulleken Denvor Damons 0798843625 YES Low level of maintenance
Nouri Koedam Operators lack knowledge
4 2010/11/08 City of Cape
Town
Zandvliet Zandvliet WWTP 2 Joubert Tulleken Deiniol Walker [email protected] YES Lift station before treatment
works, odour control
Erena Myburg Conrad Newman [email protected]
5 10/09/2010 City of Cape
Town
Scottsdene Scottsdene WWTP 1 Joubert Tulleken Wardi Trautmann 0825693978 YES No major problems
Nicol Mostert Perfect example of well operated
pump station
6 21/09/2010 City of Cape
Town
Fisantekraal New station 1 Joubert Tulleken Wardi Trautmann 0825693978 YES/
FOLLOW
UP
Before station was in operation
Nicol Mostert Odour control system
Newest technology
7 29/10/2010 City of Cape
Town
Blomtuin Blomtuin Depot 1 Nicol Mostert Albertus Klerns 0219196662 YES
8 18/10/2010 Breede Rivier
Vallei
Worcester Worcester WWTP 1 Joubert Tulleken Jaco Steyn [email protected] YES
9 18/10/2010 Worcester Worcester Avian Park 1 Joubert Tulleken Jaco Steyn [email protected] YES Foreign objects in system
10 18/10/2010 Worcester Worcester Zweletemba 2 Joubert Tulleken Jaco Steyn [email protected] YES Foreign objects in system,
Removed pump for inspection
11 28/03/2011 Overstrand Hermanus Peach House 0.5 Joubert Tulleken De Wet Nel 0825651898 YES Most houses have septic tanks
Mark Hoppe Relatively clean sewage
JB Scheepers
12 28/03/2011 Overstrand Hermanus Zwelihle Sport 0.25 Joubert Tulleken De Wet Nel 0825651898 YES
Stellenbosch University http://scholar.sun.ac.za
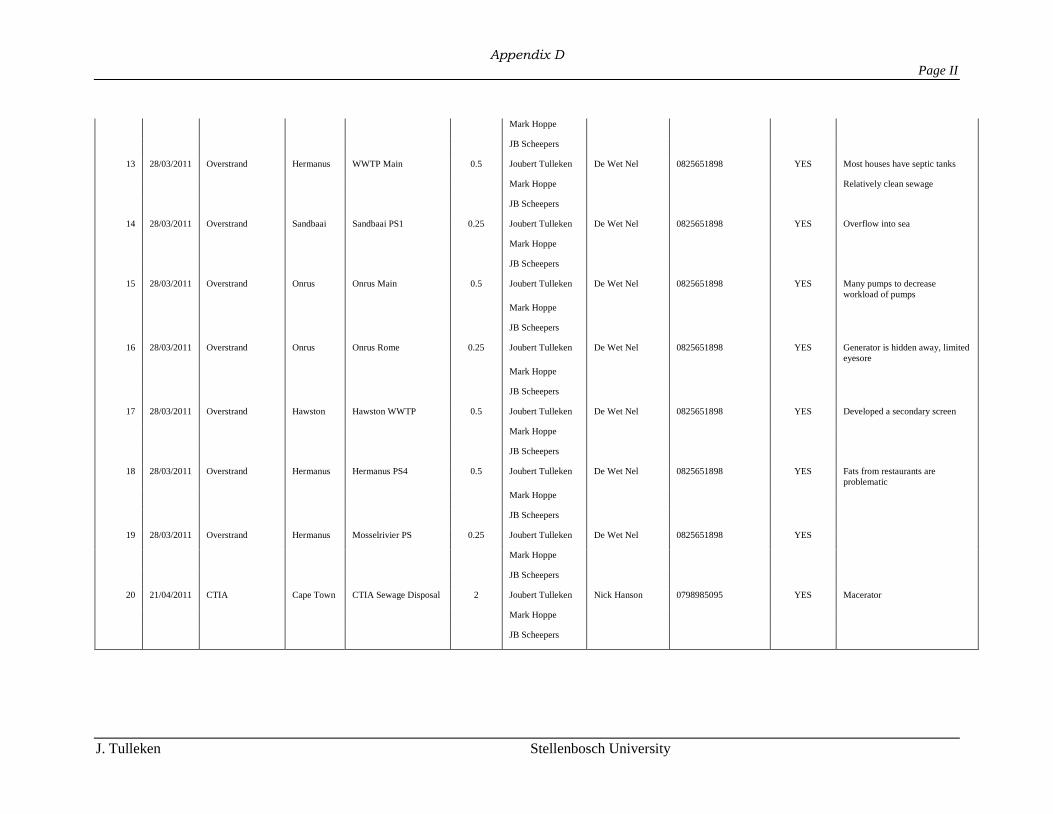
Appendix D Page II
J. Tulleken Stellenbosch University
Mark Hoppe
JB Scheepers
13 28/03/2011 Overstrand Hermanus WWTP Main 0.5 Joubert Tulleken De Wet Nel 0825651898 YES Most houses have septic tanks
Mark Hoppe Relatively clean sewage
JB Scheepers
14 28/03/2011 Overstrand Sandbaai Sandbaai PS1 0.25 Joubert Tulleken De Wet Nel 0825651898 YES Overflow into sea
Mark Hoppe
JB Scheepers
15 28/03/2011 Overstrand Onrus Onrus Main 0.5 Joubert Tulleken De Wet Nel 0825651898 YES Many pumps to decrease
workload of pumps
Mark Hoppe
JB Scheepers
16 28/03/2011 Overstrand Onrus Onrus Rome 0.25 Joubert Tulleken De Wet Nel 0825651898 YES Generator is hidden away, limited
eyesore
Mark Hoppe
JB Scheepers
17 28/03/2011 Overstrand Hawston Hawston WWTP 0.5 Joubert Tulleken De Wet Nel 0825651898 YES Developed a secondary screen
Mark Hoppe
JB Scheepers
18 28/03/2011 Overstrand Hermanus Hermanus PS4 0.5 Joubert Tulleken De Wet Nel 0825651898 YES Fats from restaurants are
problematic
Mark Hoppe
JB Scheepers
19 28/03/2011 Overstrand Hermanus Mosselrivier PS 0.25 Joubert Tulleken De Wet Nel 0825651898 YES
Mark Hoppe
JB Scheepers
20 21/04/2011 CTIA Cape Town CTIA Sewage Disposal 2 Joubert Tulleken Nick Hanson 0798985095 YES Macerator
Mark Hoppe
JB Scheepers
Stellenbosch University http://scholar.sun.ac.za
Appendix E Page I
J. Tulleken Stellenbosch University
E
Appendix E Practical Implementation,
Lab Experiment Drawings
and Photos
Stellenbosch University http://scholar.sun.ac.za
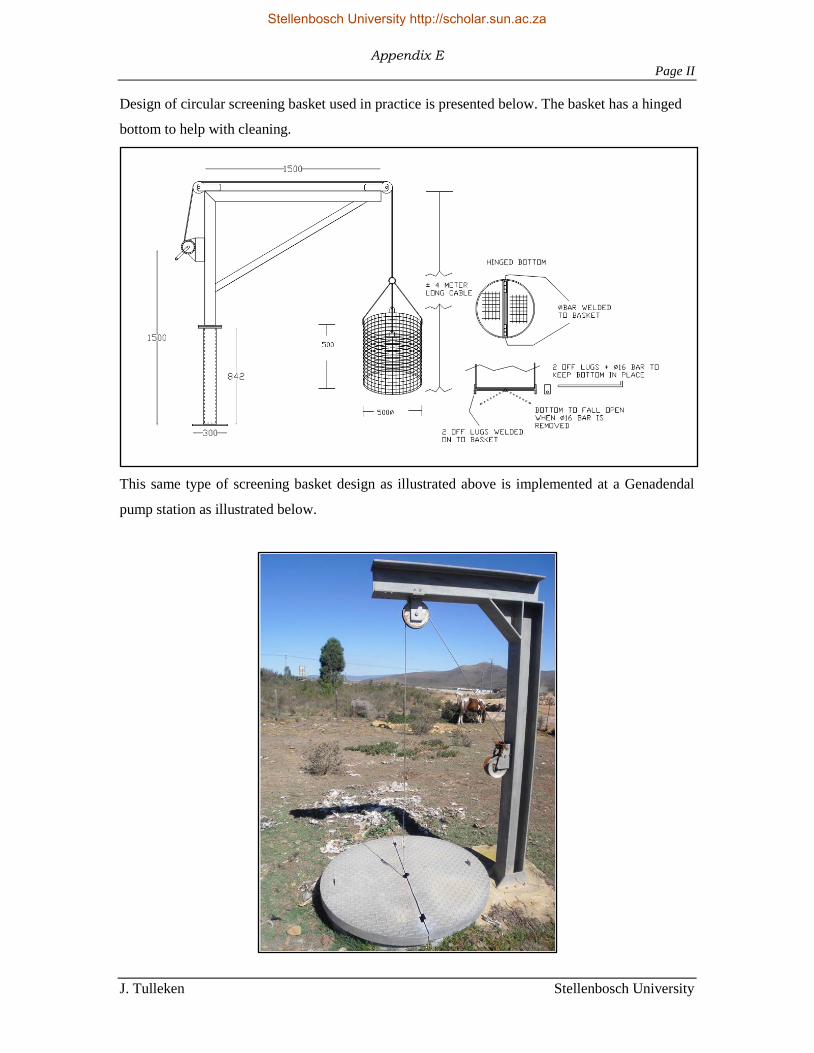
Appendix E Page II
J. Tulleken Stellenbosch University
Design of circular screening basket used in practice is presented below. The basket has a hinged
bottom to help with cleaning.
This same type of screening basket design as illustrated above is implemented at a Genadendal
pump station as illustrated below.
Stellenbosch University http://scholar.sun.ac.za
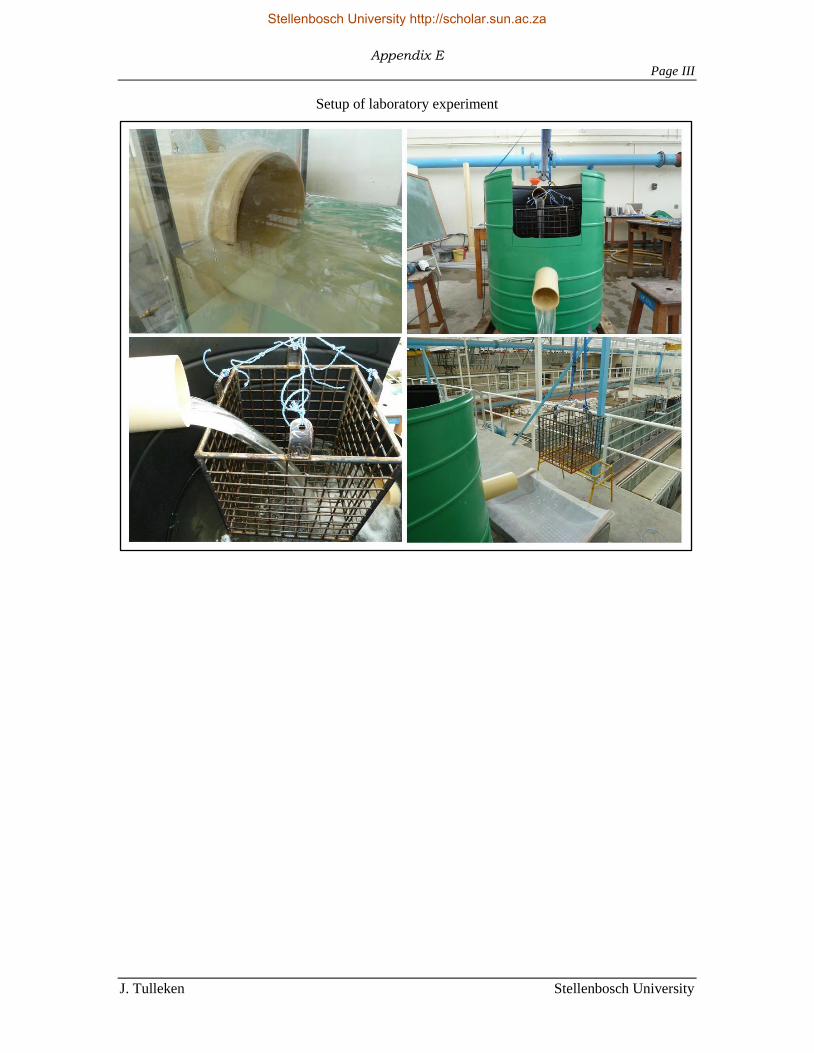
Appendix E Page III
J. Tulleken Stellenbosch University
Setup of laboratory experiment
Stellenbosch University http://scholar.sun.ac.za
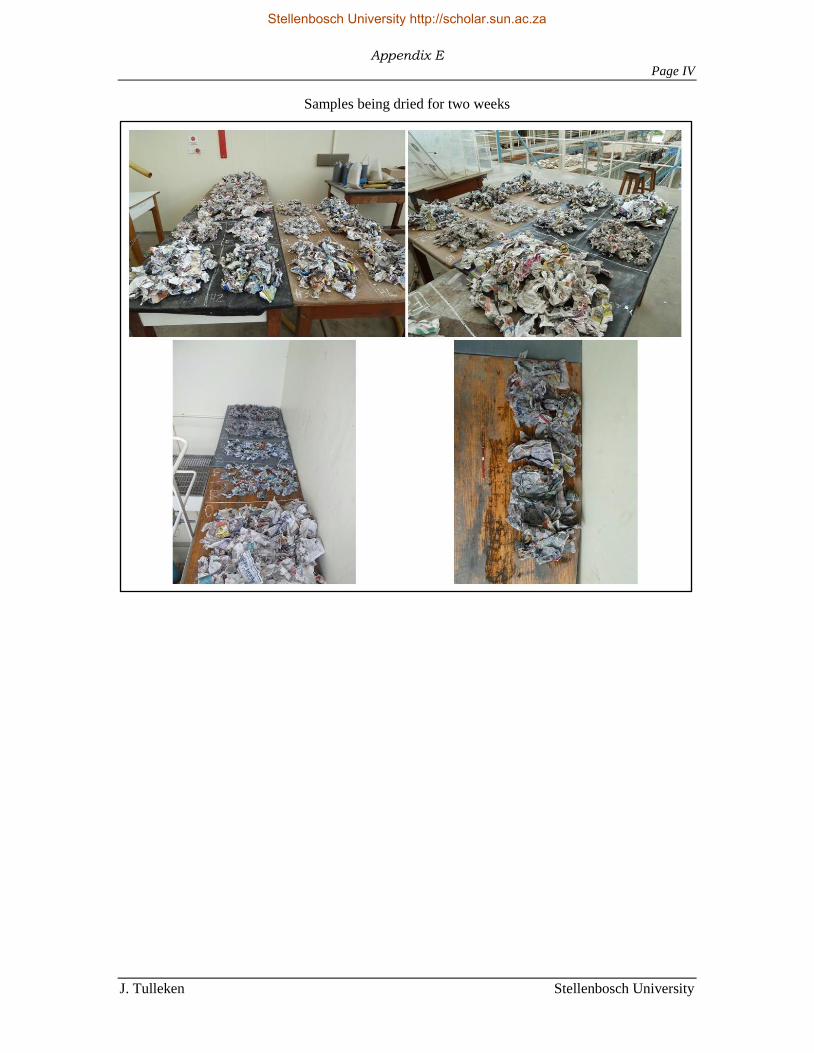
Appendix E Page IV
J. Tulleken Stellenbosch University
Samples being dried for two weeks
Stellenbosch University http://scholar.sun.ac.za
Appendix F Page V
J. Tulleken Stellenbosch University
F
Appendix F DST Program
Stellenbosch University http://scholar.sun.ac.za