DTP boek Signal-To-Noice DEF5.indd 1 22-10-2009 18:27:15 dissertation.pdfMy sources are unreliable,...
112
DTP boek Signal-To-Noice DEF5.indd 1 22-10-2009 18:27:15
Transcript of DTP boek Signal-To-Noice DEF5.indd 1 22-10-2009 18:27:15 dissertation.pdfMy sources are unreliable,...
DTP boek Signal-To-Noice DEF5.indd 1 22-10-2009 18:27:15

DTP boek Signal-To-Noice DEF5.indd 2 22-10-2009 18:27:19
VRIJE UNIVERSITEIT
The concept of the signal-to-noise ratio in the modulation domain
Predicting the intelligibility of processed noisy speech
ACADEMISCH PROEFSCHRIFT
ter verkrijging van de graad Doctor aande Vrije Universiteit Amsterdam,op gezag van de rector magnificus
prof.dr. L.M. Bouter,in het openbaar te verdedigen
ten overstaan van de promotiecommissievan de faculteit der Geneeskunde
op donderdag 3 december 2009 om 10.45 uurin de aula van de universiteit,
De Boelelaan 1105
door
Finn Dubbelboergeboren te Wageningen
DTP boek Signal-To-Noice DEF5.indd 3 22-10-2009 18:27:22
Promotoren: prof.dr.ir. T. Houtgast prof.dr.ir. J.M. Festen
DTP boek Signal-To-Noice DEF5.indd 4 22-10-2009 18:27:22

My sources are unreliable, but their information is fascinating
Ashleigh Brilliant
Voor Hante, Isidoor en Zouk
DTP boek Signal-To-Noice DEF5.indd 5 22-10-2009 18:27:23
This research project was supported by the Dutch Foundation ‘Heinsius-Houbolt Fonds’.
The preparation of this dissertation was supported by the Mgr. J.C. van Overbeekstichting te ’s-Hertogenbosch.
ISBN: 978-90-6464-362-0
Copyright © 2009 by Finn Dubbelboer.
Design & Layout by Zmyzzy
Printed by Ponsen & Looijen
Cover: The (S/N)mod reflects the strength of speech modulations (upper curve) relative to noise
modulations (lower curve).
All rights reserved. No part of this book may be reproduced, stored in a retrieval system or transmitted,
in any form or by any means, electronical, mechanical, photocopying, recording, or otherwise without
prior written permission of the holder of the copyright.
DTP boek Signal-To-Noice DEF5.indd 6 22-10-2009 18:27:23
Contents
I. General introduction 1
II. A detailed study on the effects of noise on speech intelligibility 52.1 Signal proceSSing 8
2.1.1 Signal analysis: the three noise effects 92.1.2 Signal analysis and resynthesis for the listening experiments 11
2.2 MeaSureMentS 142.3 DiScuSSion 15
2.3.1 The MTF and the STI model 152.3.2 Spectral subtraction and the second noise effect 17
2.4 concluSionS 21
III. The concept of signal-to-noise ratio in the modulation domain and speech intelligibility 23
3.1 rationale anD introDuction of (S/n)MoD 25
3.1.1 Speech envelopes and the concept of the useful modulation area 253.1.2 Spectral subtraction and the modulation floor 283.1.3 Concept of (S/N)mod, the signal-to-noise ratio in the modulation domain 32
3.2 Verification of the releVance of (S/n)MoD 36
3.2.1 Spectral subtraction and speech intelligibility 373.2.2 Deterministic and noise induced modulation reduction 373.2.3 Compression and expansion of noisy speech 40
3.3 DiScuSSion 423.3.1 STI and intelligibility of noisy speech 44
3.4 concluSionS 44
IV. The effect of varying the signal-to-noise ratio in the modulation domain on speech intelligibility in noise 47
4.1 Defining the probe Signal for eStiMating the MoDulation ratio 514.2 Manipulating the MoDulation ratio uSing the noiSe-free Signal 56
4.2.1 Manipulating the modulation ratio for the speech-matched probe 564.2.2 Application to speech-plus-noise signals 58
4.3 Manipulating the MoDulation ratio without uSing a priori knowleDge 604.3.1 Manipulating the modulation ratio for the speech-matched probe 604.3.2 Application to speech-plus-noise signals 61
4.4 DiScuSSion 664.5 concluSionS 70
DTP boek Signal-To-Noice DEF5.indd 7 22-10-2009 18:27:25

DTP boek Signal-To-Noice DEF5.indd 8 22-10-2009 18:27:25
V. Improving speech intelligibility in party babble noise 715.1 phySical characteriSticS of the StiMuli 74
5.1.1 Speech material and maskers 74
5.2 liStening experiMentS 775.2.1 Procedure 775.2.2 Participants 78
5.3 reSultS 795.4 DiScuSSion 835.5 concluSionS 84
Summary 85Samenvatting 89References 93Appendix 97Dankwoord 99Curriculum Vitae 101
DTP boek Signal-To-Noice DEF5.indd 9 22-10-2009 18:27:26

DTP boek Signal-To-Noice DEF5.indd 10 22-10-2009 18:27:27
1
I. General introduction
It is generally known that many hearing impaired persons find it difficult to follow a conversation during a party or a reception, which is often due to a reduced ability to distinguish speech from the background noise; a problem that hearing aids cannot solve at present. Traditional hearing aids can compensate for a person’s hearing loss, amplifying those frequencies that are perceived poorly. In absence of noise, this operation helps to make a larger part of the speech spectrum available to the listener, and therefore to improve the intelligibility. However, in case of background noise, speech and noise are both amplified, and the segregation problem remains. To increase the intelligibility in these situations, the noise level should be reduced before entering the ear, for instance by means of signal processing. Many types of processing have been investigated using one, two or more microphones. Although some multi-microphone techniques (such as directional microphones and microphone-array beamformers) succeed in significantly improving signal-to-noise ratio and intelligibility in the lab, the benefits of these promising techniques are often strongly reduced in daily life (reflections, reverberation, head movements, moving sound sources, etc). In the last decade, ongoing research on single microphone processing has yielded a number of excellent noise reduction techniques (Mauler, 2006; Martin, 2002), producing impressive increments of signal-to-noise ratio (S/N). Based on these increments, one would expect intelligibility to increase correspondingly when applied in hearing aids. However, it has been shown in many studies that – in spite of these S/N increments – intelligibility remains equally poor (Hu and Loizou, 2007; Marzinzik, 2000; for a review see Levitt, 2001), suggesting that S/N ratio may not be the crucial factor for intelligibility. This “noise-reduction paradox” is the driving force behind the current thesis.
When listening to a talker, the ear performs an instantaneous frequency-time analysis of the speech signal. Within the cochlea, the basilar membrane acts like a biomechanical filterbank, breaking down the (broadband) speech input into a number of narrowband (typically 1/3 octave) frequency bands. Each frequency band contains a finestructure (carrier) and a time-varying temporal envelope. The finestructure contains pitch information; the envelope contains typical temporal intensity-fluctuation patterns,
DTP boek Signal-To-Noice DEF5.indd 1 22-10-2009 18:27:27
2
Chapter I: General introduction
which are generally considered as the information carriers of speech. The success of understanding a talker depends strongly (among other things) on how well the speech information is preserved after travelling through the air from mouth to ear. Interfering noise, among other disturbances, can seriously reduce the amount of available information. A large amount of data on the relation between intelligibility and interfering noise (and other disturbances) was collected by telephone company AT&T Bell Labs in the 1920s, and was first released in the 1940s. This enormous data set provided a basis for the first model relating speech physics to intelligibility: the Articulation Index (AI) (ANSI, 1969). After a major revision, the model evolved into the Speech Intelligibility Index (SII) (ANSI, 1997), which is commonly used to predict speech intelligibility of noise-corrupted speech. Predictions are essentially based on the signal-to-noise ratio (S/N) within the (weighted) 1/3-octave frequency bands, and the SII may be interpreted as the proportion of total speech information available for a listener. When the SII is maximal (1), all speech information is available; when the SII is minimal (0), there is no information left. So, the general message – as interpreted by technicians in the field – was that speech intelligibility would automatically improve, if the SII of a noise-corrupted speech signal was increased, which – according to the model – basically came down to an increase of the signal-to-noise ratio, which seemed in correspondence to intuition. Particularly with the start of a new digital era, the prospects seemed unlimited. However, despite the good results that have been obtained through the years in terms of improving (physical!) signal-to-noise ratio, the results could not seem to be translated into benefits in the perceptual domain, and intelligibility remained equally poor: the noise-reduction paradox. Although one can think of ad hoc explanations such as the fact that signal-to-noise ratio considers only signal energy while discarding the effects of finestructure corruption, or that perhaps essential speech energy was removed by the operation too, there was still no solid underlying perceptual model that could explain or quantify the phenomenon. Hence, a different view on speech perception in noise was required. In the early seventies, a strong relation between intelligibility and the strength of intensity fluctuations within the speech envelope had been shown by Houtgast and Steeneken (1972; 1973). By subjecting the temporal intensity envelope
DTP boek Signal-To-Noice DEF5.indd 2 22-10-2009 18:27:28
3
of speech to spectral analysis, it was shown that a reduction of the speech-envelope spectrum corresponded well to a reduction of intelligibility, irrespective of the nature of that reduction (noise, reverberation, echos). The observation led to the concept of Modulation Transfer Function (MTF), which evolved into the model of the Speech Transmission Index (STI) a few years later (IEC, 2003). Nowadays, the STI model is a widely applied measure for predicting speech intelligibility under a variety of adverse listening conditions, among which interfering noise. Although the introduction of the MTF-STI concept increased our understanding of speech perception in noise, it appeared that even the MTF-STI concept could not fully explain the limited effect of noise reduction on intelligibility: increased STI values do not guaranty improvements of intelligibility (Ludvigsen, 1993). A result for which – up to now – no good explanation could be given. This notion leaves us with the uncomfortable feeling that the relation between S/N (or SII and STI) and intelligibility may be well understood when noise is added to speech, but becomes fuzzy when attempts are made to subsequently reduce the noise. This almost automatically brings up the question related to any intelligibility-related signal-processing effort: “what must we improve?”. Or, formulated somewhat more scientifically: “what exactly should be restored in a noise-corrupted speech signal in order to improve intelligibility?”. This question can be considered as the starting point for the current thesis.
As a first step, it was analysed in detail how a speech signal changes physically after adding stationary, stochastic noise (Chapter II). After unsuccessful attempts to interpret the (somewhat surprising) results in terms of existing speech perception models – particularly in terms of modulations and STI, a new concept was formulated relating signal physics to intelligibility, particularly after signal processing. The “concept of the signal-to-noise ratio in the modulation domain” or (S/N)mod, as it was called, will be introduced and discussed in Chapter III. It will be shown that if the (S/N)mod does not change after processing, intelligibility does not change either. In Chapter IV, the relation between (S/N)mod and intelligibility is studied further by varying the (S/N)mod of noisy signals, and comparing (S/N)mod-based intelligibility predictions with actual intelligibility measurements in a number of listening tests
DTP boek Signal-To-Noice DEF5.indd 3 22-10-2009 18:27:28
4
Chapter I: General introduction
performed with normal hearing and hearing impaired persons. The intelligibility is typically measured in Speech Reception Threshold (SRT) experiments (Plomp and Mimpen, 1979), the SRT indicating the S/N for which listeners are able to reproduce 50% of a series of monaurally presented simple meaningful sentences in an adaptive procedure. It will be shown that the variations imposed on the (S/N)mod’s of the signals are followed by corresponding variations of the intelligibility, substantiated by correlation coefficients of typically 0.8. It is also argued that the applied type of signal processing may be useful for future practical applications, as the results indicated that intelligibility (SRT) improvements of typically +2 dB can be reached for hearing impaired persons. The practical relevance of this approach strongly relies on the question whether the positive effects are restricted to stationary stochastic noises only, or whether they could also be obtained for more realistic noise types, such as babble noise. Chapter V describes the results of an experiment, performed with normal hearing and hearing impaired persons, in which SRT’s were measured for party babble. It is shown that SRT’s typically improved by 0.8 dB for the normal hearing listeners, and with 1.6 dB for the hearing-impaired listeners.
This thesis contains five chapters that are based on papers that have been published (Chapter II and Chapter III) or are in preparation for publishing (Chapter IV and Chapter V) in the Journal of the Acoustical Society of America.
DTP boek Signal-To-Noice DEF5.indd 4 22-10-2009 18:27:29
5
II A detailed study on the effects of noise on speech intelligibility
Abstract
A wavelet representation of speech was used to display the instantaneous amplitude and phase within ¼ octave frequency bands, representing the envelope and the carrier within each band. Adding stationary noise alters the wavelet pattern, which can be understood as a combination of three simultaneously occurring subeffects: two effects on the wavelet levels (one systematic and one stochastic) and one effect on the wavelet phases. Specific types of signal processing were applied to speech, which allowed each effect to be either included or excluded. The impact of each effect (and of combinations) on speech intelligibility was measured with CVC’s. It appeared that the systematic level effect (i.e. the increase of each speech wavelet intensity with the mean noise intensity) has the most degrading effect on speech intelligibility, which is in accordance with measures such as the Modulation Transfer Function and the Speech Transmission Index. However, also the introduction of stochastic level fluctuations and disturbance of the carrier phase seriously contribute to reduced intelligibility in noise. It is argued that these stochastic effects are responsible for the limited success of spectral subtraction as a means to improve speech intelligibility. Results can provide clues for effective noise suppression with respect to intelligibility.
Journal of the Acoustical Society of America 122: 2865-2870, 2007
DTP boek Signal-To-Noice DEF5.indd 5 22-10-2009 18:27:29
6
II. A detailed study on the effects of noise on speech intelligibility
Introduction
When noise is added to speech, the speech signal is altered by the stochastic processes involved in the interaction. This chapter describes the nature and consequences of these interactions in detail. Sometimes speech processing is used to counteract these alterations, for instance in hearing aids and (mobile) communication devices. When noisy speech is recorded by a single microphone, the noise spectrum can be estimated and subtracted from the speech-plus-noise input, an operation known as spectral subtraction (Lim, 1978; Boll, 1979). Spectral subtraction is one of the first “easy-to-implement” reduction schemes among single-microphone noise-reduction techniques and currently often used, for instance in hearing aids and mobile phones. Various alternative techniques have been investigated since, aiming at estimating essential parameters for restoring the speech envelope. Three fundamental differences among these techniques can be distinguished. First, the type of parameter that is estimated [spectral magnitude, log spectral magnitude, complex valued spectral coefficient–Lee, 1960; Ephraim and Malah, 1984]. Second, the way this parameter is estimated (expected value, maximum a posteriori criterion) and third, the assumptions that are made concerning the amplitude distributions of speech and noise [Gaussian, Laplacian, Gamma, super-Gaussian–Martin, 2002; Breithaupt and Martin, 2003]. Currently, psychoacoustics plays an increasingly important role during the design process, which leads to “perceptually optimized” algorithms. Although positive results have been reported in terms of listening comfort and fatigue, the overall success of signal restoration is somewhat disappointing. The improved quality of the output signal seldom leads to improved intelligibility (Lim and Oppenheim, 1979; Levitt, 1986; WGCA, 1991), suggesting that the exact nature of the speech-noise interactions and their consequences for speech intelligibility are not fully understood. In order to improve speech intelligibility in noise one should know (1) how speech is physically changed, (2) which of these changes are most detrimental for intelligibility and (3) how the most detrimental changes can be counteracted, without introducing new distortions. The idea of speech being affected in several ways by adding noise was recognized earlier in work by Drullman and Noordhoek (see the following).
DTP boek Signal-To-Noice DEF5.indd 6 22-10-2009 18:27:30
7
Introduction
One way of analyzing the properties of speech is to consider the speech signal as a sum of amplitude-modulated carriers in adjacent frequency bands; it is known that these modulations are essential for speech intelligibility. Presence of noise (or reverberation) reduces these modulations and therefore reduces intelligibility. This is the basis of the concept of the Modulation Transfer Function (MTF) and the Speech Transmission Index (STI) (Houtgast and Steeneken, 1985). The STI is a widely used measure (IEC, 2003) for estimating intelligibility in auditoria, working places, public areas, etc. Drullman (1995) found that equal MTF’s do not necessarily lead to equal intelligibility. Noordhoek and Drullman (1997) compared the effect of two types of modulation reduction on speech perception. In the first set of stimuli a multichannel compression scheme was applied on the temporal speech envelope (deterministic modulation reduction). In the second set, modulations were reduced by adding noise, which was referred to as stochastic modulation reduction. They found that “pure” modulation reduction – the one effect considered in the STI – could not fully explain the detrimental effect of added noise. Two possible additional noise effects were suggested. First, nonrelevant modulations arising from the stochastic nature of the noise-speech interaction can be responsible for reducing the perceptual distance between speech and noise. Secondly, the finestructure is damaged, which may affect possible cues that rely on this finestructure. Noordhoek and Drullman showed that, in case of adding noise, these additional effects grow proportionally with the effect of modulation reduction. Under normal circumstances, their impact remains relatively small and is implicitly included in the experimentally determined relation between the modulation-reduction based STI and speech intelligibility. However, in case of specific types of noise suppression, for instance spectral subtraction, this relation is disturbed and the STI is no longer a reliable predictor (Ludvigsen, 1993). Apparently, noise reduction algorithms cannot compensate for all three noise effects. In fact, it seems that extra effects are introduced, of which the consequences for speech perception are not clearly understood. The first part of this chapter describes a type of signal analysis that enables us to identify different speech alterations involved with additive noise. Thinking of the speech signal in terms of a sum of amplitude-modulated carriers in adjacent frequency
DTP boek Signal-To-Noice DEF5.indd 7 22-10-2009 18:27:30
8
II. A detailed study on the effects of noise on speech intelligibility
bands, three effects can be distinguished: (1) a systematic lift of the envelope equal to the mean noise intensity, (2) stochastic envelope fluctuations and (3) the corruption of the finestructure. Subsequently, it will be shown how this type of analysis can be applied to isolate each of these effects and how the perceptual consequences of these three effects were measured in a series of listening experiments. Finally, the results will be discussed in relation to the limited effects of noise suppression on speech intelligibility.
Signal proceSSing2.1 For defining the different effects of noise on the speech signal, and for preparing the stimuli for the listening experiment, a type of Wavelet Transformation (WT) (Strang, 1994; Rioul, 1991) was used. By choosing an appropriate mother wavelet, WT can provide a spectrotemporal representation that roughly corresponds to auditory frequency-time analysis. The quality of the ‘match’ depends on how well the spectrotemporal segmentation or tiling (determined by the shape of the wavelet) is in agreement with auditory frequency-time resolutions. In a number of experiments, van Schijndel (1999) determined parameter settings for an optimal ‘auditory’ mother wavelet. This involved the shape of the temporal envelope and the number of cycles, which determine the effective duration and the effective spectral bandwidth of a wavelet, and together the spectrotemporal resolution. This resolution approaches a theoretical limit – dictated by the uncertainty principle (Landau and Polak, 1961) – for Gaussian shaped envelopes. An appealing property of a Gaussian shaped wavelet is its symmetry in frequency and time, which is an advantage from the signal processing point of view. Although it does not strictly correspond to auditory filtering, it can be considered a first order approximation of the auditory filter, which is often assumed to be Gammatone shaped (Patterson et al., 1992). A less appealing property of a Gaussian shape is the fact that, when applying wavelet analysis and resynthesis, the reconstructed signal is not identical to the original signal: a Gaussian envelope causes imperfections during inverse transformation. This effect can be counteracted by increasing the sample rate both in time and in frequency, and thereby increasing the amount of overlap between subsequent wavelets. This also improves the robustness
DTP boek Signal-To-Noice DEF5.indd 8 22-10-2009 18:27:31
9
2.1 Signal processing
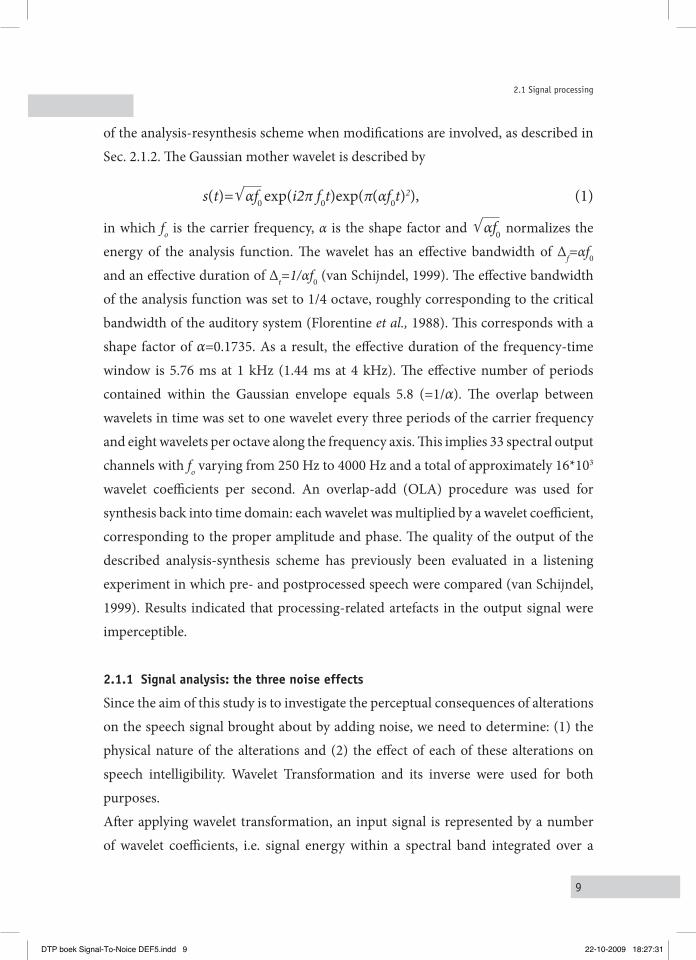
of the analysis-resynthesis scheme when modifications are involved, as described in Sec. 2.1.2. The Gaussian mother wavelet is described by
s(t)=√ αf0 exp(i2π f0t)exp(π(αf0t)2), (1)
in which fo is the carrier frequency, α is the shape factor and √ αf0 normalizes the energy of the analysis function. The wavelet has an effective bandwidth of ∆f=αf0
and an effective duration of ∆t=1/αf0 (van Schijndel, 1999). The effective bandwidth of the analysis function was set to 1/4 octave, roughly corresponding to the critical bandwidth of the auditory system (Florentine et al., 1988). This corresponds with a shape factor of α=0.1735. As a result, the effective duration of the frequency-time window is 5.76 ms at 1 kHz (1.44 ms at 4 kHz). The effective number of periods contained within the Gaussian envelope equals 5.8 (=1/α). The overlap between wavelets in time was set to one wavelet every three periods of the carrier frequency and eight wavelets per octave along the frequency axis. This implies 33 spectral output channels with fo varying from 250 Hz to 4000 Hz and a total of approximately 16*103 wavelet coefficients per second. An overlap-add (OLA) procedure was used for synthesis back into time domain: each wavelet was multiplied by a wavelet coefficient, corresponding to the proper amplitude and phase. The quality of the output of the described analysis-synthesis scheme has previously been evaluated in a listening experiment in which pre- and postprocessed speech were compared (van Schijndel, 1999). Results indicated that processing-related artefacts in the output signal were imperceptible.
Signal analysis: the three noise effects2.1.1
Since the aim of this study is to investigate the perceptual consequences of alterations on the speech signal brought about by adding noise, we need to determine: (1) the physical nature of the alterations and (2) the effect of each of these alterations on speech intelligibility. Wavelet Transformation and its inverse were used for both purposes. After applying wavelet transformation, an input signal is represented by a number of wavelet coefficients, i.e. signal energy within a spectral band integrated over a
DTP boek Signal-To-Noice DEF5.indd 9 22-10-2009 18:27:31
10
II. A detailed study on the effects of noise on speech intelligibility
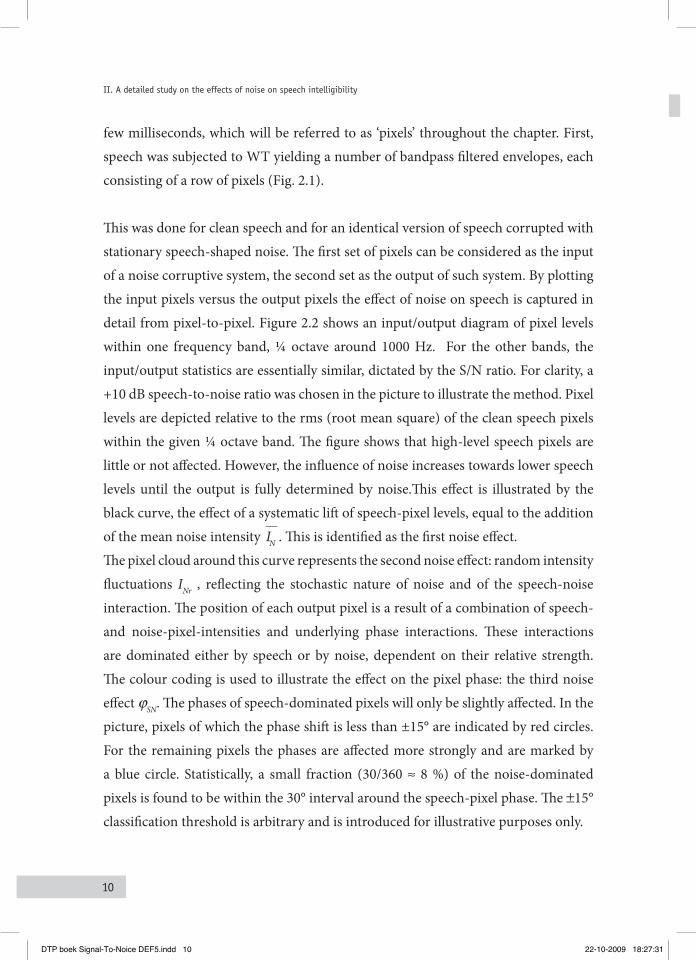
few milliseconds, which will be referred to as ‘pixels’ throughout the chapter. First, speech was subjected to WT yielding a number of bandpass filtered envelopes, each consisting of a row of pixels (Fig. 2.1).
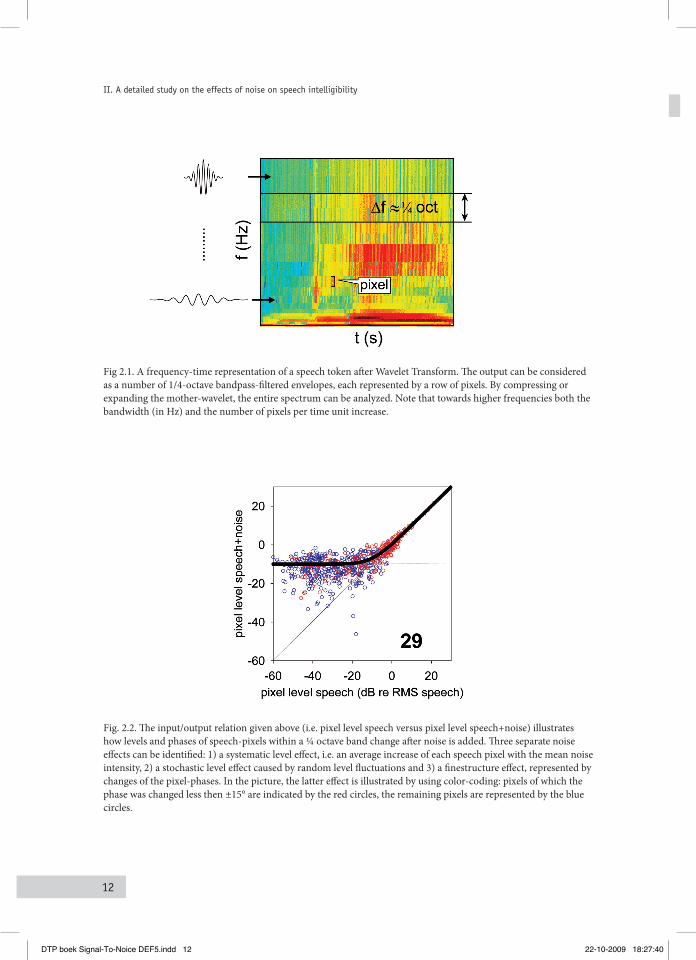
This was done for clean speech and for an identical version of speech corrupted with stationary speech-shaped noise. The first set of pixels can be considered as the input of a noise corruptive system, the second set as the output of such system. By plotting the input pixels versus the output pixels the effect of noise on speech is captured in detail from pixel-to-pixel. Figure 2.2 shows an input/output diagram of pixel levels within one frequency band, ¼ octave around 1000 Hz. For the other bands, the input/output statistics are essentially similar, dictated by the S/N ratio. For clarity, a +10 dB speech-to-noise ratio was chosen in the picture to illustrate the method. Pixel levels are depicted relative to the rms (root mean square) of the clean speech pixels within the given ¼ octave band. The figure shows that high-level speech pixels are little or not affected. However, the influence of noise increases towards lower speech levels until the output is fully determined by noise.This effect is illustrated by the black curve, the effect of a systematic lift of speech-pixel levels, equal to the addition of the mean noise intensity IN . This is identified as the first noise effect.The pixel cloud around this curve represents the second noise effect: random intensity fluctuations INr , reflecting the stochastic nature of noise and of the speech-noise interaction. The position of each output pixel is a result of a combination of speech- and noise-pixel-intensities and underlying phase interactions. These interactions are dominated either by speech or by noise, dependent on their relative strength. The colour coding is used to illustrate the effect on the pixel phase: the third noise effect ϕSN. The phases of speech-dominated pixels will only be slightly affected. In the picture, pixels of which the phase shift is less than ±15° are indicated by red circles. For the remaining pixels the phases are affected more strongly and are marked by a blue circle. Statistically, a small fraction (30/360 ≈ 8 %) of the noise-dominated pixels is found to be within the 30° interval around the speech-pixel phase. The ±15° classification threshold is arbitrary and is introduced for illustrative purposes only.
DTP boek Signal-To-Noice DEF5.indd 10 22-10-2009 18:27:31
11
2.1 Signal processing
Signal analysis and resynthesis for the listening experiments 2.1.2
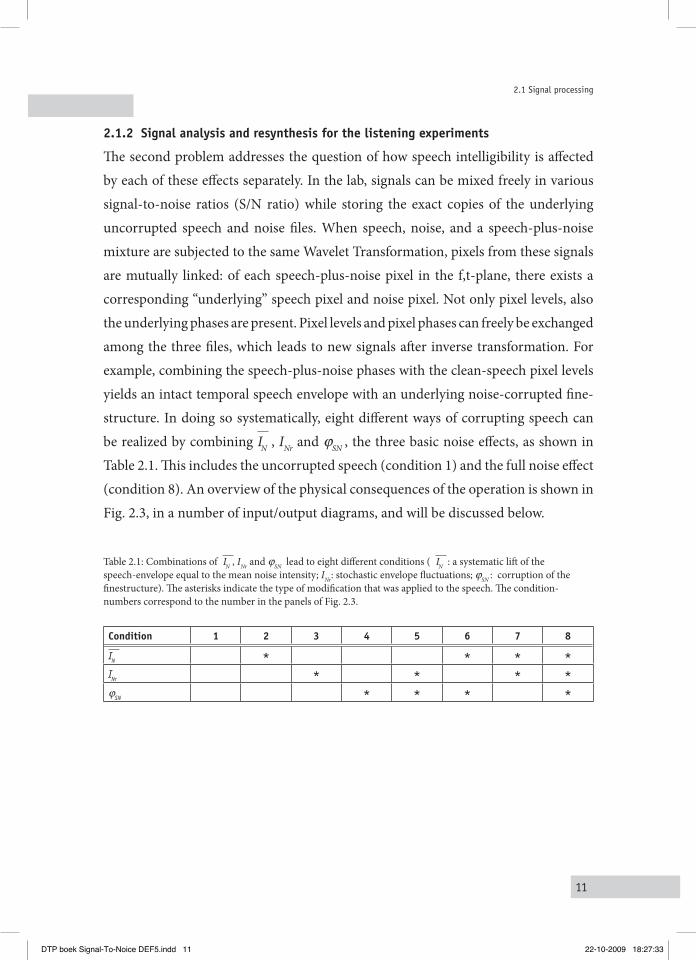
The second problem addresses the question of how speech intelligibility is affected by each of these effects separately. In the lab, signals can be mixed freely in various signal-to-noise ratios (S/N ratio) while storing the exact copies of the underlying uncorrupted speech and noise files. When speech, noise, and a speech-plus-noise mixture are subjected to the same Wavelet Transformation, pixels from these signals are mutually linked: of each speech-plus-noise pixel in the f,t-plane, there exists a corresponding “underlying” speech pixel and noise pixel. Not only pixel levels, also the underlying phases are present. Pixel levels and pixel phases can freely be exchanged among the three files, which leads to new signals after inverse transformation. For example, combining the speech-plus-noise phases with the clean-speech pixel levels yields an intact temporal speech envelope with an underlying noise-corrupted fine-structure. In doing so systematically, eight different ways of corrupting speech can be realized by combining IN , INr and ϕSN , the three basic noise effects, as shown in Table 2.1. This includes the uncorrupted speech (condition 1) and the full noise effect (condition 8). An overview of the physical consequences of the operation is shown in Fig. 2.3, in a number of input/output diagrams, and will be discussed below.
Table 2.1: Combinations of IN , INr and ϕSN lead to eight different conditions ( IN : a systematic lift of the speech-envelope equal to the mean noise intensity; INr: stochastic envelope fluctuations; ϕSN : corruption of the finestructure). The asterisks indicate the type of modification that was applied to the speech. The condition-numbers correspond to the number in the panels of Fig. 2.3.
Condition 1 2 3 4 5 6 7 8
IN * * * *
INr * * * *ϕ
SN * * * *
DTP boek Signal-To-Noice DEF5.indd 11 22-10-2009 18:27:33
12
II. A detailed study on the effects of noise on speech intelligibility
Fig 2.1. A frequency-time representation of a speech token after Wavelet Transform. The output can be considered as a number of 1/4-octave bandpass-filtered envelopes, each represented by a row of pixels. By compressing or expanding the mother-wavelet, the entire spectrum can be analyzed. Note that towards higher frequencies both the bandwidth (in Hz) and the number of pixels per time unit increase.
Fig. 2.2. The input/output relation given above (i.e. pixel level speech versus pixel level speech+noise) illustrates how levels and phases of speech-pixels within a ¼ octave band change after noise is added. Three separate noise effects can be identified: 1) a systematic level effect, i.e. an average increase of each speech pixel with the mean noise intensity, 2) a stochastic level effect caused by random level fluctuations and 3) a finestructure effect, represented by changes of the pixel-phases. In the picture, the latter effect is illustrated by using color-coding: pixels of which the phase was changed less then ±15° are indicated by the red circles, the remaining pixels are represented by the blue circles.
DTP boek Signal-To-Noice DEF5.indd 12 22-10-2009 18:27:40
13
2.1 Signal processing
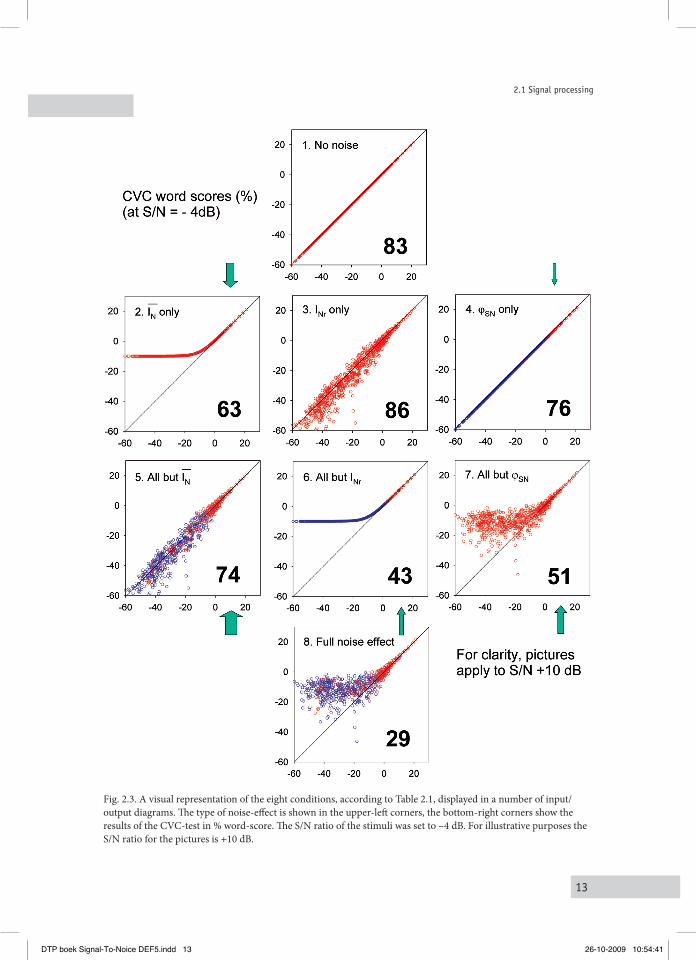
Fig. 2.3. A visual representation of the eight conditions, according to Table 2.1, displayed in a number of input/output diagrams. The type of noise-effect is shown in the upper-left corners, the bottom-right corners show the results of the CVC-test in % word-score. The S/N ratio of the stimuli was set to –4 dB. For illustrative purposes the S/N ratio for the pictures is +10 dB.
DTP boek Signal-To-Noice DEF5.indd 13 26-10-2009 10:54:41
14
II. A detailed study on the effects of noise on speech intelligibility
At this stage, only signal physics was discussed, no listener was yet involved. The above-described type of signal processing was used as a protocol to compute a large set of specifically corrupted speech. The speech in this set was used as stimuli in a listening experiment with normal hearing subjects.
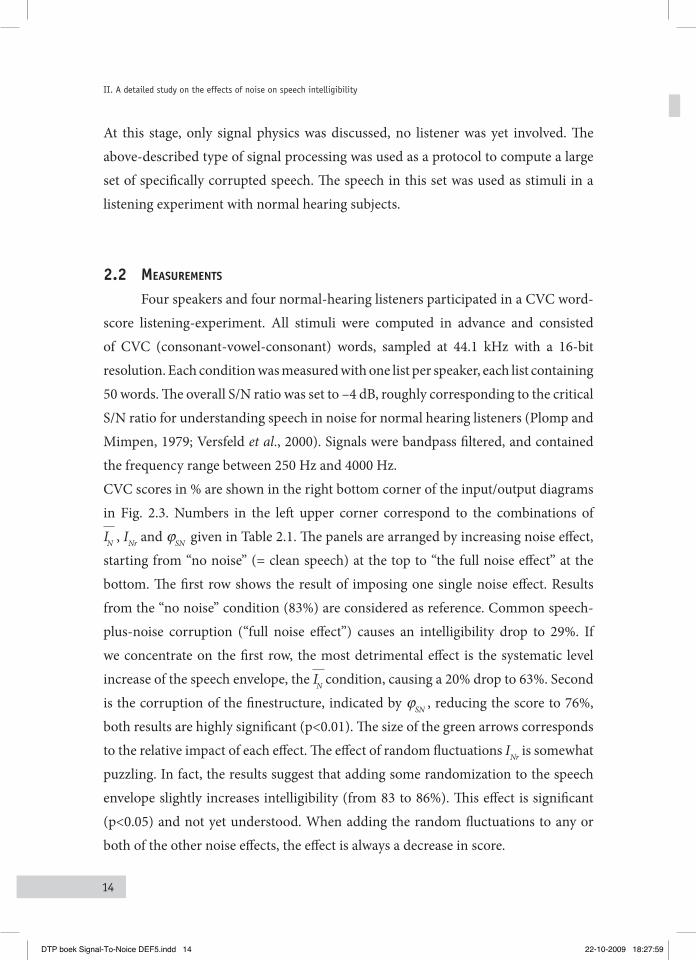
MeaSureMentS2.2 Four speakers and four normal-hearing listeners participated in a CVC word-score listening-experiment. All stimuli were computed in advance and consisted of CVC (consonant-vowel-consonant) words, sampled at 44.1 kHz with a 16-bit resolution. Each condition was measured with one list per speaker, each list containing 50 words. The overall S/N ratio was set to –4 dB, roughly corresponding to the critical S/N ratio for understanding speech in noise for normal hearing listeners (Plomp and Mimpen, 1979; Versfeld et al., 2000). Signals were bandpass filtered, and contained the frequency range between 250 Hz and 4000 Hz. CVC scores in % are shown in the right bottom corner of the input/output diagrams in Fig. 2.3. Numbers in the left upper corner correspond to the combinations of IN , INr and ϕSN given in Table 2.1. The panels are arranged by increasing noise effect, starting from “no noise” (= clean speech) at the top to “the full noise effect” at the bottom. The first row shows the result of imposing one single noise effect. Results from the “no noise” condition (83%) are considered as reference. Common speech-plus-noise corruption (“full noise effect”) causes an intelligibility drop to 29%. If we concentrate on the first row, the most detrimental effect is the systematic level increase of the speech envelope, the IN condition, causing a 20% drop to 63%. Second is the corruption of the finestructure, indicated by ϕSN , reducing the score to 76%, both results are highly significant (p<0.01). The size of the green arrows corresponds to the relative impact of each effect. The effect of random fluctuations INr is somewhat puzzling. In fact, the results suggest that adding some randomization to the speech envelope slightly increases intelligibility (from 83 to 86%). This effect is significant (p<0.05) and not yet understood. When adding the random fluctuations to any or both of the other noise effects, the effect is always a decrease in score.
DTP boek Signal-To-Noice DEF5.indd 14 22-10-2009 18:27:59
15
2.3 Discussion
In general, adding a second effect to the first (second row) degrades intelligibility, and again IN contributes most as illustrated in panel 6 and 7 compared to 5. Finally, adding a third effect (second row to the bottom panel) leads to the “full noise effect” and is again dominated by IN (condition 5 to condition 8). Figure 2.3 shows that an intensity lift of the speech envelope (equal to the mean noise intensity) is the most detrimental effect: going from condition 1 to condition 2 causes the largest (single noise-effect) drop in word-score, from 83% to 63%. An alternative way to weigh the relative contribution of each effect is by going from the bottom panel, the full-noise effect, up and compare the result of removing one of these noise effects. The size of the green arrows indicates the effect of removing the corresponding noise effect on intelligibility. Also from this viewpoint, the first noise effect appears to be the most important one. It is interesting to note that this effect is the only effect considered in measures such as the Modulation Transfer Function (MTF) and the Speech Transmission Index (STI), in which signal physics is related to speech perception.
DiScuSSion2.3 When considering the effect of additive stationary noise on the speech signal, the second noise effect is often not fully recognized. The general view is that the instantaneous speech intensity is increased by the mean noise intensity, and that the fine structure (the carrier) is corrupted to some extent. The consequences of combinations with the stochastic level fluctuations, the second noise effect, are not always fully acknowledged. This issue will be discussed with respect to two topics, the MTF-STI concept for predicting speech intelligibility, and the spectral subtraction approach for noise reduction.
The MTF and the STI model2.3.1
The success of models like the Modulation Transfer Function (MTF) and the Speech Transmission Index (STI) in predicting intelligibility of noise-corrupted speech is generally recognized. However, these models only take account of the first noise effect,
DTP boek Signal-To-Noice DEF5.indd 15 22-10-2009 18:28:00
16
II. A detailed study on the effects of noise on speech intelligibility
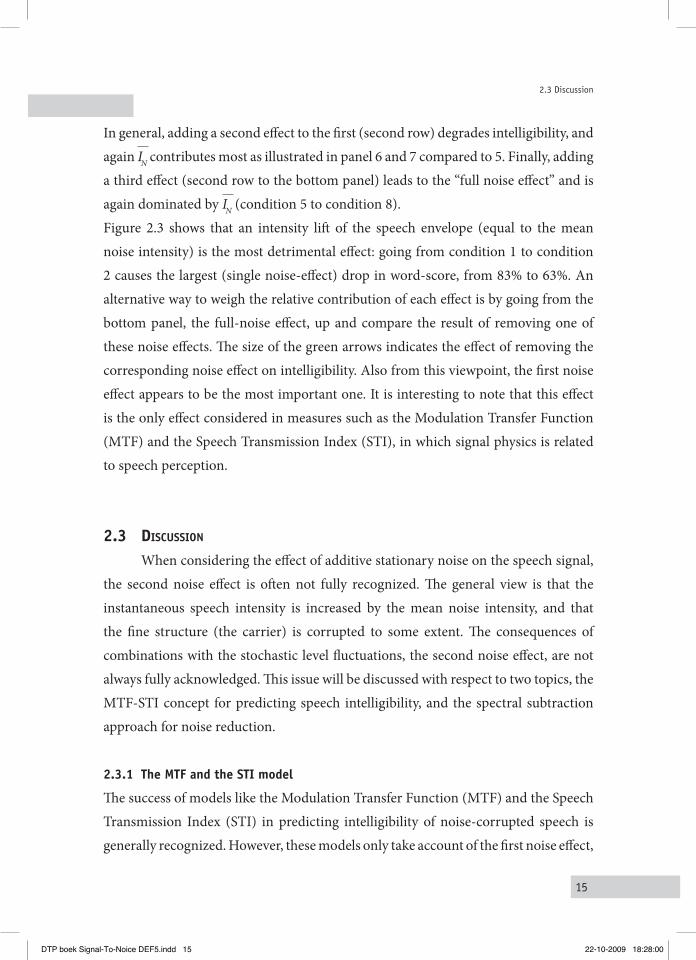
and therefore are based on a simplified image of the actual speech/noise interaction. According to the MTF-STI model, intelligibility-reduction is a direct consequence of the extent to which modulations within speech envelopes are reduced. It can easily be shown that these modulation reductions are caused by the first noise effect only (i.e., by the addition of the mean noise intensity), and are not affected by the second and third noise effects. To illustrate this, speech was subjected to exactly the same wavelet analysis and resynthesis as described before. Resulting pixel levels and pixel phases were modified in correspondence to the eight conditions in Table 2.1 and Fig. 2.3. The resulting modified speech envelopes, i.e. arrays of pixel levels, were subjected to a Fast Fourier Transformation. Normalizing for the mean intensity and integration within 1-octave modulation bands, yielded the eight modulation spectra in the frequency range from 0.25 to 32 Hz that are depicted in Fig. 2.4.
Fig. 2.4. Two clusters of modulation-spectra derived from eight modified envelopes corresponding to the eight conditions illustrated in Fig. 2.3. The eight conditions fall apart in two groups: a first group of four conditions, including the clean speech, all showing the original speech envelope spectrum, and a second group, including the full noise effect, all showing the same reduced envelope spectra. In- or excluding the phase-effect results in identical modulation-spectra (1-4, 3-5, 2-6, and 7-8).
The eight conditions fall apart in two groups: a first group of four conditions, including the clean speech, all showing the original speech envelope spectrum, and a second group, including the full noise effect, all showing the same reduced envelope spectra. Note that the two groups only differ by the absence (conditions 1, 3, 4 and 5)
DTP boek Signal-To-Noice DEF5.indd 16 26-10-2009 10:56:39
17
2.3 Discussion
or the presence (conditions 2, 6, 7 and 8) of the first noise effect. Within groups, the four conditions with equal envelope spectra would yield equal STI’s, and thus equal predicted intelligibility. Figure 2.3 shows that this is clearly not the case. Hence, when speech is corrupted by noise (the ‘full noise’-effect), the intelligibility is reduced as the result of three noise effects, while the modulation-reduction based STI model only accounts for one of these three effects, i.e. the lift of the speech envelope by the mean noise intensity. In normal circumstances, this does not pose a real problem since all three noise effects will depend on the S/N ratio, and are thus highly related. This means that the STI is still uniquely related to intelligibility, as long as the mutual relation among the three noise effects is maintained. However, when the three effects are manipulated individually, disturbing their normal relation given by the full noise effect, the STI predictions will fail. The data in Fig. 2.3 do illustrate this, and are just an example of specific types of signal processing for which the modulation-reduction based STI approach may fail.
Spectral subtraction and the second noise effect2.3.2
In noise reduction research, the motivation for the concept of spectral subtraction, as a means to restore the original speech envelope, is most convincing when only the first noise effect is considered. However, it will be shown that the second noise effect plays a crucial role in diminishing the expected benefits. In Fig. 2.5, the two panels in the upper row refer to the simplified image, only considering the first noise effect. The thin line represents a row of wavelet pixels defining the envelope of a small fragment of speech filtered ¼ octave around 1kHz. These pixels can be considered as the input pixels in the panels of Fig. 2.3. In condition 1 the speech pixels remain unchanged, in condition 2 the speech pixels are lifted by the mean noise intensity, indicated by the thick line in Fig. 2.5. Since perception of modulations involves top-valley ratios rather than top-valley differences, the effect of the envelope increment on perceived modulations can be illustrated by equalizing both mean intensities (panel B). reduced. In this simplified image, reducing the effect of noise is an extremely simple operation: estimate the mean noise intensity and subtract this from the speech+noise envelope.
DTP boek Signal-To-Noice DEF5.indd 17 22-10-2009 18:28:02
18
II. A detailed study on the effects of noise on speech intelligibility
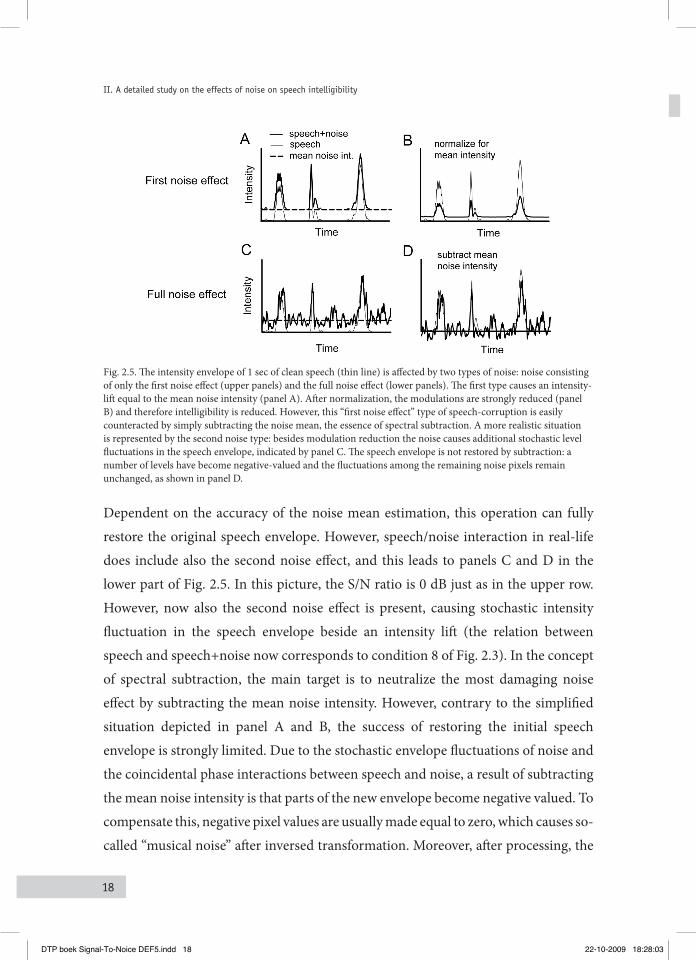
Fig. 2.5. The intensity envelope of 1 sec of clean speech (thin line) is affected by two types of noise: noise consisting of only the first noise effect (upper panels) and the full noise effect (lower panels). The first type causes an intensity-lift equal to the mean noise intensity (panel A). After normalization, the modulations are strongly reduced (panel B) and therefore intelligibility is reduced. However, this “first noise effect” type of speech-corruption is easily counteracted by simply subtracting the noise mean, the essence of spectral subtraction. A more realistic situation is represented by the second noise type: besides modulation reduction the noise causes additional stochastic level fluctuations in the speech envelope, indicated by panel C. The speech envelope is not restored by subtraction: a number of levels have become negative-valued and the fluctuations among the remaining noise pixels remain unchanged, as shown in panel D.
Dependent on the accuracy of the noise mean estimation, this operation can fully restore the original speech envelope. However, speech/noise interaction in real-life does include also the second noise effect, and this leads to panels C and D in the lower part of Fig. 2.5. In this picture, the S/N ratio is 0 dB just as in the upper row. However, now also the second noise effect is present, causing stochastic intensity fluctuation in the speech envelope beside an intensity lift (the relation between speech and speech+noise now corresponds to condition 8 of Fig. 2.3). In the concept of spectral subtraction, the main target is to neutralize the most damaging noise effect by subtracting the mean noise intensity. However, contrary to the simplified situation depicted in panel A and B, the success of restoring the initial speech envelope is strongly limited. Due to the stochastic envelope fluctuations of noise and the coincidental phase interactions between speech and noise, a result of subtracting the mean noise intensity is that parts of the new envelope become negative valued. To compensate this, negative pixel values are usually made equal to zero, which causes so-called “musical noise” after inversed transformation. Moreover, after processing, the
DTP boek Signal-To-Noice DEF5.indd 18 22-10-2009 18:28:03
19
2.3 Discussion
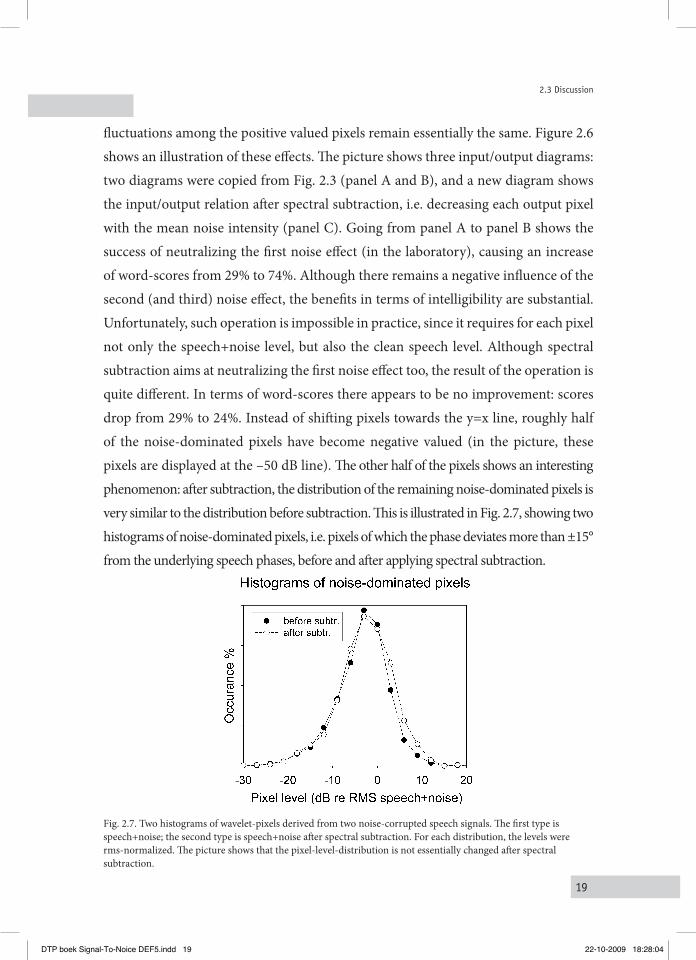
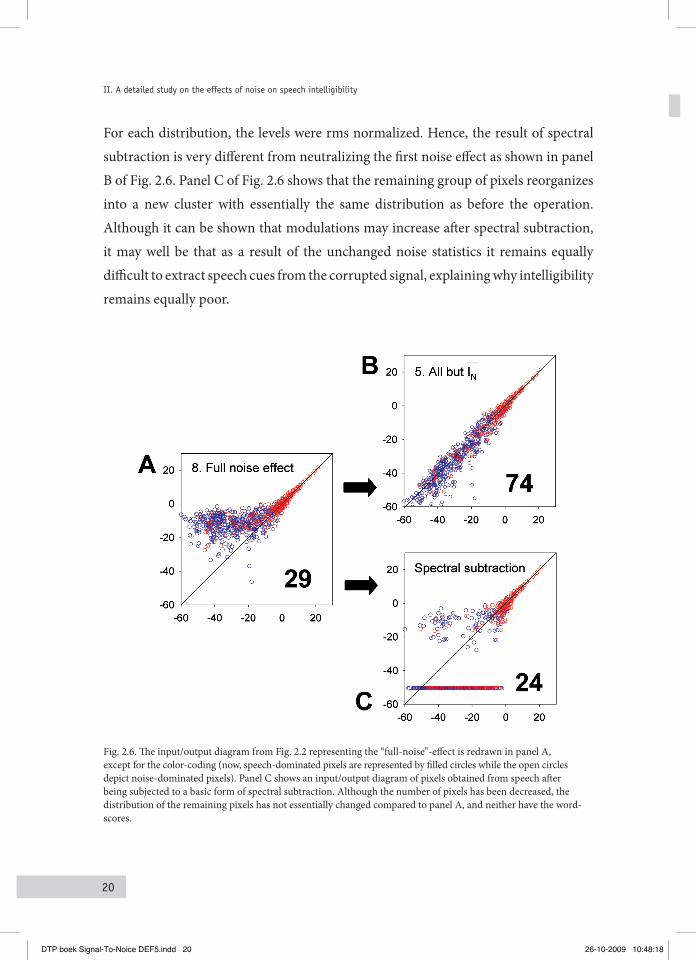
fluctuations among the positive valued pixels remain essentially the same. Figure 2.6 shows an illustration of these effects. The picture shows three input/output diagrams: two diagrams were copied from Fig. 2.3 (panel A and B), and a new diagram shows the input/output relation after spectral subtraction, i.e. decreasing each output pixel with the mean noise intensity (panel C). Going from panel A to panel B shows the success of neutralizing the first noise effect (in the laboratory), causing an increase of word-scores from 29% to 74%. Although there remains a negative influence of the second (and third) noise effect, the benefits in terms of intelligibility are substantial. Unfortunately, such operation is impossible in practice, since it requires for each pixel not only the speech+noise level, but also the clean speech level. Although spectral subtraction aims at neutralizing the first noise effect too, the result of the operation is quite different. In terms of word-scores there appears to be no improvement: scores drop from 29% to 24%. Instead of shifting pixels towards the y=x line, roughly half of the noise-dominated pixels have become negative valued (in the picture, these pixels are displayed at the –50 dB line). The other half of the pixels shows an interesting phenomenon: after subtraction, the distribution of the remaining noise-dominated pixels is very similar to the distribution before subtraction. This is illustrated in Fig. 2.7, showing two histograms of noise-dominated pixels, i.e. pixels of which the phase deviates more than ±15° from the underlying speech phases, before and after applying spectral subtraction.
Fig. 2.7. Two histograms of wavelet-pixels derived from two noise-corrupted speech signals. The first type is speech+noise; the second type is speech+noise after spectral subtraction. For each distribution, the levels were rms-normalized. The picture shows that the pixel-level-distribution is not essentially changed after spectral subtraction.
DTP boek Signal-To-Noice DEF5.indd 19 22-10-2009 18:28:04
20
II. A detailed study on the effects of noise on speech intelligibility
For each distribution, the levels were rms normalized. Hence, the result of spectral subtraction is very different from neutralizing the first noise effect as shown in panel B of Fig. 2.6. Panel C of Fig. 2.6 shows that the remaining group of pixels reorganizes into a new cluster with essentially the same distribution as before the operation. Although it can be shown that modulations may increase after spectral subtraction, it may well be that as a result of the unchanged noise statistics it remains equally difficult to extract speech cues from the corrupted signal, explaining why intelligibility remains equally poor.
Fig. 2.6. The input/output diagram from Fig. 2.2 representing the “full-noise”-effect is redrawn in panel A, except for the color-coding (now, speech-dominated pixels are represented by filled circles while the open circles depict noise-dominated pixels). Panel C shows an input/output diagram of pixels obtained from speech after being subjected to a basic form of spectral subtraction. Although the number of pixels has been decreased, the distribution of the remaining pixels has not essentially changed compared to panel A, and neither have the word-scores.
DTP boek Signal-To-Noice DEF5.indd 20 26-10-2009 10:48:18
21
2.4 Conclusions
concluSionS2.4 The effect of noise on speech was divided into three subeffects: (1) a systematic lift of the envelope equal to the mean noise intensity, (2) the introduction of stochastic envelope fluctuations and (3) the corruption of the finestructure. Wavelet Transformation provides a suitable analysis tool for isolating and identifying these effects, and a strong processing tool for modifying speech by each of these effects separately or in any combination. CVC listening experiments were performed for the various noise effects. It was found that the most detrimental effect of the three subeffects is the systematic envelope lift, as essential speech modulations are reduced as a result of this effect. However, the remaining two effects are not negligible, and appear to be especially detrimental in case of noise suppression. It is argued that especially the introduction of the stochastic level fluctuations prevents spectral subtraction to be successful in terms of improving speech perception in noise.
DTP boek Signal-To-Noice DEF5.indd 21 22-10-2009 18:28:09

22
DTP boek Signal-To-Noice DEF5.indd 22 22-10-2009 18:28:09
23
III. The concept of signal-to-noise ratio in the modulation domain and speech intelligibility
Abstract
A new concept is proposed that relates to intelligibility of speech in noise. The concept combines traditional estimations of signal-to-noise ratios (S/N) with elements from the Modulation Transfer Function model (MTF), which results in the definition of the signal-to-noise ratio in the modulation domain: the (S/N)mod. It is argued that this (S/N)mod, quantifying the strength of speech modulations relative to a floor of spurious modulations arising from the speech-noise interaction, is the key factor in relation to speech intelligibility. It is shown that, by using a specific test signal, the strength of these spurious modulations can be measured, allowing an estimation of the (S/N)mod for various conditions of additive noise, noise suppression and amplitude compression. By relating these results to intelligibility data for these same conditions, the relevance of the (S/N)mod as the key factor underlying speech intelligibility is clearly illustrated. For instance, it is shown that the commonly observed limited effect of noise suppression on speech intelligibility is correctly predicted by the (S/N)mod, whereas traditional measures such as the STI, considering only the changes in the speech modulations, fall short in this respect. It is argued that (S/N)mod may provide a relevant tool in the design of successful noise-suppression systems.
Journal of the Acoustical Society of America 124(6): 3937-3946, 2008
DTP boek Signal-To-Noice DEF5.indd 23 22-10-2009 18:28:09
24
III. The concept of signal-to-noise ratio in the modulation domain and speech intellibility
Introduction
The concept of MTF-STI (IEC, 2003) has proven to be successful in predicting intelligibility for a variety of practical situations, typically in noisy, reverberant or echoing enclosures, suggesting that the factors affecting speech intelligibility are understood completely. Although the idea of speech intelligibility being strongly related to the strength of temporal modulations within the intensity envelope of speech is generally accepted, this notion may be too optimistic, as STI-predictions can sometimes be completely misleading. For instance, for some forms of noise reduction the original speech modulations are largely restored, while intelligibility remains equally poor (WGCA, 1991; Levitt, 2001). Hence, the perceptual consequences of noise suppression schemes are not fully recognized by the STI (Steeneken, 1992). Drullman (1994a, 1994b), among others, explored the limits of the STI model by systematically manipulating the temporal envelope of continuous speech in various ways (smearing the envelope, reducing slow modulations) and found that the STI model may under- or overestimate intelligibility in specific conditions. Subsequently, it was demonstrated by Noordhoek and Drullman (1997), that reduced intelligibility of noise-corrupted speech can not fully be explained by reduced speech-modulations alone, but involves additional noise effects that are not considered by the STI, i.e. the introduction of nonrelevant modulations originating from speech-noise interactions – possibly inducing a ‘sorting problem’ – and the corruption of the speech carrier. The effect of the intrinsic envelope fluctuations of a noise carrier on the detection of amplitude modulation was studied by Dau and Verhey (1999), who performed modulation-detection threshold experiments for a variety of bandfiltered noise carriers, each with a specific modulation spectrum. It was concluded that the intrinsic envelope power of the carrier at the output of the modulation filter tuned to the signal modulation frequency provides a good estimate for the amplitude modulation detection threshold. Along this line, Ewert and Dau (2000) developed the EPSM (Envelope Power Spectrum Model), in which a certain signal-plus-noise-to-noise ratio in the modulation domain at the AM-detection threshold is assumed. In essence, their model predictions are based on estimations for the modulation noise power, derived indirectly from a formula by Lawson and Uhlenbeck (see Ewert and Dau, 2000) in
DTP boek Signal-To-Noice DEF5.indd 24 22-10-2009 18:28:10
25
3.1 Rationale and introduction of (S/N)mod
which a rectangular shape of the power spectrum of a Gaussian noise is assumed.Recently, it was suggested by Dubbelboer and Houtgast (2007) that these noise-induced modulations may be responsible for the limited effects of noise reduction – e.g. spectral subtraction – on intelligibility, explaining the subtraction paradox of Ludvigsen (1993). Spectral subtraction is one of the first “easy-to-implement” reduction schemes among single-microphone noise-reduction techniques and currently often used, especially in hearing aids and mobile phones. Ludvigsen showed that in spite of increased speech modulations and increased STI values the intelligibility of the output signal remained equally poor. In this chapter, a concept is proposed that may underlie this paradox by focussing on the interaction between speech and noise, and the consequence of this interaction for the perception of speech modulations. Understanding this mechanism may result in future models that can accurately predict intelligibility of noisy speech after being subjected to nonlinear processing in the laboratory, where current measures such as S/N and STI essentially fail, and may contribute to the optimization of noise reduction algorithms.
rationale anD introDuction of (S/n)3.1 MoD
Speech envelopes and the concept of the useful modulation area3.1.1
Continuous speech can be considered as a flow of sound with a specific spectrotemporal intensity pattern. This pattern contains temporal variations, corresponding to the rhythms of basic speech elements such as phonemes, syllables and words. The ear is suited to extract these structures in a way that can be compared with a filterbank analysis: breaking down the signal into a number of adjacent frequency bands. Each frequency band output consists of an envelope and a carrier. The envelope contains the modulations, which are considered essential for the intelligibility of speech. The carrier wave contains information about, for instance, the pitch. Frequency analysis performed on the (intensity) envelope of a frequency-band output displays the modulation content within that band in a modulation-frequency spectrum (the envelope spectrum). Thinking about speech in terms of envelopes and envelope
DTP boek Signal-To-Noice DEF5.indd 25 22-10-2009 18:28:10
26
III. The concept of signal-to-noise ratio in the modulation domain and speech intellibility
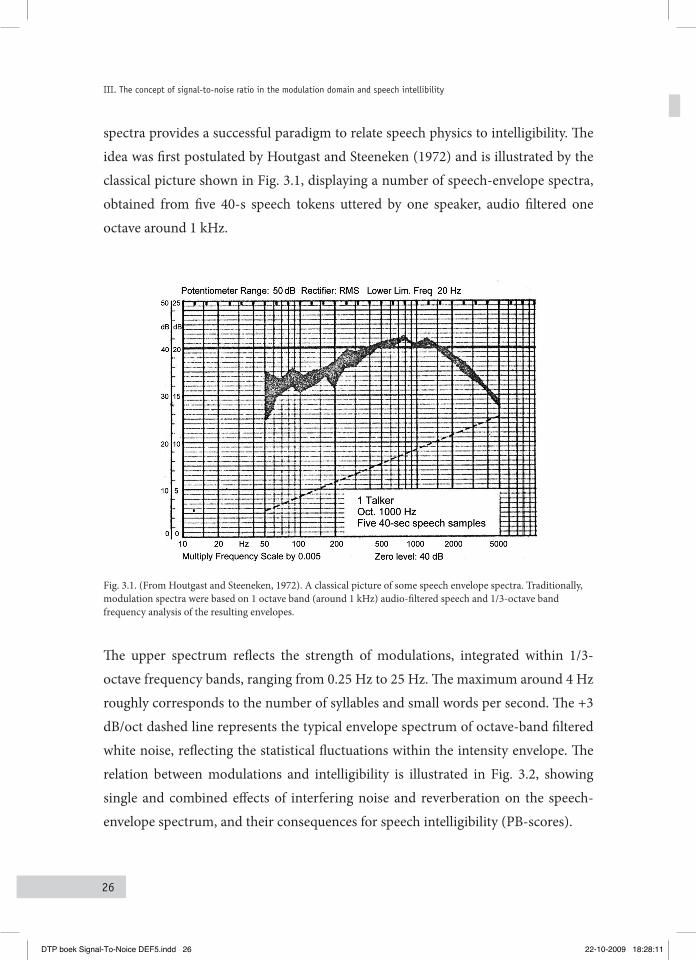
spectra provides a successful paradigm to relate speech physics to intelligibility. The idea was first postulated by Houtgast and Steeneken (1972) and is illustrated by the classical picture shown in Fig. 3.1, displaying a number of speech-envelope spectra, obtained from five 40-s speech tokens uttered by one speaker, audio filtered one octave around 1 kHz.
Fig. 3.1. (From Houtgast and Steeneken, 1972). A classical picture of some speech envelope spectra. Traditionally, modulation spectra were based on 1 octave band (around 1 kHz) audio-filtered speech and 1/3-octave band frequency analysis of the resulting envelopes.
The upper spectrum reflects the strength of modulations, integrated within 1/3-octave frequency bands, ranging from 0.25 Hz to 25 Hz. The maximum around 4 Hz roughly corresponds to the number of syllables and small words per second. The +3 dB/oct dashed line represents the typical envelope spectrum of octave-band filtered white noise, reflecting the statistical fluctuations within the intensity envelope. The relation between modulations and intelligibility is illustrated in Fig. 3.2, showing single and combined effects of interfering noise and reverberation on the speech-envelope spectrum, and their consequences for speech intelligibility (PB-scores).
DTP boek Signal-To-Noice DEF5.indd 26 22-10-2009 18:28:11
27
3.1 Rationale and introduction of (S/N)mod
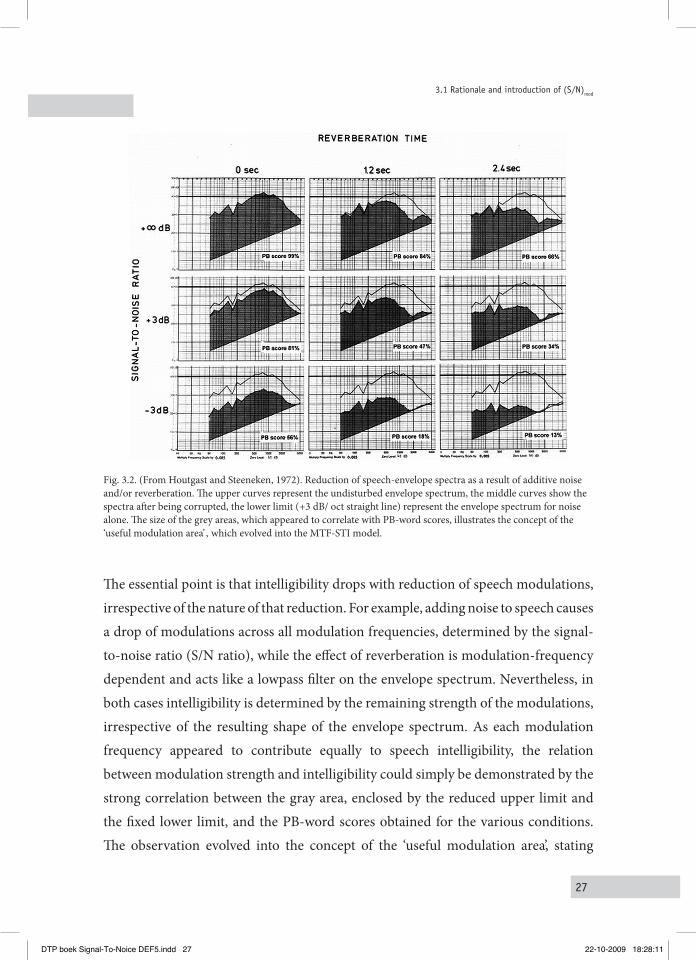
Fig. 3.2. (From Houtgast and Steeneken, 1972). Reduction of speech-envelope spectra as a result of additive noise and/or reverberation. The upper curves represent the undisturbed envelope spectrum, the middle curves show the spectra after being corrupted, the lower limit (+3 dB/ oct straight line) represent the envelope spectrum for noise alone. The size of the grey areas, which appeared to correlate with PB-word scores, illustrates the concept of the ‘useful modulation area’ , which evolved into the MTF-STI model.
The essential point is that intelligibility drops with reduction of speech modulations, irrespective of the nature of that reduction. For example, adding noise to speech causes a drop of modulations across all modulation frequencies, determined by the signal-to-noise ratio (S/N ratio), while the effect of reverberation is modulation-frequency dependent and acts like a lowpass filter on the envelope spectrum. Nevertheless, in both cases intelligibility is determined by the remaining strength of the modulations, irrespective of the resulting shape of the envelope spectrum. As each modulation frequency appeared to contribute equally to speech intelligibility, the relation between modulation strength and intelligibility could simply be demonstrated by the strong correlation between the gray area, enclosed by the reduced upper limit and the fixed lower limit, and the PB-word scores obtained for the various conditions. The observation evolved into the concept of the ‘useful modulation area’, stating
DTP boek Signal-To-Noice DEF5.indd 27 22-10-2009 18:28:11
28
III. The concept of signal-to-noise ratio in the modulation domain and speech intellibility
that exclusively the fraction of relevant modulations (upper limit) that exceeds the noise-envelope spectrum (lower limit) contributes to speech intelligibility. The larger the area size, the better the intelligibility. Generally, the S/N range between –15 dB and +15 dB S/N is considered to be relevant for speech perception. For lower S/N, the upper limit starts to coincide with the lower limit. At that point, the remaining envelope spectrum is completely determined by random fluctuations within the noise envelope. Historically, the idea of a useful modulation area led to the development of the STI as a measure to predict intelligibility in suboptimal acoustical environments. As the lower limit of the useful modulation area was considered fixed, the model was exclusively based on the shift of the upper limit: the reduction of the speech-envelope spectrum. To understand why the STI fails in case of spectral subtraction, the interaction between speech and noise is considered in the light of this STI fundament.
Spectral subtraction and the modulation floor3.1.2
Three envelope spectra were computed for speech in different conditions. First, clean speech was filtered in the audio domain, resulting in a number of 1/3-octave frequency bands. The frequency band around 1 kHz was subjected to Hilbert transform, and the magnitude of the analytic signal was squared and lowpass filtered. Frequency analysis of the resulting intensity envelope yielded frequency components that were integrated within octave bands and normalized for the mean intensity afterwards, yielding a speech-envelope spectrum as presented in panel A of Fig. 3.31.
1 Note that the modulation-frequency-bandwidth is one octave rather than the 1/3-octave bands shown in previous pictures, in order to relate more closely to auditory processing of temporal modulations (Houtgast and Steeneken, 1985; Houtgast, 1989; Dau et al., 1997). Also for this reason, speech was filtered in 1/3-octave bands in the audio-domain, instead of the traditional octave-band on which Fig. 3.1 and Fig. 3.2 were based. However, these choices are not relevant for the main message of this chapter.
DTP boek Signal-To-Noice DEF5.indd 28 22-10-2009 18:28:12
29
3.1 Rationale and introduction of (S/N)mod
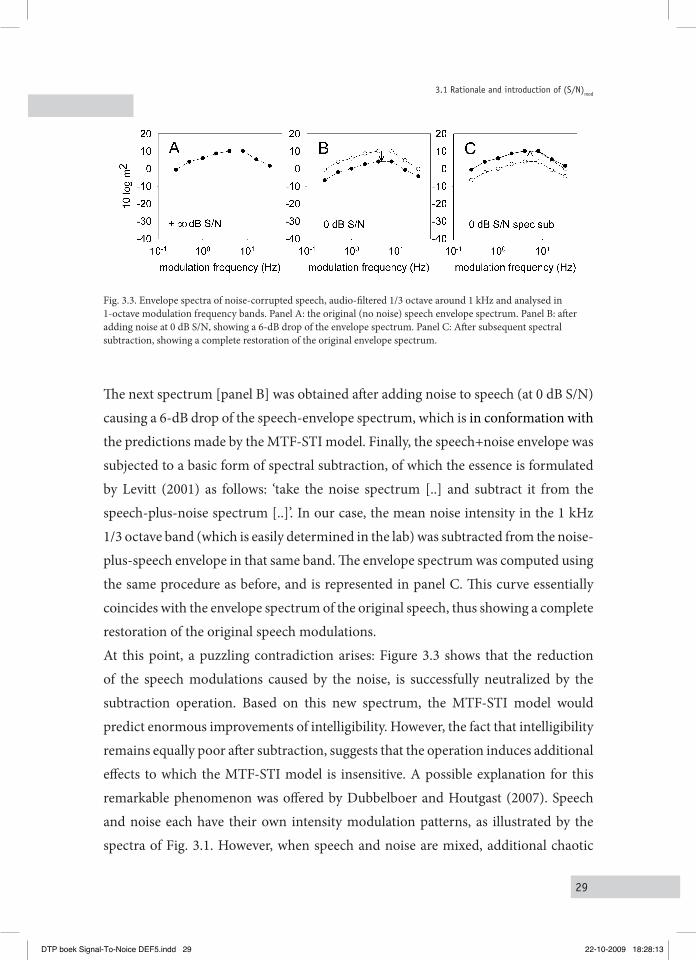
Fig. 3.3. Envelope spectra of noise-corrupted speech, audio-filtered 1/3 octave around 1 kHz and analysed in 1-octave modulation frequency bands. Panel A: the original (no noise) speech envelope spectrum. Panel B: after adding noise at 0 dB S/N, showing a 6-dB drop of the envelope spectrum. Panel C: After subsequent spectral subtraction, showing a complete restoration of the original envelope spectrum.
The next spectrum [panel B] was obtained after adding noise to speech (at 0 dB S/N) causing a 6-dB drop of the speech-envelope spectrum, which is in conformation with the predictions made by the MTF-STI model. Finally, the speech+noise envelope was subjected to a basic form of spectral subtraction, of which the essence is formulated by Levitt (2001) as follows: ‘take the noise spectrum [..] and subtract it from the speech-plus-noise spectrum [..]’. In our case, the mean noise intensity in the 1 kHz 1/3 octave band (which is easily determined in the lab) was subtracted from the noise-plus-speech envelope in that same band. The envelope spectrum was computed using the same procedure as before, and is represented in panel C. This curve essentially coincides with the envelope spectrum of the original speech, thus showing a complete restoration of the original speech modulations.At this point, a puzzling contradiction arises: Figure 3.3 shows that the reduction of the speech modulations caused by the noise, is successfully neutralized by the subtraction operation. Based on this new spectrum, the MTF-STI model would predict enormous improvements of intelligibility. However, the fact that intelligibility remains equally poor after subtraction, suggests that the operation induces additional effects to which the MTF-STI model is insensitive. A possible explanation for this remarkable phenomenon was offered by Dubbelboer and Houtgast (2007). Speech and noise each have their own intensity modulation patterns, as illustrated by the spectra of Fig. 3.1. However, when speech and noise are mixed, additional chaotic
DTP boek Signal-To-Noice DEF5.indd 29 22-10-2009 18:28:13
30
III. The concept of signal-to-noise ratio in the modulation domain and speech intellibility
modulations arise from the interaction between the respective waveforms, as a result of the statistical nature of noise. The new envelope contains a combination of speech modulations and spurious modulations (i.e., noise modulations and interaction modulations). It was argued that spectral subtraction does not only increase the strength of the speech modulations, but may also increase the strength of the spurious modulations. It may be that, if their relative strength remains unchanged, it remains equally difficult for a listener to extract essential speech cues from the corrupted signal, resulting in equally poor intelligibility. To verify this hypothesis, one should add noise to a speech signal and monitor the relative strength of the speech modulations and the nonspeech modulations in various conditions. Normally, in the audio domain, the relative strength between speech and noise is defined as an S/N ratio based on the intensities of speech and noise before mixing. However, this principle does not apply in the modulation domain, as an essential part of the nonspeech modulations originate from the interaction between speech and noise: these modulations do not exist until speech and noise are actually mixed. So, contrary to the signal-to-noise ratio in the audio domain, the signal-to-noise ratio in the modulation domain2 can – in principal – not be computed from speech and noise alone. It seems that the only way to determine the relative strength of the floor of spurious modulations, which lies below the speech envelope spectrum, is by monitoring the behavior of these modulations within the noisy-speech envelope itself, for instance by looking through a ‘peephole’ in the speech-envelope spectrum. For this purpose, a testsignal was designed comprising speech with a ‘hole’ in the envelope spectrum, which was realized by bandstop filtering the temporal envelope. In essence, the envelope spectrum of this signal is similar to that of unmodified speech, except for one modulation band, which is completely suppressed. Constructing peephole speech involves a frequency analysis of the speech-intensity envelope, suppression of the modulations in the 4-Hz octave band, and retransformation of the new spectrum into the intensity envelope domain. An example of a peephole speech envelope is shown in Fig. 3.4 (compare to Fig. 3.3, panel A).
2 In fact a speech-to-non-speech modulation ratio.
DTP boek Signal-To-Noice DEF5.indd 30 22-10-2009 18:28:14
31
3.1 Rationale and introduction of (S/N)mod
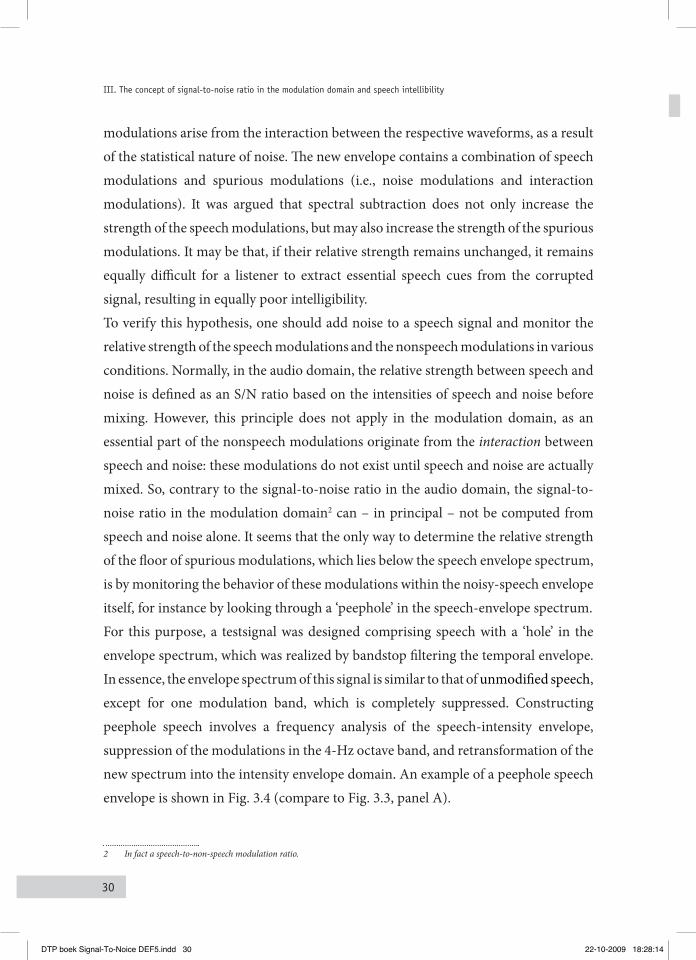
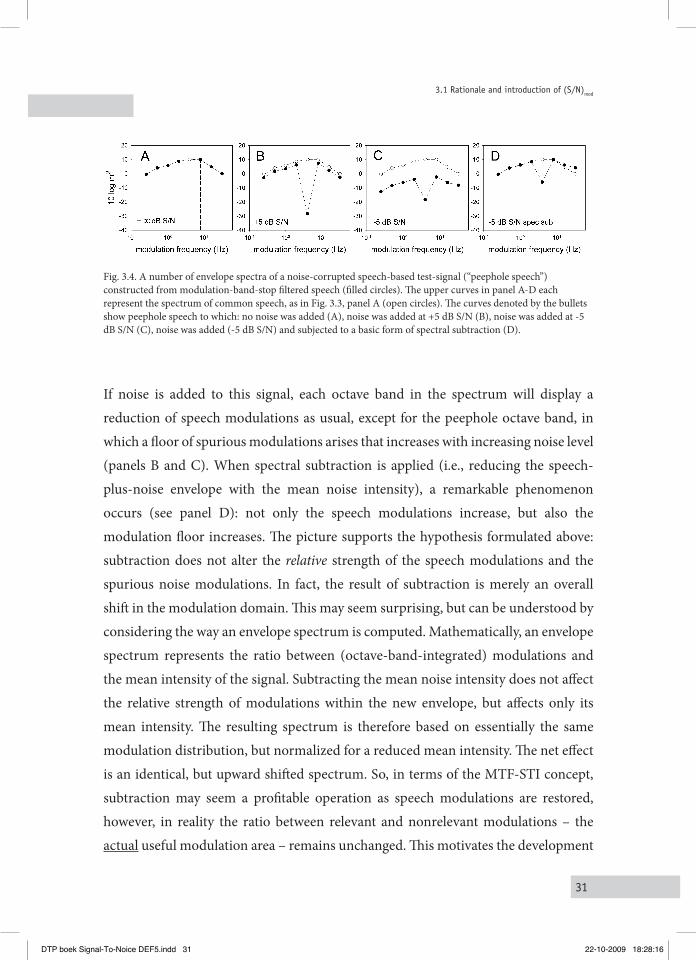
Fig. 3.4. A number of envelope spectra of a noise-corrupted speech-based test-signal (“peephole speech”) constructed from modulation-band-stop filtered speech (filled circles). The upper curves in panel A-D each represent the spectrum of common speech, as in Fig. 3.3, panel A (open circles). The curves denoted by the bullets show peephole speech to which: no noise was added (A), noise was added at +5 dB S/N (B), noise was added at -5 dB S/N (C), noise was added (-5 dB S/N) and subjected to a basic form of spectral subtraction (D).
If noise is added to this signal, each octave band in the spectrum will display a reduction of speech modulations as usual, except for the peephole octave band, in which a floor of spurious modulations arises that increases with increasing noise level (panels B and C). When spectral subtraction is applied (i.e., reducing the speech-plus-noise envelope with the mean noise intensity), a remarkable phenomenon occurs (see panel D): not only the speech modulations increase, but also the modulation floor increases. The picture supports the hypothesis formulated above: subtraction does not alter the relative strength of the speech modulations and the spurious noise modulations. In fact, the result of subtraction is merely an overall shift in the modulation domain. This may seem surprising, but can be understood by considering the way an envelope spectrum is computed. Mathematically, an envelope spectrum represents the ratio between (octave-band-integrated) modulations and the mean intensity of the signal. Subtracting the mean noise intensity does not affect the relative strength of modulations within the new envelope, but affects only its mean intensity. The resulting spectrum is therefore based on essentially the same modulation distribution, but normalized for a reduced mean intensity. The net effect is an identical, but upward shifted spectrum. So, in terms of the MTF-STI concept, subtraction may seem a profitable operation as speech modulations are restored, however, in reality the ratio between relevant and nonrelevant modulations – the actual useful modulation area – remains unchanged. This motivates the development
DTP boek Signal-To-Noice DEF5.indd 31 22-10-2009 18:28:16
32
III. The concept of signal-to-noise ratio in the modulation domain and speech intellibility
of a concept that relates intelligibility to the ratio between relevant and nonrelevant modulations: the signal-to-noise ratio in the modulation domain.
Concept of (S/N)3.1.3 mod, the signal-to-noise ratio in the modulation domain
For common noisy speech signals, the strength of the modulation in the 4-Hz octave band is roughly equal to the strength in the two adjacent bands (see Fig. 3.3). To get an impression of the relative strength of the speech- and the nonspeech modulations within the 4-Hz band, one could consider panel B or C of Fig. 3.4 and determine the ratio between an interpolation of the 2 Hz and 8 Hz modulation strengths and the strength of the modulation floor. The effect of spectral subtraction on the speech modulations and noise modulations was successfully illustrated above by using the peephole speech approach. However, during further analysis with other types of processing, it appeared that the peephole approach can be used for illustrative purposes only. Problems related to envelope filtering have extensively been analyzed by Ghitza (2001), who showed that effects of envelope filtering (after separating the envelope from the carrier) largely reduce after combining the envelope and the carrier again for transformation back into time domain, demonstrating that much of the modulation information is preserved in the carrier, i.e. in the signal phase. This effect does not play a role in our peephole-speech demonstration, as the operation is entirely performed in the modulation domain, but would play a role when evaluating processing schemes in time domain. Therefore, a new deterministic test signal was designed that could produce relevant quantitative data on a variety of processing types. Panel A of Fig. 3.5 shows a one second segment of this test signal: a 1 kHz carrier with a 4-Hz sinusoidal intensity modulation.
DTP boek Signal-To-Noice DEF5.indd 32 22-10-2009 18:28:17
33
3.1 Rationale and introduction of (S/N)mod
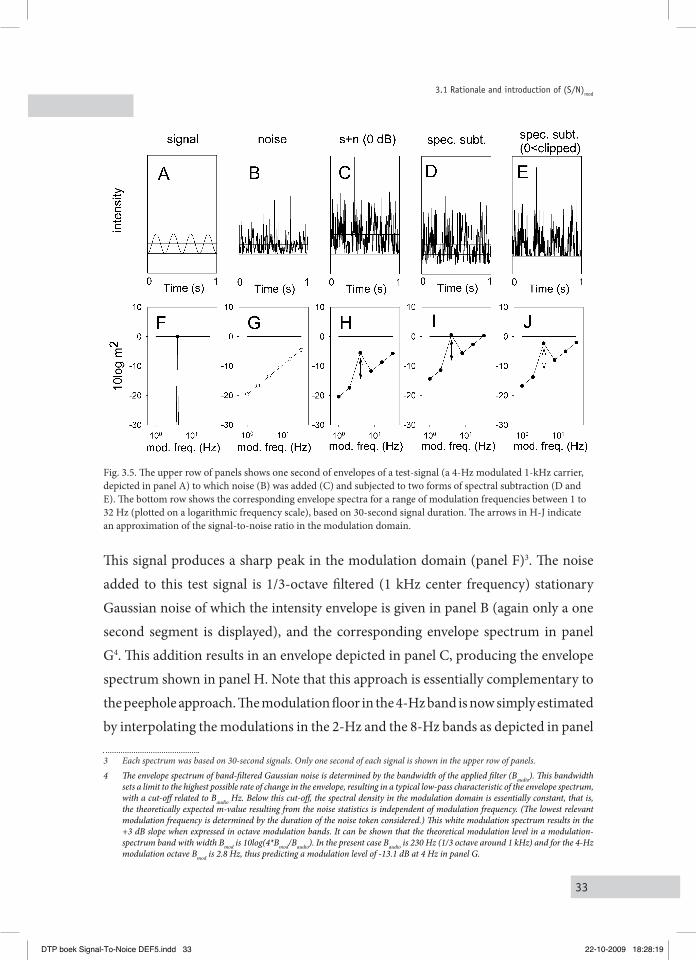
Fig. 3.5. The upper row of panels shows one second of envelopes of a test-signal (a 4-Hz modulated 1-kHz carrier, depicted in panel A) to which noise (B) was added (C) and subjected to two forms of spectral subtraction (D and E). The bottom row shows the corresponding envelope spectra for a range of modulation frequencies between 1 to 32 Hz (plotted on a logarithmic frequency scale), based on 30-second signal duration. The arrows in H-J indicate an approximation of the signal-to-noise ratio in the modulation domain.
This signal produces a sharp peak in the modulation domain (panel F)3. The noise added to this test signal is 1/3-octave filtered (1 kHz center frequency) stationary Gaussian noise of which the intensity envelope is given in panel B (again only a one second segment is displayed), and the corresponding envelope spectrum in panel G4. This addition results in an envelope depicted in panel C, producing the envelope spectrum shown in panel H. Note that this approach is essentially complementary to the peephole approach. The modulation floor in the 4-Hz band is now simply estimated by interpolating the modulations in the 2-Hz and the 8-Hz bands as depicted in panel
3 Each spectrum was based on 30-second signals. Only one second of each signal is shown in the upper row of panels.4 The envelope spectrum of band-filtered Gaussian noise is determined by the bandwidth of the applied filter (Baudio). This bandwidth
sets a limit to the highest possible rate of change in the envelope, resulting in a typical low-pass characteristic of the envelope spectrum, with a cut-off related to Baudio Hz. Below this cut-off, the spectral density in the modulation domain is essentially constant, that is, the theoretically expected m-value resulting from the noise statistics is independent of modulation frequency. (The lowest relevant modulation frequency is determined by the duration of the noise token considered.) This white modulation spectrum results in the +3 dB slope when expressed in octave modulation bands. It can be shown that the theoretical modulation level in a modulation-spectrum band with width Bmod is 10log(4*Bmod/Baudio). In the present case Baudio is 230 Hz (1/3 octave around 1 kHz) and for the 4-Hz modulation octave Bmod is 2.8 Hz, thus predicting a modulation level of -13.1 dB at 4 Hz in panel G.
DTP boek Signal-To-Noice DEF5.indd 33 22-10-2009 18:28:19
34
III. The concept of signal-to-noise ratio in the modulation domain and speech intellibility
H. The distance between the peak and this interpolated noise floor provides a rough estimate of the signal-to-noise ratio in the modulation domain. Applying spectral subtraction (reducing the s+n envelope in panel C with the mean noise intensity from panel B, resulting in the envelope in panel D) does not change this ratio, which is in agreement with the previous observations: the entire envelope spectrum is shifted up by 6 dB (panel I), emphasizing the general nature of the phenomenon. Note that unwanted side effects of subtraction appear in panel D: negative valued intensities. These values principally obstruct synthesis of audible signals, a problem that is commonly counteracted by zero clipping, which is illustrated in panel E. It was shown by Dubbelboer and Houtgast (2007) that the noise distribution within a zero-clipped noisy speech envelope does not essentially differ from the unclipped and unprocessed versions, which is illustrated by the unchanged ratio between peak- and floor modulations (as illustrated by the arrows in panels H, I and J). Hence, it appears that the phenomena observed for peephole speech can also be shown for an artificial probe envelope with the advantage of producing reliable estimates of the modulation floor for a wide range of S/N. Panel A of Fig. 3.6 shows a series of modulation spectra as a function of S/N (note the reversed scaling on the x-axis), derived in the same way as the envelope spectrum for 0 dB S/N in panel H of Fig. 3.5.
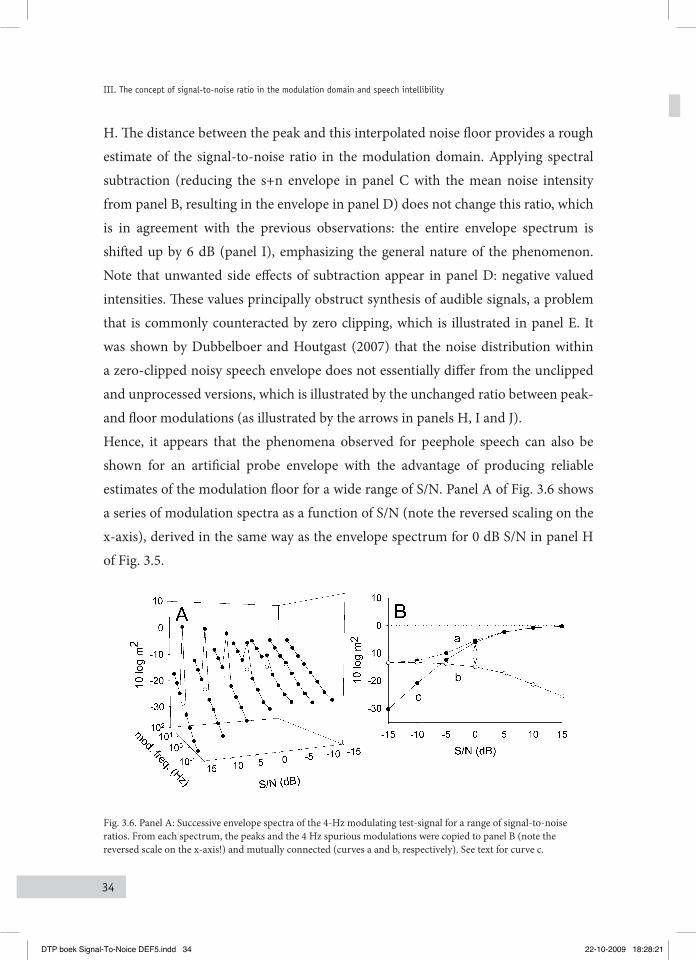
Fig. 3.6. Panel A: Successive envelope spectra of the 4-Hz modulating test-signal for a range of signal-to-noise ratios. From each spectrum, the peaks and the 4 Hz spurious modulations were copied to panel B (note the reversed scale on the x-axis!) and mutually connected (curves a and b, respectively). See text for curve c.
DTP boek Signal-To-Noice DEF5.indd 34 22-10-2009 18:28:21
35
3.1 Rationale and introduction of (S/N)mod
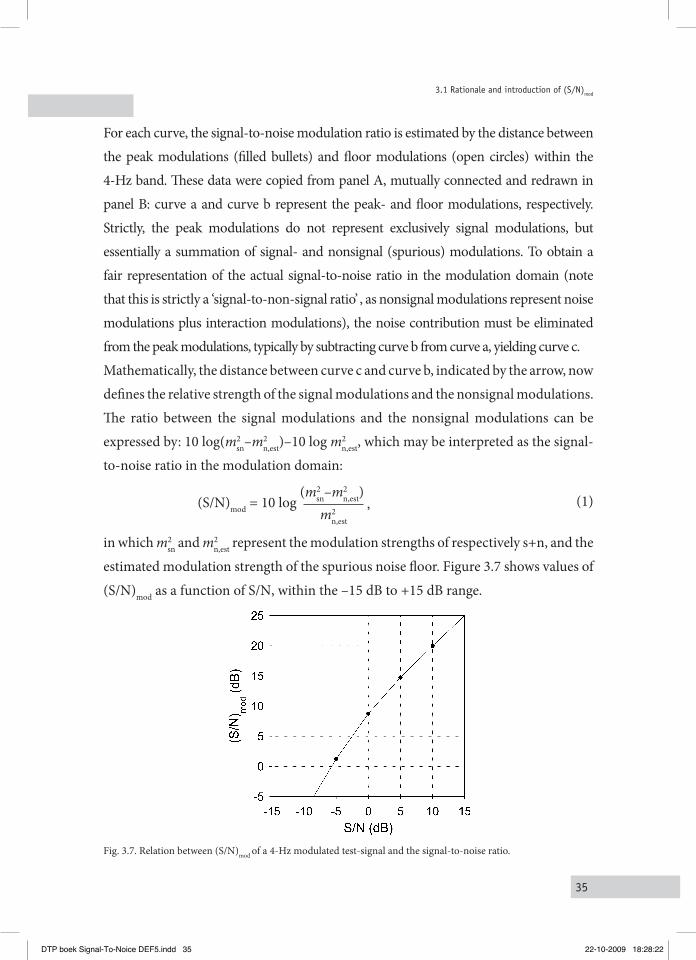
For each curve, the signal-to-noise modulation ratio is estimated by the distance between the peak modulations (filled bullets) and floor modulations (open circles) within the 4-Hz band. These data were copied from panel A, mutually connected and redrawn in panel B: curve a and curve b represent the peak- and floor modulations, respectively. Strictly, the peak modulations do not represent exclusively signal modulations, but essentially a summation of signal- and nonsignal (spurious) modulations. To obtain a fair representation of the actual signal-to-noise ratio in the modulation domain (note that this is strictly a ‘signal-to-non-signal ratio’ , as nonsignal modulations represent noise modulations plus interaction modulations), the noise contribution must be eliminated from the peak modulations, typically by subtracting curve b from curve a, yielding curve c. Mathematically, the distance between curve c and curve b, indicated by the arrow, now defines the relative strength of the signal modulations and the nonsignal modulations. The ratio between the signal modulations and the nonsignal modulations can be expressed by: 10 log(m2
sn–m2n,est)–10 log m
2n,est, which may be interpreted as the signal-
to-noise ratio in the modulation domain:
(S/N)mod = 10 log (m2
sn–m2n,est) (1) , m2
n,est
in which m2sn and m2
n,est represent the modulation strengths of respectively s+n, and the
estimated modulation strength of the spurious noise floor. Figure 3.7 shows values of
(S/N)mod as a function of S/N, within the –15 dB to +15 dB range.
Fig. 3.7. Relation between (S/N)mod of a 4-Hz modulated test-signal and the signal-to-noise ratio.
DTP boek Signal-To-Noice DEF5.indd 35 22-10-2009 18:28:22
36
III. The concept of signal-to-noise ratio in the modulation domain and speech intellibility
The position of the curve depends on the characteristics of the testsignal. Note that extremely high (S/N)mod values – due to extremely low spurious modulations – will be limited in practice by the ‘effective dynamic modulation range’ being restricted by the modulation threshold, i.e. the modulation equivalent of the effective dynamic range in the audio domain being restricted by the hearing threshold. I will return to this point in Sec. 3.2.2.
Verification of the releVance of (S/n)3.2 MoD
This chapter is about relating the physical changes associated with disturbing a signal to intelligibility. Although this seems straightforward when the signal is speech, the relation may seem less obvious when using an artificial probe signal. However, the success of the MTF-STI model indicates that applying artificial probes (sinewave modulated envelopes) to predict the intelligibility of speech can be most functional. This can be understood by considering the fact that the STI model considers exclusively intensity envelopes. In the intensity domain, a summation of uncorrelated signals (e.g. speech and noise) is, on average, a linear operation, therefore the effect on the envelope spectrum can be considered as the result of an attenuation filter acting on the original envelope spectrum, irrespective of the nature of the input signal. That attenuation filter is defined by the distortions (S/N ratio, degree of reverberation), and applies to the envelope spectrum of any signal subjected to the same degree of noise and/or reverberation. So, observed modulation reductions of any signal envelope also apply to the speech envelope, and are thus relevant for speech perception. In this line of thinking, the current section will expand on the relation between intelligibility and the (S/N)mod derived for our 4-Hz modulated test probe. (S/N)mod’s were computed for signals that were subjected to various types of signal processing. The results are compared to intelligibility data from the literature and will be discussed briefly and qualitatively. It should be noted that the level distribution of our sine wave shaped envelope obviously differs from that of 1/3-octave-band filtered speech, leading to different absolute (S/N)mod values. As a concept is proposed in this chapter, rather than a fully defined quantitative model, particular the changes of the
DTP boek Signal-To-Noice DEF5.indd 36 22-10-2009 18:28:22
37
3.2 Verification of the relevance of (S/N)mod
(S/N)mod for the 4-Hz modulated test probe (improvement, degradation or no change) will be discussed for certain types of processing, rather than on exact predictions of intelligibility.
Spectral subtraction and speech intelligibility3.2.1
Some aspects of spectral subtraction were discussed above in Sec. 3.1.2. In a listening experiment performed by Dubbelboer and Houtgast (2007), CVC word lists (consonant-vowel-consonants test words, spoken in a brief carrier phrase) were corrupted with stationary Gaussian noise and processed. Scores for the unprocessed conditions at –4 dB and –7 dB S/N were 29% and 15%, respectively. After spectral subtraction, scores remained essentially unchanged (24% and 16% respectively), which is in agreement with literature. Then, (S/N)mod’s were obtained for the 4-Hz modulated test probe subjected to the same processing: for –7 dB S/N, the (S/N)mod was –2.1 dB both before and after spectral subtraction, and +3.2 dB for –4 dB S/N, again with no effect of spectral subtraction. The overall picture being that equal (S/N)mod corresponds with equal intelligibility.
Deterministic and noise induced modulation reduction3.2.2
According to the traditional concept of useful modulations in the MTF-STI model, noise affects intelligibility of speech in only one way: it reduces the strength of modulations that are required for perception. The concept also states that the nature of the modulation reduction is irrelevant. To verify this, Noordhoek and Drullman (1997) performed a listening experiment using speech stimuli in which the modulations were reduced in two different ways: simply by adding noise (stochastic reduction) and by compressing the intensity envelope (deterministic reduction). They argued that, according to the traditional concept, both reduction types should equally affect intelligibility. They used the sentence lists as commonly applied in measuring the Speech Reception Threshold SRT (Plomp and Mimpen, 1979). First, the speech envelopes were compressed by a factor referred to as modulation reduction factor mdet, and then a noise reduction factor mstoch was imposed by gradually adding noise. By varying the amount of noise, the SRT was determined: the S/N ratio for which
DTP boek Signal-To-Noice DEF5.indd 37 22-10-2009 18:28:23
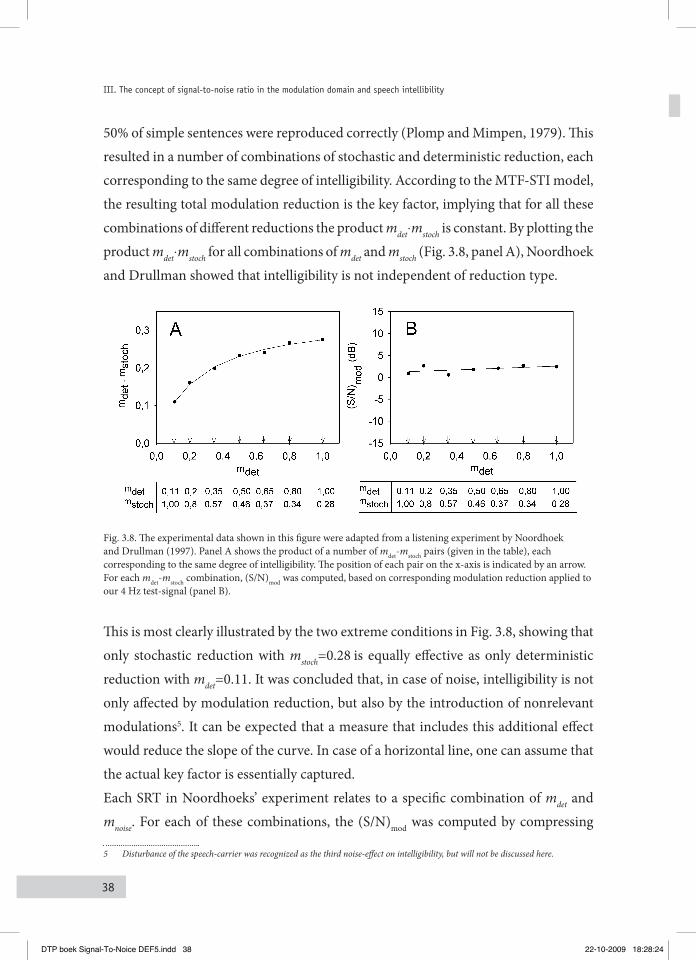
38
III. The concept of signal-to-noise ratio in the modulation domain and speech intellibility
50% of simple sentences were reproduced correctly (Plomp and Mimpen, 1979). This resulted in a number of combinations of stochastic and deterministic reduction, each corresponding to the same degree of intelligibility. According to the MTF-STI model, the resulting total modulation reduction is the key factor, implying that for all these combinations of different reductions the product mdet⋅mstoch is constant. By plotting the product mdet⋅mstoch for all combinations of mdet and mstoch (Fig. 3.8, panel A), Noordhoek and Drullman showed that intelligibility is not independent of reduction type.
Fig. 3.8. The experimental data shown in this figure were adapted from a listening experiment by Noordhoek and Drullman (1997). Panel A shows the product of a number of mdet-mstoch pairs (given in the table), each corresponding to the same degree of intelligibility. The position of each pair on the x-axis is indicated by an arrow. For each mdet-mstoch combination, (S/N)mod was computed, based on corresponding modulation reduction applied to our 4 Hz test-signal (panel B).
This is most clearly illustrated by the two extreme conditions in Fig. 3.8, showing that only stochastic reduction with mstoch=0.28 is equally effective as only deterministic reduction with mdet=0.11. It was concluded that, in case of noise, intelligibility is not only affected by modulation reduction, but also by the introduction of nonrelevant modulations5. It can be expected that a measure that includes this additional effect would reduce the slope of the curve. In case of a horizontal line, one can assume that the actual key factor is essentially captured. Each SRT in Noordhoeks’ experiment relates to a specific combination of mdet and mnoise. For each of these combinations, the (S/N)mod was computed by compressing
5 Disturbance of the speech-carrier was recognized as the third noise-effect on intelligibility, but will not be discussed here.
DTP boek Signal-To-Noice DEF5.indd 38 22-10-2009 18:28:24
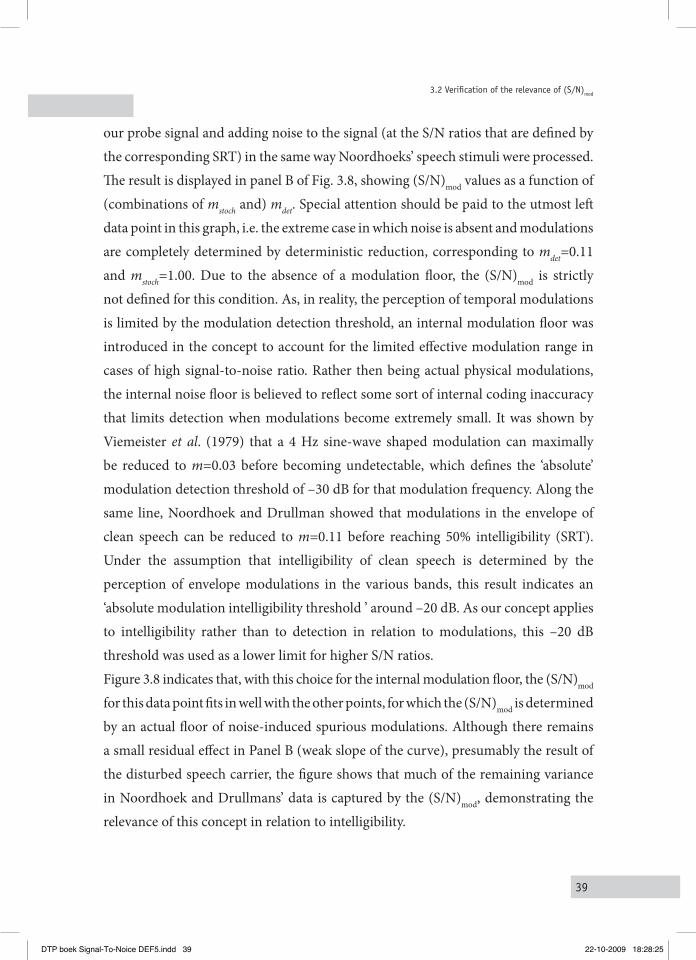
39
3.2 Verification of the relevance of (S/N)mod
our probe signal and adding noise to the signal (at the S/N ratios that are defined by the corresponding SRT) in the same way Noordhoeks’ speech stimuli were processed. The result is displayed in panel B of Fig. 3.8, showing (S/N)mod values as a function of (combinations of mstoch and) mdet. Special attention should be paid to the utmost left data point in this graph, i.e. the extreme case in which noise is absent and modulations are completely determined by deterministic reduction, corresponding to mdet=0.11 and mstoch=1.00. Due to the absence of a modulation floor, the (S/N)mod is strictly not defined for this condition. As, in reality, the perception of temporal modulations is limited by the modulation detection threshold, an internal modulation floor was introduced in the concept to account for the limited effective modulation range in cases of high signal-to-noise ratio. Rather then being actual physical modulations, the internal noise floor is believed to reflect some sort of internal coding inaccuracy that limits detection when modulations become extremely small. It was shown by Viemeister et al. (1979) that a 4 Hz sine-wave shaped modulation can maximally be reduced to m=0.03 before becoming undetectable, which defines the ‘absolute’ modulation detection threshold of –30 dB for that modulation frequency. Along the same line, Noordhoek and Drullman showed that modulations in the envelope of clean speech can be reduced to m=0.11 before reaching 50% intelligibility (SRT). Under the assumption that intelligibility of clean speech is determined by the perception of envelope modulations in the various bands, this result indicates an ‘absolute modulation intelligibility threshold ’ around –20 dB. As our concept applies to intelligibility rather than to detection in relation to modulations, this –20 dB threshold was used as a lower limit for higher S/N ratios.Figure 3.8 indicates that, with this choice for the internal modulation floor, the (S/N)mod for this data point fits in well with the other points, for which the (S/N)mod is determined by an actual floor of noise-induced spurious modulations. Although there remains a small residual effect in Panel B (weak slope of the curve), presumably the result of the disturbed speech carrier, the figure shows that much of the remaining variance in Noordhoek and Drullmans’ data is captured by the (S/N)mod, demonstrating the relevance of this concept in relation to intelligibility.
DTP boek Signal-To-Noice DEF5.indd 39 22-10-2009 18:28:25
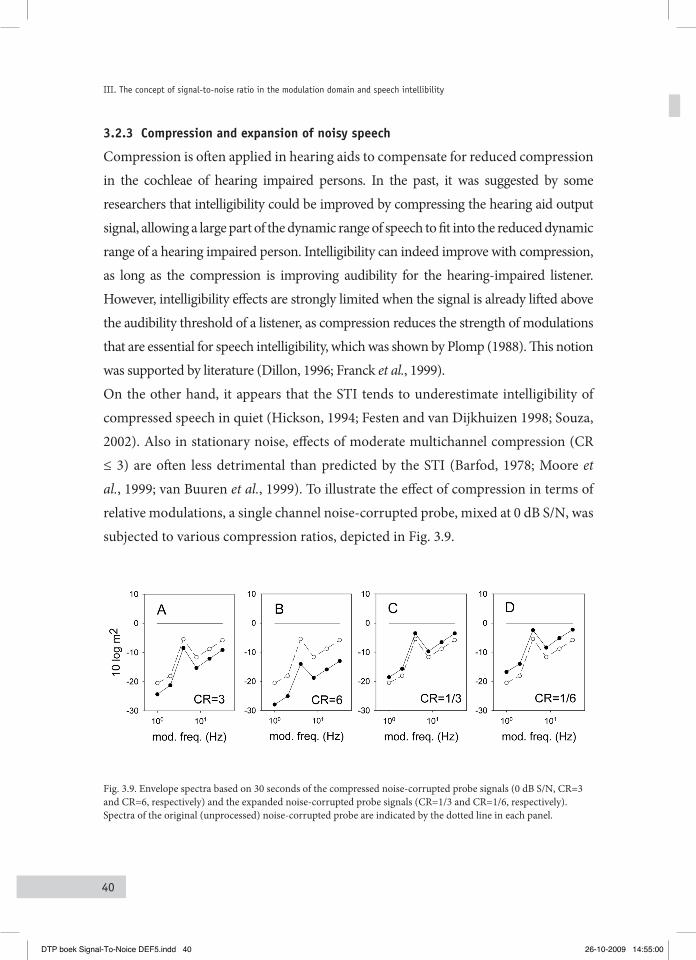
40
III. The concept of signal-to-noise ratio in the modulation domain and speech intellibility
Compression and expansion of noisy speech3.2.3
Compression is often applied in hearing aids to compensate for reduced compression in the cochleae of hearing impaired persons. In the past, it was suggested by some researchers that intelligibility could be improved by compressing the hearing aid output signal, allowing a large part of the dynamic range of speech to fit into the reduced dynamic range of a hearing impaired person. Intelligibility can indeed improve with compression, as long as the compression is improving audibility for the hearing-impaired listener. However, intelligibility effects are strongly limited when the signal is already lifted above the audibility threshold of a listener, as compression reduces the strength of modulations that are essential for speech intelligibility, which was shown by Plomp (1988). This notion was supported by literature (Dillon, 1996; Franck et al., 1999).On the other hand, it appears that the STI tends to underestimate intelligibility of compressed speech in quiet (Hickson, 1994; Festen and van Dijkhuizen 1998; Souza, 2002). Also in stationary noise, effects of moderate multichannel compression (CR ≤ 3) are often less detrimental than predicted by the STI (Barfod, 1978; Moore et al., 1999; van Buuren et al., 1999). To illustrate the effect of compression in terms of relative modulations, a single channel noise-corrupted probe, mixed at 0 dB S/N, was subjected to various compression ratios, depicted in Fig. 3.9.
Fig. 3.9. Envelope spectra based on 30 seconds of the compressed noise-corrupted probe signals (0 dB S/N, CR=3 and CR=6, respectively) and the expanded noise-corrupted probe signals (CR=1/3 and CR=1/6, respectively). Spectra of the original (unprocessed) noise-corrupted probe are indicated by the dotted line in each panel.
DTP boek Signal-To-Noice DEF5.indd 40 26-10-2009 14:55:00
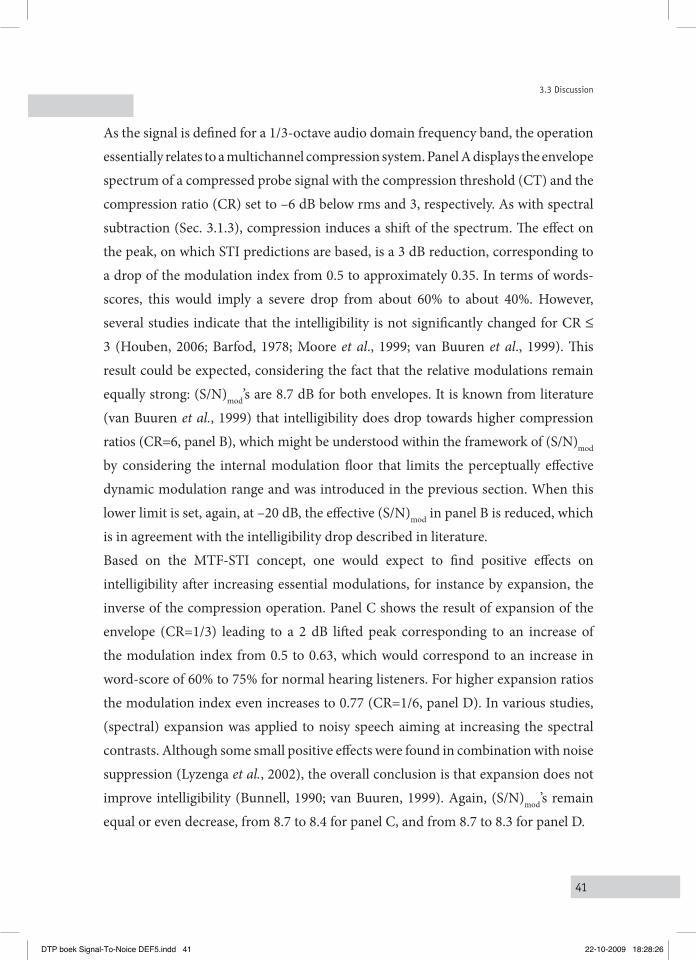
41
3.3 Discussion
As the signal is defined for a 1/3-octave audio domain frequency band, the operation essentially relates to a multichannel compression system. Panel A displays the envelope spectrum of a compressed probe signal with the compression threshold (CT) and the compression ratio (CR) set to –6 dB below rms and 3, respectively. As with spectral subtraction (Sec. 3.1.3), compression induces a shift of the spectrum. The effect on the peak, on which STI predictions are based, is a 3 dB reduction, corresponding to a drop of the modulation index from 0.5 to approximately 0.35. In terms of words-scores, this would imply a severe drop from about 60% to about 40%. However, several studies indicate that the intelligibility is not significantly changed for CR ≤ 3 (Houben, 2006; Barfod, 1978; Moore et al., 1999; van Buuren et al., 1999). This result could be expected, considering the fact that the relative modulations remain equally strong: (S/N)mod’s are 8.7 dB for both envelopes. It is known from literature (van Buuren et al., 1999) that intelligibility does drop towards higher compression ratios (CR=6, panel B), which might be understood within the framework of (S/N)mod by considering the internal modulation floor that limits the perceptually effective dynamic modulation range and was introduced in the previous section. When this lower limit is set, again, at –20 dB, the effective (S/N)mod in panel B is reduced, which is in agreement with the intelligibility drop described in literature. Based on the MTF-STI concept, one would expect to find positive effects on intelligibility after increasing essential modulations, for instance by expansion, the inverse of the compression operation. Panel C shows the result of expansion of the envelope (CR=1/3) leading to a 2 dB lifted peak corresponding to an increase of the modulation index from 0.5 to 0.63, which would correspond to an increase in word-score of 60% to 75% for normal hearing listeners. For higher expansion ratios the modulation index even increases to 0.77 (CR=1/6, panel D). In various studies, (spectral) expansion was applied to noisy speech aiming at increasing the spectral contrasts. Although some small positive effects were found in combination with noise suppression (Lyzenga et al., 2002), the overall conclusion is that expansion does not improve intelligibility (Bunnell, 1990; van Buuren, 1999). Again, (S/N)mod’s remain equal or even decrease, from 8.7 to 8.4 for panel C, and from 8.7 to 8.3 for panel D.
DTP boek Signal-To-Noice DEF5.indd 41 22-10-2009 18:28:26
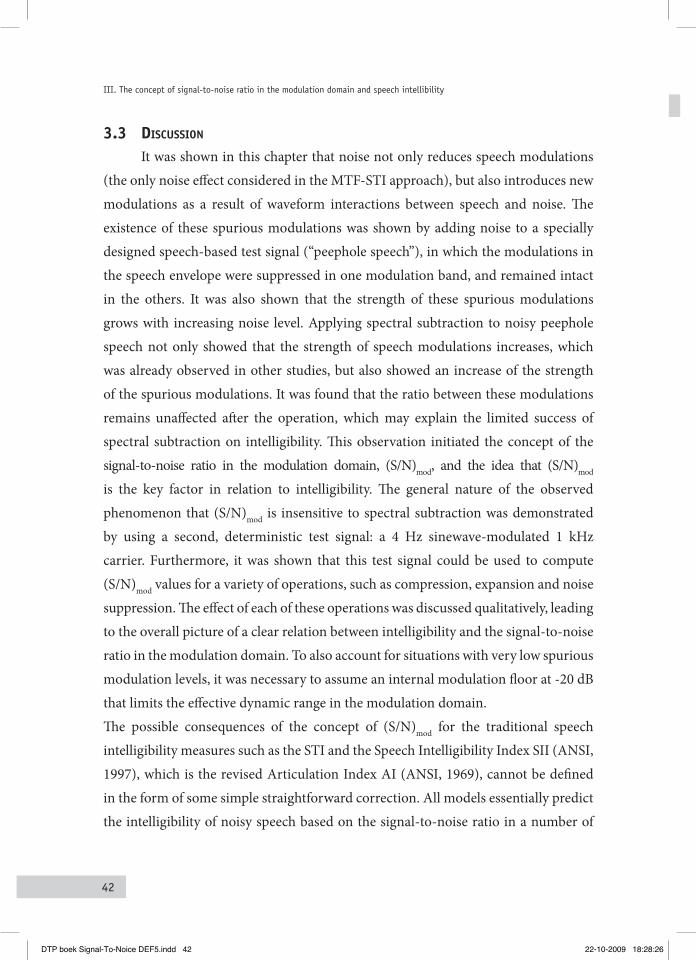
42
III. The concept of signal-to-noise ratio in the modulation domain and speech intellibility
DiScuSSion3.3 It was shown in this chapter that noise not only reduces speech modulations (the only noise effect considered in the MTF-STI approach), but also introduces new modulations as a result of waveform interactions between speech and noise. The existence of these spurious modulations was shown by adding noise to a specially designed speech-based test signal (“peephole speech”), in which the modulations in the speech envelope were suppressed in one modulation band, and remained intact in the others. It was also shown that the strength of these spurious modulations grows with increasing noise level. Applying spectral subtraction to noisy peephole speech not only showed that the strength of speech modulations increases, which was already observed in other studies, but also showed an increase of the strength of the spurious modulations. It was found that the ratio between these modulations remains unaffected after the operation, which may explain the limited success of spectral subtraction on intelligibility. This observation initiated the concept of the signal-to-noise ratio in the modulation domain, (S/N)mod, and the idea that (S/N)mod is the key factor in relation to intelligibility. The general nature of the observed phenomenon that (S/N)mod is insensitive to spectral subtraction was demonstrated by using a second, deterministic test signal: a 4 Hz sinewave-modulated 1 kHz carrier. Furthermore, it was shown that this test signal could be used to compute (S/N)mod values for a variety of operations, such as compression, expansion and noise suppression. The effect of each of these operations was discussed qualitatively, leading to the overall picture of a clear relation between intelligibility and the signal-to-noise ratio in the modulation domain. To also account for situations with very low spurious modulation levels, it was necessary to assume an internal modulation floor at -20 dB that limits the effective dynamic range in the modulation domain. The possible consequences of the concept of (S/N)mod for the traditional speech intelligibility measures such as the STI and the Speech Intelligibility Index SII (ANSI, 1997), which is the revised Articulation Index AI (ANSI, 1969), cannot be defined in the form of some simple straightforward correction. All models essentially predict the intelligibility of noisy speech based on the signal-to-noise ratio in a number of
DTP boek Signal-To-Noice DEF5.indd 42 22-10-2009 18:28:26
43
3.3 Discussion
adjacent frequency bands6. For the SII, the traditional approach is to measure the speech and noise levels separately, thus not including the effects resulting from the speech-noise interactions. In case of noise reduction or other processing algorithms applied to a speech-plus-noise signal, the definition of the relevant speech and noise levels from the resulting signal poses great difficulties, making the SII virtually impossible to apply in such cases. For the STI, the S/N ratios are derived from the observed reduction in the speech-envelope spectrum. This is based on an analysis of the speech-plus-noise signal and can thus in principle be applied in cases of processing applied to the speech-plus-noise signal. However, it was shown that the observed changes in the envelope spectrum should be related to changes in the spurious modulations. With the development of a specific speechlike test signal to allow the analysis of both the speech modulations and the floor of spurious modulations, the STI-approach might be adapted to the new concept of the (S/N)mod. At this point, the author would like to emphasize that the aim of this part of the thesis is to introduce a new concept, rather than presenting a well-balanced model. In the past, the STI model was preceded by a new idea, i.e. the concept of the MTF. Likewise, the (S/N)mod concept may evolve into a new model for intelligibility predictions. Such model would allow a more quantitative analysis of data in more of a meta-analysis format (i.e., applying the model to data across many studies) and may produce more accurate intelligibility estimations than the ‘no improvement’, ‘small improvement’ or ‘large improvement’ qualifications used in this chapter. Still, even these rough terms indicate that the concept performs principally better than current measures when nonlinear processing is involved.Ergo, the concept of (S/N)mod provides relevant information about expected intelligibility of noisy speech signals after being processed by a noise suppression system or a speech enhancement system, where commonly known measures as the STI fall short. This suggests that improving the (S/N)mod may be a highly relevant guiding principle for the development of effective noise suppression systems.
6 Including some other factors, such as the hearing threshold, which are not considered here.
DTP boek Signal-To-Noice DEF5.indd 43 22-10-2009 18:28:27
44
III. The concept of signal-to-noise ratio in the modulation domain and speech intellibility
STI and intelligibility of noisy speech3.3.1
A final remark concerning the MTF-STI model. As the existence of an S/N dependent spurious modulation noise floor in noisy signals was convincingly demonstrated in this chapter, the idea of the modulation floor being fixed – as assumed in the concept of useful modulation area – must be rejected. This implies that the MTF-STI model – that evolved from this concept – is based on an invalid principle. How can the STI be so successful knowing that its fundament is invalid? We should now acknowledge that the envelope effects of additive noise are twofold: a reduction of the speech modulations and an increase of the floor of spurious modulations. The MTF-STI approach only considers the first effect. Under normal circumstances, both effects will depend on the S/N ratio, and are thus highly related. This means that, even when (S/N)mod is the key parameter, the STI can still be uniquely related to intelligibility, as long as the strict relation between these two effects is maintained. Apparently, in some cases of signal processing, for example spectral subtraction or compression, this relation is disturbed and intelligibility is no longer a function of exclusively the reduction effect. In these cases, one should consider the signal-to-noise ratio in the modulation domain, the (S/N)mod.
concluSionS3.4 In this chapter, a novel concept was introduced that relates intelligibility of noisy speech to the relative strength of speech modulations and spurious modulations arising from speech-noise interactions. The conclusions are summarized below. (1) When noise is added to speech, spurious modulations are created as a result of
phase-interactions between the speech- and noise waveforms. (2) The existence of these spurious modulations was demonstrated by adding
noise to a special test signal, referred to as “peephole speech”, containing a speech envelope spectrum in which one frequency band is suppressed. Also a more deterministic test signal (a 4-Hz modulated 1-kHz carrier) can be used for this purpose.
DTP boek Signal-To-Noice DEF5.indd 44 22-10-2009 18:28:27
45
3.4 Conclusions
(3) The strength of the speech modulations relative to the spurious modulations can be defined by the signal-to-noise ratio in the modulation domain: (S/N)mod.
(4) It was shown that (S/N)mod remains unchanged after spectral subtraction, which corresponds to the commonly observed ineffectiveness of spectral subtraction in improving speech intelligibility.
(5) The effect on (S/N)mod of a variety of signal processing procedures was determined, and appeared to correspond well with data on intelligibility. A modulation threshold is introduced to predict intelligibility in case of speech processing in quiet, e.g. for amplitude compression. However, the evidence in support of this application of the modulation signal-to-noise ratio is of a qualitative nature and further work is needed to explore this application of the modulation signal-to-noise ratio for nonlinear processing in quiet, such as amplitude compression.
DTP boek Signal-To-Noice DEF5.indd 45 22-10-2009 18:28:27

46
DTP boek Signal-To-Noice DEF5.indd 46 22-10-2009 18:28:27
47
IV. The effect of varying the signal-to-noise ratio in the modulation domain on speech intelligibility in noise
Abstract
The signal-to-noise ratio in the modulation domain (S/N)mod of noisy speech, as estimated with a specific speech-matched probe signal, was varied artificially by means of signal processing. Under the assumption that (S/N)mod is the key factor for understanding speech in noise [Dubbelboer and Houtgast, J. Acoust. Soc. Am. 124 (6), 3937-3946 (2008)], the observed variations in (S/N)mod for the processed probe signal lead to predictions for corresponding variations of the SRT for speech in noise subjected to the same type of processing. The relation between these predicted SRT’s and those actually measured was investigated for a range of imposed (S/N)mod variations. Mean SRT values obtained for 15 normal-hearing and 12 hearing-impaired subjects correlated well with predicted SRT’s for corresponding settings of the processing algorithm (correlation coefficients of typically 0.8), supporting the significance of the concept of the (S/N)mod for speech intelligibility in noise. Additionally, the observed improvements in (S/N)mod suggest that the concept provides a basis for improving intelligibility on a real-time basis in an FFT-based environment (in the order of a 2-dB improvement in the SRT in stationary Gaussian noise for hearing-impaired subjects), which may be relevant for practical applications.
In preparation for publishing in the Journal of the Acoustical Society of America
DTP boek Signal-To-Noice DEF5.indd 47 22-10-2009 18:28:28
48
IV. The effect of varying the signal-to-noise ratio in the modulation domain on speech intelligibility in noise
Introduction
It is often difficult to understand speech in a noisy environment, especially for hearing impaired persons. Hearing aids cannot solve this problem, as essentially all incoming sounds are amplified, irrespective of their nature. Although modern hearing aids may be equipped with a variety of noise reduction techniques, including single-microphone processing (MMSE, spectral subtraction, Wiener-filtering) and multi-microphone processing (e.g. directional filtering, beamforming), intelligibility of noise-corrupted speech is seldomly improved by this processing in daily life situations (WGCA, 1991; Marzinzik, 2000; Wittkop, 2001). In fact, it has been argued by some researchers that improving intelligibility by means of single channel noise reduction is in principal impossible (Marzinzik, 2000; Wittkop, 2001). Traditionally, engineers approached the problem in terms of the signal-to-noise ratio (S/N ratio). However, it appeared that improved signal-to-noise ratios after processing do not necessarily lead to improved intelligibility (WGCA, 1991). Recently, more perceptually relevant approaches were chosen, motivated by insights on the crucial role of speech modulations on the perception of speech (Srinivasan et al., 2003; Hu, 2003). It was shown that the major effect of noise on speech perception is associated with noise filling up the valleys in the speech envelope, thereby reducing the peak-to-valley distance and thus reducing the modulation depth. Houtgast and Steeneken (1985) showed that intelligibility drops with the reduction of the modulation depth, which led to the concept of the Modulation Transfer Function (MTF) and Speech Transmission Index (STI) model, which became an International Electrotechnical Commission standard (IEC, 2003). Although the model has proven to be successful for a variety of acoustical disturbances, it was shown that for some signal processing schemes intelligibility is sometimes under- or overestimated (Ludvigsen, 1993; Drullman et al., 1994a, 1994b; Noordhoek and Drullman, 1997; Franck et al., 1999). By comparing STI values to intelligibility scores, Ludvigsen showed that the STI is an unreliable predictor when nonlinear processes are involved. In general, it must be concluded that successful speech processing in terms of intelligibility is neither guaranteed by improvements of S/N ratio nor by improvements of STI values, indicating that intelligibility of (processed) noise-corrupted speech is not completely understood.
DTP boek Signal-To-Noice DEF5.indd 48 22-10-2009 18:28:28
49
Introduction
This motivated Dubbelboer and Houtgast (2007) to perform a detailed study on the intelligibility of noise-corrupted speech and the effects of signal processing. In that study, noisy speech was subjected to a specific type of wavelet analysis (reference) and to a basic form of spectral subtraction, i.e. a well-known type of noise reduction (Lim and Oppenheim, 1979). Analysis of the output signal indicated that, as expected, S/N ratios and STI values improved, while the intelligibility remained equally poor. It also appeared that the distribution of noise-dominated envelope intensities had not changed either. It was concluded that, as a result of the unchanged noise statistics, it might remain equally difficult to extract speech cues from the processed signal, explaining why intelligibility remains equally poor after processing. In Dubbelboer and Houtgast (2008), attempts were made to interpret this result in terms of modulations, leading to the hypothesis – in line with suggestions made earlier by Noordhoek and Drullman (1997) – that intelligibility is not only determined by the strength of speech modulations, but also by the strength of interfering noise modulations. The hypothesis was that if the relative strength of the speech modulations and the noise modulations is not changed after processing, intelligibility would not change either. As the relative strength between speech modulations and noise modulations is in fact a signal-to-noise ratio for modulations, the idea led to a new concept: the signal-to-noise ratio in the modulation domain (Dubbelboer and Houtgast, 2008). As in the MTF-STI concept, the concept relates speech physics (i.e., the reduction of the speech-envelope spectrum) to intelligibility, but adds the disturbing effect of noise modulations. In most real-life situations in which speech is corrupted by noise, the disturbing effect of the interfering noise modulations is much smaller than the effect of the reduced speech modulations. As the effects are normally linked to each other, one can obtain a fair indication of intelligibility by considering just the speech-envelope-reduction effect, explaining why the STI is successful in practice. However, it was shown that in some cases of speech processing the two effects become disconnected, and that the speech modulation reduction is no longer a reliable predictor by itself. For those situations, one should include the effect of the
DTP boek Signal-To-Noice DEF5.indd 49 22-10-2009 18:28:28
50
IV. The effect of varying the signal-to-noise ratio in the modulation domain on speech intelligibility in noise
noise modulations, as proposed in the concept of the signal-to-noise ratio in the modulation domain7.In Dubbelboer and Houtgast (2008), it was shown for various types of speech processing, that the intelligibility of noise-corrupted speech does not change as long as the signal-to-noise ratio in the modulation domain remains unchanged, irrespective of STI values. In the current chapter, some implications of the (S/N)mod
concept are verified by artificially varying the signal-to-noise ratio in the modulation domain in noisy speech, and measuring the effect on intelligibility. Throughout the chapter, intelligibility is measured in terms of speech reception thresholds or SRT’s (Plomp and Mimpen, 1979). In an adaptive procedure, the S/N ratio is determined at which listeners are able to correctly reproduce 50% of simple everyday sentences. The resulting ‘critical’ S/N ratio defines the SRT in dB. Two approaches for studying the relation between (S/N)mod and intelligibility are considered in this study. After defining a suitable probe signal for measuring (changes in) the (S/N)mod of a noisy signal, the first part of this chapter addresses the question whether the (S/N)mod can be changed with signal processing at all. In this first part, a priori knowledge of the original noise-free signal (only available in the laboratory) plays a central role. Intensity envelopes are artificially modified by means of signal processing and (S/N)mod ratios are computed. Then, the same signal processing is applied to noisy speech, of which the intelligibility is measured in listening tests with normal hearing persons. Measured intelligibility scores (SRT’s) are compared with predicted intelligibility scores based on (S/N)mod changes. In the second part, it is investigated whether the (S/N)mod can also be changed without using the noise-free signal, as this information is not available in real-life. Signal processing with a variety of parameter settings is applied to modify the intensity envelope of the noisy input, resulting in (modest) variations of the (S/N)mod. These are compared with the variations in SRT’s as obtained from listening experiments with speech-in-noise stimuli for which exactly the same processing schemes have been applied.
7 Throughout this thesis, the term ‘signal-to-noise ratio in the modulation domain’ will frequently be replaced by the shorter terms ‘modulation ratio’ or (S/N)mod.
DTP boek Signal-To-Noice DEF5.indd 50 22-10-2009 18:28:29
51
4.1 Defining the probe signal for estimating the modulation ratio
Defining the probe Signal for eStiMating the MoDulation ratio4.1 One cannot determine the modulation ratio from the envelope spectrum of noise-corrupted speech directly, as this spectrum essentially reflects a summation of both modulations: the speech modulations and the noise modulations are not available separately. It should also be kept in mind that spurious modulations, arising from the interaction between the speech and noise waveforms, are an essential part of what is called here the noise modulations. To estimate the effect of adding noise on the modulation ratio, Dubbelboer and Houtgast (2008) used a 4-Hz intensity-modulated 1-kHz carrier as a probe signal, to which a 1/3-octave band filtered Gaussian noise (1-kHz center frequency) was added. So, as the probe signal itself only contains the 4-Hz modulation, the envelope spectrum of the probe-plus-noise signal at all other modulation frequencies reflects the non-probe-related noise modulations. The noise modulations at 4 Hz can be estimated by interpolation, allowing an estimate of the entire modulation ratio (for the 4-Hz modulation octave band). Admittedly, this is a very simple approach, providing an estimate of the modulation ratio for only a single 1/3 octave band (at 1-kHz) and for only a single octave band modulation (the 4-Hz band). It was shown however that this modulation ratio, estimated for various types of processing applied to the probe-plus-noise signal, provides relevant information concerning the speech intelligibility when those same types of processing are applied to a speech-plus-noise signal. Contrary to these types of processing – in which the intensities of a noise-corrupted speech envelope were manipulated irrespective of their origin (speech or noise) – the types of processing considered in this chapter differentiate between speech- and noise intensity envelopes. In this approach, the intensity distribution function of the probe is matched to the typical intensity distribution pattern of speech. So, in the current study a similar approach is adopted as before, but with a slightly modified probe signal.As the involved processing scheme is based on manipulating the intensity envelope, the probe intensity distribution was matched to the intensity distribution pattern of speech. As can be observed in the upper left panel of Fig. 4.1, the histogram of the instantaneous levels of the original probe signal is quite different from that of a 1/3 octave band filtered 1-kHz center frequency) speech signal.
DTP boek Signal-To-Noice DEF5.indd 51 22-10-2009 18:28:29
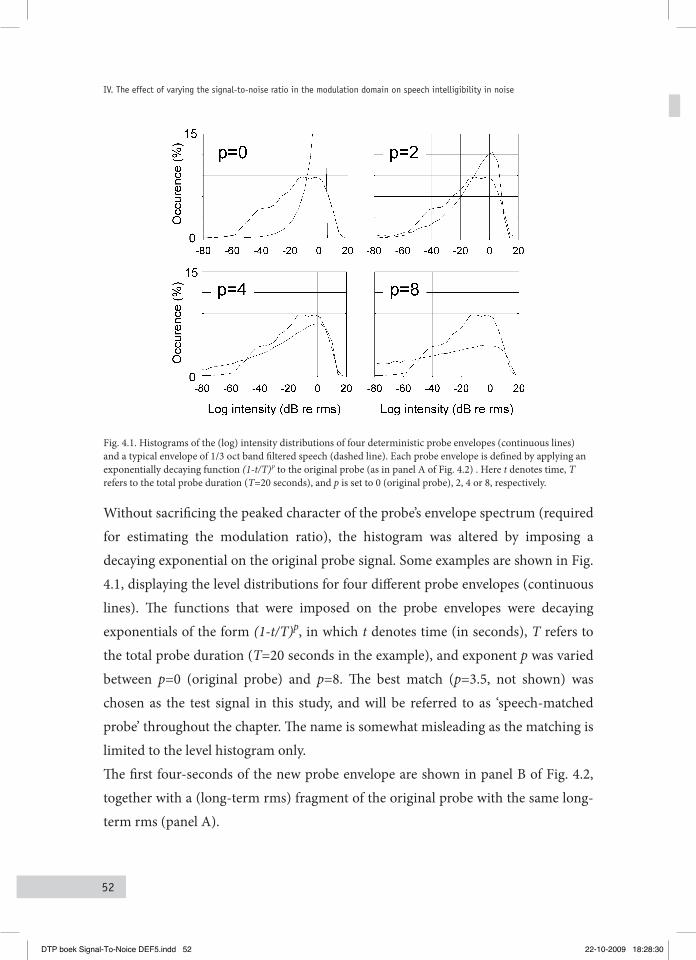
52
IV. The effect of varying the signal-to-noise ratio in the modulation domain on speech intelligibility in noise
Fig. 4.1. Histograms of the (log) intensity distributions of four deterministic probe envelopes (continuous lines) and a typical envelope of 1/3 oct band filtered speech (dashed line). Each probe envelope is defined by applying an exponentially decaying function (1-t/T)P to the original probe (as in panel A of Fig. 4.2) . Here t denotes time, T refers to the total probe duration (T=20 seconds), and p is set to 0 (original probe), 2, 4 or 8, respectively.
Without sacrificing the peaked character of the probe’s envelope spectrum (required for estimating the modulation ratio), the histogram was altered by imposing a decaying exponential on the original probe signal. Some examples are shown in Fig. 4.1, displaying the level distributions for four different probe envelopes (continuous lines). The functions that were imposed on the probe envelopes were decaying exponentials of the form (1-t/T)p, in which t denotes time (in seconds), T refers to the total probe duration (T=20 seconds in the example), and exponent p was varied between p=0 (original probe) and p=8. The best match (p=3.5, not shown) was chosen as the test signal in this study, and will be referred to as ‘speech-matched probe’ throughout the chapter. The name is somewhat misleading as the matching is limited to the level histogram only.The first four-seconds of the new probe envelope are shown in panel B of Fig. 4.2, together with a (long-term rms) fragment of the original probe with the same long-term rms (panel A).
DTP boek Signal-To-Noice DEF5.indd 52 22-10-2009 18:28:30
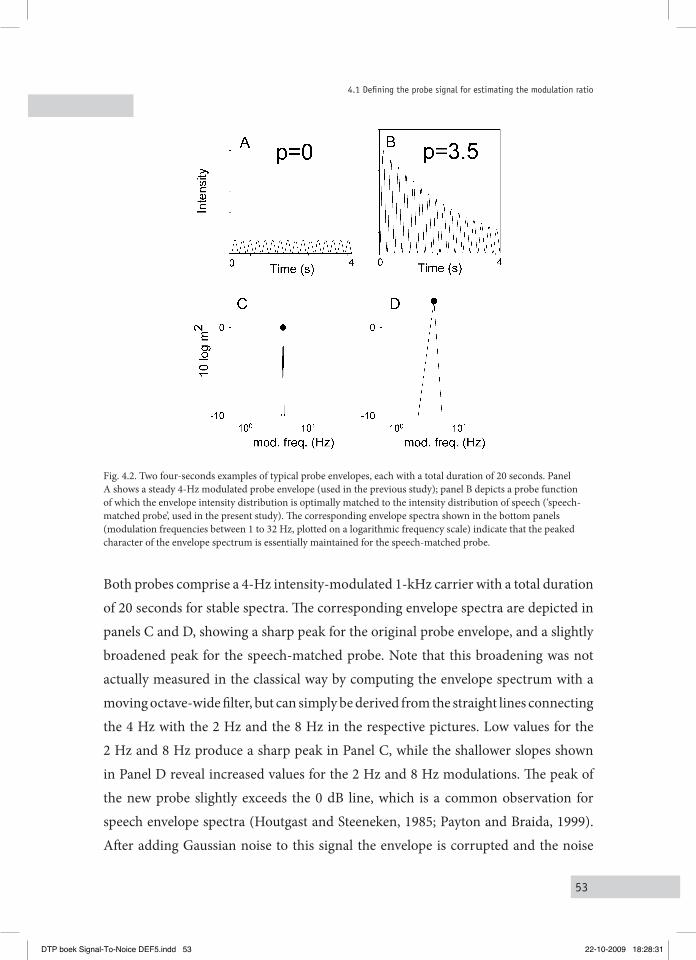
53
4.1 Defining the probe signal for estimating the modulation ratio
Fig. 4.2. Two four-seconds examples of typical probe envelopes, each with a total duration of 20 seconds. Panel A shows a steady 4-Hz modulated probe envelope (used in the previous study); panel B depicts a probe function of which the envelope intensity distribution is optimally matched to the intensity distribution of speech (‘speech-matched probe’, used in the present study). The corresponding envelope spectra shown in the bottom panels (modulation frequencies between 1 to 32 Hz, plotted on a logarithmic frequency scale) indicate that the peaked character of the envelope spectrum is essentially maintained for the speech-matched probe.
Both probes comprise a 4-Hz intensity-modulated 1-kHz carrier with a total duration of 20 seconds for stable spectra. The corresponding envelope spectra are depicted in panels C and D, showing a sharp peak for the original probe envelope, and a slightly broadened peak for the speech-matched probe. Note that this broadening was not actually measured in the classical way by computing the envelope spectrum with a moving octave-wide filter, but can simply be derived from the straight lines connecting the 4 Hz with the 2 Hz and the 8 Hz in the respective pictures. Low values for the 2 Hz and 8 Hz produce a sharp peak in Panel C, while the shallower slopes shown in Panel D reveal increased values for the 2 Hz and 8 Hz modulations. The peak of the new probe slightly exceeds the 0 dB line, which is a common observation for speech envelope spectra (Houtgast and Steeneken, 1985; Payton and Braida, 1999). After adding Gaussian noise to this signal the envelope is corrupted and the noise
DTP boek Signal-To-Noice DEF5.indd 53 22-10-2009 18:28:31
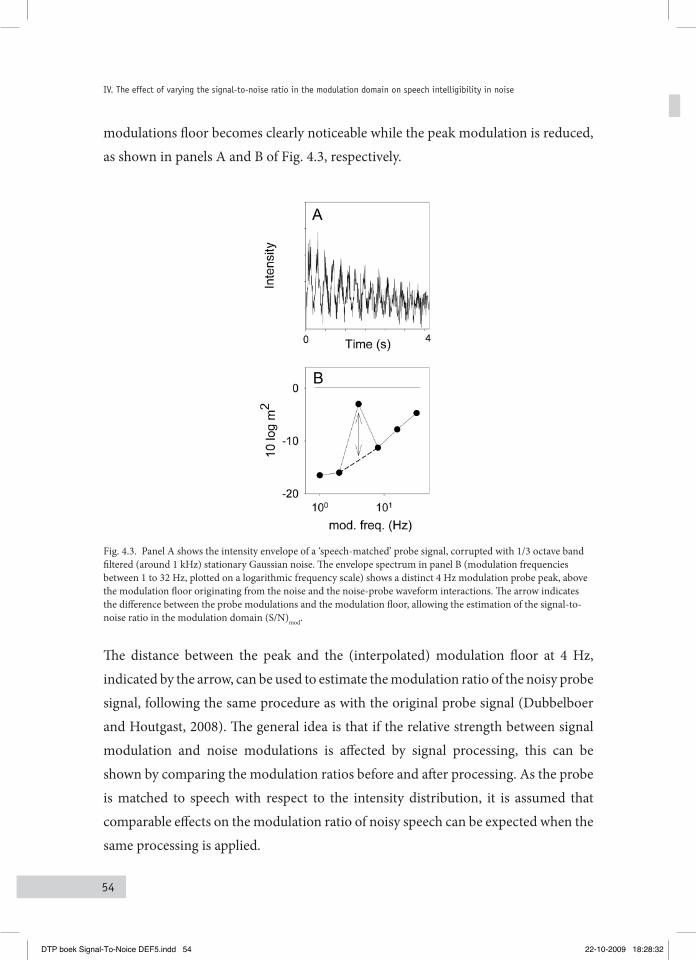
54
IV. The effect of varying the signal-to-noise ratio in the modulation domain on speech intelligibility in noise
modulations floor becomes clearly noticeable while the peak modulation is reduced, as shown in panels A and B of Fig. 4.3, respectively.
Fig. 4.3. Panel A shows the intensity envelope of a ‘speech-matched’ probe signal, corrupted with 1/3 octave band filtered (around 1 kHz) stationary Gaussian noise. The envelope spectrum in panel B (modulation frequencies between 1 to 32 Hz, plotted on a logarithmic frequency scale) shows a distinct 4 Hz modulation probe peak, above the modulation floor originating from the noise and the noise-probe waveform interactions. The arrow indicates the difference between the probe modulations and the modulation floor, allowing the estimation of the signal-to-noise ratio in the modulation domain (S/N)mod.
The distance between the peak and the (interpolated) modulation floor at 4 Hz, indicated by the arrow, can be used to estimate the modulation ratio of the noisy probe signal, following the same procedure as with the original probe signal (Dubbelboer and Houtgast, 2008). The general idea is that if the relative strength between signal modulation and noise modulations is affected by signal processing, this can be shown by comparing the modulation ratios before and after processing. As the probe is matched to speech with respect to the intensity distribution, it is assumed that comparable effects on the modulation ratio of noisy speech can be expected when the same processing is applied.
DTP boek Signal-To-Noice DEF5.indd 54 22-10-2009 18:28:32
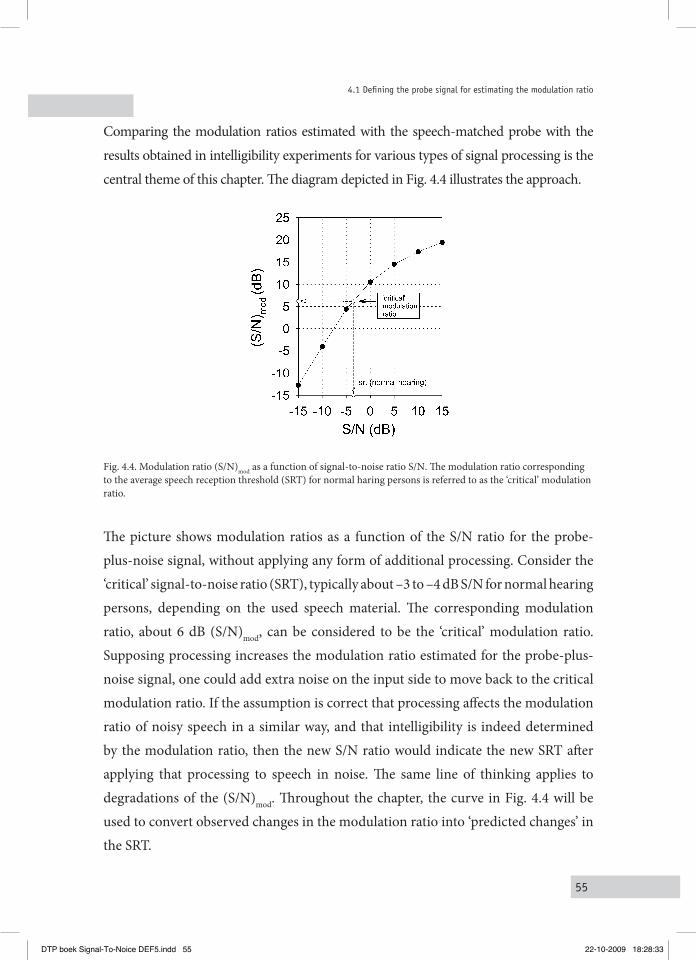
55
4.1 Defining the probe signal for estimating the modulation ratio
Comparing the modulation ratios estimated with the speech-matched probe with the
results obtained in intelligibility experiments for various types of signal processing is the
central theme of this chapter. The diagram depicted in Fig. 4.4 illustrates the approach.
Fig. 4.4. Modulation ratio (S/N)mod as a function of signal-to-noise ratio S/N. The modulation ratio corresponding to the average speech reception threshold (SRT) for normal haring persons is referred to as the ‘critical’ modulation ratio.
The picture shows modulation ratios as a function of the S/N ratio for the probe-plus-noise signal, without applying any form of additional processing. Consider the ‘critical’ signal-to-noise ratio (SRT), typically about –3 to –4 dB S/N for normal hearing persons, depending on the used speech material. The corresponding modulation ratio, about 6 dB (S/N)mod, can be considered to be the ‘critical’ modulation ratio. Supposing processing increases the modulation ratio estimated for the probe-plus-noise signal, one could add extra noise on the input side to move back to the critical modulation ratio. If the assumption is correct that processing affects the modulation ratio of noisy speech in a similar way, and that intelligibility is indeed determined by the modulation ratio, then the new S/N ratio would indicate the new SRT after applying that processing to speech in noise. The same line of thinking applies to degradations of the (S/N)mod. Throughout the chapter, the curve in Fig. 4.4 will be used to convert observed changes in the modulation ratio into ‘predicted changes’ in the SRT.
DTP boek Signal-To-Noice DEF5.indd 55 22-10-2009 18:28:33
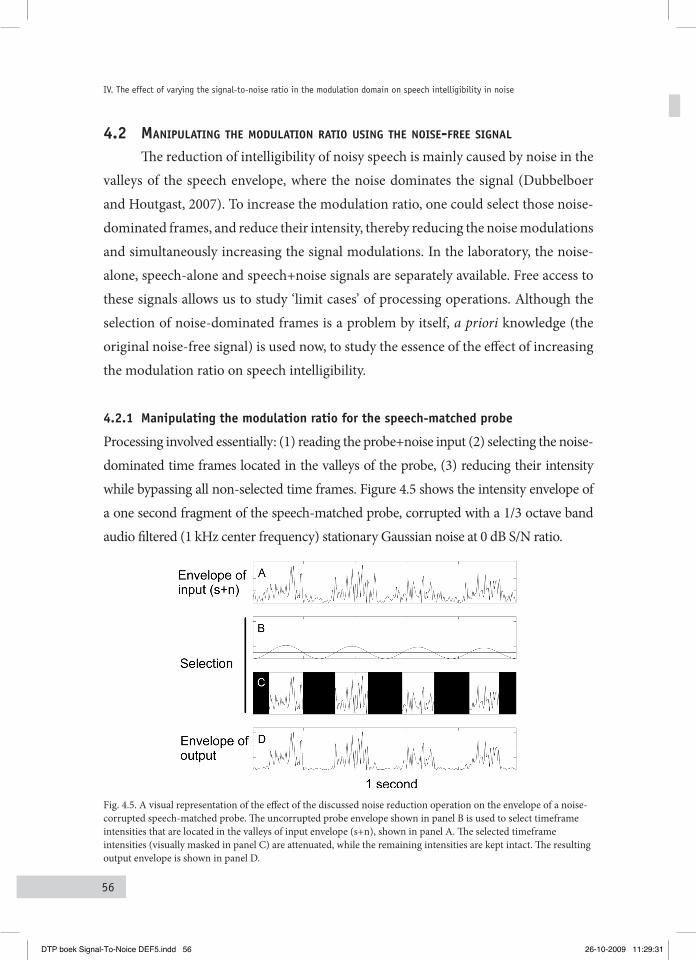
56
IV. The effect of varying the signal-to-noise ratio in the modulation domain on speech intelligibility in noise
Manipulating the Modulation ratio using the noise-free signal4.2 The reduction of intelligibility of noisy speech is mainly caused by noise in the valleys of the speech envelope, where the noise dominates the signal (Dubbelboer and Houtgast, 2007). To increase the modulation ratio, one could select those noise-dominated frames, and reduce their intensity, thereby reducing the noise modulations and simultaneously increasing the signal modulations. In the laboratory, the noise-alone, speech-alone and speech+noise signals are separately available. Free access to these signals allows us to study ‘limit cases’ of processing operations. Although the selection of noise-dominated frames is a problem by itself, a priori knowledge (the original noise-free signal) is used now, to study the essence of the effect of increasing the modulation ratio on speech intelligibility.
Manipulating the modulation ratio for the speech-matched probe4.2.1
Processing involved essentially: (1) reading the probe+noise input (2) selecting the noise-dominated time frames located in the valleys of the probe, (3) reducing their intensity while bypassing all non-selected time frames. Figure 4.5 shows the intensity envelope of a one second fragment of the speech-matched probe, corrupted with a 1/3 octave band audio filtered (1 kHz center frequency) stationary Gaussian noise at 0 dB S/N ratio.
Fig. 4.5. A visual representation of the effect of the discussed noise reduction operation on the envelope of a noise-corrupted speech-matched probe. The uncorrupted probe envelope shown in panel B is used to select timeframe intensities that are located in the valleys of input envelope (s+n), shown in panel A. The selected timeframe intensities (visually masked in panel C) are attenuated, while the remaining intensities are kept intact. The resulting output envelope is shown in panel D.
DTP boek Signal-To-Noice DEF5.indd 56 26-10-2009 11:29:31
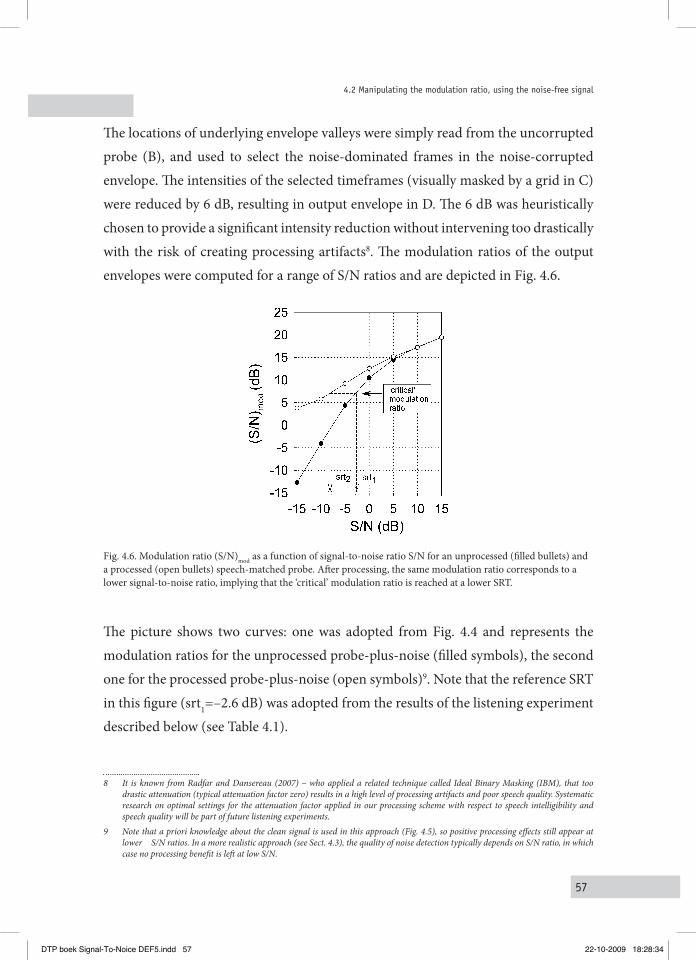
57
4.2 Manipulating the modulation ratio, using the noise-free signal
The locations of underlying envelope valleys were simply read from the uncorrupted probe (B), and used to select the noise-dominated frames in the noise-corrupted envelope. The intensities of the selected timeframes (visually masked by a grid in C) were reduced by 6 dB, resulting in output envelope in D. The 6 dB was heuristically chosen to provide a significant intensity reduction without intervening too drastically with the risk of creating processing artifacts8. The modulation ratios of the output envelopes were computed for a range of S/N ratios and are depicted in Fig. 4.6.
Fig. 4.6. Modulation ratio (S/N)mod as a function of signal-to-noise ratio S/N for an unprocessed (filled bullets) and a processed (open bullets) speech-matched probe. After processing, the same modulation ratio corresponds to a lower signal-to-noise ratio, implying that the ‘critical’ modulation ratio is reached at a lower SRT.
The picture shows two curves: one was adopted from Fig. 4.4 and represents the modulation ratios for the unprocessed probe-plus-noise (filled symbols), the second one for the processed probe-plus-noise (open symbols)9. Note that the reference SRT in this figure (srt1=–2.6 dB) was adopted from the results of the listening experiment described below (see Table 4.1).
8 It is known from Radfar and Dansereau (2007) – who applied a related technique called Ideal Binary Masking (IBM), that too drastic attenuation (typical attenuation factor zero) results in a high level of processing artifacts and poor speech quality. Systematic research on optimal settings for the attenuation factor applied in our processing scheme with respect to speech intelligibility and speech quality will be part of future listening experiments.
9 Note that a priori knowledge about the clean signal is used in this approach (Fig. 4.5), so positive processing effects still appear at lower S/N ratios. In a more realistic approach (see Sect. 4.3), the quality of noise detection typically depends on S/N ratio, in which case no processing benefit is left at low S/N.
DTP boek Signal-To-Noice DEF5.indd 57 22-10-2009 18:28:34
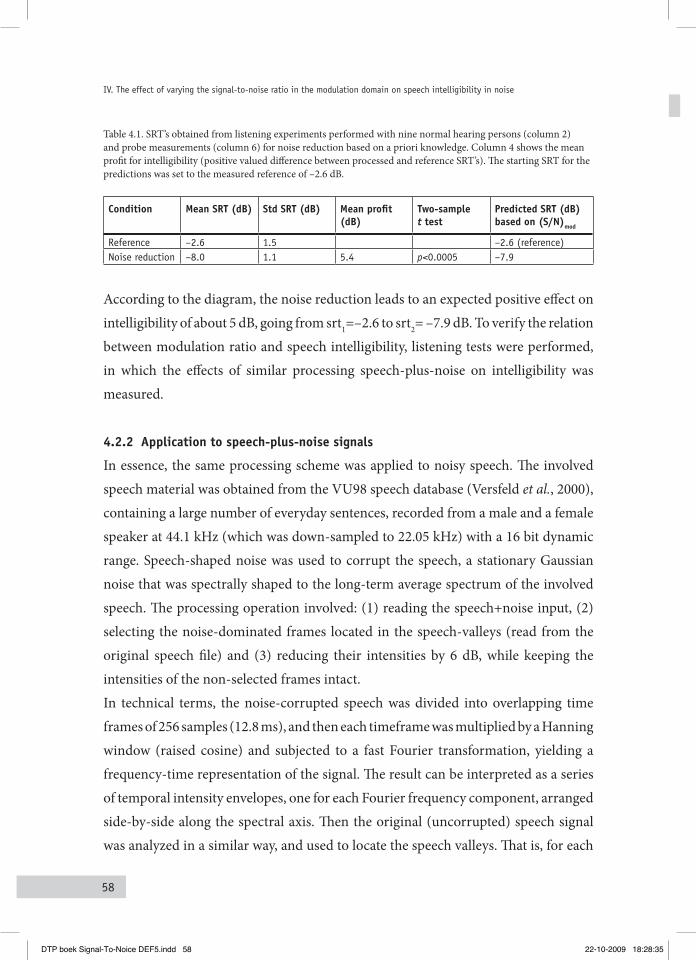
58
IV. The effect of varying the signal-to-noise ratio in the modulation domain on speech intelligibility in noise
Table 4.1. SRT’s obtained from listening experiments performed with nine normal hearing persons (column 2) and probe measurements (column 6) for noise reduction based on a priori knowledge. Column 4 shows the mean profit for intelligibility (positive valued difference between processed and reference SRT’s). The starting SRT for the predictions was set to the measured reference of –2.6 dB.
Condition Mean SRT (dB) Std SRT (dB) Mean profit(dB)
Two-sample t test
Predicted SRT (dB) based on (S/N)mod
Reference –2.6 1.5 –2.6 (reference)Noise reduction –8.0 1.1 5.4 p<0.0005 –7.9
According to the diagram, the noise reduction leads to an expected positive effect on intelligibility of about 5 dB, going from srt1=–2.6 to srt2= –7.9 dB. To verify the relation between modulation ratio and speech intelligibility, listening tests were performed, in which the effects of similar processing speech-plus-noise on intelligibility was measured.
Application to speech-plus-noise signals4.2.2
In essence, the same processing scheme was applied to noisy speech. The involved speech material was obtained from the VU98 speech database (Versfeld et al., 2000), containing a large number of everyday sentences, recorded from a male and a female speaker at 44.1 kHz (which was down-sampled to 22.05 kHz) with a 16 bit dynamic range. Speech-shaped noise was used to corrupt the speech, a stationary Gaussian noise that was spectrally shaped to the long-term average spectrum of the involved speech. The processing operation involved: (1) reading the speech+noise input, (2) selecting the noise-dominated frames located in the speech-valleys (read from the original speech file) and (3) reducing their intensities by 6 dB, while keeping the intensities of the non-selected frames intact. In technical terms, the noise-corrupted speech was divided into overlapping time frames of 256 samples (12.8 ms), and then each timeframe was multiplied by a Hanning window (raised cosine) and subjected to a fast Fourier transformation, yielding a frequency-time representation of the signal. The result can be interpreted as a series of temporal intensity envelopes, one for each Fourier frequency component, arranged side-by-side along the spectral axis. Then the original (uncorrupted) speech signal was analyzed in a similar way, and used to locate the speech valleys. That is, for each
DTP boek Signal-To-Noice DEF5.indd 58 22-10-2009 18:28:35
59
4.2 Manipulating the modulation ratio, using the noise-free signal
Fourier component envelope, the bins coinciding with the valleys were labeled, and the intensities of corresponding bins in the noise-corrupted envelope were reduced. This procedure was repeated for each Fourier component individually10. The result was converted back into the time domain to produce audible signals. These signals were used as stimuli in the listening experiment described below.
Listening experiment with normal hearing personsNine normal-hearing subjects (aged between 25 and 37) participated in an experiment in which SRT’s were measured, both for processed and unprocessed (reference) speech-plus-noise stimuli. Each condition was measured four times. Processed stimuli were computed in advance for a range of S/N ratios, and retrieved from a HDD during the adaptive SRT measurements. Stimuli were presented monaurally through Sony MDR-V900 headphones, at a fixed presentation level of 65 dB SPL. The test was performed double blind: neither the experimenter nor the subject was informed about the measurement condition. The eight conditions (processing yes/no, four times each) were presented in a randomised order. Subjects were allowed to practice first before results were included in the dataset. The results (see Table 4.1) show a SRT shift from –2.6 dB to –8.0 dB, which appears to correspond remarkably well with the predicted SRT shift shown in Fig. 4.6, based on the modulation ratios of the probe11. Hence, the overall conclusions are that the (S/N)mod can indeed be controlled by manipulating the intensity envelope of a noisy signal (so far, by using the noise free signal!), and that the predicted SRT based on the new (S/N)mod agrees well with the actually measured SRT. It would be interesting to know whether (S/N)mod changes can also be achieved without a priori knowledge. This implies that the selection of noise-dominated frames in the valleys of the signal will be less accurate, possibly reducing the predictability of the result of an applied processing scheme. However, at this point, our aim is to produce any variation of (S/N)mod, irrespective of whether that variation was achieved realistically or not.
10 Strictly, the Fourier components should be grouped in 1/3-octave bands first, to relate to the 1/3 octave band analysis on which the concept of modulation ratio is essentially based. However, as signal analysis indicated that differences between grouped and ungrouped processed signals were only minor, it was preferred to keep the signal processing as simple as possible.
11 Note that the –2.6 dB (reference SRT) was used as a reference value in the computation of the predicted SRT.
DTP boek Signal-To-Noice DEF5.indd 59 22-10-2009 18:28:35
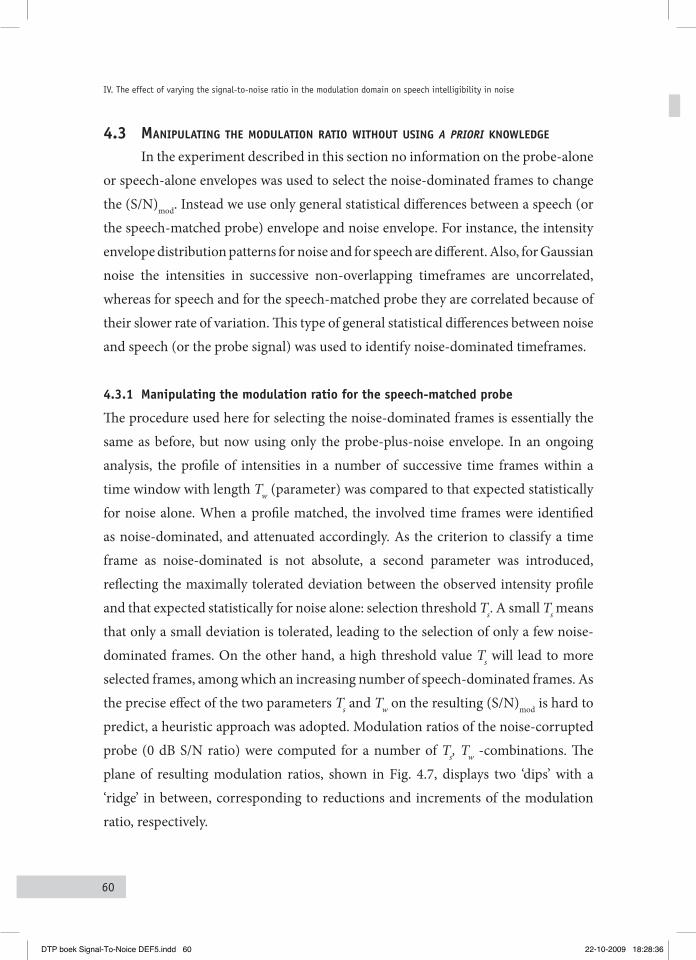
60
IV. The effect of varying the signal-to-noise ratio in the modulation domain on speech intelligibility in noise
Manipulating the MoDulation ratio without uSing 4.3 a priori knowleDge
In the experiment described in this section no information on the probe-alone or speech-alone envelopes was used to select the noise-dominated frames to change the (S/N)mod. Instead we use only general statistical differences between a speech (or the speech-matched probe) envelope and noise envelope. For instance, the intensity envelope distribution patterns for noise and for speech are different. Also, for Gaussian noise the intensities in successive non-overlapping timeframes are uncorrelated, whereas for speech and for the speech-matched probe they are correlated because of their slower rate of variation. This type of general statistical differences between noise and speech (or the probe signal) was used to identify noise-dominated timeframes.
Manipulating the modulation ratio for the speech-matched probe4.3.1
The procedure used here for selecting the noise-dominated frames is essentially the same as before, but now using only the probe-plus-noise envelope. In an ongoing analysis, the profile of intensities in a number of successive time frames within a time window with length Tw (parameter) was compared to that expected statistically for noise alone. When a profile matched, the involved time frames were identified as noise-dominated, and attenuated accordingly. As the criterion to classify a time frame as noise-dominated is not absolute, a second parameter was introduced, reflecting the maximally tolerated deviation between the observed intensity profile and that expected statistically for noise alone: selection threshold Ts. A small Ts means that only a small deviation is tolerated, leading to the selection of only a few noise-dominated frames. On the other hand, a high threshold value Ts will lead to more selected frames, among which an increasing number of speech-dominated frames. As the precise effect of the two parameters Ts and Tw on the resulting (S/N)mod is hard to predict, a heuristic approach was adopted. Modulation ratios of the noise-corrupted probe (0 dB S/N ratio) were computed for a number of Ts, Tw -combinations. The plane of resulting modulation ratios, shown in Fig. 4.7, displays two ‘dips’ with a ‘ridge’ in between, corresponding to reductions and increments of the modulation ratio, respectively.
DTP boek Signal-To-Noice DEF5.indd 60 22-10-2009 18:28:36
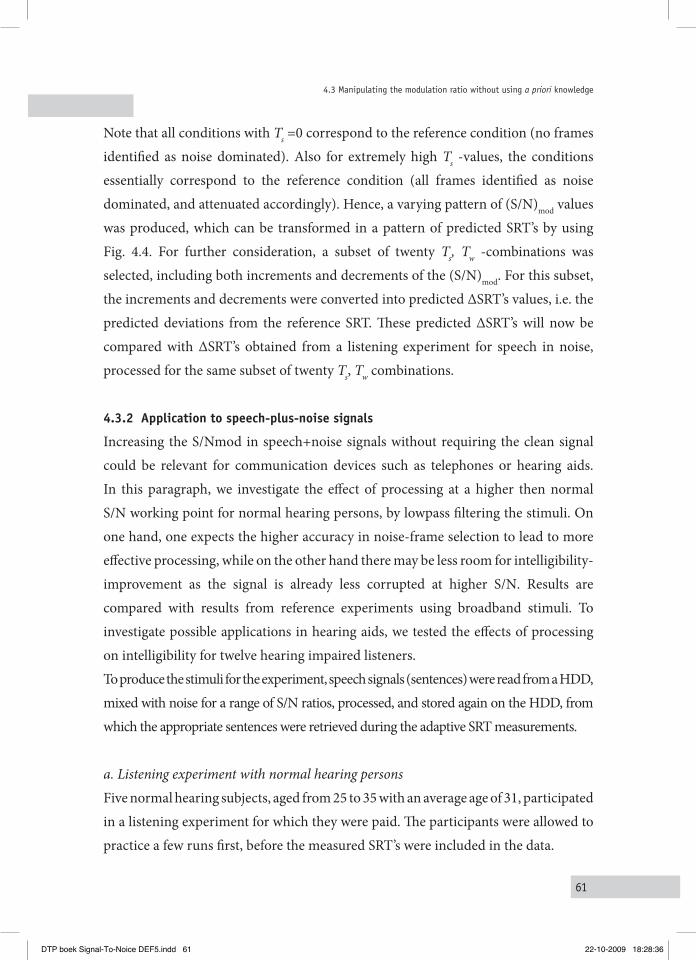
61
4.3 Manipulating the modulation ratio without using a priori knowledge
Note that all conditions with Ts =0 correspond to the reference condition (no frames identified as noise dominated). Also for extremely high Ts -values, the conditions essentially correspond to the reference condition (all frames identified as noise dominated, and attenuated accordingly). Hence, a varying pattern of (S/N)mod values was produced, which can be transformed in a pattern of predicted SRT’s by using Fig. 4.4. For further consideration, a subset of twenty Ts, Tw -combinations was selected, including both increments and decrements of the (S/N)mod. For this subset, the increments and decrements were converted into predicted ΔSRT’s values, i.e. the predicted deviations from the reference SRT. These predicted ΔSRT’s will now be compared with ΔSRT’s obtained from a listening experiment for speech in noise, processed for the same subset of twenty Ts, Tw combinations.
Application to speech-plus-noise signals4.3.2
Increasing the S/Nmod in speech+noise signals without requiring the clean signal could be relevant for communication devices such as telephones or hearing aids. In this paragraph, we investigate the effect of processing at a higher then normal S/N working point for normal hearing persons, by lowpass filtering the stimuli. On one hand, one expects the higher accuracy in noise-frame selection to lead to more effective processing, while on the other hand there may be less room for intelligibility-improvement as the signal is already less corrupted at higher S/N. Results are compared with results from reference experiments using broadband stimuli. To investigate possible applications in hearing aids, we tested the effects of processing on intelligibility for twelve hearing impaired listeners.To produce the stimuli for the experiment, speech signals (sentences) were read from a HDD, mixed with noise for a range of S/N ratios, processed, and stored again on the HDD, from which the appropriate sentences were retrieved during the adaptive SRT measurements.
a. Listening experiment with normal hearing personsFive normal hearing subjects, aged from 25 to 35 with an average age of 31, participated in a listening experiment for which they were paid. The participants were allowed to practice a few runs first, before the measured SRT’s were included in the data.
DTP boek Signal-To-Noice DEF5.indd 61 22-10-2009 18:28:36
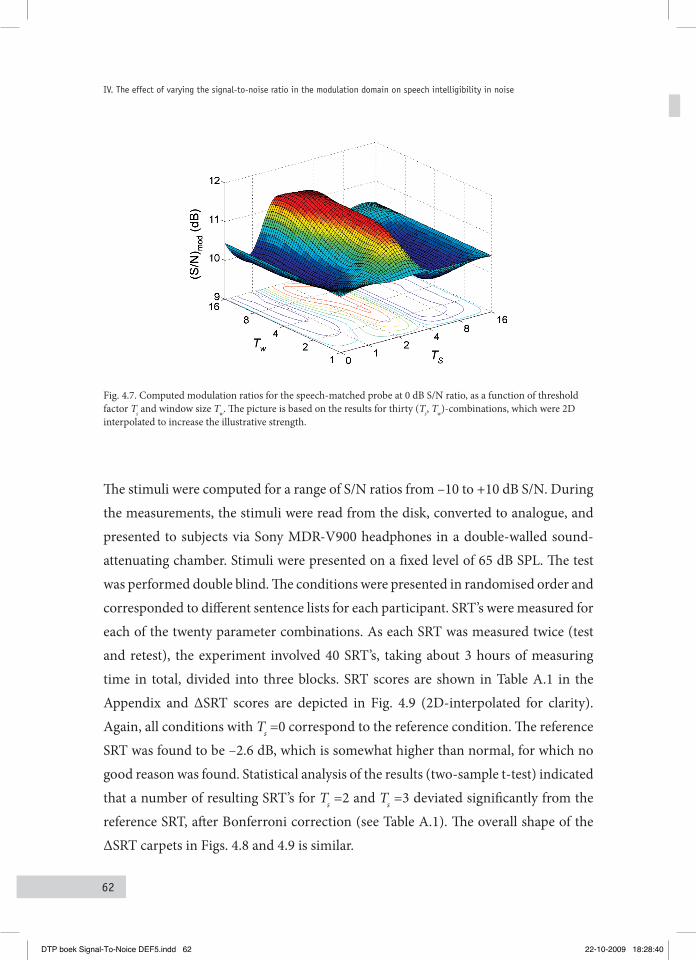
62
IV. The effect of varying the signal-to-noise ratio in the modulation domain on speech intelligibility in noise
Fig. 4.7. Computed modulation ratios for the speech-matched probe at 0 dB S/N ratio, as a function of threshold factor Ts and window size Tw. The picture is based on the results for thirty (Ts, Tw)-combinations, which were 2D interpolated to increase the illustrative strength.
The stimuli were computed for a range of S/N ratios from –10 to +10 dB S/N. During the measurements, the stimuli were read from the disk, converted to analogue, and presented to subjects via Sony MDR-V900 headphones in a double-walled sound-attenuating chamber. Stimuli were presented on a fixed level of 65 dB SPL. The test was performed double blind. The conditions were presented in randomised order and corresponded to different sentence lists for each participant. SRT’s were measured for each of the twenty parameter combinations. As each SRT was measured twice (test and retest), the experiment involved 40 SRT’s, taking about 3 hours of measuring time in total, divided into three blocks. SRT scores are shown in Table A.1 in the Appendix and ΔSRT scores are depicted in Fig. 4.9 (2D-interpolated for clarity). Again, all conditions with Ts =0 correspond to the reference condition. The reference SRT was found to be –2.6 dB, which is somewhat higher than normal, for which no good reason was found. Statistical analysis of the results (two-sample t-test) indicated that a number of resulting SRT’s for Ts =2 and Ts =3 deviated significantly from the reference SRT, after Bonferroni correction (see Table A.1). The overall shape of the ΔSRT carpets in Figs. 4.8 and 4.9 is similar.
DTP boek Signal-To-Noice DEF5.indd 62 22-10-2009 18:28:40
63
4.3 Manipulating the modulation ratio without using a priori knowledge
Fig. 4.8. A 2D interpolated pattern of predicted SRT’s based on converted modulation ratios, computed for processed and unprocessed speech-matched probes. Note that the starting S/N ratio for the reference condition (Ts =0) was set to the average SRT obtained for the reference condition for the normal hearing subjects, see Fig. 4.9.
Fig. 4.9. A 2D interpolated SRT pattern based on the averaged SRT’s produced by five normal hearing subjects for twenty conditions (values for Ts =0, corresponding to the reference condition, are averaged, as explained in the text).
DTP boek Signal-To-Noice DEF5.indd 63 22-10-2009 18:29:03
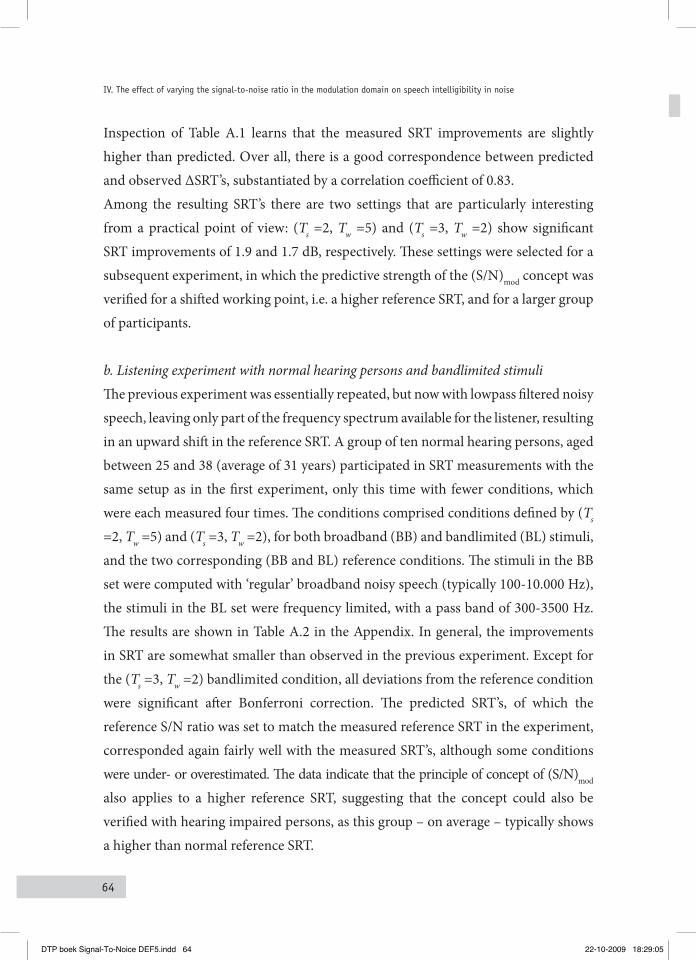
64
IV. The effect of varying the signal-to-noise ratio in the modulation domain on speech intelligibility in noise
Inspection of Table A.1 learns that the measured SRT improvements are slightly higher than predicted. Over all, there is a good correspondence between predicted and observed ΔSRT’s, substantiated by a correlation coefficient of 0.83.Among the resulting SRT’s there are two settings that are particularly interesting from a practical point of view: (Ts =2, Tw =5) and (Ts =3, Tw =2) show significant SRT improvements of 1.9 and 1.7 dB, respectively. These settings were selected for a subsequent experiment, in which the predictive strength of the (S/N)mod concept was verified for a shifted working point, i.e. a higher reference SRT, and for a larger group of participants.
b. Listening experiment with normal hearing persons and bandlimited stimuliThe previous experiment was essentially repeated, but now with lowpass filtered noisy speech, leaving only part of the frequency spectrum available for the listener, resulting in an upward shift in the reference SRT. A group of ten normal hearing persons, aged between 25 and 38 (average of 31 years) participated in SRT measurements with the same setup as in the first experiment, only this time with fewer conditions, which were each measured four times. The conditions comprised conditions defined by (Ts =2, Tw =5) and (Ts =3, Tw =2), for both broadband (BB) and bandlimited (BL) stimuli, and the two corresponding (BB and BL) reference conditions. The stimuli in the BB set were computed with ‘regular’ broadband noisy speech (typically 100-10.000 Hz), the stimuli in the BL set were frequency limited, with a pass band of 300-3500 Hz. The results are shown in Table A.2 in the Appendix. In general, the improvements in SRT are somewhat smaller than observed in the previous experiment. Except for the (Ts =3, Tw =2) bandlimited condition, all deviations from the reference condition were significant after Bonferroni correction. The predicted SRT’s, of which the reference S/N ratio was set to match the measured reference SRT in the experiment, corresponded again fairly well with the measured SRT’s, although some conditions were under- or overestimated. The data indicate that the principle of concept of (S/N)mod also applies to a higher reference SRT, suggesting that the concept could also be verified with hearing impaired persons, as this group – on average – typically shows a higher than normal reference SRT.
DTP boek Signal-To-Noice DEF5.indd 64 22-10-2009 18:29:05

65
4.3 Manipulating the modulation ratio without using a priori knowledge
c. Listening experiment with hearing impaired personsIn the final experiment, the intelligibility for a number of hearing impaired listeners was measured to investigate whether the variations in the measured SRT values for this group agree with the variations in the predicted SRT’s based on modulation ratios. Twelve hearing impaired persons with a moderate sensorineural high frequency hearing loss, aged between 25 and 64 (average 46), participated in an experiment with a comparable setup as described above, except that the stimuli were shaped to fit into the dynamic range of each individual listener. The intelligibility score of the participants for monosyllabic words in quiet was at least 75% correct. The pure tone threshold, averaged over 0.5, 1, and 2 kHz (the pure tone average or PTA) of their best ear, which was used for the measurements ranged from 15 to 60 dB, with a mean PTA of 45 dB HL. For the experiment, hearing thresholds were measured for 125, 250, 500, 1000, 2000, 4000 and 8000 Hz using a Béséky tracking procedure (300-ms 1/3 octave band white noise bursts; repetition rate 2.5 Hz; step size 1 dB). To present as much speech information as possible in the dynamic range of the subjects, all stimuli were spectrally adapted according to the half-gain rule. This spectral adaptation function was shaped according to the half-way point between the absolute threshold and a 110-dB SPL uncomfortable loudness level. The results of the experiment are shown in Table A.3 in the Appendix. Figure 4.10 shows the results in a 2D-interpolated plot, displaying a ‘carpet-shaped‘ plane of ΔSRT’s, of which the contours are essentially similar to the data plane of normal hearing persons in Fig. 4.9. The mean reference SRT was close to 0 dB. Among the highly significant SRT-increments (after Bonferroni correction) were conditions (Ts =2, Tw =5), (Ts =3, Tw =1) and (Ts =2, Tw =3) with increments of 2.0 dB, 1.6 dB and 1.5 dB, respectively, which are higher than expected. Also for conditions (Ts =2, Tw =4), (Ts =3, Tw =2) and (Ts =2, Tw =2) significant increments are shown, of 1.4 dB, 1.4 dB and 1.0 dB, respectively. Inspection of the data in Table A.3. reveals that the predicted SRT’s and the measured data are fairly in agreement, which is substantiated by a correlation coefficient of 0.86.
DTP boek Signal-To-Noice DEF5.indd 65 22-10-2009 18:29:06
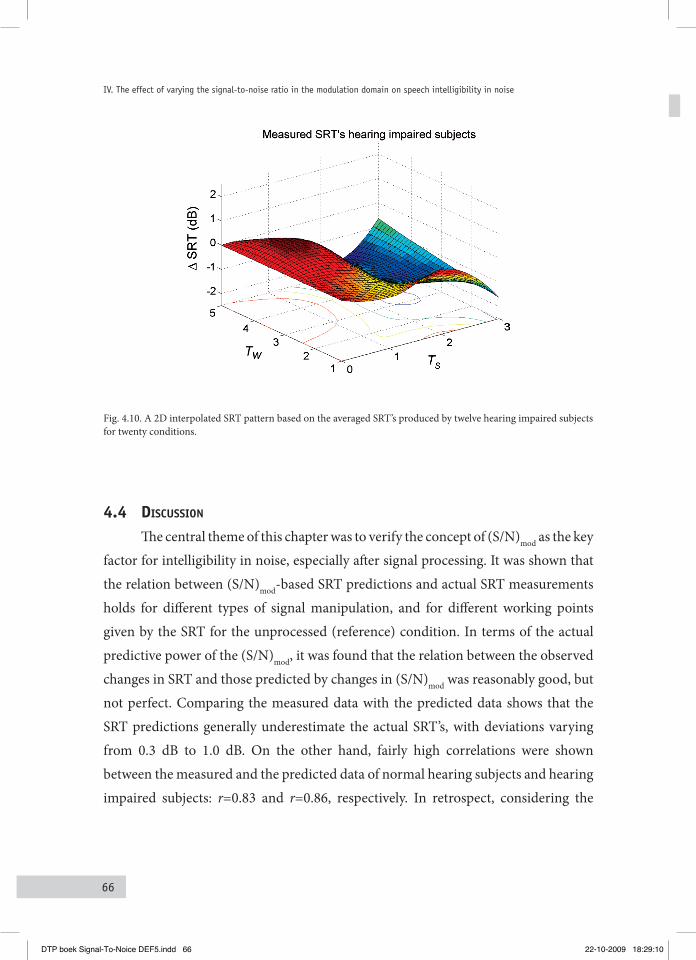
66
IV. The effect of varying the signal-to-noise ratio in the modulation domain on speech intelligibility in noise
Fig. 4.10. A 2D interpolated SRT pattern based on the averaged SRT’s produced by twelve hearing impaired subjects for twenty conditions.
DiScuSSion4.4 The central theme of this chapter was to verify the concept of (S/N)mod as the key factor for intelligibility in noise, especially after signal processing. It was shown that the relation between (S/N)mod-based SRT predictions and actual SRT measurements holds for different types of signal manipulation, and for different working points given by the SRT for the unprocessed (reference) condition. In terms of the actual predictive power of the (S/N)mod, it was found that the relation between the observed changes in SRT and those predicted by changes in (S/N)mod was reasonably good, but not perfect. Comparing the measured data with the predicted data shows that the SRT predictions generally underestimate the actual SRT’s, with deviations varying from 0.3 dB to 1.0 dB. On the other hand, fairly high correlations were shown between the measured and the predicted data of normal hearing subjects and hearing impaired subjects: r=0.83 and r=0.86, respectively. In retrospect, considering the
DTP boek Signal-To-Noice DEF5.indd 66 22-10-2009 18:29:10
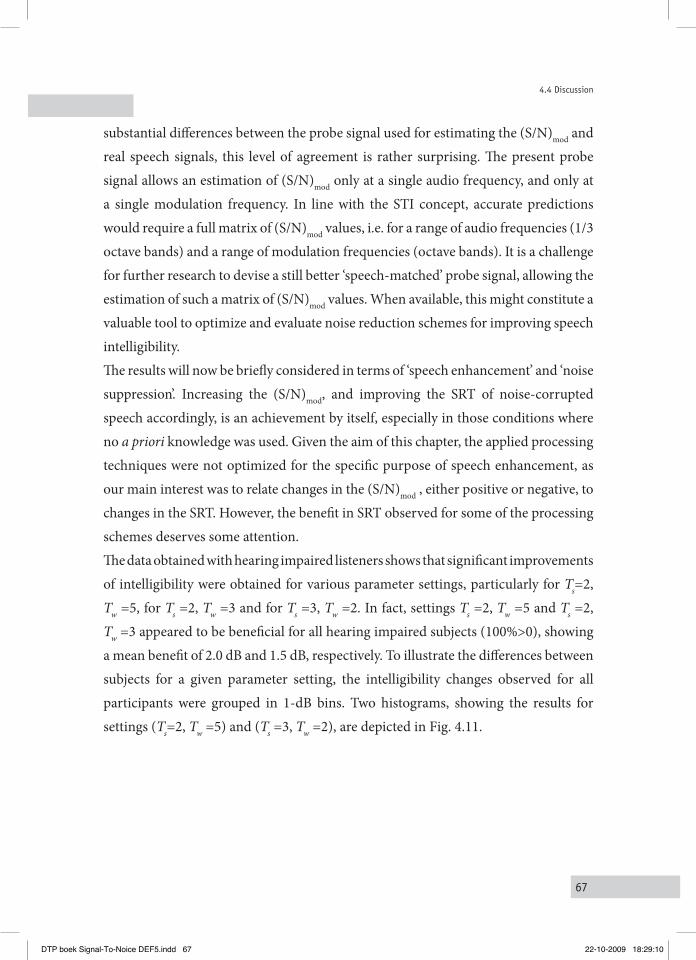
67
4.4 Discussion
substantial differences between the probe signal used for estimating the (S/N)mod and real speech signals, this level of agreement is rather surprising. The present probe signal allows an estimation of (S/N)mod only at a single audio frequency, and only at a single modulation frequency. In line with the STI concept, accurate predictions would require a full matrix of (S/N)mod values, i.e. for a range of audio frequencies (1/3 octave bands) and a range of modulation frequencies (octave bands). It is a challenge for further research to devise a still better ‘speech-matched’ probe signal, allowing the estimation of such a matrix of (S/N)mod values. When available, this might constitute a valuable tool to optimize and evaluate noise reduction schemes for improving speech intelligibility.Th e results will now be briefly considered in terms of ‘speech enhancement’ and ‘noise suppression’. Increasing the (S/N)mod, and improving the SRT of noise-corrupted speech accordingly, is an achievement by itself, especially in those conditions where no a priori knowledge was used. Given the aim of this chapter, the applied processing techniques were not optimized for the specific purpose of speech enhancement, as our main interest was to relate changes in the (S/N)mod , either positive or negative, to changes in the SRT. However, the benefit in SRT observed for some of the processing schemes deserves some attention.The data obtained with hearing impaired listeners shows that significant improvements of intelligibility were obtained for various parameter settings, particularly for Ts=2, Tw =5, for Ts =2, Tw =3 and for Ts =3, Tw =2. In fact, settings Ts =2, Tw =5 and Ts =2, Tw =3 appeared to be beneficial for all hearing impaired subjects (100%>0), showing a mean benefit of 2.0 dB and 1.5 dB, respectively. To illustrate the differences between subjects for a given parameter setting, the intelligibility changes observed for all participants were grouped in 1-dB bins. Two histograms, showing the results for settings (Ts=2, Tw =5) and (Ts =3, Tw =2), are depicted in Fig. 4.11.
DTP boek Signal-To-Noice DEF5.indd 67 22-10-2009 18:29:10
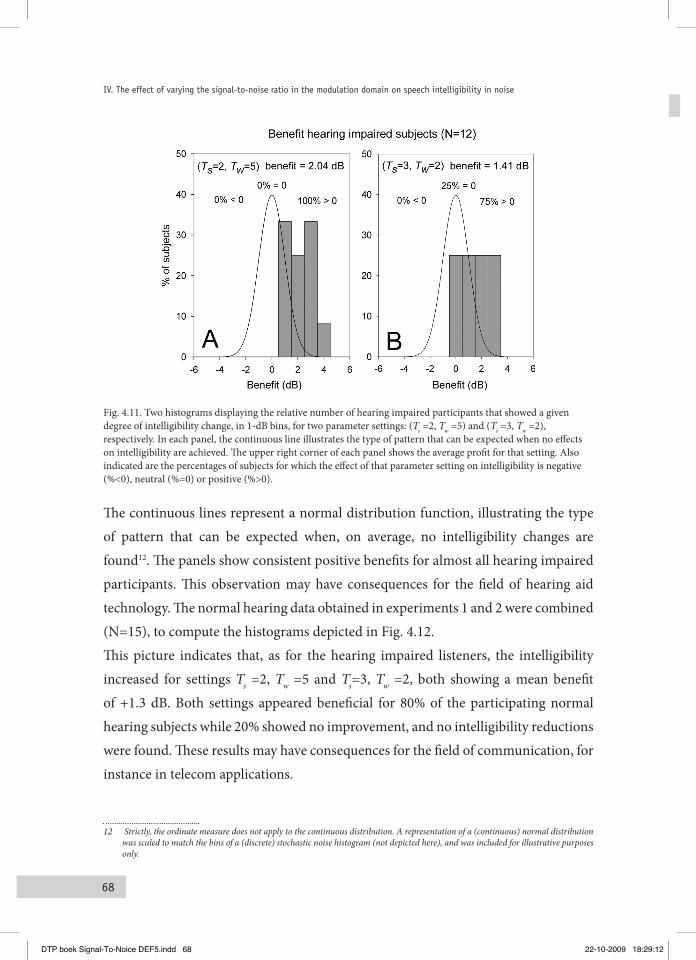
68
IV. The effect of varying the signal-to-noise ratio in the modulation domain on speech intelligibility in noise
Fig. 4.11. Two histograms displaying the relative number of hearing impaired participants that showed a given degree of intelligibility change, in 1-dB bins, for two parameter settings: (Ts =2, Tw =5) and (Ts =3, Tw =2), respectively. In each panel, the continuous line illustrates the type of pattern that can be expected when no effects on intelligibility are achieved. The upper right corner of each panel shows the average profit for that setting. Also indicated are the percentages of subjects for which the effect of that parameter setting on intelligibility is negative (%<0), neutral (%=0) or positive (%>0).
The continuous lines represent a normal distribution function, illustrating the type of pattern that can be expected when, on average, no intelligibility changes are found12. The panels show consistent positive benefits for almost all hearing impaired participants. This observation may have consequences for the field of hearing aid technology. The normal hearing data obtained in experiments 1 and 2 were combined (N=15), to compute the histograms depicted in Fig. 4.12. This picture indicates that, as for the hearing impaired listeners, the intelligibility increased for settings Ts =2, Tw =5 and Ts=3, Tw =2, both showing a mean benefit of +1.3 dB. Both settings appeared beneficial for 80% of the participating normal hearing subjects while 20% showed no improvement, and no intelligibility reductions were found. These results may have consequences for the field of communication, for instance in telecom applications.
12 Strictly, the ordinate measure does not apply to the continuous distribution. A representation of a (continuous) normal distribution was scaled to match the bins of a (discrete) stochastic noise histogram (not depicted here), and was included for illustrative purposes only.
DTP boek Signal-To-Noice DEF5.indd 68 22-10-2009 18:29:12
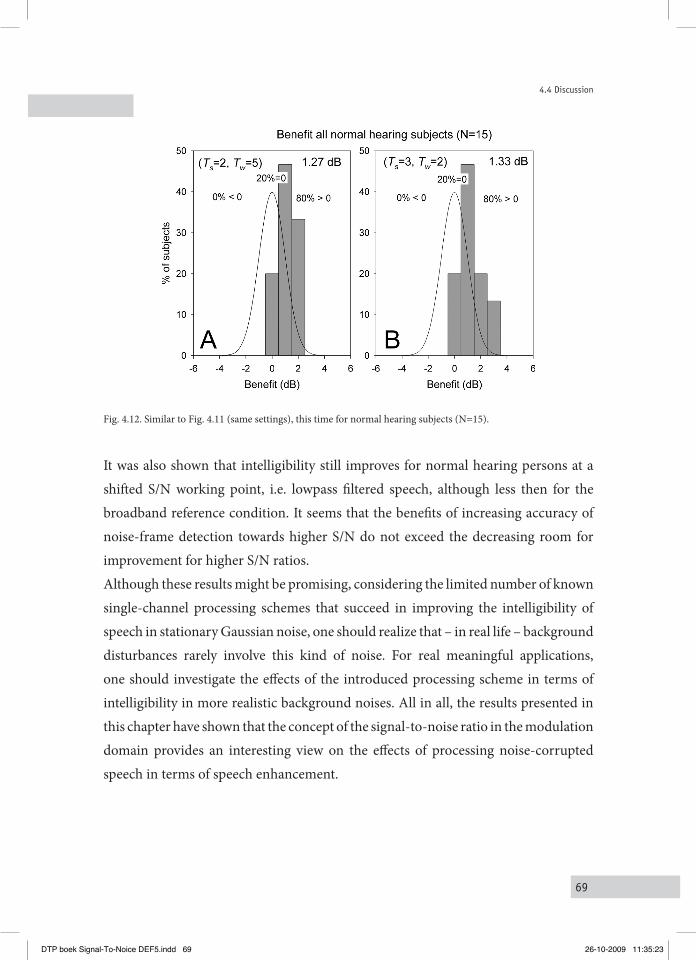
69
4.4 Discussion
Fig. 4.12. Similar to Fig. 4.11 (same settings), this time for normal hearing subjects (N=15).
It was also shown that intelligibility still improves for normal hearing persons at a shifted S/N working point, i.e. lowpass filtered speech, although less then for the broadband reference condition. It seems that the benefits of increasing accuracy of noise-frame detection towards higher S/N do not exceed the decreasing room for improvement for higher S/N ratios.Although these results might be promising, considering the limited number of known single-channel processing schemes that succeed in improving the intelligibility of speech in stationary Gaussian noise, one should realize that – in real life – background disturbances rarely involve this kind of noise. For real meaningful applications, one should investigate the effects of the introduced processing scheme in terms of intelligibility in more realistic background noises. All in all, the results presented in this chapter have shown that the concept of the signal-to-noise ratio in the modulation domain provides an interesting view on the effects of processing noise-corrupted speech in terms of speech enhancement.
DTP boek Signal-To-Noice DEF5.indd 69 26-10-2009 11:35:23
70
IV. The effect of varying the signal-to-noise ratio in the modulation domain on speech intelligibility in noise
concluSionS4.5 (1) The strong relation between (S/N)mod-based SRT predictions and measured
SRT’s (correlation coefficients of typically 0.8) that was shown here for a wide range of parameter settings of the used signal processing, supports the significance of the (S/N)mod as a crucial factor for explaining speech intelligibility in noise.
(2) It was shown that, by applying a processing scheme intended to enforce changes in (S/N)mod, for some conditions intelligibility in noise was improved in the order of 1 dB for normal hearing persons and of about 2 dB for hearing impaired persons.
DTP boek Signal-To-Noice DEF5.indd 70 22-10-2009 18:29:15
71
V. Improving speech intelligibility in party babble noise
Abstract
The new type of signal processing, which was applied in the previous chapter to speech in stationary Gaussian noise, was applied to speech that was corrupted with babble noise recorded at a lively reception (party babble). In the present study, it was chosen not to pre-process the party babble in any way, to remain as close to a real-life situation as possible. Envelope-spectrum analysis indicated that the temporal structure of the party babble closely relates to that of the more commonly used multi-talker mixture, with an N of typically 16. As in the previous chapter, the effectiveness of the new processing scheme for speech masked by this party babble is evaluated by converting changes in (S/N)mod ratios into predictions of changes in the speech reception threshold (SRT). Overall, these predictions were found to relate well to the results of listening experiments with normal hearing and hearing-impaired subjects, indicating average SRT improvements after signal processing of 0.6 dB and 1.6 dB, respectively.
DTP boek Signal-To-Noice DEF5.indd 71 22-10-2009 18:29:17
72
V. Improving speech intelligibility in party babble noise
Introduction
It is often difficult to understand a talker at a party or a reception. Especially for hearing impaired persons this task can be tiring and frustrating, and may affect their social life (Hallberg et al., 2008). It has been shown in many studies that, up to now, signal processing in hearing aids could not alleviate this problem, although some (multi-microphone) techniques seem promising (Levitt, 2001; Wittkop, 2001; Marzinzik, 2000; WGCA, 1991). Recently, a new type of signal processing was introduced (Chapter IV, Dubbelboer and Houtgast, 2009, in preparation) that was inspired by the principle of increasing the strength of speech modulations relative to the strength of noise modulations, as described by the concept of signal-to-noise ratio in the modulation domain (S/N)mod (Chapter III, Dubbelboer and Houtgast, 2008). Changes in the intelligibility of speech, masked by stationary speech-shaped Gaussian noise (or “speech noise”) that was subjected to the new type of processing, were well predicted by the concept, as was verified in listening experiments (Chapter IV, Dubbelboer and Houtgast, 2009, in preparation). Basically, the same procedure (i.e. predictions and measurements) was applied in the current study, but this time for party babble noise instead of the previously used speech noise. Speech noise is widely used in laboratories for investigating processing effects on speech in noise, however, it is not very representative for daily-life disturbances. To obtain a fair estimate of the benefit of processing methods in practice, one needs to apply less artificial noise maskers. More realistic conditions, like a reception are often mimicked acoustically by using a multi-talker mixture (for a review see Bronkhorst, 2000), which are usually produced by summing N equal-levelled speech signals, obtained from standardized speech sets such as TIMIT Acoustic-Phonetic Continuous Speech Corpus (Garofolo et al., 1993), ICRA databases (Dreschler et al., 2001), the VU98 set (Versfeld et al., 2000), the Plomp and Mimpen speech set (Plomp and Mimpen, 1979) or comparable speech-research corpi. As the speech is recorded from professional talkers under controlled circumstances, the physical properties of the involved speech are balanced and well documented. Although the multi-talker mixture has proven to be an interesting masker for many types of research, such as investigations of the masking effects caused by
DTP boek Signal-To-Noice DEF5.indd 72 22-10-2009 18:29:19
73
Introduction
fluctuations within the temporal noise envelope (Festen and Plomp, 1990) or effects of informational masking13 (Simpson and Cooke, 2005; Brungart et al., 2001), it differs in various aspects from real-life recordings. Real-life recordings reflect additional factors, such as the spatial distribution of talkers and the reverberation of the room, that will influence the resulting signal physics and therefore, potentially, also intelligibility. Nevertheless, as a multi-talker mixture and a life recording of party babble are related, the physical properties of the present party-babble recording are evaluated here relatively to the properties of a multi-talker babble mixture.The party babble used in this study was obtained from a lively reception, without any additional spectrotemporal shaping of the resulting signal, and therefore without sacrificing the naturalness of the recording14. The first part of this chapter compares the temporal characteristics of this party babble to that of a multi-talker mixture and of stationary Gaussian noise. We use the envelope spectrum for that purpose (Houtgast and Steeneken, 1972). This chapter continues with analysing the behaviour of the noise suppression system for the present party babble for various parameter settings of the suppression system as specified in Chapter IV. As the concept of (S/N)mod has proven successful in predicting changes in intelligibility after processing, it was used in this study as well. Using the probe signal as described in Chapter IV, (S/N)mod ratios were measured before and after processing, and used to predict ∆SRT’s. In the last part of this chapter, the predicted ∆SRT’s are compared with measured ∆SRT’s, obtained from a series of listening experiments performed with normal-hearing and hearing-impaired persons. Finally, the results will be discussed in the light of practical applications and the concept of signal-to-noise ratio in the modulation domain.
13 Informational masking is defined by Freyman et al. (2004) as: “features of masking or release from masking, that cannot be explained in terms of traditional energetic masking”.
14 In experiments with hearing-impaired listeners, the stimuli (speech plus noise) were shaped according to the individual hearing loss before aural presentation.
DTP boek Signal-To-Noice DEF5.indd 73 22-10-2009 18:29:22
74
V. Improving speech intelligibility in party babble noise
phySical characteriSticS of the StiMuli5.1 Speech material and maskers5.1.1
The used speech material was obtained from the VU98 speech database (Versfeld et al., 2000), which contains a large number of everyday sentences, recorded from a male and a female speaker (both used as a target) at 44.1 kHz (which was downsampled to 22.05 kHz) with a 16 bit dynamic range. The speech was mixed with a masker at a range of S/N ratios between –15 dB and 15 dB. The applied maskers were: (1) speech noise, i.e. a stationary Gaussian noise with a spectrum shaped to match the long-term spectral average of the VU98- speech; (2) a multi-talker mixture constructed by summing a series of N sentences (male+female) from the VU98 dataset for N=2, 4, 8, 16 or 32, and (3) a party babble, the aforementioned recording at a lively reception that was attended by about 50 people. The recording was made with a Dell Inspiron 5160 computer, equipped with an 4 GHz Intel Pentium 4 CPU 512 MB RAM, and a SigmaTel 24 bit soundcard. Recordings were made in Cool Edit Pro (44.1 kHz, 16 bit), with a Røde NT3 polarized condenser, hyper-cardioid polar response, microphone.
a. Envelope spectra The temporal characteristics of the three types of maskers are compared by performing a spectral analysis of their temporal envelopes, i.e. by comparing the envelope spectra (Houtgast and Steekenen, 1972; 1985). Note that the procedure for computing envelope spectra as used in this thesis is somewhat different from that described in (Houtgast and Steeneken, 1985): we now apply 1/3-octave band filtering (rather than octave band filtering, to closer relate to auditory filtering) in the audio domain, and octave band grouping (rather than 1/3-octave band grouping, which seems unnecessarily fine from the perceptual point of view [Houtgast, 1989]) for displaying the envelope spectrum. Figure 5.1 shows typical envelope spectra, for the 1-kHz 1/3-octave band, for speech (N=1) and multi-talker mixture (N=2, 4, 8, 16, 32), (open bullets), Gaussian noise (filled bullets), and party babble (open bullets, dashed line), all based on 6 masker samples of 30 seconds each.
DTP boek Signal-To-Noice DEF5.indd 74 22-10-2009 18:29:23
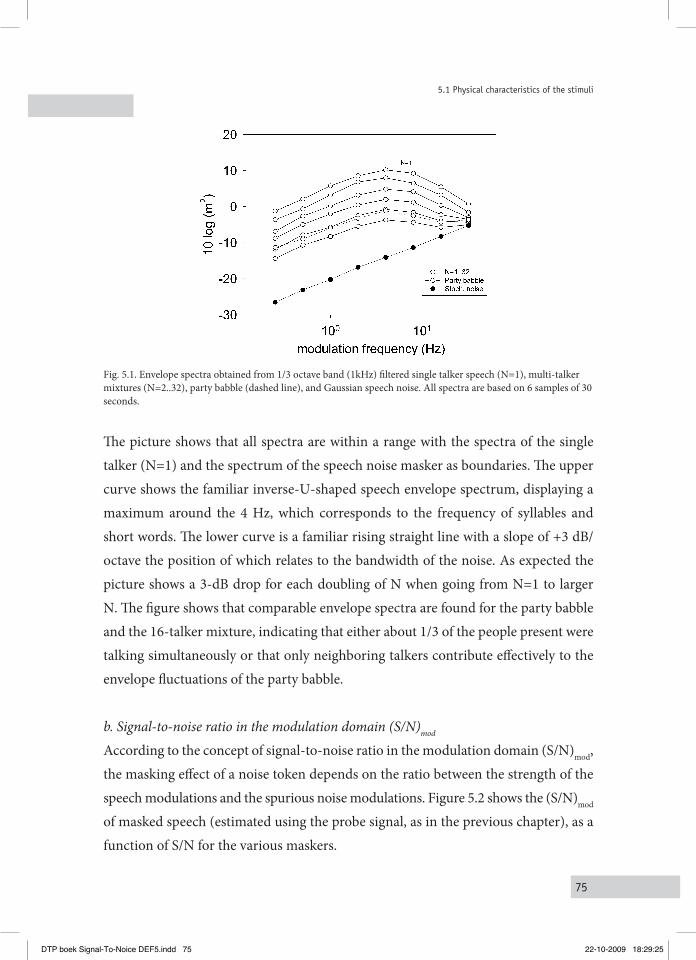
75
5.1 Physical characteristics of the stimuli
Fig. 5.1. Envelope spectra obtained from 1/3 octave band (1kHz) filtered single talker speech (N=1), multi-talker mixtures (N=2..32), party babble (dashed line), and Gaussian speech noise. All spectra are based on 6 samples of 30 seconds.
The picture shows that all spectra are within a range with the spectra of the single talker (N=1) and the spectrum of the speech noise masker as boundaries. The upper curve shows the familiar inverse-U-shaped speech envelope spectrum, displaying a maximum around the 4 Hz, which corresponds to the frequency of syllables and short words. The lower curve is a familiar rising straight line with a slope of +3 dB/octave the position of which relates to the bandwidth of the noise. As expected the picture shows a 3-dB drop for each doubling of N when going from N=1 to larger N. The figure shows that comparable envelope spectra are found for the party babble and the 16-talker mixture, indicating that either about 1/3 of the people present were talking simultaneously or that only neighboring talkers contribute effectively to the envelope fluctuations of the party babble.
b. Signal-to-noise ratio in the modulation domain (S/N)mod
According to the concept of signal-to-noise ratio in the modulation domain (S/N)mod, the masking effect of a noise token depends on the ratio between the strength of the speech modulations and the spurious noise modulations. Figure 5.2 shows the (S/N)mod of masked speech (estimated using the probe signal, as in the previous chapter), as a function of S/N for the various maskers.
DTP boek Signal-To-Noice DEF5.indd 75 22-10-2009 18:29:25
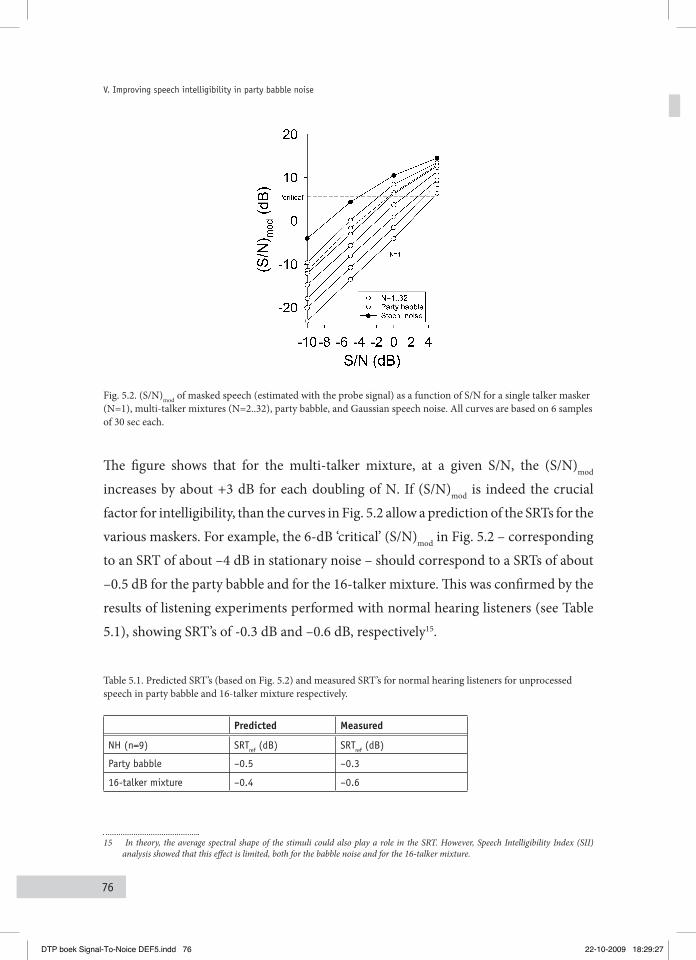
76
V. Improving speech intelligibility in party babble noise
Fig. 5.2. (S/N)mod of masked speech (estimated with the probe signal) as a function of S/N for a single talker masker (N=1), multi-talker mixtures (N=2..32), party babble, and Gaussian speech noise. All curves are based on 6 samples of 30 sec each.
The figure shows that for the multi-talker mixture, at a given S/N, the (S/N)mod increases by about +3 dB for each doubling of N. If (S/N)mod is indeed the crucial factor for intelligibility, than the curves in Fig. 5.2 allow a prediction of the SRTs for the various maskers. For example, the 6-dB ‘critical’ (S/N)mod in Fig. 5.2 – corresponding to an SRT of about –4 dB in stationary noise – should correspond to a SRTs of about –0.5 dB for the party babble and for the 16-talker mixture. This was confirmed by the results of listening experiments performed with normal hearing listeners (see Table 5.1), showing SRT’s of -0.3 dB and –0.6 dB, respectively15.
Table 5.1. Predicted SRT’s (based on Fig. 5.2) and measured SRT’s for normal hearing listeners for unprocessed speech in party babble and 16-talker mixture respectively.
Predicted Measured
NH (n=9) SRTref (dB) SRTref (dB)
Party babble –0.5 –0.3
16-talker mixture –0.4 –0.6
15 In theory, the average spectral shape of the stimuli could also play a role in the SRT. However, Speech Intelligibility Index (SII) analysis showed that this effect is limited, both for the babble noise and for the 16-talker mixture.
DTP boek Signal-To-Noice DEF5.indd 76 22-10-2009 18:29:27
77
5.2 Listening experiments
However, the predicted SRT’s seem to contradict with literature when following this same reasoning towards smaller N. From the data in Fig. 5.2 one would predict an SRT of about +5 dB for N=1 (single-talker masker), whereas it is known that for only one or a few interfering talkers the SRT decreases as a result of masking release (Festen and Plomp, 1990; Freyman et al., 2004), i.e. the ability of listeners to take advantage of the silent periods of the masker. This implies that the (S/N)mod does not apply for small N, as release from masking (and other effects related to small N’s like ‘informational masking’) is not considered by the concept of (S/N)mod. However, for N=16, the SRT predictions based on (S/N)mod’s agree with the data shown in Table 5.1. This suggests that for typical party babble with an effective N of about 16, the nature of the temporal envelope fluctuations is such that (S/N)mod is the prime factor for intelligibility, much the same as for stationary Gaussian noise, because for this number of interfering talkers masking release hardly occurs yet. As in the previous chapters, the (S/N)mod is measured with a probe signal: a 1 kHz carrier with a 4 Hz sinewave-modulated intensity envelope (of which the amplitude distribution is shaped according to the distribution of speech) which is corrupted with 1/3 oct band filtered noise positioned around 1 kHz. The effects of the new algorithm on (S/N)mod and intelligibility are studied by converting observed ∆(S/N)mod’s into ∆SRT’s using the curves in Fig. 5.2, and comparing these predicted ∆SRT’s with measured ∆SRT’s.
liStening experiMentS5.2
Procedure5.2.1
For each listener, the monaural speech reception threshold (SRT) was measured for speech in noise and party babble, in two signal-processing conditions for normal-hearing subjects, and four processing conditions for hearing-impaired subjects, including the reference conditions. The conditions were presented in a randomised order, and each condition was measured twice. In all conditions, a list of 13 sentences, unknown to the listener, was used to estimate the level at which 50% of the sentences could be correctly reproduced. Processed stimuli were computed in advance for a
DTP boek Signal-To-Noice DEF5.indd 77 22-10-2009 18:29:28
78
V. Improving speech intelligibility in party babble noise
range of S/N ratios, and retrieved from HDD during the adaptive SRT measurements. Stimuli were presented monaurally through Sony MDR-V900 headphones. The test was performed double blind: neither the experimenter nor the subject was informed about the specific measurement condition. Subjects were allowed to practice first before results were included in the dataset. The processing details of the FFT-based algorithm are extensively described in Dubbelboer and Houtgast (2009, in preparation). The first part of the processing detects noise-dominated segments in the speech+noise signal in an ongoing comparison between signal profiles within a time window (Tw) and the average noise profile obtained from speech-nonspeech detection. The maximally tolerated difference is defined by threshold Ts. In the second part, the amplitudes of the noise-dominated bins are attenuated. For the normal hearing listeners, only one parameter combination (Ts=2 and Tw=5) was tested, as this combination was shown to be most successful in previous studies with stationary noise. For the hearing impaired listeners two of the most successful combinations (Ts=2, Tw=5) and (Ts=3, Tw=2) were adopted from the previous studies. A third setting was added to verify whether the mountain-shaped plot in Fig. 4.7 represents an underlying continuous ‘band of optimal settings’, or rather a number of independent local optima, visually connected in the picture by interpolated (S/N)mod values. This third parameter combination (Ts=2.5, Tw=4), is located in between the two known combinations.
Participants5.2.2
Nine normal hearing subjects (aged from 26 to 37 with an average age of 32) and sixteen hearing impaired persons with moderate sensory neural high frequency hearing loss, aged between 32 and 72 (average 54), participated in an experiment in which SRT’s were measured, for processed and unprocessed (reference) speech-plus-noise stimuli. For the hearing-impaired listeners, the intelligibility score for monosyllabic words in quiet was at least 75% correct. The pure-tone threshold, averaged over 0.5, 1, and 2 kHz (the pure-tone average or PTA) ranged (for their best ear, which was used for the measurements) from 15 to 60 dB, with a mean PTA of 45 dB HL. To present as much speech information as possible in the dynamic range of
DTP boek Signal-To-Noice DEF5.indd 78 22-10-2009 18:29:28
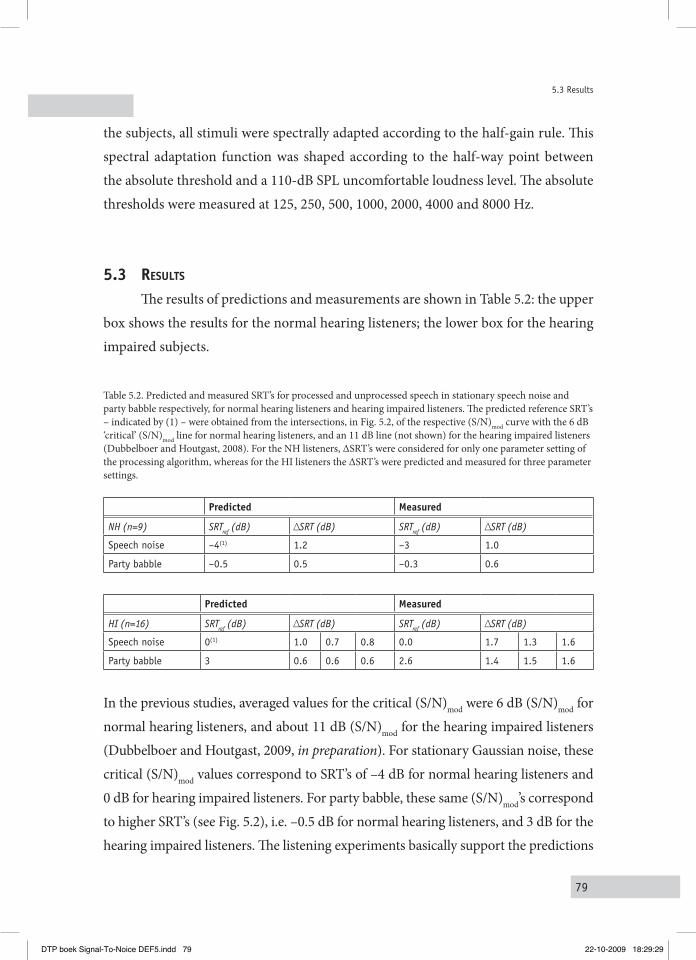
79
5.3 Results
the subjects, all stimuli were spectrally adapted according to the half-gain rule. This spectral adaptation function was shaped according to the half-way point between the absolute threshold and a 110-dB SPL uncomfortable loudness level. The absolute thresholds were measured at 125, 250, 500, 1000, 2000, 4000 and 8000 Hz.
reSultS5.3 The results of predictions and measurements are shown in Table 5.2: the upper box shows the results for the normal hearing listeners; the lower box for the hearing impaired subjects.
Table 5.2. Predicted and measured SRT’s for processed and unprocessed speech in stationary speech noise and party babble respectively, for normal hearing listeners and hearing impaired listeners. The predicted reference SRT’s – indicated by (1) – were obtained from the intersections, in Fig. 5.2, of the respective (S/N)mod curve with the 6 dB ‘critical’ (S/N)mod line for normal hearing listeners, and an 11 dB line (not shown) for the hearing impaired listeners (Dubbelboer and Houtgast, 2008). For the NH listeners, ∆SRT’s were considered for only one parameter setting of the processing algorithm, whereas for the HI listeners the ∆SRT’s were predicted and measured for three parameter settings.
Predicted Measured
NH (n=9) SRTref
(dB) ∆SRT (dB) SRTref
(dB) ∆SRT (dB)
Speech noise –4(1) 1.2 –3 1.0
Party babble –0.5 0.5 –0.3 0.6
Predicted Measured
HI (n=16) SRTref
(dB) ∆SRT (dB) SRTref
(dB) ∆SRT (dB)
Speech noise 0(1) 1.0 0.7 0.8 0.0 1.7 1.3 1.6
Party babble 3 0.6 0.6 0.6 2.6 1.4 1.5 1.6
In the previous studies, averaged values for the critical (S/N)mod were 6 dB (S/N)mod for normal hearing listeners, and about 11 dB (S/N)mod for the hearing impaired listeners (Dubbelboer and Houtgast, 2009, in preparation). For stationary Gaussian noise, these critical (S/N)mod values correspond to SRT’s of –4 dB for normal hearing listeners and 0 dB for hearing impaired listeners. For party babble, these same (S/N)mod’s correspond to higher SRT’s (see Fig. 5.2), i.e. –0.5 dB for normal hearing listeners, and 3 dB for the hearing impaired listeners. The listening experiments basically support the predictions
DTP boek Signal-To-Noice DEF5.indd 79 22-10-2009 18:29:29
80
V. Improving speech intelligibility in party babble noise
for these two maskers, with recorded SRTs of –0.3 dB and 2.6 dB, respectively. The effects of processing are shown in the ∆SRT columns, showing the (Ts=2, Tw=5) condition for normal-hearing listeners, and the (Ts=2, Tw=5), (Ts=2.5, Tw=4) and (Ts=3, Tw=2) conditions for the hearing impaired listeners. For the steady speech noise, an average SRT shift of 1.2 dB was predicted for the normal hearing listeners, which agrees well with the measured shift of 1.0 dB. For the same group and party babble, the predicted ∆SRT of 0.5 dB corresponds well to the 0.6 dB improvement found in the experiment. This effect is small but significant (p<0.05, after Bonferoni correction). Individual results for normal-hearing participants, shown in Fig. 5.3 and Fig. 5.4 for speech noise and babble, respectively, show positive effects on intelligibility (averages of 1.0 dB and 0.6 dB) for most subjects (for 59% and 76% of the subjects, respectively). Negative effects on intelligibility were found in some cases for speech noise (18% of the subjects), but not for the party babble. For the hearing impaired listeners, positive effects of signal processing were predicted for each of the three investigated conditions. Predictions ranged between 0.7 dB and 1.0 dB for speech noise, and around 0.6 dB for party babble. In general, the predictions underestimated the experimental data, as indicated by ∆SRT’s between 1.3 dB and 1.7 dB for speech noise, and 1.4 dB to 1.6 dB for party babble (typical significance thresholds of p<0.005 and p<0.05, after Bonferoni correction). The individual results displayed in Fig. 5.5 (for the speech noise) and Fig. 5.6 (for the babble noise) indicate that intelligibility improves in most cases: 75%-88% of the subjects in case of speech noise, 62%-69% in case of babble noise. However, for roughly 10% of the subjects intelligibility is slightly reduced. For about 20% of the subjects, the intelligibility remained basically unchanged.
DTP boek Signal-To-Noice DEF5.indd 80 22-10-2009 18:29:30
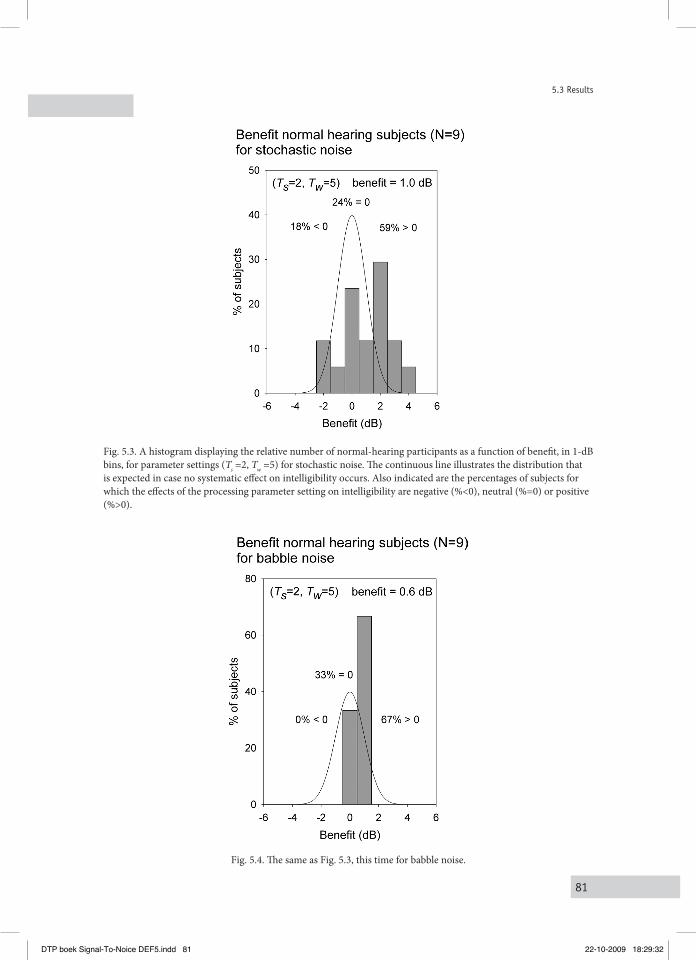
81
5.3 Results
Fig. 5.3. A histogram displaying the relative number of normal-hearing participants as a function of benefit, in 1-dB bins, for parameter settings (Ts =2, Tw =5) for stochastic noise. The continuous line illustrates the distribution that is expected in case no systematic effect on intelligibility occurs. Also indicated are the percentages of subjects for which the effects of the processing parameter setting on intelligibility are negative (%<0), neutral (%=0) or positive (%>0).
Fig. 5.4. The same as Fig. 5.3, this time for babble noise.
DTP boek Signal-To-Noice DEF5.indd 81 22-10-2009 18:29:32
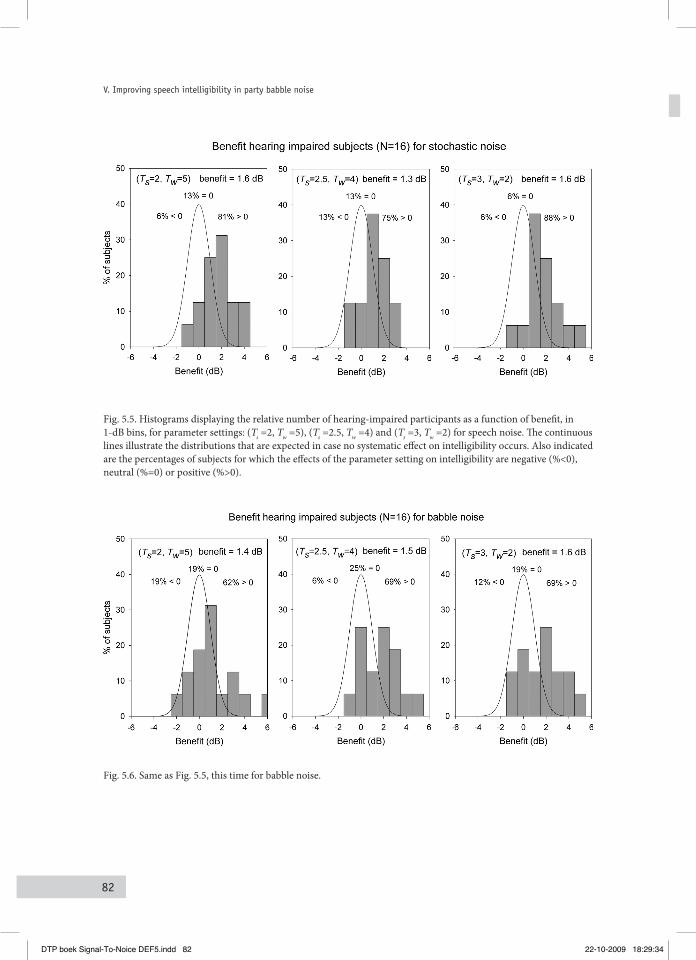
82
V. Improving speech intelligibility in party babble noise
Fig. 5.5. Histograms displaying the relative number of hearing-impaired participants as a function of benefit, in 1-dB bins, for parameter settings: (Ts =2, Tw =5), (Ts =2.5, Tw =4) and (Ts =3, Tw =2) for speech noise. The continuous lines illustrate the distributions that are expected in case no systematic effect on intelligibility occurs. Also indicated are the percentages of subjects for which the effects of the parameter setting on intelligibility are negative (%<0), neutral (%=0) or positive (%>0).
Fig. 5.6. Same as Fig. 5.5, this time for babble noise.
DTP boek Signal-To-Noice DEF5.indd 82 22-10-2009 18:29:34
83
5.4 Discussion
DiScuSSion5.4 The results indicate that the new algorithm improves speech intelligibility in babble and stationary noise both in normal hearing listeners and hearing impaired listeners. The crux of the algorithm is to bring about an increase of the strength of speech modulations relative to spurious noise modulations, reflected by an increase in the (S/N)mod. Although at present the obtained improvements are small, the concept behind the algorithm is promising and holds potential for larger improvements in the future. For normal hearing listeners, it was shown in Chapter IV that the concept in principle allows improvements up to 5 dB for speech noise. An important part of the processing algorithm is the discrimination between speech and nonspeech fragments, which was performed by a speech/nonspeech detector with equal settings for the different noise types. Increasing the quality of the speech/nonspeech detector (for instance by applying individual optimal settings for the various noise types) will most likely increase the overall quality of the algorithm. Although ∆SRT’s were basically predicted correctly for the various conditions, improvements for the hearing-impaired listeners were consistently underestimated by the (S/N)mod. At this point, it should be noted that the predictions with the current probe signal are based on only a single audio-frequency band (around 1 kHz) and a single modulation band (around 4 Hz). By increasing these numbers, one may expect to obtain a more reliable and complete image of the actual modulation ratio in the signal, thus increasing the accuracy of the predictions. As also such ‘full’ (S/N)mod measurement should result in a single value, one should investigate the relative contribution to intelligibility for each individual audio-frequency band and modulation-frequency band, and convert these values into an appropriate weighing function and add the totals, much like in the model of Speech Transmission Index (STI).In more general terms, the current study revealed a fundamental limitation of the concept of (S/N)mod. Although the SRT’s were correctly predicted for party babble and 16-talker mixture, the predictions became less reliable towards smaller N (i.e., predicting the poorest SRT for N=1), as psychophysical effects not included in the concept, such as masking release and informational masking, then become
DTP boek Signal-To-Noice DEF5.indd 83 22-10-2009 18:29:34
84
V. Improving speech intelligibility in party babble noise
increasingly important. Additional research is required to explore the limitations of the (S/N)mod concept as a function of the modulation characteristics of the masker in more detail. The practical potential of the new algorithm requires real-time processing and robust performance in realistic situations. The first condition is met, as the algorithm can perform in real time on a standard FFT-based processing platform, and a first step concerning the second condition has been studied in the current chapter: the intelligibility of the speech in a realistic babble. The next step will be to perform an experiment outside the laboratory, in daily-life environments. Considering the positive results for normal-hearing listeners, the practical potential may not be restricted to just the hearing aid industry, but may also include applications in the telecom industry and speech recognition industry.
concluSionS5.5 (1) The agreement between the various predicted and measured SRT’s and ∆SRT’s
support the idea of the (S/N)mod being a crucial factor in predicting speech intelligibility in noise.
(2) The predictions based on the (S/N)mod do not apply for small numbers of interfering talkers, as the concept does not account for the release of masking observed for such conditions.
(3) The new algorithm improves speech intelligibility in party babble for both normal-hearing listeners (0.6 dB SRT) and hearing-impaired listeners (1.6 dB).
DTP boek Signal-To-Noice DEF5.indd 84 22-10-2009 18:29:34
85
Summary
Motivated by the observation that most noise reduction algorithms fail to improve the intelligibility of speech in background noise, the aim of the present thesis was to identify the crucial factor – in signal-analysis terms – for the intelligibility of noise-corrupted speech. By definition, such a factor must be independent of any type of signal processing applied to the noise-corrupted speech signal. Recent publications have shown that this is not the case for common measures like signal-to-noise ratio (S/N ratio) and Speech Transmission Index (STI). It has been observed that S/N ratios and STI values of noise-corrupted speech can improve as a result of signal processing, while the intelligibility of the processed noisy speech remains equally poor. Until this paradox is unravelled there remains a gap in the theory of noisy speech perception, and it remains unclear what principle noise-reduction algorithms should aim for in terms of signal restoration. To understand this paradox is the driving force behind the current thesis, in which the physical and psychophysical effects of noise on speech and its perception were studied in detail. The general idea is that when noise is added to speech, the speech waveform is altered in various ways. Each alteration has a specific degrading effect on intelligibility, some more then others. Once the most degrading effect is identified, we can attempt to improve the intelligibility of noise-corrupted speech in general by counteracting particularly this most prominent effect of noise.
After a general introduction in Chapter I, a specific type of signal analysis is introduced in Chapter II, designed for identifying and isolating the different speech-waveform alterations when noise is added. As it was intended to relate signal processing to auditory processing, the applied signal analysis was matched to human auditory analysis with respect to the applied spectro-temporal resolution. It is known that the spectral resolution of the auditory system is roughly constant on a logarithmic frequency scale. Wavelet analysis is well suited for a logarithmic frequency scale, and was used in this study to capture the instantaneous amplitude and phase of 1/3-octave band output signals, in a way roughly corresponding to the auditory bandwidth. After subjecting speech-plus-noise to a wavelet analysis, three different effects of noise on the
DTP boek Signal-To-Noice DEF5.indd 85 22-10-2009 18:29:35
86
Summary
wavelet representation were identified: two effects on the wavelet level (one systematic and one stochastic) and one effect on the wavelet phase. Using signal processing, each of these three effects could be included or excluded in speech stimuli. The resulting eight conditions were subjected to intelligibility tests (CVC word scores), which indicated that the systematic level effect (i.e. increase of each speech wavelet with the mean noise intensity) has the most detrimental effect on intelligibility, causing a drop in word score from 83% (no noise) to 63%. The phase effect appeared less degrading (76%), while stochastic perturbation of the speech envelope (86%) did not seem to have any negative effect by itself, only in combination with a second effect did it affect scores. In general, adding a second effect reduced the intelligibility further. Up to this point, the results seemed in good agreement with models like the MTF-STI. In this model, the effect of noise on speech intelligibility is understood as a reduction of speech modulations essential for intelligibility, expressed in the reduced peak/valley ratio in the fluctuating speech envelope caused by noise filling up the speech valleys. On average, the valleys are raised by an amount equal to the mean noise intensity, which corresponds exactly to the ‘first noise effect’ found in our experiment.So, increasing the intelligibility of noise-corrupted speech seems basically a matter of neutralizing the first noise effect. In signal-technical terms, this operation is identical to applying all noise effects excluding the systematic level effect, which was one of the eight measured conditions. Results indicated that intelligibility indeed increased, from 29% (‘full noise effect’) to 74% after applying the all noise effects but the main one, confirming the significance of neutralizing the first noise effect.For practical applications, however, the applied operation is strongly limited by the fact that access to the original, uncorrupted, speech signal is required. An alternative operation, in which an estimate of the mean noise intensity was directly subtracted from the intensity of the speech-plus-noise mixture – a basic form of ‘spectral subtraction’ – did improve STI values, indicating successful neutralization of the first noise effect, but failed to improve intelligibility.To try and understand the completely different perceptual effects for both types of noise reduction (with and without a priori knowledge), the output signals of both operations were compared, showing completely different details in their effects on the
DTP boek Signal-To-Noice DEF5.indd 86 26-10-2009 11:40:04
87
Summary
signal. The first operation (using original speech) restored the global contours of the speech envelope, and thus effectively reduced the noise fluctuations relative to those contours. The second operation (spectral subtraction) compensated for the overall level increase caused by the noise, but did not effectively change the distribution of the speech and noise fluctuations. As a result, the strength of noise modulations was strongly reduced in the first case, but remained essentially unchanged in the second case, suggesting that the intelligibility of speech in noise may not only depend on the strength of speech modulations, but also on the strength of noise modulations. It was suggested that intelligibility might depend on the ratio between speech modulations and noise modulation.To verify this idea, noise-corrupted speech was subjected to various types of processing (spectral subtraction, deterministic modulation reduction, amplitude compression and expansion), and the ratios between speech and noise modulations (the “modulation ratio”) of the processed signals were compared with intelligibility scores obtained from listening experiments (described in Chapter III). As the modulation ratio cannot be determined directly from the noisy speech itself, a special probe signal was designed for this purpose which, mixed with noise, was subjected to the various signal processing types. For each processing type, modulation ratios were determined for this probe signal, and compared to intelligibility scores of noisy speech that was processed in the same way. The results of this study corroborated the relation between the modulation ratio and intelligibility, and motivated the introduction of a new concept: the signal-to-noise ratio in the modulation domain, or (S/N)mod.Increasing the intelligibility of noise-corrupted speech appears to be basically a matter of increasing the (S/N)mod, i.e. increasing the strength of speech modulations re noise modulations. To further investigate this concept, the (S/N)mod of noisy signals was artificially manipulated by means of specific signal processing, and again compared to intelligibility scores obtained from listening experiments (Chapter IV). This time, the artificial probe (used to estimate (S/N)mod) was adjusted to match the intensity distribution of actual speech, allowing (S/N)mod values to be converted into the expected SRTs. In the first part of the chapter, the imposed variations in (S/N)mod were controlled with a priori knowledge about the original (uncorrupted)
DTP boek Signal-To-Noice DEF5.indd 87 22-10-2009 18:29:35
88
Summary
signal. As this information is only available in the laboratory, an alternative approach was tested in the second part of the chapter, in which (S/N)mods were manipulated without this type of information. It was shown that the variations imposed on the (S/N)mods of the signals were essentially followed by corresponding variations in intelligibility, substantiated by correlation coefficients of typically 0.8. It is argued that the applied type of signal processing may be useful for future practical applications, as the results indicated that (without a priori knowledge) intelligibility improvements of typically +2 dB could be reached for hearing-impaired persons. For practical applications of this type of processing, it is important to know whether improvements can also be shown for more realistic noise types, such as, for example, babble noise. To obtain some clarification, an experiment was performed (Chapter V) using realistic babble noise obtained from a live recording of about fifty talking persons at a lively reception. Nine normally-hearing and sixteen hearing-impaired persons participated in the experiment, which was performed in essentially the same way as the previous experiments. The results indicated that the processing still improved intelligibility for normally-hearing and hearing-impaired persons, on average by 0.6 and 1.6 dB in SRT, respectively. It was also found that the predictions based on the (S/N)mod did not apply well for small numbers of interfering talkers, as the present concept does not account for the release of masking observed for such strongly fluctuating maskers. This limitation of the applicability of the (S/N)mod concept requires further investigations.
DTP boek Signal-To-Noice DEF5.indd 88 22-10-2009 18:29:36
89
Samenvatting
Het concept van de signaal/ruis verhouding in het modulatie domein
Het voorspellen van de verstaanbaarheid van bewerkte spraak in ruis
De constatering dat de meeste ruisonderdrukkings-algoritmen niet in staat zijn het om verstaan van spraak in achtergrondruis te verbeteren, vormde de basis voor dit proefschrift. Het doel was om te onderzoeken wat de meest cruciale – signaaltechnische – factor is bij het verstaan van spraak in achtergrondruis. Een dergelijke factor is per definitie onafhankelijk van het type signaalbewerking dat wordt toegepast op het spraak-plus-ruis signaal. Recente publicaties laten zien dat dit niet het geval is voor gangbare maten zoals signaal/ruis verhouding (S/N ratio) en de Speech Transmission Index (STI). Het is bekend dat signaalbewerking zowel de S/N ratio als de STI kunnen verbeteren, terwijl de verstaanbaarheid toch gelijk blijft. Zolang deze paradox niet is opgelost, blijft de theorie rond het spraakverstaan in ruis onvolledig, en blijft het tevens onduidelijk waar ruisonderdrukkings-algoritmen zich precies op moeten richten in termen van signaal reconstructie. Het begrijpen van deze tegenstelling is de drijvende kracht geweest achter dit promotieonderzoek, waarin de fysische en psychofysische effecten van ruis op spraak in detail zijn onderzocht. Het globale idee is dat ruis op een aantal manieren de golfvorm van het spraaksignaal verandert. Elke afzonderlijke verandering heeft een specifiek (negatief) effect op de verstaanbaarheid; de ene verandering meer dan de ander. Door het meest dominante effect te identificeren, kan de verstaanbaarheid van spraak in ruis in het algemeen wellicht worden verbeterd door juist dit effect te neutraliseren.
Na een algemene introductie in Hoofdstuk I wordt in Hoofdstuk II een speciaal type signaalanalyse geïntroduceerd waarmee de verschillende veranderingen in het spraaksignaal (als gevolg van het toevoegen van ruis) systematisch kunnen worden geïdentificeerd en geïsoleerd. Om zo dicht mogelijk bij menselijke auditieve verwerking te blijven, is ervoor gezorgd dat de analyse – wat betreft de spectro-temporele eigenschappen – sterk lijkt op de signaalanalyse van het auditieve systeem. Het is bekend dat de spectrale resolutie van het auditieve systeem grofweg constant is
DTP boek Signal-To-Noice DEF5.indd 89 22-10-2009 18:29:36
90
Samenvatting
op een logaritmische schaal, hetgeen ook geldt voor wavelet analyse. Derhalve is deze techniek gebruikt als analyse methode voor het vaststellen van de instantane amplitude en fase van een reeks van 1/3-oktaafband uitgangssignaal. Deze bandbreedte correspondeert grofweg met de bandbreedte van het auditieve systeem. Door wavelet analyse toe te passen op zowel het schone spraaksignaal als op het spraak-plus-ruis signaal, en de resulterende wavelet-pixels te vergelijken, konden drie typen effecten in de wavelet representatie van de spraak worden vastgesteld: twee effecten op de wavelet sterkte (een systematisch en een stochastisch effect) en een effect op de wavelet fase. Met behulp van signaalbewerking konden elk van deze effecten afzonderlijk worden in- of uitgeschakeld. De resulterende acht mogelijke condities (=23) waren de basis voor luisterexperimenten (CVC woordscores). Hiermee werd aangetoond dat het systematische intensiteit-effect het grootste effect op verstaanbaarheid had. In deze conditie zakten de CVC scores van 83% (geen ruis toegevoegd) naar 63%. Het fase-effect bleek minder destructief (76%), en de stochastische verstoring van de intensiteits-omhullende van de spraak leek geen enkel effect te hebben (86%), behalve in combinatie met een tweede effect. Het toevoegen van een tweede effect leidde in het algemeen tot een verdere reductie in de verstaanbaarheid. Tot dit punt leken de resultaten in overeenstemming met modellen als het MFT-STI model (Modulation Transfer Function – Speech Transmission Index). In dit model wordt het effect van ruis op het spraakverstaan gekoppeld aan een reductie van essentiële spraakmodulaties, ofwel een afname van de piek/dal verhouding in de spraakomhullende als gevolg van ruis in de dalen van de spraak. Gemiddeld genomen neemt de intensiteit in de dalen toe met een waarde gelijk aan de gemiddelde ruisintensiteit, hetgeen exact overeenkomt met het ‘eerste ruiseffect’ uit het experiment. Het verbeteren van de verstaanbaarheid van spraak na het toevoegen van ruis lijkt dus eigenlijk een kwestie van het neutraliseren van het eerste ruiseffect. In signaalanalytische termen is deze operatie identiek aan het opleggen van alle ruiseffecten minus het systematische intensiteit effect. Dit was een van de acht gemeten condities. In deze conditie nam de spraakverstaanbaarheid toe van 29% (het volledige ruiseffect) tot 74% na de operatie, wat het belang aangeeft van het neutraliseren van het eerste ruis effect.Voor mogelijke applicaties in de praktijk wordt deze operatie echter sterk beperkt door het feit dat het originele (ruisvrije) spraak signaal nodig is. Een tweede, alternatieve
DTP boek Signal-To-Noice DEF5.indd 90 22-10-2009 18:29:36
91
Samenvatting
operatie waarin een schatting van de gemiddelde ruisintensiteit direct werd afge- trokken van de spraak-plus-ruis mix – een basale vorm van ‘spectral subtraction’ – bleek de STI waarde weliswaar te verbeteren, en dus het eerste ruiseffect succesvol te neutraliseren, terwijl de verstaanbaarheid toch gelijk bleef. Beide typen ruisonderdrukking (met en zonder voorkennis) bleken dus volstrekt verschillende effecten op het spraakverstaan te hebben.Om dit te begrijpen werden de uitgangssignalen van beide typen bewerkingen vergeleken, waarbij duidelijke verschillen in signaalstructuur naar voren kwamen. Deze verschillen bleken het best te duiden in termen van spraakmodulaties en niet-spraak (ruis)modulaties. Na de eerste operatie (waarbij de originele spraak werd gebruikt) werden de globale contouren van de spraakomhullende, dus de spraakmodulaties, hersteld, en de ruismodulaties sterk gereduceerd. De tweede operatie (‘spectral subtraction’) compenseerde weliswaar de toename van de totale energie, maar veranderde niet wezenlijk de distributie van de spraak- en ruisfluctuaties. Kortom, de relatieve sterkte van de ruismodulaties (t.o.v. de spraakmodulaties) werd fors gereduceerd in het eerste geval, maar bleef in essentie gelijk in het tweede geval. Dit suggereert dat spraakverstaanbaarheid wellicht niet alleen afhankelijk is van de sterkte van spraak-modulaties, maar ook van ruis-modulaties. Aldus ontstaat het beeld dat spraakverstaan in achtergrondruis wellicht afhankelijk is van de verhouding tussen sterkte van spraakmodulaties en ruismodulaties. Om dit idee te verifiëren werd spraak-plus-ruis onderworpen aan verscheidene typen signaalbewerking (spectral subtraction, deterministische modulatie reductie, amplitude compressie en amplitude expansie), met als doel om de relatieve sterkte van de spraakmodulaties en de ruismodulaties in het signaal (“modulatie ratio”) te vergelijken met metingen van verstaanbaarheid. Aangezien de modulatie ratio niet direct uit het uitgangssignaal zelf kan worden bepaald, werd gebruik gemaakt van een speciaal testsignaal dat, na het toevoegen van ruis, werd onderworpen aan verschillende typen signaalbewerking. Voor elk type bewerking werden modulatie ratio’s bepaald en vergeleken met verstaanbaarheidscores van spraak-plus-ruis signalen die op dezelfde manier waren bewerkt (beschreven in Hoofdstuk III). De resultaten van deze studie leken de relatie tussen modulatie ratio en verstaanbaarheid te bevestigen. Aldus werd een nieuw concept geïntroduceerd: de signaal/ruis verhouding in het modulatiedomein, ofwel (S/N)mod.
DTP boek Signal-To-Noice DEF5.indd 91 26-10-2009 11:47:40
92
Samenvatting
Het verbeteren van de verstaanbaarheid van spraak in ruis leek nu in essentie een kwestie van het vergroten van de (S/N)mod, ofwel het vergroten van de relatieve sterkte van de spraakmodulaties ten opzichte van de ruismodulaties. Om dit concept verder te onderzoeken, werd de (S/N)mod van spraak-plus-ruis kunstmatig gevarieerd met signaalbewerking, en vervolgens vergeleken met verstaanbaarheidscores (Hoofdstuk IV). Dit keer werd het testsignaal (nodig om de (S/N)mod te schatten) zodanig aangepast dat de distributie van intensiteiten sterk overeenkwam met die van werkelijke spraak, zodat de (S/N)mod kon worden omgezet naar een te verwachten verstaanbaarheiddrempel ofwel Speech Reception Threshold (SRT). In het eerste deel van dit hoofdstuk werd bij het opleggen van variaties in de (S/N)mod gebruik gemaakt van voorkennis over het originele (ruisvrije) signaal. Aangezien deze informatie enkel beschikbaar is in het laboratorium, werd tevens een alternatieve aanpak getest zonder voorkennis. De resultaten gaven aan dat de opgelegde (S/N)mod-variaties in het algemeen werden gevolgd door variaties in het spraakverstaan (correlatiecoëfficiënt r=0.8). Niet alleen ondersteunden de resultaten het belang van het nieuwe concept, het duidde mogelijk ook op een praktische toepassing van de gebruikte signaalbewerking methode zelf, gegeven de gemiddelde +2 dB verbetering in verstaanbaarheid (bij bewerking zonder voorkennis) voor slechthorenden. Voor het toepassen van een dergelijk systeem in de praktijk is het nodig om te weten of verbeteringen ook worden gevonden voor meer realistische ruistypen zoals achtergrondgebabbel. Om een indruk te krijgen werd een luisterexperiment uitgevoerd (Hoofdstuk V), met realistisch achtergrondrumoer (gebabbel) opgenomen tijdens een receptie met ongeveer vijftig personen. Negen normaalhorende- en zestien slechthorende proefpersonen namen deel aan het experiment dat in opzet gelijk was aan het hiervoor beschreven experiment. De resultaten gaven aan dat de operatie nog steeds een verbetering in het spraakverstaan gaf, zowel voor de normaalhorende proefpersonen (gemiddeld +0.6 dB), als voor de slechthorende proefpersonen (gemiddeld +1.6 dB). Anderzijds volgde uit de resultaten ook dat verstaanbaarheidvoorspellingen gebaseerd op de (S/N)mod onbetrouwbaar zijn voor maskeerders die bestaan uit achtergrondrumoer geproduceerd wordt door slechts enkele sprekers, aangezien het concept geen rekening houdt met ‘release of masking’ effecten die bekend zijn bij dit type sterk fluctuerende maskeerder. Deze principiële restrictie op de toepassingmogelijkheden van het (S/N)mod concept vereist verder onderzoek.
DTP boek Signal-To-Noice DEF5.indd 92 22-10-2009 18:29:37
93
ReferencesANSI (1969). ANSI S3.5-1969, “American National Standard Methods for the Calculation of the
Articulation Index” (American National Standards Institute, New York).ANSI (1997). ANSI S3.5-1997, “American National Standard Methods for the Calculation of the Speech
Intelligibility Index” (American National Standards Institute, New York).Barfod, J. (1978). “Automatic regulation systems with relevance to hearing aids,” Sensorineural Hearing
Impairment and Hearing Aids, edited by C. Ludvigsen and J. Barfod, Scand. Audiol. Suppl. 6, 355-378.
Boll, S.F. (1979). “Suppression of acoustic noise in speech using spectral subtraction,” IEEE Trans. Acoust., Speech, Signal Process. 27, 113-120.
Breithaupt, C., and Martin, R. (2003). “MMSE estimation of magnitude-squared dft coefficients with superGaussian priors,” IEEE International Conference on Acoustics, Speech and Signal Processing (ICASSP), pp. 848-851.
Bronkhorst, A. W. (2000). “The Cocktail party phenomenon: a review of research on speech intelligibility in multi-talker conditions,” Acustica 86, 117-128.
Brungart, D. S., Simpson, B. D., Ericson, M. A., and Scott, K. R. (2001). ”Informational and energetic masking effects in the perception of multiple simultaneous talkers,” J. Acoust. Soc. Am. 110, 2527-2538.
Bunnell, H. T. (1990). “On enhancement of spectral contrast in speech for hearing-impaired listeners,” J. Acoust Soc. Am. 88, 2546-2556.
Dau, T., Kollmeier, B., and Kohlrausch, A. (1997). “Modeling auditory processing of amplitude modulation. I. Detection and masking with narrow-band carriers,” J. Acoust. Soc. Am. 102, 2892-2905.
Dau, T., Verhey, J. L., and Kohlrausch, A. (1999). “Intrinsic envelope fluctuations and modulation-detection thresholds for narrow-band noise carriers,” J. Acoust. Soc. Am. 106 (5), 2752-2760.
Dillon, H. (1996). “Compression?: Yes, but for low and high frequencies, for low and high intensities, and with what response times ?” Ear Hear. 17, 287-307.
Dreschler, W. A., Verschuure, H., Ludvigsen, C., and Westermann, S. (2001). “ICRA Noises: Artificial noise signals with speech-like spectral and temporal properties for hearing aid assessment,” Audiology 40, 148-157.
Drullman, R., Festen, J. M., and Plomp, R. (1994a). “Effect of temporal envelope smearing on speech reception,” J. Acoust. Soc. Am. 95, 1053-1064.
Drullman, R., Festen, J. M., and Plomp, R. (1994b). “Effect of reducing slow temporal modulations on speech reception,” J. Acoust. Soc. Am. 95, 2670-2680.
Drullman, R. (1995). “Temporal envelope and fine structure cues for speech intelligibility,” J. Acoust. Soc. Am. 97, 585-592.
Dubbelboer, F., and Houtgast, T. (2007). “A detailed study on the effects of noise on speech intelligibility,” J. Acoust. Soc. Am. 122, 2865-2871.
Dubbelboer, F., and Houtgast, T. (2008). “The concept of signal-to-noise ratio in the modulation domain and speech intelligibility,” J. Acoust. Soc. Am. 124, 3937-3946.
Dubbelboer, F, and Houtgast, T. (2009). “The effect of varying the signal-to-noise ratio in the modulation domain on speech intelligibility in noise,” in preparation for publishing in J. Acoust. Soc. Am.
Ephraim, Y., and Malah, D. (1984). “Speech enhancement using a minimum mean-square error short-time spectral amplitude estimator,” IEEE Trans. on Acoust. Speech, Signal Process. 32, 1109-1121.
Festen, J. M., and van Dijkhuizen, J. N. (1998). “Modeling the speech reception threshold for amplitude-compressed speech,” in Psychophysics, Physiology and models of hearing, edited by T. Dau, V. Hohmann and B. Kollmeier, (World Scientific, Singapore), pp. 249-254.
DTP boek Signal-To-Noice DEF5.indd 93 22-10-2009 18:29:37
94
References
Ewert, S. D., and Dau, T. (2000). “Characterizing frequency selectivity for envelope fluctuations,” J. Acoust. Soc. Am. 108, 1181-1196.
Festen, J. M., and Plomp, R. (1990). “Effects of fluctuating noise and interfering speech on the speech reception threshold for impaired and normal hearing,” J. Acoust. Soc. Am. 88, 1725-1736.
Florentine, M., Fastl, H., and Buus, S. (1988). “ Temporal integration in normal hearing, cochlear impairment, and impairment simulated by masking,” J. Acoust. Soc. Am. 84, 195-203.
Franck, B. A., Kreveld-Bos, C. S., Dreschler, W. A., and Verschuure, H. (1999). “Evaluation of spectral enhancement in hearing aids, combined with phonetic compression,” J. Acoust. Soc Am. 106, 1452-1464.
Freyman, R. L., Balakrishnan, U., and Helfer, K. S. (2004). “Effect of number of masking talkers and auditory priming on informational masking in speech reception,” J. Acoust. Soc. Am. 115, 2246-2256.
Garofolo, J. S. (1993). ”TIMIT Acoustic-Phonetic Continuous Speech Corpus,”(Linguistic Data Consortium, Philadelphia).
Ghitza, O. (2001). “On the upper cutoff frequency of the auditoary critical-band envelope detectors in the context of speech perception,” J. Acoust. Soc. Am. 110, 1628-1640.
Hallberg, L. R., Hallberg, U., and Kramer, S. E. (2008). “Self-reported hearing difficulties, communication strategies and psychological general well-being (quality of life) in patients with acquired hearing impairment,” Disabil Rehabil. 30, 203-212.
Hickson, L. (1994). “Compression amplification in hearing aids,” Am. J. of Audiol. 3, 51-65.Houben, A. C. H. (2006). “The effect of amplitude compression on the perception of speech in noise by
the hearing impaired,” Doctoral Thesis, University of Utrecht.Houtgast, T., and Steeneken, H. J. M. (1972). “Envelope spectrum and intelligibility of speech in
Enclosures,” Proceedings IEEE Speech conference, Newton, MA, 392-395.Houtgast, T., and Steeneken, H. J. M. (1973). “The modulation transfer function in room acoustics as a
predictor of speech intelligibility,” Acustica 28, 66-73.Houtgast, T., and Steeneken, H. J. M. (1985). “A review of the MTF concept in room acoustics and its use
for estimating speech intelligibility in auditoria,” J. Acoust. Soc. Am., 77, 1069-1077.Houtgast, T. (1989). “Frequency selectivity in amplitude-modulation detection,” J. Acoust. Soc. Am. 85,
1676-1680.Hu, Y., and Loizou, P. C. (2003). “A perceptually motivated approach for speech enhancement,” IEEE
Trans. Speech Audio Processing, 11: 457-465.Hu, Y., and Loizou, P. C. (2007). “A comparative intelligibility study of single-microphone noise reduction
algorithms,” J. Acoust. Soc. Am. 122, 1777-1786.IEC (2003). “Objective rating of speech intelligibility by speech transmission index,” IEC 60268-16-
2003, (3rd ed., International Electrotechnical Commision, Geneva).Landau, H. J., and Polak, H. O. (1961). “Prolate spheroidal wave functions, Fourier analysis and
uncertainty. II,” The Bell Syst. Tech. J. 40, 65-84.Lee, Y. W. (1960). Statistical Theory of communication (Wiley, New York).Levitt, H. (1986). “Hearing impairment and sensory aids: A tutorial review,” J. Rehab. Res. Dev. 23,
xiii-xviii.Levitt, H. (2001). “Noise reduction in hearing aids: An overview,” J. Rehabil. Res. Dev. 38, No. 1, 111-
121.
DTP boek Signal-To-Noice DEF5.indd 94 22-10-2009 18:29:38
95
References
Lim, J. S. (1978), “Evaluation of a correlation subtraction method for enhancing speech degraded by additive white noise,” IEEE Trans. Acoust. Speech Signal Process. 26, 471-472.
Lim, J. S., and Oppenheim, A. V. (1979). “Enhancement and bandwidth compression of noisy speech,” Proc. IEEE 67, 1586-1604.
Ludvigsen, C., Elberling, C., and Keidser, G. (1993). “Evaluation of a noise reduction method– Comparison between observed scores and scores predicted from STI,” Scand. Audiol. Suppl. 38, 50-55.
Lyzenga, J., Festen, J. M., and Houtgast, T. (2002). “A speech enhancement scheme incorporating spectral expansion evaluated with simulated loss of frequency selectivity,” J. Acoust. Soc. Am. 112, 1145-1157.
Mauler, D. (2006). “Noise power density estimation on highly correlated data,” Proceedings of the International Workshop Acoustic Echo and Noise Control (IWAENC).
Martin, R. (2002). “Speech enhancement using MMSE short-time spectral estimation with gamma distributed speech priors,” Proceedings of the IEEE International Conference on Acoustics, Speech, and Signal Processing (ICASPP), Vol. I, pp. 253-256.
Marzinzik, M. (2000). “Digital hearing aids and their use for the hearing impaired,” Doctoral Thesis, University of Oldenburg.
Marzinzik, M., and Kollmeier, B. (2002). “Speech pause detection for noise spectrum estimation by tracking power envelope dynamics,” IEEE Trans. Speech Audio Process. 10, 109-118.
Moore, B. C., Peters, R. W., and Stone, M. A. (1999). “Benefits of linear amplification and multichannel compression for speech comprehension in backgrounds with spectral and temporal dips,” J. Acoust. Soc. Am. 105, 400-411.
Noordhoek, I. M., and Drullman, R. (1997). “Effect of reducing temporal intensity modulations on sentence intelligibility,” J. Acoust. Soc. Am. 101, 498-502.
Patterson, R.D., Robinson, K., Holdsworth, J., McKeown, D., Zhang, C., and Allerhand, M. (1992). “Complex sounds and auditory images,” in Auditory Physiology and Perception, (Pergamon ,Oxford), pp. 429-446.
Payton, K. J., and Braida, L. D. (1999). “A method to determine the speech transmission index from speech waveforms,” J. Acoust. Soc. Am. 106, 3637-3648.
Plomp, R., and Mimpen, A. M. (1979). “Improving the reliability of testing the speech reception threshold for sentences,” Audiology 18, 43-52.
Plomp, R. (1988). “The negative effect of amplitude compression in multichannel hearing aids in the light of the modulation-transfer function,” J. Acoust. Soc. Am. 83, 2322-2327.
Pollák, P., Sovka, P., and Uhlíř, J. (1995). “Cepstral speech/pause detectors,” In Proceedings of IEEE Workshop on Nonlinear Signal Image Processing.
Radfar, M. H., and Dansereau, R. M. (2007). “Single_channel speech seperation using soft mask filtering, ” IEEE transactions on audio, speech and lanquage processing, Vol. 15, pp. 2299-2310.
Rioul, O., and Vetterli, M. (1991). “Wavelets and signal processing,” IEEE Signal Process. Mag., 14-38.Simpson, S. A., and Cooke, M. (2005). “Consonant identification in N-talker babble is a nonmonotonic
function of N (L),” J. Acoust. Soc. Am. 118, 2775-2778.Souza, P. E. (2002), “Effects of compression on speech acoustics, intelligibility, and sound quality,”
Trends Amplif. 6, 131-165.Srinivasan, S., Samuelsson, J., and Kleijn, W. B. (2003). “Single channel speech enhancement using
a priori information,” Technical report, ANITA Deliverable D-4.2, Royal Institute of Technology (KTH), Stockholm.
DTP boek Signal-To-Noice DEF5.indd 95 22-10-2009 18:29:39
96
References
Steeneken, H. J. M. (1992). “On measuring and predicting speech intelligibility,” Doctoral Thesis, University of Amsterdam.
Strang, G. (1994). “Wavelets,” Am. Sci. 82, 250-255.van Buuren, R. A., Festen, J. M., and Houtgast, T. (1999). “Compression and expansion of the temporal
envelope: evaluation of speech intelligibility and sound quality,” J. Acoust. Soc. Am. 105, 2903-2913.
van Schijndel, N. H., Houtgast, T., and Festen, J. M. (1999). “Intensity discrimination of Gaussian-windowed tones: Indications for the shape of the auditory frequency-time window,” J. Acoust. Soc. Am. 105, 3425-3435.
Versfeld, N. J., Daalder, L., Festen, J. M., and Houtgast, T. (2000). “Method for the selection of sentence materials for efficient measurement of the speech reception threshold,” J. Acoust. Soc. Am. 107, 1671-1684.
Viemeister, N. F. (1979). “Temporal modulation transfer functions based upon modulation thresholds,” J. Acoust. Soc. Am. 66, 1364-1380.
Wittkop, T. (2001). “Two-channel noise reduction algorithm motivated by models of binaural interaction,” Doctoral Thesis, University of Oldenburg.
Working Group on Communication Aids for the Hearing-Impaired (WGCA). (1991). “Speech perception aids for hearing-impaired people: current status and needed research,” J. Acoust. Soc. Am. 90, 637-685.
DTP boek Signal-To-Noice DEF5.indd 96 22-10-2009 18:29:40
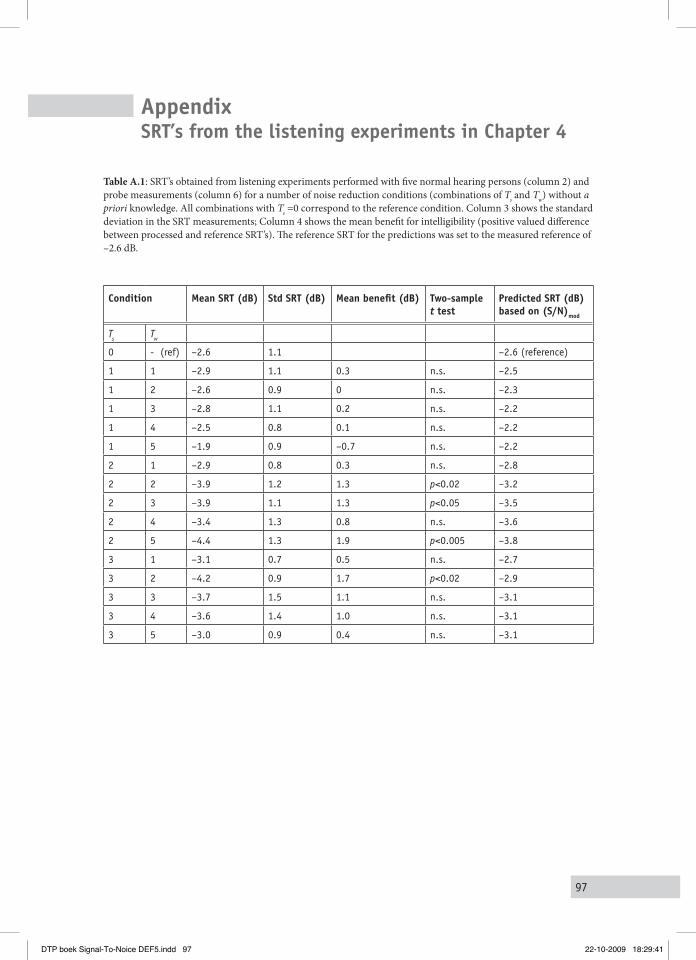
97
Appendix SRT’s from the listening experiments in Chapter 4
Table A.1: SRT’s obtained from listening experiments performed with five normal hearing persons (column 2) and probe measurements (column 6) for a number of noise reduction conditions (combinations of Ts and Tw) without a priori knowledge. All combinations with Ts =0 correspond to the reference condition. Column 3 shows the standard deviation in the SRT measurements; Column 4 shows the mean benefit for intelligibility (positive valued difference between processed and reference SRT’s). The reference SRT for the predictions was set to the measured reference of –2.6 dB.
Condition Mean SRT (dB) Std SRT (dB) Mean benefit (dB) Two-sample t test
Predicted SRT (dB) based on (S/N)mod
Ts
Tw
0 - (ref) –2.6 1.1 –2.6 (reference)
1 1 –2.9 1.1 0.3 n.s. –2.5
1 2 –2.6 0.9 0 n.s. –2.3
1 3 –2.8 1.1 0.2 n.s. –2.2
1 4 –2.5 0.8 0.1 n.s. –2.2
1 5 –1.9 0.9 –0.7 n.s. –2.2
2 1 –2.9 0.8 0.3 n.s. –2.8
2 2 –3.9 1.2 1.3 p<0.02 –3.2
2 3 –3.9 1.1 1.3 p<0.05 –3.5
2 4 –3.4 1.3 0.8 n.s. –3.6
2 5 –4.4 1.3 1.9 p<0.005 –3.8
3 1 –3.1 0.7 0.5 n.s. –2.7
3 2 –4.2 0.9 1.7 p<0.02 –2.9
3 3 –3.7 1.5 1.1 n.s. –3.1
3 4 –3.6 1.4 1.0 n.s. –3.1
3 5 –3.0 0.9 0.4 n.s. –3.1
DTP boek Signal-To-Noice DEF5.indd 97 22-10-2009 18:29:41
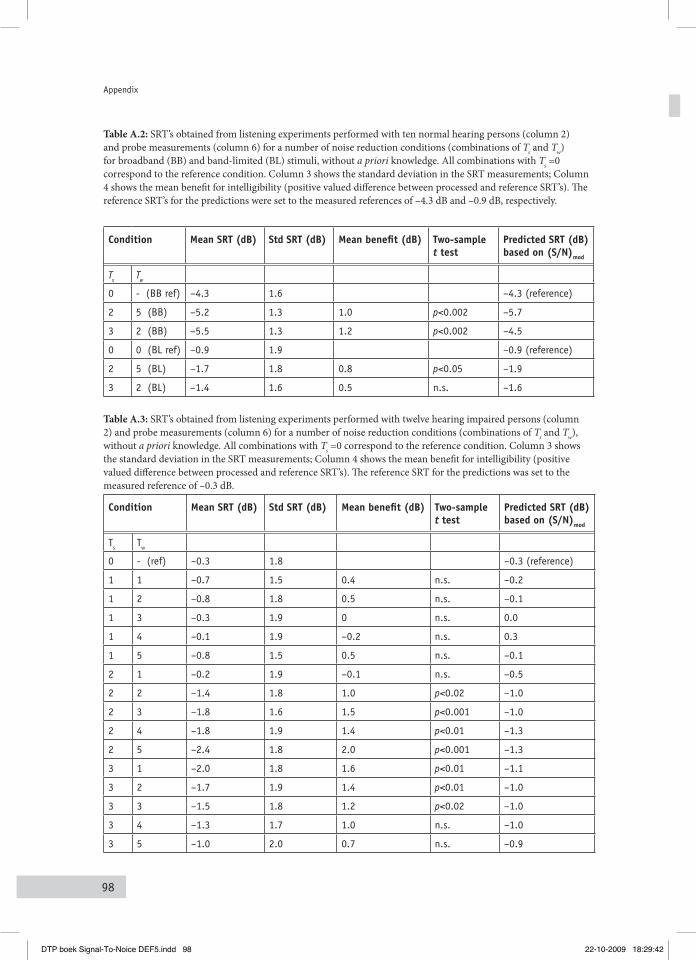
98
Appendix
Table A.2: SRT’s obtained from listening experiments performed with ten normal hearing persons (column 2) and probe measurements (column 6) for a number of noise reduction conditions (combinations of Ts and Tw) for broadband (BB) and band-limited (BL) stimuli, without a priori knowledge. All combinations with Ts =0 correspond to the reference condition. Column 3 shows the standard deviation in the SRT measurements; Column 4 shows the mean benefit for intelligibility (positive valued difference between processed and reference SRT’s). The reference SRT’s for the predictions were set to the measured references of –4.3 dB and –0.9 dB, respectively.
Condition Mean SRT (dB) Std SRT (dB) Mean benefit (dB) Two-sample t test
Predicted SRT (dB) based on (S/N)mod
Ts
Tw
0 - (BB ref) –4.3 1.6 –4.3 (reference)
2 5 (BB) –5.2 1.3 1.0 p<0.002 –5.7
3 2 (BB) –5.5 1.3 1.2 p<0.002 –4.5
0 0 (BL ref) –0.9 1.9 –0.9 (reference)
2 5 (BL) –1.7 1.8 0.8 p<0.05 –1.9
3 2 (BL) –1.4 1.6 0.5 n.s. –1.6
Table A.3: SRT’s obtained from listening experiments performed with twelve hearing impaired persons (column 2) and probe measurements (column 6) for a number of noise reduction conditions (combinations of Ts and Tw), without a priori knowledge. All combinations with Ts =0 correspond to the reference condition. Column 3 shows the standard deviation in the SRT measurements; Column 4 shows the mean benefit for intelligibility (positive valued difference between processed and reference SRT’s). The reference SRT for the predictions was set to the measured reference of –0.3 dB.
Condition Mean SRT (dB) Std SRT (dB) Mean benefit (dB) Two-sample t test
Predicted SRT (dB) based on (S/N)mod
Ts Tw
0 - (ref) –0.3 1.8 –0.3 (reference)
1 1 –0.7 1.5 0.4 n.s. –0.2
1 2 –0.8 1.8 0.5 n.s. –0.1
1 3 –0.3 1.9 0 n.s. 0.0
1 4 –0.1 1.9 –0.2 n.s. 0.3
1 5 –0.8 1.5 0.5 n.s. –0.1
2 1 –0.2 1.9 –0.1 n.s. –0.5
2 2 –1.4 1.8 1.0 p<0.02 –1.0
2 3 –1.8 1.6 1.5 p<0.001 –1.0
2 4 –1.8 1.9 1.4 p<0.01 –1.3
2 5 –2.4 1.8 2.0 p<0.001 –1.3
3 1 –2.0 1.8 1.6 p<0.01 –1.1
3 2 –1.7 1.9 1.4 p<0.01 –1.0
3 3 –1.5 1.8 1.2 p<0.02 –1.0
3 4 –1.3 1.7 1.0 n.s. –1.0
3 5 –1.0 2.0 0.7 n.s. –0.9
DTP boek Signal-To-Noice DEF5.indd 98 22-10-2009 18:29:42
99
Dankwoord
Tot slot de meest gelezen, en voor sommigen wellicht de enige gelezen pagina. Er zijn velen die direct of indirect hebben bijgedragen aan deze ridderproef. Allereerst mijn ouders, zonder wie dit proefschrift in elk geval niet door mij zou zijn geschreven: pa en ma, bedankt lieverds! Mijn promotoren Prof. dr. ir. T. Houtgast en Prof. dr. ir. J. M. Festen. Joost, bedankt voor jouw rake terugkoppelingen en het ontwarren van warrige teksten. Tammo, bedankt voor jouw grenzeloze inspiratie en het ontwarren van warrige gedachten. De externe leden van de leescommissie Prof. A. Kohlrausch, Prof. T. Dau, Dr. R. Drullman, Dr. J. Lyzenga en Dr. N. H. van Schijndel, zeer veel dank voor het verbeteren van de kwaliteit van dit proefschrift. Dank oud-collega’s, met speciale dank aan Nicolle, Ingrid, Dick en Hans. De leden van het ATO (Auditief Tafel Overleg, dat Dick, Marcel, Natalie en ik ooit hebben opgericht om borrelbonnetjes te declareren): Johannes, Gaston, Rolph en Koen: Tara! Helenius en Marijke, altijd geïnteresseerd (bedankt ook voor jullie oudste dochter!). Jan en Paulien, jullie zijn fantastische mensen. Mijn super-paranimfen Janneke, lieve zus, en dr. Marjet, lieve vriendin, die dit voor mij willen doen. KJ en Roel, Margien en Rik, Edu, Loïs en Yasmin, dikke kus. Mijn vrienden die ik niet allemaal ga noemen, maar ik maak een uitzondering voor mijn muziekvrienden: General P., Roon Baboon, Millaman, Bob Martin, Rudi, Dickmeister, Roel v. P., IngeB, Juk, Patricia, Theo, Frank, Walle, Bas en Ard. Ik ben ook zeer veel dank verschuldigd aan alle proefpersonen die hebben meegewerkt aan dit onderzoek: zonder jullie geen resultaten. Bedankt G. Heij van Tektronix, Gerard van Willigenburg, Bart Klijsen en TTO, en Marlies (Zmyzzy) voor design.
En de meeste dank gaat uit naar mijn grote liefde Hante, zonder wie ik sowieso nergens toe zou komen xx. En natuurlijk naar Isidoor en Zouk, super dat jullie er zijn!
Johannes, Rolfjan, Tammo, wij eten geen honing, maar kauwen op bijen. Dank.
DTP boek Signal-To-Noice DEF5.indd 99 26-10-2009 14:43:49

100
DTP boek Signal-To-Noice DEF5.indd 100 22-10-2009 18:29:43
101
Curriculum Vitae
Finn Dubbelboer was born on the 30est of August, 1971, in the city of Wageningen. He attended the Rijksscholengemeenschap ‘Het Wagenings Lyceum’ (VWO) from 1983 to 1989. After traveling through Asia, he studied Agrotechnology at Wageningen University and graduated in the directions Technical Physics, and Systems and Control. After graduation, he was alternately PhD student at the Faculty of Medicine of the VU University Amsterdam, musician, and scientific researcher at the Department of Otorhinolaryngology/Audiology at VU Medical Center in Amsterdam. Recently, he founded a spin-off company in Speech Processing and Audio Technology in Amsterdam.
DTP boek Signal-To-Noice DEF5.indd 101 22-10-2009 18:29:43

102
DTP boek Signal-To-Noice DEF5.indd 102 22-10-2009 18:29:43


![Het blad van/voor muziekliefhebbers 7 december 2012 | nr ... · SaxoPhonE atem Saxophone Quartet & orchestra città aperta Brilliant Classics – 9266 (3cd) [3024361] ... cd’s een](https://static.fdocuments.nl/doc/165x107/5e45b76e3db5e00f946e6e53/het-blad-vanvoor-muziekliefhebbers-7-december-2012-nr-saxophone-atem-saxophone.jpg)