
Computers, Environment and Urban Systemsmeasuring spatial attractiveness (Section 2.2) with various...
11
Contents lists available at ScienceDirect Computers, Environment and Urban Systems journal homepage: www.elsevier.com/locate/ceus An easy-to-use spatial simulation for urban planning in smaller municipalities Christian Mueller a, ⁎ , Ulrike Klein a , Angela Hof b a Lennershofstr. 140, 44801 Bochum, Germany b Hellbrunnerstraße 34, 5020 Salzburg, Austria ARTICLE INFO Keywords: Spatial simulation System dynamics Hybrid modeling Urban planning Spatial attractiveness Gamification ABSTRACT In order to produce precise outcomes, most spatial simulations require great volumes of data input, intensive data preparation or programming skills. Consequently, high quality spatial simulations are usually not applied in practice in municipalities of smaller size (< 25,000 citizens). This study aims to provide an easy-to-use tool for smaller urban administrations. A web application was developed which requires a minimum of manual user input for automated data preparation. Gamified elements aim to encourage the user to experience the underlying mechanisms of the system under alternating planning scenarios. These mechanisms are modelled as a combi- nation of spatially implicit and explicit rules which can be derived from dependencies in the data itself. Spatial attractiveness was modelled as a function of accessibility of facilities, ground value, soil sealing, traffic intensity and noise pollution in a multi-variate spatial autoregressive regression analysis. A case study for the city center of Herdecke (Germany) revealed that the establishment of a new event location in the northern part of the study area was most appropriate for increasing spatial attractiveness. The presented easy-to-use tool is suitable for practical application in everyday administrative processes of smaller municipalities and thereby contributes to more applied sustainable urban planning. 1. Introduction In the 21st century, urban decision makers find themselves si- multaneously faced with a plethora of interconnected societal and ecological challenges. These challenges comprise, for instance, con- sequences of demographic change (Champion, 2001; Danielzyk, Meyer, & Grüber-Töpfer, 2010), demand-adapted local supply with basic ser- vices (Libbe, Köhler, & Beckmann, 2010), progressive soil sealing and its multi-scale effects on urban heat islands and heavy rains (Arnfield, 2003; Oke, 1973; Tyrna & Hochschild, 2010). Spatial decision support tools can provide informative assistance for urban planners and policy makers in order to meet the interconnected challenges of complex urban systems and to estimate consequences of specific planning stra- tegies. In the last 70 years, various spatial simulations were created within the fields of system dynamics and agent-based modeling. The former dates back to the 1960s, when it was founded by Forrester (1969) at the Massachusetts Institute of Technology. It models circular causalities with reinforcing or extenuating feedback loops, which are usually spatially implicit (Scholl, 2001). Examples for system dynamics modeling platforms include Vensim (Ventana Systems, 2015), Powersim (Powersim Software, 2017) and Stella (isee systems, 2017). Agent-based models (ABM), also called individual-based or multi- agent models, represent the second large research strain regarding system simulations. It dates back to the first cellular automata (CA) in the 1940s which – after the astonishing results of the game of life CA - experienced a renaissance in the 1970s when it was used in many disciplines (Gardner, 1970; Janssen, 2005). In recent years, CA models have been applied in various research fields such as savanna fire pro- pagation (Berjak & Hearne, 2002), vegetation distribution and de- sertification (Kéfi et al., 2007), land cover and land use changes (Verstegen, Karssenberg, van der Hilst, & Faaij, 2014) and urban de- velopment (Batty, 2005; White & Engelen, 1993). Recent developments in this field of research include, for instance, CA models with varying cell shapes (Pinto, Antunes, & Roca, 2017), considering modeling un- certainties (Şalap-Ayça, Jankowski, Clarke, Kyriakidis, & Nara, 2018), patched-based logistic regression (Chen, Li, Liu, & Ai, 2014) and Bayesian CA approaches (Verstegen et al., 2014; Verstegen, Karssenberg, van der Hilst, & Faaij, 2016). “Agent-based models consist of a space, framework, or environment in which interactions take place and a number of agents whose behavior in this space is defined by a basic set of rules and by characteristic parameters” (Scholl, 2001, p. 2). Reynolds (1999, on his web page) further sets out that “there is an https://doi.org/10.1016/j.compenvurbsys.2018.05.002 Received 21 December 2017; Received in revised form 25 April 2018; Accepted 2 May 2018 ⁎ Corresponding author. E-mail addresses: [email protected] (C. Mueller), [email protected] (U. Klein), [email protected] (A. Hof). Computers, Environment and Urban Systems xxx (xxxx) xxx–xxx 0198-9715/ © 2018 Elsevier Ltd. All rights reserved. Please cite this article as: Mueller, C., Computers, Environment and Urban Systems (2018), https://doi.org/10.1016/j.compenvurbsys.2018.05.002
Transcript of Computers, Environment and Urban Systemsmeasuring spatial attractiveness (Section 2.2) with various...
Contents lists available at ScienceDirect
Computers, Environment and Urban Systems
journal homepage: www.elsevier.com/locate/ceus
An easy-to-use spatial simulation for urban planning in smallermunicipalities
Christian Muellera,⁎, Ulrike Kleina, Angela Hofb
a Lennershofstr. 140, 44801 Bochum, GermanybHellbrunnerstraße 34, 5020 Salzburg, Austria
A R T I C L E I N F O
Keywords:Spatial simulationSystem dynamicsHybrid modelingUrban planningSpatial attractivenessGamification
A B S T R A C T
In order to produce precise outcomes, most spatial simulations require great volumes of data input, intensivedata preparation or programming skills. Consequently, high quality spatial simulations are usually not applied inpractice in municipalities of smaller size (< 25,000 citizens). This study aims to provide an easy-to-use tool forsmaller urban administrations. A web application was developed which requires a minimum of manual userinput for automated data preparation. Gamified elements aim to encourage the user to experience the underlyingmechanisms of the system under alternating planning scenarios. These mechanisms are modelled as a combi-nation of spatially implicit and explicit rules which can be derived from dependencies in the data itself. Spatialattractiveness was modelled as a function of accessibility of facilities, ground value, soil sealing, traffic intensityand noise pollution in a multi-variate spatial autoregressive regression analysis. A case study for the city centerof Herdecke (Germany) revealed that the establishment of a new event location in the northern part of the studyarea was most appropriate for increasing spatial attractiveness. The presented easy-to-use tool is suitable forpractical application in everyday administrative processes of smaller municipalities and thereby contributes tomore applied sustainable urban planning.
1. Introduction
In the 21st century, urban decision makers find themselves si-multaneously faced with a plethora of interconnected societal andecological challenges. These challenges comprise, for instance, con-sequences of demographic change (Champion, 2001; Danielzyk, Meyer,& Grüber-Töpfer, 2010), demand-adapted local supply with basic ser-vices (Libbe, Köhler, & Beckmann, 2010), progressive soil sealing andits multi-scale effects on urban heat islands and heavy rains (Arnfield,2003; Oke, 1973; Tyrna & Hochschild, 2010). Spatial decision supporttools can provide informative assistance for urban planners and policymakers in order to meet the interconnected challenges of complexurban systems and to estimate consequences of specific planning stra-tegies. In the last 70 years, various spatial simulations were createdwithin the fields of system dynamics and agent-based modeling.
The former dates back to the 1960s, when it was founded byForrester (1969) at the Massachusetts Institute of Technology. It modelscircular causalities with reinforcing or extenuating feedback loops,which are usually spatially implicit (Scholl, 2001). Examples for systemdynamics modeling platforms include Vensim (Ventana Systems, 2015),Powersim (Powersim Software, 2017) and Stella (isee systems, 2017).
Agent-based models (ABM), also called individual-based or multi-agent models, represent the second large research strain regardingsystem simulations. It dates back to the first cellular automata (CA) inthe 1940s which – after the astonishing results of the game of life CA -experienced a renaissance in the 1970s when it was used in manydisciplines (Gardner, 1970; Janssen, 2005). In recent years, CA modelshave been applied in various research fields such as savanna fire pro-pagation (Berjak & Hearne, 2002), vegetation distribution and de-sertification (Kéfi et al., 2007), land cover and land use changes(Verstegen, Karssenberg, van der Hilst, & Faaij, 2014) and urban de-velopment (Batty, 2005; White & Engelen, 1993). Recent developmentsin this field of research include, for instance, CA models with varyingcell shapes (Pinto, Antunes, & Roca, 2017), considering modeling un-certainties (Şalap-Ayça, Jankowski, Clarke, Kyriakidis, & Nara, 2018),patched-based logistic regression (Chen, Li, Liu, & Ai, 2014) andBayesian CA approaches (Verstegen et al., 2014; Verstegen,Karssenberg, van der Hilst, & Faaij, 2016). “Agent-based models consistof a space, framework, or environment in which interactions take placeand a number of agents whose behavior in this space is defined by abasic set of rules and by characteristic parameters” (Scholl, 2001, p. 2).Reynolds (1999, on his web page) further sets out that “there is an
https://doi.org/10.1016/j.compenvurbsys.2018.05.002Received 21 December 2017; Received in revised form 25 April 2018; Accepted 2 May 2018
⁎ Corresponding author.E-mail addresses: [email protected] (C. Mueller), [email protected] (U. Klein), [email protected] (A. Hof).
Computers, Environment and Urban Systems xxx (xxxx) xxx–xxx
0198-9715/ © 2018 Elsevier Ltd. All rights reserved.
Please cite this article as: Mueller, C., Computers, Environment and Urban Systems (2018), https://doi.org/10.1016/j.compenvurbsys.2018.05.002
overlap between individual-based models and cellular automata” andthat “cellular automata are similar to spatially-explicit, grid-based,immobile individual-based models”. In these models, the overall sys-temic patterns emerge from behavior of individual agents. This beha-vior is usually defined by a simple set of rules which, in most cases, isprobabilistic and spatially explicit. Agent-based models have recentlybeen applied to model, for instance, pedestrian movements in urbancontexts (Omer & Kaplan, 2017), movements of individuals during anevacuation scenario (Tan, Wu, & Lin, 2015) and tenants' choice of re-sidence within a city (Shirzadi Babakan & Alimohammadi, 2016). Ex-amples of platforms for modeling ABMs include RePast (Collier, 2003),SWARM (Minar, Burkhart, Langton, & Askenazi, 1996), Echo (Forrest &Jones, 1995), Boids (Reynolds, 2001), CORMAS (Bommel, Becu, LePage, & Bousquet, 2016) and MASON (Luke, Balan, Sullivan, & Panait,2015).
As research in the fields of system dynamics and agent-based modelswas strikingly isolated from each other until the early 2000s, there wasa general call for mixed models in order to exploit the advantages ofboth modeling approaches (Macal, 2010; Nava Guerrero, Schwarz, &Slinger, 2016; Scholl, 2001). Since then, various mixed models, whichare also called multimethod models, have been presented, such asMASGISmo (Gebetsroither, 2010) NetLogo (Uri Wilensky, 2016), Any-Logic (AnyLogic, 2014), Nova (Salter, 2013) and an intercity transportmodel (Lewe, Hivin, & Mavris, 2014). All of these modeling platforms,however, require great volumes of data input, intensive data prepara-tion, programming, modeling, analysis, GIS or other specialized tech-nical skills (Nava Guerrero et al., 2016).
A deficit in financial and staff resources is a universal phenomenonamong small administrations (< 25,000 citizens). Consequently, spatialsimulations are usually not applied in practice in municipalities ofsmaller size and systemic feedbacks and respective reasonable andevidence-based measures are usually not considered for planning stra-tegies and policies in these communities (Janssen & Ostrom, 2006;Pullin & Knight, 2003; Pullin, Knight, & Watkinson, 2009; Russo,Lanzilotti, Costabile, & Pettit, 2018).
One approach to overcome these restraints of spatial simulation forthe application in everyday urban panning routines is the “gamifica-tion” or “serious game” approach (Ahlqvist, Khodke, & Ramnath,2018). It picks up findings from the field of psychology which indicatethat rather than instruction, the most efficient way to comprehendcomplex matters is by personal experience and by evoking the learner'scuriosity (Deterding, Sicart, Nacke, O'Hara, & Dixon, 2011). As gamesprovide both, the gamification approach puts complex and serious to-pics into an easy-to-use and enticing game environment (Deterdinget al., 2011; Ingensand et al., 2015; Prensky, 2003). The user is re-warded for appropriate action with motivational affordances, such asgame scores, which aim to trigger psychological and, ultimately, be-havioral outcomes (Hamari & Koivisto, 2014).
Another drawback of most decision support tools for urban planningis a predominant technical perspective rather than addressing theoverall well-being of citizens which is the main objective of urbanplanning (Nam & Pardo, 2011; Neirotti, Marco, Cagliano, Mangano, &Scorrano, 2014). However, the level of self-perceived well-being and ifcitizens feel comfortable within the given space is highly subjective,individually different and geographically bound. This raises the ques-tion as to how spatial attractiveness can be quantified, compared andbest integrated into an easy-to-use spatial simulation.
1.1. Objectives and structure of the paper
This present study aims to integrate geospatial methodologies formeasuring spatial attractiveness (Section 2.2) with various geo datasources (Sections 2.3, 2.4) and combines gamification (Section 3.1),system dynamics (Section 3.2) and agent-based modeling (3.3) ap-proaches in a novel, easy-to-use platform for creating spatial simula-tions for urban systems (SimUSys). In this context, an urban system is
defined as the construct of all interconnected social, environmental andtechnical entities within a city which can be quantitatively expressedand for which data is provided (see Section 5 for a discussion on in-corporating qualitative approaches). It aims to deploy as of yet under-exploited synergies of the individual approaches from a geospatialperspective.
A web-based user interface which requires no local installation al-lows planners with no technical geospatial skills to simulate variousplanning measures such as the establishment of a new facility of basicgoods and services and the resulting systemic effects for e.g. the spatialattractiveness for a city district. It thereby investigates whether themethodological synergies allow for practical application and con-sideration of complex systemic feedbacks in everyday planning rou-tines. Moreover, it thereby supports knowledge transfer and main-streaming of technical learnings. A high usability for non-technicalusers is accounted for by, for example, integrating methods for auto-mated geospatial data preparation.
In accordance with the gamification approach, users get incentivesto evaluate planning strategies, for example, by game scores. In addi-tion, the model parametrization is straightforward as the rules for thismixed model can be derived automatically from influences and de-pendencies in the data itself using geographical regression methods.These models influence the simulations which can be created with theSimUSys platform, as they can be used to define the behavioral rules ofthe agents (Section 3.3).
In a case study, it is shown how SimUSys can be used to build asimulation for the identification of facilities with the highest influenceon spatial attractiveness and the most suitable site for a new facility(Section 4). The SimUSys platform for creating urban simulations wasset up in cooperation with city planners and its layout is applicable byadministrations of smaller municipalities but in principle, it is scalableto other urban and regional planning contexts.
2. Methodology and data
A platform for creating spatial simulations was created which makesuse of the gamification approach and is straightforward to access, set upand use for evaluating different planning strategies. The followingsections describe how the main benchmark for this evaluation, thespatial attractiveness, was measured (Section 2.2) for a use case inHerdecke in Western Germany (Section 2.1) and how a multitude ofdata sets were automatically integrated (Sections 2.3, 2.4) in order toinvestigate influences and dependencies.
2.1. Study area
The city of Herdecke is located at the southern rim of the me-tropolitan Ruhr-Area in Western Germany, south of the larger cities ofBochum and Dortmund. The Ruhr-Area is an urban agglomeration ofeleven metropolitan cities and four administrative districts in-corporating a total of 53 communities. It covers an area of ~ 4436 km2
and is inhabited by ~ 5million citizens which results in a populationdensity of about 1200 citizens per km2 (Regionalverband Ruhr). Thecity of Herdecke itself covers an area of about 22 km2 and is inhabitedby ~ 25,000 people (IT.NRW, 2017), resulting in a population densityof ~ 1100 citizens per km2. The cities administration employs 265people in total, and the department for construction and planning is runby 4 people (City of Herdecke). This number of staff is typical for a cityof this size in this region and does not allow for elaborate data pre-paration, programming and validation of urban system simulations ineveryday planning routines. SimUSys was set up in cooperation withHerdecke's city planners. Their user demands were that in order toexploit insights into system behavior for more effective and sustainablepractical application, SimUSys had to be easy-to-use and its results in-tuitively comprehensible.
C. Mueller et al. Computers, Environment and Urban Systems xxx (xxxx) xxx–xxx
2
2.2. Measuring spatial attractiveness
The overall benchmark for simulations created with SimUSys is thelevel of self-perceived well-being of citizens within the given space.This concept is defined as “spatial attractiveness”. As it is highly sub-jective and individually different, measuring this parameter is an in-tricate task. In (Mueller, Klein, & Hof, 2016b) a methodological fra-mework was supposed for measuring spatial attractiveness. A web mapapplication was designed which allowed citizens to define places inwhich they would “feel good” or “not feel good” using a topographicbase map. This application was promoted by the local press and thesurvey was carried out at two Christmas markets in Herdecke. In ad-dition to the web map application, a printed map could be used by theparticipants (Mueller et al., 2016b). The collected data on spatial at-tractiveness was aggregated to an analysis grid with a cell size of100m×100m for comparison with additional data and modeling in-fluences.
2.3. Automated data integration
Additional data was collected from the federal state of North Rhine-Westphalia and its public company for road maintenance (“StrassenNRW”), the cities association of the Ruhr-Area (“RegionalverbandRuhr”), the administrative district of “Ennepe-Ruhr Kreis”, the re-sidents' registration office of Herdecke, the city's administration itself,OpenStreetMap, as well as self-acquired data. Data comprised spatialand attributive information which can be subsumed under the headingsof (1) “environment and services”, such as land use, protected areas,waste water treatment plants, …, (2) “networks”, such as streets, paths,pipelines, …, (3) “points of interest” (POIs), such as parks, grocerystores, event locations, …, and (4) “planning entities”, such as admin-istrative districts, zoning plans, addresses. The collected data con-stituted various data models, types and formats with different co-ordinate systems, geometries and writing conventions.
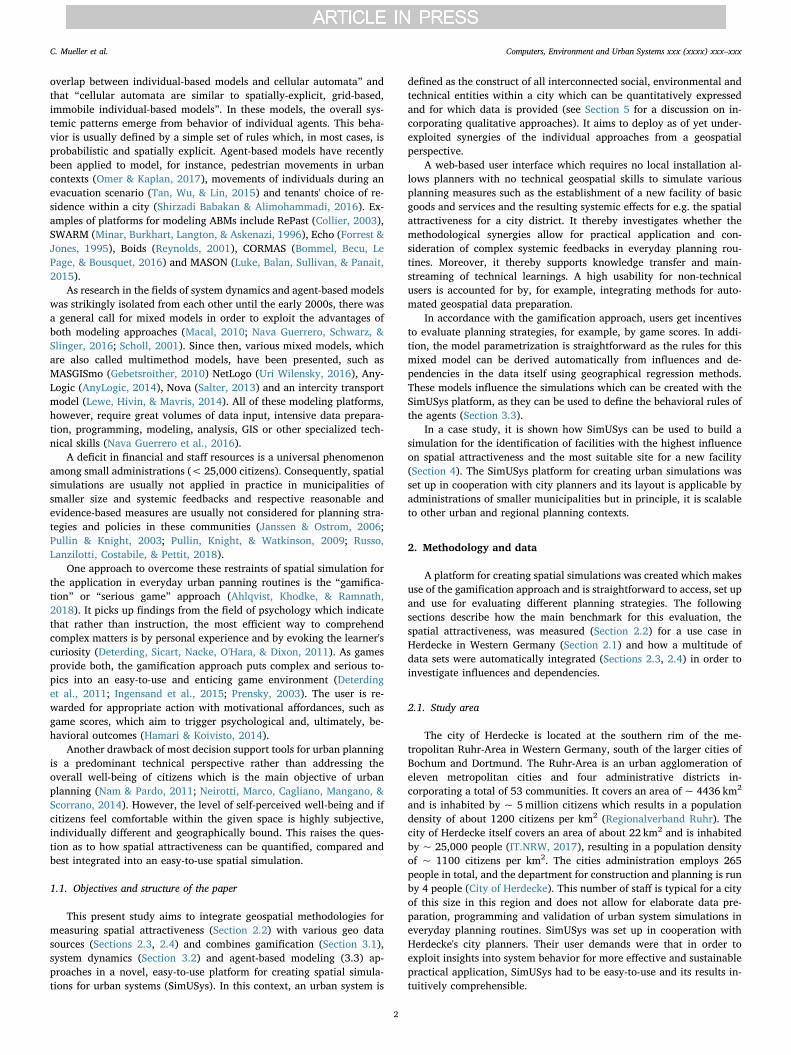
In order to use this broad data for investigations about influences onspatial attractiveness, a tool for automated data integration was created(Mueller, Klein, & Hof, 2016a). This tool is easy-to-use and solely re-quires a directory path to the inhomogeneous data collection and anoutput location to which the combined and integrated data should be
saved to (Fig. 1). The tool makes use of tabular catalogues which areeasily expandable by the user with standard office software. Using thistool for automated data integration, coordinate systems were con-sistently re-projected, files renamed, geometries converted and re-paired, missing data gathered from external open data sources, geo-databases extracted, features and attributes combined, duplicates andspecial characters removed, networks created and addresses georefer-enced. Ultimately, all data sets were aggregated to an analysis grid witha cell size of 100m×100m, in order to investigate their mutual in-fluence and the influence on spatial attractiveness.
2.4. Accessibility
For each cell midpoint of the 100× 100m analysis grid, the ac-cessibility to facilities of basic goods and services was calculated. Forsome issues (e.g. noise pollution) the Euclidean distance towards fa-cilities makes sense. However, a network-based accessibility analysisoutperforms Euclidean distances for most planning issues.Consequently, both methods were applied in order to allow the user tochoose either (a) Euclidean distances or (b) network distances to beincorporated as variables in the respective models. For the latter (b), atransition raster with a cell size of 5×5m was created based on thepedestrian, bicycle and road networks, respectively. The walking,biking and car driving distances were calculated as the accumulatedtravel costs through this transition raster to the respective facilities. Inaddition (a), distances as the crow flies were calculated using a uniformtransition raster resulting in Euclidean distances.
2.5. Used software
The web application for measuring the spatial attractiveness inHerdecke was prepared in ArcGIS for Desktop 10.3.1 (Esri, 1999-2015),uploaded into a web map in ArcGIS Online and integrated into the finalweb application using the App Builder by Esri Inc. Redlands, CA. Thetool for automated data integration was created with Python (V 2.7)and R (V 3.3.1) scripts. Nonetheless, Esri software was already in usewithin the administration of Herdecke which is also the case for mostdepartments for construction and planning across Germany and Europe.According to requirements of the cooperation partners, the scripts were
Fig. 1. Schematic diagram of the automated integration of inhomogeneous data sources.
C. Mueller et al. Computers, Environment and Urban Systems xxx (xxxx) xxx–xxx
3
additionally implemented into a tool for ArcGIS. Accessibility calcula-tions were conducted in R using the gDistance package (V 1.1). Thegamified simulation and the web-based user interface (described in thefollowing section 3) were created using the Shiny (V 1.0.4) and Leaflet(V 1.1.0) packages for R.
3. Calculation
The spatially implicit (Section 3.2) and explicit rules (Section 3.3),resembling system dynamics and agent-based models (ABM), respec-tively, were combined into a spatial simulation of urban systems. Thefollowing sections set out how the rules for this simulation can be im-plemented in a straightforward way by users and how a web-based andgamified approach (Section 3.1) makes SimUSys platform for creatingsimulations intuitive to use and its results easily comprehensible. This isdemonstrated with a case study in which the most suitable out of threeplaces for a new location where public events, e.g. concerts, can takeplace were identified within the city center of Herdecke consideringfive simulation rules.
3.1. Web-based user interface and gamified simulation
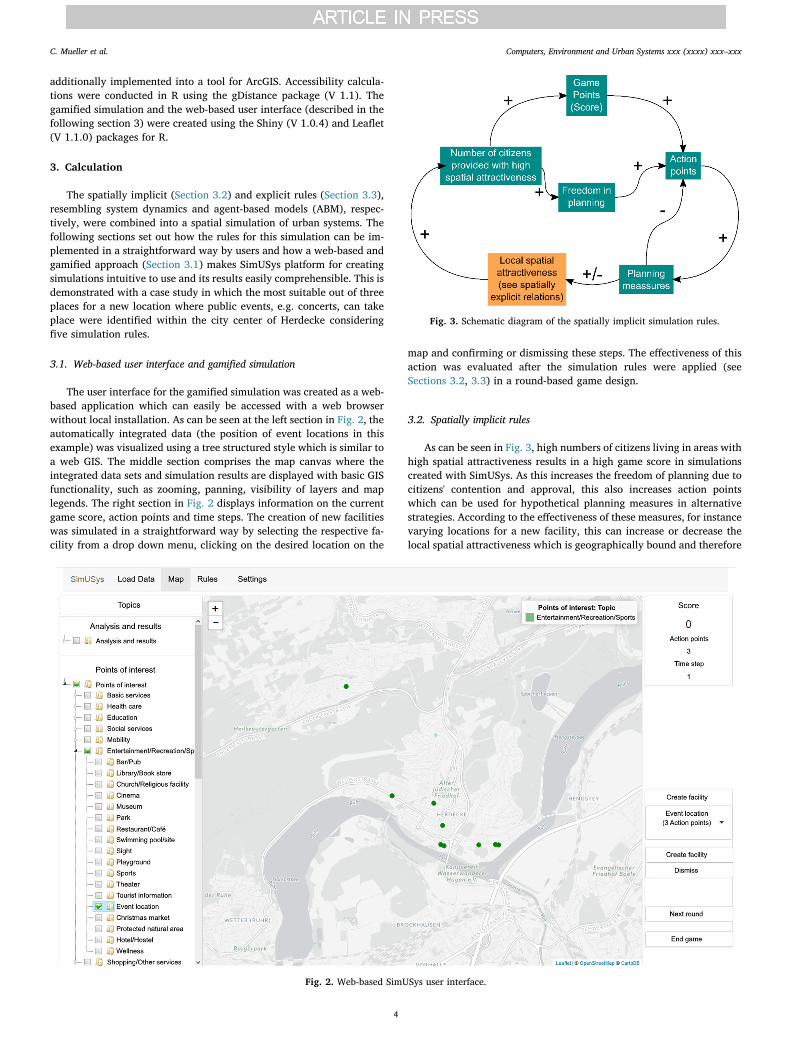
The user interface for the gamified simulation was created as a web-based application which can easily be accessed with a web browserwithout local installation. As can be seen at the left section in Fig. 2, theautomatically integrated data (the position of event locations in thisexample) was visualized using a tree structured style which is similar toa web GIS. The middle section comprises the map canvas where theintegrated data sets and simulation results are displayed with basic GISfunctionality, such as zooming, panning, visibility of layers and maplegends. The right section in Fig. 2 displays information on the currentgame score, action points and time steps. The creation of new facilitieswas simulated in a straightforward way by selecting the respective fa-cility from a drop down menu, clicking on the desired location on the
map and confirming or dismissing these steps. The effectiveness of thisaction was evaluated after the simulation rules were applied (seeSections 3.2, 3.3) in a round-based game design.
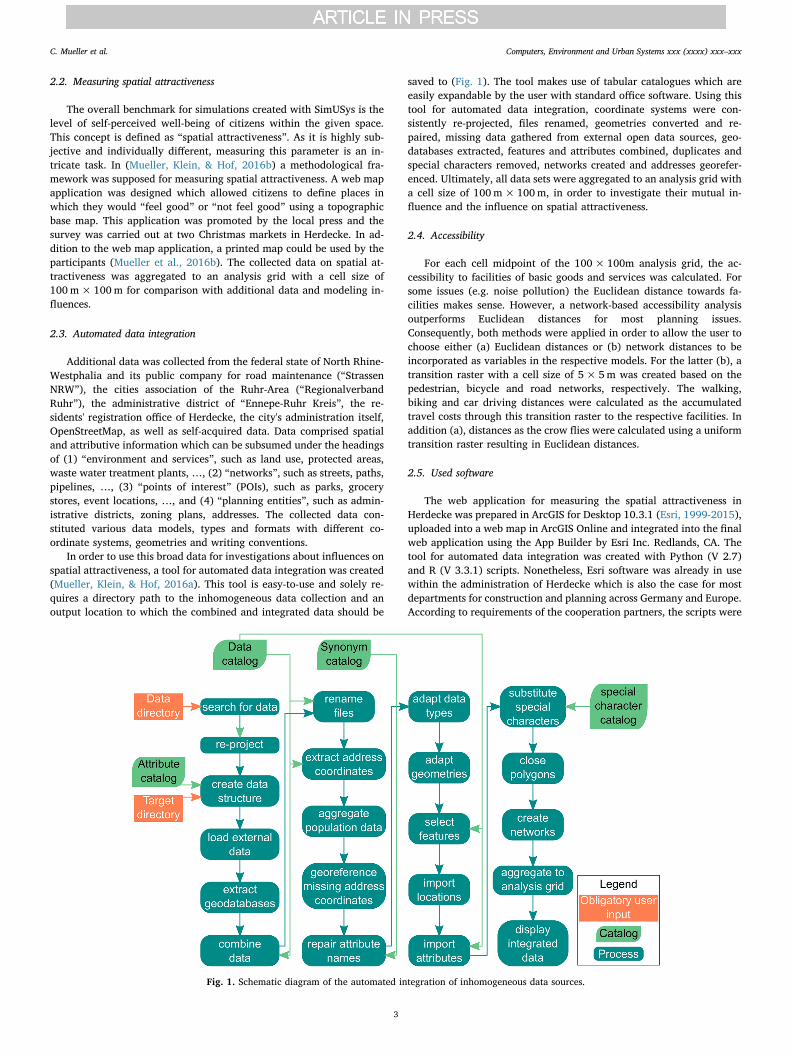
3.2. Spatially implicit rules
As can be seen in Fig. 3, high numbers of citizens living in areas withhigh spatial attractiveness results in a high game score in simulationscreated with SimUSys. As this increases the freedom of planning due tocitizens' contention and approval, this also increases action pointswhich can be used for hypothetical planning measures in alternativestrategies. According to the effectiveness of these measures, for instancevarying locations for a new facility, this can increase or decrease thelocal spatial attractiveness which is geographically bound and therefore
Fig. 2. Web-based SimUSys user interface.
Fig. 3. Schematic diagram of the spatially implicit simulation rules.
C. Mueller et al. Computers, Environment and Urban Systems xxx (xxxx) xxx–xxx
4
defined by spatially dependent rules as described in the followingsection 3.3 on spatially explicit rules.
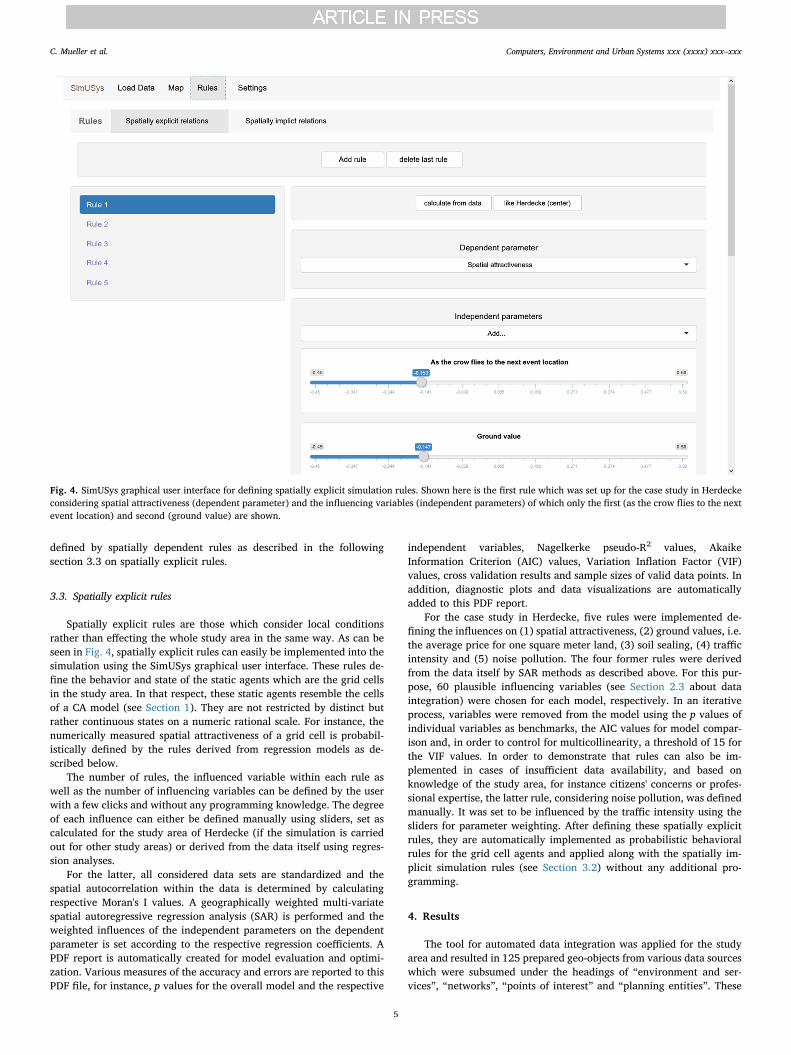
3.3. Spatially explicit rules
Spatially explicit rules are those which consider local conditionsrather than effecting the whole study area in the same way. As can beseen in Fig. 4, spatially explicit rules can easily be implemented into thesimulation using the SimUSys graphical user interface. These rules de-fine the behavior and state of the static agents which are the grid cellsin the study area. In that respect, these static agents resemble the cellsof a CA model (see Section 1). They are not restricted by distinct butrather continuous states on a numeric rational scale. For instance, thenumerically measured spatial attractiveness of a grid cell is probabil-istically defined by the rules derived from regression models as de-scribed below.
The number of rules, the influenced variable within each rule aswell as the number of influencing variables can be defined by the userwith a few clicks and without any programming knowledge. The degreeof each influence can either be defined manually using sliders, set ascalculated for the study area of Herdecke (if the simulation is carriedout for other study areas) or derived from the data itself using regres-sion analyses.
For the latter, all considered data sets are standardized and thespatial autocorrelation within the data is determined by calculatingrespective Moran's I values. A geographically weighted multi-variatespatial autoregressive regression analysis (SAR) is performed and theweighted influences of the independent parameters on the dependentparameter is set according to the respective regression coefficients. APDF report is automatically created for model evaluation and optimi-zation. Various measures of the accuracy and errors are reported to thisPDF file, for instance, p values for the overall model and the respective
independent variables, Nagelkerke pseudo-R2 values, AkaikeInformation Criterion (AIC) values, Variation Inflation Factor (VIF)values, cross validation results and sample sizes of valid data points. Inaddition, diagnostic plots and data visualizations are automaticallyadded to this PDF report.
For the case study in Herdecke, five rules were implemented de-fining the influences on (1) spatial attractiveness, (2) ground values, i.e.the average price for one square meter land, (3) soil sealing, (4) trafficintensity and (5) noise pollution. The four former rules were derivedfrom the data itself by SAR methods as described above. For this pur-pose, 60 plausible influencing variables (see Section 2.3 about dataintegration) were chosen for each model, respectively. In an iterativeprocess, variables were removed from the model using the p values ofindividual variables as benchmarks, the AIC values for model compar-ison and, in order to control for multicollinearity, a threshold of 15 forthe VIF values. In order to demonstrate that rules can also be im-plemented in cases of insufficient data availability, and based onknowledge of the study area, for instance citizens' concerns or profes-sional expertise, the latter rule, considering noise pollution, was definedmanually. It was set to be influenced by the traffic intensity using thesliders for parameter weighting. After defining these spatially explicitrules, they are automatically implemented as probabilistic behavioralrules for the grid cell agents and applied along with the spatially im-plicit simulation rules (see Section 3.2) without any additional pro-gramming.
4. Results
The tool for automated data integration was applied for the studyarea and resulted in 125 prepared geo-objects from various data sourceswhich were subsumed under the headings of “environment and ser-vices”, “networks”, “points of interest” and “planning entities”. These
Fig. 4. SimUSys graphical user interface for defining spatially explicit simulation rules. Shown here is the first rule which was set up for the case study in Herdeckeconsidering spatial attractiveness (dependent parameter) and the influencing variables (independent parameters) of which only the first (as the crow flies to the nextevent location) and second (ground value) are shown.
C. Mueller et al. Computers, Environment and Urban Systems xxx (xxxx) xxx–xxx
5

objects provided 275 attributes, including 15 demographic attributes,such as number and age of citizens, 7 infrastructural and environmentalattributes, such as traffic intensity and soil sealing. In addition, thewalking, bicycle, car and Euclidean distances to 62, 56, 52 and 64 fa-cilities of basic goods and services were calculated, respectively. Thesegeo-objects and their respective attributes were automatically preparedand were ready for defining simulation rules in SimUSys.
For the case study for Herdecke, a survey on spatial attractivenesswas carried out using a type of online public participatory GIS and theanswers of the survey questions were georeferenced (Mueller et al.,2016b). This survey revealed a positive overall atmosphere with localheterogeneities. In total, 266 places were evaluated throughout the cityof which 158 were assessed as “feel good” and 108 as “feel not good”places. The former were mostly located in recreational areas and thecity center, whereas the latter were mostly brought forward in thecontext of construction sites and noise pollution by a highly frequentedhighway.
In the use case, five rules for the static grid cell agents were im-plemented defining the weighted influences on (1) spatial attractive-ness, (2) ground values, (3) soil sealing, (4) traffic intensity and (5)noise pollution. High and significant Moran's I values of ~ 0.75 ± 0.29(median ± standard deviation) indicated considerable spatial auto-correlation in the data. This was accounted for during the modelingusing SAR methods.
As can be seen in Fig. 5, all regression models were highly sig-nificant with p values for the overal models< 0.01. As these modelswere implemented as probabilistic behavioral rules for the grid cellagents, their accuracy and errors provide information about the per-formance of the respective agents. The explanatory power, expressed bythe Nagelkerke pseudo-R2 values, were approximately 0.28, 0.76, 0.76and 0.37 for the spatial attractiveness, ground value, soil sealing andtraffic intensity models, respectively. Regression coefficients of the in-dividual parameters were siginificant in all models. All variables, ex-cept for two, did show VIF values lower than 2, indicating very lowmulticollinearity in the data. These two exceptions with VIF values of13.23 and 13.48 were the Euclidean distance to the next healthcarecenter and the walking distance to the next bus stop, respectively.
A far Euclidean distance to theaters and event locations and highsoil sealing, noise pollution and ground values showed the most nega-tive influence on spatial attractiveness. In contrast, far Euclidean andwalking distances to healthcare centers and bus stops showed the mostpositive influence on spatial attractiveness in the model. These facilitieswere in parts located in the outskirts of the study area. It is worth notingthat the influences which have been determined by the regressionanalysis should be checked for plausibility and adapted using the slidersas shown in Fig. 4 by the user. Traffic intensity was positively influ-enced by the traveling distance by car to the next event location. Soilsealing depended negatively on short walking distances to protectednatural areas and positively on high ground values. Ground values, inreturn, were negatively influenced by far distances as the crow flies toparks and bus stops and long traveling distances by car to event loca-tions. As described in Section 3.3, traffic intensity was manually set toexert a positive influence on the noise pollution, demonstrating thatrules can also be implemented in SimUSys based on local knowlegde ofthe study area. For the case study in Herdecke, this was the case asnumerous people uttered complaints during the surveys regarding noisepollution by a highly frequented highway. In addition, Fig. 5 indicatesthe interconnected dependencies within this simple rule set of fivedefining simulation rules for the grid agents, the model accuracies aswell as the influences of a new event location on this system.
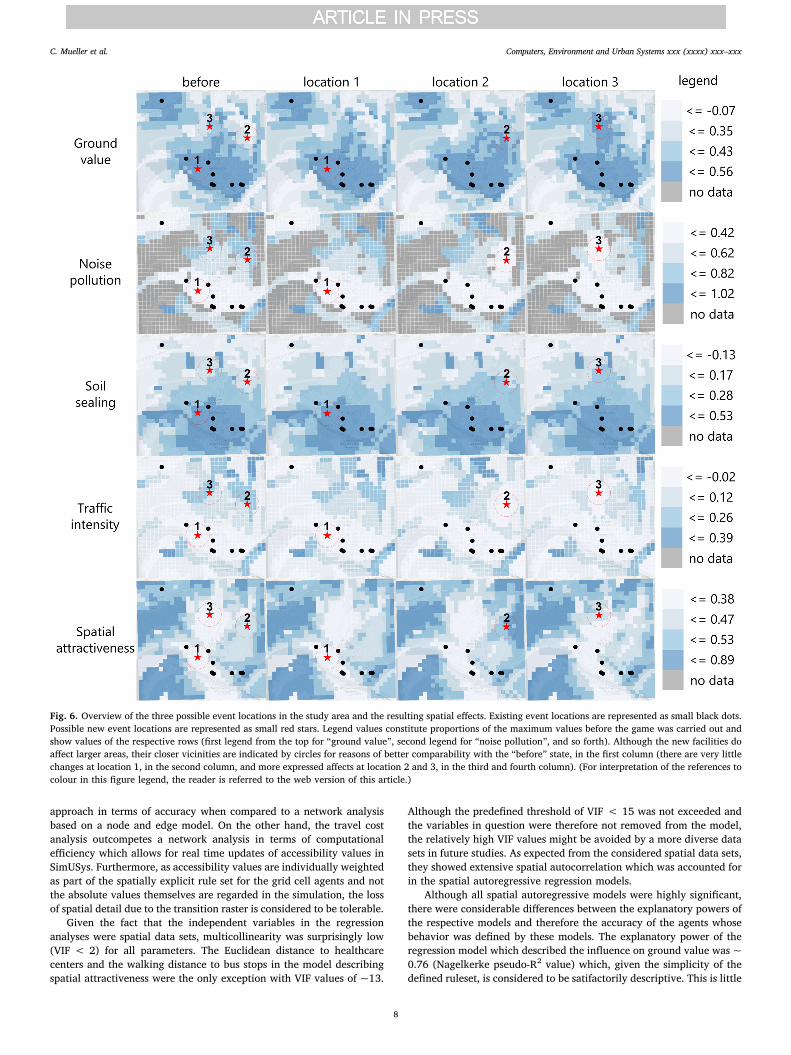
Using this set of rules for the grid agents, a serious game was playedin order to evaluate three possible places for a new event location in thestudy area. As can be seen in Fig. 6 (first column), before the simulationwas carried out, the spatial attractiveness was highest in the outskirts ofthe city where natural forest and river areas can be found as well as inparts of the city center itself (in the middle of the study area). Traffic
intensity was highest in the southern and northern outskirts where re-gional roads and a highway are located. The same holds true for noisepollution. Soil sealing as well as ground values were highest in the citycenter and lowest in the outskirts of Herdecke.
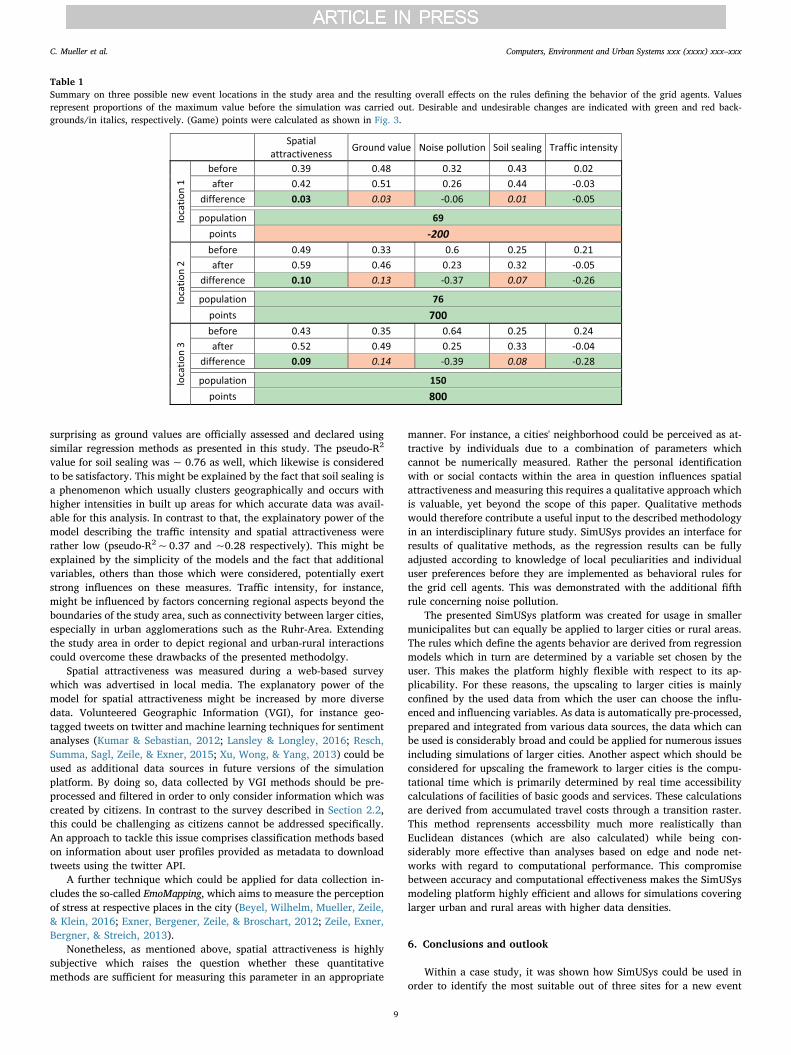
After the new event location was created in the simulation, thetraffic intensity and noise pollution decreased and the ground value,soil sealing and spatial attractiveness increased locally (see Fig. 6,columns 2, 3 and 4) as well as in terms of the whole study area (seeTable 1) for all three tested sites.
The least effective site was location 1. The creation of a new eventlocation at this place decreased the traffic intensity and noise pollutionby −5% and −6% and increased the soil sealing and ground value by+1% and +3%, respectively. This resulted in a+ 3% increase of theoverall spatial attractiveness which directly affected 69 citizens, whoresided within 100m of Euclidean distance (see Section 2.3 for in-tegration of data by the city's registration office). These were the lowestnumbers of the three tested sites and resulted in a game score of −200.
The most effective location for decreasing traffic intensity (−28%)and noise pollution (−39%) was location 3 (Table 1). However, thecreation of a new event location at this place increased the soil sealingand ground value by +8% and+14%, respectively. This resulted in anincrease of the overall spatial attractiveness of 9% for a new event lo-cation at this place and directly affected 150 people.
The most effective place for increasing the overall spatial attrac-tiveness was location 2 (+10%). Traffic intensity and noise pollutiondecreased by −26% and− 37%, while soil sealing and the groundvalue increased by +7% and+13%, respectively. The creation of anew event location at site 2 directly affected 76 citizens. Nonetheless,although location 2 was most suitable for increasing spatial attrac-tiveness with a game score of 700, location 3 was identified as the mostefficient place for a new event location with a game score of 800, asmore people were directly affected at this site.
5. Discussion
The presented platform for creating spatial simulation for urbansystems (SimUSys) incorporates aspects of system dynamics, ABM andgamification approaches. The spatially implicit rules for this gamifiedsimulation define the motivational affordances, such as game scoresand action points, and were implemented as positive and negativesystemic feedback loops resembling those of system dynamics models.The spatially explicit rules can be implemented by the user in astraightforward way using the web-based user interface. These spatiallyexplicit rules for the static grid cell agents are in accordance with Batty,Xie, and Sun (1999), who proposed a system modeling framework forGIS-based cellular automata, and constitutes a blend of the cellularautomata approach and “spatially explicit, grid-based, immobile”(Reynolds, 1999 on his web page) agents of an ABM. A use case for thecity of Herdecke demonstrated how these rules can be derived from thedata itself using spatially autoregressive regression analyses. This is inaccordance with the tendency in research to incorporate empiricalevidence-based data into agent-based models for decision support andpolicy making (Heracleous, Kolios, Panayiotou, Ellinas, & Polycarpou,2017; Janssen & Ostrom, 2006; Macal, 2010; Nava Guerrero et al.,2016; Pullin et al., 2009; Pullin & Knight, 2003; Wu et al., 2017).
The tool for automated data integration allowed straightforwardaccess to various data sources which could be used in SimUSys withoutintensive manual data preparation. This allowed for a combined use ofopen and official data, of which some data sets could be consideredsensitive concerning privacy. In exchange with the cooperating partnersin the study area, this was accounted for by the fact that the tool fordata integration can be run locally and in an isolated environment incontrast to a web-based service.
The accessibility of local facilities of basic goods and services wasevaluated by accumulated travel cost through a transition raster with acell size of 5m×5m. On the one hand, this comprises an inferior
C. Mueller et al. Computers, Environment and Urban Systems xxx (xxxx) xxx–xxx
6
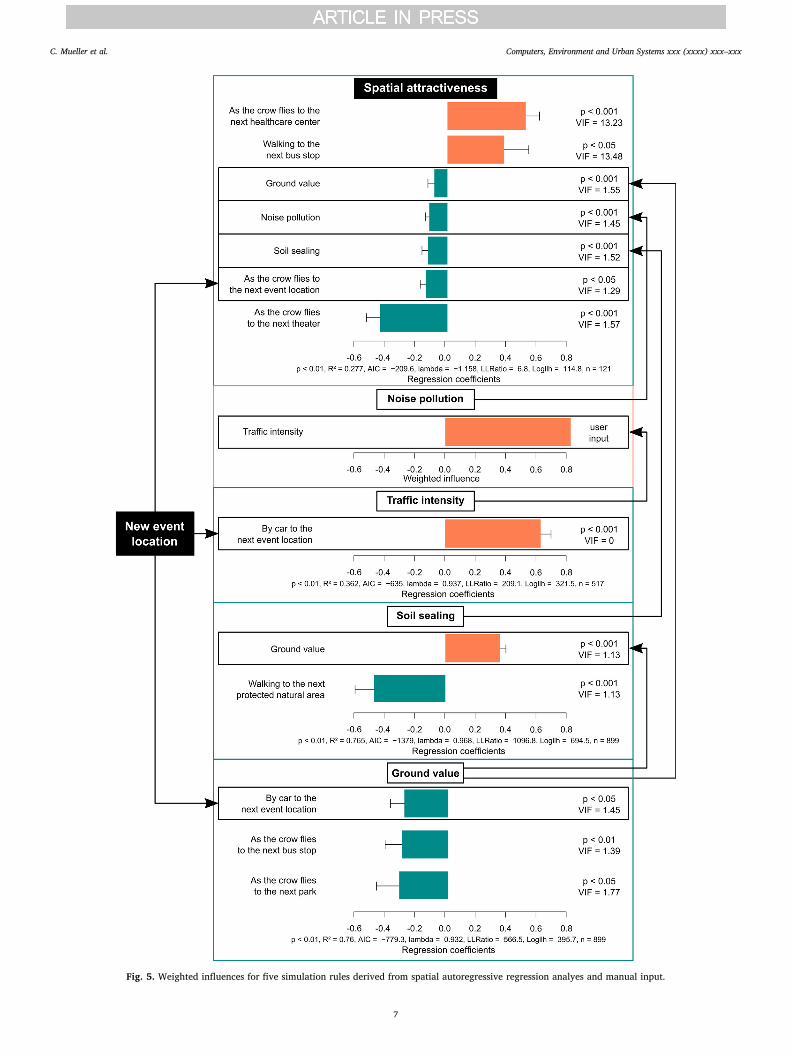
Fig. 5. Weighted influences for five simulation rules derived from spatial autoregressive regression analyes and manual input.
C. Mueller et al. Computers, Environment and Urban Systems xxx (xxxx) xxx–xxx
7
approach in terms of accuracy when compared to a network analysisbased on a node and edge model. On the other hand, the travel costanalysis outcompetes a network analysis in terms of computationalefficiency which allows for real time updates of accessibility values inSimUSys. Furthermore, as accessibility values are individually weightedas part of the spatially explicit rule set for the grid cell agents and notthe absolute values themselves are regarded in the simulation, the lossof spatial detail due to the transition raster is considered to be tolerable.
Given the fact that the independent variables in the regressionanalyses were spatial data sets, multicollinearity was surprisingly low(VIF < 2) for all parameters. The Euclidean distance to healthcarecenters and the walking distance to bus stops in the model describingspatial attractiveness were the only exception with VIF values of ~13.
Although the predefined threshold of VIF < 15 was not exceeded andthe variables in question were therefore not removed from the model,the relatively high VIF values might be avoided by a more diverse datasets in future studies. As expected from the considered spatial data sets,they showed extensive spatial autocorrelation which was accounted forin the spatial autoregressive regression models.
Although all spatial autoregressive models were highly significant,there were considerable differences between the explanatory powers ofthe respective models and therefore the accuracy of the agents whosebehavior was defined by these models. The explanatory power of theregression model which described the influence on ground value was ~0.76 (Nagelkerke pseudo-R2 value) which, given the simplicity of thedefined ruleset, is considered to be satifactorily descriptive. This is little
Fig. 6. Overview of the three possible event locations in the study area and the resulting spatial effects. Existing event locations are represented as small black dots.Possible new event locations are represented as small red stars. Legend values constitute proportions of the maximum values before the game was carried out andshow values of the respective rows (first legend from the top for “ground value”, second legend for “noise pollution”, and so forth). Although the new facilities doaffect larger areas, their closer vicinities are indicated by circles for reasons of better comparability with the “before” state, in the first column (there are very littlechanges at location 1, in the second column, and more expressed affects at location 2 and 3, in the third and fourth column). (For interpretation of the references tocolour in this figure legend, the reader is referred to the web version of this article.)
C. Mueller et al. Computers, Environment and Urban Systems xxx (xxxx) xxx–xxx
8
surprising as ground values are officially assessed and declared usingsimilar regression methods as presented in this study. The pseudo-R2
value for soil sealing was ~ 0.76 as well, which likewise is consideredto be satisfactory. This might be explained by the fact that soil sealing isa phenomenon which usually clusters geographically and occurs withhigher intensities in built up areas for which accurate data was avail-able for this analysis. In contrast to that, the explainatory power of themodel describing the traffic intensity and spatial attractiveness wererather low (pseudo-R2 ~ 0.37 and ~0.28 respectively). This might beexplained by the simplicity of the models and the fact that additionalvariables, others than those which were considered, potentially exertstrong influences on these measures. Traffic intensity, for instance,might be influenced by factors concerning regional aspects beyond theboundaries of the study area, such as connectivity between larger cities,especially in urban agglomerations such as the Ruhr-Area. Extendingthe study area in order to depict regional and urban-rural interactionscould overcome these drawbacks of the presented methodolgy.
Spatial attractiveness was measured during a web-based surveywhich was advertised in local media. The explanatory power of themodel for spatial attractiveness might be increased by more diversedata. Volunteered Geographic Information (VGI), for instance geo-tagged tweets on twitter and machine learning techniques for sentimentanalyses (Kumar & Sebastian, 2012; Lansley & Longley, 2016; Resch,Summa, Sagl, Zeile, & Exner, 2015; Xu, Wong, & Yang, 2013) could beused as additional data sources in future versions of the simulationplatform. By doing so, data collected by VGI methods should be pre-processed and filtered in order to only consider information which wascreated by citizens. In contrast to the survey described in Section 2.2,this could be challenging as citizens cannot be addressed specifically.An approach to tackle this issue comprises classification methods basedon information about user profiles provided as metadata to downloadtweets using the twitter API.
A further technique which could be applied for data collection in-cludes the so-called EmoMapping, which aims to measure the perceptionof stress at respective places in the city (Beyel, Wilhelm, Mueller, Zeile,& Klein, 2016; Exner, Bergener, Zeile, & Broschart, 2012; Zeile, Exner,Bergner, & Streich, 2013).
Nonetheless, as mentioned above, spatial attractiveness is highlysubjective which raises the question whether these quantitativemethods are sufficient for measuring this parameter in an appropriate
manner. For instance, a cities' neighborhood could be perceived as at-tractive by individuals due to a combination of parameters whichcannot be numerically measured. Rather the personal identificationwith or social contacts within the area in question influences spatialattractiveness and measuring this requires a qualitative approach whichis valuable, yet beyond the scope of this paper. Qualitative methodswould therefore contribute a useful input to the described methodologyin an interdisciplinary future study. SimUSys provides an interface forresults of qualitative methods, as the regression results can be fullyadjusted according to knowledge of local peculiarities and individualuser preferences before they are implemented as behavioral rules forthe grid cell agents. This was demonstrated with the additional fifthrule concerning noise pollution.
The presented SimUSys platform was created for usage in smallermunicipalites but can equally be applied to larger cities or rural areas.The rules which define the agents behavior are derived from regressionmodels which in turn are determined by a variable set chosen by theuser. This makes the platform highly flexible with respect to its ap-plicability. For these reasons, the upscaling to larger cities is mainlyconfined by the used data from which the user can choose the influ-enced and influencing variables. As data is automatically pre-processed,prepared and integrated from various data sources, the data which canbe used is considerably broad and could be applied for numerous issuesincluding simulations of larger cities. Another aspect which should beconsidered for upscaling the framework to larger cities is the compu-tational time which is primarily determined by real time accessibilitycalculations of facilities of basic goods and services. These calculationsare derived from accumulated travel costs through a transition raster.This method reprensents accessbility much more realistically thanEuclidean distances (which are also calculated) while being con-siderably more effective than analyses based on edge and node net-works with regard to computational performance. This compromisebetween accuracy and computational effectiveness makes the SimUSysmodeling platform highly efficient and allows for simulations coveringlarger urban and rural areas with higher data densities.
6. Conclusions and outlook
Within a case study, it was shown how SimUSys could be used inorder to identify the most suitable out of three sites for a new event
Table 1Summary on three possible new event locations in the study area and the resulting overall effects on the rules defining the behavior of the grid agents. Valuesrepresent proportions of the maximum value before the simulation was carried out. Desirable and undesirable changes are indicated with green and red back-grounds/in italics, respectively. (Game) points were calculated as shown in Fig. 3.
C. Mueller et al. Computers, Environment and Urban Systems xxx (xxxx) xxx–xxx
9
location. The rule set of five spatially explicit and the implicit ruleswere automatically implemented and applied in this case study andallowed to experience the behavior of this system in a gamified en-vironment.
Envisaged improvements to SimUSys involve the ability to simulatenot only the creation of new but also closure of existing facilities andmaking alterations to the underlying streets and paths, which is thebasis for the real time accessibility calculations. Furthermore, the userwill be able to add polygons in future versions of SimUSys in order tomodel alternative zoning plans with respective probabilities for theestablishment of new facilities which again might be derived from thedata itself using SAR methodologies. This might pose a more realisticmodel for urban planning, especially for private facilities which are notplaced to a specific location by the city administration but ratherregulated by zoning plans.
Further improvements include temporarily dynamic population andmigration models which should be able to account for different sce-narios regarding the dramatic demographic changes in the region. Oneresult of these changes is a severe increase in the absolute number ofsenior citizens. The proportion of people with reduced personal mobi-lity is much higher than in other age groups. Consequently, mobilitybarriers will become more important and should be considered in theaccessibility calculations in SimUSys (Mueller, Beyel, & Klein, 2017).
Ultimately, it is worth noting that the presented simulation does notconstitute an image of the real world, but rather a tool for experiencingsystem behavior and complexity and, by doing so, providing a startingpoint for informed discussions.
The presented easy-to-use decision support tool incorporates aspectsof system dynamics, ABM and gamification approaches. It auto-matically integrates data from various sources with data on spatial at-tractiveness and is suitable for practical application in everyday ad-ministrative processes of smaller municipalities and thereby contributesto more targeted, informed and sustainable urban planning.
Glossary
SimUSys Spatial Simulation of Urban SystemsSARS patial Autoregressive RegressionABM Agent-Based ModelsMoran's I Statistical measure for spatial autocorrelationAIC Akaike Information Criterion, relative measure for model
comparisonGUI Graphical User InterfaceSpatially implicit geographically not bound/location does not matterSpatially explicit geographically bound/location mattersVIF Variation Inflation Factor, measure for multicollinearityn Sample size(Nagelkerke pseudo-)R2 Coefficient of determination (or substitute
with similar reading), measure for explanatory powerp value Significance valueλ= lambda Maximum likelihood autoregressive coefficient, measure
used in model quality evaluationLLRatio Log likelihood ratio, measure used in model quality evalua-
tionLogllh Log likelihood, measure used in model quality evaluationPOI Point of interest
References
Ahlqvist, O., Khodke, N., & Ramnath, R. (2018). GeoGame analytics – A cyber-enabledpetri dish for geographic modeling and simulation. Computers, Environment and UrbanSystems, 67(Suppl. C), 1–8. http://dx.doi.org/10.1016/j.compenvurbsys.2017.08.013.
AnyLogic (2014). AnyLogic. Retrieved from https://www.anylogic.com/use-of-simulation/agent-based-modeling/.
Arnfield, A. J. (2003). Two decades of urban climate research: A review of turbulence,exchanges of energy and water, and the urban heat island. International Journal of
Climatology, 23(1), 1–26.Batty, M. (2005). Agents, cells, and cities: New representational models for simulating
multiscale urban dynamics. Environment and Planning A, 37(8), 1373–1394.Batty, M., Xie, Y., & Sun, Z. (1999). Modeling urban dynamics through GIS-based cellular
automata. Computers, Environment and Urban Systems, 23(3), 205–233.Berjak, S. G., & Hearne, J. W. (2002). An improved cellular automaton model for simu-
lating fire in a spatially heterogeneous Savanna system. Ecological Modelling, 148(2),133–151.
Beyel, S., Wilhelm, J., Mueller, C., Zeile, P., & Klein, U. (2016). Stresstest städtischerInfrastrukturen – ein Experiment zur Wahrnehmung des Alters im öffentlichen Raum.Retrieved from http://conference.corp.at/archive/CORP2016_42.pdfhttps://www.researchgate.net/publication/304570481_Stresstest_stadtischer_Infrastrukturen_-_ein_Experiment_zur_Wahrnehmung_des_Alters_im_offentlichen_Raum.
Bommel, P., Becu, N., Le Page, C., & Bousquet, F. (2016). Cormas: an agent-based si-mulation platform for coupling human decisions with computerized dynamics.Simulation and Gaming in the Network Society (pp. 387–410). Springer.
Champion, A. G. (2001). A changing demographic regime and evolving poly centric urbanregions: Consequences for the size, composition and distribution of city populations.Urban Studies, 38(4), 657–677.
Chen, Y., Li, X., Liu, X., & Ai, B. (2014). Modeling urban land-use dynamics in a fastdeveloping city using the modified logistic cellular automaton with a patch-basedsimulation strategy. International Journal of Geographical Information Science, 28(2),234–255.
City of Herdecke Bau- und Planungsamt. Retrieved from http://www.herdecke.de/rathaus-buergerservice/verwaltung/organisation/organisation/show/bau-und-planungsamt.html.
Collier, N. (2003). RePast: An extensible framework for agent simulation. The Universityof Chicago's. Social Science Research, 36, 2003.
ILS-Forschung 01/2010. Demographischer Wandel in Nordrhein-Westfalen (2. Auflage (1.Auflage 2007)). In R. Danielzyk, C. Meyer, & W. Grüber-Töpfer (Eds.). Dortmung:Institut für Landes- und Stadtentwicklungsforschung und Bauwesen des Landes Nordrhein-Westfalen (ILS NRW). Retrieved from http://www.ils-forschung.de/files_publikationen/pdfs/DEMOGRAFISCHER%20WANDEL_NRW.pdf.
Deterding, S., Sicart, M., Nacke, L., O'Hara, K., & Dixon, D. (2011). Gamification. Usinggame-design elements in non-gaming contexts. CHI'11 Extended Abstracts on HumanFactors in Computing Systems (pp. 1–4). ACM. Retrieved from http://citeseerx.ist.psu.edu/viewdoc/download?doi=10.1.1.186.3039&rep=rep1&type=pdf.
Esri (1999-2015). ArcGIS Desktop. Redlands: CAEsri.Exner, J.-P., Bergener, B., Zeile, P., & Broschart, D. (2012). Humansensorik in der
räumlichen Planung. Angewandte Geoinformatik, 2012, 690–699.Forrest, S., & Jones, T. (1995). Modeling complex adaptive systems with Echo. Santa Fe
Institute Working Papers (pp. 1–21). . Retrieved from https://www.santafe.edu/research/results/working-papers/modeling-complex-adaptive-systems-with-echo.
Forrester, J. W. (1969). Urban dynamics. Industrial Management Review (pre-1986) (pp.11). .
Gardner, M. (1970). Mathematical games: The fantastic combinations of John Conway'snew solitaire game “life”. Scientific American, 223(4), 120–123.
Gebetsroither, E. (2010). Combining multi-agent systems modelling and system dynamicsmodelling in theory and practice. Klagenfurt: Alpen-Adria Universität Klagenfurt.
Hamari, J., Koivisto, J., & Sarsa, H. (2014). Does gamification work?—a literature reviewof empirical studies on gamification. In 47th International Conference on SystemSciences (HICSS), Hawaii 3025–3034). IEEE. Retrieved from http://ieeexplore.ieee.org/stamp/stamp.jsp?arnumber=6758978.
Heracleous, C., Kolios, P., Panayiotou, C. G., Ellinas, G., & Polycarpou, M. M. (2017).Hybrid systems modeling for critical infrastructures interdependency analysis.Reliability Engineering & System Safety, 165(Supplement C), 89–101. http://dx.doi.org/10.1016/j.ress.2017.03.028.
Ingensand, J., Composto, S., Nappez, M., Cheseaux, R. D., Joost, S., Widmer, I., & Rappo,D. (2015). Motivating citizens to take action for biodiversity conservation usinggeospatial systems. AGILE 2015. Springer.
Isee systems (2017). Stella Architect. Retrieved from https://www.iseesystems.com/store/products/stella-architect.aspx.
IT.NRW (2017). Bevölkerung am Ort der Hauptwohnung nach Geschlecht. Retrieved fromhttps://www.landesdatenbank.nrw.de/ldbnrw/online/data;jsessionid=5A1D0959D631A854550D81410299211B.ldb2?operation=abruftabelleBearbeiten&levelindex=1&levelid=1513001960694&auswahloperation=abruftabelleAuspraegungAuswaehlen&auswahlverzeichnis=ordnungsstruktur&auswahlziel=werteabruf&selectionname=121-5-01i&auswahltext=&werteabruf=Werteabruf.
Janssen, M. A. (2005). Agent-based modelling. Modelling in ecological economics (pp. 155–172). . Retrieved from http://isecoeco.org/pdf/agent_based%20_modeling.pdf.
Janssen, M., & Ostrom, E. (2006). Empirically based, agent-based models. Ecology andSociety, 11(2).
Kéfi, S., Rietkerk, M., Alados, C. L., Pueyo, Y., Papanastasis, V. P., ElAich, A., & Ruiter, P.C.d. (2007). Spatial vegetation patterns and imminent desertification inMediterranean arid ecosystems. Nature, 449(7159), 213.
Kumar, A., & Sebastian, T. M. (2012). Sentiment analysis on twitter. IJCSI InternationalJournal of Computer Science Issues, 9(4), 372. Retrieved from https://pdfs.semanticscholar.org/ce41/114db57c2d58ce5592f274e2eede914bd9e9.pdf.
Lansley, G., & Longley, P. A. (2016). The geography of twitter topics in London.Computers, Environment and Urban Systems, 58(Suppl. C), 85–96. http://dx.doi.org/10.1016/j.compenvurbsys.2016.04.002.
Lewe, J.-H., Hivin, L. F., & Mavris, D. N. (2014). A multi-paradigm approach to systemdynamics modeling of intercity transportation. Transportation Research Part E:Logistics and Transportation Review, 71, 188–202.
Libbe, J., Köhler, H., & Beckmann, K. J. (2010). Infrastruktur und Stadtentwicklung:
C. Mueller et al. Computers, Environment and Urban Systems xxx (xxxx) xxx–xxx
10
Technische und soziale Infrastrukturen - Herausforderungen und Handlungsoptionenfür Infrastruktur- und Stadtplanung : [Forschungsprojekt des Deutschen Instituts fürUrbanistik (Difu) im Auftrag der Wüstenrot-Stiftung]. Edition Difu - Stadt, Forschung,Praxis: Vol. 10. Berlin: Dt. Inst. für Urbanistik.
Luke, S., Balan, G. C., Sullivan, K., & Panait, L. (2015). MASON. Retrieved from https://cs.gmu.edu/~eclab/projects/mason/.
Macal, C. M. (2010). To agent-based simulation from system dynamics. Proceedings of thewinter simulation conference (pp. 371–382). Winter Simulation Conference.
Minar, N., Burkhart, R., Langton, C. G., & Askenazi, M. (1996). The swarm simulationsystem: A toolkit for building multi-agent simulations. Santa Fe Institute WorkingPapers (pp. 1–11). . Retrieved from https://www.santafe.edu/research/results/working-papers/the-swarm-simulation-system-a-toolkit-for-building.
Mueller, C., Klein, U., & Hof, A. (2016a). Automatisierte Integration heterogenerGeodaten für ganzheitliche Raumplanung. AGIT – Journal für AngewandteGeoinformatik, 2, 498–507. Retrieved from http://gispoint.de/gisopen-paper/3918-automatisierte-integration-heterogener-geodaten-fuer-ganzheitliche-raumplanung.htmlhttps://www.researchgate.net/publication/305145782_Automatisierte_Integration_heterogener_Geodaten_fur_ganzheitliche_Raumplanung.
Mueller, C., Klein, U., & Hof, A. (2016b). Smart planning: Different participation methodsfor evaluating spatial attractiveness. Proceedings REAL CORP 2016. Retrieved fromhttp://conference.corp.at/archive/CORP2016_46.pdfhttps://www.researchgate.net/publication/305209963_Smart_Planning_Different_Participation_Methods_for_Evaluating_Spatial_Attractiveness?ev=prf_pub.
Mueller, C., Beyel, S., & Klein, U. (2017). Barrierefreie Erreichbarkeit von Einrichtungender lokalen Daseinsvorsorge und Raumattraktivität für Senioren:Betroffenheitsanalyse und kartographische Darstellungen zur Erkenntnisgewinnung -Accessibility of facilities of basic services and spatial attractiveness for senior citizens:GIS-based demographic assessment of impact and cartographic illustrations forgaining knowledge. Kartographische Nachrichten - Journal of Cartography andGeographic Information, 202–209. 4.2017. Retrieved from https://www.researchgate.net/publication/319623932_Barrierefreie_Erreichbarkeit_von_Einrichtungen_der_lokalen_Daseinsvorsorge_und_Raumattraktivitat_fur_Senioren_Betroffenheitsanalyse_und_kartographische_Darstellungen_zur_Erkenntnisgewinnung_Accessibil?_iepl%5BviewId%5D=ODt5UyXhOyl1SEY0tZcD6Z6p&_iepl%5BprofilePublicationItemVariant%5D=default&_iepl%5Bcontexts%5D%5B0%5D=prfpi&_iepl%5BtargetEntityId%5D=PB%3A319623932&_iepl%5BinteractionType%5D=publicationTitle.
Nam, T., & Pardo, A. T. (Eds.). (2011). Conceptualizing smart city with dimensions of tech-nology, people, and institutionsMaryland, USA: ACM. Retrieved from https://www.ctg.albany.edu/publications/journals/dgo_2011_smartcity/dgo_2011_smartcity.pdf.
Nava Guerrero, G., Schwarz, P., & Slinger, J. (2016). A recent overview of the integrationof system dynamics and agent-based modelling and simulation. 34th InternationalConference of the System Dynamics Society.
Neirotti, P., Marco, A. de, Cagliano, A. C., Mangano, G., & Scorrano, F. (2014). Currenttrends in Smart City initiatives: Some stylised facts. Cities, 38, 25–36. Retrieved fromhttp://porto.polito.it/2522888/1/SmartCity_Trends_paper.pdf
Oke, T. R. (1973). City size and the urban heat island. Atmospheric Environment (1967),7(8), 769–779.
Omer, I., & Kaplan, N. (2017). Using space syntax and agent-based approaches formodeling pedestrian volume at the urban scale. Computers, Environment and UrbanSystems, 64, 57–67.
Pinto, N., Antunes, A. P., & Roca, J. (2017). Applicability and calibration of an irregularcellular automata model for land use change. Computers, Environment and UrbanSystems, 65, 93–102.
Prensky, M. (2003). Digital game-based learning. Computers in Entertainment (CIE),1(1), 21.
Pullin, A. S., & Knight, T. M. (2003). Support for decision making in conservation prac-tice: An evidence-based approach. Journal for Nature Conservation, 11(2), 83–90.
Pullin, A. S., Knight, T. M., & Watkinson, A. R. (2009). Linking reductionist science and
holistic policy using systematic reviews: Unpacking environmental policy questionsto construct an evidence-based framework. Journal of Applied Ecology, 46(5),970–975.
Regionalverband Ruhr Informationsportal. Retrieved from http://www.metropoleruhr.de/land-leute/daten-fakten/bevoelkerung.html.
Resch, B., Summa, A., Sagl, G., Zeile, P., & Exner, J.-P. (2015). Urban emotions—Geo-semantic emotion extraction from technical sensors, human sensors and crowd-sourced data. Progress in location-based services (pp. 199–212). Springer. Retrievedfrom http://www.berndresch.com/download/work/publications/resch-et-al_urban-emotions_lbs-2014.pdf.
Reynolds, C. (1999). Individual-based models. Retrieved from https://www.red3d.com/cwr/ibm.html.
Reynolds, C. (2001). Boids: background and update. Retrieved from https://www.red3d.com/cwr/boids/.
Russo, P., Lanzilotti, R., Costabile, M. F., & Pettit, C. J. (2018). Towards satisfyingpractitioners in using planning support systems. Computers, Environment and UrbanSystems, 67(Supplement C), 9–20. http://dx.doi.org/10.1016/j.compenvurbsys.2017.08.009.
Şalap-Ayça, S., Jankowski, P., Clarke, K. C., Kyriakidis, P. C., & Nara, A. (2018). A meta-modeling approach for spatio-temporal uncertainty and sensitivity analysis: An ap-plication for a cellular automata-based Urban growth and land-use change model.International Journal of Geographical Information Science, 32(4), 637–662.
Salter, R. M. (2013). Nova: A modern platform for system dynamics, spatial, and agent-based modeling. Procedia Computer Science, 18, 1784–1793.
Scholl, H. J. (2001). Agent-based and system dynamics modeling: A call for cross studyand joint research. Proceedings of the 34th annual Hawaii international conference onsystem sciences. IEEE.
Shirzadi Babakan, A., & Alimohammadi, A. (2016). An agent-based simulation of re-sidential location choice of tenants in Tehran, Iran. Transactions in GIS, 20(1),101–125.
Powersim Software (2017). Powersim. Retrieved from http://www.powersim.com/.Tan, L., Wu, L., & Lin, H. (2015). An individual cognitive evacuation behaviour model for
agent-based simulation: A case study of a large outdoor event. International Journal ofGeographical Information Science, 29(9), 1552–1568.
Tyrna, B. G., & Hochschild, V. (2010). Modellierung von lokalen Überschwemmungennach Starkniederschlägen. Angewandte Geoinformatik, 2010, 325–334.
Uri Wilensky (2016). NetLogo. Retrieved from https://ccl.northwestern.edu/netlogo/index.shtml.
Ventana Systems (2015). Vensim. Retrieved from http://vensim.com/.Verstegen, J. A., Karssenberg, D., van der Hilst, F., & Faaij, A. P. C. (2014). Identifying a
land use change cellular automaton by Bayesian data assimilation. EnvironmentalModelling & Software, 53, 121–136.
Verstegen, J. A., Karssenberg, D., van der Hilst, F., & Faaij, A. C. (2016). Detecting sys-temic change in a land use system by Bayesian data assimilation. EnvironmentalModelling & Software, 75, 424–438.
White, R., & Engelen, G. (1993). Cellular automata and fractal urban form: A cellularmodelling approach to the evolution of urban land-use patterns. Environment andPlanning A, 25(8), 1175–1199.
Wu, S. R., Li, X., Apul, D., Breeze, V., Tang, Y., Fan, Y., & Chen, J. (2017). Agent-basedmodeling of temporal and spatial dynamics in life cycle sustainability assessment.Journal of Industrial Ecology, 21(6), 1507–1521.
Xu, C., Wong, D. W., & Yang, C. (2013). Evaluating the “geographical awareness” ofindividuals: An exploratory analysis of twitter data. Cartography and GeographicInformation Science, 40(2), 103–115.
Zeile, P., Exner, J.-P., Bergner, B., & Streich, B. (2013). Humansensorik und Kartierungvon Emotionen in der räumlichen Planung. Proceedings of Digital LandscapeArchitecture 2013. Retrieved from gispoint.de/fileadmin/user_upload/paper_gis_open/DLA_2013/537527037.pdf.
C. Mueller et al. Computers, Environment and Urban Systems xxx (xxxx) xxx–xxx
11


![Lu Zheng Kun Han arXiv:1805.12312v1 [cs.IR] 31 May 2018 · 2018-06-01 · presented in Section 2. Section 3 describes the retrieval system in details. In Section 4, we provide the](https://static.fdocuments.nl/doc/165x107/5ec6ccb7ffd150065c6e5ccd/lu-zheng-kun-han-arxiv180512312v1-csir-31-may-2018-2018-06-01-presented-in.jpg)