B van Woezik_Runaway and thermally safe operation of a nitric acid oxidation in a semi-batch reactor
168
Runaway and thermally safe operation of a nitric acid oxidation in a semi-batch reactor B.A.A. van Woezik
-
Upload
bob-van-woezik -
Category
Documents
-
view
115 -
download
4
Transcript of B van Woezik_Runaway and thermally safe operation of a nitric acid oxidation in a semi-batch reactor

Runaway and thermally safe operationof a nitric acid oxidation in a
semi-batch reactor
B.A.A. van Woezik

RUNAWAY AND THERMALLY SAFE OPERATIONOF A NITRIC ACID OXIDATION IN A
SEMI-BATCH REACTOR
PROEFSCHRIFT
ter verkrijging vande graad van doctor aan de Universiteit Twente,
op gezag van de rector magnificus,prof. dr. F.A. van Vught,
volgens besluit van het College voor Promotiesin het openbaar te verdedigen
op vrijdag 22 september 2000 te 13.15 uur.
door
Bob Arnold August van Woezik
geboren op 6 januari 1969te Nijmegen

Dit proefschrift is goedgekeurd door de promotor
Prof.dr.ir. K.R. Westerterp

This research was supported by the Technology Foundation STW, appliedscience division of NWO and the technology program of the Ministry ofEconomic Affairs.
Copyright © 2000 B.A.A. van Woezik, Eindhoven, The Netherlands
No part of this book may be reproduced in any form by any means, nortransmitted, nor translated into a machine language without written permissionfrom the author.
CIP-GEGEVENS KONINKLIJKE BIBLIOTHEEK, DEN HAAG
Woezik, Bob Arnold August van
Runaway and thermally safe operation of a nitric acid oxidation in a semi-batchreactor / Bob Arnold August van Woezik.Thesis University of Twente, Enschede. – With ref. – With summary in Dutch.ISBN 90 - 365 14878Subject headings: runaway, liquid-liquid reactions, nitric acid oxidation.

1
Summary and Conclusions
A number of serious accidents has occurred due to a runaway reaction of aheterogeneous liquid-liquid reaction whereby a secondary side reaction wastriggered. A basic lack of proper knowledge of all the phenomena, occurring insuch a system, is one of the prime causes that may lead to overheating andeventually a thermal runaway. Therefore, a better understanding of these kindsof processes is of great importance for the safe and economic design as well assafe operation of those reactions. This thesis deals with the safe operation of amultiple liquid-liquid reaction in a semi-batch reactor in the example of thenitric acid oxidation of 2-octanol. A general introduction about runaways in(semi) batch reactors is given in Chapter 1.
In Chapter 2 the oxidation of 2-octanol with nitric acid is studied. The oxidationof 2-octanol with nitric acid has been selected as a model reaction for aheterogeneous liquid-liquid reaction with an undesired side reaction. 2-Octanolis first oxidized to 2-octanone, which can be further oxidized to carboxylicacids. The oxidation of 2-octanol and 2-octanone with nitric acid exhibits thetypical features of nitric acid oxidations, like a long induction time withoutinitiator; autocatalytic reaction; strong dependence of mineral acid concentrationand high energy of activation. However, there is a limited knowledge of theexact chemical structure of the compounds in the aqueous reaction phase and ofa number of unknown, unstable compounds in the organic phase. Next to thisthe exact mechanism is still not elucidated. As a consequence of this, aconsiderable model reduction was necessary to describe the overall reactionrates.
An extensive experimental program has been followed using heat flowcalorimetry supported by chemical analysis. The oxidation reactions have beencarried out in a reaction calorimeter RC1 of Mettler Toledo, which contains ajacketed 1-liter glass vessel. The reactions have been studied in the range 0 to 40ºC, with initial nitric acid concentrations of 50 to 65 wt% and a stirring rate of700 rpm. The kinetic constants have been determined for both reactions. Theobserved conversion rates of the complex reactions of 2-octanol and 2-octanonewith nitric acids can be correlated using only two kinetic equations, in which theeffect on temperature is described through the Arrhenius equation and the effecton acid strength through Hammett’s acidity function.

Summary and Conclusions
2
The nitric acid and the organic solution are immiscible, so chemical reaction andmass transfer phenomena occur simultaneously. The results indicate theoxidation of 2-octanol is operated in the non-enhanced regime when nitric acidis below 60 wt% or when the temperature is below 25 ºC at 60 wt% HNO3,while the oxidation of 2-octanone is operated in the non-enhanced regime for thewhole range of experimental conditions considered. Under these conditions themass transfer resistance does not influence the overall conversion rate, so thegoverning parameters are the reaction rate constant and the solubility of theorganic compounds in the nitric acid solution. This has also been experimentallyconfirmed by determining the influence on stirring rate.
In parallel a model has been developed to describe the conversion rates, thatsuccessfully can predict the behavior of the semi-batch reactor, i.e. concentrationand temperature time profiles. The experimental results and simulations are ingood agreement and it has been found possible to describe the thermal behaviorof the semi-batch reactor for the nitric acids oxidation reactions with the filmmodel for slow liquid-liquid reactions and a simplified reaction scheme.
In Chapter 3 the thermal behavior of this consecutive heterogeneous liquid-liquid reaction system is studied in more detail by experiments and modelcalculations. An experimental installation has been built, containing a 1-literglass reactor, followed by a thermal characterization of the equipment. Twoseparate cooling circuits have been installed to study different coolingcapacities: a cooling jacket and a cooling coil. The reactor has been operated inthe semi-batch mode under isoperibolic conditions, i.e. with a constant coolingtemperature. A series of oxidation experiments has been carried out to study theinfluence of different initial and operating conditions. The thermal behavior hasbeen studied with a coolant temperature of -5 to 60 ºC, a dosing time of 0.5 to 4hours, an initial nitric acid concentration of 60 wt% and a stirring rate of 1000rpm.
The reaction is executed in a cooled SBR in which the aqueous nitric acid ispresent right from the start and the organic component 2-octanol is added at aconstant feed rate. The 2-octanol reacts to 2-octanone, which can be furtheroxidized to unwanted carboxylic acids. A dangerous situation may arise whenthe transition of the reaction towards acids takes place in such a fast way that thereaction heat is liberated in a very short time and it results in a temperaturerunaway. The use of a longer dosing time or a larger cooling capacity effectivelymoderates the temperature effects and it will eventually even avoid such anundesired temperature overshoot. In the later, the process is regarded asinvariably safe and no runaway will take place for any coolant temperature and
Summary and Conclusions
3
the reactor temperature will always be maintained between well-known limits.The conditions leading to an invariably safe process are determinedexperimentally and by model calculations.
Because of the plant economics one must achieve a high yield in a short timeand under safe conditions. The reaction conditions should rapidly lead to themaximum yield of intermediate product 2-octanone and after that the reactionshould be stopped at the optimum reaction time. The appropriate moment intime to stop the reaction can be determined by model calculations. The influenceof operation conditions, e.g. dosing time and coolant temperature, on themaximum yield are studied and will be discussed.
In the oxidation of 2-octanol one focuses on the first reaction because highyields of ketone are required, while the danger of a runaway reaction must beattributed to the ignition of the secondary reaction. The reaction system can beconsidered as two single reactions and, therefore, also the boundary diagram− developed by Steensma and Westerterp [1990] − for single reactions has beenused to estimate critical conditions for the multiple reaction system. Theboundary diagram can be used to determine the dosing time and coolanttemperature required for safe execution of the desired reaction. However, forsuppression of the undesired reaction it leads to too optimistic coolanttemperatures.
Studying the dynamic behavior of heterogeneous liquid-liquid reactions involvesa number of difficulties, because chemical reaction and mass transferphenomena occur simultaneously. The interfacial area is essential for anaccurate prediction of the mass transfer and chemical reaction rates in liquid-liquid reactions. The interfacial area for a liquid-liquid system in a mechanicallyagitated reactor is determined in Chapter 4. This has been done by means of thechemical reaction method. This method deals with absorption accompanied by afast pseudo-first order reaction. The saponification of butyl formate ester with 8M sodium hydroxide solution has been used. The extraction rate is determinedin a stirred cell with a well-defined interfacial area equal to 33.4 cm2 and acorrelation has been derived to describe the mole flux of ester through theinterface. The kinetic rate constants have been calculated and are compared todata from literature. The reaction is affected by the amount of ions in thesolution. The reaction rate constant is described by an extra term in the usualArrhenius equation to account for this effect of the ionic strength.
The reactor, with a total volume of 0.5 liter, has been operated continuously tostudy the interfacial area in a turbulently mixed dispersion. A correlation has

Summary and Conclusions
4
been derived for the Sauter mean diameter for both, reaction in the dispersedphase as well as reaction in the continuous phase. A viscosity factor had to beincorporated to obtain one single correlation. The Sauter mean diameter can bedescribed by correlations similar to those in literature, only the constantsdeviate, because the specific properties of the system investigated and thereactor configuration are different. These constants were found to depend alsoon the phase that is dispersed. With the organic ester phase dispersed, dropletdiameters were found between 35 and 75 µm and between 65 and 135 µm incase the aqueous phase is dispersed. The drop size seems to be influenced by thedensity of the continuous phase as well as the ratio of the viscosities of the twophases. It is not unambiguous which phase dispersed will give the smallest dropsize and, hence, the largest interfacial area. It is, therefore, recommended todetermine the drop size for both liquids as the dispersed phase.
The mass transfer with reaction is described using the film theory. This modelcan usually be applied within the uncertainties of the estimated physico-chemical parameters, even though it is the simplest approach. The validation forthe chemically enhanced reaction regime is presented. The necessary conditionsare all full-filled in all experiments except that of a large Hinterland ratio.Therefore, the reaction between ester and sodium hydroxide in a single drop hasbeen described numerically. The effect of a small Hinterland ratio shows itselfby the inability of either the film theory or penetration theory to allow foreventual depletion of the reactant within the droplet. For the used experimentalset-up and experimental conditions, the contact time is relatively short anddeviations due to depletion of NaOH in the droplet are not to be expected. Forthe smallest experimentally determined droplet diameters, the assumption of aflat interface is no longer valid and the influence of the curvature of the interfacehas to be taken into account, otherwise the film theory can be used withconfidence.
References
Steensma, M. and Westerterp, K.R., Thermally safe operation of a semi-batchreactor for liquid-liquid reactions. Slow reactions, Ind. Eng. Chem. Res. 29(1990) 1259-1270.

5
Contents
Summary and Conclusions 1
Chapter 1: General Introduction 9
1.1 General 111.2 Present work 13References 14
Chapter 2: The nitric acid oxidation of 2-octanol and 2-octanone 17
Abstract 182.1 Introduction 192.2 Oxidation reactions with nitric acid 19
Oxidation of 2-octanolOxidation of 2-octanone
2.3 Derivation of overall conversion rates 22Kinetic expressionsConversion rates in a semi-batch reactor
2.4 Experimental set-up and principle of measurements 27Reaction calorimeterExperimental set-up and experimental procedureChemical treatment and chemical analysis
2.5 Experimental results 34Identification of reaction regimeDetermination of kinetic parameters
2.6 Simulation of isothermal runs 452.7 Model validation and limitations 49
Model verification with isoperibolic experiments2.8 Discussion and conclusions 55Notation 56References 59

Contents
6
Chapter 3: Runaway behavior and thermally safe operation of multipleliquid-liquid reactions in the semi-batch reactor 63
Abstract 643.1 Introduction 653.2 Nitric acid oxidation in a semi-batch reactor 66
Reaction systemMathematical model
3.3 Thermal behavior of the nitric acid oxidation of 2-octanol 75Sudden reaction transitionGradual reaction transition
3.4 Recognition of a dangerous state 863.5 Experimental set-up and procedure 88
Thermal characterization of equipmentCheck on the validity of the model for slow reactions
3.6 Experimental results 95Temperature profilesThermally safe operation of the nitric acid oxidationInfluence of dosing timeInfluence of cooling capacityInvariably safe operation
3.7 Prediction of safe operation based on the individual reactions 1053.8 Discussion and conclusions 108Notation 109References 112
Chapter 4: Determination of interfacial areas with the chemicalmethod for a system with alternating dispersed phases 113
Abstract 1144.1 Introduction 1154.2 Measurement of interfacial area, the theory 116
Determination by the chemical method4.3 Experimental set-up 120
Chemical treatment and chemical analysis4.4 Measurements in the stirred cell 123
Experimental procedureDetermination of flux equationCalculation of kinetics

Contents
7
4.5 Determination of interfacial area 130Experimental procedureDetermination of drop size correlation
4.6 Validity of the assumed conditions 137The effect of small Hinterland ratio
4.7 Discussion and conclusions 145Notation 146References 148Appendix 4.A: Physico-chemical parameters 151Appendix 4.B: Numerical model 154
Samenvatting en conclusies 155
Dankwoord 159
List of publications 162
Levensloop 163

Contents
8

1
General Introduction

Chapter 1
10

General Introduction
11
Temperature
Hea
t rat
es
Heat production rate
Heat removal rate 2
1
1.1 General
At Seveso on July 10th 1976 a runaway reaction took place that led to adischarge of highly toxic dioxin contaminating the neighboring village. Therunaway reaction in the unstirred mixture took place seven hours after stirringhad been stopped and was triggered by a small heat input from the hot wall, seeKletz [1988]. It turned out to be one of the best-known chemical plant accidentsand it became clear that the safety margins had not been recognized. Theaccident induced the fine chemicals industry to review their safety systems andto develop more refined methods for safeguarding their reactors.
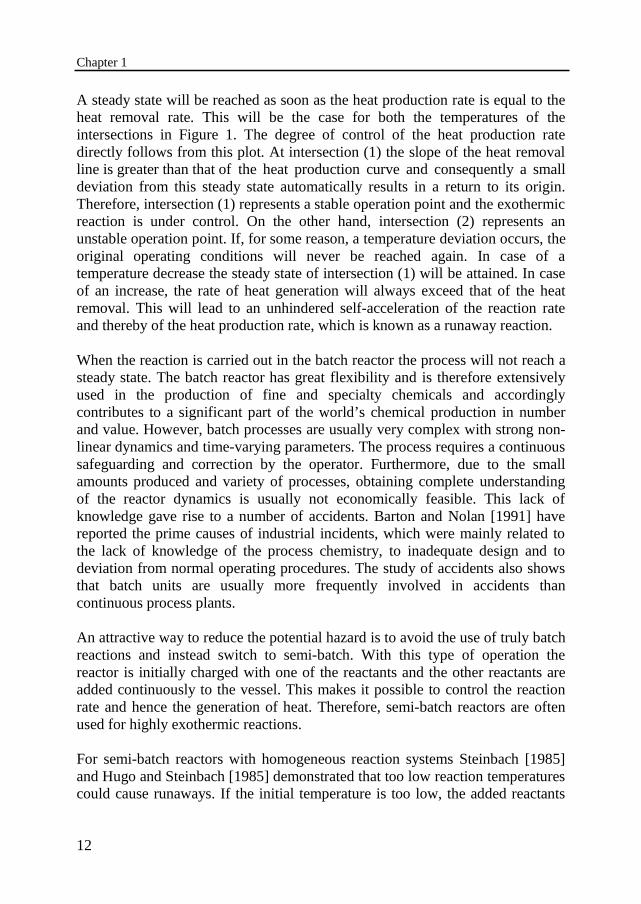
A considerable number of accidents has occurred, that can be attributed to thisso-called runaway reaction. The basic understanding of a runaway reactionarises from the thermal explosion theory according to Semenov. This theorydeals with the competition between heat generation by an exothermic reactionand heat removal from the reaction mass to, for instance, the cooling jacket. Theheat generation depends, according to Arrhenius, exponentially on temperature,while the heat removal depends linearly on temperature, see Figure 1.
Figure 1: Heat flow diagram. Heat production rate by chemical reaction andheat removal rate by cooling.
Chapter 1
12
A steady state will be reached as soon as the heat production rate is equal to theheat removal rate. This will be the case for both the temperatures of theintersections in Figure 1. The degree of control of the heat production ratedirectly follows from this plot. At intersection (1) the slope of the heat removalline is greater than that of the heat production curve and consequently a smalldeviation from this steady state automatically results in a return to its origin.Therefore, intersection (1) represents a stable operation point and the exothermicreaction is under control. On the other hand, intersection (2) represents anunstable operation point. If, for some reason, a temperature deviation occurs, theoriginal operating conditions will never be reached again. In case of atemperature decrease the steady state of intersection (1) will be attained. In caseof an increase, the rate of heat generation will always exceed that of the heatremoval. This will lead to an unhindered self-acceleration of the reaction rateand thereby of the heat production rate, which is known as a runaway reaction.
When the reaction is carried out in the batch reactor the process will not reach asteady state. The batch reactor has great flexibility and is therefore extensivelyused in the production of fine and specialty chemicals and accordinglycontributes to a significant part of the world’s chemical production in numberand value. However, batch processes are usually very complex with strong non-linear dynamics and time-varying parameters. The process requires a continuoussafeguarding and correction by the operator. Furthermore, due to the smallamounts produced and variety of processes, obtaining complete understandingof the reactor dynamics is usually not economically feasible. This lack ofknowledge gave rise to a number of accidents. Barton and Nolan [1991] havereported the prime causes of industrial incidents, which were mainly related tothe lack of knowledge of the process chemistry, to inadequate design and todeviation from normal operating procedures. The study of accidents also showsthat batch units are usually more frequently involved in accidents thancontinuous process plants.
An attractive way to reduce the potential hazard is to avoid the use of truly batchreactions and instead switch to semi-batch. With this type of operation thereactor is initially charged with one of the reactants and the other reactants areadded continuously to the vessel. This makes it possible to control the reactionrate and hence the generation of heat. Therefore, semi-batch reactors are oftenused for highly exothermic reactions.
For semi-batch reactors with homogeneous reaction systems Steinbach [1985]and Hugo and Steinbach [1985] demonstrated that too low reaction temperaturescould cause runaways. If the initial temperature is too low, the added reactants

General Introduction
13
will not react immediately and will start to accumulate. Under certaincircumstances the combination of increasing concentration and a gradualtemperature rise may lead to a runaway. Criteria for safe operation of a semi-batch reactor are based on the prevention of accumulation of unreactedreactants. The semi-batch reactor should therefore be operated with atemperature high enough to maintain the reaction rate approximately equal tothe feed rate.
A great number of industrial processes in semi-batch reactors involve systems inwhich two immiscible phases coexist, generally an organic and an aqueous one.Like in the manufacturing of organic peroxides, sulphonates, nitrate esters andother nitrocompounds. Steensma and Westerterp [1990, 1991] developed modelsfor liquid-liquid reactions to study thermal runaways taking place in suchheterogeneous systems. In case the reaction takes place in the dispersed phase,the system was found to be more prone to accumulation than when the reactiontakes place in the continuous phase. In the latter case, the system exhibits abetter conversion rate at the start, which reduces the danger of runawayreactions. Also a distinction could be made between slow reactions, where thereaction takes place in the bulk of one of the liquid phases, and fast reactions -i.e. chemical enhanced - with reaction in the boundary layer of one of thephases. A runaway can occur in liquid-liquid reaction systems due toaccumulation of the added reactants in the reacting phase for slow reactions, andin the non-reacting phase for fast reactions.
Although the contents of a reactor vessel may normally yield the desiredreaction products, deviations from normal operating conditions or upsetconditions such as loss of jacket cooling can lead to increased temperatures.This may initialize unwanted decomposition reactions, elevate the systempressure and lead to an emission as in the case of Seveso. The general approachin preventing a runaway reaction is to avoid triggering off side and chainreactions. It is a rather conservative approach, while in some cases it isinevitable to allow an unwanted reaction partially to take place.
1.2 Present work
The thermal behavior is studied of a multiple liquid-liquid reaction in a semi-batch reactor. The main goal is to understand and to ensure safe operation of thiskind of system by means of experiments and model calculations.

Chapter 1
14
Experimental studies of the thermal behavior of runaway reactions in a (semi)batch reactor are scarce and no experimental systems have been described indetail in which strongly exothermic side reactions can be triggered. Theoxidation reaction of 2-octanol has been chosen as a model reaction. Chapter 2deals with the kinetic study of the nitric acid oxidation of 2-octanol to 2-octanone and to the further oxidation products. The reactions have been studiedin a reaction calorimeter and a model, based on the film theory, has beendeveloped to describe the conversion rates.
In chapter 3 the nitric acid oxidation of 2-octanol is used to study experimentallythe thermal runaway behavior of an exothermic heterogeneous multiple reactionsystem in a 1-liter glass reactor. The reactor is operated in a semi-batch mannerwith a constant cooling temperature. Typical reaction regions can bedistinguished with increasing operation temperatures, which will bedemonstrated and explained. Parameters are studied to produce the requiredintermediate product, 2-octanone, with a high yield and in a safe manner. Theresults of the simulations are compared to the experimental observations.
One of the causes of accidents, see Barton [1991], is that the phenomena in, forinstance, liquid-liquid reactions are not understood. Essential for an accurateprediction of the mass transfer and chemical reaction rates in liquid-liquidreactions is the interfacial area. Chapter 4 deals with the interfacial area in amechanically agitated reactor. The interfacial area of a liquid-liquid system hasbeen determined by the chemical reaction method using the saponification ofbutyl formate ester. Although drop sizes in dispersions have been studiedextensively, experimental data for the same system and alternating phasesdispersed are scarce. In this chapter the results are given for the two types ofdispersion. The mass transfer with reaction is described using the film theoryand the necessary conditions are verified. For the smallest droplets with hardlyany bulk, the film model is not realistic anymore. Induced deviations are studiedand discussed.
References
Barton, J.A. and Nolan, P.F., Incidents in the chemical industry due to thermal-runaway chemical reactions. In: Euro courses, Reliability and risk analysis,Vol.1: Safety of Chemical Batch Reactors and Storage Tanks, A. Benuzzi andJ.M. Zaldivar (eds.), Kluwer Academic, Dordrecht 1991, pp. 1-17.
General Introduction
15
Hugo, P. and Steinbach J., Praxisorientierte Darstellung der thermischenSicherheitsgrenzen für den indirekt gekühlten Semibatch-Reaktor. Chem. Ing.Tech. 57 (1985) 780-782.
Kletz, T., Learning from accidents in industry, Butterworths, London 1988, pp.79-83.
Steensma, M. and Westerterp, K.R., Thermally safe operation of a semibatchreactor for liquid-liquid reactions. Slow reactions, Ind. Eng. Chem. Res. 29(1990) 1259-1270.
Steensma, M. and Westerterp, K.R., Thermally safe operation of a semibatchreactor for liquid-liquid reactions - Fast reactions, Chem. Eng. Technol. 14(1991) 367-375.
Steinbach, J., Untersuchung zur thermischen Sicherheit des indirekt gekühltenSemibatch-Reaktors, PhD-thesis, Technical University of Berlin, Berlin, 1985.

Chapter 1
16
2
The Nitric Acid Oxidation of2-Octanol and 2-Octanone
Chapter 2
18
Abstract
The oxidation of 2-octanol with nitric acid has been selected as a model reactionfor a heterogeneous liquid-liquid reaction with an undesired side reaction. 2-Octanol is first oxidized to 2-octanone, which can be further oxidized tocarboxylic acids. An extensive experimental program has been followed usingheat flow calorimetry supported by chemical analysis. A series of oxidationexperiments has been carried out to study the influence of different initial andoperating conditions such as temperature, stirring speed and feed rate. In parallela semi-empirical model has been developed to describe the conversion rates.

The Nitric Acid Oxidation of 2-Octanol and 2-Octanone
19
2.1 Introduction
A number of incidents concerning runaway reactions involve systems in whichtwo immiscible phases coexist, generally an organic and an aqueous one.Examples of such systems, in which simultaneously mass transfer and chemicalreaction are important, are nitrations, sulphonations, hydrolyses, esterificationsand oxidations. Experimental studies of the thermal behavior of runawayreactions in a (semi) batch reactor are scarce. Only homogeneous reactionsystems are described in literature: the homogeneous, sulfuric acid catalyzedhydrolysis of acetic anhydride, see e.g. Haldar and Rao [1992a,b] and thehomogeneous, acid catalyzed esterification of 2-butanol and propionicanhydride, see Snee and Hare [1992]. No experimental systems have beendescribed in detail for a heterogeneous liquid-liquid reaction, in which stronglyexothermic side reactions can be triggered. However, in many nitrations it isknown that dangerous side reactions can play a role like undesired oxidationreactions, see Camera et al. [1983]. They studied the oxidation of ethanol withnitric acid, where decomposition reactions can give rise to explosions.
To study the thermal behavior of a liquid-liquid reaction the oxidation of a longchain alcohol with nitric acid has been chosen. The ketones formed in theoxidation of secondary alcohols are more stable than aldehydes, so the oxidationof 2-octanol with nitric acid has been chosen as a model reaction. Secondaryalcohols are also oxidized in the commercial production of adipic acid, in whichcyclohexanol is oxidized. This reaction has been studied by van Asselt and vanKrevelen [1963a,b,c,d] and has been reviewed by Castellan et al. [1991].
This work presents experimental data for the oxidation of 2-octanol to 2-octanone and further oxidation products. The main objective is to develop amodel to describe the conversion rates of 2-octanol and 2-octanone.
2.2 Oxidation reactions with nitric acid
Nitric acid is a commonly used oxidizer. Especially alcohols, ketones, andaldehydes are oxidized to produce the corresponding carboxylic acids, forinstance adipic acid, see Davis [1985]. The oxidation of cyclohexanol with nitricacid is very similar to the oxidation of 2-octanol, see Castellan et al. [1991]. Themechanism of these nitric acid oxidations is still not elucidated. Oxidations withnitric acid are in general very complex and usually several intermediates areformed, see e.g. Ogata [1978]. The elucidation of the real pathways was beyond
Chapter 2
20
the scope of the project: therefore, it has been chosen to simplify the descriptionof the conversion rates of 2-octanol and 2-octanone.
The oxidation of 2-octanol occurs in a two-phase reaction system in which aliquid organic phase, containing 2-octanol, is contacted with an aqueous, nitricacid phase. The main organic components during the reactions can berepresented as follows:
These reactions are further described in more detail in the following paragraphs.Experimental results of nitric acid oxidations from literature will also be used.
Oxidation of 2-octanol
Different reacting species have been proposed like N2O4 by Horvath et al.[1988], NO+ by Strojny et al. [1971] and NO2 by Camera et al. [1983]. Castellanet al. [1991] concluded that at ambient temperatures the oxidation proceedsmainly via an ionic-molecular mechanism. This indicates that the (NO+)nitrosonium ion mechanism is applicable for the conditions used in this work.This ion can be formed from nitrous acid and nitric acid through reaction (1):
HNO HNO NO NO H O2 3 3 2+ ↔ + ++ − (1)
The oxidations with pure nitric acid exhibit in general a long induction period,see e.g. van Asselt and van Krevelen [1963a] and Ogata et al [1966]. Thisinduction time can be shortened or even eliminated by adding an initiator likeNaNO2, which forms nitrous acid:
NaNO H O HNO Na H O2 3 2 2+ → + ++ + (2)
The reaction is completely suppressed by addition of urea, which reacts withnitrous acid, see e.g. Camera et al. [1979], according to:
2 2 32 2 2 2 2 2HNO CO NH N CO H O+ → + +( ) (3)
This is in agreement with the above-mentioned formation of a nitrosonium ionor its equivalent.
2-octanone2-octanol carboxylic acids
The Nitric Acid Oxidation of 2-Octanol and 2-Octanone
21
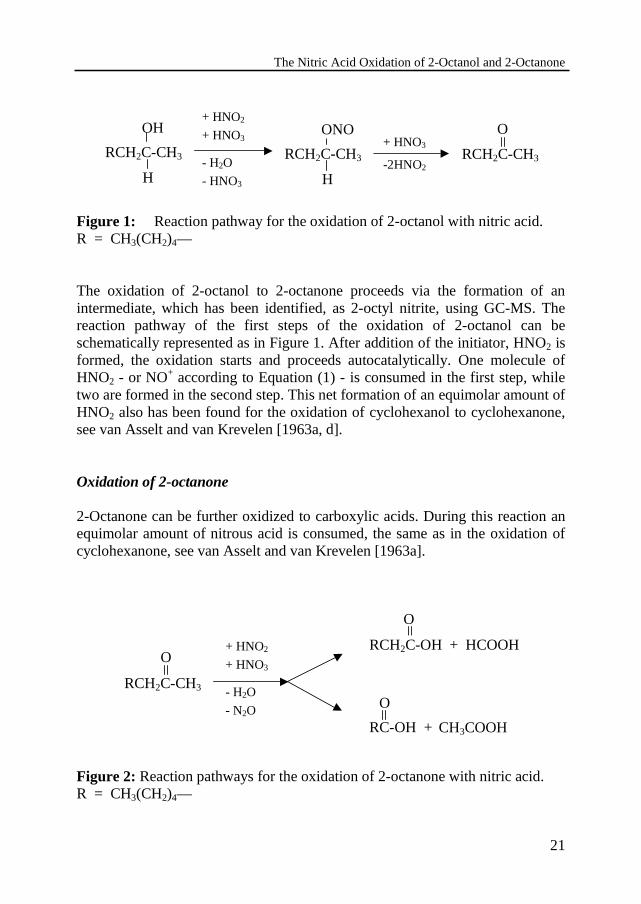
Figure 1: Reaction pathway for the oxidation of 2-octanol with nitric acid.R = CH3(CH2)4—
The oxidation of 2-octanol to 2-octanone proceeds via the formation of anintermediate, which has been identified, as 2-octyl nitrite, using GC-MS. Thereaction pathway of the first steps of the oxidation of 2-octanol can beschematically represented as in Figure 1. After addition of the initiator, HNO2 isformed, the oxidation starts and proceeds autocatalytically. One molecule ofHNO2 - or NO+ according to Equation (1) - is consumed in the first step, whiletwo are formed in the second step. This net formation of an equimolar amount ofHNO2 also has been found for the oxidation of cyclohexanol to cyclohexanone,see van Asselt and van Krevelen [1963a, d].
Oxidation of 2-octanone
2-Octanone can be further oxidized to carboxylic acids. During this reaction anequimolar amount of nitrous acid is consumed, the same as in the oxidation ofcyclohexanone, see van Asselt and van Krevelen [1963a].
Figure 2: Reaction pathways for the oxidation of 2-octanone with nitric acid.R = CH3(CH2)4—
RCH2C-CH3
OH
H
RCH2C-CH3
O+ HNO2
+ HNO3
- H2O
- HNO3
+ HNO3
-2HNO2RCH2C-CH3
ONO
H
RCH2C-CH3
O+ HNO2
+ HNO3
- H2O
- N2ORC-OH +
O
CH3COOH
O
RCH2C-OH + HCOOH

Chapter 2
22
The nitric acid oxidation of 2-octanone is studied simultaneously with theoxidation of 2-octanol. Van Asselt and van Krevelen [1963a] found differentproducts when oxidizing cyclohexanone with nitric acid and nitrite, compared tothe oxidation of cyclohexanol. This probably has been caused by side reactionswith the NO2 formed, when a large amount of nitrite is added. The oxidation of2-octanone is accompanied by the formation of small amounts of unidentifiedand unstable compounds. These compounds were too unstable to be isolated andidentified. The simplified reaction pathways can be represented as in Figure 2.
Depending on the carbon bond broken, hexanoic acid and acetic acid orheptanoic acid and formic acid are formed. The amount of hexanoic acid asfound experimentally is approximately two times the amount of heptanoic acid.The formic acid may further react to CO2, see Longstaff and Singer [1954].During the reaction nitrous acid and nitric acid are consumed.
In the description of the oxidation reactions it is assumed that the reactionproceeds only via the nitrosonium ion NO+. However, at high temperaturesabove 60 ºC, the oxidation is known to proceed via a radical mechanism, seeCastellan et al. [1991]. This is outside the operating conditions that will beapplied.
2.3 Derivation of overall conversion rates
The determination of unambiguous stoichiometry and kinetic parameters foroxidation reactions is impossible due to the lacking knowledge of the exactcomposition of the inorganic compounds in the aqueous reaction phase and theunidentified and unstable intermediates in the organic phase. Hugo and Mauser[1983] confirmed this for the nitric acid oxidation of acetaldehyde. Therefore, ithas been chosen to derive semi-empirical equations for the conversion rates andheat production rates.
The oxidation of 2-octanol (A) to 2-octanone (P) and further oxidation products(X) is simplified to the following two reactions:
A B P B rnol+ → + 2 (4)
P B X rnone+ → (5)
where B represents the nitrosonium ion which accounts for the autocatalyticbehavior. The reactions with the nitrosonium ion take place in the aqueous nitric
The Nitric Acid Oxidation of 2-Octanol and 2-Octanone
23
acid phase, so also the mass transfer rates of the organic compounds have to betaken into account.
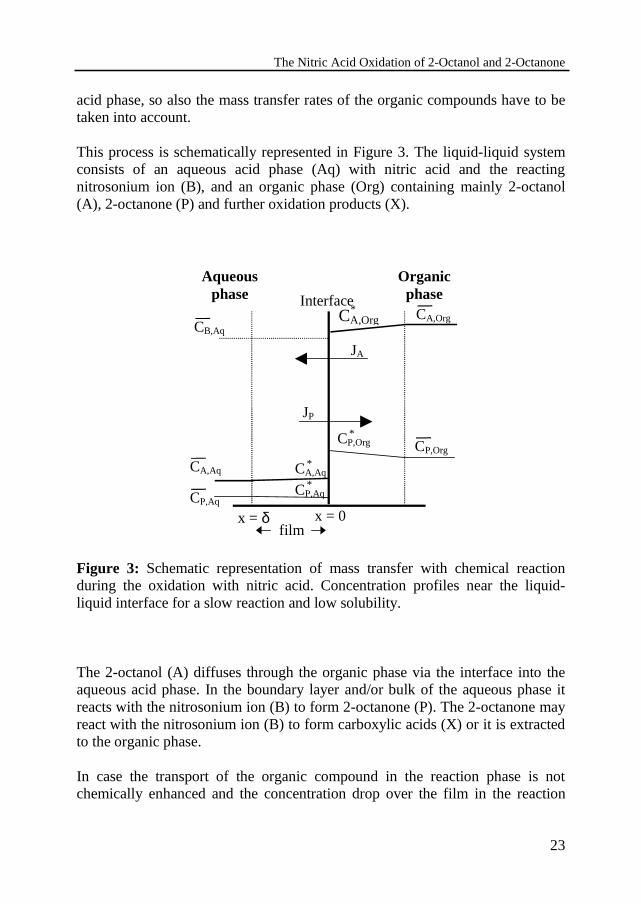
This process is schematically represented in Figure 3. The liquid-liquid systemconsists of an aqueous acid phase (Aq) with nitric acid and the reactingnitrosonium ion (B), and an organic phase (Org) containing mainly 2-octanol(A), 2-octanone (P) and further oxidation products (X).
Figure 3: Schematic representation of mass transfer with chemical reactionduring the oxidation with nitric acid. Concentration profiles near the liquid-liquid interface for a slow reaction and low solubility.
The 2-octanol (A) diffuses through the organic phase via the interface into theaqueous acid phase. In the boundary layer and/or bulk of the aqueous phase itreacts with the nitrosonium ion (B) to form 2-octanone (P). The 2-octanone mayreact with the nitrosonium ion (B) to form carboxylic acids (X) or it is extractedto the organic phase.
In case the transport of the organic compound in the reaction phase is notchemically enhanced and the concentration drop over the film in the reaction
CB,AqCA,Org
*
JP
CA,Org
OrganicphaseInterface
film
Aqueousphase
x = δ x = 0
JA
CP,Org*
CP,Org
CA,Aq*CA,Aq
CP,Aq*
CP,Aq
Chapter 2
24
phase being relatively small, it is possible to derive an overall reaction rateexpression, see Steensma and Westerterp [1990]:
r k C Ci eff i Aq B Aq= −( )1 ε , , (6)
where ( )1− ε refers to the volume fraction of the aqueous reaction phase; keff isthe effective reaction rate constant. Equation (6) can be used under the followingconditions:
• The rate of chemical reaction is slow with respect to the rate of mass transfer,the rate of mass transfer is not enhanced by reaction, and the reaction mainlyproceeds in the bulk of the reaction phase. One must check that the consumptionby reaction in the thin boundary layer is negligible, which is justified if Ha < 0 3.holds, see Westerterp et al. [1987]. The Hatta number Ha is defined as:
Hak C D
keff B Aq i
L Aq
= ,
,
(7)
and Di is the diffusivity of the organic compound A and kL Aq, the mass transfercoefficient for A, both in the aqueous phase.
• The solubility of the organic compound in the aqueous phase is so low, thatmass transfer limitations in the organic phase can be neglected. At the interfaceholds C mCi Aq i Org.
*.*= .
• The concentration drop over the film of the organic component transferred isless than 5%, see Steensma and Westerterp [1990], so C Ci Aq i Aq,
*,≈ can be
assumed.
If these conditions are fulfilled the conversion rate is independent of thehydrodynamic conditions and interfacial area, hence independent of the stirringrate. The conversion rates are determined by the kinetics of the homogeneouschemical reactions, which can be described by the effective reaction rateconstants keff,nol and keff,none for the oxidations of 2-octanol and 2-octanone,respectively.
The Nitric Acid Oxidation of 2-Octanol and 2-Octanone
25
Kinetic expressions
The effective reaction rate expressions should also account for the effect oftemperature and the acid concentration. Oxidation reactions with nitric acidsolutions are usually very sensitive towards the acid strength, see Ogata [1978].The influence of the acid strength can be accounted for with the Hammett’sacidity function, H0, see e.g. Rochester [1970]. So the kinetic constant becomes:
k T H kE
RTm Heff eff
effHo eff( , ) exp, ,0 0= − −%
&'
()*
∞ 2 7 (8)
For this expression the preexponential factor, k eff∞, , the energy of activation,
E Reff / , and Hammett’s coefficient, mHo eff, , have to be determinedexperimentally.
Conversion rates in a semi-batch reactor
In a semi-batch operation, where 2-octanol is fed to a reactor initially loadedwith nitric acid, the overall balances list:
- for the 2-octanol, A:dn
dtC r VA
dos A dos nol r= −ϕ , (9)
where ϕ dos is the volumetric flow rate of the feed dosed into the reactor.
- for the 2-octanone, P:dn
dtr V r VPnol r none r= − (10)
- for the carboxylic acids, X:dn
dtr VXnone r= (11)
- for the nitrosonium ion, B:dn
dtr V r VBnol r none r= − (12)
- for the nitric acid, N: dn
dtr V r VNnol r none r= − − (13)
Chapter 2
26
The yields are defined, on the basis of the total amount of 2-octanol fed, nA1:
ζ PP
A
n
n=
1
ζ XX
A
n
n=
1
ζ BB
A
n
n=
1
The mass balances above can be made dimensionless, see Chapter 3 for thederivation, as follows:
d
dm k t C
d
dP
A eff nol dos A dos P XP B Xζ
θθ ζ ζ ζ ζ
θζθ
= − − + −, , 1 6 0 (14)
d
dm k t CX
P eff none dos A dos PP Bζ
θζ ζ ζ
θ= +
, , 1 6 0 (15)
in which θ is the dimensionless dosing time t/tdos. After the end of the dosingθ =1 in Equations (14) and (15) and the reaction proceeds as in a batch reactor.ζ B0 is the initial concentration of nitrosonium ion which will be formed afteraddition of the initiator. The boundary conditions for these differential equationsand the corresponding heat balance will be discussed later.
It is assumed the volumes of the aqueous phase and the organic phase are notaffected by reaction. During the oxidation of 2-octanol and 2-octanone theaverage molecular weight of the organic compounds does not change much, sothis assumption is justified. The assumption of low solubility of reactants andproducts in the aqueous phase, which also may result in a change in volume, hasto be validated.
In the simplified representation of the oxidation reactions, Equations (4) and (5),the reactions can be described with only two dimensionless partial massbalances. The model of Equations (9)-(15) will be used to obtain the relevantkinetic parameters and to simulate the experimental conversion rates.

The Nitric Acid Oxidation of 2-Octanol and 2-Octanone
27
2.4 Experimental set-up
Reaction calorimeter
The oxidation reactions have been studied in a reaction calorimeter RC1 ofMettler Toledo, which contains a jacketed reactor vessel. Using the reactioncalorimeter the flow of the heat Qcool is determined, which is transferred throughthe wall of the vessel and which is proportional to the temperature differencebetween the reactor contents Tr and the coolant temperature Tcool:
Q UA T Tcool cool r= ⋅ −1 6 (16)
The proportionality factor UA has to be determined by calibration, which is doneby introducing via an electrical heating element a known amount of energy QC:
UAQ
T TC
r cool
=−1 6
(17)
The reaction calorimeter enables an accurate measurement of the temperaturesof the reactor contents and of the coolant. The heat balance for the reactoroperating in the semi-batch mode can be written as:
dT
dt
dT
dtQ Q Q Q Qr
rw
w R dos cool stirΓ Γ+ = + + + + ∞ (18)
where Γr is the thermal capacity of the reaction mixture and internal devices inthe reactor, and Γw is the thermal capacity of the reactor wall. The walltemperature is estimated by: T T Tw r cool= +1
21 6. The different heat flows takeninto account are QR by the chemical reaction, Qdos by mass addition, Qcool to thecoolant, Qstir by the agitation and Q∞ to the surroundings.
Chapter 2
28
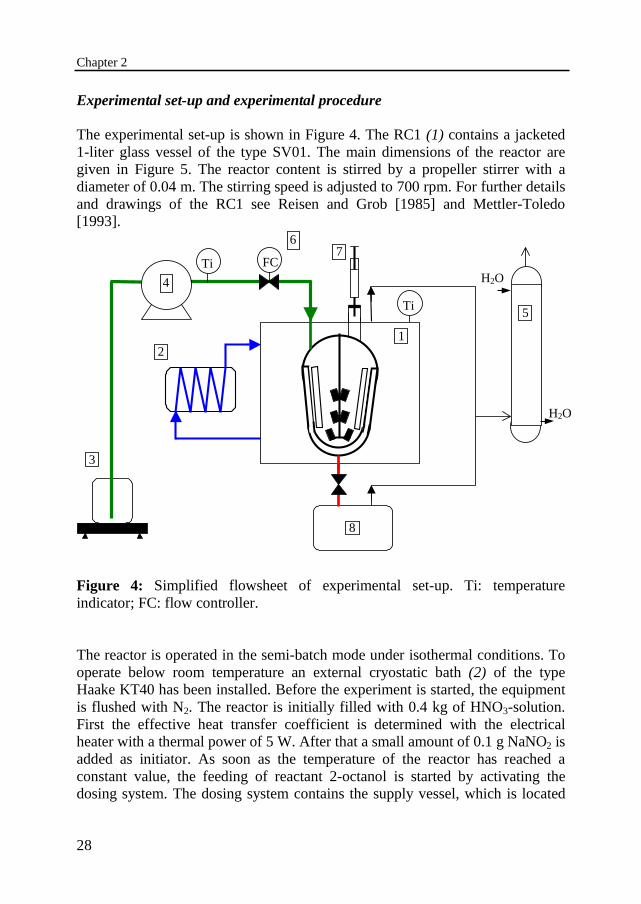
Experimental set-up and experimental procedure
The experimental set-up is shown in Figure 4. The RC1 (1) contains a jacketed1-liter glass vessel of the type SV01. The main dimensions of the reactor aregiven in Figure 5. The reactor content is stirred by a propeller stirrer with adiameter of 0.04 m. The stirring speed is adjusted to 700 rpm. For further detailsand drawings of the RC1 see Reisen and Grob [1985] and Mettler-Toledo[1993].
Figure 4: Simplified flowsheet of experimental set-up. Ti: temperatureindicator; FC: flow controller.
The reactor is operated in the semi-batch mode under isothermal conditions. Tooperate below room temperature an external cryostatic bath (2) of the typeHaake KT40 has been installed. Before the experiment is started, the equipmentis flushed with N2. The reactor is initially filled with 0.4 kg of HNO3-solution.First the effective heat transfer coefficient is determined with the electricalheater with a thermal power of 5 W. After that a small amount of 0.1 g NaNO2 isadded as initiator. As soon as the temperature of the reactor has reached aconstant value, the feeding of reactant 2-octanol is started by activating thedosing system. The dosing system contains the supply vessel, which is located
H2O
H2O
5
8
Ti
12
6
3
4
FCTi7

The Nitric Acid Oxidation of 2-Octanol and 2-Octanone
29
Dbaffles = 0.1Dvessel
Dstirrer = 0.04 m
Dvessel, min = 0.06 m
hcone = 0.16 mαcone = 18º
Dbaffles
Dstirrer
Dvessel, min
hcone
αcone
on a balance of the type Mettler pm3000 (3), a Verder gear pump (4) and aMettler dosing controller RD10 (6). The feed rate is kept constant in the range of0.05 to 0.4 kg/h. The nitric acid and organic solutions are immiscible and form adispersion. The nitric acid remains the continuous phase during the wholeexperiment. During the oxidation of 2-octanol NOX-gases are formed, whichaccumulate above the reaction mixture and are let off through an opening in thereactor lid to the scrubber (5) to be washed with water. After addition of 0.1 kg2-octanol the dosing is automatically stopped and the experiment is continuedfor at least two times the total dosing time. The experiment is then brought to anend by heating up the reactor contents to complete the conversion and after thatagain a determination of the effective heat transfer coefficient.
Also the temperatures of the feed and of the surroundings are measured andtogether with the feed flow rate monitored and stored by a computer. When thereactor temperature exceeds a certain value the computer automatically triggersan emergency cooling program and opens the electric valve in the reactorbottom to dump the reactor content and quench it in ice (8). During anexperiment 4 to 10 samples of the dispersion are taken via a syringe, asindicated by (7) in Figure 4.
Figure 5: Dimensions of the SV01 glass reactor.
Chapter 2
30
Chemical treatment and chemical analysis
During an experiment samples of the dispersion are taken of approximately 1ml, using a syringe. The dispersion, once in the syringe, separates directly in twophases. The total amount of strong and weak acids in the aqueous phase isdetermined by titration with a 0.1 M NaOH-solution in an automatic titrationapparatus of the type Titrino 702 SM of Metrohm. During the reaction someunstable and unidentified compounds are formed and the composition of anuntreated sample changes with time. Therefore, the samples of the organic phaseare contacted with demineralized water to stabilize the sample and remove thenitric acid from the organic phase. The organic phase is then analyzed by gaschromatography using a Varian 3400 with a FID detector. The injector anddetector temperatures are set at 240 ºC. The column is packed with Carbopack Cand is operated at 190 ºC with N2 as carrier gas. The concentrations of 2-octanol,2-octanone, hexanoic acid and heptanoic acid are determined using referencesamples and an integrator of type HP3392A.
To study the influence of temperature the oxidation reaction has beeninvestigated in the temperature range of 0 ºC to 40 ºC, for dosing times of 900 to7200 s, for 100 g of 2-octanol and an initial nitric acid concentration of 60 wt%.Furthermore a series of experiments has been carried out in the range of 50 to 65wt% with a dosing time of 1800 s to study the influence of the initial nitric acidconcentration. A total of 33 runs were carried out to obtain kinetic data.
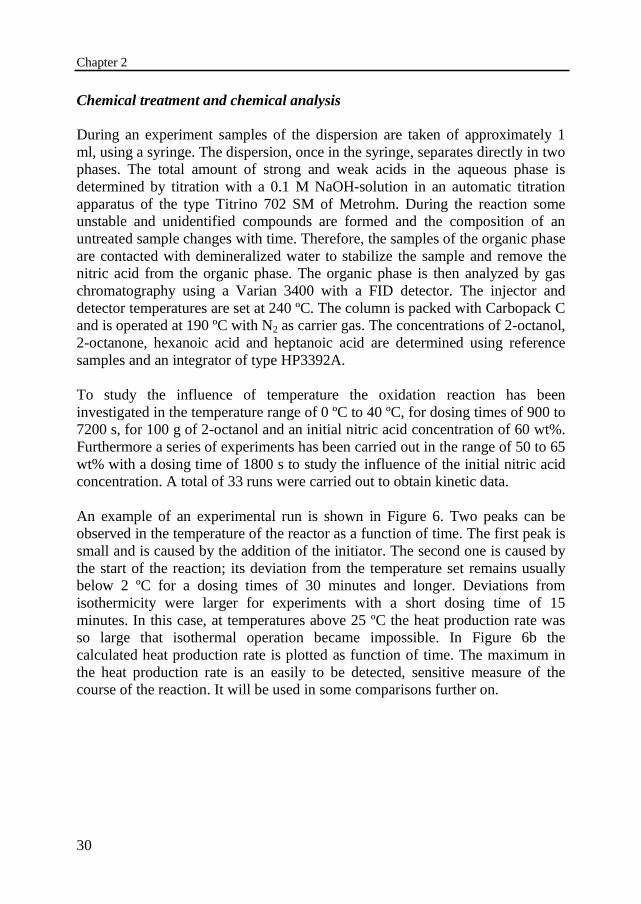
An example of an experimental run is shown in Figure 6. Two peaks can beobserved in the temperature of the reactor as a function of time. The first peak issmall and is caused by the addition of the initiator. The second one is caused bythe start of the reaction; its deviation from the temperature set remains usuallybelow 2 ºC for a dosing times of 30 minutes and longer. Deviations fromisothermicity were larger for experiments with a short dosing time of 15minutes. In this case, at temperatures above 25 ºC the heat production rate wasso large that isothermal operation became impossible. In Figure 6b thecalculated heat production rate is plotted as function of time. The maximum inthe heat production rate is an easily to be detected, sensitive measure of thecourse of the reaction. It will be used in some comparisons further on.
The Nitric Acid Oxidation of 2-Octanol and 2-Octanone
31
0
5
10
15
20
25
-2000 0 2000 4000 6000 8000
time [s]
Tem
per
atur
e [º
C]
addition initiator
start dosing Treactor
Tcooling
stop dosing
Treactor setpoint
-25
0
25
50
75
100
-2000 0 2000 4000 6000 8000
time [s]
Hea
t flo
w Q
R [W
]
start dosing
stop dosing
Qmax
a.
b.
Figure 6: Example of an isothermal semi-batch experiment at 20 ºC with aninitial load of 0.4 kg 60 wt% HNO3 and 0.1 g NaNO2. Addition of 0.1 kg 2-octanol in a dosing time of 30 min.a. Measured temperature of reactor contents and cooling jacketb. Measured heat flow

Chapter 2
32
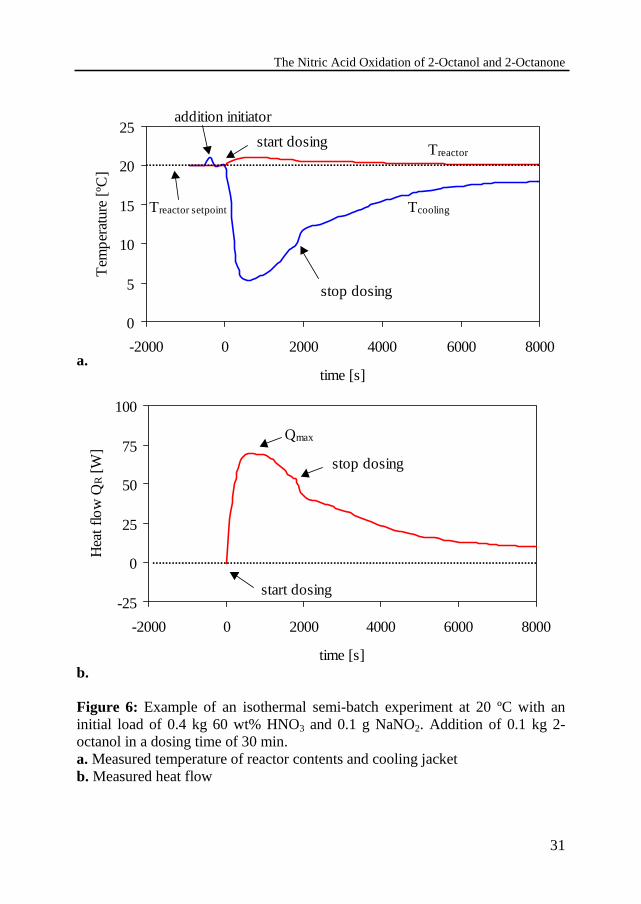
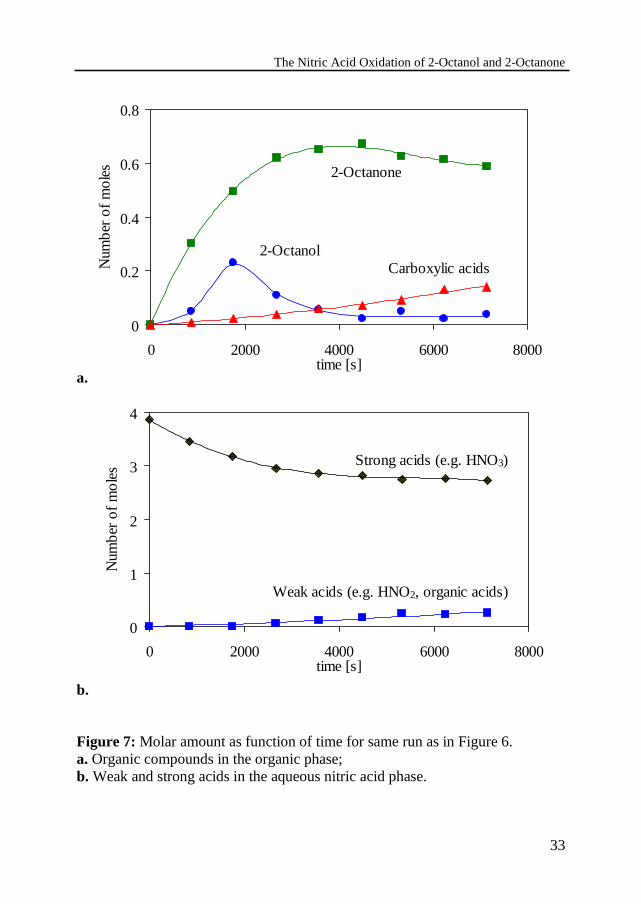
For the same experiment the molar amounts of the organic compounds in theorganic phase and the total molar amounts of weak and strong acids in theaqueous nitric acid solution are given as a function of time in Figure 7. 2-Octanol accumulates in the reactor and a part of the dosed 2-octanol reacts to 2-octanone, which is partly converted into carboxylic acids. As a result, the yieldof 2-octanone exhibits a maximum.
The distribution of 2-octanol and 2-octanone has been estimated on the basis ofTOC analysis of a saturated 60 wt% nitric acid solution and mA = 0.005 and mP= 0.006 for 2-octanol and 2-octanone, respectively. The distribution coefficientsof the carboxylic acids are estimated on the basis of gas chromatographyanalysis and m ≈ 0.01 for both heptanoic acid and hexanoic acid and m ≈ 1.5 foracetic acid. Thus, in view of the low solubilities for 2-octanol, 2-octanone,heptanoic acid and hexanoic acid, the amounts of organic compounds in theaqueous phase can be neglected. The simultaneously formed acetic and formicacids will be distributed over both the organic phase and aqueous phase and, as aresult, the volume of aqueous phase will increase as the reaction proceeds. Atthe same time a considerable quantity of nitric acid will dissolve into the organicphase. The overall effect on the volume ratio is small, since hardly any changein volume is observed during the experiments.
The aqueous phase contains strong and weak acids. The strong acid is nitricacid, the different weak acids could not be distinguished in the titration methodused. The weak acids probably consist of acetic and formic acids as well as anamount of inorganic acids like HNO2.
Due to the extraction of nitric acid a part is not available for reaction. Theamount of nitric acid in the organic phase is determined by titration with a 0.1 MNaOH solution and is approximately 2.5 mol/kg organic phase for 50 to 60 wt%HNO3. Therefore the amount of strong acid in the aqueous phase, determined bytitration as shown in Figure 7b, appears to decrease faster then one may expectbased on the stoichiometry of the reactions.
The Nitric Acid Oxidation of 2-Octanol and 2-Octanone
33
0
0.2
0.4
0.6
0.8
0 2000 4000 6000 8000time [s]
Num
ber
of m
ole
s
2-OctanolCarboxylic acids
2-Octanone
0
1
2
3
4
0 2000 4000 6000 8000time [s]
Num
ber
of m
ole
s Strong acids (e.g. HNO3)
Weak acids (e.g. HNO2, organic acids)
a.
b.
Figure 7: Molar amount as function of time for same run as in Figure 6.a. Organic compounds in the organic phase;b. Weak and strong acids in the aqueous nitric acid phase.
Chapter 2
34
2.5 Experimental results
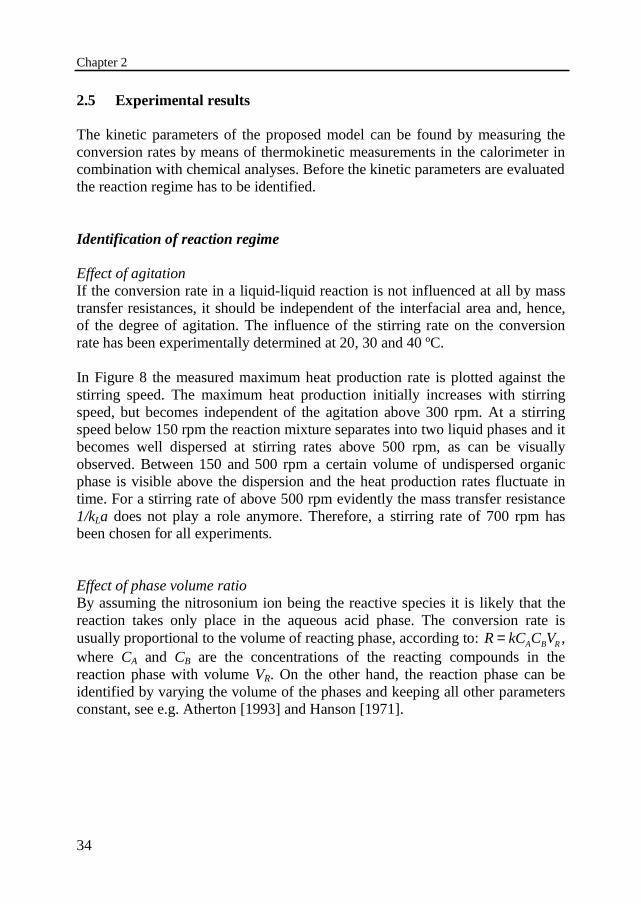
The kinetic parameters of the proposed model can be found by measuring theconversion rates by means of thermokinetic measurements in the calorimeter incombination with chemical analyses. Before the kinetic parameters are evaluatedthe reaction regime has to be identified.
Identification of reaction regime
Effect of agitationIf the conversion rate in a liquid-liquid reaction is not influenced at all by masstransfer resistances, it should be independent of the interfacial area and, hence,of the degree of agitation. The influence of the stirring rate on the conversionrate has been experimentally determined at 20, 30 and 40 ºC.
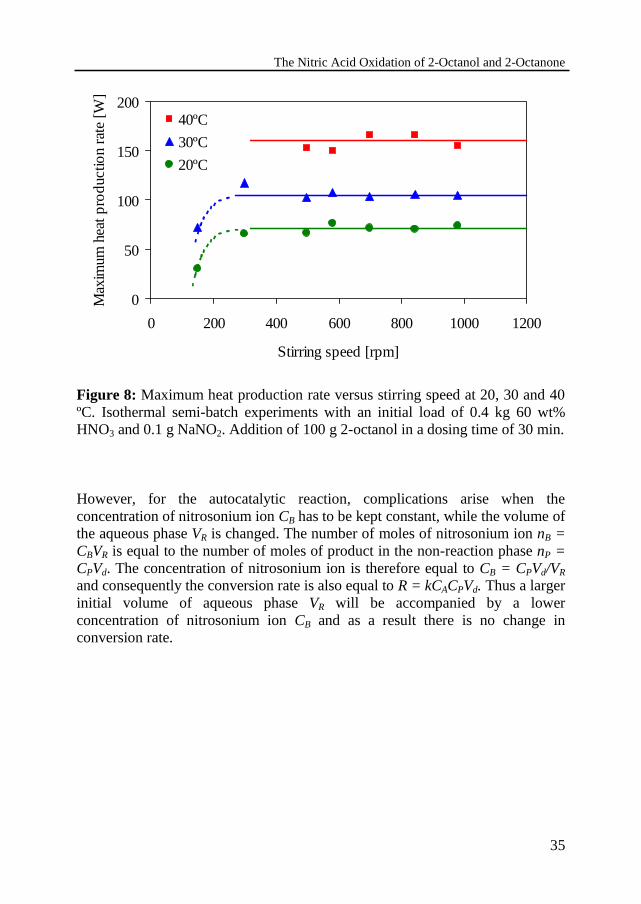
In Figure 8 the measured maximum heat production rate is plotted against thestirring speed. The maximum heat production initially increases with stirringspeed, but becomes independent of the agitation above 300 rpm. At a stirringspeed below 150 rpm the reaction mixture separates into two liquid phases and itbecomes well dispersed at stirring rates above 500 rpm, as can be visuallyobserved. Between 150 and 500 rpm a certain volume of undispersed organicphase is visible above the dispersion and the heat production rates fluctuate intime. For a stirring rate of above 500 rpm evidently the mass transfer resistance1/kLa does not play a role anymore. Therefore, a stirring rate of 700 rpm hasbeen chosen for all experiments.
Effect of phase volume ratioBy assuming the nitrosonium ion being the reactive species it is likely that thereaction takes only place in the aqueous acid phase. The conversion rate isusually proportional to the volume of reacting phase, according to: R kC C VA B R= ,where CA and CB are the concentrations of the reacting compounds in thereaction phase with volume VR. On the other hand, the reaction phase can beidentified by varying the volume of the phases and keeping all other parametersconstant, see e.g. Atherton [1993] and Hanson [1971].
The Nitric Acid Oxidation of 2-Octanol and 2-Octanone
35
0
50
100
150
200
0 200 400 600 800 1000 1200
Stirring speed [rpm]
Max
imum
hea
t p
rod
uctio
n ra
te [W
]40ºC
30ºC
20ºC
Figure 8: Maximum heat production rate versus stirring speed at 20, 30 and 40ºC. Isothermal semi-batch experiments with an initial load of 0.4 kg 60 wt%HNO3 and 0.1 g NaNO2. Addition of 100 g 2-octanol in a dosing time of 30 min.
However, for the autocatalytic reaction, complications arise when theconcentration of nitrosonium ion CB has to be kept constant, while the volume ofthe aqueous phase VR is changed. The number of moles of nitrosonium ion nB =CBVR is equal to the number of moles of product in the non-reaction phase nP =CPVd. The concentration of nitrosonium ion is therefore equal to CB = CPVd/VR
and consequently the conversion rate is also equal to R = kCACPVd. Thus a largerinitial volume of aqueous phase VR will be accompanied by a lowerconcentration of nitrosonium ion CB and as a result there is no change inconversion rate.
Chapter 2
36
Run Volume of acidphase[ml]
Volume oforganic phase
[ml]
Feed concentration2-octanol[mol/l]
1 293 120 6.402 450 120 6.403 525 120 6.404 295 150 4.985 295 173 4.336 295 225 3.647 295 278 2.77
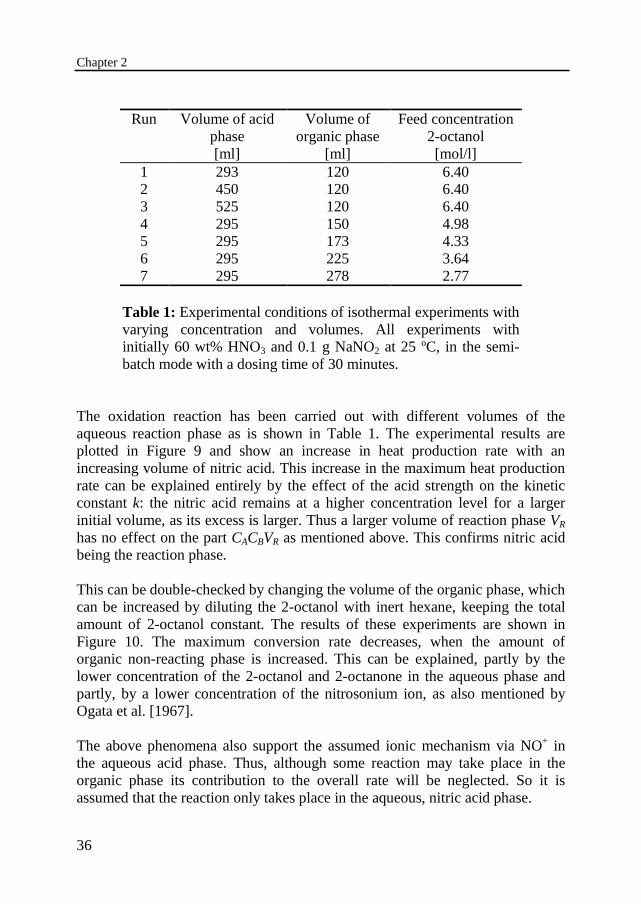
Table 1: Experimental conditions of isothermal experiments withvarying concentration and volumes. All experiments withinitially 60 wt% HNO3 and 0.1 g NaNO2 at 25 ºC, in the semi-batch mode with a dosing time of 30 minutes.
The oxidation reaction has been carried out with different volumes of theaqueous reaction phase as is shown in Table 1. The experimental results areplotted in Figure 9 and show an increase in heat production rate with anincreasing volume of nitric acid. This increase in the maximum heat productionrate can be explained entirely by the effect of the acid strength on the kineticconstant k: the nitric acid remains at a higher concentration level for a largerinitial volume, as its excess is larger. Thus a larger volume of reaction phase VR
has no effect on the part CACBVR as mentioned above. This confirms nitric acidbeing the reaction phase.
This can be double-checked by changing the volume of the organic phase, whichcan be increased by diluting the 2-octanol with inert hexane, keeping the totalamount of 2-octanol constant. The results of these experiments are shown inFigure 10. The maximum conversion rate decreases, when the amount oforganic non-reacting phase is increased. This can be explained, partly by thelower concentration of the 2-octanol and 2-octanone in the aqueous phase andpartly, by a lower concentration of the nitrosonium ion, as also mentioned byOgata et al. [1967].
The above phenomena also support the assumed ionic mechanism via NO+ inthe aqueous acid phase. Thus, although some reaction may take place in theorganic phase its contribution to the overall rate will be neglected. So it isassumed that the reaction only takes place in the aqueous, nitric acid phase.

The Nitric Acid Oxidation of 2-Octanol and 2-Octanone
37
60
80
100
120
0.1 0.3 0.5 0.7
Volume of aqueous phase [l]
Qm
ax.
[W]
20
40
60
80
100
0.1 0.15 0.2 0.25 0.3
Volume organic phase [l]
Qm
ax.
[W]
Figure 9: Maximum heat production rate versus volume aqueous nitric acidphase. Isothermal semi-batch experiments with an initial load of 60 wt% HNO3
and 0.1 g NaNO2. Addition of 0.1 kg 2-octanol in a dosing time of 30 min.
Figure 10: Maximum heat production rate versus volume organic phase.Isothermal semi-batch experiments with an initial load of 0.4 kg 60 wt% HNO3
and 0.1 g NaNO2. Addition of 2-octanol in hexane as indicated in Table 1.
Chapter 2
38
Determination of kinetic parameters
Now the kinetic parameters can be determined using the conversion rateexpressions for slow liquid-liquid reactions, provided the heats of reaction areknown.
Determination of effective heats of reactionThe heat production is determined by the chemical reactions and physicalphenomena like dilution, etc. The heat production rate by n chemical reactionscan be written as:
Q r H VR i ii
n
r= ∑ ∆ (19)
The amount of heat released by the reaction ∆Ε is determined by integrating theexperimentally measured heat generation rate QR over the reaction time:
∆E Q dt Q Q dtcalorimeter R
t
nol none
t
= = +I I0 0
1 6 (20)
where Qnol and Qnone are the heat generated by the oxidation of 2-octanol and 2-octanone, respectively. The results of the chemical analyses are used to calculatethe amounts of heat generated by both reactions separately:
∆ ∆ ∆E H n H nanalyses eff nol P X A eff none X A= ⋅ + ⋅ + ⋅ ⋅, ,ζ ζ ζ1 6 1 1 (21)
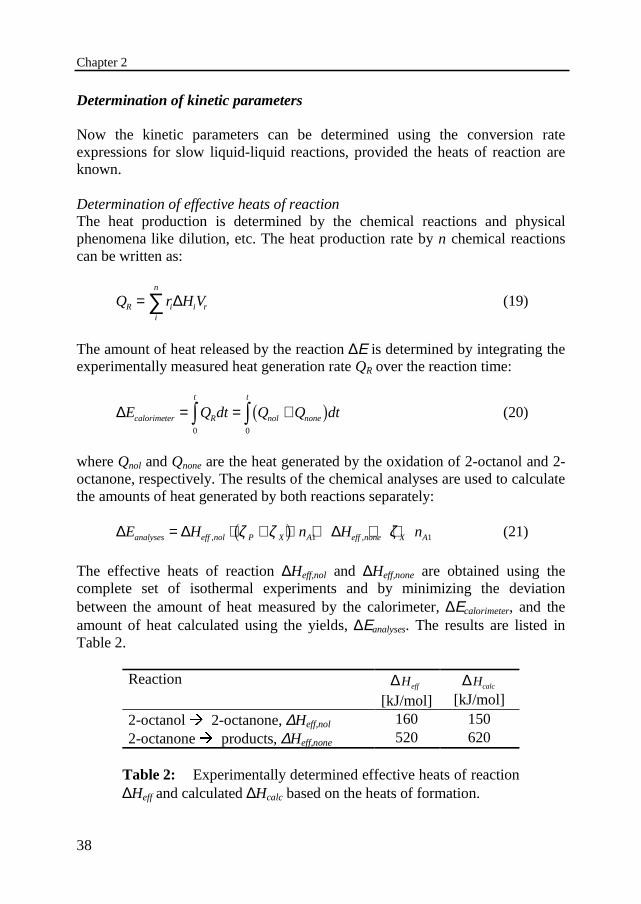
The effective heats of reaction ∆Heff,nol and ∆Heff,none are obtained using thecomplete set of isothermal experiments and by minimizing the deviationbetween the amount of heat measured by the calorimeter, ∆Εcalorimeter, and theamount of heat calculated using the yields, ∆Εanalyses. The results are listed inTable 2.
Reaction ∆Heff
[kJ/mol]∆Hcalc
[kJ/mol]2-octanol Æ 2-octanone, ∆Heff,nol 160 1502-octanone Æ products, ∆Heff,none 520 620
Table 2: Experimentally determined effective heats of reaction∆Heff and calculated ∆Hcalc based on the heats of formation.

The Nitric Acid Oxidation of 2-Octanol and 2-Octanone
39
0
100
200
300
400
500
0 1800 3600 5400 7200
Time [s]
∆Ε [k
J]
∆Ηeff, none/∆Ηeff, nol = H = 3.25
∆Εnone
∆Εnol
1.1•H
0.9•H
∆Εnol+∆Enone
∆Εcalorimeter
Figure 11: Amount of heat generated as a function of time by the oxidation of2-octanol ∆Enol and 2-octanone ∆Enone as measured in the calorimeter, and ascalculated on the basis of the concentration time profiles.
The heat generated as a function of time is shown for a single run in Figure 11,where the heat generated by the separate reactions ∆Enol and ∆Enone and the totalamount of heat generated ∆Eanalyses = ∆Enol + ∆Enone using Eq.(21) or ∆Ecalorimeter
using Eq.(20), respectively, are displayed. The ratio of the effective heats ofreaction, H H Heff none eff nol= ∆ ∆, ,/ , is equal to H = 3.25. In the same figure are
shown the calculated amount of heat ∆Ε with 0.9H and 1.1H respectively. Forthis single run the amount of heat ∆Eanalyses calculated with the conversions is inagreement with ∆Ecalorimeter measured by the calorimeter, during the time of theexperimental run.
A comparison between the calculated heat production and the experimentaldetermined heat production for all runs is given in Figure 12. Although thepoints do not seem completely random by distribution, the deviations are smalland the values of ∆Heff,nol and ∆Heff,none are acceptable.

Chapter 2
40
10
100
1000
10 100 1000
Amount of heat ∆Qanalyses [kJ]
Am
ount
of
hea
t ∆Q
calo
rimet
er [k
J]
Figure 12: Parity plot of calculated amount of heat generated according toEq.(21) and in the calorimeter experimentally determined amount of heatproduced, Eq.(20), for all runs.
An approximate estimate of the heats of reaction can be made using the heats offormation of the reacting species as depicted in Figure 1 and Figure 2. For theoxidation of 2-octanol to 2-octanone the calculated heat of formation is in goodagreement with the experimentally determined reaction heat. For the oxidationof 2-octanone to carboxylic acids a 16% difference was found; this is probablythe result of endothermic decomposition reactions, which produce NOX-gases,and which have not been taken into account.
Determination of the model parametersThe kinetic constants for the proposed model can now be found by comparingthe experimental conversion rates of 2-octanol and 2-octanone and the proposedmodel equations. During an experiment the conversion rates can be determinedby evaluating the heat flow measurements or the results of the chemical
The Nitric Acid Oxidation of 2-Octanol and 2-Octanone
41
0
0.2
0.4
0.6
0.8
1
0 0.5 1 1.5 2
θ = t/tdos [-]
Co
ncen
trat
ion
[-]
nX
nA1
nP
nA1
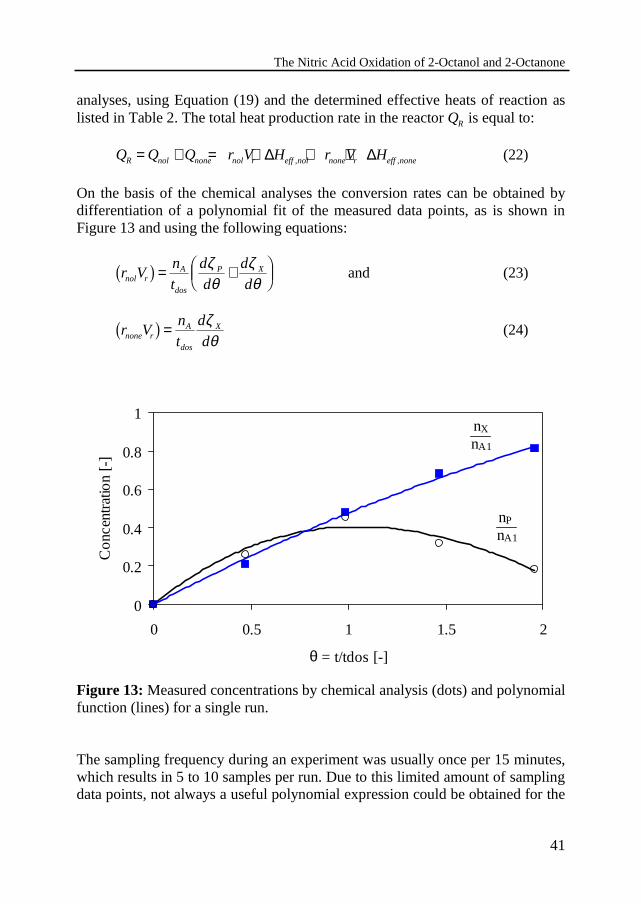
analyses, using Equation (19) and the determined effective heats of reaction aslisted in Table 2. The total heat production rate in the reactor QR is equal to:
Q Q Q r V H r V HR nol none nol r eff nol none r eff none= + = ⋅ + ⋅∆ ∆, , (22)
On the basis of the chemical analyses the conversion rates can be obtained bydifferentiation of a polynomial fit of the measured data points, as is shown inFigure 13 and using the following equations:
r Vn
t
d
d
d
dnol rA
dos
P X1 6 = +���
���
ζθ
ζθ
and (23)
r Vn
t
d
dnone rA
dos
X1 6 =ζθ
(24)
Figure 13: Measured concentrations by chemical analysis (dots) and polynomialfunction (lines) for a single run.
The sampling frequency during an experiment was usually once per 15 minutes,which results in 5 to 10 samples per run. Due to this limited amount of samplingdata points, not always a useful polynomial expression could be obtained for the

Chapter 2
42
2-octanone (P) concentration. The concentration of the further oxidationproducts (X) increases approximately linearly with time under the experimentalconditions applied and good polynomial functions could be found, as shown inFigure 13. To improve upon the accuracy of the conversion rate of 2-octanolrnolVr the total conversion rate from the heat flow measurements QR is combinedwith the information of chemical composition of the further oxidation products(X) as function of time. The conversion rate of 2-octanol rnolVr can also beexpressed as:
r VQ r V H
Hnol rR none r eff none
eff nol1 6
2 7=− ⋅ ∆
∆,
,(25)
For every run in the reaction calorimeter first the conversion rate of 2-octanoner Vnone r is evaluated using Equation (24) and the polynomial expression. Then theconversion rate of 2-octanol r Vnol r is evaluated by Equation (25).The conversion rates can also be found after combining the conversion ratesfrom Equation (23) and (24) with the mass balances Equation (14) and (15):
r Vn
tm k t Cnol r
A
dosA eff nol dos A dos P X
P B1 6 1 6= − − +���
���, , θ ζ ζ ζ ζ
θ0 (26)
r Vn
tm k t Cnone r
A
dosP eff none dos A dos P
P B1 6 1 6= +, , ζ ζ ζ
θ0 (27)
All parameters in the Equations (26) and (27) are known, except mAkeff,nol andmPkeff,none. The kinetic constants of the proposed expression of Equation (8) areobtained by non-linear regression using the complete set of isothermalexperiments and fitting the Equations (26) and (27) to the results of Equations(24) and (25). The results determined in the range of 0 to 60 ºC and acid strengthof H0 = 2.4 to 3.5 are listed in Table 3. The standard deviation of theexperimentally determined reaction rate constants compared to the calculatedones is 60%. The accuracy will be visualized in the following.
Reaction mk�,eff
[l/mol s]Eeff/R[K]
mHo,eff
[-]2-octanol Æ 2-octanone 1 · 105 11300 6.62-octanone Æ products 1 · 1010 12000 2.2
Table 3: The effective reaction rate constants for theoxidation reactions.

The Nitric Acid Oxidation of 2-Octanol and 2-Octanone
43
1.E-07
1.E-06
1.E-05
1.E-04
1.E-03
1.E-02
1.E-01
1.E+00
2.1 2.6 3.1 3.6
-H0 [-]
mk e
ff [m
3 /km
ol s
] 2-octanol 2-octanone
2-octanone carboxylic acids
100
10-1
10-2
10-3
10-4
10-5
10-6
10-7
The effective kinetic constant depends on temperature and acid strength. Todiscuss the influence of these parameters on the kinetic constants the value ofmkeff is measured for both reactions. The kinetic constant is very sensitive to thenitric acid concentration: below 40 wt% the reaction is so slow that hardly anyheat production is measurable, while above 65 wt% the reaction becomes toofast. Expressed as an exponential order in the concentration of HNO3, theexponent would be as high as 12 for the oxidation of 2-octanol. This has nophysical or chemical meaning, so Hammett’s acidity function is used, seeRochester [1970]. Figure 14 shows a plot of mkeff at 20 ºC as a function ofHammett’s acidity function H0. The slope of ln(mkeff) versus -H0 is 1.25 and 0.41for the oxidations of 2-octanol and 2-octanone, respectively. These values canbe compared to those reported in literature. Ogata et al. [1966] found a slope of0.95 for the nitric acid oxidation of benzyl alcohol, while for the oxidation ofbenzaldehyde a value of 0.43 has been reported, see Ogata et al. [1967]. Theoxidation of 2-octanol depends more strongly on the nitric acid concentrationthen the oxidation of 2-octanone. This has also been found for the oxidation ofbenzyl alcohol and benzaldehyde respectively as described above. Therefore, toincrease the yield of 2-octanone the concentration of nitric acid should be high.The term mHo,eff accounts for the acidity effect on the conversion rate includingthe acidity influence on the solubility, which is known to increase withincreasing HNO3 concentration, see Rudakov et al. [1994].
Figure 14: Effect of acid strength on the reaction rate constants for theoxidation of 2-octanol and 2-octanone, respectively. Lines calculated accordingto Eq.(8) and parameters from Table 3 for T = 20 ºC.

Chapter 2
44
1.E-07
1.E-06
1.E-05
1.E-04
1.E-03
1.E-02
1.E-01
1.E+00
1.E+01
2.8 3.0 3.2 3.4 3.6 3.8
1000/T [1/K]
mk e
ff [m
3 /km
ol s
]
2-octanol 2-octanone
2-octanone carboxylic acids
100
10-1
10-2
10-3
10-4
10-5
10-6
10-7
101
In Figure 15 the value of mkeff is plotted at 60 wt% HNO3 as a function oftemperature. The term Eeff/R accounts for the temperature influence on theconversion rate, including the temperature influence on the solubility and, moreimportant, the Hammett acidity. The latter is only well tabulated for HNO3-solutions at 25 ºC, see Rochester [1970], but some data points at 20 ºC indicatean increasing acidity with increasing temperature, hence the value of Eeff/R isoverestimated.
Although no experimental data on the oxidation of 2-octanol or 2-octanone havebeen published, comparable data can be found in literature for other nitric acidoxidations. The reported data on energy of activation vary from 9000 K for theoxidation of methoxyethanol, see Strojny [1971], to 14230 K for benzyl alcohol,see Ogata et al. [1966]. The same range is found for aldehydes or ketones: from8000 K for cyclohexanone, see van Asselt and van Krevelen [1963c] to 14400 Kfor benzaldehyde, see Ogata et al [1967]. When the determined values of mkeff
for both reactions are compared, an equal trend is observed with respect totemperature. As the energy of activation has comparable values for the oxidationof alcohols, aldehydes or ketones, selectivity can not be influenced bytemperature.
Figure 15: Effect of temperature on the reaction rate constants for theoxidation of 2-octanol and 2-octanone, respectively. Lines calculated accordingto Eq.(8) and parameters from Table 3 for 60 wt% HNO3.
The Nitric Acid Oxidation of 2-Octanol and 2-Octanone
45
2.6 Simulation of isothermal runs
The mathematical model for the oxidation rates has been tested using the kineticparameters as described above. The mass balances Equation (14) and (15) areexpressed as two differential equations and can be solved simultaneously using afifth order Runge-Kutta method with an adaptive step size control, see Press etal. [1986]. In view of the autocatalytic behavior, whereby some reaction productmust be present before the reaction can start, an initiator has to be added. For allexperiments an addition of 0.1 g NaNO2 has been chosen. This is, asexperimentally found, the minimum amount to be added to ensure the reactionstarts immediately. To solve the differential equations and to account for theinitial reaction rate, an initial concentration of nitrosonium ion ζB0 has to betaken, which is an optimizing problem. The initial reaction rates asexperimentally determined and calculated are in good agreement provided aninitial concentration of nitrosonium ion equal to 3.5% is taken. Thus, theboundary conditions for these differential equations are: ζP0 = 0, ζX0 = 0 and ζB0
= 0.035 at θ = 0. The differential equations together with the kinetic parametersin Table 3 can now be used to simulate the experiments.
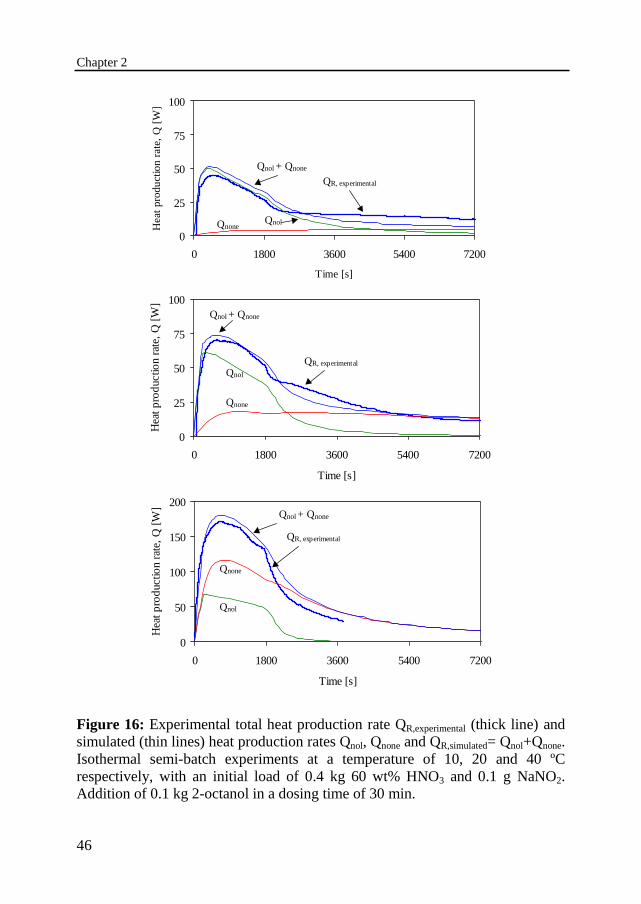
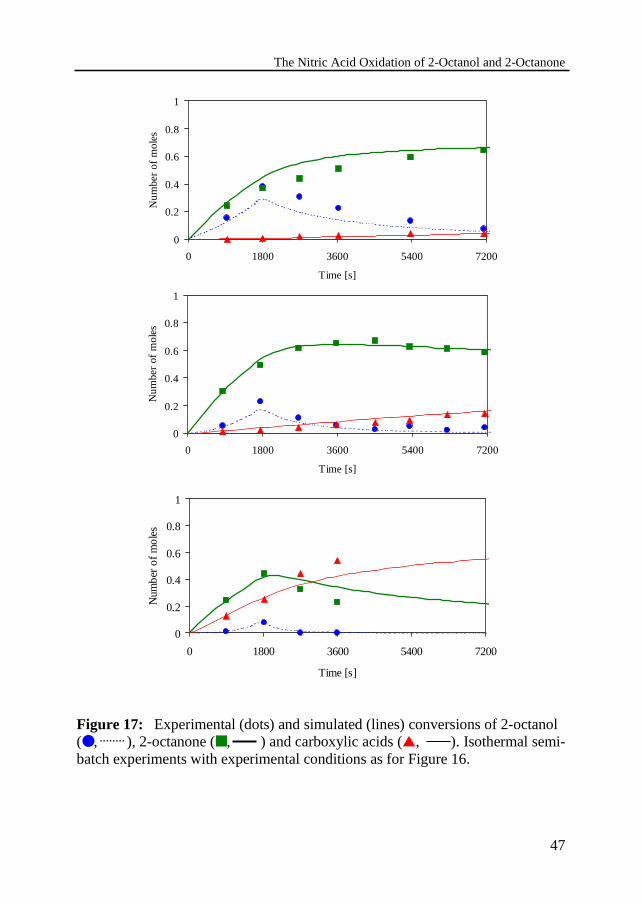
Figure 16 shows the experimentally determined and simulated heat productionrates as a function of time. The simulated heat production rates Qnol and Qnone areplotted for the separate reactions. Also both, the simulated and experimental,total heat production rates Q Q QR nol none= + are plotted. The measured andsimulated conversion-time profiles for 2-octanol, 2-octanone and carboxylicacids are shown in Figure 17 for the same series. The 2-octanol was added in 30minutes to 60 wt% HNO3 at a temperature of 10, 20 and 40 ºC respectively. Onecan observe that the heat generation rate increases with increasing temperature,which is the result of both the increasing conversion rate of 2-octanol as well asthe increasing rate of the more exothermic oxidation of 2-octanone.
Chapter 2
46
0
50
100
150
200
0 1800 3600 5400 7200
Time [s]
Hea
t pro
duc
tion
rate
, Q
[W]
Qnol + Qnone
Qnone
Qnol
QR, experimental
0
25
50
75
100
0 1800 3600 5400 7200
Time [s]
Hea
t pro
duc
tion
rate
, Q
[W]
Qnone
Qnol
QR, experimental
Qnol + Qnone
0
25
50
75
100
0 1800 3600 5400 7200
Time [s]
He
at p
rodu
ctio
n ra
te,
Q [
W]
Qnone Qnol
QR, experimental
Qnol + Qnone
Figure 16: Experimental total heat production rate QR,experimental (thick line) andsimulated (thin lines) heat production rates Qnol, Qnone and QR,simulated= Qnol+Qnone.Isothermal semi-batch experiments at a temperature of 10, 20 and 40 ºCrespectively, with an initial load of 0.4 kg 60 wt% HNO3 and 0.1 g NaNO2.Addition of 0.1 kg 2-octanol in a dosing time of 30 min.
The Nitric Acid Oxidation of 2-Octanol and 2-Octanone
47
0
0.2
0.4
0.6
0.8
1
0 1800 3600 5400 7200
Time [s]
Num
ber
of m
ole
s
0
0.2
0.4
0.6
0.8
1
0 1800 3600 5400 7200
Time [s]
Nu
mbe
r of
mol
es
0
0.2
0.4
0.6
0.8
1
0 1800 3600 5400 7200
Time [s]
Nu
mbe
r of
mol
es
Figure 17: Experimental (dots) and simulated (lines) conversions of 2-octanol(●, ), 2-octanone (■, ) and carboxylic acids (▲, ). Isothermal semi-batch experiments with experimental conditions as for Figure 16.
Chapter 2
48
0
0.2
0.4
0.6
0.8
1
0 1 2 3 4
Dimensionless time θ = t/tdos [-]
Co
ncen
trat
ion
2-o
ctan
one
[-]
20 ºC
40 ºC
60 ºC
nP
nA1( )max
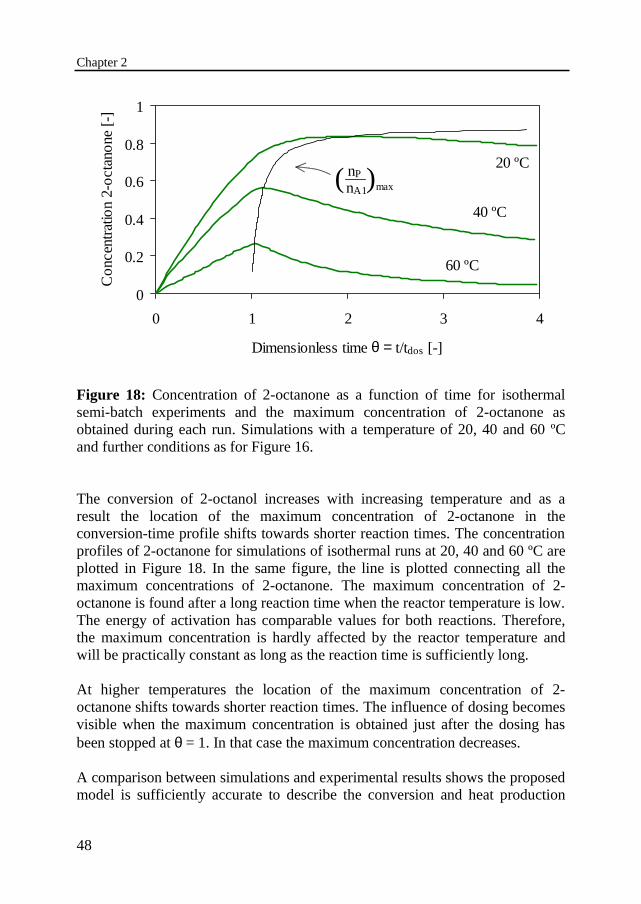
Figure 18: Concentration of 2-octanone as a function of time for isothermalsemi-batch experiments and the maximum concentration of 2-octanone asobtained during each run. Simulations with a temperature of 20, 40 and 60 ºCand further conditions as for Figure 16.
The conversion of 2-octanol increases with increasing temperature and as aresult the location of the maximum concentration of 2-octanone in theconversion-time profile shifts towards shorter reaction times. The concentrationprofiles of 2-octanone for simulations of isothermal runs at 20, 40 and 60 ºC areplotted in Figure 18. In the same figure, the line is plotted connecting all themaximum concentrations of 2-octanone. The maximum concentration of 2-octanone is found after a long reaction time when the reactor temperature is low.The energy of activation has comparable values for both reactions. Therefore,the maximum concentration is hardly affected by the reactor temperature andwill be practically constant as long as the reaction time is sufficiently long.
At higher temperatures the location of the maximum concentration of 2-octanone shifts towards shorter reaction times. The influence of dosing becomesvisible when the maximum concentration is obtained just after the dosing hasbeen stopped at θ = 1. In that case the maximum concentration decreases.
A comparison between simulations and experimental results shows the proposedmodel is sufficiently accurate to describe the conversion and heat production
The Nitric Acid Oxidation of 2-Octanol and 2-Octanone
49
rates of the oxidation reactions. Especially, when one takes into account thecomplexity of the oxidations reaction and the simplicity of the model.
2.7 Model validation and limitations
The process of mass transfer with chemical reaction during the oxidations of 2-octanol and 2-octanone with nitric acid has been modeled by assuming that theconversion rate is not affected by mass transfer rates. The verification of theassumptions described in Section 2.3 regarding these mass transfer rates isdiscussed below:
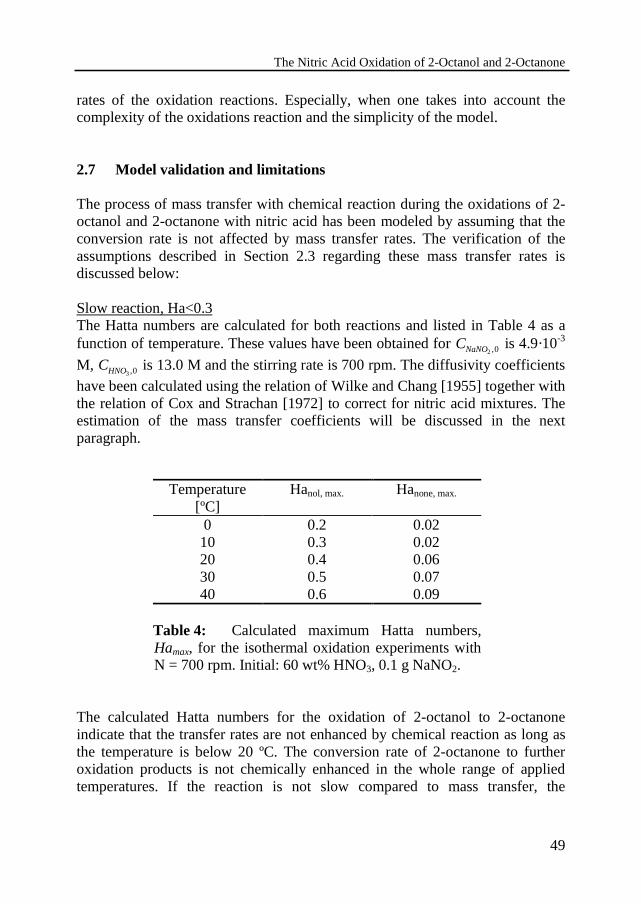
Slow reaction, Ha<0.3The Hatta numbers are calculated for both reactions and listed in Table 4 as afunction of temperature. These values have been obtained for CNaNO2 0, is 4.9·10-3
M, CHNO3 0, is 13.0 M and the stirring rate is 700 rpm. The diffusivity coefficientshave been calculated using the relation of Wilke and Chang [1955] together withthe relation of Cox and Strachan [1972] to correct for nitric acid mixtures. Theestimation of the mass transfer coefficients will be discussed in the nextparagraph.
Temperature[ºC]
Hanol, max. Hanone, max.
0 0.2 0.0210 0.3 0.0220 0.4 0.0630 0.5 0.0740 0.6 0.09
Table 4: Calculated maximum Hatta numbers,Hamax, for the isothermal oxidation experiments withN = 700 rpm. Initial: 60 wt% HNO3, 0.1 g NaNO2.
The calculated Hatta numbers for the oxidation of 2-octanol to 2-octanoneindicate that the transfer rates are not enhanced by chemical reaction as long asthe temperature is below 20 ºC. The conversion rate of 2-octanone to furtheroxidation products is not chemically enhanced in the whole range of appliedtemperatures. If the reaction is not slow compared to mass transfer, the

Chapter 2
50
enhancement can be estimated by the expression of Danckwerts, see e.g.Westerterp et al. [1987]:
E HaA = +1 2 (28)
The deviations are within 5% and 10% up to a temperature of 10 ºC and 20 ºCrespectively. The deviation is slightly higher at 40 ºC: 17%, but still reasonablysmall as also experimentally demonstrated by the influence of stirring speed.
Mass transfer resistance in the organic phase negligibleThe mass transfer resistance in the organic phase is zero if the phase consists ofpure reactant without solvent as in the case of the oxidation of 2-octanol. As thereaction proceeds, 2-octanone is formed and dilutes the organic phase. Thus thevalidity of the neglect of the mass transfer resistance in the organic phase mustbe examined. This assumption holds, see Westerterp [1987], if:
k
k mL Org
L Aq
,
,
>> 1 (29)
The mass transfer coefficients kL,Aq for 2-octanol and 2-octanone in thecontinuous, aqueous phase can be estimated with the empirical correlation ofCalderbank and Moo-Young [1961] as discussed in detail in Chapter 4. Atypical value of the mass transfer coefficients for both 2-octanol and 2-octanonein the continuous phase is kL,Aq = 20·10-6 m/s for the range of experimentalconditions. This value is in agreement with the value reported by Chapman et al.[1974]. They found experimentally kL = 10.3·10-6 m/s for toluene in aHNO3/H2SO4 solution.
In view of the low solubility of the organic compounds in nitric acid with mA =0.005 and mP = 0.006 for 2-octanol and 2-octanone, respectively, and the masstransfer coefficient in liquid-liquid dispersions of the same order of magnitude,see e.g. Laddha and Degaleesan [1976] and Heertjes and Nie [1971], this givesfor k k mL Org L Aq, ,( ) a value of approximately 200. Therefore, the mass transferresistance in the organic phase is negligible for the transport of both 2-octanoland 2-octanone.
The concentration drop over the film is negligibleThe concentration drop from Ci Aq,
* to Ci Aq, is relatively more important if masstransfer resistance in the aqueous phase is higher. When the concentration dropis more than say 5%, the simple approximation C Ci Aq i Aq,
*,≈ starts to lead to

The Nitric Acid Oxidation of 2-Octanol and 2-Octanone
51
inaccuracies, see Steensma and Westerterp [1990]. To check this approximationit is possible to compare the rate of mass transfer with the chemical reaction, seeZaldivar et al. [1995]:
Ja k C C aL i Aq i Aq= −,*
,2 7 (30)
Ja k C Ceff i Aq B Aq= −( )1 ε , , (31)
where a is the interfacial area per unit volume of reactor content. Thecombination of both equations gives:
11
−( )= −
ε k C
k a
C
Ceff B Aq
L
i Aq
i Aq
, ,*
,
(32)
Hence, in the case where C Ci Aq i Aq,*
,≈ it must be checked whether
( ) ,1 1− <<ε k C k aeff B Aq L . The total interfacial area is estimated by means of theSauter mean drop diameter, d32, which is defined as:
d a32 6= ε / (33)
where ε is volume fraction of dispersed phase and a the interfacial area per unitvolume of reactor content. The average drop size depends upon the conditions ofagitation and the physical properties of the liquids. For baffled stirred tankreactors the Sauter mean drop diameter d32 can be estimated using thecorrelation:
d
DA B We
stir
32 0 61= + −( ) .ε (34)
where Dstir is the impeller diameter, ε is the volume fraction of dispersed phase,A and B are empirical constants, which must be determined experimentally for agiven reactor set-up and liquid-liquid system, see Chapter 4. We is the Webernumber, defined as:
WeN Dstir c=
2 3 ρσ
(35)
where N is the stirring rate, ρc is the density of the continuous phase and σ isthe interfacial tension. Equation (34) has been used by numerous workers,

Chapter 2
52
whereby the values of A and B depend on the geometry. With the used values forA and B reasonable values have been obtained for the drop size. This issufficiently accurate to estimate the validity of the concentration drop over thefilm.
The interfacial tension is predicted using the empirical correlation of Good andElbing [1970]:
σ γ γ φ γ γ12 1 2 12 1 22= + − (36)
where φ12 is an experimentally determined interaction parameter and γ 1 and γ 2
are the surface tensions of the pure components. The interaction parameter φ12 isnot known for 2-octanol. Therefore the value for n-octanol has been used, seeGood and Elbing [1970], which is equal to φ12=0.97. The surface tensions forboth 2-octanol and 2-octanone are equal to 0.026 N/m at 20 ºC, see Daubert etal. [1989], and for a 60 wt% HNO3 solution it is equal to 0.063 N/m, seeZaldivar et al. [1996]. The liquid-liquid interfacial tension between 2-octanol, 2-octanone or a mixture of both with a 60 wt% nitric acid solution is thus equal toσ = 0.010 N/m. This can be compared to the experimental value betweenoctanol and water of σ = 0.0085 N/m, as measured by van Heuven and Beek[1971].
Temperature[ºC]
( ) , ,1− ε k C k aeff nol B Aq L ( ) , ,1− ε k C k aeff none B Aq L
0 0.02 0.000110 0.05 0.000420 0.07 0.00130 0.15 0.00440 0.20 0.006
Table 5: Validity of the assumption of a negligibleconcentration drop over film for 2-octanol (reaction ‘nol’)and 2-octanone (reaction ‘none’), respectively. Isothermaloxidation experiments with N = 700 rpm and initially60wt% HNO3 and 0.1 g NaNO2.
The Weber-number is now equal to We=1175. The interfacial area increaseswith the hold-up of the organic phase for the used system from 8000 to 15000m2/m3. Typical values of ( ) ,1− ε k C k aeff B Aq L are listed in Table 5 as a function of

The Nitric Acid Oxidation of 2-Octanol and 2-Octanone
53
temperature. The assumption of a negligible concentration drop over the film for2-octanone is valid. For 2-octanol this is not true and the simple approximationC Ci Aq i Aq,
*,≈ leads to inaccuracies. The deviations are within 5% and 10% up to a
temperature of 10 ºC and 20 ºC respectively.
As can be concluded from Table 4 and Table 5, all assumptions are valid withdeviations below 10% as long as temperature is lower than 20 ºC. At a highertemperature the description of the oxidation of 2-octanol using the reaction rateexpression of Equation (6) may lead to deviations of up to 20% at 40 ºC.Fortunately, the deviations are small and still within the experimental error.Thus the model based on the slow liquid-liquid reaction regime can be usedwithout introducing larger inaccuracies.
Model verification with isoperibolic experiments
The data from the isothermal experiments, being the concentrations versus timeand heat production rate versus time, were used to fit the reaction rate equations.Data from isoperibolic experiments can be used to test the accuracy of thederived kinetic expressions. The data from experiments with a constant jackettemperature have not been used to determine the kinetic expressions.
The mathematical model with the mass balances Equation (14) and (15) togetherwith the heat balance Equation (18) now can be used to describe the temperatureprofile. The isoperibolic experiments were carried out in the same way as theisothermal runs, except that the calorimeter now is operated with a constantjacket temperature. In Figure 19 the temperature profiles are plotted for fiveisoperibolic experiments with different jacket temperatures: the experimentalprofiles are in good agreement with the simulations. In Figure 20 thetemperature profiles are plotted for four isoperibolic experiments with differentjacket temperatures and a faster dosing rate. As can be seen one is working in aparametric sensitivity region, where the maximum reactor temperature, Tmax, issensitive towards the cooling temperature Tcool.
Under these conditions even a small deviation between model and actualparameters will lead to large discrepancies. At higher temperatures the modeloverestimates the reactor temperature, which can be attributed to evaporation ofthe nitric acid solution, which has not been incorporated in the model. However,the simulated and the experimental results show the same thermal behavior. Thisthermal behavior of the oxidation reaction will be discussed in more detail andunder varying experimental conditions in Chapter 3.

Chapter 2
54
0
20
40
60
80
100
120
0 0.5 1 1.5 2
theta [-]
Tem
per
atur
e [º
C]
0
10
20
30
40
50
60
0 0.5 1 1.5 2
theta [-]
Tem
per
atur
e [º
C]
Figure 19: Experimental (continuous line) and simulated (dotted lines) reactortemperatures in some isoperibolic semi-batch experiments with varying coolanttemperature with T0 = Tcool. Initial load of 60 wt% HNO3 and 0.1 g NaNO2.Addition of 100 g 2-octanol in a dosing time of 120 min.
Figure 20: Experimental (continuous line) and simulated (dotted lines) reactortemperatures in some isoperibolic semi-batch experiments with varying coolanttemperature with T0 = Tcool. Initial load of 60 wt% HNO3 and 0.1 g NaNO2.Addition of 100 g 2-octanol in a dosing time of 30 min.
The Nitric Acid Oxidation of 2-Octanol and 2-Octanone
55
2.8 Discussion and conclusions
The main objective of this chapter is to determine the kinetic parameters of themodel proposed to describe the heterogeneous oxidation of 2-octanol to 2-octanone and the unwanted, further oxidation reactions to carboxylic acids. Theoxidation of 2-octanol and 2-octanone with nitric acid exhibits the typicalfeatures of nitric acid oxidation reactions, like a long induction time withoutinitiator; autocatalytic reaction; strong dependence of mineral acid concentrationand high energy of activation, see Ogata [1978]. Although the main phenomenaof nitric acid oxidation reactions are well known the exact mechanism is still notelucidated. There is a limited knowledge of the exact chemical structure of thecompounds in the aqueous reaction phase and of a number of unknown, unstablecompounds in the organic phase. As a consequence of this a strong modelreduction was necessary to describe the overall reaction rates. The modelreduction in this case gave satisfactory results, as also demonstrated by Hugoand Mauser [1983].
The observed conversion rates of the complex reactions of 2-octanol and 2-octanone with nitric acids can be correlated using only two kinetic equations, inwhich the effect on temperature is described through the Arrhenius equation andthe effect on acid strength through Hammett’s acidity function. Theexperimental results and simulations are in good agreement, hence the employedfilm model is satisfactory.
The oxidation reactions have been studied in the range 0 to 40 ºC, with initialnitric acid concentrations of 50 to 65 wt% and a stirring rate of 700 rpm. Theresults indicate the oxidation of 2-octanol is operated in the non-enhancedregime when nitric acid is below 60 wt% or when the temperature is below 25ºC at 60 wt% HNO3, while the oxidation of 2-octanone is operated in the non-enhanced regime for the whole range of experimental conditions considered.Under these conditions the mass transfer resistance does not influence theoverall conversion rate, so the governing parameters are the reaction rateconstant and the solubility of the organic compounds in the nitric acid solution.This has also been experimentally confirmed by determining the influence onstirring rate.
Even though the kinetic constants have been determined only up to atemperature of 40 ºC, the simulated results for isoperibolic experiments at highertemperatures are still acceptable. Therefore it can be concluded that it has beenpossible to describe the thermal behavior of the semi-batch reactor for the nitricacids oxidation reactions with the film model for slow liquid-liquid reactions
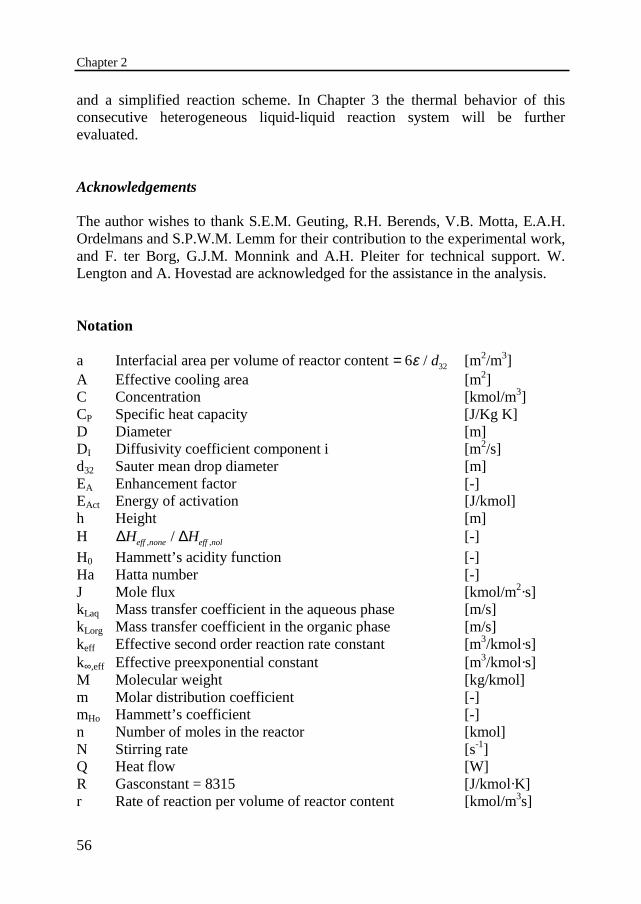
Chapter 2
56
and a simplified reaction scheme. In Chapter 3 the thermal behavior of thisconsecutive heterogeneous liquid-liquid reaction system will be furtherevaluated.
Acknowledgements
The author wishes to thank S.E.M. Geuting, R.H. Berends, V.B. Motta, E.A.H.Ordelmans and S.P.W.M. Lemm for their contribution to the experimental work,and F. ter Borg, G.J.M. Monnink and A.H. Pleiter for technical support. W.Lengton and A. Hovestad are acknowledged for the assistance in the analysis.
Notation
a Interfacial area per volume of reactor content = 6 32ε / d [m2/m3]A Effective cooling area [m2]C Concentration [kmol/m3]CP Specific heat capacity [J/Kg K]D Diameter [m]DI Diffusivity coefficient component i [m2/s]d32 Sauter mean drop diameter [m]EA Enhancement factor [-]EAct Energy of activation [J/kmol]h Height [m]H ∆ ∆H Heff none eff nol, ,/ [-]H0 Hammett’s acidity function [-]Ha Hatta number [-]J Mole flux [kmol/m2·s]kLaq Mass transfer coefficient in the aqueous phase [m/s]kLorg Mass transfer coefficient in the organic phase [m/s]keff Effective second order reaction rate constant [m3/kmol·s]k∞,eff Effective preexponential constant [m3/kmol·s]M Molecular weight [kg/kmol]m Molar distribution coefficient [-]mHo Hammett’s coefficient [-]n Number of moles in the reactor [kmol]N Stirring rate [s-1]Q Heat flow [W]R Gasconstant = 8315 [J/kmol·K]r Rate of reaction per volume of reactor content [kmol/m3s]
The Nitric Acid Oxidation of 2-Octanol and 2-Octanone
57
t Time [s]tdos Dosing time [s]T Temperature [K]U Overall heat transfer coefficient [W/m2K]V Volume [m3]
Greek symbols
α Angle of cone [º]∆H Heat of reaction [kJ/mol]∆E Amount of heat [kJ]ε Volume fraction dispersed phase = +V V Vd d c( ) [-]ϕ Flow [m3/s]Γ Effective heat capacity [J/K]µ Viscosity [Ns/m2]θ Dimensionless dosing time = t/tdos [-]ρ Density [kg/m3]σ Interfacial tension [N/m]ζ i Yield of component i = ni/nA1 [-]ζ B0 Initial concentration of nitrosonium ion = 0.035 [-]
Dimensionless groups
Po Power number Q
N Ddis stirρ 3 5 [-]
Re Reynolds numberρ
µdis stir
dis
ND2
[-]
We Weber number N Dstir c
2 3 ρσ
[-]
Chapter 2
58
Subscripts and superscripts
0 Initial, at t = 01 Final (after dosing is completed)nol Reaction of 2-octanol, see Equation (4)none Reaction of 2-octanone, see Equation (5)A Component A (2-octanol)Aq Aqueous phase (nitric acid solution)B Component B (nitrosonium ion)c Continuous (aqueous) phaseC Calibrationcool Coolingd Dispersed (organic) phasedis Dispersiondos Dosingeff Effectivef Formationi Component imax MaximumOrg Organic phaseP Component P (2-octanone)R Reactionr Reactorstir Stirringw Reactor wallX Component X (carboxylic acids)∗ At interface¯ Average∞ Ambient
The Nitric Acid Oxidation of 2-Octanol and 2-Octanone
59
References
van Asselt, W.J. and van Krevelen, D.W., Preparation of adipic acid byoxidation of cyclohexanol and cyclohexanone with nitric acid. Part IReaction mechanism., Rec. Trav. Chim. Pays-Bas 82 (1963) 51-67.
van Asselt, W.J. and van Krevelen, D.W., Preparation of adipic acid byoxidation of cyclohexanol and cyclohexanone with nitric acid. Part IIReaction kinetics of the decomposition of 6-hydroxyimino-6-nitro-hexanoic acid. Rec. Trav. Chim. Pays-Bas 82 (1963) 429-437.
van Asselt, W.J. and van Krevelen, D.W., Preparation of adipic acid byoxidation of cyclohexanol and cyclohexanone with nitric acid. Part IIIReaction kinetics of the oxidation. Rec. Trav. Chim. Pays-Bas 82 (1963)438-449.
van Asselt, W.J. and van Krevelen, D.W., Adipic acid formation by oxidation ofcyclohexanol and cyclohexanone with nitric acid, measurements in acontinuous stirred tank reactor, reactor stability. Chem. Eng. Sci. 18(1963) 471-483.
Atherton, J.H., Methods for study of reaction mechanisms in liquid/liquid andliquid/solid reaction systems and their relevance to the development offine chemical processes., Trans. Inst. Chem. Eng. 71 (1993) 111-118.
Calderbank, P.H. and Moo-Young, M.B., The continuous phase and heat andmass transfer properties of dispersions, Chem. Eng. Sci. 16 (1961) 39-54.
Camera, E., Zotti, B., and Modena, G., On the behaviour of nitrate esters in acidsolution. Chim. Ind. 61 (1979) 179-183.
Camera, E., Modena, G. and Zotti, B., On the behaviour of nitrate esters in acidsolution. III. Oxidation of ethanol by nitric acid in sulphuric acid.Propellants, Explos., Pyrotech. 8 (1983) 70-73.
Castellan, A., Bart, J.C.J. and Cavallaro, S., Nitric acid reaction of cyclohexanolto adipic acid, Catal. Today 9 (1991) 255-283.
Chapman, J.W., Cox, P.R. and Strachan, A.N., Two phase nitration of tolueneIII, Chem. Eng. Sci. 29 (1974) 1247-1251.
Cox, P.R. and Strachan, A.N., Two-phase nitration of toluene, Part II. Chem.Eng. J. 4 (1972) 253-261.
Daubert, T.E., Danner, R.P., Sibul, H.M. and Stebbins, C.C., Physical andthermodynamic properties of pure chemicals: data compilation, Taylor &Francis, London, 1989.
Davis, D.D., Adiptic acid, in: Ullmann’s Encyclopedia of Industrial chemistry,Volume A1, VCH, Weinheim, 5th edn. 1985, pp. 269-278.
Good, R.J. and Elbing, E., Generalization of theory for estimation of interfacialenergies, Ind. Eng. Chem., 62 (1970) 54-78.
Chapter 2
60
Haldar, R. and Rao, D.P., Experimental studies on parametric sensitivity of abatch reactor, Chem. Eng. Technol. 15 (1992), 34-38.
Haldar, R. and Rao, D.P., Experimental studies on semibatch reactor parametricsensitivity, Chem. Eng. Technol. 15 (1992), 39-43.
Hanson, C. Mass transfer with simultaneous chemical reaction, in: C. Hanson(ed.), Recent advances in liquid-liquid extraction, Pergamon Press,Oxford 1971, p. 429-453.
Heertjes, P.M. and de Nie, L.H., Mass transfer to drops, in: C. Hanson (ed.),Recent advances in liquid-liquid extraction, Pergamon Press, Oxford,1971, p. 367-406.
van Heuven, J.W. and Beek, W.J., Power input, drop size and minimum stirrerspeed for liquid-liquid dispersions in stirred vessels, Proc. Int. Solv. Extr.Conference, Society of Chemical Industries, 1971, pp. 70-81.
Horvath, M., Lengyel, I. and Bazsa, G., Kinetics and mechanism of autocatalyticoxidation of formaldehyde by nitric acid, Int. J. Chem. Kinet., 20 (1988)687-697.
Hugo, P. and Mauser, H., Detaillierte und modellreduzierte Beschreibung derchemischen Wärmeentwicklung am Beispiel der Oxidation vonAcetaldehyd mit Salpetersäure. Chem. Ing. Tech. 55 (1983) 984-985.
Laddha, G.S. and Degaleesan, T.E., Transport phenomena in liquid extraction,McGraw-Hill, New Delhi, 1976.
Longstaff, J.V.L. and Singer, K., The kinetics of oxidation by nitrous acid. PartII. Oxidation of formic acid in aqueous nitric acid, J. Chem. Soc. (1954)2610-2617.
Mettler-Toledo AG, Operating instructions RC1 Reaction Calorimeter, Mettler-Toledo AG, Switzerland 1993.
Ogata, Y., Sawaki, Y., Matsunaga, F. and Tezuka, H., Kinetics of the nitric acidoxidation of benzyl alcohols to benzaldehydes. Tetrahedron 22 (1966)2655-2664.
Ogata, Y., Tezuka, H. and Sawaki, Y., Kinetics of the nitric acid oxidation ofbenzaldehydes to benzoic acid. Tetrahedron 23 (1967) 1007-1014.
Ogata, Y., Oxidations with nitric acid or nitrogen oxides, in: Oxidation inorganic chemistry, part C, ed. W.S. Trahanovsky, Academic press, NewYork, 1978, pp. 295-342.
Press, W.H., Flannery, B.P., Teukolsky, S.A. and Vetterling, W.T., Numericalrecipes, Cambridge University Press, Cambridge, 1986.
Reisen, R. and Grob, B., Reaction calorimetry in chemical process development,Swiss Chem., 7 (1985) 39-43.
Rochester, C.H., Organic chemistry, A series of monographs: Acidity functions,Academic press, London, 1970.

The Nitric Acid Oxidation of 2-Octanol and 2-Octanone
61
Rudakov, E.S., Lutsyk, A.I. and Gundilovich, G.G., Propane solubility inaqueous mineral acids (0-100%): a significant difference in the solvatingproperties of H2SO4, HNO3 and H3PO4. Mendeleev Commun. 1 (1994)p.27-28.
Snee, T.J. and Hare, J.A., Development and application of pilot scale facility forstudying runaway exothermic reactions, J. Loss Prev. Process Ind. 5(1992) 46-54.
Steensma, M. and Westerterp, K.R., Thermally safe operation of a semi-batchreactor for liquid-liquid reactions. Slow reactions, Ind. Eng. Chem. Res.29 (1990) 1259-1270.
Strojny, E.J., Iwamasa, R.T. and Frevel, L.K., Oxidation of 2-methoxyethanol tomethoxyacetic acid by nitric acid solutions, J. Am. Chem. Soc. 93 (1971)1171-1178.
Westerterp, K.R., van Swaaij, W.P.M. and Beenackers, A.A.C.M., Chemicalreactor design and operation, Wiley, Chichester, student edn., 1987.
Wilke, C.R. and Chang, P., Correlation of diffusion coefficients in dilutesolutions, AIChE J. 1 (1955) 264-270.
Zaldivar, J.M., Molga, E., Alos, M.A., Hernandez, H. and Westerterp, K.R.,Aromatic nitrations by mixed acid. Slow liquid-liquid reaction regime,Chem. Eng. Process. 34 (1995) 543-559.
Zaldivar, J.M., Molga, E., Alos, M.A., Hernandez, H. and Westerterp, K.R.,Aromatic nitrations by mixed acid. Fast liquid-liquid reaction regime,Chem. Eng. Process. 35 (1996) 91-105.

Chapter 2
62

3
Runaway Behavior and Thermally SafeOperation of Multiple Liquid-LiquidReactions in the Semi-Batch Reactor
Chapter 3
64
Abstract
The thermal runaway behavior of an exothermic, heterogeneous, multiplereaction system has been studied in a cooled semi-batch reactor. The nitric acidoxidation of 2-octanol has been used to this end. During this reaction 2-octanoneis formed, which can be further oxidized to unwanted carboxylic acids. Adangerous situation may arise when the transition of the reaction towards acidstakes place accompanied by a temperature runaway.
An experimental set-up was build, containing a 1-liter glass reactor, followed bya thermal characterization of the equipment. The operation conditions, e.g.dosing time and coolant temperature, to achieve a high yield under safeconditions are studied and discussed.
The reaction conditions should rapidly lead to the maximum yield ofintermediate product 2-octanone under safe conditions and stopped at theoptimum reaction time. The appropriate moment in time to stop the reaction canbe determined by model calculations. Also operation conditions are found whichcan be regarded as invariably safe. In that case no runaway reaction will occurfor any coolant temperature and the reactor temperature will always bemaintained between well-known limits.
The boundary diagram of Steensma and Westerterp [1990] for single reactionscan be used to determine the dosing time and coolant temperature required forsafe execution of the desired reaction. For suppression of the undesired reactionit led to too optimistic coolant temperatures.

Runaway Behavior and Thermally Safe Operation
65
3.1 Introduction
To reduce the risk associated with exothermic chemical reactions, in a semi-batch operation one of the reactants is fed gradually to control the heatgeneration by chemical reaction. In practice the added compound is notimmediately consumed and will partly accumulate in the reactor. The amountaccumulated is a direct measure for the hazard potential. A definition of acritical value of accumulation, to discern between safe and unsafe conditions,may be rather arbitrary. From a safety point of view an accurate selection ofoperation and design parameters is required to obtain the minimumaccumulation.
Hugo and Steinbach [1985] started investigations on the safe operation of semi-batch reactors for homogeneous reaction systems. Steensma and Westerterp[1990,1991] studied semi-batch reactors for heterogeneous liquid-liquidreactions. They demonstrated that it is important to obtain a smooth and stabletemperature profile in the reactor. These authors dealt with single reactions.However, many problems of runaway reactions encountered in practice arecaused by multiple and more complex reaction systems.
The usual objective is to suppress side reactions whose rates are negligible atinitial conditions but may become significant at higher temperatures, see e.g.Hugo et al. [1988], Koufopanos et al. [1994], Serra et al. [1997]. In these worksa maximum allowable temperature is defined as the temperature, wheredecomposition or secondary reactions are not yet initialized. Limiting thetemperature increase is usually very effective in suppressing side reactions. It isa rather conservative approach, but necessary to obtain an inherently safeprocess, see e.g. Stoessel [1993,1995]. No work has been published on safeoperation of exothermic multiple reactions in which an unwanted reaction iskept in hand and partially is allowed to take place.
To prevent a runaway one has to operate outside regions of high sensitivity ofthe maximum reactor temperature towards the coolant temperature. In case of amultiple reaction system complications arise: one has to discern between theheat production rates of the different reactions, see e.g. Eigenberger and Schuler[1986]. The extension of the theory of temperature sensitivity to multiple, morecomplex, kinetic schemes is not obvious: the interaction of parameters in amultiple reaction system makes the development of an unambiguous criterionimpossible. Each reaction network requires an individual approach and theoptimum temperature strongly depends on the kinetic and thermal parameters ofall the reactions involved.
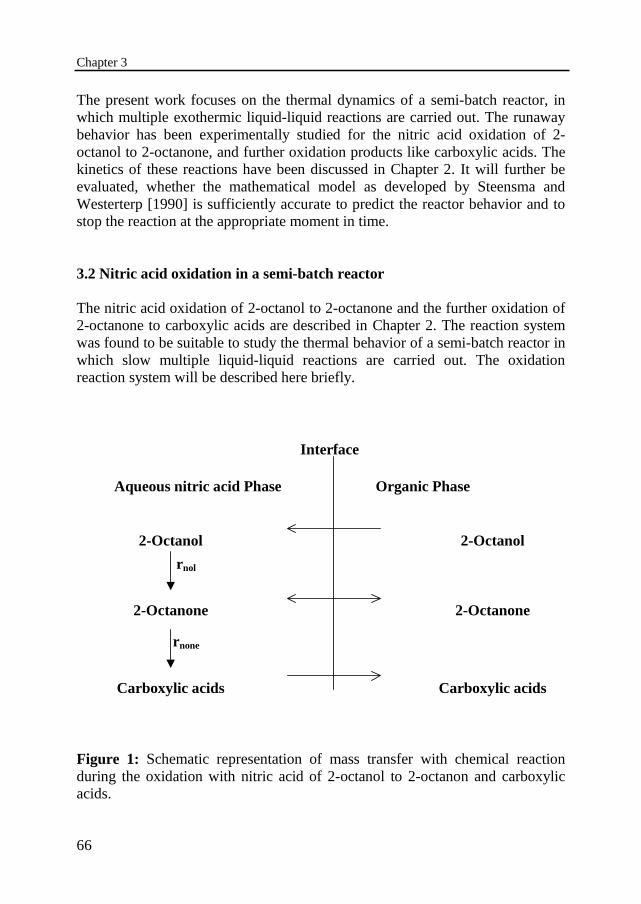
Chapter 3
66
The present work focuses on the thermal dynamics of a semi-batch reactor, inwhich multiple exothermic liquid-liquid reactions are carried out. The runawaybehavior has been experimentally studied for the nitric acid oxidation of 2-octanol to 2-octanone, and further oxidation products like carboxylic acids. Thekinetics of these reactions have been discussed in Chapter 2. It will further beevaluated, whether the mathematical model as developed by Steensma andWesterterp [1990] is sufficiently accurate to predict the reactor behavior and tostop the reaction at the appropriate moment in time.
3.2 Nitric acid oxidation in a semi-batch reactor
The nitric acid oxidation of 2-octanol to 2-octanone and the further oxidation of2-octanone to carboxylic acids are described in Chapter 2. The reaction systemwas found to be suitable to study the thermal behavior of a semi-batch reactor inwhich slow multiple liquid-liquid reactions are carried out. The oxidationreaction system will be described here briefly.
Figure 1: Schematic representation of mass transfer with chemical reactionduring the oxidation with nitric acid of 2-octanol to 2-octanon and carboxylicacids.
r nol
r none
Aqueous nitric acid Phase Organic Phase
2-Octanol2-Octanol
2-Octanone
Carboxylic acids
2-Octanone
Carboxylic acids
Interface
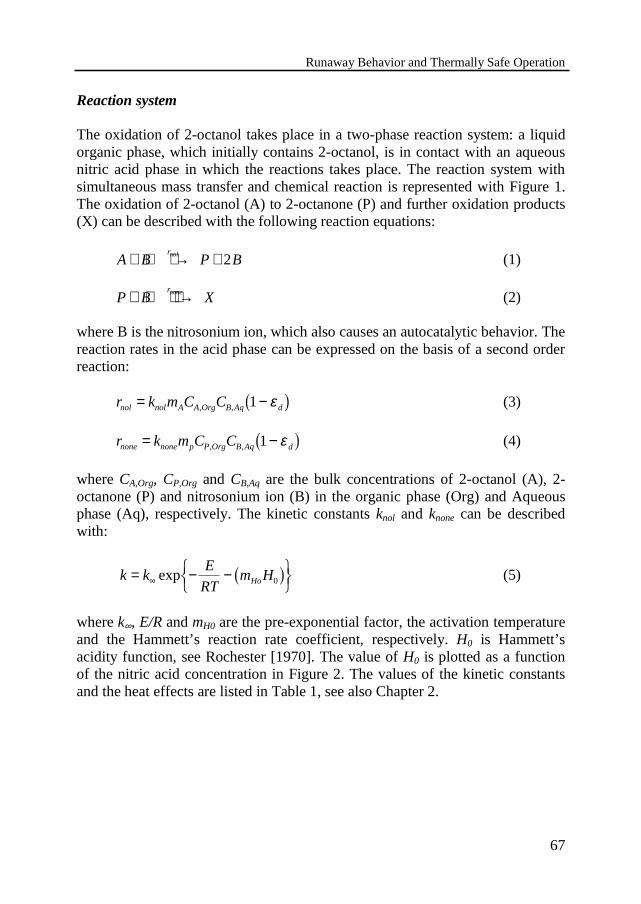
Runaway Behavior and Thermally Safe Operation
67
Reaction system
The oxidation of 2-octanol takes place in a two-phase reaction system: a liquidorganic phase, which initially contains 2-octanol, is in contact with an aqueousnitric acid phase in which the reactions takes place. The reaction system withsimultaneous mass transfer and chemical reaction is represented with Figure 1.The oxidation of 2-octanol (A) to 2-octanone (P) and further oxidation products(X) can be described with the following reaction equations:
A B P Brnol+ → + 2 (1)
P B Xrnone+ → (2)
where B is the nitrosonium ion, which also causes an autocatalytic behavior. Thereaction rates in the acid phase can be expressed on the basis of a second orderreaction:
r k m C Cnol nol A A Org B Aq d= −, , 1 ε1 6 (3)
r k m C Cnone none p P Org B Aq d= −, , 1 ε1 6 (4)
where CA,Org, CP,Org and CB,Aq are the bulk concentrations of 2-octanol (A), 2-octanone (P) and nitrosonium ion (B) in the organic phase (Org) and Aqueousphase (Aq), respectively. The kinetic constants knol and knone can be describedwith:
k kE
RTm HHo= − −%&'
()*∞ exp 01 6 (5)
where k∞, E/R and mH0 are the pre-exponential factor, the activation temperatureand the Hammett’s reaction rate coefficient, respectively. H0 is Hammett’sacidity function, see Rochester [1970]. The value of H0 is plotted as a functionof the nitric acid concentration in Figure 2. The values of the kinetic constantsand the heat effects are listed in Table 1, see also Chapter 2.

Chapter 3
68
Figure 2: Hammett’s acidity function H0 as a function of the nitric acid solutionconcentration.
ParametermA k��nol 1·105 m3/kmol·sEnol/R 11300 KmHo,nol 6.6 -∆Hnol 160·106 J/kmol
mP k�,none 1·1010 m3/kmol·sEnone/R 12000 KmHo,none 2.2 -∆Hnone 520·106 J/kmol
Table 1: Kinetic parameters and reaction heats forthe nitric acid oxidation of 2-octanol and 2-octanone, respectively. Taken from Chapter 2.
-1
0
1
2
3
4
0 10 20 30 40 50 60 70
Concentration HNO3 [wt%]
- H
0 [-
]

Runaway Behavior and Thermally Safe Operation
69
Mathematical model
The reaction will be executed in an indirectly cooled SBR in which aqueousnitric acid is present right from the start and the organic component 2-octanol(A) added at a constant feed rate until a desired molar ratio of the reactants hasbeen reached. The 2-octanol reacts to 2-octanone and to carboxylic acids. Theheat of reaction is removed by a coolant, which flows through an internal coiland/or an external jacket. The temperature in the reactor and the concentrationsof the reactants and products as a function of time can be found by solving theheat and mass balances over the reactor, using the appropriate initial conditions.
In the model for the semi-batch reactor considered in this work it is assumed,that the following conditions holds:- Uniform reaction temperature- Volumes and heat capacities are additive- The reactions take place in the aqueous nitric acid phase only- The nitric acid phase is the continuous phase throughout the experiment, phaseinversion does not occur- No change in the volume of the separate phases- A low mutual solubility of the reactants
Mass and energy balancesThe yields of 2-octanone ζ P and of carboxylic acids ζ X respectively, are definedon the basis of the total amount of 2-octanol fed nA1, see notation, and can beused to obtain dimensionless concentrations of the components in Equations (1)and (2) and of the nitric acid concentration CN,Aq:
Cn
V
n
VA OrgA
dos
P X A
dos, ≈ =
− −
1
1
1θθ ζ ζ
θ1 6
(6)
Cn
V
n
VB AqB
r
P B A
r,
( )≈ = +
0
0 1
0
ζ ζ(7)
Cn
V
n
VP OrgP
dos
P A
dos, ≈ =
1
1
1θζ
θ(8)
Cn
V
n
VX OrgX
dos
X A
dos, ≈ =
1
1
1θζ
θ(9)

Chapter 3
70
Cn
V
n n
VN AqN
r
N B P X A
r, ≈ =
− + +
0
0 0 1
0
2ζ ζ ζ1 6(10)
The dimensionless time θ is obtained by dividing the time t by the dosing timetdos, and after dosing is completed θ = 1. Vdos1θ is the volume of the dispersed,organic phase. The initial concentrations at θ = 0 of 2-octanol CA,Org, 2-octanoneCP,Org and carboxylic acids CX,Org respectively, are equal to zero. The reactionwill only start after addition of an initiator. The initiator will produce the initialconcentration of nitrosonium ion: C n V n VB Aq B r B A r0 0 0 0 1 0, = = ζ . The addition of
initiator will consume a small amount nitric acid equal to ζ B An0 1. Thus the yieldζP starts at zero at the start of the reaction, reaches a maximum and after thatdecreases. At the end of the secondary reaction ζP is again equal to zero.
Due to the low solubilities one can neglect the amount of the organiccomponents A, P and X present in the aqueous phase and assume for themacroscopic mass balance that CA Aq, = 0, CP Aq, = 0 and CX Aq, = 0. The massbalances for the oxidations have been derived by substitution of theconcentrations Equations (6)-(8) and using the reaction rates Equations (3) and(4):
d
dm k t C
d
dP
A nol dos A dos P XP B Xζ
θθ ζ ζ ζ ζ
θζθ
= − − + −, 1 6 0 (11)
d
dm k t CX
P none dos A dos PP Bζ
θζ ζ ζ
θ= +
, 1 6 0 (12)
where CA,dos is the concentration of reactant 2-octanol in the feed as dosed to thereactor vessel. The initial boundary conditions will be discussed later.
Steensma and Westerterp [1990] have derived the basic equations anddefinitions describing the thermal phenomena in a cooled semi-batch reactor, inwhich a single liquid-liquid reaction is carried out. Their expression for the heatbalance has been written in a more general way and can easily be extended tomultiple reactions and take into account the additional heat sources likeagitation, etc.:
dT
dtQ Q Q Q Qr
totR dos cool stir= + + + + ∞
1
Γ1 6 (13)

Runaway Behavior and Thermally Safe Operation
71
where Γtot is the total heat capacity of the system, being the sum of the heatcapacities of the reaction mixture mCp and the effective heat capacity Γeff, whichconsists of the heat capacities of the devices wetted and the heat capacity of thereactor wall. The different heat flows included are the QR: chemical reactionheat, Qdos: heat input due to reactant addition, Qcool: heat exchanged with thecoolant, Qstir: heat supplied by the agitator, and Q∞: heat exchanged with thesurroundings. The heat released by chemical reaction is the sum of the heatreleased by the oxidation of 2-octanol, Qnol, and 2-octanone, Qnone, respectivelyand can be written as:
Q Q Qn
t
d
d
d
dH
n
t
d
dHR nol none
A
dos
P Xnol
A
dos
Xnone= + = +�
����� +1 1ζ
θζθ
ζθ
∆ ∆ (14)
where the dimensionless conversion rates d dPζ θ and d dXζ θ are taken fromthe mass balances, Eq.(11) and Eq.(12).
During a semi-batch process the added mass is not necessarily at the sametemperature as the reactor and so contributes to cooling or heating of thereactant mass. In that case this temperature difference must be taken intoaccount in the energy balance.
Q C T Tdos v dos P dos dos r= −ϕ ρ, 1 6 1 6 (15)
where ϕ v dos, is the volumetric flow rate of the feed dosed into the reactor. Theheat exchanged with the heat transfer fluid can be expressed with:
Q UA T Tcool cool cool r= ⋅ −1 6 (16)
where UAcool is the product of the effective heat transfer coefficient and the areaof the cooling jacket or cooling coil. UAcool usually depends on the volume of thereaction mixture. The power introduced by the stirrer can be correlated in theturbulent flow regime by:
Q Po N Dstir dis stir= ρ 3 5 (17)
In reactor used the power number Po is constant and equal to Po = 4.6. Theimportance of the amount of heat exchanged with the surroundings increaseswith the temperature difference between the system and the surroundings, theheat flow can be expressed with:
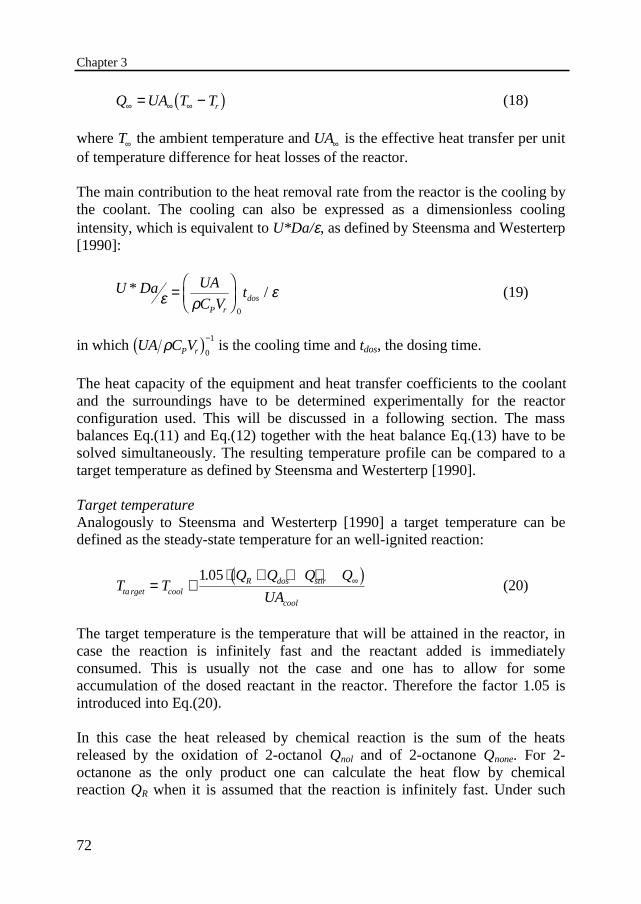
Chapter 3
72
Q UA T Tr∞ ∞ ∞= −1 6 (18)
where T∞ the ambient temperature and UA∞ is the effective heat transfer per unitof temperature difference for heat losses of the reactor.
The main contribution to the heat removal rate from the reactor is the cooling bythe coolant. The cooling can also be expressed as a dimensionless coolingintensity, which is equivalent to U*Da/ε, as defined by Steensma and Westerterp[1990]:
U Da UA
C Vt
P rdos
* /ε ρε=
���
���
0
(19)
in which UA C VP rρ1 601− is the cooling time and tdos, the dosing time.
The heat capacity of the equipment and heat transfer coefficients to the coolantand the surroundings have to be determined experimentally for the reactorconfiguration used. This will be discussed in a following section. The massbalances Eq.(11) and Eq.(12) together with the heat balance Eq.(13) have to besolved simultaneously. The resulting temperature profile can be compared to atarget temperature as defined by Steensma and Westerterp [1990].
Target temperatureAnalogously to Steensma and Westerterp [1990] a target temperature can bedefined as the steady-state temperature for an well-ignited reaction:
T TQ Q Q Q
UAta rget coolR dos stir
cool
= +⋅ + + + ∞105. 1 6
(20)
The target temperature is the temperature that will be attained in the reactor, incase the reaction is infinitely fast and the reactant added is immediatelyconsumed. This is usually not the case and one has to allow for someaccumulation of the dosed reactant in the reactor. Therefore the factor 1.05 isintroduced into Eq.(20).
In this case the heat released by chemical reaction is the sum of the heatsreleased by the oxidation of 2-octanol Qnol and of 2-octanone Qnone. For 2-octanone as the only product one can calculate the heat flow by chemicalreaction QR when it is assumed that the reaction is infinitely fast. Under such

Runaway Behavior and Thermally Safe Operation
73
conditions the rate of formation is equal to the dosing rate, because theconsumption rate of the ketone is equal to zero. Thus the conversion rated dPζ θ is equal to unity throughout the supply period until dosing is stopped atθ = 1 and, because no carboxylic acids are formed, d dXζ θ = 0. The heat flowby the chemical reaction QR becomes in this case:
Qn
tHnol
A
dosnol= 1 ∆ (21)
In case only the carboxylic acids are produced, hence for d dPζ θ = 0 andd dXζ θ = 1, the heat flow by chemical reaction is equal to:
Q Qn
tH Hnol none
A
dosnol none+ = +1 ∆ ∆1 6 (22)
For the oxidations two target temperatures can be defined: one for 2-octanoneand one for the carboxylic acids. To this end Equation (21) or Equation (22) issubstituted in Equation (20). In this way two pre-defined target temperatureprofiles are obtained, which can be used to evaluate the reaction temperature.
The temperature and concentration versus time profiles of the nitric acidoxidation of 2-octanol can be calculated when the mass balances Equations (11)and (12) and the heat balance Equation (13) are solved simultaneously using afifth order Runge-Kutta method with an adaptive step size control. The divisionby θ in Equations (11) and (12) with θ = 0 can be solved numerically aftersubstitution of θ plus a very small number equal to 10-15: θ = θ + 10-15. Theinitial boundary conditions for these differential equations are: ζP0 = 0, ζX0 = 0and ζB0 = 0.035 at θ = 0 and Tr = T0 = Tcool at θ = 0. The initial concentration ofnitrosonium ion has been set at ζB0 = 0.035 to compensate for the autocatalyticbehavior, whereby it is necessary to have some of the reaction productnitrosonium ion present directly at the start. The value of ζB0 has been chosen insuch a way that a good agreement between the initial reaction rates asexperimentally determined and the calculated ones is obtained. The exact valueof ζB0 has a strong influence on the calculated results, in case the initial reactionrate is very low. In this work rather long dosing times are used and is operated athigh temperatures, hence the initial reaction rate is large and will be lesssensitive towards ζB0.
The characteristic behavior of the nitric acid oxidation of 2-octanol will beexplained in the following section using the results of the simulations. It will
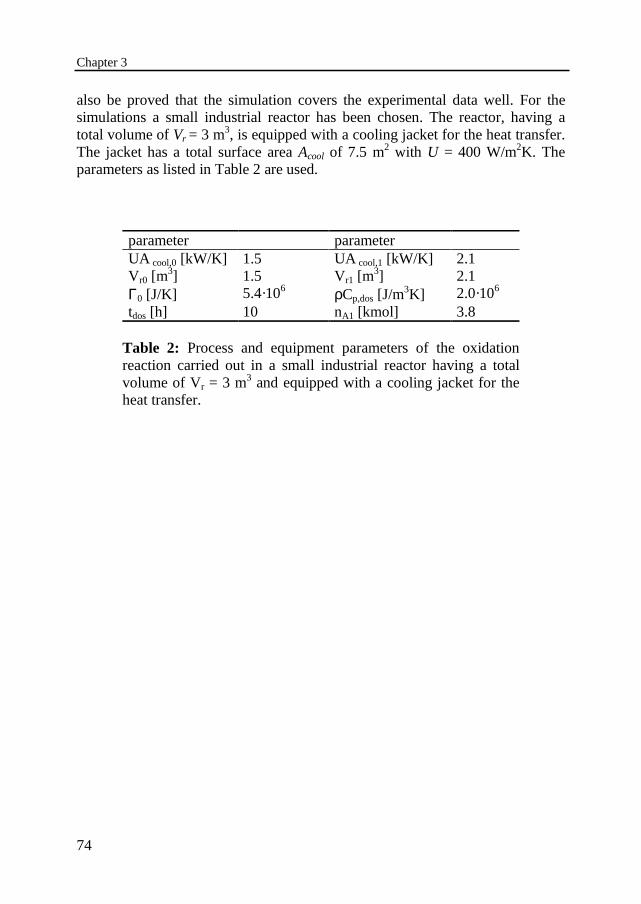
Chapter 3
74
also be proved that the simulation covers the experimental data well. For thesimulations a small industrial reactor has been chosen. The reactor, having atotal volume of Vr = 3 m3, is equipped with a cooling jacket for the heat transfer.The jacket has a total surface area Acool of 7.5 m2 with U = 400 W/m2K. Theparameters as listed in Table 2 are used.
parameter parameterUA cool,0 [kW/K] 1.5 UA cool,1 [kW/K] 2.1Vr0 [m
3] 1.5 Vr1 [m3] 2.1
Γ0 [J/K] 5.4·106 ρCp,dos [J/m3K] 2.0·106
tdos [h] 10 nA1 [kmol] 3.8
Table 2: Process and equipment parameters of the oxidationreaction carried out in a small industrial reactor having a totalvolume of Vr = 3 m3 and equipped with a cooling jacket for theheat transfer.

Runaway Behavior and Thermally Safe Operation
75
3.3 Thermal behavior of the nitric acid oxidation of 2-octanol
To give insight into the reaction behavior of the nitric acid oxidation of 2-octanol, it is assumed that the reaction is executed in a SBR and only the coolanttemperature, which is the most important control variable, is varied. Threetypical reaction regimes can be distinguished with increasing operationtemperatures:i) Oxidation of 2-octanol to 2-octanoneii) Simultaneously the reaction of 2-octanol to 2-octanone and the furtheroxidation of 2-octanone to carboxylic acidsiii) Oxidation of 2-octanol to carboxylic acidsThe calculated temperature profile, heat production rates and molar amounts as afunction of time are shown in figures 3-5.
i) Production of 2-octanoneAt a low coolant temperature and for the chosen further operating conditions,mainly 2-octanone is formed, see Figure 3. The reaction has a good start,followed by a period of a practically constant reaction temperature. The reactortemperature curve approaches the target temperature of 2-octanone,Ttarget, 2-octanone, and the yield of 2-octanone is high. This type of profile is called aQFS profile - with a Quick onset, Fair conversion and Smooth temperatureprofile - by Steensma and Westerterp [1990]. The chosen regime is usually theoptimal operating regime for semi-batch processes. One can observe that inFigure 3 the maximum concentration of 2-octanone, where the reaction has to bestopped, has not yet been reached. In practice the coolant temperature would beincreased as soon as the reactor temperature becomes lower than Ttarget ,2-octanone.
The reactor operation as depicted in Figure 3 may appear reasonably safe. Thereis no temperature jump, no sudden conversion of 2-octanol and no largeaccumulation of 2-octanol. However, a large quantity of 2-octanoneaccumulates, which creates a potential for extra heat production as it can befurther oxidized by nitric acid. This can be seen in Figure 4.
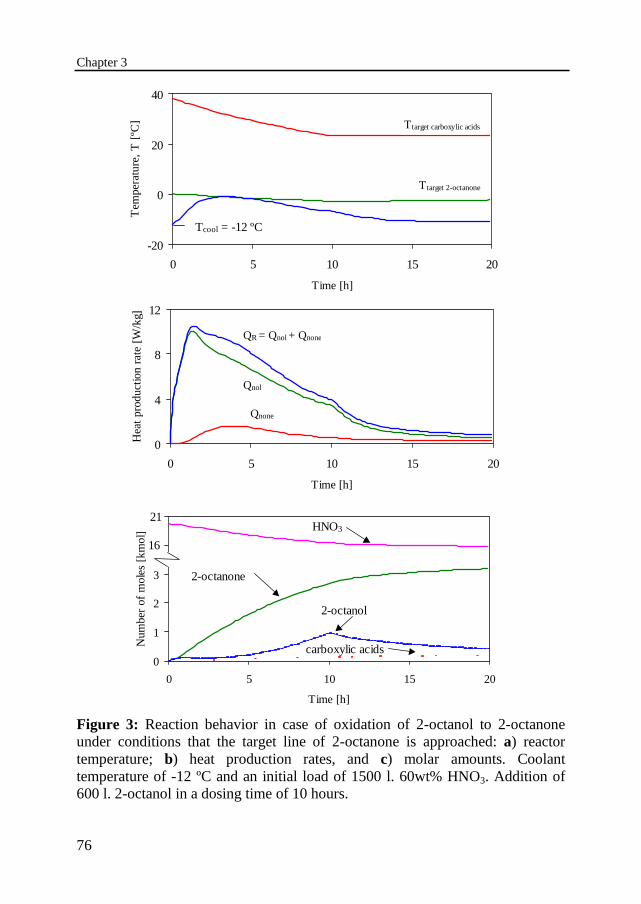
Chapter 3
76
0
1
2
3
4
5
0 5 10 15 20
Time [h]
Num
ber
of m
ole
s [k
mo
l]
-2
3
8
13
18HNO3
2-octanone
2-octanol
carboxylic acids
21
16
0
4
8
12
0 5 10 15 20
Time [h]
Hea
t pr
oduc
tion
ra
te [
W/k
g]
QR = Qnol + Qnone
Qnone
Qnol
-20
0
20
40
0 5 10 15 20
Time [h]
Tem
pera
ture
, T
[ºC
]Ttarget carboxylic acids
Ttarget 2-octanone
Tcool = -12 ºC
Figure 3: Reaction behavior in case of oxidation of 2-octanol to 2-octanoneunder conditions that the target line of 2-octanone is approached: a) reactortemperature; b) heat production rates, and c) molar amounts. Coolanttemperature of -12 ºC and an initial load of 1500 l. 60wt% HNO3. Addition of600 l. 2-octanol in a dosing time of 10 hours.
Runaway Behavior and Thermally Safe Operation
77
ii) Transition of the oxidation reactionsAs the temperature is increased also the simultaneous production of carboxylicacids takes place. The conditions in this case are critical so that, after a goodstart of the first reaction, they lead to a temperature runaway: the targettemperatures of 2-octanone and of the carboxylic acids are both undesirablyexceeded. During such an experiment larger amounts of 2-octanone accumulatein the reactor before the secondary reaction is triggered. The produced 2-octanone is then very rapidly consumed by further oxidation reactions. The heatof reaction of the secondary reaction is liberated in a short time resulting in alarge temperature peak. The heat production rate then decreases, as theconcentration of the reactants has dropped to a low level, while the heat removalrate by cooling is still high due to the high temperature difference between thereaction mixture and the coolant, so the reactor temperature decreases rapidly.When the reaction temperature decreases the heat production rates of bothreactions decrease very fast and, hence, the reaction rates. This is due not only tothe influence of the temperature, but above all to influence of the acid strengthon the reaction rates. The nitric acid concentration decreases in this case from 60wt% to 45 wt%, which corresponds to H0 = -3.38 and –2.68, respectively, seeFigure 2. This lowers the kinetic constant knol, see Equation (5), with a factor100. Thus, the reaction is practically extinguished.
iii) Production of carboxylic acids.When the temperature is further increased practically no 2-octanone accumulatesduring the whole reaction period, it reacts away immediately to acids. Thesystem again behaves as a single reaction in which 2-octanol reacts to carboxylicacids and again one can observe a good start of the reaction with a smoothtemperature profile, see Figure 5. Such a situation is thermally safe but isundesirable, because a high yield of 2-octanone is desired. Also in this case thestrong influence of the nitric acid is visible. At the moment dosing is stopped thenitric acid concentration is only 40 wt%, i.e. H0 = -2.39, and again, the reactionrate is drastically reduced.
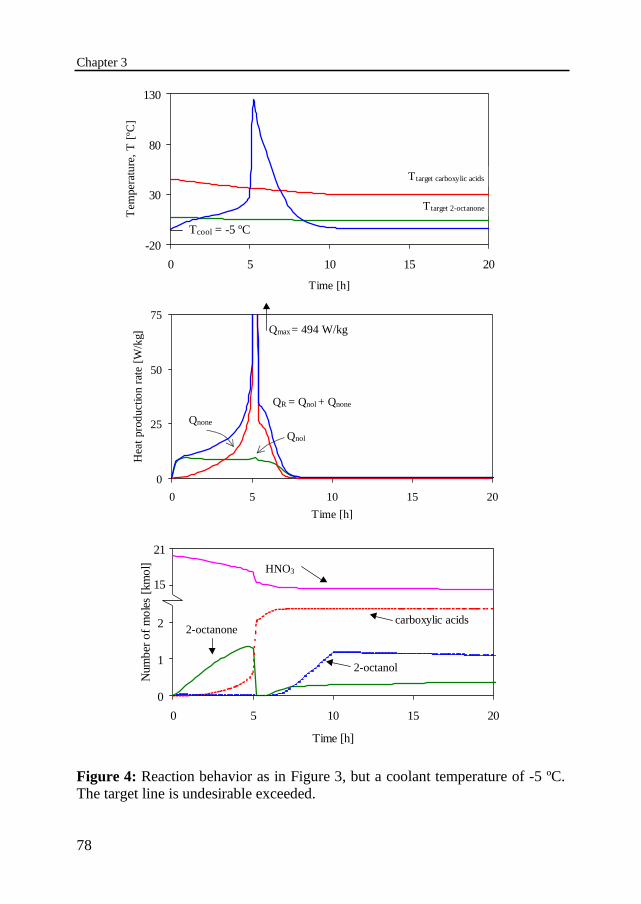
Chapter 3
78
-20
30
80
130
0 5 10 15 20
Time [h]
Tem
pera
ture
, T
[ºC
]
Ttarget carboxylic acids
Ttarget 2-octanone
Tcool = -5 ºC
0
25
50
75
0 5 10 15 20
Time [h]
Hea
t pr
oduc
tion
rate
[W
/kg]
QR = Qnol + Qnone
Qnol
Qnone
Qmax = 494 W/kg
0
1
2
3
4
0 5 10 15 20
Time [h]
Num
ber
of m
ole
s [k
mo
l]
-2
3
8
13
18HNO3
2-octanone
2-octanol
carboxylic acids
21
15
Figure 4: Reaction behavior as in Figure 3, but a coolant temperature of -5 ºC.The target line is undesirable exceeded.

Runaway Behavior and Thermally Safe Operation
79
0
1
2
3
4
5
6
0 5 10 15 20
Time [h]
Num
ber
of m
ole
s [k
mo
l]
-18
-13
-8
-3
2
7
12
17HNO3
2-octanone2-octanol
carboxylic acids
14
21
0
25
50
0 5 10 15 20
Time [h]
Hea
t p
rod
uctio
n ra
te [W
/kg]
QR = Qnol + Qnone
Qnone
Qnol
Figure 5: Reaction behavior as in Figure 3, but a coolant temperature of 30 ºC.The target line of carboxylic acids is approached.
20
40
60
80
0 5 10 15 20
Time [h]
Tem
per
atur
e, T
[ºC
]Ttarget carboxylic acids
Ttarget 2-octanone
Tcool = 30 ºC
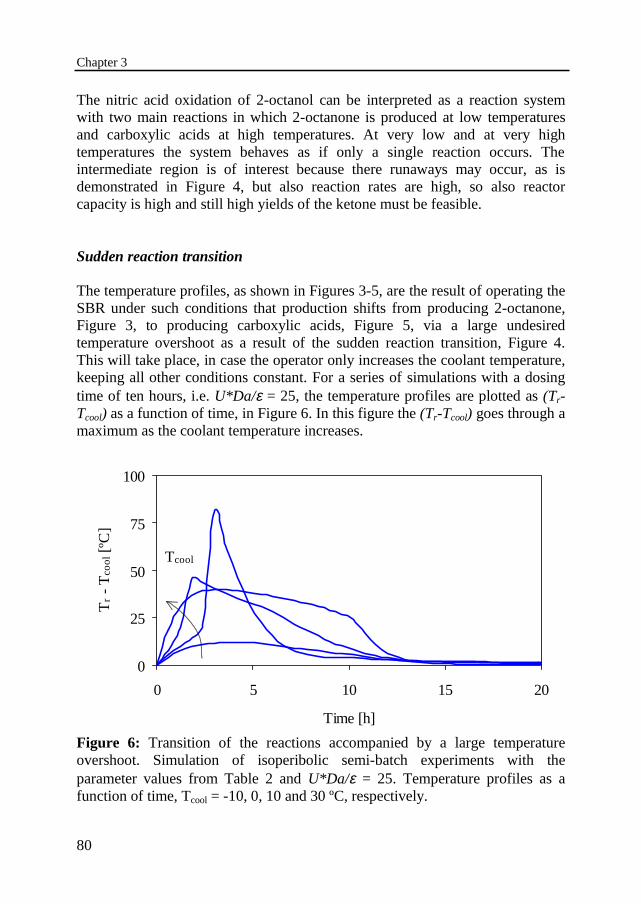
Chapter 3
80
0
25
50
75
100
0 5 10 15 20
Time [h]
Tr -
Tco
ol [
ºC]
Tcool
The nitric acid oxidation of 2-octanol can be interpreted as a reaction systemwith two main reactions in which 2-octanone is produced at low temperaturesand carboxylic acids at high temperatures. At very low and at very hightemperatures the system behaves as if only a single reaction occurs. Theintermediate region is of interest because there runaways may occur, as isdemonstrated in Figure 4, but also reaction rates are high, so also reactorcapacity is high and still high yields of the ketone must be feasible.
Sudden reaction transition
The temperature profiles, as shown in Figures 3-5, are the result of operating theSBR under such conditions that production shifts from producing 2-octanone,Figure 3, to producing carboxylic acids, Figure 5, via a large undesiredtemperature overshoot as a result of the sudden reaction transition, Figure 4.This will take place, in case the operator only increases the coolant temperature,keeping all other conditions constant. For a series of simulations with a dosingtime of ten hours, i.e. U*Da/ε = 25, the temperature profiles are plotted as (Tr-Tcool) as a function of time, in Figure 6. In this figure the (Tr-Tcool) goes through amaximum as the coolant temperature increases.
Figure 6: Transition of the reactions accompanied by a large temperatureovershoot. Simulation of isoperibolic semi-batch experiments with theparameter values from Table 2 and U*Da/ε = 25. Temperature profiles as afunction of time, Tcool = -10, 0, 10 and 30 ºC, respectively.

Runaway Behavior and Thermally Safe Operation
81
The temperature overshoot as a function of coolant temperature can best bevisualized when the maximum temperature obtained in the reactor is plotted as afunction of the coolant temperature. A typical example is shown in Figure 7a. Ata very low coolant temperature one can observe a region of insufficient ignition.Under these conditions the reactor temperature does not approach the targettemperature for 2-octanone. The reaction rate is much lower than the dosingrate, the reactor operates as a batch reactor and a long time is needed tocomplete the reaction, so dosing has no use.
At a somewhat higher coolant temperature the maximum temperature and theyield of 2-octanone increase. The conversion rate of the alcohol is close to thedosing rate and only a small amount of 2-octanol will accumulate. The semi-batch process now operates under QFS conditions and 2-octanone is produced.The coolant temperature is in this case lower then the coolant temperature thatleads to a temperature runaway. At -6 ºC one can observe a sharp increase in themaximum temperature. At this temperature also carboxylic acids are producedand a temperature runaway occurs.
Further increasing the coolant temperature results in earlier ignition of thefurther oxidation to acids. The maximum temperature is lower and is reached atan earlier stage. At very high Tcool the maximum temperature approaches thetarget temperature for the carboxylic acids and the oxidation can be regarded asa single reaction, but the undesired one.
The nitric acid oxidation of 2-octanol and 2-octanone is a consecutive reactionsystem in which the intermediate product 2-octanone is the one desired. Thus,the yield of 2-octanone reaches a maximum and after a certain reaction time all2-octanol has been converted, while 2-octanone is still being converted into theundesired carboxylic acids. In order to obtain a high yield of 2-octanone thereaction should be stopped as soon as the concentration of 2-octanone hasreached its maximum value. This can be done for this heterogeneous reactionsystem by stopping the stirrer, so that the dispersion separates and the interfacialarea becomes so small that the reaction rate is practically negligible, or bydiluting the nitric acid with water, which also effectively reduces the reactionrate.
The necessary reaction time to reach the maximum yield of 2-octanone dependson the reactor temperature. The conversion rate of 2-octanol increases withincreasing temperature and as a result the location of the maximum yield of 2-octanone in the conversion-time profile shifts towards shorter reaction times.

Chapter 3
82
-30
20
70
120
170
-30 -20 -10 0 10 20 30
Coolant temperature [ºC]
Max
imum
tem
per
atur
e [º
C]
TTarget, carboxylic acids
QFScarboxylic acids
ThermalRunaway
TTarget, 2-octanone
QFS2-octanone
Insuf.ignition
0
0.2
0.4
0.6
0.8
1
-30 -20 -10 0 10 20 30
Coolant temperature [ºC]
Rel
ativ
e m
olar
am
ount
[-]
0
20
40
60
80
100
Tim
e un
til m
axi
mum
[h]2-octanone
carboxylic acids
a
b
Figure 7: Transition of the reactions accompanied by a large temperatureovershoot. Simulation as Figure 6. a: Maximum temperature of the reactor as afunction of the coolant temperature. b: Maximum molar amount of 2-octanoneas a function of the coolant temperature, together with the corresponding molaramount of carboxylic acids and the reaction time, when the reaction is stopped.
The maximum yield of 2-octanone and the necessary time to reach it are shownin Figure 7b as a function of the coolant temperature together with the amount ofcarboxylic acids formed. When the coolant temperature is increased the time toobtain the maximum yield of 2-octanone decreases, which increases the reactor

Runaway Behavior and Thermally Safe Operation
83
0
10
20
30
0 10 20 30 40
Time [h]
Tr -
Tco
ol [
ºC]
Tcool
capacity. On the other hand the amount of carboxylic acids increases, whichleads to loss of raw materials. The time until the maximum increases just beforethe runaway reaction is triggered, which can be attributed to the large amount ofcarboxylic acids formed during the dosing period. Consequently, more nitricacid is consumed and reaction rate decreases. At a coolant temperature of higherthan -6 ºC one can also observe a sharp decrease in the maximum yield of 2-octanone together with a rapid reduction of the reaction time. At higher coolanttemperatures the maximum yield of 2-octanone is obtained before the dosing isstopped, which, of course, is an undesired situation.
Gradual reaction transition
The use of a longer dosing time may reduce or even avoid an undesiredtemperature overshoot. To this end the dosing time is doubled, compared to theconditions in Figures 6 and 7, and the value of U*Da/ε increases from 25 to 50.In Figure 8 the temperature profiles are plotted, as (Tr - Tcool) as a function oftime for this case and, again, only the coolant temperature is varied.
Figure 8: Transition of the reactions accompanied by a gradual temperatureincrease. Simulation of isoperibolic semi-batch experiments as in Figure 6 withthe parameter values from Table 2, but a dosing time of 20 hours, U*Da/ε = 50and Tcool = -15, -5, 3 and 30 ºC, respectively.
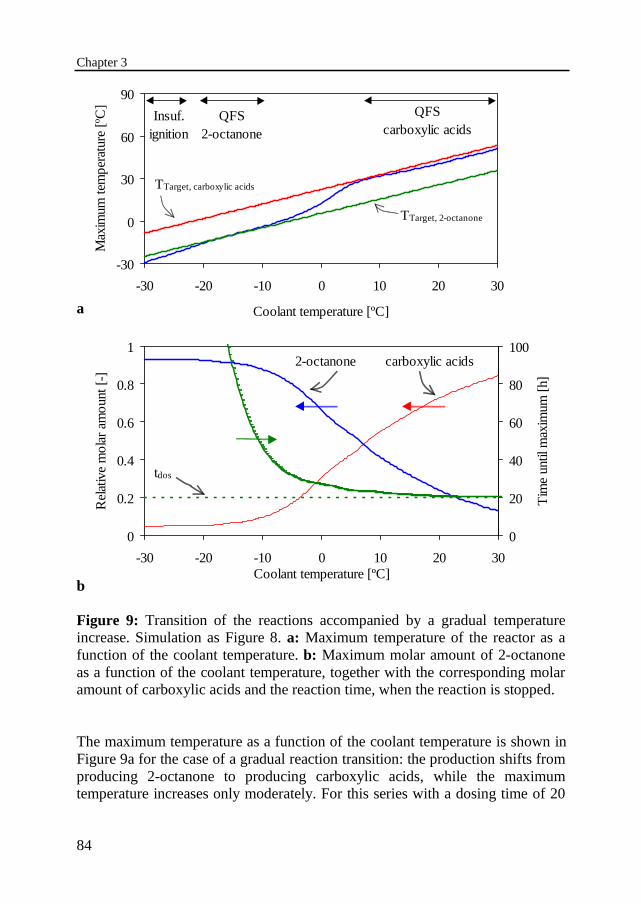
Chapter 3
84
-30
0
30
60
90
-30 -20 -10 0 10 20 30
Coolant temperature [ºC]
Max
imum
tem
per
atur
e [º
C]
TTarget, carboxylic acids
QFScarboxylic acids
TTarget, 2-octanone
QFS2-octanone
Insuf.ignition
0
0.2
0.4
0.6
0.8
1
-30 -20 -10 0 10 20 30Coolant temperature [ºC]
Rel
ativ
e m
ola
r am
oun
t [-]
0
20
40
60
80
100
Tim
e un
til m
axim
um [
h]
tdos
2-octanone carboxylic acids
a
b
Figure 9: Transition of the reactions accompanied by a gradual temperatureincrease. Simulation as Figure 8. a: Maximum temperature of the reactor as afunction of the coolant temperature. b: Maximum molar amount of 2-octanoneas a function of the coolant temperature, together with the corresponding molaramount of carboxylic acids and the reaction time, when the reaction is stopped.
The maximum temperature as a function of the coolant temperature is shown inFigure 9a for the case of a gradual reaction transition: the production shifts fromproducing 2-octanone to producing carboxylic acids, while the maximumtemperature increases only moderately. For this series with a dosing time of 20
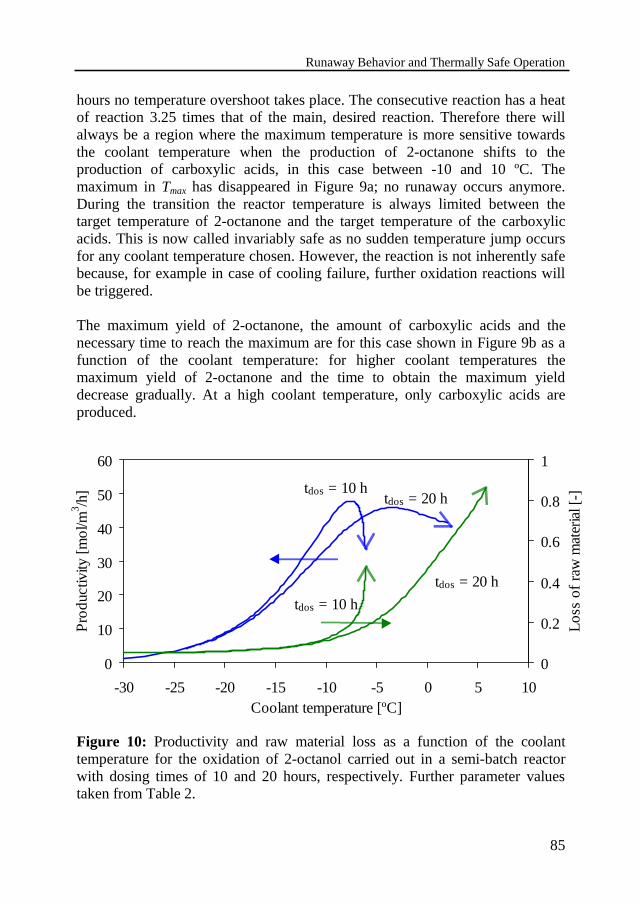
Runaway Behavior and Thermally Safe Operation
85
0
10
20
30
40
50
60
-30 -25 -20 -15 -10 -5 0 5 10Coolant temperature [ºC]
Pro
duc
tivity
[mo
l/m3 /h
]
0
0.2
0.4
0.6
0.8
1
Loss
of r
aw m
ater
ial [
-]tdos = 10 h
tdos = 10 h
tdos = 20 h
tdos = 20 h
hours no temperature overshoot takes place. The consecutive reaction has a heatof reaction 3.25 times that of the main, desired reaction. Therefore there willalways be a region where the maximum temperature is more sensitive towardsthe coolant temperature when the production of 2-octanone shifts to theproduction of carboxylic acids, in this case between -10 and 10 ºC. Themaximum in Tmax has disappeared in Figure 9a; no runaway occurs anymore.During the transition the reactor temperature is always limited between thetarget temperature of 2-octanone and the target temperature of the carboxylicacids. This is now called invariably safe as no sudden temperature jump occursfor any coolant temperature chosen. However, the reaction is not inherently safebecause, for example in case of cooling failure, further oxidation reactions willbe triggered.
The maximum yield of 2-octanone, the amount of carboxylic acids and thenecessary time to reach the maximum are for this case shown in Figure 9b as afunction of the coolant temperature: for higher coolant temperatures themaximum yield of 2-octanone and the time to obtain the maximum yielddecrease gradually. At a high coolant temperature, only carboxylic acids areproduced.
Figure 10: Productivity and raw material loss as a function of the coolanttemperature for the oxidation of 2-octanol carried out in a semi-batch reactorwith dosing times of 10 and 20 hours, respectively. Further parameter valuestaken from Table 2.

Chapter 3
86
Because of the plant economics one must achieve a high yield of 2-octanone in ashort time under safe conditions. For a time tidle for filling, emptying andcleaning of the reactor the productivity is (ζ p · nA,1/Vr,1) / (treac + tidle). For thetwo dosing times the productivities are plotted in Figure 10, as well as therelative loss of raw material defined as the amount of raw material A convertedinto X per unit of P produced. For a coolant temperature below Tcool = -15 ºC themaximum yield of 2-octanone is obtained a long time after the dosing has beenstopped. For this low coolant temperature a high yield is obtained and it is forboth U*Da/ε = 25 and 50 equal to ζ p = 90%. Thus, for a high yield both dosingtimes give similar productivities. A larger dosing time makes the processinvariably safe, while the total time for reaction is not much longer, so for thiscase the longer dosing period of tdos = 20 hours must be recommended. The mosteconomical operating conditions depend on numerous parameters, and should bedetermined for each individual case.
3.4 Recognition of a dangerous state
In the oxidation of 2-octanol one focuses on the first reaction because highyields of ketone are required, while the danger of a runaway reaction must beattributed to the ignition of the secondary reaction. The reaction system can beconsidered as two single reactions and, therefore, the boundary diagramdeveloped by Steensma and Westerterp [1990] for single reactions may behelpful to estimate critical conditions for the multiple reaction system.
Their boundary diagram for a slow reaction in the continuous phase is given inFigure 11. The area enclosed by the boundary lines is where overheating, i.e. arunaway, will occur and therefore it should be avoided. For reaction conditionslocated below the boundary area the reaction does not ignite. The discontinuousline in Figure 11 is the route through the diagram if only the coolant temperatureis increased. The insufficiently ignited reaction will, in that case, first changeinto a runaway reaction and eventually become a QFS reaction when the coolanttemperature is further increased. The coolant temperature should thereforepreferably be chosen such that: 1) the oxidation of 2-octanol to 2-octanone is a QFS reaction, and 2) the secondary reaction remains insufficiently ignited.
When Ex < Exmin, no runaway will take place for any coolant temperature. Inthat case at higher values of the Reactivity number the reaction will be a QFSreaction. The minimum exothermicity number Exmin corresponds to theinvariably safe operation as described in the previous paragraph.

Runaway Behavior and Thermally Safe Operation
87
Later on, the experimental results will be used to verify whether the boundarydiagram as developed by Steensma and Westerterp [1990] is sufficientlyaccurate to predict the reactor behavior of a multiple reaction system.
Figure 11: Boundary diagram for a slow reaction in the continuous phase forU*Da/ε = 5, 10 and 20, respectively. From Steensma and Westerterp [1988].
0
0.01
0.02
0.03
0.04
0 2 4 6 8 10 12
Ex = Exothermicity [-]
Ry
= R
eact
ivity
[-]
U*Da/ε = 5
U*Da/ε = 10
U*Da/ε = 20
increasing Tcool
Insufficient ignitionExmin
Runaway
QFS

Chapter 3
88
3.5 Experimental set-up and procedure
The experimental set-up is shown in Figure 12. The reactor (1) is a jacketed 1-liter glass vessel of the type HWS Mainz. The glass reactor has a diameter of0.10 m and is equipped with four equally spaced stainless steel baffles with awidth of 10 mm. The reactor content is agitated by a stainless steel turbinestirrer with a diameter of 36 mm and six blades of 7.4 x 9.4 mm2 each. Thestirrer is driven by a Janke and Kunkel motor and its speed is kept constant at1000 rpm.
Figure 12: Simplified flowsheet of experimental set-up. Ti, temperatureindictor. See text for further details.
2
3
Ti
Ti
Ti
4
7
1
Ti
6
Ti
Ti
Ti
H2O
H2O
5

Runaway Behavior and Thermally Safe Operation
89
The reactor is operated in the semi-batch mode with a constant coolanttemperature. To study the influence of different heat transfer coefficients twoseparate cooling circuits are used: one via the cooling jacket and one via acooling coil. The coolant is pumped from a cryostat (2) of the type Julabo FP50through the cooling jacket by a Pompe Caster gear pump or through the coolingcoil by a Verder gear pump. The coil consists of tubes made of stainless steelwith a diameter of 6 mm and wall thickness of 1 mm. The reactor is initiallyloaded with 0.5 liter of a 60 wt% HNO3-solution. Before the experiment isstarted a small amount of 0.12 g NaNO2 is added as initiator. When thetemperature of the reactor has become constant, the feeding of pure 2-octanol isstarted. The supply vessel has been located on a balance of the type Mettlerpm1200 (3) to measure the mass of the feed. The organic compound is fed to thereactor by a Verder gear pump (4) with a constant feed rate in the range of 0.03to 0.33 kg/h. The nitric acid and the organic solutions are immiscible and form adispersion in the reactor, provided the mixing rates are high. The nitric acid istaken in excess and forms the continuous phase during the whole experiment.Before an experiment is started, the equipment is flushed with N2. During theoxidation NOX-gases are formed, which are allowed to escape through a hole inthe reactor lid towards a scrubber (5), where they are washed with water. Afteran amount of 0.16 kg 2-octanol has been added, the dosing is stopped manually.After that the experiment is continued till at least t = 2 tdos. The experiment isthen brought to an end by heating up the reactor contents, so that the remainingreactants are converted to carboxylic acids.
The temperatures of the reaction mixture, coolant inlet and outlet, feed andsurroundings are measured by thermocouples. The temperatures and the feedmass flow rate are monitored and stored by a Data Acquisition and Control Unitin combination with a computer of the type HP486-25 of Hewlett Packard.When the reactor temperature exceeds a certain unacceptable value, thecomputer in an emergency procedure activates actuators to open: a) The valve inthe reactor bottom to dump the reactor content and quench it on ice in acontainer (6) and b) The valve on the reactor lid to dump an amount of 0.5 literwater into the reactor from the container (7). During an experiment samples ofthe dispersion are taken manually via a syringe. Approximately 5 samples aretaken during each run. In the syringe the dispersion separates immediately intwo phases; both phases are analyzed. The nitric acid concentration in theaqueous phase is determined by titration and the organic phase is analyzed bygas chromatography, see Chapter 2.
An example run is shown in Figure 13, with the temperatures as measured andthe number of moles of the compounds as determined via the chemical analysis.

Chapter 3
90
5
10
15
20
25
-1000 0 1000 2000 3000 4000 5000 6000
Time [s]
Tem
per
atur
e [º
C]
startdosing
Treactor
Tjacketstopdosing
Tspiral
Tambient
Tfeed
0
0.5
1
1.5
2
-1000 0 1000 2000 3000 4000 5000 6000
Time [s]
Num
ber
of m
ole
s
2-OctanolCarboxylic acids
2-Octanone
HNO3
7
5
6
a
b
Figure 13: Isoperibolic semi-batch experiment with jacket and spiral cooling at10 ºC with an initial load of 0.5 liter of 60 wt% HNO3 and 0.12 gram NaNO2.Addition of 0.2 liter 2-octanol in a dosing time of 42 minutes. a) Measuredtemperatures of the feed, ambient, reactor contents, cooling spiral and coolingjacket. b) Molar amounts as function of time of the nitric acid in the aqueousphase and of 2-octanol, 2-octanone and carboxylic acids, respectively in theorganic phase.
Runaway Behavior and Thermally Safe Operation
91
Thermal characterization of equipment
To describe the thermal dynamics of the reactor set-up a proper equipmentcharacterization is necessary, see also Barcons [1991]. It is carried out bydetermining heat capacities and heat flows as enumerated in Equation (13) asfollows:
Thermal capacitiesThe effective heat capacity Γeff involves the heat capacities of the vessel walland inserts, like the cooling coil, baffles, and stirrer: it is determined by a rapidaddition to the reactor vessel of an amount of hot water of a temperature Tw,0 anda mass m and measure the temperature of the liquid phase as a function of time.The temperature of the added water will decrease from Tw,0 to T1 and heat-up thesystem from Tr,0 to T1. The total heat capacity Γtot follows from:
Γ Γtot effP w w
r
mmC T T
T Tm= + =
−−
+(( )
(,
,
C ) C )P w P w0 1
1 0
2 72 7
(23)
UAThe product of the overall heat transfer coefficient and the cooling area UAcool ofthe cooling jacket and cooling coil are determined by introducing an amount ofenergy with a cartridge heater of the type Superwatt 7310 put into the reactionmixture. A heat flow of approximately Qelement ≈ 10 Watt is adequate. Thecooling circuit removes the heat and the temperature of the reaction mixture andcoolant are measured as a function of time: a steady state will be reached assoon as the heat production rate by the electrical heater is equal to the heat flowto the coolant Qcool. Under these conditions the temperature difference betweenthe reaction mixture and cooling medium (Tr -Tcool) can be used to determine thevalue of UAcool according to:
UAQ
T Tcoolelement
r cool
=−1 6
(24)
UAcool has been determined for different volumes of dispersion in the reactor andincreases linearly with the volume dosed.
Heat losses to the surroundingsA good estimate can be obtained by introducing a known amount of energy withthe electrical heater into the reaction mixture without cooling. The heat input isset at approximately Qelement ≈ 5 Watt and the temperature of the reaction
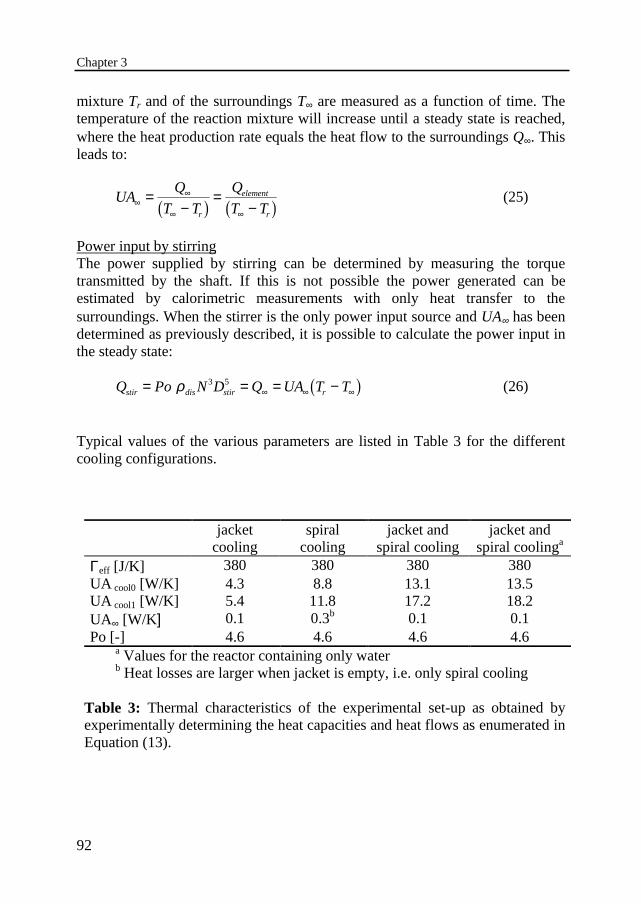
Chapter 3
92
mixture Tr and of the surroundings T∞ are measured as a function of time. Thetemperature of the reaction mixture will increase until a steady state is reached,where the heat production rate equals the heat flow to the surroundings Q∞. Thisleads to:
UAQ
T T
Q
T Tr
element
r∞
∞
∞ ∞
=−
=−1 6 1 6
(25)
Power input by stirringThe power supplied by stirring can be determined by measuring the torquetransmitted by the shaft. If this is not possible the power generated can beestimated by calorimetric measurements with only heat transfer to thesurroundings. When the stirrer is the only power input source and UA∞ has beendetermined as previously described, it is possible to calculate the power input inthe steady state:
Q Po N D Q UA T Tstir dis stir r= = = −∞ ∞ ∞ρ 3 5 1 6 (26)
Typical values of the various parameters are listed in Table 3 for the differentcooling configurations.
jacketcooling
spiralcooling
jacket andspiral cooling
jacket andspiral coolinga
Γeff [J/K] 380 380 380 380UA cool0 [W/K] 4.3 8.8 13.1 13.5UA cool1 [W/K] 5.4 11.8 17.2 18.2UA∞ [W/K ] 0.1 0.3b 0.1 0.1Po [-] 4.6 4.6 4.6 4.6
a Values for the reactor containing only waterb Heat losses are larger when jacket is empty, i.e. only spiral cooling
Table 3: Thermal characteristics of the experimental set-up as obtained byexperimentally determining the heat capacities and heat flows as enumerated inEquation (13).
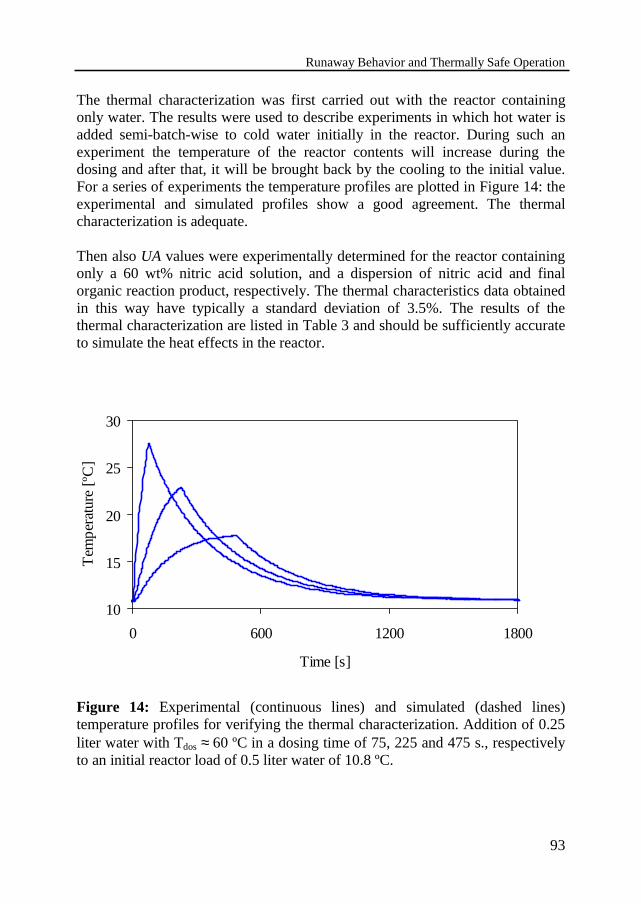
Runaway Behavior and Thermally Safe Operation
93
10
15
20
25
30
0 600 1200 1800
Time [s]
Tem
per
atur
e [º
C]
The thermal characterization was first carried out with the reactor containingonly water. The results were used to describe experiments in which hot water isadded semi-batch-wise to cold water initially in the reactor. During such anexperiment the temperature of the reactor contents will increase during thedosing and after that, it will be brought back by the cooling to the initial value.For a series of experiments the temperature profiles are plotted in Figure 14: theexperimental and simulated profiles show a good agreement. The thermalcharacterization is adequate.
Then also UA values were experimentally determined for the reactor containingonly a 60 wt% nitric acid solution, and a dispersion of nitric acid and finalorganic reaction product, respectively. The thermal characteristics data obtainedin this way have typically a standard deviation of 3.5%. The results of thethermal characterization are listed in Table 3 and should be sufficiently accurateto simulate the heat effects in the reactor.
Figure 14: Experimental (continuous lines) and simulated (dashed lines)temperature profiles for verifying the thermal characterization. Addition of 0.25liter water with Tdos ≈ 60 ºC in a dosing time of 75, 225 and 475 s., respectivelyto an initial reactor load of 0.5 liter water of 10.8 ºC.

Chapter 3
94
Check on the validity of the model for slow reactions
The mass balances for the oxidations, Equation (11) and (12), have been derivedby assuming the rate of mass transfer is not enhanced by reaction, and thereaction mainly proceeds in the bulk of the reaction phase. This has to bevalidated for the current reactor set-up and the applied experimental conditions.For such situations, one must check that Ha < 0 3. holds, see Westerterp et al.[1987], where the Hatta number Ha is defined as:
HakC D
kB Aq i
L
= , (27)
The mass transfer coefficients kL,Aq for 2-octanol and 2-octanone in thecontinuous, aqueous phase is typically kL,Aq = 40·10-6 m/s, which has beendiscussed in more detail in Chapter 2. This value is larger than the valuereported by Chapman et al. [1974]. They found experimentally kL = 10.3·10-6
m/s for toluene in a HNO3/H2SO4 solution with an acid strength of 76%. Theacid strength used in the present work is much lower and, therefore, at the lowerviscosity a larger value of the mass transfer coefficient is found. The Hattanumber for the oxidation of 2-octanone is always below 0.3, for the wholeexperimental range. The calculated Hatta numbers for the oxidation of 2-octanolindicate that this is also the case as long as the temperature is below 40 ºC as Ha< 0.3. This includes the temperature range for high yields of 2-octanone.
Furthermore, the mass transfer resistance in the organic phase can be neglectedas the solubility of the organic compounds in the nitric acid solution is low andthe mass transfer coefficients are of the same order of magnitude, see Chapter 2.
If the conversion rate for a liquid-liquid reaction is not influenced by a masstransfer resistance, it should be independent of the stirring rate. The influence ofthe stirring rate on the conversion rate has been experimentally determined inthe temperature range of 10 to 60 ºC at 720, 1000 and 1400 rpm. The maximumheat production rate is plotted against the stirring speed in Figure 15 and isindependent of the stirring speed. For the chosen stirring rate of 1000 rpm in theexperiments mass transfer resistance 1/kLa does not play a role. Visually it canbe observed that above N = 600 rpm the mixture becomes well dispersed.

Runaway Behavior and Thermally Safe Operation
95
0
100
200
300
400
500
500 700 900 1100 1300 1500
Stirring speed [rpm]
Max
imum
hea
t p
rod
uctio
n ra
te [W
]60 ºC
30 ºC
15 ºC
Figure 15: Maximum heat production rate versus stirring speed for semi-batchexperiments at a temperature of 15, 30 and 60 ºC. Reactor initial loaded with 0.7kg 60 wt% HNO3 and 0.12 g NaNO2. Addition of 0.16 kg 2-octanol in a dosingtime of 42 min.
3.6 Experimental results
Temperature profilesThe nitric acid oxidation of 2-octanol has been experimentally studied underisoperibolic conditions i.e. with a constant coolant temperature, at differentvalues of the coolant temperature. The semi-batch reactor is initially chargedwith 0.5 liter of a 60 wt% HNO3 solution, after that 0.2 liter of 2-octanol isadded at ambient temperature, in all experiments. First, a series of experimentshas been carried out with a constant feed rate during one hour and with coolingonly via the cooling jacket. Second, a series of experiments has been carried outwith both cooling jacket and cooling coil in use. The temperature profiles areshown in Figure 16: a good agreement between the experimental and simulatedvalues can be observed, except for high temperatures. For the reaction systemthe upper temperature limit is approximately 90 ºC, where the mixture starts toboil. In Figure 16a the temperature profiles are shown for experiments withU*Da/ε = 21 whereby, as a result of increasing coolant temperature, thetransition to the consecutive reaction is accompanied by a large temperatureovershoot. For a higher cooling capacity – U*Da/ε = 65 – in Figure 16b thetransition is gradual and no sudden temperature jumps can be observed.

Chapter 3
96
0
20
40
60
80
0 1800 3600 5400 7200
Time [s]
Tem
per
atur
e [º
C]
0
20
40
60
80
100
0 1800 3600 5400 7200
Time [s]
Tem
per
atur
e [º
C]
a
b
Figure 16: Experimental (continuous lines) and simulated (dashed lines)temperature profiles of isoperibolic semi-batch experiments with an initial loadof 0.5 liter 60 wt% HNO3 and 0.12 gram NaNO2. Addition of 0.2 liter 2-octanolin a dosing time of 60 minutes with (a) U*Da/ε = 21: the transition of thereaction is accompanied by a large temperature overshoot, and (b) U*Da/ε = 65:a gradual temperature increase.

Runaway Behavior and Thermally Safe Operation
97
-20
20
60
100
-20 0 20 40 60
Coolant temperature [ºC]
Max
imum
tem
per
atur
e [º
C]
61
21
48
U*Da/ε
Thermally safe operation of the nitric acid oxidation of 2-octanol
The objective is to produce 2-octanone with a high yield and under safeconditions. To this end the nitric acid oxidation of 2-octanol is experimentallystudied together with the region of a high yield of 2-octanone.
Influence of dosing timeIncreasing dosing time makes it possible to spread the produced heat of reactionover a longer period of time and should therefore reduce or avoid temperatureovershoots. A series of experiments has been carried out at different coolanttemperatures with dosing times of 60, 135 and 170 minutes, respectively, whichis equivalent to U*Da/ε values of 21, 48 and 61. The maximum temperatureobtained during a run is plotted versus the coolant temperature in Figure 17.
Figure 17: Influence of the dosing time on the maximum temperature.Experimental (dots) and simulated (lines) isoperibolic semi-batch experimentswith an initial load of 0.5 liter of 60 wt% HNO3 and 0.12 gram NaNO2. Additionof 0.2 liter 2-octanol in a dosing time of 60(●), 135(❍) and 170(▲) minutes,which is equivalent to U*Da/ε values of 21, 48 and 61.

Chapter 3
98
0
0.2
0.4
0.6
0.8
1
0 10 20 30 40 50
Coolant temperature [ºC]
Max
imum
yie
ld [-
]61
21
U*Da/ε
0
2
4
6
8
10
0 10 20 30 40 50
Coolant temperature [ºC]
Rea
ctio
n tim
e [h
]
61
21
U*Da/ε
a
b
Figure 18: Influence of the dosing time on (a) the yield of 2-octanone and (b)the reaction time as function of the coolant temperature. Parameters as in Figure17.
Increasing U*Da/ε from 21 to 48 effectively reduces the temperature overshoot,which even disappears for U*Da/ε = 61. Thus, for a long dosing time anincrease in coolant temperature leads to a gradual transition of the reactions andno runaway occurs anymore for any coolant temperature chosen; the process isinvariably safe.
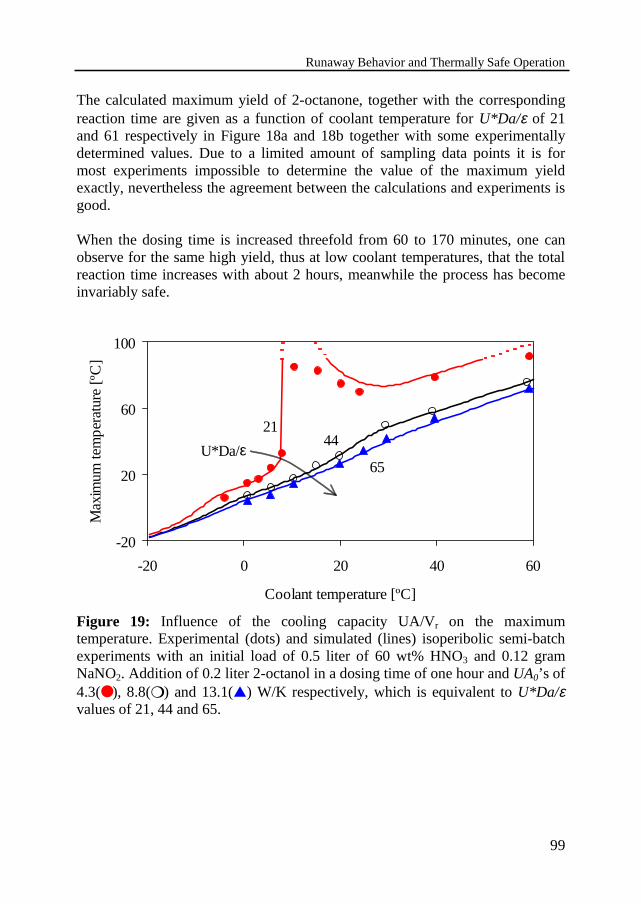
Runaway Behavior and Thermally Safe Operation
99
-20
20
60
100
-20 0 20 40 60
Coolant temperature [ºC]
Max
imum
tem
per
atur
e [º
C]
65
2144
U*Da/ε
The calculated maximum yield of 2-octanone, together with the correspondingreaction time are given as a function of coolant temperature for U*Da/ε of 21and 61 respectively in Figure 18a and 18b together with some experimentallydetermined values. Due to a limited amount of sampling data points it is formost experiments impossible to determine the value of the maximum yieldexactly, nevertheless the agreement between the calculations and experiments isgood.
When the dosing time is increased threefold from 60 to 170 minutes, one canobserve for the same high yield, thus at low coolant temperatures, that the totalreaction time increases with about 2 hours, meanwhile the process has becomeinvariably safe.
Figure 19: Influence of the cooling capacity UA/Vr on the maximumtemperature. Experimental (dots) and simulated (lines) isoperibolic semi-batchexperiments with an initial load of 0.5 liter of 60 wt% HNO3 and 0.12 gramNaNO2. Addition of 0.2 liter 2-octanol in a dosing time of one hour and UA0’s of4.3(●), 8.8(❍) and 13.1(▲) W/K respectively, which is equivalent to U*Da/εvalues of 21, 44 and 65.
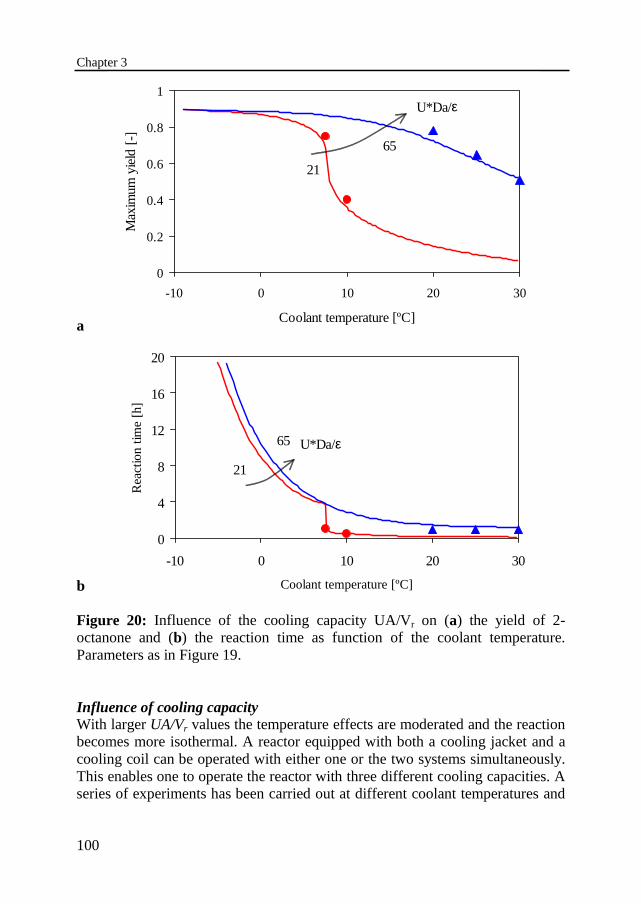
Chapter 3
100
0
0.2
0.4
0.6
0.8
1
-10 0 10 20 30
Coolant temperature [ºC]
Max
imum
yie
ld [-
]65
21
U*Da/ε
0
4
8
12
16
20
-10 0 10 20 30
Coolant temperature [ºC]
Rea
ctio
n t
ime
[h]
65
21
U*Da/ε
a
b
Figure 20: Influence of the cooling capacity UA/Vr on (a) the yield of 2-octanone and (b) the reaction time as function of the coolant temperature.Parameters as in Figure 19.
Influence of cooling capacityWith larger UA/Vr values the temperature effects are moderated and the reactionbecomes more isothermal. A reactor equipped with both a cooling jacket and acooling coil can be operated with either one or the two systems simultaneously.This enables one to operate the reactor with three different cooling capacities. Aseries of experiments has been carried out at different coolant temperatures and
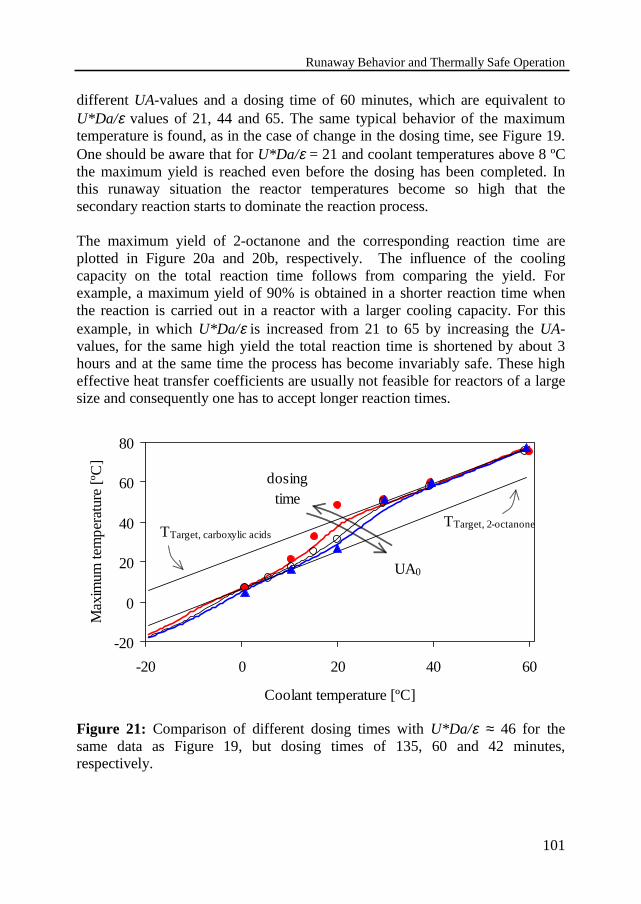
Runaway Behavior and Thermally Safe Operation
101
-20
0
20
40
60
80
-20 0 20 40 60
Coolant temperature [ºC]
Max
imum
tem
per
atur
e [º
C]
TTarget, carboxylic acidsTTarget, 2-octanone
dosingtime
UA0
different UA-values and a dosing time of 60 minutes, which are equivalent toU*Da/ε values of 21, 44 and 65. The same typical behavior of the maximumtemperature is found, as in the case of change in the dosing time, see Figure 19.One should be aware that for U*Da/ε = 21 and coolant temperatures above 8 ºCthe maximum yield is reached even before the dosing has been completed. Inthis runaway situation the reactor temperatures become so high that thesecondary reaction starts to dominate the reaction process.
The maximum yield of 2-octanone and the corresponding reaction time areplotted in Figure 20a and 20b, respectively. The influence of the coolingcapacity on the total reaction time follows from comparing the yield. Forexample, a maximum yield of 90% is obtained in a shorter reaction time whenthe reaction is carried out in a reactor with a larger cooling capacity. For thisexample, in which U*Da/ε is increased from 21 to 65 by increasing the UA-values, for the same high yield the total reaction time is shortened by about 3hours and at the same time the process has become invariably safe. These higheffective heat transfer coefficients are usually not feasible for reactors of a largesize and consequently one has to accept longer reaction times.
Figure 21: Comparison of different dosing times with U*Da/ε ≈ 46 for thesame data as Figure 19, but dosing times of 135, 60 and 42 minutes,respectively.
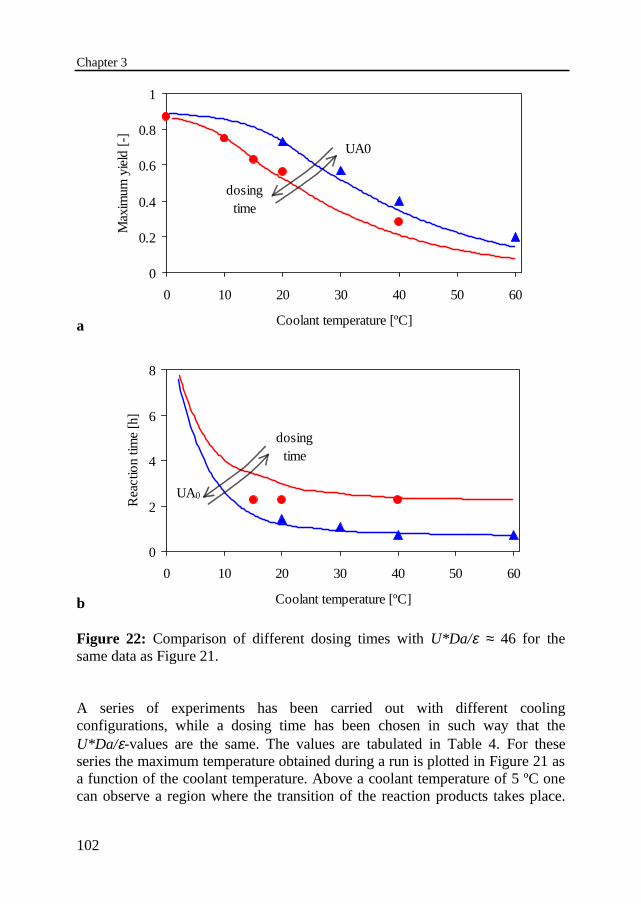
Chapter 3
102
0
0.2
0.4
0.6
0.8
1
0 10 20 30 40 50 60
Coolant temperature [ºC]
Max
imum
yie
ld [-
]
dosingtime
UA0
0
2
4
6
8
0 10 20 30 40 50 60
Coolant temperature [ºC]
Rea
ctio
n tim
e [h
]
dosingtime
UA0
a
b
Figure 22: Comparison of different dosing times with U*Da/ε ≈ 46 for thesame data as Figure 21.
A series of experiments has been carried out with different coolingconfigurations, while a dosing time has been chosen in such way that theU*Da/ε-values are the same. The values are tabulated in Table 4. For theseseries the maximum temperature obtained during a run is plotted in Figure 21 asa function of the coolant temperature. Above a coolant temperature of 5 ºC onecan observe a region where the transition of the reaction products takes place.
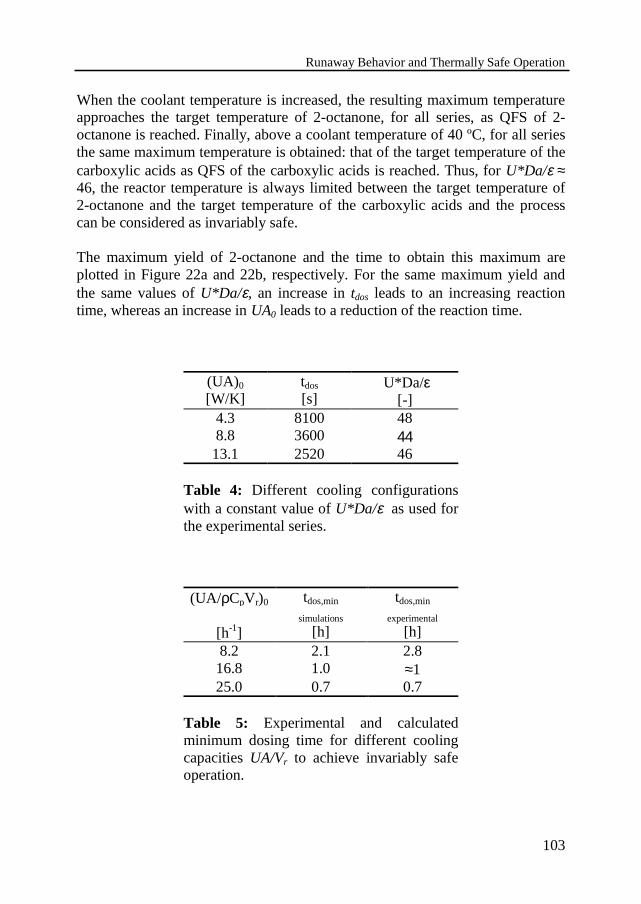
Runaway Behavior and Thermally Safe Operation
103
When the coolant temperature is increased, the resulting maximum temperatureapproaches the target temperature of 2-octanone, for all series, as QFS of 2-octanone is reached. Finally, above a coolant temperature of 40 ºC, for all seriesthe same maximum temperature is obtained: that of the target temperature of thecarboxylic acids as QFS of the carboxylic acids is reached. Thus, for U*Da/ε ≈46, the reactor temperature is always limited between the target temperature of2-octanone and the target temperature of the carboxylic acids and the processcan be considered as invariably safe.
The maximum yield of 2-octanone and the time to obtain this maximum areplotted in Figure 22a and 22b, respectively. For the same maximum yield andthe same values of U*Da/ε, an increase in tdos leads to an increasing reactiontime, whereas an increase in UA0 leads to a reduction of the reaction time.
(UA)0
[W/K]tdos
[s] U*Da/ε
[-]4.3 8100 488.8 3600 4413.1 2520 46
Table 4: Different cooling configurationswith a constant value of U*Da/ε as used forthe experimental series.
(UA/ρCpVr)0
[h-1]
tdos,min
simulations
[h]
tdos,min
experimental
[h]8.2 2.1 2.816.8 1.0 ≈125.0 0.7 0.7
Table 5: Experimental and calculatedminimum dosing time for different coolingcapacities UA/Vr to achieve invariably safeoperation.

Chapter 3
104
0.1
1
10
100
0.1 1 10 100
(UA/ρCpVr)0 [h-1]
t do
s [h]
Runaway
Boundary line
U*Da/ε = 45
Safe
U*Da/ε < 45
U*Da/ε > 45
Experimental points
Invariably safe operationThe process can be regarded as invariably safe when no runaway can occur forany coolant temperature. This can be achieved for large values of U*Da/ε, thatis for a long dosing time tdos or a large cooling capacity UA/Vr, as has beenshown. When this is one of the conditions to be fulfilled the minimum dosingtime tdos,min should be found that just meets this requirement. It can bedetermined experimentally by carrying out experiments with different coolanttemperatures and different dosing times. This demands much experimentaleffort. First a dosing time was chosen and a series of experiments was carriedout with different coolant temperatures. When one of the experiments led to arunaway a second series was carried out with a longer dosing time. This wasrepeated, until the dosing time was found that led to invariably safe operation.This has been done for the different cooling capacities of the reactor set-up. Theresulting minimum dosing times tdos,min are tabulated in table 5 and plotted inFigure 23. The process is invariably safe for U*Da/ε > 45. As can be seen inFigure 23, the experimental and simulated results are in reasonable agreement inpredicting the boundary region. This region is very critical, as it is very sensitivetowards small changes. The experimental and calculated results suggest thatscale-up can be done, for a given cooling capacity of the reactor, by selecting theminimum dosing time from Figure 23. Consequently, a few laboratory-scaleexperiments should be enough to establish conditions for a large-scale reactor toachieve an invariably safe operation.
Figure 23: Boundary line for invariably safe operation of the nitric acidoxidation of 2-octanol for U*Da/ε = 45. Results of the simulations (solid line)and the experimentally determined points.

Runaway Behavior and Thermally Safe Operation
105
3.7 Prediction of safe operation based on the individual reactions
Now the boundary diagram developed by Steensma and Westerterp [1990] willbe used to estimate the QFS conditions of the oxidation of 2-octanol to 2-octanone, as well as the critical conditions at which the further oxidationreaction will be triggered.
Prediction of QFS conditions for the oxidation of 2-octanol to 2-octanoneIn case 2-octanone is produced with a high yield, the reaction is: A + B Æ P +2B. This reaction is considered as a slow single reaction in the continuous phase.The boundary diagram can be used to determine the coolant temperature atwhich QFS conditions are obtained. This will be explained with the oxidation of2-octanol as an example. To obtain a value of U*Da/ε = 20 for a reactor initiallyloaded with HNO3 and UA0 = 4.3 W/K a dosing time has to be chosen equal totdos = 0.93 hour, which can be compared to the experiments with U*Da/ε = 21 inFigure 17.
The required coolant temperature can be found after iteration. For Tcool = -1 ºCone can calculate the Exothermicity number to be Ex = 2.0. The correspondingreactivity number, for QFS conditions, can be read from Figure 11: Ry = 0.02.The coolant temperature Tcool follows from the definition for Ry, see notation,provided the other initial reaction conditions are known. After rewriting:
T E R m HRy R U Da
C t mkcool HH
B dos
= − −+�
�����
���
���∞
/ ln*
0 00
ε1 6(28)
The initial concentration of nitrosonium ion has been set at ζ B0 0 035= . , thusC n VB A B0 1 0 0= ⋅ =ζ / 0.088 M. So, for the oxidation of 2-octanol and the relevantparameters as listed in Tables 1 and 6 it follows that QFS conditions will beobtained for Tcool > -1 ºC. The oxidation of 2-octanol was experimentally foundto be under QFS conditions for a coolant temperature of Tcool > -5 ºC, see Figure17, which is close to the calculated value.
Prediction of runaway conditions for the oxidation of 2-octanoneNow is has to be verified that the unwanted reaction will not be triggered as aresult of the first reaction. When the conversion to 2-octanone is complete andno carboxylic acids are formed, one obtains: C n VB A P0 1 0 0= ⋅ =ζ / 2.46 M and theacid strength of the nitric acid will drop to a value of H0 = -2.86. With a coolanttemperature of Tcool = -1 ºC for the first reaction, a maximum temperature of Tmax
= 12 ºC is found experimentally, see Figure 17. Using these conditions as initial
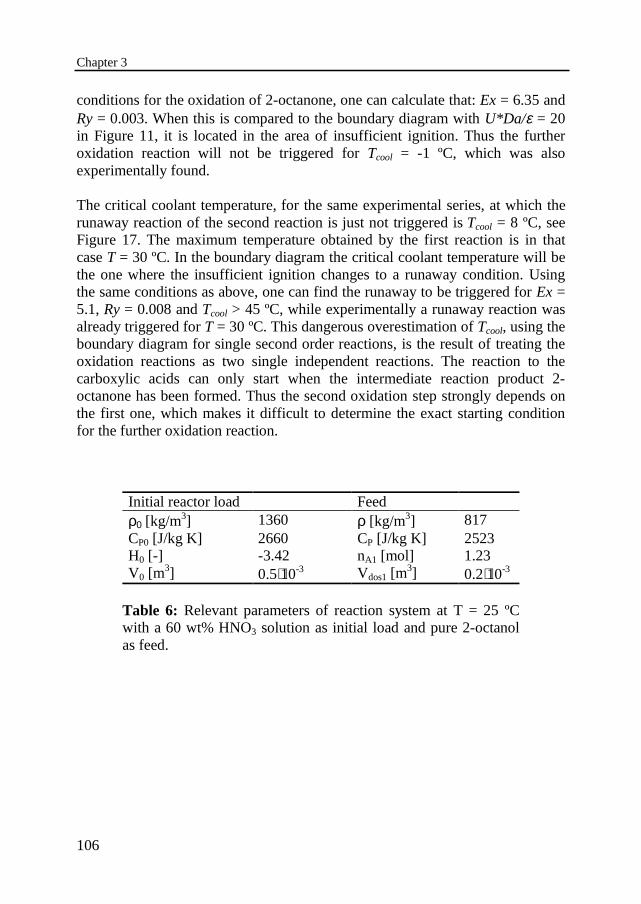
Chapter 3
106
conditions for the oxidation of 2-octanone, one can calculate that: Ex = 6.35 andRy = 0.003. When this is compared to the boundary diagram with U*Da/ε = 20in Figure 11, it is located in the area of insufficient ignition. Thus the furtheroxidation reaction will not be triggered for Tcool = -1 ºC, which was alsoexperimentally found.
The critical coolant temperature, for the same experimental series, at which therunaway reaction of the second reaction is just not triggered is Tcool = 8 ºC, seeFigure 17. The maximum temperature obtained by the first reaction is in thatcase T = 30 ºC. In the boundary diagram the critical coolant temperature will bethe one where the insufficient ignition changes to a runaway condition. Usingthe same conditions as above, one can find the runaway to be triggered for Ex =5.1, Ry = 0.008 and Tcool > 45 ºC, while experimentally a runaway reaction wasalready triggered for T = 30 ºC. This dangerous overestimation of Tcool, using theboundary diagram for single second order reactions, is the result of treating theoxidation reactions as two single independent reactions. The reaction to thecarboxylic acids can only start when the intermediate reaction product 2-octanone has been formed. Thus the second oxidation step strongly depends onthe first one, which makes it difficult to determine the exact starting conditionfor the further oxidation reaction.
Initial reactor load Feedρ0 [kg/m3] 1360 ρ [kg/m3] 817CP0 [J/kg K] 2660 CP [J/kg K] 2523H0 [-] -3.42 nA1 [mol] 1.23V0 [m
3] 0.5⋅10-3 Vdos1 [m3] 0.2⋅10-3
Table 6: Relevant parameters of reaction system at T = 25 ºCwith a 60 wt% HNO3 solution as initial load and pure 2-octanolas feed.

Runaway Behavior and Thermally Safe Operation
107
1
10
100
1 10 100
U*Da/ε [-]
Exo
ther
mic
ity [-
]
Calculated Ex
Ex = Exmin
Exmin
from Figure 11
Prediction of invariably safe operation conditions using Exmin
The boundary diagram can also be used to determine the minimum dosing timetdos,min, which leads to invariably safe operation. This corresponds to theminimum exothermicity number Exmin. Exmin can be read from the boundarydiagram for a single reaction in the continuous phase in Figure 11 and is equal toExmin = 4.3, 6 and 8.6 for U*Da/ε = 20, 10 and 5, respectively. For the oxidationof 2-octanone one can calculate, using the relevant parameters as listed in Tables1 and 6, ∆Tad0 = 354 K, ε = 0.4 and RH =0.57. For Tcool = 20 ºC one cancalculate Ex = 6.0, 11.7 and 18.4 for U*Da/ε = 20, 10 and 5, respectively, whichnow can be compared to the Exmin-values taken from Figure 11. This is done inFigure 24. When U*Da/ε is increased the exothermicity Ex decreases faster thanExmin and consequently there exist a point where Ex = Exmin and hence tdos equalstdos,min. In this case Exmin = 2.8 can be found and for U*Da/ε > 47 no runawaywill take place for any coolant temperature and the process has becomeinvariably safe. This value can be compared to U*Da/ε > 45, which was foundexperimentally.
Figure 24: Exothermicity number Ex for the oxidation of 2-octanone tocarboxylic acids as a function of U*Da/ε to determine the minimumexothermicity number Exmin.
Chapter 3
108
3.8 Discussion and conclusions
The nitric acid oxidation of 2-octanol has been studied experimentally in a 1-liter glass reactor. The reaction rates of the oxidation reactions as experimentallydetermined and modeled, see Chapter 2, have been successfully applied tosimulate the experiments and a satisfactory agreement has been obtainedbetween experiments and calculations.
Thermally safe operation of a semi-batch reactor usually implies that undernormal operating conditions a runaway is avoided. To this end one has to avoidaccumulation of the dosed reactant in the reaction phase. However, in case theintermediate is the required product, accumulation of the reactant for theconsecutive reaction necessarily occurs. So for the second reaction, conditionsmust be such that the reaction will not occur at all or at least remainsinsufficiently ignited. The reaction conditions should rapidly lead to themaximum yield of 2-octanone under safe conditions and stopped at the optimumreaction time.
The process can be regarded as invariably safe when no runaway takes place forany coolant temperature. This is possible for a large value of U*Da/ε, and hencea long dosing time or a large cooling capacity, which effectively moderates thetemperature effects. For the oxidation of 2-octanol to 2-octanone and carboxylicacids the process is invariably safe for U*Da/ε > 45. Under such conditions thereactor temperature is always limited between pre-defined known temperaturelimits. These predefined temperatures are based on the target temperaturedeveloped by Steensma and Westerterp [1990] and can be successfully appliedin case of a multiple reaction.
The conditions leading to invariably safe operation correspond with theminimum exothermicity number Exmin. The value for Exmin can be derived fromthe boundary diagram of Steensma and Westerterp [1990]. For the oxidation of2-octanone and using the boundary diagram a minimum exothermicity numberof Exmin = 2.8 and U*Da/ε > 47, the process was found to be invariably safe.Experimentally a value of U*Da/ε > 45 was found.
For a single reaction the conditions leading to QFS conditions and to thermalrunaway can be extracted from the boundary diagram. The coolant temperatureleading to a QFS condition for the oxidation of 2-octanol to 2-octanone aspredicted in the boundary diagram agrees with the experimental result.

Runaway Behavior and Thermally Safe Operation
109
However, it is not possible to predict with sufficient accuracy the conditionsleading to a runaway of the secondary oxidation reaction. This reaction can onlystart when the intermediate reaction product 2-octanone has been formed.Regretfully, it is difficult to determine the exact starting conditions for thefurther oxidation reaction, which is necessary for an accurate estimation.
The reaction conditions should rapidly lead to the maximum yield of 2-octanoneunder safe conditions and stopped at the optimum reaction time. Themathematical model as developed by Steensma and Westerterp [1990], andextended in this work to a multiple reaction system, can be used to predict thereactor behavior and the moment to stop the reaction. The most economicaloperation condition depends on a number of parameters and must be determinedfor each specific case.
Acknowledgements
The author wishes to thank A.B. Wonink and S.J. Metz for their contribution tothe experimental work, M.T. van Os and A.B. Kleijn for their contribution to thepreliminary calculations and further F. ter Borg, K. van Bree, G.J.M. Monninkand A.H. Pleiter for the technical support.
Notation
a Interfacial area per volume of reactor content = 6 32ε / d [m2/m3]A Surface area [m2]C Concentration [kmol/m3]CP Specific heat capacity [J/Kg·K]D Diameter [m]Di Diffusivity coefficient of component i [m2/s]d32 Sauter mean drop diameter [m]E Energy of activation [J/kmol]H0 Hammett’s acidity function [-]Ha Hatta number [-]kL Mass transfer coefficient in the aqueous phase [m/s]k Second-order reaction rate constant [m3/kmol·s]k∞ Pre-exponential constant [m3/kmol·s]mi Molar distribution coefficient of component i=C Ci Aq i Org, , [-]m Mass [kg]mHo Hammett’s reaction rate coefficient [-]n Number of moles [kmol]N Stirring rate [s-1]

Chapter 3
110
Q Heat flow [W]R Gas constant = 8315 [J/kmol·K]RH Heat capacity ratio = ( ) ( )ρ ρC CP dos P 0 [-]r Rate of reaction per volume of reactor content [kmol/m3·s]t Time [s]tdos Dosing time [s]tdos,minMinimum dosing time [s]T Temperature [K]U Overall heat transfer coefficient [W/m2·K]V Volume [m3]
Greek symbols
∆H Heat of reaction [J/kmol]∆Tad0 Adiabatic temperature rise = ∆H n C VA P r1 0( )ρ [K]ε d Volume fraction of dispersed phase = +V V Vdos dos1 1 0( ) [-]ε Relative volume increase at end of dosing = V Vdos1 0 [-]ϕ v Flow [m3/s]Γ Heat capacity [J/K]ρ Density [kg/m3]θ Dimensionless dosing time = t/tdos [-]ζ i Yield of component i = n ni A1 [-]ζ B0 Initial concentration of nitrosonium ion = 0.035 [-]
Dimensionless groups
Ex Exothermicity number = ∆T E R
T R U Daad
cool H
, /
*02
1
ε +[-]
Ry Reactivity number = C t mk E RT m H
R U DaB dos H
H
0 0 0 0∞ − −+
exp /
*
1 6ε
[-]
Po Power number = Q
N Ddis stirρ 3 5[-]
U*Da Cooling number = UA
C Vt
P rdosρ
���
���
0
[-]
Runaway Behavior and Thermally Safe Operation
111
Subscripts and superscripts
0, 1 Initial, Final (after dosing is completed)A Component A (2-octanol)Aq Aqueous phase (nitric acid solution)B Component B (nitrosonium ion)cool Coolantdis Dispersiondos Dosingelement Electrical heater elementi Component iN Component N (nitric acid)nol Reaction of 2-octanol, see Equation (1)none Reaction of 2-octanone, see Equation (2)Org Organic phaseP Component P (2-octanone)R Reactionr Reactorstir Stirringtot Totalw WaterX Component X (carboxylic acids)∞ Ambient

Chapter 3
112
References
Barcons I Ribes, C., Equipment characterisation, in: A. Benuzzi, J.M. Zaldivar(eds.), Euro Courses, Reliability and Risk Analysis, Vol.1: Safety ofChemical Batch Reactors and Storage Tanks, Kluwer Academic,Dordrecht 1991, pp. 99-123.
Chapman, J.W., Cox, P.R. and Strachan, A.N., Two phase nitration of tolueneIII, Chem. Eng. Sci. 29 (1974) 1247-1251.
Eigenberger, G. and Schuler, H., Reaktorstabilität und sichereReaktionsführung, Chem. Ing. Tech. 58 (1986) 655-665.
Hugo, P. and Steinbach J., Praxisorientierte Darstellung der thermischenSicherheitsgrenzen fur den indirekt gekühlten Semibatch-Reaktor, Chem.Ing. Tech. 57 (1985) 780-782.
Hugo, P., Steinbach, J. and Stoessel, F., Calculation of the maximumtemperature in stirred tank reactors in case of a breakdown of cooling,Chem. Eng. Sci. 43 (1988) 2147-2152.
Koufopanos, C.A., Karetsou, A. and Papayannakos, N.G., Dynamic responseand safety assessment of a batch process on cooling breakdown, Chem.Eng. Technol. 17 (1994) 358-363.
Rochester, C.H., Organic chemistry, A Series of Monographs: AcidityFunctions, Academic press, London, 1970.
Serra, E., Nomen, R. and Sempere, J., Maximum temperature attainable byrunaway of synthesis reaction in semi-batch processes, J. Loss Prev.Process Ind. 10 (1997) 211-215.
Steensma, M. and Westerterp, K.R., Thermally safe operation of a cooled semi-batch reactor. Slow liquid-liquid reactions, Chem. Eng. Sci. 43 (1988)2125-2132.
Steensma, M. and Westerterp, K.R., Thermally safe operation of a semi-batchreactor for liquid-liquid reactions. Slow reactions, Ind. Eng. Chem. Res.29 (1990) 1259-1270.
Steensma, M. and Westerterp, K.R., Thermally safe operation of a semi-batchreactor for liquid-liquid reactions. Fast reactions, Chem. Eng. Technol. 14(1991) 367-375.
Stoessel, F., What is your thermal risk? Chem. Eng. Progress 89 (1993) 68-75.Stoessel, F., Design thermally safe semi-batch reactors, Chem. Eng. Progress 91
(1995) 46-53.Westerterp, K.R., van Swaaij, W.P.M. and Beenackers, A.A.C.M., Chemical
Reactor Design and Operation, student edition, Wiley, Chichester, 1987.
4
Determination of Interfacial Areas withthe Chemical Method for a System with
Alternating Dispersed Phases

Chapter 4
114
Abstract
The interfacial area for a liquid-liquid system has been determined by thechemical reaction method. The saponification of butyl formate ester with 8 Msodium hydroxide has been used to this end. A correlation has been derived todescribe the mole flux of ester through the interface and the kinetic rateconstants have been calculated.
For a continuously operated reactor a correlation has been derived for the Sautermean drop diameter for both reaction in the dispersed phase as well as reactionin the continuous phase. A viscosity factor had to be incorporated to obtain onesingle correlation. The validation for this chemically enhanced reaction regimeis presented and discussed.
Determination of Interfacial Areas with the Chemical Method
115
4.1 Introduction
Many industrially important reactions such as nitrations, sulfonations,saponifications, and oxidations are often performed under conditions wherebytwo immiscible phases coexist. The knowledge of the effective interfacial area isessential for an accurate prediction of the mass transfer and chemical reactionrates. Numerous methods, see Tavlarides and Stamatoudis [1981], have beendeveloped for the determination of the interfacial area, such as withdrawal of asample of the dispersion, immobilization by encapsulation and then analysis, seee.g. van Heuven and Beek [1971] or photography of the dispersion via a probeor through a window in a vessel, see e.g. Giles et al. [1971], or lighttransmittance, measuring the fraction of a light beam which is not scattered bythe dispersion, see e.g. Calderbank [1958]. In all these methods a local value ofthe interfacial area is determined.
Absorption accompanied by a fast pseudo-first order reaction has first been usedby Westerterp et al. [1963] to evaluate the effective interfacial area. Since thenthis method has been used extensively for gas-liquid systems to determineinterfacial areas of absorbers, see Sharma and Danckwerts [1970]. The chemicalmethod also has been employed to determine the interfacial areas in liquid-liquid systems e.g. in an extraction column, first by Nanda and Sharma [1966].Overviews of different reaction systems have been given by Tavlarides andStamatoudis [1981] and Doraiswamy and Sharma [1984]. The saponification ofbutyl formate was found to be a suitable reaction system by Nanda and Sharma[1966], Santiago and Trambouze [1971a,b] and Onda et al. [1975]. In all thesemethods the total interfacial area in the entire apparatus is determined.
Contradictory observations have been reported in literature as to the phase to bedispersed in order to obtain the largest interfacial area. The difference ininterfacial area has been explained by the density difference and viscositydifference between the two phases. Fernandes and Sharma [1967] examined thehydrolysis of 2-ethylhexyl formate with 2 M NaOH in an agitated contactor.They found smaller droplets for the aqueous phase being dispersed. This wasexplained by the hindrance to coalescence of drops with a higher viscosity. Leleet al. [1983] examined the effect of emulsifiers on the rate of alkaline hydrolysisof tridecyl formate. They also found smaller droplets for an aqueous reactionphase being dispersed as expected: the aqueous phase had a higher viscosity. Onthe other hand, Zaldivar et al. [1996] studied the reaction between diisobutylenein toluene and H2SO4 and found larger droplets for the aqueous phase beingdispersed. This was explained by the density of the continuous phase, which wassmaller when the aqueous phase was dispersed compared to the organic phase

Chapter 4
116
dispersed. Godfrey et al. [1989] found a larger drop size for the systemcumene/water when the aqueous phase was dispersed. This could not only beexplained by the smaller density of the continuous phase; they also had to takeinto account the effect of the viscosity.
Although drop sizes in dispersions have been studied extensively, experimentaldata for the same system and alternating phases dispersed are scarce. Thepresent work presents experimental data for the two dispersion types. The firstobjective of this work is to find a correlation to describe the interfacial area inthe used experimental set-up using the saponification of butyl formate.
4.2 Measurement of interfacial area, the theory
The average drop size depends upon the conditions of agitation as well as thephysical properties of the liquids. The Sauter mean drop diameter, d32, is definedas:
d a32 6= ε / (1)
where ε is volume fraction of dispersed phase and a the interfacial area per unitvolume of reactor content.
Drops in an agitated dispersion are subject to shear stresses and to turbulentvelocity and pressure variations along their surfaces. These processes cause adrop to deform and to break into smaller parts if these dissipative forces exceedthe restoring forces, which consist of interfacial tension forces and viscousforces in the drop. On the other hand drops also collide with each other. Theywill coalesce when they remain together for a time long enough to overcome theresistance of the continuous phase separating the drops. Breakage andcoalescence take place simultaneously and after a certain time the dispersionreaches a dynamic equilibrium, containing drops of different sizes. Themicroscopic phenomena occurring in an agitated vessel are extremely complexand are still not very well understood.
Semi-empirical correlations are usually based on the theory of Kolmogorov fordrops in locally isotropic, turbulent fields. The theory is reviewed by Peters[1992] and Davies [1992]. The basic assumption in this theory is that for a dropto become unstable and break, the kinetic energy of the drop oscillations must besufficiently high. Hinze [1955] characterized the maximum drop size by acritical Weber number, defined as the ratio of the kinetic energy to the surface
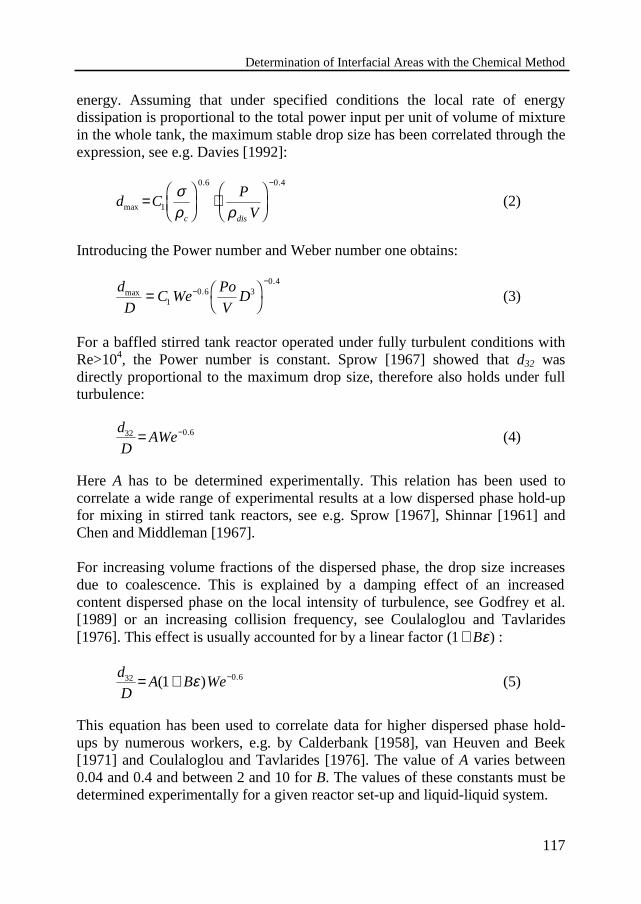
Determination of Interfacial Areas with the Chemical Method
117
energy. Assuming that under specified conditions the local rate of energydissipation is proportional to the total power input per unit of volume of mixturein the whole tank, the maximum stable drop size has been correlated through theexpression, see e.g. Davies [1992]:
d CP
Vc dismax
. .
=���
���
⋅���
���
−
1
0 6 0 4σρ ρ
(2)
Introducing the Power number and Weber number one obtains:
d
DC We
Po
VDmax .
.
= ��
��
−−
10 6 3
0 4
(3)
For a baffled stirred tank reactor operated under fully turbulent conditions withRe>104, the Power number is constant. Sprow [1967] showed that d32 wasdirectly proportional to the maximum drop size, therefore also holds under fullturbulence:
d
DAWe32 0 6= − . (4)
Here A has to be determined experimentally. This relation has been used tocorrelate a wide range of experimental results at a low dispersed phase hold-upfor mixing in stirred tank reactors, see e.g. Sprow [1967], Shinnar [1961] andChen and Middleman [1967].
For increasing volume fractions of the dispersed phase, the drop size increasesdue to coalescence. This is explained by a damping effect of an increasedcontent dispersed phase on the local intensity of turbulence, see Godfrey et al.[1989] or an increasing collision frequency, see Coulaloglou and Tavlarides[1976]. This effect is usually accounted for by a linear factor ( )1+ Bε :
d
DA B We32 0 61= + −( ) .ε (5)
This equation has been used to correlate data for higher dispersed phase hold-ups by numerous workers, e.g. by Calderbank [1958], van Heuven and Beek[1971] and Coulaloglou and Tavlarides [1976]. The value of A varies between0.04 and 0.4 and between 2 and 10 for B. The values of these constants must bedetermined experimentally for a given reactor set-up and liquid-liquid system.

Chapter 4
118
Many researchers have mentioned the influence of the viscosity on the drop size.The viscosity is believed to hinder coalescence and therefore leads to smallerdroplets. If the dispersed phase is significantly more viscous than the continuousphase, the drop size correlation has to be corrected. Calderbank [1958] and morerecently Godfrey et al. [1989] have introduced an empirical viscosity factorf d c
Cµ µ µ0 5 1 6= in which C has to be determined experimentally.
Figure 1: Concentration profiles for chemically enhanced mass transfer.
Determination by the chemical method
The liquid-liquid system consists of an aqueous phase (Aq) containing sodiumhydroxide (B) and an organic phase (Org) containing n-butyl formate ester (A).The reaction between n-butyl formate and the NaOH-solution takes place in theaqueous phase according to:
HCOC4H9
OOH+ C4H9OHHCO
O+
JA
Organicphase
CA,Org*CA,OrgCB,Aq
x = δ
Interface
x = 0
film
Aqueousphase
CA,Aq* = mACA,Org.*
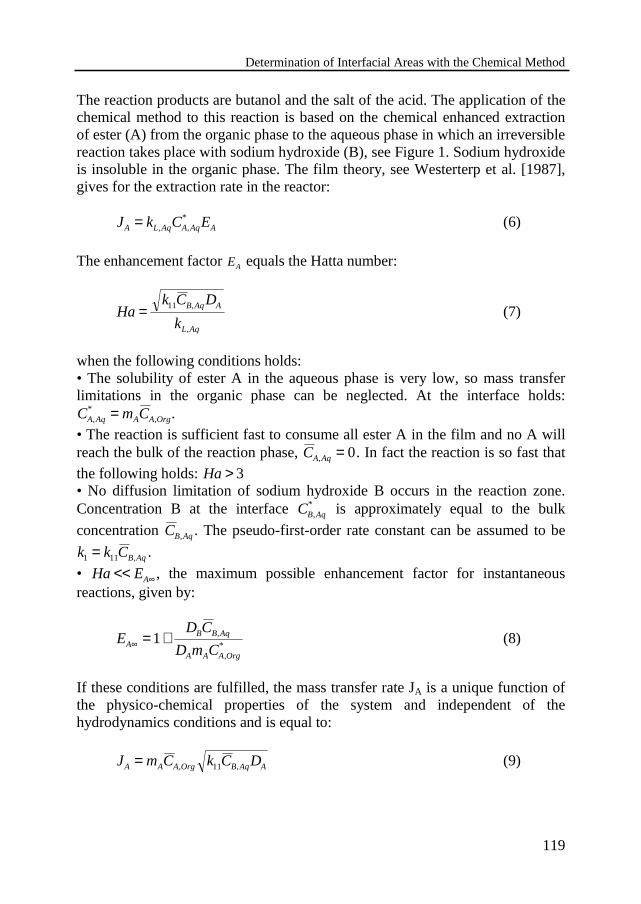
Determination of Interfacial Areas with the Chemical Method
119
The reaction products are butanol and the salt of the acid. The application of thechemical method to this reaction is based on the chemical enhanced extractionof ester (A) from the organic phase to the aqueous phase in which an irreversiblereaction takes place with sodium hydroxide (B), see Figure 1. Sodium hydroxideis insoluble in the organic phase. The film theory, see Westerterp et al. [1987],gives for the extraction rate in the reactor:
J k C EA L Aq A Aq A= , ,* (6)
The enhancement factor EA equals the Hatta number:
Hak C D
kB Aq A
L Aq
= 11 ,
,
(7)
when the following conditions holds:• The solubility of ester A in the aqueous phase is very low, so mass transferlimitations in the organic phase can be neglected. At the interface holds:C m CA Aq A A Org,
*,= .
• The reaction is sufficient fast to consume all ester A in the film and no A willreach the bulk of the reaction phase, CA Aq, = 0. In fact the reaction is so fast thatthe following holds: Ha > 3• No diffusion limitation of sodium hydroxide B occurs in the reaction zone.Concentration B at the interface CB Aq,
* is approximately equal to the bulk
concentration CB Aq, . The pseudo-first-order rate constant can be assumed to be
k k CB Aq1 11= , .
• Ha EA<< ∞ , the maximum possible enhancement factor for instantaneousreactions, given by:
ED C
D m CAB B Aq
A A A Org∞ = +1 ,
,*
(8)
If these conditions are fulfilled, the mass transfer rate JA is a unique function ofthe physico-chemical properties of the system and independent of thehydrodynamics conditions and is equal to:
J m C k C DA A A Org B Aq A= , ,11 (9)

Chapter 4
120
The value of the term m k DA A11 for a given system can be determinedseparately, for instance in a stirred cell reactor with a well defined interfacialarea. Under these conditions the extraction rate becomes:
J aV m C k C D aVA R A A Org B Aq A R= , ,11 (10)
With all data in relation (10) known, the interfacial area can be determined, aslong as the same conditions are satisfied, for any piece of equipment by:
aC C
J VV Aq B Aq in B Aq out
A R
=−ϕ , . , . , .2 7
(11)
in which ϕV Aq B Aq in B Aq outC C, . , . , .−2 7 is the amount of solute extracted per unit of
time.
4.3 Experimental set-up
The extraction rate measurements and the interfacial area determinations havebeen carried out in the experimental set-up as shown in Figure 2. Theexperimental set-up consists of three sections:
1) The feed section. The supply vessels of 5 liter are located on balances of thetypes Mettler-Toledo PG8001 and Mettler PM6000. One of the supply vesselsis filled with sodium hydroxide solution, the other one with pure butyl formate.Each vessel is stirred by a magnetic stirrer and under a continuous flow ofnitrogen. The nitrogen is used to prevent CO2 to dissolve into the liquids, whichwould react with OH− to form CO3
2−. The chemicals are pumped via a ball valveto the reactor by two gear pumps of Verder with maximum flow rates of 25 g/sand 5 g/s respectively.
2) The reactor section. The reactor is a jacketed glass vessel, clamped betweentwo stainless steel flanges. The inner diameter of the vessel is 85 mm and theheight of the vessel is 88 mm. The reactor content is agitated by a stainless steelturbine stirrer, driven via a magnetic Medimex coupling by a Janke and Kunkelmotor of the type RW20DZM. The stirring rate of the stirrer is read from thedisplay with a digital tacho-meter of the type Ebro DT-2234. The temperature ofthe reactor content is measured by a thermocouple. The conductivity probe of a
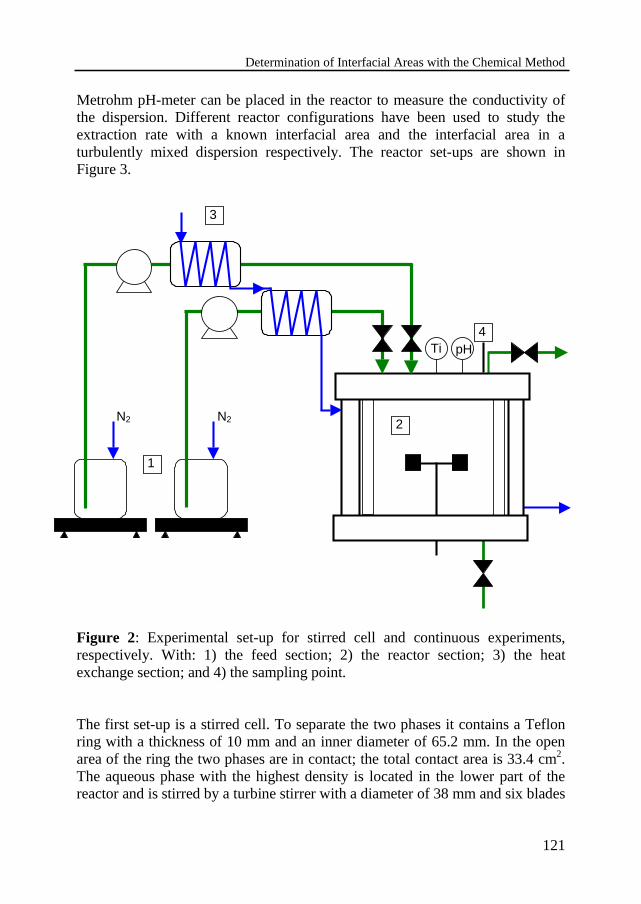
Determination of Interfacial Areas with the Chemical Method
121
Metrohm pH-meter can be placed in the reactor to measure the conductivity ofthe dispersion. Different reactor configurations have been used to study theextraction rate with a known interfacial area and the interfacial area in aturbulently mixed dispersion respectively. The reactor set-ups are shown inFigure 3.
Figure 2: Experimental set-up for stirred cell and continuous experiments,respectively. With: 1) the feed section; 2) the reactor section; 3) the heatexchange section; and 4) the sampling point.
The first set-up is a stirred cell. To separate the two phases it contains a Teflonring with a thickness of 10 mm and an inner diameter of 65.2 mm. In the openarea of the ring the two phases are in contact; the total contact area is 33.4 cm2.The aqueous phase with the highest density is located in the lower part of thereactor and is stirred by a turbine stirrer with a diameter of 38 mm and six blades
Ti4
pH
1
N2N2
3
2

Chapter 4
122
of 7.6x10 mm2 each. It is placed 20 mm above the bottom. The vessel isequipped with four equally spaced, 8 mm wide stainless steel baffles. The ringweakens the interface fluctuations, so that it is possible to have good mixingwithout disturbing the interface.
The second reactor set-up is a continuously operated contactor. The ring hasbeen removed and the turbine stirrer has been replaced by another one with adiameter of 40 mm, six blades of 8x10 mm2 each. It is now placed 44 mm abovethe bottom. The vessel contains four equally spaced, 9 mm wide, glass baffles.
3) The heat exchange section. The experiments are carried out isothermally. Toachieve this, two heat exchangers have been installed made of stainless steal andwith an exchange area of 0.1 m2 each. The reactor has also been equipped with acooling jacket. The coolant consists of 50 wt% water in glycol: it is pumpedthrough the system by the internal pump of the cryostat, which is of the typeJulabo FP50. The coolant first passes through the heat exchangers and thenthrough the cooling jacket of the reactor and finally is returned to the cryostat.
During all experiments the temperature, conductivity and mass of the chemicalson the balances are measured and stored by a Data Acquisition and Control Unitof Hewlett Packard in combination with a computer of the type HP486-33.
a. b.
Figure 3: Dimensions of the reactor in millimeters.a. Stirred cell.b. Continuously operated contactor.
40
8
1044
9
88
Teflonring 7.6
38
1020
8
85
65.2
10

Determination of Interfacial Areas with the Chemical Method
123
Chemical treatment and chemical analysis
The butyl formate ester is first washed with demineralized water to remove asmall amount of ethyl formate and after that it is dried on molecular sieves. Thebutyl formate now contains only small amounts of butanol and water, and has apurity of 99+ vol%. The solution of sodium hydroxide is prepared by dissolvingNaOH pellets in demineralized water under a continuous flow of nitrogen toprevent any CO2 to dissolve into the solution. The equipment is also flushedwith N2 before an experiment is started. In this way the concentration of CO3
2− inthe sodium hydroxide solution at the outlet of the reactor was always kept below0.08 M.
During each experiment samples are taken. For the stirred cell experimentssamples are taken from the reactor of both phases separately with a syringe via aseptum placed in the lid of the reactor, number 4 in Figure 2. For thecontinuously operated contactor samples are taken from the reactor outlet. Theoutlet flow consists of the dispersion, which separates directly on standing.
The organic phase is analyzed in a gas chromatograph to determine theconcentrations of butyl formate, butanol, and water. The aqueous phase isanalyzed by titration with trifluoromethanesulfonic acid in acetone/water todetermine the concentrations of OH− , CO3
2− and HCO2− .
4.4 Measurements in the stirred cell
Experimental procedure
Before each experiment the equipment is flushed with nitrogen. After that thelower part of the reactor is filled with approximately 0.23 l NaOH-solution tillhalf way in the Teflon ring. Then a volume pure ester of approximately 0.23 l iscarefully pumped into the upper part of the reactor. After that the experiment isstarted by starting the stirrer. The stirring rate is set at 80 – 125 rpm to obtaingood mixing without disturbing the interface. Samples are taken of the aqueousphase as well as the organic phase with a syringe before and during the run.

Chapter 4
124
Determination of flux equation
The mass balance for sodium hydroxide B in the aqueous phase can be writtenas follows:
VdC
dtJ A m C k C D AAq
B AqA A A Org B Aq A
,, ,= − = − ⋅11 (12)
After integration of Equation (12) with C CB Aq B Aq, ,= 0 and J JA A= 0 at t = 0 theconcentration of NaOH in the aqueous phase can be expressed as function oftime:
C t
C
A
V CJ t
A
V CJ tB Aq
B Aq Aq B AqA
Aq B AqA
,
. , ,
( )
0 00
00
2
211
4= −
���
���
+���
���
(13)
The last term in Equation (13) can be neglected for relatively short reactiontimes. When the conversion is kept below 10% the contribution of the last termis less than 2.5% and the concentration of NaOH in the aqueous phase is givenby:
C t
C
A
V CJ tB Aq
B Aq Aq B AqA
,
, ,
( )
0 001≈ −
���
���
(14)
The amount of OH− consumed equals the amount of HCO2− formed. This leads
to the following expression:
10 0 0
0− = ≈���
���
C t
C
C t
C
A
V CJ tB Aq
B Aq
C Aq
B Aq Aq B AqA
,
,
,
, ,
( ) ( )(15)
The flux can thus be calculated from the decrease in concentration of sodiumhydroxide and production of formate salt.Typical plots for the measured, relative concentration of sodium hydroxideC CB Aq B Aq, , 0 versus time are shown in Figure 4. The mass transfer rate iscalculated from the slope of these concentration profiles, using the least squaresmethod, for different temperatures and concentrations of NaOH. The flux isknown to be sensitive towards the ionic strength of the solution, see Nanda andSharma [1966, 1967]. This is explained by the change in solubility of the ester inthe aqueous phase, which reduces substantially with an increase in the ionicstrength. This can be seen in Table 1 where the mass transfer rates are listed ascalculated on the basis of the experiments in the stirred cell.
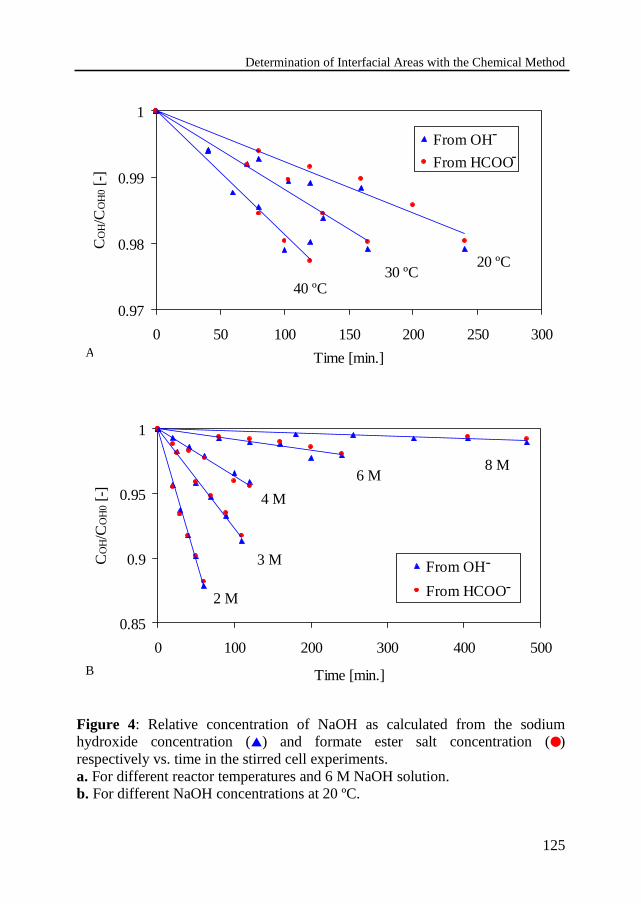
Determination of Interfacial Areas with the Chemical Method
125
Figure 4: Relative concentration of NaOH as calculated from the sodiumhydroxide concentration (▲) and formate ester salt concentration (●)respectively vs. time in the stirred cell experiments.a. For different reactor temperatures and 6 M NaOH solution.b. For different NaOH concentrations at 20 ºC.
0.97
0.98
0.99
1
0 50 100 150 200 250 300
Time [min.]
CO
H/C
OH
0 [-
]
From OH
From HCOO
20 ºC
40 ºC30 ºC
-
-
0.85
0.9
0.95
1
0 100 200 300 400 500
Time [min.]
CO
H/C
OH
0 [-
]
From OH
From HCOO2 M
8 M6 M
4 M
3 M -
-
B
A

Chapter 4
126
The physico-chemical parameters depend on temperature T and ionic strength Iand are usually exponentially related to these. So, one can use the relation:
ln( ) /m k D A B T C IA A11 = + + ⋅ (16)
to correlate the data. The following constants are found for the experiments aslisted in Table 1, with the ionic strength I calculated as described in appendix4A:
m k D T IA A11 2 05 3350 0 65= − − − ⋅( )exp . / . (17)
A parity plot is given in Figure 5 to compare the experimental and calculatedvalues as calculated using Equation (17). The standard deviation for the data is3.5%. In the same figure the flux of butyl formate is given as reported inliterature by Nanda and Sharma [1967], Santiago and Bidner [1971] andSantiago and Trambouze [1971a]. The data in this work and data from literatureare in good agreement, as long as the reaction takes place in the fast reactionregime.
Temperature[ºC]
Ionic strength[kmol/m3]
COH,average
[kmol/m3]Jester ·106
[kmol/m2s]19.0 2.02 1.93 4.6520.1 2.02 1.90 4.2520.0 3.05 2.98 2.6320.0 4.00 3.91 1.6120.2 4.00 3.92 1.6420.0 5.01 4.91 0.8920.1 6.02 5.96 0.5420.0 8.08 8.04 0.18620.0 8.00 7.96 0.18425.0 5.99 5.92 0.6725.0 6.00 5.90 0.6730.6 5.99 5.93 0.8035.1 5.92 5.84 1.0340.2 5.95 5.89 1.25
Table 1: Experimental conditions and results for the fluxmeasurements in the stirred cell.
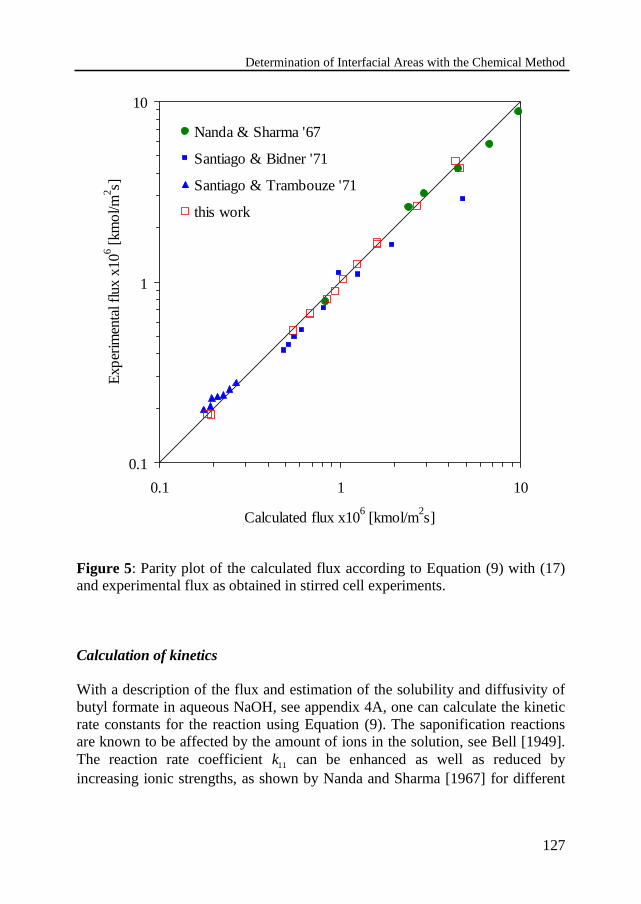
Determination of Interfacial Areas with the Chemical Method
127
0.1
1
10
0.1 1 10
Calculated flux x106 [kmol/m2s]
Exp
erim
enta
l flu
x x1
06 [km
ol/m
2 s]Nanda & Sharma '67
Santiago & Bidner '71
Santiago & Trambouze '71
this work
Figure 5: Parity plot of the calculated flux according to Equation (9) with (17)and experimental flux as obtained in stirred cell experiments.
Calculation of kinetics
With a description of the flux and estimation of the solubility and diffusivity ofbutyl formate in aqueous NaOH, see appendix 4A, one can calculate the kineticrate constants for the reaction using Equation (9). The saponification reactionsare known to be affected by the amount of ions in the solution, see Bell [1949].The reaction rate coefficient k11 can be enhanced as well as reduced byincreasing ionic strengths, as shown by Nanda and Sharma [1967] for different
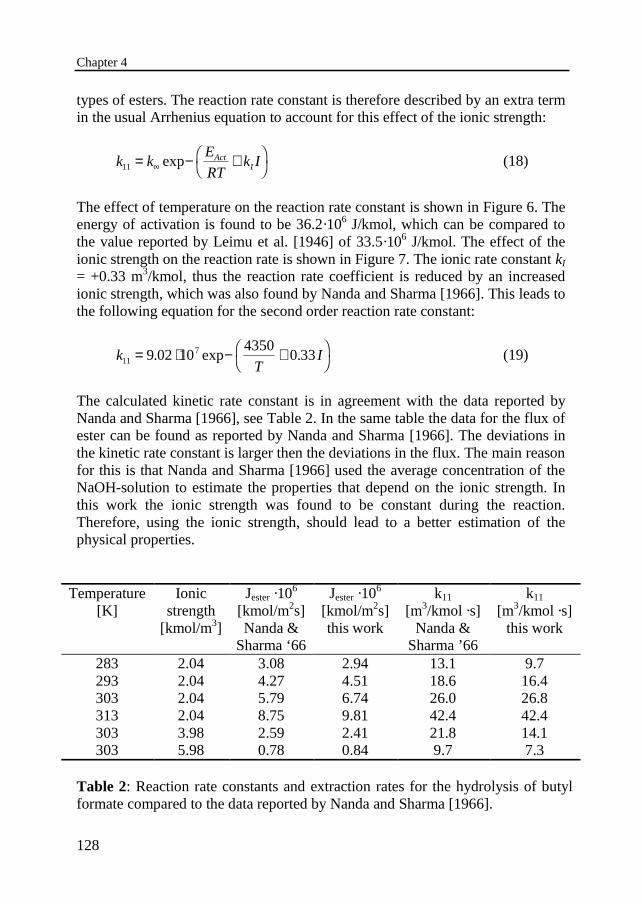
Chapter 4
128
types of esters. The reaction rate constant is therefore described by an extra termin the usual Arrhenius equation to account for this effect of the ionic strength:
k kE
RTk IAct
I11 = − +��
��∞ exp (18)
The effect of temperature on the reaction rate constant is shown in Figure 6. Theenergy of activation is found to be 36.2·106 J/kmol, which can be compared tothe value reported by Leimu et al. [1946] of 33.5·106 J/kmol. The effect of theionic strength on the reaction rate is shown in Figure 7. The ionic rate constant kI
= +0.33 m3/kmol, thus the reaction rate coefficient is reduced by an increasedionic strength, which was also found by Nanda and Sharma [1966]. This leads tothe following equation for the second order reaction rate constant:
kT
I1179 02 10
43500 33= ⋅ − +�
���. exp . (19)
The calculated kinetic rate constant is in agreement with the data reported byNanda and Sharma [1966], see Table 2. In the same table the data for the flux ofester can be found as reported by Nanda and Sharma [1966]. The deviations inthe kinetic rate constant is larger then the deviations in the flux. The main reasonfor this is that Nanda and Sharma [1966] used the average concentration of theNaOH-solution to estimate the properties that depend on the ionic strength. Inthis work the ionic strength was found to be constant during the reaction.Therefore, using the ionic strength, should lead to a better estimation of thephysical properties.
Temperature[K]
Ionicstrength
[kmol/m3]
Jester ·106
[kmol/m2s]Nanda &
Sharma ‘66
Jester ·106
[kmol/m2s]this work
k11
[m3/kmol ·s]Nanda &
Sharma ’66
k11
[m3/kmol ·s]this work
283 2.04 3.08 2.94 13.1 9.7293 2.04 4.27 4.51 18.6 16.4303 2.04 5.79 6.74 26.0 26.8313 2.04 8.75 9.81 42.4 42.4303 3.98 2.59 2.41 21.8 14.1303 5.98 0.78 0.84 9.7 7.3
Table 2: Reaction rate constants and extraction rates for the hydrolysis of butylformate compared to the data reported by Nanda and Sharma [1966].

Determination of Interfacial Areas with the Chemical Method
129
1
10
3.15 3.2 3.25 3.3 3.35 3.4 3.45
k 11
[m3 /k
mo
ls]
1000/T [1/K]
20
10
8
6
4
33.15 3.2 3.25 3.3 3.35 3.4 3.45
1
10
100
1 3 5 7 9
Ionic strength [kmol/m3]
k 11 [m
3 /km
ols
]
5 73 912
3
5
7
20
10
Figure 6: Effect of temperature on the reaction rate constant for the alkalinehydrolysis of butyl formate with 6 M NaOH.
Figure 7: Effect of ionic strength on the reaction rate constant for the alkalinehydrolysis of butyl formate with a NaOH solution at 20 ºC.
Determination of Interfacial Areas with the Chemical Method

Chapter 4
130
4.5 Determination of interfacial area
Experimental procedure
For a complete dispersion a minimum stirring speed is required. The minimumstirring speed is estimated on the basis of the correlation of van Heuven andBeek [1971]: it is for the used set-up 700 rpm. For the determination of theinterfacial area steady state conditions in the continuously operated reactorshould be reached as soon as possible in order to minimize the consumption ofchemicals. Therefore the reactor is first operated for a short time in the batchmode. While the reaction proceeds, the system approaches the steady state andthen close to steady state the feed flows are started. An example run is shown inFigure 8. The steady state condition is obtained as soon as temperature, pH, andhold-up have reached a constant value. The temperature and pH are measuredonline, while the hold-up of dispersed phase is calculated from the measuredvolumes of both phases at the outlet of the reactor. The volumes are determinedin a measuring cylinder of 10 ml after filling it with the dispersion at the reactoroutlet.
Determination of drop size correlation
The mass balance for NaOH, respectively formed formiate salt, in the aqueousphase under steady state conditions reads:
J aV C C C
m C k C D aV
A R OH Aq OH Aq in OH Aq out OH Aq C Aq out
A A Org out OH Aq out A R
= − =
=
ϕ ϕ, . , . , . , . , .
, . , .
2 7 2 7
11
(20)
So the interfacial area is equal to:
aC C
V m C k C DOH Aq OH Aq in OH Aq out
R A A Org out OH Aq out A
=−ϕ , . , . , .
, . , .
2 711
(21)
In this relation all data are known or have been experimentally determined. Withd a32 6= ε / one can calculate the drop size.With increasing conversion the composition of the phases will change. Santiagoand Trambouze [1971a] observed the interfacial area to be independent of theamount of butanol in the organic phase, as long as the conversion of sodiumhydroxide as well as of butyl formate is kept below 15%.

Determination of Interfacial Areas with the Chemical Method
131
Figure 8: Example of a run with started as a batch operation and switched tocontinuous operation after 4 min.a. On-line measured variables.b. Indirectly measured variables.
0
5
10
15
20
25
0 5 10 15 20 25
Time [min.]
Tem
per
atur
e [º
C],
pH
[-]
0
2
4
6
8
10
12
Flo
w [g
/s]
flow continous phase
flow dispersed phase
pH
Temperature
start batch start flow
0
0.1
0.2
0.3
0.4
0 5 10 15 20 25
Time [min.]
Co
nver
sio
n [-
]; H
old
-up
[-]
Conversion
Hold-up dispersed phase
start batch start flow
B
A

Chapter 4
132
The experimental conditions for the runs in the continuously operated reactorand the conversion of NaOH are listed in Table 3. The influence of the stirringrate on the drop size can be seen in Figure 9. Within the experimental accuracy aslope of –1.2 can be found, which is expected on the basis of the Equation (5).The effect of the hold-up of the dispersed phase on the drop size is shown inFigure 10: the drop size increases linearly with increasing hold-up.
runN
[rpm]ϕ NaOH ·106
[m3/s]ϕ ester·106
[m3/s]T
[ºC]COH0
[kmol/m3]1-C COH OH1 0
[-]1 1115 8.83 1.50 19.6 7.92 0.0282 1108 5.60 3.02 20.1 8.00 0.0313 1102 7.14 2.98 20.2 8.00 0.0464 1108 8.95 2.34 19.8 8.00 0.0725 1113 5.22 3.54 21.2 8.00 0.0666 900 7.21 2.95 18.9 8.00 0.0347 1009 7.23 3.00 20.9 8.00 0.0368 1203 5.34 2.37 20.3 8.01 0.0699 1305 7.41 2.72 21.3 7.83 0.05610 1312 8.22 3.47 20.6 7.95 0.05611 1410 8.30 3.80 19.3 7.89 0.060
12 1113 3.85 5.95 19.2 8.06 0.04613 1114 2.70 5.10 20.4 7.82 0.08714 1102 2.08 6.38 19.6 7.94 0.07815 1105 1.69 6.91 19.6 7.87 0.08216 918 2.42 6.01 19.5 7.89 0.06117 1003 2.60 6.13 19.2 7.98 0.06418 1115 2.88 7.02 19.1 7.75 0.07019 1315 2.87 7.04 19.4 7.88 0.08420 1516 2.86 7.03 19.9 7.88 0.103
Table 3: Experimental runs in the continuously operated reactor, all with purebutyl formate and a concentrated sodium hydroxide solution of around 8M. Run1-11: NaOH as the continuous phase; Run 12-20: NaOH as the dispersed phase.

Determination of Interfacial Areas with the Chemical Method
133
10
100
10
Stirring rate N [1/s]
Dro
ple
t d
iam
eter
d 32 [
µm]
100
30
50
70
200
12 14 16 2420 30
150
slope: -1.2
NaOH continuous phase
NaOH dispersed phase
0
25
50
75
100
125
150
0 0.1 0.2 0.3 0.4 0.5
Hold-up dispersed phase [-]
Dro
ple
t d
iam
eter
d 32 [
µm] NaOH dispersed phase
NaOH continuous phase
Figure 9: Influence of the stirring rate on the drop size for a sodium hydroxidesolution as the dispersed or continuous phase respectively.
Figure 10: Influence of the hold-up of the dispersed phase on drop size for asodium hydroxide solution as the dispersed or continuous phase respectively.
Determination of Interfacial Areas with the Chemical Method
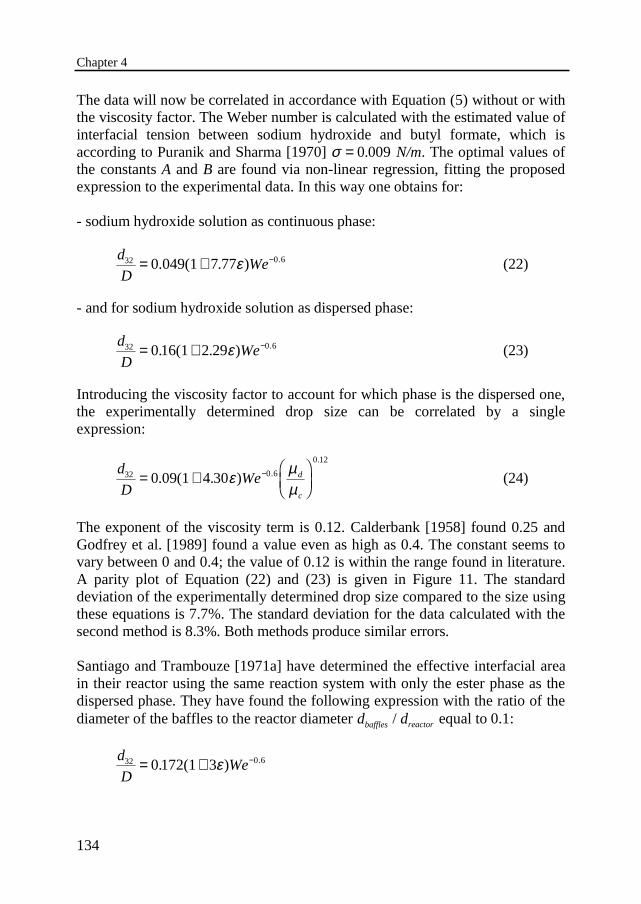
Chapter 4
134
The data will now be correlated in accordance with Equation (5) without or withthe viscosity factor. The Weber number is calculated with the estimated value ofinterfacial tension between sodium hydroxide and butyl formate, which isaccording to Puranik and Sharma [1970] σ = 0 009. N/m. The optimal values ofthe constants A and B are found via non-linear regression, fitting the proposedexpression to the experimental data. In this way one obtains for:
- sodium hydroxide solution as continuous phase:
d
DWe32 0 67 77= + −0.049(1 . ) .ε (22)
- and for sodium hydroxide solution as dispersed phase:
d
DWe32 0 616 2 29= + −0. (1 . ) .ε (23)
Introducing the viscosity factor to account for which phase is the dispersed one,the experimentally determined drop size can be correlated by a singleexpression:
d
DWe d
c
32 0 6
0 12
0 09 4 30= +���
���
−. (1 . ) .
.
ε µµ
(24)
The exponent of the viscosity term is 0.12. Calderbank [1958] found 0.25 andGodfrey et al. [1989] found a value even as high as 0.4. The constant seems tovary between 0 and 0.4; the value of 0.12 is within the range found in literature.A parity plot of Equation (22) and (23) is given in Figure 11. The standarddeviation of the experimentally determined drop size compared to the size usingthese equations is 7.7%. The standard deviation for the data calculated with thesecond method is 8.3%. Both methods produce similar errors.
Santiago and Trambouze [1971a] have determined the effective interfacial areain their reactor using the same reaction system with only the ester phase as thedispersed phase. They have found the following expression with the ratio of thediameter of the baffles to the reactor diameter d dbaffles reactor/ equal to 0.1:
d
DWe32 0 6172 3= + −0. (1 ) .ε

Determination of Interfacial Areas with the Chemical Method
135
100
d32 experimental [µm]
d32
calc
ula
ted
[ µm]
30 50 70 100 200
100
30
50
70
200
-15%
+15%
Organic phase dispersed (■)
Aqueous phase dispersed (▲)
Figure 11: Parity plot of calculated droplets diameter according to Equation(22) and (23) and experimental droplets diameter in the continuous contactor.
The drop size is calculated for the same conditions as function of the hold-up ofthe dispersed phase, see Figure 12, to compare the drop size correlation foundby Santiago and Trambouze [1971a] with this work. The drop size calculatedfrom their results is larger. Santiago and Trambouze [1971a] have used a 0.8liter batch reactor with a relatively smaller turbine stirrer: Their ratio of thediameter of the turbine to the reactor diameter d dturbine reactor/ = 0.33, compared to0.47 in this work. Fernandes and Sharma [1967] found experimentally that theinterfacial area is independent of the agitator height above the bottom andpractically independent of its diameter. Konno et al. [1987] concluded it takes
Determination of Interfacial Areas with the Chemical Method
NaOH dispersed phase (x)
NaOH continuous phase (s)
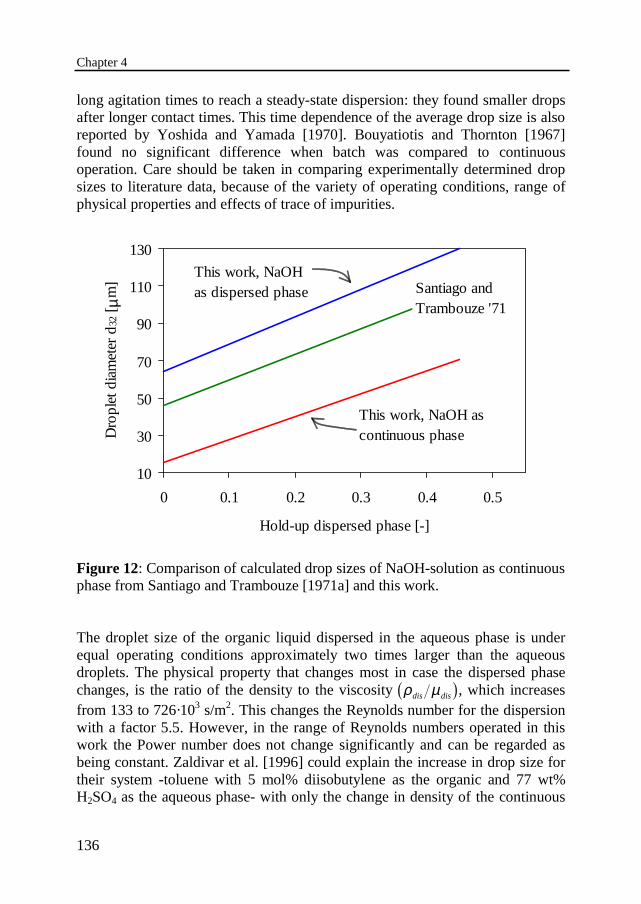
Chapter 4
136
10
30
50
70
90
110
130
0 0.1 0.2 0.3 0.4 0.5
Hold-up dispersed phase [-]
Dro
ple
t d
iam
eter
d 32 [
µm]
This work, NaOH as dispersed phase Santiago and
Trambouze '71
This work, NaOH as continuous phase
long agitation times to reach a steady-state dispersion: they found smaller dropsafter longer contact times. This time dependence of the average drop size is alsoreported by Yoshida and Yamada [1970]. Bouyatiotis and Thornton [1967]found no significant difference when batch was compared to continuousoperation. Care should be taken in comparing experimentally determined dropsizes to literature data, because of the variety of operating conditions, range ofphysical properties and effects of trace of impurities.
Figure 12: Comparison of calculated drop sizes of NaOH-solution as continuousphase from Santiago and Trambouze [1971a] and this work.
The droplet size of the organic liquid dispersed in the aqueous phase is underequal operating conditions approximately two times larger than the aqueousdroplets. The physical property that changes most in case the dispersed phasechanges, is the ratio of the density to the viscosity ρ µdis dis1 6, which increasesfrom 133 to 726·103 s/m2. This changes the Reynolds number for the dispersionwith a factor 5.5. However, in the range of Reynolds numbers operated in thiswork the Power number does not change significantly and can be regarded asbeing constant. Zaldivar et al. [1996] could explain the increase in drop size fortheir system -toluene with 5 mol% diisobutylene as the organic and 77 wt%H2SO4 as the aqueous phase- with only the change in density of the continuous
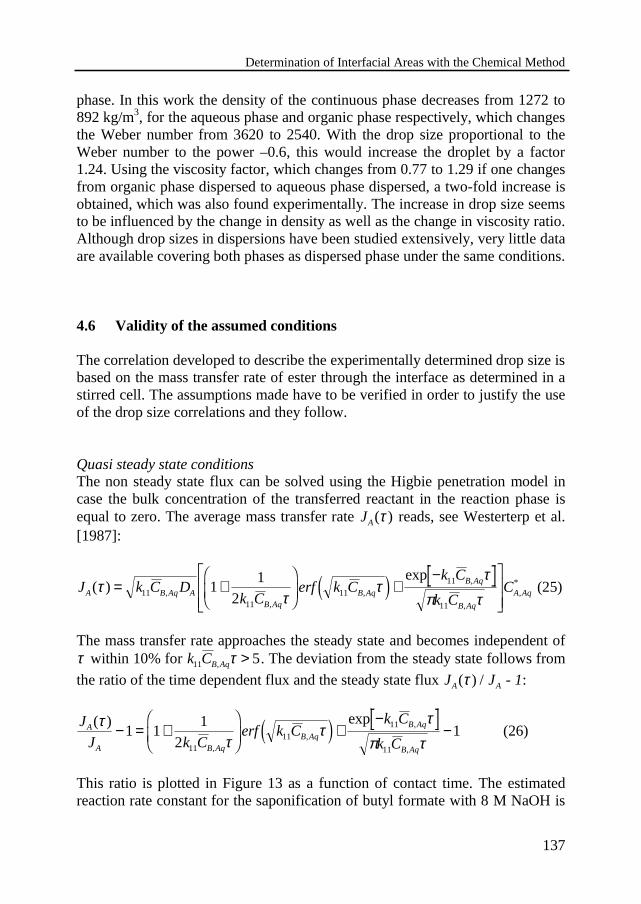
Determination of Interfacial Areas with the Chemical Method
137
phase. In this work the density of the continuous phase decreases from 1272 to892 kg/m3, for the aqueous phase and organic phase respectively, which changesthe Weber number from 3620 to 2540. With the drop size proportional to theWeber number to the power –0.6, this would increase the droplet by a factor1.24. Using the viscosity factor, which changes from 0.77 to 1.29 if one changesfrom organic phase dispersed to aqueous phase dispersed, a two-fold increase isobtained, which was also found experimentally. The increase in drop size seemsto be influenced by the change in density as well as the change in viscosity ratio.Although drop sizes in dispersions have been studied extensively, very little dataare available covering both phases as dispersed phase under the same conditions.
4.6 Validity of the assumed conditions
The correlation developed to describe the experimentally determined drop size isbased on the mass transfer rate of ester through the interface as determined in astirred cell. The assumptions made have to be verified in order to justify the useof the drop size correlations and they follow.
Quasi steady state conditionsThe non steady state flux can be solved using the Higbie penetration model incase the bulk concentration of the transferred reactant in the reaction phase isequal to zero. The average mass transfer rate JA( )τ reads, see Westerterp et al.[1987]:
J k C Dk C
erf k Ck C
k CCA B Aq A
B AqB Aq
B Aq
B Aq
A Aq( )exp
,,
,
,
,
,*τ
ττ
τπ τ
= +���
���
+−�
!
"
$##11
1111
11
11
11
24 9 (25)
The mass transfer rate approaches the steady state and becomes independent ofτ within 10% for k CB Aq11 5, τ > . The deviation from the steady state follows from
the ratio of the time dependent flux and the steady state flux J JA A( ) /τ - 1:
J
J k Cerf k C
k C
k CA
A B AqB Aq
B Aq
B Aq
( ) exp
,,
,
,
ττ
ττ
π τ− = +
���
���
+−
−1 11
21
1111
11
11
4 9 (26)
This ratio is plotted in Figure 13 as a function of contact time. The estimatedreaction rate constant for the saponification of butyl formate with 8 M NaOH is
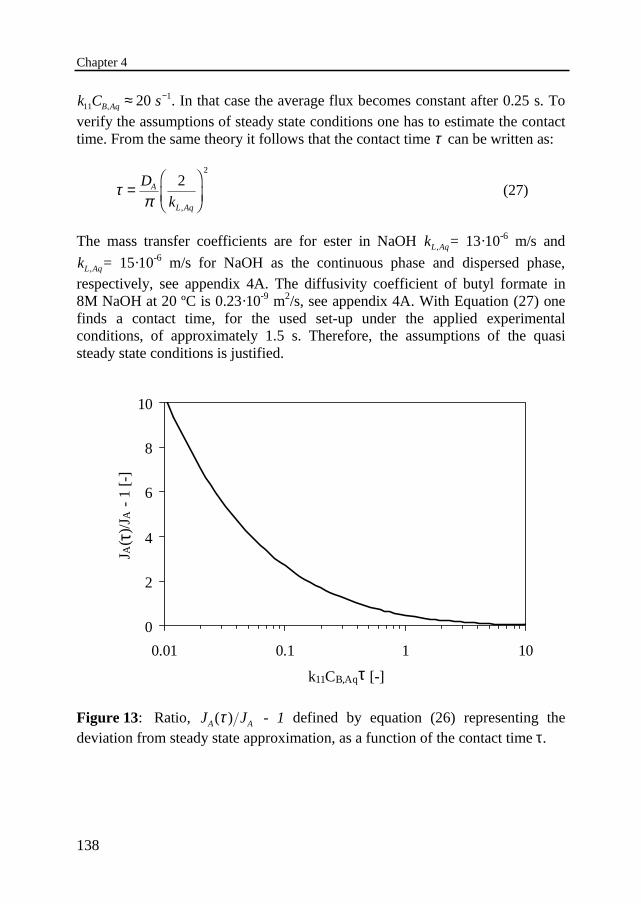
Chapter 4
138
0
2
4
6
8
10
0.01 0.1 1 10
k11CB,Aqτ [-]
J A( τ
)/J A
- 1
[-]
k C sB Aq11120, ≈ − . In that case the average flux becomes constant after 0.25 s. To
verify the assumptions of steady state conditions one has to estimate the contacttime. From the same theory it follows that the contact time τ can be written as:
τπ
=���
���
D
kA
L Aq
22
,
(27)
The mass transfer coefficients are for ester in NaOH kL Aq, = 13·10-6 m/s and
kL Aq, = 15·10-6 m/s for NaOH as the continuous phase and dispersed phase,respectively, see appendix 4A. The diffusivity coefficient of butyl formate in8M NaOH at 20 ºC is 0.23·10-9 m2/s, see appendix 4A. With Equation (27) onefinds a contact time, for the used set-up under the applied experimentalconditions, of approximately 1.5 s. Therefore, the assumptions of the quasisteady state conditions is justified.
Figure 13: Ratio, J JA A( )τ - 1 defined by equation (26) representing thedeviation from steady state approximation, as a function of the contact time τ.

Determination of Interfacial Areas with the Chemical Method
139
Fast reaction, Ha>3The enhancement can be calculated by the experimentally determined flux andthe physical transfer rate:
E J J m C k C D k m CA A with reaction A physical A A Org B Aq A L Aq A A Org= =, , , , , ,11 2 7 (28)
m C k C DA A Org B Aq A, ,11 is for 8M NaOH at 20 ºC equal to 0.185·10-6 kmol/m2s. The
mass transfer coefficients of ester in NaOH are kL Aq, = 13·10-6 m/s and kL Aq, =15·10-6 m/s for NaOH as the continuous phase and dispersed phase respectively,see appendix 4A. The solubility of butyl formate in 8M NaOH solution is equalto m CA A Org, = 2.6 mol/m3. Thus the enhancement factor is equal to around 5,which implicates operation in the fast reaction regime.
Mass transfer resistance in the organic phase negligibleThis holds, see Westerterp et al. [1987] if:
k
k m EL Org
L Aq A A
,
,
>> 1 (29)
At the start of the run the organic phase consists of pure butyl formate, hence theresistance to mass transfer in this phase is negligible. As the reaction proceeds,the reaction product butanol dilutes the organic phase more and more. For allexperiments the conversion is kept below 15%. The distribution coefficient isabout mA ≈ 0.3·10-3, the enhancement factor is around 5 and the kL values ofester in butanol and ester in NaOH-solution are 30·10-6 m/s and 15·10-6 m/srespectively. This gives for k k m EL Org L Aq A A, ,( ) a value of 1000. Therefore, masstransfer resistance in the organic phase is negligible.
Pseudo first order approximationAccording to the penetration theory, see Westerterp et al. [1987] , the (1,1)-reaction can be regarded as a reaction first order in CA Aq, , if
Ha ED C
D m C
D
DAB B Aq
A A A Org
A
B
<< = +���
���∞ 1 ,
,*
(30)

Chapter 4
140
The initial concentrations of pure butyl formate, CA Org, ≈ 8.6 M, and sodium
hydroxide, CB Aq, ≈ 8 M, are of the same magnitude, while the conversion is keptbelow 15%. The ratio between the diffusivities is reported by Onda et al. [1975]to be 4. The enhancement factor for instantaneous reaction is thus in the order of104, which is much larger than the estimated Hatta number.
Hinterland ratio, Al>>1Al is the ratio between the total reaction phase volume and the volume of thefilm in which the reaction takes place. For the case that sodium hydroxide isdispersed, e.g. the reaction takes place in the dispersed phase Al can beexpressed as:
AlD
k dA
L Aq
=
− −���
���
1
1 12
32
3
,
(31)
The dispersed phase mass transfer coefficient is estimated by the correlation ofTreybal [1963], see appendix 4A for an evaluation. This leads to Al ≈15. in casesodium hydroxide solution is dispersed.
For the case that the ester is dispersed, e.g. the reaction takes place in thecontinuous phase Al can be expressed as:
AlD
k dA
L Aq
= −
+���
���
−�
��
�
��
1
12
132
3
ε
ε,
(32)
The continuous phase mass transfer coefficient is estimated by the correlation ofCalderbank and Moo-Young [1961], see appendix 4A for an evaluation. Thisleads to Al ≈ 1 in case sodium hydroxide solution is the continuous phase.
The effect of small hinterland ratio on the mass transfer of ester will bediscussed in the next section
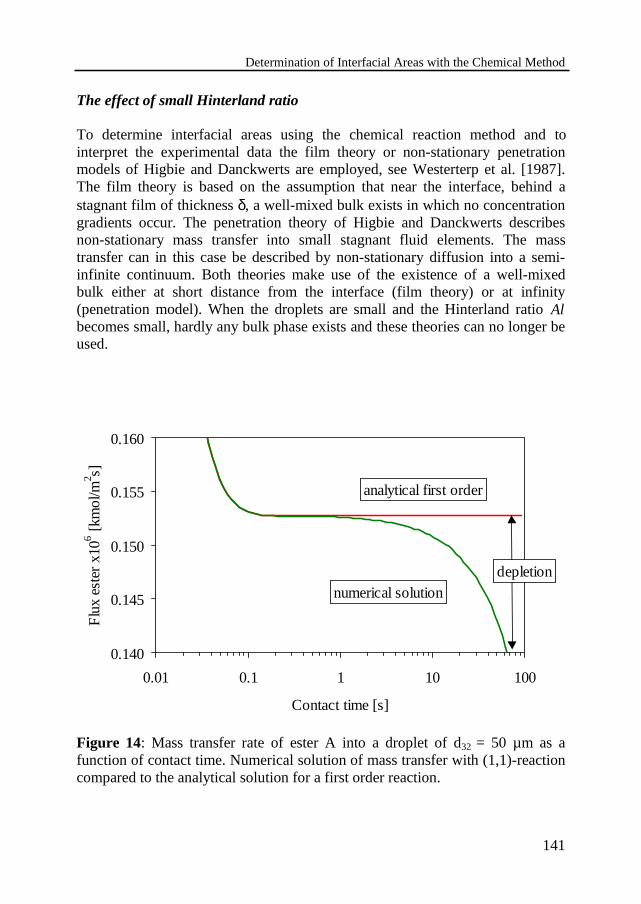
Determination of Interfacial Areas with the Chemical Method
141
0.140
0.145
0.150
0.155
0.160
0.01 0.1 1 10 100
Contact time [s]
Flu
x es
ter
x106
[km
ol/m
2 s]
numerical solution
analytical first order
depletion
The effect of small Hinterland ratio
To determine interfacial areas using the chemical reaction method and tointerpret the experimental data the film theory or non-stationary penetrationmodels of Higbie and Danckwerts are employed, see Westerterp et al. [1987].The film theory is based on the assumption that near the interface, behind astagnant film of thickness δ, a well-mixed bulk exists in which no concentrationgradients occur. The penetration theory of Higbie and Danckwerts describesnon-stationary mass transfer into small stagnant fluid elements. The masstransfer can in this case be described by non-stationary diffusion into a semi-infinite continuum. Both theories make use of the existence of a well-mixedbulk either at short distance from the interface (film theory) or at infinity(penetration model). When the droplets are small and the Hinterland ratio Albecomes small, hardly any bulk phase exists and these theories can no longer beused.
Figure 14: Mass transfer rate of ester A into a droplet of d32 = 50 µm as afunction of contact time. Numerical solution of mass transfer with (1,1)-reactioncompared to the analytical solution for a first order reaction.
Chapter 4
142
For small values of Al and at high conversion of sodium hydroxide, deviationsmay be expected due to depletion of reactant sodium hydroxide, see Westerterpet al. [1987]. Furthermore, the equations derived based on these theories usuallyassume a flat interface, which is not found for small droplets. In these cases onehas to solve the mass transfer equations numerically.
The reaction between ester and sodium hydroxide in a single drop has beendescribed, see appendix 4B for the derivation; the transfer rate of ester A iscalculated as a function of contact time for a small droplet of d32 = 50 µm, seeFigure 14. The flux decreases very fast to a practically constant value in a periodof 0.1 s., after this the steady state flux is JA = 0.153·10-6 kmol/m2s. For longcontact times, the concentration of B in the dispersed phase decreases anddepletion can be observed. The ester flux now again decreases with time. Theeffect of depletion is low for short contact time or a large amount of B. Thedeviation as a result of depletion is defined as a ratio of the numerical solutionof the flux to the analytical solution for a first order reaction, according to:J JA numerical A analytical, ,/ - 1. The analytical solution can be found for spherical polarcoordinates, see e.g. Hoogendoorn [1985]:
J r tD Rm C
rAA A A org( , ) ,= ⋅2
π(33)
1 1 11
12 2 2
12
2 21
2 2
21r n k R D n
n r
R
k R
Dn k
D n
Rt
n
A A
A
n
−( )+
��
�� ⋅ + − +�
�����
�!
"$#
���
���
�!
"$##
���
+
=
∞
∑ /sin exp
ππ π π
− −( )+
��
�� ⋅ + − +�
�����
�!
"$#
���
���
�!
"$##���
+
=
∞
∑ 1 1
13 2 2
12
2 21
2 2
21
n
A A
A
n n
n
k R D Rn
n r
R
k R
Dn k
D n
Rt
ππ
π π π/
cos exp
The ratio J JA numerical A analytical, ,/ - 1 is shown in Figure 15 for a droplet of d32 = 50µm. For the experimental set-up and experimental conditions the contact time is1.5 s., while the smallest droplets found had a size d32 of 65 µm for the NaOHsolution as the dispersed phase. Therefore, deviations due to depletion of NaOHin the droplet are not to be expected in the experiments.

Determination of Interfacial Areas with the Chemical Method
143
-0.15
-0.10
-0.05
0.00
0.05
0.1 1 10 100
Contact time [s]
Jnu
mer
ical /J
anal
ytic
al -1
[-]
depletion
Figure 15: Ratio J JA numerical A analytical, ,/ -1 representing the deviation as a result ofdepletion of component B in the droplet with d32 = 50 µm.
More important is the assumption of a flat interface, on which the film theoryand Higbie penetration theory are based. The deviation between a plain interfaceor a curved interface can best be seen, when the steady state flux through theinterface of a sphere is compared with the flux through a plain interface. Thesteady state solution for Equation (33) is with k k CB Aq1 11= , , see Hoogendoorn[1985], Bird et al. [1960]:
J R m C k C DD
RA A A Org B Aq AA( ) , ,= −�
���11 (34)
The deviation is now calculated as follows:
J R J x
J x
D
R k C DA A
A
A
B Aq A
( ) ( )
( ),
− = ±11
(35)
in which J xA( ) is equal to the steady-state flux through a plain interface, seeEquation (9). The value of this ratio is plotted as a function of droplet diameterin Figure 16. As expected the largest deviations occur for the smallest diameters.

Chapter 4
144
-0.25
-0.15
-0.05
0.05
0.15
0.25
10 100 1000
Droplet diameter [µm]
J(R
)/J(
x)-1
flux to sphere
flux from sphere
Figure 16: Ratio J R J xA A( ) / ( )-1 as defined by equation (35), representing thedeviation as a result of assuming a flat interface.
For a reaction outside the droplet the mass transfer is directed outwards and theflux is underestimated (+), when a flat interface is assumed. For a reaction insidethe droplet the flux is overestimated (-). For reaction inside the droplets theexperimentally found droplets were larger in diameter 65 µm: deviations, causedby assuming a flat interface, are small and lower than 7.5%. For reaction outsidethe droplet the smallest droplets found had a d32 larger than 33 µm, resulting in amaximum deviation of 17%. Thus for the smallest droplets the assumption of aflat interface results in an underestimate of the mass transfer rate and hence, ofthe average drop size. However, for the normal operation conditions the dropletsin general are larger than 35 µm and thus the deviations are smaller than 15%,which can be accepted within the accuracy of the physical properties.
The effect of a small Hinterland ratio shows itself by the inability of thepenetration theory to allow for eventual depletion of the reactant B within thesphere. Furthermore, when at the same time the droplet diameter is small, theassumption of a flat interface is no longer valid. In industrial applications thecontact time generally is relative short, see Brunson and Wellek [1971].Therefore, in liquid droplets the penetration depth is generally small comparedto the diameter, thus the deviations are small as well.

Determination of Interfacial Areas with the Chemical Method
145
4.7 Discussion and Conclusions
The mass transfer rate of butyl formate through the interface as experimentallydetermined in a stirred cell, has been used to predict the interfacial area in acontinuously operated contactor. The Sauter mean diameter can be described bycorrelations similar to those in literature, only the constants deviate, because thespecific properties of the system investigated and the reactor configuration aredifferent. These constants were found to depend also on the phase that isdispersed. This has been also mentioned by Pacek et al. [1994].
With the organic ester phase dispersed, droplet diameters were found between35 and 75 µm; between 65 and 135 µm in case the aqueous phase is dispersed.The drop size seems to be influenced by the density of the continuous phase aswell as the ratio of the viscosities of the two phases. It is not unambiguouswhich phase dispersed will give the smallest drop size and, hence, the largestinterfacial area. It is, therefore, recommended to determine the drop size for bothliquids as the dispersed phase.
The simplest approach to describe mass transfer with reaction is the film theory.This theory can be applied within the uncertainties of the estimated physico-chemical parameters. The necessary conditions are all full-filled in allexperiments except that of a large Hinterland ratio. For the smallest droplets theinfluence of the curvature of the interface has to be taken into account.Otherwise the film theory can be used with confidence.
Acknowledgements
The author wishes to thank B.T. Sikkens, R.B.F. Horsthuis, and P. Meulenbergfor their contribution to the experimental work, and F. ter Borg and A.H. Pleiterfor technical support. W. Lengton and A. Hovestad are acknowledged for theassistance in the analysis.

Chapter 4
146
Notation
A Cross-sectional area [m2]A Constant [-]a Interfacial area per volume of reactor content = 6 32ε / d [m2/m3]Al Hinterland ratio [-]B Constant [-]C Concentration [kmol/m3]C, C1 Constants [-]D Diameter stirrer [m]Di Diffusivity coefficient component i [m2/s]d32 Sauter mean drop diameter [m]d Diameter [m]EA Enhancement factor [-]EA∞ Maximum enhancement factor [-]EAct Energy of activation [J/kmol]g Gravity constant = 8.91 [m/s2]Ha Hatta number [-]I Ionic strength [kmol/m3]J Mole flux [kmol/m2·s]kLaq Mass transfer coefficient in the aqueous phase [m/s]kLorg Mass transfer coefficient in the organic phase [m/s]k∞ Preexponential constant [m3/kmol·s]k1 First-order reaction rate constant [s-1]k11 Second-order reaction rate constant [m3/kmol·s]kI Ionic strength reaction rate constant [m3/kmol]KS Salting-in or salting-out coefficient [m3/kmol]m Molar distribution coefficient [-]N Stirring rate [s-1]P Power of stirring [J/s]r Radial direction [m]R Radius of sphere [m]R Gas constant = 8315 [J/kmol·K]t Time [s]T Temperature [K]V Volume [m3]w Impeller blade height [m]Z Charge of ion [-]

Determination of Interfacial Areas with the Chemical Method
147
Greek symbols
ε Volume fraction dispersed phase = +V V Vd d c( ) [-]ϕ Flow [m3/s]µ Viscosity [Ns/m2]ρ Density [kg/m3]σ Interfacial tension [N/m]τ Contact time [s]
Dimensionless groups
Po Power numberP
N Ddisρ 3 5 [-]
Re Reynolds numberρ
µdis
dis
ND2
[-]
We Weber numberN D c
2 3ρσ
[-]
Subscripts and superscripts
0 InitialAq Aqueous phaseOrg Organic phaseA Component A (ester)B Component B (OH-)C Component C (HCOO-)c Continuous phased Dispersed phasedis DispersionR Reactorw Watermax Maximum∗ At interface¯ Average
Chapter 4
148
References
Baker, G.A. and Oliphant, T. A., An implicit, numerical method for solving thetwo-dimensional heat equation, Q. Appl. Math., 17 (1960) 361-373.
Bell, P., Acid-base catalysis, Oxford university press, London 1949.Bidner, M.S. and de Santiago, M., Solubilite de liquides non-électrolytes dans
des solution aqueuses d’électrolytes, Chem. Eng. Sci., 26 (1971) 1484-1488.
Bird, R.B., Stewart, W.E. and Lightfoot, E.N., Transport phenomena, Wiley,New York, 1960.
Bouyatiotis, B.A. and Thornton, J.D., Liquid-liquid extraction studies in stirredtanks. Part I: Droplet size and hold-up measurements in a seven-inchdiameter baffled vessel, Inst. Chem. Eng. Symp. Ser. 26 (1967) 43-51.
Brunson, R.J. and Wellek, R.M., Mass transfer inside liquid droplets and gasbubbles accompanied by a second order chemical reaction, AIChE J. 17(1971) 1123-1130.
Calderbank, P.H., Physical rate processes in industrial fermentation, part 1: Theinterfacial area in gas-liquid contacting with mechanical agitation., Trans.Inst. Chem. Eng. 36 (1958) 443-463.
Calderbank, P.H. and Moo-Young, M.B., The continuous phase heat and mass-transfer properties of dispersions, Chem. Eng. Sci. 16 (1961) 39-54.
Chen, H.T. and Middleman, S., Drop size distribution in agitated liquid-liquidsystems AIChE J. 13 (1967) 989-995.
Coulaloglou, C.A. and Tavlarides, L.L., Drop size distributions and coalescencefrequencies of liquid-liquid dispersions in flow vessels, AIChE J. 22(1976) 289-297.
Daubert, T.E., Danner, R.P., Sibul, H.M. and Stebbins, C.C., Physical andthermodynamic properties of pure chemicals: data compilation, Taylor &Francis, London, 1989.
Davies, G.A., Mixing and coalescence phenomena in liquid-liquid systems, in:J.D. Thornton (ed.), Science and practice of liquid-liquid extraction,Vol.1, Clarendon press, Oxford, 1992, p. 244.
Doraiswamy, L.K. and Sharma, M.M., Heterogeneous reactions: Analysis,examples and reactor design, Vol. 2: Fluid-fluid-solid reactions, JohnWiley and Sons, New York, 1984.
Fernandes, J.B. and Sharma, M.M., Effective interfacial area in agitated liquid-liquid contactors, Chem. Eng. Sci. 22 (1967) 1267-1282.
Giles, J.W., Hanson, C. and Marsland, J.G., Drop size distribution in agitatedliquid-liquid systems with simultaneous interface mass transfer andchemical reaction, Proc. Int. Solv. Extr. Conference, Society of ChemicalIndustries, 1971, pp. 91-111.
Determination of Interfacial Areas with the Chemical Method
149
Godfrey, J.C., Obi, F.I.N. and Reeve, R.N., Measuring drop size in continuousliquid-liquid mixers, Chem. Eng. Prog. 85 (1989) 61-69.
Heertjes, P.M. and de Nie, L.H., Mass transfer to drops, in: C. Hanson (ed.),Recent advances in liquid-liquid extraction, Pergamon Press, Oxford,1971, p. 367.
van Heuven, J.W. and Beek, W.J., Power input, drop size and minimum stirrerspeed for liquid-liquid dispersions in stirred vessels, Proc. Int. Solv. Extr.Conference, Society of Chemical Industries, 1971, pp. 70-81.
Hinze, J.O., Fundamentals of the hydrodynamic mechanism of splitting indispersion processes, AIChE J. 1 (1955) 289-295.
Hoffman, J.D., Numerical Methods for Engineers and Scientists, McGraw Hill,New York, 1992.
Hoogendoorn, C.J. (in dutch) Fysische transportverschijnselen II, DelftseUitgevers, Delft, 2nd edn., 1985.
Konno, M. and Daito, S., Correlation of drop sizes in liquid-liquid agitation atlow dispersed phase volume fractions, J. Chem. Eng. Jpn. 20 (1987) 533-535.
Leimu, R., Korte, R., Laaksonen, E. and Lehmuskoski, U., The alkalinehydrolysis of formic esters, Suom. Kemistil. B. 19 (1946) 93-97.
Lele, S.S., Bhave, R.R. and Sharma, M.M., Fast liquid-liquid reactions: Role ofemulsifiers, Ind. Eng. Chem. Process Des. Dev. 22 (1983) 73-76.
Long, F.A. and McDevit, W.F., Activity coefficients of nonelectrolyte solutes inaqueous salt solutions, Chem. Rev. 51 (1952) 119-169.
Nanda, A.K. and Sharma, M.M., Effective interfacial area in liquid-liquidextraction, Chem. Eng. Sci. 21 (1966) 707-713.
Nanda, A.K. and Sharma, M.M., Kinetics of fast alkaline hydrolyses of esters,Chem. Eng. Sci. 22 (1967) 769-775.
Onda, K., Takenchi, H., Fujine, M. and Takahashi, Y., Study of mass transferbetween phases by a diaphragm cell - alkaline hydrolysis of esters inaqueous NaOH solution-, J. Chem. Eng. Jpn. 8 (1975) 30-34.
Pacek, A.W., Nienow, A.W. and Moore, I.P.T., On the structure of turbulentliquid-liquid dispersed flows in an agitated vessel, Chem. Eng. Sci. 49(1994) 3485-3498.
Perry, R.H. and Chilton, C.H., Chemical engineers’ handbook, McGraw-Hill,New York, 6th edn., 1984.
Peters, D.C., Dynamics of emulsification, in: N. Harnby, M.F. Edwards andA.W. Nienow (eds.), Mixing in the process industries, Butterworth,Oxford, 2nd edn., 1992, pp. 294-317.
Puranik, S.A. and Sharma, M.M., Effective interfacial area in packed liquidextraction columns, Chem. Eng. Sci. 25 (1970) 257-266.
Chapter 4
150
de Santiago, M. and Trambouze, P., Réacteurs parfaitement agites à deux phasesliquides: mesure de l’aire interfaciale par méthode chimique, Chem. Eng.Sci. 26 (1971a) 29-38.
de Santiago, M. and Trambouze, P., Applicabilité de la méthode chimique demesure de l’aire interfaciale, Chem. Eng. Sci. 26 (1971b) 1803-1815.
de Santiago, M. and Bidner, M.S., Etude de la réaction formiate de n-butyl-soude en vue de son emploi pour la mesure des aires interfaciales liquide-liquide, Chem. Eng. Sci. 26 (1971) 175-176.
Sharma, M.M. and Danckwerts, P.V., Chemical methods of measuringinterfacial area and mass transfer coefficients in two-fluid systems, Br.Chem. Eng. 15 (1970) 522-528.
Shinnar, R., On the behaviour of liquid dispersions in mixing vessels. J. FluidMech. 10 (1961) 259.
Sprow, F.B., Distribution of drop sizes produced in turbulent liquid-liquiddispersion, Chem. Eng. Sci. 22 (1967) 435-442.
Tavlarides, L.L. and Stamatoudis, M., The analysis of interphase reactions andmass transfer in liquid-liquid dispersions, in: T.B. Drew, G.R. Cokelet,J.W. Hoopes and T. Vermeulen (eds.), Advances in ChemicalEngineering, Vol.11, Academic Press, New York, 1981, p.199.
Treybal, R.E., Liquid extraction, McGraw-Hill, New York, 2nd edn., 1963,pp.150-195.
Vermeulen, T., Williams, G.M. and Langlois, G.E., Interfacial area in liquid-liquid and gas-liquid agitation, Chem. Eng. Prog. 51 (1955) 85-94.
Wesselingh, J.A., The velocity of particles, drops and bubbles, Chem. Eng.Process., 21 (1987) 9-14.
Westerterp, K.R., van Dierendonck, L.L. and de Kraa, J.A., Interfacial areas inagitated gas-liquid contactors, Chem. Eng. Sci., 18 (1963) 157-176.
Westerterp, K.R., van Swaaij, W.P.M. and Beenackers, A.A.C.M., Chemicalreactor design and operation, Wiley, Chichester, student edn., 1987.
Wilke, C.R. and Chang, P., Correlation of diffusion coefficients in dilutesolutions, AIChE J. 1 (1955) 264-270.
Yoshida, F. and Yamada, T., Dispersion of oil in water in gas-bubble columnsand agitated vessels, Chemeca ’70 Conf., Butterworths, Sydney, 1970, pp.19-26.
Zaldivar, J.M., Molga, E., Alos, M.A., Hernandez, H. and Westerterp, K.R.,Aromatic nitrations by mixed acid. Fast liquid-liquid reaction regime,Chem. Eng. Process., 35 (1996) 91-105.

Determination of Interfacial Areas with the Chemical Method
151
Appendix 4.A: Physico-chemical parameters
DiffusivityThe diffusivity of butyl formate in a concentrated sodium hydroxide solution iscalculated by the relation proposed by Onda et al. [1975]. This relation gives thediffusivity ratio of ester in water and ester in a sodium hydroxide solution:
D
DI IA w
A
, . .= + ⋅ + ⋅1 0118413 0 02171242 (36)
The diffusivity of butyl formate in water is estimated by the method of Wilkeand Chang [1955]:
DT
A ww
, .= ⋅ −2 67 1015
µ(37)
Ionic strengthThe ionic strength of the NaOH solution is calculated with the contribution ofsmall amounts CO3
2− included, as:
I C Z C Z C ZNa Na OH OH CO CO
= + ++ + − − − −1
22 2 2
32
324 9 (38)
ViscosityThe viscosity of pure butyl formate µOrg is calculated with the correlation of
Daubert et al. [1989]. The viscosity of the NaOH solution µ Aq is calculated withthe correlation of Onda et al. [1975], which gives the viscosity of sodiumhydroxide in relation to the viscosity of water:
µ µAq w I I= + ⋅ + ⋅( . . )1 0177 0 0527 2 (39)
The viscosity of water µw is calculated with:
log. ( . ) . ( . )
.µw
T T
T= − − −
−−13271 29315 0 001053 29315
168153
2
(40)

Chapter 4
152
Viscosity of the dispersion is calculated with the correlation of Vermeulen et al.[1955]:
µ µε
εµµ µdis
c d
d c
=−
++
���
���1
1 15. (41)
DensityThe density of pure butyl formate ρOrg is calculated with the correlation of
Daubert et al. [1989]. The density of the aqueous NaOH solution ρ Aq is takenfrom Perry and Chilton [1984]. The density of the dispersion is calculated with:
ρ ερ ε ρdis d c= + −( )1 (42)
SolubilityThe solubility of butyl formate in concentrated electrolyte solutions is estimatedby a salting-out parameter Ks, see: Long and McDevit [1952]:
C CA Aq AwK Is
,∗ −= ⋅10 (43)
The salting-out parameter is taken from Bidner and Santiago [1971], Ks =0.1793 m3/kmol. The solubility of butyl formate in water is taken from Nandaand Sharma [1966] who found CA w, =0.075 kmol/m3 for 10 to 30 ºC and a smallincrease in solubility for 30 to 40 ºC, according to the correlation:
C TA w, . . ( . )= ⋅ + ⋅ −− −5 57 10 6 32 10 273152 4 (44)
Continuous phase mass transfer coefficientThe empirical correlation of Calderbank and Moo-Young [1961] is used todetermine the mass transfer coefficient kL,Aq of ester (A) in the continuous phase(B):
kP V
DL AqC C
C
C
C A,
/ /
.( / )=
�!
"$#
�!
"$#
−
0132
1 4 2 3µ
ρµ
ρ(45)
P is the power dissipated by agitator, which can be calculated by:
P Po N Ddis= ⋅ ρ 3 5 (46)

Determination of Interfacial Areas with the Chemical Method
153
The power number Po is practically constant and for a turbine stirrer it equalsPo=5.
This gives for the continuous phase mass transfer coefficient kL,Aq= 13·10-6 m/s,which is in agreement with the value reported by Fernandes and Sharma [1967].They found experimentally kL= 11.3-16·10-6 m/s for n-hexyl formate in aNaOH/Na2SO4 solution.
Dispersed phase mass transfer coefficientThe dispersed phase mass transfer coefficient will depend on whether the dropbehaves as a rigid body or not, see: Treybal [1963] and Heertjes and Nie [1971].The mass transfer coefficient for rigid spheres is, Treybal [1963]:
kD
dL AqA
, =⋅
23
2
32
π(47)
This relationship is valid for spheres with no circulation and with transfer bypure molecular diffusion.
In order to evaluate whether the drop behaves as a rigid body, the diameternumber d* is calculated, see Wesselingh [1987]:
d dg
C
C
*
/
=�!
"$#
−
32
2 1 3µ
ρ ρ∆(48)
When d* <10 the bubbles or drops can be regarded as rigid spheres. For theexperimental range with NaOH as the dispersed phase, the diameter numbervaries between 1 and 3, hence the drops behave like rigid spheres. The dispersedphase mass transfer coefficient can be calculated using Equation (47) and isequal to kL,Aq = 15·10-6 m/s.
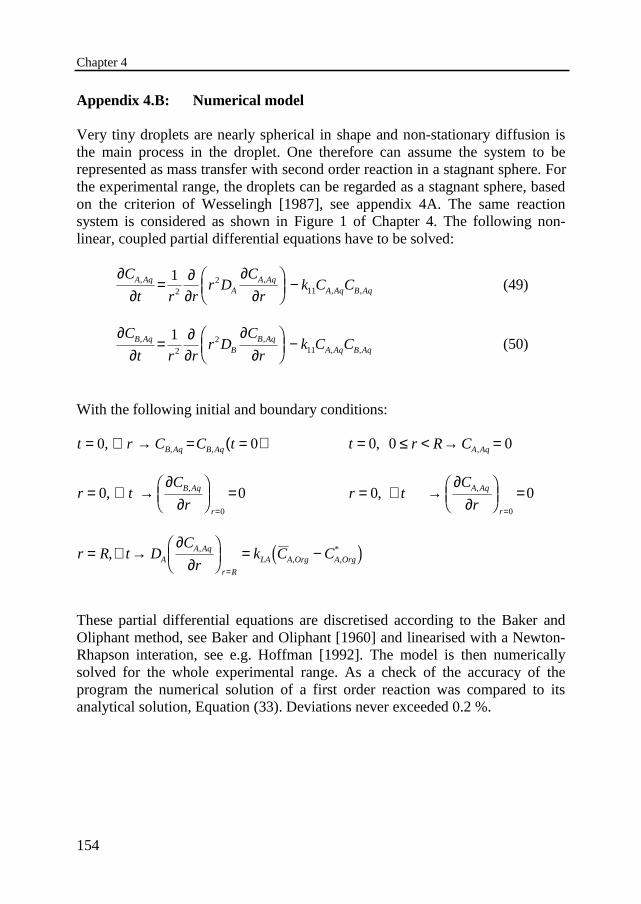
Chapter 4
154
Appendix 4.B: Numerical model
Very tiny droplets are nearly spherical in shape and non-stationary diffusion isthe main process in the droplet. One therefore can assume the system to berepresented as mass transfer with second order reaction in a stagnant sphere. Forthe experimental range, the droplets can be regarded as a stagnant sphere, basedon the criterion of Wesselingh [1987], see appendix 4A. The same reactionsystem is considered as shown in Figure 1 of Chapter 4. The following non-linear, coupled partial differential equations have to be solved:
∂∂
= ∂∂
∂∂
���
��� −
C
t r rr D
C
rk C CA Aq
AA Aq
A Aq B Aq, ,
, ,
12
211 (49)
∂∂
= ∂∂
∂∂
���
��� −
C
t r rr D
C
rk C CB Aq
BB Aq
A Aq B Aq, ,
, ,
12
211 (50)
With the following initial and boundary conditions:
t r C C tB Aq B Aq= ∀ → = =( )0 0, , , t r R CA Aq= ≤ < → =0 0 0, ,
r tC
rB Aq
r
= ∀ →∂
∂���
��� =
=
0 00
, , r tC
rA Aq
r
= ∀ →∂
∂���
��� =
=
0 00
, ,
r R t DC
rk C CA
A Aq
r R
LA A Org A Org= ∀ →∂
∂���
��� = −
=
, ,, ,
*2 7
These partial differential equations are discretised according to the Baker andOliphant method, see Baker and Oliphant [1960] and linearised with a Newton-Rhapson interation, see e.g. Hoffman [1992]. The model is then numericallysolved for the whole experimental range. As a check of the accuracy of theprogram the numerical solution of a first order reaction was compared to itsanalytical solution, Equation (33). Deviations never exceeded 0.2 %.
155
Samenvatting en Conclusies
Een aantal ernstige ongelukken in de chemische industrie werd veroorzaakt dooreen runaway van een heterogene vloeistof-vloeistof reactie waarbij eenongewenste reactie optrad. Een van de voornaamste oorzaken van dezerunaways is een gebrek aan inzicht van de fenomenen welke plaatsvinden indeze reactiesystemen. Om dit type processen veilig en economische teontwerpen en te bedrijven is een gedegen kennis van deze processen uiterstbelangrijk. Dit proefschrift gaat over het veilig bedrijven van een meervoudigevloeistof-vloeistof reactie, uitgevoerd in een semi-batch reactor, met desalpeterzuur oxidatie van 2-octanol als voorbeeld. Een algemene inleiding totrunaways in (semi) batch reactoren wordt gegeven in Hoofdstuk 1.
In Hoofdstuk 2 wordt de oxidatie van 2-octanol behandeld. De oxidatie van 2-octanol met salpeterzuur is geselecteerd als modelreactie voor een heterogenevloeistof-vloeistof reactie met een ongewenste zijreactie. Hierbij wordt 2-octanol eerst geoxideerd tot 2-octanon dat vervolgens verder geoxideerd kanworden tot carbonzuren. De oxidatie van 2-octanol met salpeterzuur vertoont detypische kenmerken van salpeterzuur oxidaties, zoals: lange inductietijd zondertoevoeging van initiator; autokatalytische reactie, sterke invloed vanzuurconcentratie en hoge activeringsenergie. Er is een beperkte kennis over deexacte chemische structuur van de componenten in de waterige reactiefase enover een aantal ongeïdentificeerde, onstabiele verbindingen, in de organischefase. Daarbij is ook het exacte mechanisme van de reactie nog niet opgehelderd.Hierdoor was een sterke vereenvoudiging nodig van het model om dereactiesnelheden te kunnen beschrijven.
Een uitgebreid experimenteel programma is gevolgd met behulp vanreactiecalorimetrie ondersteund met chemische analyses. De oxidatie reactieszijn uitgevoerd in de reactie calorimeter RC1 van Mettler Toledo welke isuitgevoerd met een dubbelwandige glazen reactievat ter grootte van 1 liter. Dereacties zijn onderzocht in de temperatuurrange van 0 tot 40 ºC, eenbeginconcentratie salpeterzuur van 50 tot 65 massa% en een toerental van 700tpm. De kinetiekconstanten zijn bepaald voor beide reacties. De waargenomenomzettingssnelheden van de complexe reacties van 2-octanol en 2-octanon metsalpeterzuur kunnen beschreven worden met slechts tweekinetiekvergelijkingen. Hierin wordt de invloed van de temperatuur beschreven

Samenvatting en Conclusies
156
met de Arrhenius-vergelijking en de invloed van de zuursterkte met Hammett’szuurfunctie.
Salpeterzuur en de organische oplossing zijn onmengbaar. Hierdoor verlopen dechemische reactie en de stofoverdrachtverschijnselen gelijktijdig. De resultatengeven aan dat de oxidatie van 2-octanol is uitgevoerd in het niet-chemischversnelde regiem, zolang de salpeterzuurconcentratie lager is dan 60 massa% ofde temperatuur beneden 25 ºC is bij een concentratie van 60 massa%. Deoxidatie van 2-octanon is uitgevoerd in het niet-chemisch versnelde regiem vooralle experimenteel toegepaste condities. Onder deze condities wordt deomzettingssnelheid niet beïnvloed door de weerstand tegen stofoverdracht. Deheersende parameters zijn in dit geval de reactiesnelheidsconstante en deoplosbaarheid van de organische componenten in de salpeterzuuroplossing. Ditis ook experimenteel bevestigd door de invloed van het toerental te bepalen.
Gelijktijdig is een model ontwikkeld waarmee de omzettingssnelhedenbeschreven kunnen worden. Hiermee kan het gedrag van de semi-batch reactor,de concentratie- en temperatuur-tijd profielen, met succes voorspeld worden. Deexperimentele resultaten en de simulaties zijn in goede overeenstemming en hetis mogelijk gebleken om het thermische gedrag van de salpeterzuuroxidatiereacties in de semi-batch reactor te beschrijven met het filmmodel in hetlangzame reactie regiem en een vereenvoudigd reactie schema.
In hoofdstuk 3 is het thermisch gedrag van dit heterogene vloeistof-vloeistofreactie systeem in meer detail beschreven. Een experimentele opstelling isgebouwd, met een glazen reactor van 1 liter, gevolgd door een thermischekarakterisering van de opstelling. Twee gescheiden koelcircuits zijngeïnstalleerd, één via een koelspiraal en één via een koelwand, om verschillendekoelcapaciteiten te onderzoeken. De reactor wordt bedreven op semi-batch wijzeonder isoperibole condities, d.i. met constante koeltemperatuur. Een serieoxidatie experimenten is uitgevoerd om de invloed van verschillende initiële enoperatiecondities te onderzoeken. De reacties zijn uitgevoerd met eenkoeltemperatuur van –5 tot 60 ºC, doseertijden van 0.5 tot 4 uur, een initiëlesalpeterzuur concentratie van 60 massa% en een toerental van 1000 tpm.
De reactie is uitgevoerd in een gekoelde SBR waarbij salpeterzuur wordtvoorgelegd en de organische component 2-octanol gedoseerd wordt met eenconstant debiet. 2-Octanol reageert tot 2-octanon dat vervolgens verdergeoxideerd kan worden tot ongewenste carbonzuren. Een gevaarlijke situatiekan ontstaan wanneer de overgang van de reactie naar zuren op zo een snellewijze plaatsvindt dat de reactiewarmte in zeer korte tijd vrijkomt waardoor een

Samenvatting en Conclusies
157
temperatuur-runaway optreedt. Het toepassen van een langere doseertijd of eengrotere koelcapaciteit is een effectieve manier om de temperatuureffecten tematigen en uiteindelijk zal een ongewenste temperatuurstijging voorkomenkunnen worden. In het laatste geval kan het proces beschouwd worden als ‘altijdveilig’ en zal er voor geen enkele koeltemperatuur een runaway plaatsvinden ende reactortemperatuur blijft gehandhaafd tussen bekende grenzen. De conditieswelke leiden tot een ‘altijd veilig’ proces zijn bepaald met experimenten en metmodelberekeningen.
Voor de winstgevendheid van een fabriek is het gewenst om een hoge opbrengstte bereiken in een korte tijd en onder veilige omstandigheden. Dereactiecondities moeten zo gekozen worden dat de maximale opbrengst aantussenproduct 2-octanon snel bereikt wordt en vervolgens dient de reactiegestopt te worden bij het bereiken van de optimale reactietijd. Het geschiktemoment om de reactie te stoppen kan bepaald worden met modelberekeningen.De invloed van de operatiecondities, bijv. doseertijd en koeltemperatuur, op demaximale opbrengst is bestudeerd en wordt besproken.
Bij de oxidatie van 2-octanol is de aandacht gericht op de eerste gewenstereactie, terwijl het gevaar van een runaway-reactie toegeschreven kan wordenaan het ontsteken van de tweede reactie. Het reactiesysteem kan worden opgevatals twee enkelvoudige reacties en daarom is ook het grensdiagram − ontwikkelddoor Steensma en Westerterp [1990] − voor enkelvoudige reacties gebruikt omde kritische condities te bepalen voor het meervoudige reactiesysteem. Hetgrensdiagram kan gebruikt worden om de doseertijd en de koeltemperatuur tebepalen nodig voor het veilig bedrijven van de gewenste reactie, maar het leidttot een te optimistische koeltemperatuur om de ongewenste reactie teonderdrukken.
Het bestuderen van het dynamische gedrag van vloeistof-vloeistof reactiesystemen gaat gepaard met enkele complicaties, omdat de chemische reactie enstofoverdracht gelijktijdig optreden. De kennis over het oppervlak van hetfasengrensvlak in een vloeistof-vloeistof systeem is essentieel voor eennauwkeurige beschrijving van de stofoverdracht en snelheden van de chemischereacties. In Hoofdstuk 4 is het contactoppervlak van een vloeistof-vloeistofsysteem in een mechanisch geroerde reactor bepaald met behulp van dechemische reactie methode. Bij deze methode wordt gebruik gemaakt vanabsorptie welke gepaard gaat met een snelle pseudo-eerste orde reactie. Alsmodelreactie is gekozen voor de verzeping van butylformiaat met een 8 Mnatronloog oplossing. De extractiesnelheid van de ester is bepaald in eengeroerde cel met een goed gedefinieerd contactoppervlak van 33.4 cm2 en er is
Samenvatting en Conclusies
158
een correlatie afgeleid om de molflux van de ester door het oppervlak tebeschrijven. De kinetiekconstanten zijn berekend en worden vergeleken met deliteratuurwaarden. De snelheid van de reactie wordt beïnvloed door dehoeveelheid ionen in de oplossing. Om dit effect van de ion-sterkte te kunnenbeschrijven is de reactiesnelheidconstante beschreven met een extra term in degebruikelijke Arrhenius-vergelijking.
Om het contactoppervlak in een turbulent gemengde dispersie te onderzoeken isde reactor, met een volume van 0.5 liter, continu bedreven. Een correlatie voorde Sauter gemiddelde druppeldiameter is afgeleid voor zowel reactie in dedisperse fase als voor reactie in de continue fase. Een viscositeitfactor moestingevoerd worden om beide situaties met één enkele correlatie te kunnenbeschrijven. De Sauter gemiddelde druppeldiameter kan beschreven worden metvergelijkbare correlaties als vermeld in de literatuur, alleen de constantenverschillen. Dit is het gevolg van verschillen in de specifieke eigenschappen vanhet onderzochte systeem en verschillen in de configuratie van de reactor. Hierbijis gevonden dat deze constanten afhangen van welke fase gedispergeerd wordt.Met de organische fase als de gedispergeerde fase worden diameters van dedruppels gevonden tussen 35 en 75 µm en tussen 65 en 135 µm als de waterigefase wordt gedispergeerd. De druppelgrootte lijkt af te hangen van de dichtheidvan de continue fase en de verhouding van de viscositeiten van de twee fasen.Het is niet eenduidig welke fase gedispergeerd de kleinste druppels geeft endaarmee het grootste contactoppervlak. Het wordt daarom aanbevolen om hetcontactoppervlak te bepalen voor beide vloeistoffen als de gedispergeerde fase.
De stofoverdracht met chemische reactie is beschreven met het filmmodel. Dezetheorie kan over het algemeen toegepast worden binnen de onzekerheden van degeschatte fysische en chemische parameters, terwijl het model eenvoudig is. Degeldigheid van het toepassen van het chemisch versnelde regiem is getoetst. Erwordt voor alle experimenten voldaan aan de noodzakelijke condities, behalvede voorwaarde van een grote Achterland verhouding. Hierom is de reactie tussenester en natronloog in een druppel beschreven met een numeriek model. Heteffect van een kleine Achterland verhouding manifesteert zich omdat, voorzowel de filmtheorie als penetratietheorie, het niet mogelijk is om deuiteindelijke uitputting van reactant in de druppel te beschrijven. Voor deexperimentele opstelling en experimentele condities is de contacttijd relatief korten zijn afwijkingen, ten gevolge van uitputting van NaOH in de druppel, niet teverwachten. Voor de experimenteel gemeten kleinste druppeldiameters is deaanname van een vlak contactoppervlak niet meer geldig. In dat geval zal deinvloed van de kromming meegenomen moeten worden. In de andere gevallenkan het filmmodel met vertrouwen worden toegepast.

159
Dankwoord
De totstandkoming van dit proefschrift is het resultaat van de inspanning vaneen groot aantal mensen. Iedereen die een bijdrage heeft geleverd wil ik hierbijbedanken. Een aantal mensen wil ik zeker niet onvermeld laten.
Ik wil allereerst mijn promotor, Professor Westerterp, noemen. Toen ik begonwas ik mij maar ten dele bewust van de moeilijkheid van het voortzetten van eenreeds begonnen onderzoek. Hij heeft vertrouwen getoond en de vrijheid gegevenom het onderzoek een nieuwe richting te geven. Na het schrijven van deartikelen werden de discussies gevoerd. Dit moest meestal per fax van en naarSpanje. Hoewel dat niet altijd even makkelijk is gegaan heeft zijn kritische bliker voor gezorgd dat het proefschrift aan duidelijkheid heeft gewonnen.Daarnaast heb ik grootste bewondering voor zijn enthousiasme en gedrevenheidwaarmee hij altijd heeft gezorgd voor een hechte groep met een brede blik.
Een groot gedeelte van het beschreven werk is uitgevoerd door studenten in hetkader van hun afstudeeropdracht. Waarvan Bart Sikkens veruit de eerste. Hijhad de opdracht al gekozen voordat ik in dienst getreden was. Samen zijn webegonnen met de ‘kinso-opstelling’ en hebben het onderzoek op poten gezetnaar het meten van grensvlakken in vloeistof-vloeistof dispersies. Het werkwerd voortgezet door de eerste van een groep vrienden: Rob Horsthuis, waarmeehet onderzoek snel vorderde. De meeste bezieling in het Hoge DrukLaboratorium werd ingebracht door Pieter Meulenberg, hij introduceerde deHDL-shuffle.
Veel tijd is gaan zitten in het vinden van een geschikte modelreactie. Demogelijke reactiesystemen werden getest door Sander Geuting in de reactiecalorimeter. Altijd begon Sander met een kleurloze oplossing welke vervolgensgroen, blauw, geel, bruin of rood werd. Robert Berends vervolgde het werk metde oxidatie van alcoholen met salpeterzuur. Wat waren we blij toen detemperatuur plotseling snel opliep, bruine dampen ontstonden en de stoppen vande reactordeksel om onze oren vlogen: onze eerste runaway!! Dat was hetsysteem dat we zochten. Vincent Motta heeft enkele oriënterende metingenuitgevoerd in een adiabatisch vat en Emiel Ordelmans heeft het systeem verderonderzocht in de calorimeter. Ondanks het complexe gedrag van het systeem ismet Sjoerd Lemm een beschrijving verkregen van de kinetiek van de oxidatie

Dankwoord
160
reacties. Hij hield er wel bruine vingers aan over en kreeg er de gaten van in zijnbroek.
Bas Wonink is begonnen met de bouw van een gekoelde semi-batch reactor ende warmtekarakterisering daarvan. Sybrand Metz heeft deze karakteriseringafgerond en heeft vele malen de salpeterzuuroxidatie in de reactor uitgevoerd.Het veroorzaken van een runaway werd zijn specialisme, maar ook het veiligeoperatiegebied werd ontdekt.
Veel begripsvorming rondom runaways van systemen met meervoudige reactiesis ontstaan door modelleerwerk, waarvan Menno van Os een deel op zich heeftgenomen. Menno is een van de weinige die een kwaliteitselftal weet tewaarderen: En weer trekken wij ten strijde... Dit werk werd voortgezet doorArnold ‘Mo’ Kleijn die, naar zijn zeggen, enkele handige ‘tools’ heeft bedacht,maar vooral zijn ‘most worthy models’ hebben indruk gemaakt. Tot slot hebbenVeroniek Joosten, Maurice Prins, Marc Weemer en Jeroen Bouwman als TBKP-studenten metingen verricht in het kader van hun technische opdracht.
Tevens wil ik alle leden van binnen en buiten de vakgroep bedanken, die alscommissielid van het onderzoek hebben deelgenomen: Louis van der Ham, ImreRácz, Günter Weickert, Konrad Mündlein, Rahul Vas Bhat, Frank van Veggel,Maarten Vrijland, en speciale dank gaat naar Wim Brilman en MetskeSteensma. Met Wim heb ik altijd waardevolle discussies kunnen voeren enMetske van Akzo Nobel Deventer heeft vooral in de beginfase nodigeaanwijzingen gegeven.
Het onderzoek omvatte een groot deel experimenteel werk. Vele opstellingenzijn gebouwd en vele runaways zijn beheerst opgetreden. Dit was alleenmogelijk met de hulp van alle technici in het Hoge Druk Laboratorium. Zijsleutelen niet alleen aan de opstellingen, maar dachten ook altijd mee oververbeteringen. Arie Pleiter en Fred ter Borg maakten altijd even tijd vrij om ietste doen. Maar ook zonder de inspanningen van Karst van Bree en in de laatsteperiode vooral de bijdrage van Geert Monnik had mijn onderzoek niet continukunnen doorlopen. En natuurlijk Gert Banis. Hij weet je het gevoel te geven datje rijk bent, terwijl je niks hebt.
Vele analyses zijn uitgevoerd door Wim Lengton en Adri Hovestad. Met namewil ik hun bedanken voor de hulp en tips om zelf analyse methoden op testarten. Mijn dank gaat dan ook onvermijdelijk uit naar Bert Kamp, dievakkundig de gas-chromatograaf repareerde. De glasblazers voor hetvervaardigen van het glaswerk en na intensief gebruik: het herstellen van de

Dankwoord
161
barsten. Henny Bevers dank ik voor het uitvoeren van de TOC-analyses, netvoordat het apparaat ter zielen is gegaan.
Een ieder van Financiële Zaken, Personeels Zaken wil ik bedanken voor al hetwerk dat ze voor mij hebben verricht. Het Apparatencentrum, en met name WimPlatvoet en Jan Jagt die de bestellingen van de juiste apparatuur hebben geregelden Henk Bruinsma voor de chemicaliën en laboratorium spullen. Ik heb veel vanhet internet mogen genieten omdat ik (bijna) altijd on-line was. Dit was alleenmogelijk dankzij de hulp van SGA en met name Jan Heezen en Marc Hulshof.
Tevens gaat mijn dank uit naar de gehele vakgroep Industriële Processen enProdukten: de stafleden, (ex)promovendi, postdoc’s en het secretariaat. Familieen vrienden wil ik bedanken voor hun morele steun die zij mij gegeven hebbenen de welkome uitjes. Mijn moeder wil ik bedanken voor haar steun en begrip.Zij wilde altijd op de hoogte blijven van de stand van zaken, maar daar moest iksoms in teleurstellen. Ik hoop dat ze kan leven met hetgeen dat vermeld is in hetproefschrift. En in het bijzonder Geralda. Zij stond altijd klaar wanneer datnodig was, terwijl ze ook begrip had als ik geen tijd had om iets voor haar tedoen zolang het nog niet af was. Maar nu, voor je verjaardag, … het is af!
162
List of Publications
L. van de Beld, R.A. Borman, O.R. Derkx, B.A.A. van Woezik and K.R.Westerterp, 1994. Removal of volatile organic compounds from polluted air in areverse flow reactor: An experimental study. Ind. Eng. Chem. Res. 33 2946-2956.
B.A.A. van Woezik and K.R. Westerterp, 2000. Measurement of interfacialareas with the chemical method for a system with alternating phases dispersed.Chem. Eng. Process. 39 299-314.(Chapter 4 of this thesis)
E.J. Molga, B.A.A. van Woezik and K.R. Westerterp, 2000. Neural networks formodelling of chemical reaction systems with complex kinetics: oxidation of 2-octanol with nitric acid. Chem. Eng. Process. 39 323-334.
B.A.A. van Woezik and K.R. Westerterp, 2000. The nitric acid oxidation of 2-octanol. A model reaction for multiple heterogeneous liquid-liquid reactions.Chem. Eng. Process. 39 521-537.(Chapter 2 of this thesis)
B.A.A. van Woezik and K.R. Westerterp, 2000. Runaway behavior andthermally safe operation of multiple liquid-liquid reactions in the semi-batchreactor. The nitric acid oxidation of 2-octanol. Accepted for publication inChem. Eng. Process.(Chapter 3 of this thesis)
163
Levensloop
Bob van Woezik is op 6 januari 1969 geboren te Nijmegen. Na de lagere schoolbezocht hij de Dukenburg College te Nijmegen waar hij in juni 1986 hetH.A.V.O. diploma behaalde en vervolgens in juni 1988 het V.W.O. diploma.
In augustus van datzelfde jaar begon hij met de studie Chemische Technologieaan de Universiteit Twente. De propaedeuse werd in augustus 1989 behaald.Gedurende de opleiding werd een jaar aan extra keuzevakken gevolgd en in april1994 sloot hij het theoretische deel van deze opleiding af met een onderzoekbinnen de vakgroep Industriële Processen en Produkten naar de invloed vanprocesparameters op het bedrijven van een omkeerreactor.
In de zomerperiode beëindigde hij de opleiding met een stage bij decementfabriek Adelaide Brighton Cement Ltd. te Angaston, Australië. Hieronderzocht hij de mogelijkheid om de agglomeraatvorming te regelen en tecontroleren aan de hand van geluidsniveaumetingen.
Vervolgens trad hij in december 1994 in dienst als medewerker onderzoek,vanaf maart 1995 als onderzoeker in opleiding in dienst van het NWO, en vanafjanuari 1997 als assistent in opleiding, bij de vakgroep Industriële Processen enProdukten. Onder leiding van Prof.dr.ir. K.R.Westerterp heeft hij het in ditproefschrift beschreven onderzoek verricht. Tegelijkertijd volgde hij depostdoctorale Ontwerpersopleiding Procestechnologie tot procesontwikkelaar,waarvan hij het diploma ontving. Sinds 1 november 1999 is hij werkzaam alsprocestechnoloog bij Akzo Nobel Functional Chemicals, locatie Herkenbosch.

ISBN 90 - 365 14878