B van Woezik_Runaway and thermally safe operation of a nitric acid oxidation in a semi-batch reactor
i
A NOVEL REVERSE FLOW REACTORCOUPLING ENDOTHERMIC
AND EXOTHERMIC REACTIONS
PROEFSCHRIFT
ter verkrijging vande graad van doctor aan de Universiteit Twente,
op gezag van de rector magnificus,prof.dr. F.A. van Vught,
volgens besluit van het College voor Promotiesin het openbaar te verdedigen
op vrijdag 27 oktober 2000, te 16.45 uur.
door
Martin van Sint Annaland
geboren op 2 juni 1971te Apeldoorn

ii
Dit proefschrift is goedgekeurd door de promotoren
prof.dr.ir. J.A.M. Kuipers
prof.dr.ir. W.P.M. van Swaaij

iii
aan mijn ouders
iv
Samenstelling promotiecommissie:
prof.dr. W.E. van der Linden, voorzitter Universiteit Twente
prof.dr.ir. J.A.M. Kuipers, promotor Universiteit Twente
prof.dr.ir. W.P.M. van Swaaij, promotor Universiteit Twente
prof.dr. M.P. Duduković Washington University
prof.dr.ir. A. Bliek Universiteit van Amsterdam
prof.dr.ir. L. Lefferts Universiteit Twente
prof.dr.ir. G.F. Versteeg Universiteit Twente
ir. M.J. van der Burgt, referent
The research in this thesis was funded by the Netherlands Organization for Scientific
Research (N.W.O.).
Cover by H.M.P. van Sint Annaland, M. van Sint Annaland
© October 2000 M. van Sint Annaland, Enschede, The Netherlands
No part of this book may be reproduced in any form by print, photoprint, microfilm or any
other means without written permission from the author / publisher.
Niets uit deze uitgave mag worden verveelvoudigd en/of openbaar gemaakt door middel van
druk, fotokopie, microfilm of op welke andere wijze dan ook zonder voorafgaande
schriftelijke toestemming van de schrijver / uitgever.
ISBN 90-36515009
v
Contents
Summary 1
Samenvatting 5
1. General introduction 11
Abstract 121. Introduction 13
1.1 Direct and indirect coupling of endothermic and exothermic reactions 131.2 Open-loop and closed-loop reverse flow processes 151.3 Comparison with conventional technologies 17
2. Reactor system 183. This thesis 22References 25
2. Irreversible endothermic reactions –comparison of reactor configurations 29Abstract 301. Introduction 312. Simulation models 34
2.1 The Dynamic Model and the High Switching Frequency Model 342.2 Model assumptions 35
3. Design criteria 404. Sequential reactor configuration 42
4.1 Overall energy balance 424.2 Matching of Damköhler numbers 434.3 Zero differential creep velocity 48
5. Simultaneous reactor configuration 585.1 Co-current operation 595.2 Counter-current operation 61
5.2.1 Effect of switching of compartments 656. Comparison of reactor configurations 677. Summary and conclusions 71Acknowledgements 72Notation 73References 75Appendix A – Maximum temperature in a reverse flow reactor 78
Contents
vi
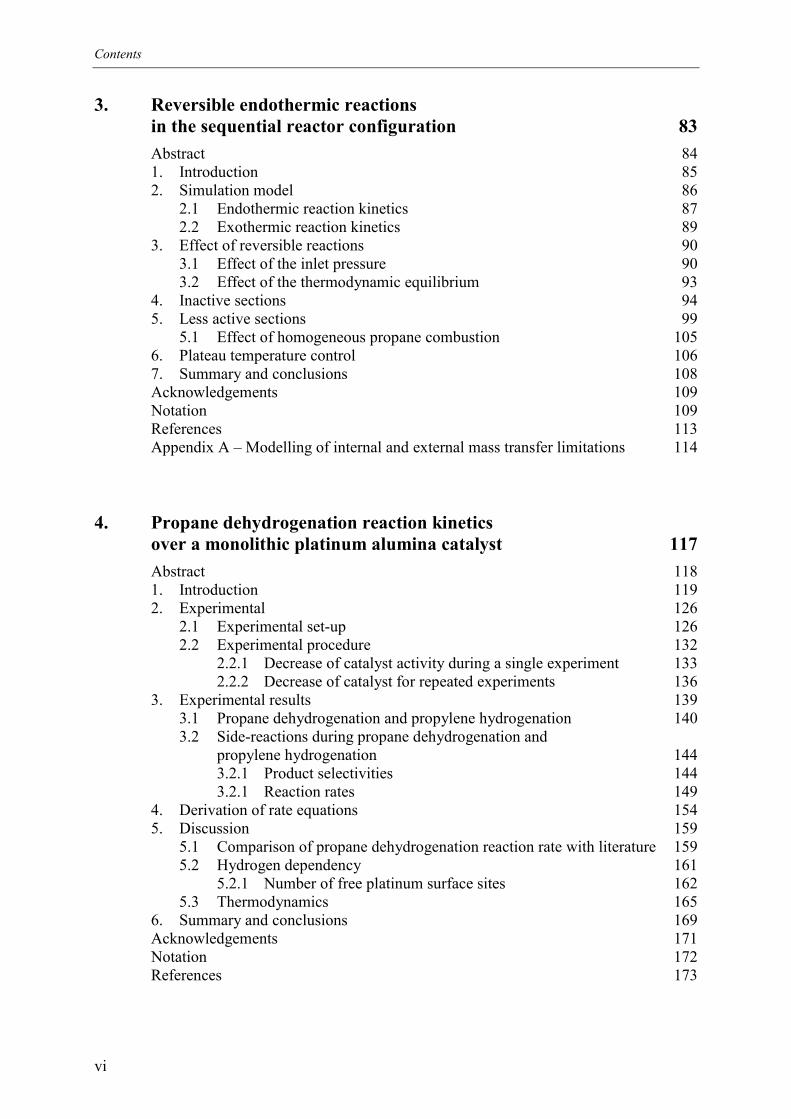
3. Reversible endothermic reactionsin the sequential reactor configuration 83Abstract 841. Introduction 852. Simulation model 86
2.1 Endothermic reaction kinetics 872.2 Exothermic reaction kinetics
3. Effect of reversible reactions3.1 Effect of the inlet pressure3.2 Effect of the thermodynamic equilibrium
4. Inactive sections5. Less active sections
5.1 Effect of homogeneous propane combustion6. Plateau temperature control7. Summary and conclusionsAcknowledgementsNotationReferencesAppendix A – Modelling of internal and external mass transf
4. Propane dehydrogenation reaction kineticsover a monolithic platinum alumina catalyst Abstract1. Introduction2. Experimental
2.1 Experimental set-up2.2 Experimental procedure
2.2.1 Decrease of catalyst activity during a single2.2.2 Decrease of catalyst for repeated experimen
3. Experimental results3.1 Propane dehydrogenation and propylene hydrogen3.2 Side-reactions during propane dehydrogenation an
propylene hydrogenation3.2.1 Product selectivities3.2.1 Reaction rates
4. Derivation of rate equations5. Discussion
5.1 Comparison of propane dehydrogenation reaction 5.2 Hydrogen dependency
5.2.1 Number of free platinum surface sites5.3 Thermodynamics
6. Summary and conclusionsAcknowledgementsNotationReferences
8990
90939499105106108109109
113er limitations 114
117118119126126132
experiment 133ts 136
139ation 140d
144144149154159
rate with literature 159161162165169171172173
Contents
vii
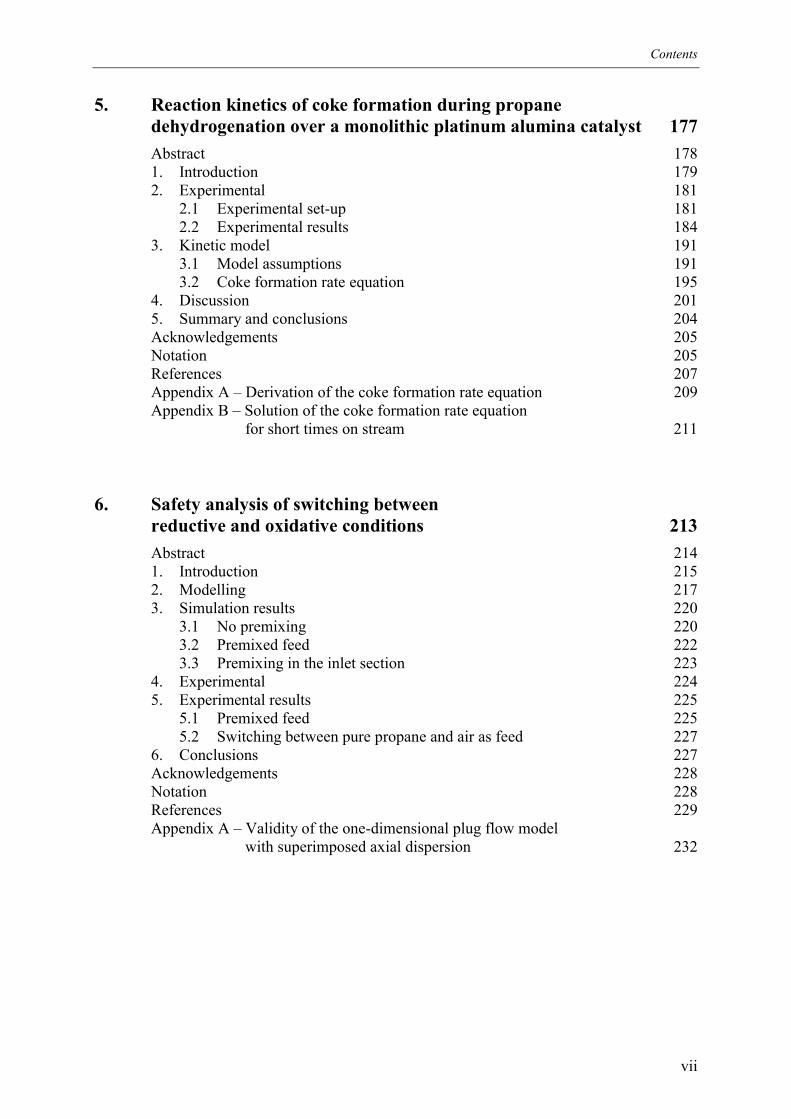
5. Reaction kinetics of coke formation during propanedehydrogenation over a monolithic platinum alumina catalyst 177Abstract 1781. Introduction 1792. Experimental 181
2.1 Experimental set-up 1812.2 Experimental results 184
3. Kinetic model 1913.1 Model assumptions 1913.2 Coke formation rate equation 195
4. Discussion 2015. Summary and conclusions 204Acknowledgements 205Notation 205References 207Appendix A – Derivation of the coke formation rate equation 209Appendix B – Solution of the coke formation rate equation
for short times on stream 211
6. Safety analysis of switching betweenreductive and oxidative conditions 213Abstract 2141. Introduction 2152. Modelling 2173. Simulation results 220
3.1 No premixing 2203.2 Premixed feed 2223.3 Premixing in the inlet section 223
4. Experimental 2245. Experimental results 225
5.1 Premixed feed 2255.2 Switching between pure propane and air as feed 227
6. Conclusions 227Acknowledgements 228Notation 228References 229Appendix A – Validity of the one-dimensional plug flow model
with superimposed axial dispersion 232
Contents
viii
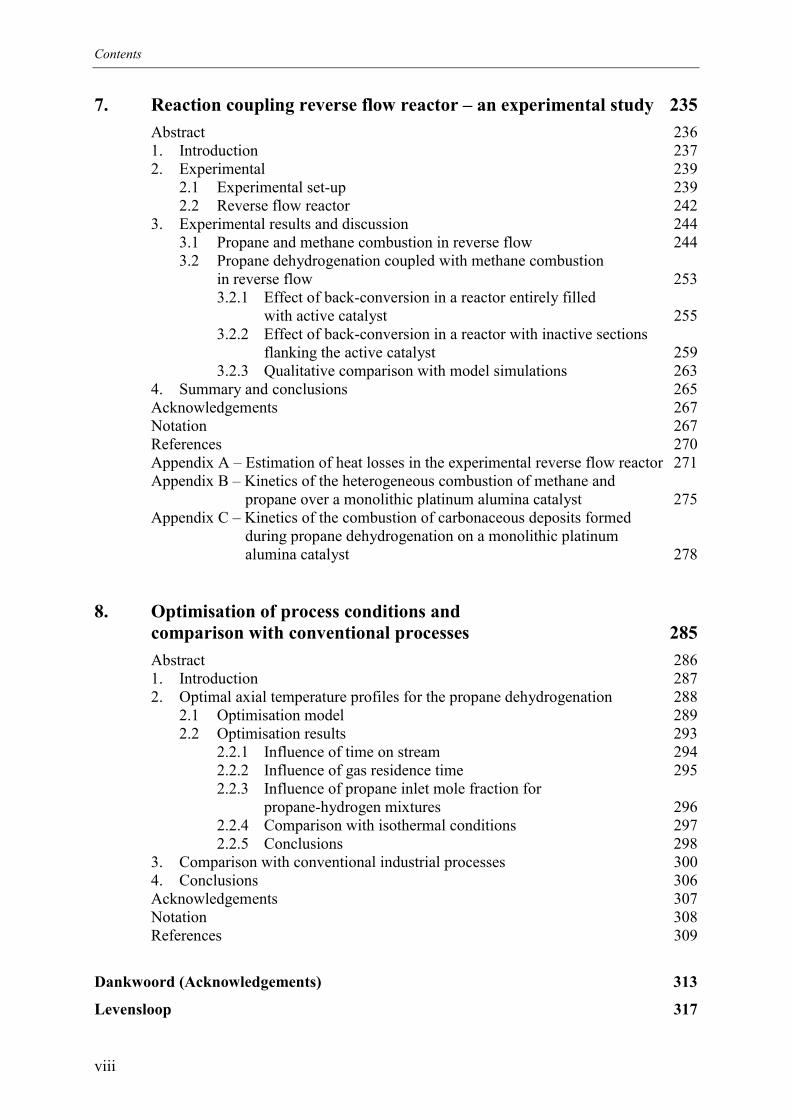
7. Reaction coupling reverse flow reactor – an experimental study 235Abstract 2361. Introduction 2372. Experimental 239
2.1 Experimental set-up 2392.2 Reverse flow reactor 242
3. Experimental results and discussion 2443.1 Propane and methane combustion in reverse flow 2443.2 Propane dehydrogenation coupled with methane combustion
in reverse flow 2533.2.1 Effect of back-conversion in a reactor entirely filled
with active catalyst 2553.2.2 Effect of back-conversion in a reactor with inactive sections
flanking the active catalyst 2593.2.3 Qualitative comparison with model simulations 263
4. Summary and conclusions 265Acknowledgements 267Notation 267References 270Appendix A – Estimation of heat losses in the experimental reverse flow reactor 271Appendix B – Kinetics of the heterogeneous combustion of methane and
propane over a monolithic platinum alumina catalyst 275Appendix C – Kinetics of the combustion of carbonaceous deposits formed
during propane dehydrogenation on a monolithic platinumalumina catalyst 278
8. Optimisation of process conditions andcomparison with conventional processes 285Abstract 2861. Introduction 2872. Optimal axial temperature profiles for the propane dehydrogenation 288
2.1 Optimisation model 2892.2 Optimisation results 293
2.2.1 Influence of time on stream 2942.2.2 Influence of gas residence time 2952.2.3 Influence of propane inlet mole fraction for
propane-hydrogen mixtures 2962.2.4 Comparison with isothermal conditions 2972.2.5 Conclusions 298
3. Comparison with conventional industrial processes 3004. Conclusions 306Acknowledgements 307Notation 308References 309
Dankwoord (Acknowledgements) 313
Levensloop 317
Summary
Highly endothermic heterogeneously catalysed gas phase reactions at high temperatures with
possible rapid but reversible catalyst deactivation are an industrially important class of
chemical transformations. Because of the energy supply at high temperatures and the
necessary catalyst regeneration dedicated reactor technology is required. In this thesis a new
reactor concept is proposed for this type of reactions, aiming for improved energy efficiency
through multi-functionality. The reactor concept aims to combine the indirect coupling of
energy necessary for endothermic reactions and energy released by exothermic reactions,
without mixing of endothermic and exothermic reactants, with closed-loop adiabatic reverse
flow operation. The p odic flow reversals while feeding the reactants thout any preheating
result in low tempera
of the reactor, incor
concept, called the ‘R
the non-oxidative pr
platinum alumina ca
coke, formed as a sid
overall energy balanc
at high temperatures
exchange are all inte
for the propane deh
conditions with high
catalyst regeneration
theoretical study focu
on the kinetics of the
in a small laboratory
economic potential
production by catalyt
Indirect coupling of
flow can be accompl
and ‘simultaneous’
endothermic and exo
catalyst bed, where
eri
tures at both reactor ends, while high temperatur
porating recuperative heat exchange inside th
action Coupling Reverse Flow Reactor’ (RCRF
opane dehydrogenation to propylene and hydro
talyst, indirectly coupled with the exothermic c
e-product during the dehydrogenation, and adde
e. In the RCRFR the propane dehydrogenation
, catalyst regeneration by burning off the coke
grated in one apparatus. This reactor concept is
ydrogenation, because it allows operation at
er product yields in addition to savings on exte
equipment. In this thesis the reactor concept ha
ssing on how the RCRFR should be operated, by
main reactions, by testing the technical feasibilit
scale reactor aiming for a proof of principle and
via comparison with conventional processes fo
ic propane dehydrogenation.
reaction energies of endothermic and exotherm
ished in two basic reactor configurations, design
reactor configuration. In the sequential rea
thermic reactants are fed discontinuously and se
the bed acts as an energy repository deliver
wi
es prevail in the centre
e reactor. This reactor
R), has been studied for
e1
gen over a monolithic
ombustion with air of
d hydrocarbon fuels for
reaction, energy supply
and recuperative heat
particularly interesting
more severe reaction
rnal heat exchange and
s been developed by a
an experimental study
y of the reactor concept
finally by assessing its
r industrial propylene
ic reactions in reverse
ated by the ‘sequential’
ctor configuration the
quentially to the same
ing energy during the
Summary
2
endothermic reaction phase and storing energy during the consecutive exothermic reaction
phase, while concurrently regenerating the catalyst. In the simultaneous reactor configuration
the endothermic and exothermic reactants are fed continuously and simultaneously to
different catalyst beds exchanging energy, either in co-current or counter-current operation
mode, and the endothermic and exothermic feed streams are periodically switched in order to
counteract catalyst deactivation. The dynamic reactor behaviour has been studied via detailed
numerical simulations and energy constraints to achieve an ignited cyclic steady state with
maximum conversion for both the endothermic and exothermic process steps while satisfying
a maximum temperature constraint have been examined for both reactor configurations. In an
adiabatic reverse flow reactor the axial temperature profile results from the chosen operating
conditions. It is shown that for a single first order exothermic reaction the maximum
dimensionless temperature depends on a single dimensionless number and that for high
throughputs the maximum temperature can only be controlled via the exothermic inlet
concentration. If a maximum temperature constraint limits the production capacity, only in the
sequential reactor configuration the endothermic inlet concentration can be optimised at high
throughput and maximum energy efficiency without adjusting the gas velocities, by the choice
of a switching scheme with inherently zero differential creep velocity and by using the ratio of
the cycle times.
For reversible endothermic reactions the equilibrium can be shifted towards the reactants at
the reactor outlet because of the low exit temperatures due to the reverse flow concept,
resulting in significantly lower conversions. A new solution is introduced for the sequential
reactor configuration to achieve both full equilibrium conversion and recuperative heat
exchange while simultaneously avoiding too high temperatures. The proposed solution
utilises the movement of the temperature fronts and employs less active catalyst sections
installed at either end of the active catalyst bed and optionally completely inactive sections at
the reactor ends, whereas simultaneous propane and methane combustion is used for energy
supply and control of the plateau temperature.
To assess the potential of the RCRFR for the propane dehydrogenation, quantitative
predictive reaction rate expressions were experimentally determined for the propane
dehydrogenation, propylene hydrogenation and their most important side-reactions, viz.
propane cracking, propane and propylene hydrogenolysis and coke formation, covering very
wide concentration and temperature ranges over a partially deactivated monolithic platinum
alumina catalyst, resembling the conditions occurring in a RCRFR.
Summary
3
The reaction kinetics of the gas phase reactions over the monolithic platinum alumina catalyst
were determined in a differentially operated reactor, where the same catalyst sample was used
for many experiments consisting of reduction, (de)hydrogenation and temperature
programmed oxidation (TPO), so that the measured reaction rates could be corrected for the
decrease in catalytic activity caused by sintering and destruction of the most active sites or
decrease in platinum dispersion. The propane dehydrogenation and propylene hydrogenation
reaction rates typically decrease during the course of a single experiment due to the formation
of carbonaceous deposits on the active sites and reach an asymptotic steady state after about
half an hour. For the steady state reaction rates of the propane dehydrogenation and
hydrogenolysis at higher temperatures, the propane cracking and propylene hydrogenolysis,
reaction orders for hydrogen were observed corresponding to the reaction stoichiometry.
However, the propane dehydrogenation and hydrogenolysis at lower temperatures and the
propylene hydrogenation show a remarkable additional order in the hydrogen concentration.
This finding was interpreted by assuming that the reactions can take place at two different
surface sites: platinum and acid alumina surface sites. The reactions taking place at the
platinum surface sites have a supplementary order in the hydrogen concentration, which could
be explained by the influence of hydrogen on the number of free platinum surface sites not
covered with carbonaceous deposits.
Coke formation reaction rates under propane dehydrogenation reaction conditions over a
monolithic platinum alumina catalyst were determined separately in a thermogravimetric
analyser (TGA) as a function of time on stream covering wide temperature and concentration
ranges. For relatively short times on stream, especially at low temperatures and low propylene
concentrations, a remarkable initial quadratic increase was observed in the coke content
versus time with a high apparent propylene reaction order. After longer times on stream the
coke formation rate decreases to a constant residual coke growth. The experimental data have
been successfully described by a kinetic rate expression based on a mechanistic dual coke
growth model.
Subsequently, the technical feasibility of the RCRFR concept was tested. Firstly, from a
safety analysis on the effects of the possible formation of combustible gas mixtures of
hydrocarbons and air upon switching between reductive and oxidative conditions due to
mixing in the monolith channels and in the inlet sections it was concluded that intermediate
Summary
4
flushing with inert gases can safely be omitted, provided that proper precautions are taken. A
proof of principle of the RCRFR concept was demonstrated in a small laboratory scale
reactor. Experiments coupling propane dehydrogenation with methane combustion in a
reactor entirely filled with active catalyst showed the seriousness of conversion losses at the
reactor end due to the low exit temperatures. Inactive sections installed at either end of the
active catalyst section could effectively counteract this back-conversion, as predicted by
detailed numerical simulations. The oxygen concentration during the methane combustion
cycles needed to be reduced in order to avoid excessive temperatures due to local combustion
of carbonaceous products in the wascoat deposited during the preceding propane
dehydrogenation cycle.
On the basis of the experimentally determined reaction rates for the propane dehydrogenation,
propylene hydrogenation and their most important side reactions including coke formation,
optimal process conditions have been determined using Pontryagin’s maximisation principle.
For undiluted propane feeds at atmospheric pressure the propylene yield is optimal is at high
reactor temperatures (675-725 °C) and short cycle times. Maximum propylene yields (50-
60%) are thus attained at high propane conversion (75-90%) and relatively low propylene
selectivity (ca. 70%) with significant amounts of coke formed as by-product. Due to the
increase of the coke formation rate as a function of time on stream the optimal axial
temperature profile shifts from a strongly increasing temperature profile at the beginning of
the dehydrogenation cycle to an almost uniform axial temperature profile after a few minutes
on stream. The RCRFR is very well suited for these ‘high intensity’ operating conditions.
Finally, process characteristics of a process for propane dehydrogenation based on the new
reactor concept were qualitatively compared with commercial propane dehydrogenation
processes. The RCRFR process resembles the Houdry Catofin process, however, large
savings on investments in expensive high-temperature heat exchange equipment in the reactor
section can be achieved. Furthermore, the higher propane conversion reduces the propane
recycle flow rate, decreasing compression costs (also because of higher reactor pressure) and
reducing investments and operating costs in the gas separation units. Concluding, the
economic potential of the RCRFR-process looks very promising, however, it still remains to
be demonstrated experimentally that indeed high propane conversion and propylene (or
olefin) yield can be achieved in the RCRFR with a high energy efficiency.
5
Samenvatting
Sterk endotherme heterogeen gekatalyseerde gasfase reacties, die bij hoge temperatuur plaats-
vinden met mogelijk snelle, maar reversibele katalystor deactivering, zijn een industrieel
belangrijke klasse van chemische conversies. De energie-overdracht bij hoge temperaturen en
de noodzakelijke katalysatorregeneratie vereist speciale reactortechnologie. In dit proefschrift
wordt voor dit type reacties een nieuw reactorconcept voorgesteld, waarbij via multi-
functionaliteit een verbeterde energie-efficiëntie wordt nagestreefd. In het reactorconcept
wordt een indirecte koppeling tussen de energie die nodig is voor endotherme reacties en de
energie die vrijkomt bij exotherme reacties, zonder menging van endotherme en exotherme
reactanten, bewerkstelligd in een adiabatische ‘omkeer’-reactor (reverse flow reactor). In een
omkeer-reactor wordt periodiek de gasstroomrichting door het katalysatorbed omgekeerd,
terwijl de reactanten zonder voorverwarming gevoed worden. Deze operatiewijze resulteert in
lage temperaturen aan beide reactoruiteinden en hoge temperaturen in het midden van de
reactor, waarmee regeneratieve warmtewisseling in de reactor geïntegreerd wordt. Dit
reactorconcept, ‘Reaction Coupling Reverse Flow Reactor’ (RCRFR) genoemd, is bestudeerd
voor de propaan dehydrogenering tot propeen en waterstof over een platina-alumina monoliet-
katalysator, waarbij de endotherme propaan dehydrogenering indirect gekoppeld wordt aan de
exotherme verbranding van koolstofproducten, die tijdens de dehydrogenering op het
katalystormateriaal worden afgezet, en extra brandstof om in de totale energiebehoefte te
voorzien. In de RCRFR wordt de propaandehydrogenering, energie-overdracht bij hoge
temperaturen, katalysatorregeneratie middels het afbranden van de koolstofproducten en
regeneratieve warmtewisseling volledig geïntegreerd in één apparaat. Dit reactorconcept is
vooral aantrekkelijk voor de katalytische propaandehydrogenering, aangezien naast
besparingen op externe apparatuur voor warmtewisseling en katalysatorregeneratie de
operatie extremere condities toelaat, waarbij hogere productopbrengsten gerealiseerd kunnen
worden. In dit proefschrift wordt het reactorconcept ontwikkeld via een theoretische studie
m.b.t. hoe de RCRFR het beste uitgevoerd en bedreven kan worden, met experimenten om de
kinetiek van de belangrijkste reacties vast te stellen, middels het testen van de technische
haalbaarheid van het reactorconcept in een kleine RCRFR-reactor op laboratorium-schaal
teneinde het reactorprincipe aan te tonen, en tenslotte middels het evalueren van het
economisch potentieel via het vergelijken met conventionele processen voor industriële
propeenproductie via katalytische propaandehydrogenering.
Samenvatting
6
Indirecte koppeling van reactie-energiën van de endotherme en exotherme reacties in een
omkeer-reactor kan gerealiseerd worden in twee basis reactorconfiguraties, aangegeven met
de ‘sequentiële’ en ‘simultane’ reactorconfiguratie. In de sequentiële reactorconfiguratie
worden de endotherme en exotherme reactanten discontinu en achtereenvolgens gevoed aan
hetzelfde katalysatorbed, waarbij het katalysatormateriaal tevens dienst doet als medium voor
energie-opslag, dat energie afgeeft tijdens de endotherme reactiefase en energie opslaat
tijdens de daaropvolgende exotherme reactiefase, waarbij tevens het katalysatormateriaal
geregenereerd wordt. In de simultane reactorconfiguratie worden de reactanten continu en
tegelijkertijd gevoed aan verschillende katalysatorbedden, die energie uitwisselen, ofwel in
meestroom of in tegenstroom contact. Hierbij worden periodiek de voedingsstromen
omgewisseld om katalysatordeactivering ongedaan te maken. Het dynamische reactorgedrag
is bestudeerd met gedetailleerde numerieke simulaties en voor beide reactorconfiguraties zijn
randvoorwaarden aangaande de energiehuishouding opgesteld om een cyclisch stationaire
toestand te bereiken met maximale conversie voor zowel de endotherme als de exotherme
processtap, terwijl tegelijkertijd aan een maximum temperatuur randvoorwaarde voldaan
wordt. In een adiabatische omkeer-reactor is het axiale temperatuurprofiel een gevolg van de
gekozen operatiecondities. Er is afgeleid dat voor een enkele eerste orde exotherme reactie de
maximale dimensieloze temperatuur slechts afhangt van een enkel dimensieloos kental en dat
voor hoge debieten de maximum temperatuur alleen ingesteld kan worden met de exotherme
ingangsconcentratie. Bij een beperkende maximum grenswaarde voor de
katalysatortemperatuur kan alleen in de sequentiële reactorconfiguratie de endotherme
ingangsconcentratie geoptimaliseerd worden bij hoge debieten en maximale energie-
efficiëntie zonder de gassnelheden aan te passen, via de keuze van een geschikt
schakelschema en de verhouding van de cycletijden.
Voor reversibele endotherme reacties kan het evenwicht naar de kant van de reactanten
verschoven worden aan het uiteinde van de reactor als gevolg van de lage
uitgangstemperaturen in de omkeerreactor, wat in een aanzienlijk conversieverlies kan
resulteren. Een nieuwe oplossing wordt geïntroduceerd voor de sequentiële
reactorconfiguratie om zowel volledige evenwichtsconversie als regeneratieve
warmtewisseling te realiseren, waarbij tevens te hoge temperaturen voorkomen kan worden.
De voorgestelde oplossing maakt gebruik van het opschuiven van de temperatuurfronten en
bestaat uit het plaatsen van minder actieve katalysatorsecties aan beide zijden van het actieve
katalysatorbed en eventueel volledig inactieve secties aan beide reactoruiteinden, waarbij
Samenvatting
7
gelijktijdige verbranding van propaan en methaan gebruikt wordt om de energie te leveren en
de plateau-temperatuur te regelen.
Om de mogelijkheden van de RCRFR voor propaandehydrogenering te kunnen bestuderen
zijn experimenteel reactiesnelheidsvergelijkingen bepaald voor de propaandehydrogenering,
propeenhydrogenering en de belangrijkste nevenreacties, zoals het kraken van propaan en de
hydrogenolyse van propaan en propeen en cokesvorming, die de reactiesnelheden kwantitatief
over een groot concentratie- en temperatuurbereik kunnen beschrijven voor een gedeeltelijk
gedeactiveerde platina-alumina monoliet-katalysator, condities die ook in de RCRFR kunnen
voorkomen.
De reactiekinetiek van de gasfase reacties is bepaald over de platina-alumina monoliet-
katalyator in een differentieel bedreven reactor, waarbij steeds hetzelfde katalysator-monster
gebruikt werd voor vele experimenten, die uit achtereenvolgens een reductiestap, een
(de)hydrogeneringsstap en een regeneratiestap (TPO) bestonden. Zodoende konden de
gemeten reactiesnelheden gecorrigeerd worden voor de afname in katalytische activiteit
tengevolge van sintering of beschadiging van de meest actieve plaatsen of een verlies van
platina dispersie. De propaandehydrogenerings- en propeenhydrogeneringsreactiesnelheden
nemen ook af gedurende een enkel experiment door de afzetting van koolstofproducten op de
actieve plaatsen aan het oppervlak, maar bereiken na ongeveer een half uur een asymptotische
stationaire waarde. Voor de quasi-stationaire reactiesnelheden van de propaan-
dehydrogenering en -hydrogenolyse bij hogere temperaturen, het kraken van propaan en de
hydrogenolyse van propeen, werd een reactie-orde voor waterstof gevonden overeenkomstig
met de reactiestoïchiometrie. Evenwel, de propaandehydrogenering en -hydrogenolyse bij
lagere temperaturen en de propeenhydrogenering vertonen een opvallende extra orde in de
waterstofconcentratie. Dit werd geïnterpreteerd door aan te nemen dat de reacties op twee
verschillende plaatsen aan het oppervlak kunnen plaatsvinden, te weten de platina- en de zure
alumina-plaatsen, waarbij de reacties die zich op de platina-plaatsen afspelen een extra orde in
de waterstofconcentratie hebben, wat verklaard kan worden door de invloed van waterstof op
het aantal vrije platina-oppervlakteplaatsen, die niet met koolstofafzettingen bedekt zijn.
Vormingssnelheden van cokes onder propaandehydrogeneringscondities op een platina-
alumina monoliet-katalysator werden afzonderlijk bepaald middels thermogravimetrische
analyse (TGA) als een functie van de procestijd voor wederom een groot concentratie- en
temperatuurbereik. Voor relatief korte procestijden, vooral bij lage temperaturen en lage
Samenvatting
8
propeenconcentraties, werd voor de cokesconcentratie een opvallende initiële kwadratische
toename in de tijd waargenomen met een hoge schijnbare orde in de propeenconcentratie.
Voor langere procestijden nam de cokesvormingssnelheid af tot een constante lage rest-
snelheid. De experimentele data kon goed beschreven worden met een kinetiekvergelijking
gebaseerd op een mechanistisch model voor de cokesvorming uitgaande van twee typen
cokes.
Vervolgens is de technische haalbaarheid van het RCRFR concept getoetst. Eerst is op basis
van een veiligheidsanalyse over de effecten van de mogelijke vorming van explosieve
gasmengsels van koolwaterstoffen in lucht, die bij het schakelen tussen reductieve en
oxidatieve condities als gevolg van menging in monolietkanaaltjes of in de inlaatsecties
kunnen ontstaan, geconcludeerd dat tussentijds spoelen met inerte gassen niet is vereist, als
passende maatregelen getroffen worden. Het principe van de RCRFR is gedemonstreerd in
een kleine laboratorium-reactor. Experimenten waarbij de propaan-dehydrogenering
gekoppeld werd aan de methaanverbranding in een reactor volledig gevuld met actief
katalysatormateriaal toonden aan dat aanzienlijke conversieverliezen aan het uiteinde van de
reactor optreden vanwege de lage uitgangstemperaturen. Met inactieve secties geplaatst aan
beide zijden van het actieve katalystorbed kon het conversieverlies effectief tegengegaan
worden, overeenkomstig de resultaten van gedetailleerde numerieke simulaties. De
zuurstofconcentratie tijdens de methaanverbrandingscycli moest verlaagd worden om te hoge
temperaturen te voorkomen als gevolge van de ale verbranding van koolstofproducten in
de washcoat die er tijdens de voorafgaande dehy
Op basis van de experimenteel bepaalde reactie
propeenhydrogenering en de belangrijkste n
optimale procescondities bepaald met behulp va
een onverdunde propaanvoeding bij atmosphe
optimaal is bij hoge reactortemperaturen (675-
propeenopbrengst (50-60%) wordt aldus berei
relatief lage propeenselectiviteit (ongeveer 70%
gevormd wordt als bijproduct. Tengevolge van
functie van de procestijd verandert het optim
oplopend temperatuurprofiel aan het begin va
loc
de
drogenering zijn afgezet.
snelheden voor de propaandehydrogenering,
evenreacties inclusief cokesvorming, zijn
n Pontryagin’s maximalisatie-principe. Voor
rische druk blijkt dat de propeenopbrengst
725 °C) en korte cycletijden. De maximale
kt bij hoge propaanconversie (75-90%) en
), waarbij een significante hoeveelheid cokes
de toename in de cokesvormingssnelheid als
ale axiale temperatuurprofiel van een sterk
n de dehydrogeneringscyclus tot een bijna
Samenvatting
9
uniform temperatuurprofiel na een paar minuten. De RCRFR is uitstekend geschikt voor deze
‘hoge-intensiteit’ bedrijfscondities.
Tenslotte zijn de proceskenmerken van een proces voor propaandehydrogenering gebaseerd
op het nieuwe reactorconcept kwalitatief vergeleken met commerciële propaan
dehydrogeneringsprocessen. Het RCRFR-proces lijkt sterk op het Houdry Catofin proces,
maar voor het RCRFR-proces kunnen grote besparingen op dure hoge-temperatuur
warmtewisselaars in de reactorsectie gerealiseerd worden. Vervolgens wordt door de hogere
propaanconversie de recycle-stroom verkleind, wat de compressiekosten reduceert (ook
tengevolge van de hogere reactordruk) en tevens de investeringskosten en bedrijfskosten van
de gasscheidingssectie verlagen. De economische mogelijkheden van het RCRFR-proces
lijken veelbelovend, maar eerst moet experimenteel aangetoond worden dat inderdaad hoge
propaanconversies en propeenopbrengst (of olefine-opbrengst) gerealiseerd kunnen worden in
de RCRFR met hoge energie-efficiëntie.

10

CHAPTER 1
GENERAL INTR
11
ODUCTION
Chapter 1
12
Abstract
Highly endothermic heterogeneously catalysed gas phase reactions at high temperatures with
possible rapid but reversible catalyst deactivation are an industrially important class of
chemical transformations and require dedicated reactor technology because of the energy
supply at high temperatures and necessary catalyst regeneration. In this thesis a new reactor
concept is proposed for this type of reactions aiming for improved energy efficiency through
multi-functionality. The reactor concept aims to achieve an indirect coupling of energy
necessary for endothermic reactions and energy released by exothermic reactions without
mixing of endothermic and exothermic reactants, in closed-loop adiabatic reverse flow
operation, i.e. incorporating recuperative heat exchange inside the reactor using periodic gas
flow reversals. In this chapter this new reactor concept is introduced and qualitatively
compared with conventional technologies. Subsequently, it is indicated that the reactor
concept is especially interesting for the non-oxidative propane dehydrogenation indirectly
coupled with fuel combustion over a platinum based monolithic catalyst. Finally, the objective
of the work is formulated and the outline of this thesis is presented.
General introduction
1. Introduction
Highly endothermic heterogeneously catalysed gas phase reactions at high temperatures with
possible rapid but reversible catalyst deactivation are an industrially important class of
chemical transformations. Examples of large industrial processes based on this type of
reactions are the dehydrogenation of lower paraffins, the dehydrogenation of ethylbenzene
and the production of synthesis gas. Processes for highly endothermic reactions with catalyst
deactivation require dedicated reactor technology. The reactors differ mainly in the method of
energy supply for the endothermic reactions and the method of catalyst regeneration,
predominantly determined by the catalyst properties and the rate of catalyst deactivation. In
this work a new reactor concept is proposed for this type of reactions aiming for improved
energy efficiency through multi-functionality.
1.1 Direct and indirect coupling of endothermic and exothermic reactions
Mixing of the endothermic reactants with exothermic reactants or other components,
designated as ‘direct coupling’ by Kulkarni (19 a), can eliminate the need for heat exchange
and it can strongly reduce or completely avoi
diluting the endothermic products and possib
side-reactions between the endothermic and ex
(1990) tested a reactor with direct coupling of
plant for synthesis gas production by partial
endothermic steam reforming of natural ga
Problems of coke formation were effective
synthesis gas generator. The direct coupling
steam added concurrently at a downstream loc
(selective catalytic reduction) with side-stream
and Subramaniam (1994, 1997). Also the o
example of the direct coupling of endothe
enthalpies of the propane dehydrogenation and
resulting in a net slightly exothermic rea
thermodynamic constraints (e.g. Cavani and Tr
96
13
d catalyst deactivation, at the cost of strongly
ly decreasing the product selectivities due to
othermic reactants and products. Blanks et al.
endothermic and exothermic reactions in a pilot
oxidation of natural gas combining the highly
s with the exothermic methane combustion.
ly eliminated in this bi-directional adiabatic
of the ethylbenzene dehydrogenation with hot
ation and the direct coupling of the NOx-SCR
ammonia introduction were studied by Snyder
xidative propane dehydrogenation is a good
rmic and exothermic reactants. The reaction
hydrogen combustion are effectively coupled,
ction and additionally allowing surpassing
ifirò, 1995).
Chapter 1
14
In this work it is assumed that strongly diluting the endothermic reactants with inert
components or mixing with exothermic reactants is undesired, so that heat supply by feeding
preheated gas is insufficient to maintain the reactor temperature at the desired level to obtain
the specified conversion and that a separate catalyst regeneration is required.
Processes based on ‘indirect coupling’ that are currently being applied in industry for highly
endothermic reactions with catalyst deactivation are based on interconnected fluidised bed or
packed or moving bed technologies.
If the catalyst is sufficiently resistant against attrition and if inevitable catalyst losses can be
tolerated, interconnected fluidised beds can be used with their excellent heat transfer
characteristics, like the FCC process. Catalyst material is continuously circulated between a
reactor in which the endothermic reactions take place deactivating the catalyst and a second
reactor where the catalyst is regenerated and reheated. The energy needed for the endothermic
reactions is supplied via catalyst circulation. The heat released during the usually exothermic
regeneration can effectively be used for the endothermic process step.
Instead of a costly catalyst transport to an external regenerator, catalyst regeneration can be
accomplished in situ by periodic alternation of the gas phase flowing through the catalyst.
Highly endothermic reactions require either a series of adiabatic packed bed reactors with
intermediate heaters or a non-adiabatic packed bed reactor. If the endothermic reactions take
place at high operating temperatures expensive high temperature heat exchange equipment is
required. Furthermore, because of poor heat transfer characteristics in packed beds and the
relatively small driving force for heat transfer because of the high temperatures, large heat
exchanging areas are required to achieve the desired heat exchange in a non-adiabatic fixed
bed reactor, as e.g. in the direct-fired non-adiabatic packed bed reactor with side-wall burners.
As an alternative for using expensive high temperature external or internal heat exchange
equipment, energy for the endothermic reactions can also be delivered in situ to the fixed
catalyst bed during the regeneration phase. Thus the catalyst bed acts as an energy repository.
During the endothermic reaction phase energy is withdrawn from the fixed catalyst bed
deactivating the catalyst both ‘thermally’ and catalytically and during the regeneration phase
the energy is restored to the bed while reactivating the catalyst.
The catalyst regeneration can be carried out either using a heat-exchanging medium heated in
a separate furnace or heat exchange equipment or by carrying out exothermic reactions in the
fixed catalyst bed. A well-known traditional process applied for indirect coupling of
General introduction
15
endothermic and exothermic reactions in the same catalyst bed is the Catofin Houdry process
(e.g. Meyers, 1997). Strongly endothermic catalytic paraffin dehydrogenation is periodically
alternated with a heating cycle feeding hot air. In the conventional process the hydrocarbons
and air are fed at the same reactor end. Recently it has been shown, however, that higher
conversions and improved energy efficiencies can be obtained with counter-current sequential
feeding of the paraffins and air, due to a more favourable axial temperature profile (Ercan and
Gartside, 1996). For obvious reasons, indirect coupling of endothermic and exothermic
reactions is only economically interesting, if the products of the endothermic reaction phase
are the products of interest.
An example of a process in which the energy for the endothermic reactions is supplied by
heating the catalyst bed by a heat exchanging medium is the ethylbenzene dehydrogenation
process over an iron oxide catalyst as studied by Heggs (1986a) and Heggs and Abdullah
(1986b). The ethylbenzene/steam feed is periodically alternated with high temperature steam
to reheat the catalyst bed. In their reactor set-up the ethylbenzene/steam feed was fed counter-
currently to the hot steam. The indirect coupling of the dehydrogenation of ethylbenzene and
hot steam as a regenerating medium in counter-current operation has also been modelled by
Haynes et al. (1992). Kulkarni (1996a) and Kulkarni and Dudukovic (1996b, 1997)
performed model simulations for the RE-GAS-process for synthesis gas production based on
indirect coupling of endothermic steam reforming and exothermic hydrocarbon combustion
with periodic flow reversals: the endothermic reactants were fed at one side of the reactor and
the exothermic reactants at the other side.
1.2 Open-loop and closed-loop reverse flow processes
To minimise energy requirements the reactants are heated by cooling the products. In
conventional processes this is achieved in an external heat exchanger. For fixed catalyst beds
recuperative heat exchange can also be accomplished with a forced dynamic operation by
periodic reversal of the gas flow direction through the catalyst bed making use of the large
thermal capacity of the catalyst bed compared to the gas phase, as firstly proposed by Cottrell
(1938). However, only since the seventies the application of forced unsteady-state operation
by periodic gas flow reversals has been studied for exothermic reactions in large industrial
processes, initiated by the pioneering work of especially Russian researchers (e.g. Boreskov et
al., 1979, 1982; Boreskov and Matros, 1983). For exothermic reactions the reverse flow
Chapter 1
16
reactor allows an autothermal operation with high temperatures in the centre of the reactor
while maintaining low temperatures at the reactor inlet and outlet. Integration of recuperative
heat exchange in the reactor odic flow reversals, referred to as ‘closed-loop’ reverse
flow operation by Matros
exothermic reactions. Most p
flow, do not recover the en
catalyst bed, but in an ex
Furthermore, for optimal ene
both the endothermic and ex
(1999) proposed an indire
reforming and methane comb
In this work the term ‘close
average temperature differen
analogy in for example the S
et al., 1997) or the pressure
processes both mass and ene
steam iron process for hydro
by Seiler and Emig (1997)
consecutive cycles of exoth
subsequent endothermic reo
hydrogen. Furthermore, the c
periodic flow reversals is a
Firstly, in this process air c
stream with nitrogen renderi
could be a very interesting b
partial oxidation) of methan
Cu/CuOx. Furthermore, usin
might be enhanced, whic
dehydrogenation.
by peri
and Bunimovich (1996), has been studied extensively for
rocesses for endothermic reactions, although operated in reverse
ergy of the product gas for preheating the inlet gas inside the
ternal heat exchanger (‘open-loop’ reverse flow operation).
rgy efficiency recuperative heat exchange should be achieved for
othermic reaction phases. Only very recently Frauhammer et al.
ct closed-loop reverse flow reactor coupling methane steam
ustion.
d-loop’ refers to the energy efficiency of the process, i.e. a low
ce between the gas inlet and outlet, in contrast to its mass transfer
imulated Moving-Bed Chromatography reactor (e.g. Dünnebier
swing reactor (e.g. Alpay et al., 1993). Additionally, for some
rgy efficiencies are important, as for example for the (modified)
gen production from industrial reducing waste gases, as studied
with model simulations. The steam iron process consists of
ermic reduction of an iron oxide (Fe3O4) by synthesis gas and
xidation of the reduced iron oxide (FeO) with steam obtaining
oncept of reduction-oxidation cycling in a fixed bed reactor with
lso very interesting for selective catalytic oxidation processes.
an be used as an indirect oxidiser without diluting the product
ng a costly separate nitrogen-oxygen separation redundant. This
enefit in for example synthesis gas production via CPO (catalytic
e via reduction-oxidation cycling in a fixed bed filled with e.g.
g the lattice oxygen as the actual oxidiser the product selectivity
h might open up possibilities for e.g. oxidative propane
General introduction
17
1.3 Comparison with conventional technologies
A qualitative comparison of the benefits and drawbacks of a closed-loop reverse flow reactor
with indirect coupling of endothermic and exothermic reactions, called the Reaction Coupling
Reverse Flow Reactor (RCRFR), compared to the conventional packed bed and
interconnected fluidised bed technologies for endothermic reactions is summarised in Table 1.
A moderately endothermic heterogeneously catalysed reaction at relatively low temperatures
with a relatively low catalyst deactivation rate is probably preferably carried out in a
conventional adiabatic or non-adiabatic packed bed reactor. For highly endothermic reactions
at high temperatures with very rapid reversible catalyst deactivation an interconnected
fluidised bed system can be beneficial, provided that the activity and selectivity properties of
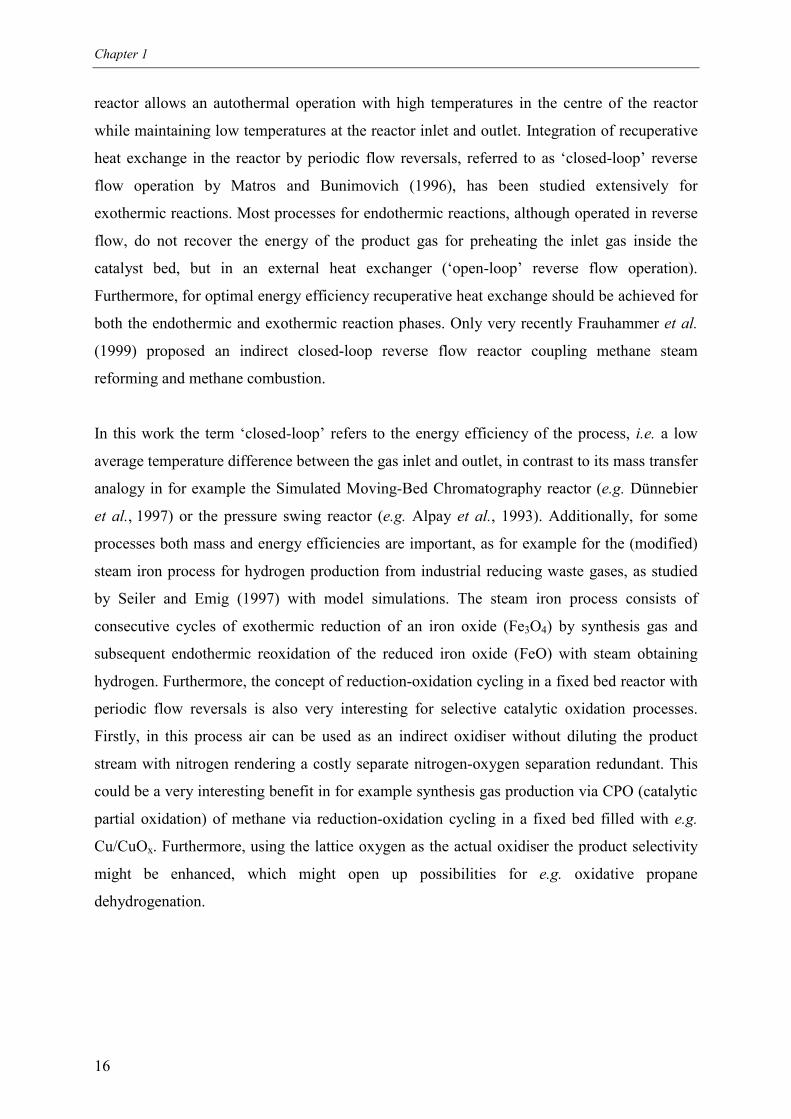
Table 1. Qualitative comparison of the ‘closed-loop’ reverse flow process with indirect couplingof endothermic and exothermic reactions with the conventional adiabatic packed bed andthe interconnected fluidised beds processes.
reactor selection criteria PBR IFBR RCRFR
reactionconditions
reaction endothermicitytemperature
attrition resistancecatalyst deactivation rate
lowlowlowlow
moderate-very highhighhigh
moderate-very high
moderate-highhighlow-
moderateprocesscontrol
temperature controlsolids handling
-+/- 1
+-
+/-+
developmentcosts
process knowledgecatalyst development
++
+-
--+/-
reactor sectiongas back mixing
equipment erosion++
--
++
auxiliary equipmentheat exchange
gas solid separation-- -
-+ 2
investmentcosts
control equipment + - -
operatingcosts
compression costs(pressure drop/solids handling)
catalyst losses/equipment erosionproduct losses
-++
- 3
-+
+ 4+- 5
PBR: Packed Bed Reactor; IFBR: Interconnected Fluidised Bed Reactor;RCRFR: Reaction Coupling Reverse Flow Reactor;1 possible plugging of the catalyst bed;2 only a start-up heater;3 large gas flows for solids transport;4 especially in case of a monolithic catalyst;5 because of flow direction and reaction phase switching;
Chapter 1
18
the catalyst do not have to be compromised in order to attain sufficiently adequate attrition
resistance. A closed-loop reverse flow reactor coupling endothermic and exothermic reactions
may offer large savings on investments for a separate regenerator and external high
temperature heat exchange equipment and operating costs for solids transport. Especially if
the high switching frequency between the endothermic and exothermic reactions can be
exploited for operation at more severe process conditions or if by unsteady operation the
optimal process conditions can be better approached – because of the dynamic properties of
the reactor as a whole or by the dynamic response of the catalyst characteristics to changes in
process conditions (e.g. Matros, 1996) – a reverse flow reactor for endothermic reactions may
have significant benefits.
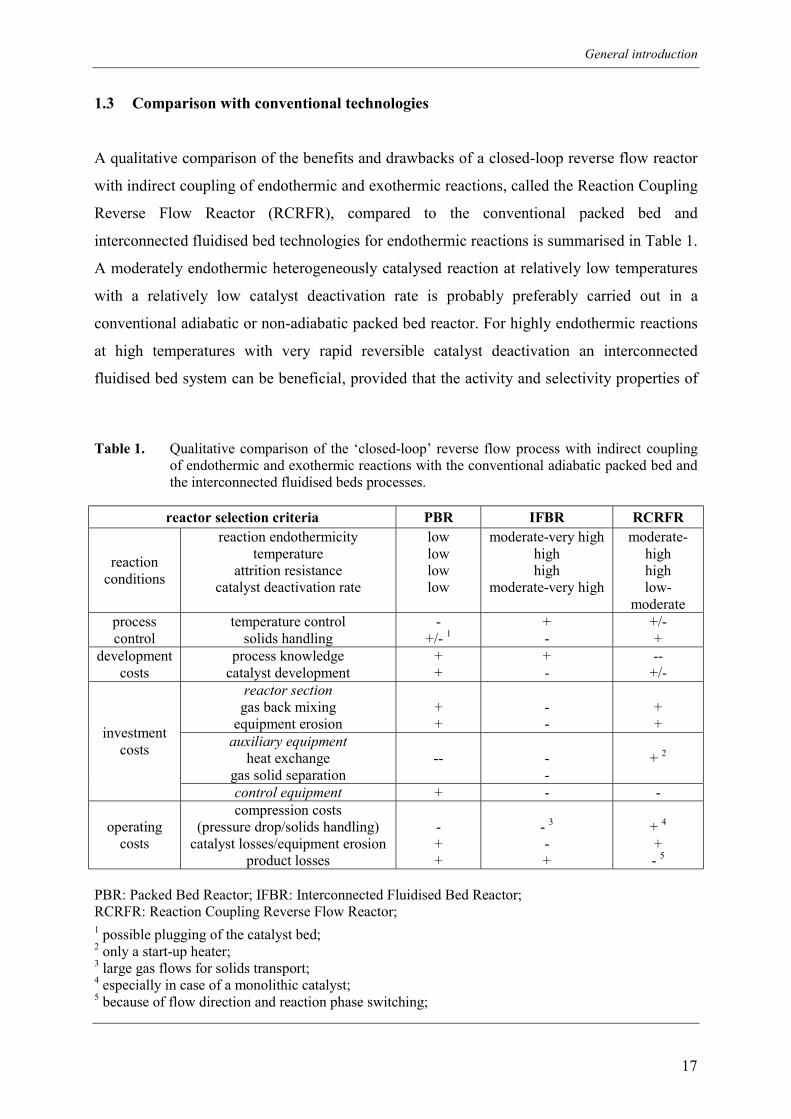
2. Reaction system
The non-oxidative propane dehydrogenation to propylene and hydrogen over a monolithic
platinum based catalyst is a very interesting reaction system for operation in a reverse flow
reactor, coupling the endothermic propane dehydrogenation indirectly with the exothermic
combustion with air of coke, formed as a side-product during the dehydrogenation, and added
hydrocarbon fuels for overall energy balance. This reaction system, schematically depicted in
Figure 1, has been selected to study the reactor behaviour of the Reaction Coupling Reverse
Flow Reactor.
Figure 1. Schematic representation of the Reaction Coupling Reverse Flow Reactor concept for thecatalytic non-oxidative propane dehydrogenation.
C3H8 C3H6 / H2
CO2 / H2O / Air
PROPANEDEHYDROGENATION
ENERGY
FUELCOMBUSTION
CATALYST COKE
CH4 / C3H8 / O2
General introduction
19
The strong increase in the demand for propylene during the last decade (Taffe, 1996; Cosyns
et al., 1998), especially because of the polypropylene production (Baker, 1999), has initiated
the development of new alternative processes in addition to traditional petrochemical or
refinery processes, where propylene is obtained as a by-product. The increased availability of
lower alkanes resulting from more strict environmental legislation has made especially
catalytic dehydrogenation processes economically attractive (Resasco and Haller, 1994).
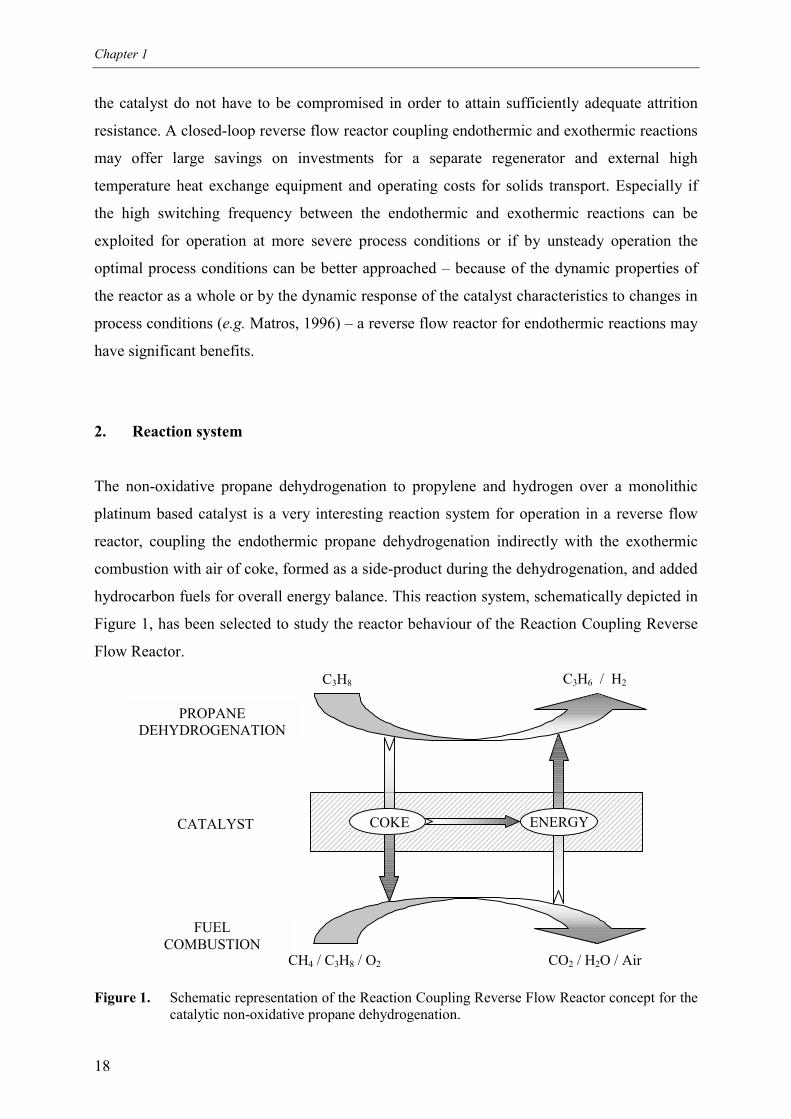
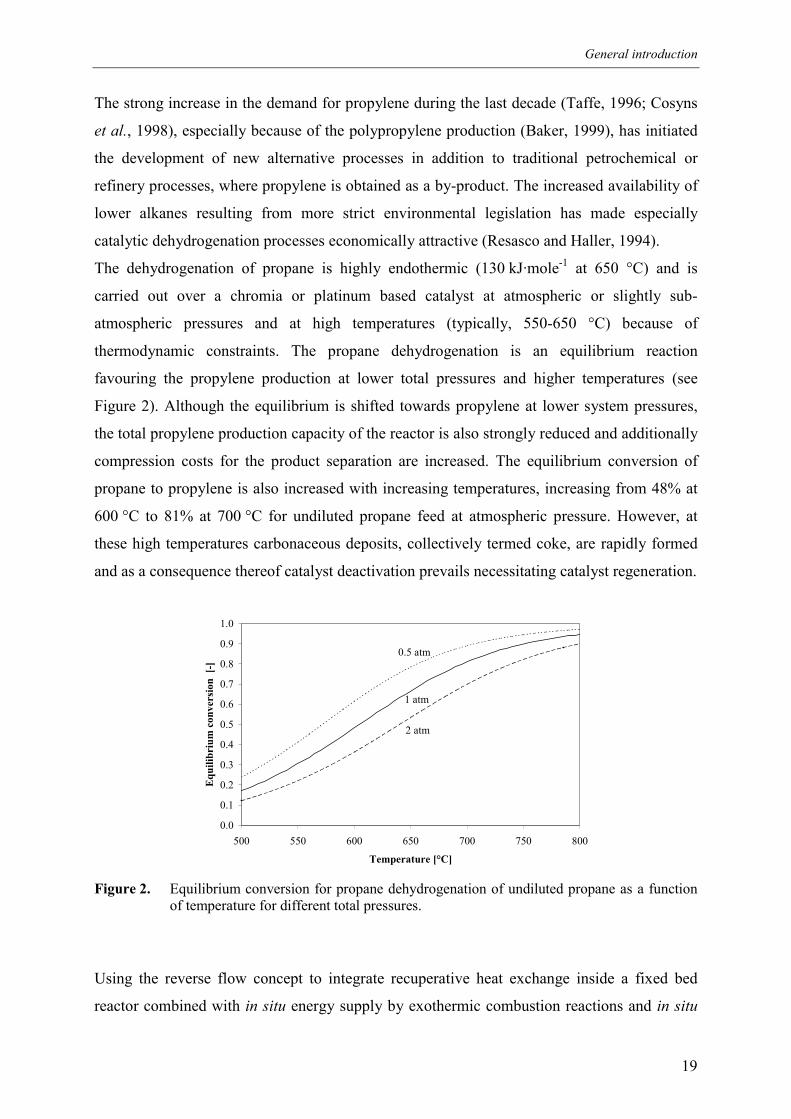
The dehydrogenation of propane is highly endothermic (130 kJ·mole-1 at 650 °C) and is
carried out over a chromia or platinum based catalyst at atmospheric or slightly sub-
atmospheric pressures and at high temperatures (typically, 550-650 °C) because of
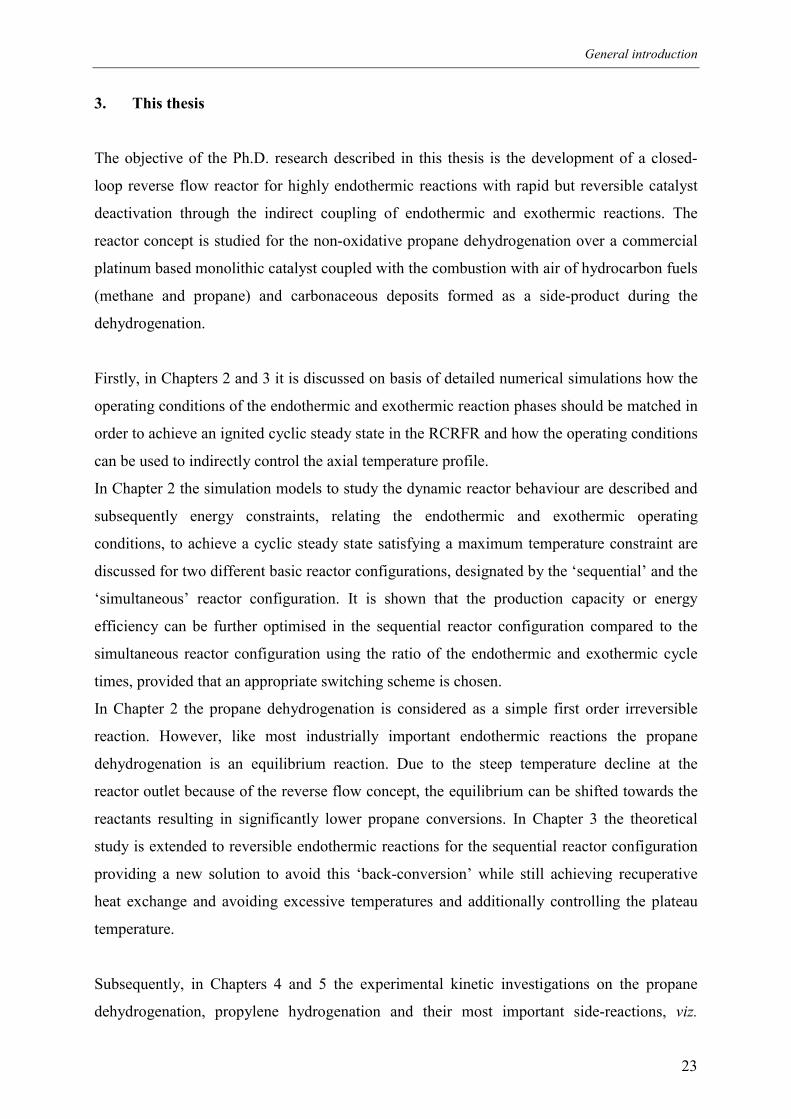
thermodynamic constraints. The propane dehydrogenation is an equilibrium reaction
favouring the propylene production at lower total pressures and higher temperatures (see
Figure 2). Although the equilibrium is shifted towards propylene at lower system pressures,
the total propylene production capacity of the reactor is also strongly reduced and additionally
compression costs for the product separation are increased. The equilibrium conversion of
propane to propylene is also increased with increasing temperatures, increasing from 48% at
600 °C to 81% at 700 °C for undiluted propane feed at atmospheric pressure. However, at
these high temperatures carbonaceous deposits, collectively termed coke, are rapidly formed
and as a consequence thereof catalyst deactivation prevails necessitating catalyst regeneration.
0.0
0.1
0.2
0.3
0.4
0.5
0.6
0.7
0.8
0.9
1.0
500 550 600 650 700 750 800
Temperature [°C]
Equ
ilibr
ium
con
vers
ion
[-]
0.5 atm
2 atm
1 atm
Figure 2. Equilibrium conversion for propane dehydrogenation of undiluted propane as a functionof temperature for different total pressures.
Using the reverse flow concept to integrate recuperative heat exchange inside a fixed bed
reactor combined with in situ energy supply by exothermic combustion reactions and in situ
Chapter 1
20
catalyst regeneration large savings on external heat exchange and catalyst regeneration
equipment can be realised. Also side-reactions in high temperature external heat exchangers
are avoided (Pujado and Vora, 1990). Furthermore, the regeneration of the catalyst and energy
supply for the endothermic propane dehydrogenation can be effectively combined by
simultaneous combustion of the coke and added hydrocarbon fuels. The heat released during
the burning of the coke can be effectively recovered for the endothermic propane
dehydrogenation, so that coke formation has no adverse effects on the process economics,
unless the propane feedstock for the propane dehydrogenation is much more expensive than
the fuel feedstock.
Moreover, in the adiabatic reverse flow reactor the endothermic and exothermic reaction
phases are alternated with relatively high frequencies because of the large energy
consumption during the propane dehydrogenation, inherently assuring very fast catalyst
regeneration. Operation with short propane dehydrogenation and regeneration cycles has the
distinct advantage of operation at a relatively low coke content at the catalyst surface with the
corresponding high catalyst activity and an easy coke removal without deteriorating the
catalyst properties. The short time on stream during the dehydrogenation process step assures
high hydrogen to carbon ratios of the coke (Brito et al., 1996), which can be combusted
completely with short regeneration times. The inherently fast catalyst regeneration therefor
allows operation at higher temperatures (or lower hydrogen concentrations) with higher
propylene yields.
Concluding, the adiabatic reverse flow reactor is a particularly interesting reactor concept for
the non-oxidative propane dehydrogenation, because it allows operation at more severe
reaction conditions with higher product yields in addition to savings on external heat
exchange equipment.
The in situ catalyst regeneration in a reverse flow reactor allows the use of a catalyst
containing highly active and expensive ingredients. The most active catalysts for the non-
oxidative propane dehydrogenation are based on platinum as the active component with
possibly tin added as promotor (a.o. Loc et al., 1991). Because of the relatively high propane
dehydrogenation reaction rates internal diffusion limitations decrease the catalyst efficiency
for particles larger than about 0.5-1 mm in diameter, especially at higher temperatures. For a
fixed bed of particulates of these dimensions the maximum gas velocity (and thus the
production capacity) is strongly limited by the permissible pressure drop. A monolithic
catalyst maximises the catalyst utilisation with a very high specific external catalyst surface
General introduction
21
area per unit reactor volume with insignificant internal diffusion limitations due to the very
small washcoat thickness, while maintaining a pressure drop about two orders of magnitude
lower than in particulate systems (Cybulski and Moulijn, 1994). Also the absence of
dispersion avoiding disadvantageous gas back-mixing, increased design flexibility and
relatively easy scale-up properties (concept of parallelism) constitute considerable advantages
of monolithic catalysts.
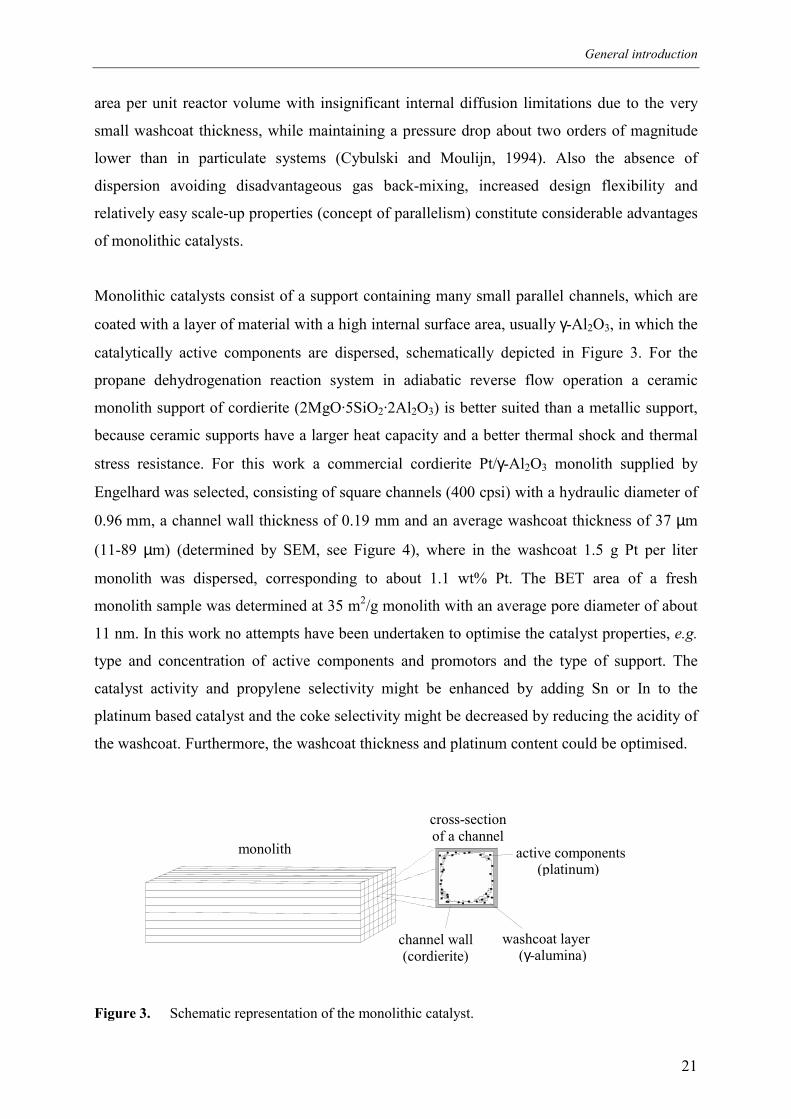
Monolithic catalysts consist of a support containing many small parallel channels, which are
coated with a layer of material with a high internal surface area, usually γ-Al2O3, in which the
catalytically active components are dispersed, schematically depicted in Figure 3. For the
propane dehydrogenation reaction system in adiabatic reverse flow operation a ceramic
monolith support of cordierite (2MgO·5SiO2·2Al2O3) is better suited than a metallic support,
because ceramic supports have a larger heat capacity and a better thermal shock and thermal
stress resistance. For this work a commercial cordierite Pt/γ-Al2O3 monolith supplied by
Engelhard was selected, consisting of square channels (400 cpsi) with a hydraulic diameter of
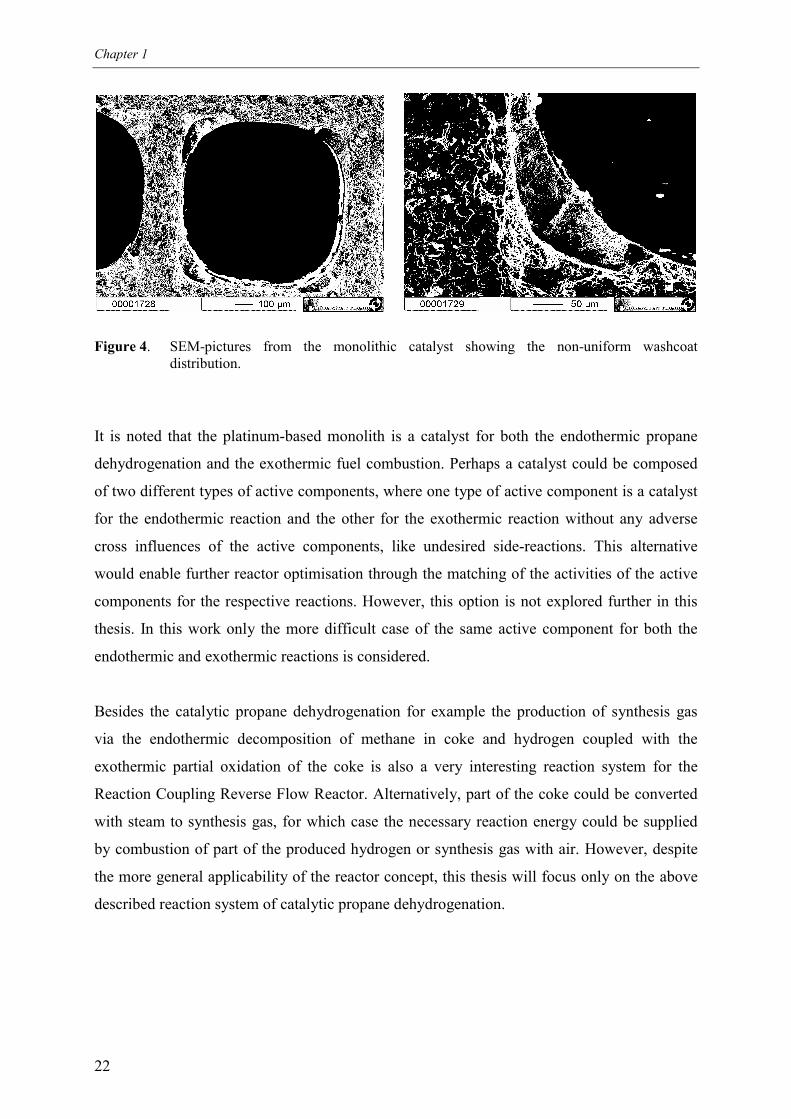
0.96 mm, a channel wall thickness of 0.19 mm and an average washcoat thickness of 37 µm
(11-89 µm) (determined by SEM, see Figure 4), where in the washcoat 1.5 g Pt per liter
monolith was dispersed, corresponding to about 1.1 wt% Pt. The BET area of a fresh
monolith sample was determined at 35 m2/g monolith with an average pore diameter of about
11 nm. In this work no attempts have been undertaken to optimise the catalyst properties, e.g.
type and concentration of active components and promotors and the type of support. The
catalyst activity and propylene selectivity might be enhanced by adding Sn or In to the
platinum based catalyst and the coke selectivity might be decreased by reducing the acidity of
the washcoat. Furthermore, the washcoat thickness and platinum content could be optimised.
Figure 3. Schematic representation of the monolithic catalyst.
channel wall(cordierite)
washcoat layer(γ-alumina)
active components(platinum)
cross-sectionof a channel
monolith
Chapter 1
22
Figure 4. SEM-pictures from the monolithic catalyst showing the non-uniform washcoatdistribution.
It is noted that the platinum-based monolith is a catalyst for both the endothermic propane
dehydrogenation and the exothermic fuel combustion. Perhaps a catalyst could be composed
of two different types of active components, where one type of active component is a catalyst
for the endothermic reaction and the other for the exothermic reaction without any adverse
cross influences of the active components, like undesired side-reactions. This alternative
would enable further reactor optimisation through the matching of the activities of the active
components for the respective reactions. However, this option is not explored further in this
thesis. In this work only the more difficult case of the same active component for both the
endothermic and exothermic reactions is considered.
Besides the catalytic propane dehydrogenation for example the production of synthesis gas
via the endothermic decomposition of methane in coke and hydrogen coupled with the
exothermic partial oxidation of the coke is also a very interesting reaction system for the
Reaction Coupling Reverse Flow Reactor. Alternatively, part of the coke could be converted
with steam to synthesis gas, for which case the necessary reaction energy could be supplied
by combustion of part of the produced hydrogen or synthesis gas with air. However, despite
the more general applicability of the reactor concept, this thesis will focus only on the above
described reaction system of catalytic propane dehydrogenation.
General introduction
23
3. This thesis
The objective of the Ph.D. research described in this thesis is the development of a closed-
loop reverse flow reactor for highly endothermic reactions with rapid but reversible catalyst
deactivation through the indirect coupling of endothermic and exothermic reactions. The
reactor concept is studied for the non-oxidative propane dehydrogenation over a commercial
platinum based monolithic catalyst coupled with the combustion with air of hydrocarbon fuels
(methane and propane) and carbonaceous deposits formed as a side-product during the
dehydrogenation.
Firstly, in Chapters 2 and 3 it is discussed on basis of detailed numerical simulations how the
operating conditions of the endothermic and exothermic reaction phases should be matched in
order to achieve an ignited cyclic steady state in the RCRFR and how the operating conditions
can be used to indirectly control the axial temperature profile.
In Chapter 2 the simulation models to study the dynamic reactor behaviour are described and
subsequently energy constraints, relating the endothermic and exothermic operating
conditions, to achieve a cyclic steady state satisfying a maximum temperature constraint are
discussed for two different basic reactor configurations, designated by the ‘sequential’ and the
‘simultaneous’ reactor configuration. It is shown that the production capacity or energy
efficiency can be further optimised in the sequential reactor configuration compared to the
simultaneous reactor configuration using the ratio of the endothermic and exothermic cycle
times, provided that an appropriate switching scheme is chosen.
In Chapter 2 the propane dehydrogenation is considered as a simple first order irreversible
reaction. However, like most industrially important endothermic reactions the propane
dehydrogenation is an equilibrium reaction. Due to the steep temperature decline at the
reactor outlet because of the reverse flow concept, the equilibrium can be shifted towards the
reactants resulting in significantly lower propane conversions. In Chapter 3 the theoretical
study is extended to reversible endothermic reactions for the sequential reactor configuration
providing a new solution to avoid this ‘back-conversion’ while still achieving recuperative
heat exchange and avoiding excessive temperatures and additionally controlling the plateau
temperature.
Subsequently, in Chapters 4 and 5 the experimental kinetic investigations on the propane
dehydrogenation, propylene hydrogenation and their most important side-reactions, viz.
Chapter 1
24
propane cracking and propane and propylene hydrogenolysis and coke formation, for wide
temperature and concentration ranges over a partially deactivated monolithic platinum
alumina catalyst, corresponding to conditions occurring in a RCRFR, are described.
In Chapter 4 the experimental work on the reaction kinetics of the gas phase reactions is
described. It is discussed how the measured reaction rates of the gas phase reactions measured
in a differentially operated reactor can be corrected for the decrease in catalytic activity
caused by sintering and destruction of the most active sites or decrease in platinum dispersion
by measuring kinetics over a catalyst sample used for many consecutive experiments
consisting of reduction, (de)hydrogenation and TPO. Based on the experimental results for
wide temperature and concentration ranges reaction rate expressions are derived describing
the observed remarkable influences of temperature and composition. An explanation is
presented for the observed extra order in the gas phase hydrogen concentration (additional to
the order expected on the basis of reaction stoichiometry) for all reactions taking place at the
platinum surface sites.
In Chapter 5 the experimental study on coke formation rates under propane dehydrogenation
reaction conditions in a thermogravimetric analyser is described. A kinetic rate expression is
derived based on a mechanistic dual coke growth model describing the experimentally
observed striking dependencies of the coke formation rate as a function of time, temperature
and composition over wide temperature and concentration ranges.
Chapter 6 deals with a safety analysis of switching between reductive and oxidative
conditions on the basis of detailed numerical simulations supplemented by some qualitative
experiments. The effects of the possible formation of combustible gas mixtures of
hydrocarbons and air due to mixing in the monolith channels and in the inlet sections are
studied in order to investigate whether intermediate flushing with inert gases could be safely
omitted. In Chapter 7 the technical feasibility of the RCRFR is subsequently tested in a small
laboratory scale reactor aiming for a proof of principle. Experimental results for the RCRFR
for propane dehydrogenation coupled with methane combustion will be presented, focussing
on the effects of back-conversion and coke formation and coke combustion.
Finally, in Chapter 8 optimal process conditions are determined on the basis of the
experimentally determined reaction rates for the propane dehydrogenation, propylene
hydrogenation and their most important side-reactions including coke formation using
Pontryagin’s maximisation principle. The effects of the propane dehydrogenation cycle time
General introduction
25
and the propane inlet concentration on the optimal axial temperature profiles are presented.
Chapter 8 concludes with a qualitative comparison of process characteristics of a process for
propane dehydrogenation based on the new reactor concept with conventional commercial
propane dehydrogenation processes, showing good economic opportunities for the new
RCRFR process.
References
Alpay, E., Kenney, C.N. and Scott, D.M. (1993). Simulation of rapid pressure swing
adsorption and reaction processes. Chem. Engng Sci., 48, 3173-3186
Baker, J. (Ed.) (1999). Propylene. European Chemical News, July 1999, 18-19
Blanks, R.F., Wittrig, T.S. and Peterson, D.A. (1990). Bidirectional adiabatic synthesis gas
generator. Chem. Engng Sci., 45, 2407-2413
Boreskov, G.K., Matros, Yu.Sh., Kiselev, O.V. (1979). Catalytic processes carried out under
nonstationary conditions. Kinet. Katal., 20, 636-641
Boreskov, G.K., Bunimovic, G.A., Matros, Yu.Sh., Ivanov, A.A. (1982). Catalytic processes
under non-steady state conditions, II. Switching the direction for the feed of the reaction
mixture to the catalyst bed. Experimental results, Kinet. Katal., 23, 402-406
Boreskov, G.K. and Matros, Yu.Sh. (1983). Unsteady-state performance of heterogeneous
catalytic reactions. Catal. Rev.-Sci. Engng, 25, 551-590
Brito, A., Arvelo, R., Villarroel, R., Garcia, F.J. and Garcia, M.T. (1996). Coke and H/C ratio
profiles on a Cr2O3/Al2O3 catalyst during the butene-1 dehydrogenation reaction. Chem. Eng.
Sci., 51, 4385-4391.
Cavani, F. and Trifirò, F. (1995). The oxidative dehydrogenation of ethane and propane as an
alternative way for the production of light olefins. Catalysis Today, 24, 307-313
Chapter 1
26
Cosyns, J., Chodorge, J., Commereuc, D. and Torck, B. (1998). Maximize propylene
production. Hydrocarbon Process., March 1998, 61-66
Cottrell, F.G. (1938). Purifying gases and apparatus therefor. US patent 2,121,733
Cybulski, A. and Moulijn, J.A. (1994). Monoliths in heterogeneous catalysis. Catal. Rev.-
Sci.Eng., 36, 179-270
Dünnebier, G., Weirich, I. and Klatt, K.-U. (1998). Computationally efficient dynamic
modelling and simulation of simulated moving bed chromatographic processes with linear
isotherms. Chem. Engng Sci., 53, 2537-2546
Ercan, C. and Gartside, R.J. (1996). Reactor performance and stability in an alternating
reaction-reheat paraffin dehydrogenation system. Can. J. Chem. Eng., 74, 626-637
Frauhammer, J., Eigenberger, G., Hippel, L.v. and Arntz, D. (1999). A new reactor concept
for endothermic high-temperature reactions. Chem. Engng Sci., 54, 3661-3670
Haynes, T.N., Georgakis, C. and Caram, H.S. (1992). The application of reverse flow reactors
to endothermic reactions. Chem. Engng Sci., 47, 2927-2932
Heggs, P.J. (1986). Modelling the dynamics of regenerative catalytic reactors. Trans. Inst.
M.C., 8, 115-122
Heggs, P.J. and Abdullah, N. (1986). Experimental investigation of a transient catalytic
reactor for the dehydrogenation of ethylbenzene to styrene. Chem. Eng. Res. Des., 6, 258-265
Kulkarni, M.S. (1996a). Dynamics of asymmetric fixed-bed reactors: coupling of exothermic
and endothermic reactions. Ph.D. Thesis, Sever Institute of Washington University, Saint
Louis, USA
Kulkarni, M.S. and Dudukovic M.P. (1996b). A bidirectional fixed-bed reactor for coupling
of exothermic and endothermic reactions. AIChE J., 42, 2897-2910
Kulkarni, M.S. and Dudukovic, M.P. (1997). Periodic operation of asymmetric bidirectional
fixed-bed reactors: energy efficiency. Chem. Engng Sci., 52, 1777-1788
General introduction
27
Loc, L.C., Gaidai, N.A., Kiperman, S.L., T’huoang, H.S., Podkletnova, N.M. and Kogan, S.B.
(1991). Kinetics of propane dehydrogenation on aluminoplatinum catalysts. Kinetics and
Catalysis, 32, 61-66
Matros, Yu. Sh. (1996). Forced unsteady-state processes in heterogeneous catalytic reactors.
Can. J. Chem. Engng, 74, 566-579
Matros, Yu.Sh. and Bunimovich, G.A. (1996). Reverse-flow operation in fixed bed catalytic
reactors. Catal. Rev.-Sci. Eng., 39, 1-68
Meyers, R.A. (1997). Handbook of petroleum refining processes, second edition, McGraw-
Hill Inc., USA
Pujado, P.R. and Vora, B.V. (1990). Make C3-C4 olefins selectively. Hydrocarbon Processing
March, 65-70
Resasco, D.E. and Haller, G.L. (1994). Catalytic dehydrogenation of lower alkanes. J. Catal.,
11, 379-411
Seiler, H. and Emig, G. (1997). Reduction-oxidation-cycling in a fixed bed reactor with
periodic flow reversal. In Froment, G.F. and Waugh, K.C. (Eds). Dynamics of surfaces and
reaction kinetics in heterogeneous catalysis. Elsevier, Amsterdam, The Netherlands, 479-488
Snyder, J.D. and Subramaniam, B. (1994). A novel reverse flow strategy for ethylbenzene
dehydrogenation in a packed-bed reactor. Chem. Engng Sci., 49, 5585-5601
Snyder, J.D. and Subramaniam, B. (1997). Numerical simulation of a reverse-flow NOx-SCR
reactor with side-stream ammonia addition. Chem. Engng Sci., 53, 727-734
Taffe, P. (1996). Propping up the propylene supply. Eur. Chem. News, 21-27 October, 27-28

28
CHAPTER 2
IRREVERSIBLE ENDOTHERMIC REACTIONS –
COMPARISON OF REACTOR CONFIG
URATIONS29
Chapter 2
30
Abstract
A new reactor concept has been developed for highly endothermic heterogeneously catalysed
gas phase reactions at high temperatures with rapid but reversible catalyst deactivation. The
reactor concept aims to achieve an indirect coupling of energy necessary for endothermic
reactions and energy released by exothermic reactions, without mixing of the endothermic
and exothermic reactants, in a closed-loop reverse flow operation. Periodic gas flow reversal
incorporates regenerative heat exchange inside the reactor. The reactor concept has been
studied for the coupling between the non-oxidative propane dehydrogenation and methane
combustion over a monolithic catalyst.
Two different reactor configurations have been considered: the sequential reactor
configuration, where the endothermic and exothermic reactants are fed sequentially to the
same catalyst bed acting as an energy repository and the simultaneous reactor configuration,
where the endothermic and exothermic reactants are fed continuously to two different
compartments directly exchanging energy. The dynamic reactor behaviour has been studied
by detailed numerical simulation for both reactor configurations. Energy constraints, relating
the endothermic and exothermic operating conditions, to achieve a cyclic steady state have
been discussed. Furthermore, it has been indicated how the operating conditions should be
matched in order to control the maximum temperature. Also, it has been shown that the
maximum dimensionless temperature for a single first order reaction in reverse flow reactors
depends on a single dimensionless number. Finally, both reactor configurations have been
compared based on their operating conditions. It has been shown that only in the sequential
reactor configuration the endothermic inlet concentration can be optimised at high
throughput and maximum reaction coupling energy efficiency independently of the gas
velocities, by the choice of a switching scheme with inherently zero differential creep velocity
and by using the ratio of the cycle times.
Irreversible endothermic reactions
31
1. Introduction
For highly endothermic heterogeneously catalysed gas phase reactions at high temperatures
with rapid but reversible catalyst deactivation a new reactor concept is developed. This
reactor concept is based on the indirect coupling of energy necessary for endothermic
reactions and energy released by exothermic reactions – i.e. without mixing of the
endothermic and exothermic reactants avoiding undesired side-reactions – in closed-loop
reverse flow operation. Under reverse flow operation the gas flow direction through a fixed
catalyst bed is periodically reversed, while the reactants are fed without any preheating. The
periodic gas flow reversals result in low inlet and outlet temperatures with high temperatures
in the centre of the reactor, so that regenerative heat exchange is integrated inside the reactor.
The reactor concept is studied for non-oxidative propane dehydrogenation coupled with the
combustion of methane over a monolithic catalyst.
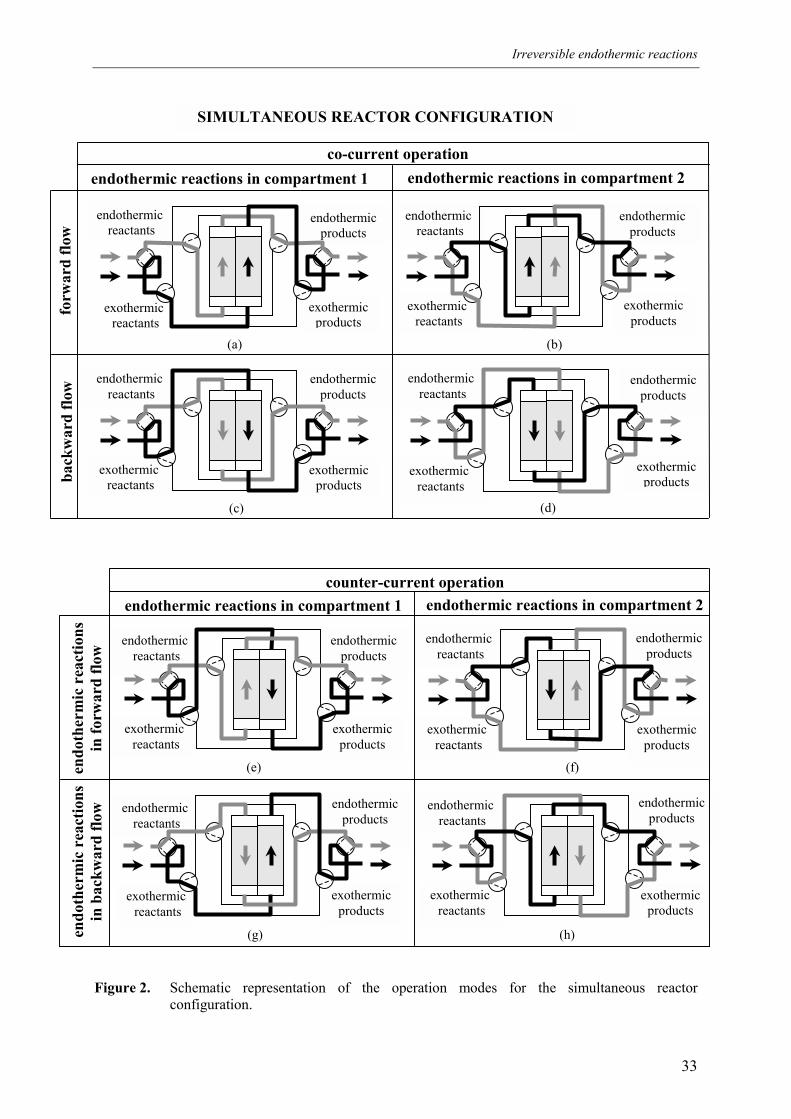
Indirect coupling of reaction energies of endothermic and exothermic reactions with
integrated recuperative heat exchange can be accomplished in two different basic reactor
configurations, termed the sequential and simultaneous reactor configuration (see Figures 1
and 2). In the sequential reactor configuration endothermic and exothermic reactants are fed
discontinuously and sequentially to the same catalyst bed, where the bed acts as an energy
repository delivering energy during the endothermic reaction phase and storing energy during
the consecutive exothermic reaction phase while concurrently regenerating the catalyst. In the
simultaneous reactor configuration the endothermic and exothermic reactants are fed
continuously to different catalyst beds exchanging energy and the endothermic and
exothermic feed streams are periodically switched in order to counteract catalyst deactivation.
In Figure 2 the endothermic and exothermic compartments are schematically depicted as two
catalyst beds. A larger heat exchanging area between the endothermic and exothermic
compartments can be achieved in a shell-and-tube heat exchanger type reactor construction or
a monolith where one part of the channels is fed with endothermic reactants and the remaining
channels with exothermic reactants, similar to the reactor set-up described by Frauhammer et
al. (1999), but without interchanging the reactants feed streams. The larger heat exchanging
area is achieved, however, at the expensive of a much more complex feed supply
construction. Both the sequential and simultaneous reactor configurations can be operated in
different modes, as schematically indicated in Figures 1 and 2. The order in which the
different operation modes are alternated is referred to as the switching scheme.
Chapter 2
32
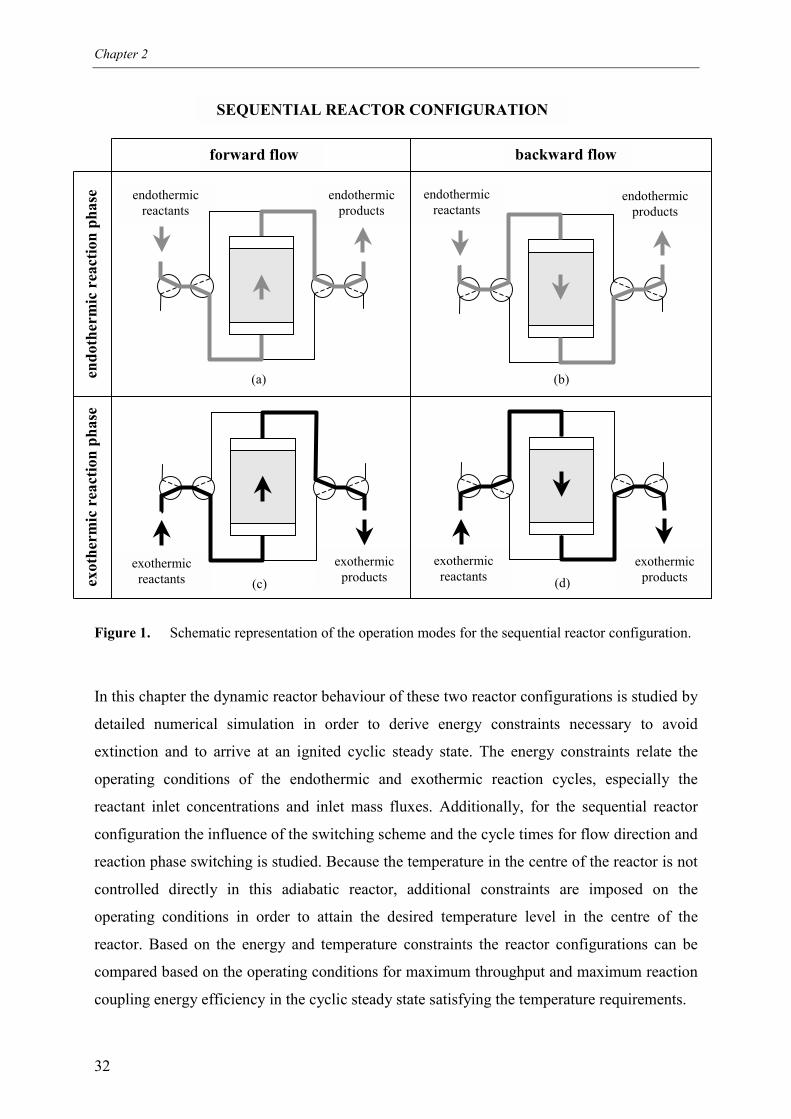
Figure 1. Schematic representation of the operation modes for the sequential reactor configuration.
In this chapter the dynamic reactor behaviour of these two reactor configurations is studied by
detailed numerical simulation in order to derive energy constraints necessary to avoid
extinction and to arrive at an ignited cyclic steady state. The energy constraints relate the
operating conditions of the endothermic and exothermic reaction cycles, especially the
reactant inlet concentrations and inlet mass fluxes. Additionally, for the sequential reactor
configuration the influence of the switching scheme and the cycle times for flow direction and
reaction phase switching is studied. Because the temperature in the centre of the reactor is not
controlled directly in this adiabatic reactor, additional constraints are imposed on the
operating conditions in order to attain the desired temperature level in the centre of the
reactor. Based on the energy and temperature constraints the reactor configurations can be
compared based on the operating conditions for maximum throughput and maximum reaction
coupling energy efficiency in the cyclic steady state satisfying the temperature requirements.
exothermicproducts
exothermicreactants
exothermicproducts
exothermicreactants
endothermicreactants
forward flow backward flow
endothermicproducts
endothermicreactants
endothermicproducts
(a) (b)
(c) (d)
endo
ther
mic
rea
ctio
n ph
ase
exot
herm
ic r
eact
ion
phas
eSEQUENTIAL REACTOR CONFIGURATION
Irreversible endothermic reactions
33
Figure 2. Schematic representation of the operation modes for the simultaneous reactorconfiguration.
SIMULTANEOUS REACTOR CONFIGURATION
endothermicproducts
endothermic reactants
exothermicproducts
exothermic reactants
(d)
co-current operation
endothermicproducts
endothermic reactants
exothermicproducts
exothermic reactants
endothermicproducts
endothermic reactants
exothermicproducts
exothermic reactants
endothermic reactions in compartment 1 endothermic reactions in compartment 2
forw
ard
flow
back
war
d flo
w
(a) (b)
(c)
endothermicproducts
endothermic reactants
exothermicproducts
exothermic reactants
counter-current operation
endothermicproducts
endothermic reactants
exothermicproducts
exothermic reactants
endothermicproducts
endothermic reactants
exothermicproducts
exothermic reactants
exothermicproducts
exothermic reactants
endothermic reactants
endothermicproducts
endothermicproducts
endothermic reactants
exothermicproducts
exothermic reactants
endothermic reactions in compartment 1 endothermic reactions in compartment 2
(e) (f)
(g) (h)
endo
ther
mic
rea
ctio
nsin
forw
ard
flow
endo
ther
mic
rea
ctio
nsin
bac
kwar
d flo
w
Chapter 2
34
The dynamic reactor behaviour is studied with two different types of simulation models,
differing in complexity in the description of the transient processes in the reverse flow reactor.
First these models and their assumptions are described. Next, using these models energy
constraints are derived for the sequential and simultaneous reactor configuration successively.
Then, based on design criteria the two reactor configurations are compared based on their
operating conditions. In this chapter the propane dehydrogenation is considered as an
irreversible reaction. However, the propane dehydrogenation is an equilibrium reaction and
the low exit temperatures resulting from the reverse flow concept entail considerable propane
conversion losses. How this ‘back-conversion’ can be counteracted is discussed in Chapter 3.
2. Simulation models
2.1 The Dynamic Model and the High Switching Frequency Model
For a given endothermic and exothermic reaction system in a ceramic monolithic catalyst the
operating conditions are determined by the inlet composition and inlet mass flow rate for the
endothermic and exothermic reaction phases. For the sequential reactor configuration, the
endothermic and exothermic reaction cycle times and flow reversal cycle times and the
switching scheme are additionally required. In order to determine how the operating
conditions effect the cyclic steady state in a reverse flow reactor indirectly coupling
endothermic and exothermic reactions, numerical models are used to simulate the transient
reactor behaviour. Two different types of models are used, differing in complexity in the
description of the transient processes in the reverse flow reactor, designated as Dynamic
Model (DM) and High Switching Frequency Model (HSFM).
The DM constitutes of unsteady-state mass, momentum and energy balances for the gas and
catalyst phase, with time-dependent boundary conditions to incorporate flow direction and
reaction phase switching. The approximate HSFM is used to facilitate the study of the
influence of the operating conditions on the cyclic steady state for the sequential reactor
configuration. Due to the large reaction enthalpies of the propane dehydrogenation and
methane combustion the reaction phase switching times are expected to be relatively short.
The HSFM assumes infinitely fast switching of the gas flow direction, and can be derived
from the DM by expanding the time-dependencies in Taylor-series (Haynes et al., 1995) or by
recognising the counter-current reactor concept in the limit of infinitely fast switching
Irreversible endothermic reactions
35
(Eigenberger and Nieken, 1988). In the HSFM the movement of the temperature fronts has
been excluded from the modelling due to cancellation of net effective heat convection,
facilitating the comparison of the cyclic steady state under different operating conditions.
Secondly, for short reaction phase and flow direction switching times the different switching
schemes approach the same limit, so that also the influence of the switching scheme is
excluded in the HSFM. Here it is assumed that the reactor is long enough to create two
different reaction zones at either side of the reactor. In the limit of very short cycle times the
catalyst temperature profile at one side of the reactor is hardly effected when reactants are fed
at the other reactor end. Thus the particular order of the reaction phases and flow direction
switching doesn’t influence the cyclic steady state temperature profiles in case of short cycle
times. However, in the HSFM it is assumed that both the endothermic and exothermic
reactants are fed from both sides of the reactor, unlike the asymmetric switching scheme
proposed by Kulkarni (1996a). The HSFM offers the opportunity to study the effect of
operating conditions on the transient reactor behaviour of a sequential reverse flow reactor
without considering the switching scheme. The results can then be refined using the DM. It
should be noted that although the HSFM is conceptually simpler, it is not so numerically.
Finally, simulations have confirmed the expected correspondence of the DM with very small
cycle times and the HSFM, irrespective of the switching scheme.
2.2 Model assumptions
The intricate transient behaviour of reverse flow reactors coupling endothermic and
exothermic reactions in monolithic catalysts has been studied by solving the transport
equations of mass, momentum and energy for both the gas and catalyst phase, using the
following general model assumptions:
1. Symmetrical adiabatic monolithic reactor
It is assumed that the inlet gas velocity is equal for all channels in the monolith and that heat
losses to the surroundings can be neglected (justified for monoliths with a large diameter),
allowing to neglect a radial temperature profile over the channels of the monolith.
Chapter 2
36
2. Impermeable pseudo-homogeneous catalyst phase
The monolithic channels consist of an impermeable ceramic support with a porous washcoat
layer in which the active component is uniformly dispersed. Mass transfer between different
channels can be left out of consideration and heat transport in the solid catalyst phase is
described with effective heat transfer properties.
3. One-dimensional plug flow with superimposed axial dispersion
A one-dimensional plug flow model with superimposed axial dispersion for gas phase mass,
momentum and energy transport sufficiently captures the most salient features of monolithic
reverse flow reactors, according to the theory for generalised Taylor dispersion for reactive
systems (see Chapter 6, Appendix A or Van Sint Annaland et al., 2000, Appendix A).
4. Gas phase in pseudo-steady state
The accumulation of energy in the gas phase can be neglected because of the negligible
volumetric heat capacity of the gas phase compared to that of the solid phase. The
accumulation of momentum in the gas phase can be ignored due to very small response times
for small channels. It is assumed that also gas phase mass accumulation can be neglected,
which is only valid if the gas phase residence time is much smaller than the cycle times for
flow reversal and gas phase switching. Although the ratio of the gas residence time to the
switching time was about 5% in some calculations, neglect of mass accumulation was
necessary to avoid calculation of moving concentration fronts, which require intolerably large
computation times. By assuming the gas phase in pseudo-steady state also the phenomena
during reaction phase switching are ignored.
Finally it should be noted that the equations of change are written in the mass average
reference frame. Heterogeneously catalysed gas phase reactions without mass deposition do
not induce a net mass flux from the gas bulk to the catalyst surface, so that the mass and heat
transfer coefficients need not be adjusted for a non-zero net mass flux (Bird et al., 1960).
Should the component continuity equations be written in terms of mole fractions, flux-
correction factors can be important in case of a non-zero net mole flux.
For the propane dehydrogenation and methane combustion reaction system the equations of
change can be further simplified. Since the conversion rate of the propane dehydrogenation in
a monolithic catalyst with its very small washcoat thickness is completely determined by
Irreversible endothermic reactions
37
intrinsic kinetics without external or internal mass transfer limitations. Moreover, only
combustion with very low fuel concentrations is considered in this work, so that diffusion
coupling plays no role in this reaction system and a Fickian description of mass and heat
transfer can be used. This allows the substitution of the catalyst phase component mass
balance in the gas phase component mass balance. Based on numerical simulations with a
more general and detailed dynamic model it has been concluded for the reactor and reaction
system and operating conditions under consideration that entrance effects on mass and heat
transfer and radiative heat transfer can safely be ignored. Furthermore, the effects of axial
dispersion of mass and heat in the gas phase are negligible for the relatively high gas flow
velocities considered.
The DM and the HSFM model equations are summarised in Tables 1 and 2. A uniform initial
axial catalyst temperature profile and the usual Danckwerts-type boundary conditions have
been implemented, where both the inlet and outlet boundary conditions are periodically
switched and the physical properties and reactions are periodically alternated upon reaction
phase switching. The gas phase physical properties have been modelled following Reid et al.
(1988) using pure component properties as described by Dauber and Danner (1985). The solid
phase is a monolith with rectangular channels (0.96 mm hydraulic diameter with a gas phase
porosity of 0.69), where 1 wt% Pt has been dispersed in a γ-Al2O3 washcoat on a cordierite
support, whose physical properties have been taken from Hayes et al. (1996). For the
simultaneous reactor configuration the temperature profile across the boundary separating the
endothermic and exothermic reaction compartments has been assumed in pseudo-steady state.
Because of the switching between the compartments the same volume fraction and specific
catalyst area and catalyst properties have been assumed for both compartments.
In this chapter the heterogeneous propane dehydrogenation and methane combustion are
considered as simple first order irreversible reactions without mass transfer limitations. The
pseudo-first order heterogeneous reaction rate constant and activation energy for the propane
dehydrogenation are approximated using experimental results obtained by Loc et al. (1991)
( endork ∞, = 4.2 m·s-1, endo
actE = 59 kJ·mole-1) and for the methane combustion using the results from
Trimm and Lam (1980), which show that the reaction order in methane reduces to first order
for very low reactant concentrations ( exork ∞, = 4400 m·s-1, exo
actE = 86 kJ·mole-1). In this chapter
homogeneous combustion is ignored, as is the axial pressure drop. Also the effects of coke
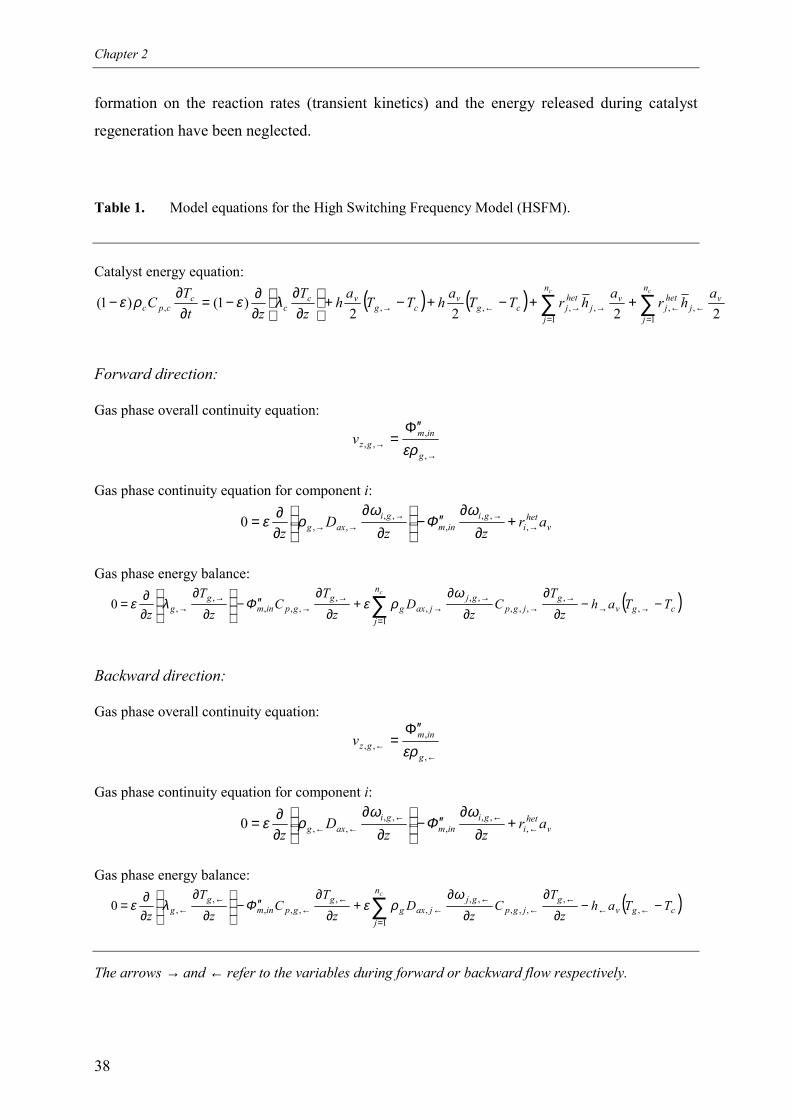
Chapter 2
38
formation on the reaction rates (transient kinetics) and the energy released during catalyst
regeneration have been neglected.
Table 1. Model equations for the High Switching Frequency Model (HSFM).
Catalyst energy equation:
( ) ( ) ∑∑=
←←=
→→←→ ++−+−+
∂∂
∂∂−=
∂∂
−cc n
j
vj
hetj
n
j
vj
hetjcg
vcg
vcc
ccpc
ahr
ahrTT
ahTT
ah
zT
ztT
C1
,,1
,,,,, 2222)1()1( λερε
Forward direction:
Gas phase overall continuity equation:
→→
Φ ′′=
,
,,,
g
inmgzv
ερ
Gas phase continuity equation for component i:
vhet
igi
inmgi
axg arzz
Dz →
→→→→ +
∂∂
′′−
∂
∂∂∂= ,
,,,
,,,,0
ωΦ
ωρε
Gas phase energy balance:
( )cgvg
jgpgj
n
jjaxg
ggpinm
gg TTah
zT
Cz
Dz
TC
zT
z
c
−−∂
∂∂
∂+
∂∂
′′−
∂
∂∂∂= →→
→→
→
=→
→→
→→ ∑ ,
,,,,
,,
1,
,,,,
,,0
ωρεΦλε
Backward direction:
Gas phase overall continuity equation:
←←
Φ ′′=
,
,,,
g
inmgzv
ερ
Gas phase continuity equation for component i:
vhet
igi
inmgi
axg arzz
Dz ←
←←←← +
∂∂
′′−
∂
∂∂∂= ,
,,,
,,,,0
ωΦ
ωρε
Gas phase energy balance:
( )cgvg
jgpgj
n
jjaxg
ggpinm
gg TTah
zT
Cz
Dz
TC
zT
z
c
−−∂
∂∂
∂+
∂∂
′′−
∂
∂∂∂= ←←
←←
←
=←
←←
←← ∑ ,
,,,,
,,
1,
,,,,
,,0
ωρεΦλε
The arrows → and ← refer to the variables during forward or backward flow respectively.
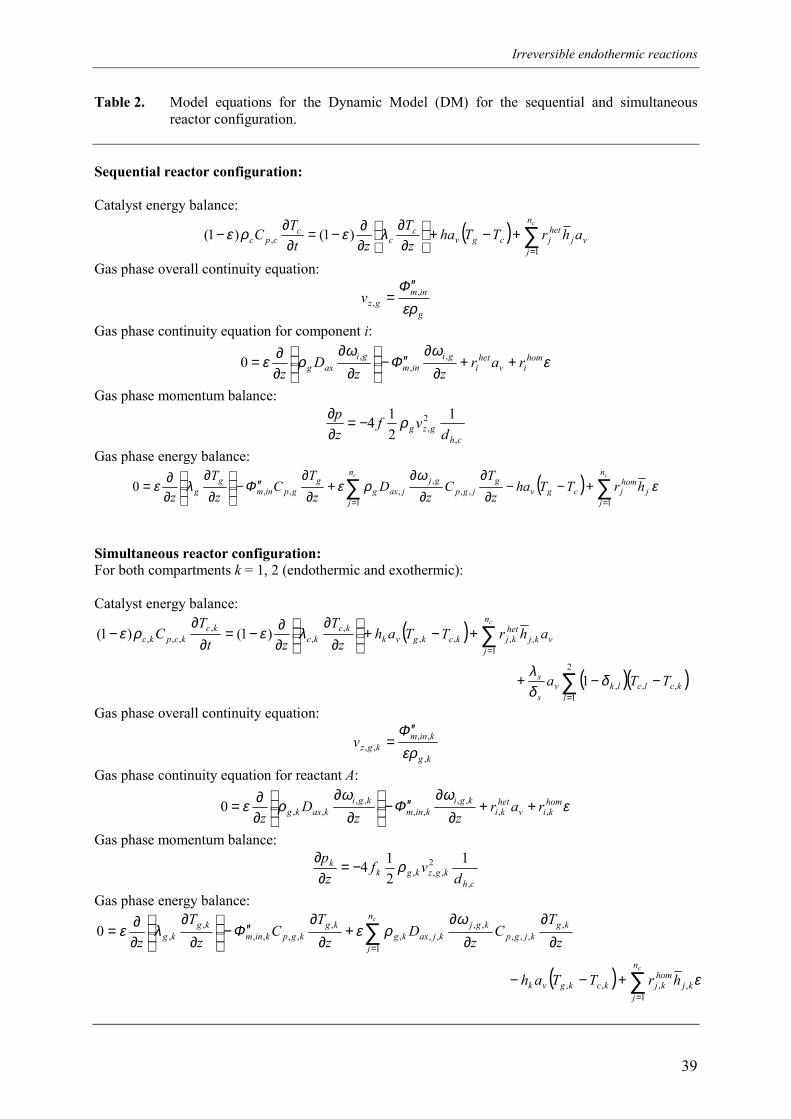
Irreversible endothermic reactions
39
Table 2. Model equations for the Dynamic Model (DM) for the sequential and simultaneousreactor configuration.
Sequential reactor configuration:
Catalyst energy balance:
( ) v
n
jj
hetjcgv
cc
ccpc ahrTTha
zT
ztTC
c
∑=
+−+
∂∂
∂∂−=
∂∂
−1
, )1()1( λερε
Gas phase overall continuity equation:
g
inmgzv
ερΦ ,
,
′′=
Gas phase continuity equation for component i:
εω
Φω
ρε homiv
heti
giinm
giaxg rar
zzD
z++
∂∂
′′−
∂
∂∂∂= ,
,,0
Gas phase momentum balance:
chgzg d
vfzp
,
2,
1214 ρ−=
∂∂
Gas phase energy balance:
( ) ∑∑==
+−−∂
∂∂
∂+
∂∂
′′−
∂
∂∂∂=
cc n
jj
homjcgv
gjgp
gjn
jjaxg
ggpinm
gg hrTTha
zT
Cz
Dz
TC
zT
z 1,,
,
1,,,0 ε
ωρεΦλε
Simultaneous reactor configuration:For both compartments k = 1, 2 (endothermic and exothermic):
Catalyst energy balance:
( )
( )( )kclcl
lkvs
s
n
jvkj
hetkjkckgvk
kckc
kckcpkc
TTa
ahrTTahz
Tzt
TC
c
,,
2
1,
1,,,,
,,
,,,,
1
)1()1(
−−+
+−+
∂
∂∂∂−=
∂∂
−
∑
∑
=
=
δδλ
λερε
Gas phase overall continuity equation:
kg
kinmkgzv
,
,,,, ερ
Φ ′′=
Gas phase continuity equation for reactant A:
εω
Φω
ρε homkiv
hetki
kgikinm
kgikaxkg rar
zzD
z ,,,,
,,,,
,,0 ++∂
∂′′−
∂
∂∂∂=
Gas phase momentum balance:
chkgzkgk
k
dvf
zp
,
2,,,
1214 ρ−=
∂∂
Gas phase energy balance:
( ) ∑
∑
=
=
+−−
∂∂
∂∂
+∂
∂′′−
∂
∂∂∂=
c
c
n
jkj
homkjkckgvk
kgkjgp
kgjn
jkjaxkg
kgkgpkinm
kgkg
hrTTah
zT
Cz
Dz
TC
zT
z
1,,,,
,,,,
,,
1,,,
,,,,,
,,0
ε
ωρεΦλε
Chapter 2
40
Both the DM and the HSFM have been solved using a finite difference technique with
Barton’s second order scheme for the convective terms (e.g. Centrella and Wilson, 1984).
From calculations it has been concluded that for the reaction and reactor system under study
with at least 1000 axial grid cells per meter reactor length and a time step less than 0.1 s
sufficiently accurate results are obtained. Generally, over a hundred complete cycles are
required to completely obtain the cyclic steady state, although the main features of the
temperature profiles clearly emerge after only about twenty full cycles.
With these models energy constraints to obtain a cyclic steady state are derived for both the
sequential and simultaneous reactor configuration. Next, the operating conditions of the two
different reactor configurations are compared. Before discussing the energy constraints and
comparing the operating conditions the criteria on which this comparison is based are briefly
outlined.
3. Design criteria
In an optimal design of a reverse flow reactor coupling endothermic and exothermic reactions
a maximisation of the time averaged production of the products of the endothermic reaction
phase is achieved, while minimising the energy requirement in terms of fuel consumption
during the exothermic reaction phase. Also maximum conversion for both the endothermic
and exothermic reaction phases is aimed for in order to minimise energy requirements for
product separation and reactant recycles. This optimisation is subdued firstly by a maximum
gas velocity, which depends mainly on the channel diameter and shape because of
compression costs (pressure drop) or capital investments (reactor length). Secondly, a
maximum allowable catalyst temperature limits the reactor optimisation. The maximum
allowable temperature is mainly determined by, on the one hand, reaction kinetics and
selectivities due to undesired by-product formation by cracking, hydrogenolysis or coking, or
on the other hand, catalyst properties because of sintering of the washcoat or reduction in the
dispersion of the active component. Thirdly, the fuel inlet concentration for the exothermic
reaction phase should be below the lower explosion limit. These optimisation variables and
constraints have been summarised in Table 3.
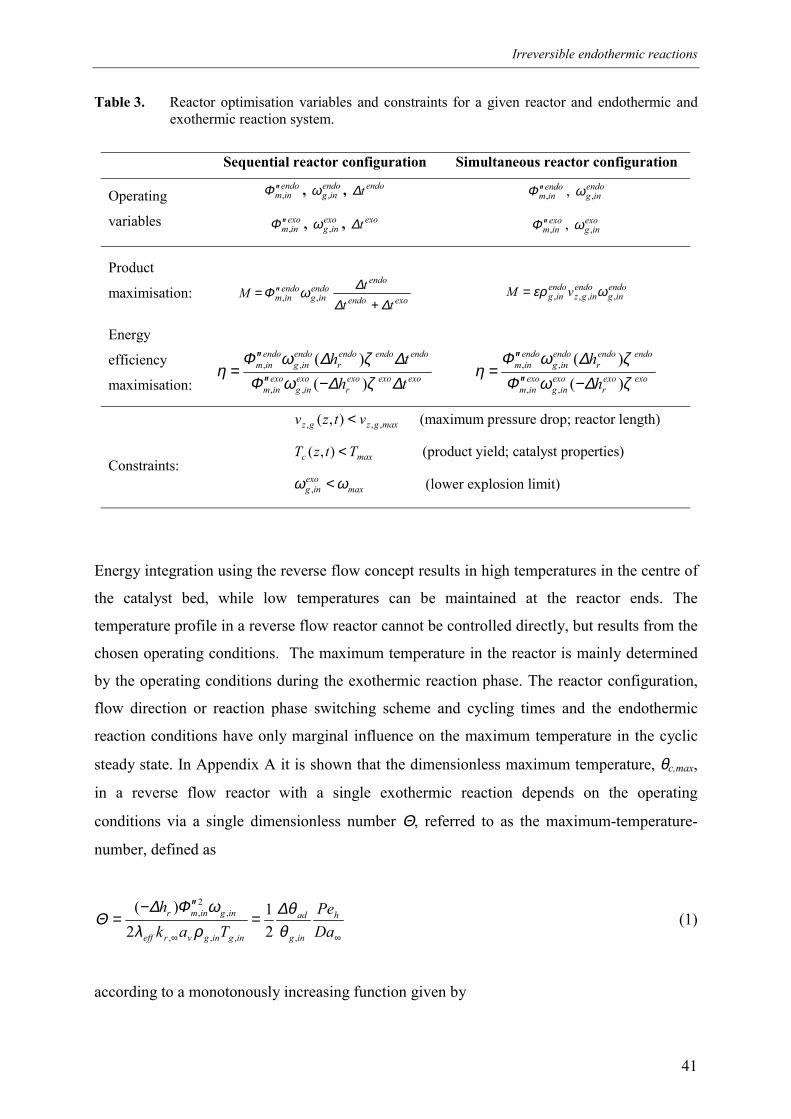
Irreversible endothermic reactions
41
Table 3. Reactor optimisation variables and constraints for a given reactor and endothermic andexothermic reaction system.
Sequential reactor configuration Simultaneous reactor configuration
Operating
variables
endoinm,Φ ′′ , endo
ing ,ω , endot∆
exoinm,Φ ′′ , exo
ing ,ω , exot∆
endoinm,Φ ′′ , endo
ing ,ω
exoinm,Φ ′′ , exo
ing ,ω
Product
maximisation: exoendo
endoendo
ingendoinm tt
tM∆∆
∆ωΦ+
′′= ,,endo
ingendo
ingzendo
ing vM ,,,, ωερ=
Energy
efficiency
maximisation: exoexoexor
exoing
exoinm
endoendoendor
endoing
endoinm
thth
∆ζ∆ωΦ∆ζ∆ωΦ
η)()(
,,
,,
−′′′′
= exoexor
exoing
exoinm
endoendor
endoing
endoinm
hh
ζ∆ωΦζ∆ωΦ
η)()(
,,
,,
−′′′′
=
Constraints:
maxgzgz vtzv ,,, ),( < (maximum pressure drop; reactor length)
maxc TtzT <),( (product yield; catalyst properties)
maxexo
ing ωω <, (lower explosion limit)
Energy integration using the reverse flow concept results in high temperatures in the centre of
the catalyst bed, while low temperatures can be maintained at the reactor ends. The
temperature profile in a reverse flow reactor cannot be controlled directly, but results from the
chosen operating conditions. The maximum temperature in the reactor is mainly determined
by the operating conditions during the exothermic reaction phase. The reactor configuration,
flow direction or reaction phase switching scheme and cycling times and the endothermic
reaction conditions have only marginal influence on the maximum temperature in the cyclic
steady state. In Appendix A it is shown that the dimensionless maximum temperature, θc,max,
in a reverse flow reactor with a single exothermic reaction depends on the operating
conditions via a single dimensionless number Θ, referred to as the maximum-temperature-
number, defined as
∞∞
=′′−
=DaPe
Takh h
ing
ad
ingingvreff
inginmr
,,,,
,2,
21
2)(
θθ∆
ρλωΦ∆
Θ (1)
according to a monotonously increasing function given by
Chapter 2
42
Θθθ
θθ
θ =
−−
−− 2maxc
maxcmaxc,
maxcmaxc
,
,
,, 51
211)1exp( (2)
In order to avoid extinction and to achieve a cyclic steady state in a reverse flow reactor
coupling endothermic and exothermic reactions, the operating conditions of the endothermic
reaction phase need to be adjusted to the exothermic reaction phase. For a given reaction
system and endothermic and exothermic reactions the variables available for tuning are the
inlet reactant concentrations, inlet mass fluxes and – for the sequential reactor configuration –
the switching scheme and the flow direction and reaction phase cycle times. Due to the
different reactor behaviour of the sequential and simultaneous reactor configuration the
energy constraints will be discussed separately.
4. Sequential reactor configuration
Starting with a simple overall energy balance the dynamic reactor behaviour is studied in
increasing detail, from the HSFM to the DM, leading to new energy constraints for a cyclic
steady state.
4.1 Overall energy balance
Firstly, a cyclic steady state can only be achieved, if the total energy production during the
exothermic reaction phase cycle exceeds the total energy consumption during the consecutive
endothermic reaction phase cycle, because of energy losses by convective gas transport at the
reactor outlet (heat losses through the reactor wall are neglected). Considering the reactor as a
black-box, the overall energy balance reads
( )[ ]
( )[ ]∫
∫
−′′−′′−+
+
−′′−−′′+
=
endo
exo
t
ingendo
ingpoutgendo
outgpendoinm
endoendor
endoing
endoinmexoendo
t
ingexo
ingpoutgexo
outgpexoinm
exoexor
exoing
exoinmexoendo
dtTCTChtt
dtTCTChtt
∆
∆
Φζ∆ωΦ∆∆
Φζ∆ωΦ∆∆
0,,,,,,,,,
0,,,,,,,,,
)(1
)(10(3)
Irreversible endothermic reactions
43
which after rearanging yields
( )
( ) )()(
)(
)(
,
,
,
,
,
,
,
,endor
exor
endoing
endoggpendoendo
r
exoing
exoggpexoexo
r
exo
endo
exoing
endoing
exoinm
endoinm
hh
TCh
TCh
tt
∆∆
ω∆
ζ∆
ω∆
ζ∆
∆∆
ωω
ΦΦ −≤
+
−−=
′′′′
(4)
stating that the multiplication of the ratios of inlet mass fluxes, inlet reactant mass fractions
and cycle times of the endothermic reaction phase compared to the exothermic reaction phase
is bounded by the ratio of the reaction enthalpy of the exothermic reaction and the
endothermic reaction.
4.2 Matching of Damköhler numbers
While still satisfying the overall energy balance, different sets of operating conditions can be
selected. In Figure 3 the influence of different sets of operating conditions, all satisfying the
overall energy balance, on the axial profiles in the cyclic steady state for the sequential reactor
configuration obtained from the HSFM are shown. In these calculations the operating
conditions of the endothermic reaction phase have been kept the same in order to keep the
total energy demand for the endothermic conversions constant. The endothermic inlet mass
fraction has been set to unity, the endothermic inlet interstitial gas velocity to 0.25 m·s-1 and
the endothermic reaction phase cycle time has been kept at 30 s. The reactor length has been
chosen long enough to avoid overlapping reaction zones. Also the total amount of energy
which can be produced during the exothermic reaction phase is kept constant in these
calculations and somewhat larger than necessary for the endothermic process step to account
for convective heat losses avoiding extinction of the reactor. Figure 3 clearly shows that the
cyclic steady state axial temperature and mass fraction profiles strongly depend on the choice
of operating conditions. The operating conditions influence firstly the axial position of the
reaction zones in the reactor, and secondly the relative position of the endothermic and
exothermic reaction zones.
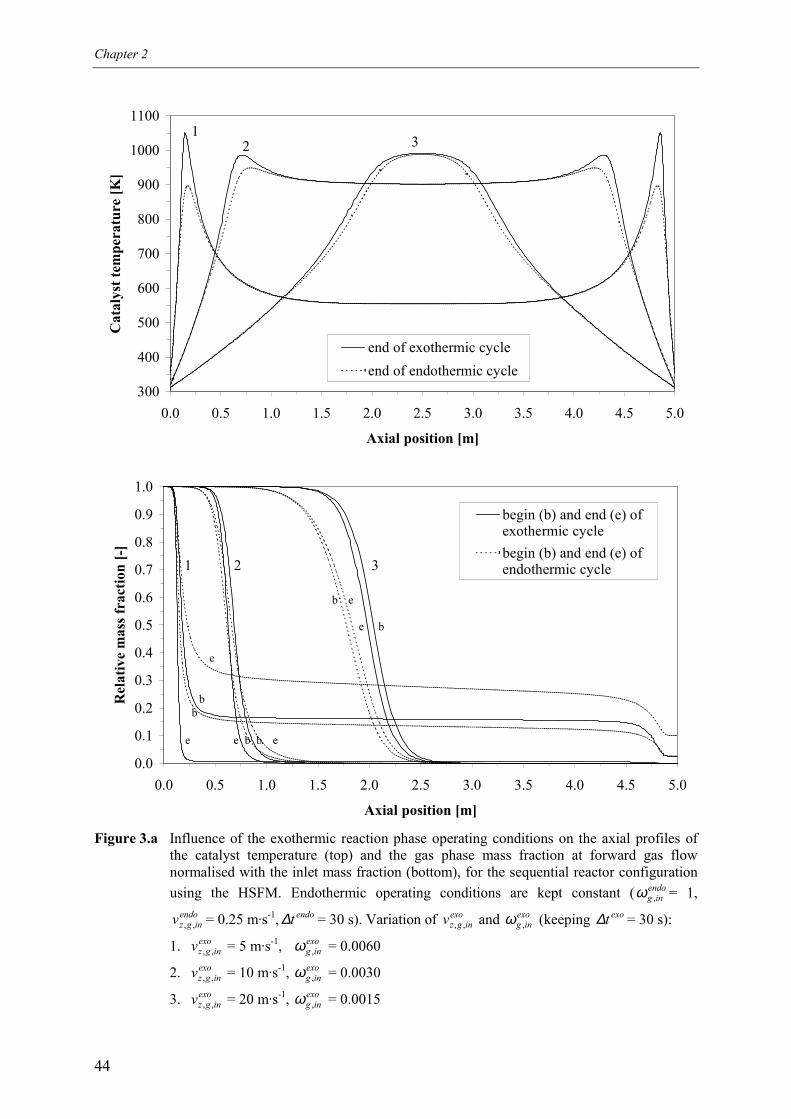
Chapter 2
44
300
400
500
600
700
800
900
1000
1100
0.0 0.5 1.0 1.5 2.0 2.5 3.0 3.5 4.0 4.5 5.0
Axial position [m]
Cat
alys
t tem
pera
ture
[K]
end of exothermic cycleend of endothermic cycle
12 3
0.0
0.1
0.2
0.3
0.4
0.5
0.6
0.7
0.8
0.9
1.0
0.0 0.5 1.0 1.5 2.0 2.5 3.0 3.5 4.0 4.5 5.0
Axial position [m]
Rel
ativ
e m
ass f
ract
ion
[-]
begin (b) and end (e) ofexothermic cyclebegin (b) and end (e) ofendothermic cycle321
e e
e
bb
e
e
e b
b
b b
Figure 3.a Influence of the exothermic reaction phase operating conditions on the axial profiles ofthe catalyst temperature (top) and the gas phase mass fraction at forward gas flownormalised with the inlet mass fraction (bottom), for the sequential reactor configurationusing the HSFM. Endothermic operating conditions are kept constant ( endo
ing ,ω = 1,endo
ingzv ,, = 0.25 m·s-1, endot∆ = 30 s). Variation of exoingzv ,, and exo
ing ,ω (keeping exot∆ = 30 s):
1. exoingzv ,, = 5 m·s-1, exo
ing ,ω = 0.0060
2. exoingzv ,, = 10 m·s-1, exo
ing ,ω = 0.0030
3. exoingzv ,, = 20 m·s-1, exo
ing ,ω = 0.0015
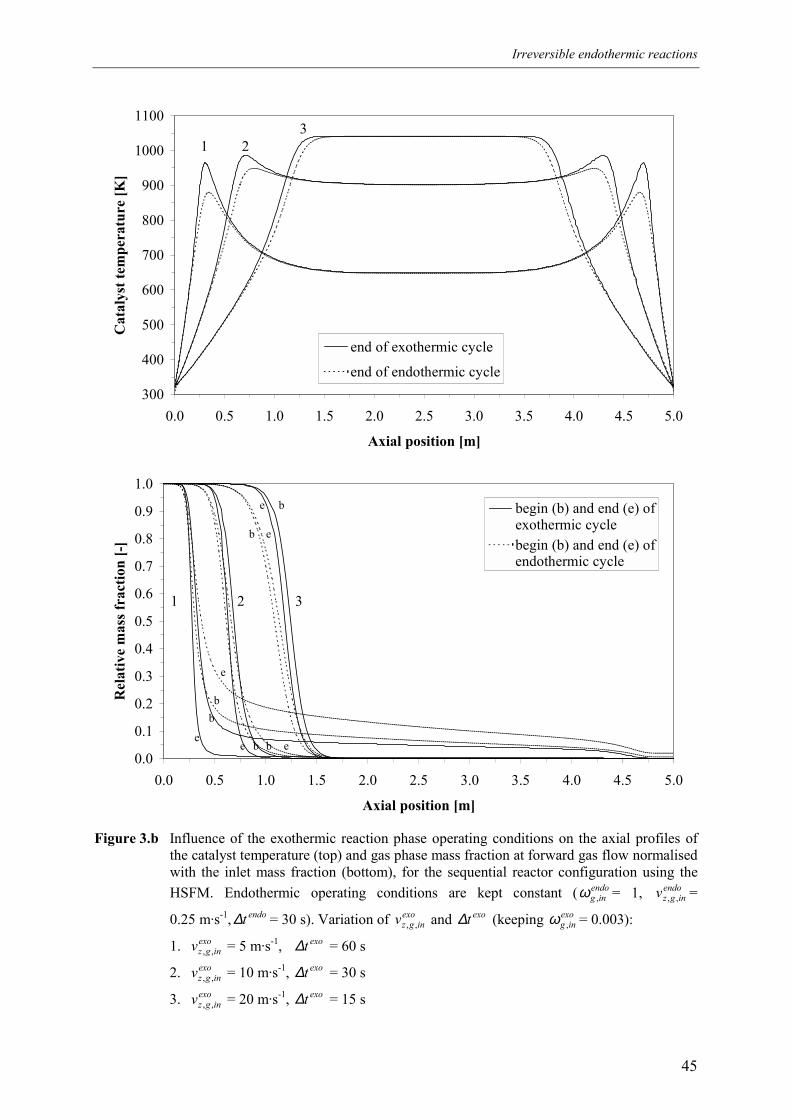
Irreversible endothermic reactions
45
300
400
500
600
700
800
900
1000
1100
0.0 0.5 1.0 1.5 2.0 2.5 3.0 3.5 4.0 4.5 5.0
Axial position [m]
Cat
alys
t tem
pera
ture
[K]
end of exothermic cycle
end of endothermic cycle
1 23
0.0
0.1
0.2
0.3
0.4
0.5
0.6
0.7
0.8
0.9
1.0
0.0 0.5 1.0 1.5 2.0 2.5 3.0 3.5 4.0 4.5 5.0
Axial position [m]
Rel
ativ
e m
ass f
ract
ion
[-]
begin (b) and end (e) ofexothermic cyclebegin (b) and end (e) ofendothermic cycle
321
ee
e
bb
e
e
e b
b
bb
Figure 3.b Influence of the exothermic reaction phase operating conditions on the axial profiles ofthe catalyst temperature (top) and gas phase mass fraction at forward gas flow normalisedwith the inlet mass fraction (bottom), for the sequential reactor configuration using theHSFM. Endothermic operating conditions are kept constant ( endo
ing ,ω = 1, endoingzv ,, =
0.25 m·s-1, endot∆ = 30 s). Variation of exoingzv ,, and exot∆ (keeping exo
ing ,ω = 0.003):
1. exoingzv ,, = 5 m·s-1, exot∆ = 60 s
2. exoingzv ,, = 10 m·s-1, exot∆ = 30 s
3. exoingzv ,, = 20 m·s-1, exot∆ = 15 s
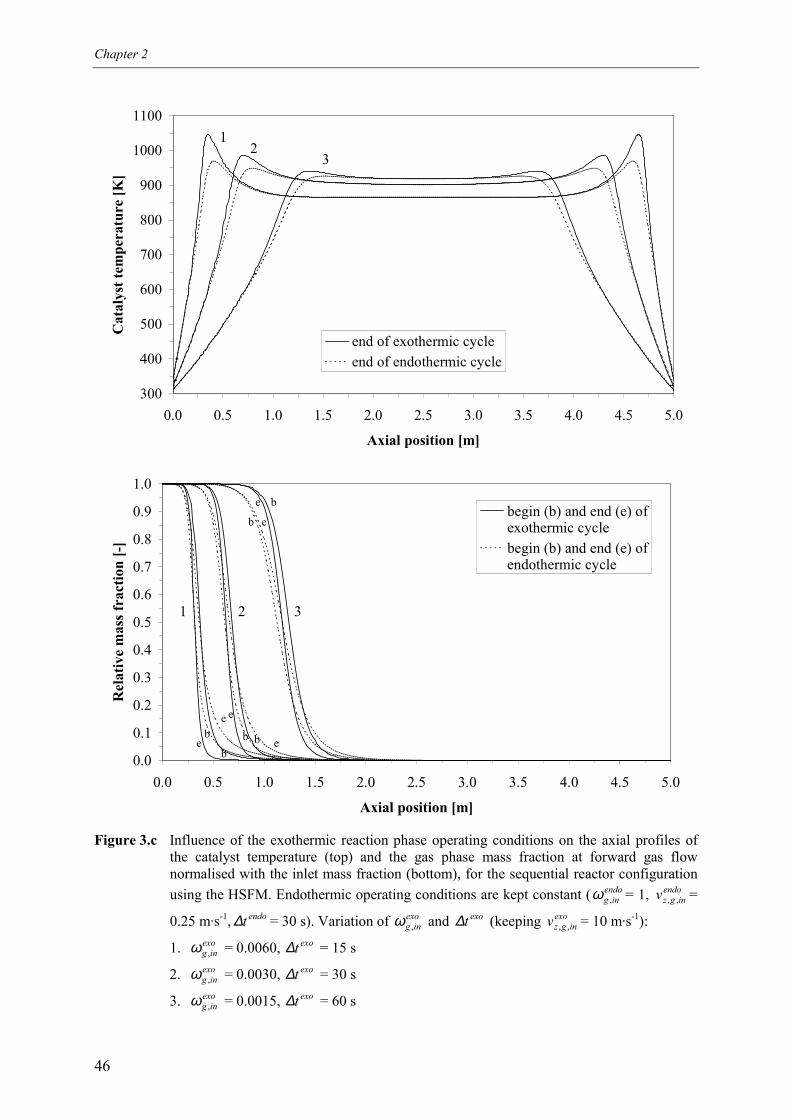
Chapter 2
46
300
400
500
600
700
800
900
1000
1100
0.0 0.5 1.0 1.5 2.0 2.5 3.0 3.5 4.0 4.5 5.0
Axial position [m]
Cat
alys
t tem
pera
ture
[K]
end of exothermic cycleend of endothermic cycle
12
3
0.0
0.1
0.2
0.3
0.4
0.5
0.6
0.7
0.8
0.9
1.0
0.0 0.5 1.0 1.5 2.0 2.5 3.0 3.5 4.0 4.5 5.0
Axial position [m]
Rel
ativ
e m
ass f
ract
ion
[-]
begin (b) and end (e) ofexothermic cyclebegin (b) and end (e) ofendothermic cycle
321
e
ee
b
be
e
e b
b
b b
Figure 3.c Influence of the exothermic reaction phase operating conditions on the axial profiles ofthe catalyst temperature (top) and the gas phase mass fraction at forward gas flownormalised with the inlet mass fraction (bottom), for the sequential reactor configurationusing the HSFM. Endothermic operating conditions are kept constant ( endo
ing ,ω = 1, endoingzv ,, =
0.25 m·s-1, endot∆ = 30 s). Variation of exoing ,ω and exot∆ (keeping exo
ingzv ,, = 10 m·s-1):
1. exoing ,ω = 0.0060, exot∆ = 15 s
2. exoing ,ω = 0.0030, exot∆ = 30 s
3. exoing ,ω = 0.0015, exot∆ = 60 s
Irreversible endothermic reactions
47
The position of the reaction zones is determined by the inlet temperature gradient and the
ignition temperature of the exothermic reaction. Using the HSFM, it has been found that the
inlet temperature gradient increases linearly with increasing exothermic reactant inlet mass
fractions and decreases linearly with increasing inlet gas velocities in case the effective axial
heat transport is completely dominated by gas convection (see Appendix A). At higher inlet
reactant mass fractions and lower inlet gas velocities the temperature gradient is larger and the
exothermic reaction reaches its ignition temperature at an axial position closer to the feed
inlet.
Furthermore, the relative position of the endothermic and exothermic reaction zones
determines whether a constant temperature plateau at the maximum temperature is formed at
the centre of the monolith, or whether temperature maxima are created near the inlet and
outlet with a low temperature plateau while the maximum temperature varies with time. The
first situation arises when the exothermic reaction zone is located more inward compared to
the endothermic reaction zone, and the latter when the opposite is true, as can be clearly seen
from Figures 3.a and b. Moreover, in case the endothermic reaction zone is located more
inward than the exothermic reaction zone, full conversion is not reached during both the
endothermic and exothermic reaction phase due to the resulting unfavourable temperature
profile, despite the fact that sufficient energy has been introduced during the exothermic
reaction phase. The endothermic reaction has consumed all possible energy at the centre of
the reactor, rendering the centre of the reactor ineffective for both the endothermic and
exothermic reactions. Besides, it should be noted that at the temperature plateau no
conversion takes place, allowing a reduction of the reactor length.
In order to achieve maximum conversion during the endothermic and exothermic reaction
phases maximising the overall energy efficiency and to obtain an advantageous temperature
profile with a constant temperature plateau at the maximum design temperature, not only the
total amount of energy transferred from the exothermic to the endothermic reaction phase
needs to tuned, also the axial position relative to the heat front where the exothermic reaction
delivers energy and where the endothermic reaction consumes energy needs to be adjusted.
This matching of the reaction zones, or Damköhler numbers, can only be achieved by
adjusting the exothermic inlet gas velocity to the endothermic inlet gas velocity according to
at least the inverse of the ratio of their reaction constants. Generally, the exothermic fuel
combustion reaction rate is much larger than the endothermic dehydrogenation reaction rate,
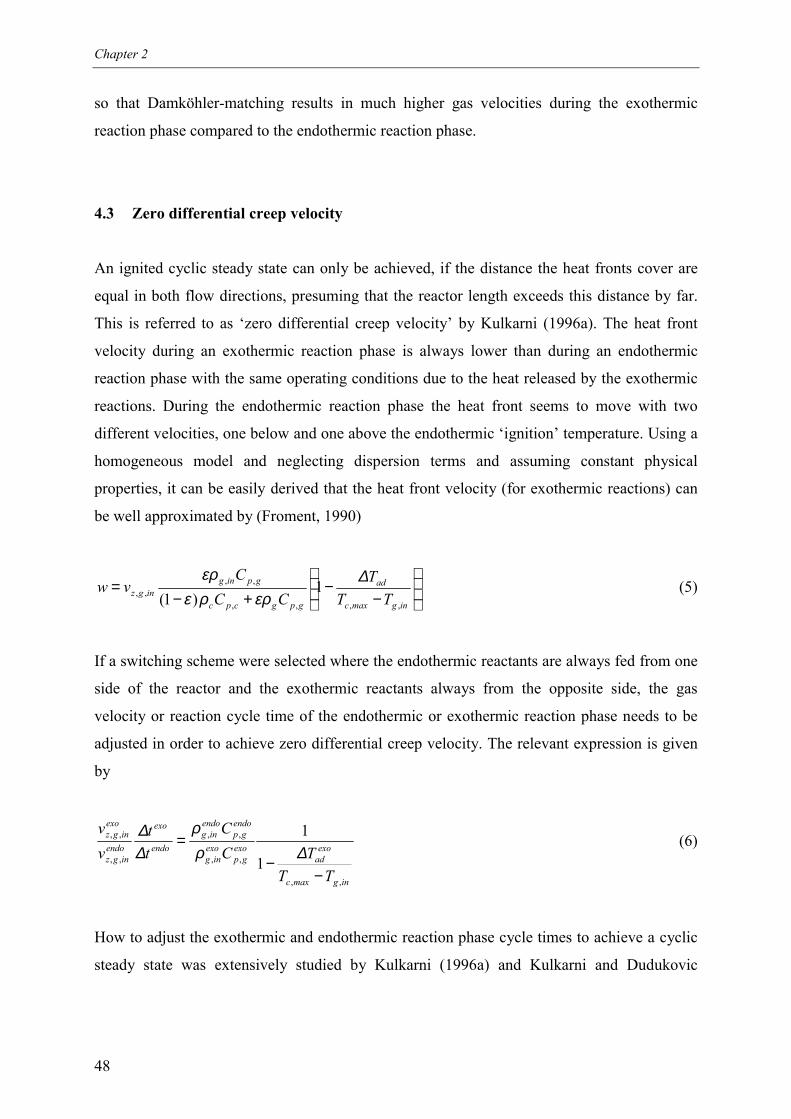
Chapter 2
48
so that Damköhler-matching results in much higher gas velocities during the exothermic
reaction phase compared to the endothermic reaction phase.
4.3 Zero differential creep velocity
An ignited cyclic steady state can only be achieved, if the distance the heat fronts cover are
equal in both flow directions, presuming that the reactor length exceeds this distance by far.
This is referred to as ‘zero differential creep velocity’ by Kulkarni (1996a). The heat front
velocity during an exothermic reaction phase is always lower than during an endothermic
reaction phase with the same operating conditions due to the heat released by the exothermic
reactions. During the endothermic reaction phase the heat front seems to move with two
different velocities, one below and one above the endothermic ‘ignition’ temperature. Using a
homogeneous model and neglecting dispersion terms and assuming constant physical
properties, it can be easily derived that the heat front velocity (for exothermic reactions) can
be well approximated by (Froment, 1990)
−
−+−
=ingmaxc
ad
gpgcpc
gpingingz TT
TCC
Cvw
,,,,
,,,, 1
)1(∆
ερρεερ
(5)
If a switching scheme were selected where the endothermic reactants are always fed from one
side of the reactor and the exothermic reactants always from the opposite side, the gas
velocity or reaction cycle time of the endothermic or exothermic reaction phase needs to be
adjusted in order to achieve zero differential creep velocity. The relevant expression is given
by
ingmaxc
exoad
exogp
exoing
endogp
endoing
endo
exo
endoingz
exoingz
TTTC
Ctt
vv
,,
,,
,,
,,
,,
1
1
−−
=∆ρ
ρ∆∆ (6)
How to adjust the exothermic and endothermic reaction phase cycle times to achieve a cyclic
steady state was extensively studied by Kulkarni (1996a) and Kulkarni and Dudukovic
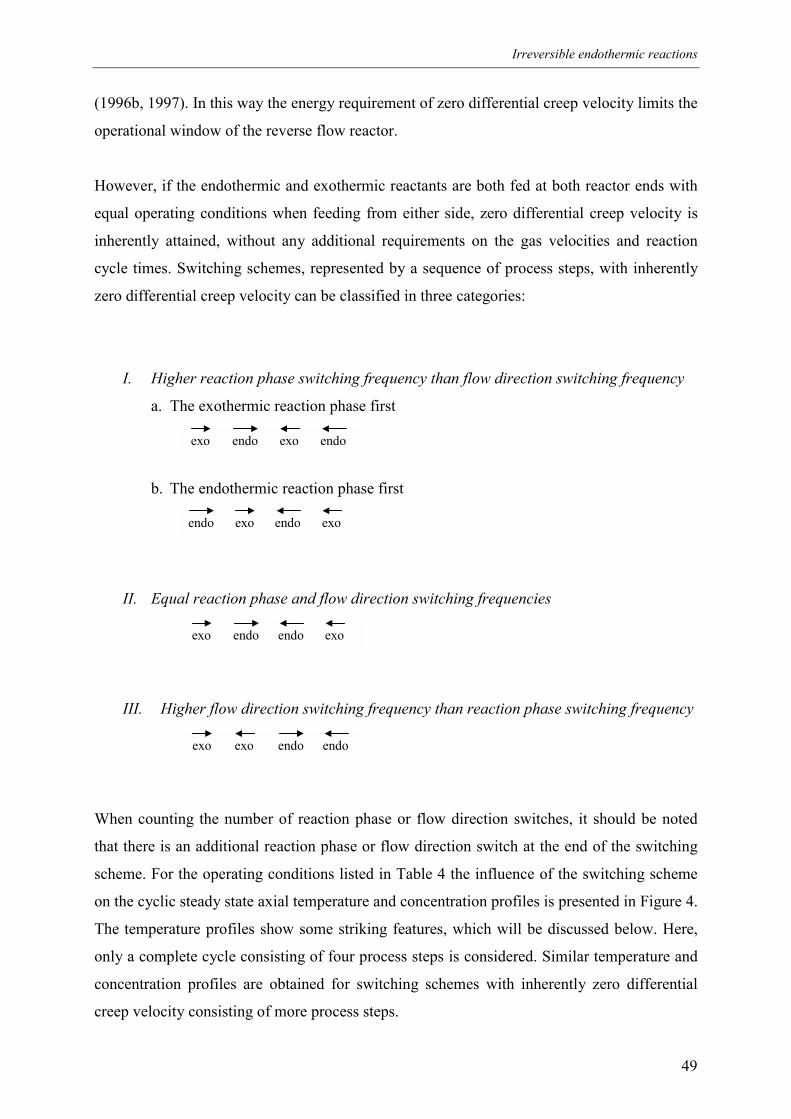
Irreversible endothermic reactions
49
(1996b, 1997). In this way the energy requirement of zero differential creep velocity limits the
operational window of the reverse flow reactor.
However, if the endothermic and exothermic reactants are both fed at both reactor ends with
equal operating conditions when feeding from either side, zero differential creep velocity is
inherently attained, without any additional requirements on the gas velocities and reaction
cycle times. Switching schemes, represented by a sequence of process steps, with inherently
zero differential creep velocity can be classified in three categories:
I. Higher reaction phase switching frequency than flow direction switching frequency
a. The exothermic reaction phase first
b. The endothermic reaction phase first
II. Equal reaction phase and flow direction switching frequencies
III. Higher flow direction switching frequency than reaction phase switching frequency
When counting the number of reaction phase or flow direction switches, it should be noted
that there is an additional reaction phase or flow direction switch at the end of the switching
scheme. For the operating conditions listed in Table 4 the influence of the switching scheme
on the cyclic steady state axial temperature and concentration profiles is presented in Figure 4.
The temperature profiles show some striking features, which will be discussed below. Here,
only a complete cycle consisting of four process steps is considered. Similar temperature and
concentration profiles are obtained for switching schemes with inherently zero differential
creep velocity consisting of more process steps.
endo exo endo exo
endoexo endoexo
endoexo endo exo
endoexo endoexo
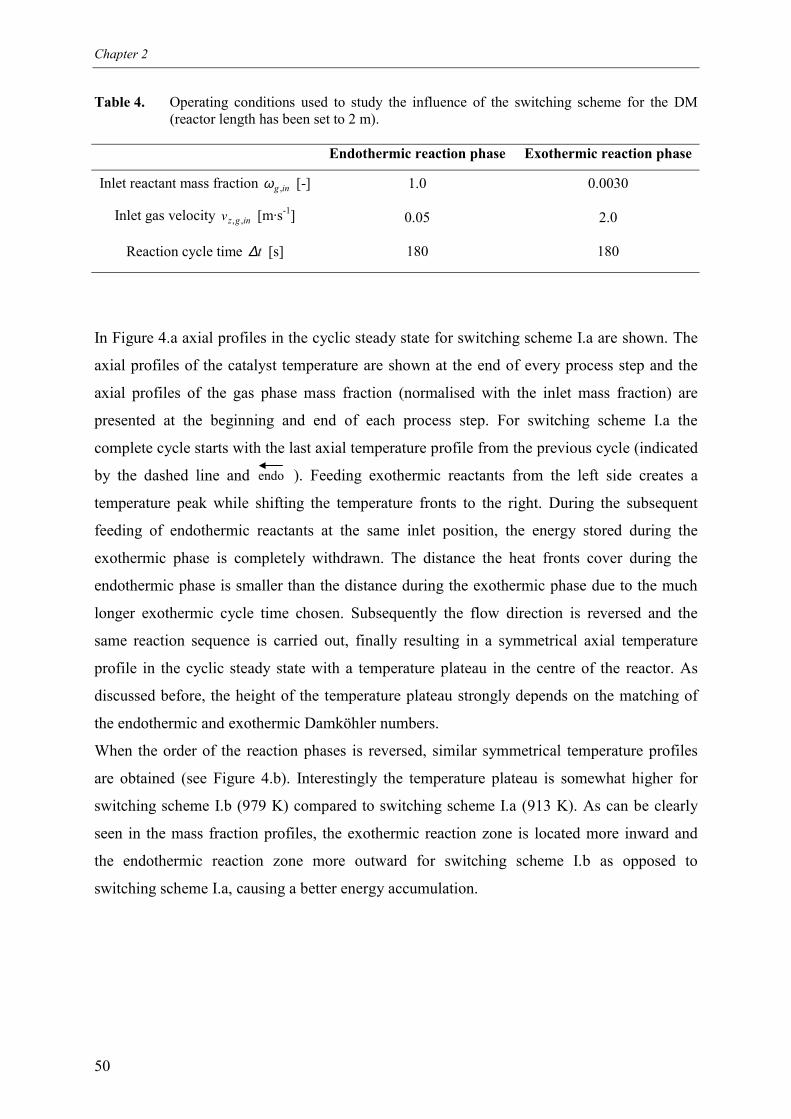
Chapter 2
50
Table 4. Operating conditions used to study the influence of the switching scheme for the DM(reactor length has been set to 2 m).
Endothermic reaction phase Exothermic reaction phase
Inlet reactant mass fraction ing ,ω [-] 1.0 0.0030
Inlet gas velocity ingzv ,, [m·s-1] 0.05 2.0
Reaction cycle time t∆ [s] 180 180
In Figure 4.a axial profiles in the cyclic steady state for switching scheme I.a are shown. The
axial profiles of the catalyst temperature are shown at the end of every process step and the
axial profiles of the gas phase mass fraction (normalised with the inlet mass fraction) are
presented at the beginning and end of each process step. For switching scheme I.a the
complete cycle starts with the last axial temperature profile from the previous cycle (indicated
by the dashed line and ). Feeding exothermic reactants from the left side creates a
temperature peak while shifting the temperature fronts to the right. During the subsequent
feeding of endothermic reactants at the same inlet position, the energy stored during the
exothermic phase is completely withdrawn. The distance the heat fronts cover during the
endothermic phase is smaller than the distance during the exothermic phase due to the much
longer exothermic cycle time chosen. Subsequently the flow direction is reversed and the
same reaction sequence is carried out, finally resulting in a symmetrical axial temperature
profile in the cyclic steady state with a temperature plateau in the centre of the reactor. As
discussed before, the height of the temperature plateau strongly depends on the matching of
the endothermic and exothermic Damköhler numbers.
When the order of the reaction phases is reversed, similar symmetrical temperature profiles
are obtained (see Figure 4.b). Interestingly the temperature plateau is somewhat higher for
switching scheme I.b (979 K) compared to switching scheme I.a (913 K). As can be clearly
seen in the mass fraction profiles, the exothermic reaction zone is located more inward and
the endothermic reaction zone more outward for switching scheme I.b as opposed to
switching scheme I.a, causing a better energy accumulation.
endo
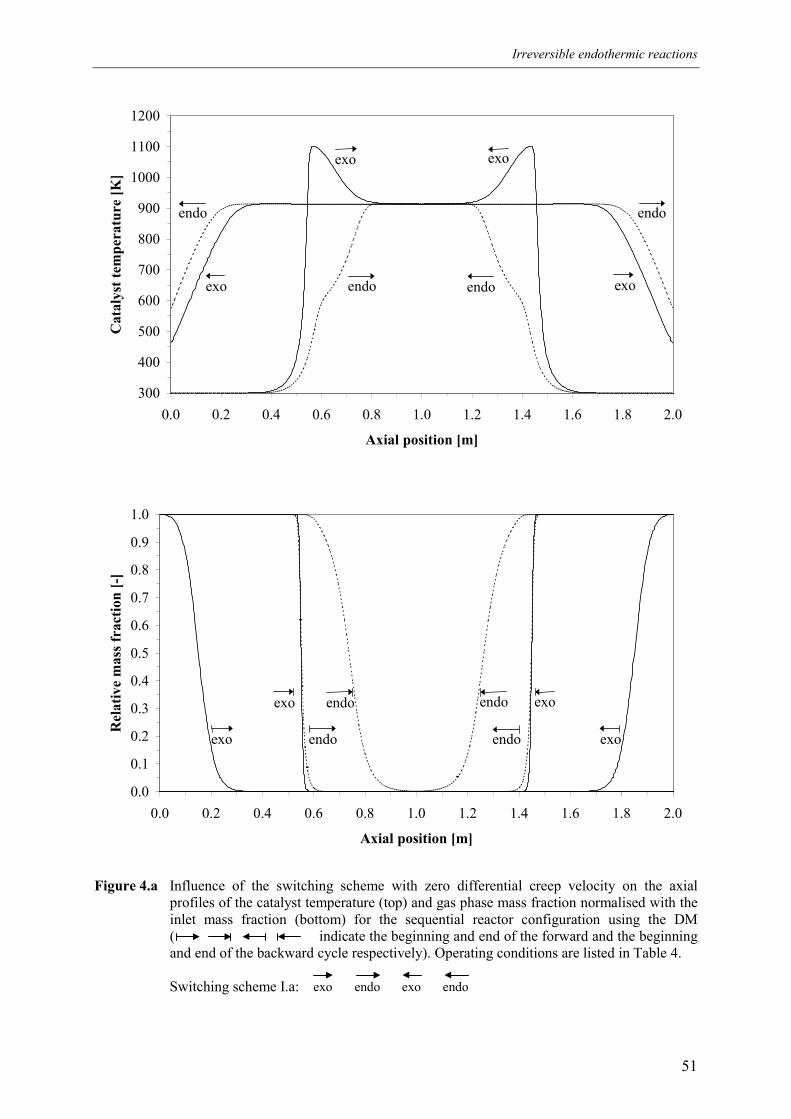
Irreversible endothermic reactions
51
300
400
500
600
700
800
900
1000
1100
1200
0.0 0.2 0.4 0.6 0.8 1.0 1.2 1.4 1.6 1.8 2.0
Axial position [m]
Cat
alys
t tem
pera
ture
[K]
exo
endo
exoendo
exo
endoexo
endo
0.0
0.1
0.2
0.3
0.4
0.5
0.6
0.7
0.8
0.9
1.0
0.0 0.2 0.4 0.6 0.8 1.0 1.2 1.4 1.6 1.8 2.0
Axial position [m]
Rel
ativ
e m
ass f
ract
ion
[-]
exo endo
exo endo exoendo
exoendo
Figure 4.a Influence of the switching scheme with zero differential creep velocity on the axialprofiles of the catalyst temperature (top) and gas phase mass fraction normalised with theinlet mass fraction (bottom) for the sequential reactor configuration using the DM( indicate the beginning and end of the forward and the beginningand end of the backward cycle respectively). Operating conditions are listed in Table 4.
Switching scheme I.a: endoexo endoexo
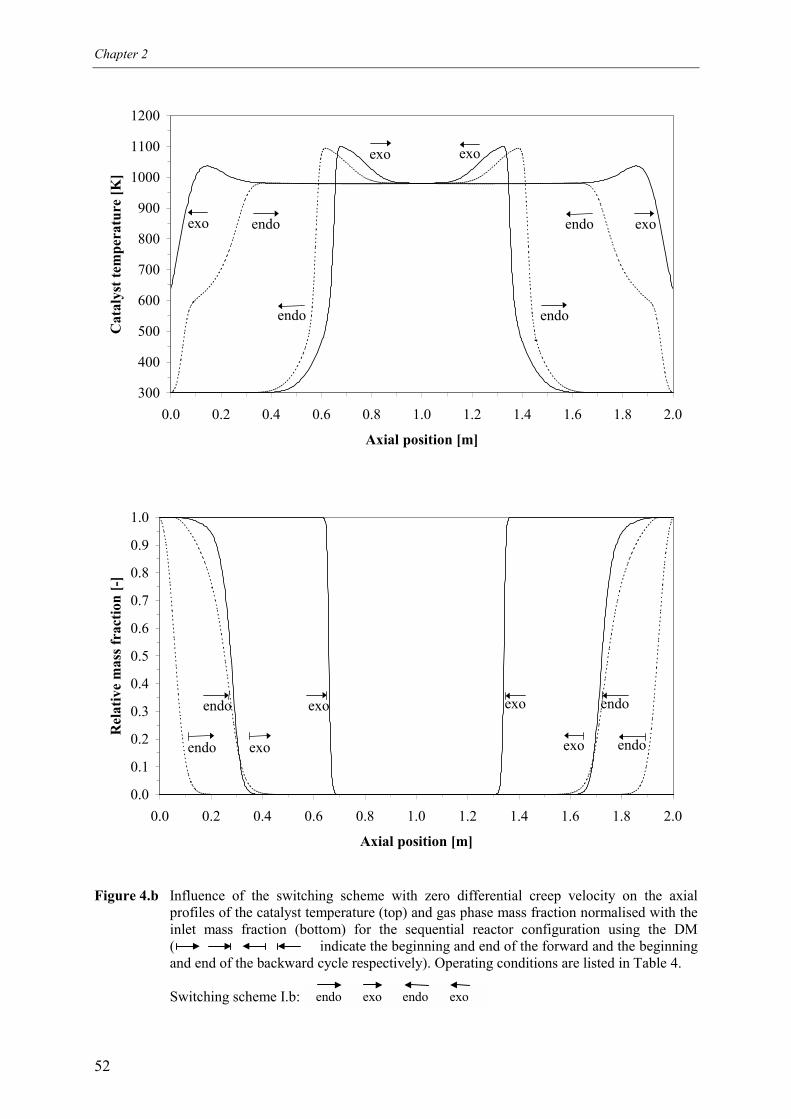
Chapter 2
52
300
400
500
600
700
800
900
1000
1100
1200
0.0 0.2 0.4 0.6 0.8 1.0 1.2 1.4 1.6 1.8 2.0
Axial position [m]
Cat
alys
t tem
pera
ture
[K]
exo
endo exo
endo
exo
endoexo
endo
0.0
0.1
0.2
0.3
0.4
0.5
0.6
0.7
0.8
0.9
1.0
0.0 0.2 0.4 0.6 0.8 1.0 1.2 1.4 1.6 1.8 2.0
Axial position [m]
Rel
ativ
e m
ass f
ract
ion
[-]
exoendo
exoendo exo endo
exo endo
Figure 4.b Influence of the switching scheme with zero differential creep velocity on the axialprofiles of the catalyst temperature (top) and gas phase mass fraction normalised with theinlet mass fraction (bottom) for the sequential reactor configuration using the DM( indicate the beginning and end of the forward and the beginningand end of the backward cycle respectively). Operating conditions are listed in Table 4.
Switching scheme I.b: endo exo endo exo
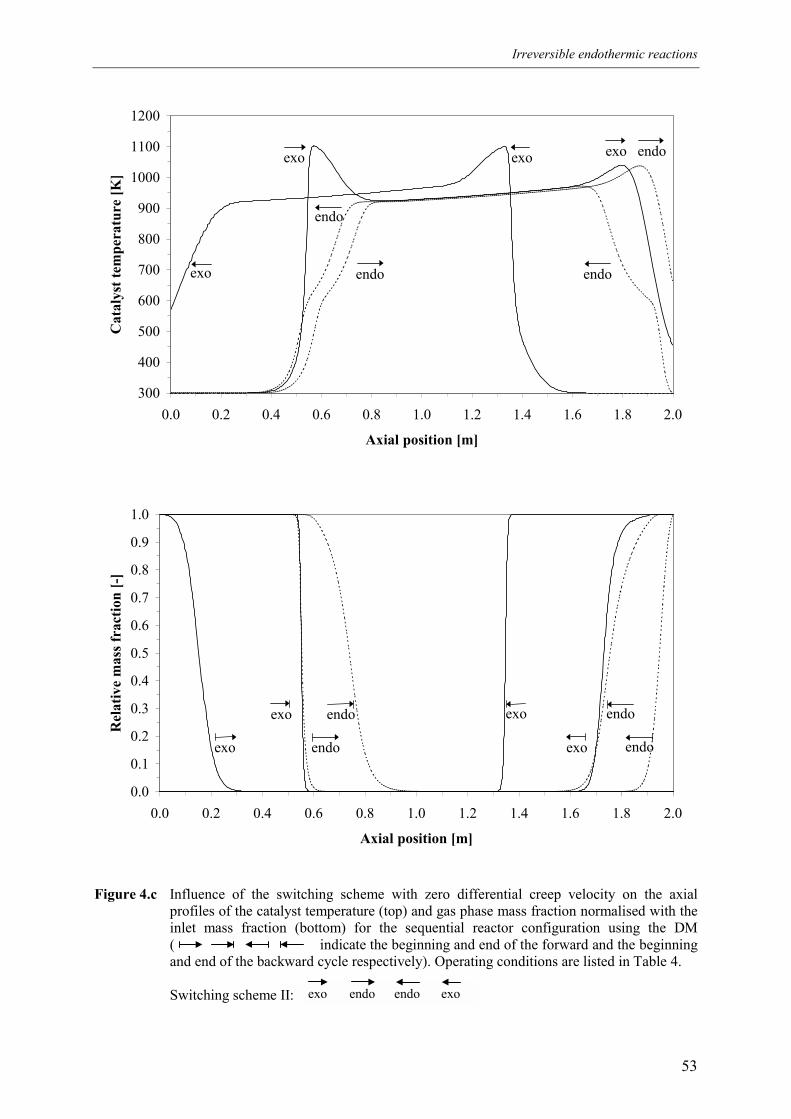
Irreversible endothermic reactions
53
300
400
500
600
700
800
900
1000
1100
1200
0.0 0.2 0.4 0.6 0.8 1.0 1.2 1.4 1.6 1.8 2.0
Axial position [m]
Cat
alys
t tem
pera
ture
[K]
exo
endo
exo endo
exo endo
exo
endo
0.0
0.1
0.2
0.3
0.4
0.5
0.6
0.7
0.8
0.9
1.0
0.0 0.2 0.4 0.6 0.8 1.0 1.2 1.4 1.6 1.8 2.0
Axial position [m]
Rel
ativ
e m
ass f
ract
ion
[-]
exo endo
exo endo exo endo
exo endo
Figure 4.c Influence of the switching scheme with zero differential creep velocity on the axialprofiles of the catalyst temperature (top) and gas phase mass fraction normalised with theinlet mass fraction (bottom) for the sequential reactor configuration using the DM( indicate the beginning and end of the forward and the beginningand end of the backward cycle respectively). Operating conditions are listed in Table 4.
Switching scheme II: endoexo endo exo
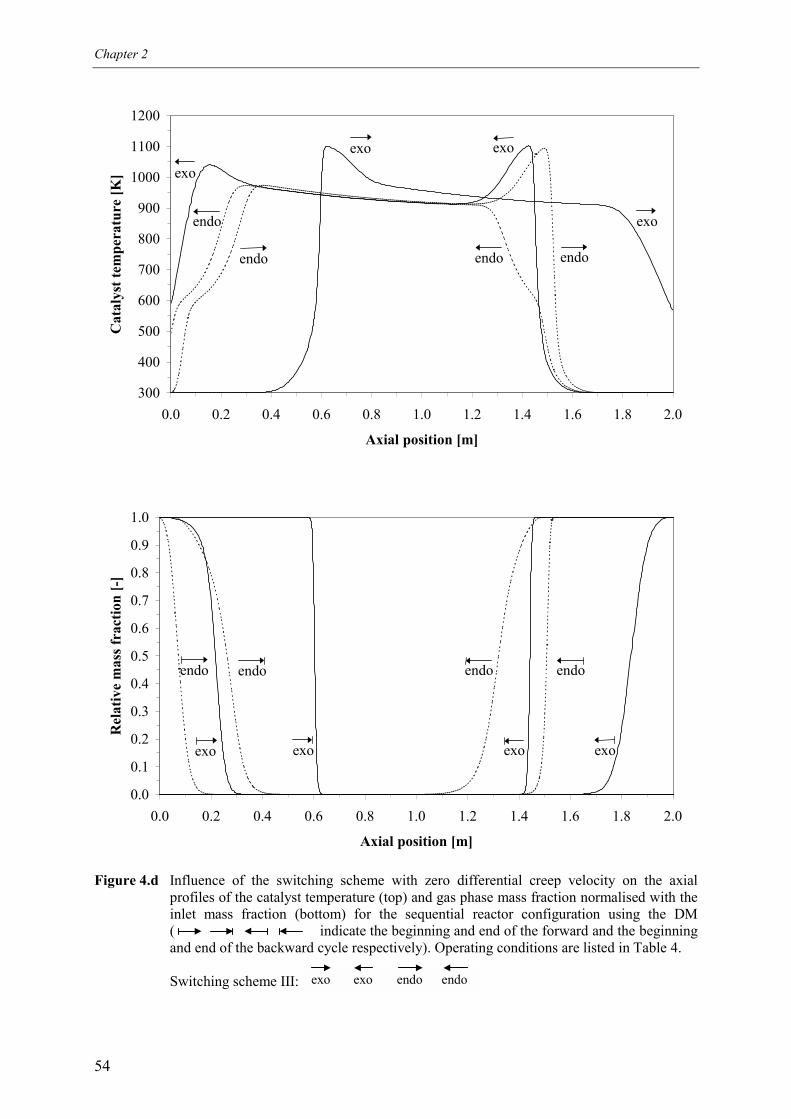
Chapter 2
54
300
400
500
600
700
800
900
1000
1100
1200
0.0 0.2 0.4 0.6 0.8 1.0 1.2 1.4 1.6 1.8 2.0
Axial position [m]
Cat
alys
t tem
pera
ture
[K]
exo
endo
exo
endo
exo
endo
exo
endo
0.0
0.1
0.2
0.3
0.4
0.5
0.6
0.7
0.8
0.9
1.0
0.0 0.2 0.4 0.6 0.8 1.0 1.2 1.4 1.6 1.8 2.0
Axial position [m]
Rel
ativ
e m
ass f
ract
ion
[-]
exo
endo
exo
endo
exo
endo
exo
endo
Figure 4.d Influence of the switching scheme with zero differential creep velocity on the axialprofiles of the catalyst temperature (top) and gas phase mass fraction normalised with theinlet mass fraction (bottom) for the sequential reactor configuration using the DM( indicate the beginning and end of the forward and the beginningand end of the backward cycle respectively). Operating conditions are listed in Table 4.
Switching scheme III: endoexo endoexo
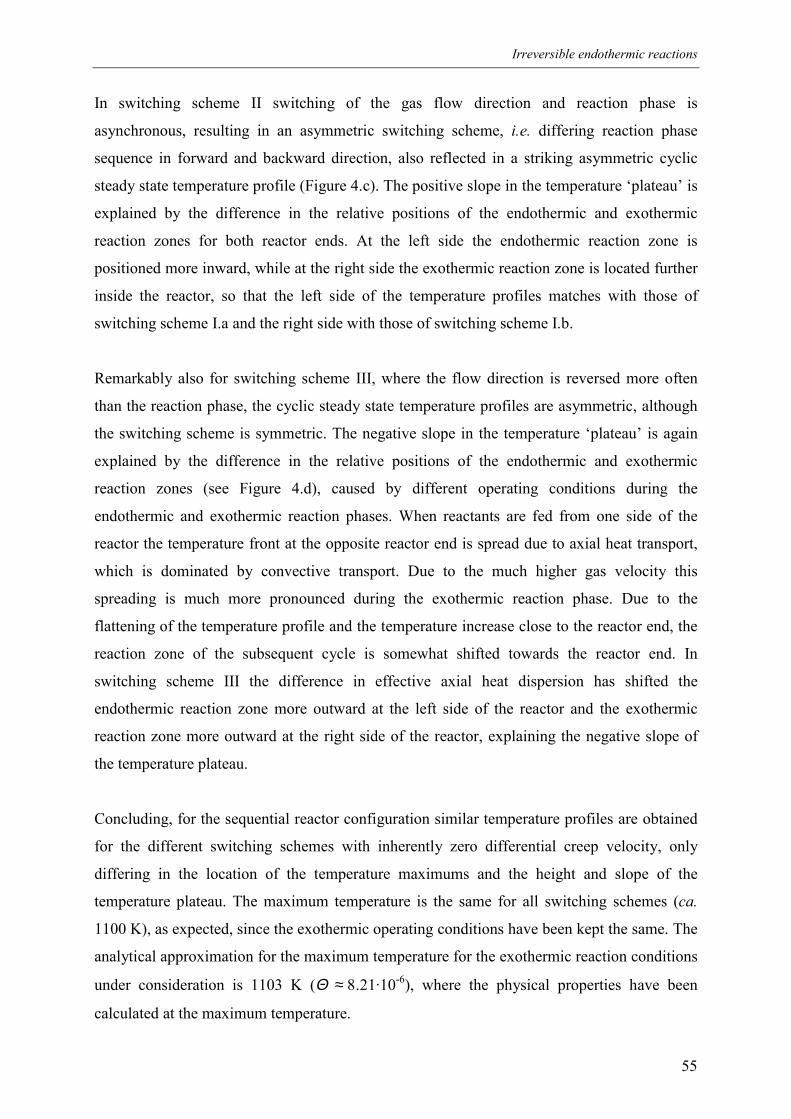
Irreversible endothermic reactions
55
In switching scheme II switching of the gas flow direction and reaction phase is
asynchronous, resulting in an asymmetric switching scheme, i.e. differing reaction phase
sequence in forward and backward direction, also reflected in a striking asymmetric cyclic
steady state temperature profile (Figure 4.c). The positive slope in the temperature ‘plateau’ is
explained by the difference in the relative positions of the endothermic and exothermic
reaction zones for both reactor ends. At the left side the endothermic reaction zone is
positioned more inward, while at the right side the exothermic reaction zone is located further
inside the reactor, so that the left side of the temperature profiles matches with those of
switching scheme I.a and the right side with those of switching scheme I.b.
Remarkably also for switching scheme III, where the flow direction is reversed more often
than the reaction phase, the cyclic steady state temperature profiles are asymmetric, although
the switching scheme is symmetric. The negative slope in the temperature ‘plateau’ is again
explained by the difference in the relative positions of the endothermic and exothermic
reaction zones (see Figure 4.d), caused by different operating conditions during the
endothermic and exothermic reaction phases. When reactants are fed from one side of the
reactor the temperature front at the opposite reactor end is spread due to axial heat transport,
which is dominated by convective transport. Due to the much higher gas velocity this
spreading is much more pronounced during the exothermic reaction phase. Due to the
flattening of the temperature profile and the temperature increase close to the reactor end, the
reaction zone of the subsequent cycle is somewhat shifted towards the reactor end. In
switching scheme III the difference in effective axial heat dispersion has shifted the
endothermic reaction zone more outward at the left side of the reactor and the exothermic
reaction zone more outward at the right side of the reactor, explaining the negative slope of
the temperature plateau.
Concluding, for the sequential reactor configuration similar temperature profiles are obtained
for the different switching schemes with inherently zero differential creep velocity, only
differing in the location of the temperature maximums and the height and slope of the
temperature plateau. The maximum temperature is the same for all switching schemes (ca.
1100 K), as expected, since the exothermic operating conditions have been kept the same. The
analytical approximation for the maximum temperature for the exothermic reaction conditions
under consideration is 1103 K (Θ ≈ 8.21·10-6), where the physical properties have been
calculated at the maximum temperature.
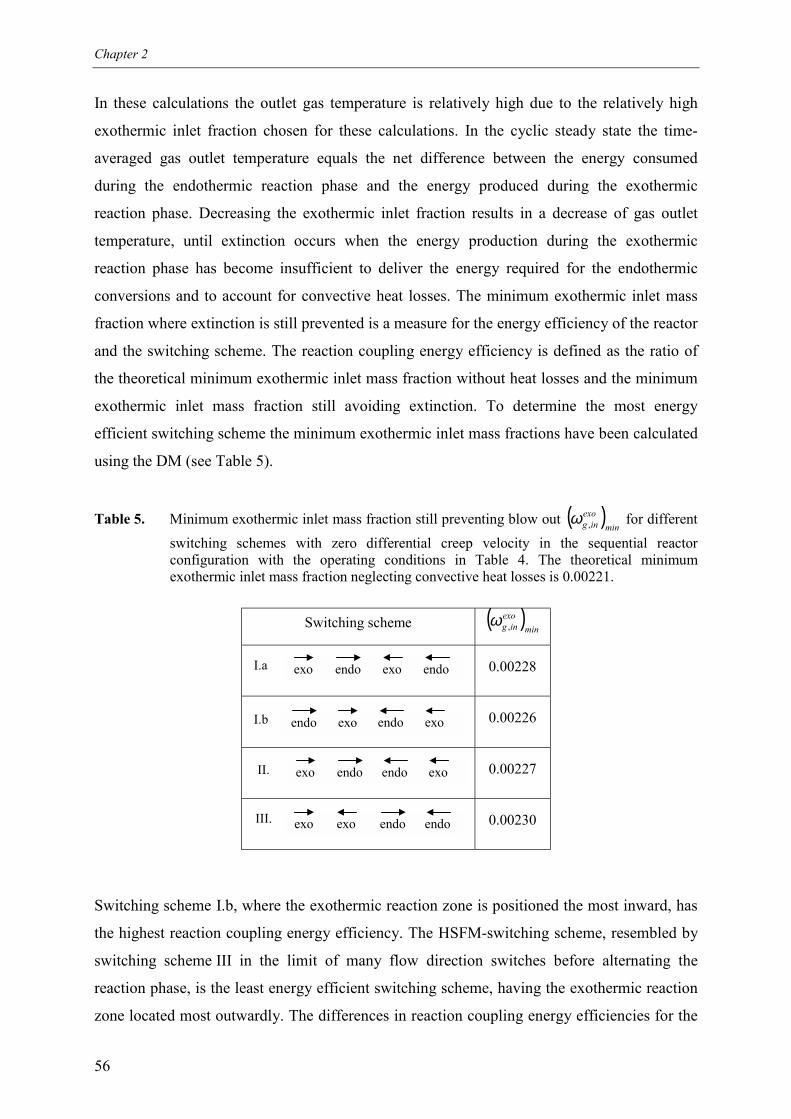
Chapter 2
56
In these calculations the outlet gas temperature is relatively high due to the relatively high
exothermic inlet fraction chosen for these calculations. In the cyclic steady state the time-
averaged gas outlet temperature equals the net difference between the energy consumed
during the endothermic reaction phase and the energy produced during the exothermic
reaction phase. Decreasing the exothermic inlet fraction results in a decrease of gas outlet
temperature, until extinction occurs when the energy production during the exothermic
reaction phase has become insufficient to deliver the energy required for the endothermic
conversions and to account for convective heat losses. The minimum exothermic inlet mass
fraction where extinction is still prevented is a measure for the energy efficiency of the reactor
and the switching scheme. The reaction coupling energy efficiency is defined as the ratio of
the theoretical minimum exothermic inlet mass fraction without heat losses and the minimum
exothermic inlet mass fraction still avoiding extinction. To determine the most energy
efficient switching scheme the minimum exothermic inlet mass fractions have been calculated
using the DM (see Table 5).
Table 5. Minimum exothermic inlet mass fraction still preventing blow out ( )min
exoing ,ω for different
switching schemes with zero differential creep velocity in the sequential reactorconfiguration with the operating conditions in Table 4. The theoretical minimumexothermic inlet mass fraction neglecting convective heat losses is 0.00221.
Switching scheme ( )min
exoing ,ω
0.00228
0.00226
0.00227
0.00230
Switching scheme I.b, where the exothermic reaction zone is positioned the most inward, has
the highest reaction coupling energy efficiency. The HSFM-switching scheme, resembled by
switching scheme III in the limit of many flow direction switches before alternating the
reaction phase, is the least energy efficient switching scheme, having the exothermic reaction
zone located most outwardly. The differences in reaction coupling energy efficiencies for the
endoexo endoexo
endoexo endo exo
endo exo endo exo
endoexo endoexoI.a
I.b
II.
III.
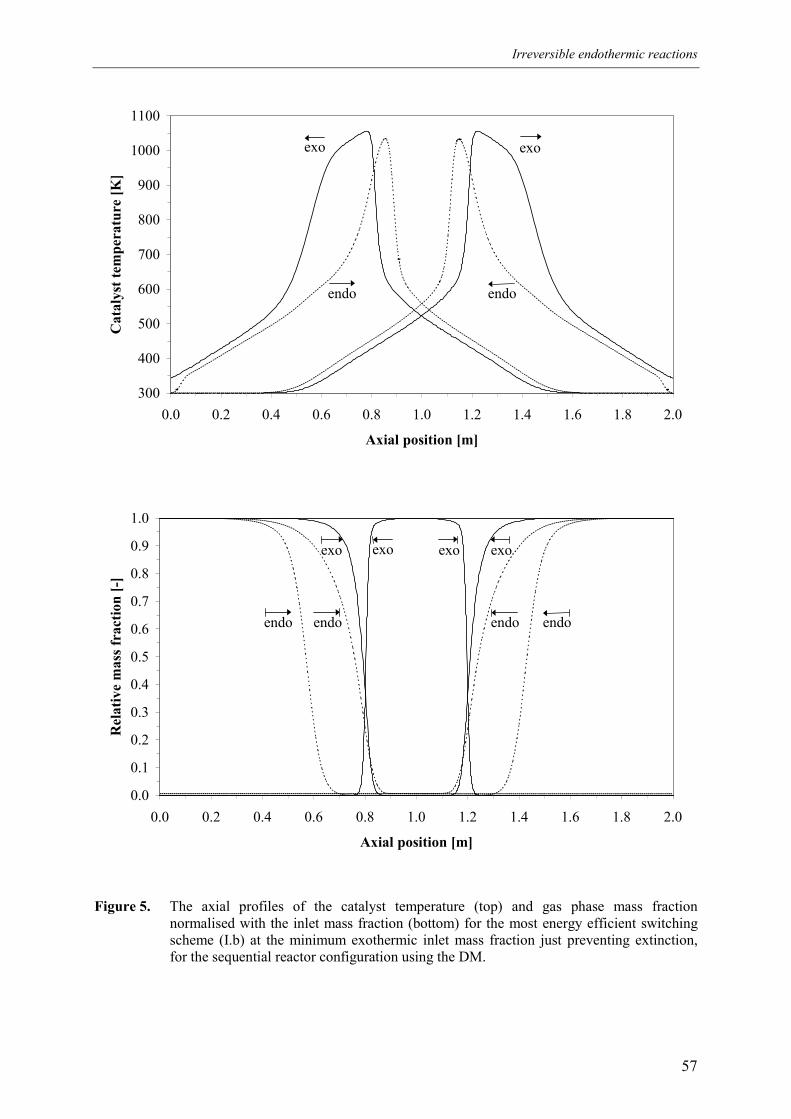
Irreversible endothermic reactions
57
300
400
500
600
700
800
900
1000
1100
0.0 0.2 0.4 0.6 0.8 1.0 1.2 1.4 1.6 1.8 2.0
Axial position [m]
Cat
alys
t tem
pera
ture
[K]
exo
endo
exo
endo
0.0
0.1
0.2
0.3
0.4
0.5
0.6
0.7
0.8
0.9
1.0
0.0 0.2 0.4 0.6 0.8 1.0 1.2 1.4 1.6 1.8 2.0
Axial position [m]
Rel
ativ
e m
ass f
ract
ion
[-]
exo
endo
exo
endo
exo
endo
exo
endo
Figure 5. The axial profiles of the catalyst temperature (top) and gas phase mass fractionnormalised with the inlet mass fraction (bottom) for the most energy efficient switchingscheme (I.b) at the minimum exothermic inlet mass fraction just preventing extinction,for the sequential reactor configuration using the DM.
Chapter 2
58
different switching schemes are however marginal. For all switching schemes reaction
coupling energy efficiencies over 96% have been found. In Figure 5 the cyclic steady state
profiles are shown for switching scheme I.b. at the minimum exothermic inlet concentration.
Note the overlapping reaction zones for both reaction phases. The energy efficiency of
switching schemes with more reaction phase switches before alternating the flow direction is
only marginally higher, although a longer reactor is needed.
It should be realised that the reaction coupling energy efficiency strongly depends on the
reactor length chosen. At lower exothermic inlet mass fractions the initial temperature
gradient is much lower and the ignition temperature is reached further inside the reactor. The
economically optimal energy efficiency results from a compromise between investment costs
(reactor length) and operating costs (fuel consumption).
5. Simultaneous reactor configuration
In the simultaneous reactor configuration the endothermic and exothermic reactants are fed
continuously and simultaneously to two different compartments. The reactants can be fed at
the same reactor end or at opposite reactor ends, referred to as co-current and counter-current
operation respectively.
The reactor behaviour of the co-currently-operated simultaneous reactor configuration is very
similar to the reactor behaviour of the sequential reactor configuration, especially for small
reaction cycle times. It is assumed that the inlet and outlet positions for both the endothermic
and exothermic reaction phases are switched concurrently, for there is no obvious reason to
switch asynchronously. Furthermore, switching of the endothermic and exothermic
compartments has no effect on the dynamic reactor behaviour, when energy effects during
catalyst regeneration can be ignored.
The simultaneous reactor in counter-current operation is actually not a reverse flow reactor,
since the flow direction is not alternated and a real steady state is obtained, in contrast to the
sequential reactor configuration and the co-currently operated simultaneous reactor
configuration. However, the reactor behaviour is similar to asymmetric reverse flow reactors,
also allowing recuperative heat exchange inside the reactor (Kulkarni, 1996a; Frauhammer et
al., 1999).
Irreversible endothermic reactions
59
The overall energy balance for the simultaneous reactor configuration in both operation
modes is identical to the overall energy balance for the sequentially operated reactor
configuration for equal reaction cycle times,
( )
( ) )()(
)(
)(
,
,
,
,
,
,
,
,endor
exor
endoing
endoggpendoendo
r
exoing
exoggpexoexo
r
exoing
endoing
exoinm
endoinm
hh
TCh
TCh
∆∆
ω∆
ζ∆
ω∆
ζ∆
ωω
ΦΦ −≤
+
−−=
′′′′
(7)
5.1 Co-current operation
Firstly, zero differential creep velocity is trivial if the cycle times for flow direction switching
are chosen equal. Furthermore, as for the sequential reactor configuration, also for the co-
currently operated simultaneous reactor configuration the reaction zones of the endothermic
and exothermic reactions need to be tuned in order to form a temperature plateau at high
temperatures at the centre of the reactor in the cyclic steady state and to achieve maximum
conversion for both reaction phases.
In Figure 6 it is shown that this can be achieved by choosing the Damköhler number of the
exothermic reaction phase smaller than the Damköhler number of the endothermic reaction
phase. Furthermore, the maximum catalyst temperature for the co-currently operated
simultaneous reactor configuration is somewhat lower than for the maximum catalyst
temperature for the sequential reactor configuration, due to the immediate heat transfer from
the exothermic to the endothermic compartment. In Figure 6 infinitely fast heat transfer
between the endothermic and exothermic compartments has been assumed, as is the case for
the very thin channel walls of a monolithic catalyst, where the endothermic and exothermic
reactions are carried out in adjoining channels in chessboard-like arrangement. Remarkably,
the maximum temperature doesn’t necessarily increase in case of less efficient heat transfer
between the compartments. Due to obstruction of heat transfer from the exothermic reaction
phase to the endothermic reaction phase, less efficient heat transfer actually leads to a better
matching of the exothermic and endothermic reaction zones in this case, resulting in
somewhat lower maximum temperatures (see Figure 7).
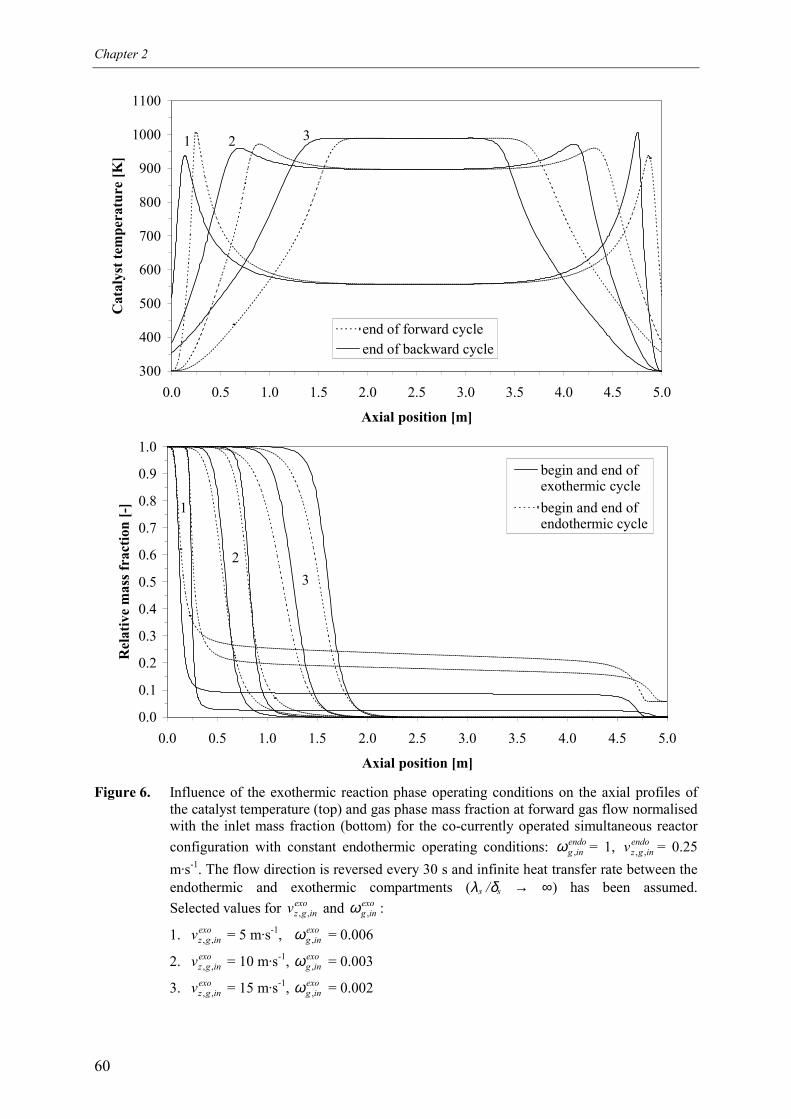
Chapter 2
60
300
400
500
600
700
800
900
1000
1100
0.0 0.5 1.0 1.5 2.0 2.5 3.0 3.5 4.0 4.5 5.0
Axial position [m]
Cat
alys
t tem
pera
ture
[K]
end of forward cycleend of backward cycle
1 2 3
0.0
0.1
0.2
0.3
0.4
0.5
0.6
0.7
0.8
0.9
1.0
0.0 0.5 1.0 1.5 2.0 2.5 3.0 3.5 4.0 4.5 5.0
Axial position [m]
Rel
ativ
e m
ass f
ract
ion
[-]
begin and end ofexothermic cyclebegin and end ofendothermic cycle
1
23
Figure 6. Influence of the exothermic reaction phase operating conditions on the axial profiles ofthe catalyst temperature (top) and gas phase mass fraction at forward gas flow normalisedwith the inlet mass fraction (bottom) for the co-currently operated simultaneous reactorconfiguration with constant endothermic operating conditions: endo
ing ,ω = 1, endoingzv ,, = 0.25
m·s-1. The flow direction is reversed every 30 s and infinite heat transfer rate between theendothermic and exothermic compartments (λs /δs → ∞) has been assumed.Selected values for exo
ingzv ,, and exoing ,ω :
1. exoingzv ,, = 5 m·s-1, exo
ing ,ω = 0.006
2. exoingzv ,, = 10 m·s-1, exo
ing ,ω = 0.003
3. exoingzv ,, = 15 m·s-1, exo
ing ,ω = 0.002
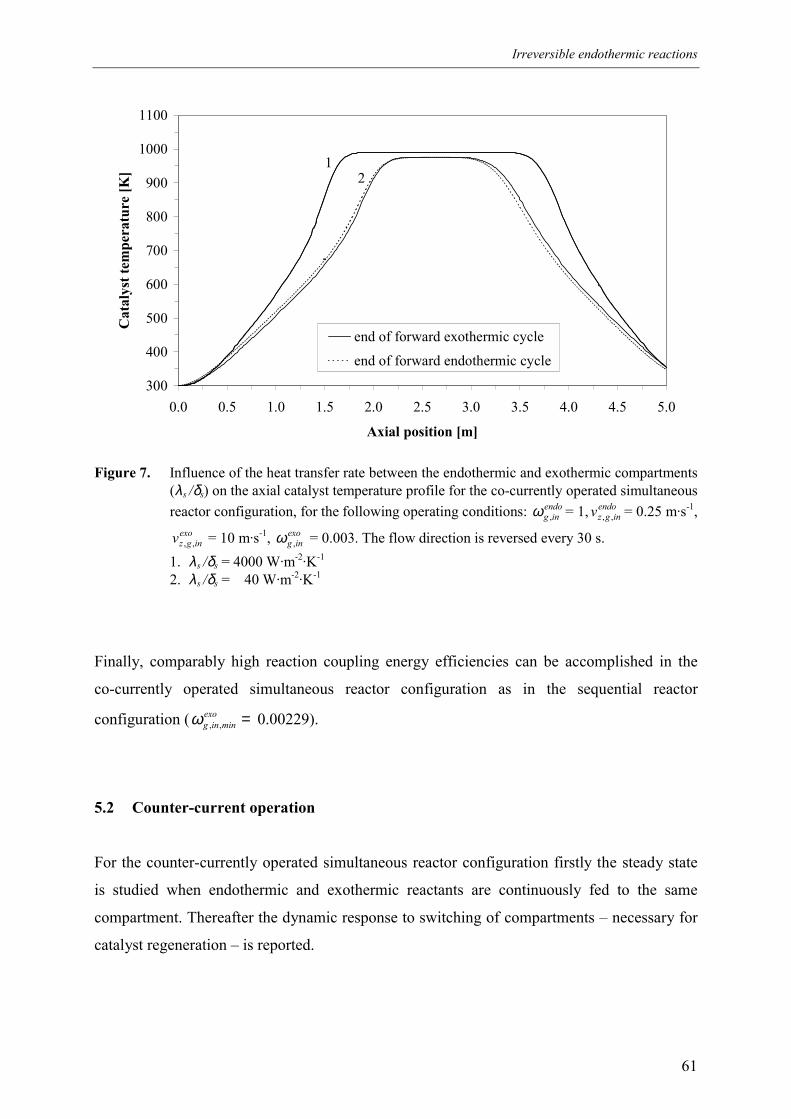
Irreversible endothermic reactions
61
300
400
500
600
700
800
900
1000
1100
0.0 0.5 1.0 1.5 2.0 2.5 3.0 3.5 4.0 4.5 5.0
Axial position [m]
Cat
alys
t tem
pera
ture
[K]
end of forward exothermic cycle
end of forward endothermic cycle
12
Figure 7. Influence of the heat transfer rate between the endothermic and exothermic compartments(λs /δs) on the axial catalyst temperature profile for the co-currently operated simultaneousreactor configuration, for the following operating conditions: endo
ing ,ω = 1, endoingzv ,, = 0.25 m·s-1,
exoingzv ,, = 10 m·s-1, exo
ing ,ω = 0.003. The flow direction is reversed every 30 s.1. λs /δs = 4000 W·m-2·K-1
2. λs /δs = 40 W·m-2·K-1
Finally, comparably high reaction coupling energy efficiencies can be accomplished in the
co-currently operated simultaneous reactor configuration as in the sequential reactor
configuration ( =exomining ,,ω 0.00229).
5.2 Counter-current operation
For the counter-currently operated simultaneous reactor configuration firstly the steady state
is studied when endothermic and exothermic reactants are continuously fed to the same
compartment. Thereafter the dynamic response to switching of compartments – necessary for
catalyst regeneration – is reported.
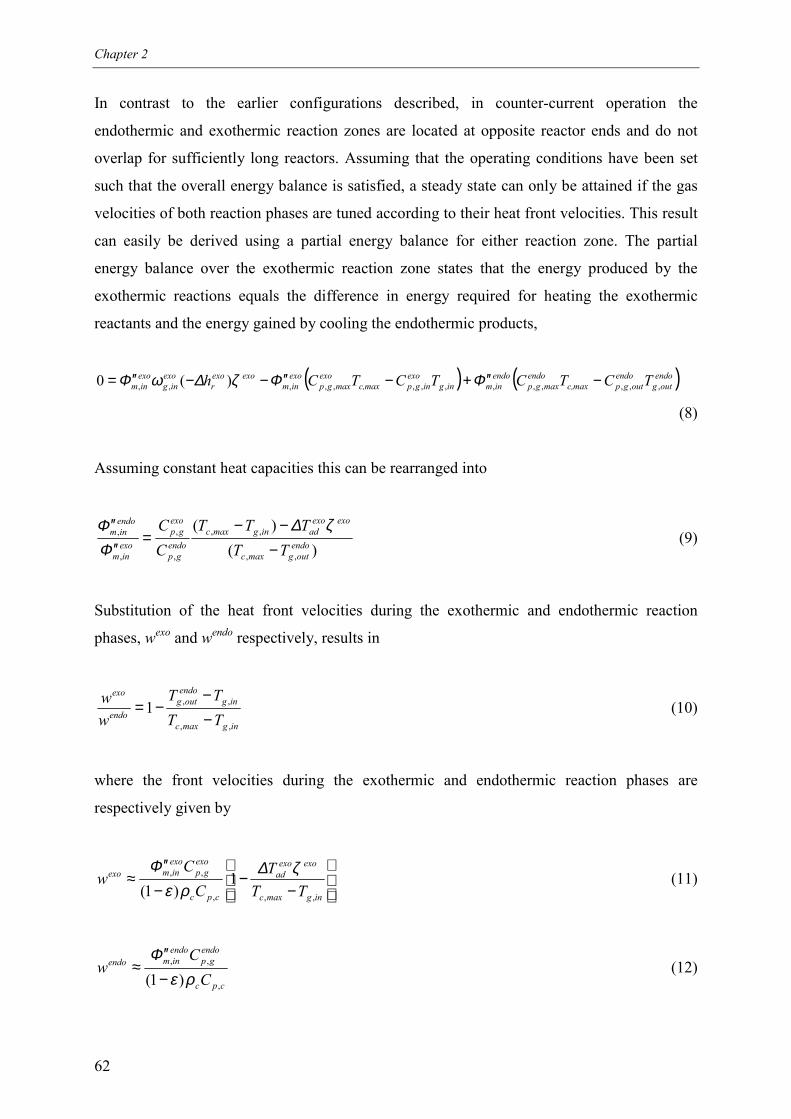
Chapter 2
62
In contrast to the earlier configurations described, in counter-current operation the
endothermic and exothermic reaction zones are located at opposite reactor ends and do not
overlap for sufficiently long reactors. Assuming that the operating conditions have been set
such that the overall energy balance is satisfied, a steady state can only be attained if the gas
velocities of both reaction phases are tuned according to their heat front velocities. This result
can easily be derived using a partial energy balance for either reaction zone. The partial
energy balance over the exothermic reaction zone states that the energy produced by the
exothermic reactions equals the difference in energy required for heating the exothermic
reactants and the energy gained by cooling the endothermic products,
( ) ( )endooutg
endooutgpmaxc,
endomaxgp
endoinming
exoingpmaxc,
exomaxgp
exoinm
exoexor
exoing
exoinm TCTCTCTCh ,,,,,,,,,,,,,, )(0 −′′+−′′−−′′= ΦΦζ∆ωΦ
(8)
Assuming constant heat capacities this can be rearranged into
)()(
,,
,,
,
,
,
,endo
outgmaxc
exoexoadingmaxc
endogp
exogp
exoinm
endoinm
TTTTT
CC
−−−
=′′′′ ζ∆
ΦΦ
(9)
Substitution of the heat front velocities during the exothermic and endothermic reaction
phases, wexo and wendo respectively, results in
ingmaxc
ingendo
outgendo
exo
TTTT
ww
,,
,,1−−
−= (10)
where the front velocities during the exothermic and endothermic reaction phases are
respectively given by
−
−−
′′≈
ingmaxc
exoexoad
cpc
exogp
exoinmexo
TTT
CC
w,,,
,, 1)1(
ζ∆ρε
Φ(11)
cpc
endogp
endoinmendo
CC
w,
,,
)1( ρεΦ
−′′
≈ (12)
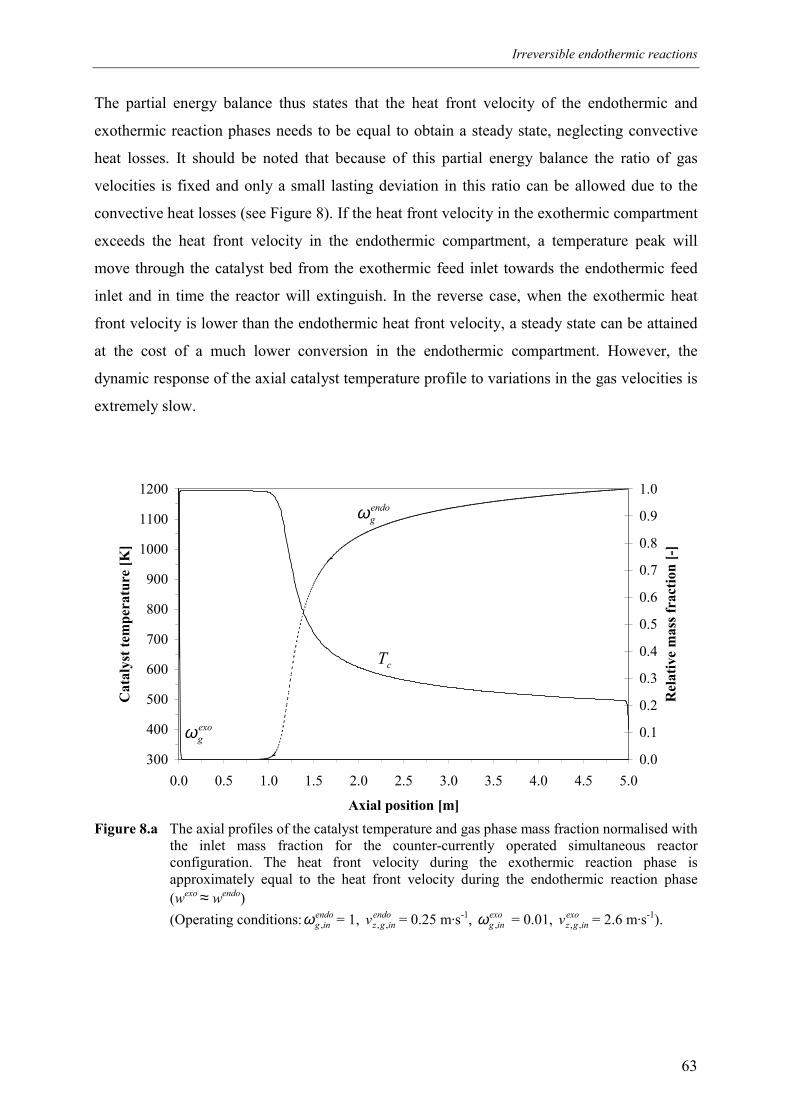
Irreversible endothermic reactions
63
The partial energy balance thus states that the heat front velocity of the endothermic and
exothermic reaction phases needs to be equal to obtain a steady state, neglecting convective
heat losses. It should be noted that because of this partial energy balance the ratio of gas
velocities is fixed and only a small lasting deviation in this ratio can be allowed due to the
convective heat losses (see Figure 8). If the heat front velocity in the exothermic compartment
exceeds the heat front velocity in the endothermic compartment, a temperature peak will
move through the catalyst bed from the exothermic feed inlet towards the endothermic feed
inlet and in time the reactor will extinguish. In the reverse case, when the exothermic heat
front velocity is lower than the endothermic heat front velocity, a steady state can be attained
at the cost of a much lower conversion in the endothermic compartment. However, the
dynamic response of the axial catalyst temperature profile to variations in the gas velocities is
extremely slow.
300
400
500
600
700
800
900
1000
1100
1200
0.0 0.5 1.0 1.5 2.0 2.5 3.0 3.5 4.0 4.5 5.0
Axial position [m]
Cat
alys
t tem
pera
ture
[K]
0.0
0.1
0.2
0.3
0.4
0.5
0.6
0.7
0.8
0.9
1.0
Rel
ativ
e m
ass f
ract
ion
[-]
cT
exogω
endogω
Figure 8.a The axial profiles of the catalyst temperature and gas phase mass fraction normalised withthe inlet mass fraction for the counter-currently operated simultaneous reactorconfiguration. The heat front velocity during the exothermic reaction phase isapproximately equal to the heat front velocity during the endothermic reaction phase(wexo ≈ wendo)(Operating conditions: endo
ing ,ω = 1, endoingzv ,, = 0.25 m·s-1, exo
ing ,ω = 0.01, exoingzv ,, = 2.6 m·s-1).
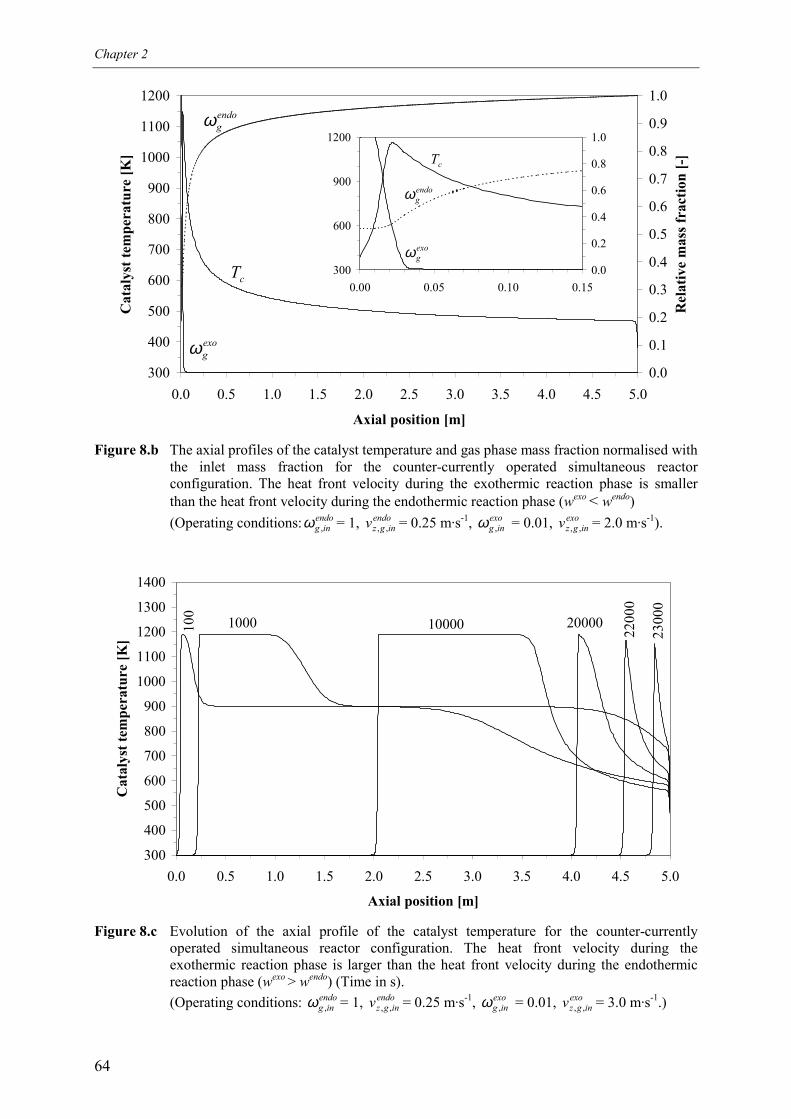
Chapter 2
64
Figure 8.b The axial profiles of the catalyst temperature and gas phase mass fraction normalised withthe inlet mass fraction for the counter-currently operated simultaneous reactorconfiguration. The heat front velocity during the exothermic reaction phase is smallerthan the heat front velocity during the endothermic reaction phase (wexo < wendo)(Operating conditions: endo
ing ,ω = 1, endoingzv ,, = 0.25 m·s-1, exo
ing ,ω = 0.01, exoingzv ,, = 2.0 m·s-1).
300
400
500
600
700
800
900
1000
1100
1200
1300
1400
0.0 0.5 1.0 1.5 2.0 2.5 3.0 3.5 4.0 4.5 5.0
Axial position [m]
Cat
alys
t tem
pera
ture
[K]
100001000100
2000022
000
2300
0
Figure 8.c Evolution of the axial profile of the catalyst temperature for the counter-currentlyoperated simultaneous reactor configuration. The heat front velocity during theexothermic reaction phase is larger than the heat front velocity during the endothermicreaction phase (wexo > wendo) (Time in s).(Operating conditions: endo
ing ,ω = 1, endoingzv ,, = 0.25 m·s-1, exo
ing ,ω = 0.01, exoingzv ,, = 3.0 m·s-1.)
300
400
500
600
700
800
900
1000
1100
1200
0.0 0.5 1.0 1.5 2.0 2.5 3.0 3.5 4.0 4.5 5.0
Axial position [m]
Cat
alys
t tem
pera
ture
[K]
0.0
0.1
0.2
0.3
0.4
0.5
0.6
0.7
0.8
0.9
1.0
Rel
ativ
e m
ass f
ract
ion
[-]
cT
exogω
endogω
300
600
900
1200
0.00 0.05 0.10 0.150.0
0.2
0.4
0.6
0.8
1.0
cT
exogω
endogω
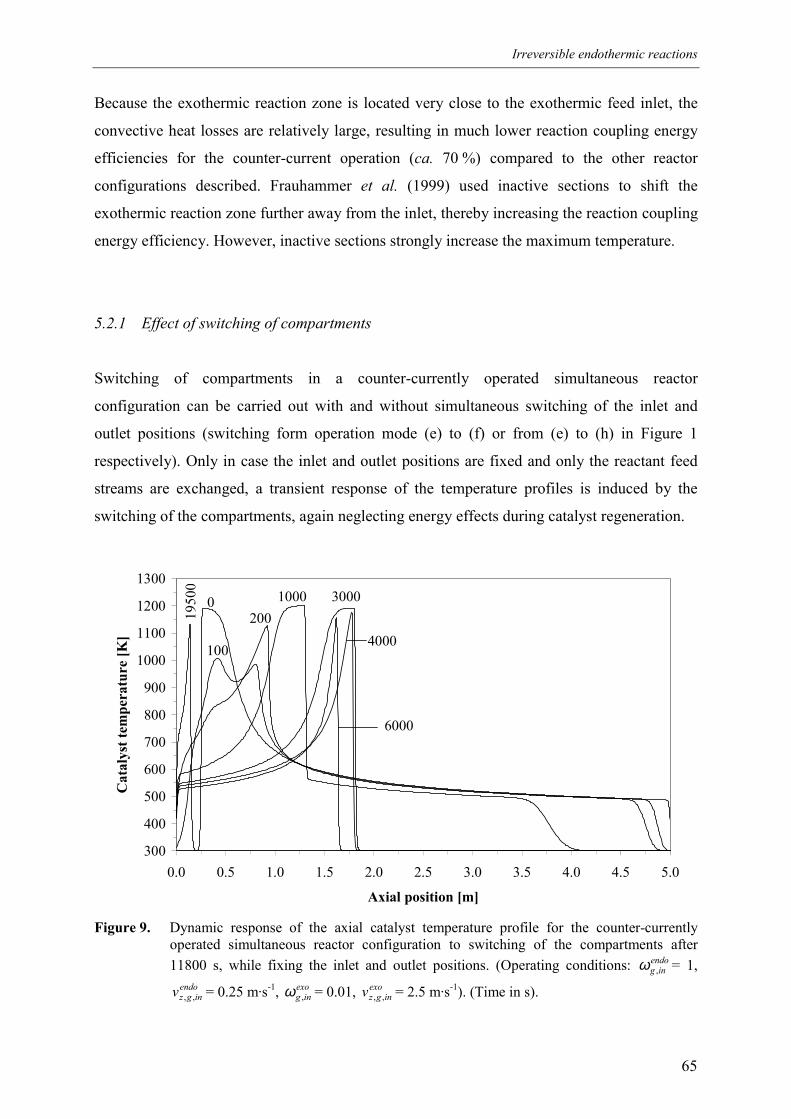
Irreversible endothermic reactions
65
Because the exothermic reaction zone is located very close to the exothermic feed inlet, the
convective heat losses are relatively large, resulting in much lower reaction coupling energy
efficiencies for the counter-current operation (ca. 70 %) compared to the other reactor
configurations described. Frauhammer et al. (1999) used inactive sections to shift the
exothermic reaction zone further away from the inlet, thereby increasing the reaction coupling
energy efficiency. However, inactive sections strongly increase the maximum temperature.
5.2.1 Effect of switching of compartments
Switching of compartments in a counter-currently operated simultaneous reactor
configuration can be carried out with and without simultaneous switching of the inlet and
outlet positions (switching form operation mode (e) to (f) or from (e) to (h) in Figure 1
respectively). Only in case the inlet and outlet positions are fixed and only the reactant feed
streams are exchanged, a transient response of the temperature profiles is induced by the
switching of the compartments, again neglecting energy effects during catalyst regeneration.
300
400
500
600
700
800
900
1000
1100
1200
1300
0.0 0.5 1.0 1.5 2.0 2.5 3.0 3.5 4.0 4.5 5.0
Axial position [m]
Cat
alys
t tem
pera
ture
[K]
0
100
2001000 3000
4000
6000
1950
0
Figure 9. Dynamic response of the axial catalyst temperature profile for the counter-currentlyoperated simultaneous reactor configuration to switching of the compartments after11800 s, while fixing the inlet and outlet positions. (Operating conditions: endo
ing ,ω = 1,endo
ingzv ,, = 0.25 m·s-1, exoing ,ω = 0.01, exo
ingzv ,, = 2.5 m·s-1). (Time in s).
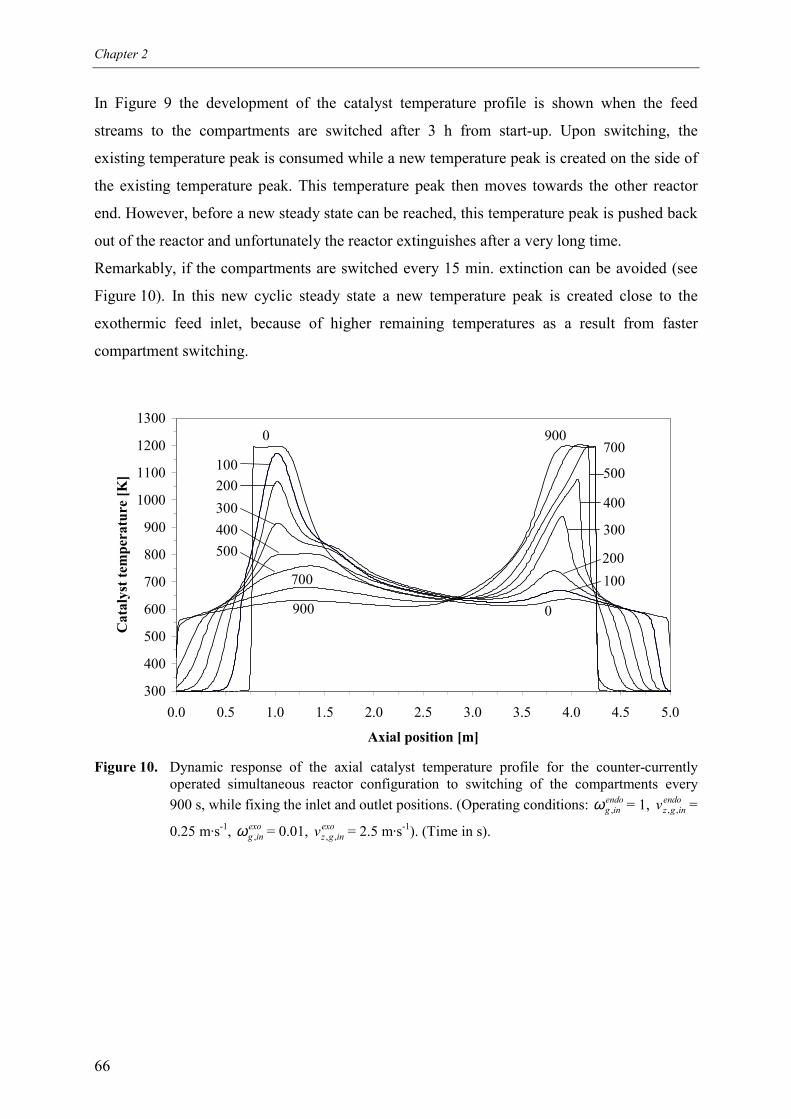
Chapter 2
66
In Figure 9 the development of the catalyst temperature profile is shown when the feed
streams to the compartments are switched after 3 h from start-up. Upon switching, the
existing temperature peak is consumed while a new temperature peak is created on the side of
the existing temperature peak. This temperature peak then moves towards the other reactor
end. However, before a new steady state can be reached, this temperature peak is pushed back
out of the reactor and unfortunately the reactor extinguishes after a very long time.
Remarkably, if the compartments are switched every 15 min. extinction can be avoided (see
Figure 10). In this new cyclic steady state a new temperature peak is created close to the
exothermic feed inlet, because of higher remaining temperatures as a result from faster
compartment switching.
300
400
500
600
700
800
900
1000
1100
1200
1300
0.0 0.5 1.0 1.5 2.0 2.5 3.0 3.5 4.0 4.5 5.0
Axial position [m]
Cat
alys
t tem
pera
ture
[K]
0
0
100200300
900
400500
700
900
100200
300
400
500
700
Figure 10. Dynamic response of the axial catalyst temperature profile for the counter-currentlyoperated simultaneous reactor configuration to switching of the compartments every900 s, while fixing the inlet and outlet positions. (Operating conditions: endo
ing ,ω = 1, endoingzv ,, =
0.25 m·s-1, exoing ,ω = 0.01, exo
ingzv ,, = 2.5 m·s-1). (Time in s).
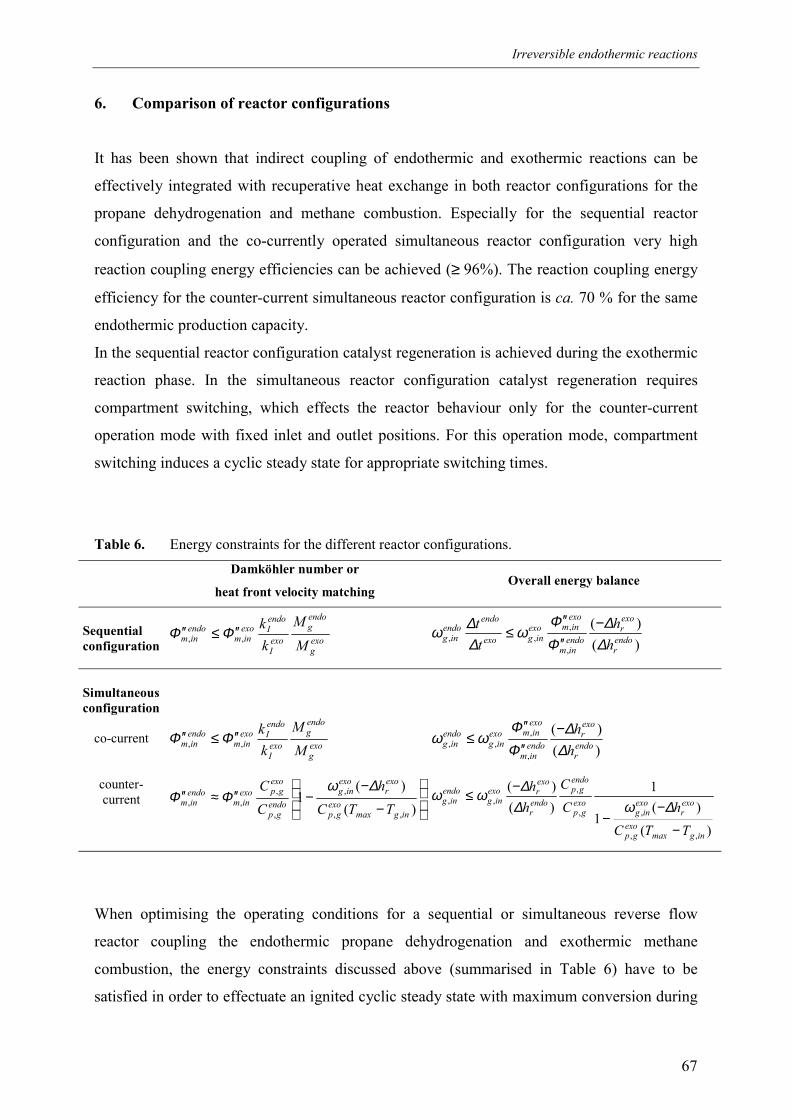
Irreversible endothermic reactions
67
6. Comparison of reactor configurations
It has been shown that indirect coupling of endothermic and exothermic reactions can be
effectively integrated with recuperative heat exchange in both reactor configurations for the
propane dehydrogenation and methane combustion. Especially for the sequential reactor
configuration and the co-currently operated simultaneous reactor configuration very high
reaction coupling energy efficiencies can be achieved (≥ 96%). The reaction coupling energy
efficiency for the counter-current simultaneous reactor configuration is ca. 70 % for the same
endothermic production capacity.
In the sequential reactor configuration catalyst regeneration is achieved during the exothermic
reaction phase. In the simultaneous reactor configuration catalyst regeneration requires
compartment switching, which effects the reactor behaviour only for the counter-current
operation mode with fixed inlet and outlet positions. For this operation mode, compartment
switching induces a cyclic steady state for appropriate switching times.
Table 6. Energy constraints for the different reactor configurations.
Damköhler number or
heat front velocity matchingOverall energy balance
Sequentialconfiguration exo
g
endog
exoI
endoIexo
inmendoinm M
Mkk
,, ΦΦ ′′≤′′)()(
,
,,, endo
r
exor
endoinm
exoinmexo
ingexo
endoendo
ing hh
tt
∆∆
ΦΦ
ω∆∆ω −
′′′′
≤
Simultaneousconfiguration
co-current
counter-current
exog
endog
exoI
endoIexo
inmendoinm M
Mkk
,, ΦΦ ′′≤′′
−
−−′′≈′′
)()(
1,,
,
,
,,,
ingmaxexo
gp
exor
exoing
endogp
exogpexo
inmendoinm TTC
hCC ∆ω
ΦΦ
)()(
,
,,, endo
r
exor
endoinm
exoinmexo
ingendo
ing hh
∆∆
ΦΦ
ωω −′′′′
≤
)(
)(1
1)()(
,,
,,
,,,
ingmaxexo
gp
exor
exoing
exogp
endogp
endor
exorexo
ingendo
ing
TTChC
Chh
−
−−
−≤
∆ω∆∆ωω
When optimising the operating conditions for a sequential or simultaneous reverse flow
reactor coupling the endothermic propane dehydrogenation and exothermic methane
combustion, the energy constraints discussed above (summarised in Table 6) have to be
satisfied in order to effectuate an ignited cyclic steady state with maximum conversion during
Chapter 2
68
both reaction phases. Furthermore, additional constraints on the operating conditions need to
be taken into account, of which a maximum catalyst temperature, maximum gas velocity and
maximum exothermic inlet mass fraction are the most important. Firstly, it is very important
to note that the axial catalyst temperature profile results from the dynamic reactor behaviour
and can only be controlled indirectly by adjusting the exothermic inlet conditions. For the
sequential reactor configuration the maximum catalyst temperature is almost solely dependent
on the exothermic inlet mass fraction and the inlet gas velocity with negligible influence of
the switching scheme, cycle times and endothermic operating conditions. Also for the
counter-current simultaneous reactor the maximum temperature is completely determined by
the exothermic inlet conditions. Inactive sections flanking the catalyst bed have been
proposed to control the maximum temperature (e.g. Eigenberger and Nieken, 1988;
Frauhammer et al., 1999). However, inert sections increase the maximum catalyst
temperature. Due to immediate heat transfer between the endothermic and exothermic
reaction zones in the co-currently operated simultaneous reactor configuration the
endothermic reaction conditions can influence the maximum catalyst temperature to some
extent. Nevertheless, the maximum temperature constraint restricts the possible inlet
conditions for the exothermic reaction phase.
Secondly, the ratio of the gas velocities need to be matched; for the sequential configuration
and the co-currently operated simultaneous reactor configuration according to the ratio of the
Damköhler numbers and for the counter-currently operated simultaneous reactor according to
the ratio of the heat front velocities. Since on the one hand combustion reactions are much
faster than dehydrogenation reactions, and on the other hand the heat front velocity during the
exothermic phase is lower than during the endothermic reaction phase, generally, the
exothermic gas velocity has to be chosen higher than the endothermic gas velocity for all
reactor configurations.
Maximum throughput during the endothermic reaction phase can thus be achieved by setting
the exothermic gas velocity to the maximum allowable value,
maxgzexo
ingexoinm v ,,,, ερΦ =′′ (13)
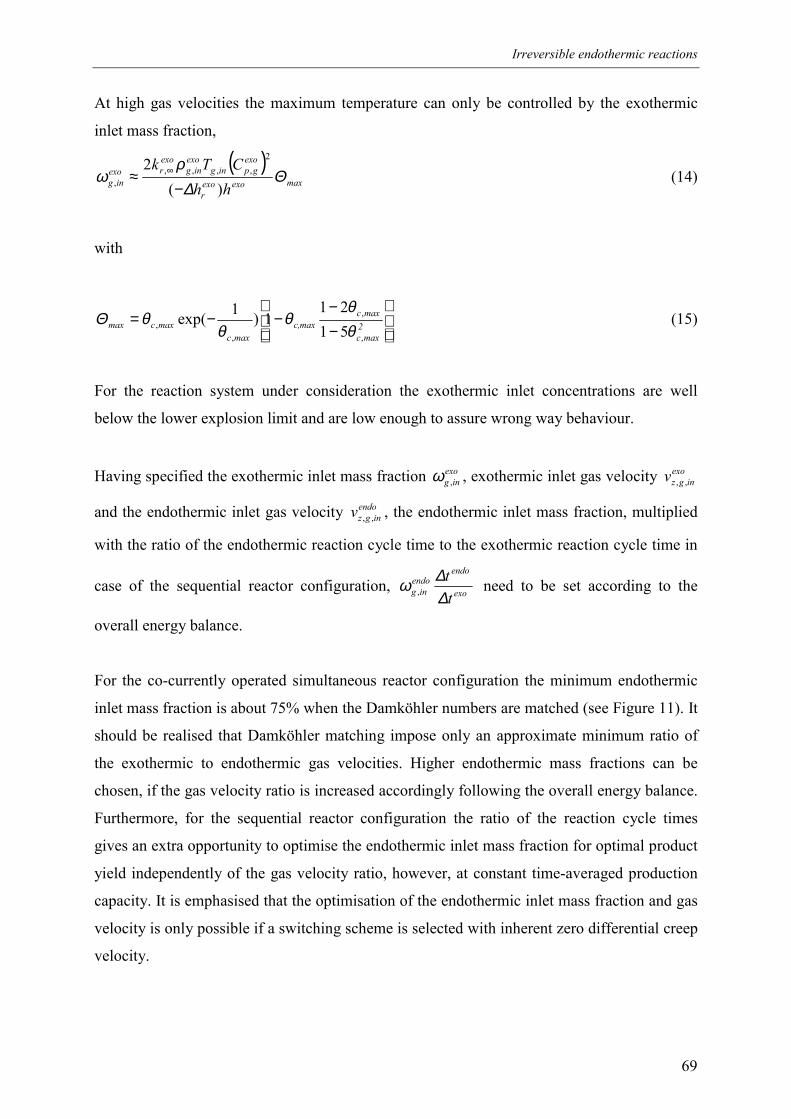
Irreversible endothermic reactions
69
At high gas velocities the maximum temperature can only be controlled by the exothermic
inlet mass fraction,
( )maxexoexo
r
exogping
exoing
exorexo
ing hhCTk
Θ∆
ρω
)(2 2
,,,,, −
≈ ∞ (14)
with
−−
−−= 2maxc
maxcmaxc,
maxcmaxcmax
,
,
,, 51
211)1exp(
θθ
θθ
θΘ (15)
For the reaction system under consideration the exothermic inlet concentrations are well
below the lower explosion limit and are low enough to assure wrong way behaviour.
Having specified the exothermic inlet mass fraction exoing ,ω , exothermic inlet gas velocity exo
ingzv ,,
and the endothermic inlet gas velocity endoingzv ,, , the endothermic inlet mass fraction, multiplied
with the ratio of the endothermic reaction cycle time to the exothermic reaction cycle time in
case of the sequential reactor configuration, exo
endoendo
ing tt
∆∆ω , need to be set according to the
overall energy balance.
For the co-currently operated simultaneous reactor configuration the minimum endothermic
inlet mass fraction is about 75% when the Damköhler numbers are matched (see Figure 11). It
should be realised that Damköhler matching impose only an approximate minimum ratio of
the exothermic to endothermic gas velocities. Higher endothermic mass fractions can be
chosen, if the gas velocity ratio is increased accordingly following the overall energy balance.
Furthermore, for the sequential reactor configuration the ratio of the reaction cycle times
gives an extra opportunity to optimise the endothermic inlet mass fraction for optimal product
yield independently of the gas velocity ratio, however, at constant time-averaged production
capacity. It is emphasised that the optimisation of the endothermic inlet mass fraction and gas
velocity is only possible if a switching scheme is selected with inherent zero differential creep
velocity.
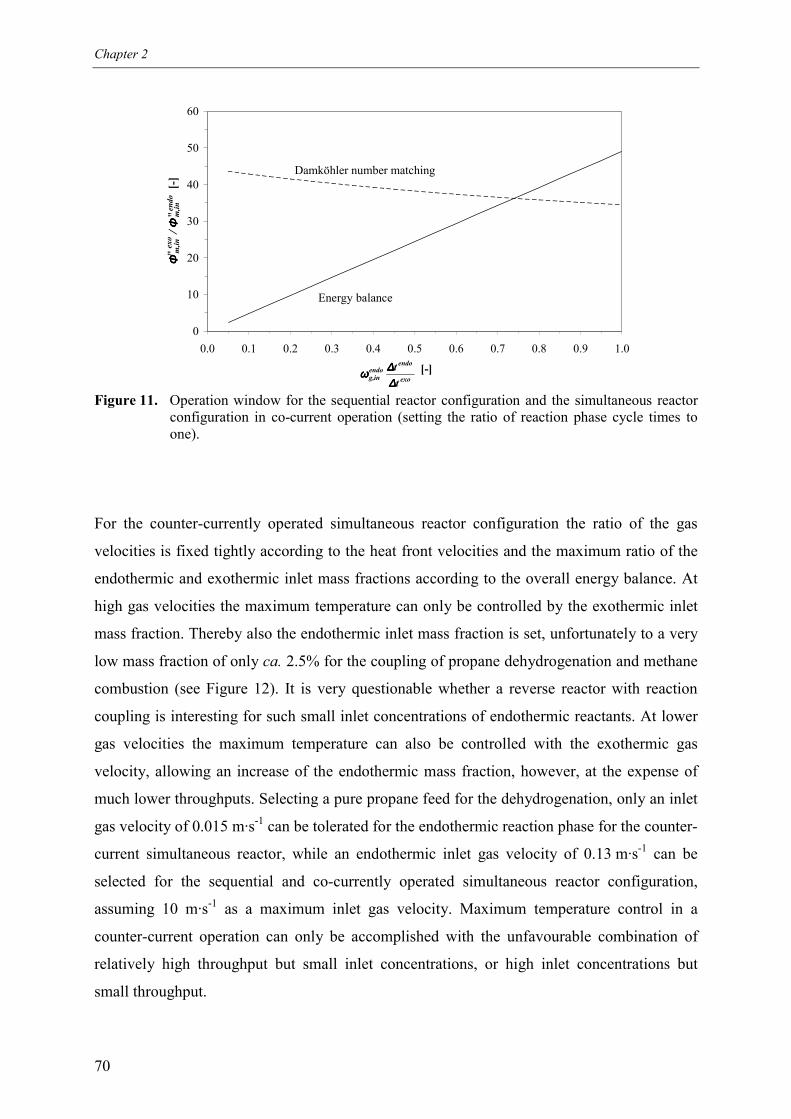
Chapter 2
70
0
10
20
30
40
50
60
0.0 0.1 0.2 0.3 0.4 0.5 0.6 0.7 0.8 0.9 1.0
[-]
Φ ΦΦΦm
,in /
Φ ΦΦΦm
,in
[-] Damköhler number matching
Energy balance
""
exo
endoendo
ing, tt
∆∆∆∆∆∆∆∆ωωωω
endo
exo
Figure 11. Operation window for the sequential reactor configuration and the simultaneous reactorconfiguration in co-current operation (setting the ratio of reaction phase cycle times toone).
For the counter-currently operated simultaneous reactor configuration the ratio of the gas
velocities is fixed tightly according to the heat front velocities and the maximum ratio of the
endothermic and exothermic inlet mass fractions according to the overall energy balance. At
high gas velocities the maximum temperature can only be controlled by the exothermic inlet
mass fraction. Thereby also the endothermic inlet mass fraction is set, unfortunately to a very
low mass fraction of only ca. 2.5% for the coupling of propane dehydrogenation and methane
combustion (see Figure 12). It is very questionable whether a reverse reactor with reaction
coupling is interesting for such small inlet concentrations of endothermic reactants. At lower
gas velocities the maximum temperature can also be controlled with the exothermic gas
velocity, allowing an increase of the endothermic mass fraction, however, at the expense of
much lower throughputs. Selecting a pure propane feed for the dehydrogenation, only an inlet
gas velocity of 0.015 m·s-1 can be tolerated for the endothermic reaction phase for the counter-
current simultaneous reactor, while an endothermic inlet gas velocity of 0.13 m·s-1 can be
selected for the sequential and co-currently operated simultaneous reactor configuration,
assuming 10 m·s-1 as a maximum inlet gas velocity. Maximum temperature control in a
counter-current operation can only be accomplished with the unfavourable combination of
relatively high throughput but small inlet concentrations, or high inlet concentrations but
small throughput.
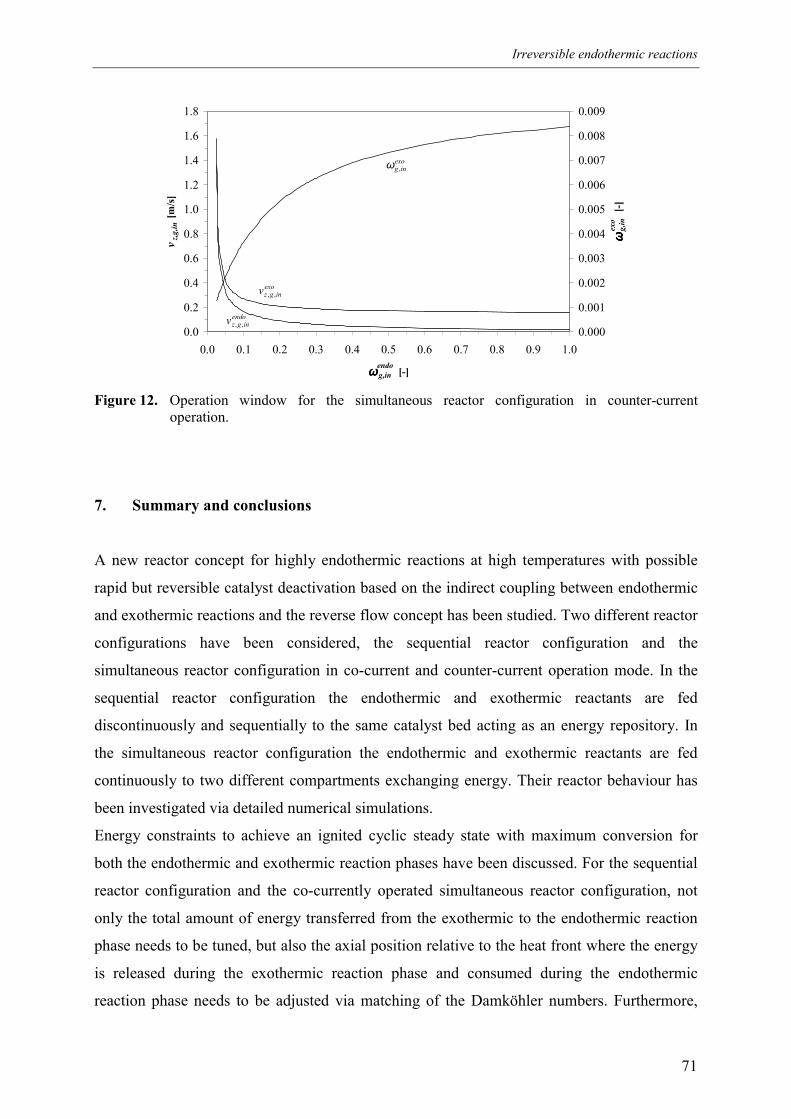
Irreversible endothermic reactions
71
0.0
0.2
0.4
0.6
0.8
1.0
1.2
1.4
1.6
1.8
0.0 0.1 0.2 0.3 0.4 0.5 0.6 0.7 0.8 0.9 1.0
ωωωωg,in [-]
v z,g
,in [
m/s
]
0.000
0.001
0.002
0.003
0.004
0.005
0.006
0.007
0.008
0.009
ω ωωωg,
in [
-]ex
o
endo
endoingzv ,,
exoingzv ,,
exoing ,ω
Figure 12. Operation window for the simultaneous reactor configuration in counter-currentoperation.
7. Summary and conclusions
A new reactor concept for highly endothermic reactions at high temperatures with possible
rapid but reversible catalyst deactivation based on the indirect coupling between endothermic
and exothermic reactions and the reverse flow concept has been studied. Two different reactor
configurations have been considered, the sequential reactor configuration and the
simultaneous reactor configuration in co-current and counter-current operation mode. In the
sequential reactor configuration the endothermic and exothermic reactants are fed
discontinuously and sequentially to the same catalyst bed acting as an energy repository. In
the simultaneous reactor configuration the endothermic and exothermic reactants are fed
continuously to two different compartments exchanging energy. Their reactor behaviour has
been investigated via detailed numerical simulations.
Energy constraints to achieve an ignited cyclic steady state with maximum conversion for
both the endothermic and exothermic reaction phases have been discussed. For the sequential
reactor configuration and the co-currently operated simultaneous reactor configuration, not
only the total amount of energy transferred from the exothermic to the endothermic reaction
phase needs to be tuned, but also the axial position relative to the heat front where the energy
is released during the exothermic reaction phase and consumed during the endothermic
reaction phase needs to be adjusted via matching of the Damköhler numbers. Furthermore,
Chapter 2
72
zero differential creep velocity – trivial for the co-currently operated simultaneous reactor
configuration – can be achieved in the sequential reactor configuration without additional
constraints on the operating conditions by choosing an appropriate switching scheme. To
avoid extinction in the counter-currently operated simultaneous reactor configuration the
endothermic and exothermic gas velocities need to be set to attain equal heat front velocities.
For the coupling of propane dehydrogenation and methane combustion over a monolithic
platinum-based catalyst the maximum temperature constraint limits the operating conditions
during the exothermic reaction zone and thus the total production capacity. It has been shown
that the maximum temperature depends on a single dimensionless number. At high gas
velocities this maximum-temperature-number depends only on the exothermic inlet mass
fraction, so that control of the maximum temperature can only be achieved via the exothermic
inlet concentration at high throughputs. Since the ratio of the endothermic and exothermic
inlet mass fractions is fixed in the counter-currently operated simultaneous reactor
configuration, a limiting maximum temperature constraint entails the unfavourable
combination of a relatively high throughput with small inlet concentrations, or high inlet
concentrations with a small throughput. Moreover, relatively low reaction coupling energy
efficiencies (ca. 70 %) are obtained with the counter-currently operated simultaneous reactor
configuration.
With the sequential reactor configuration or the co-currently operated simultaneous reactor
configuration much higher capacity for the production of the endothermic products can be
achieved with very high reaction coupling energy efficiencies (≥ 96%). Due to the choice of a
switching scheme with inherent zero differential creep velocity, only in the sequential reactor
configuration the endothermic inlet concentration can be optimised without adjusting the gas
velocities, using the ratio of the endothermic to exothermic reaction cycle times.
Acknowledgements
The author wishes to thank H.A. Bottenberg and H.A.R. Scholts for their contributions.
Furthermore, the financial support by the Netherlands Organization for Scientific Research
(N.W.O.) is gratefully acknowledged.
Irreversible endothermic reactions
73
Notation
av specific external catalyst surface area [m2·m-3]
Cp heat capacity [J·kg-1·K-1]
dh,c hydraulic channel diameter [m]
D diffusivity [m2·s-1]
Dax,j axial dispersion coefficient for component j [m2·s-1]
f friction coefficient [-]
h external heat transfer coefficient [J·m-2·K-1·s-1]
jh partial molar enthalpy of component j [J·kg-1]
∆hr reaction enthalpy [J·kg-1]
Eact activation energy [J·mole-1]
kr,∞ pre-exponential first order heterogeneous reaction rate constant [m·s-1]
kx external mass transfer coefficient [m·s-1]
L reactor length [m]
M (time-averaged) production capacity [kg·m-2·s-1]
nc total number of components
p pressure [Pa]hetjr production rate of component j by heterogeneous reactions [kg·m-2·s-1]
homjr production rate of component j by homogeneous reactions [kg·m-3·s-1]
R gas constant [J·mole-1·K-1]
t time [s]
∆t reaction cycle time [s]
T temperature [K]
∆Tad adiabatic temperature difference [K]
vz,g axial interstitial gas velocity [m·s-1]
w heat front velocity [m·s-1]
z axial position [m]
Greek letters
sδ thickness of support separating endothermic and exothermic compartments [m]
ji ,δ Kronecker delta (= 1, if i = j; = 0, if i ≠ j )
Chapter 2
74
∆ difference between inlet and outlet (averaged over the reaction cycle time)
ε porosity [m3·m-3]
ζ conversion [-]
η energy efficiency [-]
θ dimensionless temperature (= )actE
RT
λ conductivity [J·m-1·K-1·s-1]
effλ effective heat dispersivity [J·m-1·K-1·s-1] ( ( ) ( )v
gpinmc ha
C 2,,1
Φλε
′′+−= )
ξ dimensionless axial position (= )Lz
ρ density [kg·m-3]
mΦ ′′ mass flux [kg·m-2·s-1]
ω mass fraction [kg·kg-1]
Subscripts
avg average
c catalyst phase
g gas phase
in at the inlet
i,j component i, j
k,l compartment k,l
max maximum
min minimum
out at the outlet
s support separating endothermic and exothermic compartments
Superscripts
endo endothermic reaction phase
exo exothermic reaction phase
het heterogeneous reactions
hom homogeneous reactions
Irreversible endothermic reactions
75
Dimensionless numbers
∞Da Damköhler number (inm
ingvr Lak
,
,,
Φρ′′
= ∞ )
hPe Peclet number for heat transport (eff
gpinm LCλ
Φ ,,′′= )
adθ∆ dimensionless adiabatic temperature (gp
ingr
actact
ad
Ch
ER
ETR
,
,)( ω∆∆ −== )
0=ξξθ
dd c Dimensionless initial temperature gradient (
( )acteff
ringinmhad E
RLhPe
λ∆ωΦ
θ∆22
1 ,, −′′== )
Θ Maximum temperature number (ingingvreff
inginmrh
ing
ad
ing
c
Takh
DaPe
Dadd
,,,
,2,
,,
0
2)(
21
ρλωΦ∆
θθ∆
θξθ
ξ
∞∞∞
= ′′−=== )
Symbols
→ forward flow
← backward flow
→ forward flow, at the beginning of the cycle
→ forward flow, at the end of the cycle
← backward flow, at the beginning of the cycle
← backward flow, at the end of the cycle
References
Agrawal, R.K. and Sivasubramanian, M.S. (1987). Integral approximations for nonisothermal
kinetics. AIChE J., 33, 1212-1214
Bird, R.B. Stewart, W.E. and Lightfoot, E.N. (1960). Transport phenomena. John Wiley &
sons, New York, USA
Chapter 2
76
Centrella, J. and Wilson, J. (1984). Planar numerical cosmology. II. The difference equations
and numerical tests, Astrophysical J. Suppl. Ser., 54, 229-249
Dauber, T.E. and Danner, R.P. (1985). Data compilation tables of properties of pure
compounds, AIChE, New York, USA
Eigenberger, G. and Nieken, U. (1988). Catalytic combustion with periodic flow reversal.
Chem. Engng Sci., 43, 2109-2115
Frauhammer, J., Eigenberger, G., Hippel, L.v. and Arntz, D. (1999). A new reactor concept
for endothermic high-temperature reactions. Chem. Engng Sci., 54, 3661-3670
Froment, G.F. (1990). Reversed flow operation of fixed bed catalytic reactors. In Matros, Yu.
Sh. (Ed.) Unsteady state processes in catalysis, VSP, Utrecht, The Netherlands, 57-89
Hayes, R.E., Kolaczkowski, S.T., Thomas, W.J. and Titiloye, J. (1996). Transient
experiments and modeling of the catalytic combustion of methane in a monolith reactor. Ind.
Eng. Chem. Res., 35, 406-414
Haynes, T.N., Georgakis, C. and Caram, H.S. (1995). The design of reverse flow reactors for
catalytic combustion systems. Chem. Engng Sci., 50, 401-416
Kulkarni, M.S. (1996a). Dynamics of asymmetric fixed-bed reactors: coupling of exothermic
and endothermic reactions. Ph.D. Thesis, Sever Institute of Washington University, Saint
Louis, USA
Kulkarni, M.S. and Dudukovic M.P. (1996b). A bidirectional fixed-bed reactor for coupling
of exothermic and endothermic reactions. AIChE J., 42, 2897-2910
Kulkarni, M.S. and Dudukovic, M.P. (1997). Periodic operation of asymmetric bidirectional
fixed-bed reactors: energy efficiency. Chem. Engng Sci., 52, 1777-1788
Irreversible endothermic reactions
77
Loc, L.C., Gaidai, N.A., Kiperman, S.L., T’huoang, H.S., Podkletnova, N.M. and Kogan, S.B.
(1991). Kinetics of propane dehydrogenation on aluminoplatinum catalysts. Kinetics and
Catalysis, 32, 61-66
Matros, Yu. Sh. (1990). Performance of catalytic processes under unsteady-state conditions.
In Matros, Yu. Sh. (Ed.) Unsteady state processes in catalysis, VSP, Utrecht, The
Netherlands, 131-163
Matros, Yu. Sh. and Bunimovich, G.A. (1997). Unsteady-state reactor operation. In Ertl, G.,
Knötzinger, H. and Weitkamp, J. (Eds.) Handbook of heterogeneous catalysis, Wiley-VCH,
Weinheim, 1464-1479
Nieken, U., Kolios, G., and Eigenberger G. (1995). Limiting cases and approximate solutions
for fixed-bed reactors with periodic flow reversal. AIChE J., 41, 1915-1925
Reid, R.C., Prausnitz, J.M. and Poling, B.E. (1988). The properties of gases and liquids.
McGraw-Hill Book Company, New York, USA
Trimm, D.L. and Lam, C.-W. (1980). The combustion of methane on platinum-alumina fibre
catalysts – I. Kinetics and mechanism. Chem. Engng Sci., 35, 1405-1413
Van Sint Annaland, M., Kuipers, J.A.M. and van Swaaij, W.P.M. (2000). Safety analysis of
switching between reductive and oxidative conditions in a Reaction Coupling Reverse Flow
Reactor. Accepted for publication in Chem. Engng Sci. (presented at ISCRE 16, Cracow,
Poland).
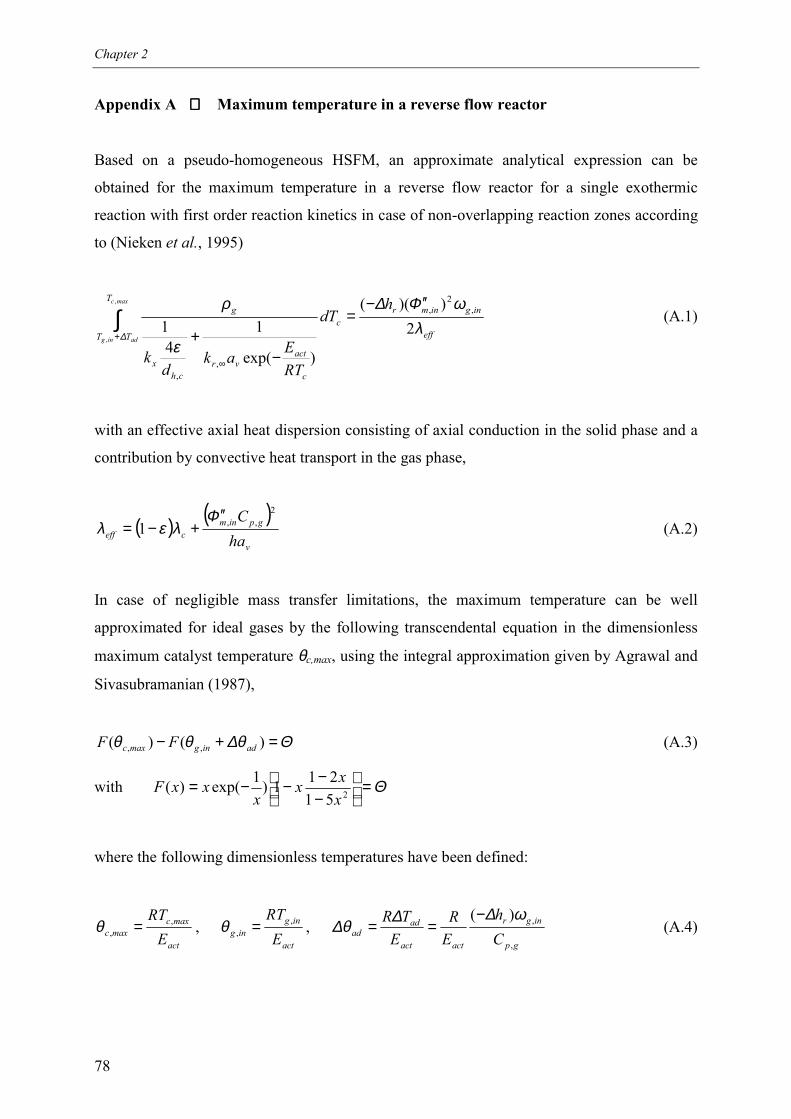
Chapter 2
78
Appendix A Maximum temperature in a reverse flow reactor
Based on a pseudo-homogeneous HSFM, an approximate analytical expression can be
obtained for the maximum temperature in a reverse flow reactor for a single exothermic
reaction with first order reaction kinetics in case of non-overlapping reaction zones according
to (Nieken et al., 1995)
eff
inginmrT
TTc
c
actvr
chx
g hdT
RTEak
dk
maxc
adingλ
ωΦ∆
ε
ρ
∆ 2))((
)exp(
14
1,
2,
,,
,
,
′′−=
−+
∫+
∞
(A.1)
with an effective axial heat dispersion consisting of axial conduction in the solid phase and a
contribution by convective heat transport in the gas phase,
( ) ( )v
gpinmceff ha
C 2,,1
Φλελ
′′+−= (A.2)
In case of negligible mass transfer limitations, the maximum temperature can be well
approximated for ideal gases by the following transcendental equation in the dimensionless
maximum catalyst temperature θc,max, using the integral approximation given by Agrawal and
Sivasubramanian (1987),
Θθ∆θθ =+− )()( ,, adingmaxc FF (A.3)
with Θ=
−−−−= 251
211)1exp()(xxx
xxxF
where the following dimensionless temperatures have been defined:
act
maxcmaxc E
RT ,, =θ ,
act
inging E
RT ,, =θ ,
gp
ingr
actact
adad C
hER
ETR
,
,)( ω∆∆θ∆−
== (A.4)
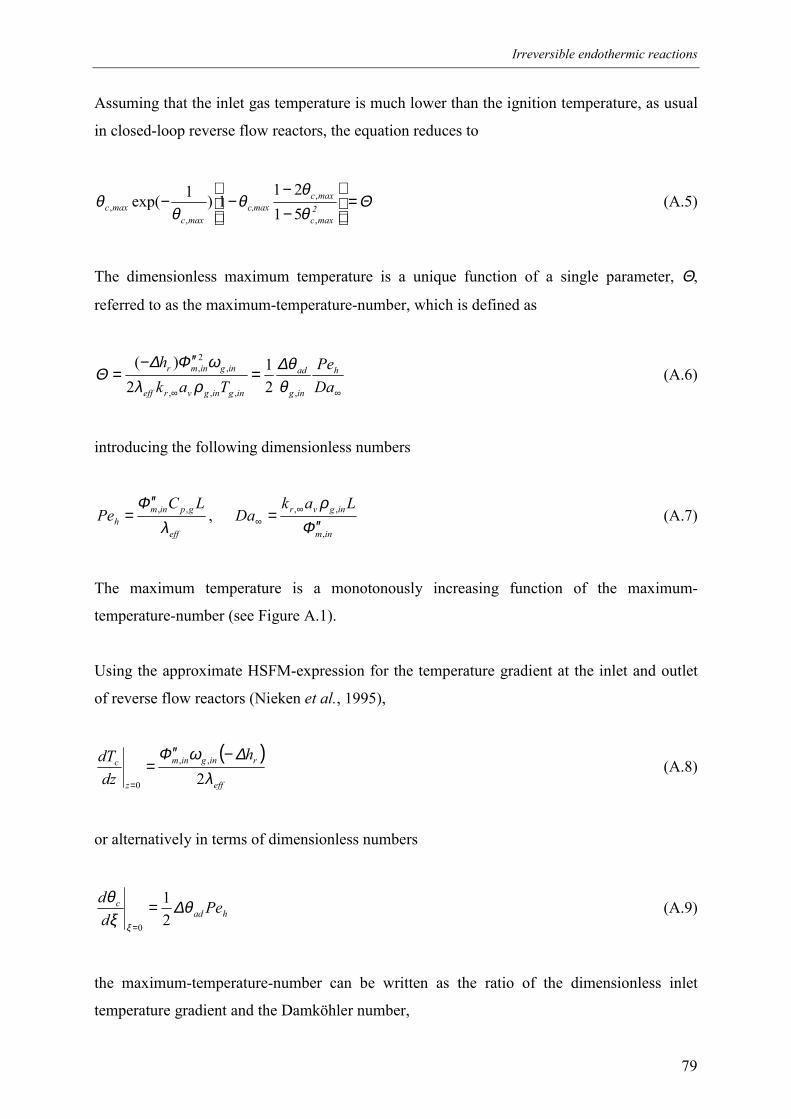
Irreversible endothermic reactions
79
Assuming that the inlet gas temperature is much lower than the ignition temperature, as usual
in closed-loop reverse flow reactors, the equation reduces to
Θθθ
θθ
θ =
−−
−− 2maxc
maxcmaxc,
maxcmaxc
,
,
,, 51
211)1exp( (A.5)
The dimensionless maximum temperature is a unique function of a single parameter, Θ,
referred to as the maximum-temperature-number, which is defined as
∞∞
=′′−
=DaPe
Takh h
ing
ad
ingingvreff
inginmr
,,,,
,2,
21
2)(
θθ∆
ρλωΦ∆
Θ (A.6)
introducing the following dimensionless numbers
eff
gpinmh
LCPe
λΦ ,,′′= ,
inm
ingvr LakDa
,
,,
Φρ′′
= ∞∞ (A.7)
The maximum temperature is a monotonously increasing function of the maximum-
temperature-number (see Figure A.1).
Using the approximate HSFM-expression for the temperature gradient at the inlet and outlet
of reverse flow reactors (Nieken et al., 1995),
( )eff
ringinm
z
c hdzdT
λ∆ωΦ
2,,
0
−′′=
=
(A.8)
or alternatively in terms of dimensionless numbers
hadc Pe
dd θ∆
ξθ
ξ 21
0
==
(A.9)
the maximum-temperature-number can be written as the ratio of the dimensionless inlet
temperature gradient and the Damköhler number,
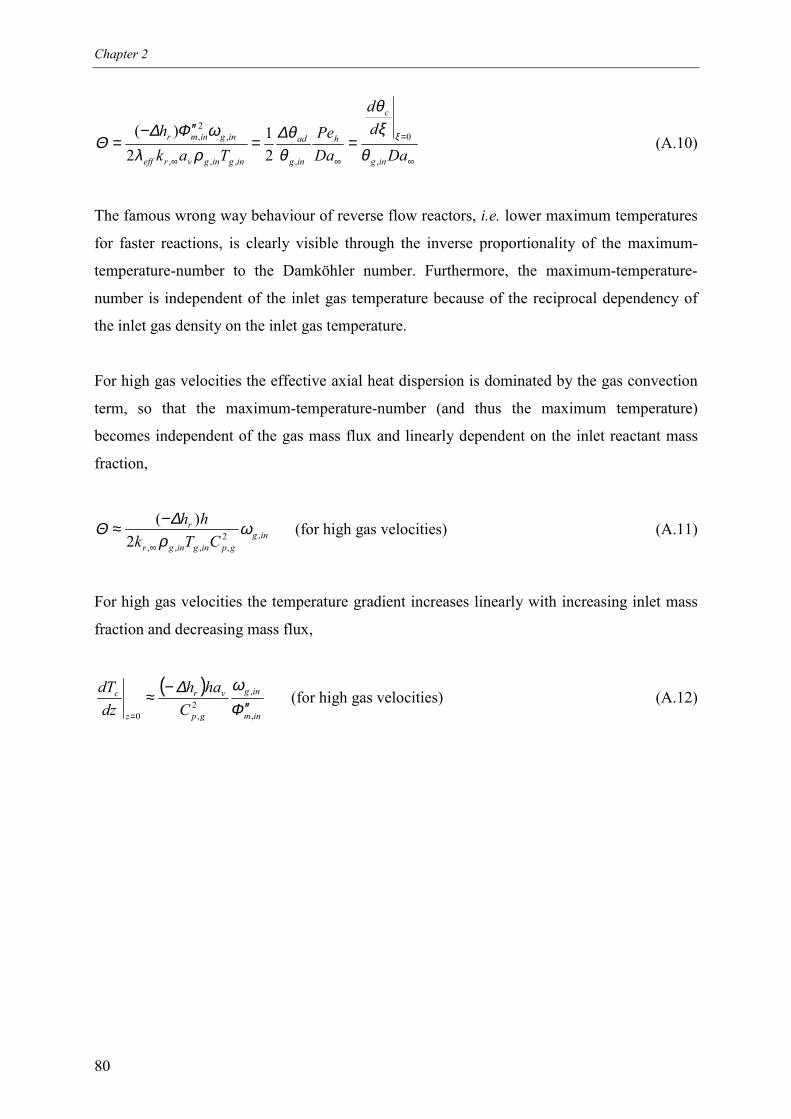
Chapter 2
80
∞
=
∞∞
==′′−
=Da
dd
DaPe
Takh
ing
c
h
ing
ad
ingingvreff
inginmr
,
0
,,,,
,2,
21
2)(
θξθ
θθ∆
ρλωΦ∆
Θ ξ (A.10)
The famous wrong way behaviour of reverse flow reactors, i.e. lower maximum temperatures
for faster reactions, is clearly visible through the inverse proportionality of the maximum-
temperature-number to the Damköhler number. Furthermore, the maximum-temperature-
number is independent of the inlet gas temperature because of the reciprocal dependency of
the inlet gas density on the inlet gas temperature.
For high gas velocities the effective axial heat dispersion is dominated by the gas convection
term, so that the maximum-temperature-number (and thus the maximum temperature)
becomes independent of the gas mass flux and linearly dependent on the inlet reactant mass
fraction,
inggpingingr
r
CTkhh
,2,,,,2
)( ωρ
∆Θ∞
−≈ (for high gas velocities) (A.11)
For high gas velocities the temperature gradient increases linearly with increasing inlet mass
fraction and decreasing mass flux,
( )inm
ing
gp
vr
z
c
Chah
dzdT
,
,2
,0 Φω∆
′′−≈
=
(for high gas velocities) (A.12)
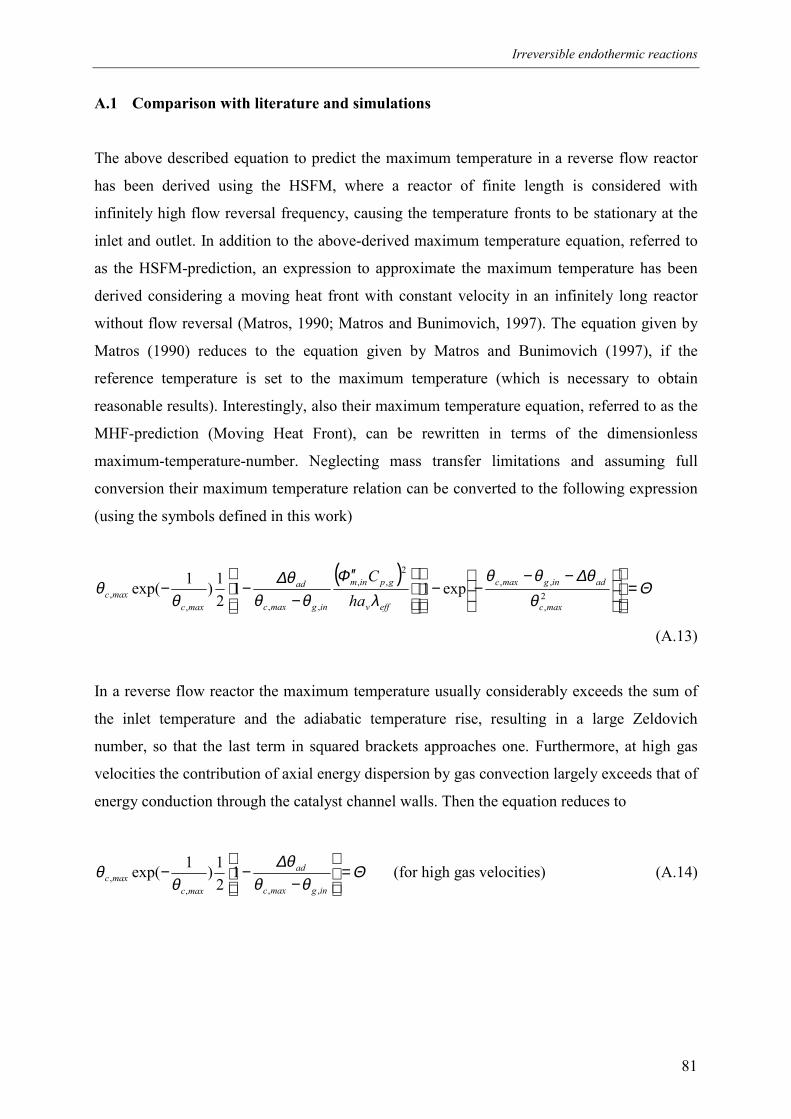
Irreversible endothermic reactions
81
A.1 Comparison with literature and simulations
The above described equation to predict the maximum temperature in a reverse flow reactor
has been derived using the HSFM, where a reactor of finite length is considered with
infinitely high flow reversal frequency, causing the temperature fronts to be stationary at the
inlet and outlet. In addition to the above-derived maximum temperature equation, referred to
as the HSFM-prediction, an expression to approximate the maximum temperature has been
derived considering a moving heat front with constant velocity in an infinitely long reactor
without flow reversal (Matros, 1990; Matros and Bunimovich, 1997). The equation given by
Matros (1990) reduces to the equation given by Matros and Bunimovich (1997), if the
reference temperature is set to the maximum temperature (which is necessary to obtain
reasonable results). Interestingly, also their maximum temperature equation, referred to as the
MHF-prediction (Moving Heat Front), can be rewritten in terms of the dimensionless
maximum-temperature-number. Neglecting mass transfer limitations and assuming full
conversion their maximum temperature relation can be converted to the following expression
(using the symbols defined in this work)
( )Θ
θθ∆θθ
λΦ
θθθ∆
θθ =
−−−−
′′−
−− 2,
,,2
,,
,,,, exp11
21)1exp(
maxc
adingmaxc
effv
gpinm
ingmaxc
ad
maxcmaxc ha
C
(A.13)
In a reverse flow reactor the maximum temperature usually considerably exceeds the sum of
the inlet temperature and the adiabatic temperature rise, resulting in a large Zeldovich
number, so that the last term in squared brackets approaches one. Furthermore, at high gas
velocities the contribution of axial energy dispersion by gas convection largely exceeds that of
energy conduction through the catalyst channel walls. Then the equation reduces to
Θθθ
θ∆θ
θ =
−
−−ingmaxc
ad
maxcmaxc
,,,, 1
21)1exp( (for high gas velocities) (A.14)
Chapter 2
82
0.08
0.09
0.10
0.11
0.12
0.13
0.14
0.15
1.E-06 1.E-05 1.E-04
ΘΘΘΘ
θθθθc,
max
HSFM predictionMHF predictionDM simulationHSFM simulation
lowest ∆θ ad
highest ∆θ ad
Figure A.1 The dimensionless maximum catalyst temperature θc,max as a function of the maximum-temperature-number Θ, comparing the HSFM- and MHF-predictions with the HSFM-and DM-simulations for methane combustion. (The inlet methane mass fraction wasvaried in the simulations between 0.001 and 0.006.)
In Figure A.1 the HSFM and the MHF predictions for the maximum temperature are
compared with several methane combustion simulations using the HSFM and the DM, for
different values of the maximum temperature number by varying different parameters and
operating conditions. The figure clearly shows that the HSFM-prediction gives a good
correspondence with the simulation results and improves the MHF-prediction. Small
deviations between the HSFM-predictions and the HSFM-simulations result from the
temperature dependency of several physical properties and transport parameters not taken into
account in the maximum temperature prediction.
83
CHAPTER 3
REVERSIBLE ENDOTHERMIC REACTIONS
IN THE SEQUENTIAL REACTOR CONFIGURATION
Chapter 3
84
Abstract
The new reactor concept for highly endothermic reactions at elevated temperatures with
possible rapid catalyst deactivation based on the indirect coupling of endothermic and
exothermic reactions in reverse flow, developed for irreversible reactions in chapter 2, has
been extended to reversible endothermic reactions for the sequential reactor configuration. In
the sequential reactor configuration the endothermic and exothermic reactants are fed
discontinuously and sequentially to the same catalyst bed, which acts as an energy repository
delivering energy during the endothermic reaction phase and storing energy during the
consecutive exothermic reaction phase. The periodic flow reversals to incorporate
recuperative heat exchange result in low temperatures at both reactor ends, while high
temperatures prevail in the centre of the reactor. For reversible endothermic reactions these
low exit temperatures can shift the equilibrium back towards the reactants side, causing
‘back-conversion’ at the reactor outlet.
The extent of back-conversion has been investigated for the propane dehydrogenation /
methane combustion reaction system, considering a worst case scenario for the kinetics by
assuming that the propylene hydrogenation reaction rate at low temperatures is only limited
by mass transfer. It has been shown for this reaction system that full equilibrium conversion
of the endothermic reactants cannot be combined with recuperative heat exchange, if the
reactor is filled entirely with active catalyst. Inactive sections installed at the reactor ends
can reduce this back-conversion, but cannot completely prevent it. Furthermore, undesired
high temperature peaks can be formed at the transition point between the inactive and active
sections, exceeding the maximum allowable temperature (at least for the relatively fast
combustion reactions).
A new solution is introduced to achieve both full equilibrium conversion and recuperative
heat exchange while simultaneously avoiding too high temperatures, even for the worst case
scenario of very fast propylene hydrogenation and fuel combustion reaction rates. The
proposed solution utilises the movement of the temperature fronts in the sequential reactor
configuration and employs less active sections installed at either end of the active catalyst bed
and completely inactive sections at the reactor ends, whereas propane combustion is used for
energy supply. Finally, it is shown that the plateau temperature can be effectively controlled
by simultaneous combustion of propane and methane during the exothermic reaction phase.
Reversible endothermic reactions
85
1. Introduction
A new reactor concept for highly endothermic reactions at elevated temperatures with
possible catalyst deactivation is developed based on the indirect coupling of endothermic and
exothermic reactions in reverse flow. The indirect coupling of the endothermic and
exothermic reactions can be accomplished in two different basic reactor configurations,
referred to as the sequential and simultaneous reactor configuration. In the sequential reactor
configuration the endothermic and exothermic reactants are fed discontinuously and
sequentially to the same catalyst bed, as opposed to the simultaneous reactor configuration,
where the endothermic and exothermic reactants are fed continuously and simultaneously to
two different compartments exchanging energy through the separating walls. In chapter 2 it
has been discussed for both reactor configurations how the operating conditions of both
reaction phases should be set in order to achieve an optimal cyclic steady state. It has been
shown that only in the sequential reactor configuration the inlet concentration can be
optimised independently of the gas velocities at maximum throughput and maximum reaction
coupling energy efficiency where at the same time control of the maximum temperature can
be achieved. In chapter 2 the reactor concept has been studied for the indirect coupling
between the propane dehydrogenation and methane combustion considering both reactions as
first order irreversible reactions. However, the propane dehydrogenation is an equilibrium
reaction and due to the low exit temperatures resulting from the reverse flow concept, the
equilibrium can be shifted back towards the reactant side at the reactor outlet. We now extend
the theoretical study of the reactor behaviour of the sequential reactor configuration for the
propane dehydrogenation/fuel combustion reaction system on a Pt/γ-Al2O3 monolithic catalyst
to include thermodynamic equilibrium effects and to discuss possible counteractions to avoid
this ‘back-conversion’.
For the unusual case where a catalyst with two different types of active components could be
used (and fabricated), where one type of active component is a catalyst for the endothermic
reaction and the other component the exothermic reaction without any undesired influences of
the active components on the other reaction (like side-reactions), back-conversion could
simply be prevented by optimising the axial concentration profiles of the active components.
However, for this reaction system the platinum-based monolith is a catalyst for both the
endothermic dehydrogenation and the fuel combustion.
Although this work focuses on the propane dehydrogenation equilibrium reaction, a general
solution to avoid back-conversion is proposed. It is important to study the reactor behaviour
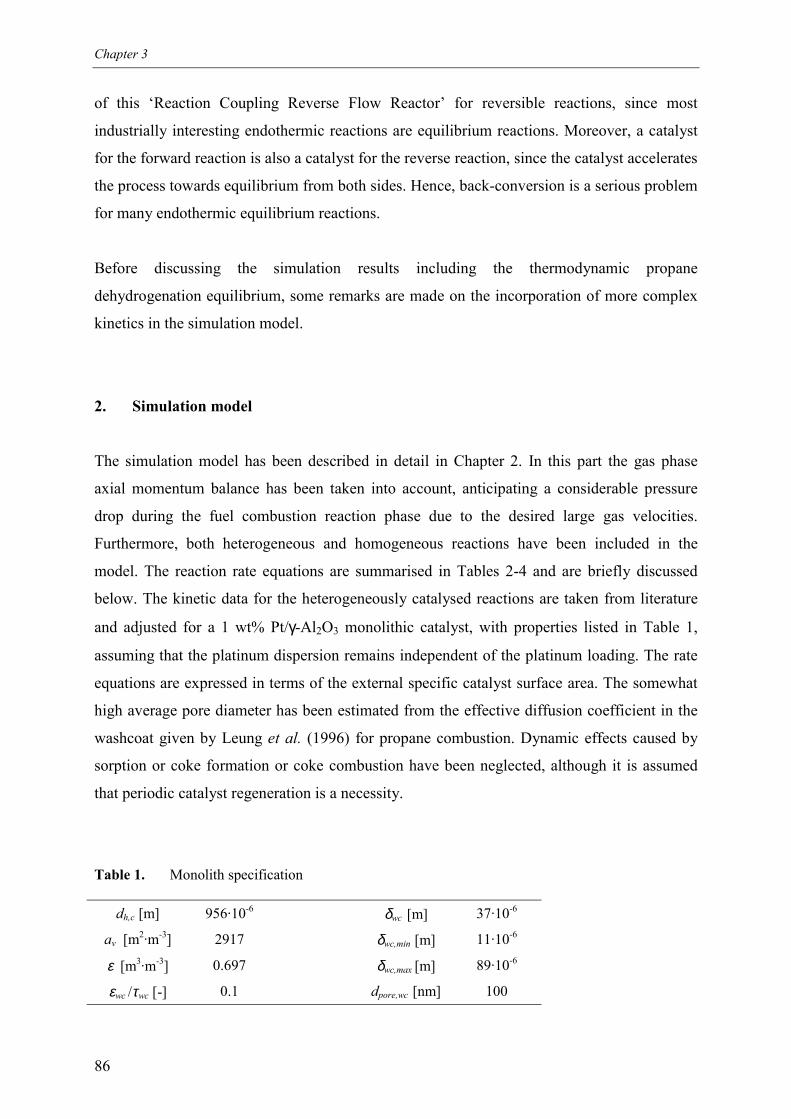
Chapter 3
86
of this ‘Reaction Coupling Reverse Flow Reactor’ for reversible reactions, since most
industrially interesting endothermic reactions are equilibrium reactions. Moreover, a catalyst
for the forward reaction is also a catalyst for the reverse reaction, since the catalyst accelerates
the process towards equilibrium from both sides. Hence, back-conversion is a serious problem
for many endothermic equilibrium reactions.
Before discussing the simulation results including the thermodynamic propane
dehydrogenation equilibrium, some remarks are made on the incorporation of more complex
kinetics in the simulation model.
2. Simulation model
The simulation model has been described in detail in Chapter 2. In this part the gas phase
axial momentum balance has been taken into account, anticipating a considerable pressure
drop during the fuel combustion reaction phase due to the desired large gas velocities.
Furthermore, both heterogeneous and homogeneous reactions have been included in the
model. The reaction rate equations are summarised in Tables 2-4 and are briefly discussed
below. The kinetic data for the heterogeneously catalysed reactions are taken from literature
and adjusted for a 1 wt% Pt/γ-Al2O3 monolithic catalyst, with properties listed in Table 1,
assuming that the platinum dispersion remains independent of the platinum loading. The rate
equations are expressed in terms of the external specific catalyst surface area. The somewhat
high average pore diameter has been estimated from the effective diffusion coefficient in the
washcoat given by Leung et al. (1996) for propane combustion. Dynamic effects caused by
sorption or coke formation or coke combustion have been neglected, although it is assumed
that periodic catalyst regeneration is a necessity.
Table 1. Monolith specification
dh,c [m] 956·10-6 δwc [m] 37·10-6
av [m2·m-3] 2917 δwc,min [m] 11·10-6
ε [m3·m-3] 0.697 δwc,max [m] 89·10-6
εwc /τwc [-] 0.1 dpore,wc [nm] 100
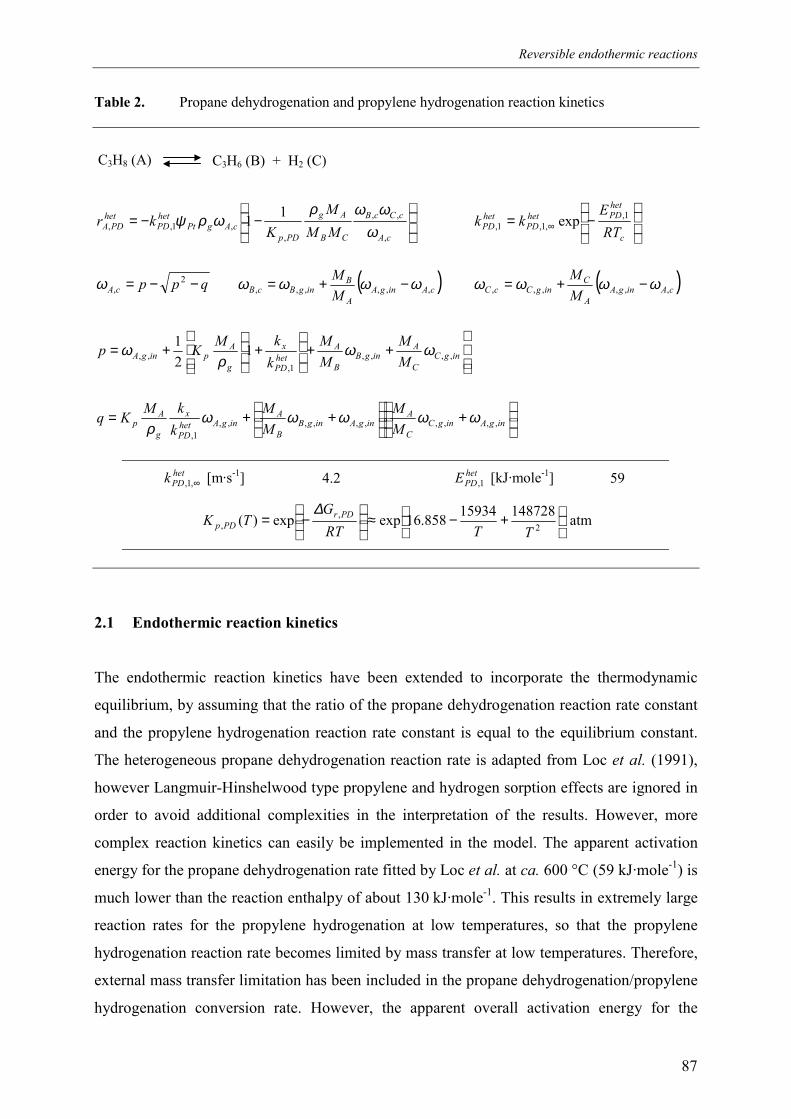
Reversible endothermic reactions
87
Table 2. Propane dehydrogenation and propylene hydrogenation reaction kinetics
−−=
cA
cCcB
CB
Ag
PDpcAgPt
hetPD
hetPDA MM
MK
kr,
,,
,,1,,
11ω
ωωρωρψ
−= ∞
c
hetPDhet
PDhetPD RT
Ekk 1,
,1,1, exp
qppcA −−= 2,ω ( )cAingA
A
BingBcB M
M,,,,,, ωωωω −+= ( )cAingA
A
CingCcC M
M,,,,,, ωωωω −+=
++
++= ingC
C
AingB
B
AhetPD
x
g
ApingA M
MMM
kkMKp ,,,,
1,,, 1
21 ωω
ρω
+
++= ingAingC
C
AingAingB
B
AingAhet
PD
x
g
Ap M
MMM
kkMKq ,,,,,,,,,,
1,
ωωωωωρ
hetPDk ∞,1, [m·s-1] 4.2 het
PDE 1, [kJ·mole-1] 59
+−≈
−= 2
,,
14872815934858.16expexp)(TTRT
GTK PDr
PDp∆
atm
2.1 Endothermic reaction kinetics
The endothermic reaction kinetics have been extended to incorporate the thermodynamic
equilibrium, by assuming that the ratio of the propane dehydrogenation reaction rate constant
and the propylene hydrogenation reaction rate constant is equal to the equilibrium constant.
The heterogeneous propane dehydrogenation reaction rate is adapted from Loc et al. (1991),
however Langmuir-Hinshelwood type propylene and hydrogen sorption effects are ignored in
order to avoid additional complexities in the interpretation of the results. However, more
complex reaction kinetics can easily be implemented in the model. The apparent activation
energy for the propane dehydrogenation rate fitted by Loc et al. at ca. 600 °C (59 kJ·mole-1) is
much lower than the reaction enthalpy of about 130 kJ·mole-1. This results in extremely large
reaction rates for the propylene hydrogenation at low temperatures, so that the propylene
hydrogenation reaction rate becomes limited by mass transfer at low temperatures. Therefore,
external mass transfer limitation has been included in the propane dehydrogenation/propylene
hydrogenation conversion rate. However, the apparent overall activation energy for the
C3H8 (A) C3H6 (B) + H2 (C)
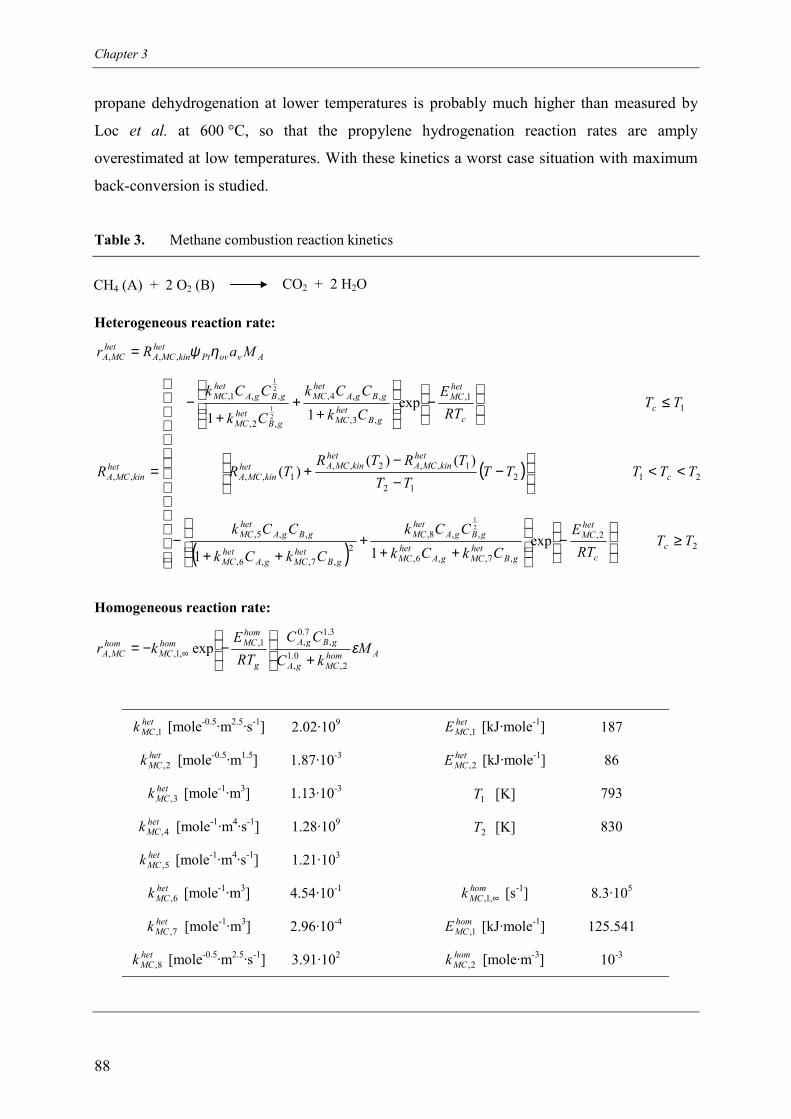
Chapter 3
88
propane dehydrogenation at lower temperatures is probably much higher than measured by
Loc et al. at 600 °C, so that the propylene hydrogenation reaction rates are amply
overestimated at low temperatures. With these kinetics a worst case situation with maximum
back-conversion is studied.
Table 3. Methane combustion reaction kinetics
Heterogeneous reaction rate:
AvovPthet
kinMCAhet
MCA MaRr ηψ,,, =
( )
( )
≥
−
+++
++−
<<
−
−−
+
≤
−
++
+−
=
22,
,7,,6,
,,8,2
,7,,6,
,,5,
21212
1,,2,,1,,
11,
,3,
,,4,
,2,
,,1,
,,
exp11
)()()(
exp11
21
21
21
TTRT
ECkCk
CCk
CkCk
CCk
TTTTTTT
TRTRTR
TTRT
ECkCCk
Ck
CCk
R
cc
hetMC
gBhetMCgA
hetMC
gBgAhetMC
gBhetMCgA
hetMC
gBgAhetMC
c
hetkinMCA
hetkinMCAhet
kinMCA
cc
hetMC
gBhetMC
gBgAhetMC
gBhetMC
gBgAhetMC
hetkinMCA
Homogeneous reaction rate:
AhomMCgA
gBgA
g
homMChom
MChom
MCA MkC
CCRT
Ekr ε
2,0.1,
3.1,
7.0,1,
,1,, exp+
−−= ∞
hetMCk 1, [mole-0.5·m2.5·s-1] 2.02·109 het
MCE 1, [kJ·mole-1] 187
hetMCk 2, [mole-0.5·m1.5] 1.87·10-3 het
MCE 2, [kJ·mole-1] 86
hetMCk 3, [mole-1·m3] 1.13·10-3
1T [K] 793
hetMCk 4, [mole-1·m4·s-1] 1.28·109
2T [K] 830
hetMCk 5, [mole-1·m4·s-1] 1.21·103
hetMCk 6, [mole-1·m3] 4.54·10-1 hom
MCk ∞,1, [s-1] 8.3·105
hetMCk 7, [mole-1·m3] 2.96·10-4 hom
MCE 1, [kJ·mole-1] 125.541
hetMCk 8, [mole-0.5·m2.5·s-1] 3.91·102 hom
MCk 2, [mole·m-3] 10-3
CH4 (A) + 2 O2 (B) CO2 + 2 H2O
Reversible endothermic reactions
89
2.2 Exothermic reaction kinetics
In this work combustion of methane and propane is considered. The heterogeneous methane
combustion reaction kinetics have been taken from Trimm and Lam (1980) and slightly
adjusted to include an overall temperature dependency. The heterogeneous propane
combustion reaction kinetics has been approximated from Hiam et al. (1968). It should be
noted that the maximum temperatures in the simulations considerably exceed the temperatures
for which the reaction rate equations were experimentally derived, especially for the
heterogeneous propane combustion reaction rate. Internal and external mass transfer
limitations for the heterogeneous combustion reactions are included using an average
effectiveness factor. The usually radially non-uniform washcoat thickness distribution is taken
into account via an approximate averaging procedure for the effectiveness factor, shortly
outlined in appendix A.
Furthermore, also homogeneous methane and propane combustion reactions are included
using simple one step kinetic rate equations, adapted from Westbrook and Dryer (1981). Due
to the overall negative reaction order for methane in the homogeneous methane combustion
reaction rate infinite reaction rates are extrapolated for small methane concentrations. These
computational problems have been overcome by adjusting the homogeneous methane
combustion reaction rate equation so that for low methane concentrations the methane
reaction order approaches the positive methane reaction order derived for the two step kinetic
model by Dryer and Glassman (1973). It should be realised that the one step homogeneous
combustion models overestimate the overall homogeneous combustion rate for the small fuel
concentrations considered in this work.
Finally, it is emphasised here that the kinetic data as described above constitute a worst case
scenario, since both the propylene hydrogenation reaction rate and the homogeneous and
heterogeneous fuel combustion reaction rates are considerably overestimated. The qualitative
effects of the operating conditions on the reactor behaviour of a reverse flow reactor coupling
fuel combustion reactions with reversible endothermic reactions are investigated using these
worst case kinetic data, in order to challenge a general solution to avoid back-conversion even
for endothermic equilibrium reactions with a very fast reaction rate of the reverse reaction.
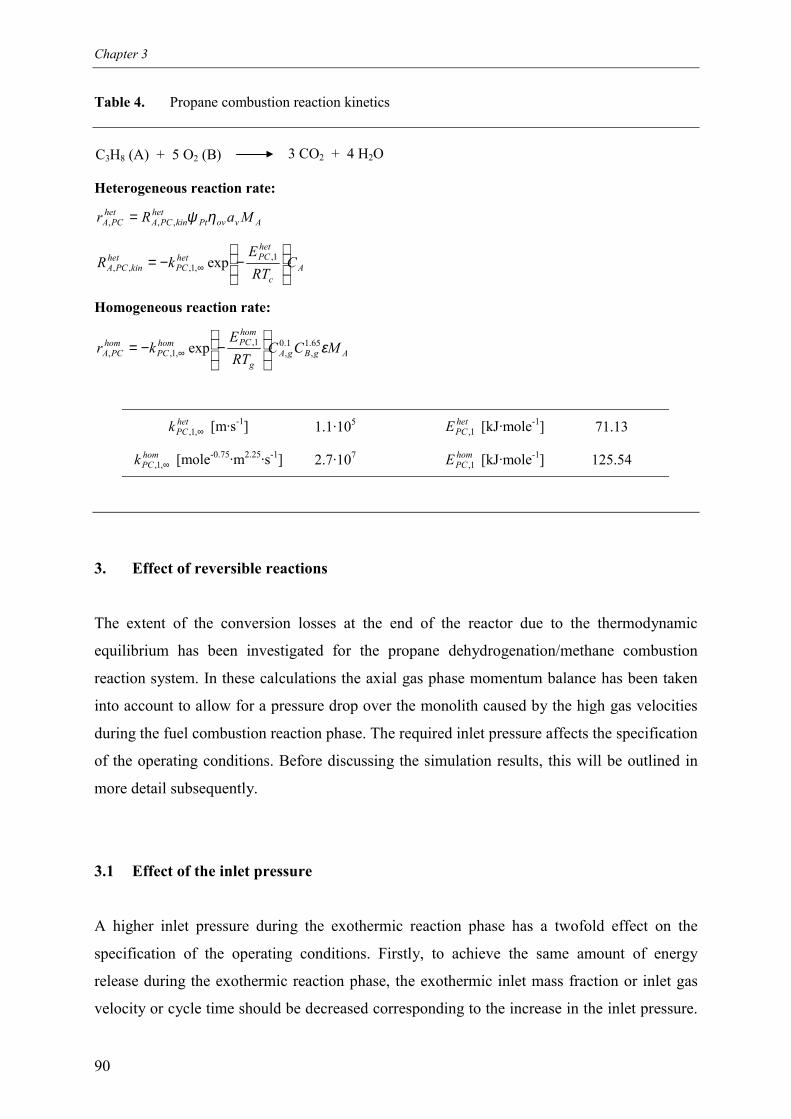
Chapter 3
90
Table 4. Propane combustion reaction kinetics
Heterogeneous reaction rate:
AvovPthet
kinPCAhet
PCA MaRr ηψ,,, =
Ac
hetPChet
PChet
kinPCA CRTE
kR
−−= ∞
1,,1,,, exp
Homogeneous reaction rate:
AgBgAg
homPChom
PChom
PCA MCCRTE
kr ε65.1,
1.0,
1,,1,, exp
−−= ∞
hetPCk ∞,1, [m·s-1] 1.1·105 het
PCE 1, [kJ·mole-1] 71.13
homPCk ∞,1, [mole-0.75·m2.25·s-1] 2.7·107 hom
PCE 1, [kJ·mole-1] 125.54
3. Effect of reversible reactions
The extent of the conversion losses at the end of the reactor due to the thermodynamic
equilibrium has been investigated for the propane dehydrogenation/methane combustion
reaction system. In these calculations the axial gas phase momentum balance has been taken
into account to allow for a pressure drop over the monolith caused by the high gas velocities
during the fuel combustion reaction phase. The required inlet pressure affects the specification
of the operating conditions. Before discussing the simulation results, this will be outlined in
more detail subsequently.
3.1 Effect of the inlet pressure
A higher inlet pressure during the exothermic reaction phase has a twofold effect on the
specification of the operating conditions. Firstly, to achieve the same amount of energy
release during the exothermic reaction phase, the exothermic inlet mass fraction or inlet gas
velocity or cycle time should be decreased corresponding to the increase in the inlet pressure.
C3H8 (A) + 5 O2 (B) 3 CO2 + 4 H2O
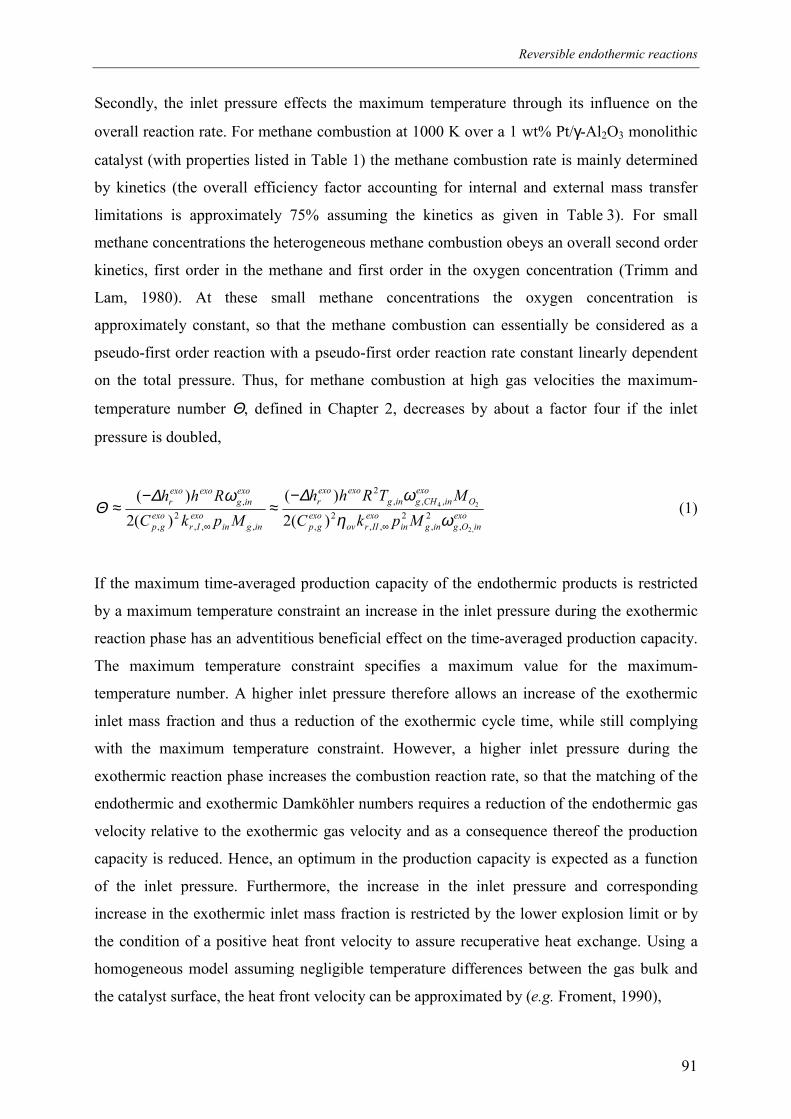
Reversible endothermic reactions
91
Secondly, the inlet pressure effects the maximum temperature through its influence on the
overall reaction rate. For methane combustion at 1000 K over a 1 wt% Pt/γ-Al2O3 monolithic
catalyst (with properties listed in Table 1) the methane combustion rate is mainly determined
by kinetics (the overall efficiency factor accounting for internal and external mass transfer
limitations is approximately 75% assuming the kinetics as given in Table 3). For small
methane concentrations the heterogeneous methane combustion obeys an overall second order
kinetics, first order in the methane and first order in the oxygen concentration (Trimm and
Lam, 1980). At these small methane concentrations the oxygen concentration is
approximately constant, so that the methane combustion can essentially be considered as a
pseudo-first order reaction with a pseudo-first order reaction rate constant linearly dependent
on the total pressure. Thus, for methane combustion at high gas velocities the maximum-
temperature number Θ, defined in Chapter 2, decreases by about a factor four if the inlet
pressure is doubled,
exoinOgingin
exoIIrov
exogp
Oexo
inCHgingexoexo
r
inginexo
Irexo
gp
exoing
exoexor
MpkCMTRhh
MpkCRhh
,2
24
,2
,2
,,2
,
,,,2
,,,2
,
,
)(2)(
)(2)(
ωηω∆ω∆
Θ∞∞
−≈
−≈ (1)
If the maximum time-averaged production capacity of the endothermic products is restricted
by a maximum temperature constraint an increase in the inlet pressure during the exothermic
reaction phase has an adventitious beneficial effect on the time-averaged production capacity.
The maximum temperature constraint specifies a maximum value for the maximum-
temperature number. A higher inlet pressure therefore allows an increase of the exothermic
inlet mass fraction and thus a reduction of the exothermic cycle time, while still complying
with the maximum temperature constraint. However, a higher inlet pressure during the
exothermic reaction phase increases the combustion reaction rate, so that the matching of the
endothermic and exothermic Damköhler numbers requires a reduction of the endothermic gas
velocity relative to the exothermic gas velocity and as a consequence thereof the production
capacity is reduced. Hence, an optimum in the production capacity is expected as a function
of the inlet pressure. Furthermore, the increase in the inlet pressure and corresponding
increase in the exothermic inlet mass fraction is restricted by the lower explosion limit or by
the condition of a positive heat front velocity to assure recuperative heat exchange. Using a
homogeneous model assuming negligible temperature differences between the gas bulk and
the catalyst surface, the heat front velocity can be approximated by (e.g. Froment, 1990),
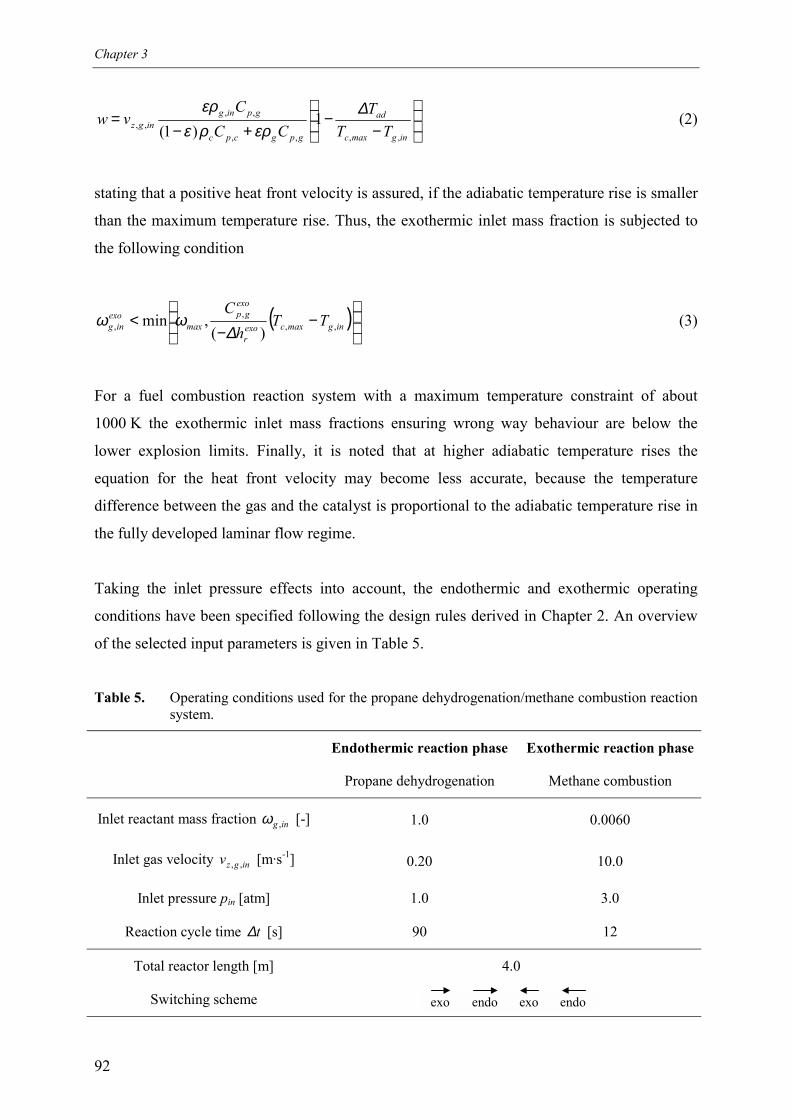
Chapter 3
92
endoexo endoexo
−
−+−
=ingmaxc
ad
gpgcpc
gpingingz TT
TCC
Cvw
,,,,
,,,, 1
)1(∆
ερρεερ
(2)
stating that a positive heat front velocity is assured, if the adiabatic temperature rise is smaller
than the maximum temperature rise. Thus, the exothermic inlet mass fraction is subjected to
the following condition
( )
−
−< ingmaxcexo
r
exogp
maxexo
ing TTh
C,,
,, )(
,min∆
ωω (3)
For a fuel combustion reaction system with a maximum temperature constraint of about
1000 K the exothermic inlet mass fractions ensuring wrong way behaviour are below the
lower explosion limits. Finally, it is noted that at higher adiabatic temperature rises the
equation for the heat front velocity may become less accurate, because the temperature
difference between the gas and the catalyst is proportional to the adiabatic temperature rise in
the fully developed laminar flow regime.
Taking the inlet pressure effects into account, the endothermic and exothermic operating
conditions have been specified following the design rules derived in Chapter 2. An overview
of the selected input parameters is given in Table 5.
Table 5. Operating conditions used for the propane dehydrogenation/methane combustion reactionsystem.
Endothermic reaction phase
Propane dehydrogenation
Exothermic reaction phase
Methane combustion
Inlet reactant mass fraction ing ,ω [-] 1.0 0.0060
Inlet gas velocity ingzv ,, [m·s-1] 0.20 10.0
Inlet pressure pin [atm] 1.0 3.0
Reaction cycle time t∆ [s] 90 12
Total reactor length [m] 4.0
Switching scheme
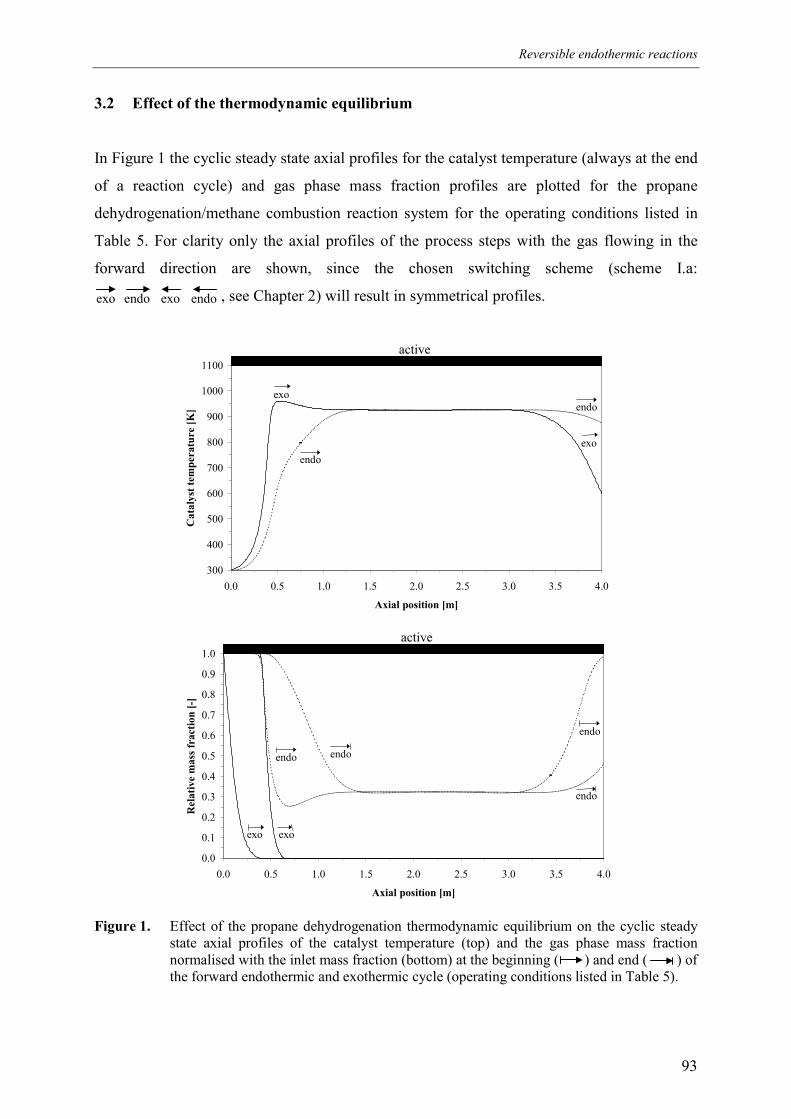
Reversible endothermic reactions
93
3.2 Effect of the thermodynamic equilibrium
In Figure 1 the cyclic steady state axial profiles for the catalyst temperature (always at the end
of a reaction cycle) and gas phase mass fraction profiles are plotted for the propane
dehydrogenation/methane combustion reaction system for the operating conditions listed in
Table 5. For clarity only the axial profiles of the process steps with the gas flowing in the
forward direction are shown, since the chosen switching scheme (scheme I.a:
, see Chapter 2) will result in symmetrical profiles.
300
400
500
600
700
800
900
1000
1100
0.0 0.5 1.0 1.5 2.0 2.5 3.0 3.5 4.0
Axial position [m]
Cat
alys
t tem
pera
ture
[K]
exo
endo
endo
exo
0.0
0.1
0.2
0.3
0.4
0.5
0.6
0.7
0.8
0.9
1.0
0.0 0.5 1.0 1.5 2.0 2.5 3.0 3.5 4.0
Axial position [m]
Rel
ativ
e m
ass f
ract
ion
[-]
exo
endo
exo
endo
endo
endo
Figure 1. Effect of the propane dehydrogenation thermodynamic equilibrium on the cyclic steadystate axial profiles of the catalyst temperature (top) and the gas phase mass fractionnormalised with the inlet mass fraction (bottom) at the beginning ( ) and end ( ) ofthe forward endothermic and exothermic cycle (operating conditions listed in Table 5).
endoexo endoexo
active
active
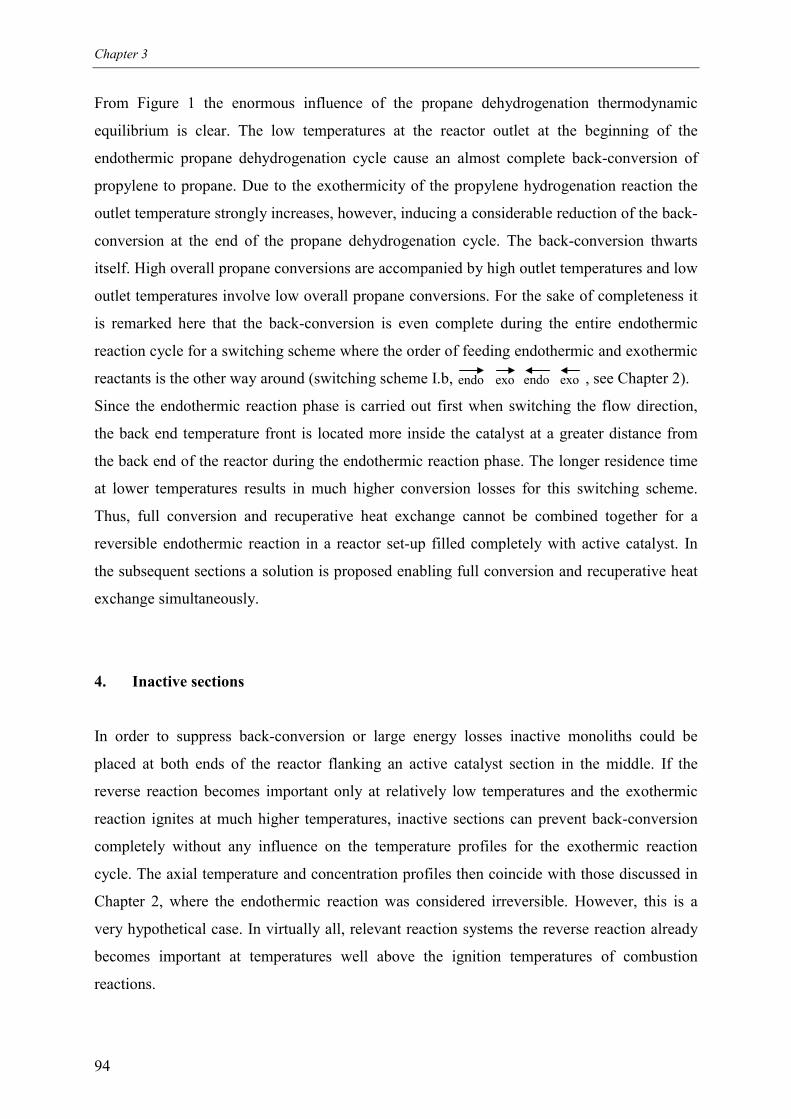
Chapter 3
94
From Figure 1 the enormous influence of the propane dehydrogenation thermodynamic
equilibrium is clear. The low temperatures at the reactor outlet at the beginning of the
endothermic propane dehydrogenation cycle cause an almost complete back-conversion of
propylene to propane. Due to the exothermicity of the propylene hydrogenation reaction the
outlet temperature strongly increases, however, inducing a considerable reduction of the back-
conversion at the end of the propane dehydrogenation cycle. The back-conversion thwarts
itself. High overall propane conversions are accompanied by high outlet temperatures and low
outlet temperatures involve low overall propane conversions. For the sake of completeness it
is remarked here that the back-conversion is even complete during the entire endothermic
reaction cycle for a switching scheme where the order of feeding endothermic and exothermic
reactants is the other way around (switching scheme I.b, , see Chapter 2).
Since the endothermic reaction phase is carried out first when switching the flow direction,
the back end temperature front is located more inside the catalyst at a greater distance from
the back end of the reactor during the endothermic reaction phase. The longer residence time
at lower temperatures results in much higher conversion losses for this switching scheme.
Thus, full conversion and recuperative heat exchange cannot be combined together for a
reversible endothermic reaction in a reactor set-up filled completely with active catalyst. In
the subsequent sections a solution is proposed enabling full conversion and recuperative heat
exchange simultaneously.
4. Inactive sections
In order to suppress back-conversion or large energy losses inactive monoliths could be
placed at both ends of the reactor flanking an active catalyst section in the middle. If the
reverse reaction becomes important only at relatively low temperatures and the exothermic
reaction ignites at much higher temperatures, inactive sections can prevent back-conversion
completely without any influence on the temperature profiles for the exothermic reaction
cycle. The axial temperature and concentration profiles then coincide with those discussed in
Chapter 2, where the endothermic reaction was considered irreversible. However, this is a
very hypothetical case. In virtually all, relevant reaction systems the reverse reaction already
becomes important at temperatures well above the ignition temperatures of combustion
reactions.
endo exo endo exo
Reversible endothermic reactions
95
Nevertheless, if the temperature front at the back end (in relation to gas flow direction) of the
temperature profile could be located inside the inactive section at the rear end of the reactor
during the complete endothermic reaction cycle, back-conversion and thus large energy losses
could be prevented. In this case, the composition of the product gases can be ‘frozen’ at the
equilibrium composition corresponding to the conditions of high temperatures in the active
catalyst section when the product gases are cooled in the inactive section. In order to move the
back end temperature front inside the inactive section the endothermic reaction phase should
be carried out after the exothermic reaction phase in the same gas flow direction, so that
switching scheme I.a should be selected.
300
400
500
600
700
800
900
1000
1100
0.0 0.5 1.0 1.5 2.0 2.5 3.0 3.5 4.0
Axial position [m]
Cat
alys
t tem
pera
ture
[K] exo endo endoexo
0.0
0.1
0.2
0.3
0.4
0.5
0.6
0.7
0.8
0.9
1.0
0.0 0.5 1.0 1.5 2.0 2.5 3.0 3.5 4.0
Axial position [m]
Rel
ativ
e m
ass f
ract
ion
[-]
exo
endo
exo
endo endo
endo
Figure 2. Effect of inactive sections of 0.5 m length flanking the catalyst bed at both sides on thecyclic steady state axial profiles of the catalyst temperature (top) and the gas phase massfraction normalised with the inlet mass fraction (bottom) at the beginning ( ) and end( ) of the forward endothermic and exothermic cycle (operating conditions listed inTable 5).
inactive inactiveactive
inactive inactiveactive
Chapter 3
96
Figure 2 shows axial profiles in the cyclic steady state of the catalyst temperature and gas
phase mass fraction for the forward process steps, for the case where the active section is
shortened and two inactive sections of 0.5 m length are positioned at both reactor ends
(keeping the total reactor length the same), again for the propane dehydrogenation/methane
combustion reaction system and the operating conditions listed in Table 5.
Firstly, by comparing the axial profiles of Figures 1 and 2 it is clear that the inactive sections
are effective in reducing the back-conversion and convective energy losses. However, the
back-conversion cannot be completely avoided. Especially at the beginning of endothermic
reaction cycle the back end temperature front of the axial temperature profile is not
completely situated in the inactive section. The temperature at the transition from the active to
the inactive section at the back end of the reactor is about 840 K at the beginning of the
endothermic cycle, which is well below the plateau temperature in the centre of the reactor
(ca. 1000 K). Due to this temperature gradient in the active catalyst section still considerable
conversion losses occur during the first stages of the endothermic reaction cycle. Due to the
movement of the temperature fronts towards the back end of the reactor during the forward
endothermic reaction cycle and the energy production by the reverse reaction the temperature
at the transition from the active to the inactive section increases, causing a further reduction of
the back-conversion. The temperature decrease at the back end of the active catalyst section is
caused by the order of the reaction phases in the switching scheme. Although it is necessary to
carry out the endothermic reaction phase after the exothermic reaction phase in the same gas
flow direction in order to move the back end temperature gradient inside the inactive section,
the front temperature gradient is strongly decreased during the endothermic reaction phase.
This results in a large endothermic reaction zone at the end of the endothermic reaction phase
and furthermore lower temperatures at the transition between the active and inactive sections
when the endothermic reactants are fed from the opposite side. The conversion losses could
be reduced somewhat by decreasing the endothermic inlet gas velocity relative to the
exothermic gas velocity (better matching of reaction zones), however, at the expense of a
lower overall production capacity.
Secondly, high temperature peaks are formed at the transition from the inactive to the active
section. In the first half of the exothermic cycle the temperature peak is formed and then the
maximum temperature diminishes when the temperature front moves into the active catalyst
bed (see Figure 3.a). The high temperature peaks directly result from the requirement to locate
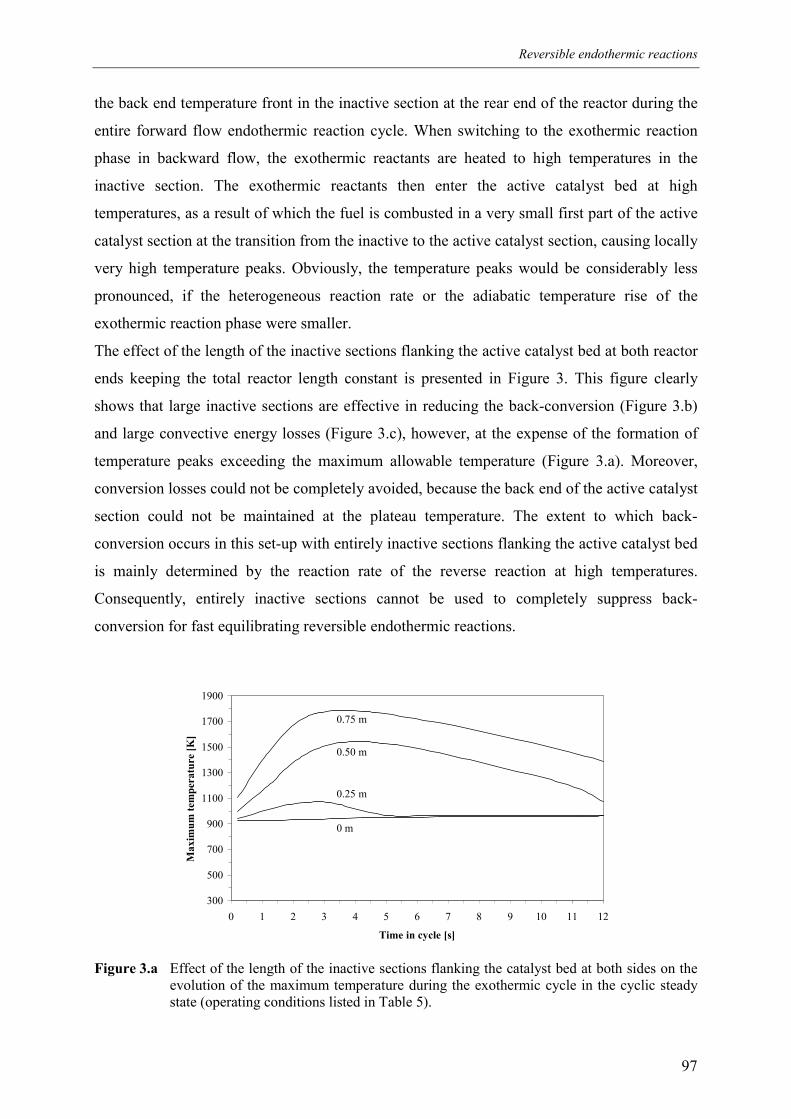
Reversible endothermic reactions
97
the back end temperature front in the inactive section at the rear end of the reactor during the
entire forward flow endothermic reaction cycle. When switching to the exothermic reaction
phase in backward flow, the exothermic reactants are heated to high temperatures in the
inactive section. The exothermic reactants then enter the active catalyst bed at high
temperatures, as a result of which the fuel is combusted in a very small first part of the active
catalyst section at the transition from the inactive to the active catalyst section, causing locally
very high temperature peaks. Obviously, the temperature peaks would be considerably less
pronounced, if the heterogeneous reaction rate or the adiabatic temperature rise of the
exothermic reaction phase were smaller.
The effect of the length of the inactive sections flanking the active catalyst bed at both reactor
ends keeping the total reactor length constant is presented in Figure 3. This figure clearly
shows that large inactive sections are effective in reducing the back-conversion (Figure 3.b)
and large convective energy losses (Figure 3.c), however, at the expense of the formation of
temperature peaks exceeding the maximum allowable temperature (Figure 3.a). Moreover,
conversion losses could not be completely avoided, because the back end of the active catalyst
section could not be maintained at the plateau temperature. The extent to which back-
conversion occurs in this set-up with entirely inactive sections flanking the active catalyst bed
is mainly determined by the reaction rate of the reverse reaction at high temperatures.
Consequently, entirely inactive sections cannot be used to completely suppress back-
conversion for fast equilibrating reversible endothermic reactions.
300
500
700
900
1100
1300
1500
1700
1900
0 1 2 3 4 5 6 7 8 9 10 11 12
Time in cycle [s]
Max
imum
tem
pera
ture
[K]
0.25 m
0.50 m
0.75 m
0 m
Figure 3.a Effect of the length of the inactive sections flanking the catalyst bed at both sides on theevolution of the maximum temperature during the exothermic cycle in the cyclic steadystate (operating conditions listed in Table 5).
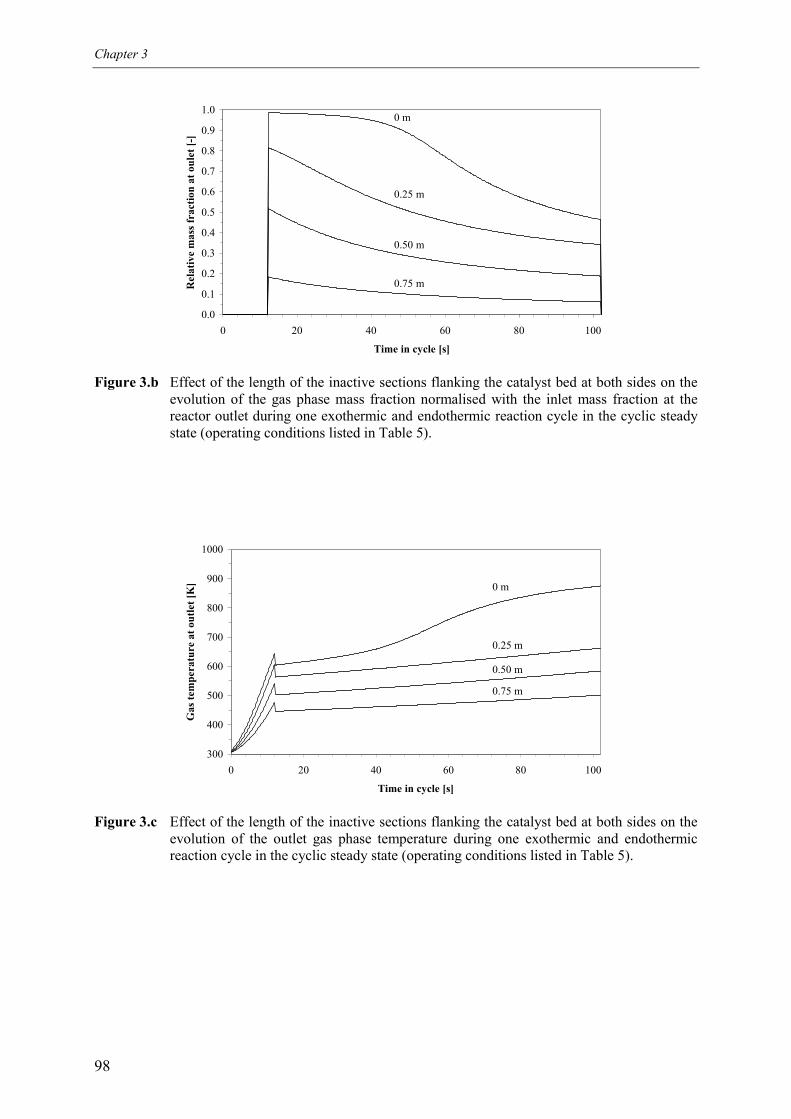
Chapter 3
98
0.0
0.1
0.2
0.3
0.4
0.5
0.6
0.7
0.8
0.9
1.0
0 20 40 60 80 100
Time in cycle [s]
Rel
ativ
e m
ass f
ract
ion
at o
ulet
[-]
0 m
0.25 m
0.50 m
0.75 m
Figure 3.b Effect of the length of the inactive sections flanking the catalyst bed at both sides on theevolution of the gas phase mass fraction normalised with the inlet mass fraction at thereactor outlet during one exothermic and endothermic reaction cycle in the cyclic steadystate (operating conditions listed in Table 5).
300
400
500
600
700
800
900
1000
0 20 40 60 80 100
Time in cycle [s]
Gas
tem
pera
ture
at o
utle
t [K
] 0 m
0.25 m
0.50 m
0.75 m
Figure 3.c Effect of the length of the inactive sections flanking the catalyst bed at both sides on theevolution of the outlet gas phase temperature during one exothermic and endothermicreaction cycle in the cyclic steady state (operating conditions listed in Table 5).
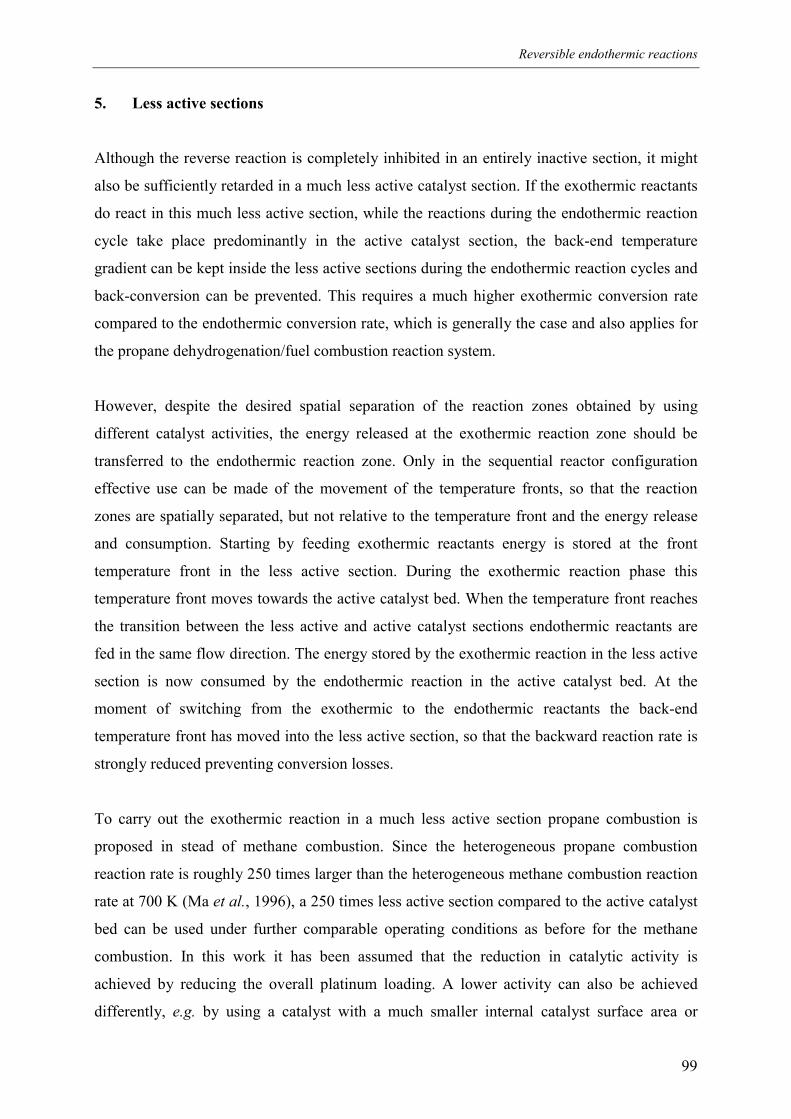
Reversible endothermic reactions
99
5. Less active sections
Although the reverse reaction is completely inhibited in an entirely inactive section, it might
also be sufficiently retarded in a much less active catalyst section. If the exothermic reactants
do react in this much less active section, while the reactions during the endothermic reaction
cycle take place predominantly in the active catalyst section, the back-end temperature
gradient can be kept inside the less active sections during the endothermic reaction cycles and
back-conversion can be prevented. This requires a much higher exothermic conversion rate
compared to the endothermic conversion rate, which is generally the case and also applies for
the propane dehydrogenation/fuel combustion reaction system.
However, despite the desired spatial separation of the reaction zones obtained by using
different catalyst activities, the energy released at the exothermic reaction zone should be
transferred to the endothermic reaction zone. Only in the sequential reactor configuration
effective use can be made of the movement of the temperature fronts, so that the reaction
zones are spatially separated, but not relative to the temperature front and the energy release
and consumption. Starting by feeding exothermic reactants energy is stored at the front
temperature front in the less active section. During the exothermic reaction phase this
temperature front moves towards the active catalyst bed. When the temperature front reaches
the transition between the less active and active catalyst sections endothermic reactants are
fed in the same flow direction. The energy stored by the exothermic reaction in the less active
section is now consumed by the endothermic reaction in the active catalyst bed. At the
moment of switching from the exothermic to the endothermic reactants the back-end
temperature front has moved into the less active section, so that the backward reaction rate is
strongly reduced preventing conversion losses.
To carry out the exothermic reaction in a much less active section propane combustion is
proposed in stead of methane combustion. Since the heterogeneous propane combustion
reaction rate is roughly 250 times larger than the heterogeneous methane combustion reaction
rate at 700 K (Ma et al., 1996), a 250 times less active section compared to the active catalyst
bed can be used under further comparable operating conditions as before for the methane
combustion. In this work it has been assumed that the reduction in catalytic activity is
achieved by reducing the overall platinum loading. A lower activity can also be achieved
differently, e.g. by using a catalyst with a much smaller internal catalyst surface area or
Chapter 3
100
endoexo endoexo
washcoat thickness or by selecting a catalyst with a different active component. The operating
conditions used to study the effect of the less active sections for the propane
dehydrogenation/propane combustion reaction system are given in Table 6. The reactor length
has been increased to 5 m to avoid overlapping reaction zones, necessitating a corresponding
increase in the inlet pressure during the exothermic reaction cycle to 4 atm.
Table 6. Operating conditions used for the propane dehydrogenation/propane combustion reactionsystem.
Endothermic reaction phase
Propane dehydrogenation
Exothermic reaction phase
Propane combustion
Inlet reactant mass fraction ing ,ω [-] 1.0 0.0030
Inlet gas velocity ingzv ,, [m·s-1] 0.20 10.0
Inlet pressure pin [atm] 1.0 4.0
Reaction cycle time t∆ [s] 45 15
Total reactor length [m] 5.0
Switching scheme
Simulation results for the case using two 1.5 m length, 250 times less active sections flanking
the catalyst bed at both ends are presented in Figure 4. In this calculation homogeneous
propane combustion has been ignored. The influence of the homogeneous propane
combustion is discussed below. The axial mass fraction profile clearly shows the spatial
separation of the exothermic and endothermic reaction zones, while the energy released by the
exothermic reaction is effectively transferred to the endothermic reactants, shown by the axial
temperature profile. At the transition between the less active and active sections a small
temperature peak is created during the exothermic reaction phase. However, the maximum
temperature increases only to some extent and the maximum allowable temperature is not
exceeded (see Figure 5).
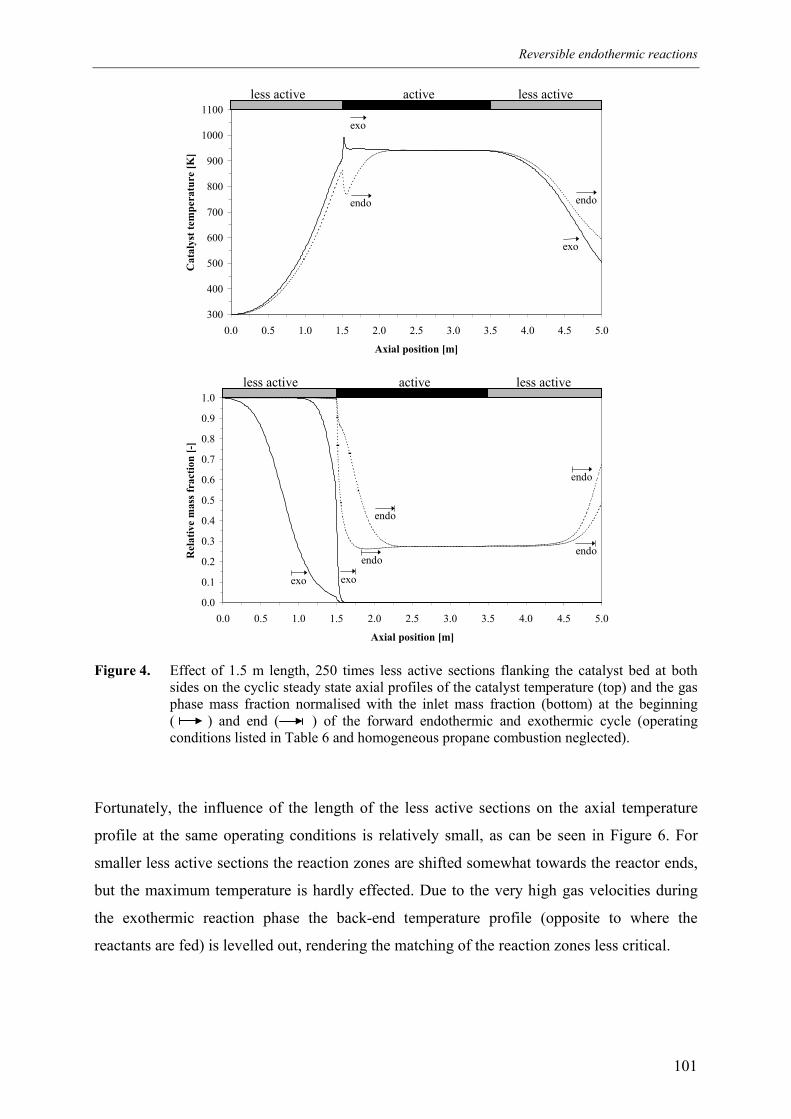
Reversible endothermic reactions
101
300
400
500
600
700
800
900
1000
1100
0.0 0.5 1.0 1.5 2.0 2.5 3.0 3.5 4.0 4.5 5.0
Axial position [m]
Cat
alys
t tem
pera
ture
[K]
exo
endo endo
exo
0.0
0.1
0.2
0.3
0.4
0.5
0.6
0.7
0.8
0.9
1.0
0.0 0.5 1.0 1.5 2.0 2.5 3.0 3.5 4.0 4.5 5.0
Axial position [m]
Rel
ativ
e m
ass f
ract
ion
[-]
exo
endo
exo
endo
endo
endo
Figure 4. Effect of 1.5 m length, 250 times less active sections flanking the catalyst bed at bothsides on the cyclic steady state axial profiles of the catalyst temperature (top) and the gasphase mass fraction normalised with the inlet mass fraction (bottom) at the beginning( ) and end ( ) of the forward endothermic and exothermic cycle (operatingconditions listed in Table 6 and homogeneous propane combustion neglected).
Fortunately, the influence of the length of the less active sections on the axial temperature
profile at the same operating conditions is relatively small, as can be seen in Figure 6. For
smaller less active sections the reaction zones are shifted somewhat towards the reactor ends,
but the maximum temperature is hardly effected. Due to the very high gas velocities during
the exothermic reaction phase the back-end temperature profile (opposite to where the
reactants are fed) is levelled out, rendering the matching of the reaction zones less critical.
less active less activeactive
less active less activeactive
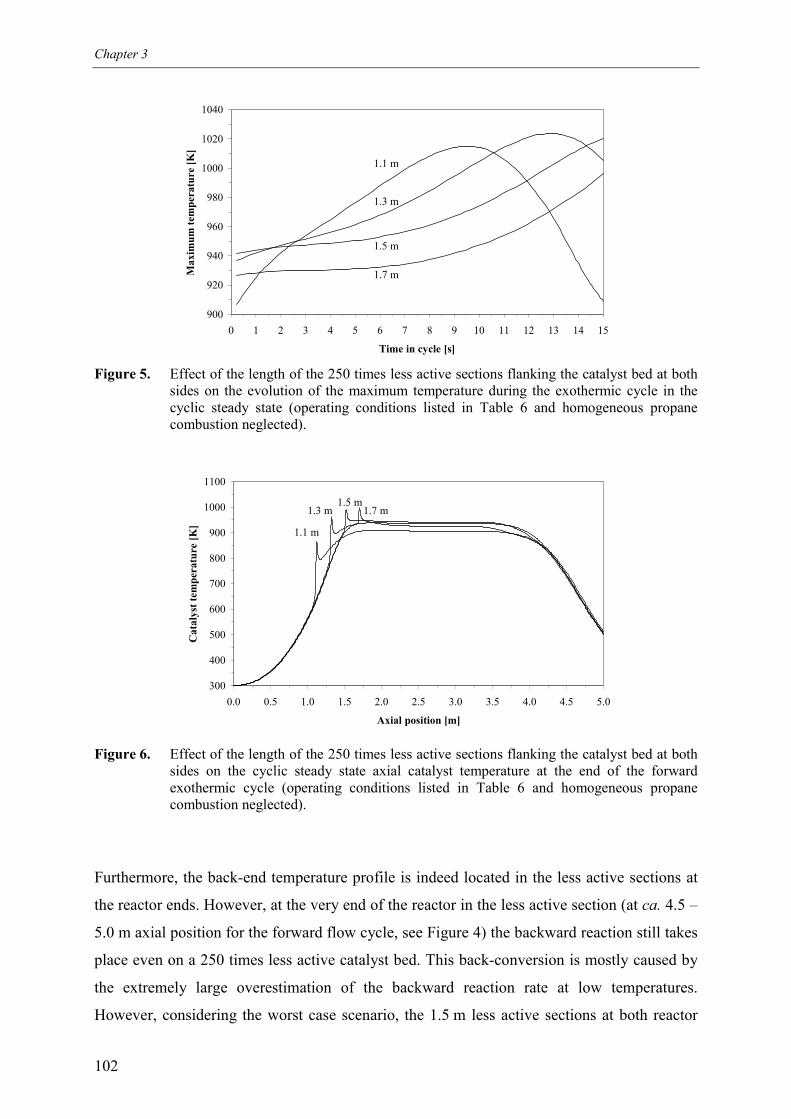
Chapter 3
102
900
920
940
960
980
1000
1020
1040
0 1 2 3 4 5 6 7 8 9 10 11 12 13 14 15
Time in cycle [s]
Max
imum
tem
pera
ture
[K]
1.5 m
1.7 m
1.1 m
1.3 m
Figure 5. Effect of the length of the 250 times less active sections flanking the catalyst bed at bothsides on the evolution of the maximum temperature during the exothermic cycle in thecyclic steady state (operating conditions listed in Table 6 and homogeneous propanecombustion neglected).
300
400
500
600
700
800
900
1000
1100
0.0 0.5 1.0 1.5 2.0 2.5 3.0 3.5 4.0 4.5 5.0
Axial position [m]
Cat
alys
t tem
pera
ture
[K]
1.5 m1.7 m
1.1 m
1.3 m
Figure 6. Effect of the length of the 250 times less active sections flanking the catalyst bed at bothsides on the cyclic steady state axial catalyst temperature at the end of the forwardexothermic cycle (operating conditions listed in Table 6 and homogeneous propanecombustion neglected).
Furthermore, the back-end temperature profile is indeed located in the less active sections at
the reactor ends. However, at the very end of the reactor in the less active section (at ca. 4.5 –
5.0 m axial position for the forward flow cycle, see Figure 4) the backward reaction still takes
place even on a 250 times less active catalyst bed. This back-conversion is mostly caused by
the extremely large overestimation of the backward reaction rate at low temperatures.
However, considering the worst case scenario, the 1.5 m less active sections at both reactor
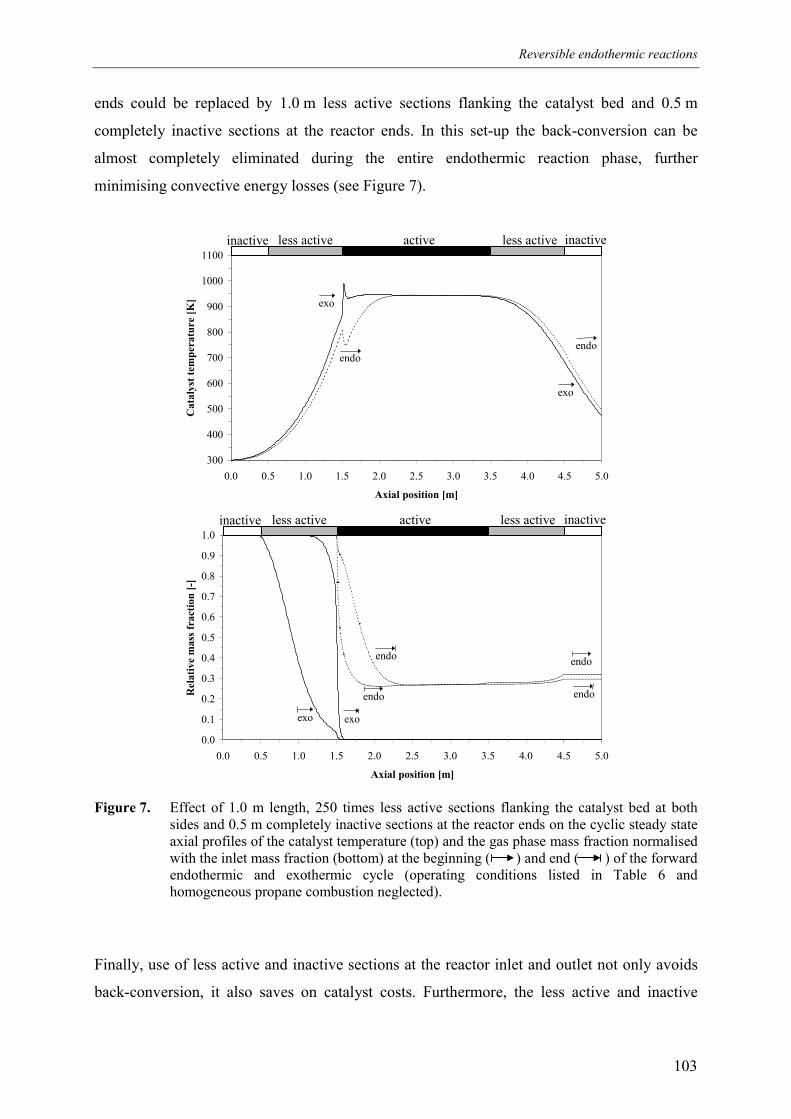
Reversible endothermic reactions
103
ends could be replaced by 1.0 m less active sections flanking the catalyst bed and 0.5 m
completely inactive sections at the reactor ends. In this set-up the back-conversion can be
almost completely eliminated during the entire endothermic reaction phase, further
minimising convective energy losses (see Figure 7).
300
400
500
600
700
800
900
1000
1100
0.0 0.5 1.0 1.5 2.0 2.5 3.0 3.5 4.0 4.5 5.0
Axial position [m]
Cat
alys
t tem
pera
ture
[K] exo
endoendo
exo
0.0
0.1
0.2
0.3
0.4
0.5
0.6
0.7
0.8
0.9
1.0
0.0 0.5 1.0 1.5 2.0 2.5 3.0 3.5 4.0 4.5 5.0
Axial position [m]
Rel
ativ
e m
ass f
ract
ion
[-]
exo
endo
exo
endo endo
endo
Figure 7. Effect of 1.0 m length, 250 times less active sections flanking the catalyst bed at bothsides and 0.5 m completely inactive sections at the reactor ends on the cyclic steady stateaxial profiles of the catalyst temperature (top) and the gas phase mass fraction normalisedwith the inlet mass fraction (bottom) at the beginning ( ) and end ( ) of the forwardendothermic and exothermic cycle (operating conditions listed in Table 6 andhomogeneous propane combustion neglected).
Finally, use of less active and inactive sections at the reactor inlet and outlet not only avoids
back-conversion, it also saves on catalyst costs. Furthermore, the less active and inactive
less active less activeactive inactiveinactive
less active less activeactive inactiveinactive
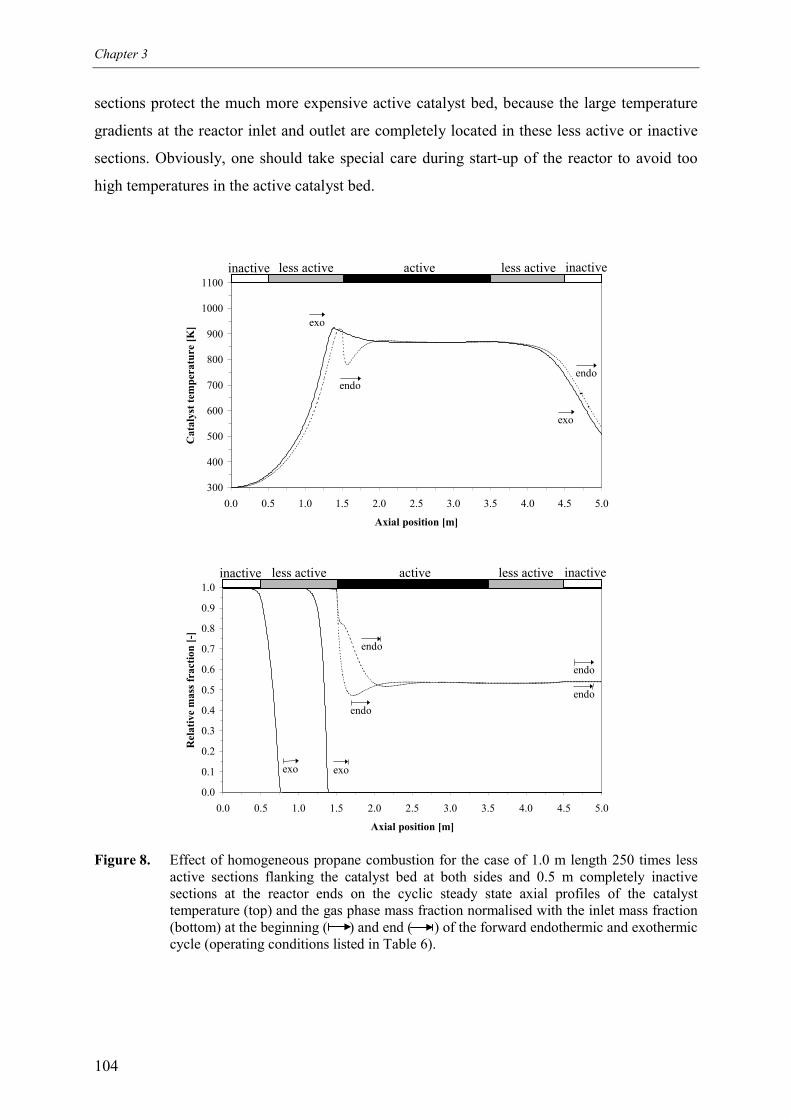
Chapter 3
104
sections protect the much more expensive active catalyst bed, because the large temperature
gradients at the reactor inlet and outlet are completely located in these less active or inactive
sections. Obviously, one should take special care during start-up of the reactor to avoid too
high temperatures in the active catalyst bed.
300
400
500
600
700
800
900
1000
1100
0.0 0.5 1.0 1.5 2.0 2.5 3.0 3.5 4.0 4.5 5.0
Axial position [m]
Cat
alys
t tem
pera
ture
[K] exo
endoendo
exo
0.0
0.1
0.2
0.3
0.4
0.5
0.6
0.7
0.8
0.9
1.0
0.0 0.5 1.0 1.5 2.0 2.5 3.0 3.5 4.0 4.5 5.0
Axial position [m]
Rel
ativ
e m
ass f
ract
ion
[-]
exo
endo
exo
endo
endo
endo
Figure 8. Effect of homogeneous propane combustion for the case of 1.0 m length 250 times lessactive sections flanking the catalyst bed at both sides and 0.5 m completely inactivesections at the reactor ends on the cyclic steady state axial profiles of the catalysttemperature (top) and the gas phase mass fraction normalised with the inlet mass fraction(bottom) at the beginning ( ) and end ( ) of the forward endothermic and exothermiccycle (operating conditions listed in Table 6).
less active less activeactive inactiveinactive
less active less activeactive inactiveinactive
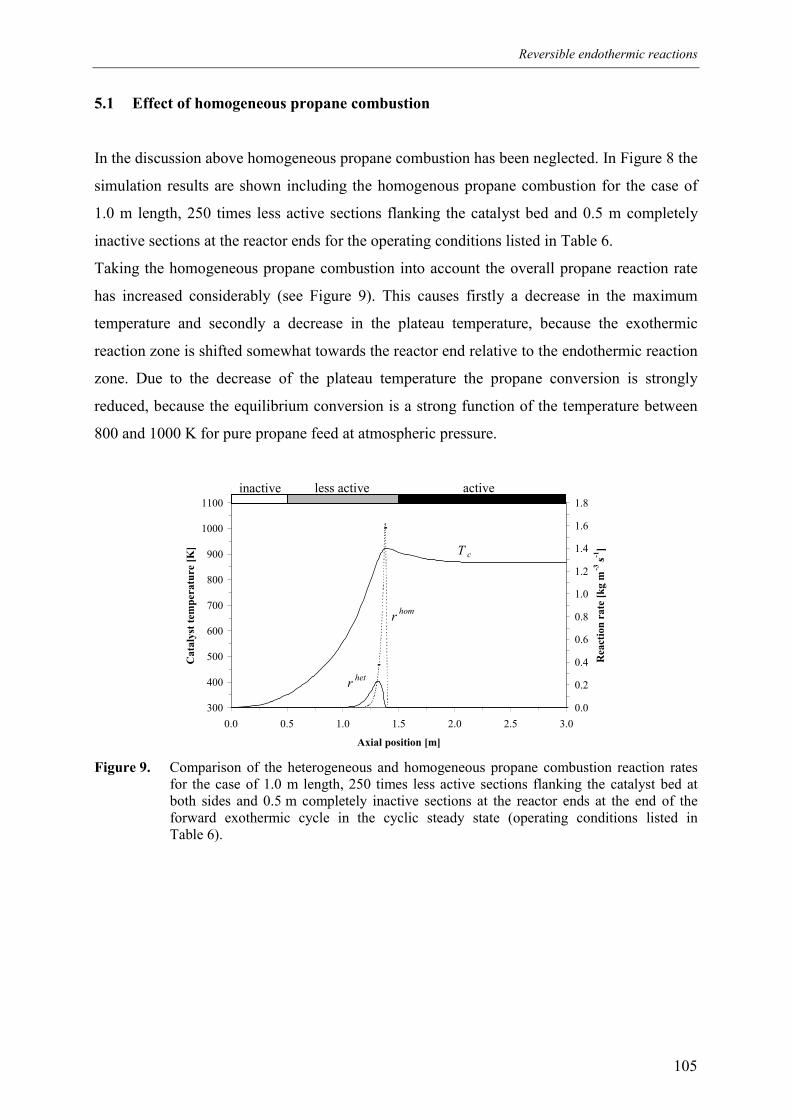
Reversible endothermic reactions
105
5.1 Effect of homogeneous propane combustion
In the discussion above homogeneous propane combustion has been neglected. In Figure 8 the
simulation results are shown including the homogenous propane combustion for the case of
1.0 m length, 250 times less active sections flanking the catalyst bed and 0.5 m completely
inactive sections at the reactor ends for the operating conditions listed in Table 6.
Taking the homogeneous propane combustion into account the overall propane reaction rate
has increased considerably (see Figure 9). This causes firstly a decrease in the maximum
temperature and secondly a decrease in the plateau temperature, because the exothermic
reaction zone is shifted somewhat towards the reactor end relative to the endothermic reaction
zone. Due to the decrease of the plateau temperature the propane conversion is strongly
reduced, because the equilibrium conversion is a strong function of the temperature between
800 and 1000 K for pure propane feed at atmospheric pressure.
300
400
500
600
700
800
900
1000
1100
0.0 0.5 1.0 1.5 2.0 2.5 3.0
Axial position [m]
Cat
alys
t tem
pera
ture
[K]
0.0
0.2
0.4
0.6
0.8
1.0
1.2
1.4
1.6
1.8
Rea
ctio
n ra
te [k
g m
-3 s-1
]
r het
r hom
T c
Figure 9. Comparison of the heterogeneous and homogeneous propane combustion reaction ratesfor the case of 1.0 m length, 250 times less active sections flanking the catalyst bed atboth sides and 0.5 m completely inactive sections at the reactor ends at the end of theforward exothermic cycle in the cyclic steady state (operating conditions listed inTable 6).
less active activeinactive
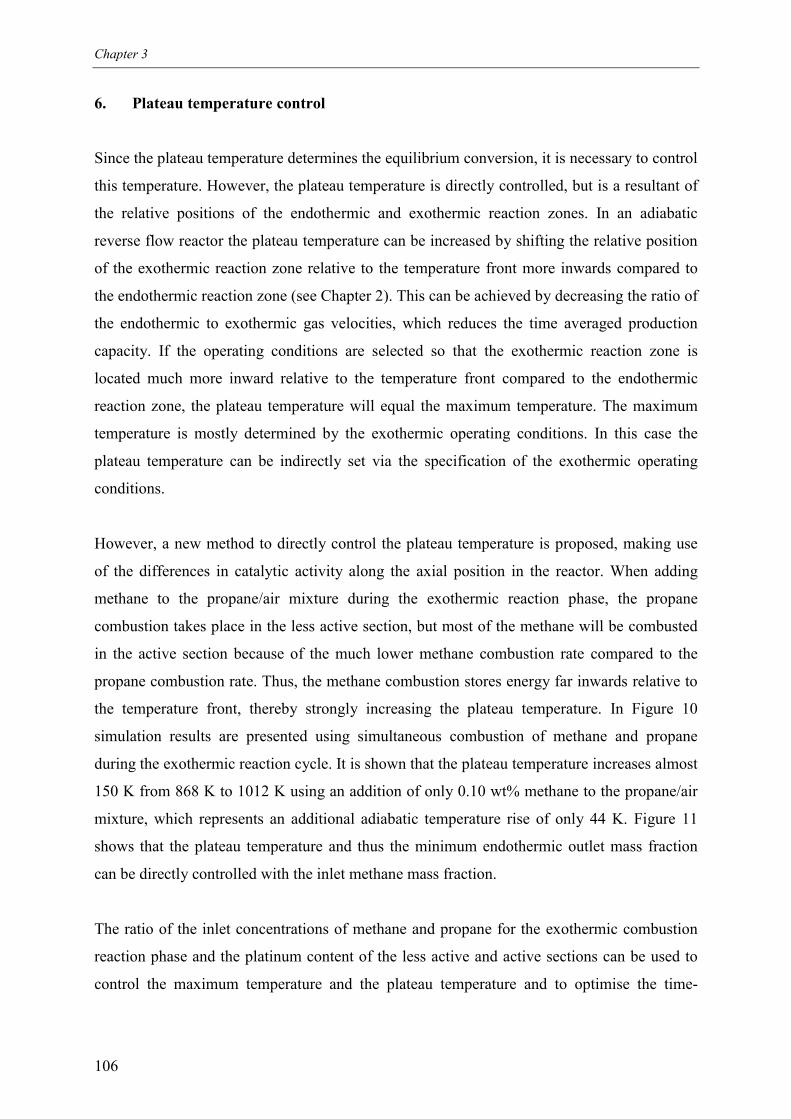
Chapter 3
106
6. Plateau temperature control
Since the plateau temperature determines the equilibrium conversion, it is necessary to control
this temperature. However, the plateau temperature is directly controlled, but is a resultant of
the relative positions of the endothermic and exothermic reaction zones. In an adiabatic
reverse flow reactor the plateau temperature can be increased by shifting the relative position
of the exothermic reaction zone relative to the temperature front more inwards compared to
the endothermic reaction zone (see Chapter 2). This can be achieved by decreasing the ratio of
the endothermic to exothermic gas velocities, which reduces the time averaged production
capacity. If the operating conditions are selected so that the exothermic reaction zone is
located much more inward relative to the temperature front compared to the endothermic
reaction zone, the plateau temperature will equal the maximum temperature. The maximum
temperature is mostly determined by the exothermic operating conditions. In this case the
plateau temperature can be indirectly set via the specification of the exothermic operating
conditions.
However, a new method to directly control the plateau temperature is proposed, making use
of the differences in catalytic activity along the axial position in the reactor. When adding
methane to the propane/air mixture during the exothermic reaction phase, the propane
combustion takes place in the less active section, but most of the methane will be combusted
in the active section because of the much lower methane combustion rate compared to the
propane combustion rate. Thus, the methane combustion stores energy far inwards relative to
the temperature front, thereby strongly increasing the plateau temperature. In Figure 10
simulation results are presented using simultaneous combustion of methane and propane
during the exothermic reaction cycle. It is shown that the plateau temperature increases almost
150 K from 868 K to 1012 K using an addition of only 0.10 wt% methane to the propane/air
mixture, which represents an additional adiabatic temperature rise of only 44 K. Figure 11
shows that the plateau temperature and thus the minimum endothermic outlet mass fraction
can be directly controlled with the inlet methane mass fraction.
The ratio of the inlet concentrations of methane and propane for the exothermic combustion
reaction phase and the platinum content of the less active and active sections can be used to
control the maximum temperature and the plateau temperature and to optimise the time-
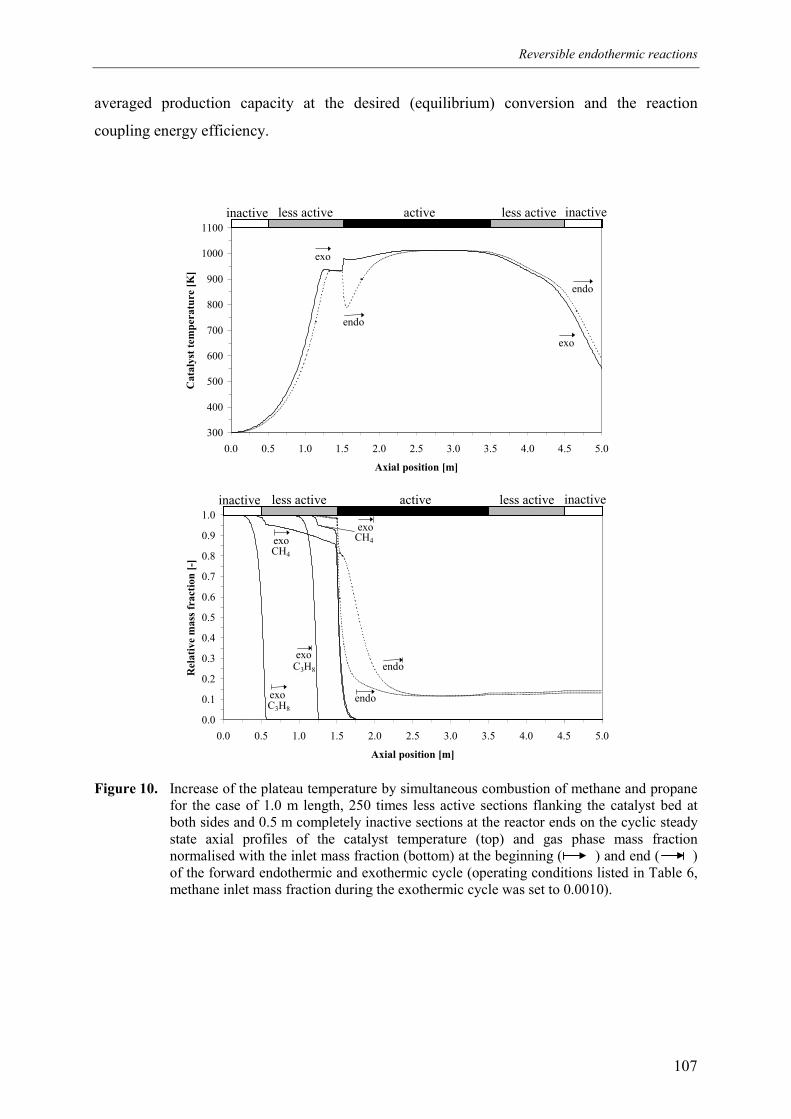
Reversible endothermic reactions
107
averaged production capacity at the desired (equilibrium) conversion and the reaction
coupling energy efficiency.
300
400
500
600
700
800
900
1000
1100
0.0 0.5 1.0 1.5 2.0 2.5 3.0 3.5 4.0 4.5 5.0
Axial position [m]
Cat
alys
t tem
pera
ture
[K]
exo
endo
endo
exo
0.0
0.1
0.2
0.3
0.4
0.5
0.6
0.7
0.8
0.9
1.0
0.0 0.5 1.0 1.5 2.0 2.5 3.0 3.5 4.0 4.5 5.0
Axial position [m]
Rel
ativ
e m
ass f
ract
ion
[-]
endo
endo
exoC3H8
exoC3H8
exoCH4
exoCH4
Figure 10. Increase of the plateau temperature by simultaneous combustion of methane and propanefor the case of 1.0 m length, 250 times less active sections flanking the catalyst bed atboth sides and 0.5 m completely inactive sections at the reactor ends on the cyclic steadystate axial profiles of the catalyst temperature (top) and gas phase mass fractionnormalised with the inlet mass fraction (bottom) at the beginning ( ) and end ( )of the forward endothermic and exothermic cycle (operating conditions listed in Table 6,methane inlet mass fraction during the exothermic cycle was set to 0.0010).
less active less activeactive inactiveinactive
less active less activeactive inactiveinactive
Chapter 3
108
800
850
900
950
1000
1050
1100
0.0000 0.0002 0.0004 0.0006 0.0008 0.0010
Methane mass fraction [-]
Plat
eau
tem
pera
ture
[K]
0.0
0.1
0.2
0.3
0.4
0.5
0.6
min
imum
end
othe
rmic
ou
tlet m
ass f
ract
ion
[-]
Figure 11. Effect of the methane inlet mass fraction on the cyclic steady state plateau temperatureand minimum endothermic outlet mass fraction using simultaneous combustion ofmethane and propane during the exothermic reaction phase for the case of 1.0 m length,250 times less active sections flanking the catalyst bed at both sides and 0.5 m completelyinactive sections at the reactor ends (operating conditions listed in Table 6).
7. Summary and conclusions
The novel reactor concept for highly endothermic reactions at elevated temperatures with
possible rapid catalyst deactivation, based on the indirect coupling of endothermic and
exothermic reactions in reverse flow in the sequential reactor configuration, has been
extended for reversible endothermic reactions. Using a detailed simulation model it has been
shown that for the propane dehydrogenation/methane combustion reaction system in a
platinum-based monolithic catalyst, considering a worst case scenario for the kinetics, most of
the propane conversion is lost at the end of the reactor due to low exit temperatures resulting
from the reverse flow concept. Due to the exothermicity of the propylene hydrogenation the
temperatures at the reactor outlet could increase, reducing this ‘back-conversion’, but
increasing convective energy losses. Full conversion and recuperative heat exchange cannot
be combined for reversible reactions in a reactor filled entirely with active catalyst.
It has been demonstrated that positioning inactive sections flanking the catalyst bed at both
reactor ends can reduce this back-conversion or convective energy losses. However, the back-
conversion cannot be avoided completely. Furthermore, at the transition between the inactive
and active sections large temperature peaks are formed, largely exceeding the maximum
allowable temperature, at least for relatively fast combustion reactions.
Reversible endothermic reactions
109
For the sequential reactor configuration effective use can be made of the movement of the
temperature fronts enabling one to separate the exothermic and endothermic reaction zones
spatially, but not relative to the temperature front. Due to the movement of the temperature
front the energy released by the exothermic reactions can be efficiently transferred to the
endothermic reactants although the reaction zones are at different axial positions. The solution
proposed to achieve full equilibrium conversion and recuperative heat exchange
simultaneously and avoiding too high temperatures is to place less active sections flanking the
active catalyst bed and small completely inactive sections at the reactor ends and to use
propane combustion for energy supply. In the less active sections the propane combustion can
take place and the propylene hydrogenation can be sufficiently retarded. Small completely
inactive sections can be placed at the reactor ends to avoid back-conversion where the
temperature decreases to very low temperatures, if the propylene hydrogenation reaction rate
might become significant even on a much less active catalyst section. Furthermore, the
temperature gradients are located completely in the less active or inactive sections, protecting
the active catalyst bed. Finally, adding methane to the propane/air feed during the exothermic
reaction cycle allows direct control of the plateau temperature and thus the propane
conversion during the endothermic reaction cycle.
Acknowledgements
The author wishes to thank H.A.R. Scholts for his valuable contribution to the modelling
work. The financial support by the Netherlands Organization for Scientific Research
(N.W.O.) is gratefully acknowledged.
Notation
av specific external catalyst surface area [m2·m-3]
Cp heat capacity [J·kg-1·K-1]
CA,g gas phase concentration of component A (A
gAg
M,ωρ
= )
dpore,wc average pore diameter in the washcoat [m]
Deff effective diffusion coefficient [m2·s-1]
Chapter 3
110
Dij binary diffusion coefficient [m2·s-1]
DK Knudsen diffusion coefficient [m2·s-1]
fc fraction of the washcoat distributed in the channel corners [-]
∆Gr reaction free enthalpy [J·kg-1]
h external heat transfer coefficient [J·m-2·K-1·s-1]
∆hr reaction enthalpy [J·kg-1]
Eact activation energy [J·mole-1]
k reaction rate constant
kI pseudo first order reaction rate constant [s-1]
kr,∞ pre-exponential reaction rate constant [m·s-1]
kr,I,∞ pre-exponential pseudo first order heterogeneous reaction rate constant [m·s-1]
kr,II,∞ pre-exponential pseudo second order heterogeneous reaction rate constant
[m4·mole-1·s-1]
kx external mass transfer coefficient [m·s-1]
Kp thermodynamic equilibrium constant [atm]
M molar mass [kg·mole-1]
nc total number of components [-]
p pressure [Pa]
p parameter in the calculation of the propane dehydrogenation reaction rate
q parameter in the calculation of the propane dehydrogenation reaction rate
kinAR , reaction rate of component A without mass transfer limitations [mole·m-2·s-1]
hetAr production rate of component A by heterogeneous reactions [kg·m-2·s-1]homAr production rate of component A by homogeneous reactions [kg·m-3·s-1]
R gas constant [J·mole-1·K-1]
SBET total internal and external specific catalyst surface area [m2·kg-1]
∆t cycle time [s]
T temperature [K]
∆Tad adiabatic temperature difference [K]
vz,g axial interstitial gas velocity [m·s-1]
w heat front velocity [m·s-1]
x mole fraction [mole·mole-1]
Reversible endothermic reactions
111
Greek letters
wcδ washcoat thickness [m]
ε monolith porosity [m3·m-3]
wcε washcoat porosity [m3·m-3]
η catalyst efficiency [-]
λ conductivity [J·m-1·K-1·s-1]
effλ effective heat dispersivity [J·m-1·K-1·s-1] ( ( ) ( )v
gpinmc ha
C 2,,1
Φλε
′′+−= )
ρ density [kg·m-3]
τwc washcoat tortuosity [-]
mΦ ′′ mass flux [kg·m-2·s-1]
Ptψ platinum loading in the washcoat [%]
ω mass fraction [kg·kg-1]
Subscripts
A, B, C component A, B, C
avg average
c catalyst phase
g gas phase
i component i
in at the inlet
max maximum
MC methane combustion
min minimum
ov overall
PC propane combustion
PD propane dehydrogenation
wc washcoat
Chapter 3
112
Superscripts
endo endothermic reaction phase
exo exothermic reaction phase
het heterogeneous reactions
hom homogeneous reactions
Dimensionless numbers
Θ Maximum temperature number (ingingvreff
inginmr
Takh
,,,
,2,
2)(
ρλωΦ∆
∞
′′−= )
Bix Biot number for mass transport (wceff
wcx
Dk
,
δ= )
Φwc washcoat Thiele modulus (wceff
Iwc D
k
,
δ= )
Symbols
→ forward flow
← backward flow
→ forward flow, at the beginning of the cycle
→ forward flow, at the end of the cycle
← backward flow, at the beginning of the cycle
← backward flow, at the end of the cycle
Reversible endothermic reactions
113
References
Dryer, F.L. and Glassman, I. (1973). High Temperature oxidation of CO and CH4. 14th
Symposium (international) on combustion, 987
Froment, G.F. (1990). Reversed flow operation of fixed bed catalytic reactors. In Matros, Yu.
Sh. (Ed.) Unsteady state processes in catalysis, VSP, Utrecht, The Netherlands, 57-89
Hayes, R.E., Kolaczkowski, S.T. (1997). Introduction to catalytic combustion. Gordon and
Breach Science Publishers, Singapore
Hiam, L., Wise, H. and Chaikin, S. (1968). Catalytic oxidation of hydrocarbons on platinum.
J. Catalysis, 9-10, 272-276
Leung, D., Hayes, R.E., and Kolaczkowski, S.T. (1996). Diffusion limitation effects in the
washcoat of a catalytic monolith reactor, Can. J. Chem. Engng, 74, 94-103
Loc, L.C., Gaidai, N.A., Kiperman, S.L., T’huoang, H.S., Podkletnova, N.M. and Kogan, S.B.
(1991). Kinetics of propane dehydrogenation on aluminoplatinum catalysts. Kinetics and
Catalysis, 32, 61-66
Ma, L., Trimm, D.L. and Jiang, C. (1996). The design and testing of an autothermal reator for
the conversion of light hydrocarbons to hydrogen: I. The kinetics of the catalytic oxidation of
light hydrocarbons. Applied Catalysis A: General, 138, 275-283
Reid, R.C., Prausnitz, J.M. and Poling, B.E. (1988). The properties of gases and liquids.
McGraw-Hill Book Company, New York, USA
Trimm, D.L.and Lam, C.-W. (1980). The combustion of methane on platinum-alumina fibre
catalysts – I Kinetics and mechanism. Chem. Engng Sci., 35, 1405-1413
Westbrook, C.K. and Dryer, F.L. (1981). Simplified reaction mechanisms for the oxidation of
hydrocarbon fuels in flames. Combustion Science and Technology, 27, 31-43
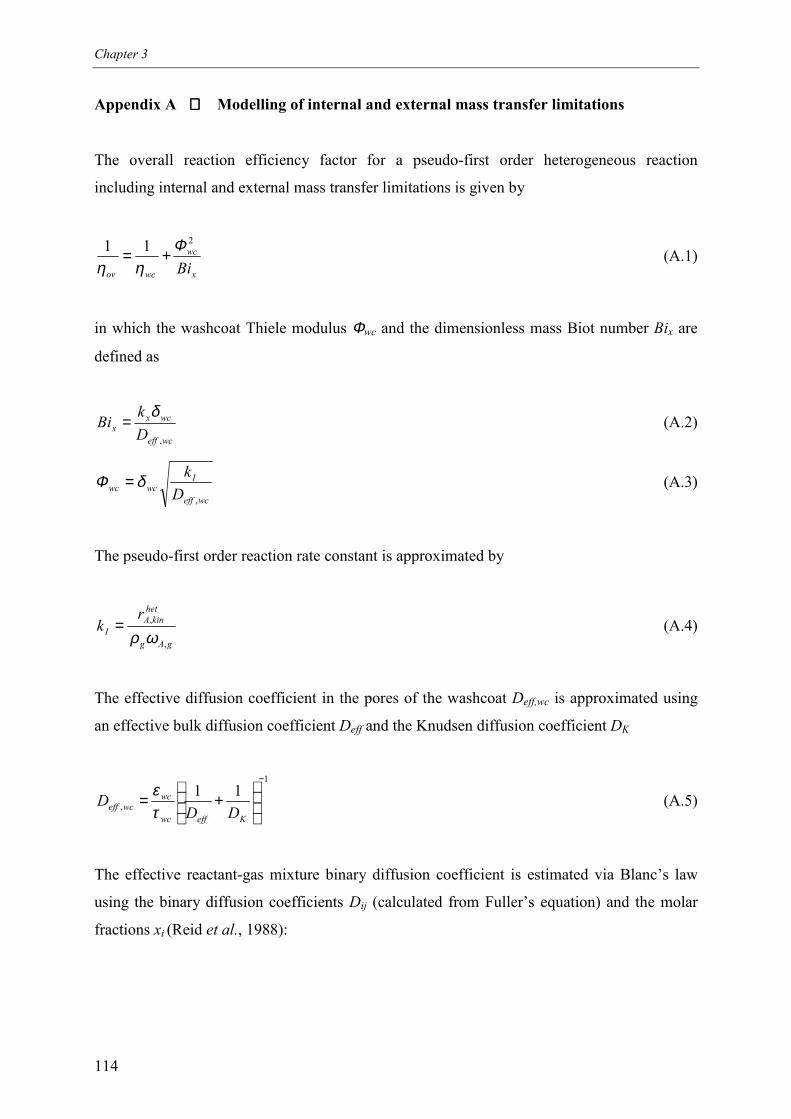
Chapter 3
114
Appendix A Modelling of internal and external mass transfer limitations
The overall reaction efficiency factor for a pseudo-first order heterogeneous reaction
including internal and external mass transfer limitations is given by
x
wc
wcov Bi
211 Φηη
+= (A.1)
in which the washcoat Thiele modulus Φwc and the dimensionless mass Biot number Bix are
defined as
wceff
wcxx D
kBi,
δ= (A.2)
wceff
Iwcwc D
k
,
δΦ = (A.3)
The pseudo-first order reaction rate constant is approximated by
gAg
hetkinA
I
rk
,
,
ωρ= (A.4)
The effective diffusion coefficient in the pores of the washcoat Deff,wc is approximated using
an effective bulk diffusion coefficient Deff and the Knudsen diffusion coefficient DK
1
,11
−
+=
Keffwc
wcwceff DD
Dτε (A.5)
The effective reactant-gas mixture binary diffusion coefficient is estimated via Blanc’s law
using the binary diffusion coefficients Dij (calculated from Fuller’s equation) and the molar
fractions xi (Reid et al., 1988):
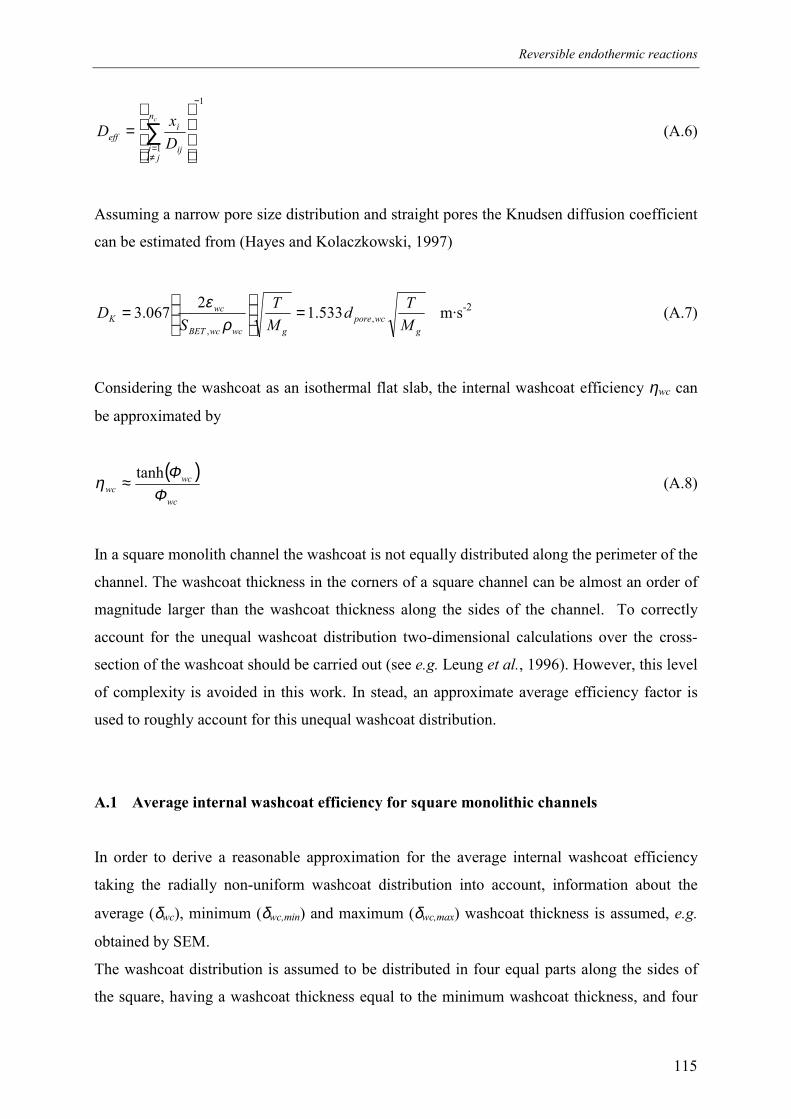
Reversible endothermic reactions
115
1
1
−
≠=
= ∑
cn
jij ij
ieff D
xD (A.6)
Assuming a narrow pore size distribution and straight pores the Knudsen diffusion coefficient
can be estimated from (Hayes and Kolaczkowski, 1997)
gwcpore
gwcwcBET
wcK M
TdMT
SD ,
,
533.12067.3 =
=
ρε m·s-2 (A.7)
Considering the washcoat as an isothermal flat slab, the internal washcoat efficiency ηwc can
be approximated by
( )wc
wcwc Φ
Φη tanh≈ (A.8)
In a square monolith channel the washcoat is not equally distributed along the perimeter of the
channel. The washcoat thickness in the corners of a square channel can be almost an order of
magnitude larger than the washcoat thickness along the sides of the channel. To correctly
account for the unequal washcoat distribution two-dimensional calculations over the cross-
section of the washcoat should be carried out (see e.g. Leung et al., 1996). However, this level
of complexity is avoided in this work. In stead, an approximate average efficiency factor is
used to roughly account for this unequal washcoat distribution.
A.1 Average internal washcoat efficiency for square monolithic channels
In order to derive a reasonable approximation for the average internal washcoat efficiency
taking the radially non-uniform washcoat distribution into account, information about the
average (δwc), minimum (δwc,min) and maximum (δwc,max) washcoat thickness is assumed, e.g.
obtained by SEM.
The washcoat distribution is assumed to be distributed in four equal parts along the sides of
the square, having a washcoat thickness equal to the minimum washcoat thickness, and four
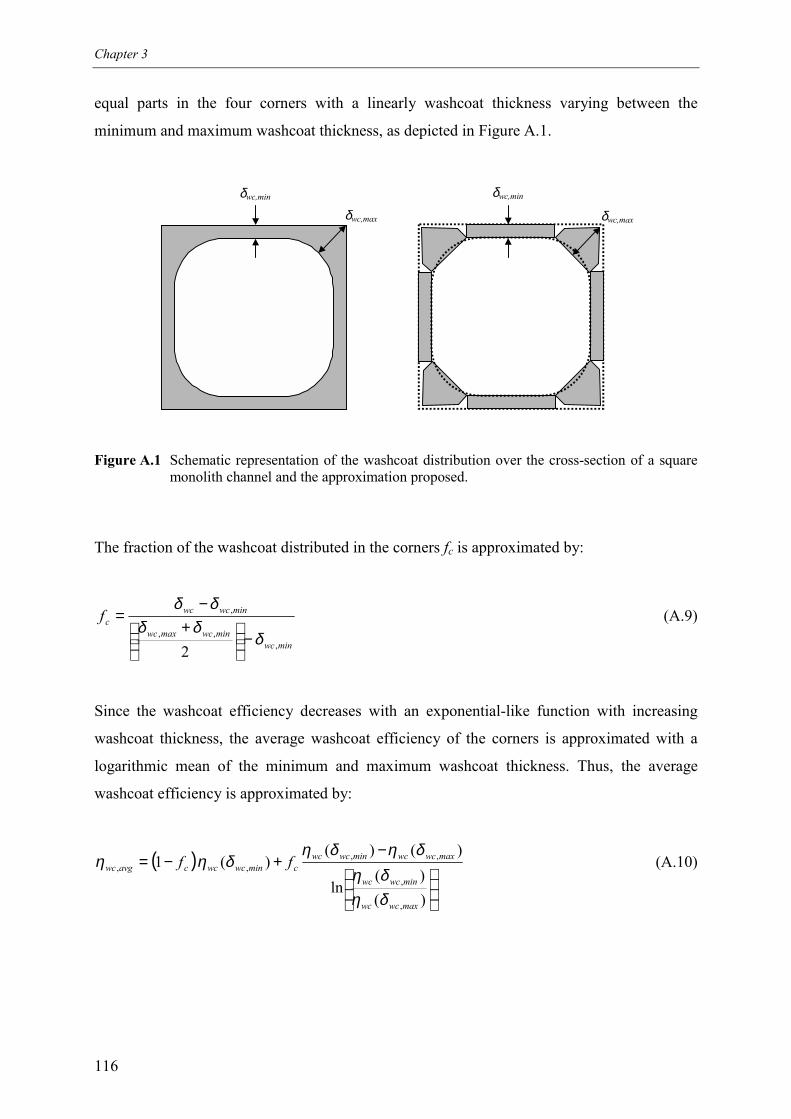
Chapter 3
116
equal parts in the four corners with a linearly washcoat thickness varying between the
minimum and maximum washcoat thickness, as depicted in Figure A.1.
Figure A.1 Schematic representation of the washcoat distribution over the cross-section of a squaremonolith channel and the approximation proposed.
The fraction of the washcoat distributed in the corners fc is approximated by:
minwcminwcmaxwc
minwcwccf
,,,
,
2δ
δδδδ
−
+−
= (A.9)
Since the washcoat efficiency decreases with an exponential-like function with increasing
washcoat thickness, the average washcoat efficiency of the corners is approximated with a
logarithmic mean of the minimum and maximum washcoat thickness. Thus, the average
washcoat efficiency is approximated by:
( )
−
+−=
)()(
ln
)()()(1
,
,
,,,,
maxwcwc
minwcwc
maxwcwcminwcwccminwcwccavgwc ff
δηδη
δηδηδηη (A.10)
δwc,min
δwc,max
δwc,min
δwc,max
117
CHAPTER 4
PROPANE DEHYDROGENATION
REACTION KINETICS
OVER A MONOLITHIC
PLATINUM ALUMINA CATALYST
Chapter 4
118
Abstract
The propane dehydrogenation and propylene hydrogenation reaction kinetics on a monolithic
Pt/γ-Al2O3 catalyst have been experimentally investigated in a differentially operated reactor.
The same catalyst sample was used for many experiments consisting of reduction,
(de)hydrogenation and TPO, in order to simulate the reaction conditions in a Reaction
Coupling Reverse Flow Reactor and to correct the measured reaction rates for the decrease
in catalytic activity caused by sintering and destruction of the most active sites or decrease in
platinum dispersion, via interpolation of the catalytic activity of standard experiments. The
propane dehydrogenation and propylene hydrogenation reaction rates typically decrease
during the course of an experiment, due to the formation of carbonaceous deposits on the
active sites. Although the extent of and the rate at which the catalytic activity decreases
depends on the operating conditions prior to and during the experiments, the reaction rates
reached an asymptotic steady state value after about half an hour. These pseudo steady state
reaction rates of the propane dehydrogenation and propylene hydrogenation have been
determined as a function of temperature and composition over wide temperature and
concentration ranges. From the selectivity data information about the kinetics of the most
important gas phase side reactions, viz. propane cracking and propane and propylene
hydrogenolysis, was extracted.
For the reaction rates of the propane dehydrogenation and hydrogenolysis at higher
temperatures, the propane cracking and the propylene hydrogenolysis reaction orders for
hydrogen were observed corresponding to the reaction stoichiometry. However, the propane
dehydrogenation and hydrogenolysis at lower temperatures and the propylene hydrogenation
show a remarkable additional order in the hydrogen concentration. This was interpreted by
assuming that the reactions can take place at two different surface sites, platinum surface
sites and acid alumina surface sites, where the reactions taking place at the platinum surface
sites have a supplementary order in the hydrogen concentration. It has been shown that the
additional hydrogen order can be explained by the influence of hydrogen on the number of
free surface sites not covered with carbonaceous deposits.
Reaction rate expressions based on the above assumption were capable of describing the
experimentally observed remarkable influences of temperature and composition on the
pseudo-steady state reaction rates for reaction mixtures whose composition strongly deviates
from the equilibrium composition. However, a necessary adjustment has been included to
predict the thermodynamic equilibrium correctly.
Propane dehydrogenation reaction kinetics
119
1. Introduction
The highly endothermic non-oxidative heterogeneously catalysed propane dehydrogenation is
carried out at high temperatures (550-650 °C) because of thermodynamic constraints.
However, at high temperatures carbonaceous site-products, collectively termed coke, are
formed at the catalyst surface, necessitating catalyst regeneration. A new multifunctional
reactor is developed, where the propane dehydrogenation reaction, energy supply at high
temperatures, catalyst regeneration and recuperative heat exchange are all integrated in one
apparatus. In this ‘Reaction Coupling Reverse Flow Reactor’ (RCRFR) endothermic propane
dehydrogenation reaction phases are alternated by fuel combustion reaction phases, where the
fixed catalyst is used as an energy store, indirectly coupling the reaction enthalpies of the
endothermic and exothermic reactions. During the endothermic propane dehydrogenation
reaction phase energy is withdrawn from the catalyst cooling down the catalyst and
simultaneously coke is deposited on the catalyst surface. During a consecutive exothermic
fuel combustion process step the catalyst is reheated and concurrently regenerated by burning
off the coke. Furthermore, by periodically alternating the gas flow direction through the
catalyst material the reactants can be fed to the reactor without any pre-heating, while still
high temperatures prevail in the centre of the reactor. Via the reverse flow concept
recuperative heat exchange is integrated in the reactor.
In the RCRFR the catalyst is regenerated in situ, which allows the application of a catalyst
with highly active (and expensive) components. For the non-oxidative propane
dehydrogenation the highest reaction rates have been reported for a catalyst with platinum as
the active component and possibly tin added as promotor (a.o. Loc et al., 1991a). In our study
a monolithic catalyst was selected, mainly because of the very high specific external catalyst
surface area per unit reactor volume (maximising catalyst efficiency especially for the desired
high temperatures) while maintaining a pressure drop of about two orders of magnitude lower
than for a bed of particles (Cybulski and Moulijn, 1994). Using a monolithic catalyst, very
high gas velocities can be applied during the combustion process step. This is necessary to
maximise the propylene production capacity, while matching the Damköhler numbers of the
endothermic and exothermic reaction phases which is necessary to utilise the entire catalyst
efficiently (see Chapter 2). Furthermore, the absence of dispersion in the monolithic channels
combined with low temperatures at the reactor inlet and outlet resulting from the reverse flow
Chapter 4
120
concept allows switching between the propane dehydrogenation reaction phase and the
combustion reaction phase without intermediate flushing with nitrogen (see Chapter 6).
Due to the large reaction enthalpies of the propane dehydrogenation step and fuel combustion
step the cycle times for reaction phase switching are relatively short, assuring fast catalyst
regeneration. Subsequently, fast catalyst regeneration allows operation of the endothermic
propane dehydrogenation reaction phase at more severe reaction conditions, because the
shorter the time on stream, the smaller the amount of coke deposited and the larger the
hydrogen to carbon ratio of the coke (Brito et al., 1996), either facilitating the burning of the
coke. Thus, the fast catalyst regeneration allows operation at higher temperatures and lower
hydrogen concentrations with higher equilibrium conversions. This makes the RCRFR a
particularly interesting reactor concept for the propane dehydrogenation reaction, next to
possible large savings on investments for heat exchange equipment thanks to the reverse flow
concept.
However, the allowed increase in the temperature and decrease in the hydrogen concentration
to maximise the propylene production rate (i.e. benefit of fast regeneration), strongly depend
on the reaction rate of the propane dehydrogenation and its side-reactions. The following
issues have to be considered in this respect:
1. The decrease of coke deposition during the endothermic propane dehydrogenation process
step due to the smaller cycle times compared to the increase in coke deposition at higher
temperatures and lower hydrogen concentrations;
2. The extent of the increase in the time-averaged propane dehydrogenation reaction rate
(averaged over an entire propane dehydrogenation reaction cycle) due to operation with a
catalyst, which has just been regenerated, i.e. the time-dependency of the propane
dehydrogenation reaction rate due to coke formation;
3. The extent of the decrease in the propylene selectivity at higher temperatures and the
extent of the increase in the propylene selectivity for lower hydrogen concentrations, i.e.
the extent of the increase in the reaction rates of the propane dehydrogenation compared to
the gas phase side-reactions, especially propane cracking, and propane and propylene
hydrogenolysis. Since the energy released by the combustion of the coke can be effectively
used for the propane dehydrogenation, the coke selectivity is only important, if the propane
feedstock for the propane dehydrogenation is much more expensive than the fuel
Propane dehydrogenation reaction kinetics
121
feedstock. Furthermore, also the total olefin selectivity is important, since ethylene is a
very valuable side-product.
It should be realised that a relatively large increase in the equilibrium conversion can be
achieved with a relatively small temperature increase, because the equilibrium conversion is
strongly temperature dependent in the temperature range of 600 to 700 °C. For undiluted
propane feed the equilibrium conversion of propane to propylene increases from about 50% at
600 °C to 80% at 700 °C. Furthermore, the propylene production rate is optimised through
operation at low hydrogen concentrations, because dilution with hydrogen decreases the
reactor capacity (propane flow rate), equilibrium propane conversion and gas phase propylene
and olefin selectivity, provided that stable operation is possible due to the fast catalyst
regeneration. Moreover, it has been shown that the retardation of the coke formation by
hydrogen strongly decreases at higher temperatures (see Chapter 5).
To determine optimal process conditions information about the reaction rates of the propane
dehydrogenation and propylene hydrogenation and their most important side-reactions, viz.
propane cracking, propane and propylene hydrogenolysis and coke formation, as a function of
temperature and composition and as a function of time on stream, is indispensable.
Furthermore, because of the reverse flow concept a trapezoid axial temperature profile is
established in the cyclic steady state with low temperatures at the reactor inlet and outlet and
high temperatures in the centre of the reactor. The temperature fronts at the reactor inlet and
outlet wander back and forth during the different process steps. Thus, large temperature and
concentration gradients prevail in the RCRFR, so that information about the reaction kinetics
is required over wide temperature and concentration ranges.
Moreover, the propane dehydrogenation is an endothermic equilibrium reaction and due the
low exit temperatures the equilibrium can be shifted towards the reactant side at the reactor
outlet. How this ‘back-conversion’ can be counteracted by positioning less active and
possibly also inactive catalyst material at the reactor inlet and outlet has been discussed in
Chapter 3. To investigate the extent of the back-conversion and the optimal catalyst
concentration profile also information about the propylene hydrogenation rate as a function of
temperature and composition over wide temperature and concentration ranges is required.
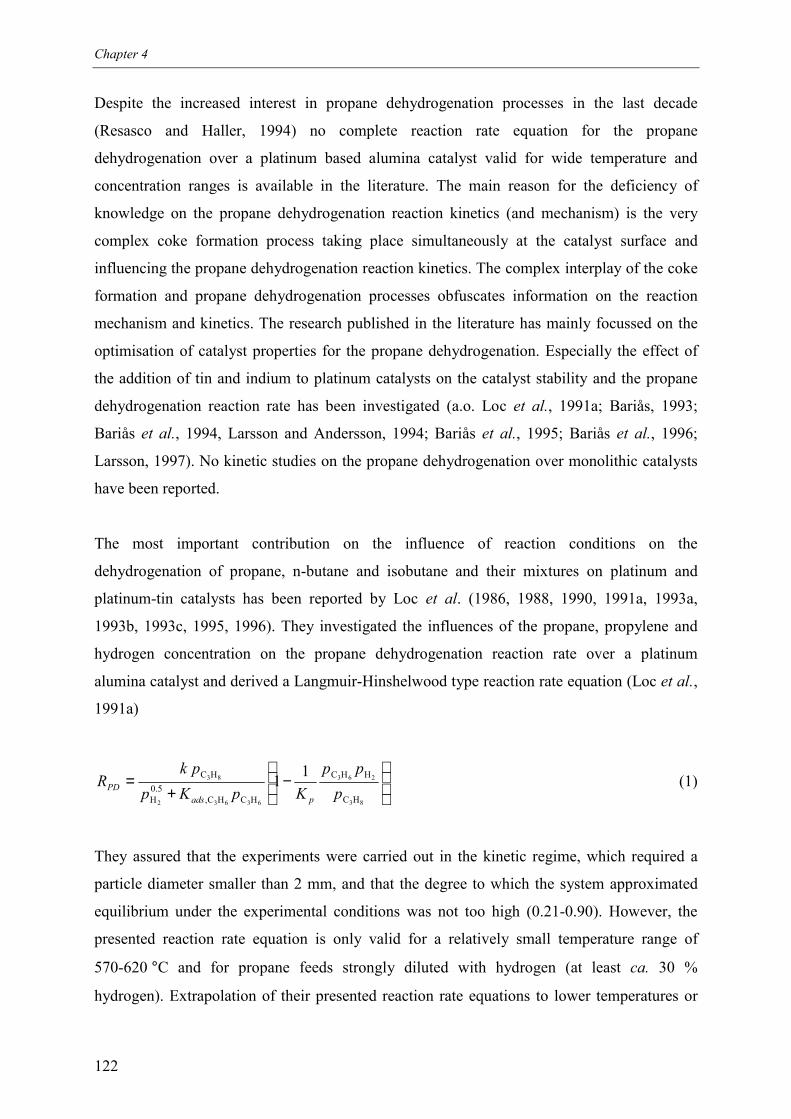
Chapter 4
122
Despite the increased interest in propane dehydrogenation processes in the last decade
(Resasco and Haller, 1994) no complete reaction rate equation for the propane
dehydrogenation over a platinum based alumina catalyst valid for wide temperature and
concentration ranges is available in the literature. The main reason for the deficiency of
knowledge on the propane dehydrogenation reaction kinetics (and mechanism) is the very
complex coke formation process taking place simultaneously at the catalyst surface and
influencing the propane dehydrogenation reaction kinetics. The complex interplay of the coke
formation and propane dehydrogenation processes obfuscates information on the reaction
mechanism and kinetics. The research published in the literature has mainly focussed on the
optimisation of catalyst properties for the propane dehydrogenation. Especially the effect of
the addition of tin and indium to platinum catalysts on the catalyst stability and the propane
dehydrogenation reaction rate has been investigated (a.o. Loc et al., 1991a; Bariås, 1993;
Bariås et al., 1994, Larsson and Andersson, 1994; Bariås et al., 1995; Bariås et al., 1996;
Larsson, 1997). No kinetic studies on the propane dehydrogenation over monolithic catalysts
have been reported.
The most important contribution on the influence of reaction conditions on the
dehydrogenation of propane, n-butane and isobutane and their mixtures on platinum and
platinum-tin catalysts has been reported by Loc et al. (1986, 1988, 1990, 1991a, 1993a,
1993b, 1993c, 1995, 1996). They investigated the influences of the propane, propylene and
hydrogen concentration on the propane dehydrogenation reaction rate over a platinum
alumina catalyst and derived a Langmuir-Hinshelwood type reaction rate equation (Loc et al.,
1991a)
−
+=
83
263
63632
83
HC
HHC
HCHC,5.0
H
HC 11p
ppKpKp
pkR
padsPD (1)
They assured that the experiments were carried out in the kinetic regime, which required a
particle diameter smaller than 2 mm, and that the degree to which the system approximated
equilibrium under the experimental conditions was not too high (0.21-0.90). However, the
presented reaction rate equation is only valid for a relatively small temperature range of
570-620 °C and for propane feeds strongly diluted with hydrogen (at least ca. 30 %
hydrogen). Extrapolation of their presented reaction rate equations to lower temperatures or
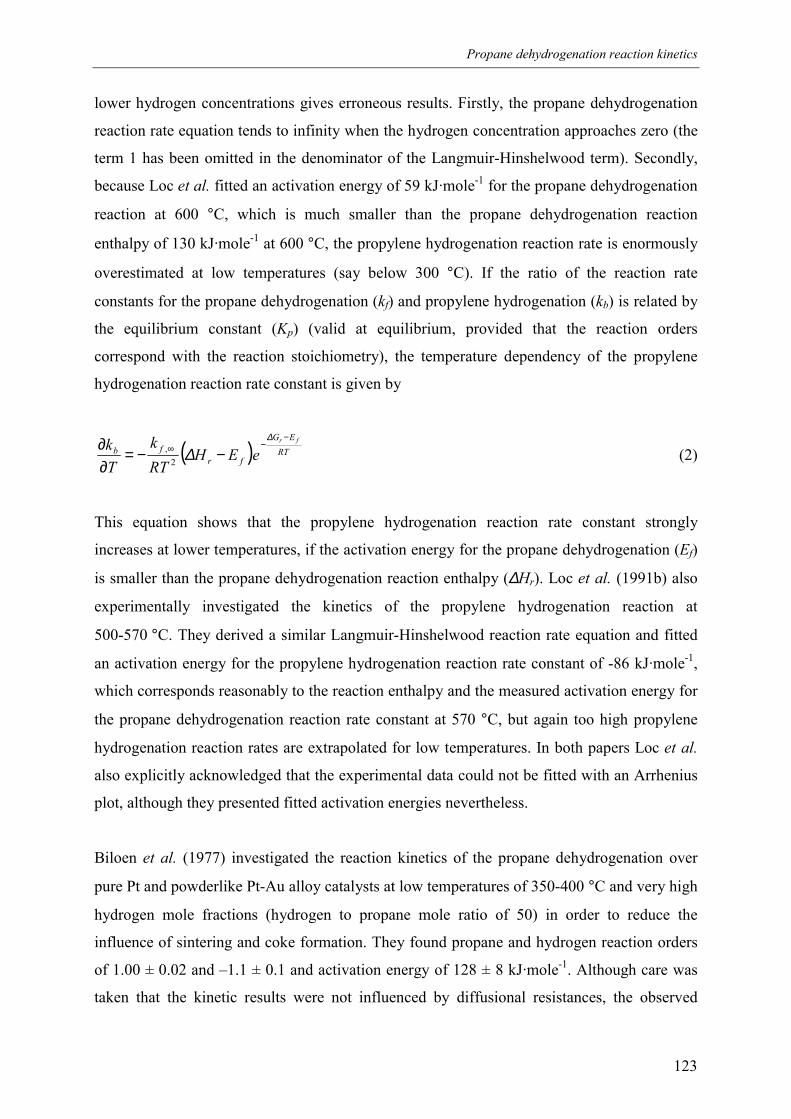
Propane dehydrogenation reaction kinetics
123
lower hydrogen concentrations gives erroneous results. Firstly, the propane dehydrogenation
reaction rate equation tends to infinity when the hydrogen concentration approaches zero (the
term 1 has been omitted in the denominator of the Langmuir-Hinshelwood term). Secondly,
because Loc et al. fitted an activation energy of 59 kJ·mole-1 for the propane dehydrogenation
reaction at 600 °C, which is much smaller than the propane dehydrogenation reaction
enthalpy of 130 kJ·mole-1 at 600 °C, the propylene hydrogenation reaction rate is enormously
overestimated at low temperatures (say below 300 °C). If the ratio of the reaction rate
constants for the propane dehydrogenation (kf) and propylene hydrogenation (kb) is related by
the equilibrium constant (Kp) (valid at equilibrium, provided that the reaction orders
correspond with the reaction stoichiometry), the temperature dependency of the propylene
hydrogenation reaction rate constant is given by
( ) RTEG
frfb
fr
eEHRTk
Tk −
−∞ −−=∂∂ ∆
∆2, (2)
This equation shows that the propylene hydrogenation reaction rate constant strongly
increases at lower temperatures, if the activation energy for the propane dehydrogenation (Ef)
is smaller than the propane dehydrogenation reaction enthalpy (∆Hr). Loc et al. (1991b) also
experimentally investigated the kinetics of the propylene hydrogenation reaction at
500-570 °C. They derived a similar Langmuir-Hinshelwood reaction rate equation and fitted
an activation energy for the propylene hydrogenation reaction rate constant of -86 kJ·mole-1,
which corresponds reasonably to the reaction enthalpy and the measured activation energy for
the propane dehydrogenation reaction rate constant at 570 °C, but again too high propylene
hydrogenation reaction rates are extrapolated for low temperatures. In both papers Loc et al.
also explicitly acknowledged that the experimental data could not be fitted with an Arrhenius
plot, although they presented fitted activation energies nevertheless.
Biloen et al. (1977) investigated the reaction kinetics of the propane dehydrogenation over
pure Pt and powderlike Pt-Au alloy catalysts at low temperatures of 350-400 °C and very high
hydrogen mole fractions (hydrogen to propane mole ratio of 50) in order to reduce the
influence of sintering and coke formation. They found propane and hydrogen reaction orders
of 1.00 ± 0.02 and –1.1 ± 0.1 and activation energy of 128 ± 8 kJ·mole-1. Although care was
taken that the kinetic results were not influenced by diffusional resistances, the observed
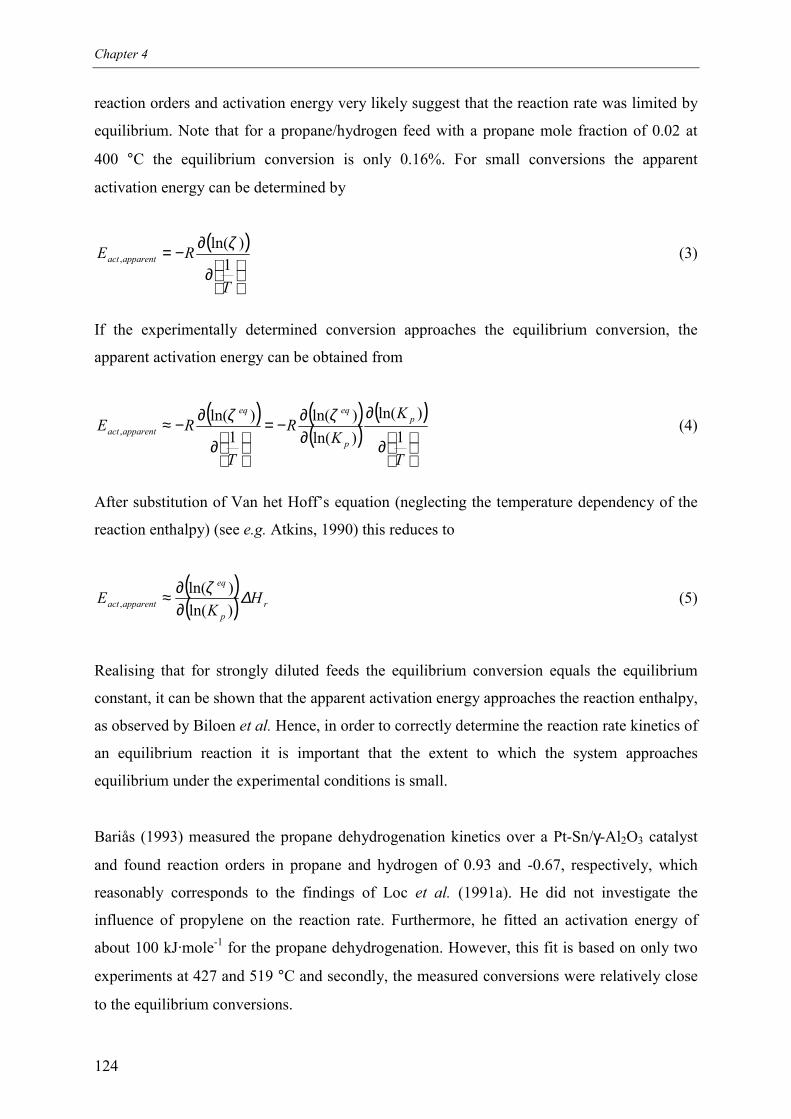
Chapter 4
124
reaction orders and activation energy very likely suggest that the reaction rate was limited by
equilibrium. Note that for a propane/hydrogen feed with a propane mole fraction of 0.02 at
400 °C the equilibrium conversion is only 0.16%. For small conversions the apparent
activation energy can be determined by
( )
∂
∂−=
T
RE apparentact 1)ln(
,ζ (3)
If the experimentally determined conversion approaches the equilibrium conversion, the
apparent activation energy can be obtained from
( ) ( )( )
( )
∂
∂∂∂−=
∂
∂−≈
T
KK
R
T
RE p
p
eqeq
apparentact 1)ln(
)ln()ln(
1)ln(
,ζζ (4)
After substitution of Van het Hoff’s equation (neglecting the temperature dependency of the
reaction enthalpy) (see e.g. Atkins, 1990) this reduces to
( )( ) r
p
eq
apparentact HK
E ∆ζ)ln()ln(
, ∂∂≈ (5)
Realising that for strongly diluted feeds the equilibrium conversion equals the equilibrium
constant, it can be shown that the apparent activation energy approaches the reaction enthalpy,
as observed by Biloen et al. Hence, in order to correctly determine the reaction rate kinetics of
an equilibrium reaction it is important that the extent to which the system approaches
equilibrium under the experimental conditions is small.
Bariås (1993) measured the propane dehydrogenation kinetics over a Pt-Sn/γ-Al2O3 catalyst
and found reaction orders in propane and hydrogen of 0.93 and -0.67, respectively, which
reasonably corresponds to the findings of Loc et al. (1991a). He did not investigate the
influence of propylene on the reaction rate. Furthermore, he fitted an activation energy of
about 100 kJ·mole-1 for the propane dehydrogenation. However, this fit is based on only two
experiments at 427 and 519 °C and secondly, the measured conversions were relatively close
to the equilibrium conversions.
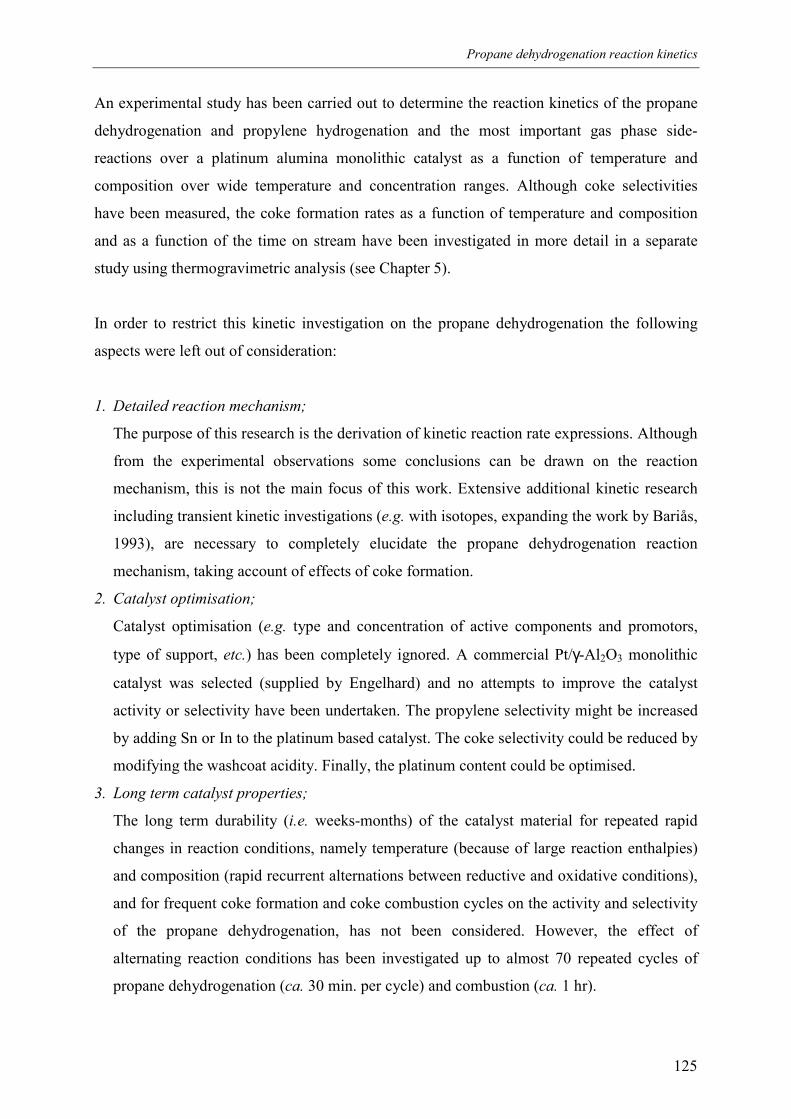
Propane dehydrogenation reaction kinetics
125
An experimental study has been carried out to determine the reaction kinetics of the propane
dehydrogenation and propylene hydrogenation and the most important gas phase side-
reactions over a platinum alumina monolithic catalyst as a function of temperature and
composition over wide temperature and concentration ranges. Although coke selectivities
have been measured, the coke formation rates as a function of temperature and composition
and as a function of the time on stream have been investigated in more detail in a separate
study using thermogravimetric analysis (see Chapter 5).
In order to restrict this kinetic investigation on the propane dehydrogenation the following
aspects were left out of consideration:
1. Detailed reaction mechanism;
The purpose of this research is the derivation of kinetic reaction rate expressions. Although
from the experimental observations some conclusions can be drawn on the reaction
mechanism, this is not the main focus of this work. Extensive additional kinetic research
including transient kinetic investigations (e.g. with isotopes, expanding the work by Bariås,
1993), are necessary to completely elucidate the propane dehydrogenation reaction
mechanism, taking account of effects of coke formation.
2. Catalyst optimisation;
Catalyst optimisation (e.g. type and concentration of active components and promotors,
type of support, etc.) has been completely ignored. A commercial Pt/γ-Al2O3 monolithic
catalyst was selected (supplied by Engelhard) and no attempts to improve the catalyst
activity or selectivity have been undertaken. The propylene selectivity might be increased
by adding Sn or In to the platinum based catalyst. The coke selectivity could be reduced by
modifying the washcoat acidity. Finally, the platinum content could be optimised.
3. Long term catalyst properties;
The long term durability (i.e. weeks-months) of the catalyst material for repeated rapid
changes in reaction conditions, namely temperature (because of large reaction enthalpies)
and composition (rapid recurrent alternations between reductive and oxidative conditions),
and for frequent coke formation and coke combustion cycles on the activity and selectivity
of the propane dehydrogenation, has not been considered. However, the effect of
alternating reaction conditions has been investigated up to almost 70 repeated cycles of
propane dehydrogenation (ca. 30 min. per cycle) and combustion (ca. 1 hr).
Chapter 4
126
Obviously, especially these last two issues need to be addressed when investigating the
economic potential of this new propane dehydrogenation process compared to conventional
processes.
Before presenting and discussing experimental results, first the experimental set-up and the
experimental procedure used to determine the reaction kinetics are described in the next
section.
2. Experimental
In the RCRFR the catalyst changes often and rapidly from reductive to oxidative reaction
conditions because of the rapid switching between the propane dehydrogenation and fuel
combustion reaction phases. In order to investigate the reaction kinetics under comparable
reaction conditions a reactor has been designed to determine reaction kinetics over a
monolithic catalyst, which has endured several (de)hydrogenation and combustion cycles. In
almost all other kinetic research published in the literature a fresh sample of catalyst is used
for each experiment. By using the same monolith piece for many different experiments the
effects of sintering and destruction of the most active sites can be excluded from the effects of
coke formation, as explained below. Due to the open structure of monolithic catalysts with a
large frontal surface area for the gas flow (large gas phase porosity) problems of catalyst
plugging resulting from coke formation do not occur in monoliths, unlike in packed bed
reactors, where plugging can be a serious problem.
First the kinetics-reactor and the experimental set-up are described. Then the experimental
procedure used to determine the reaction kinetics is discussed with special attention for the
time-dependency of the catalyst activity during the propane dehydrogenation because of
sintering and coke formation.
2.1 Experimental set-up
A special reactor was constructed to carry out propane dehydrogenation and propylene
hydrogenation kinetic experiments on a monolithic catalyst in differential operation, i.e. at
low reactant conversion (< 10 %), so that the influence of axial concentration gradients or
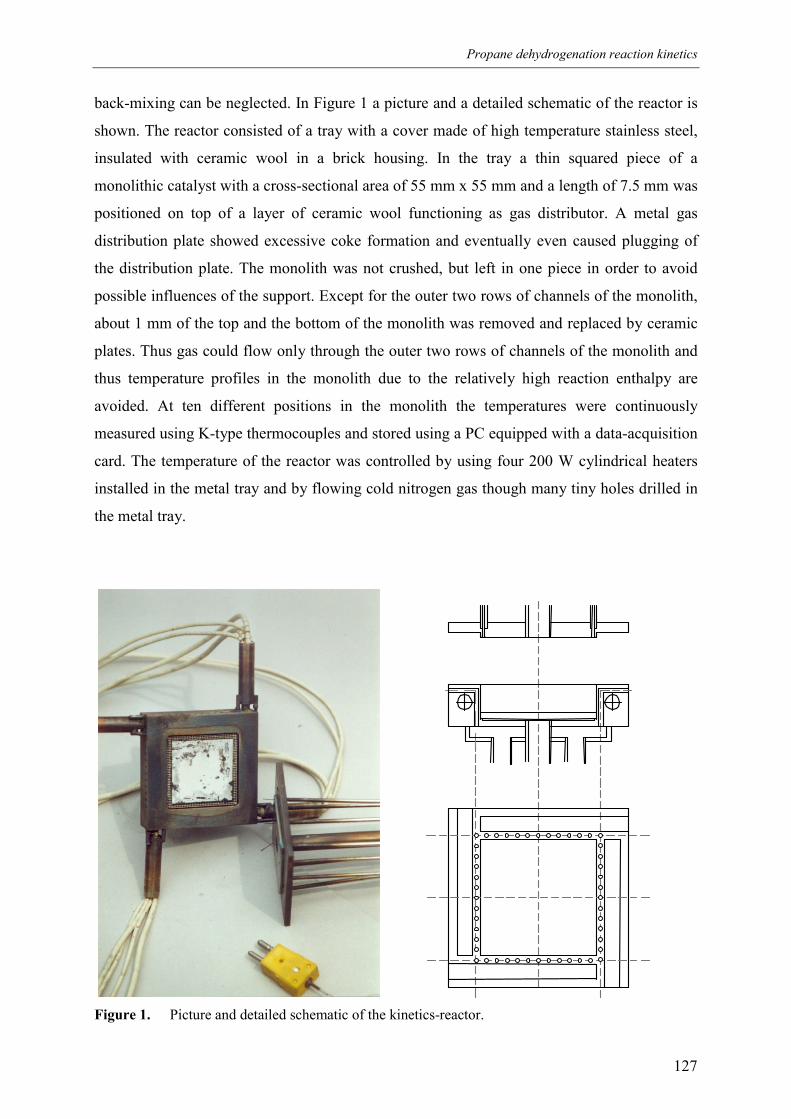
Propane dehydrogenation reaction kinetics
127
back-mixing can be neglected. In Figure 1 a picture and a detailed schematic of the reactor is
shown. The reactor consisted of a tray with a cover made of high temperature stainless steel,
insulated with ceramic wool in a brick housing. In the tray a thin squared piece of a
monolithic catalyst with a cross-sectional area of 55 mm x 55 mm and a length of 7.5 mm was
positioned on top of a layer of ceramic wool functioning as gas distributor. A metal gas
distribution plate showed excessive coke formation and eventually even caused plugging of
the distribution plate. The monolith was not crushed, but left in one piece in order to avoid
possible influences of the support. Except for the outer two rows of channels of the monolith,
about 1 mm of the top and the bottom of the monolith was removed and replaced by ceramic
plates. Thus gas could flow only through the outer two rows of channels of the monolith and
thus temperature profiles in the monolith due to the relatively high reaction enthalpy are
avoided. At ten different positions in the monolith the temperatures were continuously
measured using K-type thermocouples and stored using a PC equipped with a data-acquisition
card. The temperature of the reactor was controlled by using four 200 W cylindrical heaters
installed in the metal tray and by flowing cold nitrogen gas though many tiny holes drilled in
the metal tray.
Figure 1. Picture and detailed schematic of the kinetics-reactor.
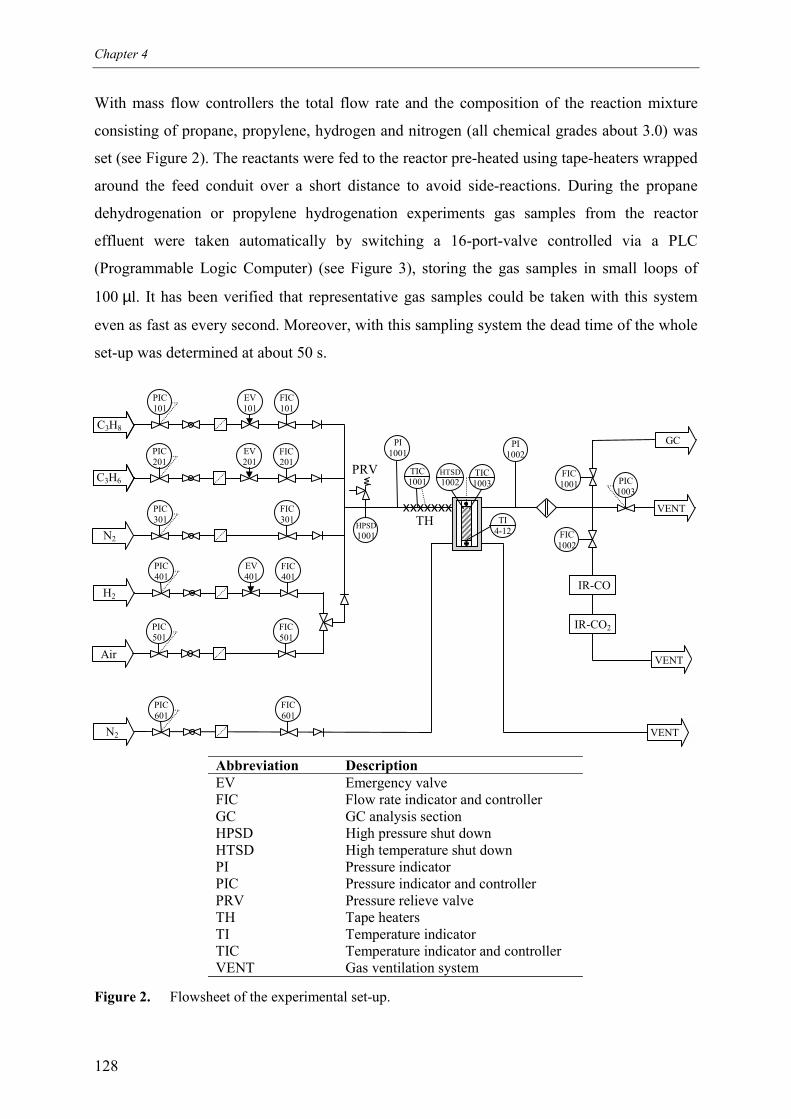
Chapter 4
128
With mass flow controllers the total flow rate and the composition of the reaction mixture
consisting of propane, propylene, hydrogen and nitrogen (all chemical grades about 3.0) was
set (see Figure 2). The reactants were fed to the reactor pre-heated using tape-heaters wrapped
around the feed conduit over a short distance to avoid side-reactions. During the propane
dehydrogenation or propylene hydrogenation experiments gas samples from the reactor
effluent were taken automatically by switching a 16-port-valve controlled via a PLC
(Programmable Logic Computer) (see Figure 3), storing the gas samples in small loops of
100 µl. It has been verified that representative gas samples could be taken with this system
even as fast as every second. Moreover, with this sampling system the dead time of the whole
set-up was determined at about 50 s.
Abbreviation DescriptionEV Emergency valveFIC Flow rate indicator and controllerGC GC analysis sectionHPSD High pressure shut downHTSD High temperature shut downPI Pressure indicatorPIC Pressure indicator and controllerPRV Pressure relieve valveTH Tape heatersTI Temperature indicatorTIC Temperature indicator and controllerVENT Gas ventilation system
Figure 2. Flowsheet of the experimental set-up.
C3H8
C3H6
N2
H2
Air
TIC1001
N2
PI1001
PI1002
HPSD1001
VENT
FIC1001
FIC1002
VENT
VENT
TI4-12
TIC1003
HTSD1002
FIC201
PIC201
EV201
GC
FIC101
PIC101
EV101
FIC301
PIC301
FIC401
PIC401
EV401
FIC501
PIC501
FIC601
PIC601
PIC1003
IR-CO
IR-CO2
PRV
xxxxxxxTH
Propane dehydrogenation reaction kinetics
129
The samples were analysed on a GC-TCD (Gas Chromatograph with a Thermal Conductivity
Detector) using helium (5.0) as carrier gas (see Figure 3). With two columns, a Chrompack
PoraPLOT column (a 50 m fused silica capillary column with a 10 µm Al2O3/Na2SO4
washcoat) and a Molsieve packed column (5A 80-100 Mesh, 2 m * 1/8 inch * 2 mm SS), the
relative concentrations of nitrogen, propane, propylene, ethane, ethylene and methane could
be quantitatively determined in about 25 minutes. With the PLC the analysis of the samples
was carried out automatically over night. Samples with very high propane and very low
propylene concentrations and vice versa could be analysed quantitatively. Due to the very low
conversions and low selectivities the concentrations of ethane, ethylene and methane were
very small (e.g. 1% conversion of a feed consisting of 10% propane in nitrogen and a product
selectivity of 5% results in a product concentrations of about 50 ppm, strongly diluted in
propane and nitrogen). The concentrations of ethane and ethylene could still be determined
with good accuracy, but in some cases the quantitative determination of methane suffered
from larger experimental errors. From the relative concentrations the propane conversion and
product selectivities were calculated. The hydrogen concentration was not measured, but
calculated from overall hydrogen and carbon atom balances over the reactor, taking account
of changes in the gas velocity due to the chemical reactions. For verification the hydrogen
concentration in the effluent was determined with TCD for some experiments, where the
TCD-signal was corrected for the influence of propane and propylene. The calculated
hydrogen concentrations corresponded well with the corrected measured hydrogen
concentrations.
In order to regenerate the catalyst and to determine the amount of coke deposited on the
monolith during the (de)hydrogenation, the set-up was flushed with nitrogen for a few
minutes and subsequently air was introduced into the reactor to burn off the coke. The
concentrations of the formed carbon monoxide and carbon dioxide were determined
continuously by routing part of the reactor effluent to IR-analysers and the data was recorded
automatically on a PC using a data-acquisition card. To avoid too high temperatures at the
catalyst surface, possibly deteriorating the catalyst properties, and too high carbon monoxide
and dioxide concentrations (i.e. above the maximum concentration detectable by the IR-
analysers) during the coke combustion, the reactor was first cooled to about 300 °C before air
was introduced. Under a constant air flow the temperature was increased to about 650 °C. Air
was fed to the reactor until the carbon monoxide and dioxide concentrations approached zero.
Chapter 4
130
Via integration of the sum of the carbon monoxide and carbon dioxide concentrations with
time (using Simpson’s rule) and multiplication with the air flow through the reactor the
amount of coke (carbon) deposited was determined.
The experiments were carried out on a Pt/γ-Al2O3 cordierite monolith (supplied by Engelhard)
with 1.5 g/l Pt dispersed in the washcoat, corresponding to about 1.1 wt% Pt in the washcoat,
under steady state operating conditions at temperatures up to a maximum of about 700 °C and
at pressure slightly above the atmospheric pressure (1.2 bar absolute). The monolith consisted
of squared channels with a hydraulic channel diameter of 0.96 mm, a channel wall thickness
of 0.19 mm and an average washcoat thickness of 37 µm (11-89 µm) (determined by SEM).
The gas residence time was kept constant for all the experiments and equal to 0.074 s,
corresponding to a gas velocity through the monolithic channels of 0.10 m·s-1 and a GHSV of
45000 h-1. For experiments at different temperatures the total gas flow (ca. 30 l·h-1) was
adjusted to achieve the same gas residence time. A GHSV of 45000 h-1 can be considered
very large in comparison with other kinetic research reported in literature for the non-
oxidative propane dehydrogenation; e.g. Loc et al. (1991a) used a GHSV of 400-8000 h-1,
Babenkova et al. (1994) 2000 h-1 and Bariås et al. (1996) only 3-10 h-1. The high GHSV
assured, firstly, that the reactor was operated under differential operating conditions
(conversion always smaller than 10 %, except for propylene hydrogenation at lower
temperatures). Secondly, the small residence time ensured that the experimentally observed
conversion was always much smaller than the equilibrium conversion (except for propane
dehydrogenation at temperatures below 450 °C).
Finally, using the maximum observed reaction rate it has been verified by calculations that
concentration and temperature differences between the gas bulk and catalyst phase are
negligibly small, so that influences of mass and heat transfer limitations can be excluded.
Calculated overall mass transfer efficiency factors were well above 99%, as expected, because
of the very small washcoat thickness. Furthermore, also based on the experimentally observed
very strong increase in the reaction rates at high temperatures (described in the next section)
influences of mass transfer limitations can be excluded.
Moreover, the temperature measurements confirmed that the experiments were performed
isothermally (no significant temperature differences between temperatures measured in the
outermost channel and the channel next to it, nor at different axial positions.

Propane dehydrogenation reaction kinetics
131
Figure 3.Flow
sheet of the GC
-analysis section (explanation of the abbrevations in Figure 2).
He
PIC2001
FIC2001
PIC2002
VENT
2004
EV2002
EV2003
EV2001
VENT
VENT
VENT
TCD VENT
PIC2003
PIC2004
PIC2005
2006
FIC2002
Integrator
PoraPLOTcolum
molsievecolumn
emptycolumn
EX REACTOR
calibration gas
2005EV
EV
EV
2007EV
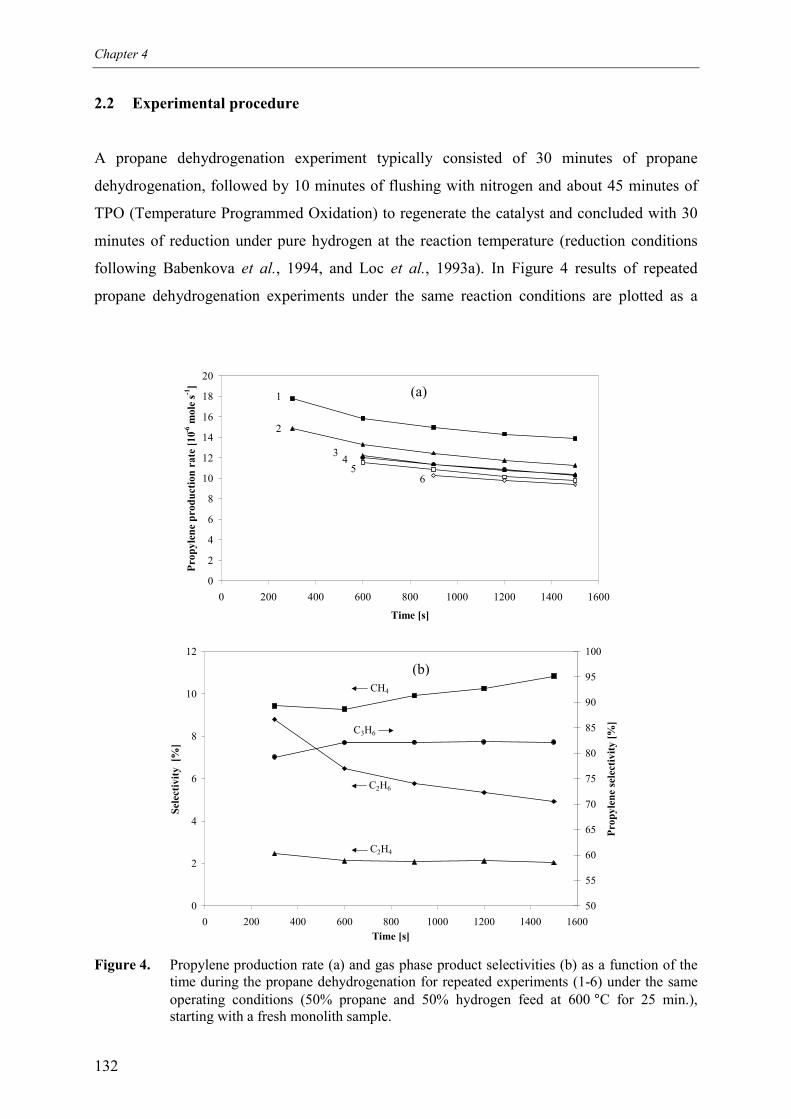
Chapter 4
132
2.2 Experimental procedure
A propane dehydrogenation experiment typically consisted of 30 minutes of propane
dehydrogenation, followed by 10 minutes of flushing with nitrogen and about 45 minutes of
TPO (Temperature Programmed Oxidation) to regenerate the catalyst and concluded with 30
minutes of reduction under pure hydrogen at the reaction temperature (reduction conditions
following Babenkova et al., 1994, and Loc et al., 1993a). In Figure 4 results of repeated
propane dehydrogenation experiments under the same reaction conditions are plotted as a
0
2
4
6
8
10
12
14
16
18
20
0 200 400 600 800 1000 1200 1400 1600
Time [s]
Prop
ylen
e pr
oduc
tion
rate
[10-6
mol
e s-1
]
1
2
3 45
6
0
2
4
6
8
10
12
0 200 400 600 800 1000 1200 1400 1600Time [s]
Sele
ctiv
ity [
%]
50
55
60
65
70
75
80
85
90
95
100
Prop
ylen
e se
lect
ivity
[%]
C3H6
CH4
C2H4
C2H6
Figure 4. Propylene production rate (a) and gas phase product selectivities (b) as a function of thetime during the propane dehydrogenation for repeated experiments (1-6) under the sameoperating conditions (50% propane and 50% hydrogen feed at 600 °C for 25 min.),starting with a fresh monolith sample.
(b)
(a)
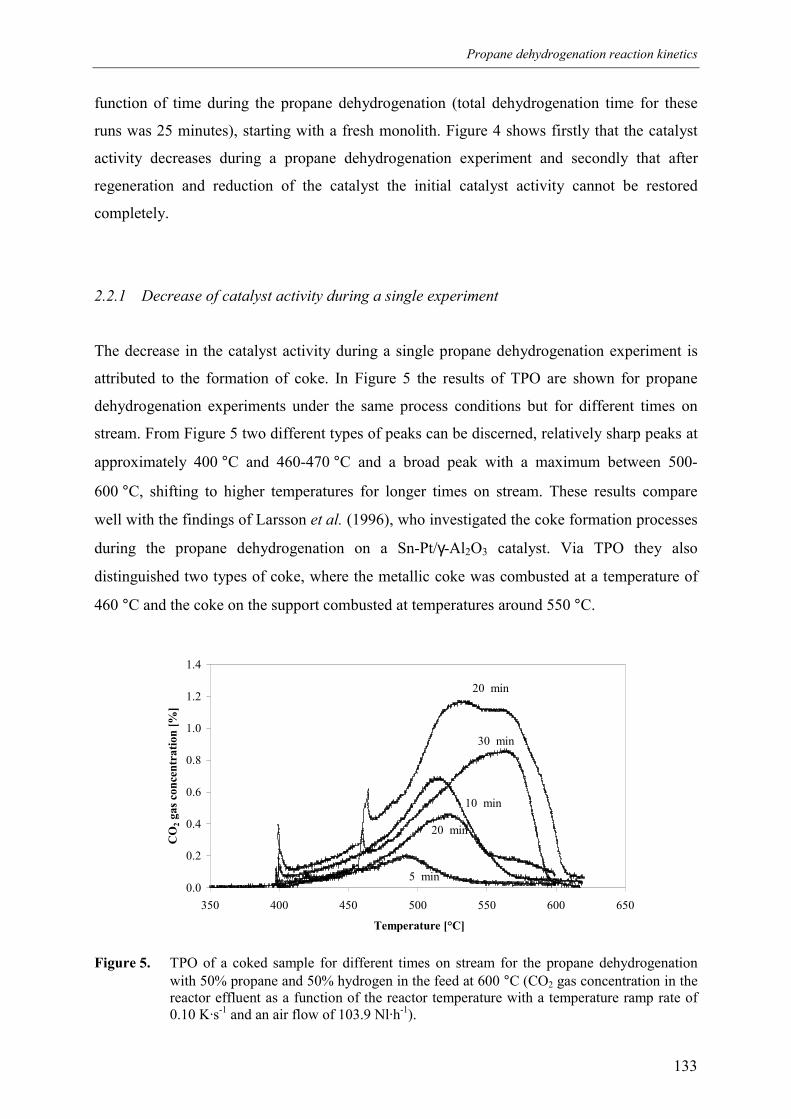
Propane dehydrogenation reaction kinetics
133
function of time during the propane dehydrogenation (total dehydrogenation time for these
runs was 25 minutes), starting with a fresh monolith. Figure 4 shows firstly that the catalyst
activity decreases during a propane dehydrogenation experiment and secondly that after
regeneration and reduction of the catalyst the initial catalyst activity cannot be restored
completely.
2.2.1 Decrease of catalyst activity during a single experiment
The decrease in the catalyst activity during a single propane dehydrogenation experiment is
attributed to the formation of coke. In Figure 5 the results of TPO are shown for propane
dehydrogenation experiments under the same process conditions but for different times on
stream. From Figure 5 two different types of peaks can be discerned, relatively sharp peaks at
approximately 400 °C and 460-470 °C and a broad peak with a maximum between 500-
600 °C, shifting to higher temperatures for longer times on stream. These results compare
well with the findings of Larsson et al. (1996), who investigated the coke formation processes
during the propane dehydrogenation on a Sn-Pt/γ-Al2O3 catalyst. Via TPO they also
distinguished two types of coke, where the metallic coke was combusted at a temperature of
460 °C and the coke on the support combusted at temperatures around 550 °C.
0.0
0.2
0.4
0.6
0.8
1.0
1.2
1.4
350 400 450 500 550 600 650
Temperature [°C]
CO
2 gas
con
cent
ratio
n [%
]
5 min
20 min
20 min
10 min
30 min
Figure 5. TPO of a coked sample for different times on stream for the propane dehydrogenationwith 50% propane and 50% hydrogen in the feed at 600 °C (CO2 gas concentration in thereactor effluent as a function of the reactor temperature with a temperature ramp rate of0.10 K·s-1 and an air flow of 103.9 Nl·h-1).
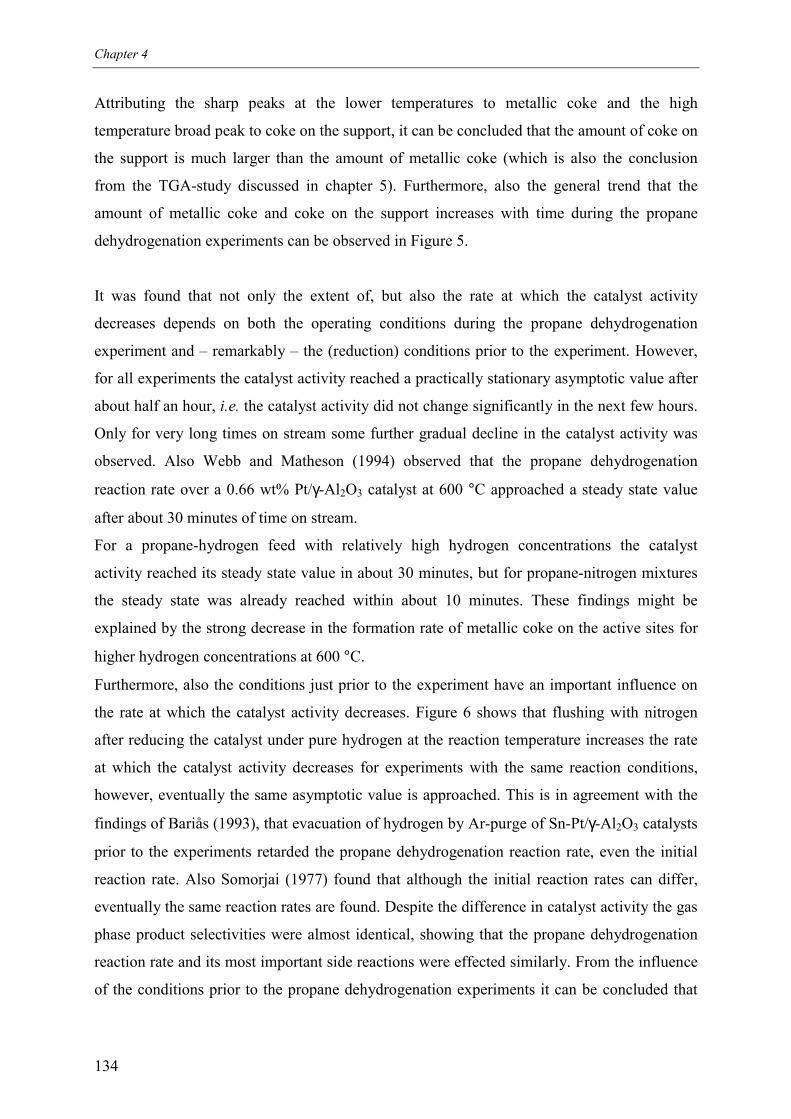
Chapter 4
134
Attributing the sharp peaks at the lower temperatures to metallic coke and the high
temperature broad peak to coke on the support, it can be concluded that the amount of coke on
the support is much larger than the amount of metallic coke (which is also the conclusion
from the TGA-study discussed in chapter 5). Furthermore, also the general trend that the
amount of metallic coke and coke on the support increases with time during the propane
dehydrogenation experiments can be observed in Figure 5.
It was found that not only the extent of, but also the rate at which the catalyst activity
decreases depends on both the operating conditions during the propane dehydrogenation
experiment and – remarkably – the (reduction) conditions prior to the experiment. However,
for all experiments the catalyst activity reached a practically stationary asymptotic value after
about half an hour, i.e. the catalyst activity did not change significantly in the next few hours.
Only for very long times on stream some further gradual decline in the catalyst activity was
observed. Also Webb and Matheson (1994) observed that the propane dehydrogenation
reaction rate over a 0.66 wt% Pt/γ-Al2O3 catalyst at 600 °C approached a steady state value
after about 30 minutes of time on stream.
For a propane-hydrogen feed with relatively high hydrogen concentrations the catalyst
activity reached its steady state value in about 30 minutes, but for propane-nitrogen mixtures
the steady state was already reached within about 10 minutes. These findings might be
explained by the strong decrease in the formation rate of metallic coke on the active sites for
higher hydrogen concentrations at 600 °C.
Furthermore, also the conditions just prior to the experiment have an important influence on
the rate at which the catalyst activity decreases. Figure 6 shows that flushing with nitrogen
after reducing the catalyst under pure hydrogen at the reaction temperature increases the rate
at which the catalyst activity decreases for experiments with the same reaction conditions,
however, eventually the same asymptotic value is approached. This is in agreement with the
findings of Bariås (1993), that evacuation of hydrogen by Ar-purge of Sn-Pt/γ-Al2O3 catalysts
prior to the experiments retarded the propane dehydrogenation reaction rate, even the initial
reaction rate. Also Somorjai (1977) found that although the initial reaction rates can differ,
eventually the same reaction rates are found. Despite the difference in catalyst activity the gas
phase product selectivities were almost identical, showing that the propane dehydrogenation
reaction rate and its most important side reactions were effected similarly. From the influence
of the conditions prior to the propane dehydrogenation experiments it can be concluded that
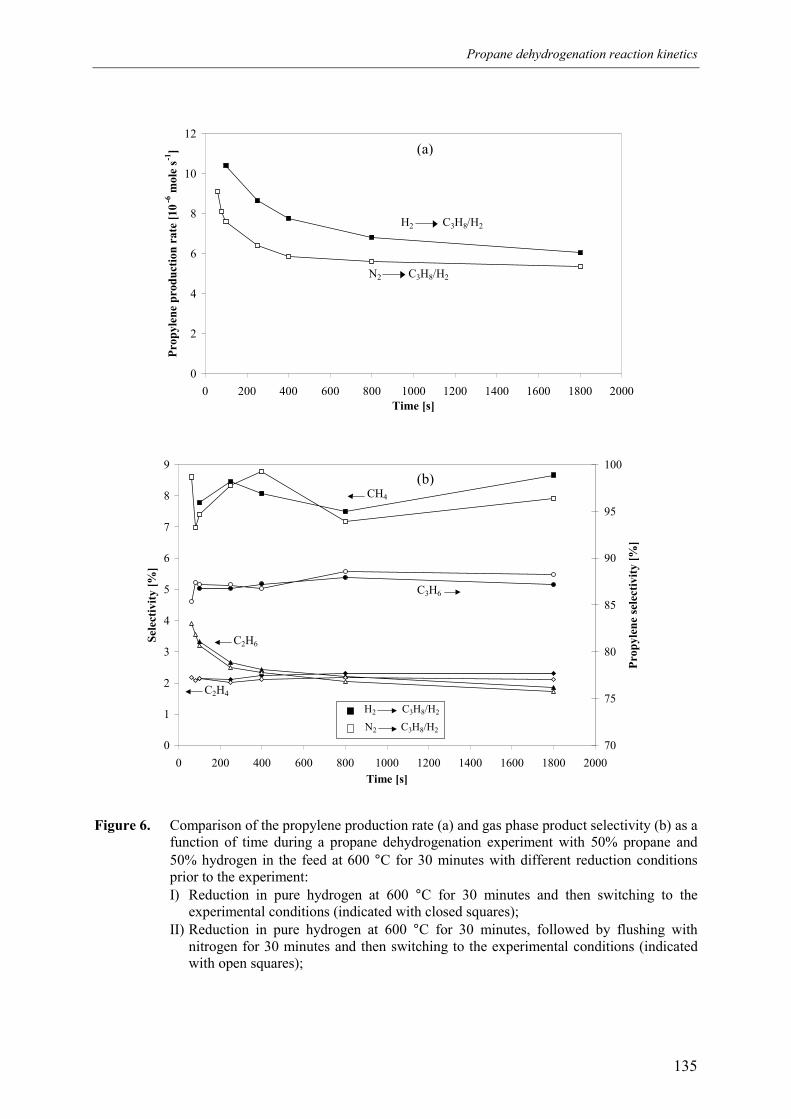
Propane dehydrogenation reaction kinetics
135
0
2
4
6
8
10
12
0 200 400 600 800 1000 1200 1400 1600 1800 2000Time [s]
Prop
ylen
e pr
oduc
tion
rate
[10-6
mol
e s-1
]
N2 C3H8/H2
H2 C3H8/H2
0
1
2
3
4
5
6
7
8
9
0 200 400 600 800 1000 1200 1400 1600 1800 2000Time [s]
Sele
ctiv
ity [%
]
70
75
80
85
90
95
100
Prop
ylen
e se
lect
ivity
[%]
CH4
C3H6
C2H6
C2H4
N2 C3H8/H2
H2 C3H8/H2
Figure 6. Comparison of the propylene production rate (a) and gas phase product selectivity (b) as afunction of time during a propane dehydrogenation experiment with 50% propane and50% hydrogen in the feed at 600 °C for 30 minutes with different reduction conditionsprior to the experiment:I) Reduction in pure hydrogen at 600 °C for 30 minutes and then switching to the
experimental conditions (indicated with closed squares);II) Reduction in pure hydrogen at 600 °C for 30 minutes, followed by flushing with
nitrogen for 30 minutes and then switching to the experimental conditions (indicatedwith open squares);
(b)
(a)
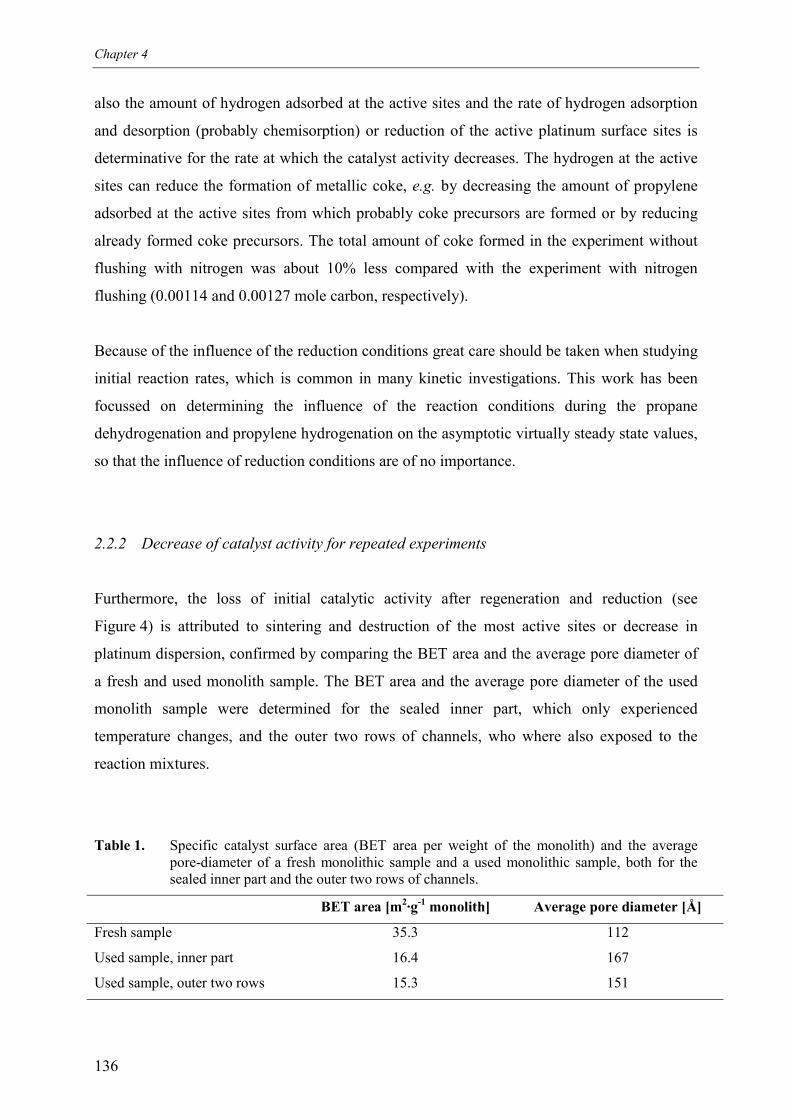
Chapter 4
136
also the amount of hydrogen adsorbed at the active sites and the rate of hydrogen adsorption
and desorption (probably chemisorption) or reduction of the active platinum surface sites is
determinative for the rate at which the catalyst activity decreases. The hydrogen at the active
sites can reduce the formation of metallic coke, e.g. by decreasing the amount of propylene
adsorbed at the active sites from which probably coke precursors are formed or by reducing
already formed coke precursors. The total amount of coke formed in the experiment without
flushing with nitrogen was about 10% less compared with the experiment with nitrogen
flushing (0.00114 and 0.00127 mole carbon, respectively).
Because of the influence of the reduction conditions great care should be taken when studying
initial reaction rates, which is common in many kinetic investigations. This work has been
focussed on determining the influence of the reaction conditions during the propane
dehydrogenation and propylene hydrogenation on the asymptotic virtually steady state values,
so that the influence of reduction conditions are of no importance.
2.2.2 Decrease of catalyst activity for repeated experiments
Furthermore, the loss of initial catalytic activity after regeneration and reduction (see
Figure 4) is attributed to sintering and destruction of the most active sites or decrease in
platinum dispersion, confirmed by comparing the BET area and the average pore diameter of
a fresh and used monolith sample. The BET area and the average pore diameter of the used
monolith sample were determined for the sealed inner part, which only experienced
temperature changes, and the outer two rows of channels, who where also exposed to the
reaction mixtures.
Table 1. Specific catalyst surface area (BET area per weight of the monolith) and the averagepore-diameter of a fresh monolithic sample and a used monolithic sample, both for thesealed inner part and the outer two rows of channels.
BET area [m2·g-1 monolith] Average pore diameter [Å]
Fresh sample 35.3 112
Used sample, inner part 16.4 167
Used sample, outer two rows 15.3 151
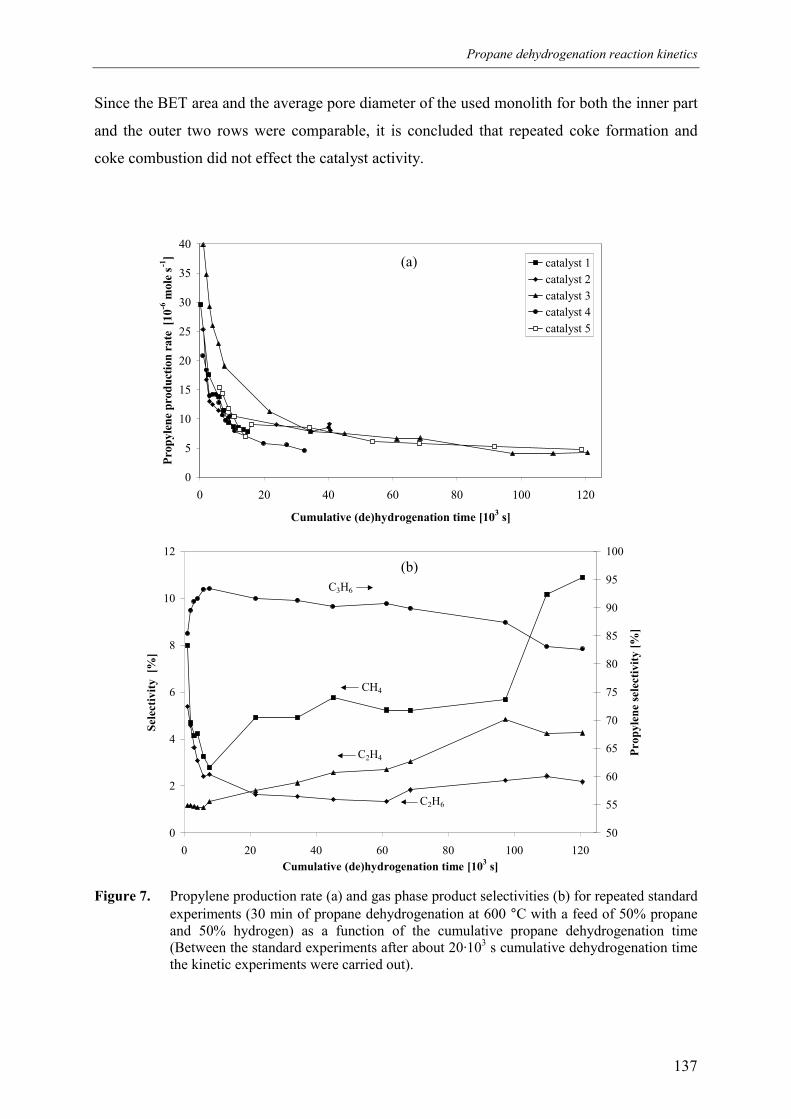
Propane dehydrogenation reaction kinetics
137
Since the BET area and the average pore diameter of the used monolith for both the inner part
and the outer two rows were comparable, it is concluded that repeated coke formation and
coke combustion did not effect the catalyst activity.
0
5
10
15
20
25
30
35
40
0 20 40 60 80 100 120
Cumulative (de)hydrogenation time [103 s]
Prop
ylen
e pr
oduc
tion
rate
[10-6
mol
e s-1
] catalyst 1catalyst 2catalyst 3catalyst 4catalyst 5
0
2
4
6
8
10
12
0 20 40 60 80 100 120Cumulative (de)hydrogenation time [103 s]
Sele
ctiv
ity [
%]
50
55
60
65
70
75
80
85
90
95
100
Prop
ylen
e se
lect
ivity
[%]
C3H6
C2H4
CH4
C2H6
Figure 7. Propylene production rate (a) and gas phase product selectivities (b) for repeated standardexperiments (30 min of propane dehydrogenation at 600 °C with a feed of 50% propaneand 50% hydrogen) as a function of the cumulative propane dehydrogenation time(Between the standard experiments after about 20·103 s cumulative dehydrogenation timethe kinetic experiments were carried out).
(b)
(a)

Chapter 4
138
In order to exclude the influence of sintering and destruction of the most active sites on the
reaction rates a standard propane dehydrogenation experiment was defined as 30 minutes of
propane dehydrogenation with a 50% propane and 50% hydrogen feed at 600 °C. By
repeatedly carrying out this standard experiment after a few experiments at different operating
conditions the loss of catalytic activity could be monitored.
In Figure 7 the propylene production rates determined for the standard experiments are plotted
as a function of the total dehydrogenation time, ignoring that an experiment also consisted of
flushing with nitrogen, TPO and reduction (which was about the same for all the
experiments). Moreover, to assure the removal of all carbonaceous deposits the reactor with
the monolith sample was usually kept under air at about 400 °C over night. Figure 7 clearly
shows, that the catalyst activity reduces strongly in the first few hours of cumulative
dehydrogenation time, even up to a factor of 5 to 10. Since the decrease in catalytic activity is
a factor of 5 to 10, but the decrease in the BET area is about a factor of 2, it is concluded that
also the destruction of the most active sites or the decrease in the platinum dispersion reduces
the catalyst activity. However, the rate at which the catalyst activity decreases reduces
strongly after 5 to 6 hours of cumulative dehydrogenation time. The kinetic experiments were
carried out on this partly deactivated monolith sample with a relatively small further decrease
in catalyst activity. Via linear interpolation between the standard experiments the reaction
rates determined under different operating conditions were corrected for the loss in activity
and scaled to a reference value. A reference value (6.03·10-6 mole·s-1) has been chosen,
corresponding to the catalyst activity for long cumulative dehydrogenation times. Using this
method of interpolation between standard experiments the reaction rates were compensated
for the decrease in catalytic activity due to sintering and destruction of the most active sites or
decrease in platinum dispersion, which also allowed easier comparison of experiments,
carried out on different catalyst samples.
Finally Figure 7.b shows that for large cumulative dehydrogenation times the selectivity
towards propylene decreases somewhat (from about 90 to 85 %) and the selectivity towards
ethylene and methane increases considerably, while the selectivity towards ethane increases
only mildly. Apparently the contribution of cracking of propane giving ethylene and methane
increases for longer times on stream compared to the propane dehydrogenation, suggesting
that the cracking of propane does not (primarily) occur at the same surface sites, but either at
different surface sites or in the gas phase.
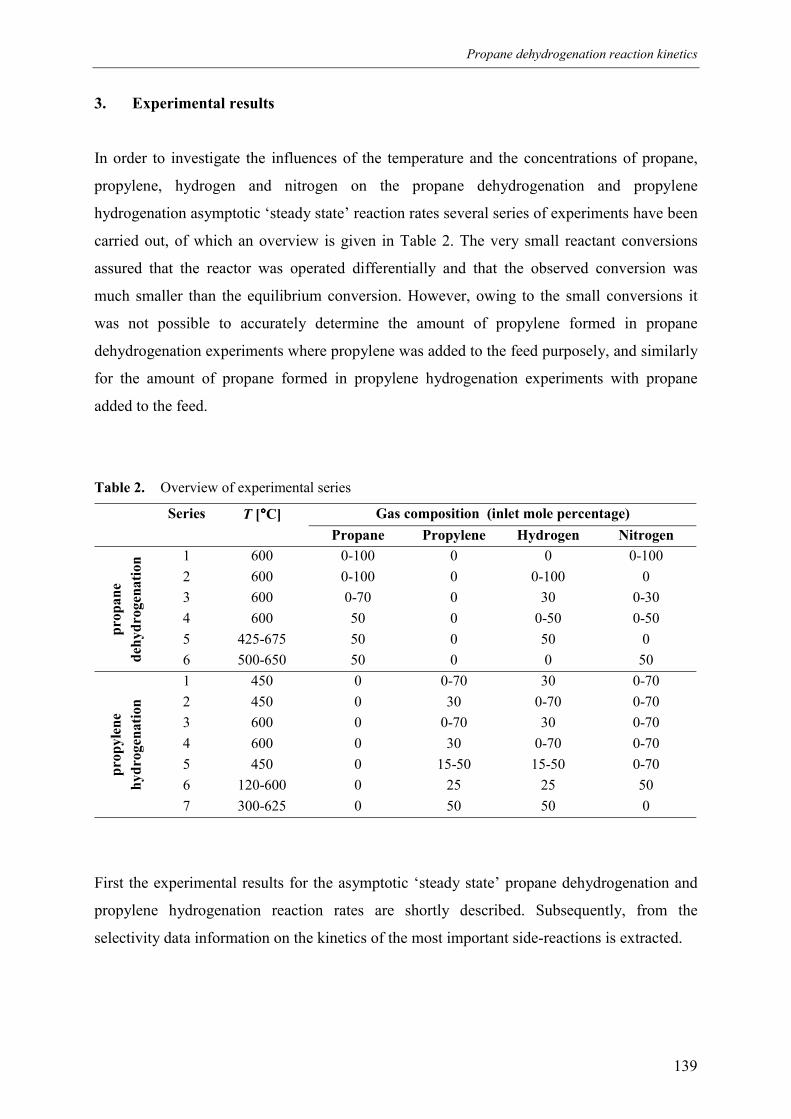
Propane dehydrogenation reaction kinetics
139
3. Experimental results
In order to investigate the influences of the temperature and the concentrations of propane,
propylene, hydrogen and nitrogen on the propane dehydrogenation and propylene
hydrogenation asymptotic ‘steady state’ reaction rates several series of experiments have been
carried out, of which an overview is given in Table 2. The very small reactant conversions
assured that the reactor was operated differentially and that the observed conversion was
much smaller than the equilibrium conversion. However, owing to the small conversions it
was not possible to accurately determine the amount of propylene formed in propane
dehydrogenation experiments where propylene was added to the feed purposely, and similarly
for the amount of propane formed in propylene hydrogenation experiments with propane
added to the feed.
Table 2. Overview of experimental series
Series T [°°°°C] Gas composition (inlet mole percentage)Propane Propylene Hydrogen Nitrogen
1 600 0-100 0 0 0-1002 600 0-100 0 0-100 03 600 0-70 0 30 0-304 600 50 0 0-50 0-505 425-675 50 0 50 0pr
opan
ede
hydr
ogen
atio
n
6 500-650 50 0 0 501 450 0 0-70 30 0-702 450 0 30 0-70 0-703 600 0 0-70 30 0-704 600 0 30 0-70 0-705 450 0 15-50 15-50 0-706 120-600 0 25 25 50
prop
ylen
ehy
drog
enat
ion
7 300-625 0 50 50 0
First the experimental results for the asymptotic ‘steady state’ propane dehydrogenation and
propylene hydrogenation reaction rates are shortly described. Subsequently, from the
selectivity data information on the kinetics of the most important side-reactions is extracted.
Chapter 4
140
3.1 Propane dehydrogenation and propylene hydrogenation
In Figures 8-12 the ‘steady state’ propylene production rates during propane dehydrogenation
experiments and in Figures 13-18 the ‘steady state’ propane production rates during propylene
hydrogenation experiments are given as a function of composition and temperature. In these
figures also the results of the kinetic rate expressions derived in the next paragraph are shown.
The following important observations can be discerned from the experimental results:
Propane dehydrogenation:
1. For propane-nitrogen mixtures the propane dehydrogenation reaction rate increases
linearly with the propane inlet concentration, at least up to propane inlet concentrations of
about 90% (Figure 8).
2. For propane-hydrogen mixtures the propane dehydrogenation reaction rate shows a weak
optimum between propane inlet concentrations of about 40-60% (Figure 9).
3. Experiments with pure propane in the feed exhibit a somewhat higher propane
dehydrogenation reaction rate than extrapolated from other experiments (Figures 8 and 9).
4. For propane-hydrogen-nitrogen mixtures with a constant propane inlet concentration the
propane dehydrogenation reaction rate increases linearly with the hydrogen inlet
concentration, which is quite unexpected (Figure 10).
5. For propane-nitrogen mixtures the propane dehydrogenation reaction rate shows a typical
exponential increase as a function of temperature. However for propane-hydrogen mixtures
a remarkably different temperature dependency was found. Between 500 °C and 600 °C a
plateau in the propane dehydrogenation reaction rate was observed, where the propane
dehydrogenation reaction rate hardly increased with increasing temperature. For
temperatures below 500 °C the reaction rate decreased exponentially and also for
temperatures above 600 °C the reaction rate increased exponentially (Figure 12).
6. On a monolith sample without platinum dispersed in the washcoat comparable propane
dehydrogenation reaction rates were found as for a monolith sample with platinum
dispersed in the washcoat for a 50% propane – 50% hydrogen mixture, both at 600 °C and
675 °C.
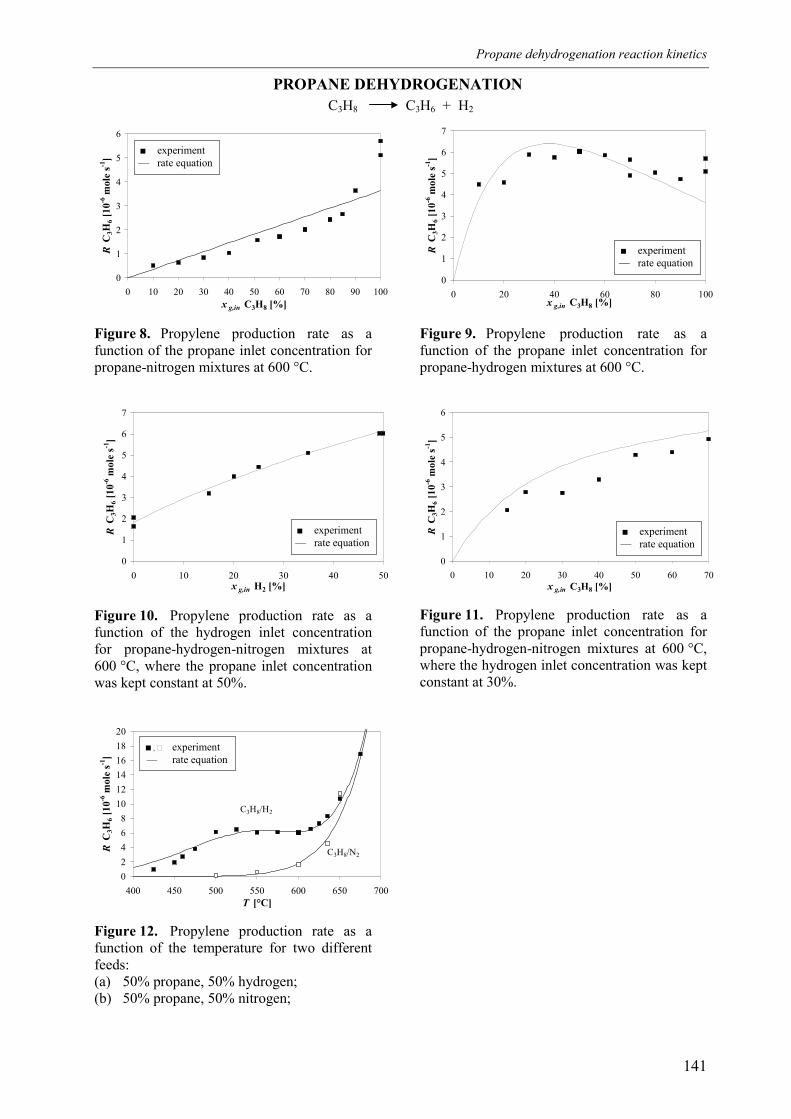
Propane dehydrogenation reaction kinetics
141
0
1
2
3
4
5
6
0 10 20 30 40 50 60 70 80 90 100x g,in C3H8 [%]
R C
3H6 [
10-6
mol
e s-1
]
Figure 8. Propylene production rate as afunction of the propane inlet concentration forpropane-nitrogen mixtures at 600 °C.
0
1
2
3
4
5
6
7
0 10 20 30 40 50x g,in H2 [%]
R C
3H6 [
10-6
mol
e s-1
]
Figure 10. Propylene production rate as afunction of the hydrogen inlet concentrationfor propane-hydrogen-nitrogen mixtures at600 °C, where the propane inlet concentrationwas kept constant at 50%.
02468
101214161820
400 450 500 550 600 650 700T [°C]
R C
3H6 [
10-6
mol
e s-1
]
C3H8/H2
C3H8/N2
Figure 12. Propylene production rate as afunction of the temperature for two differentfeeds:(a) 50% propane, 50% hydrogen;(b) 50% propane, 50% nitrogen;
0
1
2
3
4
5
6
7
0 20 40 60 80 100x g,in C3H8 [%]
R C
3H6 [
10-6
mol
e s-1
]
Figure 9. Propylene production rate as afunction of the propane inlet concentration forpropane-hydrogen mixtures at 600 °C.
0
1
2
3
4
5
6
0 10 20 30 40 50 60 70x g,in C3H8 [%]
R C
3H6 [
10-6
mol
e s-1
]
Figure 11. Propylene production rate as afunction of the propane inlet concentration forpropane-hydrogen-nitrogen mixtures at 600 °C,where the hydrogen inlet concentration was keptconstant at 30%.
PROPANE DEHYDROGENATIONC3H8 C3H6 + H2
■ experiment— rate equation
■ , ! experiment — rate equation
■ experiment— rate equation
■ experiment— rate equation
■ experiment— rate equation
Chapter 4
142
Propylene hydrogenation:
1. The propylene hydrogenation reaction rate for propylene-hydrogen-nitrogen mixtures with
constant hydrogen inlet concentration hardly increases with increasing propylene inlet
concentration above about 20% at 450 °C and increases less than proportional at 600 °C
(Figures 13 and 15).
2. For a propylene-hydrogen-nitrogen feed with constant propylene concentration the
propylene hydrogenation reaction rate increases peculiarly with the square of the hydrogen
inlet concentration (Figures 14 and 16).
3. The propylene hydrogenation reaction rate increases at lower temperatures and shows a
remarkable optimum as a function of temperature (at about 200 °C for a mixture with 25%
propylene, 25% hydrogen and 50% nitrogen). Furthermore, note that the propylene
hydrogenation reaction rates at 200 °C are very much larger than the propane
dehydrogenation reaction rates at 650 °C (Figure 18).
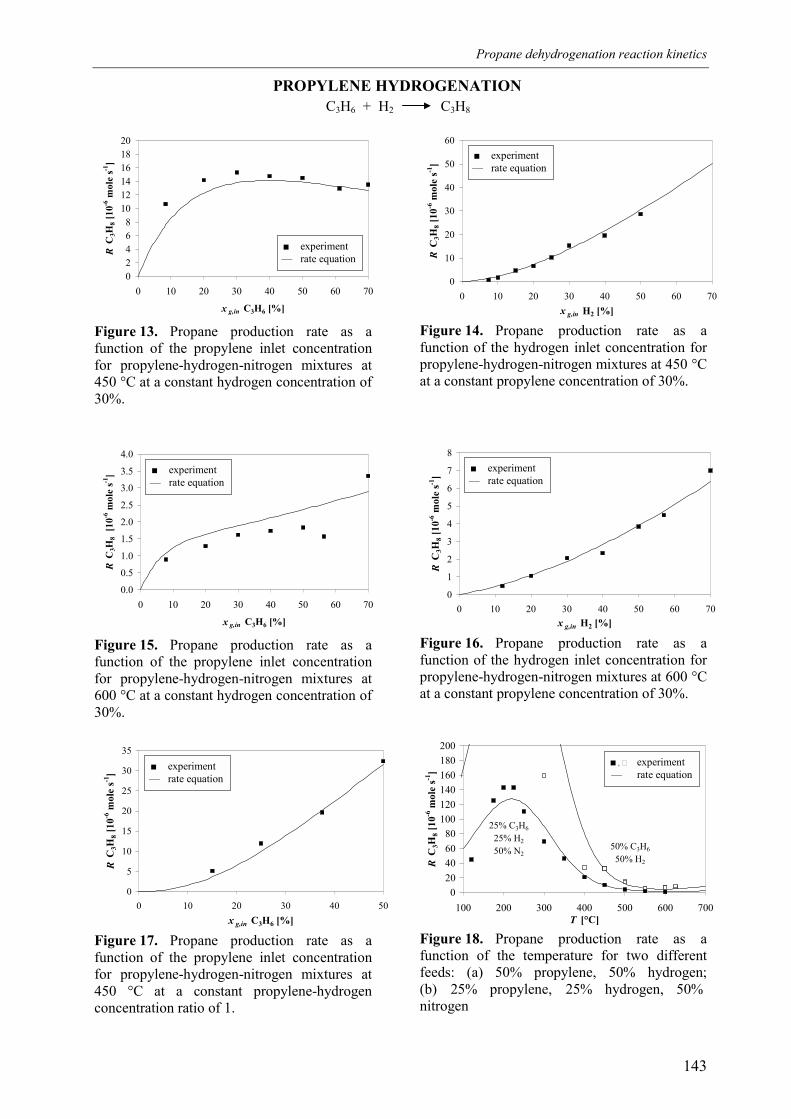
Propane dehydrogenation reaction kinetics
143
02468
101214161820
0 10 20 30 40 50 60 70
x g,in C3H6 [%]
R C
3H8 [
10-6
mol
e s-1
]
Figure 13. Propane production rate as afunction of the propylene inlet concentrationfor propylene-hydrogen-nitrogen mixtures at450 °C at a constant hydrogen concentration of30%.
0.0
0.5
1.0
1.5
2.0
2.5
3.0
3.5
4.0
0 10 20 30 40 50 60 70
x g,in C3H6 [%]
R C
3H8
[10-6
mol
e s-1
]
Figure 15. Propane production rate as afunction of the propylene inlet concentrationfor propylene-hydrogen-nitrogen mixtures at600 °C at a constant hydrogen concentration of30%.
0
5
10
15
20
25
30
35
0 10 20 30 40 50x g,in C3H6 [%]
R C
3H8 [
10-6
mol
e s-1
]
Figure 17. Propane production rate as afunction of the propylene inlet concentrationfor propylene-hydrogen-nitrogen mixtures at450 °C at a constant propylene-hydrogenconcentration ratio of 1.
0
10
20
30
40
50
60
0 10 20 30 40 50 60 70x g,in H2 [%]
R C
3H8 [
10-6
mol
e s-1
]
Figure 14. Propane production rate as afunction of the hydrogen inlet concentration forpropylene-hydrogen-nitrogen mixtures at 450 °Cat a constant propylene concentration of 30%.
0
1
2
3
4
5
6
7
8
0 10 20 30 40 50 60 70x g,in H2 [%]
R C
3H8 [
10-6
mol
e s-1
]
Figure 16. Propane production rate as afunction of the hydrogen inlet concentration forpropylene-hydrogen-nitrogen mixtures at 600 °Cat a constant propylene concentration of 30%.
020406080
100120140160180200
100 200 300 400 500 600 700T [°C]
R C
3H8 [
10-6
mol
e s-1
]
50% C3H6
50% H2
25% C3H6
25% H2
50% N2
Figure 18. Propane production rate as afunction of the temperature for two differentfeeds: (a) 50% propylene, 50% hydrogen;(b) 25% propylene, 25% hydrogen, 50% nitrogen
PROPYLENE HYDROGENATIONC3H8C3H6 + H2
■ , ! experiment — rate equation
■ experiment— rate equation
■ experiment— rate equation
■ experiment— rate equation
■ experiment— rate equation
■ experiment— rate equation
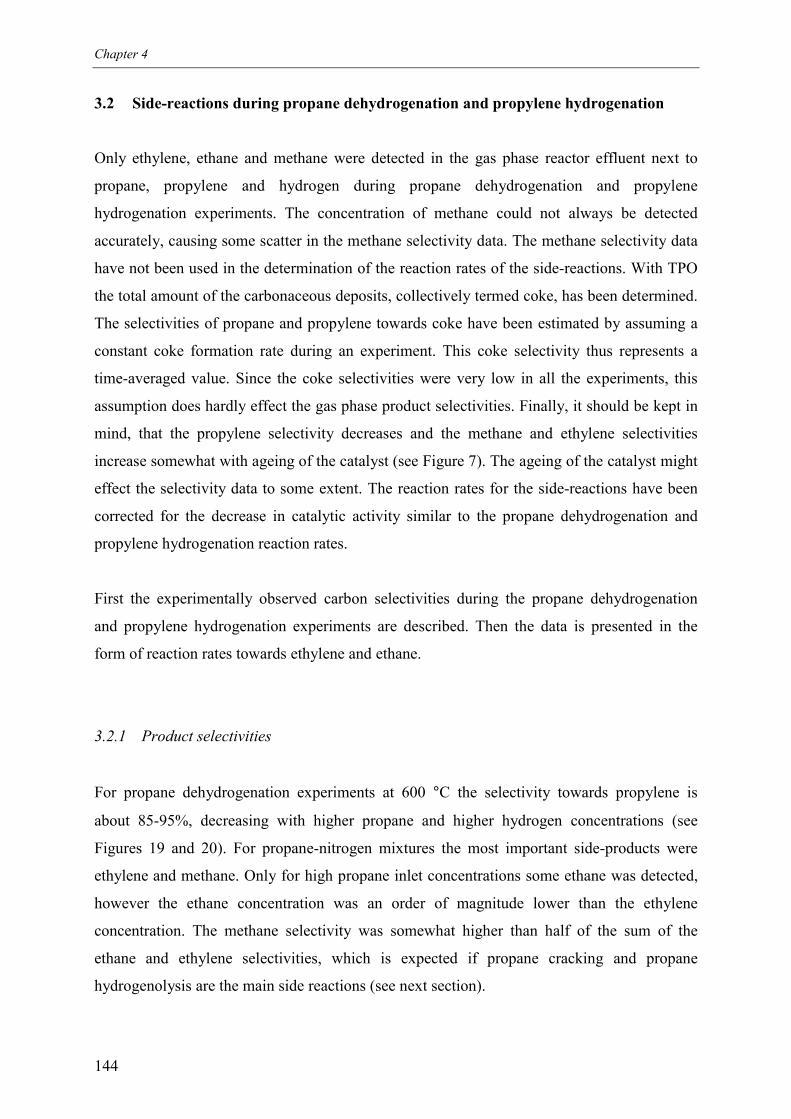
Chapter 4
144
3.2 Side-reactions during propane dehydrogenation and propylene hydrogenation
Only ethylene, ethane and methane were detected in the gas phase reactor effluent next to
propane, propylene and hydrogen during propane dehydrogenation and propylene
hydrogenation experiments. The concentration of methane could not always be detected
accurately, causing some scatter in the methane selectivity data. The methane selectivity data
have not been used in the determination of the reaction rates of the side-reactions. With TPO
the total amount of the carbonaceous deposits, collectively termed coke, has been determined.
The selectivities of propane and propylene towards coke have been estimated by assuming a
constant coke formation rate during an experiment. This coke selectivity thus represents a
time-averaged value. Since the coke selectivities were very low in all the experiments, this
assumption does hardly effect the gas phase product selectivities. Finally, it should be kept in
mind, that the propylene selectivity decreases and the methane and ethylene selectivities
increase somewhat with ageing of the catalyst (see Figure 7). The ageing of the catalyst might
effect the selectivity data to some extent. The reaction rates for the side-reactions have been
corrected for the decrease in catalytic activity similar to the propane dehydrogenation and
propylene hydrogenation reaction rates.
First the experimentally observed carbon selectivities during the propane dehydrogenation
and propylene hydrogenation experiments are described. Then the data is presented in the
form of reaction rates towards ethylene and ethane.
3.2.1 Product selectivities
For propane dehydrogenation experiments at 600 °C the selectivity towards propylene is
about 85-95%, decreasing with higher propane and higher hydrogen concentrations (see
Figures 19 and 20). For propane-nitrogen mixtures the most important side-products were
ethylene and methane. Only for high propane inlet concentrations some ethane was detected,
however the ethane concentration was an order of magnitude lower than the ethylene
concentration. The methane selectivity was somewhat higher than half of the sum of the
ethane and ethylene selectivities, which is expected if propane cracking and propane
hydrogenolysis are the main side reactions (see next section).
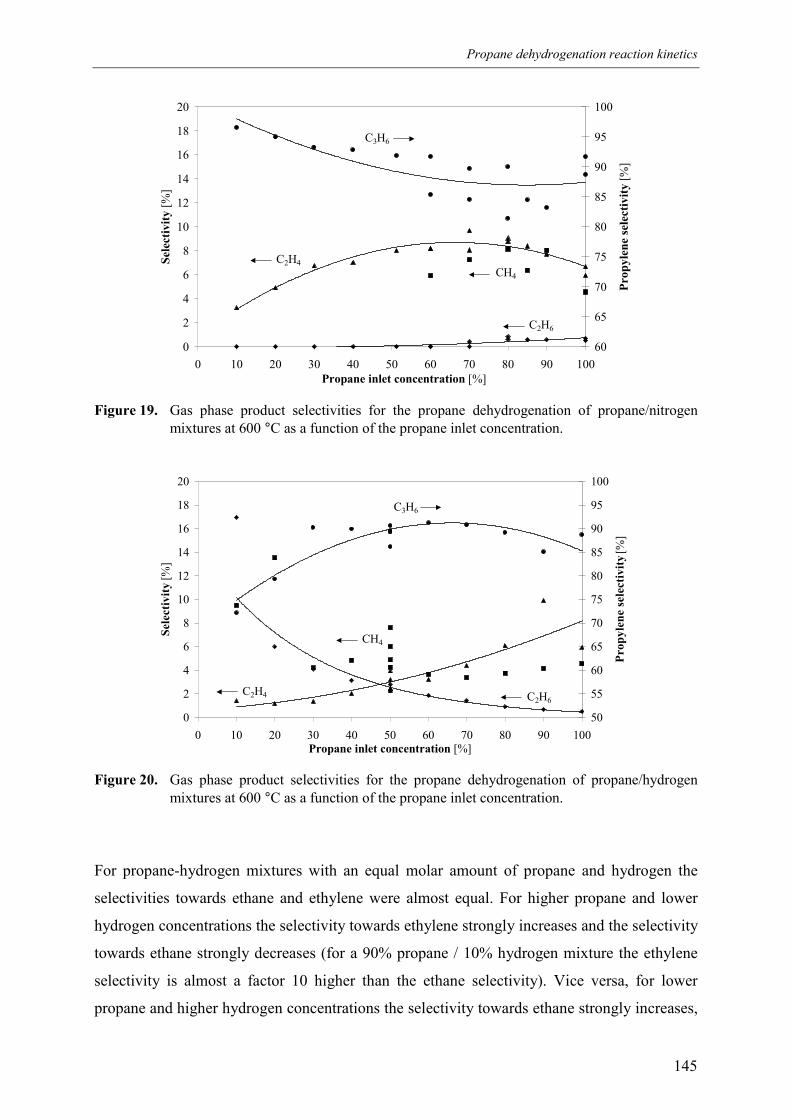
Propane dehydrogenation reaction kinetics
145
0
2
4
6
8
10
12
14
16
18
20
0 10 20 30 40 50 60 70 80 90 100Propane inlet concentration [%]
Sele
ctiv
ity [%
]
60
65
70
75
80
85
90
95
100
Prop
ylen
e se
lect
ivity
[%]
C3H6
CH4
C2H4
C2H6
Figure 19. Gas phase product selectivities for the propane dehydrogenation of propane/nitrogenmixtures at 600 °C as a function of the propane inlet concentration.
0
2
4
6
8
10
12
14
16
18
20
0 10 20 30 40 50 60 70 80 90 100Propane inlet concentration [%]
Sele
ctiv
ity [%
]
50
55
60
65
70
75
80
85
90
95
100
Prop
ylen
e se
lect
ivity
[%]
C3H6
C2H4 C2H6
CH4
Figure 20. Gas phase product selectivities for the propane dehydrogenation of propane/hydrogenmixtures at 600 °C as a function of the propane inlet concentration.
For propane-hydrogen mixtures with an equal molar amount of propane and hydrogen the
selectivities towards ethane and ethylene were almost equal. For higher propane and lower
hydrogen concentrations the selectivity towards ethylene strongly increases and the selectivity
towards ethane strongly decreases (for a 90% propane / 10% hydrogen mixture the ethylene
selectivity is almost a factor 10 higher than the ethane selectivity). Vice versa, for lower
propane and higher hydrogen concentrations the selectivity towards ethane strongly increases,
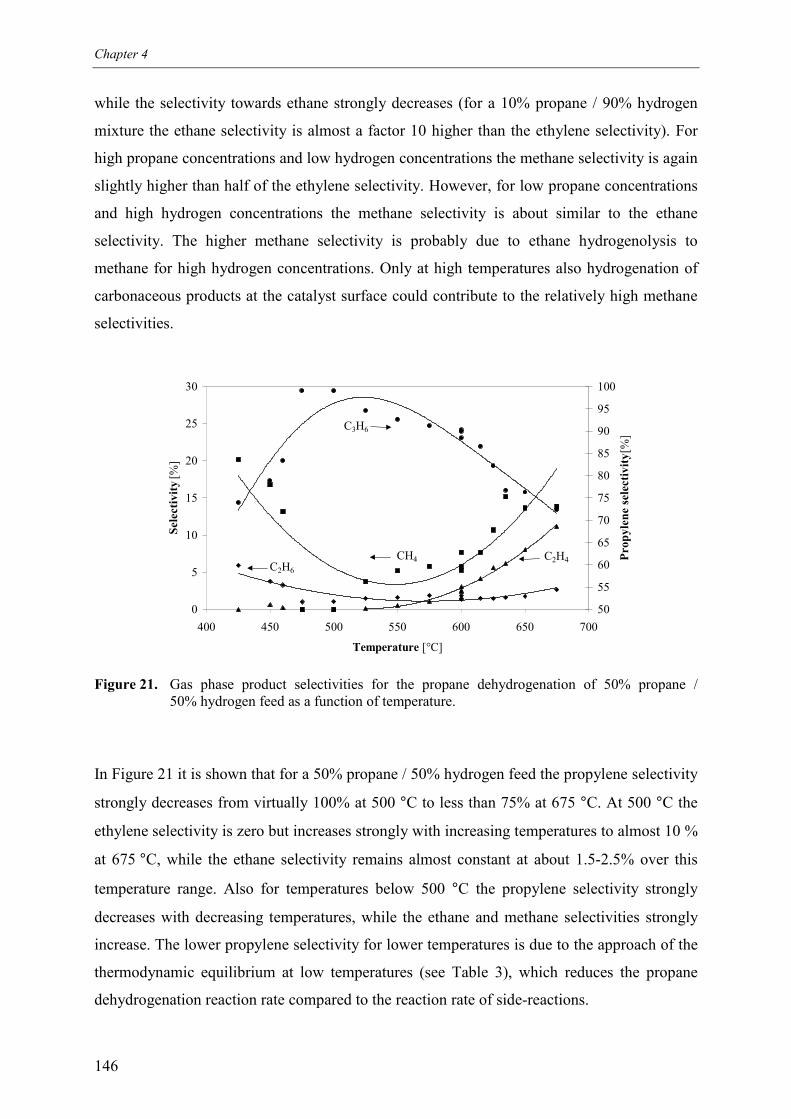
Chapter 4
146
while the selectivity towards ethane strongly decreases (for a 10% propane / 90% hydrogen
mixture the ethane selectivity is almost a factor 10 higher than the ethylene selectivity). For
high propane concentrations and low hydrogen concentrations the methane selectivity is again
slightly higher than half of the ethylene selectivity. However, for low propane concentrations
and high hydrogen concentrations the methane selectivity is about similar to the ethane
selectivity. The higher methane selectivity is probably due to ethane hydrogenolysis to
methane for high hydrogen concentrations. Only at high temperatures also hydrogenation of
carbonaceous products at the catalyst surface could contribute to the relatively high methane
selectivities.
0
5
10
15
20
25
30
400 450 500 550 600 650 700
Temperature [°C]
Sele
ctiv
ity [%
]
50
55
60
65
70
75
80
85
90
95
100
Prop
ylen
e se
lect
ivity
[%]
C3H6
CH4C2H6
C2H4
Figure 21. Gas phase product selectivities for the propane dehydrogenation of 50% propane /50% hydrogen feed as a function of temperature.
In Figure 21 it is shown that for a 50% propane / 50% hydrogen feed the propylene selectivity
strongly decreases from virtually 100% at 500 °C to less than 75% at 675 °C. At 500 °C the
ethylene selectivity is zero but increases strongly with increasing temperatures to almost 10 %
at 675 °C, while the ethane selectivity remains almost constant at about 1.5-2.5% over this
temperature range. Also for temperatures below 500 °C the propylene selectivity strongly
decreases with decreasing temperatures, while the ethane and methane selectivities strongly
increase. The lower propylene selectivity for lower temperatures is due to the approach of the
thermodynamic equilibrium at low temperatures (see Table 3), which reduces the propane
dehydrogenation reaction rate compared to the reaction rate of side-reactions.
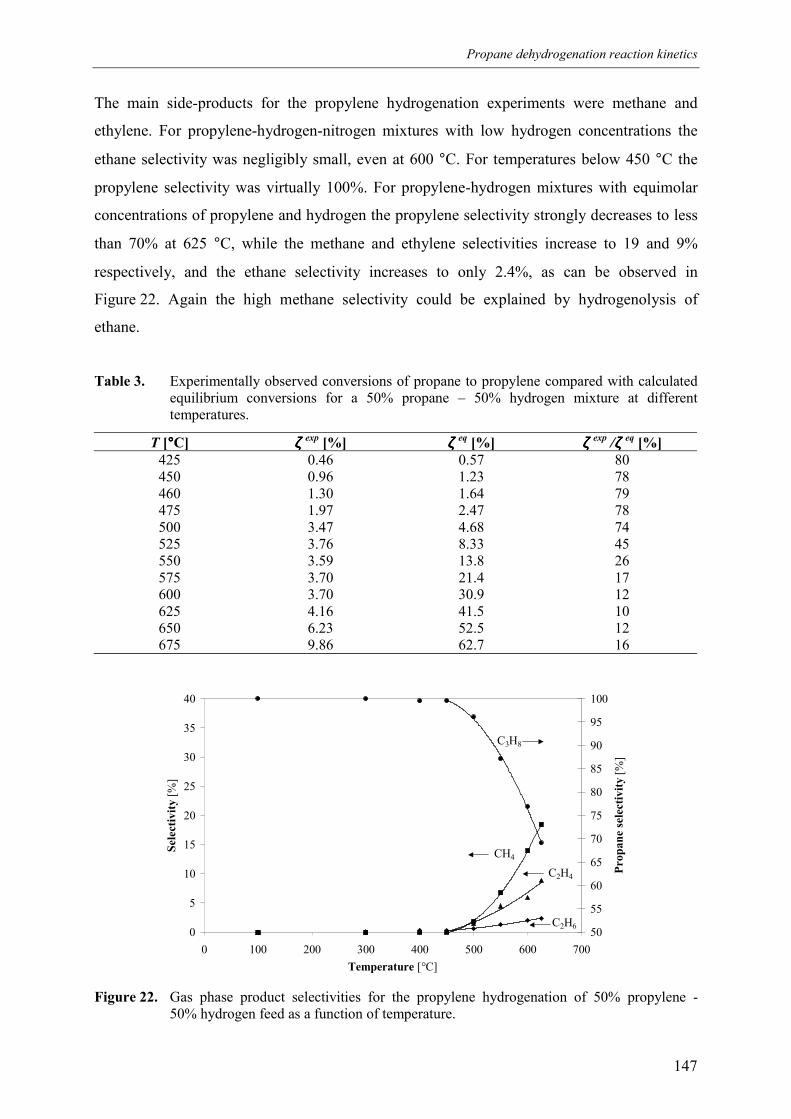
Propane dehydrogenation reaction kinetics
147
The main side-products for the propylene hydrogenation experiments were methane and
ethylene. For propylene-hydrogen-nitrogen mixtures with low hydrogen concentrations the
ethane selectivity was negligibly small, even at 600 °C. For temperatures below 450 °C the
propylene selectivity was virtually 100%. For propylene-hydrogen mixtures with equimolar
concentrations of propylene and hydrogen the propylene selectivity strongly decreases to less
than 70% at 625 °C, while the methane and ethylene selectivities increase to 19 and 9%
respectively, and the ethane selectivity increases to only 2.4%, as can be observed in
Figure 22. Again the high methane selectivity could be explained by hydrogenolysis of
ethane.
Table 3. Experimentally observed conversions of propane to propylene compared with calculatedequilibrium conversions for a 50% propane – 50% hydrogen mixture at differenttemperatures.
T [°°°°C] ζζζζ exp [%] ζζζζ eq [%] ζζζζ exp /ζζζζ eq [%]425 0.46 0.57 80450 0.96 1.23 78460 1.30 1.64 79475 1.97 2.47 78500 3.47 4.68 74525 3.76 8.33 45550 3.59 13.8 26575 3.70 21.4 17600 3.70 30.9 12625 4.16 41.5 10650 6.23 52.5 12675 9.86 62.7 16
0
5
10
15
20
25
30
35
40
0 100 200 300 400 500 600 700Temperature [°C]
Sele
ctiv
ity [%
]
50
55
60
65
70
75
80
85
90
95
100
Prop
ane
sele
ctiv
ity [%
]
CH4
C3H8
C2H4
C2H6
Figure 22. Gas phase product selectivities for the propylene hydrogenation of 50% propylene -50% hydrogen feed as a function of temperature.
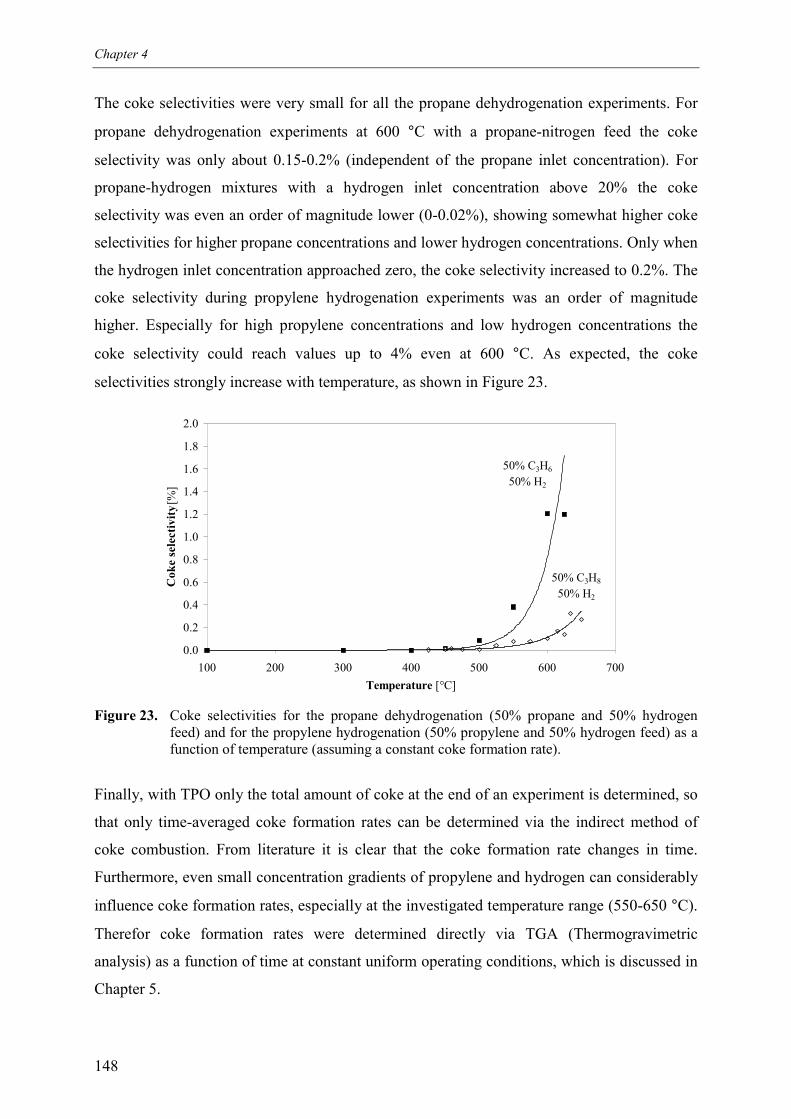
Chapter 4
148
The coke selectivities were very small for all the propane dehydrogenation experiments. For
propane dehydrogenation experiments at 600 °C with a propane-nitrogen feed the coke
selectivity was only about 0.15-0.2% (independent of the propane inlet concentration). For
propane-hydrogen mixtures with a hydrogen inlet concentration above 20% the coke
selectivity was even an order of magnitude lower (0-0.02%), showing somewhat higher coke
selectivities for higher propane concentrations and lower hydrogen concentrations. Only when
the hydrogen inlet concentration approached zero, the coke selectivity increased to 0.2%. The
coke selectivity during propylene hydrogenation experiments was an order of magnitude
higher. Especially for high propylene concentrations and low hydrogen concentrations the
coke selectivity could reach values up to 4% even at 600 °C. As expected, the coke
selectivities strongly increase with temperature, as shown in Figure 23.
0.0
0.2
0.4
0.6
0.8
1.0
1.2
1.4
1.6
1.8
2.0
100 200 300 400 500 600 700Temperature [°C]
Cok
e se
lect
ivity
[%]
50% C3H6
50% H2
50% C3H8
50% H2
Figure 23. Coke selectivities for the propane dehydrogenation (50% propane and 50% hydrogenfeed) and for the propylene hydrogenation (50% propylene and 50% hydrogen feed) as afunction of temperature (assuming a constant coke formation rate).
Finally, with TPO only the total amount of coke at the end of an experiment is determined, so
that only time-averaged coke formation rates can be determined via the indirect method of
coke combustion. From literature it is clear that the coke formation rate changes in time.
Furthermore, even small concentration gradients of propylene and hydrogen can considerably
influence coke formation rates, especially at the investigated temperature range (550-650 °C).
Therefor coke formation rates were determined directly via TGA (Thermogravimetric
analysis) as a function of time at constant uniform operating conditions, which is discussed in
Chapter 5.
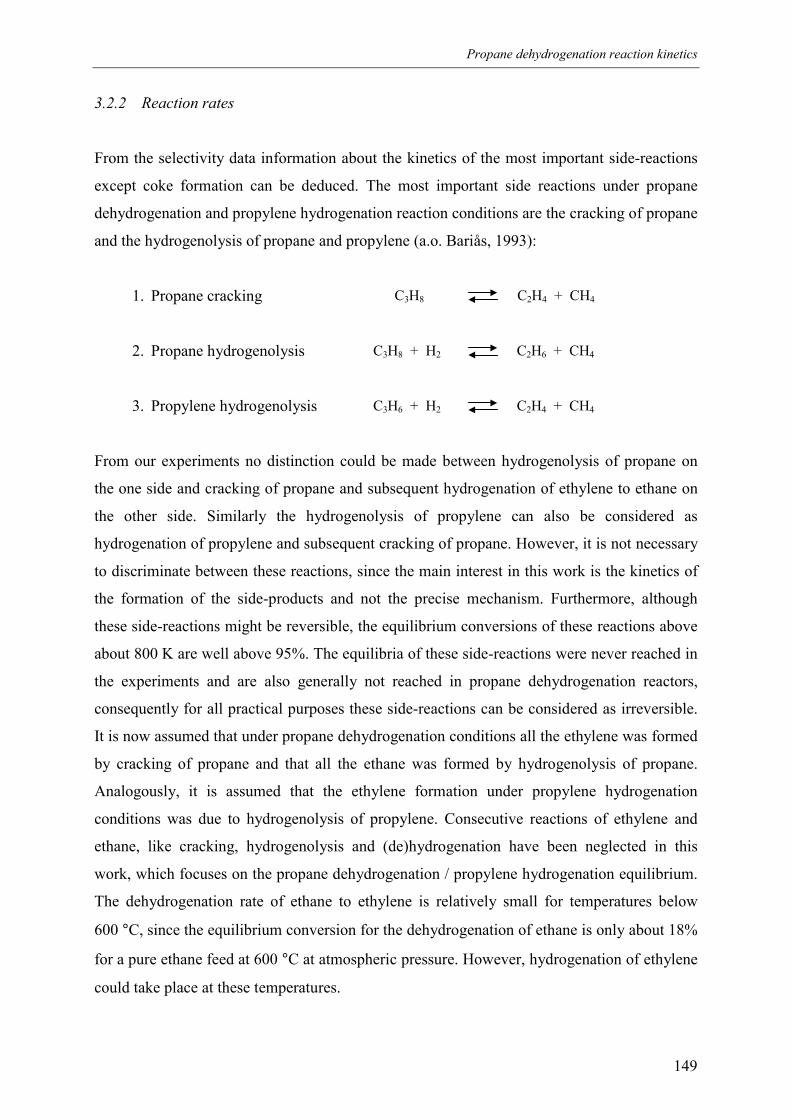
Propane dehydrogenation reaction kinetics
149
3.2.2 Reaction rates
From the selectivity data information about the kinetics of the most important side-reactions
except coke formation can be deduced. The most important side reactions under propane
dehydrogenation and propylene hydrogenation reaction conditions are the cracking of propane
and the hydrogenolysis of propane and propylene (a.o. Bariås, 1993):
1. Propane cracking
2. Propane hydrogenolysis
3. Propylene hydrogenolysis
From our experiments no distinction could be made between hydrogenolysis of propane on
the one side and cracking of propane and subsequent hydrogenation of ethylene to ethane on
the other side. Similarly the hydrogenolysis of propylene can also be considered as
hydrogenation of propylene and subsequent cracking of propane. However, it is not necessary
to discriminate between these reactions, since the main interest in this work is the kinetics of
the formation of the side-products and not the precise mechanism. Furthermore, although
these side-reactions might be reversible, the equilibrium conversions of these reactions above
about 800 K are well above 95%. The equilibria of these side-reactions were never reached in
the experiments and are also generally not reached in propane dehydrogenation reactors,
consequently for all practical purposes these side-reactions can be considered as irreversible.
It is now assumed that under propane dehydrogenation conditions all the ethylene was formed
by cracking of propane and that all the ethane was formed by hydrogenolysis of propane.
Analogously, it is assumed that the ethylene formation under propylene hydrogenation
conditions was due to hydrogenolysis of propylene. Consecutive reactions of ethylene and
ethane, like cracking, hydrogenolysis and (de)hydrogenation have been neglected in this
work, which focuses on the propane dehydrogenation / propylene hydrogenation equilibrium.
The dehydrogenation rate of ethane to ethylene is relatively small for temperatures below
600 °C, since the equilibrium conversion for the dehydrogenation of ethane is only about 18%
for a pure ethane feed at 600 °C at atmospheric pressure. However, hydrogenation of ethylene
could take place at these temperatures.
C3H6 + H2 C2H4 + CH4
C3H8 C2H4 + CH4
C3H8 + H2 C2H6 + CH4
Chapter 4
150
From the selectivity data the following important observations can be discerned for the
‘steady state’ reaction rates of the side-reactions.
Propane cracking
1. The ethylene production rate during the propane dehydrogenation increases linearly with
the propane inlet concentration (Figure 24).
2. The reaction rate of propane cracking is independent of the hydrogen inlet concentration
(Figures 25 and 26).
3. The propane cracking reaction rate increases exponentially with temperature (Figures 28
and 29).
Propane hydrogenolysis
1. The ethane production rate is negligible if no hydrogen is present in the gas phase (as
concluded from propane dehydrogenation experiments with propane-nitrogen feeds).
2. For propane-hydrogen mixtures the propane hydrogenolysis reaction shows a very
remarkable almost linear decrease for increasing propane inlet concentrations (Figure 30).
3. The propane hydrogenolysis reaction rate increases less than proportional with increasing
propane inlet concentration for propane-hydrogen-nitrogen mixtures with a constant
hydrogen concentration at 600 °C (Figure 31).
4. The propane hydrogenolysis reaction rate follows a striking second order dependency on
the hydrogen gas phase concentration (Figure 32).
5. For low temperatures the propane hydrogenolysis reaction rate is almost independent of
temperature, but at temperatures above 600 °C the reaction rate increases exponentially.
(Figures 33 and 34).
Propylene hydrogenolysis
1. The ethylene production rate in propylene hydrogenation experiments is almost
independent of the propylene inlet concentration at 450 °C and increases less than linear at
600 °C (Figure 35).
2. The propylene hydrogenolysis reaction rate follows an approximately linear dependency
on the hydrogen gas phase concentration at both 450 and 600 °C (Figure 36).
3. The propylene hydrogenolysis reaction rate increases exponentially with temperature
(Figures 37 and 38).
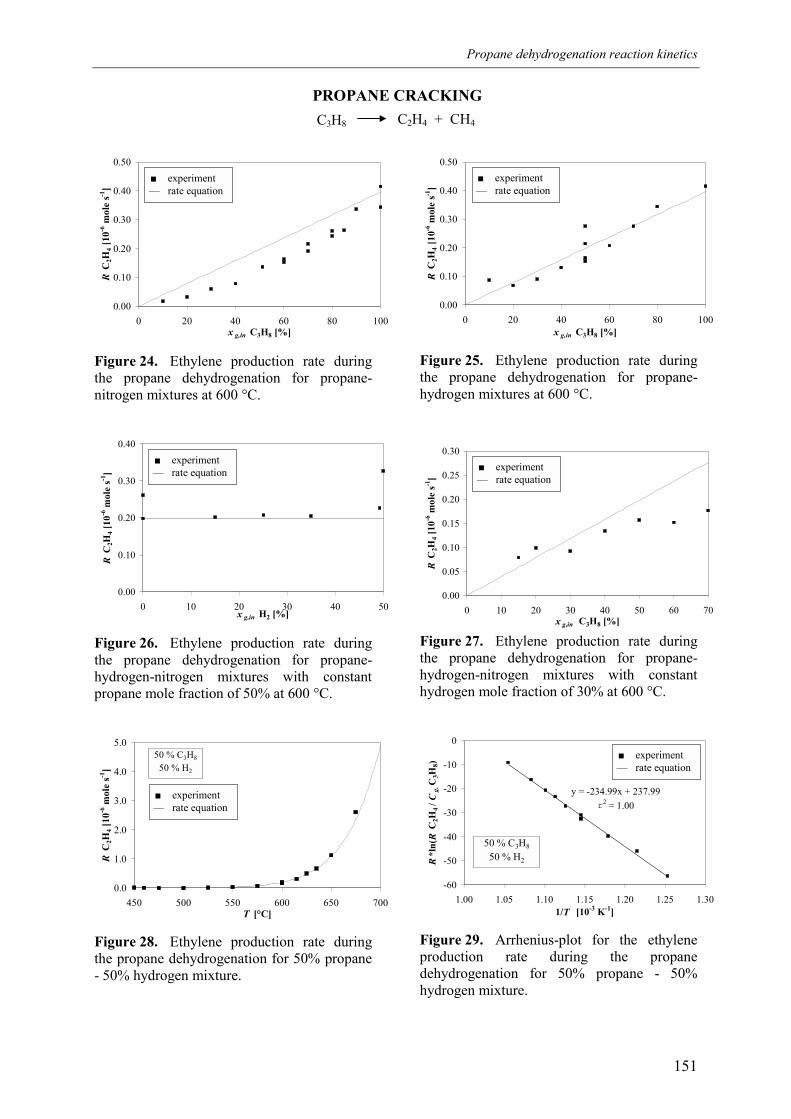
Propane dehydrogenation reaction kinetics
151
0.00
0.10
0.20
0.30
0.40
0.50
0 20 40 60 80 100x g,in C3H8 [%]
R C
2H4 [
10-6
mol
e s-1
]
Figure 24. Ethylene production rate duringthe propane dehydrogenation for propane-nitrogen mixtures at 600 °C.
0.00
0.10
0.20
0.30
0.40
0 10 20 30 40 50x g,in H2 [%]
R C
2H4 [
10-6
mol
e s-1
]
Figure 26. Ethylene production rate duringthe propane dehydrogenation for propane-hydrogen-nitrogen mixtures with constantpropane mole fraction of 50% at 600 °C.
0.0
1.0
2.0
3.0
4.0
5.0
450 500 550 600 650 700T [°C]
R C
2H4 [
10-6
mol
e s-1
]
50 % C3H8
50 % H2
Figure 28. Ethylene production rate duringthe propane dehydrogenation for 50% propane- 50% hydrogen mixture.
0.00
0.10
0.20
0.30
0.40
0.50
0 20 40 60 80 100x g,in C3H8 [%]
R C
2H4 [
10-6
mol
e s-1
]
Figure 25. Ethylene production rate duringthe propane dehydrogenation for propane-hydrogen mixtures at 600 °C.
0.00
0.05
0.10
0.15
0.20
0.25
0.30
0 10 20 30 40 50 60 70x g,in C3H8 [%]
R C
2H4 [
10-6
mol
e s-1
]
Figure 27. Ethylene production rate duringthe propane dehydrogenation for propane-hydrogen-nitrogen mixtures with constanthydrogen mole fraction of 30% at 600 °C.
y = -234.99x + 237.99r2 = 1.00
-60
-50
-40
-30
-20
-10
0
1.00 1.05 1.10 1.15 1.20 1.25 1.301/T [10-3 K-1]
R*l
n(R
C2H
4 / C
g,C
3H8)
50 % C3H8
50 % H2
Figure 29. Arrhenius-plot for the ethyleneproduction rate during the propanedehydrogenation for 50% propane - 50%hydrogen mixture.
PROPANE CRACKINGC3H8 C2H4 + CH4
■ experiment— rate equation
■ experiment— rate equation
■ experiment— rate equation
■ experiment— rate equation ■ experiment
— rate equation
■ experiment— rate equation
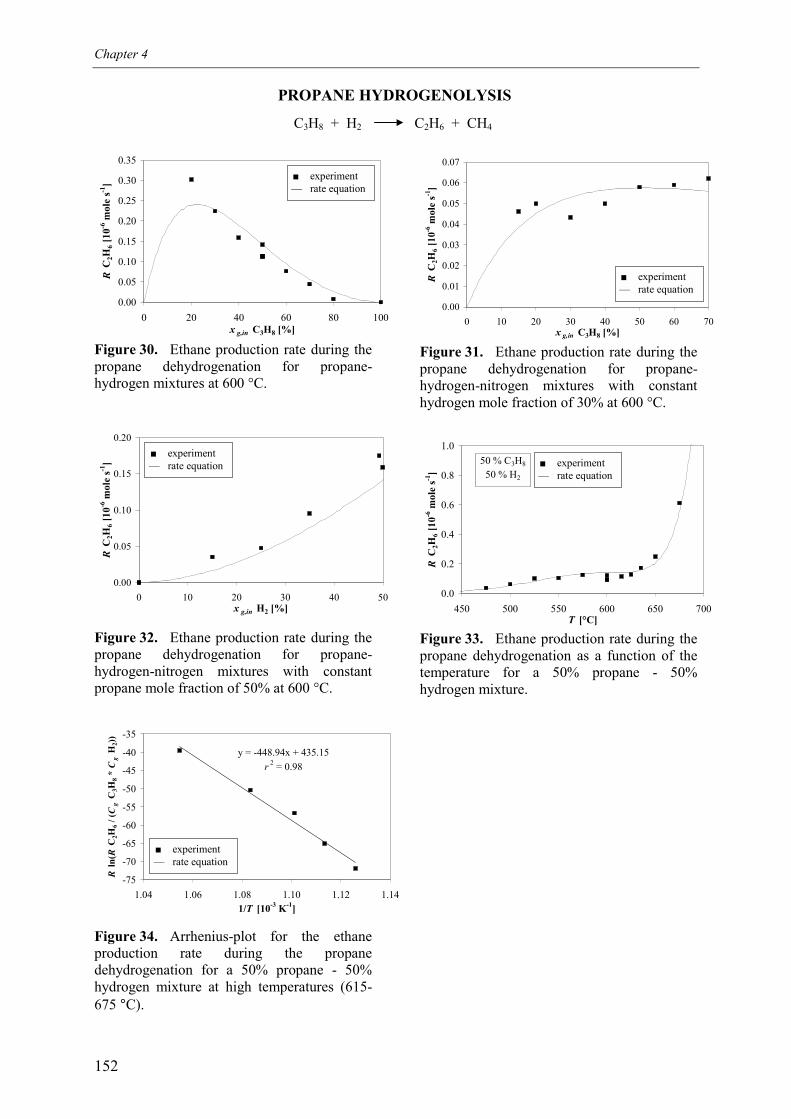
Chapter 4
152
0.00
0.05
0.10
0.15
0.20
0.25
0.30
0.35
0 20 40 60 80 100x g,in C3H8 [%]
R C
2H6 [
10-6
mol
e s-1
]
Figure 30. Ethane production rate during thepropane dehydrogenation for propane-hydrogen mixtures at 600 °C.
0.00
0.05
0.10
0.15
0.20
0 10 20 30 40 50x g,in H2 [%]
R C
2H6 [
10-6
mol
e s-1
]
Figure 32. Ethane production rate during thepropane dehydrogenation for propane-hydrogen-nitrogen mixtures with constantpropane mole fraction of 50% at 600 °C.
y = -448.94x + 435.15r 2 = 0.98
-75
-70
-65
-60
-55
-50
-45
-40
-35
1.04 1.06 1.08 1.10 1.12 1.141/T [10-3 K-1]
R ln
( R C
2H6 /
( Cg
C3H
8 * C
g H
2))
Figure 34. Arrhenius-plot for the ethaneproduction rate during the propanedehydrogenation for a 50% propane - 50%hydrogen mixture at high temperatures (615-675 °C).
0.00
0.01
0.02
0.03
0.04
0.05
0.06
0.07
0 10 20 30 40 50 60 70x g,in C3H8 [%]
R C
2H6 [
10-6
mol
e s-1
]
Figure 31. Ethane production rate during thepropane dehydrogenation for propane-hydrogen-nitrogen mixtures with constanthydrogen mole fraction of 30% at 600 °C.
0.0
0.2
0.4
0.6
0.8
1.0
450 500 550 600 650 700T [°C]
R C
2H6 [
10-6
mol
e s-1
]
50 % C3H8
50 % H2
Figure 33. Ethane production rate during thepropane dehydrogenation as a function of thetemperature for a 50% propane - 50%hydrogen mixture.
PROPANE HYDROGENOLYSIS
C3H8 + H2 C2H6 + CH4
■ experiment— rate equation
■ experiment— rate equation
■ experiment— rate equation ■ experiment
— rate equation
■ experiment— rate equation
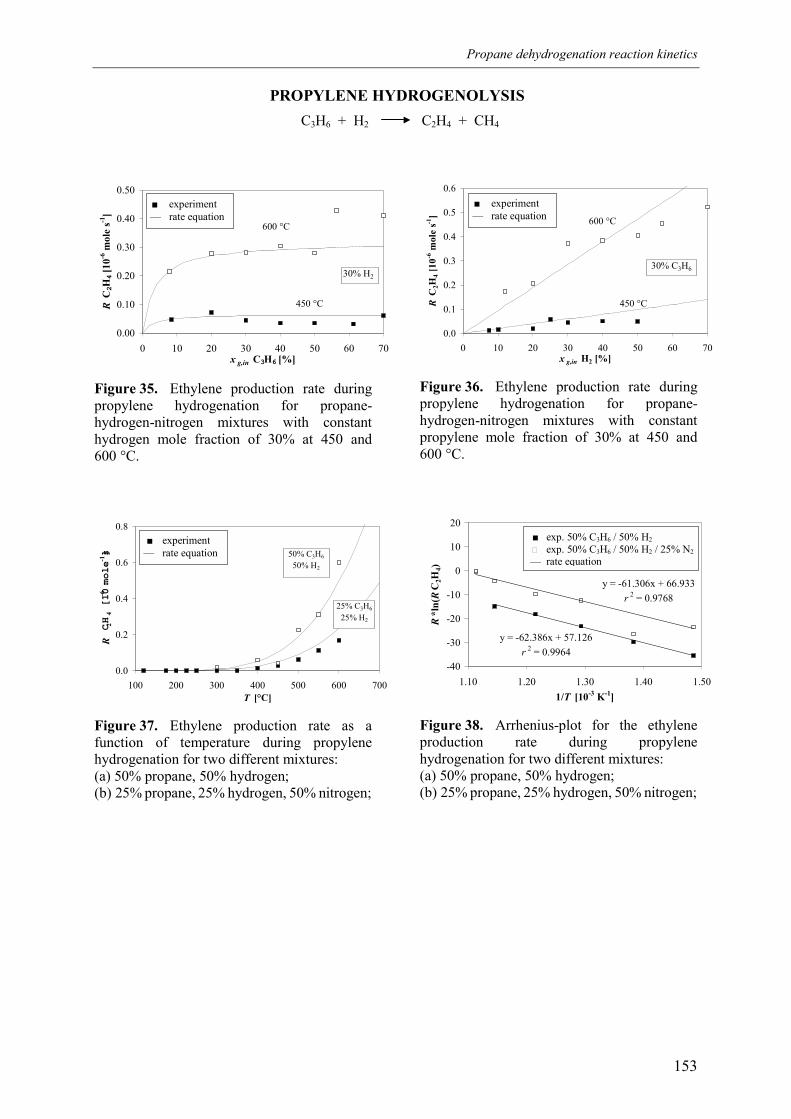
Propane dehydrogenation reaction kinetics
153
0.00
0.10
0.20
0.30
0.40
0.50
0 10 20 30 40 50 60 70x g,in C3H6 [%]
R C
2H4 [
10-6
mol
e s-1
]
450 °C
600 °C
30% H2
Figure 35. Ethylene production rate duringpropylene hydrogenation for propane-hydrogen-nitrogen mixtures with constanthydrogen mole fraction of 30% at 450 and600 °C.
0.0
0.2
0.4
0.6
0.8
100 200 300 400 500 600 700T [°C]
R C 2H
4 [10-6 mole s
-1] 50% C3H6
50% H2
25% C3H6
25% H2
Figure 37. Ethylene production rate as afunction of temperature during propylenehydrogenation for two different mixtures:(a) 50% propane, 50% hydrogen;(b) 25% propane, 25% hydrogen, 50% nitrogen;
0.0
0.1
0.2
0.3
0.4
0.5
0.6
0 10 20 30 40 50 60 70x g,in H2 [%]
R C
2H4 [
10-6
mol
e s-1
]
30% C3H6
450 °C
600 °C
Figure 36. Ethylene production rate duringpropylene hydrogenation for propane-hydrogen-nitrogen mixtures with constantpropylene mole fraction of 30% at 450 and600 °C.
y = -62.386x + 57.126r 2 = 0.9964
y = -61.306x + 66.933r 2 = 0.9768
-40
-30
-20
-10
0
10
20
1.10 1.20 1.30 1.40 1.501/T [10-3 K-1]
R*l
n(R
C2H
4)
Figure 38. Arrhenius-plot for the ethyleneproduction rate during propylenehydrogenation for two different mixtures:(a) 50% propane, 50% hydrogen;(b) 25% propane, 25% hydrogen, 50% nitrogen;
PROPYLENE HYDROGENOLYSISC3H6 + H2 C2H4 + CH4
■ experiment— rate equation
■ experiment— rate equation
■ experiment— rate equation
■ exp. 50% C3H6 / 50% H2
! exp. 50% C3H6 / 50% H2 / 25% N2 — rate equation
Chapter 4
154
4. Derivation of rate equations
The objective of this work is the derivation of ‘steady state’ reaction rate equations for the
propane dehydrogenation, propylene hydrogenation and their most important side-reactions,
which can describe all the experimental observations reported in the previous section as a
function of temperature and composition over wide temperature and concentration ranges.
The main conclusions obtained from the experimental results for the concentration
dependency of the reaction rates are summarised below.
The propane dehydrogenation reaction rate consists of two contributions. The first
contribution is proportional with the propane concentration, since the reaction rate is
proportional with the propane concentration for propane-nitrogen mixtures. The second
contribution is proportional with both the propane and the hydrogen concentration, because,
firstly the propane dehydrogenation rate increases linearly with increasing hydrogen
concentrations for propane-hydrogen-nitrogen mixtures with constant propane concentration,
and secondly, the propane dehydrogenation shows for propane-hydrogen mixtures an
optimum for propane concentrations of about 50%. The second contribution is dominant at
lower temperatures (below 600 °C), but the first contribution becomes important and
dominant at higher temperatures (above ca. 650 °C). The deviation for the reaction rates of
pure propane at 600 °C is attributed to the production of hydrogen during the propane
dehydrogenation. Even small amounts of hydrogen produced can considerably increase the
propane dehydrogenation reaction rate (i.e. non-differential operating conditions for
experiments with pure propane feed, because of an axial hydrogen concentration profile).
Secondly the reaction rates for pure propane feed had not yet completely reached the ‘steady
state’.
The propylene hydrogenation reaction rate shows a Langmuir-Hinshelwood type dependency
on the propylene concentration and a second order dependency on the hydrogen
concentration.
For the reaction rates of the side-reactions it can be concluded that the cracking of propane is
proportional with the propane concentration and independent of the hydrogen concentration.
Furthermore, the cracking of propane becomes only important at higher temperatures (above
600 °C). The hydrogenolysis of propane consists of two contributions, which has been
Propane dehydrogenation reaction kinetics
155
inferred from the very strong increase in the reaction rate at about 650 °C. For lower
temperatures the propane hydrogenolysis depends on the propane concentration according to a
Langmuir-Hinshelwood type dependency and on the square of the hydrogen concentration.
The reaction orders for the propane hydrogenolysis at high temperatures were not determined.
It is assumed that the high temperature contribution to the propane hydrogenolysis increases
linearly with both the propane and the hydrogen concentration, following the reaction
stoichiometry and satisfying the experimental observation that no ethane was produced
without hydrogen present in the gas mixture. Finally the propylene hydrogenolysis is
proportional to the hydrogen concentration and depends on the propylene concentration
according to a Langmuir-Hinshelwood type dependency.
Especially remarkable is the influence of the hydrogen concentration on the propylene
hydrogenation reaction rate and the low temperature contributions of the propane
dehydrogenation and propane hydrogenolysis reaction rates. All these reaction rates show a
reaction order in the hydrogen concentration one higher than expected according to the
reaction stoichiometry. On the other hand, the propane cracking, propylene hydrogenolysis
and the high temperature contributions to the propane dehydrogenation and propane
hydrogenolysis reactions have reaction orders following the reaction stoichiometry without an
additional influence of the hydrogen concentration. This experimental observation can be
interpreted by assuming that the reactions take place at two different surface sites, platinum
surface sites and acid alumina surface sites, where propane dehydrogenation and propane
hydrogenolysis reactions can take place at both sites, while propane cracking and propylene
hydrogenolysis occur only at the acid surface sites and propylene hydrogenation mainly at the
platinum surface sites.
The propane cracking, propylene hydrogenolysis and the high temperature contributions to
the propane dehydrogenation and propane hydrogenolysis reactions are assumed to take place
at the acid surface sites because the reaction orders of these reactions correspond to the
reaction stoichiometry and because of the relatively high apparent activation energies. It is
important to emphasise that from the experiments conducted in this work it is difficult to
discriminate whether the reactions take place at the acid surface sites or in the gas phase or
both. The experimentally observed linear dependency on the propane concentration for these
reactions can be well explained by either assuming gas phase reactions or by assuming Henry-
type adsorption of propane. However, since the reactions already take place at temperatures
Chapter 4
156
below 500 °C and because the reaction rates of the side-reactions show a good correlation
with the decrease in catalytic activity, it is tentatively proposed that the side-reactions take
place mainly at the alumina washcoat surface at the investigated temperature range.
Furthermore, at these temperatures a higher propane concentration per unit volume might be
realised at the catalyst surface compared to the gas phase. However, at higher temperatures
the adsorption of propane decreases and probably at temperatures above 650-700 °C
thermally activated propane dehydrogenation, cracking and hydrogenolysis become
important.
With additional experiments on a monolith sample with a different channel diameter – but the
same other catalyst properties – it might be possible to conclude whether the reactions take
place at the acid surface sites or in the gas phase. For a monolith with a larger channel
diameter the catalyst specific surface area is much smaller (less washcoat) and the gas phase
porosity is higher. If the reaction rate of the side-reactions decrease for this monolith sample,
it can be concluded that the reactions indeed occur at the surface sites. By comparing reaction
rates on monolith samples with different channel diameters for different temperatures it is
possible to investigate whether at lower temperatures the most important contribution is by
reactions at the acid surface sites and at higher temperatures the gas phase reactions are
dominant. However, the derived kinetics in this work is at least valid for monoliths with a
channel diameter of 1.0 mm.
The propylene hydrogenation and the low temperature contributions of the propane
dehydrogenation and propane hydrogenolysis are assumed to take place at the platinum
surface sites, because these reactions show a remarkably additional order in the hydrogen
concentration on top of the hydrogen dependency according to the reaction stoichiometry.
Propane and propylene seem to adsorb according to a Langmuir-Hinshelwood type adsorption
isotherm. However, it should be realised that many other mechanisms give similar types of
concentration dependencies. Moreover, it is generally assumed that hydrogen chemisorbs
dissociatively at the platinum sites (a.o. Loc et al., 1991a; Bariås, 1993). For dissociative
hydrogen chemisorption the surface fraction of hydrogen is proportional to the square root of
the gas phase hydrogen concentration, at least for mixtures strongly diluted with inert
components like nitrogen. In order to correctly describe the peculiar temperature dependency
of the propane dehydrogenation and propane hydrogenolysis reaction rates it is necessary to
assume that the additional reaction order in the hydrogen concentration results from the
square of the dissociatively chemisorbed hydrogen surface fraction.
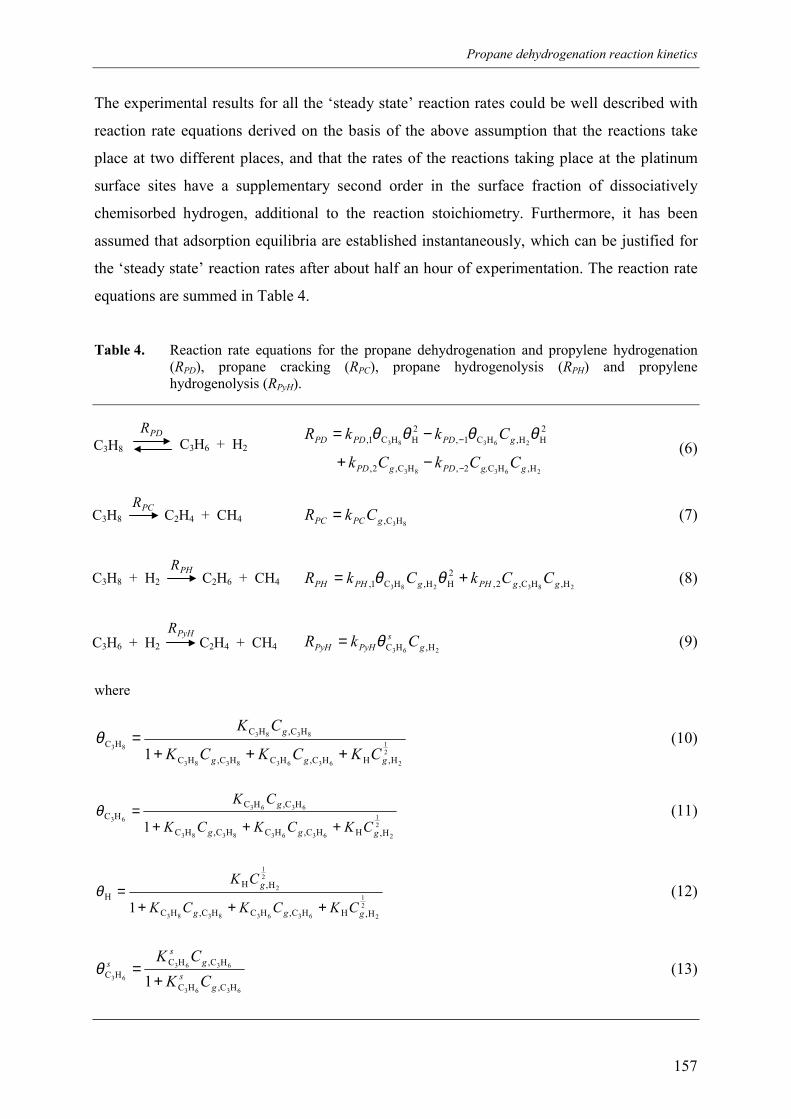
Propane dehydrogenation reaction kinetics
157
The experimental results for all the ‘steady state’ reaction rates could be well described with
reaction rate equations derived on the basis of the above assumption that the reactions take
place at two different places, and that the rates of the reactions taking place at the platinum
surface sites have a supplementary second order in the surface fraction of dissociatively
chemisorbed hydrogen, additional to the reaction stoichiometry. Furthermore, it has been
assumed that adsorption equilibria are established instantaneously, which can be justified for
the ‘steady state’ reaction rates after about half an hour of experimentation. The reaction rate
equations are summed in Table 4.
Table 4. Reaction rate equations for the propane dehydrogenation and propylene hydrogenation(RPD), propane cracking (RPC), propane hydrogenolysis (RPH) and propylenehydrogenolysis (RPyH).
26383
26383
H,HC2,HC,2,
2HH,HC1,
2HHC1,
gg,PDgPD
gPDPDPD
CCkCk
CkkR
−
−
−+
−= θθθθ(6)
83HC,gPCPC CkR = (7)
283283 H,HC,2,2HH,HC1, ggPHgPHPH CCkCkR += θθ (8)
263 H,HC gs
PyHPyH CkR θ= (9)
where
21
263638383
8383
83
H,HHC,HCHC,HC
HC,HCHC
1 ggg
g
CKCKCK
CK
+++=θ (10)
21
263638383
6363
63
H,HHC,HCHC,HC
HC,HCHC
1 ggg
g
CKCKCK
CK
+++=θ (11)
21
263638383
21
2
H,HHC,HCHC,HC
H,HH
1 ggg
g
CKCKCK
CK
+++=θ (12)
6363
6363
63HC,HC
HC,HCHC 1 g
sg
ss
CKCK
+=θ (13)
C3H8 C3H6 + H2PDR
C3H8 C2H4 + CH4PCR
C3H8 + H2 C2H6 + CH4PHR
C3H6 + H2 C2H4 + CH4PyHR
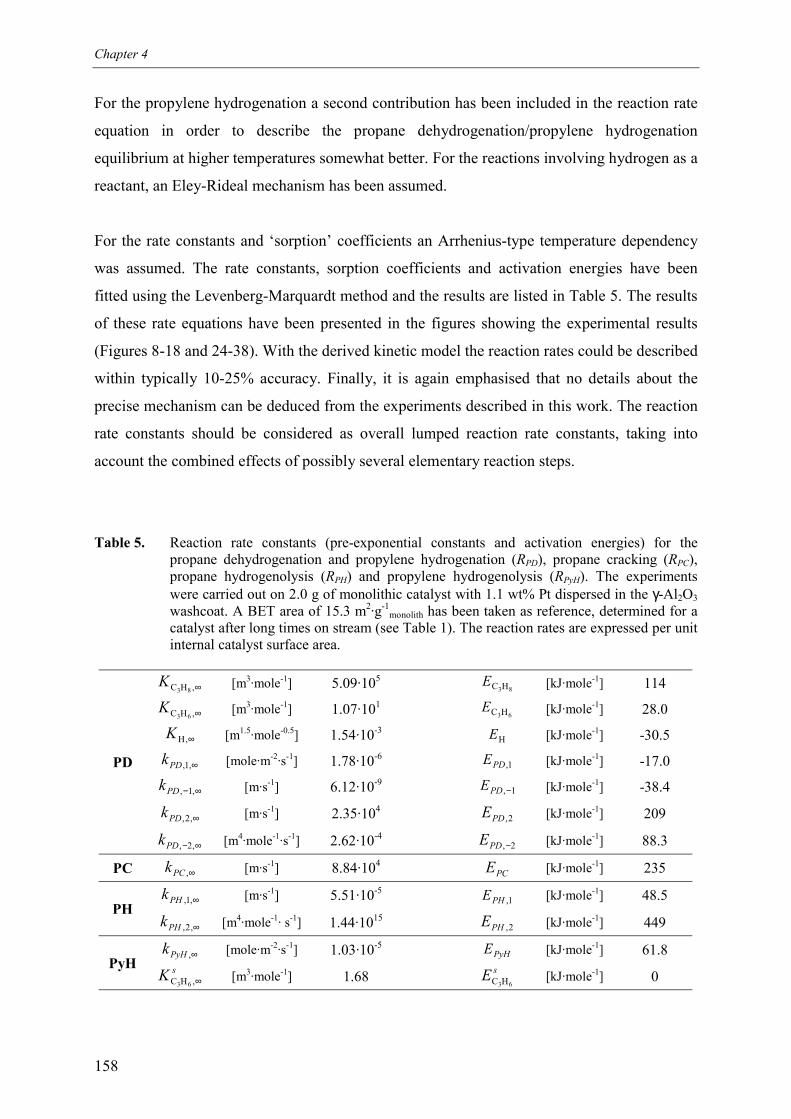
Chapter 4
158
For the propylene hydrogenation a second contribution has been included in the reaction rate
equation in order to describe the propane dehydrogenation/propylene hydrogenation
equilibrium at higher temperatures somewhat better. For the reactions involving hydrogen as a
reactant, an Eley-Rideal mechanism has been assumed.
For the rate constants and ‘sorption’ coefficients an Arrhenius-type temperature dependency
was assumed. The rate constants, sorption coefficients and activation energies have been
fitted using the Levenberg-Marquardt method and the results are listed in Table 5. The results
of these rate equations have been presented in the figures showing the experimental results
(Figures 8-18 and 24-38). With the derived kinetic model the reaction rates could be described
within typically 10-25% accuracy. Finally, it is again emphasised that no details about the
precise mechanism can be deduced from the experiments described in this work. The reaction
rate constants should be considered as overall lumped reaction rate constants, taking into
account the combined effects of possibly several elementary reaction steps.
Table 5. Reaction rate constants (pre-exponential constants and activation energies) for thepropane dehydrogenation and propylene hydrogenation (RPD), propane cracking (RPC),propane hydrogenolysis (RPH) and propylene hydrogenolysis (RPyH). The experimentswere carried out on 2.0 g of monolithic catalyst with 1.1 wt% Pt dispersed in the γ-Al2O3washcoat. A BET area of 15.3 m2·g-1
monolith has been taken as reference, determined for acatalyst after long times on stream (see Table 1). The reaction rates are expressed per unitinternal catalyst surface area.
∞,HC 83K [m3·mole-1] 5.09·105
83HCE [kJ·mole-1] 114
∞,HC 63K [m3·mole-1] 1.07·101
63HCE [kJ·mole-1] 28.0
∞,HK [m1.5·mole-0.5] 1.54·10-3HE [kJ·mole-1] -30.5
∞,1,PDk [mole·m-2·s-1] 1.78·10-61,PDE [kJ·mole-1] -17.0
∞− ,1,PDk [m·s-1] 6.12·10-91,−PDE [kJ·mole-1] -38.4
∞,2,PDk [m·s-1] 2.35·1042,PDE [kJ·mole-1] 209
PD
∞− ,2,PDk [m4·mole-1·s-1] 2.62·10-42,−PDE [kJ·mole-1] 88.3
PC ∞,PCk [m·s-1] 8.84·104PCE [kJ·mole-1] 235
∞,1,PHk [m·s-1] 5.51·10-51,PHE [kJ·mole-1] 48.5
PH∞,2,PHk [m4·mole-1· s-1] 1.44·1015
2,PHE [kJ·mole-1] 449
∞,PyHk [mole·m-2·s-1] 1.03·10-5PyHE [kJ·mole-1] 61.8
PyH sK ∞,HC 63[m3·mole-1] 1.68 sE
63HC [kJ·mole-1] 0
Propane dehydrogenation reaction kinetics
159
5. Discussion
In this section the experimental results for the ‘steady state’ reaction rates are discussed. The
discussion is restricted to the following topics. Firstly, the experimentally determined reaction
rates for the propane dehydrogenation are compared with some literature values. Then, an
explanation is proposed for the peculiar additional hydrogen dependency of the reactions
taking place at the platinum surface sites. Finally, the derived ‘steady state’ reaction rate
equations are valid for reaction mixtures with a composition largely deviating from the
equilibrium composition. It is shortly discussed how the derived reaction rate equations can
be tentatively adjusted so that the reaction rates coincide with thermodynamic data when the
system approaches equilibrium.
5.1 Comparison of propane dehydrogenation reaction rate with literature
The experimentally determined ‘steady state’ propane dehydrogenation reaction rate is
compared with reaction data given by Loc et al. (1991a) and Bariås (1993). For a 50%
propane and 50% hydrogen mixture the propane dehydrogenation reaction rate was practically
independent of the temperature at temperatures between 500 and 600 °C (at 1.2 bara) and was
about 3.0 µmole·g-1·s-1 for a 1.1 wt% Pt/γ-Al2O3 monolith sample for large cumulative
experimentation times. From the reaction rate equation given by Loc et al. an initial propane
dehydrogenation reaction rate of 48 µmole·g-1·s-1 is calculated for a 50% propane, 50%
hydrogen mixture over a 0.6 wt% Pt/γ-Al2O3 at 600 °C. The reaction rate equation given by
Bariås for propane dehydrogenation over a Sn-Pt/γ-Al2O3 catalyst, with also about 0.6 wt%
Pt, gives an initial propane dehydrogenation reaction of 46 µmole·g-1·s-1 for a reaction mixture
with the same composition at 500 °C. Bariås showed that the initial reaction rates of the
propane dehydrogenation over Pt/γ-Al2O3 and Sn-Pt/γ-Al2O3 catalysts are comparable (in
strong contrast to longer times on stream).
Before comparing these values, the reaction rates need to be corrected for the platinum
loading and the specific catalyst surface area. At these relatively low platinum concentrations
the platinum dispersion can approximately be considered constant (cf. Biloen et al., 1977).
Subsequently, the specific catalyst surface area of a used monolith sample was determined at
Chapter 4
160
15.3 m2·g-1, while Bariås used a catalyst with a catalyst surface area of 150-180 m2·g-1.
Unfortunately Loc et al. did not mention the specific catalyst surface area of their catalysts.
The specific surface area of the monolith is roughly a factor of 10 lower, corresponding to the
weight fraction of the washcoat in the monolith (estimated at about 8 wt%). Correcting the
reaction rate by Bariås for a 1 wt% Pt catalyst a propane dehydrogenation reaction rate of ca.
0.7 µmole·m-2·s-1 is obtained, compared to 0.2 µmole·m-2·s-1 for the monolith in this work.
Next, the reaction rates given by Loc et al. and Bariås are extrapolated to t = 0, while in this
work the ‘steady state’ reaction rates reached after roughly 30 minutes of operation are
reported. Compared with the initial reaction rates the ‘steady state’ reaction rate has decreased
about a factor of two because of the deposition of carbonaceous products for a equimolar
propane-hydrogen mixture at 600 °C (see Figure 6). Finally, it is noted that Bariås measured
the propane dehydrogenation reaction rate on a fresh catalyst. The catalytic activity of the
monolith sample strongly decreases with times on stream because of sintering (35 m2·g-1 to
15.3 m2·g-1 for a fresh and used monolith sample, see Table 1), which is corrected for, but also
additionally because of the destruction of the most active sites or decrease in platinum
dispersion. The catalytic activity on a used catalyst has decreased more than a factor of 5 (see
Figure 7.a). Concluding, the order of magnitude of the experimentally observed propane
dehydrogenation reaction rates corresponds well to the literature values.
Furthermore, Bariås (1993) observed a relatively high apparent activation energy of
100 kJ·mole-1 between 427 and 519 °C, while Loc et al. (1991a) determined an activation
energy of 59 kJ·mole-1 at temperatures between 570 and 620 °C, although they indicated that
they did not obtain a straight line in their Arrhenius plot. These apparent activation energies
correspond very well with the experimental results obtained in this work, see Figure 39. Note,
that for low temperatures the activation energy approaches the reaction enthalpy, because the
experimentally determined conversions approach the equilibrium conversions, as discussed
before.
In this work a positive influence of the hydrogen concentration on the propane
dehydrogenation reaction rate was observed. Neither Loc et al. (1991a) or Bariås (1993)
found a positive influence of the hydrogen concentration (hydrogen reaction orders were -0.5
and -0.67, respectively). An explanation for the discrepancy in the influence of the hydrogen
concentration is given in the next section.
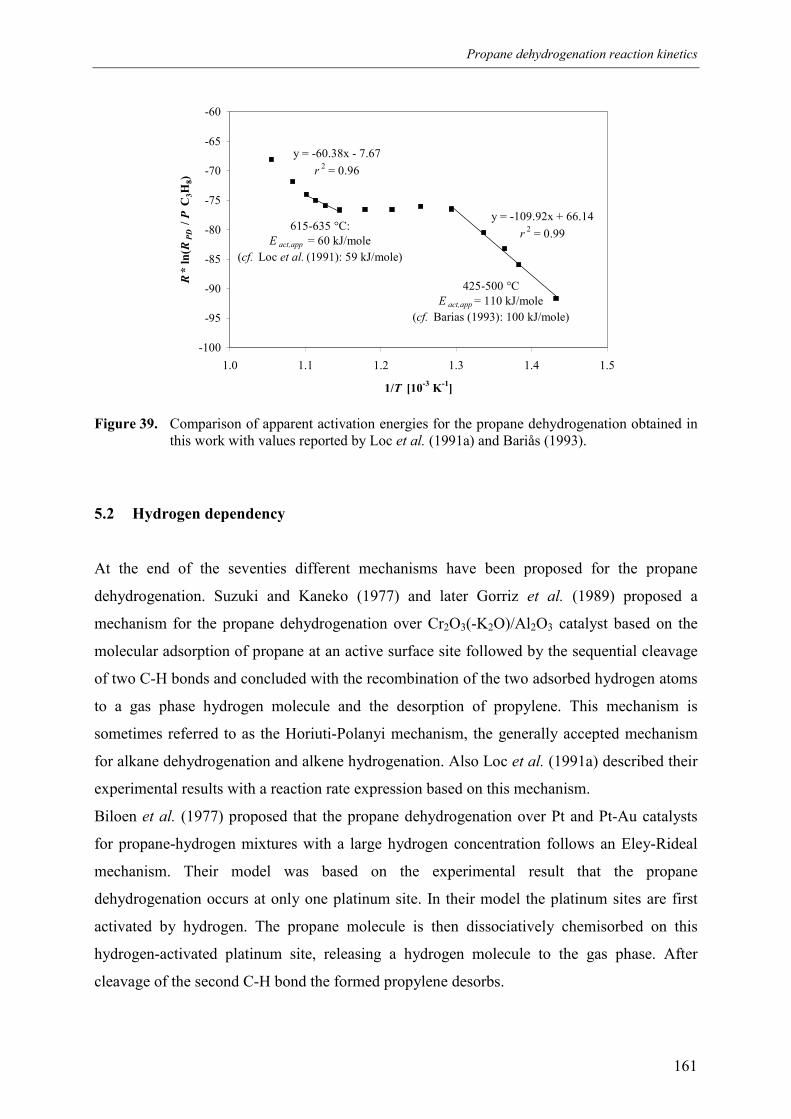
Propane dehydrogenation reaction kinetics
161
y = -60.38x - 7.67r 2 = 0.96
y = -109.92x + 66.14r 2 = 0.99
-100
-95
-90
-85
-80
-75
-70
-65
-60
1.0 1.1 1.2 1.3 1.4 1.5
1/T [10-3 K-1]
R*
ln( R
PD /
P C
3H8)
615-635 °C:E act,app = 60 kJ/mole
(cf. Loc et al. (1991): 59 kJ/mole)
425-500 °CE act,app = 110 kJ/mole
(cf. Barias (1993): 100 kJ/mole)
Figure 39. Comparison of apparent activation energies for the propane dehydrogenation obtained inthis work with values reported by Loc et al. (1991a) and Bariås (1993).
5.2 Hydrogen dependency
At the end of the seventies different mechanisms have been proposed for the propane
dehydrogenation. Suzuki and Kaneko (1977) and later Gorriz et al. (1989) proposed a
mechanism for the propane dehydrogenation over Cr2O3(-K2O)/Al2O3 catalyst based on the
molecular adsorption of propane at an active surface site followed by the sequential cleavage
of two C-H bonds and concluded with the recombination of the two adsorbed hydrogen atoms
to a gas phase hydrogen molecule and the desorption of propylene. This mechanism is
sometimes referred to as the Horiuti-Polanyi mechanism, the generally accepted mechanism
for alkane dehydrogenation and alkene hydrogenation. Also Loc et al. (1991a) described their
experimental results with a reaction rate expression based on this mechanism.
Biloen et al. (1977) proposed that the propane dehydrogenation over Pt and Pt-Au catalysts
for propane-hydrogen mixtures with a large hydrogen concentration follows an Eley-Rideal
mechanism. Their model was based on the experimental result that the propane
dehydrogenation occurs at only one platinum site. In their model the platinum sites are first
activated by hydrogen. The propane molecule is then dissociatively chemisorbed on this
hydrogen-activated platinum site, releasing a hydrogen molecule to the gas phase. After
cleavage of the second C-H bond the formed propylene desorbs.
Chapter 4
162
Finally, Somorjai (1977) proposed a dynamic restructuring surface model. In their model the
platinum surface is covered by a near monolayer amount of carbonaceous deposits. The
cleavage of the two C-H bonds is proposed to take place on top of this overlayer and the
recombination of the hydrogen atoms takes place at the platinum surface.
Only the mechanism proposed by Biloen et al. (1977) can explain a positive influence of
hydrogen on the propane dehydrogenation reaction rate. However, this mechanism fails to
explain the experimentally observed second order dependency on the gas phase hydrogen
concentration of the propylene hydrogenation and propane hydrogenolysis reaction rates. It is
proposed that the experimentally observed additional order in the gas phase hydrogen
concentration for all the reactions taking place at the platinum surface sites does not result
from the influence of hydrogen on the elementary reaction steps, but results from the
influence of hydrogen on the number of free active platinum surface sites which are not
covered by carbonaceous deposits. The positive influence of the hydrogen concentration on
the reaction rates for all the reactions taking place at the platinum sites is thus explained by
the retardation by hydrogen of the formation of carbonaceous products which cover platinum
surface sites and withhold these sites to participate in other reactions.
5.2.1 Number of free platinum surface sites
It was observed in the experiments that the propane dehydrogenation and propylene
hydrogenation reaction rates over Pt/γ-Al2O3 catalysts at ca. 600 °C became practically
constant after 10-30 minutes. The decrease in the catalyst activity can be explained by the
deposition of carbonaceous products on the active platinum sites. After about half an hour the
number of platinum sites covered with coke seem to have stabilised, explaining the virtually
constant reaction rate. However, the total coke content on the monolith sample still increases
with time at these reaction conditions (see Chapter 5) because of coke formation at the acid
surface sites of the washcoat. The steady state in the number of free active sites is tentatively
explained by a dynamic equilibrium between the formation of carbonaceous products on the
platinum sites and the regeneration of these sites by reduction of the carbonaceous products
with hydrogen or by removal of the coke precursors via transport from the platinum sites to
different places at the surface. Recent research explains the improved stability of
Propane dehydrogenation reaction kinetics
163
Sn-Pt/γ-Al2O3 catalysts over Pt/γ-Al2O3 catalysts by the enhanced transport of carbonaceous
products from the platinum sites to the support by the addition of tin (e.g. Bariås, 1993).
Larsson (1997) described the catalyst deactivation by a model – kept as simple as possible –
based on the assumption that two types of coke were formed on the platinum sites, one type
reversible and the other irreversible. The reversible type of coke is formed out of coke
precursors mainly originating from adsorbed propylene. The reversible type of coke can be
removed by hydrogen or can be converted into the irreversible type of coke. The propane
dehydrogenation reaction rate could be described by
( )irrrevrr θθ −−= 10 (14)
where r0 represents the reaction rate on a fresh catalyst without any coke deposits and θrev and
θirr represent the fraction of platinum surface sites covered by reversible and irreversible coke,
respectively. The reversible and irreversible coke surface fractions as a function of time were
described by
( ) revrevirrrevrev kpk
pp
kdt
d θθθθθ3H2
H
HC1 2
2
63 1 −−−−= (15)
revirr k
dtd θθ
3= (16)
For the relative short dehydrogenation times of about 30 minutes used in this work, compared
with dehydrogenation times of many hours in the work of Larsson (1997), it is assumed that
the amount of irreversible coke and the rate at which irreversible coke is formed is negligible
(θirr << θrev, and 2H23 pkk << ). This explains the virtually constant propane dehydrogenation
reaction rate after 30 minutes of experimentation.
For the pseudo-steady state for relatively short times on stream equation 15 can be simplified
to
Chapter 4
164
2
2
63
2
63
H2H
HC1
H
HC1
pkp
pk
pp
k
rev
+≈θ (17)
The pseudo-steady state reaction rate relative to the initial reaction rate on a surface without
coke deposits equals the fraction of free platinum surface sites and is then given by
2
2
63
2
HH
HC
2
1
H
0
1p
pp
kk
prr
rev
+≈−≈ θ (18)
Since the reaction rates have decreased about a factor of 2 to 3 in the pseudo-steady state
compared to the initial reaction rates, the formation rate of reversible coke is of the same
order of magnitude as the rate of removal of reversible coke via hydrogenation.
Note that the expression used by Larsson for the formation of reversible coke is only valid for
reaction mixtures with relatively high hydrogen concentrations and for high conversions of
propane to propylene. Assuming that the formation rate of reversible coke is proportional to
propylene and propane surface concentrations, yielding the term in equation 15 in the limit of
high hydrogen concentrations and high propane conversions, equation 18 can be represented
in a more general form by
283
83
63
63
2
H0,HC2
HC,10,HC
2
HC,1
H
0 pk
kk
kp
rr
+
+
≈θθ
(19)
which shows the additional order in the hydrogen concentration for the reactions taking place
at the platinum sites, if the term between the brackets in the denominator of equation 19 is
larger than the hydrogen pressure. Larsson (1997) assumed that the hydrogenation of
reversible coke occurs via hydrogen from the gas phase. However, further research about the
details of the kinetics of the coke formation processes at the platinum surface sites is
necessary to discriminate whether reversible type coke is removed by gas phase hydrogen or
by molecularly or dissociatively adsorbed hydrogen.
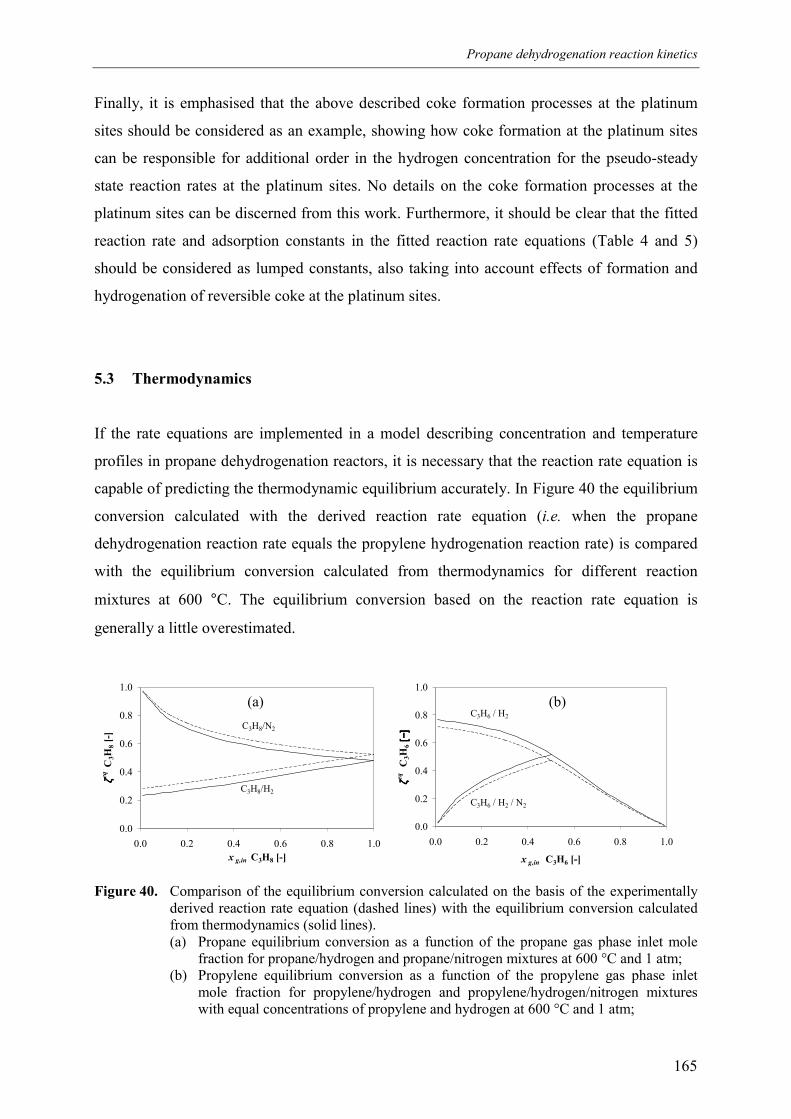
Propane dehydrogenation reaction kinetics
165
Finally, it is emphasised that the above described coke formation processes at the platinum
sites should be considered as an example, showing how coke formation at the platinum sites
can be responsible for additional order in the hydrogen concentration for the pseudo-steady
state reaction rates at the platinum sites. No details on the coke formation processes at the
platinum sites can be discerned from this work. Furthermore, it should be clear that the fitted
reaction rate and adsorption constants in the fitted reaction rate equations (Table 4 and 5)
should be considered as lumped constants, also taking into account effects of formation and
hydrogenation of reversible coke at the platinum sites.
5.3 Thermodynamics
If the rate equations are implemented in a model describing concentration and temperature
profiles in propane dehydrogenation reactors, it is necessary that the reaction rate equation is
capable of predicting the thermodynamic equilibrium accurately. In Figure 40 the equilibrium
conversion calculated with the derived reaction rate equation (i.e. when the propane
dehydrogenation reaction rate equals the propylene hydrogenation reaction rate) is compared
with the equilibrium conversion calculated from thermodynamics for different reaction
mixtures at 600 °C. The equilibrium conversion based on the reaction rate equation is
generally a little overestimated.
0.0
0.2
0.4
0.6
0.8
1.0
0.0 0.2 0.4 0.6 0.8 1.0x g,in C3H8 [-]
ζ ζζζeq C
3H8 [
-]
C3H8/H2
C3H8/N2
0.0
0.2
0.4
0.6
0.8
1.0
0.0 0.2 0.4 0.6 0.8 1.0
x g,in C3H6 [-]
ζ ζζζeq C
3H6
[−]
[−]
[−]
[−]
C3H6 / H2 / N2
C3H6 / H2
Figure 40. Comparison of the equilibrium conversion calculated on the basis of the experimentallyderived reaction rate equation (dashed lines) with the equilibrium conversion calculatedfrom thermodynamics (solid lines).(a) Propane equilibrium conversion as a function of the propane gas phase inlet mole
fraction for propane/hydrogen and propane/nitrogen mixtures at 600 °C and 1 atm;(b) Propylene equilibrium conversion as a function of the propylene gas phase inlet
mole fraction for propylene/hydrogen and propylene/hydrogen/nitrogen mixtureswith equal concentrations of propylene and hydrogen at 600 °C and 1 atm;
(a) (b)
Chapter 4
166
The differences between the equilibrium conversions calculated from kinetics and
thermodynamics increase at lower temperatures, because in this case the propane
dehydrogenation reaction rate is still relatively large, but the equilibrium conversion is very
small.
Since the rate equation is based on experiments with either propane or propylene in the feed,
the fitted reaction rate equation for the propane dehydrogenation/propylene hydrogenation
reaction (Table 4 and 5) is only valid for reaction mixtures whose composition strongly
deviates from the equilibrium composition, explaining the discrepancies between the
equilibrium conversions calculated based on kinetics or thermodynamics. More detailed
knowledge of the propane dehydrogenation and propylene hydrogenation reaction mechanism
and kinetics, especially closer to the equilibrium, is necessary to arrive at better rate
equations.
Knowledge on the thermodynamic equilibrium has not been incorporated explicitly in the
reaction rate equation derived in this work. Loc et al. (1991a) included the thermodynamic
equilibrium explicitly in their reaction rate expression (equation 1) by assuming that the
backward reaction rate constant equals the forward reaction rate constant divided by the
equilibrium constant. However, this method can only be applied for a single reaction where
the reaction orders correspond to the reaction stoichiometry (at least relatively). It has been
tried to set both backward reaction rate constants equal to their respective forward reaction
rate constants divided by the equilibrium constant
p
PDPD K
kk 1,
1, =− and p
PDPD K
kk 2,
2, =− (20 a,b)
However, this failed to produce a reasonable fit to the experiments. Especially the observed
peculiar temperature dependencies of the propane dehydrogenation and propylene
hydrogenation reaction rates could not be captured.
A palliative is proposed to overcome this inadequacy of the derived reaction rate equation. It
is proposed that in case of net propane dehydrogenation the reaction rate of the propylene
hydrogenation is adjusted in such a way that the reaction rates are equal at the equilibrium
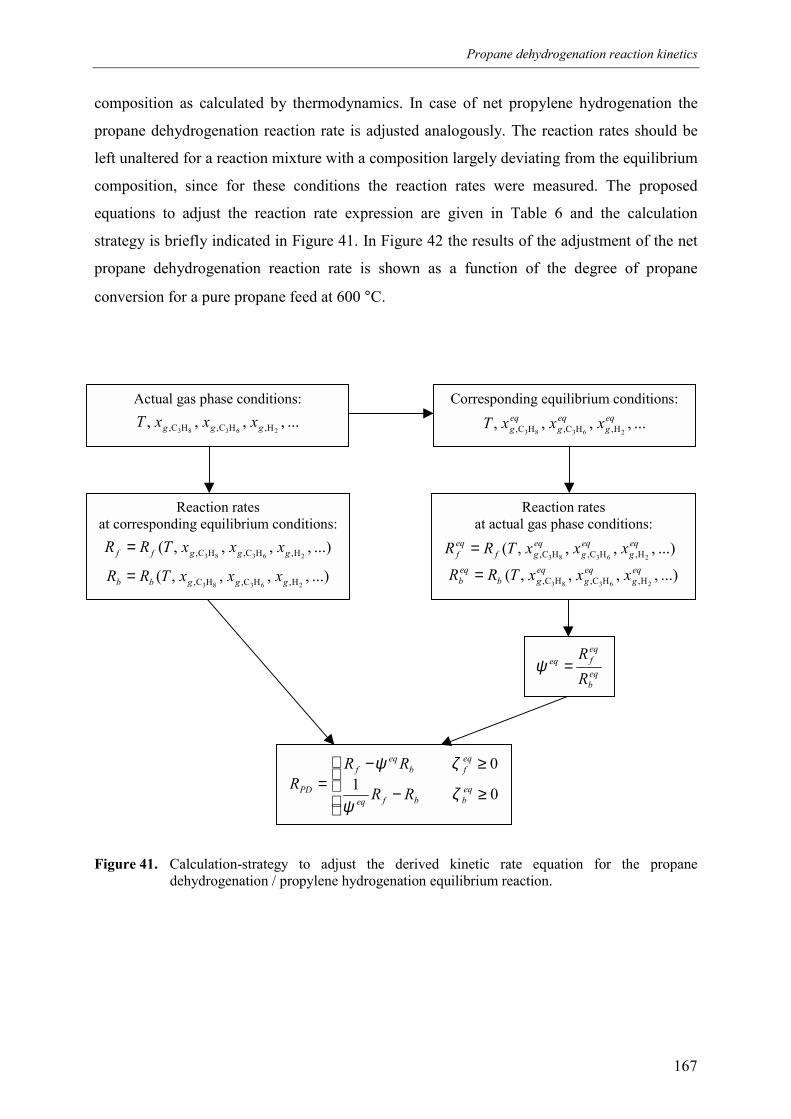
Propane dehydrogenation reaction kinetics
167
composition as calculated by thermodynamics. In case of net propylene hydrogenation the
propane dehydrogenation reaction rate is adjusted analogously. The reaction rates should be
left unaltered for a reaction mixture with a composition largely deviating from the equilibrium
composition, since for these conditions the reaction rates were measured. The proposed
equations to adjust the reaction rate expression are given in Table 6 and the calculation
strategy is briefly indicated in Figure 41. In Figure 42 the results of the adjustment of the net
propane dehydrogenation reaction rate is shown as a function of the degree of propane
conversion for a pure propane feed at 600 °C.
Figure 41. Calculation-strategy to adjust the derived kinetic rate equation for the propanedehydrogenation / propylene hydrogenation equilibrium reaction.
Actual gas phase conditions:...,,,,
26383 H,HC,HC, ggg xxxTCorresponding equilibrium conditions:
...,,,,26383 H,HC,HC,
eqg
eqg
eqg xxxT
Reaction ratesat actual gas phase conditions:
...),,,,(26383 H,HC,HC,
eqg
eqg
eqgf
eqf xxxTRR =
...),,,,(26383 H,HC,HC,
eqg
eqg
eqgb
eqb xxxTRR =
Reaction ratesat corresponding equilibrium conditions:
...),,,,(26383 H,HC,HC, gggff xxxTRR =
...),,,,(26383 H,HC,HC, gggbb xxxTRR =
eqb
eqfeq
RR
=ψ
≥−
≥−= 01
0eqbbfeq
eqfb
eqf
PD RR
RRR ζ
ψ
ζψ
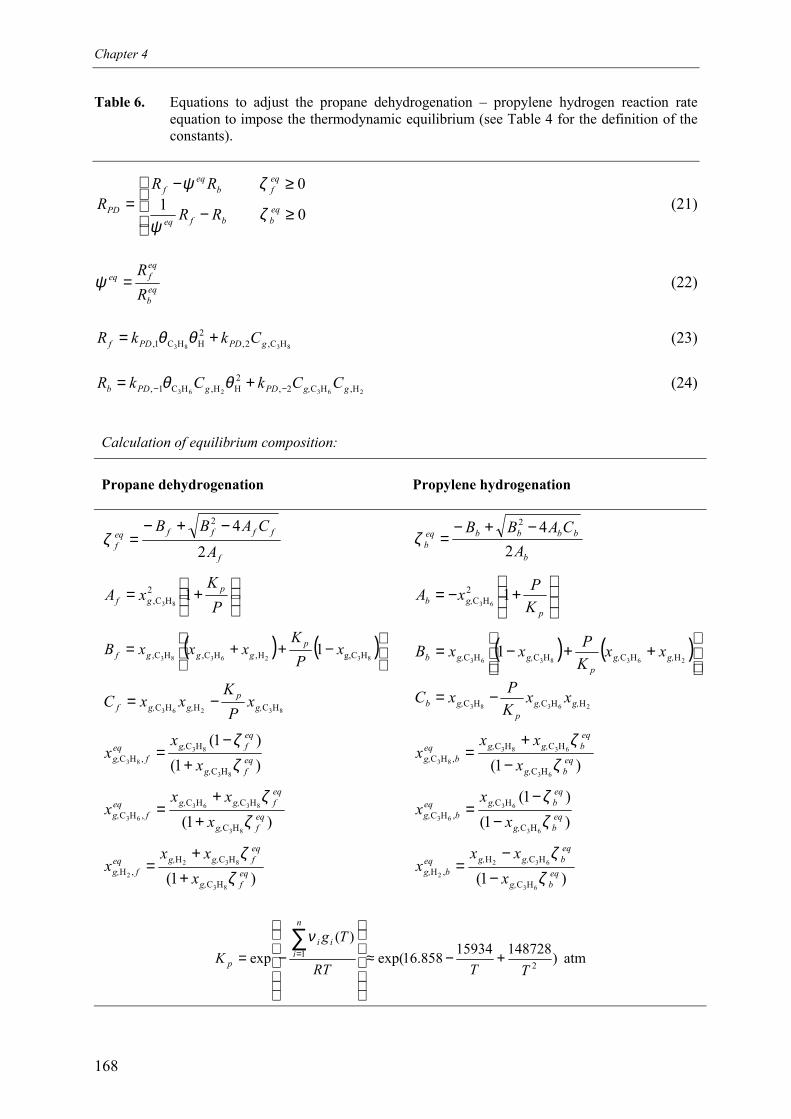
Chapter 4
168
Table 6. Equations to adjust the propane dehydrogenation – propylene hydrogen reaction rateequation to impose the thermodynamic equilibrium (see Table 4 for the definition of theconstants).
≥−
≥−=
010
eqbbfeq
eqfb
eqf
PD RR
RRR ζ
ψ
ζψ(21)
eqb
eqfeq
RR
=ψ (22)
8383 HC,2,2HHC1, gPDPDf CkkR += θθ (23)
263263 H,HC2,2HH,HC1, gg,PDgPDb CCkCkR −− += θθ (24)
Calculation of equilibrium composition:
Propane dehydrogenation Propylene hydrogenation
f
ffffeqf A
CABB2
42 −+−=ζ
b
bbbbeqb A
CABB2
42 −+−=ζ
+=
PK
xA pgf 12
HC, 83
+−=
pg,b K
PxA 12HC 63
( ) ( )
−++=
8326383 HCg,H,HC,HC, 1 xP
KxxxB p
gggf ( ) ( )
++−=
2638363 HHCHCHC 1 g,g,p
g,g,b xxKPxxB
83263 HCHHC g,p
g,g,f xP
KxxC −= 26383 HHCHC g,g,
pg,b xx
KPxC −=
)1()1(
83
83
83HC
HC,HC eq
fg,
eqfg,eq
fg, xx
xζζ
+−
=)1(
63
6383
83HC
HCHC,HC eq
bg,
eqbg,g,eq
bg, xxx
xζ
ζ−
+=
)1(83
8363
63HC
HCHC,HC eq
fg,
eqfg,g,eq
fg, xxx
xζ
ζ+
+=
)1()1(
63
63
63HC
HC,HC eq
bg,
eqbg,eq
bg, xx
xζζ
−−
=
)1(83
832
2HC
HCH,H eq
fg,
eqfg,g,eq
fg, xxx
xζ
ζ+
+=
)1(63
632
2HC
HCH,H eq
bg,
eqbg,g,eq
bg, xxx
xζ
ζ−
−=
atm )14872815934858.16exp()(
exp 21
TTRT
TgK
n
iii
p +−≈
−=∑
=
ν
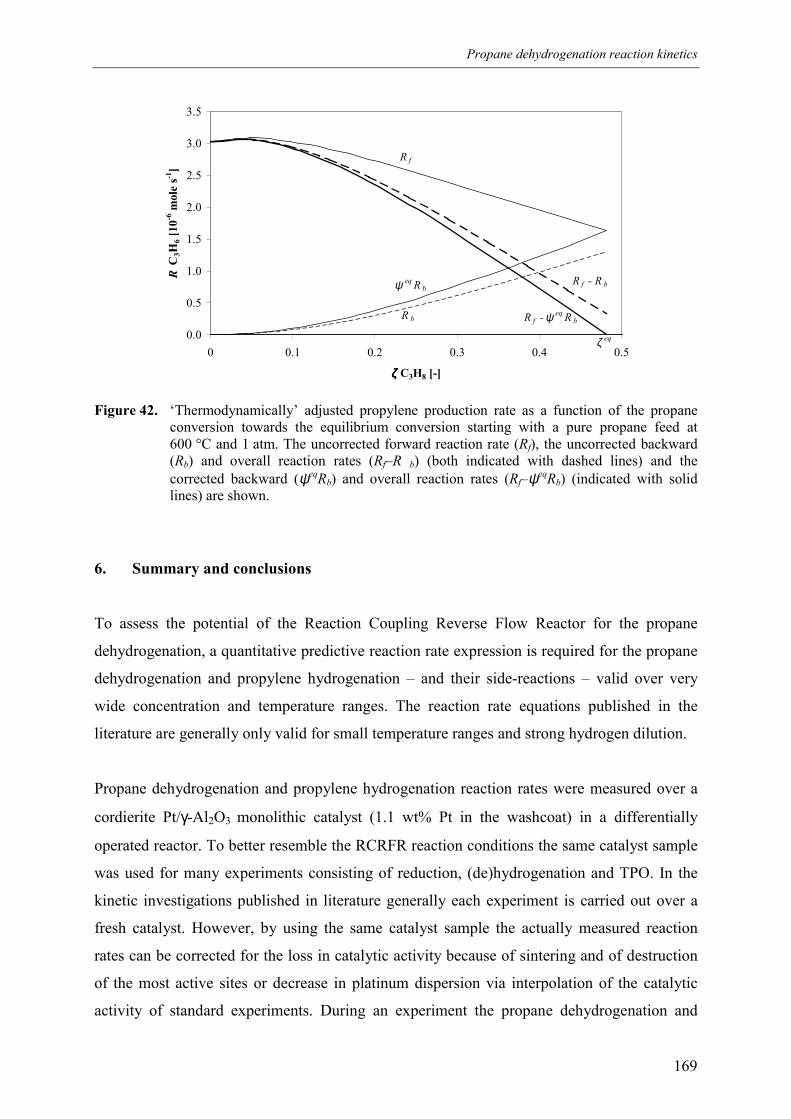
Propane dehydrogenation reaction kinetics
169
0.0
0.5
1.0
1.5
2.0
2.5
3.0
3.5
0 0.1 0.2 0.3 0.4 0.5
ζζζζ C3H8 [-]
R C
3H6 [
10-6
mol
e s-1
]
R f - R b
R f
R b
ψ eq R b
ζ eq
R f - ψ eq R b
Figure 42. ‘Thermodynamically’ adjusted propylene production rate as a function of the propaneconversion towards the equilibrium conversion starting with a pure propane feed at600 °C and 1 atm. The uncorrected forward reaction rate (Rf), the uncorrected backward(Rb) and overall reaction rates (Rf–R b) (both indicated with dashed lines) and thecorrected backward (ψeqRb) and overall reaction rates (Rf–ψeqRb) (indicated with solidlines) are shown.
6. Summary and conclusions
To assess the potential of the Reaction Coupling Reverse Flow Reactor for the propane
dehydrogenation, a quantitative predictive reaction rate expression is required for the propane
dehydrogenation and propylene hydrogenation – and their side-reactions – valid over very
wide concentration and temperature ranges. The reaction rate equations published in the
literature are generally only valid for small temperature ranges and strong hydrogen dilution.
Propane dehydrogenation and propylene hydrogenation reaction rates were measured over a
cordierite Pt/γ-Al2O3 monolithic catalyst (1.1 wt% Pt in the washcoat) in a differentially
operated reactor. To better resemble the RCRFR reaction conditions the same catalyst sample
was used for many experiments consisting of reduction, (de)hydrogenation and TPO. In the
kinetic investigations published in literature generally each experiment is carried out over a
fresh catalyst. However, by using the same catalyst sample the actually measured reaction
rates can be corrected for the loss in catalytic activity because of sintering and of destruction
of the most active sites or decrease in platinum dispersion via interpolation of the catalytic
activity of standard experiments. During an experiment the propane dehydrogenation and
Chapter 4
170
propylene hydrogenation reaction rates also decrease as a function of time, which is attributed
to the formation of carbonaceous deposits on the active sites. Although the extent of and the
rate at which the catalytic activity decreases depends on the operating conditions prior to and
during the experiments, the reaction rates reached a virtually asymptotic steady state value
after about half an hour. For both the propane dehydrogenation and propylene hydrogenation
these pseudo steady state reaction rates were determined for a wide variation of temperature
and composition. The observed reaction rates and activation energies for the propane
dehydrogenation correspond reasonably to values reported in the literature. From the
selectivity data information about the kinetics of the most important gas phase side reactions
was extracted. Only propane cracking, propane hydrogenolysis and propylene hydrogenolysis
were considered as side reactions.
From the experiments it was concluded that the propane dehydrogenation and propane
hydrogenolysis reaction rates consist of two contributions, one dominant at lower
temperatures (below 600 °C) and one dominant at higher temperatures (above 650 °C). The
low temperature contributions of the propane dehydrogenation and propane hydrogenolysis
reaction rates, but also the propylene hydrogenation reaction rate show a remarkable
additional reaction order in the hydrogen concentration, one higher than expected according to
the reaction stoichiometry. On the other hand, propane cracking, propylene hydrogenolysis
and the high temperature contributions of the propane dehydrogenation and propane
hydrogenolysis have reaction orders corresponding to the reaction stoichiometry without
additional influence of the hydrogen concentration.
These experimental observations were interpreted by assuming that the reactions can take
place at two different surface sites: platinum surface sites and acid alumina surface sites. It is
assumed that the propane dehydrogenation, propylene hydrogenation and propane
hydrogenolysis reactions can take place at both sites, while propane cracking and propylene
hydrogenolysis occur only at the acid surface sites. The reaction orders for the reactions
taking place at the acid surface sites correspond to the reaction stoichiometry, but the
reactions taking place at the platinum surface sites show a supplementary second order in the
surface fraction of dissociatively chemisorbed hydrogen, additional to the reaction
stoichiometry. The observed influences of composition and temperature on the propane
dehydrogenation, propylene hydrogenation, propane cracking and propane and propylene
hydrogenolysis pseudo-steady state reaction rates could be well described with rate equations
Propane dehydrogenation reaction kinetics
171
based on the above assumption (see Tables 4 and 5). It has been shown that the additional
order in the gas phase hydrogen concentration for all the reactions taking place at the platinum
surface sites can be explained by the influence of hydrogen on the number of free surface sites
not covered with carbonaceous products.
Finally, it has been shown that the derived kinetic rate expression for the propane
dehydrogenation and propylene hydrogenation overestimate the equilibrium conversion as
calculated by thermodynamics. The rate expression has been based on experiments for
mixtures with a composition largely deviating from the equilibrium composition.
Furthermore, no knowledge of the thermodynamic equilibrium has been included in the rate
expression. A palliative has been proposed to overcome the discrepancies between
equilibrium conversions calculated by thermodynamics and the derived kinetic rate
expression. Obviously, the kinetic investigation should be continued by carrying out
experiments for propane, propylene, hydrogen and nitrogen mixtures with a composition
closer to the equilibrium conversion. Moreover, if by extensive additional kinetic research
(a.o. transient kinetic investigations) more knowledge about the propane dehydrogenation /
propylene hydrogenation reaction mechanism can be obtained, a better rate equation might be
formulated making the thermodynamic adjustment unnecessary. However, the derived rate
expressions for the propane dehydrogenation / propylene hydrogenation equilibrium reaction
and their most important side reactions provide valuable information for the optimisation of
the process conditions – especially the temperature and hydrogen concentration – in propane
dehydrogenation reactors, and for the design, development and optimisation of the RCRFR in
particular.
Acknowledgements
The author wishes to thank W. Vos and R.G.S. de Boer for their valuable contribution to the
experimental work and H.J. Moed for the construction and maintenance of the kinetics reactor
and the experimental set-up. Also the help by B.G.J. Kamp for the GC-analysis section is
greatly appreciated. Furthermore, the financial support by the Netherlands Organization for
Scientific Research (N.W.O.) is gratefully acknowledged.
Chapter 4
172
Notation
A,B,C constants for calculation of equilibrium composition
Cg gas phase concentration [mole·m-3]
E activation energy [kJ·mole-1]
∆Hr reaction enthalpy [kJ·mole-1]
∆Gr reaction Gibbs free enthalpy [kJ·mole-1]
k reaction rate constant
K adsorption constant
Kp thermodynamic equilibrium constant [atm]
pi partial pressure of component i [Pa]
r2 linear regression coefficient [-]
R gas constant (= 8.314) [J·mole-1·K-1]
Ri reaction rate of component i [mole·s-1] or [mole·m-2·s-1]
t time [s]
T temperature [K] or [°C]
xg gas phase molar fraction [mole·mole-1]
Greek symbols
ζ conversion [-]
θi surface fraction of component i [-]
θirr surface fraction of irreversible type coke [-]
θrev surface fraction of reversible type coke [-]
ψeq correction factor to include thermodynamic equilibrium [-]
Subscripts
act activation
ads adsorbed
app apparent
b backward (i.e. proylene hydrogenation)
f forward (i.e. propane dehydrogenation)
g gas phase
in inlet
Propane dehydrogenation reaction kinetics
173
PC propane cracking
PD propane dehydrogenation / propylene hydrogenation
PH propane hydrogenolysis
PyH propylene hydrogenolysis
0 at initial conditions (i.e. fresh catalyst)
∞ pre-exponential
Superscripts
eq at thermodynamic equilibrium
exp experimentally determined
s adsorbed at the support (i.e. γ-Al2O3 washcoat)
References
Atkins, P.W. (1990). Physical Chemistry. Fourth Edition, Oxford University Press, Oxford,
219
Babenkova, L.V., Szabó, S., Naidina, I.N. and Kulievskaya, Yu. G. (1994). Correlation
between hydrogen chemisorption, state of metals, and the activity of Pt/Al2O3 and Pt-Sn-
Al2O3 catalysis in propane dehydrogenation, Models in chemistry: an international forum for
all aspects of chemistry-related models and modelling, ISSN 1217-8969, 131(1), 113
Bariås, O.A. (1993). Transient kinetic investigation of the catalytic dehydrogenation of
propane. Ph.D. Thesis, Department of Industrial Chemistry, Norwegian Institute of
Technology, University of Trondheim, Norway.
Bariås, O.A., Holmen, A. and Blekkan, E.A. (1994). Propane dehydrogenation over supported
platinum catalysts: the influence of tin on the coking properties. Stud. Surf. Sci. Catal., 88,
519-524.
Bariås, O.A., Holmen, A. and Blekkan, E.A. (1995). Propane dehydrogenation over supported
platinum catalysts: effect of tin as a promotor. Catalysis Today, 24, 361-364
Chapter 4
174
Bariås, O.A., Holmen, A. and Blekkan, E.A. (1996). Propane dehydrogenation over supported
Pt and Pt-Sn catalysts: catalyst preparation, characterization, and activity measurements, J.
Catal., 158, 1-12
Biloen, P., Dautzenberg, F.M. and Sachtler, W.M.H. (1977). Catalytic dehydrogenation of
propane to propene over platinum and platinum-gold alloys. J.Catal., 50, 77-86
Brito, A., Arvelo, R., Villarroel, R., Garcia, F.J. and Garcia, M.T. (1996). Coke and H/C ratio
profiles on a Cr2O3/Al2O3 catalyst during the butene-1 dehydrogenation reaction. Chem. Eng.
Sci., 51, 4385-4391.
Cybulski, A. and Moulijn, J.A. (1994). Monoliths in heterogeneous catalysis. Catal. Rev.-
Sci.Eng., 36, 179-270.
Gorriz, O.F., Cadus, L.E. and Rivarola, J.B. (1989). Catalytic dehydrogenation of propane:
deactivation by coke formation. Latin American Applied Research, 19, 31-40
Larsson, M. and Andersson, B. (1994). The use of the H2-D2 equilibration reaction as a probe
reaction to study the deactivation on Pt-Al2O3 and Pt-Sn-Al2O3 catalysts during propane
dehydrogenation. Catal. Deact., 88, 233-241
Larsson, M., Hultén, M., Blekkan, E.A. and Andersson, B. (1996). The effect of reaction
conditions and time on stream on the coke formed during propane dehydrogenation, J. Catal.,
164, 44-53
Larsson, M. (1997). Coke on supported palladium and platinum catalysts. Ph.D. Thesis.
Department of Chemical Reaction Engineering, Chalmers University of Technology,
Göteborg, Sweden.
Loc, L.C., Gaidai, N.A., Gudkov, B.S., Kiperman, S.L. and Kogan, S.B. (1986). Investigation
of the kinetics and mechanism of the dehydrogenation of isobutane on platinum-tin catalysts.
Kinet. Catal., 27, 1184-1189
Propane dehydrogenation reaction kinetics
175
Loc, L.C., Gaidai, N.A. and Kiperman, S.L. (1988). Promotion effects in platinum-alumina
catalysts for isobutane dehydrogenation. Proc. 9th Intern. Congress on Catalysis, Calgary,
Vol. 3, 1262-1267
Loc, L.C., Gaidai, N.A., Kiperman, S.L. and Kogan, S.B. (1990). Kinetics of dehydrogenation
of n-butane on platinum catalysts. Kinet. Catal., 31, 421-424
Loc, L.C., Gaidai, N.A., Kiperman, S.L. and T’huoang, H.S., Podkletnova, N.M. and Kogan,
S.B. (1991a). Kinetics of propane dehydrogenation on aluminoplatinum catalysts. Kinet.
Catal., 34, 61-64
Loc, L.C., Gaidai, N.A., Kiperman, S.L., T’huoang, H.S. and Kogan, S.B. (1991b). Kinetics
and mechanism of propylene hydrogenation on platinum catalysts, Kinet. Catal., 32, 1256-
1261
Loc, L.C., Gaidai, N.A., Kiperman, S.L. and Thoang, H.S. (1993a). Kinetics of the
dehydrogenation of n-butane and its mixtures with propane over platinum catalysts. Kinet.
Catal., 34, 505-509
Loc, L.C. and Thoang, H.S. (1993b). Kinetic effects in conversion of propane, isobutane and
propane-isobutane mixtures on K-Pt-gamma-Al2O3 catalysts, modified by Sn and In, New
frontiers in catalysis, 2277-2279
Loc, L.C., Gaidai, N.A., Kiperman, S.L. and Thoang, H.S., Podkletnova, N.M., Kogan, S.B.
and Georgievskii, V.Yu. (1993c). Kinetics of dehydrogenation of isobutane and isobutane-
propane mixtures on platinum catalysts. Kinet. Catal., 34, 604-607
Loc, L.C., Gaidai, N.A., Kiperman, S.L., Thoang, H.S., Podkletnova, N.M. and Gerogievskii,
V.Yu. (1995). Kinetics of isobutane dehydrogenation over platinum-alumina catalysts in the
presence of water vapour. Kinet. Catal., 36, 517-523
Loc, L.C., Gaidai, N.A., Kiperman, S.L. and Thoang, H.S. (1996). Kinetics of propane and
n-butane dehydrogenation over platinum-alumina catalysts in the presence of hydrogen and
water vapour. Kinet. Catal., 37, 790-796
Chapter 4
176
Resasco, D.E. and Haller, G.L. (1994). Catalytic dehydrogenation of lower alkanes. J. Catal.,
11, 379-411
Somorjai, G.A. (1977). Active sites in heterogeneous catalysis. Advances in Catalysis, Vol.
26, Eds. Eley, D.D., Pines, H. and Weisz, P.B., Academic Press, New York, 1-68
Suzuki, I. and Kaneko, Y. (1977). Dehydrogenation of propane over chromia-alumina-
potassiumoxide catalyst, J. Catal., 47, 239-248
Webb, G. and Matheson, I.M. (1994). An isotope labeling study of the deactivation of a Pt –
alumina catalyst used for propane dehydrogenation, Catal. Deact., 88, 297-304
177
CHAPTER 5
REACTION KINETICS OF COKE FORMATION
DURING PROPANE DEHYDROGENATION
OVER A MONOLITHIC PLATINUM ALUMINA CATALYST
Chapter 5
178
Abstract
Coke formation rates under propane dehydrogenation reaction conditions on a used
monolithic Pt/γ-Al2O3 catalyst have been experimentally determined in a thermogravimetric
analyser (TGA) as a function of time on stream covering wide temperature and concentration
ranges. For relatively short times on stream, especially at low temperatures and low
propylene concentrations, a remarkable initial quadratic increase has been observed in the
coke formation content versus time with a high apparent propylene reaction order. After
longer times on stream the coke formation rate decreases to a constant residual coke growth
above approximately 12 wt% coke content. The experimental data have been successfully
described by a kinetic rate expression based on a mechanistic dual coke growth model. In this
model it has been assumed that initially coke precursor is formed via a propylene
oligomerisation process, explaining the observed auto-catalysis for short times on stream.
Reaction kinetics of coke formation during propane dehydrogenation
179
1. Introduction
The strong increase in the demand for lower olefins during the last decade (Taffe, 1996;
Cosyns et al., 1998) has initiated the development of new alternative processes in addition to
traditional petrochemical or refinery processes, where lower olefins are obtained as by-
products. The increased availability of lower alkanes resulting from more strict environmental
legislation has made especially catalytic dehydrogenation processes economically attractive
(Resasco and Haller, 1994). Dehydrogenation reactions of lower alkanes are highly
endothermic and are carried out at high temperatures because of thermodynamic constraints.
At these high temperatures carbonaceous deposits, collectively termed coke, are rapidly
formed and as a consequence thereof catalyst deactivation prevails necessitating catalyst
regeneration. These difficult process features require dedicated reactor technology.
A novel multifunctional reactor is developed for the non-oxidative propane dehydrogenation.
Using a fixed monolithic catalyst as an energy repository, an indirect coupling is achieved
between energy necessary for the endothermic propane dehydrogenation and energy released
by the combustion with air of the formed coke and added hydrocarbons for overall thermal
balance. During the endothermic propane dehydrogenation energy is withdrawn from the
catalyst cooling down the catalyst. Simultaneously coke is deposited on the catalyst surface.
During a consecutive exothermic fuel combustion reaction phase the catalyst is reheated and
concurrently regenerated by burning off the coke. Secondly, recuperative heat exchange is
integrated inside the reactor using the concept of reverse flow, i.e. periodic change of the gas
flow direction while feeding the reactants without any preheating. In this ‘Reaction Coupling
Reverse Flow Reactor’ (RCRFR), the propane dehydrogenation reaction, energy supply at
high temperatures, catalyst regeneration and recuperative heat exchange are all integrated in
one apparatus.
The optimal operating conditions in the RCRFR, e.g. the optimal temperature (profile), inlet
composition, gas residence time and cycle times for reaction phase and flow direction
switching, strongly depend on the amount of coke deposited during the dehydrogenation step
of the overall process. In the literature strong effects of time-on-stream (auto-deactivation),
temperature and composition (particularly the hydrogen concentration) on the coke formation
rates during dehydrogenation reactions have been reported. Due to the large temperature and
concentration gradients in a reverse flow reactor, continuously moving back and forth,
Chapter 5
180
information on the time-dependent rate of coke formation as a function of temperature and
composition is indispensable for operation and optimisation of the RCRFR.
Catalyst deactivation during propane dehydrogenation over platinum alumina catalysts has
received considerable attention in the past few years (e.g. Peña et al., 1993; Larsson et al.,
1996; Bariås et al., 1996). However, the research has mainly focussed on the effect of tin
addition to platinum catalysts, especially on the extent of reduction of intrinsic catalytic
activity caused by the coke deposits. From temperature programmed oxidation studies (TPO)
of coked Pt-Sn/Al2O3 during propane dehydrogenation Larsson et al. (1996) concluded that
there are three different types of coke: coke on and in the vicinity of the metal, coke on the
carrier and graphitic coke on the carrier. Only a small part of the first two types of coke seems
to be responsible for the observed strong decrease in catalytic activity. They correlated the
decrease in intrinsic catalytic dehydrogenation activity to only a small part of the first two
types of coke, in contrast to the total amount of all types of carbonaceous products produced,
as before (Dumez and Froment, 1976). Also Peña et al. (1993) correlated the decrease in
catalytic activity to only part of the total amount of coke. In this work, however, the focus is
on the determination of the total amount of coke deposited on the catalyst surface as a
function of time at given operating conditions. Although the effects of operating conditions
have been identified qualitatively, no complete quantitatively predictive time-dependent coke
formation rate equation has been published, to the authors’ knowledge, for the propane
dehydrogenation over platinum alumina catalysts as a function of temperature and
composition over wide concentration and temperature ranges.
For the 1-butene dehydrogenation to 1,3-butadiene over a Cr2O3-Al2O3 catalyst, however,
extensive models have been developed describing the time-dependent coke formation rate as a
function of the operating conditions. Marin et al. (1986) extended the models by Beeckman
and Froment (1979, 1980) describing the coke formation rates measured by Dumez and
Froment (1976), assuming that the coke formation follows two stages. In a first stage sites are
covered by coke precursor, originating from both 1-butene and 1,3-butadiene, which is
accompanied by an instantaneous growth up to an intermediate size. The second stage
corresponds to a further growth of the coke at a finite rate. In their model blockage of the
smallest pores by coke deposits is taken into account, causing some 15% reduction of
available catalyst surface area. However, they concluded that the pore blockage of the
smallest pores occurs within a few seconds, so that only a negligible amount of coke is
Reaction kinetics of coke formation during propane dehydrogenation
181
deposited in these pores. Peña et al. (1993) fitted the coking rates during 1-butene
dehydrogenation on a Cr2O3/Al2O3 catalyst using the monolayer-multilayer coke growth
model (MMCGM) (Nam and Kittrell, 1984), which considers simultaneous coke deposition
directly on the catalyst surface (monolayer coke) and on coke previously deposited
(multilayer coke). In the MMCGM the internal structure of the catalyst is left out of
consideration, neglecting pore blocking.
The aim of this work is to derive a kinetic rate expression to qualitatively and quantitatively
describe the total amount of coke deposits in time on a used platinum alumina monolithic
catalyst during propane dehydrogenation reaction conditions using a differentially operated
thermogravimetric unit. The rate equation is based on a mechanistic model adopted from Peña
et al. (1993), extended with considerations put forward in the model proposed by Marin et al.
(1986) and furthermore adjusted using experimental observations.
2. Experimental
2.1 Experimental set-up
Experiments were carried out in a thermogravimetric analyser (TGA) operated under
differential isothermal reactor conditions at atmospheric pressure (see Figure 1). In a quartz
tubular reactor (inner diameter 15 mm) a small sample (ca. 6 x 6 x 3 mm, approximately
80 mg) of a commercial Pt/γ-Al2O3 monolithic cordierite catalyst, supplied by Engelhard, was
connected with a platinum wire connected to the balance. Using SEM analysis the average
channel diameter was determined at 956 µm, the support thickness at 189 µm and the average
washcoat thickness at 37 µm (11-89 µm). In the washcoat 1.5 g Pt/l monolith was dispersed.
The temperature was measured just below the catalyst sample. The tubular reactor was
enwrapped with resistance wire and covered with insulation material allowing temperature
control.
The electronic balance was continuously purged with a nitrogen flow (ca. 1 Ncm3/s) to avoid
coke depositions on the balance. It was checked that the nitrogen purge flow rate had no
influence on the experimental results and that negligible coke formation occurred on the
platinum wire.
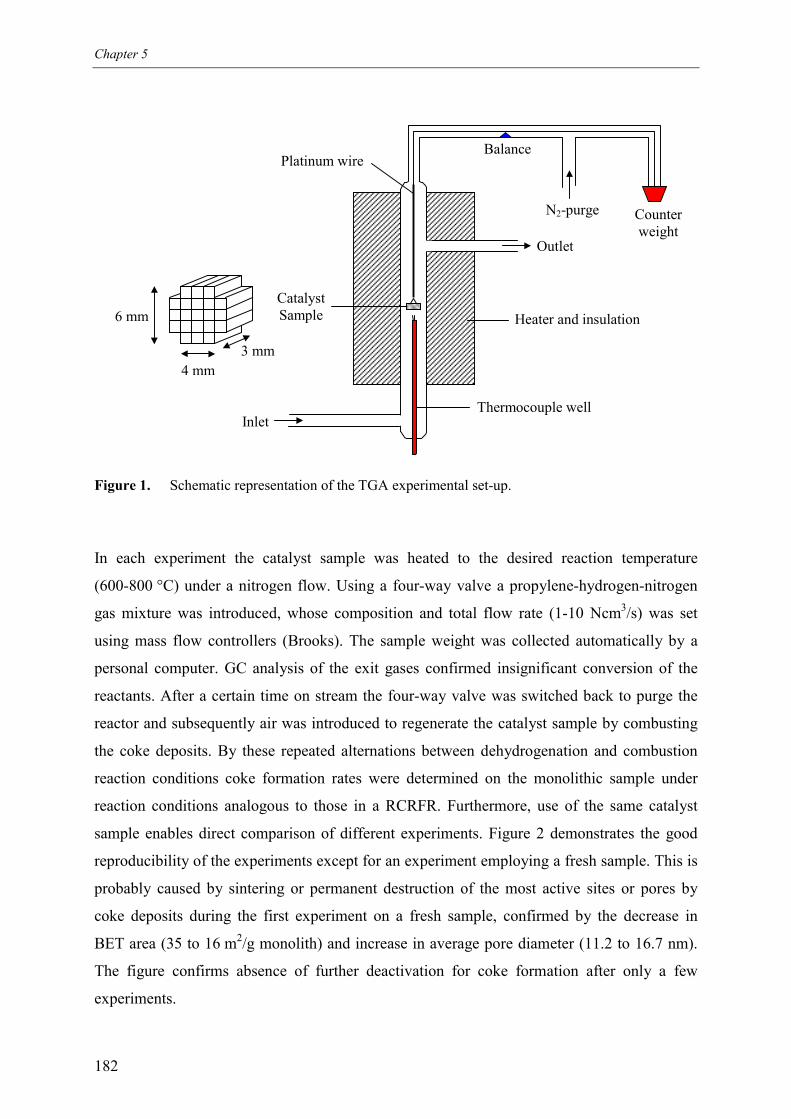
Chapter 5
182
Figure 1. Schematic representation of the TGA experimental set-up.
In each experiment the catalyst sample was heated to the desired reaction temperature
(600-800 °C) under a nitrogen flow. Using a four-way valve a propylene-hydrogen-nitrogen
gas mixture was introduced, whose composition and total flow rate (1-10 Ncm3/s) was set
using mass flow controllers (Brooks). The sample weight was collected automatically by a
personal computer. GC analysis of the exit gases confirmed insignificant conversion of the
reactants. After a certain time on stream the four-way valve was switched back to purge the
reactor and subsequently air was introduced to regenerate the catalyst sample by combusting
the coke deposits. By these repeated alternations between dehydrogenation and combustion
reaction conditions coke formation rates were determined on the monolithic sample under
reaction conditions analogous to those in a RCRFR. Furthermore, use of the same catalyst
sample enables direct comparison of different experiments. Figure 2 demonstrates the good
reproducibility of the experiments except for an experiment employing a fresh sample. This is
probably caused by sintering or permanent destruction of the most active sites or pores by
coke deposits during the first experiment on a fresh sample, confirmed by the decrease in
BET area (35 to 16 m2/g monolith) and increase in average pore diameter (11.2 to 16.7 nm).
The figure confirms absence of further deactivation for coke formation after only a few
experiments.
Inlet
CatalystSample
N2-purge
Outlet
BalancePlatinum wire
Heater and insulation
Thermocouple well
Counterweight
4 mm3 mm
6 mm
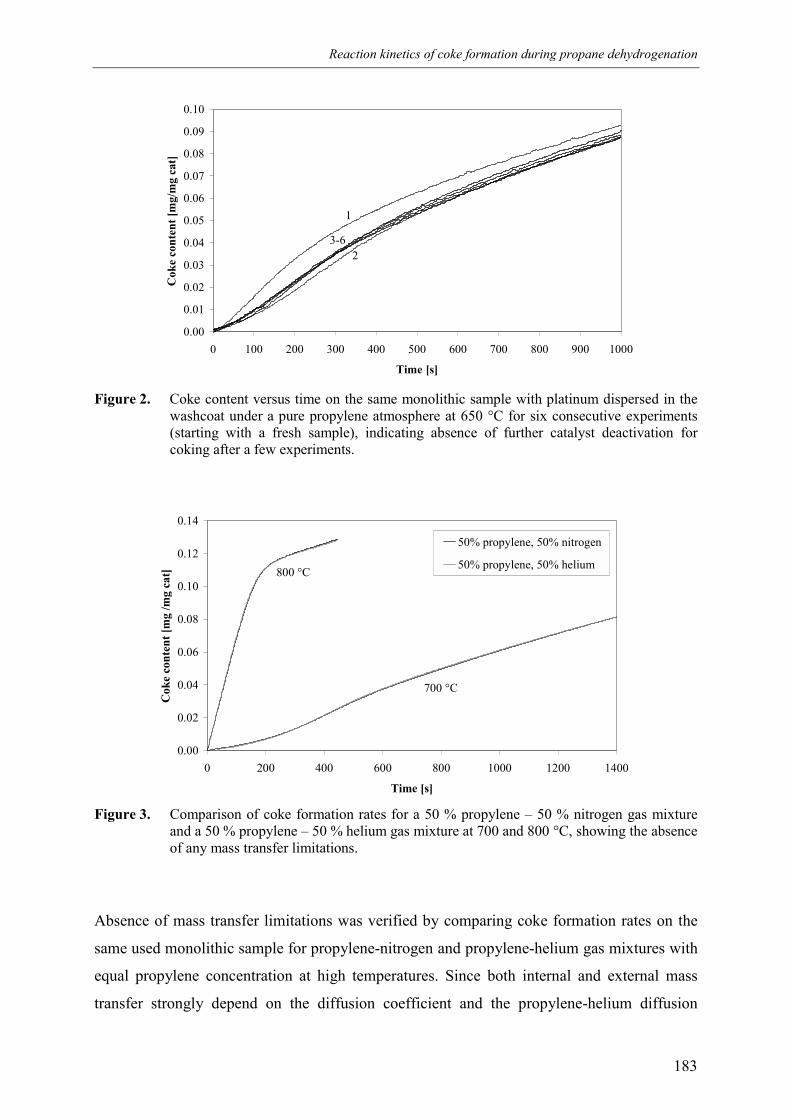
Reaction kinetics of coke formation during propane dehydrogenation
183
0.00
0.01
0.02
0.03
0.04
0.05
0.06
0.07
0.08
0.09
0.10
0 100 200 300 400 500 600 700 800 900 1000
Time [s]
Cok
e co
nten
t [m
g/m
g ca
t]
1
23-6
Figure 2. Coke content versus time on the same monolithic sample with platinum dispersed in thewashcoat under a pure propylene atmosphere at 650 °C for six consecutive experiments(starting with a fresh sample), indicating absence of further catalyst deactivation forcoking after a few experiments.
0.00
0.02
0.04
0.06
0.08
0.10
0.12
0.14
0 200 400 600 800 1000 1200 1400
Time [s]
Cok
e co
nten
t [m
g /m
g ca
t]
50% propylene, 50% nitrogen
50% propylene, 50% helium800 °C
700 °C
Figure 3. Comparison of coke formation rates for a 50 % propylene – 50 % nitrogen gas mixtureand a 50 % propylene – 50 % helium gas mixture at 700 and 800 °C, showing the absenceof any mass transfer limitations.
Absence of mass transfer limitations was verified by comparing coke formation rates on the
same used monolithic sample for propylene-nitrogen and propylene-helium gas mixtures with
equal propylene concentration at high temperatures. Since both internal and external mass
transfer strongly depend on the diffusion coefficient and the propylene-helium diffusion
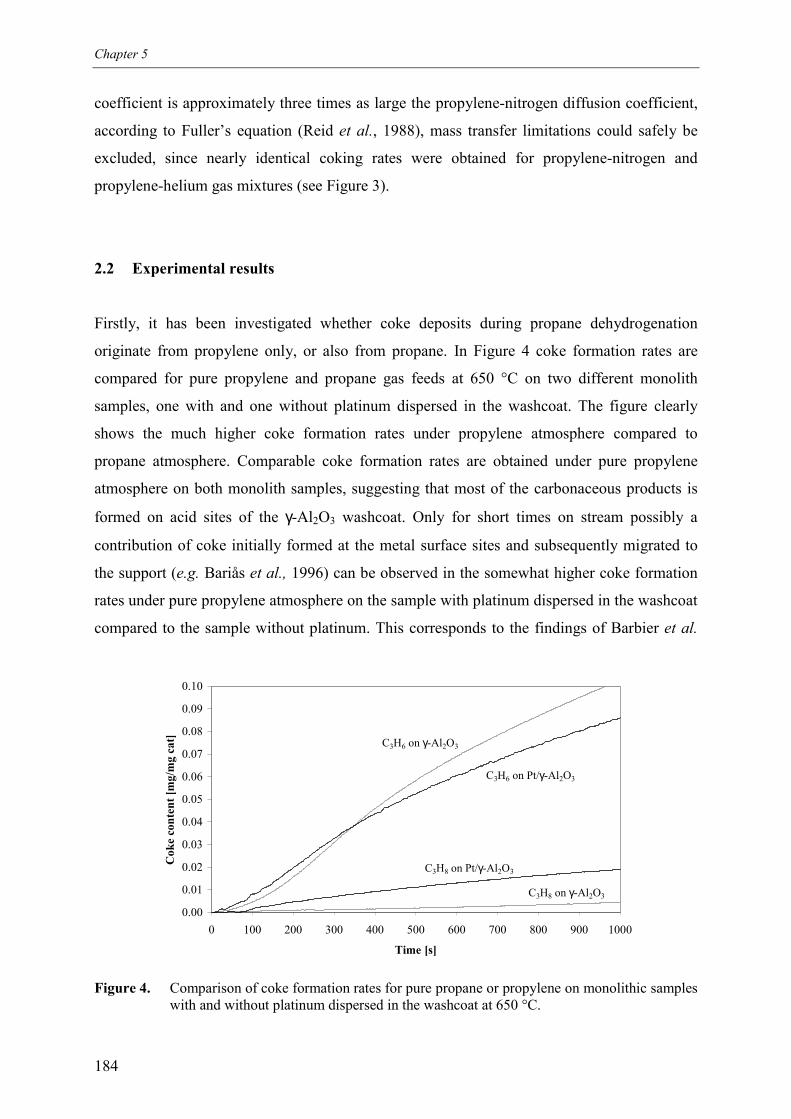
Chapter 5
184
coefficient is approximately three times as large the propylene-nitrogen diffusion coefficient,
according to Fuller’s equation (Reid et al., 1988), mass transfer limitations could safely be
excluded, since nearly identical coking rates were obtained for propylene-nitrogen and
propylene-helium gas mixtures (see Figure 3).
2.2 Experimental results
Firstly, it has been investigated whether coke deposits during propane dehydrogenation
originate from propylene only, or also from propane. In Figure 4 coke formation rates are
compared for pure propylene and propane gas feeds at 650 °C on two different monolith
samples, one with and one without platinum dispersed in the washcoat. The figure clearly
shows the much higher coke formation rates under propylene atmosphere compared to
propane atmosphere. Comparable coke formation rates are obtained under pure propylene
atmosphere on both monolith samples, suggesting that most of the carbonaceous products is
formed on acid sites of the γ-Al2O3 washcoat. Only for short times on stream possibly a
contribution of coke initially formed at the metal surface sites and subsequently migrated to
the support (e.g. Bariås et al., 1996) can be observed in the somewhat higher coke formation
rates under pure propylene atmosphere on the sample with platinum dispersed in the washcoat
compared to the sample without platinum. This corresponds to the findings of Barbier et al.
0.00
0.01
0.02
0.03
0.04
0.05
0.06
0.07
0.08
0.09
0.10
0 100 200 300 400 500 600 700 800 900 1000
Time [s]
Cok
e co
nten
t [m
g/m
g ca
t]
C3H8 on γ-Al2O3
C3H8 on Pt/γ-Al2O3
C3H6 on Pt/γ-Al2O3
C3H6 on γ-Al2O3
Figure 4. Comparison of coke formation rates for pure propane or propylene on monolithic sampleswith and without platinum dispersed in the washcoat at 650 °C.
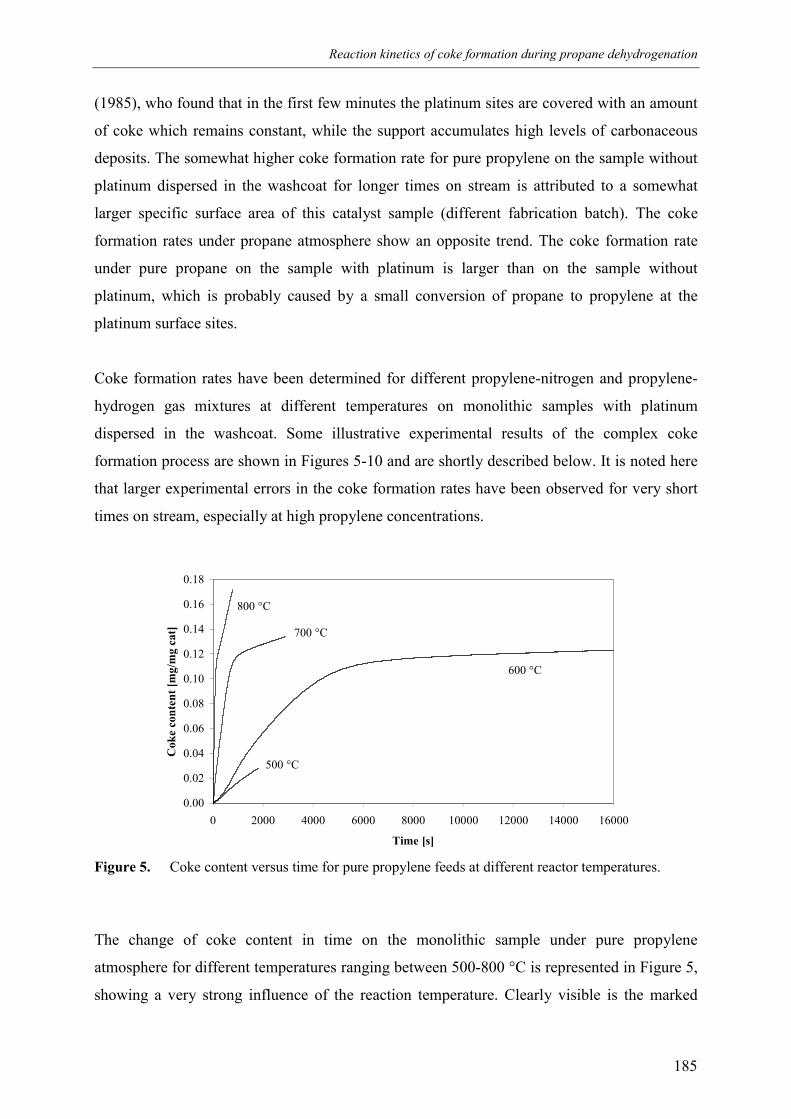
Reaction kinetics of coke formation during propane dehydrogenation
185
(1985), who found that in the first few minutes the platinum sites are covered with an amount
of coke which remains constant, while the support accumulates high levels of carbonaceous
deposits. The somewhat higher coke formation rate for pure propylene on the sample without
platinum dispersed in the washcoat for longer times on stream is attributed to a somewhat
larger specific surface area of this catalyst sample (different fabrication batch). The coke
formation rates under propane atmosphere show an opposite trend. The coke formation rate
under pure propane on the sample with platinum is larger than on the sample without
platinum, which is probably caused by a small conversion of propane to propylene at the
platinum surface sites.
Coke formation rates have been determined for different propylene-nitrogen and propylene-
hydrogen gas mixtures at different temperatures on monolithic samples with platinum
dispersed in the washcoat. Some illustrative experimental results of the complex coke
formation process are shown in Figures 5-10 and are shortly described below. It is noted here
that larger experimental errors in the coke formation rates have been observed for very short
times on stream, especially at high propylene concentrations.
0.00
0.02
0.04
0.06
0.08
0.10
0.12
0.14
0.16
0.18
0 2000 4000 6000 8000 10000 12000 14000 16000
Time [s]
Cok
e co
nten
t [m
g/m
g ca
t]
800 °C
500 °C
700 °C
600 °C
Figure 5. Coke content versus time for pure propylene feeds at different reactor temperatures.
The change of coke content in time on the monolithic sample under pure propylene
atmosphere for different temperatures ranging between 500-800 °C is represented in Figure 5,
showing a very strong influence of the reaction temperature. Clearly visible is the marked
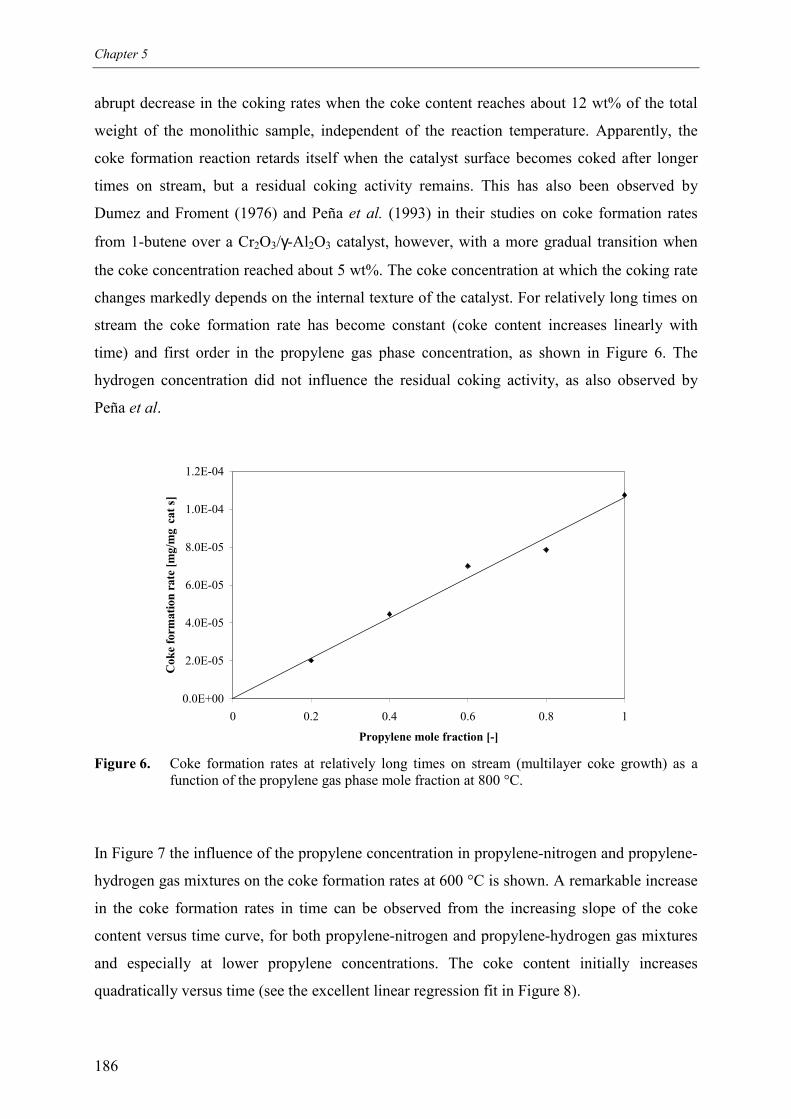
Chapter 5
186
abrupt decrease in the coking rates when the coke content reaches about 12 wt% of the total
weight of the monolithic sample, independent of the reaction temperature. Apparently, the
coke formation reaction retards itself when the catalyst surface becomes coked after longer
times on stream, but a residual coking activity remains. This has also been observed by
Dumez and Froment (1976) and Peña et al. (1993) in their studies on coke formation rates
from 1-butene over a Cr2O3/γ-Al2O3 catalyst, however, with a more gradual transition when
the coke concentration reached about 5 wt%. The coke concentration at which the coking rate
changes markedly depends on the internal texture of the catalyst. For relatively long times on
stream the coke formation rate has become constant (coke content increases linearly with
time) and first order in the propylene gas phase concentration, as shown in Figure 6. The
hydrogen concentration did not influence the residual coking activity, as also observed by
Peña et al.
0.0E+00
2.0E-05
4.0E-05
6.0E-05
8.0E-05
1.0E-04
1.2E-04
0 0.2 0.4 0.6 0.8 1
Propylene mole fraction [-]
Cok
e fo
rmat
ion
rate
[mg/
mg
cat s
]
Figure 6. Coke formation rates at relatively long times on stream (multilayer coke growth) as afunction of the propylene gas phase mole fraction at 800 °C.
In Figure 7 the influence of the propylene concentration in propylene-nitrogen and propylene-
hydrogen gas mixtures on the coke formation rates at 600 °C is shown. A remarkable increase
in the coke formation rates in time can be observed from the increasing slope of the coke
content versus time curve, for both propylene-nitrogen and propylene-hydrogen gas mixtures
and especially at lower propylene concentrations. The coke content initially increases
quadratically versus time (see the excellent linear regression fit in Figure 8).
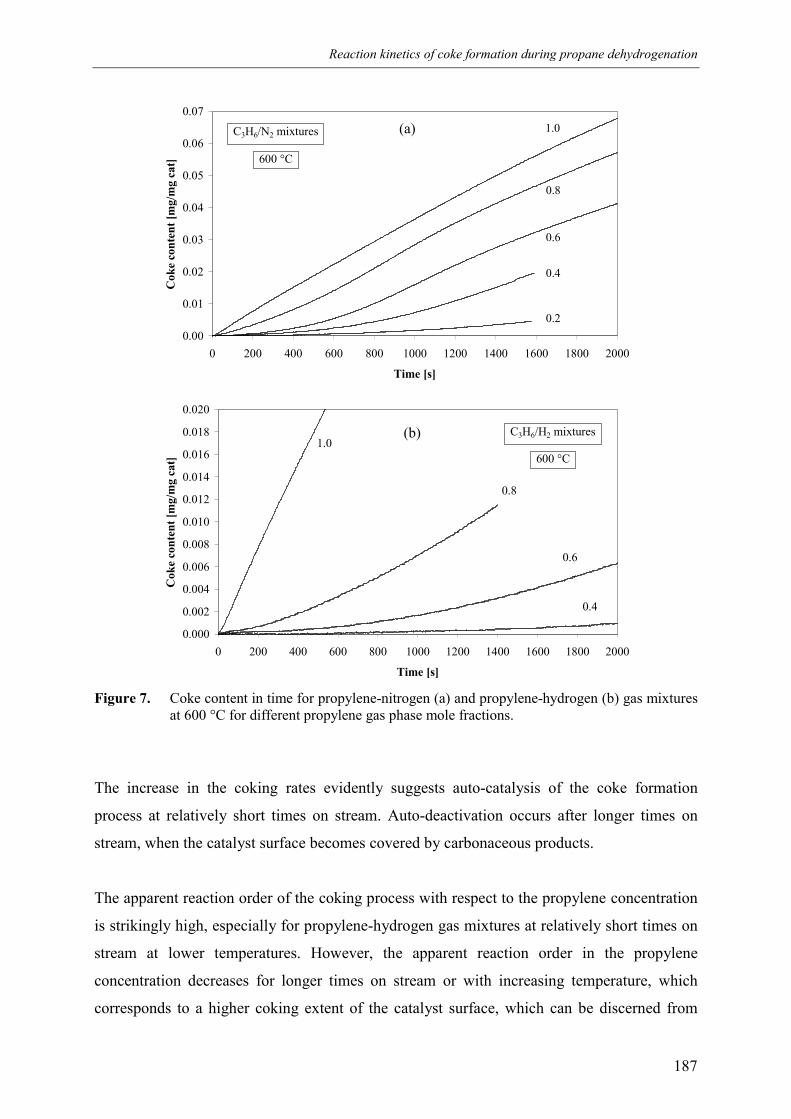
Reaction kinetics of coke formation during propane dehydrogenation
187
0.00
0.01
0.02
0.03
0.04
0.05
0.06
0.07
0 200 400 600 800 1000 1200 1400 1600 1800 2000
Time [s]
Cok
e co
nten
t [m
g/m
g ca
t]
1.0
0.8
0.6
0.4
0.2
C3H6/N2 mixtures
600 °C
0.000
0.002
0.004
0.006
0.008
0.010
0.012
0.014
0.016
0.018
0.020
0 200 400 600 800 1000 1200 1400 1600 1800 2000
Time [s]
Cok
e co
nten
t [m
g/m
g ca
t]
1.0
0.8
0.6
0.4
C3H6/H2 mixtures
600 °C
Figure 7. Coke content in time for propylene-nitrogen (a) and propylene-hydrogen (b) gas mixturesat 600 °C for different propylene gas phase mole fractions.
The increase in the coking rates evidently suggests auto-catalysis of the coke formation
process at relatively short times on stream. Auto-deactivation occurs after longer times on
stream, when the catalyst surface becomes covered by carbonaceous products.
The apparent reaction order of the coking process with respect to the propylene concentration
is strikingly high, especially for propylene-hydrogen gas mixtures at relatively short times on
stream at lower temperatures. However, the apparent reaction order in the propylene
concentration decreases for longer times on stream or with increasing temperature, which
corresponds to a higher coking extent of the catalyst surface, which can be discerned from
(b)
(a)
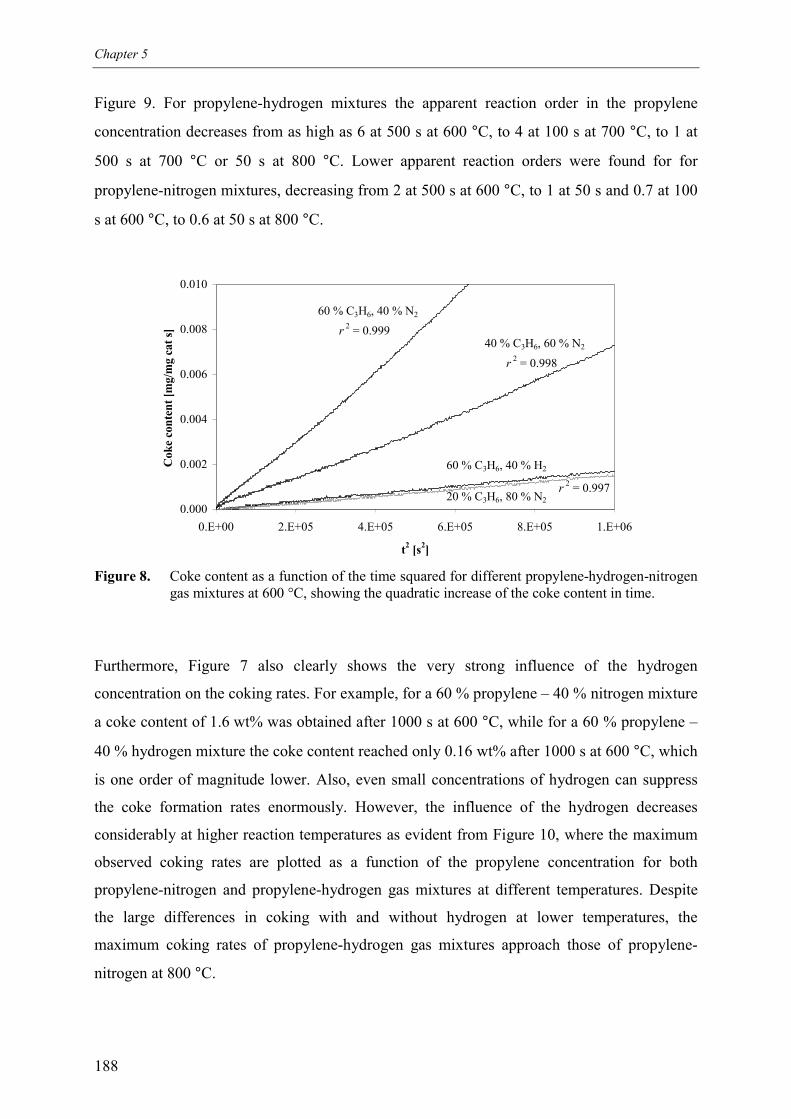
Chapter 5
188
Figure 9. For propylene-hydrogen mixtures the apparent reaction order in the propylene
concentration decreases from as high as 6 at 500 s at 600 °C, to 4 at 100 s at 700 °C, to 1 at
500 s at 700 °C or 50 s at 800 °C. Lower apparent reaction orders were found for for
propylene-nitrogen mixtures, decreasing from 2 at 500 s at 600 °C, to 1 at 50 s and 0.7 at 100
s at 600 °C, to 0.6 at 50 s at 800 °C.
0.000
0.002
0.004
0.006
0.008
0.010
0.E+00 2.E+05 4.E+05 6.E+05 8.E+05 1.E+06
t2 [s2]
Cok
e co
nten
t [m
g/m
g ca
t s] r 2 = 0.999
r 2 = 0.998
r 2 = 0.997
60 % C3H6, 40 % N2
40 % C3H6, 60 % N2
20 % C3H6, 80 % N2
60 % C3H6, 40 % H2
Figure 8. Coke content as a function of the time squared for different propylene-hydrogen-nitrogengas mixtures at 600 °C, showing the quadratic increase of the coke content in time.
Furthermore, Figure 7 also clearly shows the very strong influence of the hydrogen
concentration on the coking rates. For example, for a 60 % propylene – 40 % nitrogen mixture
a coke content of 1.6 wt% was obtained after 1000 s at 600 °C, while for a 60 % propylene –
40 % hydrogen mixture the coke content reached only 0.16 wt% after 1000 s at 600 °C, which
is one order of magnitude lower. Also, even small concentrations of hydrogen can suppress
the coke formation rates enormously. However, the influence of the hydrogen decreases
considerably at higher reaction temperatures as evident from Figure 10, where the maximum
observed coking rates are plotted as a function of the propylene concentration for both
propylene-nitrogen and propylene-hydrogen gas mixtures at different temperatures. Despite
the large differences in coking with and without hydrogen at lower temperatures, the
maximum coking rates of propylene-hydrogen gas mixtures approach those of propylene-
nitrogen at 800 °C.
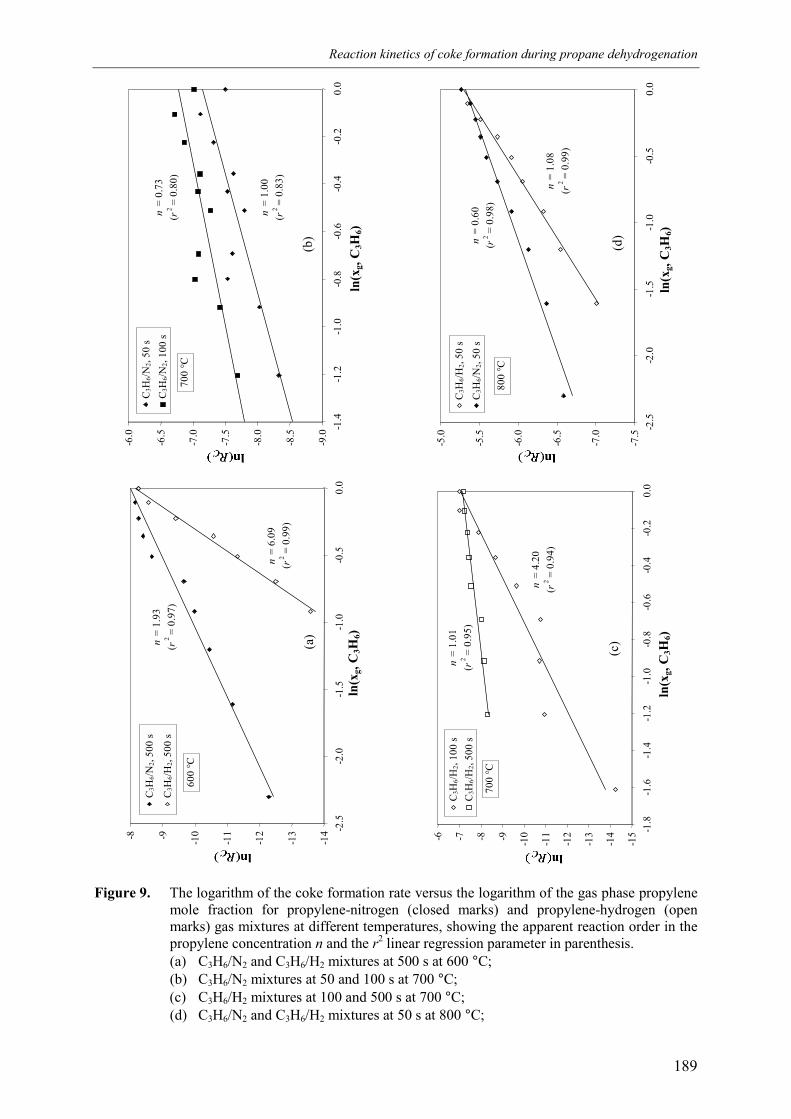
Reaction kinetics of coke formation during propane dehydrogenation
189
Figure 9. The logarithm of the coke formation rate versus the logarithm of the gas phase propylenemole fraction for propylene-nitrogen (closed marks) and propylene-hydrogen (openmarks) gas mixtures at different temperatures, showing the apparent reaction order in thepropylene concentration n and the r2 linear regression parameter in parenthesis.(a) C3H6/N2 and C3H6/H2 mixtures at 500 s at 600 °C;(b) C3H6/N2 mixtures at 50 and 100 s at 700 °C;(c) C3H6/H2 mixtures at 100 and 500 s at 700 °C;(d) C3H6/N2 and C3H6/H2 mixtures at 50 s at 800 °C;
(c)
-15
-14
-13
-12
-11
-10-9-8-7-6
-1.8
-1.6
-1.4
-1.2
-1.0
-0.8
-0.6
-0.4
-0.2
0.0
C3H
6/H2,
100
sC
3H6/H
2, 50
0 s
700
°C
n=
1.01
( r2 =
0.9
5)
n =
4.2
0( r
2 = 0
.94)
ln(x
g, C
3H6)
(d)
-7.5
-7.0
-6.5
-6.0
-5.5
-5.0
-2.5
-2.0
-1.5
-1.0
-0.5
0.0
C3H
6/H2,
50 s
C3H
6/N2,
50 s
800
°C
n =
0.6
0( r
2 = 0
.98)
n =
1.08
(r2 =
0.9
9)
ln(x
g, C
3H6)
-14
-13
-12
-11
-10-9-8
-2.5
-2.0
-1.5
-1.0
-0.5
0.0
C3H
6/N2,
500
s
C3H
6/H2,
500
s
600
°C
n =
1.93
(r2 =
0.9
7)
n =
6.0
9( r
2 = 0
.99)
ln(x
g, C
3H6)
(a)
-9.0
-8.5
-8.0
-7.5
-7.0
-6.5
-6.0
-1.4
-1.2
-1.0
-0.8
-0.6
-0.4
-0.2
0.0
C3H
6/N2,
50 s
C3H
6/N2,
100
s
700
°C
n =
0.7
3( r
2 = 0
.80)
n =
1.0
0(r
2 = 0
.83)
ln(x
g, C
3H6)
(b)
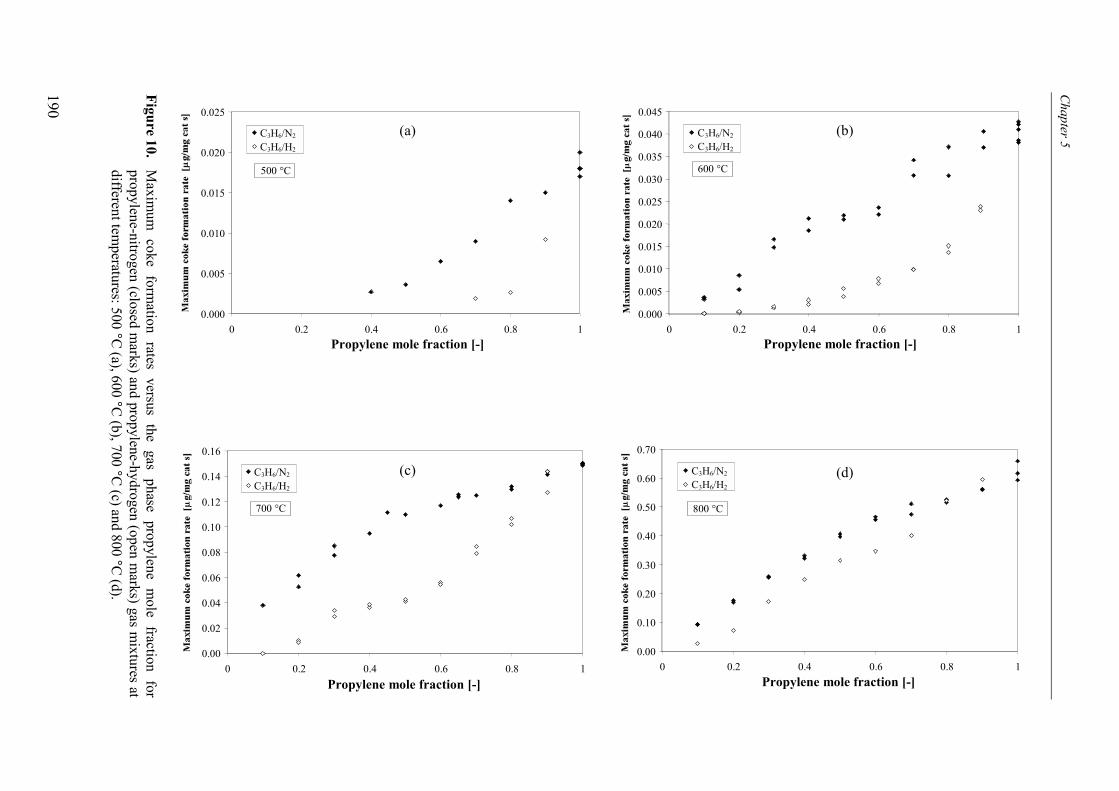
Chapter 5
190
Figure 10.M
aximum
coke formation rates versus the gas phase propylene m
ole fraction forpropylene-nitrogen (closed m
arks) and propylene-hydrogen (open marks) gas m
ixtures atdifferent tem
peratures: 500 °C (a), 600 °C (b), 700 °C
(c) and 800 °C (d).
0.000
0.005
0.010
0.015
0.020
0.025
0 0.2 0.4 0.6 0.8 1
C3H6/N2
C3H6/H2
500 °C
Propylene mole fraction [-]
(a)
0.000
0.005
0.010
0.015
0.020
0.025
0.030
0.035
0.040
0.045
0 0.2 0.4 0.6 0.8 1
C3H6/N2
C3H6/H2
600 °C
Propylene mole fraction [-]
(b)
0.00
0.02
0.04
0.06
0.08
0.10
0.12
0.14
0.16
0 0.2 0.4 0.6 0.8 1
C3H6/N2
C3H6/H2
700 °C
Propylene mole fraction [-]
(c)
Propylene mole fraction [-]
0.00
0.10
0.20
0.30
0.40
0.50
0.60
0.70
0 0.2 0.4 0.6 0.8 1
C3H6/N2
C3H6/H2
800 °C
(d)
Reaction kinetics of coke formation during propane dehydrogenation
191
Finally, it is has been tried to regenerate the catalyst by hydrogen treatment. It was not
possible to decrease the coke content under a hydrogen atmosphere, not even at 800 °C. This
is in accordance with findings of Larsson et al. (1996), who also reported a minor effect of
exposing deactivated catalyst samples to hydrogen on the free metal surface area. However, if
the coke deposits were subsequently combusted in air after the hydrogen treatment, their coke
combustion rate was strongly increased. This possibly indicates that the hydrogen treatment
increased the hydrogen/carbon ratio via e.g. hydrogenation of the carbonaceous compounds at
the catalyst surface facilitating its combustion, but not it’s desorption.
3. Kinetic model
3.1 Model assumptions
A kinetic rate expression is developed based on a, as simple as possible, mechanistic model
but able to quantitatively describe the above mentioned experimental observations. The basic
assumptions are as follows:
1. All coke deposits originate from propylene. Coke formation from propane can be
neglected.
2. Since similar coke formation rates have been determined on monolithic samples with and
without platinum dispersed in the washcoat, it is concluded that most of the coke deposits
are formed at acid γ-Al2O3 surface sites. Therefore, to describe the total amount of
carbonaceous compounds as a function of time no distinction is necessary in coke formed
at different surface sites, like Bariås et al. (1996) assumed in their explanation of the role
of tin on the coke formation rates.
3. Furthermore, the internal structure of the catalyst is not taken into account assuming that
the conclusion drawn by Marin et al. (1986) for their Cr2O3/γ-Al2O3 catalyst also holds
for the monolithic catalyst used in this work. The important assumption here is that the
smallest pores are blocked during the very early stages of the coke formation process
resulting in negligible coke amount of coke deposits in these smallest pores. The
usefulness of this assumption has also been demonstrated by Peña et al. (1993), who were
Chapter 5
192
able to quantitatively describe coke formation rates up to 8 wt% coke content while
neglecting pore blocking.
4. Following Peña et al. (1993) and Marin et al. (1986) the marked sudden decrease in the
coke formation rate when the coke concentration reaches ca. 12 wt% is attributed to two
different stages in the coke formation process. In the first stage carbonaceous compounds
are formed at the catalyst surface from a coke precursor (CP), which originates from
propylene adsorbed at the catalyst surface. These coke deposits are termed monolayer
coke, since it is formed directly on the catalyst surface. The second stage of this dual
coke growth model consists of growth of these monolayer coke deposits, which is termed
multilayer coke formation, since it is formed on coke previously deposited. The
terminology of monolayer and multilayer coke, denoted by Cm and CM respectively, does
not necessarily stand for coke growth in layers. The principal difference in these coke
formation stages is merely the assumption that monolayer coke is formed through
reaction of coke precursor with adsorbed propylene, while multilayer coke is formed via
reaction of monolayer coke with propylene directly from the gas phase.
5. Following Marin et al. (1986) it is assumed that the formation of coke precursor is the
rate determining step in the coke formation process and the coke precursor grows
instantaneously to monolayer coke with adsorbed propylene molecules. Peña et al. (1993)
calculated an average molecular mass of monolayer coke originating from 1-butene on a
Cr2O3/Al2O3 catalyst of 1.2·104 kg coke/kmole, using results reported by Marin et al. and
their own results. This would correspond to a monolayer coke consisting of almost 300
propylene molecules. However, as indicated by Marin et al., only the product of the
average molecular mass of monolayer coke and the total surface site concentration is
necessary to describe the coke content in time if pore blocking is ignored.
6. The auto-catalytic behaviour of the coke formation process for short times on stream,
reflected by the quadratic increase in the coke content as function of time, is attributed to
the formation of an intermediary product in the formation of coke precursor. Because the
concentration of this intermediary product increases initially, also the coke precursor
concentration and thus the coke formation rate increases initially.
Reaction kinetics of coke formation during propane dehydrogenation
193
7. Because of the high apparent reaction order in the propylene concentration observed for
the coke formation rate for relatively short times on stream, it is tentatively proposed that
coke deposits are formed through an oligomerisation process, as proposed by Hamid and
Cerouane (1994). From dimerisation of adsorbed propylene an intermediary product is
formed, possibly hexene or an even further dehydrogenated or aromatised product. From
the reaction of this propylene dimer, denoted by PD, with another adsorbed propylene
molecule a coke precursor is formed. From the initial quadratic increase in the coke
content versus time it can be concluded that there is only one rate-determining
intermediary product in the coke precursor formation. Every additional rate-determining
intermediary product would have raised the order of the time dependency of the coke
content by the same number of additional intermediates.
It is assumed that coke precursors can also be formed from the reaction of monolayer
coke with adsorbed propylene or propylene dimer. This last assumption is necessary to
describe the very sudden marked transition from initially primarily monolayer coke
formation to only multilayer coke formation for longer times on stream when the catalyst
becomes coked, as observed in the experiments.
8. Finally, the decreased influence of the hydrogen concentration at higher temperatures is
explained by a decreased hydrogen chemisorption at the catalyst surface sites. It is
assumed that propylene and hydrogen adsorb competitively at the same surface sites and
that hydrogen chemisorbs dissociatively at these surface sites. Furthermore, it is assumed
that the adsorption equilibria are established instantaneously. Again following Dumez
and Froment (1976) and Peña et al. (1993) it is assumed that the deactivation reaction
involves two surface sites, so that it is assumed that coke precursor and monolayer coke
occupy two surface sites.
9. Since hydrogen treatment does not decrease the coke content of a coked catalyst sample,
the reaction of coke with hydrogen to form methane is omitted in this model, in contrast
to Resasco and Haller (1994). However, all coke deposits can be dehydrogenated or
hydrogenated and can also undergo further processes like cyclisation, aromatisation or
graphitisation. Its possible influence on the overall coke formation rate is ignored in this
model.
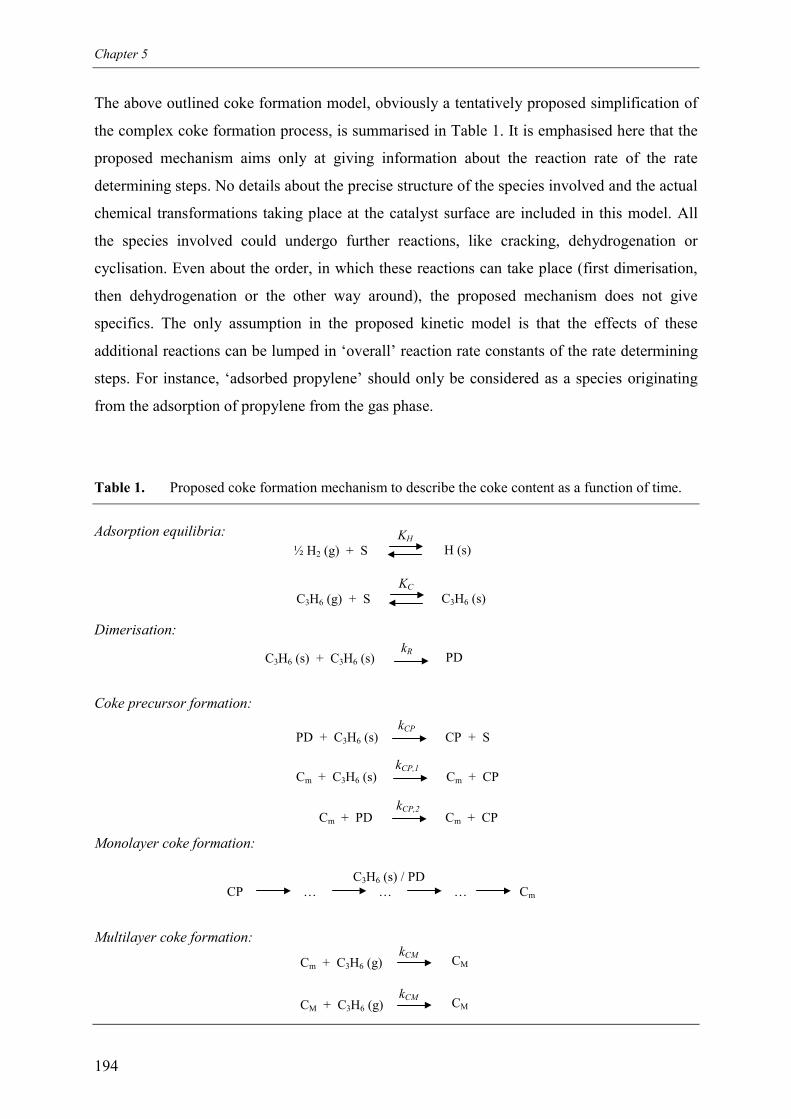
Chapter 5
194
The above outlined coke formation model, obviously a tentatively proposed simplification of
the complex coke formation process, is summarised in Table 1. It is emphasised here that the
proposed mechanism aims only at giving information about the reaction rate of the rate
determining steps. No details about the precise structure of the species involved and the actual
chemical transformations taking place at the catalyst surface are included in this model. All
the species involved could undergo further reactions, like cracking, dehydrogenation or
cyclisation. Even about the order, in which these reactions can take place (first dimerisation,
then dehydrogenation or the other way around), the proposed mechanism does not give
specifics. The only assumption in the proposed kinetic model is that the effects of these
additional reactions can be lumped in ‘overall’ reaction rate constants of the rate determining
steps. For instance, ‘adsorbed propylene’ should only be considered as a species originating
from the adsorption of propylene from the gas phase.
Table 1. Proposed coke formation mechanism to describe the coke content as a function of time.
Adsorption equilibria:
Dimerisation:
Coke precursor formation:
Monolayer coke formation:
Multilayer coke formation:
½ H2 (g) + S H (s)KH
C3H6 (g) + S C3H6 (s)KC
C3H6 (s) + C3H6 (s) PDkR
Cm + C3H6 (g) CMkCM
CM + C3H6 (g) CMkCM
PD + C3H6 (s) CP + SkCP
Cm + C3H6 (s) Cm + CPkCP,1
Cm + PD Cm + CPkCP,2
C3H6 (s) / PDCP Cm… … …
Reaction kinetics of coke formation during propane dehydrogenation
195
3.2 Coke formation rate equation
The derivation of the kinetic rate expression to describe the coke content in time based on the
model described above is given in Appendix A. The results are summarised below.
The increase in coke content, MC, in time is given by the sum of the monolayer and multilayer
coke production rates, thus:
CmHC,CmCMCmC
63θθ
gCM Ckdt
dwdt
dMdt
dMdt
dM +=+= (1)
introducing w as the maximum monolayer coke concentration. The fraction of the total
surface sites occupied by propylene dimer, θPD, and monolayer coke, θCm, are described by
the following balances,
CmPD2,PDHC2
HCPD
6363θθθθθθ
CPCPR kkkdt
d −−= (2)
CmPD2,CmHC1,PDHCCPCm
6363θθθθθθθθ
CPCPCP kkkdt
ddt
d ++== (3)
Note that the formation rate of monolayer coke equals the formation rate of coke precursor,
because of the assumption of instantaneous growth of coke precursor to monolayer coke as
soon as coke precursor is formed. The surface fractions of the free surface sites, θS,
dissociatively chemisorbed hydrogen, θH, and propylene, 63HCθ , are given by the following
algebraic equations respectively:
( )63
21
2 HC,H,
CmPDS
1
1
gCgH CKCK ++
−−= θθθ (4)
( )
63
21
2
21
2
HC,H,
CmPDH,H
1
1
gCgH
gH
CKCK
CK
++
−−=
θθθ (5)
Chapter 5
196
( )
63
21
2
63
63
HC,H,
CmPDHC,HC
1
1
gCgH
gC
CKCK
CK
++
−−=
θθθ (6)
Intially, the catalyst surface is free of any coke components, thus the initial conditions are
given by:
t = 0: 0CmPD ==θθ and MC = MCm = MCM = 0 (7)
For the adsorption and reaction rate constants an Arrhenius-type temperature dependency has
been assumed.
For relatively short times on stream the kinetic rate expression for the coke formation rate can
be simplified and solved analytically (see Appendix B), giving the following for the coke
content as a function of time:
( )( )
−+
+−−
+==
−−
11
111
)(
0,HC
20,HC
120,HC
20,HC
20,HC
CmC
63
63
0,6H3C63
63
63
θθ
θθ
θθ
θ
R
CPR
kk
R
R
R
kktk
tktk
tkwwtM
R
CP
(8)
where 0,HC 63θ denotes the initial propylene surface fraction. A Taylor series expansion of the
coke content as a function of time around t = 0 results in
( )
++−≈ )(4
311
21)( 2
0,HC0,HC23
0,HCC 636363ttkktkwktM CPRCPR Οθθθ (9)
which shows the experimentally observed second order time dependency of the coke content
and the observed high apparent reaction order in the propylene concentration, as long as
)4(3
0,HC0,HC 6363 CPR kkt
+<<
θθ(10)
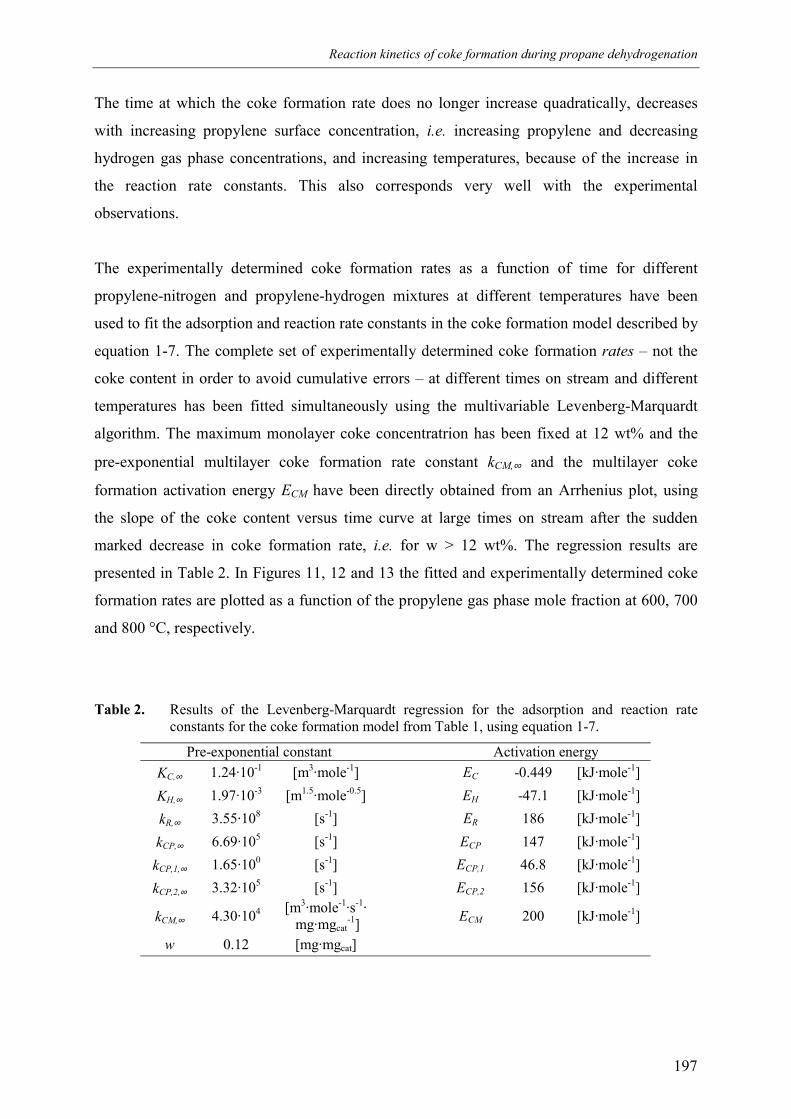
Reaction kinetics of coke formation during propane dehydrogenation
197
The time at which the coke formation rate does no longer increase quadratically, decreases
with increasing propylene surface concentration, i.e. increasing propylene and decreasing
hydrogen gas phase concentrations, and increasing temperatures, because of the increase in
the reaction rate constants. This also corresponds very well with the experimental
observations.
The experimentally determined coke formation rates as a function of time for different
propylene-nitrogen and propylene-hydrogen mixtures at different temperatures have been
used to fit the adsorption and reaction rate constants in the coke formation model described by
equation 1-7. The complete set of experimentally determined coke formation rates – not the
coke content in order to avoid cumulative errors – at different times on stream and different
temperatures has been fitted simultaneously using the multivariable Levenberg-Marquardt
algorithm. The maximum monolayer coke concentratrion has been fixed at 12 wt% and the
pre-exponential multilayer coke formation rate constant kCM,∞ and the multilayer coke
formation activation energy ECM have been directly obtained from an Arrhenius plot, using
the slope of the coke content versus time curve at large times on stream after the sudden
marked decrease in coke formation rate, i.e. for w > 12 wt%. The regression results are
presented in Table 2. In Figures 11, 12 and 13 the fitted and experimentally determined coke
formation rates are plotted as a function of the propylene gas phase mole fraction at 600, 700
and 800 °C, respectively.
Table 2. Results of the Levenberg-Marquardt regression for the adsorption and reaction rateconstants for the coke formation model from Table 1, using equation 1-7.
Pre-exponential constant Activation energyKC,∞ 1.24·10-1 [m3·mole-1] EC -0.449 [kJ·mole-1]KH,∞ 1.97·10-3 [m1.5·mole-0.5] EH -47.1 [kJ·mole-1]kR,∞ 3.55·108 [s-1] ER 186 [kJ·mole-1]kCP,∞ 6.69·105 [s-1] ECP 147 [kJ·mole-1]kCP,1,∞ 1.65·100 [s-1] ECP,1 46.8 [kJ·mole-1]kCP,2,∞ 3.32·105 [s-1] ECP,2 156 [kJ·mole-1]
kCM,∞ 4.30·104 [m3·mole-1·s-1· mg·mgcat
-1] ECM 200 [kJ·mole-1]
w 0.12 [mg·mgcat]
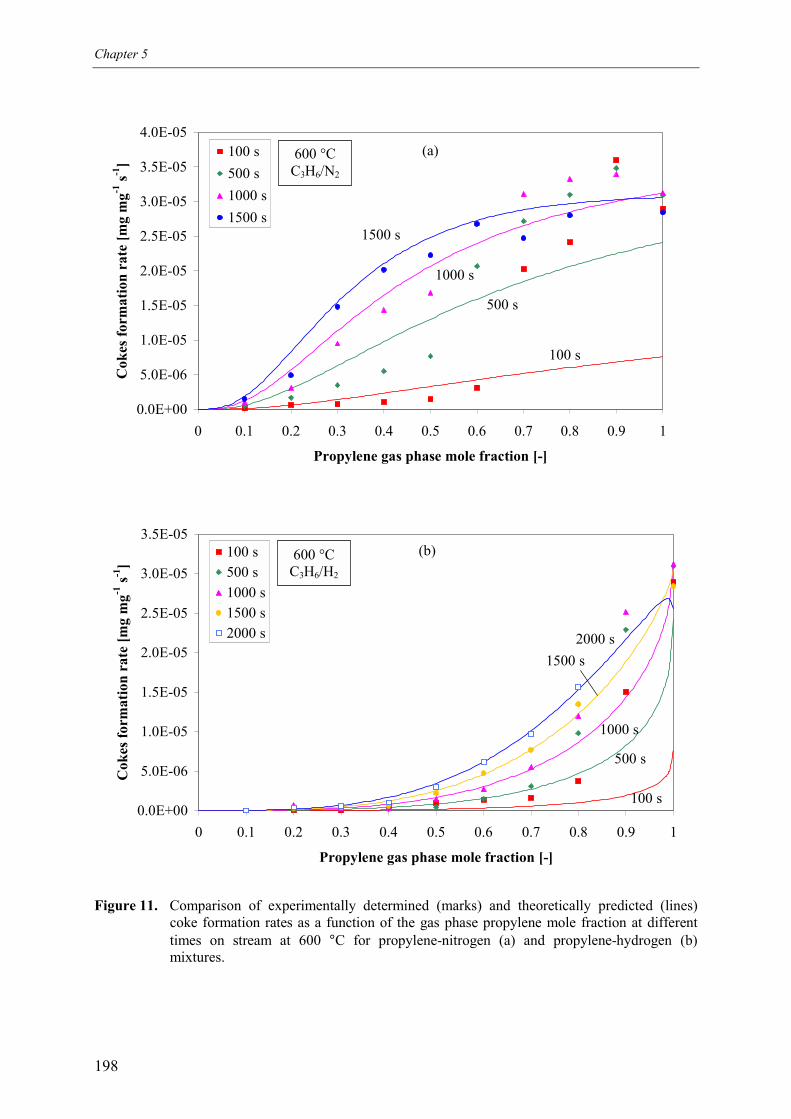
Chapter 5
198
0.0E+00
5.0E-06
1.0E-05
1.5E-05
2.0E-05
2.5E-05
3.0E-05
3.5E-05
4.0E-05
0 0.1 0.2 0.3 0.4 0.5 0.6 0.7 0.8 0.9 1
Propylene gas phase mole fraction [-]
Cok
es fo
rmat
ion
rate
[mg
mg-1
s-1]
100 s500 s1000 s1500 s
100 s
500 s
1000 s
1500 s
0.0E+00
5.0E-06
1.0E-05
1.5E-05
2.0E-05
2.5E-05
3.0E-05
3.5E-05
0 0.1 0.2 0.3 0.4 0.5 0.6 0.7 0.8 0.9 1
Propylene gas phase mole fraction [-]
Cok
es fo
rmat
ion
rate
[mg
mg-1
s-1]
100 s500 s1000 s1500 s2000 s 2000 s
1500 s
1000 s
100 s
500 s
Figure 11. Comparison of experimentally determined (marks) and theoretically predicted (lines)coke formation rates as a function of the gas phase propylene mole fraction at differenttimes on stream at 600 °C for propylene-nitrogen (a) and propylene-hydrogen (b)mixtures.
(b)
(a)600 °CC3H6/N2
600 °CC3H6/H2
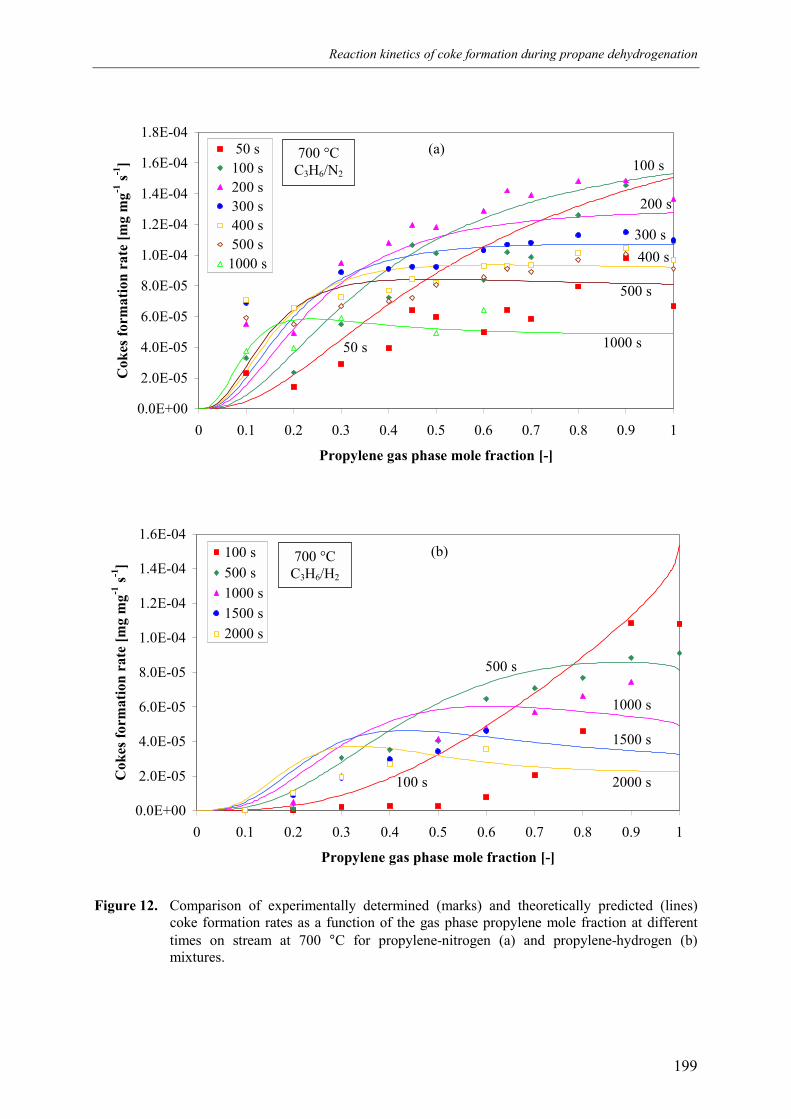
Reaction kinetics of coke formation during propane dehydrogenation
199
0.0E+00
2.0E-05
4.0E-05
6.0E-05
8.0E-05
1.0E-04
1.2E-04
1.4E-04
1.6E-04
1.8E-04
0 0.1 0.2 0.3 0.4 0.5 0.6 0.7 0.8 0.9 1
Propylene gas phase mole fraction [-]
Cok
es fo
rmat
ion
rate
[mg
mg-1
s-1]
50 s 100 s 200 s 300 s 400 s 500 s1000 s
1000 s
500 s
400 s300 s
200 s
50 s
100 s
0.0E+00
2.0E-05
4.0E-05
6.0E-05
8.0E-05
1.0E-04
1.2E-04
1.4E-04
1.6E-04
0 0.1 0.2 0.3 0.4 0.5 0.6 0.7 0.8 0.9 1
Propylene gas phase mole fraction [-]
Cok
es fo
rmat
ion
rate
[mg
mg-1
s-1]
100 s500 s1000 s1500 s2000 s
100 s
500 s
1000 s
1500 s
2000 s
Figure 12. Comparison of experimentally determined (marks) and theoretically predicted (lines)coke formation rates as a function of the gas phase propylene mole fraction at differenttimes on stream at 700 °C for propylene-nitrogen (a) and propylene-hydrogen (b)mixtures.
(b)
(a)700 °CC3H6/N2
700 °CC3H6/H2
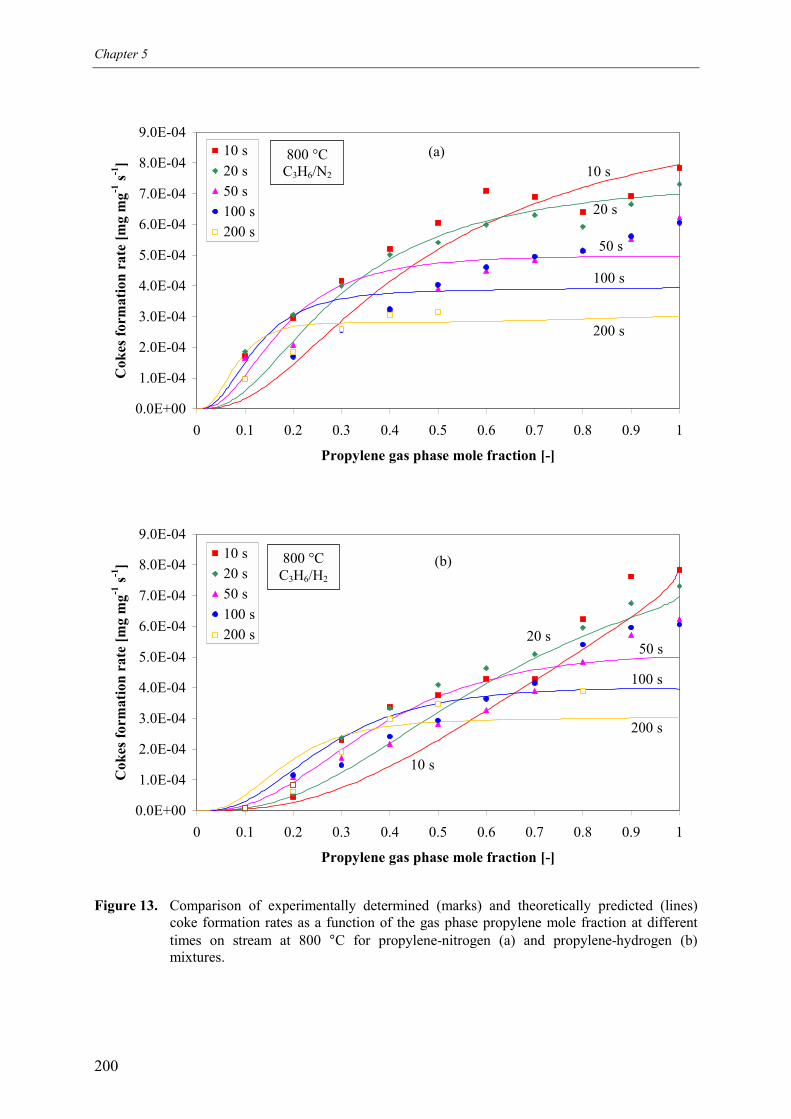
Chapter 5
200
0.0E+00
1.0E-04
2.0E-04
3.0E-04
4.0E-04
5.0E-04
6.0E-04
7.0E-04
8.0E-04
9.0E-04
0 0.1 0.2 0.3 0.4 0.5 0.6 0.7 0.8 0.9 1
Propylene gas phase mole fraction [-]
Cok
es fo
rmat
ion
rate
[mg
mg-1
s-1]
10 s20 s50 s100 s200 s
10 s
200 s
100 s
50 s
20 s
0.0E+00
1.0E-04
2.0E-04
3.0E-04
4.0E-04
5.0E-04
6.0E-04
7.0E-04
8.0E-04
9.0E-04
0 0.1 0.2 0.3 0.4 0.5 0.6 0.7 0.8 0.9 1
Propylene gas phase mole fraction [-]
Cok
es fo
rmat
ion
rate
[mg
mg-1
s-1]
10 s20 s50 s100 s200 s
10 s
20 s50 s
100 s
200 s
Figure 13. Comparison of experimentally determined (marks) and theoretically predicted (lines)coke formation rates as a function of the gas phase propylene mole fraction at differenttimes on stream at 800 °C for propylene-nitrogen (a) and propylene-hydrogen (b)mixtures.
(b)
(a)800 °CC3H6/N2
800 °CC3H6/H2
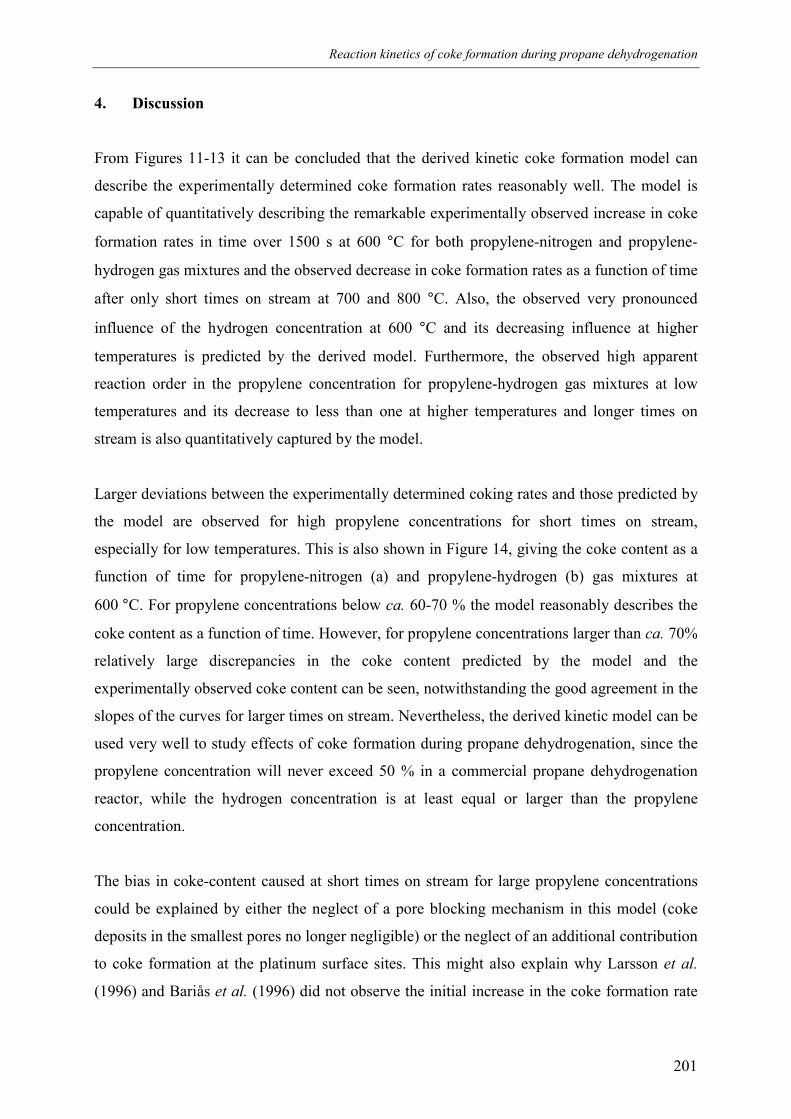
Reaction kinetics of coke formation during propane dehydrogenation
201
4. Discussion
From Figures 11-13 it can be concluded that the derived kinetic coke formation model can
describe the experimentally determined coke formation rates reasonably well. The model is
capable of quantitatively describing the remarkable experimentally observed increase in coke
formation rates in time over 1500 s at 600 °C for both propylene-nitrogen and propylene-
hydrogen gas mixtures and the observed decrease in coke formation rates as a function of time
after only short times on stream at 700 and 800 °C. Also, the observed very pronounced
influence of the hydrogen concentration at 600 °C and its decreasing influence at higher
temperatures is predicted by the derived model. Furthermore, the observed high apparent
reaction order in the propylene concentration for propylene-hydrogen gas mixtures at low
temperatures and its decrease to less than one at higher temperatures and longer times on
stream is also quantitatively captured by the model.
Larger deviations between the experimentally determined coking rates and those predicted by
the model are observed for high propylene concentrations for short times on stream,
especially for low temperatures. This is also shown in Figure 14, giving the coke content as a
function of time for propylene-nitrogen (a) and propylene-hydrogen (b) gas mixtures at
600 °C. For propylene concentrations below ca. 60-70 % the model reasonably describes the
coke content as a function of time. However, for propylene concentrations larger than ca. 70%
relatively large discrepancies in the coke content predicted by the model and the
experimentally observed coke content can be seen, notwithstanding the good agreement in the
slopes of the curves for larger times on stream. Nevertheless, the derived kinetic model can be
used very well to study effects of coke formation during propane dehydrogenation, since the
propylene concentration will never exceed 50 % in a commercial propane dehydrogenation
reactor, while the hydrogen concentration is at least equal or larger than the propylene
concentration.
The bias in coke-content caused at short times on stream for large propylene concentrations
could be explained by either the neglect of a pore blocking mechanism in this model (coke
deposits in the smallest pores no longer negligible) or the neglect of an additional contribution
to coke formation at the platinum surface sites. This might also explain why Larsson et al.
(1996) and Bariås et al. (1996) did not observe the initial increase in the coke formation rate
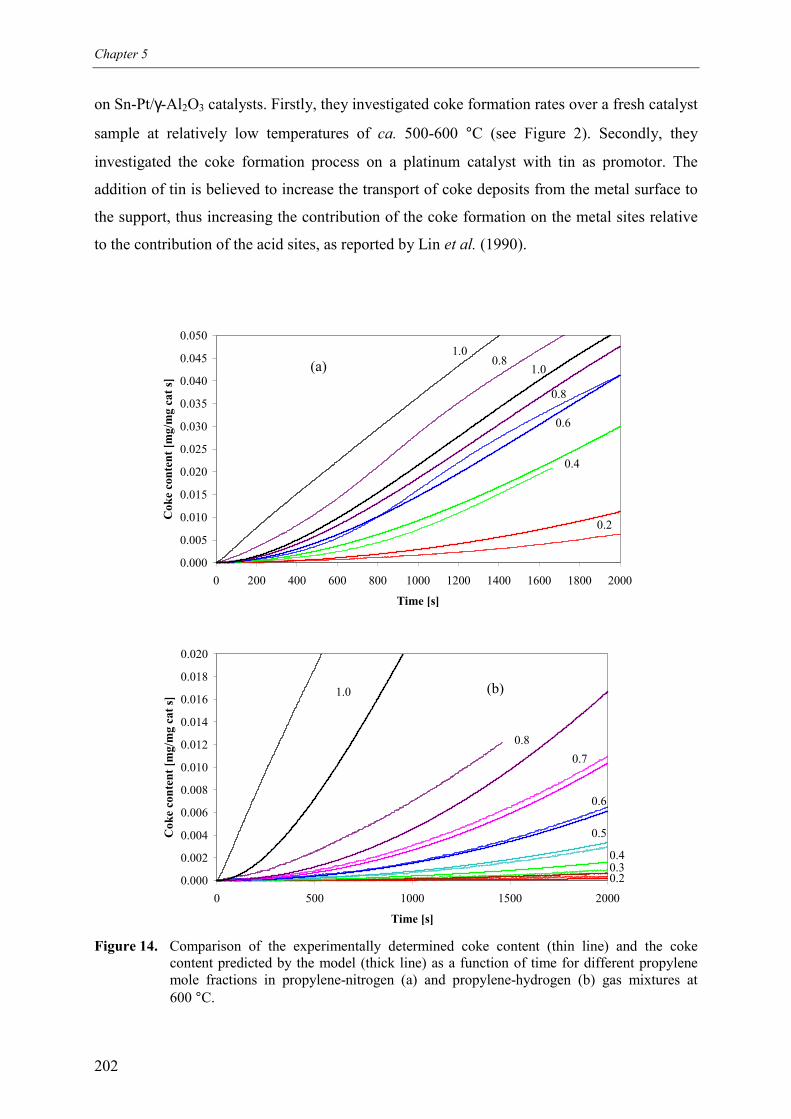
Chapter 5
202
on Sn-Pt/γ-Al2O3 catalysts. Firstly, they investigated coke formation rates over a fresh catalyst
sample at relatively low temperatures of ca. 500-600 °C (see Figure 2). Secondly, they
investigated the coke formation process on a platinum catalyst with tin as promotor. The
addition of tin is believed to increase the transport of coke deposits from the metal surface to
the support, thus increasing the contribution of the coke formation on the metal sites relative
to the contribution of the acid sites, as reported by Lin et al. (1990).
0.000
0.005
0.010
0.015
0.020
0.025
0.030
0.035
0.040
0.045
0.050
0 200 400 600 800 1000 1200 1400 1600 1800 2000
Time [s]
Cok
e co
nten
t [m
g/m
g ca
t s]
0.2
0.4
0.6
1.00.8
1.0
0.8
0.000
0.002
0.004
0.006
0.008
0.010
0.012
0.014
0.016
0.018
0.020
0 500 1000 1500 2000
Time [s]
Cok
e co
nten
t [m
g/m
g ca
t s]
0.20.30.4
0.5
0.6
0.70.8
1.0
Figure 14. Comparison of the experimentally determined coke content (thin line) and the cokecontent predicted by the model (thick line) as a function of time for different propylenemole fractions in propylene-nitrogen (a) and propylene-hydrogen (b) gas mixtures at600 °C.
(b)
(a)
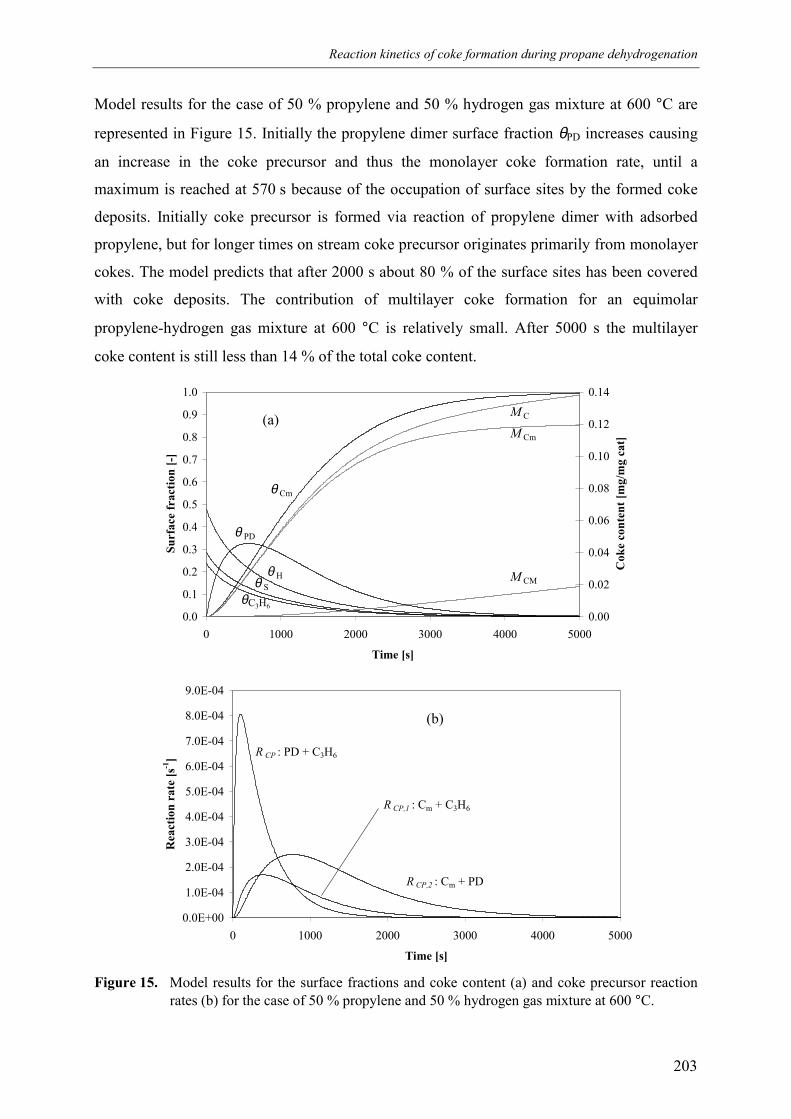
Reaction kinetics of coke formation during propane dehydrogenation
203
Model results for the case of 50 % propylene and 50 % hydrogen gas mixture at 600 °C are
represented in Figure 15. Initially the propylene dimer surface fraction θPD increases causing
an increase in the coke precursor and thus the monolayer coke formation rate, until a
maximum is reached at 570 s because of the occupation of surface sites by the formed coke
deposits. Initially coke precursor is formed via reaction of propylene dimer with adsorbed
propylene, but for longer times on stream coke precursor originates primarily from monolayer
cokes. The model predicts that after 2000 s about 80 % of the surface sites has been covered
with coke deposits. The contribution of multilayer coke formation for an equimolar
propylene-hydrogen gas mixture at 600 °C is relatively small. After 5000 s the multilayer
coke content is still less than 14 % of the total coke content.
0.0
0.1
0.2
0.3
0.4
0.5
0.6
0.7
0.8
0.9
1.0
0 1000 2000 3000 4000 5000
Time [s]
Surf
ace
frac
tion
[-]
0.00
0.02
0.04
0.06
0.08
0.10
0.12
0.14
Cok
e co
nten
t [m
g/m
g ca
t]
θ Cm
θ H
θθ S
C3H6
θ PD
M CM
M Cm
M C
0.0E+00
1.0E-04
2.0E-04
3.0E-04
4.0E-04
5.0E-04
6.0E-04
7.0E-04
8.0E-04
9.0E-04
0 1000 2000 3000 4000 5000
Time [s]
Rea
ctio
n ra
te [s
-1] R CP : PD + C3H6
R CP,1 : Cm + C3H6
R CP,2 : Cm + PD
Figure 15. Model results for the surface fractions and coke content (a) and coke precursor reactionrates (b) for the case of 50 % propylene and 50 % hydrogen gas mixture at 600 °C.
(b)
(a)
Chapter 5
204
Differences in the model assumptions make a direct comparison of the fitted adsorption and
reaction rate constants and their activation energies with values from literature difficult.
However, the fitted activation energies for coke precursor formation (ECP) and multilayer
coke formation (ECM) given in Table 2, 147 and 200 kJ·mole-1 respectively, compare very well
with the (overall) activation energies fitted by Peña et al. (1993), 155 and 210 kJ·mole-1 for
monolayer and multilayer coke formation and with the 135 kJ·mole-1 for the activation energy
for coke precursor formation from 1-butene fitted by Marin et al. (1986). Furthermore, also
the fitted adsorption coefficient for propylene on the used γ-Al2O3 monolithic catalyst at
600 °C (0.13 m3·mole-1) compare well with the adsorption coefficients for 1-butene and
1,3-butadiene on the γ-Al2O3/Cr2O3 catalyst fitted by Marin et al. (1986), 0.15 and 0.24
m3·mole-1 respectively, and the adsorption coefficient for hydrogen is in the same order of
magnitude. Besides, as in the work of Marin et al. (1986), it turned out not to be necessary to
assume that hydrogen can reverse the coke precursor formation process in order to describe
the coke formation rates with hydrogen present in the gas mixture. However, this cannot be
excluded from this work.
Finally it is noted that in this work the kinetic rate expression for the time-dependent coke
formation rate has been derived under steady state gas phase conditions, viz. the temperature
and gas phase composition. The kinetic investigation could be extended by examining the
coke formation rate under transient operating conditions. Transient kinetic experiments to
determine coke formation rates under unsteady operating conditions have not been reported in
the literature before. However, if the same reaction steps as in the steady state are rate
determining (thus assuming that all other reaction steps are still instantaneous) and if mass
accumulation effects of intermediary products not taken into account explicitly in the model
are small, transient kinetic effects can be neglected. It is assumed that the derived ‘steady
state’ kinetic expression for the time-dependent coke formation rate can be applied for
unsteady conditions, as in the RCRFR.
5. Summary and conclusions
Experimentally determined coke formation rates as a function of time on stream for
propylene-nitrogen and propylene-hydrogen gas mixtures in a thermogravimetric analyser
Reaction kinetics of coke formation during propane dehydrogenation
205
over a used Pt/γ-Al2O3 monolithic catalyst can be adequately described using a mechanistic
dual coke growth model following Peña et al. (1993) and Marin et al. (1988).
Their model has been extended by assuming that the rate-determining coke precursor
formation initially occurs via propylene oligomerisation process. Based on this mechanistic
model (see Table 1) a kinetic rate expression has been derived (equation 1-7) and the
adsorption and reaction rate constants and activation energies have been fitted using the
Levenberg-Marquardt multivariable algorithm (see Table 2). The kinetic rate expression
quantitatively describes the coke formation rates over a wide temperature range (600-800 °C)
and wide concentration range (at least 0-50 % propylene in nitrogen or hydrogen).
The model satisfactorily describes the remarkable experimentally observed initial quadratic
increase in the coke formation rates versus time (auto-catalysis) with its high apparent
propylene reaction order, and the decrease in coke formation rates after longer times on
stream (auto-deactivation), with a constant residual coke formation rate when the coke content
exceeds 12 wt%. Also the observed very pronounced influence of the hydrogen concentration
at low temperatures and its diminishing influence at higher temperatures is quantitatively
captured by the model. The derived kinetic rate expression provides valuable information for
the design and optimisation of propane dehydrogenation reactors.
Acknowledgements
The author wishes to thank H. bij de Vaate for her valuable contribution to the experimental
work and W. Leppink for the construction and maintenance of the TGA. Furthermore, the
financial support by the Netherlands Organization for Scientific Research (N.W.O.) is
gratefully acknowledged.
Notation
C total coke
Cg gas phase concentration [mole·m-3]
Cs surface concentration [mole·m-2]
Cm monolayer coke
CM multilayer coke
Chapter 5
206
CP coke precursor
E activation energy [kJ·mole-1]
(g) gas phase
k reaction rate constant
K adsorption constant
M weight content [mg·mgcat-1]
n apparent reaction order in the propylene concentration [-]
PD propylene dimer
r2 linear regression coefficient [-]
RC coke formation rate [mg·mgcat-1·s-1]
(s) adsorbed
S free surface site
t time [s]
xg gas phase molar fraction [mole·mole-1]
w maximum monolayer coke content [mg·mgcat-1]
Greek symbols
θ surface fraction [-]
Subscripts
C propylene (adsorption equilibrium) / total coke
CP coke precursor (formation reaction)
Cm monolayer coke (formation reaction)
CM multilayer coke (formation reaction)
g gas phase
H hydrogen (chemisorption equilibrium)
R propylene dimer (formation reaction)
s adsorbed
S free surface site
tot total
0 at initial conditions
∞ pre-exponential
Reaction kinetics of coke formation during propane dehydrogenation
207
References
Barbier, J., Corro, G. and Zhang, Y. (1985). Coke formation on platinum-alumina catalyst of
wide varying dispersion. Appl. Catal., 13, 245-255
Bariås, O.A., Holmen, A., and Blekkan, E.A. (1996). Propane dehydrogenation over
supported Pt and Pt-Sn catalysts: catalyst preparation, characterization, and activity
measurements. J. Catal., 158, 1-12
Beeckman, J.W. and Froment, G.F. (1979). Catalyst deactivation by active site coverage and
pore blockage. Ind. Eng. Chem. Fundam., 18, 245-256
Beeckman, J.W. and Froment, G.F. (1980). Catalyst deactivation by site coverage and pore
blockage. Chem. Eng. Sci., 35, 805-815
Cosyns, J., Chodorge, J., Commereuc, D. and Torck, B. (1998). Maximize propylene
production. Hydrocarbon Process., March 1998, 61-66
Dumez, F.J. and Froment, G.F. (1976). Dehydrogenation of 1-butene into butadiene. Kinetics,
catalyst coking, and reactor design. Ind. Eng. Chem. Process Des. Dev., 15, 291-301
Hamid, S.B.A. and Cerouane, E.G. (1994). Effect of temperature on propane aromatisation by
Ga – H-MFI(Si, Al) catalysts, Zeolites and related microporous materials: state of the art, 84,
2335-2344
Larsson, M., Hultén, M., Blekkan, E.A. and Andersson, B. (1996). The effect of reaction
conditions and time on stream on the coke formed during propane dehydrogenation, J. Catal.,
164, 44-53
Lin, L., Zao, T., Zang, J. and Xu, Z. (1990). Dynamic process of carbon deposition on
platinum and platinum-tin catalysts for alkane dehydrogenation. Appl. Catal., 67, 11-23
Chapter 5
208
Marin, G.B., Beeckman, J.W. and Froment G.F. (1986). Rigorous kinetic models for catalyst
deactivation by coke deposition: application to butene dehydrogenation. J. Catal., 97,
416-426
Nam, I.S. and Kittrell, J.R. (1984). Use of catalyst coke content in deactivation modeling. Ind.
Eng. Chem. Process Des. Dev., 23, 237-242
Peña, J.A., Monzón, A. and Santamaría, J. (1993). Deactivation by coke of a Cr2O3/Al2O3
catalyst during butene dehydrogenation. J. Catal., 142, 59-69
Reid, R.C., Prausnitz, J.M. and Poling, B.E. (1988). The properties of gases and liquids.
McGraw-Hill Book Company, New York.
Resasco, D.E. and Haller, G.L. (1994). Catalytic dehydrogenation of lower alkanes. J. Catal.,
11, 379-411
Taffe, P. (1996). Propping up the propylene supply. Eur. Chem. News, 21-27 October, 27-28
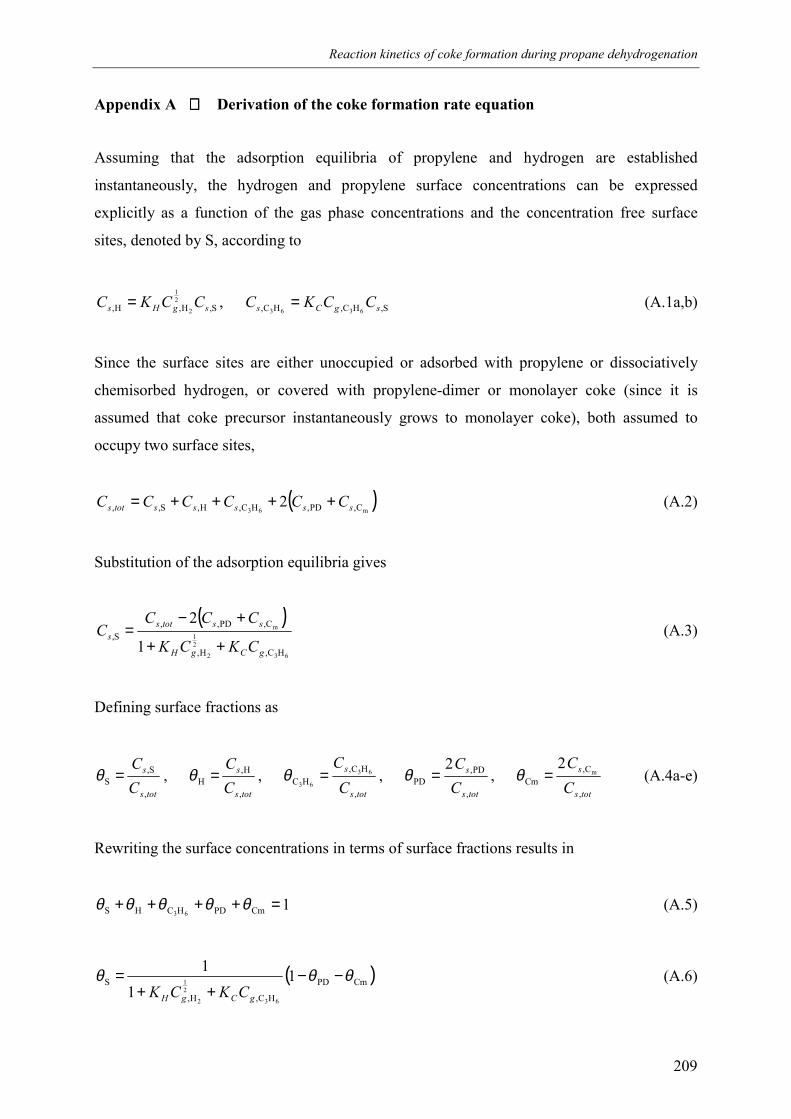
Reaction kinetics of coke formation during propane dehydrogenation
209
Appendix A Derivation of the coke formation rate equation
Assuming that the adsorption equilibria of propylene and hydrogen are established
instantaneously, the hydrogen and propylene surface concentrations can be expressed
explicitly as a function of the gas phase concentrations and the concentration free surface
sites, denoted by S, according to
S,H,H,21
2 sgHs CCKC = , S,HC,HC, 6363 sgCs CCKC = (A.1a,b)
Since the surface sites are either unoccupied or adsorbed with propylene or dissociatively
chemisorbed hydrogen, or covered with propylene-dimer or monolayer coke (since it is
assumed that coke precursor instantaneously grows to monolayer coke), both assumed to
occupy two surface sites,
( )m63 C,PD,HC,H,S,, 2 ssssstots CCCCCC ++++= (A.2)
Substitution of the adsorption equilibria gives
( )63
21
2
m
HC,H,
C,PD,,S,
1
2
gCgH
sstotss
CKCK
CCCC
++
+−= (A.3)
Defining surface fractions as
tots
s
CC
,
S,S =θ ,
tots
s
CC
,
H,H =θ ,
tots
s
CC
,
HC,HC
63
63=θ ,
tots
s
CC
,
PD,PD
2=θ ,
tots
s
CC
,
C,Cm
m2
=θ (A.4a-e)
Rewriting the surface concentrations in terms of surface fractions results in
1CmPDHCHS 63=++++ θθθθθ (A.5)
( )CmPD
HC,H,
S 11
1
63
21
2
θθθ −−++
=gCgH CKCK
(A.6)
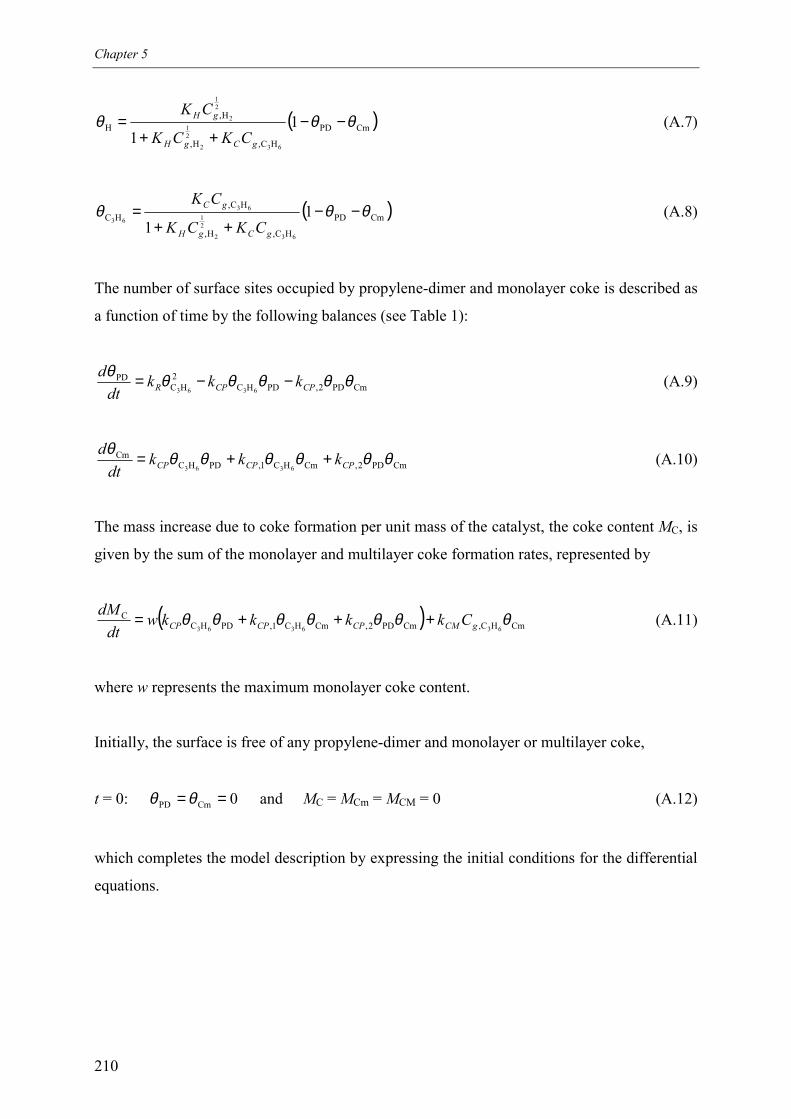
Chapter 5
210
( )CmPD
HC,H,
H,H 1
163
21
2
21
2 θθθ −−++
=gCgH
gH
CKCK
CK(A.7)
( )CmPD
HC,H,
HC,HC 1
163
21
2
63
63θθθ −−
++=
gCgH
gC
CKCK
CK(A.8)
The number of surface sites occupied by propylene-dimer and monolayer coke is described as
a function of time by the following balances (see Table 1):
CmPD2,PDHC2
HCPD
6363θθθθθθ
CPCPR kkkdt
d −−= (A.9)
CmPD2,CmHC1,PDHCCm
6363θθθθθθθ
CPCPCP kkkdt
d ++= (A.10)
The mass increase due to coke formation per unit mass of the catalyst, the coke content MC, is
given by the sum of the monolayer and multilayer coke formation rates, represented by
( ) CmHC,CmPD2,CmHC1,PDHCC
636363θθθθθθθ gCMCPCPCP Ckkkkw
dtdM +++= (A.11)
where w represents the maximum monolayer coke content.
Initially, the surface is free of any propylene-dimer and monolayer or multilayer coke,
t = 0: 0CmPD ==θθ and MC = MCm = MCM = 0 (A.12)
which completes the model description by expressing the initial conditions for the differential
equations.
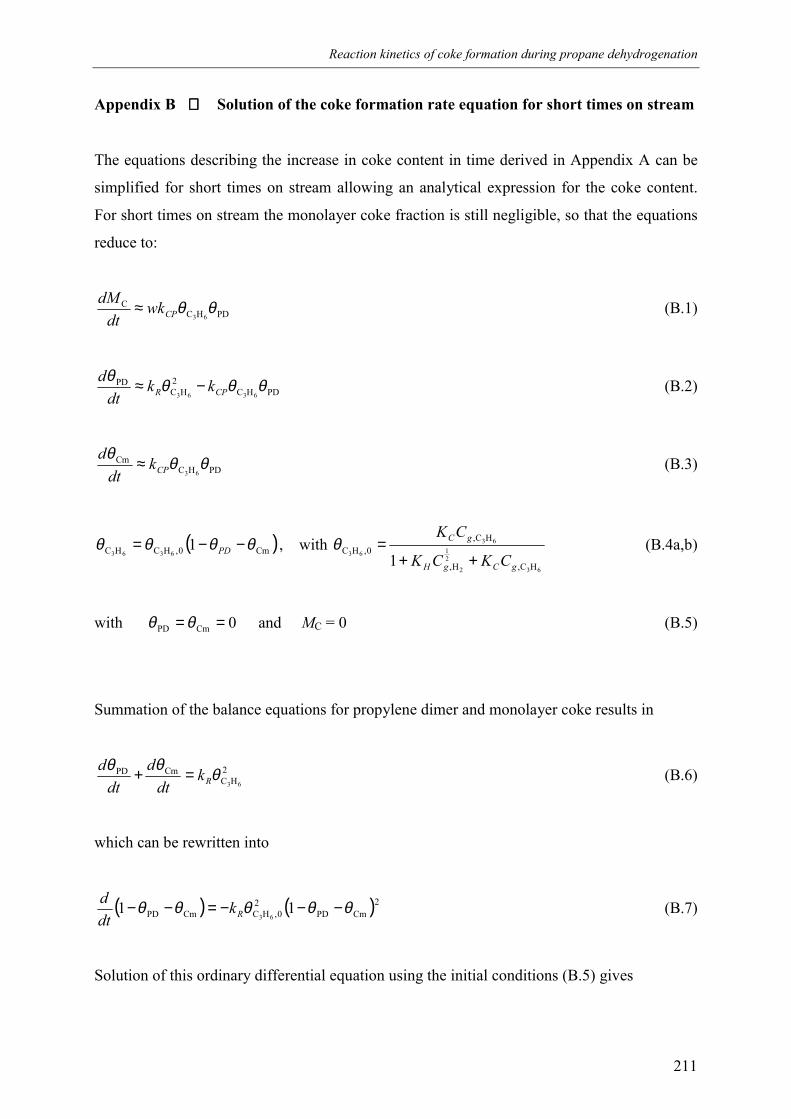
Reaction kinetics of coke formation during propane dehydrogenation
211
Appendix B Solution of the coke formation rate equation for short times on stream
The equations describing the increase in coke content in time derived in Appendix A can be
simplified for short times on stream allowing an analytical expression for the coke content.
For short times on stream the monolayer coke fraction is still negligible, so that the equations
reduce to:
PDHCC
63θθCPwk
dtdM ≈ (B.1)
PDHC2
HCPD
6363θθθθ
CPR kkdt
d −≈ (B.2)
PDHCCm
63θθθ
CPkdt
d ≈ (B.3)
( )Cm0,HCHC 16363
θθθθ −−= PD , with 63
21
2
63
63
HC,H,
HC,0,HC
1 gCgH
gC
CKCK
CK
++=θ (B.4a,b)
with 0CmPD ==θθ and MC = 0 (B.5)
Summation of the balance equations for propylene dimer and monolayer coke results in
2HC
CmPD63
θθθRk
dtd
dtd =+ (B.6)
which can be rewritten into
( ) ( )2CmPD
20,HCCmPD 11
63θθθθθ −−−=−− Rk
dtd (B.7)
Solution of this ordinary differential equation using the initial conditions (B.5) gives
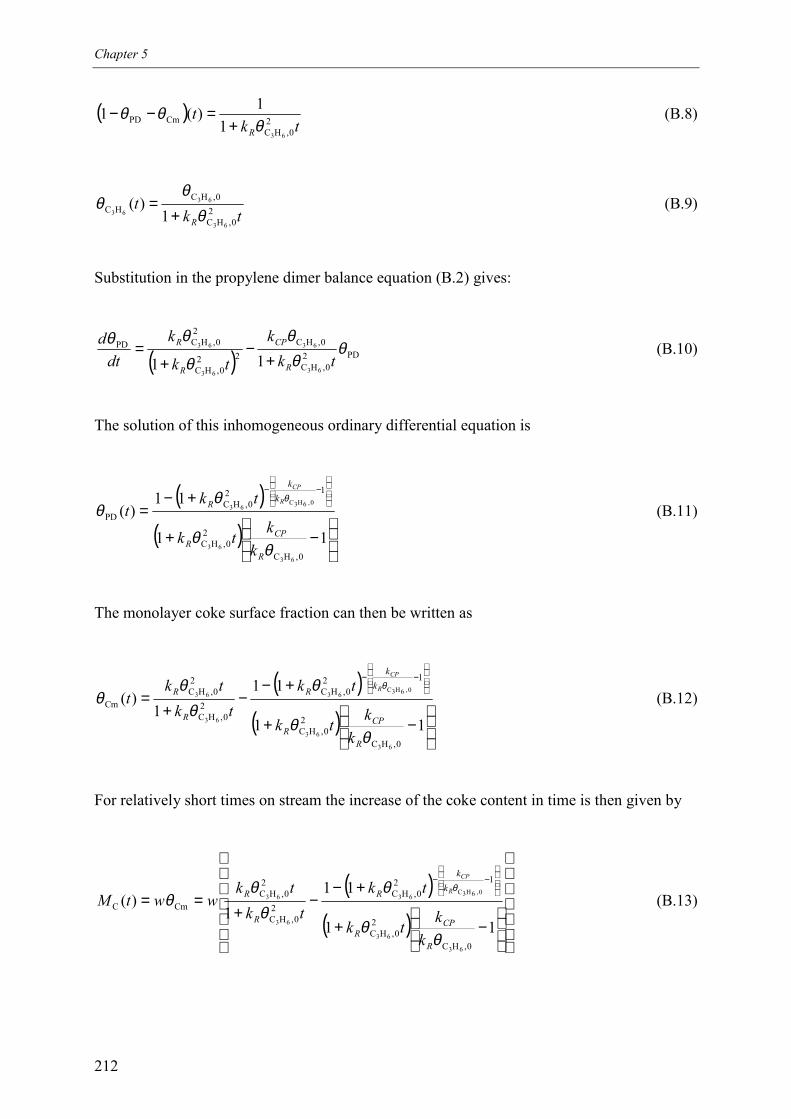
Chapter 5
212
( )tk
tR
20,HC
CmPD63
11)(1θ
θθ+
=−− (B.8)
tkt
R2
0,HC
0,HCHC
63
63
63 1)(
θθ
θ+
= (B.9)
Substitution in the propylene dimer balance equation (B.2) gives:
( ) PD20,HC
0,HC22
0,HC
20,HCPD
63
63
63
63
11θ
θθ
θ
θθtk
k
tk
kdt
d
R
CP
R
R
+−
+= (B.10)
The solution of this inhomogeneous ordinary differential equation is
( )( )
−+
+−=
−−
11
11)(
0,HC
20,HC
120,HC
PD
63
63
0,6H3C63
θθ
θθ
θ
R
CPR
kk
R
kktk
tkt
R
CP
(B.11)
The monolayer coke surface fraction can then be written as
( )( )
−+
+−−
+=
−−
11
111
)(
0,HC
20,HC
120,HC
20,HC
20,HC
Cm
63
63
0,6H3C63
63
63
θθ
θθ
θθ
θ
R
CPR
kk
R
R
R
kktk
tktk
tkt
R
CP
(B.12)
For relatively short times on stream the increase of the coke content in time is then given by
( )( )
−+
+−−
+==
−−
11
111
)(
0,HC
20,HC
120,HC
20,HC
20,HC
CmC
63
63
0,6H3C63
63
63
θθ
θθ
θθ
θ
R
CPR
kk
R
R
R
kktk
tktk
tkwwtM
R
CP
(B.13)
213
CHAPTER 6
SAFETY ANALYSIS OF SWITCHING BETWEEN
REDUCTIVE AND OXIDATIVE CONDITIONS
Chapter 6
214
Abstract
A new reverse flow reactor is developed where endothermic reactants (propane
dehydrogenation) and exothermic reactants (fuel combustion) are fed sequentially to a
monolithic catalyst, while periodically alternating the inlet and outlet positions. Upon
switching from reductive to oxidative conditions hydrocarbons come into contact with air.
Due to mixing in the monolith channels and in the inlet sections, combustible gas mixtures
can be formed. In this chapter the effects during reaction phase switching are studied by
detailed numerical simulations and some qualitative experiments. Due to the reverse flow
concept and the use of a monolithic catalyst, switching between oxidative and reductive
conditions can be carried out without intermediate flushing with inert gases, provided that
proper precautions are taken.
Safety analysis of switching between reductive and oxidative conditions
215
1. Introduction
A new reactor concept is developed for the non-oxidative propane dehydrogenation to
propylene and hydrogen over a platinum based monolithic catalyst. The highly endothermic
propane dehydrogenation is carried out at high temperatures (550-650 °C) because of
thermodynamic constraints on the propane conversion. However, at these temperatures
carbonaceous side-products, collectively termed coke, are formed at the catalyst surface,
necessitating catalyst regeneration.
The reactor concept is based on, firstly, the indirect coupling between energy necessary for
endothermic reactions and energy released by exothermic reactions, using a fixed catalyst as
an energy repository. During the endothermic propane dehydrogenation reaction phase energy
is withdrawn from the catalyst leading to a temperature drop of the catalyst and
simultaneously coke deposition on the catalyst surface. During a consecutive exothermic fuel
combustion reaction phase the catalyst is reheated and concurrently regenerated by burning
off the coke. Secondly, recuperative heat exchange is integrated inside the reactor using the
concept of reverse flow, i.e. periodic alternation of the gas flow direction while feeding the
endothermic and exothermic reactants without any preheating. In this novel multifunctional
reactor, called the Reaction Coupling Reverse Flow Reactor (RCRFR), the propane
dehydrogenation reaction, energy supply at high temperatures, catalyst regeneration and
recuperative heat exchange are all integrated in one apparatus.
Upon switching between the endothermic propane dehydrogenation reaction phase to the
exothermic fuel combustion reaction phase and vice versa hydrocarbons and hydrogen come
into contact with oxygen, at least for a short time. Thus, due to mixing a combustible gas
mixture might be formed, possibly causing a temperature runaway (hot spot) or even an
explosion. The effects resulting from switching between reductive and oxidative conditions in
a monolithic catalyst have not been reported before in literature.
Mixing of oxygen and hydrocarbons can occur because of dispersion inside the monolith
channels or mixing in the feed sections (present at both reactor sides because of the reverse
flow concept), including the piping, valves and gas distribution sections.
Even if mixing induces an explosive gas mixture, heterogeneous deflagration or detonation is
excluded in the monolith channels, if the channel diameter is smaller than the quenching
diameter. Minimal quenching distances have been determined from spark ignition between
Chapter 6
216
parallel plates for propane, propylene and hydrogen combustion in air at 2.0, 1.5 and
0.64 mm, respectively (Lewis and von Elbe, 1961). The quenching diameter is somewhat
larger for tubes (Turns, 1996) and minimal at a fuel/air equivalence ratio of slightly exceeding
unity and strongly increases for smaller or larger equivalence ratios (Kroschwitz and Howe-
Grant, 1993). Depending on the operating conditions and reactor design of the RCRFR, the
duration of explosive gas mixtures entering the monolith is very short. Hence, in a monolithic
catalyst with a channel diameter of 1 mm or smaller deflagrations can be excluded.
Because of the reverse flow concept the temperatures in the inlet section will – under normal
operation – always be well below the auto-ignition temperatures for propane, propylene and
hydrogen combustion, 723 K, 733 K and 823-873 K respectively (Lewis and von Elbe, 1961;
Zabetakis, 1965), so that the danger of a homogeneous explosion in the inlet section is
negligible. However, if due to mixing a hot spot is created at the monolith entrance, an
explosive gas mixture in the inlet section might be ignited. These gas phase back-
deflagrations to the gas inlet can occur if the monolith inlet temperature exceeds about
1000 °C (Lewis and von Elbe, 1961; Minkoff and Tipper, 1962).
Potential hazards can obviously be avoided by flushing the reactor with inert gases like
nitrogen prior to reaction phase switching. However, if a flushing cycle could be prevented
this would greatly enhance the feasibility of the RCRFR by avoiding additional complexity of
a flushing cycle on the already very complex dynamic reactor behaviour, and by avoiding
extra energy losses and nitrogen costs.
The aim of this work is the study of the phenomena occurring during reaction phase switching
in a RCRFR by detailed numerical simulations backed up by some qualitative experiments.
Having identified gas phase back-deflagration as the most dangerous hazard, this work
focuses on the increase of the monolith entrance temperature in time due to combustion
reactions in the monolith channels, where combustible gas mixtures are formed because of
mixing in the monolith channels and the inlet section.
Firstly, effects occurring during reaction phase switching have been investigated by
simulating three different scenarios. Before taking all mixing processes into account, two
limiting cases are studied. In the first limiting case all pre-mixing effects are neglected and
only dispersion in the monolith is taken into account. Upon reaction phase switching a step
Safety analysis of switching between reductive and oxidative conditions
217
change in the inlet concentrations is assumed. In the second limiting case it is assumed that
mixing in the inlet section is complete and lasts for an infinitely long time, resulting in a
continuous feed of an explosive gas mixture. Finally, the case is simulated where explosive
mixtures arise from premixing in an inlet section, resulting in time-dependent boundary
conditions for the monolith inlet concentrations. The inlet section is represented as an ideally
stirred vessel to consider a worst case scenario.
Secondly, qualitative effects discerned from the simulations are checked by some qualitative
experiments.
Since more heat is released during propane combustion compared to propylene and hydrogen
combustion under comparable operating conditions, only switching between propane and air
feed and vice versa has been studied. Effects of additional coke combustion were ignored,
since coke is only deposited in the centre of the reactor due to the low inlet and outlet
temperatures in a RCRFR.
2. Modelling
The phenomena occurring in an adiabatic RCRFR upon reaction phase switching have been
modelled with mass and energy balances for the gas and catalyst phase, using a
one-dimensional plug flow model with superimposed axial dispersion. The model equations
are summarised in Table 1. In Appendix A, the validity of the model approach is
substantiated. Concluding from the theory for generalised Taylor dispersion for reactive
systems, the effects of axial mixing due to a radial velocity profile arising from laminar flow
are slightly overestimated when using Taylor’s equation for the effective axial dispersion. By
implementing Taylor’s equation a worst case of axial mixing in the monolith channels is
considered.
Furthermore, because of the very small pressure drop over a monolithic catalyst and since
only relatively small catalyst lengths are considered in this work (< 25 cm), the gas phase
momentum balance could be ignored.
The gas phase physical properties have been modelled following Reid et al. (1988), using
pure component properties as described by Dauber and Danner (1985). The solid phase is a
cordierite monolith with rectangular channels having a hydraulic channel diameter of
0.96 mm and a gas phase porosity of 0.69, where 1 wt% Pt has been dispersed in the γ-Al2O3
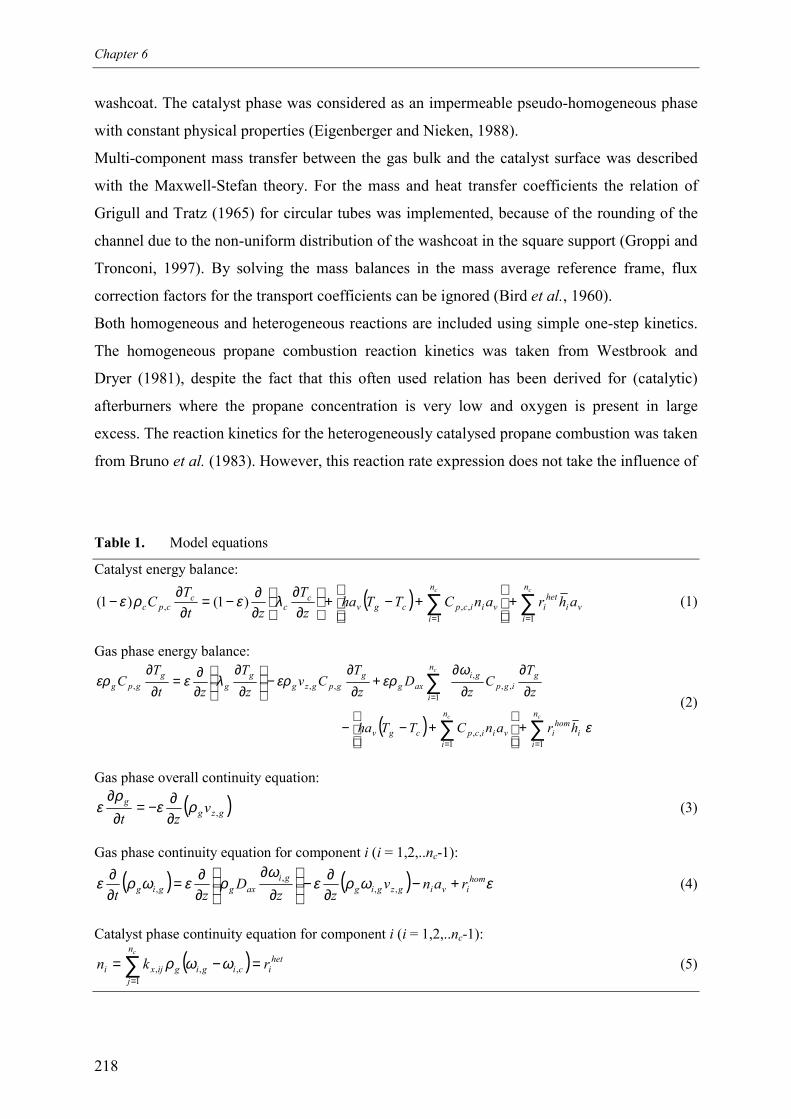
Chapter 6
218
washcoat. The catalyst phase was considered as an impermeable pseudo-homogeneous phase
with constant physical properties (Eigenberger and Nieken, 1988).
Multi-component mass transfer between the gas bulk and the catalyst surface was described
with the Maxwell-Stefan theory. For the mass and heat transfer coefficients the relation of
Grigull and Tratz (1965) for circular tubes was implemented, because of the rounding of the
channel due to the non-uniform distribution of the washcoat in the square support (Groppi and
Tronconi, 1997). By solving the mass balances in the mass average reference frame, flux
correction factors for the transport coefficients can be ignored (Bird et al., 1960).
Both homogeneous and heterogeneous reactions are included using simple one-step kinetics.
The homogeneous propane combustion reaction kinetics was taken from Westbrook and
Dryer (1981), despite the fact that this often used relation has been derived for (catalytic)
afterburners where the propane concentration is very low and oxygen is present in large
excess. The reaction kinetics for the heterogeneously catalysed propane combustion was taken
from Bruno et al. (1983). However, this reaction rate expression does not take the influence of
Table 1. Model equations
Catalyst energy balance:
( ) v
n
ii
hetiv
n
iiicpcgv
cc
ccpc ahranCTTha
zT
ztT
Ccc
∑∑==
+
+−+
∂∂
∂∂−=
∂∂
−11
,,, )1()1( λερε (1)
Gas phase energy balance:
( ) ∑∑
∑
==
=
+
+−−
∂∂
∂∂
+∂
∂−
∂
∂∂∂=
∂∂
cc
c
n
ii
homiv
n
iiicpcgv
gigp
gin
iaxg
ggpgzg
gg
ggpg
hranCTTha
zT
Cz
Dz
TCv
zT
ztT
C
11,,
,,,
1,,,
ε
ωερερλεερ
(2)
Gas phase overall continuity equation:
( )gzgg v
zt ,ρερ
ε∂∂−=
∂∂
(3)
Gas phase continuity equation for component i (i = 1,2,..nc-1):
( ) ( ) εωρεω
ρεωρε homivigzgig
giaxggig ranv
zzD
zt+−
∂∂−
∂
∂∂∂=
∂∂
,,,
, (4)
Catalyst phase continuity equation for component i (i = 1,2,..nc-1):
( ) heti
n
jcigigijxi rkn
c
=−= ∑=1
,,, ωωρ (5)
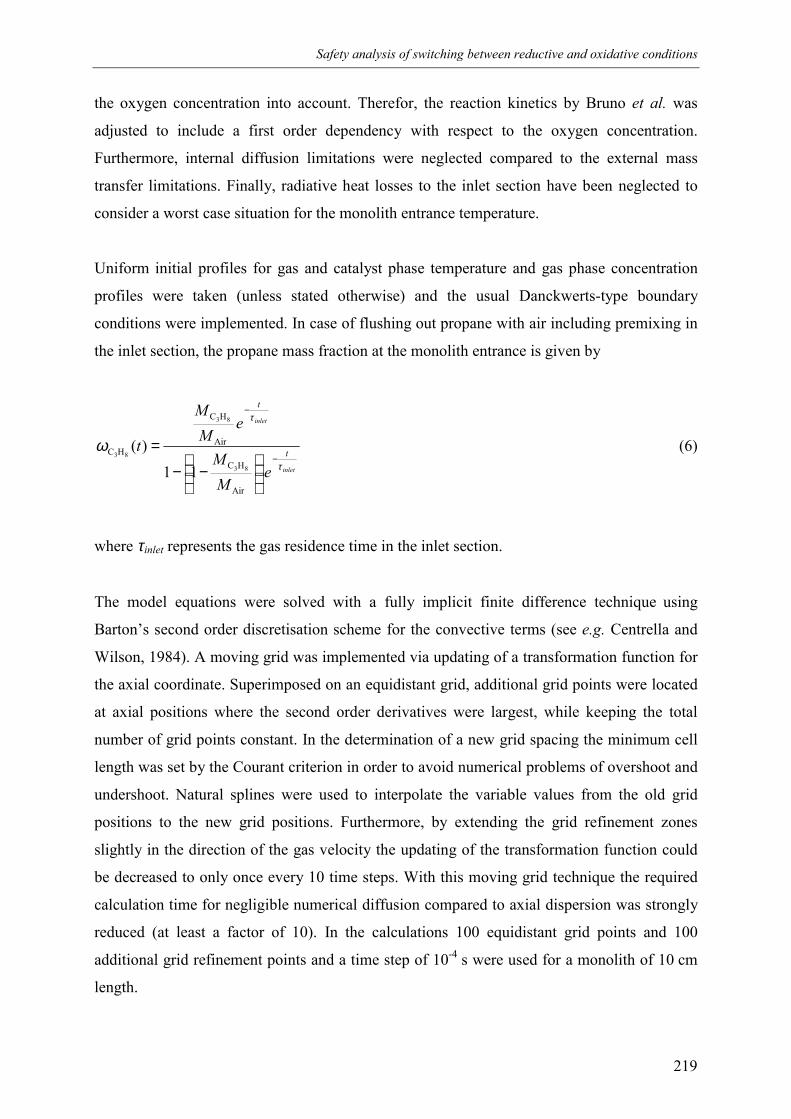
Safety analysis of switching between reductive and oxidative conditions
219
the oxygen concentration into account. Therefor, the reaction kinetics by Bruno et al. was
adjusted to include a first order dependency with respect to the oxygen concentration.
Furthermore, internal diffusion limitations were neglected compared to the external mass
transfer limitations. Finally, radiative heat losses to the inlet section have been neglected to
consider a worst case situation for the monolith entrance temperature.
Uniform initial profiles for gas and catalyst phase temperature and gas phase concentration
profiles were taken (unless stated otherwise) and the usual Danckwerts-type boundary
conditions were implemented. In case of flushing out propane with air including premixing in
the inlet section, the propane mass fraction at the monolith entrance is given by
inlet
inlet
t
t
eM
M
eM
M
tτ
τ
ω−
−
−−
=
Air
HC
Air
HC
HC
83
83
83
11
)( (6)
where τinlet represents the gas residence time in the inlet section.
The model equations were solved with a fully implicit finite difference technique using
Barton’s second order discretisation scheme for the convective terms (see e.g. Centrella and
Wilson, 1984). A moving grid was implemented via updating of a transformation function for
the axial coordinate. Superimposed on an equidistant grid, additional grid points were located
at axial positions where the second order derivatives were largest, while keeping the total
number of grid points constant. In the determination of a new grid spacing the minimum cell
length was set by the Courant criterion in order to avoid numerical problems of overshoot and
undershoot. Natural splines were used to interpolate the variable values from the old grid
positions to the new grid positions. Furthermore, by extending the grid refinement zones
slightly in the direction of the gas velocity the updating of the transformation function could
be decreased to only once every 10 time steps. With this moving grid technique the required
calculation time for negligible numerical diffusion compared to axial dispersion was strongly
reduced (at least a factor of 10). In the calculations 100 equidistant grid points and 100
additional grid refinement points and a time step of 10-4 s were used for a monolith of 10 cm
length.
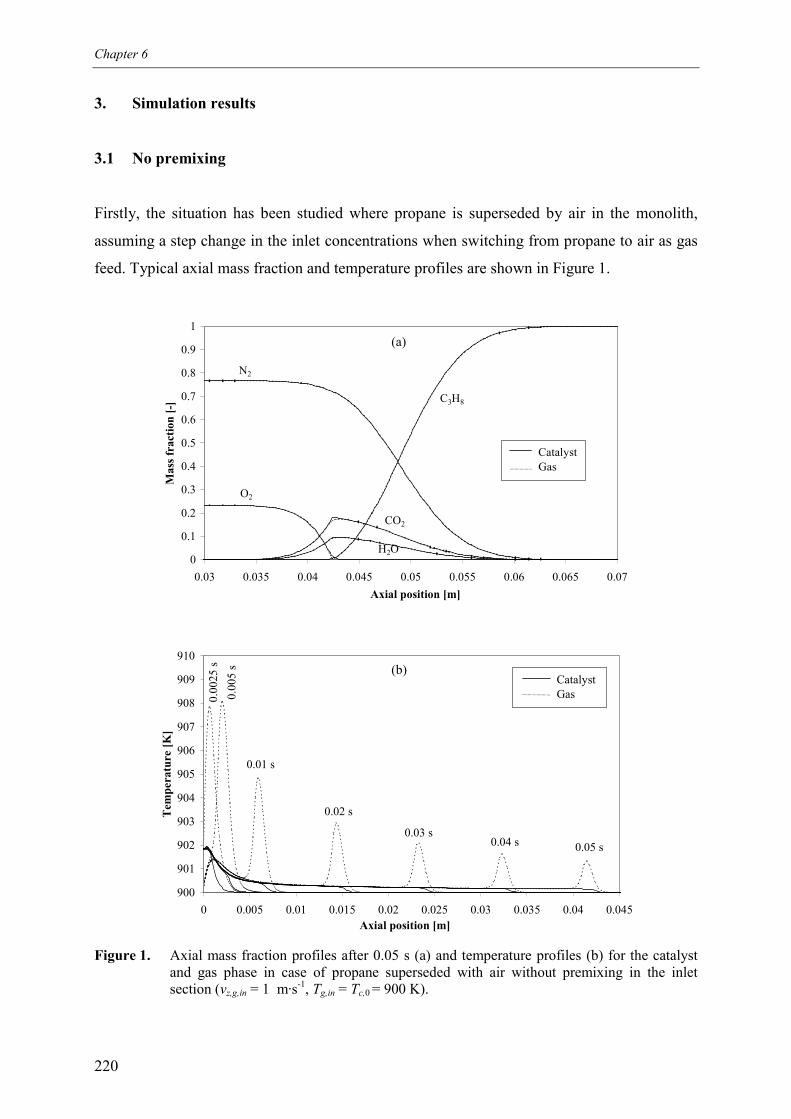
Chapter 6
220
3. Simulation results
3.1 No premixing
Firstly, the situation has been studied where propane is superseded by air in the monolith,
assuming a step change in the inlet concentrations when switching from propane to air as gas
feed. Typical axial mass fraction and temperature profiles are shown in Figure 1.
0
0.1
0.2
0.3
0.4
0.5
0.6
0.7
0.8
0.9
1
0.03 0.035 0.04 0.045 0.05 0.055 0.06 0.065 0.07Axial position [m]
Mas
s fra
ctio
n [-]
O2
C3H8
N2
CO2
H2O
CatalystGas
900
901
902
903
904
905
906
907
908
909
910
0 0.005 0.01 0.015 0.02 0.025 0.03 0.035 0.04 0.045Axial position [m]
Tem
pera
ture
[K]
CatalystGas0.
0025
s0.
005
s
0.01 s
0.02 s
0.03 s0.04 s 0.05 s
Figure 1. Axial mass fraction profiles after 0.05 s (a) and temperature profiles (b) for the catalystand gas phase in case of propane superseded with air without premixing in the inletsection (vz,g,in = 1 m·s-1, Tg,in = Tc,0 = 900 K).
(a)
(b)
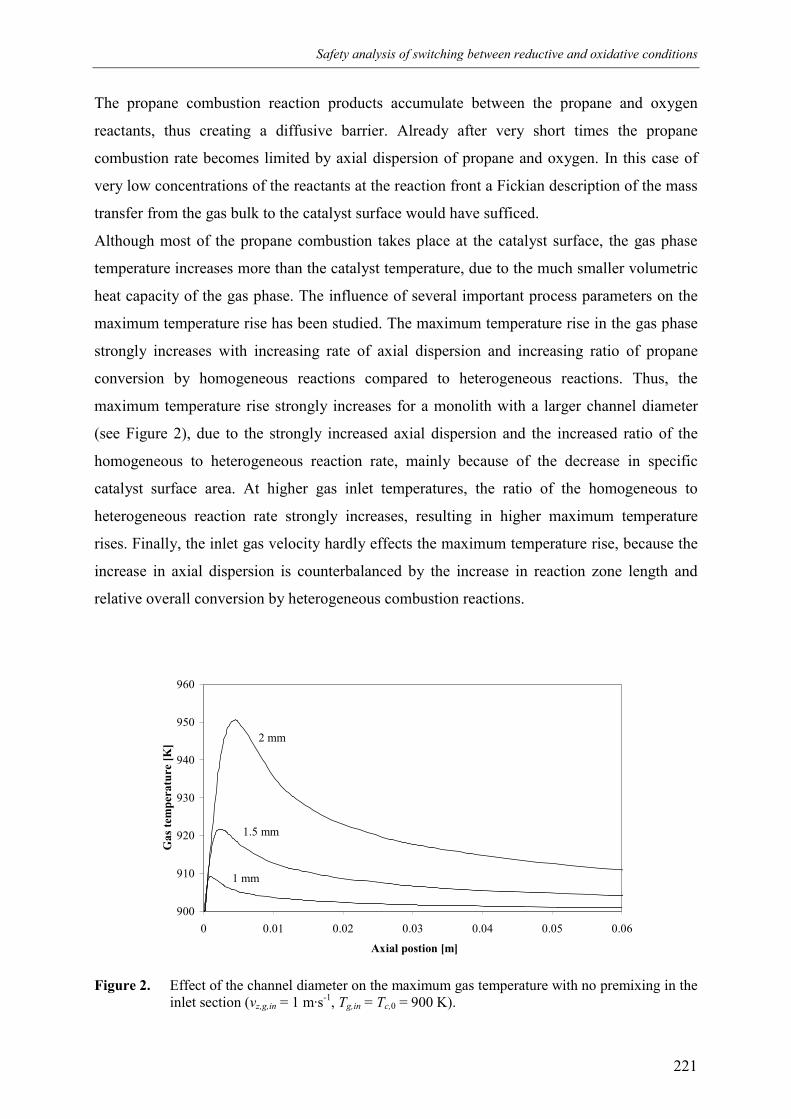
Safety analysis of switching between reductive and oxidative conditions
221
The propane combustion reaction products accumulate between the propane and oxygen
reactants, thus creating a diffusive barrier. Already after very short times the propane
combustion rate becomes limited by axial dispersion of propane and oxygen. In this case of
very low concentrations of the reactants at the reaction front a Fickian description of the mass
transfer from the gas bulk to the catalyst surface would have sufficed.
Although most of the propane combustion takes place at the catalyst surface, the gas phase
temperature increases more than the catalyst temperature, due to the much smaller volumetric
heat capacity of the gas phase. The influence of several important process parameters on the
maximum temperature rise has been studied. The maximum temperature rise in the gas phase
strongly increases with increasing rate of axial dispersion and increasing ratio of propane
conversion by homogeneous reactions compared to heterogeneous reactions. Thus, the
maximum temperature rise strongly increases for a monolith with a larger channel diameter
(see Figure 2), due to the strongly increased axial dispersion and the increased ratio of the
homogeneous to heterogeneous reaction rate, mainly because of the decrease in specific
catalyst surface area. At higher gas inlet temperatures, the ratio of the homogeneous to
heterogeneous reaction rate strongly increases, resulting in higher maximum temperature
rises. Finally, the inlet gas velocity hardly effects the maximum temperature rise, because the
increase in axial dispersion is counterbalanced by the increase in reaction zone length and
relative overall conversion by heterogeneous combustion reactions.
900
910
920
930
940
950
960
0 0.01 0.02 0.03 0.04 0.05 0.06
Axial postion [m]
Gas
tem
pera
ture
[K]
1 mm
1.5 mm
2 mm
Figure 2. Effect of the channel diameter on the maximum gas temperature with no premixing in theinlet section (vz,g,in = 1 m·s-1, Tg,in = Tc,0 = 900 K).
Chapter 6
222
3.2 Premixed feed
Simulation results for the case of feeding a premixed propane/air mixture (with constant inlet
composition) to a fully active monolith and a 5000 times less active monolith are presented in
Figures 3 and 4.
500
600
700
800
900
1000
1100
1200
1300
1400
1500
0 0.001 0.002 0.003 0.004 0.005 0.006 0.007 0.008 0.009 0.01Axial position [m]
Tem
pera
ture
[K]
2.4 s
1.2 s
2.0 s
1.6 s
0.8 s
0.4 s
CatalystGas
Figure 3. Catalyst and gas phase axial temperature profiles at every 0.4 s when feeding a premixedpropane/air mixture to a catalytic monolith ( ing ,,HC 83
ω = 0.05, vz,g,in = 1 m·s-1, Tg,in = Tc,0 =500 K).
When feeding a premixed gas mixture to a fully active monolith almost all propane
conversion takes place at the catalyst surface very close to the monolith entrance, creating a
hot spot in only a few seconds. When feeding the same mixture to a much less active
monolith, the temperature initially increases much further inside the monolith to a very high
temperature. Subsequently the temperature front moves back towards the monolith entrance
opposite to the gas flow direction, creating a hot spot after a few minutes. Remarkably, the
entrance temperature increases fastest for a propane/air mixture with an equivalence ratio of
about 2, regardless of the catalyst activity. Although the largest adiabatic temperature rise is
generated for a stoichiometric mixture, the homogeneous reaction rate, dominant at these high
temperatures, is largest for a mixture with an equivalence ratio of 3.3 (corresponding to
18 wt% propane in air).
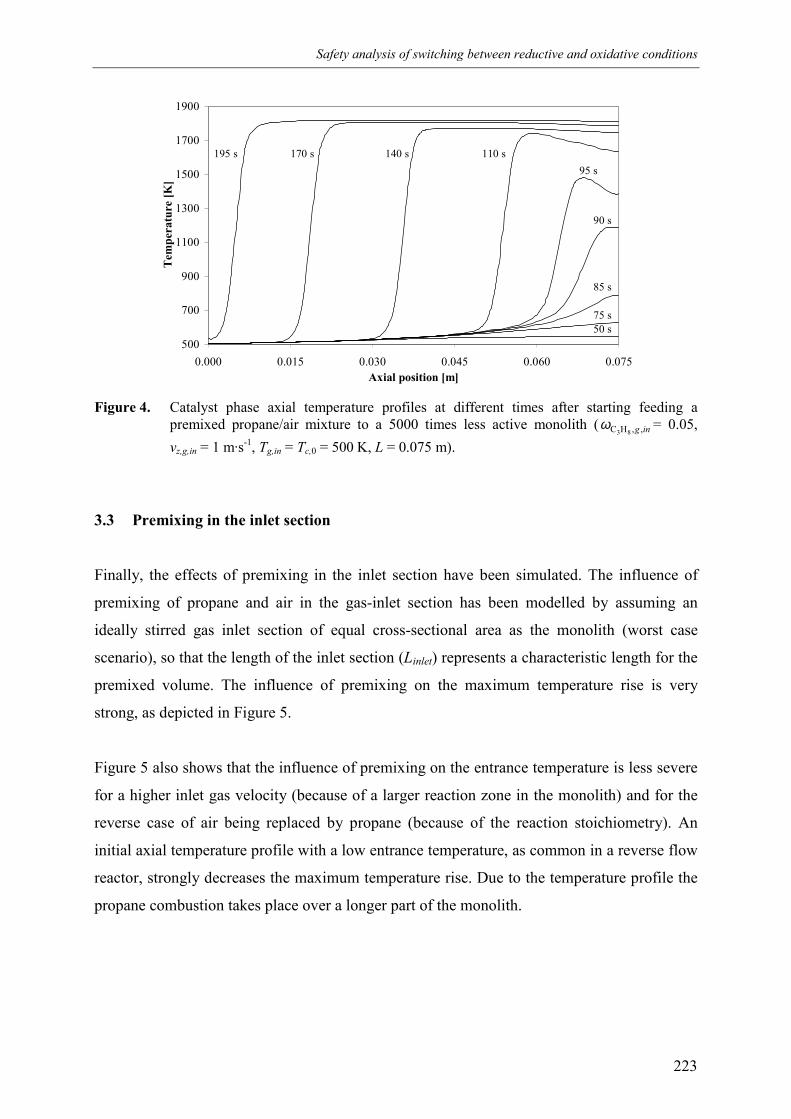
Safety analysis of switching between reductive and oxidative conditions
223
500
700
900
1100
1300
1500
1700
1900
0.000 0.015 0.030 0.045 0.060 0.075Axial position [m]
Tem
pera
ture
[K]
140 s170 s195 s 110 s
85 s
95 s
90 s
50 s75 s
Figure 4. Catalyst phase axial temperature profiles at different times after starting feeding apremixed propane/air mixture to a 5000 times less active monolith ( ing ,,HC 83
ω = 0.05,vz,g,in = 1 m·s-1, Tg,in = Tc,0 = 500 K, L = 0.075 m).
3.3 Premixing in the inlet section
Finally, the effects of premixing in the inlet section have been simulated. The influence of
premixing of propane and air in the gas-inlet section has been modelled by assuming an
ideally stirred gas inlet section of equal cross-sectional area as the monolith (worst case
scenario), so that the length of the inlet section (Linlet) represents a characteristic length for the
premixed volume. The influence of premixing on the maximum temperature rise is very
strong, as depicted in Figure 5.
Figure 5 also shows that the influence of premixing on the entrance temperature is less severe
for a higher inlet gas velocity (because of a larger reaction zone in the monolith) and for the
reverse case of air being replaced by propane (because of the reaction stoichiometry). An
initial axial temperature profile with a low entrance temperature, as common in a reverse flow
reactor, strongly decreases the maximum temperature rise. Due to the temperature profile the
propane combustion takes place over a longer part of the monolith.
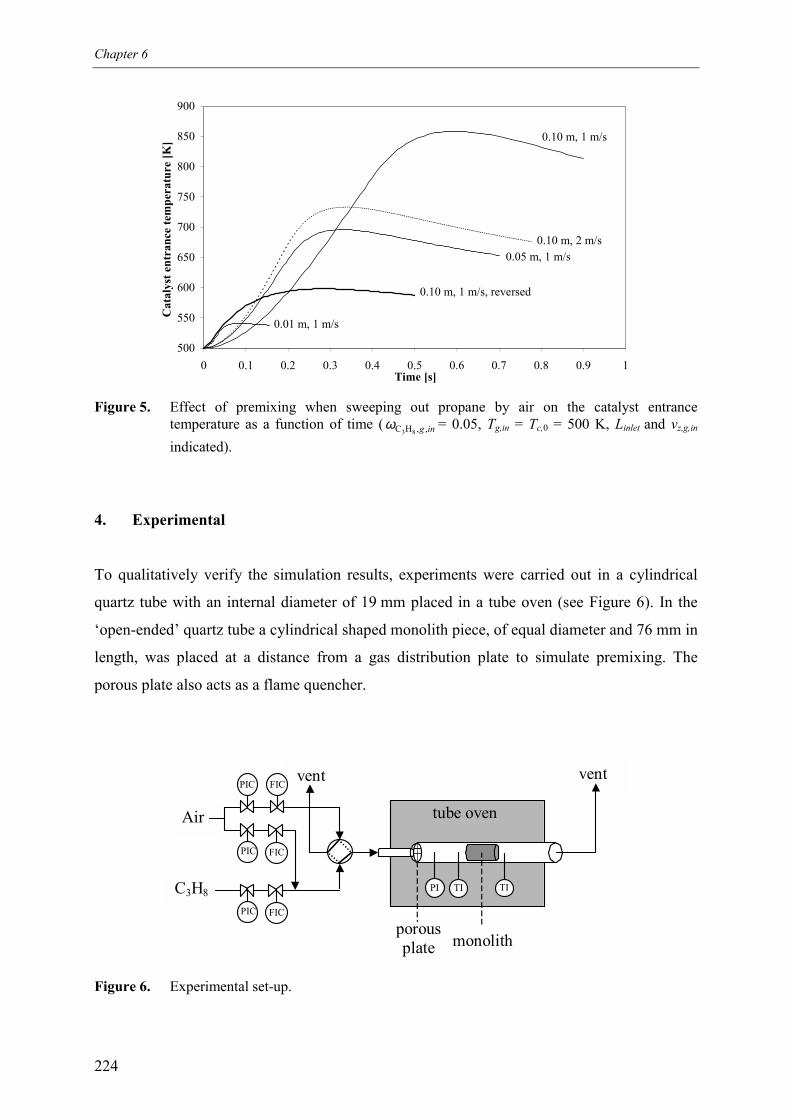
Chapter 6
224
500
550
600
650
700
750
800
850
900
0 0.1 0.2 0.3 0.4 0.5 0.6 0.7 0.8 0.9 1Time [s]
Cat
alys
t ent
ranc
e te
mpe
ratu
re [K
]
0.05 m, 1 m/s
0.10 m, 1 m/s
0.01 m, 1 m/s
0.10 m, 1 m/s, reversed
0.10 m, 2 m/s
Figure 5. Effect of premixing when sweeping out propane by air on the catalyst entrancetemperature as a function of time ( ing ,,HC 83
ω = 0.05, Tg,in = Tc,0 = 500 K, Linlet and vz,g,in
indicated).
4. Experimental
To qualitatively verify the simulation results, experiments were carried out in a cylindrical
quartz tube with an internal diameter of 19 mm placed in a tube oven (see Figure 6). In the
‘open-ended’ quartz tube a cylindrical shaped monolith piece, of equal diameter and 76 mm in
length, was placed at a distance from a gas distribution plate to simulate premixing. The
porous plate also acts as a flame quencher.
ventvent
C3H8
Air tube oven����������
porousplate
PI TI TI
PIC FIC
PIC FIC
PIC FIC
monolith
Figure 6. Experimental set-up.
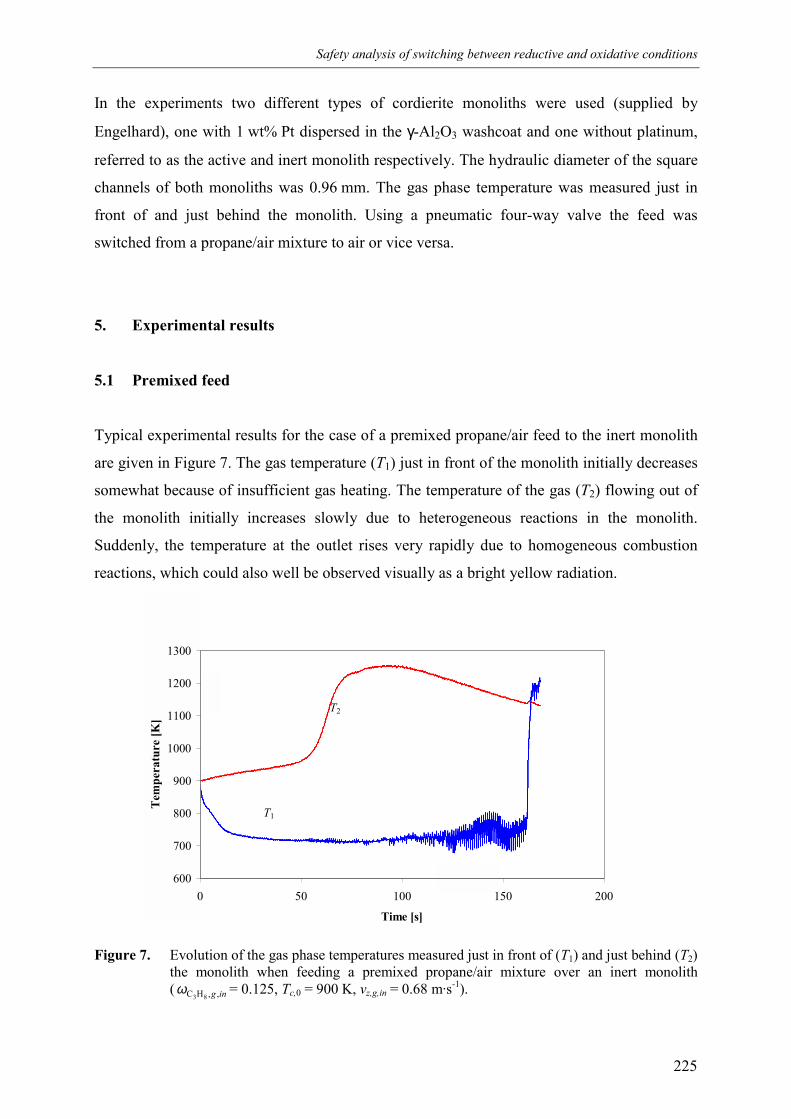
Safety analysis of switching between reductive and oxidative conditions
225
600
700
800
900
1000
1100
1200
1300
0 50 100 150 200
Time [s]
Tem
pera
ture
[K]
T1
T2
In the experiments two different types of cordierite monoliths were used (supplied by
Engelhard), one with 1 wt% Pt dispersed in the γ-Al2O3 washcoat and one without platinum,
referred to as the active and inert monolith respectively. The hydraulic diameter of the square
channels of both monoliths was 0.96 mm. The gas phase temperature was measured just in
front of and just behind the monolith. Using a pneumatic four-way valve the feed was
switched from a propane/air mixture to air or vice versa.
5. Experimental results
5.1 Premixed feed
Typical experimental results for the case of a premixed propane/air feed to the inert monolith
are given in Figure 7. The gas temperature (T1) just in front of the monolith initially decreases
somewhat because of insufficient gas heating. The temperature of the gas (T2) flowing out of
the monolith initially increases slowly due to heterogeneous reactions in the monolith.
Suddenly, the temperature at the outlet rises very rapidly due to homogeneous combustion
reactions, which could also well be observed visually as a bright yellow radiation.
Figure 7. Evolution of the gas phase temperatures measured just in front of (T1) and just behind (T2)the monolith when feeding a premixed propane/air mixture over an inert monolith( ing ,,HC 83ω = 0.125, Tc,0 = 900 K, vz,g,in = 0.68 m·s-1).
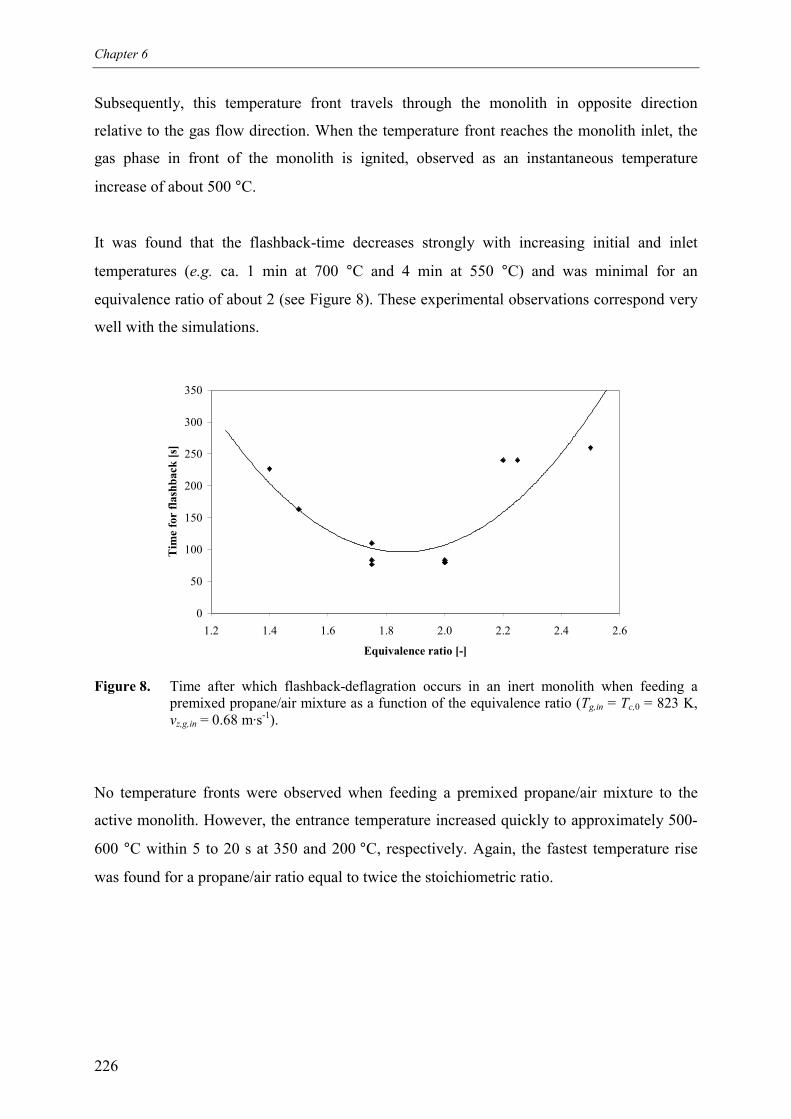
Chapter 6
226
Subsequently, this temperature front travels through the monolith in opposite direction
relative to the gas flow direction. When the temperature front reaches the monolith inlet, the
gas phase in front of the monolith is ignited, observed as an instantaneous temperature
increase of about 500 °C.
It was found that the flashback-time decreases strongly with increasing initial and inlet
temperatures (e.g. ca. 1 min at 700 °C and 4 min at 550 °C) and was minimal for an
equivalence ratio of about 2 (see Figure 8). These experimental observations correspond very
well with the simulations.
0
50
100
150
200
250
300
350
1.2 1.4 1.6 1.8 2.0 2.2 2.4 2.6
Equivalence ratio [-]
Tim
e fo
r fla
shba
ck [s
]
Figure 8. Time after which flashback-deflagration occurs in an inert monolith when feeding apremixed propane/air mixture as a function of the equivalence ratio (Tg,in = Tc,0 = 823 K,vz,g,in = 0.68 m·s-1).
No temperature fronts were observed when feeding a premixed propane/air mixture to the
active monolith. However, the entrance temperature increased quickly to approximately 500-
600 °C within 5 to 20 s at 350 and 200 °C, respectively. Again, the fastest temperature rise
was found for a propane/air ratio equal to twice the stoichiometric ratio.
Safety analysis of switching between reductive and oxidative conditions
227
5.2 Switching between pure propane and air as feed
In the experimental set-up no gas phase back-deflagrations were observed when switching
from pure propane to air as feed or vice versa, not even if the active monolith was heated up
to 1000 °C and placed almost at the end of the quartz tube. Presumably, the extent of mixing
in the ‘inlet-section’ is much less severe than the ideal mixing assumed in the simulations.
6. Conclusions
Simulations have shown that flushing with inert gasses is not necessary for monoliths with a
small channel diameter, if premixing in the gas inlet section is minimised and if the gas inlet
and outlet temperatures are relatively low. The latter condition also excludes gas phase back-
deflagrations. Due to the reverse flow concept and the high overall efficiency of the indirect
energy transfer, inlet and outlet temperatures are low. The axial temperature profile further
diminishes the temperature rise during reaction phase switching. To assure operation at low
inlet and outlet temperatures, the monolith inlet and outlet temperatures should be measured
continuously as a safety measure. The gas distribution plate acts as a flame-arresting device.
In order to use the whole monolith effectively and obtain maximum conversion, the
Damköhler numbers of the endothermic and exothermic reaction phases need to be matched.
Because the combustion reaction rate is much larger compared to the dehydrogenation
reaction rate, the gas velocity during the fuel combustion cycle is relatively high, even further
decreasing possible effects when switching from propane to air as gas feed. Temperature
effects of switching from air to propane feed are less severe because of the reaction
stoichiometry. Furthermore, switching from endothermic to exothermic reactants or vice versa
could be carried out asynchronously with switching the gas flow direction. In this switching
scheme the switching between the reaction phases is always carried out when the temperature
front has moved somewhat further into the monolith, assuring a cold monolith inlet at a
temperature equal to the gas inlet temperature (room temperature).
In a small set-up consisting of an open-ended quartz-tube containing a monolith and placed in
a tube-oven, it has been experimentally confirmed that gas phase back-deflagrations do not
occur during reaction phase switching, even with high initial uniform axial temperature
Chapter 6
228
profiles. Taking proper precautions, switching between oxidative and reductive conditions can
be carried out without intermediate flushing with inert gases. Without flushing, the heat
released by propane combustion during reaction phase switching can actually be used to
reheat the catalyst.
Acknowledgements
The theoretical and experimental work by R. K. Drijfholt is greatly appreciated. Also the
financial support by the Netherlands Organization for Scientific Research (N.W.O.) is
gratefully acknowledged.
Notation
av specific external catalyst surface area [m2·m-3]
Cp heat capacity [J·kg-1·K-1]
dh,c hydraulic channel diameter [m]
D diffusivity [m2·s-1]
D* dispersion dyadic [m2·s-1]
Dax axial dispersion coefficient [m2·s-1]
h external heat transfer coefficient [W·m-2·K-1]
h partial molar enthalpy [J·kg-1]
ks heterogeneous conversion rate constant [m·s-1]
kx external mass transfer coefficient [m·s-1]
L monolith length [m]
Linlet length of inlet section [m]
M molecular weight [kg·mole-1]
n interfacial mass flux [kg·m-2·s-1]
nc total number of components
Pe Peclet number for mass transport
rhet heterogeneous reaction rate [kg·m-2·s-1]
rhom homogeneous reaction rate [kg·m-3·s-1]
R gas constant [J·mole-1·K-1]
Safety analysis of switching between reductive and oxidative conditions
229
Rt tube radius [m]
t time [s]
T temperature [K]
U* mean global-space reactant velocity [m·s-1]
U0 centreline velocity [m·s-1]
vz,g axial interstitial gas velocity [m·s-1]
z axial position [m]
Greek letters
βn positive roots of Bessel function equation: )(J)(J 01 nnn βµββ = (n = 0, 1, 2, …)
ε gas phase porosity [m3·m-3]
λ conductivity [W·m-1·K-1]
µ dimensionless reaction rate constant
ρ density [kg·m-3]
τinlet gas residence time in inlet section [s]
ω mass fraction [kg·kg-1]
Subscripts
avg average
c catalyst phase
g gas phase
in at the inlet
i,j component i, j
0 initial
References
Bird, R.B. Stewart, W.E. and Lightfoot, E.N. (1960). Transport phenomena. John Wiley &
sons, New York, USA
Brenner, H., Edwards, D.A. (1993). Macrotransport processes, Butterworth-Heinemann,
Stoneham, USA
Chapter 6
230
Bruno, C., Walsh, P.M., Santavicca, S.A., Sinha, N., Yaw, Y. and Bracco, F.V. (1983).
Catalytic combustion of propane/air mixtures on platinum, Comb. Sci. and Techn., 31, 43-74
Centrella, J. and Wilson, J. (1984). Planar numerical cosmology. II. The difference equations
and numerical tests, Astrophysical J. Suppl. Ser., 54, 229-249
Dauber, T.E. and Danner, R.P. (1985). Data compilation tables of properties of pure
compounds, AIChE, New York, USA
Eigenberger,G. and Nieken, U. (1988). Catalytic combustion with periodic flow reversal.
Chem. Engng Sci., 43, 2109-2115
Grigull, U. and Tratz, H. (1965). Thermischer Einlauf in ausgebildeter laminarer
Rohrströmung, Int. J. Heat and Mass Transfer, 8, 669-678
Groppi, G. and Tronconi, E. (1997). Theoretical analysis of mass and heat transfer in
monolith catalysts with triangular channels, Chem. Engng Sci., 52, 3521-3526
Kroshwitz, J.I. and Howe-Grant, M. (1993). Kirk-Othmer, Encyclopedia of chemical
technology, 4th ed., Vol. 6, John Wiley & sons, New York, USA, 1056
Lewis, B. and von Elbe, G. (1961). Combustion, flames and explosions of gases, Academic
Press, New York, USA
Minkoff, G.J. and Tipper, C.F.H. (1962). Chemistry of combustion reactions. Bulletworth &
Co. Ltd., Belfast, Northern Ireland
Reid, R.C., Prausnitz, J.M. and Poling, B.E. (1988). The properties of gases and liquids.
McGraw-Hill, New York, USA
Sankasubramanian, R. and Gill, W.N. (1973). Unsteady convective diffusion with interphase
mass transfer. Proc. R. Soc. Lond., A333, 115-132
Safety analysis of switching between reductive and oxidative conditions
231
Shapiro, M. and Brenner, H. (1986). Taylor dispersion of chemically reactive species:
Irreversible first-order reactions in bulk and on boundaries, Chem. Engng Sci., 41, 1417-1433
Turns, S.R. (1996). An introduction to combustion: concepts and applications, McGraw-Hill,
New York, USA
Westbrook, C.K. and Dryer, F.L. (1981). Simplified reaction mechanisms for the oxidation of
hydrocarbon fuels in flames. Comb. Sci. Techn., 27, 31-43
Zabetakis, M.K. (1965). Flammability characteristics of combustible gases and vapours, PhD.
Thesis, Dept. of the Interior, Bureau of mines, Washington, USA
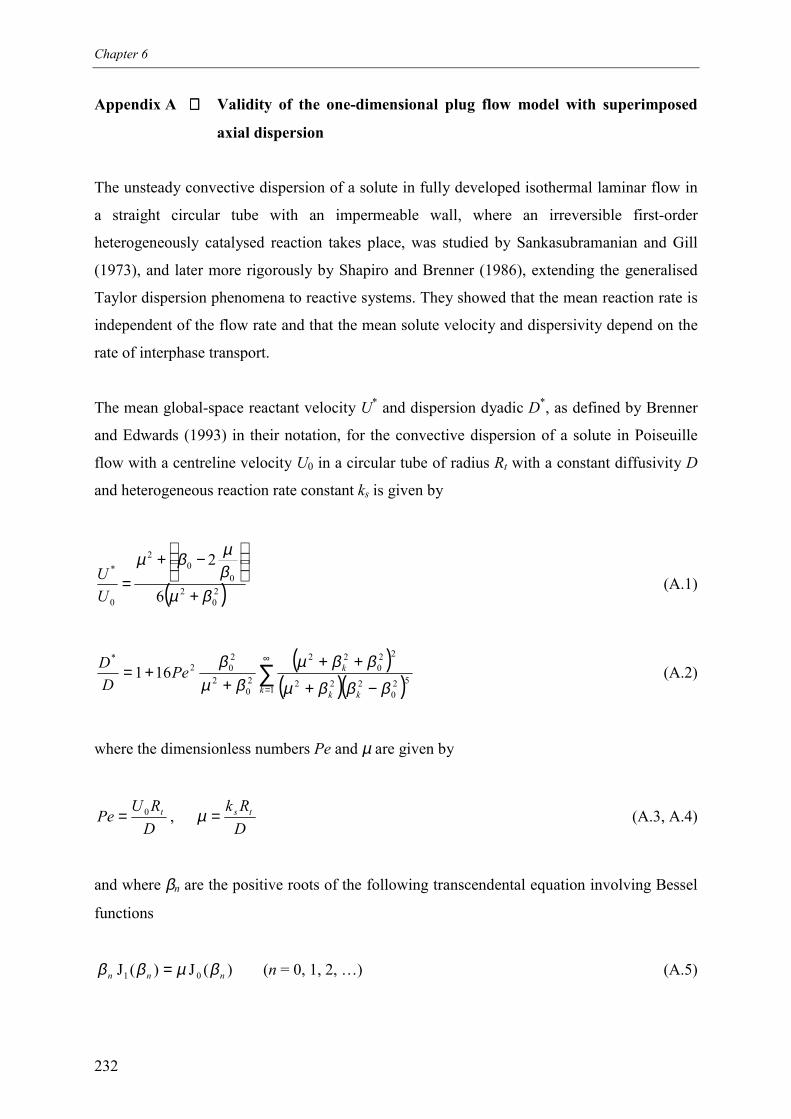
Chapter 6
232
Appendix A Validity of the one-dimensional plug flow model with superimposed
axial dispersion
The unsteady convective dispersion of a solute in fully developed isothermal laminar flow in
a straight circular tube with an impermeable wall, where an irreversible first-order
heterogeneously catalysed reaction takes place, was studied by Sankasubramanian and Gill
(1973), and later more rigorously by Shapiro and Brenner (1986), extending the generalised
Taylor dispersion phenomena to reactive systems. They showed that the mean reaction rate is
independent of the flow rate and that the mean solute velocity and dispersivity depend on the
rate of interphase transport.
The mean global-space reactant velocity U* and dispersion dyadic D*, as defined by Brenner
and Edwards (1993) in their notation, for the convective dispersion of a solute in Poiseuille
flow with a centreline velocity U0 in a circular tube of radius Rt with a constant diffusivity D
and heterogeneous reaction rate constant ks is given by
( )20
20
02
0
*
6
2
βµβµβµ
+
−+
=UU (A.1)
( )( )( )∑
∞
= −+
+++
+=1
520
222
220
22
20
2
202
*
161k kk
kPeDD
βββµ
ββµβµ
β(A.2)
where the dimensionless numbers Pe and µ are given by
DRUPe t0= ,
DRk ts=µ (A.3, A.4)
and where βn are the positive roots of the following transcendental equation involving Bessel
functions
)(J)(J 01 nnn βµββ = (n = 0, 1, 2, …) (A.5)
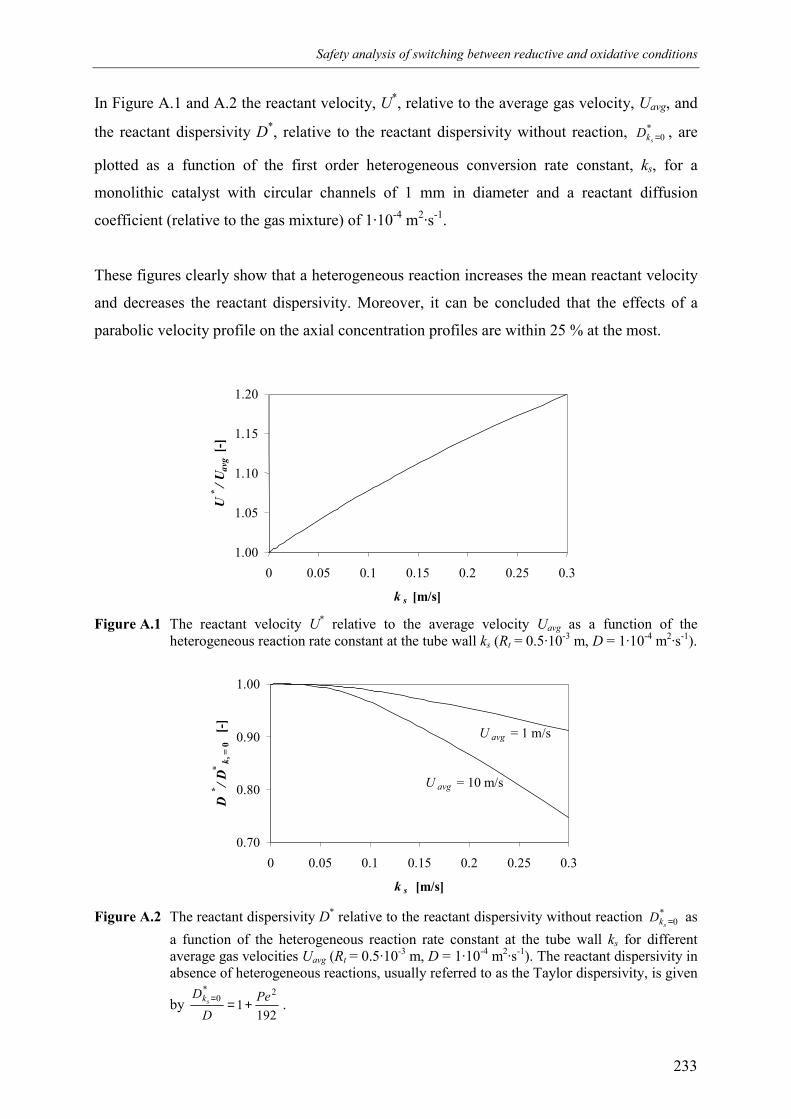
Safety analysis of switching between reductive and oxidative conditions
233
In Figure A.1 and A.2 the reactant velocity, U*, relative to the average gas velocity, Uavg, and
the reactant dispersivity D*, relative to the reactant dispersivity without reaction, *0=skD , are
plotted as a function of the first order heterogeneous conversion rate constant, ks, for a
monolithic catalyst with circular channels of 1 mm in diameter and a reactant diffusion
coefficient (relative to the gas mixture) of 1·10-4 m2·s-1.
These figures clearly show that a heterogeneous reaction increases the mean reactant velocity
and decreases the reactant dispersivity. Moreover, it can be concluded that the effects of a
parabolic velocity profile on the axial concentration profiles are within 25 % at the most.
Figure A.1 The reactant velocity U* relative to the average velocity Uavg as a function of theheterogeneous reaction rate constant at the tube wall ks (Rt = 0.5·10-3 m, D = 1·10-4 m2·s-1).
Figure A.2 The reactant dispersivity D* relative to the reactant dispersivity without reaction *0=skD as
a function of the heterogeneous reaction rate constant at the tube wall ks for differentaverage gas velocities Uavg (Rt = 0.5·10-3 m, D = 1·10-4 m2·s-1). The reactant dispersivity inabsence of heterogeneous reactions, usually referred to as the Taylor dispersivity, is given
by 192
12*
0 PeD
Dsk +== .
1.00
1.05
1.10
1.15
1.20
0 0.05 0.1 0.15 0.2 0.25 0.3
k s [m/s]
U*
/ Uav
g [-
]
0.70
0.80
0.90
1.00
0 0.05 0.1 0.15 0.2 0.25 0.3
k s [m/s]
D
*
/ D*
k s =
0[-
]
U avg = 10 m/s
U avg = 1 m/s

234
235
CHAPTER 7
REACTION COUPLING
REVERSE FLOW REACTOR –
AN EXPERIMENTAL STUDY
Chapter 7
236
Abstract
In a small laboratory scale reactor the concept of the Reaction Coupling Reverse Flow
Reactor has been investigated experimentally for the propane dehydrogenation coupled with
methane combustion over a monolithic catalyst in reverse flow aiming for a proof of
principle.
Despite the inherently and inevitably large influences of radial heat losses on the axial
temperature profiles in a laboratory scale reactor, as shown with some experiments with
propane and methane combustion in reverse flow without propane dehydrogenation cycles,
introductory experiments have shown that indeed endothermic and exothermic reactions can
be integrated inside the reactor together with recuperative heat exchange. The cyclic steady
state was easily obtained without any problems associated with process control. Furthermore,
intermediate flushing with nitrogen between the propane dehydrogenation and methane
combustion cycles could be safely omitted. However, the oxygen concentration during the
methane combustion cycles needed to be reduced in order to avoid too high temperatures due
to local combustion of carbonaceous products in the washcoat deposited during the preceding
propane dehydrogenation cycle.
Propane dehydrogenation experiments in a reactor filled entirely with active catalyst
demonstrated the seriousness of ‘back-conversion’, a term used to indicate the loss of
propane conversion due to propylene hydrogenation because of the low exit temperatures.
Experiments performed in a reactor with inactive sections flanking the active catalyst section
at both ends showed that the back-conversion could be effectively counteracted.
RCRFR - An experimental study
237
1. Introduction
For highly endothermic reactions at high temperatures with rapid but reversible catalyst
deactivation a new multifunctional reactor is developed aiming for high energy-efficiency by
integration of in situ energy supply, catalyst regeneration and recuperative heat exchange
inside the reactor. The reactor concept effectuates an indirect coupling between energy
necessary for the endothermic reactions and energy released by exothermic reactions using
the catalyst material as an intermediary energy store. During the endothermic reaction cycle
energy is withdrawn from the catalyst cooling down the catalyst, while simultaneously the
catalyst is deactivated. During a consecutive exothermic reaction cycle the catalyst is reheated
and concurrently regenerated. Furthermore, the direction of the gas flow through the fixed
catalyst bed is periodically reversed while the reactants are fed without any preheating, which
allows integration of recuperative heat exchange inside the reactor.
Application of this new reactor, called the ‘Reaction Coupling Reverse Flow Reactor’
(RCRFR), is especially interesting for the non-oxidative propane dehydrogenation indirectly
coupled with fuel combustion over a platinum based monolithic catalyst. Due to the inherent
fast switching between endothermic and exothermic reaction phases because of energy
constraints, fast catalyst regeneration is assured, which allows operation at more severe
operating conditions, viz. higher temperatures and lower hydrogen concentrations, with higher
equilibrium conversions and olefin selectivities.
The reactor behaviour and energy constraints for the RCRFR coupling the propane
dehydrogenation and fuel combustion have been studied in detail in Chapters 2 and 3 using
numerical simulations. In this chapter the feasibility of the reactor concept is tested
experimentally. The main purpose of this experimental work is to present a proof of principle,
i.e. to show with experiments that endothermic and exothermic reactions can be integrated
inside the reactor with recuperative heat exchange. Secondly, with a preparatory experimental
study some features of the reactor behaviour can be investigated experimentally and possible
technical problems inherent to the reactor concept can be identified. Especially the following
questions are important in this respect:
1. Are dangerous gas phase back-deflagrations indeed excluded by the use of the reverse flow
concept in a monolith, as studied in Chapter 6, so that intermediate flushing with nitrogen
between the propane dehydrogenation and fuel combustion reaction cycles can be omitted?
Chapter 7
238
2. Can the cyclic steady state be obtained easily, or are there any difficulties associated with
process control?
3. Is back-conversion (hydrogenation of propylene) at the end of the reactor due to the low
exit-temperatures resulting from the reverse flow concept a serious problem? Can inactive
sections or less active sections reduce this back-conversion, as studied in Chapter 3?
4. What are the effects of coke formation during the endothermic propane dehydrogenation
cycle and coke combustion during the exothermic fuel combustion cycle? Are the
carbonaceous products deposited uniformly along the axial coordinate? Can all the coke be
combusted during the exothermic regeneration cycle? What are the temperature effects?
Because large scale industrial reverse flow reactors operate almost adiabatically, it would be
ideal to closely approach adiabatic operating conditions also in our laboratory scale reactor.
From experimental work on reverse flow reactors it is well known that even very small heat
losses can influence the axial temperature profiles enormously. In most experimental studies
insulation has been applied to suppress radial heat losses, sometimes with additional electrical
compensatory heating (see Van de Beld, 1995). However, the insulation material acts as an
additional heat buffer and also the compensatory heating influences the process dynamics. A
better way of minimising radial heat losses and influences of the surroundings is the use of an
evacuated jacked, as applied by Neophytides and Froment (1992) and Van de Beld (1995) and
Van de Beld and Westerterp (1996). However, at higher temperatures the contribution of heat
losses due to radiation might be considerable, even when radiation shields are used. The best
way of approaching adiabatic operating conditions is by increasing the reactor diameter, as
also recognised by Blanks et al. (1990).
In the RCRFR the Damköhler numbers of the endothermic and exothermic reaction cycles
need to be matched in order to use the entire catalyst bed efficiently (see Chapter 2). For the
propane dehydrogenation – fuel combustion reaction system this results in high gas velocities
during the combustion reaction cycle compared to the gas velocity during the
dehydrogenation cycle. Moreover, in order to minimise the influences of radial heat losses the
throughput during the endothermic dehydrogenation phase should be chosen as high as
possible, resulting in very high throughputs during the combustion reaction phase. Increasing
the reactor diameter to suppress radial heat losses increases the throughput quadratically.
Construction of a pilot scale RCRFR would, however, largely exceed the limited financial
means of this project. For a laboratory scale RCRFR with a maximum air flow rate a
compromise between the desired gas velocity during the endothermic reaction cycle and the
RCRFR - An experimental study
239
desired reactor diameter need to be effected and relatively large influences of radial heat
losses need to be accepted unfortunately. Nevertheless, a proof of principle and some
important introductory experimental investigations can be conducted in a laboratory scale
RCRFR. No optimisation of the reactor set-up, catalyst properties (e.g. platinum loading),
operating conditions, reactant conversions and product selectivities and overall reaction
coupling energy efficiencies are considered in this work.
Firstly, the experimental set-up and the reverse flow reactor are described. Then, some
experimental results of only methane or propane combustion performed in reverse flow mode
without dehydrogenation cycles are presented and discussed in order to investigate whether
reported influences of operating conditions can be actually observed in the laboratory scale
RCRFR in a qualitative sense. Finally, propane dehydrogenation experiments coupled with
methane combustion are discussed.
2. Experimental
2.1 Experimental set-up
In Figure 1 a schematic drawing of the fully automated experimental set-up is given. With
Brooks’ mass flow controllers the composition of the reaction mixtures consisting of propane,
hydrogen and nitrogen for the endothermic reaction cycle on the one hand and propane,
methane, oxygen and nitrogen for the exothermic reaction cycle on the other hand can be set.
With an electrical valve (EV1002) one of these reaction mixtures is fed to the reactor, while
the other mixture is vented (optionally the mass flow controller set-points for the gasses that
are vented can be set to zero). The direction of the gas flow through the reactor, placed in
horizontal position, can be reversed by switching two three-way valves (EV1003), with the
same pneumatic actuator to assure that the valves are switched simultaneously. Because of
large differences in the flow rates between the endothermic and exothermic reaction cycles
the reactor pressure is controlled by a back-pressure controller for small flows during the
dehydrogenation cycles (PC1003) and by one for large flows during the combustion cycles
(PC1004) via switching of an electrical valve (EV1005). The pressure at the reactor inlet
(PI1001) and outlet (PI1002) were measured with electronic transducers. For safety reasons a
pressure relieve valve was installed (with a maximum overpressure of 2 bar). Before an
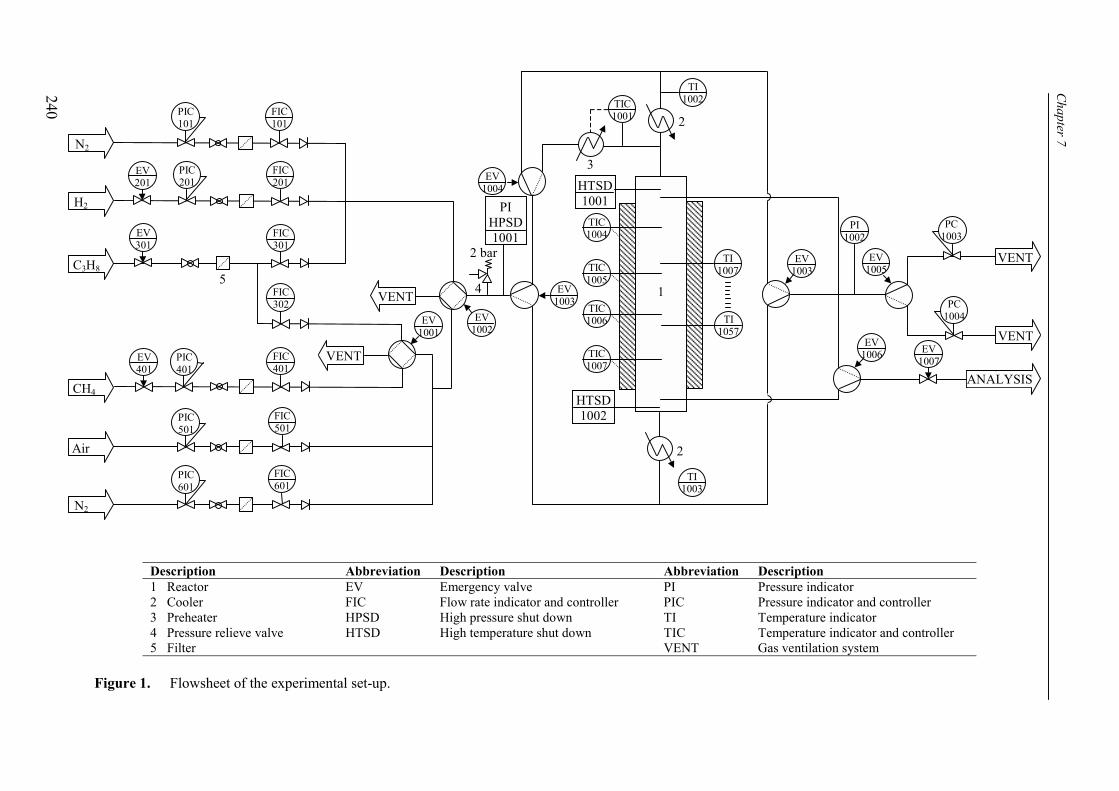
Description Abbreviation Description Abbreviation Description1 Reactor EV Emergency valve PI Pressure indicator2 Cooler FIC Flow rate indicator and controller PIC Pressure indicator and controller3 Preheater HPSD High pressure shut down TI Temperature indicator4 Pressure relieve valve HTSD High temperature shut down TIC Temperature indicator and controller5 Filter VENT Gas ventilation system
Figure 1. Flowsheet of the experimental set-up.
FIC201
PIC101
PIC201
FIC101
FIC301
FIC302
FIC401
FIC501
VENT
PI1002
VENT
EV1006
ANALYSIS
2 bar
EV1003
EV1004
EV1003
EV1002
TIC1004
EV1001
PIHPSD1001
HTSD1001
HTSD1002
TIC1001
TIC1005
TIC1007
TI1002
TI1003
EV401
PIC501
VENT
EV1005
TI1007
TI1057
PC1004
VENT
EV301
EV201
PIC401
PC1003
EV1007
TIC1006
N2
H2
C3H8
CH4
Air
1
2
2
3
45
FIC601
PIC601
N2
Chapter 7
240
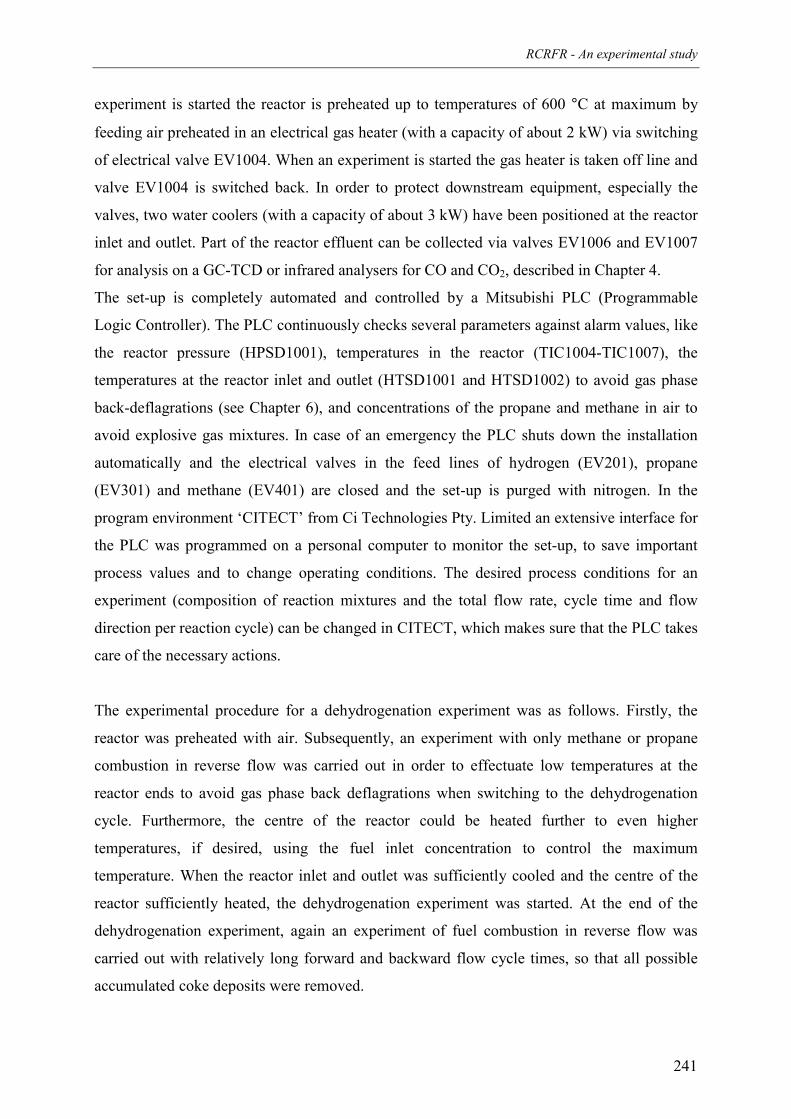
RCRFR - An experimental study
241
experiment is started the reactor is preheated up to temperatures of 600 °C at maximum by
feeding air preheated in an electrical gas heater (with a capacity of about 2 kW) via switching
of electrical valve EV1004. When an experiment is started the gas heater is taken off line and
valve EV1004 is switched back. In order to protect downstream equipment, especially the
valves, two water coolers (with a capacity of about 3 kW) have been positioned at the reactor
inlet and outlet. Part of the reactor effluent can be collected via valves EV1006 and EV1007
for analysis on a GC-TCD or infrared analysers for CO and CO2, described in Chapter 4.
The set-up is completely automated and controlled by a Mitsubishi PLC (Programmable
Logic Controller). The PLC continuously checks several parameters against alarm values, like
the reactor pressure (HPSD1001), temperatures in the reactor (TIC1004-TIC1007), the
temperatures at the reactor inlet and outlet (HTSD1001 and HTSD1002) to avoid gas phase
back-deflagrations (see Chapter 6), and concentrations of the propane and methane in air to
avoid explosive gas mixtures. In case of an emergency the PLC shuts down the installation
automatically and the electrical valves in the feed lines of hydrogen (EV201), propane
(EV301) and methane (EV401) are closed and the set-up is purged with nitrogen. In the
program environment ‘CITECT’ from Ci Technologies Pty. Limited an extensive interface for
the PLC was programmed on a personal computer to monitor the set-up, to save important
process values and to change operating conditions. The desired process conditions for an
experiment (composition of reaction mixtures and the total flow rate, cycle time and flow
direction per reaction cycle) can be changed in CITECT, which makes sure that the PLC takes
care of the necessary actions.
The experimental procedure for a dehydrogenation experiment was as follows. Firstly, the
reactor was preheated with air. Subsequently, an experiment with only methane or propane
combustion in reverse flow was carried out in order to effectuate low temperatures at the
reactor ends to avoid gas phase back deflagrations when switching to the dehydrogenation
cycle. Furthermore, the centre of the reactor could be heated further to even higher
temperatures, if desired, using the fuel inlet concentration to control the maximum
temperature. When the reactor inlet and outlet was sufficiently cooled and the centre of the
reactor sufficiently heated, the dehydrogenation experiment was started. At the end of the
dehydrogenation experiment, again an experiment of fuel combustion in reverse flow was
carried out with relatively long forward and backward flow cycle times, so that all possible
accumulated coke deposits were removed.
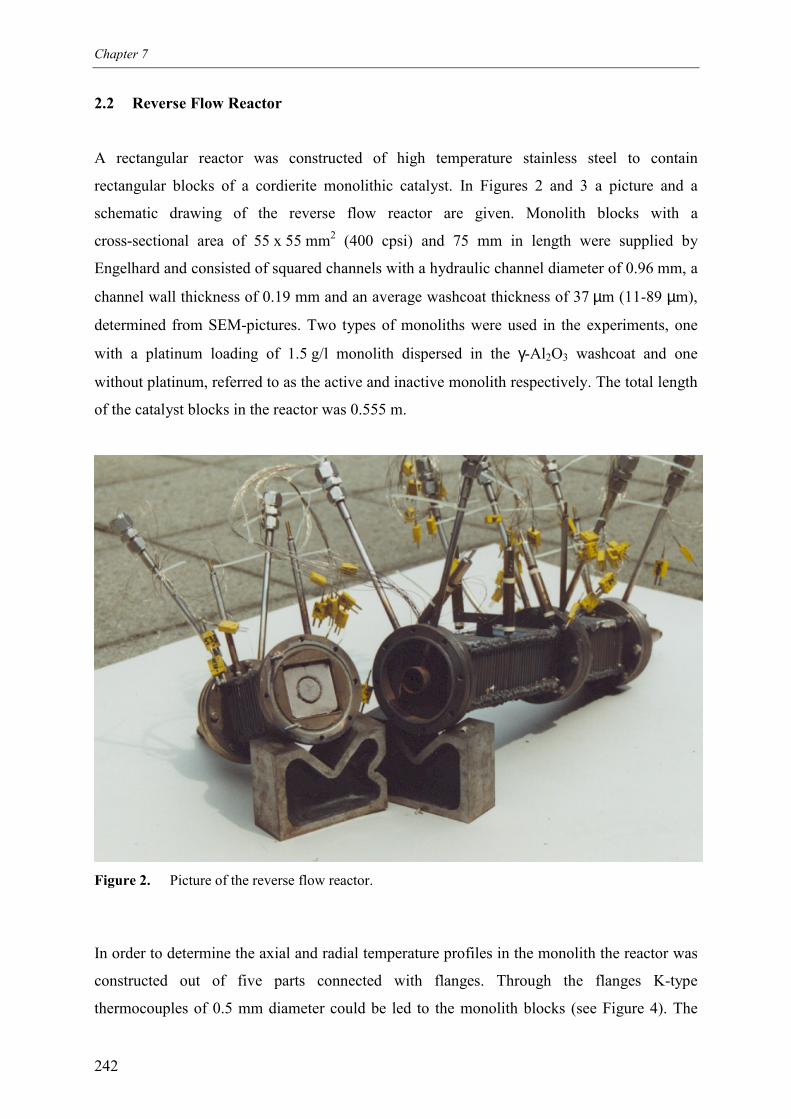
Chapter 7
242
2.2 Reverse Flow Reactor
A rectangular reactor was constructed of high temperature stainless steel to contain
rectangular blocks of a cordierite monolithic catalyst. In Figures 2 and 3 a picture and a
schematic drawing of the reverse flow reactor are given. Monolith blocks with a
cross-sectional area of 55 x 55 mm2 (400 cpsi) and 75 mm in length were supplied by
Engelhard and consisted of squared channels with a hydraulic channel diameter of 0.96 mm, a
channel wall thickness of 0.19 mm and an average washcoat thickness of 37 µm (11-89 µm),
determined from SEM-pictures. Two types of monoliths were used in the experiments, one
with a platinum loading of 1.5 g/l monolith dispersed in the γ-Al2O3 washcoat and one
without platinum, referred to as the active and inactive monolith respectively. The total length
of the catalyst blocks in the reactor was 0.555 m.
Figure 2. Picture of the reverse flow reactor.
In order to determine the axial and radial temperature profiles in the monolith the reactor was
constructed out of five parts connected with flanges. Through the flanges K-type
thermocouples of 0.5 mm diameter could be led to the monolith blocks (see Figure 4). The
RCRFR - An experimental study
243
thermocouples were positioned at the desired position either parallel to the channels or
perpendicular to the channels through small holes drilled in the monolith at different
positions. About 45 thermocouples were used to determine the axial temperature profile in the
innermost channels and 8 thermocouples were used to determine the ‘radial’ (i.e.
perpendicular to the average gas flow direction) temperature profile at a fixed axial position
(after 0.37 m catalyst length). Ten additional thermocouples were used for control and safety
purposes. All temperature data was collected at least twice every second by a program
developed in Borland Delphi, running on a separate personal computer with five Advantech
data-acquisition cards. Through a link between the data-acquisition cards and the PLC the
time on stream during an experiment was synchronised.
Figure 3. Schematic drawing of the reverse flow reactor.
Due to the absence of radial mixing of the gas in a monolith the influence of the surroundings
are largest on the outermost channels, protecting the innermost channels from radial heat
losses to some extent. With small rings in the flanges it was assured that also between
different catalyst blocks gas flowing through the innermost channels was not mixed with gas
flowing through the outermost channels. It was experimentally verified that the radial
temperature profile for the innermost channels is practically uniform (see Appendix A). The
axial temperature profiles were detected in the innermost channels.
At the base of the conical reactor ends, both periodically acting as inlet and outlet, a metal
porous plate was installed to distribute the gas flow evenly over the channels. Part of the gas
effluent from the innermost channels could be collected for analysis via a small conduit.
5
Flanges
Analysis
1 2 3 4
Analysis
∆V ∆V ∆V ∆V
Thermocouple inlet
In/Outlet
Gas distributorGasdistributor
In/Outlet61
mm120 mm
120 mm 12 mm
140 mm
0.88 m
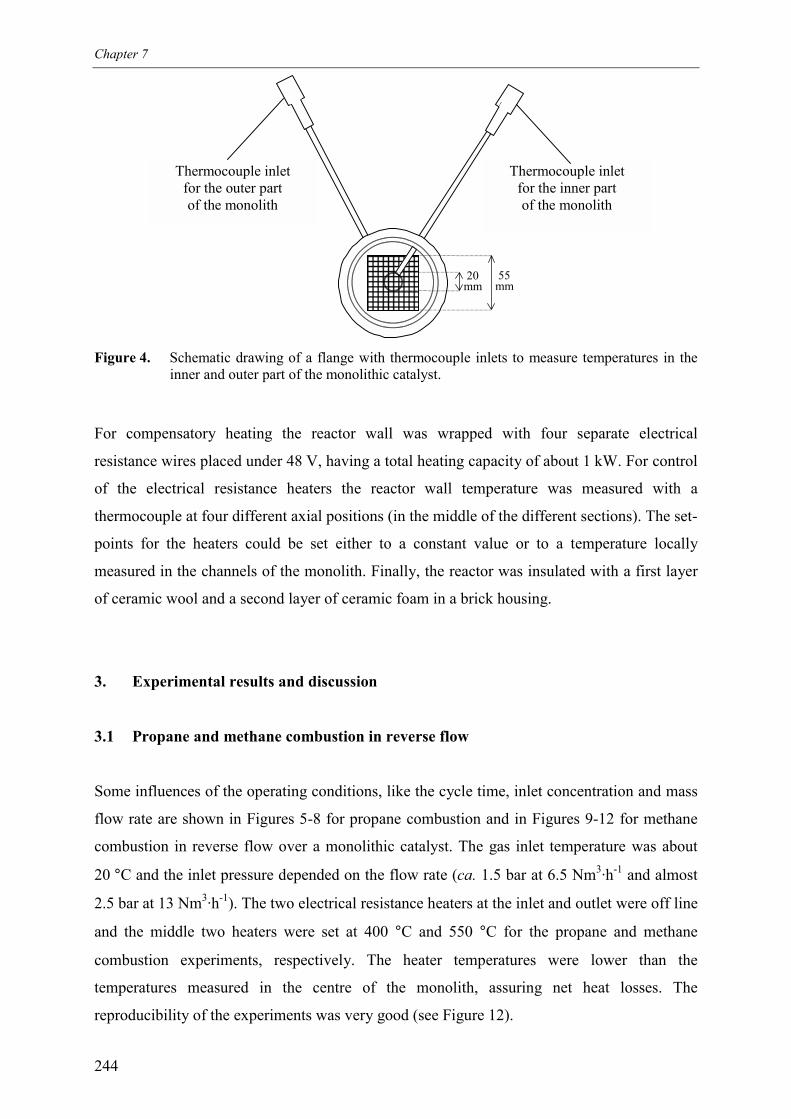
Chapter 7
244
Figure 4. Schematic drawing of a flange with thermocouple inlets to measure temperatures in theinner and outer part of the monolithic catalyst.
For compensatory heating the reactor wall was wrapped with four separate electrical
resistance wires placed under 48 V, having a total heating capacity of about 1 kW. For control
of the electrical resistance heaters the reactor wall temperature was measured with a
thermocouple at four different axial positions (in the middle of the different sections). The set-
points for the heaters could be set either to a constant value or to a temperature locally
measured in the channels of the monolith. Finally, the reactor was insulated with a first layer
of ceramic wool and a second layer of ceramic foam in a brick housing.
3. Experimental results and discussion
3.1 Propane and methane combustion in reverse flow
Some influences of the operating conditions, like the cycle time, inlet concentration and mass
flow rate are shown in Figures 5-8 for propane combustion and in Figures 9-12 for methane
combustion in reverse flow over a monolithic catalyst. The gas inlet temperature was about
20 °C and the inlet pressure depended on the flow rate (ca. 1.5 bar at 6.5 Nm3·h-1 and almost
2.5 bar at 13 Nm3·h-1). The two electrical resistance heaters at the inlet and outlet were off line
and the middle two heaters were set at 400 °C and 550 °C for the propane and methane
combustion experiments, respectively. The heater temperatures were lower than the
temperatures measured in the centre of the monolith, assuring net heat losses. The
reproducibility of the experiments was very good (see Figure 12).
Thermocouple inletfor the inner partof the monolith
Thermocouple inletfor the outer partof the monolith
20mm
55mm
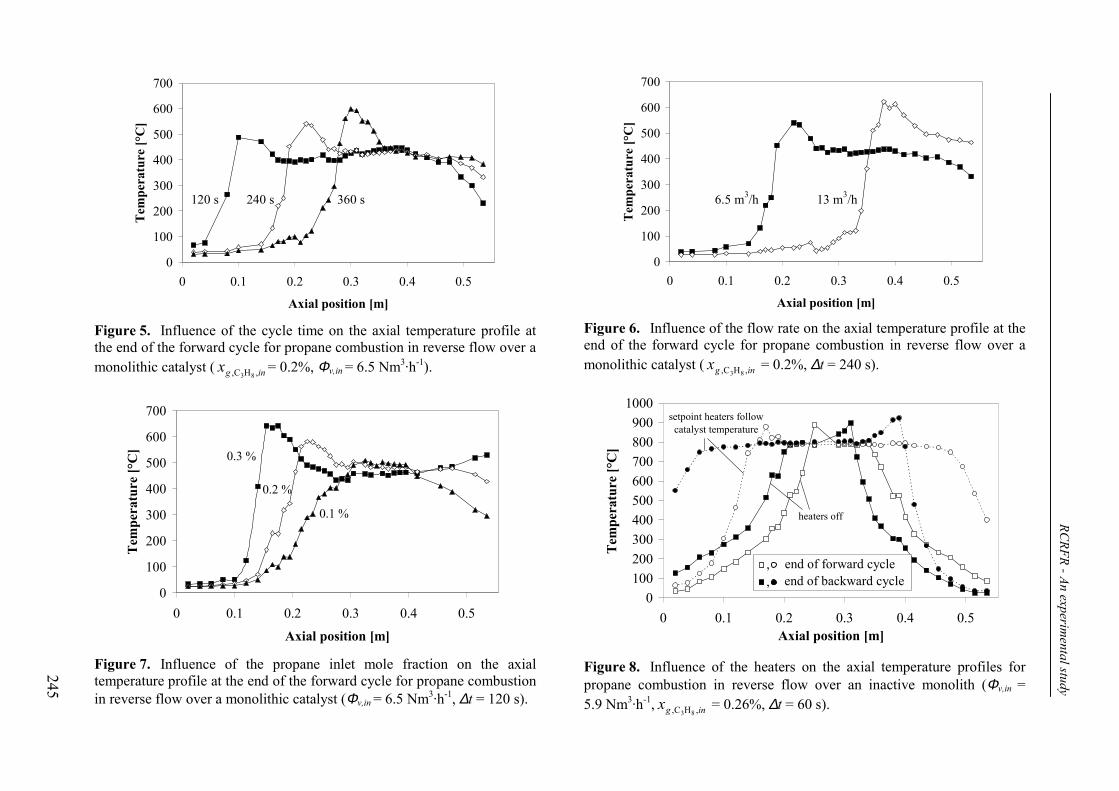
0
100
200
300
400
500
600
700
0 0.1 0.2 0.3 0.4 0.5
Axial position [m]
Tem
pera
ture
[°C
]
240 s120 s 360 s
Figure 5. Influence of the cycle time on the axial temperature profile atthe end of the forward cycle for propane combustion in reverse flow over amonolithic catalyst ( ingx ,HC, 83
= 0.2%, Φv,in = 6.5 Nm3·h-1).
0
100
200
300
400
500
600
700
0 0.1 0.2 0.3 0.4 0.5
Axial position [m]
Tem
pera
ture
[°C
] 0.3 %
0.2 %
0.1 %
Figure 7. Influence of the propane inlet mole fraction on the axialtemperature profile at the end of the forward cycle for propane combustionin reverse flow over a monolithic catalyst (Φv,in = 6.5 Nm3·h-1, ∆t = 120 s).
0
100
200
300
400
500
600
700
0 0.1 0.2 0.3 0.4 0.5
Axial position [m]
Tem
pera
ture
[°C
]
6.5 m3/h 13 m3/h
Figure 6. Influence of the flow rate on the axial temperature profile at theend of the forward cycle for propane combustion in reverse flow over amonolithic catalyst ( ingx ,HC, 83
= 0.2%, ∆t = 240 s).
0100200300400500600700800900
1000
0 0.1 0.2 0.3 0.4 0.5Axial position [m]
Tem
pera
ture
[°C
]
setpoint heaters follow catalyst temperature
heaters off
Figure 8. Influence of the heaters on the axial temperature profiles forpropane combustion in reverse flow over an inactive monolith (Φv,in =5.9 Nm3·h-1, ingx ,HC, 83
= 0.26%, ∆t = 60 s).
end of forward cycleend of backward cycle
,,
RCRFR - An experimental study
245

0
100
200
300
400
500
600
700
800
0 0.1 0.2 0.3 0.4 0.5Axial position [m]
Tem
pera
ture
[°C
]
60 s 30 s
90 s
Figure 9. Influence of the cycle time on the axial temperature profiles formethane combustion in reverse flow over a monolithic catalyst ( ingx ,CH, 4
=0.5%, Φv,in = 6.5 Nm3·h-1).
0
100
200
300
400
500
600
700
800
0 0.1 0.2 0.3 0.4 0.5Axial position [m]
Tem
pera
ture
[°C
]
0.5 %
0.7 %
0.4 %
0.6 %
0.3 %
Figure 11. Influence of the methane inlet mole fraction on the axialtemperature profile at the end of the forward cycle for methane combustionin reverse flow over a monolithic catalyst (Φv,in = 6.5 Nm3·h-1, ∆t = 30 s).
0
100
200
300
400
500
600
700
800
0 0.1 0.2 0.3 0.4 0.5Axial position [m]
Tem
pera
ture
[°C
]
13 m3/h
6.5 m3/h
3.25 m3/h
10 m3/h
Figure 10. Influence of the flow rate on the axial temperature profile atthe end of the forward cycle for methane combustion in reverse flow over amonolithic catalyst ( ingx ,CH, 4
= 0.5%, ∆t = 30 s).
0
100
200
300
400
500
600
700
800
0 0.1 0.2 0.3 0.4 0.5Axial position [m]
Tem
pera
ture
[°C
]
Figure 12. Reproducibility test: axial temperature profiles for methanecombustion in reverse flow over a monolithic catalyst ( ingx ,CH, 4
= 0.5%,Φv,in = 6.5 Nm3·h-1, ∆t = 30 s).
end of forward cycleend of backward cycle
Chapter 7
246
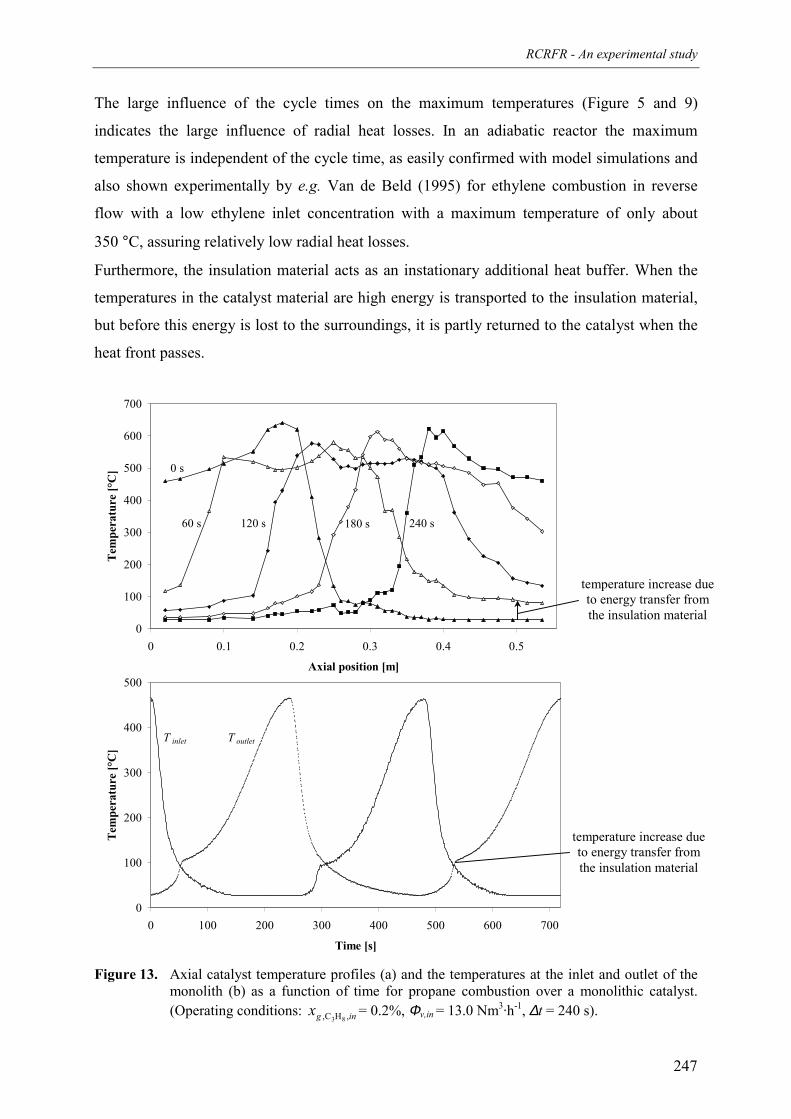
RCRFR - An experimental study
247
The large influence of the cycle times on the maximum temperatures (Figure 5 and 9)
indicates the large influence of radial heat losses. In an adiabatic reactor the maximum
temperature is independent of the cycle time, as easily confirmed with model simulations and
also shown experimentally by e.g. Van de Beld (1995) for ethylene combustion in reverse
flow with a low ethylene inlet concentration with a maximum temperature of only about
350 °C, assuring relatively low radial heat losses.
Furthermore, the insulation material acts as an instationary additional heat buffer. When the
temperatures in the catalyst material are high energy is transported to the insulation material,
but before this energy is lost to the surroundings, it is partly returned to the catalyst when the
heat front passes.
0
100
200
300
400
500
600
700
0 0.1 0.2 0.3 0.4 0.5
Axial position [m]
Tem
pera
ture
[°C
] 0 s
60 s 120 s 180 s 240 s
0
100
200
300
400
500
0 100 200 300 400 500 600 700
Time [s]
Tem
pera
ture
[°C
]
T inlet T outlet
Figure 13. Axial catalyst temperature profiles (a) and the temperatures at the inlet and outlet of themonolith (b) as a function of time for propane combustion over a monolithic catalyst.(Operating conditions: ingx ,HC, 83
= 0.2%, Φv,in = 13.0 Nm3·h-1, ∆t = 240 s).
temperature increase dueto energy transfer fromthe insulation material
temperature increase dueto energy transfer fromthe insulation material
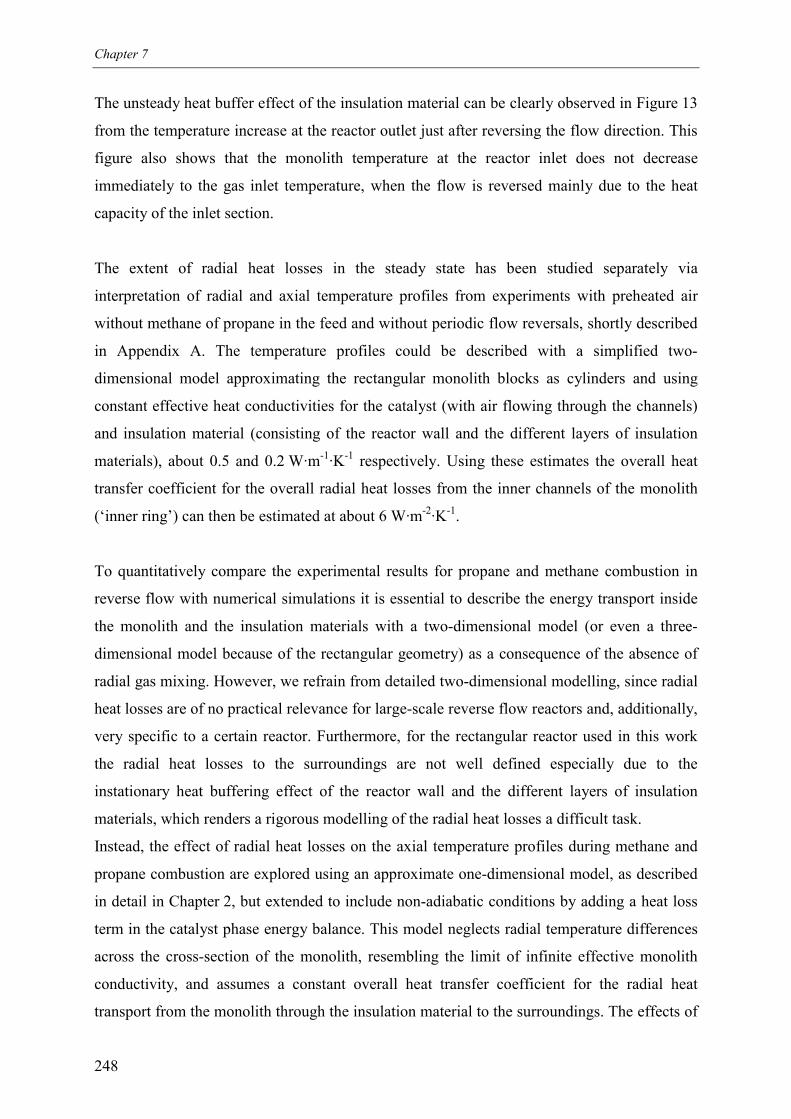
Chapter 7
248
The unsteady heat buffer effect of the insulation material can be clearly observed in Figure 13
from the temperature increase at the reactor outlet just after reversing the flow direction. This
figure also shows that the monolith temperature at the reactor inlet does not decrease
immediately to the gas inlet temperature, when the flow is reversed mainly due to the heat
capacity of the inlet section.
The extent of radial heat losses in the steady state has been studied separately via
interpretation of radial and axial temperature profiles from experiments with preheated air
without methane of propane in the feed and without periodic flow reversals, shortly described
in Appendix A. The temperature profiles could be described with a simplified two-
dimensional model approximating the rectangular monolith blocks as cylinders and using
constant effective heat conductivities for the catalyst (with air flowing through the channels)
and insulation material (consisting of the reactor wall and the different layers of insulation
materials), about 0.5 and 0.2 W·m-1·K-1 respectively. Using these estimates the overall heat
transfer coefficient for the overall radial heat losses from the inner channels of the monolith
(‘inner ring’) can then be estimated at about 6 W·m-2·K-1.
To quantitatively compare the experimental results for propane and methane combustion in
reverse flow with numerical simulations it is essential to describe the energy transport inside
the monolith and the insulation materials with a two-dimensional model (or even a three-
dimensional model because of the rectangular geometry) as a consequence of the absence of
radial gas mixing. However, we refrain from detailed two-dimensional modelling, since radial
heat losses are of no practical relevance for large-scale reverse flow reactors and, additionally,
very specific to a certain reactor. Furthermore, for the rectangular reactor used in this work
the radial heat losses to the surroundings are not well defined especially due to the
instationary heat buffering effect of the reactor wall and the different layers of insulation
materials, which renders a rigorous modelling of the radial heat losses a difficult task.
Instead, the effect of radial heat losses on the axial temperature profiles during methane and
propane combustion are explored using an approximate one-dimensional model, as described
in detail in Chapter 2, but extended to include non-adiabatic conditions by adding a heat loss
term in the catalyst phase energy balance. This model neglects radial temperature differences
across the cross-section of the monolith, resembling the limit of infinite effective monolith
conductivity, and assumes a constant overall heat transfer coefficient for the radial heat
transport from the monolith through the insulation material to the surroundings. The effects of
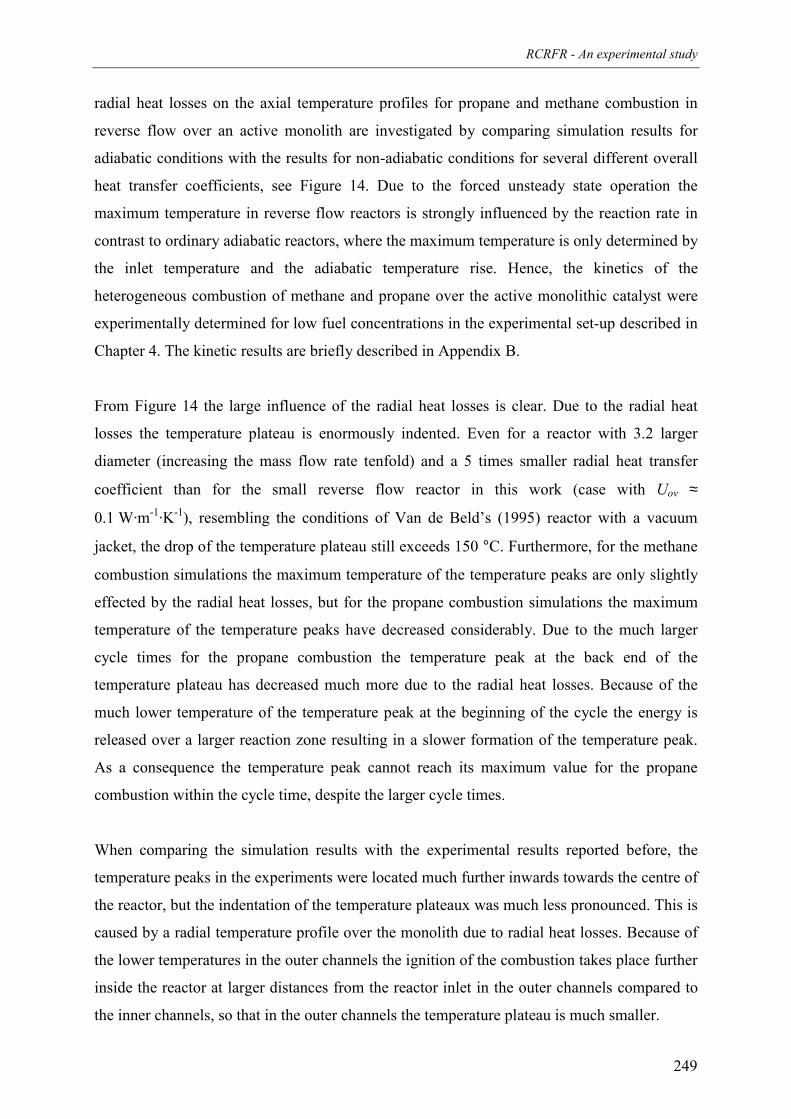
RCRFR - An experimental study
249
radial heat losses on the axial temperature profiles for propane and methane combustion in
reverse flow over an active monolith are investigated by comparing simulation results for
adiabatic conditions with the results for non-adiabatic conditions for several different overall
heat transfer coefficients, see Figure 14. Due to the forced unsteady state operation the
maximum temperature in reverse flow reactors is strongly influenced by the reaction rate in
contrast to ordinary adiabatic reactors, where the maximum temperature is only determined by
the inlet temperature and the adiabatic temperature rise. Hence, the kinetics of the
heterogeneous combustion of methane and propane over the active monolithic catalyst were
experimentally determined for low fuel concentrations in the experimental set-up described in
Chapter 4. The kinetic results are briefly described in Appendix B.
From Figure 14 the large influence of the radial heat losses is clear. Due to the radial heat
losses the temperature plateau is enormously indented. Even for a reactor with 3.2 larger
diameter (increasing the mass flow rate tenfold) and a 5 times smaller radial heat transfer
coefficient than for the small reverse flow reactor in this work (case with Uov ≈
0.1 W·m-1·K-1), resembling the conditions of Van de Beld’s (1995) reactor with a vacuum
jacket, the drop of the temperature plateau still exceeds 150 °C. Furthermore, for the methane
combustion simulations the maximum temperature of the temperature peaks are only slightly
effected by the radial heat losses, but for the propane combustion simulations the maximum
temperature of the temperature peaks have decreased considerably. Due to the much larger
cycle times for the propane combustion the temperature peak at the back end of the
temperature plateau has decreased much more due to the radial heat losses. Because of the
much lower temperature of the temperature peak at the beginning of the cycle the energy is
released over a larger reaction zone resulting in a slower formation of the temperature peak.
As a consequence the temperature peak cannot reach its maximum value for the propane
combustion within the cycle time, despite the larger cycle times.
When comparing the simulation results with the experimental results reported before, the
temperature peaks in the experiments were located much further inwards towards the centre of
the reactor, but the indentation of the temperature plateaux was much less pronounced. This is
caused by a radial temperature profile over the monolith due to radial heat losses. Because of
the lower temperatures in the outer channels the ignition of the combustion takes place further
inside the reactor at larger distances from the reactor inlet in the outer channels compared to
the inner channels, so that in the outer channels the temperature plateau is much smaller.
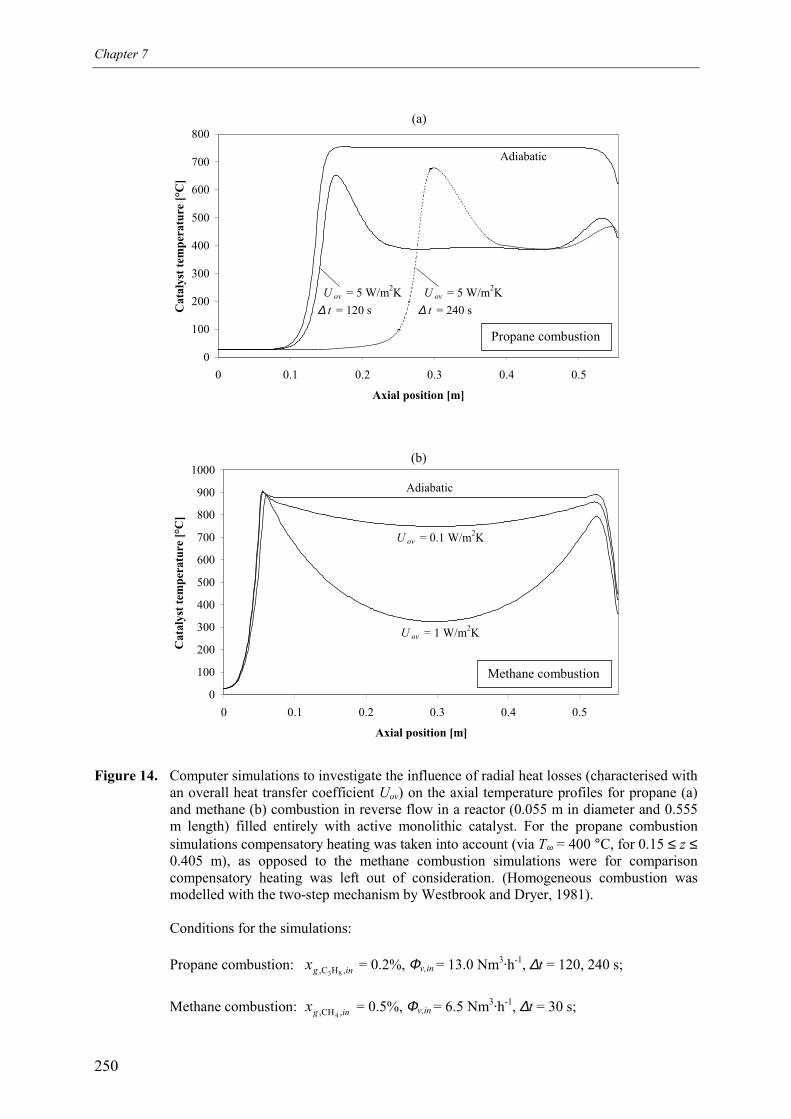
Chapter 7
250
0
100
200
300
400
500
600
700
800
0 0.1 0.2 0.3 0.4 0.5
Axial position [m]
Cat
alys
t tem
pera
ture
[°C
]
Adiabatic
U ov = 5 W/m2K∆ t = 120 s
U ov = 5 W/m2K∆ t = 240 s
0
100
200
300
400
500
600
700
800
900
1000
0 0.1 0.2 0.3 0.4 0.5
Axial position [m]
Cat
alys
t tem
pera
ture
[°C
]
Adiabatic
U ov = 1 W/m2K
U ov = 0.1 W/m2K
Figure 14. Computer simulations to investigate the influence of radial heat losses (characterised withan overall heat transfer coefficient Uov) on the axial temperature profiles for propane (a)and methane (b) combustion in reverse flow in a reactor (0.055 m in diameter and 0.555m length) filled entirely with active monolithic catalyst. For the propane combustionsimulations compensatory heating was taken into account (via T∞ = 400 °C, for 0.15 ≤ z ≤0.405 m), as opposed to the methane combustion simulations were for comparisoncompensatory heating was left out of consideration. (Homogeneous combustion wasmodelled with the two-step mechanism by Westbrook and Dryer, 1981).
Conditions for the simulations:
Propane combustion: ingx ,HC, 83 = 0.2%, Φv,in = 13.0 Nm3·h-1, ∆t = 120, 240 s;
Methane combustion: ingx ,CH, 4 = 0.5%, Φv,in = 6.5 Nm3·h-1, ∆t = 30 s;
(b)
Propane combustion
Methane combustion
(a)
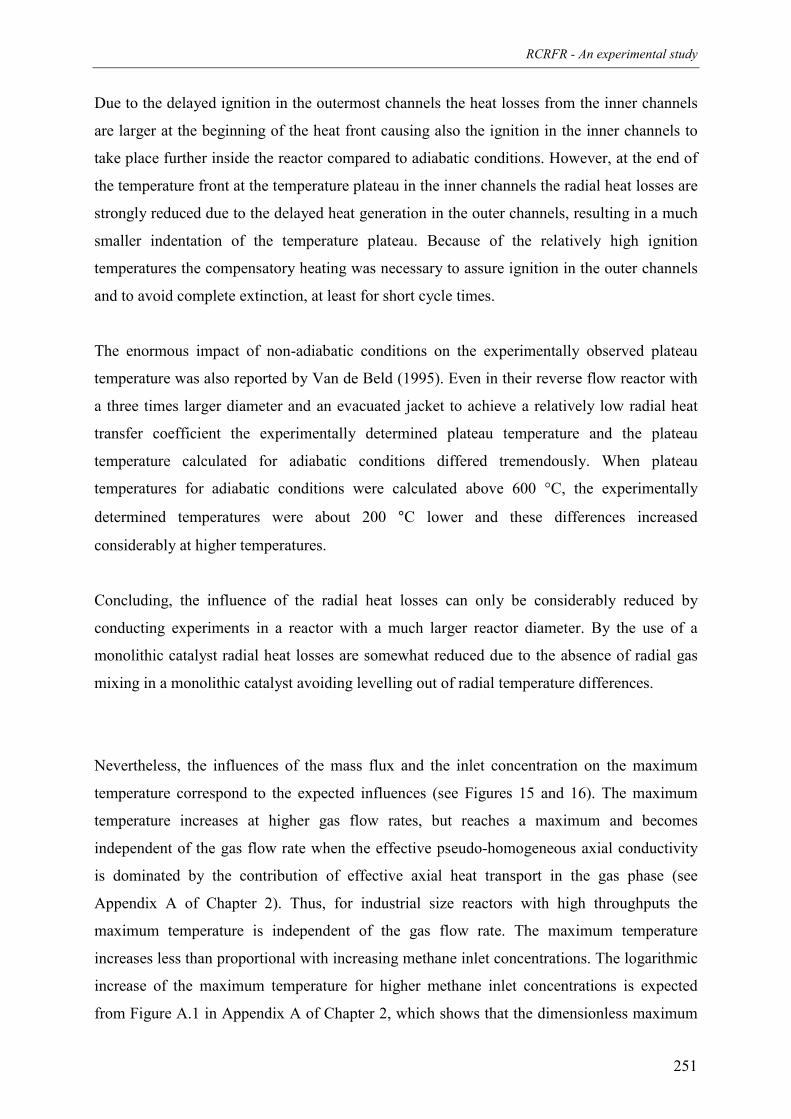
RCRFR - An experimental study
251
Due to the delayed ignition in the outermost channels the heat losses from the inner channels
are larger at the beginning of the heat front causing also the ignition in the inner channels to
take place further inside the reactor compared to adiabatic conditions. However, at the end of
the temperature front at the temperature plateau in the inner channels the radial heat losses are
strongly reduced due to the delayed heat generation in the outer channels, resulting in a much
smaller indentation of the temperature plateau. Because of the relatively high ignition
temperatures the compensatory heating was necessary to assure ignition in the outer channels
and to avoid complete extinction, at least for short cycle times.
The enormous impact of non-adiabatic conditions on the experimentally observed plateau
temperature was also reported by Van de Beld (1995). Even in their reverse flow reactor with
a three times larger diameter and an evacuated jacket to achieve a relatively low radial heat
transfer coefficient the experimentally determined plateau temperature and the plateau
temperature calculated for adiabatic conditions differed tremendously. When plateau
temperatures for adiabatic conditions were calculated above 600 °C, the experimentally
determined temperatures were about 200 °C lower and these differences increased
considerably at higher temperatures.
Concluding, the influence of the radial heat losses can only be considerably reduced by
conducting experiments in a reactor with a much larger reactor diameter. By the use of a
monolithic catalyst radial heat losses are somewhat reduced due to the absence of radial gas
mixing in a monolithic catalyst avoiding levelling out of radial temperature differences.
Nevertheless, the influences of the mass flux and the inlet concentration on the maximum
temperature correspond to the expected influences (see Figures 15 and 16). The maximum
temperature increases at higher gas flow rates, but reaches a maximum and becomes
independent of the gas flow rate when the effective pseudo-homogeneous axial conductivity
is dominated by the contribution of effective axial heat transport in the gas phase (see
Appendix A of Chapter 2). Thus, for industrial size reactors with high throughputs the
maximum temperature is independent of the gas flow rate. The maximum temperature
increases less than proportional with increasing methane inlet concentrations. The logarithmic
increase of the maximum temperature for higher methane inlet concentrations is expected
from Figure A.1 in Appendix A of Chapter 2, which shows that the dimensionless maximum
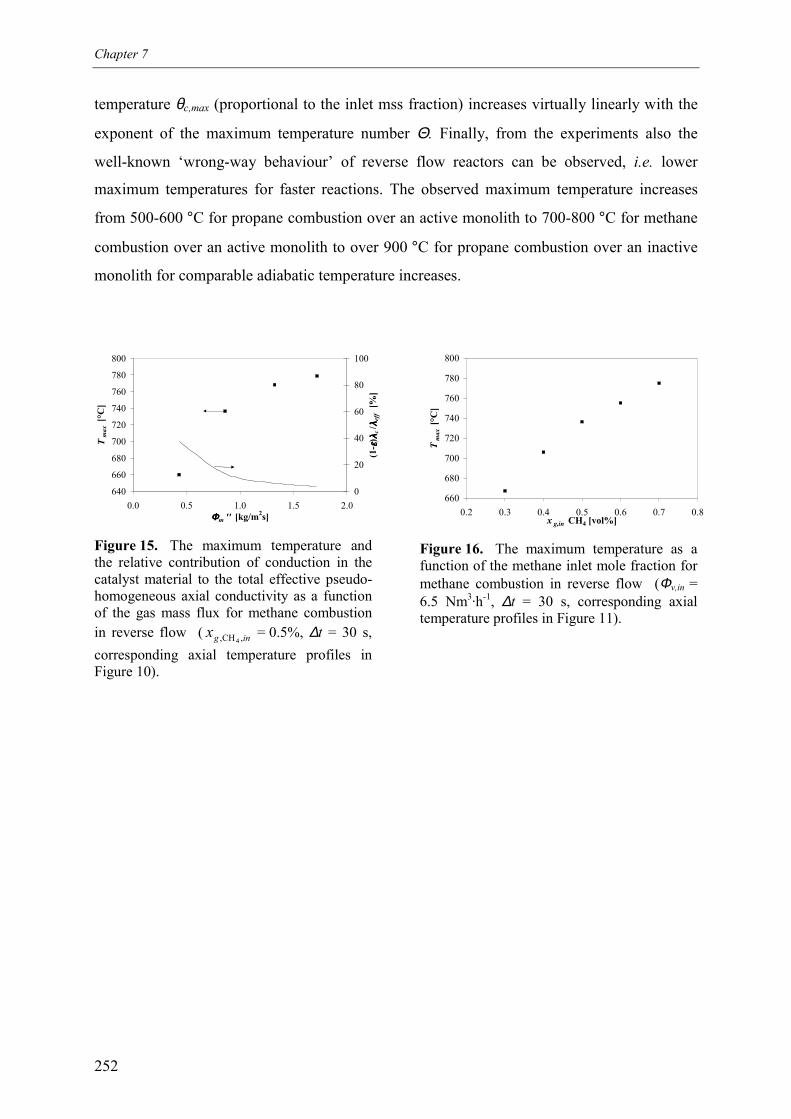
Chapter 7
252
temperature θc,max (proportional to the inlet mss fraction) increases virtually linearly with the
exponent of the maximum temperature number Θ. Finally, from the experiments also the
well-known ‘wrong-way behaviour’ of reverse flow reactors can be observed, i.e. lower
maximum temperatures for faster reactions. The observed maximum temperature increases
from 500-600 °C for propane combustion over an active monolith to 700-800 °C for methane
combustion over an active monolith to over 900 °C for propane combustion over an inactive
monolith for comparable adiabatic temperature increases.
640
660
680
700
720
740
760
780
800
0.0 0.5 1.0 1.5 2.0ΦΦΦΦm '' [kg/m2s]
Tm
ax [°
C]
0
20
40
60
80
100(1
- ε εεε) λ λλλ
c/ λ λλλ
eff
[%]
Figure 15. The maximum temperature andthe relative contribution of conduction in thecatalyst material to the total effective pseudo-homogeneous axial conductivity as a functionof the gas mass flux for methane combustionin reverse flow ( ingx ,CH, 4
= 0.5%, ∆t = 30 s,corresponding axial temperature profiles inFigure 10).
660
680
700
720
740
760
780
800
0.2 0.3 0.4 0.5 0.6 0.7 0.8x g,in CH4 [vol%]
Tm
ax [°
C]
Figure 16. The maximum temperature as afunction of the methane inlet mole fraction formethane combustion in reverse flow (Φv,in =6.5 Nm3·h-1, ∆t = 30 s, corresponding axialtemperature profiles in Figure 11).
RCRFR - An experimental study
253
3.2 Propane dehydrogenation coupled with methane combustion in reverse flow
Since radial heat losses determine to a large extent the shape of the axial temperature profiles
in a small laboratory scale reverse flow reactor, it was not possible to experimentally validate
the typical shape of axial temperature profiles occurring in a reverse flow reactor coupling
endothermic and exothermic reactions for, for instance, different ratios of the endothermic
and exothermic Damköhler numbers and for different switching schemes, as simulated in
Chapters 2 and 3. For large Damköhler numbers of the exothermic reaction cycle compared to
the Damköhler number of the endothermic reaction cycle simulations have shown that the
plateau temperature strongly decreases and only two small high temperature peaks remain,
rendering a large part of the reactor ineffective. Unfortunately, radial heat losses have a
similar effect on the shape of the axial temperature profiles. Furthermore, for asymmetric
switching schemes a slope in the plateau temperature was calculated, but this effect is
completely overshadowed by the dominating effects of radial heat losses.
Nevertheless, from some introductory dehydrogenation experiments it could be concluded
that a cyclic steady state could be easily obtained without any problems associated with
process control, generally within about two hours after starting the dehydrogenation
experiment. Furthermore, intermediate flushing with nitrogen between the propane
dehydrogenation and fuel combustion reaction cycles could be safely omitted. However, to
avoid too high temperatures during the fuel combustion reaction cycle it was necessary to
dilute the methane/air mixture with nitrogen. In Figure 17 axial temperature profiles are
shown for dehydrogenation experiments conducted with different oxygen inlet concentrations
during the methane combustion cycle. Although the axial temperature profiles at the end of
the endothermic and exothermic cycles in the cyclic steady state were hardly altered if the
oxygen inlet concentration was decreased, very high temperatures were observed at the
beginning of the combustion cycle, unless the oxygen concentration was less than about 5%.
Temperature increases well above 300 °C have been detected when air was used, severely
damaging the catalyst. Since these high temperatures were also detected when the reactor was
flushed with nitrogen between the dehydrogenation and combustion cycles, effects of mixing
of the endothermic and exothermic reactants and products (or combustion of adsorbed
components) can be excluded and the high temperatures can only be attributed to the
combustion of carbonaceous products formed as a side product during the dehydrogenation
cycle. As soon as the oxygen supply was stopped, the high temperatures rapidly disappeared.
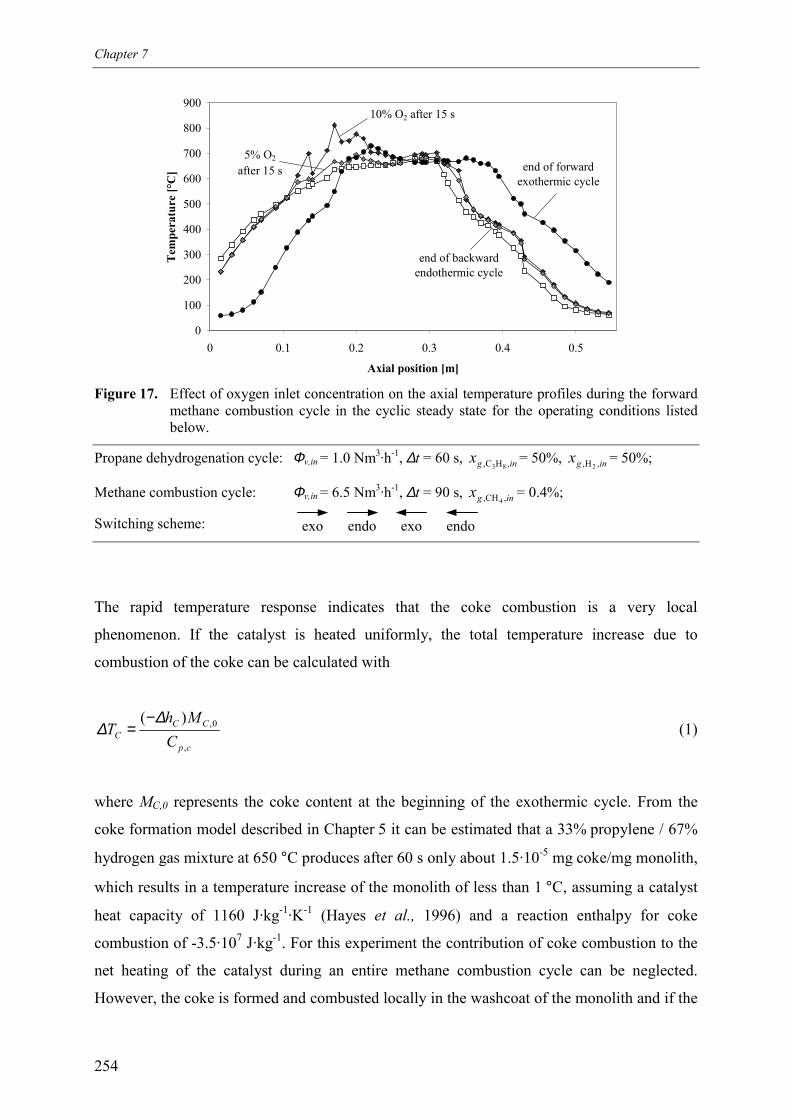
Chapter 7
254
0
100
200
300
400
500
600
700
800
900
0 0.1 0.2 0.3 0.4 0.5
Axial position [m]
Tem
pera
ture
[°C
]
end of backward endothermic cycle
5% O2
after 15 s
10% O2 after 15 s
end of forward exothermic cycle
Figure 17. Effect of oxygen inlet concentration on the axial temperature profiles during the forwardmethane combustion cycle in the cyclic steady state for the operating conditions listedbelow.
Propane dehydrogenation cycle: Φv,in = 1.0 Nm3·h-1, ∆t = 60 s, ingx ,HC, 83= 50%, ingx ,H, 2
= 50%;
Methane combustion cycle: Φv,in = 6.5 Nm3·h-1, ∆t = 90 s, ingx ,CH, 4= 0.4%;
Switching scheme:
The rapid temperature response indicates that the coke combustion is a very local
phenomenon. If the catalyst is heated uniformly, the total temperature increase due to
combustion of the coke can be calculated with
cp
CCC C
MhT
,
0,)( ∆∆
−= (1)
where MC,0 represents the coke content at the beginning of the exothermic cycle. From the
coke formation model described in Chapter 5 it can be estimated that a 33% propylene / 67%
hydrogen gas mixture at 650 °C produces after 60 s only about 1.5·10-5 mg coke/mg monolith,
which results in a temperature increase of the monolith of less than 1 °C, assuming a catalyst
heat capacity of 1160 J·kg-1·K-1 (Hayes et al., 1996) and a reaction enthalpy for coke
combustion of -3.5·107 J·kg-1. For this experiment the contribution of coke combustion to the
net heating of the catalyst during an entire methane combustion cycle can be neglected.
However, the coke is formed and combusted locally in the washcoat of the monolith and if the
exo endo exo endo
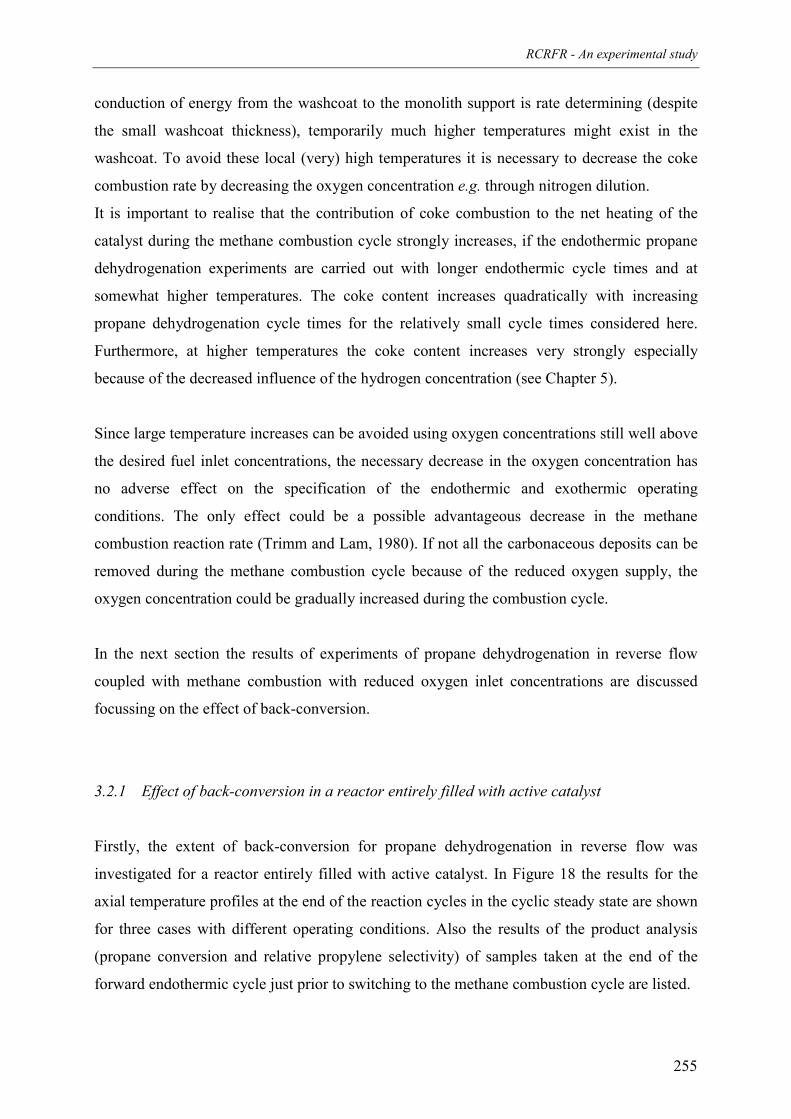
RCRFR - An experimental study
255
conduction of energy from the washcoat to the monolith support is rate determining (despite
the small washcoat thickness), temporarily much higher temperatures might exist in the
washcoat. To avoid these local (very) high temperatures it is necessary to decrease the coke
combustion rate by decreasing the oxygen concentration e.g. through nitrogen dilution.
It is important to realise that the contribution of coke combustion to the net heating of the
catalyst during the methane combustion cycle strongly increases, if the endothermic propane
dehydrogenation experiments are carried out with longer endothermic cycle times and at
somewhat higher temperatures. The coke content increases quadratically with increasing
propane dehydrogenation cycle times for the relatively small cycle times considered here.
Furthermore, at higher temperatures the coke content increases very strongly especially
because of the decreased influence of the hydrogen concentration (see Chapter 5).
Since large temperature increases can be avoided using oxygen concentrations still well above
the desired fuel inlet concentrations, the necessary decrease in the oxygen concentration has
no adverse effect on the specification of the endothermic and exothermic operating
conditions. The only effect could be a possible advantageous decrease in the methane
combustion reaction rate (Trimm and Lam, 1980). If not all the carbonaceous deposits can be
removed during the methane combustion cycle because of the reduced oxygen supply, the
oxygen concentration could be gradually increased during the combustion cycle.
In the next section the results of experiments of propane dehydrogenation in reverse flow
coupled with methane combustion with reduced oxygen inlet concentrations are discussed
focussing on the effect of back-conversion.
3.2.1 Effect of back-conversion in a reactor entirely filled with active catalyst
Firstly, the extent of back-conversion for propane dehydrogenation in reverse flow was
investigated for a reactor entirely filled with active catalyst. In Figure 18 the results for the
axial temperature profiles at the end of the reaction cycles in the cyclic steady state are shown
for three cases with different operating conditions. Also the results of the product analysis
(propane conversion and relative propylene selectivity) of samples taken at the end of the
forward endothermic cycle just prior to switching to the methane combustion cycle are listed.
0
100
200
300
400
500
600
700
800
0 0.1 0.2 0.3 0.4 0.5Axial position [m]
Tem
pera
ture
[°C
]
0
100
200
300
400
500
600
700
800
0 0.1 0.2 0.3 0.4 0.5
Axial position [m]
Tem
pera
ture
[°C
]
0
100
200
300
400
500
600
700
800
0 0.1 0.2 0.3 0.4 0.5
Axial position [m]
Tem
pera
ture
[°C
]
Exp. 1 Exp. 2 Exp. 3Φv [Nm3·h-1] 0.10 0.20 0.50
∆t [s] 120 60 60Propanedehydro-genation xg,in C3H8 [%] 100 100 100
Φv [m3·h-1] 4.0 4.0 10.0∆t [s] 120 120 120
xg,in CH4 [%] 0.5 0.5 0.5methane
combustionxg,in O2 [%] 5.0 5.0 2.5
ζendo C3H8 [%] < 0.1 1.8 1.9productanalysis * σ C3H6 / σ C2H6 - 0.33 0.47switchingscheme
* Samples were taken ca. 5 s before switching;No ethylene was detected in these experiments.
end of forward exothermic cycle end of forward endothermic cycleend of backward exothermic cycle end of backward endothermic cycle
Exp. 1 Exp. 2
Exp. 3
Figure 18. Propane dehydrogenation coupled with methane combustion over a monolithic catalyst: influence of the endothermic flow rate on the axial tempe-rature profiles and the propane conversion and propylene selectivity during the propane dehydrogenation cycle (middle two heaters set at 550 °C).
exo endo exo endo
Chapter 7
256
RCRFR - An experimental study
257
In view of the relatively large gas residence time compared to the cycle time for the
endothermic cycle, only the concentration at the end of the endothermic cycle was
determined. For all three experiments the differences between the axial temperature profiles at
the end of the endothermic and exothermic cycle are relatively small and the temperature
plateau increases and decreases more or less uniformly. The uniform increase and decrease of
the temperature plateaux indicates relatively small conversions, as expected because of the
short length of the temperature plateau. Therefore, experiments with different (asymmetric)
switching schemes gave similar temperature profiles. The decrease in the temperature plateau
during the propane dehydrogenation could not have been caused by merely radial heat losses.
This was verified experimentally with an experiment where nitrogen was substituted for
propane during the ‘propane dehydrogenation’ cycle, which showed a significantly smaller
decrease of the temperature plateau during the ‘endothermic’ cycle. The temperature
difference between the axial temperature profiles at the beginning and end of the propane
dehydrogenation cycle is thus indicative for the average conversion during the propane
dehydrogenation cycle.
The effect of increasing the endothermic gas velocity and simultaneously decreasing the
endothermic cycle time while keeping the operating conditions of the exothermic cycle
constant, so that the same amount of energy is supplied, can be seen by comparing
experiments 1 and 2. For Experiment 1 with the lower endothermic gas velocity the
temperature plateau is somewhat higher at the end of the exothermic cycles, probably because
of more overlap of the methane combustion zones. The temperature difference between the
beginning and the end of the endothermic cycle, and thus the propane conversion, is larger for
the case with the lower endothermic gas velocity, as expected because of the longer gas
residence time (note: the propane conversion is much smaller than the equilibrium
conversion). However, the conversion determined from a sample taken at the reactor outlet
was negligible for the low gas velocity experiment and remarkably larger for the experiment
with a higher endothermic gas velocity. This can only be explained by the increased
conversion and back-conversion for lower gas velocities during the dehydrogenation cycle.
By shifting the plateau temperature towards the end of the reactor by increasing the cycle
times for the forward endothermic and exothermic cycles compared to the backward cycles, a
gas sample could be taken at the end of the temperature plateau and a propane conversion of
about 10% was determined. These experiments show the enormous detrimental effect of the
back-conversion on the overall propane conversion. Even if the endothermic gas velocity is
Chapter 7
258
increased again with a factor 2.5, increasing the exothermic gas velocity with the same factor
to keep the total energy input constant, (cf. experiments 2 and 3), the propane conversion is
hardly effected. The plateau temperature at the end of the endothermic and exothermic cycle
has increased only some 25 °C due to the larger gas velocity during the exothermic reaction
cycle while the length of the temperature plateau is about the same. The decrease in the
propane conversion by propane hydrogenation due to the smaller gas residence time is
counteracted by an apparently equivalent decrease in the propane back-conversion by
propylene hydrogenation, also because of the smaller gas residence time and the somewhat
higher outlet temperatures.
Remarkably, only ethane and no ethylene was detected for these three experiments, although
higher selectivities for ethylene compared to ethane are expected for a pure propane feed,
based on the kinetic study reported in Chapter 4. Indeed, for the experiment where the
temperature plateau was moved to the reactor outlet a high ethylene to ethane ratio was
determined. The absence of ethylene in the dehydrogenation experiments is probably caused
by hydrogenation of ethylene to ethane at the end of the reactor, just like the hydrogenation of
propylene to propane. The equilibrium conversion of ethane to ethylene and hydrogen is even
lower than the equilibrium conversion of propane to propylene at the same temperature and
pressure. The back-conversion of ethylene is also very undesired, since ethylene is a valuable
side-product in contrast to ethane.
The temperature peaks at the back end of the exothermic cycle are caused by local coke
combustion in the washcoat. These temperature peaks disappear within a few seconds after
switching to the dehydrogenation cycle. These temperature peaks indicate that not all the
carbonaceous products have been removed from the catalyst surface at the end of the
exothermic cycle. This is mainly caused by the movement of the temperature profiles,
especially during the exothermic cycle because of the much higher gas velocities. At the end
of the backward propane dehydrogenation cycle the temperature plateau is located most to the
left. Upon switching to the forward methane combustion cycle the plateau moves to the right
and before all the coke at the left end of the plateau can be combusted, the temperature front
passes and the catalyst temperature decreases to too low temperatures for coke combustion.
When the temperature plateau returns to the left during the backward methane combustion
cycle part of these remaining carbonaceous deposits are combusted. During the propane
dehydrogenation experiments carbonaceous deposits accumulated at the ends of the part of
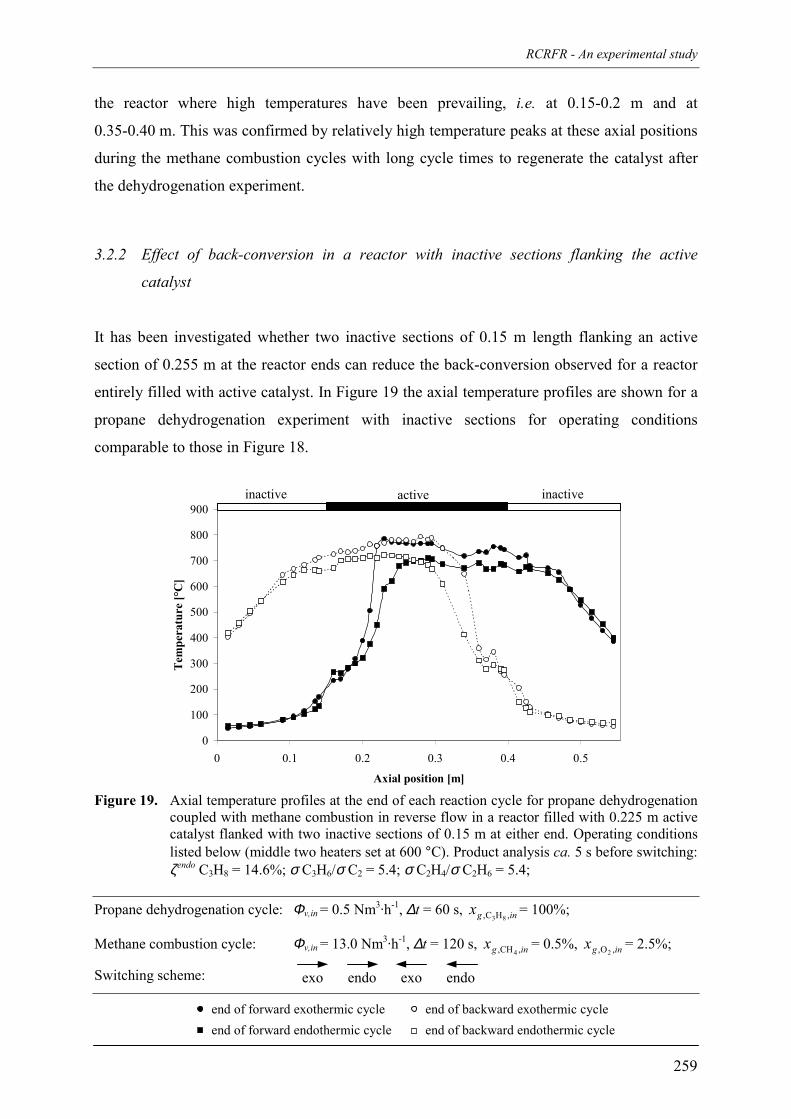
RCRFR - An experimental study
259
the reactor where high temperatures have been prevailing, i.e. at 0.15-0.2 m and at
0.35-0.40 m. This was confirmed by relatively high temperature peaks at these axial positions
during the methane combustion cycles with long cycle times to regenerate the catalyst after
the dehydrogenation experiment.
3.2.2 Effect of back-conversion in a reactor with inactive sections flanking the active
catalyst
It has been investigated whether two inactive sections of 0.15 m length flanking an active
section of 0.255 m at the reactor ends can reduce the back-conversion observed for a reactor
entirely filled with active catalyst. In Figure 19 the axial temperature profiles are shown for a
propane dehydrogenation experiment with inactive sections for operating conditions
comparable to those in Figure 18.
0
100
200
300
400
500
600
700
800
900
0 0.1 0.2 0.3 0.4 0.5
Axial position [m]
Tem
pera
ture
[°C
]
Figure 19. Axial temperature profiles at the end of each reaction cycle for propane dehydrogenationcoupled with methane combustion in reverse flow in a reactor filled with 0.225 m activecatalyst flanked with two inactive sections of 0.15 m at either end. Operating conditionslisted below (middle two heaters set at 600 °C). Product analysis ca. 5 s before switching:ζendo C3H8 = 14.6%; σ C3H6/σ C2 = 5.4; σ C2H4/σ C2H6 = 5.4;
Propane dehydrogenation cycle: Φv,in = 0.5 Nm3·h-1, ∆t = 60 s, ingx ,HC, 83= 100%;
Methane combustion cycle: Φv,in = 13.0 Nm3·h-1, ∆t = 120 s, ingx ,CH, 4= 0.5%, ingx ,O, 2
= 2.5%;
Switching scheme:
active inactiveinactive
exo endo exo endo
end of forward exothermic cycleend of forward endothermic cycle
end of backward exothermic cycleend of backward endothermic cycle
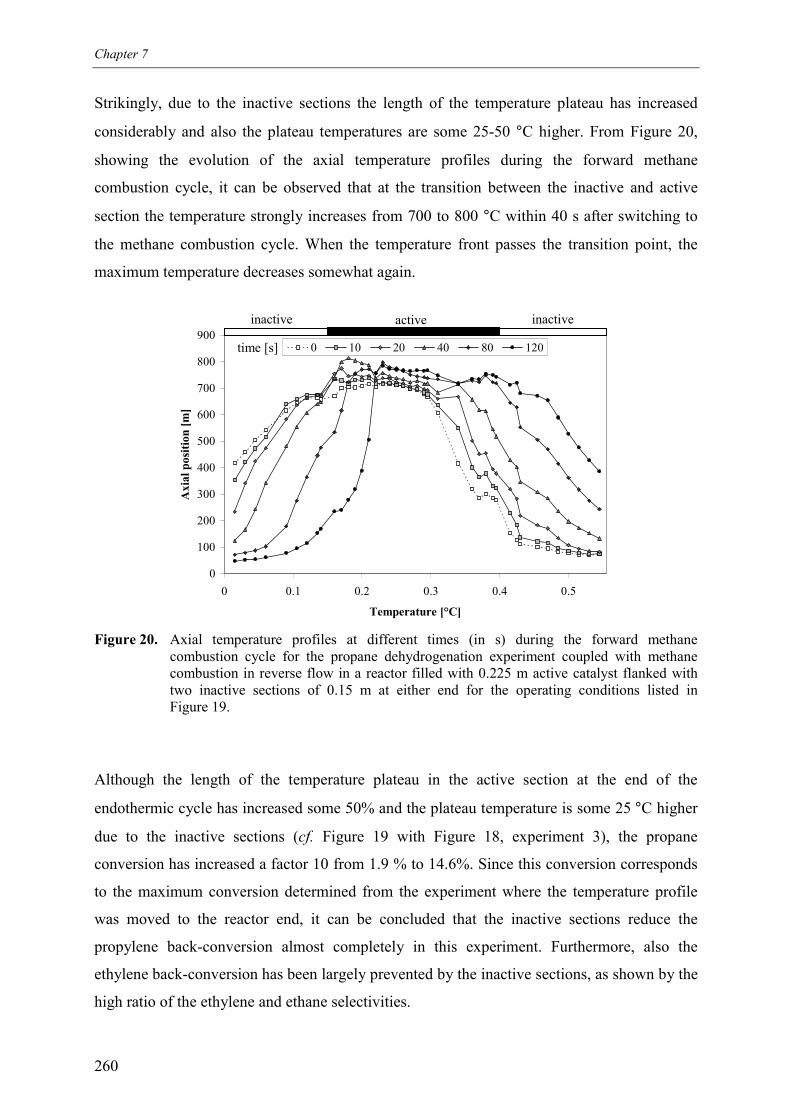
Chapter 7
260
Strikingly, due to the inactive sections the length of the temperature plateau has increased
considerably and also the plateau temperatures are some 25-50 °C higher. From Figure 20,
showing the evolution of the axial temperature profiles during the forward methane
combustion cycle, it can be observed that at the transition between the inactive and active
section the temperature strongly increases from 700 to 800 °C within 40 s after switching to
the methane combustion cycle. When the temperature front passes the transition point, the
maximum temperature decreases somewhat again.
0
100
200
300
400
500
600
700
800
900
0 0.1 0.2 0.3 0.4 0.5
Temperature [°C]
Axi
al p
ositi
on [m
]
0 10 20 40 80 120
Figure 20. Axial temperature profiles at different times (in s) during the forward methanecombustion cycle for the propane dehydrogenation experiment coupled with methanecombustion in reverse flow in a reactor filled with 0.225 m active catalyst flanked withtwo inactive sections of 0.15 m at either end for the operating conditions listed inFigure 19.
Although the length of the temperature plateau in the active section at the end of the
endothermic cycle has increased some 50% and the plateau temperature is some 25 °C higher
due to the inactive sections (cf. Figure 19 with Figure 18, experiment 3), the propane
conversion has increased a factor 10 from 1.9 % to 14.6%. Since this conversion corresponds
to the maximum conversion determined from the experiment where the temperature profile
was moved to the reactor end, it can be concluded that the inactive sections reduce the
propylene back-conversion almost completely in this experiment. Furthermore, also the
ethylene back-conversion has been largely prevented by the inactive sections, as shown by the
high ratio of the ethylene and ethane selectivities.
active inactiveinactive
time [s]
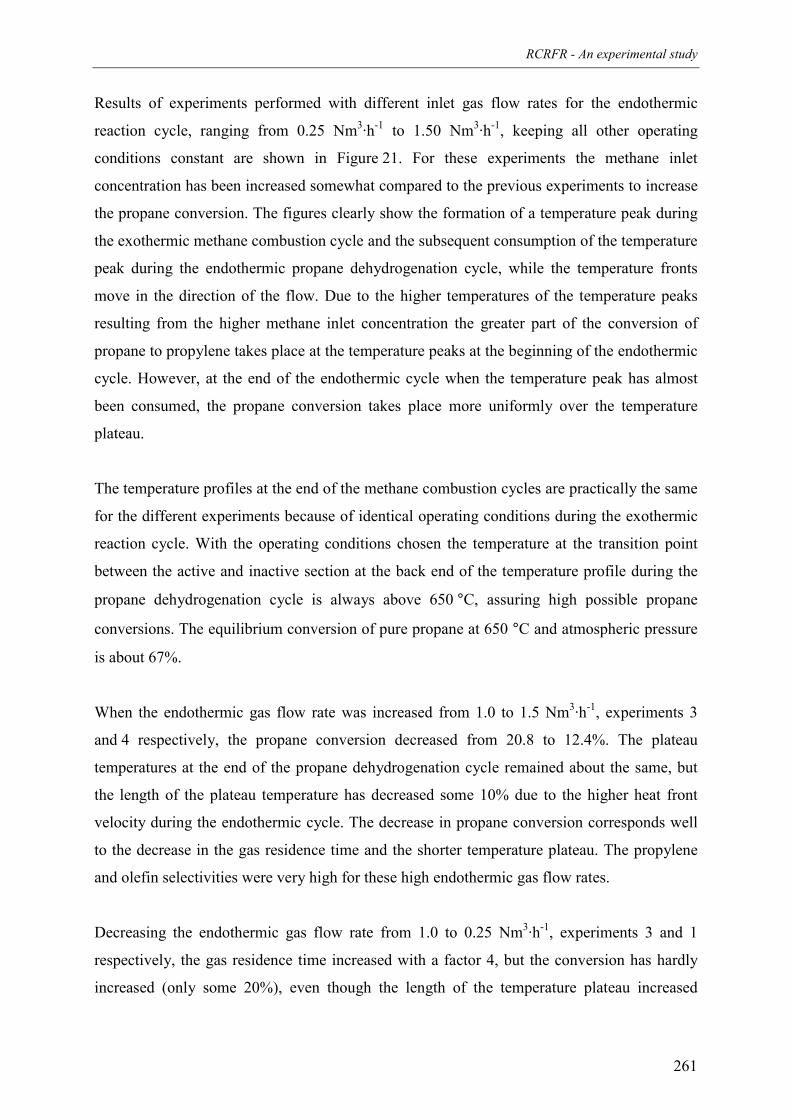
RCRFR - An experimental study
261
Results of experiments performed with different inlet gas flow rates for the endothermic
reaction cycle, ranging from 0.25 Nm3·h-1 to 1.50 Nm3·h-1, keeping all other operating
conditions constant are shown in Figure 21. For these experiments the methane inlet
concentration has been increased somewhat compared to the previous experiments to increase
the propane conversion. The figures clearly show the formation of a temperature peak during
the exothermic methane combustion cycle and the subsequent consumption of the temperature
peak during the endothermic propane dehydrogenation cycle, while the temperature fronts
move in the direction of the flow. Due to the higher temperatures of the temperature peaks
resulting from the higher methane inlet concentration the greater part of the conversion of
propane to propylene takes place at the temperature peaks at the beginning of the endothermic
cycle. However, at the end of the endothermic cycle when the temperature peak has almost
been consumed, the propane conversion takes place more uniformly over the temperature
plateau.
The temperature profiles at the end of the methane combustion cycles are practically the same
for the different experiments because of identical operating conditions during the exothermic
reaction cycle. With the operating conditions chosen the temperature at the transition point
between the active and inactive section at the back end of the temperature profile during the
propane dehydrogenation cycle is always above 650 °C, assuring high possible propane
conversions. The equilibrium conversion of pure propane at 650 °C and atmospheric pressure
is about 67%.
When the endothermic gas flow rate was increased from 1.0 to 1.5 Nm3·h-1, experiments 3
and 4 respectively, the propane conversion decreased from 20.8 to 12.4%. The plateau
temperatures at the end of the propane dehydrogenation cycle remained about the same, but
the length of the plateau temperature has decreased some 10% due to the higher heat front
velocity during the endothermic cycle. The decrease in propane conversion corresponds well
to the decrease in the gas residence time and the shorter temperature plateau. The propylene
and olefin selectivities were very high for these high endothermic gas flow rates.
Decreasing the endothermic gas flow rate from 1.0 to 0.25 Nm3·h-1, experiments 3 and 1
respectively, the gas residence time increased with a factor 4, but the conversion has hardly
increased (only some 20%), even though the length of the temperature plateau increased

0100200300400500600700800900
0 0.1 0.2 0.3 0.4 0.5Axial position [m]
Tem
pera
ture
[°C
]
0100200300400500600700800900
0 0.1 0.2 0.3 0.4 0.5Axial position [m]
Tem
pera
ture
[°C
]
0100200300400500600700800900
0 0.1 0.2 0.3 0.4 0.5Axial position [m]
Tem
pera
ture
[°C
]
Exp. 1 Exp. 2 ¹ Exp. 3 Exp. 4Φv [Nm3·h-1] 0.25 0.50 1.00 1.50
∆t [s] 60 60 60 60Propanedehydro-genation xg,in C3H8 [%] 100 100 100 100
Φv [m3·h-1] 13.0 13.0 13.0 13.0∆t [s] 60 60 60 60
xg,in CH4 [%] 0.7 0.7 0.7 0.7methane
combustionxg,in O2 [%] 2.5 2.5 2.5 2.5
ζendo C3H8 [%] 25.2 22.1 20.8 12.4σ C3H6/σ C2 3.3 3.3 4.3 6.9product
analysis ²σ C2H4/σ C2H6 2.3 4.6 7.8 12.4
switchingscheme
¹ Axial temperature profiles not shown;² Samples were taken ca. 5 s before switching;
Exp. 1 Exp. 3
Exp. 4
end of forward exothermic cycle end of forward endothermic cycleend of backward exothermic cycle end of backward endothermic cycle
Figure 21. Propane dehydrogenation coupled with methane combustion over a monolithic catalyst of 0.155 m length in the centre of the reactor and two0.15 m inactive sections at the reactor ends: Influence of the endothermic flow rate on the axial temperature profiles and the propane conversionand propylene selectivity during the propane dehydrogenation cycle (middle two heaters set at 600 °C).
exo endo exo endo
active inactiveinactive
active inactiveinactive
active inactiveinactiveChapter 7
262
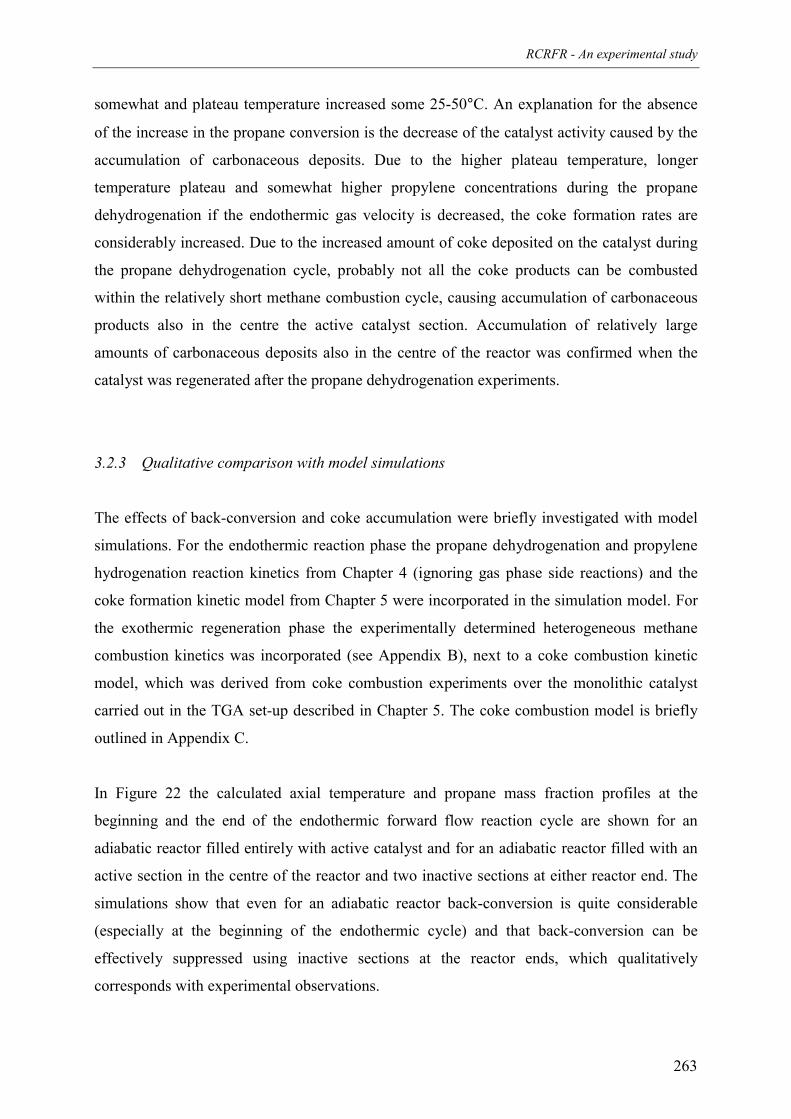
RCRFR - An experimental study
263
somewhat and plateau temperature increased some 25-50°C. An explanation for the absence
of the increase in the propane conversion is the decrease of the catalyst activity caused by the
accumulation of carbonaceous deposits. Due to the higher plateau temperature, longer
temperature plateau and somewhat higher propylene concentrations during the propane
dehydrogenation if the endothermic gas velocity is decreased, the coke formation rates are
considerably increased. Due to the increased amount of coke deposited on the catalyst during
the propane dehydrogenation cycle, probably not all the coke products can be combusted
within the relatively short methane combustion cycle, causing accumulation of carbonaceous
products also in the centre the active catalyst section. Accumulation of relatively large
amounts of carbonaceous deposits also in the centre of the reactor was confirmed when the
catalyst was regenerated after the propane dehydrogenation experiments.
3.2.3 Qualitative comparison with model simulations
The effects of back-conversion and coke accumulation were briefly investigated with model
simulations. For the endothermic reaction phase the propane dehydrogenation and propylene
hydrogenation reaction kinetics from Chapter 4 (ignoring gas phase side reactions) and the
coke formation kinetic model from Chapter 5 were incorporated in the simulation model. For
the exothermic regeneration phase the experimentally determined heterogeneous methane
combustion kinetics was incorporated (see Appendix B), next to a coke combustion kinetic
model, which was derived from coke combustion experiments over the monolithic catalyst
carried out in the TGA set-up described in Chapter 5. The coke combustion model is briefly
outlined in Appendix C.
In Figure 22 the calculated axial temperature and propane mass fraction profiles at the
beginning and the end of the endothermic forward flow reaction cycle are shown for an
adiabatic reactor filled entirely with active catalyst and for an adiabatic reactor filled with an
active section in the centre of the reactor and two inactive sections at either reactor end. The
simulations show that even for an adiabatic reactor back-conversion is quite considerable
(especially at the beginning of the endothermic cycle) and that back-conversion can be
effectively suppressed using inactive sections at the reactor ends, which qualitatively
corresponds with experimental observations.
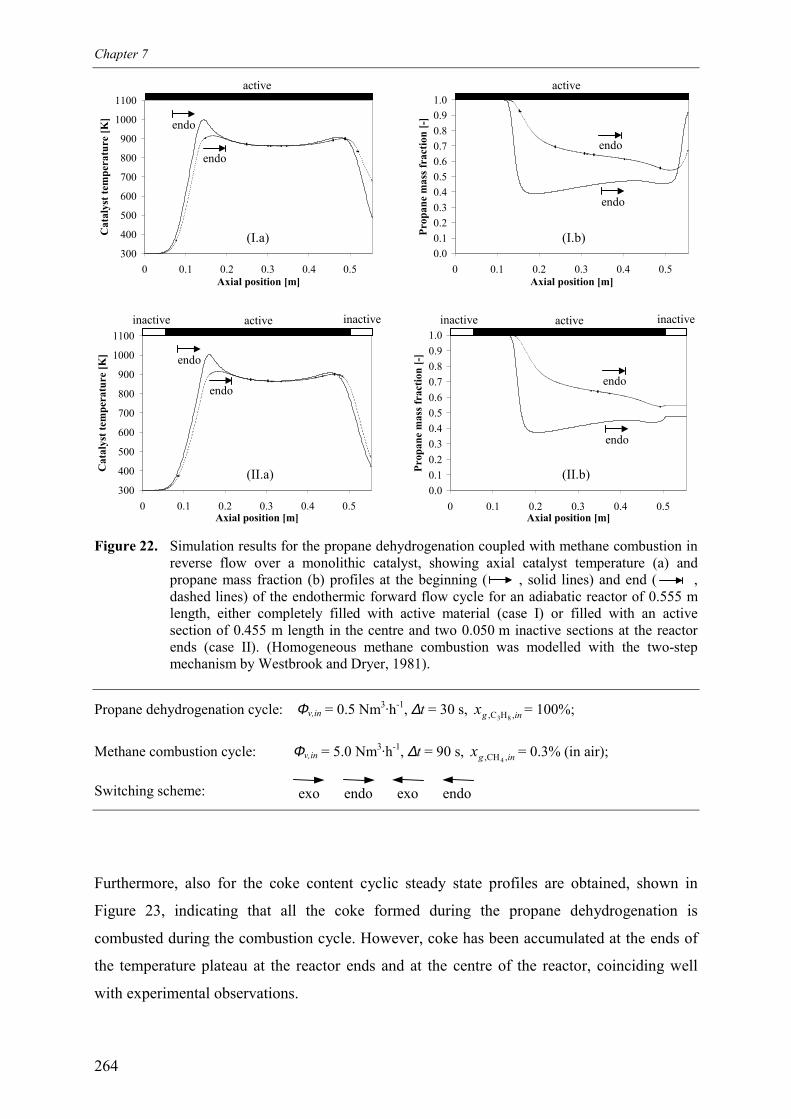
Chapter 7
264
300
400
500
600
700
800
900
1000
1100
0 0.1 0.2 0.3 0.4 0.5Axial position [m]
Cat
alys
t tem
pera
ture
[K]
0.00.10.20.30.40.50.60.70.80.91.0
0 0.1 0.2 0.3 0.4 0.5Axial position [m]
Prop
ane
mas
s fra
ctio
n [-]
300
400
500
600
700
800
900
1000
1100
0 0.1 0.2 0.3 0.4 0.5Axial position [m]
Cat
alys
t tem
pera
ture
[K]
0.00.10.20.30.40.50.60.70.80.91.0
0 0.1 0.2 0.3 0.4 0.5Axial position [m]
Prop
ane
mas
s fra
ctio
n [-]
Figure 22. Simulation results for the propane dehydrogenation coupled with methane combustion inreverse flow over a monolithic catalyst, showing axial catalyst temperature (a) andpropane mass fraction (b) profiles at the beginning ( , solid lines) and end ( ,dashed lines) of the endothermic forward flow cycle for an adiabatic reactor of 0.555 mlength, either completely filled with active material (case I) or filled with an activesection of 0.455 m length in the centre and two 0.050 m inactive sections at the reactorends (case II). (Homogeneous methane combustion was modelled with the two-stepmechanism by Westbrook and Dryer, 1981).
Propane dehydrogenation cycle: Φv,in = 0.5 Nm3·h-1, ∆t = 30 s, ingx ,HC, 83= 100%;
Methane combustion cycle: Φv,in = 5.0 Nm3·h-1, ∆t = 90 s, ingx ,CH, 4= 0.3% (in air);
Switching scheme:
Furthermore, also for the coke content cyclic steady state profiles are obtained, shown in
Figure 23, indicating that all the coke formed during the propane dehydrogenation is
combusted during the combustion cycle. However, coke has been accumulated at the ends of
the temperature plateau at the reactor ends and at the centre of the reactor, coinciding well
with experimental observations.
(I.a) (I.b)
(II.a) (II.b)
endo
endo
endo
endo
endo
endo
endo
endo
exo endo exo endo
active inactiveinactive
activeactive
active inactiveinactive
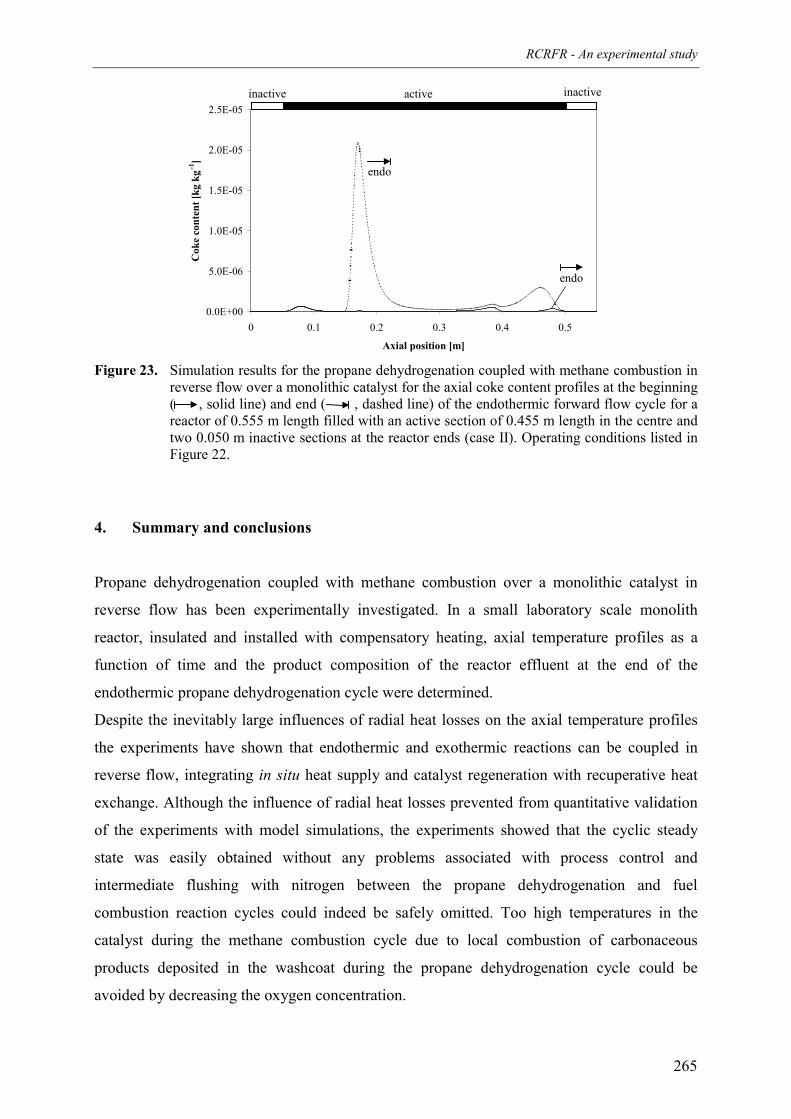
RCRFR - An experimental study
265
0.0E+00
5.0E-06
1.0E-05
1.5E-05
2.0E-05
2.5E-05
0 0.1 0.2 0.3 0.4 0.5
Axial position [m]
Cok
e co
nten
t [kg
kg-1
]
Figure 23. Simulation results for the propane dehydrogenation coupled with methane combustion inreverse flow over a monolithic catalyst for the axial coke content profiles at the beginning( , solid line) and end ( , dashed line) of the endothermic forward flow cycle for areactor of 0.555 m length filled with an active section of 0.455 m length in the centre andtwo 0.050 m inactive sections at the reactor ends (case II). Operating conditions listed inFigure 22.
4. Summary and conclusions
Propane dehydrogenation coupled with methane combustion over a monolithic catalyst in
reverse flow has been experimentally investigated. In a small laboratory scale monolith
reactor, insulated and installed with compensatory heating, axial temperature profiles as a
function of time and the product composition of the reactor effluent at the end of the
endothermic propane dehydrogenation cycle were determined.
Despite the inevitably large influences of radial heat losses on the axial temperature profiles
the experiments have shown that endothermic and exothermic reactions can be coupled in
reverse flow, integrating in situ heat supply and catalyst regeneration with recuperative heat
exchange. Although the influence of radial heat losses prevented from quantitative validation
of the experiments with model simulations, the experiments showed that the cyclic steady
state was easily obtained without any problems associated with process control and
intermediate flushing with nitrogen between the propane dehydrogenation and fuel
combustion reaction cycles could indeed be safely omitted. Too high temperatures in the
catalyst during the methane combustion cycle due to local combustion of carbonaceous
products deposited in the washcoat during the propane dehydrogenation cycle could be
avoided by decreasing the oxygen concentration.
endo
endo
active inactiveinactive
Chapter 7
266
Propane dehydrogenation experiments in a reactor entirely filled with active catalyst showed
that almost all the propylene formed at the high temperature plateau was again hydrogenated
at the reactor end, resulting in a low propane conversion. Remarkably, for higher endothermic
gas velocities the propane conversion increased. The lower gas residence time decreased the
conversion of propane by propane dehydrogenation at the high temperatures of the
temperature plateau, but also decreased the back-conversion of propylene by propylene
hydrogenation at the lower temperatures at the reactor end. Noteworthily, also the ethylene
formed as a side-product was hydrogenated to ethane at the reactor ends. Experiments with
two inactive sections at the reactor ends flanking an active catalyst section in the centre
showed that the back-conversion of both propylene and ethylene could be effectively
suppressed. The inactive sections also increased the length of the temperature plateau and the
plateau temperature.
Furthermore, the propane dehydrogenation experiments have shown that carbonaceous
deposits can accumulate at the ends of the temperature plateau most to the left and most to the
right. Due to the much larger heat front velocity during the exothermic combustion cycle
compared to the endothermic dehydrogenation cycle because of the much higher throughput,
the duration of time that high temperatures prevailed at these positions was much larger
during the endothermic cycle compared to the exothermic cycle. As a result, the time during
the combustion cycle was insufficient to remove all the carbonaceous deposits formed during
the endothermic cycle. Accumulation of coke deposits at these positions can be reduced, if the
exothermic cycle is allowed to act in the same flow direction as the endothermic cycle for a
little while before the flow direction is reversed, simultaneously purging the reactor and
minimising the propylene losses. Additionally, accumulation of coke deposits can be
counteracted by choosing the forward exothermic and endothermic cycle times somewhat
larger than the backward cycles times, so that the temperature profiles move gradually over
several complete cycles to the right, and subsequently smaller forward cycle times to move
the temperatures back to the left, and so on, obviously at the expense of somewhat larger heat
losses. Moreover, if necessary, once in a while two additional cycles can be included after the
methane combustion cycle and before switching to the propane dehydrogenation cycle.
During these two cycles (a forward and backward cycle) with mainly air as feed (possibly
with methane added to maintain high temperatures and possibly diluted with nitrogen to avoid
exceeding maximum temperature constraints) the temperature plateau can be moved through
the entire reactor removing all the coke deposits and completely regenerate the catalyst.
Furthermore, if the plateau temperature during the propane dehydrogenation cycle is very
RCRFR - An experimental study
267
high the coke formation rate can be higher than the coke combustion rate (with the low
oxygen concentration to avoid too high temperatures). In this case coke can also accumulate
in the centre of the temperature plateau. At high operating temperatures the contribution of
coke combustion to the net heating of the catalyst can be considerable. To avoid accumulation
of coke the maximum allowable operating temperatures are restricted by the coke formation
and coke combustion rates and, moreover, the ratio of the exothermic to endothermic cycle
times needs to be large enough to combust all the coke.
Acknowledgements
The investigations were financially supported by the Netherlands Organization for Scientific
Research (N.W.O.). The author wishes to thank in particular H.J. Moed for the construction
and maintenance of the experimental set-up. Also the help of R. Meijer with the process
control is greatly appreciated. Finally, the author is grateful to R.C. Nijssen for his valuable
contribution to the experimental work.
Notation
av specific external catalyst surface area [m2·m-3]
Cg gas phase concentration [mole·m-3]
Cp heat capacity [J·mole-1·kg-1]
d reactor diameter or width [m]
dins insulation thickness [m]
E activation energy [kJ·mole-1]
∆hC reaction enthalpy of coke combustion [J·kg-1]
Ji ith order Bessel function
k reaction rate constant
kg external mass transfer coefficient [m·s-1]
K* constant defined in coke combustion rate equation [m3·mole-1·kgC·kgcat-1·s-1]
L reactor length [m]
M molar mass [kg·mole-1]
MC coke content [mgcoke·mgcat-1]
Chapter 7
268
q hydrogen to carbon ratio of the coke [-]
r radial coordinate (i.e. direction perpendicular to flow direction) [m]
r2 linear regression coefficient [-]
rC coke combustion rate [kgC·kgcat-1·s-1]
R gas constant [J·mole-1·K-1]; reactor radius [m]
Ri reaction rate of component i [mole·m-2·s-1]
CR ′′′ volumetric coke combustion rate [kgC·m-3·s-1]
t time [s]
∆t cycle time [s]
T temperature [K]
T∞ temperature of the surroundings [K]
∆TC temperature increase due to coke combustion [K]
Uov overall heat transfer coefficient [W·m-2·K-1]
w maximum monolayer coke content [kgC·kgcat-1]
xg gas phase molar fraction [mole·mole-1]
z axial position [m]
Greek symbols
ε monolith porosity [m3·m-3]
θc,max dimensionless maximum temperature [-] (= E
RTmax )
θCm monolayer coke surface fraction [-]
θCM multilayer coke surface fraction [-]
ζ conversion [-]
λ conductivity [W·m-1·K-1]
ξ dimensionless radial coordinate [-] (= Rr )
ρ density [kg·m-3]
σ selectivity [-]
φ dimensionless axial coordinate [-] (=Lz )
Φv volumetric flow rate [m3·s-1 or Nm3·h-1]
mΦ ′′ mass flux [kg·m-2·s-1]
RCRFR - An experimental study
269
Subscripts
c catalyst phase
C coke
eff effective (i.e. considering the monolith as a pseudo-homogeneous medium)
g gas phase
in inlet
ins insulation material
max maximum
MC methane combustion
ov overall
PC propane combustion
0 initial
∞ pre-exponential; surroundings
Superscripts
endo endothermic reaction phase
exo exothermic reaction phase
het heterogeneous reactions
hom homogeneous reactions
Dimensionless numbers
Bi Biot number (=
+
Rdinseffc
ins
1ln
1
,λλ )
Gz Graetz number (= 2,
,
RCL
gpm
effc
Φλ′′
)
Y dimensionless temperature gradient (=in
in
TTTT
−−
∞
)
Θ maximum temperature number (for definition see Chapter 2)
Chapter 7
270
References
Bernett, C.J., Kolaczkowski, S.T. and Thomas, W.J. (1991). Determination of heterogeneous
reaction kinetics and reaction rates under mass transfer controlled conditions for a monolith
reactor. Trans. I. Chem. E., 69, 209-220.
Blanks, R.F., Wittrig, T.S. and Peterson, D.A. (1990). Bidirectional adiabatic synthesis gas
generator. Chem. Engng Sci., 45, 2407-2413.
Carlslaw, H.S. and Jaeger, J.C. (1959). Conduction of heat in solids. 2nd ed., Clarendon Press,
Oxford, United Kingdom.
Hayes, R.E., Kolaczkowski, S.T., Thomas, W.J. and Titiloye, J. (1996). Transient
experiments and modeling of the catalytic combustion of methane in a monolith reactor. Ind.
Eng. Chem. Res., 35, 406-414.
Neophytides, S.G. and Froment, G.F. (1992). A bench scale study of reversed flow methanol
synthesis. Ind. Eng. Chem. Res., 31, 1583-1589.
Trimm, D.L. and Lam, C.-W. (1980). The combustion of methane on platinum-alumina fibre
catalysts – I. Kinetics and mechanism. Chem. Engng Sci., 35, 1405-1413.
Van de Beld, L. (1995). Air purification by catalytic oxidation in an adiabatic packed bed
reactor with periodic flow reversal. Ph.D. Thesis, Twente University, Enschede, The
Netherlands.
Van de Beld, L. and Westerterp, K.R. (1996). Air purification in a reverse-flow reactor:
model simulations vs. experiments. AIChE J., 42, 1139-1148.
Westbrook, C.K. and Dryer, F.L. (1981). Simplified reaction mechanisms for the oxidation of
hydrocarbon fuels in flames. Combustion Science and Technology, 27, 31-43.
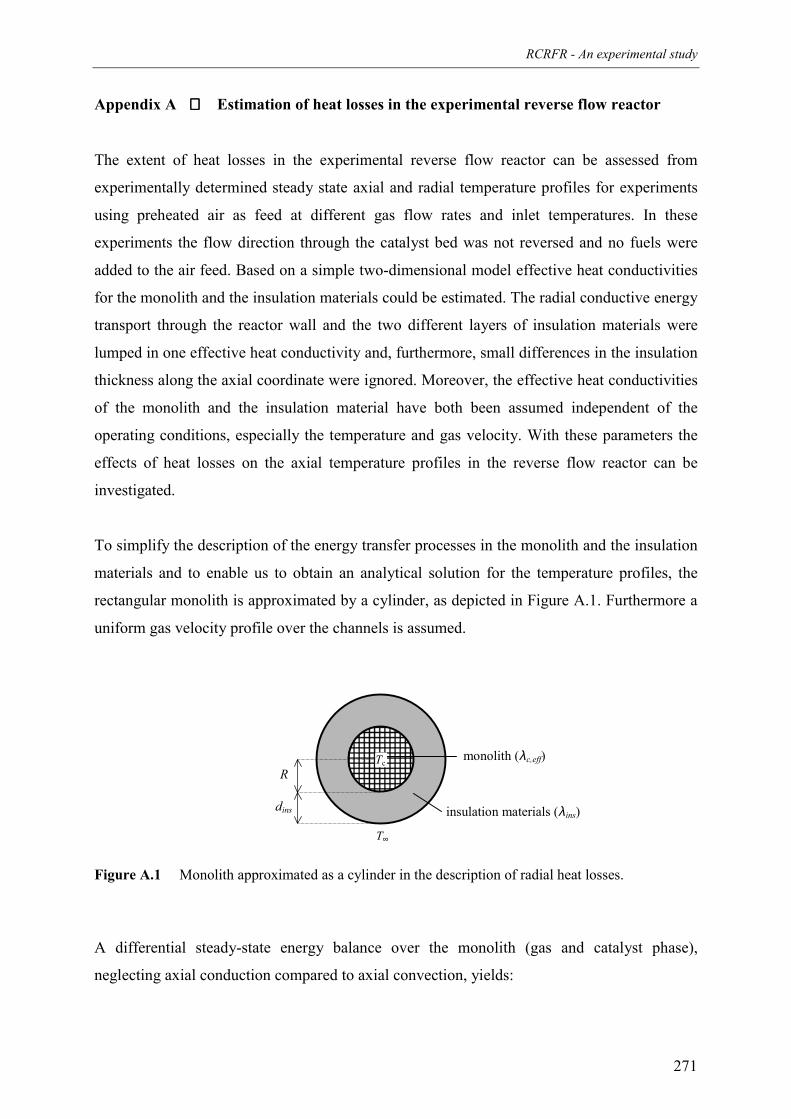
RCRFR - An experimental study
271
Appendix A Estimation of heat losses in the experimental reverse flow reactor
The extent of heat losses in the experimental reverse flow reactor can be assessed from
experimentally determined steady state axial and radial temperature profiles for experiments
using preheated air as feed at different gas flow rates and inlet temperatures. In these
experiments the flow direction through the catalyst bed was not reversed and no fuels were
added to the air feed. Based on a simple two-dimensional model effective heat conductivities
for the monolith and the insulation materials could be estimated. The radial conductive energy
transport through the reactor wall and the two different layers of insulation materials were
lumped in one effective heat conductivity and, furthermore, small differences in the insulation
thickness along the axial coordinate were ignored. Moreover, the effective heat conductivities
of the monolith and the insulation material have both been assumed independent of the
operating conditions, especially the temperature and gas velocity. With these parameters the
effects of heat losses on the axial temperature profiles in the reverse flow reactor can be
investigated.
To simplify the description of the energy transfer processes in the monolith and the insulation
materials and to enable us to obtain an analytical solution for the temperature profiles, the
rectangular monolith is approximated by a cylinder, as depicted in Figure A.1. Furthermore a
uniform gas velocity profile over the channels is assumed.
Figure A.1 Monolith approximated as a cylinder in the description of radial heat losses.
A differential steady-state energy balance over the monolith (gas and catalyst phase),
neglecting axial conduction compared to axial convection, yields:
insulation materials (λins)
monolith (λc,eff)R
dins
Tc
T∞
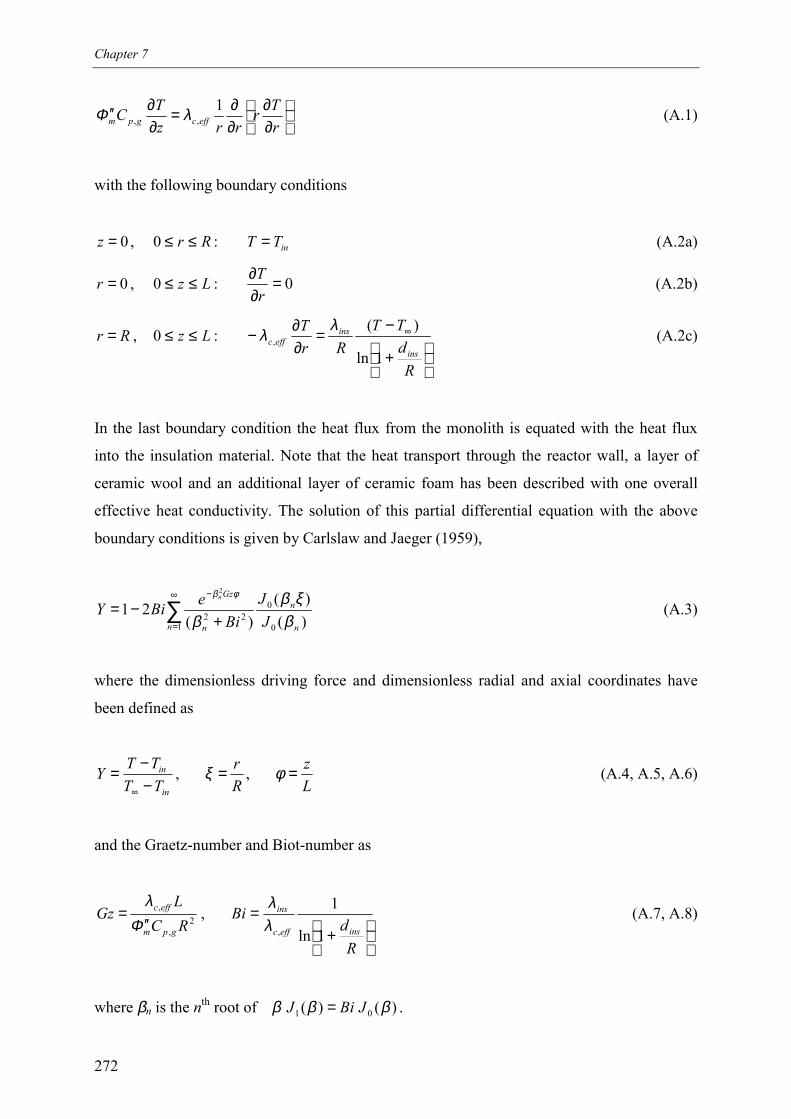
Chapter 7
272
∂∂
∂∂=
∂∂′′
rTr
rrzTC effcgpm
1,, λΦ (A.1)
with the following boundary conditions
0=z , Rr ≤≤0 : inTT = (A.2a)
0=r , Lz ≤≤0 : 0=∂∂
rT (A.2b)
Rr = , Lz ≤≤0 :
+
−=∂∂− ∞
RdTT
RrT
ins
inseffc
1ln
)(,
λλ (A.2c)
In the last boundary condition the heat flux from the monolith is equated with the heat flux
into the insulation material. Note that the heat transport through the reactor wall, a layer of
ceramic wool and an additional layer of ceramic foam has been described with one overall
effective heat conductivity. The solution of this partial differential equation with the above
boundary conditions is given by Carlslaw and Jaeger (1959),
∑∞
=
−
+−=
1 0
022 )(
)()(
212
n n
n
n
Gz
JJ
BieBiY
n
βξβ
β
φβ
(A.3)
where the dimensionless driving force and dimensionless radial and axial coordinates have
been defined as
in
in
TTTTY
−−=
∞
, Rr=ξ ,
Lz=φ (A.4, A.5, A.6)
and the Graetz-number and Biot-number as
2,
,
RCL
Gzgpm
effc
Φλ′′
= ,
+
=
Rd
Biinseffc
ins
1ln
1
,λλ
(A.7, A.8)
where βn is the nth root of )()( 01 βββ JBiJ = .
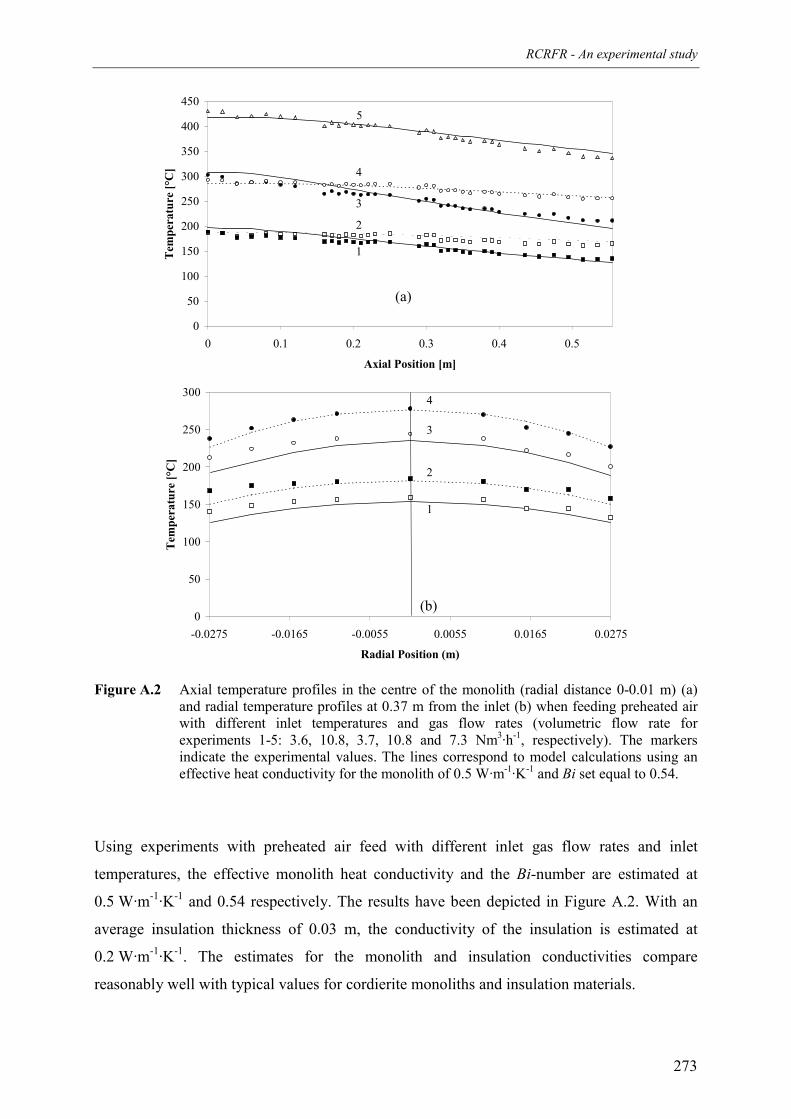
RCRFR - An experimental study
273
0
50
100
150
200
250
300
350
400
450
0 0.1 0.2 0.3 0.4 0.5
Axial Position [m]
Tem
pera
ture
[°C
]
5
1
2
3
4
0
50
100
150
200
250
300
-0.0275 -0.0165 -0.0055 0.0055 0.0165 0.0275
Radial Position (m)
Tem
pera
ture
[°C
]
1
2
3
4
Figure A.2 Axial temperature profiles in the centre of the monolith (radial distance 0-0.01 m) (a)and radial temperature profiles at 0.37 m from the inlet (b) when feeding preheated airwith different inlet temperatures and gas flow rates (volumetric flow rate forexperiments 1-5: 3.6, 10.8, 3.7, 10.8 and 7.3 Nm3·h-1, respectively). The markersindicate the experimental values. The lines correspond to model calculations using aneffective heat conductivity for the monolith of 0.5 W·m-1·K-1 and Bi set equal to 0.54.
Using experiments with preheated air feed with different inlet gas flow rates and inlet
temperatures, the effective monolith heat conductivity and the Bi-number are estimated at
0.5 W·m-1·K-1 and 0.54 respectively. The results have been depicted in Figure A.2. With an
average insulation thickness of 0.03 m, the conductivity of the insulation is estimated at
0.2 W·m-1·K-1. The estimates for the monolith and insulation conductivities compare
reasonably well with typical values for cordierite monoliths and insulation materials.
(a)
(b)
Chapter 7
274
From these experiments it can be concluded that the temperature in the innermost channels is
practically uniform in the direction perpendicular to the average flow direction (see
Figure A.2b). Furthermore, ignoring radial temperature profiles overall radial heat transfer
coefficients can be estimated from the experiments at 2-5 W·m-2·K-1. This is only slightly
higher than the heat transfer coefficient of about 1.6 W·m-2·K-1 in the reverse flow reactor of
Van de Beld (1995) equipped with an evacuated jacket. Especially because of the reactor
dimensions (length and width 0.055 m in this work versus 0.145 m inner diameter of Van de
Beld’s reverse flow reactor) higher overall heat transfer coefficients were expected.
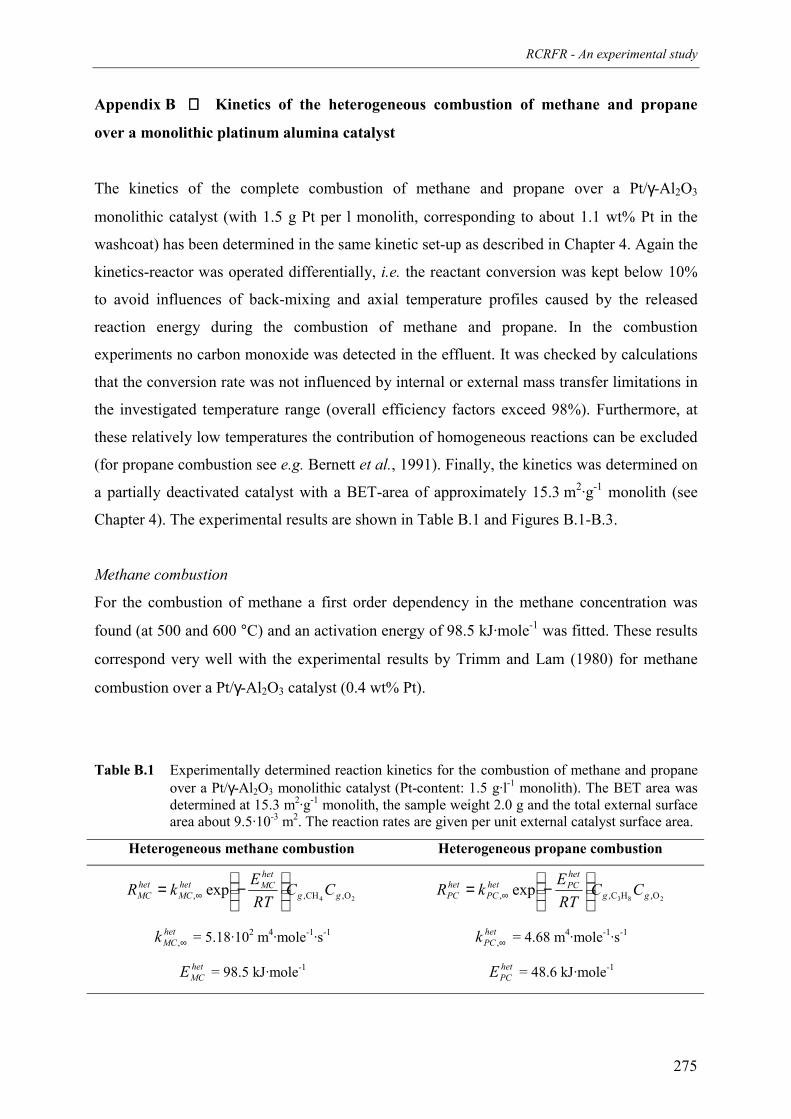
RCRFR - An experimental study
275
Appendix B Kinetics of the heterogeneous combustion of methane and propane
over a monolithic platinum alumina catalyst
The kinetics of the complete combustion of methane and propane over a Pt/γ-Al2O3
monolithic catalyst (with 1.5 g Pt per l monolith, corresponding to about 1.1 wt% Pt in the
washcoat) has been determined in the same kinetic set-up as described in Chapter 4. Again the
kinetics-reactor was operated differentially, i.e. the reactant conversion was kept below 10%
to avoid influences of back-mixing and axial temperature profiles caused by the released
reaction energy during the combustion of methane and propane. In the combustion
experiments no carbon monoxide was detected in the effluent. It was checked by calculations
that the conversion rate was not influenced by internal or external mass transfer limitations in
the investigated temperature range (overall efficiency factors exceed 98%). Furthermore, at
these relatively low temperatures the contribution of homogeneous reactions can be excluded
(for propane combustion see e.g. Bernett et al., 1991). Finally, the kinetics was determined on
a partially deactivated catalyst with a BET-area of approximately 15.3 m2·g-1 monolith (see
Chapter 4). The experimental results are shown in Table B.1 and Figures B.1-B.3.
Methane combustion
For the combustion of methane a first order dependency in the methane concentration was
found (at 500 and 600 °C) and an activation energy of 98.5 kJ·mole-1 was fitted. These results
correspond very well with the experimental results by Trimm and Lam (1980) for methane
combustion over a Pt/γ-Al2O3 catalyst (0.4 wt% Pt).
Table B.1 Experimentally determined reaction kinetics for the combustion of methane and propaneover a Pt/γ-Al2O3 monolithic catalyst (Pt-content: 1.5 g·l-1 monolith). The BET area wasdetermined at 15.3 m2·g-1 monolith, the sample weight 2.0 g and the total external surfacearea about 9.5·10-3 m2. The reaction rates are given per unit external catalyst surface area.
Heterogeneous methane combustion Heterogeneous propane combustion
24 O,CH,, exp gg
hetMChet
MChetMC CC
RTEkR
−= ∞ 283 O,HC,, exp gg
hetPChet
PChetPC CC
RTEkR
−= ∞
hetMCk ∞, = 5.18·102 m4·mole-1·s-1 het
PCk ∞, = 4.68 m4·mole-1·s-1
hetMCE = 98.5 kJ·mole-1 het
PCE = 48.6 kJ·mole-1
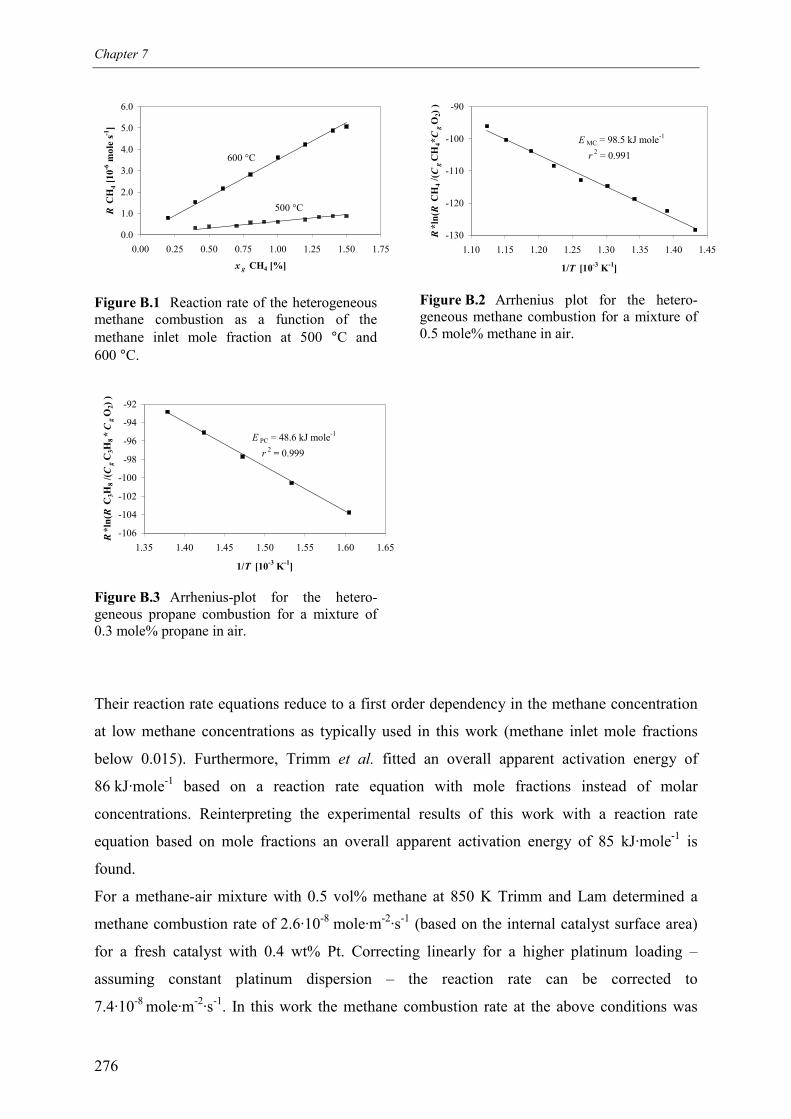
Chapter 7
276
0.0
1.0
2.0
3.0
4.0
5.0
6.0
0.00 0.25 0.50 0.75 1.00 1.25 1.50 1.75
x g CH4 [%]
R C
H4 [
10-6
mol
e s-1
]
600 °C
500 °C
Figure B.1 Reaction rate of the heterogeneousmethane combustion as a function of themethane inlet mole fraction at 500 °C and600 °C.
-106
-104
-102
-100
-98
-96
-94
-92
1.35 1.40 1.45 1.50 1.55 1.60 1.65
1/T [10-3 K-1]
R*l
n(R
C3H
8 /( C
gC
3H8
* C
gO
2) )
E PC = 48.6 kJ mole-1
r 2 = 0.999
Figure B.3 Arrhenius-plot for the hetero-geneous propane combustion for a mixture of0.3 mole% propane in air.
-130
-120
-110
-100
-90
1.10 1.15 1.20 1.25 1.30 1.35 1.40 1.45
1/T [10-3 K-1]
R*l
n(R
CH
4 /( C
gC
H4*
Cg
O2)
)
E MC = 98.5 kJ mole-1
r 2 = 0.991
Figure B.2 Arrhenius plot for the hetero-geneous methane combustion for a mixture of0.5 mole% methane in air.
Their reaction rate equations reduce to a first order dependency in the methane concentration
at low methane concentrations as typically used in this work (methane inlet mole fractions
below 0.015). Furthermore, Trimm et al. fitted an overall apparent activation energy of
86 kJ·mole-1 based on a reaction rate equation with mole fractions instead of molar
concentrations. Reinterpreting the experimental results of this work with a reaction rate
equation based on mole fractions an overall apparent activation energy of 85 kJ·mole-1 is
found.
For a methane-air mixture with 0.5 vol% methane at 850 K Trimm and Lam determined a
methane combustion rate of 2.6·10-8 mole·m-2·s-1 (based on the internal catalyst surface area)
for a fresh catalyst with 0.4 wt% Pt. Correcting linearly for a higher platinum loading –
assuming constant platinum dispersion – the reaction rate can be corrected to
7.4·10-8 mole·m-2·s-1. In this work the methane combustion rate at the above conditions was
RCRFR - An experimental study
277
determined at 1.2·10-6 mole·s-1 for a 1.1 wt% Pt in the washcoat. The internal specific catalyst
surface area was about 15 m2·g-1 and the sample weight was 2.0 g, so that the experimentally
determined reaction rate based on the internal catalyst surface area is about
4·10-8 mole·m-2·s-1, which also corresponds quite reasonably with the experimental results of
Trimm et al. The influence of the oxygen concentration on the methane combustion rate was
not determined in this work. A first order dependency was assumed (based on the rate
equations given by Trimm and Lam, 1980).
Propane combustion
Because of the very high reaction enthalpy of the propane combustion, the propane
combustion rates could only be determined for very low propane concentrations (<0.5 vol%)
at relatively low temperatures (350 – 450 °C). For very low propane concentrations a first
order dependency was found for the propane concentration and an activation energy of only
48.6 kJ·mole-1. For the propane combustion rate over a monolithic Pt-Rh/γ-Al2O3 catalyst
(with 1.4 g·l-1 noble metal loading) Bernett et al. (1991) also found a first order dependency in
the propane concentration with a much higher activation energy of 89.8 kJ·mole-1, also for
very small propane concentrations (<0.4 vol%) and at somewhat lower temperatures (290 –
375 °C). For a propane-air mixture with 0.3 vol% propane at 650 K Bernett et al. determined
a propane disappearance rate of 8.1·10-4 mole·m-2·s-1 (based on the external catalyst surface
area). With the experimental set-up in this work a propane combustion rate of 1.3·10-6
mole·s-1 was observed for the same conditions over a catalyst with approximately the same
platinum loading. With a total external catalyst surface area in the monolith channels of about
9.5·10-3 m2, the experimentally determined reaction rate is 1.4·10-4 mole·m-2·s-1 (based on the
external catalyst surface area). The lower propane combustion rate determined in this work is
probably caused by differences in the catalyst properties, especially the specific catalyst
surface area. The propane combustion rate in this work was determined over a catalyst, which
had been operated at high temperatures (600-700 °C) for significantly long periods of time
(>24 h.), while Bernett et al. used a fresh catalyst, or at least a catalyst which has not been at
high temperatures. As shown in Chapter 4 (Figure 7) the catalytic activity can decrease even
up to a factor of 10 due to sintering and destruction of active sites (e.g. by decrease in
platinum dispersion) at high temperatures. Finally, again a first order in the oxygen
concentration was assumed.
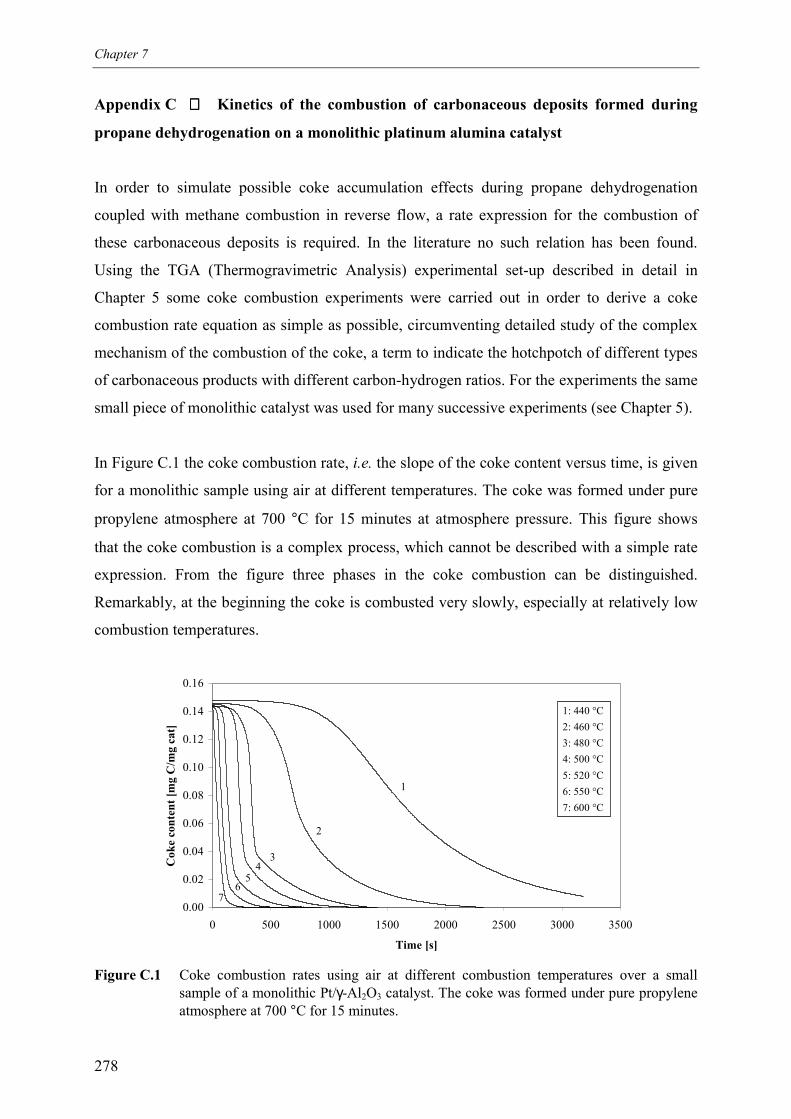
Chapter 7
278
Appendix C Kinetics of the combustion of carbonaceous deposits formed during
propane dehydrogenation on a monolithic platinum alumina catalyst
In order to simulate possible coke accumulation effects during propane dehydrogenation
coupled with methane combustion in reverse flow, a rate expression for the combustion of
these carbonaceous deposits is required. In the literature no such relation has been found.
Using the TGA (Thermogravimetric Analysis) experimental set-up described in detail in
Chapter 5 some coke combustion experiments were carried out in order to derive a coke
combustion rate equation as simple as possible, circumventing detailed study of the complex
mechanism of the combustion of the coke, a term to indicate the hotchpotch of different types
of carbonaceous products with different carbon-hydrogen ratios. For the experiments the same
small piece of monolithic catalyst was used for many successive experiments (see Chapter 5).
In Figure C.1 the coke combustion rate, i.e. the slope of the coke content versus time, is given
for a monolithic sample using air at different temperatures. The coke was formed under pure
propylene atmosphere at 700 °C for 15 minutes at atmosphere pressure. This figure shows
that the coke combustion is a complex process, which cannot be described with a simple rate
expression. From the figure three phases in the coke combustion can be distinguished.
Remarkably, at the beginning the coke is combusted very slowly, especially at relatively low
combustion temperatures.
0.00
0.02
0.04
0.06
0.08
0.10
0.12
0.14
0.16
0 500 1000 1500 2000 2500 3000 3500
Time [s]
Cok
e co
nten
t [m
g C
/mg
cat]
1
2
34
56
7
Figure C.1 Coke combustion rates using air at different combustion temperatures over a smallsample of a monolithic Pt/γ-Al2O3 catalyst. The coke was formed under pure propyleneatmosphere at 700 °C for 15 minutes.
1: 440 °C2: 460 °C3: 480 °C4: 500 °C5: 520 °C6: 550 °C7: 600 °C
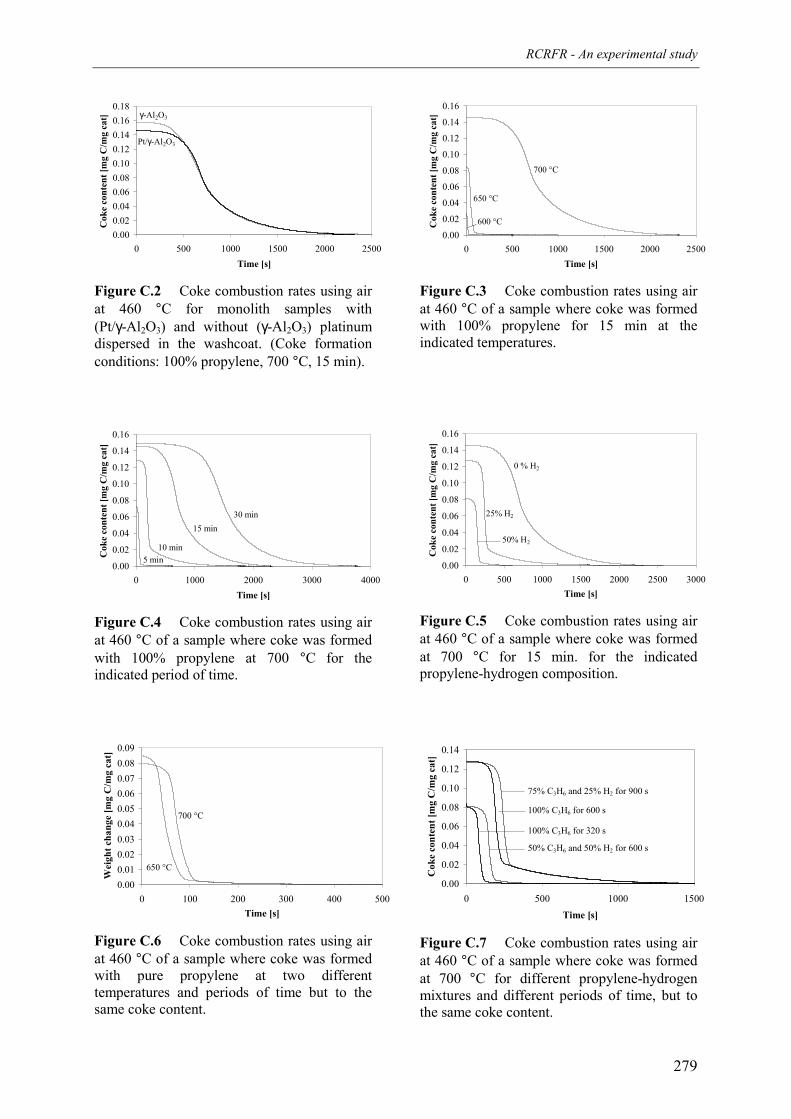
RCRFR - An experimental study
279
0.000.020.040.060.080.100.120.140.160.18
0 500 1000 1500 2000 2500Time [s]
Cok
e co
nten
t [m
g C
/mg
cat] γ-Al2O3
Pt/γ-Al2O3
Figure C.2 Coke combustion rates using airat 460 °C for monolith samples with(Pt/γ-Al2O3) and without (γ-Al2O3) platinumdispersed in the washcoat. (Coke formationconditions: 100% propylene, 700 °C, 15 min).
0.00
0.02
0.04
0.06
0.08
0.10
0.12
0.14
0.16
0 1000 2000 3000 4000Time [s]
Cok
e co
nten
t [m
g C
/mg
cat]
30 min15 min
10 min5 min
Figure C.4 Coke combustion rates using airat 460 °C of a sample where coke was formedwith 100% propylene at 700 °C for theindicated period of time.
0.000.010.020.030.040.050.060.070.080.09
0 100 200 300 400 500Time [s]
Wei
ght c
hang
e [m
g C
/mg
cat]
700 °C
650 °C
Figure C.6 Coke combustion rates using airat 460 °C of a sample where coke was formedwith pure propylene at two differenttemperatures and periods of time but to thesame coke content.
0.00
0.02
0.04
0.06
0.08
0.10
0.12
0.14
0.16
0 500 1000 1500 2000 2500Time [s]
Cok
e co
nten
t [m
g C
/mg
cat]
700 °C
600 °C
650 °C
Figure C.3 Coke combustion rates using airat 460 °C of a sample where coke was formedwith 100% propylene for 15 min at theindicated temperatures.
0.00
0.02
0.04
0.06
0.08
0.10
0.12
0.14
0.16
0 500 1000 1500 2000 2500 3000Time [s]
Cok
e co
nten
t [m
g C
/mg
cat]
0 % H2
50% H2
25% H2
Figure C.5 Coke combustion rates using airat 460 °C of a sample where coke was formedat 700 °C for 15 min. for the indicatedpropylene-hydrogen composition.
0.00
0.02
0.04
0.06
0.08
0.10
0.12
0.14
0 500 1000 1500Time [s]
Cok
e co
nten
t [m
g C
/mg
cat]
100% C3H6 for 600 s
75% C3H6 and 25% H2 for 900 s
100% C3H6 for 320 s
50% C3H6 and 50% H2 for 600 s
Figure C.7 Coke combustion rates using airat 460 °C of a sample where coke was formedat 700 °C for different propylene-hydrogenmixtures and different periods of time, but tothe same coke content.
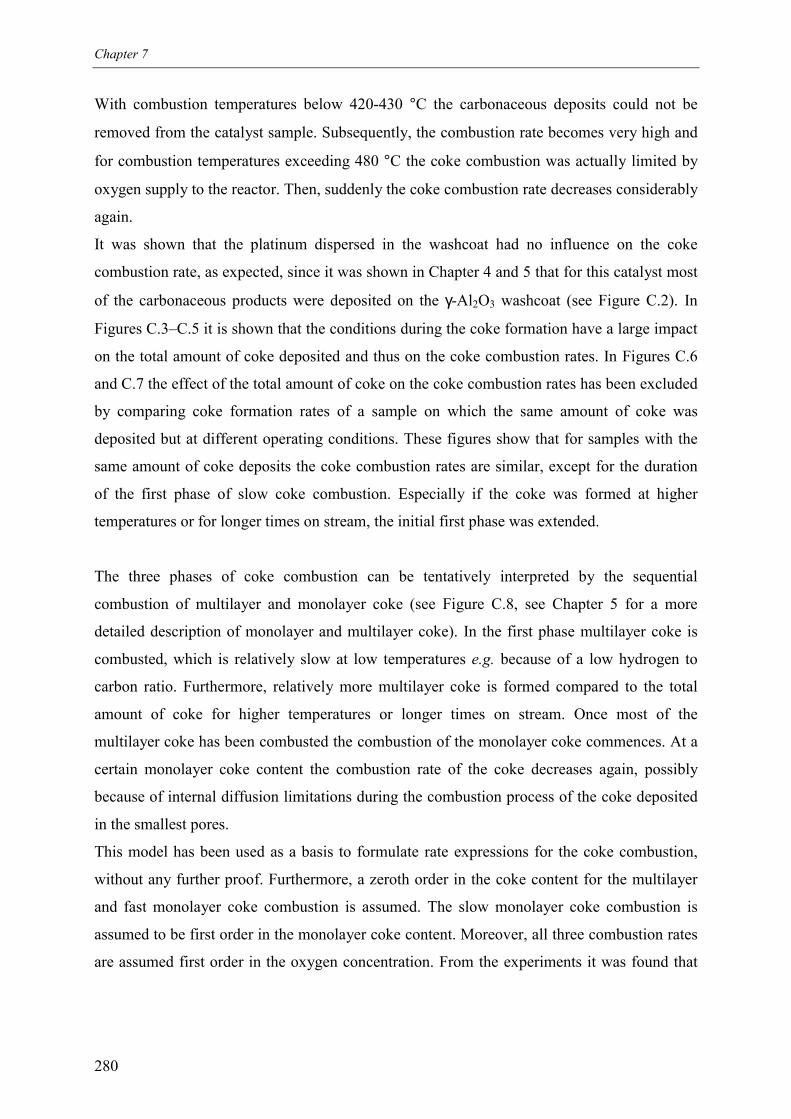
Chapter 7
280
With combustion temperatures below 420-430 °C the carbonaceous deposits could not be
removed from the catalyst sample. Subsequently, the combustion rate becomes very high and
for combustion temperatures exceeding 480 °C the coke combustion was actually limited by
oxygen supply to the reactor. Then, suddenly the coke combustion rate decreases considerably
again.
It was shown that the platinum dispersed in the washcoat had no influence on the coke
combustion rate, as expected, since it was shown in Chapter 4 and 5 that for this catalyst most
of the carbonaceous products were deposited on the γ-Al2O3 washcoat (see Figure C.2). In
Figures C.3–C.5 it is shown that the conditions during the coke formation have a large impact
on the total amount of coke deposited and thus on the coke combustion rates. In Figures C.6
and C.7 the effect of the total amount of coke on the coke combustion rates has been excluded
by comparing coke formation rates of a sample on which the same amount of coke was
deposited but at different operating conditions. These figures show that for samples with the
same amount of coke deposits the coke combustion rates are similar, except for the duration
of the first phase of slow coke combustion. Especially if the coke was formed at higher
temperatures or for longer times on stream, the initial first phase was extended.
The three phases of coke combustion can be tentatively interpreted by the sequential
combustion of multilayer and monolayer coke (see Figure C.8, see Chapter 5 for a more
detailed description of monolayer and multilayer coke). In the first phase multilayer coke is
combusted, which is relatively slow at low temperatures e.g. because of a low hydrogen to
carbon ratio. Furthermore, relatively more multilayer coke is formed compared to the total
amount of coke for higher temperatures or longer times on stream. Once most of the
multilayer coke has been combusted the combustion of the monolayer coke commences. At a
certain monolayer coke content the combustion rate of the coke decreases again, possibly
because of internal diffusion limitations during the combustion process of the coke deposited
in the smallest pores.
This model has been used as a basis to formulate rate expressions for the coke combustion,
without any further proof. Furthermore, a zeroth order in the coke content for the multilayer
and fast monolayer coke combustion is assumed. The slow monolayer coke combustion is
assumed to be first order in the monolayer coke content. Moreover, all three combustion rates
are assumed first order in the oxygen concentration. From the experiments it was found that
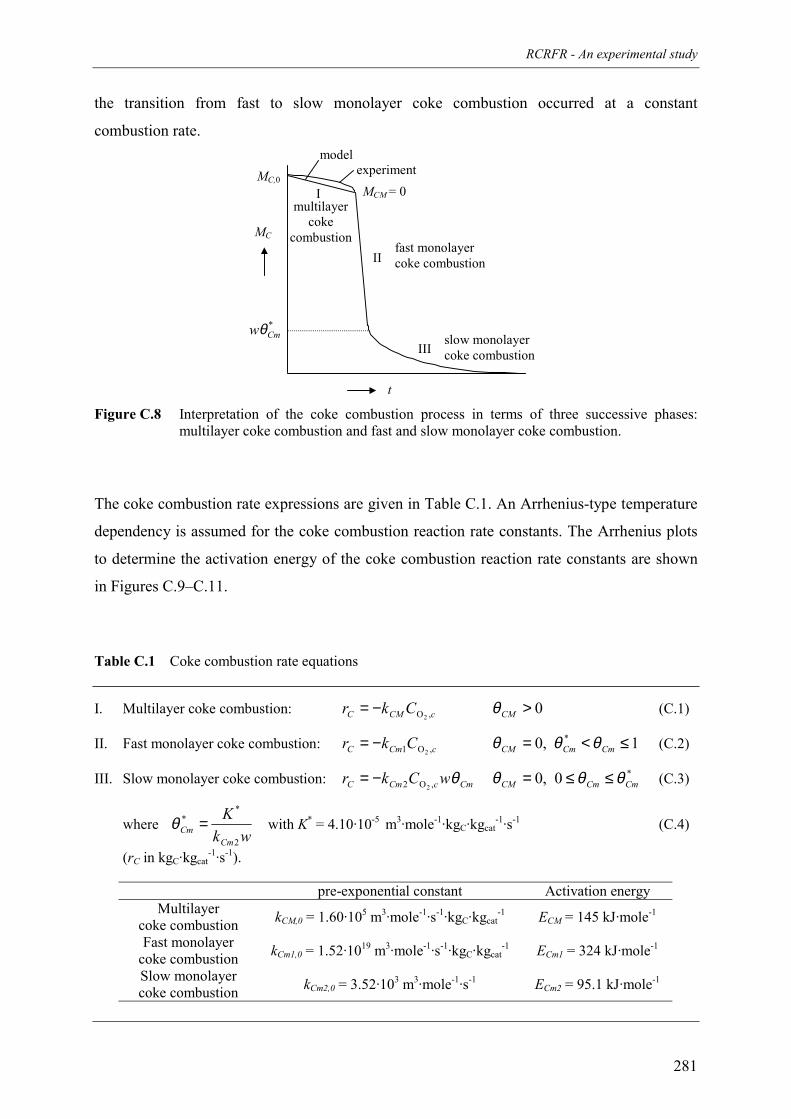
RCRFR - An experimental study
281
the transition from fast to slow monolayer coke combustion occurred at a constant
combustion rate.
Figure C.8 Interpretation of the coke combustion process in terms of three successive phases:multilayer coke combustion and fast and slow monolayer coke combustion.
The coke combustion rate expressions are given in Table C.1. An Arrhenius-type temperature
dependency is assumed for the coke combustion reaction rate constants. The Arrhenius plots
to determine the activation energy of the coke combustion reaction rate constants are shown
in Figures C.9–C.11.
Table C.1 Coke combustion rate equations
I. Multilayer coke combustion: cCMC Ckr ,O2−= 0>CMθ (C.1)
II. Fast monolayer coke combustion: cCmC Ckr ,O1 2−= 1,0 * ≤<= CmCmCM θθθ (C.2)
III. Slow monolayer coke combustion: CmcCmC wCkr θ,O2 2−= *0,0 CmCmCM θθθ ≤≤= (C.3)
wherewk
KCm
Cm2
** =θ with K* = 4.10·10-5
m3·mole-1·kgC·kgcat-1·s-1 (C.4)
(rC in kgC·kgcat-1·s-1).
pre-exponential constant Activation energyMultilayer
coke combustion kCM,0 = 1.60·105 m3·mole-1·s-1·kgC·kgcat-1 ECM = 145 kJ·mole-1
Fast monolayercoke combustion kCm1,0 = 1.52·1019 m3·mole-1·s-1·kgC·kgcat
-1 ECm1 = 324 kJ·mole-1
Slow monolayercoke combustion kCm2,0 = 3.52·103 m3·mole-1·s-1 ECm2 = 95.1 kJ·mole-1
t
MC
*Cmwθ
MC,0MCM = 0
modelexperiment
I
II
IIIslow monolayercoke combustion
fast monolayercoke combustion
multilayercoke
combustion
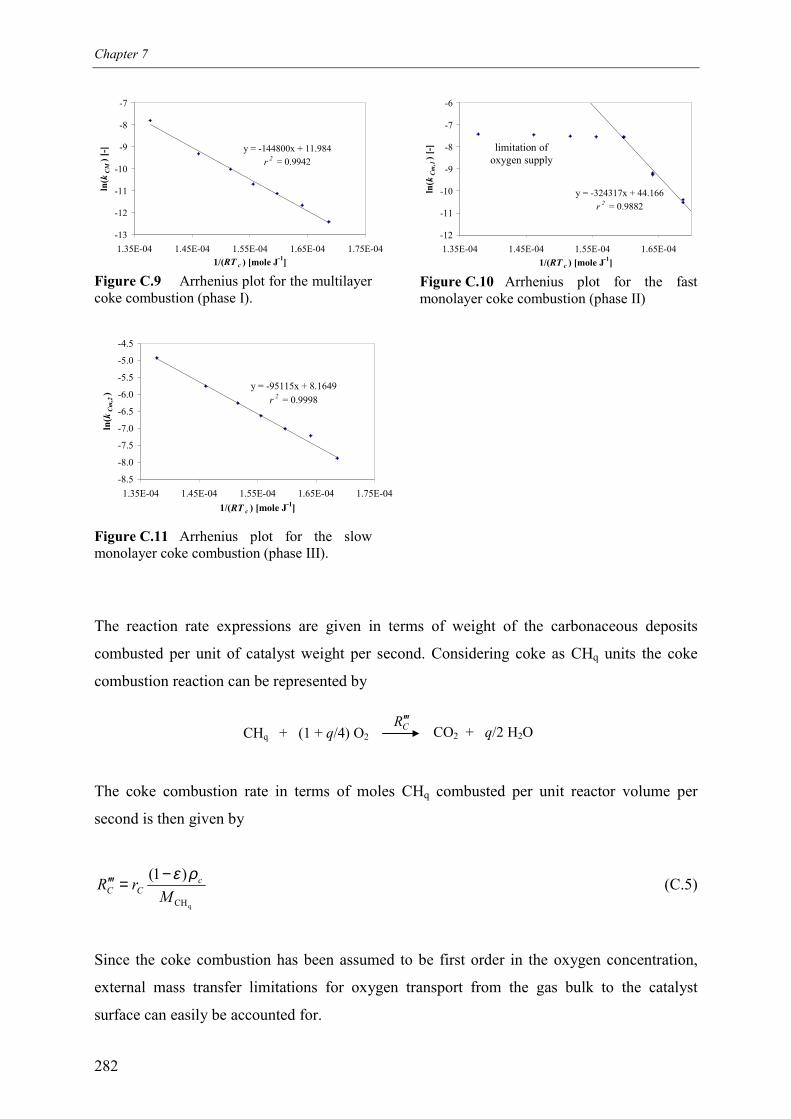
Chapter 7
282
y = -144800x + 11.984r 2 = 0.9942
-13
-12
-11
-10
-9
-8
-7
1.35E-04 1.45E-04 1.55E-04 1.65E-04 1.75E-041/(RT c ) [mole J-1]
ln( k
CM) [
-]
Figure C.9 Arrhenius plot for the multilayercoke combustion (phase I).
y = -95115x + 8.1649r 2 = 0.9998
-8.5
-8.0
-7.5
-7.0
-6.5
-6.0
-5.5
-5.0
-4.5
1.35E-04 1.45E-04 1.55E-04 1.65E-04 1.75E-041/(RT c ) [mole J-1]
ln( k
Cm
,2)
Figure C.11 Arrhenius plot for the slowmonolayer coke combustion (phase III).
y = -324317x + 44.166r 2 = 0.9882
-12
-11
-10
-9
-8
-7
-6
1.35E-04 1.45E-04 1.55E-04 1.65E-041/(RT c ) [mole J-1]
ln( k
Cm
,1) [
-]
Figure C.10 Arrhenius plot for the fastmonolayer coke combustion (phase II)
The reaction rate expressions are given in terms of weight of the carbonaceous deposits
combusted per unit of catalyst weight per second. Considering coke as CHq units the coke
combustion reaction can be represented by
The coke combustion rate in terms of moles CHq combusted per unit reactor volume per
second is then given by
qCH
)1(M
rR cCC
ρε−=′′′ (C.5)
Since the coke combustion has been assumed to be first order in the oxygen concentration,
external mass transfer limitations for oxygen transport from the gas bulk to the catalyst
surface can easily be accounted for.
limitation ofoxygen supply
CHq + (1 + q/4) O2 CO2 + q/2 H2OCR ′′′
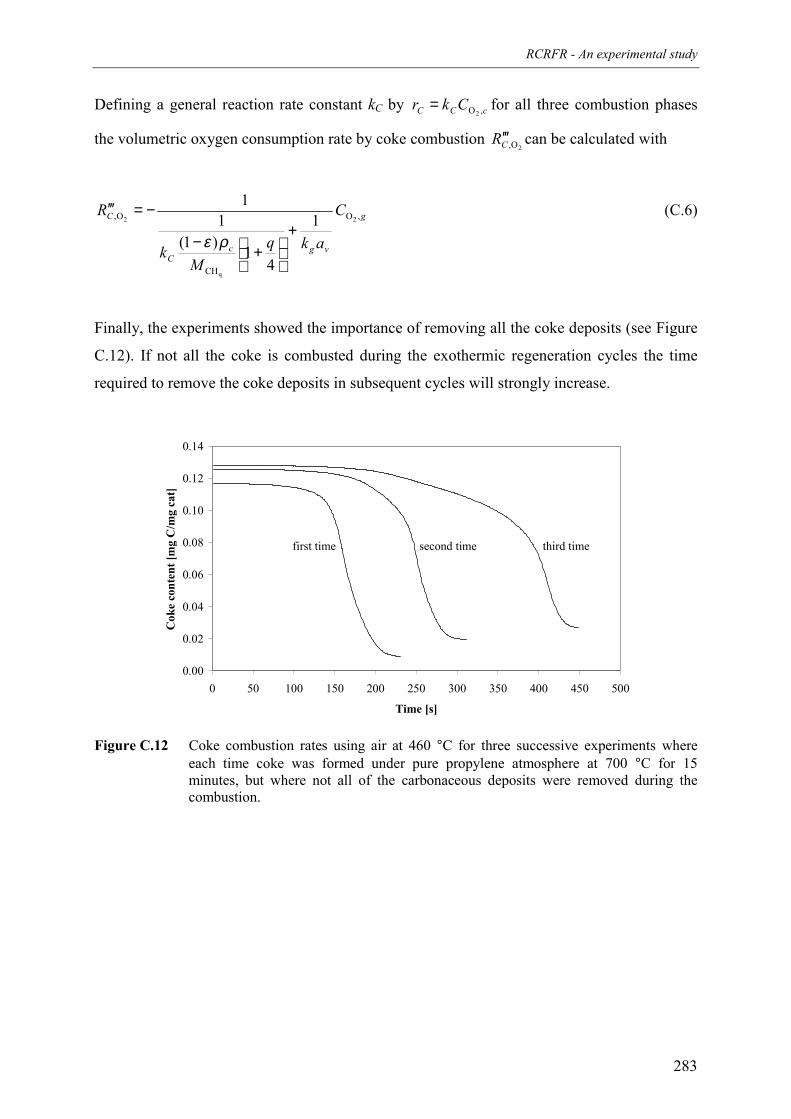
RCRFR - An experimental study
283
Defining a general reaction rate constant kC by cCC Ckr ,O2= for all three combustion phases
the volumetric oxygen consumption rate by coke combustion 2O,CR ′′′ can be calculated with
g
vgcC
C C
akqM
k
R ,O
CH
O, 2
q
2 1
41)1(
11
+
+−
−=′′′
ρε
(C.6)
Finally, the experiments showed the importance of removing all the coke deposits (see Figure
C.12). If not all the coke is combusted during the exothermic regeneration cycles the time
required to remove the coke deposits in subsequent cycles will strongly increase.
0.00
0.02
0.04
0.06
0.08
0.10
0.12
0.14
0 50 100 150 200 250 300 350 400 450 500
Time [s]
Cok
e co
nten
t [m
g C
/mg
cat]
first time second time third time
Figure C.12 Coke combustion rates using air at 460 °C for three successive experiments whereeach time coke was formed under pure propylene atmosphere at 700 °C for 15minutes, but where not all of the carbonaceous deposits were removed during thecombustion.

284
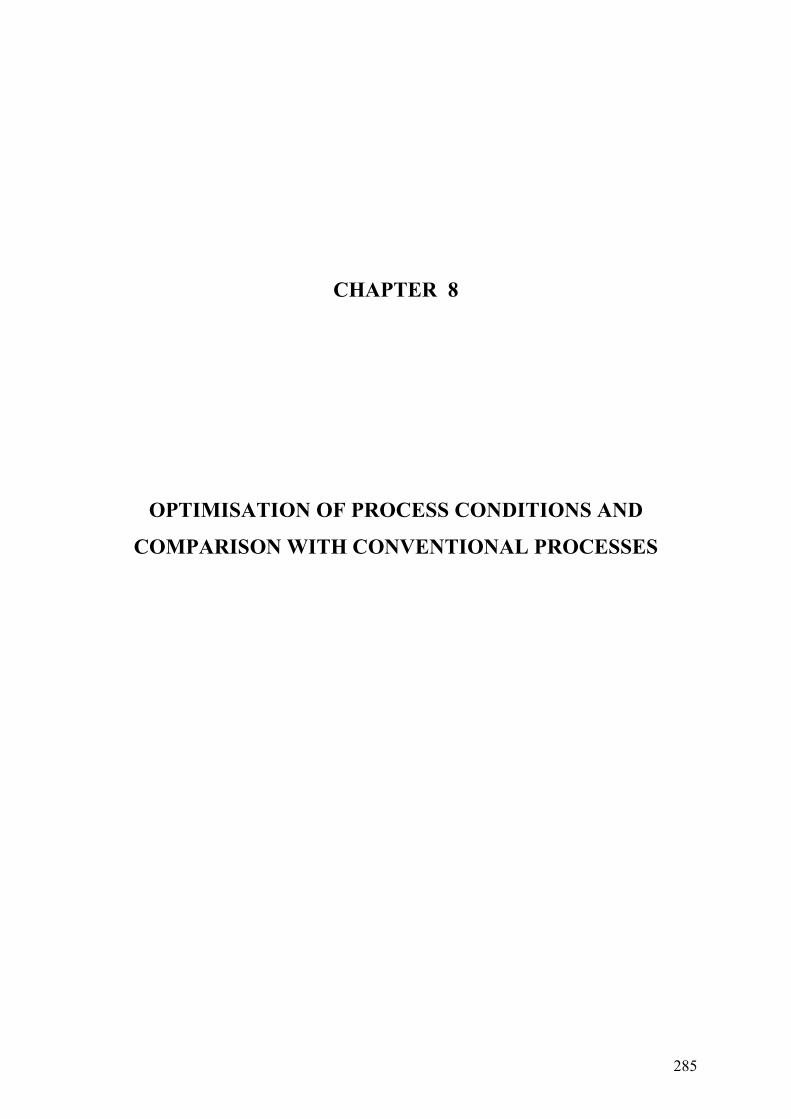
285
CHAPTER 8
OPTIMISATION OF PROCESS CONDITIONS AND
COMPARISON WITH CONVENTIONAL PROCESSES
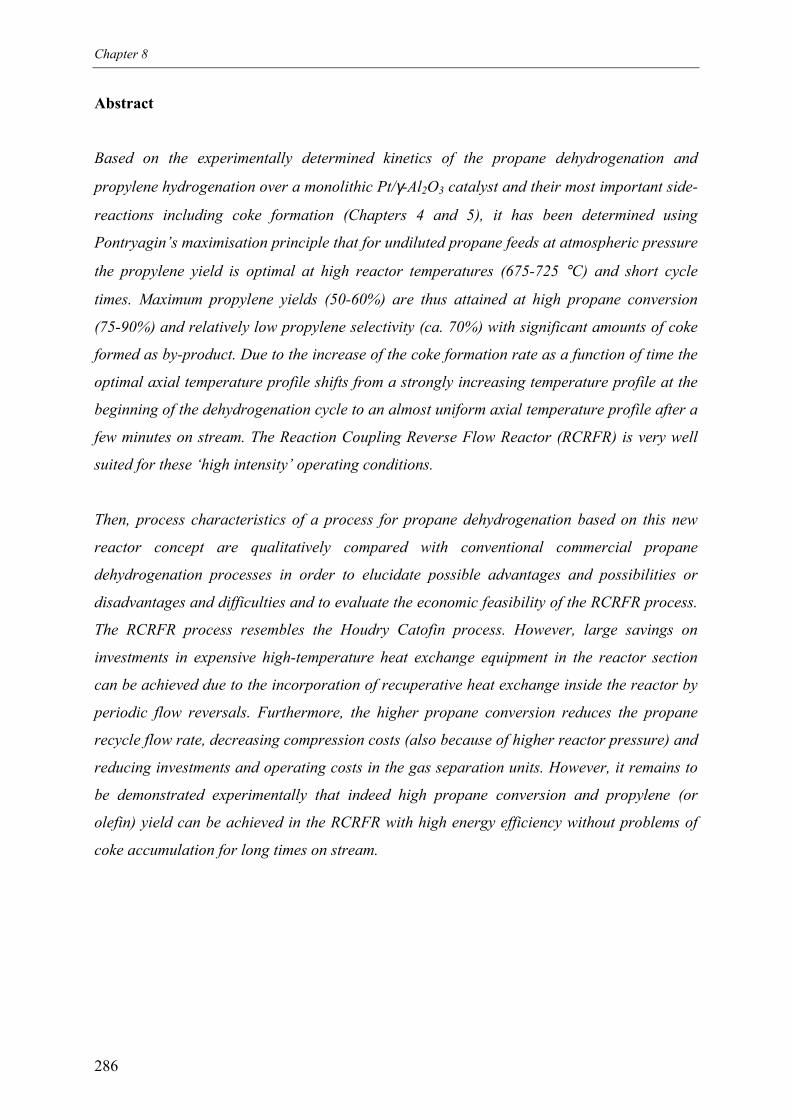
Chapter 8
286
Abstract
Based on the experimentally determined kinetics of the propane dehydrogenation and
propylene hydrogenation over a monolithic Pt/γ-Al2O3 catalyst and their most important side-
reactions including coke formation (Chapters 4 and 5), it has been determined using
Pontryagin’s maximisation principle that for undiluted propane feeds at atmospheric pressure
the propylene yield is optimal at high reactor temperatures (675-725 °C) and short cycle
times. Maximum propylene yields (50-60%) are thus attained at high propane conversion
(75-90%) and relatively low propylene selectivity (ca. 70%) with significant amounts of coke
formed as by-product. Due to the increase of the coke formation rate as a function of time the
optimal axial temperature profile shifts from a strongly increasing temperature profile at the
beginning of the dehydrogenation cycle to an almost uniform axial temperature profile after a
few minutes on stream. The Reaction Coupling Reverse Flow Reactor (RCRFR) is very well
suited for these ‘high intensity’ operating conditions.
Then, process characteristics of a process for propane dehydrogenation based on this new
reactor concept are qualitatively compared with conventional commercial propane
dehydrogenation processes in order to elucidate possible advantages and possibilities or
disadvantages and difficulties and to evaluate the economic feasibility of the RCRFR process.
The RCRFR process resembles the Houdry Catofin process. However, large savings on
investments in expensive high-temperature heat exchange equipment in the reactor section
can be achieved due to the incorporation of recuperative heat exchange inside the reactor by
periodic flow reversals. Furthermore, the higher propane conversion reduces the propane
recycle flow rate, decreasing compression costs (also because of higher reactor pressure) and
reducing investments and operating costs in the gas separation units. However, it remains to
be demonstrated experimentally that indeed high propane conversion and propylene (or
olefin) yield can be achieved in the RCRFR with high energy efficiency without problems of
coke accumulation for long times on stream.
Optimisation of process conditions and comparison with conventional processes
287
1. Introduction
In this thesis a new reactor concept has been developed aiming for high energy-efficiency
through multi-functionality. Energy supply, catalyst regeneration and recuperative heat
exchange are all integrated inside the reactor by carrying out consecutively endothermic and
exothermic cycles in reverse flow. The applicability of the new reactor concept, termed
‘Reaction Coupling Reverse Flow Reactor’ (RCRFR), has been studied for the non-oxidative
propane dehydrogenation over a Pt/γ-Al2O3 monolithic catalyst.
In Chapters 2 and 3 it has been studied on the basis of detailed modelling how the operating
conditions of the endothermic and exothermic reaction phases need to be matched in order to
achieve a cyclic steady state. It has been shown that for a switching scheme with an inherently
zero differential creep velocity the endothermic inlet concentration can be optimised
independently of the gas velocities, while controlling the maximum temperature at high
throughput and maximum energy efficiency. Furthermore, simulation results have
demonstrated that by employing less active sections installed at either end of an active
catalyst bed and completely inactive sections at the reactor ends and using combined propane
and methane combustion for the exothermic reaction phase full equilibrium conversion and
recuperative heat exchange can be achieved simultaneously even for reversible endothermic
reactions, while controlling the maximum temperature and the plateau temperature. An
experimental proof of principle of the reactor concept has been given in a small laboratory
scale reverse flow reactor, as described in Chapter 7. Due to the low inlet and outlet
temperatures resulting from the reverse flow concept and low axial dispersion of a monolithic
catalyst purge-cycles with nitrogen between the endothermic and exothermic cycles could
safely be omitted (see also Chapter 6).
The non-oxidative propane dehydrogenation over a monolithic catalyst was identified as a
very interesting reaction system for operation in reverse flow coupled with fuel combustion,
especially because the inherently short cycle times (as a consequence of the energy
constraints) allows operation at more severe reaction conditions with higher equilibrium
conversions. The reaction kinetics of the propane dehydrogenation – propylene hydrogenation
and the most important side-reactions, including propane cracking, propane and propylene
hydrogenolysis and coke formation, have been determined for wide temperature and
concentration ranges (see Chapters 4 and 5). Based on the derived reaction kinetics optimal
Chapter 8
288
process conditions, particularly the optimal axial temperature profile, can be determined for
the propane dehydrogenation. Obviously, a true optimisation of the operating conditions in a
propane dehydrogenation reactor would involve an economic optimisation of an entire
production facility minimising the investment and production costs for all process units
including all gas separation units and compression and heat exchange equipment. However,
because the operation and investment costs increase with decreasing propane conversions (per
pass) due to an increased propane recycle and simultaneously the revenues decrease with
decreasing propylene selectivities, the optimal process conditions can be approximated by the
reaction conditions for maximum propylene yield. In this chapter optimal axial temperature
profiles for maximum propylene yield are determined based on the experimentally derived
reaction kinetics for the propane dehydrogenation reaction system. Based on these results
possible benefits of operation at more severe reaction conditions with higher equilibrium
conversions can be assessed.
Then, characteristics of a process for the propane dehydrogenation based on this new reactor
concept are qualitatively compared with conventional processes for propane dehydrogenation
in order to elucidate possible advantages and possibilities or disadvantages and difficulties
and to evaluate the economic feasibility of the RCRFR.
2. Optimal axial temperature profiles for the propane dehydrogenation
Many authors have noted benefits of increasing temperatures along the axial coordinate for
the propane dehydrogenation. Higher propane conversion and energy efficiency were reported
by Ercan and Gartside (1996) for a recent modification of the commercial Houdry Catofin
process for propane dehydrogenation due to an increasing temperature profile, achieved by
feeding the regenerating gas in counter-current flow to the process gas. In the classical
Houdry Catofin process the regeneration and process gasses are fed in the same direction,
resulting in a decreasing temperature profile.
Stitt et al. (1999) compared the overall reactor performance for different forms of temperature
profiles, viz. uniform, linear and exponential increase and decrease via numerical modelling.
In their model they simply imposed selected forms of axial temperature profiles and compared
the resulting overall propane conversion and propylene selectivity and coke content profiles,
and found surprisingly little influence of the form of the axial temperature profile on the
Optimisation of process conditions and comparison with conventional processes
289
overall reactor performance. In their reactor model they assumed that all by-products are
formed directly from propane according to a simple first order rate expression for the side-
reactions. They did take the decrease in the catalyst activity due to coke formation into
account using a first order deactivation model, however, they assumed that carbonaceous
deposits originate from propane instead of propylene and ignored the important complex
composition and time dependency of the coke formation rates. Especially the influence of the
hydrogen concentration on the coke formation rates should be included in order to predict the
coke formation rates correctly at the investigated temperature range (see Chapter 5). Finally,
Stitt et al. only considered temperature profiles with the same average temperature of only
600 °C and assumed a constant GHSV of 4000 hr-1 (resulting in calculated overall propylene
yields of only ca. 25%) without examining the important effect of different average
temperatures and gas residence times.
Using the derived reaction kinetics for the propane dehydrogenation – propylene
hydrogenation and their most important side reactions over a Pt/γ-Al2O3 monolithic catalyst,
optimal axial temperature profiles for maximum propylene yield for this catalyst can be
calculated using Pontryagin’s maximisation principle. Because the coke formation rates
change as a function of time on stream also the optimal axial temperature profiles change with
time. Especially the influences of the time on stream for very short operating times, the
influence of the gas residence time and the effect of hydrogen dilution on the optimal axial
temperature profile and propane conversion and propylene selectivity are investigated.
2.1 Optimisation model
The most important model assumptions are as follows:
1. The reactor is entirely filled with the same active monolithic catalyst (uniform platinum
loading) with the same catalyst properties as for which the kinetics was determined. Due
to the small washcoat thickness and high specific external catalyst surface area internal
and external mass transfer limitations for the conversion rate of the propane
dehydrogenation-propylene hydrogenation and their side reactions are absent.
Furthermore, for a monolithic catalyst axial dispersion and the pressure drop can be
neglected. The pressure was kept constant at atmospheric conditions.
Chapter 8
290
2. The time-dependency of the reaction rates of the propane dehydrogenation and its side
reactions is neglected. The ‘pseudo’ steady state reaction kinetics over a coked catalyst
have been taken for the optimisation. Without a hydrogen reduction cycle prior to the
dehydrogenation cycle (as in the RCRFR) and especially for a pure propane feed the
asymptotic steady state is approached quickly. Furthermore, the benefits of a higher
catalyst activity at the ‘initial’ catalyst conditions might be lost due to lower propylene
selectivity. Adsorption phenomena taking place at the beginning of the propane
dehydrogenation cycle have been ignored.
3. At low propane dehydrogenation cycle times the formation of multilayer coke can be
neglected. For the RCRFR the propane dehydrogenation cycle time should actually be
chosen small enough to avoid the formation of multilayer coke, since multilayer coke
considerably retards the regeneration of the catalyst, see Appendix C of Chapter 7. With
the coke model derived in Chapter 5 the coke formation rate for short times on stream can
be represented by
( ) tkkwm CPRCC3
,0HC 631 θερ −=& (1)
4. Hydrogen formation during coke formation is ignored. For the very short cycle times
considered in this work high hydrogen to carbon ratio of the carbonaceous deposits are
expected. The conversion rate of propylene to carbonaceous deposits is then given by
CC mr &−=,HC 63(2)
The decrease in the total mass flux due to carbon deposition is, however, taken into
account.
5. The maximum allowable temperature is specified at a high value of 750 °C. At even
higher temperatures the catalyst activity might deteriorate enormously by sintering of the
washcoat and losses of platinum dispersion. It should be noted that the reaction kinetics
was determined up to temperatures of 675 °C, so that some extrapolation is required.
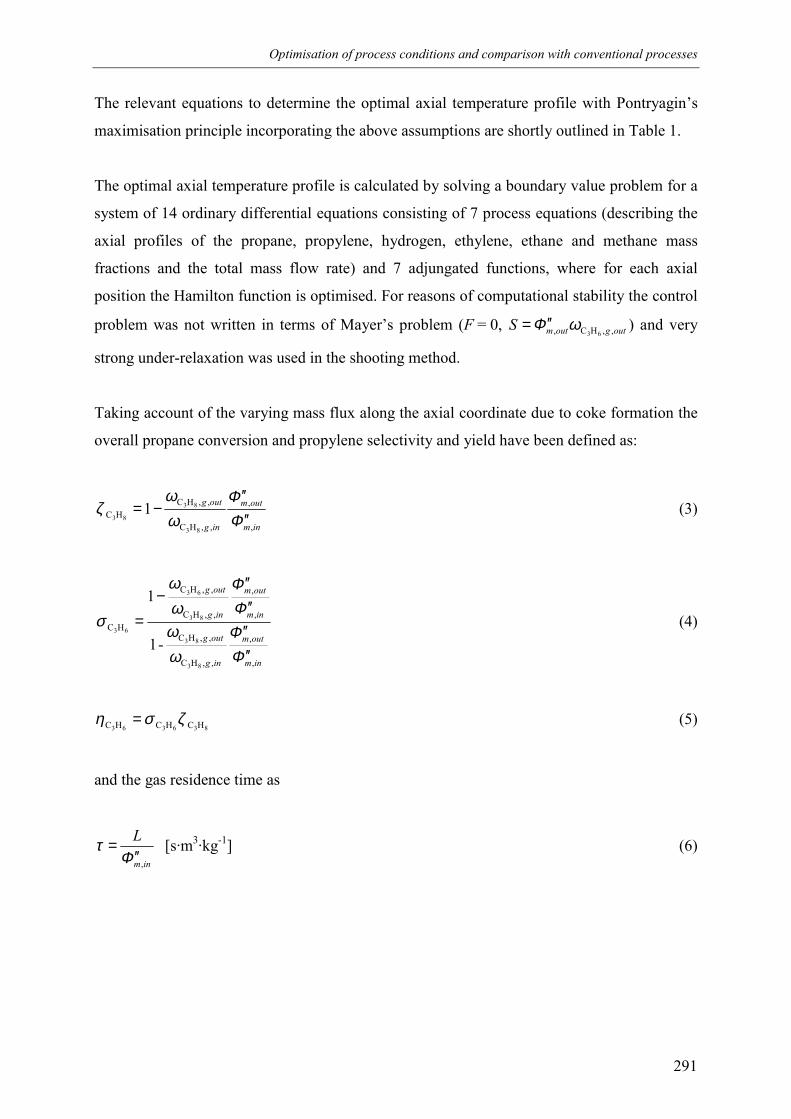
Optimisation of process conditions and comparison with conventional processes
291
The relevant equations to determine the optimal axial temperature profile with Pontryagin’s
maximisation principle incorporating the above assumptions are shortly outlined in Table 1.
The optimal axial temperature profile is calculated by solving a boundary value problem for a
system of 14 ordinary differential equations consisting of 7 process equations (describing the
axial profiles of the propane, propylene, hydrogen, ethylene, ethane and methane mass
fractions and the total mass flow rate) and 7 adjungated functions, where for each axial
position the Hamilton function is optimised. For reasons of computational stability the control
problem was not written in terms of Mayer’s problem (F = 0, outgoutmS ,,HC, 63ωΦ ′′= ) and very
strong under-relaxation was used in the shooting method.
Taking account of the varying mass flux along the axial coordinate due to coke formation the
overall propane conversion and propylene selectivity and yield have been defined as:
inm
outm
ing
outg
,
,
,,HC
,,HCHC
83
83
831
ΦΦ
ωω
ζ′′′′
−= (3)
inm
outm
ing
outg
inm
outm
ing
outg
,
,
,,HC
,,HC
,
,
,,HC
,,HC
HC
83
83
83
63
63
-1
1
ΦΦ
ωω
ΦΦ
ωω
σ
′′′′′′′′
−= (4)
836363 HCHCHC ζση = (5)
and the gas residence time as
inm
L,Φ
τ′′
= [s·m3·kg-1] (6)
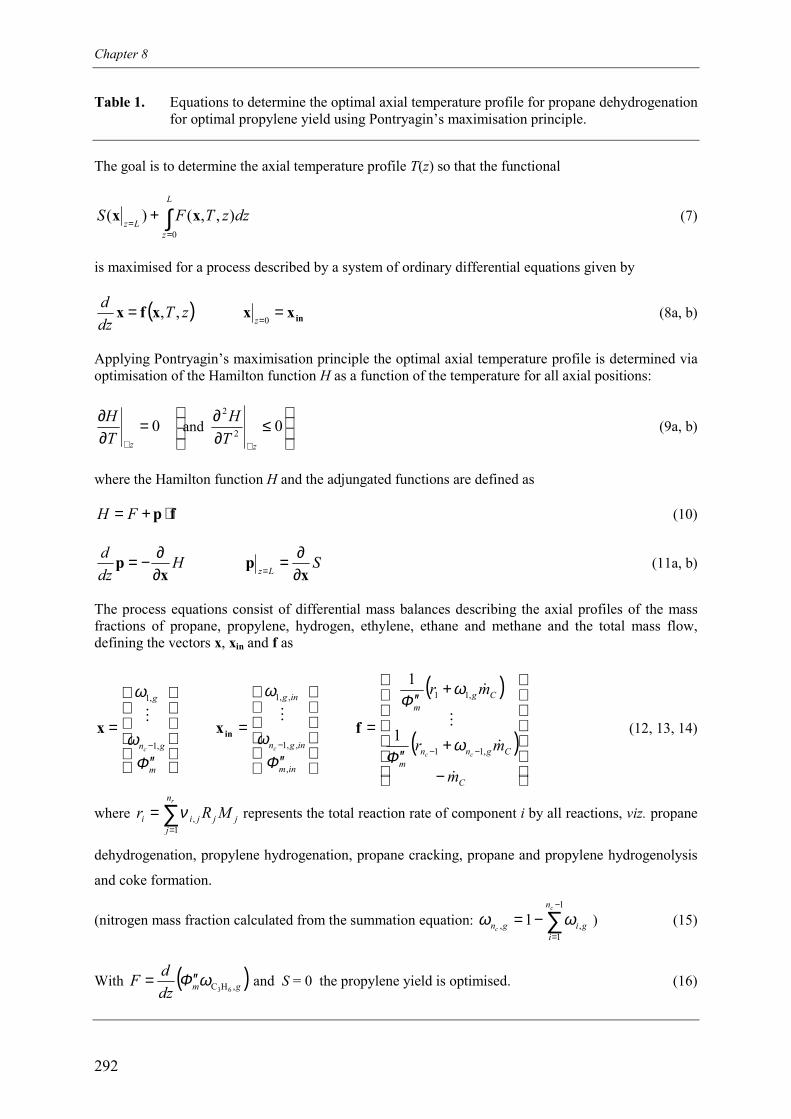
Chapter 8
292
Table 1. Equations to determine the optimal axial temperature profile for propane dehydrogenationfor optimal propylene yield using Pontryagin’s maximisation principle.
The goal is to determine the axial temperature profile T(z) so that the functional
∫=
=+
L
zLz
dzzTFS0
),,()( xx (7)
is maximised for a process described by a system of ordinary differential equations given by
( )zTdzd ,,xfx = inxx =
=0z(8a, b)
Applying Pontryagin’s maximisation principle the optimal axial temperature profile is determined viaoptimisation of the Hamilton function H as a function of the temperature for all axial positions:
≤
∂∂=
∂∂
∀∀
0 0 2
2
andzz T
HTH
(9a, b)
where the Hamilton function H and the adjungated functions are defined as
fp ⋅+= FH (10)
Hdzd
xp
∂∂−= S
Lz xp
∂∂=
=(11a, b)
The process equations consist of differential mass balances describing the axial profiles of the massfractions of propane, propylene, hydrogen, ethylene, ethane and methane and the total mass flow,defining the vectors x, xin and f as
′′
=−
m
gn
g
c
Φω
ω
,1
,1
Mx
′′
=−
inm
ingn
ing
c
,
,,1
,,1
Φω
ωM
inx
( )
( )
−
+′′
+′′
=−−
C
Cgnnm
Cgm
m
mr
mr
cc
&
&
M
&
,11
,11
1
1
ωΦ
ωΦ
f (12, 13, 14)
where ∑=
=rn
jjjjii MRr
1,ν represents the total reaction rate of component i by all reactions, viz. propane
dehydrogenation, propylene hydrogenation, propane cracking, propane and propylene hydrogenolysis
and coke formation.
(nitrogen mass fraction calculated from the summation equation: ∑−
=
−=1
1,, 1
c
c
n
igign ωω ) (15)
With ( )gmdzdF ,HC 63
ωΦ ′′= and S = 0 the propylene yield is optimised. (16)
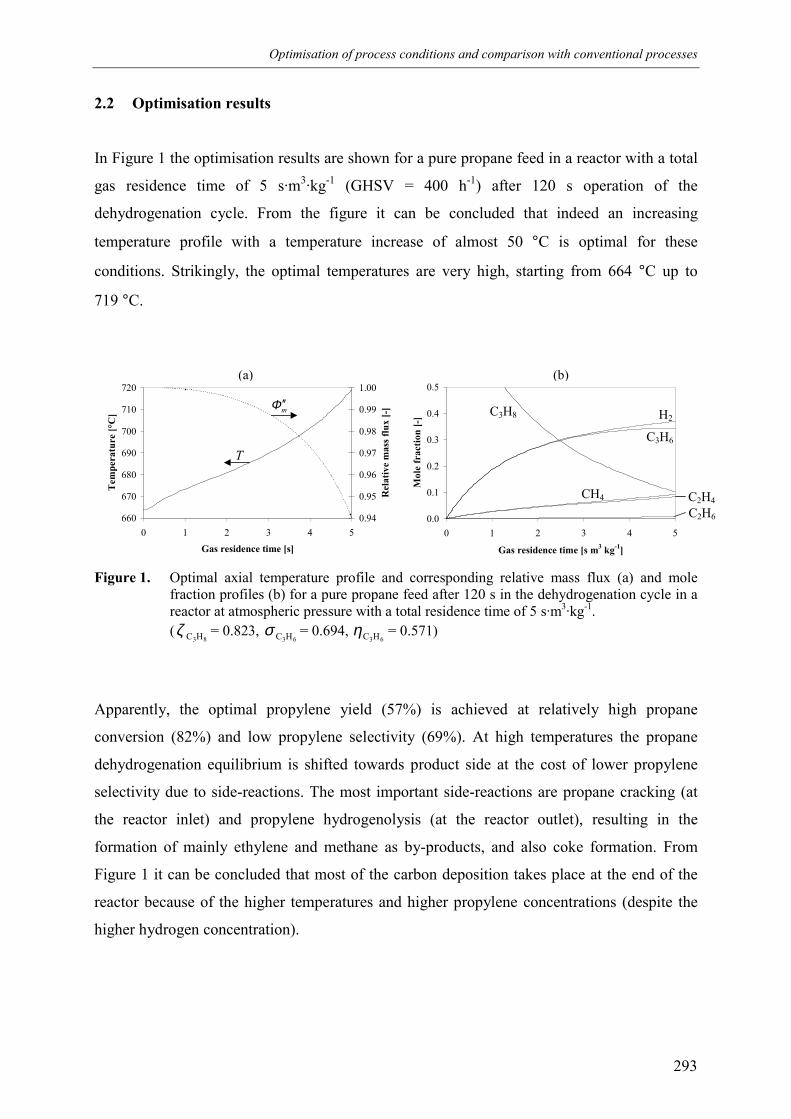
Optimisation of process conditions and comparison with conventional processes
293
2.2 Optimisation results
In Figure 1 the optimisation results are shown for a pure propane feed in a reactor with a total
gas residence time of 5 s·m3·kg-1 (GHSV = 400 h-1) after 120 s operation of the
dehydrogenation cycle. From the figure it can be concluded that indeed an increasing
temperature profile with a temperature increase of almost 50 °C is optimal for these
conditions. Strikingly, the optimal temperatures are very high, starting from 664 °C up to
719 °C.
660
670
680
690
700
710
720
0 1 2 3 4 5
Gas residence time [s]
Tem
pera
ture
[°C
]
0.94
0.95
0.96
0.97
0.98
0.99
1.00R
elat
ive
mas
s flu
x [-
]
0.0
0.1
0.2
0.3
0.4
0.5
0 1 2 3 4 5
Gas residence time [s m3 kg-1]
Mol
e fr
actio
n [-
]
Figure 1. Optimal axial temperature profile and corresponding relative mass flux (a) and molefraction profiles (b) for a pure propane feed after 120 s in the dehydrogenation cycle in areactor at atmospheric pressure with a total residence time of 5 s·m3·kg-1.(
83HCζ = 0.823, 63HCσ = 0.694,
63HCη = 0.571)
Apparently, the optimal propylene yield (57%) is achieved at relatively high propane
conversion (82%) and low propylene selectivity (69%). At high temperatures the propane
dehydrogenation equilibrium is shifted towards product side at the cost of lower propylene
selectivity due to side-reactions. The most important side-reactions are propane cracking (at
the reactor inlet) and propylene hydrogenolysis (at the reactor outlet), resulting in the
formation of mainly ethylene and methane as by-products, and also coke formation. From
Figure 1 it can be concluded that most of the carbon deposition takes place at the end of the
reactor because of the higher temperatures and higher propylene concentrations (despite the
higher hydrogen concentration).
(a) (b)
mΦ ′′
T
C3H8 H2
C3H6
CH4 C2H4C2H6
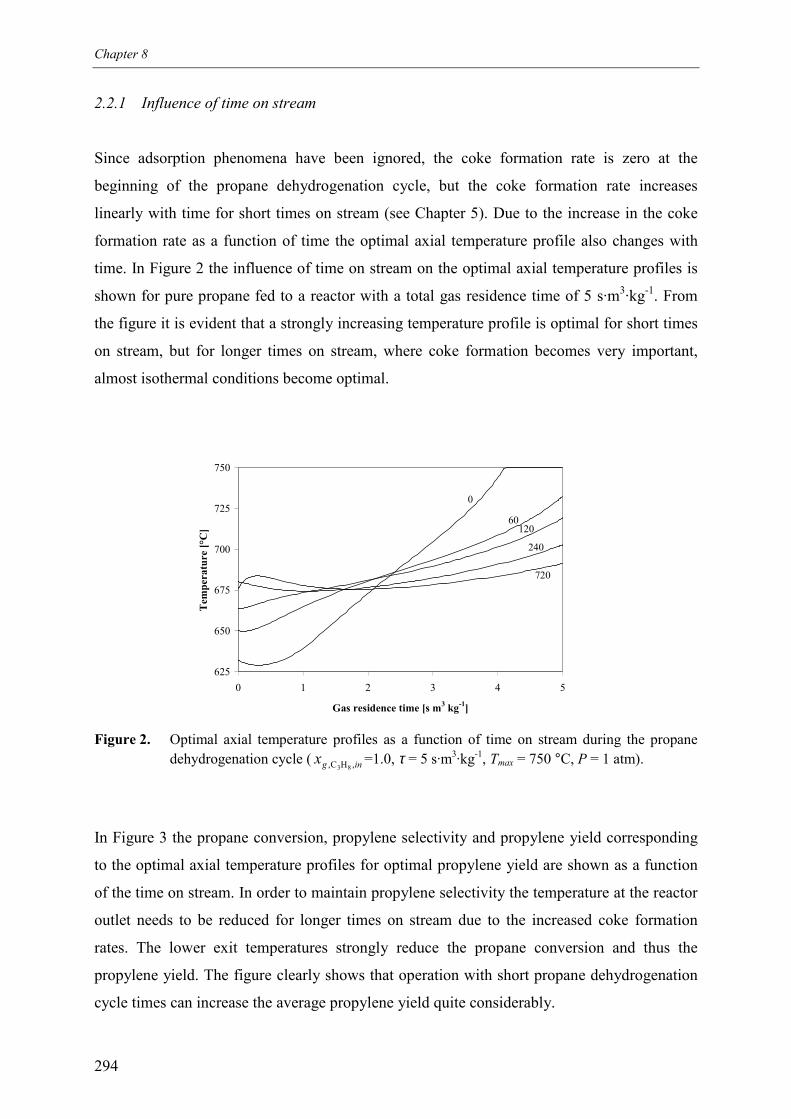
Chapter 8
294
2.2.1 Influence of time on stream
Since adsorption phenomena have been ignored, the coke formation rate is zero at the
beginning of the propane dehydrogenation cycle, but the coke formation rate increases
linearly with time for short times on stream (see Chapter 5). Due to the increase in the coke
formation rate as a function of time the optimal axial temperature profile also changes with
time. In Figure 2 the influence of time on stream on the optimal axial temperature profiles is
shown for pure propane fed to a reactor with a total gas residence time of 5 s·m3·kg-1. From
the figure it is evident that a strongly increasing temperature profile is optimal for short times
on stream, but for longer times on stream, where coke formation becomes very important,
almost isothermal conditions become optimal.
625
650
675
700
725
750
0 1 2 3 4 5
Gas residence time [s m3 kg-1]
Tem
pera
ture
[°C
]
0
60120
240
720
Figure 2. Optimal axial temperature profiles as a function of time on stream during the propanedehydrogenation cycle ( ingx ,HC, 83
=1.0, τ = 5 s·m3·kg-1, Tmax = 750 °C, P = 1 atm).
In Figure 3 the propane conversion, propylene selectivity and propylene yield corresponding
to the optimal axial temperature profiles for optimal propylene yield are shown as a function
of the time on stream. In order to maintain propylene selectivity the temperature at the reactor
outlet needs to be reduced for longer times on stream due to the increased coke formation
rates. The lower exit temperatures strongly reduce the propane conversion and thus the
propylene yield. The figure clearly shows that operation with short propane dehydrogenation
cycle times can increase the average propylene yield quite considerably.
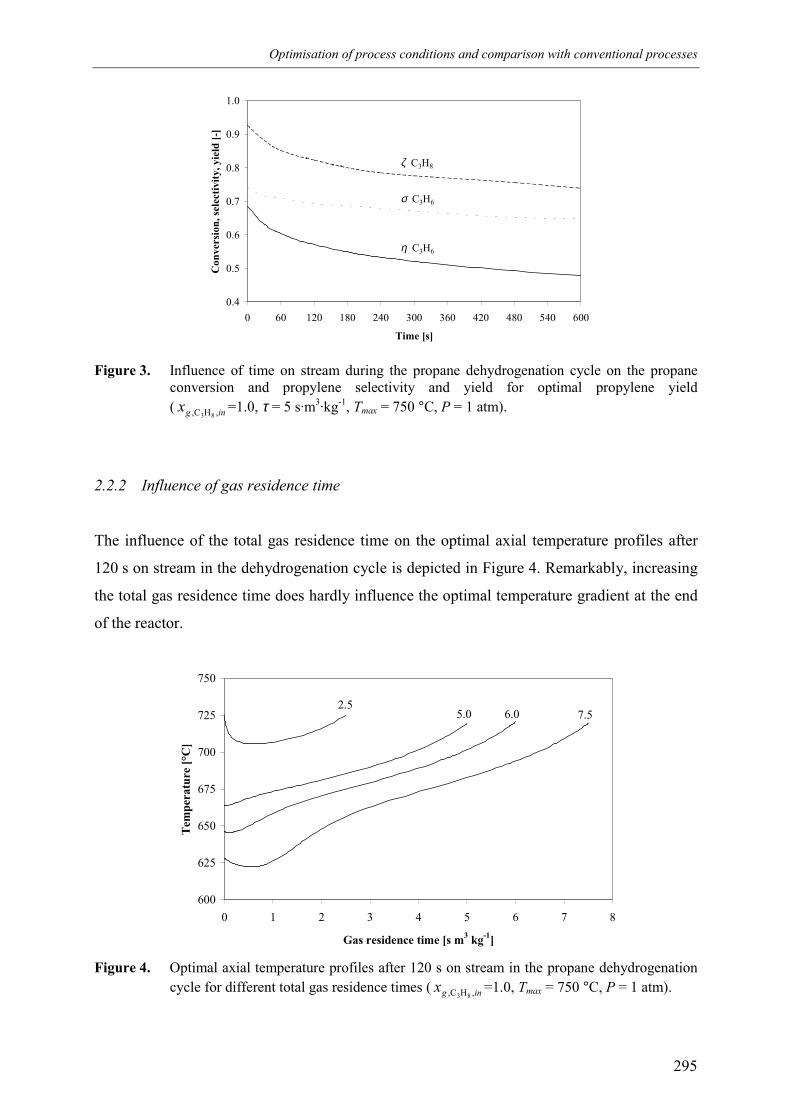
Optimisation of process conditions and comparison with conventional processes
295
0.4
0.5
0.6
0.7
0.8
0.9
1.0
0 60 120 180 240 300 360 420 480 540 600
Time [s]
Con
vers
ion,
sele
ctiv
ity, y
ield
[-]
ζ C3H8
σ C3H6
η C3H6
Figure 3. Influence of time on stream during the propane dehydrogenation cycle on the propaneconversion and propylene selectivity and yield for optimal propylene yield( ingx ,HC, 83
=1.0, τ = 5 s·m3·kg-1, Tmax = 750 °C, P = 1 atm).
2.2.2 Influence of gas residence time
The influence of the total gas residence time on the optimal axial temperature profiles after
120 s on stream in the dehydrogenation cycle is depicted in Figure 4. Remarkably, increasing
the total gas residence time does hardly influence the optimal temperature gradient at the end
of the reactor.
600
625
650
675
700
725
750
0 1 2 3 4 5 6 7 8
Gas residence time [s m3 kg-1]
Tem
pera
ture
[°C
]
2.55.0 7.56.0
Figure 4. Optimal axial temperature profiles after 120 s on stream in the propane dehydrogenationcycle for different total gas residence times ( ingx ,HC, 83
=1.0, Tmax = 750 °C, P = 1 atm).
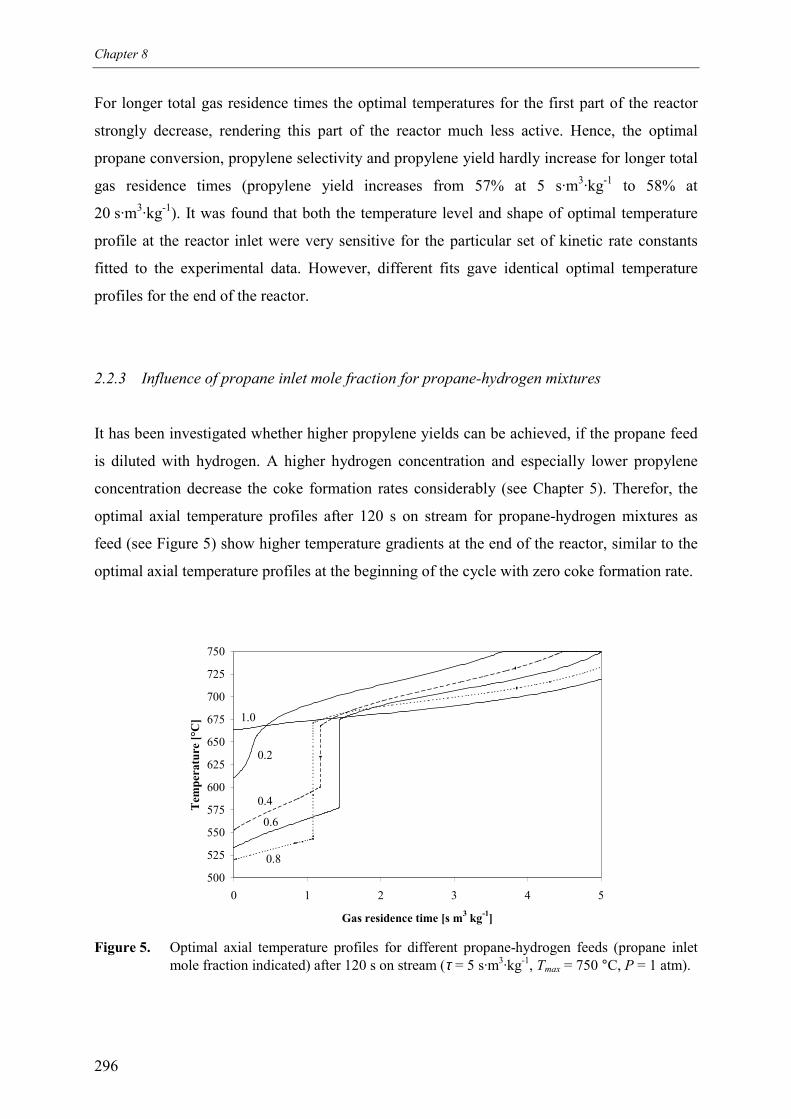
Chapter 8
296
For longer total gas residence times the optimal temperatures for the first part of the reactor
strongly decrease, rendering this part of the reactor much less active. Hence, the optimal
propane conversion, propylene selectivity and propylene yield hardly increase for longer total
gas residence times (propylene yield increases from 57% at 5 s·m3·kg-1 to 58% at
20 s·m3·kg-1). It was found that both the temperature level and shape of optimal temperature
profile at the reactor inlet were very sensitive for the particular set of kinetic rate constants
fitted to the experimental data. However, different fits gave identical optimal temperature
profiles for the end of the reactor.
2.2.3 Influence of propane inlet mole fraction for propane-hydrogen mixtures
It has been investigated whether higher propylene yields can be achieved, if the propane feed
is diluted with hydrogen. A higher hydrogen concentration and especially lower propylene
concentration decrease the coke formation rates considerably (see Chapter 5). Therefor, the
optimal axial temperature profiles after 120 s on stream for propane-hydrogen mixtures as
feed (see Figure 5) show higher temperature gradients at the end of the reactor, similar to the
optimal axial temperature profiles at the beginning of the cycle with zero coke formation rate.
500
525
550
575
600
625
650
675
700
725
750
0 1 2 3 4 5
Gas residence time [s m3 kg-1]
Tem
pera
ture
[°C
]
0.2
0.4
0.8
1.0
0.6
Figure 5. Optimal axial temperature profiles for different propane-hydrogen feeds (propane inletmole fraction indicated) after 120 s on stream (τ = 5 s·m3·kg-1, Tmax = 750 °C, P = 1 atm).
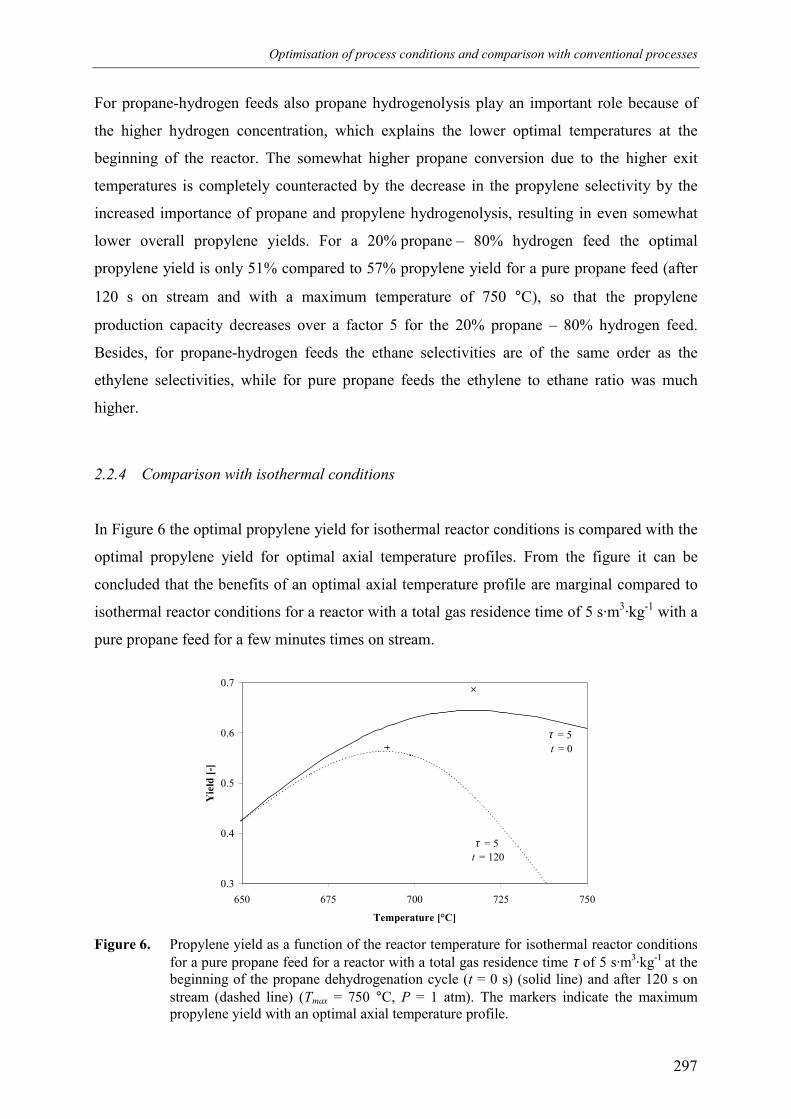
Optimisation of process conditions and comparison with conventional processes
297
For propane-hydrogen feeds also propane hydrogenolysis play an important role because of
the higher hydrogen concentration, which explains the lower optimal temperatures at the
beginning of the reactor. The somewhat higher propane conversion due to the higher exit
temperatures is completely counteracted by the decrease in the propylene selectivity by the
increased importance of propane and propylene hydrogenolysis, resulting in even somewhat
lower overall propylene yields. For a 20% propane – 80% hydrogen feed the optimal
propylene yield is only 51% compared to 57% propylene yield for a pure propane feed (after
120 s on stream and with a maximum temperature of 750 °C), so that the propylene
production capacity decreases over a factor 5 for the 20% propane – 80% hydrogen feed.
Besides, for propane-hydrogen feeds the ethane selectivities are of the same order as the
ethylene selectivities, while for pure propane feeds the ethylene to ethane ratio was much
higher.
2.2.4 Comparison with isothermal conditions
In Figure 6 the optimal propylene yield for isothermal reactor conditions is compared with the
optimal propylene yield for optimal axial temperature profiles. From the figure it can be
concluded that the benefits of an optimal axial temperature profile are marginal compared to
isothermal reactor conditions for a reactor with a total gas residence time of 5 s·m3·kg-1 with a
pure propane feed for a few minutes times on stream.
0.3
0.4
0.5
0.6
0.7
650 675 700 725 750
Temperature [°C]
Yie
ld [-
]
τ = 5 t = 120
τ = 5 t = 0
Figure 6. Propylene yield as a function of the reactor temperature for isothermal reactor conditionsfor a pure propane feed for a reactor with a total gas residence time τ of 5 s·m3·kg-1 at thebeginning of the propane dehydrogenation cycle (t = 0 s) (solid line) and after 120 s onstream (dashed line) (Tmax = 750 °C, P = 1 atm). The markers indicate the maximumpropylene yield with an optimal axial temperature profile.
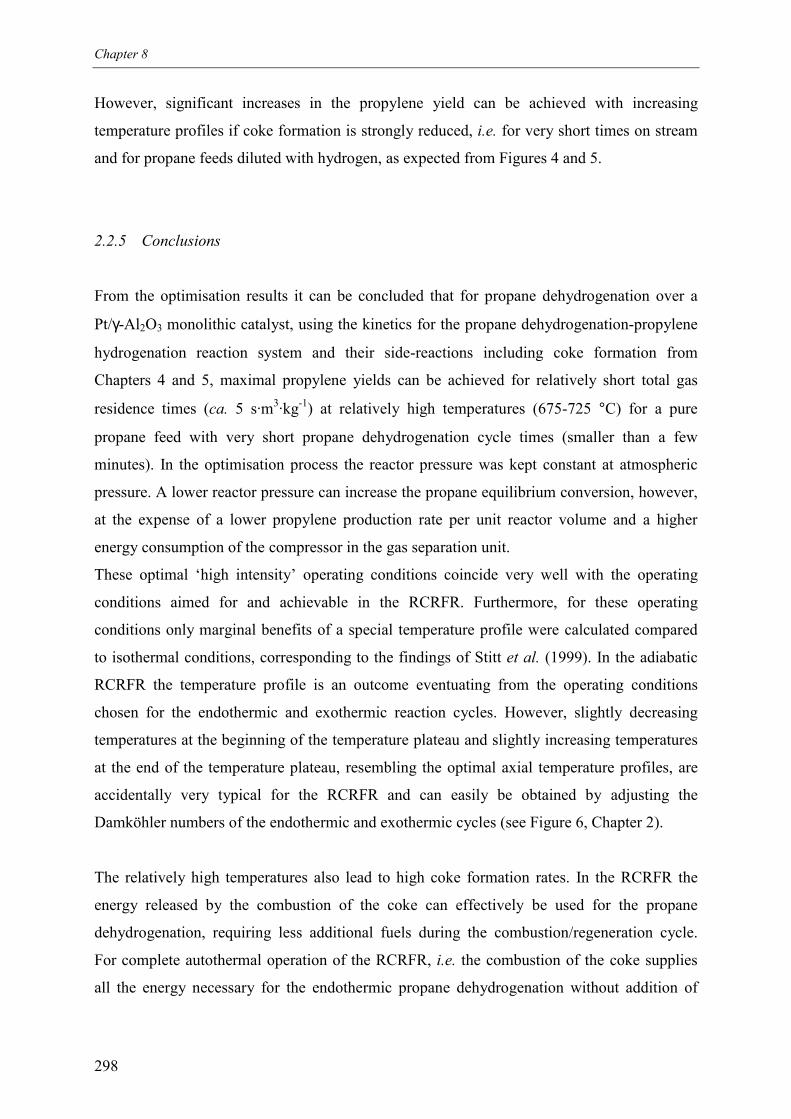
Chapter 8
298
However, significant increases in the propylene yield can be achieved with increasing
temperature profiles if coke formation is strongly reduced, i.e. for very short times on stream
and for propane feeds diluted with hydrogen, as expected from Figures 4 and 5.
2.2.5 Conclusions
From the optimisation results it can be concluded that for propane dehydrogenation over a
Pt/γ-Al2O3 monolithic catalyst, using the kinetics for the propane dehydrogenation-propylene
hydrogenation reaction system and their side-reactions including coke formation from
Chapters 4 and 5, maximal propylene yields can be achieved for relatively short total gas
residence times (ca. 5 s·m3·kg-1) at relatively high temperatures (675-725 °C) for a pure
propane feed with very short propane dehydrogenation cycle times (smaller than a few
minutes). In the optimisation process the reactor pressure was kept constant at atmospheric
pressure. A lower reactor pressure can increase the propane equilibrium conversion, however,
at the expense of a lower propylene production rate per unit reactor volume and a higher
energy consumption of the compressor in the gas separation unit.
These optimal ‘high intensity’ operating conditions coincide very well with the operating
conditions aimed for and achievable in the RCRFR. Furthermore, for these operating
conditions only marginal benefits of a special temperature profile were calculated compared
to isothermal conditions, corresponding to the findings of Stitt et al. (1999). In the adiabatic
RCRFR the temperature profile is an outcome eventuating from the operating conditions
chosen for the endothermic and exothermic reaction cycles. However, slightly decreasing
temperatures at the beginning of the temperature plateau and slightly increasing temperatures
at the end of the temperature plateau, resembling the optimal axial temperature profiles, are
accidentally very typical for the RCRFR and can easily be obtained by adjusting the
Damköhler numbers of the endothermic and exothermic cycles (see Figure 6, Chapter 2).
The relatively high temperatures also lead to high coke formation rates. In the RCRFR the
energy released by the combustion of the coke can effectively be used for the propane
dehydrogenation, requiring less additional fuels during the combustion/regeneration cycle.
For complete autothermal operation of the RCRFR, i.e. the combustion of the coke supplies
all the energy necessary for the endothermic propane dehydrogenation without addition of
Optimisation of process conditions and comparison with conventional processes
299
extra fuels during the exothermic regeneration cycle, the average coke formation rate Cm&
should at least be higher than
endo
C
PD
C
ingendo
endoendC
C hh
tm
m τ∆
∆ερ
ηω∆ )()1(
6383 HC,,HC,
−−>=& . (17)
To achieve 50% propylene yield from a pure propane feed in a reactor with 5 s·m3·kg-1 total
gas residence time the average coke formation rate should be about 1·10-5 kgC·kgcat-1·s-1,
taking the catalyst density at 650 kg·m-3 reactor and the propane dehydrogenation and coke
combustion reaction enthalpies at 2.3·106 and -3.5·107 J·kg-1 (assuming complete combustion
of the coke). At the end of the reactor the propylene and hydrogen concentrations are about
30% both and the temperature is about 725 °C (see Figure 1). With the coke formation model
from Chapter 5, the coke content after 60 s can then be estimated at 9.6·10-4 kgC·kgcat-1, so that
the maximum coke formation rate averaged over 1 minute dehydrogenation time is about
1.6·10-5 kgC·kgcat-1·s-1. However, in the major part of the reactor much lower temperatures and
propylene concentrations prevail, resulting in much lower coke formation rates. Concluding,
for optimal propylene yield the RCRFR cannot be operated completely autothermally, but the
energy released in the catalyst regeneration can considerably contribute in heat supply for the
propane dehydrogenation, saving on fuel costs.
In the above discussion only the total energy balance was considered. Obviously, not only the
total amount of energy transferred, but also the zones of energy production and energy
consumption need to be matched (see Chapter 2 and 3). From Figure 1 it was concluded that
most of the carbon deposition takes place at the end of the reactor, while most of the propane
conversion takes place in the first part of the reactor. Due to the flow reversals the energy
released during the combustion of the coke can effectively be used for the propane
dehydrogenation. Additionally, coke combustion in the centre of the reactor helps avoiding
low plateau temperatures, just like the effect of methane addition to the propane-air feed in a
RCRFR with less active sections at both reactor ends (see Chapter 3). Thus the coke
formation and combustion alleviates the requirement of Damköhler matching of the
endothermic and exothermic reaction phases, which is beneficial for a higher propylene
production capacity. Finally, using the propane and methane concentrations the energy
balance can be fulfilled and the maximum temperature of the temperature peaks and the
temperature plateau can be controlled (also using the platinum loading of the less active
Chapter 8
300
sections as an optimisation parameter for the maximum temperature). Future work should
extend the numerical simulations reported in Chapter 3 by including coke formation and coke
combustion with simultaneous methane and propane combustion to demonstrate the
feasibility of the above.
In the next paragraph a propane dehydrogenation process based on the RCRFR is compared
with currently applied ‘conventional’ propane dehydrogenation processes.
3. Comparison with conventional industrial processes
Currently most of the world’s propylene production is accounted for by steam cracking and
fluid catalytic cracking (FCC), where propylene is produced as a by-product in the ethylene
production and oil refinery respectively. In 1998 steam crackers produced about 75% of the
total propylene demand, 24% was produced by FCC units and only 1% of the total propylene
production was by propane dehydrogenation (Baker, 1999b). The strong increase in the
demand for propylene relative to ethylene during the last decade (e.g. Taffe, 1996; Cosyns et
al., 1998) has initiated the development of new alternative processes for selective propylene
production in addition to the traditional petrochemical and refinery processes. The increased
availability of lower alkanes resulting from more strict environmental legislation has made
especially catalytic propane dehydrogenation economically attractive (Resasco and Haller,
1994). With minor adaptations conventional commercial processes originally designed for
hydrocarbon dehydrogenation of higher alkanes (C3-C5) could also be applied for the
dehydrogenation of propane. Propylene was first commercially produced by catalytic propane
dehydrogenation in 1986 using the Houdry Catofin process. Several processes have now been
commercialised for the catalytic propane dehydrogenation, viz. the Houdry Catofin, UOP
Oleflex, Phillips STAR, BASF/Linde and the Samprogetti-Yarsintez processes. These
processes differ mainly in the manner of heat supply for the endothermic dehydrogenation
(adiabatic or non-adiabatic reactor conditions) and catalyst regeneration (continuous or
periodic catalyst regeneration). Some typical process features, process data and reactor
operating conditions for these processes have been summarised in Tables 2 and 3.
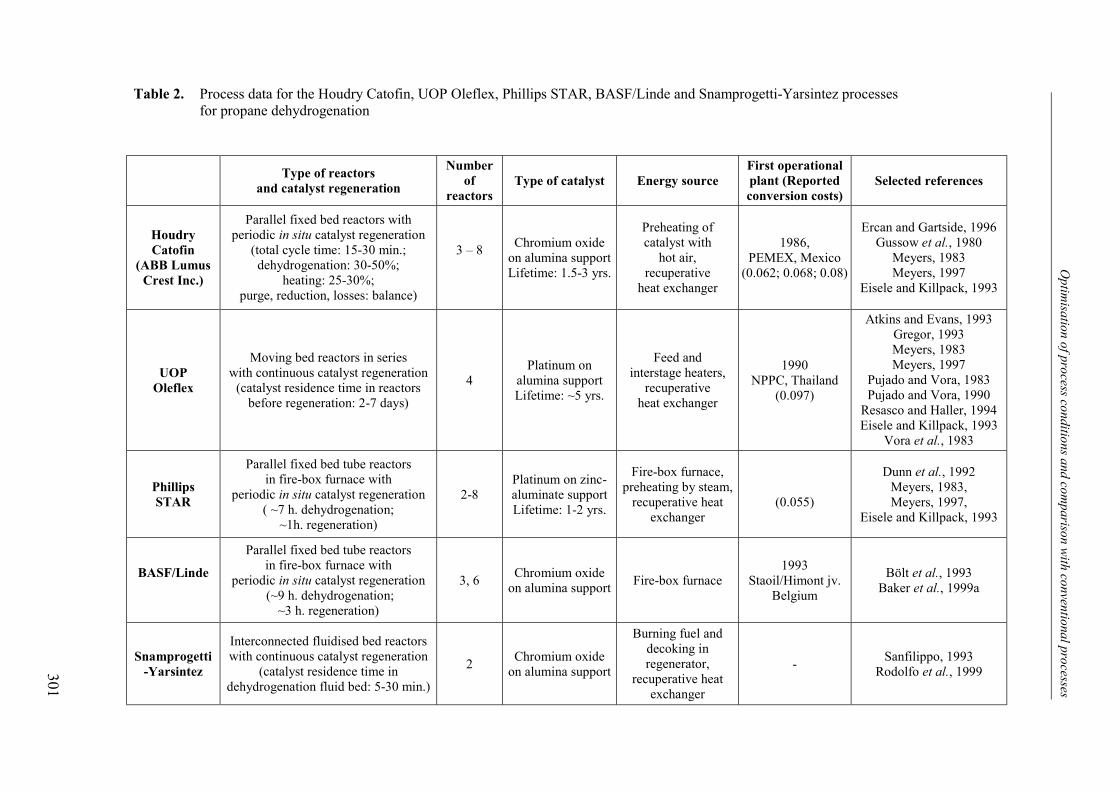
Optim
isation of process conditions and comparison with conventional processes
301
Selected references
Ercan and Gartside, 1996Gussow et al., 1980
Meyers, 1983Meyers, 1997
Eisele and Killpack, 1993
Atkins and Evans, 1993Gregor, 1993Meyers, 1983Meyers, 1997
Pujado and Vora, 1983Pujado and Vora, 1990
Resasco and Haller, 1994Eisele and Killpack, 1993
Vora et al., 1983
Dunn et al., 1992Meyers, 1983,Meyers, 1997,
Eisele and Killpack, 1993
Bölt et al., 1993Baker et al., 1999a
Sanfilippo, 1993Rodolfo et al., 1999
First operationalplant (Reportedconversion costs)
1986,PEMEX, Mexico
(0.062; 0.068; 0.08)
1990NPPC, Thailand
(0.097)
(0.055)
1993Staoil/Himont jv.
Belgium
-
Energy source
Preheating ofcatalyst with
hot air,recuperative
heat exchanger
Feed andinterstage heaters,
recuperativeheat exchanger
Fire-box furnace,preheating by steam,
recuperative heatexchanger
Fire-box furnace
Burning fuel anddecoking inregenerator,
recuperative heatexchanger
Type of catalyst
Chromium oxideon alumina supportLifetime: 1.5-3 yrs.
Platinum onalumina supportLifetime: ~5 yrs.
Platinum on zinc-aluminate supportLifetime: 1-2 yrs.
Chromium oxideon alumina support
Chromium oxideon alumina support
Numberof
reactors
3 – 8
4
2-8
3, 6
2
Type of reactorsand catalyst regeneration
Parallel fixed bed reactors withperiodic in situ catalyst regeneration
(total cycle time: 15-30 min.;dehydrogenation: 30-50%;
heating: 25-30%;purge, reduction, losses: balance)
Moving bed reactors in serieswith continuous catalyst regeneration
(catalyst residence time in reactorsbefore regeneration: 2-7 days)
Parallel fixed bed tube reactorsin fire-box furnace with
periodic in situ catalyst regeneration( ~7 h. dehydrogenation;
~1h. regeneration)
Parallel fixed bed tube reactorsin fire-box furnace with
periodic in situ catalyst regeneration (~9 h. dehydrogenation;
~3 h. regeneration)
Interconnected fluidised bed reactorswith continuous catalyst regeneration
(catalyst residence time indehydrogenation fluid bed: 5-30 min.)
HoudryCatofin
(ABB LumusCrest Inc.)
UOPOleflex
PhillipsSTAR
BASF/Linde
Snamprogetti-Yarsintez
Table 2. Process data for the Houdry Catofin, UOP Oleflex, Phillips STAR, BASF/Linde and Snamprogetti-Yarsintez processesfor propane dehydrogenation
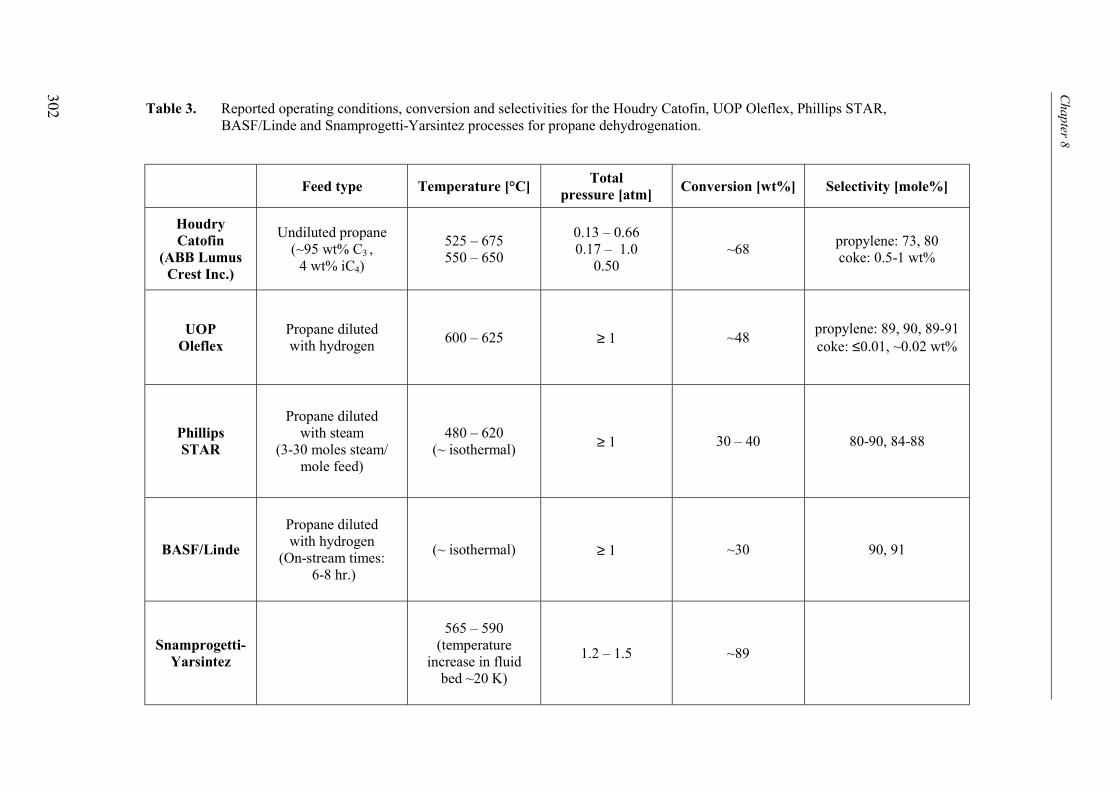
Chapter 8
302
Selectivity [mole%]
propylene: 73, 80coke: 0.5-1 wt%
propylene: 89, 90, 89-91coke: ≤0.01, ~0.02 wt%
80-90, 84-88
90, 91
Conversion [wt%]
~68
~48
30 – 40
~30
~89
Totalpressure [atm]
0.13 – 0.660.17 – 1.0
0.50
≥ 1
≥ 1
≥ 1
1.2 – 1.5
Temperature [°C]
525 – 675550 – 650
600 – 625
480 – 620(~ isothermal)
(~ isothermal)
565 – 590(temperature
increase in fluidbed ~20 K)
Feed type
Undiluted propane(~95 wt% C3 ,
4 wt% iC4)
Propane dilutedwith hydrogen
Propane dilutedwith steam
(3-30 moles steam/mole feed)
Propane dilutedwith hydrogen
(On-stream times: 6-8 hr.)
HoudryCatofin
(ABB LumusCrest Inc.)
UOPOleflex
PhillipsSTAR
BASF/Linde
Snamprogetti-Yarsintez
Table 3. Reported operating conditions, conversion and selectivities for the Houdry Catofin, UOP Oleflex, Phillips STAR,BASF/Linde and Snamprogetti-Yarsintez processes for propane dehydrogenation.
Optimisation of process conditions and comparison with conventional processes
303
Research and innovations for new propane dehydrogenation processes have, not surprisingly,
centred on perturbing the equilibrium conversion by removal of the hydrogen, either via a
catalytic membrane permselective for hydrogen (e.g. Reo et al., 1997; Zaika et al., 1993a,
1993b) or via oxidation of the hydrogen to water by oxidative propane dehydrogenation (e.g.
Cavani and Trifirò, 1995; Wan et al., 1999). Especially the low product of hydrogen
permeability and separation factor and the high cost of the membranes and problems with
sintering and deactivation by coke formation have prevented commercialisation of catalytic
membrane reactors for propane dehydrogenation up until now. For the oxidative propane
dehydrogenation further improvements on the catalyst’s propylene (or olefin) selectivity (at
high propane conversions) are required to make this process economically feasible.
In the Reaction Coupling Reverse Flow Reactor higher propane conversions are achieved by
operation at higher reactor temperatures (675-725 °C) for undiluted propane feeds at
atmospheric pressure. For pure propane feed at atmospheric pressure the equilibrium propane
conversion increases from 67% at 650 °C to 90% at 750 °C. At even higher temperatures the
equilibrium propane conversion increases only very gradually. Although the increase in the
propane conversion (75-90%) is somewhat counterbalanced by a decrease in the propylene
selectivity (ca. 70%) at these high operating temperatures, still relatively high propylene
yields can be achieved (50-60%) (see Figure 3), compared to 53-60% for the Houdry Catofin,
43% for the UOP Oleflex, 24-36% for the Phillips STAR and about 27% for the BASF/Linde
processes. The optimal temperatures for the RCRFR are somewhat higher than the optimal
temperatures for the Houdry Catofin process because of the higher reactor pressure in the
RCRFR.
By using higher reactor temperatures also the coke formation rates are increased. The increase
in the coke selectivities is, however, somewhat compensated for by smaller cycle times for the
RCRFR, which also greatly facilitates the combustion of the coke (see Appendix C,
Chapter 7). In the RCRFR the energy released by the combustion of the coke can very
efficiently be used for the propane dehydrogenation, reducing the amounts of fuels required
during the combustion/regeneration via decreasing the ratio of exothermic to endothermic
cycle times. Furthermore, in the RCRFR the most important gas phase hydrocarbon by-
products are ethylene and methane. Higher temperatures at the surface of the
(de)hydrogenation catalyst favours ethane dehydrogenation over ethylene hydrogenation,
assuring higher olefin selectivities. To exemplify, the ethane dehydrogenation equilibrium
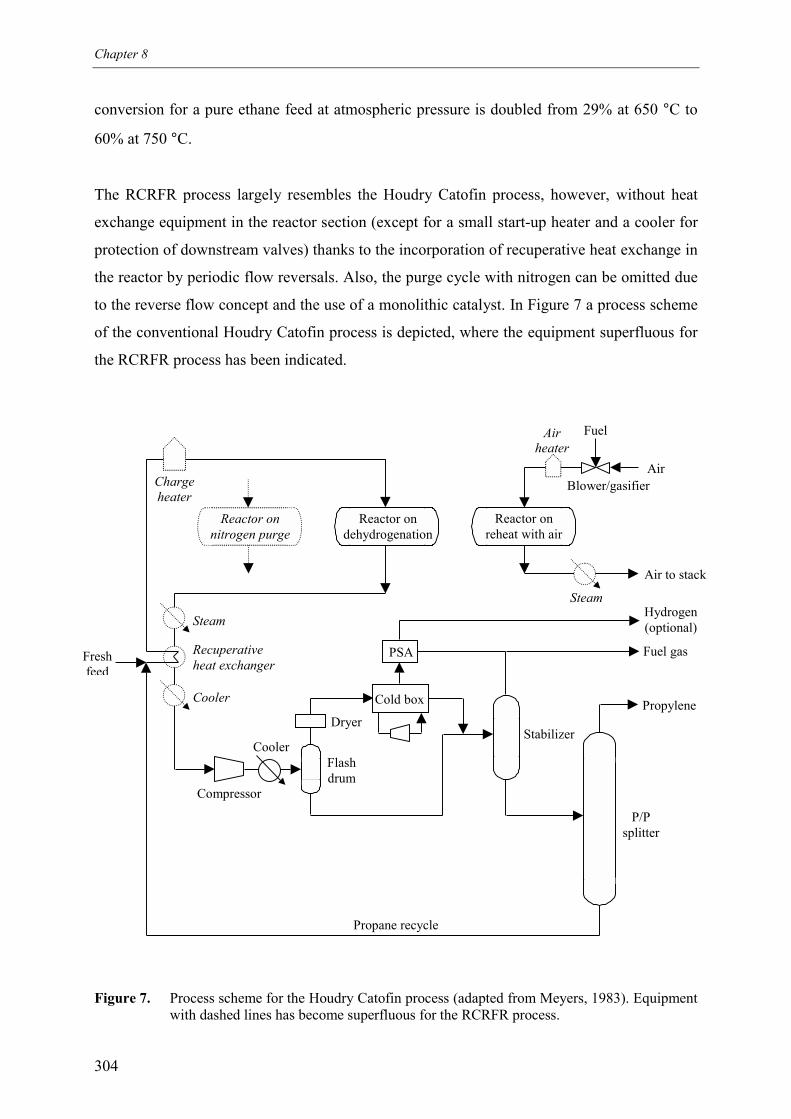
Chapter 8
304
conversion for a pure ethane feed at atmospheric pressure is doubled from 29% at 650 °C to
60% at 750 °C.
The RCRFR process largely resembles the Houdry Catofin process, however, without heat
exchange equipment in the reactor section (except for a small start-up heater and a cooler for
protection of downstream valves) thanks to the incorporation of recuperative heat exchange in
the reactor by periodic flow reversals. Also, the purge cycle with nitrogen can be omitted due
to the reverse flow concept and the use of a monolithic catalyst. In Figure 7 a process scheme
of the conventional Houdry Catofin process is depicted, where the equipment superfluous for
the RCRFR process has been indicated.
Figure 7. Process scheme for the Houdry Catofin process (adapted from Meyers, 1983). Equipmentwith dashed lines has become superfluous for the RCRFR process.
Chargeheater
Steam
Cooler
Recuperativeheat exchanger
Freshfeed
Compressor
CoolerFlashdrum
Dryer
Cold box
Stabilizer
P/Psplitter
PSA
Hydrogen(optional)
Fuel gas
Propylene
Propane recycle
Air to stack
Steam
Air
FuelAirheater
Blower/gasifier
Reactor ondehydrogenation
Reactor onreheat with air
Reactor onnitrogen purge
Optimisation of process conditions and comparison with conventional processes
305
Next to large savings on investments in expensive high temperature heat exchange equipment,
also savings on investments and operating costs in the separation units might be achieved.
Firstly, the RCRFR operates at about atmospheric conditions as opossed to the Houdry
Catofin process which operates at slightly sub-atmospheric pressure (about 51 kPa; Ercan and
Gartside, 1996), resulting in lower compression costs for the RCRFR-process. Secondly, the
higher propane conversion in the RCRFR process strongly reduces the propane recycle, so
that the flow rates through the reactor and separation units are reduced, enabling further
savings on investments and operating costs. Optionally, an even higher propane conversion
can be aimed for in order to produce chemical grade propylene (92-94% propylene) without
the need for a P/P splitter and a propane recycle, obviously at the expensive of a somewhat
lower propylene selectivity.
Moreover, the number of reactors put in parallel in the RCRFR-process depends primarily on
the ratio of the endothermic and exothermic cycle times in order to achieve a constant
propylene production rate, just like the Houdry Catofin process. The length of the RCRFR-
reactors strongly depends on the gas velocities and cycle times of both the endothermic and
exothermic reaction phases. The length of the RCRFR-reactors will probably be longer than
the length of the reactors in the Houdry Catofin process (at the same gas velocity), since
recuperative heat exchange is integrated inside the reactor and the RCRFR-reactors
accommodate two reaction zones, one for each flow direction. However, due to the increased
production capacity per reactor volume thanks to higher operating pressures and temperatures,
the length of a single reaction zone in the RCRFR-reactor is significantly smaller. With a
monolithic catalyst very high intrinsic catalyst activities can be achieved without internal or
external mass transfer limitations assuring high catalyst efficiency factors and maximal
propylene selectivity. Furthermore, in a monolithic catalyst high throughputs can be realised
with negligible pressure drop. Also, the construction of the monolithic RCRFR-reactors is
relatively simple (ease of scale-up) and the reactors can be positioned horizontally, possibly
facilitating catalyst replacement.
The major drawbacks of the RCRFR-process are the more complex reactor behaviour
(process control) and the probable larger product losses due to the smaller cycle times despite
the lower axial dispersion in the monoliths.
Chapter 8
306
4. Conclusions
Based on the derived kinetics of the propane dehydrogenation – propylene hydrogenation
over a monolithic Pt/γ-Al2O3 catalyst and their most important side reactions including coke
formation, it was determined using Pontryagin’s maximisation principle that the propylene
yield is optimal (50-60%) at high reactor temperatures (675-725 °C) for undiluted propane
feeds at atmospheric pressure – with high propane conversion (75-90%) and relatively low
propylene selectivity (ca. 70%) – and short cycle times. The RCRFR is very well suited for
these ‘high intensity’ operating conditions.
Especially the integration of recuperative heat exchange by the reverse flow concept makes
the RCRFR economically attractive because of possible large savings on investments in
expensive high-temperature heat exchange equipment compared to the Houdry Catofin
process. Furthermore, the relatively high propane conversion (even for pure propane feed at
atmospheric pressure) can be exploited to decrease investments and operating costs for the gas
separation units by the strong decrease of the propane recycle flow rate, however, at the
expense of a lower propylene selectivity (but high ethylene to ethane selectivity). Although
the economic potential of the RCRFR-process looks promising, its true technical and
economic feasibility still remains to be proven. Further research is necessary to better assess
the economic potential of the RCRFR-process.
Firstly, with extensive, detailed numerical simulations including coke formation and coke
combustion the design of the RCRFR and the operating conditions of both reaction phases
should be optimised, especially with respect to maximal propylene production capacity per
unit reactor volume and reaction coupling energy efficiency. Special attention should be paid
to the influence of coke formation and coke combustion on the reactor behaviour and the
optimal process conditions. For example, can coke accumulation problems indeed be solved
by choosing the proper operating conditions and switching schemes? Furthermore, what are
the optimal methane, propane (or different fuels like LPG?) and oxygen inlet concentrations
(as a function of time?) during the combustion/regeneration cycle, and what are the optimal
platinum loadings, or catalyst properties in general, of the less active and active catalysts
sections? Furthermore, in the optimisation of the cycle times the propylene losses due to
switching – completely ignored in this work – should be quantified, which entails an
Optimisation of process conditions and comparison with conventional processes
307
economic optimisation between higher propylene yields but also higher propylene losses for
smaller propane dehydrogenation cycle times. Moreover, in the optimisation of the reactor
the whole process including the gas separation units need to be considered, where even
different possibilities for the separation units and product specifications need to be evaluated.
Secondly, the catalyst properties should be optimised. Benefits of a monolithic catalyst have
been discussed before, but the optimisation of the properties of the monolithic catalyst has
been left entirely out of consideration in this work, despite its important influence on the
reactor performance. Obviously, the concentration and type of active components and
promotors, but also the type (acidity) and thickness of the washcoat need to be optimised for
optimal use of the expensive catalyst (an overall efficiency factor just below 1 for the propane
dehydrogenation) and for maximal propylene selectivity and minimal coke selectivity. Also
the volumetric heat capacity of the support (channel diameter, support thickness, support
material etc.) should be maximised in order to maximise the ratio of the cycle times to the gas
residence time. Special attention should be paid to the long-term stability of the catalyst,
especially in view of the high temperatures (sintering and platinum (dispersion) losses),
temperature gradients (thermal stresses) and frequent alternations between reductive
conditions (coke formation) and oxidative conditions (coke combustion), and the influence of
small impurities in the feed on the catalyst performance. Since the catalyst is operated at
forced unsteady state conditions at the catalyst surface, the catalyst properties should be
optimised for these ‘initial’ conditions.
Finally and most importantly, it should be demonstrated in an experimental set-up that indeed
high propane conversion and propylene (or olefin) yield can be achieved in the RCRFR with
high energy efficiency without problems of coke accumulation for long times on stream.
Obviously, due to the requirement of adiabaticity the scale of this reactor (especially with
respect to the volumetric flow rates) is necessarily large.
Acknowledgements
The author wishes to thank E.J. Bergsma for his contribution to the economic evaluation of
the processes and the Netherlands Organization for Scientific Research (N.W.O.) for their
financial support.
Chapter 8
308
Notation
f functions describing the process in terms of process variables x (see Table 1)
F function integrated over reactor length to be optimised (see Table 1)
H Hamilton function
∆h reaction enthalpy [J·kg-1]
kCP reaction rate constant of coke precursor formation (see Chapter 5) [s-1]
kR reaction rate constant of propylene dimer formation (see Chapter 5) [s-1]
L reactor length [m]
M average molecular mass [kg·mol-1]
Cm coke content [kgC·m-3]
Cm& coke formation rate [kgC·m-3·s-1]
nc number of components
nr number of reactions
p vector with adjungated functions (see Table 1)
P total pressure [atm]
ri reaction rate of component i [kg·m-3·s-1]
Rj reaction rate of reaction j [mole·m-3·s-1]
S function to be optimised (see Table 1)
t time [s]
T temperature [K, °C]
∆t cycle time [s]
w monolayer coke concentration [kgC·kgcat-1]
x vector with process variables (see Table 1)
xi,g gas phase mole fraction of component i [mole·mole-1]
z axial coordinate [m]
Greek symbols
ε monolith porosity [m3·m-3]
ζ conversion [kg·kg-1]
η yield [kg·kg-1]
θi surface fraction of component i [-]
Optimisation of process conditions and comparison with conventional processes
309
νi,j stoichiometry coefficient of component i in reaction j
ρ density [kg·m-3]
σ selectivity [kg·kg-1]
τ gas residence time divided by inlet gas density [s·m3·kg-1]
mΦ ′′ total mass flux [kg·m-2·s-1]
ωi,g gas phase mass fraction of component i [kg·kg-1]
Subscripts
C coke, coke formation
end at the end of the cycle
g gas phase
in at the inlet
max maximum
out at the outlet
PD propane dehydrogenation
0 at initial conditions (i.e. fresh catalyst)
Superscripts
endo endothermic cycle
References
Atkins, M.P. and Evans, G.R. (1993). Catalytic dehydrogenation: A review of current
processes and innovations, presented at the DGMK-conference on Selective hydrogenations
and dehydrogenations, November 11-12, 1993, Kassel, Germany, 200-210
Baker, J. (Ed.) (1999a). Linde set to license C3/C4 dehydrogenation process. European
Chemical News, March 1992, 19
Baker, J. (Ed.) (1999b). Propylene. European Chemical News, July 1999, 18-19
Chapter 8
310
Bölt, H., Zimmerman, H. (1993). Dehydrogenation process for propane and isobutane,
presented at the DGMK-conference on Selective hydrogenations and dehydrogenations,
November 11-12, 1993, Kassel, Germany, 175-187
Cavani, F. and Trifirò, F. (1995). The oxidative dehydrogenation of ethane and propane as an
alternative way for the production of light olefins. Catalysis Today, 24, 307-313
Cosyns, J., Chodorge, J., Commereuc, D. and Torck, B. (1998). Maximize propylene
production. Hydrocarbon Processing, March 1998, 61-66
Dunn, R.O. and Shoemaker, L.W. (1992). The Phillips steam active reforming (STAR)
process for the dehydrogenation of C3, C4 and C5 paraffins, presented at the Refining, LNG
and PetrochemAsia 1992, Technology Conference and Exhibition, Singapore, December 1-4,
1992
Eisele, P. and Killpack, R. (1993) Ullmann’s Encyclopedia of industrial chemistry, fifth
completely revised ed., Vol. A22, Eds. Elvers, Hawkins, Russey and Schulz, VCH
Verlagsgesellschaft mbH, Weinheim, Germany, 211-271
Ercan, C. and Gartside, R.J. (1996). Reactor performance and stability in an alternating
reaction-reheat paraffin dehydrogenation system. Can. J. Chem. Engng, 75, 626-637
Gregor, J.H., Zimmerman, J.E. and Cottrell, P.R. (1993). The Oleflex process: evolution,
commercialisation and optimization of a dehydrogenation technology, presented at the
DGMK-conference on Selective hydrogenations and dehydrogenations, November 11-12,
1993, Kassel, Germany, 189-200
Gussow, S., Spence, D.C. and White, E. A. (1980). Dehydrogenation links LPG to more
octanes, Oil and Gas J., Dec. 1980, 96-101
Meyers, R.A. (1983). Handbook of petroleum refining processes, first edition, McGraw-Hill
Inc., USA
Optimisation of process conditions and comparison with conventional processes
311
Meyers, R.A. (1997). Handbook of petroleum refining processes, second edition, McGraw-
Hill Inc., USA
Pujado, P.R. and Vora, B.V. (1983). Production of LPG olefins and derivatives. UOP Process
Division Technology Seminar 1983, UOP inc., Des Plaines, Illinois, USA
Pujado, P.R. and Vora, B.V. (1990). Make C3-C4 olefins selectively. Hydrocarbon Processing,
March 1990, 65-70
Reo, C.M., Bernstein, L.A. and Lund, C.R.F. (1997). Cocurrent membrane reactors vs. PFRs
for shifting dehydrogenation equilibrium. AIChE J., 43, 495-504
Resasco, D.E. and Haller, G.L. (1994). Catalytic dehydrogenation of lower alkanes. J. Catal.,
11, 379-411
Rodolfo, L., Bartolini, A., Buonomo, F., Kotelnikov, G.Y. and Bespalov, V.Y. (1999).
Process for obtaining light olefins by the dehydrogenation of the corresponding paraffins.
European Patent no. 0 894 781 A1
Sanfilippo, D. (1993). Dehydrogenation in a fluidized bed: an east-west collaboration.
Chemtech August 1993, 35-39
Stitt, E.H., Jackson, S.D., Ahern, J. and King, F. (1999). Modelling for design of a
deactivating non-isothermal propane dehydrogenation reactor. In Delmon, B. and Froment,
G.F. (Eds). Catalyst Deactivation 1999, 137-144
Taffe, P. (1996) Propping up the propylene supply. Eur. Chem. News, 21-27 October, 27-28
Vora, B.V., Berg, R.C., Pujado, P.R. (1983). UOP Oleflex process for LPG-Paraffin
dehydrogenation, UOP Process Division Technology Seminar 1983, UOP inc., Des Plaines,
Illinois, USA
Chapter 8
312
Wan, H.L., Zhou, X.P., Weng, W.Z., Long, R.Q., Chao, Z.S., Zhang, W.D., Chen, M.S., Luo,
J.Z. and Zhou, S.Q. (1999). Catalytic performance, structure, surface properties and active
oxygen species of the fluoride-containing rate earth (alkaline earth)-based catalysts for the
oxidative coupling of methane and oxidative dehydrogenation of light alkanes. Catalysis
Today, 51, 161-175
Zaika, Z.D., Minet, R.G., Tsotsis, T.T. (1993a). A high temperature catalytic membrane
reactor for propane dehydrogenation, J. membrane science, 77, 221-232
Zaika, Z.D., Minet, R.G., Tsotsis, T.T. (1993b). Propane dehydrogenation in a packed-bed
membrane reactor, AIChE J., 39, 526-529
313
Dankwoord (Acknowledgements)
Aan de totstandkoming van dit proefschrift hebben velen een belangrijke bijdrage geleverd en
ik wil hen dan ook allen bedanken voor hun inzet. Een aantal presonen wil ik in het bijzonder
bedanken voor hun bijdrage.
Allereerst wil mijn promotoren Hans Kuipers en Wim van Swaaij bedanken voor de
mogelijkheid die zij mij hebben geboden om het in dit proefschrift beschreven onderzoek uit
te voeren. Met name het grote vertrouwen dat zij in mij hebben gesteld om het onderzoek met
grote vrijheid naar eigen inzicht in te vullen en uit te voeren, heb ik zeer gewaardeerd. Hierbij
fungeerde Hans niet alleen als onmisbaar wetenschappelijk klankboord, maar vooral ook als
een goede coach die op de juiste momenten het onderzoek een zet in de juiste richting wist te
geven. Zijn efficiënte, doelgerichte en systematische werkwijze en zijn open en directe
communicatie zijn een voorbeeld voor mij en hebben sterk bijgedragen aan de plezierige en
stimulerende samenwerking. Wim, die het onderzoek op wat grotere afstand volgde, wil ik
bedanken voor zijn oprechte interesse en aanstekelijke enthousiasme bij het ontwikkelen van
nieuwe reactorconcepten. Daarnaast wil ik referent Maarten van der Burgt en de overige leden
van de promotie-commissie bedanken. De Nederlandse Organisatie voor Wetenschappelijk
Onderzoek (NWO) ben ik erkentelijk voor de beschikbaar gestelde financiële middelen voor
dit onderzoek.
Acht studenten hebben in het kader van hun afstudeeropdracht een zeer belangrijke bijdrage
geleverd aan dit promotie-onderzoek. Roelf Drijfholt bestudeerde de mogelijke gevolgen van
het schakelen van propaan naar lucht als voeding aan de reactor. In zijn ‘explosie-reactor’
heeft gelukkig geen enkele explosie plaatsgevonden. Herman Bottenberg heeft een goed begin
gemaakt van de bestudering van de invloed van schakelschema’s en procesparameters op de
axiale temperatuurprofielen in de reactor (zoals bijvoorbeeld de ‘scheve temperatuur-
plateau’s). Zijn opvolger Harold Scholts heeft dit verder uitgebreid met de bestudering van
verschillende reactor-configuraties en de noodzakelijke modificaties om het reactorconcept
geschikt te maken voor evenwichtsreacties. Wouter Vos en zijn opvolger Remco de Boer
hebben de experimenten uitgevoerd waarmee de kinetiek van de propaandehydrogenering
onderzocht is en Heleen bij de Vaate de experimenten waarmee de kinetiek van de
cokesvorming tijdens de propaandehydrogenering bestudeerd is. Robert Nijssen heeft de
experimenten in de ‘echte’ reverse flow reactor uitgevoerd, waarmee het principe van het
Dankwoord
314
reactorconcept experimenteel is aangetoond. Bertus Bergsma voerde een inventarisatie uit van
de economische mogelijkheden van het reactorconcept. Ik wil hen allen hartelijk bedanken
voor het vele werk dat zij hebben verzet, wat zijn weerslag heeft gevonden in de dikte van dit
proefschrift, en ook voor de prettige en goede samenwerking waardoor we als een team aan
dit promotie-onderzoek gewerkt hebben. Dit heeft de periode van mijn promotie-onderzoek
tot een zeer leuke en gezellige tijd gemaakt.
Al het experimentele werk had niet uitgevoerd kunnen worden zonder technische
ondersteuning van met name Henk-Jan Moed en Robert Meijer. Hun technische creativiteit en
praktijkervaringen brachten zij in bij het ontwerp van de reactoren en was van doorslaggevend
belang voor het welslagen van het experimentele onderzoek. Henk-Jan Moed heeft de
opstellingen van de kinetiek-reactor en de reverse flow reactor zeer vakkundig en snel
gemaakt. Robert Meijer zorgde adequaat voor de procesbesturing en procesregeling van de
opstellingen en de on-line data-acquisitie systemen. Daarnaast wil ik Wim Leppink hartelijk
bedanken voor het vervaardigen en onderhouden van de TGA-opstelling, alsmede Benno
Knaken en Gerrit Schorfhaar, die altijd bereid waren te helpen bij de wat kleinere hand-en-
span diensten.
Bert Kamp ben ik veel dank verschuldigd voor het bijna compleet reviseren en aanpassen van
de GC. Ook kapotte IR’s en ander electrische apparatuur werden altijd snel en goed
gerepareerd. Harry Olde Veldhuis wil ik bedanken voor het ombouwen van de vele MFC’s
die binnen mijn project gebruikt zijn en Benny Hövels voor de aan- en afvoer van de vele
gascylinders. Voor ondersteuning bij computer en netwerk-problemen kon ik altijd terecht bij
Jan Heezen en Joachim Olde Bolhaar. De bestelling van gewenste artikelen werd verzorgd
door Wim Platvoet, Nelly Vos en Jan Jagt.
De administratieve ondersteuning was in goede handen van Gery Stratingh, Nicole Haitjema,
Ria Stegehuis-de Vegte, Brigitte Sanderink en Ria Hofs-Winkelman, terwijl Rik Akse zorgde
voor een keurige afhandeling van de financiële aspecten van het onderzoek. Medewerkers,
studenten en promovendi die tijdens mijn promotie-onderzoek in het Vlugterlaboratorium
werkzaam waren, wil ik hartelijk bedanken voor de gezellige tijd en prettige werksfeer. Ook
wil ik mijn paranimfen, mijn broer Peter van Sint Annaland en collega Wim Brilman,
bedanken voor hun inzet en enthousiasme.

Dankwoord
315
Tenslotte, wil ik mijn ouders bedanken, die altijd voor mij klaar stonden, mij
onvoorwaardelijk steunden en mij in mijn studie stimuleerden. Zo kon ik voor software-
vraagstukken altijd bij mijn vader aankloppen en voor meer huishoudelijke vraagstukken bij
mijn moeder.
Bedankt allemaal!
Martin.

316
317
Levensloop
Martin van Sint Annaland werd geboren op 2 juni 1971 in Apeldoorn, waar hij ook de
openbare lagere school bezocht. In 1989 behaalde hij het VWO diploma aan het Stedelijk
Gymnasium te Apeldoorn.
In september 1989 begon hij met de studie Chemische Technologie aan de Universiteit
Twente te Enschede. In het kader van deze ingenieursopleiding liep hij van augustus tot
oktober 1993 stage bij een raffinaderij van Shell in Clyde, gelegen in Sydney, Australië. In
september 1994 studeerde hij cum laude af bij de vakgroep Proceskunde op de modellering
van de hydrodynamica van circulerende fluïd bedden middels een twee-dimensionaal Two-
Fluid model met de kinetische theorie voor granulaire stroming.
Na het behalen van het ingenieursdiploma startte hij in oktober 1994 met de
Ontwerpersopleiding Procestechnologie van de Universiteit Twente in samenwerking met de
Rijksuniversiteit Groningen. De jaaropdracht van deze opleiding is uitgevoerd bij TNO in
Apeldoorn op de zuivering van gasstromen die verontreinigd zijn met organische
componenten in zeer lage concentraties middels fotokatalytische oxidatie.
In augustus 1996 begon hij als promovendus (OIO) via N.W.O. een promotie-onderzoek bij
de vakgroep Proceskunde naar het ontwikkelen van een nieuw reactorconcept, waarbij de
reactiewarmte van endotherme en exotherme reacties indirect gekoppeld wordt met
gelijktijdige periodieke omkering van de gasstromingsrichting. De resultaten van dit
onderzoek zijn in dit proefschrift beschreven.
In februari 2000 trad hij in dienst als Universitair Docent bij werkeenheid PK-FAP
(Fundamentele Aspecten van de Proceskunde) van de faculteit Chemische Technologie van de
Universiteit Twente.
STELLINGEN
behorende bij het proefschrift
A NOVEL REVERSE FLOW REACTOR COUPLINGENDOTHERMIC AND EXOTHERMIC REACTIONS
van M. van Sint Annalandoktober 2000
1. Koppeling van de reactie-enthalpiën van endotherme en exotherme reacties metgeïntegreerde recuperatieve warmtewisseling via periodieke omkering van destromingsrichting door een gepakt bed waarbij de temperatuur een maximum waardeniet mag overschrijden, kan het meest efficiënt worden uitgevoerd in de sequentiëlereactorconfiguratie mits een geschikt schakelschema gekozen wordt.(Dit proefschrift)
2. De maximum temperatuur in een reverse flow reactor waarbij de reactanten van deexotherme reactiefase volgens een eerste orde kinetiek worden omgezet, wordtbepaald door een enkel dimensieloos kental.(Dit proefschrift)
3. Initieel neemt de cokesvormingssnelheid uit propeen op een γ-Al2O3 oppervlaklineair toe met de tijd, wat duidt op een autokatalytische reactie.(Dit proefschrift)
4. CFD (Computational Fluid Dynamics) is niet geschikt voor ongeduldige mensen,aangezien – in tegenstelling tot wat men zou verwachten – de rekentijd niet zalafnemen met de komst van krachtigere computers.
5. De meeste wetenschappers rekenen ten onrechte de beweegredenen voor hunonderzoek niet tot hun wetenschappelijk onderzoek.
6. Door alleen tweede-geldstroom onderzoeksprojecten met een aanzienlijke financiëlepremie te belonen blijkt dat de ‘ondernemende’ Universiteit Twente een hogereprioriteit geeft aan onderzoek dat (indirect) door de overheid gefinancieerd wordtdan aan onderzoek dat mede door het bedrijfsleven gefinancieerd wordt.
7. Een doeltreffende maatregel om een onderdeel van een organisatie weg te ‘saneren’is het invoeren van een intern verrekeningsmodel van de kosten.
8. Hoewel de IT-sector claimt het file-probleem te kunnen verminderen middelsflexibele werktijden of tele-werken, bewerkstelligt zij echter tot dusver juist hettegenovergestelde door het werven van nieuw personeel met een ‘auto van de zaak’.