Arthniti August 28-08-2021
24
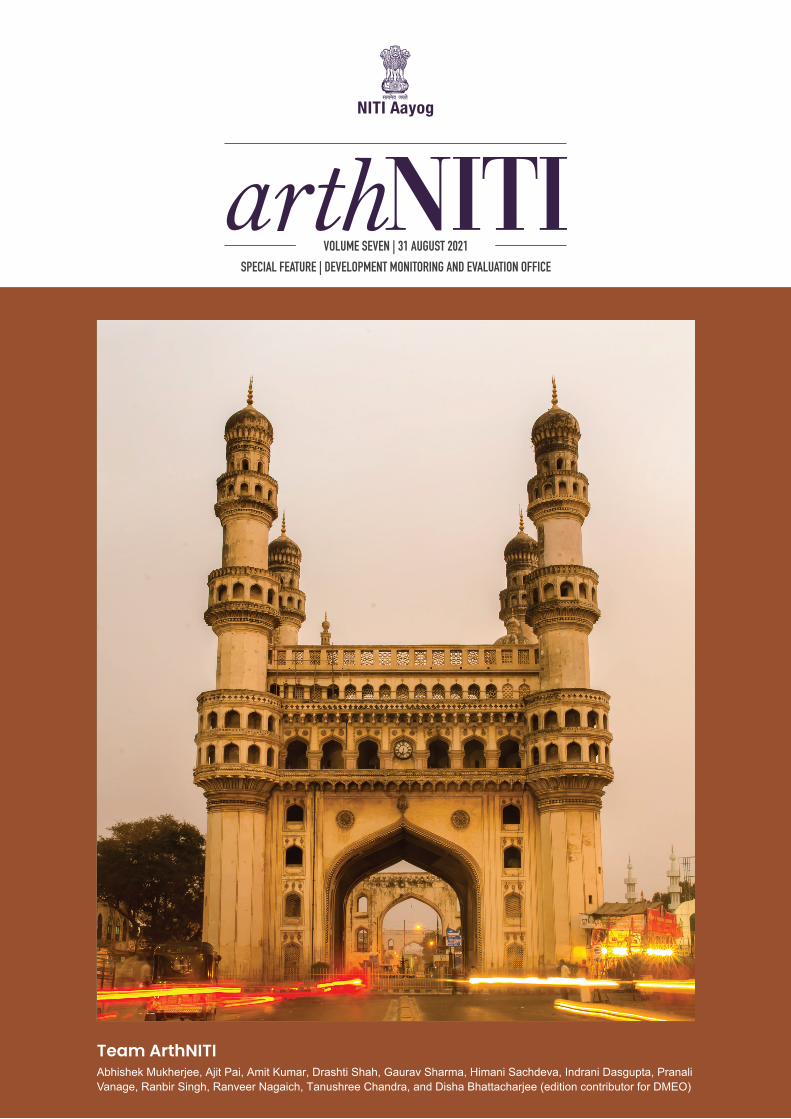
Team ArthNITI Abhishek Mukherjee, Ajit Pai, Amit Kumar, Drashti Shah, Gaurav Sharma, Himani Sachdeva, Indrani Dasgupta, Pranali Vanage, Ranbir Singh, Ranveer Nagaich, Tanushree Chandra, and Disha Bhattacharjee (edition contributor for DMEO) VOLUME SEVEN | 31 AUGUST 2021 SPECIAL FEATURE | DEVELOPMENT MONITORING AND EVALUATION OFFICE
Transcript of Arthniti August 28-08-2021
1
Team ArthNITIAbhishek Mukherjee, Ajit Pai, Amit Kumar, Drashti Shah, Gaurav Sharma, Himani Sachdeva, Indrani Dasgupta, Pranali Vanage, Ranbir Singh, Ranveer Nagaich, Tanushree Chandra, and Disha Bhattacharjee (edition contributor for DMEO)
VOLUME SEVEN | 31 AUGUST 2021
SPECIAL FEATURE | DEVELOPMENT MONITORING AND EVALUATION OFFICE


3
FROM THE VICE CHAIRMAN’S DESK
Dr Rajiv Kumar,August 2021,
According to the World Bank, the global economy is on a path of robust recovery, with a projected growth of 5.6% in 2021—the strongest post-recession pace in 80 years. The real GDP of advanced economies is projected to expand by 5.4% whereas emerging markets and developing economies are expected to grow by 6.0%. However, the pace of recovery is diverging across countries, reflecting variations in pandemic-induced disruptions and the extent of policy support.
In the first half of 2021, the global recovery was primarily led by the US and China. The two largest economies are expected to grow by 6.8% and 8.5%, respectively, and are likely to contribute about one quarter each of global growth in 2021. Recovery in several emerging markets and developing economies is likely to be constrained by the resurgence of Covid-19 infections, uneven vaccinations, and limited fiscal space.
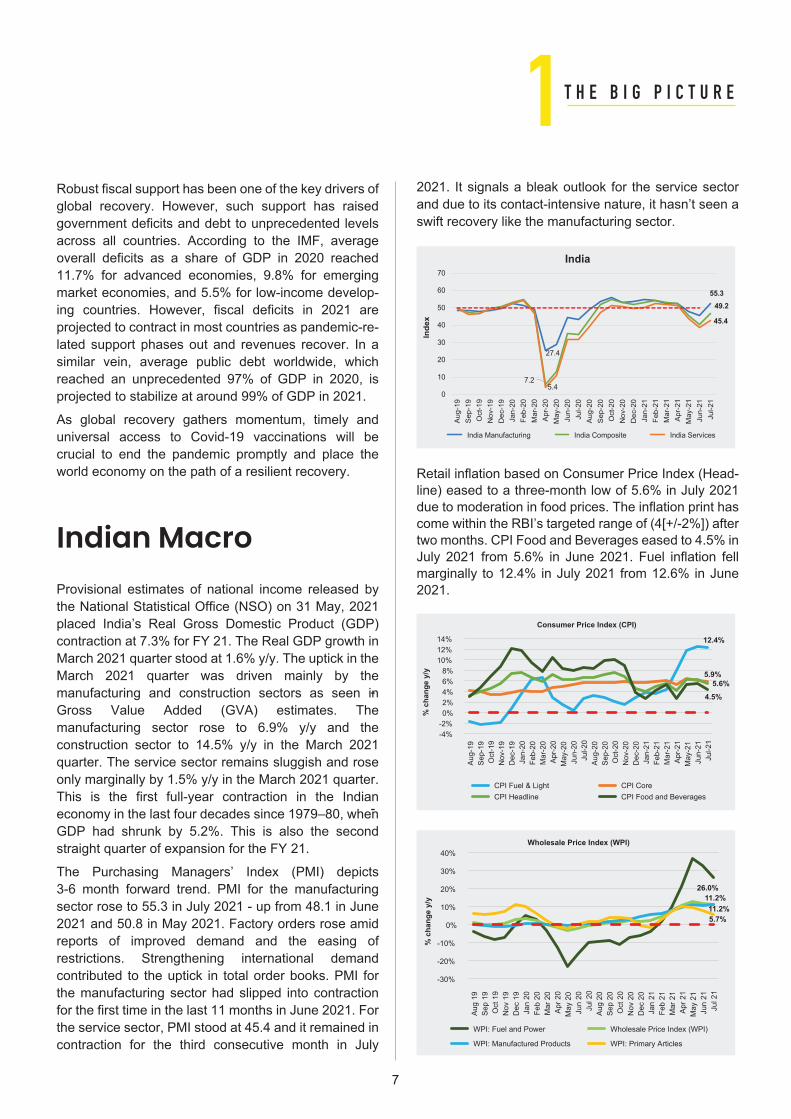
Inflation is emerging as a key risk to sustainable global economic recovery. Energy and industrial commodity prices have continued their upward surge. Average crude oil prices in Q2 increased by >13% q/q due to both higher demand and OPEC-induced supply constraints. The average price of aluminum and copper also increased by >14% in Q2/Q1. The IMF has warned that rising inflation, notably in the US, can pose significant risks of an earlier-than-expected tightening of monetary policy by the Federal Reserve, which could lead to significant capital outflows from emerging economies. Therefore, we would do well to make our policy environment as attractive as possible to foreign investors.
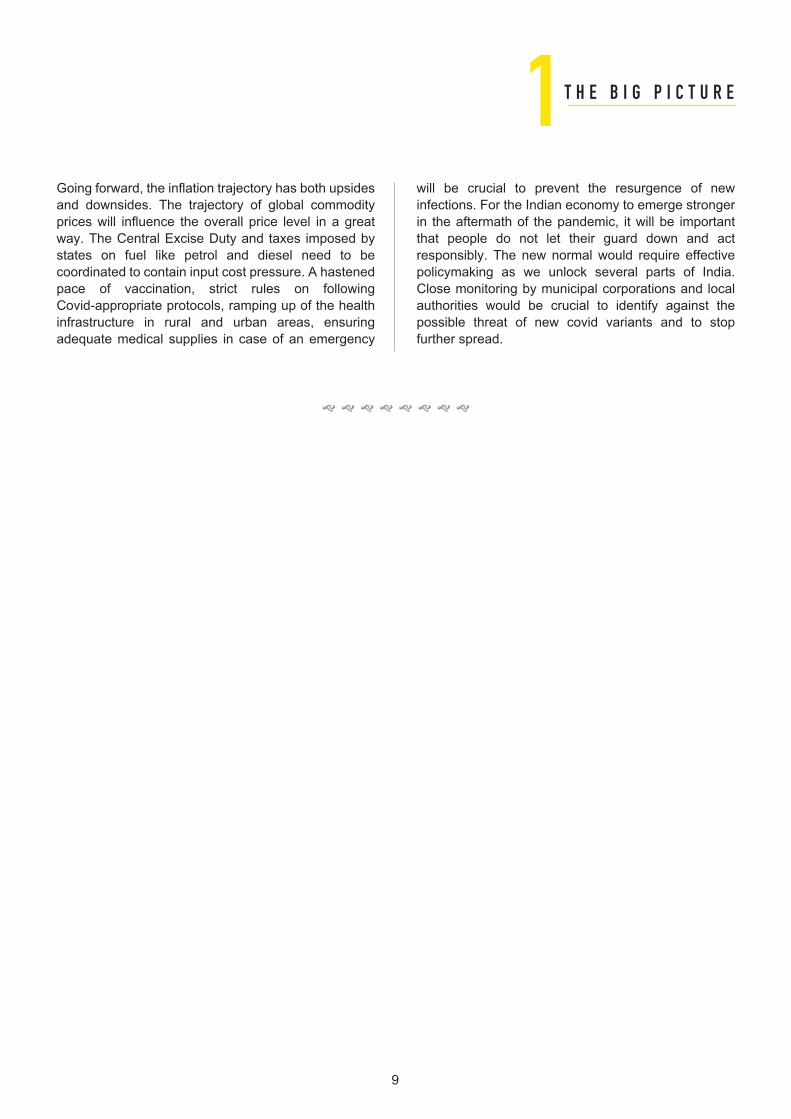
Compared to steady expansion in the first five months of 2021, the global Purchasing Managers’ Index (PMI) recorded slower growth in June and July. However, it continues to remain in the expansion zone. In Asia, the manufacturing PMI witnessed deceleration in China. In India, manufacturing PMI rose to a three-month high of 55.3 in July, reflecting likely expansion of manufacturing activity in the coming months. India’s services PMI improved to 45.4 but remained in the contraction zone.
Subsequent to a fairly robust recovery in the March quarter, the Indian economy was impacted by a much stronger Covid second wave, leading to imposition of strict curbs across states and decline in economic activity. High-frequency indicators, such as PMI, cement and steel production, power demand, auto
sales, etc., show that recovery was negatively impacted in the June quarter. The RBI, in the monetary policy review in June, lowered its projection of real GDP growth for FY22 from 10.5% to 9.5%.
However, as per consensus estimates, despite downward revision in GDP growth projections, India is expected to be amongst the fastest-growing major economies in the world. A strong rebound is expected on the back of rapid vaccinations, a recovering monsoon boosting agricultural output, thrust on infrastructure investments by the Government, growth in exports, which have performed remarkably during April–June registering a growth of 18% over the same period in the pre-pandemic year of 2019-20. We also expect consumption to recover in the third and fourth quarters of the fiscal year.
In May 2021, the Consumer Price Index (CPI) inflation rose to 6.3% and breached RBI’s threshold of 4(+/-2)% for the first time in six months, whereas the Wholesale Price Index (WPI) inflation spiked to an 11-year high of 12.9%. CPI inflation declined to 5.6% and WPI came down to 11.2% in July. Current high inflation is largely due to supply-side factors rather than demand-side issues and hence can be expected to be transitory.
After phased unlocking post the second Covid wave, economic activity has gained strength. The Government has also stepped in to provide another dose of stimulus of Rs 6.3 lakh crore, focused on healthcare, tourism, agriculture, infrastructure, MSMEs and exports. As growth momentum gathers pace, supported by the measures undertaken by the government, the Indian economy will emerge stronger on a sustainable development path.
This edition of ArthNITI has a special feature on the Development Monitoring and Evaluation Office (DMEO), which actively monitors and evaluates the implementation of government programmes and initiatives. A performance evaluation of the programmes of the government across sectors by the DMEO yield important findings and help maximise the return on public expenditure.
I look forward to your feedback on this edition.

4
Data as of 31st Jul 2021Commodity Price ($) Price (INR)
Copper (MT) 9,450.8 7,60,000Iron Ore (dmtu) 214.1 6,160^Aluminium (MT) 2,497.6 2,10,000Steel (Rebar, MT) 720.6 51,640Brent Crude Oil (bbl) 73.3 5,517Coal (MT) 152.0 2,747^Natural Gas, US (MMBtu) 3.8 289.4
31st Jul 21 31st Jul 20DJI 34,935.47 (32.2) 26,428.32NASDAQ 100 14,672.68 (36.6) 10,745.27SSE Composite 3,397.36 (2.6) 3,310.01Nikkei 225 27,663.39 (27.4) 21,710.00FTSE 100 7,032.30 (19.2) 5,897.76Hang Seng 25,961.03 (5.1) 24,710.59STI 3,166.94 (23.8) 2,558.37BSE Sensex 52,586.84 (39.8) 37,606.89
Source: $ Prices from World Bank Commodity Prices Pink Sheet. London Metal Exchange. Rs. Prices from MCX, CEIC. ^NMDC/CIL Price (excl taxes etc).
Source: Yahoo Finance. % change from last year in brackets.
G20: The Macro SceneReal Sector
% Share of World GDP, 2020
GDP Per Capita ($), 2020
Latest GDP Growth (%)* (y/y, %)
Industrial Output Growth (y/y,%)
Manufacturing (%) of GDP^, 2020
Manufacturing PMI
United States 24.7 63,544 12.5 Q2 5.4 Jul 9.7 Jun 10.9 63.4 JulChina 17.4 10,500 7.9 Q2 1.0 Jul 8.3 Jun 26.2 50.3 JulJapan 5.8 40,113 -1.6 Q2 -0.4 Jun 22.6 Jun 20.7 53.0 JulGermany 4.5 45,724 9.6 Q2 3.8 Jul 8.9 Jun 17.8 65.9 JulUnited Kingdom 3.2 40,285 -6.0 Q1 2.5 Jun 8.4 Jun 8.4 60.4 JulIndia 3.1 1,901 1.6 Q1 5.6 Jul 13.6 Jun 13.0 55.3 JulFrance 3.1 38,625 19.1 Q2 1.2 Jul 9.9 Jun 9.3 58.0 JulItaly 2.2 31,676 0.1 Q1 2.0 Jul 14.0 Jun 14.9 60.3 JulCanada 1.9 43,242 -0.1 Q1 3.1 Jun - 10.6 56.2 JulKorea 1.9 31,489 5.9 Q2 2.6 Jul 11.9 Jun 24.9 53.0 JulRussia 1.8 10,127 -0.7 Q1 6.5 Jul 10.4 Jun 13.3 47.5 JulBrazil 1.7 6,797 1.0 Q1 9.0 Jul 12.0 Jun 9.8 56.7 JulAustralia 1.6 51,812 1.1 Q1 3.7 Jun -1.6 Mar 5.7 56.9 JulMexico 1.3 8,347 19.7 Q2 5.8 Jul 13.5 Jun 17.2 49.6 JulIndonesia 1.2 3,870 7.1 Q2 1.5 Jul - 19.9 40.1 JulTurkey 0.9 8,538 7.0 Q1 18.6 Jul 23.7 Jun 18.8 54.0 JulSaudi Arabia 0.8 20,110 1.5 Q2 6.2 Jun 12.5 Jun 13.0 55.8 JulArgentina 0.5 8,442 2.5 Q1 51.2 Jul 19.1 Jun 13.9 -South Africa 0.4 5,091 -3.2 Q1 4.9 Jun 12.5 Jun 11.5 46.1 JulEuropean Union 17.9 33,928 -1.3 Q1 2.2 Jul 10.6 Jun 13.9 62.5 JulSource: CEIC, World Bank, * Calendar Year 2021. ^Japan (2018) & US (2019) values. PMI below 50: contraction; above 50: expansion. For KSA & RSA, PMI reported for whole economy. No new industrial production releases from Indonesia & Canada since March 2020. Data for December is from 2020.
Financial and External SectorsInterest Rates External Sector^
10Y Bond
Bank Lending Rate
(% of GDP, 2020)LCU/$* (%,y/y)
Current Account Trade Exports Imports Inward Revenue
($ Bn)USA 1.32 3.25 Jul 1 -3.1 26.3 11.7 14.6 3,092China 2.95 4.35 Jul 6.46 (-2.6) 1.9 34.5 18.5 16.0 2,993Japan 0.06 1.48 Jul 109.70 (3.7) 3.5 34.9 17.5 17.4 1,094Germany -0.45 1.93 Jun 0.84 (-0.4) 7.0 81.8 43.8 38.0 1,914India 6.39 8.80 Jun 74.34 (-0.7) 1.3 36.4 18.1 18.3 912UK 0.62 1.10 Jun 0.72 (-5.6) -3.5 55.1 27.3 27.8 591France -0.01 1.33 Jun 0.84 (-0.4) -1.9 58.3 28.0 30.3 950Italy 0.75 1.77 Jun 0.84 (-0.4) 3.7 55.3 29.5 25.8 647Brazil 4.88 39.93 Jun 5.14 (-1.1) -1.7 32.3 16.9 15.4 575Canada 1.76 2.45 Jun 1.25 (-6.9) -1.9 59.9 29.0 30.9 650Russia 6.93 6.42 May 73.14 (-0.3) 2.9 46.1 25.5 20.6 433Korea, Rep. 1.87 2.77 Jun 1,151.86 (-3.4) 4.6 70.1 36.9 33.2 253Australia 1.25 6.51 Jul 1.36 (-2.6) 2.5 44.0 23.9 20.1 346Mexico 2.84 4.40 Jul 19.85 (-10.7) 2.5 78.0 40.1 37.9 486Indonesia 6.45 8.96 Jun 14,491.01 (-1.1) -0.4 33.2 17.2 16.0 193Saudi Arabia 0.79 0.63 Jul 3.75 (0.0) -2.8 50.6 26.3 24.3 211Turkey 14.29 22.98 Jul 8.51 (22.5) -5.2 60.9 28.6 32.3 208Argentina# 44.53 39.88 Jul 96.69 (33.7) 0.8 30.5 16.6 13.9 69South Africa 9.60 7.00 Jun 14.56 (-14.2) 2.2 56.0 30.5 25.5 101EU 0.16 1.75 Jun 0.84 (-0.4) 2.6 84.6 43.9 40.7 8,701As of 31.07.2021,unless otherwise stated. Source: CEIC, World Bank, Investing.com & Trading Economics. # 7Y bond. * - sign indicates appreciation. Inward revenue = export of goods & services+ primary income+ remittances. ^ US & Japan 2019 values. `52 week bond yield & 3 month interbank rate. .
Commodities and Markets
5
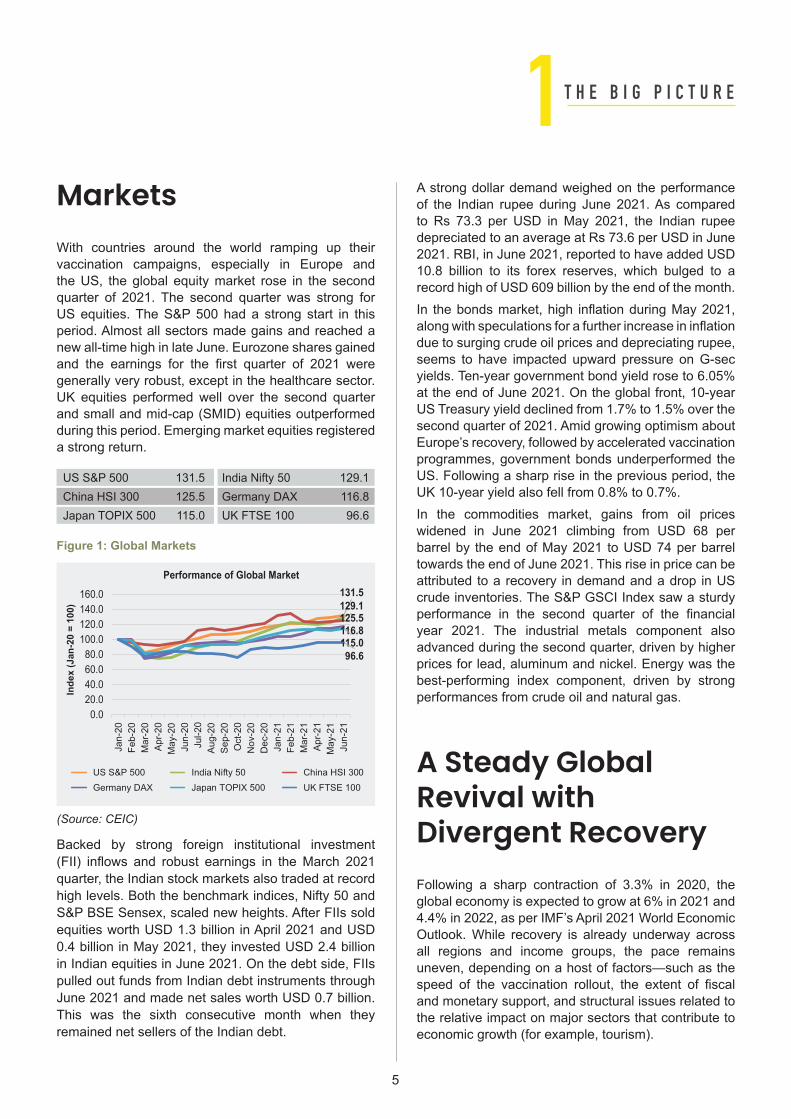
Markets
period. Almost all sectors made gains and reached a
and small and mid-cap (SMID) equities outperformed
a strong return.
Figure 1: Global Markets
pulled out funds from Indian debt instruments through
remained net sellers of the Indian debt.
(Source: CEIC)
of the Indian rupee during June 2021. As compared
due to surging crude oil prices and depreciating rupee,
programmes, government bonds underperformed the
performances from crude oil and natural gas.
A Steady Global Revival with Divergent Recovery
all regions and income groups, the pace remains uneven, depending on a host of factors—such as the
the relative impact on major sectors that contribute to
T H E B I G P I C T U R E1
US S&P 500 131.5 India Nifty 50 129.1China HSI 300 125.5 Germany DAX 116.8Japan TOPIX 500 115.0 UK FTSE 100 96.6
131.5129.1125.5116.8115.096.6
0.020.040.060.080.0
100.0120.0140.0160.0
Jan-
20Fe
b-20
Mar
-20
Apr-2
0M
ay-2
0Ju
n-20
Jul-2
0Au
g-20
Sep-
20O
ct-2
0N
ov-2
0D
ec-2
0Ja
n-21
Feb-
21M
ar-2
1Ap
r-21
May
-21
Jun-
21
Inde
x (J
an-2
0 =
100)
Performance of Global Market
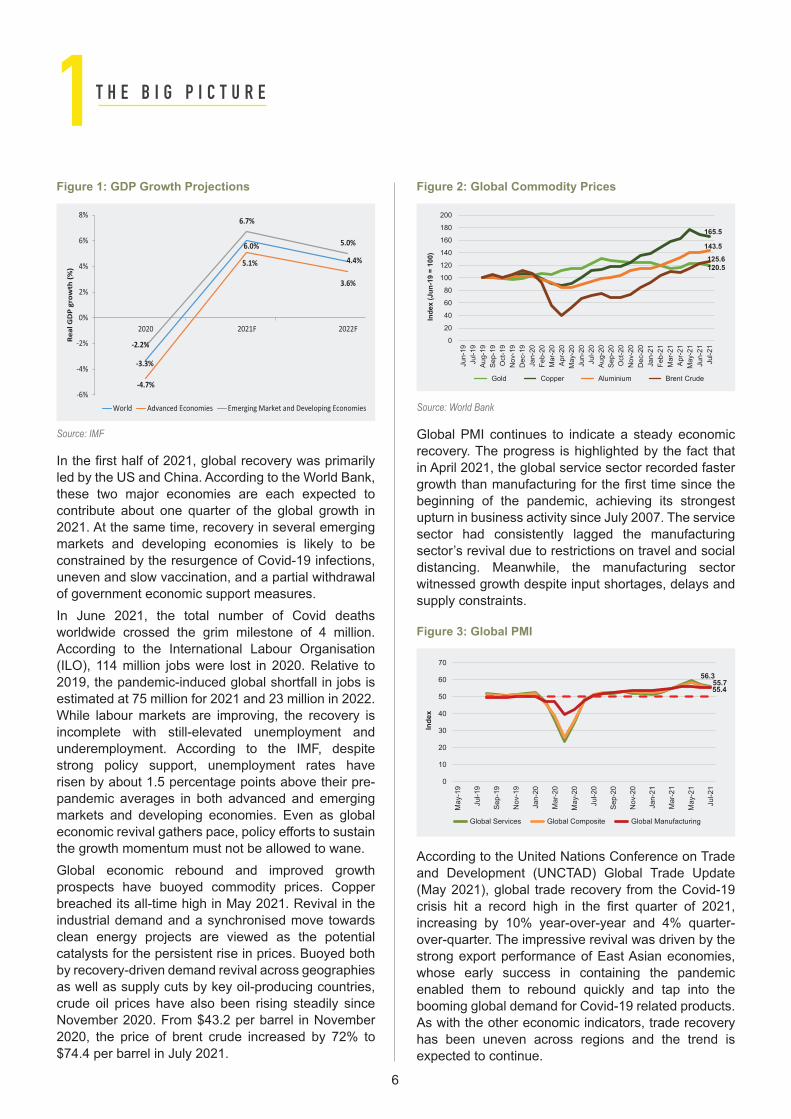
Figure 1: GDP Growth Projections
Source: IMF
of government economic support measures.
According to the International Labour Organisation
2019, the pandemic-induced global shortfall in jobs is
pandemic averages in both advanced and emerging
Figure 2: Global Commodity Prices
Source: World Bank
in April 2021, the global service sector recorded faster
beginning of the pandemic, achieving its strongest
Figure 3: Global PMI
has been uneven across regions and the trend is
T H E B I G P I C T U R E1
November 2020. From $43.2 per barrel in November 2020, the price of brent crude increased by 72% to $74.4 per barrel in July 2021.
120.5
165.5
143.5
125.6
0
20
40
60
80
100
120
140
160
180
200
Jun-
19Ju
l-19
Aug-
19Se
p-19
Oct
-19
Nov
-19
Dec
-19
Jan-
20Fe
b-20
Mar
-20
Apr-2
0M
ay-2
0Ju
n-20
Jul-2
0Au
g-20
Sep-
20O
ct-2
0N
ov-2
0D
ec-2
0Ja
n-21
Feb-
21M
ar-2
1Ap
r-21
May
-21
Jun-
21Ju
l-21
Inde
x (J
un-1
9 =
100)
Gold Copper Aluminium Brent Crude
56.355.755.4
0
10
20
30
40
50
60
70
May
-19
Jul-1
9
Sep-
19
Nov
-19
Jan-
20
Mar
-20
May
-20
Jul-2
0
Sep-
20
Nov
-20
Jan-
21
Mar
-21
May
-21
Jul-2
1
Inde
x
Global Services Global Composite Global Manufacturing
Robust fiscal support has been one of the key drivers of global recovery. However, such support has raised government deficits and debt to unprecedented levels across all countries. According to the IMF, average overall deficits as a share of GDP in 2020 reached 11.7% for advanced economies, 9.8% for emerging market economies, and 5.5% for low-income develop-ing countries. However, fiscal deficits in 2021 are projected to contract in most countries as pandemic-re-lated support phases out and revenues recover. In a similar vein, average public debt worldwide, which reached an unprecedented 97% of GDP in 2020, is projected to stabilize at around 99% of GDP in 2021.
As global recovery gathers momentum, timely and universal access to Covid-19 vaccinations will be crucial to end the pandemic promptly and place the world economy on the path of a resilient recovery.
Indian Macro Provisional estimates of national income released by the National Statistical Office (NSO) on 31 May, 2021 placed India’s Real Gross Domestic Product (GDP) contraction at 7.3% for FY 21. The Real GDP growth in March 2021 quarter stood at 1.6% y/y. The uptick in the March 2021 quarter was driven mainly by the manufacturing and construction sectors as seen in Gross Value Added (GVA) estimates. The manufacturing sector rose to 6.9% y/y and the construction sector to 14.5% y/y in the March 2021 quarter. The service sector remains sluggish and rose only marginally by 1.5% y/y in the March 2021 quarter. This is the first full-year contraction in the Indian economy in the last four decades since 1979–80, when GDP had shrunk by 5.2%. This is also the second straight quarter of expansion for the FY 21.
The Purchasing Managers’ Index (PMI) depicts 3-6 month forward trend. PMI for the manufacturing sector rose to 55.3 in July 2021 - up from 48.1 in June 2021 and 50.8 in May 2021. Factory orders rose amid reports of improved demand and the easing of restrictions. Strengthening international demand contributed to the uptick in total order books. PMI for the manufacturing sector had slipped into contraction for the first time in the last 11 months in June 2021. For the service sector, PMI stood at 45.4 and it remained in contraction for the third consecutive month in July
-
-
Retail inflation based on Consumer Price Index (Head-line) eased to a three-month low of 5.6% in July 2021 due to moderation in food prices. The inflation print has come within the RBI’s targeted range of (4[+/-2%]) after two months. CPI Food and Beverages eased to 4.5% in July 2021 from 5.6% in June 2021. Fuel inflation fell marginally to 12.4% in July 2021 from 12.6% in June 2021.
T H E B I G P I C T U R E1
12.4%
5.9%5.6%
4.5%
-4%-2%0%2%4%6%8%
10%12%14%
Aug-
19Se
p-19
Oct
-19
Nov
-19
Dec
-19
Jan-
20Fe
b-20
Mar
-20
Apr-2
0M
ay-2
0Ju
n-20
Jul-2
0Au
g-20
Sep-
20O
ct-2
0N
ov-2
0D
ec-2
0Ja
n-21
Feb-
21M
ar-2
1Ap
r-21
May
-21
Jun-
21Ju
l-21
% c
hang
e y/
y
CPI Fuel & Light CPI CoreCPI Headline CPI Food and Beverages
Consumer Price Index (CPI)
26.0%11.2%11.2%5.7%
-30%
-20%
-10%
0%
10%
20%
30%
40%
Aug
19Se
p 19
Oct
19
Nov
19
Dec
19
Jan
20Fe
b 20
Mar
20
Apr 2
0M
ay 2
0Ju
n 20
Jul 2
0Au
g 20
Sep
20O
ct 2
0N
ov 2
0D
ec 2
0Ja
n 21
Feb
21M
ar 2
1Ap
r 21
May
21
Jun
21Ju
l 21
% c
hang
e y/
y
WPI: Fuel and Power Wholesale Price Index (WPI)
WPI: Manufactured Products WPI: Primary Articles
Wholesale Price Index (WPI)
2021. It signals a bleak outlook for the service sector and due to its contact-intensive nature, it hasn’t seen a swift recovery like the manufacturing sector.

8
Inflation as measured by the Wholesale Price Index (WPI) stood at 11.2% in July 2021, falling from a record high of 13.1% in May 2021. The high rate of inflation is due to the low base effect and soaring prices of crude oil and manufactured goods. Inflation in manufactured products, the largest component of the index rose 11.2% and fuel and power index rose 26.0% in July 2021 compared to a year ago.
India’s factory output that is tracked by Index of Indus-trial Production (IIP) rose by 13.6% y/y in June 2021 on the back of low base effect (IIP saw a contraction of 16.6% in June 2020 due to the nationwide lockdown). The core sector output grew 8.9% y/y in June 2021, supported by six sectors reporting positive growth, albeit on a low base effect. However, the anecdotal evidence suggests of industrial activity being greatly impacted in many states due to the second wave of the pandemic in the months of April and May 2021.
With phased unlocking taking place, high frequency indicators like finished steel, cement production and electricity demand saw an increase as compared to the previous year. Finished steel and electricity demand witnessed a growth of 8.3% y/y and 11.1% y/y in July 2021. Cement production rose by 7.9% y/y in May 21. However, there has been a sequential decline for cement production if we compare the values of May 2021 against April 2021. With the second wave of the pandemic having affected the rural areas, the data on tractor sales showed a fall for May 2021 and a pickup is seen for June and July 2021, which shows a rise of 8.2% y/y for July 2021.
The contact-intensive service sector continues to be impacted with passenger bookings for air and rail transport falling steeply in May 2021. The latest rail freight data for the month of July 2021 shows that freight traffic increased by 18.4% y/y, which is also the highest-ever loading and collection of freight revenue in the past 10 months. Thus, amid challenges posed by the Covid-19 pandemic, the railway sector regis-tered a high momentum mainly due to freight traffic. In terms of automobiles, passenger vehicle and two-wheeler sales also showed a significant decline for May 2021; however, with easing of mobility restrictions across states a pickup in consumption is seen for July 2021. Passenger vehicle sales rose 44.7% y/y and 14.2% m/m, while two wheeler sales rose 18.8% m/m but witnessed a decline of 2.1% y/y.
High-Frequency Indicators
T H E B I G P I C T U R E1Going forward, the inflation trajectory has both upsides and downsides. The trajectory of global commodity prices will influence the overall price level in a great way. The Central Excise Duty and taxes imposed by states on fuel like petrol and diesel need to be coordinated to contain input cost pressure. A hastened pace of vaccination, strict rules on following Covid-appropriate protocols, ramping up of the health infrastructure in rural and urban areas, ensuring adequate medical supplies in case of an emergency
will be crucial to prevent the resurgence of new infections. For the Indian economy to emerge stronger in the aftermath of the pandemic, it will be important that people do not let their guard down and act responsibly. The new normal would require effective policymaking as we unlock several parts of India. Close monitoring by municipal corporations and local authorities would be crucial to identify against the possible threat of new covid variants and to stop further spread.
264.4
44.7%14.2%
-100%-50%0%50%100%150%200%250%
050
100150200250300350
Aug
19Se
p 19
Oct
19
Nov
19
Dec
19
Jan
20Fe
b 20
Mar
20
Apr 2
0M
ay 2
0Ju
n 20
Jul 2
0Au
g 20
Sep
20O
ct 2
0N
ov 2
0D
ec 2
0Ja
n 21
Feb
21M
ar 2
1Ap
r 21
May
21
Jun
21Ju
l 21
% change
Uni
ts (0
00)
Domestic Passenger Vehicle Sales % Change y/y % Change m/m
Passenger Vehicles
76.4
8.2%
-36.6%-100%
0%
100%
200%
300%
400%
500%
600%
0
20
40
60
80
100
120
140
Aug
19Se
p 19
Oct
19
Nov
19
Dec
19
Jan
20Fe
b 20
Mar
20
Apr 2
0M
ay 2
0Ju
n 20
Jul 2
0Au
g 20
Sep
20O
ct 2
0N
ov 2
0D
ec 2
0Ja
n 21
Feb
21M
ar 2
1Ap
r 21
May
21
Jun
21Ju
l 21
% change
Thou
sand
Uni
ts
Tractor Sales % change y/y % change m/m
Tractor Sales
112.7
18.4%
-0.1%
-60%
-40%
-20%
0%
20%
40%
60%
80%
0
20
40
60
80
100
120
140
Aug-
19Se
p-19
Oct
-19
Nov
-19
Dec
-19
Jan-
20Fe
b-20
Mar
-20
Apr-2
0M
ay-2
0Ju
n-20
Jul-2
0Au
g-20
Sep-
20O
ct-2
0N
ov-2
0D
ec-2
0Ja
n-21
Feb-
21M
ar-2
1Ap
r-21
May
-21
Jun-
21Ju
l-21
% changeM
illio
n To
ns
Railway Freight Traffic % change y/y % change m/m
Freight Traffic
8,807.0
8.3%1.1%
-200%
-100%
0%
100%
200%
300%
400%
500%
0
2,000
4,000
6,000
8,000
10,000
12,000
Aug-
19Se
p-19
Oct
-19
Nov
-19
Dec
-19
Jan-
20Fe
b-20
Mar
-20
Apr-2
0M
ay-2
0Ju
n-20
Jul-2
0Au
g-20
Sep-
20O
ct-2
0N
ov-2
0D
ec-2
0Ja
n-21
Feb-
21M
ar-2
1Ap
r-21
May
-21
Jun-
21Ju
l-21
% change
Thou
sand
Met
ric T
ons
Finished Steel: Production: Crude Steel to Finished Steel Equivalent(India)% change y/y % change m/m
Finished Steel Production
Inflation as measured by the Wholesale Price Index (WPI) stood at 11.2% in July 2021, falling from a record high of 13.1% in May 2021. The high rate of inflation is due to the low base effect and soaring prices of crude oil and manufactured goods. Inflation in manufactured products, the largest component of the index rose 11.2% and fuel and power index rose 26.0% in July 2021 compared to a year ago.
India’s factory output that is tracked by Index of Indus-trial Production (IIP) rose by 13.6% y/y in June 2021 on the back of low base effect (IIP saw a contraction of 16.6% in June 2020 due to the nationwide lockdown). The core sector output grew 8.9% y/y in June 2021, supported by six sectors reporting positive growth, albeit on a low base effect. However, the anecdotal evidence suggests of industrial activity being greatly impacted in many states due to the second wave of the pandemic in the months of April and May 2021.
With phased unlocking taking place, high frequency indicators like finished steel, cement production and electricity demand saw an increase as compared to the previous year. Finished steel and electricity demand witnessed a growth of 8.3% y/y and 11.1% y/y in July 2021. Cement production rose by 7.9% y/y in May 21. However, there has been a sequential decline for cement production if we compare the values of May 2021 against April 2021. With the second wave of the pandemic having affected the rural areas, the data on tractor sales showed a fall for May 2021 and a pickup is seen for June and July 2021, which shows a rise of 8.2% y/y for July 2021.
The contact-intensive service sector continues to be impacted with passenger bookings for air and rail transport falling steeply in May 2021. The latest rail freight data for the month of July 2021 shows that freight traffic increased by 18.4% y/y, which is also the highest-ever loading and collection of freight revenue in the past 10 months. Thus, amid challenges posed by the Covid-19 pandemic, the railway sector regis-tered a high momentum mainly due to freight traffic. In terms of automobiles, passenger vehicle and two-wheeler sales also showed a significant decline for May 2021; however, with easing of mobility restrictions across states a pickup in consumption is seen for July 2021. Passenger vehicle sales rose 44.7% y/y and 14.2% m/m, while two wheeler sales rose 18.8% m/m but witnessed a decline of 2.1% y/y.
High-Frequency Indicators
T H E B I G P I C T U R E1
9
Going forward, the inflation trajectory has both upsides and downsides. The trajectory of global commodity prices will influence the overall price level in a great way. The Central Excise Duty and taxes imposed by states on fuel like petrol and diesel need to be coordinated to contain input cost pressure. A hastened pace of vaccination, strict rules on following Covid-appropriate protocols, ramping up of the health infrastructure in rural and urban areas, ensuring adequate medical supplies in case of an emergency
will be crucial to prevent the resurgence of new infections. For the Indian economy to emerge stronger in the aftermath of the pandemic, it will be important that people do not let their guard down and act responsibly. The new normal would require effective policymaking as we unlock several parts of India. Close monitoring by municipal corporations and local authorities would be crucial to identify against the possible threat of new covid variants and to stop further spread.
10
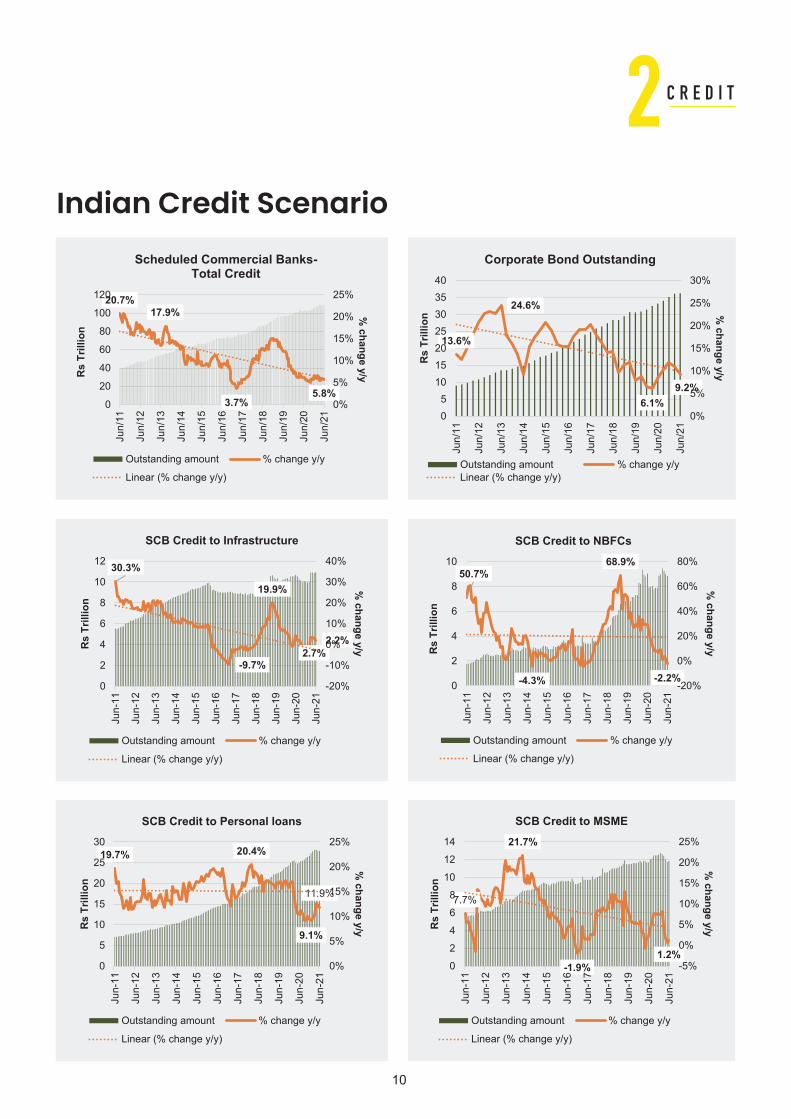
Indian Credit Scenario
C R E D I T2
20.7%17.9%
3.7%5.8%
0%
5%
10%
15%
20%
25%
0
20
40
60
80
100
120
Jun/
11
Jun/
12
Jun/
13
Jun/
14
Jun/
15
Jun/
16
Jun/
17
Jun/
18
Jun/
19
Jun/
20
Jun/
21
% change y/yR
s Tr
illio
n
Scheduled Commercial Banks-Total Credit
Outstanding amount % change y/y
Linear (% change y/y)
13.6%
24.6%
6.1%9.2%
0%
5%
10%
15%
20%
25%
30%
05
10152025303540
Jun/
11
Jun/
12
Jun/
13
Jun/
14
Jun/
15
Jun/
16
Jun/
17
Jun/
18
Jun/
19
Jun/
20
Jun/
21
% change y/y
Rs
Trill
ion
Corporate Bond Outstanding
Outstanding amount % change y/yLinear (% change y/y)
30.3%
-9.7%
19.9%
2.7%2.2%
-20%
-10%
0%
10%
20%
30%
40%
0
2
4
6
8
10
12
Jun-
11
Jun-
12
Jun-
13
Jun-
14
Jun-
15
Jun-
16
Jun-
17
Jun-
18
Jun-
19
Jun-
20
Jun-
21
% change y/yRs
Tril
lion
SCB Credit to Infrastructure
Outstanding amount % change y/y
Linear (% change y/y)
50.7%
-4.3%
68.9%
-2.2%-20%
0%
20%
40%
60%
80%
0
2
4
6
8
10
Jun-
11
Jun-
12
Jun-
13
Jun-
14
Jun-
15
Jun-
16
Jun-
17
Jun-
18
Jun-
19
Jun-
20
Jun-
21
% change y/yR
s Tr
illio
n
SCB Credit to NBFCs
Outstanding amount % change y/y
Linear (% change y/y)
19.7% 20.4%
9.1%
11.9%
0%
5%
10%
15%
20%
25%
0
5
10
15
20
25
30
Jun-
11
Jun-
12
Jun-
13
Jun-
14
Jun-
15
Jun-
16
Jun-
17
Jun-
18
Jun-
19
Jun-
20
Jun-
21
% change y/yRs
Tril
lion
SCB Credit to Personal loans
Outstanding amount % change y/y
Linear (% change y/y)
7.7%
21.7%
-1.9%1.2%
-5%
0%
5%
10%
15%
20%
25%
0
2
4
6
8
10
12
14
Jun-
11
Jun-
12
Jun-
13
Jun-
14
Jun-
15
Jun-
16
Jun-
17
Jun-
18
Jun-
19
Jun-
20
Jun-
21
% change y/yR
s Tr
illio
n
SCB Credit to MSME
Outstanding amount % change y/y
Linear (% change y/y)

11
C R E D I T213.7%
21.6%
-3.3%1.3%
-5%
0%
5%
10%
15%
20%
25%
0.0
0.5
1.0
1.5
2.0
2.5
Jun/
11
Jun/
12
Jun/
13
Jun/
14
Jun/
15
Jun/
16
Jun/
17
Jun/
18
Jun/
19
Jun/
20
Jun/
21
% change y/y
Rs
Trill
ion
SCB Credit to Real Estate
Outstanding amount % change y/y
Linear (% change y/y)
7.3%
47.3%
-54.8%
18.3%
-80%
-60%
-40%
-20%
0%
20%
40%
60%
0.0
0.1
0.2
0.3
0.4
0.5
0.6
Jun-
11
Jun-
12
Jun-
13
Jun-
14
Jun-
15
Jun-
16
Jun-
17
Jun-
18
Jun-
19
Jun-
20
Jun-
21
% c
hang
e y/
y
Rs
Trill
ion
SCB Credit to Exporters
Outstanding amount % change y/y
Linear (% change y/y)
12.5%
9.9%
11.9%
9.1% 8.7%
11.7%
8.0%
6%
7%
8%
9%
10%
11%
12%
13%
Sep/
14
Jun/
15
Mar
/16
Dec
/16
Sep/
17
Jun/
18
Mar
/19
Dec
/19
Sep/
20
Jun/
21
Inte
rest
rate
WALR on Outstanding Rupee Loans
Private Sector BanksScheduled Commercial BanksPublic Sector BanksForeign Banks
12.2%
8.3%
11.52
7.7%
10.9%
5.8% 5%
6%
7%
8%
9%
10%
11%
12%
13%
Sep/
14
Jun/
15
Mar
/16
Dec
/16
Sep/
17
Jun/
18
Mar
/19
Dec
/19
Sep/
20
Jun/
21
Inte
rest
rate
WALR on Fresh Rupee Loans Sanctioned
Private Sector BanksScheduled Commercial BanksPublic Sector BanksForeign Banks
12
Telangana
is situated in the Deccan Plateau and Krishna and
It has 33 districts and Telugu is the main language for
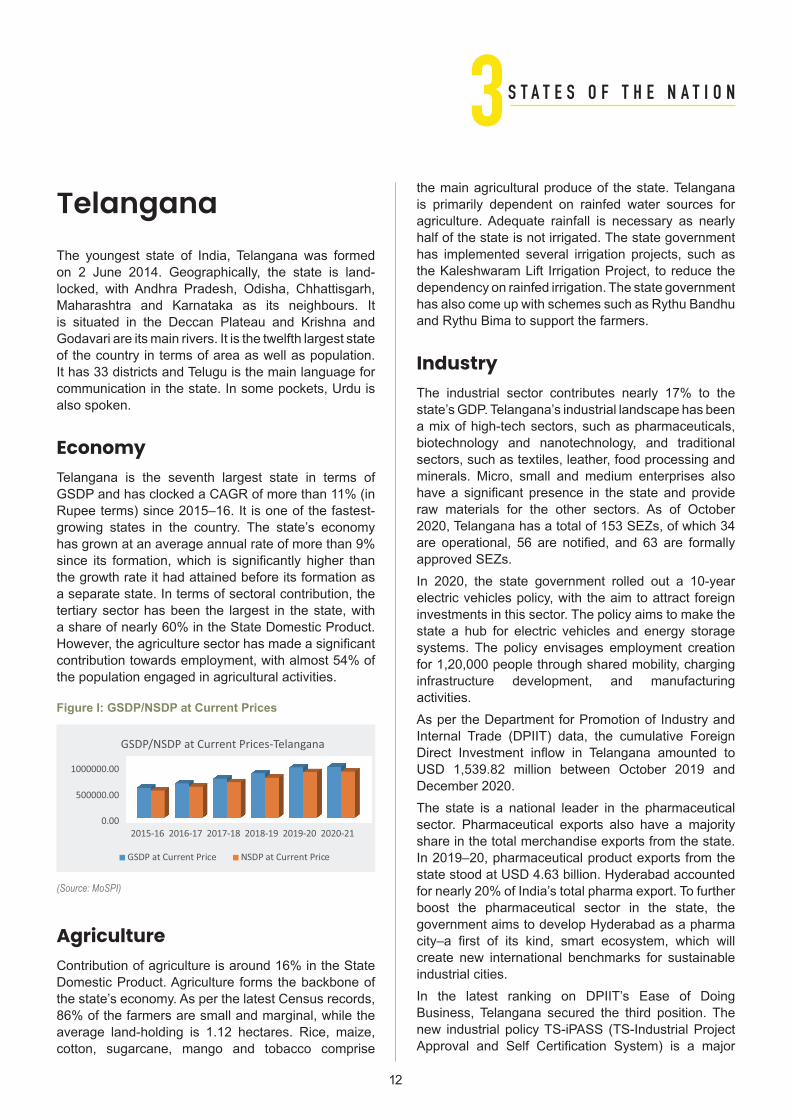
EconomyTelangana is the seventh largest state in terms of
a separate state. In terms of sectoral contribution, the
the population engaged in agricultural activities.
Figure I: GSDP/NSDP at Current Prices
(Source: MoSPI)
Agriculture
average land-holding is 1.12 hectares. Rice, maize, cotton, sugarcane, mango and tobacco comprise
the main agricultural produce of the state. Telangana
half of the state is not irrigated. The state government has implemented several irrigation projects, such as
Industry
minerals. Micro, small and medium enterprises also
approved SEZs.
infrastructure development, and manufacturing activities.
December 2020.The state is a national leader in the pharmaceutical
boost the pharmaceutical sector in the state, the
industrial cities.
Business, Telangana secured the third position. The
S T A T E S O F T H E N A T I O N3
13
the state.
ServicesApart from being a pharmaceuticals hub, Telangana is
State Finances
FY 20.Rs 13,990 crore—an annual decrease of 6% over
Infrastructure
10% of the overall road length in the state. Telangana
Tourism
India but also from abroad. In 2018, domestic tourist
S T A T E S O F T H E N A T I O N3

14
Development Monitoring and Evaluation Office
Overview and Key Initiatives
and other intensive area development schemes.
in November 2010.
monitoring and evaluating government policies and programmes. It aims to support rigorous, data-driven, citizen-centric, and outcomes-driven programme
Figure 1: Genesis of DMEO
Mandate of DMEO
evaluating the implementation of programmes and
to provide cross- and inter-ministerial perspectives. Its
departments of the Government of India.
Monitoring and Evaluation Activities at DMEO
Output-Outcome Monitoring Framework
for monitoring the outputs and outcomes of more
Budget and Detailed Demand for Grants. The Output-
provide measurable indicators for achievement
P O L I C Y A N D P R O G R A M M E4

15
Figure 2: Monitoring, Evaluation and Other Functions of DMEO
Evaluation
StudiesEvaluation Studies
Assessment Studies
Figure 3: Outcome Budget Document1
Evaluations of Centrally Sponsored Schemes (CSS)
-getE2021_2022.pdf
governments.-
-
practices emerging from the studies have also been
be accessed here.
Sector Reviews
infrastructure sectors and 4 social sectors for some
actions are often initiated from the highest levels of the government, improving overall development outcomes.
P O L I C Y A N D P R O G R A M M E4

16
In this endeavour, DMEO has developed an interactive
dashboard has been made accessible to ministries or departments, enabling them to upload progress data
in the sector, challenges and proposed interventions,
Engagement with States
the planning departments of all the state governments
studies, among others.
held in June. Panel members of the session included
to have similar such presentation for all the other 8
Global Indices for Reforms and Growth (GIRG)
indices through a single dashboard. The objective is to use the indices as tools for self-improvement for guiding reforms in policies and processes of
To enable this, DMEO has developed an interactive dashboard to monitor the indices and reforms. It is
the dashboard.
Data Governance Quality Index (DGQI)
2 As the have been proposed to be
and improve data capabilities. This initiative is an
Figure 4: Objective and Index Composition of DGQI
Objectives of DGQI
Competitive
To and thereview assessdata preparedness of the
data/ MIS systems
To prepare a selfassessment diagnostic tool- Trigger on
-
contemplationimprovements
To prepare a DataGovernance Quality Index
to drive healthycompetition.
practices
To document &disseminate best
Cooperative
DataGovernance
QualityIndex
Use ofTechnology
(10%)
Data Analysis, Use& Dissemination
(30%)
DataQuality(15%)
DataGeneration
( %)20
Data Security &HR Capacity
(10%)
CaseStudies
(15%)
P O L I C Y A N D P R O G R A M M E4
evaluator competencies in countries such as the
through our and sessions. These have been envisioned as a platform
Partnerships
a development data architecture for programme management.
national conference on
on monitoring and evaluation in the government.
Way Forward
Transforming DMEO into a Globally Recognized Institution
helping government institutions improve and sustain
monitoring and evaluation at all levels of government
of results.
Quick Assessment Studies
studies provided urgent inputs for reform and future
the pipeline include process evaluation of the National
of the Bureau of Indian Standards (BIS)
Other Activities at DMEO
Toolkits
resources to support practitioners of the same. Various have been developed and made available on
Capacity Building
Since its inception in 2015, DMEO has focused
long-term, continuous and sustainable engagement
state governments—to inculcate and institutionalise an understanding of monitoring and evaluation as a management tool that should be used to improve
In order to strengthen capacities at the central and state level, DMEO has developed a comprehensive
understand best practices for evaluations and
P O L I C Y A N D P R O G R A M M E4
17
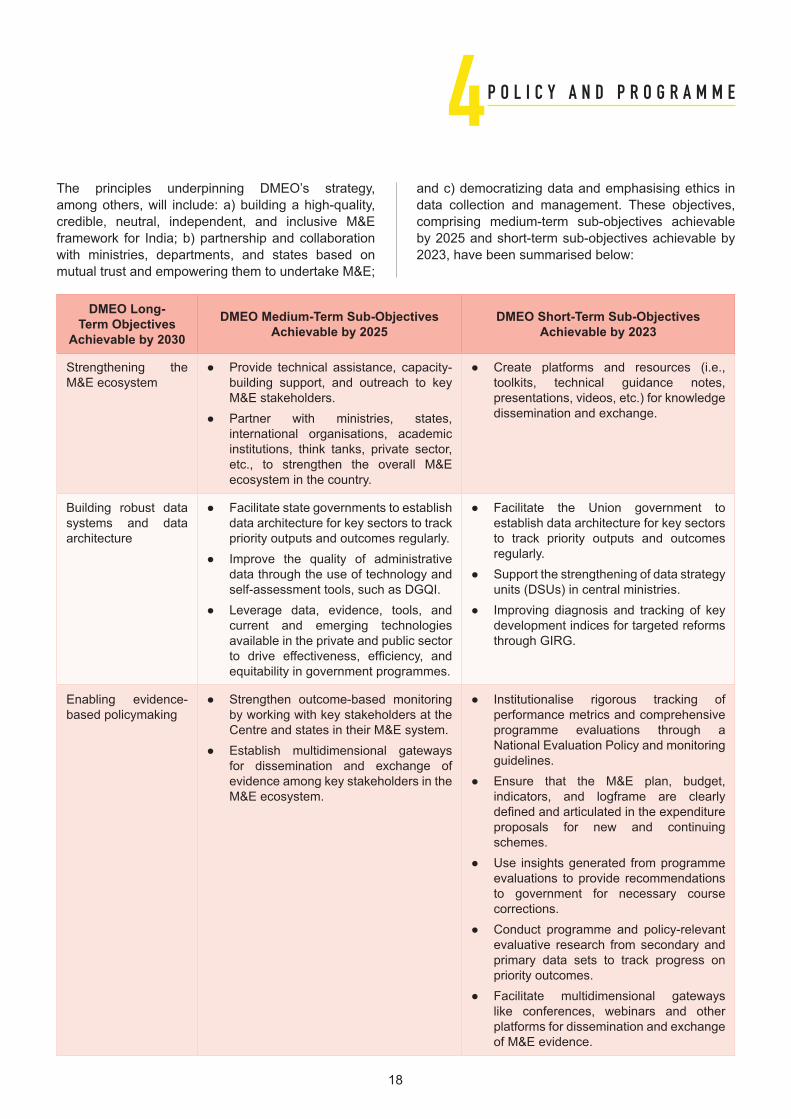
and c) democratizing data and emphasising ethics in data collection and management. These objectives, comprising medium-term sub-objectives achievable
DMEO Long-Term Objectives
Achievable by 2030
DMEO Medium-Term Sub-Objectives Achievable by 2025
DMEO Short-Term Sub-Objectives Achievable by 2023
Strengthening the
international organisations, academic
Building robust data
architecture
self-assessment tools, such as DGQI. Leverage data, evidence, tools, and
current and emerging technologies available in the private and public sector
development indices for targeted reforms through GIRG.
Enabling evidence- Strengthen outcome-based monitoring
performance metrics and comprehensive programme evaluations through a
guidelines.
schemes.
evaluations to provide recommendations
corrections.
P O L I C Y A N D P R O G R A M M E4
18
19
G L O B A L N E W S5Since 2008According to the US Bureau of Labour Statistics, the CPI rose at an annual rate of 5% in May, up from 4.2% in April and the highest since August 2008, as the world’s largest economy rebounded strongly from the coronavirus crisis.
Read more: https://on.wsj.com/3CafdpH
Fuelled by economic recovery, consumer prices in the US rose 5.4% in July. The CPI rose 0.5% in July from June, at a significantly slower pace than its 0.9% increase in June from May, though well above the aver-age 0.2% rate from 2000 to 2019.
Read more: https://on.wsj.com/3iTcZ6q
China Cuts Reserve Ratio for Banks to Catalyze Eco RecoveryThe People’s Bank of China reduced the reserve
statement published on 9 July 2021. This move is expected to unleash about 1 trillion Yuan ($154 billion) of long-term liquidity into the economy. The cut was made effective from 15 July.
Read more: https://bloom.bg/3A8sltn
India Records 13% FDI Growth in 2020Touching a major milestone, India recorded 13% growth in Foreign Direct Investment (FDI) in 2020 at a
economies such as the UK, US, and Russia. Amidst the global collapse, China is the only other country to have shown remarkably high FDI growth.
Read more: https://bit.ly/3jjMmGO
UK to Launch £15 bn Green Bonds to Assist Net-Zero AimOn 1 July 2021, the Chancellor of the Exchequer, Rishi
services industry through $20.72 billion green bonds that will support projects that decarbonize key parts of the UK while improving climate resiliency and adaptation.
Read more: https://reut.rs/3fu6dBW
G7 Summit in UK Ends with Pledge on CovidThe Group of Seven (G7) advanced economies met in Cornwall, UK, on 11 June 2021. Some of the key outcomes of the summit included the G7 leaders’ pledge to deliver an additional 870 million vaccine doses for the developing world, besides the 250 million doses already promised by the US and 100 million by the UK. The G7 economies also pledged to phase out
$2.8 billion to help them switch to cleaner fuels; and to levy a minimum 15% corporate tax rate globally.
Read more: https://bit.ly/3jlOfCL
Powell Signals Two Rate Hikes by 2023In its July 21 meeting, the Federal Reserve held its benchmark interest rate (0.0%-0.25%) near zero and is likely to maintain this stance until late 2022. Chair Jerome Powell signalled two rate hikes by the end of 2023 as economic recovery gathers momentum.
Read more: https://bit.ly/3szZNqk
UK Economy Grows 4.8% in Second Quarter of 2021UK GDP is estimated to have jumped by 4.8% between April and June 2021 as services, production and construction output all increased with the easing of Covid-19 restrictions. Despite the country’s reopening giving the economy a boost, estimates show GDP in the UK is still 4.4% below where it was before the coronavirus pandemic, at the end of 2019.
Read more: https://on.ft.com/3mcURqf

20
S T A T E N E W S6Meghalaya Targets Adoption of
from 1 April 2021 and remain in operation and valid for
Read more:
(indiatimes.com)
Uttar Pradesh Launches e-Mandi Project
farmers. The scheme entails the establishment of grain
Read more:
Index 2020
than a million. In the million-plus cities, Bengaluru
Read more:
for Applied Economic Research Land Records and
an improvement in their efforts to digitize land records,
Read more:
Bihar Launches Ethanol Production Promotion Policy
Read more:
Expenditure
amount of up to Rs 150 billion to states as part of the
assistance is provided to states in the form of a 50-
Read more:
Tripura Launches Education Channel for Students
Read More:

21
Smart City Projects
Read More:
Read More:
Madhya Pradesh Tops Anaemia
Read More:
pandemic, the Gujarat government announced
Read More:
Haryana Launches App for
and calendars, among others.
Read More:
S T A T E N E W S6
22
N I T I N E W S7AIM Gets New Mission Director
Acclaimed socio-technologist Dr Chintan Vaishnav has been appointed as the new Mission Director of Atal Innovation Mission (AIM). Dr Vaishnav took over the charge from Ramanathan Ramanan, who had been leading AIM as its first Mission Director since its conception in June 2017.
NITI Aayog Launches India Energy Dashboards (Version 2.0)
The India Energy Dashboards Version 2.0 was launched by Dr Rajiv Kumar (Vice Chairman, NITI Aayog), Dr VK Saraswat (Member, NITI Aayog), Shri Amitabh Kant (CEO, NITI Aayog) and Dr Rakesh Sarwal (Additional Secretary, NITI Aayog). India Energy Dashboards aims to provide a single-window access to energy data for the country via the Central Electricity Authority, Coal Controller’s Organisation, and Ministry of Petroleum and Natural Gas is compiled in the Dashboards.
NITI Aayog Launches ‘Poshan Gyan’
NITI Aayog, in partnership with Bill and Melinda Gates Foundation and Centre for Social and Behaviour Change, Ashoka University, launched Poshan Gyan, a national digital repository on health and nutrition. The repository has been conceptualized as a resource, enabling search of communication materials on 14 thematic areas of health and nutrition across diverse languages, media types, target audiences and sources.
NITI Aayog & Mastercard Release Report on ‘Connected Commerce’
NITI Aayog and Mastercard released a report titled ‘Connected Commerce: Creating a Roadmap for a Digitally Inclusive Bharat’. The report identifies challenges in accelerating digital financial inclusion in India and provides recommendations for making
digital services accessible to its 1.3 billion citizens. It highlights key issues and opportunities, with inferences and recommendations on policy and capacity building across agriculture, small business, urban mobility and cyber security.
NITI Aayog & Piramal Foundation Launch Surakshit Hum Surakshit Tum Abhiyaan
NITI Aayog and Piramal Foundation launched Surakshit Hum Surakshit Tum Abhiyaan in 112 Aspirational Districts to assist district administrations in providing home-care support to Covid-19 patients who are asymptomatic or have mild symptoms. Piramal Foundation will work withdistrict magistrates to support the training of NGOs and volunteers.
UNDP Report Lauds Aspirational Districts Programme, Recommends Replication
In an independent appraisal report released by the United Nations Development Programme (UNDP) India has lauded the Aspirational Districts Programme (ADP) as ‘a very successful model of local area development’ that ‘should serve as a best practice for several other countries where regional disparities in development status persist for many reasons’.
NITI Aayog Releases Report on Not-for-Profit Hospital Model in India
NITI Aayog released a comprehensive study on the not-for-profit hospital model in the country. The study provides insights into the operation model of not-for-profit hospitals. It presents research-based findings on such hospitals—categorized under ownership and premise of service—and makes subsequent comparisons with private hospitals and health schemes of the Union government.