Armando Guzman
33
Copyrig ht © SEL 2004 Local and Wide-Area Network Protection Systems Improve Power System Reliability A. Guzman D. Tziouvaras E. O. Schweitzer Schweitzer Engineering Laboratories, Inc. K. E. Martin Bonneville Power Administration
Transcript of Armando Guzman
8/9/2019 Armando Guzman
http://slidepdf.com/reader/full/armando-guzman 1/33
Copyright © SEL 2004
Local and Wide-Area
Network Protection SystemsImprove Power System Reliability
A. Guzman
D. Tziouvaras
E. O. Schweitzer Schweitzer Engineering
Laboratories, Inc.
K. E. Martin
Bonneville Power
Administration
8/9/2019 Armando Guzman
http://slidepdf.com/reader/full/armando-guzman 2/33
Power System Challenges
l Load-generation separation
l Environmental restrictions (NIMBY)
l Limited network growth
l Network resource optimization
l Separate companies for G,T,D
8/9/2019 Armando Guzman
http://slidepdf.com/reader/full/armando-guzman 3/33
Main Causes of
Wide-Area System Disruptions
l Voltage collapse
l Rotor angle instability
8/9/2019 Armando Guzman
http://slidepdf.com/reader/full/armando-guzman 4/33
Voltage Collapse Per Carson Taylor
“A power system at a given
operating state and subject to a
given disturbance undergoes voltage
collapse if post-disturbance equilibriumvoltages are below acceptable limits”
Power System Voltage Stability , EPRI,
ISBN 0-07-063184-0
8/9/2019 Armando Guzman
http://slidepdf.com/reader/full/armando-guzman 5/33
Generation ≠ Load DuringTransient Angle Instability
Generators cannot deliver their totaloutput power to the system
8/9/2019 Armando Guzman
http://slidepdf.com/reader/full/armando-guzman 6/33
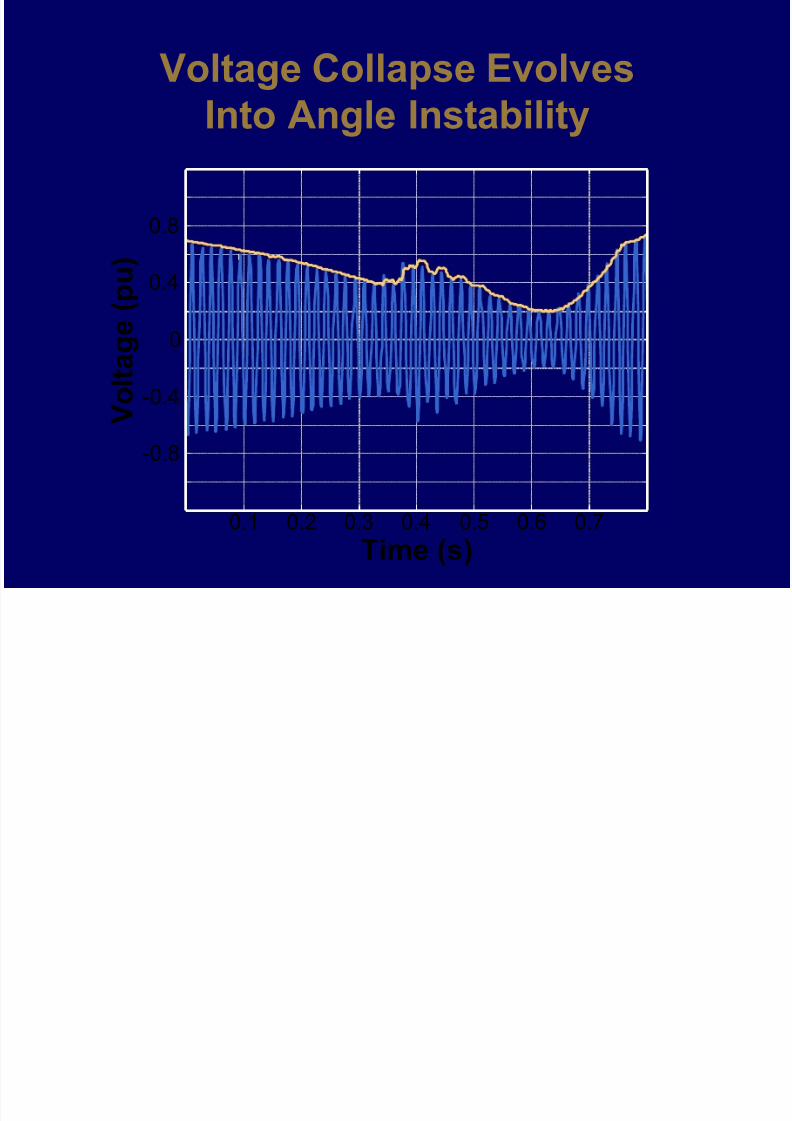
Voltage Collapse Evolves
Into Angle Instability
0.1 0.2 0.3 0.4 0.5 0.6 0.7
Time (s)
V
o l t a g e ( p u
)
-0.8
-0.4
0
0.4
0.8
8/9/2019 Armando Guzman
http://slidepdf.com/reader/full/armando-guzman 7/33
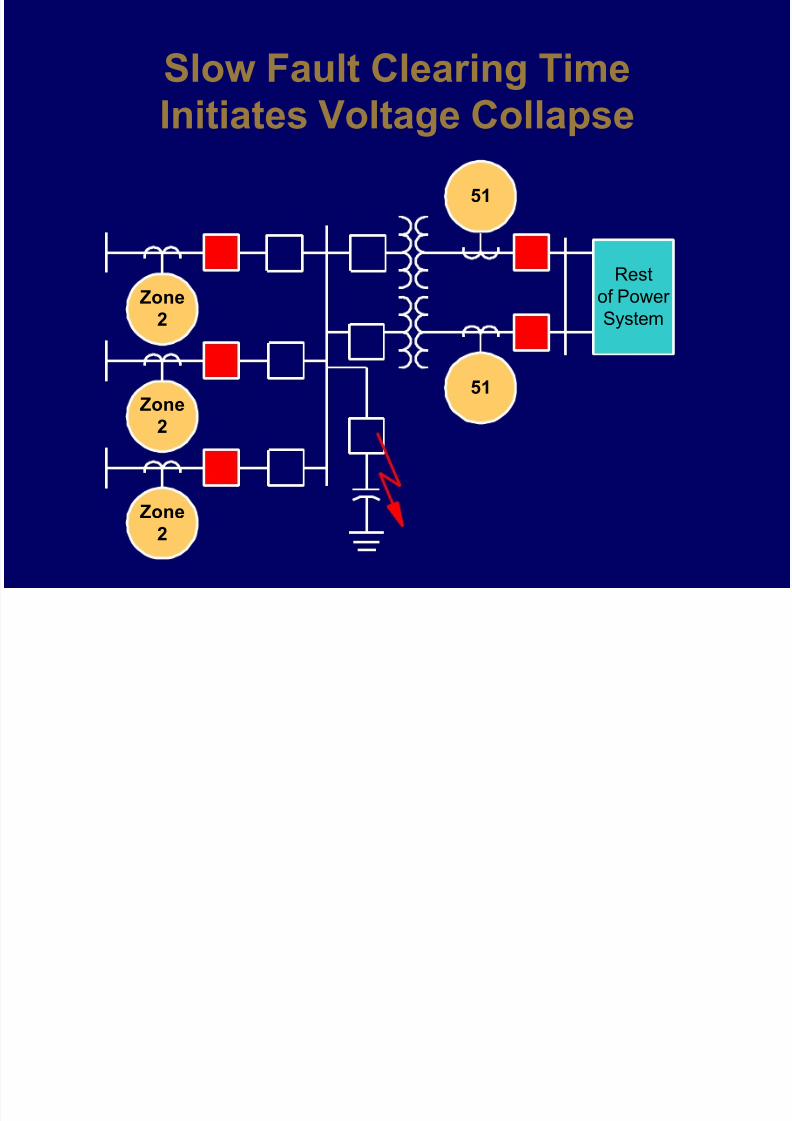
Slow Fault Clearing Time
Initiates Voltage Collapse
Zone
2
Zone
2
Zone
2
51
51
Restof Power
System
8/9/2019 Armando Guzman
http://slidepdf.com/reader/full/armando-guzman 8/33
8/9/2019 Armando Guzman
http://slidepdf.com/reader/full/armando-guzman 9/33
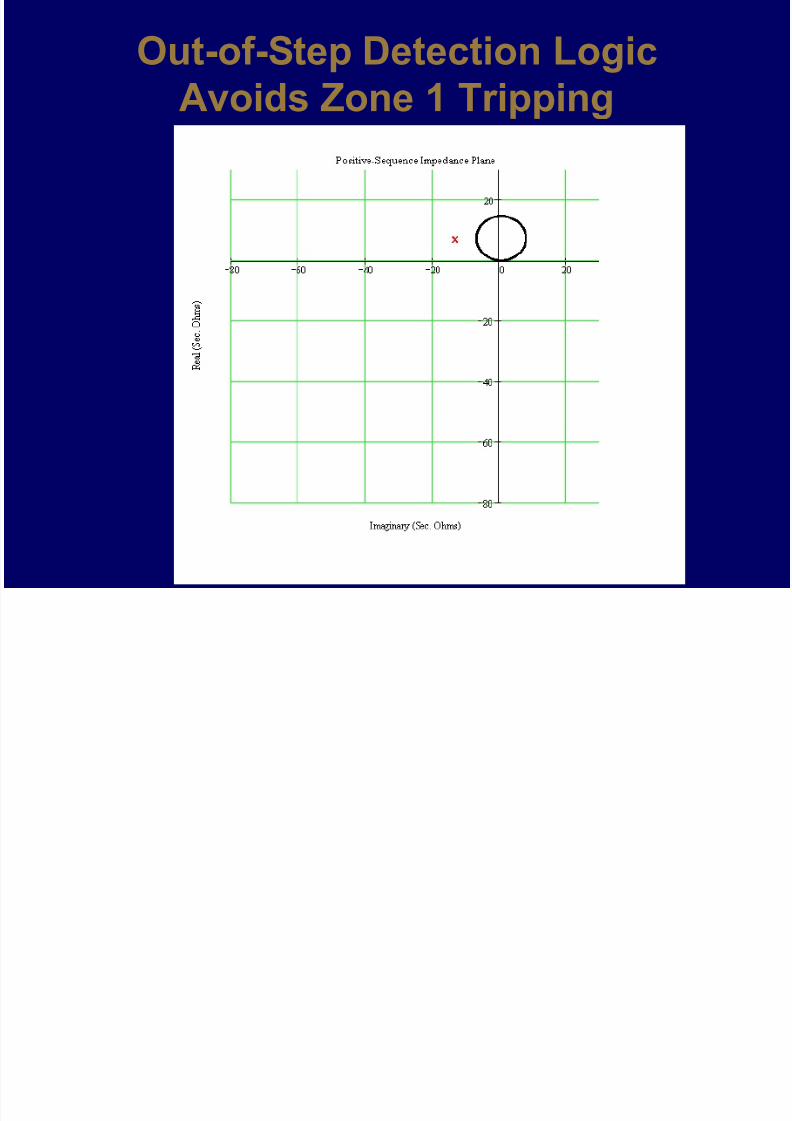
Out-of-Step Detection Logic
Avoids Zone 1 Tripping
8/9/2019 Armando Guzman
http://slidepdf.com/reader/full/armando-guzman 10/33
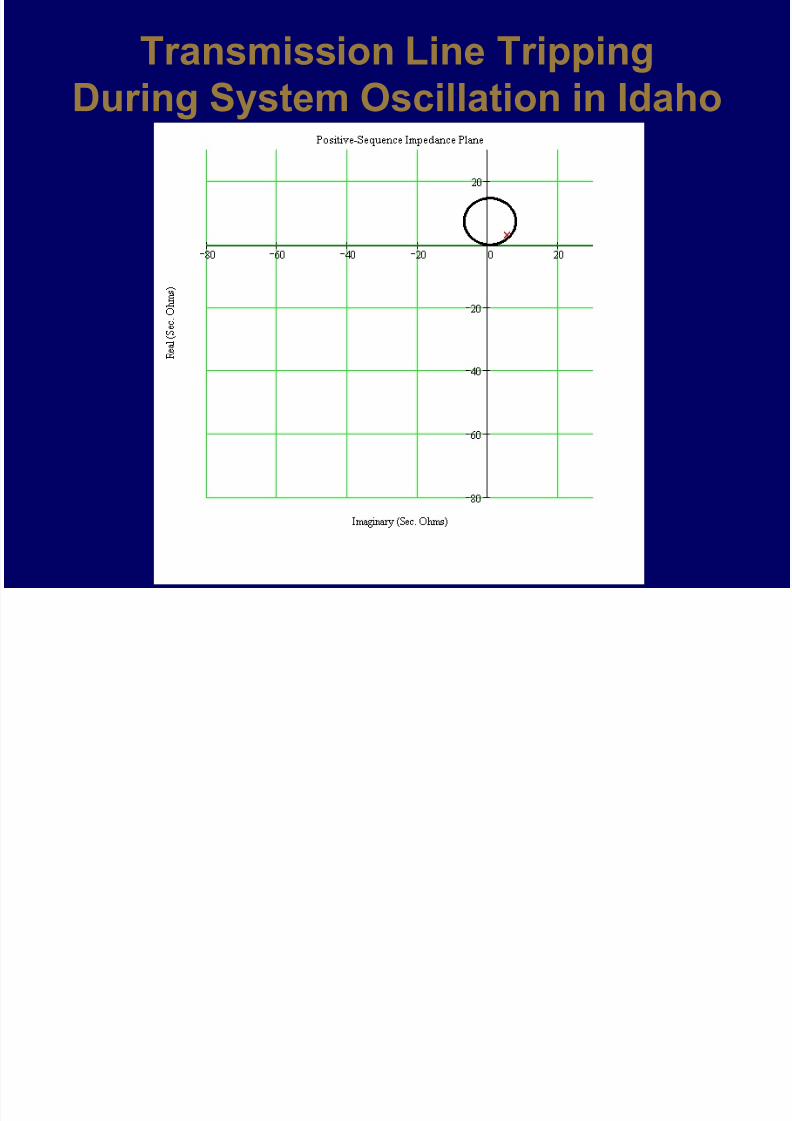
Transmission Line Tripping
During System Oscillation in Idaho
8/9/2019 Armando Guzman
http://slidepdf.com/reader/full/armando-guzman 11/33
Wide-Area Protection Systems
Protection systems to minimize risk
of wide-area disruptions and increasesystem power transfer capability
8/9/2019 Armando Guzman
http://slidepdf.com/reader/full/armando-guzman 12/33
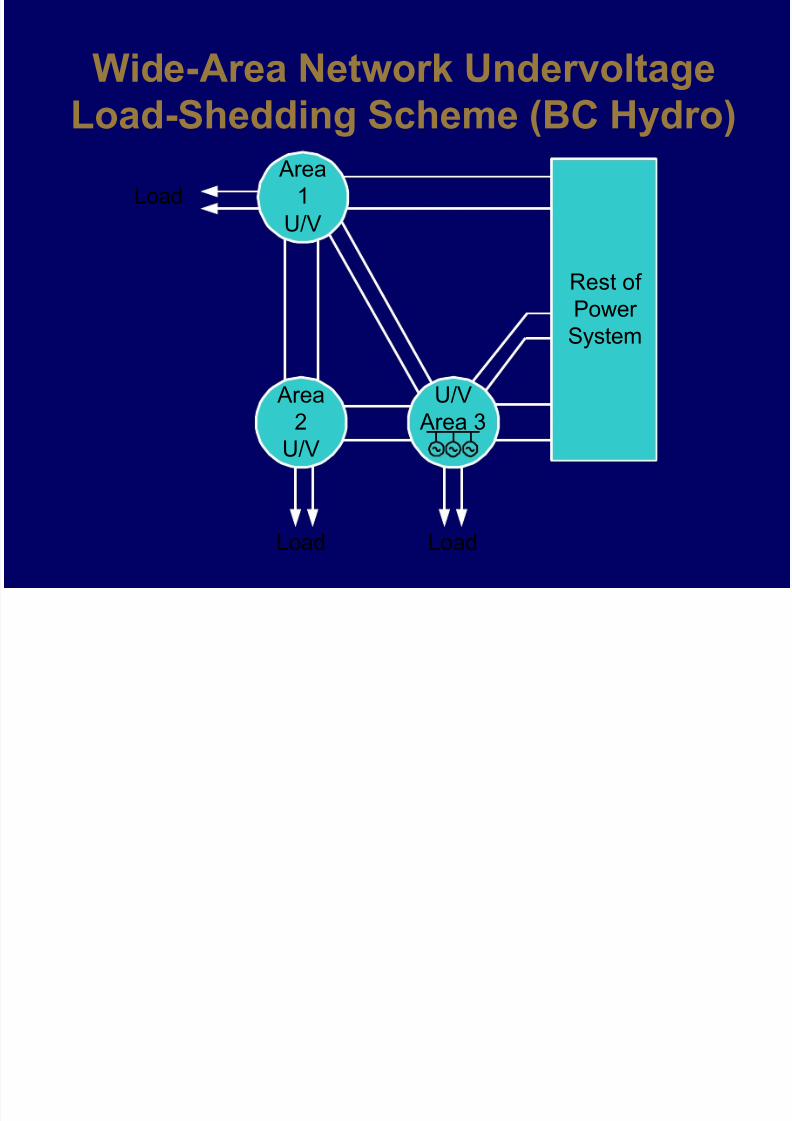
Wide-Area Network Undervoltage
Load-Shedding Scheme (BC Hydro)
Rest of Power
System
Load Load
Load
Area
1
U/V
Area
2U/V
U/V
Area 3
8/9/2019 Armando Guzman
http://slidepdf.com/reader/full/armando-guzman 13/33
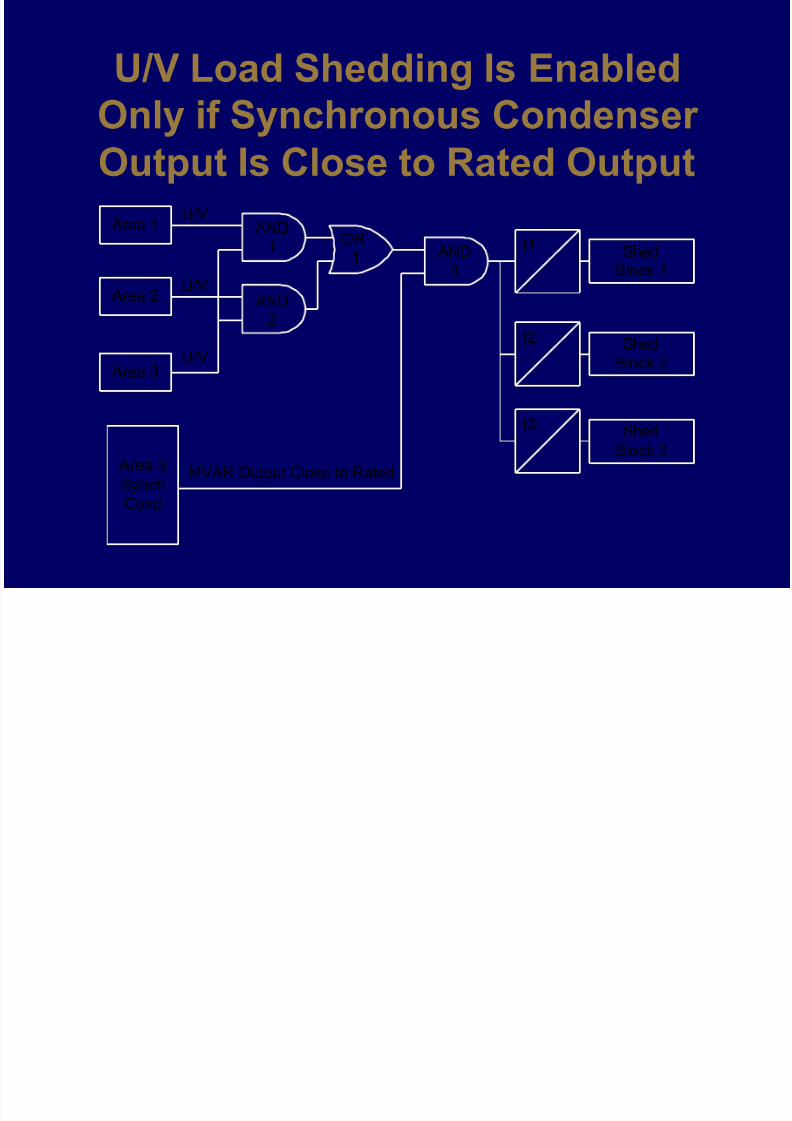
U/V Load Shedding Is Enabled
Only if Synchronous Condenser
Output Is Close to Rated Output
t1
MVAR Output Close to Rated
U/V
Shed
Block 1
Area 1
Area 2
Area 3
Area 3
Synch
Cond
AND
1
AND
2
OR
1 AND
3
t2
t3
Shed
Block 2
Shed
Block 3
U/V
U/V
8/9/2019 Armando Guzman
http://slidepdf.com/reader/full/armando-guzman 14/33
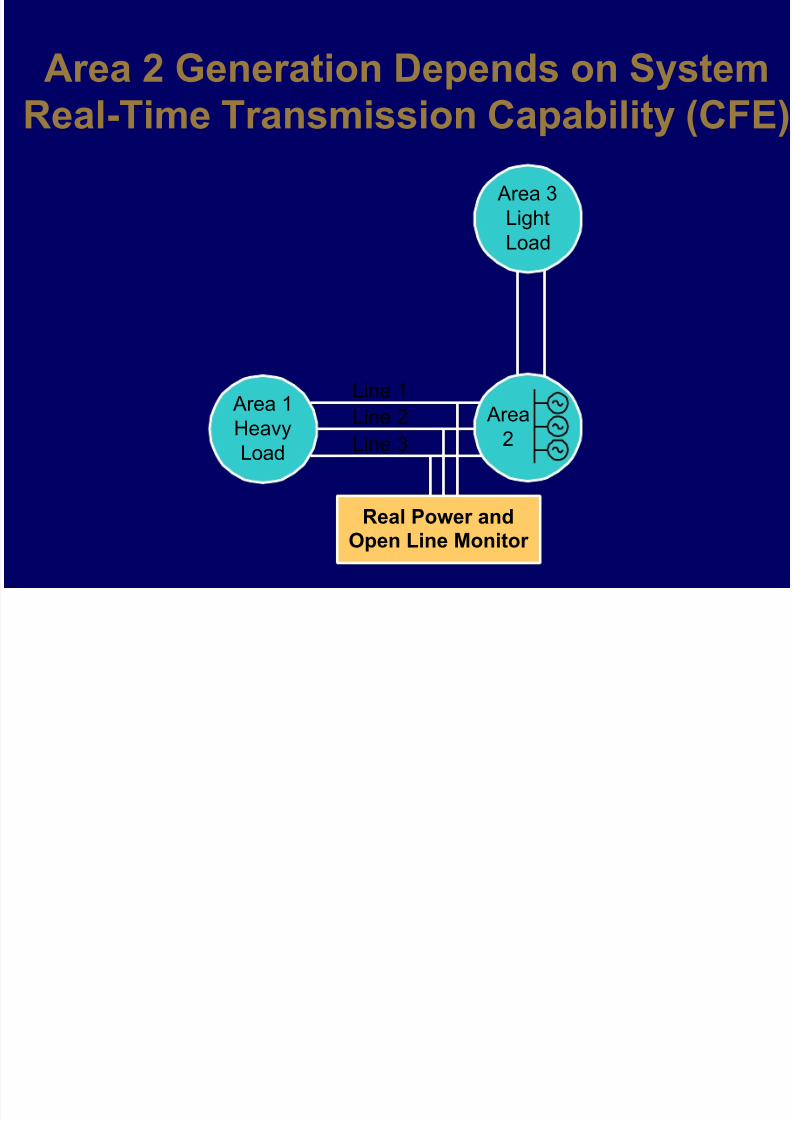
Area 2 Generation Depends on System
Real-Time Transmission Capability (CFE)
Area 1
Heavy
Load
Real Power andOpen Line Monitor
Area 3
Light
Load
Area2
Line 1
Line 2Line 3
8/9/2019 Armando Guzman
http://slidepdf.com/reader/full/armando-guzman 15/33
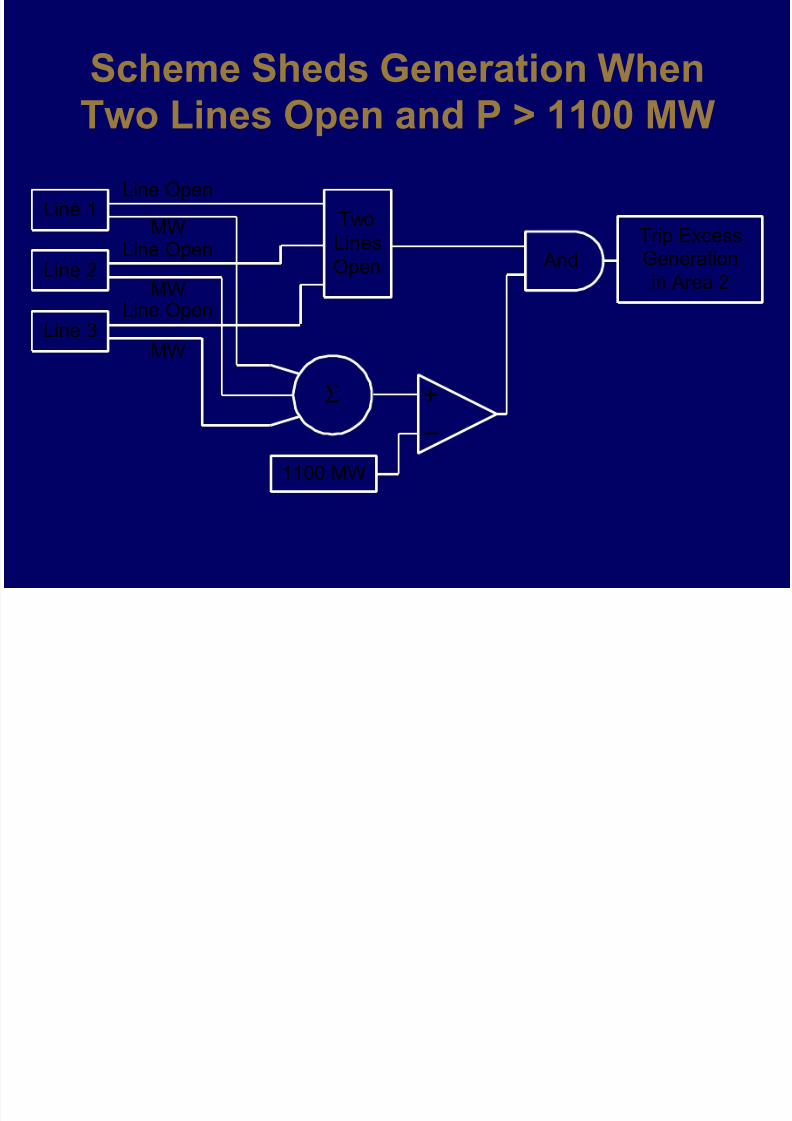
Scheme Sheds Generation When
Two Lines Open and P > 1100 MW
Line 1
Line 2
Line 3
Two
Lines
Open
1100 MW
And
Trip ExcessGeneration
in Area 2
Line Open
Σ
–
+
Line Open
Line Open
MW
MW
MW
8/9/2019 Armando Guzman
http://slidepdf.com/reader/full/armando-guzman 16/33
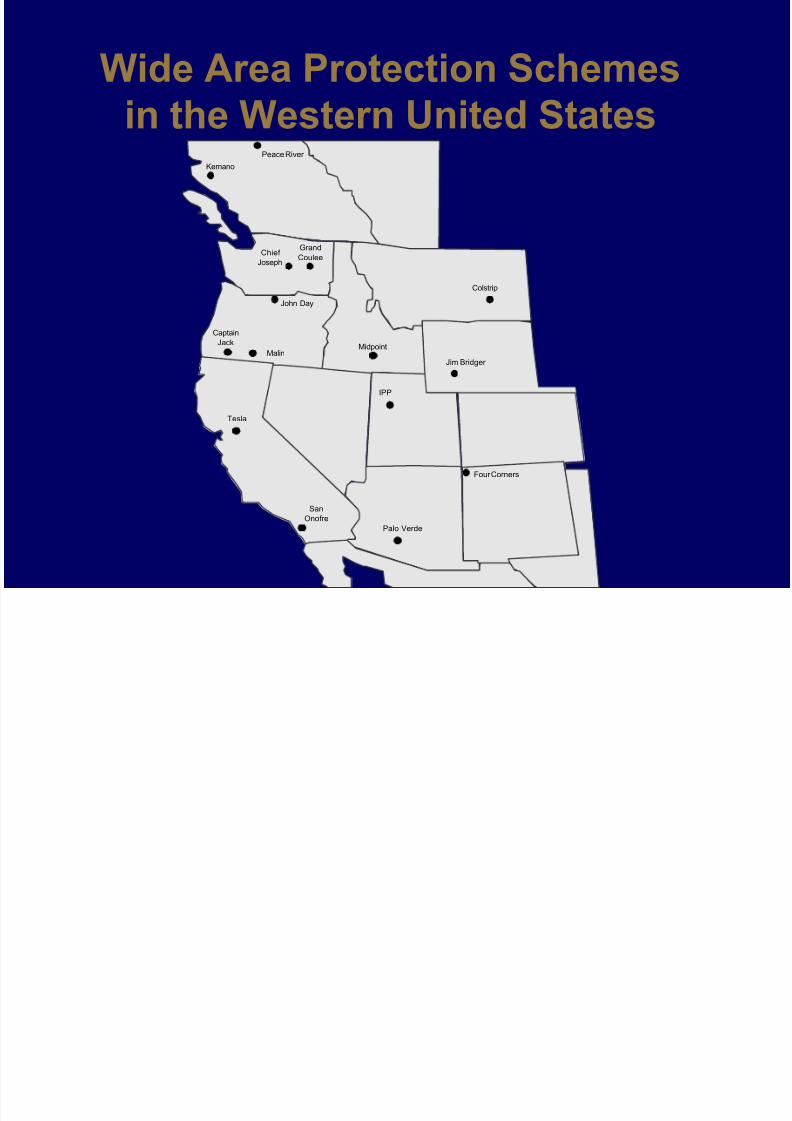
Wide Area Protection Schemes
in the Western United StatesKemano
Colstrip
Malin
John Day
Peace River
Midpoint
Jim Bridger
IPP
Captain
Jack
Grand
CouleeChief
Joseph
Four Corners
Tesla
San
Onofre
Palo Verde
8/9/2019 Armando Guzman
http://slidepdf.com/reader/full/armando-guzman 17/33
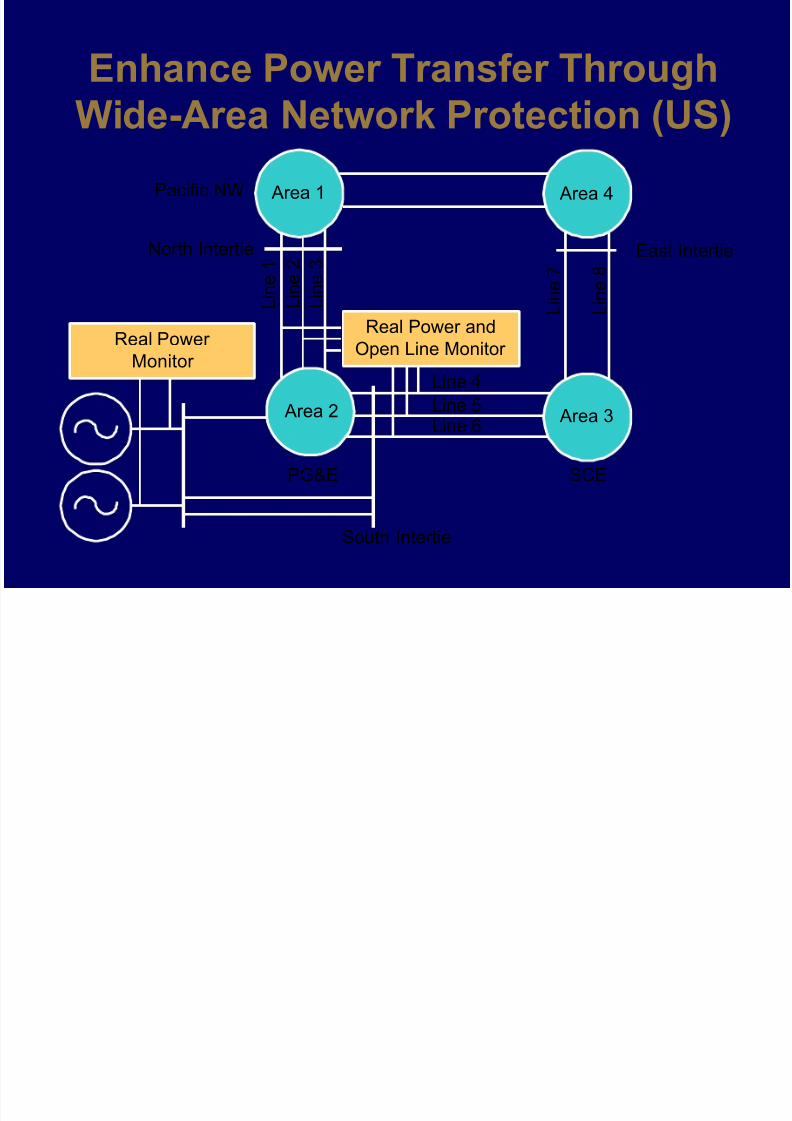
Enhance Power Transfer Through
Wide-Area Network Protection (US)
L i n e
3
L i n e
2
L i n e
1North Intertie
South Intertie
East Intertie
Area 4 Area 1
Real Power and
Open Line Monitor
Area 2 Area 3
Real Power
Monitor Line 4
Line 6Line 5
L i n e 7
L i n e 8
Pacific NW
PG&E SCE
8/9/2019 Armando Guzman
http://slidepdf.com/reader/full/armando-guzman 18/33
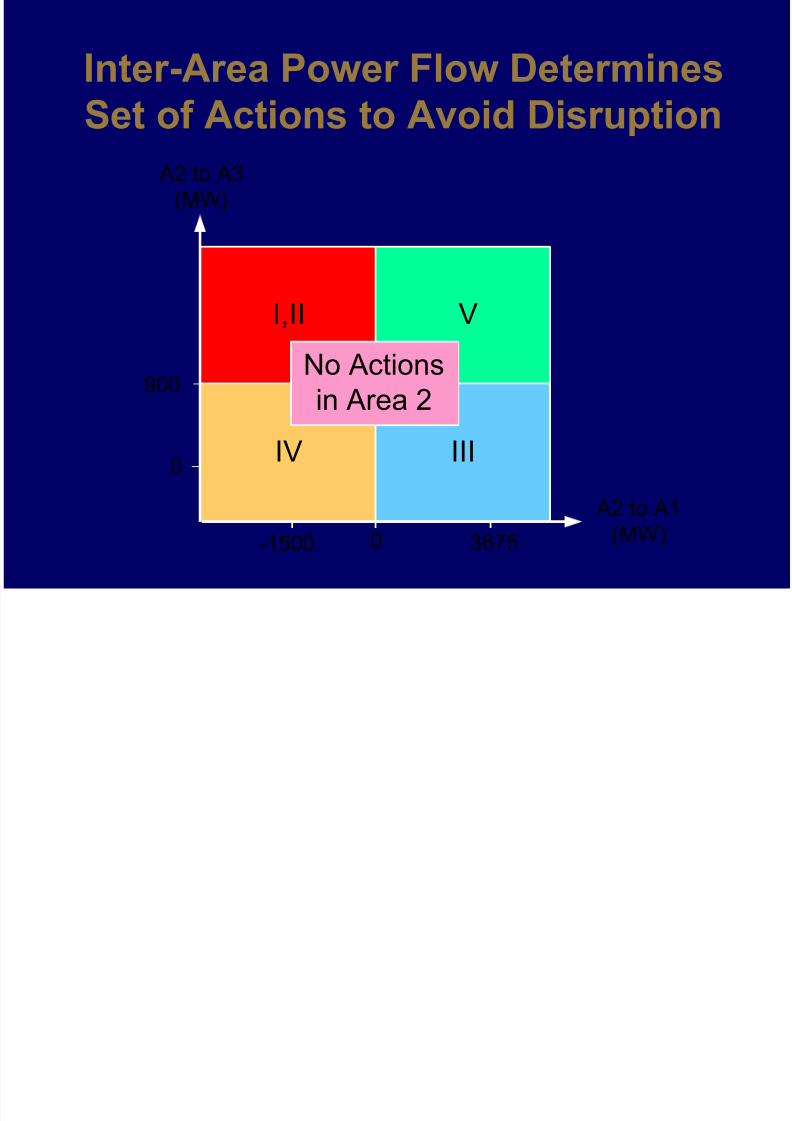
Inter-Area Power Flow Determines
Set of Actions to Avoid Disruption
0-1500
A2 to A3
(MW)
A2 to A1
(MW)
I,II
IV
II
I
V
IV III
I,II V
No Actions
in Area 2900
0
3675
8/9/2019 Armando Guzman
http://slidepdf.com/reader/full/armando-guzman 19/33
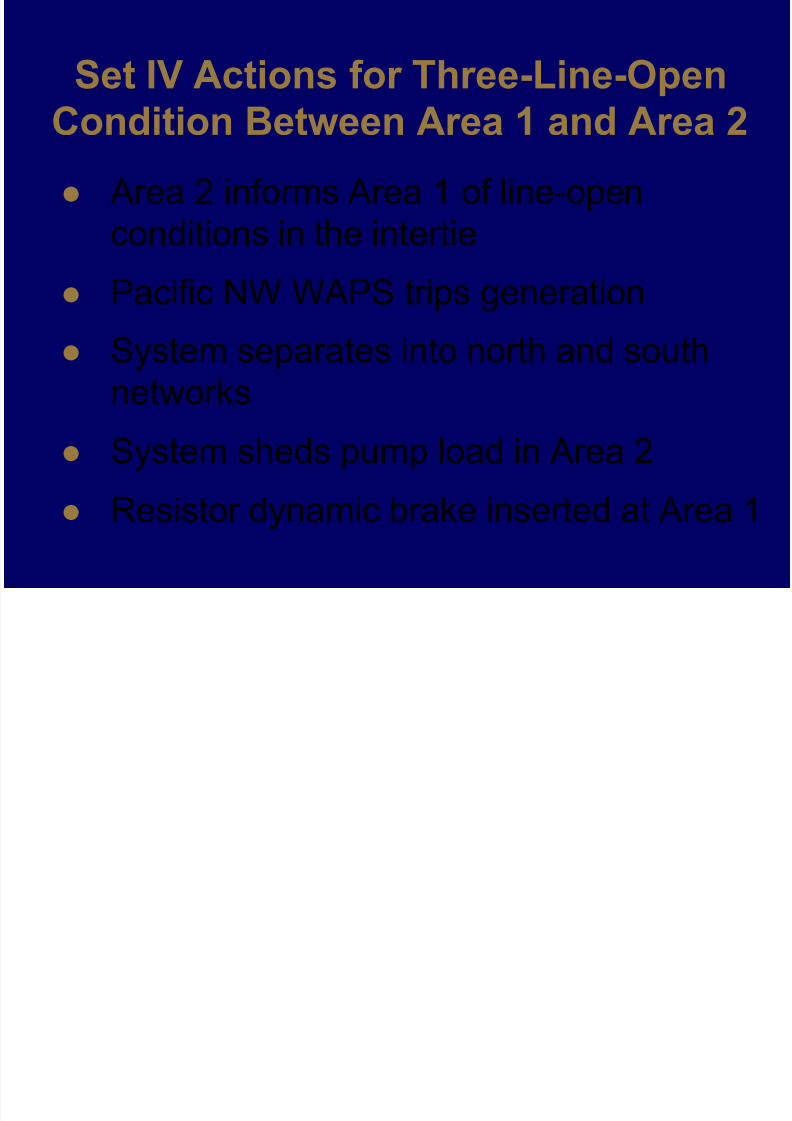
Set IV Actions for Three-Line-Open
Condition Between Area 1 and Area 2l Area 2 informs Area 1 of line-open
conditions in the intertie
l Pacific NW WAPS trips generation
l System separates into north and south
networks
l System sheds pump load in Area 2
l Resistor dynamic brake inserted at Area 1
8/9/2019 Armando Guzman
http://slidepdf.com/reader/full/armando-guzman 20/33
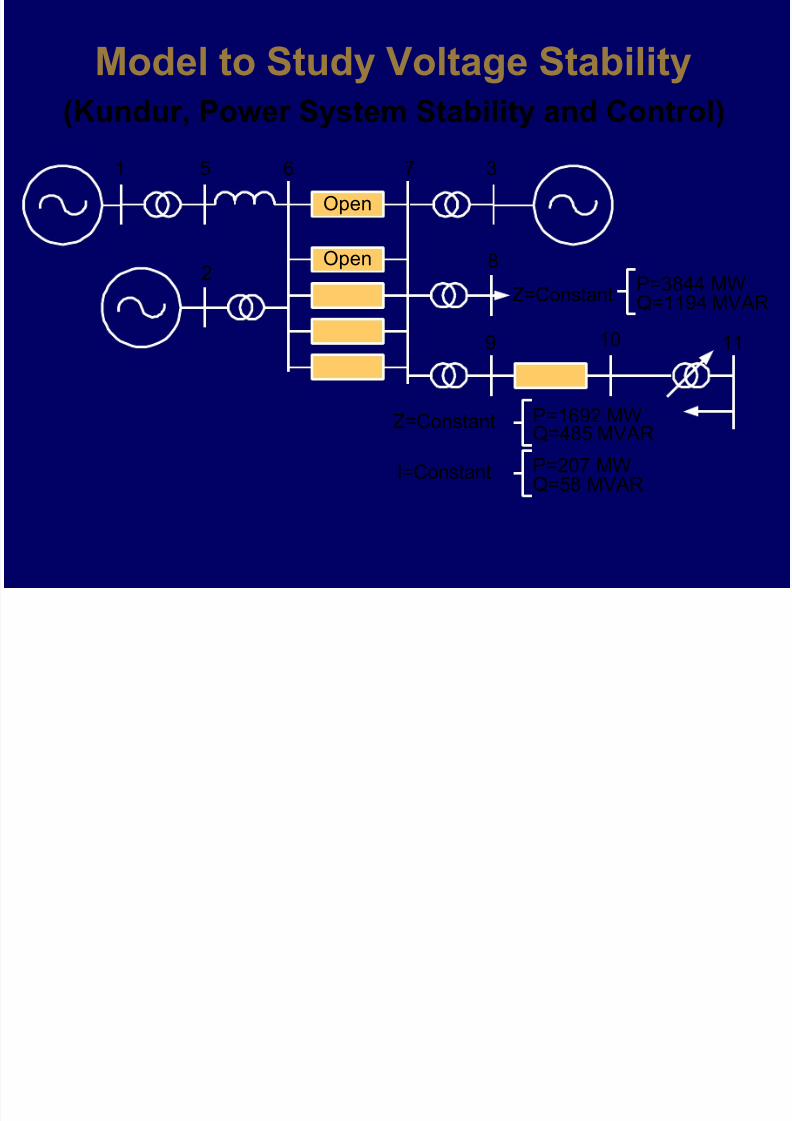
Model to Study Voltage Stability
(Kundur, Power System Stability and Control)
11
1
10
Open
Open
5
2
376
8
9
Z=Constant
P=1692 MWQ=485 MVAR
P=207 MWQ=58 MVAR
Z=Constant
I=Constant
P=3844 MWQ=1194 MVAR
8/9/2019 Armando Guzman
http://slidepdf.com/reader/full/armando-guzman 21/33
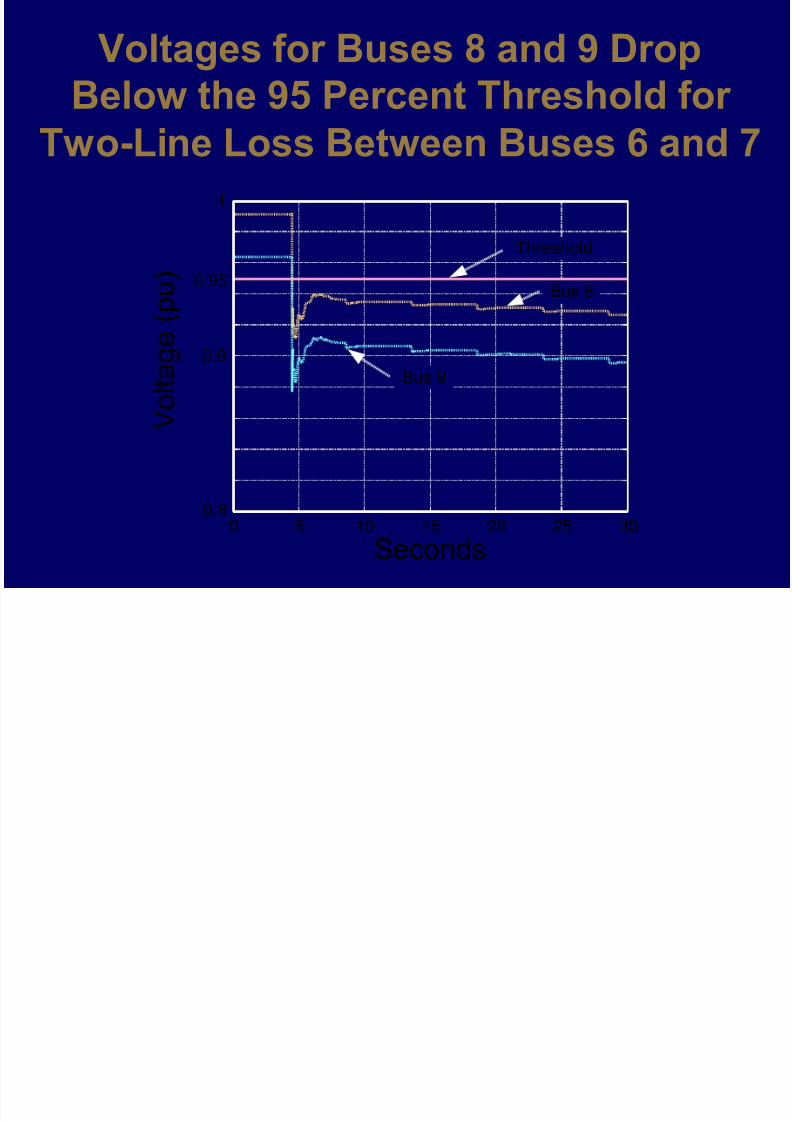
Voltages for Buses 8 and 9 Drop
Below the 95 Percent Threshold for
Two-Line Loss Between Buses 6 and 7
0 5 10 15 20 25 30
V
o l t a g e
( p u )
Seconds
0.8
0.9
1
0.95 Bus 8
Bus 9
Threshold
8/9/2019 Armando Guzman
http://slidepdf.com/reader/full/armando-guzman 22/33
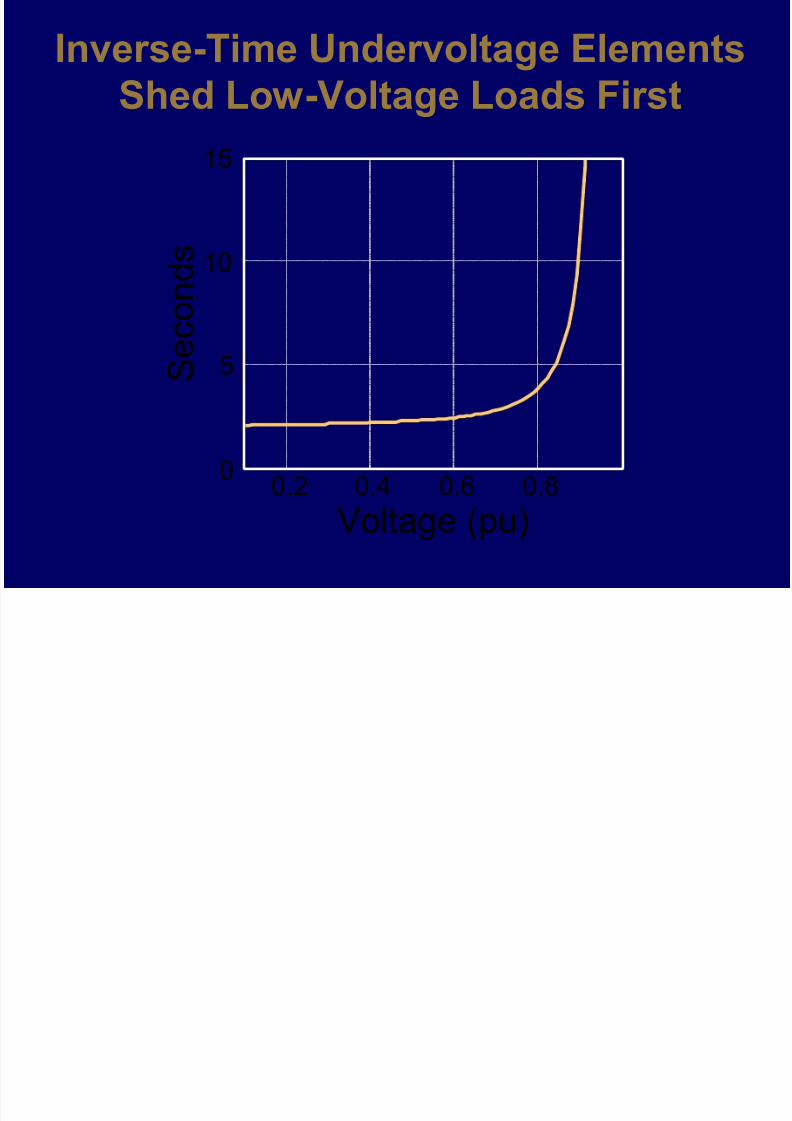
Inverse-Time Undervoltage Elements
Shed Low-Voltage Loads First
0.2 0.4 0.6 0.8
Voltage (pu)
S e c o n d
s
0
5
10
15
8/9/2019 Armando Guzman
http://slidepdf.com/reader/full/armando-guzman 23/33
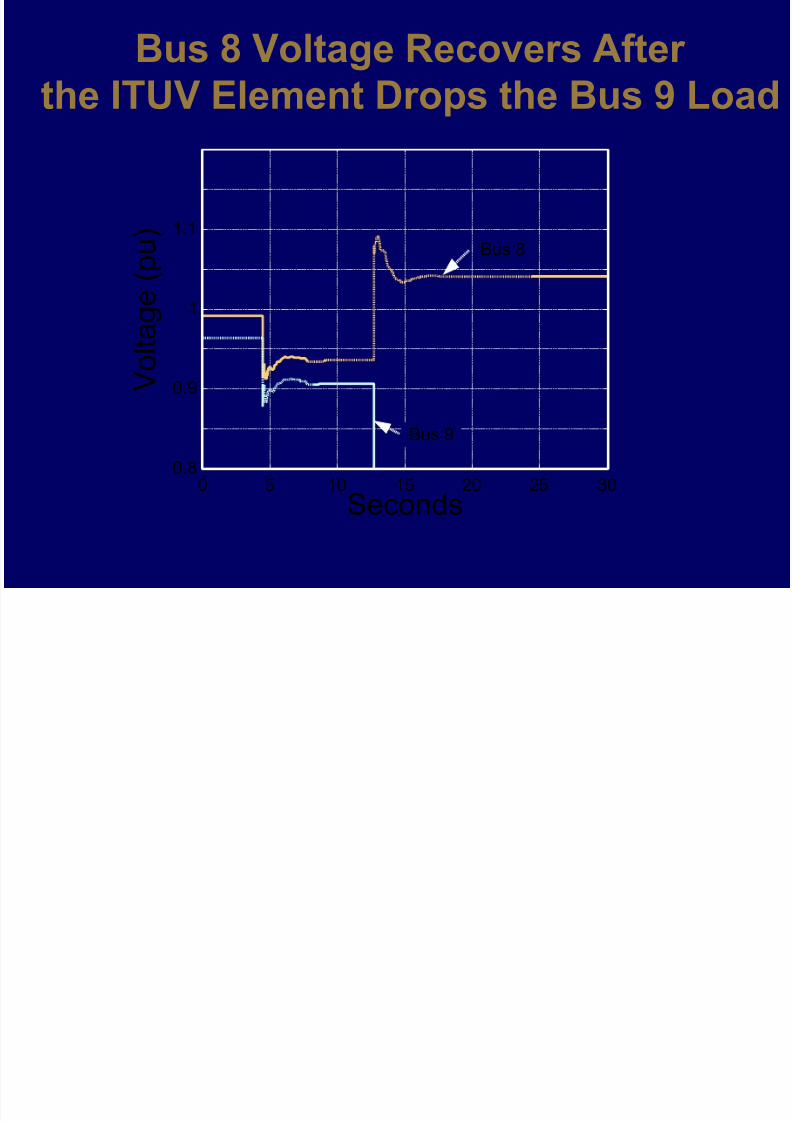
Bus 8 Voltage Recovers After
the ITUV Element Drops the Bus 9 Load
0 5 10 15 20 25 30
V o l t a g e (
p u )
Seconds
0.8
0.9
1
1.1
Bus 8
Bus 9
8/9/2019 Armando Guzman
http://slidepdf.com/reader/full/armando-guzman 24/33
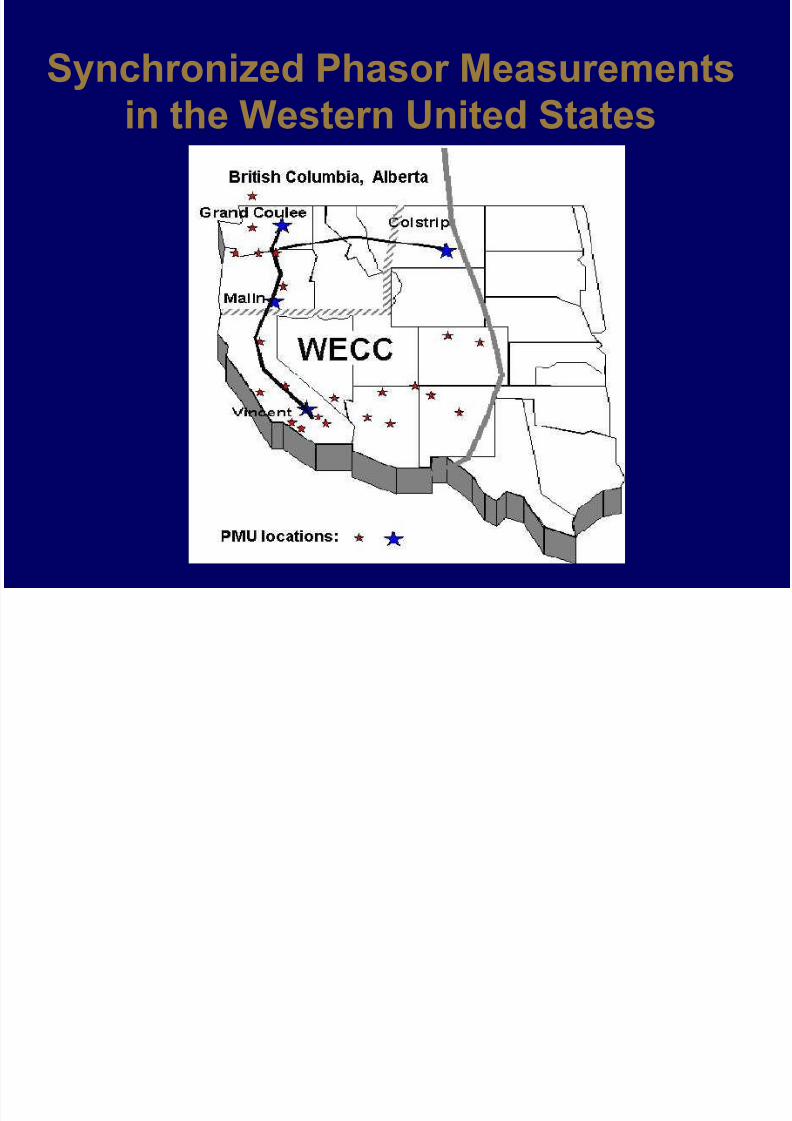
Synchronized Phasor Measurements
in the Western United States
8/9/2019 Armando Guzman
http://slidepdf.com/reader/full/armando-guzman 25/33
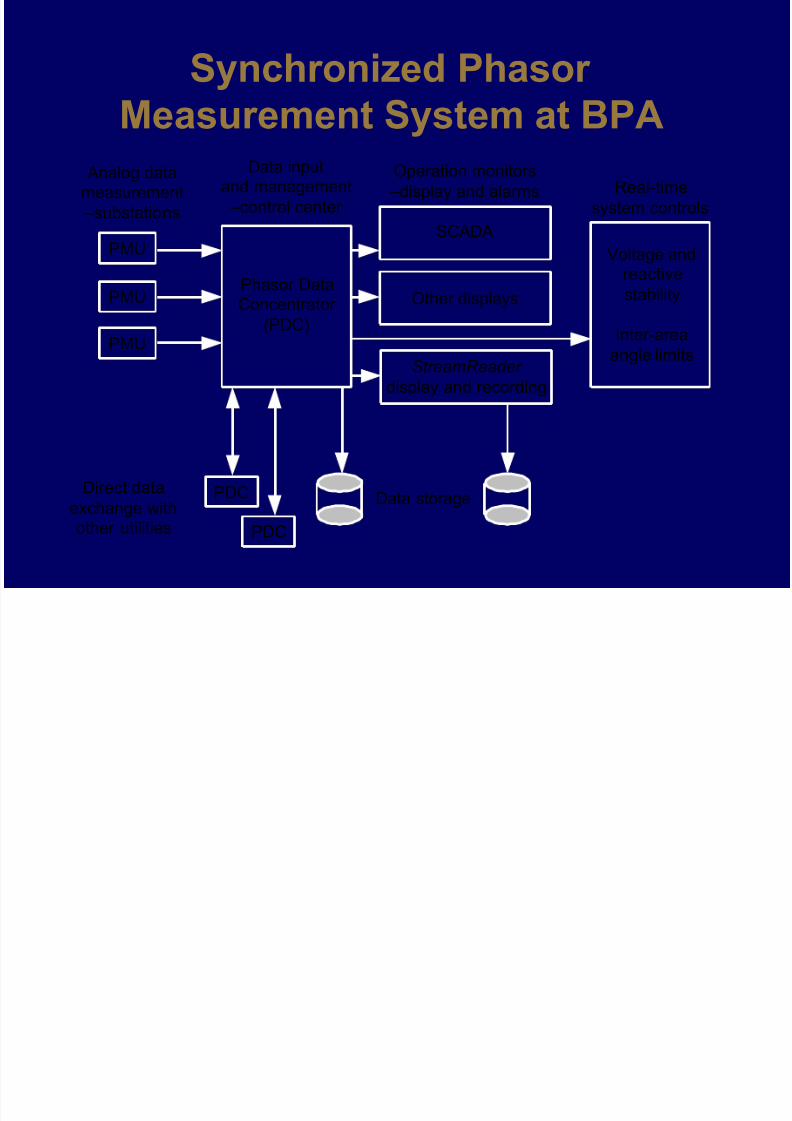
Synchronized Phasor
Measurement System at BPA
PMU
PDC
StreamReader
display and recording
Direct data
exchange withother utilities
Phasor DataConcentrator
(PDC)
SCADA
Data storage
Analog datameasurement
–substations
Data inputand management
–control center
Other displays
Operation monitors
–display and alarms Real-time
system controls
PMU
PMU
PDC
Voltage and
reactivestability
Inter-area
angle limits
8/9/2019 Armando Guzman
http://slidepdf.com/reader/full/armando-guzman 26/33
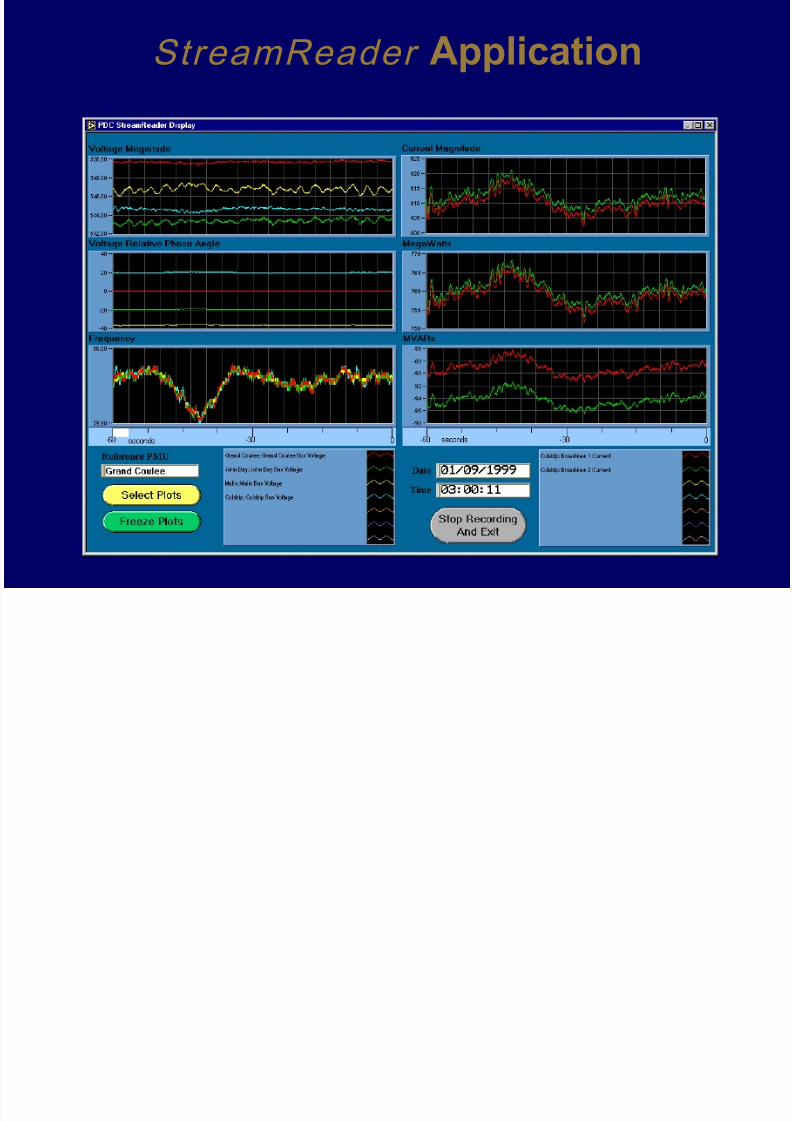
StreamReader Application
8/9/2019 Armando Guzman
http://slidepdf.com/reader/full/armando-guzman 27/33
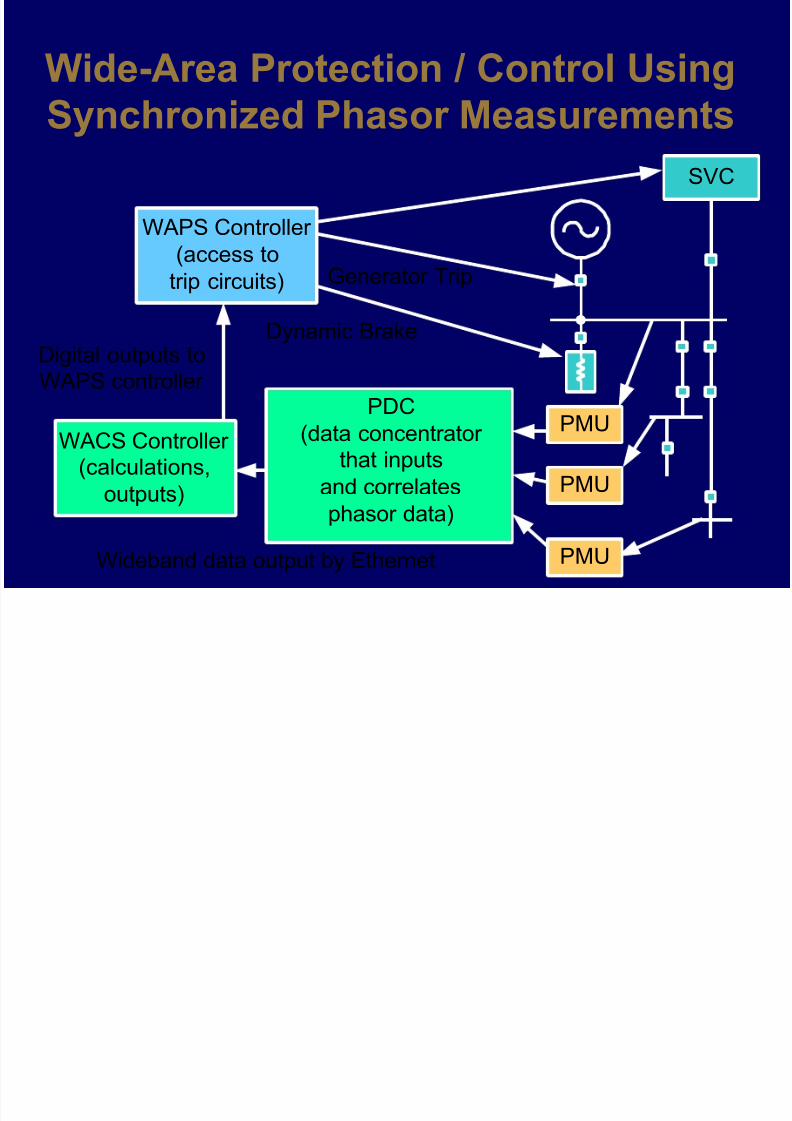
Wide-Area Protection / Control Using
Synchronized Phasor Measurements
PDC(data concentrator
that inputs
and correlates
phasor data)
SVC
WACS Controller
(calculations,
outputs)
Wideband data output by Ethernet
Digital outputs to
WAPS controller
WAPS Controller
(access to
trip circuits)
Dynamic Brake
Generator Trip
PMU
PMU
PMU
8/9/2019 Armando Guzman
http://slidepdf.com/reader/full/armando-guzman 28/33
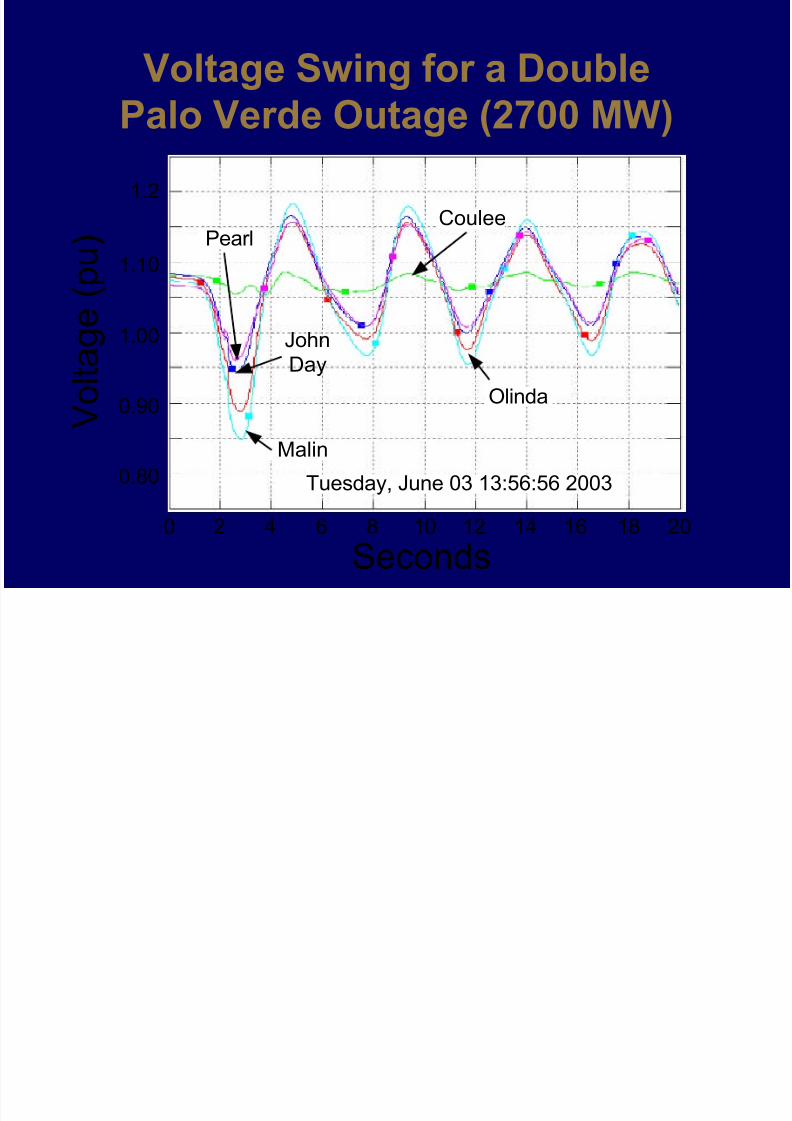
Voltage Swing for a Double
Palo Verde Outage (2700 MW)
V
o l t a g e ( p
u )
CouleePearl
JohnDay
Olinda
Malin
Seconds
Tuesday, June 03 13:56:56 2003
200 2 4 6 8 10 12 14 16 18
1.2
1.10
1.00
0.90
0.80
8/9/2019 Armando Guzman
http://slidepdf.com/reader/full/armando-guzman 29/33
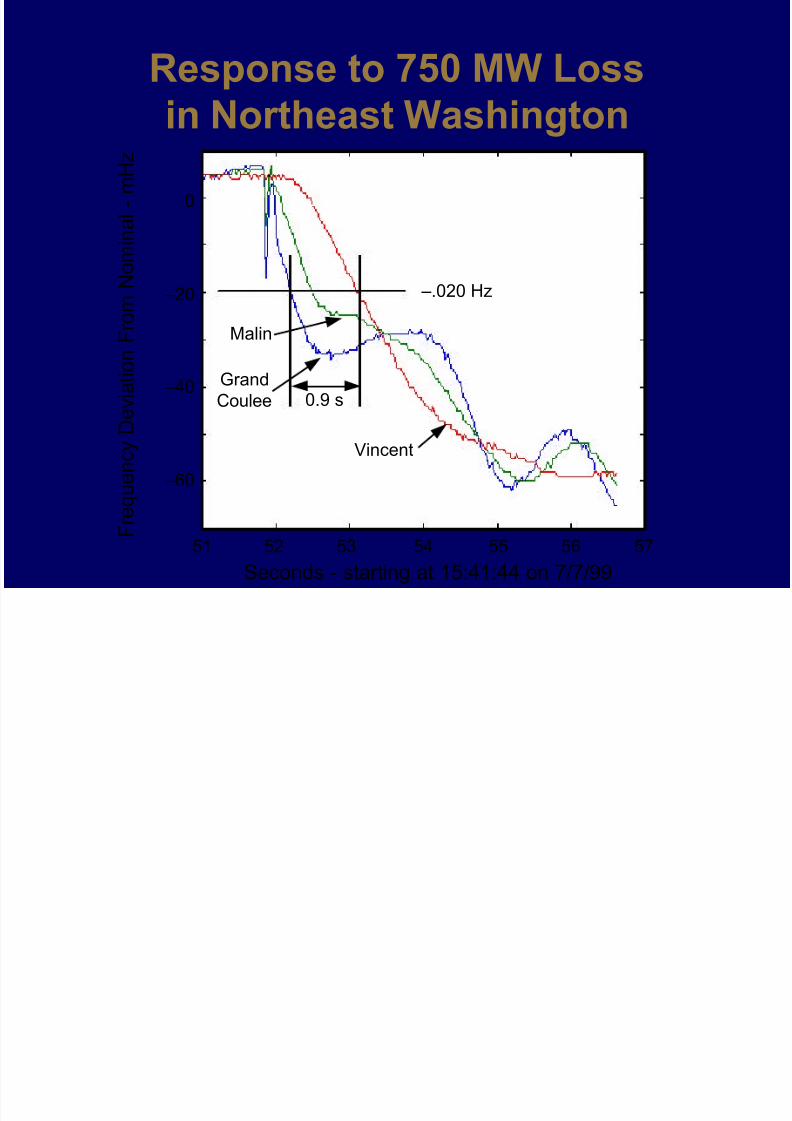
Response to 750 MW Loss
in Northeast Washington
F r e q u e n c y D e
v i a t i o n F r o m N
o m i n a l - m H z
51 52 53 54 55 56 57
Seconds - starting at 15:41:44 on 7/7/99
Malin
Grand
Coulee
Vincent
–.020 Hz
0.9 s
0
–20
–40
–60
8/9/2019 Armando Guzman
http://slidepdf.com/reader/full/armando-guzman 30/33
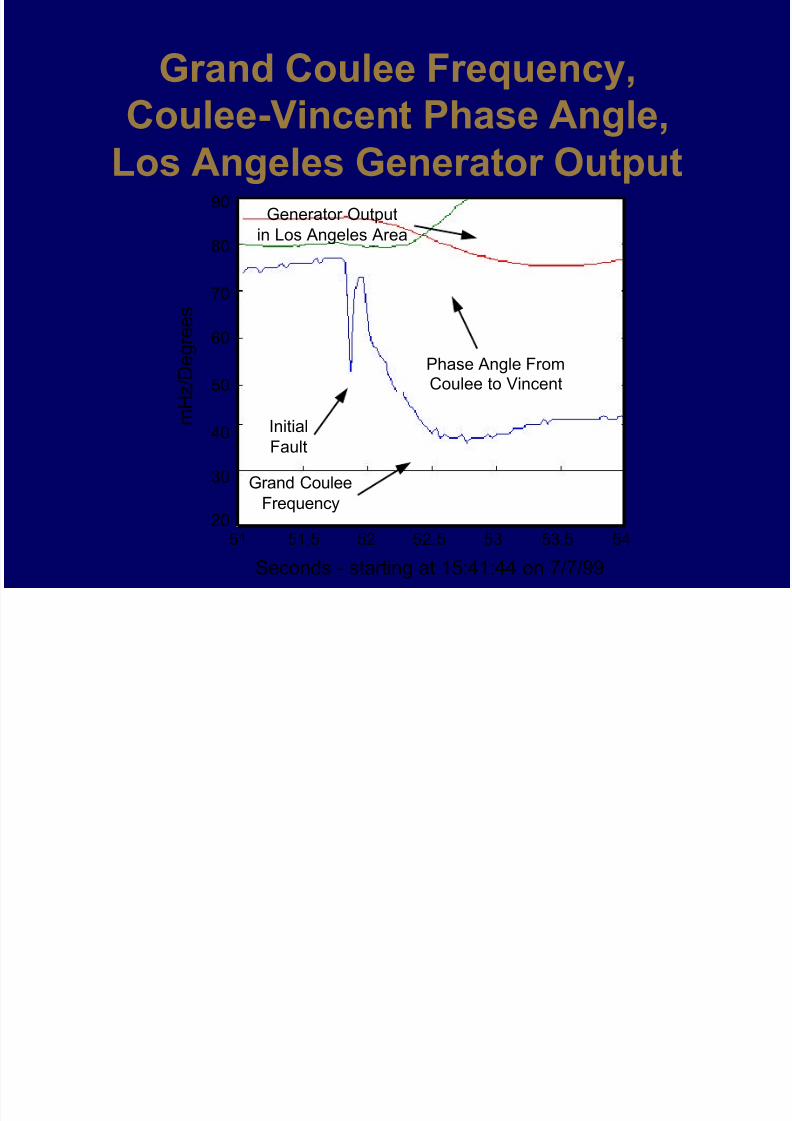
Grand Coulee Frequency,
Coulee-Vincent Phase Angle,
Los Angeles Generator Output
54
Generator Output
in Los Angeles Area
Phase Angle FromCoulee to Vincent
Initial
Fault
Grand Coulee
Frequency
m
H z
/ D e g r e e s
Seconds - starting at 15:41:44 on 7/7/99
51 51.5 52 52.5 53 53.5
90
80
70
60
50
40
30
20
8/9/2019 Armando Guzman
http://slidepdf.com/reader/full/armando-guzman 31/33
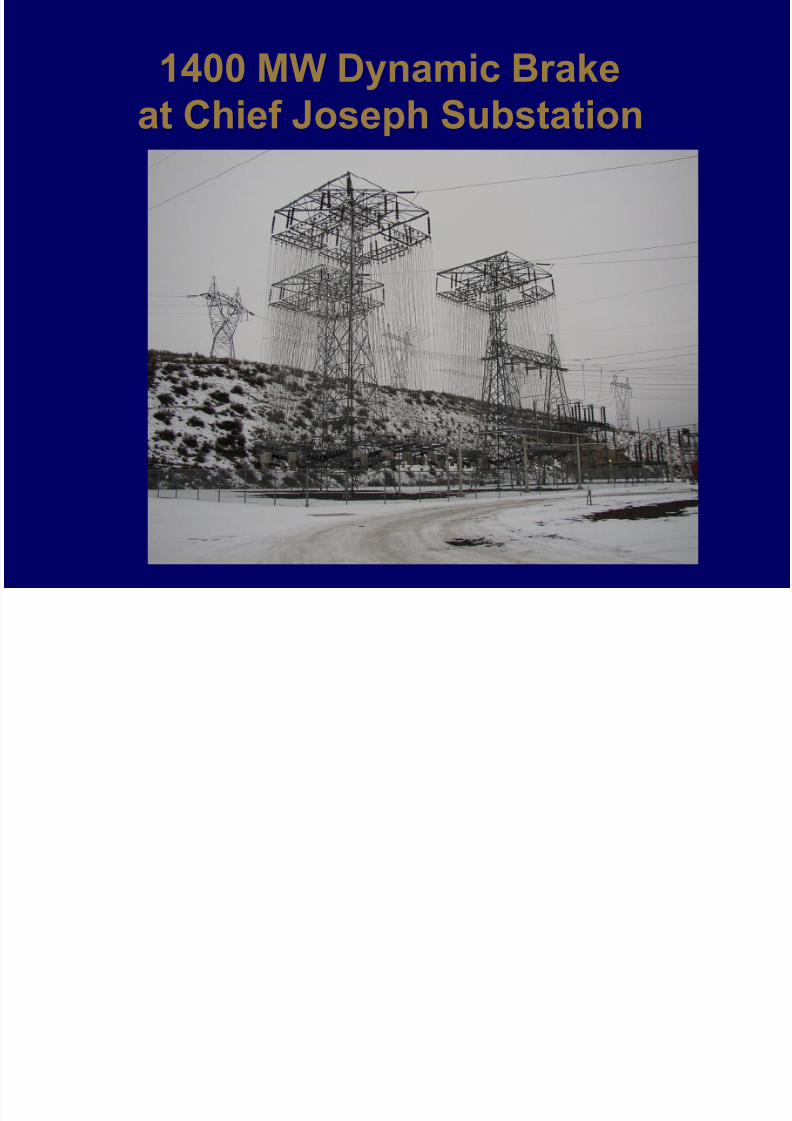
1400 MW Dynamic Brake
at Chief Joseph Substation
8/9/2019 Armando Guzman
http://slidepdf.com/reader/full/armando-guzman 32/33
Conclusions (1)
l Use breaker failure together with direct
transfer trip instead of Zones 2 and 3 for
backup protection
l Timely, appropriate actions are required
to avoid system disruptions
l
Wide-area protection systems minimizerisk of system disruptions and increase
power transfer capacity
8/9/2019 Armando Guzman
http://slidepdf.com/reader/full/armando-guzman 33/33
Conclusions (2)
l Time-synchronized measurementsimprove power system dynamics
assessment
t They can be used for analysis and controls
l Inverse-time undervoltage elements
optimize load shedding to prevent system
voltage collapse without communications!