Architecture framework in support of effort estimation...
138
Architecture framework in support of effort estimation of legacy systems modernization towards a SOA environment Towards a SOA Modernization Impact Analysis Final Version Zdravko Anguelov
Transcript of Architecture framework in support of effort estimation...

Architecture framework in support ofeffort estimation of legacy systems
modernization towards a SOAenvironment
Towards a SOA Modernization Impact Analysis
Final Version
Zdravko Anguelov

IBM Nederland B.V. verleent toestemming dat deze scriptie ter inzage wordt gegeven middels plaatsingin bibliotheken. Voor publicatie, geheel of gedeeltelijk van deze scriptie dient vooraf toestemming doorIBM Nederland B.V. te worden verleend.
Architecture framework in support ofeffort estimation of legacy systems
modernization towards a SOAenvironment
THESIS
submitted in partial fulfillment of therequirements for the degree of
MASTER OF SCIENCE
in
COMPUTER SCIENCE
by
Zdravko Anguelov
Software Engineering Research GroupDepartment of Software TechnologyFaculty EEMCS, Delft University of TechnologyDelft, the Netherlandswww.ewi.tudelft.nl
Global Business ServicesIBM Nederland B.V.
Johan Huizingalaan 765Amsterdam, The Netherlands
www.ibm.com

c© 2009 Zdravko Anguelov. LATEX
Architecture framework in support ofeffort estimation of legacy systems
modernization towards a SOAenvironment
Author: Zdravko AnguelovStudent id: 1232436Email: [email protected]
Abstract
Because of their poor Business/IT alignment, many legacy systems lack the flexi-bility to support rapid changes to the business processes they implement, required bytoday’s enterprises. Furthermore, after many years of maintenance, there is a need tomanage their resulting increased complexity and maximize asset utilization throughreuse. The third complicating circumstance is that these legacy systems cannot simplybe replaced as it is too expensive and risky. For these three reasons, legacy systems aremodernized towards a Service Oriented Architecture.
This thesis presents a framework for performing an impact analysis of such a mod-ernization. It supports the trade-off analysis, needed in the planning phase, for findingthe optimal selection of modernization strategies and judging their yield. The impact isexpressed through the estimation of, on the one side, the effort and, on the other side,the gain of the changes these modernization strategies entail. The thesis concentrateson one of the many types of changes in modernization – the architectural and designchanges to the software system.
The presented framework structures current approaches to modernization in a setof class definitions, system model relationships and a process description. This is doneaccording to the effort they produce, preparing them for its estimation. For this effortestimation, this thesis introduces a Rating Model for quantifying the modernizationeffort using the system models of the framework. This quantification is done throughthe identification of so-called Points of Modernization, a categorization of the modern-ization strategies and a set of effort indicator metrics.
Based on this framework, this thesis also presents an experiment. For a subjectlegacy system, concrete approaches are shown for the instantiation of the frameworkmodels and the subsequent effort estimation is done using the indicator of Scattering.
The analysis of the resulting effort and its relation to the gain show the optimal solu-tions for the modernization of the subject system. Concluding, this thesis discusses thefeasibility of the approach and the future work such as more quantitative research onthe rest of the effort indicators.
Thesis Committee:
Chair: Prof. Dr. A. van Deursen, Faculty EEMCS, TU DelftUniversity supervisor: Dr. Hans-Gerhard Gross, Faculty EEMCS, TU DelftCompany supervisor: Dr. Raymond van Diessen, IBMCommittee Member: Ir. Bernard Sodoyer, Faculty EEMCS, TU Delft
ii
Preface
This thesis is the final work of my Masters study Computer Science at the Delft Universityof Technology. It was conducted between December 2008 and December 2009 in collab-oration with IBM Amsterdam. The subject domain of the research is the modernization oflegacy systems towards a Service-Oriented environment. The existing modernization strate-gies in this domain are analyzed for the changes they require to the architecture and designof legacy systems. This has served as basis for the construction of a framework for evalu-ating the overall impact of legacy system modernization and in particular the estimation ofeffort required for performing the modernization strategies.
The contribution of this research is the organization of the modernization changes insuch a way that their effort impact can be estimated following a suggested process. Nextto this theoretical contribution, the thesis suggests concrete automated approaches for theinstantiation of the architectural models prescribed in the framework. These approaches areapplied for the purpose of effort estimation on a contemplated modernization of a subjectlegacy system. The outcome of this case study is analyzed in the context of impact analysisand trade-off analysis. This work concludes with an evaluation of the presented frameworkand with the outlines for further development of this field through future work.
The reason for performing this research is the need in IBM for a quantitative model ofthe origin and propagation of impact for the domain of SOA modernization. In particular, anestimation is needed of the formation of effort due to modernization. Such a model wouldhave the predictive power needed for a trade-off analysis of future modernization initiativesin enterprises.
This thesis had two complementing goals on the road to the needed impact analysis. Inthe first place, to do a broad investigation of the field of modernization towards SOA and laythe grounds for impact analysis, which encompasses amongst others the estimation of effort,gain and risk of the modernization. To do this, the important issues had to be identified thathave impact on the modernization process and results. After which, an inventory had to bemade of the existing approaches to modernization considering the issues they belong to andthe way they produce effort. As there was no such previous work bringing together thesemultiple domains, the literature study phase of the research was a real challenge.
On the other hand, this thesis also had as a goal to contribute quantitative results to thefield. For this purpose, we have concentrated on the issue of effort estimation. In this field,
iii

PREFACE
we investigate into detail a concrete instance of legacy system modernization and evaluatethe effort estimation results in the context of the broad goal of SOA modernization. Manyof the issues in constructing the framework were cleared through the literature research.However the experimental part helped me to get a more clear view on issues and make thewhole more precise. I hope that I have been able to find the balance between the two goalsand produce useful results to both theory and practice.
Finally, I would like to express my gratitude and give thanks to everybody that madethis thesis possible. In the first place, these are my supervisors Raymond van Diessen fromIBM and Hans-Gerhard Gross from the Software Evolution Research Lab at TU Delft. Ithank them for their support and feedback throughout all the research phases. I would alsolike to thank my people-managers at IBM, Jochem Harteveld and Schelto van Heemstra,who welcomed me into the Business Application Modernization team and helped me feelat home there. Of course, I would also like to thank all the team members themselves forhaving me and especially David Stern who helped me with the technical realization of theexperiment of this thesis. For this, I would also like to thank Marcel Wulterkens and histeam at IBM for making the experiment possible with their readiness to provide me withthe code of the subject legacy system. And finally the many others at IBM I talked to aboutprojects and issues, which opened my eyes also for the practical issues and considerationsin real modernization projects.
Zdravko AnguelovDelft, the Netherlands
January 20, 2010
iv
Contents
Preface iii
Contents v
List of Figures vii
Listings ix
1 Problem Statement 1
2 Theoretical context 52.1 Software Architecture . . . . . . . . . . . . . . . . . . . . . . . . . . . . . 52.2 Service Oriented Architecture . . . . . . . . . . . . . . . . . . . . . . . . 102.3 Existing approaches to system evolution . . . . . . . . . . . . . . . . . . . 14
2.3.1 Renaissance . . . . . . . . . . . . . . . . . . . . . . . . . . . . . . 152.3.2 Architecture Driven Modernization and RMM . . . . . . . . . . . 172.3.3 SMART . . . . . . . . . . . . . . . . . . . . . . . . . . . . . . . . 19
2.4 Modernization towards Service Oriented Architectures . . . . . . . . . . . 202.4.1 Impact Analysis . . . . . . . . . . . . . . . . . . . . . . . . . . . 202.4.2 Classification of modernization strategies . . . . . . . . . . . . . . 222.4.3 Architectural and design features . . . . . . . . . . . . . . . . . . . 25
3 Effort Estimation Framework – Research description 273.1 Targeting the Effort in the Software Application domain . . . . . . . . . . . 273.2 Framework foundation on the existing approaches . . . . . . . . . . . . . . 303.3 Framework configuration . . . . . . . . . . . . . . . . . . . . . . . . . . . 32
3.3.1 Class definitions . . . . . . . . . . . . . . . . . . . . . . . . . . . 323.3.2 Relationships . . . . . . . . . . . . . . . . . . . . . . . . . . . . . 393.3.3 Control Model . . . . . . . . . . . . . . . . . . . . . . . . . . . . 40
3.4 Framework specification . . . . . . . . . . . . . . . . . . . . . . . . . . . 423.4.1 Framework Meta Model . . . . . . . . . . . . . . . . . . . . . . . 42
v
CONTENTS
3.4.2 Framework instantiation process . . . . . . . . . . . . . . . . . . . 423.4.3 Effort estimation Rating Model . . . . . . . . . . . . . . . . . . . 43
4 Legacy Logistics System – effort estimation experiment 474.1 Experiment definition . . . . . . . . . . . . . . . . . . . . . . . . . . . . . 474.2 Experiment planning . . . . . . . . . . . . . . . . . . . . . . . . . . . . . 47
4.2.1 Context selection . . . . . . . . . . . . . . . . . . . . . . . . . . . 474.2.2 Hypothesis . . . . . . . . . . . . . . . . . . . . . . . . . . . . . . 484.2.3 Variable selection . . . . . . . . . . . . . . . . . . . . . . . . . . . 484.2.4 Subject system description . . . . . . . . . . . . . . . . . . . . . . 494.2.5 Experiment design . . . . . . . . . . . . . . . . . . . . . . . . . . 504.2.6 Instrumentation . . . . . . . . . . . . . . . . . . . . . . . . . . . . 524.2.7 Validity evaluation . . . . . . . . . . . . . . . . . . . . . . . . . . 52
4.3 Experiment operation . . . . . . . . . . . . . . . . . . . . . . . . . . . . . 534.3.1 Business Model . . . . . . . . . . . . . . . . . . . . . . . . . . . . 534.3.2 Architectural Model . . . . . . . . . . . . . . . . . . . . . . . . . 544.3.3 Complete as-is model and Rating Model . . . . . . . . . . . . . . . 54
4.4 Data Analysis . . . . . . . . . . . . . . . . . . . . . . . . . . . . . . . . . 554.4.1 Rating Model indicator of Scattering . . . . . . . . . . . . . . . . . 554.4.2 Resulting Effort . . . . . . . . . . . . . . . . . . . . . . . . . . . . 56
4.5 Interpretation of results . . . . . . . . . . . . . . . . . . . . . . . . . . . . 574.5.1 Effort development and relationship to Gain . . . . . . . . . . . . . 574.5.2 Trade-off analysis – Gain/Effort . . . . . . . . . . . . . . . . . . . 57
4.6 Discussion and conclusion . . . . . . . . . . . . . . . . . . . . . . . . . . 584.6.1 Future work – Increase accuracy with Service Model . . . . . . . . 60
5 Research evaluation 615.1 Contribution and applications of research results . . . . . . . . . . . . . . . 615.2 Limitations of the framework . . . . . . . . . . . . . . . . . . . . . . . . . 625.3 Resulting quality of the framework . . . . . . . . . . . . . . . . . . . . . . 64
6 Summary, Conclusion and Future Work 676.1 Summary . . . . . . . . . . . . . . . . . . . . . . . . . . . . . . . . . . . 676.2 Conclusion . . . . . . . . . . . . . . . . . . . . . . . . . . . . . . . . . . 686.3 Future work . . . . . . . . . . . . . . . . . . . . . . . . . . . . . . . . . . 69
Bibliography 71
A Glossary 81
B MATLAB code used for performing the experiment 85
C Figures 89
vi
List of Figures
1.1 Simple model of system modernization . . . . . . . . . . . . . . . . . . . . . 2
2.1 ADM modernization paths . . . . . . . . . . . . . . . . . . . . . . . . . . . . 18
3.1 Graph of the expected relationship between Effort and Gain . . . . . . . . . . . 283.2 Componentization- and Integration effort for different legacy sets . . . . . . . . 39
C.1 Hierarchy of structural paradigms in software architecture . . . . . . . . . . . 89C.2 Service Component Architecture (SCA) . . . . . . . . . . . . . . . . . . . . . 90C.3 Service Component Architecture using Service Data Object (SDO) . . . . . . . 90C.4 Data Access Service (DAS) . . . . . . . . . . . . . . . . . . . . . . . . . . . . 90C.5 SOA Process View . . . . . . . . . . . . . . . . . . . . . . . . . . . . . . . . 91C.6 SOA Development View . . . . . . . . . . . . . . . . . . . . . . . . . . . . . 91C.7 Renaissance - Incremental Process model . . . . . . . . . . . . . . . . . . . . 92C.8 Renaissance - Portfolio analysis . . . . . . . . . . . . . . . . . . . . . . . . . 92C.9 Renaissance - Data flow diagram for evolution modeling . . . . . . . . . . . . 92C.10 Renaissance - Evolution strategies . . . . . . . . . . . . . . . . . . . . . . . . 93C.11 Renaissance - Information sources for performing modernization . . . . . . . . 93C.12 Risk-management modernization approach (RMM) . . . . . . . . . . . . . . . 94C.13 ADM Transformation types in the horseshoe model . . . . . . . . . . . . . . . 94C.14 SMART process for the identification of a modernization strategy towards SOA 95C.15 Architectural goal of the modernization towards SOA . . . . . . . . . . . . . . 96C.16 Legacy systems components impacted by modernization . . . . . . . . . . . . 96C.17 Impact domains involved in system modernization (ADM) . . . . . . . . . . . 97C.18 Framework entities for modeling the legacy system . . . . . . . . . . . . . . . 97C.19 Framework entities for modeling the target SOA system . . . . . . . . . . . . . 98C.20 Framework entities for modeling the modernization process . . . . . . . . . . . 98C.21 Framework relationships between models and the contained entities . . . . . . 99C.22 Framework - impact analysis process . . . . . . . . . . . . . . . . . . . . . . . 100C.23 Framework - Rating Model . . . . . . . . . . . . . . . . . . . . . . . . . . . . 101C.24 Experiment - Business Model extraction and traceability to the code level . . . 102
vii
LIST OF FIGURES
C.25 Experiment - Architectural Model extraction and traceability to the code . . . . 102C.26 Experiment - Business Process Model mapped on the Architectural Model . . . 102C.27 Experiment - Overview of the experiment software prototype design . . . . . . 103C.28 Experiment validity . . . . . . . . . . . . . . . . . . . . . . . . . . . . . . . . 103C.29 Experiment - Subject system call map export . . . . . . . . . . . . . . . . . . 104C.30 Business Process for entry-point node #12 . . . . . . . . . . . . . . . . . . . . 104C.31 Business Process for entry-point node #49 . . . . . . . . . . . . . . . . . . . . 104C.32 Business Process for entry-point node #5174 . . . . . . . . . . . . . . . . . . . 105C.33 Architectural Model - complete hierarchical clustering dendrogram . . . . . . . 106C.34 Architectural Model - magnified hierarchical clustering dendrogram . . . . . . 107C.35 Architectural Model - component definition for different granularities . . . . . 108C.36 D300 – scattering distribution for granularity level of 300 . . . . . . . . . . . . 109C.37 D500 – scattering distribution for granularity level of 500 . . . . . . . . . . . . 109C.38 D1000 – scattering distribution for granularity level of 1000 . . . . . . . . . . . 110C.39 D3000 – scattering distribution for granularity level of 3000 . . . . . . . . . . . 110C.40 D5386 – scattering distribution for granularity level of 5386 . . . . . . . . . . . 111C.41 Box plot of five scattering distributios Dg with g=300, 500, 1000, 3000, 5386 . 112C.42 Experiment analysis - scattering median . . . . . . . . . . . . . . . . . . . . . 113C.43 Experiment analysis - scattering mean . . . . . . . . . . . . . . . . . . . . . . 113C.44 Experiment analysis - scattering standard deviation . . . . . . . . . . . . . . . 114C.45 Experiment analysis - ripple effect scattering . . . . . . . . . . . . . . . . . . . 115C.46 Experiment analysis - E f f ort(g) . . . . . . . . . . . . . . . . . . . . . . . . . 116C.47 Experiment analysis - difference in scattering growth between processes . . . . 117C.48 Best approximations of the Gain/Effort relationship . . . . . . . . . . . . . . . 118C.49 Trade-off analysis - Pareto frontier . . . . . . . . . . . . . . . . . . . . . . . . 119C.50 Trade-off analysis - optimal solutions . . . . . . . . . . . . . . . . . . . . . . 120C.51 Trade-off analysis - rate of change around optimal solutions . . . . . . . . . . . 121C.52 Experiment future work - Service Model mapped to Application Model . . . . 122C.53 Experiment future work - Business Model mapped to Service Model . . . . . . 122C.54 Experiment future work - building the to-be architecture using SCA . . . . . . 122C.55 Experiment future work -service encapsulation model . . . . . . . . . . . . . . 123C.56 Future work overview . . . . . . . . . . . . . . . . . . . . . . . . . . . . . . . 124
viii
Listings
B.1 Business Model abstraction . . . . . . . . . . . . . . . . . . . . . . . . . . 85B.2 Visualization of Business Process abstraction for entry-node #5174 . . . . . 86B.3 Architectural Model abstraction . . . . . . . . . . . . . . . . . . . . . . . 87B.4 Business to Architectural model mapping for all granularities . . . . . . . . 88
ix

Chapter 1
Problem Statement
Many enterprises have legacy systems that are up to several decades old. Such systems arecharacterized by the fact that they have been changed and enhanced, through maintenance,during the long period of time of their existence. The reasons for these changes, are changesin the business requirements(environment), which have to be reflected in the supporting ITsystem. This continuous evolution, with 5 to 7% functionality modification a year [51], hasmade these systems large, complex and heterogeneous. Due to the inevitable maintenance,the system’s design has deteriorated, which makes further changes even more difficult andless isolated (with greater impact on the rest of the system). Such legacy systems havebecome essential to the operation of the enterprise and cannot just be discarded and rebuiltfrom scratch. This is often too risky (functionality may get lost, too complex functionality,undocumented functionality), too expensive and takes too much time.
At the same time, enterprises have goals that require changes of their systems to bemade, ranging from technology driven maintenance to the incorporation of new businessrequirements. Two main goals are: 1) becoming agile and 2) reducing the cost of technol-ogy. Enterprises want to become more competitive by being able to react fast to marketchanges [30]. This means that it must be possible for them to change business processesfast and thus reduce the time-to-market of their products. Reducing the cost of technologycan be achieved by improving system interoperability and increasing reuse. Interoperabilityneeds to be improved internally, between the enterprise’s own applications, but also exter-nally, with other parties such as suppliers and customers. There is thus a need for creating adynamic and easily reconfigurable IT environment, which corresponds to the dynamic busi-ness environment of today. Furthermore, increasing reuse will increase efficiency and givethe enterprise a competitive edge on the market. All the above-mentioned characteristics,that will improve the agility of the system and reduce the cost of technology, are not easilyachievable in most legacy systems, because of the systems’ rigid design and heterogeneity.
Legacy System Modernization
This description of the current state of legacy systems and of the desired business organiza-tion exposes a mismatch. This is the mismatch between modern business requirements and
1
1. PROBLEM STATEMENT
the supporting legacy software systems. It is manifested through the fact that the structureof legacy IT systems is not optimal for a good IT-to-Business alignment. At the same time,industry case studies and research indicate that an architectural change of legacy systems,towards Service Oriented Architecture, can remedy this problem [8, 74, 66]. Thus, so farwe have established two facts:
1. Legacy systems do not satisfy the business needs of the enterprises using them: Theyare not easy to change at the pace of change of the business processes they support.They are also not economically efficient as there is little reuse possible due to theirdesign.
2. SOA addresses many of theses issues: SOA-based systems offer a good solution forsupporting a fast changing environment, because of better IT-to-Business alignment.SOA also structures the system in such a way that reuse is much easier.
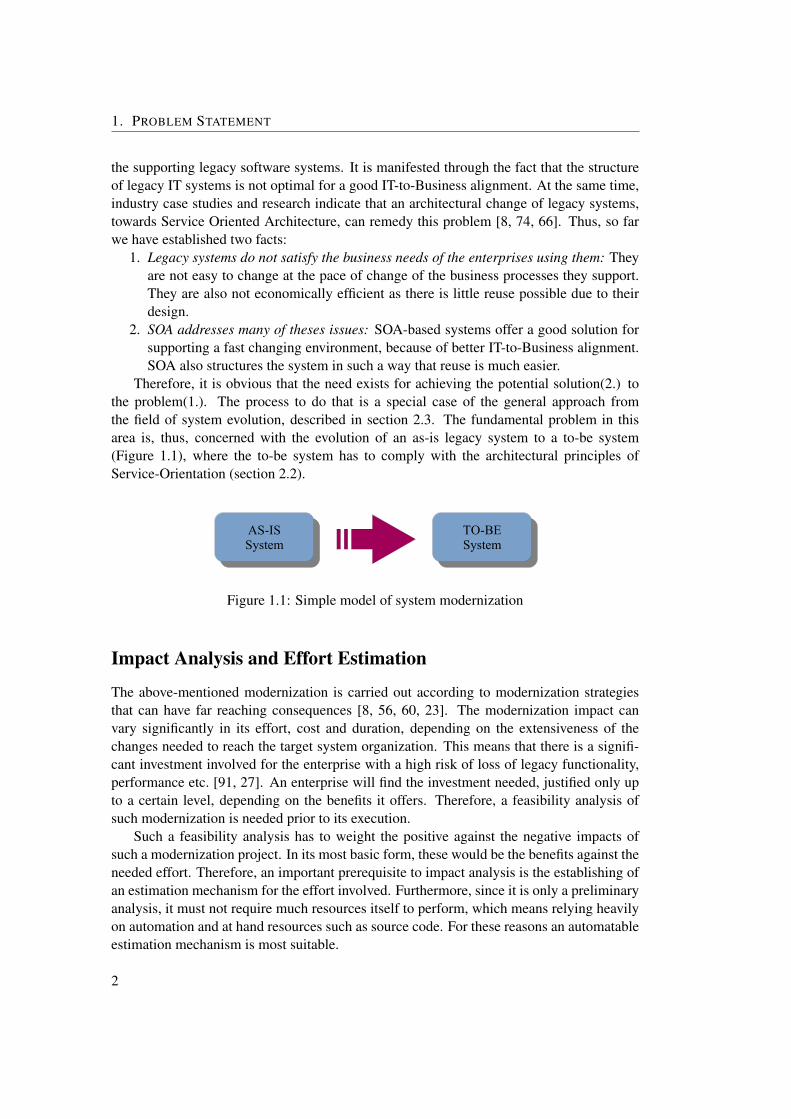
Therefore, it is obvious that the need exists for achieving the potential solution(2.) tothe problem(1.). The process to do that is a special case of the general approach fromthe field of system evolution, described in section 2.3. The fundamental problem in thisarea is, thus, concerned with the evolution of an as-is legacy system to a to-be system(Figure 1.1), where the to-be system has to comply with the architectural principles ofService-Orientation (section 2.2).
AS-ISSystem
TO-BESystem
Figure 1.1: Simple model of system modernization
Impact Analysis and Effort Estimation
The above-mentioned modernization is carried out according to modernization strategiesthat can have far reaching consequences [8, 56, 60, 23]. The modernization impact canvary significantly in its effort, cost and duration, depending on the extensiveness of thechanges needed to reach the target system organization. This means that there is a signifi-cant investment involved for the enterprise with a high risk of loss of legacy functionality,performance etc. [91, 27]. An enterprise will find the investment needed, justified only upto a certain level, depending on the benefits it offers. Therefore, a feasibility analysis ofsuch modernization is needed prior to its execution.
Such a feasibility analysis has to weight the positive against the negative impacts ofsuch a modernization project. In its most basic form, these would be the benefits against theneeded effort. Therefore, an important prerequisite to impact analysis is the establishing ofan estimation mechanism for the effort involved. Furthermore, since it is only a preliminaryanalysis, it must not require much resources itself to perform, which means relying heavilyon automation and at hand resources such as source code. For these reasons an automatableestimation mechanism is most suitable.
2
Research Question Formulation
Modernization towards SOA has many aspects, each having some form of impact on theeventual effort needed. Hence the subtitle of this thesis – “Towards SOA modernizationimpact analysis”, as we will concentrate only on part of the issues relevant to a completeimpact analysis . As an initial division, the literature study has identified the organizational,business and technology (information and systems) aspects. From these, the aspect we aremost interested in is the technology and specifically the software architecture organization.Concentrating on the software architecture description of the as-is and to-be systems is agood choice as an indicator of the changes the modernization will require for three reasons.
In the first place, the architectural view is an abstraction from the ”how?” [53, p.42].Thus an approach based on it will give a more generic approach, applicable to a broaderset of subject systems and will not be influenced by low level implementation dependentdifferences.
Second, as is shown in section 2.2 on Service Oriented Architecture, many of the deci-sions in such systems are done on a high-abstraction level – architectural and design level.There they are more easily relatable to the business domain. The software architectural levelis, thus, where the link can be more easily made between rather different system organiza-tions such as legacy and SOA.
Finally, architectural views have as an advantage that they usually can be derived in anautomated way from the legacy source code. Finding an automated approach is of moreinterest compared to expert-driven approaches, because legacy systems display two charac-teristics, which can be most efficiently handled through automation:
1. size and complexity: due to the size and complexity of legacy systems the sought afterapproach by the research has to be repeatable and be able to handle a large volume ofinput information. This will make it applicable to projects in different contexts, basedon reuse with the same initial development investment.
2. poor understanding and documentation: due to the limited availability of other sys-tem design sources, the approach has to mainly rely on hard assets such as sourcecode and deployment configurations.
So in summary, this research is focused on how to use this architectural informationabout a legacy system to analyze the impact of modernizing towards an Service OrientedArchitecture by estimating the needed effort. This is formulated as the following researchquestion:
The modernization process of legacy systems to a SOA environment imposes systemarchitectural/design changes. How to perform an automated overall (software) changeimpact analysis for these changes?
Thesis Research Goals
The literature study has identified the following existing work relevant to the research prob-lem described above:
3
1. PROBLEM STATEMENT
• generic modernization frameworks such as ADM, RMM, Renaissance and SMART(automated vs expert-driven)• legacy system portfolio analysis for identification and prioritization of sub-system
modernization needs• SOA target environment specification guidelines• set of modernization strategies on the architectural level
From the survey of current approaches (section 2.3), it becomes apparent there is nomethod that binds them together. Such a method would make it possible to relate the appli-cation of the known modernization strategies in the context of legacy system modernizationtowards SOA. In doing so, such a methodology can be used to evaluate the impact and ex-tent of the architectural changes that are the consequence of the modernization strategies.This would give the basis for performing a SOA change impact analysis and modernizationeffort estimation. So the broad setting for the problem stated above is the identificationand targeting of the legacy system weak points, specification of target SOA architecture,and application of SOA modernization strategies as part of a broader process of systemmodernization. Thus, the sub-problems this thesis research focuses on are:• Which selection of elementary modernization changes on architectural/design level
should be used to describe the SOA modernization strategies? These strategies asdefined in section sec:strategies can be described through the software architecturemodeling entities described in section sec:architecture. A selection of these elemen-tary changes will form the basis for describing the modernization plan towards SOAof the legacy system.• How to organize these modernization changes? Are there groups of related changes?
Is there impact propagation (between groups) based on these relationships?• How to relate the changes in this organization to each other, so that the total impact of
the modernization can be quantified? What scale of measurement is most appropriateand feasible to rate this impact–nominal, ordinal, interval or ratio scale?
This report began in this chapter with a clear statement of the research problem to besolved. The purpose of the rest of the report is to describe the findings of the thesis research.In chapter 2, a selection of existing approaches is described that were identified during theliterature study and that together form the context for the further thesis research. Theseinclude software architecture modeling concepts, SOA specification concepts and modern-ization strategies. Chapter 3 describes the concrete approach suggested for tackling theproblem stated in the research question. It consists of a framework specification togetherwith its scope and the assumptions made. This approach is then applied in practice. Theexperimental setting for that and the results are presented in chapter 4. The chapter con-sists of the description of a case study legacy system and a concrete implementation of thesuggested framework used to analyze it. In the last section of that chapter the results of theexperiment are analyzed. In chapter 5 the whole research is evaluated as to whether it canbe considered successful and what its added value is. Finally in chapter 6 the conclusionsof the research as a whole and the possibilities for future work are presented.
4
Chapter 2
Theoretical context
This chapter describes the theoretical context of the research problem. It summarizes thefields of research relevant to the problem statement. These established facts, theories andnotions will function as premises for the research. They form the theoretical context thatwill be extensively referenced later on. It is needed in order to make a clear distinctionbetween background knowledge, which will not be put in question throughout the rest ofthe research, and the sought after knowledge. This will help in the identification of theaccomplishments of the performed research. The purpose of the theoretical framework isalso to mark the boundaries of the research project.
The research problem is at the intersection of four research areas: Software Archi-tecture, Service-Oriented Architectures, System Evolution, Impact Analysis. They aredescribed in the following sections with the artifacts from these domains and the methods tomanipulate them. First is the the domain of Software Architecture in section 2.1, listing theconcepts used to describe the structure of software systems. Based on this foundation, sec-tion 2.2 describes the characteristics of the specific class of Service-Oriented Systems. Insection 2.3 we present the existing approaches for overall system evolution and moderniza-tion. We conclude in section 2.4 with field of Impact Analysis and its application in legacymodernization focusing on the specific issues in transforming the architectural aspects oflegacy systems towards SOA.
2.1 Software Architecture
Complex systems can benefit from a high-level design, guiding its construction and mainte-nance [49]. Architecturing involves the specification on a high, abstract level, of a system,its elements and the way they interact with each other.
Definition 2.1 Architecture: The fundamental organization of a system, embodied in itscomponents, their relationships to each other and the environment, and the principles gov-erning its design and evolution, IEEE standard P1471–2000 [49]
Based on this definition, we can conclude that using software architecture is useful fortwo reasons. First, architectural descriptions manage to stay focused on the fundamental
5
2. THEORETICAL CONTEXT
software system characteristics. This is possible through the use of abstraction and hidingof detail. One such example of filtering out information and concentrating on a particularsystem aspect is through system views [49], such as a development view, process viewetc. [61].
Second, it is possible to distinguish between different levels of abstraction throughsoftware architecture. This can be summarized in a hierarchy of structural abstractionparadigms [53], shown in figure C.1. This demonstrates the difference in abstraction levelbetween software architecture, software design and implementation structures. The systemsarchitecture consists of early design decisions, on a higher abstraction level, meant to guidethe further more detailed system design. This view has also been adopted by the IEEE [49].
These two characteristics of software architectural descriptions make them very suit-able as models for reasoning about system modernization. Through software architecture,a level of abstraction can be found where it is possible to describe different systems or dif-ferent states of the same system using the same architectural concepts. This enables thecomparison of these instances even though they may be implemented very differently. Inthe following subsections we describe concepts on three levels of abstraction that are usedto capture software architectural views – components, patterns and frameworks.
Components and Connectors
One of the main viewpoints, to document the software architecture, is in terms of compo-nents and connectors [36, 2, 53]. These are two concepts on a medium level of abstraction(Figure C.1). There is no exact definition of a component [53, p.30], only a general under-standing about its characteristics. A component is considered the basic building block ofan application. It is an autonomous, encapsulated computational entity which accomplishespre-defined tasks through internal computation and external communication. There are nolimitations on the granularity of a component. Its size can vary from a GUI button througha collection of classes to a complex application service. Procedures, packages, objects andclusters can all be viewed as instances of the same abstraction - the software component.Components define their contract, to be used for external communication, in the form ofinterfaces. An interface thus defines the services the implementing component supplies toits requesters. Two components can communicate with each other through a connector, thatadheres to the communication definitions of the interfaces of both components. A connectoris thus the collection of rules and constraints that define the relationship between compo-nents [69]. The purpose of this representation is to decouple the functionality of a systemin independent entities - components and connectors. This way different compositions ofthese entities are made possible, through the pre-defined interfaces, and ultimately supportreusability. This decoupling makes it also possible to focus on select groups of softwarecomponents in isolation when designing or analyzing a software architecture.
Definition 2.2 Component: an autonomous, encapsulated computational entity which ac-complishes pre-defined tasks through internal computation and external communication
Definition 2.3 Connector: the collection of rules and constraints that define the relation-ship between components through their interfaces
6
Software Architecture
Component attributes are used to describe the components. Put together, they form aComponent Model [53, p.113-120]. Sample elements of this model are the specificationof the externally visible properties of the component, constraints on these properties and anevent model. Based on this component view of a system’s architecture and the componentmodels one can reason about the software architecture as a collection of components. Gar-lan et al. [37] have introduced the term architectural mismatch to denote interoperabilityproblems between components due to assumptions about:• the nature of components: functionality supply, infrastructure, control model, data
manipulation• the nature of connectors: protocols and data models• the architecture of the assemblies: constraints on interactions• the runtime construction process: order of instantiation
Further component attributes that can have influence on component ensembles interoper-ability are given by Bhuta et al. [7]. In their work the authors describe an automated methodto evaluate the compatibility of components given their component descriptions. Thesedescription consists of four four categories of attributes:• General attributes• Interface attributes: control inputs, data inputs, data outputs• Internal assumption attributes: concurrency, encapsulation, layering, preemption• Dependency attributes: communication dependency, execution language support
In system modernization, architectural transformations are part of the process (sec-tion 2.4). Mismatches between the resulting subsystems and components will have to beovercome, leading to additional effort. In an effort estimation framework, it is thus neces-sary to be able to estimate the compatibility of resulting subsystems and components. Theabove-mentioned Component Models offer a quantifying approach for this purpose.
Patterns
A further concept for describing the software architecture of a system is a pattern. Hess [45]emphasizes the application of patterns in the modernization of legacy systems. Experiencehas shown that well designed systems in the same problem domain, display similar architec-ture [42]. Groups of components and connectors display characteristic structures, that aretypical for certain commonly encountered problems. These typical groups of componentsare instances of the abstract solution to the common problem which is called a pattern. Thedefinition of a pattern we are going to use is given by Buschamann [18] as follows:
Definition 2.4 Pattern: A pattern for software architecture describes a particular recur-ring design problem that arises in specific design contexts, and represents a well-provengeneric scheme for its solution. The solution scheme is specified by describing its con-stituent components, their responsibilities and the ways in which they collaborate.
Patterns can be found on each of the abstraction levels of figure C.1. Kaisler [53, p.29]and Buschmann [18] make the distinction between architectural patterns, design patterns
7
2. THEORETICAL CONTEXT
and idioms in order of decreasing abstraction. The definition of architectural patterns ac-cording to Buschmann [18, p.12] as a means of capturing the overall structuring principlesof a system is:
Definition 2.5 Architectural pattern: An architectural pattern expresses a fundamentalstructural organization schema for software systems. It provides a set of predefined subsys-tems, specifies their responsibilities, and includes rules and guidelines for organizing therelationship between them.
The most widely spread architectural patterns are first documented by Garlan and Shawin 1994 [38] who use the term architectural styles. These architectural styles have been alsocategorized in taxonomies [83, 58], [53, p.218-327] based on similarities and differencesin their properties and application. Architectural patterns help achieve a specific globalsystem property, such as the adaptability of the user interface of a system. An overviewof the patterns on the design level is given by Gamma et al. [35]. They are categorizedas creational, structural and behavioral. The most important four from their work are alsoknown as the Gang Of Four. Design patterns are, as architectural patterns, a proven solutionto a common problem in a generic form [53]. They must be instantiated for the particularcontext they are going to be used in. The difference with architectural patterns is that theirsolution space is much more fine-grained. The definition given by Buschmann:
Definition 2.6 Design Pattern: A design pattern provides a scheme for refining the sub-systems or components of a software system, or the relationship between them. It describesa commonly-recurring structure of communicating components that solves a general designproblem within a particular context.
Patterns can be nested in each other to combine their advantages and solve the softwareengineering problem gradually at different levels. A single system may use multiple archi-tectural styles. They can be combined in multiple ways, for example hierarchically, to forma heterogeneous architecture [38].
Frameworks
Using components and patterns, a framework goes even further and specifies a partialrealization of a system. Frameworks are above the level of software architecture in theabstraction hierarchy (Figure C.1). The main goal of frameworks is to enable reuse of theentire system designs and application structures, found in these lower abstraction levels [53,p.344]. This is done by making only the fundamental choices/assumptions on architecturaland design level for a particular domain and packaging these as a ready-to-use infrastruc-ture. This supplies the guidelines for the structure of the class of solutions in the particulardomain. At the same time, it leaves open the implementation of the details to each concreteapplication using the framework. As a result, the framework determines the overall structureof the applications derived from it, but also allows for flexibility and customization.
Definition 2.7 Framework: a generic architecture complemented by an extensible set ofcomponents [53, p.343]
8
Software Architecture
The specification of a framework is built up from the following three parts:• Class definitions: collection of concept definitions [53, p.405]• Relationships: set of structural and behavioral relationships between the classes
of the framework. Together the classes and relationships capture the structure of aframework [53, p.405]• Control Model: this interactions’ specification [53, p.345, Taligent Corp.] “ties the
parts of the framework together to provide a skeletal solution for a class of prob-lems” [53, p.410]. Usually this results in an inverted role of control between theapplication and the infrastructure – the infrastructure calls/invokes application rou-tines
By definition, a framework supports Instantiation(of the framework), Refinement(for aspecific domain) and Extension(for a more general domain) [53, p.406-407]. These ca-pabilities and the above-mentioned structure of frameworks offer the following advan-tages [53]:• improved maintainability, because of the consistent reuse of the framework facilities
within each application. But also because of the consistency between applicationsusing the same framework.• improved quality and reliability, because all concrete applications based on a frame-
work use proven design/architecture and best practices.• shorter design-time, because the set of common facilities and solution structures are
supplied by the infrastructure of the framework and are reused for each new applica-tion.
Frameworks are relevant to this research for three reasons:I. frameworks complete the set of abstraction concepts for architecture description
II. our definition of Service Oriented Architecture (Definition 2.8) is based on the con-cept of a framework
III. frameworks are useful for the structuring of our own approach to effort estimation
Knowledge about the presence of a framework in the architectural description of a sys-tem is useful for modernization effort estimation. In the first place, just as patterns, frame-works indicate a degree of cohesion between the components they consist of. This cohesionis the source of resistance to change of only part of the structure. Changes due to moderniza-tion of only one part, may propagate to the rest of the structure and result in additional effort.Furthermore, frameworks are bound to contain a lot of architectural assumptions leading tointeroperability problems between different frameworks: architectural mismatches betweenthe control models, mismatch between the provided and required services by the differentframeworks [53, p.410-411].
A framework arrangement is also useful for the specification of the impact analysisand effort estimation suggested in this research. Frameworks are also used outside thedomain of software architecture. There, they can specify any generic structure togetherwith the provision of facilities for extension and customization. Also in this broader sense,the advantages and capabilities of using a framework apply. Because this research is just
9
2. THEORETICAL CONTEXT
an initial attempt in the field, we want it to have the advantages of frameworks describedabove to enable future improvements. The construction of the framework will be done instages. The set of assumptions will be separated from the set of configuration parameters.The challenge of framework design is in finding the balance between reuse and flexibility.On the one hand, the goal is to increase reusability by packaging components so that theycan be reused in as many application domains as possible. But at the same time, an equallyimportant goal is to design architectures that are easily adapted to the requirements of thetarget application domains, thus, achieving flexibility [53, p.404].
2.2 Service Oriented Architecture
This section gives a description of Service Oriented Architecture (SOA). It describes thefeatures of SOA that distinguish it from the typical legacy system architecture. The mod-ernization process this thesis considers has SOA as the target environment. Achieving everycharacterizing feature of this target environment impacts the amount of effort required. Thisis why we need to define what has to be established through modernization in order to quan-tify the resulting effort.
Enterprise Total Architecture
Businesses need to employ a holistic view of their enterprise in order to be successful. Inthis view the enterprise consists of four interrelated elements: business processes, peo-ple, information and systems brought together by a purpose and described in the so-calledEnterprise Total Architecture [17]. The success of this total architecture is directly relatedto its ability to enable the achievement of the enterprise purpose. The purpose of the ar-chitecture is, thus, to support the business processes that make the enterprise work. Thismeans that understanding these business processes is an essential prerequisite to creatingthat architecture. Service Oriented Architecture is a paradigm on how to arrange the fourabove-mentioned elements of the Total Architecture of the Enterprise in such a way that theenterprise can reach its goal. Through its guidelines on all four aspects it helps build a co-ordinated whole, that can evolve and still keep up a good overall quality. Designing a SOAaids, for example, in building an environment that integrates the business process architec-ture and the software architecture of the enterprise. There are more aspects to designing aSOA that the software and the applications. This holistic view of the enterprise by the SOAparadigm distinguishes it from the approaches used to engineer legacy IT systems.
Service Oriented Architecture challenge
A fundamental idea of the Service Oriented Architecture paradigm, as we have seen above,is the case for any ICT infrastructure, is that the business processes do not simply dependon the information systems - they define the services these systems should provide [16].In other words SOA is a Business-Driven approach [32, p.52]. The business processes in-evitably change and this leads to changes in the supporting systems. Here lies the majorchallenge for SOA - designing systems in such a way that accommodating most business
10
Service Oriented Architecture
process changes can be achieved by simply rearranging existing business services. Thus,the main aim is to achieve flexibility [52]. But this flexibility is determined by each of theabove-mentioned aspects of the Total Architecture. This means that, besides system flexi-bility, a SOA must ensure a clear and flexible organization, roles and processes. Achievingflexibility is hindered by the challenges of existing distributed systems in the enterprise,different owners and system heterogeneity [52, p.13].
SOA definition
In the following sections we give the characteristics of the Service Oriented Architectureparadigm, by giving definitions of its most important concepts, including its own designparadigm and design principles, design patterns, a distinct architectural model, and relatedconcepts and technologies. Three of the most important of these concepts are services,interoperability and loose coupling [52, p.16]. Service Oriented Architecture is still anevolving field of research and there is still no single industry-wide definition. We give thedefinition, that captures best all the aspects in a single formulation.
Definition 2.8 Service-Oriented Architecture: A service-oriented architecture is a frame-work for integrating business processes and supporting IT infrastructure as secure, stan-dardized components services - that can be reused and combined to address changingbusiness priorities [9]
Definition 2.9 Capability: A capability is a resource that may be used by a service providerto achieve a real world effect on behalf of a service consumer [67]
Definition 2.10 Business Process: A business process is a description of the tasks, partic-ipants’ roles and information needed to fulfill a business objective [67]
“So an SOA is not simply an approach to designing computer systems; it is an approachto designing the enterprise. Shared capabilities are utilized in different contexts to achieveeconomies of scale and consistency of operations and control. The computer system shouldbe designed to align with the design of the business” [26, p.32]. The technological founda-tion of SOA is the design paradigm of Service-Orientation. It is guided by a set of 8 designprinciples that will be described later on. The service is here the fundamental unit throughwhich solution logic is represented [32]. However designing a SOA is not just making surethat a system displays characteristics of integration, loose coupling and is built out of ser-vices. For a successful SOA the following four ingredients are important - Infrastructure,Architecture, Processes, Governance [52, p.18].
Services
As already mentioned, SOA is a Business-Driven approach, so the main goal is to structurethe supporting software system following the structure of the business processes. The idealend-situation is an easy and direct 1-to-1 mapping, between business and software solutionlogic, which results in improved flexibility. This results in flexibility, because the cause
11
2. THEORETICAL CONTEXT
for change is often initiated from the business. Thus, being able to follow the changes inthe business processes by only reconfiguring(reconnecting components) and not function-ality redistribution results in flexibility. This is why the concepts of services and Service-Orientation are introduced. The definition of a service is not yet settled upon [16, 30, 82].We follow:
Definition 2.11 Service: A service is an implementation of a well-defined piece of businessfunctionality, with a published interface that is discoverable and can be used by serviceconsumers when building different applications and business processes [82, Ch1.5].
Services have been mentioned in the section on software architecture as general con-cepts for functionality that a component can supply to a requesting party. This is mainly afine-grained concept on the level of function calls. In SOA, a service has a more course-grained meaning. Services form a Service Layer [30, p.23] as an abstraction above com-ponents, functioning as a convenient way of encapsulating functionality and offering it as acapability. Ideally ”services map to the business functions that are identified during businessprocess analysis“[30, p.28].
In spite of the absence of concrete definitions there is a common set of characteristicsmost associated with service orientation [75]. These are further distiled, by Erl [31], to the8 Design Principles, mentioned in the SOA definition subsection:Contracts: Services share a formal contract defining the terms of information exchange in
their interactionReusability: Services are designed to support potential reuseCoupling: Services are loosely coupledAbstraction: Services abstract underlying logic. The only part of a service that is visible to
the outside world is what is exposed via the services description and formal contract.The underlying logic is invisible and irrelevant to service requestors.
Composability: Services may compose other services. This possibility allows logic to berepresented at different levels of granularity and promotes reusability and the creationof abstraction layers
Autonomy: Services are autonomous. The logic governed by a service resides within anexplicit boundary. The service has complete autonomy within this boundary and isnot dependent on other services for the execution of this governance
Statelessness: Services should be designed to maximize statelessness even if that meansdeferring state management elsewhere
Discoverability: Services are discoverable. They should allow their descriptions to bediscovered and understood by humans and service users who may be able to makeuse of the services logic
From the principles mentioned above autonomy, loose coupling, abstraction and the need fora formal contract can be considered the core that forms the foundation for SOA. From thispoint of view, SOA is nothing more than a paradigm aimed at improving system flexibility.As such, it is appropriate for large distributed systems with different owners and a highdegree of heterogeneity [52].
12
Service Oriented Architecture
SOA Software Architecture Modeling
Two architectural views of the software architecture of Service-Oriented systems are centralto identifying modernization changes and thus effort. The first view captures the aspects ofProcess View described by Kruchten [61] and is given by Lewis et al. [64] (Figure C.5). Inthis view, central is the interoperation between Service Providers and Services Consumers.
Definition 2.12 Service Provider: a participant that offers a service that permits somecapability to be used by other participants [67]
Definition 2.13 Service Consumer: a participant that interacts with a service in order toaccess a capability to address a need [67]
Besides these entities, Infrastructure is also an important enabling concept. The SOAInfrastructure connects service consumers to service providers. It usually implements aloosely coupled, synchronous or asynchronous, message-based communication model, butother mechanisms are possible. The infrastructure contains elements to provide support forcross-cutting concerns in achieving system integration such as service discovery, security,transaction management and logging. A common SOA infrastructure is an Enterprise Ser-vice Bus (ESB) to support web service environments [64]. The Process View of SOA illus-trates the present separation of concerns on an architectural level between Service Providers,Service Consumers and Infrastructure.
The second view of the software architecture of Service-Oriented systems is from thework of Gimnich [39] (Figure C.6). It demonstrates the difference in architecture betweenService-Oriented systems and legacy systems through the Development View describedin [61]. In legacy systems the functionality from the layers 1, 2, and 4 – OperationalSystems, Service Components and Business Processes – can be found, albeit not alwaysso neatly separated. This results in direct coupling between the business processes andthe supporting software systems. SOA introduces the additional abstraction of the ServiceLayer [30] between the Business and the Components. It enables that important IT-to-Business alignment mentioned in the problem description in chapter 1 by decoupling thebusiness process from the implementing components.
There are two standards for modeling the Development View. One standard is con-cerned with modeling the application logic. The other, models the data used by the appli-cations. The first is the Service Components Architecture (SCA)1,2, used to model thelink between the elements from each of the four layers of the Development View. The SCAspecification (Figure C.2) defines how the system components are built and how to com-bine those components into complete applications. The Service Components layer of theDevelopment View is organized according to SCA through the concepts of Componentsand Composites. By adding Services and References to the them, the mapping is donefrom the Service Components layer to the Service layer. The components are linked to theservices they supply. Linking Services and References to each other through the concept ofWires, the further link upwards is done to the Business Processes layer. The wired services
1http://osoa.org2http://www.oasis-opencsa.org/
13
2. THEORETICAL CONTEXT
are aggregated into business processes. Finally this resulting implementation independentmodel can also be linked through Bindings to a specific implementation from the bottomlayer of the Development View – Operational Systems.
The second standard complementing SCA is the Service Data Objects (SDO)3. It spec-ifies an architecture for handling the business data in an implementation independent way.The goal is unified data access to heterogeneous data sources. The SDO representation ofthe data is exchanged through the wires of the SCA model (Figure C.3). The SDO architec-ture is based on the concept of disconnected Data Graphs built out of Data Objects. Infor-mation about the structure is contained as a Metadata(Figure C.4). Access to data sourcesis provided by a class of components called Data Access Services (DAS). The DAS is re-sponsible for the marshaling and unmarshaling of the implementation specific and possiblyheterogeneous data sources into the SDO representation as Data Graphs (Figure C.4).
Both architectural views, mentioned in this subsection, are needed for the estimation ofmodernization effort. They model architectural characteristics that are impacted by modern-ization. These are the structure of components and their interoperation of both applicationlogic and data (section 2.4). To manage the complexity of the effort estimation problem, the“divide and conquer” approach has to be applied. Using the above-mentioned views enablesthe division of the target SOA architecture in pieces for which the effort can be estimated inrelative isolation and in respect to different modernization concerns.
2.3 Existing approaches to system evolution
This section describes three existing approaches for performing system evolution and mod-ernization – Renaissance, ADM and SMART. Only when the steps of modernizing a sys-tem are clearly defined, can an estimation be made of the effort this process will require.The definition of these steps is what these approaches supply. They share some commonfeatures, but also complement each other in other areas. Each one emphasizes on differentaspects of the modernization process.
Renaissance has the most oversight of the three. It defines all phases of the modern-ization process. This gives a good starting point and orientation of where the effort ofmodernizing a legacy system lies. Renaissance focuses on possible modernization strate-gies, cost factors and their categorization. On the other hand, ADM and the accompanyingRMM approach focus on the modernization planning phase. They model the changes in-volved on the architectural level and the distinction between affected domains. This is animportant extension to Renaissance as modernization towards SOA consists for an impor-tant part of architectural transformations. The reason for this is that the differences that needto be overcome between legacy and SOA systems ares mainly in the software architecture.
Both Renaissance and ADM are approaches that lend themselves for automation. Thatis not the case with SMART. It is an expert-driven approach in a questionnaire form. How-ever, it has to its advantage that it is specifically developed for evaluating the modernizationtowards SOA. Therefore, parts of these three approaches will be combined for the construc-tion of the overall effort estimation framework in chapter 3. The rest is mentioned as an
3http://osoa.org/display/Main/Service+Data+Objects+Home
14
Existing approaches to system evolution
indicator of how much is left out of the scope of this research and will be mentioned in thechapter on future work, chapter 6.
2.3.1 Renaissance
Renaissance is a generic incremental approach for performing legacy system modernization.“Renaissance provides and end-to-end guidance, from project conception through to systemdeployment, for managing evolution projects” [98, p.17]. The method defines:
1. a generic process that guides practitioners through the activities of evolution projects2. practical advice and techniques on how to perform the activities of the process3. an information repository defining the information to gather during the process
The process of modernization iterates through four phases: Plan Evolution, Implement,Deliver, Deploy (Appendix C.7). In the Planning phase is decided whether to decommis-sion the system, continue to maintain it, improve through reengineering or replace it. ThisPortfolio Analysis is based on an assessment of the legacy system and its operational con-text. The system’s “technical quality” and “business value” are estimated by quantifyinga corresponding set of parameters. For the technical quality, attributes such as age of thesystem, failure rate, complexity and size are important [98, Table3.2]. The choice of furtheraction depends on the cost/risk trade-off decisions taken for the project. Once the technicalquality and business value have been quantified, Renaissance prescribes a recommendationabout further action, depending on the combination (Figure C.8).
Evolution strategies
In the case of further action, the Renaissance method identifies six evolution strategies toevolve to a new desired state, given in figure C.10. Each of them involves certain effort anhas its benefits, given in the description [98, p.50-54].
Evolution modeling
To support the modernization process, Renaissance gives the evolutionary steps that have tobe taken, together with the information they require (Appendix C.9). Two main aspects aremodeled: the Legacy System and the Target System. Each of these models consist of twoparts Context Model and Technical Model [98, Figure4.1].
Context modeling is done from four viewpoints on the system [98, Figure4.4]. To rep-resent these viewpoints a set of documents [98, Table4.1] and capturing techniques [98,Table4.2] is recommended for each of them.• Business: captures the system’s support for the business processes• Functional: describes the system functionality which implements the business pro-
cesses captured in the business view• Structural: overview of the system’s software architecture and data structures model• Environmental: describes the physical system structure such as its network organi-
zation and communication model
15
2. THEORETICAL CONTEXT
Technical modeling is done by further decomposing the documents from the structural andenvironment view for both the legacy and target system. The objectives for the techni-cal modeling are three: a) identify components which can be worked on independentlyb) provide a base to extract, adopt, and reuse components c) provide sufficient detail tosubsequently implement the target system.
Information Management
Renaissance defines six categories of information needed for the evolution process:• Business: contains Business goals, Business process description, Problem statement• Legacy system: contains the Assessment report, System documentation, Context
model, technical model• Target System: contains the Context model and Technical model• Evolution strategy: contains Possible evolution strategies, Cost Benefit Risk analy-
sis, System evolution strategy• Project Management: contains Project plan and Deployment plan• Test: contains the Test strategy plan, Test data, Test report
The first four are needed in order to plan the modernization of the system (Appendix C.11).The target system specification does not need to created into detail as it is adjusted in theImplementation and Delivery phases. The last two information sources, Project Manage-ment and Test, contribute to the effort and costs required, but are dependent on the first fourand are only made after these are ready.
Integration Models
Renaissance presents six Integration Models for the components of the legacy system [98,Fig5.7]. Each integration model is appropriate for a particular reengineering strategy [98,Table5.2]. It describes a logical structure and how to integrate parts of the legacy systemthrough it into a target system. Here we list the models and the way to achieve them sug-gested by Renaissance:• Data Integration - Direct access, Meta-data encapsulation• Service Integration - Remote Procedure Call, Message-oriented middleware• Presentation Integration - Screen scraping• Distributed Object Integration - Direct Access, Encapsulation
Cost Drivers
Renaissance gives a process for estimating the risks and costs associated with each evolutionstrategy [98, Figure3.14]. The costs are divided in three categories:
I. RIC – Reengineering Investment CostsII. OSRC – Operations and Support costs for Reengineered Components
III. OSLC – Operations and Support costs for Legacy Components
16
Existing approaches to system evolution
The costs are a consequence of effort required for modernization activities such as [98, p.25,Table3.7]:• Reverse engineering• Software development• Data migration• Incremental evolution• Target system deployment• Legacy system integration
• Integration testing• Licensing costs• Hardware• Training• Operational site activation
The possible estimation techniques for the above-mentioned costs are: a) Expert judg-ment b) Analogy-based c) Top-down d) Bottom-up e) Parametric [98, Table3.8].
2.3.2 Architecture Driven Modernization and RMM
The Risk-Management Modernization (RMM) approach gives a more detailed process de-scription (Appendix C.12) of the first two steps in a modernization track, identified by theRenaissance method – Plan Evolution and Implement. The initial portfolio analysis is sim-ilar to the one performed according to the Renaissance method [82, Figure3-2]. Once theparts of the system, that need to be modernized, are identified – the modernization candi-dates, the process continues by identifying the stakeholders and their requirements. Theseare then used in a cost-benefit analysis to “help decide which approaches, if any, should beevaluated further” [82, p.31].
ADM Horseshoe model
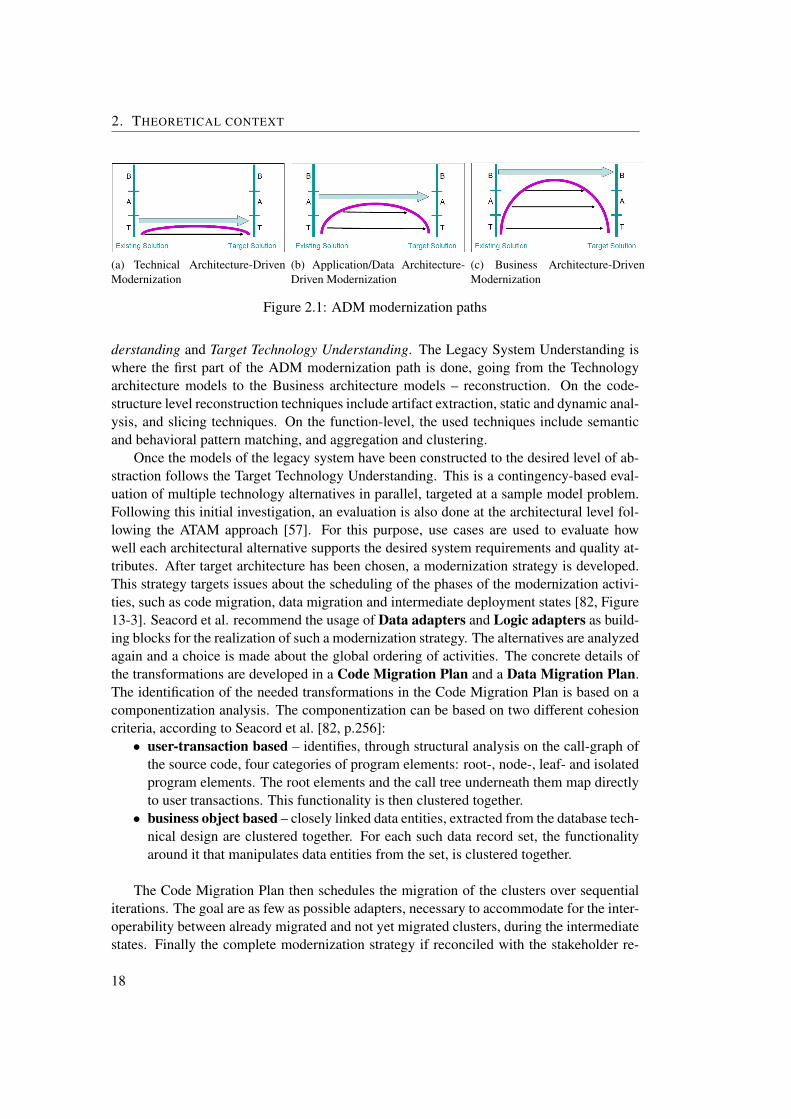
The actions part of the modernization are performed in the context of the ArchitectureDriven Modernization(ADM) model [60, 59]. According to ADM, the existing legacysystem as well as the target solution can be represented by models on three levels of ab-straction: Business architecture domain, Application architecture domain and Technol-ogy architecture domain. The modernization effort is then represented by a path startingfrom the Technology models of the legacy system and ending at the Technology modelsof the target solution. This path can go through the higher abstraction levels or remainlimited to the lower levels. This leads to three basic types of modernization approaches,Figure 2.1. They range from less invasive and at the same time with less modernizationimpact(Figure 2.1a), to more invasive and more difficult to perform, but with much moremodernizing impact(Figure 2.1c).
Going between the models of the different layers is done by transforming them. Thereare three types of such transformations: Formal transformations, Abstraction transforma-tions and Enhancing transformations (Appendix C.13). The path that is thus traversed hasthe form of a horseshoe and thus the name of this model – the ADM Horseshoe Model.
RMM Program understanding
In order to evaluate the modernization in terms of risk and effort, RMM includes the phaseof Program Understanding. It consists of two parallel activities of Legacy System Un-
17
2. THEORETICAL CONTEXT
(a) Technical Architecture-DrivenModernization
(b) Application/Data Architecture-Driven Modernization
(c) Business Architecture-DrivenModernization
Figure 2.1: ADM modernization paths
derstanding and Target Technology Understanding. The Legacy System Understanding iswhere the first part of the ADM modernization path is done, going from the Technologyarchitecture models to the Business architecture models – reconstruction. On the code-structure level reconstruction techniques include artifact extraction, static and dynamic anal-ysis, and slicing techniques. On the function-level, the used techniques include semanticand behavioral pattern matching, and aggregation and clustering.
Once the models of the legacy system have been constructed to the desired level of ab-straction follows the Target Technology Understanding. This is a contingency-based eval-uation of multiple technology alternatives in parallel, targeted at a sample model problem.Following this initial investigation, an evaluation is also done at the architectural level fol-lowing the ATAM approach [57]. For this purpose, use cases are used to evaluate howwell each architectural alternative supports the desired system requirements and quality at-tributes. After target architecture has been chosen, a modernization strategy is developed.This strategy targets issues about the scheduling of the phases of the modernization activi-ties, such as code migration, data migration and intermediate deployment states [82, Figure13-3]. Seacord et al. recommend the usage of Data adapters and Logic adapters as build-ing blocks for the realization of such a modernization strategy. The alternatives are analyzedagain and a choice is made about the global ordering of activities. The concrete details ofthe transformations are developed in a Code Migration Plan and a Data Migration Plan.The identification of the needed transformations in the Code Migration Plan is based on acomponentization analysis. The componentization can be based on two different cohesioncriteria, according to Seacord et al. [82, p.256]:• user-transaction based – identifies, through structural analysis on the call-graph of
the source code, four categories of program elements: root-, node-, leaf- and isolatedprogram elements. The root elements and the call tree underneath them map directlyto user transactions. This functionality is then clustered together.• business object based – closely linked data entities, extracted from the database tech-
nical design are clustered together. For each such data record set, the functionalityaround it that manipulates data entities from the set, is clustered together.
The Code Migration Plan then schedules the migration of the clusters over sequentialiterations. The goal are as few as possible adapters, necessary to accommodate for the inter-operability between already migrated and not yet migrated clusters, during the intermediatestates. Finally the complete modernization strategy if reconciled with the stakeholder re-
18
Existing approaches to system evolution
quirements and the resources needed to realize the modernization strategy are estimated,using the estimated size of the system and cost models such as COCOMO II [13].
2.3.3 SMART
The Service Migration and Reuse Technique(SMART) [63, 64] is a modernization approachdeveloped by the SEI specifically for the migration towards SOA. The method analyzes,through a questionnaire of more than 60 categories, the viability of reusing legacy com-ponents as the basis for services by answering questions like: What services make sense todevelop? What components can be mined to derive these services? What changes are neededto accomplish the migration? What migration strategies are most appropriate? What are thepreliminary estimates of cost and risk? The method contains three important elements:SMART process a systematic means to gather information about the legacy components,
the candidate services, and the target SOA environment (Appendix C.14).Service Migration Interview Guide (SMIG) contains the questions that guide the infor-
mation gathering. Its goal is to cover all known issues that could influence the migra-tion in cost and effort.
Artifact Templates output of the SMART process – Stakeholder List, Characteristics List,Migration Issues List, Business Process-Service Mapping, Service Table, ComponentTable, Notional Service-Oriented System Architecture, Service-Component Alterna-tives, Migration Strategy
SMART process activities
Establish Context Understand the business and technical context for migration. Identifystakeholders, Understand the legacy system and target SOA environment at a highlevel, Identify a set of candidate services for migration
Define Candidate Services select a small number of services from the initial list of candi-date services, that perform concrete functions, have clear inputs and outputs, and canbe reused across a variety of potential applications
Describe Existing Capability technical personnel are questioned to gather informationabout the legacy system components that contain the functionality meeting the needsof the services selected in the Define Candidate Services activity.
Describe Target SOA Environment gather information about major components of theSOA environment, impact of specific technologies and standards used in the environ-ment, guidelines for service implementation, state of target environment, interactionpatterns between services and the environment and execution environment for ser-vices. Build the so-called Notional Service-Oriented System Architecture to describethe system in terms of its components – service consumers, infrastructure, services,legacy components – and how they interact with each other, resulting in a representa-tion similar to the SOA Process View (section 2.2).
Analyze the Gap provide preliminary estimates of the effort, risk, and cost to convert thecandidate legacy components into services, given the candidate service requirementsand target SOA characteristics. The discussion of the changes that are necessary for
19
2. THEORETICAL CONTEXT
each component is used as the input to calculate these preliminary estimates. TheService-Component Alternatives artifact is created during this activity to illustratethe potential sources for functionality to satisfy service requirements.
Develop Strategy generate a strategy to address the migration issues generated by the pre-vious steps
Overall, although the SMART method has a few disadvantages, it is an important ad-dition to Renaissance and ADM. Its first disadvantage is that it is a proprietary approachand the concrete content of the questionnaires is not publicly available. But even then, theapproach is not based on automated data collection or artifacts. It does not rely on scanningand analyzing the source code of the legacy system. This means that the SMART Processmust be performed by trained experts, collecting information through interviews or manualinspection. In spite of these two disadvantages, SMART does provide indicators about thespecifics of modeling the modernization towards SOA, which the previous methods lack– Artifact Templates, Define Candidate Services, Describe Existing Capabilities. For thisreason, these will be used to extend the approaches of Renaissance and ADM.
2.4 Modernization towards Service Oriented Architectures
Previously it was described how to model legacy system architectures, target SOA environ-ments and the overall process of modernization. There is a fourth and final element neededto address the research question. This is the issue of quantifying the impact and effortinvolved in performing the modernization towards SOA in the context of the approachespresented earlier. Specifically, we will concentrate on the use of software architecture in-formation – the concrete models and changes on the architectural level, that we consider toinfluence the modernization effort.
The section begins with the fundamentals of evaluating the impact of modernization– Impact Analysis. It gives an overview of the aspects where the impact is manifested –Global, Organizational, Business and Technological. In this context, the Software Impacton legacy systems is positioned relative to the impact on the organization and business. Thispositioning of the impact on the software aspect in the Global Impact of modernization isnecessary for the definition of the research scope and the relation to future work.
The remaining two sections get into the details of the modernization towards SOA atthe software architecture level. They present the ways to organize the known moderniza-tion strategies and their architectural and design changes looking at the effort they require.Their known impact on the modernization effort will be used as a base for the overall effortestimation of this research’s framework.
2.4.1 Impact Analysis
System evolution and modernization involve performing changes to the system. The es-timation of the consequences and extent of these changes is done through the process ofImpact Analysis. We distinguish three areas that are impacted in the case of legacy systemmodernization towards SOA. We present them all here in order to make clear what is theextend of the scope of the research specified later in chapter 3.
20
Modernization towards Service Oriented Architectures
Definition 2.14 Impact Analysis: the activity of identifying what needs to be modified inorder to make a change, or to determine the consequences on the system if the change isimplemented [50]
Global Impact
The SOA modernization effort is concerned with all aspects of the Enterprise Total Architec-ture – people, business processes, information, and systems (section 2.2). A similar holisticview is adopted by Renaissance (Appendix C.16). In addition, Josuttis [52] describes fourareas of concern specific to developing a Service Oriented Architecture: Architecture, In-frastructure, Processes, and Governance. In the case of SOA as target architecture, mod-ernization changes are not only limited to the software system, but have a more globallyreaching impact.
Each of these aspects needs to be addressed in the modernization and initiates its ownseries of changes. However they are all interrelated and changes in one impact the others.One example is the relationship of the technology aspect to the business. The architecturalchoices made, limit the possible options and/or create opportunities for the business [78]. Asecond example is the relation of the technology aspect to the organization of the enterprise.Once the Service Oriented Solution is in place it has to be maintained and the facilities forthis SOA Governance have to be put in place [16, ch13], [76, §2.5], [52, p.261].
For a complete Impact Analysis of the modernization all of these aspects have to beinvolved. But we will further concentrate on the change impact in the software systemaspect. We cannot consider it in isolation and will have to make assumptions about the restand the enterprise purpose.
Impact organization aspect
The organization must be set up to enable the anticipated changes to the legacy system and atthe same time adjust to them. This is characterized by Tilley in [93, §5.6] as organizationalreadiness. The ripple-effects of the change impact will create the need for also modernizingthe organizational structures [52, ch.8]. Part of assessing the severity of this impact is thecapability assessment, an inventory of the training needs, an application usage survey, anoperational deployment considerations and the available capabilities in managing organi-zational change. Furthermore, specifically for Service-Oriented systems, it has been shownthat a different set of roles is needed for their development and maintenance [54],[16, ch7].The overall degree of impact of the modernization towards SOA is, thus, also related to itsorganizational SOA readiness – SOA maturity [16, ch6],[5],[44, p.532, ch13]. The samechanges in a different organization may lead to a different impact and effort.
Impact business aspect
The modernization towards SOA has also an impact on the business aspect of the legacyarchitecture [17, ch.9]. The design principles of Service-Orientation have clear guidelinesabout participants, roles and responsibilities in the enterprise business processes. Thus themodernization of the legacy system calls for the introduction of their clear definitions and
21
2. THEORETICAL CONTEXT
possible restructuring of orchestration and responsibilities [52, ch.7]. There exist a numberof approaches for the identification of business legacy affected by the modernization. ThisBusiness Domain Analysis helps identify the problematic points in the business processlandscape that need modernization and thus deduce the impact such as the IBM ComponentBusiness Model (CBM) [33].
Impact technology aspect
The emphasis of this research lies with the impact analysis for the technology and softwaresystems aspect. SOA is a Business-Driven paradigm so the input of the impact analysisprocess for the technology aspects must be the result of the Business Domain Analysis. Theimpact on software systems manifests itself in two different ways: architecture/design andsystem quality attributes [65, 74, 76]. There are two aspects to their quantification:
I. difference/similarity analysis• between architectural models of as-is and to-be system: data [22] or functional-
ity [2, 69]• based on system quality attributes characteristic for Service-Oriented Architec-
tures: interoperability [55, 7], compatibility [2], service-orientation [46]• reuse potential: identification reusable components [40]
II. change propagation [101]
2.4.2 Classification of modernization strategies
Besides the differences between as-is and to-be system architectures, the modernizationeffort is also determined by the modernization strategies chosen to overcome these differ-ences [48]. In order to make an estimation of the overall effort, we need to quantify thedifference between these modernization strategies in terms of effort. Existing work makesit possible to do this on an ordinal scale in two dimensions. First, we classify them ac-cording to the issues they addressed in the modernization towards SOA. Second, we use aclassification of modernization strategies according to their impact and required effort.
We use the following identified issues in modernizing towards SOA to make a classifi-cation of the modernization strategies according to which one they target:
O’Brien [76]Identification/Mining of servicesintegration of common shared servicesdevelopment SOA InfrastructureDevelopment service providers/consumersSOA GovernanceArchitectural Trade-off Analysis
Sneed [89, 90, 86]degree of dependency on the environment(none, partially, totally)identify business rules (“code striping”)achieving statelessness of servicesn:m relationship between business rules and code blocksdatamodel mapping to SOA technology(eg.XML)
22
Modernization towards Service Oriented Architectures
Bierhoff - Architectural mismatch [10]the nature of services
- functionality supply- infrastructure expectations- control model- data manipulation
communication between services- asynchronous communication- message data model
global architecture structureconstruction process
Depending on their impact, modernization strategies can be classified in two differentcategories: Black-Box modernization and White-Box modernization [82, p.9].
Black-box modernization involves examining only the external behavior of the legacysystem through its inputs and outputs. The system’s internal working mechanisms are ig-nored. There are two common motives for this approach. Either there is simply no descrip-tion of the internals available (no source code) or the internals are considered too complexand are abstracted away by considering only their effect on the environment. A commonblack-box method is wrapping. Unfortunately this approach is not always practical andoften still requires knowledge about the system component’s internals through white-boxtechniques [80].
White-box modernization is much more extensive and complex than the black-box ap-proach. It requires the expertise of software engineers on a much more deeper level and isthus also known as software reengineering.
Definition 2.15 Software reengineering: Reengineering is the systematic transformationof an existing system into a new form to realize quality improvements in operation, systemcapability, functionality, performance, or evolvability at a lower cost, schedule or risk tothe customer [82].
The reengineering process involves three phases. First, it gathers information about theinternals of the legacy system through program understanding [24]: modeling the domain,extracting information from the code, creating abstractions that describe the underling sys-tem structure. This process is also known as reverse engineering:
Definition 2.16 Reverse engineering: The process of analyzing a subject system to iden-tify the system’s components and their interrelationships and create representations of thesystem in another form or at a higher level of abstraction [24].
Then, using the knowledge from this analysis, follows software restructuring. Afterwhich the third and last phase of forward engineering is performed. This view on systemreengineering is also advocated by the Architecture Driven Modernization approach.
Definition 2.17 Software restructuring: the transformation from one representation formto another at the same relative abstraction level, while preserving the subject system’s ex-ternal behavior(functionality and semantics) [24].
23
2. THEORETICAL CONTEXT
Reengineering is often based on graphs as a representation of the system. This has alsobeen done by Cremer et al. [25] for a system written in Cobol similar to the one used in theexperiment of this research.
Within the white-box and black-box categories, we distinguish specifically for the mod-ernization towards SOA three main non-mutually exclusive categories: wrapping approaches,componentization, service extraction. They are aimed at achieving the changes neededfor Service-Orientation (Appendix C.15 [39]).
Wrapping approaches
Wrapping is a way of overcoming the mismatches between the interface offered by a soft-ware component and the interface required by its environment. This approach correspondsto the replacement of a connector between two components with a new component with aconnector to each of the components.
Definition 2.18 Wrapping: surrounding the legacy system with a software layer that hidesthe unwanted complexity of the old system and exports a modern interface [82]
Wrapping can be performed for different parts of the system and with different degreeof added functionality in the wrapper. In all cases, the application of this approach aimedat satisfying the SOA design principle of Contracts. Wrapping approaches have been ex-tensively studied [15, 23, 47, 85, 88, 89, 12, 1, 19, 21] with the following most significantexamples of different types:• Simple wrapper for encapsulation and integration of services [89]• Wrapper containing additional functionality: Logic adapter for the request-response
pattern [19, 21], Session Based, Transaction Based, Data Based [1]• Replacement with COTS components [7, 47] such as an ESB [8] complying with the
same contract• Componentization combined with wrapping towards a MVC design pattern [12]
Componentization
Componentization is a group of restructuring approaches. They are based on clustering/-grouping together functionality into components according to some criteria they share, suchas the use of the same data source or the implementation of the same concern. By doingthat, the cohesion of the code is increased according to the clustering criteria and the cou-pling to the rest of the functionality is decreased. This approach introduces autonomousand manageable units of reuse – the components – and defines clear separating lines be-tween them. The result of such restructuring makes possible the fulfillment of the SOAdesign principles of coupling, autonomy and reusability. The following work describes theimportant characteristics of the method and the variations in the approach:• Componentization according to a domain model: use domain knowledge to identify
“features” supported by the legacy system and identifying the functionality belong-ing to each feature. This code is then clustered per feature [68]
24
Modernization towards Service Oriented Architectures
• Componentization according to existing code structure (coupling, dependency ma-trix): automatic identification of components [40]• Componentization for a concern: clustering for client-server architecture [20]• Componentization for a quality: component mining for reusability [84]
Service extraction
The group of service extraction approaches is a special case of componentization. Here,extra effort is spent on making sure that the resulting components are also suitable to beused as services in the infrastructure of a Service-Oriented architecture. This means that theSOA design principles of contracts, composability, statelessness, and discoverability arecentral. The clustering criteria are chosen accordingly in the following approaches:• Combining black-box and white-box approaches: legacy system decomposition into
components and exposing them as services to be integrated into a service orientedarchitecture [103]• Service extraction as part of ADM: service extraction by following datamodel defini-
tions [41]• Business process and service extraction [104]
2.4.3 Architectural and design features
The modernization strategies described above are targeted at transforming the legacy archi-tecture into a Service-Oriented organization. In this transformation process, most entitiesfrom the legacy architecture have their analog in to Service Oriented Architecture. Thiscorrespondence can be one-to-many, many-to-one or many-to-many. For example a set oflegacy components can be chosen to form one SCA Composite exposing a set of Servicesor one legacy component can be split and each part wrapped and exposed as a Service.
However, not every entity from the legacy architecture has its SOA counterpart and theother way around. We can illustrate this by saying that the entities described in the abovetransformations form the intersection between the source and target architectures. Thereare however, entities that belong to only one of them. This means that on the one hand, theaddition may be required of architectural features not present in the legacy architecture. Onthe other hand, it may be necessary to remove architectural features that are obsolete in thetarget architecture. Here we describe these two categories according to their root cause.
Target Architecture
The first category is formed by the features that are required in the target SOA architecture,but that don’t have their analogue in the legacy system. Papazoglou [79] gives an overviewof the basic architectural implications of introducing a Service-Oriented Architecture. Hespecially emphasizes on the concept of the Enterprise Service Bus (ESB). Together with it,a set of SOA capabilities are describes such as:• Transaction capabilities• Reliable messaging capabilities• Dynamic connectivity
25
2. THEORETICAL CONTEXT
These are features that may not b present in the legacy architecture and thus have to beadded from scratch.
Next to these features, Stal [92] points out the use of certain patterns as a result ofenforcing SOA design principles. This relationship is valid both ways: the presence of theparticular pattern leads to the enforcement of the corresponding design principle and on theother hand the pursuit of a particular design principle leads to the use of the correspondingpattern. Some of the correspondences Stal mentions are:• Loose coupling⇔ Bridge- , Observer- , Reactor- , Store-and-Forward patterns• Statelessness⇔ Resource Lifecycle Manager, Activator- , Evictor patterns• Composability⇔ Coordinator pattern, Strategy pattern
Legacy Architecture
Modernization may also necessitate the removal of entities from the legacy architecture.These can be components, connectors or whole patterns these form. To estimate the impactof this, we need to know what the functionality represents that is being removed. We quan-tify how much of it is taken over by either replacement in another form or by dropping it alltogether. For this, a classification is very suitable of connectors, components and structuralrelationships.
The classification of connectors is given by Mehta et al. [69] through an extensive tax-onomy. Removing or replacing connectors can be a way of decreasing coupling, one of themain goals of SOA. This taxonomy makes is possible to identify what capability supportedby the connector is dropped that may need (partial)replacement and which other connectorsshould be considered that are close to it in the taxonomy.
A similar approach for components is based on architectural mismatches [10, 7]. Theset of properties describing the component (Component Model, section 2.1) are used toidentify mismatches and similarities between it and its replacement or between the leftover components. Thus, when components are removed, these mismatches can be used toquantify the effort needed to make the whole work together again.
Removal can also affect a whole group of components and connectors following a de-sign pattern. In such cases, it is also important to classify the removed functionality. Thereare two types of information that have influence on the effort for modernization. The firstis what feature is removed described by the pattern’s rationale. The second is which furthercomponents may be affected captured by the set of components involved in the pattern. Ar-celli [3] describes a set of patterns that are useful for this purpose as they are most relevantfor the case of modernization towards SOA.
26
Chapter 3
Effort Estimation Framework –Research description
In this chapter, we present the theoretical results of the conducted research. These results aretwofold. In the first place, this is the combination of the described existing approaches mostsuitable for the goal of modernization effort estimation. Secondly, that is the contributionof our own concepts and argumentation about how those approaches should be extendedto use in the form of an Effort Estimation Framework. This chapter consists of two parts.The first two sections specify the preconditions of the research. The following two sectionscontain the above-mentioned original contribution of this thesis.
The preconditions of the research begin with the presentation of the scope in section 3.1.Within this scope, the goal, as described in the problem statement (chapter 1), is to constructa framework that structures the process of impact analysis of the modernization towardsService Oriented Architectures of legacy systems. Continuing the research preconditions,section 3.2 presents the assumptions on which the framework is built. They form theinvariable part that is the basis for the framework.
The following two sections present the original work of this research. First, section 3.3presents the configuration of the Effort Estimation Framework. In this process the issues inmodernization effort estimation with their multiple possible solutions are considered. Foreach of them, the preferred choice is presented and how it fits in the framework. Finally,all of these configurations are combined and presented in the form of the resulting EffortEstimation Framework. Section 3.4 presents its three components Class definitions, Rela-tionships and Control Model.
3.1 Targeting the Effort in the Software Application domain
This section presents the initial scoping of the research, done by narrowing down the appli-cation domain of the framework. Three aspects are used to limit the relevant domains:
1. type of impact2. modernization impact aspect3. abstraction domains
27
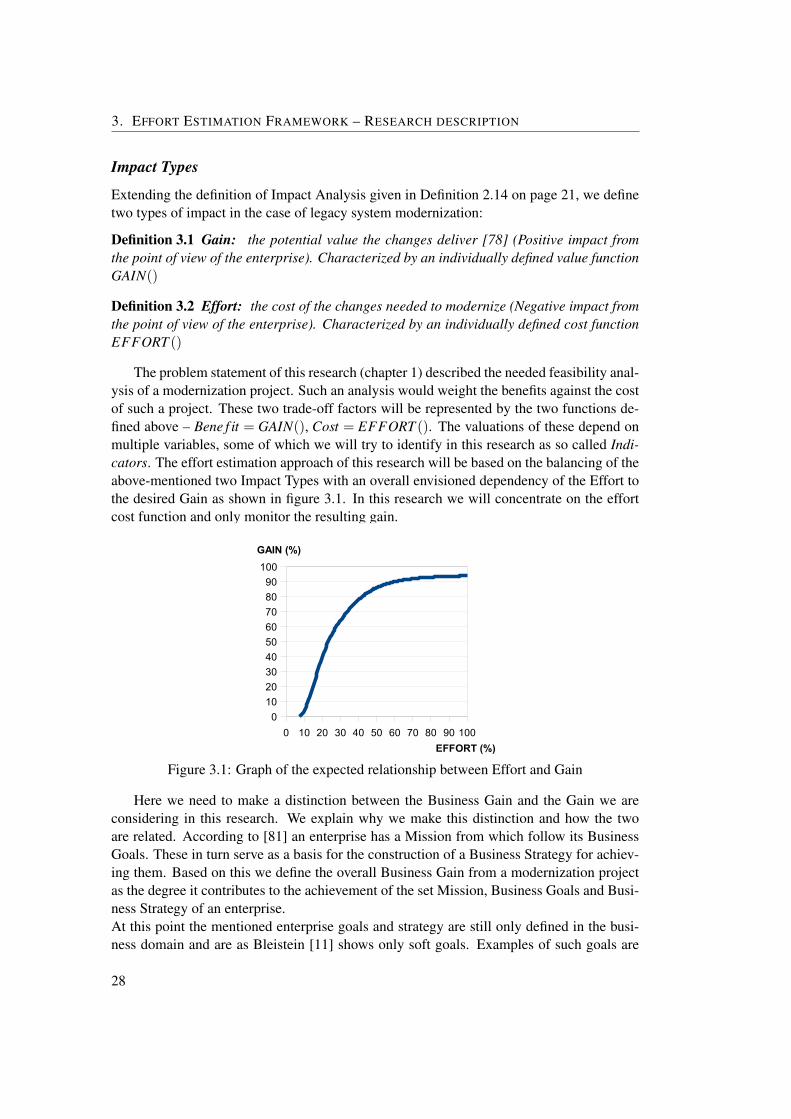
3. EFFORT ESTIMATION FRAMEWORK – RESEARCH DESCRIPTION
Impact Types
Extending the definition of Impact Analysis given in Definition 2.14 on page 21, we definetwo types of impact in the case of legacy system modernization:
Definition 3.1 Gain: the potential value the changes deliver [78] (Positive impact fromthe point of view of the enterprise). Characterized by an individually defined value functionGAIN()
Definition 3.2 Effort: the cost of the changes needed to modernize (Negative impact fromthe point of view of the enterprise). Characterized by an individually defined cost functionEFFORT ()
The problem statement of this research (chapter 1) described the needed feasibility anal-ysis of a modernization project. Such an analysis would weight the benefits against the costof such a project. These two trade-off factors will be represented by the two functions de-fined above – Bene f it = GAIN(), Cost = EFFORT (). The valuations of these depend onmultiple variables, some of which we will try to identify in this research as so called Indi-cators. The effort estimation approach of this research will be based on the balancing of theabove-mentioned two Impact Types with an overall envisioned dependency of the Effort tothe desired Gain as shown in figure 3.1. In this research we will concentrate on the effortcost function and only monitor the resulting gain.
EFFORT (%)
GAIN (%)
0 10 20 30 40 50 60 70 80 90 1000102030405060708090100
Figure 3.1: Graph of the expected relationship between Effort and Gain
Here we need to make a distinction between the Business Gain and the Gain we areconsidering in this research. We explain why we make this distinction and how the twoare related. According to [81] an enterprise has a Mission from which follow its BusinessGoals. These in turn serve as a basis for the construction of a Business Strategy for achiev-ing them. Based on this we define the overall Business Gain from a modernization projectas the degree it contributes to the achievement of the set Mission, Business Goals and Busi-ness Strategy of an enterprise.At this point the mentioned enterprise goals and strategy are still only defined in the busi-ness domain and are as Bleistein [11] shows only soft goals. Examples of such goals are
28
Targeting the Effort in the Software Application domain
an increase in Return On Investment, decrease in Time To Market and increased flexibility.In order to translate them into measurable hard goals an implementation plan needs to bedefined containing the concrete Objectives to achieve. The realization of this implementa-tion plan depends on the enabling factors such as people, processes, structures and culture,and IT. We speak of alignment when these are ready for the execution of the strategy [81].Part of achieving alignment is the IT-Business alignment [71]. Bleistein suggests an ap-proach for achieving such an alignment through the translation of the Business Goals to ITrequirements [11]. For the realization of these requirements and the implementation of thebusiness strategy there are multiple choices for enabling technologies amongst which SOA.So a decision needs to be made whether the elicited requirements can be best satisfied bythe Service-Oriented approach and the advantages it offers such as flexibility and reuse orwhether there are other more suitable technologies. The Gain considered in this research isthus on the level of implementing the above-mentioned Objectives and is defined as the de-gree of gained conformance to the principles of Service Orientation. Increase in this Gainwill lead to an increased Business Gain only and only if SOA and its advantages fit thebusiness requirements resulting from the Business Goals [71]. In [81], [71] and [70] arementioned classifications of business strategies. Based on these we give an indication ofthose that will most likely experience the greatest Business Gain from the modernizationtowards a Service Oriented Architecture. These include the adaptive firm in a very chal-lenging environment, the entrepreneurial conglomerate, the innovator and companies thathave as main strategy the entering of new markets through process innovation or productdifferentiation.
Concluding, we assume for the further research that the process of Business Strategydetermination has resulted in the decision for SOA as enabling technology. Based on thisgoal, the subsequent gain is determined by the degree of achievement of Service-Orientationexpressed through the SOA design principles such as loose coupling, reusability and auton-omy described in section 2.2.
Modernization Impact Aspects
As mentioned in the context of this research (§2.4, §2.3), there are many aspects of thelegacy system where the impact of modernization is visible. This research is concentratedon the Application Software sub-part of the Technical aspect (Appendix C.16). Within thisApplication Software sub-part, we recognize three factors that influence the effort estima-tion: (1) as-is system state, (2) to-be target state, (3) modernization strategies (known fromfigure 1.1).
Modernization Domains
All the above-mentioned three factors can be viewed on three levels of abstraction as de-scribed in the Architecture Driven Modernization (§2.3.2). The impact of the modernizationon both gain and effort relative to the domain is shown in figure C.17 [60]. The researchis concentrated on the Application/Data domain together with its links to the Business do-main. The reason for this choice is that these domains are concerned with abstraction and
29
3. EFFORT ESTIMATION FRAMEWORK – RESEARCH DESCRIPTION
enhancing transformations, where the link to the Technology domain merely involves for-mal transformations [59].
3.2 Framework foundation on the existing approaches
In this section, we give the basic assumptions of this research within the scope given inthe previous section. These are based on the existing approaches presented in sections 2.3and 2.4. These assumptions further define the outlines of the proposed solution and theinvariable parts in its application.
First and foremost, we assume a framework structure of the research end-result. Theadvantages of such an organization (§ 2.1) are needed for two reasons. First, the mod-ernization process can be viewed as a transformation function between a Domain – as-islegacy systems and a Range – to-be SOA systems. Both the domain and the range of themodernization represent large sets of systems. With a framework we can specify the high-level guidelines for the effort estimation common to the modernization between differentinstances. Thus allowing its extension with additional modernization effort aspects andmore information sources. Second, a framework offers a clear division between the compo-nents of modernization effort estimation. This makes it possible to concentrate on a subpartin isolation and specialize it for a particular set of instance systems. This will leave the restunaffected and will still produce overall results.
The Effort Estimation Framework as such has to define:
Class definitions: Meta-model presented in section 3.4.1 + Rating ModelRelationships: Relationships, part of Meta-model presented in section 3.4.1Control Model: Process + Rating Model + Relationships
This research takes into account the challenge in finding the balance between reusabilityand flexibility (§2.1) of the resulting framework. In order to make the flexibility level of theframework clear, we divide its theoretical base in two parts. First, we present the rigid set ofassumptions in the rest of this section that define the frameworks broad reuse domain. Then,in section 3.3, we present a set of configuration issues that give it flexibility. These offerchoices for concrete instantiation of issues from the framework. A different set of choicescould be made there to influence the estimation outcome, but that would still preserve theoverall relationships within the framework. For example, for each step in the Control Modela concrete approach can be chosen. In the framework instantiation process there is still onelast level of implementational choices left, which we will present in chapter 4.
The assumptions of the framework that follow have two dimensions:1. the subject they are about: Legacy system, SOA system or Modernization strategies2. the framework part they belong to: Class definitions, Relationships or Control Model
We will present them grouped together according to the first one and indicate where neces-sary which framework part they are relevant for.
30
Framework foundation on the existing approaches
Overall
O-1. use models on each level expressed in (abstraction)concepts in order to make theframework possible. These models can be replaced or extended and instantiated fora particular system. As long as they supply the required information to fit in theframework. One can add indicators, concepts etc.
O-2. the framework contains 3 Domains – Business, Application, Technology – based onADM figure C.17[Class definitions, Control Model]
O-3. concepts are linked top-down to other domains’ concepts (relation ”is-implemented-by”) – makes sequential causal impact propagation analysis possible
O-4. Concepts are linked to the concrete data sources they originate from and are repre-sented in Architectural Views [Class Definitions]
O-5. portfolio analysis(fig.C.8) is performed prior to effort estimation. See also FutureWork in chapter 6
O-6. cost estimation is the phase following this estimation output. Assume cost division asgiven by Renaissance on page 16
Legacy System
L-1. the software system legacy code is the only input source (no documentation, no expertknowledge) [Class Definitions]
L-2. the considered programming paradigm is that of procedural languages (no OO andits advantages of embedded semantics). There is different research done to modellegacy systems and each is tailored at a specific paradigm. Only the OMG has so farproduced a standard (KDM) that attempts to bring all paradigms together. Currentlyit is only a standard and there are no implementations of it [Class Definitions]
Modernization
M-1. both the legacy system and the SOA target can be abstracted to the architectural level,expressed with the same concepts, where the only difference will be in the structure
M-2. 4 Phases based on Renaissance(fig. C.9) and RMM(fig. C.12) [Entities]. See alsoFuture Work in chapter 6
M-3. changes and their impact propagate top-down starting from the Business Processlevel(see fig.C.17)
M-4. model overall steps of SOA modernization based on SMART (see fig.C.14). Steps:Establish context, Define Candidate Services, Describe Existing Capability, Describetarget SOA environment, Analyze the Gap
M-5. using Renaissance modernization strategies shown in fig.C.10 as basisM-6. using Data Adapters and Logic Adapters as strategy types (see RMM on page 18M-7. set of available approaches to be: wrapping, componentization, service extraction
(see section 2.4.2)M-8. although there are also other factors, the effort is largely determined by the architec-
tural changes needed to the legacy system architecture
31
3. EFFORT ESTIMATION FRAMEWORK – RESEARCH DESCRIPTION
M-9. rating is to be done based on gap analysis between as-is and to-be, fig.C.9 [ProcessModel - Stages]
M-10. a hierarchical rating approach with modernization issues on the top and concrete mea-surable indicators on the bottom
SOA
S-1. two categories of entities – infrastructure/services, see definition 2.8 [Entities, RatingModel]
S-2. definition 2.11 ”well-defined piece of business functionality” for service identifica-tion [Service extraction methods]
S-3. SOA Design Principles(sec.2.2) are the guiding force behind architectural decisionsabout the target environment
S-4. possible SOA capabilities are the ones listed by Papazoglou in [79] [Rating Model]S-5. 2 architectural views on SOA systems – Development View (fig.C.5) and Process
View (fig.C.6) [Rating model]S-6. it is possible to describing the target Service-Oriented system in terms of SCA con-
cepts (fig.C.2)
3.3 Framework configuration
Starting in this section, we present the original work of this thesis. Here, the configurationis presented of each of the three components of the Effort Estimation Framework – Classdefinitions (§3.3.1), Relationships (§3.3.2) and Control Model (§3.3.3). The configurationis done by first presenting the possible options for addressing an issue and then giving thechoices we have made. The resulting framework is then presented in the next section 3.4.
The contribution in all three parts is two types. In the first place, concepts from existingapproaches are selected and combined through categorization. This is the case for the enti-ties selection in the Class Definitions, the model selection in the Relationships and phasesand domains in the Control Model. Secondly, this section introduces a Rating Model builton top of the selection of existing approaches. It uses the information gathered with themto produce an effort estimation of the modeled system modernization.
3.3.1 Class definitions
Configuration categorization
C-1. we organize the class definitions as a meta-model consisting of 3 sets of modelingconcepts: Legacy System, SOA system and Modernization strategies
C-2. choose for the modeling concepts on the architectural level: component, connector,interfaces (sections 2.1)
C-3. the differences between legacy systems and SOA-based ones, that cause the needfor evolution are the Service Abstraction Layer and the resulting grouping of func-
32
Framework configuration
tionality on the implementational level, mapping business functionality to softwarefunctionality (1:1)
C-4. architectural and design patterns (see section 2.1) are considered important conceptsfor the modernization towards SOA as noted by Arcelli [3] and Stal [92]. Their workshows that certain patterns can be used to achieve SOA design principles as describedin section 2.4.3. However, in the literature study there is no concrete indicator foundfor the estimation of the modernization effort needed given the presence/absence of apattern. Based on this, the use of architectural and design patterns in the frameworkis configured to be limited. On the one side, the place of patterns in the meta-model isdefined by the correspondence between their rationale and the SOA design principles.However, they cannot be included in the Rating Model until further research is doneon the relation between patterns and modernization effort such as: a) the effort neededto transform a set of legacy entities into a pattern b) the effort that is saved by reusingan existing pattern binding a set of legacy entities
C-5. use a Rating Model to organize the aggregation of the different factors to a effort es-timation output
Configuration Rating Model
The Rating Model is base on the Goal/Question/Metric method [97]. Two issues that standat the basis of the configuration of the Rating Model are the choice of an effort quantifica-tion method and the choice of a rating scale for the estimation output.
Quantification method – an effort estimation analysis could be based on:1. quality attributes and general legacy system characteristics such as size, complexity,
etc. These are easily measurable, but would produce too inaccurate results. The rea-son for that is that they do not provide enough information, and only give an indica-tion of the resistance of the system to change. What is equally important is measuringthe need, the spreading of the changes. Such an approach cannot, thus, produce anaccurate estimation of the effort, which is the product of the resistance and the need
2. a second and much more accurate approach is to try and approximate the moderniza-tion process that would take place. In doing so, giving an estimation for both resis-tance and need. This though means modeling the modernization changes followingthe ADM modernization scenario from section 2.3.2, a more extensive process
Rating scale – the effort estimation can be expressed on one of four measurement scales:1. Nominal scale: division in sets through labels2. Ordinal scale: relative order, but no magnitude of the difference3. Interval scale: difference magnitude, but no absolute zero point4. Ratio scale: rating with an absolute zero point
33
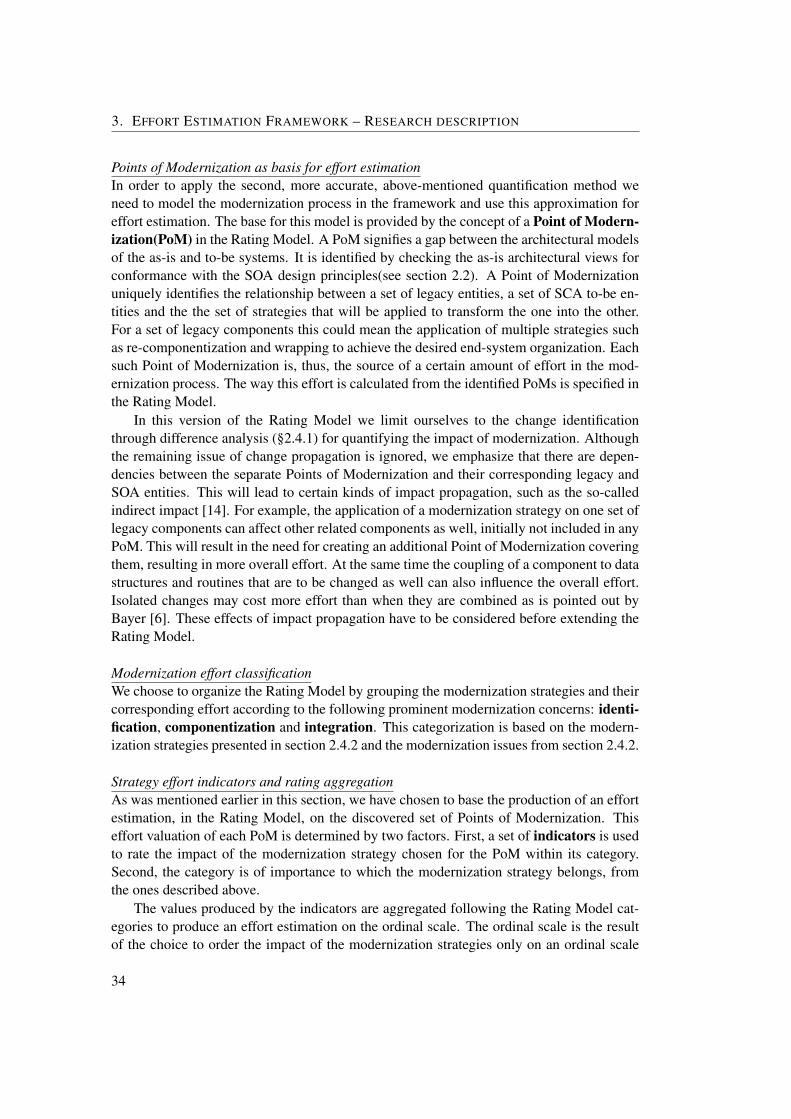
3. EFFORT ESTIMATION FRAMEWORK – RESEARCH DESCRIPTION
Points of Modernization as basis for effort estimationIn order to apply the second, more accurate, above-mentioned quantification method weneed to model the modernization process in the framework and use this approximation foreffort estimation. The base for this model is provided by the concept of a Point of Modern-ization(PoM) in the Rating Model. A PoM signifies a gap between the architectural modelsof the as-is and to-be systems. It is identified by checking the as-is architectural views forconformance with the SOA design principles(see section 2.2). A Point of Modernizationuniquely identifies the relationship between a set of legacy entities, a set of SCA to-be en-tities and the the set of strategies that will be applied to transform the one into the other.For a set of legacy components this could mean the application of multiple strategies suchas re-componentization and wrapping to achieve the desired end-system organization. Eachsuch Point of Modernization is, thus, the source of a certain amount of effort in the mod-ernization process. The way this effort is calculated from the identified PoMs is specified inthe Rating Model.
In this version of the Rating Model we limit ourselves to the change identificationthrough difference analysis (§2.4.1) for quantifying the impact of modernization. Althoughthe remaining issue of change propagation is ignored, we emphasize that there are depen-dencies between the separate Points of Modernization and their corresponding legacy andSOA entities. This will lead to certain kinds of impact propagation, such as the so-calledindirect impact [14]. For example, the application of a modernization strategy on one set oflegacy components can affect other related components as well, initially not included in anyPoM. This will result in the need for creating an additional Point of Modernization coveringthem, resulting in more overall effort. At the same time the coupling of a component to datastructures and routines that are to be changed as well can also influence the overall effort.Isolated changes may cost more effort than when they are combined as is pointed out byBayer [6]. These effects of impact propagation have to be considered before extending theRating Model.
Modernization effort classificationWe choose to organize the Rating Model by grouping the modernization strategies and theircorresponding effort according to the following prominent modernization concerns: identi-fication, componentization and integration. This categorization is based on the modern-ization strategies presented in section 2.4.2 and the modernization issues from section 2.4.2.
Strategy effort indicators and rating aggregationAs was mentioned earlier in this section, we have chosen to base the production of an effortestimation, in the Rating Model, on the discovered set of Points of Modernization. Thiseffort valuation of each PoM is determined by two factors. First, a set of indicators is usedto rate the impact of the modernization strategy chosen for the PoM within its category.Second, the category is of importance to which the modernization strategy belongs, fromthe ones described above.
The values produced by the indicators are aggregated following the Rating Model cat-egories to produce an effort estimation on the ordinal scale. The ordinal scale is the resultof the choice to order the impact of the modernization strategies only on an ordinal scale
34
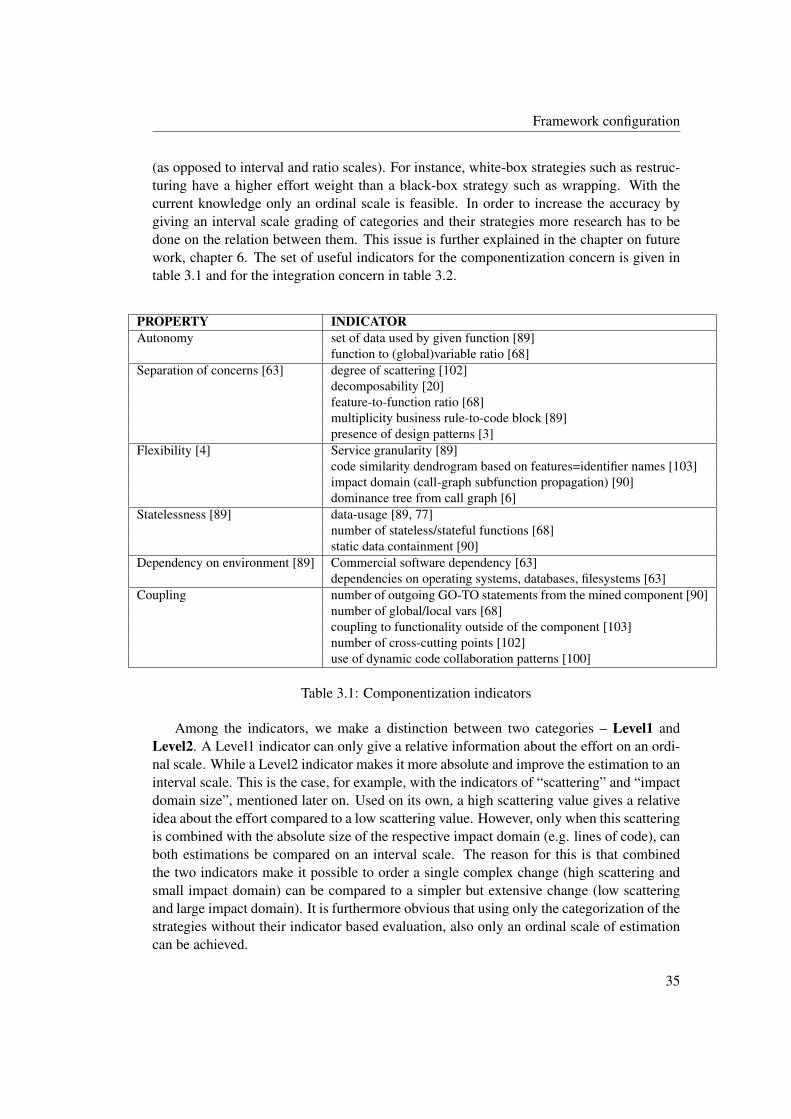
Framework configuration
(as opposed to interval and ratio scales). For instance, white-box strategies such as restruc-turing have a higher effort weight than a black-box strategy such as wrapping. With thecurrent knowledge only an ordinal scale is feasible. In order to increase the accuracy bygiving an interval scale grading of categories and their strategies more research has to bedone on the relation between them. This issue is further explained in the chapter on futurework, chapter 6. The set of useful indicators for the componentization concern is given intable 3.1 and for the integration concern in table 3.2.
PROPERTY INDICATORAutonomy set of data used by given function [89]
function to (global)variable ratio [68]Separation of concerns [63] degree of scattering [102]
decomposability [20]feature-to-function ratio [68]multiplicity business rule-to-code block [89]presence of design patterns [3]
Flexibility [4] Service granularity [89]code similarity dendrogram based on features=identifier names [103]impact domain (call-graph subfunction propagation) [90]dominance tree from call graph [6]
Statelessness [89] data-usage [89, 77]number of stateless/stateful functions [68]static data containment [90]
Dependency on environment [89] Commercial software dependency [63]dependencies on operating systems, databases, filesystems [63]
Coupling number of outgoing GO-TO statements from the mined component [90]number of global/local vars [68]coupling to functionality outside of the component [103]number of cross-cutting points [102]use of dynamic code collaboration patterns [100]
Table 3.1: Componentization indicators
Among the indicators, we make a distinction between two categories – Level1 andLevel2. A Level1 indicator can only give a relative information about the effort on an ordi-nal scale. While a Level2 indicator makes it more absolute and improve the estimation to aninterval scale. This is the case, for example, with the indicators of “scattering” and “impactdomain size”, mentioned later on. Used on its own, a high scattering value gives a relativeidea about the effort compared to a low scattering value. However, only when this scatteringis combined with the absolute size of the respective impact domain (e.g. lines of code), canboth estimations be compared on an interval scale. The reason for this is that combinedthe two indicators make it possible to order a single complex change (high scattering andsmall impact domain) can be compared to a simpler but extensive change (low scatteringand large impact domain). It is furthermore obvious that using only the categorization of thestrategies without their indicator based evaluation, also only an ordinal scale of estimationcan be achieved.
35
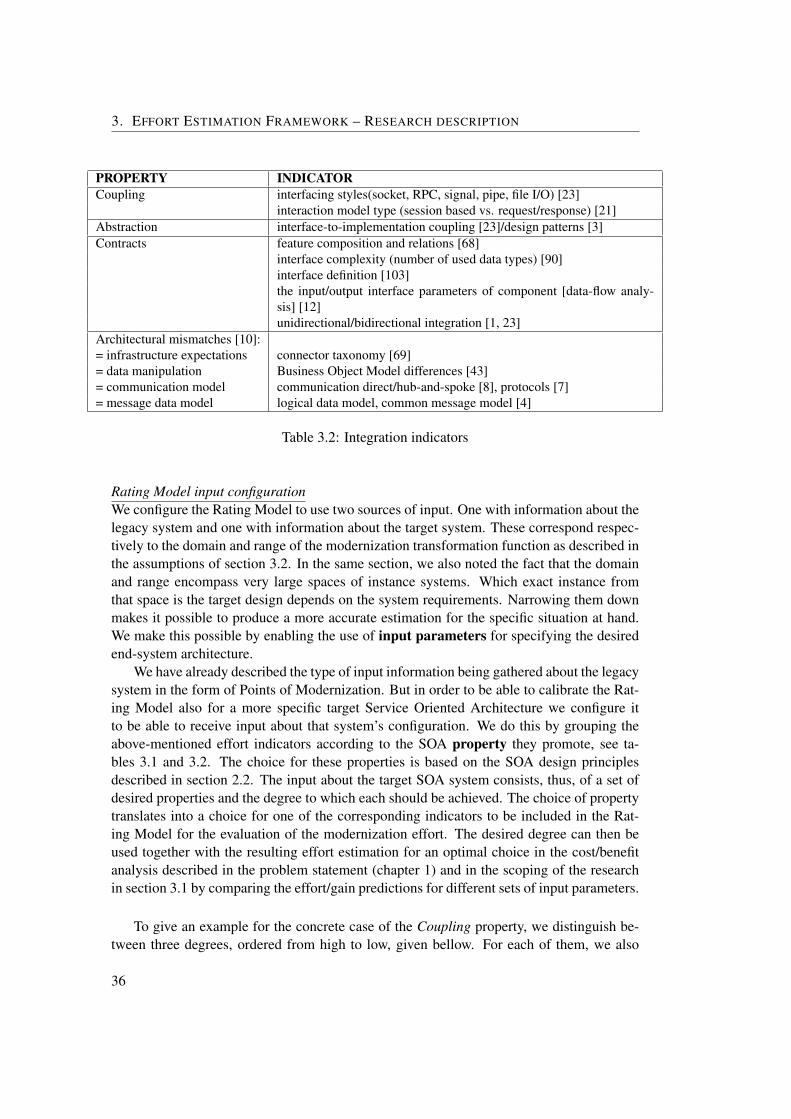
3. EFFORT ESTIMATION FRAMEWORK – RESEARCH DESCRIPTION
PROPERTY INDICATORCoupling interfacing styles(socket, RPC, signal, pipe, file I/O) [23]
interaction model type (session based vs. request/response) [21]Abstraction interface-to-implementation coupling [23]/design patterns [3]Contracts feature composition and relations [68]
interface complexity (number of used data types) [90]interface definition [103]the input/output interface parameters of component [data-flow analy-sis] [12]unidirectional/bidirectional integration [1, 23]
Architectural mismatches [10]:= infrastructure expectations connector taxonomy [69]= data manipulation Business Object Model differences [43]= communication model communication direct/hub-and-spoke [8], protocols [7]= message data model logical data model, common message model [4]
Table 3.2: Integration indicators
Rating Model input configurationWe configure the Rating Model to use two sources of input. One with information about thelegacy system and one with information about the target system. These correspond respec-tively to the domain and range of the modernization transformation function as described inthe assumptions of section 3.2. In the same section, we also noted the fact that the domainand range encompass very large spaces of instance systems. Which exact instance fromthat space is the target design depends on the system requirements. Narrowing them downmakes it possible to produce a more accurate estimation for the specific situation at hand.We make this possible by enabling the use of input parameters for specifying the desiredend-system architecture.
We have already described the type of input information being gathered about the legacysystem in the form of Points of Modernization. But in order to be able to calibrate the Rat-ing Model also for a more specific target Service Oriented Architecture we configure itto be able to receive input about that system’s configuration. We do this by grouping theabove-mentioned effort indicators according to the SOA property they promote, see ta-bles 3.1 and 3.2. The choice for these properties is based on the SOA design principlesdescribed in section 2.2. The input about the target SOA system consists, thus, of a set ofdesired properties and the degree to which each should be achieved. The choice of propertytranslates into a choice for one of the corresponding indicators to be included in the Rat-ing Model for the evaluation of the modernization effort. The desired degree can then beused together with the resulting effort estimation for an optimal choice in the cost/benefitanalysis described in the problem statement (chapter 1) and in the scoping of the researchin section 3.1 by comparing the effort/gain predictions for different sets of input parameters.
To give an example for the concrete case of the Coupling property, we distinguish be-tween three degrees, ordered from high to low, given bellow. For each of them, we also
36
Framework configuration
show how it manifests itself on the application level through the coupling classification byMyers [72]. The rating scale for this input is also ordinal, because a higher accuracy issuperfluous as it would just be lost when used in the ordinal Rating Model.
High: high coupling between components exists both in the application logic and in thedata models. High coupling in the application logic manifests itself through theuse of global variables (Common coupling) and direct calls between components(Control/Content coupling). The coupling between data models is demonstratedby Data and Stamp coupling, where components share data type definitions, whichmakes them dependent on each other.
Medium: only high coupling between the data models of different components exists,while their application logic is loosely coupled. A loose coupling between the func-tionality of components is introduced through the use of contracts (interfaces) orthrough design patterns such as the Mediator.
Low: the components are loosely coupled both in their application logic and their datadefinitions. The additional decoupling between data models in this level is demon-strated through the use of a canonical data model to which each component canmake its own mapping for internal use. An possible architectural organization forthis level of coupling, where both the data and logic of components are decoupled,is an environment based on messaging with a canonical data model of the for thecommunication messages.
Concluding the input configuration, it can differ which indicator will be included in theRating Model or will be evaluated as part of the effort estimation. It depends on the SOAproperty requirements and the degree they should be present in the end-system. The selec-tion of these is part of the configuration and calibration process of the framework.
Rating Model effort estimation variablesHere we configure the internal workings of the Rating Model valuation. We presentedthe functions EFFORT () and GAIN() in definitions 3.1 and 3.2, which are evaluated inthe Rating Model. The variables in these functions are the input variables of the RatingModel and through them also the effort indicators. The cost/benefit analysis is performed byevaluating these two functions for a given set of input variables and weighting them againsteach other. By changing the set of used variables and their values different situations can beconsidered for finding an optimal choice.
The variables of the gain function GAIN() follow from the scope definition in sec-tion 3.1 and the configuration of the Rating Model input. It is a function of the SOA proper-ties. For the concrete valuation function we assume a simple weighted sum of their achieveddegree, where the weights are specific to the modernization goals and proportional to theirrelative importance. Thus, we write:
GAIN( f lexibility,coupling, ..) = w f ∗ f lexibility+wc ∗ coupling+ ... (3.1)
The effort function EFFORT (), however, is the one this framework concentrates on and isthus more elaborate. It is based in the Rating Model and it depends on the effort indicators
37
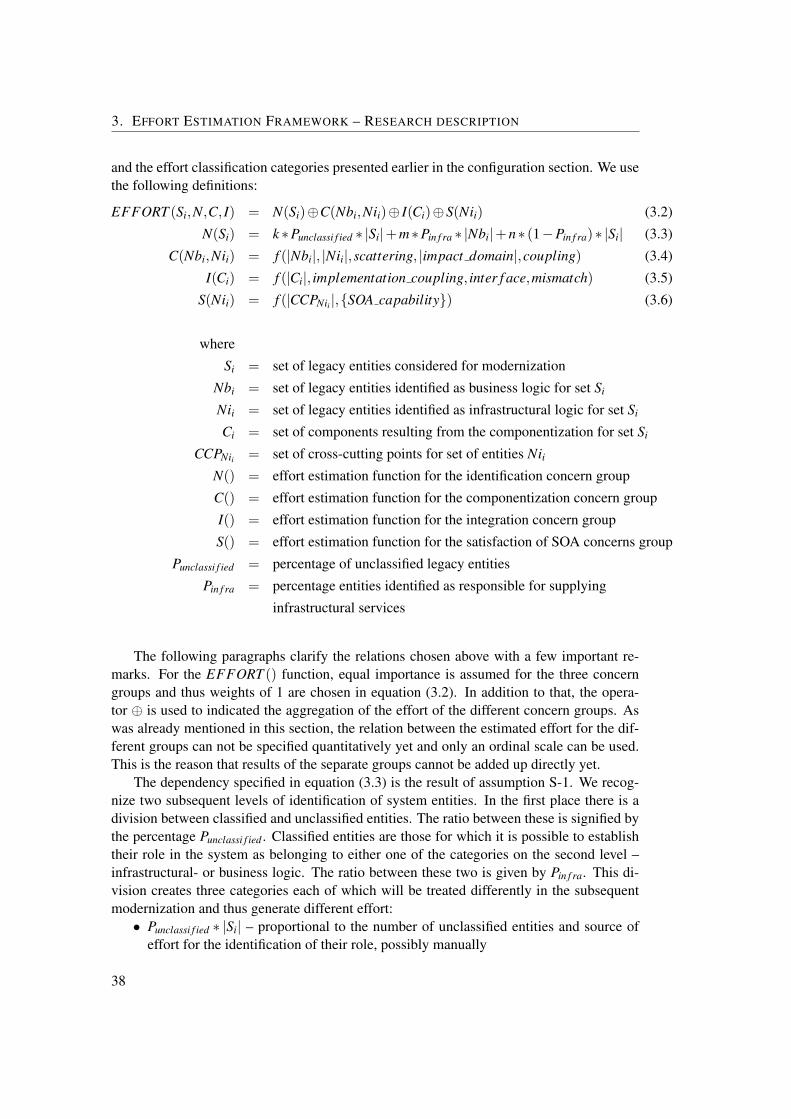
3. EFFORT ESTIMATION FRAMEWORK – RESEARCH DESCRIPTION
and the effort classification categories presented earlier in the configuration section. We usethe following definitions:
EFFORT (Si,N,C, I) = N(Si)⊕C(Nbi,Nii)⊕ I(Ci)⊕S(Nii) (3.2)
N(Si) = k ∗Punclassi f ied ∗ |Si|+m∗Pin f ra ∗ |Nbi|+n∗ (1−Pin f ra)∗ |Si| (3.3)
C(Nbi,Nii) = f (|Nbi|, |Nii|,scattering, |impact domain|,coupling) (3.4)
I(Ci) = f (|Ci|, implementation coupling, inter f ace,mismatch) (3.5)
S(Nii) = f (|CCPNii |,{SOA capability}) (3.6)
where
Si = set of legacy entities considered for modernization
Nbi = set of legacy entities identified as business logic for set Si
Nii = set of legacy entities identified as infrastructural logic for set Si
Ci = set of components resulting from the componentization for set Si
CCPNii = set of cross-cutting points for set of entities NiiN() = effort estimation function for the identification concern group
C() = effort estimation function for the componentization concern group
I() = effort estimation function for the integration concern group
S() = effort estimation function for the satisfaction of SOA concerns group
Punclassi f ied = percentage of unclassified legacy entities
Pin f ra = percentage entities identified as responsible for supplying
infrastructural services
The following paragraphs clarify the relations chosen above with a few important re-marks. For the EFFORT () function, equal importance is assumed for the three concerngroups and thus weights of 1 are chosen in equation (3.2). In addition to that, the opera-tor ⊕ is used to indicated the aggregation of the effort of the different concern groups. Aswas already mentioned in this section, the relation between the estimated effort for the dif-ferent groups can not be specified quantitatively yet and only an ordinal scale can be used.This is the reason that results of the separate groups cannot be added up directly yet.
The dependency specified in equation (3.3) is the result of assumption S-1. We recog-nize two subsequent levels of identification of system entities. In the first place there is adivision between classified and unclassified entities. The ratio between these is signified bythe percentage Punclassi f ied . Classified entities are those for which it is possible to establishtheir role in the system as belonging to either one of the categories on the second level –infrastructural- or business logic. The ratio between these two is given by Pin f ra. This di-vision creates three categories each of which will be treated differently in the subsequentmodernization and thus generate different effort:• Punclassi f ied ∗ |Si| – proportional to the number of unclassified entities and source of
effort for the identification of their role, possibly manually
38
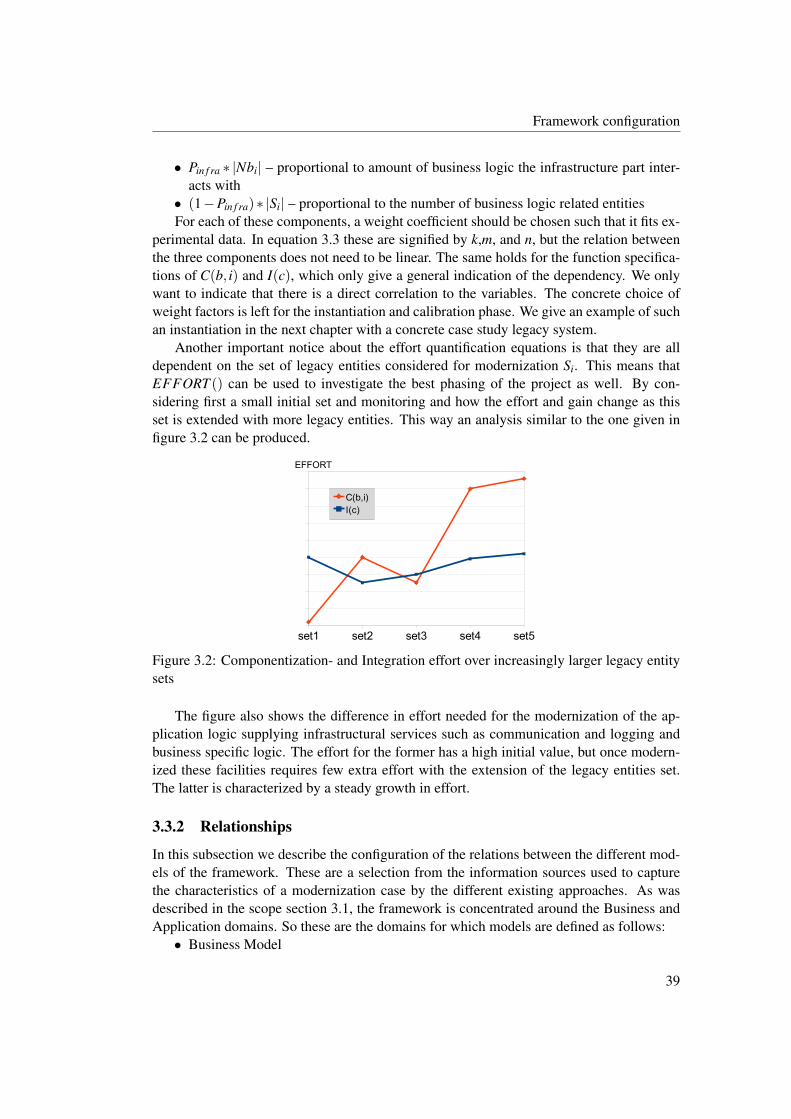
Framework configuration
• Pin f ra ∗ |Nbi| – proportional to amount of business logic the infrastructure part inter-acts with• (1−Pin f ra)∗ |Si| – proportional to the number of business logic related entitiesFor each of these components, a weight coefficient should be chosen such that it fits ex-
perimental data. In equation 3.3 these are signified by k,m, and n, but the relation betweenthe three components does not need to be linear. The same holds for the function specifica-tions of C(b, i) and I(c), which only give a general indication of the dependency. We onlywant to indicate that there is a direct correlation to the variables. The concrete choice ofweight factors is left for the instantiation and calibration phase. We give an example of suchan instantiation in the next chapter with a concrete case study legacy system.
Another important notice about the effort quantification equations is that they are alldependent on the set of legacy entities considered for modernization Si. This means thatEFFORT () can be used to investigate the best phasing of the project as well. By con-sidering first a small initial set and monitoring and how the effort and gain change as thisset is extended with more legacy entities. This way an analysis similar to the one given infigure 3.2 can be produced.
set1 set2 set3 set4 set5
C(b,i)I(c)
EFFORT
Figure 3.2: Componentization- and Integration effort over increasingly larger legacy entitysets
The figure also shows the difference in effort needed for the modernization of the ap-plication logic supplying infrastructural services such as communication and logging andbusiness specific logic. The effort for the former has a high initial value, but once modern-ized these facilities requires few extra effort with the extension of the legacy entities set.The latter is characterized by a steady growth in effort.
3.3.2 Relationships
In this subsection we describe the configuration of the relations between the different mod-els of the framework. These are a selection from the information sources used to capturethe characteristics of a modernization case by the different existing approaches. As wasdescribed in the scope section 3.1, the framework is concentrated around the Business andApplication domains. So these are the domains for which models are defined as follows:• Business Model
39
3. EFFORT ESTIMATION FRAMEWORK – RESEARCH DESCRIPTION
• Architectural Model, Integration Model• Service Model• Development View, Process View• Rating Model
We keep the relation between the Business domain and the Application domain as isshown in figure C.17. All the information from the Business domain is contained in a sin-gle Business model. However, the Application domain is captured in two separate modelscontaining information about two separate concerns – Architecture model concerned withComponentization and Integration model concerned with Integration. Together they formthe as-is model of the legacy application.
To these as-is models we relate two models of the to-be system - the Service model andthe Development View/Process View. We introduce the additional Service Model based onour assumption C-3. It is positioned between the Business and Application models and hasa correspondence relation to both in a similar way to the relation depicted in figure C.6. TheDevelopment and Process views capture again application domain information, but aboutthe SOA to-be system. They are also split based on the concerns they model – Compo-nentization and Integration respectively. Both are expressed through Service ComponentArchitecture entities from figure C.2.
Finally we have the Rating Model. It consists of two parts. First is the rating aggrega-tion part, which contains the strategy and indicator entities. Second is the part containingthe Points of Modernization mentioned in the previous subsection. These are also relatedto the rest of the models, specifically the Development/Processes views and the Architec-tural/Integration models, and thus function as an interface to the rating part with input aboutthe legacy system. The complete overview of the resulting relationships configuration isshown as part of the framework in figure C.21.
3.3.3 Control Model
In the configuration of the Control Model we decide on the workflow to be followed whenusing the framework. This is why in this subsection we present the two major parts thatdefine it – the order of model construction and the choices for approaches to achievingparticular steps.
We decide for the analysis process to follow a simple pipe-and-filter configuration. Thismeans that the order of model construction is sequential, with each step using the resultsof the previous one. This is motivated by both ADM where each model has its roots in alower/higher level model and the steps described in the modernization methodologies Re-naissance and SMART, section 2.3. The configuration of the steps of the Control Modelconsists of the following four phases, which apply for all the three domains of the frame-work:Reverse Engineering First identify the available sources: code, documentation, deploy-
ment configuration, maintenance history. Then gain structural(as opposed to se-mantic) knowledge of the legacy system architecture by constructing its static(as op-posed to dynamic) model with the concepts specified in the Meta-model(table C.18).
40
Framework configuration
The result of this phase for each of the three domains is an as-is Model, Business-,Application- and Technology respectively
Restructuring Taking the as-is models, result of the Reverse Engineering phase, in eachof the domains as a starting point, restructuring is done to identify the desired end-system organization. This is done according to the SOA design principles and usingthe known requirements for the end Service Oriented Architecture
Gap Analysis The analysis consists of three important parts. First make an inventory of thedifferences by comparing as-is to to-be models in each domain in the form of Points ofModernization. Second, assign a set of possible solutions to each PoM and propagatethe impact of the change within the same or to a lower domain if necessary. And last,give a valuation to the end-result by using the decision variables in the Rating Model
Forward Engineering This phase considers the bridging options, result of the gap analysisphase. The end-system requirements and the limitations they impose are percolatedup the domains starting from the Technical domain. There, first SOA environmentrestrictions are taken into consideration and their impact on the Application domainis evaluated. In this way a refinement of the effort estimation made in the previousphase is produced
Approaches for each of the above-mentioned phases tend to divide in two groups – au-tomated vs expert-driven – as is the case with ADM and SMART described in section 2.3.We choose to use techniques that are simpler and produce more crude results, but are au-tomatable.
Business Service identification can be done top-down or bottom-up [31, 76]:1. Top-down: identify needed business services based on a business domain analysis
and map them to existing components, by searching which components capabilitycould satisfy the need
2. Bottom-up: identify the business needs by looking at the capabilities offered by thecomponents
The business domain analysis part of the top-down approach involves domain expert par-ticipation. Although it has the disadvantage to be less accurate, the bottom-up approach ispreferred in the further configuration of the framework because of its suitability for automa-tion and less supervision.
Constraint percolationTO-BE system requirement based constraints percolate in the direction opposite to the im-pact(see RMM and fig.C.12). This is recognized and part of the overall process model infigure C.22, but will not be further explored in this research.
Automated analysis typeWe have chosen for static structural analysis. This is the most basic type of analysis, but atthe same time the one most prone to automation. The analysis could be extended to dynamicand even semantic, but they require an increasing degree of expert supervision.
41
3. EFFORT ESTIMATION FRAMEWORK – RESEARCH DESCRIPTION
3.4 Framework specification
This section presents the complete framework for modernization effort estimation basedon the scope, assumptions and configuration from the previous sections of this chapter. Itconsists of a set of deliverables forming together the framework that can be instantiated,refined and extended. The contribution of the framework is twofold. In the first place, itcombines and integrates existing approaches and concepts. Secondly. these are then usedas a base for the new effort estimation Rating Model.
First we describe the meta model of the framework in subsection 3.4.1, containing theclass definitions and relationships. Following, in subsection 3.4.2, is the description of theprocess of instantiating the framework and its control model. Finally, we present the RatingModel result of the framework configuration.
3.4.1 Framework Meta Model
This meta model contains the Class Definitions and Relationships part of the framework.The Class Definitions consist of a categorization of entities from the existing approachesdivided over the three effort factors described in the scope: Legacy system (Appendix C.18),SOA target system (Appendix C.19) and Modernization strategies (Appendix C.20).
Secondly, the relationships are presented that the framework defines between the differ-ent models and the entities they contain. These were initially configured in subsection 3.3.2.Here we present them in detail in UML notation in figure C.21. For each model, we alsoshow the major entities from the meta model that it contains. Through these entities therelationships between the models are concretely defined. In the figure is also indicated thedistribution of the models over the framework domains. The layering is similar to the ADMapproach, with the Business domain on top.
3.4.2 Framework instantiation process
The instantiation process of the framework, that prepares it for the effort estimation analysis,is depicted in two figures, C.21 and C.22. Figure C.22 shows the global order in which themodels of the framework should be created. It is based on the configuration of the ControlModel and shows its 4 Phases split over the 3 domains of modernization described in thescope. This defines twelve different activities in their intersection. These are shown asnumbered green rectangles in figure C.22. Each of these steps identifies and separates out aparticular goal for a particular domain. For example, step#1 is concerned with extracting orreverse engineering the as-is legacy system in terms of the business domain entities specifiedin table C.18 of the meta-model. The figure also specifies the set of input and output modelsfor each of the above-mentioned steps. A central role is played by the PoM Model. For eachof the domains, this model contains the set of Points of Modernization identified throughthe Gap Analysis comparing the as-is to the to-be models.
It is further also important to note the indicated impact propagation direction and therequirements percolation in the opposite direction. This is based on the assumption that theBusiness Domain models are implemented through the Application Domain models. And
42
Framework specification
this means that any changes in the former may propagate and impact the later. The samealso holds for the relationship between the Application Domain models and the TechnologyDomain models. This is indicated by the assumption M-3 in section 3.2.
Compared to the higher-level specification of figure C.22, figure C.21 is a concreteinstantiation resulting from the framework configuration of section 3.3. Based on the con-figuration of the Rating Model, it shows the concrete models to be used to supply it with theneeded input. The numbers next to the inter-model relationships indicate the order in whichthe models are to be produced.
3.4.3 Effort estimation Rating Model
The Rating Model configuration was presented in section 3.3. The resulting model is shownhere in figure C.23. It is based on aggregating the effort estimated for the modernizationstrategy attached to each Point of Modernization. This aggregation is first done in the threeconcern groups – identification, componentization and integration – with their strategiesindicated in the meta model table C.20. Next to these groups, aimed at the achievement ofseparation of concerns, there is a forth group concerned with the satisfaction of the end-result system requirements that may not have a correspondence in the legacy system. Theseare the SOA capabilities also mentioned in the meta-model in table C.19. The Rating Modelthus contains three levels: at the highest level are the concerns, at the middle level the mod-ernization strategies that belong to that concern, and at the lowest level the effort indicators.These were already described in the framework configuration section. For this version ofthe Rating Model we have kept the choice of indicators limited as there is not yet enoughempirical evidence to indicate the exact relation of indicators to modernization strategiesto be able to distribute them correctly over the categories. Both effort and gain can beaggregated according to the same scheme presented here.
The configuration section of the Rating Model (3.3, “Strategy effort indicators andrating aggregation”) explained the choice for an ordinal scale of strategy rating. This orderis also depicted here in the diagram of the Rating Model by the order of the concern groupsthey belong to. In addition to their relative effort, this order also indicates the succession inwhich the groups are evaluated for an increasing accuracy of the effort estimation. Startingfrom the left with “Identification”, the strategies require increasingly less effort. This isbased on the way these strategies are implemented as was presented in section 2.4. Here westate the main points:• Identification: may require a large amount of manual effort• Componentization: great deal of restructuring, which requires also more insight into
the implementation• Integration: merely mismatch alignment through wrapping and adapter addition• Concern satisfaction: merely plugging in or removal of functionality similar to the
COTS strategy and to some degree wrappingFollowing, we will go into the rating for each of these groups and their strategies. We willconclude with the role design patterns can play in the rating process.
43
3. EFFORT ESTIMATION FRAMEWORK – RESEARCH DESCRIPTION
Identification
The result in this concern group is an estimation of the effort needed for the Reverse En-gineering activities in the modernization. As presented earlier in figure C.22, the activitiesof this phase are present in all three domains – Business, Application and Technology andthus, identification effort is required in each of them. This is why the rating model reserves aplace for strategies for each of the domains. The business category from figure C.23 is aboutidentifying Business Model entities and Technology about building a technology model ofthe system including such as operating systems, etc (see Meta-model entities figure C.18).We acknowledge these aspects and give their place in the rating model. However we con-centrate on the Application aspect, as was described in the scope in section 3.1 and give itsbuildup of strategies and indicators.
The rating for the Application Domain is based on strategies for the classification ofthe legacy entities according to two criteria. The first has to do with the role of the entity– component (COMPONENT)or connector (CONNECTOR). While the second makes adistinction based on the purpose – business application logic (APP LOGIC) or infrastruc-tural functionality (INFRASTRUCTURE). This is expressed in assumption S-1 (page 32),stating these two types of functionality. The combination of these two criteria with twoalternatives each, creates four categories for the identification of legacy entities. Once it hasbeen identified for every legacy entity in which category it belongs, the rating can be doneusing the two indicators shown in the figure – the percentage classified legacy entities andthe percentage that implements infrastructural functionality.
The reason for choosing this division is that specific business logic and more generalfunctionality can benefit best from different modernization strategies. Thus, investing effortearly on in identifying them correctly, will pay off in less effort in later phases as it would bepossible to apply the most appropriate strategy. The APP LOGIC entities are more likelyto be kept during the modernization and bring about effort in the componentization andintegration concern groups. Their functionality will most likely be encapsulated into ser-vices and integrated to work together to perform the same business processes. On the otherhand, the infrastructural facilities such as communication and resource discovery are morelikely to be replaced as a whole in favor of a new infrastructure/framework that suppliesthe same services. This, as opposed to reengineering it. The former will result in effort inthe integration and satisfaction of concerns groups, while the later will result in effort forcomponentization.
Concluding this concern group, we need to make an important remark about its effortoutput and how it will be influenced in case of an extension of the framework. Currently,it has been setup for the ordinal scale. As is shown in equation 3.3, this means usingthe enumeration of PoMs to be identified, a qualitative relationship between them suchas infrastructure entities require more effort to identify than business logic and giving aneffort estimation based on the size of this set and its composition. However, if the rating isextended to an interval or ratio scale, the degree of automation that can be applied for theextraction of the models in the Reverse Engineering phase will start influencing the effort.This is a consequence of the difference in realization effort needed between automatedand manual expert-driven approaches. This was discussed in section 3.3.3 and throughout
44
Framework specification
chapter 2. Once a unit of measure is introduced on an absolute scale such as costs, differentweights will be used when translating to it for automated and expert-driven identification.For the expert-driven part this weight factor will be much greater for two reasons: greatertime investment per PoM and greater costs per time unit.
Componentization
The componentization rating is concerned with delivering an estimation of the effort basedon only local subsystem restructuring where needed. The modernization strategies that fallin this group are the more invasive white-box modernization strategies. The effort estima-tion resulting from this category gives a local estimate about restructuring subsystems inisolation. This means that different subsets can be considered for modernization togetherby only summing their corresponding efforts.
The goal of the strategies in this category is to achieve the rough architectural descrip-tion of the application as required by the Service-Oriented paradigm. This means, sepa-ration of concerns, Business-to-IT alignment and SOA design principles. The selection ofindicators from table 3.1 was thus made such that it would measure the effort of the changesthe modernization strategies would involve.
Integration
Through this category the effort and gain for the system as a whole are estimated. This isdone by rating the impact of the integration issues between the component subsets chosenafter the componentization. The strategies here represent the possible actions that may beneeded for Points of Modernization. They are all aimed at achieving a seamless whole byconsidering the separate components as a black-box. This is why these strategies are con-sidered to have less impact than the componentization strategies. Internally there is alsoan order in the estimated amount of effort required by each strategy. In the diagram, theWrapper strategy is the one requiring the least amount and the replacement of a compo-nents with a COTS (Commercial Of The Shelve) solution has the greatest estimated effort.A selection was made from the possible indicators from table 3.2, which can be used witheach strategy.
SOA concern satisfaction
All the concern groups and their strategies described so far rate the effort in transformingexisting assets through restructuring or integration. This covers the intersection of func-tionality present in both the legacy and the SOA system. The category of SOA concernsatisfaction, on the other hand, is responsible for estimating the effort needed for handlingentities that don’t have an equivalent in either the as-is or the to-be system. This means thatthere are two strategies that could be applied – ADD or REMOVE. The former is necessaryin case one of the SOA capabilities mentioned in table C.20 is required in the target sys-tem, but has no equivalent in the legacy system. For example the addition of a messagingcapability to a system based on direct communication through API’s. The latter strategy– REMOVE – is applied to legacy entities that are obsolete in the SOA environment. For
45
3. EFFORT ESTIMATION FRAMEWORK – RESEARCH DESCRIPTION
both strategies holds that their effort depends on the number of places they interact with therest of the application as they represent cross-cutting concerns, described in section 2.2 inthe subsection on “SOA Software Architecture”. Thus, a quantifiable indicators for thesestrategies is the so called number of cross-cutting points (CCP) [102], used in equation (3.6)of the Rating Model EFFORT () function. It is also mentioned in table 3.1 as an useful in-dicator for the Componentization concerns of which SOA concern satisfaction is a specialcase.
Rating through the use of design patternsDesign patterns play an important role in the forward engineering step of the target SOA [3].In the reverse engineering part though, they are less useful. Their use is based on the fact thatthe presence of a design pattern can help to induce semantic knowledge from the structureonly by assuming that the pattern structure was used with the intent of its rationale. So thepresence of a pattern in the legacy system means two things:• there is a clear structure, so restructuring will be easier• the structure has a rationale(pattern forces). This can then be compared to the to-be
situation forces.The presence of a pattern and thus the certain degree of separation of concerns it achievesdoes not automatically mean that the involved components can be reused as is. It still mightbe the case that the whole composite would have to be rewritten from scratch. In such acase the pattern’s only added value is that it aids in the system understanding. A patterncould also indicate a less optimal solution, but one that is easier to achieve by following thepatterns structure. For example including in the component all other classes participating inthe pattern, although they do not directly have any relationship with the core functionality.
46
Chapter 4
Legacy Logistics System –effort estimation experiment
This chapter has two goals. The first is to demonstrate the instantiation of the Effort Estima-tion Framework for a concrete legacy system. The second goal is to evaluate the resultingeffort estimation and through it the effectiveness of the framework that delivered it.
The chapter begins in section 4.1 with the definition of the experiment performed toreach the above-mentioned goals. This experiment is structured according to the guidelinesby Wohlin [99] on experimentation in software engineering. Based on the experiment defi-nition, section 4.2 describes the planning for performing the experiment. This includes thehypothesis and design of the experiment, the description of the legacy system used as a sub-ject and the instrumentation. The execution of this planning is then presented in section 4.3Experiment operation. The results of the experiment are presented in section Data Analysis(4.4) noting the important facts about them. An interpretation of these results is given insection 4.5. We end the chapter with a discussion and the conclusions from the experimentin section 4.6. This last section also containing ideas about future work for extending theexperiment setting.
4.1 Experiment definition
The rest of the chapter describes the experiment with object of study the Effort EstimationFramework from chapter 3. The purpose is to evaluate the effectiveness of the suggestedframework and the effort estimation results it produces. This experiment is a single objectstudy done from the perspective of the researcher. The single subject of the study is theLegacy Logistics System undergoing the experiment through a prototype software system.
4.2 Experiment planning
4.2.1 Context selection
The experiment is executed by the research student himself with no test subjects. Profes-sional software engineers were involved, but their contribution was not related to the test
47
4. LEGACY LOGISTICS SYSTEM – EFFORT ESTIMATION EXPERIMENT
data itself. The tests are performed in an off-line situation parallel to a real life moderniza-tion project. Although the examined problem is from a real situation, it is constrained insize due to time restrictions. These constraints are both on the study object as well as on thestudy subject. For the experiment only part of the framework is considered and only part ofthe subject legacy system.
4.2.2 Hypothesis
To evaluate the effectiveness of the framework, the following null hypothesis is formulated:“According to the Effort Estimation Framework, the specified input Gain is unrelated to theframework output Effort”. The experiment is designed with the goal to deliver empiricaldata to reject this null hypothesis in favor of the alternative hypothesis. That alternative isformulated as “The Gain is related to the Effort following the Effort Estimation Frameworkin an exponential relationship”. This expectation was mentioned in figure 3.1, section 3.1.
4.2.3 Variable selection
In order to disprove the null hypothesis, the relevant parameters from the framework areselected as independent and dependent variables to monitor during the experiment.
NotationDue to the restricted setup, not all framework variables will be involved in the experiment.We introduce a notation to emphasize that only a limited subset of the parameters included inthe framework are being evaluated. The two main functions are GAIN() and EFFORT (),defined in section 3.3.1. When these are only evaluated in relation to only some of theirspecified parameters, we respectively denote them by Gain() and E f f ort().
Independent variablesThe controlled environment is created by the set of selected independent variables. The firstof theses is the input factor of the experiment – Granularity. It is chosen, because it isa measurable entity proportional to the frameworks input parameters of Flexibility [8] andComposability (section 2.2). The Effort Estimation Framework defines these on their turnto be linearly proportional to the Gain – GAIN( f lexibility,coupling, ...) (equation 3.1). Sofor the experiment we have Gain( f lexibility) as theoretical cause to be examined throughthe treatment of the independent variable granularity, denoted with g (see Appendix C.28).For each treatment of g a test will be done executing the Effort Estimation Framework withit as input. The granularity is measured as the total number of components to partition thelegacy system in and has a range of [0..5386] on a ratio scale.
The remaining set of independent variables will, however, be kept constant. Thesevariables together with their value and measurement scale are:• Legacy components subset (Si): value = all; scale = Ordinal• Rating Model concern: value = Componentization; scale = Ordinal• Modernization strategy: value = Restructure; scale = Ordinal
48
Experiment planning
• Model extraction methods: described in the experiment design; scale = Nominal
Dependent variablesThe experiment will monitor the development of two dependent variables:• Scattering: indicator from the framework Rating Model; scale = Ratio• Effort: indirect measurement based on the scattering; scale = Ratio
The function EFFORT () is defined in equation 3.2. Because this experiment evaluatesonly the Componentization concern, we use only the C(Nbi,Nii) part of the equation. Fur-thermore, assumption iii on page 50 about the supplied LLS code means that Nii = Ø fromwhich follows that Nbi = Si. So for the effort estimation in this case study holds that:
EFFORT ()≈C(Nbi,Nii) = E f f ort(scattering) (4.1)
Because the Componentization concern is considered in isolation, no aggregation ofeffort estimations is done. This makes it possible to do the experiment on the ratio scale. Thescore however is an index internal for the indicator/modernization strategy combination.It cannot be related to an index produced for a different strategy with different indicator.The relation between these two is defined only on the ordinal scale by the Rating Model.Currently, when merging multiple indicators or categories the score has to be converted tothe Ordinal scale by a custom scaling that divides the scores in a couple of groups. With the100% being the maximal total effort.
4.2.4 Subject system description
The subject legacy system for the experiment was selected through stratified random sam-pling. A set of criteria were important for the characterization of the group from whicha system was randomly chosen. These criteria are typical for the problem domain of theEffort Estimation Framework: legacy application, implemented in a procedural language,complex interdependencies, in need of modernization indicated by the maintenance team.
The chosen system is the Logistics Legacy System – LLS. It contains many subsys-tems with heterogeneous implementations and with many interdependencies. The devisionbetween them is based on their responsibility domains. Three of these subsystems are givenbellow with their corresponding implementation language and runtime environment. Theyshare the following characteristics: a) transaction oriented, b) work on a common datamodel (in DB2) and c) rely on some types of infrastructure support (CICS vs. IMS-TM).• Request Handling – CICS/Cobol• Warehouse Management – IMS/PL1• Location Planning – IMS/PL1
We concentrate on the Request Handling sub-system, which will be further referredto as RH. It is concerned with the management of incoming requests for parts and, thus,the implementation code includes request process flows and inventory management. Thecode considered as belonging to this sub-system was exported from the LLS codebase andsupplied by the maintaining team.
49
4. LEGACY LOGISTICS SYSTEM – EFFORT ESTIMATION EXPERIMENT
A brief examination of it gives the following points of consideration:i. the relation of compilation to run-time units is one-on-one. One PROGRAM/PRO-
CEDURE per file. This means that the units in a fine grain representation of the codecan be seen as both files and programs.
ii. No built in environment facility for program address passing. This has had to becustom implemented as part of the code base. This code falls into a different cate-gory when it comes to modernizing possibly to other platform/language with differentcapabilities. It contains no business functionality but utility
iii. we assumed that the code contains application logic and no infrastructural facilities
4.2.5 Experiment design
For each treatment of the granularity factor, the experiment instantiates four parts of theEffort Estimation Framework: the meta-model entities (section 3.4.1), the meta-model re-lationships (section 3.4.1), the analysis process steps and models (section 3.4.2) and theRating Model (section 3.4.3). Here follows a list of the parts used for each of them.
Meta-model entities:• Legacy – table C.18, columns Business and Application• SOA – table C.19, column Application• Strategies – table C.20, column Componentization
Meta-model relationships (figure C.21):1. Business Model: processes/activities2. Architectural Model, Integration Model: Legacy Components and Connectors3. map Business Model to Architectural Model: which ”Legacy Components” imple-
ment each ”Business Process”4. Service Model: information(cluster around data types), business(logic), general(rest) [96]5. Rating Model
Analysis process (figure C.22):• steps: 1, 2, 3, 4, 5, 6• models: AS-IS Business Model, AS-IS Software System Model, TO-BE Business
Model, TO-BE Software System Model, Business PoM Model, Software PoM Model
For each test run in the experiment, three steps are executed to build the models de-scribed above. First is constructed the AS-IS Business Model. Followed by the extractionand abstraction of the AS-IS and TO-BE Architectural models. In the third step, the twoare combined giving the PoM Model. This is used to calculate the dependent variables ofScattering and Effort. These three steps are described below.
Business ModelThe Business Model of the RH subsystem is constructed through extraction and abstractionof the source code. The end result is a representation of the business process flows inthe Business Process layer from the Development View of figure C.6. The approach is asimplified version of the one described by Zou [104]. While extracting this view we keep
50
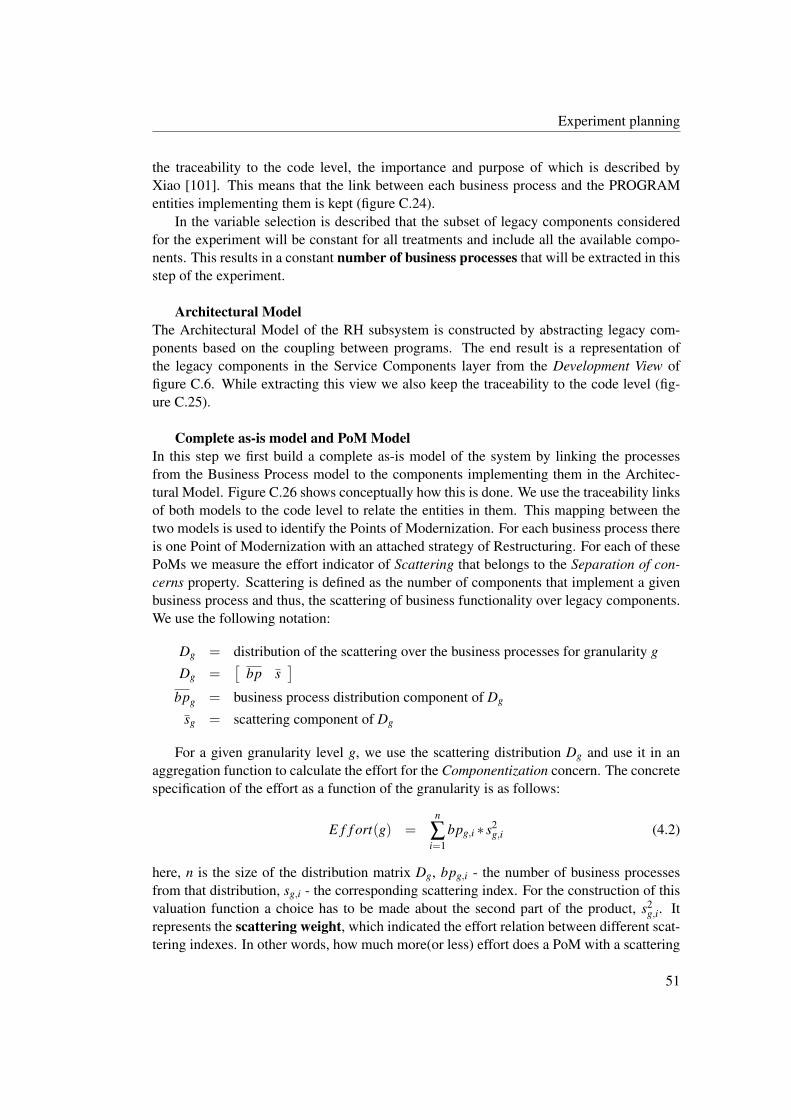
Experiment planning
the traceability to the code level, the importance and purpose of which is described byXiao [101]. This means that the link between each business process and the PROGRAMentities implementing them is kept (figure C.24).
In the variable selection is described that the subset of legacy components consideredfor the experiment will be constant for all treatments and include all the available compo-nents. This results in a constant number of business processes that will be extracted in thisstep of the experiment.
Architectural ModelThe Architectural Model of the RH subsystem is constructed by abstracting legacy com-ponents based on the coupling between programs. The end result is a representation ofthe legacy components in the Service Components layer from the Development View offigure C.6. While extracting this view we also keep the traceability to the code level (fig-ure C.25).
Complete as-is model and PoM ModelIn this step we first build a complete as-is model of the system by linking the processesfrom the Business Process model to the components implementing them in the Architec-tural Model. Figure C.26 shows conceptually how this is done. We use the traceability linksof both models to the code level to relate the entities in them. This mapping between thetwo models is used to identify the Points of Modernization. For each business process thereis one Point of Modernization with an attached strategy of Restructuring. For each of thesePoMs we measure the effort indicator of Scattering that belongs to the Separation of con-cerns property. Scattering is defined as the number of components that implement a givenbusiness process and thus, the scattering of business functionality over legacy components.We use the following notation:
Dg = distribution of the scattering over the business processes for granularity g
Dg =[
bp s]
bpg = business process distribution component of Dg
sg = scattering component of Dg
For a given granularity level g, we use the scattering distribution Dg and use it in anaggregation function to calculate the effort for the Componentization concern. The concretespecification of the effort as a function of the granularity is as follows:
E f f ort(g) =n
∑i=1
bpg,i ∗ s2g,i (4.2)
here, n is the size of the distribution matrix Dg, bpg,i - the number of business processesfrom that distribution, sg,i - the corresponding scattering index. For the construction of thisvaluation function a choice has to be made about the second part of the product, s2
g,i. Itrepresents the scattering weight, which indicated the effort relation between different scat-tering indexes. In other words, how much more(or less) effort does a PoM with a scattering
51
4. LEGACY LOGISTICS SYSTEM – EFFORT ESTIMATION EXPERIMENT
indicator value of sn require than one with scattering of sn−1.The choice of scattering weight relation we have made here, is based on two assumptions:• same scattering index means same scattering weight. However two PoMs with the
same scattering index do not have to valuate to the same scattering weight. Think ofother factors such as size, structure etc that could influence the relation.• we assume a fully connected graph between all the implementing programs of one
business process. This means that splitting them into n+ 1 components would leadto n∗(n−1)
2 connections. This is of order O(n2) so we also assume a quadratic relationfor the scattering weights.
4.2.6 Instrumentation
The above-mentioned experiment steps will be fully automated with a prototype softwaresystem. The process of model instantiation and evaluation is implemented in this prototypein the following phases:
1. Extraction+Abstraction ->AS-IS Models:• Business Model• Application Model
– Architectural Model– Integration Model
2. Restructure ->TO-BE Models:• Service Model+SOA Infrastructure• Development View• Process View
3. Analysis• Rating Model
The flow between these phases and the data that is saved is shown in figure C.27. Mi-nor preprocessing of the source code files was needed before they could be parsed in theExtraction phase. This was done with a custom written Java processor and involved theremoval of invalid characters from the source such as EOF. For the Extraction phase itself,the Relativity Modernization Workbench R©1 was used. The extracted information was thenexported in Excel format. A second custom Java application was used to transform this datainto a format that could be imported in the tool used for the following phase of Abstraction.For it as well as for the Restructuring and Rating Model analysis, MATLAB R©2 was used.
4.2.7 Validity evaluation
Here are presented the considered threats to the validity of the experiment, mainly internaland external. The concepts under study in this experiment are shown according to [99] inAppendix C.28.
1http://www.microfocus.com/products/modernizationworkbench/index.asp2http://www.mathworks.com/products/matlab/
52
Experiment operation
None of the main threats to the internal validity apply to the designed experiment, be-cause it is automated through the software prototype. This means that the application of thetreatments does not change with time, they do not have any side effects on the subject sys-tem and there are no human factors influencing the test results. Thus, the experiment offersa high degree of certainty that the applied treatment is the cause of the observed effects. Thesingle exception is the instrumentation. It forms however no big threat as the tools used areconsidered reliable. Relativity is a commercial workbench of high quality. The main partsof the custom MATLAB code are to be found in appendix B for inspection.
The external validity of the experiment is also not jeopardized, which increases thepossibility to generalize the results. Again, because of the automated process performedby the prototype, the test data is not susceptible to the moment in time the tests are run orany characteristics of the population of subject participants. In addition, the subject legacysystem has been chosen so that is representative for the problem domain targeted by theEffort Estimation Framework (section 4.2.4). This makes any generalizations based on thetest data valid for the domain of similar legacy systems.
4.3 Experiment operation
As an input Application Model was used the call-graph of the RH subsystem. The Rela-tivity Modernization Workbench R© was used to parse the legacy Cobol code and produce acaller/callee map. That was exported in the form of a report, an excerpt of which is shownin appendix C.29. This callmap was converted to a directed graph represented as an adjencymatrix in MATLAB, which we will further refer to under as M.
The unique id of each node in this graph representation is shown in column 2 in fig-ure C.29. Each such node corresponds to a PROGRAM entity from the code. The edgesrepresent the calls between the programs. The graph contains in total 5386 nodes and 8349edges. It is important to note that the caller/callee map produced by Relativity contains onlyinformation about which program calls/is called by other programs. It does not extract theorder in which these are called. So the nesting part of the flow is preserved, but the orderwithin a program is not. This means there is no particular order (pre-, in- or post-) in whichthe tree nodes should be read, but for our purposes this is no limitation.
A second observation worth noting is that M was found to be an acyclic graph (DAG).This fact simplifies some of the algorithms used in the Business Model (4.3.1) and Archi-tectural Model (4.3.2) sections, but does not invalidate their generality.
4.3.1 Business Model
As input for this step we used the adjency matrix M. To extract an approximation of thebusiness process flows in the RH subsystem, the code from Listing B.1 was used. Accordingto it, we first identify the set of entry-nodes. These are programs that are not called by anyother program but only invoke others. These root nodes are considered the starting pointof business processes, which can be invoked from outside or through the system’s front-end. In total we identified 1026 such entry-point nodes out of a total of 5386. Once theentry-point nodes are identified, we extract the subtree of nodes from the call-graph with
53
4. LEGACY LOGISTICS SYSTEM – EFFORT ESTIMATION EXPERIMENT
root each of the entry-nodes. This produces the end-result subtrees. This is a set of size1026 containing the sets with the nodes belonging to each business process. This result isonly an approximation of the real business processes of the RH subsystem, because of thecall-graph limitations described in the introduction. This means that the extracted businessprocesses do not completely depict the order of activity execution, but that for our purposesthis limitation does not influence the end result. The traceability to the code level is kept bypreserving the ids of the nodes in the subtrees, which uniquely identify the implementingprograms.
Visualization of the extracted process flows was done with the code from Listing B.2.Three such flows with increasing size are shown in figures C.30, C.31 and C.32. The oneshown in figure C.32 contains the most nodes in the whole RH subsystem. For the resultingprocess trees, it is common to share subtrees. This could be used as an indicator for thechoice of granularity level (see subsection 4.3.2) so as to optimize reuse.
4.3.2 Architectural Model
Here as well, the adjacency matrix M was used as starting point. It was process with thecode from listing B.3 with the goal of identifying clusters of program nodes to form compo-nents. First the distances between the different programs in the call-graph was calculated,forming the DIST MATRIX. Then this information was used to calculate their hierarchi-cal clustering structure, similar to the approach of Fan-Chao [34], which clusters the nodesclosest to each other first. For the concrete implementation we used weighted clustering(WPGMA).
The result of the clustering is a dendrogram showing the way the program nodes canbe gradually clustered together forming larger components. This dendrogram, which wewill further refer to as TREE is shown in figure C.34. From this, clusters can be definedby deciding on the level of granularity at which the tree should be cut up into components.Such a sample devision is shown in figure C.35, where the different resulting componentsare colored differently.
4.3.3 Complete as-is model and Rating Model
The Rating Model is instantiated and used to estimate the effort for modernizing towardsachieving the SOA property of Composability. This is in our case the input parameter forthe Rating Model about the to-be system as specified in 3.3. Figure C.26 shows how thisstep was performed. On the left side, we have the set of subtrees and on the right we havethe TREE clustering structure. From these, we calculate the scattering using the code fromlisting B.4.
54
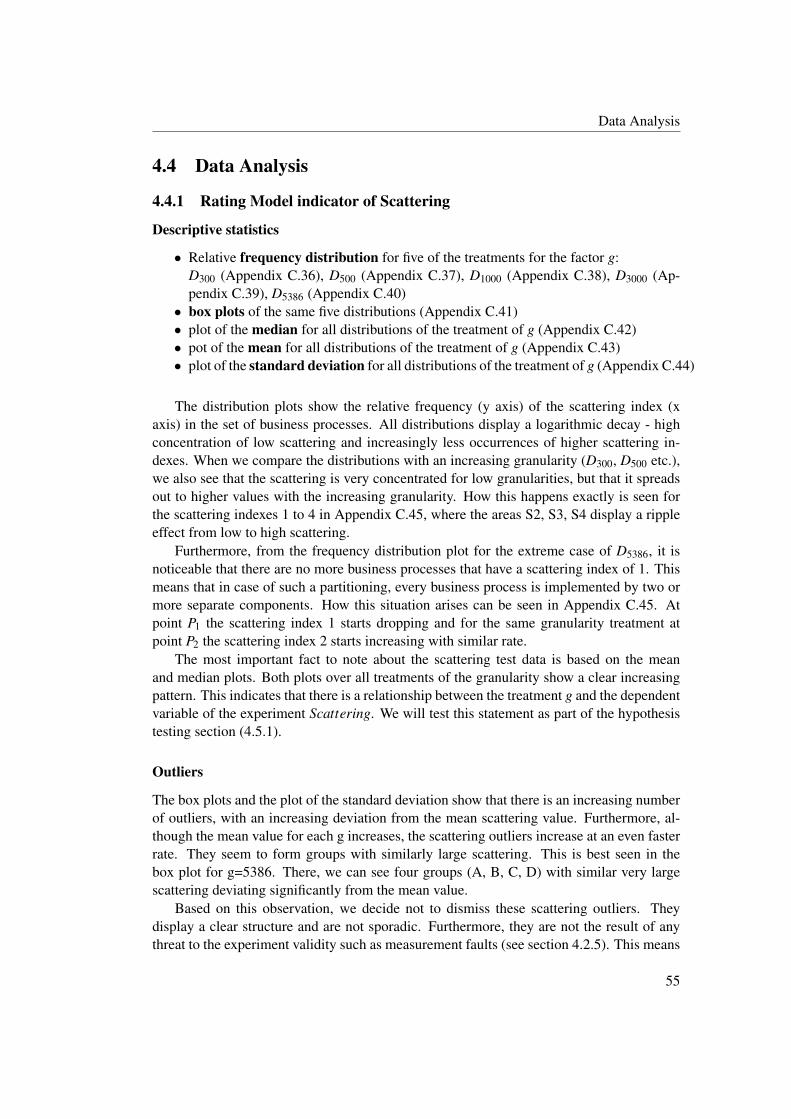
Data Analysis
4.4 Data Analysis
4.4.1 Rating Model indicator of Scattering
Descriptive statistics
• Relative frequency distribution for five of the treatments for the factor g:D300 (Appendix C.36), D500 (Appendix C.37), D1000 (Appendix C.38), D3000 (Ap-pendix C.39), D5386 (Appendix C.40)• box plots of the same five distributions (Appendix C.41)• plot of the median for all distributions of the treatment of g (Appendix C.42)• pot of the mean for all distributions of the treatment of g (Appendix C.43)• plot of the standard deviation for all distributions of the treatment of g (Appendix C.44)
The distribution plots show the relative frequency (y axis) of the scattering index (xaxis) in the set of business processes. All distributions display a logarithmic decay - highconcentration of low scattering and increasingly less occurrences of higher scattering in-dexes. When we compare the distributions with an increasing granularity (D300, D500 etc.),we also see that the scattering is very concentrated for low granularities, but that it spreadsout to higher values with the increasing granularity. How this happens exactly is seen forthe scattering indexes 1 to 4 in Appendix C.45, where the areas S2, S3, S4 display a rippleeffect from low to high scattering.
Furthermore, from the frequency distribution plot for the extreme case of D5386, it isnoticeable that there are no more business processes that have a scattering index of 1. Thismeans that in case of such a partitioning, every business process is implemented by two ormore separate components. How this situation arises can be seen in Appendix C.45. Atpoint P1 the scattering index 1 starts dropping and for the same granularity treatment atpoint P2 the scattering index 2 starts increasing with similar rate.
The most important fact to note about the scattering test data is based on the meanand median plots. Both plots over all treatments of the granularity show a clear increasingpattern. This indicates that there is a relationship between the treatment g and the dependentvariable of the experiment Scattering. We will test this statement as part of the hypothesistesting section (4.5.1).
Outliers
The box plots and the plot of the standard deviation show that there is an increasing numberof outliers, with an increasing deviation from the mean scattering value. Furthermore, al-though the mean value for each g increases, the scattering outliers increase at an even fasterrate. They seem to form groups with similarly large scattering. This is best seen in thebox plot for g=5386. There, we can see four groups (A, B, C, D) with similar very largescattering deviating significantly from the mean value.
Based on this observation, we decide not to dismiss these scattering outliers. Theydisplay a clear structure and are not sporadic. Furthermore, they are not the result of anythreat to the experiment validity such as measurement faults (see section 4.2.5). This means
55
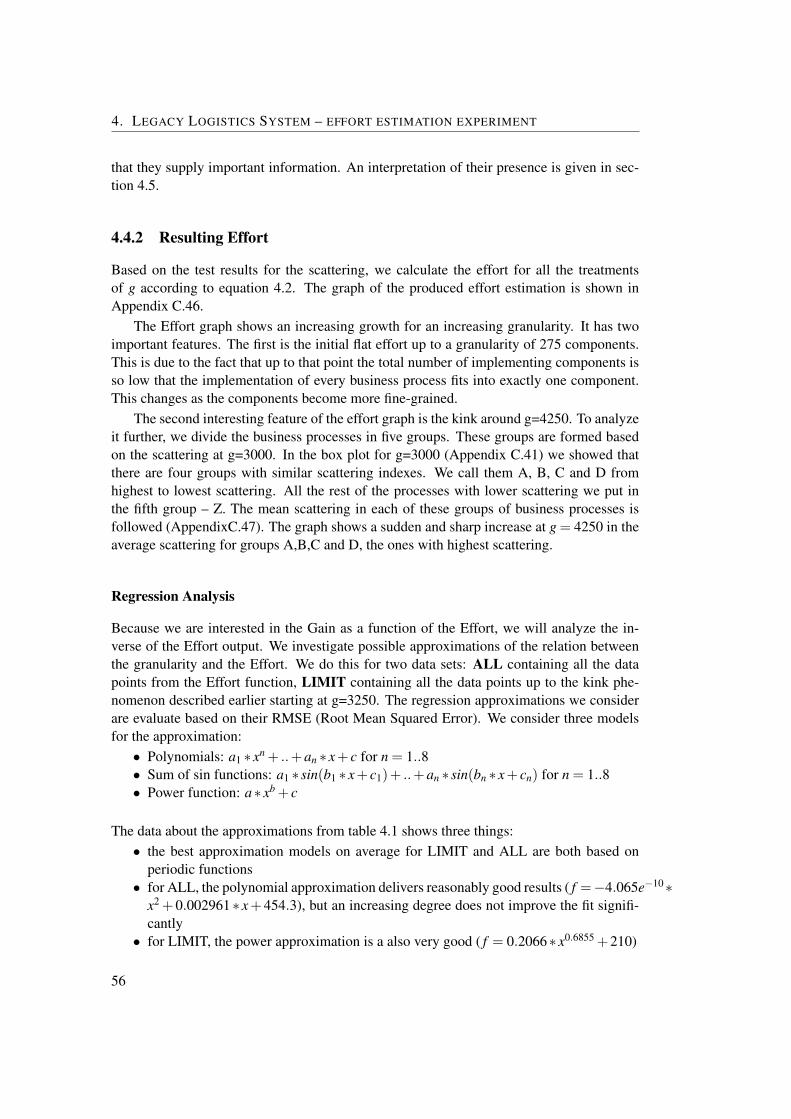
4. LEGACY LOGISTICS SYSTEM – EFFORT ESTIMATION EXPERIMENT
that they supply important information. An interpretation of their presence is given in sec-tion 4.5.
4.4.2 Resulting Effort
Based on the test results for the scattering, we calculate the effort for all the treatmentsof g according to equation 4.2. The graph of the produced effort estimation is shown inAppendix C.46.
The Effort graph shows an increasing growth for an increasing granularity. It has twoimportant features. The first is the initial flat effort up to a granularity of 275 components.This is due to the fact that up to that point the total number of implementing components isso low that the implementation of every business process fits into exactly one component.This changes as the components become more fine-grained.
The second interesting feature of the effort graph is the kink around g=4250. To analyzeit further, we divide the business processes in five groups. These groups are formed basedon the scattering at g=3000. In the box plot for g=3000 (Appendix C.41) we showed thatthere are four groups with similar scattering indexes. We call them A, B, C and D fromhighest to lowest scattering. All the rest of the processes with lower scattering we put inthe fifth group – Z. The mean scattering in each of these groups of business processes isfollowed (AppendixC.47). The graph shows a sudden and sharp increase at g = 4250 in theaverage scattering for groups A,B,C and D, the ones with highest scattering.
Regression Analysis
Because we are interested in the Gain as a function of the Effort, we will analyze the in-verse of the Effort output. We investigate possible approximations of the relation betweenthe granularity and the Effort. We do this for two data sets: ALL containing all the datapoints from the Effort function, LIMIT containing all the data points up to the kink phe-nomenon described earlier starting at g=3250. The regression approximations we considerare evaluate based on their RMSE (Root Mean Squared Error). We consider three modelsfor the approximation:• Polynomials: a1 ∗ xn + ..+an ∗ x+ c for n = 1..8• Sum of sin functions: a1 ∗ sin(b1 ∗ x+ c1)+ ..+an ∗ sin(bn ∗ x+ cn) for n = 1..8• Power function: a∗ xb + c
The data about the approximations from table 4.1 shows three things:• the best approximation models on average for LIMIT and ALL are both based on
periodic functions• for ALL, the polynomial approximation delivers reasonably good results ( f =−4.065e−10∗
x2 +0.002961∗ x+454.3), but an increasing degree does not improve the fit signifi-cantly• for LIMIT, the power approximation is a also very good ( f = 0.2066∗ x0.6855 +210)
56
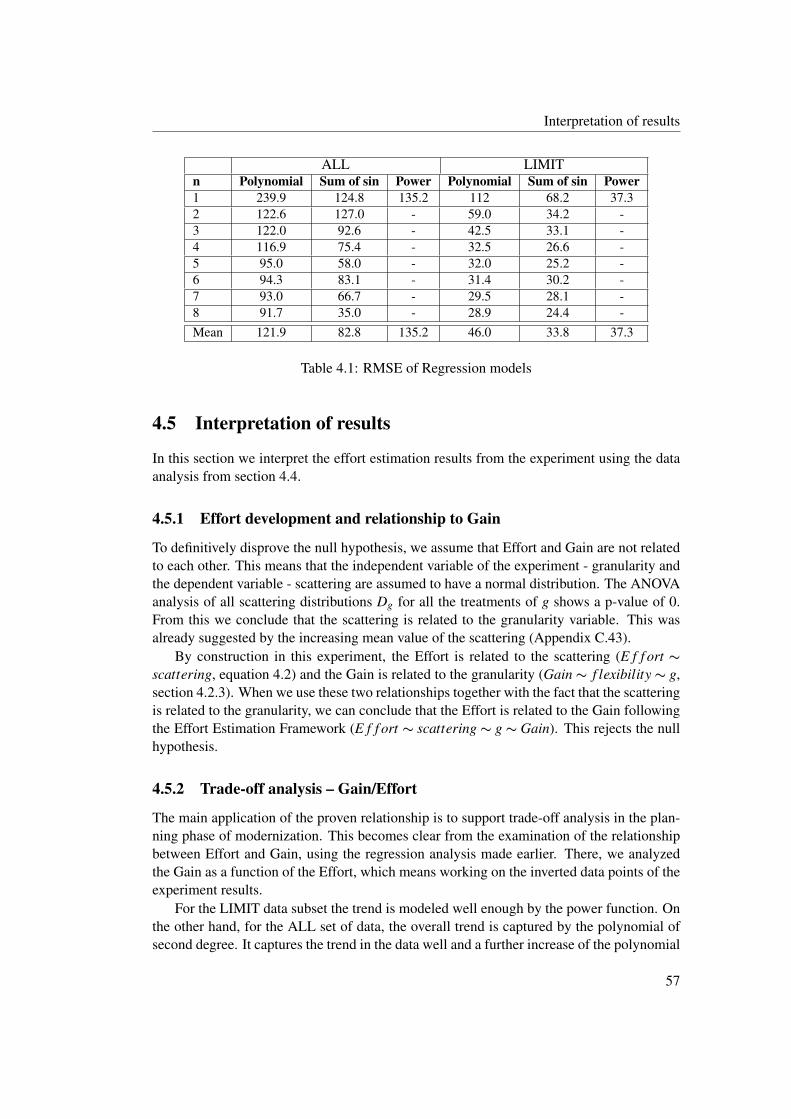
Interpretation of results
ALL LIMITn Polynomial Sum of sin Power Polynomial Sum of sin Power1 239.9 124.8 135.2 112 68.2 37.32 122.6 127.0 - 59.0 34.2 -3 122.0 92.6 - 42.5 33.1 -4 116.9 75.4 - 32.5 26.6 -5 95.0 58.0 - 32.0 25.2 -6 94.3 83.1 - 31.4 30.2 -7 93.0 66.7 - 29.5 28.1 -8 91.7 35.0 - 28.9 24.4 -Mean 121.9 82.8 135.2 46.0 33.8 37.3
Table 4.1: RMSE of Regression models
4.5 Interpretation of results
In this section we interpret the effort estimation results from the experiment using the dataanalysis from section 4.4.
4.5.1 Effort development and relationship to Gain
To definitively disprove the null hypothesis, we assume that Effort and Gain are not relatedto each other. This means that the independent variable of the experiment - granularity andthe dependent variable - scattering are assumed to have a normal distribution. The ANOVAanalysis of all scattering distributions Dg for all the treatments of g shows a p-value of 0.From this we conclude that the scattering is related to the granularity variable. This wasalready suggested by the increasing mean value of the scattering (Appendix C.43).
By construction in this experiment, the Effort is related to the scattering (E f f ort ∼scattering, equation 4.2) and the Gain is related to the granularity (Gain ∼ f lexibility ∼ g,section 4.2.3). When we use these two relationships together with the fact that the scatteringis related to the granularity, we can conclude that the Effort is related to the Gain followingthe Effort Estimation Framework (E f f ort ∼ scattering ∼ g ∼ Gain). This rejects the nullhypothesis.
4.5.2 Trade-off analysis – Gain/Effort
The main application of the proven relationship is to support trade-off analysis in the plan-ning phase of modernization. This becomes clear from the examination of the relationshipbetween Effort and Gain, using the regression analysis made earlier. There, we analyzedthe Gain as a function of the Effort, which means working on the inverted data points of theexperiment results.
For the LIMIT data subset the trend is modeled well enough by the power function. Onthe other hand, for the ALL set of data, the overall trend is captured by the polynomial ofsecond degree. It captures the trend in the data well and a further increase of the polynomial
57
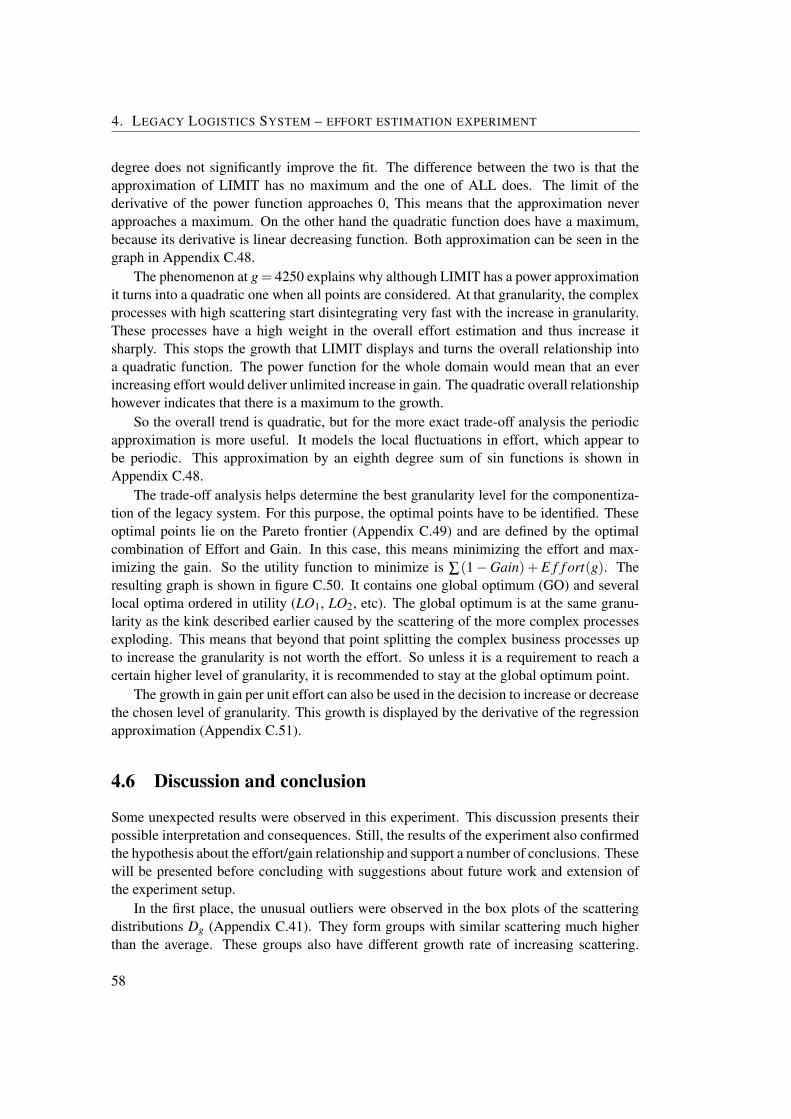
4. LEGACY LOGISTICS SYSTEM – EFFORT ESTIMATION EXPERIMENT
degree does not significantly improve the fit. The difference between the two is that theapproximation of LIMIT has no maximum and the one of ALL does. The limit of thederivative of the power function approaches 0, This means that the approximation neverapproaches a maximum. On the other hand the quadratic function does have a maximum,because its derivative is linear decreasing function. Both approximation can be seen in thegraph in Appendix C.48.
The phenomenon at g= 4250 explains why although LIMIT has a power approximationit turns into a quadratic one when all points are considered. At that granularity, the complexprocesses with high scattering start disintegrating very fast with the increase in granularity.These processes have a high weight in the overall effort estimation and thus increase itsharply. This stops the growth that LIMIT displays and turns the overall relationship intoa quadratic function. The power function for the whole domain would mean that an everincreasing effort would deliver unlimited increase in gain. The quadratic overall relationshiphowever indicates that there is a maximum to the growth.
So the overall trend is quadratic, but for the more exact trade-off analysis the periodicapproximation is more useful. It models the local fluctuations in effort, which appear tobe periodic. This approximation by an eighth degree sum of sin functions is shown inAppendix C.48.
The trade-off analysis helps determine the best granularity level for the componentiza-tion of the legacy system. For this purpose, the optimal points have to be identified. Theseoptimal points lie on the Pareto frontier (Appendix C.49) and are defined by the optimalcombination of Effort and Gain. In this case, this means minimizing the effort and max-imizing the gain. So the utility function to minimize is ∑(1−Gain) +E f f ort(g). Theresulting graph is shown in figure C.50. It contains one global optimum (GO) and severallocal optima ordered in utility (LO1, LO2, etc). The global optimum is at the same granu-larity as the kink described earlier caused by the scattering of the more complex processesexploding. This means that beyond that point splitting the complex business processes upto increase the granularity is not worth the effort. So unless it is a requirement to reach acertain higher level of granularity, it is recommended to stay at the global optimum point.
The growth in gain per unit effort can also be used in the decision to increase or decreasethe chosen level of granularity. This growth is displayed by the derivative of the regressionapproximation (Appendix C.51).
4.6 Discussion and conclusion
Some unexpected results were observed in this experiment. This discussion presents theirpossible interpretation and consequences. Still, the results of the experiment also confirmedthe hypothesis about the effort/gain relationship and support a number of conclusions. Thesewill be presented before concluding with suggestions about future work and extension ofthe experiment setup.
In the first place, the unusual outliers were observed in the box plots of the scatteringdistributions Dg (Appendix C.41). They form groups with similar scattering much higherthan the average. These groups also have different growth rate of increasing scattering.
58
Discussion and conclusion
This seams to indicate that there is an additional factor that is related to the scattering -the complexity of the business process. This complexity is defined as the number of steps(executing Cobol PROGRAMs). More complex processes react differently to the increase ingranularity than more simple ones. This indicates than an additional experiment parameter(independent variable) is in its place - the percentage of complex processes in the legacysystem. It might be possible to use it as an effort indicator.
The second unexpected observation is in the discovered dependency between the Gainand the Effort. It does resemble to a certain degree the overall expected dependency fromfigure 3.1. However, the growth of the effort is not exponential as expected, but polynomial.One explanation for this could be that the effort growth is a system dependent characteristicrelated to the percentage of complex processes in it. As the experiment examined onlyone subject system there is not enough evidence to give a definitive answer. An extendedresearch comparing different systems could clarify this issue.
A second reason for the limited polynomial growth of the Effort could be the constrainedsetup of this experiment. It considers only one factor for the Gain and only one effort indi-cator. The absence of certain factors in the experiment that are are inversely related to thenumber of system components and are more dominant for higher granularities such as per-formance (or maintenance of the resulting components) might be the reason for the limitedgrowth of the effort. Generalizing this idea, effort indicators could be classified accordingto the degree they stimulate (negative factors) or limit (positive factors) the growth in ef-fort. This would make it possible to estimate how balanced and thus how representative theestimation is. Too many indicators from one category could make the results skewed.
Finally, the third interesting observation is related to the effort regression analysis. Therelation of the effort and thus also the scattering to the granularity seams to be periodic. Thebest approximation on average of the effort is the sum of sin functions. It has an error lowerthan polynomial and power approximations even for low degrees. An explanation for thismight be the ripple effect in the scattering development that was shown in appendix C.45.Business processes gradually ascent into higher degrees of scattering with the increasinggranularity following a periodic motion.
We can conclude that with this experiment the relationship between scattering and gran-ularity was established. Through this, also the Gain was related to the Effort in the contextof the Effort Estimation Framework. It was also shown that these scattering and effort esti-mations can be used for trade-off analysis. It was shown that there is a point where splittingfurther the processes is not lucrative any more looking at the effort/gain ratio. However,an extension of the experiment is necessary with more independent variables in order toclarify two of the observations mentioned in the discussion above. In the first place, whatis the significance of the suspected new parameter for the percentage of complex businessprocess. Secondly, are there any other parameters that would make the effort estimationdisplay exponential growth.
59
4. LEGACY LOGISTICS SYSTEM – EFFORT ESTIMATION EXPERIMENT
4.6.1 Future work – Increase accuracy with Service Model
This subsection presents the suggested approach for increasing the accuracy of the effortestimation in the experiment. It has not been tested in practice due to time constraints.The increased accuracy is based on the fact that also the service layer is being taken intoconsideration for the modernization. This more closely resembles the desired SOA end-organization. The service layer is the intermediate abstraction layer between the invokingbusiness processes and implementing components in the Development View (figure C.6.
For producing a model of this layer different identification techniques can be used. For-mal Concept Analysis(FCA) [28, 62, 96] for the abstracting the Business Object Model, as-pect mining for the identification of infrastructural services [102] and program slicing [20,73] for the extraction of the three basic service type defined by the estimation framework– Information Services, Business Services, General Services. For the extraction of the ser-vices the following encapsulation model can be used, suggested by Sneed [89] shown infigure C.55. Specifically for Information services, the approach should be to componentizebased on coupling to data types (cluster functionality around data types) and encapsulationas DAS as shown in figure C.4
Incorporation of this approach in the structure of the performed experiment is similarto the existing model extraction steps. The goal here is also to keep the traceability tothe code level. This is possible because the above-mentioned techniques are bottom-up,generating abstractions from the code. This, opposed to the top-down approaches using adomain model put together by domain experts. This relation of the service model to thecode level entities can then be used to establish their corresponding legacy components andbusiness processes. This process is shown in figures C.52 and C.53. Figure C.54 depicts thereorganization that would have to take place in order to reach a 1-to-1 mapping between theimplementing components and the business process activities.
60
Chapter 5
Research evaluation
This research was targeted at the problem stated in chapter 1, in the field of system modern-ization towards SOA. That problem is the need for effort estimation in support of decisionmaking in such modernization projects. Now that this thesis has presented the Effort Es-timation Framework in chapter 3 together with an empirical experiment in chapter 4, wecan evaluate how they contributes to achieving the goal expressed in the problem statement.First, the contribution of this research is evaluated based on the applications of the deliveredEffort Estimation Framework (§5.1). Despite its broad applicability, the framework still hasits limitations, which are evaluated in section 5.2. In conclusion, both the framework’scontribution and its limitations are taken into consideration in an evaluation of the overallquality (§5.3).
5.1 Contribution and applications of research results
The main contribution of this thesis is the structure it gives to the domain of effort estimationin modernizing towards SOA. The framework that is presented, creates the organizationnecessary to tackle to problem of effort estimation in a systematic way that did not existbefore.
In the first place, the thesis identifies the multiple dimensions relevant to forming acomplete view of the problem domain from existing research. These dimensions encom-pass approaches to system and modernization process modeling. Building on this base, aninnovative contribution is made consisting of two parts. The first innovative addition is theselection and combination of different parts of the existing approaches. A decision is madeon how to fit the complementing parts together. The second innovative addition of this re-search is the method for effort estimation. It delivers a rating based on the systematizationof the issues relevant to effort estimation and the causes of modernization effort. The centralconcept in this Rating Model is the Point of Modernization. This abstraction decouples theeffort estimation from the underlying system models created by existing approaches.
The presented Effort Estimation Framework has two main applications. The first is intrade-off analysis as part of the planning phase of modernization projects. The second is its
61
5. RESEARCH EVALUATION
use as a frame of reference for future work on impact analysis of the modernization towardsSOA.
The framework supports trade-off analysis between effort and gain, because of its con-struction. It accepts an input in the form of parameters describing the desired gain from themodernization towards SOA such as flexibility and lower coupling. On the other hand theframework produces the effort estimation as output. The framework relates effort estima-tion to gain and enables in this way the search for an optimal modernization plan with a setof requirements for both entities as a starting point.
The framework also offers a frame of reference for future work on the impact of mod-ernization towards SOA. It contains an organization of the basics of the problem domain ina form allowing extension. This reference can be used in defining a clear scope of futureresearch through its overview of the related areas. In this way, concrete areas can be studiedin isolation and afterwards the findings can be related to the whole. This can also be used inthe definition of empirical experiments and case studies. The framework eases the design(choice of independent and dependent variables) and the comparison of results.
Finally, such a frame of reference is also useful for work in the industry. It deliversguidance for modernization discussions by relating the major issues of modernizing to eachother. It can function as a checklist in assessing the impact of decisions. The framework is ata high enough level to be instantiated for many different legacy systems. Most importantly,the rational behind the construction of the framework can be traced back to the scientificsources and its applicability can be verified for a particular case at hand.
The thesis also discusses the possible influence of issues/factors that fall outside ofthe framework scope such as business gain, modernization impact on the organization andbusiness and modernization process phases and cost drivers.
5.2 Limitations of the framework
The Effort Estimation Framework is based on a set of assumptions and configurations fortwo reasons, both of which are aimed at improving the framework. The first is to narrowdown the domain of considered systems and modernization strategies so that the effort es-timation is more accurate. But at the same time also not making it too specific in order tokeep the framework reusable(the framework dilemma, section 2.1). The second reason is toenable the choice, through configuration, for the most suitable effort estimation techniques,by considering the target Service Oriented Architecture and the strategies to modernize to-wards such an environment.
Next to leading to the above-mentioned improvements, these choices of assumptionsand configurations also lead to limitations. We consider a limitation to be an ability orfeature that the framework does not have, but that is desirable in order to deliver the mostcomplete effort estimation results. Furthermore, we consider the limitations to manifestthemselves in one of three possible areas:• the application area of the framework and the supported input types• the achieved estimation accuracy of the framework• the relevancy of the output
62
Limitations of the framework
Following is the discussion of these limitations. We do this per root cause, starting with thescope and ending with the framework assumptions and configuration.
Scope limitations
Risk – the framework considers the trade-off analysis between effort and gain. This is theresult of the impact assumption in section 3.1. There is also another important moderniza-tion factor in the literature – risk [87, 94]. It is not included as a factor in the evaluations inthe Rating Model and affects the accuracy of the framework’s optimal point estimation.Business domain – the effort estimation is done in the technical domain. This makes it moreeasily quantifiable, but it also distances it from the business domain which is generally morerelevant for the enterprise strategy management. This separation between the Business gainand Technical gain was also made explicit in section 3.1 and limits the both input and outputof the framework to technical entities. This is something that the framework certainly needsto be extended in and that is why this issue is also treated in the chapter on future work 6.Technical implementation – The framework is specified in isolation from the out-of-scopedomains. The fact that such a relationship exists has been noted in section 3.1. However,because of the scope of this research, the concrete interaction between the domains hasnot been defined, such as for example impact propagation between them. Specifically, theseparation from the Technical domain creates limitations. The framework does not specifythe exact impact propagation to the implementation level an this limits the relevancy of theoutput it supplies. It still is on a relatively high-level of abstraction and not expressed inconcrete realization terms. This limitation, however, is justifiable for two reasons. The firstis that this link falls under the category of formal transformations [59] and is consideredtrivial. The second is that it is implementation technology dependent and this step should,thus, be left for the instantiation and calibration of the framework.
Framework assumptions and configuration limitations
Procedural legacy systems – another limitation on the input is due the assumption L-2 insection 3.3. The effort estimation in the Identification group of the Rating Model couldbe more accurate through a more effective legacy system modeling if extended with otherparadigms (e.g. Object-Oriented). However, this is not a serious limitation as a largestpart of the legacy systems considered for modernization do make use of the proceduralparadigm.
Business service identification approach – the approach to Business service identificationconfigured in the Control Model in section 3.3.3, limits the accuracy of the effort estimation.Because the models are extracted bottom-up from the existing code they tend to preserveits flaws such as inefficient business process flows or low level of reuse. The bottom-upapproach taken in the framework introduces, thus, an error in the estimation as it preservesthe system organization mainly in the Business domain. It would eventually be needed toremove these flaws at the cost of extra effort.
63
5. RESEARCH EVALUATION
Furthermore, the consequence of the current configuration as presented in section 3.3 arethe following limitations:• Input: the approach taken, using SOA properties as input, gives a rather limited range
of options and is possibly on a too high-level of abstraction. This could be overcomeby extending the target system specification possibilities. For this purpose, we suggestusing the approaches for the evaluation of a Service-Oriented system, which wereidentified in the literature study such as [46, 95, 8].• Output: the precision of the output is currently limited to the ordinal scale. This
is the consequence of the absence of quantitative information about the relationshipbetween the effort for different modernization strategies. This issue was described inthe “Strategy effort indicators and rating aggregation” subsection of section 3.3.1.• Accuracy: the accuracy of the effort estimation is limited due to the following:
– the level of abstraction used in the architectural models is rather high. It goesdown only to components and connectors and not to function level (section 3.3.1,configuration C-2)
– the choice not to consider the propagation of impact between domains yet. Thisconfiguration issue is described in the “Points of Modernization as basis foreffort estimation” subsection of section 3.3.1.
– the Rating Model does not take into account such an impact propagation andassumes a single effort aggregation pass in the order identification, componen-tization, integration, SOA capabilities.
– no quantitative use of pattern information. As was argued in section 3.3.1 con-figuration C-4, the use of design patterns in this estimation framework remainslimited. The extend of this limitation is described at the end of section 3.4.3.
– the absence of concrete quantitative data about the relation of the strategies andindicators to effort. The field of effort estimation for modernization towardsSOA is rather unexplored so currently the presented indicators and strategiesare only qualitatively related to effort. Each one of them has to be researchedto make this relation concrete and also how combining them together influencesthe estimation.
5.3 Resulting quality of the framework
From the description of the limitations above, we can conclude that the framework is coarsegrained in its approach and the resulting estimations. This is due to the absence of empiricalresults to support a more accurate relationship specification between indicators and effort.It does not, however, lack any essential aspects in rating the modernization effort. It offersa structure that can be further refined by systematically investigating its subparts.
The quantification method’s accuracy depends on the correctness of the relationshipbetween effort indicators, modernization strategies and identification of PoM. And also onthe weights of these relationships. These should generally be calibrated through industryexperience. But even if the method is calibrated the analysis process is generally as good asthe information it has to work with. This makes the concrete approaches used in the Reverse
64

Resulting quality of the framework
Engineering phase the weakest link. And because we configure the framework to rely onautomated evaluation, this introduces the limitations of the absence of expert knowledge.
65

Chapter 6
Summary, Conclusion andFuture Work
6.1 Summary
This thesis is aimed at the problem of impact analysis of the modernization of legacy sys-tems towards Service Oriented Architecture. Chapter 1 specified the need for a methodfor decision making specifically relying on the estimation of the effort expected for mod-ernization. The goal of the research is to establish a method for the estimation of thismodernization effort as part of overall impact analysis.
The solution proposed in this thesis is the Effort Estimation Framework. It is based onexisting work from several areas of research. Chapter 2 describes this background in the ar-eas of software architecture (§2.1), service-orientation (§2.2) and modernization approaches(§2.3, §2.4). These existing approaches are used to capture the information on which theeffort estimation is based. There are four such important sources of information. In the firstplace, these are the models of the legacy architecture and Service Oriented Architecture. Inaddition to this, the process of modernization, the strategies used and their impact is alsomodeled. In third place, the overall context of the modernization is described such as stake-holders, domains and costs-drivers to put the effort estimation into perspective. Finally, thespecific issues in the modernization of software system towards SOA are identified.
The framework itself is presented in chapter 3. It is built in several stages - assumptions(§3.1, §3.2), configuration (§3.3) and specification (§3.4). This allows the adaptation of theframework to specific domain or as a result of further research. Its contribution is the orga-nization of the existing approaches so that they can be used for effort estimation specificallyfor the modernization towards Service Oriented Architectures (§3.4.1). For the purpose ofestablishing such an effort estimation, the framework specifies on top of the approaches aRating Model (§3.4.3) and a process for gathering the required information (§3.4.2). TheRating Model relates measurements of architectural characteristics to effort and aggregatesthese estimations. Essential for this is the concept of Point of Modernization (PoM). TheRating Model offers an effort estimation output on an ordinal scale. It is based on a dis-tinction between impact types, classification of modernization concerns, ordering of themodernization strategies according to effort and a classification of measurable indicators.
67
6. SUMMARY, CONCLUSION AND FUTURE WORK
The use of the framework is presented in chapter 5. The chapter describes an empiricalexperiment that demonstrates the instantiation of part of the framework (§4.2.5, §4.3). Theexperiment evaluates the effectiveness of the framework based on the measurement of theeffort indicator of Scattering. The outcome of the experiment shows the relationship thatexists between the framework input of Gain and its output of Effort (§4.4.2). This demon-strates that the Effort Estimation Framework is effective in producing an effort estimationgiven input of required gain. This relationship is then used to demonstrate the applicationof the effort estimation for trade-off analysis (§4.5).
Finally, the Effort Estimation Framework and the research results are evaluated in chap-ter 5. The evaluation treats three aspects. The first is concerned with the application of theproposed framework. The suitability of the framework is discussed for impact and trade-off analysis (§5.1). Secondly, the limitations of the framework are discussed anticipatedas a result of the assumptions and choices made (§5.2). Finally, the overall quality of theapproach taken in the framework is confirmed (§5.3).
6.2 Conclusion
The main conclusion from this thesis is that automated estimation of modernization efforttowards SOA is feasible. The theoretical context (chapter 2) shows that there are existingmethods describing the main aspects of the problem of modernization effort estimation.What is missing is a method to bring them together. This thesis shows that they can becombined to form a structure for tackling the problem (chapter 3).
The suggested Effort Estimation Framework shows how the different aspects/methodsfrom software architecture and modernization can be integrated. They complement eachother in different areas which makes it possible to build an all-round view of the causes ofeffort in legacy modernization. The resulting framework divides the problem of effort esti-mation in separate fragments (phases, domains, responsibilities, modernization strategies).This lowers the complexity of the problem as estimations can be made for the different partsseparately and then aggregated. The Rating Model makes this possible through the Pointsof Modernization and the categorizations it uses.
Furthermore, the empirical part of the research using the Effort Estimation Framework(chapter 4) leads to establishing the following facts:• the Gain and Effort in the constructed framework are related to each other through on
the scattering and granularity variables• this relationship can be used for trade-off analysis and to find an optimal solution with
given required levels of Effort and Gain• the discovery of an unexpected parameter which could be useful - the percentage of
complex business processes• the parameters used are not enough to model all the expected characteristics of the
Effort estimation developmentWe conclude with the remark that this research is only an initial attempt and requires
much more work, both theoretical and empirical. A vision on the direction of this futurework is described in the following section.
68
Future work
6.3 Future work
This section presents the big picture around the findings of this research, emphasizing onthe future possibilities. We describe the path towards an accurate effort estimation of mod-ernization projects (Appendix C.56), the eventual goal in legacy system modernization, andposition our current work on it.
The path towards a good estimation of modernization effort is divided in stages in termsof cost. Each stage introduces a change in scale and units of measurement, increasing theaccuracy of the Rating Model. This gradation is shown on the left side in figure C.56. Inthe middle is shown the central for this research process of modernizing. Based on themodernization strategies that can be applied to perform this process, we presented a RatingModel. This model is concentrated in the stage in the estimation path - the Difference Iden-tification. The highest accuracy level achievable here based on the available information isan estimation on the ordinal scale. The availability of the source information is determinedin the preceding stage of Model Extraction and SOA specification for the legacy and targetsystems respectively. Their goals are determined during the Portfolio Analysis stage. Fol-lowing the Difference Identification stage is the Trade-off Analysis weighting the possiblemodernization strategies against each other. Finally comes the stage that translates the effortinto cost through a Cost Model. Each of these stages and their possibilities are clarified inthe following subsections.
Portfolio Analysis
The existing approach to portfolio analysis is rather limited (section 2.3). In addition tothis, the results of this essential process are not yet related to the framework. One of theassumptions of the research is that this analysis has been successfully performed and itsresults can readily used as input for the effort estimation. The future challenge is to extendthe framework by shifting its input side further in the direction of the Business Goals. Thiswill make the link possible between the Business Gain and the SOA gain (section 3.1).
A second area for improvement is the models used as input for the framework. Theyare currently fixed, but they depend on the business goals. For example, a custom selec-tion of models could be made in case of a target of greater Return on investment throughincreased reuse. The same applies for the specification of the target system configuration.The decision for or against SOA as enabling technology and the selection of desired SOAcapabilities depends on the set Business Goals. The aim is to link the business need to thetechnical need. So linking the framework to the output of the Portfolio Analysis process willlead to improved: a) legacy model selection, b) SOA capabilities specification. Altogether,this will make it possible to make a more precise estimation guided directly by the businessgoals of the company.
Decision Model
The currently used Rating Model does not support any constraints. These do exist in practiceand may mean that a sub-optimal solution must be chosen. This means that the estimation
69
6. SUMMARY, CONCLUSION AND FUTURE WORK
given actually forms and lower limit estimation of the modernization effort. Taking intoaccount constraints such as resources, technology, know-how to make a selection from theavailable modernization strategies, could lead to an increase in the estimation. These con-straints can also be seen as requirements(soft and hard) on the to-be system as for examplefixed operating system, programming language, SOA infrastructure supplier, performance.Together these form the Decision Model. The final output of the analysis based on thismodel is a modernization plan containing a chosen strategy covering all Points of Mod-ernization. The criteria for making these choices can differ depending on the goals of thecompany. For this reason we theorize that an additional Relation Model is necessary. It isan interchangeable view on the system on how to prioritize/valuate the constraints incor-porated in the Decision Model. Possible approaches are to prioritize the application of theredesign strategy to components with a high business value or to consider only black-boxstrategies for components with a high reusability degree. The Decision Model is used toquantify the differences between the solutions the different strategies suggest. This makesit possible to switch over to an interval scale. It also has to include a more elaborate gainvaluation of the impact of modernization as explained in section 3.1.
Cost Model
The effort output of the framework is intended as input to a Cost Model. This model willrelate the effort to a concrete implementation and its costs. This will make it possible toswitch to a ratio scale and use money as output. Here we come back to the types of costsinvolved in a modernization project mentioned in section 2.3. The cost items mentionedthere each belong to one of the three categories:
1. Reengineering Investment Costs (RIC)2. Operations and Support Costs for Reengineered Components (OSRC)3. Operations and Support Costs for Legacy Components (OSLC)
Each of these cost items has its origins in one of the four phases of system evolution: A).PlanEvolution, B).Implement, C).Deliver and D).Deploy.
The framework gives an effort estimation that serves as input for the combination A1 -the RIC costs in the Planning stage. The challenge for the future is to extend this frameworkwith the estimation of the effort needed for the calculation of the other possible combina-tions. In this phase it is also of importance to know how the estimates can be improved. Asthe output of this phase can be verified with real projects, there is a possibility for calibrationthrough iteration.
Extension current approach
Furthermore, the accuracy of the current approach could be improved by extending it with:• extend service model identification approximation with business-goal driven service
identification (top-down approach)• add dynamic analysis(Wu [100]): run the system and keep track of the invocation of
each business rule to obtain an indication of its business value. higher usage ->higherbusiness value
70
Bibliography
[1] W. Al Belushi and Y. Baghdadi. An approach to wrap legacy applications into webservices. June 2007.
[2] Robert Allen and David Garlan. A formal basis for architectural connection. ACMTrans. Softw. Eng. Methodol., 6(3):213–249, 1997.
[3] Francesca Arcelli, Christian Tosi, and Marco Zanoni. Can design pattern detectionbe useful for legacy systemmigration towards soa? In SDSOA ’08: Proceedings ofthe 2nd international workshop on Systems development in SOA environments, pages63–68, New York, NY, USA, 2008. ACM.
[4] A. Arsanjani, S. Ghosh, A. Allam, T. Abdollah, S. Gariapathy, and K. Holley. Soma:a method for developing service-oriented solutions. IBM Syst. J., 47(3):377–396,2008.
[5] Ali Arsanjani and Kerrie Holley. The service integration maturity model: Achiev-ing flexibility in the transformation to soa. In SCC ’06: Proceedings of the IEEEInternational Conference on Services Computing, page 515, Washington, DC, USA,2006. IEEE Computer Society.
[6] Joachim Bayer, Jean-Francois Girard, Martin Wurthner, Jean-Marc DeBaud, andMartin Apel. Transitioning legacy assets to a product line architecture. SIGSOFTSoftw. Eng. Notes, 24(6):446–463, 1999.
[7] Jesal Bhuta and Barry Boehm. A framework for identification and resolution of in-teroperability mismatches in cots-based systems. In IWICSS ’07: Proceedings of theSecond International Workshop on Incorporating COTS Software into Software Sys-tems: Tools and Techniques, page 2, Washington, DC, USA, 2007. IEEE ComputerSociety.
[8] Phil Bianco, Rick Kotermanski, Summa Technologies, and Paulo Merson. Evaluatinga service-oriented architecture. Technical Report CMU/SEI-2007-TR-015, CarnegieMellon University, Pittsburgh, PA, USA, 2007.
71
BIBLIOGRAPHY
[9] Norbert Bieberstein, Robert G. Laird, Dr. Keith Jones, and Tilak Mitra. ExecutingSOA: A Practical Guide for the Service-Oriented Architect. IBM Press, May 2008.
[10] Kevin Bierhoff, Mark Grechanik, and Edy S. Liongosari. Architectural mismatchin service-oriented architectures. In SDSOA ’07: Proceedings of the InternationalWorkshop on Systems Development in SOA Environments, page 4, Washington, DC,USA, 2007. IEEE Computer Society.
[11] Steven J. Bleistein, Karl Cox, and June Verner. Strategic alignment in requirementsanalysis for organizational it: an integrated approach. In SAC ’05: Proceedings ofthe 2005 ACM symposium on Applied computing, pages 1300–1307, New York, NY,USA, 2005. ACM.
[12] T. Bodhuin, E. Guardabascio, and M. Tortorella. Migrating cobol systems to the webby using the mvc design pattern. In WCRE ’02: Proceedings of the Ninth WorkingConference on Reverse Engineering (WCRE’02), page 329, Washington, DC, USA,2002. IEEE Computer Society.
[13] B. Boehm, B. Clark, E. Horowitz, C. Westland, R. Madachy, and R. Selby. Costmodels for future software life cycle processes: Cocomo 2.0. Annals of SoftwareEngineering, 1:57–94, December 1995.
[14] Shawn A. Bohner. Extending software change impact analysis into cots components.In SEW ’02: Proceedings of the 27th Annual NASA Goddard Software EngineeringWorkshop (SEW-27’02), page 175, Washington, DC, USA, 2002. IEEE ComputerSociety.
[15] Diego Bovenzi, Gerardo Canfora, and Anna Rita Fasolino. Enabling legacy systemaccessibility by web heterogeneous clients. In CSMR ’03: Proceedings of the Sev-enth European Conference on Software Maintenance and Reengineering, page 73,Washington, DC, USA, 2003. IEEE Computer Society.
[16] Paul Brown. Succeeding with SOA: Realizing Business Value Through Total Archi-tecture. Addison-Wesley Professional, 2007.
[17] Paul Brown. Implementing SOA: Total Architecture in Practice. Addison-WesleyProfessional, 2008.
[18] Frank Buschmann, Regine Meunier, Hans Rohnert, Peter Sommerlad, and MichaelStal. Pattern-oriented software architecture: a system of patterns. John Wiley &Sons, Inc., New York, NY, USA, 1996. TU-Bib: IN69D22Busc.
[19] G. Canfora, A.R. Fasolino, G. Frattolillo, and P. Tramontana. Migrating interactivelegacy systems to web services. Software Maintenance and Reengineering, 2006.CSMR 2006. Proceedings of the 10th European Conference on, pages 10 pp.–36,March 2006.
72
[20] Gerardo Canfora, Aniello Cimitile, Andrea De Lucia, and Giuseppe A. Di Lucca.Decomposing legacy programs: a first step towards migrating to client-server plat-forms. J. Syst. Softw., 54(2):99–110, 2000.
[21] Gerardo Canfora, Anna Rita Fasolino, Gianni Frattolillo, and Porfirio Tramontana. Awrapping approach for migrating legacy system interactive functionalities to serviceoriented architectures. J. Syst. Softw., 81(4):463–480, 2008.
[22] Satish Chandra, Jackie de Vries, John Field, Howard Hess, Manivannan Kalidasan,Komondoor V. Raghavan, Frans Nieuwerth, Ganesan Ramalingam, and Justin Xue.Using logical data models for understanding and transforming legacy business appli-cations. IBM Syst. J., 45(3):647–655, 2006.
[23] Chia-Chu Chiang. Automated software wrapping. In ACM-SE 45: Proceedings ofthe 45th annual southeast regional conference, pages 59–64, New York, NY, USA,2007. ACM.
[24] E. J. Chikofsky and J. H. Cross. Reverse engineering and design recovery: A taxon-omy. IEEE Software, 7(1):13–17, 1990.
[25] Katja Cremer, Andre Marburger, and Bernhard Westfechtel. Graph-based tools forre-engineering. Journal of Software Maintenance, 14(4):257–292, 2002.
[26] Fred A. Cummins. Building the Agile Enterprise: With SOA, BPM and MBM. Mor-gan Kaufmann Publishers Inc., San Francisco, CA, USA, September 2008. TU-Bib:IN69D33Cumm.
[27] Andrea De Lucia, Rita Francese, Giuseppe Scanniello, and Genoveffa Tortora. De-veloping legacy system migration methods and tools for technology transfer. Softw.Pract. Exper., 38(13):1333–1364, 2008.
[28] Concettina Del Grosso, Massimiliano Di Penta, and Ignacio Garcia-Rodriguezde Guzman. An approach for mining services in database oriented applications. InCSMR ’07: Proceedings of the 11th European Conference on Software Maintenanceand Reengineering, pages 287–296, Washington, DC, USA, 2007. IEEE ComputerSociety.
[29] Merriam-webster’s online dictionary, 11th edition. http://www.merriam-webster.com/dictionary/dendrogram.
[30] Mark Endrei, Jenny Ang, Ali Arsanjani, Sook Chua, Philippe Comte, Pl Krogdahl,Min Luo, and Tony Newling. Patterns: Service-oriented Architecture and Web Ser-vices. IBM Redbook, April 2004.
[31] Thomas Erl. SOA: Principles of Service Design. Prentice Hall, July 2007.
[32] Thomas Erl. SOA Design Patterns. Prentice Hall, December 2008.
73
BIBLIOGRAPHY
[33] M. Ernest and J. M. Nisavic. Adding value to the it organization with the componentbusiness model. IBM Syst. J., 46(3):387–403, 2007.
[34] Meng Fan-Chao, Zhan Den-Chen, and Xu Xiao-Fei. Business component identifica-tion of enterprise information system: A hierarchical clustering method. In ICEBE’05: Proceedings of the IEEE International Conference on e-Business Engineering,pages 473–480, Washington, DC, USA, 2005. IEEE Computer Society.
[35] Erich Gamma, Richard Helm, Ralph Johnson, and John Vlissides. Design patterns:elements of reusable object-oriented software. Addison-Wesley Longman PublishingCo., Inc., Boston, MA, USA, 1995.
[36] David Garlan. Software architecture: a roadmap. In ICSE ’00: Proceedings of theConference on The Future of Software Engineering, pages 91–101, New York, NY,USA, 2000. ACM.
[37] David Garlan, Robert Allen, and John Ockerbloom. Architectural mismatch: Whyreuse is so hard. IEEE Softw., 12(6):17–26, 1995.
[38] David Garlan and Mary Shaw. An introduction to software architecture. Technicalreport, Carnegie Mellon University, Pittsburgh, PA, USA, 1994.
[39] Rainer Gimnich. Component models in soa realization. ftp://ftp.software.ibm.com/software/emea/de/soa/sqm2007_gimnich_presentation.pdf, 2007.
[40] Eduardo Machado Goncalves, Marcilio Silva Oliveira, and Kleber Rogerio Bacili.Digitalassets discoverer: automatic identification of reusable software components.In OOPSLA ’07: Companion to the 22nd ACM SIGPLAN conference on Object-oriented programming systems and applications companion, pages 872–873, NewYork, NY, USA, 2007. ACM.
[41] I. Garcia-Rodriguez de Guzman, M. Polo, and M. Piattini. An adm approach toreengineer relational databases towards web services. In WCRE ’07: Proceedingsof the 14th Working Conference on Reverse Engineering, pages 90–99, Washington,DC, USA, 2007. IEEE Computer Society.
[42] Neil B. Harrison, Paris Avgeriou, and Uwe Zdun. Using patterns to capture architec-tural decisions. IEEE Softw., 24(4):38–45, 2007.
[43] Carsten Hentrich and Uwe Zdun. Patterns for business object model integration inprocess-driven and service-oriented architectures. In PLoP ’06: Proceedings of the2006 conference on Pattern languages of programs, pages 1–14, New York, NY,USA, 2006. ACM.
[44] Peter Herzum and Oliver Sims. Business Components Factory: A ComprehensiveOverview of Component-Based Development for the Enterprise. John Wiley & Sons,Inc., New York, NY, USA, 2000.
74
[45] H. M. Hess. Aligning technology and business: applying patterns for legacy trans-formation. IBM Syst. J., 44(1):25–45, 2005.
[46] Helge Hofmeister and Guido Wirtz. Supporting service-oriented design with met-rics. In EDOC ’08: Proceedings of the 2008 12th International IEEE EnterpriseDistributed Object Computing Conference, pages 191–200, Washington, DC, USA,2008. IEEE Computer Society.
[47] Z.-W. Hong and H. Jiau. A design pattern for reengineering windows software ap-plications into reusable corba objects. In FTDCS ’01: Proceedings of the 8th IEEEWorkshop on Future Trends of Distributed Computing Systems, page 215, Washing-ton, DC, USA, 2001. IEEE Computer Society.
[48] John Hutchinson, Gerald Kotonya, James Walkerdine, Peter Sawyer, Glen Dobson,and Victor Onditi. Migrating to soas by way of hybrid systems. IT Professional,10(1):34–42, 2008.
[49] IEEE. Recommended practice for architectural description of software intensive sys-tems, September 2000.
[50] Per Jnsson and Mikael Lindvall. Impact analysis. In Engineering and ManagingSoftware Requirements. Springer Berlin Heidelberg, 2005.
[51] Capers Jones. Assessment and control of software risks. Yourdon Press, Upper SaddleRiver, NJ, USA, 1994.
[52] Nicolai Josuttis. SOA in practice. O’Reilly, 2007.
[53] Stephen H. Kaisler. Software Paradigms. John Wiley & Sons, 2005.
[54] Mira Kajko-Mattsson, Grace A. Lewis, and Dennis B. Smith. A framework for rolesfor development, evolution and maintenance of soa-based systems. In SDSOA ’07:Proceedings of the International Workshop on Systems Development in SOA Envi-ronments, page 7, Washington, DC, USA, 2007. IEEE Computer Society.
[55] Mark Kasunic and William Anderson. Measuring systems interoperability: Chal-lenges and opportunities. Technical Report CMU/SEI-2004-TN-003, Carnegie Mel-lon University, Pittsburgh, PA, USA, 2004.
[56] Mansour Kavianpour. Soa and large scale and complex enterprise transformation.In ICSOC ’07: Proceedings of the 5th international conference on Service-OrientedComputing, pages 530–545, Berlin, Heidelberg, 2007. Springer-Verlag.
[57] Rick Kazman, Mario Barbacci, Mark Klein, S. Jeromy Carriere, and Steven G.Woods. Experience with performing architecture tradeoff analysis. In ICSE ’99: Pro-ceedings of the 21st international conference on Software engineering, pages 54–63,New York, NY, USA, 1999. ACM. ATAM.
75
BIBLIOGRAPHY
[58] Rick Kazman, Paul C. Clements, Len Bass, and Gregory D. Abowd. Classifyingarchitectural elements as a foundation for mechanism matching. In COMPSAC ’97:Proceedings of the 21st International Computer Software and Applications Confer-ence, pages 14–17, Washington, DC, USA, 1997. IEEE Computer Society.
[59] Vitaly Khusidman. Adm transformation. architecture-driven modernization andtransformation. http://www.omg.org/docs/admtf/08-06-10.pdf, 2008.
[60] Vitaly Khusidman and William Ulrich. Architecture-driven modernization: Trans-forming the enterprise. http://www.omg.org/docs/admtf/07-12-01.pdf, 2007.
[61] Phillippe Kruchten. Architecture blueprints—the “4+1” view model of software ar-chitecture. In TRI-Ada ’95: Tutorial proceedings on TRI-Ada ’91, pages 540–555,New York, NY, USA, 1995. ACM.
[62] Tobias Kuipers and Leon Moonen. Types and concept analysis for legacy systems.In IWPC ’00: Proceedings of the 8th International Workshop on Program Compre-hension, page 221, Washington, DC, USA, 2000. IEEE Computer Society.
[63] Grace Lewis, Edwin Morris, and Dennis Smith. Analyzing the reuse potential of mi-grating legacy components to a service-oriented architecture. In CSMR ’06: Proceed-ings of the Conference on Software Maintenance and Reengineering, pages 15–23,Washington, DC, USA, 2006. IEEE Computer Society.
[64] Grace A. Lewis, Edwin J. Morris, Dennis B. Smith, and Soumya Simanta. Smart:Analyzing the reuse potential of legacy components in a service-oriented architectureenvironment. Technical Report CMU/SEI-2008-TN-008, Carnegie Mellon Univer-sity, Pittsburgh, PA, USA, 2008.
[65] Lars Lundberg, Jan Bosch, Daniel Hggander, and Per olof Bengtsson. Quality at-tributes in software architecture design. In Proceedings of the IASTED 3rd Interna-tional Conference on Software Engineering and Applications, pages 353–362, 1999.
[66] C. Matthew MacKenzie, Ken Laskey, Francis G. McCabe, Peter F Brown, and Re-bekah Metz. Reference model for service oriented architecture 1.0. Technical report,OASIS, October 2006.
[67] Francis G. McCabe, Jeff A. Estefan, Ken Laskey, and Danny Thornton. Referencearchitecture for service oriented architecture version 1.0. Technical report, OASIS,April 2008.
[68] Alok Mehta and George T. Heineman. Evolving legacy system features into fine-grained components. In ICSE ’02: Proceedings of the 24th International Conferenceon Software Engineering, pages 417–427, New York, NY, USA, 2002. ACM.
[69] Nikunj R. Mehta, Nenad Medvidovic, and Sandeep Phadke. Towards a taxonomy ofsoftware connectors. In ICSE ’00: Proceedings of the 22nd international conferenceon Software engineering, pages 178–187, New York, NY, USA, 2000. ACM.
76
[70] Danny Miller and Peter H. Friesen. Archetypes of Strategy Formulation. MANAGE-MENT SCIENCE, 24(9):921–933, 1978.
[71] Abhay Nath Mishra. Business strategy and it-enabled business capabilities: Fits,misfits and firm performance. http://auapps.american.edu/˜alberto/IT/Mishra.ppt, 2008.
[72] Glenford J Myers. Reliable software through composite design. Petrocelli/Charter,1975.
[73] Ph. Newcomb and L. Markosian. Automating the modularization of large COBOLprograms: application of an enabling technology for reengineering. In Proceedingsof the 1st Working Conference on Reverse Engineering, pages 222–230, 1993. Expe-rience report using the Software Refinery to build a modularization tool for COBOL.
[74] Liam O’Brien, Len Bass, and Paulo Merson. Quality attributes and service-orientedarchitectures. Technical Report CMU/SEI-2005-TN-014, Carnegie Mellon Univer-sity, Pittsburgh, PA, USA, 2005.
[75] Liam O’Brien, Len Bass, and Paulo Merson. Quality attributes and service-orientedarchitectures. Technical Report CMU/SEI-2005-TN-014, Software Engineering In-stitute of Carnegie Mellon University, 2005.
[76] Liam O’Brien, Paul Brebner, and Jon Gray. Business transformation to soa: aspectsof the migration and performance and qos issues. In SDSOA ’08: Proceedings ofthe 2nd international workshop on Systems development in SOA environments, pages35–40, New York, NY, USA, 2008. ACM.
[77] Liam O’Brien, Dennis Smith, and Grace Lewis. Supporting migration to servicesusing software architecture reconstruction. In STEP ’05: Proceedings of the 13thIEEE International Workshop on Software Technology and Engineering Practice,pages 81–91, Washington, DC, USA, 2005. IEEE Computer Society.
[78] Ipek Ozkaya, Rick Kazman, and Mark Klein. Quality-attribute based economic val-uation of architectural patterns. In ESC ’07: Proceedings of the First InternationalWorkshop on The Economics of Software and Computation, page 5, Washington, DC,USA, 2007. IEEE Computer Society.
[79] Mike P. Papazoglou and Willem-Jan Heuvel. Service oriented architectures: ap-proaches, technologies and research issues. The VLDB Journal, 16(3):389–415, July2007.
[80] Daniel Plakosh, Scott Hissam, and Kurt Wallnau. Into the black box: A case study inobtaining visibility into commercial software. Technical Report CMU/SEI-99-TN-010, Carnegie Mellon University, Pittsburgh, PA, USA, 1999.
[81] Harvard Business School Press. The essentials of strategy. Harvard Business SchoolPress, 2006.
77
BIBLIOGRAPHY
[82] Robert C. Seacord, Daniel Plakosh, and Grace A. Lewis. Modernizing Legacy Sys-tems: Software Technologies, Engineering Process and Business Practices. Addison-Wesley Longman Publishing Co., Inc., Boston, MA, USA, 2003.
[83] Mary Shaw and Paul C. Clements. A field guide to boxology: Preliminary classifica-tion of architectural styles for software systems. In COMPSAC ’97: Proceedings ofthe 21st International Computer Software and Applications Conference, pages 6–13,Washington, DC, USA, 1996. IEEE Computer Society.
[84] Dennis B. Smith, Liam O’ Brien, and John Bergey. Using the options analysis forreengineering (oar) method for mining components for a product line. In SPLC2: Proceedings of the Second International Conference on Software Product Lines,pages 316–327, London, UK, 2002. Springer-Verlag.
[85] H. M. Sneed. Encapsulating legacy software for use in client/server systems. InWCRE ’96: Proceedings of the 3rd Working Conference on Reverse Engineering(WCRE ’96), page 104, Washington, DC, USA, 1996. IEEE Computer Society.
[86] Harry M. Sneed. Program interface reengineering for wrapping. In WCRE ’97:Proceedings of the Fourth Working Conference on Reverse Engineering (WCRE ’97),page 206, Washington, DC, USA, 1997. IEEE Computer Society.
[87] Harry M. Sneed. Risks involved in reengineering projects. In WCRE ’99: Proceed-ings of the Sixth Working Conference on Reverse Engineering, page 204, Washington,DC, USA, 1999. IEEE Computer Society.
[88] Harry M. Sneed. Wrapping legacy cobol programs behind an xml-interface. InWCRE ’01: Proceedings of the Eighth Working Conference on Reverse Engineering(WCRE’01), page 189, Washington, DC, USA, 2001. IEEE Computer Society.
[89] Harry M. Sneed. Integrating legacy software into a service oriented architecture. InCSMR ’06: Proceedings of the Conference on Software Maintenance and Reengi-neering, pages 3–14, Washington, DC, USA, 2006. IEEE Computer Society.
[90] Harry M. Sneed and Stephan H. Sneed. Creating web services from legacy hostprograms. Web Site Evolution, IEEE International Workshop on, 0:59, 2003.
[91] H.M. Sneed. Risks involved in reengineering projects. In Reverse Engineering, 1999.Proceedings. Sixth Working Conference on, pages 204–211, Oct 1999.
[92] Michael Stal. Using architectural patterns and blueprints for service-oriented archi-tecture. IEEE Softw., 23(2):54–61, 2006.
[93] S.R. Tilley and D.B. Smith. Perspectives on legacy system reengineering, 1995.
[94] Amjad Umar and Adalberto Zordan. Reengineering for service oriented architec-tures: A strategic decision model for integration versus migration. Journal of Systemsand Software, 82(3):448 – 462, 2009.
78
[95] Andre van der Hoek, Ebru Dincel, and Nenad Medvidovic. Using service utilizationmetrics to assess the structure of product line architectures. In METRICS ’03: Pro-ceedings of the 9th International Symposium on Software Metrics, page 298, Wash-ington, DC, USA, 2003. IEEE Computer Society.
[96] Arie van Deursen and Tobias Kuipers. Identifying objects using cluster and conceptanalysis. In ICSE ’99: Proceedings of the 21st international conference on Softwareengineering, pages 246–255, New York, NY, USA, 1999. ACM.
[97] R. Van Solingen and E. Berghout. The Goal/Question/Metric Method – A PracticalGuide for Quality Improvement of Software Development. McGraw-Hill PublishingCompany, 1999.
[98] Ian Warren. The Renaissance of Legacy Systems: Method Support for Software-System Evolution. Springer-Verlag New York, Inc., Secaucus, NJ, USA, 1999.
[99] Claes Wohlin, Per Runeson, Martin Host, Magnus C. Ohlsson, Bjoorn Regnell, andAnders Wesslen. Experimentation in software engineering: an introduction. KluwerAcademic Publishers, Norwell, MA, USA, 2000.
[100] Lei Wu, Houari Sahraoui, and Petko Valtchev. Program comprehension with dynamicrecovery of code collaboration patterns and roles. In CASCON ’04: Proceedings ofthe 2004 conference of the Centre for Advanced Studies on Collaborative research,pages 56–67. IBM Press, 2004.
[101] Hua Xiao, Jin Guo, and Ying Zou. Supporting change impact analysis for serviceoriented business applications. In SDSOA ’07: Proceedings of the InternationalWorkshop on Systems Development in SOA Environments, page 6, Washington, DC,USA, 2007. IEEE Computer Society.
[102] Charles Zhang and Hans-Arno. Jacobsen. Quantifying aspects in middleware plat-forms. In AOSD ’03: Proceedings of the 2nd international conference on Aspect-oriented software development, pages 130–139, New York, NY, USA, 2003. ACM.
[103] Zhuopeng Zhang and Hongji Yang. Incubating services in legacy systems for archi-tectural migration. In APSEC ’04: Proceedings of the 11th Asia-Pacific SoftwareEngineering Conference, pages 196–203, Washington, DC, USA, 2004. IEEE Com-puter Society.
[104] Ying Zou, Terence C. Lau, Kostas Kontogiannis, Tack Tong, and Ross McKeg-ney. Model-driven business process recovery. In WCRE ’04: Proceedings of the11th Working Conference on Reverse Engineering, pages 224–233, Washington, DC,USA, 2004. IEEE Computer Society.
79

Appendix A
Glossary
In this appendix we give an overview of frequently used terms and abbreviations.
Architecture: The fundamental organization of a system embodied in its components, theirrelationships to each other, and to the environment, and the principles guiding its de-sign and evolution [49]
ADM (Architecture Driven Modernization): an approach to modeling the moderniza-tion process of legacy systems. It is shown in figure C.13
Architectural description: A collection of products to document an architecture [49]
Architectural view: A representation of a whole system from the perspective of a relatedset of concerns [49]
Component: an autonomous, encapsulated computational entity which accomplishes pre-defined tasks through internal computation and external communication. This defini-tion (2.2) is explained in detail in section 2.1 on page 6.
Dendrogram: a branching diagram representing a hierarchy of categories based on de-gree of similarity or number of shared characteristics especially in biological taxon-omy1 [29]
Design pattern: a design pattern describes a commonly-recurring structure of communi-cating components that solves a general design problem within a particular context.The complete definition (2.6) and its context are explained on page 8
Design principle: an accepted industry practice with a specific design goal. The service-orientation design paradigm is comprised of a set of design principles that are applied
1http://en.wikipedia.org/wiki/Dendrogram
81
A. GLOSSARY
together to achieve the goals of service-oriented computing [32]
Development View: one of four architectural views according to Kruchten [61] that fo-cuses on the software module organization in subsystems, layers and libraries defininggrouping and visibility. This view is shown for the Service-Oriented set of systemsin figure C.6
Effort: the cost of the changes needed to modernize (see definition 3.2)
Framework: a generic architecture complemented by an extensible set of components (seedefinition 2.7)
Gain: the potential value changes deliver (see definition 3.1)
Impact: what needs to be modified in a system in order to make a change or the conse-quences on the system if the change is implemented(see definition 2.14)
Indicator: “Strategy effort indicators and rating aggregation” in section 3.3.1
Modernization strategy: an approach for handling the difference in a Point of Modern-ization and transforming its set of legacy entities into the desired set of target systementities.
PoM (Point of Modernization): an entity identifying a difference between an as-is and ato-be model, which is the base for the effort estimation analysis (see section 3.3.1 onpage 34)
Process View: one of four architectural views according to Kruchten [61] that focuses onrepresenting the runtime aspects of a system such as communication and synchro-nization and non-functional requirements such as performance, availability, systemsintegrity and fault-tolerance. This view is shown for the Service-Oriented set of sys-tems in figure C.5
Rating scale: the measurement scale used to express the effort in the Rating Model of theframework in. It can range from a nominal to a ratio scale and is explained in detailin section 3.3.1 on page 33
SCA (Service Component Architecture): a modeling standard for the architecture of Service-Oriented systems (see figure C.2)
SDO (Service Data Object): a data modeling standard for Service-Oriented systems (seefigure C.3)
Viewpoint: A specification of the conventions for constructing and using a view. A pattern
82

or template from which to develop individual views by establishing the purposes andaudience for a view and the techniques for its creation and analysis [49]
83

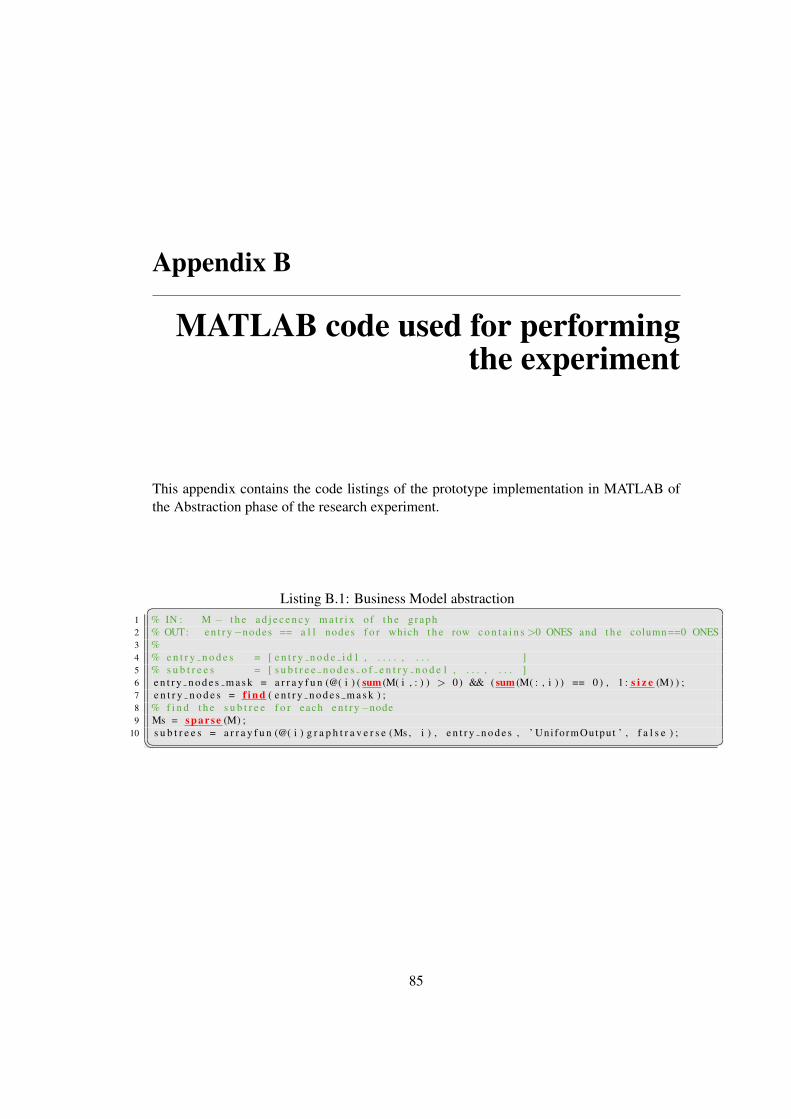
Appendix B
MATLAB code used for performingthe experiment
This appendix contains the code listings of the prototype implementation in MATLAB ofthe Abstraction phase of the research experiment.
Listing B.1: Business Model abstraction� �1 % IN : M − t h e a d j e c e n c y m a t r i x o f t h e g raph2 % OUT: e n t r y−nodes == a l l nodes f o r which t h e row c o n t a i n s >0 ONES and t h e column ==0 ONES3 %4 % e n t r y n o d e s = [ e n t r y n o d e i d 1 , . . . . , . . . ]5 % s u b t r e e s = [ s u b t r e e n o d e s o f e n t r y n o d e 1 , . . . , . . . ]6 e n t r y n o d e s m a s k = a r r a y f u n (@( i ) ( sum (M( i , : ) ) > 0) && ( sum (M( : , i ) ) == 0 ) , 1 : s i z e (M) ) ;7 e n t r y n o d e s = f i n d ( e n t r y n o d e s m a s k ) ;8 % f i n d t h e s u b t r e e f o r each e n t r y−node9 Ms = sp ar se (M) ;
10 s u b t r e e s = a r r a y f u n (@( i ) g r a p h t r a v e r s e (Ms , i ) , e n t r y n o d e s , ’ Uni formOutput ’ , f a l s e ) ;� �
85
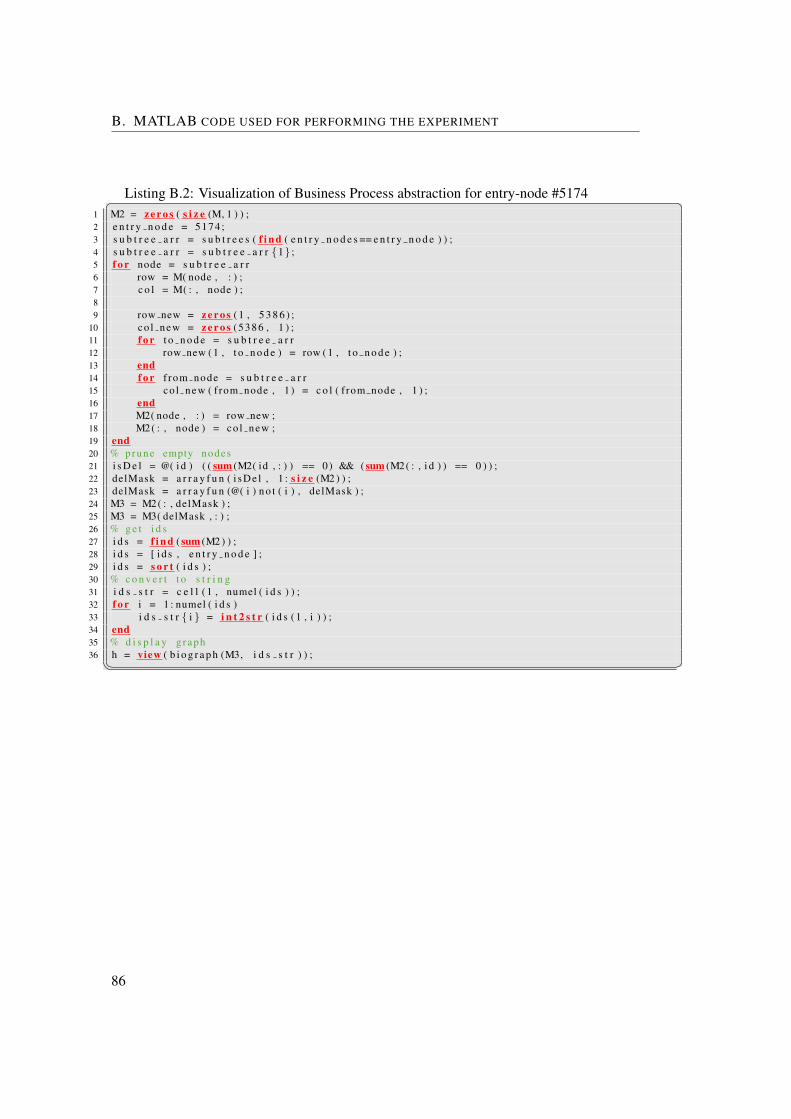
B. MATLAB CODE USED FOR PERFORMING THE EXPERIMENT
Listing B.2: Visualization of Business Process abstraction for entry-node #5174� �1 M2 = z e r o s ( s i z e (M, 1 ) ) ;2 e n t r y n o d e = 5174 ;3 s u b t r e e a r r = s u b t r e e s ( f i n d ( e n t r y n o d e s == e n t r y n o d e ) ) ;4 s u b t r e e a r r = s u b t r e e a r r {1} ;5 f o r node = s u b t r e e a r r6 row = M( node , : ) ;7 c o l = M( : , node ) ;89 row new = z e r o s ( 1 , 5 3 8 6 ) ;
10 co l new = z e r o s ( 5 3 8 6 , 1 ) ;11 f o r t o n o d e = s u b t r e e a r r12 row new ( 1 , t o n o d e ) = row ( 1 , t o n o d e ) ;13 end14 f o r f rom node = s u b t r e e a r r15 co l new ( from node , 1 ) = c o l ( f rom node , 1 ) ;16 end17 M2( node , : ) = row new ;18 M2( : , node ) = co l new ;19 end20 % prune empty nodes21 i s D e l = @( i d ) ( ( sum (M2( id , : ) ) == 0) && ( sum (M2( : , i d ) ) == 0 ) ) ;22 delMask = a r r a y f u n ( i s D e l , 1 : s i z e (M2 ) ) ;23 delMask = a r r a y f u n (@( i ) n o t ( i ) , delMask ) ;24 M3 = M2( : , delMask ) ;25 M3 = M3( delMask , : ) ;26 % g e t i d s27 i d s = f i n d ( sum (M2 ) ) ;28 i d s = [ i d s , e n t r y n o d e ] ;29 i d s = s o r t ( i d s ) ;30 % c o n v e r t t o s t r i n g31 i d s s t r = c e l l ( 1 , numel ( i d s ) ) ;32 f o r i = 1 : numel ( i d s )33 i d s s t r { i } = i n t 2 s t r ( i d s ( 1 , i ) ) ;34 end35 % d i s p l a y graph36 h = view ( b i o g r a p h (M3, i d s s t r ) ) ;� �
86
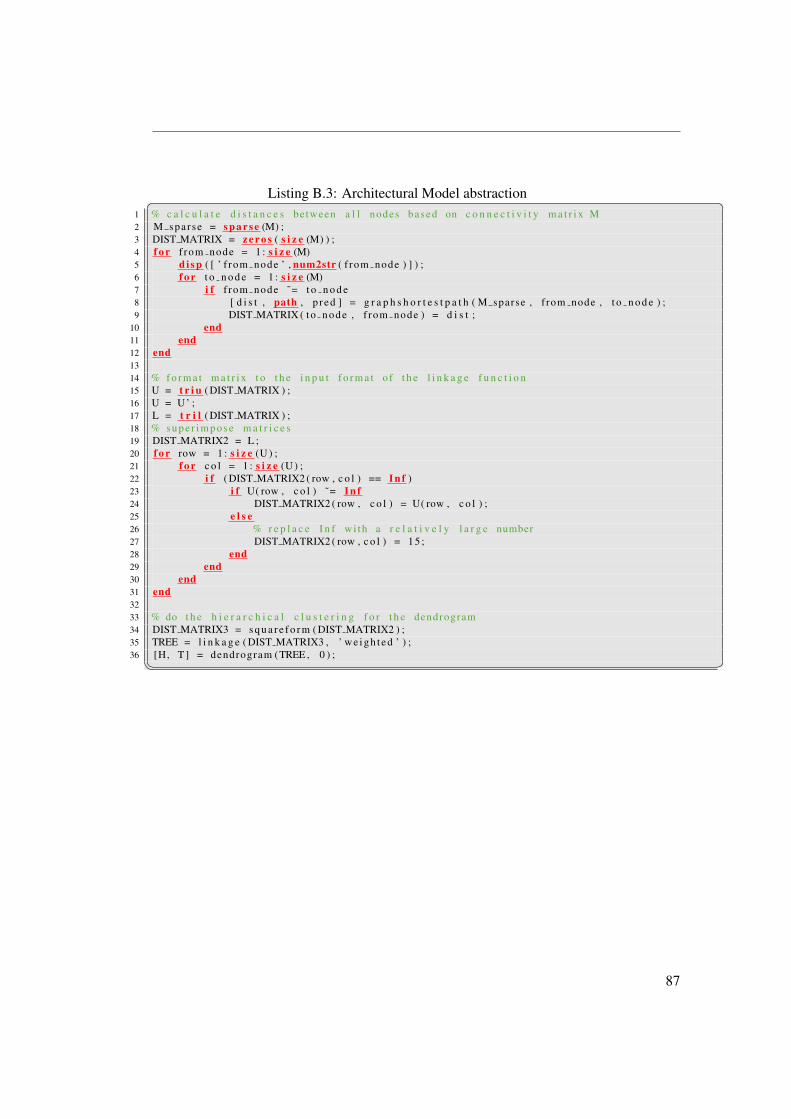
Listing B.3: Architectural Model abstraction� �1 % c a l c u l a t e d i s t a n c e s between a l l nodes based on c o n n e c t i v i t y m a t r i x M2 M sparse = sp ar se (M) ;3 DIST MATRIX = z e r o s ( s i z e (M) ) ;4 f o r f rom node = 1 : s i z e (M)5 di sp ( [ ’ f rom node ’ , num2str ( f rom node ) ] ) ;6 f o r t o n o d e = 1 : s i z e (M)7 i f f rom node ˜= t o n o d e8 [ d i s t , path , p r ed ] = g r a p h s h o r t e s t p a t h ( M sparse , f rom node , t o n o d e ) ;9 DIST MATRIX ( to node , f rom node ) = d i s t ;
10 end11 end12 end1314 % f o r m a t m a t r i x t o t h e i n p u t f o r m a t o f t h e l i n k a g e f u n c t i o n15 U = t r i u ( DIST MATRIX ) ;16 U = U’ ;17 L = t r i l ( DIST MATRIX ) ;18 % s u p e r i m p o s e m a t r i c e s19 DIST MATRIX2 = L ;20 f o r row = 1 : s i z e (U ) ;21 f o r c o l = 1 : s i z e (U ) ;22 i f ( DIST MATRIX2 ( row , c o l ) == I n f )23 i f U( row , c o l ) ˜= I n f24 DIST MATRIX2 ( row , c o l ) = U( row , c o l ) ;25 e l s e26 % r e p l a c e I n f wi th a r e l a t i v e l y l a r g e number27 DIST MATRIX2 ( row , c o l ) = 1 5 ;28 end29 end30 end31 end3233 % do t h e h i e r a r c h i c a l c l u s t e r i n g f o r t h e dendrogram34 DIST MATRIX3 = s q u a r e f o r m ( DIST MATRIX2 ) ;35 TREE = l i n k a g e ( DIST MATRIX3 , ’ w e i g h t e d ’ ) ;36 [H, T ] = dendrogram (TREE , 0 ) ;� �
87
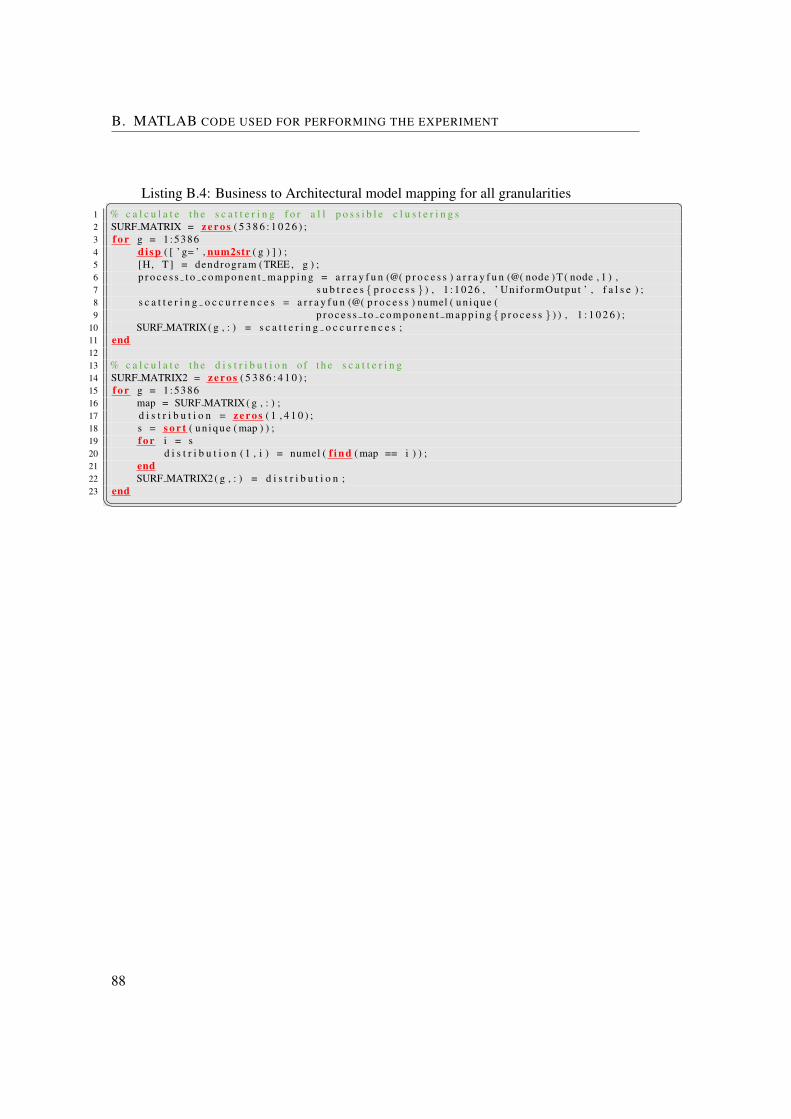
B. MATLAB CODE USED FOR PERFORMING THE EXPERIMENT
Listing B.4: Business to Architectural model mapping for all granularities� �1 % c a l c u l a t e t h e s c a t t e r i n g f o r a l l p o s s i b l e c l u s t e r i n g s2 SURF MATRIX = z e r o s ( 5 3 8 6 : 1 0 2 6 ) ;3 f o r g = 1:53864 di sp ( [ ’ g= ’ , num2str ( g ) ] ) ;5 [H, T ] = dendrogram (TREE , g ) ;6 p r o c e s s t o c o m p o n e n t m a p p i n g = a r r a y f u n (@( p r o c e s s ) a r r a y f u n (@( node ) T ( node , 1 ) ,7 s u b t r e e s { p r o c e s s } ) , 1 : 1 0 2 6 , ’ Uni formOutput ’ , f a l s e ) ;8 s c a t t e r i n g o c c u r r e n c e s = a r r a y f u n (@( p r o c e s s ) numel ( u n i qu e (9 p r o c e s s t o c o m p o n e n t m a p p i n g { p r o c e s s } ) ) , 1 : 1 0 2 6 ) ;
10 SURF MATRIX( g , : ) = s c a t t e r i n g o c c u r r e n c e s ;11 end1213 % c a l c u l a t e t h e d i s t r i b u t i o n o f t h e s c a t t e r i n g14 SURF MATRIX2 = z e r o s ( 5 3 8 6 : 4 1 0 ) ;15 f o r g = 1:538616 map = SURF MATRIX( g , : ) ;17 d i s t r i b u t i o n = z e r o s ( 1 , 4 1 0 ) ;18 s = s o r t ( un iq ue ( map ) ) ;19 f o r i = s20 d i s t r i b u t i o n ( 1 , i ) = numel ( f i n d ( map == i ) ) ;21 end22 SURF MATRIX2( g , : ) = d i s t r i b u t i o n ;23 end� �
88
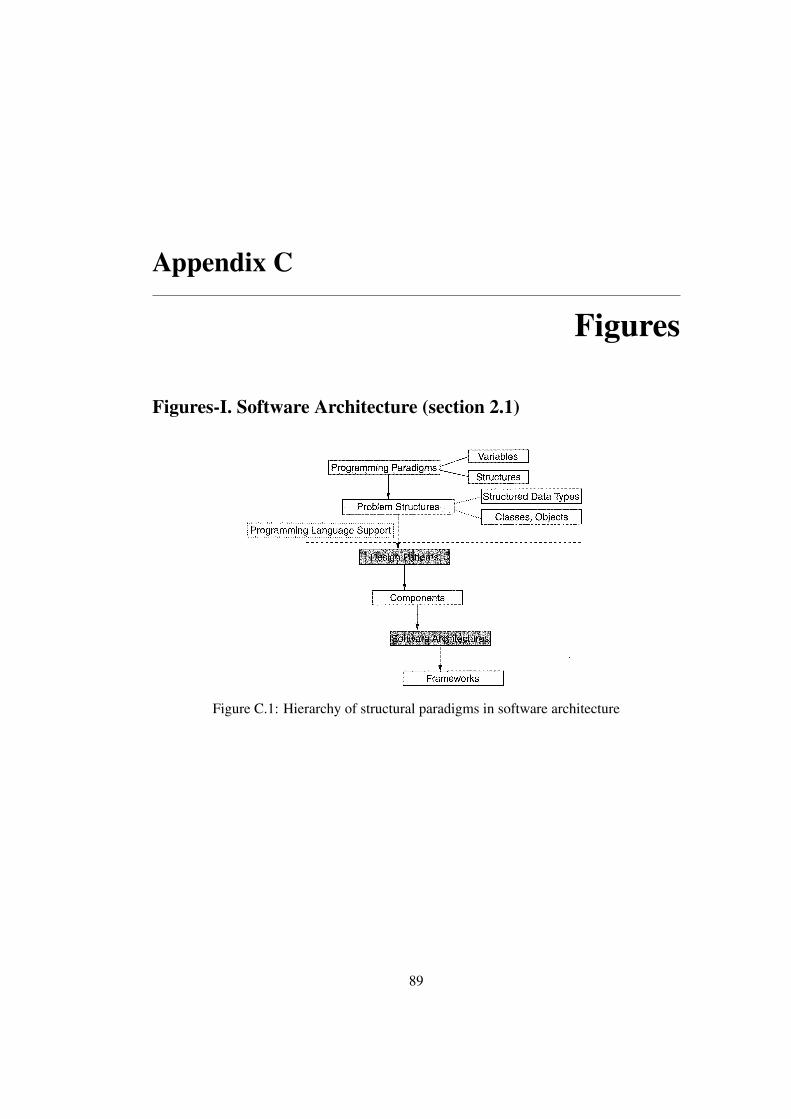
Appendix C
Figures
Figures-I. Software Architecture (section 2.1)
Figure C.1: Hierarchy of structural paradigms in software architecture
89
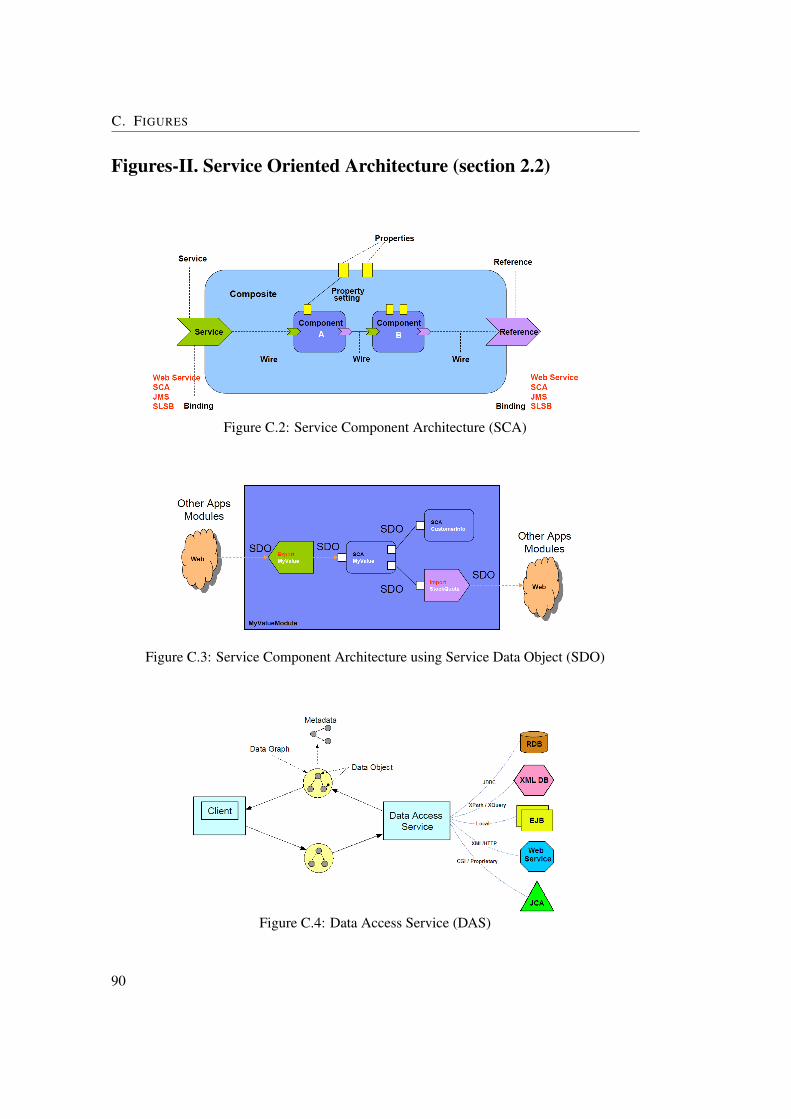
C. FIGURES
Figures-II. Service Oriented Architecture (section 2.2)
Figure C.2: Service Component Architecture (SCA)
Figure C.3: Service Component Architecture using Service Data Object (SDO)
Figure C.4: Data Access Service (DAS)
90
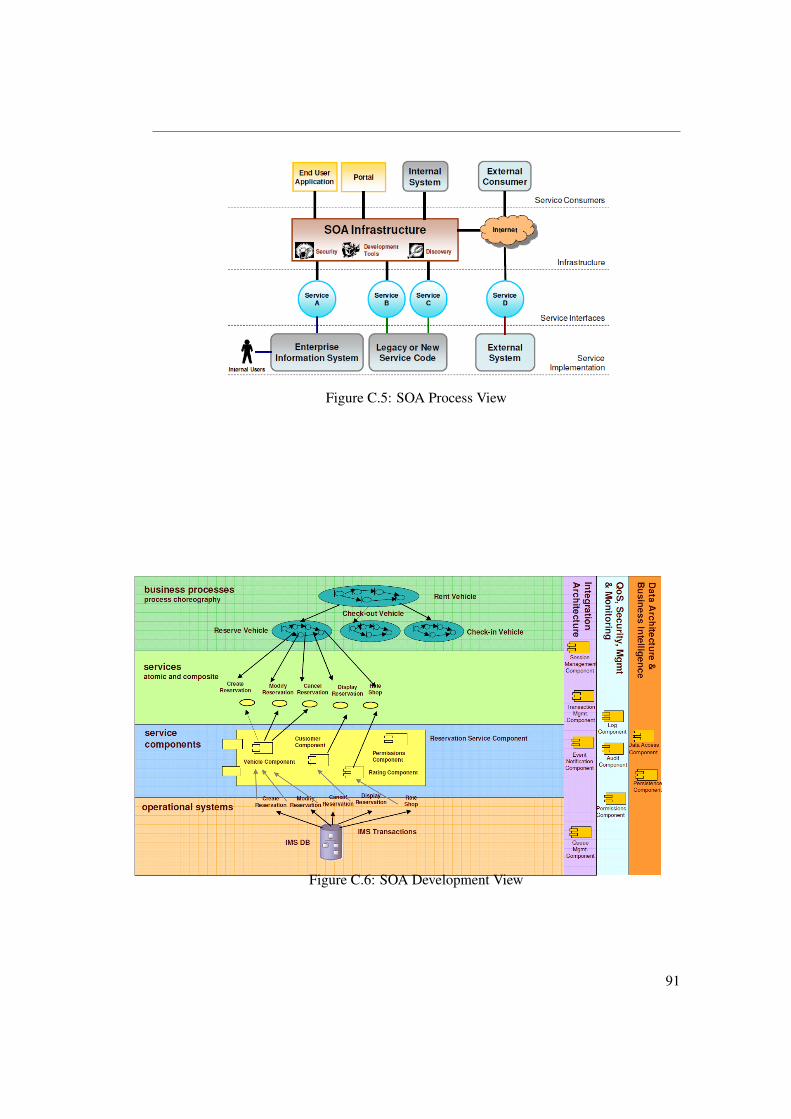
Figure C.5: SOA Process View
Figure C.6: SOA Development View
91
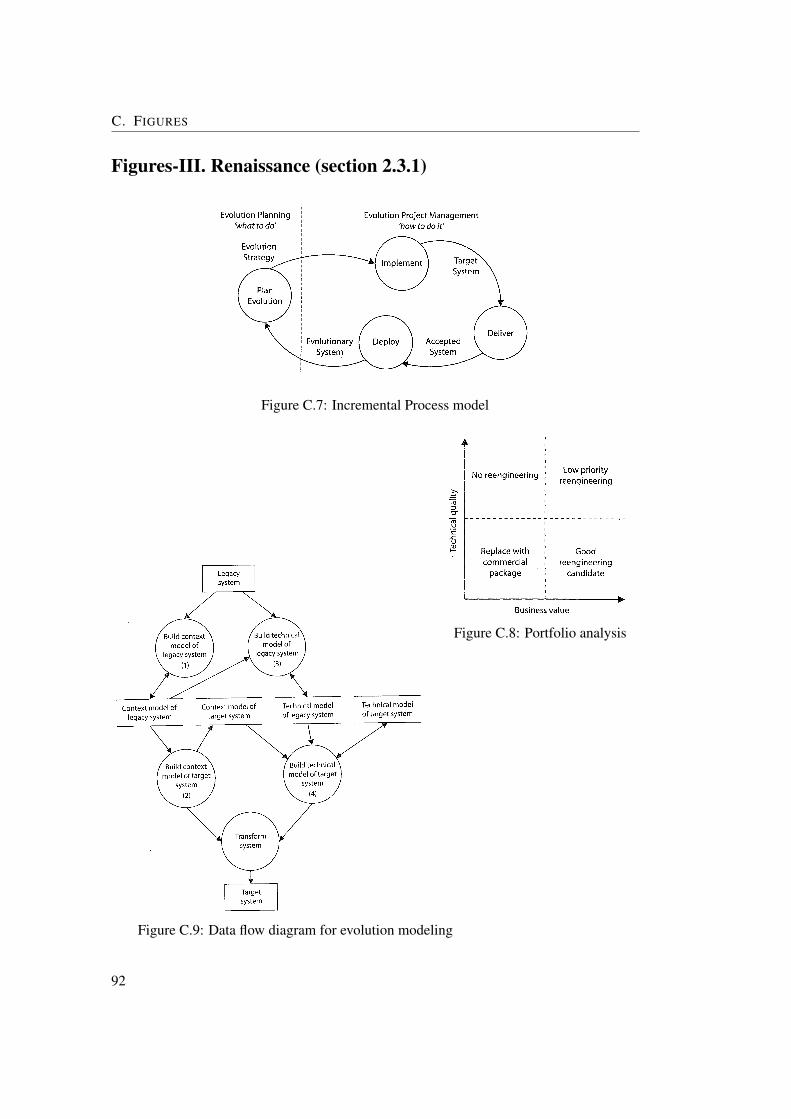
C. FIGURES
Figures-III. Renaissance (section 2.3.1)
Figure C.7: Incremental Process model
C.8: Figure C.8: Portfolio analysis
Figure C.9: Data flow diagram for evolution modeling
92
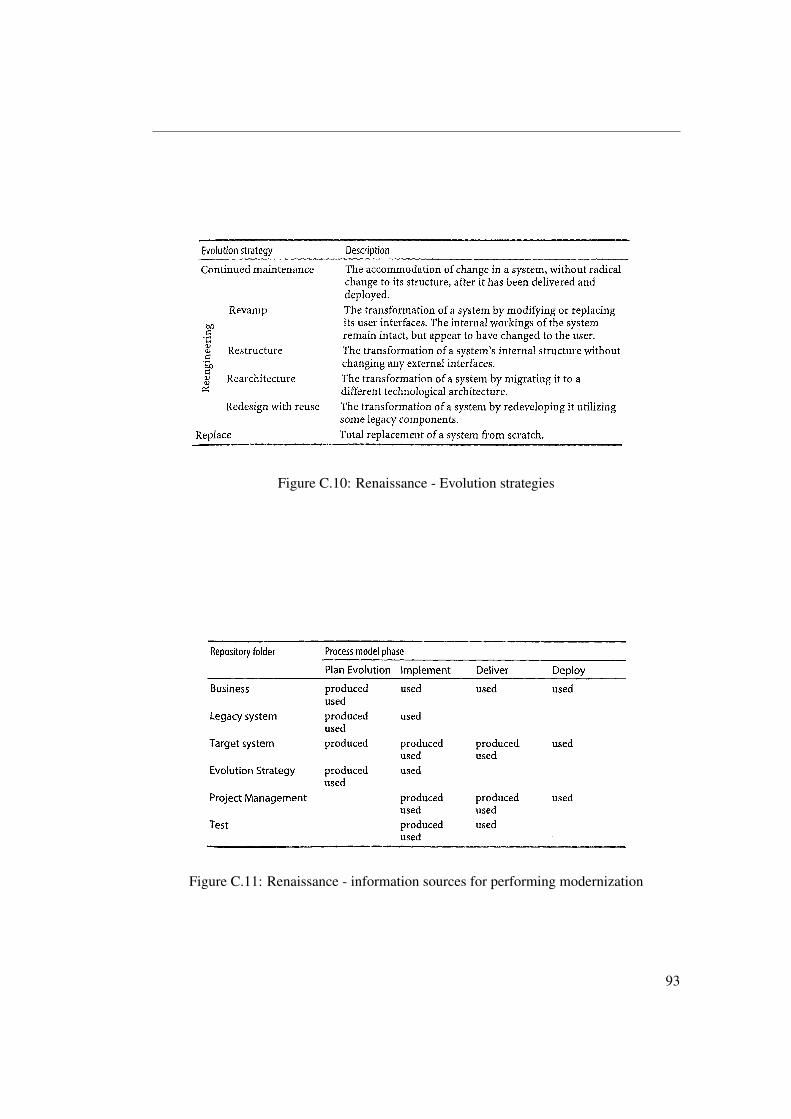
Figure C.10: Renaissance - Evolution strategies
Figure C.11: Renaissance - information sources for performing modernization
93
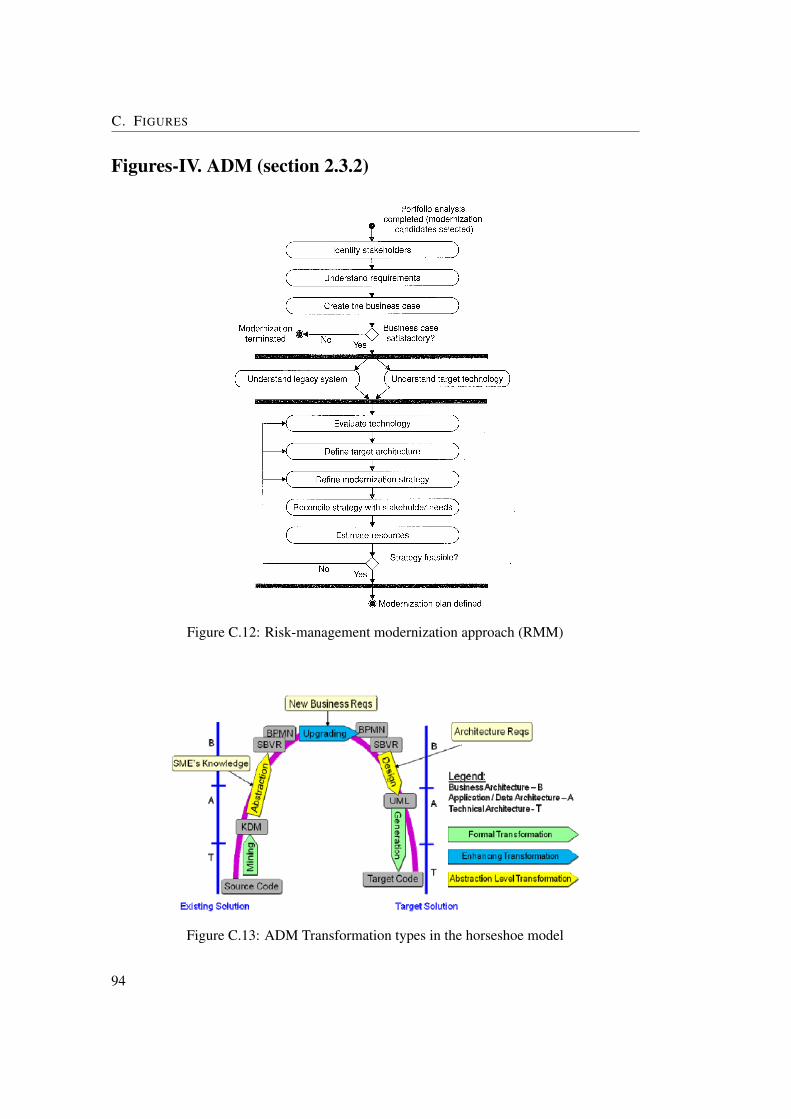
C. FIGURES
Figures-IV. ADM (section 2.3.2)
Figure C.12: Risk-management modernization approach (RMM)
Figure C.13: ADM Transformation types in the horseshoe model
94
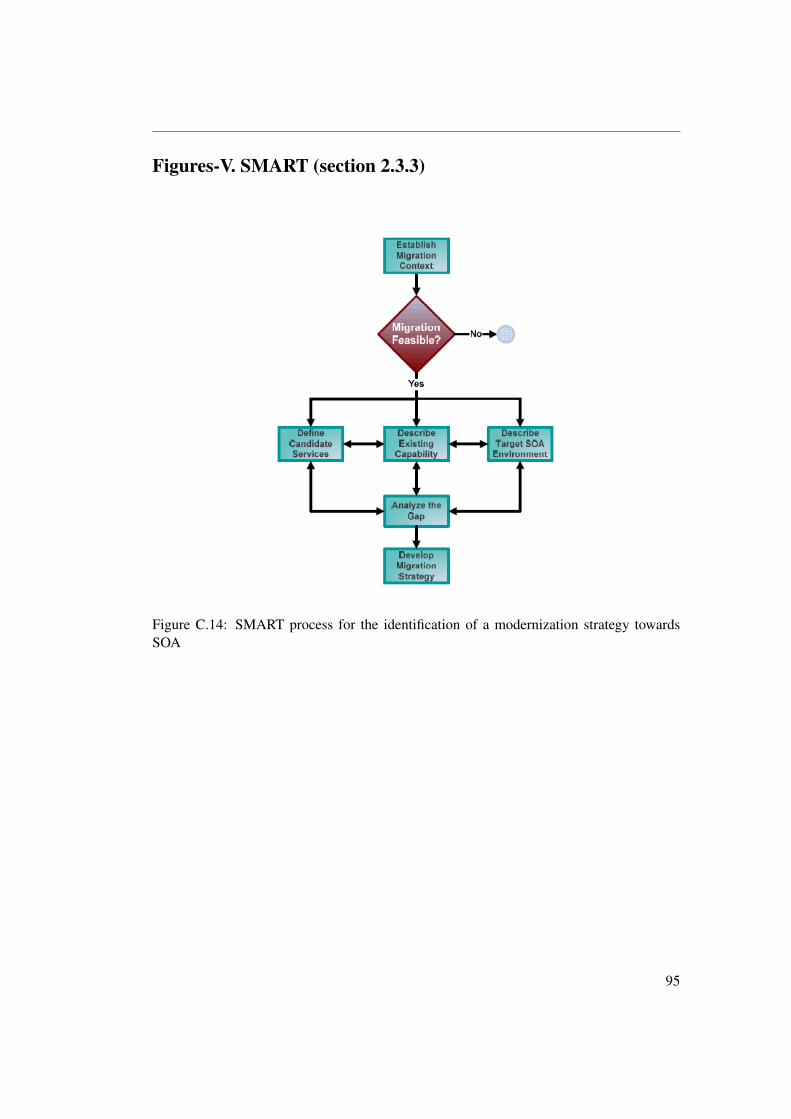
Figures-V. SMART (section 2.3.3)
Figure C.14: SMART process for the identification of a modernization strategy towardsSOA
95
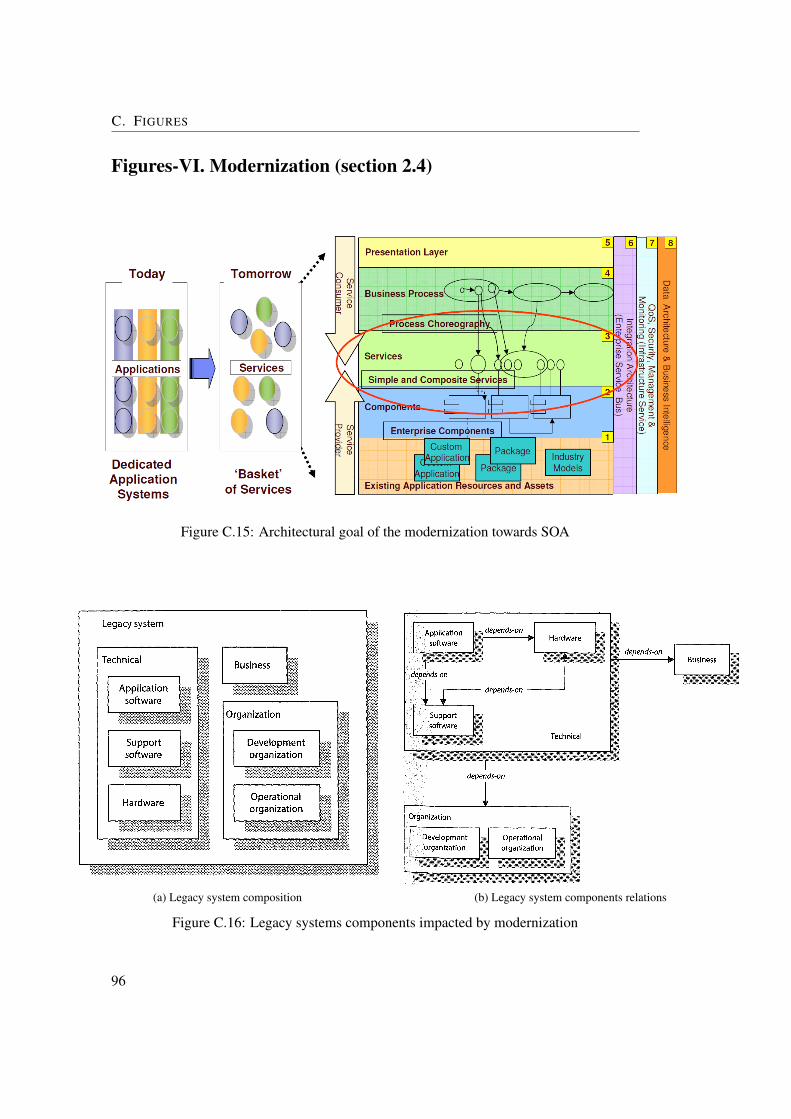
C. FIGURES
Figures-VI. Modernization (section 2.4)
Figure C.15: Architectural goal of the modernization towards SOA
(a) Legacy system composition (b) Legacy system components relations
Figure C.16: Legacy systems components impacted by modernization
96
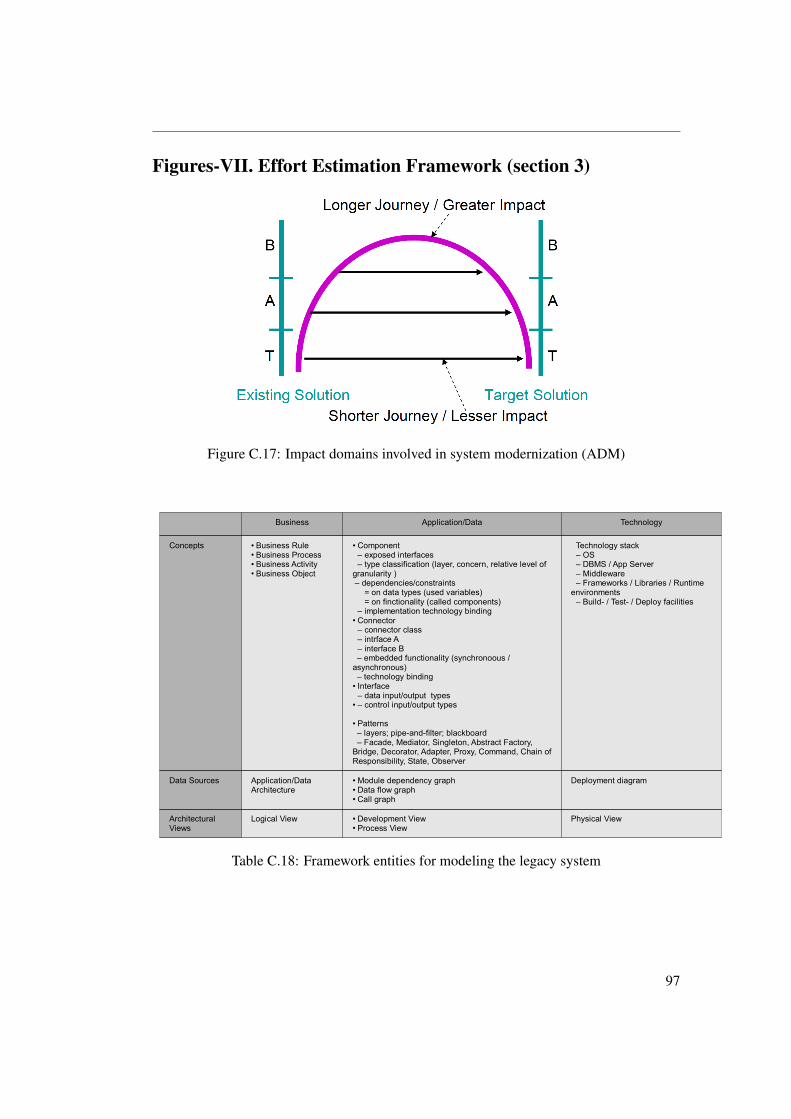
Figures-VII. Effort Estimation Framework (section 3)
Figure C.17: Impact domains involved in system modernization (ADM)
Business Application/Data Technology
Concepts ● Business Rule● Business Process● Business Activity● Business Object
● Component – exposed interfaces – type classification (layer, concern, relative level of
granularity ) – dependencies/constraints = on data types (used variables) = on finctionality (called components) – implementation technology binding
● Connector – connector class – intrface A – interface B
– embedded functionality (synchronoous / asynchronous) – technology binding● Interface – data input/output types
● – control input/output types
● Patterns – layers; pipe-and-filter; blackboard – Facade, Mediator, Singleton, Abstract Factory, Bridge, Decorator, Adapter, Proxy, Command, Chain of Responsibility, State, Observer
Technology stack – OS – DBMS / App Server – Middleware – Frameworks / Libraries / Runtime
environments – Build- / Test- / Deploy facilities
Data Sources Application/Data Architecture
● Module dependency graph● Data flow graph● Call graph
Deployment diagram
Architectural Views
Logical View ● Development View● Process View
Physical View
Table C.18: Framework entities for modeling the legacy system
97
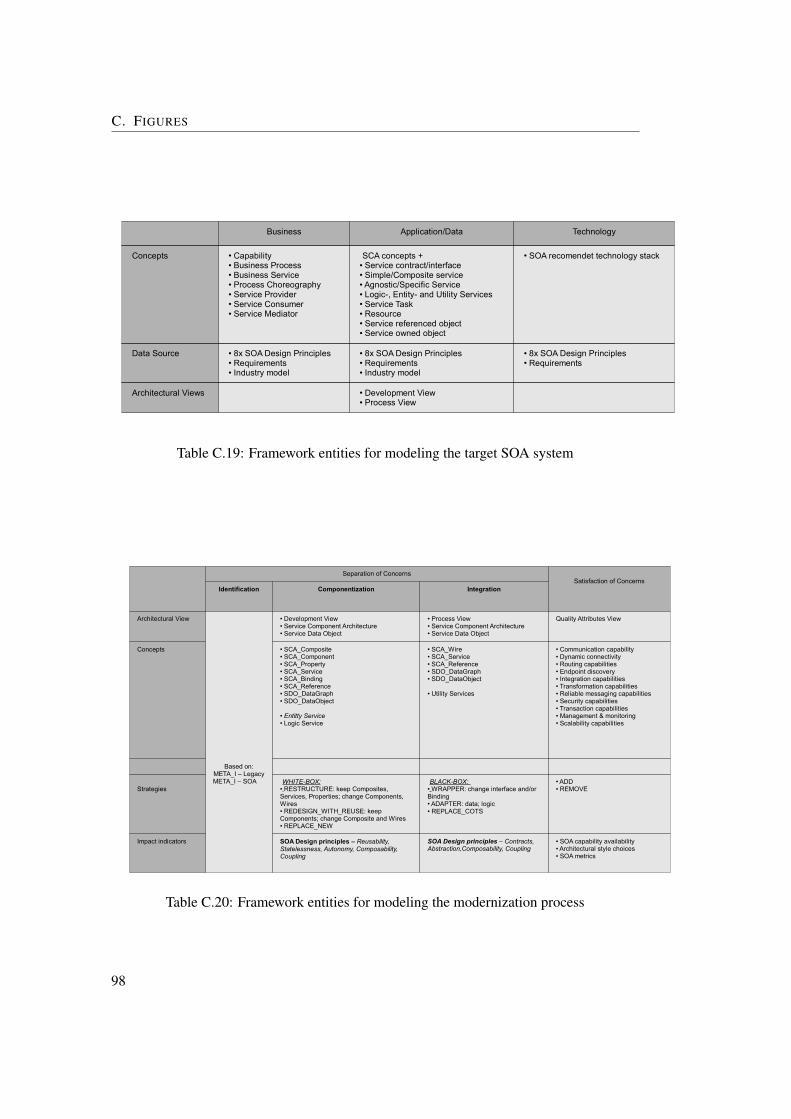
C. FIGURES
Business Application/Data Technology
Concepts ● Capability● Business Process● Business Service● Process Choreography● Service Provider● Service Consumer ● Service Mediator
SCA concepts + ● Service contract/interface● Simple/Composite service● Agnostic/Specific Service● Logic-, Entity- and Utility Services● Service Task● Resource● Service referenced object● Service owned object
● SOA recomendet technology stack
Data Source ● 8x SOA Design Principles● Requirements● Industry model
● 8x SOA Design Principles● Requirements● Industry model
● 8x SOA Design Principles● Requirements
Architectural Views ● Development View● Process View
Table C.19: Framework entities for modeling the target SOA system
Separation of ConcernsSatisfaction of Concerns
Identification Componentization Integration
Architectural View
Based on: META_I – LegacyMETA_I – SOA
● Development View● Service Component Architecture ● Service Data Object
● Process View● Service Component Architecture● Service Data Object
Quality Attributes View
Concepts ● SCA_Composite● SCA_Component● SCA_Property● SCA_Service● SCA_Binding● SCA_Reference● SDO_DataGraph● SDO_DataObject
● Entitty Service● Logic Service
● SCA_Wire● SCA_Service● SCA_Reference ● SDO_DataGraph● SDO_DataObject
● Utility Services
● Communication capability● Dynamic connectivity● Routing capabilities● Endpoint discovery● Integration capabilities● Transformation capabilities● Reliable messaging capabilities● Security capabilities● Transaction capabilities● Management & monitoring● Scalability capabilities
StrategiesWHITE-BOX:
● RESTRUCTURE: keep Composites, Services, Properties; change Components, Wires● REDESIGN_WITH_REUSE: keep Components; change Composite and Wires● REPLACE_NEW
BLACK-BOX: ● WRAPPER: change interface and/or Binding● ADAPTER: data; logic● REPLACE_COTS
● ADD● REMOVE
Impact indicators SOA Design principles – Reusability, Statelessness, Autonomy, Composability, Coupling
SOA Design principles – Contracts, Abstraction,Composability, Coupling
● SOA capability availability● Architectural style choices● SOA metrics
Table C.20: Framework entities for modeling the modernization process
98
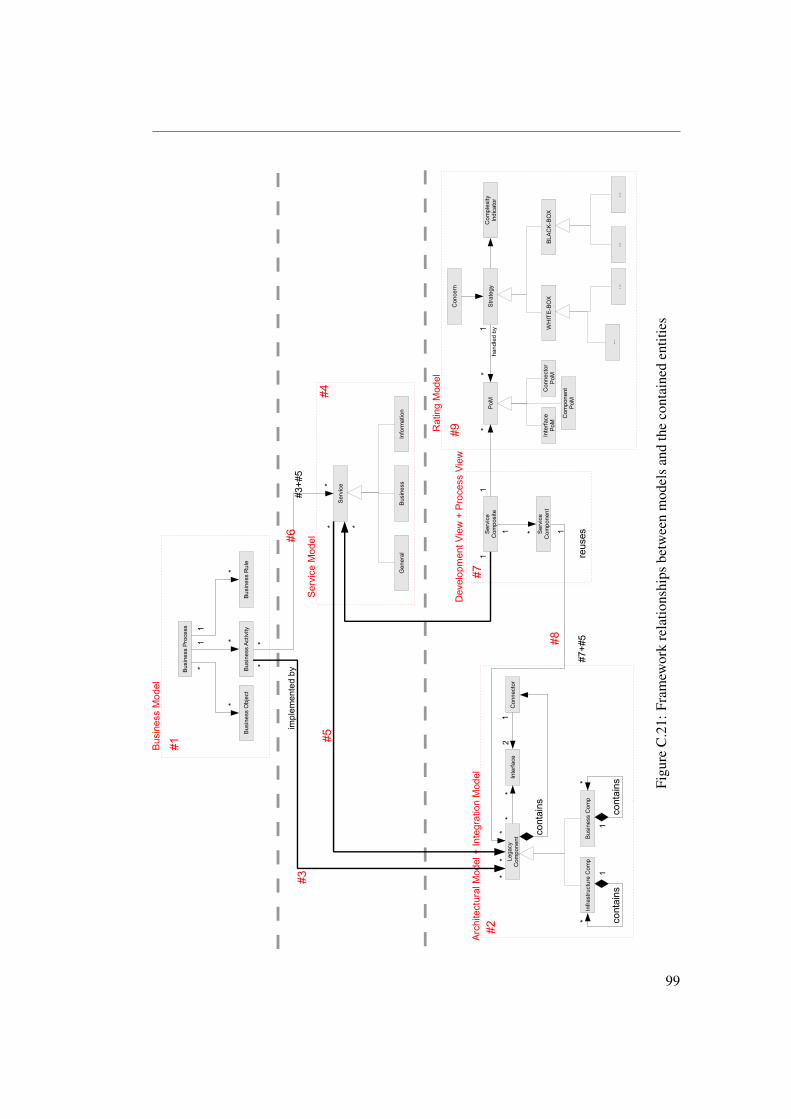
Dev
elop
men
t Vie
w +
Pro
cess
Vie
w
Rat
ing
Mod
el
#7+#
5re
uses
Arch
itect
ural
Mod
el +
Inte
grat
ion
Mod
el
Serv
ice
Mod
el
Infra
stru
ctur
e C
omp
Inte
rface
2*
Con
nect
or*
1Le
gacy
Com
pone
nt Bus
ines
s C
omp
Bus
ines
s A
ctiv
ity
Bus
ines
s Pr
oces
s 1*
Busi
ness
Rul
e
*
Bus
ines
s O
bjec
t
*1
*
Ser
vice
Gen
eral
Bus
ines
sIn
form
atio
n
#3+#
5
Ser
vice
Com
posi
te
Ser
vice
Com
pone
nt
impl
emen
ted
by
PoM
Stra
tegy
Com
plex
ityIn
dica
tor
Con
cern
#1
#2
#3
#4#5
cont
ains
cont
ains
cont
ains
Busi
ness
Mod
el
#6
#7
han
dled
by
#8W
HIT
E-BO
XB
LAC
K-B
OX
*
1
*
1
**
11
1
*
**
**
**
Inte
rface
PoM
Con
nect
orP
oM
Com
pone
ntP
oM
......
......
1
*1 *
#9
Figu
reC
.21:
Fram
ewor
kre
latio
nshi
psbe
twee
nm
odel
san
dth
eco
ntai
ned
entit
ies
99
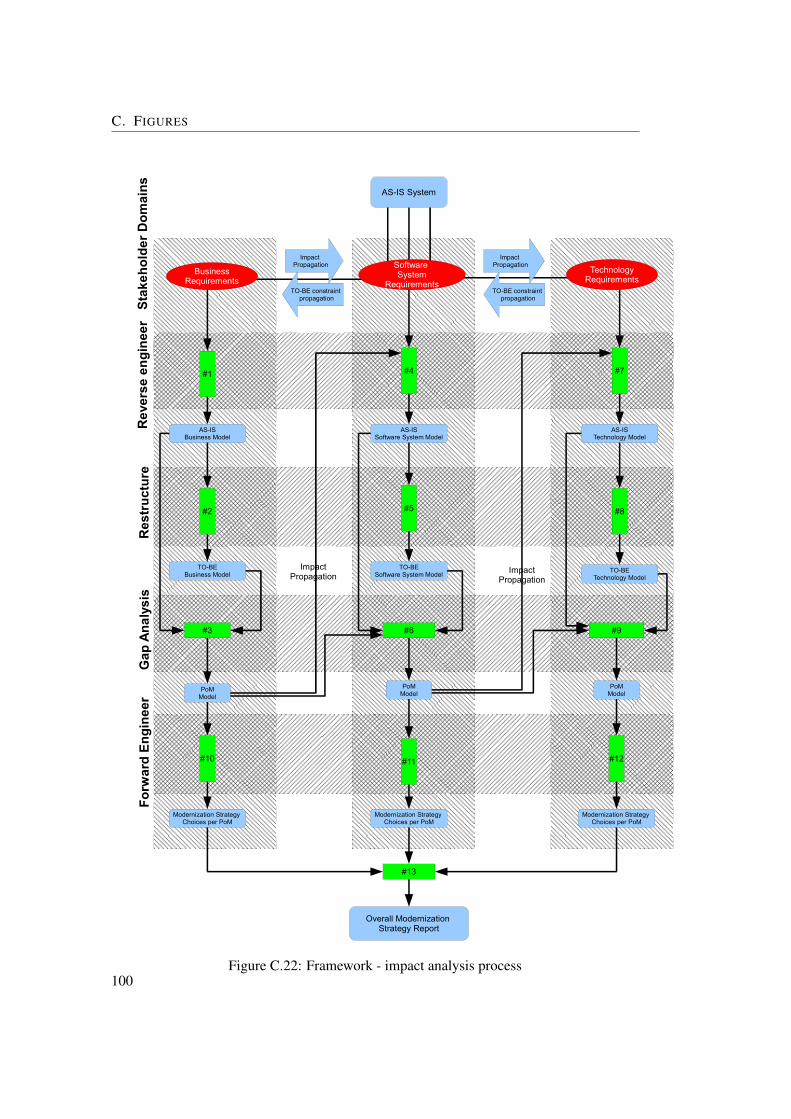
C. FIGURES
AS-IS System
AS-ISBusiness Model
TO-BEBusiness Model
Res
truc
ture
AS-ISSoftware System Model
TO-BESoftware System Model
AS-ISTechnology Model
TO-BETechnology Model
Rev
erse
eng
inee
r
BusinessRequirements
Software System
Requirements
TechnologyRequirements
#1 #4 #7
#2 #5 #8
PoMModel
PoMModel
Gap
Ana
lysi
s
#3 #6
PoMModel
#9
Impact Propagation
ImpactPropagation
Forw
ard
Engi
neer
Modernization Strategy Choices per PoM
Modernization Strategy Choices per PoM
Modernization Strategy Choices per PoM
Overall Modernization Strategy Report
#10 #11 #12
Stak
ehol
der D
omai
ns
TO-BE constraint propagation
Impact Propagation
TO-BE constraint propagation
Impact Propagation
#13
Figure C.22: Framework - impact analysis process100
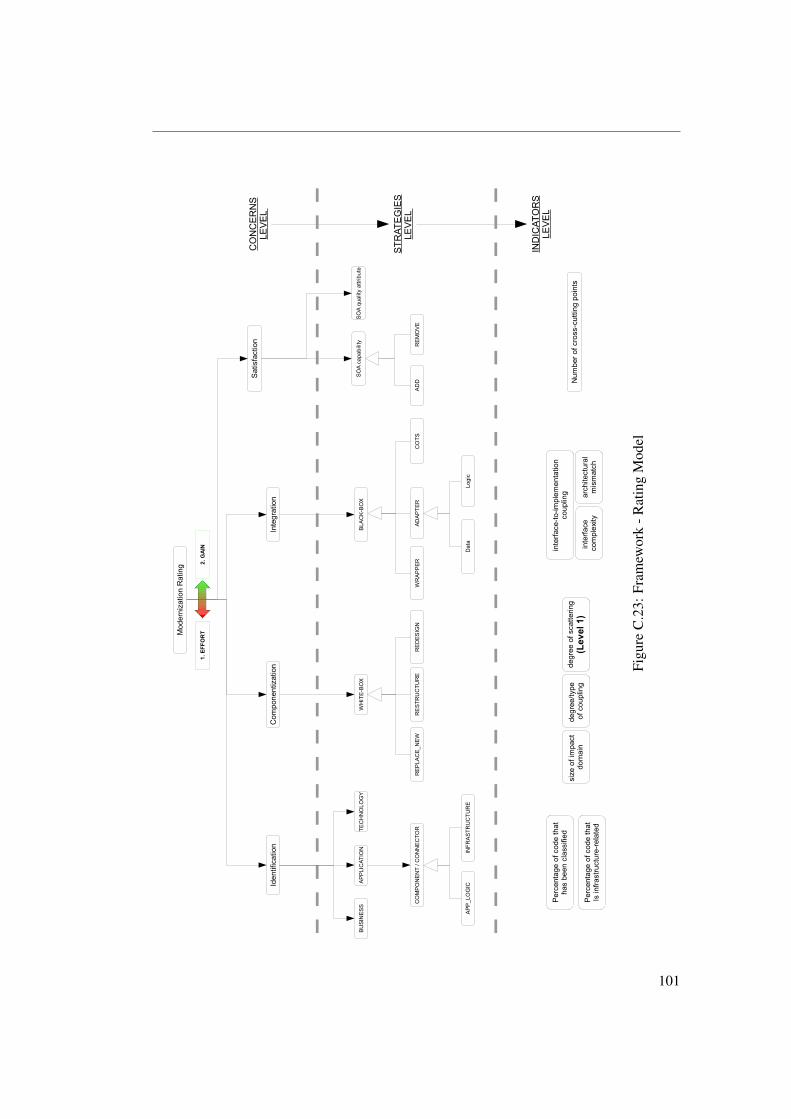
Iden
tific
atio
nIn
tegr
atio
nC
ompo
nent
izat
ion
Mod
erni
zatio
n R
atin
g
ADAP
TER
WR
APP
ER
CO
NC
ERN
SLE
VEL
IND
ICAT
OR
SLE
VEL
STR
ATEG
IES
LEVE
L
WH
ITE
-BO
XB
LAC
K-B
OX
CO
TS
Logi
cD
ata
RE
DES
IGN
RE
STR
UC
TUR
ER
EPL
AC
E_N
EW
Sat
isfa
ctio
n
1. E
FFO
RT
2. G
AIN
CO
MP
ON
ENT
/ CO
NN
EC
TOR
BU
SIN
ES
SA
PPLI
CAT
ION
TEC
HN
OLO
GY
APP
_LO
GIC
INFR
AS
TRU
CTU
RE
Per
cent
age
of c
ode
that
has
bee
n cl
assi
fied
Per
cent
age
of c
ode
that
Is in
frast
ruct
ure-
rela
ted
SO
A ca
pabi
lity
SO
A qu
ality
attr
ibut
e
AD
DR
EM
OVE
Num
ber o
f cro
ss-c
uttin
g po
ints
size
of i
mpa
ct
dom
ain
degr
ee/ty
pe
of c
oupl
ing
degr
ee o
f sca
tterin
g(L
evel
1)
inte
rface
-to-im
plem
enta
tion
coup
ling
inte
rface
co
mpl
exity
arch
itect
ural
mis
mat
ch
Figu
reC
.23:
Fram
ewor
k-R
atin
gM
odel
101
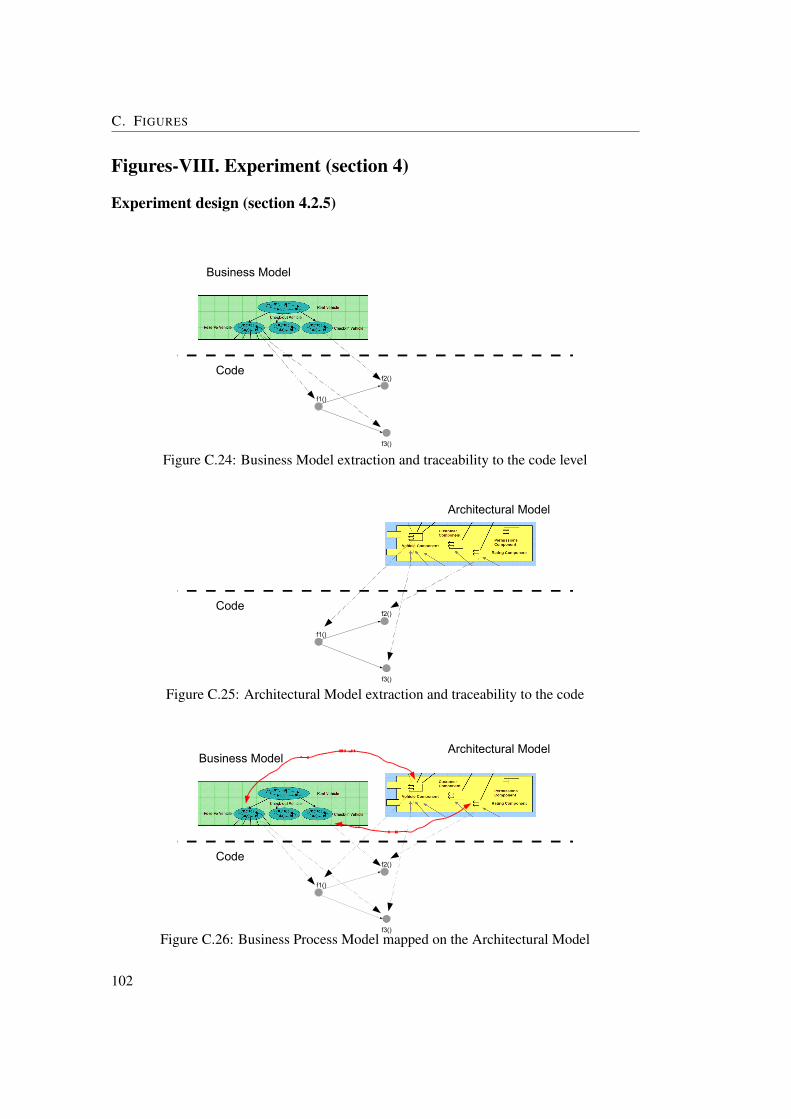
C. FIGURES
Figures-VIII. Experiment (section 4)
Experiment design (section 4.2.5)
f3()
f2()
f1()
Code
Business Model
Figure C.24: Business Model extraction and traceability to the code level
f3()
f2()
f1()
Code
Architectural Model
#2
Figure C.25: Architectural Model extraction and traceability to the code
f3()
f2()
f1()
Code
Architectural ModelBusiness Model
#3
Figure C.26: Business Process Model mapped on the Architectural Model
102
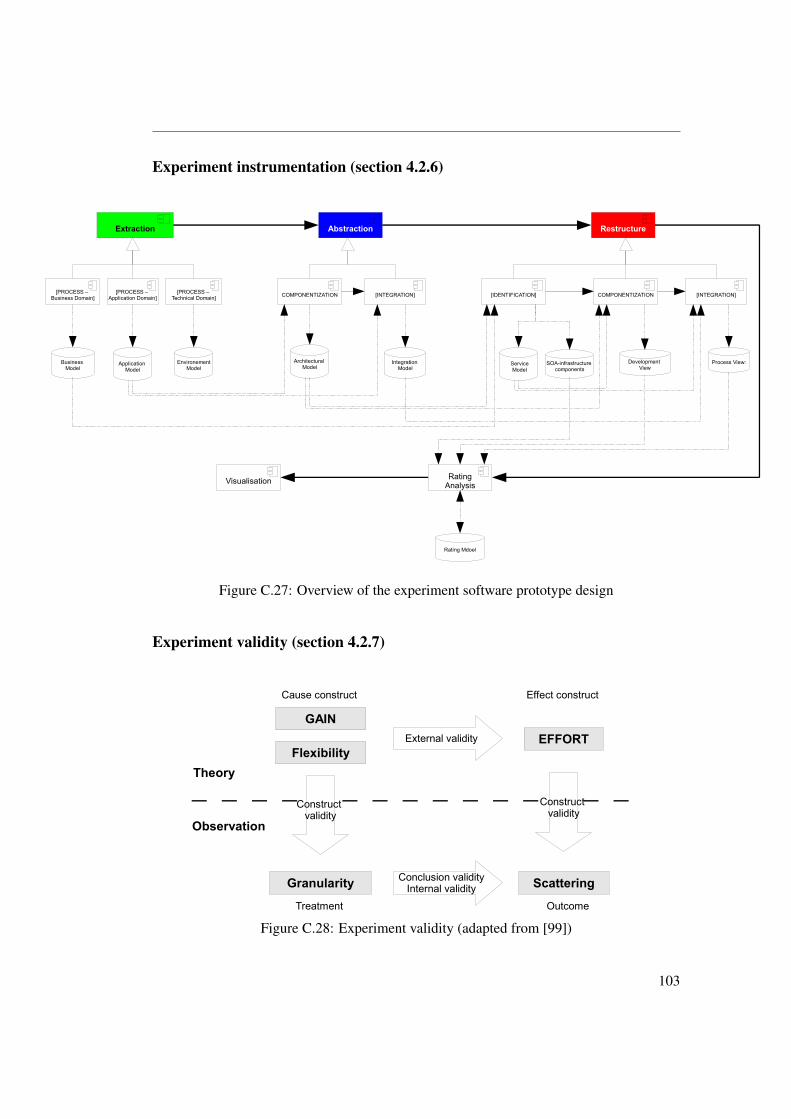
Experiment instrumentation (section 4.2.6)
Extraction Abstraction
COMPONENTIZATION [INTEGRATION][PROCESS – Business Domain]
[PROCESS – Application Domain]
Restructure
RatingAnalysis
[PROCESS – Technical Domain]
ServiceModel
EnvironementModel
Architectural Model
COMPONENTIZATION [INTEGRATION][IDENTIFICATION]
Business Model
Application Model
Integration Model
Visualisation
Development View
Process View:SOA-infrastructure components
Rating Mdoel
Figure C.27: Overview of the experiment software prototype design
Experiment validity (section 4.2.7)
GAINEFFORT
Flexibility
ScatteringGranularity Conclusion validityInternal validity
External validity
Observation
Theory
Cause construct
Construct validity
Construct validity
Effect construct
Treatment Outcome
Figure C.28: Experiment validity (adapted from [99])
103
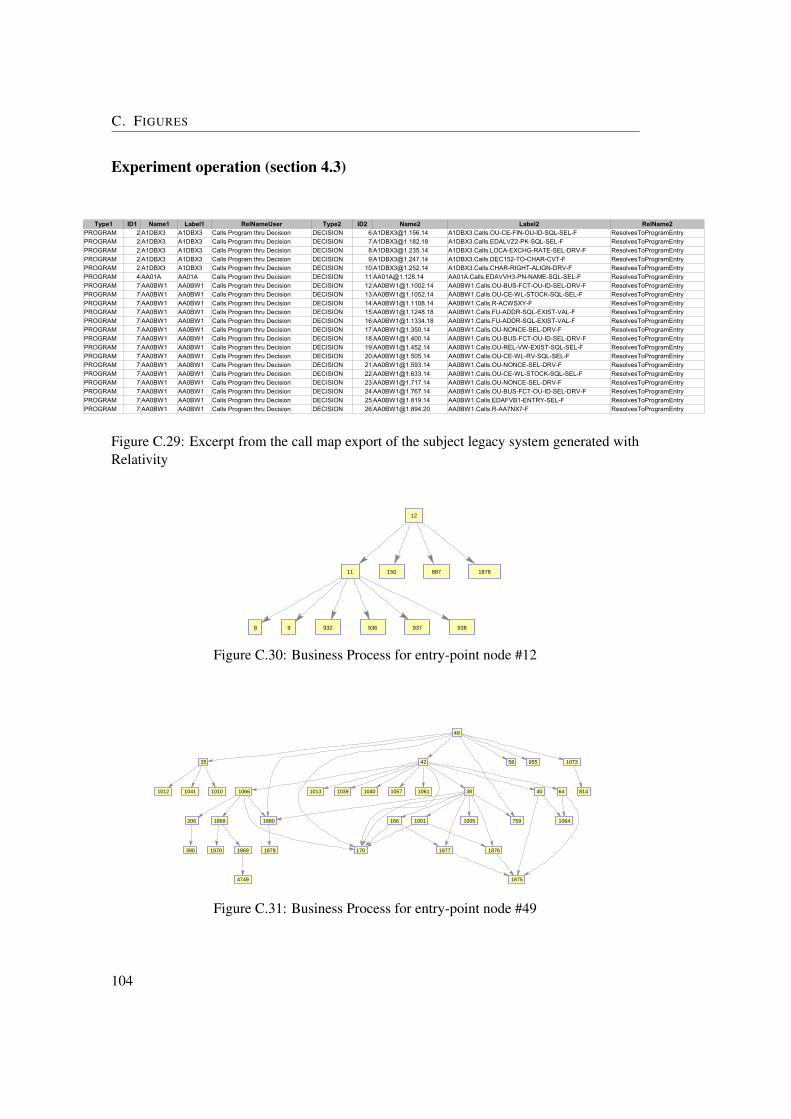
C. FIGURES
Experiment operation (section 4.3)
Type1 ID1 Name1 Label1 RelNameUser Type2 ID2 Name2 Label2 RelName2PROGRAM 2 A1DBX3 A1DBX3 Calls Program thru Decision DECISION 6 [email protected] A1DBX3.Calls.OU-CE-FIN-OU-ID-SQL-SEL-F ResolvesToProgramEntryPROGRAM 2 A1DBX3 A1DBX3 Calls Program thru Decision DECISION 7 [email protected] A1DBX3.Calls.EDALVZ2-PK-SQL-SEL-F ResolvesToProgramEntryPROGRAM 2 A1DBX3 A1DBX3 Calls Program thru Decision DECISION 8 [email protected] A1DBX3.Calls.LOCA-EXCHG-RATE-SEL-DRV-F ResolvesToProgramEntryPROGRAM 2 A1DBX3 A1DBX3 Calls Program thru Decision DECISION 9 [email protected] A1DBX3.Calls.DEC152-TO-CHAR-CVT-F ResolvesToProgramEntryPROGRAM 2 A1DBX3 A1DBX3 Calls Program thru Decision DECISION 10 [email protected] A1DBX3.Calls.CHAR-RIGHT-ALIGN-DRV-F ResolvesToProgramEntryPROGRAM 4 AA01A AA01A Calls Program thru Decision DECISION 11 [email protected] AA01A.Calls.EDAVVH3-PN-NAME-SQL-SEL-F ResolvesToProgramEntryPROGRAM 7 AA0BW1 AA0BW1 Calls Program thru Decision DECISION 12 [email protected] AA0BW1.Calls.OU-BUS-FCT-OU-ID-SEL-DRV-F ResolvesToProgramEntryPROGRAM 7 AA0BW1 AA0BW1 Calls Program thru Decision DECISION 13 [email protected] AA0BW1.Calls.OU-CE-WL-STOCK-SQL-SEL-F ResolvesToProgramEntryPROGRAM 7 AA0BW1 AA0BW1 Calls Program thru Decision DECISION 14 [email protected] AA0BW1.Calls.R-ACWSXY-F ResolvesToProgramEntryPROGRAM 7 AA0BW1 AA0BW1 Calls Program thru Decision DECISION 15 [email protected] AA0BW1.Calls.FU-ADDR-SQL-EXIST-VAL-F ResolvesToProgramEntryPROGRAM 7 AA0BW1 AA0BW1 Calls Program thru Decision DECISION 16 [email protected] AA0BW1.Calls.FU-ADDR-SQL-EXIST-VAL-F ResolvesToProgramEntryPROGRAM 7 AA0BW1 AA0BW1 Calls Program thru Decision DECISION 17 [email protected] AA0BW1.Calls.OU-NONCE-SEL-DRV-F ResolvesToProgramEntryPROGRAM 7 AA0BW1 AA0BW1 Calls Program thru Decision DECISION 18 [email protected] AA0BW1.Calls.OU-BUS-FCT-OU-ID-SEL-DRV-F ResolvesToProgramEntryPROGRAM 7 AA0BW1 AA0BW1 Calls Program thru Decision DECISION 19 [email protected] AA0BW1.Calls.OU-REL-VW-EXIST-SQL-SEL-F ResolvesToProgramEntryPROGRAM 7 AA0BW1 AA0BW1 Calls Program thru Decision DECISION 20 [email protected] AA0BW1.Calls.OU-CE-WL-RV-SQL-SEL-F ResolvesToProgramEntryPROGRAM 7 AA0BW1 AA0BW1 Calls Program thru Decision DECISION 21 [email protected] AA0BW1.Calls.OU-NONCE-SEL-DRV-F ResolvesToProgramEntryPROGRAM 7 AA0BW1 AA0BW1 Calls Program thru Decision DECISION 22 [email protected] AA0BW1.Calls.OU-CE-WL-STOCK-SQL-SEL-F ResolvesToProgramEntryPROGRAM 7 AA0BW1 AA0BW1 Calls Program thru Decision DECISION 23 [email protected] AA0BW1.Calls.OU-NONCE-SEL-DRV-F ResolvesToProgramEntryPROGRAM 7 AA0BW1 AA0BW1 Calls Program thru Decision DECISION 24 [email protected] AA0BW1.Calls.OU-BUS-FCT-OU-ID-SEL-DRV-F ResolvesToProgramEntryPROGRAM 7 AA0BW1 AA0BW1 Calls Program thru Decision DECISION 25 [email protected] AA0BW1.Calls.EDAFVB1-ENTRY-SEL-F ResolvesToProgramEntryPROGRAM 7 AA0BW1 AA0BW1 Calls Program thru Decision DECISION 26 [email protected] AA0BW1.Calls.R-AA7NX7-F ResolvesToProgramEntry
Figure C.29: Excerpt from the call map export of the subject legacy system generated withRelativity
8 9
11
12
150 887
932 936 937 938
1878
Figure C.30: Business Process for entry-point node #12
35
38 40
42
49
58
64
166
170
206
390
759
814
955
1001 1005
10101012 1013 1039 10401041 1057 1061
1064
1066
1073
1868
18691870
1875
187618771879
1880
4749
Figure C.31: Business Process for entry-point node #49
104
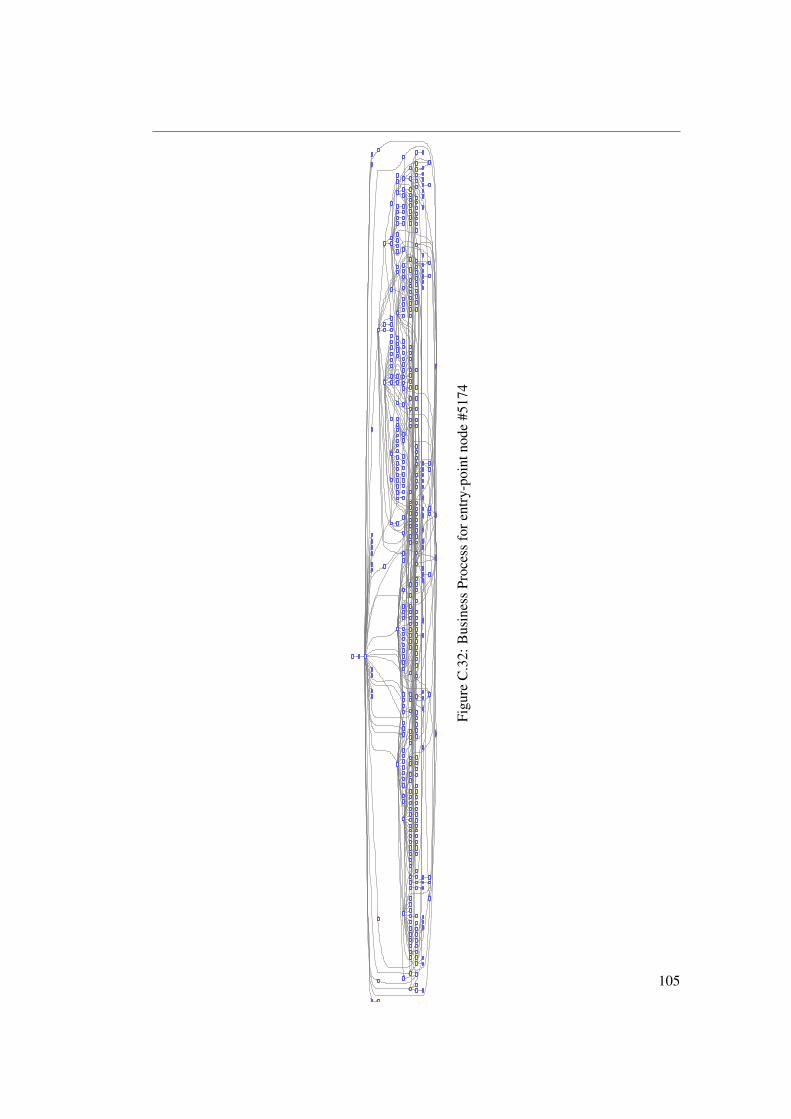
Figu
reC
.32:
Bus
ines
sPr
oces
sfo
rent
ry-p
oint
node
#517
4
105
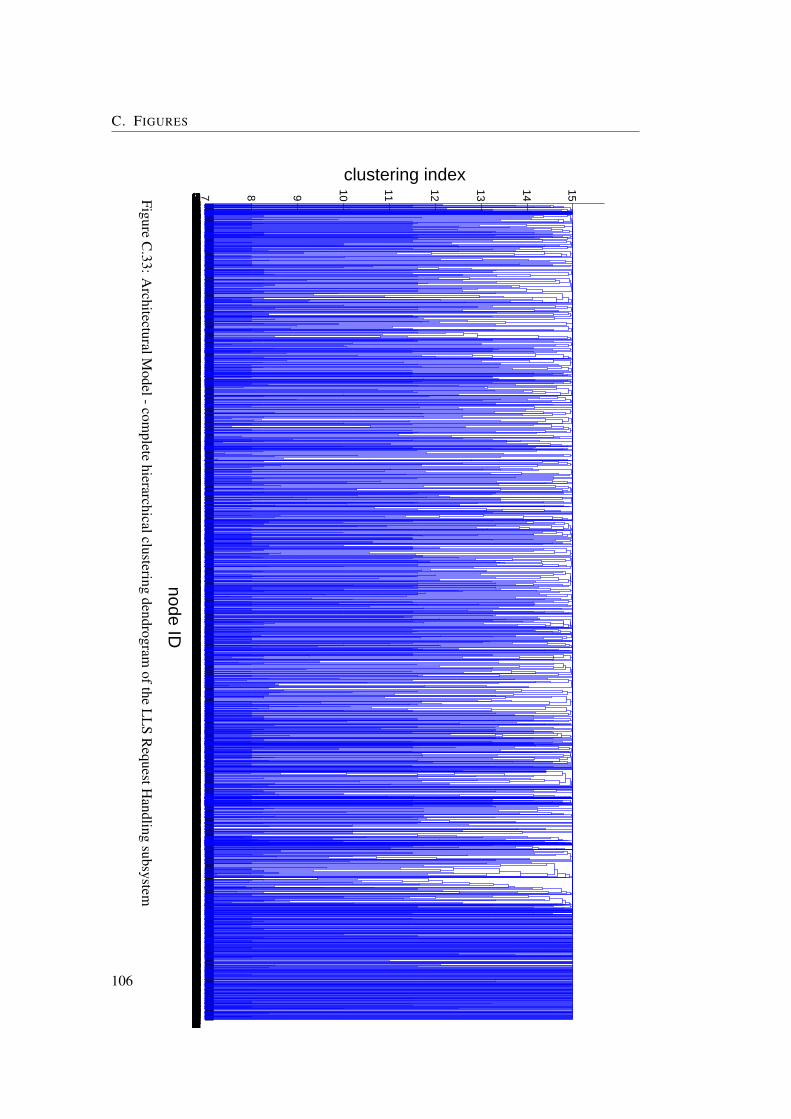
C. FIGURES
53185361534349965355534251784999535051881543 936154453475297154851035240530852845280533153031545141715471542 8 11 97 145 9 932 12 150 887 937 9381419538153225317149953735319531152961483501852931507149814975131149214871486 1875167 1861541154653215320528352381495500950195010 1
4764 73329982999 253 2541118112035483549491053335044533211131115111411321134 8048054806 754 755476248111378222222232224221622252226480748094818481948024828482948034817 757 758 7611101 3963992 3983993212121222123212621273547356635673558355935543555 2 330 407 653 266 276 238 258 245 283 301 416 419 465 271 320 325 305 947 949 844863 310 313 334 57 649 540 7604872 794487448734875 792 803 805 110 8061724 520 784 798 80017231166 450 504 60 92 775101921042105 485 528 492 511 519 5231016 542 226 813487148704876 863 76311371214 287 339 383 366 371 376 303 304 5355012 6421554 644 601 640 76913341379134213431355 773133013741366137013561362133313581377 120 315 319 324 678 293 74810211060 99510041028 2241043 2251024 668 999 777 78148691008 7791035 693102510231022104410321045104610331574 318 3221047 768 81210591048 815 81010381056 208 220 454 699 747 814 698 700 658 659 718 6574893 683 734 694 660 735 661 695 685 713 716 6 7 14 829 917 17 165 185 62 671387 9071385139052285295 31619061607166410851663166515631605167216681602156416941692169316011560169816701671186316993421372235103732342234231027140714054771477513894766477416661667 460189218931890189118591896189919001908190919051907189418951897189819691975199119891990188418851888188618871889190221552158216021592167216821652166215721642169 10 16 193506350655073 413 41525302531 862 865 894 897 901 902 408361436155156 41036063613361636173618 414 449360936083336 440 4383607361036113612 41 697 43 59 212 421 663 691 802 822 405 500 570 572 593 587 5901015 522 524 529 5573331348836584175417741764155416441744178418341844181418241794180416541694172417341704171416641684167398340044003398440053986400139853996398939903987398839914152418841924195419841994196419741904191399741934194399941894134413541364145413241474146413341434144414141424137413840464063406240504053405640574054405540964149410441074110411141084109409741004139414041024103409840994101411241134105410641144115401340584024402540684026403340354059403440664022406540644023402740484049403040314028402940324036404140424039404040374038 4412381250124312451232124812361239124713351251 21118624466 40618581854185539984047405140522252214621562161216321472162 72918564847 730 873161447495264475152671455146114561463 2611868531218694769187049722129 81620132066211521482149215021512152343934513440 68238124765477618571861213021312143213221332144 321 412 417 448 459 461 129481621852329241112645023499450074274427542734278427942764277427242804283428442814282 870426942704271 880 393 597 612 958 959 963 96247604804 952 960 9531696169717031155116111621157115811591160 614 619 620 62314721474192119851988192219241923198019921982198319861987 8661961196419711963196019701965197219671968 503518351939793980 5435283529 489 531 83939784060406139813982 241 909 904 2474095 249 906 285 891 900 918 279 911 881 883 326 328 896 332 892 922 945 262 934 928 272 291 311 307504219761977 488 491409040934094 498 514 517 1272092209621112112211320242025209349302097208220832175210021012084208549402095 40251775060501621532154217021714985499153001993199420982106210721082109 188 189 190 70734923441344233423343457445754576459845993443345234444588458945904608460934453446459145924593461046113403340446064607460246033806458045814582460446054583458445774578457946004601362417015323170234543459345534703471495451954968496049584955 13 135 88920152016 56214591462 28 78 160 895 83 94 103 20 29 1124781 27 32 98 340 100 1411036 96 143 124 87 1074787 95 9931018103716041606 133 13922002212 45513731363137510495182521613241361136013711367136813651369136413724903490449055091490949084906154952335236523552341551155052275239523252305229 154794 858 126 411 74213401341 137 168 171 18 948 3947854784479148244825 374786 943 864 940 882 7447894788479047784779478047824783 153 1554797479847954796 33 114 11647924793 65 893 13436302198 29548154830484248464832483448494957483148334841484348524853481348144836483848354837 2104770484848514850476747684844484548394840 878 879 88414044777 96152815175 969 971 97449765302530150875137121515865021503248824891503153345072518652315033518752435249498851685089500150565226492552484929492849324937 306 868 840 44152425247142153465244 91347074708144014451446145349755011518451935325144714484939510751285130509253775329511051095096510051015241525352515102518553785190 2148584861 53 851 853 497 823 811 8092027202848564855 4848594854 117 122 123 11548574862 723 45 200 239 240475747581426 246 521 656 631 243 273 244 275 259 646 647 628 634 598 651 655 55314134914533535903591 174 182 179 1831030219443224323 778 175 181 184217221732176218021782179221345474393439448924894188136754759365036521883218821892174218721952196218421812183488548892192219320992190219120142202218620882102211021032086208750942089209020912094288929062890288729052888 118441344144415442244234335433620183799201938004489376237643798380537963797440744081164432443255255441144174412432943304409441044054406432643274390439237933794500552455121497343204321 3551940193119433502521319101911145114521458148514941496148848011490197819841979198111383526352735243525456345664565338836993389370045623701 148464346424639469046891146114734494688463246334634463746444645464646404641 807120611811186120711824678469311401167119011841197118812011187120411431144117618204677468146384674468746514684465246824683467946804675467615522248228222832241488122472275186450951865186750491866233623872404238822042246220622492251223022612284226222052285220748954896228622882287192919331935193419381930193219361939193722032210221122762277 2972145 595 74348605152 86136313632 365187436513647364847024703 42218721873 599 48021773579 394 9701229363336344378437943804382213721382140213921412142 715365436603351225036594822482336533655367036713668366936563657117534753663366636673352364936773676366136643665327732993283327932963297328032923289329832913282329332903278329432953281328433004612461346144622462346214624461746184619462046254626462746294628 724 7511179 7521195 725 72811711189120211831196119811681172116911851174117812191180119112171230 615 61744494451445444574476447744624463446044614452445343314332 624 626445844594450447144554470446944684456446744654464 242 506 490 512 966 509 539 494 544 554 551 888 555 89010682077207820712072206820732074207520762067208120692070207920802022202620232032206520292030203120552033206020592034206120352062206320402041203620372051205220382039205320542047204820442045204620492050205620582057 5485054 55050485057142250514949 5585052 5594951494849475053505050475046 222 248 26543574358436443634365436143624372437043714368436943664367252625892590258825912593259225945078509850822294229823222323229723212300229523012299233123022319230322962304230523202306 73942094216488342104212421942204214421542224223422442064207420848804211423342174232423042294234423118604377334443754383437343814374447444752405453624064376421342184221431543164317431844874488381638173818382138253822 63034333434371052375176343543283436 76234253426 81934533468346934643465345634583457346034613462346334663467 998146610001468145414571469146414651914191519171916440445101918191919201958220119741959195619731957229122922293233023072310231123122308231323142315230923322317231823162395239623282416241724182420232724122413241424192415232423972364236524072408236623672368232523392363239924002369239823942326240123382425242824262427233323842335238523372409241024022403238623892390239123922393 343 361 377 933 379 375 384 388 39118091810294129592960296229442961294529632965296429422943180129031802290229042907297129082967296629682970297229392940 965 968289528942897289629272946292929322931293329282938293028912893289229202921289829012899290018461847185018512429290932613262291829242919325732583259326029162917291229132910291129142915292229232334234223592372237323742340235123492350242124222341234323572344235323452355234823522358237023792378234723562360238323822346235423612381238023622377237623712375 9541107110621162117221722782279228122802227222822332234222922562231223222352237223622382270224422712245227222543431343222592267226022682269225722582239224022532255224222432118211949424945 46357735885345 101 9311002165935753586534151615173516351624965 574 92410811092 602 635356340833564356536253626 158 159 169 172 2013573 541487948983585533953381148359435951083108749314933534849353574533753363581358235833584141253444971 356358935783580 360 403 404150915361510152915201521153451061522153215281531502850551533152350261524153050155014152615274977510549815134513649875027497849844983507650835024503050295025503750365034161151115279510850905077516451145113510415581561156815701565156715661621527652781559156215691571164252601643525952615270526916151644163916301637163816311645164916571647164816201646165616541653165016511655165253095314531353165315529052925291529952985294 55107610891091 842 526107510793571 2341072 513105410701071 1764900 119 121 125 162 368 370 99 629 632 675 671 673 677 2741069 830492251921014101737683769143637783779378037811442144414432017378637873784378537883789108610881437 780 78252075224522352185380525852225220 195 19835503551 764 766111611031104 3894334 8674558 886 912345045674597 859 86044724473 898 899 579 58210031007101145574564 71122092208111011114572457345704571 252 335 9961026 942 944 9503686368711091122 5473598 596415410981099357053403572 399 838 5803568456935691058 5611108 5831112 771 790 785 804 786 787 791 793 799 795 796 797 236370253763836 401384738483837383938403841 836 84938383844121847635208 5921228121612201263 348 3504306430743014302 439430838313834383538323833 54542444245 5773829500216101628 3533619362736283483356236225351 648 652 45735213520339833963416372834813485 606369233613693369036914544454533995117352235233684368937823783 7023479347834743473347234763477368536883814382838263827 4184516 44345174518339245044521452945054506339445353790379138013802 828 834 832 845 921 847 920 831 8334756 850 44426711473265826622677267814092670267326721408267426691410266026752676 55637671142155333743375 8272657455945614560 903 905 908 910 923 946 941 9291871 6084444 60944454446219721994447455444484555455633973773381337703771377437725386381038093775377638113777150839533954395539703956396539673966396239643963395139523957396839693960396139583959 994 99710201034343711451153339534383642364336443645364616091612161616135266526816171634163316415262526352735265161816191622162916321623162416255274527552715272353135343535353235363537353335413545354635433544493851155118512251295123499051255368536653575124536353625132 3 39052823480 543 206106610951420166016611691 486 493 5844424443444254426151151815211 76 77 11141594162416341604185416141864187 18014241439142514381338142914311434142314321441143314351339 81363938685067 323 3803641364021824867 7262128390539063907 85 88 109415340824006 835 4364069196219663869407740784091412941304131 496 49940844092407140724018407041214122 525 52741164016401941174118401740204021404340444045 857359936043605 856415041574158386738703871393139323933389138923893 433 435 2218784812 29619012114 131 1781094109737033704 177 463 349 8762218221922202221 3445159 3781882108210901096 4463302467146724673 973126112691274127512701272128412851273128612811279128312821276128012891288128713521875350917791313134413261332134513471346134813491351135013251329122112241226401440674015 223 232 233 102 104 136 128 130 14411301131 213 132 156 138 151 157 209 5031006 278 2841084100935133515494348865210 7324884 147 149194119531945194919461951195219481954194419551947 108 105 1731262 164 167 300363814061277169036373672 877160813191328 575 604 576 578 581 534 567 537 5694997 770 774 885 776 78840874088 290 294 23272327241579271927262722 79 86 2192698520031965201 221 855 83726672668 98626881450 9872704 9882700264326992697270326832684244826872449264226802681268227012702275027582760275127522759 2352538256825693195257025662567 204 22918172513309625142631297329762969297429772978271127122738 216270827062748274927152717271627252718 453273127292435243424361518262924372439243825443033254515192430243127622763263026332632153727282730322627052707271327141535311531163085308430863087311430923121309331263129312831271848307918493106310731083109308031103081308230832634263726352636284828622861297547502853285628542855284928522851285028602517251827612765276727642766 227264426482649264649442645264726852686 927 930265026512735273749532736148914911525287928812878288028742875287628772864270927103071307228632865325532563253325428662867286828693251325215403057307030603036304230583050306930513059303730403041303830393066306830673044306430653055305230633053305630541415141631983199153932323233320232033200320131973225322732103211322832293230323132043222320532213223323432353245324629923214299332133216321532243244323632373212321732203219321811331135280628232796288228832797280528132814282428852825282631403177282728302831282828291538316131623188315531563187318931483154315231533151316331643157315831593160314931753150318031823181288428863165317931843186319131923176319031783166318527882789280728082809 1911733174017321736 20717371730173117341735173817391741174417431746174717511745174917501752174217481762183418351753175417561755175717581761175917601233123418362841244512401237284028432842130013101307130813161337130213111305130313061844178418111812184517891795184117801782178117831785123112951297129012981291129912961318124612491427150315041505150615141515176917781842184317631765177417701773177117761772177718041807180518081803180627702771278628032787280228043269327032653266277227733267326832633264283228342833283528372836277427752782278327782779277627772780278124702489248824712472247524762473247424772478 140 2682732273329253032292615161517252125392573257426192620 250 308 363 309 312 314 317 397 2024761 358 367254826172610261625472615 329261425462572249624992612261325002561250432473248 964 96724972501257924982502251225032580261126182515251625402542255625622560255725582541254326212622255925632600260326012602257825842583258525952596 975250625052525 99225232527 976 98325082528252425072529 984 264 288 352 985 980 333 341 3461484 990 981 991 359 982 989 280 282 423146751575189500850205180521950975138507450755088515851965286528514715148515051661500503950175040497452525035504150005038516050435197534952035199519811771357493449365225525052545256525752771252125412533094313247553133454631343095309830973099310231013100311131133112312231253124312317962981300224462447300330053000300129822983300430082984299129853010301130063020300730093013301830123016298929902994299629951255125712591260206441514752400241484156475426272628125612581593262526262433284428452846313528471592262326241729243217051706475352895288528753075310495649594923492429572958295529562953295431193120295129523117311818131814182918181819 192 197431943334478 199 251449444954492449344904491 738 765 841449844991598159916003830439544163765379243844387376643984399439144964402440344004401115136621575157615881589159049664967439644974397 5053741371337393748376137353745 8691042374637553759538537363714374337183747375434004479448036793815375337603673367436824701368346944709471047114700473315951597370653533712517937093730371151544980498649695215505817251728172653285327172747064728472944404441438543884730473146984699469547234724472147224726473247273725 27024802481247924832482 338302730213022303030313028302930233024 801 825 926 935 818 820 826 919 925 35 49101010411065 759 401063 641064 38 42 17010011876 16610671877 97711541555100510731013107810291050105210311222 9551012107415561557104010611057103910551051 5810621722170417071721172017161715171916881673171716751678168716821679167616891686109316581677171817101681171216801714171117131684167417091708 264864 749 750 821 808 3871139 767 7464868 61 8938753910391239113919 215 21739083909391739183915391639133914 90 913896389838973920 228 23138943895390339043901390238993900 196 292 3694000 327 331 336 337 277 2811502 289 302 362 364 386 736 342 357 392 372 37437954073407441254126411941204127412841234124407540762456246124642462246324572460245824592486248713151323138613881327140313171396132013361392 442 471 469 470 502 466 481 473 475 484 468 507 482 510 477 478 479111711191121316731833170316931683193319444274428443744354436443244334429443144304438443946304631466046634664466146624658465946914692199819992000200120112002201220032004200920102007200820052006393439353940394539463943394439413942393639373939393843394340434543494350434443484355435343544351435243464347 218 257 256 424 267 2693807380845864587 674 600 603 645 650 670 627 63645944595 633 65433903391 672 705 688 680 689 719 737 690 720 741 74045504596458547474748 721 731 722 684 676 679 687 2553635492736365116127836003973 5304012169516274085 710 714 681 706 709 717 704 708 71248264827 546 552 589 591 571 594 573 2143884 565 566387438833885392139303926387238773882388638893890388738883880388139273879392338733876 82439223878 8443924 523587 605 823576 54911001102392539283929 430 4313487362936213620 237 2863348 5643514 516 518 843375833474533454945224530332033493345 532 568 563 533 536 538 4514539373445284532375745094523455145241594159645344543 852333833394537453845484704470547134714471947204717471847154716369753583698 56117322142215330133403341 194 263 351372137204531 20353791271 38233293861330333043362341553823393330533064519452043864389338433853695348234843729 400333716623365538336803372337334863742349137563737 643351235113862 8173489334633103354332134194982499250855093333038423843 639 6411414141843034299430050065174429816854296532433093350330837513727332833593360 97236963694374450035004 5603353333433353332333312231225 735330 7533143315 7047254507455244834484160316693763524616831587 69647124540454133553356336434203417456851913427342834303429338033813715372637524508452545263382338334183723349335053506368137333716538444814482 607 610 6213494 611 6133307336333115371537033124304430553673495537553695365340134063402112911363496349734983501353034993500 48334093410340734243408187918804979451133681460431033264311332743094235431242384239423642974237424335923593 2054485448635033504 345374037313678373837084920511214111482162648874899515515133490370753645356371937505372535415123319535937495374338633873717535239473948370553264989384552023846424149074911491551195120 9511200 9561192499311931203 957119449121213491650225013121133573358362335173516 420 447331833693313 428 429 872 8753324332533163317452745424553469646974514451544204421441844194313431437243376337734133414 501 586 464 585 467 5883370337133783379340535073508332233234512451317004743474449021152115642405045514150845081507150685061506950705360514751492652265321342135213625362537 665 6672484248548774878 637 6382450245124652466 347 373 354 939 3951927192849264998497018151830183125342535 47 515086509951264995508050795127397639771828183718382509251042634264468546864250425142004201 298 2992452245342894290 161 16347414742 93 14650595066506450624356435943603025302622632264281628222818282038193820 701 7032492249318271839184013911397140113931394140213951912191343374338513551531105355635571925192642674268 432 434194219501293130144424443114911504655465646574665466615771585513351445151514651455139514351425140516513141359255425552936293730473048265626592661267911413994399520422043328532872511252217881794126712684649465013041312 4744913 476 508 5151852185326892690474547462519252014771478227322744897490126912692157215733971397227682769313831392020202128382839 106 14222652266320832094635463629472948112311261127112815912720272727212423242449174918314531473146380338043141314230883089 24 2534113412425942603447344846154616394939503090309151695194521427982800428742885170517252055217520452065212520951711903190431303131 753 78351835221 381 38526402655264138493850353835423034304324902491 1134866 72748652949295011991205424242534255425242541797301717982987301929881799301418002986301529974341434243434261426225522571138113834227422826632664 871 874 19 914 34 36 30 31 63 66 68 69 71 72178617871791179217901793 4523602108036013603 616 61825322533 230 2601242124412651266 744 7454963496414491470176417671768 437 456 462 458 409 44529342935105310774202420338593860307330743560356146474648323832403239263826542639228922902753275527572754275612271321132238573858 772 78932713272199519961997473847394740353935401821182518264919492140794086408040814089428542862608260949504952279027912794279528122792279347344735 848 85425982599 487 495244224442443 978 97924402441382338243249325030773078 622 625466746684500450138513852258625872604260524942495269526961380479948002734274712081209 4721235124127432746255025532744274548204821 5 916530453055306 4 915359635973366336738533854306130622581258247364737328632882799280139743975 686 75627842785281028112741274225772597494149461163116511701581158442044205465346542606260727392740130913981399140029792980256425654256425742582120212421254248424931733174426542661124112530353049 152 154304530461331135313761354310331053104 425 426 427 662 664 666 669 692317131723863386418161832183342254226385538562815282128172819386538661428143031363137163516361640285728592858287328702871287246694670320632074772477312101212 846148014931501147914813143314430753076266526664808481017661775129212941578158240074011401040084009450245032693269432753276158015832454245513821384324132433242147514764961496242914294429542924293182218231824257525764246424725492551355235533273327424672469246848884890
7 8 9 10 11 12 13 14 15
node ID
clustering index
FigureC
.33:ArchitecturalM
odel-complete
hierarchicalclusteringdendrogram
oftheL
LS
RequestH
andlingsubsystem
106
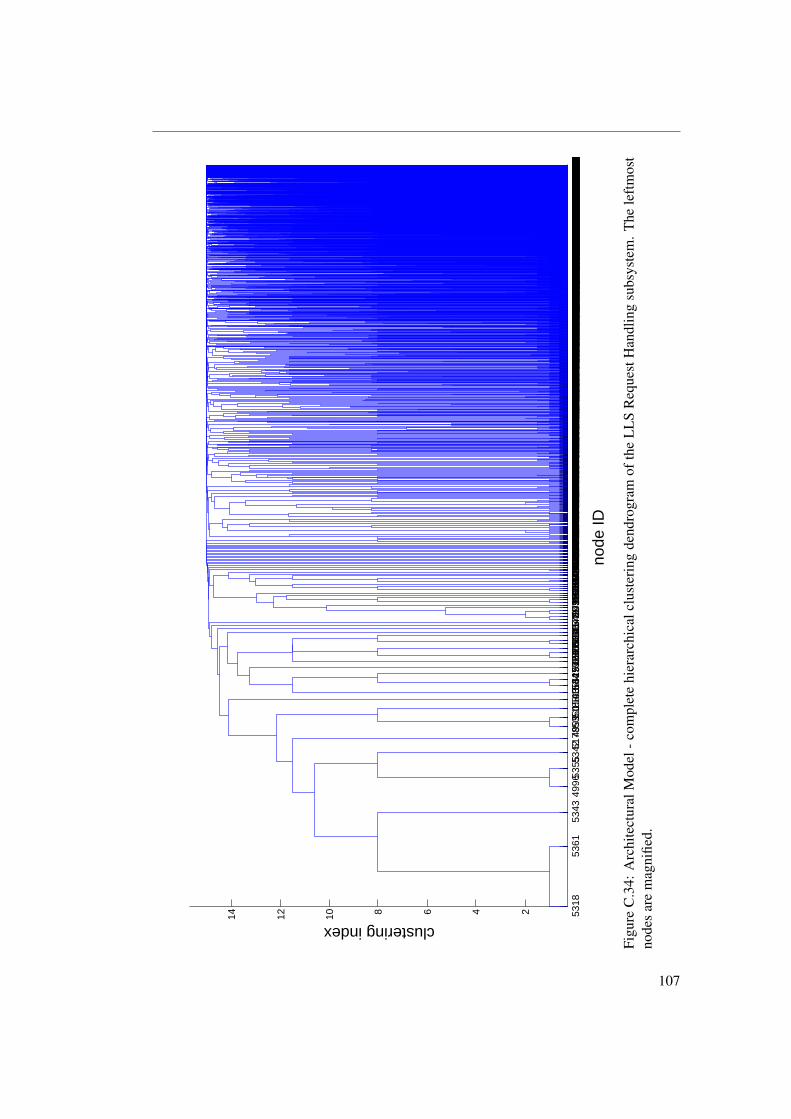
5318
5361
5343
4996
53555
34251
78499
953
50518815
43 93615
44534752
971548
5103
5240
5308
5284
5280
5331
5303
1545
1417
1547
1542 8
11
97
145 9
932 1
2 1
50 8
87 9
37 9
3814
1953
8153
2253
1714
9953
7353
1953
1152
9614
8350
1852
9315
0714
9814
9751
3114
9214
8714
86 1
8751
67 1
8615
4115
4653
2153
2052
8352
3814
9550
0950
1950
10
147
64 7
3329
9829
99 2
53 2
5411
1811
2035
4835
4949
1053
3350
4453
3211
1311
1511
1411
3211
34 8
048
0548
06 7
54 7
5547
6248
1113
7822
2222
2322
2422
1622
2522
2648
0748
0948
1848
1948
0248
2848
2948
0348
17 7
57 7
58 7
6111
01 3
9639
92 3
9839
9321
2121
2221
2321
2621
2735
4735
6635
6735
5835
5935
5435
55
2 3
30 4
07 6
53 2
66 2
76 2
38 2
58 2
45 2
83 3
01 4
16 4
19 4
65 2
71 3
20 3
25 3
05 9
47 9
49 8
448
63 3
10 3
13 3
34 5
7 6
49 5
40 7
6048
72 7
9448
7448
7348
75 7
92 8
03 8
05 1
10 8
0617
24 5
20 7
84 7
98 8
0017
2311
66 4
50 5
04 6
0 9
2 7
7510
1921
0421
05 4
85 5
28 4
92 5
11 5
19 5
2310
16 5
42 2
26 8
1348
7148
7048
76 8
63 7
6311
3712
14 2
87 3
39 3
83 3
66 3
71 3
76 3
03 3
04 5
3550
12 6
4215
54 6
44 6
01 6
40 7
6913
3413
7913
4213
4313
55 7
7313
3013
7413
6613
7013
5613
6213
3313
5813
77 1
20 3
15 3
19 3
24 6
78 2
93 7
4810
2110
60 9
9510
0410
28 2
2410
43 2
2510
24 6
68 9
99 7
77 7
8148
6910
08 7
7910
35 6
9310
2510
2310
2210
4410
3210
4510
4610
3315
74 3
18 3
2210
47 7
68 8
1210
5910
48 8
15 8
1010
3810
56 2
08 2
20 4
54 6
99 7
47 8
14 6
98 7
00 6
58 6
59 7
18 6
5748
93 6
83 7
34 6
94 6
60 7
35 6
61 6
95 6
85 7
13 7
16 6
7
14
829
917
17
165
185
62
67
1387
907
1385
1390
5228
5295
316
1906
1607
1664
1085
1663
1665
1563
1605
1672
1668
1602
1564
1694
1692
1693
1601
1560
1698
1670
1671
1863
1699
3421
3722
3510
3732
3422
3423
1027
1407
1405
4771
4775
1389
4766
4774
1666
1667
460
1892
1893
1890
1891
1859
1896
1899
1900
1908
1909
1905
1907
1894
1895
1897
1898
1969
1975
1991
1989
1990
1884
1885
1888
1886
1887
1889
1902
2155
2158
2160
2159
2167
2168
2165
2166
2157
2164
2169
10
16
193
5063
5065
5073
413
415
2530
2531
862
865
894
897
901
902
408
3614
3615
5156
410
3606
3613
3616
3617
3618
414
449
3609
3608
3336
440
438
3607
3610
3611
3612
41
697
43
59
212
421
663
691
802
822
405
500
570
572
593
587
590
1015
522
524
529
557
3331
3488
3658
4175
4177
4176
4155
4164
4174
4178
4183
4184
4181
4182
4179
4180
4165
4169
4172
4173
4170
4171
4166
4168
4167
3983
4004
4003
3984
4005
3986
4001
3985
3996
3989
3990
3987
3988
3991
4152
4188
4192
4195
4198
4199
4196
4197
4190
4191
3997
4193
4194
3999
4189
4134
4135
4136
4145
4132
4147
4146
4133
4143
4144
4141
4142
4137
4138
4046
4063
4062
4050
4053
4056
4057
4054
4055
4096
4149
4104
4107
4110
4111
4108
4109
4097
4100
4139
4140
4102
4103
4098
4099
4101
4112
4113
4105
4106
4114
4115
4013
4058
4024
4025
4068
4026
4033
4035
4059
4034
4066
4022
4065
4064
4023
4027
4048
4049
4030
4031
4028
4029
4032
4036
4041
4042
4039
4040
4037
4038
44
1238
1250
1243
1245
1232
1248
1236
1239
1247
1335
1251
211
1862
4466
406
1858
1854
1855
3998
4047
4051
4052
2252
2146
2156
2161
2163
2147
2162
729
1856
4847
730
873
1614
4749
5264
4751
5267
1455
1461
1456
1463
261
1868
5312
1869
4769
1870
4972
2129
816
2013
2066
2115
2148
2149
2150
2151
2152
3439
3451
3440
682
3812
4765
4776
1857
1861
2130
2131
2143
2132
2133
2144
321
412
417
448
459
461
129
4816
2185
2329
2411
1264
5023
4994
5007
4274
4275
4273
4278
4279
4276
4277
4272
4280
4283
4284
4281
4282
870
4269
4270
4271
880
393
597
612
958
959
963
962
4760
4804
952
960
953
1696
1697
1703
1155
1161
1162
1157
1158
1159
1160
614
619
620
623
1472
1474
1921
1985
1988
1922
1924
1923
1980
1992
1982
1983
1986
1987
866
1961
1964
1971
1963
1960
1970
1965
1972
1967
1968
50
3518
3519
3979
3980
54
3528
3529
489
531
839
3978
4060
4061
3981
3982
241
909
904
247
4095
249
906
285
891
900
918
279
911
881
883
326
328
896
332
892
922
945
262
934
928
272
291
311
307
5042
1976
1977
488
491
4090
4093
4094
498
514
517
127
2092
2096
2111
2112
2113
2024
2025
2093
4930
2097
2082
2083
2175
2100
2101
2084
2085
4940
2095
402
5177
5060
5016
2153
2154
2170
2171
4985
4991
5300
1993
1994
2098
2106
2107
2108
2109
188
189
190
707
3492
3441
3442
3342
3343
4574
4575
4576
4598
4599
3443
3452
3444
4588
4589
4590
4608
4609
3445
3446
4591
4592
4593
4610
4611
3403
3404
4606
4607
4602
4603
3806
4580
4581
4582
4604
4605
4583
4584
4577
4578
4579
4600
4601
3624
1701
5323
1702
3454
3459
3455
3470
3471
4954
5195
4968
4960
4958
4955
13
135
889
2015
2016
562
1459
1462
28
78
160
895
83
94
103
20
29
112
4781
27
32
98
340
100
141
1036
96
143
124
87
107
4787
95
993
1018
1037
1604
1606
133
139
2200
2212
455
1373
1363
1375
1049
5182
5216
1324
1361
1360
1371
1367
1368
1365
1369
1364
1372
4903
4904
4905
5091
4909
4908
4906
1549
5233
5236
5235
5234
1551
1550
5227
5239
5232
5230
5229
15
4794
858
126
411
742
1340
1341
137
168
171
18
948
39
4785
4784
4791
4824
4825
37
4786
943
864
940
882
74
4789
4788
4790
4778
4779
4780
4782
4783
153
155
4797
4798
4795
4796
33
114
116
4792
4793
65
893
134
3630
2198
295
4815
4830
4842
4846
4832
4834
4849
4957
4831
4833
4841
4843
4852
4853
4813
4814
4836
4838
4835
4837
210
4770
4848
4851
4850
4767
4768
4844
4845
4839
4840
878
879
884
1404
4777
961
5281
5175
969
971
974
4976
5302
5301
5087
5137
1215
1586
5021
5032
4882
4891
5031
5334
5072
5186
5231
5033
5187
5243
5249
4988
5168
5089
5001
5056
5226
4925
5248
4929
4928
4932
4937
306
868
840
441
5242
5247
1421
5346
5244
913
4707
4708
1440
1445
1446
1453
4975
5011
5184
5193
5325
1447
1448
4939
5107
5128
5130
5092
5377
5329
5110
5109
5096
5100
5101
5241
5253
5251
5102
5185
5378
5190
21
4858
4861
53
851
853
497
823
811
809
2027
2028
4856
4855
48
4859
4854
117
122
123
115
4857
4862
723
45
200
239
240
4757
4758
1426
246
521
656
631
243
273
244
275
259
646
647
628
634
598
651
655
553
1413
4914
5335
3590
3591
174
182
179
183
1030
2194
4322
4323
778
175
181
184
2172
2173
2176
2180
2178
2179
2213
4547
4393
4394
4892
4894
1881
3675
4759
3650
3652
1883
2188
2189
2174
2187
2195
2196
2184
2181
2183
4885
4889
2192
2193
2099
2190
2191
2014
2202
2186
2088
2102
2110
2103
2086
2087
5094
2089
2090
2091
2094
2889
2906
2890
2887
2905
2888
118
4413
4414
4415
4422
4423
4335
4336
2018
3799
2019
3800
4489
3762
3764
3798
3805
3796
3797
4407
4408
1164
4324
4325
5255
4411
4417
4412
4329
4330
4409
4410
4405
4406
4326
4327
4390
4392
3793
3794
5005
5245
5121
4973
4320
4321
355
1940
1931
1943
3502
5213
1910
1911
1451
1452
1458
1485
1494
1496
1488
4801
1490
1978
1984
1979
1981
1138
3526
3527
3524
3525
4563
4566
4565
3388
3699
3389
3700
4562
3701
148
4643
4642
4639
4690
4689
1146
1147
3449
4688
4632
4633
4634
4637
4644
4645
4646
4640
4641
807
1206
1181
1186
1207
1182
4678
4693
1140
1167
1190
1184
1197
1188
1201
1187
1204
1143
1144
1176
1820
4677
4681
4638
4674
4687
4651
4684
4652
4682
4683
4679
4680
4675
4676
1552
2248
2282
2283
2241
4881
2247
2275
1864
5095
1865
1867
5049
1866
2336
2387
2404
2388
2204
2246
2206
2249
2251
2230
2261
2284
2262
2205
2285
2207
4895
4896
2286
2288
2287
1929
1933
1935
1934
1938
1930
1932
1936
1939
1937
2203
2210
2211
2276
2277
297
2145
595
743
4860
5152
861
3631
3632
365
1874
3651
3647
3648
4702
4703
422
1872
1873
599
480
2177
3579
394
970
1229
3633
3634
4378
4379
4380
4382
2137
2138
2140
2139
2141
2142
715
3654
3660
3351
2250
3659
4822
4823
3653
3655
3670
3671
3668
3669
3656
3657
1175
3475
3663
3666
3667
3352
3649
3677
3676
3661
3664
3665
3277
3299
3283
3279
3296
3297
3280
3292
3289
3298
3291
3282
3293
3290
3278
3294
3295
3281
3284
3300
4612
4613
4614
4622
4623
4621
4624
4617
4618
4619
4620
4625
4626
4627
4629
4628
724
751
1179
752
1195
725
728
1171
1189
1202
1183
1196
1198
1168
1172
1169
1185
1174
1178
1219
1180
1191
1217
1230
615
617
4449
4451
4454
4457
4476
4477
4462
4463
4460
4461
4452
4453
4331
4332
624
626
4458
4459
4450
4471
4455
4470
4469
4468
4456
4467
4465
4464
242
506
490
512
966
509
539
494
544
554
551
888
555
890
1068
2077
2078
2071
2072
2068
2073
2074
2075
2076
2067
2081
2069
2070
2079
2080
2022
2026
2023
2032
2065
2029
2030
2031
2055
2033
2060
2059
2034
2061
2035
2062
2063
2040
2041
2036
2037
2051
2052
2038
2039
2053
2054
2047
2048
2044
2045
2046
2049
2050
2056
2058
2057
548
5054
550
5048
5057
1422
5051
4949
558
5052
559
4951
4948
4947
5053
5050
5047
5046
222
248
265
4357
4358
4364
4363
4365
4361
4362
4372
4370
4371
4368
4369
4366
4367
2526
2589
2590
2588
2591
2593
2592
2594
5078
5098
5082
2294
2298
2322
2323
2297
2321
2300
2295
2301
2299
2331
2302
2319
2303
2296
2304
2305
2320
2306
739
4209
4216
4883
4210
4212
4219
4220
4214
4215
4222
4223
4224
4206
4207
4208
4880
4211
4233
4217
4232
4230
4229
4234
4231
1860
4377
3344
4375
4383
4373
4381
4374
4474
4475
2405
4536
2406
4376
4213
4218
4221
4315
4316
4317
4318
4487
4488
3816
3817
3818
3821
3825
3822
630
3433
3434
3710
5237
5176
3435
4328
3436
762
3425
3426
819
3453
3468
3469
3464
3465
3456
3458
3457
3460
3461
3462
3463
3466
3467
998
1466
1000
1468
1454
1457
1469
1464
1465
1914
1915
1917
1916
4404
4510
1918
1919
1920
1958
2201
1974
1959
1956
1973
1957
2291
2292
2293
2330
2307
2310
2311
2312
2308
2313
2314
2315
2309
2332
2317
2318
2316
2395
2396
2328
2416
2417
2418
2420
2327
2412
2413
2414
2419
2415
2324
2397
2364
2365
2407
2408
2366
2367
2368
2325
2339
2363
2399
2400
2369
2398
2394
2326
2401
2338
2425
2428
2426
2427
2333
2384
2335
2385
2337
2409
2410
2402
2403
2386
2389
2390
2391
2392
2393
343
361
377
933
379
375
384
388
391
1809
1810
2941
2959
2960
2962
2944
2961
2945
2963
2965
2964
2942
2943
1801
2903
1802
2902
2904
2907
2971
2908
2967
2966
2968
2970
2972
2939
2940
965
968
2895
2894
2897
2896
2927
2946
2929
2932
2931
2933
2928
2938
2930
2891
2893
2892
2920
2921
2898
2901
2899
2900
1846
1847
1850
1851
2429
2909
3261
3262
2918
2924
2919
3257
3258
3259
3260
2916
2917
2912
2913
2910
2911
2914
2915
2922
2923
2334
2342
2359
2372
2373
2374
2340
2351
2349
2350
2421
2422
2341
2343
2357
2344
2353
2345
2355
2348
2352
2358
2370
2379
2378
2347
2356
2360
2383
2382
2346
2354
2361
2381
2380
2362
2377
2376
2371
2375
954
1107
1106
2116
2117
2217
2278
2279
2281
2280
2227
2228
2233
2234
2229
2256
2231
2232
2235
2237
2236
2238
2270
2244
2271
2245
2272
2254
3431
3432
2259
2267
2260
2268
2269
2257
2258
2239
2240
2253
2255
2242
2243
2118
2119
4942
4945
46
3577
3588
5345
101
931
1002
1659
3575
3586
5341
5161
5173
5163
5162
4965
574
924
1081
1092
602
635
3563
4083
3564
3565
3625
3626
158
159
169
172
201
3573
541
4879
4898
3585
5339
5338
1148
3594
3595
1083
1087
4931
4933
5348
4935
3574
5337
5336
3581
3582
3583
3584
1412
5344
4971
356
3589
3578
3580
360
403
404
1509
1536
1510
1529
1520
1521
1534
5106
1522
1532
1528
1531
5028
5055
1533
1523
5026
1524
1530
5015
5014
1526
1527
4977
5105
4981
5134
5136
4987
5027
4978
4984
4983
5076
5083
5024
5030
5029
5025
5037
5036
5034
1611
5111
5279
5108
5090
5077
5164
5114
5113
5104
1558
1561
1568
1570
1565
1567
1566
1621
5276
5278
1559
1562
1569
1571
1642
5260
1643
5259
5261
5270
5269
1615
1644
1639
1630
1637
1638
1631
1645
1649
1657
1647
1648
1620
1646
1656
1654
1653
1650
1651
1655
1652
5309
5314
5313
5316
5315
5290
5292
5291
5299
5298
5294
55
1076
1089
1091
842
526
1075
1079
3571
234
1072
513
1054
1070
1071
176
4900
119
121
125
162
368
370
99
629
632
675
671
673
677
274
1069
830
4922
5192
1014
1017
3768
3769
1436
3778
3779
3780
3781
1442
1444
1443
2017
3786
3787
3784
3785
3788
3789
1086
1088
1437
780
782
5207
5224
5223
5218
5380
5258
5222
5220
195
198
3550
3551
764
766
1116
1103
1104
389
4334
867
4558
886
912
3450
4567
4597
859
860
4472
4473
898
899
579
582
1003
1007
1011
4557
4564
711
2209
2208
1110
1111
4572
4573
4570
4571
252
335
996
1026
942
944
950
3686
3687
1109
1122
547
3598
596
4154
1098
1099
3570
5340
3572
399
838
580
3568
4569
3569
1058
561
1108
583
1112
771
790
785
804
786
787
791
793
799
795
796
797
236
3702
5376
3836
401
3847
3848
3837
3839
3840
3841
836
849
3838
3844
1218
4763
5208
592
1228
1216
1220
1263
348
350
4306
4307
4301
4302
439
4308
3831
3834
3835
3832
3833
545
4244
4245
577
3829
5002
1610
1628
353
3619
3627
3628
3483
3562
3622
5351
648
652
457
3521
3520
3398
3396
3416
3728
3481
3485
606
3692
3361
3693
3690
3691
4544
4545
3399
5117
3522
3523
3684
3689
3782
3783
702
3479
3478
3474
3473
3472
3476
3477
3685
3688
3814
3828
3826
3827
418
4516
443
4517
4518
3392
4504
4521
4529
4505
4506
3394
4535
3790
3791
3801
3802
828
834
832
845
921
847
920
831
833
4756
850
444
2671
1473
2658
2662
2677
2678
1409
2670
2673
2672
1408
2674
2669
1410
2660
2675
2676
556
3767
1142
1553
3374
3375
827
2657
4559
4561
4560
903
905
908
910
923
946
941
929
1871
608
4444
609
4445
4446
2197
2199
4447
4554
4448
4555
4556
3397
3773
3813
3770
3771
3774
3772
5386
3810
3809
3775
3776
3811
3777
1508
3953
3954
3955
3970
3956
3965
3967
3966
3962
3964
3963
3951
3952
3957
3968
3969
3960
3961
3958
3959
994
997
1020
1034
3437
1145
1153
3395
3438
3642
3643
3644
3645
3646
1609
1612
1616
1613
5266
5268
1617
1634
1633
1641
5262
5263
5273
5265
1618
1619
1622
1629
1632
1623
1624
1625
5274
5275
5271
5272
3531
3534
3535
3532
3536
3537
3533
3541
3545
3546
3543
3544
4938
5115
5118
5122
5129
5123
4990
5125
5368
5366
5357
5124
5363
5362
5132
3
390
5282
3480
543
206
1066
1095
1420
1660
1661
1691
486
493
584
4424
4434
4425
4426
1511
5181
5211
76
77
111
4159
4162
4163
4160
4185
4161
4186
4187
180
1424
1439
1425
1438
1338
1429
1431
1434
1423
1432
1441
1433
1435
1339
81
3639
3868
5067
323
380
3641
3640
2182
4867
726
2128
3905
3906
3907
85
88
109
4153
4082
4006
835
436
4069
1962
1966
3869
4077
4078
4091
4129
4130
4131
496
499
4084
4092
4071
4072
4018
4070
4121
4122
525
527
4116
4016
4019
4117
4118
4017
4020
4021
4043
4044
4045
857
3599
3604
3605
856
4150
4157
4158
3867
3870
3871
3931
3932
3933
3891
3892
3893
433
435
22
1878
4812
296
1901
2114
131
178
1094
1097
3703
3704
177
463
349
876
2218
2219
2220
2221
344
5159
378
1882
1082
1090
1096
446
3302
4671
4672
4673
973
1261
1269
1274
1275
1270
1272
1284
1285
1273
1286
1281
1279
1283
1282
1276
1280
1289
1288
1287
1352
1875
3509
1779
1313
1344
1326
1332
1345
1347
1346
1348
1349
1351
1350
1325
1329
1221
1224
1226
4014
4067
4015
223
232
233
102
104
136
128
130
144
1130
1131
213
132
156
138
151
157
209
503
1006
278
284
1084
1009
3513
3515
4943
4886
5210
732
4884
147
149
1941
1953
1945
1949
1946
1951
1952
1948
1954
1944
1955
1947
108
105
173
1262
164
167
300
3638
1406
1277
1690
3637
3672
877
1608
1319
1328
575
604
576
578
581
534
567
537
569
4997
770
774
885
776
788
4087
4088
290
294
23
2723
2724
1579
2719
2726
2722
79
86
219
2698
5200
3196
5201
221
855
837
2667
2668
986
2688
1450
987
2704
988
2700
2643
2699
2697
2703
2683
2684
2448
2687
2449
2642
2680
2681
2682
2701
2702
2750
2758
2760
2751
2752
2759
235
2538
2568
2569
3195
2570
2566
2567
204
229
1817
2513
3096
2514
2631
2973
2976
2969
2974
2977
2978
2711
2712
2738
216
2708
2706
2748
2749
2715
2717
2716
2725
2718
453
2731
2729
2435
2434
2436
1518
2629
2437
2439
2438
2544
3033
2545
1519
2430
2431
2762
2763
2630
2633
2632
1537
2728
2730
3226
2705
2707
2713
2714
1535
3115
3116
3085
3084
3086
3087
3114
3092
3121
3093
3126
3129
3128
3127
1848
3079
1849
3106
3107
3108
3109
3080
3110
3081
3082
3083
2634
2637
2635
2636
2848
2862
2861
2975
4750
2853
2856
2854
2855
2849
2852
2851
2850
2860
2517
2518
2761
2765
2767
2764
2766
227
2644
2648
2649
2646
4944
2645
2647
2685
2686
927
930
2650
2651
2735
2737
4953
2736
1489
1491
1525
2879
2881
2878
2880
2874
2875
2876
2877
2864
2709
2710
3071
3072
2863
2865
3255
3256
3253
3254
2866
2867
2868
2869
3251
3252
1540
3057
3070
3060
3036
3042
3058
3050
3069
3051
3059
3037
3040
3041
3038
3039
3066
3068
3067
3044
3064
3065
3055
3052
3063
3053
3056
3054
1415
1416
3198
3199
1539
3232
3233
3202
3203
3200
3201
3197
3225
3227
3210
3211
3228
3229
3230
3231
3204
3222
3205
3221
3223
3234
3235
3245
3246
2992
3214
2993
3213
3216
3215
3224
3244
3236
3237
3212
3217
3220
3219
3218
1133
1135
2806
2823
2796
2882
2883
2797
2805
2813
2814
2824
2885
2825
2826
3140
3177
2827
2830
2831
2828
2829
1538
3161
3162
3188
3155
3156
3187
3189
3148
3154
3152
3153
3151
3163
3164
3157
3158
3159
3160
3149
3175
3150
3180
3182
3181
2884
2886
3165
3179
3184
3186
3191
3192
3176
3190
3178
3166
3185
2788
2789
2807
2808
2809
191
1733
1740
1732
1736
207
1737
1730
1731
1734
1735
1738
1739
1741
1744
1743
1746
1747
1751
1745
1749
1750
1752
1742
1748
1762
1834
1835
1753
1754
1756
1755
1757
1758
1761
1759
1760
1233
1234
1836
2841
2445
1240
1237
2840
2843
2842
1300
1310
1307
1308
1316
1337
1302
1311
1305
1303
1306
1844
1784
1811
1812
1845
1789
1795
1841
1780
1782
1781
1783
1785
1231
1295
1297
1290
1298
1291
1299
1296
1318
1246
1249
1427
1503
1504
1505
1506
1514
1515
1769
1778
1842
1843
1763
1765
1774
1770
1773
1771
1776
1772
1777
1804
1807
1805
1808
1803
1806
2770
2771
2786
2803
2787
2802
2804
3269
3270
3265
3266
2772
2773
3267
3268
3263
3264
2832
2834
2833
2835
2837
2836
2774
2775
2782
2783
2778
2779
2776
2777
2780
2781
2470
2489
2488
2471
2472
2475
2476
2473
2474
2477
2478
140
268
2732
2733
2925
3032
2926
1516
1517
2521
2539
2573
2574
2619
2620
250
308
363
309
312
314
317
397
202
4761
358
367
2548
2617
2610
2616
2547
2615
329
2614
2546
2572
2496
2499
2612
2613
2500
2561
2504
3247
3248
964
967
2497
2501
2579
2498
2502
2512
2503
2580
2611
2618
2515
2516
2540
2542
2556
2562
2560
2557
2558
2541
2543
2621
2622
2559
2563
2600
2603
2601
2602
2578
2584
2583
2585
2595
2596
975
2506
2505
2525
992
2523
2527
976
983
2508
2528
2524
2507
2529
984
264
288
352
985
980
333
341
346
1484
990
981
991
359
982
989
280
282
423
1467
5157
5189
5008
5020
5180
5219
5097
5138
5074
5075
5088
5158
5196
5286
5285
1471
5148
5150
5166
1500
5039
5017
5040
4974
5252
5035
5041
5000
5038
5160
5043
5197
5349
5203
5199
5198
1177
1357
4934
4936
5225
5250
5254
5256
5257
5277
1252
1254
1253
3094
3132
4755
3133
4546
3134
3095
3098
3097
3099
3102
3101
3100
3111
3113
3112
3122
3125
3124
3123
1796
2981
3002
2446
2447
3003
3005
3000
3001
2982
2983
3004
3008
2984
2991
2985
3010
3011
3006
3020
3007
3009
3013
3018
3012
3016
2989
2990
2994
2996
2995
1255
1257
1259
1260
2064
4151
4752
4002
4148
4156
4754
2627
2628
1256
1258
1593
2625
2626
2433
2844
2845
2846
3135
2847
1592
2623
2624
1729
2432
1705
1706
4753
5289
5288
5287
5307
5310
4956
4959
4923
4924
2957
2958
2955
2956
2953
2954
3119
3120
2951
2952
3117
3118
1813
1814
1829
1818
1819
192
197
4319
4333
4478
199
251
4494
4495
4492
4493
4490
4491
738
765
841
4498
4499
1598
1599
1600
3830
4395
4416
3765
3792
4384
4387
3766
4398
4399
4391
4496
4402
4403
4400
4401
1151
3662
1575
1576
1588
1589
1590
4966
4967
4396
4497
4397
505
3741
3713
3739
3748
3761
3735
3745
869
1042
3746
3755
3759
5385
3736
3714
3743
3718
3747
3754
3400
4479
4480
3679
3815
3753
3760
3673
3674
3682
4701
3683
4694
4709
4710
4711
4700
4733
1595
1597
3706
5353
3712
5179
3709
3730
3711
5154
4980
4986
4969
5215
5058
1725
1728
1726
5328
5327
1727
4706
4728
4729
4440
4441
4385
4388
4730
4731
4698
4699
4695
4723
4724
4721
4722
4726
4732
4727
3725
270
2480
2481
2479
2483
2482
338
3027
3021
3022
3030
3031
3028
3029
3023
3024
801
825
926
935
818
820
826
919
925
35
49
1010
1041
1065
759
40
1063
64
1064
38
42
170
1001
1876
166
1067
1877
977
1154
1555
1005
1073
1013
1078
1029
1050
1052
1031
1222
955
1012
1074
1556
1557
1040
1061
1057
1039
1055
1051
58
1062
1722
1704
1707
1721
1720
1716
1715
1719
1688
1673
1717
1675
1678
1687
1682
1679
1676
1689
1686
1093
1658
1677
1718
1710
1681
1712
1680
1714
1711
1713
1684
1674
1709
1708
26
4864
749
750
821
808
387
1139
767
746
4868
61
89
3875
3910
3912
3911
3919
215
217
3908
3909
3917
3918
3915
3916
3913
3914
90
91
3896
3898
3897
3920
228
231
3894
3895
3903
3904
3901
3902
3899
3900
196
292
369
4000
327
331
336
337
277
281
1502
289
302
362
364
386
736
342
357
392
372
374
3795
4073
4074
4125
4126
4119
4120
4127
4128
4123
4124
4075
4076
2456
2461
2464
2462
2463
2457
2460
2458
2459
2486
2487
1315
1323
1386
1388
1327
1403
1317
1396
1320
1336
1392
442
471
469
470
502
466
481
473
475
484
468
507
482
510
477
478
479
1117
1119
1121
3167
3183
3170
3169
3168
3193
3194
4427
4428
4437
4435
4436
4432
4433
4429
4431
4430
4438
4439
4630
4631
4660
4663
4664
4661
4662
4658
4659
4691
4692
1998
1999
2000
2001
2011
2002
2012
2003
2004
2009
2010
2007
2008
2005
2006
3934
3935
3940
3945
3946
3943
3944
3941
3942
3936
3937
3939
3938
4339
4340
4345
4349
4350
4344
4348
4355
4353
4354
4351
4352
4346
4347
218
257
256
424
267
269
3807
3808
4586
4587
674
600
603
645
650
670
627
636
4594
4595
633
654
3390
3391
672
705
688
680
689
719
737
690
720
741
740
4550
4596
4585
4747
4748
721
731
722
684
676
679
687
255
3635
4927
3636
5116
1278
3600
3973
530
4012
1695
1627
4085
710
714
681
706
709
717
704
708
712
4826
4827
546
552
589
591
571
594
573
214
3884
565
566
3874
3883
3885
3921
3930
3926
3872
3877
3882
3886
3889
3890
3887
3888
3880
3881
3927
3879
3923
3873
3876
824
3922
3878
844
3924
52
3587
605
82
3576
549
1100
1102
3925
3928
3929
430
431
3487
3629
3621
3620
237
286
3348
564
3514
516
518
843
3758
3347
4533
4549
4522
4530
3320
3349
3345
532
568
563
533
536
538
451
4539
3734
4528
4532
3757
4509
4523
4551
4524
1594
1596
4534
4543
852
3338
3339
4537
4538
4548
4704
4705
4713
4714
4719
4720
4717
4718
4715
4716
3697
5358
3698
56
1173
2214
2215
3301
3340
3341
194
263
351
3721
3720
4531
203
5379
1271
382
3329
3861
3303
3304
3362
3415
5382
3393
3305
3306
4519
4520
4386
4389
3384
3385
3695
3482
3484
3729
400
3337
1662
3365
5383
3680
3372
3373
3486
3742
3491
3756
3737
643
3512
3511
3862
817
3489
3346
3310
3354
3321
3419
4982
4992
5085
5093
3330
3842
3843
639
641
1414
1418
4303
4299
4300
5006
5174
4298
1685
4296
5324
3309
3350
3308
3751
3727
3328
3359
3360
972
3696
3694
3744
5003
5004
560
3353
3334
3335
3332
3333
1223
1225
73
5330
75
3314
3315
70
4725
4507
4552
4483
4484
1603
1669
3763
5246
1683
1587
696
4712
4540
4541
3355
3356
3364
3420
3417
4568
5191
3427
3428
3430
3429
3380
3381
3715
3726
3752
4508
4525
4526
3382
3383
3418
3723
3493
3505
3506
3681
3733
3716
5384
4481
4482
607
610
621
3494
611
613
3307
3363
3311
5371
5370
3312
4304
4305
5367
3495
5375
5369
5365
3401
3406
3402
1129
1136
3496
3497
3498
3501
3530
3499
3500
483
3409
3410
3407
3424
3408
1879
1880
4979
4511
3368
1460
4310
3326
4311
3327
4309
4235
4312
4238
4239
4236
4297
4237
4243
3592
3593
205
4485
4486
3503
3504
345
3740
3731
3678
3738
3708
4920
5112
1411
1482
1626
4887
4899
5155
1513
3490
3707
5364
5356
3719
3750
5372
5354
1512
3319
5359
3749
5374
3386
3387
3717
5352
3947
3948
3705
5326
4989
3845
5202
3846
4241
4907
4911
4915
5119
5120
951
1200
956
1192
4993
1193
1203
957
1194
4912
1213
4916
5022
5013
1211
3357
3358
3623
3517
3516
420
447
3318
3369
3313
428
429
872
875
3324
3325
3316
3317
4527
4542
4553
4696
4697
4514
4515
4420
4421
4418
4419
4313
4314
3724
3376
3377
3413
3414
501
586
464
585
467
588
3370
3371
3378
3379
3405
3507
3508
3322
3323
4512
4513
1700
4743
4744
4902
1152
1156
4240
5045
5141
5084
5081
5071
5068
5061
5069
5070
5360
5147
5149
2652
2653
2134
2135
2136
2536
2537
665
667
2484
2485
4877
4878
637
638
2450
2451
2465
2466
347
373
354
939
395
1927
1928
4926
4998
4970
1815
1830
1831
2534
2535
47
51
5086
5099
5126
4995
5080
5079
5127
3976
3977
1828
1837
1838
2509
2510
4263
4264
4685
4686
4250
4251
4200
4201
298
299
2452
2453
4289
4290
161
163
4741
4742
93
146
5059
5066
5064
5062
4356
4359
4360
3025
3026
2263
2264
2816
2822
2818
2820
3819
3820
701
703
2492
2493
1827
1839
1840
1391
1397
1401
1393
1394
1402
1395
1912
1913
4337
4338
5135
5153
1105
3556
3557
1925
1926
4267
4268
432
434
1942
1950
1293
1301
4442
4443
1149
1150
4655
4656
4657
4665
4666
1577
1585
5133
5144
5151
5146
5145
5139
5143
5142
5140
5165
1314
1359
2554
2555
2936
2937
3047
3048
2656
2659
2661
2679
1141
3994
3995
2042
2043
3285
3287
2511
2522
1788
1794
1267
1268
4649
4650
1304
1312
474
4913
476
508
515
1852
1853
2689
2690
4745
4746
2519
2520
1477
1478
2273
2274
4897
4901
2691
2692
1572
1573
3971
3972
2768
2769
3138
3139
2020
2021
2838
2839
106
142
2265
2266
3208
3209
4635
4636
2947
2948
1123
1126
1127
1128
1591
2720
2727
2721
2423
2424
4917
4918
3145
3147
3146
3803
3804
3141
3142
3088
3089
24
25
3411
3412
4259
4260
3447
3448
4615
4616
3949
3950
3090
3091
5169
5194
5214
2798
2800
4287
4288
5170
5172
5205
5217
5204
5206
5212
5209
5171
1903
1904
3130
3131
753
783
5183
5221
381
385
2640
2655
2641
3849
3850
3538
3542
3034
3043
2490
2491
113
4866
727
4865
2949
2950
1199
1205
4242
4253
4255
4252
4254
1797
3017
1798
2987
3019
2988
1799
3014
1800
2986
3015
2997
4341
4342
4343
4261
4262
2552
2571
1381
1383
4227
4228
2663
2664
871
874
19
914
34
36
30
31
63
66
68
69
71
72
1786
1787
1791
1792
1790
1793
452
3602
1080
3601
3603
616
618
2532
2533
230
260
1242
1244
1265
1266
744
745
4963
4964
1449
1470
1764
1767
1768
437
456
462
458
409
445
2934
2935
1053
1077
4202
4203
3859
3860
3073
3074
3560
3561
4647
4648
3238
3240
3239
2638
2654
2639
2289
2290
2753
2755
2757
2754
2756
1227
1321
1322
3857
3858
772
789
3271
3272
1995
1996
1997
4738
4739
4740
3539
3540
1821
1825
1826
4919
4921
4079
4086
4080
4081
4089
4285
4286
2608
2609
4950
4952
2790
2791
2794
2795
2812
2792
2793
4734
4735
848
854
2598
2599
487
495
2442
2444
2443
978
979
2440
2441
3823
3824
3249
3250
3077
3078
622
625
4667
4668
4500
4501
3851
3852
2586
2587
2604
2605
2494
2495
2695
2696
1380
4799
4800
2734
2747
1208
1209
472
1235
1241
2743
2746
2550
2553
2744
2745
4820
4821
5
916
5304
5305
5306
4
915
3596
3597
3366
3367
3853
3854
3061
3062
2581
2582
4736
4737
3286
3288
2799
2801
3974
3975
686
756
2784
2785
2810
2811
2741
2742
2577
2597
4941
4946
1163
1165
1170
1581
1584
4204
4205
4653
4654
2606
2607
2739
2740
1309
1398
1399
1400
2979
2980
2564
2565
4256
4257
4258
2120
2124
2125
4248
4249
3173
3174
4265
4266
1124
1125
3035
3049
152
154
3045
3046
1331
1353
1376
1354
3103
3105
3104
425
426
427
662
664
666
669
692
3171
3172
3863
3864
1816
1832
1833
4225
4226
3855
3856
2815
2821
2817
2819
3865
3866
1428
1430
3136
3137
1635
1636
1640
2857
2859
2858
2873
2870
2871
2872
4669
4670
3206
3207
4772
4773
1210
1212
846
1480
1493
1501
1479
1481
3143
3144
3075
3076
2665
2666
4808
4810
1766
1775
1292
1294
1578
1582
4007
4011
4010
4008
4009
4502
4503
2693
2694
3275
3276
1580
1583
2454
2455
1382
1384
3241
3243
3242
1475
1476
4961
4962
4291
4294
4295
4292
4293
1822
1823
1824
2575
2576
4246
4247
2549
2551
3552
3553
3273
3274
2467
2469
2468
4888
4890
2468101214
node
ID
clustering index
Figu
reC
.34:
Arc
hite
ctur
alM
odel
-com
plet
ehi
erar
chic
alcl
uste
ring
dend
rogr
amof
the
LL
SR
eque
stH
andl
ing
subs
yste
m.T
hele
ftm
ost
node
sar
em
agni
fied.
107
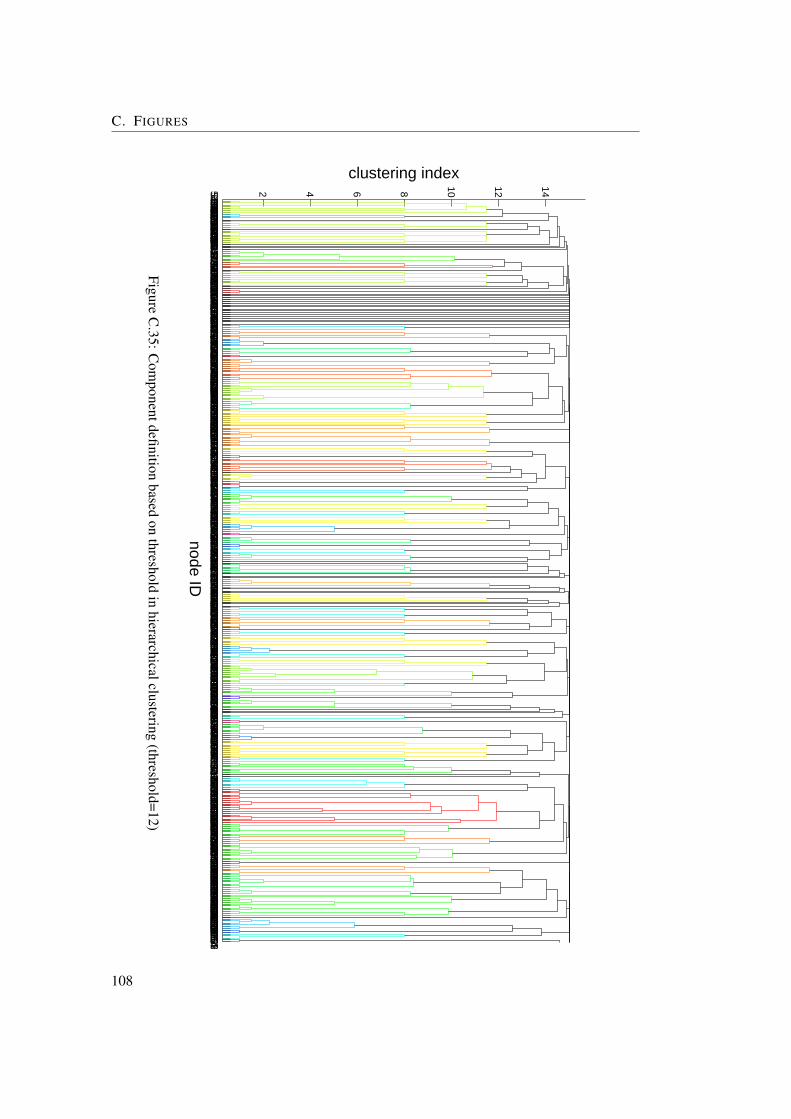
C. FIGURES
53185361534349965355534251784999535051881543 936154453475297154851035240530852845280533153031545141715471542
8 11 97 145 9 932 12 150 887 937 9381419538153225317149953735319531152961483501852931507149814975131149214871486 1875167 1861541154653215320528352381495500950195010
14764 73329982999 253 2541118112035483549491053335044533211131115111411321134 8048054806 754 755476248111378222222232224221622252226480748094818481948024828482948034817 757 758 7611101 3963992 3983993212121222123212621273547356635673558355935543555
2 330 407 653 266 276 238 258 245 283 301 416 419 465 271 320 325 305 947 949 844863 310 313 334 57 649 540 7604872 794487448734875 792 803 805 110 8061724 520 784 798 80017231166 450 504 60 92 775101921042105 485 528 492 511 519 5231016 542 226 813487148704876 863 76311371214 287 339 383 366 371 376 303 304 5355012 6421554 644 601 640 76913341379134213431355 773133013741366137013561362133313581377 120 315 319 324 678 293 74810211060 99510041028 2241043 2251024 668 999 777 78148691008 7791035 693102510231022104410321045104610331574 318 3221047 768 81210591048 815 81010381056 208 220 454 699 747 814 698 700 658 659 718 6574893 683 734 694 660 735 661 695 685 713 716 6 7 14 829 917 17 165 185 62 671387 9071385139052285295 31619061607166410851663166515631605167216681602156416941692169316011560169816701671186316993421372235103732342234231027140714054771477513894766477416661667 460189218931890189118591896189919001908190919051907189418951897189819691975199119891990188418851888188618871889190221552158216021592167216821652166215721642169 10 16
2 4 6 8 10 12 14
node ID
clustering index
FigureC
.35:Com
ponentdefinitionbased
onthreshold
inhierarchicalclustering
(threshold=12)
108
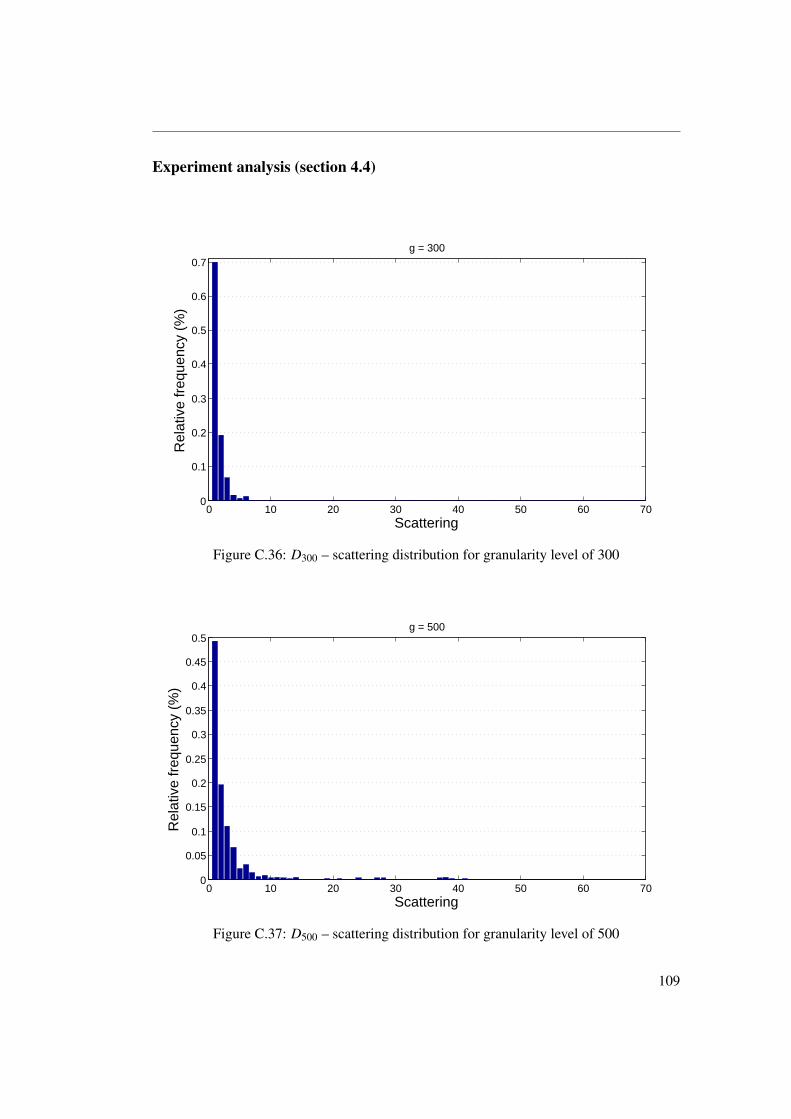
Experiment analysis (section 4.4)
0 10 20 30 40 50 60 700
0.1
0.2
0.3
0.4
0.5
0.6
0.7
Scattering
Rel
ativ
e fr
eque
ncy
(%)
g = 300
Figure C.36: D300 – scattering distribution for granularity level of 300
0 10 20 30 40 50 60 700
0.05
0.1
0.15
0.2
0.25
0.3
0.35
0.4
0.45
0.5
Scattering
Rel
ativ
e fr
eque
ncy
(%)
g = 500
Figure C.37: D500 – scattering distribution for granularity level of 500
109
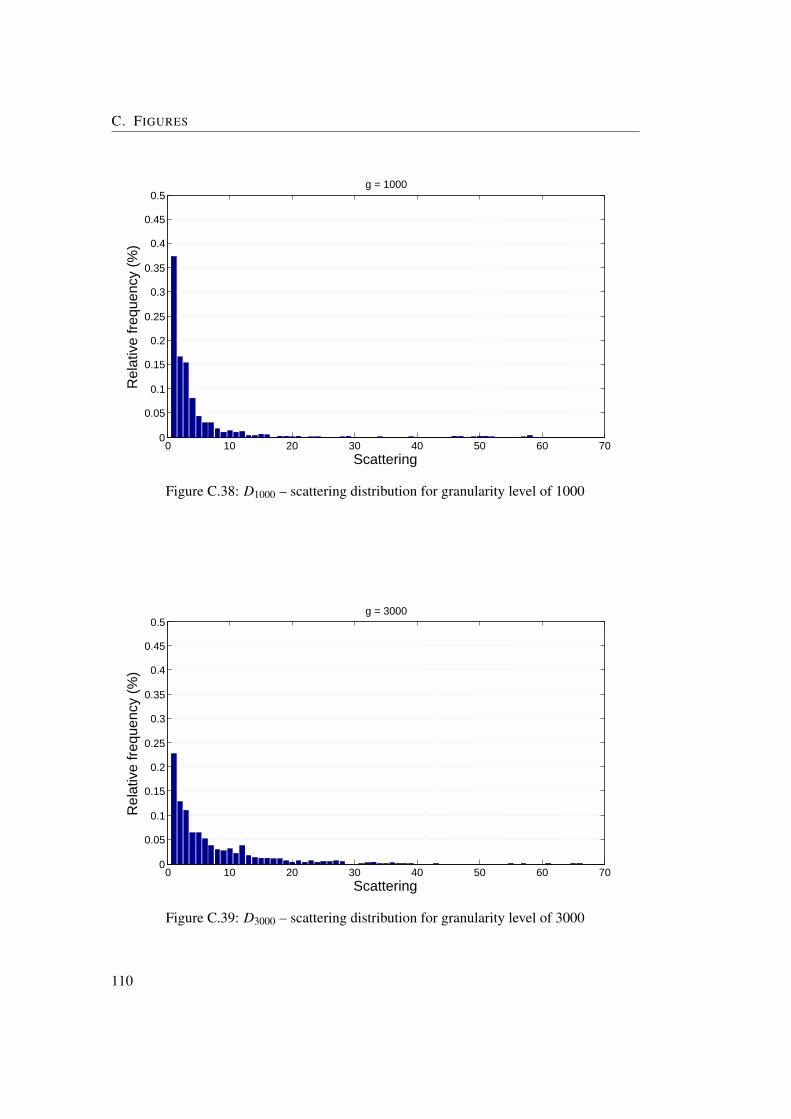
C. FIGURES
0 10 20 30 40 50 60 700
0.05
0.1
0.15
0.2
0.25
0.3
0.35
0.4
0.45
0.5
Scattering
Rel
ativ
e fr
eque
ncy
(%)
g = 1000
Figure C.38: D1000 – scattering distribution for granularity level of 1000
0 10 20 30 40 50 60 700
0.05
0.1
0.15
0.2
0.25
0.3
0.35
0.4
0.45
0.5
Scattering
Rel
ativ
e fr
eque
ncy
(%)
g = 3000
Figure C.39: D3000 – scattering distribution for granularity level of 3000
110
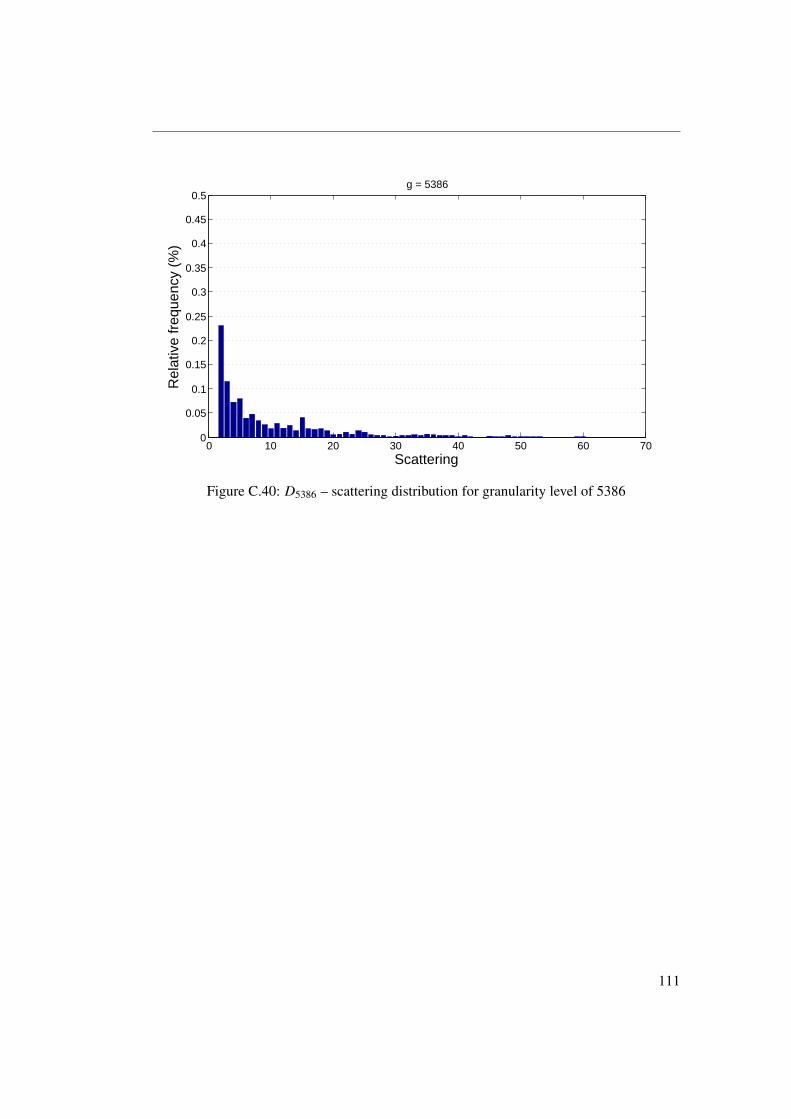
0 10 20 30 40 50 60 700
0.05
0.1
0.15
0.2
0.25
0.3
0.35
0.4
0.45
0.5
Scattering
Rel
ativ
e fr
eque
ncy
(%)
g = 5386
Figure C.40: D5386 – scattering distribution for granularity level of 5386
111
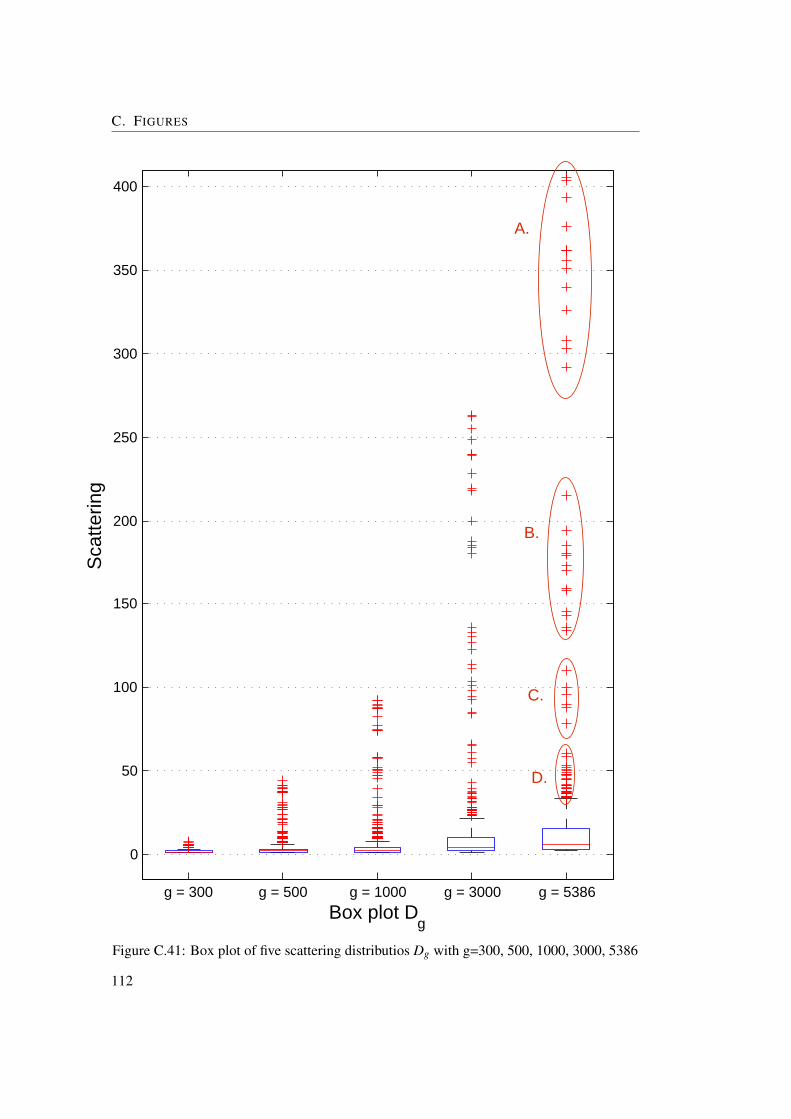
C. FIGURES
g = 300 g = 500 g = 1000 g = 3000 g = 5386
0
50
100
150
200
250
300
350
400
Sca
tterin
g
Box plot Dg
A.
C.
D.
B.
Figure C.41: Box plot of five scattering distributios Dg with g=300, 500, 1000, 3000, 5386
112
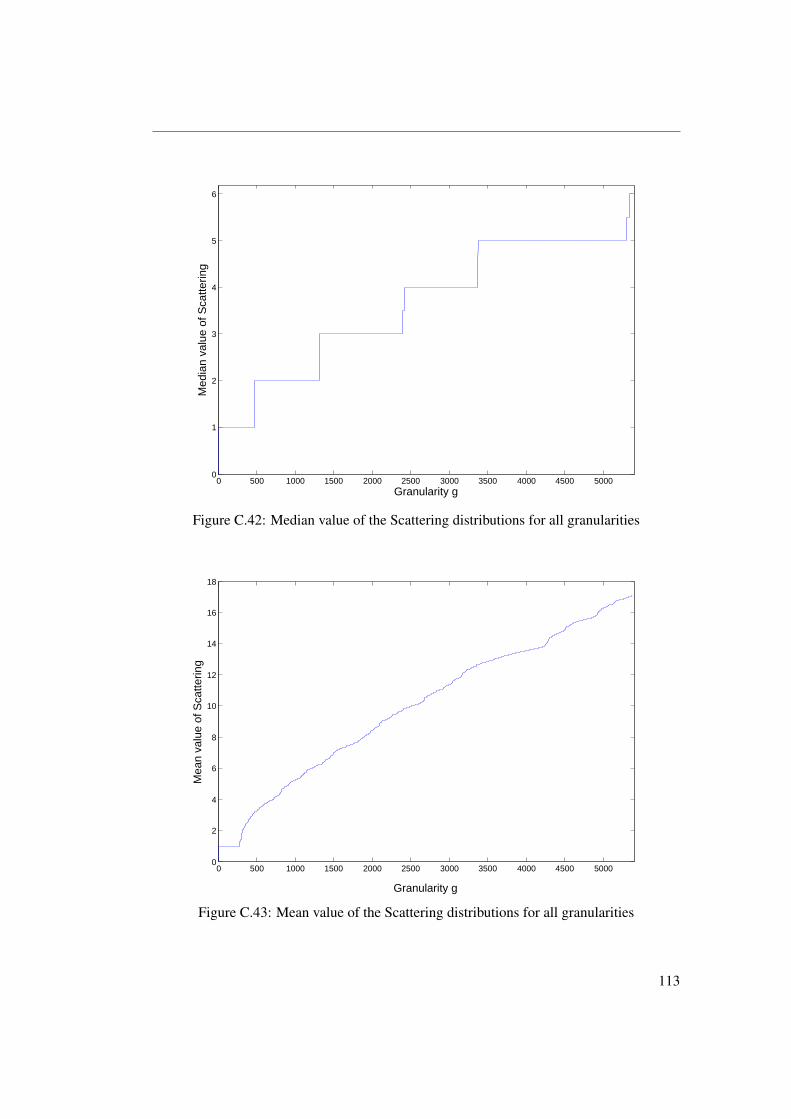
0 500 1000 1500 2000 2500 3000 3500 4000 4500 50000
1
2
3
4
5
6
Granularity g
Med
ian
valu
e of
Sca
tterin
g
Figure C.42: Median value of the Scattering distributions for all granularities
0 500 1000 1500 2000 2500 3000 3500 4000 4500 50000
2
4
6
8
10
12
14
16
18
Granularity g
Mea
n va
lue
of S
catte
ring
Figure C.43: Mean value of the Scattering distributions for all granularities
113

C. FIGURES
0 500 1000 1500 2000 2500 3000 3500 4000 4500 50000
5
10
15
20
25
30
35
40
45
50
Granularity g
Sta
ndar
d de
viat
ion
valu
e of
Sca
tterin
g
Figure C.44: Standard deviation value of the Scattering distributions for all granularities
114
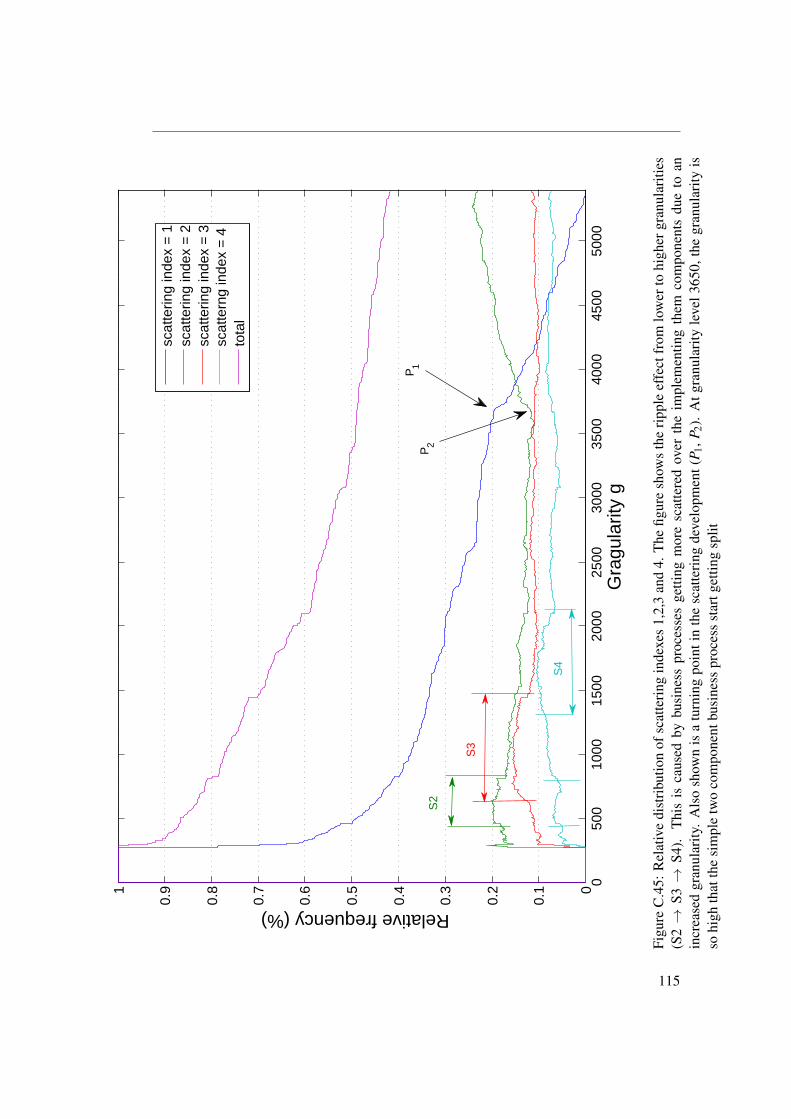
050
010
0015
0020
0025
0030
0035
0040
0045
0050
000
0.1
0.2
0.3
0.4
0.5
0.6
0.7
0.8
0.91
Gra
gula
rity
g
Relative frequency (%)
scat
terin
g in
dex
= 1
scat
terin
g in
dex
= 2
scat
terin
g in
dex
= 3
scat
tern
g in
dex
= 4
tota
l
S2
S3
S4
P2
P1
Figu
reC
.45:
Rel
ativ
edi
stri
butio
nof
scat
teri
ngin
dexe
s1,
2,3
and
4.T
hefig
ure
show
sth
eri
pple
effe
ctfr
omlo
wer
tohi
gher
gran
ular
ities
(S2→
S3→
S4).
Thi
sis
caus
edby
busi
ness
proc
esse
sge
tting
mor
esc
atte
red
over
the
impl
emen
ting
them
com
pone
nts
due
toan
incr
ease
dgr
anul
arity
.A
lso
show
nis
atu
rnin
gpo
inti
nth
esc
atte
ring
deve
lopm
ent(
P 1,P
2).
Atg
ranu
lari
tyle
vel3
650,
the
gran
ular
ityis
sohi
ghth
atth
esi
mpl
etw
oco
mpo
nent
busi
ness
proc
ess
star
tget
ting
split
115
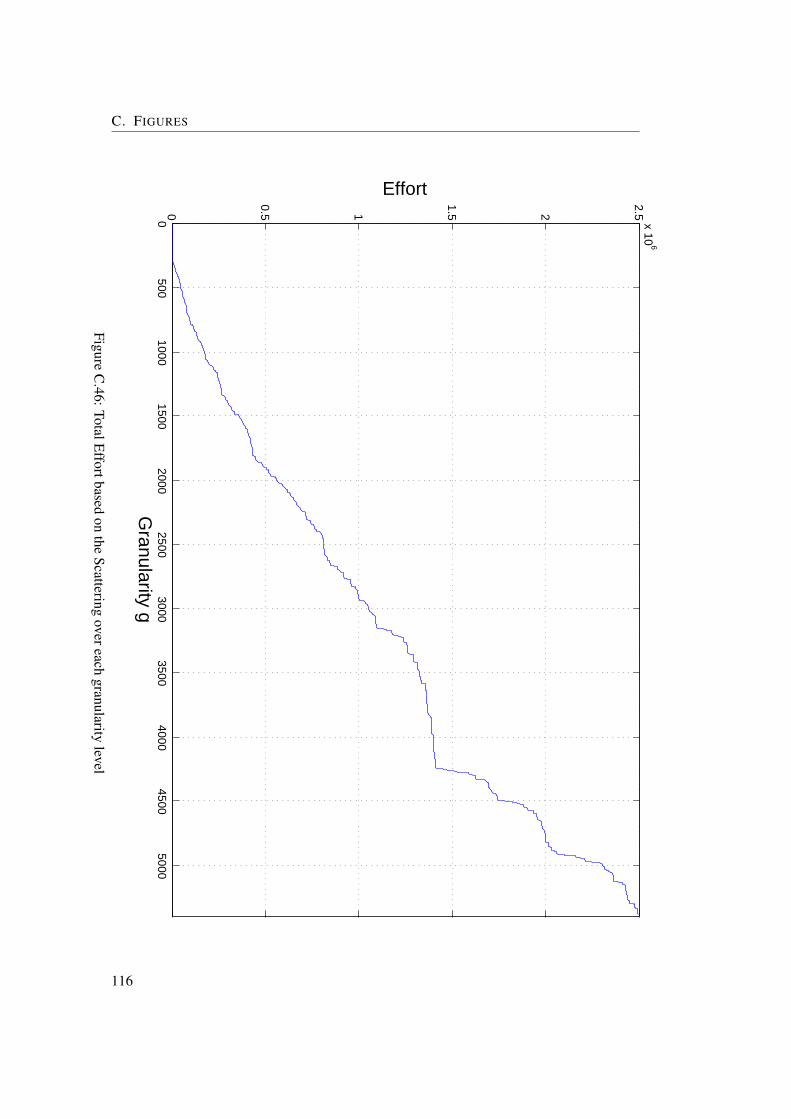
C. FIGURES
0500
10001500
20002500
30003500
40004500
50000
0.5 1
1.5 2
2.5x 10
6
Granularity g
Effort
FigureC
.46:TotalEffortbased
onthe
Scatteringovereach
granularitylevel
116
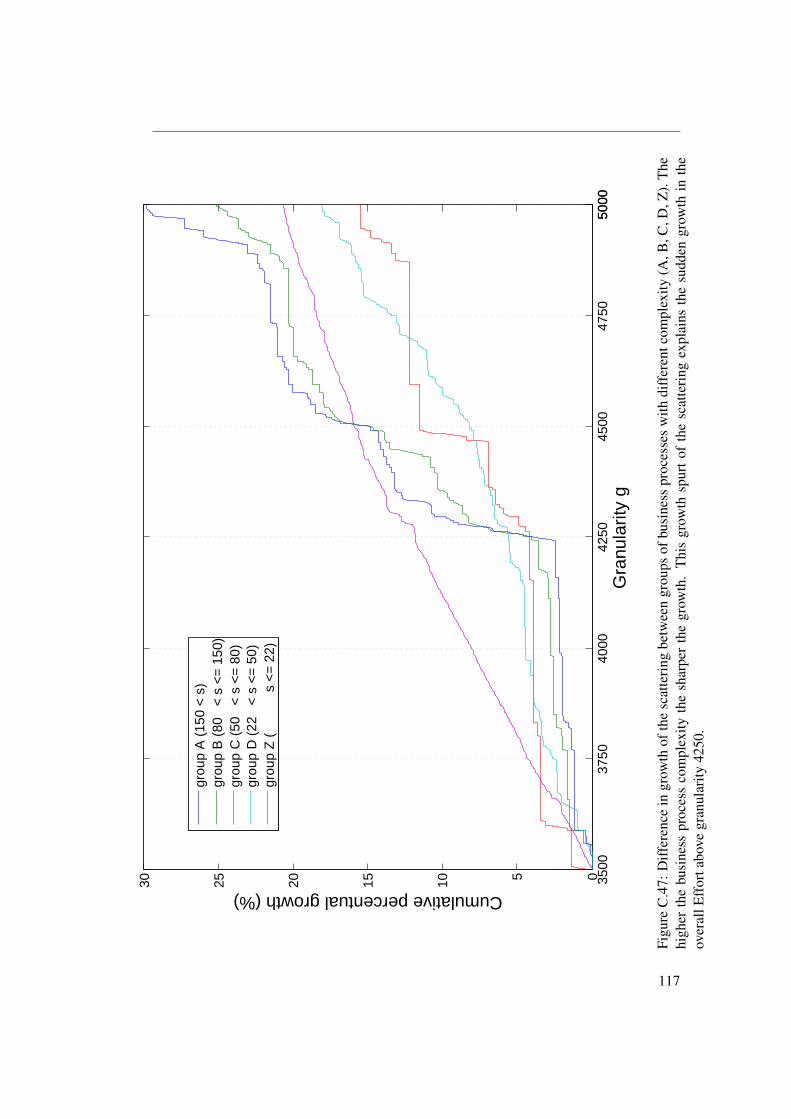
3500
3750
4000
4250
4500
4750
5000
5000
051015202530
Gra
nula
rity
g
Cumulative percentual growth (%)
grou
p A
(15
0 <
s)
grou
p B
(80
<
s <
= 1
50)
grou
p C
(50
<
s <
= 8
0)gr
oup
D (
22
< s
<=
50)
grou
p Z
(
s <
= 2
2)
Figu
reC
.47:
Diff
eren
cein
grow
thof
the
scat
teri
ngbe
twee
ngr
oups
ofbu
sine
sspr
oces
ses
with
diff
eren
tcom
plex
ity(A
,B,C
,D,Z
).T
hehi
gher
the
busi
ness
proc
ess
com
plex
ityth
esh
arpe
rth
egr
owth
.T
his
grow
thsp
urt
ofth
esc
atte
ring
expl
ains
the
sudd
engr
owth
inth
eov
eral
lEff
orta
bove
gran
ular
ity42
50.
117
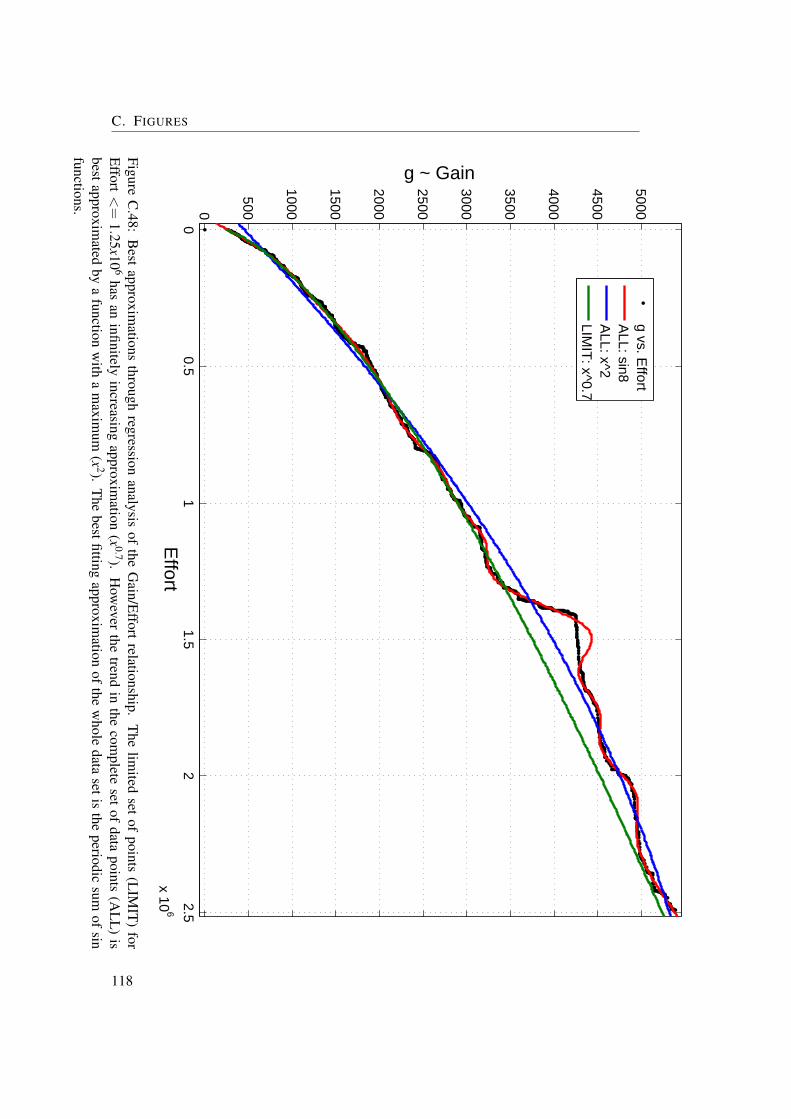
C. FIGURES
00.5
11.5
22.5
x 106
0
500
1000
1500
2000
2500
3000
3500
4000
4500
5000
Effort
g ~ Gain
g vs. Effort
ALL: sin8
ALL: x^2
LIMIT
: x^0.7
FigureC
.48:B
estapproxim
ationsthrough
regressionanalysis
ofthe
Gain/E
ffortrelationship.
The
limited
setof
points(L
IMIT
)for
Effort
<=
1.25x10
6has
aninfinitely
increasingapproxim
ation(x
0.7).H
owever
thetrend
inthe
complete
setof
datapoints
(AL
L)
isbestapproxim
atedby
afunction
with
am
aximum
(x2).
The
bestfittingapproxim
ationof
thew
holedata
setisthe
periodicsum
ofsin
functions.
118
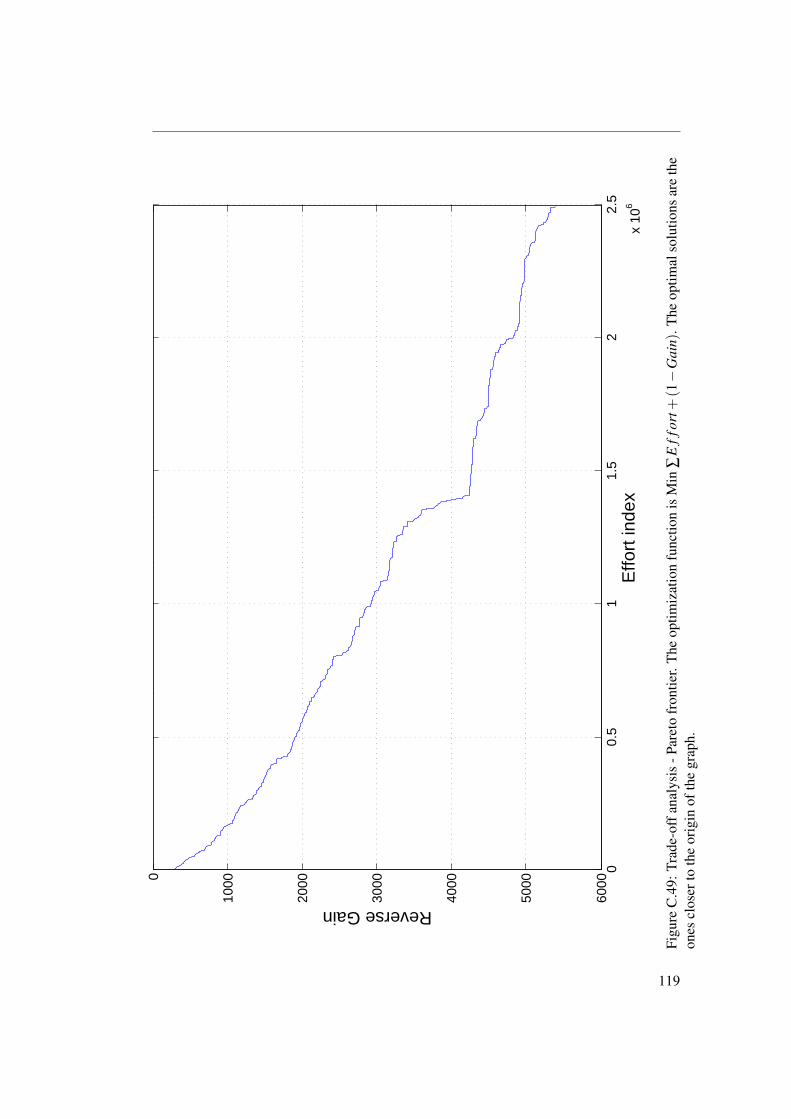
00.
51
1.5
22.
5
x 10
6
0
1000
2000
3000
4000
5000
6000
Effo
rt in
dex
Reverse Gain
Figu
reC
.49:
Trad
e-of
fana
lysi
s-P
aret
ofr
ontie
r.T
heop
timiz
atio
nfu
nctio
nis
Min
∑E
ffor
t+(1−
Gai
n).T
heop
timal
solu
tions
are
the
ones
clos
erto
the
orig
inof
the
grap
h.
119
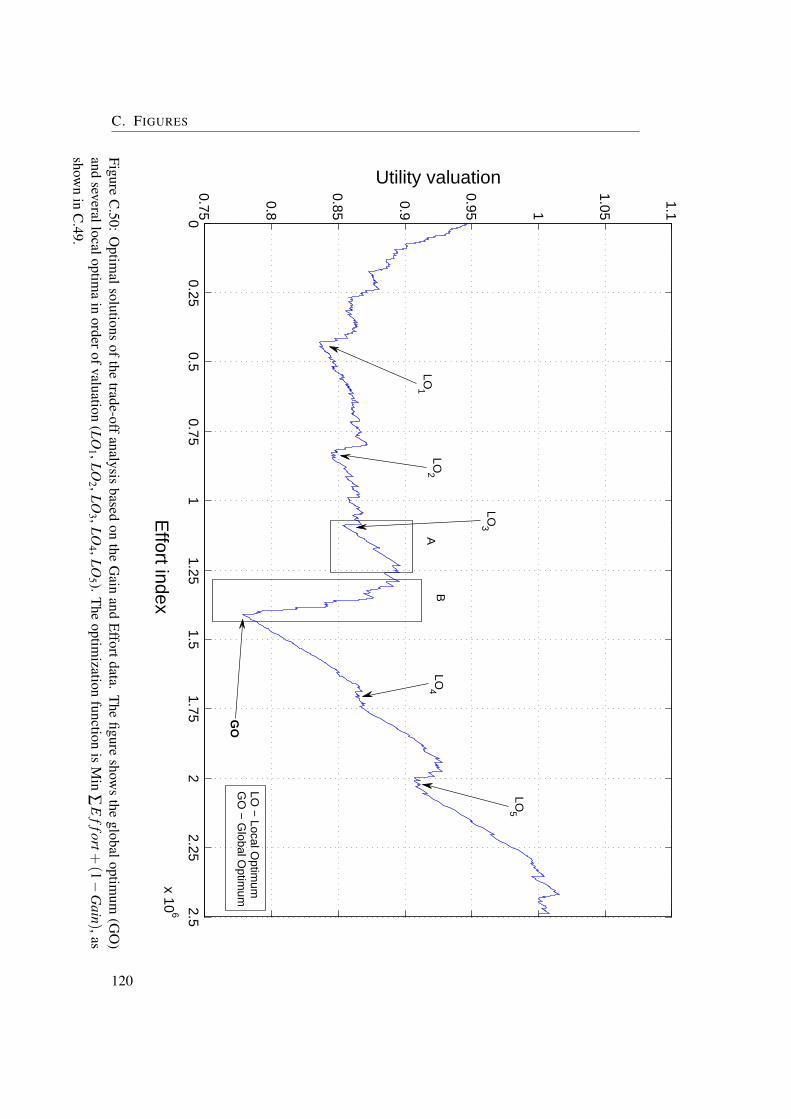
C. FIGURES
00.25
0.50.75
11.25
1.51.75
22.25
2.5
x 106
0.75
0.8
0.85
0.9
0.95 1
1.05
1.1
Effort index
Utility valuation
AB
LO1
LO2
LO3
LO4
LO5
LO −
Local Optim
umG
O −
Global O
ptimum
GO
FigureC
.50:O
ptimalsolutions
ofthe
trade-offanalysis
basedon
theG
ainand
Effortdata.
The
figureshow
sthe
globaloptimum
(GO
)and
severallocaloptima
inorderofvaluation
(LO1 ,LO
2 ,LO3 ,LO
4 ,LO5 ).
The
optimization
functionis
Min
∑E
ffort+(1−
Gain),as
shown
inC
.49.
120
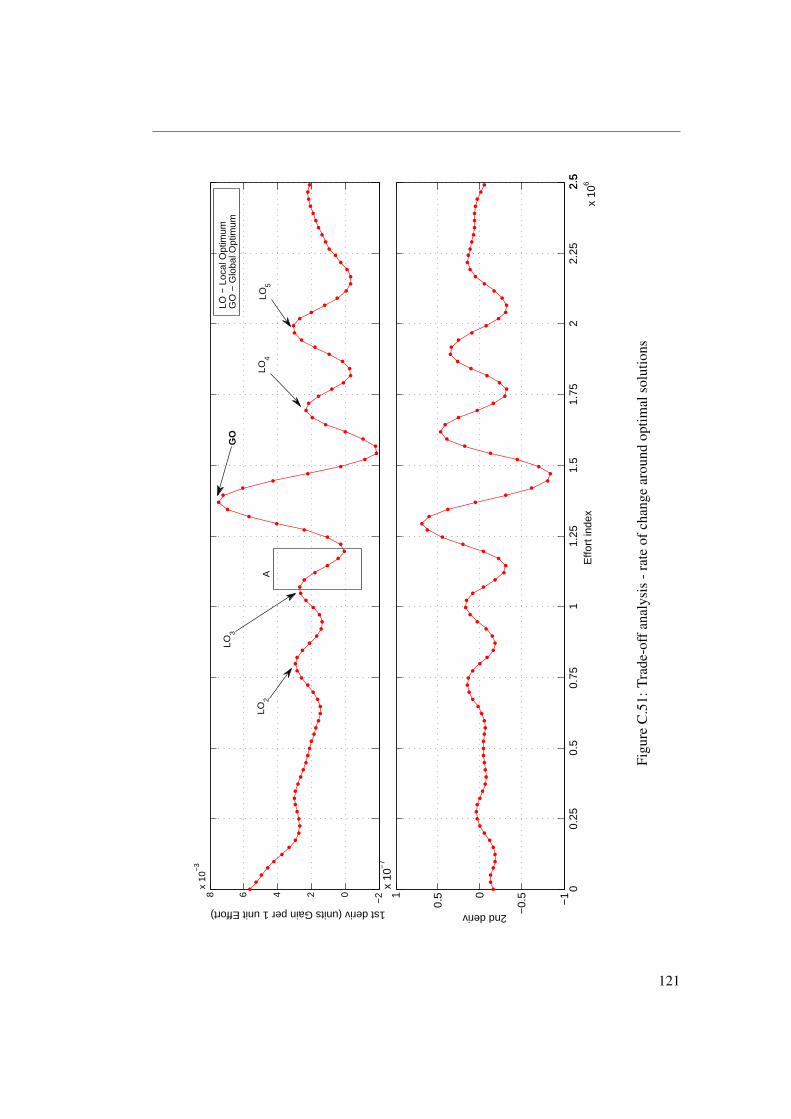
−202468
x 10
−3
1st deriv (units Gain per 1 unit Effort)
00.
250.
50.
751
1.25
1.5
1.75
22.
252.
52.
5
x 10
6
−1
−0.
50
0.51
x 10
−7
2nd deriv
Effo
rt in
dex
LO3
LO2
GO
LO5
LO4
LO −
Loc
al O
ptim
umG
O −
Glo
bal O
ptim
um
A
Figu
reC
.51:
Trad
e-of
fana
lysi
s-r
ate
ofch
ange
arou
ndop
timal
solu
tions
121
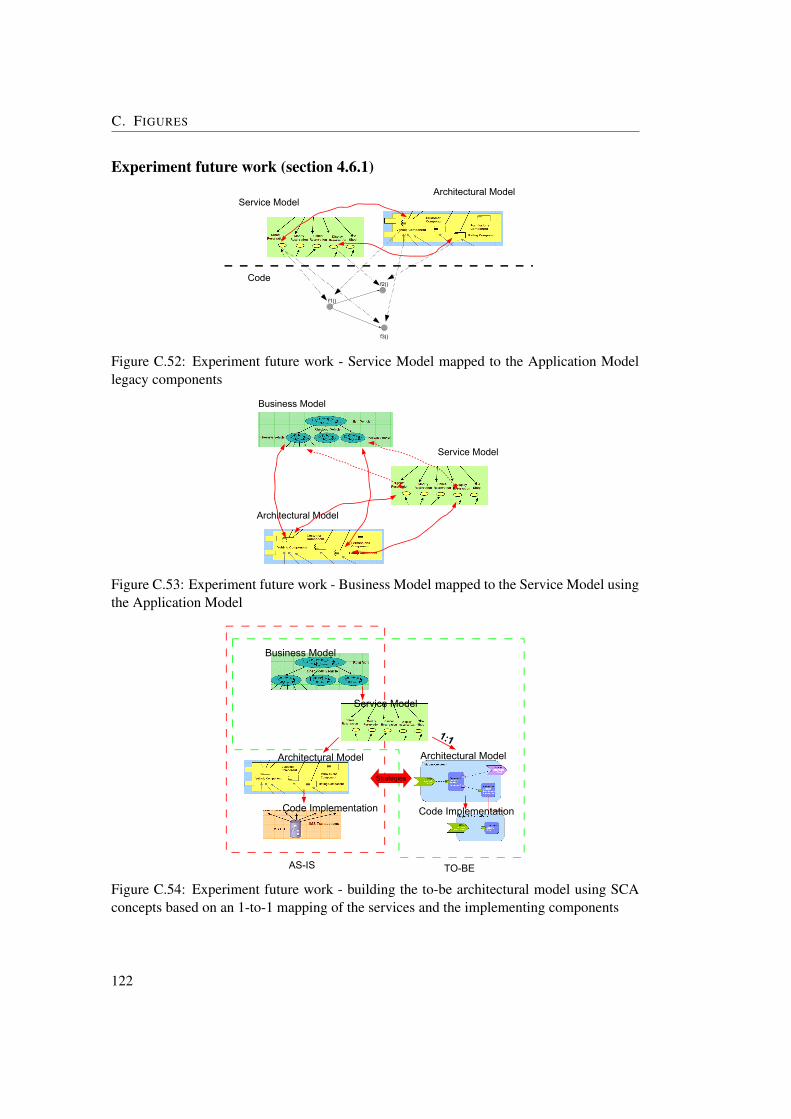
C. FIGURES
Experiment future work (section 4.6.1)#5
f3()
f2()
f1()
Code
Architectural ModelService Model
Figure C.52: Experiment future work - Service Model mapped to the Application Modellegacy components#6
Service Model
Architectural Model
Business Model
Figure C.53: Experiment future work - Business Model mapped to the Service Model usingthe Application Model
Business Model
Architectural Model
Code Implementation
Architectural Model
Code Implementation
1:1
AS-IS TO-BE
Strategies
Service Model
Figure C.54: Experiment future work - building the to-be architectural model using SCAconcepts based on an 1-to-1 mapping of the services and the implementing components
122
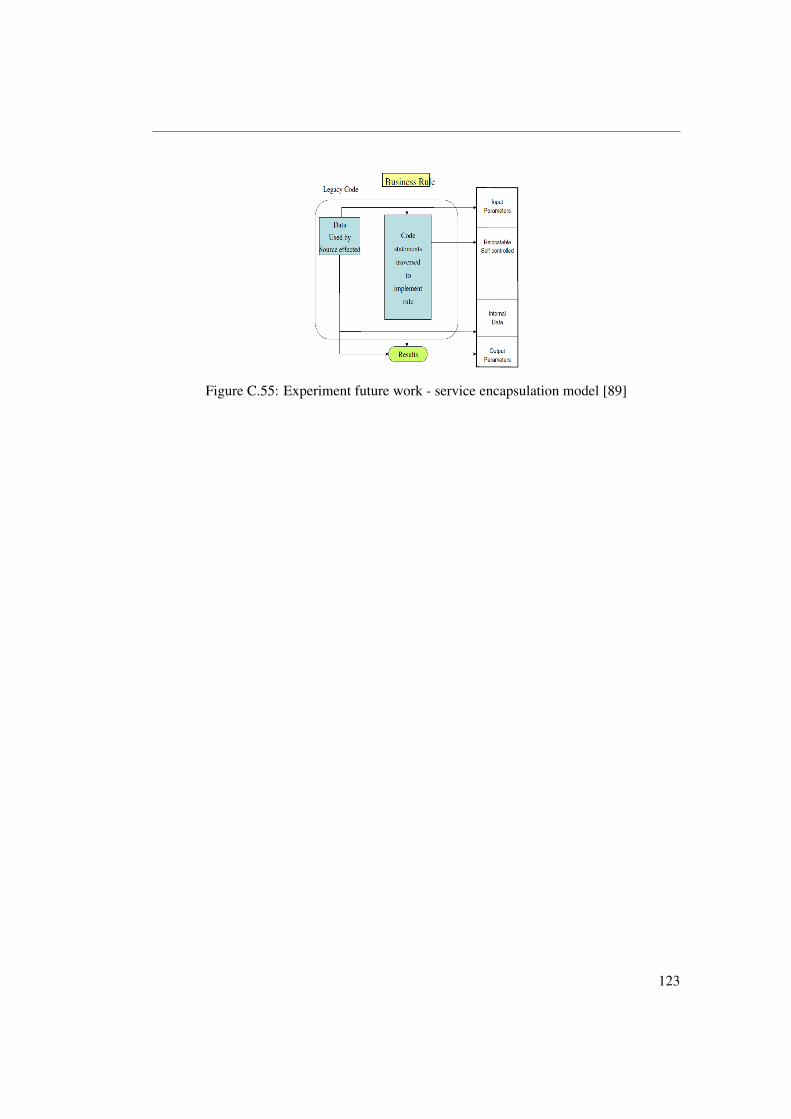
Figure C.55: Experiment future work - service encapsulation model [89]
123
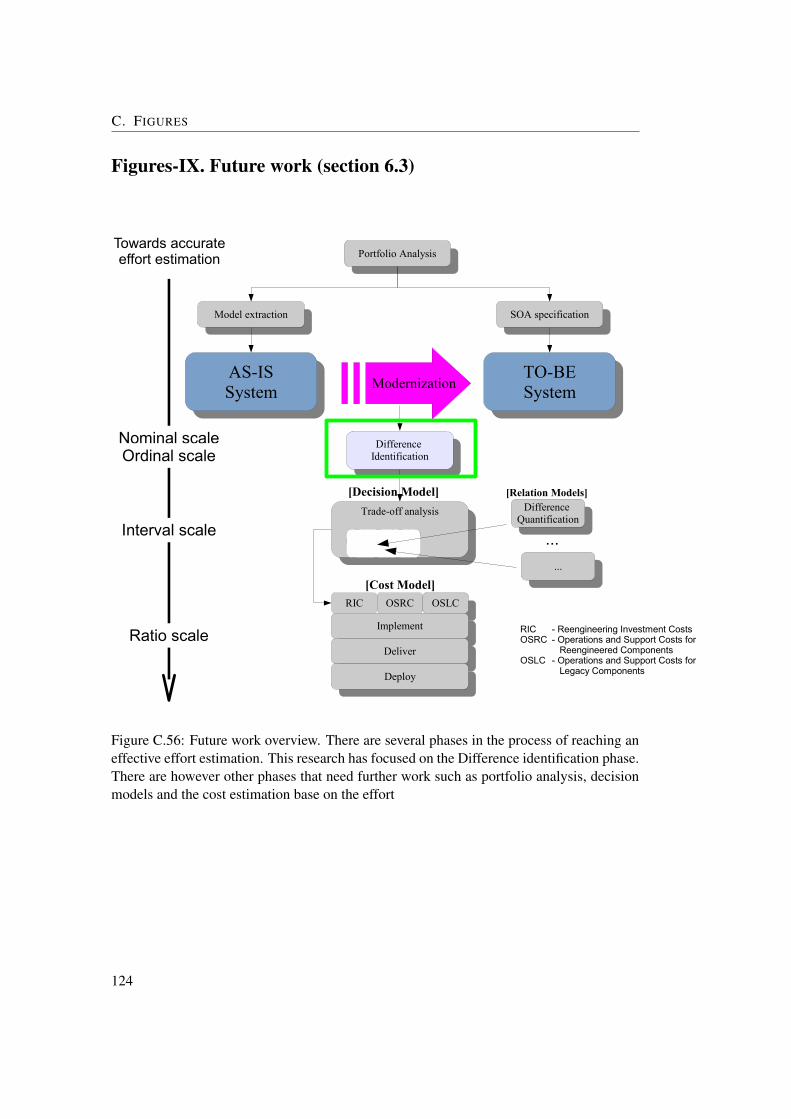
C. FIGURES
Figures-IX. Future work (section 6.3)
Difference Identification
Difference Identification
Difference Quantification
Difference Quantification
AS-ISSystemAS-ISSystem
TO-BESystem
TO-BESystem Modernization
Towards accurate effort estimation
Model extractionModel extraction
SOA specificationSOA specification
Nominal scaleOrdinal scale
Interval scale
Ratio scale
Portfolio AnalysisPortfolio Analysis
RIC OSRCOSLC
OSLC
ImplementImplement
DeliverDeliver
DeployDeploy
[Cost Model]
[Relation Models][Decision Model]
Trade-off analysisTrade-off analysis
......
...
RIC - Reengineering Investment CostsOSRC - Operations and Support Costs for
Reengineered ComponentsOSLC - Operations and Support Costs for
Legacy Components
Figure C.56: Future work overview. There are several phases in the process of reaching aneffective effort estimation. This research has focused on the Difference identification phase.There are however other phases that need further work such as portfolio analysis, decisionmodels and the cost estimation base on the effort
124