1 Klik op het icoontje om een nieuwe afbeelding in PORT OF ... › imagens › 33 › 57 ›...
35
© Copyright - Port of Rotterdam 1 PORT OF ROTTERDAM René van der Plas, Director Port of Rotterdam International
Transcript of 1 Klik op het icoontje om een nieuwe afbeelding in PORT OF ... › imagens › 33 › 57 ›...
© Copyright - Port of Rotterdam 1
Titeldia
Klik op het icoontje om een nieuwe afbeelding in te voegen.
Zoek en selecteer de gewenste afbeelding. Klik op ´Invoegen´
1
2
Invoe
gen
AFBEELDING
INVOEGEN
PORT OF ROTTERDAM
René van der Plas, Director Port of Rotterdam International
© Copyright - Port of Rotterdam 2
Port of Rotterdam footprint
1400 - 1800
1800 - 1900
1906 - 1922
1934 - 1946
1929 - 1949
1948 - 1957
1960 - 1970
1970 - 2008
2008 - 2030
© Copyright - Port of Rotterdam 3
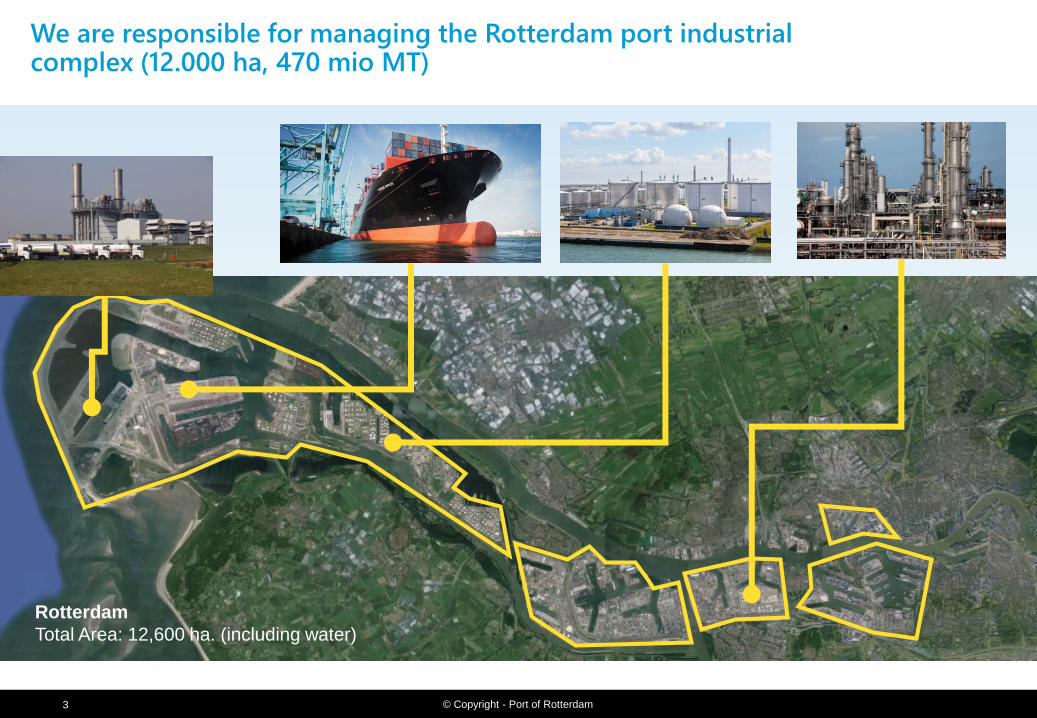
We are responsible for managing the Rotterdam port industrial complex (12.000 ha, 470 mio MT)
Rotterdam
Total Area: 12,600 ha. (including water)
© Copyright - Port of Rotterdam 4
Afbeelding (XL) 4x
Klik op het icoontje om een nieuwe afbeelding in te voegen.
Zoek en selecteer de gewenste afbeelding. Klik op ´Invoegen´
1
2
Invoeg
en
AFBEELDING
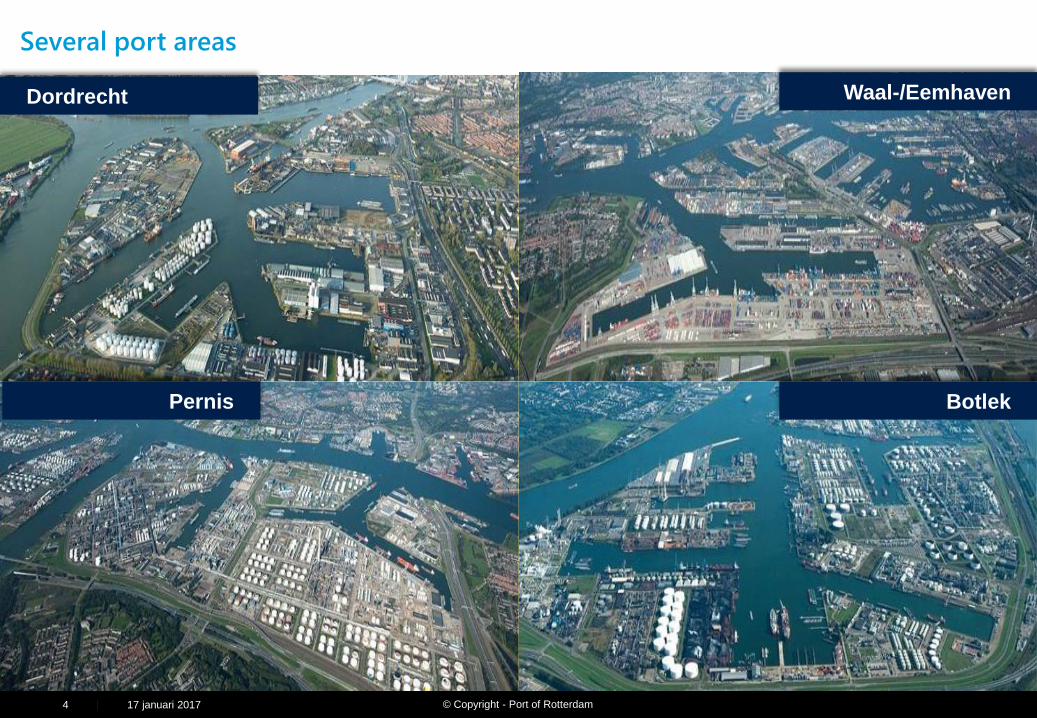
INVOEGEN Several port areas
17 januari 2017 |
4
Waal-/Eemhaven
Pernis
Dordrecht
Botlek
© Copyright - Port of Rotterdam 5
Afbeelding (XL) 4x
Klik op het icoontje om een nieuwe afbeelding in te voegen.
Zoek en selecteer de gewenste afbeelding. Klik op ´Invoegen´
1
2
Invoeg
en
AFBEELDING
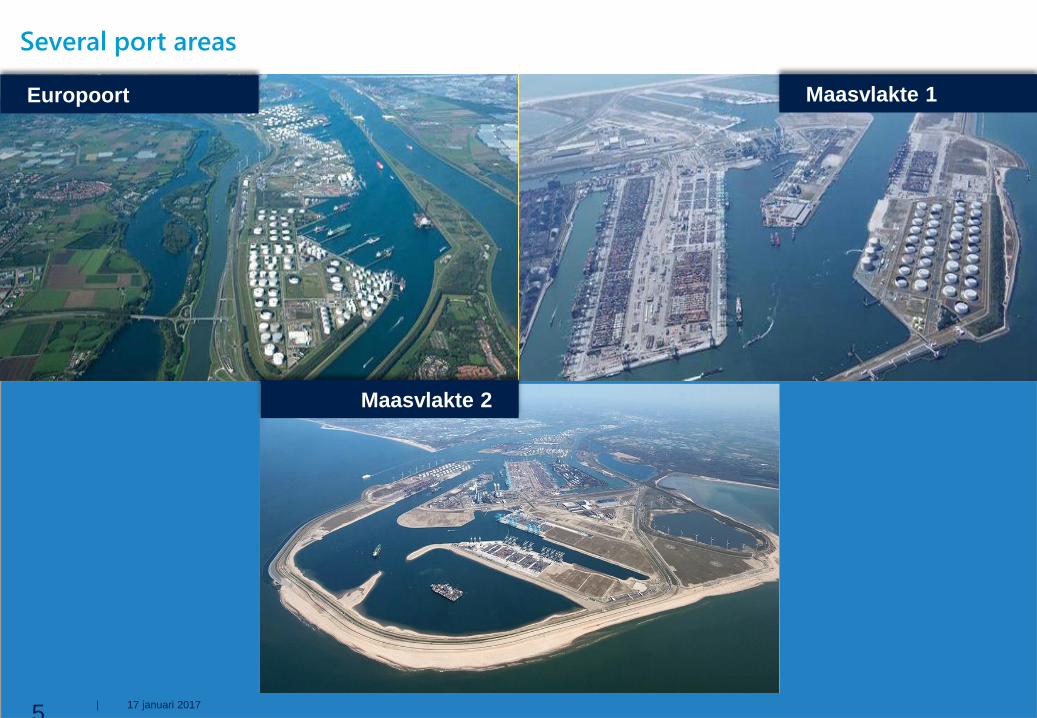
INVOEGEN Several port areas
17 januari 2017 |
5
Maasvlakte 2
Europoort Maasvlakte 1
© Copyright - Port of Rotterdam 6
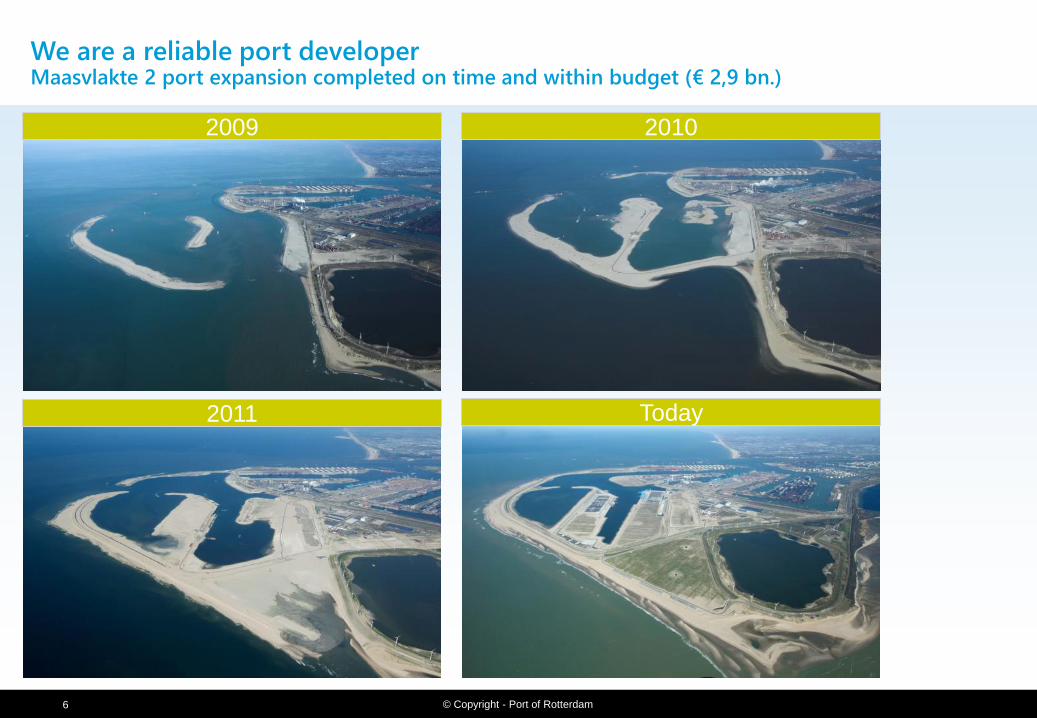
We are a reliable port developer Maasvlakte 2 port expansion completed on time and within budget (€ 2,9 bn.)
2009 2010
Today 2011
© Copyright - Port of Rotterdam 7
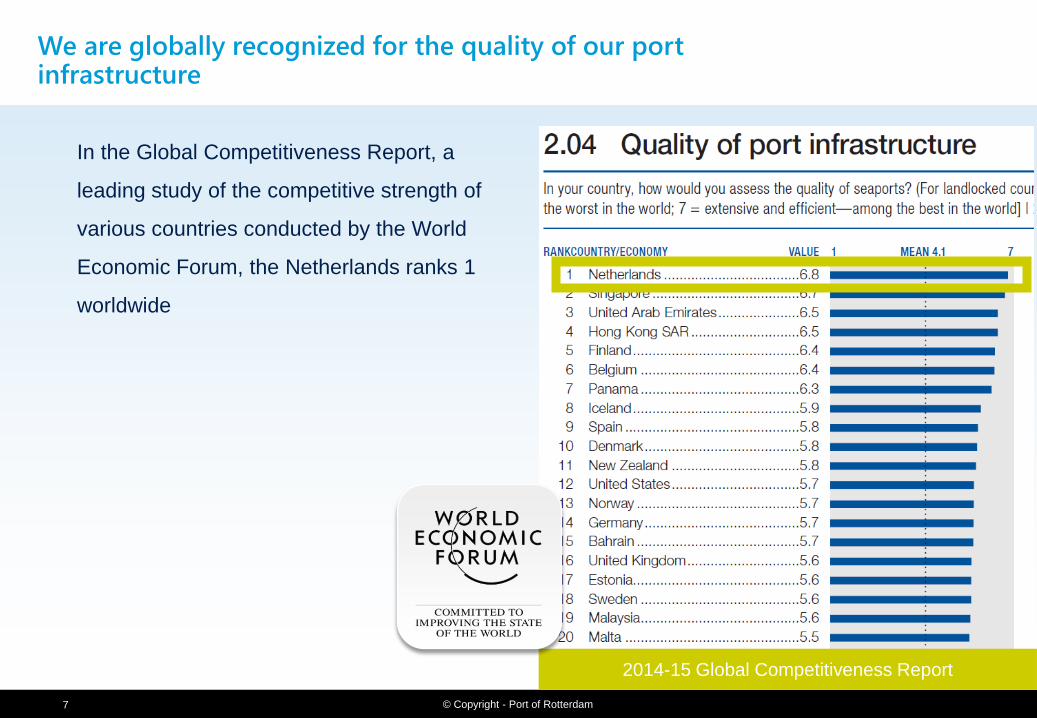
We are globally recognized for the quality of our port infrastructure
2014-15 Global Competitiveness Report
In the Global Competitiveness Report, a
leading study of the competitive strength of
various countries conducted by the World
Economic Forum, the Netherlands ranks 1
worldwide
© Copyright - Port of Rotterdam 8
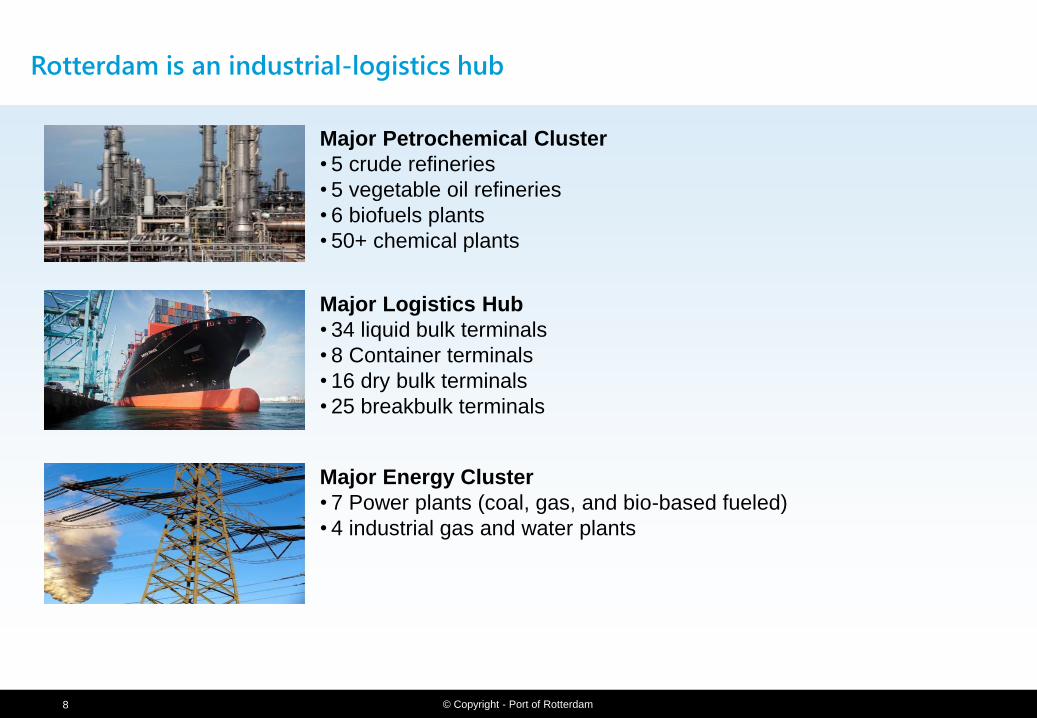
Rotterdam is an industrial-logistics hub
Major Petrochemical Cluster
• 5 crude refineries
• 5 vegetable oil refineries
• 6 biofuels plants
• 50+ chemical plants
Major Logistics Hub
• 34 liquid bulk terminals
• 8 Container terminals
• 16 dry bulk terminals
• 25 breakbulk terminals
Major Energy Cluster
• 7 Power plants (coal, gas, and bio-based fueled)
• 4 industrial gas and water plants
© Copyright - Port of Rotterdam 9
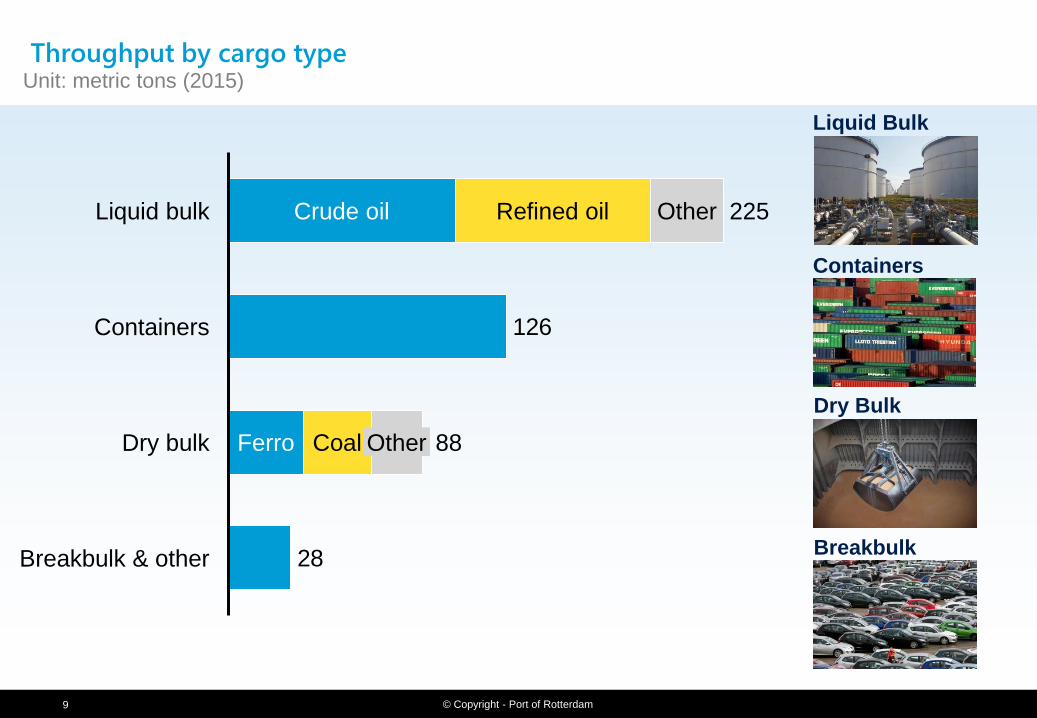
Throughput by cargo type Unit: metric tons (2015)
Liquid Bulk
Dry Bulk
Containers
Breakbulk 28
126
Crude oil 225
Containers
Liquid bulk Refined oil Other
88 Ferro Dry bulk
Breakbulk & other
Coal Other
© Copyright - Port of Rotterdam 10
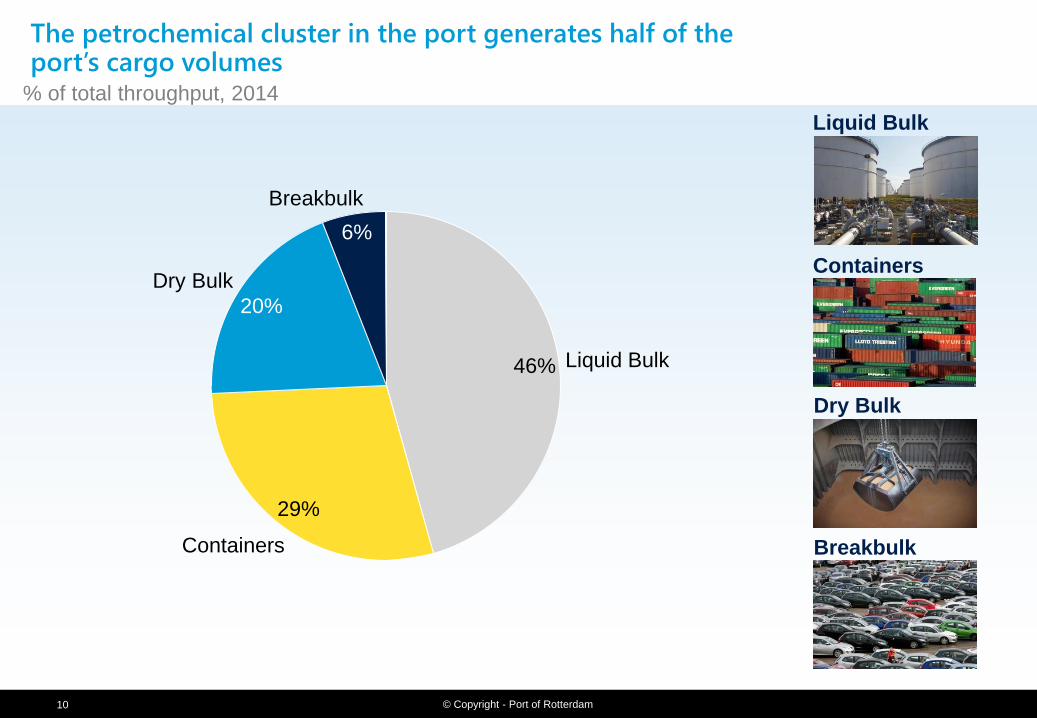
The petrochemical cluster in the port generates half of the port’s cargo volumes
29%
6%
20%
Breakbulk
Containers
Dry Bulk
Liquid Bulk 46%
% of total throughput, 2014
Liquid Bulk
Dry Bulk
Containers
Breakbulk
© Copyright - Port of Rotterdam 11
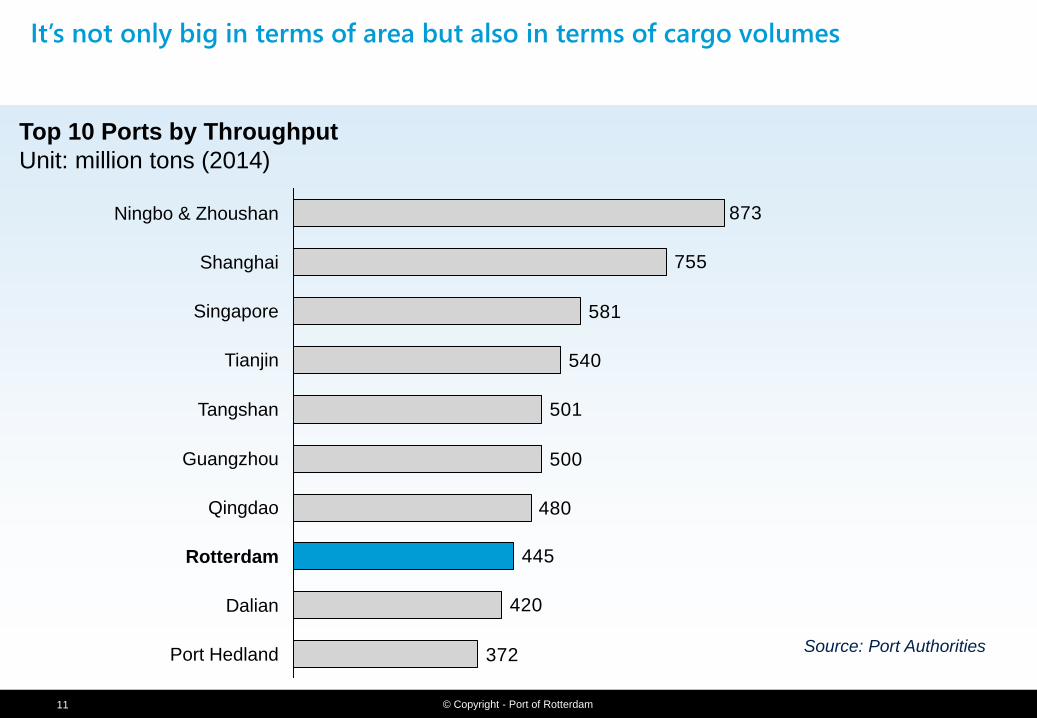
It’s not only big in terms of area but also in terms of cargo volumes
Source: Port Authorities 372
420
445
480
500
501
540
581
755
873
Tangshan
Tianjin
Ningbo & Zhoushan
Shanghai
Singapore
Port Hedland
Rotterdam
Qingdao
Guangzhou
Dalian
Top 10 Ports by Throughput
Unit: million tons (2014)
© Copyright - Port of Rotterdam 12
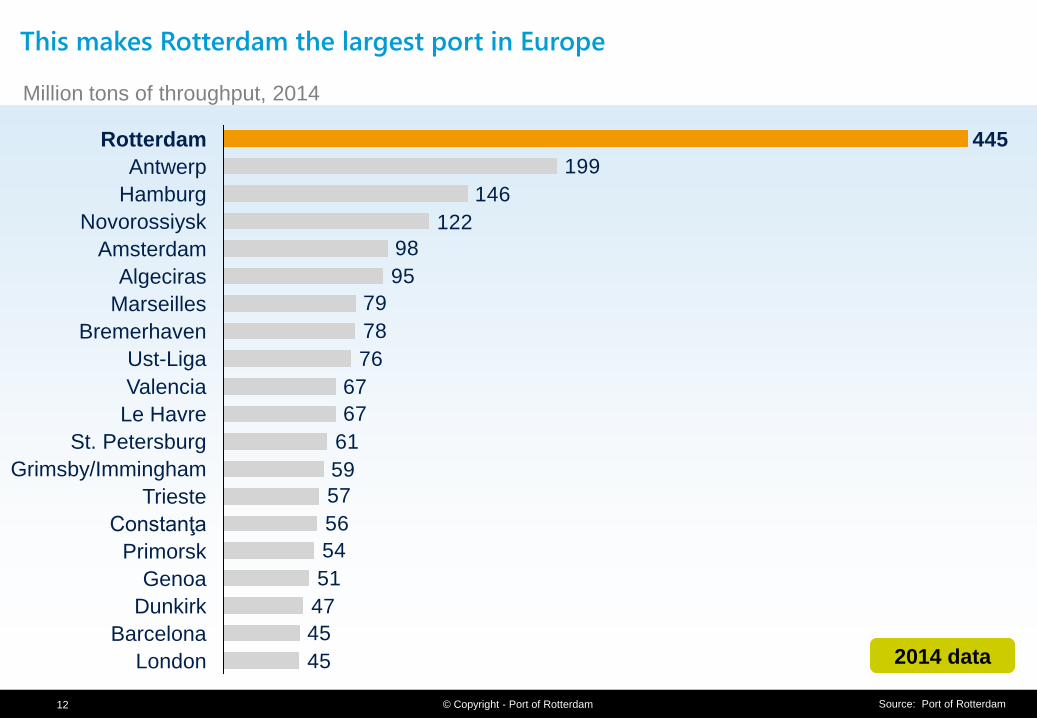
This makes Rotterdam the largest port in Europe
45
45
47
51
54
56
57
59
61
67
67
76
78
79
95
98
122
146
199
445
Barcelona
Hamburg
Antwerp
St. Petersburg
Novorossiysk
Amsterdam
Algeciras
Marseilles
Bremerhaven
Le Havre
Valencia
Dunkirk
Genoa
Trieste
Constanţa
Ust-Liga
Primorsk
Grimsby/Immingham
London
Rotterdam
Million tons of throughput, 2014
Source: Port of Rotterdam
2014 data
© Copyright - Port of Rotterdam 13
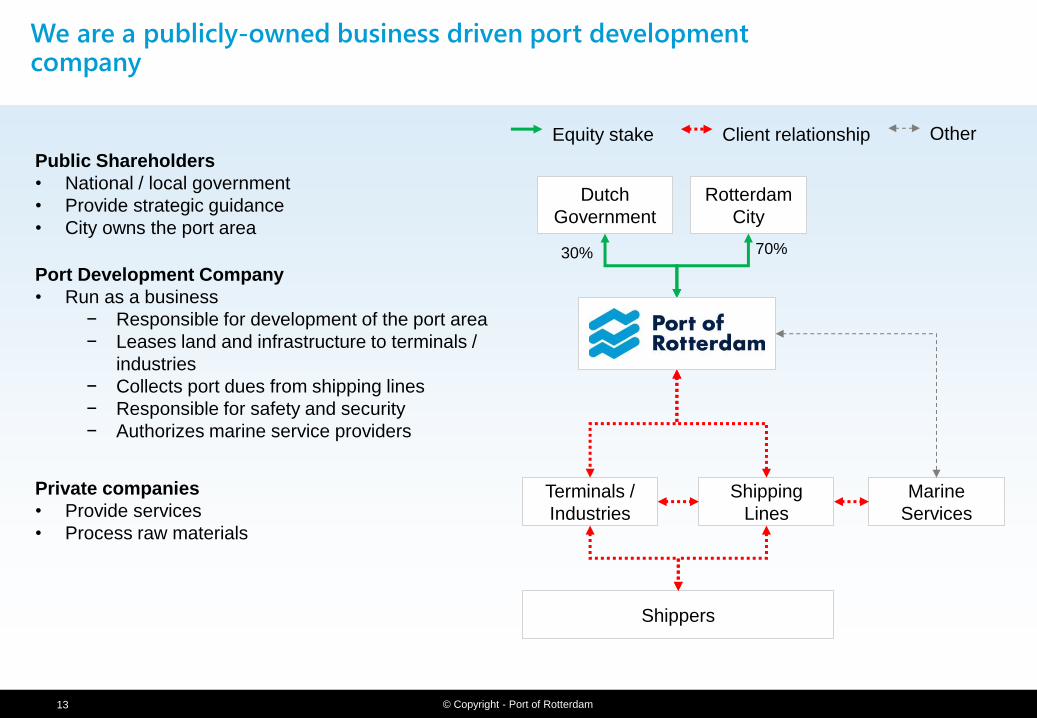
We are a publicly-owned business driven port development company
Dutch
Government
Terminals /
Industries
Shippers
Shipping
Lines
Rotterdam
City
Public Shareholders
• National / local government
• Provide strategic guidance
• City owns the port area
Port Development Company
• Run as a business
− Responsible for development of the port area
− Leases land and infrastructure to terminals /
industries
− Collects port dues from shipping lines
− Responsible for safety and security
− Authorizes marine service providers
Private companies
• Provide services
• Process raw materials
Equity stake Client relationship Other
30% 70%
Marine
Services
© Copyright - Port of Rotterdam 14
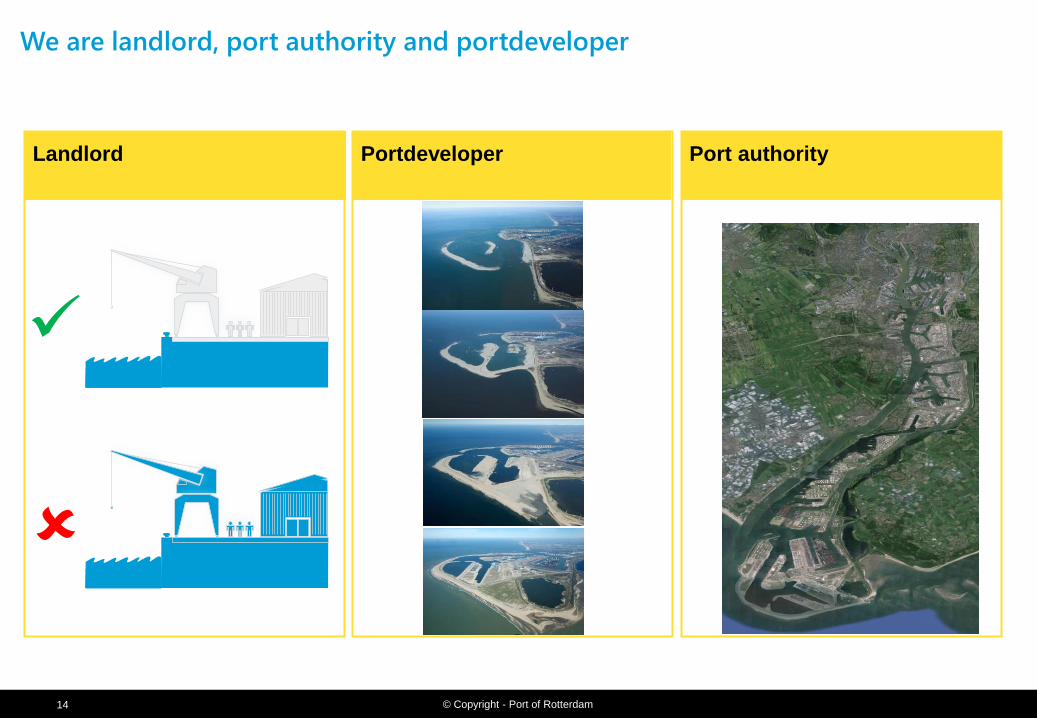
We are landlord, port authority and portdeveloper
Landlord
Port authority
Portdeveloper
© Copyright - Port of Rotterdam 15
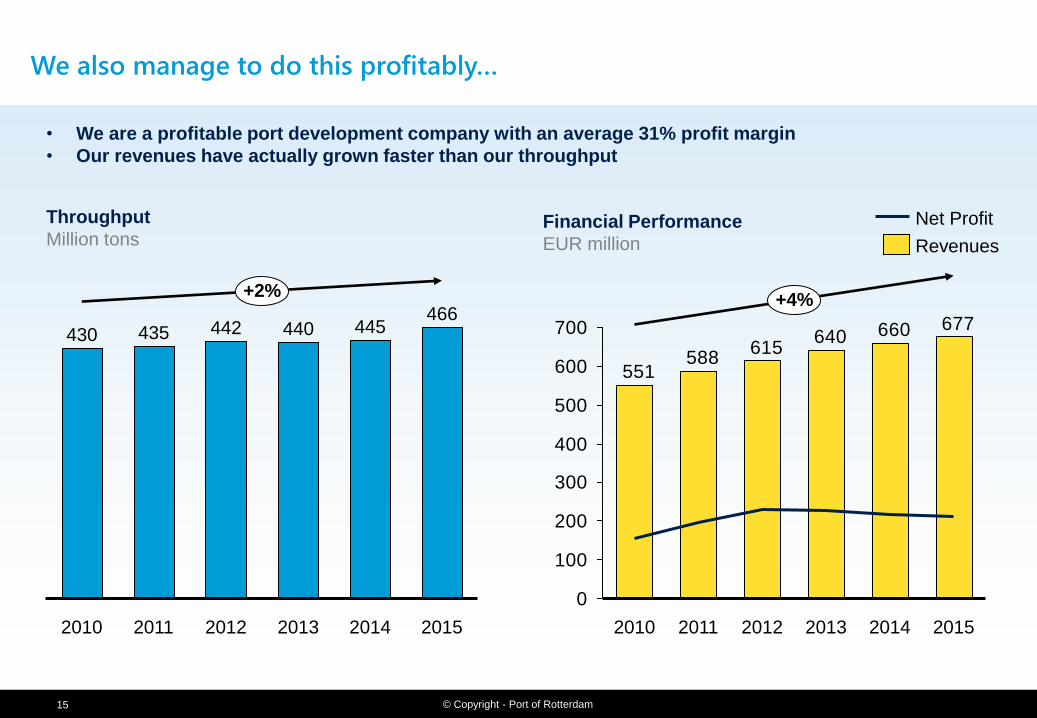
We also manage to do this profitably…
Financial Performance
EUR million
• We are a profitable port development company with an average 31% profit margin
• Our revenues have actually grown faster than our throughput
Throughput
Million tons
2015
466
+2%
2014
445
2013
440
2012
442
2011
435
2010
430 677660640
615588
551
0
100
200
300
400
500
600
700
2015
+4%
2014 2013 2012 2011 2010
Revenues
Net Profit
© Copyright - Port of Rotterdam 16
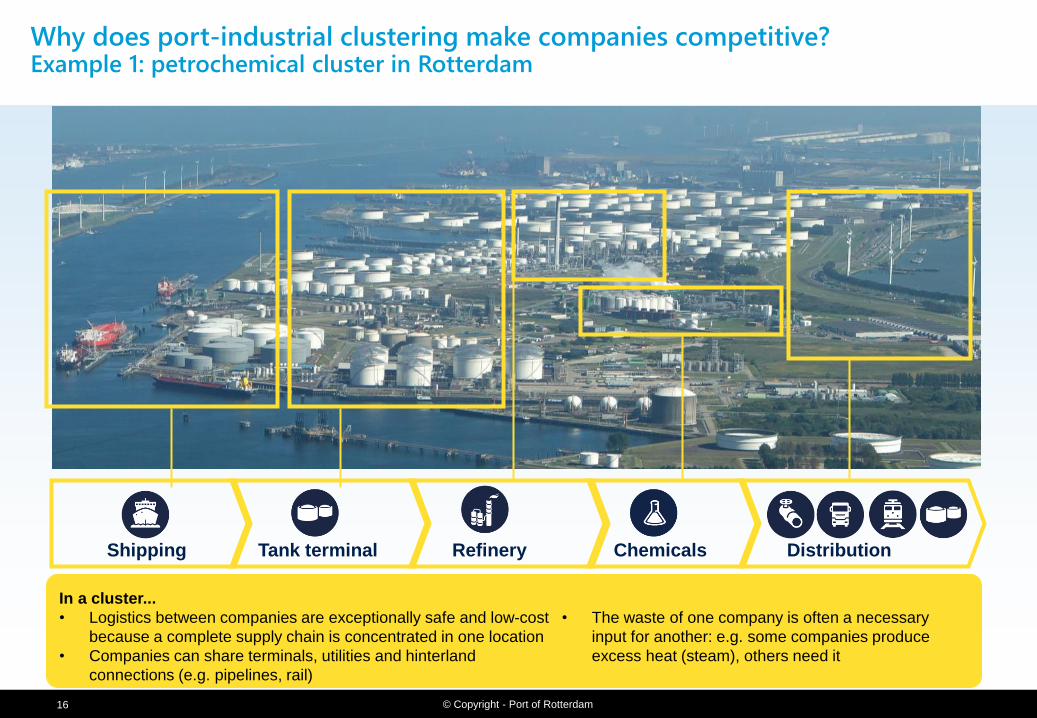
Why does port-industrial clustering make companies competitive? Example 1: petrochemical cluster in Rotterdam
Shipping Tank terminal Refinery Chemicals Distribution
In a cluster...
• Logistics between companies are exceptionally safe and low-cost
because a complete supply chain is concentrated in one location
• Companies can share terminals, utilities and hinterland
connections (e.g. pipelines, rail)
• The waste of one company is often a necessary
input for another: e.g. some companies produce
excess heat (steam), others need it
© Copyright - Port of Rotterdam 17
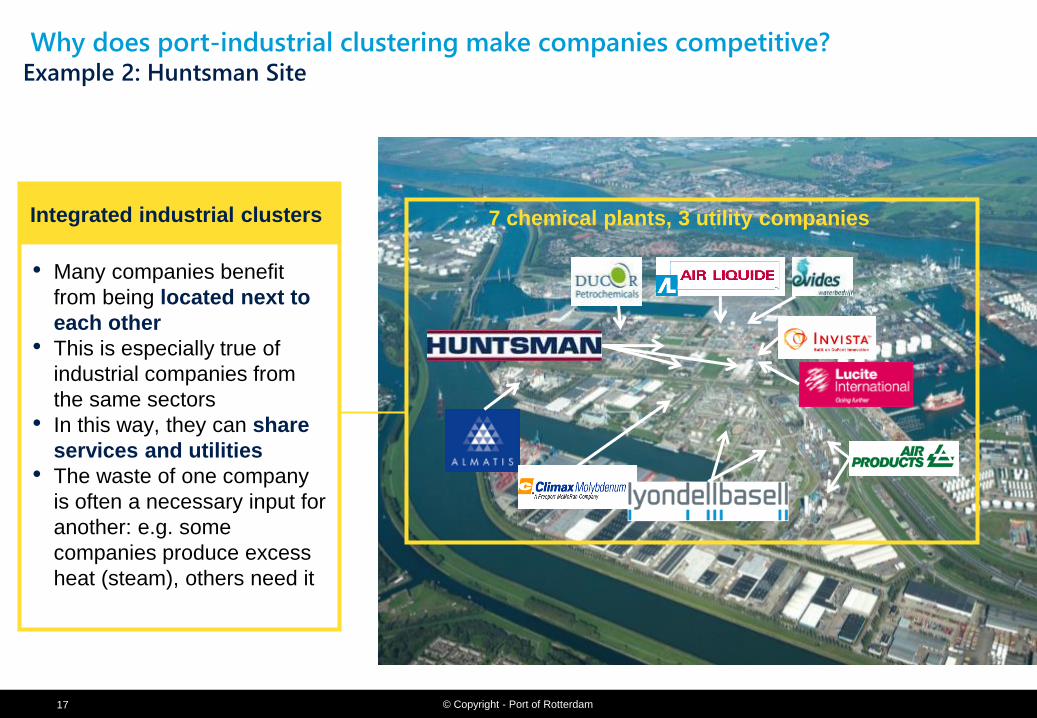
Why does port-industrial clustering make companies competitive?
Integrated industrial clusters
• Many companies benefit
from being located next to
each other
• This is especially true of
industrial companies from
the same sectors
• In this way, they can share
services and utilities
• The waste of one company
is often a necessary input for
another: e.g. some
companies produce excess
heat (steam), others need it
7 chemical plants, 3 utility companies
Example 2: Huntsman Site
© Copyright - Port of Rotterdam 18
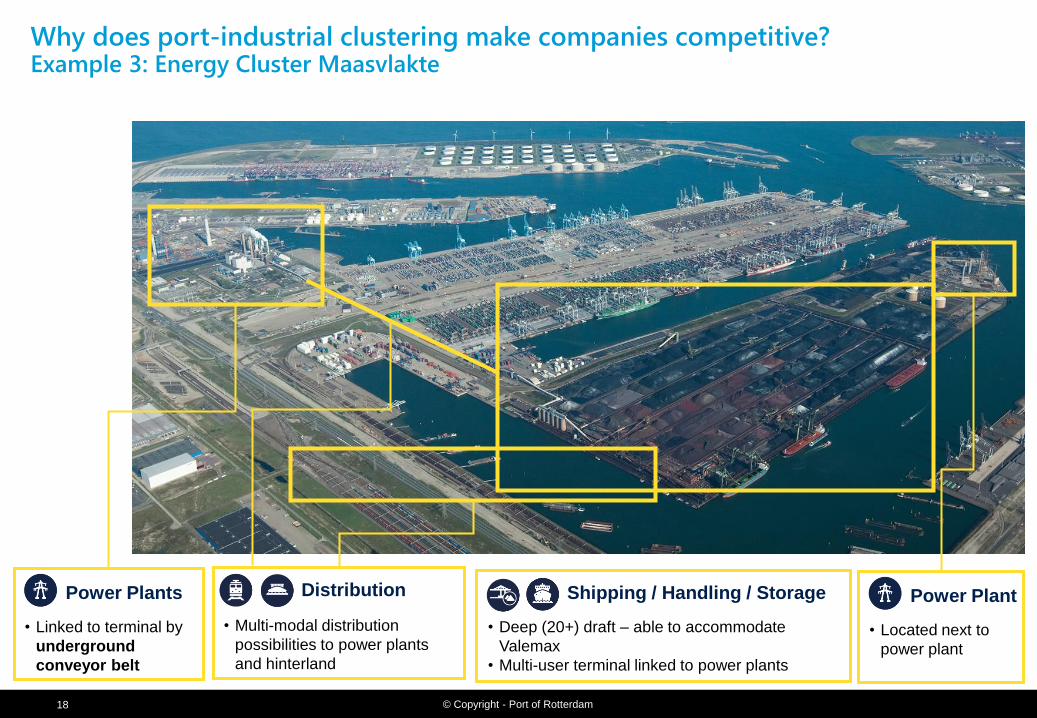
Why does port-industrial clustering make companies competitive? Example 3: Energy Cluster Maasvlakte
Power Plants
• Linked to terminal by
underground
conveyor belt
Shipping / Handling / Storage
• Deep (20+) draft – able to accommodate
Valemax
• Multi-user terminal linked to power plants
Distribution
• Multi-modal distribution
possibilities to power plants
and hinterland
Power Plant
• Located next to
power plant
© Copyright - Port of Rotterdam 19
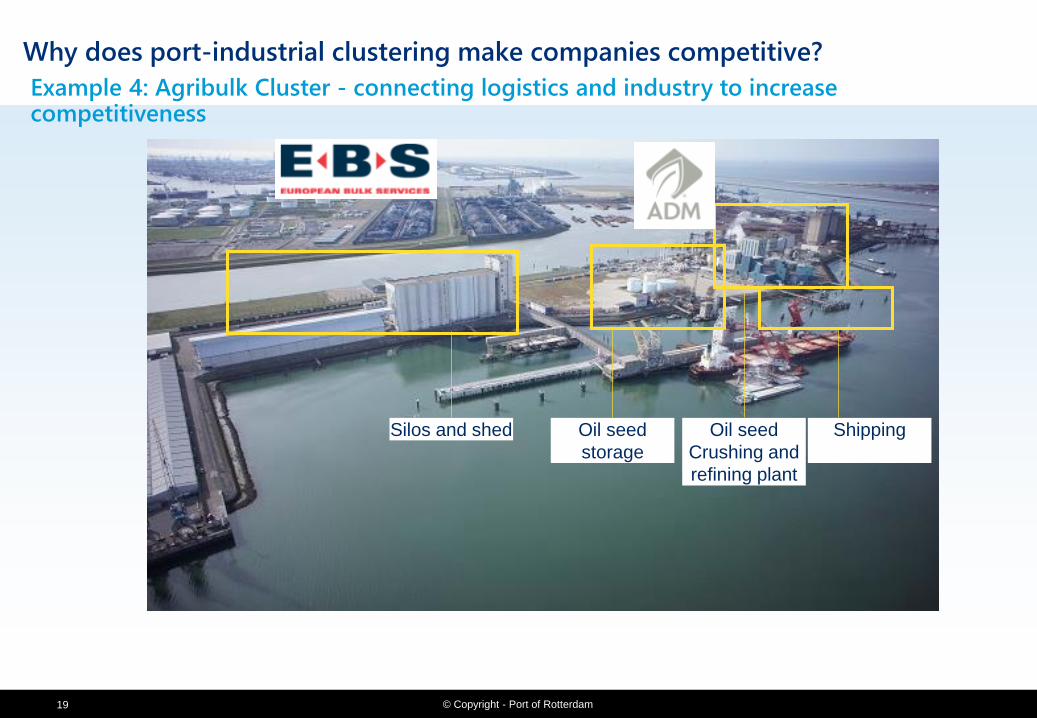
Example 4: Agribulk Cluster - connecting logistics and industry to increase competitiveness
Shipping
Oil seed
storage
Oil seed
Crushing and
refining plant
Silos and shed
Why does port-industrial clustering make companies competitive?
© Copyright - Port of Rotterdam 20
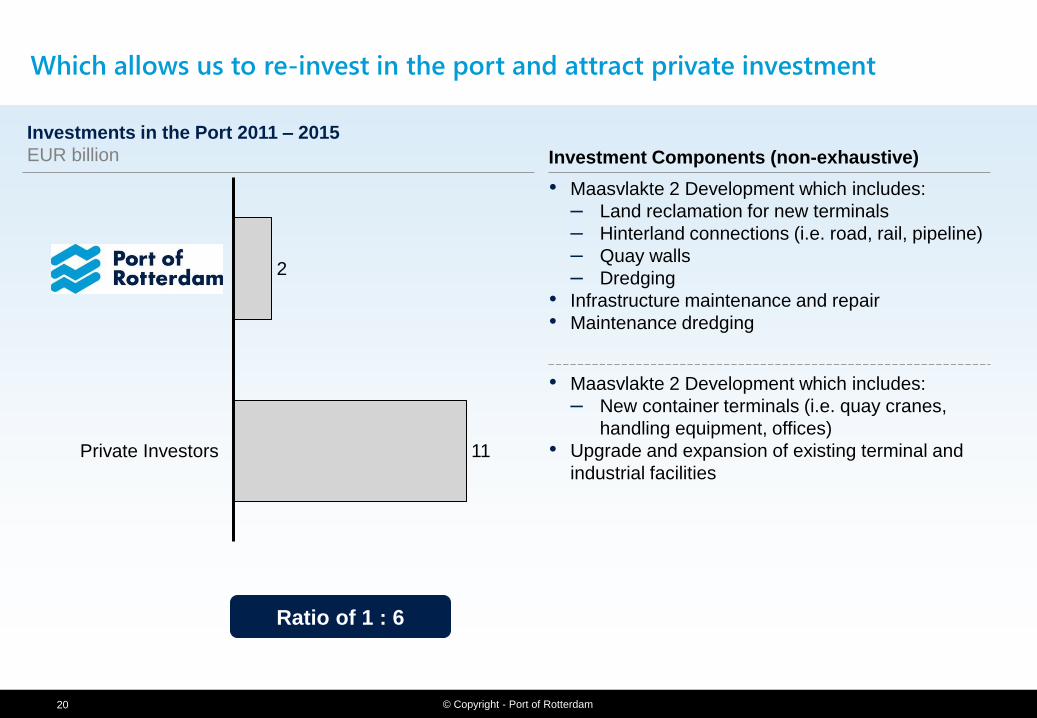
Which allows us to re-invest in the port and attract private investment
Investments in the Port 2011 – 2015
EUR billion
Ratio of 1 : 6
2
Private Investors 11
Investment Components (non-exhaustive)
• Maasvlakte 2 Development which includes:
– New container terminals (i.e. quay cranes,
handling equipment, offices)
• Upgrade and expansion of existing terminal and
industrial facilities
• Maasvlakte 2 Development which includes:
– Land reclamation for new terminals
– Hinterland connections (i.e. road, rail, pipeline)
– Quay walls
– Dredging
• Infrastructure maintenance and repair
• Maintenance dredging
© Copyright - Port of Rotterdam 21
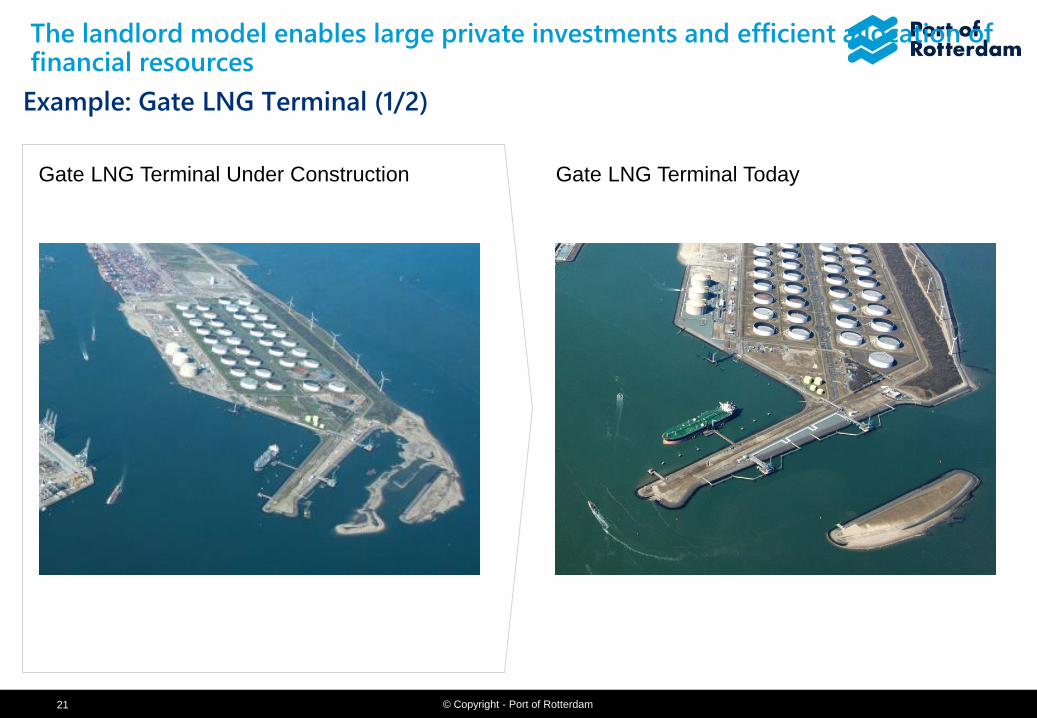
The landlord model enables large private investments and efficient allocation of financial resources
Example: Gate LNG Terminal (1/2)
Gate LNG Terminal Under Construction Gate LNG Terminal Today
© Copyright - Port of Rotterdam 22
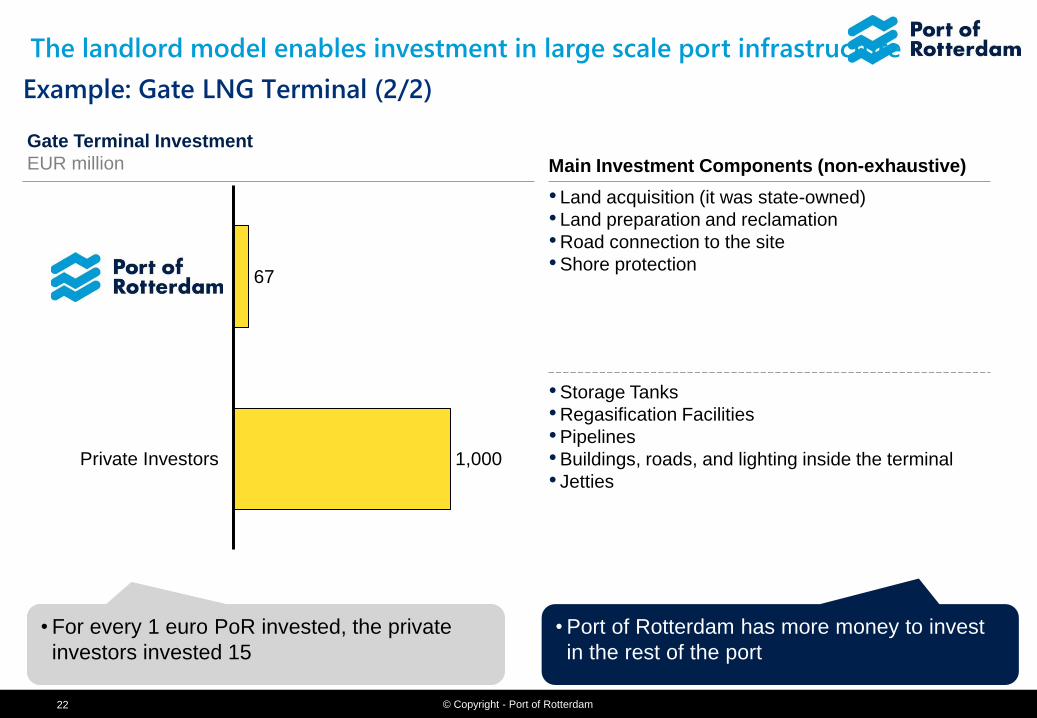
The landlord model enables investment in large scale port infrastructure
Example: Gate LNG Terminal (2/2)
Gate Terminal Investment
EUR million
1,000 Private Investors
67
Main Investment Components (non-exhaustive)
• Storage Tanks
• Regasification Facilities
• Pipelines
• Buildings, roads, and lighting inside the terminal
• Jetties
• Land acquisition (it was state-owned)
• Land preparation and reclamation
• Road connection to the site
• Shore protection
• For every 1 euro PoR invested, the private
investors invested 15
• Port of Rotterdam has more money to invest
in the rest of the port
© Copyright - Port of Rotterdam 23
Tekst + Objecten
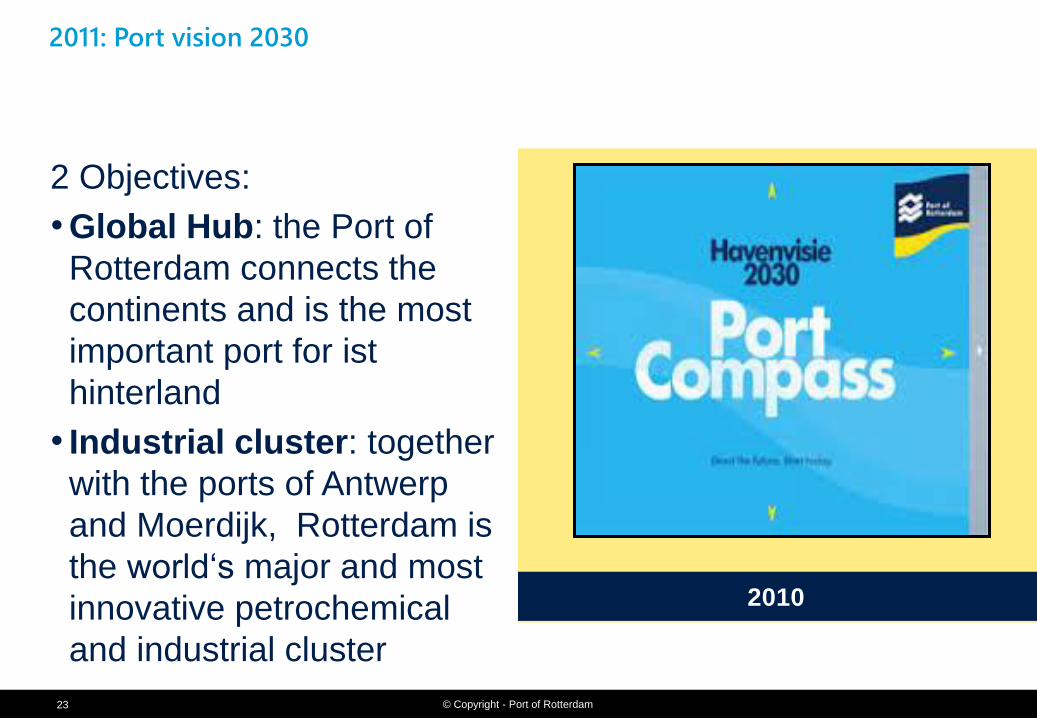
2011: Port vision 2030
2 Objectives:
• Global Hub: the Port of
Rotterdam connects the
continents and is the most
important port for ist
hinterland
• Industrial cluster: together
with the ports of Antwerp
and Moerdijk, Rotterdam is
the world‘s major and most
innovative petrochemical
and industrial cluster
2010
© Copyright - Port of Rotterdam 24
Tekst + Objecten
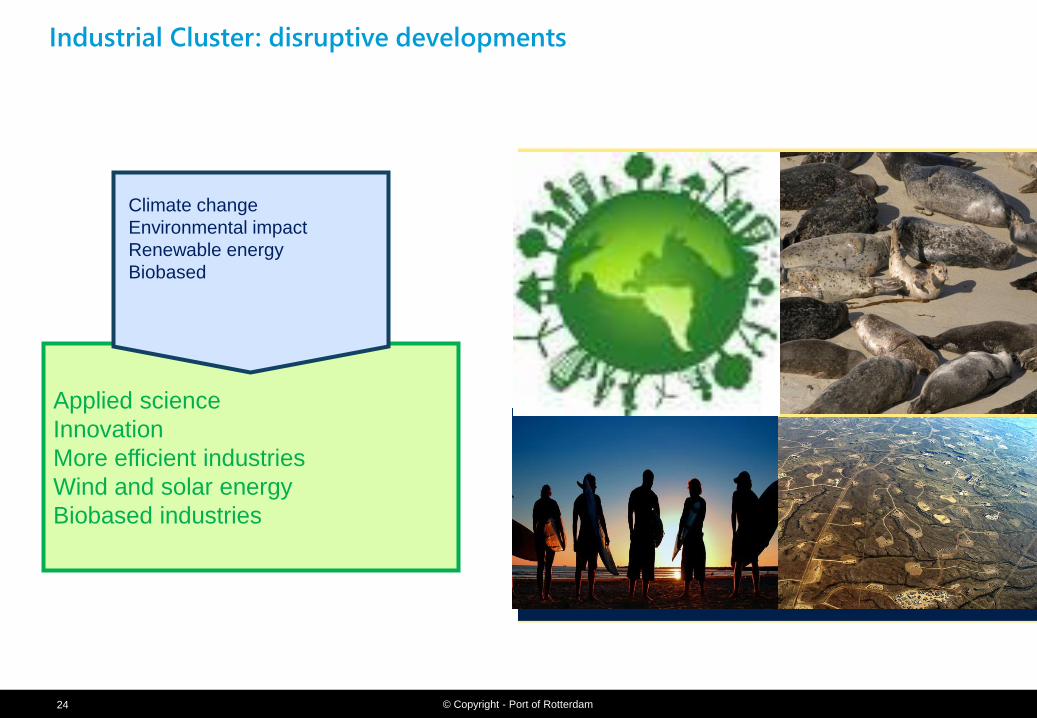
Industrial Cluster: disruptive developments
Applied science
Innovation
More efficient industries
Wind and solar energy
Biobased industries
Climate change
Environmental impact
Renewable energy
Biobased
© Copyright - Port of Rotterdam 25
Text & Image 50/50
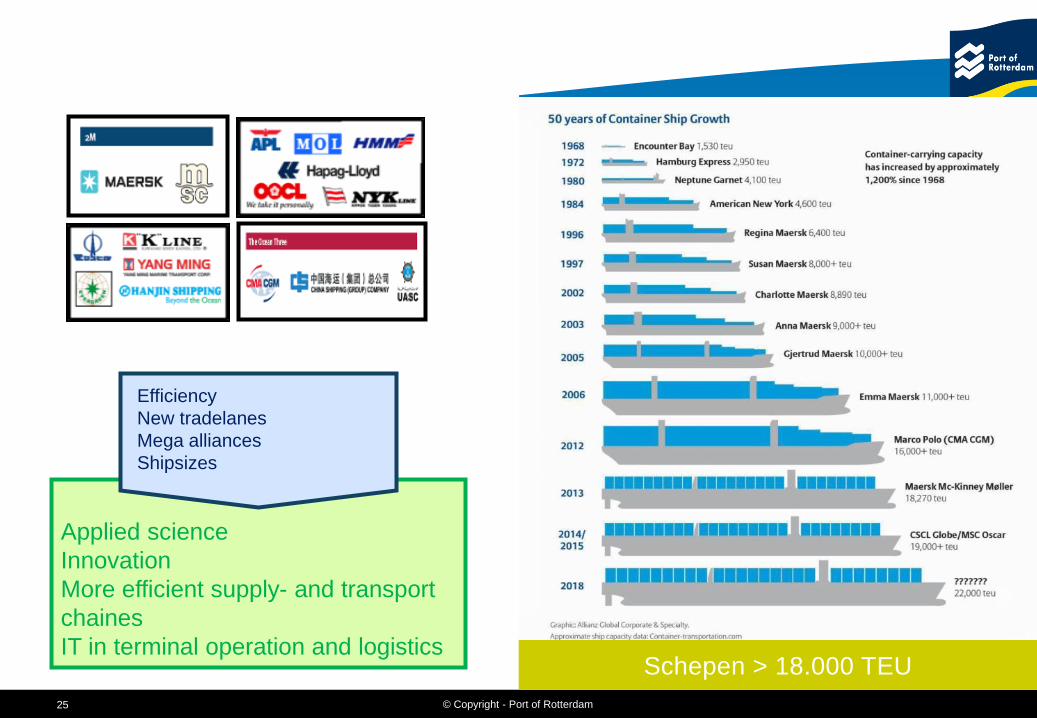
Schepen > 18.000 TEU
Consolidation in container shipping
Applied science
Innovation
More efficient supply- and transport
chaines
IT in terminal operation and logistics
Efficiency
New tradelanes
Mega alliances
Shipsizes
© Copyright - Port of Rotterdam 26
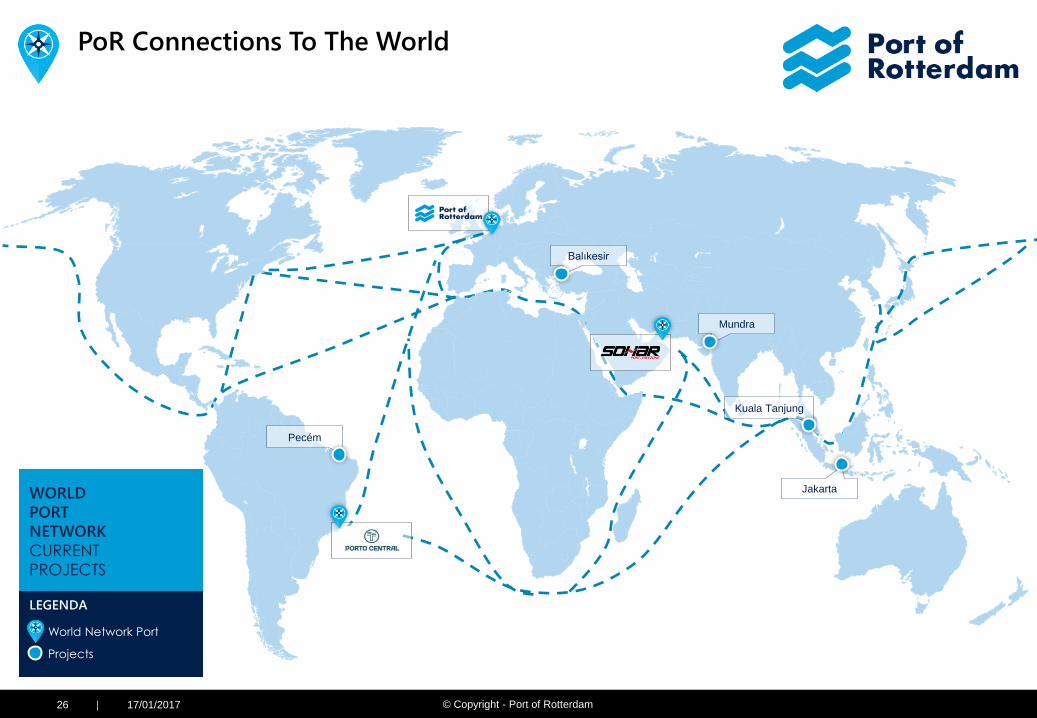
PoR Connections To The World
Current Network
Projects
Pecém
Balıkesir
Jakarta
Kuala Tanjung
Mundra
WORLD
PORT
NETWORK
CURRENT
PROJECTS
LEGENDA
World Network Port
Projects
17/01/2017 |
26
© Copyright - Port of Rotterdam 27
1. For the Port of Rotterdam
Attracting new customers
Additional cargo flows
Rationale for international port development …. CREATING VALUE
2. For clients / business partners
Unlocking and sharing market
intelligence
Creating business opportunities
(matchmaking)
3. For our shareholders
Additional revenue
Improves competitive position of the
port
© Copyright - Port of Rotterdam 28
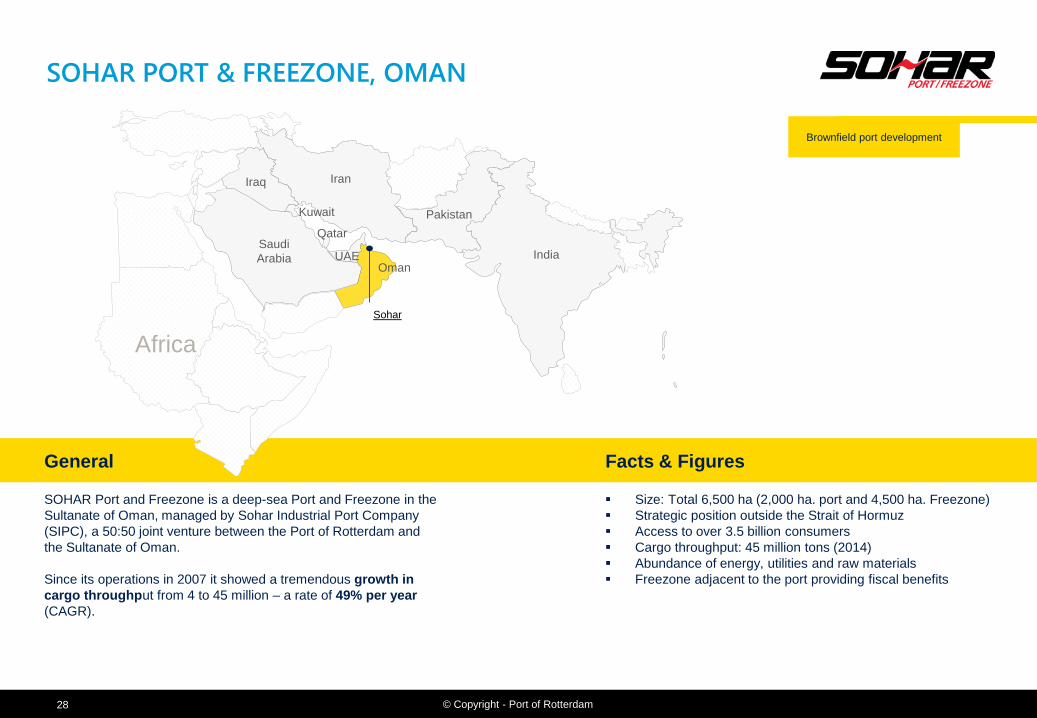
SOHAR PORT & FREEZONE, OMAN
General Facts & Figures
Africa
India
Iran Iraq
Saudi
Arabia
Pakistan
UAE
Qatar
Kuwait
Oman
Sohar
SOHAR Port and Freezone is a deep-sea Port and Freezone in the
Sultanate of Oman, managed by Sohar Industrial Port Company
(SIPC), a 50:50 joint venture between the Port of Rotterdam and
the Sultanate of Oman.
Since its operations in 2007 it showed a tremendous growth in
cargo throughput from 4 to 45 million – a rate of 49% per year
(CAGR).
Size: Total 6,500 ha (2,000 ha. port and 4,500 ha. Freezone)
Strategic position outside the Strait of Hormuz
Access to over 3.5 billion consumers
Cargo throughput: 45 million tons (2014)
Abundance of energy, utilities and raw materials
Freezone adjacent to the port providing fiscal benefits
Brownfield port development
© Copyright - Port of Rotterdam 29
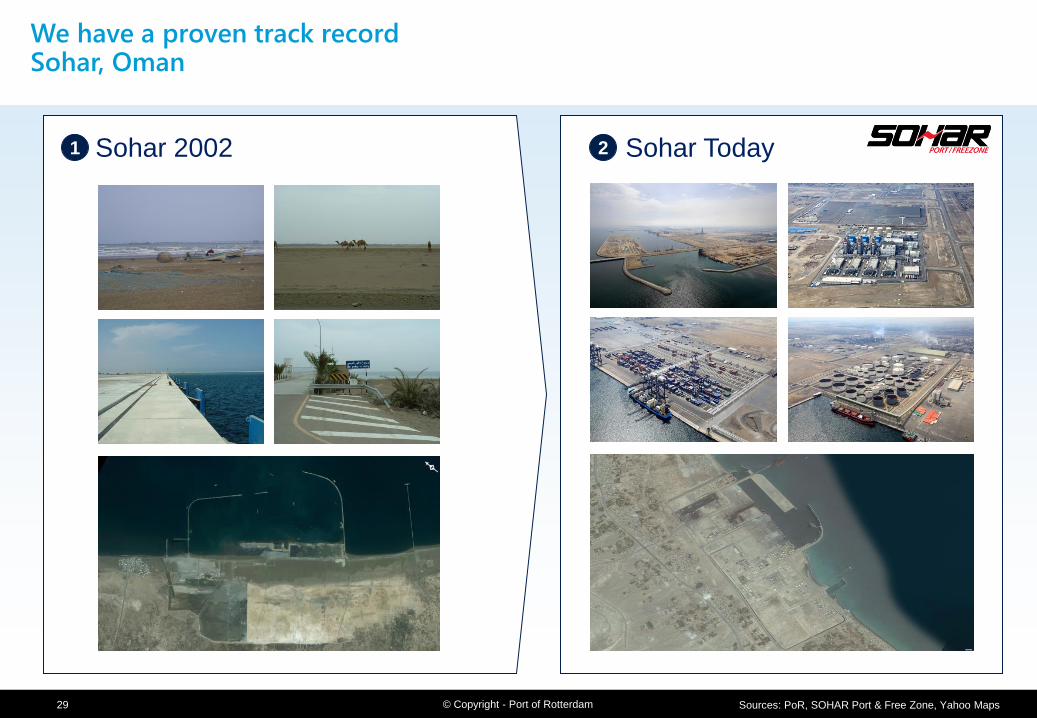
We have a proven track record Sohar, Oman
Sohar 2002 Sohar Today
Sources: PoR, SOHAR Port & Free Zone, Yahoo Maps
1 2
© Copyright - Port of Rotterdam 30
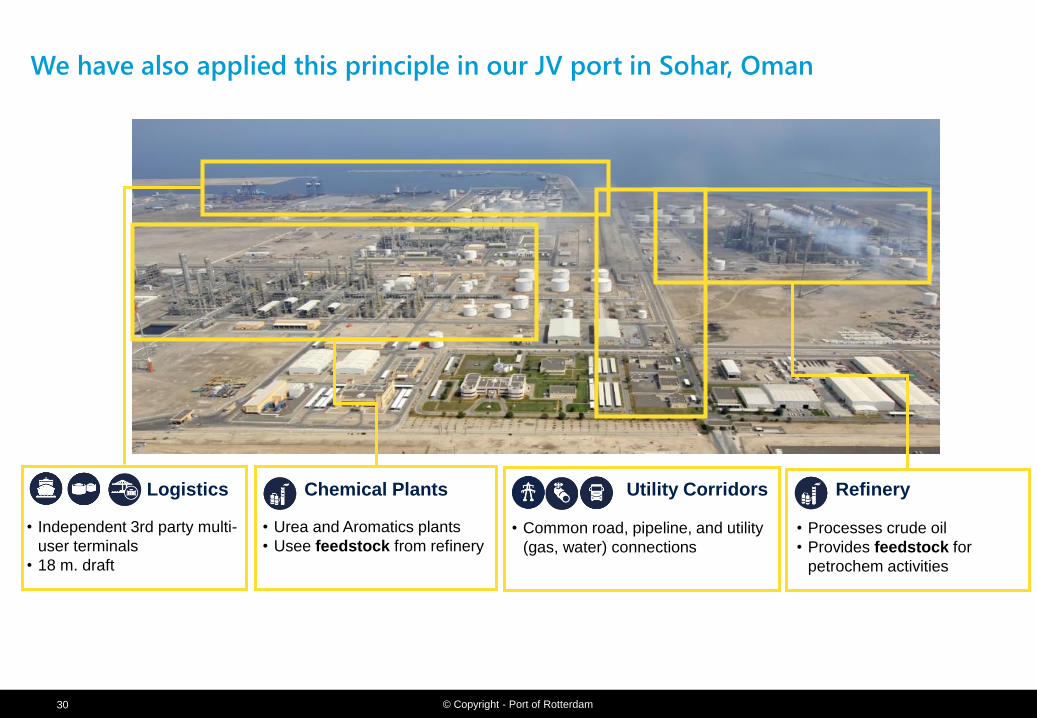
We have also applied this principle in our JV port in Sohar, Oman
Logistics
• Independent 3rd party multi-
user terminals
• 18 m. draft
Chemical Plants
• Urea and Aromatics plants
• Usee feedstock from refinery
Utility Corridors
• Common road, pipeline, and utility
(gas, water) connections
Refinery
• Processes crude oil
• Provides feedstock for
petrochem activities
© Copyright - Port of Rotterdam 31
Custom (Geel)
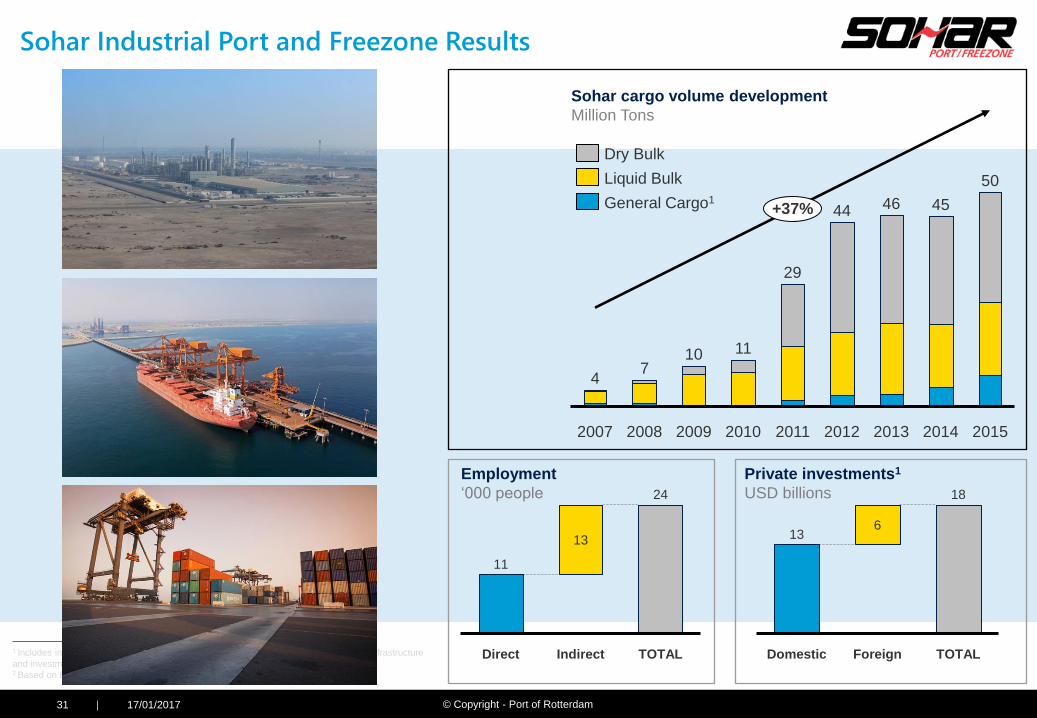
Sohar Industrial Port and Freezone Results
17/01/2017 |
31
Sohar cargo volume development
Million Tons
Employment
‘000 people
Private investments1
USD billions
11
24
Direct
13
Indirect TOTAL Foreign TOTAL
18
6
Domestic
13
+37%
2015
50
2014
45
2013
46
2012
44
2011
29
2010
11
2009
10
2008
7
2007
4
General Cargo1
Liquid Bulk
Dry Bulk
1 Includes investments by Omani SOEs but excludes government investments in basic infrastructure
and investments in the Free Trade Zone 2 Based on EBITDA multiple of 10.
© Copyright - Port of Rotterdam 32
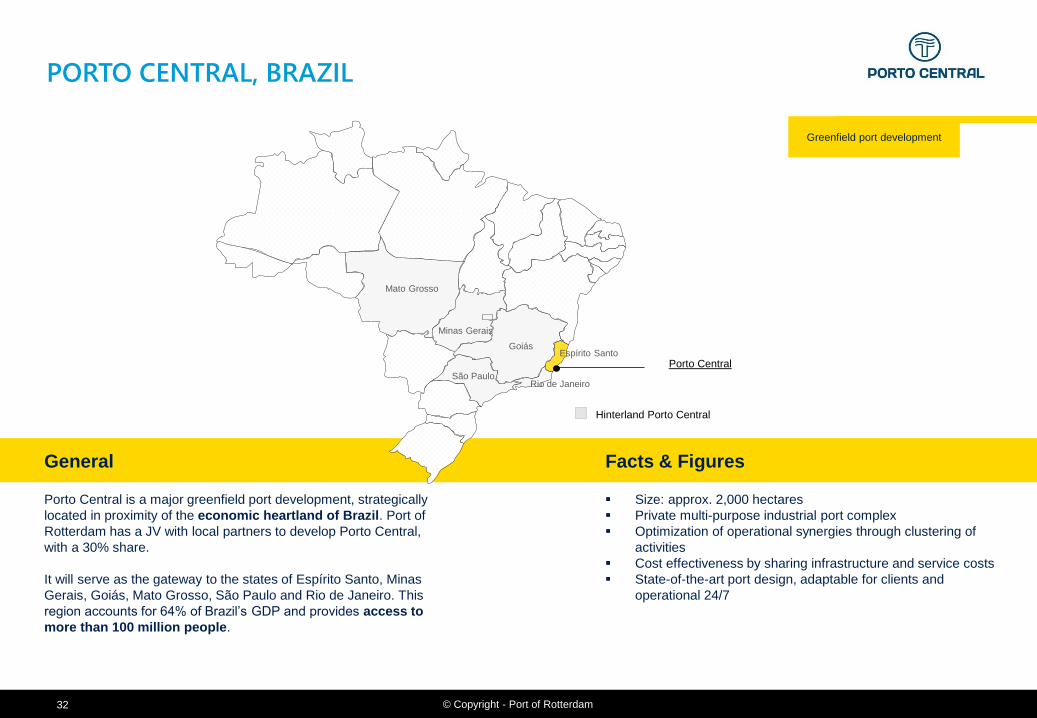
PORTO CENTRAL, BRAZIL
General Facts & Figures
Porto Central is a major greenfield port development, strategically
located in proximity of the economic heartland of Brazil. Port of
Rotterdam has a JV with local partners to develop Porto Central,
with a 30% share.
It will serve as the gateway to the states of Espírito Santo, Minas
Gerais, Goiás, Mato Grosso, São Paulo and Rio de Janeiro. This
region accounts for 64% of Brazil’s GDP and provides access to
more than 100 million people.
Size: approx. 2,000 hectares
Private multi-purpose industrial port complex
Optimization of operational synergies through clustering of
activities
Cost effectiveness by sharing infrastructure and service costs
State-of-the-art port design, adaptable for clients and
operational 24/7
Porto Central
Hinterland Porto Central
Greenfield port development
Mato Grosso
Minas Gerais
Goiás Espírito Santo
Rio de Janeiro São Paulo
© Copyright - Port of Rotterdam 33
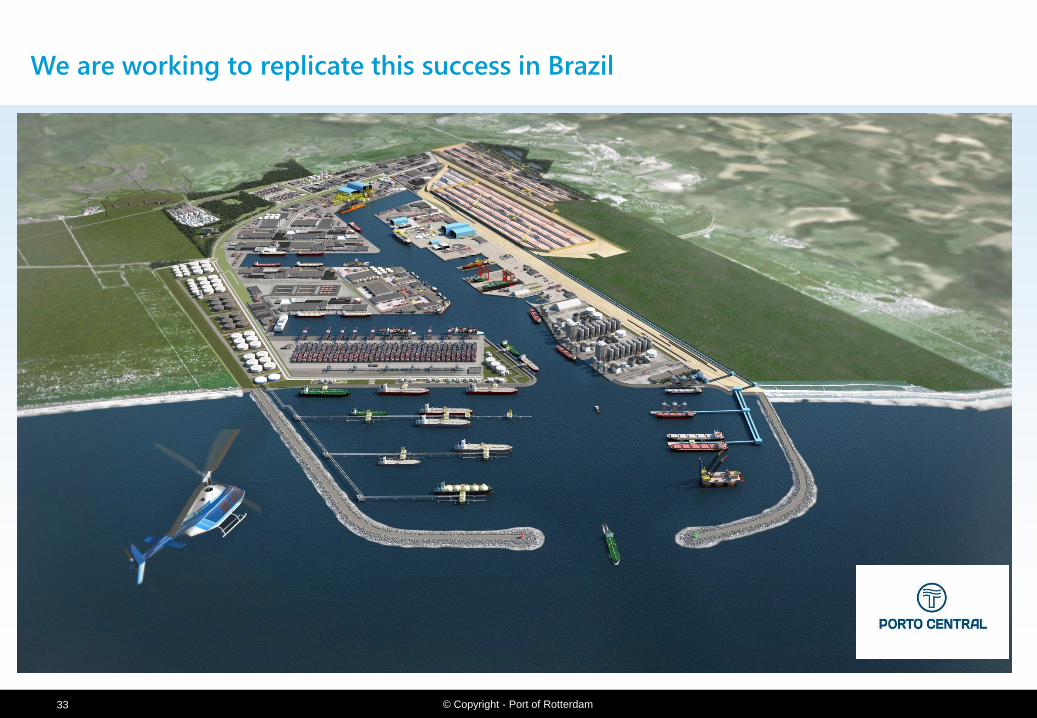
We are working to replicate this success in Brazil
© Copyright - Port of Rotterdam 34
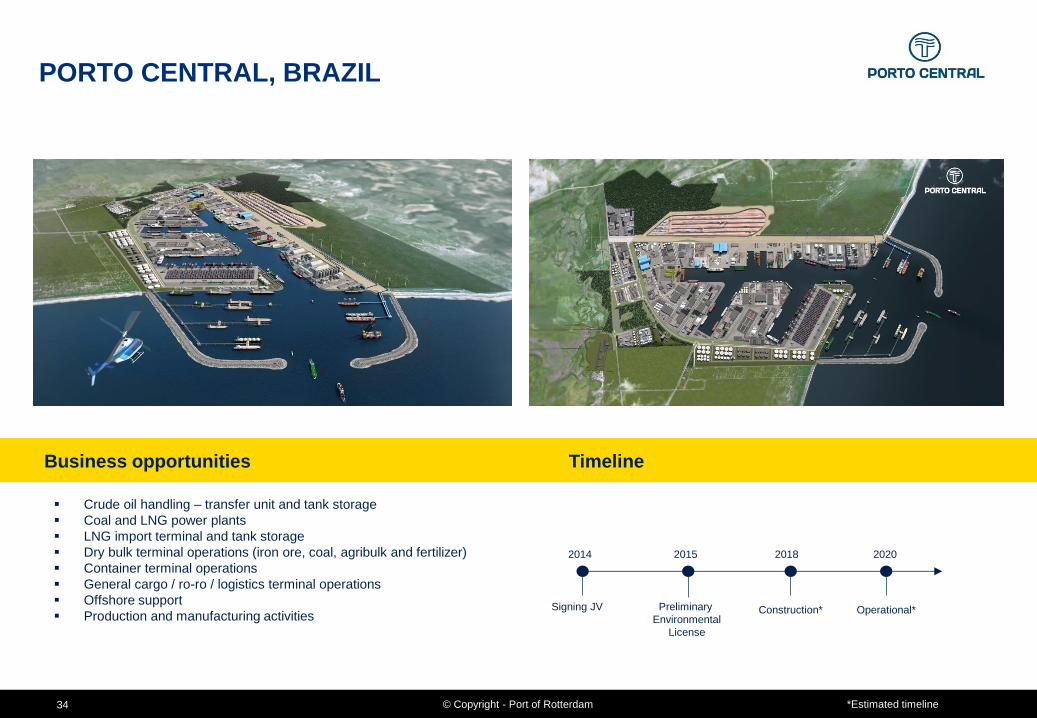
Crude oil handling – transfer unit and tank storage
Coal and LNG power plants
LNG import terminal and tank storage
Dry bulk terminal operations (iron ore, coal, agribulk and fertilizer)
Container terminal operations
General cargo / ro-ro / logistics terminal operations
Offshore support
Production and manufacturing activities
Business opportunities Timeline
PORTO CENTRAL, BRAZIL
Signing JV Preliminary
Environmental
License
2014 2015 2018
Construction*
2020
Operational*
*Estimated timeline
© Copyright - Port of Rotterdam 35
THE BEST WAY
TO CREATE OPPORTUNITIES FOR YOURSELF
IS TO CREATE THEM FOR
OTHERS
www.worldportnetwork.com

![FACULTEIT GENEESKUNDE EN FARMACIE i.s.m FACULTEIT … · 2018. 7. 3. · ligament, showed increases in joint amplitude [25]. In a similar study where the scapholunate ... Registration](https://static.fdocuments.nl/doc/165x107/60a76ec0fff8a468542e4518/faculteit-geneeskunde-en-farmacie-ism-faculteit-2018-7-3-ligament-showed.jpg)


![Desiree van den Hurk - Oncowijs Cancer screening guideli… · erfelijke aanleg]. ... Hourly throughput – up to 4 patients per hour Radiation dose one tenth of diagnostic CT Cancer](https://static.fdocuments.nl/doc/165x107/6010458256c7c251d33e5739/desiree-van-den-hurk-oncowijs-cancer-screening-guideli-erfelijke-aanleg-.jpg)