
^WfOffifj - UiTM IRir.uitm.edu.my/id/eprint/5962/1/AJ_TING KIEN HWA BEJ 04.pdf · 2016-07-28 ·...
20
'",:••" v - \ : : •••' ^WfOffifj if J t 7 h MH , if! 3 jfc *rJ **\ , - • **2 i •^ r lll'll^***!*'''-' * : •* ' 1 • ' i i«_ 1 SM Jtadiah UiTM (F$PU) • Ik
Transcript of ^WfOffifj - UiTM IRir.uitm.edu.my/id/eprint/5962/1/AJ_TING KIEN HWA BEJ 04.pdf · 2016-07-28 ·...

' " , : • • " v - \ : : •••'
^WfOffifj
if J t
7 h
MH ,
if! 3
jfc
*rJ **\ , -
•
**2 i
•^
r lll'll̂ ***!*'''-' * : • *
' 1 • '
i
i«_ 1 SM
Jtadiah
UiTM (F$PU)
• Ik

NOTES FOR CONTRIBUTORS
SUBMISSION
All materials submitted for publication must be original, unpublished work and are not under consideration for publication elsewhere.
Alternatively, 2 copies of the manuscript together with a full version on diskette must be submitted to the Kditorial Board. The file should be supplied on IBM PX '. compatible disks as MS Word or RTF files.
Address: Assoc. Prof. Dr. Dasimah Omar B ink-environment Journal Faculty of Architecture, Planning and Surveying Universiti Tcknologi MARA 40450 Shah Alam Selangor, Malaysia.
Editors reserve the right to edit/comment on the content of the manuscript. If major or substantial amendments are recommended by the editors, the authors will be given the option to acceptor reject the recommendations (and withdraw participation).
MANUSCRIPTS PREPARATION Language The manuscript must be submitted in Engli in Bahasa Malaysia. If the manuscript is in Bahasa Malaysia, the abstract must be in English. Length
llie manuscript should be within the range of 2000 - 5000 words in Arial font, 12 point type. Authors are requested to state how many words their paper contains. The manuscripts should be typed and double spaced on one side of A4 paper only, with 4 em margins on both sides, top and bottom. All text should be set aligned justified throughout. The pages should be numbered in order. • l p , .jjm Title Page m-1 he first page of the manuscripts must contain the full title, name of authoifs), designationisj of affiliation's), and the present address(es) with the tclephone/fax/e-mall contact information listed. Abstract and Keywords The abstract must not exceed 200 words and should summarise the paper including the main conclusions. The key words should not exceed 5. Text
The order when typing manuscripts: title, author(s), Affiliations, Abstract, Keywords, Acknowledgements, Main text, References, and Appendix (if any). Simple language, short sentences and a good use of headings are encouraged. I leadings should be numbered and
the use of more than three levels of heading should be avoided. I leadings and paragraphs should be separated by two carriage returns. Text following a heading should not be indented. Illustration
Photographs, diagrams and charts should be referred to as"Figure(s)"and numbered in the order in which they arc referred to in the text. Maps and diagrams should be submitted in a form ready for reproduction, all in legible digital format. Maps, plans and the like provided on disks should be either TIFF or EPS format. Units
AH measurement ami data should be given in metric units or, if other units arc used, then the metric equivalent should be given in parentheses. Reference
The I larvard system is used. The reference in referred to in the text by the following manner: chow (1999) or (Chow, 1999) and then listed in alphabetical order at the end of the article. The styles should follow the example below: Betts, M. & Wood-Harper, T. (1994) Re-engineering construction: a new management research Construction Management and Economics, 12,551-6 Flanagan, R, & Tate, B. (1997) Cost Control in Building Design, Blackwell Science, Oxford. Kelly, .1. (2003), Value management in public-private partnership procurement. In Akintoyc, A,. Beck, M. & I Iardcastle, C. (eds) Public-Private Partnerships, Blackwell Science, Oxford, pp 59-77 Bowen, P.A., Hindlc, R.D. & Pearl, R.G. (1997 The effectiveness of building procurement system in the attainment of client objectives. In Proceedings of W-92 Conference on Procurement Systems, ( LI.B. Publication No. 203. Government of Malaysia, Total Planning and Development Guidelines, I )cpartment of Town and ( 'ountiy Planning, Peninsular Malaysia, Kuala Lumpur, (2nd Printed), 2001.
COPYRIGHT Once published in the Built-Environment Journal, the copyright including electronic copyrights of the article is automatically invested with UiTM. The copyright covers the exclusive use of rights to reproduce and distribute the article, including reprints, photography reproductions, microfilm, electronic publication or any reproduction of a similar nature and translations. Permission to publish illustrations must be obtained by the author before submission. Any acknowledgements should be included in the figure captions.
%

Built Environment Journal NUMBER 1 JANUARY 2004
Contents Editorial
Preface
1 4 FEB ZQC5 I
Built Environment & Crime Prevention: Development & Issues MOHAMEDYUSOFFABBAS
Prevention of Crime in Housing Through Environmental Planning IDA NOORJULIANTI SUGIJANTO
Therapeutic Outdoor Design For Mental Patients ABD HARIS SHAMSUDDIN
14
New Towns in Peninsular Malaysia: Planning and Development DASIMAH OMAR
22
Risk-Return Analysis of The Malaysian Residential Property Sector TING KIEN HWA & MOHD SALIM JASIMAN
32
FACULTY OF ARCHITECTURE, PLANNING AND SURVEYING
UNIVERSITI TEKNOLOGI MARA, 40450 SHAH ALAM
SELANGOR DARUL EHSAN, MALAYSIA
TEL: 603 5544 4347/3513 FAX: 603 5544 4353
*^^&
Universiti Teknologi MARA
1

Risk-Return Analysis of Sector The Malaysian Residential Property Sector
TING KIEN HWA & MOHD SALIM JASIMAN
ABSTRACT
This paper examines the performance of Malaysian residential property sectors between 1989 - 2001, focusing on risk-return, comparison of residential risk-adjusted performance with equity investments, and identification of risk reduction benefits through portfolio diversification.
Performance of residential properties is compared on a risk-adjusted basis with shares. In addition a further analysis is carried out to identify the risk reduction benefits of adding properties to an investment portfolio through diversification.
The results show that in terms of residential property type, detached houses provide higher capital appreciation compared to other forms of housing. But the higher returns are associated with higher risks.
The best states to invest in residential properties are Kuala Lumpur, Penang and Johor. In terms of regions, investment performance is highest in Johor Bahru followed by Penang Island and Klang "Valley.
On an inter-asset comparison basis, the best risk-adjusted performance comes from detached and semi-detached houses in Kuala Lumpur which have outperformed shares represented by the Kuala Lumpur Composite Index.
For individual investors, the better direct residential property performance over shares clearly identifies the residential property sector as a comparatively attractive investment option.
In conclusion, Malaysian residential properties in selected states and by types have performed well and individual investors could enjoy considerable risk reduction by incorporating residential properties in their investment portfolios.
INTRODUCTION
A potential investor, before making an investment decision for a particular type of investment, would like to know its past performance and related risk-return characteristics. Similarly, an investor who has made an investment would like to know how the investment has performed in comparison with similar assets and with different types of investment options. In this regard, a comparative performance analysis of investment options is necessary.
Residential property investment is a popular form of investment among Malaysians apart from fixed deposits (FD), unit trusts and equities. The launching of the Malaysian House Price Index (MHPI) in February 1997, provides an opportunity to measure the investment performance of residential properties in Malaysia.
Prior to the publication of the MHPI, it was difficult to measure and compare the performance of residential properties. The heterogeneous nature of residential properties prevented direct comparison of performance, even with the same type of property in the same locality.
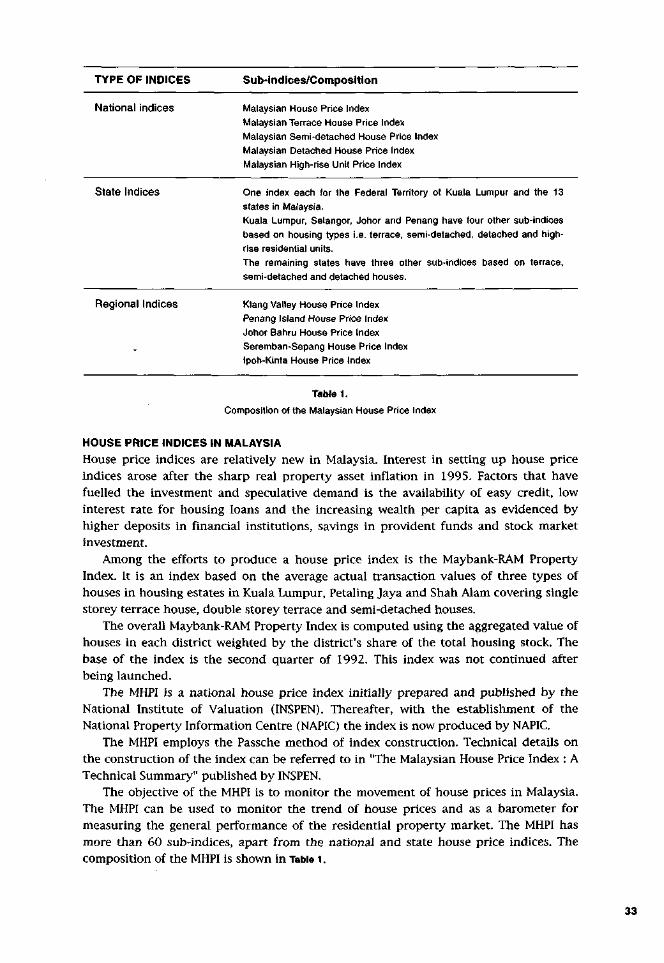
TYPE OF INDICES Sub-indices/Composit ion
National indices Malaysian House Price Index
Malaysian Terrace House Price Index
Malaysian Semi-detached House Price Index
Malaysian Detached House Price Index
Malaysian High-rise Unit Price Index
State Indices One index each for the Federal Territory of Kuala Lumpur and the 13
states in Malaysia.
Kuala Lumpur, Selangor, Johor and Penang have four other sub-indices
based on housing types i.e. terrace, semi-detached, detached and high-
rise residential units.
The remaining states have three other sub-indices based on terrace,
semi-detached and detached houses.
Regional Indices Klang Valley House Price Index
Penang Island House Price Index
Johor Bahru House Price Index
Seremban-Sepang House Price Index
Ipoh-Kinta House Price Index
Table 1.
Composition of the Malaysian House Price Index
HOUSE PRICE INDICES IN MALAYSIA
House price indices are relatively new in Malaysia. Interest in setting up house price indices arose after the sharp real property asset inflation in 1995. Factors that have fuelled the investment and speculative demand is the availability of easy credit, low interest rate for housing loans and the increasing wealth per capita as evidenced by higher deposits in financial institutions, savings in provident funds and stock market investment.
Among the efforts to produce a house price index is the Maybank-RAM Property Index. It is an index based on the average actual transaction values of three types of houses in housing estates in Kuala Lumpur, Petaling Jaya and Shah Alam covering single storey terrace house, double storey terrace and semi-detached houses.
The overall Maybank-RAM Property Index is computed using the aggregated value of houses in each district weighted by the district's share of the total housing stock. The base of the index is the second quarter of 1992. This index was not continued after being launched.
The MHPI is a national house price index initially prepared and published by the National Institute of Valuation (INSPEN). Thereafter, with the establishment of the National Property Information Centre (NAPIC) the index is now produced by NAPIC.
The MHPI employs the Passche method of index construction. Technical details on the construction of the index can be referred to in "The Malaysian House Price Index : A Technical Summary" published by INSPEN.
The objective of the MHPI is to monitor the movement of house prices in Malaysia. The MHPI can be used to monitor the trend of house prices and as a barometer for measuring the general performance of the residential property market. The MHPI has more than 60 sub-indices, apart from the national and state house price indices. The composition of the MHPI is shown in Table 1.
33
RISK-RETURN ANALYSES OF THE MALAYSIAN RESIDENTIAL PROPERTY SECTOR
Apart from price indices, the MHPI also contains related data and information on various aspects of the residential property sector:
a) the total number of residential property transactions, based on states; b) the total number of residential property transactions, based on price range; c) the total number of residential property transactions, based on year for each state; d) the value of property transactions; e) the value per transaction; and f) descriptive statistics (i.e. lowest, highest and mean of prices) on each type of housing types by districts/mukims in each state.
OBJECTIVES OF STUDY
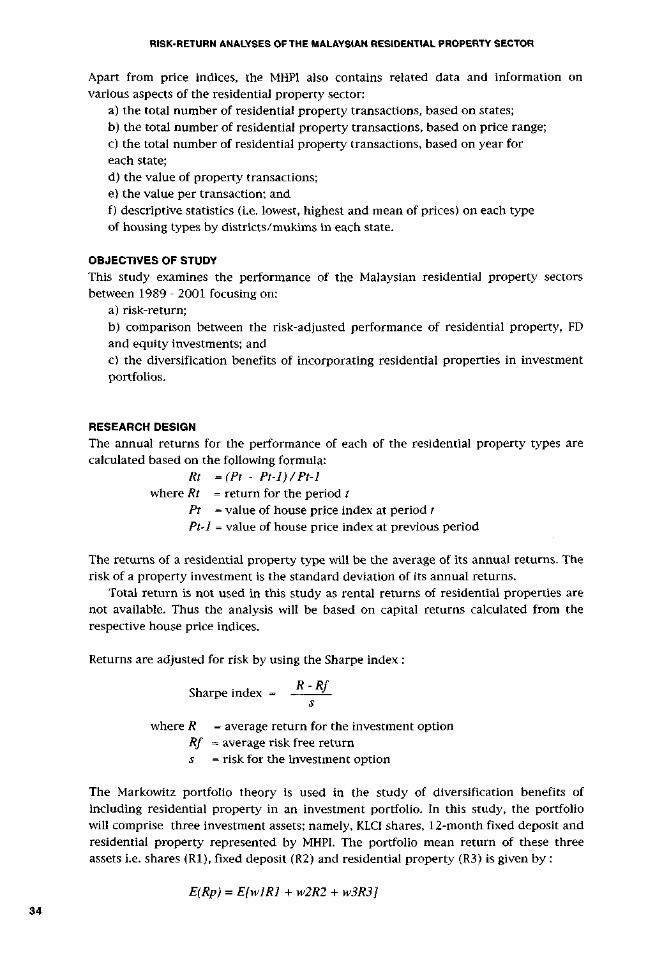
This study examines the performance of the Malaysian residential property sectors between 1989 - 2001 focusing on:
a) risk-return; b) comparison between the risk-adjusted performance of residential property, FD and equity investments; and c) the diversification benefits of incorporating residential properties in investment portfolios.
RESEARCH DESIGN
The annual returns for the performance of each of the residential property types are calculated based on the following formula:
Rt =(Pt - Pt-1)/Pt-1 where Rt = return for the period t
Pt = value of house price index at period t Pt-1 = value of house price index at previous period
The returns of a residential property type will be the average of its annual returns. The risk of a property investment is the standard deviation of its annual returns.
Total return is not used in this study as rental returns of residential properties are not available. Thus the analysis will be based on capital returns calculated from the respective house price indices.
Returns are adjusted for risk by using the Sharpe index :
Sharpe index = — s
where R = average return for the investment option Rf = average risk free return s = risk for the investment option
The Markowitz portfolio theory is used in the study of diversification benefits of including residential property in an investment portfolio. In this study, the portfolio will comprise three investment assets; namely, KLCI shares, 12-month fixed deposit and residential property represented by MHPI. The portfolio mean return of these three assets i.e. shares (Rl), fixed deposit (R2) and residential property (R3) is given by :
E(Rp) = E[wlRl + w2R2 + w3R3]
34
TING KIEN HWA & MOHD SALIM JASIMAN
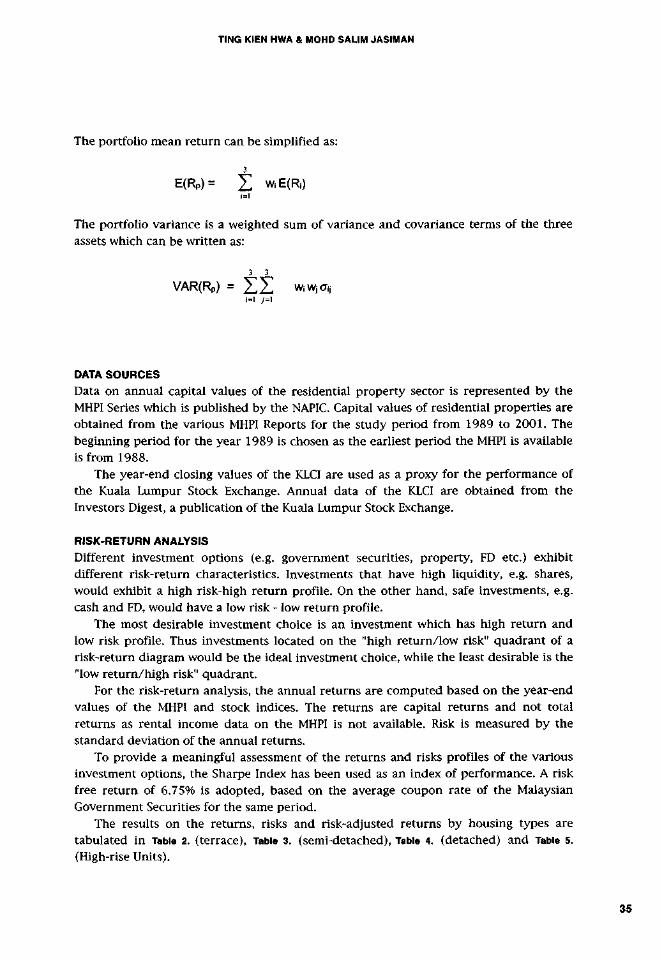
The portfolio mean return can be simplified as:
3
E(Rp)= Z w iE(R0 1=1
The portfolio variance is a weighted sum of variance and covariance terms of the three assets which can be written as:
3 3
VAR(Rp) = Z Z WiWjO-ij i=i y=i
DATA SOURCES
Data on annual capital values of the residential property sector is represented by the MHPI Series which is published by the NAPIC. Capital values of residential properties are obtained from the various MHPI Reports for the study period from 1989 to 2001. The beginning period for the year 1989 is chosen as the earliest period the MHPI is available is from 1988.
The year-end closing values of the KLCI are used as a proxy for the performance of the Kuala Lumpur Stock Exchange. Annual data of the KLCI are obtained from the Investors Digest, a publication of the Kuala Lumpur Stock Exchange.
RISK-RETURN ANALYSIS
Different investment options (e.g. government securities, property, FD etc.) exhibit different risk-return characteristics. Investments that have high liquidity, e.g. shares, would exhibit a high risk-high return profile. On the other hand, safe investments, e.g. cash and FD, would have a low risk - low return profile.
The most desirable investment choice is an investment which has high return and low risk profile. Thus investments located on the "high return/low risk" quadrant of a risk-return diagram would be the ideal investment choice, while the least desirable is the "low return/high risk" quadrant.
For the risk-return analysis, the annual returns are computed based on the year-end values of the MHPI and stock indices. The returns are capital returns and not total returns as rental income data on the MHPI is not available. Risk is measured by the standard deviation of the annual returns.
To provide a meaningful assessment of the returns and risks profiles of the various investment options, the Sharpe Index has been used as an index of performance. A risk free return of 6.75% is adopted, based on the average coupon rate of the Malaysian Government Securities for the same period.
The results on the returns, risks and risk-adjusted returns by housing types are tabulated in Table 2. (terrace), Table 3. (semi-detached), Table 4. (detached) and Table 5. (High-rise Units).
35

FORTHCOMING PUBLICATION
TING KIEN HWA & MOHD SALIM JASIMAN
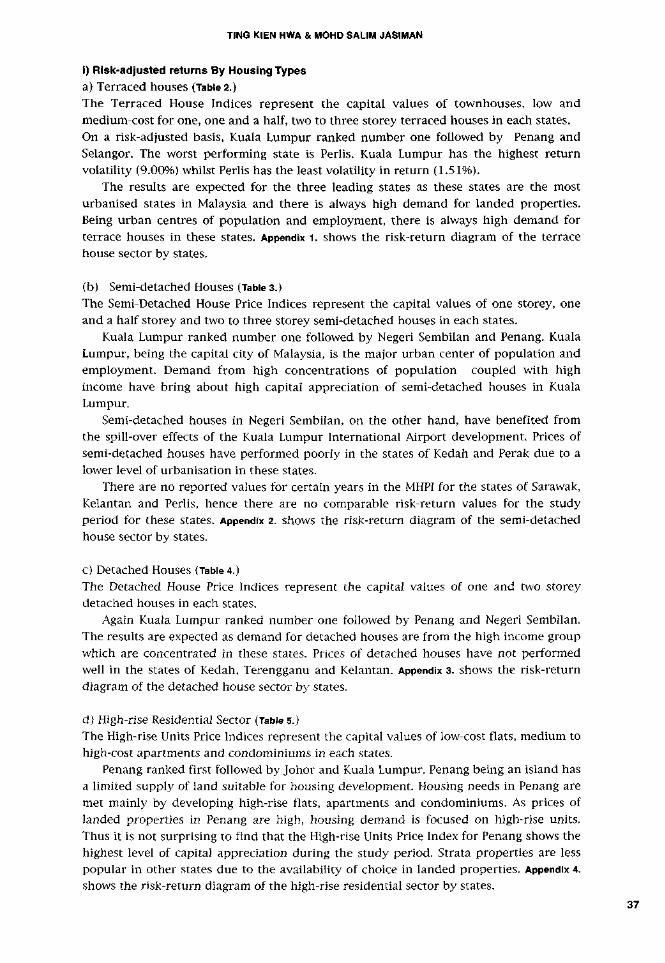
i) Risk-adjusted returns By Housing Types
a) Terraced houses (Table 2.) The Terraced House Indices represent the capital values of townhouses, low and medium-cost for one, one and a half, two to three storey terraced houses in each states. On a risk-adjusted basis, Kuala Lumpur ranked number one followed by Penang and Selangor. The worst performing state is Perlis. Kuala Lumpur has the highest return volatility (9.00%) whilst Perlis has the least volatility in return (1.51%).
The results are expected for the three leading states as these states are the most urbanised states in Malaysia and there is always high demand for landed properties. Being urban centres of population and employment, there is always high demand for terrace houses in these states. Appendix 1. shows the risk-return diagram of the terrace house sector by states.
(b) Semi-detached Houses (Table 3.) The Semi-Detached House Price Indices represent the capital values of one storey, one and a half storey and two to three storey semi-detached houses in each states.
Kuala Lumpur ranked number one followed by Negeri Sembilan and Penang. Kuala Lumpur, being the capital city of Malaysia, is the major urban center of population and employment. Demand from high concentrations of population coupled with high income have bring about high capital appreciation of semi-detached houses in Kuala Lumpur.
Semi-detached houses in Negeri Sembilan, on the other hand, have benefited from the spill-over effects of the Kuala Lumpur International Airport development. Prices of semi-detached houses have performed poorly in the states of Kedah and Perak due to a lower level of urbanisation in these states.
There are no reported values for certain years in the MHPI for the states of Sarawak, Kelantan and Perlis, hence there are no comparable risk-return values for the study period for these states. Appendix 2. shows the risk-return diagram of the semi-detached house sector by states.
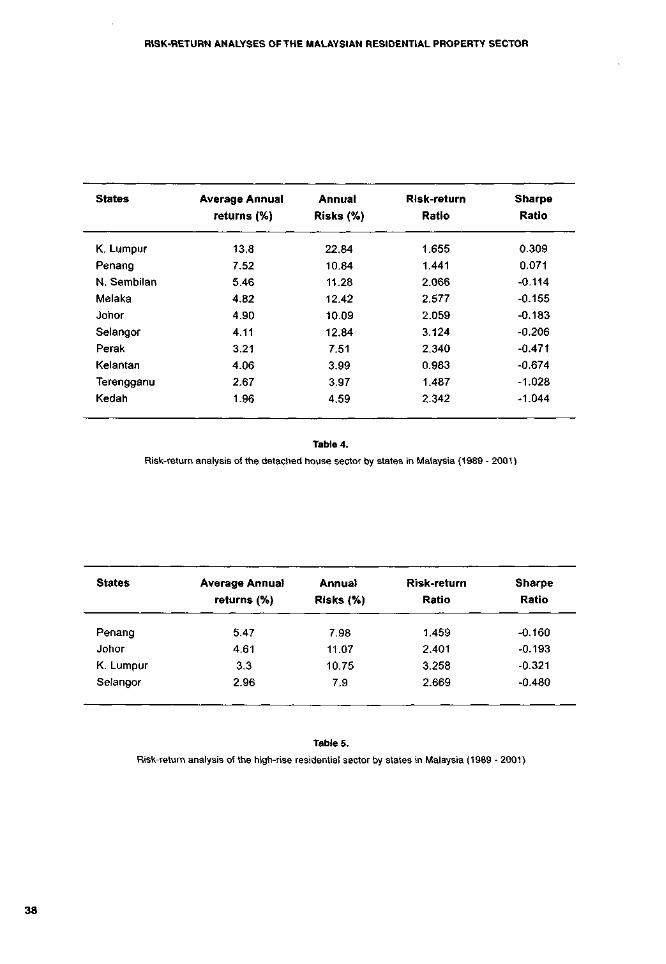
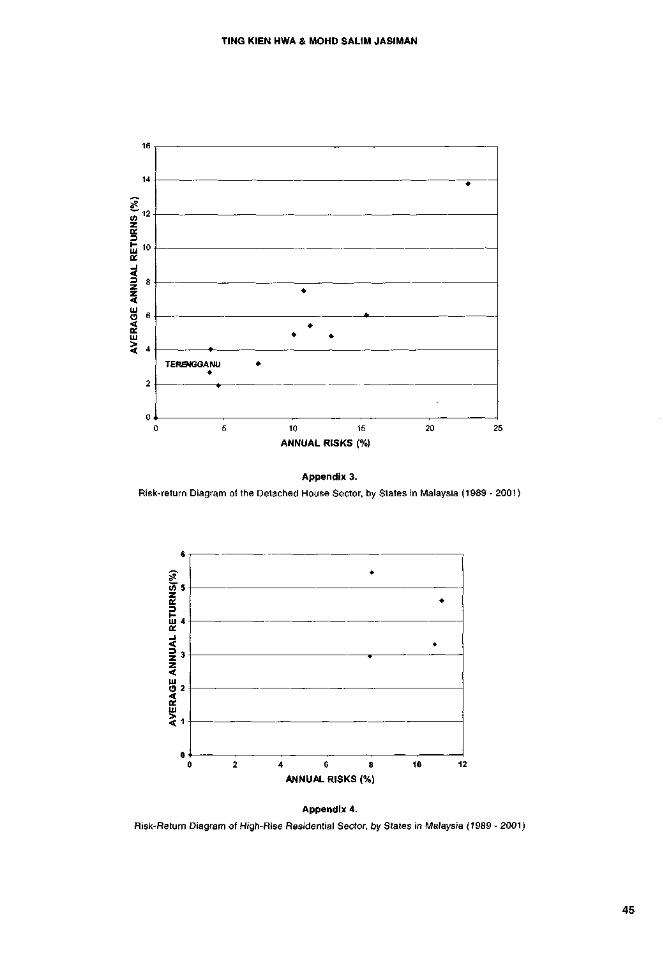
c) Detached Houses (Table 4.) The Detached House Price Indices represent the capital values of one and two storey detached houses in each states.
Again Kuala Lumpur ranked number one followed by Penang and Negeri Sembilan. The results are expected as demand for detached houses are from the high income group which are concentrated in these states. Prices of detached houses have not performed well in the states of Kedah, Terengganu and Kelantan. Appendix 3. shows the risk-return diagram of the detached house sector by states.
d) High-rise Residential Sector (Table 5.) The High-rise Units Price Indices represent the capital values of low-cost flats, medium to high-cost apartments and condominiums in each states.
Penang ranked first followed by Johor and Kuala Lumpur. Penang being an island has a limited supply of land suitable for housing development. Housing needs in Penang are met mainly by developing high-rise flats, apartments and condominiums. As prices of landed properties in Penang are high, housing demand is focused on high-rise units. Thus it is not surprising to find that the High-rise Units Price Index for Penang shows the highest level of capital appreciation during the study period. Strata properties are less popular in other states due to the availability of choice in landed properties. Appendix 4. shows the risk-return diagram of the high-rise residential sector by states.
37
RISK-RETURN ANALYSES OF THE MALAYSIAN RESIDENTIAL PROPERTY SECTOR
States
K. Lumpur
Penang
N. Sembilan
Melaka
Johor
Selangor
Perak
Kelantan
Terengganu
Kedah
Average Annual
returns (%)
13.8
7.52
5.46
4.82
4.90
4.11
3.21
4.06
2.67
1.96
Annual
Risks (%)
22.84
10.84
11.28
12.42
10.09
12.84
7.51
3.99
3.97
4.59
Risk-return
Ratio
1.655
1.441
2.066
2.577
2.059
3.124
2.340
0.983
1.487
2.342
Sharpe
Ratio
0.309
0.071
-0.114
-0.155
-0.183
-0.206
-0.471
-0.674
-1.028
-1.044
Table 4.
Risk-return analysis of the detached house sector by states in Malaysia (1989 - 2001)
States
Penang
Johor
K. Lumpur
Selangor
Average Annual
returns (%)
5.47
4.61
3.3
2.96
Annual
Risks (%)
7.98
11.07
10.75
7.9
Risk-return
Ratio
1.459
2.401
3.258
2.669
Sharpe
Ratio
-0.160
-0.193
-0.321
-0.480
Table 5.
Risk-return analysis of the high-rise residential sector by states in Malaysia (1989 - 2001)
38
TING KIEN HWA & MOHD SALIM JASIMAN
States Average Annual Annual Risk-return Sharpe
returns (%) Risks (%) Ratio Ratio
K. Lumpur
Penang
Selangor
Johor
N. Sembilan
Melaka
Pahang
Terengganu
Perak
Sarawak
Sabah
Kelantan
Kedah
Perlis
7.34
5.74
5.16
4.92
4.58
4.21
3.47
3.47
3.31
3.18
3.18
3.23
2.84
1.53
10.04
5.22
6.65
5.35
5.1
5.98
4.56
4.38
3.45
3.45
3.25
2.89
2.75
1.66
368
.909
.289
.087
.114
.420
.314
.262
.042
085
022
895
.968
.085
0.059
-0.193
-0.239
-0.342
-0.425
-0.425
-0.719
-0.749
-0.997
-1.035
-1.098
-1.218
-1.422
-3.145
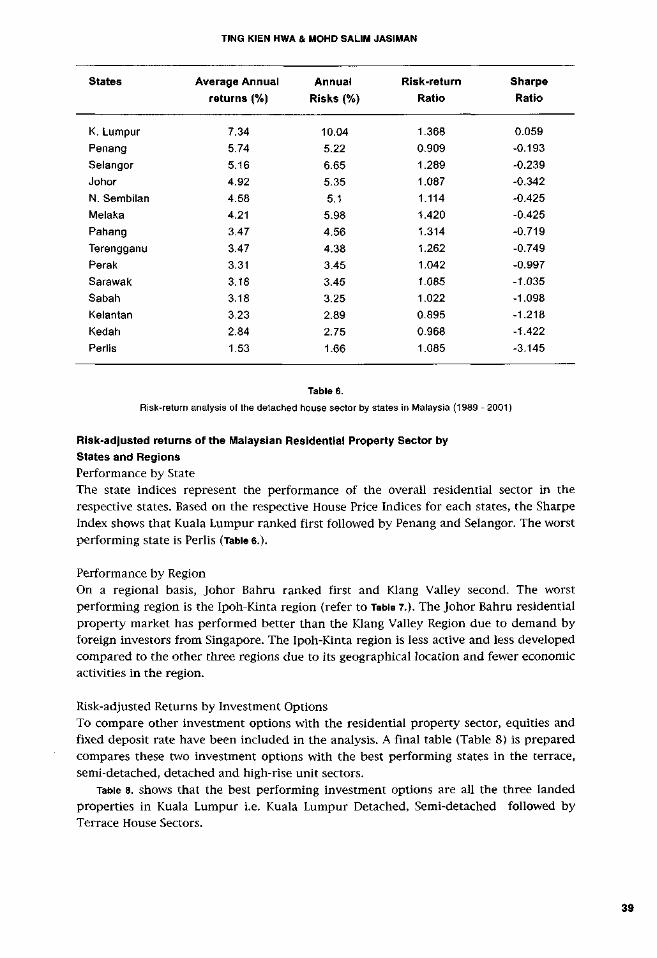
Table 6.
Risk-return analysis of the detached house sector by states in Malaysia (1989 - 2001)
Risk-adjusted returns of the Malaysian Residential Property Sector by
States and Regions
Performance by State The state indices represent the performance of the overall residential sector in the respective states. Based on the respective House Price Indices for each states, the Sharpe Index shows that Kuala Lumpur ranked first followed by Penang and Selangor. The worst performing state is Perlis (Table 6.).
Performance by Region On a regional basis, Johor Bahru ranked first and Klang Valley second. The worst performing region is the Ipoh-Kinta region (refer to Table 7.). The Johor Bahru residential property market has performed better than the Klang Valley Region due to demand by foreign investors from Singapore. The Ipoh-Kinta region is less active and less developed compared to the other three regions due to its geographical location and fewer economic activities in the region.
Risk-adjusted Returns by Investment Options To compare other investment options with the residential property sector, equities and fixed deposit rate have been included in the analysis. A final table (Table 8) is prepared compares these two investment options with the best performing states in the terrace, semi-detached, detached and high-rise unit sectors.
Table 8. shows that the best performing investment options are all the three landed properties in Kuala Lumpur i.e. Kuala Lumpur Detached, Semi-detached followed by Terrace House Sectors.
39

RISK-RETURN ANALYSES OF THE MALAYSIAN RESIDENTIAL PROPERTY SECTOR
States
Johor Bahru
Klang Valley
Penang Island
Seremban -
Sepang
Ipoh - Kinta
Average Annual
returns (%)
6.5
5.44
5.12
4.4
3.32
Annual
Risks (%)
12.05
8.42
8.09
5.73
3.16
Risk-return
Ratio
1.854
1.548
1.580
1.302
0.952
Sharpe
Ratio
-0.021
-0.156
-0.201
-0.410
-1.085
Table 7.
Risk-return analysis of the Malaysian residential sector by regions in West Malaysia (1989 - 2001)
States
Kuala Lumpur Detached
Kuala Lumpur Semi-detached
Kuala Lumpur Terrace
KLCI
Penang Detached
Kuala Lumpur State
Johor Bahru Region
N. Sembilan Semi-detached
Penang Semi-detached
Selangor Semi-detached
FD
Johor Terrace
Average Annual
returns (%)
13.80
11.37
7.94
11.18
7.52
7.34
6.50
6.47
6.57
6.07
6.31
5.22
Annual
Risks (%)
22.84
17.02
9.00
38.03
10.84
10.04
12.05
10.09
6.23
15.39
1.72
5.13
Risk-return
Ratio
1.655
1.497
1.134
3.402
1.441
1.368
1.854
1.560
0.948
2.535
0.27
0.983
Sharpe
Ratio
0.309
0.271
0.132
0.116
0.071
0.059
-0.021
-0.028
-0.029
-0.044
-0.256
-0.298
Table 8.
Risk-adjusted returns by investment options (1989 - 2001)
40

TING KIEN HWA & MOHD SALIM JASIMAN
Risk Return Share 12 month FD rate MHPI
(%) (%) (KLCI) (Commercial bank)
8.25
7.08
8.20
7.78
10.77
10.69
11.89
14.42
18.22
22.04
26.04
30.09
34.17
38.03
6.46
6.93
7.40
7.39
7.86
7.84
7.98
8.31
8.80
9.28
9.75
10.22
10.69
11.18
0.0
0.1
0.2
0.2
0.3
0.3
0.333
0.4
0.5
0.6
0.7
0.8
0.9
1.0
0.1
0.1
0.1
0.2
0.2
0.3
0.333
0.3
0.2
0.1
0.1
0.1
0.1
0.0
0.9
0.8
0.7
0.6
0.5
0.4
0.333
0.3
0.3
0.3
0.2
0.1
0.0
0.0
Table 9.
Risk and return of asset mixes with residential property included
PORTFOLIO DIVERSIFICATION BENEFITS OF MALAYSIAN RESIDENTIAL PROPERTY
Share investment is a popular investment option among Malaysian individual investors. Direct property investment particularly in the residential sector is equally popular.
Theoretically, adding property into an investment portfolio will provide diversification benefit by reducing the level of overall risk. The reduction is achieved due to the negative correlation of property with shares.
Correlation analyses are carried out on residential properties, shares and fixed deposit rates. Residential properties are represented by the MHPI, shares by year-end values of KLSE Composite Index and FD by 12-month fixed-deposit rates of commercial banks. Correlation analyses on the three investment options are carried out and the resulting correlation factors (r) are:
KLCI and MHPI r = 0.023 KLCI and FD r = -0.268 MHPI and FD r = 0.506
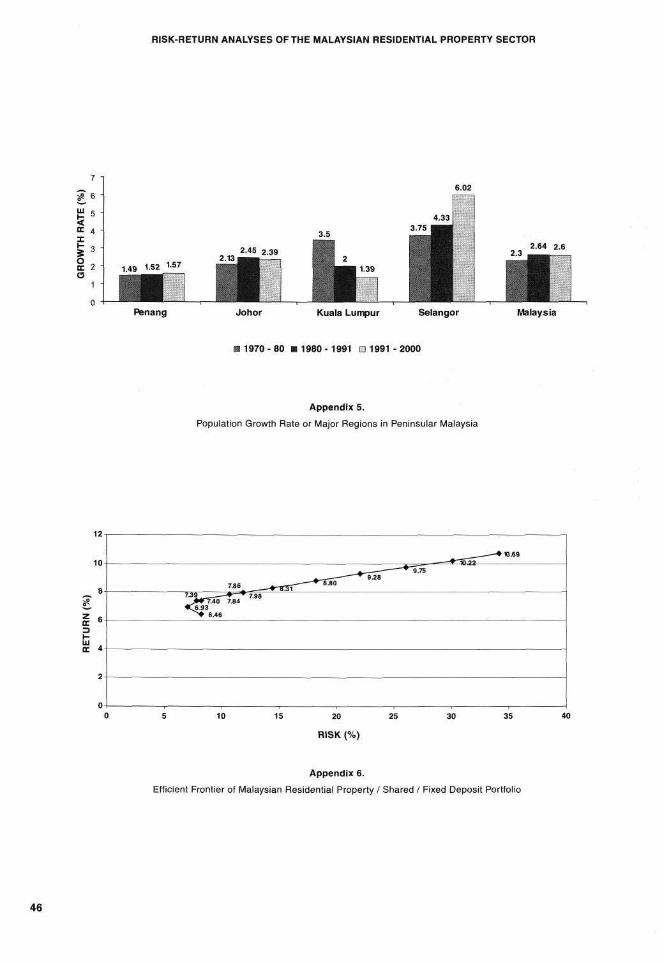
Appendix 5. shows the efficient frontier of the Malaysian share/FD/residential property portfolio. The efficient frontier shows the risk-return trade-off of the three investment options and demonstrates the potential of residential property for providing diversification benefits when combined in a mixed asset portfolio of shares, property and fixed deposits.
Table 9. shows the asset mixes incorporating residential property investment. A high percentage of property is found to form the optimal portfolio mix (Residential/share/FD : 80%/10%/10%). The reason could be due to serial correlation of the house price indices as the index construction is based on market values of stamp duty valuations on transacted residential properties. The percentage of residential property in the optimal portfolio mix is expected to be lower when adjustments are made for valuation smoothing.
41
RISK-RETURN ANALYSES OF THE MALAYSIAN RESIDENTIAL PROPERTY SECTOR
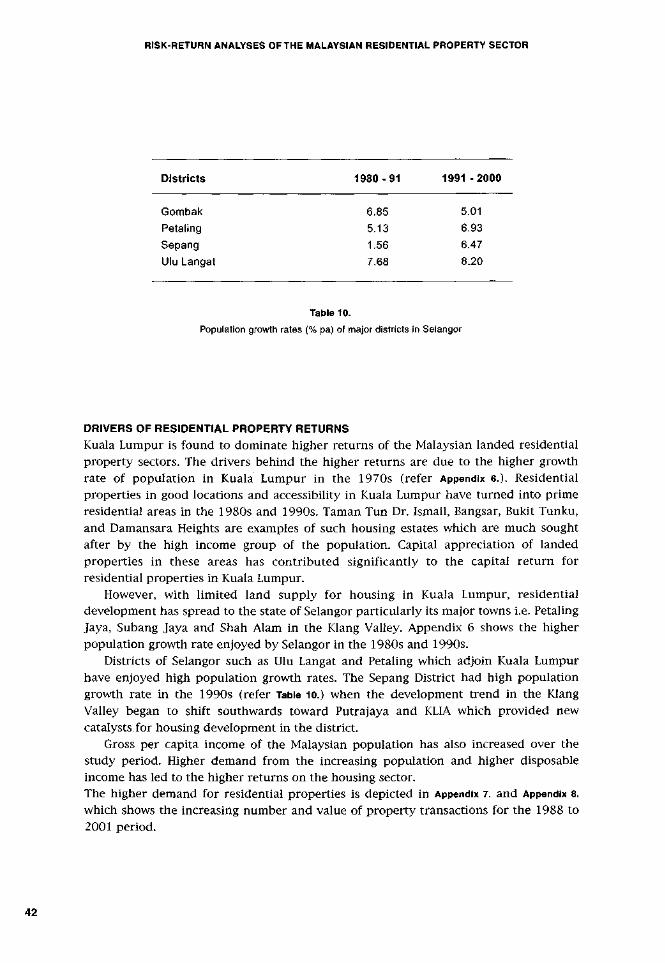
Districts 1 9 8 0 - 9 1 1 9 9 1 - 2 0 0 0
Gombak
Petaling
Sepang
Ulu Langat
Table 10.
Population growth rates (% pa) of major districts in Selangor
6.85 5.13
1.56 7.68
5.01 6.93 6.47
8.20
DRIVERS OF RESIDENTIAL PROPERTY RETURNS
Kuala Lumpur is found to dominate higher returns of the Malaysian landed residential property sectors. The drivers behind the higher returns are due to the higher growth rate of population in Kuala Lumpur in the 1970s (refer Appendix 6.). Residential properties in good locations and accessibility in Kuala Lumpur have turned into prime residential areas in the 1980s and 1990s. Taman Tun Dr. Ismail, Bangsar, Bukit Tunku, and Damansara Heights are examples of such housing estates which are much sought after by the high income group of the population. Capital appreciation of landed properties in these areas has contributed significantly to the capital return for residential properties in Kuala Lumpur.
However, with limited land supply for housing in Kuala Lumpur, residential development has spread to the state of Selangor particularly its major towns i.e. Petaling Jaya, Subang Jaya and Shah Alam in the Klang Valley. Appendix 6 shows the higher population growth rate enjoyed by Selangor in the 1980s and 1990s.
Districts of Selangor such as Ulu Langat and Petaling which adjoin Kuala Lumpur have enjoyed high population growth rates. The Sepang District had high population growth rate in the 1990s (refer Table 10.) when the development trend in the Klang Valley began to shift southwards toward Putrajaya and KLIA which provided new catalysts for housing development in the district.
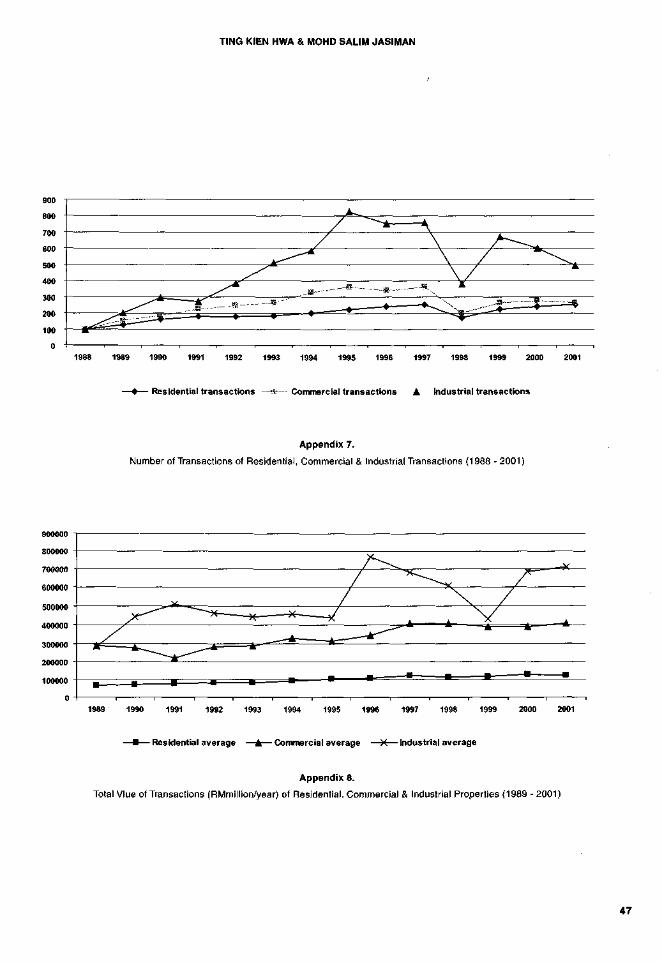
Gross per capita income of the Malaysian population has also increased over the study period. Higher demand from the increasing population and higher disposable income has led to the higher returns on the housing sector. The higher demand for residential properties is depicted in Appendix 7. and Appendix 8. which shows the increasing number and value of property transactions for the 1988 to 2001 period.
42
TING KIEN HWA & MOHD SALIM JASIMAN
LIMITATIONS OF ANALYSIS
The MHPI is a constant quality price index constructed using the hedonic method. To have a sufficient number of observations for the construction of the indices, the pooling and aggregation of data is necessary so that statistical inferences can be made with confidence. However such aggregations may cause the loss of explanatory power for price changes by property types or by locations/zones within a region/state. Due to the lack of transactions, a price index created may not have enough data points to test for time trend differences across locations/zones within a region. Similarly, separate regressions for each location are not possible without sufficient data (Guttery and Sirmans, 1998).
The lack of transaction data possibly explains why there is no 1997 index values for the Perlis and Kelantan Semi-detached House Indices and the Pahang, Perlis, Sabah and Sarawak Detached House Indices.
The regional indices provide an useful indicator on price trends of residential properties in regional growth centres. The indices could be made more useful if a series of sub-indices based on property types were produced which could provide further insight into regional residential price movements. Maps should be used to indicate the boundaries of the regions.
The study period (1989-2001) coincide with a full property cycle; thus the performance analyses provide insight into the risk-return characteristics of the various residential property sectors in Malaysia.
It would be useful to include Government Securities/Bonds into the study. However, there is a difficulty in establishing the Government bond capital returns, despite the existence of a RAM-Quant Shop Malaysian Government Securities Index. That Index is an accumulation index and the fact that the Malaysian Government Securities are long-term bonds of varying terms, different years of issue and varying interest rates makes it a difficulty to establish a new bond capital series that would allow risks and returns to be analysed and compared.
Currently there are no commercial property indices being developed in Malaysia. The lack of such property performance measures hampers any analysis that compares the performance of the residential sector with commercial property sectors. However the NAPIC is currently in the process of developing more performance indices.
The analyses of the performance analysis have been constrained by the lack of a higher frequency MHPI (i.e. semi-annual or quarterly data). Semi-annual data are available only from the January-June 1997 period. The results of the analyses could have been biased with a higher volatility on risks and returns due to the use of annual data.
CONCLUSIONS
In terms of housing type, the results show that detached houses provide higher capital appreciation compared to other forms of housing, but the high returns are associated with high risks. Thus, although a detached house provide the highest returns, it has higher variability in its return. In other words, investors in detached houses may enjoy higher capital gains during housing booms but they will suffer from a higher drop in their house prices compared to other forms of housing during recession periods.
The best states to invest in residential properties are Kuala Lumpur, Penang and Johor. In terms of regions, investors would perform well by investing in Johor Bahru followed by the Klang Valley and Penang Island.
On an inter-asset comparison basis, the best risk-adjusted performance comes from detached and semi-detached houses in Kuala Lumpur which have outperformed shares

RISK-RETURN ANALYSES OF THE MALAYSIAN RESIDENTIAL PROPERTY SECTOR
represented by the KLCI. For individual investors, the better direct residential property performance over
shares clearly identifies the residential property sector as a comparatively attractive investment option.
In conclusion, Malaysian residential properties in selected states and by types have performed well, and individual investors could enjoy considerable risk reduction by incorporating residential properties in their investment portfolios.
V)
z 1 -111 * s _ l J
<
Z 4 < 111
2 3
HI
5 2
1
0
•
•
• •
• • •
• • •
•
•
0 1 2 3 4 5 6 7 8 9 10
ANNUAL RISKS (%)
Appendix 1.
Risk-return Diagram of the Terrace House Sector, by States in Malaysia (1989 - 2001)
11
~ 10
£ (O 9 Z OS 3 8 I-111 * 7 _l < 3 6 Z Z < 5 HI < 4 K UJ
5 3
0 0 1 2 3 4 5 6 7 8 9 10 11 12 13 14 15 16 17 18
ANNUAL RISKS (%)
Appendix 2.
Risk- Return Diagram of the Semi-Detached House Sector, by States in Malaysia (1989 - 2001)
44
TING KIEN HWA & MOHD SALIM JASIMAN
s (3 6
LU
% 4
•
TERENGGANU •
•
•
• • •
, , , , , 0 5 10 15 20 25
ANNUAL RISKS (%)
Appendix 3.
Risk-return Diagram of the Detached House Sector, by States in Malaysia (1989 - 2001)
(0 5 z a.
m 4 oc _i < Z 3
Z < Ui O 2 < 111
5i
4 6 8
ANNUAL RISKS (%)
Appendix 4.
Risk-Return Diagram of High-Rise Residential Sector, by States in Malaysia (1989 - 2001)
45
RISK-RETURN ANALYSES OF THE MALAYSIAN RESIDENTIAL PROPERTY SECTOR
£5 <= 4 X
a 1
2-45 2.39
1.52 1-57
3.75 |
Penang Johor Kuala Lumpur Selangor
2.64 2.6
M
Malaysia
1970 - 80 • 1980 - 1991 • 1991 - 2000
Appendix 5.
Population Growth Rate or Major Regions in Peninsular Malaysia
Appendix 6.
Efficient Frontier of Malaysian Residential Property / Shared / Fixed Deposit Portfolio
46
TING KIEN HWA & MOHD SALIM JASIMAN
1988 1989 1990 1991 1992 1993 1994 1995 1996 1997 1998 1999 2000 2001
-4—Residential transactions —••—Commercial transactions • Industrial transactions
Appendix 7.
Number of Transactions of Residential, Commercial & Industrial Transactions (1988 - 2001)
0 H 1 1 1 1 1 1 1 1 1 1 1 1
1989 1990 1991 1992 1993 1994 1995 1996 1997 1998 1999 2000 2001
—•—Residential average —A—Commercial average —H—Industrial average
Appendix 8.
Total Vlue of Transactions (RMmillion/year) of Residential. Commercial & Industrial Properties (1989 - 2001)
47
RISK-RETURN ANALYSES OF THE MALAYSIAN RESIDENTIAL PROPERTY SECTOR
REFERENCES Bloch, B. (1997) Volatility in the residential housing market : an international perspective, Property
Management, (15 : 1) Bounds, M., Dwyer, W. & Mallik, G. (1999) The Sydney Olympics and Movements in the Price of
Residential Property (International Real Estate Society Conference. 26-30 January, Kuala Lumpur) Collett, Alan P. (2000) Prospects for investment in the private rented sector Journal of Property
Investment & Finance (18:4, 507 - 516) Copeland, T. E. & Weston, J. F. (1988) Financial theory and corporate policy 3e (Addison-Wesley) Crook, A. D. H., Hughes, J. & Kemp, P. A. (1998) Housing investment trusts and returns from
residential lettings. Journal of Property Research (15:3 , 229 - 248) Guttery, R. S. and C. F. Sirmans. (1998) Aggregation Bias in Price Indices for Multi-family Rental
Properties. Journal of Real Estate Research (15:3, 309 - 325) Hutchison, Norman E. (1994) Housing as an investment? A Comparison of Returns from Housing with
Other Types of Investment. Journal of Property Finance (5 : 2, 47 - 61) Lau, Wai Seang. (1999) Performance indicators for the Malaysian residential market (International Real Estate Society Conference. 26 - 30 January, Kuala Lumpur) Locke, S.M. (1985) Is buying a house good financial sense? The Valuer. July (596 - 597, 664) Mansfield, J. R. (1999) Practical difficulties associated with constructing a residential investment
portfolio. Property Management (17: 4, 321-335) Mansfield, J R. (2000) Investment potential within the private rented sector. Property Management
(18: 1, 34-45) National Institute of Valuation (1996) The Malaysian House Price Index : A Technical Summary.
Kuala Lumpur: Valuation & Property Services Department
National Property Information Centre.(1997) Malaysian House Price Indices. Kuala Lumpur :
Valuation & Property Services Department
Jacob, O. & Higgins, D. (1998) The Residential Property Price - An Overview. The Valuer & Land
Economist, May, (174 - 178) Rating Agency Malaysia Berhad (1996) RAM Industry Outlook : Residential Property Sector (Kuala Lumpur) Tan, Y.K. (1999) A Hedonic model for house prices in Malaysia (International Real Estate Society Conference. 26-30 January, Kuala Lumpur)
48