· Web viewSocial inequality is a core research theme of sociologists and research into social...
61
Social Inequality Door: Daniëlle van Helvoirt | Docent: Jochem Tolsma| Vakcode: SOW- SOB2010 Deze samenvatting is afkomstig uit het collegejaar 2016-2017. Het kan zijn dat sommige onderdelen iets verschillen van de huidige tentamenstof. Dit is een combinatie van de colleges, artikelen en de aantekeningen van de colleges. Cursusomschrijving: Social inequality is a core research theme of sociologists and research into social stratification and social mobility has a long tradition within sociology. In this course we describe and explain the causes and consequences of social inequality. The focus is on inequality with respect to income, wealth, educational attainment, occupational success and health. We start the course with defining the core concepts. This will enable us to formulate questions related to inequality that explicate the type of inequality (inequality of distributions, inequality of opportunities), the dimension of inequality (e.g. income, wealth, education), between whom inequality exists (e.g. young/old, men/women, social origin groups), where this inequality exists (e.g. countries, institutions) and in which period this inequality exists. Doelstellingen: At the end of this course, you will be able to: define core concepts related to social inequality; describe trends in social inequality; explain the causes and consequences of social inequality with different theoretical frameworks that start from methodological individualism and in which social resources (e.g. social, cultural, economic, human capital) and rules and norms of institutions play a central role; engage yourself constructively in the current debates on social inequality. Additionally you will be able to: calculate inequality in the distribution of income and wealth with, among others, the GINI-index; calculate the level of educational and occupational social mobility and determine the openness of a society; explain and draw conceptual models related to social inequality that contain spurious, mediated and moderated relationships.
Transcript of · Web viewSocial inequality is a core research theme of sociologists and research into social...

Social InequalityDoor: Daniëlle van Helvoirt | Docent: Jochem Tolsma| Vakcode: SOW-SOB2010
Deze samenvatting is afkomstig uit het collegejaar 2016-2017. Het kan zijn dat sommige onderdelen iets verschillen van de huidige tentamenstof. Dit is een combinatie van de colleges, artikelen en de aantekeningen van de colleges.
Cursusomschrijving: Social inequality is a core research theme of sociologists and research into social stratification and social mobility has a long tradition within sociology. In this course we describe and explain the causes and consequences of social inequality. The focus is on inequality with respect to income, wealth, educational attainment, occupational success and health. We start the course with defining the core concepts. This will enable us to formulate questions related to inequality that explicate the type of inequality (inequality of distributions, inequality of opportunities), the dimension of inequality (e.g. income, wealth, education), between whom inequality exists (e.g. young/old, men/women, social origin groups), where this inequality exists (e.g. countries, institutions) and in which period this inequality exists.
Doelstellingen:
At the end of this course, you will be able to:
define core concepts related to social inequality; describe trends in social inequality; explain the causes and consequences of social inequality with different theoretical
frameworks that start from methodological individualism and in which social resources (e.g. social, cultural, economic, human capital) and rules and norms of institutions play a central role;
engage yourself constructively in the current debates on social inequality.
Additionally you will be able to:
calculate inequality in the distribution of income and wealth with, among others, the GINI-index;
calculate the level of educational and occupational social mobility and determine the openness of a society;
explain and draw conceptual models related to social inequality that contain spurious, mediated and moderated relationships.
LecturesLecture 1Social inequality is two questions
1. The problem of social stratification inequality of outcomes

2. The problem of social mobility inequality of opportunities- Intergenerational mobility- Intragenerational mobility
Concept as intended theoretical definition of the social conceptConcept as determined (measurement of the) indicator of the conceptSocial origin may be defined as the position of one’s parents in a hierarchy on the basis of power, privilege, status and material resources. Income
- From labor Salary, bonus
- From capital Profit, royalty’s, rent, interest, dividend
Capital all resources that can be traded (in principle) at a (legal) market: buildings, land, machines, financial products.
- Private capital personal- Public capital state
National income total income of all residents of a country (most important)GDP gross domestic product worth of all produced goods and services within a countryNDP net domestic product GDP – depreciationPPP purchasing power parity translates money to goods
Income ratio (rj) income of individual j divided by the average income.Formula: rj = Xj/∑jpjXj
Gini coefficient- People with lower r qj
- People with higher r Qj
Formula: gini = ∑jpjrj(qj-Qj)
Inequality between countries has decreased- Differences in population growth- Differences in growth rates
Differences in industrialization Differences in post-industrialization
Total mobility is the consequence of structural (forced) mobility. Circular mobility is the switch from low to high or other way around.
Steps1. Calculate the marginals (totals)2. Calculate the total mobility
- 200+100=300- 300/850*100=35,3%
3. Calculate the upward mobility- 100/850*100=11.7%
4. Calculate the downward mobility- 200/850*100=23,5%
5. Calculate the structural mobility- ((450-350) + (400-500))/2=100- 100/850*100=11,8%
6. Calculate the circular mobility - 35.3-11.8=23.5%
7. Calculate the relative mobility (openness of society)

- Calculate probability for children with high parents to end up high 300/500=0.6
- Calculate probability for children with high parents to end up low 200/500=0.4
- Calculate the corresponding odds 0.6/0.4=1.5
- Repeat for children with low parents 100/350=0.29 250/350=0.71 0.29/0.71=0.41
- Calculate the odds ratio 1.5/0.41=3.66
Piketty focuses on:- Inequality within countries- Inequality of outcomes- Distribution of wealth and income and on the relation between wealth and income- “Inequality is not necessarily bad in itself: the key question is to decide whether it is
justified whether there are reasons for it”- Income/wealth top 10% or income/wealth top 1%- Inequality decreased until around 1950s but increases from the 1970s- Wealth/income inequality has a U-shaped pattern- Capital income ratio has followed a U-shaped pattern- Wealth inequality is more pronounced than income inequality
Most important conclusions- Income and wealth inequality has increased since 1970s in many countries. - Reason for the trend r>g- Past trends in inequality are bad predictors of future trends in equality; there is no
deterministic process- There is no natural, spontaneous process that will dampen destabilizing and increasing
inequalityProcesses that could lead to more equality
- Diffusion of knowledge and occupational skills This will lead to economic growth and makes income from labor more important Makes previous accumulated wealth less important
- Population growth Leads to economic growth and accumulated capital has to be divided to more
children/beneficiaries- Mechanism of supply and demand- Human capital
Financial capital will be less important to add value to a commodityProcesses that could lead to more inequality
- R > g Low economic growth & high rate of return on capital Wealth is not evenly distributed R is higher the more wealth has been accumulated
- High incomes increased more than lower incomesLecture 2Pikkety:
- Wealth (inequality) is often hidden (inequality)- Rate of return on wealth is higher the more wealth one has- Keep track of capital streams

- Global tax on capitalA sociological problem starts with a description/discovery of a social phenomena
- Piketty describes that income and wealth inequality is increasing again- New phenomena: super rich
Inequality of distribution and opportunities are entwined.
Part 1One: Income and output
- Labor and capital are ‘factors of production’- A tension how to divide earnings between profits and wages- Capital-income-ratio = beta- “The capital income ratio for the country as a whole does not tell us nothing about the
inequalities within the country. But beta does measure the overall importance of capital in society, …” (p. 51) Why not? Wealth could be distributed equally Distribution of wealth could change radically across generations
- The first fundamental Law of Capitalism Alpha = r * Beta Alpha = income from capital R = rate of return on capital Beta is capital income ratio
- A trend towards output equality is not necessarily accompanied by a trend towards income equality
- Distribution of income is more unequal than distribution of outputTwo: growth: illusions and realities
- Economic growth/rate of growth Population growth Growth in output per capita
- The Law of Cumulative Growth Growth as a factor for equalization
o Population growth decreases the importance of inherited wealth: every generation must in some sense construct itself
o Some countries face or approach negative population growth rateso Growth in output per capita: the occupational structure will change
Possibility for social mobility Human capita will become more important
A small difference in r and g can have enormous consequences in the long runPart 2Three: The Metamorphoses of capital
- Capital is U-shapedFour: From Old Europe to the New World
- France, Britain, Germany have the same pattern- Explanation for U-shape
War: physical destruction of capital Decolonization Political policies
o Nationalization of firmso Inflationo On rents
- Why differences Europe & US?
The American Dream R>g and Beta = s/g See Piketty and Saez – Inequality in the long run
Five: The Capital/Income Ratio over the Long Run- The second fundamental Law of capitalism; beta = s/g- This law explains differences in the development of capital across countries- This law explains capital’s comeback
Low growth rate (especially population growth) Continued high saving (low of cumulative growth) From public to private wealth Increase of asset prices (stocks/houses)
Reducing inequality- Which type of inequality?
Inequality of outcomes Inequality of opportunities
- Between whom? Own fault vs. bad luck Clear distinction?
- Why (not)? Political choice
o Based on attitudes about fairness Scientific arguments
o Consequences of (in)equality for macro-outcomeso Consequences of (in)equality for micro-outcomes
- How? Prevention
o Imposing restrictions (rules, norms, laws) Redistribution
o TaxesPikkety:
- Global tax on income Progressive Use tax for openness Regulation market Why global?
Lecture 3Fairness of income inequality subjective evaluation of a distribution by which not everybody has the same.Income inequality is accumulated over your life
- Differences between countriesHow do these inequalities emerge?
- Believe in Europe: earnings based on education and qualification- Meritocracy
Fairness? Look at the principle behind the (in)equality first!- Merit/equity principle
Inequality based on input Input = education training, working hours Outcome = earnings I/O Idea of fairness: Ia/Oa = Ib/Ob
This is conditional inequality
- Ascription principle Income based on status Family, age, gender
- Need principle Unattached to performance and status Everybody gets what they need to make their living Low incomes should get more Not labor market but state
- Equality principle Everybody gets the same income regardless of their effort When you know nothing of the situation
Fairness- Philosophy
Analytical thought Normative research
- Social sciences What do the people judge as fair? Don’t invent principles Why do people think this?
Differences in income grows bigger; top earns more, poor get poorer, mostly driven by labor earnings. Equality of income distribution is not necessarily an indicator of fairness!
- Fairness attitudes are subjective, but also relative (comperative- It depends on social context, position within the social stratification and culture
Thomas theorem : If men define situations as real, they are real in their consequences- Low wages perceive the earnings as unequal more than high wages
Lecture 4Inequality
- From labor- From capital- Growing inequality at the top in recent decades is mainly due to increases in inequality in
income from laborNeckerman & Torche
- The ‘upper-tail’ (top 10/20%)inequality kept increasing in recent decades’ Top managers set their own salaries Higher productivity of higher educated people as a consequence of technological
developments Maximizing shareholder value principle
o Focus on growth changes to focus on profit Decrease in trade union membership Ageing of the babyboom generation
- The bottom-tail (lowest 10/20%)inequality stopped growing in recent decadesDifferent kinds of social problems are attributed to increasing economic inequality – inequality of outcomes.
- Health problems, criminal behavior, lack of civic participationDownward spiral – inequality of opportunities
- Education and social capital4 effects
1. Mechanical effect- Economic status has an influence on other spheres- Income Happiness

2. Non-linear effect (emotional)- Supposing that X has a non-linear connection with the Y, a decrease in inequality of X can
lead to an even stronger decrease in inequality in Y. - Income (middle to high) Happiness
Income (low to middle)- Doubling everyone’s income does not change the inequality in income, but it does
change the inequality in participation3. Relational effect
- Supposing that the relation between economic status and the outcome changes, inequality in the outcome also changes
- See example in slides to explain4. Context effect
- The extent to which income inequality at the macro-level affects outcomes on the individual level
Main claim Wilkinson & Pickett- Greater economic inequality leads to worse health outcomes in a given country
Especially for outcomes with a steep social gradient- Average income in a country cannot explain away the negative effect of income
inequality on health outcomes Paradox! National level: inequality DOES lead to poor health results and average income DOES
NOT lead to poor health outcomes On local level this is the other way around
- Inequality effect is not caused by direct social comparison But by importance of social stratification in a society as a whole Inequality gives rise to ore residential segregation
- Income inequality is bad for people at the bottom of the social ladder as well as for people at the top of the social ladder
- Status competition explains the negative effect of inequality on health outcomes In unequal societies social status is a more important part of people’s social identity This leads to status competition; in unequal societies the chance for negative
comparisons is greater than in equal societies Competition does not only concern poop people This leads to insecurity, fear, stress and consequently health problems
Critique- Spurious relationship
Number of ethnic minorities and democratic governance can explain the link between income inequality and health problems
- Alternative mechanisms Loss of support for the welfare state
o Less investment in human capitalo Less support for investments in (public) health care
Decrease in Social Cohesiono Moderation and mediating
- Measures of income inequality Focus on status, but should the inequality also be measured by it?
- Selection of countries in the sample Only developed countries
Lecture 5Inequality in educational outcomes
- Vertical
Level, years- Horizontal
Tracks, field of studyMattheweffect rich get richer, poor get poorer
It is impossible to see inequality in educational outcomes as separate from inequality in educational opportunities
What the preferred level of inequality is, is an ideological question. The Dutch educational system is good in bringing most students up to speed but offers the very talented students relatively few opportunities
Even nowadays we face a situation of inequality of horizontal and vertical educational outcomes between social origin groups, men and women, ethnic groups
The women have caught up with men. With minority groups the differences are more or less the same, because both grew equally. Past social origin determined successNow talent is all that matters
Meritocratisation led to:- Educational expansion
Structural upwards mobility- Relative mobility
Upwards Downwards
Equal opportunities implies also downwards mobility Social origin is – even nowadays – strongly related to educational success
Inequality in educational opportunities is decreasing, but it is still large.For every additional ear of education of your parents, you have 0,32 year of extra education. For cohorts, if you were born 1 decade later, you will have 0,39 years more education.
Status attainment model:

Spuriousness means that social origin can explain the other two
Education is two-faced- Big equalizer
Equal opportunities for all From ascription to achievement
- Channel for inequality No direct intergenerational transmission of inequality, but via education Education as compensating strategy
Differences for young and old generations- Inequality is growing again
Education has been both the big equalizer and a way by which inequality has been reproduced
There is a fear that education offers less and less equal opportunities for all. This fear is in part grounded in empirical evidence
Primary effect part of the relationship between social origin and educational success can be explained by early cognitive abilitiesSecondary effects other reasons behind this relationship
Measuring early cognitive abilities- IQ-tests- Grades after primary school
Social origin is related to parental recourses (capital):- Material resources- Financial resources- Cultural resources- Social resources
Lecture 6Inequality of educational opportunity IEO social origin based inequality of educational opportunityRestrictions meso- or macro-level characteristics that influence how Social Origin is related to resources and/or how resources affect educational success.Meso-level institutionsMacro-level countries

Country characteristics: welfare system- Differentiation
Number of transitions Timing of transitions Number of alternatives
o Levelo Field
- School autonomy Selection processes
o Examinationo Importance of teacher
Teaching method Curriculum
The relation between abilities and educational success grew, while the socio-economic resources became less important for abilities and educational success.Why is there still a social origin effect once we control for abilities?
- Cultural reproduction theory Capitals as listed by lecture before Financial resources lost importance Bourdieu: cultural reproduction and distinction
o Cultural capital as compensating strategy to reproduce inequaity Cultural capital
o Cultural compentences which will help you to succeed in the educational system
o Educational abilities, aspirations and behavior- Rational choice theory / relative risk aversion mechanism
How to explain educational transition decisions?o At transition points different mutually exclusive options
Stop educational career Continue educational career in a specific track
Costs vs. benefitso Costs
Direct intuition fee, travel costs Indirect opportunity costs
o Benefits educational returns lifelong income Missing element: expectation of success
- Explaining class based inequality of educational opportunities Costs are not very important Abilities are assumed as perfect measurement for differences in expected
success probabilities Therefore, focus is on one educational return

Additional assumption: parents strive for educational returns by which downward class mobility can be avoided
Children from higher social origins have higher educational aspirationsSex based IEO
- Until recently women were lower educated than men Sex-specific socialization led to different educational aspirations Differences in educational returns Avoidance of downwards mobility via partner Sex affects the relationship between abilities and expected success probabilities
and the relationship between success probabilities and educational decisions
Recently: the boys problem- Sex-specific socialization no
longer leads to different educational aspirations (cultural modernization)
- Less differences in educational returns (cultural and economic modernization)
- No longer avoidance of downwards mobility via partner (individualisation)- The school context changed
Zie aantekeningen voor figuren!
Ethnic based IEO- Language as cultural capital- Lower educational aspirations because avoiding downwards mobility is easy
Lecture 7The higher the level of education, the more occupational success
- Indicators: status of job, income, social class, employment, permanent contractSocial origin mainly matters in the educational system and plays a marginal role in directly determining occupational success, although there is an indirect effect via education.
Is the labor market meritocratic?- No- The consensus is that SO does matter, even when the effect of SO is controlled for
educational attainment- Recent empirical evidence suggests that the relative importance of SO is increasing
compared to educational attainment- There are other ascriptive characteristics besides SO
Example: genderParents still influence your job, though not your first
- Social capitalAscription in the labor market
- Inheriting or taking over a family business Self-employement and farmers
- Occupational preferences- Effect of SO on occupational position is mainly the result of school choices
Human capital theory- A higher level of human capital means a higher level of productivity- More human capital, more chance of getting a job- At labor market entry, educational credentials are crutial

Credential inflation- When educational expansion is developing at a faster rate than the upgrading of jobs- The expected returns of education in the labor market decrease- Explained by job queue theory
Employers place employees in an imaginary queue Job seekers are in order from first to last according to their human capital First in line means getting the job Therefore, higher educated job seekers are more likely to get a job
- This theory is mainly applicable to the situation at labor market entryEducation is often regarded as positional good
- Its value depends on how much others have- Not about how much you have, but how much you have more
Educational expansion keeps itself going- Related to credential inflation is overqualification employees have higher educational
degree than required for the job Knowledge and skills are wasted
Above is vertical mismatchesBelow is horizontal mismatches
- Field of study does not correspond to the job- Demand and supply problems- Mismatches are temporary
Consequences of a lack of information of both employers and job seekersGeneral vs. vocational education
- General Not on a specific job
- Vocational Like mbo and hbo
Consequences of job mismatches- Micro
Overqualification is associated with lower wages due to a lower position, but overqualified employees earn more than qualified individuals in that position
Mismatches lead to frustration and job dissatisfaction Job dissatisfaction leads to job mobility
- Macro Societal returns of education under pressure The educational system is not always well-equipped to supply labor market
entrants with educational qualifications that meet the job demandsThis was intergenerational mobility, how about intragenerational mobility?
- Comparison of labor market positions over the life course- Various kinds of mobility are conceivable
Changing jobs within a firm (internal mobility)o Upward mobilityo Downward mobilityo Changing departments
Changing jobs between firms (external mobility)o Upward mobilityo Etc.
Getting fired Becoming disabled Full-time to part-time employment
- These transitions are not always voluntarily

Individual career mobility has received much less scholarly attention than the status attainment model
- Substantive arguments Researches often do not realize that intragenerational mobility could also be an
indicator of social inequality Social origin does not exert a strong influence on children’s employment careers.
It is especially the intergenerational transmission of occupations that plays a role- Practical issue
To examine career mobility, longitudinal data are needed. However, this data is scarce and difficult to analyze, although longitudinal data are becoming increasingly available
Youth unemployment- Both scientists and policy makers show considerable interest in school-to-work
transitions- A significant share of young people experiences unemployment at labor market entry
and if they find a job, it is often a precarious position Temporary contract, part-time, etc.
- Many youngsters face great difficulties and insecurities when they enter the labor marketDutch definition of unemployment people who do not have paid work, recently looked for work and are directly available. Lecture 8

BooksEducation, occupation and social origin by Bernadi & BallarinoChapter 11.1 MotivationCrime and victimization statistics show that individuals from a low-income household have more risk of experiencing violent crime. The claim that education is a social leveler is much more complex, contested and politically important in times of increasing income inequality across the world. Education as the great social equalizer = EGE. Education-based meritocracies = EBMs. A society may be considered an EBM if a person’s socioeconomic position in society is exclusively determined by their achieved education. The EGE can be considered a weak variant of the EBM thesis, because it suggests that once two individuals achieve the same level of education, they become equal and have the same chances of success in the labor market. Stronger version of EBM:
- Inequality in educational achievement No association between individuals’ social origins and their educational
attainment Individuals’ occupational outcomes are fully determined by their level of
education There is no direct association between individuals’ occupational outcomes and
their social origins, once their level of education has been taken into accountThese propositions form a triangle: the social origin-education-destination triangle (OED). The strong version of EBM requires
- A zero association between O and E- A zero association between O and D- And a strong association between E and D
This book focuses on the direct relation between the socioeconomic status of individuals and that of their parents. Questions:
1. Is there and association between individuals’ social origins and their occupational outcomes, once their educational attainment has been controlled for?
2. Has this intergenerational association declined over time?3. Does the intergenerational association vary across levels of schooling4. Have returns on education varied over time in each of the countries covered by this study?
1.2 Theories and HypothesisA central claim from the theories of industrialization and post-industrialization is that the position attained in the labour market will increasingly depend exclusively on own achieved education. The driving force behind education-based meritocracies is market competition among different employers, who are constrained to hire the more productive workers in order not to be pushed out of the market by their competitors, and then use educational qualifications as screening devices. Testing this: relation between social origin and occupational achievement should decline, while the relation between education and occupational success should increase. There is, however, still a direct relation, which could be due to different mechanisms, including productivity, social networks, aspirations and favouritism. Two reasons those mechanisms don’t disappear:
1. Modernization has come about with an expansion of participation in higher education2. Non-cognitive skills are more highly rewarded in the service sector than in manufacturing
Three reasons OD decreases:1. Labour market for the highly educated operates more meritocratically

2. Persons from lower social origins who manage to achieve a higher education are likely to be positively selected on characteristics such as ability and motivation
3. From a life-course perspective one may argue that people who stay at school longer start their careers at a later age, when they are less likely to be influenced by their parents.
This means OD should be lower, when the educational level is higher. Different view of the three-way OED interaction
- Intergenerational mobility strategies of the upper class Expectation: low educational achievement persons from the most socio-
economic advantaged backgrounds will be able to achieve occupations better than those that on average match the level of education that they have achieved
Based on compensatory advantageo Which predicts that an early disadvantage is likely to persist or grow
larger over time for those from disadvantaged families- Key tenet of social stratification research
Mobility patterns are driven by the goal of avoiding social demotion Downward mobility is the worst-case-scenario Parents help their children with their social contacts, and learn them other skills
- Compensatory advantage Among individuals with the same level of education, social background should
matter more- Skill-biased technological change hypothesis (SBTC)
Evidence of a widening wage gap in the US between individuals who hold a college degree and individuals who do not
Explaining this gap by focus on market competition Evolution of technology, driven by market competition, allows employers to
substitute the standardized jobs of poorly educated workers with machines, thus raising productivity and reducing the market value of the low-educated
Same process gives more value to the skills of the highly educated- Inflation of educational credentials hypothesis (IEC)
An increase in the number of higher education qualifications in the population, lowers the signalling value of these qualifications to employers
Returns on education are thus expected to decreaseTo be noted is that the mechanisms described by the SBTC and IEC hypotheses can both be active at the same time.
- Absolute returns to education Proportion of persons with a given educational level who reach a specified class
position IEC
- Relative returns to education Based on the comparison between the proportion of persons who have a given
educational level who reach a specified class position and the equivalent proportion of those with a different educational level
SBTC1.3 Previous Research?Direct comparison of the size of the estimates of the direct origin effect produced in previous research is not possible due to different measurements of the dependent variable. There are also differences in model specification and in the statistical analyses. There are differences in the direct effect OD for European countries. The large majority of the studies reviewed document a non-trivial DESO. Second, the results on its variation over time are mixed, and there is too limited research on whether educational returns vary according to the social class of origin to allow for any
generalization. Finally, absolute and relative returns to education (ED) and their variation over time depend on the interplay between educational expansion and occupational upgrading. 1.4 Design, variables and methodsNot really important?
8 Social origin and inequality in educational returns in the Dutch labour market8.1 IntroductionIt is claimed that the trend from ascription to achievement is caused by technological developments in the labour market which have led to a shift in demand from a low-skilled to a high-skilled labour force. This process of skills upgrading is referred to as skill-biased technological change. Besides economic modernization, cultural modernization has taken place in the form of a shift in dominant value patterns. In modern societies, particularistic value patterns, which were predominant in pre-industrial societies, have been replaced by universalistic ones. Nowadays, individuals no longer accept being judged on the basis of their social origin; rather, they believe that status positions should be distributed according to achievement and merit. Moreover, modern societies have become bureaucratic. Cultural modernization has also led to institutional reforms aimed at making educational systems more meritocratic.
- Decreasing direct and indirect costs of education, leading to more equal distribution of parental resources
- Increasing age of compulsory education8.2 Previous research for the NetherlandsIn the Netherlands your social origin has a direct effect on both your first and last job. The effect of the father’s occupation on the child’s occupation has declined. Also the indirect effect of father’s occupation, mediated by the level of education of his child, decreased in the course of time, because the impact of social origin on educational achievement decreased faster than the direct impact of education on occupational attainment increased. Recent Dutch studies reported more nuanced results. They observed decreasing direct effects of social origin on the occupational attainment of the first job, although no decrease in the relative impact of social origin compared to educational for men. The decrease in the direct impact of social origin on the occupational status of the current or last job was nog significant, and the impact of social origin compared to education even increased. Previous studies demonstrated that the educational returns in the Dutch labour market have changed over the past decades. There is a considerable inflation of credentials in the Netherlands. 8.3 Data and measurementData
- Family Survey Dutch Population (FSDP)- Dependent variables
Occupational status in the first job Occupational status in the current job Earnings in the current job
- Independent variables8.4 ResultsThough intergenerational downward educational mobility is increasing, there is no clear indication that the increase in the mean educational level has come to a halt. Also to be noted is that gender inequality in educational achievement has largely diminished in the course of time. The average occupational status of the first job of respondents has considerably increased over time. The decrease in the ratio between the mean occupational status and the mean level of education over time suggests that the occupational returns to education have declined. This finding is a first indication that educational qualifications may lose their differentiating ability in the labour market.

There is a strong, positive effect of level of education on the occupational status of the first job. The explanatory power of level of education is much larger than that of father’s occupational status. Recent cohorts enter the labour market at a lower occupational status than do those with the same level of education and belonging to older cohorts. There is no support for the prediction that the effect of social origin on occupational status attainment is weaker among those with higher qualification. The effect of level of education is smaller for younger birth cohorts than older ones, although this interaction effect only reaches statistical significance among our women subsample. The effects on the occupational status of the current job are similar to the effects on the occupational status of the first job, for both men and women. Finally, the earnings of the current job are regresses on social origin and level of education. The results reveal that the pecuniary returns to education have risen over time, although for men and women separately the estimates do not reach the conventional significance level. 8.5 Robustness check: non-linearityWe clearly see that the impact of father’s occupational status on the occupational status of his child’s first job is to a large extent mediated by level of education. The current non-linear model shows that the reduction in the direct effect of social origin may have come to a halt; the parameter estimate for the effect of father’s occupational status for the most recent cohort increased again, but we have to be cautious given he wide confidence intervals. 8.6 Conclusion and discussionFirst of all, it was found that an individual’s occupational success, in terms of both occupational status and earnings, depends upon their father’s occupational status, as a measure of social origin. Second, it was established that the effect of social origin on occupational status attainment has declined linearly over time. Third, the effect of an individual’s level of education on occupational status attainment has also decreased over time. With regard to the occupational status of the first job, this mainly holds true for women, whereas for the occupational status of the current job, the decrease in the effect of level of educational on occupational status is only significant for men. Fourth, we have found in this chapter limited evidence for a weaker impact of social origin on occupational success for higher-educated individuals, as suggested in earlier studies. In recent times, the picture is not clear at all, and we may be at a cross-roads as to how education moderates social origin effects. Chapter 1616.1 IntroductionThe core topic of this book has been the direct effect of social origin (DESO) on achieved social position, over and above own education. This is the phenomenon by which socio-economic inequality is transmitted from one generation to the next, even when two individuals have the same levels of education. 16.2 Overview of the findings16.2.1 Does a Direct Intergenerational Socio-Economic Association Exist?All countries document the existence of DESO. Most of the intergenerational transmission of inequality passes through education, although a direct association remains everywhere. Consequently, in all countries we find a sizeable deviation from a solely education-based meritocratic process of job allocation. The direct social background penalty in occupational achievement, associated with being born to working-class parents, is larger than both the ethnic and gender penalties, which have attracted a great deal of scholarly research and attention by public opinion. We find a direct intergenerational association in income net of educational achievement in all the countries. 16.2.2 Does the Direct Influence of Social Background Decline over Time?Although the existence of a sizeable direct effect of social origins on occupational achievement in terms of income in the majority of the 14 countries considered in this book already casts serious doubts on the soundness of the hypothesis that education is the great equalizer, it still might be the

case that the DESO is decreasing over time. All modernization theories assume this. The second important finding of our book is that when we consider the ISEI as occupational outcome, in almost all the countries the DESO does not decrease across cohorts or periods. It has been argued that social-democratic policies intended to enlarge the welfare state’s provisions, and the enactment of measures increasing the economic security of the working class, may have decreased the extent of intergenerational reproduction of socio-economic inequality in Sweden and, partly, also in the Netherlands. 16.3.2 Is University Education the Great Equalizer?The existence of a non-trivial DESO and the lack of consistent results indicating its decline over time suggest a negative answer to the question of whether education is the great equalizer. As we have seen, the occupational outcomes for two individuals with the same level of education still differ depending on their social origin. There is no association found between social origin and occupational outcomes among people with a university degree in the USA. This finding is interpreted by arguing that the labour market for university graduates is likely to be more meritocratic than the labour market for people with a lower education. An additional explanation is that people who originate from disadvantaged socio-economic backgrounds and manage to achieve a college degree are likely to be positively selected in terms of motivation and cognitive skills. Overall, we conclude that the results for the ISEI bear out the notion of compensatory advantage and, for the time being, also the argument that the LM for graduates is more meritocratic, and that university graduates from lower social backgrounds are positively selected on talent and motivation. Consistent with this finding, the quantile regressions for Norway, Russia, Spain and the USA point to a larger DESO in the top quantiles. This means that social origins provide an additional advantage to those already in the top area of the earnings distribution. For the time being, we propose to label it as a ‘boosting effect’ of social origin. One the one hand, socio-economically advantaged parents are likely to lift their adult children with low educational attainment up to acceptable occupations in order to minimize their risk of downward mobility. On the other hand, they may also help in maximizing the income returns to education of their adult children who have been high achievers at school. In the case of the intergenerational transmission of income, therefore, the key assumption in social mobility studies may be unwarranted. The core assumption that has guided the research on educational inequalities and social mobility over the past four decades is that the educational choices and social mobility strategies of parents are driven by the concern to prevent downward mobility for their children. The documented boosting effect suggests, that when there are possibilities to earn more, persons from a privileged background seem to be better equipped to take advantage of them. 16.2.4 Do Returns to Education Change over Time?One the one hand, the theory of skill-based technological change predicts, consistently with the modernization arguments, an increasing advantage for the tertiary-educated; on the other hand, the theory of inflation of educational credentials predicts declining returns to education because of the increasing diffusion of educational titles among the population, which decreases their signalling value, unless there is a corresponding upgrading of the occupational structure. In most of the countries studied, the upgrading of the occupational structure has been slower than the increase in the proportion of university graduates. This is clearly apparent in the ratio between the share of service class occupations and university graduates, which is found to have been decreasing over time in all the countries for which it has been computed. In the case of income, the evidence is more mixed. In some countries we find an increase in the higher education premium, in others a decline, and in yet others we find stability. These different patterns seem to be related to the country-specific balance, or imbalance, between the supply of and demand for skills. All in all, it is not possible to identify a consistent pattern across countries in favour of either skill-biased technological change or the credential inflation theory. According to both theories, indeed, the variation of educational returns crucially depends on the interplay between supply and demand.

16.2.5 Further FindingsWhat we find is that the direct intergenerational association tends to be larger for men in the case of the ISEI and for women in the case of income. Moreover, a stronger impact of the DESO is found for the current job compared with the first job on entry into the labour market, in all countries where the data allow the comparison. The finding that the DESO on the current job tends to be larger than the DESO on the first job is in line with the classic counter-mobility argument which maintains that individuals from socio-economically advantaged families may experience downward social mobility at the beginning of their occupational career. 16.3 A discussion on mechanismsThe main purpose of the collective research project that led to publication of this book was to ‘establish the phenomenon’. We aimed at ascertaining whether in contemporary societies we still observe an influence of family background on an individual’s occupational attainment, on top of their achieved education, and eventually, whether this direct influence varies over time and by educational level. 16.4 Suggestions for future research
1. The multidimensional measurement of intergenerational inequality- One does not have to choose the best measure of labour market success- It might be more useful to consider a wide range of measures in the same analysis
2. Empirical study of the mechanisms involved in the production of the DESO- Employ large data sets with a detailed list of occupations, in order to understand the
extent to which the patterns identified above occur in specific occupations3. More direct tests of the non-cognitive skills hypothesis4. Empirical limitations of research are related to theoretical limitations5. Issue of causality
- Discussion on this could be more focused16.5 Policy remarksThe core findings of this book show that education is not the great equalizer, and that this is because better-off families find a number of ways to influence the occupational achievement of their offspring over and above their achieved level of education. To repeat, we have found evidence that socio-economically advantaged parents compensate the occupational attainment of their children who are low achievers at school, and boost the earning opportunities of those who are high achievers. Two classes of mechanisms underlying the DESO should be distinguished
1. Purposive strategic actions by the parents- Such as the direct transmission of economic resources, the search for and transmission
of occupationally relevant information2. Individual characteristics and personality traits
- Such as motivation, risk aversion and social skillsGeneral conclusion: DESO seems unavoidable.
Capital in the Twenty-First CenturyPart 3 The structure of inequality7. Inequality and Concentration: Preliminary BearingsIn the next few chapters, I will show that the two world wars, and the public policies that followed from there, played a central role in reducing inequalities in the twentieth century. There was nothing natural about this process, in contrast to the optimistic predictions of Kuznets’s theory. I will also show that inequality began to rise sharply again since the 1970 and 1980s. The Key Question: Work or Inheritance?In nineteenth-century France and, for that matter, into the early twentieth century, work and study alone were not enough to achieve the same level of comfort afforded by inherited wealth and the

income derived from it. The same conditions were in Britain. One of the few exceptions to this rule was the USA, or at any rate the various ‘pioneer’ micro societies in the northern and western states, where inherited capital had little influence in the eighteenth and nineteenth centuries – a situation that did not last long, however. Income from labor is not always equitably distributed, and it would be unfair to reduce the question of social justice to the importance of income from labor versus income from inherited wealth. During the decades that followed WW11, inherited wealth lost much of its importance, and for the first time in history, perhaps, work and study became the surest routes to the top. Today, even though all sorts of inequalities have reemerged, and many beliefs in social and democratic progress have been shaken, most people still believe that the world has changed radically. Two questions
1. Can we be sure that the relative importance of income from labor versus income from inherited wealth has been transformed over time and if so, to what extend?
2. If we assume that such a transformation has to some degree occurred, why exactly did it happen, and can it be reversed?
Inequalities with Respect to Labor and CapitalIn all societies, income inequality is the result of adding up these two components
- Inequality of income from labor- Inequality of income from capital
The more unequally distributed each of these two components is, the greater the total inequality. Third factor:
- To what extent do individuals with high income from labor also enjoy high income from capital?
Technically speaking, this relation is a statistical correlation, and the greater the correlation, the greater the total inequality, all other things being equal. Inequality of income from capital may be greater than inequality of capital itself, if individuals with large fortunes somehow manage to obtain a higher return than those with modest to middling fortunes. When analyzing the unequal distribution of income, it is essential to carefully distinguish these various aspects and components of inequality, first for normative and moral reasons (justification of inequality) and second, because the economic, social, and political mechanisms capable of explaining the observed evolutions are totally distinct. Capital: Always More Unequally Distributed Than Labor
1. The first regularity we observe when we try to measure income inequality in practice is that inequality with respect to capital is always greater than inequality with respect to labor
- We find this regularity in all countries in all periods for which data are available- This regularity is by no means foreordained, its existence tells us something important about
the nature of the economic and social processes that shape the dynamics of capital accumulation and the distribution of wealth
A longer term perspective would be ideal for studying the true inequalities of opportunity and status that are quite difficult to measure. The main reason for accumulating wealth
- Precautionary In which case, inequality of wealth would be smaller than wage inequality
We can also imagine mechanisms that would imply an inequality of wealth comparable in magnitude to the inequality of income from albor. Specifically, if wealth is accumulated primarily for life-cycle reasons, then everyone would be expected to accumulate a stock of capital more or less proportional to his or her wage level in order to maintain approximately the same standard of living after retirement. In that case, inequality of wealth would be a simple translation in time of inequality of income from labor and would as such have only limited importance, since the only real source of social inequality would be inequality with respect to labor. Contrary to a widespread belief, intergenerational warfare has not replaced class warfare.

Very high concentration of wealth- Importance of inherited wealth- Its cumulative effects
Inequalities and Concentration: Some Orders of Magnitude
Lower, Middle, and Upper ClassesThe way the population is divided up usually reflects an implicit or explicit position concerning the justice and legitimacy of the amount of income or wealth claimed by a particular group.
- Middle class Term for individuals who clearly fall within the upper decile of the social hierarchy and
who may even be quite close to the upper centile Purpose of a broad definition is to insist that even though such individuals dispose of
resources considerably above the average for the society in question, they nevertheless retain a certain proximity to the average
- The people / the elite May be accurate for some societies
- Piketty Middle 40% is middle class
The truth is that any representation of inequality that relies on a small number of categories is doomed to be crudely schematic, since the underlying social reality is always a continuous distribution. Using deciles is internationally accepted, which makes it easier to compare through time and countries. Class Struggle or Centile Struggle?My fundamental goal is to compare the structure of inequality in societies more remote from one another in time and space, and that use different words and concepts to refer to social groups. To judge the inequality of a society, it is not enough to observe that some individuals earn very high incomes. The share of income going to the top decile or centile is a useful index for judging how unequal a society is, because it reflects not just the existence of extremely high incomes or extremely large fortunes but also the number of individuals who enjoy such rewards. Deciles and centiles are defined separately for income from labor, ownership of capital and total income, with the third being a synthesis of the first two. The correlation between the two used to be negative, but are becoming more and more positive. Inequalities with Respect to Labor: Moderate Inequality?
- Income from labor generally accounts for two-thirds to three-quarters of national income- There are quite substantial differences between countries in the distribution of income from
laborIn the most egalitarian countries, the bottom 50% received nearly twice as much total income as the top 10%. The gap between the male-female distribution is large, because women are significantly overrepresented in the bottom 50% of earners. The same mean wage is compatible with very different distributions of income from labor, which can result in very disparate social and economic realities for different social groups. In some cases, these inequalities may give rise to conflict. Inequalities with Respect to Capital: Extreme InequalityAlthough inequality with respect to income from labor is sometimes seen – incorrectly – as moderate inequality that no longer gives rise to conflict, this is largely a consequence of comparing it with the distribution of capital ownership, which is extremely inegalitarian everywhere. The most striking fact is no doubt that in all these societies, half of the population own virtually nothing: the poorest 50% invariably own less than 10% of national wealth, and generally less than 5%. In the USA, the most recent survey indicates that the top decile owns 72% of America’s wealth, while the bottom half claim just 2%. Even in the most egalitarian countries the wealth inequality is larger than the income from labor inequality. It is important to have a good grasp of exactly what these wealth figures mean. The upper decile of the wealth distribution is itself extremely unequal, even more so than the upper

decile of the wage distribution. Real estate becomes less important the more wealth you have, instead stocks become more important. A Major Innovation: The Patrimonial Middle ClassThe growth of a true patrimonial middle class was the principal structural transformation of the distribution of wealth in the developed countries in the twentieth century. To go back a century in time, in all the countries of Europe, the concentration of capital was then much more extreme than it is today. There was no middle class in the specific sense that the middle 40% of the wealth distribution were almost as poor as the bottom 50%. The vast majority of people owned virtually nothing. The emerge of a patrimonial middle class was an important, if fragile, historical innovation, and it would be a serious mistake to underestimate it. To be sure, it is tempting to insist on the fact that wealth is still extremely concentrated today.
- The rise of a propertied middle class was accompanied by a very sharp decrease in the wealth share of the upper centile
- The extreme concentration of wealth in Europe was in fact characteristic for the entire nineteenth century
- Concentration of capital is in fact a necessary condition for societies based on accumulated and inherited wealth
Inequality of Total Income: Two WorldsUnsurprisingly, the level of inequality for total income falls between inequality of income from labor and inequality of ownership of capital. This inequality is closer to inequality of income than of capital, which comes as no surprise, since income from labor generally accounts for two-thirds to three-quarters of the national income. There are no grounds for asserting that the upper decile can never claim more than 50% of national income or that a country’s economy would collapse if this symbolic threshold were crossed. In fact, the available historical data are far from perfect, and it is not out of the question that this symbolic threshold were crossed. This depends primarily on the effectiveness of the apparatus of justification. The key issue is the justification of inequalities rather than their magnitude as such. That is why it is essential to analyze the structure of inequality.Ways of achieving high inequalities
- Hyperpatrimonial society A society in which inherited wealth is very important and where the concentration of
wealth attains extreme levels The total income hierarchy is then dominated by very high incomes from capital,
especially inherited capital- Hypermertitocratic society
Relatively new Very inegalitarian society, but one in which the peak of the income hierarchy is
dominated by very high incomes from labor rather than by inherited wealthThe two types can coexist. There is more than one way of achieving the same level of inequality, and what primarily characterizes the US at the moment is a record level of inequality of income from labor together with a level of inequality of wealth. Problems of Synthetic IndicesProblems with Gini
- Claim to summarize in a single numerical index all that a distribution can tell us about inequality
- Simple and appealing at first glance but misleading- Tend to confuse inequality in regard to labor with inequality with regard to capital
Distribution tables are also valuable because they force everyone to take note of the income and wealth levels of the various social groups that make up the existing hierarchy. These levels are expressed in cash terms rather than by way of artificial statistical measures that can be difficult to interpret.
The Chaste Veil of Official PublicationsThe most frequently used interdecile ratio is the 90/10, that is, the ratio between the 90 th and the 10th percentile. By construction, these ratios totally ignore the evolution of the distribution beyond the ninetieth percentile. Shares give a much more stable picture of reality than the interdecile ratios. Back to “Social Tables” and Pilitical ArithmeticThe next step is to naturally break down to these total income and walth figures by decile and centile. A useful step in this direction would be a breakdown indicating the poorest 50%, the middle 40% and the top 10%. Such an approach would allow any observer to see just how much the growth of domestic output and national income is or is not reflected in the income actually received by these different social groups. 8. Two WorldsA Simple Case: The Reduction of Inequality in France in the Twentieth CenturyIncome inequality has greatly diminished in France since the Belle Époque. The top 10% lost 15 percentage points in income. It represents a decrease of about one-third in the share of each year’s output going to the wealthiest 10% of the population and an increase of about a third in the share going to the other 90%. This is about primary incomes (before taxes and transfers). The significant compression of income inequality over the course of the twentieth century was due entirely to diminished top incomes from capital. If we ignore income from capital and concentrate on wage inequality, we find that the distribution remained quite stable over the long run. The wage hierarchy has remained more or less the same. The top centile’s share of income literally collapsed in France over the course of the twentieth century. This collapse was due solely to the decrease of very high incomes from capital. The reduction of inequality in France during the twentieth century is largely explained by the fall of the rentier and the collapse of very high incomes from capital. The History of Inequality: A Chaotic Political HistoryThe history of inequality has not been a long, tranquil river. These have been many twists and turns and certainly no irrepressible, regular tendency toward a natural equilibrium. Socioeconomic inequalities are always both causes and effects of other developments in other spheres.
- The Great Depression- Destruction by the WWs- New policies
Those shocks led to a sharp drop in the capital/income ratio. From a “Society of Rentiers” to a “Society of Managers”Income from capital still represented the main source of income for the top 0,5% of the distribution in 1932. But when we look at the composition of the top income group today, we find that a profound change has occurred. Today one has to climb much higher in the social hierarchy before income from capital outweighs income from labor. Income from capital assumes decisive importance only in the top thousandth or top ten-thousandth. Its influence in the top centile as a whole is relatively insignificant. To a large extent, we have gone from a society of rentiers to a society of managers, that is, from a society in which the top centile is dominantly rentiers to a society in which the top of the income hierarchy consists mainly of highly paid individuals who live on income from labor. The rentiers fell behind the managers, not the other way around!!The Different Worlds of the Top DecileIt is particularly striking to note that in all the countries for which we have this type of data, in all periods, the composition of the top income group can be characterized by this: the share of income from labor always decrease rapidly as one moves progressively higher in the top decile, and the share of income from capital always rises sharply. The labor market was totally transformed over the past century, but the structure of wage inequality across the market barely changed over the long run.
The Limits of Income Tax ReturnsSince income form capital is overrepresented in the top decile, this underdeclaration of capital income also implies that the shares of the upper decile and centile indicated on income tax returns are underestimated. In the French case, we can compare self-declared income on tax returns with other sources to estimate ehow much we need to adjust our results to compensate for the underdeclaration of capital income. Income from mobile capital was already significantly underreported in the early twentieth century and during the interwar years. To a first approximation, we may assume that accounting for tax avoidance and evasion would increase the levels of inequality derived from tax returns by similar proportions in different periods and would therefore not substantially modify the time trends and evolutions I have identified. We have not yet attempted to apply such corrections in a systematic and consistent way in different countries. This is an important limitation of the World Top Incomes Database.
- Our series underestimate the increase of inequality that can be observed in most countries after 1970, and in particular the role of income from capital
Different capital taxation laws may bias international comparisons. there are significant variations in the treatment of capital gains.
- Income tax returns contain no information about the origin of the capital whose income is being reported
An identical level of inequality with respect to income from capital can in fact reflect very different situations, and we would never learn anything about these differences if we restricted ourselves to tax return data. The Chaos of the Interwar Years The income inequality declined during the interwar years. It reflects the long and virtually uninterrupted series of shocks sustained by capital during this time. The share of the top decile of the income hierarchy decreased much less steadily. Most of the income of the 1 percent fell in the Great Depression, because their income was mostly stocks and bonds. The 9 percent included many managers, who were the great beneficiaries of the Depression. It is a hard period to research. The Clash of TemporalitiesThe focus on the long period must not be allowed to obscure the fact that shorter-term trends also exist. During both world wars, the wage hierarchy was compressed, but in the aftermath of each war, wage inequalities reasserted themselves. Wages at the bottom of the wage scale generally rise, and are somewhat more generously protected from inflation than those at the tip. This can induce significant changes in the wage distribution if inflation is high. The Increase of Inequality in France since the 1980s
- The profit share in 1966-1967 was historically high, a consequence of the restoration of capital’s share that began at the end of WW11
- Very top salariesA more complex Case: The Transformation of Inequality in the united StatesUS became more unequal than France.
1. European income inequality was significantly bigger at the turn of the twentieth century than USA Capital/income ratio bigger in Europe Inequality of ownership of capital was somewhat less extreme in the New World
2. Income inequality increased in the US during the 1920s3. Great Depression income inequality compressed4. 1940/1950 compression of inequality noticeably smaller in US than France
The Explosion of US Inequality after 1980Income inequality has exploded, the shape of the curve is rather impressively steep and it is natural to wonder how long such a rapid increase can continue.
1. Recall that the series represented take account only of income declared in tax returns and in particular do not correct for any possible understatement of capital income for legal or extralegal reasons
2. Stock market euphoria and capital gains can account for only part of the structural increase in the top decile’s share over the past thirty or forty years.
Looking at evolutions without capital gains also allows us to identify the structural character of the increase of inequality in the US more clearly. In fact, from the late 1970s to 2010, the increase in the upper decile’s share appears to have been relatively steady and constant. Much more striking is the fact that the level attained in 2010 is already significantly higher than the level attained in 2007, on the eve of the financial crisis. Top 10 percent
- Top 1 percent- Next 4 percent- Bottom 5 percent
Did the Increase of Inequality Cause the Financial Crisis?One consequence of increasing inequality was virtual stagnation of the purchasing power of the lower and middle classes in the US, which inevitably made it more likely that modest households would take on debt, especially since unscrupulous banks and financial intermediaries, freed from regulation and eager to earn good yield on the enormous savings injected into the system by the well-to-do, offered credit on increasingly generous terms. It is hard to imagine an economy and society that can continue functioning with indefinitely with such extreme divergence between social groups. It would altogether be too much to claim that the increase of inequality in the US was the sole or even primary cause of the financial crisis of 2008 or, more generally, of the chronic instability of the global financial system. A potentially more important cause of instability is the structural increase of the capital/income ratio coupled with an enormous increase in aggregate international asset positions.The Rise of SupersalariesThe increase of inequality in the USA was largely the result of an unprecedented increase in wage inequality and in particular the emerge of extremely high remunerations at the summit of the wage hierarchy, particularly among top managers of large firms.
- This unprecedented increase in wage inequality does not appear to have been compensated by increased wage mobility over the course of one’s career.
- If each individual were to enjoy a very high income for part of his or her life, then an increase in the level characterized as ‘very high pay’ would not necessarily imply that inequality with respect to labor had truly increased
- Increase in wage is identical in all cases, no matter what the reference period wasCohabitation in the Upper CentileThe fact that the unprecedented increase of wage inequality explains most of the increase in US income inequality does not mean that income from capital played no role. It is important ot dispel the notion that capital income has vanished from the summit of the US social hierarchy. In the US and France (but to a lesser degree) you have to climb much further up the income hierarchy before income from capital takes the upper hand. Final and perhaps most important point
- The increase in very high incomes and very high salaries primarily reflects the advent of supermanagers, that is, top executives of large firms who have managed to obtain extremely high, historically unprecedented compensation packages for their labor.
Financial professionals are about twice as common in the very high income groups as in the economy overall.
9. Inequality of labor incomeWage Inequality: A Race between Education and TechnologyThe most widely accepted theory is that of a race between education and technology. This theory does not explain everything.
- No satisfactory explanation for the rise of the supermanager- No satisfactory explanation for the of wage inequality in the US after 1980 - Suggest interesting and important clues for explaining certain historical events- Two hypotheses
A worker’s wage is equal to his marginal productivity o His individual contribution to the output of the firm/office
The worker’s productivity depends above all on his skill and on supply and demand for that skill in a given society
- Emphasizing two social and economic forces Supply and demand
o Supply depends on educational systemo Demand depends on state of the technologies available
- Naïve and limitedDemocratization of the educational system did not eliminate educational inequality and therefore did not reduce wage inequality. Over the long run, education and technology are the decisive determinants of wage levels. The Limits of the Theoretical Model: The Role of InstitutionsThe main problem with the theory of marginal productivity is quite simply that it fails to explain the diversity of the wage distributions we observe in different countries at different times. In order to understand the dynamics of wage inequality, we must introduce other factors, such as the institutions and rules that govern the operation of the labor market in each society. Explaining important episodes of compression and expansion of wage hierarchies
- Negotiations over wage scales in the public and private sector- Changes in minimum wage
Wage Scales and the Minimum WageWhat is in fact the justification for minimum wages and rigid wage schadules?
1. It is not always easy to measure the marginal productivity of a worker- To be sure, one can estimate marginal productivity- Firm: efficient to ensure wages remain stable
The justification of setting wages in advance obviously has its limits. The other classic argument in favor of minimum wages and fixed wage schedules is the problem of ‘specific investments’.
- People do more to get accepted into the job when they know the earnings in advanceThe goal of a minimum wage is to make sure that no employer can exploit his competitive advantage beyond a certain limit. If the minimum wage increases, the negative effects on the level of employment will eventually win out. The best way to increase wages and reduce wage inequalities in the long run is to invest in education and skills. How to explain the Explosion of Inequality in the United States?The most striking failure of the marginal productivity theory and race theory
- Inability to adequately explain the explosion of very high incomes from labor observed in the US since 1980 Theory: explainable by skills Tautological quality technological chance not trustable Top grows faster than rest
Two distinct phenomena have been at work in recent decades- The wage gap between college graduates and high schoolers is increasing- The top 1% is growing
- The second is more important than the firstThe Rise of the Supermanager: An Anglo-Saxon PhenomenonWe do not have separate series for wage inequality and total income inequality for all the countries as we do for France and the US. In all of these countries the explosion of top incomes explains most of the increase in the top centile’s share of national income; the rest is explained by robust income from capital. In all the English-speaking countries, the primary reason for increased income inequality in recent decades is the rise of the supermanager in both the financial and nonfinancial sectors. Still, there are differences even within the Anglo-Saxon countries. If we look at European countries, we observe slight increases, with the top centile’s share increasing by two or three points of national income over the past thirty years. The higher one climbs into the income hierarchy, the more spectacular the raises. Even if the number of individuals benefiting from such salary increases is fairly limited, they are nevertheless quite visible, and this visibility naturally raises the question of what justifies such high levels of compensation. The fact remains that the evolution in continental Europe and Japan is thus far much less serious than in the US. Europe: More Inegalitarian Than the New World in 1900-1910Income inequality was actually quite high in Europe in the beginning of the twentieth century. Most top incomes in that period came from capital. Compared with Europe, in the US and Canada, the inequality was pretty low. The explanation is that shocks to capital were large in the World Wars, which made the European top incomes drop. Inequalities in Emerging Economies: Lower than in the United States?The most striking result is that the upper centile’s share of national income in poor and emerging economies is roughly the same as in the rich countries. In china, the top centile’s share of national income rose rapidly over the past several decades but starting from a fairly low level. There is few information and data. Black hole of growth: paradox incomes are certainly increasing rapidly, but nog as one would infer from official growth figures. Whatever flaws the tax authorities in poor and emerging countries may exhibit, the tax data reveal much higher – and more realistic – top income levels than do household surveys. Household surveys give a biased and misleadingly complacent view of the distribution of wealth. The Illusion of Marginal ProductivityThe fact that income inequality in the US in 2000-2010 attained a level higher than that observed in the poor and emerging countries at various times in the past also casts doubt on any explanation based solely on objective inequalities of productivity. Most convincing explanation for the explosion of the very top US incomes
- Vast majority of top earners are senior managers of large firms- When an individual’s job functions are unique, you cannot estimate the marginal product- Introducing the hypothesis of imperfect information
Individual marginal productivity is hard to define- Remunerations are set by hierarchical superiors- It is only reasonable to think that people who can choose their own salary have a natural
incentive to treat themselves generously- People also look at the norms in their country when setting salaries- In the US (and other English-speaking countries) people are more tolerant of big pay
packages- Less so in Europe and Japan
The Takeoff of the Supermanagers: A Powerful Force for DivergenceThis theory only shifts the difficulty to another level. The problem is now to explain where these social norms come from and how they evolve. the explanatory power of the skills-technology logic then diminishes, and that of social norms increases. Only a small minority of employees are affected, a few percent at most. The key fact is that the top centile’s share of total wages can vary considerably by country and period, as the disparate evolutions in the wealthy countries after 1980 demonstrate. The most convincing proof of the failure of corporate governance and of the absence

of a rational productivity justification for extremely high executive pay is that when we collect data about individual firms, it is very difficult to explain the observed variations in terms of firm performance. You would say a manager’s pay would depend on nonexternal factors, but the opposite is true. Things like the state of the economy can raise a manager’s pay. 10. Inequality of Capital OwnershipHyperconcentrated Wealth: Europe and AmericaWealth data have one enormous advantage over the income data: they allow us in some cases to go much farther back in time.France: An Observatory of Private WealthFrance is a particularly interesting case, becaut it is the only country for which we have a truly homogeneous historical source that allows us to study the distribution of wealth continuously rom the late eighteenth century to the present. The new estate tax was universal in three ways
- It applied to all types of property- It applied to owners of wealth- It applied to fortunes of all sizes
The purpose of this fundamental reform was not only to fill the coffers of the new regime but also to enable the government to record all transfers of wealth, whether by bequest or gift. The purpose of the law was thus to allow every property owner to record his title and thus enjoy his property rights in full security. The Metamorphoses of a Patrimonial SocietyPrior to the shocks of 1914-1945, there was no visible trend toward reduced inequality of capital ownership. During the nineteenth and twentieth century, inequality in capital remained almost stable in France. Inequality of Capital in Belle Époque EuropeThe level of inequality was a little big larger in Britain, but it roughly followed the same pattern as France. Sweden wasn’t as egalitarian as one might think. We find the same extremely high concentration of wealth in most societies prior to the nineteenth century and in particular in traditional agrarian societies in the modern era, as well as in the Middle Ages and antiquity. The Emerge of the Patrimonial Middle ClassThree questions:
1. Why were inequalities of wealth so extreme, and increasing, before WW12. Why, despite the fact that wealth is once again prospering at the beginning of the twenty-
first century as it did at the beginning of the twentieth century, is the concentration of wealth today significantly below its historical record high?
3. Is this state of affairs irreversible?The second conclusion that emerges very clearly from the French data presented is that the concentration of wealth, as well as the concentration of income from wealth, has never fully recovered from the shocks of 1914-1945. Inequality of wealth began to increase again in 1980-1990, and financial globalization has made it more and more difficult to measure wealth and its distribution in a national framework: inequality of wealth in the twenty-first century will have to be gauged more and more at the global level. The major structural transformation was the emergence of a middle group, representing nearly half of the population, consisting of individuals who managed to acquire some capital of their own. Inequality of Wealth in AmericaEstimated based on the probate data can be supplemented by information from the detailed wealth surveys that the Federal Reserve Bank has conducted since the 1960s. differences Europe and US
- Inequality of wealth used to be around the same level- Wealth in the US became increasingly concentrated over the course of the nineteenth
century- Deconcentration of wealth in the US was fairly limited
The Mechanism of Wealth Divergence: r versus g in HistoryHyperconcentration of wealth in traditional agrarian societies
- Low-growth societies- Rate of return on capital higher than the rate of growth
Why is the Return on Capital Greater Than the Growth Rate?Long period: r > g
- Demographic and economic growth lowTaxes
- Before WW1 Low taxes Rate of return same as before taxes
- After WW1 Taxes on top incomes rose high
Both fiscal and nonfiscal shocks made it possible that g > r. Signs are that this is about to end. The Question of Time PreferenceNog nooit van gehoordIs There an Equilibrium Distribution?Processes to reduce r
- Income/wealth ratio grows- Shocks of various kinds, think demographic or economic
The Civil Code and the Illusion of the French RevolutionIf the gap between the return on capital and the growth rate is as high as that observed in France in the nineteenth century, when the average rate of return was 5% a year and growth was roughly 1%, the model predicts that the cumulative dynamics of wealth accumulation will automatically give rise to an extremely high concentration of wealth, with typically around 90% of capital owned by the top decile and more than 50% by the top decile. If the difference r – g surpasses a certain threshold, there is no equilibrium distribution: inequality of wealth will increase without limit, and the gap between the peak of the distribution and the average will grow indefinitely. Pareto and the Illusion of Stable InequalityPareto didn’t really have evidence to support his theory of stability. Pareto’s conclusions were clouded by his political prejudices. Why Inequality of Wealth Has Not Returned to the Levels of the PastThe largest fortunes left more exposed to the losses of the World Wars. Also the extremely violent shocks. The first one should not be overstated, because the wealthiest individuals were often in a good position to reallocate their portfolios at the most profitable moment. End of the WW meant a redistribution of wealth in Europe. Some Partial Explanations: Time, Taxes and Growth
ArticlesInequality in the long run by Pikkety and SaezThis review presents basic facts regarding the long-run evolution of income and wealth inequality in Europe and the United States.
For a long time, social science research on the distribution of income and wealth was set was based on a relatively limited set of firmly established facts together with a wide variety of purely theoretical speculations.

Data and methods1913-1948: Kuznets used tabulated income data coming from income tax returns and statistical interpolation techniques based upon Pareto laws to estimate incomes for the top decile and percentile of the US population. By dividing the national income, he obtained top income share.1960s-1970s: inheritance tax records were used to measure the top wealth shares. Data was used all the way back to the 18th century. 2000s: such data collection efforts on income and wealth dynamics have started to become more systematic and broader in scope and time only. This is due to:
1. Advent of information technologies- Which allow much larger volumes of data to be collected and processed than were
accessible to previous generations of scholars2. Most modern research on inequality has focused on micro-survey data that became available
in the 60’s and 70’sDISADVANTAGES OF SURVEY DATA
- It cannot measure to percentile incomes accordingly Because of the small sample size and top coding The top percentile plays a very large role in the evolution of inequality
- It has a much shorter lifespan than tax data A few decades vs. a century or more
Using Kuznets’s type of methods, there is now the “World Top Incomes Database”, which is the most extensive data set available on the historical evolution of income inequality. It counts 25 countries. There is also a smaller set with information on the 8 largest economic countries with data that goes back to the 1800s.
Three facts about inequality in the Long RunWe find large changes in the levels of inequality, both over time and across countries. Country-specific institutions and historical circumstances can lead to very different inequality outcomes. Income inequalityTop decile income share over the years
Years Europe (France, UK, Germany & Sweden)
United States
1910s 45-50% 40%1950-1960s 30% 30-35%1970-1980s Rising slow Rising fast
now 35% 50%This is about primary incomes. The decline in Europe would have been bigger if we took into account taxes and transfers and measure income after taxes and transfers. Wealth inequalityThe share of total net private wealth owned by the top 10% of wealth holders was notably larger in Europe than in the US one century ago, while the opposite is true today. Important differences between income and wealth dynamics:
1. Wealth concentration is always much higher than income concentration- The concentration of capital is always extreme, so that the very notion of capital is fairly
abstract for large segments of the population- Less controversial, it is viewed as more merit-based
2. US wealth inequality levels have still not regained the record levels observed in Europe before WW1. - To a large extent there has always been a wealth middle class in the US

The reason that income inequality is larger in the US now than Europe pre-WW1 is that modern US inequality is based on a very large rise of top labor incomes than upon the extreme levels of wealth concentration that characterized the societies of the past. Wealth-to-Income RatiosIf we look at the evolution of the aggregate value of wealth relative to income, we find large historical variations. This ratio is of critical importance for the analysis of inequality, as it measures the overall importance of wealth in a given society, as well as the capital intensity of production. European wealth-to-income ratios follow a U-shaped pattern. The US pattern is flatter. The US is the land of booming top labor incomes; Europe is the land of booming wealth. These are two distinct phenomena, involving different economic mechanisms and different parts of the developed world.
Interpreting the Long-Run EvidenceWealth-to-Income ratio’sThe fall of European wealth-to-income ratios following 1914-1945 capital shocks can be well accounted for by three main factors:
1. Direct war-related physical destruction of domestic capital assets2. Lack of investment3. A fall in relative asset prices
Why did the postwar recovery of European wealth-income ratios take so much time?- Capital accumulation is a slow process- Harrod-Domar-Solow formula- In the long-run, assuming no systematic divergence between the relative price of capital
assets and consumption goods, one can show that the wealth-to-income ratio is βt = Kt/Yt
converges toward β = s/g, where s means long-run annual saving rate and the g is the long-run annual total growth rate (sum of population growth and productivity growth).
The share of capital income in national income is defined as where r is the average annual real rate of return. As the volume of β grows, it usual that r declines. The a is logically constant, because when r rises, β declines and the other way around. Yet, historically, this is not always correct. Wealth Inequality: r> gHigh capital intensity is measured by a high β and a high r. The most powerful model to analyze structural changes in wealth inequality is a dynamic model with multiplicative random shocks. R – g is the formula of the rate of return minus the initial wealth inequalities. It implies that past wealth is capitalized at a faster pace, and that it is less likely to be overtaken by the general growth of the economy. R – g was very large during a big part of history. The r was large, but there was little growth, which explains the big concentration of capital of before WW1. After the wars, there was a lot of growth, which explains why the big wealth concentrations did not come back.
The dynamics of Income Inequality- Kuznets: income inequality rises with economic development and new, high-productivity
sectors emerge but then decreases as more workers join these sectors- Data: this is false
- Data: fall of top capital incomes induced by the WW’s, the great depression and the regulatory and fiscal policies developed in response to these shocks are the reason for income inequality
- Most used model fr determining level of labor income inequality in the long run: Race between education and technology Expansion of education -> rise in supply of skills Technological chance -> rise in demand for skills Which one is faster? Fall or rise in inequality
- Recent explanation: globalization- Supplementary material: taxes!
Bridge or trap? Temporary workers’ transitions to unemployment and to the standard employment contract by Gash14 percent of workers in the EU are on temporary contracts. This article focuses on the presumed redeeming characteristic of temporary employment; its ability to integrate workers to the standard employment contract. It does so by assessing the relative proportions of temporary workers who go on to either obtain a permanent contract or are fired/dropped at the end of their contract and become unemployed. This article presents a comparative analysis of four countries with very different institutional structures: France, West Germany, Denmark and the UK. Theory and ExpectationsTemporary work has inferior quality:
- Lower wages- Fewer benefits- Reduced access to employer-provided training
Employee’s perspective:- Has redeeming characteristics
Workers voluntarily choose temporary employment for its flexibility It provides a ‘bridge’ to the standard employment contract
Theories predicting a bridgeThe theories reviewed in this section regard the employment of workers on temporary contracts as an opportunity for employees to either prove themselves on the job, or as a means to flexibilize a rigid market and thereby render it more amenable to all labour market transitions.
- At their most basic one can regard temporary contracts as a form of ‘probationary contract’, where workers are hired for a short period so that employers can screen their skills and abilities before offering them a standard contract. Predicts a reasonable flow of workers from temporary contracts to permanent
contracts Predict greater recourse to this form of probationary contract in markets where
employers’ information concerning skills and capabilities is bound by poor skills development and coordination
Limitation of screening theories: they fail to recognize employers’ differential use of probation by skill
Theories predicting a TrapTheories and findings reviewed below suggest that temporary work is a trap offering few opportunities for upward progression.
- Evidence from employer surveys reveal significant proportions of employers use temporary contracts to provide external flexibility
- Employers have been found to use temporary workers to fill short-term vacancy gaps and staff absences
- There is no expectation here that these jobs become permanent
- They also articulate the segmenting effect that contract type has on market structureThese theories predict stark skills differences between workers in the core and peripheral segments as a result of the different technological requirements of each sector.
- Core Production and employment are stable This requires both economies of scale and consistency in product demand to offset
the costs of the technological advancements required- Periphery
Based on low-skill, low-cost labour Hired and fired in accordance to fluctuations in product demand
Proponents of this perspective argue that the flexibility required in the secondary sector is likely to be obtained through the generation of temporary work. French and German studies are in line with this. The theories reviewed present us with competing hypotheses concerning temporary workers’ propensity for mobility to permanent contracts.
- Screening theories lead us to expect a proportion of temps, those who after probation failed their employers’ expectations, to be at risk of unemployment.
- Crucially, this theory also leads us to expect unemployment risk to be associated with unobserved criteria, such as motivation or collegiality; attributes that can only be determined on probation screening theories, therefore, lead us to expect little observed difference between temporary workers who make transitions to unemployment and those who do not.
Market segmentation theories also lead us to expect stark differences between the attributes of individual workers exposed to unemployment. While the theories reviewed suggest that institutional structures will influence both; the utilities employers derive from temporary contract employment as well as the structure of the markets temporary workers find themselves in, few have investigated the differential impact of these structures on the transitions of temporary workers.
- This article compares the risk of experiencing unemployment with the chances of obtaining a permanent contract
- This article aims to determine whether some markets are more supportive of temporary workers’ transitions And if so, which institutional components is presented in the next section
Divergence or Convergence? How Different can Labour Markets Be?There is a tendency to attribute between-country differences in labour market outcome to between-country differences in employment protection legislation (EPL). Countries with rigid EPL are expected to have low job-to-job mobility and high unemployment. It is seen as a cost for employers and an impediment to demand-size market flexibility. This article hopes to reveal the impact of both EPL as well as education and industrial relations systems on the market outcomes of temporary workers. EPL and Demand-side FlexibilityRigid employment lesiglation is thought to decrease job-to-job transitions and increase unemployment risk for non-permanent workers.
- France & Germany Dismissal regulations for permanent workers stipulate notice periods based on
measures such as tenure, age and job type The employer needs to specify a reason for dismissal Germany: works council is involved with the dismissal procedure Germany: employees are not automatically entitled to redundancy pay France: not necessarily France: entitled to quite low payments of 3 days pay per year of service Maximum duration of temporary contracts is 24 (Germany) and 18 (France) months
This cap may have the unintended consequence of increasing temporary workers unemployment risk at the end of their contract.
- Denmark % UK Low levels of employment protection Few procedural inconveniences in the termination of employment contracts End-of-contract payments are low to non-existent Few legislative specifications concerning the length of temporary contracts Few limitations to number of times an employee can be re-employed on successive
temporary contractsRigid EPL is also likely to encourage the use of temporary contracts as extended probationary periods particularly when trial periods before eligibility to unfair dismissals are short.
- Germany & France Trial period for permanent contracts is 6 and 1,5 months respectively Both countries have relatively stringent criteria in their definitions of an unfair
dismissal- Denmark & UK
10,5 and 24 months trial period for permanent contracts Definition of an unfair dismissal is not as stringent
Employers in Germany and France are more likely to use temporary employment as a means of obtaining external flexibility and a means of obtaining an extended period of probation than in either Denmark or the UK. Coordination in Educational and Industrial Relation SystemsRigid EPL market failure. This is challenged by varieties of capitalism literature. The literature identifies two different market economies
- Coordinated market economies (CMEs) Rigid EPL can support this Where employers, strong unions and the state ensure a match between skill
formation and employer demand for firm and industry-specific skills Rigidity fulfils
o Employees’ need for securityo Encouraging employees’ to invest in specific skillso Employers’ needs for a highly trained workforceo It ensures that employers provide their workers with further portable skills
and that these investments are not lost due to poaching- Liberal market economies (LMEs)
Cannot provide the incentives for specific skill investment as a result ofo Low job securityo Poor coordination between the state and employers and weak trade unions
The educational systems are rather seen to produce general skills Skills directly relevant to firms’ needs Obtained through work experience
This perspective leads us to expect support for temporary workers’ transitions to permanent employment in countries where coordinated economies impart desired and recognizable skills.
- Germany & Denmark Having coordinated educational systems that support stable occupational careers
and low youth unemployment- UK
Educational system is described as uncoordinated An underdeveloped vocational training system Large portion of occupationally relevant skills are acquired through work experience
- France

Dualistic training system It is a bit of both
Crucial to the success of a coordinated economy is the character of its trade unions that are expected to be supportive of all workers, including temporary workers.
- Germany & Denmark Coordinated and consensual trade union movements
- France Far from consensual Trade union coverage is high, but their ability to enforce agreements is diminished
with only one-in-ten employees’ members of trade unions- UK
Comparatively weak Trade union density is somewhat higher than in France One-third of working members of of a trade union Little to no say in market management
Hypotheses1. An analysis of EPL, in isolation of other institu tional features, led us to expect temporary
workers in the 'flexible economies' of Denmark and the UK to be the most likely to obtain permanent employment relative to temporary workers in the 'rigid economies' of Germany and France. Rigid EPL is thought to decrease overall job-to-job mobility and increase unemployment risk for outsiders.
2. However, once we bring in the competing arguments from the varieties of capitalism literature, which suggest that rigid EPL is supportive of a coordinated economy, we have reason to expect the coordinated education and industrial relations systems of Denmark and Germany to provide the most supportive structures for temporary workers. Coordinated economies are thought to improve the match between workers' capabilities and firms' requirements; whilst their unions are expected to support the interests of all workers.
3. Nonetheless, it is important to note that not all 'rigid economies' are coordinated economies. France, with its rigid EPL, does not possess a coordinated or consensual union movement, nor is its educational system comparable to the German and Danish systems. For these reasons, we can expect French temporary workers to be the most exposed to market risk.
Data and Methodology- Final seven waves of the ECHP
Standardized comparative cross-national survey Conducted in the Member States of the European Union Simple random samples within the countries, panel interviews
- Definition temporary workers All workers who are on a fixed-term or other short-term contract
- The sample excludes all workers on training schemes or in apprenticeships- Event history analysis
Allows us to examine the transition rates of temporary workers to the standard employment contract and to unemployment
The methodology controls for right censored datao Data that identifies when an event began but not when it ended
Hazard/transition rateo Conditional likelihood that an event takes place at time interval, conditional
on it not having occurred before time t t + 1. o We apply ‘competing risks models’ to analyse the transitions of temporary
workers to permanent contract employment and to unemployment.o All exits other than we are looking for are censored

Tests were conducted to ensure that a continuous time format, rather than a discrete time format, offered adequate descriptions of the data
Apply the piecewise constant exponential model as it relaxes the assumptions concerning the distribution of the hazard function by allowing the hazard to vary between specified segments of the time axis
This allows us to establish whether the risk of exiting a temporary contract to unemployment increases or decreases through time
Functional form of the model was also chosen on the basis of an empirical investigation of model fit
Given the short-term nature of temporary employment, it was vital to use the information the dataset provided indicating whether job mobility occurred between panel years as well as the information provided at panel year.
- Dependent variable Duration of the individual in a temporary contract
o First recorded job start date was set as the starting point of the dependent variable
o The date at which the job ended was collected in later waves of the panel, as was the event at job-end
We find that, other than censored cases, the most common destination states are to a permanent contract and to unemployment. Limits of the article
- Cell size restrictions prevent us from conducting a comparative analysis to the other destination states
- The article chose to compare two clearly negative and positive outcomes of temporary employment, with a transition to further temporary employment or to economic inactivity more difficult to classify as troublesome than a transition to unemployment.
Variables usedHuman capital variablesWe include education level as a categorical variable, with third level education excluded as the reference category. Possession of formal skills training is introduced as a varying variable. Demographic variableAge and its square are introduced to the model, as well as gender.Labour market variablesOccupational status is included in the models to control for variations in the transitions of different grades of worker. Based on the ISCO-88 occupational categorization. We distinguish between the public and private sector. Working-time is included with a distinction made between those working more or less than 30 hours a week. FindingsBridge or Trap? Relative Hazards to Permanent Employment and to UnemploymentTemporary workers who make a transition to permanent employment
- The majority of temporary workers obtain a permanent job within the observation period
- West Germany and UK temporary workers are slightly more likely to enter a permanent contract than those in Denmark or France
- French workers exhibit the lowest rates of transition to permanent contract employmentTemporary workers who make a transition to unemployment
- UK temporary workers have the lowest transition rates to unemployment- French workers have the highest transition rates
The bridging function of temporary employment is the strongest in West Germany and the UK. It is not robust to different specifications of the change of status variable. If we broaden our conceptualization of non-integrative exits to include all transitions other than those to permanent employment, we find temporary workers less likely to obtain a permanent contract in all countries save for West Germany. Who Gets Permanent Jobs?We had expected human capital variables to be strong predictors of temporary workers’ transitions to permanent employment though only find this to be the case for West Germany and the UK. The strongest predictors of temporary workers’ transitions to permanent employment relate to the type and grade of jobs temporary workers hold.
- Denmark & France, temporary workers in manual occupations are less likely to make a transition to permanent contract employment than other occupational groups
- This is the most pronounced in France- This fits with our expectation that employers will use temporary employment for lower
grades of worker to access external flexibility and in these situations we expect few transitons to permanent employment
- Higher grades of work are likely to be on probation and once screened will be offered a permanent job
- Germany & UK, temporary workers in the highest occupational positions to be less likely to make transitions to permanent employment than the reference group
- France & West Germany Temporary workers in the private sector are more likely to make transition to a
permanent contract No similar effect is found for the other two countries
In principle the sample excludes apprenticeships, tough it is possible that some apprentices have incorrectly self-described as temporary workers. This is why we could attribute a portion of this finding to the considerable investment of the French state in active labour market programmes a large portion of which involve the generation of short-term contracts in the public sector. Alternatively, we could attribute this finding to the generation of a buffer of temporary workers in the highly regulated public sector of both countries.Which Country Offers the Best Access to Permanent Jobs?French temporary workers are the least likely to make integrative transitions. West German and Danish workers are more likely to make transitions to permanent employment than French temporary workers. West German temporary workers appear to make the most transitions to permanent employment. The West German effect was largely a function of the disproportionately high transition rates of manual, skilled manual and clerical workers relative to these workers in other countries. Who Becomes Unemployed?
- Differences between temporary workers in their unemployment risks Temporary workers with formal training were less likely to become unemployed in
Denmark The presence of a spell of unemployment before the start of a temporary job is the
strongest predictor- The country within which temporary workers are most exposed to unemployment risks
There is a decreased likelihood to become unemployed for professional workers in the UK
There is an increased exposure to unemployment of reduced hour workers in FranceWhich Country Presents the Greatest Unemployment Risk?It is usually France, but when you don’t control for variation in the composition of the temporary workforce, then it is the UK.
DiscussionWhen we compared the relative rates of transition to either permanent employment or unemployment, we found temporary employment to be a bridge rather than a trap in each country. When we broadened our definition of a trap to include all other non-integrative exits the odds of obtaining secure employment dropped dramatically for all countries except for West Germany.
- Hypothesis 1 In France, rigid EPL inhibits temporary workers’ chances of obtaining a permanent
contract and increases their risk of unemployment Not applicable to the German context
- Hypothesis 2 While Denmark does not have rigid EPL both it and Germany do have highly
coordinated trade union movements and education systems- Hypothesis 3
While the French temporary workforce was the most exposed to unemployment, this finding was found to be a function of its composition
ConclusionIn this article it is established that the majority of temporary workers do, eventually, get permanent jobs. This is not to say, nonetheless, that those who have experienced temporary work will not experience negative repercussions in the longer term.
Samenvatting van MarleenIntroductionLecture 1: Introduction in inequality
- Social stratification inequality in outcomes- Social mobility inequality in opportunities
Inter- & intragenerational mobilityConcept as intended theoretical definition of the social conceptConcept as determined (measurement of the) indicator of the conceptSocial origin may be defined as the position of one’s parents in a hierarchy on the basis of power, privilege, status and material resources. Income
- From labor Salary, bonus
- From capital Profit, royalty’s, rent, interest, dividend
Capital all resources that can be traded (in principle) at a (legal) market: buildings, land, machines, financial products.
- Private capital personal- Public capital state
National income total income of all residents of a country (most important)GDP gross domestic product worth of all produced goods and services within a countryNDP net domestic product GDP – depreciationPPP purchasing power parity translates money to goods
Measuring income inequality- Income ratio (rj) = income of individual/country (Xj) / average income
Rj=Xj/average income If this is 20, group A earns 20 times more than group B
- Gini coefficient Compares the incomes of group j with the income of other groups Takes into account how many people are richer and poorer People with lower r = q People with higher r = Q Relative group size*income ratio * (q-Q)
- Lorentz-curve 0 = equal 1 = unequal
Global income inequality = within & between countriesGlobal income inequality : Ig = ib + Iw
- Has decreased: relatively poor countries developing at a faster pace than average
Measuring social mobilityMobility tables
- See the relationship between two persons in class or education- Total mobility- Structural = forced mobility- Circular mobility = the result of some equality opportunities- Measure the inequality with odds ratio’s
Piketty’s most important conclusions- Income & wealth inequality is increasing since 1970
Reason = r>g- No determinism: past trends say nothing about the now- No natural, spontaneous process that will dampen destabilizing and increasing inequality
More equality because- Diffusion of knowledge and occupational skills
Human capital Economic growth makes income from labor more important
- Population growth Makes inherited capital less important
- Mechanism of supply and demand- Human capital thesis
Financial capital will be less importantMore inequality because
- Low economic growth with high rate of return on capital Wealth is not evenly distributed R is higher the more wealth has been accumulated
- Income inequality increased because high incomes increased more than low incomesPractice 1: Measuring inequality
- Income shares- Ratio of income- Gini-coefficient- Odds ratio
Piketty & Saez: inequality in the long run1. Income inequality
- Was larger in EU, now larger in US- Eve of WW
EU top 10% earns 50% US top 10% earns 40% Now reversed
- Compression of incomes occurred primarily because of Fall of top incomes induced by both wars Great depression Regulatory and fiscal policies
2. Wealth inequality- Same as income inequality- Differences income and wealth
Higher wealth concentration than income concentration always US wealth inequality levels are still not on the records seen as in EU In US total wealth inequality is lower than 1913 EU, but more income inequality
o Based on more very large rise top labor incomes than extreme levels of wealth
3. Wealth-to-income ratios- Overall importance of wealth in a society- Capital intensity of production- Eu: U-shaped pattern- US: flatter U-shaped pattern
The US is the land of booming top labor incomes and EU is the land of booming WealthInterpreting the long run evidence
- Fall of wealth-to-income ratios Direct destruction of the war Lack of investment Fall in relative assets prices
Bt=Kt/Yt converges into b = s/g with s= savings and g= growth rate. Capital is back because low growth is back. As long as there is a positive net saving rate s>0, the quantity of accumulated capital K will go to infinity.
- Long run of wealth inequality R > g R –g will increase again, which could lead to a structural rise in wealth concentration
- Long run of income inequality Main forces that determine level of labor income inequality
o Race between education and technologyo Rise in the global competition for skills
Social stratificationLecture 2: Wealth inequalityIntroduction in Piketty
- Inequality within countries- Inequality of outcomes- Distribution of wealth and income - Relation between wealth and income- Income/wealth shares
Most important conclusions- Income/wealth inequality increasing since 1970- No determinism- No natural, spontaneous process that will dampen destabilizing and decreasing
inequalityPiketty part 1: income and capital
1. Income and output- Capital income ratio (=Beta) measures the overall importance of capital in society- FIRST FUNDAMENTAL LAW OF CAPITALISM
Alpha = r*Beta
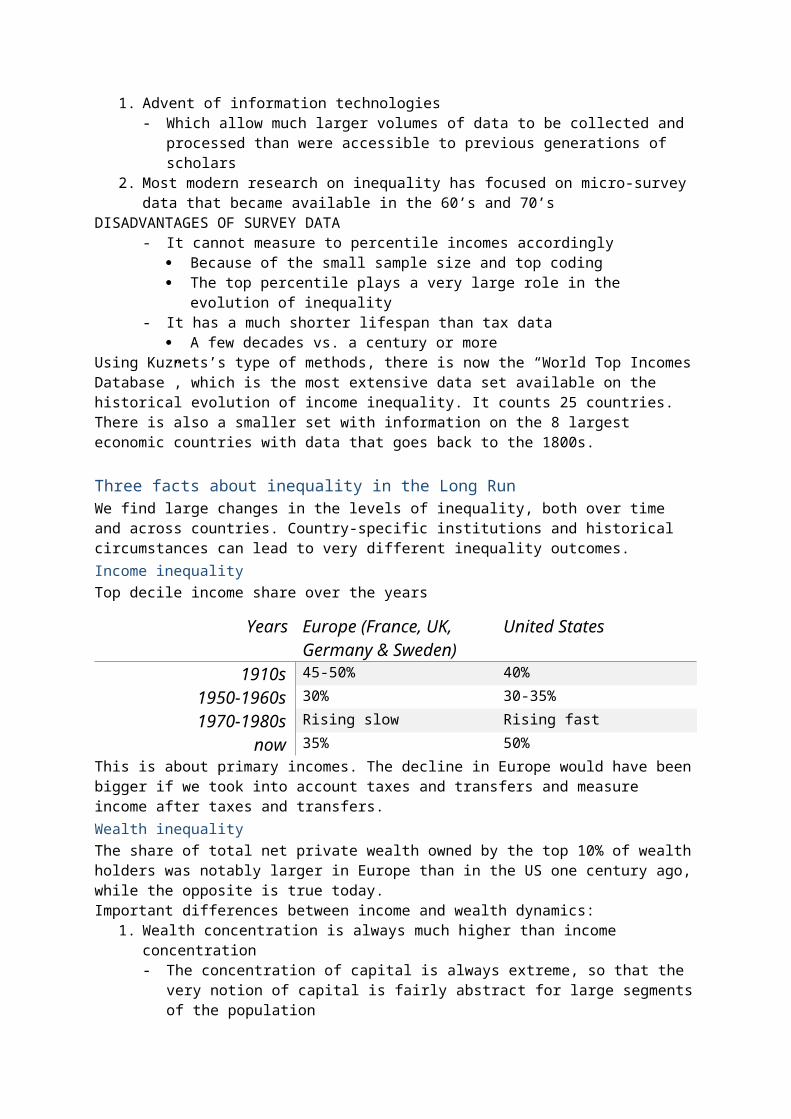
Alpha = income from capital R = rate of return on capital Describes the part of income that comes from return of capital
- Distribution of income is more unequal than distribution of output2. Growth: illusions and realities
- Law of cumulative growth Growth as a factor for equalization Population growth decreases the importance of inherited wealth
- Small differences in r and g can have enormous effects in the long runPiketty part 2
3. The metamorphoses of capital- U-shaped pattern over time
4. From old EU to the New World:- Why are developments in Capital/Income ratio different in US than in Europe? r>g and
Beta = s/g5. The capital/income ratio over the long run:
- Second fundamental law of capitalism: Beta = s/g. S = savings G = growth Whern there is a lot of savings and slow growth, capital is more important This law explains differences in the development of capital across countries
- Over the long term, capital/ income ratio increase slowly. The mean reasons for this trends are low population growth from public wealth to private wealth increase of asset prices (housing, stock market)
Piketty part 3: the structure of inequality- Inequality based on merits is fine- Inequality in work and wealth
Inequality in earnings Inequality in scale of capital Inequality in return of capital
- Society Low-class – 50% of total population
o 30% total incomeo Less than 5% total wealth
Middle-class – 40% of total populationo 25/30% total wealth
Upper-class – 10% of total populationo 25% of total wealth
EU vs. US- Capital
US: Top 10% owns 70% capital (half of top 1%) EU: Top 10% owns 60% capital (25% of top 1%)
- Incomes US: Top 10% earns 5.0 times average income EU: Top 10% earns 3.5 times average income
R was for a long time larger than g, which is why the top 10% owns a lot of capital now. The capital/income ratio increased.
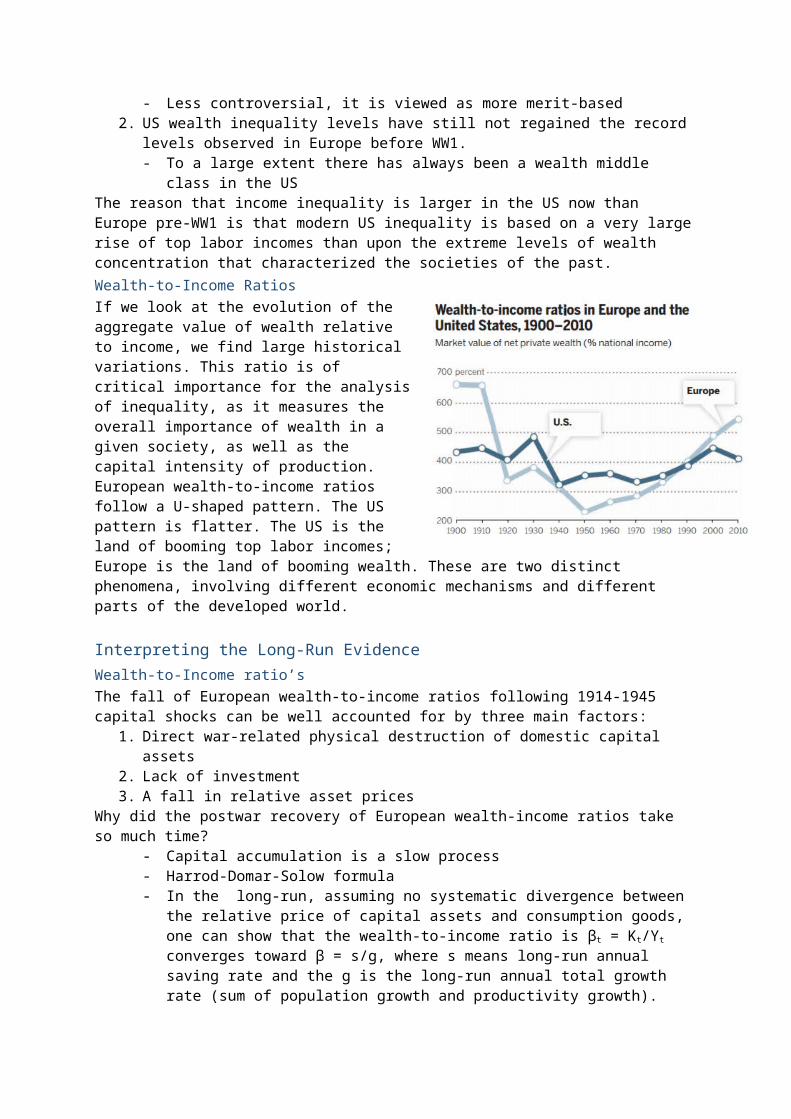
Lecture 3: fairness perceptions of income inequalityFairness attitudes are subjective. Fairness evaluations are relative, people compare themselves with others.
- Social sciences How do people come to their judgements What do they think about fairness Differences between social groups?
Four principles- Equity/merit principle
Based on input Same input leads to same outcome Equality based on relevant individual characteristics
- Equality principle Everybody gets unconditionally the same Dominant when you know nobody
- Need principle Everybody gets what they need to make a living Redistribution system
- Ascription principle Based in status characteristics Older people earn more than younger people, for example Dominant principle in family companies
Research show that when the equity principle is violated by the ascription principle, people experience inequality -> conflict. Maybe the inequality is not the problem but how they emerge. Distributive fairness vs. redistributed fairness
- Redistribution redcues inequality- Comparing net vs gross earnings- Social welfare states
Reducing inequality Making sure everyone can cover basic needs
Piketty chapter 14 & 15Different view on the income tax
- Progressive income tax - Progressive succession duties
4 types of taxes- Income- Wealth- Consumption- Contributions for social insurance
International wealth taxTo control the international financial markets by the democratic government, we need transparency and progressive capital taxes. There should be a financial register and countries have to work together to improve the taxes data and they should be obliged to report.
- Ensure fair payment - Give incentives (prikkels) to lead to higher returns for money- Transparency
Conclusion Piketty Capital:The problem r > g is not simple to solve
- Investment in education - Capital taxes that can reduce economic growth
- If yearly taxes are progressive, all the disadvantages expire
Lecture 4: consequences of inequalityPart 1: in what ways does economic inequality influence social inequalityWhy do we observe growth of upper-tail inequality?
- Top managers set their own salaries- Higher productivity of higher educated people as a consequence of technological
developments- Maximizing shareholder value
Goal is to make more profit- Decrease in (trade) union membership- Ageing of the baby boomers
We are worried about- Social problems- Downward spiral in inequality of opportunities
4 types of effects1. Mechanical effects
- Individual economic status has an influence on other spheres2. Non-linear effects
- An increase of income has a stronger effect on happiness at the bottom-tail than the upper-tail
3. Relational effects- Supposing that the relation between economic status and the outcome changes,
inequality in the outcome also changes4. Context effects
- The extent to which income inequality at the macro-level affects outcomes on the individual level
Part 1: Inequality and HealthEffects to health
- Richer people health- Income health poor / health rich- Income health
^public health care- Economic inequality health outcomes
Main claims Wilkinson & Picket- Greater economic inequality leads to worse health outcomes in a given country- Average income in a country cannot explain away the negative effect of income
inequality on health outcomes On the country level inequality does lead to poor health outcomes, and the average
income does not lead to poor health outcomes Paradox: the other way around on local level
- Incme inequality effect is not caused by direct social comparison but by importance of social stratification in a society as a whole + inequality gives rise to more residential segregation
- Income inequality is bad for people at the bottom as the top of the social ladder- Status competition explains the negative effect of inequality on health outcomes: in
unequal societies social status is more important part of people’s social identity. This leads to status competition, this leads to insecurity, fear stress and health problems
Critics on Wilkinson & Picket1. Spurious relationship
- Democratic governance

- Number of ethnic minorities2. Alternative mechanisms
- Loss of support for the welfare state Less investment for human capital Less support investment in public healthcare
- Decrease in social cohesion3. Measure of income inequality
- Focus on status, but something else?4. Selection of countries in the sample
- Only developed
EXAM: CONSEQUENCES FOR ECONOMIC INEQUALITY + FOUR WAYS IN WHICH INEQUALITY CAN INFLUENCE SOCIAL OUTCOMES + CLAIMS & CRITICS
Neckerman & Torch: Inequality; causes and consequencesTrends and patterns of wage inequality in the USWage inequality started growing in the US in the mid-1970s, stabilizing in the 1990s. during the 1980s, both the upper-tail and lower-tail inequality grew. Lower-tail inequality stopped growing in 1987 and declined slightly in the 1990s. the upper-tail inequality continued to rise. Growing concentration at the top of the distribution is a striking departure from earlier patterns of inequality. In another break with the past, the new concentration of income among the rich is not driven by capital income but by labor market earnings. Causes for the trends of wage inequality in the USConsensus:
- Trends in the real value of minimum wage account for a significant rise in lower-tail inequality during the 1980s and its decline during the 1990s
- Rising returns to higher education have had a significant impact on income inequality, especially upper-tail inequality
- Lemieux proposes that the aging of baby boom generation and the increase in educational levels, explain a significant share of inequality during the 1990s
Contested- Most contested question remains the role of technology
The skill-biased technological change (SBTC) hypothesis claims that the value of education and skills increase because of the computerization
Institutional changes in firms and labor markets are difficult to quantify but are likely to have had a substantial effect on inequality
Trends and patterns of wealth inequality in the USWealth is much more unevenly distributed than income
- Declined in early 1900s to mid 1900s because of the Great Depression and W11- Wealth inequality grew in the 1980s
Causes for the trends of wealth inequality in the USCurrent tax structure and antitrust legislationTrends and patterns of opportunity inequality in the USUnclear
- Common measure is intergenerational association of income, earnings, class or other resources
- Contrasting results of different approaches- Race is inherited and has important economic correlates
Consequences of economic inequality