vtechworks.lib.vt.edu · v Table of Contents Acknowledgements vii 1 Introduction 3 1.1 Degradation...
216
Consuming the Savings: Water conservation in a vegetation barrier system at the Central Plateau in Burkina Faso
Transcript of vtechworks.lib.vt.edu · v Table of Contents Acknowledgements vii 1 Introduction 3 1.1 Degradation...

Consuming the Savings:
Water conservation in a vegetation barrier system at
the Central Plateau in Burkina Faso

ii
Promotor: Prof. dr.ir. L. Stroosnijder
Hoogleraar in de erosie en bodem- en waterconservering
Samenstelling promotiecommissie:
Prof. dr. ir. J. Bouma (Wageningen Universiteit)
Prof. dr. ir. D. Gabriels (Universiteit van Gent)
Prof. dr. ir. P.A. Troch (Wageningen Universiteit)
Dr. ir. M.A. Slingerland (Wageningen Universiteit)

iii
Consuming the Savings:
Water conservation in a vegetation barrier system at
the Central Plateau in Burkina Faso
Wim Spaan
Proefschrift
ter verkrijging van de graad van doctor
op gezag van de rector magnificus
van Wageningen Universiteit,
Prof. dr. ir. L. Speelman
in het openbaar te verdedigen
op woensdag 25 juni 2003
des namiddags te 16.00 uur in de Aula

iv
Wim Spaan (2003)
Consuming the Savings: Water conservation in a vegetation barrier system at the Central Plateau in
Burkina Faso. PhD Thesis, Wageningen University and Research Centre
ISBN 90-5808-864-2
Copyright © 2003 Wim Spaan
Cover Photo: Research area Gampela, Burkina Faso
v
Table of Contents
Acknowledgements vii
1 Introduction 3
1.1 Degradation 3
1.2 Regeneration 4
1.3 Soil and water conservation interventions 6
1.4 Research questions and objectives 7
1.5 Outline of the thesis 7
1.6 References 8
2 Soil and water conservation technology (Theory) 11
2.1 Introduction 13
2.2 Choice of technology and implementation in five soil and water
conservation projects in the Sahel 14
2.3 Evaluation of the effectiveness of soil and water conservation measures
in a closed silvo-pastoral area in Burkina Faso 35
2.4 The costs of soil and water conservation measures in the Sahel 42
3 The vegetation barrier system (Theory and Materials & Methods) 53
3.1 Introduction 55
3.2 Land management on the Central Plateau in Burkina Faso 55
3.3 Hedgerows on the Central Plateau 56
3.4 The Gampela experiment 59
3.5 Measurements and data collection 64
3.6 References 68
4 The Savings (Effects) 71
4.1 Introduction 73
4.2 Effect of scale and vegetation on runoff in Burkina Faso, West Africa 74
4.3 Effect of vegetation barriers on runoff in an alley crop system in
Burkina Faso, West Africa 82
4.4 Sediment dynamics in an alley crop system in Burkina Faso,
West Africa 99
5 Consuming the savings (Use) 111
5.1 Introduction 113
5.2 Crop yields 114
5.3 Water availability and water use 124
5.4 Competition in an alley crop system. 139
5.5 References 151
vi
6 Planning of alley-barrier systems (Design) 153
6.1 Introduction 155
6.2 Rainfall runoff relations for vegetation barriers in the Sahel 156
6.3 The influence of rain intensity and crop stages on runoff production 161
6.4 Estimation of water use by vegetation barriers based on climatological
factors and soil moisture levels 166
6.5 Implementation of contour vegetation barriers under farmer conditions in
Burkina Faso and Mali 172
6.6 Incentives for soil and water conservation in semi arid zones:
A case study from Burkina Faso 184
7 The potential of vegetation barriers on soil and water
conservation at the Central Plateau of Burkina Faso 191
7.1 Conclusions 193
7.2 Recommendations
Summary 201
Samenvatting 204
Curriculum Vitae 209
vii
Acknowledgements
Around 1993 I was asked by Leo Stroosnijder to join the Sahel Research Group. Wim van Driel,
who up to that moment had been responsible for the research into soil and water conservation
interventions in that team was appointed as director of the Antenne Sahelienne. It did not take me
long to decide. New challenges were there: new research and new areas to explore.
In the first year of my commitment I looked around in the area and discussed with several
researchers. It appeared that a lot of soil and water conservation research already had been done
and/or was in motion. The orientating research of “Choice of technology and implementation in five
soil and water conservation projects in the Sahel” originated from that period. Aad Kessler did a
very good job, visiting the project areas, discussing the SWC items with the responsible project
managers and writing a provisional report. Thank you very much Aad for your important
contribution. Unfortunately Aad left a few months after the fieldwork was finished. It was quite a
struggle to finish the TRMP no 8 report in which this research was described.
By finishing the TRMP no. 8 report and discussing SWC interventions with people
involved, it became clear that the effectiveness of vegetation strips in soil and water conservation
had been scarcely investigated. In dialogue with Leo Stroosnijder it was decided to set up a field
experiment to test the effectiveness of vegetation barriers. In 1996 Leo Stroosnijder gave me the
suggestion to write a PhD thesis about this subject. This occurred during the turbulent times when
Wageningen University threatened to dismiss universitaire docenten without a PhD. In my
innocence I admitted, I did not know the long road to follow. Leo I thank you very much for the
confidence you put in me, the encouragement and the support you have given me during the
research and the writing up.
I owe many thanks to all the people of the “Antenne Sahelienne”. They took care of the
progress of the research when I had to be in the Netherlands for my other duties. During my stays in
Burkina Faso I had a lot of interesting discussions with the colleagues of the Antenne about the
setup of the experiment and development of the research. They took care of the logistics and the
management of the research site. Thank you Wim van Driel, Maja Slingerland, Joop Begemann, Jan
Willem Nibbering, Teunis van Rheenen, Paul Kiepe, Roger Kaboré, Abdoulaye Mando, Fidèle
Hien
I owe a lot to the farmers around the research station. In 1994 they helped me to establish
the field experiment within three weeks. I thank Damien Nana and Mathieu Nikièma for the
organization of the work and the safeguarding of the research site Gampela. Their skills,
determination and loyalty impressed me. Thanks for all your efforts.
I thank the University of Ouagadougou for giving me the opportunity to do my research on
the university experimental farm. They gave 3 ha to my disposal and allowed me to access to their
climate and soil data.
A number of MSc students supported the research with their thesis work. Thank you Arnold
Sikking, Erik Boerrigter, Robert van der Steeg, Petra Nooyens, Laurens Nijzink, Hilde Ludwig,
Matthijs Bouwknegt, Anne-Jan Brouwer en Oemar Idoe.
In the turbulent years of reorganization of the Wageningen University when most of the
attention was focussed on the survival of groups and persons in the organization, Arnold Sikking
and Helena Posthumus played an important part in taking care of the progress of the research. This
progress was even more stimulated by the support of Jacquelijn Ringersma and Emiel van Loon.
Jacquelijn brought a lot of experience on a number of aspects of the water balance into the research
team. Emiel gave important input during the time the data had to be analyzed. I thank all of you
very much for your dedication and enthusiasm. The co-operation with Jacquelijn, Helena, Emiel
and Arnold resulted in a number of joint publications forming part of this thesis. Thank you for this
fruitful work.
viii
In the final stage of thesis writing I needed critical readers. In that respect I owe a lot of
thanks to Huiberdien Sweeris, Helena Posthumus, Jacquelijn Ringersma and Jayne Rattray. Ladies
many thanks for your suggested improvements in text and layout.
In that final stage a number of publications had to be finalized. Particularly Willem
Hoogmoed, Jan de Graaff en Ferko Bodnar have introduced their specific knowledge in the research
and made it possible to finish the work in time. Gentlemen I thank you very much for your support.
The Erosion and Soil and Water Conservation Group was very important for me during my
research. They gave me the possibility to divert myself during the breaks. Thank you Dirk
Meindertsma, Fred de Klerk, Trudy Freriks, Jacquelijn Ringersma, Jan de Graaff, Geert Sterk, Piet
Peters, Michel Riksen, Luuk Fleskens, Jolanda Hendriks and other members of the group.
Thanks also to Leo Eppink. After his retirement he took care of the soil technology lectures
a few times. By doing so, he gave me time to spend on the thesis work and above that he and his
wife Ton took care of my relaxation and my excitement to play the famous card game
“Dobbelkoppen” with my wife and myself in the weekends.
My greatest thanks go to my wife and children. They had to live with a busy man and father who
“jailed” himself every evening in his study to keep the research going on. Sometimes I was a little
bit antisocial, but fortunately we enjoyed the weekends, which were always without thesis work.
Thank you Wil, Marieke, Anneloes, Michiel and Hikmet you gave me relief.
The booklet is ready now. Let us all take profit from it, which means: “Consuming the
Savings” and investing in future activities.
Wim
Renkum, 30 April 2003

Chapter 1
Introduction

2
3
Introduction
The dynamics of soil resources embrace the outcome of two antagonistic processes: degradation
and regeneration. The net result of these interactions is important for human existence, since natural
resources can only be safely exploited in the long run if regeneration counter-balances degradation.
Human interventions have a distinct influence on degradation as well as regeneration processes, but
even without the presence of Man, natural degradation and regeneration processes occur although
the speed and extent of these processes differ. It is often difficult to distinguish natural from human-
induced causes. Most natural processes are active on a time scale that stretches far beyond the
human life cycle. Experiments attempting to quantify these processes are not designed to separate
natural causes from human-induced causes (Kiepe et al., 2001).
1.1 Degradation
When defining degradation, some authors such as Blaikie and Brookfield (1987) take both natural
and human-induced processes into consideration. They defined degradation as ‘the reduction of the
capacity of the soil to conserve a certain mode of exploitation’. Aronson et al. (1993) clarified the
above-mentioned definition by stating that degradation occurs when the intensity, duration and
frequency of man-imposed stress or natural process induced stress are such that the productive
condition of soil is reduced to a less-productive state from which it cannot recover in the chosen time
scale either naturally or with inputs that are economically feasible. From this definition it appears that
degradation is a relative value, related to the function of the land that is being managed, to the soil type
and to the scale, in time as well as in space, and to the pressure that is exerted upon the soil. Such
relativity of degradation led Barrow (1991) to admit that a precise definition of degradation is simply
impossible because too many factors are involved. Degradation is only a problem for land users if
there is not enough land available or when supplementary measures or supplementary land (Van
Dijk, 1994) cannot compensate the reduction in productivity.
Degradation may cause disturbance of the nutrient cycling process, loss of soil fauna and
ultimately lower yields. The West African Sudano-Sahelian Zone (SSZ) is characterised by low-
input farming systems. The vast majority of land users make a living by farming small family plots,
where mainly staple crops like sorghum, millet and maize are produced for subsistence use. The
occurrence of degradation of soil resources is hard to prove because of the complicated interaction
between climatic, biological and edaphic factors. The spatial scale effect of each process as well as
the different time scales of the processes involved complicate the interpretation of currently
available data. According to some authors (e.g. Kaboré, 1994; Mando, 1997) the productivity of
agricultural fields in Burkina Faso has declined during the last decades of the 20th century, which
has led in a number of cases to abandonment of fields. Mazzucato and Niemeijer (2000) analysed
soil samples, long term yield and rain fall data in eastern Burkina Faso but could not find solid
proof of land degradation. Yields of major crops in many areas of the Sahel have risen despite
continued low-input farming and rapid population growth (Niemeijer and Mazzucato, 2002).
However, generally speaking yields have failed to impress (Stroosnijder and Van Rheenen, 2001).
Water erosion is the most important remover of soil particles, soil organic matter (SOM) and
plant nutrients in the Sudano Sahelian Zone (SSZ). It seems a contradiction that water can be the
cause of severe erosion in areas with so little rainfall. However occasionally, rainfall amounts and
intensities can be surprisingly high. During heavy downpours, the blessing of the rain turns sour
when it causes runoff and erosion. It is more than disappointing when water, that is so badly
needed, runs over the land and disappears, taking away the fertile topsoil (Van Roode, 2000). Roose
(1977) reviewed erosion studies from West Africa and found that under traditional farming
practices, the average soil loss due to water erosion was about 7 t ha-1
y-1
. At the onset of the rainy
4
season when the soil is bare, the first rains wash away large quantities of wind deposits, crop
residues and animal droppings. Later in the season, loss of topsoil, including valuable organic
matter and fine particles as well as crop seedlings, may be the result of erosive forces under
aggressive rainfall, even on very gentle slopes that are hardly noticeable in the field. Although the
main cause of physical soil degradation may be water erosion, wind erosion plays an important role
too.
The constant removal of products coupled with low input results in a strong decline of the
organic matter content of the soil (Taonda et al., 1995). Moreover, under the prevailing climate
conditions in the SSZ the mineralisation rate of organic matter is high to very high and is another
threat to soil fertility (Sedogo, 1993). Organic matter in the topsoil is of vital importance in
maintaining a minimum degree of aggregation. A decrease in SOM content leads to a sharp
decrease of the infiltration rate and an increase in crust formation after rainstorms (Hoogmoed et
al., 2000).
Loss of organic matter from the topsoil will result in a deterioration of soil structure. The
majority of soils found in the SSZ are of a fine-sandy or silty nature (Valentin, 1993). Clay minerals
in these soils are, apart from the typical vertisols in valley bottoms, of the non-swelling and
shrinking type (Bourgeon, 1992). Due to their physical characteristics, these soils may be expected
to show sealing, crusting and hardsetting behaviour (Mullins et al., 1990; Hoogmoed, 1999).
Soil fertility is not a static feature and changes constantly. Its direction (replenishment or
depletion) is determined by the interplay between physical, chemical and anthropogenic processes
(Smaling et al., 1997). In the Sahel, continuous farming of soils with inherently low mineral
reserves and without nutrient replenishment has led to severe nutrient depletion. Nutrients are lost
from the soil through exportation of food crops as well as crop residues. In Burkina Faso crop
residues are often totally removed from the field and used as building material or fodder. Together
with processes such as erosion, leaching and volatilisation, farming practices such as burning of
crop residues and shrubs during land preparation (the so-called slash and burn) also account for
nutrient losses from the soil. This leads to nutrient mining, which is according to Sanchez et al.,
(1997) the fundamental biophysical root cause for declining per capita food production in Sub-
Saharan Africa. Furthermore, nutrient input from weatherable rock to the soil is very limited in the
SSZ due to the highly weathered status of the soils that developed from parent material, which was
originally derived from the African (Precambium) Shield. As a consequence, soils are old, leached
and poor (Breman, 1992).
The vast majority of farmers in Burkina Faso lack the means to buy fertilisers or afford other
investments. Traditionally, a natural fertilisation of the fields was practised by maintaining long
fallow periods. Population pressure and increasing farm size have put an end to this. Since then,
continuous farming has almost imperceptibly changed into nutrient mining, which is defined as the
removal each year of more nutrients than are being added (Van der Pol, 1992).
1.2 Regeneration
In order to stop the decline in soil fertility through erosion, exhaustion, deterioration and depletion,
degradation should be counter-balanced by regeneration processes. Regeneration or rehabilitation
can be described as restoration of the productivity of degraded lands (Critchley et al., 1992).
Aronson et al. (1993) stated that rehabilitation seeks to halt degradation and to repair damaged or
blocked soil functions, with the primary goal of raising ecosystem productivity for the benefit of local
inhabitants.
Regeneration processes such as sedimentation or deposition of entrained or wind-blown
particles, accumulation of SOM through enclosures or mulching, soil structure improvement as well
as natural replenishment of nutrients through weathering or human interventions including
agroforestry techniques or fertilisation, must reverse the degradation process.
5
Natural deposition of sediments in water takes place in depressions, flood plains and valley
bottoms. Apart from the beneficial effect of the addition of plant nutrients, deposition can
sometimes be quite destructive. This is not only the case with large amounts of material in the form
of landslides and mudflows, but also smaller amounts may cause damage to crops. However, when
sediment-rich runoff slows down, the water will drop part of its load and enrich the soil. This type
of deposition can be encouraged by erection of conservation measures such as earth dams, stone
lines or vegetation strips (Kiepe and Young, 1992; Kiepe and Rao, 1994; Hien et al., 1992; Kessler
et al., 1995).
Aeolian deposition occurs throughout the Sahel, i.e. from October to April (dry season),
when the continental trade wind or "Harmattan" sweeps the country. Aeolian deposition augments
nutrient inputs through conservation measures such as windbreaks or shelterbelts. Dust deposits
from this wind are rich in sodium, potassium, magnesium and calcium, but poor in phosphorus
(Hermann et al., 1996).
During fallow periods, processes such as the accumulation of carbon and nutrients in
biomass and organic matter, active biological cycling of elements, and build-up of soil fauna, take
place on the formerly cropped land. On rangelands restoration of the productive capacity can be
triggered when the area is protected integrally (enclosure: no biomass removal, no grazing, no
burning) or partially for some time (Spaan and Van Dijk, 1998).
On cropped land the SOM balance can be improved by leaving crop residues on the fields
and by mulching. Although mulching is being practised primarily as a water conservation technique
(Slingerland and Masdewel, 1996), simultaneously restoring part of the SOM balance can be seen
as a positive side effect. However, there is a considerable amount of dry matter necessary for
keeping a minimum SOM content on fields. Regenerating physically degraded soils requires that
conditions be created for effective water infiltration into soil and for the improvement of the water
holding capacity of the soil (Mando and Stroosnijder, 1999). Mulching is the most common
technique used by traditional farmers in the Sahel. Mulching is effective in improving soil physical
properties because of its many tiny barriers that obstruct runoff (Young, 1989; Mando, 1997) and
increase infiltration (Kiepe, 1996). It protects the soil against heavy rains, prevents crusting,
contributes to soil organic matter and nutrients and attracts soil fauna, notably termites. The positive
role of termites on the soil structure is often ignored (Mando and Van Rheenen, 1998). Termites
process and bury organic matter, while protecting it against bush fires. Moreover, tunnels dug by
termites contribute to the porosity of the soil, improve the soil conditions (Critchley et al., 1992;
Mando, 1997) and create a preferable condition for effective water infiltration within a short time
span. Worms play the same prominent role in the wetter climate of Zoundwéogo (south Burkina
Faso), that termites play as decomposers and soil improvers in Sanmatenga (north Burkina Faso).
Traditional farming methods, such as hand hoeing and shallow ploughing with animal
traction, are superficial and not aimed at minimising the risk of degradation of the physical
properties of the arable layer (Pieri, 1989). Unfortunately, the severity of sealing, crusting and
hardsetting is such that mechanical loosening is necessary. Superficial application of crop residue is
insufficient to improve the structure of the soil in the short term, to overcome the adverse effects on
water infiltration and seedling emergence. A hard-set soil will not regenerate by itself. On such a
soil not only the soil profile is dense and hard, the surface is smooth and impermeable. Thus,
rainfall will quickly run off and wind borne seeds may not find enough anchoring possibilities to
start new vegetation. Mechanical breaking up of crusted and hard-set soils is necessary to improve
infiltration and to create a favourable environment for the establishment of an adequate root system
by the crops, which are commonly grown in the area (Nicou et al., 1993).
As the amount of weatherable minerals in the parent material of the soils in the SSZ is
limited, the natural input of nutrients from weathering is very little. The atmospheric input from
dust deposits may be considerable, compared to the nutrient stock, but (except for potassium) not
enough to balance the losses through erosion and harvest. Therefore replenishment must come from
6
human interventions, either by applying external inputs or by biological interventions such as
agroforestry. Agroforestry offers a natural source of nutrient input for subsistence farmers,
especially when they do not use external inputs, either because they do not have the financial means
or because it simply is not available at the local market. Nitrogen (N) is a major nutrient that can be
restored biologically by using N-fixing plants. This can be done either by intercropping staple crops
with N-fixing legumes or by planting enriched fallows (Young 1989).
A frequently mentioned cause of low yields in the SSZ is, beside the low inherent fertility,
the low level of external inputs. The application rate of external inputs in Africa is among the
lowest in the world (Van Keulen and Breman, 1990). An increase in yield can only be expected
from a higher fertiliser application rate and an increase in nutrient use efficiency (Breman, 1990).
Lack of financial means does not offer a solution to the low input farming on the short term.
1.3 Soil and water conservation interventions
Frequent years of low rainfall as well as physical soil conditions (surface crusts, compaction) cause
high runoff and small amounts of water to infiltrate. Water is probably the most critical resource for
farming in the semi-arid tropics. Rainfall is often the only source of water available in these areas,
and is not only little, but also unpredictable and may not occur when needed by crops. Water is
therefore often the limiting factor for crop production (Van Roode, 2000). Due to a lack of water
crops often suffer from water stress, resulting in limited crop development, directly influencing crop
performance.
Another cause of low yields is that the stock of nutrients is seldom fully exploited because
of low water availability (Stroosnijder and Koné, 1982). Nutrients need water to come available for
the plant. Especially in dry years this may be a big problem. For the benefit of the use of the
nutrient stock an increase of water availability in all crop stages is an explicit condition. Increasing
the application rate of external inputs without appropriate soil and water conservation measures is
futile.
Better soil water management, through appropriate water conservation methods will
increase infiltration and soil water availability (to the plants). When a ‘natural’ landscape is
transformed into a ‘cultural’ landscape, the subsequent decrease in soil organic carbon (SOC)
affects the field water balance: runoff and evaporation increase, while infiltration and transpiration
decrease. This has direct and indirect effects such as lower rainwater use efficiency (RUE). Soil and
water conservation (SWC) practices reduce erosion, improve soil qualities and increase RUE. In
semi-arid Africa SWC can easily double RUE and can provide the water needed for the
‘regreening’ of land use systems (Stroosnijder, 2003). Soil and water conservation measures of a
different nature have been applied at the Central Plateau of Burkina Faso and have all proved to be
effective in conserving soil and water. Mechanical and biological as line and area measures were
used. A major problem for mechanical measures is the lack of money and that implementation and
maintenance is labour intensive. However, labour is often a scarce resource (Kuchelmeister, 1989).
Execution of these measures is often done by mediation of development project using big machines.
Farmers only carry out conservation measures when they see direct tangible benefits. In low input
subsistence farming conservation technology should by preference be cheap and provide short term
economic benefits in addition to the long term conservation benefits. Biological soil and water
conservation measures are not only capable of conserving soil and water but also capable of
improving the soil properties (Van Roode, 2000). From the variety of soil and water conservation
techniques that are used in the Sahel, there is a preference for semi-permeable line measures that
slow down runoff and catch sediment, but prevent water logging in the wet season. Stone rows are
the most popular of the semi-permeable barriers at this moment on the Central Plateau of Burkina
7
Faso. However, in areas without stones vegetation barriers are also popular. There is little known of
the latter, thus prompting the start of the study described in this thesis.
1.4 Research questions and objectives
For the vegetation barrier system on the Central Plateau 5 research questions were formulated:
• Can species be found that are as effective in conserving soil and water as the semi-
permeable barriers as stone rows?
• How serious is the danger and harm of competition for light, water and nutrients?
• Can aims of effectiveness, limited competition, useful products and mulch production be
combined?
• What management regime can be recommended?
• Is implementation a simple happening?
In order to answer above-mentioned research questions the following objectives were formulated:
• To select barrier species that effectively conserves soil and water and do not cause excess
loss of soil water.
• To select barrier species that has an economic water use.
• To find modalities on different scales (farmer, projects) for implementation of vegetation
barriers that are socially and economically feasible.
• To draw up guidelines to fit vegetation barriers in land use planning.
• To develop adequate management techniques for different types of vegetation barriers and
to minimise potential negative side effects.
1.5 Outline of the thesis
This thesis is mainly compiled from several published and submitted papers about research in five
development projects in Burkina Faso, Mali and Niger, and field research in Burkina Faso about
water conservation of vegetation barrier systems.
Section 2.2 presents the results of a study of five development projects in three Sahelian
countries, to ascertain the rationale behind the choice of technology and implementation strategy.
The choice of the measures and the way of implementation differ greatly, but why? Section 2.3
describes a special regeneration intervention for degraded silvo-pastoral areas, the so-called
enclosure, safeguarding from land use activities for a number of years to rehabilitate the land.
Within the enclosed area an evaluation on the effectiveness of line and area soil and water
conservation measures was executed. In section 2.4 a study on the cost of mechanical and biological
soil and water conservation practices are presented and analysed. The practices, all line
interventions, are the three main soil and water conservation measures in Burkina Faso: stone rows,
earth bunds and vegetation barriers. The studies in Chapter 2 led to the choice of the main topic of
the thesis: water conservation in a vegetation barrier system at the Central Plateau in Burkina Faso.
Given the outcome of three explorative studies, the research described in this thesis concentrates on
semi-permeable barriers at the Central Plateau in Burkina Faso.
The first two sections of Chapter 3 give a description of the setting of the research and the
current management on the Central Plateau. Section 3.3 describes the current state of the art in
vegetation barriers. Section 3.4 presents the vegetation barrier on-station research at Gampela. In
section 3.5 a description of the measurements and data collection is given.
Section 4.2 describes the water conservation effectiveness of vegetation barriers in the first
stage of the research. Section 4.3 presents the effect of vegetation barriers on runoff in an alley

8
barrier system (second stage). Section 4.4 describes the sediment dynamics during both stages of
the research.
In section 5.2 of Chapter 5 crop yields of the different barrier crop combinations are
evaluated. In section 5.3 the water use of crops and vegetation barriers is determined. Section 5.4
presents the competition in the alley crop system for different climate settings and different barrier
crop combinations.
In Chapter 6 the design aspects of the alley-barrier system is presented. Runoff and water
use estimations are given, as well as a description of implementation, management and adoption.
An evaluation on the need of incentives for implementing of conservation measures finalises this
chapter.
Finally the potential for vegetation barriers for soil and water conservation is discussed in
Chapter 7, conclusions are drawn and recommendations are given.
1.6 References
Aronson, J., Floret, C., Le Floch, E., Ovalle, C., and Pontanier, R., 1993. Restoration and rehabilitation of
degraded ecosystems in arid and semi-arid lands, I: a view from the South. Restoration Ecology, 1: 8-17.
Barrow, C.J., 1991. Land Degradation: development and breakdown of terrestrial ecosystems. Cambridge Univ.
Press, Cambridge, UK, 295 p.
Blaikie P.M. and Brookfield, H.C. (Eds.), 1987. Land Degradation and Society. Methuen & Co., Ltd., London,
UK, 296 p.
Bourgeon, G., 1992. Mecanismes d’agregation des sols tropicaux pauvres en argiles gonflantes. Rapport Final,
Projet CEE/STD2, CIRAD-CA, BRGM, CNRS, IER, INERA, UAW, CIRAD, Paris, 156 p.
Breman, H., 1990. No sustainability without external inputs. Beyond adjustment, Sub-Saharan Africa. Africa
Seminar Maastricht. Min. Foreign Affairs, The Hague, 124-134.
Breman, H., 1992. The sustainability concept in relation to rural development: Offering stones for bread, pp 37-
52. In: Sustainable Development in the Sahel. Lykke, Tybirk and Jorgensen (Eds.) proceedings of the 4th
Sahel Workshop 6-8 January 1992, Aarhus.
Critchley, W.R.S., Reij, C.P. and Turner, S.D., 1992. Soil and water conservation in Sub-Saharan Africa,
towards sustainable production by the rural poor. IFAD, Rome and CDCS, Free Univ., Amsterdam, The
Netherlands, 110 p.
Hermann, L.K., Stahr, K. and Sivakumar, M.V.K., 1996. Dust depositions on soils of south-west Niger. In: B.
Buerkert, B. Allison and M. van Oppen (Eds.), Wind Erosion in West Africa, the Problem and its
Control. Margraf Verlag, Weikersheim, Germany, 319-326.
Hien, F., Stroosnijder, L. and Zoungrana, I., 1992. Les mesures de conservation des eaux et des sols pour la
régénération des espaces sylvo-pastoraux: diversité et effectivité dans le plateau central du Burkina Faso.
Université Agronomique, Wageningen, Les Pays-Bas, 16 p.
Hoogmoed, W.B., 1999. Tillage for soil and water conservation in the semi-arid tropics. Tropical Resource
Management Papers, 24. Wageningen University and Research Centre, 184 p.
Hoogmoed, W.B., L. Stroosnijder, H. Posthumus and B. Tammes, 2000. Effect of Decreasing Soil Organic
Matter Content and Tillage on Physical Properties of Sandy Sahelian Soils. P. 191-203 in Laflen, Tian
and Huang (eds.). Soil Erosion and Dryland Farming. CRC Press, Boca Raton FL.
Kaboré, V., 1994. Amélioration de la production végétale des sols dégradés (“zipellés”) du Burkina Faso par la
technique des poquets (zaí). Thèse. Ecole Polytechnique Fédérale de Lausanne, Switzerland, 199 p.
Kessler, C.A., Spaan, W.P. Van Driel, W.F. Stroosnijder, L., 1995. Choix et modalités d’exécution des mesures
de conservation des eaux et des sols au Sahel. Une comparaison de cinq projets de développement.
Tropical Resource Management Papers no.8, Wageningen University, Nieuwe Kanaal 11, Wageningen,
The Netherlands, 94p.
Kiepe, P., Mando, A., Spaan W.P and Hoogmoed W.B., (2001). Dynamics of soil resources in Sahelian Villages.
In: Agro-Silvo-Pastoral Land Use in Sahelian Villages, Advances in Geoecology 33. Stroosnijder and
Van Rheenen (Eds.), Reiskirchen, Catena Verlag 2001, pp 133-145.
Kiepe, P., 1996. Cover and barrier effect of Cassia siamea hedgerows on soil conservation in semi-arid Kenya.
Soil Technology 9: 161-171.

9
Kiepe, P. and Rao, M.R., 1994. Management of agroforestry for the conservation and utilisation of land and
water resources. Outlook on Agriculture 23: 17-25.
Kiepe, P. and Young, A., 1992. Soil conservation through agroforestry: experience from four years of
demonstrations at Machakos, Kenya. In: H. Hurni and K. Tato (eds.), Erosion, conservation and small-
scale farming. Geographica Bernensia, ISCO and WASWC, Berne, 303-312.
Kuchelmeister, G., 1989. Hedges for resource poor land users in developing countries. Deutsche Gesellschaft fűr
Technische Zusammenarbeit (GTZ) GmbH, Technical Co-operation Federal Republic of Germany,
Eschborn 1989, 256p.
Mando, A., 1997. The role of termites and mulch in rehabilitation of crusted Sahelian soils. Tropical Resource
Management Papers, 16. Wageningen Agricultural University, 101 p.
Mando, A., 1999. Integrated land management for food production and environmental protection in Burkina
Faso: environmental, technological, institutional and policy issues. FAO Regional office for Africa.
Accra.
Mando, A. and Stroosnijder, L., 1999. The biological and physical role of mulch in the rehabilitation of crusted
soil in the Sahel. Soil Use and Management 15: 123-127.
Mando, A. and Van Rheenen, T., 1998. Termites and agricultural production in the Sahel, from enemy to friend?
Neth. J. Agric. Sci, 46: 77-85.
Mazzucato, V. and Niemeijer, D., 2000. Rethinking soil and water conservation in a changing society: a case
study in Wastern Burkina Faso. Tropical Resource Management Papers 32. Wageningen University and
Research Centre, 380 p.
Mullins, C.E., McLeod, D.A., Northcote, K.H., Tisdall, J.M. and Young, I.M., 1990. Hardsetting soils:
behaviour, occurrence and management. Advances in Soil Science 11: 37-108.
Nicou, R., Charreau, C. and Chopart, J.L., 1993. Tillage and soil physical properties in semi-arid West Africa.
Soil Tillage Res. 27: 125-147.
Niemeijer, D. and Mazzucato, V., 2002. Soil degradation in the West African Sahel: How serious is it?
Environment, 44(2): 20-31.
Pieri, C., 1989. Fertilité des terres des savanes, bilan de trente ans de recherche et de développement agricole au
sud Sahara. CIRAD, Paris, 433 p.
Roose, E., 1977. Erosion et ruissellement en Afrique de l’Ouest: vingt années de mesures en petites parcelles
expérimentales. Travaux et Documents: 78, ORSTOM, Paris, 108 p.
Sanchez, P.A., Shepherd, K.D., Soule, M.J., Place, F.M., Buresh, J.R., Izac, A.M., Mokwunye, A.U., Kwesiga,
F.R., Ndiritu, C.G. and Woomer, P.L., 1997. Soil fertility replenishment in Africa: an investment in
natural resource capital. In: R.J. Buresh, P.A. Sanchez and F. Calhoun (Eds), Replenishing soil fertility
in Africa. SSSA Special Publication, 51. Madison, WI, USA, 1-46.
Sedogo, M.P., 1993. Evolution des sols ferrugineux tropicaux lessivés sous culture, incidence des modes de
gestion sur la fertilité. Thèse. Université d’Abidjan, Cote d’Ivoire, 371p.
Smaling, E.M.A., Nandwa, S.M. and Janssen, B.H. 1997. Soil fertility in Africa is at stake. In: R.J. Buresh, P.A.
Sanchez and F. Calhoun (Eds), Replenishing soil fertility in Africa. SSSA Special Publication, 51.
Madison, WI, USA, 47-61.
Slingerland, M.A. and Masdewel, M., 1996. Mulching on the Central Plateau of Burkina Faso. In: C. Reij, I.
Scoones and C. Toolmin (Eds), Sustaining the soil, indigenous soil and water conservation in Africa.
Earthscan Publications, London, 85-89.
Spaan, W.P. and Van Dijk, K.J., 1998. Evaluation of the effectiveness of soil and water conservation measures
in a closed silvo pastoral area in Burkina Faso. Advances in
Geoecology 31, 1295-1301.
Stroosnijder, L. and Koné, D., 1982. Le bilan d’eau du sol. In: F.W.T. Penning de Vries and M.A. Djitèye (Eds.),
La productivité des pâturages sahéliens. Une étude des sols, des végétations et de l’exploitation de cette
ressource naturelle. Agric. Res. Rep., 918. Pudoc, Wageningen, 133-165.
Stroosnijder, L and Van Rheenen, T., 2001. Epilogue. In: Agro-silvo-pastoral land use in Sahelian Villages.
Stroosnijder and van Rheenen (eds) Reiskirchen: Catena Verl., 2001. (Advances in Geoecology; 33),
385-390, ISBN 3-923381-45-X.
Stroosnijder, L., 2003. Technologies for Improving Rain Water Use Efficiency in Semi-Arid Africa. Proceedings
Water Conservation Technologies for Sustainable Dryland Agriculture in Sub-Saharan Africa.
Symposium and Workshop, Bloemfontein, South Africa, 8-11 April 2003.

10
Taonda, S.J.B., Bertrand, R., Dicky, J. Morel, J.L. and Sanon, K., 1995. Degradation des sols en agriculture
miniere au Burkina Faso. Cahiers Agricultures 4: 363-369.
Valentin, C., 1993. Soil crusting and sealing in West Africa and possible approaches to improved management.
In: Soil tillage in Africa: needs and challenges, FAO Soils Bulletin 69, 95-128.
Van der Pol, F., 1992. Soil mining, an unseen contributor to farm income in southern Mali. Bulletin 325, Royal
Tropical Institute (KIT), Amsterdam, 47 p.
Van Dijk, K.J., 1994. Evaluation des mesures de régénération des terres dégradées à Zana Mogho, Burkina Faso.
Antenne Sahélienne de l’Université Agronomique Pays Bas et l’Université de Ouagadougou Burkina
Faso, 40p.
Van Keulen, H. and Breman, H., 1990. Agricultural development in the West African Sahelian region: a cure
against land hunger? Agriculture, Ecosystems and Environment 32: 177-197.
Van Roode, M., 2000. The effects of vegetative barrier strips on surface runoff and soil erosion in Machakos,
Kenya. A statistical versus a spatial modelling approach. PhD thesis, 283p.
Young, A., 1989. Agroforestry for soil conservation. ICRAF and CAB International, Wallingford, UK, 276 p.
Chapter 2
Soil and water conservation technology (Theory)

12
13
Soil and water conservation technology (Theory)
2.1 Introduction
The three explorative studies that led to the choice of a detailed study on vegetation barrier systems
are described in this chapter. It is well known that in the Sahel a large variety of soil & water
conservation (SWC) strategies and practices exist. Both area interventions (applied over the whole
surface) and line interventions, comprised of indigenous techniques as well as introduced
techniques can be encountered.
The first study (Chapter 2.2) tries to explain why 5 large development projects in Burkina Faso,
Niger and Mali advocate different practices and follow different implementation paths. What are the
driving forces of these differences? Dissimilarities in agro-ecological conditions, the socio-
economic situation and the farming system only partly explain the observed differences. It has been
hypothesized that the internal demands of donors, preferences of identification and evaluation
missions, team leaders and other involved people have a strong influence on the modalities of a
project. This paper also describes a number of current SWC practices in the Sahel, the area
practices; Zay, half moons and tree trenches and the linear practices; stone lines, earthen banks, live
fences and filtering stone dikes.
The above mentioned study of the five development projects is rather dated and since then all
kinds of developments in technology and approaches have taken place. In 2001 a repetition of the
study in the five projects was planned. It was intended to visit the project areas again to determine the
changes since the preceding inventory. However, due to a lack of manpower and money the visit was
postponed.
The second paper (Chapter 2.3) describes a special practice for degraded silvo-pastoral areas, the
so-called enclosure technique, i.e. during a number of years the local population restrict the use of a
delineated area. To speed-up the natural regeneration process a number of practices can be applied.
Mulching degraded surfaces with tree branches, herbs and grasses as an area measure has been
compared with line measures in the form of rows of tree trunks and stones. In this study the line
measures performed better than the area measures.
In the third paper (Chapter 2.4), the results of chapter 2.3 have been extrapolated and the three most
promising line measures subjected to a more detailed analysis. Since it is well accepted that the
adoption of SWC practices depends for a large part on the costs and benefits of these practices for
the local farmers, the detailed study took the form of a qualitative multi-criteria analysis. The
analysis had necessarily to be limited to a qualitative study since the costs could be reasonably well
estimated, however little quantified knowledge was available on the benefits of the various
practices. The analysis showed a preference of the stone row technique. However, it has been
concluded that if more attention could be paid to extension, the vegetation barriers (which have at
least equal potential to the stone rows) are the preferred practices in areas where stone rows are
scarce. This conclusion was the starting point of the study that forms the heart of this thesis.

14
2.2 Choice of technology and implementation in five soil and water conservation
projects in the Sahel
This chapter is based on the following publication:
Kessler, C.A., Spaan, W.P., Van Driel, W.F. and Stroosnijder, L. (1995). Choix et modalités
d'exécution des mesures de conservation des eaux et des sols au Sahel. Tropical Resource
Management Paper (TRMP) no 8, Wageningen, 1995.
Abstract
This abstract presents the results of a study of five large soil and water conservation projects in
three Sahelian countries, to ascertain the rationale behind the choice of soil and water conservation
measures and the implementation strategy. The soil and water conservation measures and the way
they are implemented differ greatly between projects. This is attributable more to the preference of
donors and projects than to any physical, socio-economic and agronomic differences. Projects
aiming at conserving natural resources should have a short-term as well as a long-term strategy and
benefits. On the basis of project performance, a recommendable strategy for fields appear to be the
use of the local Zay technique in combination with manure (from compost pits) to achieve the short-
term improvement, and to combine this with stone lines or vegetation barriers for a long-term
effect. A recommendable set of measures for range lands is to exclude free-grazing livestock from
certain areas to achieve a short term effect and to combine this with reforestation of parts of the
range lands, intensification of livestock production and a reduction of livestock units for a long term
effect. Reproduction of a set of measures is a good standard for the success of the intervention. The
analysis reveals that incentives should only be given in exceptional circumstances and that the
village is the best scale at which to implement conservation measures in the Sahel. In all project
areas degradation is severe, so maximum participation of the population is needed. It has been
concluded that the project approach offers a small prospect of arresting degradation sufficiently.
Only a change of policy by national governments towards rural producers can create a more
sustainable exploitation of the natural resources in the Sahel, through intensification of production
methods.
2.2.1 Introduction
In this chapter the results of a study of five large soil and water conservation projects in three
Sahelian countries are presented. The motive of the study was the observation that the chosen
technologies and the implementation strategies differed greatly between projects, for reasons that
were not clear. The objective of this study was therefore to discover the underlying principles
behind the choice of soil and water conservation technology and implementation strategy. This
study is by no means meant as an evaluation of the five projects.
The fieldwork in this study was conducted from January 1993 until May 1993. During this
period five projects that are committed to soil and water conservation and erosion control were visited
in the countries Burkina Faso, Mali and Niger. In each of the five project regions field observations
were carried out for a period of two weeks, project documents were studied and issues were discussed
with the project staff.
Dynamics of soil resources embrace the net sum of two antagonistic processes, namely degradation
and regeneration. Water erosion is the most important remover of soil particles, soil organic matter
(SOM) and plant nutrients, while wind erosion also plays a significant role. The constant removal of
products coupled with low input (agriculture) results in a decrease in soil organic matter content.
This initiate seal and crust formation on the soil surface leads to reduced infiltration. Continuous
farming in certain areas of the Sahel with inherently low mineral reserves and without nutrient
15
replenishment can also lead to nutrient depletion. The vast majority of land users make a living by
farming small family plots where mainly staple crops like sorghum, millet and maize are produced.
Regeneration processes such as sedimentation or deposition of entrained or wind-blown
particles, or accumulation of SOM through enclosures or mulching, can reverse the degradation
process. Replenishment must come from human interventions, either by applying external inputs or
by biological interventions such as agro-forestry.
When the degradation and regeneration are quantified individually, the sum of the processes
turns out to be negative (Stroosnijder and Van Rheenen, 2001). However, the expected effect on soil
productivity cannot be proven. Despite a decrease in annual rainfall of some 150 – 200 mm in a little
less than 40 years and the increase of population and livestock, productivity of all major crops has
increased (Stroosnijder and Van Rheenen, 2001; Mazzucato and Niemeijer, 2000). This indicates that
farmers do not wait for a crisis situation to develop before they will practise some form of soil and
water conservation. Moreover different soil and water conservation projects have been active in the
region for many years. A lot of time, energy and money have been invested in research on how to stop
or at least to slow down the progress of degradation and resulting desertification. Each of the projects
active in the past in this region had its own strategy and its own options to solve the degradation
problem. Improvement took place during the active period of the projects. However the population
was not always able to understand and to adopt the interventions. New projects came with new ideas
and lessons from the past were not learnt. Therefore despite the limited distance between the different
projects there was hardly any cross-communication between them.
The central question of this study is; “Why do these projects adhere to the different SWC
practices?” Very often this question is not easy to answer and a lot of inside information is needed.
In most of these cases the difference originates from the wishes and ideas of individual persons.
In section 2.2.2 a description of the five projects is given. In order to see if there is a possible
explanation for the differences between the projects, this study analyses the context in which the
projects operate. Section 2.2.3 deals with the agro-ecological conditions and the socio-economic
situation of the region. The major part of this study is an analysis of the approach of the projects and
the tangible differences between the five examined projects. The approach consists of two parts: the
choice and analysis of the technology (sections 2.2.4 and 2.2.5 respectively) and the implementation
(section 2.2.6). The choice of the technology can also be split up in two parts: the area in which the
practices are executed (silvo-pastoral or crop fields) and the real practices. Considering the execution
modalities a lot of aspects play a role. In section 2.2.7 the consequences of the chosen approach are
given. In section 2.2.8 the conclusions are drawn.
2.2.2 Overview of the projects
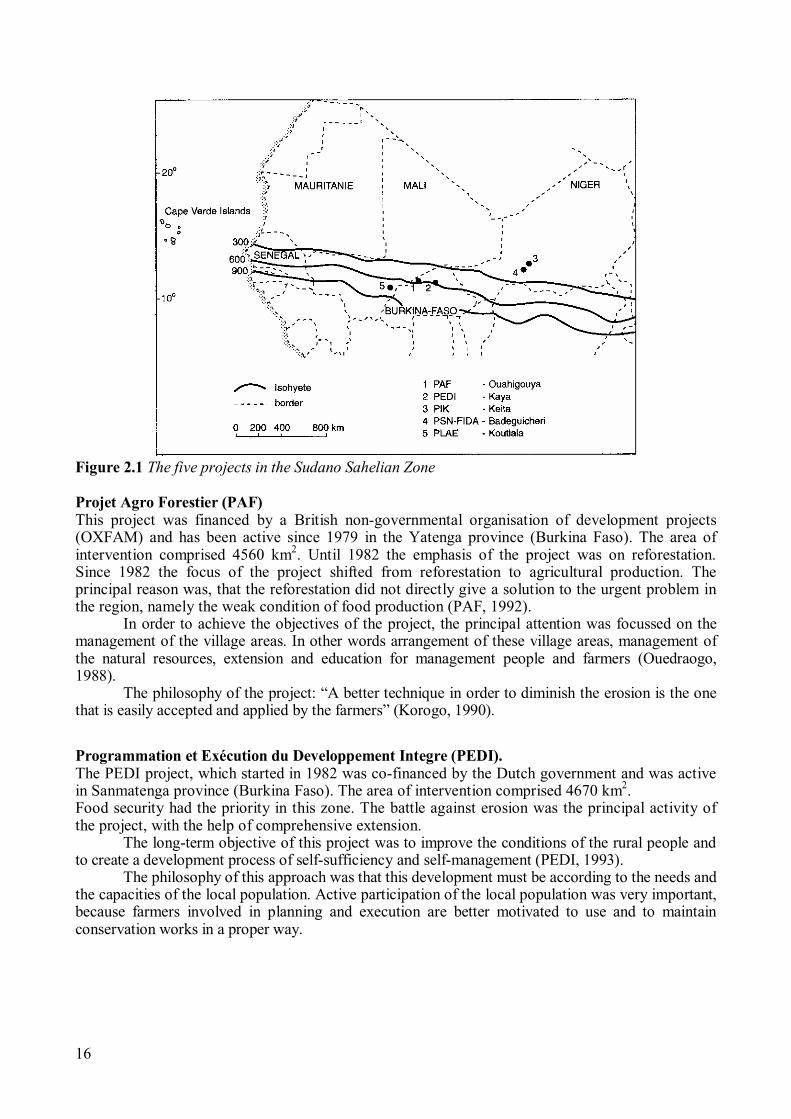
The five projects involved in the research are situated in Burkina Faso, Niger and Mali. These
countries are part of the Soudan Sahelian zone of Western Africa. Figure 2.1 shows where the
projects areas are situated.
Two of the projects situated in Burkina Faso, Projet Agro Forestier (PAF) and Programmation et
Execution du Developpement Integré (PEDI), active on the densely populated Mossi Plateau, have
a long experience in soil and water conservation. In Niger the two projects, Projet Integré Keita
(PIK) and Programme Special National du Fonds International du Développement Agricole (PSN-
FIDA), are active in the Ader-Doutchi-Maggia region. This region is characterised by a strong
relief, and rather fertile soils. Due to the demographic pressure and the physical conditions of the
environment, these soils are threatened by soil degradation. The 5th project, Projet Lutte Anti
Erosive (PLAE), is located in the southern part of Mali. In comparison with the other projects the
environment in this area is less harsh and the population pressure is not as high.
16
Figure 2.1 The five projects in the Sudano Sahelian Zone
Projet Agro Forestier (PAF)
This project was financed by a British non-governmental organisation of development projects
(OXFAM) and has been active since 1979 in the Yatenga province (Burkina Faso). The area of
intervention comprised 4560 km2
. Until 1982 the emphasis of the project was on reforestation.
Since 1982 the focus of the project shifted from reforestation to agricultural production. The
principal reason was, that the reforestation did not directly give a solution to the urgent problem in
the region, namely the weak condition of food production (PAF, 1992).
In order to achieve the objectives of the project, the principal attention was focussed on the
management of the village areas. In other words arrangement of these village areas, management of
the natural resources, extension and education for management people and farmers (Ouedraogo,
1988).
The philosophy of the project: “A better technique in order to diminish the erosion is the one
that is easily accepted and applied by the farmers” (Korogo, 1990).
Programmation et Exécution du Developpement Integre (PEDI).
The PEDI project, which started in 1982 was co-financed by the Dutch government and was active
in Sanmatenga province (Burkina Faso). The area of intervention comprised 4670 km2
.
Food security had the priority in this zone. The battle against erosion was the principal activity of
the project, with the help of comprehensive extension.
The long-term objective of this project was to improve the conditions of the rural people and
to create a development process of self-sufficiency and self-management (PEDI, 1993).
The philosophy of this approach was that this development must be according to the needs and
the capacities of the local population. Active participation of the local population was very important,
because farmers involved in planning and execution are better motivated to use and to maintain
conservation works in a proper way.
17
Projet Intégré Keita (PIK)
The PIK project was an integrated rural development project, financed by the Italian and Niger
government and executed by the Food and Agricultural Organization (FAO). The area of
intervention comprised 4860 km2
.
In 1983 when the project started, the focus was on protection of arable soils in three valleys of
the Keita department (Niger). After the drought of 1984 the attention was shifted towards
regeneration of degraded and abandoned agricultural soils and land use planning of the silvo-pastoral
area. The principal starting point was that no part of the landscape may be forgotten (PIK, 1992), and
for each landscape unit the best type of conservation practice and the best land use has to be
implemented according to capabilities.
Programme Special National du Fonds International du Developpement Agricole (PSN-FIDA)
The PSN project had the objective to reduce the vulnerability of drought and desertification of the
Niger agriculture (FIDA, 1987). The objective of the project was to increase the food security by
means of sustainable production, offering at the same time the money (means) to the farmers to buy
agricultural inputs. This soil and water conservation project has been active since 1988 in a part of
Illela province (Niger). The area of intervention comprised 4500 km2
. The soil and water
conservation techniques had to decrease the impact of drought and attribute to the arresting of
physical limitations obstructing the agricultural development.
In practice the project gave information about soil and water conservation (FIDA, 1993) to a
certain number of villages in the intervention zone, with the emphasis on indigenous techniques and
‘farmers’ choice. Besides this there were experimental plots in the area serving as demonstration
objects. The experimental plots were also used for the determination of the effectiveness of the
different practices in connection with production. According to the preference and motivation of the
villages the project was active on agricultural fields as well as on the silvo pastoral area. The
philosophy of the project is to let the farmers decide whether they want to apply the practices (FIDA,
1992).
Projet Lutte Anti Erosive (PLAE)
The PLAE project (Mali) started in 1986 and was co-financed by the Dutch government and
managed by the Koninklijk Instituut voor de Tropen (KIT). The PLAE project was integrated in the
cotton production society, Compagnie Malienne pour le Developpement des Textiles (CMDT). The
principal objective of the project was to give extension to the CMDT villages, concerning erosion
control and soil conservation. The area of intervention comprised 100.000 km2.
In 1993 PLAE
changed into Division de Défense et Restoration des Sols (DDRS). The general objective of DDRS
was to diminish the degradation of the agricultural and pastoral resources, to create favourable
conditions for maintenance and increase of the production and promote a take-over by the
population to meet a sustainable management (DDRS, 1993).
The philosophy of the project was to make the population conscious that there are possibilities
to solve problems related to over-use of natural resources. The population was confronted with the
fact that environmental problems are related to each other and that sustainable management is asking
for another approach (PLAE, 1992b).
2.2.3 The context in which the projects operate.
This section deals with agro-ecological and socio-economic data of the project areas and gives
information about the most important production systems, relevant institutions and the preferences
and requirements of donors. The factors that determine the context will be discussed in order to get
more insight in boundary conditions and limitations.
18
Agro-ecological conditions
Annual average rainfall differs between the projects: PIK (350 mm), PSN (450 mm), PAF (500
mm), PEDI (600 mm), PLAE (600 mm). However, the most important characteristic of the climate
in the project areas is the unpredictability of the precipitation, the quantities and the distribution
over the rainy season. The start of the rainy season may differ enormously even within a project
area (Sivakumar, 1991).
The geomorphology in the five project areas is very different, even inside a project area there
are several geo-morphological units, especially in the PIK area (Traoré, 1991). The soils in the whole
region are in general of low productivity, caused by a deficit of plant nutrients and a weak moisture
retention capacity (Van Campen and Hallam, 1986).
Social-economical situation
In the whole region the population growth is high, highest in the PEDI area. The number of
inhabitants ranges from (PEDI) 60 p km-2
, (PAF) 55 p km-2
, (PIK and PSN) 35 p km-2
and PLAE 20
p km-2
. The population density has to be seen in relation to the arable area in a region. The pressure
on the land is highest in the PEDI area and least in the PLAE area.
In general the population is not able to produce its own food supply during the whole year.
Additional food has to be bought and migration is a necessity for the region. The percentage of
people that migrate may amount to about 20% (Ouedraogo, 1992). In the PIK area 55 % of men
between 14 and 60 years migrate in the dry season (PIK, 1987; PIK, 1992). The majority of the
people migrate to neighbouring countries to work as traders or artisans. At the end of the dry season
they return and usually invest their money in cattle (PIK, 1991b). The absence of labourers in the
dry season has negative consequences on soil and water conservation practices to be executed in
that season. Consequently in most of the projects the women do the work.
An important difference between the villages in the several project areas is the organisation
level. In villages with a good internal organisation the work can be done in a collective way. Efforts
are made to strengthen the collective thought in the villages and to change existing power relations. In
Burkina Faso the villages in the PAF area are better organised than the ones in the PEDI area. In
Niger there is no strong will to co-operate in executing the works, because during a long time people
were paid in money or food to execute the practices. In the PLAE region the villages are organised by
the cotton co-operative union (Van Campen and Kèbé, 1986).
Land rights may cause big limitations for the development projects. At the moment in Burkina
Faso there is a mix between the traditional and a modern system. Very often the period that a farmer
is assured to be able to work on the same plot is unknown. Therefore investments in soil and water
conservation are scarce and sometimes conservation practices are even forbidden by the landowner. In
Niger there is a traditional regulation of land tenure. The land will stay in one family for generations.
By inheritance the parcel may become smaller and smaller (PIK, 1987). In Mali the land is property
of the people that founded the villages. For a symbolic payment one may rent plots. All uncultivated
land belongs to the government (Van Campen, 1990).
Financial possibilities in the region are limited. Mostly people are focussed on the first
necessities of life. Working outside the region usually brings in enough money to bridge periods of
food shortages, but in none of the regions is there enough money available for extra investments
(Deneve et al, 1990). The cotton production in Mali has a positive influence on the financial situation
in that region.
The farming system
In the whole region the pressure on the soil is increasing. A big part of the arable area is
permanently under cultivation (ORD, 1987). On many parcels the same crops are grown year after
year (monoculture). Even if the soils are cropped permanently, there is still a lack of food in certain
regions during years of bad rainfall.
Cattle breeding is also a very important activity occupying a large area. The numbers per head
of sedentary farmers is increasing very rapidly (Souley, 1990) and the transhumance is extending to
19
the south because of the drought in recent years (Van Campen, 1990; Vlaar, 1992). In some areas the
number of cattle is ten times higher than the carrying capacity (Van Oosten, 1986). On the other hand
in order to maintain a fair level of crop production there is a big need for cattle dung. Decreasing the
numbers of head in a region is very difficult, because of the mobility of the transhumance and the
need for sedentary people to cash cattle during drought periods.
Degradation processes such as water and wind erosion, soil organic matter exhaustion, soil
structure deterioration and nutrient depletion are having an alarming impact, and are considered a
major cause of poverty, in the Sahelian countries (Kiepe et al, 2001). According to some authors (e.g.
Kaboré 1994: Mando 1997) the productivity of agricultural fields has declined during the last decades
of the 20th
century. Only in Mali (PLAE) does the situation seem a little bit more optimistic than in
the other project areas (Jansen and Diarra, 1990).
Institutional conditions
Most of the projects co-operate with local services and organisations. The local agencies take care
of the extension, education and monitoring of the work. They have easy access to the people.
However in some of the projects there is a lack of skilled personnel (Van der Walle, 1988).
During the decennia many projects have been active in the region. Most of the projects had a top
down approach and executed practices with large equipment, on a large scale and high investments.
For instance in the Yatenga region of Burkina Faso, graded channel terraces were constructed over
huge areas and entire catchments were covered with terraces (IFAD, 1992). However, not many of
these works are still existing. At the same time people have become used to living with projects and
know what they can easily gain from projects. New projects have to take that into account because
people are used to certain ‘advantages’.
The presence of other projects in the region offers good possibilities for co-operation.
Unfortunately in most of the cases the cross-communication is very limited. Between the projects
there is awareness about the other project’s activities, but the projects continue in their own way. For
the population and the local services in the area it is very confusing and it may create tension.
The internal demands of the donors, evaluation missions, team leaders of the project and other
responsible people may influence the strategy for a project. In most of the cases these preferences are
not explicitly written down in reports, but they play a deciding role. In most cases the preferences are
based on ideas and philosophies of certain influential people. Usually the requirements and the budget
of a project are more explicit. The PAF approach is highly influenced by the originators who have
already worked in the area for many years. For example, the activities of PEDI are to a high degree
determined by the Dutch government. The influence on the PIK project by the donor Italy is
indisputable, and the PLAE project is greatly influenced by the guidelines of the Dutch government.
2.2.4 Choice of the technology
For the population the first priority is on the farmland, with its direct function in the production of
the first necessities of life. Investments in the silvo-pastoral area are less interesting for the farmers,
as it does not contribute directly to food production. However, from the viewpoint of sustainable
development, regeneration of the silvo-pastoral area is very important. This area contributes
indirectly to the preservation of the fertility of agricultural fields by supplying mulch and manure
(Deneve et al, 1990). Sustainable agriculture in the region is impossible when regeneration of arable
soils is at the expense of the silvo-pastoral area (Kessler, 1992). Projects have a very large area of
intervention and do not even succeed in protecting the arable fields.
Once the area of intervention is determined, the type of SWC practice has to be chosen. Function
and final goal of the practices need to be considered before choice of a specific practice can be
made. Soil and nutrient conservation is important, but water conservation is essential especially in
years with a limited amount of rain. Collection of water and promotion of infiltration are important
issues. Each project has its reasons to select certain types of SWC practice that may be preventive
20
or remedial, depending on the aim of the project practices. Familiarity with the practice used by the
local people also plays a very important role in determining which practice will be used.
Description of the practices
In West Africa a range of soil and water conservation practices can be encountered, such as area
interventions and line interventions, comprised of indigenous and introduced techniques. As the
SWC practices are regularly adapted to local circumstances, it is often difficult to determine
whether a given technique is indigenous or introduced (Stroosnijder and Van Rheenen, 2001).
Figure 2.2 displays in detail the individual practices used in the five projects.
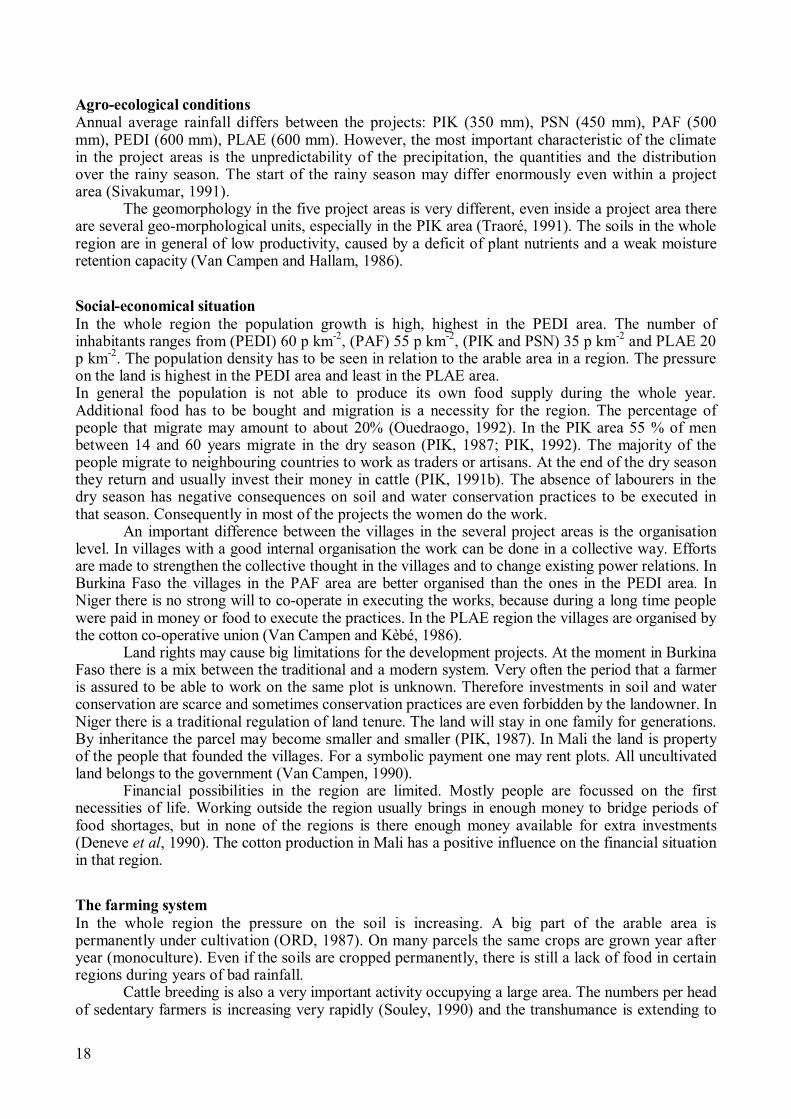
Figure 2.2.a Zay Figure 2.2.b Stone lines
Zay
Zay or planting pits are an indigenous practice for the regeneration of degraded soils. In the dry
season holes with a diameter of 0.30 m and a depth of 0.20 m, 0.50–1.00 m apart are hoed in the
crusted soil. (Figure 2.2.a). The dimension and the distances are dependent on the permeability and
the depth of the soil, the availability of labourers and the distances between the plants (FIDA,
1992). The objective of the planting pit is to catch the runoff water to store it temporarily and to
have the water infiltrated. After cutting the pit nutrients are introduced by means of compost
provided close to the plants. This way of fertilisation attracts termites that perforate the soil when
consuming part of the organic material. At the same time the water intake and aeration of the soil
will drastically be improved (Vlaar, 1992).
Stone lines
Stone lines are laid out along the contour line, perpendicular to the slope. This placement slows
down the velocity of the run off water and promotes infiltration and sedimentation near the lines.
The base of the stone line is a small trench with a depth of about 0.10m. The height of the stone line
varies between the 0.15 and 0.20m (Vlaar, 1992). The number of stones in the row depends on the
availability, the transport capacity and the available labour (Figure 2.2.b). Theoretically the distance
between the stone lines depends on slope and rain intensity, in practice it varies between 10 and
50m, giving about 750m/ha. A limitation for the construction of stone lines is often the lack of
transportation, the transport distances and even the scarcity of stones in the area (PLAE, 1992a)

21
Figure 2.2.c Filtering stone dike Figure 2.2.d Earthen bank
Filtering stone dikes
Filtering dikes are constructed on the valley bottoms to catch the runoff water and diminish peak
discharges. Sedimentation upstream of the dike builds up a soil profile creating possibilities for
agriculture (Vlaar, 1992). The foundation of the filtering dike is laid down in a ditch of 0.30 m deep
along the contour line. After construction the dike may have an elevation between the 0.40 m and
0.60 m (Figure 2.2.c). The side slopes of the dike are almost vertical at the upstream part and 1: 2 at
the downstream side. The distance between the dikes depends on the slope of the valley bottom.
Earthen bank
Earthen banks with a length of 100 m with 15 m perpendicular wings are constructed along the
contour line. These earthen banks are considered to catch and store water more effectively than
stone lines. The width of the earthen bank is 2.5 m, the height 0.60 m. Down slope side-slopes of
the earthen bank are often covered with stones and rows of trees. The distance between the earthen
banks is 45 m (Figure 2.2.d). In other words the impluvium of the earthen bank comprises 3.000 m²
(ratio 1:2).
Earthen banks are applied on agricultural fields as well as on the silvo-pastoral area. On the
silvo-pastoral area the dimensions are smaller (bank length 40 m with 4 m perpendicular wings).

22
Figure 2.2.e Tree trench Figure 2.2.f Half moon
Tree trench
On steep slopes plant trenches are dug in order to plant trees. The length of the trench is about 3m,
the depth 0.60 m. Water storage capacity mounts up to 1 m3
. In the centre of the trench is an
elevation of 0.20 m on which trees are planted. The trenches are laid out in a triangle pattern with a
distance of 4.5 m (Figure 2.2.e), 600–700 trees/ha (PIK, 1992). In about 5 years the trench is silted
up. The trees and the undergrowth take over the function of the trenches, catching and slowing
down the water.
Half moons
Half moon shaped earth constructions are laid out side by side. The half moons have a diameter of
about 4m and dikes with a height of 0.20 m. According to this height the water storage capacity will
be about 1.5 m3
. To reinforce the construction, side slopes of the dikes (FIDA, 1992) can be
covered with stones (Figure 2.2.f). When the distance in the slope’s direction is about 6 m, the area
of the impluvium amounts to 20 m2
and has a density of 300 half moons per hectare.
Figure 2.2.g Live fence

23
Live fences
Live fences often have the function of delimitation of plots (Hijkoop et al, 1991; Diarra, 1993) and
diminution of the harsh conditions of the climate, creating a mild microclimate, slowing down wind
and water and promoting infiltration and sedimentation. Under sub-humid circumstances the use of
live fences has become rather popular, because live fences take up a small surface area and the
chance of harmful weed growth is limited. Preferably plants are used that are not attractive for
cattle. For soil and water conservation live fences are planted as hedges in one or two lines along
the contour line (Van der Poel and Kaya, 1990). The distance between the plants in the row is about
0.25 m and the distance between the rows about 0.5 m (Figure 2.2.g). Amidst the hedge plants all
kinds of herbs and grasses may sprout out and improve the filtering effect of the live fence.
Local people easily accept live fences and are especially interested in live fences for the
delimitation of plots. The effect that live fences have on soil and water conservation often seems to be
of lesser importance to the local people. Plant density is of great importance for soil and water
conservation, but is usually neglected when delimitation of plots is considered. As a result of the low
plant density the soil and water conservation effect of the live fences is often unsatisfactory. The local
people can carry out maintenance of live fences. However the maintenance of live fences is very
labour-intensive.
2.2.5 Analysis of the practices
The first important step towards successful intervention is choosing the right technology. Six
recommendations can be considered in relation to the choice of practices.
1. Use existing knowledge of the local people
Practices based on the knowledge of the local people will more quickly be adopted and
reproduced than completely new technology. Information obtained from preceding projects
should be used in order to avoid making the same mistakes.
2. Keep the practice simple and inexpensive
The farmers should be able to carry out the practices by themselves without having to wait for
external help. Only when the material used is locally available and the costs are low, then
reproduction on a large scale can be expected.
3. Make sure the practice has short term effects
Farmers are interested in short-term effects that directly improve their circumstances. An
evident increase of the harvest and indirect effects, which the farmers experience as an
advantage, can lead to quicker adoption of a practice (IFAD, 1992).
4. Choose practices that do not require a large workforce
The less work needed to implement and maintain a practice, the sooner a farmer will tend to
implement the practice and will not choose for alternative practices.
5. Make sure the project design is technically appropriate and avoid risks
Technically appropriate means that the context of the practice is known and that the context is
taken into consideration. Risks should be avoided, because they can negatively influence the
adoption of a practice (Hudson, 1991).
24
6. Keep social-economic conditions in mind
Projects always bring about changes in the existing social relations in a project area. The more
a practice is adjusted to the social relations in an area, the greater is the chance of adoption of
a practice (Sanders, 1988).
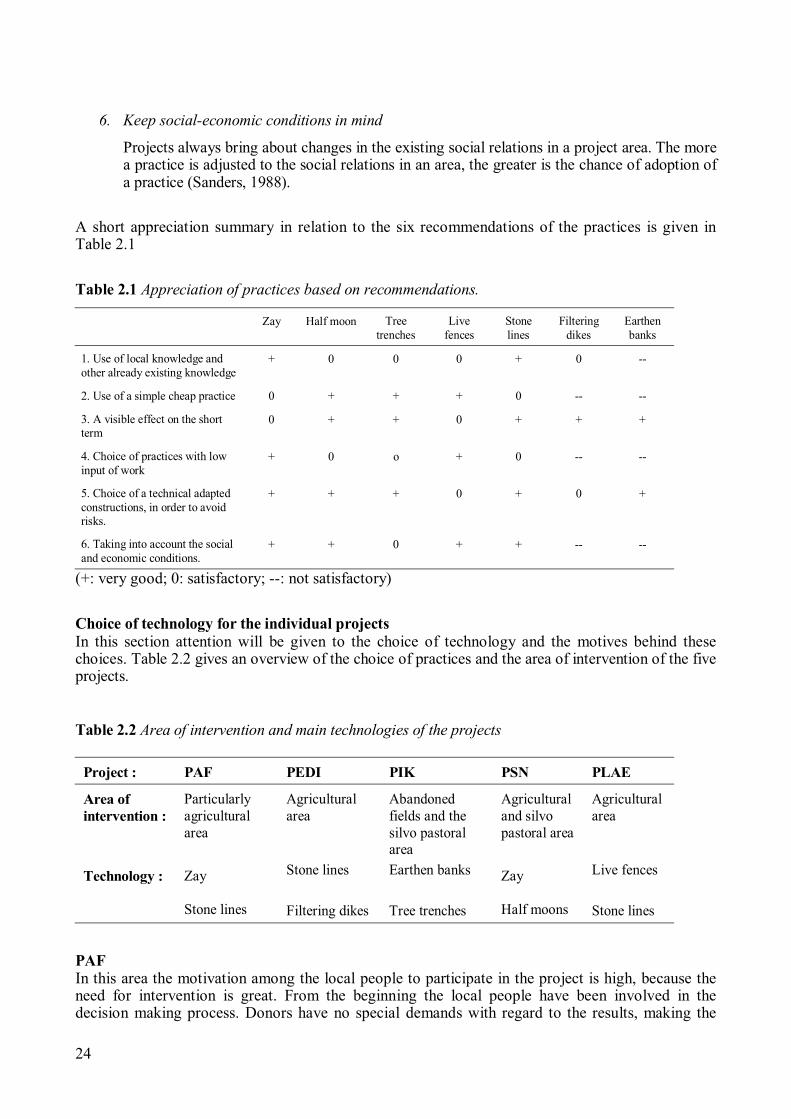
A short appreciation summary in relation to the six recommendations of the practices is given in
Table 2.1
Table 2.1 Appreciation of practices based on recommendations.
Zay Half moon Tree
trenches
Live
fences
Stone
lines
Filtering
dikes
Earthen
banks
1. Use of local knowledge and
other already existing knowledge
+ 0 0 0 + 0 --
2. Use of a simple cheap practice 0 + + + 0 -- --
3. A visible effect on the short
term
0 + + 0 + + +
4. Choice of practices with low
input of work
+ 0 o + 0 -- --
5. Choice of a technical adapted
constructions, in order to avoid
risks.
+ + + 0 + 0 +
6. Taking into account the social
and economic conditions.
+ + 0 + + -- --
(+: very good; 0: satisfactory; --: not satisfactory)
Choice of technology for the individual projects
In this section attention will be given to the choice of technology and the motives behind these
choices. Table 2.2 gives an overview of the choice of practices and the area of intervention of the five
projects.
Table 2.2 Area of intervention and main technologies of the projects
Project : PAF PEDI PIK PSN PLAE
Area of
intervention :
Particularly
agricultural
area
Agricultural
area
Abandoned
fields and the
silvo pastoral
area
Agricultural
and silvo
pastoral area
Agricultural
area
Technology : Zay
Stone lines
Stone lines
Filtering dikes
Earthen banks
Tree trenches
Zay
Half moons
Live fences
Stone lines
PAF
In this area the motivation among the local people to participate in the project is high, because the
need for intervention is great. From the beginning the local people have been involved in the
decision making process. Donors have no special demands with regard to the results, making the

25
PAF project very flexible in its approach. As a result the choice of practices can easily be adjusted
to the context. The practices used in the PAF area have both a curative and a preventive effect. The
two main soil and water conservation practices used in the PAF area is zay and stone lines. These
techniques were not new in this area. The PAF project only helped to improve an already existing
technique and spread the improved technique among the farmers by means of extension. Zay and
stone lines are if possible used in combination to increase the effect.
PEDI
The basis of the PEDI approach is the attempt to arrest and surpass the quickly developing soil
degradation. Therefore the main aim of the approach is achieving rapid results. The wish for quick
results is also heard from the donor of the project (Dutch government). In order to achieve results
quickly a means of transport and high participation among the local people is needed. This last
aspect can be problematic due to a lack of organisation inside the villages.
Stone lines are in principle combined with grass strips at the upstream side. Stone lines and filtering
stone dikes are the main soil and water conservation practices in the area. The aim of these practices
is prevention of further soil degradation. Recuperation of the soil will be speeded up by the use of
tillage and better fertilising techniques.
PIK
The approach in the PIK area is based on the idea of taking in hand the whole project area in an
integrated manner. This leads to reflection of all aspects that can create economic development of
the area. One of the restricting aspects in the project area is the fact that migration in the dry season
is high which results in a small workforce. On steep and strongly degraded hills the choice of
practices is restricted.
The donor has a strong influence on the determination of the approach. The approach aims at quick
results to stop the process of soil degradation in the area. PIK is the only project in the Sahel that
uses heavy equipment and much capital to reach long term economic security in the project area.
The technology used in the PIK area is mainly curative and aimed at recuperation of degraded soils.
On flat terrain earthen banks are applied. The earthen banks are improved versions of traditionally
used earthen dikes. They are more durable and robust and do not need a lot of maintenance. On
steep hills tree trenches are dug and trees are planted. Their function is to catch the water that
streams downhill and to assure reforestation of the hills. No maintenance is needed because after
filling up the trenches with sediment the trees and the undergrowth will protect the area.
PSN-FIDA
The PSN project has the same contextual situation as the PIK project. However the approach is less
influenced by the context, because the project does not aspire to rapid results. PSN follows a
strategy that is derived from the PAF project. Adoption and reproduction of the practices by the
local people is the main goal. PSN is a project with small-scale practices and works with a local
staff. Consequently the approach can be adjusted to the needs of the local people.
The farmers in the project area choose both preventive and curative practices. Especially
improved zay and half moons are popular among the local people. Zay is frequently used in
combination with stone lines. Half moons are also used for the reforestation of the silvo-pastoral area.
PLAE
The context of the PLAE project is undoubtedly more favourable than the other projects. Soil
degradation is not as much developed as the case in the other projects. Much attention is given to
prevention of further degradation. Due to the favourable climate (more precipitation) vegetative
practices are utilised. The cotton production provides for animal traction, which is used for the
execution of the practices. The PLAE project operates only in villages with a good internal
organisation.
In the PLAE project the terrain is divided in specific zones based on landscape, soil and slope.

26
Most practices are used on the agricultural area. Traditionally grass strips were used for the
delimitation of plots. Recently live fences have been introduced for the delimitation. Besides
delimitation of plots live fences are very useful for soil conservation. Stone lines are applied at the
upper side of the plot or even the whole slope to catch and divert the runoff water from uphill.
2.2.6 Implementation.
The second part of the study deals with the execution modalities. The execution modalities
determine the character of the project to a great extent. Execution modalities are the ideas and the
decisions concerning the way the practices are executed and realised. In this section the differences
in the scale and the organisation of the implementation, the method of extension and training and
the use of incentives and in complementary practices are presented. Table 2.3 gives an overview of
the execution modalities that have been applied in the five projects.
Level of approach
The level on which the population or the target group is approached in relation to training and
execution is defined as the level of approach. Between the projects there is variety in the level of
approach, which eventually affects the speed of adoption of the practices and their effect.
In practice there are four distinctive levels of approach:
1. Individual level: the farmer and his personal plots
2. Group level: a group of farmers within one village or catchment area
3. Village level: the village and the area around it that belongs to the village
4. Catchment area level: one catchment area including several villages
The level of approach has evident implications for the establishment of the area. Practices
implemented on the individual level give a lot of attention to the lay out of each plot. When
practices are taken on group level or catchment area level better adjustment of the practices is
reached.
From the technical point of view the catchment area level approach seems the most effective,
because a catchment area is a logical hydrological erosion unit in the landscape. However on the
catchment area level it will be difficult to establish contacts with a homogeneous group of people
who are willing to co-operate. From a social point of view the individual level of approach is the
ideal starting point. Projects try to find the most effective approach, with most individuals working
on the village level: PAF, PSN, and PLAE (Ouedraogo, 1992). The project in the PEDI area started
at village level, but changed to the group level approach. The PIK project works on catchment area
level (Carucci, 1989).
Organisation of the execution
For the execution of the work a project needs a good organisation and a division of the duties to be
exercised in the field. The principal characteristic of the organisation is to know what
responsibilities can be transferred to the villages or local organisations and the significance that
projects give to the creation of a good organisational structure on a low level. Building a good
organisation structure in the project area facilitates the local people to maintain the works after the
project has finished in the region. Creating a good organisation does not only imply building a
framework to regulate responsibilities within the villages, but also implies supplying material. The
projects PAF and PLAE are focussed on creating organisation structures in the villages. The PEDI
and PSN projects leave the local people more or less free to decide how the execution of the work
should be organised. The PIK project steers a middle course between these two extremes.

27
Table 2.3 Execution modalities of the projects
Level of
approach
Organisation
of the
execution
Extension
and
education
Participation
and
incentives
Use of
complementary
practices
PAF Village ‘Execution
committee’
and extension
workers
Particularly
in the
villages, but
also
centralised.
Only
technical
assistance,
sometimes
use of a truck
Compost pits
Vegetation strips
PEDI Farmer groups
or quarters of
villages
By means of
‘Concentrated
Execution’
with the help
of surveyors
In the
villages and
centralised
Use of a truck
for stone
transport
Compost pits,
vegetation
strips,
Tillage along the
contour
PIK Catchment area ‘Manager of
the work site
and assistance
of the project’
Particularly
at the work
site
‘Food for
work’ and
support of big
machines
Tillage with
draught cattle,
shrubs/trees,
vegetation strips
and Sub-soiling
PSN Village, via
contracts with
farmers
Village,
contact
farmers and
extension
workers
Particularly
in the
villages, but
also
centralised
Technical
assistance
and collective
groups.
Stone lines,
compost pits and
stone ridges
PLAE Only in good
organised
villages
‘Village
Association’
and ‘Soil
conservation
group’
Particularly
in the
villages
Only
technical
assistance
Compost pits,
vegetation
strips,
rotations and
tillage along the
contour
Extension and education
An important aspect with regard to the realisation of the projects is the attention given to extension
and education of local people. After an information period concerning the necessity of intervention
and different implementation possibilities, a project has already set its first steps towards success.
Essential in extension and education is to make the local people conscious of the area’s major
problems. The dialogue form is the best way of giving information. In dialogue possible obstacles
become clear and together with the local people solutions to the problems can be sought. For the
local people to continue the project independently, it is necessary to transfer the knowledge
underlying a practice. In that way continuity of the project can be reached.
In the PAF and PSN projects the focus is on making the people aware of the problems by
means of dialogue (Traoré, 1991). The projects only come into action when the local people indicate
that they need assistance. In the PLAE and PEDI areas the focus of extension and education is on well
organised villages, which in the end should lead to the founding of a team of experts for battling
erosion. In the PIK project less attention is given to extension and education. This is because the area
for each extension agent is very large and the people of the project are not specifically trained to
educate the others.
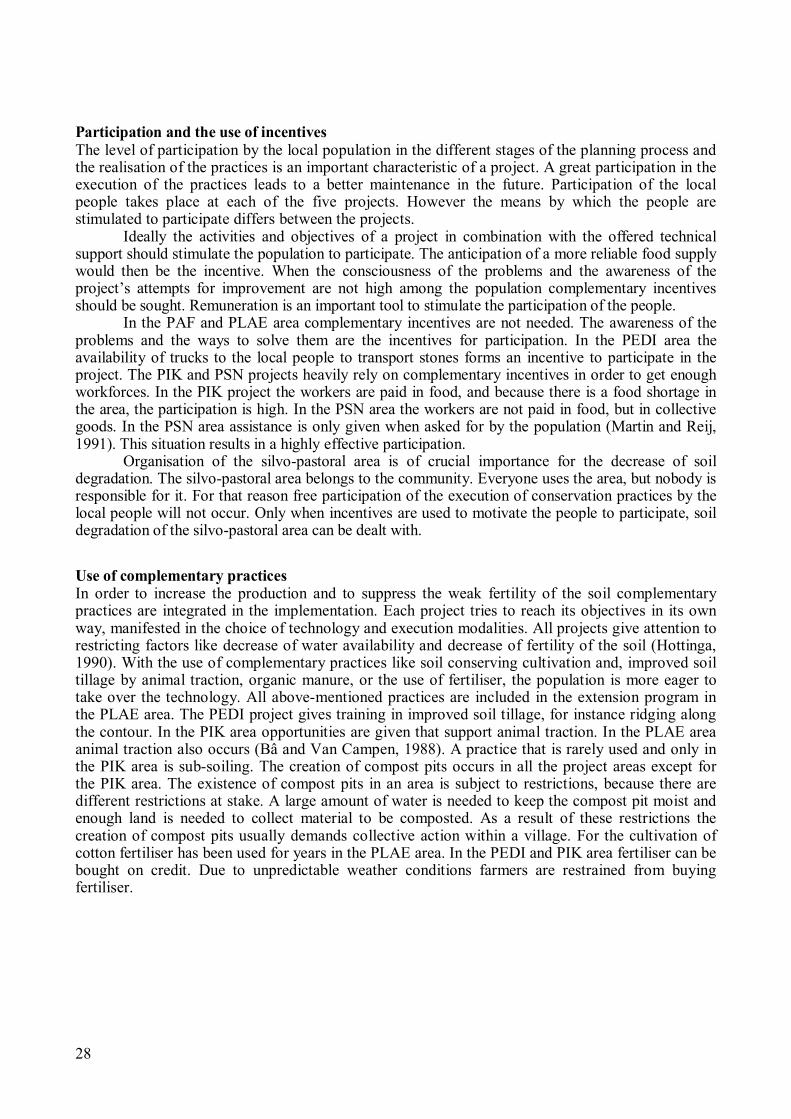
28
Participation and the use of incentives
The level of participation by the local population in the different stages of the planning process and
the realisation of the practices is an important characteristic of a project. A great participation in the
execution of the practices leads to a better maintenance in the future. Participation of the local
people takes place at each of the five projects. However the means by which the people are
stimulated to participate differs between the projects.
Ideally the activities and objectives of a project in combination with the offered technical
support should stimulate the population to participate. The anticipation of a more reliable food supply
would then be the incentive. When the consciousness of the problems and the awareness of the
project’s attempts for improvement are not high among the population complementary incentives
should be sought. Remuneration is an important tool to stimulate the participation of the people.
In the PAF and PLAE area complementary incentives are not needed. The awareness of the
problems and the ways to solve them are the incentives for participation. In the PEDI area the
availability of trucks to the local people to transport stones forms an incentive to participate in the
project. The PIK and PSN projects heavily rely on complementary incentives in order to get enough
workforces. In the PIK project the workers are paid in food, and because there is a food shortage in
the area, the participation is high. In the PSN area the workers are not paid in food, but in collective
goods. In the PSN area assistance is only given when asked for by the population (Martin and Reij,
1991). This situation results in a highly effective participation.
Organisation of the silvo-pastoral area is of crucial importance for the decrease of soil
degradation. The silvo-pastoral area belongs to the community. Everyone uses the area, but nobody is
responsible for it. For that reason free participation of the execution of conservation practices by the
local people will not occur. Only when incentives are used to motivate the people to participate, soil
degradation of the silvo-pastoral area can be dealt with.
Use of complementary practices
In order to increase the production and to suppress the weak fertility of the soil complementary
practices are integrated in the implementation. Each project tries to reach its objectives in its own
way, manifested in the choice of technology and execution modalities. All projects give attention to
restricting factors like decrease of water availability and decrease of fertility of the soil (Hottinga,
1990). With the use of complementary practices like soil conserving cultivation and, improved soil
tillage by animal traction, organic manure, or the use of fertiliser, the population is more eager to
take over the technology. All above-mentioned practices are included in the extension program in
the PLAE area. The PEDI project gives training in improved soil tillage, for instance ridging along
the contour. In the PIK area opportunities are given that support animal traction. In the PLAE area
animal traction also occurs (Bâ and Van Campen, 1988). A practice that is rarely used and only in
the PIK area is sub-soiling. The creation of compost pits occurs in all the project areas except for
the PIK area. The existence of compost pits in an area is subject to restrictions, because there are
different restrictions at stake. A large amount of water is needed to keep the compost pit moist and
enough land is needed to collect material to be composted. As a result of these restrictions the
creation of compost pits usually demands collective action within a village. For the cultivation of
cotton fertiliser has been used for years in the PLAE area. In the PEDI and PIK area fertiliser can be
bought on credit. Due to unpredictable weather conditions farmers are restrained from buying
fertiliser.

29
2.2.7 Consequences of the chosen approach.
When the type of intervention is chosen and the execution modalities are known the consequences
of the approaches can be analysed by means of some ‘indicators’ mentioned below:
• Rhythm of the realisations
• Adoption and the reproduction of the technology
• Maintenance and durability of the practices
• Effect of the practices
Rhythm of the realisations
The rhythm of the realisations is an official figure that development projects give as the attained
result over a certain period, usually one year. All the practices realised in a project area including
the practices spontaneously taken by the population are taken into consideration. The rhythm is
often considered in relation to the speed of soil degradation. In those cases the rhythm of the project
gives an indication of the degree in which the project succeeds in arresting soil degradation. Donors
often judge the project by the rhythm, in particular when in the planning of a project the number of
realisations is given.
The choice of the practice influences the rhythm to a great extent, due to the constraints of
certain practices. Execution modalities are of even bigger influence, because a project can by means
of execution modalities increase the rhythm and ensure that certain results will be reached. Execution
modalities, that have most influence on the rhythm, are extension and training, and the use of
incentives. Incentives usually lead to a constant rhythm and can be increased by giving more
incentives (Hudson, 1991). In the case of extension and training the rhythm increases in time, because
the local people become more and more conscious of the problems. Other factors that can influence
the rhythm are organisation at the project level and the use of complementary practices.
The rhythm may indicate if a project is successful in arresting the degradation of the soils, but
it gives no indication whether the technology is adopted and continued in the future. Very often
projects with a high rhythm aim at improvement in the near future. This is the case in the areas PIK
and PEDI where there is severe soil degradation. These projects try to keep the rhythm as high as
possible. Other projects focus more on long-term effects. The PAF and PSN projects are examples of
this approach. For these projects adoption and reproduction are more important than rhythm. The
main aim of these projects is to create consciousness of the problems and possible solutions by the
local people. Table 2.4 gives an overview of the realisations of dominant SWC practices in the five
project areas in selected periods for different types of land use.
Adoption and the reproduction of the practices
It is important to have a high rhythm in order to deal with existing problems effectively, but in the
long run adoption and reproduction by the local people is more important. A type of practice not
entirely accepted by the farmers may be realised during the project’s lifetime, due to the incentives.
However, most likely the population will not reproduce the intervention after the project has
finished. In general simple practices are quickly adopted and reproduced by the local people, having
no negative consequences on the rhythm of the project, like more complicated practices. The choice
of the practice is more important than the execution modalities of a project. If the population does
Table 2.4 Realisations of dominant SWC-practices in the five project areas in selected periods and for different types of
land use.
Period Target
area
km2
Number of
target
villages**
No.of
benificiary
families*
Population
density
p/km2
% of
population
involved
Technology Implemented per
technology
Area of
intervention
Implemented
area per land
use/km2
% of target
area covered
Project
PAF 83 - 89 4650 5000 55 19 zay NA cropland
stone line 8000 ha cropland 80 1.7
PEDI 86 - 92 4670 200 60 14 stone lines 7216 ha cropland 72 1.5
filtering dikes 61895 m cropland
PIK 84 - 92 4860 6200 35 36 earthen banks cropland 66.5 1.4
tree trenches silvo pastoral 38.6 0.8
reafforestation silvo pastoral 142.8 2.9
PSN 88 - 92 4500 1000 35 6 zay 591 ha cropland 5.9 0.1
half moon 303 ha silvo pastoral 3.0 0.1
silvo pastoral 25.5 0.6
PLAE 91 - 94 100.000 2.000 20 2 life fences 8 000 000m**** cropland 160 0.2
stone lines 3 000 000m*** cropland 60 0.1
Assumptions:
*10 persons per family
**200 (active) persons per village
population covered: persons active in implementation and persons receiving extension and/or training
***500m stone line per ha
****500m live fence per ha

31
not adopt a practice the 'modalities' are not able to force the people to reproduce or to maintain that
practice. Execution modalities can play a role in making the local people familiar with the effects of
a practice. By using execution modalities, projects can make a certain practice more attractive and
stimulate the people to use a practice.
Maintenance and durability
The attention for the maintenance and the durability of the practices varies between the projects.
Maintenance and durability are strongly related. A project can choose a practice that does not need
a lot of maintenance or a project can stimulate the population by means of execution modalities
performing the maintenance.
Maintenance is inherent to the execution of concrete practices. Projects should always see to it
that farmers can and will do the maintenance of the practices by themselves. Consequently the main
goal of a project during the project’s lifetime is to enable and to motivate the farmers to do the
maintenance. The farmers should have the right materials at their disposal and have to learn how to do
the maintenance of the practices properly. Extension and training should establish knowledge about
maintenance.
PIK is the clearest example of a project that tries to execute practices that hardly need any
maintenance. In the PLAE area the maintenance is done by special “erosion battling teams”. The
PEDI project used to pay little attention to maintenance, but recently maintenance has become part of
the extension program. It is not clear in what way the other projects try to stimulate maintenance.
The ability of farmers to do the maintenance of practices depends on the dimensions under
which the practices are executed. Of the examined practices only earthen banks and filtering stone
dikes are difficult to maintain by the farmers, because special material is usually needed to perform
the maintenance. The other more simple practices do not cause severe maintenance problems.
Besides the ability, there must also be a desire by the farmers to do the maintenance. This
desire is often strongly dependent on the execution modalities. Particularly involvement and
participation of the farmers at all levels of planning and execution are of great importance. Farmers
will be more motivated if they themselves take the initiatives to do the maintenance, and if they are in
charge of the execution and if they benefit by it. Maintenance on land that is owned by the community
can give problems, because it is not clear who is responsible. Strict agreements should be made about
the control over the practices. In practice maintenance remains a difficult part of soil and water
conservation practices. According to the farmers there is not enough time to do the maintenance. This
may be a result of high rhythm. New realisations of practices are more important for the rhythm than
maintenance.
Effects
The effects of the practices may be manifold. The most important effects are positive influences on
the production, the regeneration of the soil and the improvement of the social and economic
situation.
For the projects considered hardly any data exists concerning the positive effect on the
production. In spite of all the investments, hardly any research has been done into the results of the
increased production. In most of the cases the execution scale of practices is too limited to make a
good estimate of the effects of the practice. The practices usually guarantee more certainty in relation
to the harvest, because more water is conserved. However the most restricting factor for the increase
of the production, is the low fertility of the soil (Van der Pol, 1992). As a result of this low fertility the
crops cannot effectively use the available water. All projects try to deal with this problem by means of
complementary practices (Reij, 1992), like manure and fertiliser.
Throughout the whole region the soil degradation keeps on increasing. The effects of the
projects to stabilise or to decrease the soil degradation should not be overestimated. Choosing the
right practice and giving attention to extension and training is not enough. Only when the local people
become aware of the problems and are willing to take action against soil degradation then there will
be progress. For that reason it is an important development that some projects pay increasingly more
attention to extension in order to make the local people conscious of the existing problems.
32
2.2.8 Conclusions
The aim of this study was to ascertain the underlying principle behind the choice of soil and water
conservation technology and the implementation strategy. The five examined projects all have a
different approach and do not cooperate frequently. The great difference in the soil and water
conservation technology between the five projects and the way they are implemented are only partly
attributable to physical, socio-economic and agronomic context. Preferences of donors and projects
appear to be dominant in determining which practices and procedures are chosen. It is therefore a
pity that the experiences from former projects are more or less neglected.
Soil conservation is important, but water conservation is essential, particularly in dry years.
Collection of water and promotion of infiltration are important issues. It is concluded that projects
aiming at conserving natural resources should have a short-term as well as a long-term strategy. There
is rarely a single ‘best’ practice, instead a combination of short and long-term effects are usually
preferable. It appears that for fields, the local zay technique in combination with the use of manure
(from compost pits) is advisable to achieve a short-term effect; this should be combined with stone
lines to achieve a long-term effect. The use of live fences (vegetation barriers) in combination with
other practices can also achieve a long-term effect. However the effect live fences have on soil and
water conservation often seems to be less ‘investigated’ by the local people. Vegetation barriers have
the following attendant advantages; cheap, local techniques, available (attainable) resource for poor
farmers, individual implementation and management, limited need of transport facilities and
applicable in the ‘stone scarce areas’.
In the PAF project area, zay and stone lines are the two main soil and water conservation
practices. Stone lines and filtering stone dikes are the most frequently used practices in the PEDI
project. The PIK project has chosen to use earthen banks on flat terrain and tree trenches on steep
hills. In the PSN area, zay is frequently used in combination with stone lines. Half moons in this area
are used for the reforestation of the silvo-pastoral area. The PLAE project has introduced live fences
and stone lines as soil and water conservation practices.
Good management of the silvo-pastoral area is needed. This area is very often overused and
degraded quickly. A recommendable intervention for rangeland is to limit free-grazing livestock from
certain areas as a short-term effect and to combine it with reforestation and intensification of livestock
production. A reduction in the number of livestock units is needed to achieve a long-term effect.
In all areas there is severe soil degradation. Thus, maximum participation of the population is
needed. PIK, PEDI, and PLAE try to keep the rhythm as high as possible and principally a high
result on the short term. PAF and PSN are more concerned with long-term effects. For these
projects adoption and reproduction are more important than rhythm. The main aim of extension and
education in these projects is to create consciousness of the problems among local people and to
present possible solutions. These projects only come into action when local people indicate that
they need assistance. In the PLAE and PEDI projects the focus of extension and education is on a
good organisation inside the villages. In the PIK project little attention is given to extension and
education.
In the PAF and PLAE area complementary incentives are hardly needed. The awareness of the
problems and the ways to solve them are the incentives for participation. In the PEDI area the
availability of trucks to transport stones forms an incentive to participate in the project. Due to out-
migration, the PIK and PSN projects need to work with complementary incentives to get enough
workforces for the execution of the practices.
The community usually has certain rights on the silvo-pastoral land. To motivate the local
people to implement practices the use of incentives is necessary. Incentives should never be used to
apply individual practices to the agricultural fields. However, rewards that benefit the whole
community can be offered to encourage collective activities on village range-lands. Food incentives
should only be offered as relief aid in years with acute food shortages and must never be used to
induce people to carry out soil and water conservation practices.
In the Sahel the village appears to be the best level for the execution of conservation practices.
Extension and training, which should result in consciousness of the problems by the local people,
should be given on the village level. A good internal organisation in the villages is fundamental for
33
the execution of the practices. Apart from making the local people conscious of the problems, projects
should try to motivate the people to work collectively on the implementation of the practices. The
village should be involved in the decision-making in all phases, from preparation to implementation,
as involvement of the people can lead to continuity of the work in the future. As long as the initiative
or the participation to execute measures and the profit of the measures are for the participants,
motivation to maintain the measures will be widely available ensuring durability.
Project efficiency could be enhanced by better exchange of information and better co-
operation between villages and projects. This exchange and co-operation has been little formalised so
far. The total impact of all five projects is small compared to the rate of environmental degradation in
the region. However, the lack of participation by the local population is only partly responsible for
this. The project approach offers little prospect of arresting degradation. Only a change in the policy
of motivational governments towards rural producers can create a more sustainable exploitation of the
natural resources in the Sahel, through an intensification of production methods.
References :
Bâ, L. en Campen, W. van, 1988 : Description des activités du projet et de la méthode de travail dans les
villages; Contribution au séminaire international l'agro écologie dans la lutte contre la désertification
au Sahel.
Carucci, R., 1989. Aperçu sur l'approche territoriale et méthodologies d'intervention dans la lutte contre la
désertification de l'arrondissement de Keita.
DDRS, 1993. Présentation de la Division des Défens et Restauration du Sol.
Deneve, R., Dennison, S. et Kessler, J.J., 1990. Etude IOV : Impact des projets sur l'environnement et le
développement.
Diarra, S., 1993. Les expériences en matière d'agro foresterie de la DRSPR Sikasso; Présentation dans le
cadre de l'atelier sur l'agro foresterie.
FIDA, 1987. Programme Spécial National, Rapport d'évaluation.
FIDA, 1992. Rapport Annuel 1992.
FIDA, 1993. Programme Annuel d'Actions 1993
Hijkoop, J., P. van der Poel, Ba, L. and B. Kaya, 1991. Une lutte de longue haleine. Aménagements anti-
érosif et gestion de terroir. Systèmes de production anti-érosif et gestion de terroir. Systèmesde
production rurale au Mali : Volume 2. Amsterdam : Royal Tropical Institute.
Hottinga, F., 1990. Contraintes et perspectives des activités anti-érosives CRPA-PEDI.
Hudson, N.W., 1991. A study for the reasons of success or failure of soil conservation projects. FAO Soils
Bulletin No. 64, Food and Agricultural Organization, Rome.
IFAD, 1992. Soil and Water Conservation in Sub-Saharan Africa, towards substainable production by the
rural poor. Prepared by the Center for Development Cooperation Services, Free University,
Amsterdam.
Jansen, L. en S. Diarra, 1990. Le Mali-Sud vu superficiellement. Quantification des superficies agricoles et
la dégradation pour quatre terroirs villageois entre 1952 et 1987. DRSPR/LUW/KIT.
Kaboré, V., 1994.Amélioration de la production végétale de sols dégradé (‘zipellés’) du Burkina Faso par la
techniquedes poquests (zaí). Thèse Ecole Polytechnique Fédrale de Lausanne, Switzerland, 199 p.
Kessler, J.J., 1992. Influence of carité (Vitelarea paradoxa) and néré (Parkia biglobosa) trees on sorghum
production in Burkina Faso. Agroforestry Systems 17, p. 97-118
Kiepe, P., A. Mando, W.P. Spaan and W.B. Hoogmoed, 2001. Dynamics of soil resources in Sahelian
Villages. . In : Agro-silvo-pastoral land use in Sahelia Villages. Stoosnijder and Van Rheenen (eds)
Reiskirchen : Catena Verl., 2001. (Advances in Geoecology ; 33), ISBN 3-923381-45-X
Korogo, J.E., 1990. Expérience du PAF en technique d'ATV au Yatenga.
Mando, A., 1997. The role of termites and mulch in rehabilitation of crusted Sahelian soils. Tropical
Resource Management Papers, 16. Wageningen University. The Netherlands. 101 p.
Martin, P. en C. Reij, 1991: Mission d'appui technique au programme PSN, sous-programme conservation
des eaux et du sol.
34
Mazzucato, V and D. Niemeijer, 2000. Rethinking soil and water conservation in a changing society : a case
study in eastern Burkina Faso. Doctoral thesis Wageningen University. The Netherlands. 380 p.,
ISBN 90-5808-250-4. Also published as Tropical Resource Management Papers No.32 (ISBN 0926-
9495).
ORD, 1987. Rapport Annuel d'ORD.
Ouedraogo, A., 1992. L'expérience du PAF sur la méthode participative de recherche-action.
Ouedraogo, M., 1988. Rapport d'Activités campagne 1987−88
PAF, 1992. Programme d'Activités du PAF.
PEDI, 1993. Présentation du Projet PEDI.
PIK, 1984. Rapport de Mission.
PIK, 1987. Rapport de la mission d'Evaluation Tripartie.
PIK, 1991a. Rapport de Mission.
PIK, 1991b. Suivi socio-économique de 85 familles paysannes dans l'arrondissement de Keita.
PIK, 1992. Plan de Coopération FAO/Gouvernement.
PLAE, 1992a. Rapport Bilan Lutte Anti-Erosive, Campagne 1991
PLAE, 1992b. Rapport de la mission d'évaluation de la deuxième phase du Projet Lutte Anti-Erosive dans la
zone Mali-Sud.
Reij, C., 1992. Building on traditions: the improvement of indigenous techniques in the West African Sahel.
Paper presented to the "International Symposium on Soil and water Conservation: Social, Economic
and Institutional Considerations", Honolulu, Hawaï.
Sanders, D.W., 1988. Summary of workshop Discussions. In: Conservation farming on steep lands,
Moldenhauer W.C. and Hudson N.W. (eds). Soil and water Cons. Soc., Ankeny, Iowa.
Sivakumar, M.V.K., 1991. Drought spells and drought frequencies in West Africa. Research Bulletin No. 13,
International Crops Research Institute of the Semi-Arid Tropics (ICRISAT), Patancheru, India.
Sroosnijder, L. and T. Van Rheenen, 2001. Reflections on natural resources dynamics in Sahelian villages.
In : Agro-silvo-pastoral land use in Sahelia Villages. Stoosnijder and Van Rheenen (eds)
Reiskirchen : Catena Verl., 2001. (Advances in Geoecology ; 33), ISBN 3-923381-45-X
Souley, 1990. The impact of a project focusing on soil and water conservation: A case study of PIK.
Traoré, A., 1991. Le PAF/OXFAM, une approche d'ATV au Yatenga.
Van Campen, W., 1990. We moeten rustig lopen want we hebben haast.
Van Campen, W. en G. Hallam, 1986. Réactions aux plaintes des paysans concernantl'érosion du sol dans les
zones d'activités agricoles intensives au Mali-Sud: des réponses fixes aux propositions flexibles.
Van Campen, W. en D. Kèbé, 1986. Lutte anti-érosive dans la zone cotonnière au Mali-Sud; dans:
Aménagements hydro-agricoles et systèmes de production. Tome I, DSA-CIRAD, Montpellier,
France.
Van der Poel, P. en Kaya, B., 1990. Synthèse des activités de recherche de la DRSPR sur l'aménagement
anti-érosif.
Van der Pol, F., 1992. Economic aspects of the nutrient balance. (Bijdrage aan de 64ste Tropisch
Landbouwdag, Wageningen)
Van Oosten, A., 1986. Plan d'aménagement du micro-bassin versant Darkoa.
Van der Walle, J., 1988. Eindrapport SNV-Inzet.
Vlaar, J.C.J. (Ed.), 1992. Les techniques de conservation des eaux et des sols dans les pays du Sahel. CIEH
Ouaguadougou and Wageningen University, The Netherlands. 99 pp.

35
2.3 Evaluation of the effectiveness of soil and water conservation
measures in a closed silvo-pastoral area in Burkina Faso
Spaan. W.P. and K.J. Van Dijk, 1998. Evaluation of the effectiveness of soil and water conservation
measures in a closed silvo-pastoral area in Burkina Faso. Advances in GeoEcology 31, 1295−1301,
Reiskirchen 1998.
Abstract
A degraded silvo-pastoral area near the village of Zana Mogho, Bam Province, Burkina Faso, was
safeguarded from land use activities for a number of years to rehabilitate the land. Stimulating
regeneration of vegetation and improving the physical and chemical properties of the soil achieved Land
improvement. In this enclosure a number of soil and water conservation measures were taken to
accelerate the rehabilitation processes. The effectiveness of these measures as to the extent to which they
had improved the soil water, soil nutrient and biomass balances, was evaluated in an exploratory study
from May to September 1993.
The measures consisted of (1) lines of tree trunks and stones serving as low barriers to run-off, and (2)
mulching of surfaces with branches, herbs and grasses. Stone and trunk lines were the most effective in
conserving water. Soil moisture content in plots where the measures had been taken was always higher
than in mulched plots. The measures had no effect on soil fertility. The enrichment ratio of the sediment
was almost 1:0. All measures were observed to increase vegetation cover. Mulching with dry grass was
very effective in capturing soil particles. Mulching with branches had no measurable effect. Of all
measured variables, thickness of accumulated sediment and soil moisture content were the most useful for
evaluating the impact of the measures.
KEY WORDS: degradation; enclosure; regeneration; conservation measures; effectiveness
2.3.1 Introduction
The aim of this exploratory study was to evaluate the effectiveness of soil and water conservation
measures for the rehabilitation of degraded silvo-pastoral land. The study was carried out in Zana Mogho
village, 20 km north-west of the town of Bourzanga, Bam Province, Burkina Faso from May to Septem-
ber 1993 (Van Dijk, 1994). Bam Province is located on the Central Plateau, one of the flattest parts of
Burkina Faso. It is situated in the northern fringe of the northern Sudanian zone, with an annual rainfall
ranging between 600−900 mm. The rainy season lasts from May to September and is characterized by
showers with high rainfall intensities and large spatial variation (Vlaar, 1992). The population density of
Bam province is high by local standards (41 p/km2
). Population growth is 2.8 %. The present farming
system is no longer capable of feeding the growing population of people and cattle. The resulting over-
exploitation of the natural resources has led to the degradation of soil and vegetation (Claude et al., 1991).
In turn, this degradation threatens the viability of agriculture and livestock raising practiced in the area.
Therefore, for the survival of its people, it is necessary to protect the soil (Hien et al., 1992).
In this paper, degradation is defined as ‘the reduction of the capacity of the soil to conserve a certain mode
of exploitation’ (Blaikie and Brookfield, 1987). Rehabilitation is defined as ‘the restoration of the
productivity of degraded soils' (Critchley et al., 1992). Looking at changes in soil water, soil nutrient and
biomass balances can monitor rehabilitation. The effectiveness of a soil and water conservation measure
can be defined as the extent to which it improves these balances. To assess the influence of the measures
on these balances, the following variables were measured: (1) infiltration capacity and soil moisture
content (water balance); (2) sedimentation, bulk density, and soil nutrient content (soil and soil nutrient
balance), and (3) quantity, structure and composition of biomass (biomass balance).

36
In 1989 an area of about 25 ha was demarcated and henceforward safeguarded from any kind of land use
(mise en défens, enclosure), in order to stimulate natural regeneration of the vegetation, and the
restoration of the physical and chemical properties of the soil. The enclosure was established in agreement
with the local people (Kempen, 1992). Prohibited activities included cutting wood and grasses, burning
the vegetation and grazing. The area had been used as a cotton field and was abandoned as such about 15
years earlier, after which it was used as silvo-pastoral land. When the area was closed for use it was
seriously degraded. Enclosure as a single measure for land rehabilitation is only effective in slightly to
moderately degraded areas. In extremely degraded areas additional measures are required. Therefore in
1990, supporting soil and water conservation measures were taken on a trial basis.
2.3.2 Materials and methods
The following soil and water conservation measures are considered in this paper: line measures consisting
of low barriers of trunks or stones, and area measures involving the application of woody or grass mulch.
Trunk and stone lines were laid out along the contour. The height of the barriers varied between
0.20 m and 0.40 m. The trunks and stones were gathered from the surrounding area. Construction of
barriers aimed to:
• Slow down and spread run-off.
• Increase infiltration and soil moisture.
• Increase sedimentation of soil particles and litter.
• Capture seeds in order to stimulate their germination.
• To protect fields situated down-slope.
The woody mulch consisted of a cover of dead branches and small trunks. The grass mulch was made up
of a cover of dry grass and herbs collected at the end of the dry season. For an adequate protection of the
soil about 8 tons/ha was needed. Branches and grass were gathered in the vicinity of the enclosure. The
intention of mulching was to:
• Attract termites, which make the soil porous and thereby increase the infiltration rate.
• Reduce soil temperature and evaporation.
• Slow down the velocity of run-off and to spread it over the area.
• Capture sediment, litter and seeds to stimulate regeneration of the vegetation.
• Reduce rainfall energy (Roorda and Lamers, 1991).
The measures were evaluated on test plots of 10 x 10 m. The test plots were left open to runoff from up-
slope. The effect of line measures was established by measuring the above mentioned variables 0.5 m up-
slope of each measure, and compare them with conditions 8 m up-slope. On the mulched plots
measurements were conducted on areas with vegetation and compared with conditions on areas without
vegetation.
At the time of the evaluation the western part of the enclosure (Figure 2.3) was heavily degraded with 80
% bare soil and sparse herbs, nearly all of which were annual species. The eastern part of the area
consisted of savanna vegetation with shrubs, widely spaced herbs and annual grasses. In this area 50 % of
the soil was bare. All measures were replicated four times, with two replications in the most degraded part
of the area and two replications in the less degraded part. The measures with woody mulch were
replicated five times.
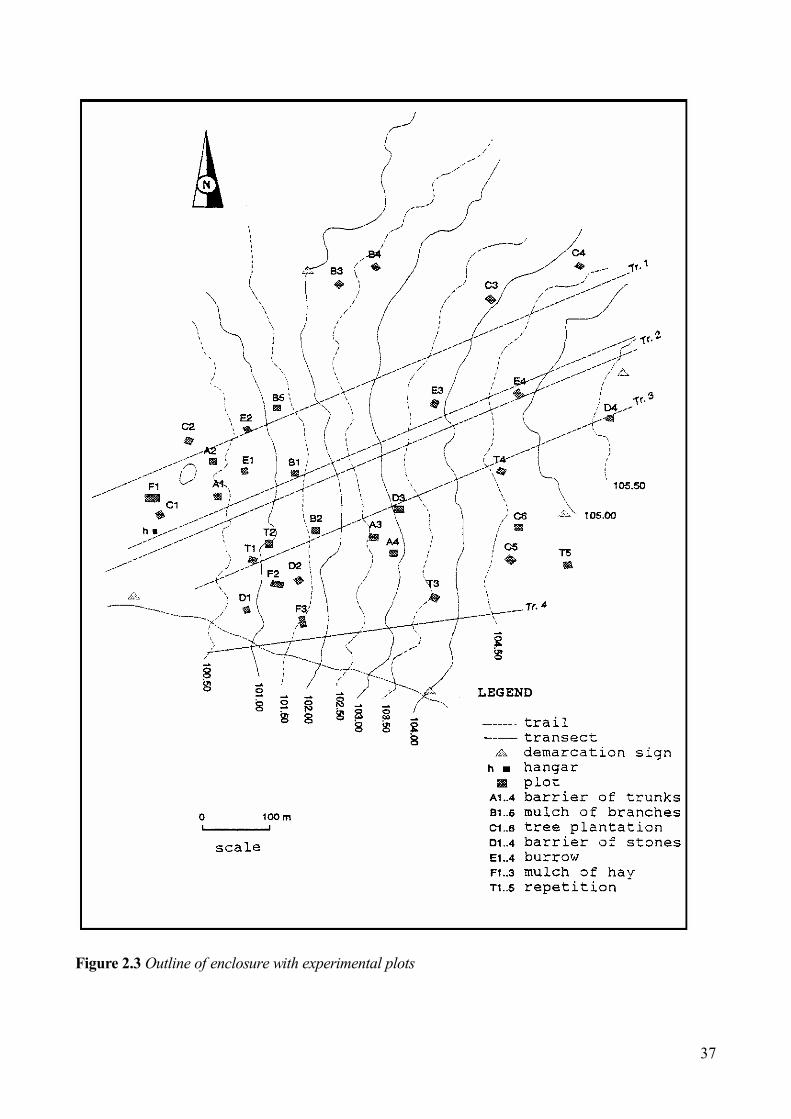
37
Figure 2.3 Outline of enclosure with experimental plots
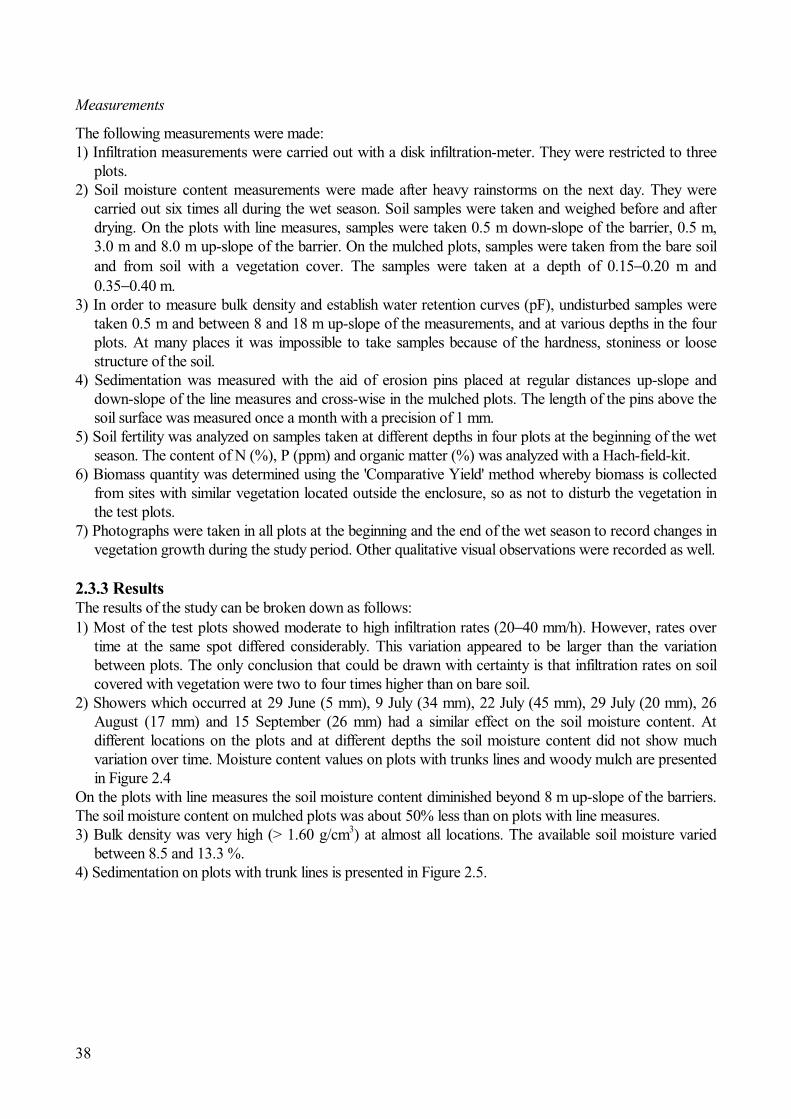
38
Measurements
The following measurements were made:
1) Infiltration measurements were carried out with a disk infiltration-meter. They were restricted to three
plots.
2) Soil moisture content measurements were made after heavy rainstorms on the next day. They were
carried out six times all during the wet season. Soil samples were taken and weighed before and after
drying. On the plots with line measures, samples were taken 0.5 m down-slope of the barrier, 0.5 m,
3.0 m and 8.0 m up-slope of the barrier. On the mulched plots, samples were taken from the bare soil
and from soil with a vegetation cover. The samples were taken at a depth of 0.15−0.20 m and
0.35−0.40 m.
3) In order to measure bulk density and establish water retention curves (pF), undisturbed samples were
taken 0.5 m and between 8 and 18 m up-slope of the measurements, and at various depths in the four
plots. At many places it was impossible to take samples because of the hardness, stoniness or loose
structure of the soil.
4) Sedimentation was measured with the aid of erosion pins placed at regular distances up-slope and
down-slope of the line measures and cross-wise in the mulched plots. The length of the pins above the
soil surface was measured once a month with a precision of 1 mm.
5) Soil fertility was analyzed on samples taken at different depths in four plots at the beginning of the wet
season. The content of N (%), P (ppm) and organic matter (%) was analyzed with a Hach-field-kit.
6) Biomass quantity was determined using the 'Comparative Yield' method whereby biomass is collected
from sites with similar vegetation located outside the enclosure, so as not to disturb the vegetation in
the test plots.
7) Photographs were taken in all plots at the beginning and the end of the wet season to record changes in
vegetation growth during the study period. Other qualitative visual observations were recorded as well.
2.3.3 Results
The results of the study can be broken down as follows:
1) Most of the test plots showed moderate to high infiltration rates (20−40 mm/h). However, rates over
time at the same spot differed considerably. This variation appeared to be larger than the variation
between plots. The only conclusion that could be drawn with certainty is that infiltration rates on soil
covered with vegetation were two to four times higher than on bare soil.
2) Showers which occurred at 29 June (5 mm), 9 July (34 mm), 22 July (45 mm), 29 July (20 mm), 26
August (17 mm) and 15 September (26 mm) had a similar effect on the soil moisture content. At
different locations on the plots and at different depths the soil moisture content did not show much
variation over time. Moisture content values on plots with trunks lines and woody mulch are presented
in Figure 2.4
On the plots with line measures the soil moisture content diminished beyond 8 m up-slope of the barriers.
The soil moisture content on mulched plots was about 50% less than on plots with line measures.
3) Bulk density was very high (> 1.60 g/cm3
) at almost all locations. The available soil moisture varied
between 8.5 and 13.3 %.
4) Sedimentation on plots with trunk lines is presented in Figure 2.5.
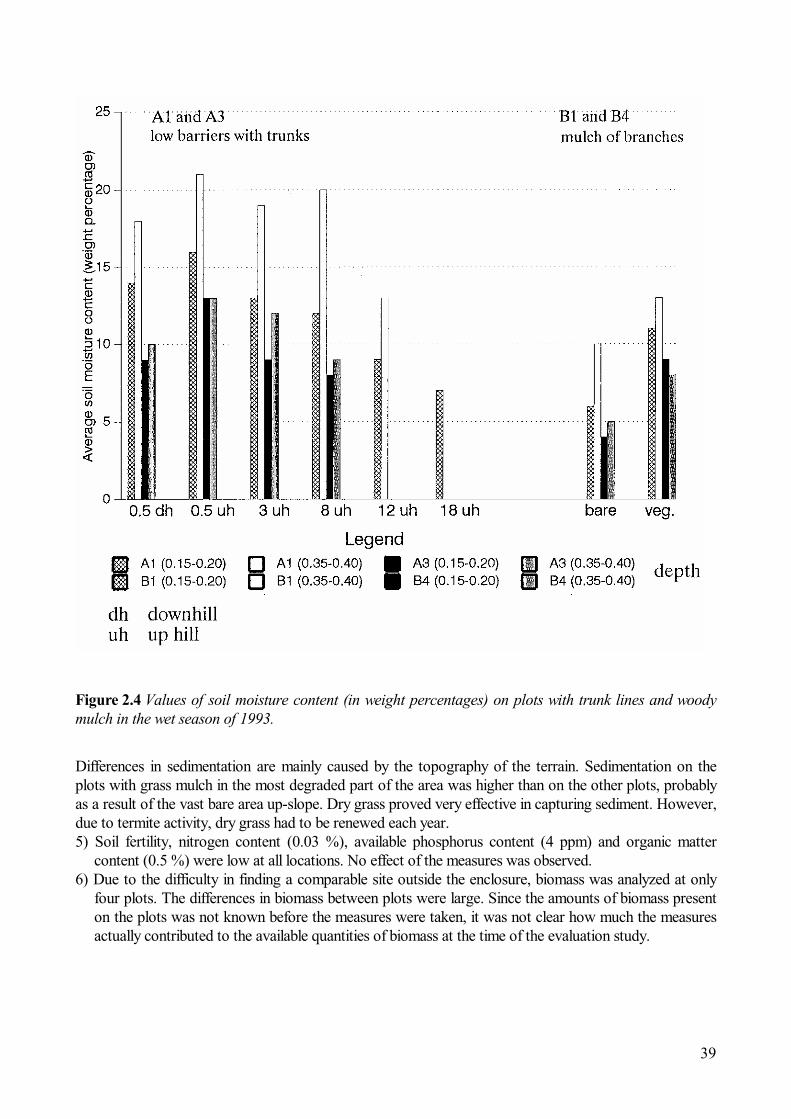
39
Figure 2.4 Values of soil moisture content (in weight percentages) on plots with trunk lines and woody
mulch in the wet season of 1993.
Differences in sedimentation are mainly caused by the topography of the terrain. Sedimentation on the
plots with grass mulch in the most degraded part of the area was higher than on the other plots, probably
as a result of the vast bare area up-slope. Dry grass proved very effective in capturing sediment. However,
due to termite activity, dry grass had to be renewed each year.
5) Soil fertility, nitrogen content (0.03 %), available phosphorus content (4 ppm) and organic matter
content (0.5 %) were low at all locations. No effect of the measures was observed.
6) Due to the difficulty in finding a comparable site outside the enclosure, biomass was analyzed at only
four plots. The differences in biomass between plots were large. Since the amounts of biomass present
on the plots was not known before the measures were taken, it was not clear how much the measures
actually contributed to the available quantities of biomass at the time of the evaluation study.

40
Figure 2.5 Thickness of accumulated sediment on plots with trunk lines (A1 and A2 in the severely
degraded part of the area, A3 and A4 in the less degraded part) in relation to the distance from the
barrier
7) According to visual observations the change in vegetation between the dry and the wet season was
impressive. At the end of the dry season the plots looked bare. At the end of the wet season there was
a strip of rather dense vegetation, with a height of about 1.50 m along the line measures and with a
width ranging from several meters up-slope to half a meter down-slope of the barriers. There was a
large variety of plant species. On mulched plots the vegetation cover was comparable to that of the
surrounding area and it was not very extensive. It seems that the presence or absence of vegetation is
not so much caused by the soil and conservation measures but by the variable terrain conditions, such
as presence of a crust, slope or presence of trees. Characteristics of the terrain around the place where
the soil conservation measure had been taken seemed to influence its impact on the rehabilitation of the
land to a large degree. For example, a soil conservation measure applied at a place with a large bare
up-slope area appeared to conserve more soil and water because it received more run-off water.
2.3.4 Conclusions
Infiltration, bulk density, water retention, soil fertility and biomass measurements did not show clear
effects caused by the soil and water conservation measures. For example, soil fertility was very low at all
locations close to the soil and water conservation measure, as well as at its reference point. On the other
hand, there were great differences due to the spatial variability of the terrain. In this exploratory study, the
above mentioned variables were not very suitable to assess the effectiveness of soil and water conservation
measures, because of the location of the measures. Photos were useful to record changes in vegetation
cover in the area over time. They were useful as qualitative indicators of the effectiveness of soil and water
conservation measures. Soil moisture content and sedimentation were easy to measure. Thickness of
sediments showed clearly the effect of measures on soil conservation, whereas soil moisture content
showed the effects on water conservation. Therefore, these two variables can be deemed suitable for
41
evaluating conservation measures in an exploratory study such as this. It can also be concluded that line
measures were effective soil and water conservation measures. There was no difference in effectiveness
between the two types of line measures. In comparison to line measures, mulching was less effective,
although grass mulch was more effective than woody mulch.
References
Blaikie, P.M., and H.C. Brookfield (eds), 1987. Land degradation and society. Methuen & Co., Ltd., London,
England, 296p.
Claude, J., M. Grouzis et P. Milleville, 1991. Un espace Sahélien, la mare d'Oursi, Burkina Faso. ORSTOM, Paris,
241p.
Critchley, W.R.S., C.P. Reij and S.D. Turner, 1992. Soil and water conservation in Sub-Saharan Africa; Towards
sustainable production by the rural poor. International Fund for Agricultural Development, Rome, 110p.
Hien, F., L. Stroosnijder and I. Zoungrana, 1992. Les mesures de conservation des eaux et des sols pour la régé-
nération des espaces silvo-pastoraux: diversité et effectivité dans le plateau central du Burkina Faso.
Université Agronomique Wageningen, Pays-Bas, 16p.
Kempen, M. 1992. Contribution au cadre conceptuel des forêts villageoises et des mises en défens au Centre Nord,
Burkina Faso. MET, SPET, Kongoussi, SNV, PAFV, Ouagadougou, Burkina Faso, 64p.
Roorda, T. and B. Lamers, 1991. Projet mise en défens 1990 (MET, SNV, AFVP): La mise en défens de
Zanamogo: Une étude pour la régénération des sols et végétations silvo-pastoraux sahéliens au Burkina
Faso. CIEH, Ouagadougou, Burkina Faso, UAW, Wageningen, Pays Bas (rapport de fin d'études), 80p.
Van Dijk, K.J., 1994. Evaluation des mesures de régénération des terres dégradées à Zana Mogho, Burkina Faso.
Antenne Sahélienne de l'Université Agronomique Wageningen Pays-Bas et de l'Université de Ouagadougou
Burkina Faso, 40p.
Vlaar, J.C.J. (ed.) 1992. Les techniques de conservation des eaux et des sols dans les pays du Sahel. Rapport d'une
étude effectuée dans le cadre de la collaboration entre le Comite Interafricain d'Etudes Hydraulique (CIEH),
Ouagadougou Burkina Faso, et l'Université Agronomique Wageningen, 99p.

42
2.4 The costs of soil and water conservation measures in the Sahel
De Graaff, J. and W.P. Spaan, 2002. The costs of soil and water conservation measures in the Sahel.
Proceeding of the Third International Congress Man and Soil at the Third Millennium, Valencia 28
March–1 April 2000, Eds. Rubio, Morgan, Asins and Adreu, Geoforma Ediciones, Logroňo, 2002,
pp 833−845.
Abstract
The low adoption rate of soil and water conservation (SWC) measures in erosion-prone areas is
often ascribed to the high investment costs of measures, such as physical or vegetation barriers.
The costs of these measures may seem modest in comparison to infrastructural costs for roads or for
irrigation, but they are often too high for the individual rainfed farmer, certainly in marginal semi-
arid zones in the Sahel.
In this paper a detailed analysis is made of the three major SWC measures in Burkina Faso; stone
rows, earth bunds and vegetation barriers. The investment costs are highest for stone rows, whereby
the transport of stones requires substantial inputs of labour and means of transport. Vegetation
measures have the disadvantage that they need to be planted in the rainy season, when agricultural
production activities have the highest priority. Earth bunds are not always effective and either have
a rather short lifetime or require major annual maintenance work. In wet years earth bunds conserve
too much water and cause ponding.
A major reason why farmers consider the costs prohibitive relates to the uncertain nature of the
benefits. These benefits comprise of several elements, some of which may have immediate effect
(e.g. moisture retention), but most of which occur only gradually over a long period of time, and are
hard to assess and even harder to quantify. Therefore the effectiveness of the three measures is here
compared by means of a qualitative multi-criteria analysis, in which both the government’s and the
farmer’s point of view is considered. Stone rows show the best results, and this is also the measure
that with the help of development projects, has now been most often applied in the study areas in
Burkina Faso. However, vegetation barriers, which have not yet been greatly promoted come a
close second and are the best solution in areas where stones are not available.
Key words: soil and water conservation measures, establishment cost, multi-criteria analysis
2.4.1 Introduction
The principal problem in the countries in the Sahelian zone of Africa consists of soil degradation,
which contributes to the impoverishment of the population and vice versa. Under the influence of
over-population and the urgency to fulfil the food requirements, fertile soils are tilled very
intensively. This results in an improper utilisation of the soil, a sharp reduction of length of fallow
periods and the increased use of marginally suitable land. The degradation is manifested by erosion
and by a reduction of soil fertility. The decreased vegetative cover is the direct cause of soil
degradation. As a result of this intensive land use and insufficient replenishment of nutrients
through fertilisation, the most fertile regions of the countries are changing into eroded and
unproductive regions. For the short term the population is developing a survival strategy. Migration
to cities and neighbouring countries to increase food security and family earnings has been more
rule then exception (OECD, 1988; Breusers, 1998).
In the past twenty years much attention has been given in the Sahelian countries to various
soil and water conservation activities. In the first instance the focus has been on so-called line
interventions to reduce the runoff and to increase infiltration, such as stone, earth and vegetation
barriers. Subsequently the emphasis shifted to area interventions, in order to cover the soil and to
maintain soil fertility. This includes on the one hand the practise of mulching (Slingerland and
Masduwel, 1996) and on the other hand manuring, composting and other ways to restore soil
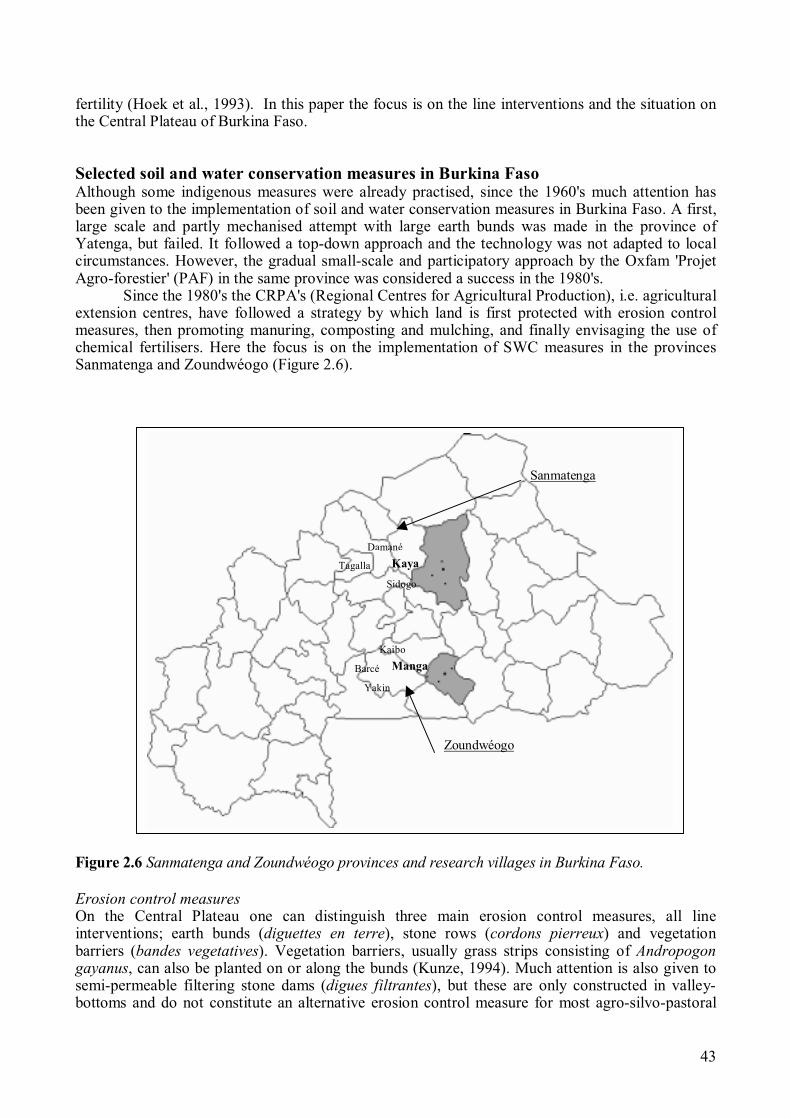
43
fertility (Hoek et al., 1993). In this paper the focus is on the line interventions and the situation on
the Central Plateau of Burkina Faso.
Selected soil and water conservation measures in Burkina Faso
Although some indigenous measures were already practised, since the 1960's much attention has
been given to the implementation of soil and water conservation measures in Burkina Faso. A first,
large scale and partly mechanised attempt with large earth bunds was made in the province of
Yatenga, but failed. It followed a top-down approach and the technology was not adapted to local
circumstances. However, the gradual small-scale and participatory approach by the Oxfam 'Projet
Agro-forestier' (PAF) in the same province was considered a success in the 1980's.
Since the 1980's the CRPA's (Regional Centres for Agricultural Production), i.e. agricultural
extension centres, have followed a strategy by which land is first protected with erosion control
measures, then promoting manuring, composting and mulching, and finally envisaging the use of
chemical fertilisers. Here the focus is on the implementation of SWC measures in the provinces
Sanmatenga and Zoundwéogo (Figure 2.6).
Figure 2.6 Sanmatenga and Zoundwéogo provinces and research villages in Burkina Faso.
Erosion control measures
On the Central Plateau one can distinguish three main erosion control measures, all line
interventions; earth bunds (diguettes en terre), stone rows (cordons pierreux) and vegetation
barriers (bandes vegetatives). Vegetation barriers, usually grass strips consisting of Andropogon
gayanus, can also be planted on or along the bunds (Kunze, 1994). Much attention is also given to
semi-permeable filtering stone dams (digues filtrantes), but these are only constructed in valley-
bottoms and do not constitute an alternative erosion control measure for most agro-silvo-pastoral
Damané
Kaya
Sidogo
Tagalla
Barcé
Yakin
Manga
Kaibo
Sanmatenga
Zoundwéogo

44
land. In some areas use is made of the 'zay' technique whereby water and nutrients are retained in
planting pits (Vlaar, 1992). Earth bunds and stone rows are normally established in the dry season,
while the vegetation barriers have to be planted during the rainy season. All three measures perform
more or less the same functions: to reduce soil losses, to reduce nutrient losses and to increase soil
moisture availability. Farmers emphasised their role in maintaining productivity, which has been
interpreted as maintaining soil fertility over a long period of time (de Graaff, 1996).
Vlaar (1992) classified the various soil and water conservation measures according to their
suitability for different agro-ecological zones and different soil types. All three measures are most
adapted to the Southern Sudan zone. Under the rainfall patterns in the Northern Sudan zone, semi-
permeable structures (stone rows and vegetation barriers) are more effective than earth bunds, and
less risky in wet years. With a minimum maintenance effort the expected lifetime of stone rows is
considerably longer than that of earth bunds, which need to be reshaped every five years. However,
earth bunds may last longer when they are planted with grass, shrubs or trees (Hien, 1995) and
when they have adequate drainage outlets.
One can distinguish between single rows of stones (usually with large stones) and stone
rows whereby (smaller) stones are put next to or on top of each other. Since in part of the
Sanmatenga province the availability of stones is not yet a major problem, earth bunds are no longer
constructed very often in this province. In Sanmatenga, individual farmers originally built stone
rows, but for efficient stone transport by lorries of development projects, the emphasis gradually
shifted towards construction by groups of farmers on 10 ha areas. Between 1985−1994 a total of
11,093 ha were treated, mostly with stone rows (DRP, Kaya; pers. comm.). In Zoundwéogo stones
are not always available within reasonable distance. The 13,596 ha treated between 1985 and 1994
consisted mostly of earth bunds (SPA, Manga; pers. comm.). However, few of the earth bunds
established before 1990 are still intact.
Table 2.5 Erosion control measures applied in six villages on Central Plateau (1993).
House- Area Cultivated area protected with: Population
Province holds cultiv. Stone Earth Grass Density
Village (sample) Rows Bunds Strips
(no) (ha) (percentage of cultivated area) (pp/km2)
Sanmatenga
Damané 25 81 38 0 18 122
Tagalla 26 129 30 0 22 58
Sidogo 31 217 31 14 20 172
Zoundwéogo
Barcé 28 150 1 10 4 52
Yakin 25 139 15 19 4 137
Kaibo-Sud V5 25 135 15 0 3 91
Total / average 160 851 21 8 12 82
Source: Antenne Sahélienne farm household studies 1992−1995.
Table 2.5 shows which part of the cultivated area in the six research villages has been protected
with the main erosion control measures. These villages were selected partly on the basis of the
extent of measures taken and are as such not representative for all cultivated land on the Central
Plateau. It is interesting to compare the situation in the respective villages. There is more emphasis
on soil conservation measures in the more densely populated villages, coinciding with experiences
in Kenya (Tiffin et al., 1993). Stone rows are the most common measure, except in Barcé where
stones are hardly available. Vegetation barriers and in particular grass strips are also common, but
they are not always planted along the contour lines and thus not always effective in erosion control
and soil and water conservation.
45
2.4.3 Costs of the tree selected soil and water conservation measures.
Costs of stone rows
In several studies estimates have been made of the costs of establishing stone rows, but these
estimates vary considerably because of different circumstances and techniques involved. Rochette
(1989) arrives at an average workload of 219 man-days per ha, but in his case farmers dig trenches
before placing the stones. Matlon (1980) arrives at a total of 181 man-days per ha, of which most is
spent on collection of stones, which may have to be cut from the rocks. However, the exact
conditions were not known and for this reason a 'time and motion' study was undertaken in the
village of Tagalla, whereby the whole operation of procuring stones and constituting the rows was
monitored (Kempkes, 1994). In this case the distance to the stone collection site was 2 km, and
stones were obtained relatively easily from loose laterite rocks and outcrops. Transport was by lorry
and per trip an average of nearly 500 stones with an average diameter of 30 cm, was transported.
The loading and return trip (including unloading) took on average 11 and 19 minutes respectively,
which allowed the driver to perform the 10 trips per day that are prescribed. The operation was
undertaken for an area of 10 ha, where stone rows were placed at a (reasonably large) average
distance of 50 m.
With a total of almost 2800 stones per ha and a group of 30 adults and 10 children involved
in stone collection, the operation was completed in six days. In this particular case, with a slope of
about 1−2 %, only about 50 man-days (equivalent) were needed per ha. In case of steeper slopes of
3 % and more, stone rows should be placed at a distance of 20 m or less.
The most important factors that determine the costs are the following:
• Means of transport: by lorry, donkey cart, wheelbarrow or head-load. The farm household
studies showed that lorries were most often used (74%), followed by head-load (10%),
donkey cart (8%), wheelbarrow (6%) and other modes of transport (2%).
• Slope of the terrain determines the average distance between rows. Together with the
choice of simple or double rows this determines the number of stones needed per ha.
• Distance the stones have to be hauled, and the ease with which they can be obtained at the
collection site.
• Assumptions about the opportunity costs of the labour involved. Due to the arduous work,
labour costs are here fixed at CFAF 500 per man-day (person-equivalent), in 1993 prices.
The 1993 farm survey showed (prior to the devaluation) average earnings per man-day in
alternative employment during the dry season of about CFAF 320 per man-day.
• Assumptions about fixed and variable costs of means of transport and number of days in
use (here fixed at 150). A new lorry is assumed to cost CFAF 40 million and a donkey and
cart CFAF 240,000 (1993 prices). The capacity of lorry and donkey cart per trip are 500
stones (4.5 m3
or 5 ton) and 50 stones (0.4 m3
or 0.5 ton) respectively. Due to the duration
of the return trip the donkey makes only 5 trips of 2 km and 2.5 trips of 4 km a day.
The traditional alternative of headload would require 350 and 700 man-days per ha at distances of 2
and 4 km respectively, only for collection of the stones. Thus constituting a very costly alternative.
Table 2.6 shows the cost of establishing 1 ha of stone rows for two modes of transport and different
circumstances.
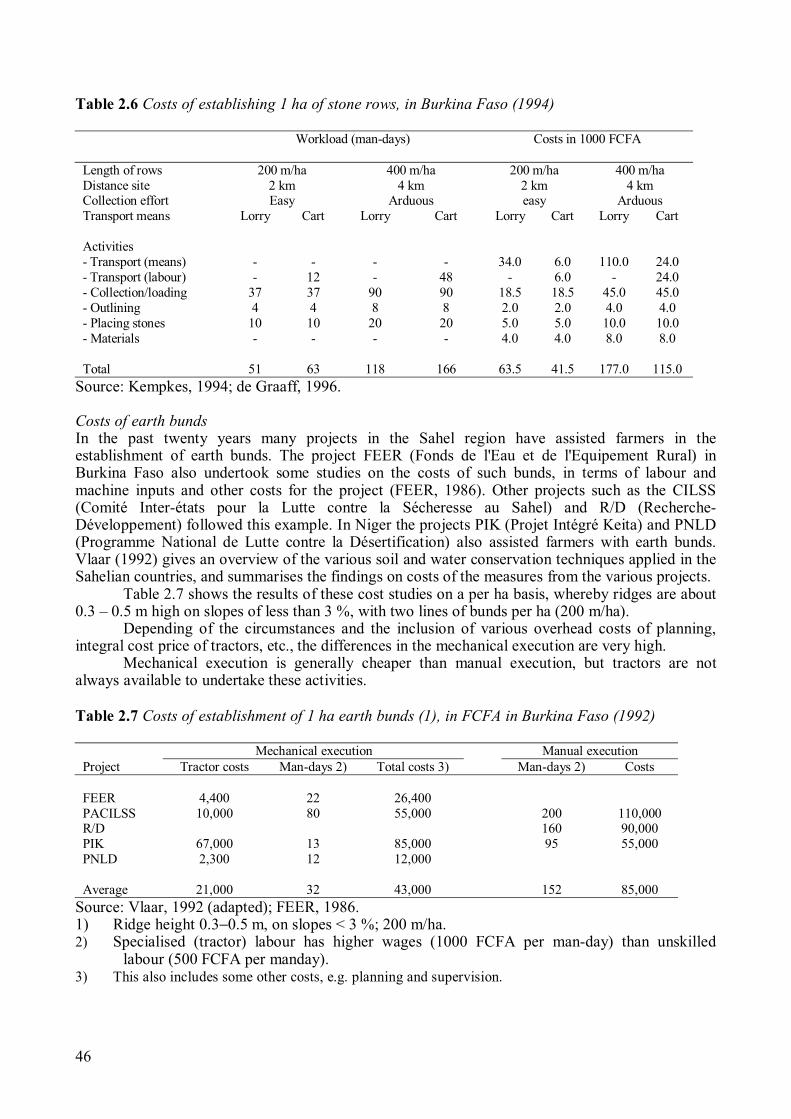
46
Table 2.6 Costs of establishing 1 ha of stone rows, in Burkina Faso (1994)
Workload (man-days) Costs in 1000 FCFA
Length of rows 200 m/ha 400 m/ha 200 m/ha 400 m/ha
Distance site 2 km 4 km 2 km 4 km
Collection effort Easy Arduous easy Arduous
Transport means Lorry Cart Lorry Cart Lorry Cart Lorry Cart
Activities
- Transport (means) - - - - 34.0 6.0 110.0 24.0
- Transport (labour) - 12 - 48 - 6.0 - 24.0
- Collection/loading 37 37 90 90 18.5 18.5 45.0 45.0
- Outlining 4 4 8 8 2.0 2.0 4.0 4.0
- Placing stones 10 10 20 20 5.0 5.0 10.0 10.0
- Materials - - - - 4.0 4.0 8.0 8.0
Total 51 63 118 166 63.5 41.5 177.0 115.0
Source: Kempkes, 1994; de Graaff, 1996.
Costs of earth bunds
In the past twenty years many projects in the Sahel region have assisted farmers in the
establishment of earth bunds. The project FEER (Fonds de l'Eau et de l'Equipement Rural) in
Burkina Faso also undertook some studies on the costs of such bunds, in terms of labour and
machine inputs and other costs for the project (FEER, 1986). Other projects such as the CILSS
(Comité Inter-états pour la Lutte contre la Sécheresse au Sahel) and R/D (Recherche-
Développement) followed this example. In Niger the projects PIK (Projet Intégré Keita) and PNLD
(Programme National de Lutte contre la Désertification) also assisted farmers with earth bunds.
Vlaar (1992) gives an overview of the various soil and water conservation techniques applied in the
Sahelian countries, and summarises the findings on costs of the measures from the various projects.
Table 2.7 shows the results of these cost studies on a per ha basis, whereby ridges are about
0.3 – 0.5 m high on slopes of less than 3 %, with two lines of bunds per ha (200 m/ha).
Depending of the circumstances and the inclusion of various overhead costs of planning,
integral cost price of tractors, etc., the differences in the mechanical execution are very high.
Mechanical execution is generally cheaper than manual execution, but tractors are not
always available to undertake these activities.
Table 2.7 Costs of establishment of 1 ha earth bunds (1), in FCFA in Burkina Faso (1992)
Mechanical execution Manual execution
Project Tractor costs Man-days 2) Total costs 3) Man-days 2) Costs
FEER 4,400 22 26,400
PACILSS 10,000 80 55,000 200 110,000
R/D 160 90,000
PIK 67,000 13 85,000 95 55,000
PNLD 2,300 12 12,000
Average 21,000 32 43,000 152 85,000
Source: Vlaar, 1992 (adapted); FEER, 1986.
1) Ridge height 0.3−0.5 m, on slopes < 3 %; 200 m/ha.
2) Specialised (tractor) labour has higher wages (1000 FCFA per man-day) than unskilled
labour (500 FCFA per manday).
3) This also includes some other costs, e.g. planning and supervision.

47
Costs of vegetation barriers
Relatively little work has been undertaken in the last decades on research and implementation of
vegetation barriers for soil and water conservation in the Sahel. However, since 1994 a research
programme on these types of barriers was undertaken at a 3 ha site near Gampela, 8 km north east
of Ouagadougou. Runoff plots of 20 x 20 m were laid out and seven plant species were planted in
three replications. The species include the perennial grasses: Andropogon gayanus and Vetiver
zizanioides; the shrubs Ziziphus mauritania and Guiera senegalensis, the small trees Acacia nilotica
and Pilostigma reticulatum, and the life fence Agave sisalana (Spaan et al., in prep.).
Apart from information of the soil water and nutrient balances behind these barriers
information was also gathered about the management of the barriers and in particular about the
costs of establishment. Table 2.8 gives an overview of the costs of establishment for 1 ha, for
respectively the local perennial grass (Andropogon gayanus) and for woody species.
It is here assumed that on slopes of about 2 % two barrier rows will be used per ha (200 m).
Table 2.8 shows that there is a large difference in costs between the sowing of local perennial
grasses or trees, and planting with container plants of woody species.
Table 2.8 Costs of establishment of 1 ha of vegetation barriers in the Sahel (200 m/ha) 1998.
Andropogon strips Woody vegetative barriers
Planting material Seed Slips Seed Cuttings Container pl.
Labour inputs 1)
- Collection 0.5 0.5 2 2 1
- Prep. Pl. mat. 0.5 0.5 1 2 -
- Outlining 0.5 0.5 0.5 0.5 0.5
- Hoeing/tillage 1 4.5 4.5 8 8
- Sowing/plant. 0.5 3 2 4 6
- Resow./repl. 1 2 1 2 2
- Watering/hoeing 1 3 1 3 3
- Cutting 2 2 2 2 2
- Other activities 2 - 2 0.5 1.5
Total labour 1) 9 14 16 24 24
Material inputs 2)
- Pl.mat (FCFA) - 19,200 - 24,000 96,000
Total costs FCFA 4,500 26,200 8,000 36,000 108,000
Source: Gampela research, Antenne Sahélienne (Spaan et al., in prep.).
1) Although present wage rates are much higher, labour is here valued at FCFA 500 per man-
day, to allow comparison with tables on costs of stone rows and earth bunds.
2) Slips: 10 FCFA, 8 per m.; Cuttings: 25 FCFA, 4 per m.; Container plants: 100 FCFA, 4 per m.
The range of cost for the various ways of execution of the three measures clearly overlaps.
However, in practise it has become clear, that the majority of the stone rows have been established
with the help of lorries and that most earth bunds are now established with tractors. It is also clear
that farmers for the time being will establish vegetation barriers mostly with grass strips, and not yet
with container plants. Therefore it may be concluded that stone rows have generally the highest
establishment costs, followed by earth bunds. The costs of vegetation barriers are relatively low.
The low adoption rate of soil and water conservation (SWC) measures in erosion-prone areas is
often ascribed to the high investment cost of measures. The costs of physical and vegetative
measures may seem modest in comparison to infrastructural costs for roads or for irrigation, but
they are often already too high for the individual rainfed farmer, certainly in marginal semi-arid
zones in the Sahel.
48
There are three major reasons why the costs of soil conservation are easily prohibitive;
• Firstly, soil conservation is seldom successfully undertaken on a large scale by all farmers
in a watershed in a common effort, with government aid. Since the common and public
interest in soil conservation remains unclear, farmers can often not rely on the support of
neighbours and the government.
• Secondly, the individual farmer has to incur most of the costs at once, since the
establishment forms the bulk of the costs and phasing is often difficult. A major part of
the costs consists of labour, which is often not amply available. The planting of vegetation
barriers has to be undertaken at the beginning of the rainy season, when farmers are
occupied with their crops. The establishment of stone rows and earth bunds may be
hampered by the fact that part of the labour force is absent during the dry season, due to
migration.
• The third and probably most important reason why the costs are considered prohibitive,
relates to the uncertain and even risky nature of the benefits. These benefits comprise of
several elements, some of which may have immediate effect (e.g. moisture retention), but
most of which occur only gradually over a long period of time, and are hard to assess and
even harder to quantify. The low prices and unreliable marketability of production
surpluses in many rainfed areas further aggravate this.
Therefore, the effectiveness of the three measures is hereunder compared by means of a qualitative
multi-criteria analysis, in which both the government and the farmer’s point of view are considered.
2.4.4 Comparative analysis of the three main measures
The three erosion control measures, stone rows, earth bunds and vegetation barriers, are alternatives
that have each their advantages and disadvantages under different circumstances, and from different
viewpoints. Vlaar (1992) compares these and other erosion control measures in the Sahel countries
on the basis of several criteria. These criteria relate to costs and impacts (efficiency and
conservation), but also to organisational aspects (bottlenecks), such as provision of transport and
know-how. Equity is not considered. Apart from a few quantitative criteria scores (e.g. costs), the
comparison mainly concerns qualitative scores. All measures involve some loss of cultivable area,
and bunds may cause waterlogging in case of big floods (Kempkes, 1994). These latter effects will
not be included here. Extension services have not yet paid much attention to vegetation barriers so
far, and the grass strips nowadays haphazardly established by farmers are not yet very effective in
soil and water conservation.
Multi-criteria analysis for the screening of erosion control alternatives
Table 2.9 shows the ten different criteria on the basis of which the three erosion control measures
are screened. Two weight sets are considered, representing the point of view of the Government or
general public and that of the farmer respectively. It further represents a situation on the Central
Plateau, that is close to average with regard to type of field, soil type, climate, availability of stones,
etc.
All scores on criteria are expressed in qualitative terms in the form of ranking. Other
benefits comprise in particular the use of Andropogon grass for fodder, thatching, mulching and the
use of stone rows to delimit parcels. The organisational preconditions concern the dependence of
farmers on lorries and tractors, the seasonality of implementation and the knowledge and extension
required for execution.
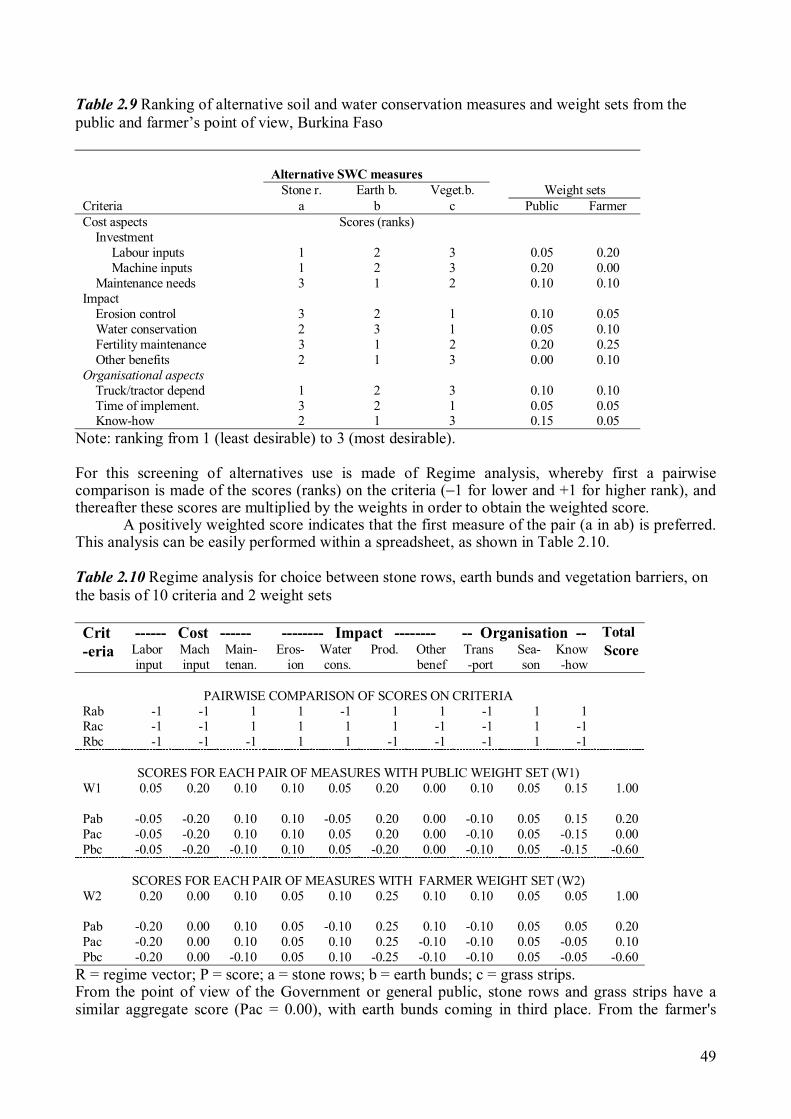
49
Table 2.9 Ranking of alternative soil and water conservation measures and weight sets from the
public and farmer’s point of view, Burkina Faso
Alternative SWC measures
Stone r. Earth b. Veget.b. Weight sets
Criteria a b c Public Farmer
Cost aspects Scores (ranks)
Investment
Labour inputs 1 2 3 0.05 0.20
Machine inputs 1 2 3 0.20 0.00
Maintenance needs 3 1 2 0.10 0.10
Impact
Erosion control 3 2 1 0.10 0.05
Water conservation 2 3 1 0.05 0.10
Fertility maintenance 3 1 2 0.20 0.25
Other benefits 2 1 3 0.00 0.10
Organisational aspects
Truck/tractor depend 1 2 3 0.10 0.10
Time of implement. 3 2 1 0.05 0.05
Know-how 2 1 3 0.15 0.05
Note: ranking from 1 (least desirable) to 3 (most desirable).
For this screening of alternatives use is made of Regime analysis, whereby first a pairwise
comparison is made of the scores (ranks) on the criteria (−1 for lower and +1 for higher rank), and
thereafter these scores are multiplied by the weights in order to obtain the weighted score.
A positively weighted score indicates that the first measure of the pair (a in ab) is preferred.
This analysis can be easily performed within a spreadsheet, as shown in Table 2.10.
Table 2.10 Regime analysis for choice between stone rows, earth bunds and vegetation barriers, on
the basis of 10 criteria and 2 weight sets
Crit ------ Cost ------ -------- Impact -------- -- Organisation -- Total
-eria Labor
input
Mach
input
Main-
tenan.
Eros-
ion
Water
cons.
Prod. Other
benef
Trans
-port
Sea-
son
Know
-how
Score
PAIRWISE COMPARISON OF SCORES ON CRITERIA
Rab -1 -1 1 1 -1 1 1 -1 1 1
Rac -1 -1 1 1 1 1 -1 -1 1 -1
Rbc -1 -1 -1 1 1 -1 -1 -1 1 -1
SCORES FOR EACH PAIR OF MEASURES WITH PUBLIC WEIGHT SET (W1)
W1 0.05 0.20 0.10 0.10 0.05 0.20 0.00 0.10 0.05 0.15 1.00
Pab -0.05 -0.20 0.10 0.10 -0.05 0.20 0.00 -0.10 0.05 0.15 0.20
Pac -0.05 -0.20 0.10 0.10 0.05 0.20 0.00 -0.10 0.05 -0.15 0.00
Pbc -0.05 -0.20 -0.10 0.10 0.05 -0.20 0.00 -0.10 0.05 -0.15 -0.60
SCORES FOR EACH PAIR OF MEASURES WITH FARMER WEIGHT SET (W2)
W2 0.20 0.00 0.10 0.05 0.10 0.25 0.10 0.10 0.05 0.05 1.00
Pab -0.20 0.00 0.10 0.05 -0.10 0.25 0.10 -0.10 0.05 0.05 0.20
Pac -0.20 0.00 0.10 0.05 0.10 0.25 -0.10 -0.10 0.05 -0.05 0.10
Pbc -0.20 0.00 -0.10 0.05 0.10 -0.25 -0.10 -0.10 0.05 -0.05 -0.60
R = regime vector; P = score; a = stone rows; b = earth bunds; c = grass strips.
From the point of view of the Government or general public, stone rows and grass strips have a
similar aggregate score (Pac = 0.00), with earth bunds coming in third place. From the farmer's
50
point of view, stone rows score slightly better than vegetation barriers (Pac = 0.10), and earth bunds
are again clearly the least attractive.
This qualitative MCA method thus shows that stone rows can presently be considered the
most attractive erosion control alternative, closely followed by vegetation barriers. When stone
quarries are too far away, vegetation barriers are the best option or a combination of earth bunds
reinforced with vegetation. Depending on the agro-ecological and socio-economic conditions
farmers and government agencies or projects may have different preferences (as shown here), and
thus other weight sets, which may alter the result.
When project and extension workers will pay more attention to vegetation barriers, these
measures will become more effective in erosion control and water conservation, therefore coming at
least second on these two criteria. In this case these barriers are slightly more attractive than stone
rows from both the government and farmer’s point of view (Pac scores become −0.10 for both
weight sets).
2.4.5 Conclusions
The costs of soil and water conservation measures vary considerably by circumstances. Since
stones are usually collected at several km distances from the fields, the costs of transport of stones
can be considerable. Earth bunds are generally cheaper and in particular when they can be
established mechanically. Vegetation barriers are very cheap when sowing is applied for grass or
tree species, but can be rather expensive when use is made of container plants for woody species.
These three types of line interventions perform more or less the same functions of reducing
soil and nutrient losses and improving soil water availability. However each of the three measures
have their own particular advantages and disadvantages. Qualitative multi-criteria analysis has been
carried out, which shows that stone rows are at present the most attractive soil and water
conservation measure. However, if more attention will be paid in extending services to vegetation
barriers, these measures have at least equal potential as stone rows and are the preferred measure in
areas where stones are scarce.
References
Breusers, M., 1998. On the move; land mobility and livelihood practices on the Central Plateau in Burkina
Faso. PhD Thesis. Agricultural University, Wageningen, 350 pp.
FEER, 1986. Evaluation des programmes de lutte contre l'érosion. FEER, 75 pp.
Graaff, J. de, 1996. The price of soil erosion; the economic evaluation of soil conservation and watershed
management. Tropical Resource Management Paper No. 14. Agricultural University, Wageningen,
299 pp.
Hien, F.G., 1995. La régénération de l'espace silvo-pastoral au Sahel; une étude de l'effet de mesures de
conservation des eaux et des sols au Burkina Faso. Tropical Resource Management Paper No. 7.
Agricultural University, Wageningen, 223 pp.
Hoek, R. van der, Groot, A., Hottinga, F., Kessler, J.J. and Peters, H., 1993. Perspectives pour le
développement soutenu des systèmes de production agrosilvopastorale au Sanmatenga, Burkina
Faso. Tropical Resource Management Paper no. 3, Agricultural University, Wageningen. Kempkes,
M., 1994. Analyse financière des cordons pierreux; Cas-étude de Tagalla, Province du Sanmatenga,
Burkina Faso. SPS student thesis report No 44a. Agricultural University, Wageningen.
Kunze, D., 1994. Typologie des systèmes d'exploitation dans la Province du BAM, Burkina Faso.
Matlon, P.J., 1980. Profile of farm units in two villages of Central Upper Volta. ICRISAT, Upper Volta.
OECD, 1988. The Sahel facing the future, increasing dependance or structural transformation. Futures study
of the Sahel countries 1985−2010. Paris: Organisation for Economic Cooperation and Development.
Rochette, R.M. (ed.), 1989. Le Sahel en lutte contre la désertification. CILSS, Eschborn: GTZ.
Slingerland, M. and Masduwel, 1996. Mulching on the Central Plateau of Burkina Faso: widespread and
well adapted to farmers' means. In: Rey, C., Scoones I. And Toulmin, C., 1996. Sustaining the
soil; indigenous soil and water conservation in Africa. London: Earthscan.
Spaan, W.P., Posthumus, H., Stroosnijder, L., and Kiepe, P., (in preparation). Barriers catch water for better
production.
Tiffin, M., Mortimore, M. and Gichuki, F., 1993. More people, less erosion; environmental recovery in
Kenya. Chichester: Wiley.

51
Vlaar, J.C.J. (ed.), 1992. Les techniques de conservation des eaux et des sols dans les pays du Sahel.
CIEH/UAW, Wageningen.
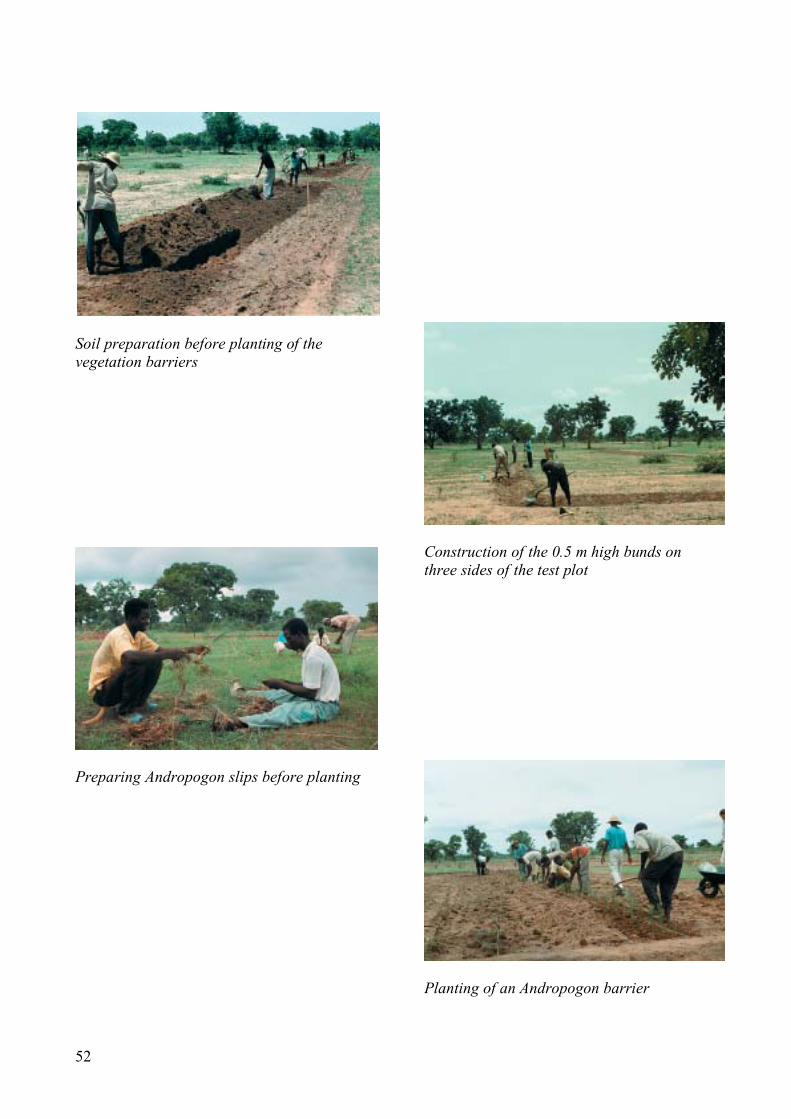
52
Soil preparation before planting of the
vegetation barriers
Preparing Andropogon slips before planting
Construction of the 0.5 m high bunds on
three sides of the test plot
Planting of an Andropogon barrier

Chapter 3
The vegetation barrier system (Theory and Materials &
Methods)

54
55
The vegetation barrier system (Theory and Materials & Methods)
This chapter is partly based on:
Wim Spaan and Jan Willem Nibbering (1998). Hedgerows on the Central Plateau, Burkina Faso:
Development and Research. BOSNiEuWSLETTER, Volume 17, no. 38, July 1998.
3.1 Introduction
In Chapter 2 the variety of soil and water conservation techniques that are used in the Sahel were
reviewed. It was explained why there is a preference for semi-permeable line measures that slow
down runoff and catch sediment but prevent water logging in the wet season. It was further shown
that stone rows are the most popular of the semi-permeable barriers at this moment on the Central
Plateau of Burkina Faso. However, in areas without stones vegetation barriers are also popular.
There is little known of the latter, thus prompting the start of the study described in this thesis.
Chapter 3 continues to describe the setting of the research with a brief introduction of
current land management on the densely populated Central Plateau. The many efforts that have
been undertaken to promote rural development are discussed. In spite of attempts to promote cash
crops, animal traction, soil and water conservation, manure and compost management, rock
phosphate, animal husbandry intensification, forest plantations and comprehensive village land use
planning the future of its natural resources and population seems bleak.
Section 3.3 describes extensively the current state of the art with respect to vegetation
barriers (and other line vegetation practices). In general, vegetation barriers are a rare phenomenon
on the Central Plateau. They are used for various purposes, as field boundary, firewood, to produce
ingredients for cooking and for soil and water conservation. The many obstacles for the
establishment and maintenance of these barriers are described. Hence, introduction of barriers
requires a comprehensive approach. The existing knowledge mainly deals with growth conditions
of barriers. Since little is known on the effectiveness of the various types of barriers, this was
chosen to be the main topic of an extensive experimental research program at Gampela in Burkina
Faso.
In Section 3.4 the on-station vegetation barrier experiment (1994−2000) is presented. The
experimental site is described and the reasons for choosing it are given. The experimental set-up
with its 7 plant species is presented and brief characteristics of these species are highlighted. The
management of the site and the barriers is described. Finally the intensified cropping of the alleys
between the barriers is presented. In the final section of this chapter (Section 3.5), measurements
and data collection of climate data, runoff, soil water, soil evaporation, vegetation development and
crop transpiration are described.
3.2 Land management on the Central Plateau in Burkina Faso
The Central Plateau is situated between 11o
and 14o
northern latitude, covering an area of about
100,000 km2
. Approximately five million people inhabit it, largely Mossi (Moose). The plateau has
an average altitude of around 300 m above sea level. Annual rainfall ranges from about 900 mm in
the south to 500 mm in the north and is concentrated in five consecutive months of the year. Soils
are generally poor in nutrients. Most of the population is subsistence or semi-subsistence farmers
growing millet and sorghum as their staple crops. Some Mossi own cattle, but goats and sheep are
more commonly kept in their households. In the dry season the population engage in home
56
industries and at some places dig for gold. The population also depends to a large extent on
remittances from relatives who have migrated.
An important minority in the area is the Fulani (Peulh or Fulbe), herdsmen keeping their
own cattle or animals entrusted to them by the Mossi. The savanna bush area, fallowed land, and
harvested cropland, which together constitute the so-called ‘silvo-pastoral areas’, are all used for
grazing. The bush is also a source of wood, thatch, fruits, vegetables, condiments and medicine.
Over the last decades, the increase in population pressure on the Central Plateau has caused
farmers to expand their cropping activities onto marginal lands. Fallow periods have shortened or
have disappeared altogether. This has resulted in land degradation and declining yields, leaving
farmers with little food security. A recent analysis of temporal patterns in the productivity of
agricultural soils has however revealed no evidence attributing lower yields to degradation. On the
contrary, yields of major crops in many areas in the Sahel have risen, despite the continued low-
input farming and rapid population growth (Niemeijer and Mazzucato, 2001). Due to the expansion
of cropland, the bush area has decreased. What is left has deteriorated due to overstocking and over-
cutting. Livestock numbers have increased, partly because Mossi farmers have started to keep more
livestock themselves, cattle for draught power, and goats and sheep for unforeseen or exceptional
expenses. The decrease in grazing areas and crop residues has constrained Fulani herding activities
forcing them more and more to take up cropping activities (Slingerland, 2000).
At first development interventions were undertaken with little regard for environmental
consequences, such as the promotion of cash crops and animal traction programs. Where it had been
adopted, ploughing often led to the expansion of cropland only, with yields falling quickly because
they were not accompanied by other measures.
After the great droughts of the 1970’s there has been more attention on combating land
degradation. Soil and water conservation measures were implemented. At first, earth bunds were
constructed on a large scale to halt erosion and improve infiltration of rainwater. Other measures
followed, such as the construction of stone rows. The adoption of these measures has been greatest
in the most densely populated areas, where land was scarcer and labour was more abundant.
Increase of soil organic matter has been attempted by promoting the integration of animal
husbandry with agriculture, production of compost, mulching, crop rotations and agroforestry
techniques. Upgrading the soil through phosphorus applications has equally been attempted. For
animal husbandry, hay production and the growing of complementary feeds have been undertaken,
on the whole with little success. In view of deficient timber and firewood production, village forest
plantations have been promoted (Kessler and Boni, 1991) at a large scale. While their establishment
could be realised thanks to strong external support, the envisaged communal management and
exploitation of these plantations has proven very difficult.
In the 1990’s, comprehensive village land use planning and management (gestion de terroir)
has come to the forefront due to a growing awareness that rules commonly agreed upon are
indispensable for the successful implementation of land rehabilitation and intensification measures.
It deals with issues such as the delimitation of arable and pastoral land, the prevention of
overstocking and the prioritisation of land improvement activities. Village land use planning has not
had much impact yet, partly because of the intractability of land rights.
The macro-economic context is highly unfavourable for most measures. Low prices and the
low level of commercialisation of agricultural produce prevents farmers from buying sufficient
external inputs. This, along with the various physical and biological measures is indispensable for
restoring and increasing the productivity of the land.
3.3 Hedgerows on the Central Plateau
Hedgerows, henceforth referred to as vegetation barriers, can be defined as closely planted lines of
shrubs or small trees. In traditional Mossi agriculture, vegetation barriers did not play any
57
significant role. They are largely innovations introduced over the last three decades by various
development projects (Figure 3.1). A few farmers implemented vegetation barriers on their own
initiative. Generally, however, without external interventions, vegetation barriers are still a rare
enomen on on the Central Plateau.
Vegetation barriers have been planted for various purposes, most of all to mark boundaries (e.g.
with Euphorbia balsamifera) and as fences around valuable crops such as cassava, vegetables or
fruit trees, in order to keep cattle out (e.g. Acacia macrostachya). To a lesser extent they are used as
sources of firewood (e.g. Acacia seyal), fodder (e.g. Acacia nilotica, Bauhinia rufescens), food for
human consumption (e.g. Ziziphus mauritiana), or as a soil and water conservation measure.
Depending on their purpose, planting has been dense e.g. in cattle fences and as soil and water
conservation barriers, or open e.g. for fodder production.
The establishment and maintenance of vegetation barriers has met many obstacles. Species
were often planted with the single purpose of delimitation or soil conservation with no direct
additional benefits. In contrast, disadvantages such as loss of cropping area, competition for water
and nutrients, pests and diseases possibly originating from vegetation barriers, and the obstruction
of tillage operations, are acutely felt. The strong variability of rainfall, depressing survival rates of
newly planted or sown trees tends to be so low as to discourage the farmers (Kaya et al., 1994).
This is aggravated by the fact that livestock, particularly small ruminants’ wander about, often
causing damage to the new vegetation barriers. Even if the benefits are clear to farmers, the fact that
the establishment of vegetation barriers requires efforts of which the returns only materialise after a
number of years may deter farmers from action. Moreover, planting and maintenance activities have
to be done in the rainy season when labour is also required for crop activities. In addition farmers
have also found themselves incapable of paying the prices that had been set for the planting
material. Clearly, the introduction of vegetation barriers requires a comprehensive approach in
which farmers’ needs, functions of the vegetation barrier, bio–physical interactions, labour
requirements, use rights and grazing regulations are taken into account.
However, compared to other interventions aimed to improve the natural resource base, vegetation
barriers have certain advantages. In areas where stones are scarce or have become so and where
earth bunds are inappropriate due to water logging and high maintenance requirements, vegetation
barriers can be a suitable alternative soil and water conservation technique, because they have an
open structure allowing excess water to flow through. At the same time water and sediment is
conserved. Planting is rather simple and can be done by local farmers and with local equipment.
Transport if needed, can be limited to short distances. As vegetation barriers can be undertaken by
individuals, they can be managed and exploited on a private basis, which can be an advantage over
village forest plantations that have to be managed collectively. However, this requires that
vegetation barriers be respected as private property. This situation is only likely to arise if all
households in a community adopt vegetation barriers to some extent on the land they cultivate.
Although much research has been executed and much expertise has been built up with
respect to vegetation barriers, it has mainly focussed on growth and plant conditions. Little is
known about the effectiveness of vegetation barriers on soil and water conservation efficiency and
water use characteristics. In cooperation with the University of Ouagadougou the "Sahel Natural
Resource Management (SNRM)" research program of Wageningen University studied these effects
while looking explicitly at their integration into the wider farming system. The research was
conducted mainly with trials on a research site at Gampela, Burkina Faso and a part with
participatory approaches.
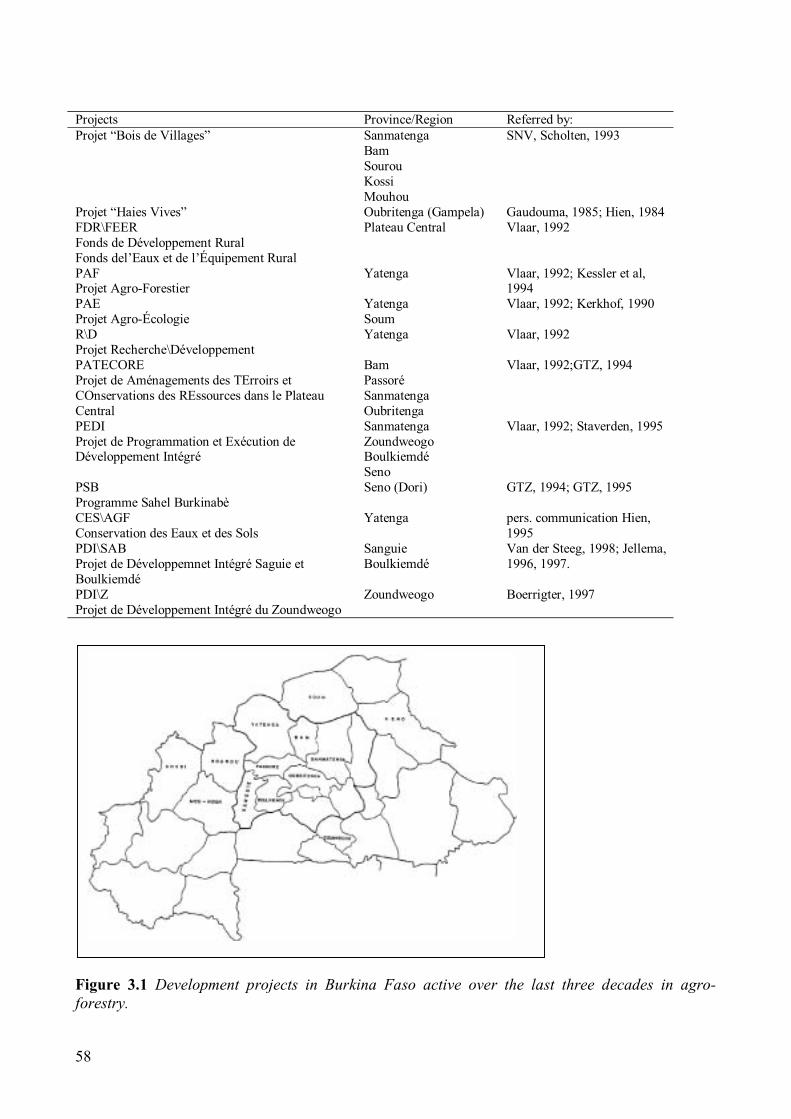
58
Figure 3.1 Development projects in Burkina Faso active over the last three decades in agro-
forestry.
Projects Province/Region Referred by:
Projet “Bois de Villages” Sanmatenga
Bam
Sourou
Kossi
Mouhou
SNV, Scholten, 1993
Projet “Haies Vives” Oubritenga (Gampela) Gaudouma, 1985; Hien, 1984
FDR\FEER
Fonds de Développement Rural
Fonds del’Eaux et de l’Équipement Rural
Plateau Central Vlaar, 1992
PAF
Projet Agro-Forestier
Yatenga Vlaar, 1992; Kessler et al,
1994
PAE
Projet Agro-Écologie
Yatenga
Soum
Vlaar, 1992; Kerkhof, 1990
R\D
Projet Recherche\Développement
Yatenga Vlaar, 1992
PATECORE
Projet de Aménagements des TErroirs et
COnservations des REssources dans le Plateau
Central
Bam
Passoré
Sanmatenga
Oubritenga
Vlaar, 1992;GTZ, 1994
PEDI
Projet de Programmation et Exécution de
Développement Intégré
Sanmatenga
Zoundweogo
Boulkiemdé
Seno
Vlaar, 1992; Staverden, 1995
PSB
Programme Sahel Burkinabè
Seno (Dori) GTZ, 1994; GTZ, 1995
CES\AGF
Conservation des Eaux et des Sols
Yatenga pers. communication Hien,
1995
PDI\SAB
Projet de Développemnet Intégré Saguie et
Boulkiemdé
Sanguie
Boulkiemdé
Van der Steeg, 1998; Jellema,
1996, 1997.
PDI\Z
Projet de Développement Intégré du Zoundweogo
Zoundweogo Boerrigter, 1997

59
3.4 The Gampela experiment
In general terms one can say that vegetation barriers as proposed in this research, can be applied on
the crop as well as on the silvo–pastoral area, with the main objective as the regeneration of the land
and an intensification of land use. Moreover, this intensification will result in a more limited use of
the silvo–pastoral area. In the first phase of the research (1996–1997) soil and water conservation
efficiency of the contour vegetation barrier concept was investigated (Rocheleau et al., 1988), whereas
in the second phase (1998–2000) practicability of the integrated vegetation barrier/crop system was the
topic of interest.
Experimental site
The research area of the vegetation barrier trial was located on a 3 ha site of the university of
Ouagadougou in the centre of Burkina Faso near Gampela (1° 20’ W, 12° 20’ N), 18 km north east
of the capital, in the province Oubritenga (Figure 3.2). Main reasons to select this research site were
that it was close to the capital (logistics) and the university (cooperation). There was also a widely
available data of soils and climate and a finished research of vegetative measures close to the
selected site (Hien, 1994).
The experimental site at an altitude of about 275 masl. was a recently abandoned crop field
with a relatively uniform slope (2 %) in which only a few trees remained. The soil of the
experimental site is classified as a Luvisol (Sivakumar et al., 1991), low in fertility and
productivity. It consists of sandy loam overlying clay with hydromorphic properties. The topsoil (0–
0.35 m) contains 8 % clay, 25 % silt and 67 % sand. The percentages for the 0.35–0.7 m layer are
23 (clay), 19 (silt) and 58 (sand) and for the deeper soil (0.7–1.2 m) are 30 (clay), 21 (silt) and 49
(sand). The soil has developed in situ on rocks of Birrimien Middle Precambrian (Anonymous,
1988) and can be considered as typical for the area (Ibrahima and Schmitt, 1991). Soil depth varies
between 0.7 and 1.3 m. Soil aggregates are small and unstable in wet conditions with a tendency for
auto-compaction early in the wet season (bulk density 1.600 kg m-3
) owing to impact of raindrops
and / or cultivation. This can result in structural crusts that reduce infiltration and hence an increase
of runoff (Ludwig, 1999; Bouwknegt and Brouwer, 2000). The unstable structure of the surface
layer is due to a weak binding of the aggregates, which in turn is due to the low (< 1 %) organic
matter content (Maduakor, 1991). The pH (H2O) of the soil varies between 5 and 7.5, and nutrient
availability and CEC (2–10 me/100g) are low. The soils are moderately suitable for cultivation and
crops like sorghum (Sorghum biocolor subsp. arundnaceum), maize (Zea maize), millet
(Pennisetum americanum ssp. Americanum) and groundnuts (Arachis hypogaea) are mainly grown.
The landscape type at the site is that of arable parkland. The natural vegetation is of the
savannah type. Most important woody species belong to the genus Acacia, Combretaceae, Guiera,
Piliostigma, and Ziziphus family (Anonymus, 1988). Pennisetum pedicellatum, Loudetia togoensis
and Eragrostis tremula dominate annual grasses. The dominant perennial grasses are Andropogon
gayanus and Hyparrhenia dissoluta. However most of the area has been cleared for agriculture and
there is little natural vegetation left (Le Houérou, 1989; Penning de Vries and Djitéye, 1982).
The experimental site was located in a semi-arid region with one rainy season usually between June
and October. The average length of the growing season is 150 days. Based upon the average rainfall
of 790 mm y-1
, the research area can be classified as part of the North Sudanian zone, which has
annual rainfall ranging between 650 and 1000 mm (Sivakumar and Gnoumou, 1987; Sivakumar et
al., 1991; Kessler and Boni, 1991). In terms of the water it receives, the area is relatively wet.
Obviously, shortage of water in the semi-arid tropics is not a consequence of poor annual rainfall.
However, rainfall is erratic and rainstorm size and intensity also vary considerably (Spaan and Van
Loon, 2001; Hoogmoed, 1999). Agriculture is problematic, due to the seasonal distribution and the
rate at which water is lost by evapo-transpiration (Monteith, 1991) and runoff. Potential evapo-
transpiration can reach 8 mm d-1
and exceeds 1900 mm y-1
(Sivakumar and Gnoumou, 1987).
During the rainy season the potential evapo-transpiration is about 850 mm (Sivakumar and
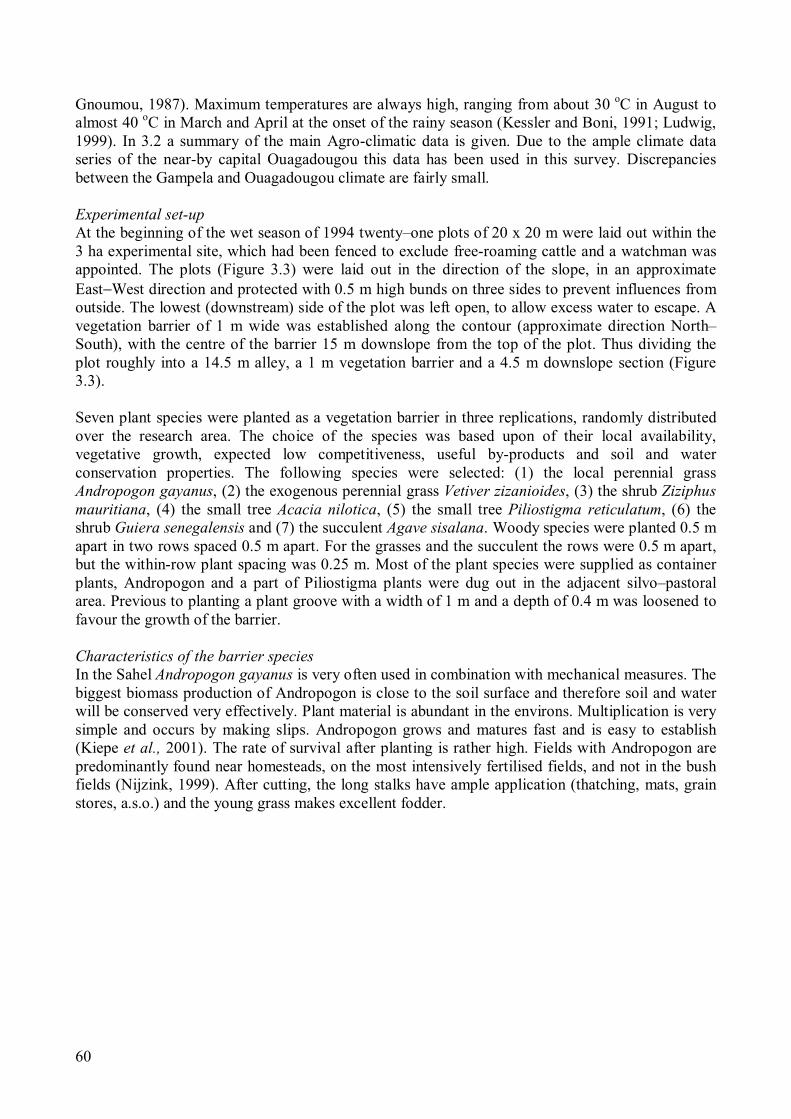
60
Gnoumou, 1987). Maximum temperatures are always high, ranging from about 30 o
C in August to
almost 40 o
C in March and April at the onset of the rainy season (Kessler and Boni, 1991; Ludwig,
1999). In 3.2 a summary of the main Agro-climatic data is given. Due to the ample climate data
series of the near-by capital Ouagadougou this data has been used in this survey. Discrepancies
between the Gampela and Ouagadougou climate are fairly small.
Experimental set-up
At the beginning of the wet season of 1994 twenty–one plots of 20 x 20 m were laid out within the
3 ha experimental site, which had been fenced to exclude free-roaming cattle and a watchman was
appointed. The plots (Figure 3.3) were laid out in the direction of the slope, in an approximate
East−West direction and protected with 0.5 m high bunds on three sides to prevent influences from
outside. The lowest (downstream) side of the plot was left open, to allow excess water to escape. A
vegetation barrier of 1 m wide was established along the contour (approximate direction North–
South), with the centre of the barrier 15 m downslope from the top of the plot. Thus dividing the
plot roughly into a 14.5 m alley, a 1 m vegetation barrier and a 4.5 m downslope section (Figure
3.3).
Seven plant species were planted as a vegetation barrier in three replications, randomly distributed
over the research area. The choice of the species was based upon of their local availability,
vegetative growth, expected low competitiveness, useful by-products and soil and water
conservation properties. The following species were selected: (1) the local perennial grass
Andropogon gayanus, (2) the exogenous perennial grass Vetiver zizanioides, (3) the shrub Ziziphus
mauritiana, (4) the small tree Acacia nilotica, (5) the small tree Piliostigma reticulatum, (6) the
shrub Guiera senegalensis and (7) the succulent Agave sisalana. Woody species were planted 0.5 m
apart in two rows spaced 0.5 m apart. For the grasses and the succulent the rows were 0.5 m apart,
but the within-row plant spacing was 0.25 m. Most of the plant species were supplied as container
plants, Andropogon and a part of Piliostigma plants were dug out in the adjacent silvo–pastoral
area. Previous to planting a plant groove with a width of 1 m and a depth of 0.4 m was loosened to
favour the growth of the barrier.
Characteristics of the barrier species
In the Sahel Andropogon gayanus is very often used in combination with mechanical measures. The
biggest biomass production of Andropogon is close to the soil surface and therefore soil and water
will be conserved very effectively. Plant material is abundant in the environs. Multiplication is very
simple and occurs by making slips. Andropogon grows and matures fast and is easy to establish
(Kiepe et al., 2001). The rate of survival after planting is rather high. Fields with Andropogon are
predominantly found near homesteads, on the most intensively fertilised fields, and not in the bush
fields (Nijzink, 1999). After cutting, the long stalks have ample application (thatching, mats, grain
stores, a.s.o.) and the young grass makes excellent fodder.
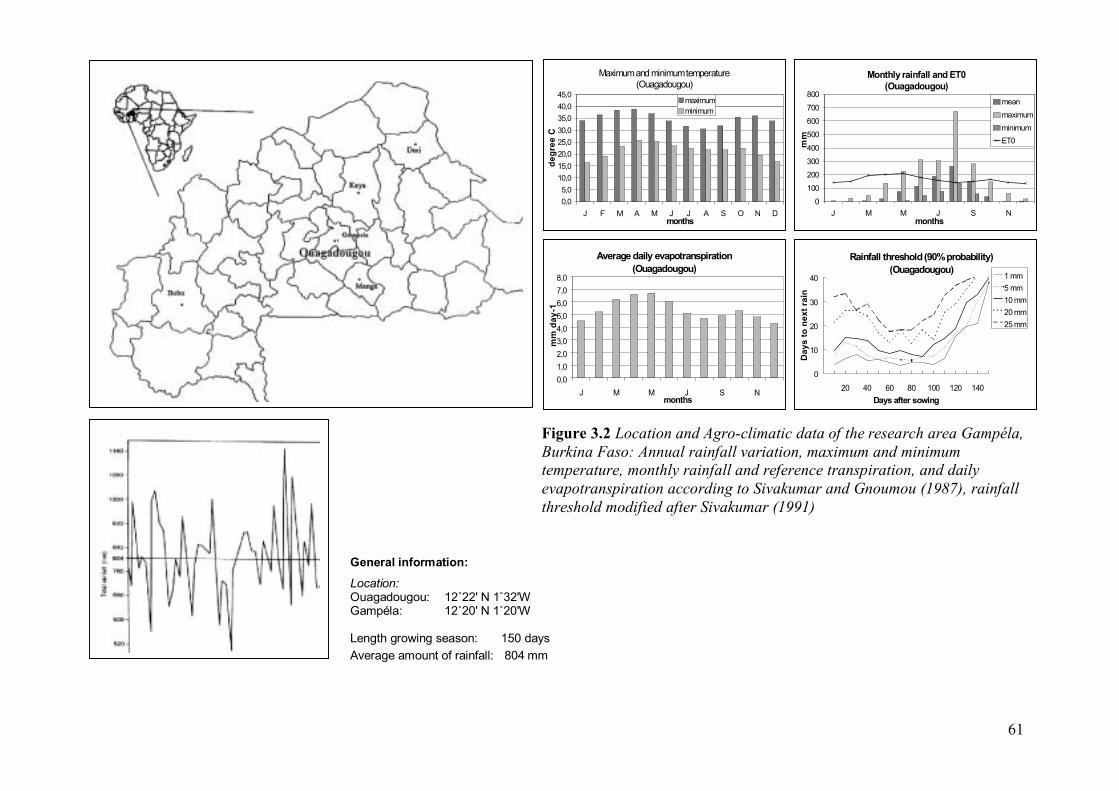
61
Average daily evapotranspiration
(Ouagadougou)
0,0
1,0
2,0
3,0
4,0
5,0
6,0
7,0
8,0
J M M J S N
months
mm
d
ay
-1
Rainfall threshold (90% probability)
(Ouagadougou)
0
10
20
30
40
20 40 60 80 100 120 140
Days after sowing
Da
ys
to
n
ex
t ra
in
1 mm
5 mm
10 mm
20 mm
25 mm
Monthly rainfall and ET0
(Ouagadougou)
0
100
200
300
400
500
600
700
800
J M M J S N
months
mm
mean
maximum
minimum
ET0
Figure 3.2 Location and Agro-climatic data of the research area Gampéla,
Burkina Faso: Annual rainfall variation, maximum and minimum
temperature, monthly rainfall and reference transpiration, and daily
evapotranspiration according to Sivakumar and Gnoumou (1987), rainfall
threshold modified after Sivakumar (1991)
Maximum and minimum temperature
(Ouagadougou)
0,0
5,0
10,0
15,0
20,0
25,0
30,0
35,0
40,0
45,0
J F M A M J J A S O N D
months
de
gre
e C
maximum
minimum
General information:
Location:
Ouagadougou: 12˚22' N 1˚32'W
Gampéla: 12˚20' N 1˚20'W
Length growing season: 150 days
Average amount of rainfall: 804 mm
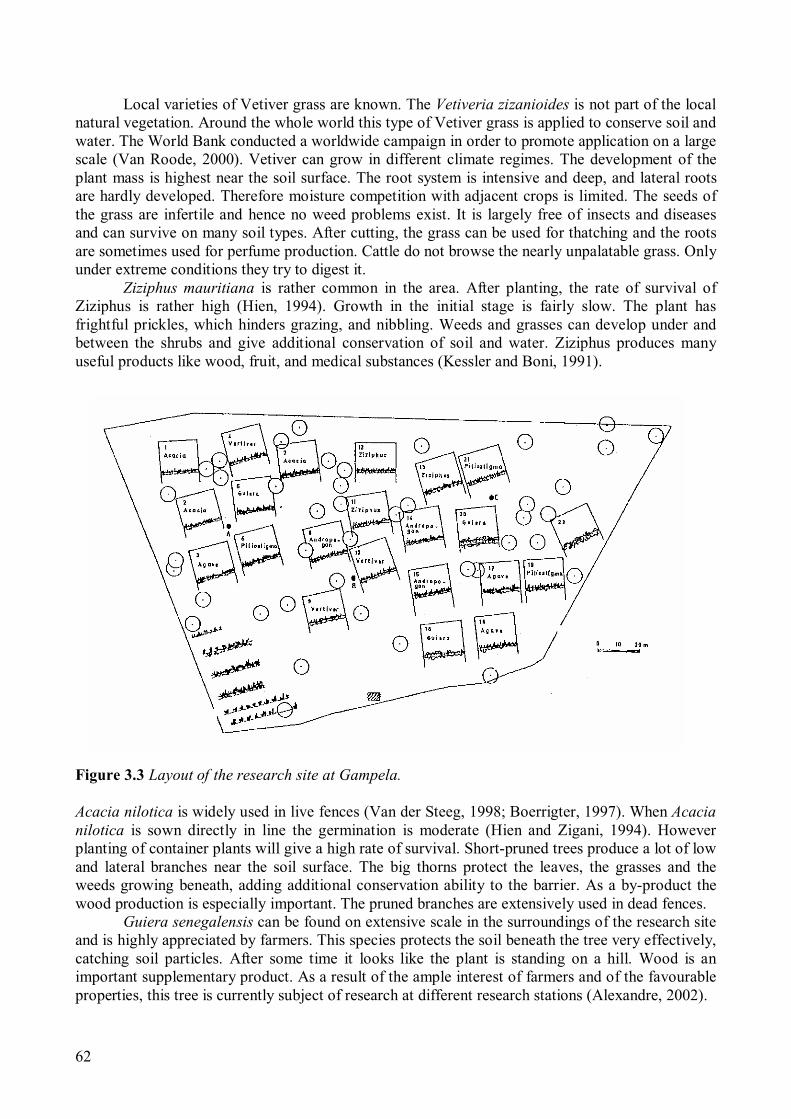
62
Local varieties of Vetiver grass are known. The Vetiveria zizanioides is not part of the local
natural vegetation. Around the whole world this type of Vetiver grass is applied to conserve soil and
water. The World Bank conducted a worldwide campaign in order to promote application on a large
scale (Van Roode, 2000). Vetiver can grow in different climate regimes. The development of the
plant mass is highest near the soil surface. The root system is intensive and deep, and lateral roots
are hardly developed. Therefore moisture competition with adjacent crops is limited. The seeds of
the grass are infertile and hence no weed problems exist. It is largely free of insects and diseases
and can survive on many soil types. After cutting, the grass can be used for thatching and the roots
are sometimes used for perfume production. Cattle do not browse the nearly unpalatable grass. Only
under extreme conditions they try to digest it.
Ziziphus mauritiana is rather common in the area. After planting, the rate of survival of
Ziziphus is rather high (Hien, 1994). Growth in the initial stage is fairly slow. The plant has
frightful prickles, which hinders grazing, and nibbling. Weeds and grasses can develop under and
between the shrubs and give additional conservation of soil and water. Ziziphus produces many
useful products like wood, fruit, and medical substances (Kessler and Boni, 1991).
Figure 3.3 Layout of the research site at Gampela.
Acacia nilotica is widely used in live fences (Van der Steeg, 1998; Boerrigter, 1997). When Acacia
nilotica is sown directly in line the germination is moderate (Hien and Zigani, 1994). However
planting of container plants will give a high rate of survival. Short-pruned trees produce a lot of low
and lateral branches near the soil surface. The big thorns protect the leaves, the grasses and the
weeds growing beneath, adding additional conservation ability to the barrier. As a by-product the
wood production is especially important. The pruned branches are extensively used in dead fences.
Guiera senegalensis can be found on extensive scale in the surroundings of the research site
and is highly appreciated by farmers. This species protects the soil beneath the tree very effectively,
catching soil particles. After some time it looks like the plant is standing on a hill. Wood is an
important supplementary product. As a result of the ample interest of farmers and of the favourable
properties, this tree is currently subject of research at different research stations (Alexandre, 2002).

63
Piliostigma reticulatum has more or less the same advantages as Guiera. Reproduction may
give more problems. It can be extensively found in the surroundings of the research site. Wood is
the most important product.
In some regions of Burkina Faso Agave sisalana is used in live fences on a fairly large scale.
The leaves end in very sharp prickles, protecting the undergrowth very effectively. The fleshy
leaves can withstand long continual drought periods. Agave furnishes the raw material for rope
production. The flesh from the leaves makes good fodder (Anonymous, 1995).
Management of the research site
The barriers were planted in 1994 and after two years, the barriers had grown to an appropriate size.
In this period the creation of favourable growing conditions stimulated plant development. During
dry spells in the wet season supplementary water was given to the plants. Every four weeks, weeds
were removed manually.
In spite of the intensive management Acacia, Vetiveria and Guiera (alelopathy) did not
establish very well during the development period and were replaced by other barriers. On the
Acacia plots, a 1 m wide strip along the contour was left to develop natural vegetation
spontaneously (Rocheleau et al., 1988). In this research this barrier is referred as ‘Natural’.
Perennials crowded out annual weeds and grasses that appeared in the natural barriers in the first
year and in subsequent years. After the second year, Andropogon appeared to be the dominant
species in this barrier. The Vetiver barriers were replaced with stone rows and the plots with Guiera
barriers functioned as control plots (no barrier).
In the first phase of the research (1996 and 1997), the alleys and downslope parts of the
plots were kept bare by application of herbicides to simulate the soil surface of a degraded silvo–
pastoral area (range land). Herbicides were preferred over weeding because weeding would have
broken the crust and would have affected rainfall-runoff relations. Barriers were pruned to create
dense barrier vegetation close to the soil surface. In this phase the soil and water conservation
effectiveness of the vegetation barrier biomass was the only issue of investigation. Undergrowth
between the barrier plants was removed and to prevent this the conservation action of grasses and
weeds was monitored, instead of the conservation effect of the barrier plant morphology.
In the second phase (1998–2000), the alleys were either planted with sorghum or protected
from free roaming cattle (enclosure) so natural vegetation for pasture could establish (Spaan and
Van Dijk, 1998), as most animal production in the Sahel depends on grazing natural vegetation
(Slingerland, 2000). The choice of a crop or pasture on the alley was based on the palatability of the
barrier species. Barrier species inedible (Piliostigma, Agave) for cattle can be used as a soil and
water conservation practice on the silvo-pastoral area, and were as such combined with pasture.
Andropogon, Ziziphus and Natural were combined with a crop (sorghum). As stone rows were
massively implemented by development projects (Kessler et al., 1995) and on a smaller scale by
farmers on their own initiative, this barrier with a crop on the alley, was introduced for comparison
with the vegetation barriers. Stone rows were laid out in a small trench of about 0.1 m deep with the
centre of the row 15 m from the top. Stones with a diameter of approximately 0.4 m were placed
one next to the other (Kessler et al., 1995) in a way that hardly any space was left between them.
Intensification of the farming system
In a mixed farming system, contour vegetation barrier with agriculture on the alley, the
intensification of the crop area is combined with limited possibilities for cattle, which has a positive
impact on natural resources. As stated by Kiepe (1995), barrier biomass availability throughout the
year is an attractive condition to feed animals in the dry season in semi arid areas. Particularly in a
mixed farming system, livestock can be fed with fodder pruned from vegetation barriers. In the
rainy season, grazing can take place on the range area.

64
Implementation of the mixed farming (alley cropping) system will give a loss of about 20 %
(Osunade and Rey, 1996) of the crop area. In order to compensate this, the crop production has to
increase drastically on the remaining 80 %. At the same time, the barriers have to produce a range
of interesting by-products (Boerrigter, 1997). Successful intensification will ultimately lead to a
concentration of the agricultural production in a smaller area. This means that the more marginal
range areas can be used again as silvo-pastoral areas (Stroosnijder and Hoogmoed, 1993).
Intensification of agriculture like mixed farming has the highest potential to stop over-exploitation
(Breman, 1992). However, sustainable economic and social development in the Sahel will only be
possible, when rural development is sufficiently accelerated and agriculture becomes considerably
more productive (Leisinger and Schmitt, 1995).
Since 1998, sorghum (Sorghum biocolor subsp. Arudinaceum (Doggett, 1987) cv. SARIASO 10)
was sown up slope of the barriers. SARIASO 10 is an improved local variety, and has a
development cycle of 115–120 growing days. Cultivation practices were traditional i.e.7 seeds were
thrown manually in ca. 0.05 m deep holes (i.e. pockets). The first crop row was planted at a distance
of 0.4 m from the barrier. Distance between crop rows was 0.8 m and within rows 0.4 m (31 250
pockets ha-l
). Organic manure was applied as fertilizer before sowing (approximately 15 kg N ha-l
)
and during stem elongation nitrogen was applied as urea 46 % (50 kg N ha-l
). Six weeks after
sowing the pockets were manually thinned out to leave three or four plants per pocket. The thinning
operation was executed during the early morning in order to keep plant stress low. Weeding was
performed before sowing and about 4 and 6 weeks after sowing. During the last three weeks before
harvesting ‘hunters’ controlled seed losses caused by birds. All these cultural practices were applied
uniformly on all plots
Management of the barriers
Type and frequency of barrier management (cutting, pruning, and weeding) were adjusted to
specific site conditions. The management depended on several factors, including the crop type and
the barrier species, the relative importance and type of products, by-products and services expected
from the barrier and the amount and timing of labour available for management and harvesting.
Standard management of an alley-cropping practice consists of coppicing the barrier plants at a
height of 0.3 m to 0.6 m, followed by lopping to the same height at intervals ranging from once a
month to once a year (Rocheleau et al., 1988). Low cuttings (0.15–0.3 m) avoid shading of the
associated agricultural crop (Kuchelmeister, 1989). At Gampela, pruning of the woody species at a
height of 0.75 m and 1.5 m barrier width was practised at the onset of the wet season. Andropogon
was cut at the end of the wet season and Agave was not cut at all. Prunings were removed from the
field and not introduced as mulch.
3.5 Measurements and data collection
Climate
At the experimental site Gampela, continuous climate measurements (averaged every 30 minutes)
were carried out by means of an automatic meteorological station with a Delta data logger.
Additionally, soil temperatures were measured. All instruments were calibrated before the
measurement period. The station was equipped with sensors and measured the following
parameters:
*Wind speed: Vector cup anemometer with a measuring range of 0.25–75 m s-1
and an accuracy of
1 % +/− 0.1 m s-1
.
*Wind direction: Vector wind vane for wind speeds between 0.6 – 75 m s-1
, accuracy 2o
at wind
speeds over 5 m s-1
.
*Solar radiation: Pyranometer, radiation sensor with a measurement range of 530–1080 nm,
accuracy of 5 %, sensitivity 10 mV/Wm2
.
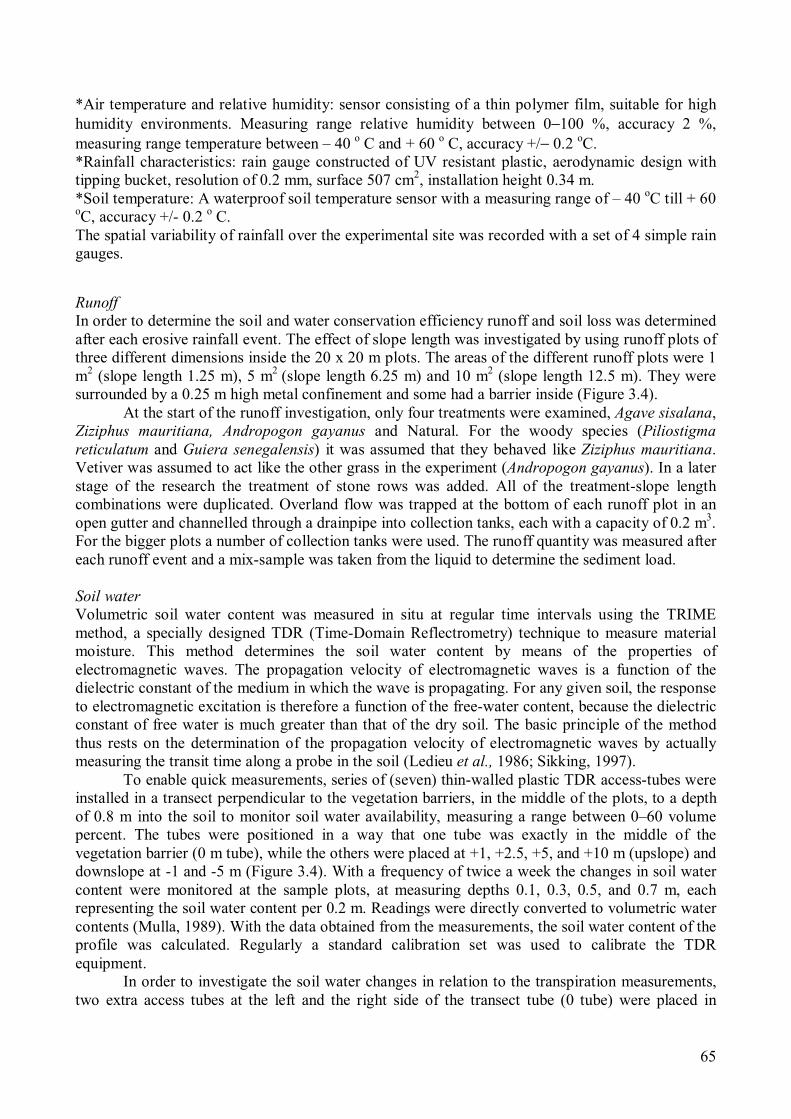
65
*Air temperature and relative humidity: sensor consisting of a thin polymer film, suitable for high
humidity environments. Measuring range relative humidity between 0−100 %, accuracy 2 %,
measuring range temperature between – 40 o
C and + 60 o
C, accuracy +/− 0.2 o
C.
*Rainfall characteristics: rain gauge constructed of UV resistant plastic, aerodynamic design with
tipping bucket, resolution of 0.2 mm, surface 507 cm2
, installation height 0.34 m.
*Soil temperature: A waterproof soil temperature sensor with a measuring range of – 40 o
C till + 60
o
C, accuracy +/- 0.2 o
C.
The spatial variability of rainfall over the experimental site was recorded with a set of 4 simple rain
gauges.
Runoff
In order to determine the soil and water conservation efficiency runoff and soil loss was determined
after each erosive rainfall event. The effect of slope length was investigated by using runoff plots of
three different dimensions inside the 20 x 20 m plots. The areas of the different runoff plots were 1
m2
(slope length 1.25 m), 5 m2
(slope length 6.25 m) and 10 m2
(slope length 12.5 m). They were
surrounded by a 0.25 m high metal confinement and some had a barrier inside (Figure 3.4).
At the start of the runoff investigation, only four treatments were examined, Agave sisalana,
Ziziphus mauritiana, Andropogon gayanus and Natural. For the woody species (Piliostigma
reticulatum and Guiera senegalensis) it was assumed that they behaved like Ziziphus mauritiana.
Vetiver was assumed to act like the other grass in the experiment (Andropogon gayanus). In a later
stage of the research the treatment of stone rows was added. All of the treatment-slope length
combinations were duplicated. Overland flow was trapped at the bottom of each runoff plot in an
open gutter and channelled through a drainpipe into collection tanks, each with a capacity of 0.2 m3
.
For the bigger plots a number of collection tanks were used. The runoff quantity was measured after
each runoff event and a mix-sample was taken from the liquid to determine the sediment load.
Soil water
Volumetric soil water content was measured in situ at regular time intervals using the TRIME
method, a specially designed TDR (Time-Domain Reflectrometry) technique to measure material
moisture. This method determines the soil water content by means of the properties of
electromagnetic waves. The propagation velocity of electromagnetic waves is a function of the
dielectric constant of the medium in which the wave is propagating. For any given soil, the response
to electromagnetic excitation is therefore a function of the free-water content, because the dielectric
constant of free water is much greater than that of the dry soil. The basic principle of the method
thus rests on the determination of the propagation velocity of electromagnetic waves by actually
measuring the transit time along a probe in the soil (Ledieu et al., 1986; Sikking, 1997).
To enable quick measurements, series of (seven) thin-walled plastic TDR access-tubes were
installed in a transect perpendicular to the vegetation barriers, in the middle of the plots, to a depth
of 0.8 m into the soil to monitor soil water availability, measuring a range between 0–60 volume
percent. The tubes were positioned in a way that one tube was exactly in the middle of the
vegetation barrier (0 m tube), while the others were placed at +1, +2.5, +5, and +10 m (upslope) and
downslope at -1 and -5 m (Figure 3.4). With a frequency of twice a week the changes in soil water
content were monitored at the sample plots, at measuring depths 0.1, 0.3, 0.5, and 0.7 m, each
representing the soil water content per 0.2 m. Readings were directly converted to volumetric water
contents (Mulla, 1989). With the data obtained from the measurements, the soil water content of the
profile was calculated. Regularly a standard calibration set was used to calibrate the TDR
equipment.
In order to investigate the soil water changes in relation to the transpiration measurements,
two extra access tubes at the left and the right side of the transect tube (0 tube) were placed in

66
different sections of the vegetation barrier, each representing a difference in vegetative
development. During the periods of transpiration measurements and the soil water content of these
plots was monitored on a daily basis.
a runoff plot 1 m2
b runoff plot 5 m2
c runoff plot 10 m2
O collection tank
• TDR tube
Figure 3.4 Layout of the test plot (20 x 20m) with runoff plots and TDR equipment.
Soil evaporation
Soil evaporation occurs when liquid water is converted into water vapour and transferred in this
form into the atmosphere (Shuttleworth, 1979). One method to measure evaporation directly from
bare soil is lysimetri. Lysimeters are essentially artificially constructed “mini-catchments” where a
block of bare soil is isolated from the surrounding soil (Wallace, 1991). By frequently measuring
the weight of the lysimeters and calculating weight differences, soil evaporation can be calculated.
A drying cycle consists of a number of days, starting when the soil is saturated (after rain) and it

67
ends after the next rainfall. A drying curve yields information on the soil characteristics. The model
of Ritchie (1972) in which two evaporation stages for bare soil are distinguished, was used in this
research to predict evaporative losses. In the first stage (constant stage) evaporation from the soil is
only limited by the energy supply to the surface. In the second stage (falling rate stage) evaporation
is limited by the water movement to the soil surface, which depends on the hydraulic properties of
the soil (Sikking, 1997).
At the research site evaporation from the soil was measured using mini-lysimeters mounted
flush with the soil surface. The isolated lysimeters were dug up and weighed three times per day (6,
12 and 18h), for two successive days. With the obtained data a graph was constructed representing
the weight loss over time, which indicates the loss of water by evaporation. Evaporation
measurements are preferably executed before the beginning or at the end of the growing season, as
a rain shower can disturb the drying curve.
Vegetation development
During the growing season the development of the vegetation (vegetation barriers and sorghum)
was monitored. The investigation of the vegetation development was mainly focussed on the
determination of the Leaf Area Index (LAI). The LAI, a dimensionless quantity is defined as the
leaf area (upper site only) per unit area of soil below. The LAI is an important parameter in the
determination of the transpiration.
To determine the LAI of vegetation barriers or of a crop row, the barrier or the row was
divided into homogenous parts. For each part a sample branch was taken. The number of leaves of
the sample branch was counted, and the average size of the leaves was determined. To obtain the
average size, the length and the width of a certain number of leaves (depending on the variability of
leaves) was measured. Some of the leaves were traced on so-called millimetre paper, as to define a
correction factor when only length and width of the leaves was determined. This factor was
determined by calculating the ratio between the actual leaf area and the calculated from the obtained
length and width. Mostly the correction factor coincided with 0.75. Multiplication of the number of
leaves with the average leaf area, divided by the ground area of the representative part of the
vegetation resulted in the LAI of a specific vegetation section.
Transpiration
Transpiration measurements on barrier plants and sorghum during different stages of the growing
season were carried out using the Dynamax flow 32 system. This system is based on the
measurement of heat movement in the transpiration stream. The principle is to induce a heat pulse
into the stem, to measure the heat transport by the sap flow.
Sap flow gauges were used to determine the transpiration. These gauges (Wallace, 1991)
measure sap flow through intact plant stems (Sakuratani, 1981,1984; Baker and Van Bavel, 1987;
Steinberg et al., 1989; Allen and Grime, 1994; Ishida et al., 1991) and allow transpiration from
whole plants to be continuously measured (Allen and Grime, 1994). Each gauge consisted of a foil
heater, enclosed in a thermally insulating foam sheath, which was wrapped around the stem under
study. After installation, the gauge was protected from temperature changes by a weather shield,
wrapped in several layers of aluminum foil to reduce solar heating. The wrapping extended along
the stem, above and below, and was attached to the stem with PVC tape.
A constant electrical power is supplied to the heater, heating the surface of the stem and
thereby increasing the temperature of the flowing sap. The gauge’s insulating sheath contains a
system of thermocouples that measure the temperature gradients associated with the conductive heat
losses up and down the stem, and radial through the sheath.
The increase of sap temperature was also measured (Allen and Grime 1994; Wallace 1991).
From these measurements, the mass flow rate of the water in the stem can be calculated (Baker and
Van Bavel, 1987). Outputs from the gauges are recorded as 30 minutes averages with automatic

68
data loggers (CR7, Campbell Scientific Ltd., Shepshed, UK), thus providing a continuous, high
time resolution measurement of the passing transpiration flow. By adding all the half-hour
transpiration values during the daytime, the total transpiration per day was determined.
A disadvantage of the system is, that only plants with sufficient stem diameter (> 0.012m)
can be used. Therefore, only the transpiration of Ziziphus mauritiana, Pilistigma reticulatum,
Guiera senegalensis and Andropogon gayanus and sorghum could be analysed. Each plant species
were examined in different periods during the growing season. The barrier was divided into
different sections each representing a certain vegetative development and a corresponding LAI. At
the start of a measurement period each section was supplied with at least one sap flow gauge fitted
at representative stalks or stems. The aim of sap flow measurements in the different stages of the
growing season was to establish the relation between transpiration and the meteorological
circumstances of the research site, and the soil water development in the monitored period. Sap
flow of the crops was measured in rows at different distances from the barrier. From the expected
difference in water uptake an explication for competition between barrier and crop could probably
be given.
Linear relationships between sapwood area (diameter) and foliage area (LAI) have been
reported for several tree species (Allen and Grime 1994; Brenner et al., 1991; Sikking, 1997; Spaan
et al., 1999). The measured sap flow of a stem equals to the sum of transpiration from all the leaves
attached to that stem. The LAI was determined per stem in each period of the growing season. The
ground surface of each investigated stem was determined, each representing a part of the barrier.
Sap flow and temperature transfer is dependent on the diameter of the stem or stalk. In order
to investigate the sap flow, the stem diameters of each shrub, tree or grass was determined just
before the measurement period. The total sap flow per stem was extrapolated by the following
formula:
sap flow (area sqm) = sap flow (stem) * 1/ground area (g d-1
).
To convert the sap flow from g d-1
to mm d-1
the sap flow has to be divided by 1000. By adding sap
flow values (transpiration) during the daytime for the different parts of the vegetation barrier or
crop row the total transpiration of the barrier or row was obtained.
3.6 References
Alexandre,D.Y., 2002.Initiation à l’agroforesterie en zone Sahélienne. Lles arbres des champs du Plateau Central
au Burkina Faso.IRD Éditions 213, rue La Fayette, 75010 Paris, pp220.
Allen, S.J. and V.L. Grime, 1994. Measurements of transpiration from savannah shrubs using sap flow gauges.
Agricultural and Forest Meteorology, 19pp.
Anonymous, 1995. A field manual for agroforestry practices in Malawi. Publication Series no.6. Malawi
Agroforestry Extension Project and Washington State University, Malawi, December 1995, 168pp.
Anonymous, 1988. Etude pédologique de la station experimentale de Gampela. Ministère de l’Agriculture et de
l’Elevage, Secretariat General, Bureau National des Sols, Ouagadougou, Burkina Faso. Rapport
Technique no 59, 279 pp.
Baker, J.M. and C.H.M. Van Bavel, 1987. Measurements of mass flow of water in stems of herbaceous plants.
Plant and Cell Environment, 777-782.
Boerrigter, E., 1997. Protection doublé: Recherche sur la possibilité de transformer des bandes anti-érosives en
méthode d’ utilisation durable de la terre. MSc-thesis, Wageningen Unversity, Nieuwe Kanaal 11, 6709
PA Wageningen, The Netherlands, 59 pp.
Bouwknegt, M. and A.J.J. Brouwer, 2000. Infiltration measurements at the research station Gampela, Burkina
Faso. Thesis I.A.H.L, Larensteinselaan 26A, 6882 CT, Velp, The Netherlands, 25 pp.
69
Breman, H., 1992. The sustainability concept in relation to rural development: Offering stones for bread, pp 37-
52. In: Sustainable Development in the Sahel. Lykke, Tybirk and Jorgensen (Eds.). Proceedings of the
4th
Sahel Workshop 6-8 January 1992, Aarhus.
Brenner,A.J., Jarvis, P.G. and R.J. Vandenbeldt, 1991. Transpiration from a neem windbreak in the Sahel. . In:
Proceedings of the International Workshop on Soil Water Balance in the Sudano Sahelian Zone,
February 1991, ICRISAT Sahelian Center, Niamey, Niger. Sivakumar, Wallace, Renard and Giroux
(eds), 375-385.
Dogget, H., 1987. Sorghum, second edition Tropical agriculture series. Longman Scientific & Technical Group
UK Limited, Longman House, Burnt Mill, Harlow, Essex CM20 2JE, England. 512pp.
Hien, F.G., 1994. Les mesures de C.E.S. pour la régénération des espacessilvo-pastoraux: analyse de la situation
dans lt Plateau Central Burkinabè. Antenne Sahélienne U.A.W./U.O. Ouaguadougou, 44pp.
Hien, F.G. and G. Zigani, 1994. Experience and prospects of the research on defensive live fences in Burkina
Faso. Antenne Sahélienne Université Agronomique de Wageningen (The Netherlands)/Ministère de
l’Environnement et du Tourisme (Burkina Faso), 16pp.
Hoogmoed, W.B., 1999. Tillage for soil and water conservation in the semi-arid tropics. PhD-thesis,
Wageningen Unversity, The Netherlands. Tropical Resource Management Papers no.24, 184pp.
Ibrahima, A. and A. Schmitt. (1991). Bilan Hydrique a la Parcelle: Cas D'une Etude Realisée sur Le Plateau
Mossi Au Burkina Faso. In: Soil Water Balance in the Sudano Sahelian Zone, IAHS, pp 289-298
Ishida, T., Campbell, G.S. and C. Calissendorf, 1991.Improved heat balance method for determining sap flow
rate. Agricultural and Forest Meteorology, 56: 35-48.
Kaya, B., Diarra, S. and A. Coulibaly, 1994. Programme de recherche sur les haies-vives en zone Mali-Sud. Etat
actuel de connaissances scientifiques et traditionelles. Institut d’Eonomie Rurale, Centre Regional de
Recherche Agronomique de Sikasso (CRRA). 23pp.
Kessler, J.J. and J. Boni, 1991. L’Agroforestrie au Burkina Faso, Bilan et analyse de la situation actuelle.
Tropical Resource Management Papers no. 1.Université Agronmique de Wageningen (Pays
Bas)/Ministère de l’Environnement et du Turisme (Burkina Faso), 144pp.
Kessler, C.A., Spaan, W.P., Van Driel W.F. and and L. Stroosnijder, 1995. Choix et modalités d’exécution des
mesures de conservation des eaux et des sols au Sahel. Une comparaison de cing projets de
développement. Tropical Resource Management Papers no.8, Wageningen University, Nieuwe Kanaal
11, Wageningen, The Netherlands, 94pp.
Kiepe, P., 1995. No Runoff, no soil loss: Soil and water conservation in hedgerow barrier systems. Ph.D. thesis,
Wageningen University, Nieuwe Kanaal 11, 6709 PA Wageningen, The Netherlands, 158 pp.
Kiepe, P., de Ridder, N., Stroosnijder. L., De Graaff, J., Slingerland, M. and F. Hien, 2001. Soil and water
conservation in Sahelian villages. In: Agro-Silvo-Pastoral Land Use in Sahelian Villages, Advances in
Geoecology 33. Stroosnijder en Van Rheenen (Eds.). Reiskirchen, Catana Verlag 2001. pp 237-254.
Küchelmeister, G, 1989. Hedges for resource poor land users in developing countries. Deutsche Gesellschaft für
Zusammenarbeit (GTZ) GmbH, Technical Co-operation, Federal republic of Germany, Eschborn, 1989.
256pp.
Ledieu, J., De Ridder, P., De Clerck, P. and S. Dautrebande, 1996. A method of measuring soil water by time
domain reflectrometry. J. Hydrol., 88:319-328.
Le Houérou, H.N., 1989. The grazing land ecosystems of the African Sahel. Ecological Studies 75. Springer -
Verlag, Berlin, Heidelberg.
Leisinger, K.M. and K. Schmitt, 1995. Survival in the Sahel. The Hague: International Service for National
Agricultural Research.
Ludwig, H., 1999. Effect of six hedgerow species on soil infiltration. MSc-thesis, Vrije Universiteit Amsterdam,
Faculty of Earth Sciences, Department of Hydrology, 54pp.
Maduakor, H.O., 1991 Physical and hydraulic properties of soils in the Sudano-Sahelian regions of Nigeria. In:
Soil Water Balance in the Sudano-Sahelian Zone, IAHS, pp 229-240.
Monteith, J.L., 1991 Weather and water in the Sudano-Sahelian zone. In: Soil Water Balance in the Sudano-
Sahelian Zone, IAHS, pp 11-30.
Mulla, D.J., 1989. Measurements and characterization of soil water relationships. In: Soil, Crop, and Water
Management Systems for rainfed agriculture in the Sudano-Sahelian Zone: Proceedings of an
International Workshop, 7-11 Jan. 1987. ICRISAT Sahelian Center, Niamey, Niger. Patancheru, A.P.
502324, India: ICRISAT. pp 75-83.
70
Niemeijer, D. and V. Mazzucato, 2001. Productivity of soil resources in Sahelian villages. In: Agro-Silvo-
Pastoral Land Use in Sahelian Villages, Advances in Geoecology 33. Stroosnijder en Van Rheenen
(Eds.). Reiskirchen, Catana Verlag 2001. pp 145-156.
Nijzink, L., 1999. More grass strips, less erosion. Intensification, market and grass strips on the Central Plateau,
Burkina Faso. Student report147, Antenne Sahelienne de l’Université Agronomique Wageningen et de l’
Université de Ouaguadougou, Burkina Faso. 109pp.
Osunade, M. and C. Rey, 1996. Back to the grass strips. In: Sustaining the soil. Indigenous soil and water
conservation in Africa. Rey, Scoones and Toolmin(Eds). Earthscan Publications Ltd, London. pp 151-
155.
Penning de Vries, F.W.T. and M.A. Djitéye. 1982. La productivité des pâturages Saheliens. Une étude des sols,
des végétations et de l’exploitation de cette resource naturelle. Agricultural Research Report 918. Center
for Agricultural Publishing and Documentation, Wageningen, The Netherlands.
Ritchie, J.T., 1972. Model for predicting evaporation from a row crop with incomplete cover. Water Res. Res.,
vol.8, no 5, Oct.1972.
Rocheleau, D., Weber, D. and A. Field-Juma, 1988. Agroforestry in dryland Africa. International Council for
Research in Agroforestry, ICRAF House, Nairobi, Kenya, 311pp.
Sakuratani, T., 1981. A heat balance method for measuring water flux in stems of intact plants. J. Agric.
Meteorol, 37: 9-17.
Sakuratani, T., 1984. Improved probe for measuring water flow rate in intact plants with the stem heat balance
method. J. Agric. Meteorol., 40:273-277.
Shuttleworth, W.J., 1979. Evaporation. Institute of Hydrology. Report no. 56, Wallingford, U.K.
Sikking, A.F.S., 1997. Hedgerows for water conservation, an alternative or a balony? A waterbalance study.
MSc-thesis, Wageningen University, Nieuwe Kanaal 11, 6709 PA Wageningen, The Netherlands,
122 pp.
Sivakumar, M.V.K. and F. Gnoumou, 1987. Agroclimatolgie de l'Afrique de l'Ouest: Le Burkina Faso Bulletin
d'Information ICRISAT Niamey, Niger
Sivakumar, M.V.K., Wallace, J.S., Renard, C. and C. Giroux. (1991). Soil Water Balance in the Sudano-
Sahelian Zone. Proceedings Niamey, Workshop, IAHS, 628 pp.
Sivakumar, M.V.K., 1991. Drought spells and drought frequencies in West Africa. Research Bulletin no. 13,
International Crops Research Institute for the Semi-Arid Tropics, Pantancheru, Andhra Pradesh 502 324,
India, 181p.
Slingerland, M.A., 2000. Mixed farming: Scope and Constraints in West African Savanna. Ph.D. thesis,
Wageningen University, The Netherlands, 289 pp.
Spaan, W.P. and K.J. Van Dijk, 1998. Evaluation of the effectiveness of soil and water conservation measures in
a closed silvo-pastoral area in Burkina Faso. Advances in GeoEcology 31:1295 – 1301, Catena Verlag.
Spaan, W.P., Ringersma, J., Stroosnijder, L. and A. Sikking, 1999. Estimation of water use by vegetation
barriers based on climatological factors and soil moisture levels. Prooceedings of the 9th
International
Rainwater Catchment Conference “Rainwater Catchments an Answer to the Water Scarcity of the Next
Millennium” Petrolina, Brazil, July 6-9, 1999 (on CD only).
Spaan, W.P. and E.E. Van Loon, 2001. The influence of rain intensity and crop stages on runoff production.
Proceedings of 10th
International Rainwater Catchment Systems Conference (IRCSA), Mannheim,
Germany, pp 231 - 235.
Steinberg, S.L., Van Bavel, C.H.M.and M.J. McFarland, 1989. A gauge to measure mass flow rates of sap in
stems and trunks of woody plants. J. Am. Soc. Hortic. Sci., 446-472.
Stroosnijder, L. and Hoogmoed, W.B., 1993. Sustainable land-use in the tropics; Management of natural
resources in the Sahel, Interdisciplinary research program 1994-1998. Wageningen University, Nieuwe
Kanaal 11, 6709PA Wageningen, The Netherlands.
Van der Steeg, R.P.1998. La réalisation et gestion des bandes de conservation.MSc-thesis, Wageningen
University, Nieuwe Kanaal 10, 6709PA Wageningen, The netherlands, 62pp.
Van Roode, M., 2000. The effects of vegetative barrier strips on surface runoff and soil erosion in Machakos,
Kenya. PhD-thesis, Universiteit Utrecht, 283pp.
Wallace , J.S., 1991. The measurement and modeling of evaporation from semi-arid land. In: Proceedings of the
International Workshop on Soil Water Balance in the Sudano Sahelian Zone, February 1991, ICRISAT
Sahelian Center, Niamey, Niger. Sivakumar, Wallace, Renard and Giroux (eds), 131-148.

Chapter 4
The Savings (Effects)

72
73
The Savings (Effects)
4.1 Introduction
After 3 explorative studies (Chapter 2) it was decided that vegetation barriers were to be the central
theme of this thesis research. In Chapter 3 the state-of-the art with respect to vegetation barriers on
the Central Plateau of Burkina Faso was presented. In addition the setting of the research, as well as
the long-term experiment (1994−2000) were described.
Chapter 4 will describe the ‘savings’, i.e. how much water (runoff) and soil (erosion) will be
gained in a vegetation barrier system. This chapter contains 3 papers. The first paper (Chapter 4.2)
was presented at a water harvesting conference in Iran in 1997. It describes runoff reduction during
the first phase (1994−1997) of the experiment where the alleys were kept bare. The effect of type of
barrier and scale (i.e. width of the alley) were reported.
The second paper (Chapter 4.3, submitted to the Journal of Soil & Water Conservation) also
concentrates on runoff and includes the second phase (1998−2000) of the research when alleys were
cropped. Four hypothesis have been tested; (1) vegetation barriers slow down runoff and extend the
opportunities for infiltration (with fine-textured barriers being more effective than course textured
barriers), (2) rain intensity is a dominant factor for runoff generation, (3) the runoff rate increases in
proportion to slope length and (4) alley land use determines the water conservation efficiency. From
this work the tested barriers could be divided into two groups: the ‘effective’ and the ‘less effective’
barriers. This naming does not indicate more value to the former group than to the latter, since the
outcome of Chapter 2 showed that it is semi-permeability which makes vegetation barriers (and
stone lines) an adapted and wanted SWC-practice under Sahelian climatic conditions.
The last paper (Chapter 4.4, submitted to Soil and Tillage Research) analyses the sediment
trapping of the various barriers. Large differences were found between the barriers. Additionally the
effect of tillage on the alleys was investigated. Two tillage situations were distinguished, ‘light
tillage’ during the initial cropping phase and ‘full tillage’ during the weeding period. Finally, a
search for the best indicator to predict erosion and sediment trapping was conducted and the effect
of extreme events on the indicator was investigated.

74
4.2 Effect of scale and vegetation on runoff in Burkina Faso,
West Africa
Spaan W.P. and L. Stroosnijder, 1997. Effect of scale and vegetation on runoff in Burkina Faso,
West Africa. Proceedings of the 8th
International Conference on Rainwater Catchment Systems
“Rainwater Catchment for Survival”, Tehran, Iran, 1997.
Abstract
The efficacy of several vegetation barriers intended to accelerate the regeneration of degraded areas
was evaluated at the research station of the Institute de Développement Rural (IDR) at Gampela,
near Ouagadougou, the capital of Burkina Faso. Vegetative measures provide food and animal
fodder, help to preserve fertility and to conserve soil and water. The influence of seven local plant
species (grasses: Andropogon gayanus, Vetiveria zizanioides: woody species: Acacia nilotica,
Guiera sengalensis, Piliostigma reticulatum, Ziziphus mauritiana; and a succulent: Agave sisalana)
on runoff was examined. The selected species were planted on a 2 % slope of a Chromic Luvisol, in
21 plots of 20 x 20 m as conservation barriers, along the contour. After each erosive storm, runoff
was measured on plots of 1 m2
and 10 m2
to determine the catch efficiency of the species.
Grasses proved to be very effective in slowing down the velocity of the runoff water and to
promote infiltration. The through flow in the strips of woody species and succulents was rather big
and water conservation upstream of the strip rather marginal. Water conservation in the strips
however was always higher than the control. Therefore all the strips had some effect. The down
stream water conservation effect depended on the through-flow of the strip. A higher through flow
resulted in a higher soil moisture content down-stream of the strip.
4.2.1 Introduction
In semi-arid regions there is rainfall during part of the year only. This often causes an excess of
water in the brief rainy period and a shortage of water for man, animal and vegetation during the
dry months. Water conservation aims at making better use of this very unequal distribution of rain
over the year.
Runoff management is one of many ways of water conservation. Two main targets of runoff
management can be distinguished, decreasing runoff by improving local in-situ infiltration of water
in the soil and increasing runoff by enhancing the catchment runoff factor. The aim of decreasing
runoff is to enhance the amount of available water in the soil for plant growth and crop production.
Appropriate land use that encourages local infiltration of water will increase the water use
efficiency (Gregory, 1989). The aim of increasing runoff is to fill a downstream water reservoir for
e.g. man, cattle or supplementary irrigation. On micro-scale, within field techniques, runoff
stimulation up-hill and blocking of the overland-flow downhill, are combined on the same plot.
For both management targets, prediction of the runoff volume as a function of management
practices in the catchment is of importance for the assessment of the conservation work. This
prediction is based on three factors; rainfall prediction (statistical analysis of rainfall), size of the
catchment and state of the catchment (e.g. bare soil, rock, vegetation, topography, etc). For
hydrological predictions there exist a number of prediction equations (e.g. Rodier, 1992; Boers and
Ben-Asher, 1982; Boers, 1994) for catchments with a minimum size of some hectares. The general
effect of scale is that the larger the catchment the smaller the annual runoff fraction. Stroosnijder
(1996) found runoff fractions decreasing from 31 to 10% with increasing catchments size from 0.36
to 1.08 km2
for Burkina Faso in West-Africa. On bare medium to fine textured soils the fraction of
75
the annual runoff that runs off may exceed 50% (Hoogmoed and Stroosnijder, 1984; Le Houérou,
1989; Cassanave and Valentin, 1992; Hien, 1995)
For agricultural development there is a need for runoff prediction for much smaller
catchments. Examples are the micro-catchments for trees (Aldon and Springfield, 1975; Boers,
1994) and the alleys in hedgerow agroforestry systems (Kiepe, 1995). This research aims at the
development of a prediction model for small (1−100 m) slope lengths for agroforestry systems. The
research includes the biological state of the catchment (slope) varying from bare soil to vegetated
with grasses/herbs and trees/shrubs. The role of termites on runoff, Mando et al, (1996) and
vegetation, Mando et al., (1997) has also been investigated. This study focuses on predicting the
enhancement of runoff due to certain management practices (in order to stimulate runoff for
increased storage downslope), as well as the reduction of runoff through the improvement of
infiltration. The latter is achieved by using vegetation as a barrier against runoff in order to increase
infiltration in alleys between the barrier and to stimulate plant growth and crop production.
4.2.2 Materials and methods
The study area
The study was conducted on a 3 ha site located in the central part of Burkina Faso near Gampela (1°20’ W, 12° 20’ N) 18 km north east of the capital Ouagadougou, in the province Oubritenga. The
soil (Chromic Luvisols), at an altitude of about 275 m, consists of sandy loam in the top layer, but is
rich in clay in deeper layers with hydromorphic properties (in French: sols ferrugineux tropicaux
lessivés indurés profonds à concretions et tâches d’hydromorphie). The soil is developed in situ on
rocks of Birrimien Precambrium moyen. Soil aggregates are small and unstable with a tendency for
autocompaction (bulkdensity 1600 kg m-3
). Soil depth varies between 0.7 and 1.3 m. The soils are
prone to crusting due to their low structural stability caused by a low soil organic matter content (<
1 %). Under these conditions surface infiltration is poor and subsequently runoff is high. The soil
pH (H2O) varies between 5 and 7.5 and nutrient availability and CEC are low. The soils in the crop
area have a suitability class S2 or moderately suitable for cultivation of groundnuts, sorghum,
millet, maize and cowpea.
With an average rainfall of 790 mm y-1
the area has a North Sudanien climate with rains
from June to October. There is a large variability in rainfall distribution over the year and between
the years. The natural vegetation is of the savannah type. Most important woody species belong to
the genus Acacia, Combretaceae, Guiera, Piliostigma, and Ziziphus family (Anonymus, 1988).
Annual grasses are dominated by Pennisetum pedicellatum, Loudetia togoensis and Eragrostis
tremula and dominant perennial grasses are Andropogon gayanus and Hyparrhenia dissoluta
(Anonymus, 1988; Le Houérou, 1989; Penning de Vries and Djitéye, 1982). Little natural
vegetation occurs in the area because of clearing activities for agriculture. The experimental site is
an abandoned agricultural field with only some useful trees left. Arable crops in the area are
sorghum, maize, millet and groundnuts.
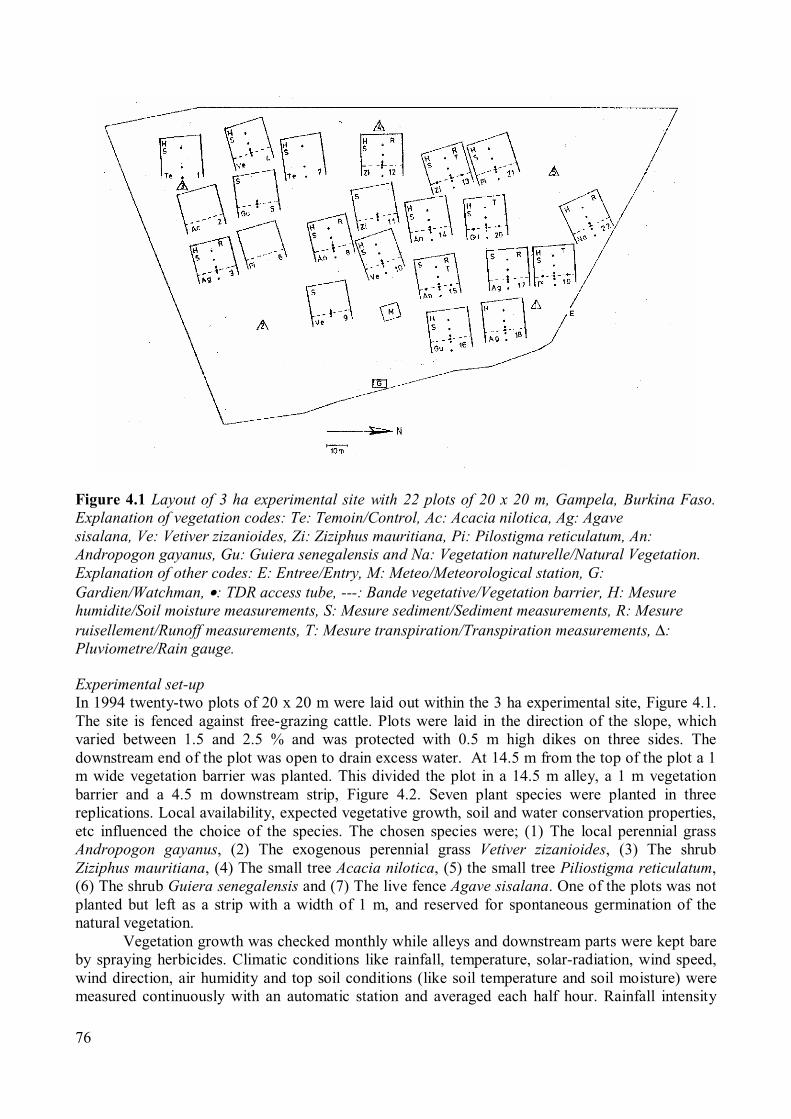
76
Figure 4.1 Layout of 3 ha experimental site with 22 plots of 20 x 20 m, Gampela, Burkina Faso.
Explanation of vegetation codes: Te: Temoin/Control, Ac: Acacia nilotica, Ag: Agave
sisalana, Ve: Vetiver zizanioides, Zi: Ziziphus mauritiana, Pi: Pilostigma reticulatum, An:
Andropogon gayanus, Gu: Guiera senegalensis and Na: Vegetation naturelle/Natural Vegetation.
Explanation of other codes: E: Entree/Entry, M: Meteo/Meteorological station, G:
Gardien/Watchman, •: TDR access tube, ---: Bande vegetative/Vegetation barrier, H: Mesure
humidite/Soil moisture measurements, S: Mesure sediment/Sediment measurements, R: Mesure
ruisellement/Runoff measurements, T: Mesure transpiration/Transpiration measurements, ∆:
Pluviometre/Rain gauge.
Experimental set-up
In 1994 twenty-two plots of 20 x 20 m were laid out within the 3 ha experimental site, Figure 4.1.
The site is fenced against free-grazing cattle. Plots were laid in the direction of the slope, which
varied between 1.5 and 2.5 % and was protected with 0.5 m high dikes on three sides. The
downstream end of the plot was open to drain excess water. At 14.5 m from the top of the plot a 1
m wide vegetation barrier was planted. This divided the plot in a 14.5 m alley, a 1 m vegetation
barrier and a 4.5 m downstream strip, Figure 4.2. Seven plant species were planted in three
replications. Local availability, expected vegetative growth, soil and water conservation properties,
etc influenced the choice of the species. The chosen species were; (1) The local perennial grass
Andropogon gayanus, (2) The exogenous perennial grass Vetiver zizanioides, (3) The shrub
Ziziphus mauritiana, (4) The small tree Acacia nilotica, (5) the small tree Piliostigma reticulatum,
(6) The shrub Guiera senegalensis and (7) The live fence Agave sisalana. One of the plots was not
planted but left as a strip with a width of 1 m, and reserved for spontaneous germination of the
natural vegetation.
Vegetation growth was checked monthly while alleys and downstream parts were kept bare
by spraying herbicides. Climatic conditions like rainfall, temperature, solar-radiation, wind speed,
wind direction, air humidity and top soil conditions (like soil temperature and soil moisture) were
measured continuously with an automatic station and averaged each half hour. Rainfall intensity
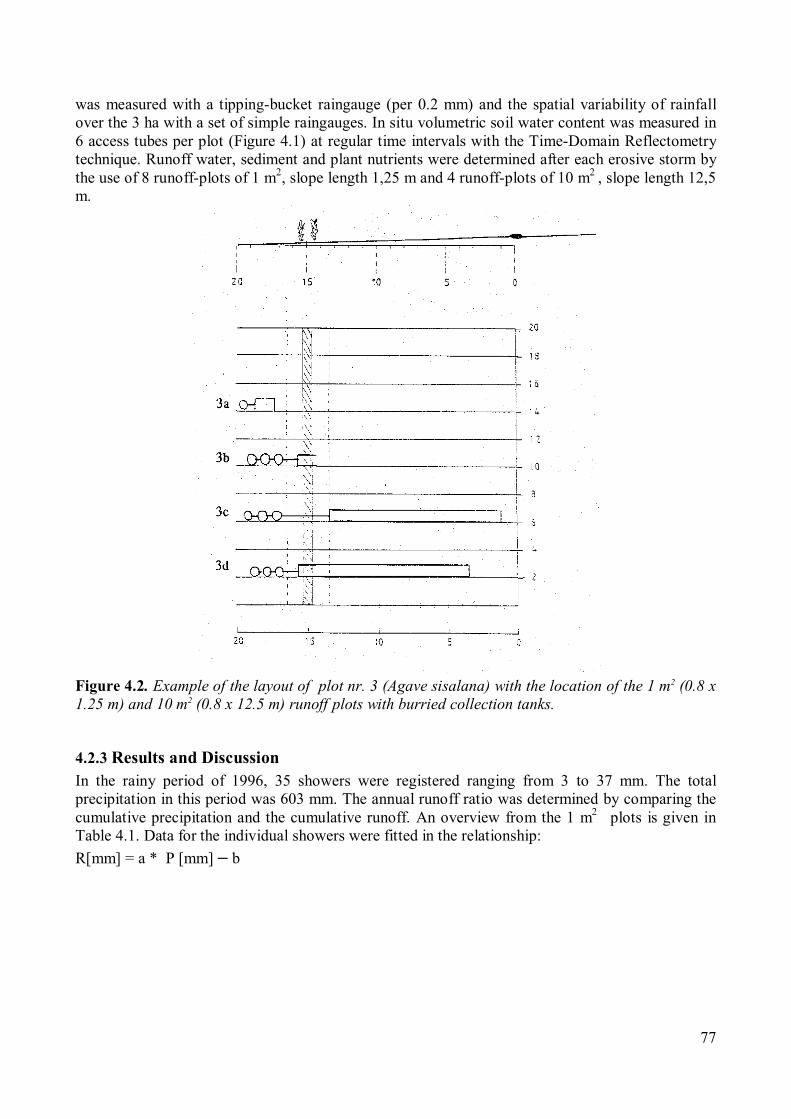
77
was measured with a tipping-bucket raingauge (per 0.2 mm) and the spatial variability of rainfall
over the 3 ha with a set of simple raingauges. In situ volumetric soil water content was measured in
6 access tubes per plot (Figure 4.1) at regular time intervals with the Time-Domain Reflectometry
technique. Runoff water, sediment and plant nutrients were determined after each erosive storm by
the use of 8 runoff-plots of 1 m2
, slope length 1,25 m and 4 runoff-plots of 10 m2
, slope length 12,5
m.
Figure 4.2. Example of the layout of plot nr. 3 (Agave sisalana) with the location of the 1 m2
(0.8 x
1.25 m) and 10 m2
(0.8 x 12.5 m) runoff plots with burried collection tanks.
4.2.3 Results and Discussion
In the rainy period of 1996, 35 showers were registered ranging from 3 to 37 mm. The total
precipitation in this period was 603 mm. The annual runoff ratio was determined by comparing the
cumulative precipitation and the cumulative runoff. An overview from the 1 m2
plots is given in
Table 4.1. Data for the individual showers were fitted in the relationship:
R[mm] = a * P [mm] − b
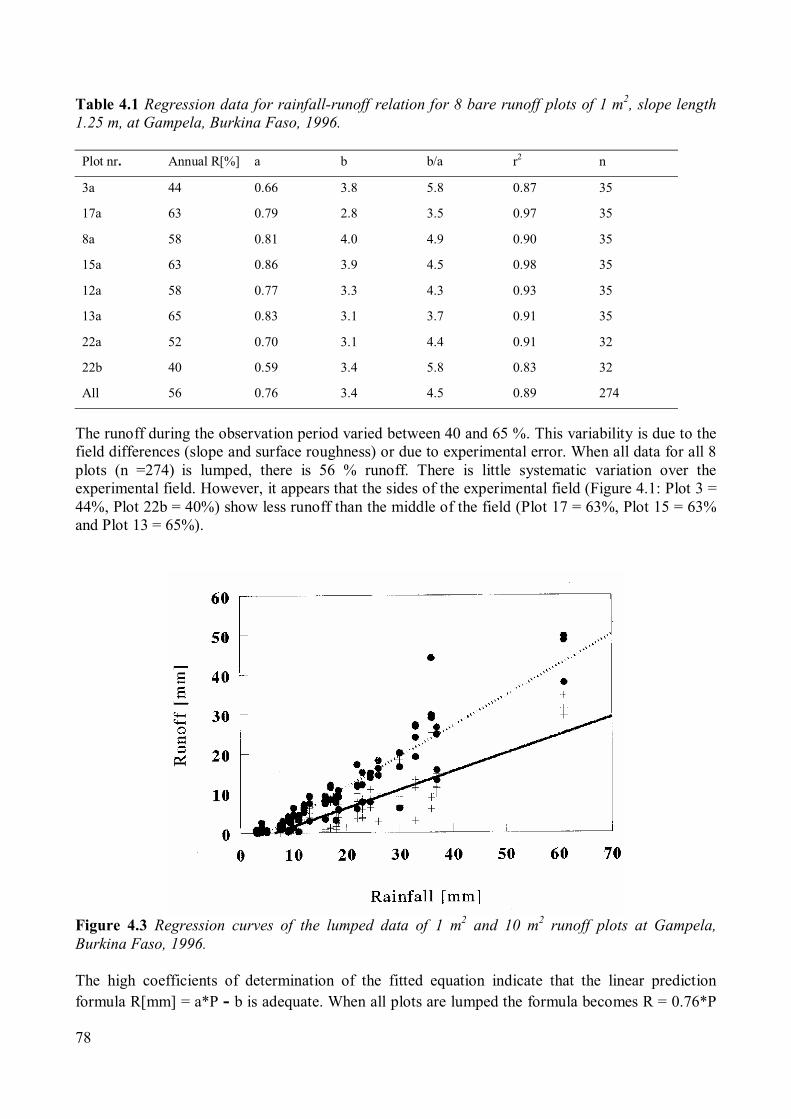
78
Table 4.1 Regression data for rainfall-runoff relation for 8 bare runoff plots of 1 m2
, slope length
1.25 m, at Gampela, Burkina Faso, 1996.
Plot nr. Annual R[%] a b b/a r2
n
3a 44 0.66 3.8 5.8 0.87 35
17a 63 0.79 2.8 3.5 0.97 35
8a 58 0.81 4.0 4.9 0.90 35
15a 63 0.86 3.9 4.5 0.98 35
12a 58 0.77 3.3 4.3 0.93 35
13a 65 0.83 3.1 3.7 0.91 35
22a 52 0.70 3.1 4.4 0.91 32
22b 40 0.59 3.4 5.8 0.83 32
All 56 0.76 3.4 4.5 0.89 274
The runoff during the observation period varied between 40 and 65 %. This variability is due to the
field differences (slope and surface roughness) or due to experimental error. When all data for all 8
plots (n =274) is lumped, there is 56 % runoff. There is little systematic variation over the
experimental field. However, it appears that the sides of the experimental field (Figure 4.1: Plot 3 =
44%, Plot 22b = 40%) show less runoff than the middle of the field (Plot 17 = 63%, Plot 15 = 63%
and Plot 13 = 65%).
Figure 4.3 Regression curves of the lumped data of 1 m2
and 10 m2
runoff plots at Gampela,
Burkina Faso, 1996.
The high coefficients of determination of the fitted equation indicate that the linear prediction
formula R[mm] = a*P - b is adequate. When all plots are lumped the formula becomes R = 0.76*P
79
− 3.4 (Figure 4.3). Note that only the total rainfall is needed in this formula and that there seems no
need to use more sophisticated rainfall data like intensity, etc. The lower limit for runoff, i.e. the
value for P when R = 0 can be calculated as b/a. This value varies (Table 4.1) between 3.5 and 5.8
mm. When checking this with real data for individual showers it appears that below 3 mm rain there
is no runoff. If all data is lumped, then the lower limit becomes 4.5 mm.
Comparing the measured runoff with the calculated runoff (using the fitted equation) it
appeared that in the first three months of the rainy season the measured runoff was always higher
than the calculated runoff. Increased soil moisture content enabled some plant growth on the alley,
with some slowing down of the overland flow resulting in a reduced measured runoff in the second
part of the rainy season. Increasing the slope length from 1.25 m to 12.5 m (upscaling) gives a
drastic reduction in runoff over the observation period from 56% to 28% (Table 4.2), if data from
all 4 plots are lumped together.
Table 4.2 Regression data for rainfall-runoff relation for slope lengths of 1.25 m and 12.5 m, bare
runoff plots at Gampela, Burkina Faso, 1996
Slope
length [m]
Plot nr. Annual
R[%]
a b b/a r2
n
1 3a 44 0.66 3.8 5.8 0.87 35
1 17a 63 0.79 2.8 3.5 0.97 35
10 3c 36 0.50 2.3 4.6 0.88 27
1 8a 58 0.81 4.0 4.9 0.90 35
1 15a 63 0.86 3.9 4.5 0.98 35
10 15c 29 0.51 3.8 7.5 0.75 27
1 12a 58 0.77 3.3 4.3 0.93 35
1 13a 65 0.83 3.1 3.7 0.91 35
10 13c 25 0.41 2.8 6.8 0.83 27
1 22a 52 0.70 3.1 4.4 0.91 32
1 22b 40 0.59 3.4 5.8 0.83 32
10 22f 20 0.34 2.1 6.2 0.80 19
1 All 56 0.76 3.4 4.5 0.89 274
10 All 28 0.46 3.0 6.5 0.79 100
On average the equation R[mm] = 0.46*P[mm] − 3.0 provides a good estimate of runoff for 10 m2
.
The lower limit for runoff increases from 4.5 mm for 1.25 m slope length to 6.5 mm at 12.5 m slope
length. The high coefficients of determination of the fitted equation indicate that the linear
prediction is adequate.
Effects of the different vegetation strips at the downward end of the plot are clearly
demonstrated in the reduction of the runoff (Table 4.3). The overland flow reduction in the strip is
influenced by the number of stems per m 2
, height, stiffness and the stand of the vegetation strip
(Haan, Barfield and Hayes, 1994).

80
Table 4.3 Regression data for rainfall-runoff relation for slope lengths of 12.5 m with and without
a vegetation strip of 1 m at the downward end of the slope, Gampela, Burkina Faso, 1996.
Vegetation type Plot nr. Annual
R[%]
a b b/a r2
n
Bare 3c 36 0.50 2.3 4.6 0.88 27
Agave 3d 43 0.57 2.5 4.4 0.86 27
Agave 17d 23 0.45 3.7 8.2 0.71 27
Bare 13c 35 0.41 2.8 5.5 0.83 27
Ziziphus 13d 18 0.28 1.8 6.4 0.83 27
Ziziphus 12d 29 0.31 0.3 1.0 0.57 27
Bare 15c 29 0.51 3.8 7.5 0.75 27
Andropogon 15b 15 0.31 2.7 8.7 0.51 27
Andropogon 8b 21 0.41 3.4 8.3 0.73 27
Bare 22f 20 0.34 2.1 6.2 0.80 19
Natural Veget. 22g 4 0.098 0.83 8.5 0.68 19
Natural Veget. 22h 3 0.063 0.53 8.4 0.50 19
Bare All 28 0.46 3.0 6.5 0.79 100
Vegetated All 21 0.36 2.5 6.9 0.58 200
For Agave the effect of a 1 m wide vegetation strip is not clear. Plot 17d gives a lower runoff but
plot 3d gives a higher runoff than the bare plot without a vegetation strip. For Ziziphus and
Andropogon the effect is clearer, one plot of each shows a drastic reduction (13d and 15b) while
other plots show little reduction (12d and 8b). The most striking result is obtained with a strip of
natural vegetation (grasses and herbs). Runoff is reduced from 20 % to 3 and 4 %. The lower limit
for runoff is not affected significantly, ranging from 6.5 to 6.9 mm.
4.2.4 Conclusion
Looking at the scale of runoff measurements, the size of the plot is very important. An increased
slope length from 1.25 m to 12.5 m reduced the runoff with 50 %. Plant species used in this
research had a very different influence on runoff and infiltration of water near the strip. Grasses and
natural vegetation proved to be effective in blocking the overland flow and in conserving water near
the strip. Woody species and Agave were less effective in slowing down the runoff. A large part of
the runoff flows through the vegetation, also enriching the downslope part of the plot. Infiltration
uphill of the woody species and the succulent was rather marginal. Water conservation using strips
was always higher than in the control plot.
83
References
Aldon, E.F. and Springfield, H.W., 1975. Using parrafin ad polyethylene to harvest water for growing shrubs. In:
Proc. Water Harvesting Symp., Phoenix, AZ, ARS W-22, USDA, pp. 251−257.
Anonymus, 1988. Etude pédologique de la station experimentale de Gampela. Ministère de l’Agriculture et de
l’Elevage, Secretariat General, Bureau National des Sols, Ouagadougou, Burkina Faso. Rapport
Technique no 59, 279 pp., juillet 1988.
Boers, Th.M. and Ben-Asher, J., 1982. A review of rainwater harvesting. In: Agric. Water Management 5:
145−158.
Boers, Th.M., 1994. Rainwater harvesting in arid and semi-arid zones. Phd-thesis, Agricultural University
Wageningen, 133 pp.
Casanave, A. and Valentin, C. 1992. A runoff capability classification system based on surface features criteria
in semi-arid areas of West Africa. Journal of Hydrology 130: 231−249.
Gregory, P.J., 1989. Water-use efficiency of crops in semi-arid tropics, pp 85−98. In: Soil, Crop, and Water
Management Systems for rainfed agriculture in the Sudano-Sahelian Zone: Proceedings of an
international workshop, 11−16 January 1987, ICRISAT Sahelian centre, Niamey, Niger.
Haan, C.T., Barfield, B.J. and Hayes, J.C., 1994. Design hydrology and sedimentology for small catchments.
Academic Press, Inc. San Diego, Carlifornia 92101−4495, USA.
Hien, F.G., 1995. La régénération de l'espace sylvo-pastoral au Sahel. Une étude de l'effet de mesures de conser-
vation des eaux et des sols au Burkina Faso. Tropical Resource Management Papers no 7, Wageningen.
ISBN 0926−9495
Hoogmoed, W.B. and Stroosnijder, L. , 1984. Crust forming on sandy soils in the Sahel.I. Rainfall and
infiltration. Soil Till. Res. 4: 5−23.
Kiepe, P., 1995. No Runoff, no soil loss: Soil ans water conservation in hedgerow barrier systems. PHd thesis,
Agricultural University Wageningen, 158 pp.
Le Houérou, H.N., 1989. The grazing land ecosystems of the African Sahel. Ecological Studies 75. Springer -
Verlag, Berlin, Heidelberg.
Mando, A., Stroosnijder, L. and Brussaard, L., 1996. Effects of termites on infiltration into crusted soil.
Geoderma 74 (1996) 107−113.
Mando, A., Brussaard, L. and Stroosnijder, L. 1997. Termite and mulch mediated rehabilitation of vegetation on
crusted soil in the Sahel (submitted Applied Ecology).
Penning de Vries, F.W.T. and Djitéye, M.A., 1982. La productivité des pâturagesSaheliens. Une étude des sols,
des végétations et de l’exploitation de cette resource naturelle. Agricultural Research Report 918. Centre
for Agricultural Publishing and Documentation, Wageningen, 1982.
Rodier, J., 1992. Du simulateur de pluie aux bassins representatifs Saheliens. Paris: ORSTOM, 1992, 76 pp.
(Collection études et theses, ISSN 0767−2888), ISBN 2-7099-1074-8
Stroosnijder, L., 1996. Modelling the effect of grazing on infiltration, runoff and primary production in the
Sahel. Ecological Modelling 92 (1996) 79−88.
82
4.3 Effect of vegetation barriers on runoff in an alley crop system in
Burkina Faso, West Africa.
Spaan, W.P., Posthumus, H., Van Loon, E.E. and L. Stroosnijder. Effect of vegetation barriers on
runoff in an alley crop system in Burkina Faso, West Africa. (Submitted to: Journal of Soil and
Water Conservation)
Abstract
Barriers along contours trap water and the impedance of runoff prolongs the opportunity for
infiltration. This is a useful water conservation technique in areas with high runoff percentages and
where crop production is largely water limited. The efficacy of different semi-permeable barriers in
reducing runoff was evaluated in an alley-crop experiment in Burkina Faso. To determine the runoff
interception efficiency of barriers and to find out the influence of slope length and alley treatment,
runoff induced by a large number of storms was measured on plots with slope lengths of 1.25 m,
6.25 m, and 12.5 m. Plots without a barrier (no barrier) were used as the control. Grass barriers and
stone rows proved to be very effective (effective barrier) in impeding runoff and reducing runoff to
only 20 % of precipitation. The runoff through woody species and succulents was about 50 % of
precipitation (less effective barrier). By comparison with the control, a barrier always resulted in
water conservation. Less effective barriers with a bare or cropped alley showed a decrease in runoff
percentage with an increase of plot length along the slope, whereas effective barriers with a bare or
cropped alley showed an increase of runoff along the slope. On short (1.25 m) and long (12.5 m)
slopes the influence of rain intensity on runoff production was marginal. On the medium slope
length (6.25 m), rain intensity influenced runoff on most plots. A general conclusion is that for
longer slopes, all factors such as type of barrier, land use and rain intensity became less important.
In that situation, large runoff volumes exceed the quantity of water that can be dammed by the
vegetation barriers (threshold), and can be intercepted as a result of land use activities and
vegetation on the alley. It is concluded that barriers improve water conservation and are most
effective when closely spaced.
Keywords: vegetation barrier, stone barrier, alley crop, runoff, water conservation.
4.3.1 Introduction
Burkina Faso lies in the Sudano-Sahelian Zone (SSZ), which is defined in terms of an annual
average rainfall ranging from about 400 to over 1000 mm (Monteith, 1991). In this semi-arid
region rain is strongly seasonal, there is large variation in precipitation between and within years,
and dry spells are frequent. Shortage of water in this area is not only the consequence of the amount
of rain but also of its distribution over the year and the high rates of evapotranspiration and runoff.
Notwithstanding the wide variation in temperature between day and night and between the seasons
in the SSZ, temperatures are always high and the potential evapotranspiration exceeds 1900 mm, of
which 900 mm is in the wet season (Sivakumar and Gnoumou, 1987). On bare soils of medium to
fine texture, the runoff rate may be 50 % (Hoogmoed and Stroosnijder, 1984; Le Houerou, 1989;
Casanave and Valentin, 1992) or more (Hien, 1995).
Runoff management is a method of water conservation that aims to enhance the amount of
available water in the soil for plant growth and crop production, or to fill a downstream water
reservoir, e.g. to supply domestic or drinking water, or water for livestock or supplementary
irrigation. Appropriate land use that encourages local infiltration of water increases the water use
efficiency (Gregory, 1989). This is especially relevant for the West African Sahel because of the

83
production of staple crops; although principally nutrient-stressed in low input systems; crops
quickly become water-limited in semi-intensified systems with moderate input of nutrients.
Alley crop systems are not yet widespread in Burkina Faso. The most frequently used
vegetation barriers for resource conservation are grass strips (Kiepe et al., 2001), which are not
often used as a SWC technique. More often, barriers containing woody perennials are used as a live
fence and as boundary demarcation. Boerrigter (1997) reports that in the province of Sanmatenga
live fences are used as SWC technique. According to Lal (1990), the planting of woody perennials
along the contour can be seen as an important strategy to stabilise slopes. For the assessment of
these conservation practices it is important to be able to predict the runoff volume as a function of
management practices in the alley-crop system. The size and density of barriers and their spacing
must be such that enough water is in the right place, even in dry years.
The inability to make reliable predictions severely hampers soil and water conservation
planning and implementation (De Graaff, 1996). The existing hydrological models for predicting
runoff (Rodier, 1992; Boers and Ben-Asher, 1982; Boers, 1994) are applicable to catchments with
a minimum size of several hectares. Yet for agricultural development, runoff in the SSZ has to be
predicted for much smaller catchments, such as micro-catchments for trees (Aldon and Springfield,
1975; Boers, 1994) and alleys in hedgerow agroforestry systems (Kiepe, 1995). A further
disadvantage of most existing models is that they are not specific for the conditions in the West
African Sahel. They are also relatively complex, requiring much data as input.
The research described in this paper aimed to predict overland flow by evaluating the effect
of barrier type, rain characteristics, slope length and alley land use on runoff, in order to assist in the
design of hedgerow barrier systems. Four hypotheses were tested:
1. Vegetation barriers slow down runoff and extend the opportunity for infiltration, with fine-
textured barriers being more effective than coarse-textured barriers.
2. Rain intensity is a dominant factor for runoff generation.
3. Runoff rate increases in proportion to slope length.
4. Alley land use determines the water conservation efficiency.
4.3.2 Materials and methods
The study was conducted on a 3 ha site in the centre of Burkina Faso near Gampela (1° 20’ W, 12°20’ N) at an altitude of about 275 m.a.s.l. The experimental site was a crop field with an average
slope of 2 % in which only a few trees remained. The soil is classified as a Luvisol (Sivakumar and
Wallace, 1991), low in fertility and productivity. It consists of sandy loam overlying clay with
hydromorphic properties. The topsoil (0 – 0.35 m) contains 8 % clay, 25 % silt and 67 % sand. The
percentages for the 0.35 – 0.7 m layer are 23, 19 and 58 and for the deeper soil (0.7–1.2 m) are 30,
21 and 49 respectively. The soil has developed in situ on rocks of Birrimien Middle Precambrian
(Anonymous, 1988) and can be considered as typical for the area (Ibrahima and Schmitt, 1991).
Soil depth varies between 0.7 and 1.3 m. Soil aggregates are small and unstable in wet conditions
with a tendency for auto-compaction early in the wet season (bulk density 1.600 kg m-3
) owing to
the impact of raindrops and /or cultivation. The soil forms structural crusts that reduce infiltration
and thus increase runoff (Ludwig, 1999; Bouwknegt and Brouwer, 2000). The unstable structure of
the surface layer is due to a weak binding of the aggregates, which in turn is due to the low (< 1%)
organic matter content (Maduakor, 1991). The pH (H2O) varies between 5 and 7.5, and nutrient
availability and CEC (2 − 10 me/100g) are low. The soils are moderately suitable for cultivation
and are used to grow sorghum (Sorghum biocolor subsp. Arundnaceum), maize (Zea maize), millet
(Pennisetum americanum ssp. Americanum) and groundnuts (Arachis hypogaea). There is little
natural vegetation (savannah type) because most of the area has been cleared for agriculture
(Penning de Vries and Djitéye, 1982).
84
In this area the rainy season is from June to October. On the basis of the average rainfall of
790 mm y-1
, the research area can be classified as part of the North Sudanian zone, which has
annual rainfall ranging between 650 and 1000 mm (Sivakumar and Gnoumou, 1987; Sivakumar et
al., 1991). In terms of average rainfall amount, the area is relatively wet.
In 1994 twenty-one plots of 20 x 20 m were laid out within the 3 ha experimental site, which
had been fenced to exclude free-roaming cattle. The plots were laid out in the direction of the slope
and protected with 0.5 m high bunds on three sides. The lowest (downstream) side of the plot was
left open to allow excess water to escape. A vegetation barrier 1 m wide was established along the
contour, with the centre of the barrier 15 m downslope from the top of the plot, dividing the plot
roughly into a 14.5 m alley, a 1 m vegetation barrier and a 4.5 m downslope section (Figure 4.4).
Seven plant species were planted in three replications, randomly distributed over the research area.
The species, chosen on the basis of their local availability, vegetative growth and soil and water
conservation properties, were; (1) the local perennial grass Andropogon gayanus, (2) the exogenous
perennial grass Vetiver zizanioides, (3) the shrub Ziziphus mauritiana, (4) the small tree Acacia
nilotica, (5) the small tree Piliostigma reticulatum, (6) the shrub Guiera senegalensis and (7) the
succulent Agave sisalana. Woody species were planted 0.50 m apart in two rows spaced 0.50 m
apart, in a triangle layout. For the grasses and the succulent the rows were 0.50 m apart, but the
within-row plant spacing was 0.25 m. Acacia, Vetiveria and Guiera that did not establish well were
replaced. On the Acacia plots a 1 m wide strip along the contour was reserved for spontaneous
germination and development. This barrier is referred in this article as ‘natural barrier’. Annual
weeds and grasses that appeared in the natural barriers in the first year were ousted in subsequent
years by perennials, mainly Andropogon. Additionally, barriers of stones replaced Vetiveria and
control plots (no barrier) replaced Guiera.
The barriers were planted in 1994 and took two years to grow to an appropriate size. In the
observation period 1996–1997, the alleys and downslope parts of the plots were kept bare by
spraying with herbicides (bare) to simulate the soil surface of a degraded range area. In the
observation period 1998–1999, the alleys were planted with sorghum (crop) or protected
(enclosure) so that natural vegetation (pasture) could establish (Spaan and Van Dijk, 1998). As
described by Slingerland (2000), most animal production in the Sahel depends on grazing natural
vegetation. The choice of crop or pasture on the alley was based on the palatability of the barrier
species. Barrier species unpalatable for cattle can be used as a SWC practice on the silvo-pastoral
(range) area and were as such combined with pasture.
Meteorological data was collected continuously with an automatic weather station. Rainfall
intensity was measured with a tipping-bucket rain gauge, and the spatial variability of rainfall over
the experimental site was recorded with a set of simple rain gauges. Runoff was determined after
each erosive storm. The effect of slope length was investigated by using runoff plots of three
different dimensions inside the 20 x 20 m plots. The runoff plots were of 1 m2
(slope length 1.25
m), 5 m2
(slope length 6.25 m) and 10 m2
(slope length 12.5 m). They were surrounded by a 0.25 m
high metal edge with some containing a barrier inside. Overland flow was trapped by the runoff
plots and channelled through a drainpipe into collection tanks, each with a capacity of 0.2 m3
. For
the bigger plots a number of collection tanks were used, Figure 4.4.
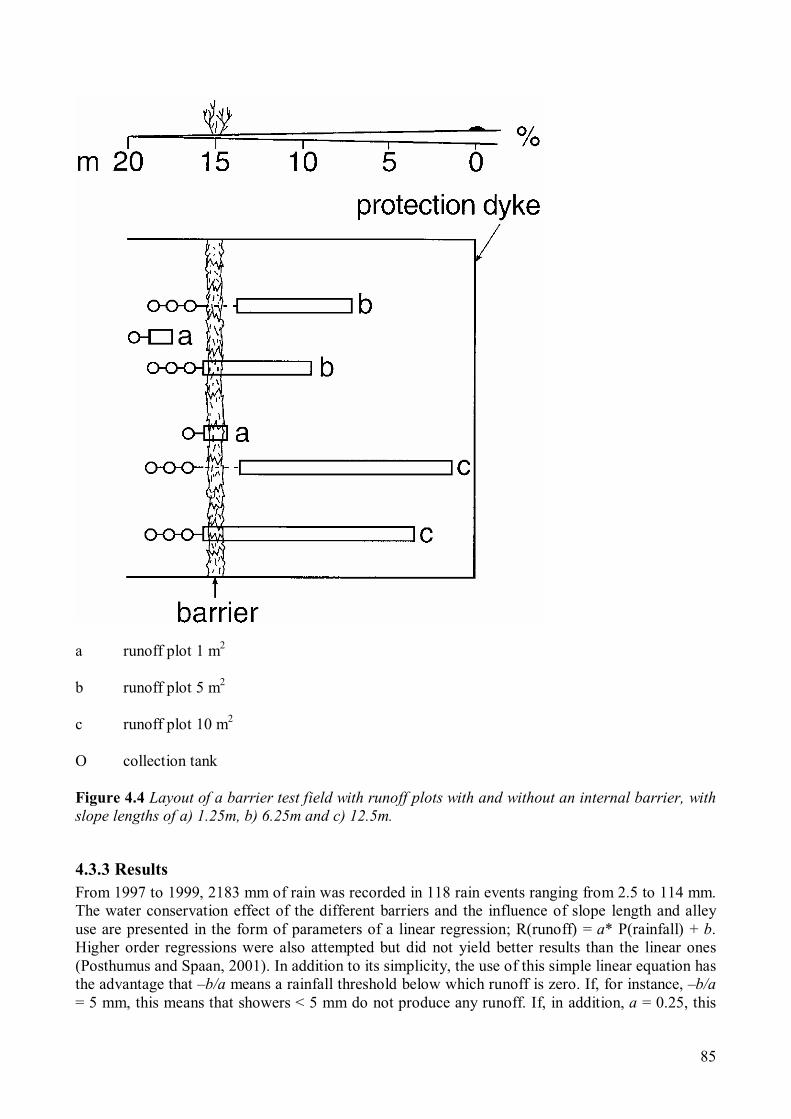
85
a runoff plot 1 m2
b runoff plot 5 m2
c runoff plot 10 m2
O collection tank
Figure 4.4 Layout of a barrier test field with runoff plots with and without an internal barrier, with
slope lengths of a) 1.25m, b) 6.25m and c) 12.5m.
4.3.3 Results
From 1997 to 1999, 2183 mm of rain was recorded in 118 rain events ranging from 2.5 to 114 mm.
The water conservation effect of the different barriers and the influence of slope length and alley
use are presented in the form of parameters of a linear regression; R(runoff) = a* P(rainfall) + b.
Higher order regressions were also attempted but did not yield better results than the linear ones
(Posthumus and Spaan, 2001). In addition to its simplicity, the use of this simple linear equation has
the advantage that –b/a means a rainfall threshold below which runoff is zero. If, for instance, –b/a
= 5 mm, this means that showers < 5 mm do not produce any runoff. If, in addition, a = 0.25, this

86
means that 25% of the rain, above the threshold of 5 mm, is lost for infiltration (and crop
production) in the form of runoff. The water conservation effect of barriers may be revealed as an
increase in the threshold (−b/a) and/or as a decrease in the a-value.
Effect of barrier type on water conservation
In Table 4.4 the parameter values for all linear regressions are presented. All rain events of 1997–
1999 were used. The significance of the relationships between rainfall and runoff was tested using
analysis of variance. It appears that all relations are highly significant as illustrated by the standard
deviation (s.d.) of the parameter a. The differences between the repetitions of Andropogon, Agave
and Piliostigma are rather large.
Comparing the barrier performance with no barrier (control) plots shows that all barriers conserve
water. The most pronounced differences in runoff between barrier species were for slopes of 1.25 m
long and will therefore be discussed below. The average values for the parameter a decreased from
0.8 (no barrier) to 0.62 (Ziziphus), 0.44 (Agave), 0.36 (Piliostigma), 0.28 (Stone row), 0.21
(Andropogon) and 0.18 (Natural). The threshold rainfall increased concomitantly, from 5.45 mm for
no barrier to > 7 mm for all barriers, except for stone rows. There is no explanation for why the
stone barriers did not conform to this. In order to facilitate further discussion it will henceforth
referred to the ‘less effective group of barriers’, with Ziziphus as the typical representative, and an
‘effective group’, with Andropogon as its representative.
Effect of rainfall intensity on water conservation
Rainfall intensity was not taken into account in the rainfall–runoff relations given in Table 4.4.
However, on the sandy soils of Yatenga province (Burkina Faso) Lamachere (1991) found a
relation between rain intensity and runoff. Therefore, using the linear regression equation and the
values as given in Table 4.4, the differences were compared between measured and estimated runoff
with the rainfall intensity of each rain event. First, the aspect of intensity (average or peak intensity
during 5, 10, 20 or 30 minutes) was determined, from which the maximum influence was obtained.
The best results were obtained using peak intensity during 10 minutes (mm h-1
: Spaan and Van
Loon, 2001). Figure 4.5 summarises the results in the form of trends in the differences between
measured and estimated runoff (analysis of residuals, Mood et al., 1974) plotted against 10−min
peak intensity. The figure is for the three slope lengths and for Andropogon, Ziziphus and the ‘no
barrier’ control with a sorghum alley (solid line), a pasture alley (dashed line) and a bare alley
(dotted line). The steeper the slope of the trend lines, the larger is the influence of the rain intensity
on the runoff. Horizontal trend lines mean that the rain intensity did not influence the runoff. As
expected, the linear regressions of Table 4.4 over predict runoff at low peak intensities. The reverse
holds for large peak intensities.

87
Table 4.4. Parameter values for the linear regression: runoff = a rainfall + b, for different barrier
types and three slope lengths in Gampela, Burkina Faso.
length 1.25m
Barrier type n a s.d. (a) b -b/a R2
no barrier (1) 114 0.83 0.02 -4.43 5.36 0.92
no barrier (2) 109 0.77 0.04 -4.16 5.43 0.81
no barrier (average) 223 0.80 0.02 -4.37 5.45 0.87
Agave (1) 73 0.58 0.04 -3.83 6.62 0.77
Agave (2) 74 0.33 0.03 -3.21 9.66 0.70
Agave (average) 147 0.44 0.03 -3.38 7.61 0.66
Andropogon (1) 76 0.31 0.03 -2.12 6.72 0.64
Andropogon (2) 74 0.11 0.01 -0.97 8.60 0.67
Andropogon (average) 150 0.21 0.02 -1.47 7.02 0.48
Natural 148 0.18 0.02 -1.29 7.35 0.48
Piliostigma (1) 45 0.40 0.02 -2.61 6.60 0.91
Piliostigma (2) 45 0.33 0.02 -3.10 9.35 0.83
Piliostigma (average) 90 0.36 0.02 -2.85 7.85 0.85
stone row (1) 76 0.25 0.02 -1.83 7.23 0.78
stone row (2) 75 0.30 0.03 -0.09 0.31 0.55
stone row (average) 151 0.28 0.02 -0.99 3.55 0.59
Ziziphus (1) 76 0.56 0.03 -4.40 7.85 0.82
Ziziphus (2) 74 0.66 0.03 -4.37 6.57 0.89
Ziziphus (average) 150 0.62 0.02 -4.43 7.20 0.85
length 6.25m
no barrier (1) 112 0.66 0.02 -3.64 5.49 0.88
no barrier (2) 111 0.62 0.03 -3.52 5.68 0.77
no barrier (average) 223 0.64 0.02 -3.64 5.68 0.82
Agave (1) 114 0.65 0.02 -5.61 8.66 0.86
Agave (2) 114 0.48 0.03 -4.39 9.23 0.76
Agave (average) 228 0.56 0.02 -4.98 8.90 0.80
Andropogon (1) 114 0.44 0.02 -3.33 7.55 0.74
Andropogon (2) 111 0.16 0.01 -1.96 11.92 0.57
Andropogon (average) 225 0.30 0.02 -2.60 8.66 0.55
Natural 219 0.13 0.01 -1.58 12.03 0.34
Piliostigma (1) 45 0.36 0.03 -3.97 11.14 0.75
Piliostigma (2) 45 0.47 0.04 -5.18 10.98 0.73
Piliostigma (average) 90 0.41 0.03 -4.57 11.05 0.72
stone row (1) 76 0.33 0.03 -3.08 9.24 0.70
stone row (2) 75 0.34 0.02 -3.33 9.88 0.78
stone row (average) 151 0.34 0.02 -3.20 9.56 0.74
Ziziphus (1) 113 0.48 0.03 -2.52 5.20 0.74
Ziziphus (2) 111 0.63 0.02 -4.15 6.62 0.85
Ziziphus (average) 224 0.56 0.02 -3.36 6.05 0.79
length 12.5m
no barrier (1) 112 0.55 0.02 -2.62 4.76 0.81
no barrier (2) 110 0.57 0.03 -3.06 5.37 0.83
no barrier (average) 222 0.56 0.02 -3.06 5.46 0.83
Agave (1) 113 0.65 0.02 -3.25 5.00 0.87
Agave (2) 113 0.34 0.02 -3.38 9.84 0.71
Agave (average) 226 0.49 0.02 -3.22 6.64 0.69
Andropogon (1) 116 0.50 0.02 -4.38 8.82 0.84
Andropogon (2) 114 0.33 0.02 -3.55 10.80 0.71
Andropogon (average) 230 0.41 0.02 -3.94 9.57 0.75
Natural 227 0.24 0.01 -2.27 9.56 0.55
Piliostigma (1) 45 0.60 0.03 -4.69 7.85 0.92
Piliostigma (2) 45 0.24 0.02 -2.66 11.01 0.74
Piliostigma (average) 90 0.42 0.03 -3.68 8.76 0.70
stone row (1) 76 0.62 0.03 -4.83 7.82 0.87
stone row (2) 75 0.49 0.03 -4.82 9.89 0.76
stone row (average) 151 0.55 0.02 -4.79 8.69 0.80
Ziziphus (1) 114 0.47 0.02 -3.17 6.80 0.82
Ziziphus (2) 114 0.37 0.02 -2.62 7.07 0.75
Ziziphus (average) 228 0.42 0.01 -2.88 6.90 0.78
n = number of events
(1), (2) repetitions
a, b = parameters of the equation R = a *rainfall + b
s.d. (a) standard deviation of the a parameter
R2
= correlation coefficient
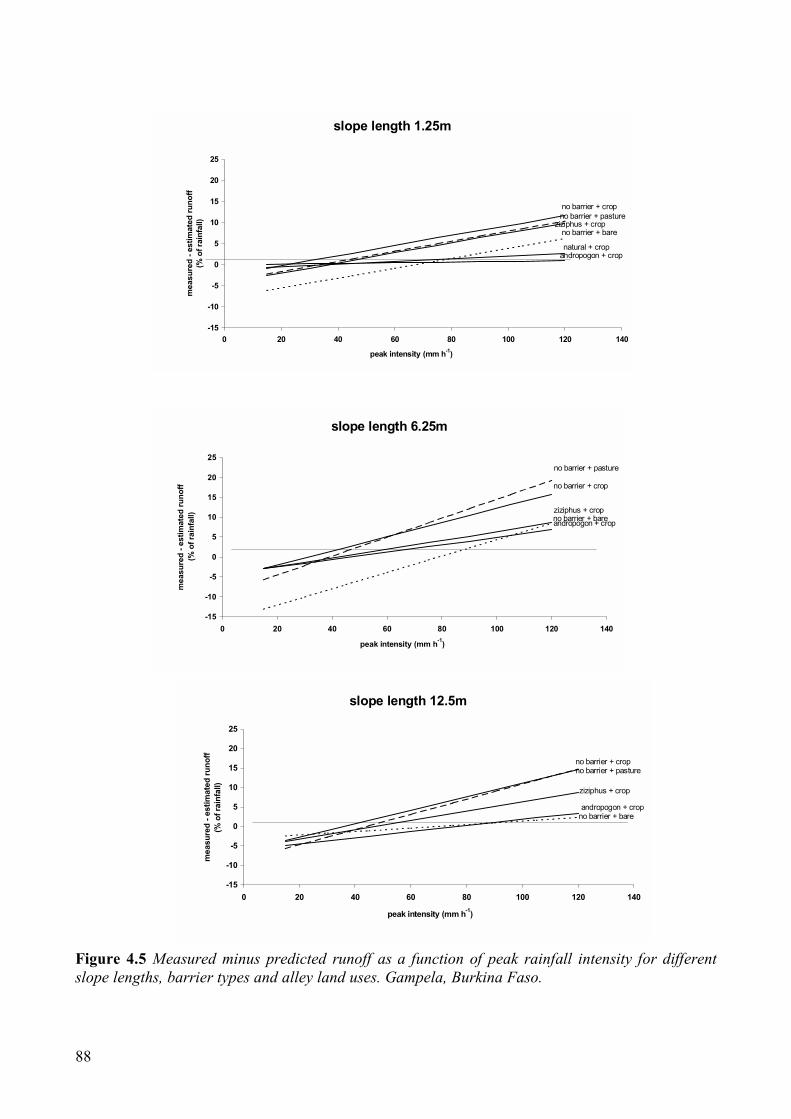
88
Figure 4.5 Measured minus predicted runoff as a function of peak rainfall intensity for different
slope lengths, barrier types and alley land uses. Gampela, Burkina Faso.
slope length 6.25m
-15
-10
-5
0
5
10
15
20
25
0 20 40 60 80 100 120 140
peak intensity (mm h
-1
)
measu
red
- estim
ated
ru
no
ff
(%
o
f rain
fall)
no barrier + pasture
no barrier + crop
ziziphus + crop
no barrier + bare
andropogon + crop
slope length 1.25m
-15
-10
-5
0
5
10
15
20
25
0 20 40 60 80 100 120 140
peak intensity (mm h-1
)
measu
red
- estim
ated
ru
no
ff
(%
o
f rain
fall)
no barrier + crop
no barrier + pasture
ziziphus + crop
no barrier + bare
natural + crop
andropogon + crop
slope length 12.5m
-15
-10
-5
0
5
10
15
20
25
0 20 40 60 80 100 120 140
peak intensity (mm h
-1
)
measu
red
- estim
ated
ru
no
ff
(%
o
f rain
fall)
no barrier + crop
no barrier + pasture
ziziphus + crop
andropogon + crop
no barrier + bare

89
The influence of rain intensity on runoff rates was minimal for slope lengths of 1.25 m and slightly
more for slope lengths of 6.25 m and 12.5 m. The influence of rain intensity was greatest for the
less effective Ziziphus barrier and the control. For most of the barrier–alley combinations the alley
treatment effect looks inferior to the barrier effect. It is therefore concluded that there is an
influence of rainfall intensity on runoff. However, since this influence seems small and in many
practical field situations intensities are not known, the simplest linear rainfall–runoff relation (used
above) was the preferred method of regression.
Effect of slope length on water conservation
The effect of the slope length shall now be investigated in more detail, i.e. the effect of slope length
on the effectiveness of the barriers. Figure 4.6 shows rainfall–runoff relations (data and linear
regressions) for the representative species Ziziphus (thin lines) and Andropogon (bold lines) for
three slope lengths. Results for the two replicates are shown separately (dotted and dashed lines) as
well as averaged (solid lines). Barriers of the same type (repetitions) can show significant
differences in development (height, density). Heterogeneity in the barrier is especially apparent for
Andropogon, and explains the low R2
values in the regressions. The same heterogeneity in
development of Andropogon barriers has often been observed in ‘farmers fields’. This led to Gilley
et al., (2000) reporting that runoff was observed to move through the grass barrier at one or two
preferential locations and not uniformly across the entire length.
Figure 4.6 shows that at slope length 1.25 m there is a significant difference between Ziziphus and
Andropogon. At 6.25 m the difference is smaller and for 12.5 m the difference has almost
disappeared. With increasing slope length and increasing runoff volume, the regression lines of the
different species lie closer together. However, Ziziphus and Andropogon show an opposite shift
with increasing slope length. With increasing slope lengths, a decreases from 0.62 to 0.42 and –b/a
decreases from 7.2 to 6.9 mm for Ziziphus, while for Andropogon a increases from 0.21 to 0.42 and
–b/a increases from 7.02 to 9.52 mm. In other words, the ‘less effective’ barriers become more
‘effective’ and the ‘effective’ barriers become less effective.
Effect of alley land use on water conservation
Given the seasonal development of sorghum and pasture on the alleys, the effect of alley use on the
effectiveness of the barriers will be shown using annual runoff data as show in the following
equation. R% = 100 * ∑R/∑P, where R = cumulative measured annual runoff and P = cumulative
rainfall in mm. Table 4.5 shows these annual runoff percentages for different barriers, slope lengths
and alley land use. Not all combinations of barrier and alley land use exist and some combinations
do not exist for all three years. For example, the representative barrier Andropogon was only
combined with sorghum, whereas Agave and Piliostigma were only combined with pasture. As
mentioned above, the choice of crop or pasture on the alley was based on the palatability of barrier
species. An unpalatable barrier can be used on the range area. The figures in Table 4.5 are averages
over two replicates; numbers in parenthesis give the standard deviation. For all combinations of no
barrier, Agave (1.25 m) and natural (6.25m) the s.d. is significant.
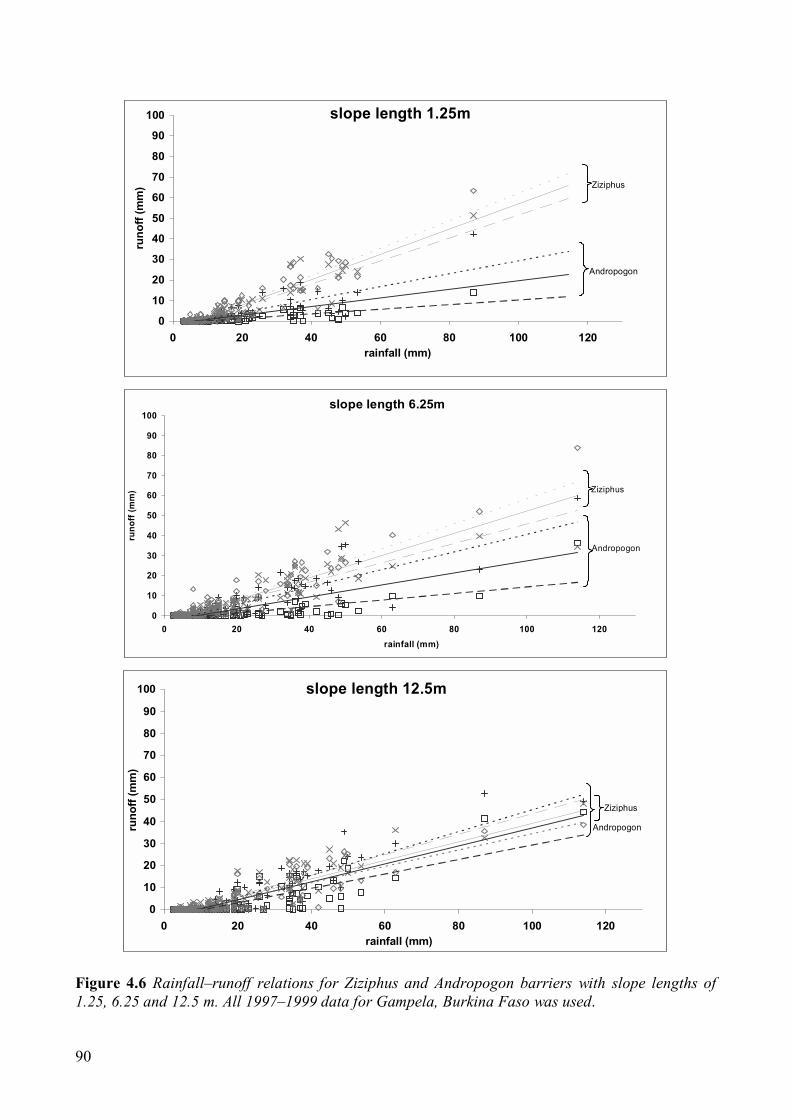
90
slope length 1.25m
0
10
20
30
40
50
60
70
80
90
100
0 20 40 60 80 100 120
rainfall (mm)
ru
no
ff (m
m)
Andropogon
Ziziphus
slope length 6.25m
0
10
20
30
40
50
60
70
80
90
100
0 20 40 60 80 100 120
rainfall (mm)
ru
no
ff (m
m)
Andropogon
Ziziphus
slope length 12.5m
0
10
20
30
40
50
60
70
80
90
100
0 20 40 60 80 100 120
rainfall (mm)
ru
no
ff (m
m)
Andropogon
Ziziphus
Figure 4.6 Rainfall–runoff relations for Ziziphus and Andropogon barriers with slope lengths of
1.25, 6.25 and 12.5 m. All 1997–1999 data for Gampela, Burkina Faso was used.
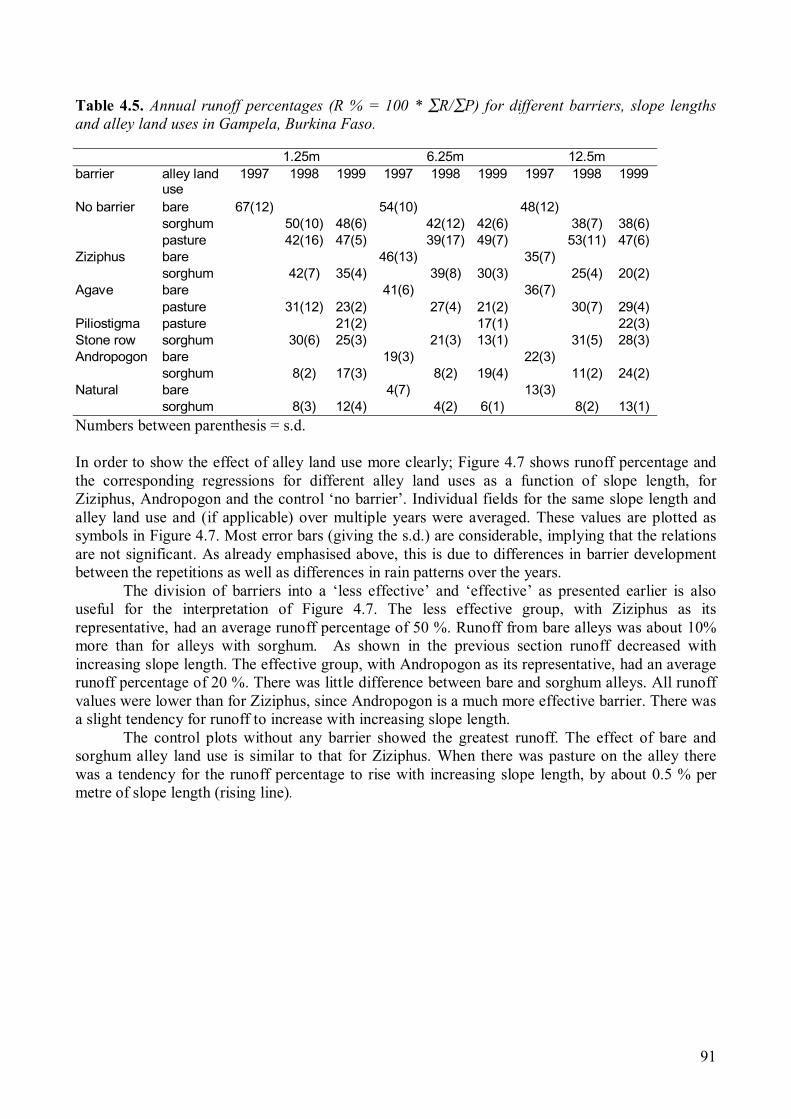
91
Table 4.5. Annual runoff percentages (R % = 100 * ∑R/∑P) for different barriers, slope lengths
and alley land uses in Gampela, Burkina Faso.
1.25m 6.25m 12.5m
1997 1998 1999 1997 1998 1999 1997 1998 1999 barrier alley land
use
No barrier bare 67(12) 54(10) 48(12)
sorghum 50(10) 48(6) 42(12) 42(6) 38(7) 38(6)
pasture 42(16) 47(5) 39(17) 49(7) 53(11) 47(6)
Ziziphus bare 46(13) 35(7)
sorghum 42(7) 35(4) 39(8) 30(3) 25(4) 20(2)
Agave bare 41(6) 36(7)
pasture 31(12) 23(2) 27(4) 21(2) 30(7) 29(4)
Piliostigma pasture 21(2) 17(1) 22(3)
Stone row sorghum 30(6) 25(3) 21(3) 13(1) 31(5) 28(3)
Andropogon bare 19(3) 22(3)
sorghum 8(2) 17(3) 8(2) 19(4) 11(2) 24(2)
Natural bare 4(7) 13(3)
sorghum 8(3) 12(4) 4(2) 6(1) 8(2) 13(1)
Numbers between parenthesis = s.d.
In order to show the effect of alley land use more clearly; Figure 4.7 shows runoff percentage and
the corresponding regressions for different alley land uses as a function of slope length, for
Ziziphus, Andropogon and the control ‘no barrier’. Individual fields for the same slope length and
alley land use and (if applicable) over multiple years were averaged. These values are plotted as
symbols in Figure 4.7. Most error bars (giving the s.d.) are considerable, implying that the relations
are not significant. As already emphasised above, this is due to differences in barrier development
between the repetitions as well as differences in rain patterns over the years.
The division of barriers into a ‘less effective’ and ‘effective’ as presented earlier is also
useful for the interpretation of Figure 4.7. The less effective group, with Ziziphus as its
representative, had an average runoff percentage of 50 %. Runoff from bare alleys was about 10%
more than for alleys with sorghum. As shown in the previous section runoff decreased with
increasing slope length. The effective group, with Andropogon as its representative, had an average
runoff percentage of 20 %. There was little difference between bare and sorghum alleys. All runoff
values were lower than for Ziziphus, since Andropogon is a much more effective barrier. There was
a slight tendency for runoff to increase with increasing slope length.
The control plots without any barrier showed the greatest runoff. The effect of bare and
sorghum alley land use is similar to that for Ziziphus. When there was pasture on the alley there
was a tendency for the runoff percentage to rise with increasing slope length, by about 0.5 % per
metre of slope length (rising line).
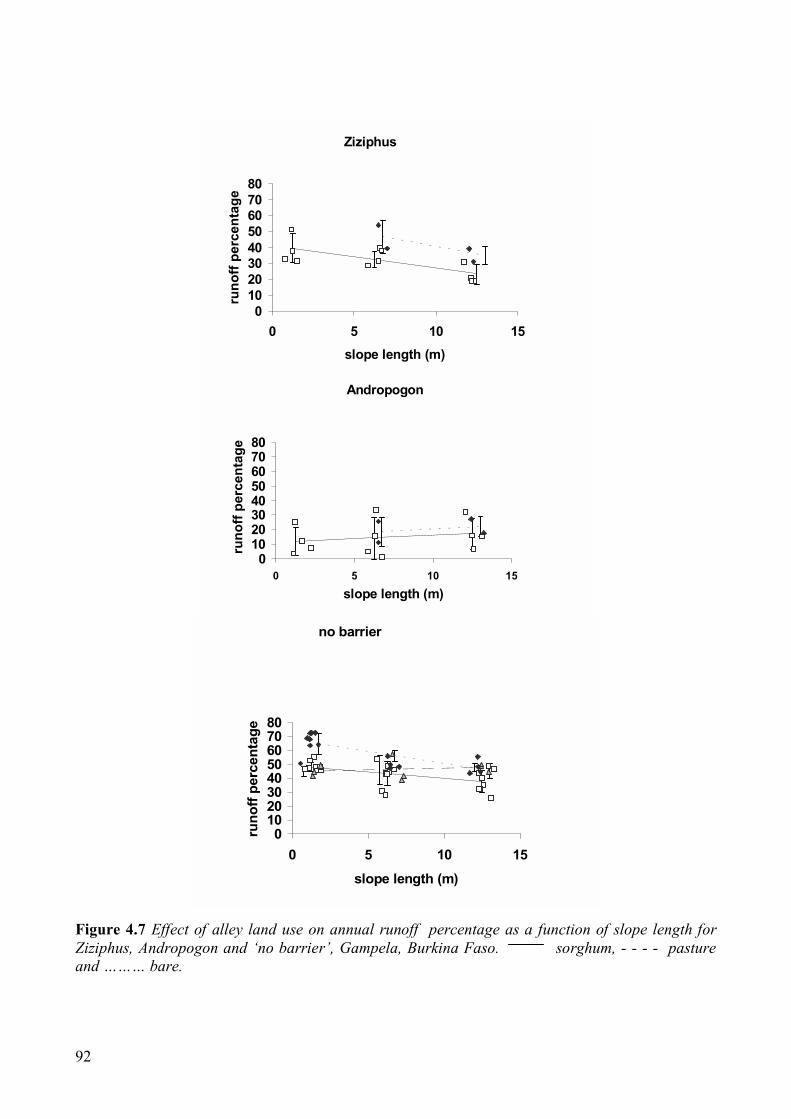
92
Figure 4.7 Effect of alley land use on annual runoff percentage as a function of slope length for
Ziziphus, Andropogon and ‘no barrier’, Gampela, Burkina Faso. sorghum, - - - - pasture
and ……… bare.
Ziziphus
0
10
20
30
40
50
60
70
80
0 5 10 15
slope length (m)
ru
no
ff p
erc
en
ta
ge
Andropogon
0
10
20
30
40
50
60
70
80
0 5 10 15
slope length (m)
ru
no
ff p
erc
en
ta
ge
no barrier
0
10
20
30
40
50
60
70
80
0 5 10 15
slope length (m)
ru
no
ff p
ercen
tag
e
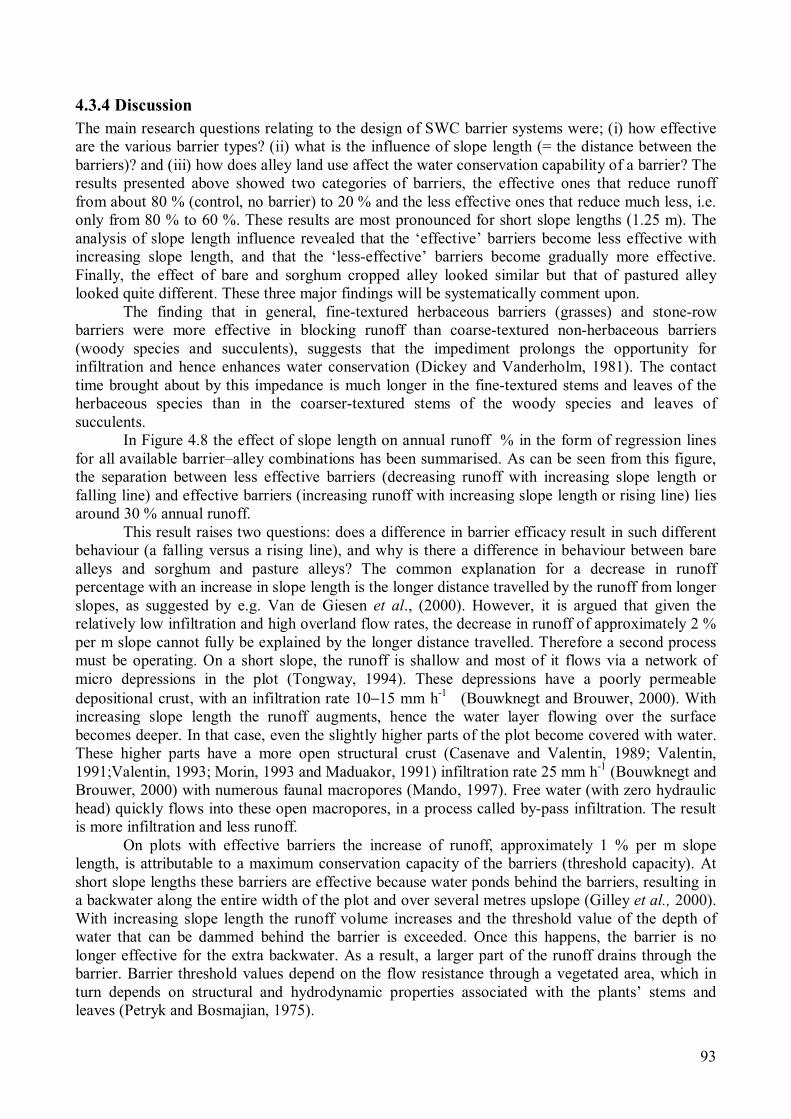
93
4.3.4 Discussion
The main research questions relating to the design of SWC barrier systems were; (i) how effective
are the various barrier types? (ii) what is the influence of slope length (= the distance between the
barriers)? and (iii) how does alley land use affect the water conservation capability of a barrier? The
results presented above showed two categories of barriers, the effective ones that reduce runoff
from about 80 % (control, no barrier) to 20 % and the less effective ones that reduce much less, i.e.
only from 80 % to 60 %. These results are most pronounced for short slope lengths (1.25 m). The
analysis of slope length influence revealed that the ‘effective’ barriers become less effective with
increasing slope length, and that the ‘less-effective’ barriers become gradually more effective.
Finally, the effect of bare and sorghum cropped alley looked similar but that of pastured alley
looked quite different. These three major findings will be systematically comment upon.
The finding that in general, fine-textured herbaceous barriers (grasses) and stone-row
barriers were more effective in blocking runoff than coarse-textured non-herbaceous barriers
(woody species and succulents), suggests that the impediment prolongs the opportunity for
infiltration and hence enhances water conservation (Dickey and Vanderholm, 1981). The contact
time brought about by this impedance is much longer in the fine-textured stems and leaves of the
herbaceous species than in the coarser-textured stems of the woody species and leaves of
succulents.
In Figure 4.8 the effect of slope length on annual runoff % in the form of regression lines
for all available barrier–alley combinations has been summarised. As can be seen from this figure,
the separation between less effective barriers (decreasing runoff with increasing slope length or
falling line) and effective barriers (increasing runoff with increasing slope length or rising line) lies
around 30 % annual runoff.
This result raises two questions: does a difference in barrier efficacy result in such different
behaviour (a falling versus a rising line), and why is there a difference in behaviour between bare
alleys and sorghum and pasture alleys? The common explanation for a decrease in runoff
percentage with an increase in slope length is the longer distance travelled by the runoff from longer
slopes, as suggested by e.g. Van de Giesen et al., (2000). However, it is argued that given the
relatively low infiltration and high overland flow rates, the decrease in runoff of approximately 2 %
per m slope cannot fully be explained by the longer distance travelled. Therefore a second process
must be operating. On a short slope, the runoff is shallow and most of it flows via a network of
micro depressions in the plot (Tongway, 1994). These depressions have a poorly permeable
depositional crust, with an infiltration rate 10−15 mm h-1
(Bouwknegt and Brouwer, 2000). With
increasing slope length the runoff augments, hence the water layer flowing over the surface
becomes deeper. In that case, even the slightly higher parts of the plot become covered with water.
These higher parts have a more open structural crust (Casenave and Valentin, 1989; Valentin,
1991;Valentin, 1993; Morin, 1993 and Maduakor, 1991) infiltration rate 25 mm h-1
(Bouwknegt and
Brouwer, 2000) with numerous faunal macropores (Mando, 1997). Free water (with zero hydraulic
head) quickly flows into these open macropores, in a process called by-pass infiltration. The result
is more infiltration and less runoff.
On plots with effective barriers the increase of runoff, approximately 1 % per m slope
length, is attributable to a maximum conservation capacity of the barriers (threshold capacity). At
short slope lengths these barriers are effective because water ponds behind the barriers, resulting in
a backwater along the entire width of the plot and over several metres upslope (Gilley et al., 2000).
With increasing slope length the runoff volume increases and the threshold value of the depth of
water that can be dammed behind the barrier is exceeded. Once this happens, the barrier is no
longer effective for the extra backwater. As a result, a larger part of the runoff drains through the
barrier. Barrier threshold values depend on the flow resistance through a vegetated area, which in
turn depends on structural and hydrodynamic properties associated with the plants’ stems and
leaves (Petryk and Bosmajian, 1975).
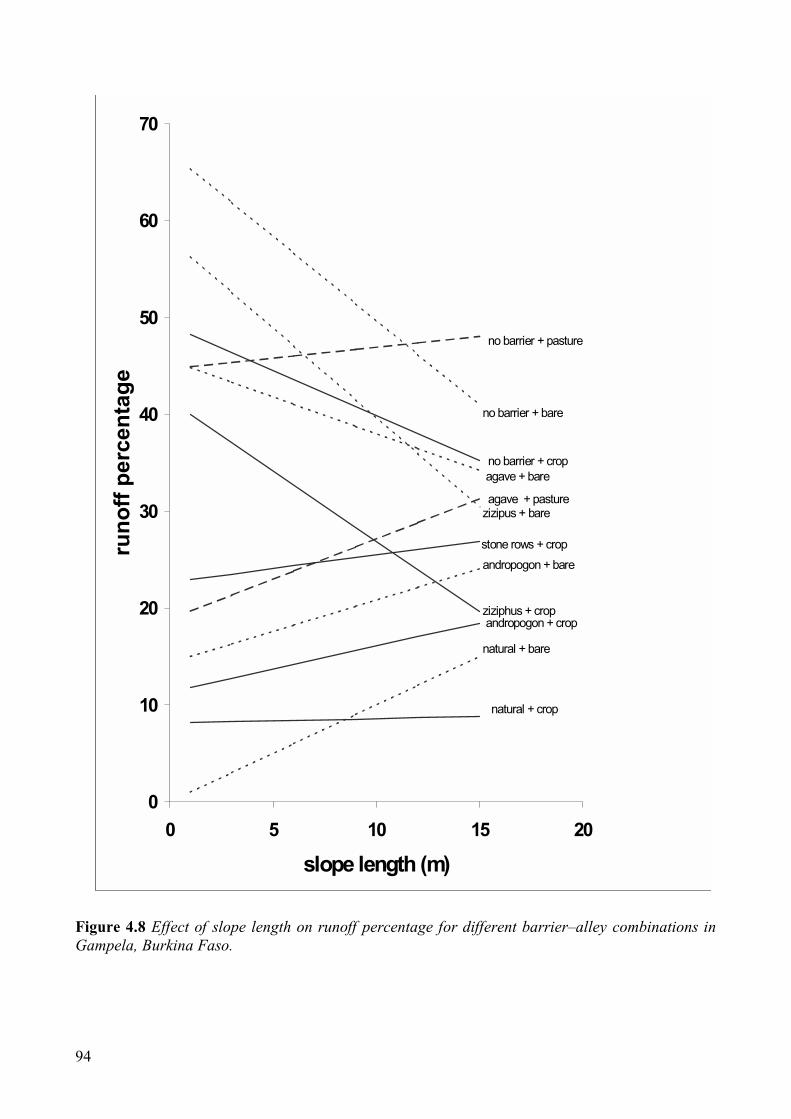
94
0
10
20
30
40
50
60
70
0 5 10 15 20
slope length (m)
ru
no
ff p
ercen
tag
e
no barrier + pasture
no barrier + bare
agave + bare
no barrier + crop
agave + pasture
zizipus + bare
stone rows + crop
andropogon + bare
ziziphus + crop
andropogon + crop
natural + bare
natural + crop
Figure 4.8 Effect of slope length on runoff percentage for different barrier–alley combinations in
Gampela, Burkina Faso.

95
Bare and cropped alleys behave similarly because the crusted state of the soil surface does
not differ much. In the ‘bare’ and ‘crop’ alleys in this experiment, it is suggested that these two land
uses produced a similar crusted soil surface. Between the sorghum stalks (row distance 0.8 m and
0.4 m distance between the seed pockets; 31 000 pockets ha-1
) the soil was bare, with no weeds and
the surface roughness was low since the sorghum had been planted in the traditional way (in
planting holes made with a hoe). Hoogmoed, (2001) reports that tillage creates a positive short-term
effect and is often almost nullified by rapid crust recovery. According to Casenave and Valentin
(1991) runoff volume mainly depends on the soil texture and cropping technique. This implies that
in this case the roughness coefficient (e.g. Manning’s) is low, and would account for the overland
flow behaviour over the alley.
Alleys under pasture had a dense vegetation cover, and the dead plant material that was
produced stimulated macro-biological activity. The combined effect of soil and vegetation is a large
hydraulic roughness impeding flow. This explains the marginal effect that variations in water depth
(resulting from variations in slope length) have on the overland flow process and hence on the
runoff fraction.
4.3.5 Conclusions
The conclusions relate to the four hypotheses that were posed in the introduction.
Vegetation barriers slow down runoff, with fine-textured barriers being more effective than coarse-
textured barriers.
Comparing the barrier plot performance with no barrier (control) plots shows that all barriers reduce
runoff. The results showed two categories of barriers, the effective ones that reduce runoff from
about 80 % (control, no barrier) to 20 %, and the less effective ones that reduce much less, i.e. only
from 80 % to 60 %. The ‘less effective group of barriers’ has Ziziphus as the typical representative
and the ‘effective group’ has Andropogon as its representative. Thus, despite their greater
heterogeneity, fine-textured barriers like Andropogon reduced runoff most effectively. The coarse-
textured, less effective barriers had a much bigger through flow, confirming the first hypothesis
Rain intensity is a dominant factor for runoff generation.
From all aspects of intensity (average or peak intensity during 5, 10, 20 or 30 minutes) maximum
influence was obtained using peak intensity during 10 minutes (mm h-1
). On slope lengths of 1.25
m, the influence of rain intensity on runoff rates was low. It was only apparent on the plots with no
barriers and with the less effective Ziziphus barrier. On slopes of 6.25 m the rain intensity
influenced the runoff rates of most plots. Again, the influence of rain intensity was largest on
Ziziphus plots and on plots with no barrier. On slopes of 12.5 m the trend was slightly less
pronounced than on plots with a slope length of 6.25 m. Using peak intensity during 10 minutes
(mm h-1
) gave the best results. To sum this up, the second hypothesis has to be rejected, as the
influence of rain intensity on runoff rates was not very important.
Runoff rate increases in proportion to slope length.
The analysis of slope length influence revealed that the ‘effective’ barriers become less effective
with increasing slope length and that the ‘less effective’ barriers become gradually more effective.
On long slopes the less effective barriers profited from having a deeper backwater, because then the
higher parts of the micro-topography, which have a coarser crust, also became covered by water. It
was this by-pass infiltration that caused runoff to decrease with slope length. The reason that the
more effective barriers gave a slight increase in the runoff percentage with increase of plot length
was their maximum conservation capacity. As the slope length increases and the runoff volume
does likewise, the maximum water level is exceeded and the backwater level falls, decreasing the
infiltration rate. It is therefore concluded that the third hypothesis can only be confirmed for the
96
effective barriers, where runoff rates increase, it must therefore be rejected, as for the less effective
barriers the runoff rates diminish with increasing slope length.
Alley land use determines water conservation efficiency.
The effect of bare and sorghum cropped alley looked similar, but that of the pastured alley looked
quite different. The runoff percentages found on cropped plots were, in general, about 15 % less
than on plots with a bare alley, and the runoff on plots with pasture on the alley was somewhat
greater than on the cropped plots. This has been attributed to tillage on the cropped plots breaking
the crust and promoting infiltration during a short period. It seems that on short slopes with pasture,
the overland flow was more effectively retarded than on long slopes, where the runoff volume
surpassed the vegetation threshold. These results show that the type of management and land use on
the alley definitely influence runoff rates, even if the differences were not very big. Therefore the
fourth hypothesis can be confirmed, albeit that the differences between the alley treatments were
rather limited.
References
Aldon, E.F. and H.W. Springfield, 1975. Using paraffin and polyethylene to harvest water for growing shrubs.
In: Proc. Water Harvesting Symp., Phoenix, AZ, ARS W-22, USDA, pp 251−257.
Anonymous, 1988. Etude pédologique de la station experimentale de Gampela. Ministère de l’Agriculture et de
l’Elevage, Secretariat General, Bureau National des Sols, Ouagadougou, Burkina Faso. Rapport
Technique no 59, 279 pp.
Boerrigter, E., 1997. Protection doublé: Recherche sur la possibilité de transformer des bandes anti-érosives en
méthode d’ utilisation durable de la terre. MSc-thesis, Wageningen Unversity, Nieuwe Kanaal 11, 6709
PA Wageningen, The Netherlands, 59 pp.
Boers, T.M. and J. Ben Asher, 1982. A review of rainwater harvesting. Agricultural Water Management
5:145−158.
Boers, T.M., 1994. Rainwater harvesting in arid and semi-arid zones. Ph.D. thesis, Wageningen University,
133 pp.
Bouwknegt, M. and A.J.J. Brouwer, 2000. Infiltration measurements at the research station Gampela, Burkina
Faso. Thesis I.A.H.L, Larensteinselaan 26A, 6882 CT, Velp, The Netherlands, 25 pp.
Casenave, A. and C. Valentin, 1989. Les états de surface de la zone sahélienne. Influence sur l’infiltration.
Editions de l’Orstom, Institut Français de Recherche Scientifique pour le Développement en
Coopération, Paris, 229 pp.
Casenave, A. and C. Valentin, 1991. Influence des états de surface sur l’infitration en zone sahélienne. . In: Soil
Water Balance in the Sudano-Sahelian Zone. Proceedings Niamey, Workshop, IAHS, pp 99−108.
Casanave, A. and C. Valentin, 1992. A runoff capability classification system based on surface features criteria
in semi-arid areas of West Africa. Journal of Hydrology 130: 231−249.
De Graaff, J., 1996. The price of soil erosion. An economic evaluation of soil conservation and watershed
development. Ph.D. thesis, Wageningen University, Nieuwe Kanaal 11, 6709 PA Wageningen, The
Netherlands, 300 pp.
Dickey, E.C. and D.H.Vanderholm, 1981. Performance and design of vegetative filters for feedlot runoff
treatment. ASAE publication No. 2−81: 357−360.
Gilley, J.E., Eghball, B., Kramer, L.A. and T.B. Moorman, 2000. Narrow grass hedge effect on runoff and soil
loss. Journal of Soil and Water Conservation, 55: 190−196.
Gregory, P.J., 1989. Water-use efficiency of crops in semi-arid tropics. In: Soil, Crop, and Water Management
Systems for rainfed agriculture in the Sudano-Sahelian Zone, ICRISAT Sahelian Center, Niamey, Niger,
pp. 85 − 98.
Hien, F.G., 1995. La régénération de l'espace sylvo-pastoral au Sahel. Une étude de l'effet de mesures de
conservation des eaux et des sols au Burkina Faso. Tropical Resource Management Papers no 7, Nieuwe
Kanaal 11, 6709 PA Wageningen, The Netherlands, 223 pp.
Hoogmoed, W.B. and L. Stroosnijder, 1984. Crust forming on sandy soils in the Sahel.I. Rainfall and infiltration.
Soil Till. Res. 4: 5−23.
97
Hoogmoed, W.B., Stroosnijder, L. and P. Yanogo, 2001. Water resources in Sahelian villages. In : Agro-silvo-
pastoral land use in Sahelian Villages. Stroosnijder and Van Rheenen (eds). Advances in
Geoecology No. 33: 157−178.
Ibrahima, A. and A. Schmitt, 1991. Bilan Hydrique a la Parcelle: Cas D'une Etude Realisée sur Le Plateau Mossi
Au Burkina Faso. In: Soil Water Balance in the Sudano Sahelian Zone, IAHS, pp 289−298
Kiepe, P., 1995. No Runoff, no soil loss: Soil and water conservation in hedgerow barrier systems. Ph.D. thesis,
Wageningen University, Nieuwe Kanaal 11, 6709 PA Wageningen, The Netherlands, 158 pp.
Kiepe, P., De Ridder, N., Stroosnijder, L., De Graaff, J., Slingerland, M. and F. Hien, 2001. Soil and water
conservation in Sahelian villages. In : Agro-silvo-pastoral land use in Sahelian Villages. Stroosnijder
and Van Rheenen (eds). Advances in Geoecology 33: 237−254.
Lal, R., 1990. Soil erosion in the tropics – principles and management; Mc Graw- Hill. Inc; U.S.A.
Lamachere, J.M., 1991. Aptitude au ruissellement et à l’infiltration d’un sol sableux fin après sarclage. In: Soil
Water Balance in the Sudano-Sahelian Zone, IAHS, pp 109−120.
Le Houérou, H.N., 1989. The grazing land ecosystems of the African Sahel. Ecological Studies 75. Springer -
Verlag, Berlin, Heidelberg.
Ludwig, H., 1999. Effect of six hedgerow species on soil infiltration. MSc-thesis, Vrije Universiteit Amsterdam,
Faculty of Earth sciences, Department of Hydrology, 54 pp.
Maduakor, H.O., 1991 Physical and hydraulic properties of soils in the Sudano-Sahelian regions of Nigeria. In:
Soil Water Balance in the Sudano-Sahelian Zone, IAHS, pp 229−240.
Mando, A., 1997. The role of termites and mulch in the rehabilitation of crusted Sahelian soils. Ph.D. thesis,
Wageningen University, Nieuwe Kanaal 11, 6709 PA Wageningen, The Netherlands, 101 pp.
Monteith, J.L., 1991 Weather and water in the Sudano-Sahelian zone. In: Soil Water Balance in the Sudano-
Sahelian Zone, IAHS, pp 11−30.
Mood, A.M, Graybill, F.A. and D.C. Boes, 1974. Introduction to the theory of statistics. McGraw-Hill, Inc.,
564 pp.
Morin, J., 1993. Soil crusting and sealing. In: Soil tillage in Africa: needs and challenges. Soil Resources,
Management and conservation Service Land and Water Development Division, FAO Soils Bulletin
69: 41−68.
Penning de Vries, F.W.T. and M.A. Djitéye, 1982. La productivité des pâturages Saheliens. Une étude des sols,
des végétations et de l’exploitation de cette resource naturelle. Agricultural Research Report 918. Center
for Agricultural Publishing and Documentation, Wageningen, The Netherlands.
Petryk, S, and G. Bosmajian, 1975. Analysis of flow through vegetation. Journal of the Hydraulics Division.
American Society of Civil Engineers, 101: 871−884.
Posthumus, H, and W.P. Spaan, 2001. Rainfall runoff relations for vegetation barriers in the Sahel. Soil Erosion
Research for the 21st
Century. Proceedings of the International Symposium, Ascough and Flanigan
(Eds), Honolulu, Hawaii, USA, pp 50 − 54.
Rodier, J., 1992. Du simulateur de pluie aux bassins representatifs Saheliens. Collection études et theses
ORSTOM, Paris, 76 pp.
Sivakumar, M.V.K. and F. Gnoumou, 1987. Agroclimatolgie de l'Afrique de l'Ouest: Le Burkina Faso Bulletin
d'Information ICRISAT Niamey, Niger
Sivakumar, M.V.K. and Wallace, J.S., Renard, C. and C. Giroux,. 1991. Soil Water Balance in the Sudano-
Sahelian Zone. Proceedings Niamey, Workshop, IAHS, 628 pp.
Slingerland, M.A., 2000. Mixed farming: Scope and Constraints in West African Savanna. Ph.D. thesis,
Wageningen University, Nieuwe Kanaal 11, 6709 PA Wageningen, The Netherlands, 289 pp.
Spaan, W.P. and K.J. Van Dijk, 1998. Evaluation of the effectiveness of soil and water conservation measures in
a closed silvo-pastoral area in Burkina Faso. Advances in GeoEcology 31: 1295–1301, Catena Verlag.
Spaan, W.P. and E.E. Van Loon, 2001. The influence of rain intensity and crop stages on runoff production.
Proceedings of 10th
International Rainwater Catchment Systems Conference (IRCSA), Mannheim,
Germany, pp 231 − 235.
Tongway, D., 1994. Rangeland soil conditions assessment manual. Division of Wildlife and Ecology, CSIRO,
Australia, 69 pp.
Valentin, C., 1991. Surface crusting in two alluvial soils in Niger. Geoderma 48: 201−222.

98
Valentin, C., 1993. Soil crusting and sealing in West Africa and possible approaches to improved management.
In: Soil tillage in Africa: needs and challenges. Soil Resources, Management and conservation Service
Land and Water Development Division, FAO Soils Bulletin 69: 95−129.
Van de Giesen, N.C. van de, Stomph, T.J. and N. de Ridder. 2000. Scale effect of Hortonian overland flow and
rainfall-runoff dynamics in a West African catena landscape. Hydrol. Process. 14: 165−175.
99
4.4 Sediment dynamics in an alley crop system in Burkina Faso,
West Africa.
W.P. Spaan, A.F.S. Sikking , and W.B. Hoogmoed. Sediment dynamics in an alley crop system in
Burkina Faso, West Africa (Submitted to: Soil and Tillage Research).
Abstract
The sediment dynamics in an alley crop system were evaluated at a research station in central
Burkina Faso. On a 2 % slope of a sandy loam various local species (grasses, woody species and a
succulent) were planted as conservation barriers in order to examine their influence on sediment
transport and sedimentation. After each erosive storm, runoff and sediment yield was determined.
Vegetation barriers always reduce sediment transport. Large differences in the amount of sediment
yield were found between the barrier types. Grasses and natural vegetation proved to be very
effective in catching soil particles and diminishing sediment transport. The dense effective barriers
slow down flow velocity, build up backwater and promote sedimentation uphill. The through flow
in the less effective barriers with woody species and succulents was slightly hampered and flow
velocity was not reduced enough, resulting in a higher soil transport. Under degraded conditions
soil loss diminished 50 % with less effective and 70–90 % with effective barriers. During the initial
cropping phase (light tillage) erosion was reduced 40–60 % with effective barriers and showed an
increase with less effective barriers. In the full tillage (weeding) period erosion decreased by 80–90
% for effective and 70 % for less effective barriers. Sediment yield could be best predicted by the
erosivity index (AIm), second best by runoff amount (mm) closely followed by maximum peak
intensity. All these parameters are related to the volume of overland flow needed to transport soil
particles. Correlation of soil loss with small rain showers was poor and correlation with big showers
was good. Sediment transport with no barrier had the highest correlation, closely followed by less
effective barriers. Due to the heterogeneity in development of the effective barrier, correlations
were much lower. The bulk of soil loss was only dependent on a few extreme events during the
observation period.
Additional keywords: vegetation barriers, tillage, runoff, sediment dynamics, soil and water
conservation
4.4.1 Introduction
In the African sub-Saharan semi-arid tropics desertification as a result of soil degradation is posing
a serious threat to drylands. This is mainly caused by three factors: overgrazing of rangelands,
excessive cutting of trees and shrubs for fuel wood and inappropriate agricultural practices. The last
factor is most prominent in dryland cropping areas, especially through inappropriate management of
rainwater and nutrients, causing a decrease in organic matter content and a loss of soil fertility.
Answers for improvement should be sought in developing more productive and sustainable farming
practices, with conservation of soil and water as driving forces (Hoogmoed, 1999).
The development of such farming practices, however, is not an easy task in view of the
conditions farmers are confronted with in the semi-arid Sudano-Sahelian zone of West Africa. Most
soils have poor physical and chemical characteristics (Mulders et al., 2001; Breman, 1992;
Leisinger and Schmitt, 1995) and are vulnerable to crust formation leading to considerable runoff
during rainstorms. On bare, medium to fine textured soils the runoff rate may exceed 50 % on
cropland (Hoogmoed and Stroosnijder, 1984; Casanave and Valentin, 1992) or even more, between
60 and 80 % on silvo-pastoral land (Hien, 1995). Crusts also form an obstacle for seedling
emergence. Soil tillage is therefore an essential agricultural operation to produce a crop (Nicou et

100
al., 1993). Soil tillage operations do on the other hand also promote soil and nutrient losses
(Hoogmoed, 1999). The aggressiveness of the climate is another inevitable factor to be coped with.
Rainfall is concentrated in a few months and is characterized by large rainstorms with high
intensities. Soil loss is closely related to rainfall partly through the detaching power of raindrops
striking the soil surface, and partly through the stream force of the runoff water (Salles et al., 2000;
Jin et al., 2000). Intensity is generally considered to be the most important rainfall characteristic
involved (Morgan, 1986; Gilley et al., 2000). Proposed sustainable farming practices should
therefore take into account the inevitability of soil tillage operations and the conflicting climatic
characteristics. Unfortunately, conservation tillage in the form of reduced or zero tillage is not a
viable option in view of the physical characteristics of the soil, the prolonged dry season and the
lack of crop residues. Recognizing the fact that additional protection against runoff and erosion
damage will be needed, various measures have been developed and applied (Hien, 1995; Scoones et
al., 1996; Vlaar, 1992).
Vegetation barriers along contour lines present an appropriate sustainable farming practice,
since they slow down runoff, build up back water, retain sediment and organic debris and still allow
drainage of excess water due to its semi-permeable nature (Kiepe, 1995). Consequently they
improve water availability both up and downstream from the barrier (Spaan, unpublished). Trapping
efficiency seems to be a direct effect of flow velocity (Griffioen, 1999; Jin et al., 2000). By
reducing the velocity of overland flow, sedimentation takes place. When using local available
species in the barrier, such a system is a protection measure that is cheap and easy to install.
This paper presents the results of a study in Burkina Faso that focussed on the sediment
catch efficiency of different vegetation barriers. Various factors influencing this efficiency, such as
tillage and cropping regimes of upstream alleys were assessed.
4.4.2 Materials and methods
Soil
The study was conducted in the central part Burkina Faso near Gampela (1° 20’ W, 12° 20’ N) at an
altitude of about 275 m. The soils (Luvisols) have hydromorphic properties, are low in fertility and
hence low in productivity. The topsoil (0–20 cm) consists of sandy loam and the subsoil comprises
a clay loam (Anonymous, 1988). The soil has a tendency for auto-compaction (bulk density 1600
kg m-3
) and typically shows a massive structure . Soil aggregates, when found, are small and
unstable. Soil depth varies between 0.7 and 1.3 m. Soils are prone to crusting due to their low
structural stability caused by a low soil organic matter content (< 1 %). Between rain showers,
crusts develop strength as the water evaporates. Surface tension forces draw particles at the surface
into an intimate contact (Reichert, et al., 1994). Under these conditions infiltration is poor and
subsequently run-off is high.
Test plots and barriers
In 1994 twenty-one plots of 20 x 20 m were laid out within a 3 ha fenced experimental site. Slopes
varied between 1.5 and 2 %. The plots were laid out in the direction of the slope and protected with
0.5m high earthen bunds on three sides to prevent influences from outside. The downstream end of
the plot was left open to drain excess water. A vegetation barrier of 1m wide was established along
the contour, with the centre of the barrier at 15 m down-slope from the top of the plot, dividing the
plot roughly into 14.5m alley, 1m vegetation barrier and a 4.5m down-slope section. Seven barrier
species were planted in three replications, randomly distributed over the research area. The species
were chosen on the basis of their local availability, vegetative growth and soil and water
101
conservation properties. After two years one of the species was replaced by a 1m wide strip, which
was left to grow natural vegetation. This barrier is referred to as “Natural”. In this study only the
results of Natural, Andropogon gayanus (a perennial grass), Ziziphus mauritiana (a shrub) and
Agave sisalana (a succulent) are considered. Natural and Andropogon developed a fine structured
dense biomass at soil surface level and were considered for water conservation as representatives of
the “effective group” and Ziziphus and Agave developed at soil surface level a coarse structured
more open barrier referred to as representatives of the “less effective group” (Spaan et al.,
submitted JSWC). In addition plots without barrier (no barrier) are analysed. In the period 1994–
1997 the upstream and downstream plots were kept bare by spraying herbicides, creating a
simulated degraded situation on the plots. In 1998 and 1999 alleys were planted with sorghum
(“crop”) or safeguarded from land use activities stimulating the regeneration of the natural
vegetation (“pasture”). The choice of crop or pasture was based on the palatability of the barrier
species. The unpalatable species Agave was combined with pasture.
Tillage
In the simulated degraded phase of the study (1994–1997), no tillage operations were carried out.
During this phase the surface retention or runoff threshold value (Posthumus and Spaan, 2001)
varied between 0.3 and 8.5 mm. In 1998, plots cropped with sorghum were slightly tilled at the
onset of the rainy season. Superficial (approx. 2 cm deep) and narrow (approx. 5 cm) sowing
furrows were dug manually with a hoe, at a distance of 80 cm along the contour (“light tillage”).
Seeds were placed in the furrows at a distance of 40 cm. At the end of August the whole plot was
hand (hoe) tilled to a depth of approx. 2 cm in order to control weeds and to break the crust to
increase infiltration (“full tillage”). The roughness thus created resulted in a surface retention
between 6 and 11 mm. Those plots not cropped, were hand tilled at the end of July and from then on
left untouched to promote spontaneous germination of herbs and grasses. However, due to the
intensive use of herbicides in the past years, initially little natural vegetation developed in 1998.
The roughness on these plots caused a surface retention of about 6 mm.
Rain
With an average rainfall of 790 mm y-1
the research area is part of the North Sudanian zone with
rainfall limits between 650 and 1000 mm (Sivakumar and Gnoumou, 1987). Rainfall was recorded
continuously at the experimental site by an automatic weather station, which was linked to a tipping
bucket rain gauge device. The tipping bucket ‘tipped’ after receiving 0.2 mm rain, thus facilitating
rainfall intensity calculations. The tipping bucket was checked by a simple manual rain gauge.
Spatial variability of rainfall over the experimental site was checked by a string of five manual rain
gauges. Rainfall data collected with the weather station over three years (1996–8) were analyzed
and presented in Table 4.6 The rain showers listed in this table account for 98, 91, and 85 % of the
total rain during that period in ’96, ’97 and ’98, respectively.
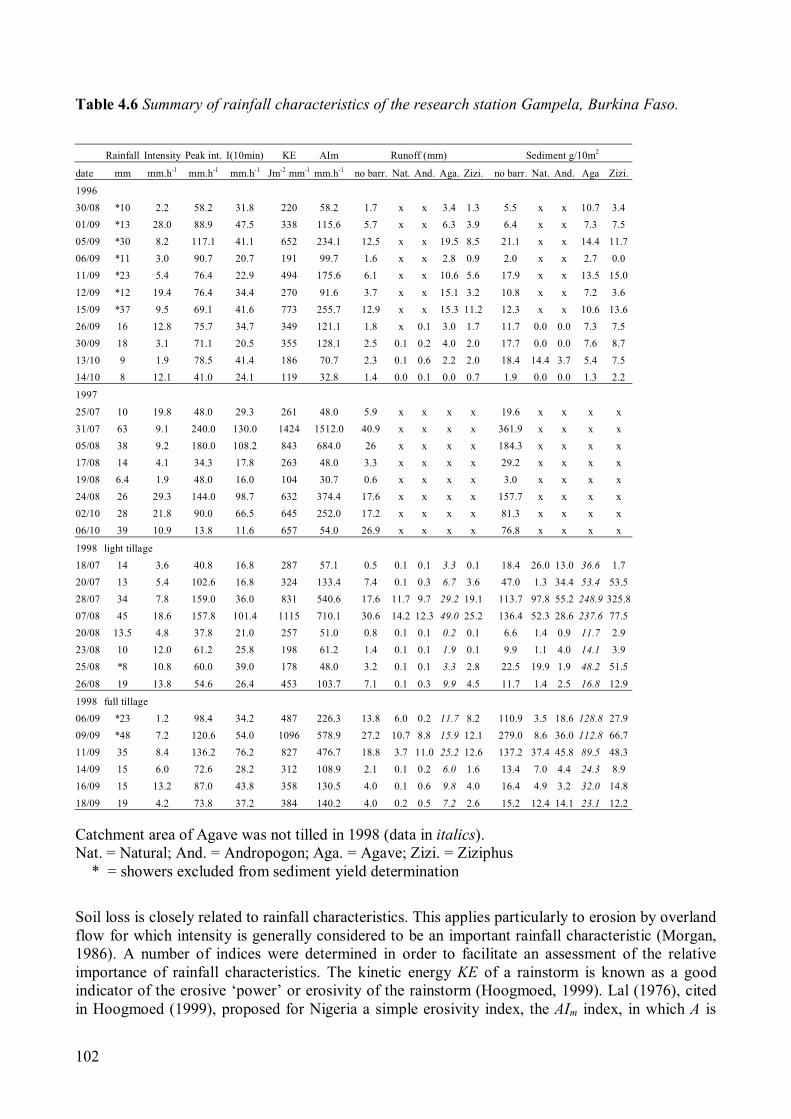
102
Table 4.6 Summary of rainfall characteristics of the research station Gampela, Burkina Faso.
Rainfall Intensity Peak int. I(10min) KE AIm Runoff (mm) Sediment g/10m2
date mm mm.h-1
mm.h-1
mm.h-1
Jm-2
mm-1
mm.h-1
no barr. Nat. And. Aga. Zizi. no barr. Nat. And. Aga Zizi.
1996
30/08 *10 2.2 58.2 31.8 220 58.2 1.7 x x 3.4 1.3 5.5 x x 10.7 3.4
01/09 *13 28.0 88.9 47.5 338 115.6 5.7 x x 6.3 3.9 6.4 x x 7.3 7.5
05/09 *30 8.2 117.1 41.1 652 234.1 12.5 x x 19.5 8.5 21.1 x x 14.4 11.7
06/09 *11 3.0 90.7 20.7 191 99.7 1.6 x x 2.8 0.9 2.0 x x 2.7 0.0
11/09 *23 5.4 76.4 22.9 494 175.6 6.1 x x 10.6 5.6 17.9 x x 13.5 15.0
12/09 *12 19.4 76.4 34.4 270 91.6 3.7 x x 15.1 3.2 10.8 x x 7.2 3.6
15/09 *37 9.5 69.1 41.6 773 255.7 12.9 x x 15.3 11.2 12.3 x x 10.6 13.6
26/09 16 12.8 75.7 34.7 349 121.1 1.8 x 0.1 3.0 1.7 11.7 0.0 0.0 7.3 7.5
30/09 18 3.1 71.1 20.5 355 128.1 2.5 0.1 0.2 4.0 2.0 17.7 0.0 0.0 7.6 8.7
13/10 9 1.9 78.5 41.4 186 70.7 2.3 0.1 0.6 2.2 2.0 18.4 14.4 3.7 5.4 7.5
14/10 8 12.1 41.0 24.1 119 32.8 1.4 0.0 0.1 0.0 0.7 1.9 0.0 0.0 1.3 2.2
1997
25/07 10 19.8 48.0 29.3 261 48.0 5.9 x x x x 19.6 x x x x
31/07 63 9.1 240.0 130.0 1424 1512.0 40.9 x x x x 361.9 x x x x
05/08 38 9.2 180.0 108.2 843 684.0 26 x x x x 184.3 x x x x
17/08 14 4.1 34.3 17.8 263 48.0 3.3 x x x x 29.2 x x x x
19/08 6.4 1.9 48.0 16.0 104 30.7 0.6 x x x x 3.0 x x x x
24/08 26 29.3 144.0 98.7 632 374.4 17.6 x x x x 157.7 x x x x
02/10 28 21.8 90.0 66.5 645 252.0 17.2 x x x x 81.3 x x x x
06/10 39 10.9 13.8 11.6 657 54.0 26.9 x x x x 76.8 x x x x
1998 light tillage
18/07 14 3.6 40.8 16.8 287 57.1 0.5 0.1 0.1 3.3 0.1 18.4 26.0 13.0 36.6 1.7
20/07 13 5.4 102.6 16.8 324 133.4 7.4 0.1 0.3 6.7 3.6 47.0 1.3 34.4 53.4 53.5
28/07 34 7.8 159.0 36.0 831 540.6 17.6 11.7 9.7 29.2 19.1 113.7 97.8 55.2 248.9 325.8
07/08 45 18.6 157.8 101.4 1115 710.1 30.6 14.2 12.3 49.0 25.2 136.4 52.3 28.6 237.6 77.5
20/08 13.5 4.8 37.8 21.0 257 51.0 0.8 0.1 0.1 0.2 0.1 6.6 1.4 0.9 11.7 2.9
23/08 10 12.0 61.2 25.8 198 61.2 1.4 0.1 0.1 1.9 0.1 9.9 1.1 4.0 14.1 3.9
25/08 *8 10.8 60.0 39.0 178 48.0 3.2 0.1 0.1 3.3 2.8 22.5 19.9 1.9 48.2 51.5
26/08 19 13.8 54.6 26.4 453 103.7 7.1 0.1 0.3 9.9 4.5 11.7 1.4 2.5 16.8 12.9
1998 full tillage
06/09 *23 1.2 98.4 34.2 487 226.3 13.8 6.0 0.2 11.7 8.2 110.9 3.5 18.6 128.8 27.9
09/09 *48 7.2 120.6 54.0 1096 578.9 27.2 10.7 8.8 15.9 12.1 279.0 8.6 36.0 112.8 66.7
11/09 35 8.4 136.2 76.2 827 476.7 18.8 3.7 11.0 25.2 12.6 137.2 37.4 45.8 89.5 48.3
14/09 15 6.0 72.6 28.2 312 108.9 2.1 0.1 0.2 6.0 1.6 13.4 7.0 4.4 24.3 8.9
16/09 15 13.2 87.0 43.8 358 130.5 4.0 0.1 0.6 9.8 4.0 16.4 4.9 3.2 32.0 14.8
18/09 19 4.2 73.8 37.2 384 140.2 4.0 0.2 0.5 7.2 2.6 15.2 12.4 14.1 23.1 12.2
Catchment area of Agave was not tilled in 1998 (data in italics).
Nat. = Natural; And. = Andropogon; Aga. = Agave; Zizi. = Ziziphus
* = showers excluded from sediment yield determination
Soil loss is closely related to rainfall characteristics. This applies particularly to erosion by overland
flow for which intensity is generally considered to be an important rainfall characteristic (Morgan,
1986). A number of indices were determined in order to facilitate an assessment of the relative
importance of rainfall characteristics. The kinetic energy KE of a rainstorm is known as a good
indicator of the erosive ‘power’ or erosivity of the rainstorm (Hoogmoed, 1999). Lal (1976), cited
in Hoogmoed (1999), proposed for Nigeria a simple erosivity index, the AIm index, in which A is
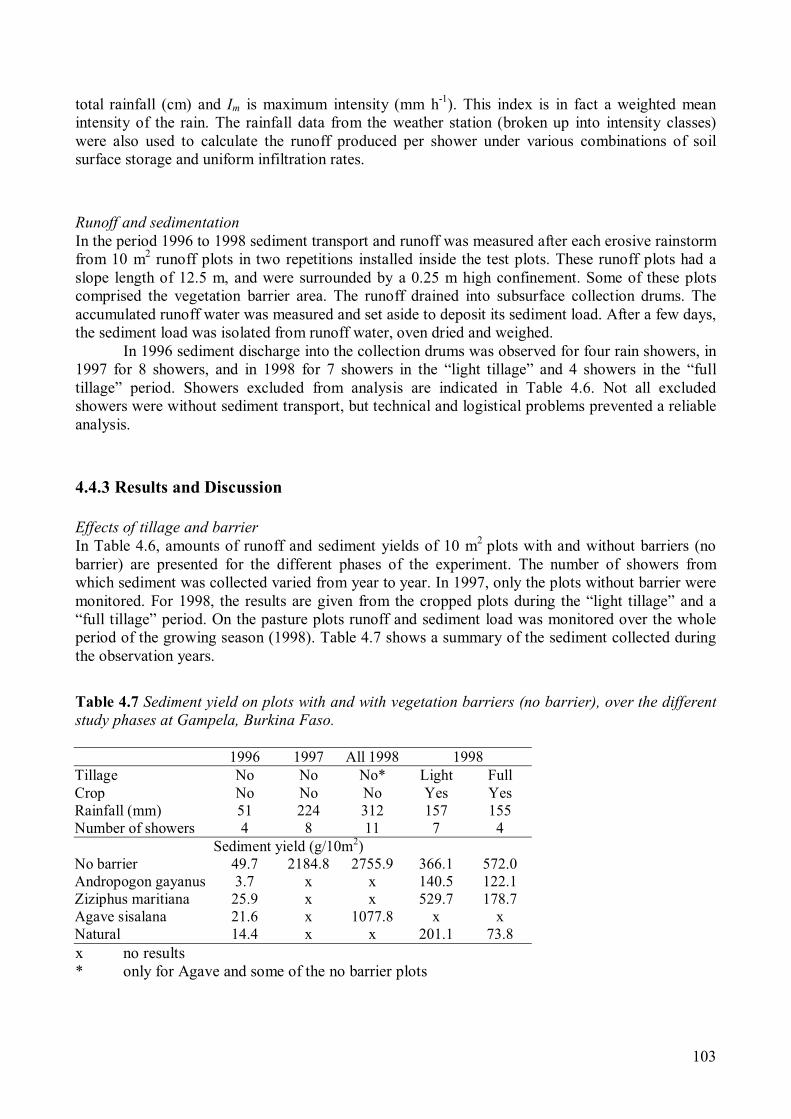
103
total rainfall (cm) and Im is maximum intensity (mm h
-1
). This index is in fact a weighted mean
intensity of the rain. The rainfall data from the weather station (broken up into intensity classes)
were also used to calculate the runoff produced per shower under various combinations of soil
surface storage and uniform infiltration rates.
Runoff and sedimentation
In the period 1996 to 1998 sediment transport and runoff was measured after each erosive rainstorm
from 10 m2
runoff plots in two repetitions installed inside the test plots. These runoff plots had a
slope length of 12.5 m, and were surrounded by a 0.25 m high confinement. Some of these plots
comprised the vegetation barrier area. The runoff drained into subsurface collection drums. The
accumulated runoff water was measured and set aside to deposit its sediment load. After a few days,
the sediment load was isolated from runoff water, oven dried and weighed.
In 1996 sediment discharge into the collection drums was observed for four rain showers, in
1997 for 8 showers, and in 1998 for 7 showers in the “light tillage” and 4 showers in the “full
tillage” period. Showers excluded from analysis are indicated in Table 4.6. Not all excluded
showers were without sediment transport, but technical and logistical problems prevented a reliable
analysis.
4.4.3 Results and Discussion
Effects of tillage and barrier
In Table 4.6, amounts of runoff and sediment yields of 10 m2
plots with and without barriers (no
barrier) are presented for the different phases of the experiment. The number of showers from
which sediment was collected varied from year to year. In 1997, only the plots without barrier were
monitored. For 1998, the results are given from the cropped plots during the “light tillage” and a
“full tillage” period. On the pasture plots runoff and sediment load was monitored over the whole
period of the growing season (1998). Table 4.7 shows a summary of the sediment collected during
the observation years.
Table 4.7 Sediment yield on plots with and with vegetation barriers (no barrier), over the different
study phases at Gampela, Burkina Faso.
1996 1997 All 1998 1998
Tillage No No No* Light Full
Crop No No No Yes Yes
Rainfall (mm) 51 224 312 157 155
Number of showers 4 8 11 7 4
Sediment yield (g/10m2
)
No barrier 49.7 2184.8 2755.9 366.1 572.0
Andropogon gayanus 3.7 x x 140.5 122.1
Ziziphus maritiana 25.9 x x 529.7 178.7
Agave sisalana 21.6 x 1077.8 x x
Natural 14.4 x x 201.1 73.8
x no results
* only for Agave and some of the no barrier plots
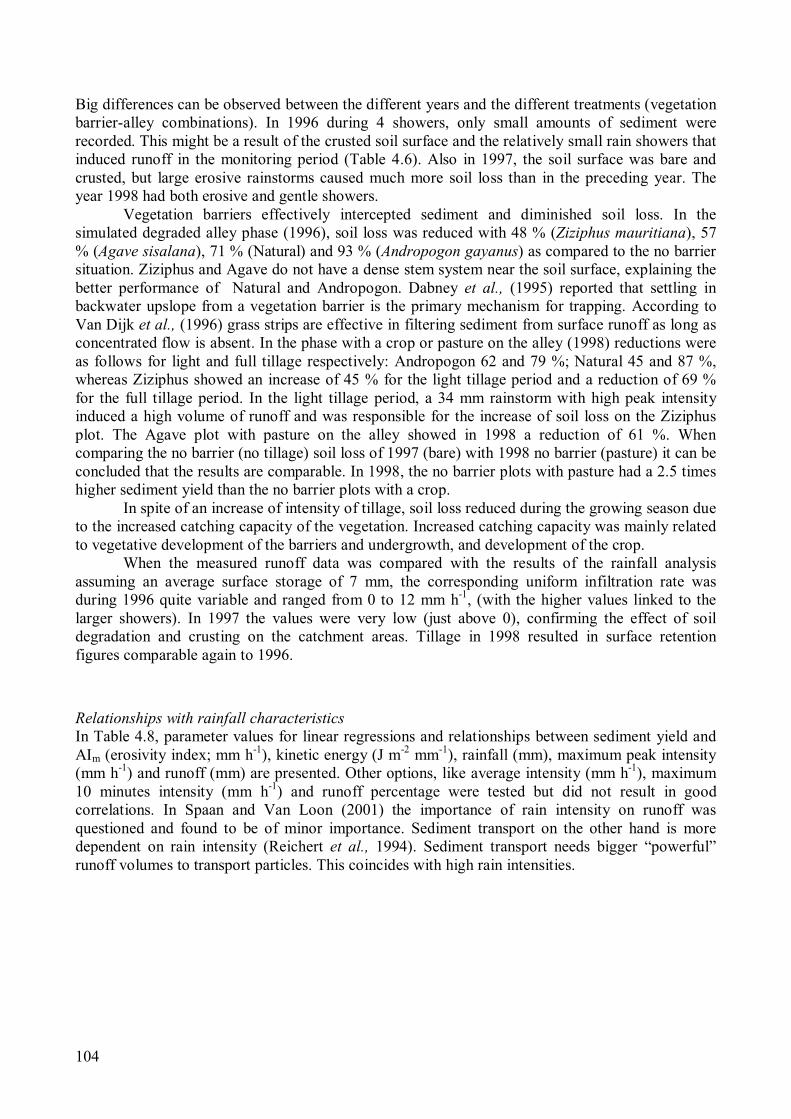
104
Big differences can be observed between the different years and the different treatments (vegetation
barrier-alley combinations). In 1996 during 4 showers, only small amounts of sediment were
recorded. This might be a result of the crusted soil surface and the relatively small rain showers that
induced runoff in the monitoring period (Table 4.6). Also in 1997, the soil surface was bare and
crusted, but large erosive rainstorms caused much more soil loss than in the preceding year. The
year 1998 had both erosive and gentle showers.
Vegetation barriers effectively intercepted sediment and diminished soil loss. In the
simulated degraded alley phase (1996), soil loss was reduced with 48 % (Ziziphus mauritiana), 57
% (Agave sisalana), 71 % (Natural) and 93 % (Andropogon gayanus) as compared to the no barrier
situation. Ziziphus and Agave do not have a dense stem system near the soil surface, explaining the
better performance of Natural and Andropogon. Dabney et al., (1995) reported that settling in
backwater upslope from a vegetation barrier is the primary mechanism for trapping. According to
Van Dijk et al., (1996) grass strips are effective in filtering sediment from surface runoff as long as
concentrated flow is absent. In the phase with a crop or pasture on the alley (1998) reductions were
as follows for light and full tillage respectively: Andropogon 62 and 79 %; Natural 45 and 87 %,
whereas Ziziphus showed an increase of 45 % for the light tillage period and a reduction of 69 %
for the full tillage period. In the light tillage period, a 34 mm rainstorm with high peak intensity
induced a high volume of runoff and was responsible for the increase of soil loss on the Ziziphus
plot. The Agave plot with pasture on the alley showed in 1998 a reduction of 61 %. When
comparing the no barrier (no tillage) soil loss of 1997 (bare) with 1998 no barrier (pasture) it can be
concluded that the results are comparable. In 1998, the no barrier plots with pasture had a 2.5 times
higher sediment yield than the no barrier plots with a crop.
In spite of an increase of intensity of tillage, soil loss reduced during the growing season due
to the increased catching capacity of the vegetation. Increased catching capacity was mainly related
to vegetative development of the barriers and undergrowth, and development of the crop.
When the measured runoff data was compared with the results of the rainfall analysis
assuming an average surface storage of 7 mm, the corresponding uniform infiltration rate was
during 1996 quite variable and ranged from 0 to 12 mm h-1
, (with the higher values linked to the
larger showers). In 1997 the values were very low (just above 0), confirming the effect of soil
degradation and crusting on the catchment areas. Tillage in 1998 resulted in surface retention
figures comparable again to 1996.
Relationships with rainfall characteristics
In Table 4.8, parameter values for linear regressions and relationships between sediment yield and
AIm (erosivity index; mm h-1
), kinetic energy (J m-2
mm-1
), rainfall (mm), maximum peak intensity
(mm h-1
) and runoff (mm) are presented. Other options, like average intensity (mm h-1
), maximum
10 minutes intensity (mm h-1
) and runoff percentage were tested but did not result in good
correlations. In Spaan and Van Loon (2001) the importance of rain intensity on runoff was
questioned and found to be of minor importance. Sediment transport on the other hand is more
dependent on rain intensity (Reichert et al., 1994). Sediment transport needs bigger “powerful”
runoff volumes to transport particles. This coincides with high rain intensities.
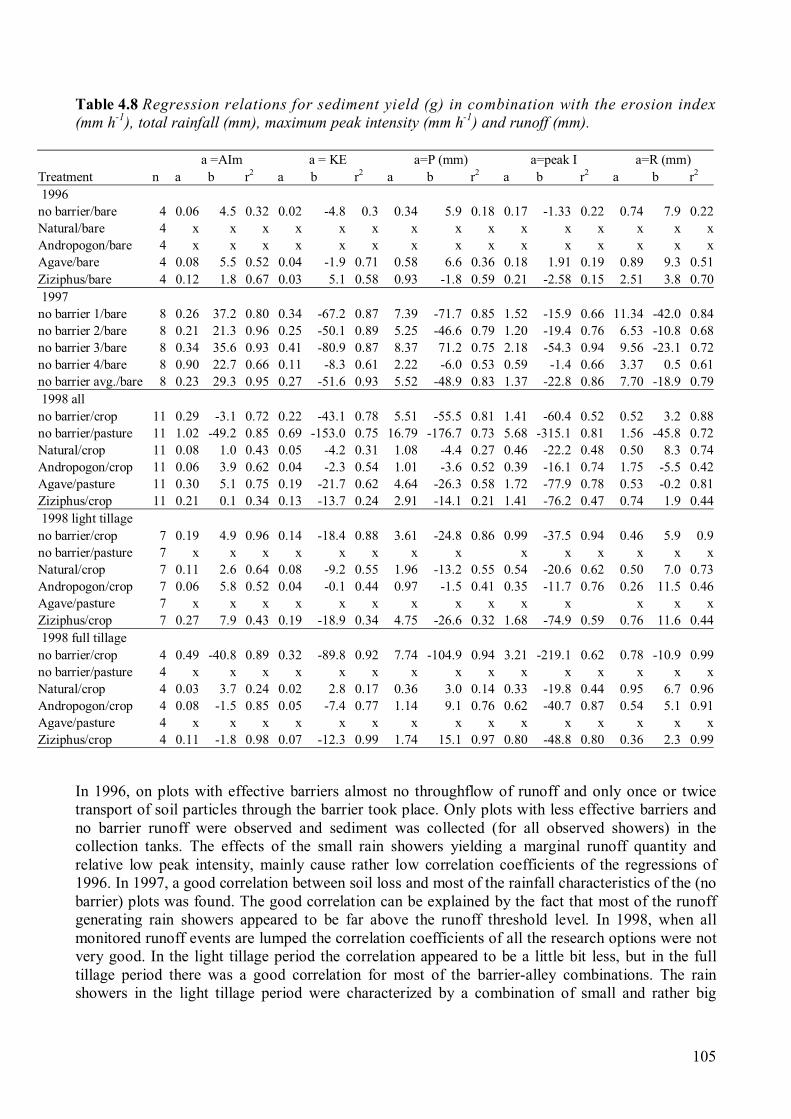
105
Table 4.8 Regression relations for sediment yield (g) in combination with the erosion index
(mm h-1
), total rainfall (mm), maximum peak intensity (mm h-1
) and runoff (mm).
a =AIm a = KE a=P (mm) a=peak I a=R (mm)
Treatment n a b r2
a b r2
a b r2
a b r2
a b r2
1996
no barrier/bare 4 0.06 4.5 0.32 0.02 -4.8 0.3 0.34 5.9 0.18 0.17 -1.33 0.22 0.74 7.9 0.22
Natural/bare 4 x x x x x x x x x x x x x x x
Andropogon/bare 4 x x x x x x x x x x x x x x x
Agave/bare 4 0.08 5.5 0.52 0.04 -1.9 0.71 0.58 6.6 0.36 0.18 1.91 0.19 0.89 9.3 0.51
Ziziphus/bare 4 0.12 1.8 0.67 0.03 5.1 0.58 0.93 -1.8 0.59 0.21 -2.58 0.15 2.51 3.8 0.70
1997
no barrier 1/bare 8 0.26 37.2 0.80 0.34 -67.2 0.87 7.39 -71.7 0.85 1.52 -15.9 0.66 11.34 -42.0 0.84
no barrier 2/bare 8 0.21 21.3 0.96 0.25 -50.1 0.89 5.25 -46.6 0.79 1.20 -19.4 0.76 6.53 -10.8 0.68
no barrier 3/bare 8 0.34 35.6 0.93 0.41 -80.9 0.87 8.37 71.2 0.75 2.18 -54.3 0.94 9.56 -23.1 0.72
no barrier 4/bare 8 0.90 22.7 0.66 0.11 -8.3 0.61 2.22 -6.0 0.53 0.59 -1.4 0.66 3.37 0.5 0.61
no barrier avg./bare 8 0.23 29.3 0.95 0.27 -51.6 0.93 5.52 -48.9 0.83 1.37 -22.8 0.86 7.70 -18.9 0.79
1998 all
no barrier/crop 11 0.29 -3.1 0.72 0.22 -43.1 0.78 5.51 -55.5 0.81 1.41 -60.4 0.52 0.52 3.2 0.88
no barrier/pasture 11 1.02 -49.2 0.85 0.69 -153.0 0.75 16.79 -176.7 0.73 5.68 -315.1 0.81 1.56 -45.8 0.72
Natural/crop 11 0.08 1.0 0.43 0.05 -4.2 0.31 1.08 -4.4 0.27 0.46 -22.2 0.48 0.50 8.3 0.74
Andropogon/crop 11 0.06 3.9 0.62 0.04 -2.3 0.54 1.01 -3.6 0.52 0.39 -16.1 0.74 1.75 -5.5 0.42
Agave/pasture 11 0.30 5.1 0.75 0.19 -21.7 0.62 4.64 -26.3 0.58 1.72 -77.9 0.78 0.53 -0.2 0.81
Ziziphus/crop 11 0.21 0.1 0.34 0.13 -13.7 0.24 2.91 -14.1 0.21 1.41 -76.2 0.47 0.74 1.9 0.44
1998 light tillage
no barrier/crop 7 0.19 4.9 0.96 0.14 -18.4 0.88 3.61 -24.8 0.86 0.99 -37.5 0.94 0.46 5.9 0.9
no barrier/pasture 7 x x x x x x x x x x x x x x
Natural/crop 7 0.11 2.6 0.64 0.08 -9.2 0.55 1.96 -13.2 0.55 0.54 -20.6 0.62 0.50 7.0 0.73
Andropogon/crop 7 0.06 5.8 0.52 0.04 -0.1 0.44 0.97 -1.5 0.41 0.35 -11.7 0.76 0.26 11.5 0.46
Agave/pasture 7 x x x x x x x x x x x x x x
Ziziphus/crop 7 0.27 7.9 0.43 0.19 -18.9 0.34 4.75 -26.6 0.32 1.68 -74.9 0.59 0.76 11.6 0.44
1998 full tillage
no barrier/crop 4 0.49 -40.8 0.89 0.32 -89.8 0.92 7.74 -104.9 0.94 3.21 -219.1 0.62 0.78 -10.9 0.99
no barrier/pasture 4 x x x x x x x x x x x x x x x
Natural/crop 4 0.03 3.7 0.24 0.02 2.8 0.17 0.36 3.0 0.14 0.33 -19.8 0.44 0.95 6.7 0.96
Andropogon/crop 4 0.08 -1.5 0.85 0.05 -7.4 0.77 1.14 9.1 0.76 0.62 -40.7 0.87 0.54 5.1 0.91
Agave/pasture 4 x x x x x x x x x x x x x x x
Ziziphus/crop 4 0.11 -1.8 0.98 0.07 -12.3 0.99 1.74 15.1 0.97 0.80 -48.8 0.80 0.36 2.3 0.99
In 1996, on plots with effective barriers almost no throughflow of runoff and only once or twice
transport of soil particles through the barrier took place. Only plots with less effective barriers and
no barrier runoff were observed and sediment was collected (for all observed showers) in the
collection tanks. The effects of the small rain showers yielding a marginal runoff quantity and
relative low peak intensity, mainly cause rather low correlation coefficients of the regressions of
1996. In 1997, a good correlation between soil loss and most of the rainfall characteristics of the (no
barrier) plots was found. The good correlation can be explained by the fact that most of the runoff
generating rain showers appeared to be far above the runoff threshold level. In 1998, when all
monitored runoff events are lumped the correlation coefficients of all the research options were not
very good. In the light tillage period the correlation appeared to be a little bit less, but in the full
tillage period there was a good correlation for most of the barrier-alley combinations. The rain
showers in the light tillage period were characterized by a combination of small and rather big
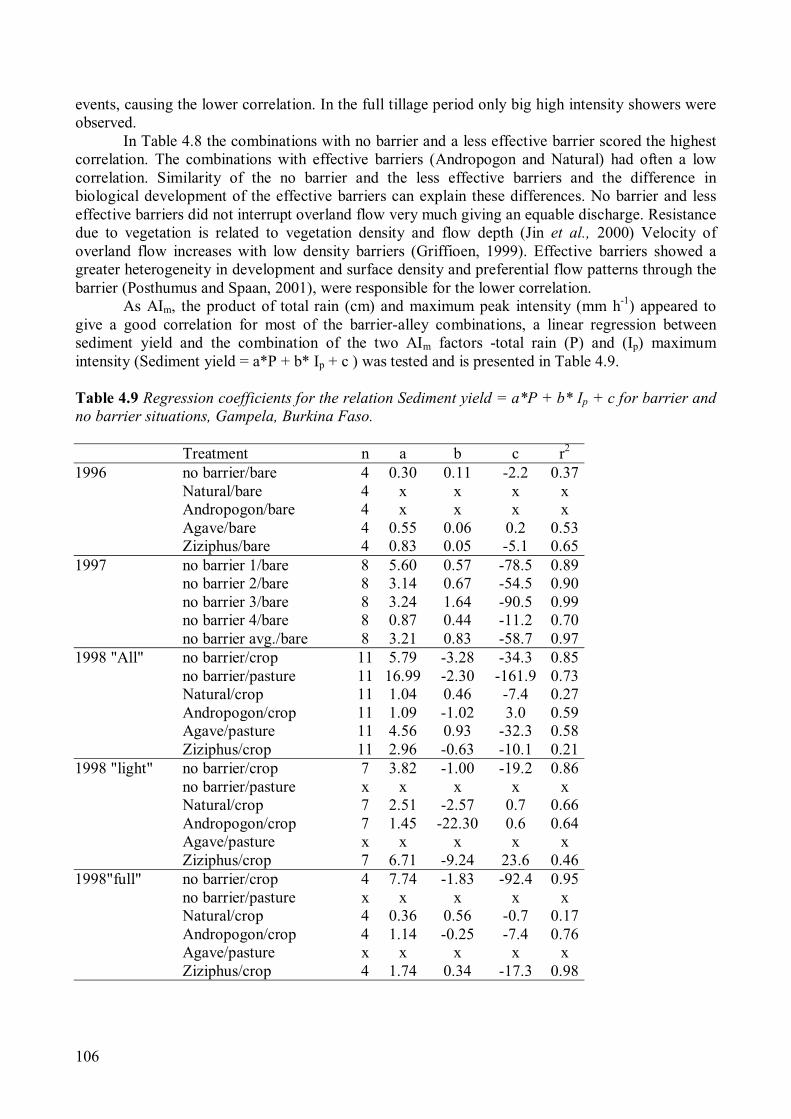
106
events, causing the lower correlation. In the full tillage period only big high intensity showers were
observed.
In Table 4.8 the combinations with no barrier and a less effective barrier scored the highest
correlation. The combinations with effective barriers (Andropogon and Natural) had often a low
correlation. Similarity of the no barrier and the less effective barriers and the difference in
biological development of the effective barriers can explain these differences. No barrier and less
effective barriers did not interrupt overland flow very much giving an equable discharge. Resistance
due to vegetation is related to vegetation density and flow depth (Jin et al., 2000) Velocity of
overland flow increases with low density barriers (Griffioen, 1999). Effective barriers showed a
greater heterogeneity in development and surface density and preferential flow patterns through the
barrier (Posthumus and Spaan, 2001), were responsible for the lower correlation.
As AIm, the product of total rain (cm) and maximum peak intensity (mm h-1
) appeared to
give a good correlation for most of the barrier-alley combinations, a linear regression between
sediment yield and the combination of the two AIm factors -total rain (P) and (Ip) maximum
intensity (Sediment yield = a*P + b* Ip + c ) was tested and is presented in Table 4.9.
Table 4.9 Regression coefficients for the relation Sediment yield = a*P + b* Ip + c for barrier and
no barrier situations, Gampela, Burkina Faso.
Treatment n a b c r2
1996 no barrier/bare 4 0.30 0.11 -2.2 0.37
Natural/bare 4 x x x x
Andropogon/bare 4 x x x x
Agave/bare 4 0.55 0.06 0.2 0.53
Ziziphus/bare 4 0.83 0.05 -5.1 0.65
1997 no barrier 1/bare 8 5.60 0.57 -78.5 0.89
no barrier 2/bare 8 3.14 0.67 -54.5 0.90
no barrier 3/bare 8 3.24 1.64 -90.5 0.99
no barrier 4/bare 8 0.87 0.44 -11.2 0.70
no barrier avg./bare 8 3.21 0.83 -58.7 0.97
1998 "All" no barrier/crop 11 5.79 -3.28 -34.3 0.85
no barrier/pasture 11 16.99 -2.30 -161.9 0.73
Natural/crop 11 1.04 0.46 -7.4 0.27
Andropogon/crop 11 1.09 -1.02 3.0 0.59
Agave/pasture 11 4.56 0.93 -32.3 0.58
Ziziphus/crop 11 2.96 -0.63 -10.1 0.21
1998 "light" no barrier/crop 7 3.82 -1.00 -19.2 0.86
no barrier/pasture x x x x x
Natural/crop 7 2.51 -2.57 0.7 0.66
Andropogon/crop 7 1.45 -22.30 0.6 0.64
Agave/pasture x x x x x
Ziziphus/crop 7 6.71 -9.24 23.6 0.46
1998"full" no barrier/crop 4 7.74 -1.83 -92.4 0.95
no barrier/pasture x x x x x
Natural/crop 4 0.36 0.56 -0.7 0.17
Andropogon/crop 4 1.14 -0.25 -7.4 0.76
Agave/pasture x x x x x
Ziziphus/crop 4 1.74 0.34 -17.3 0.98
107
In 1996 and 1997 in the simulated degraded phase and in the light and full tillage period of 1998 the
equations had a slightly better correlation than the outcomes shown in Table 4.8. In 1998 for the
whole crop period (“All”) the correlation of the equations were less good than in Table 4.8.
Differences between the two approaches are not very big.
Some concern has to be vented with respect to the use of parameters linked to intensity, as
this may lead to an overestimation of the detachment power of high intensity rainfall, as was also
observed by Salles and Poesen (2000), and an underestimation using the rainfall kinetic energy.
The effects of the larger showers are important. In terms of runoff, the large showers e.g. 63
mm in 1997 and 45 and 48 mm in 1998 caused high percentages, but these were not much higher
than some showers of over 20mm (Table 4.6). The sediment produced, however, was substantially
higher. This fact is consistent with Martinez-Mena et al., (2001) stating that major runoff and soil
loss appears to be result of extreme events and such extreme events can be considered as the major
contributors to long term soil loss (Gilley et al., 2000).
4.4.4 Conclusions
Effects of tillage
The experiments have shown that on a crusted degraded soil, the runoff percentages are higher than
on a tilled soil, but soil loss is almost negligible. For growing a crop, however, tillage is necessary
and even a superficial treatment is enough to invoke soil loss. Full tillage increases the initial
abstraction or surface storage capacity, but this effect diminishes quickly after the first showers.
Sediment load was relatively higher under the first showers after tillage. Increased intensity of
tillage did not result in an increased soil loss due to the increased cover on the alley and growth of
the barrier and undergrowth. Sediment yield from the pasture alley was about 2.5 times higher than
the cropped alley. No barrier with bare alley (1997) and no barrier with pasture on the alley (1998)
gave comparable sediment yields.
Effect of barriers
Vegetation barriers always reduce erosion. Under simulated (crusted) degraded conditions less
effective barriers reduce erosion about 50 %, the effective barriers even with 70–90 % compared to
the no barrier situation. During the light tillage period on cropped plots erosion was reduced by 40–
60 % on plots with an effective barrier and showed an increase on the plot with a less effective
barrier. In the full tillage period erosion was reduced by 80–90 % on plots with effective barriers
and about 70 % on the less effective plot. Effective barriers with dense vegetation build up
backwater and reduce the velocity of the overland flow whereby sedimentation is promoted uphill
and in the barrier. Less effective barriers with open vegetation do not interrupt the runoff much;
flow velocities are only slightly decreased and sometimes increased. Sedimentation was far less
than on the plots with effective barriers.
Relationship with rainfall characteristics
Soil loss showed the best relation with the erosivity index AIm , a combination of total rainfall and
intensity of a shower. Second best was the relation between soil loss and runoff amount (mm),
closely followed by the kinetic energy of the shower. Intensity of overland flow as driving force for
sediment transport seems most important. Correlation coefficients in periods with low rainfall
amounts and intensities are low. Sometimes the runoff threshold was hardly exceeded. Periods with
variable relative small showers also gave a low correlation, conversely periods with variable
showers of high amount gave a much better correlation. During periods with higher amounts and
intensities, correlations were good. Less effective barriers scored the highest correlation. These
barriers do not disturb the overland flow. Effective barriers had often a low correlation, caused by
108
the diversity of these barriers and preferential flows through these barriers. There is no significant
improvement in prediction using a single or a multi factor relation, correlation coefficients were
comparable. The effect of large intensive showers is most important, but some medium showers (20
mm) produced identical runoff percentages. The bulk of soil loss is mainly the result of a few
extreme events.
References
Anonymous, 1988. Etude pédologique de la station experimentale de Gampela. Ministère de l’Agriculture et de
l’Elevage, Secretariat General, Bureau National des Sols, Ouagadougou, Burkina Faso. Rapport
Technique no 59, 279 pp.
Breman, H., 1992. Agro-ecological zones in the Sahel: Potentials and constraints. In: Blokland and Van der
Staaij (Eds.), Sustainable Development in semi-arid Sub-Saharan Africa. Poverty and Development,
Analysis and Policy. Ministry of Foreign Affairs, The Hague, The Netherlands. pp19–36.
Casanave, A., Valentin, C., 1992. A runoff capability classification system based on surface features criteria in
semi-arid areas of West Africa. Journal of Hydrology 130: 231–249.
Dabney, S.M., Meyer, L.D., Grissinger, E.H., Foster, G.R., 1995. Deposition patterns of sediment trapped by
grass hedges. Transactions of ASAE, Vol. 38(6): 1719–1729.
Gilley, J.E., Eghball, B., Kramer, L.A., Moorman, T.B., 2000. Narrow grass hedge effects
on runoff and soil loss. Journal of Soil and Water Conservation, 55: 190−196.
Griffioen, F., 1999. Trapping efficiency of vegetative filter strips. MSc thesis Wageningen Agricultural
University, Department of Environmental Sciences, Erosion and Soil and Water conservation Group,
46pp.
Hien, F.G., 1995. La régénération de l'espace sylvo-pastoral au Sahel. Une étude de l'effet de mesures de
conservation des eaux et des sols au Burkina Faso. Tropical Resource Management Papers no 7,
Wageningen, 223 pp.
Hoogmoed, W.B., Stroosnijder, L., 1984. Crust formation on sandy soils in the Sahel. Rainfall and infiltration.
Soil Tillage Res. 4: 5 – 23.
Hoogmoed, W.B., 1999. Tillage for soil and water conservation in the semi-arid tropics. Tropical Resource
Management Papers No. 24, Wageningen,184 pp.
Jin. C.X., Römkens, M. J. M., Griffioen, F., 2000. Estimating Manning’s roughness coefficient for shallow
overland flow in non-submerged vegetative filter strips. Trans. ASAE, 43: 1459 – 1466.
Kiepe, P., 1995. No Runoff, no soil loss: Soil and water conservation in hedgerow barrier systems. PhD-thesis,
Agricultural University Wageningen, 158 pp.
Lal, R., 1976. Soil erosion problems on an Alfisol in Western Nigeria and their control. IITA, Monograph No 1.,
208pp.
Leisinger, K.M., Schmitt, K., 1995. Survival in the Sahel. An ecological and development challenge.
International Service for National Agricultural Research (ISNAR), The Hague, The Netherlands,
211 pp.
Martinez-Mena, M., Castillo, V., Albaladejo, J., 2001. Hydrological and erosional response to natural rainfall in
a semi-arid area of south-east Spain. Hydrol. Process. 15, 557-571.
Morgan, R.P.C., 1986. Soil erosion & conservation. Longman, UK, 298 pp.
Mulders, M., Leenaars, J., Belemvire, A., 2001. Soil Resources in Sahelian Villages. In: Agro-silvo-pastoral land
use in Sahelian Villages. Stroosnijder and Van Rheenen (eds.). Advances in Geoecology 33: 101–131.
Nicou, R., Charreau, C., Chopart, J.L., 1993. Tillage and soil physical properties in semi-arid West Africa. Soil
Tillage Res. 27: 125–147.
Posthumus, H., Spaan, W.P., 2001. Rainfall runoff relations for vegetation barriers in the Sahel. Proceedings of
the International Symposium “Soil Erosion Research for the 21th Century” Ascough and Flanigan
(Eds.)Hawaii, USA, 2001, p50–54.
Reichert, J.M., Norton, L.D., Huang, C., 1994. Sealing, amendment, and rain intensity effects on erosion of
high clay soils. Soil Sci. Soc. Am. J. 58: 1199–1205.
109
Salles, C., Poesen, J., 2000. Rain properties controlling soil splash detachment. Hydrological Processes 14, 271–
282.
Salles, C., Poesen, J., Govers, G., 2000. Statistical and physical analysisof soil detachment by raindrop impact:
rain erosivity indices and threshold energy. Water Resources Research, 36: 2721–2729
Scoones, I., Rey, C., Toulmin, C., 1996. Sustaining the soil: Indigenous soil and water conservation in Africa. In:
Rey, Scoones and Toulmin (Eds.) Sustaining the soil: Indigenous soil and water conservation in Africa,
Earthscan Publications Limited, London pp 1 – 28.
Sivakumar, M.V.K., Gnoumou, F., 1987. Agroclimatologie de l'Afrique de Ouest: le Burkina Faso. Bulletin
d'Information no
23. ICRISAT, Patancheru (Inde), 61 pp.
Spaan, W.P., Van Loon, E.E., 2001. The influence of rain intensity and crop stages on runoff production.
Proceedings of the “10th
International Rainwater Catchment Systems Conference”, Mannheim,
Germany, 2001, Margraf Verlag, pp 231–236.
Spaan, W.P., Posthumus, H., Van Loon, E.E., Stroosnijder, L., (submitted JSWC). Effect of vegetation barriers
on runoff in an alley crop system in Burkina Faso, West Africa.
Van Dijk, P.M., Kwaad, F.J.P.M., Klapwijk, M, 1996. Retention of water and sediment by grass strips.
Hydrological Processes, Vol. 10, 1069–1080.
Vlaar, J.C.J., 1992. Les techniques de conservation des eaux et des sols dans les pays du Sahel. Comité
Interafricain d’Etudes Hydraulique (CIEH) Burkina Faso et l’Université Agronomique Wageningen
(UAW) The Netherlands. 99 pp.
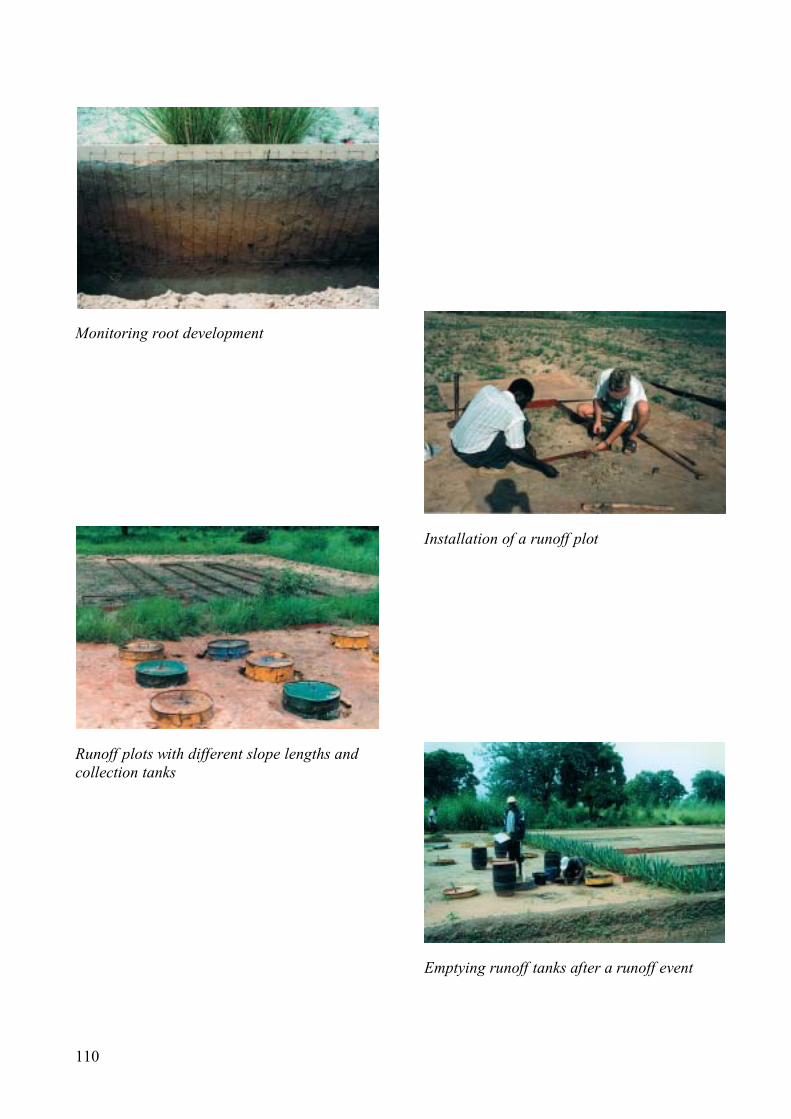
110
Monitoring root development
Runoff plots with different slope lengths and
collection tanks
Installation of a runoff plot
Emptying runoff tanks after a runoff event

Chapter 5
Consuming the savings (Use)

112
113
Consuming the savings (Use)
5.1 Introduction
In Chapter 4 it was shown that the various barrier systems show a different effectiveness with
respect to the conservation of soil and water. These results were obtained in a long-term experiment
in Gampela (Burkina Faso) described in Chapter 3. Two broad categories of barriers were
distinguished: effective barriers (example the perennial grass Andropogon) and less effective
barriers (examples Ziziphus and Piliostigma).The current chapter tries to determine the effect of the
observed improved soil water conditions on the growth of these barriers and on crop yield on the
alley.
In section 5.2 the performance of the alley is considered homogeneous and yields are
expressed in Mg ha-1
. In order to fully understand sorghum growth the properties of the used variety
are explained and the applied management practices like sowing, manuring, thinning, weeding and
harvesting are discussed in detail. The major question that is answered in this section is whether the
observed different effectiveness in water harvesting also implies differences in crop yields. And
whether it makes a difference whether a year is a wet or a dry year.
In section 5.3 the focus is on the barriers. How much water is available under the barriers
and how much of that do they use. Are the used species ‘spenders’ or ‘savers’. The availability of
water (i.e. whether the plant can take the water out of the soil) depends not only on infiltration
(replenishment of the stock of water) and soil evaporation (loss of water stored in the soil profile)
but also on physical soil properties. Besides the standard limits for available water, i.e. field
capacity and permanent wilting point, the so-called stress point is of decisive importance. Below
this water content plant water uptake still continues but at a limited (stressed) rate, i.e. at a rate that
is lower than the demand rate. Although measurements in the field were limited to the top 0.8 m of
the profile due to a laterite hardpan and it is likely that barrier roots will penetrate into this layer it is
felt that the conclusions drawn are sound.
Also in this section, much emphasis is on plant transpiration since soil evaporation under the
dense barriers is low. For most agricultural crops transpiration can be estimated to a reasonable
degree of precision using a reference evapotranspiration which is adjusted with crop (and
development) specific factors. However, for barriers in West-Africa such crop factors are not
available. So, a large effort was put into direct measurements of transpiration. Besides information
on the actual water use this research also provided, as a spinoff, a broad indication of barriers crop
factors. These could be used for extrapolation and design (Chapter 6).
The final section (5.4) tries to answer the question of competition. Since no nutrients could
be measured in detail, only competition for water and to a limited extent to light are considered. For
this purpose yields are differentiated according to distance from the barrier and are related to
moisture conditions.
114
5.2 Crop yields.
5.2.1 Introduction
In 1998 and 1999 the effect of 3 different types of barriers (Andropogon, Ziziphus and stone rows)
on sorghum production (the locally improved variety SARIASO 10) was studied. The aim was to
show their applicability in farmer’s fields in order to conserve water for crop production.
Sorghum (Sorghum bicolor subsp. arundinaceum) (the staple food of the area) is the fourth
most important cereal of the world, and is cultivated in dry tropical regions, sub–tropical and some
southern parts of the temperate zones. On average sorghum is grown between 400
South and 490
North latitude, up to an elevation of 2.500 m.a.s.l. (Kambou, 1998). Sorghum grain is mainly used
for human consumption. The straw of sorghum can be used for many purposes, like fodder for
cattle.
According to Vanderlip (1979) sorghum passes through nine development stages (DVS)
during its growing period. The duration of the development stages depends on the temperature, day
length, biological and environmental stresses and genotype (Kanemasu et al., 1984). In Figure 5.1 a
generalised outline of the development stages of the sorghum variety SARIASO 10 is given.
Stage Duration (days) Name Description
0 3–10 emergence emergence after 3–10 days, tip of first leaf
(coleoptile) just visible above the soil
1 10 3-leaf stage 3 light green leaves are visible, third leaf can just be
seen, only first leaf fully expanded
2 10 5-leaf stage 5 leaves are visible, leaves are dark green, coleoptile
may be lost, plant height 0.2–0.25 m
3 10 growing point
differentiation
7–8 leaves
growing point is just above the soil, first stem nodes
are visible, stem is growing fast, plant height 0.3–0.4
m
4 10 flag leaf stage flag leaf is visible in the curl, other leaves are fully
expanded, there are at least 4 nodes
5 10 boot stage extension of internodes, panicle enclosed by flag leaf,
maximum water use occurs at this stage
6 10 50 % flowering 50 % of the panicles are flowering, flowering takes 4–
9 days
7 10 after flowering flowers are (almost) gone, grains are visible
8 15 dough stage grain in the panicle starts to dry (about ¾ done),
panicle is bended
9 15 maturity grains are mature, i.e. dry and hard
Figure 5.1 Development stages of SARIASO 10 (adapted for the research site after Vanderlip,
1979).
Sorghum is adapted to a wide range of ecological conditions and will produce useful yields of grain
and straw under conditions, which are unfavourable for most other cereals. Sorghum is a very
drought resistant and temperature tolerant crop. It is the crop par excellence for dry regions and
115
areas with unreliable rainfall (Pursglove, 1972). The drought resistance of sorghum is a result of the
effective rooting system (Doorenbos and Kassam, 1979). Above ground the sorghum plant grows
slowly until the root system has been established. Sorghum roots extend laterally from the stem to a
distance of 1 m and when possible to a depth of 1.8 m (Dogget, 1987). Low temperatures and
prolonged wetness are not beneficial for crop development. Sorghum will stand temporarily
wetness and survives physiological drought produced by water logging when root functions are
temporarily impaired. Optimum growing conditions for sorghum are when maximum temperatures
are between 30 – 37 0
C, minimum temperatures between 10 – 15 0
C (Konate, 1984) and annual
rainfall between 400 – 600mm.
The level at which water requirements are met in the first 50 days (DVS 0 – 5) of crop
development has a decisive influence on yield (Forest and Lidon, 1984). Excess water at the start of
the growing period reduces the efficiency of organic matter and mineral fertilisation as result of
leaching (Forest and Lidon, 1984) and runoff of minerals. Water deficits always affect yield results.
During dry spells, before DVS 5, the biological processes in the plant decrease and can remain
dormant during periods of drought and resume growth when conditions become favourable
(Pursglove, 1972; Aho and Kossou, 1997). Prolonged dry spells and as a consequence exhaustion of
soil moisture has a destructive effect on plant growth and crop yields. Water availability also plays
a determinant role during the grain setting and grain–filling period (DVS 6).
In a rainfed agricultural system water availability depends mainly on rainfall distribution
and rain quantities. Figure 5.2 presents the rain characteristics of the period 1998 – 1999 in the
research area. Development stages were included in Figure 5.2 to trace the combination of water
shortage (too dry or too wet conditions) and crop development stages most sensitive to water stress.
Sorghum is a C4 crop and has the potentially high rates of dry weight production of any C4
crop (Peacock and Heinrich, 1984). In hot and sunny environments C4 plants are more productive,
i.e. they assimilate more carbon dioxide per unit leaf area and produce more biomass per unit water
transpired than C3 plant types (Mannion, 1995). Water needs per kg dry matter range between 260
– 320 kg (Dogget, 1987). The C4 system has a high light compensation point and is inefficient at
low light intensities, C4 species are therefore ineffective under shaded conditions (Begon et al,
1986).
Sorghum can be grown successfully on a wide range of soils. It tolerates a pH range from
5.0 – 8.5 (Pursglove, 1972; Dogget, 1987). It will produce crops on soils too poor for many other
crops. Generally, sorghum does not receive artificial fertilisers. For optimum growth conditions
sorghum needs about 75 kg P2O5 and 150 kg K2O (Vanderlip, 1979).
116
0
10
20
30
40
50
60
70
80
90
180 190 200 210 220 230 240 250 260 290 julian days (DOY)
pre
cip
ita
tio
n (m
m) 1
99
8
275
0 1 2 3 4 5 6 7 8 9DVS
0
10
20
30
40
50
60
70
80
90
180 190 200 210 220 230 240 250 260 290 julian days (DOY)
pre
cip
ita
tio
n (m
m) 1
99
9
275
0 1 2 3 4 5 6 7 8 9DVS
Figure 5.2 Rainfall distribution and rain quantities during consecutive sorghum stages in 1998 and
1999.
117
5.2.2 Materials and methods
In order to test the effect of different barrier types (Ziziphus, Andropogon and stone rows) on
sorghum yields, three plots per barrier type were observed. At the beginning of each season
Ziziphus barriers were pruned to a height of 0.75 m and a width of 1.5 m. Andropogon barriers
were pruned at the end of the previous wet season to a height of 0.30 m. Pruned material was set
aside and not introduced again in the system. Stone lines were laid out in a small trench of about 0.1
m deep (Kessler et al, 1995) with the centre of the row at 15m from the top of the plot. Stones with
a height and width of approximately 0.4 m were placed next to each other so that almost no space
was left between the stones.
Figure 5.3 Description and characteristics of the sorghum variety SARIASO 10
Synonymous: BF 83-3/48-2-1, IRAT 378
Genetic kind: line
Geographical origin: Burkina Faso (INERA/CIRAD Saria)
Genetic origin: line derived from cross 193-2 x IRAT 10
Year of obtainment: 1989
Race: Caudatum
Plant properties:
Days to flowering: 80-86 days
Days to maturity: 115-120 days
Photo sensitivity: low photosensitivity
Plant height: 2.5 m
Color of the plant: tan
Productive tillers: 1
Plume properties
Exsertion: good
Shape: elliptic
Length: 0.26 m
Compactness: semi-compact
Position: upright
Glum color: straw
Awns: absent
Agronomic properties
Seedling vigor: good
Lodging resistance: sufficient
Drought resistance: tolerant to post
flowering drought
Striga resistance: rather susceptible (intermediate)
Grain properties
Grain color: white
Anthocyane spots: absent
Sub-coat: absent
Texture: 3
Albumen color: white
Weight of 1000 grains: 24 g
Protein percentage: 10.8 %
Grain quality:
tô: reasonable
couscous: good
bouillie: good
beignets: good
preparation like rice: good
Susceptibility to diseases and insects:
Leaf diseases: resistant
Grain mould (mildew): resistant
Head buck (cecidomyie): sensitive
Aphis: rather sensitive
Performances
Maximum at station grain yield: 4.130 kg/ha at Saria
Average grain yield: 3.070 kg/ha (results of 19 tests between 1989 and 1995)
Average profit related to ICSV 1049: +18% (comparison of 7 years)
Average yield under farmer’s conditions: 1.240 kg/ha (10 tests in the Central Zone)
Cultivation recommendations:
Intensification level: semi-intensive to intensive
Region of cultivation: Sudanien Zone with a seasonal rainfall of 700-900 mm/y
Optimum sowing date: 15-30 June (N.B. sowing not later than 5 July)
Strong points Weak points
High-yielding and high yield stability on-
station
Resistance to drought after flowering
(terminal drought)
Good straw quality for fodder
Bad response to late sowing
Susceptible to cecidomyie and Striga
Average suitability for seed decortations
Average grain quality for tô
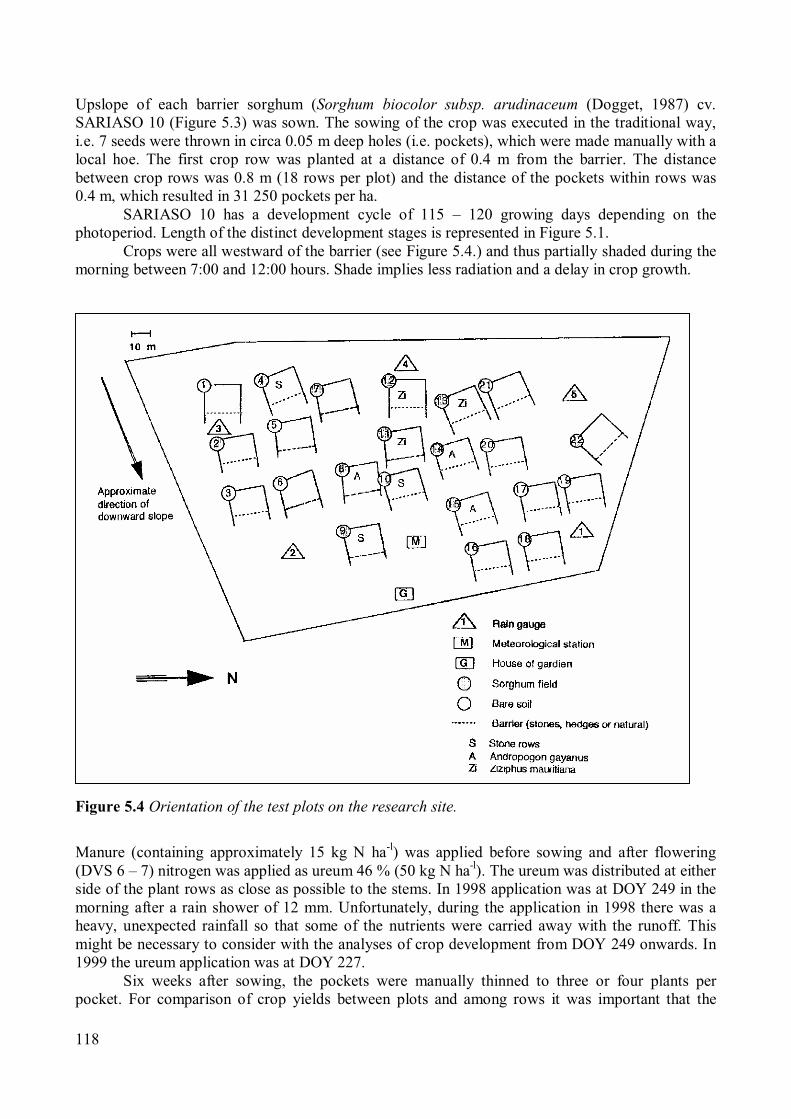
118
Upslope of each barrier sorghum (Sorghum biocolor subsp. arudinaceum (Dogget, 1987) cv.
SARIASO 10 (Figure 5.3) was sown. The sowing of the crop was executed in the traditional way,
i.e. 7 seeds were thrown in circa 0.05 m deep holes (i.e. pockets), which were made manually with a
local hoe. The first crop row was planted at a distance of 0.4 m from the barrier. The distance
between crop rows was 0.8 m (18 rows per plot) and the distance of the pockets within rows was
0.4 m, which resulted in 31 250 pockets per ha.
SARIASO 10 has a development cycle of 115 – 120 growing days depending on the
photoperiod. Length of the distinct development stages is represented in Figure 5.1.
Crops were all westward of the barrier (see Figure 5.4.) and thus partially shaded during the
morning between 7:00 and 12:00 hours. Shade implies less radiation and a delay in crop growth.
Figure 5.4 Orientation of the test plots on the research site.
Manure (containing approximately 15 kg N ha-l
) was applied before sowing and after flowering
(DVS 6 – 7) nitrogen was applied as ureum 46 % (50 kg N ha-l
). The ureum was distributed at either
side of the plant rows as close as possible to the stems. In 1998 application was at DOY 249 in the
morning after a rain shower of 12 mm. Unfortunately, during the application in 1998 there was a
heavy, unexpected rainfall so that some of the nutrients were carried away with the runoff. This
might be necessary to consider with the analyses of crop development from DOY 249 onwards. In
1999 the ureum application was at DOY 227.
Six weeks after sowing, the pockets were manually thinned to three or four plants per
pocket. For comparison of crop yields between plots and among rows it was important that the
119
number of plants left per pocket after thinning was as uniform as possible. In order to minimise
plant stress the thinning operation was carried out during early morning hours. The soil around the
pockets was pressed to avoid soil drying, wilting of and damage to plants.
Weeding was performed by hand before sowing and at 4 and 6 weeks after sowing. Control
of weeds is most important in early crop development stages (Dogget, 1987) and less important
when sorghum has become well established, since the weeds are then shaded and growth is limited.
As sorghum is very susceptible to bird damage, bird scaring methods controlled seed losses during
the last three weeks before harvest. All these and other cultivation practices were applied uniformly
on all plots. A detailed time schedule of management operations for the growing seasons of 1998
and 1999 is shown in Table 5.1.
Table 5.1. Time schedule of management operations for the
growing seasons of 1998 and 1999,at Gampela, Burkina Faso.
1998 1999 Operation
DOY DOY
Barrier trimming
Application manure
Sowing
Emergence
Re sowing
Re emergence
Weeding
Thinning
Weeding
Fertiliser N (Ureum)
Harvest at maturity
168, 169
182
183
188, 189
195
198
209
223
224
249
300
159
166
178
186
196
222
229
227
297
DOY indicates Julian day of the year
At physiologica1 maturity (DVS 9) when all the grains were dry and ripe, sorghum was harvested.
The time of the sorghum harvest was for both years about the same. Sorghum yields were
determined for all plots. For this purpose, a specific number of succeeding pockets per row parallel
to the barrier were harvested. In 1998, 30 pockets per row were harvested, and in 1999, 45 pockets.
To avoid border effects, only 16 of the 18 rows per plot were harvested. Two border rows at the
back of the plot (17 and 18) and at two pockets at the sides of each row were not used for the yield
assessment. After harvest the panicles were oven–dried at 60 °C and then threshed manually for
grain yield determination. Additionally straw biomass was dried for about three weeks in the field,
and weighed after collection. In this section (5.2) grain and straw yields determined per row will be
given as yield per plot in Mg ha-1
.
5.2.3 Results
In the period 1998 – 1999 the influence of stone row, Ziziphus and Andropogon barriers on
sorghum grain and straw yields, was monitored. Three replications of each crop–barrier
combination were tested. Figure 5.5 shows the sorghum yields of all replications of the three
barriers for the years 1998 and 1999.

120
0
2
4
6
8
10
12
barriers (3 repetitions)
pro
du
ctio
n (M
g h
a-1
)
straw
grain
1998 1999 1998 1999 1998 1999
stone rows Ziziphus Andropogon
Figure 5.5 Grain and straw yield of sorghum on plots with stone rows, Ziziphus and Andropogon
barriers in 1998 and 1999 at Gampela, Burkina Faso.
In 1998 the ratio between grain yield and straw yield (the Harvest Index) was 0.15 and 0.37 in
1999. Even in years with low grain production the straw yield of SARIASO 10 was rather high. The
differences in grain and straw yields between 1998 and 1999 for all observed barrier plots were
quite large. In 1999 the grain yields were 3 to 4 times higher and the yields of straw about 1.5 times
higher (Figure 5.5 and Table 5.2).
The crop–barrier combinations for the distinct years did not show much difference in sorghum
production. On the basis of a one way analysis of variance (ANOVA) it was observed that there was
no differences in the means up to a significance level of 35 %, leading to the conclusion that the
three barrier–crop combinations did not result in different crop yields (Table 5.2). When comparing
the figures of Table 5.2 with the published grain yield of 3.1 Mg ha-1
(Figure 5.3) it appeared that in
1999 production of the experimental plots was 0.8 and in 1998, 2.4 Mg ha-1
less than the published
yield. In 1998, the crop yield was about 0.5 Mg ha-1
less than the published output under the
farmer’s conditions (i.e. 1.2 Mg ha-1
, Figure 5.3).
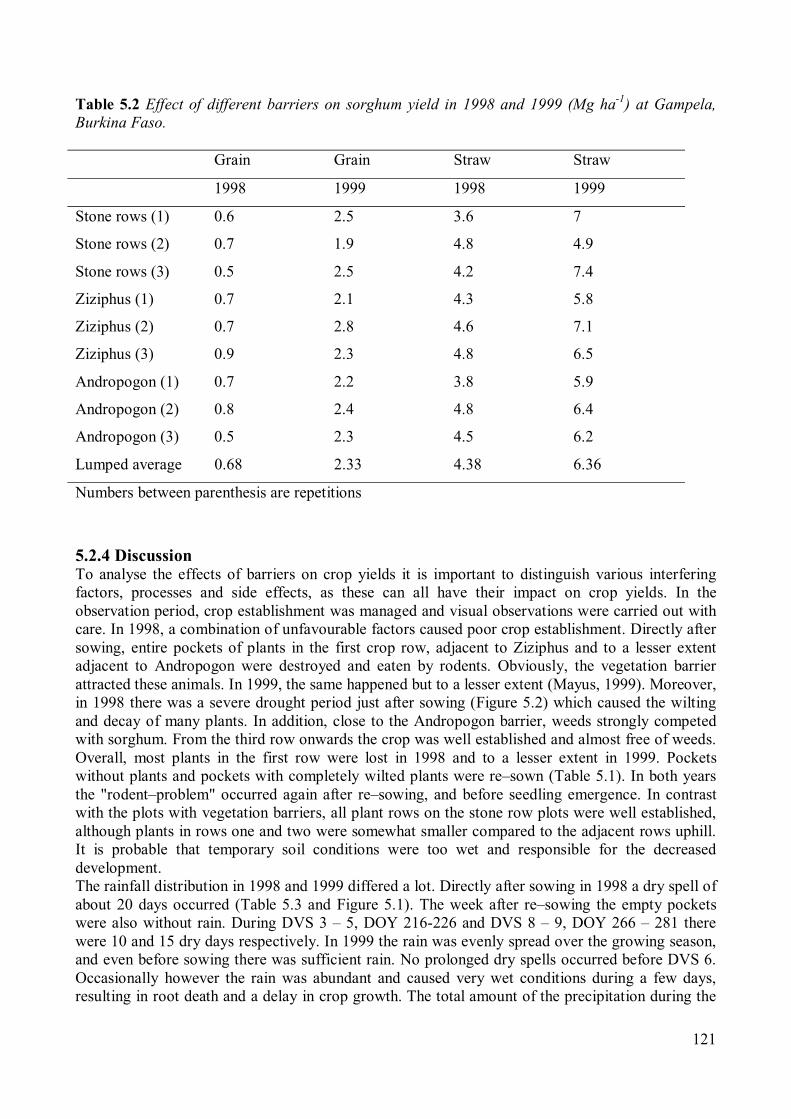
121
Table 5.2 Effect of different barriers on sorghum yield in 1998 and 1999 (Mg ha-1
) at Gampela,
Burkina Faso.
Grain Grain Straw Straw
1998 1999 1998 1999
Stone rows (1) 0.6 2.5 3.6 7
Stone rows (2) 0.7 1.9 4.8 4.9
Stone rows (3) 0.5 2.5 4.2 7.4
Ziziphus (1) 0.7 2.1 4.3 5.8
Ziziphus (2) 0.7 2.8 4.6 7.1
Ziziphus (3) 0.9 2.3 4.8 6.5
Andropogon (1) 0.7 2.2 3.8 5.9
Andropogon (2) 0.8 2.4 4.8 6.4
Andropogon (3) 0.5 2.3 4.5 6.2
Lumped average 0.68 2.33 4.38 6.36
Numbers between parenthesis are repetitions
5.2.4 Discussion
To analyse the effects of barriers on crop yields it is important to distinguish various interfering
factors, processes and side effects, as these can all have their impact on crop yields. In the
observation period, crop establishment was managed and visual observations were carried out with
care. In 1998, a combination of unfavourable factors caused poor crop establishment. Directly after
sowing, entire pockets of plants in the first crop row, adjacent to Ziziphus and to a lesser extent
adjacent to Andropogon were destroyed and eaten by rodents. Obviously, the vegetation barrier
attracted these animals. In 1999, the same happened but to a lesser extent (Mayus, 1999). Moreover,
in 1998 there was a severe drought period just after sowing (Figure 5.2) which caused the wilting
and decay of many plants. In addition, close to the Andropogon barrier, weeds strongly competed
with sorghum. From the third row onwards the crop was well established and almost free of weeds.
Overall, most plants in the first row were lost in 1998 and to a lesser extent in 1999. Pockets
without plants and pockets with completely wilted plants were re–sown (Table 5.1). In both years
the "rodent–problem" occurred again after re–sowing, and before seedling emergence. In contrast
with the plots with vegetation barriers, all plant rows on the stone row plots were well established,
although plants in rows one and two were somewhat smaller compared to the adjacent rows uphill.
It is probable that temporary soil conditions were too wet and responsible for the decreased
development.
The rainfall distribution in 1998 and 1999 differed a lot. Directly after sowing in 1998 a dry spell of
about 20 days occurred (Table 5.3 and Figure 5.1). The week after re–sowing the empty pockets
were also without rain. During DVS 3 – 5, DOY 216-226 and DVS 8 – 9, DOY 266 – 281 there
were 10 and 15 dry days respectively. In 1999 the rain was evenly spread over the growing season,
and even before sowing there was sufficient rain. No prolonged dry spells occurred before DVS 6.
Occasionally however the rain was abundant and caused very wet conditions during a few days,
resulting in root death and a delay in crop growth. The total amount of the precipitation during the
122
growing season in 1998 was only 425 mm, whereas in 1999 there was 812 mm. Taking this into
account, on a 12.5 m long slope (row 1 – 16) about 25 % of the rain was converted into runoff
(Spaan et al, submitted to JSWC), then in 1998 only 340 mm remained for crop production. With
the same approach about 650 mm was available for the crop in 1999 (Table 5.3).
Table 5.3 Rainfall distribution in the different development stages of SARIASO 10 in 1998 and
1999 at Gampela, Burkina Faso.
SARIASO 10 Precipitation Precipitation
DVS DOY 1998 1999
0 0 57
1 190–200 0 153
2 200–210 50 48
3 210–220 51 141
4 220–230 45 65
5 230–240 51 72
6 240–250 38 82
7 250–260 112 95
8 260–275 32 85
9 275–290 46 14
Total 425mm 812mm
Mayus (1999) reported that the roots of Andropogon and sorghum, both belong to the tribe of
Andropogoneaen, subtribe Sorghastrae (Kambou, 1998) and occupy the same soil horizons. In case
of an abundance of rain this may be an advantage, but a disadvantage during dry periods. The root
system of Ziziphus was only investigated during the development phase of the barriers. At that time
few lateral roots were present under the alley (Spaan, unpublished). Sorghum roots may also grow
under the vegetation barrier. Artificial barriers like stone rows exclude the interaction of living
barriers with their environment (Mayus, 1998).
Barriers of Ziziphus are more open than Andropogon and stone rows. Excess water drains
away more easily. The open structure of the Ziziphus barrier does not create inundation uphill of the
barrier and the formation of crusts that inhibit the aeration of the soil, but still conserves enough
water. In the wet year (1999) however, more weeds in the barrier decreased the permeability of the
Ziziphus barrier, and did not lead to over wet conditions. Andropogon and stone rows blocked the
runoff effectively (Djiguemde, 2000), and during large rain showers, ponding took place adjacent to
the barrier (Zougmoré et al., 2000). In the pools uphill of the barrier fine particles settled down,
creating a depositional crust almost impermeable for water and air (Mayus, 1999; Tordina, 2000).
Lamachere and Serpantié (1991) found that during wet years the impact of stone rows are not
impressive and can also be negative (Zougmoré et al, 2000).
5.2.5 Conclusions
For the investigated alley crop system it was found that, despite the difference in effectiveness of
the barriers to catch and conserve water, there were no striking differences in yield (grain and
straw) between the treatments in the distinct years. The open Ziziphus barrier was less efficient in
conserving water as the more closed barriers (Andropogon and stone rows). The disadvantage of
these effective barriers was that they conserved too much water in wet periods. Wetness during a
few days, i.e. an abundance of soil water, a shortage of air and crust formation meant a stagnation of
crop development, which was the most important reason for yield reduction.
There were big differences in crop yields between the two years. These differences were
strongly related to the amount and the distribution of the rain over the crop development stages.
However, even in the dry year 1998, there was a total amount of rain to produce maximum yields.
In the dry year 1998, about half of the water and in the wet year 1999, only about a third of the
available water was used for crop production (Table 5.4).

123
Table 5.4 Potential and actual dry matter production of sorghum and water use efficiency at
Gampela in 1998 and 1999
.
Years Water
available for
production
(Mg ha-1
)
Potential dry
matter
production
(Mg ha-1
)
Actual dry
matter
production
(Mg ha-1
)
Water
needed for
actual
production
(Mg ha-1
)
Water use
efficiency
%
1998 3400 11.724 0.68+4.38=6.1 1769 52
1999 6500 22.414 2.33+6.36=8.7 2523 38
Management actions can be undertaken to diminish the negative impacts, like ponding or excessive
water use by the barriers. During drought the barrier has to be cut back to diminish competition.
During wetness, removal of some stones in the stone row and cutting a part of the effective
Andropogon barrier can help to drain excess water. In farmers fields it was often observed that only
short rows of Andropogon were applied. Obviously their experience is that in case of drought these
short barriers catch enough water and in case of abundance, the water can flow round.
124
5.3 Water availability and water use.
5.3.1 Introduction
Vegetation barriers are rows of periodically pruned trees, shrubs or grasses grown between crops
and planted close together along the contour for soil and water conservation (Kiepe, 1995).
Vegetation barriers can be used to catch water, in order to increase the amount of water available
for crop production. Barriers slow down runoff, extend the opportunity time for infiltration, retain
sediment and allow excess water to drain down-slope because of their semi-permeability. Besides
conserving water, vegetation barriers also consume water to satisfy their own water needs. In order
to increase the soil water availability for crops, the vegetation barrier should at least conserve
sufficient water to satisfy its own transpiration demand. When the net water consumption of the
vegetation barrier exceeds the extra conservation, the barrier competes with the crop for water and
subsequently crop yields are reduced (Mayus, 1998). Nevertheless, in financial terms, the barrier
products can adequately compensate the reduced crop yields and can even generate additional
income (Kidanu et al., 2002).
It is important to quantify the impact of vegetation barriers on the water availability for both
the agricultural crop and the barrier. In this section the influence of different vegetation barriers on
soil water stock and their accessory water use is investigated.
5.3.2 Materials and methods
For the assessment of the water use of vegetation barriers, three species were selected: Andropogon
gayanus, Piliostigma reticulatum and Ziziphus mauritiana. The selection of these species was based
on the effectiveness of the different barriers to conserve water and sediment, and on the possibility
to measure transpiration (water use) on living plants in the field.
For comparison three different methods to determine water consumption of barrier species
and sorghum were applied:
a.) Soil water content: changes in soil water content were monitored with regular intervals to
quantify the water use of crops and barriers during the season.
b.) Measured transpiration: during periods in different stages of the growing seasons the stem
heat balance method (Baker and Van Bavel, 1987) was used to determine transpiration rates
of the vegetation barriers.
c.) Calculated transpiration: data from the meteorological station at the research site was used
to calculate the reference evapotranspiration (ET0). Multiplying this reference with an
appropriate plant factor for barriers (kc) gave an approximation of their transpiration rate
(Tc) and thus their water consumption needs.
Soil water
The soil water content was monitored with the TDR technique, at a transect of seven access tubes
(−5, −1, barrier, +1, +2.5, +5, and +10 m), with a frequency of twice a week at measuring depths
0.1, 0.3, 0.5 and 0.7 m (section 3.5.). The measuring depths coincided with the middle of the
observed soil layers.
On the barrier plots under examination additional soil water monitoring was executed under
the barriers during two successive days and with intervals of two days. This was only done during
the periods in which transpiration was monitored. In 1999, soil water was monitored daily (except
for the weekend days) on the Andropogon plots. In 1998, from DOY 150 to 200 the TDR
equipment was out of order.
125
Using samples from four soil pits, soil water retention curves for different soil layers were
determined in the laboratory and averaged for the research site, enabling the detection of field
capacity (10 kPa) and wilting point (1600 kPa). Although theoretically seen, water is available until
wilting point, plant water uptake is reduced well before wilting point and under too wet (< 10kPa)
conditions (Van Dam, 2000). When the soil water content drops below the plant specific depletion
level, soil water cannot be transported quickly enough to the roots to respond to the transpiration
demand and transpiration is reduced (Allen. et al., 1998).
Total available water (TAW), the difference between the water amount at field capacity and
wilting point, is the maximum root water extraction and its magnitude depends on the type of soil,
rooting depth and root density (Van Dam, 2000).
TAW= 1000 (θFC – θWP) Zr (1)
TAW total available soil water in the root zone (mm)
θFC the water content at field capacity (m3
m-3
)
θWP the water content at wilting point (m3
m-3
)
Zr the rooting depth (m)
For the perennial barriers planted at the research site it is assumed that the roots have sufficient root
density over the full soil depth of 0.8 m. The bulk of the roots can be found between 0.2 m and 0.6
m below the soil surface (Verdoes, 1990). Roots of perennials may go even deeper and penetrate the
armoured subsoil. However, soil water was monitored up to a depth of 0.8 m, because no methods
were available to test below this level.
The available water (AW) is the amount of water actually available for plants. The AW-
values were determined on the basis of regular soil water observations
The fraction of TAW that plants can extract from the root zone without suffering water
stress is the readily available soil water (RAW):
RAW = pTAW (2)
RAW the readily available soil water in the root zone (mm)
p fraction of maximum available soil water (TAW) that can be
depleted from the root zone before water stress occurs (0 ≤ p ≤ 1).
Values for p differ from one species to another. For the perennial grasses the estimate of the
depletion fraction is 0.5, for the woody species 0.6 and for sorghum 0.55 (Allen. et al., 1998;
Doorenbos and Kassam, 1979).
Reference evapotranspiration
In Allen et al., (1998) the FAO or modified Penman-Monteith equation is considered as the best
method to calculate the reference evapotranspiration (ET0). It is a method with strong likelihood of
correctly predicting ET0 in a wide range of locations and climates and has provisions for
applications in data-short situations. Reference evapotranspiration was calculated for 24 h periods
using the FAO Penman-Monteith method (FAO,1992)
126
( ) ( )
( )2
2
0
34.01
273
900
408.0
u
eeu
T
GR
ET
sa
av
n
++∆
−+
+−∆=
γ
γ(3)
ET0 reference evapotranspiration (mm d-1
)
Rn net radiation at the crop surface (MJ m-2
d-1
)
G soil heat flux density (MJ m-2
d-1
)
T mean daily air temperature at 2 m height (°C)
µ2 wind speed at 2m height (m s-1
)
es saturation vapour pressure (kPa)
es – ea saturation vapour pressure deficit (kPa)
∆ slope of vapour pressure curve (kPa °C-1
)
γ psychrometric constant (kPa °C-1
)
Evaporation
Soil evaporation was measured with micro lysimeters. Eight small cylinders with a diameter of 0.1
m, creating isolated volumes of bare soil, were mounted flush with the soil surface. They were dug
up and weighed several times a day for four days. The measurement period was without rain.
Ritchie (1972) divides evaporation from bare soil into two different stages; the first stage in which
evaporation is only limited by the energy supply to the soil surface and water is readily available. In
the second stage water movement to the soil surface is controlled by the hydraulic properties of the
soil (Allen et al., 1998; Vollebergh, 1984; Sikking, 1997). The relationship between soil hydraulic
properties, atmospheric demand and evaporation is given in equation 4:
ΣE = t1* ET0 + A √(t − t1) (4)
Where: ΣE Cumulative evaporation (mm)
t time elapsed since evaporation started (d)
ET0 reference evaporation (mm d–1
)
t1 duration of the first stage of soil evaporation (d)
A soil parameter (mm d–1/2
)
Actual transpiration
Actual transpiration was measured by using the sap-flow method (see also section 3.5.). In the
growing seasons of 1996, 1998 and 1999 transpiration measurements were executed during
development, mid and end stage of the growing season. On an average the development stage starts
with the first rain and extends from DOY 150 till 210, mid stage is from DOY 210 till 260 and the
end stage is from DOY 260 till about 300. In 1996, barriers were combined with a bare alley. In
1998 and 1999 Andropogon and Ziziphus barriers were combined with a sorghum crop, the
Piliostigma barrier with pasture on the alley.
For all barrier species and the sorghum crop, continuous sap-flow measurements were made
over four 5-day periods throughout the growing seasons of 1996 and 1998. In 1999, sap-flow of
Ziziphus and Piliostigma was only determined over a 10-day period in the beginning of the growing
season. The sap-flow of Andropogon and sorghum was monitored during periods of 10 days
throughout the whole season of 1999.
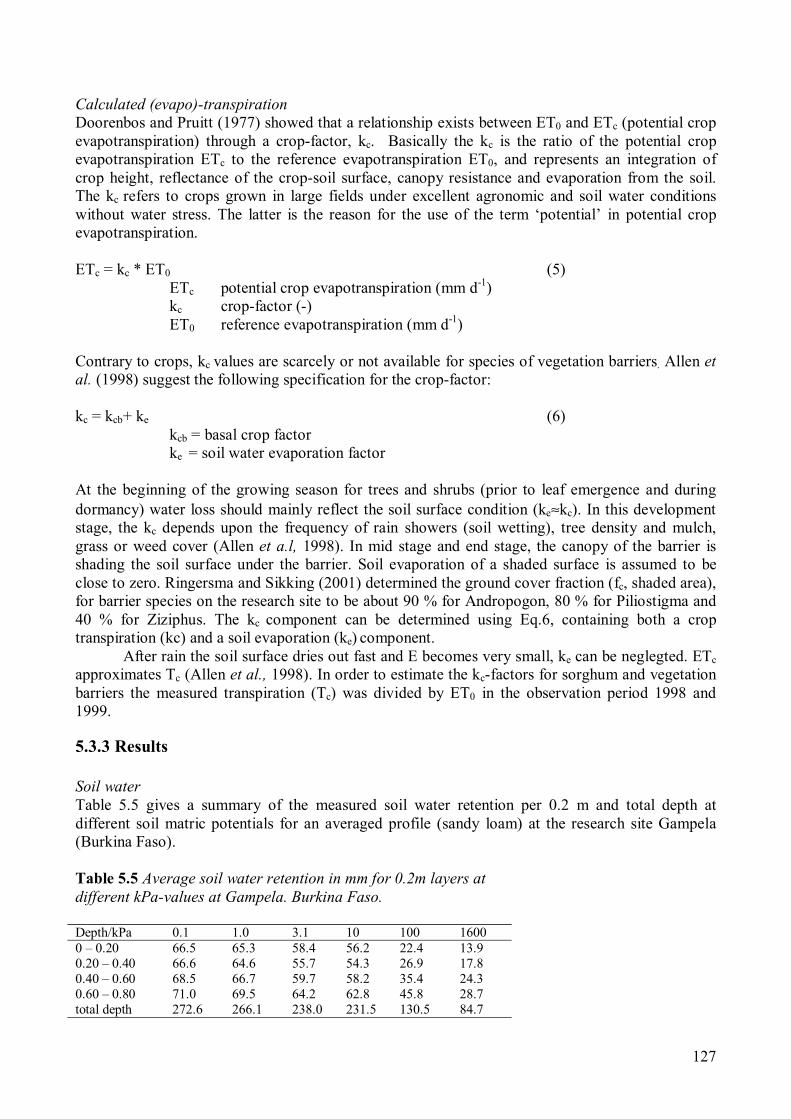
127
Calculated (evapo)-transpiration
Doorenbos and Pruitt (1977) showed that a relationship exists between ET0 and ETc (potential crop
evapotranspiration) through a crop-factor, kc. Basically the kc is the ratio of the potential crop
evapotranspiration ETc to the reference evapotranspiration ET0, and represents an integration of
crop height, reflectance of the crop-soil surface, canopy resistance and evaporation from the soil.
The kc refers to crops grown in large fields under excellent agronomic and soil water conditions
without water stress. The latter is the reason for the use of the term ‘potential’ in potential crop
evapotranspiration.
ETc = kc * ET0 (5)
ETc potential crop evapotranspiration (mm d-1
)
kc crop-factor (-)
ET0 reference evapotranspiration (mm d-1
)
Contrary to crops, kc values are scarcely or not available for species of vegetation barriers. Allen et
al. (1998) suggest the following specification for the crop-factor:
kc = kcb+ ke (6)
kcb = basal crop factor
ke = soil water evaporation factor
At the beginning of the growing season for trees and shrubs (prior to leaf emergence and during
dormancy) water loss should mainly reflect the soil surface condition (ke≈kc). In this development
stage, the kc depends upon the frequency of rain showers (soil wetting), tree density and mulch,
grass or weed cover (Allen et a.l, 1998). In mid stage and end stage, the canopy of the barrier is
shading the soil surface under the barrier. Soil evaporation of a shaded surface is assumed to be
close to zero. Ringersma and Sikking (2001) determined the ground cover fraction (fc, shaded area),
for barrier species on the research site to be about 90 % for Andropogon, 80 % for Piliostigma and
40 % for Ziziphus. The kc component can be determined using Eq.6, containing both a crop
transpiration (kc) and a soil evaporation (ke) component.
After rain the soil surface dries out fast and E becomes very small, ke can be neglegted. ETc
approximates Tc (Allen et al., 1998). In order to estimate the kc-factors for sorghum and vegetation
barriers the measured transpiration (Tc) was divided by ET0 in the observation period 1998 and
1999.
5.3.3 Results
Soil water
Table 5.5 gives a summary of the measured soil water retention per 0.2 m and total depth at
different soil matric potentials for an averaged profile (sandy loam) at the research site Gampela
(Burkina Faso).
Table 5.5 Average soil water retention in mm for 0.2m layers at
different kPa-values at Gampela. Burkina Faso.
Depth/kPa 0.1 1.0 3.1 10 100 1600
0 – 0.20 66.5 65.3 58.4 56.2 22.4 13.9
0.20 – 0.40 66.6 64.6 55.7 54.3 26.9 17.8
0.40 – 0.60 68.5 66.7 59.7 58.2 35.4 24.3
0.60 – 0.80 71.0 69.5 64.2 62.8 45.8 28.7
total depth 272.6 266.1 238.0 231.5 130.5 84.7
128
At each matric potential, the soil water content was increasing with soil depth. However, the total
available water (10 kPa – 1600 kPa) decreased with depth with about 4 mm per soil layer. The
difference between saturation (0.1 kPa) and field capacity (10 kPa) was about 10 mm for each soil
layer.
In Table 5.6 soil water values for TAW and RAW for the different soil layers and for the
whole soil profile for sorghum and barrier species are presented.
Table 5.6 Total Available soil Water (TAW), Readily Available Water (RAW) in mm for the
different soil layers (averaged profile) for sorghum and barrier species.
Depth TAW RAW Andropogon RAW
Woody species
RAW
Sorghum
0 – 0.20 42.3 21.2 25.4 23.3
0.20 – 0.40 36.5 18.3 21.9 20.1
0.40 – 0.60 33.9 17.0 20.4 18.6
0.60 – 0.80 34.1 17.0 20.4 18.7
total depth 146.8 73.5 88.1 80.7
Table 5.7 contains a summary of monthly averages of the measured AW for the rainy period of
1996 and 1998 to 1999 under the barriers of Ziziphus, Andropogon and Piliostigma. The periods in
the table where water for plants is readily available are indicated with bold figures.
Table 5.7 Average monthly data of Available Water (AW) in mm within the vegetation barriers for
the rainy season of 1996, 1998 and 1999.
Year Andropogon Ziziphus Piliostigma
depth (m) 0.10 0.30 0.50 0.70 Total 0.10 0.30 0.50 0.70 Total 0.10 0.30 0.50 0.70 Total
1996 July 9,3 0 0 9,5
August 0,4 0 0 0 0,4 23,4 2,5 0 0 28,4
September 6,8 0,6 8,6 8,8 24,7 25,3 9,5 5,1 1,8 54,0
October 7,6 0 0 0 7,6 25,8 0 0 0 41,8
1998 January 7,1 4,8 0,1 0 12 0 0 0 0 0 3,4 0 0 0 4,4
February 6,8 3,9 0 0 10,7 0 0 0 0 0 0 0 0 0 0
March 5,5 2,6 0 0 8,1 0 0 0 0 0 3,8 0 0 0 4,2
April 4,3 1,7 0 0 6 0 0 0,6 0 0,6 1,2 0 0 0 5,2
May 32,6 29,9 11,5 0 74 0 0 0 0 0 16,4 0 0 0 16,4
June 24,3 21,2 10,4 2,2 57,9 0 0 0,1 0 0,1 12,2 0,4 0 0 15,2
July 26,4 22,7 13,0 6,8 68,9 2,3 1,4 2,8 2,1 8,6 19,7 10,5 3,7 3,9 38,5
August 29,2 28,3 20,0 12,0 89,4 9,9 8,4 15,0 11,8 45,0 26,1 18,0 8,6 4,7 68,8
September 31,7 29,9 21,2 12,0 94,9 11,9 10,2 17,9 14,1 54,2 30,8 26,2 15,1 8,9 94,8
October 15,2 18,6 14,9 8,9 57,6 7,3 2,3 4,7 5,4 19,8 15,6 12,5 6,0 3,1 40,0
November 3,5 6,0 6,2 3,2 18,9 0,1 0,1 0,1 1,1 1,5 2,4 3,2 1,8 1,4 17,1
December 1,8 5,4 3,3 2,0 12,4 0 0 0 0 0 0,4 2,4 0 0 2,8
1999 January 5,4 4,5 1,1 0,9 12,0 0 0 0,1 0 0,1 1,5 0 0 0 1,5
February 3,8 4,1 0,7 0,0 8,6 0,4 0 0,2 0 0,5 0,6 0 0 0 1,6
March 2,3 2,7 2,7 1,2 8,9 0 0 0,6 0 0,6 0 0 0 0 1,0
April 4,1 4,5 0,4 0 8,9 0 0 0 0 0 0,8 0 0 0 1,0
May 3,4 3,7 0,8 0 7,9 0 0 0,6 0 0,6 4,6 0 0 0 5,0
June 5,1 4,1 2,3 1,0 12,6 2,7 0,6 0 0 3,4 11,2 3,7 0,4 0,1 15,8
July 11,2 9,4 4,9 3,9 29,4 7,4 1,4 0 0 8,8 20,6 14,0 1,7 0 37,8
August 30,6 31,9 27,4 17,1 106,9 22,8 15,8 25,1 25,7 89,4 29,0 29,9 21,7 17,1 106,9
September 36,3 36,1 30,3 22,1 124,7 27,8 19,1 28,2 28,7 103,7 38,6 34,0 27,4 23,4 138,4
October 21,4 26,0 23,1 16,6 87,1 21,0 15,5 24,0 25,1 85,6 30,7 31,7 26,2 22,2 128,3
November 6,9 9,4 5,5 1,3 23,1
In the dry years (1996 and 1998) and at the beginning of the growing season, AW was not evenly
distributed over the different soil layers. In a wet year AW was evenly distributed over the first
three layers under Andropogon and Piliostigma. Under Ziziphus an even AW distribution over the
129
whole soil profile can be observed. Looking at the AW-values of the different soil layers there
seemed to be a slight decline with increasing soil depth. The average monthly soil water content
under the effective barrier (Andropogon) was always higher than under the barriers of the more
permeable woody species (Ziziphus and Piliostigma). In 1998, (a relatively dry year), the difference
between Andropogon and woody species was much bigger than in 1999, (a relatively wet year). In
both dry and wet years AW is decreasing at the end of the growing season.
In 1998 Andropogon hardly sufferd any stress during the mid and end stage of the growing
season. Water availability under Ziziphus and Piliostigma dropped below the depletion levels, thus
transpiration was reduced for larger periods in the growing season.
In the whole dry season water appeared to be present (although limited) under the
Andropogon barrier. Under the Piliostigma barrier this can be observed only at the beginning of the
dry period. Under the Ziziphus barrier no soil water was observed during the dry season.
Figure 5.6 presents for 1998 and 1999, the daily AW for a soil depth of 0.8 m under barriers
of Ziziphus, Andropogon (with a sorghum crop on the alley) and Piliostigma with pasture on the
alley. In the graphs straight lines indicate TAW and depletion level for the above mentioned barrier
species.
From the graph it could be estimated that in 1998, about 60 days for Andropogon and about
25 days for Ziziphus and 40 days Piliostigma were without stress, although the AW did not reach
TAW. In 1999, 90 days for Andropogon and about 75 days for the woody species were without
stress. In 1999, the AW surpassed in a few occasions the TAW. From the graphs it could also be
observed that even during the dry season DOY 100 till 150 water was present under the
Andropogon barrier.
Reference evapotranspiration
Table 5.8 shows the reference evapotranspiration during three different development stages and the
whole growing season for three years (in 1996 annual precipitation P = 603 mm; in 1998 P = 594
mm; in 1999 P = 836 mm) calculated according to FAO-Penman-Monteith method and based on
climate data from the research site. As can be observed, the results do not differ too much between
the different stages and between years.

130
Figure 5.6 Available soil water for a soil depth of 0.8m under barriers of Andropogon, Ziziphus
and Piliostigma during 1998 and 1999.
Andropogon 1999
0
40
80
120
160
100 150 200 250 300 350
DOY (Julian day)
AW
(m
m) RAW TAW
Andropogon 1998
0
40
80
120
160
100 150 200 250 300 350
DOY (Julian day)
AW
(m
m)
TAW
RAW
Ziziphus 1998
0
40
80
120
160
100 150 200 250 300 350
DOY (Julian day)
AW
(m
m)
RAW TAW
Ziziphus 1999
0
40
80
120
160
100 150 200 250 300 350
DOY (Julian day)
AW
(m
m) RAW
TAW
Piliostigma 1999
0
40
80
120
160
100 150 200 250 300 350
DOY (Julian day)
AW
(m
m) RAW
TAW
Piliostigma 1998
0
40
80
120
160
100 150 200 250 300 350
DOY (Julian day)
AW
(m
m)
TAWRAW
131
Table 5.8 Reference evapotranspiration (ET0) for the rainy seasons of 1996, 1998 and 1999 and
their growing stages (FAO - Penman-Monteit).
year stage Period (DOY) ET0
mm d-1
Seasonal ET0
mm d-1
development 150−210 5.3
mid 210−259 4.5 1996
end 260−300 4.5
4.9
development 180−210 4.6
mid 210−259 4.0 1998
end 260−300 4.5
4.3
development 150−210 4.5
mid 210−259 3.6 1999
end 260−300 4.5
4.2
Evaporation
Evaporation of the main soil type at Gampela (Luvisol) follows the equation:
∑E = 0.13 * ET0 + 1.7√(t – 0.13) (7)
Using this equation, the rain data of 1996 to 1999 and the specific ground cover fractions resulted in
evaporation values given in Table 5.9.
Table 5.9 Evaporation of bare soil and evaporation under vegetation barriers and sorghum during
the growing seasons 1996−1999.
year evaporation
of
bare soil
evaporation
under
Andropogon
evaporation
under
Piliostigma s
evaporation
under
Ziziphus
evaporation
under
sorghum*
1996 176 18 35 106 53
1997 166 17 33 100 50
1998 161 16 32 97 48
1999 171 17 34 103 51
*Estimated ground cover fraction of sorghum 0.7.
Actual transpiration
In Figure 5.7 measured (actual) transpiration rates (Tc) for sorghum and the different barrier species
are presented. For comparison of actual transpiration (Tc) with reference evapotranspiration, ET0
values were included in the graphs.
133
Figure 5.7 Actual transpiration of Andropogon, Ziziphus and Piliostigma barriers, and actual
transpiration of sorghum on the alley at different distances from the barrier during 1996, 1998
and 1999.
Actual transpiration of barriers 1996
0
2
4
6
8
10
12
14
150 170 190 210 230 250 270 290
julian days
mm/d
ET0
Andropogon
Ziziphus
Piliostigma
Actual transpiration of barriers and sorghum 1998
0
2
4
6
8
10
12
14
150 170 190 210 230 250 270 290
julian days
mm
/d
ET0
Andropogon
Ziziphus
Piliostigma
Sorghum
Actual transpiration of barriers and sorghum 1999
0
2
4
6
8
10
12
14
150 170 190 210 230 250 270 290
julian days
mm/d
ET0
Andropogon
Ziziphus
Piliostigma
Sorghum 2 m
uphill
Sorghum 5m
uphill
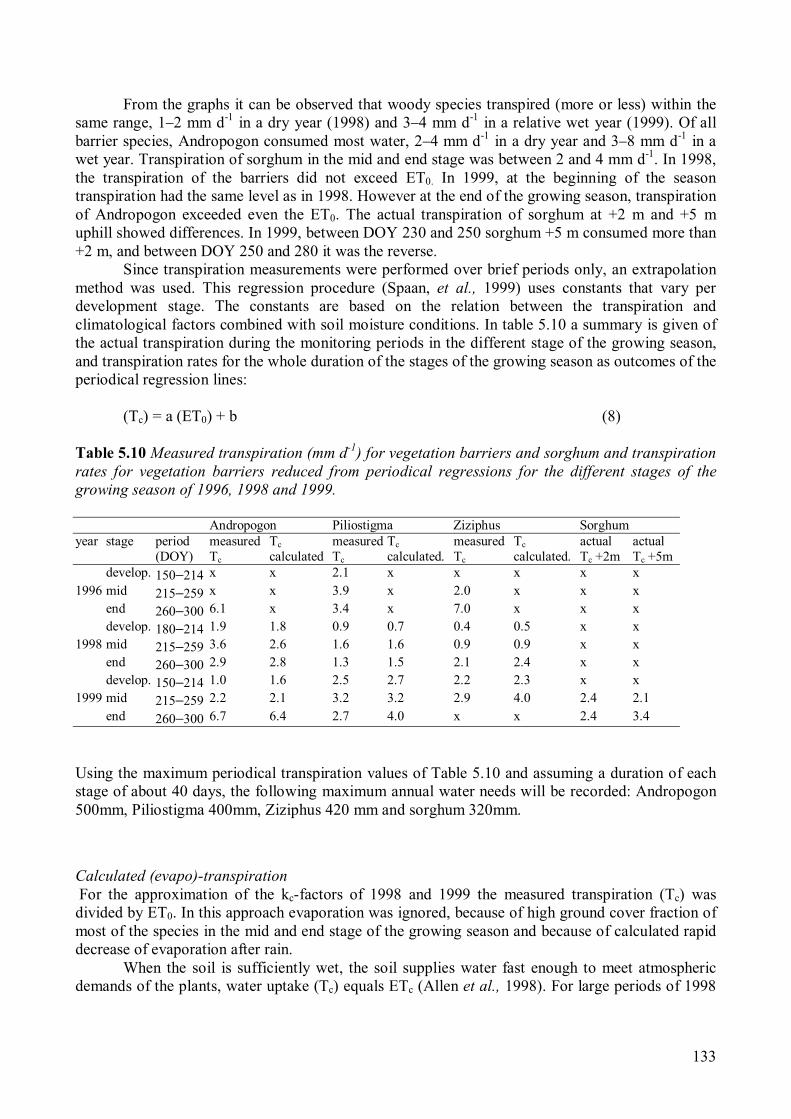
133
From the graphs it can be observed that woody species transpired (more or less) within the
same range, 1−2 mm d-1
in a dry year (1998) and 3−4 mm d-1
in a relative wet year (1999). Of all
barrier species, Andropogon consumed most water, 2−4 mm d-1
in a dry year and 3−8 mm d-1
in a
wet year. Transpiration of sorghum in the mid and end stage was between 2 and 4 mm d-1
. In 1998,
the transpiration of the barriers did not exceed ET0. In 1999, at the beginning of the season
transpiration had the same level as in 1998. However at the end of the growing season, transpiration
of Andropogon exceeded even the ET0. The actual transpiration of sorghum at +2 m and +5 m
uphill showed differences. In 1999, between DOY 230 and 250 sorghum +5 m consumed more than
+2 m, and between DOY 250 and 280 it was the reverse.
Since transpiration measurements were performed over brief periods only, an extrapolation
method was used. This regression procedure (Spaan, et al., 1999) uses constants that vary per
development stage. The constants are based on the relation between the transpiration and
climatological factors combined with soil moisture conditions. In table 5.10 a summary is given of
the actual transpiration during the monitoring periods in the different stage of the growing season,
and transpiration rates for the whole duration of the stages of the growing season as outcomes of the
periodical regression lines:
(Tc) = a (ET0) + b (8)
Table 5.10 Measured transpiration (mm d-1
) for vegetation barriers and sorghum and transpiration
rates for vegetation barriers reduced from periodical regressions for the different stages of the
growing season of 1996, 1998 and 1999.
Andropogon Piliostigma Ziziphus Sorghum
year stage period
(DOY)
measured
Tc
Tc
calculated
measured
Tc
Tc
calculated.
measured
Tc
Tc
calculated.
actual
Tc +2m
actual
Tc +5m
develop. 150−214 x x 2.1 x x x x x
1996 mid 215−259 x x 3.9 x 2.0 x x x
end 260−300 6.1 x 3.4 x 7.0 x x x
develop. 180−214 1.9 1.8 0.9 0.7 0.4 0.5 x x
1998 mid 215−259 3.6 2.6 1.6 1.6 0.9 0.9 x x
end 260−300 2.9 2.8 1.3 1.5 2.1 2.4 x x
develop. 150−214 1.0 1.6 2.5 2.7 2.2 2.3 x x
1999 mid 215−259 2.2 2.1 3.2 3.2 2.9 4.0 2.4 2.1
end 260−300 6.7 6.4 2.7 4.0 x x 2.4 3.4
Using the maximum periodical transpiration values of Table 5.10 and assuming a duration of each
stage of about 40 days, the following maximum annual water needs will be recorded: Andropogon
500mm, Piliostigma 400mm, Ziziphus 420 mm and sorghum 320mm.
Calculated (evapo)-transpiration
For the approximation of the kc-factors of 1998 and 1999 the measured transpiration (Tc) was
divided by ET0. In this approach evaporation was ignored, because of high ground cover fraction of
most of the species in the mid and end stage of the growing season and because of calculated rapid
decrease of evaporation after rain.
When the soil is sufficiently wet, the soil supplies water fast enough to meet atmospheric
demands of the plants, water uptake (Tc) equals ETc (Allen et al., 1998). For large periods of 1998
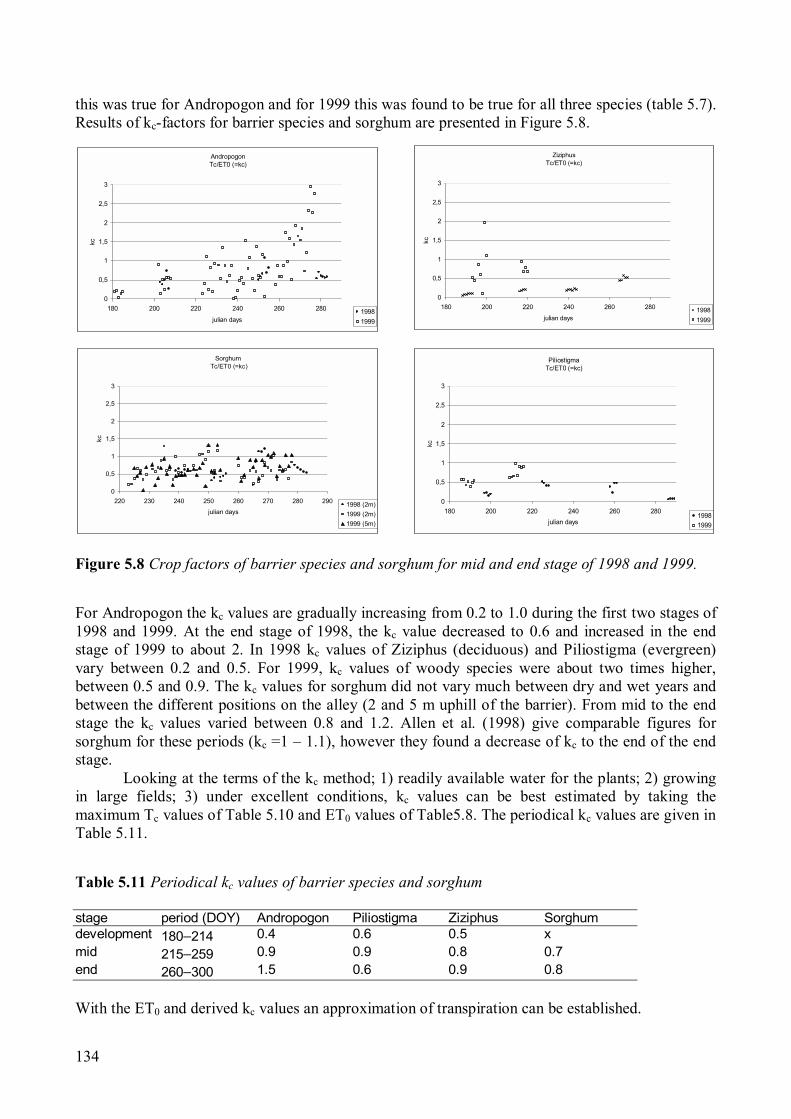
134
this was true for Andropogon and for 1999 this was found to be true for all three species (table 5.7).
Results of kc-factors for barrier species and sorghum are presented in Figure 5.8.
Figure 5.8 Crop factors of barrier species and sorghum for mid and end stage of 1998 and 1999.
For Andropogon the kc values are gradually increasing from 0.2 to 1.0 during the first two stages of
1998 and 1999. At the end stage of 1998, the kc value decreased to 0.6 and increased in the end
stage of 1999 to about 2. In 1998 kc values of Ziziphus (deciduous) and Piliostigma (evergreen)
vary between 0.2 and 0.5. For 1999, kc values of woody species were about two times higher,
between 0.5 and 0.9. The kc values for sorghum did not vary much between dry and wet years and
between the different positions on the alley (2 and 5 m uphill of the barrier). From mid to the end
stage the kc values varied between 0.8 and 1.2. Allen et al. (1998) give comparable figures for
sorghum for these periods (kc =1 – 1.1), however they found a decrease of kc to the end of the end
stage.
Looking at the terms of the kc method; 1) readily available water for the plants; 2) growing
in large fields; 3) under excellent conditions, kc values can be best estimated by taking the
maximum Tc values of Table 5.10 and ET0 values of Table5.8. The periodical kc values are given in
Table 5.11.
Table 5.11 Periodical kc values of barrier species and sorghum
stage period (DOY) Andropogon Piliostigma Ziziphus Sorghum
development 180−214 0.4 0.6 0.5 x
mid 215−259 0.9 0.9 0.8 0.7
end 260−300 1.5 0.6 0.9 0.8
With the ET0 and derived kc values an approximation of transpiration can be established.
Andropogon
Tc/ET0 (=kc)
0
0,5
1
1,5
2
2,5
3
180 200 220 240 260 280
julian days
kc
1998
1999
Ziziphus
Tc/ET0 (=kc)
0
0,5
1
1,5
2
2,5
3
180 200 220 240 260 280
julian days
kc
1998
1999
Sorghum
Tc/ET0 (=kc)
0
0,5
1
1,5
2
2,5
3
220 230 240 250 260 270 280 290
julian days
kc
1998 (2m)
1999 (2m)
1999 (5m)
Piliostigma
Tc/ET0 (=kc)
0
0,5
1
1,5
2
2,5
3
180 200 220 240 260 280
julian days
kc
1998
1999
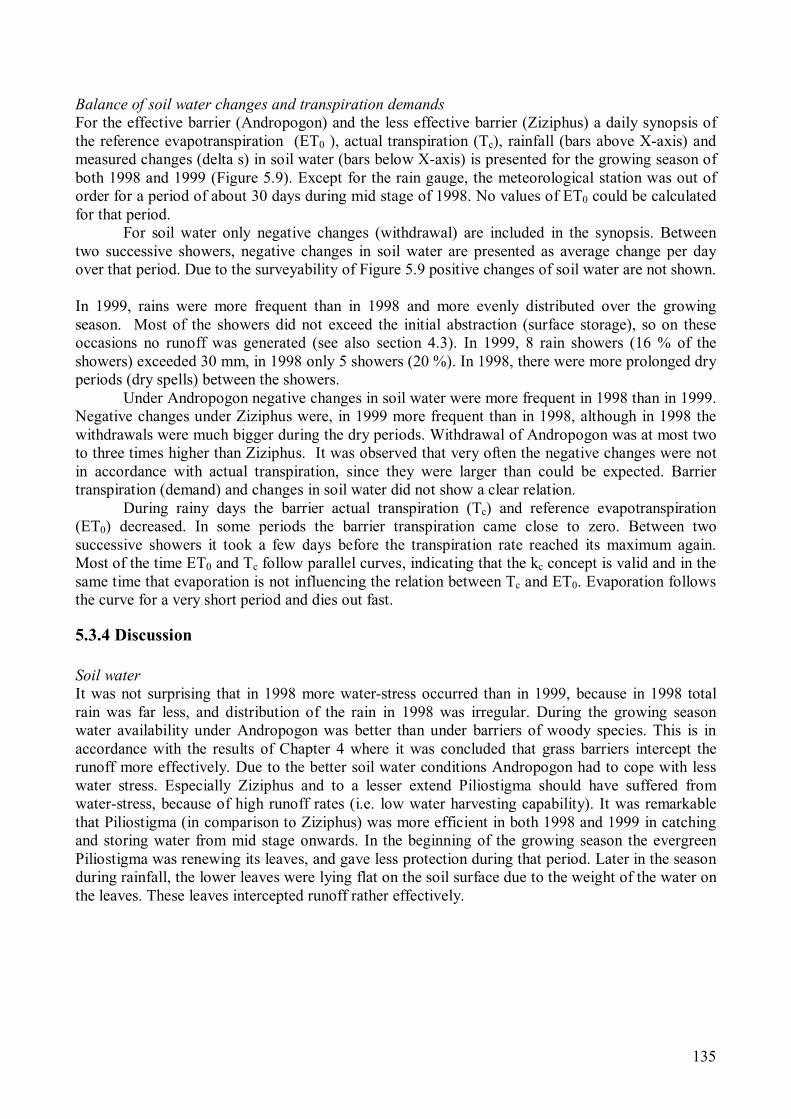
135
Balance of soil water changes and transpiration demands
For the effective barrier (Andropogon) and the less effective barrier (Ziziphus) a daily synopsis of
the reference evapotranspiration (ET0 ), actual transpiration (Tc), rainfall (bars above X-axis) and
measured changes (delta s) in soil water (bars below X-axis) is presented for the growing season of
both 1998 and 1999 (Figure 5.9). Except for the rain gauge, the meteorological station was out of
order for a period of about 30 days during mid stage of 1998. No values of ET0 could be calculated
for that period.
For soil water only negative changes (withdrawal) are included in the synopsis. Between
two successive showers, negative changes in soil water are presented as average change per day
over that period. Due to the surveyability of Figure 5.9 positive changes of soil water are not shown.
In 1999, rains were more frequent than in 1998 and more evenly distributed over the growing
season. Most of the showers did not exceed the initial abstraction (surface storage), so on these
occasions no runoff was generated (see also section 4.3). In 1999, 8 rain showers (16 % of the
showers) exceeded 30 mm, in 1998 only 5 showers (20 %). In 1998, there were more prolonged dry
periods (dry spells) between the showers.
Under Andropogon negative changes in soil water were more frequent in 1998 than in 1999.
Negative changes under Ziziphus were, in 1999 more frequent than in 1998, although in 1998 the
withdrawals were much bigger during the dry periods. Withdrawal of Andropogon was at most two
to three times higher than Ziziphus. It was observed that very often the negative changes were not
in accordance with actual transpiration, since they were larger than could be expected. Barrier
transpiration (demand) and changes in soil water did not show a clear relation.
During rainy days the barrier actual transpiration (Tc) and reference evapotranspiration
(ET0) decreased. In some periods the barrier transpiration came close to zero. Between two
successive showers it took a few days before the transpiration rate reached its maximum again.
Most of the time ET0 and Tc follow parallel curves, indicating that the kc concept is valid and in the
same time that evaporation is not influencing the relation between Tc and ET0. Evaporation follows
the curve for a very short period and dies out fast.
5.3.4 Discussion
Soil water
It was not surprising that in 1998 more water-stress occurred than in 1999, because in 1998 total
rain was far less, and distribution of the rain in 1998 was irregular. During the growing season
water availability under Andropogon was better than under barriers of woody species. This is in
accordance with the results of Chapter 4 where it was concluded that grass barriers intercept the
runoff more effectively. Due to the better soil water conditions Andropogon had to cope with less
water stress. Especially Ziziphus and to a lesser extend Piliostigma should have suffered from
water-stress, because of high runoff rates (i.e. low water harvesting capability). It was remarkable
that Piliostigma (in comparison to Ziziphus) was more efficient in both 1998 and 1999 in catching
and storing water from mid stage onwards. In the beginning of the growing season the evergreen
Piliostigma was renewing its leaves, and gave less protection during that period. Later in the season
during rainfall, the lower leaves were lying flat on the soil surface due to the weight of the water on
the leaves. These leaves intercepted runoff rather effectively.
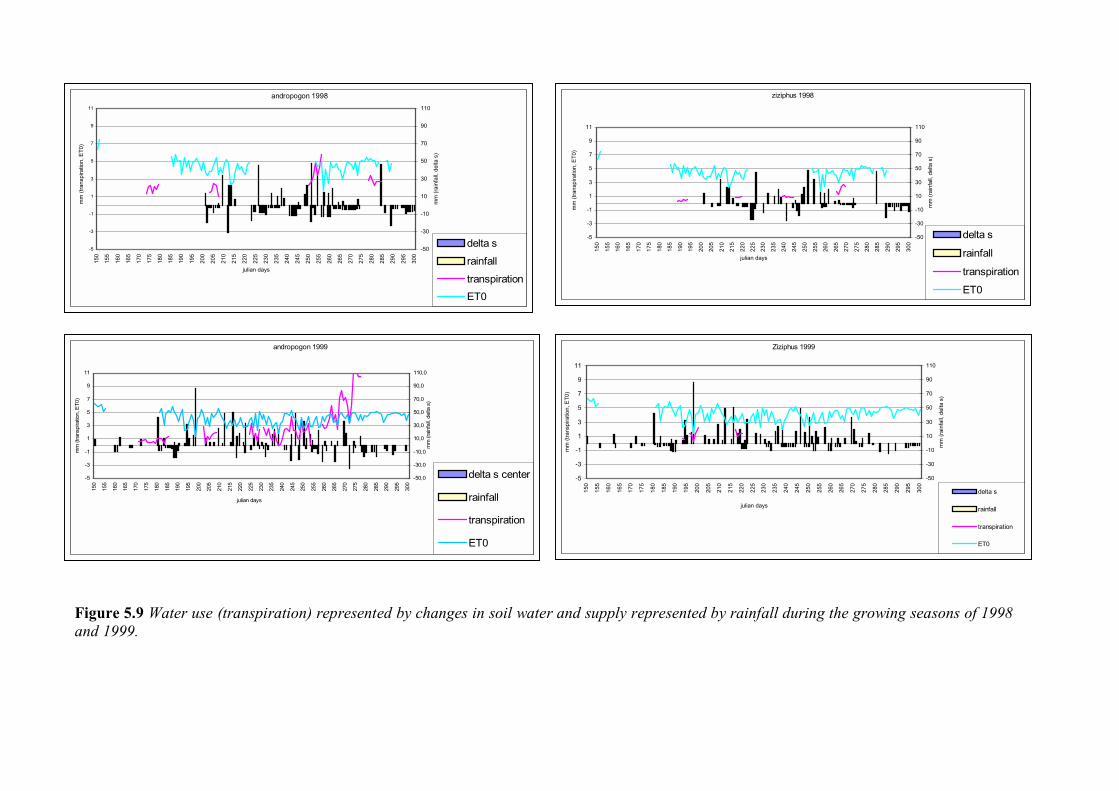
andropogon 1998
-5
-3
-1
1
3
5
7
9
11
15
0
15
5
16
0
16
5
17
0
17
5
18
0
18
5
19
0
19
5
20
0
20
5
21
0
21
5
22
0
22
5
23
0
23
5
24
0
24
5
25
0
25
5
26
0
26
5
27
0
27
5
28
0
28
5
29
0
29
5
30
0
julian days
mm
(transpiratio
n, E
T0)
-50
-30
-10
10
30
50
70
90
110
mm
(rain
fall, delta s)
delta s
rainfall
transpiration
ET0
ziziphus 1998
-5
-3
-1
1
3
5
7
9
11
15
0
15
5
16
0
16
5
17
0
17
5
18
0
18
5
19
0
19
5
20
0
20
5
21
0
21
5
22
0
22
5
23
0
23
5
24
0
24
5
25
0
25
5
26
0
26
5
27
0
27
5
28
0
28
5
29
0
29
5
30
0
julian days
mm
(transpiratio
n, E
T0)
-50
-30
-10
10
30
50
70
90
110
mm
(rain
fall, delta s)
delta s
rainfall
transpiration
ET0
andropogon 1999
-5
-3
-1
1
3
5
7
9
11
150
155
160
165
170
175
180
185
190
195
200
205
210
215
220
225
230
235
240
245
250
255
260
265
270
275
280
285
290
295
300
julian days
mm
(transpiratio
n, E
T0)
-50,0
-30,0
-10,0
10,0
30,0
50,0
70,0
90,0
110,0
mm
(rain
fall, delta s)
delta s center
rainfall
transpiration
ET0
Ziziphus 1999
-5
-3
-1
1
3
5
7
9
11
15
0
15
5
16
0
16
5
17
0
17
5
18
0
18
5
19
0
19
5
20
0
20
5
21
0
21
5
22
0
22
5
23
0
23
5
24
0
24
5
25
0
25
5
26
0
26
5
27
0
27
5
28
0
28
5
29
0
29
5
30
0
julian days
mm
(transpiratio
n, E
T0)
-50
-30
-10
10
30
50
70
90
110
mm
(rain
fall, delta s)
delta s
rainfall
transpiration
ET0
Figure 5.9 Water use (transpiration) represented by changes in soil water and supply represented by rainfall during the growing seasons of 1998
and 1999.
137
Evaporation
The length of the first evaporation stage, where evaporation equals with ET0 was calculated as 0.13
days. The evaporation of the first day was 2.2 mm, but drops very sharply to about zero in a week.
Reference evapotranspiration
The estimated ET0 was more or less the same for all three years (about 4.4 mm d-1
). This indicated
that climate circumstances had more or less the same impact, in spite of the fact that 1996 and 1998
were dry years and 1999 a wet year.
Field observations from the climate station showed that during the mid stage of 1998 and
1999 low solar radiation, due to an abundance of rain showers and cloudiness, impeded maximum
evapotranspiration.
Actual transpiration
The fact that transpiration rates of 1998 were lower than rates of 1999 suggested that in 1998 the
barrier species were suffering from water-stress. Soil water data (Figure 5.6) confirmed this. In
1998, transpiration did not exceed ET0. In 1999 there was water stress at the beginning of the
season as the rains were late and in mid stage when a few times ponding occurred, also resulting in
physical water stress. The high transpiration rate at the end of the 1999 is confirmed by abundant
vegetation growth and high solar radiation while soil water was sufficiently available. Thus factors
most influencing the variability of the transpiration of barriers are water availability and vegetation
development.
In 1999, because of the high rainfall, transpiration was very variable and rainy periods (low
Tc), alternated with sunny days (high Tc). Wetness might also have disturbed the measurements,
inducing errors by failing equipment. In 1999, transpiration for sorghum at 2 m and 5 m uphill of
the barrier differed, sorghum close to the barrier did not always show the highest transpiration rate.
Due to the better soil water conditions between DOY 250 and 280 sorghum close to the barrier had
some higher transpiration rates. For the same reason the sorghum higher on the alley consumed
more between DOY 230 and 250.
Comparing the maximum annual water needs of barriers and sorghum with the rainfall data
of Figure 3.2. (Ouagadougou) it appeared that in none of the year’s precipitation was insufficient.
However, when runoff is taken into account (50 % for woody species and 20 % for Andropogon) in
about 60 years there were 30 years for woody species and only 7 for Andropogon with a deficient
annual precipitation.
Calculated (evapo)-transpiration
When considering the soil water data it could be observed that stress occurred during large periods
of the growth stages of 1998 and during the first stage of the growing season in 1999. Stress
conditions may also be responsible for the variability of the determined kc factors. For the woody
species in both years and for Andropogon in the dry year 1998, there is a slight decrease of kc to the
end of the growing season. Changing plant physiological characteristics of the barrier species and
sorghum are responsible for this decrease in kc. The kc of Andropogon increased in the end stage of
1999 due to an abundance of soil water and biomass.
It is remarkable that the variation in kc values is larger in 1999 than in 1998. In 1999 the
changes in soil water content were bigger, and stress and ponding occurred a few times. Temporary
ponding and the resulted inhibition of water uptake seem responsible for the variation in kc. An
example of this phenomenon is in the period DOY 235−245 in 1999, where soil water conditions
exceeded field capacity.

138
Soil water dynamics under the barrier
When the balance between supply (infiltration), and evaporation and plant uptake is negative, the
soil profile is loosing water and the stock of water is reduced. In 1998 more negative changes in soil
water under Andropogon were observed. In 1999, the positive changes in soil water “overruled” the
negative changes. Ziziphus showed an opposite reaction. In 1999, water was more readily available
for Ziziphus and no ponding occurred. This resulted in more negative changes in 1999.
From soil water data files and from Figure 5.9 it appeared that it took a few days after a big
shower before soil water conditions were in balance again. As can be seen in Figure 5.9
transpiration was low and building up to a maximum during successive days after rain. Temporary
ponding in the top layer, as well as a reduced atmospheric demand and the resulting inhibition of
water uptake, could be responsible for this effect. An example of this phenomenon is the period
235−245 in 1999, where the soil water conditions exceeded field capacity and transpiration went
down to zero.
According to Verdoes (1990) barrier species do not take root in the upper 0.2 m, because of
too high soil temperatures. It will take some time before water percolates through the top layer, and
the barrier can take advantage of the rain. Moreover small showers will be absorbed in the upper
layer and will not give profit to the barriers.
5.3.5 Conclusions
At the research site annual rain quantities will seldom give rise to a shortage of water for vegetation
barriers and sorghum. Conversely, dry spells have a big influence on soil water supply, exhausting
it sometimes during the growing season, and causing delay in plant growth and the death of plants.
Barriers are very useful but have to be managed to avoid the negative side effects, trimming
in dry years to avoid excessive transpiration and additional discharge of superfluous water in wet
years. Barriers provide more soil water and procure more harvest certainty for farmers.
Evaporation of bare soil accounts for about 25 % of the annual precipitation. Water loss by
evaporation is negligible under Andropogon and of more importance under Ziziphus barriers.
Reduced evaporation and the larger effect on runoff reduction compensated the high transpiration of
Andropogon.
When water is readily available, barriers transpire without restrictions and are not economic
with water. Only Piliostigma appears to limit transpiration during the second part of the growing
season.

139
5.4 Competition in an alley crop system
5.4.1 Introduction
Besides water scarcity, arable farming in the Sahel suffers from the vicious circle of poor soils, low
crop production, low soil cover and high sensitivity to soil erosion. Key problems are unfavourable
rainfall distribution and soil crusting, both causing an unproductive loss of water, loss of soil
fertility and hence a decrease in crop production.
Barriers have shown to effectively reduce runoff and hence, water erosion, thereby reducing
losses of water and soil material. Moreover, alley crop systems are supposed to enhance the soil
water availability to the crop by improving infiltration. The effectiveness of alley crop systems
depends on their design, the species used as barriers and on the management of the system.
Hedgerow systems can however be allopathic, attracting animals and pests. Another
important negative effect of barriers could be the competition between the barrier and the crop for
soil water, nutrients and sunlight. The question remains whether the increased amount of soil water
induced by the barrier compensates for water uptake by barriers, and to which degree competition
for water between barriers and crops occurs. Kiepe (1995) reports that planting of trees in an
agricultural system is equal to the introduction of plant interference. Some perennials are more
competitive than others, and all have a large part of their root system in the top 0.5 – 1.0 m of the
soil (Young, 1997; Mayus et al., 1994). Studies on below ground competition showed that even
when trees have deep roots, they try to take water out of the upper layers. Doggett (1987) reports
that sorghum roots extend to about 1.0 m lateral and when possible to a depth of about 1.8 m.
Therefore it might be expected that in this agroforestry system the crop sorghum and the barriers are
competing for water and nutrients. However, according to Young (1997) competition for nutrients
has rarely been demonstrated.
The aim of this section is primarily to assess the competition for water between different
types of barriers and crops. Competition for nutrients was not studied, as adequate fertilisation was
given to the crop on the alley.
5.4.2 Materials and methods
Based upon their effectiveness in conserving water, Spaan et al. (submitted JSWC) distinguished
two different groups of barriers, with Ziziphus as a typical representative of “the less effective”
group and Andropogon as example of the “effective group”. Competition for water between
vegetation barriers and the adjacent crop on the alley, was studied for both Andropogon and
Ziziphus barriers on three different plots (repetitions). Plots with stone row barriers (permeable
without water consumption) were investigated as the control. Stone rows exclude competition for
water whereas the height of the stone rows (0.4 m) also excludes competition for light.
In order to assess the competition between the barrier and the sorghum crop, crop yield was
determined by harvesting grain and straw per row parallel to the barrier. To avoid border effects
two rows at the back of the plot and two pockets at the end of the rows were not harvested. After
harvesting, the grain and straw was dried and weighed. The outcomes for the different barrier-crop
combinations were compared. Yields are given in kg per ha. A more extensive description of the
layout of the barrier-crop plots was given in section 5.2.
In order to monitor soil water conditions, 6 TDR tubes were installed on one of the three
repetition plots at the following distances from the barrier: –1 m, (down stream) 0, and +1, +2.5, +5
and +10 m (up stream). During the growing season soil water was monitored twice a week at
measuring depths of 0.1, 0.3, 0.5 and 0.7 m (section 3.5. and 5.3). The water stored in the profile
was calculated as the sum of the readings to a depth of 0.8 m. In 1999 from DOY 190–215 no data
was collected because of a break down in the TDR equipment.
140
5.4.3 Results
Crop yields
Average crop yields per row parallel to barriers of Andropogon, Ziziphus and stone rows are
presented in Table 5.12. Standard deviations and the coefficient of variation (ratio of the standard
deviation over the average (CV)) are included in the table, indicating the dispersion of the results.
In 1998, grain yields for both barrier plots gave high standard deviations. In 1999, the year
with the more favourable precipitation the standard deviations were much smaller. In 1998, the CV
for grain was lowest between 6 m and 10 m up stream of the barriers. In 1999, the CV for grain was
low between 4 m and 10 m upstream of all barriers. In 1998 and 1999 the deviations from the
averages of straw yields were approximately the same as for the grain yields. The yields on the
stone row plot had a high CV over the first five rows, after which the CV becomes around 0.2.
Results shown in Table 5.12 can also be shown in graphical form as in Figure 5.10.
The results of the grain yields in Figure 5.10 can be roughly divided into three zones. The first zone
consisted of two to three crop rows, 0 – 2 m upstream of the barrier. In this zone crop yields were
relatively low, which was probably due to alternation of too wet and too dry conditions. In the
middle part of the plot, from 2 – 9 m upstream, yields were more or less equal. The zone was
characterized as the runoff transport zone and lying out of reach of the negative influences of the
barrier. The third zone at the top of the plot, 9 – 12 m up stream, had small runoff flows and lying in
the lee of the boundary bund.
In 1998, in the Andropogon plots, grain yields of the first zone increased from zero
(adjacent to the barrier) to about 1000 kg ha-1
. In the second zone the results were more or less
equal 800 – 900 kg ha-1
, while in the third zone the yield decreased to 500 – 600 kg ha-1
. In 1999, in
the first zone there was a sharp increase in grain production to about 2500 kg ha-1
. In the second
zone the results were more or less stable (about 2600 kg ha-1
) and there was no decrease of yield in
the third zone.
On the Ziziphus plots, the yield results had a few striking differences in comparison to
Andropogon plots. In 1998 over the first zone, yields were low, about 100 kg ha-1
. Yields increased
slowly from 450 to 900 kg ha-1
over the second zone, and in the third zone there was a slight
increase in yield to about 1000 kg ha-1
. In 1999, yields of the first and the second zone were
comparable, about 2400 kg ha-1
. The third zone showed a slight increase to about 2700 kg ha-1
.
In 1998, grain yields were somewhat higher on the stone row plots, when comparing the
first zone to the yields on the Andropogon barrier plots. In the second and third zone decreased
yields were lower than on the Andropogon plots. In 1999, the yields in the first zone were
somewhat lower than on the Andropogon plot, and yields were comparable with Andropogon plots
in the second and the third zone.
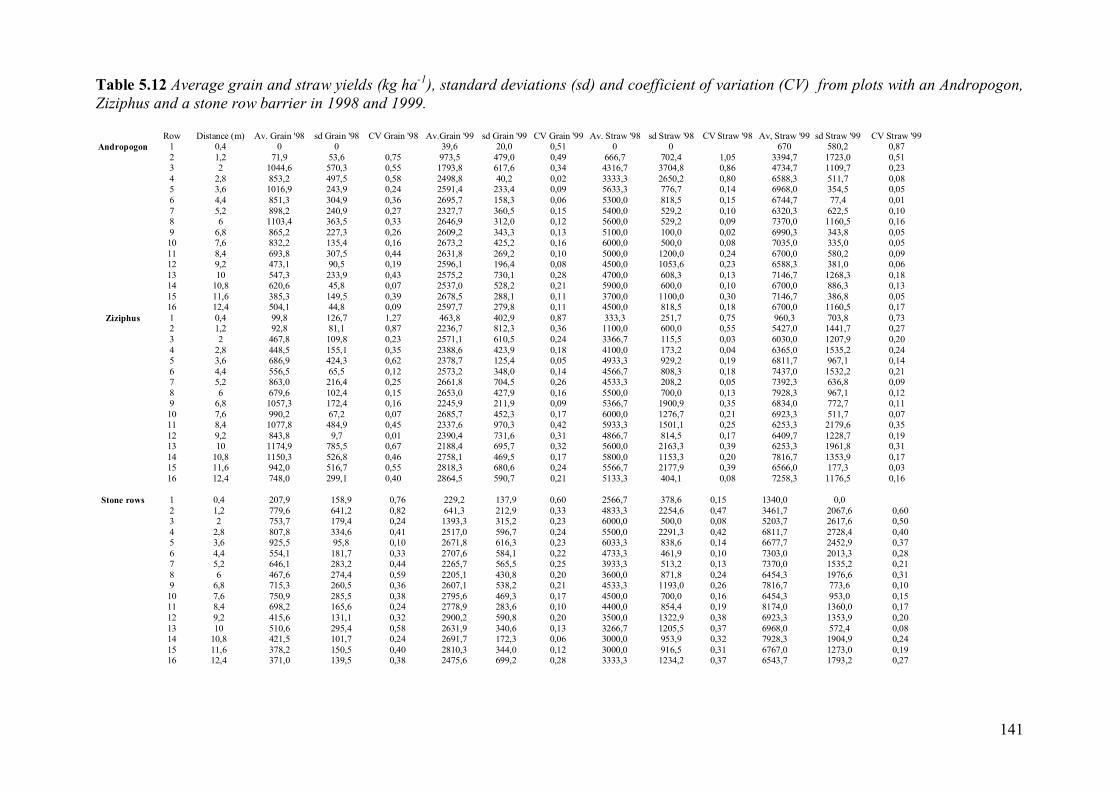
141
Table 5.12 Average grain and straw yields (kg ha-1
), standard deviations (sd) and coefficient of variation (CV) from plots with an Andropogon,
Ziziphus and a stone row barrier in 1998 and 1999.
Row Distance (m) Av. Grain '98 sd Grain '98 CV Grain '98 Av.Grain '99 sd Grain '99 CV Grain '99 Av. Straw '98 sd Straw '98 CV Straw '98 Av, Straw '99 sd Straw '99 CV Straw '99
Andropogon 1 0,4 0 0 39,6 20,0 0,51 0 0 670 580,2 0,87
2 1,2 71,9 53,6 0,75 973,5 479,0 0,49 666,7 702,4 1,05 3394,7 1723,0 0,51
3 2 1044,6 570,3 0,55 1793,8 617,6 0,34 4316,7 3704,8 0,86 4734,7 1109,7 0,23
4 2,8 853,2 497,5 0,58 2498,8 40,2 0,02 3333,3 2650,2 0,80 6588,3 511,7 0,08
5 3,6 1016,9 243,9 0,24 2591,4 233,4 0,09 5633,3 776,7 0,14 6968,0 354,5 0,05
6 4,4 851,3 304,9 0,36 2695,7 158,3 0,06 5300,0 818,5 0,15 6744,7 77,4 0,01
7 5,2 898,2 240,9 0,27 2327,7 360,5 0,15 5400,0 529,2 0,10 6320,3 622,5 0,10
8 6 1103,4 363,5 0,33 2646,9 312,0 0,12 5600,0 529,2 0,09 7370,0 1160,5 0,16
9 6,8 865,2 227,3 0,26 2609,2 343,3 0,13 5100,0 100,0 0,02 6990,3 343,8 0,05
10 7,6 832,2 135,4 0,16 2673,2 425,2 0,16 6000,0 500,0 0,08 7035,0 335,0 0,05
11 8,4 693,8 307,5 0,44 2631,8 269,2 0,10 5000,0 1200,0 0,24 6700,0 580,2 0,09
12 9,2 473,1 90,5 0,19 2596,1 196,4 0,08 4500,0 1053,6 0,23 6588,3 381,0 0,06
13 10 547,3 233,9 0,43 2575,2 730,1 0,28 4700,0 608,3 0,13 7146,7 1268,3 0,18
14 10,8 620,6 45,8 0,07 2537,0 528,2 0,21 5900,0 600,0 0,10 6700,0 886,3 0,13
15 11,6 385,3 149,5 0,39 2678,5 288,1 0,11 3700,0 1100,0 0,30 7146,7 386,8 0,05
16 12,4 504,1 44,8 0,09 2597,7 279,8 0,11 4500,0 818,5 0,18 6700,0 1160,5 0,17
Ziziphus 1 0,4 99,8 126,7 1,27 463,8 402,9 0,87 333,3 251,7 0,75 960,3 703,8 0,73
2 1,2 92,8 81,1 0,87 2236,7 812,3 0,36 1100,0 600,0 0,55 5427,0 1441,7 0,27
3 2 467,8 109,8 0,23 2571,1 610,5 0,24 3366,7 115,5 0,03 6030,0 1207,9 0,20
4 2,8 448,5 155,1 0,35 2388,6 423,9 0,18 4100,0 173,2 0,04 6365,0 1535,2 0,24
5 3,6 686,9 424,3 0,62 2378,7 125,4 0,05 4933,3 929,2 0,19 6811,7 967,1 0,14
6 4,4 556,5 65,5 0,12 2573,2 348,0 0,14 4566,7 808,3 0,18 7437,0 1532,2 0,21
7 5,2 863,0 216,4 0,25 2661,8 704,5 0,26 4533,3 208,2 0,05 7392,3 636,8 0,09
8 6 679,6 102,4 0,15 2653,0 427,9 0,16 5500,0 700,0 0,13 7928,3 967,1 0,12
9 6,8 1057,3 172,4 0,16 2245,9 211,9 0,09 5366,7 1900,9 0,35 6834,0 772,7 0,11
10 7,6 990,2 67,2 0,07 2685,7 452,3 0,17 6000,0 1276,7 0,21 6923,3 511,7 0,07
11 8,4 1077,8 484,9 0,45 2337,6 970,3 0,42 5933,3 1501,1 0,25 6253,3 2179,6 0,35
12 9,2 843,8 9,7 0,01 2390,4 731,6 0,31 4866,7 814,5 0,17 6409,7 1228,7 0,19
13 10 1174,9 785,5 0,67 2188,4 695,7 0,32 5600,0 2163,3 0,39 6253,3 1961,8 0,31
14 10,8 1150,3 526,8 0,46 2758,1 469,5 0,17 5800,0 1153,3 0,20 7816,7 1353,9 0,17
15 11,6 942,0 516,7 0,55 2818,3 680,6 0,24 5566,7 2177,9 0,39 6566,0 177,3 0,03
16 12,4 748,0 299,1 0,40 2864,5 590,7 0,21 5133,3 404,1 0,08 7258,3 1176,5 0,16
Stone rows 1 0,4 207,9 158,9 0,76 229,2 137,9 0,60 2566,7 378,6 0,15 1340,0 0,0
2 1,2 779,6 641,2 0,82 641,3 212,9 0,33 4833,3 2254,6 0,47 3461,7 2067,6 0,60
3 2 753,7 179,4 0,24 1393,3 315,2 0,23 6000,0 500,0 0,08 5203,7 2617,6 0,50
4 2,8 807,8 334,6 0,41 2517,0 596,7 0,24 5500,0 2291,3 0,42 6811,7 2728,4 0,40
5 3,6 925,5 95,8 0,10 2671,8 616,3 0,23 6033,3 838,6 0,14 6677,7 2452,9 0,37
6 4,4 554,1 181,7 0,33 2707,6 584,1 0,22 4733,3 461,9 0,10 7303,0 2013,3 0,28
7 5,2 646,1 283,2 0,44 2265,7 565,5 0,25 3933,3 513,2 0,13 7370,0 1535,2 0,21
8 6 467,6 274,4 0,59 2205,1 430,8 0,20 3600,0 871,8 0,24 6454,3 1976,6 0,31
9 6,8 715,3 260,5 0,36 2607,1 538,2 0,21 4533,3 1193,0 0,26 7816,7 773,6 0,10
10 7,6 750,9 285,5 0,38 2795,6 469,3 0,17 4500,0 700,0 0,16 6454,3 953,0 0,15
11 8,4 698,2 165,6 0,24 2778,9 283,6 0,10 4400,0 854,4 0,19 8174,0 1360,0 0,17
12 9,2 415,6 131,1 0,32 2900,2 590,8 0,20 3500,0 1322,9 0,38 6923,3 1353,9 0,20
13 10 510,6 295,4 0,58 2631,9 340,6 0,13 3266,7 1205,5 0,37 6968,0 572,4 0,08
14 10,8 421,5 101,7 0,24 2691,7 172,3 0,06 3000,0 953,9 0,32 7928,3 1904,9 0,24
15 11,6 378,2 150,5 0,40 2810,3 344,0 0,12 3000,0 916,5 0,31 6767,0 1273,0 0,19
16 12,4 371,0 139,5 0,38 2475,6 699,2 0,28 3333,3 1234,2 0,37 6543,7 1793,2 0,27

142
Figure 5.10 Production of sorghum (grain) in relation to distance from barriers of Andropogon,
Ziziphus and stone rows 3 repetitions ( 1998 ; 1999)
0
500
1000
1500
2000
2500
3000
3500
4000
0 1 2 3 4 5 6 7 8 9 10 11 12 13 14
Distance from the Andropogon barrier (m)
Pro
du
ctio
n o
f g
rain
(k
g h
a-1
)
0
500
1000
1500
2000
2500
3000
3500
4000
0 1 2 3 4 5 6 7 8 9 10 11 12 13 14
Distance from the Ziziphus barrier (m)
Pro
du
ctio
n o
f g
rain
(k
g h
a-1
)
0
500
1000
1500
2000
2500
3000
3500
4000
0 1 2 3 4 5 6 7 8 9 10 11 12 13 14
Distance from the stone row barrier (m)
Pro
du
ctio
n o
f g
rain
(k
g h
a-1
)
143
Relation between soil water and yields
The development of the soil water content over the growing season at different distances to the
barrier was compared with the production of sorghum (straw and grain). Figure 5.11 presents the
relation between crop yields on one of the Andropogon plots and the development of the soil water
content at six distances to the barrier on that plot during the growing seasons of 1998 and 1999.
Development stages of sorghum were included to trace combinations of the lack of soil water and
plant stress sensitive periods.
In 1998, the soil water conditions under the barrier and at +1 m were favourable, around depletion
level (section 5.3). At +5 and +10 m the conditions were less favourable, being below this level, but
still above the soil water content at wilting point (1600 kPa). However till DVS 4, soil water
conditions were closer to 1600 kPa.
During the DVS 0 – 3 the soil water content at –1 m was below wilting point and hardly
any flow through the barrier took place. From DVS 4 onwards conditions at –1 m became better.
As observed there was a rather big difference between the soil water content near to the
barrier and on the upstream part of the plot. Close to the barrier (+1 m) the yields of straw and grain
did not reflect the favourable water conditions. The decline in yield (grain and straw) higher up the
alley was in accordance with the soil water conditions during the growing season and according to
lack of water in stress sensitive periods. The difference in yield between +5 m and +10 m could not
be explained, for the water availability during the growing season is almost the same at the two
distances to the barrier.
After sowing in 1999, the soil water at all tube locations was around 85 mm, being the water
at 1600 kPa. From DOY 185 the soil water conditions at all distances from the barrier dropped
below wilting point. From DVS 3 (DOY 215) soil water under the barrier and at +1 m was above
the depletion level and soil water conditions at distances higher on the alley, rose just above wilting
point. The difference in soil water between the two tubes (barrier and +1 m tube) and the soil water
in the other tubes (–1, +2.5, +5 and 10 m) was quite large during DVS 3 – 7. From DOY 250
onwards (after the stress sensitive DVS 6) all the tubes (except +5 m) rose above depletion level. A
few times during the growing season the soil water under the barrier and +1 m exceeded the water
content at field capacity. Close to the barrier the yields did not reflect the favourable soil water
conditions. On the contrary yields higher on the alley were better than could be expected from the
soil water development during the growing season. In 1999, yields were comparable with average
on–station yields (Figure 5.3)
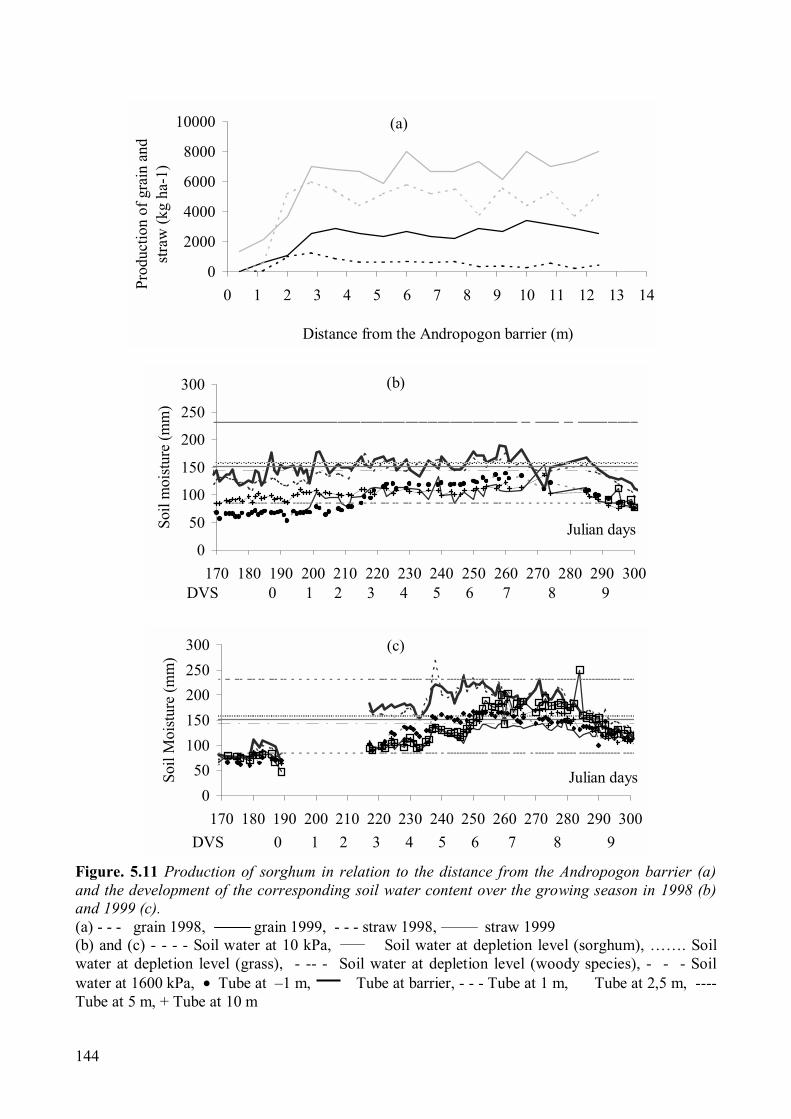
144
(a)
0
2000
4000
6000
8000
10000
0 1 2 3 4 5 6 7 8 9 10 11 12 13 14
Distance from the Andropogon barrier (m)
Pro
du
ctio
n o
f g
rain
an
d
straw
(k
g h
a-1
)
Figure. 5.11 Production of sorghum in relation to the distance from the Andropogon barrier (a)
and the development of the corresponding soil water content over the growing season in 1998 (b)
and 1999 (c).
(a) - - - grain 1998, grain 1999, - - - straw 1998, straw 1999
(b) and (c) - - - - Soil water at 10 kPa, Soil water at depletion level (sorghum), ……. Soil
water at depletion level (grass), - -- - Soil water at depletion level (woody species), - - - Soil
water at 1600 kPa, • Tube at –1 m, Tube at barrier, - - - Tube at 1 m, Tube at 2,5 m, ----
Tube at 5 m, + Tube at 10 m
�������������������������������������������������������������������������������������������������������������������������������������������������������������������������������������������������������������������������������������������������������������������������
(b)
0
50
100
150
200
250
300
170 180 190 200 210 220 230 240 250 260 270 280 290 300
Julian days
Soil m
oisture (m
m)
DVS 0 1 2 3 4 5 6 7 8 9
��������������������������������������������������������������������������������������������������������������������������������������������������������������������������������������������������������������������������������������������������������������������������������������
(c)
0
50
100
150
200
250
300
170 180 190 200 210 220 230 240 250 260 270 280 290 300
Julian daysSoil M
oisture (m
m)
DVS 0 1 2 3 4 5 6 7 8 9
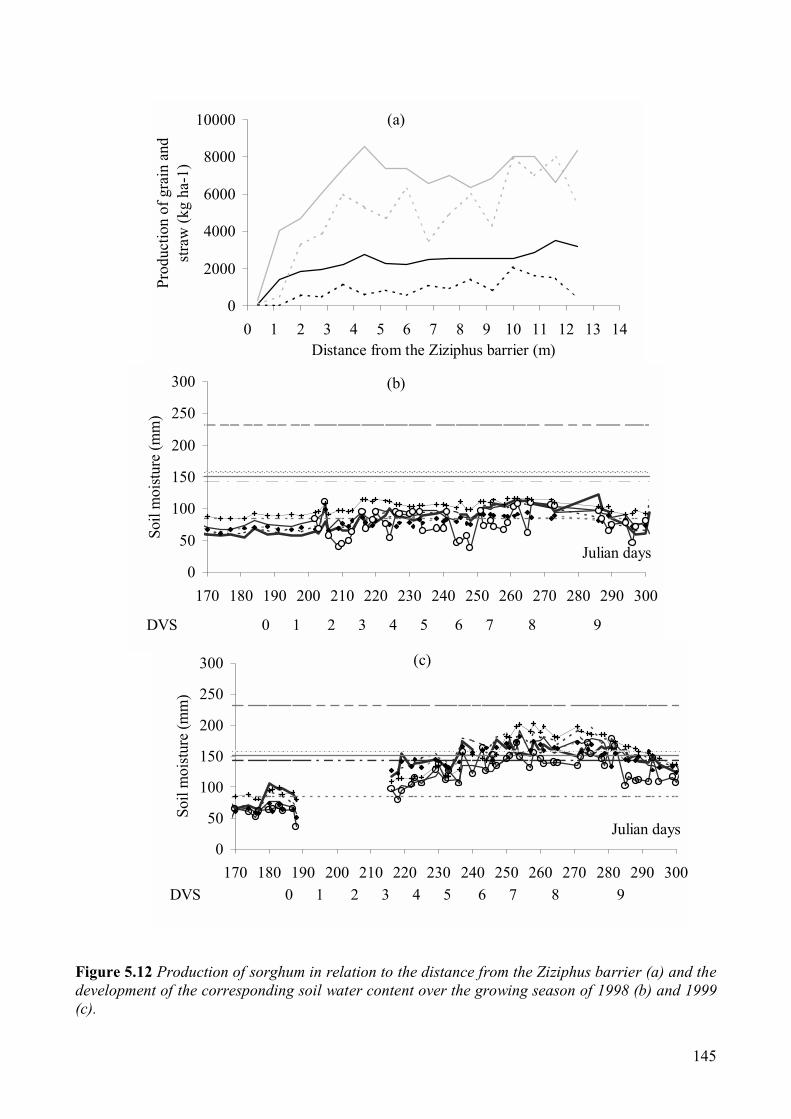
145
Figure 5.12 Production of sorghum in relation to the distance from the Ziziphus barrier (a) and the
development of the corresponding soil water content over the growing season of 1998 (b) and 1999
(c).
(a)
0
2000
4000
6000
8000
10000
0 1 2 3 4 5 6 7 8 9 10 11 12 13 14
Distance from the Ziziphus barrier (m)
Pro
du
ctio
n o
f g
rain
an
d
straw
(k
g h
a-1
)
��������������������������������������������������������������������������������������������������������������������������������������������������������������������������������������������������������������������������������������������������������������������
(b)
0
50
100
150
200
250
300
170 180 190 200 210 220 230 240 250 260 270 280 290 300
Julian days
Soil m
oisture (m
m)
DVS 0 1 2 3 4 5 6 7 8 9
��������
��������������������
������������������������
������������
��������������
��������������
������������������������������������������������������������������������
������������������������
����������������������������
������������
��������������
������������������
������������
��������������
����������������
������������
��������������
��������������
������������������
������������������������
������������
��������������
��������������
������������������
����������������
������������������
����������������������������
����������
(c)
0
50
100
150
200
250
300
170 180 190 200 210 220 230 240 250 260 270 280 290 300
Julian days
Soil m
oisture (m
m)
DVS 0 1 2 3 4 5 6 7 8 9
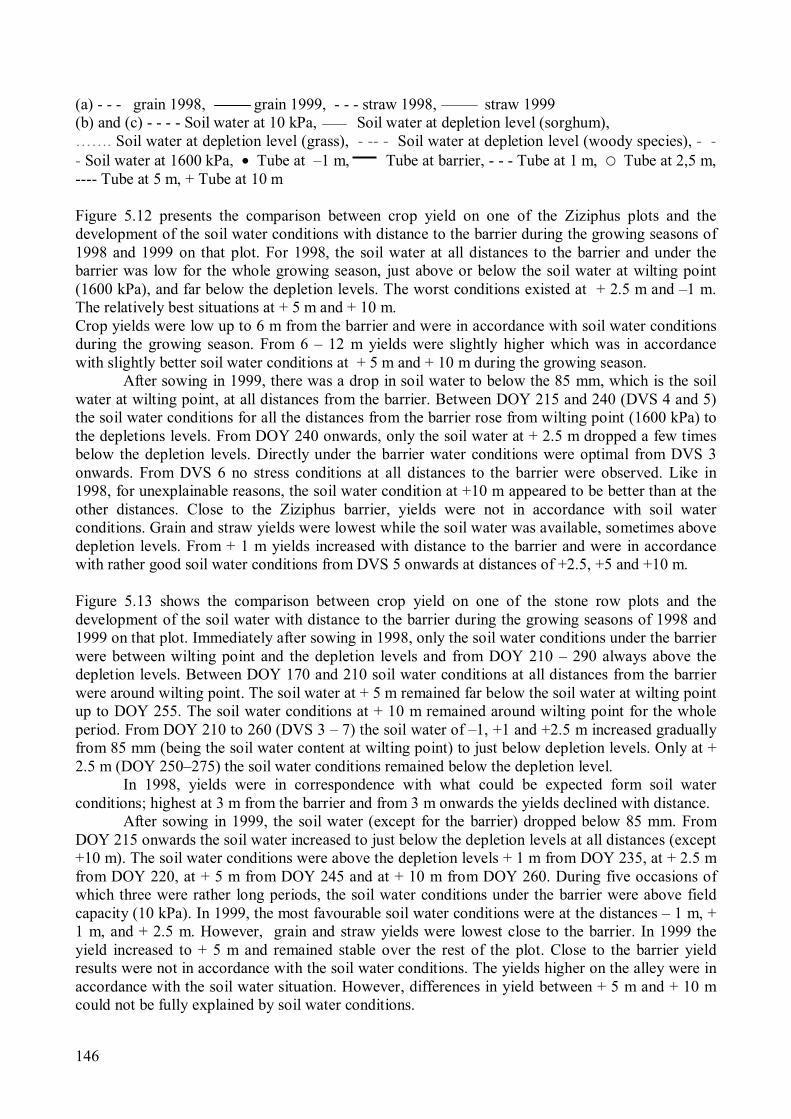
146
(a) - - - grain 1998, grain 1999, - - - straw 1998, straw 1999
(b) and (c) - - - - Soil water at 10 kPa, Soil water at depletion level (sorghum),
……. Soil water at depletion level (grass), - -- - Soil water at depletion level (woody species), - -
- Soil water at 1600 kPa, • Tube at –1 m, Tube at barrier, - - - Tube at 1 m, � Tube at 2,5 m,
---- Tube at 5 m, + Tube at 10 m
Figure 5.12 presents the comparison between crop yield on one of the Ziziphus plots and the
development of the soil water conditions with distance to the barrier during the growing seasons of
1998 and 1999 on that plot. For 1998, the soil water at all distances to the barrier and under the
barrier was low for the whole growing season, just above or below the soil water at wilting point
(1600 kPa), and far below the depletion levels. The worst conditions existed at + 2.5 m and –1 m.
The relatively best situations at + 5 m and + 10 m.
Crop yields were low up to 6 m from the barrier and were in accordance with soil water conditions
during the growing season. From 6 – 12 m yields were slightly higher which was in accordance
with slightly better soil water conditions at + 5 m and + 10 m during the growing season.
After sowing in 1999, there was a drop in soil water to below the 85 mm, which is the soil
water at wilting point, at all distances from the barrier. Between DOY 215 and 240 (DVS 4 and 5)
the soil water conditions for all the distances from the barrier rose from wilting point (1600 kPa) to
the depletions levels. From DOY 240 onwards, only the soil water at + 2.5 m dropped a few times
below the depletion levels. Directly under the barrier water conditions were optimal from DVS 3
onwards. From DVS 6 no stress conditions at all distances to the barrier were observed. Like in
1998, for unexplainable reasons, the soil water condition at +10 m appeared to be better than at the
other distances. Close to the Ziziphus barrier, yields were not in accordance with soil water
conditions. Grain and straw yields were lowest while the soil water was available, sometimes above
depletion levels. From + 1 m yields increased with distance to the barrier and were in accordance
with rather good soil water conditions from DVS 5 onwards at distances of +2.5, +5 and +10 m.
Figure 5.13 shows the comparison between crop yield on one of the stone row plots and the
development of the soil water with distance to the barrier during the growing seasons of 1998 and
1999 on that plot. Immediately after sowing in 1998, only the soil water conditions under the barrier
were between wilting point and the depletion levels and from DOY 210 – 290 always above the
depletion levels. Between DOY 170 and 210 soil water conditions at all distances from the barrier
were around wilting point. The soil water at + 5 m remained far below the soil water at wilting point
up to DOY 255. The soil water conditions at + 10 m remained around wilting point for the whole
period. From DOY 210 to 260 (DVS 3 – 7) the soil water of –1, +1 and +2.5 m increased gradually
from 85 mm (being the soil water content at wilting point) to just below depletion levels. Only at +
2.5 m (DOY 250–275) the soil water conditions remained below the depletion level.
In 1998, yields were in correspondence with what could be expected form soil water
conditions; highest at 3 m from the barrier and from 3 m onwards the yields declined with distance.
After sowing in 1999, the soil water (except for the barrier) dropped below 85 mm. From
DOY 215 onwards the soil water increased to just below the depletion levels at all distances (except
+10 m). The soil water conditions were above the depletion levels + 1 m from DOY 235, at + 2.5 m
from DOY 220, at + 5 m from DOY 245 and at + 10 m from DOY 260. During five occasions of
which three were rather long periods, the soil water conditions under the barrier were above field
capacity (10 kPa). In 1999, the most favourable soil water conditions were at the distances – 1 m, +
1 m, and + 2.5 m. However, grain and straw yields were lowest close to the barrier. In 1999 the
yield increased to + 5 m and remained stable over the rest of the plot. Close to the barrier yield
results were not in accordance with the soil water conditions. The yields higher on the alley were in
accordance with the soil water situation. However, differences in yield between + 5 m and + 10 m
could not be fully explained by soil water conditions.
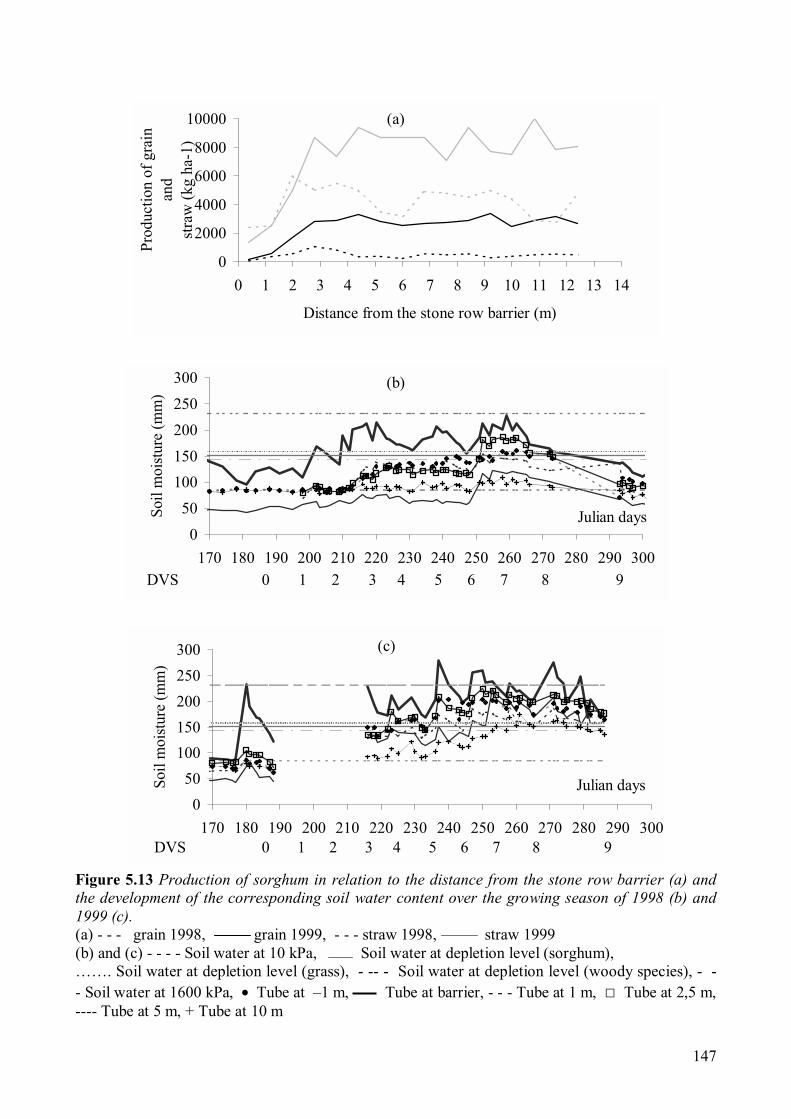
147
Figure 5.13 Production of sorghum in relation to the distance from the stone row barrier (a) and
the development of the corresponding soil water content over the growing season of 1998 (b) and
1999 (c).
(a) - - - grain 1998, grain 1999, - - - straw 1998, straw 1999
(b) and (c) - - - - Soil water at 10 kPa, Soil water at depletion level (sorghum),
……. Soil water at depletion level (grass), - -- - Soil water at depletion level (woody species), - -
- Soil water at 1600 kPa, • Tube at –1 m, Tube at barrier, - - - Tube at 1 m, □ Tube at 2,5 m,
---- Tube at 5 m, + Tube at 10 m
���������������������������������������������������������������������������������������������������������������������������������������������������������������������������������������������������������������������������������������������������������
(b)
0
50
100
150
200
250
300
170 180 190 200 210 220 230 240 250 260 270 280 290 300
Julian days
Soil m
oisture (m
m)
DVS 0 1 2 3 4 5 6 7 8 9
�����������������������������������������������������������������������������������������������������������������������������������������������������������������������������������������������������������������������������
(c)
0
50
100
150
200
250
300
170 180 190 200 210 220 230 240 250 260 270 280 290 300
Julian daysSoil m
oisture (m
m)
DVS 0 1 2 3 4 5 6 7 8 9
(a)
0
2000
4000
6000
8000
10000
0 1 2 3 4 5 6 7 8 9 10 11 12 13 14
Distance from the stone row barrier (m)
Pro
du
ctio
n o
f g
rain
an
d
straw
(k
g h
a-1
)
148
5.4.4 Discussion
In 1998, crop yields on the plots with the effective vegetative barrier (Andropogon) decreased from
the barrier after about 6 m. This decline in yield (grain and straw) can be explained by the decrease
in soil water with increasing distance from the barriers. During DVS 0 – 5 the soil water at + 5 m
and + 10 m was low. After DVS 5 there was a slight increase of the soil water, which nevertheless
remained far from sufficient. The development of the soil water under the barrier showed that
effective barriers conserved even more water than needed for their own consumption in dry years.
The soil water was almost always above the barrier specific depletion levels. The Andropogon
barrier conserved enough water for the growth of the barrier and for an increased crop yield up to 6
m from the barrier.
Only at the beginning of the growing season of 1999 was there a lack of soil water at + 1 m
and under the Andropogon barrier. From DVS 3 onwards the barrier conserved enough water for its
own consumption and sometimes even too much. Even at + 1 m soil water conditions exceeded
10kPa. The relatively low crop results in the first few meters upstream of the barrier can be
explained by water logging during a few occasions. The favourable soil water conditions (at all
distances except + 5 m) from DOY 250 onwards, just after the stress sensitive DVS 6 seem to have
compensated the meagre soil water conditions during the first part of the growing season. Even the
bad soil water conditions during that period at + 2.5 m, + 5 m and +10 m did not show a decrease in
crop results. Probably the favourable distribution of the rain showers over the growing season
(Figure 5.2) was responsible for the good result. At –1 m soil water conditions were generally quite
good during a large part of the growing season. In the wetter years the (negative) effect of the
Andropogon barrier stretched to 3 m uphill. On the rest of the plot the yield results were more or
less the same and it did not seem to be influenced by the barrier.
On plots with the less effective barrier (Ziziphus) the grain and straw yields were very
different in 1998 and 1999. The functioning of the Ziziphus barrier in a dry year (1998) was very
limited. Only a small portion of the runoff water was caught and conserved. Nearby the barrier the
soil water remained low. However, higher on the alley (+5 m and +10 m) conditions were
somewhat better. Therefore production was low close to the barrier and enhanced higher on the
alley. The Ziziphus barrier even failed to catch enough water for own consumption (Posthumus and
Spaan, 2001). In dry years competition for water between barrier and crop was at stake.
In 1999 directly under the barrier, –1 m and +1 m water conditions were from DVS 3
onwards above depletion levels. Competition for water between the barrier and crop was not likely.
In wet years, the action of the Ziziphus barrier was good. Visual observations showed that wet years
seemed to be favourable for weed development in and around the Ziziphus barrier. Obviously
weeds introduce an extra barrier effect (Kambou, 1998). Enough water was stored for its own
consumption and no water logging was observed during wet periods of the growing season. Higher
on the alley +2.5 m, +5 m and + 10 m soil water conditions were from DVS 6 onwards above
barrier and sorghum depletion levels.
Grain and straw yields for Ziziphus were not in agreement with the soil water conditions.
Close to the barrier the crop results were lower than higher on the alley. Despite the favourable soil
water conditions, the crop yield on the first meter from the barrier was lower than expected. As
over-wet conditions did not occur this could only be explained by light competition (Tordina, 2000;
Mayus, 1998; Hien and Zigani, 1994; Kessler and Boni, 1991). On the rest of the plot the yield
results were more or less the same and did seem to be influenced by the barrier.
Despite the absence of competition for water and sunlight, the yield results of stone row
plots had the same trends as the Andropogon plots. For both years soil water conditions at +5 m and
+10 m were, during a large part of the growing season, below sorghum depletion level and in 1998
at + 5 m up to DOY 250 below wilting point. In 1999 (a wet year) stone rows conserved a
considerable amount of water under and close to the barrier. Long periods of water logging
149
(Djiguemde, 2000) caused dormancy and partial dying back of the roots, resulting in low grain and
straw yields on the first 2 meters from the barrier. Due to the absence of transpiration, these
ponding periods lasted for longer than on vegetation barrier plots. On the rest of the plot the yields
were more or less the same and did not seem to have been influenced by the barrier.
In dry years when grain and straw yield results were low, the standard deviations between
the repetitions were large. Micro–morphology and small undulations of the soil surface, resulting in
extra local infiltration of water may be responsible for good and bad yield results at short distances.
In wetter years with more profitable yield results, the standard deviation between the repetitions
were much smaller, because of more uniform overall infiltration at the plot.
5.4.5 Conclusions
The overall conclusion of this Chapter is that despite of the differences in soil water dynamics on
the three barrier types plots, the differences in grain and straw yield were rather small. Therefore
explanation of the differences has to be slightly forced. Effective barriers conserve water effectively
even during dry years and compensate at least their own consumption and increase crop yields over
a distance of about 6 m upstream of the barrier. In wet years, effective barriers sometimes catch too
much water, causing water logging. The barrier effect of less effective Ziziphus barriers was not
good during dry years and even not enough to compensate its own consumption. In dry years, water
competition was responsible for yield reductions adjacent to the barrier on Ziziphus plots. In wet
years this barrier caught enough water for its own water consumption and also enough to improve
crop yields a few meters upstream.
Even when water for the sorghum crop was not always readily available during the growing
season, but when rain distribution and rain quantity were favorable (1999), yields were close to
average on–station yields. Perhaps the depletion fraction used to determine portion of readily
available water in Allen et al., (1998) has to be reconsidered. This would imply more readily
available water, and could therefore explain the yields observed.
Since the soil water was always enhanced close to and under the Andropogon barrier and
yields did not reflect to favourable soil water conditions, ponding and shading appeared to be
important growth constraints. Regular cutting of vegetation barriers during the growing season may
be an answer to competition for sunlight and forced superficial drainage could be an answer to
ponding.
Stone row barriers do not consume water and thus sometimes retain too much runoff water
and cause water logging, which consequently results in a decrease in yield. Even in dry years the
barrier effect of stone rows was less good than the effective vegetation barrier. Effective vegetation
barriers are slightly better, but the difference remains small.

150
5.5 References
Allen, R.G, Pereira, L.S., Raes, D. and M. Smith, 1998. Crop evaporation. Guidelines for computing crop water
requirements. FAO Irrigation and Drainage Paper 56. 300pp.
Aho, H. and Kossou, D.K., 1997. Précis d’agriculture tropicale, dit du flamboyant, 464pp.
Baker, J.M. and C.H.M. Van Bavel, 1987. Measurements of mass flow of water in stems of herbaceous plants.
Plant and Cell Environment, 777-782.
Begon, M., Harper, J.L. and C.R Townsend, 1986. Ecology. Individuals, populations and communities.
Blackwell Science Ltd, Editorial Office: 25 John Street, London WC1N 2BL.1068pp.
Djiguemde, P., 2000. Performance des bandes de quelques especes locales et leur influence sur l’érosion des sols
et la production de Sorgho a Gampela. Memoire de fin d’ études, présenté en vue del’obtention du
diplôme d’inspecteur des eaux et forêts, Université de Ouaguadougou, 85pp.
Dogget, H.,1987. Sorghum, second edition, Tropical agriculture series. Longman Scientific & Technical,
Longman Group UK Limited, Longman House, Burnt Mill, Harlow, Essex CM20 2JE, England, 512pp.
Doorenbos, J. and W.O. Pruitt, 1977. Crop water requirements. Irrigation and Drainage Paper No. 24, (rev)
FAO, Rome Italy, 144pp.
Doorenbos, J. and A.H. Kassam, 1979. Yield responses to water. FAO irrigation and Drainage Paper No. 33,
FAO, Rome Italy, 193pp.
FAO, 1992. Report on expert consultation on the revision of FAO methodologies for crop water requirements.
Land and Water division, FAO, Rome, Italy, 54pp.
Forest, F. and B. Lidon, 1984. Influence of rainfall pattern on fluctuations in an intensified sorghum crop yield.
In: Agrometeorology of sorghum and millet in the semi–arid tropics: Proceedings of the International
Symposium, 15–29 Nov. 1982, ICRISAT Center, India. Pantancheru, A.P. 502 324, India: ICRISAT, pp
261–273
Gregory, P.J., 1989. Water use efficiency of crops in the semi arid tropics. In: Soil, Crop, and Water
Management Systems for rainfed agriculture in the Sudano-Sahelian Zone: Proceedings of an
International Workshop, 7–11 Jan. 1987. ICRISAT Sahelian Center, Niamey, Niger. Patancheru, A.P.
502324, India: ICRISAT, pp 85-99.
Hien, F. and G. Zigani, 1994. Selection et evaluation d’especes arbustes pour la mise en place de haies
vivesdefensives au Burkina Faso. Sci. et Tech, Vol.21. no1. 1993-1994, p31-47.
Kambou, N.F., 1998. Étude des effets de bandes végétatives et de cordons pierreux sur la croissance et le
développement du Sorgho à Gampela. Rapport de fin de stage de première année I.D.R., option
Agronomie, 46pp.
Kanemasu, E.T., Piara Singh, and U.N Chaudhuri, 1984. Water use efficiency of pearl millet and sorghum. In:
Agrometeorology of sorghum and millet in the semi–arid tropics: Proceedings of the International
Symposium, 15–29 Nov. 1982, ICRISAT Center, India. Pantancheru, A.P. 502 324, India: ICRISAT,
pp175–181.
Kessler, C.A., Spaan, W.P., Van Driel, W.F. and L. Stroosnijder, 1995. Choix et modalités d’exécution des
mesures de conservation des eaux et des sols au Sahel. Une comparaison de cinq projets de
développement. Wageningen University, Tropical Resource Management Paper no.8, 94pp.
Kessler, J.J. et J. Boni, 1991. Etude sur les systèmes racinaires de quelques haies vives dans agroforestry au
Burkine Faso. Tropical Resource Management Papers no1., MET/UAW, Wageningen, 144pp.
Kidanu, S., Mamo, T. and L. Stroosnijder. Biomass production of Eucalyptus boundary plantation and its effect
on crop productivity on Ethiopian highland vertisols (submitted to J. Agroforestry Systems).
Kiepe, P., 1995. No runoff, no soil loss: soil and water conservation in hedgerow barrier systems. Ph.D. thesis,
Wageningen University, Nieuwe Kanaal 11, 6709PA Wageningen, The Netherlands, 158pp.
Konate, M. 1984. Climate of the sorghum and millet cultivation zones of the semi–arid tropical regions of West
Africa. In: Agrometeorology of sorghum and millet in the semi–arid tropics: Proceedings of the
International Symposium, 15–29 Nov. 1982, ICRISAT Center, India. Pantancheru, A.P. 502 324, India:
ICRISAT, pp 101–113.
Lamachère, J.M., and G. Serpantié, 1991. Valorisation agricole des eaux de ruisellement et lutte contre l’érosion
sur champs cultivés en mil en zone soudano–sahelienne, Bidi,Burkina Faso. In; Kergreis, A., Claude, J.
(Eds.) Utilisation rationelle del’eau des petits bassins versants en zone aride. John Libbey Eurotext,
Paris, pp165–178.
151
Maduakor, H.O., 1991 Physical and hydraulic properties of soils in the Sudano-Sahelian regions of Nigeria. In:
Soil Water Balance in the Sudano-Sahelian Zone, IAHS, pp 229–240.
Mannion, A.M.D., 1995. Agriculture and environmental change. Temporal and spatial dimensions. John Wiley
7SonsLtd, Baffins Lane, Chichester, West Sussex, PO19 1UD, England, 405pp.
Mayus, M. M., Allisson, B.E. and M.V.K. Sivakumar, 1994. Windbreak effects on millet growth in the Sudano-
Sahelian Zone. Proceedings of the International Symposium “Wind erosion in West Africa: The
Problem and its Control”. B.Buerkert. B.E. Allison and Von Oppen (Eds.); University of Hohenheim,
Germany, 5-7 December 1994.
Mayus, M., 1998. Millet growth in windbreak–shielded fields in the Sahel. Experiment and model. PhD–thesis,
Wageningen University, Nieuwe Kanaal 11, 6709Pa Wageningen, The Netherlands, 259pp.
Mayus, M., 1999. Competition in the hedge–sorghum interface, Gampela, Burkina Faso. Work document,
Wageningen University, Nieuwe Kanaal 11, 6709Pa Wageningen, The Netherlands, 32pp.
Peacock, J.M. and G.M. Heinrich, 1984. Light and temperature responses in sorghum. In: Agrometeorology of
sorghum and millet in the semi–arid tropics: Proceedings of the International Symposium, 15–29 Nov.
1982, ICRISAT Center, India. Pantancheru, A.P. 502 324, India: ICRISAT, pp143–158.
Posthumus, H. and W.P. Spaan, 2001. Rainfall runoff relations for vegetation barriers in the Sahel. Soil Erosion
Research for the 21st
Century. Proceedings of the International Symposium, Ascough and Flanigan
(Eds), Honolulu, Hawaii, USA, pp 50–54.
Pursglove, J.W., 1972. Tropical Crops, Monocotyledons. Longman Group Limited, Longman House, Burnt mill,
Harlow, essex CM20 2JE, England. 607pp. Updated in 1985.
Ringersma, J. and A.F.S. Sikking, 2001. Determining transpiration coefficients of Sahelian barriers.
Agroforestry Systems 51: 1–9, 2001.
Ritchie, J.T., 1972. Model for predicting evaporation from a row crop with incomplete cover, Water Resources
Res. 8 : 1204–1213.
Sikking, A.F.S., 1997. Hedgerows for water conservation, an alternative or baloney? A water balance study.
MSc-thesis Erosion and Soil & Water conservation, Wageningen University, March 1997, 122pp.
Smith, D.M., Jarvis, P.G. and J.C.W. Odongo, 1994, Water use by Sahelian windbreak trees. Proceedings of the
International Symposium “Wind Erosion in West Africa: The problem and its Control”, University of
Hohenheim, Germany, 5-7 December 1994, pp 115–128.
Spaan, W.P., Ringersma, J., Stroosnijder, L., and A.F.S. Sikking, 1999. Estimation of water use by vegetation
barriers based on climatological factors and soil moisture levels. Proceedings of the 9th
International
conference on Rainwater Catchment Systems, Petronlina, Brazil, Ch 10–1.
Spaan, W.P., Posthumus, H., Van Loon, E.E. and L. Stroosnijder, submitted JSWC. Effect of vegetation barriers
on runoff in an alley crop system in Burkina Faso, West Africa.
Tordina, N., 2000. Influence des techniques de conservation des eaux et des sols sur le comportement
hydrodynamique des sols et la performance du sorgho en zone Soudano-Sahelienne: Cas des cordons
pierreux et bandes vegetatives. Memoire de fin d’Étude, 69pp.
Van Dam, J.C., 2000. Field-scale water flow and solute transport.SWAP model concepts, parameter estimation
and case studies. Ph.D. thesis, Wageningen University, 167pp.
Vanderlip, R.L. 1979. How a sorghum plant develops. Contribution No. 1203, Agronomy Department, Kansas
Agricultural Experiment Station, Manhattan, 66506, 17pp.
Verdoes, A., 1990. Een wortelconcurrentie-onderzoek bij enkele haies vives in de provincie Sanguié, Burkina
Faso. MSc thesis, Vakgroep Natuurbeheer, Landbouw Universiteit Wageningen, 51pp.
Vollebergh, T., 1984. Evaporation from bare soil determined under field conditions with undisturbed soil cores.
MSc thesis, Landbouwuniversiteit, Department of Soil Science and Geology, Wageningen, Netherlands.
Young, A., 1997. Agroforestry for soil management (2nd
edition) ICRAF CAB International.
Zougmoré, R., Guillobez, S., Kambou, N.F. and G. Son, 2000. Runoff and sorghum performance as affected by
the spacing of stone lines in the semiarid Sahelian zone. Soil Tillage Research 56 (2000) 175–183.
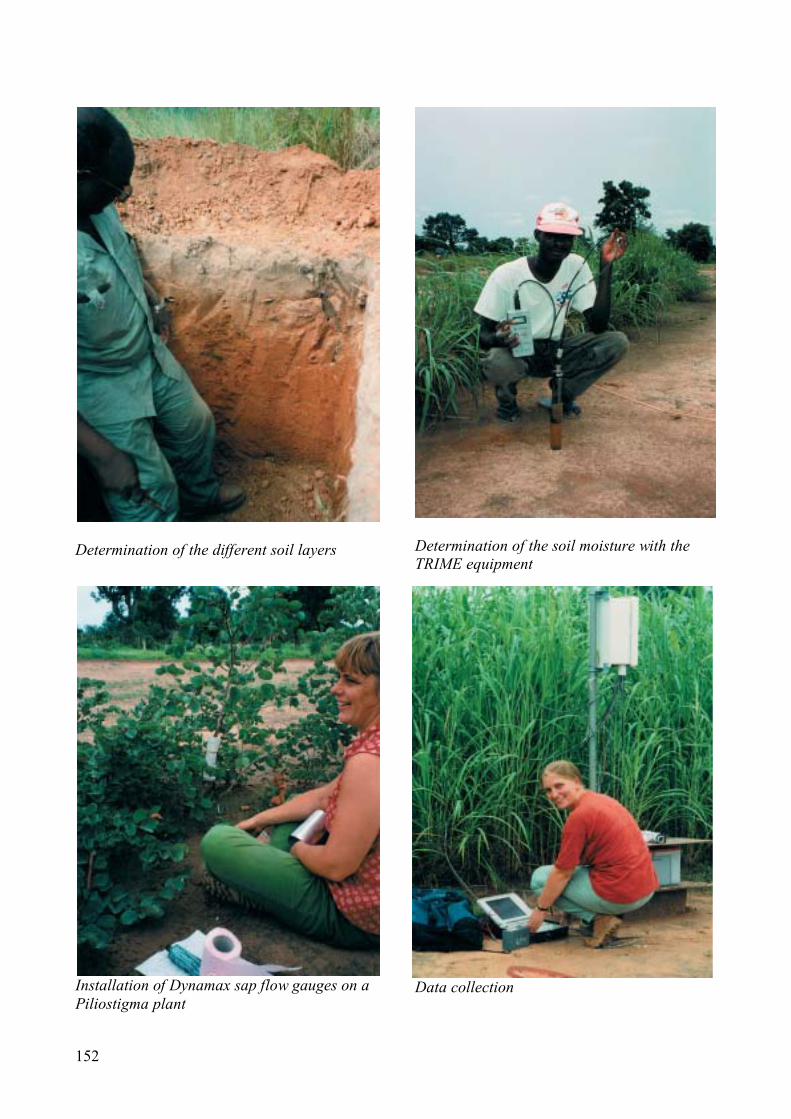
152
Determination of the different soil layers
Installation of Dynamax sap flow gauges on a
Piliostigma plant
Determination of the soil moisture with the
TRIME equipment
Data collection

Chapter 6
Planning of alley-barrier systems (Design)

154
155
Planning of alley-barrier systems (Design)
6.1 Introduction
Having presented detailed research findings on the water conservation effects of vegetation barriers
(Chapter 4) and the use of this water by the barrier itself and by the crop on the alleys between
barriers (Chapter 5). This final chapter provides elements that can be used for the planning and
design of barrier systems. No full fledge design procedure can be presented here since crucial
elements of such a comprehensive design procedure are still lacking. Instead, research findings are
transformed into simple rules (of thumb) in a process that is comparable to the parameterization of
complex deterministic models.
Section 6.5 is submitted to Quarterly Journal of International Agriculture. The other sections
are published contributions to conferences in Hawaii (6.2), Mannheim (6.3), Brazil (6.4) and
Müncheberg (6.6).
In 6.2 it will be shown that knowledge of total rainfall can be used to predict total runoff
with sufficient accuracy. Section 6.3 adds that the influence of the development stages of the crop
has no great effect on these rainfall – runoff relations. In section 6.4 a simple and reliable method is
presented whereby the transpiration of the barriers is estimated with simple meteorological data and
some information on the soil water status.
In section 6.5 socio-economic aspects are discussed that determine the implementation of
contour vegetation barriers under farmer conditions in Burkina Faso and Mali. The focus of this
section is on the labour requirements for the installation and maintenance of contour vegetation
barriers. If establishment is phased over multiple years, i.e. planting 100 m every year, this will cost
less than 10 man- days per year. The total of labour requirement of 1750 man-days per household is
only a small fraction and should not be a constraint. Nevertheless, adoption is not very high due to
lack of awareness, training and extension.
Finally, in 6.6 arguments are given why incentives are needed and what kind are needed to
help farmers’ with their implementation of vegetation barriers.
156
6.2 Rainfall runoff relations for vegetation barriers in the Sahel
Posthumus, H. and W.P. Spaan, 2001. Rainfall runoff relations for vegetation barriers in the Sahel.
Proceedings of the International Symposium “Soil Erosion Research for the 21th Century” Ascough
and Flanigan (eds.), Honolulu, Hawii, USA, 2001, ASAE Publication 701P0007, pp 50 –54.
Abstract
The efficacy of different vegetation barriers (grasses, woody species and succulents) intended to
reduce runoff was evaluated at a research station in central Burkina Faso. Large differences in
efficiency between the different barrier types were found. In average dry years grasses proved to be
very effective. The through-flow in the barriers with woody species and succulents appeared to be
rather high. In relatively wet years water logging was a problem on plots with grasses. Therefore,
on those plots, vegetation development was less and a larger volume of water drained through the
barrier. Abundant weed growth in the other barriers improved their catch efficiency during wet
years. The correlation coefficient of the linear relation between total rainfall and total runoff was
fairly good, but all relations that took rain intensity into account had a higher correlation. All
considered barriers conserved soil and water under different climate and management conditions.
Keywords: vegetation barriers, runoff, rain intensity, soil and water conservation.
6.2.1 Introduction
In semi-arid regions there is rainfall during part of the year only and very often a large part of the
rain is lost by surface runoff. On bare medium to fine textured soils the runoff rate may exceed 50%
(Casanave and Valentin, 1992) and has been reported up to 60 and 80 % (Hien, 1995). Runoff
management is one of many ways of water conservation. Estimation of the runoff volume as a
function of management practices in a catchment is of importance for the planning of conservation
measures. This approximation is based on rainfall, size and state of the catchment. For catchments
with a minimum size of some hectares, equations of e.g. Boers (1994) are used. For agricultural
development there is a need to determine the runoff volumes for much smaller catchments (Kiepe,
1995).
This research aims at approximating runoff rates for small plot lengths in agroforestry
systems, including the biological state of the catchment. Reduction of runoff is achieved by using
vegetation barriers, which also improve infiltration, and stimulate plant growth and crop production
with the extra stored water.
6.2.2 Materials and Methods
The study was conducted in the central part of Burkina Faso, near Gampela (1°20’ W, 12°20’ N), at
an altitude of about 275m. The soils (Luvisols) are low in fertility and productivity and consist of
sandy loam in the top layer, and are rich in clay with hydromorphic properties, in deeper layers
(Anonymous, 1988). Soil aggregates are small and unstable. The soil has a tendency for auto-
compaction (bulk density 1600kg m-3
). Soils are prone to crusting due to their low structural
stability caused by a low soil organic matter content (<1%). Under these conditions infiltration is
poor and subsequently runoff is high. With an average rainfall of 790 mm y-1
the research area is
part of the North Sudanian zone with rainfall limits between 650 and 1000 mm (Sivakumar and
Gnoumou, 1987).
In 1994 twenty-one plots of 20 x 20m were laid out within the 3 ha fenced experimental site.
Plots were laid out in the direction of the slope and protected with 0.5 m high dikes on three sides.
The downstream end of the plot was left open to drain excess water. At 14.5 m from the top of the
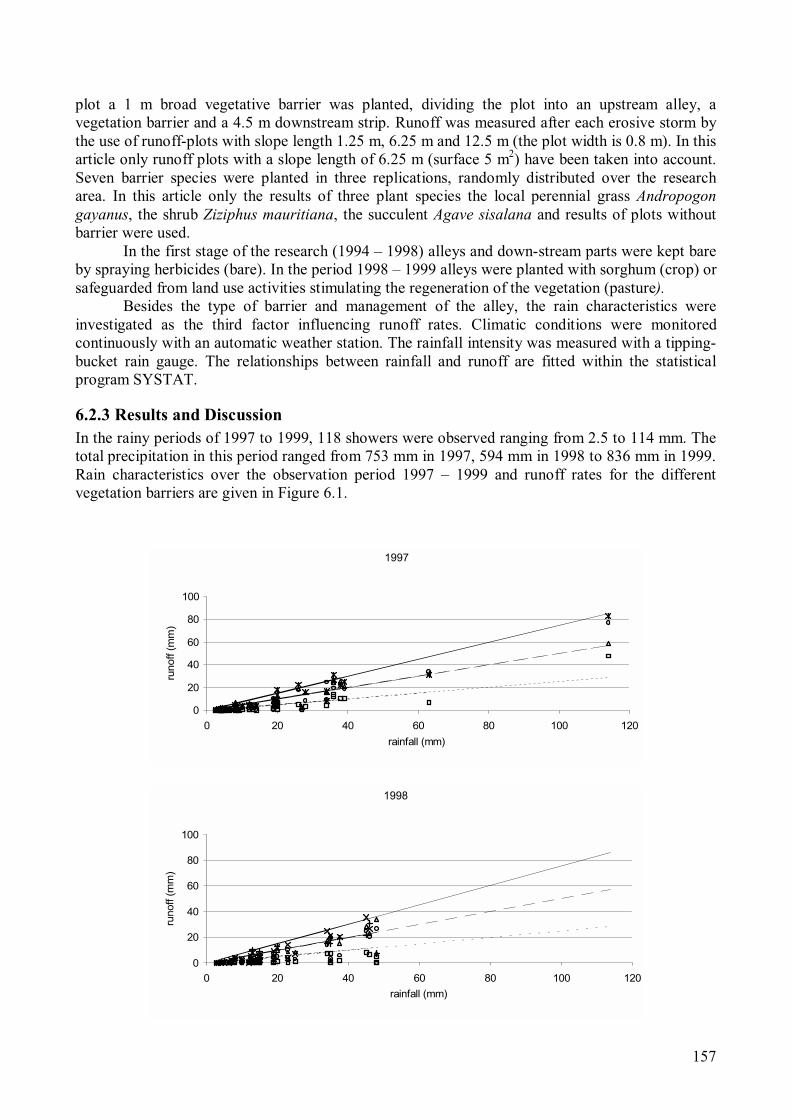
157
plot a 1 m broad vegetative barrier was planted, dividing the plot into an upstream alley, a
vegetation barrier and a 4.5 m downstream strip. Runoff was measured after each erosive storm by
the use of runoff-plots with slope length 1.25 m, 6.25 m and 12.5 m (the plot width is 0.8 m). In this
article only runoff plots with a slope length of 6.25 m (surface 5 m2
) have been taken into account.
Seven barrier species were planted in three replications, randomly distributed over the research
area. In this article only the results of three plant species the local perennial grass Andropogon
gayanus, the shrub Ziziphus mauritiana, the succulent Agave sisalana and results of plots without
barrier were used.
In the first stage of the research (1994 – 1998) alleys and down-stream parts were kept bare
by spraying herbicides (bare). In the period 1998 – 1999 alleys were planted with sorghum (crop) or
safeguarded from land use activities stimulating the regeneration of the vegetation (pasture).
Besides the type of barrier and management of the alley, the rain characteristics were
investigated as the third factor influencing runoff rates. Climatic conditions were monitored
continuously with an automatic weather station. The rainfall intensity was measured with a tipping-
bucket rain gauge. The relationships between rainfall and runoff are fitted within the statistical
program SYSTAT.
6.2.3 Results and Discussion
In the rainy periods of 1997 to 1999, 118 showers were observed ranging from 2.5 to 114 mm. The
total precipitation in this period ranged from 753 mm in 1997, 594 mm in 1998 to 836 mm in 1999.
Rain characteristics over the observation period 1997 – 1999 and runoff rates for the different
vegetation barriers are given in Figure 6.1.
1997
0
20
40
60
80
100
0 20 40 60 80 100 120
rainfall (mm)
runoff (m
m)
1998
0
20
40
60
80
100
0 20 40 60 80 100 120
rainfall (mm)
runoff (m
m)
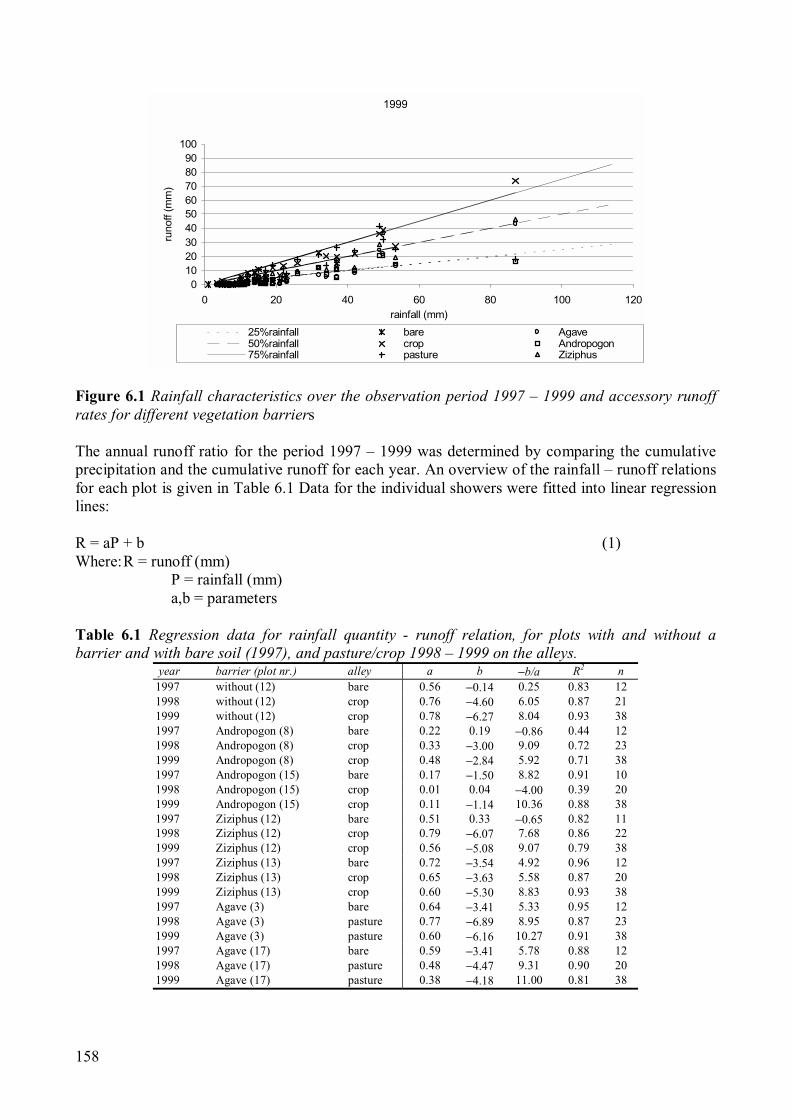
158
Figure 6.1 Rainfall characteristics over the observation period 1997 – 1999 and accessory runoff
rates for different vegetation barriers
The annual runoff ratio for the period 1997 – 1999 was determined by comparing the cumulative
precipitation and the cumulative runoff for each year. An overview of the rainfall – runoff relations
for each plot is given in Table 6.1 Data for the individual showers were fitted into linear regression
lines:
R = aP + b (1)
Where: R = runoff (mm)
P = rainfall (mm)
a,b = parameters
Table 6.1 Regression data for rainfall quantity - runoff relation, for plots with and without a
barrier and with bare soil (1997), and pasture/crop 1998 – 1999 on the alleys.
year barrier (plot nr.) alley a b −b/a R2
n
1997 without (12) bare 0.56 −0.14 0.25 0.83 12
1998 without (12) crop 0.76 −4.60 6.05 0.87 21
1999 without (12) crop 0.78 −6.27 8.04 0.93 38
1997 Andropogon (8) bare 0.22 0.19 −0.86 0.44 12
1998 Andropogon (8) crop 0.33 −3.00 9.09 0.72 23
1999 Andropogon (8) crop 0.48 −2.84 5.92 0.71 38
1997 Andropogon (15) bare 0.17 −1.50 8.82 0.91 10
1998 Andropogon (15) crop 0.01 0.04 −4.00 0.39 20
1999 Andropogon (15) crop 0.11 −1.14 10.36 0.88 38
1997 Ziziphus (12) bare 0.51 0.33 −0.65 0.82 11
1998 Ziziphus (12) crop 0.79 −6.07 7.68 0.86 22
1999 Ziziphus (12) crop 0.56 −5.08 9.07 0.79 38
1997 Ziziphus (13) bare 0.72 −3.54 4.92 0.96 12
1998 Ziziphus (13) crop 0.65 −3.63 5.58 0.87 20
1999 Ziziphus (13) crop 0.60 −5.30 8.83 0.93 38
1997 Agave (3) bare 0.64 −3.41 5.33 0.95 12
1998 Agave (3) pasture 0.77 −6.89 8.95 0.87 23
1999 Agave (3) pasture 0.60 −6.16 10.27 0.91 38
1997 Agave (17) bare 0.59 −3.41 5.78 0.88 12
1998 Agave (17) pasture 0.48 −4.47 9.31 0.90 20
1999 Agave (17) pasture 0.38 −4.18 11.00 0.81 38
1999
0
10
20
30
40
50
60
70
80
90
100
0 20 40 60 80 100 120
rainfall (mm)
runoff (m
m)
25%rainfall bare Agave
50%rainfall crop Andropogon
75%rainfall pasture Ziziphus
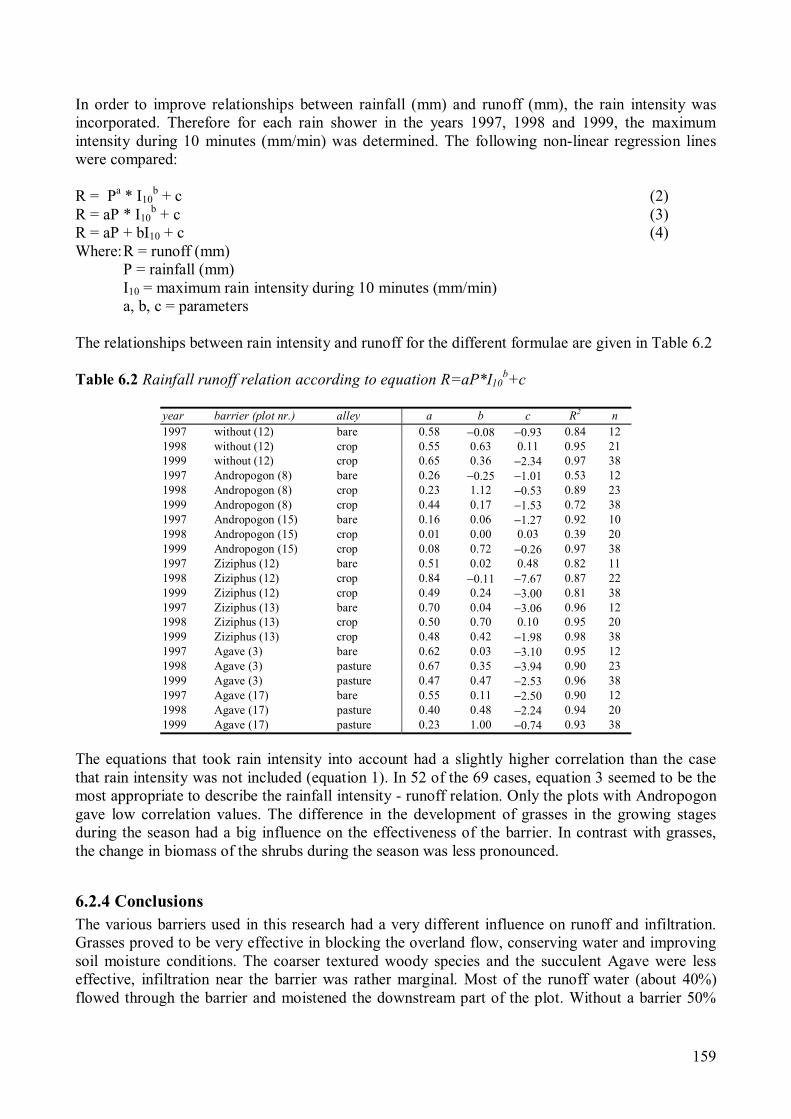
159
In order to improve relationships between rainfall (mm) and runoff (mm), the rain intensity was
incorporated. Therefore for each rain shower in the years 1997, 1998 and 1999, the maximum
intensity during 10 minutes (mm/min) was determined. The following non-linear regression lines
were compared:
R = Pa
* I10
b
+ c (2)
R = aP * I10
b
+ c (3)
R = aP + bI10 + c (4)
Where: R = runoff (mm)
P = rainfall (mm)
I10 = maximum rain intensity during 10 minutes (mm/min)
a, b, c = parameters
The relationships between rain intensity and runoff for the different formulae are given in Table 6.2
Table 6.2 Rainfall runoff relation according to equation R=aP*I10
b
+c
year barrier (plot nr.) alley a b c R2
n
1997 without (12) bare 0.58 −0.08 −0.93 0.84 12
1998 without (12) crop 0.55 0.63 0.11 0.95 21
1999 without (12) crop 0.65 0.36 −2.34 0.97 38
1997 Andropogon (8) bare 0.26 −0.25 −1.01 0.53 12
1998 Andropogon (8) crop 0.23 1.12 −0.53 0.89 23
1999 Andropogon (8) crop 0.44 0.17 −1.53 0.72 38
1997 Andropogon (15) bare 0.16 0.06 −1.27 0.92 10
1998 Andropogon (15) crop 0.01 0.00 0.03 0.39 20
1999 Andropogon (15) crop 0.08 0.72 −0.26 0.97 38
1997 Ziziphus (12) bare 0.51 0.02 0.48 0.82 11
1998 Ziziphus (12) crop 0.84 −0.11 −7.67 0.87 22
1999 Ziziphus (12) crop 0.49 0.24 −3.00 0.81 38
1997 Ziziphus (13) bare 0.70 0.04 −3.06 0.96 12
1998 Ziziphus (13) crop 0.50 0.70 0.10 0.95 20
1999 Ziziphus (13) crop 0.48 0.42 −1.98 0.98 38
1997 Agave (3) bare 0.62 0.03 −3.10 0.95 12
1998 Agave (3) pasture 0.67 0.35 −3.94 0.90 23
1999 Agave (3) pasture 0.47 0.47 −2.53 0.96 38
1997 Agave (17) bare 0.55 0.11 −2.50 0.90 12
1998 Agave (17) pasture 0.40 0.48 −2.24 0.94 20
1999 Agave (17) pasture 0.23 1.00 −0.74 0.93 38
The equations that took rain intensity into account had a slightly higher correlation than the case
that rain intensity was not included (equation 1). In 52 of the 69 cases, equation 3 seemed to be the
most appropriate to describe the rainfall intensity - runoff relation. Only the plots with Andropogon
gave low correlation values. The difference in the development of grasses in the growing stages
during the season had a big influence on the effectiveness of the barrier. In contrast with grasses,
the change in biomass of the shrubs during the season was less pronounced.
6.2.4 Conclusions
The various barriers used in this research had a very different influence on runoff and infiltration.
Grasses proved to be very effective in blocking the overland flow, conserving water and improving
soil moisture conditions. The coarser textured woody species and the succulent Agave were less
effective, infiltration near the barrier was rather marginal. Most of the runoff water (about 40%)
flowed through the barrier and moistened the downstream part of the plot. Without a barrier 50%

160
drained away. Looking at the coefficients of determination it can be determined that estimation of
the runoff by comparing total quantities of rainfall and runoff gave a fairly good result. However,
all used models taking rainfall intensity into account sometimes gave higher coefficients of
determination. Nevertheless the gain of incorporating rain intensity in the rainfall runoff relations
proved marginal, so the simple linear equations are preferred.
References
Anonymous, 1988. Etude pédologique de la station experimentale de Gampela. Ministère de l’Agriculture et de
l’Elevage, Secretariat General, Bureau National des Sols, Ouagadougou, Burkina Faso. Rapport
Technique no 59, 279 pp., Juillet 1988.
Boers, Th.M., 1994. Rainwater harvesting in arid and semi-arid zones. PhD-thesis, Agricultural University
Wageningen, 133 pp.
Casanave, A. and Valentin, C. 1992. A runoff capability classification system based on surface features criteria
in semi-arid areas of West Africa. Journal of Hydrology 130: 231 − 249.
Hien, F.G., 1995. La régénération de l'espace silvo-pastoral au Sahel. Une étude de l'effet de mesures de
conservation des eaux et des sols au Burkina Faso. Tropical Resource Management Papers no. 7,
Wageningen. ISBN 0926-9495
Kiepe, P., 1995. No Runoff, no soil loss: Soil and water conservation in hedgerow barrier systems. PhD thesis,
Agricultural University Wageningen, 158 pp.
Sivakumar, M.V.K. and Gnoumou, F., 1987. Agroclimatologie de l'Afrique de l'Ouest: Le Burkina Faso.
Bulletin d'Information ICRISAT Niamey, Niger
161
6.3 The influence of rain intensity and crop stages on runoff
production
Spaan, W.P. and E.E. Van Loon, 2001. The influence of rain intensity and crop stages on runoff
production. Proceedings of the 10th
International Rainwater Catchment Systems Conference,
Mannheim, Germany, Margraf Verlag, 2001, pp 231 – 236.
Abstract
The efficacy of vegetation barriers intended for runoff reduction was evaluated at a research station
in central Burkina Faso. On a 2 % slope of a sandy loam, seven local species (grasses, woody
species and a succulent) were planted as conservation barriers to examine their influence on soil and
water conservation. After each erosive storm, runoff was measured to determine the catch
efficiency. Large differences were found between the barrier types. Grasses proved to be very
effective. The through-flow in the barriers with woody species and succulents was rather high.
Compared to the effect of the barrier on runoff, the effect of rain intensity and crop development
were rather small. Runoff reduction during the growing season was highest on plots without a
barrier and on plots with the less effective Agave and Ziziphus barriers. The increase of rain
intensity resulted in the highest reaction on plots with Agave and Ziziphus barriers. On plots with
the more effective Andropogon barrier the influence of rain intensity and crop stages was rather
small.
Keywords: vegetation barriers, runoff, rain intensity, crop stages, soil and water conservation
6.3.1 Introduction
In semi-arid regions rainfall occurs during part of the year only and very often a large part of the
rain is lost by surface runoff. On bare, medium to fine textured soils the runoff rate may exceed
50% (Hoogmoed and Stroosnijder, 1984; Casanave and Valentin, 1992) or even more, between 60
and 80 % (Hien, 1995).
Runoff management is one of many methods of water conservation. Estimation of the runoff
volume as a function of management practices in a catchment is of importance for planning
conservation measures. This approximation is based on three factors: rainfall, size of the catchment
and state of the soil surface in the catchment. For catchments with a minimum size of some
hectares, equations of e.g. Boers (1994) can be used. For agricultural development there is a need to
determine the runoff volumes for much smaller catchments (Boers, 1994; Kiepe, 1995).
This research aims to approximate runoff rates for small plot lengths in agro-forestry
systems. In such systems a reduction of runoff is achieved by using vegetation barriers to slow
down runoff, to improve infiltration, and to stimulate crop production with the extra stored water. In
an earlier study the relation between rain depth and runoff has been investigated (Posthumus and
Spaan, 2001). Focusing on the effect of rainfall intensity and crop development has pursued this
research further.
6.3.2 Materials and methods
The study was conducted in the central part Burkina Faso near Gampela (1° 20’ W, 12° 20’ N) at an
altitude of about 275 m. The soils (Luvisols) have hydromorphic properties, are low in fertility and
hence low in productivity. The topsoil consists of sandy loam and the subsoil comprises a clay loam
(Anonymous, 1988). Soil aggregates are small and unstable, and the soil has a tendency for auto-
compaction (bulk density 1600 kg m-3
). Soil depth varies between 0.7 and 1.3 m. Soils are prone to
crusting due to their low structural stability caused by a low soil organic matter content (< 1%).
Under these conditions infiltration is poor and subsequently runoff is high. With an average rainfall
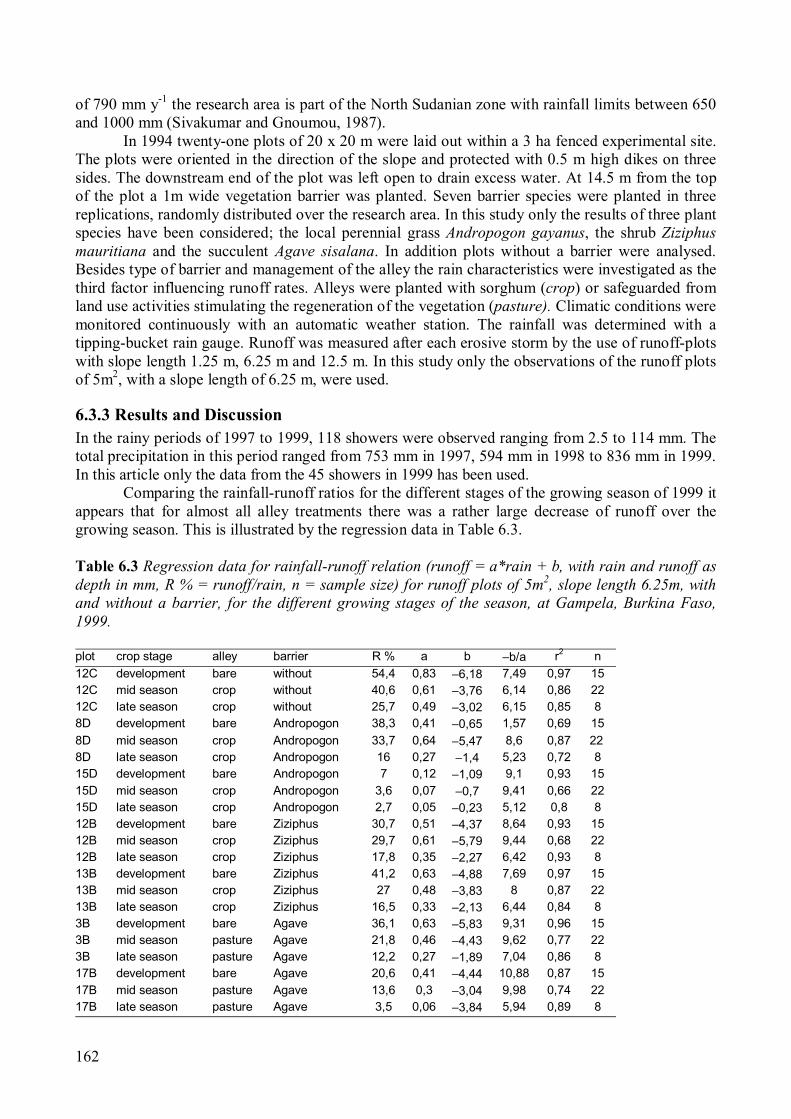
162
of 790 mm y-1
the research area is part of the North Sudanian zone with rainfall limits between 650
and 1000 mm (Sivakumar and Gnoumou, 1987).
In 1994 twenty-one plots of 20 x 20 m were laid out within a 3 ha fenced experimental site.
The plots were oriented in the direction of the slope and protected with 0.5 m high dikes on three
sides. The downstream end of the plot was left open to drain excess water. At 14.5 m from the top
of the plot a 1m wide vegetation barrier was planted. Seven barrier species were planted in three
replications, randomly distributed over the research area. In this study only the results of three plant
species have been considered; the local perennial grass Andropogon gayanus, the shrub Ziziphus
mauritiana and the succulent Agave sisalana. In addition plots without a barrier were analysed.
Besides type of barrier and management of the alley the rain characteristics were investigated as the
third factor influencing runoff rates. Alleys were planted with sorghum (crop) or safeguarded from
land use activities stimulating the regeneration of the vegetation (pasture). Climatic conditions were
monitored continuously with an automatic weather station. The rainfall was determined with a
tipping-bucket rain gauge. Runoff was measured after each erosive storm by the use of runoff-plots
with slope length 1.25 m, 6.25 m and 12.5 m. In this study only the observations of the runoff plots
of 5m2
, with a slope length of 6.25 m, were used.
6.3.3 Results and Discussion
In the rainy periods of 1997 to 1999, 118 showers were observed ranging from 2.5 to 114 mm. The
total precipitation in this period ranged from 753 mm in 1997, 594 mm in 1998 to 836 mm in 1999.
In this article only the data from the 45 showers in 1999 has been used.
Comparing the rainfall-runoff ratios for the different stages of the growing season of 1999 it
appears that for almost all alley treatments there was a rather large decrease of runoff over the
growing season. This is illustrated by the regression data in Table 6.3.
Table 6.3 Regression data for rainfall-runoff relation (runoff = a*rain + b, with rain and runoff as
depth in mm, R % = runoff/rain, n = sample size) for runoff plots of 5m2
, slope length 6.25m, with
and without a barrier, for the different growing stages of the season, at Gampela, Burkina Faso,
1999.
plot crop stage alley barrier R % a b −b/a r2
n
12C development bare without 54,4 0,83 −6,18 7,49 0,97 15
12C mid season crop without 40,6 0,61 −3,76 6,14 0,86 22
12C late season crop without 25,7 0,49 −3,02 6,15 0,85 8
8D development bare Andropogon 38,3 0,41 −0,65 1,57 0,69 15
8D mid season crop Andropogon 33,7 0,64 −5,47 8,6 0,87 22
8D late season crop Andropogon 16 0,27 −1,4 5,23 0,72 8
15D development bare Andropogon 7 0,12 −1,09 9,1 0,93 15
15D mid season crop Andropogon 3,6 0,07 −0,7 9,41 0,66 22
15D late season crop Andropogon 2,7 0,05 −0,23 5,12 0,8 8
12B development bare Ziziphus 30,7 0,51 −4,37 8,64 0,93 15
12B mid season crop Ziziphus 29,7 0,61 −5,79 9,44 0,68 22
12B late season crop Ziziphus 17,8 0,35 −2,27 6,42 0,93 8
13B development bare Ziziphus 41,2 0,63 −4,88 7,69 0,97 15
13B mid season crop Ziziphus 27 0,48 −3,83 8 0,87 22
13B late season crop Ziziphus 16,5 0,33 −2,13 6,44 0,84 8
3B development bare Agave 36,1 0,63 −5,83 9,31 0,96 15
3B mid season pasture Agave 21,8 0,46 −4,43 9,62 0,77 22
3B late season pasture Agave 12,2 0,27 −1,89 7,04 0,86 8
17B development bare Agave 20,6 0,41 −4,44 10,88 0,87 15
17B mid season pasture Agave 13,6 0,3 −3,04 9,98 0,74 22
17B late season pasture Agave 3,5 0,06 −3,84 5,94 0,89 8
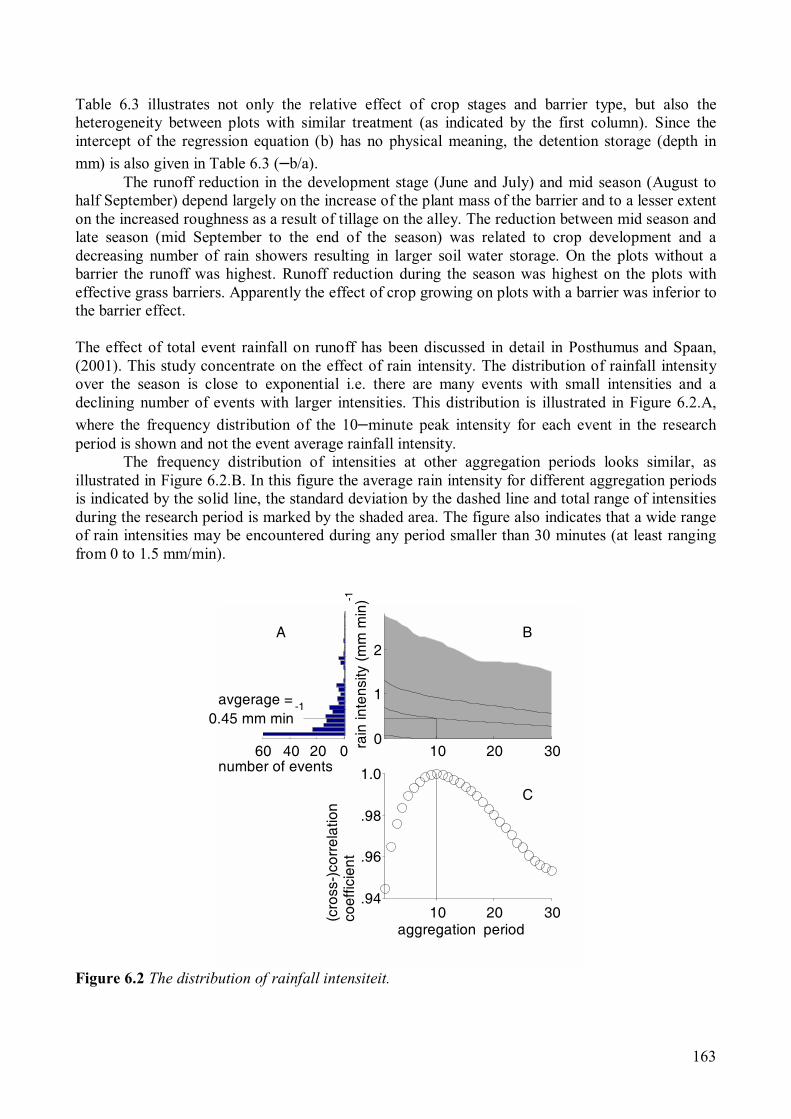
163
Table 6.3 illustrates not only the relative effect of crop stages and barrier type, but also the
heterogeneity between plots with similar treatment (as indicated by the first column). Since the
intercept of the regression equation (b) has no physical meaning, the detention storage (depth in
mm) is also given in Table 6.3 (−b/a).
The runoff reduction in the development stage (June and July) and mid season (August to
half September) depend largely on the increase of the plant mass of the barrier and to a lesser extent
on the increased roughness as a result of tillage on the alley. The reduction between mid season and
late season (mid September to the end of the season) was related to crop development and a
decreasing number of rain showers resulting in larger soil water storage. On the plots without a
barrier the runoff was highest. Runoff reduction during the season was highest on the plots with
effective grass barriers. Apparently the effect of crop growing on plots with a barrier was inferior to
the barrier effect.
The effect of total event rainfall on runoff has been discussed in detail in Posthumus and Spaan,
(2001). This study concentrate on the effect of rain intensity. The distribution of rainfall intensity
over the season is close to exponential i.e. there are many events with small intensities and a
declining number of events with larger intensities. This distribution is illustrated in Figure 6.2.A,
where the frequency distribution of the 10−minute peak intensity for each event in the research
period is shown and not the event average rainfall intensity.
The frequency distribution of intensities at other aggregation periods looks similar, as
illustrated in Figure 6.2.B. In this figure the average rain intensity for different aggregation periods
is indicated by the solid line, the standard deviation by the dashed line and total range of intensities
during the research period is marked by the shaded area. The figure also indicates that a wide range
of rain intensities may be encountered during any period smaller than 30 minutes (at least ranging
from 0 to 1.5 mm/min).
Figure 6.2 The distribution of rainfall intensiteit.
60 40 20 0
number of events
avgerage =
0.45 mm min
-1
A
ra
in in
te
nsity (m
m m
in)
-1
B
10 20 30
0
1
2
10 20 30
.94
.96
.98
1.0
(cro
ss-)co
rre
latio
n
co
effic
ien
t
aggregation period
C

164
In this study a period of 10 minutes has been used as the aggregation period to calculate a peak-
intensity for an event. The selection of 10 minutes as an aggregation period is based on the
consideration that an aggregation period can not be too long, since this does render many short but
significant events unusable in the subsequent analysis. Use of a 10−minute period made it possible
to include 92% of the events in this study. This number decreases rapidly for larger periods (when
using a 30−minute period it is approximately 45% of the events). In addition, it appears that the
intensity for any aggregation period between 1 and 30 minutes is strongly correlated to the intensity
of other aggregation periods (within the same event), for that reason the exact choice of an
aggregation period is not critical. The cross-correlation between the 10−minute intensity and
intensities for other aggregation periods (ranging from 1 to 30 minutes) is shown in Figure 6.2.C.
Note that by definition the correlation coefficient is 1 for a 10 minute aggregation period. The
maximum rain intensity during 10 minutes was calculated for each rain event. By plotting the
(measured−estimated) runoff against the accompanying peak intensity for each rain event a trend
can be discovered. The trend lines are shown in Figure 6.3.
Figure 6.3 Relation of the maximum 10 minutes rainfall intensity versus runoff during the season of
1999, for 5m2
plots, slope length 6.25 m, with and without barrier, at Gampela, Burkina Faso,
1999.
For plots with less effective barriers (Ziziphus and Agave) and without barrier in combination with
a crop on the alley the trend is rather obvious, an increase of runoff with increasing rain intensity.
Pasture and bare alleys in combination with less effective barriers and no barrier show more or less
the same trend. On plots with effective barriers (Andropogon) and a crop on the alley, the trend
lines have small slopes. This means that the rain intensity does not have a big influence on the
runoff. The same applies to for the combination of bare alley and the Andropogon barrier.
6.3.4 Conclusions
Crop stages have a big influence on runoff production on plots without a barrier and on plots with
less effective barriers. This is due to the increased roughness on the alley as a result of tillage and
crop development. The runoff reduction by these factors during the growing season is minimal on
slope length 6.25m
-15
-10
-5
0
5
10
15
20
25
0 20 40 60 80 100 120 140
peak intensity (mm h-1
)
me
as
ure
d - e
stim
ate
d ru
no
ff
(%
o
f ra
in
fa
ll)
without bare
without crop
without pasture
andropogon bare
andropogon crop
ziziphus bare
ziziphus crop
agave bare
agave pasture

165
plots with effective barriers. In all cases the barrier effect remains dominant over the alley
treatment.
Increase of runoff due to rain intensity is of the same importance on plots without a barrier
and on plots with less effective barriers. Effective barriers do not show large differences in runoff,
due to the high rain intensities.
References
Anonymous, 1988. Etude pédologique de la station experimentale de Gampela. Ministère de
l’Agriculture et de l’Elevage, Secretariat General, Bureau National des Sols, Ouagadougou, Burkina
Faso. Rapport Technique no 59, 279 pp., juillet 1988.
Boers, Th.M., 1994. Rainwater harvesting in arid and semi-arid zones. Phd-thesis, Agricultural
University Wageningen, 133 pp.
Casanave, A. and Valentin, C. 1992. A runoff capability classification system based on surface
features criteria in semi-arid areas of West Africa. Journal of Hydrology 130: 231−249.
Hien, F.G., 1995. La régénération de l'espace sylvo-pastoral au Sahel. Une étude de l'effet de
mesures de conservation des eaux et des sols au Burkina Faso. Tropical Resource Management
Papers no 7, Wageningen. ISBN 0926-9495
Hoogmoed, W.B. and Stroosnijder, L. , 1984. Crust forming on sandy soils in the Sahel. Rainfall
and infiltration. Soil Till. Res. 4: 5−23.
Kiepe, P., 1995. No Runoff, no soil loss: Soil and water conservation in hedgerow barrier systems.
PHd thesis, Agricultural University Wageningen, 158 pp.
Posthumus, H. and Spaan, W.P., 2001. Rainfall runoff relations for vegetation barriers in the Sahel.
Proceedings Hawaii.
Sivakumar, M.V.K. and Gnoumou, F., 1987. Agroclimatologie de l'Afrique de Ouest: le Burkina
Faso. Bulletin d'Information no
23. ICRISAT, Patancheru (Inde), 61 pp + annexes
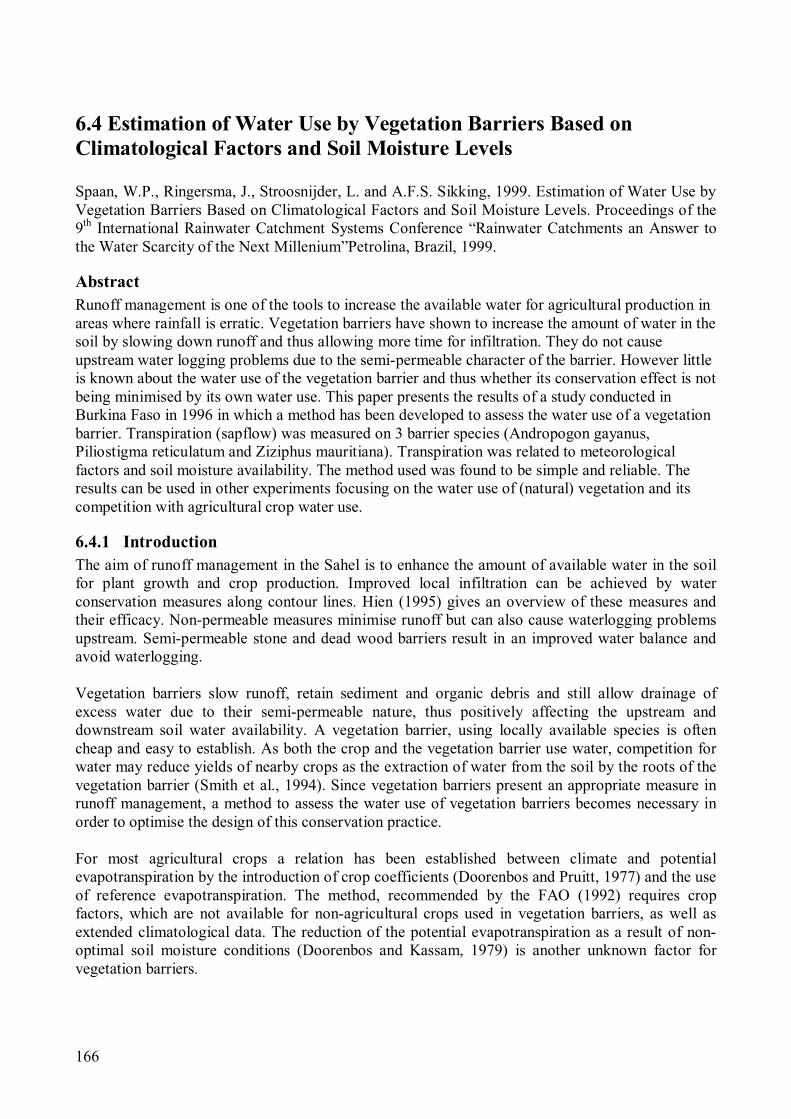
166
6.4 Estimation of Water Use by Vegetation Barriers Based on
Climatological Factors and Soil Moisture Levels
Spaan, W.P., Ringersma, J., Stroosnijder, L. and A.F.S. Sikking, 1999. Estimation of Water Use by
Vegetation Barriers Based on Climatological Factors and Soil Moisture Levels. Proceedings of the
9th
International Rainwater Catchment Systems Conference “Rainwater Catchments an Answer to
the Water Scarcity of the Next Millenium”Petrolina, Brazil, 1999.
Abstract
Runoff management is one of the tools to increase the available water for agricultural production in
areas where rainfall is erratic. Vegetation barriers have shown to increase the amount of water in the
soil by slowing down runoff and thus allowing more time for infiltration. They do not cause
upstream water logging problems due to the semi-permeable character of the barrier. However little
is known about the water use of the vegetation barrier and thus whether its conservation effect is not
being minimised by its own water use. This paper presents the results of a study conducted in
Burkina Faso in 1996 in which a method has been developed to assess the water use of a vegetation
barrier. Transpiration (sapflow) was measured on 3 barrier species (Andropogon gayanus,
Piliostigma reticulatum and Ziziphus mauritiana). Transpiration was related to meteorological
factors and soil moisture availability. The method used was found to be simple and reliable. The
results can be used in other experiments focusing on the water use of (natural) vegetation and its
competition with agricultural crop water use.
6.4.1 Introduction
The aim of runoff management in the Sahel is to enhance the amount of available water in the soil
for plant growth and crop production. Improved local infiltration can be achieved by water
conservation measures along contour lines. Hien (1995) gives an overview of these measures and
their efficacy. Non-permeable measures minimise runoff but can also cause waterlogging problems
upstream. Semi-permeable stone and dead wood barriers result in an improved water balance and
avoid waterlogging.
Vegetation barriers slow runoff, retain sediment and organic debris and still allow drainage of
excess water due to their semi-permeable nature, thus positively affecting the upstream and
downstream soil water availability. A vegetation barrier, using locally available species is often
cheap and easy to establish. As both the crop and the vegetation barrier use water, competition for
water may reduce yields of nearby crops as the extraction of water from the soil by the roots of the
vegetation barrier (Smith et al., 1994). Since vegetation barriers present an appropriate measure in
runoff management, a method to assess the water use of vegetation barriers becomes necessary in
order to optimise the design of this conservation practice.
For most agricultural crops a relation has been established between climate and potential
evapotranspiration by the introduction of crop coefficients (Doorenbos and Pruitt, 1977) and the use
of reference evapotranspiration. The method, recommended by the FAO (1992) requires crop
factors, which are not available for non-agricultural crops used in vegetation barriers, as well as
extended climatological data. The reduction of the potential evapotranspiration as a result of non-
optimal soil moisture conditions (Doorenbos and Kassam, 1979) is another unknown factor for
vegetation barriers.

167
This paper presents the results of a study conducted in Burkina Faso in which a method has been
developed to assess water use by vegetation barriers based on easily measured variables. Various
options are presented with increasing complexity and accuracy ranging from the use of a single
climatological factor, a multi-climatological factor and a combination of climate and available soil
moisture under the vegetation barrier.
6.4.2 Materials and methods
The study took place in Gampela, Burkina Faso, in 1996. Twenty-one plots of 20 x 20 m were laid
out within a 3 ha experimental site in 1994. Plots were laid in the direction of the slope, which
varied between 1.5 and 2%. At 4.5 m from the downstream side of each plot a 1 m wide vegetation
barrier was planted. Seven plant species were planted in three replications. The choice of species
was influenced by local availability, anticipated growth and soil and water conservation properties.
For the development of the water use assessment method three species were selected Andropogon
gayanus (a perennial grass), Piliostigma reticulatum (a tree), and Ziziphus mauritiana (a shrub).
Transpiration was monitored for two periods of approximately 5 days. Soil moisture content and
climatological factors were measured throughout the whole period. Transpiration measurements
started when the barriers were in the mid-season stage and since the vegetation barriers were
maintained, the biomass of the barriers remained the same over the mid-season, thus a seasonal
variation of the transpiration has not been studied.
For the measurement of transpiration use was made of the stem heat balance method (Baker and van
Bavel, 1987). The 20 m vegetation strips were divided in 4 sections according to plant size based on
visual observations. In each section the sapflow of a representative plant was monitored
continuously for 5 days and averaged every 30 minutes. Since transpiration was directly related to
the biomass of the vegetation barriers through the number of leaves on the sampled stem,
correlations found were between 0.86 and 0.99 for all observations (Figure 6.4), the transpiration of
each section could be calculated from the area of the section and the total number of leaves in the
section. The transpiration of the whole barrier was calculated from the weighted average of each
section.
Figure 6.4 Relationship between the number of leaves and transpiration for 28 July (R2
=0.98) and
14 September (R2
=0.92) of Piliostigma. Gampala, Burkina Faso, 1996.
Soil moisture was measured using a TDR tube probe. Three access tubes were placed in the
vegetation barrier and measurements were taken daily every 0.20 m to 0.8 m depth. The
measurement depth was limited to 0.8 m because of a restricting soil layer at this depth. Total soil
moisture in the profile was calculated by summing the depth of water in each layer of 0.20 m. In
order to be able to detect stress conditions for plant growth soil moisture retention curves were
made in the laboratory.
300
900
1500
2100
100 150 200 250 300 350 400
Number of Leaves
Transpiratio
n (g d-1)
28 July Pred. 14 Sept. Pred.
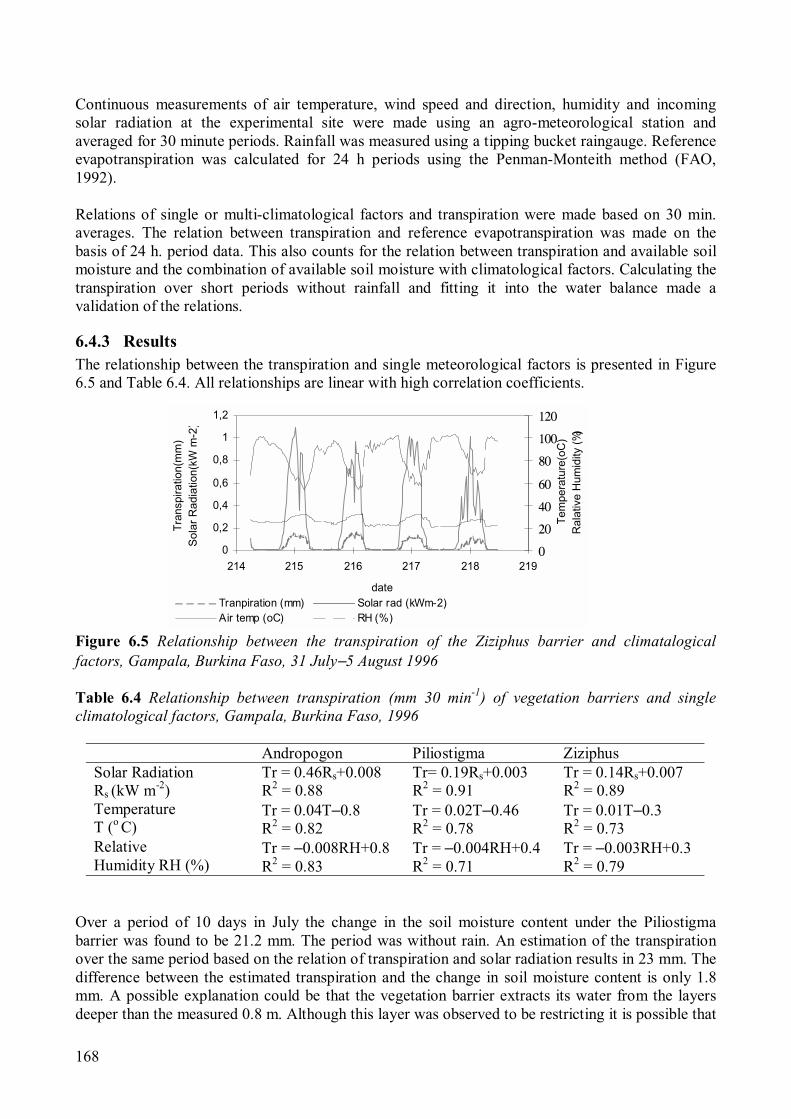
168
Continuous measurements of air temperature, wind speed and direction, humidity and incoming
solar radiation at the experimental site were made using an agro-meteorological station and
averaged for 30 minute periods. Rainfall was measured using a tipping bucket raingauge. Reference
evapotranspiration was calculated for 24 h periods using the Penman-Monteith method (FAO,
1992).
Relations of single or multi-climatological factors and transpiration were made based on 30 min.
averages. The relation between transpiration and reference evapotranspiration was made on the
basis of 24 h. period data. This also counts for the relation between transpiration and available soil
moisture and the combination of available soil moisture with climatological factors. Calculating the
transpiration over short periods without rainfall and fitting it into the water balance made a
validation of the relations.
6.4.3 Results
The relationship between the transpiration and single meteorological factors is presented in Figure
6.5 and Table 6.4. All relationships are linear with high correlation coefficients.
Figure 6.5 Relationship between the transpiration of the Ziziphus barrier and climatalogical
factors, Gampala, Burkina Faso, 31 July−5 August 1996
Table 6.4 Relationship between transpiration (mm 30 min-1
) of vegetation barriers and single
climatological factors, Gampala, Burkina Faso, 1996
Andropogon Piliostigma Ziziphus
Solar Radiation
Rs (kW m-2
)
Tr = 0.46Rs+0.008
R2
= 0.88
Tr= 0.19Rs+0.003
R2
= 0.91
Tr = 0.14Rs+0.007
R2
= 0.89
Temperature
T (o
C)
Tr = 0.04T−0.8
R2
= 0.82
Tr = 0.02T−0.46
R2
= 0.78
Tr = 0.01T−0.3
R2
= 0.73
Relative
Humidity RH (%)
Tr = −0.008RH+0.8
R2
= 0.83
Tr = −0.004RH+0.4
R2
= 0.71
Tr = −0.003RH+0.3
R2
= 0.79
Over a period of 10 days in July the change in the soil moisture content under the Piliostigma
barrier was found to be 21.2 mm. The period was without rain. An estimation of the transpiration
over the same period based on the relation of transpiration and solar radiation results in 23 mm. The
difference between the estimated transpiration and the change in soil moisture content is only 1.8
mm. A possible explanation could be that the vegetation barrier extracts its water from the layers
deeper than the measured 0.8 m. Although this layer was observed to be restricting it is possible that
0
0,2
0,4
0,6
0,8
1
1,2
214 215 216 217 218 219
date
Tra
nsp
ira
tio
n(m
m)
So
lar R
ad
iatio
n(kW
m
-2
)
0
20
40
60
80
100
120
Te
mp
era
tu
re
(o
C)
Ra
lativ
e H
um
idity (%
)
Tranpiration (mm) Solar rad (kWm-2)
Air temp (oC) RH (%)
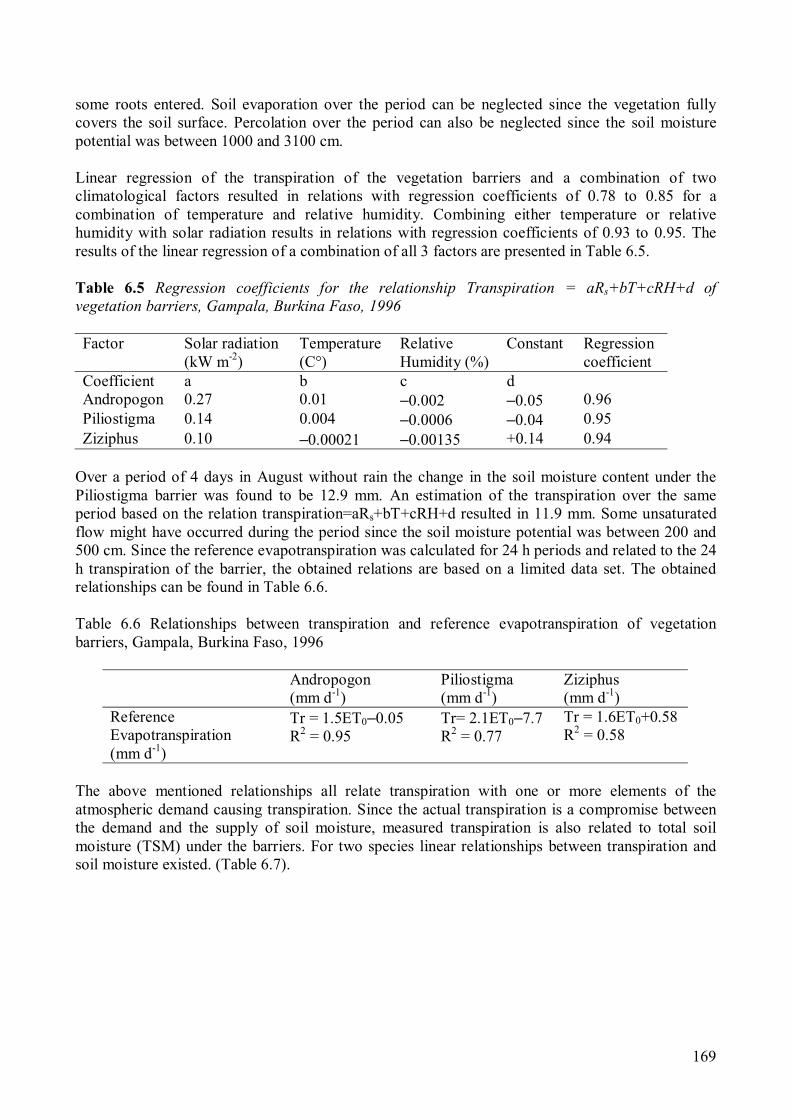
169
some roots entered. Soil evaporation over the period can be neglected since the vegetation fully
covers the soil surface. Percolation over the period can also be neglected since the soil moisture
potential was between 1000 and 3100 cm.
Linear regression of the transpiration of the vegetation barriers and a combination of two
climatological factors resulted in relations with regression coefficients of 0.78 to 0.85 for a
combination of temperature and relative humidity. Combining either temperature or relative
humidity with solar radiation results in relations with regression coefficients of 0.93 to 0.95. The
results of the linear regression of a combination of all 3 factors are presented in Table 6.5.
Table 6.5 Regression coefficients for the relationship Transpiration = aRs+bT+cRH+d of
vegetation barriers, Gampala, Burkina Faso, 1996
Factor Solar radiation
(kW m-2
)
Temperature
(C°)
Relative
Humidity (%)
Constant Regression
coefficient
Coefficient a b c d
Andropogon 0.27 0.01 −0.002 −0.05 0.96
Piliostigma 0.14 0.004 −0.0006 −0.04 0.95
Ziziphus 0.10 −0.00021 −0.00135 +0.14 0.94
Over a period of 4 days in August without rain the change in the soil moisture content under the
Piliostigma barrier was found to be 12.9 mm. An estimation of the transpiration over the same
period based on the relation transpiration=aRs+bT+cRH+d resulted in 11.9 mm. Some unsaturated
flow might have occurred during the period since the soil moisture potential was between 200 and
500 cm. Since the reference evapotranspiration was calculated for 24 h periods and related to the 24
h transpiration of the barrier, the obtained relations are based on a limited data set. The obtained
relationships can be found in Table 6.6.
Table 6.6 Relationships between transpiration and reference evapotranspiration of vegetation
barriers, Gampala, Burkina Faso, 1996
Andropogon
(mm d-1
)
Piliostigma
(mm d-1
)
Ziziphus
(mm d-1
)
Reference
Evapotranspiration
(mm d-1
)
Tr = 1.5ET0−0.05
R2
= 0.95
Tr= 2.1ET0−7.7
R2
= 0.77
Tr = 1.6ET0+0.58
R2
= 0.58
The above mentioned relationships all relate transpiration with one or more elements of the
atmospheric demand causing transpiration. Since the actual transpiration is a compromise between
the demand and the supply of soil moisture, measured transpiration is also related to total soil
moisture (TSM) under the barriers. For two species linear relationships between transpiration and
soil moisture existed. (Table 6.7).
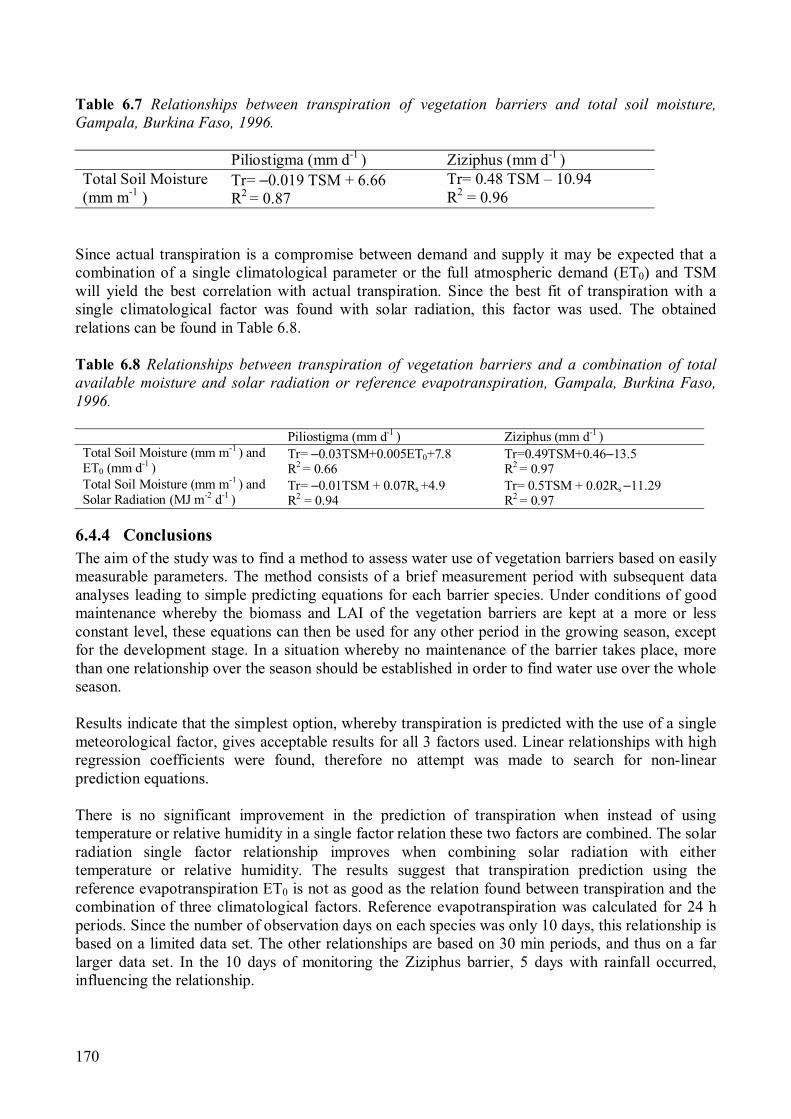
170
Table 6.7 Relationships between transpiration of vegetation barriers and total soil moisture,
Gampala, Burkina Faso, 1996.
Piliostigma (mm d-1
) Ziziphus (mm d-1
)
Total Soil Moisture
(mm m-1
)
Tr= −0.019 TSM + 6.66
R2
= 0.87
Tr= 0.48 TSM – 10.94
R2
= 0.96
Since actual transpiration is a compromise between demand and supply it may be expected that a
combination of a single climatological parameter or the full atmospheric demand (ET0) and TSM
will yield the best correlation with actual transpiration. Since the best fit of transpiration with a
single climatological factor was found with solar radiation, this factor was used. The obtained
relations can be found in Table 6.8.
Table 6.8 Relationships between transpiration of vegetation barriers and a combination of total
available moisture and solar radiation or reference evapotranspiration, Gampala, Burkina Faso,
1996.
Piliostigma (mm d-1
) Ziziphus (mm d-1
)
Total Soil Moisture (mm m-1
) and
ET0 (mm d
-1
)
Tr= −0.03TSM+0.005ET0+7.8
R2
= 0.66
Tr=0.49TSM+0.46−13.5
R2
= 0.97
Total Soil Moisture (mm m-1
) and
Solar Radiation (MJ m-2
d-1
)
Tr= −0.01TSM + 0.07Rs+4.9
R2
= 0.94
Tr= 0.5TSM + 0.02Rs−11.29
R2
= 0.97
6.4.4 Conclusions
The aim of the study was to find a method to assess water use of vegetation barriers based on easily
measurable parameters. The method consists of a brief measurement period with subsequent data
analyses leading to simple predicting equations for each barrier species. Under conditions of good
maintenance whereby the biomass and LAI of the vegetation barriers are kept at a more or less
constant level, these equations can then be used for any other period in the growing season, except
for the development stage. In a situation whereby no maintenance of the barrier takes place, more
than one relationship over the season should be established in order to find water use over the whole
season.
Results indicate that the simplest option, whereby transpiration is predicted with the use of a single
meteorological factor, gives acceptable results for all 3 factors used. Linear relationships with high
regression coefficients were found, therefore no attempt was made to search for non-linear
prediction equations.
There is no significant improvement in the prediction of transpiration when instead of using
temperature or relative humidity in a single factor relation these two factors are combined. The solar
radiation single factor relationship improves when combining solar radiation with either
temperature or relative humidity. The results suggest that transpiration prediction using the
reference evapotranspiration ET0 is not as good as the relation found between transpiration and the
combination of three climatological factors. Reference evapotranspiration was calculated for 24 h
periods. Since the number of observation days on each species was only 10 days, this relationship is
based on a limited data set. The other relationships are based on 30 min periods, and thus on a far
larger data set. In the 10 days of monitoring the Ziziphus barrier, 5 days with rainfall occurred,
influencing the relationship.
171
The influence of the available soil moisture on transpiration could be established for 2 species
(Piliostigma and Ziziphus) only. The restriction of limited data sets also counts for these
relationships. A more extended data set will improve these relationships and probably a relationship
for Andropogon can be found when more data become available. The combination of solar radiation
and available soil moisture results in the best prediction of barrier transpiration.
References
Baker, J.M. and van Bavel C.H.M. (1987) Measurement of mass flow in stems of herbaceous
plants. Plant Cell and Environment 10: 777−782
Doorenbos, J. and Pruitt, W.O. (1977) Guidelines for predicting crop water requirements, FAO
Irrigation and Drainage Paper 24, Rome
Doorenbos, J. and Kassam, A.H. (1979) Yield response to water, FAO Irrigation and Drainage
Paper 33, Rome
FAO (1992) Report on the expert consultation on the revision of the FAO methodologies for crop
water requirements, Land and water development division, FAO, Rome
Hien, F.G. (1995) La régénération de l’espace silvo-pastoral au Sahel, Tropical Resource
Management Papers 7, Wageningen Agricultural University, Wageningen, The Netherlands
Smith, D.M., Jarvis, P.G. and Odongo, J.C.W. (1994) Water use by Sahelien windbreak trees,
Presentation at The International Symposium on Wind Erosion in West Africa: the Problem and its
Control, December 5−7, Hohenheim University, Stuttgart, Germany

172
6.5 Implementation of contour vegetation barriers under farmer
conditions in Burkina Faso and Mali
W.P. Spaan, F. Bodnár, O. Idoe and J. De Graaff. Implementation of contour vegetation barriers
under farmer conditions in Burkina Faso and Mali (Submitted to: Quarterly Journal of International
Agriculture).
Abstract
Amongst the soil and water conservation (SWC) measures adopted in Burkina Faso and Mali,
contour vegetation barriers (CVB) constitute a cheap option in terms of labour and material
requirements. In order to understand the actual adoption and maintenance of CVB, labour
requirements of five commonly adopted CVB species were evaluated: Andropogon gayanus,
Ziziphus mauritiana, Piliostigma reticulatum, Euphorbia balsamifera and Jatropha curcas.
Labour requirements for the installation of 100 m CVB varied from 7-8 man-days when using
cuttings or direct sowing to 15 man-days when installed from nursery seedlings, excluding 8 days
for the installation of a dead fence. Maintenance takes 2-4 days per 100m. Phasing the installation
over several years is an option to overcome labour constraints. Low labour requirements for
establishment and management do not explain the rather low adoption and poor maintenance of
vegetation barriers. Labour requirements for CVB are lower than for stone rows, which explains the
greater enthusiasm by farmers, but the establishment of barriers coincides with the start of the
growing season. Farmers mostly choose CVB species and planting methods with low labour
requirements but prefer species with additional benefits such as thatching grass, oil for soap making
and fodder and fruits.
Key words: Contour vegetation barrier, installation, management, labour requirements, adoption,
farmer conditions.
Introduction
In the Sahel with its gentle slopes and very little cover in the dry season, line interventions along the
contour constitute the major soil and water conservation measures. These can either be mechanical
(e.g. soil bunds, stone lines) or vegetative barriers. The former are generally more costly than the
latter, in terms of construction materials, labour requirements, etc. (De Graaff and Spaan, 2002)
In selected areas of the Central Plateau in Burkina Faso, rainfall varies from 600 to 900 mm
(Vlaar, 1992). The cultivated area is protected with three erosion control practices, namely stone
rows, earth bunds and grass strips (usually consisting of Andropogon gayanus), respectively on 35
%, 5 % and 20 % of the cultivated area (De Graaff, et al., 2001). In South Mali, between 1986 and
2000, 22.000 km of live fences were installed by 17% of the farmers. In the northern part, with
annual rainfall varying from 700 to 1000 mm, Euphorbia balsamifera is the main species, while in
the southern and western part, with rainfall up to 1200 mm, Jatropha curcas is the main species.
Grass strips of Andropogon gayanus were adopted only by 3% of the farmers (CMDT-SE, 2000,
CMDT-DDRS 2001).
A contour vegetation barrier (CVB) is a soil and water conservation measure for sloping
land, which in addition provides useful products and enriches the soil. For small scale farmers with
little external resources vegetative measures are cost effective (De Graaff and Spaan, 2002). CVB is
particularly useful in areas of dense population or limited access to off-farm resources (Rocheleau
et al., 1988).
There are various ways in which farmers can install and manage a CVB. This is related to
farmers’ objectives, their farm size, the species, planting method, timing of installation, plant
density, intervals, degree of protection, weeding, pruning, etc. All these scenarios have different

173
labour and financial requirements and result in a different performance as a SWC barrier, and in
different additional benefits. In this paper the focus will be mainly on the labour requirements of
CVBs under a few different circumstances. Five hypotheses were tested:
• High total labour requirements for CVB installation and management form a constraint for
adoption by farmers.
• Labour requirements for CVB interfere with high labour requirements for agricultural
activities at the start of the rainy season and therefore result in low adoption by farmers.
• Farmers’choice of CVB species and planting method can be explained by labour
requirements.
• Labour requirements for CVB are lower than for physical structures such as stone rows,
leading to a higher adoption of CVB.
• Phasing the installation of CVB over several years is a solution to overcome the labour
constraints.
To test the above-mentioned hypotheses, five of the more important species in Burkina Faso and
Mali will be analysed, with regard to their establishment and maintenance under farmer conditions:
• Andropogon gayanus, a perennial grass used for thatching, propagated from slips and by
direct sowing. It survives browsing, is used in Burkina Faso and Mali, and needs more than
500 mm annual rainfall (Fiche de Technique CMDT, 1995).
• Ziziphus mauritiana, a small thorny fruit tree, propagated from nursery seedlings. This tree
needs protection from browsing during the first 2-3 years, is used in Burkina Faso, and
needs at least 420 mm annual rainfall (Spaan, unpublished).
• Philiostigma reticulatum, a small tree, propagated by transplanting wildlings or by nursery
seedlings. It is not browsed, is used in Burkina Faso and needs more than 400 mm annual
rainfall (Spaan, unpublished).
• Euphorbia balsamifera, a perennial shrub, propagated from cuttings. It is not browsed, is
used in Mali and needs at least 200 mm annual rainfall.
• Jatropha curcas, a perennial shrub, of which the oil from its seed is used for soap
production and which is propagated from cuttings and direct sowing. It is not browsed, is
used in South Mali and needs at least 600 mm annual rainfall.
All these 5 species are actually used by farmers and their success rates of establishment are
satisfying.
Installation of CVB
Vegetation barriers
Contour vegetation barriers may be established by maintaining strips of vegetation when clearing
new fields, particularly when natural vegetation consists of bush thickets. This technique has the
advantage of requiring little labour, while preserving some indigenous woodland and bush-land
(Rocheleau et al., 1988).
The second method requiring limited labour is to leave the tilled strip to develop natural
vegetation spontaneously. In the first year annuals appear in this barrier. These annuals are crowded
out in the subsequent years by perennials (Spaan and Nibbering, 1998).
The third method is to establish a completely new barrier usually along the contour. In other
cases, the straight upper and lower field boundaries, more or less perpendicular on the slope, are
considered for planting CVB.
174
Planting method of CVB
The establishment techniques depend on the selected species and the local ecological conditions.
The main propagation methods are: a) direct sowing, b) use of cuttings, c) planting of nursery
seedlings. Direct sowing is cheaper and faster but will only give satisfying results for a limited
number of species. Planting cuttings is also fast and cheap, except for the transport cost, and it gives
satisfying results for the species for which it is possible. Planting nursery seedlings is much more
expensive but the results can be good, even in dryer areas, for a wide range of species. The choice is
a compromise between various factors, such as the costs of planting, the survival rate and the
quality and speed of establishment.
Direct sowing
Direct sowing would appear the most convenient method in vegetative activities where a high plant
density is required and other methods of propagation become costly and inconvenient. The seeds
should exhibit a high germination rate under field conditions, with rapid development from the
seedling stage (Le Houérou, 1980a). Seeds are less bulky and can therefore be distributed efficiently
and at lower costs than cuttings or nursery seedlings. In general seed collection is not a problem,
neither for exotic nor for local species (Maydell, 1983). However, when new plant species are
introduced, seeds are frequently short in supply. Seeds can be sown with a minimum of preceding
soil tillage.
Cuttings
Some species are suitable for propagation by cuttings from stem, roots, root stalks or from young
branches. Propagation by cuttings can be practised in nurseries or directly in the field. An advantage
is that cuttings can be planted previous to the rainy season (Hummel en Jansens, 1987). However
the survival rate will be much lower (Kaya et al., 1994). A narrow and shallow groove, made by a
plough, will suffice for the planting of cuttings. The introduction of a species propagated by
cuttings is costly when plants have to be bought in other regions and transported to the area under
consideration. Once introduced, plant material is abundantly available, and cuttings become cheap.
Nowadays, in almost any village in South Mali, either Euphorbia or Jatropha can be found.
Nursery seedlings
Although more expensive, seedlings from nurseries are often preferred, especially in dryer areas,
since the chances of success are far higher. The reason is that the competition between seedlings
can be more effectively reduced or eliminated. Planting densities can be low, and it is possible to
provide watering one or more times, which will help the young plants to develop quickly (Le
Houérou, 1980b). The advantages of nursery seedlings over other propagation techniques include a
prolonged planting period, a higher survival and a faster initial growth. The young plants should be
about 75 to 100 days old when they are transplanted and should not exceed 20 to 25 cm in height.
For nursery seedlings, planting holes of 30 x 30 x 30 cm have to be dug. The availability of
seedlings can be limited by transport problems in the rainy period when roads are not easy passable.
An alternative for farmers is to produce the seedlings themselves in private nurseries (Van den
Berg, 1982) and they may eventually be cheaper than buying seedlings. Nursery work includes the
construction of an enclosure, mixing soil, filling pots, sowing, watering twice a day, weeding and
thinning. ICRAF estimated the labour needed in the tree nursery for the production of 200 plants,
enough for 100 meter CVB, at 4-5 man-days (ICRAF, 1996).
Plant density in the CVB and distance between CVB
Plant spacing and density within the barriers depend on the species and management requirements.
Under farmer conditions plant density in CVB is often lower than required for an optimal erosion
175
barrier. This is mainly due to poor establishment and low survival rate in the first year, and lack of
maintenance in the subsequent years. The position and spacing of barriers depend on plant species,
climate, slope, soil conditions, etc. For the effectiveness of the system, the two most important
factors are the width of the barriers and the intervals between them (Rocheleau et al., 1988). The
distance between two CVB lines is often much larger than the optimum under experimental
conditions. In Mali, many farmers are willing to plant CVB on their field boundaries, but only very
few are willing to plant them inside their fields. They do not want to give up land and do not want
to be hindered during mechanised ploughing and weeding. The actual implementation of CVB by
farmers is a compromise between the technical desired erosion control performance and the
practical feasibility under farmer conditions. In other words farmers often go for adaptation in the
adoption of CVB. When planted on the boundaries and with an average field size of 4 hectares, the
distance between CVB is about 200 meters, if all farmers have installed them. In reality, only few
farmers install CVB so the actual interval will be even larger.
Soil preparation
Soil preparation is a necessity to remove the existing vegetation and to prevent competition during
barrier development. It is generally done by tillage along the contour to roughen the surface and
additionally to encourage infiltration of runoff water for enriching soil water and promoting
germination and growth. Tillage with an ox-plough of 100 m plant strip needs less than an hour,
tillage by hand 1 man-day. Demarcating a contour line of 100 m takes about 1 man-day (Hijkoop et
al., 1989). In South Mali vegetation barriers are often planted along the existing field boundaries, so
no extra labour for demarcation is needed.
Protection from animals
Establishment of agroforestry measures is only possible when at least a temporary but complete
protection against uncontrolled grazing of free roaming cattle is warranted (Oldeman, 1981).
Disintegration of local institutions and lack of efficient modern organisations make it possible for
individuals to exploit the common property and hamper co-ordination of communal interventions.
On the other hand resource poor people may not be able to protect the vegetative measures from
animals, since establishment of CVB always implies an initial intensification of labour input (dead
fences, guard-duty).
Protection by a dead fence can be more feasible where farmers want to protect their small
vegetable or cassava gardens, but will be practically impossible for large fields where traditionally
animals are allowed to graze on the stubble after crop harvest. Material for dead fences (thorny
branches) is collected in the nearby environment. Bonkoungou et al., (1996) explain however that
the continuous withdrawal of material for dead fences is not sustainable and that some species have
been dramatically reduced or have disappeared at some places.
Protection by regulation is also possible but requires a collective collaboration between
farmers and herdsmen.
Management of the installed CVB
Weeding
To avoid competition between barrier plants and weeds, weeding is a necessity during the rainy
seasons of the first 3 years. The weeding action has to be repeated 2 to 3 times during the growing
season. ICRAF (1996) estimates that one day is needed in the first year to weed 100 m of CVB in
case of nursery seedlings. It can be assumed that more time will be needed for a directly sown CVB.
176
Survival rate
According to literature from the beginning of the 1990s, germination rates for direct sowing were
often rather low (Hien and Zigani, 1994; Hien, 1991). Newer publications report of germination
rates between 80 and 90 %. This improvement may be due to training and to better collection and
storing techniques and better timing of the planting operation. The “Centre National de Semences
Forestières” (CNSF) in Burkina Faso guarantees in its leaflets a germination result of 75 %.
Different factors influence the survival rate of cuttings. For Euphorbia, factors influencing
survival were the age of the mother plant, thickness of cutting, moment of collection, duration of
storage, moment of planting, planting depth, protection from animals and weeding. Cuttings of
Euphorbia with a length of 50 cm, planted to a depth of 15 cm and with a diameter of 4 cm gave the
best survival rate (60 %). During introduction in Mali, cuttings transported over long distances had
survival rates below 40%. Cuttings planted in the dry season, March-April, suffered from termite
attack while cuttings planted in the rainy season easily rotted. An average survival rate of 50% was
considered acceptable (Zeppenfeldt, 1993). For seedlings from nurseries survival rates of more than
90 % are reported. However, low and uncertain rainfall and degraded soils result in poor survival
(Kuchelmeister, 1989).
Filling gaps
To assure the functioning of the vegetation barrier, dead plants have to be replaced, preferably with
plants of the same size (Boerboom, 1981). To promote a good growth of the replant, pruning of
plant roots may be needed to limit competition between earlier established and new plants. ICRAF
(1996) estimates that one day of work is needed in the second year to replant the gaps of 100 meter
CVB. In the subsequent years, about half a day is needed.
Pruning
Once established, trees and shrubs are usually left to grow for 6 to 18 months before pruning. The
timing of pruning depends on the type of barrier species, root development, the vigour and height of
the barrier plants. Fast growing species need to be pruned every 5-6 weeks to avoid competition.
Most species however, are pruned once a year. Frequent pruning in the establishment year can have
a negative effect (die-backs).
Low cutting (15-30 cm) avoids shading of an associated agricultural crop, particularly when
the alley width is narrow. Some plant species however cannot stand low cutting. A medium height
(60 cm) may be appropriate, also making annual pruning convenient for the farmer. This is
particularly important when the farmer cannot assure pruning at the appropriate time, because of
migration and off farm activities. The height of pruning will probably be determined more by
considerations of ease and speed than by the effect of pruning on re-growth and tree longevity.
With species, which besides their main function of soil and water conservation provide other
products, pruning has to be adapted. For thatching material (Andropogon) at the end of the wet
season; for fuel wood once in the 3 to 4 years; for fodder a few times during the wet season and for
fruits (Piliostigma, Ziziphus) pruning should be very limited. In practice CVB of Euphorbia or
Jatropha are generally not pruned enough. Some CVB of Euphorbia have not been pruned for more
than 10 years and occupy at least an area of 3 meter wide, leaving an area of about 5 meters wide
where the crop does not grow well.
Labour
Labour requirements for farm household activities
It is often assumed that there is a surplus of labour in developing countries. However, for small-
scale farmers in sub-Saharan Africa, family labour is often a scarce resource (Kuchelmeister, 1989).
Table 6.9 gives a summary of the household activities in the dry and the wet season (number of

177
days per household) in villages on the Central Plateau of Burkina Faso. It shows that all persons in
the household are well occupied, with a variety of activities, also in the dry season.
Table 6.9 Summary of the household activities in the dry and the wet season (number of days per
household) in six villages on the Central Plateau of Burkina Faso (1992-1994).
Dry season Wet season Whole year
Farm household activities Days % days % Days %
Agriculture 36 5 475 50 511 29
Livestock* 192 24 221 23 413 24
Non-farm income earning activities 228 29 31 3 259 15
Migration/work elsewhere 117 15 31 3 148 8
Household activities 222 28 193 21 415 24
Total per household** 795 100 951 100 1746 100
Persons per household 9,5 9,7 9,6
Total per person 84 98 182
Source: Antenne Sahelienne agro-economic surveys 1992-1995 and De Graaff et al., 2001.
* The high labour inputs in livestock activities result from the fact that Fulani (herdsman) households constituted a
quarter of the sample, and that many children are involved in these activities.
**Including social activities, market visits, education and child care the total labour requirements per household will be
around 2500 man-days and about 250 man-days per person
The composition of households may be subject to large fluctuations over the year. Seasonal
migration of young adult men may reduce the labour supply drastically in the dry season (De Graaff
et al., 1999). In these areas in Burkina Faso on average 25 man-days per household per year were
invested in soil and water conservation activities, in the period 1992-94 (De Graaff et al., 2001).
This constituted about 1−2 % of the total labour requirements per household. In Mali, estimated
labour investments on SWC activities, per household per year, ranged from 12 man-days in 1994 in
targeted SWC villages (Schrader, et. al. 1996), to an average of only one man-day in 1998 in all
villages (CMDT-DDRS 2001).
In subsistence agriculture in the region the main interest of the farmer is on tilling crops.
Labour is first applied to work for the crops. A specification of the labour requirements (in man-day
per ha) for crops is given in Table 6.10.
Table 6.10 Crop labour requirements (in man-days per ha) on the Central Plateau, Burkina Faso.
Land
preparation
Sowing & re-
sowing
Weeding 1
st
time
Weeding 2
nd
time
Harvest Other Total *Perc. Land
occupied
Month May-June June-July June-July Aug.-Oct. Oct.-Nov. Dec.-Apr.
sorghum 12 10 12 18 15 6 73 42
millet 12 10 10 15 12 5 64 25
maize 12 10 12 18 3 6 61 2
peanuts 11 30 16 12 8 6 83 4
cowpeas 12 8 12 8 9 4 53 1
Source: Antenne Sahelienne agro-economic surveys 1992-1995 (adapted).
*The rest of the land is fallow or used for vegetable and fruit growing
178
With average yields of 500–700 kg ha-1
, 0.3–0.4 ha per person is needed to reach the subsistence
level of about 200 kg grain per head. De Graaff et al. (2001) report that on the Central Plateau of
Burkina Faso the cropping area per person is about 0.5 ha. An average household size of about 10
persons on the Central Plateau of Burkina Faso resulting in a farm size of about 5 ha. This results
in a labour need of about 350 man-days for the area under grains and about 160 man-days for other
crops (e.g. vegetables and fruits) , soil conservation and other agricultural activities.
Hijkoop et al., (1989) report for South Mali an average household size of 13 persons,
resulting in a farm size of about 5–6 ha. A study by Dembele et al. (1997) shows that in South Mali
agricultural and livestock activities require more than twice the amount of labour in the wet season
than in the dry season (from December until May). Women spend less labour on agricultural
activities than men, but have a higher overall workload (Table 6.11). The study shows that both
men and women are well occupied, and that the overall work load does not differ very much by
season. The busiest months are July, August and November and the slack season lasts from
January until April.
Table 6.11 Average time spent on agricultural and on all household activities, by gender and by
month (hours per person per day)
Month J F M A M J J A S O N D Tot
Activities by men (hours by person per day):
Agricultural 3 2 2 2 3 5 7 7 6 4 6 5 4,4
All activities 6 7 8 7 7 8 9 9 7 7 9 8 7,6
Activities by women (hours per person per day):
Agricultural 2 1 1 1 1 3 4 4 3 3 5 4 2,7
All activities 6 8 8 7 8 9 10 10 8 8 10 10 8,5
Activities by men and women (hours per person per day)
Agricultural 2 2 2 1 2 4 6 6 4 4 6 5 3,5
All activities 6 8 8 7 8 9 9 9 8 8 9 9 8,0
Source: Dembele et al., 1997; adapted by De Graaff.
Note: Agricultural activities include also livestock activities; All activities include apart from agricultural also trade,
artisan, hunting, collection (including fish, water, wood, etc.) and home activities.
Labour requirements for installation and maintenance of CVB
Planning of labour to establish vegetation barriers often meets problems. The choice may be to plant
very early and to be confronted with drying up of the vegetation or to plant in the first half of the
rainy season with a better chance of survival but when everybody is focussed on crop activities.
High labour peaks at the start of the rainy season (Table 6.10) often result in a late installation of the
CVB. Vegetative line interventions have to fit into the household labour profile. In the dryer
regions, because of the short growing season, tree planting often conflicts with regular farming
activities. In those regions the planting season for both crops and vegetative measures lasts only a
few weeks. Farmers choose to spend that critical period working on food crops rather than on
vegetative measures.
The labour input for establishment and management varies considerably, depending on the
availability of planting materials (seeds, cuttings, containers), reproduction methods applied, barrier
spacing, topography, soils, skills, etc.
With an average farm size of 5 ha assuming a barrier spacing of 200 m and assuming that
not on all plots barriers will be established, the total barrier length on a farm will be about 600 m.
179
With an establishment pace of 100 m per year, six years will be needed. After that period renewing
of the barriers will start or they will gradually be replaced by more interesting species. In the first
two years extra labour is needed for training, establishment of nurseries and eventually for
establishment of dead fences. Based on a diversity of technical project papers from the Sahel, an
estimation of the labour requirements for different establishment and management actions for 100
m contour vegetation barrier, per year over a two-year period, is given in Table 6.12. Seedlings are
used for Piliostigma and Ziziphus, cuttings for Andropogon (slips), Euphorbia and Jatropha, and
seed for Andropogon, Jatropha and Ziziphus.
Table 6.12 Estimated labour requirements of a two year sequence (in man-days) for training,
establishment and maintenance of vegetative measures, based on the establishment of 100 m CVB
per year.
Month J F M A M J J A S O N D Y1 Y2
Seedling Training nurs. 1 1
Estab_nursery 2 2
Prep. Plant pots 1,1 1 1
Maint_nursery 2,2 2,2 4 4
Train. Planting 1 1
Prep. plant lines 1,1 1 1
Digging holes 2,2 2 2
Planting 1,1 1 1
Weeding 1,1 1,1 2 2
Pruning 1 1 2
Total: 4,1 2,2 2,2 2,1 3,4 1,1 1,1 1 15 13
Cuttings Train. planting 1 1
Collect cuttings 1,1 1 1
Prep. plant lines 1,1 1 1
Soil tillage 1,1 1 1
Plant cuttings 1,1 1 1
Weeding 1,1 1,1 2 2
Pruning 1 1 2
Total 3,2 2,3 1,1 1,1 1 7 8
Seed Training 1 1
Collect seeds 1,1 1 1
Prep. plant lines 1,1 1 1
Soil tillage 1,1 1 1
Direct drilling 1,1 1,1 2 2
Weeding 1,1 1,1 2 2
Pruning 1 1 2
Total 2,1 2,3 2,2 1,1 1 1,1 8 9
Extra: Dead fence 5,8 3,5 8 13
Sources: Van den Ende and Geuze, 1999; Hijkoop et al, 1989; Idoe, in prep.; ICRAF, 1996.
Notes: The first straight figure represents labour needs in first year, the figure in italics and bold
represent the second year.
For tillage, drilling and weeding half-a-man-day often suffices; it has been rounded off to one; tillage with a plough
requires only one hour.
The preparation of planting lines is not required when planting is along the field boundary.
Labour requirements for the establishment and management of 100 m CVB are for all three
propagation methods in both years less than the 25 man-days spent on average per household per
year on soil and water conservation measures in Burkina Faso (De Graaff et al., 2001). Only in the
exceptional case that a dead fence is required for Ziziphus propagated with seedlings, the total
annual labour requirements would be about 25 man-days per household.
180
The labour requirements for the establishment are also considerably less than those for stone rows,
which depending on the length of rows, type of terrain, distance of quarries and means of transport
of stones (cart or lorry) vary from a low of 51 to a high of 166 man-days per ha per year (De Graaff,
1996). While the maintenance costs of stone rows are low, they provide less additional benefits
than CVB (e.g. thatching material, fruits).
Adoption
Factors influencing adoption
There are many factors that influence farmers to adopt soil and water conservation measures.
Farmers have first to recognise erosion symptoms, take the negative erosion effects seriously and
have had the opportunity to see some successful examples of measures in their neighbourhood.
Low adoption rates can also be due to land shortage and the lack of land tenure security. Adoption
rates are often also related to the availability of labour and material inputs and the presence of
effective extension and training services.
Bodnar and De Graaff (2002) have investigated the factors that influence the adoption of SWC
measures in southern Mali. They compare the adoption of the three measures: live fences, stone
rows and grass strips, and consider different stages of adoption: first installation, completion (in the
sense of fully protecting the visited field), maintenance and planning further installation (either to
protect the same field or other fields).
It appeared that only a minority of the adopters have SWC measures that are complete and well
maintained. There were some clear differences in adoption of the three measures:
• Live fences: Farmers adopt live fences more than other measures. A majority of farmers,
adopters and non-adopters, plan to install live fences in the future. However, live fences are
less complete and less maintained than the other two measures. On average live fences were
for 64% still intact.
• Stone rows: Farmer adoption of stone rows is between that of live fences and that of grass
strips. A minority of farmers, adopters and non-adopters, plan to install stone rows in the
future. Stone rows are more complete and better maintained than the other measures. Stone
rows are for 87% still intact.
• Grass strips: Farmers adopt grass strips less than any other measure. A minority of non-
adopters plan to install grass strips in the future, but a majority of the adopters plan to
continue installation of grass strips. Grass strips are often incomplete but usually well
maintained. Grass strips are for 80% intact.
The following factors had a major influence on adoption:
• In high land pressure areas farmers adopt more SWC practices.
• There does not seem to be a clear effect of cash crop growing (cotton) on adoption of SWC.
The fact that farmers in the non-cotton growing area are generally poorer and less equipped
and cultivate in a relatively flat and dry area, does not decrease SWC adoption. On the
contrary, more live fences are installed in the non-cotton growing area.
• Farm families with more ploughing equipment adopt more SWC measures. This could be
due to their higher availability of time and money to invest in SWC.
• Most farmers have a donkey (or horse) cart. There seems to be a positive effect on the
adoption of grass strips, but this is not significant.

181
• The training of a village team on erosion control measures increased the adoption of erosion
control measures, especially stone rows. The additional training on soil fertility increased
adoption of both erosion control and soil fertility measures, but its effect is less pronounced
than the effect of the training on erosion control measures.
On the Central Plateau of Burkina Faso, stone rows as the major soil and water conservation
measure, have been adopted on a large scale, thanks to the stone transport facilities made available
by projects and government agencies in the area.
The adoption of CVB
An important constraint for CVB, is that planting material is often limited to a few species and that
the quality is often low. The short-term benefits in terms of improved crop yield may not be
convincing, certainly not when the CVB is not properly established and maintained. The
establishment of vegetation barriers is only possible when there is certainty about property rights
(Hummel and Jansens, 1987) and external factors such as marketing and safety.
During the installation phase, extension and training are important means to involve farmers
in the establishment process of vegetation barriers. Besides exchange of knowledge participation is
of prime importance. The choice of species used in CVB has strongly been determined by the
approach of the village conservation work. When conservation work started in a new village in
Mali, first priority was given to stone rows above the fields, then to Euphorbia and Jatropha hedges
around the fields, and finally to Andropogon strips in the field. Many stone rows and live fences
have been planted but often it never came as far as planting Andropogon.
One of the reasons of the poor performance of CVB on farmer’s land (after installation) is
that CVB (from Euphorbia and Jatropha) are often planted as demarcation of a farmer’s territory, to
avoid property conflicts with the neighbours, and only in the second place as erosion barrier.
In Mali, farmers prefer Jatropha and Andropogon above Euphorbia. Some farmers replace
Euphoria by Jatropha, which is often planted on request by women. The limitation of Jatropha is the
rainfall, as it doesn’t grow in dryer areas, where Euphorbia still grows.
Labour requirements for CVB is just one of the many constraints in its adoption. While on
the one hand CVB require much less labour than physical measures, its installation period coincides
with the period of peak labour demand for the crops, at the start of the rainy season.
There are, finally, also certain positive factors, that may enhance the adoption of CVB.
These conservation measures not only yield additional benefits such as fruits, fodder, fuelwood,etc.,
but the planting of trees or border hedges is often also regarded as the first step in claiming
ownership of land.
Conclusions
Contour vegetation barriers constitute an important soil and water conservation measure in the
Sahel. There are various forms of the barriers, which among others relate to the species used. Five
of the major species in the area have been considered here, as typical examples. Attention has been
paid to the installation, management and adoption of these CVB, whereby special emphasis was
given to the labour requirements.
In the introduction five different hypotheses have been formulated with regard to labour
requirements of CVB. These have been tested, whereby the following conclusions can be drawn:
• Labour requirements for establishment of CVB are relatively low. Labour inputs vary from
7 to 15 man-days per 100 m CVB and these low inputs do not explain low adoption. Labour
requirements for CVB maintenance is also low (2 to 4 man-days per 100 m CVB) and these
do not explain the poor maintenance.
• There is indeed a labour peak at the start of the rainy seasons (days of over 8 working hours
in June – August) and in that period 3 to 4 man-days are needed for the establishment and

182
management of 100m CVB. Given the fact that some CVB can be installed with cuttings
before the rains, this is not always a reason for low adoption.
• In South Mali, the species (Euphorbia and Jatropha) and the planting methods (cuttings and
direct sowing on field boundaries) used on a large scale by farmers, do indeed require a low
labour input (7 man-days per 100 m CVB).
• Species that demand full protection against animals are hardly adopted because of the
additional labour requirements (8 to 13 man-days per 100 m CVB dead fence), unless
planted inside an already existing dead fence, often around vegetable gardens.
• The lower labour requirement for CVB as compared with the requirement for stone rows
explains the higher adoption of CVB in Mali. Only a minority of farmers, even of those who
have installed stone rows in the past, intend to install stone rows in the future, while a
majority intends to install CVB in the future.
• If establishment of CVB is phased, planting 100 m CVB per year, and use is made of
cuttings or seed, only 7-8 man-days are needed per year, which should not be a constraint. In
South Mali, most farmers have incomplete CVB and the majority of them plan to continue
installation.
In the introduction phase of CVB, a start can be made with 'easy species' with low labour
requirements on planting, protection and maintenance, gradually complemented or replaced by
more useful species with higher labour and protection requirements, that serves not only as a SWC
barrier but also provides useful products. During introduction much emphasis is needed on
awareness and training, and on organising the local availability of planting materials and the
gradually increasing variety of species.
References
Anonymus, 1983. Agroforestry in the West African Sahel. National Academy Press, Washington, D.C. 1983.
86p.
Bodnár, F. and De Graaff, J., 2003. Factors influencing adoption of SWC measures in Southern Mali.
Proceedings of the International Symposium “Effect of Land Use Management on Erosion and Carbon
Sequestration”, Montpellier, 23−28 September 2002, Réseau Erosion Bulletin 23, 11p.
Boerboom, J.H.A., 1981. Bosaanleg in tropen en subtropen. Syllabus Vakgroep Bosteelt, Landbouwuniversiteit,
Wageningen, The Netherlands.
Bonkoungou, E.G., Djimdé, M., Ayuk, E.T., Zoungrana, I. And Tchoundjeu, Z., 1998. Taking stock of
agroforestry in the Sahel ─ harvesting results for the future. End of phase report: 1989 ─1996.
International Centre for Research in Agroforestry, P.O. Box 30677, Nairobi, Kenya, 58p.
CMDT, 1995. Fiche de technique bandes enherbées, 11p.
CMDT-SE, 2000. Annuaire statistique 1999/2000. Résultats de l’enquête agricole permanente.
CMDT-DDRS, 2001. Réalisations Mantien du Potentiel Productif. Résumé 1999/2000. DDRS Koutiala, 2p.
De Graaff, J., 1996. The price of soil erosion; an economic evaluation of soil conservation and watershed
development. TRMP paper no. 14. Wageningen Agricultural University, Wageningen, 300 p.
De Graaff, J., Nibbering, J.W., and J.P. Van der Mijl, 1999. Farm survey design in the Sahel; Experiences from
Burkina Faso. Quarterly Journal of International Agriculture, Vol. 38. No.1, p 35–52.
De Graaff, J., Nikiema, R., Tapsoba, G. and S. Nederlof, 2001. Socio-economic land use analysis in Sahelian
Villages. In: Agro-silvo-pastoral land use in Sahelian villages. Stroosnijder and Van Rheenen (eds).
Advances in Geoecology No. 33: 23–50.
De Graaff, J., and W.P. Spaan, 2002. The costs of soil and water conservation measures in the Sahel.
Proceedings of the Third International Congress “Man and Soil at the Third Millennium” Valencia,
2000, Eds. Rubio, Morgan, Asins and Andreu. Geoforma Ediciones, Logroňo, 2002. p 833–845.
Dembele, I., H. De Grootte and T. Hilhorst, 1997. Role de la femme dans la filière coton en zone Mali-Sud.
Rapport de recherche. CMDT, FeD, Bamako and IER, ESPGRN, Sikasso.
Hien, F., 1991. Mise en place et conduite des haies vives defensives: Aquis et perspectives de recherches au
Burkina Faso, 16p.
183
Hien, F. and Zigani, G., 1994. Selection et evaluation d’espèces arbustives pour la mise en place de haies vives
defensives au Burkina Faso, Sci. etTecn. Vol 21, no 1 1993−1994, p 31−48.
Hijkoop, J., Van der Poel, P. and B. Kaya, 1989. Une lutte de longue haleine, Aménagements anti-érosifs et
gestion de terroir. Systemes de production rurale au Mali: Volume 2. Institut Royal des Tropiques (KIT),
Amsterdam, Pays Bas, 154p.
Hummel, L. and J.W. Jansens, 1987. Lijnvormige beplantingen in de Sahel- Soudanzone. MSc-thesis
Landbouwuniversiteit, Wageningen, 108p.
Le Houérou, H.N., 1980a. The role of browse in the management of the natural grazing lands. In: Browse in
Africa. The current state of knowledge. (Ed. Le Houérou). International Livestock Centre for Africa,
P.O. Box 5689, Addis Ababa, Ethiopia, p 329–339.
Le Houérou, H.N., 1980b. Planting and management methods of browse trees and shrubs. In: Browse in Africa.
The current state of knowledge. (Ed. Le Houérou). International Livestock Centre for Africa, P.O. Box
5689, Addis Ababa, Ethiopia, p 351–360.
ICRAF, 1996. Annual report 1995, International Centre for Research in Agroforestry, PO Box 30677, Nairobi,
Kenya, 288pp.
Idoe, O. (In preparation). Labour requirements, costs and financial benefits of contour vegetation barriers in
South Mali. Work placement report. MSc-thesis, Wageningen University.
Kaya, B., Diarra, S. and A Coulibaly, 1994. Le haies vives en zone Mal-Sud: Etat actuel des connaissances
scientifiques et traditionelles. Document No. 95/05, Ministère du Développement et de
l’Environnement, 23 pp.
Kuchelmeister, G., 1989. Hedges for resource-poor land users in developing countries. Deutsche Gesellschaft fűr
Technische Zusammenarbeit (GTZ) GmbH, Technical Co-operation Federal Republic of Germany,
Eschborn 1989, 256p.
Oldeman, R.A.A., 1981. The design of ecologically sound agroforests. LH – Bosteelt, Paper presented at
ICRAF, Nairobi, 25p.
Posthumus, H., Zougmoré, R., Spaan, W.P. and J. De Graaff, 2001. Incentives for soil and water conservation in
semi-ard zones: a case study from Burkina Faso. Proceedings of the International Symposium
“Multidisciplinary Approaches to Soil and Water Conservation Strategies”, Germany, 2001, ZALF-
Bericht Nr. 47, Helming (eds.), Müncheberg, 2001, pp 91–98.
Rocheleau, D., Weber, F. and A. Field-Juma, 1988. Agroforestry in dryland Africa. International Council for
Research in Agroforestry, ICRAF House, off the Limuru road, P.O. Box 30677, Nairobi, Kenya, 311p.
Schrader, T.H. and B.H. Wennink, 1996. La lutte anti erosive en zone CMDT. Rapport du Projet LAE. CMDT,
Bamako/KIT, Amsterdam, 66p.
Spaan, W.P. and J.W. Nibbering, 1998. Hedgerows on the Central Plateau of Burkina Faso: Development and
Research. BosNiEuWsletter, Vol. 17(1), No.38, July 1998, p28–34.
Van den Berg, M., 1982. Nôtes sur l’expérimentation des haies vives dans le Tagazar. Projet de Diversification
Agricole et Haies Vives (DAHV) de Balleyara, Niger.
Van den Ende, P.G.M. and T. Geuze, 1999. Fiche de technique pour l’installation et l’entretien de la ferme
écologique. PDISAB, Koudougou, Burkina Faso, 6p.
Vlaar, J.C.J. (Ed.), 1992. Les techniques de conservation des eaux et des sols dans les pays du Sahel. Rapport
d’une étude effectué dans le cadre de la collaboration entre le Comité Interafricain d’Ėtudes
Hydrauliques (CIEH), Ouagadougou Burkina Faso, et l’Université Agronomique Wageningen (UAW),
Wageningen, les Pays Bas, 99p
Von Maydell, H.J., 1983. Arbres at arbustes du Sahel. Leur caractérestiques et leurs utilisations. Schriftreihe der
GTZ No.147, Eschborn 1983, 531p.
Zeppenfeldt, T., 1993. L’ápprovisionnement des villages dans la region de San en boutures d’Euphorbia
balsamifera ; Une description des experiences. San, CMDT.
184
6.6 Incentives for soil and water conservation in semi-arid zones:
A case study from Burkina Faso.
Posthumus, H., Zougmoré, R., Spaan, W.P. and J. De Graaff, 2001. Incentives for soil and water
conservation in semi-arid zones: a case study from Burkina Faso. Proceedings of the International
Symposium “Multidisciplinary Approaches to Soil and Water Conservation Strategies, Germany,
2001, ZALF-Bericht Nr. 47, Helming (eds.), Müncheberg, 2001, pp 91–98.
Abstract
In Burkina Faso much attention has been given to the establishment of stone rows and vegetative
barriers, to reduce runoff, soil loss and increase crop yields. Cost-benefit analyses show that the
implementation of stone rows is only profitable if projects provide free stone transport facilities.
This way, dependency is created and farmers prefer to wait for their turn to get stones. However,
soil conservation measures would become more profitable if combined with fertilisation practices.
It is therefore important to find appropriate incentives to stimulate farmers in applying more
fertilising materials. Farmers acknowledge the importance of organic and chemical fertilisation, but
often lack the materials and means. A system should be devised whereby farmers can obtain
subsidised fertilisers, after making investments in both erosion control measures and fertilisation.
The subsidy rate should gradually diminish over time.
Keywords: incentives, soil and water conservation, Burkina Faso
6.6.1 Introduction
In the Sahel, the combined effects of climatic conditions, soil quality and human activities have
resulted in (physical) soil degradation and the loss of nutrients through erosion and runoff, causing a
great threat to agricultural production. Much attention is thus paid to erosion control and soil
fertility measures with the ultimate aim of increasing on-site production and income of both the
present and future population. In Burkina Faso several soil and water conservation (SWC) projects
have been undertaken since the 1960s. These large scale and top-down projects often failed. Since
the 1980’s the CRPA's (i.e. agricultural extension centres) followed a strategy by which land is first
protected with erosion control measures, then upgraded by using manure, compost and mulching
and finally enriched with chemical fertilisers.
This paper discusses several soil and water conservation measures in Burkina Faso, and the
incentives used to make them attractive to farmers. It is mainly based on the results of several
studies on the effectiveness of SWC measures. A socio-economic research project was undertaken
on farmers’ fields in the region of Kaya, Sanmatenga (the villages Damané, Tagalla and Sidogo)
and in the region of Manga, Zoundwéogo (the villages Kaibo, Barcé and Yakin). Research was also
done on the effects of SWC measures on soil fertility and production on research sites in Kirsi and
in Gampela (Figure 6.6).
In Burkina Faso, the most common erosion control measures are the so-called line
interventions, like stone rows (cordon pierreux), grass strips / hedgerows (haies vives or bandes
vegetatives) and earth bunds (diguettes en terre). These measures can be applied alone or in
combination. The barriers are implemented along the contour lines on sloping agricultural fields. In
valley bottoms (bas-fonds) permeable stone dams (digues filtrantes) are implemented. All measures
perform more or less the same functions: reducing soil and nutrient losses, increasing infiltration (or
reducing runoff), and improvement of the soil profile upstream from the measure. These functions
can be translated into the maintenance of soil fertility and productivity. Several other so-called area
interventions, like mulching and compost use, are stimulated in order to increase soil fertility
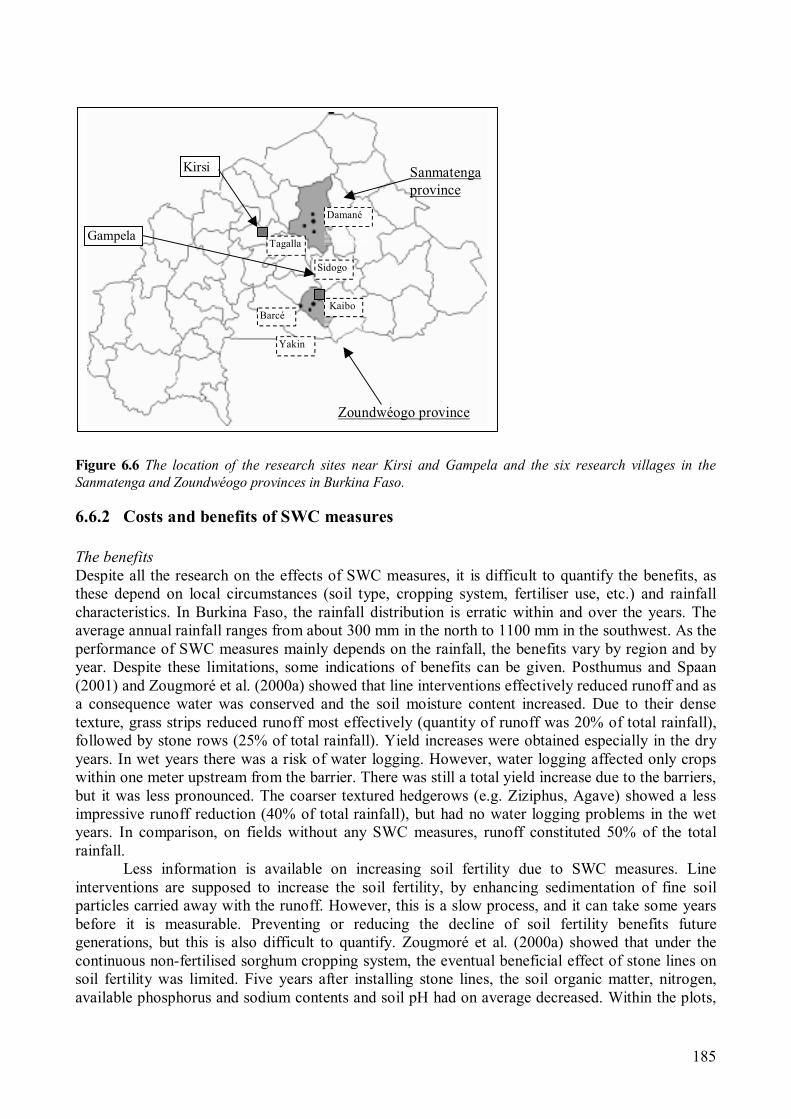
185
Figure 6.6 The location of the research sites near Kirsi and Gampela and the six research villages in the
Sanmatenga and Zoundwéogo provinces in Burkina Faso.
6.6.2 Costs and benefits of SWC measures
The benefits
Despite all the research on the effects of SWC measures, it is difficult to quantify the benefits, as
these depend on local circumstances (soil type, cropping system, fertiliser use, etc.) and rainfall
characteristics. In Burkina Faso, the rainfall distribution is erratic within and over the years. The
average annual rainfall ranges from about 300 mm in the north to 1100 mm in the southwest. As the
performance of SWC measures mainly depends on the rainfall, the benefits vary by region and by
year. Despite these limitations, some indications of benefits can be given. Posthumus and Spaan
(2001) and Zougmoré et al. (2000a) showed that line interventions effectively reduced runoff and as
a consequence water was conserved and the soil moisture content increased. Due to their dense
texture, grass strips reduced runoff most effectively (quantity of runoff was 20% of total rainfall),
followed by stone rows (25% of total rainfall). Yield increases were obtained especially in the dry
years. In wet years there was a risk of water logging. However, water logging affected only crops
within one meter upstream from the barrier. There was still a total yield increase due to the barriers,
but it was less pronounced. The coarser textured hedgerows (e.g. Ziziphus, Agave) showed a less
impressive runoff reduction (40% of total rainfall), but had no water logging problems in the wet
years. In comparison, on fields without any SWC measures, runoff constituted 50% of the total
rainfall.
Less information is available on increasing soil fertility due to SWC measures. Line
interventions are supposed to increase the soil fertility, by enhancing sedimentation of fine soil
particles carried away with the runoff. However, this is a slow process, and it can take some years
before it is measurable. Preventing or reducing the decline of soil fertility benefits future
generations, but this is also difficult to quantify. Zougmoré et al. (2000a) showed that under the
continuous non-fertilised sorghum cropping system, the eventual beneficial effect of stone lines on
soil fertility was limited. Five years after installing stone lines, the soil organic matter, nitrogen,
available phosphorus and sodium contents and soil pH had on average decreased. Within the plots,
Damané
Sidogo
Tagalla
Barcé
Yakin
Kaibo
Sanmatenga
province
Zoundwéogo province
Kirsi
Gampela
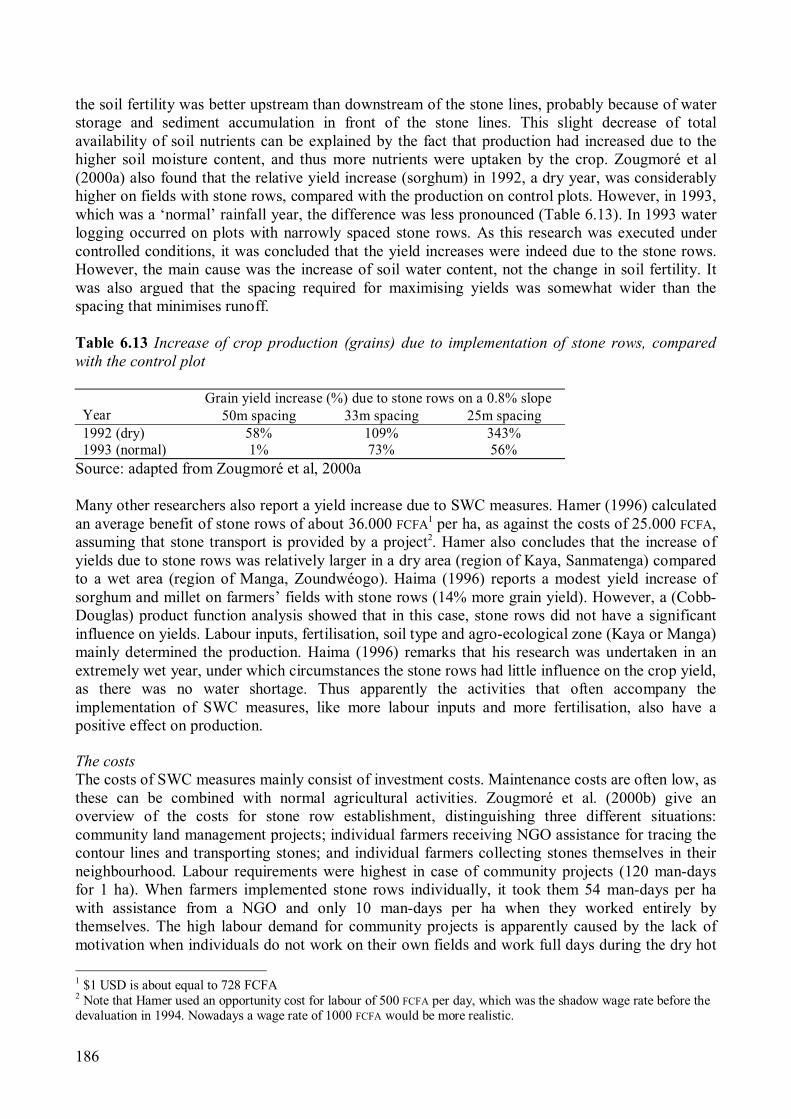
186
the soil fertility was better upstream than downstream of the stone lines, probably because of water
storage and sediment accumulation in front of the stone lines. This slight decrease of total
availability of soil nutrients can be explained by the fact that production had increased due to the
higher soil moisture content, and thus more nutrients were uptaken by the crop. Zougmoré et al
(2000a) also found that the relative yield increase (sorghum) in 1992, a dry year, was considerably
higher on fields with stone rows, compared with the production on control plots. However, in 1993,
which was a ‘normal’ rainfall year, the difference was less pronounced (Table 6.13). In 1993 water
logging occurred on plots with narrowly spaced stone rows. As this research was executed under
controlled conditions, it was concluded that the yield increases were indeed due to the stone rows.
However, the main cause was the increase of soil water content, not the change in soil fertility. It
was also argued that the spacing required for maximising yields was somewhat wider than the
spacing that minimises runoff.
Table 6.13 Increase of crop production (grains) due to implementation of stone rows, compared
with the control plot
Grain yield increase (%) due to stone rows on a 0.8% slope
Year 50m spacing 33m spacing 25m spacing
1992 (dry) 58% 109% 343%
1993 (normal) 1% 73% 56%
Source: adapted from Zougmoré et al, 2000a
Many other researchers also report a yield increase due to SWC measures. Hamer (1996) calculated
an average benefit of stone rows of about 36.000 FCFA1
per ha, as against the costs of 25.000 FCFA,
assuming that stone transport is provided by a project2
. Hamer also concludes that the increase of
yields due to stone rows was relatively larger in a dry area (region of Kaya, Sanmatenga) compared
to a wet area (region of Manga, Zoundwéogo). Haima (1996) reports a modest yield increase of
sorghum and millet on farmers’ fields with stone rows (14% more grain yield). However, a (Cobb-
Douglas) product function analysis showed that in this case, stone rows did not have a significant
influence on yields. Labour inputs, fertilisation, soil type and agro-ecological zone (Kaya or Manga)
mainly determined the production. Haima (1996) remarks that his research was undertaken in an
extremely wet year, under which circumstances the stone rows had little influence on the crop yield,
as there was no water shortage. Thus apparently the activities that often accompany the
implementation of SWC measures, like more labour inputs and more fertilisation, also have a
positive effect on production.
The costs
The costs of SWC measures mainly consist of investment costs. Maintenance costs are often low, as
these can be combined with normal agricultural activities. Zougmoré et al. (2000b) give an
overview of the costs for stone row establishment, distinguishing three different situations:
community land management projects; individual farmers receiving NGO assistance for tracing the
contour lines and transporting stones; and individual farmers collecting stones themselves in their
neighbourhood. Labour requirements were highest in case of community projects (120 man-days
for 1 ha). When farmers implemented stone rows individually, it took them 54 man-days per ha
with assistance from a NGO and only 10 man-days per ha when they worked entirely by
themselves. The high labour demand for community projects is apparently caused by the lack of
motivation when individuals do not work on their own fields and work full days during the dry hot
1
$1 USD is about equal to 728 FCFA
2
Note that Hamer used an opportunity cost for labour of 500 FCFA per day, which was the shadow wage rate before the
devaluation in 1994. Nowadays a wage rate of 1000 FCFA would be more realistic.
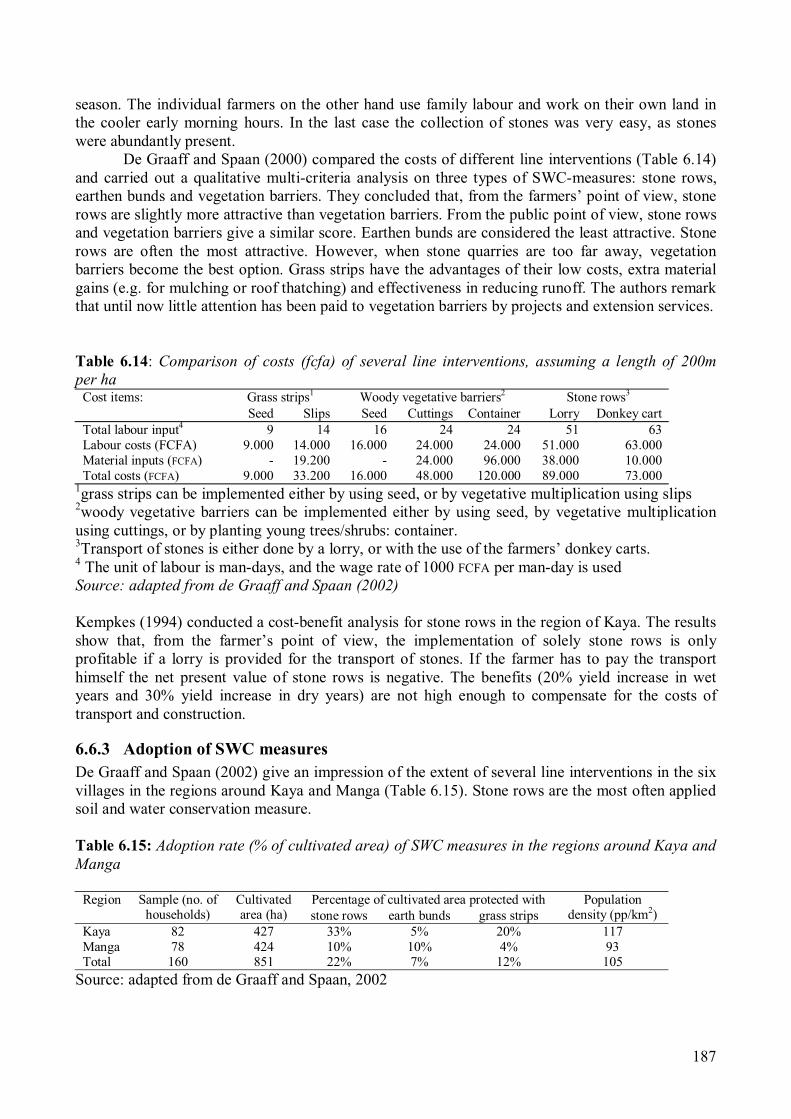
187
season. The individual farmers on the other hand use family labour and work on their own land in
the cooler early morning hours. In the last case the collection of stones was very easy, as stones
were abundantly present.
De Graaff and Spaan (2000) compared the costs of different line interventions (Table 6.14)
and carried out a qualitative multi-criteria analysis on three types of SWC-measures: stone rows,
earthen bunds and vegetation barriers. They concluded that, from the farmers’ point of view, stone
rows are slightly more attractive than vegetation barriers. From the public point of view, stone rows
and vegetation barriers give a similar score. Earthen bunds are considered the least attractive. Stone
rows are often the most attractive. However, when stone quarries are too far away, vegetation
barriers become the best option. Grass strips have the advantages of their low costs, extra material
gains (e.g. for mulching or roof thatching) and effectiveness in reducing runoff. The authors remark
that until now little attention has been paid to vegetation barriers by projects and extension services.
Table 6.14: Comparison of costs (fcfa) of several line interventions, assuming a length of 200m
per ha
Grass strips1
Woody vegetative barriers2
Stone rows3
Cost items:
Seed Slips Seed Cuttings Container Lorry Donkey cart
Total labour input4
9 14 16 24 24 51 63
Labour costs (FCFA) 9.000 14.000 16.000 24.000 24.000 51.000 63.000
Material inputs (FCFA) - 19.200 - 24.000 96.000 38.000 10.000
Total costs (FCFA) 9.000 33.200 16.000 48.000 120.000 89.000 73.000
1
grass strips can be implemented either by using seed, or by vegetative multiplication using slips
2
woody vegetative barriers can be implemented either by using seed, by vegetative multiplication
using cuttings, or by planting young trees/shrubs: container.
3
Transport of stones is either done by a lorry, or with the use of the farmers’ donkey carts.
4
The unit of labour is man-days, and the wage rate of 1000 FCFA per man-day is used
Source: adapted from de Graaff and Spaan (2002)
Kempkes (1994) conducted a cost-benefit analysis for stone rows in the region of Kaya. The results
show that, from the farmer’s point of view, the implementation of solely stone rows is only
profitable if a lorry is provided for the transport of stones. If the farmer has to pay the transport
himself the net present value of stone rows is negative. The benefits (20% yield increase in wet
years and 30% yield increase in dry years) are not high enough to compensate for the costs of
transport and construction.
6.6.3 Adoption of SWC measures
De Graaff and Spaan (2002) give an impression of the extent of several line interventions in the six
villages in the regions around Kaya and Manga (Table 6.15). Stone rows are the most often applied
soil and water conservation measure.
Table 6.15: Adoption rate (% of cultivated area) of SWC measures in the regions around Kaya and
Manga
Percentage of cultivated area protected with Region Sample (no. of
households)
Cultivated
area (ha) stone rows earth bunds grass strips
Population
density (pp/km2
)
Kaya 82 427 33% 5% 20% 117
Manga 78 424 10% 10% 4% 93
Total 160 851 22% 7% 12% 105
Source: adapted from de Graaff and Spaan, 2002

188
Schaper (1993) gives more insight in the actual adoption of SWC measures in the region of Kaya.
Almost 50% of the implemented SWC measures were undertaken on individual initiative, 25% on
initiative of an extension officer, 20% on initiative of a project and 5% on initiative of a groupement
villageois3
. The extension officer and the projects mainly initiate the construction of stone rows and
permeable stone dams, whereas farmers mainly implement vegetative barriers individually. Farmers
indicate that they prefer stone rows, but that they depend on the project for the its construction. Den
Boef (1993) did a similar study on adoption in the region of Manga. Stone rows are not established
as frequent as in Sanmatenga, probably because of a scarcity of stones in this area. It appeared that
collective action is important in this region. In contrast with Sanmatenga, 18% of the SWC
measures were implemented on initiative of a groupement villageois and 29% on individual
initiative. The percentages of SWC measures initiated by extension officers and projects were more
or less the same. Schaper (1993) and den Boef (1993) both report large differences in adoption rates
between villages and even between neighbourhoods, due to accessibility, social position of heads of
households and availability of capital means.
Low adoption rates of soil and water conservation (SWC) measures are often ascribed to the high
investment costs. The costs of the measures discussed above might seem modest, but are often too
high for individual rainfed farmers in marginal semi-arid zones in the Sahel, who mainly produce
for self-sufficiency (de Graaff and Spaan, 2002). From the above studies it is clear that stone rows
are only profitable to farmers if their costs are reduced by the free of charge provision of stone
transport.
6.6.4 Incentives used for stimulating adoption of SWC measures
Incentives to compensate farmers for part of the costs are needed for two reasons, as the costs are
only gradually recuperated by benefits, and since a part of these benefits accrue to downstream
people and future generations. Soil conservation projects in Burkina Faso use various incentives, in
order to stimulate farmers to implement SWC measures. These incentives are discussed below.
Free of charge facilities
In several areas in Burkina Faso farmers benefit from transport facilities (e.g. hiring of a lorry)
financed by projects and/or government agencies for the establishment of stone rows. Kempkes
(1994) reports that the CRPA only hires a lorry for farmers under certain conditions: the demand
has to be made by a groupement villageois, and stone rows have to be installed on an area of at least
10 ha. The use of donkey carts for stone transportation is cheaper from a national economic point of
view, but since the transport by lorry is free of charge, farmers seldom use donkey carts for this
purpose, and wait for their turn for the lorry (de Graaff, 1999). Zougmoré et al. (2000b) also show
that using donkey carts for transport would be more efficient, as the farmer is then able to plan this
activity when it suits him best and he will work more efficiently. However, collective action seems
to be a good initiative in case of stone row construction. Stone rows require a lot of labour, and not
every household can provide this (e.g. elder people, female-headed households). According to the
farmers, the main reasons of the non-adoption of stone rows are the lack of labour and (capital)
means (Schaper, 1993). The use of lorries could theoretically also be justified on the grounds that it
may accelerate the establishment of stone rows (and erosion control) and that the responsible
agencies can steer the programme towards the conservation priorities. On the other hand the use of
lorries creates an attitude of dependency among farmers who are not involved in the planning of
measures, and will also wait for the next steps on government assistance. A third reason of not
implementing stone rows was that it was not yet the ‘turn’ of the farmer (Schaper, 1993). Once the
3
In many villages in Burkina Faso, farmers unite in a so-called groupement villageois: they collaborate in marketing
activities, provide labour for community works if needed, exchange knowledge and skills, etcetera.
189
project or programme terminates, farmers will probably not be ready to continue stone row
construction on their own.
Subsidies on inputs
The term ‘subsidies’ in fact covers a large number of incentives, like free or subsidised inputs, such
as seedlings and fertilisers, payments for construction works on the own farm, subsidised credit, etc.
The free of charge provision of good quality seedlings for trees and tree crops can be an important
contribution when commercial nurseries do not exist in an area. The Ministry of the Environment
and Tourism has assisted village farmer groups in the establishment of temporary nurseries for
village forests and private tree plantings (Kessler et al., 1995). However, these projects were mostly
ad hoc and small-scale, with no significant regional effect.
Fertilisers were subsidised until the early 1990s, but it did not lead to the large-scale
adoption. Artificial fertilisers are almost exclusively used for cotton production and hybrid maize.
Fertiliser subsidies constitute a costly intervention in a country like Burkina Faso.
Improved incentive systems
A major issue in Sahelian countries is to find appropriate incentives to stimulate farmers to apply
more fertilising materials. The farmers in densely populated villages are generally aware of the
importance of using mulch, compost and manure, but do not have enough of these materials to
apply it on more than one or two plots. It has to be supplemented with external, inorganic fertilisers,
to have major effects and to allow them to produce more on less land, in a more sustainable way.
Many farmers operate more or less outside the monetary economy, and most don’t get enough cash
from non-agricultural activities or migration, so that income does not satisfy the family demands,
which are more pressing than the investment in soil fertility. Since farmers may only adopt fertiliser
application when the yield increase is about two or three times as high as additional costs, a system
could be devised whereby farmers can obtain subsidised fertilisers after making investments in
stone rows, compost pits, mulching, etc. The subsidy rate should gradually diminish over time, but
take into account the climatic circumstances, e.g. drought periods.
6.6.5 Conclusions
Stone rows and vegetative barriers have the short-term positive effect to improve water retention.
However, the investment costs still exceed the short-term benefits. Although not the most efficient
from an economic point of view, it seems to be necessary that projects provide free transport of
stones. The advantage is that collective action is stimulated. It is important though that the incentive
is well organised. Area interventions, such as compost pits and mulching, have the long-term
positive effect of improving soil fertility. In combination with water retention by the line
interventions, this can result in more permanent yield increases and more sustainable agriculture. As
the combination of these two types of interventions is the most effective, it may be worthwhile to
induce integral incentive systems that combine these interventions. Thus, instead of several ad hoc
activities, interventions should be integrated in one system of agricultural extension.
When establishing an incentive system, local circumstances should be accounted for. As an
example, in Kaya stones were abundant, but farmers did not adopt compost pits on large scale.
Projects could subsidise the establishment of compost pits, linked with the construction of stone
rows. However, if there is not sufficient material present to fill the pits afterwards, other
interventions have to be thought of (e.g. facilitate access to chemical fertilisers). In Manga, stones
are rare, but the adoption rate of compost pits is larger. Attention could be paid to the
implementation of vegetation barriers. Projects should stimulate this, for example by providing
nurseries and extension. As collective action is more common around Manga, projects could
provide the groupements villageois with credits and seeds for managing nurseries.

190
References
Boef, J.C. den (1993): Les mesures de conservation des eaux et du sol dans trois villages de la province du
Zoundwéogo; rapport des étudiants 13 Antenne Sahélienne, Ouagadougou.
Graaff, J. de (1999): Evaluating incentive systems for soil and water conservation on the basis of case studies in four
countries. in: Sanders, D.W., Huszar, P.C., Sombatpanit, S. and Enters, T.(eds.), 1999. Incentives in soil
conservation: from theory to practice. Oxford & IBH Publishing Co. PVT, Ltd, New Dehli.
Graaff, J. de, and W.P. Spaan (2002): The costs of soil and water conservation measures in the Sahel; third international
congress of the European society for soil conservation, Valencia 28 March – 1 April 2000
Haima, P. (1996): Economische analyse van de aanleg van stenen rijen ten behoeve van bodem- en waterconservering;
rapport des étudiants 54 Antenne Sahélienne, Ouagadougou
Hamer, A. (1996): Etude sur les bénéfices des cordons pierreux dans les régions de Kaya et Manga, Burkina Faso; rapport
des étudiants 80 Antenne Sahélienne, Ouagadougou
Kempkes, M. (1994): Analyse financière des cordons pierreux: cas d’étude de Tagalla, province du Sanmatenga au Burkina
Faso; rapport des étudiants 44a Antenne Sahélienne, Ouagadougou.
Kessler, C.A., W.P. Spaan, W.F. van Driel and L. Stroosnijder (1995): Choix et modalités d’exécution des mesures de
conservation des eaux et des sols au Sahel. Tropical Resource Management Paper No. 7, Wageningen.
Posthumus H., and W.P. Spaan (2001): Rainfall runoff relations for vegetation barriers in the Sahel. Proceedings
of the International Symposium ‘Soil erosion research for the 21st century’. Honolulu, Hawaii.
Schaper, P.A.J. (1993): Les mesures de conservation des eaux et des sols dans trois villages de la province du Sanmatenga:
une étude de base sur les aspects socio-économiques; rapport des étudiants 14 Antenne Sahélienne, Ouagadougou.
Zougmoré, R., S. Guillobez, N.F. Kambou, G. Son (2000a): Runoff and sorghum performance as affected by the
spacing of stone lines in the semi-arid Sahelian zone; Soil & Tillage Research 56 (2000) 175-183
Zougmoré, R., D. Kaboré, J. Lowenberg-de Boer (2000b): Optimal spacing of soil conservation barriers:
example of rock bunds in Burkina Faso; Agronomy Journal vol. 92:361–368 (2000)
Chapter 7
The potential of vegetation barriers on soil and water
conservation at the Central Plateau of Burkina Faso.

192

193
The potential of vegetation barriers on soil and water conservation at
the Central Plateau of Burkina Faso.
7.1 Conclusions
The Central Plateau of Burkina Faso is characterized by low-input farming systems. The majority of
farmers make a living by cultivating crops on small plots, where mainly staple crops are produced
for subsistence. Some authors state that due to soil degradation crop yields were declining over the
last decades. Soil degradation can be counterbalanced by regeneration processes such as
sedimentation and deposition, accumulation of soil organic matter, soil structure improvement, and
through human interventions like conservation activities and increase of external inputs.
In order to ascertain the underlying principle behind the choice of soil and water
conservation activities, five development projects active in three countries in the Sahel were
surveyed. All projects had a different approach and did not cooperate frequently. The great
difference in soil and water conservation technology and the method of implementation was only
partly attributable to the physical, socio-economic and agricultural context. Preferences of donors
and projects appeared to be most significant in determining which practices and strategy were
chosen. Experiences from former projects in the area were for the greater part neglected. The
surveyed development projects tried to tackle the soil degradation problem. However, the total
impact of all five projects was small compared to the rate of degradation in the area. There was not
“a single best practice”, instead a combination of short and long term effects was preferable. On the
basis of project performance it was concluded that for conserving soil resources the local zay
technique in combination with manure was a recommendable strategy for the short term, in
combination with stone rows or vegetation barriers for the long-term effect. The strategy for
rangelands was excluding free grazing for the short term and for the long term reforestation and
reduction of live stock numbers.
Agricultural intensification in the Sahel implies the application of external inputs in arable
farming in the form of a mixture of organic and inorganic fertilizers. Their present-day low use
efficiency needs to be enhanced by avoiding nutrient losses in runoff water and erosion and by
improving water availability. This can be achieved by enhancing the infiltration capacity of soils or
by barring at regular intervals the lateral flow of water and nutrients over the soil surface. Given the
extreme variation in the amount of rainfall in single rain events, barriers must be semi-permeable
(stone rows or vegetation barriers), i.e. partly blocking water but allowing the passage of excess
water in case of heavy rainfall.
Soil conservation is important, but water conservation is essential, particularly in dry areas.
Collection of water and increase of infiltration are important issues. The infiltration capacity
however, strongly depends on the physical state of the soil surface. In many cases at the Central
Plateau a crust at the soil surface heavily reduces the infiltration capacity so that half of the rainfall
do not replenish the stock of water in the soil from which plants have to withdraw their transpiration
needs. A major factor causing crusts is the low organic matter content of most Sahelian soils. The
only way that this process can be stopped is to produce biomass of whatever quality that can be
given back to the soil in the form of mulch so that soil fauna is able to transform it into soil organic
matter. Vegetation barriers can play a very important role in that process.
Laying stone rows as barriers at field borders is an indigenous technique. The adapted
technique is to lay them out along the contour as highly promoted by development projects. This is
nowadays a widespread soil and water conservation practice on the Central Plateau and is
moderately successful. However, research has identified the following limitations of stone rows:
1. Limited availability of stones hampers further ample application.
194
2. Due to sedimentation behind the stones the barrier effectiveness of the row decreases with
time as infiltration is impeded and in some cases the stones has to be taken up and laid into
new rows after 3 years.
3. Stone rows do not produce useful products.
4. Stone rows do not produce biomass that can be used as mulch or for compost making, or
may be used as fodder.
5. High labour input is needed for collecting stones, transportation and laying them out. An
advantage is that all of these actions can be undertaken in the dry season.
An alternative for stone rows is the planting of rows of live plants (along the contour) that develop
into semi-permeable barriers. Moreover, live contour barriers can overcome some of the limitations
of stone rows:
1. There is no limitation in volume that can be applied. Cuttings and seeds have limited volume
and can easily be transported by local means. Container plants have some more volume.
2. Barrier effectiveness does not decrease due to sedimentation. Barrier development keeps
pace with the accumulation of sediment in the barrier.
3. Certain species can provide useful products. Pruning material can be introduced as mulch or
being transformed into compost, but was not investigated as such in this research.
4. Vegetation barriers are easy to install and do not need a high financial input. Propagation of
most of the selected plant species is rather simple.
There are certainly also drawbacks of live contour barriers:
1. Live contour barriers can die or be destroyed by animals (termites, browsing cattle, etc).
2. They can compete with crops for limited resources of light, water and nutrients.
3. The main labour input to establish and maintain live contour barriers is in the wet season,
when most of the labour potential is needed for crop growing. Moreover, the shorter the
growing season the smaller the opportunity to establish live barriers.
4. Live contour barriers can be host of pests and diseases that may affect crops.
In order to find out the pros and the contras of semi-permeable barriers, a research with different
types of line interventions was set up. From 1994-2000 on-station research in Gampela (Burkina
Faso) was executed to evaluate the effectiveness of live contour barriers for soil and especially for
water conservation under semi-arid conditions. Barrier species like the local perennial grass
Andropogon gayanus, the shrub Ziziphus mauritiana, the small tree Piliostigma reticulatum, the
succulent Agave sisalana, a barrier with natural vegetation “Natural”, and additional stone rows
were tested. From 1996 to 1998 barriers were tested with a bare up-slope alley and from 1998−2000
with a sorghum crop on the alley.
The results from seven years research at Gampela yield the following answers:
Can species be found that are as effective in conserving soil and water as the semi-permeable
barriers as stone rows?
• All vegetation barrier types reduced runoff and conserved soil and water.
• The plant species used at Gampela could be divided into effective barriers (grasses and
Natural) and a less effective group (woody species and succulents).
• Effective means that sediment was caught around and in the barriers and that runoff was
largely reduced and as a consequence the zone of 3-5 m upstream of the barrier received
more water.
• This conservation of water enhanced crop production over this limited 3-5 m zone (in the
absence of competition) in dry rainfall years but sometimes reduced crop production over
195
the same zone in wet years due to the negative effect of water logging on crop production on
the plots with effective barriers. However, it was felt that the positive effect in dry years
(with food shortages) outweighed the negative effects in wet years. In a wet year the general
grain production is sufficient (with food abundance and subsequent low cereal prices), and
some water logging adjacent to the barrier is in that year a minor problem.
• The representatives of the effective group (Andropogon and Natural) had about the same
performance as stone rows and were even slightly better. The less effective barriers
(Ziziphus, Piliostigma and Agave) had less influence on runoff and conserved less soil and
water.
• Less effective barriers suffered most from drought and effective barriers most from
drowning.
• Effective barriers became less effective and less effective barriers became more effective
with increasing slope length. Large runoff volumes exceeded the quantity that can be
dammed by vegetation barriers.
• Vegetation barriers improve water conservation, but are most effective when closely spaced
(e.g. 10 m).
• The influence of rain intensity was not very important for runoff rates and only apparent on
plots with less effective barriers. On the contrary, soil loss (sediment transport) showed a
good relationship with rain intensity.
• Despite of the differences in soil water dynamics, there were no striking differences in yield
(grain and straw) between the less effective and the effective barriers.
How serious is the danger and harm of competition for light, water and nutrients?
• In the second phase of the research the C4-crop sorghum was grown on the alley. Since the
soil water was always enhanced close to the effective vegetation barriers and yields did not
reflect these favourable soil water conditions, competition for light was an important
constraint. One can say that, when a barrier conserves water, but crop growth is strongly
reduced by light competition, all the efforts to conserve water are in vain.
• In dry years the water conservation effect of effective barriers was sufficient for the
consumption of the live barriers itself and enough to have a positive effect on water
availability for the adjacent crop (in absence of other competing factors). On the plots with
less effective barriers not enough water was stored for the own consumption of the barrier
and competition for water took place in dry years.
• The soil (and hence nutrient) conservation effect of effective barriers was good and minimal
for less effective barriers. Due to a crusted soil surface transport of soil particles on the plots
was minimal. Not many positive effects could be expected from accumulation of soil
particles (nutrients) in and around the barrier. Competition for nutrients between crop and
barrier is highly probable.
• Given the ample availability of land in the Sahel, the loss of a few meters of land due to
light competition does not seem harmful. However, it was in these few meters that water and
nutrients were conserved and in order to make profit of this it is essential to crop the 3-5
meter zone adjacent to the barrier. So, avoiding light competition (short pruning) is a
prerequisite for taking full advantage of the soil and water conserving potential of live
barriers, provided that excess water in wet years can be adequately drained.
Can aims of effectiveness, limited competition, useful products and mulch production be combined?
• Some effective species may produce useful products but need for that full-grown barriers
and this will always lead to light competition, which could not be tolerated since it undercuts
the main aim of the barrier system in cropping systems.
196
• It also appeared (from farmers interviews) that the need for and benefit of useful products
are greatly overestimated by the development scene. In most regions of the Central Plateau
these products can still be found in the communal silvo-pastoral area. Increase of land
pressure however, can create a future situation where products of the communal area
become scarce and products from the barriers are needed. In that case extension of the
vegetation barrier area at the expense of the crop area is advisable.
• Pruning of the live barrier produced mulch. For optimal use it has to be harvested a few
times per year, asking for extra labour input.
What management regime can be recommended?
• The preferable orientation of barriers to diminish adverse effects of shading is east-west.
However, planting of barriers along the contour often result in deviation from this
orientation. To avoid competition extra pruning will be needed.
• In all cases light competition had to be avoided. This implies that the height of the live
barriers should be always kept below the height of the adjacent crop. Several cuttings are
needed in one cropping season. However, in this research barriers were cut once a year, the
woody species to a height of 0.75 m, the grasses to 0.3 m and no cutting for Agave.
• No light competition also implies annual pruning till the lowest possible height so that the
barriers still remain effective, i.e. in the order of 10 cm. It was not researched if all the used
species could stand this management regime.
• For optimal use the time of pruning should be such that the mulching or compost making
effect of the cuttings is in its optimum.
• For Andropogon this implies the use of this species as fodder for animal husbandry and not
for the 3 m long stems to use in mats and grain stores.
• For Agave this implies that it is not suitable because it cannot be pruned till a height of 10
cm. Agave might be a suitable live barrier in silvo-pastoral areas or as live fence around
fields.
• For barriers planted in the silvo-pastoral area maintenance can be less intensive and barriers
can grow and produce useful byproducts.
Is implementation a simple happening?
• Land property rights are not always clear. Only sustainable implementation can take place
on own fields. Installation of barriers is often seen as demarcation of property and therefore
not used when land is rented.
• To collect products from barriers the property question has to be resolved. The distance to
markets is of great importance for barrier product exploitation.
• Some preparations for barrier planting can take place in the preamble of the wet season.
Establishment and management of barriers is not very time consuming (3−4 man-days), but
has to take place in the labour intensive wet season. The length of the growing season is
decisive for the possibility to grow crops and to plant and manage barriers.
• The direct costs of barriers are not high. After introduction of barrier species enough plant
material is available and collection will not take a lot of time. The problem is that the time
needed for barrier establishment and care cannot be used for paid labour activities. A lack of
money may be the result.
• The above-mentioned reasons make implementation of vegetation barriers not an easy
straightforward business. The benefits have to be large enough and to be cashed on the short
term.
197
• Vegetation barriers have a short-term positive effect to improve water conservation,
however the investment costs still exceed short term benefits. An incentive can be to provide
(at reduced costs) planting material and training.
• Farmers in Mali adopted vegetation barriers (live fences) more than other practices (stone
rows and grass strips). In Burkina Faso stone rows were best adopted and grass strips were
more adopted than other vegetative measures. These preferences can be explained by the
strategies of development projects in the two countries.
7.2 Recommendations
• In the on-station research at Gampela, only one barrier per plot was tested. As part of the
runoff flows through the barrier, there will be an increase of soil and water transport down-
slope. This effect has to be investigated in future research.
• It appeared in this research, that sorghum is not very vulnerable to drought and that it can
resume growing, yielding a good harvest after a drought period. In future research other
crops have to be included.
• In a few occasions when soil water was sufficient available, it was concluded that light
competition had taken place. Light competition measurements have to be included in future
research.
• During the research period the first article appeared in which the accuracy of the soil water
content measurements by the TDR-method was questioned, being temperature sensitive and
the system being susceptible to disturbance close to the access tube during installation.
Deviations of 5 to 10 % were recorded. The use of other systems along side is advisable.
• Although barrier plant growth was followed in this research, quantitative estimates of barrier
products cannot be given. As barrier products are often mentioned as benefits it has to be
investigated.
• Barries were pruned once a year and the pruning material was set aside. Introduction of
pruning material as mulch in the system improves the soil quality and soil properties. The
relation between these improvements and the change in soil and water conservation has to
be investigated.
• The present research has shown that effective barriers need drainage in wet years in spite of
their principle semi-permeable character. This confirms observations at farmers’ fields
where barriers are never very homogeneous or extend over a large width. Therefore, in
future research barriers should not be designed in an ideal homogeneous fashion but more in
a farmers’ fashion.
• In the present research the field water balance could only be determined over an 0.8 m soil
profile due to laterite layer and instrumental limitations. It is likely that the roots of
perennial vegetation barriers penetrate the laterite and draw some water from this layer.
Therefore, in future research equipment should be used that can also measure in this hard
deep layer.
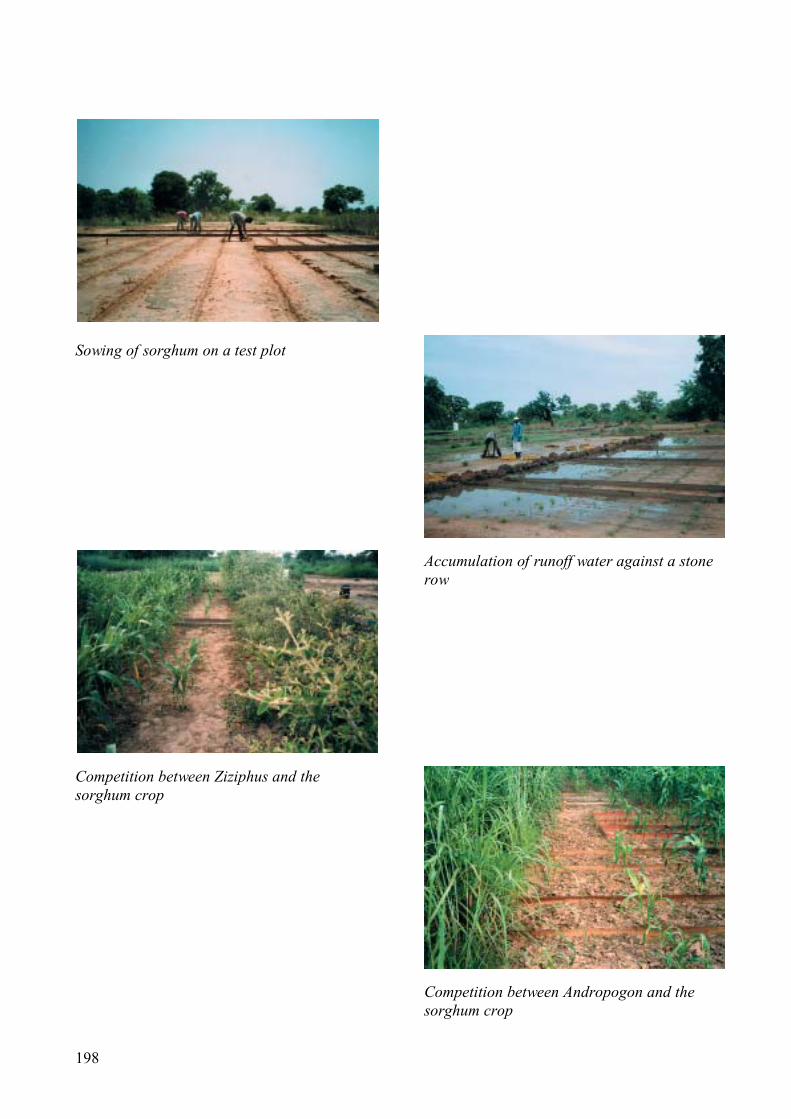
198
Sowing of sorghum on a test plot
Competition between Ziziphus and the
sorghum crop
Accumulation of runoff water against a stone
row
Competition between Andropogon and the
sorghum crop

Summary
Samenvatting

200

201
Summary
The vast majority of land users at the Central Plateau of Burkina Faso make a living by farming
small plots, where mainly staple crops are produced for subsistence use. Both area interventions and
line interventions comprising indigenous techniques as well as introduced techniques can be
encountered at the Central Plateau and have proved to be effective. There is a preference for semi-
permeable line measures that slow down runoff and prevent water logging in wet periods.
In order to ascertain the rationale behind the choice of soil and water conservation measures
and the implementation strategy, five large soil and water conservation projects in three Sahelian
countries have been investigated. The choice of technology and the way of implementation differed
greatly between projects. This was attributable more to the preference of donors and projects than to
any physical, socio-economic and agronomic differences. On the basis of project performances, a
recommendable strategy for farmers’ fields appeared to be the use of the local zay technique to
achieve a short-term improvement, and to combine this with stone lines or vegetation barriers for a
long-term effect.
Low adoption rate of soil and water conservation (SWC) measures in erosion-prone areas is
often ascribed to the high investment costs of measures. The costs of these measures may seem
modest in comparison to costs for infrastructure, but they are often too high for the individual
subsistence farmer, especially in marginal semi-arid zones in the Sahel. Investment costs are highest
for stone rows, whereby the transport of stones requires substantial inputs of labour and means of
transport. Vegetation barriers are less costly, but have the disadvantage that they need to be planted
in the rainy season, when agricultural production activities have the highest priority.
A major reason why farmers consider the costs prohibitive relates to the uncertain nature of
the benefits. These benefits comprise of several elements, some of which may have immediate
effect (e.g. moisture retention), but most of which occur only gradually over a long period of time,
and are hard to assess and even harder to quantify. In a qualitative multi-criteria analysis stone rows
showed the best results, and this was also the measure that with the help of development projects,
has been most often applied at the Central Plateau in Burkina Faso. However, vegetation barriers,
which have not yet been greatly promoted come a close second and are the best solution in areas
where stones are scarce or not available. This conclusion was the starting point of the water
conservation research by means of vegetation barriers.
The on station field experiment was set up to evaluate the effectiveness of vegetation
barriers for soil and water conservation under semi-arid conditions at the research station of the
Institute de Développement Rural (IDR) at Gampela.
Seven local plant species (grasses: Andropogon gayanus, Vetiveria zizanioides; woody
species: Acacia nilotica, Guiera sengalensis, Piliostigma reticulatum, Ziziphus mauritiana; and a
succulent: Agave sisalana) were planted on a 2 % slope of a sandy loam (Chromic Luvisol), in 21
plots of 20 x 20 m as conservation barriers, along the contour.
To determine the runoff interception efficiency of barriers and to find out the influence of
slope length and alley treatment, runoff induced by a large number of storms was measured on plots
with slope lengths of 1.25 m (1 m2
), 6.25 m (5 m2
), and 12.5 m (10 m2
). Plots without a barrier (no
barrier) were used as the control. Grass barriers and stone rows proved to be very effective
(effective barrier) in impeding runoff and reducing runoff to only 20 % of precipitation. The runoff
through woody species and succulents (less effective barrier) was about 50 % of precipitation. By
comparison with the control, a barrier always resulted in water conservation. Less effective barriers
with a bare or cropped alley showed a decrease in runoff percentage with an increase of plot length
along the slope, whereas effective barriers with a bare or cropped alley showed an increase of
runoff along the slope. The effect of crop development on runoff was rather small. Runoff reduction
during the growing season was highest on plots without a barrier and on plots with the less effective
barriers.
202
On short (1.25 m) and long (12.5 m) slopes the influence of rain intensity on runoff
production was marginal. On the medium slope length (6.25 m), rain intensity influenced runoff
most on plots with a less effective barrier. A general conclusion was that for longer slopes, all
factors such as type of barrier, land use and rain intensity became less important. In that situation,
large runoff volumes exceeded the quantity of water that can be dammed by the vegetation barriers,
and can be intercepted as a result of land use activities and vegetation on the alley. It is concluded
that barriers improve water conservation and are most effective when closely spaced.
Large differences in sediment transport in the amount of sediment yield were found between
the barrier types. Grasses and natural vegetation proved to be very effective in catching soil
particles and diminishing sediment transport. The dense effective barriers slow down flow velocity,
build up backwater and promote sedimentation upstream. The through flow in the less effective
barriers with woody species and succulents was slightly hampered and flow velocity was not
reduced enough, resulting in a higher sediment transport. Under degraded conditions soil loss
diminished 50 % with less effective and 70–90 % with effective barriers. During the initial cropping
phase (light tillage) sediment transport was reduced 40–60 % with effective barriers and showed an
increase with less effective barriers. In the full tillage (weeding) period sediment transport
decreased by 80–90 % for effective and 70 % for less effective barriers. Sediment yield could be
best predicted by the erosivity index, second best by runoff amount (mm) closely followed by
maximum peak intensity. All these parameters were related to the volume of overland flow needed
to transport soil particles.
At the research site annual rain quantities seldom gave rise to a shortage of water for
vegetation barriers and sorghum. Conversely, dry spells had a big influence on soil water,
exhausting it sometimes during the growing season, and causing delay in plant growth. Water loss
by evaporation was negligible under (effective) Andropogon and substantial under (less effective)
Ziziphus barriers. Reduced evaporation and the larger effect on runoff reduction compensated the
high transpiration of Andropogon. Most barriers transpired without restrictions, when water was
readily available. Only Piliostigma showed to limit transpiration during the second part of the
growing season.
The soil water content was monitored twice a week at different measuring depths with the
TDR technique at a transect perpendicular to the barriers. For the investigated alley crop system it
was found that, despite the difference in effectiveness of the barriers and soil water dynamics, there
were no striking differences in yield (grain and straw) between the treatments in the distinct years.
However, there were big differences in crop yields between the respective years. These differences
were strongly related to the amount and the distribution of the rain over the crop development
stages. When water for the sorghum crop was not always readily available during the growing
season, but when rain distribution and rain quantity were favourable (1999), yields were close to
average on–station yields. In the dry year 1998, there was a total annual amount of rain to produce
maximum yields, but a number of dry spells had a big influence. In 1998, about half of the annual
water and in 1999, only about a third of the available annual water was used for crop production.
Effective barriers conserved water even during dry years and compensated at least their own
consumption and increased crop yields over a distance of about 6 m upstream of the barrier. Since
the soil water was always enhanced close to and under the effective (Andropogon) barrier and
yields did not reflect to favourable soil water conditions, ponding and shading appeared to be
important growth constraints. The barrier effect of less effective Ziziphus barriers was not good
during dry years and even not enough to compensate its own consumption. In dry years, water
competition was responsible for yield reductions adjacent to the barrier on the less effective barrier
plots. In wet years this barrier caught enough water for its own water consumption and also enough
to improve crop yields a few meters upstream. Stone row barriers sometimes retained too much
runoff water causing water logging. Even in dry years the barrier effect of stone rows was less good

203
than the effective vegetation barrier. Effective vegetation barriers were slightly better than stone
rows, but the difference remained small.
Management actions have to be undertaken to diminish the negative impacts, like ponding
or excessive water use by the barriers. During drought the barrier has to be cut back to diminish
competition. During wetness, removal of some stones in the stone row and cutting a part of the
effective vegetation barrier can help to drain excess water. In farmers fields it was often observed
that only short rows of Andropogon were applied. Obviously their experience is that in case of
drought these short barriers catch enough water and in case of abundance, the water can flow round.
Runoff management is one of the tools to increase the available water for agricultural
production in areas where rainfall is erratic. From the Gampela research runoff percentages can be
estimated for design purposes. Water use of vegetation barriers was related to meteorological
factors and soil moisture availability and found to be simple and reliable to predict transpiration.
Amongst the soil and water conservation (SWC) measures adopted in the Sahel, contour
vegetation barriers (CVB) constitute a cheap option in terms of labour and material requirements. In
order to understand the actual adoption and maintenance of CVB, labour requirements of commonly
adopted CVB species were evaluated. Labour requirements for the installation of 100 m CVB
varied from 7-8 man-days when using cuttings or direct sowing to 15 man-days when installed from
nursery seedlings, excluding 8 days for the installation of a dead fence. Maintenance takes 2-4 days
per 100m. Phasing the installation over several years is an option to overcome labour constraints.
Low labour requirements for establishment and management do not explain the rather low adoption
and poor maintenance of vegetation barriers. The labour requirement for establishment of barriers at
the beginning of the growing season is not a real constraint. Farmers mostly choose CVB species
and planting methods with low labour requirements and prefer species with additional benefits such
as thatching grass, oil for soap making and fodder and fruits.
At the Central Plateau vegetation barriers can play a vital role in conserving soil and water.
Well managed vegetation barriers can contribute to the re-greening of the area.

204
Samenvatting
De overgrote meerderheid van de landgebruikers op het Centraal Plateau in Burkina Faso voorziet
in het levensonderhoud door “te boeren” op kleine percelen, waarop voor zelfvoorziening
voornamelijk hoofdvoedselgewassen worden geteeld. Bodem- en waterconserveringsinterventies,
zowel traditionele als geïntroduceerde, worden aangetroffen op het Centraal Plateau en hebben hun
effectiviteit bewezen. Er bestaat een voorkeur voor half doorlatende lijn maatregelen, die het
afstromend water afremmen en voorkomen dat er in de bodem wateroverlast ontstaat tijdens
regenrijke perioden.
Om vast te stellen wat de beweegreden is achter de keuze van bodem- en
waterconserveringsmaatregelen en de uitvoeringsstrategie, zijn vijf grote bodem- en
waterconserveringsprojecten in drie Sahel landen onderzocht. Tussen de projecten was er een groot
verschil in technologiekeuze en de manier van uitvoering. Dit was meer toe te schrijven aan de
voorkeur van donoren en projecten dan aan fysische, socio-economische of agronomische
verschillen. Op basis van projectuitkomsten bleek voor boeren het gebruik van de locale zay
techniek voor korte termijn verbetering, en de combinatie met stenen rijen of vegetatiebarrières
welke de hoogtelijnen volgen, voor het lange termijn effect een aan te bevelen strategie.
De lage adoptie van bodem- en waterconserveringsmaatregelen in gebieden met hoge
potentiële erosie en waterverlies door afstroming wordt vaak toegeschreven aan de hoge
investeringskosten voor die maatregelen. De kosten voor deze maatregelen blijken echter
bescheiden te zijn in vergelijking tot kosten voor infrastructurele werken, maar zij zijn vaak te hoog
voor de individuele zelfvoorzieningsboer, vooral in marginale semi-aride gebieden in de Sahel. De
investeringskosten zijn het hoogst voor stenen rijen, waarbij het transport van stenen een
substantiële inzet van arbeid en transportmiddelen vereist. Vegetatiebarrières zijn minder duur,
maar hebben het nadeel, dat ze geplant moeten worden in het regenseizoen, als agrarische productie
activiteiten de hoogste prioriteit hebben.
Een belangrijke reden waarom boeren de kosten bezwaarlijk vinden komt voort uit de
onzekerheid over de te behalen baten. De baten bestaan uit verschillende onderdelen, waarvan
sommige een direct effect hebben (b.v opslag van water in de bodem), maar de meeste baten
worden eerst geleidelijk over een langere periode waarneembaar en zijn daarnaast moeilijk te
kwantificeren. In een kwalitatieve multi-criteria analyse bleken stenen rijen de beste resultaten te
geven. Het is tevens de maatregel, die door ontwikkelingsprojecten op het Centraal Plateau het
meest is toegepast. Echter vegetatiebarrières, hoewel niet grootschalig gepromoot, komen op een
goede tweede plaats en in de analyse wordt aangegeven dat het de beste oplossing is in gebieden
waar stenen schaars of afwezig zijn. Deze conclusie stond aan de basis van het onderhavige
waterconserveringsonderzoek d.m.v. vegetatiebarrières.
Het veldexperiment van het onderzoek op het onderzoekscentrum van het “Institute de
Développement Rural (IDR) in Gampela werd opgezet om de bodem- en waterconserverings-
effectiviteit van vegetatiebarrières onder semi-aride condities te evalueren.
Zeven locale plantensoorten (grassen Andropogon gayanus, Vetiveria zizanioidus; houtige
soorten: Acacia nilotica, Guiera senegalensis, Piliostigma reticulatum, Ziziphus mauritiana; en een
succulent Agave sisalana) werden op een zandige leem grond (Chromic Luvisol) met een helling
van 2 %, in 21 proefpercelen van 20 x 20 m als vegetatiebarrières langs de hoogtelijn geplant.
Enkele van de geplante soorten, werden in een latere fase vervangen door stenen rijen en barrières
bestaande uit natuurlijke begroeiing (Natural).
Om de interceptie-effectiviteit van bovengrondse afstroming, de invloed van hellinglengte
en behandeling het bovenstrooms (beteelde) gebied te bepalen, werd bovengrondse afstroming,
gegenereerd door een groot aantal regenbuien op proefpercelen met hellinglengtes van 1.25 m, 6.25
m en 12.5 m bepaald. Proefpercelen zonder barrière (no barrier) werden aangemerkt als controle
proefperk. Barrières bestaande uit gras, Natural en stenen rijen bleken het meest effectief
205
(effectieve barrière) om afstroming af te remmen en beperkten deze tot 20 % van de neerslag. De
reductie van de afstroming door de houtige soorten en de succulent (minder effectieve barrière) was
tot ongeveer 50 % van de neerslag. In vergelijking met het controle proefperk, resulteerde een
proefperk met een barrière altijd in waterconservering. Minder effectieve barrières met een kaal of
een beteeld bovenstrooms gebied gaven een afname van bovengrondse afstroming te zien met de
toename van de hellinglengte, terwijl effectieve barrières met een kaal of beteeld bovenstrooms
gebied resulteerde juist in een toename van de afvoer met toename van de hellinglengte.
De invloed van regenintensiteit op de hoeveelheid afstroming was op korte (1.25 m) en
lange (12.5 m) hellingen marginaal. Op middellange hellingen (6.25 m) had regenintensiteit alleen
invloed op proefperken waarop minder effectieve barrières waren aangeplant. Een algemene
conclusie voor bovengrondse afstroming was, dat voor langere hellinglengtes alle factoren zoals
barrière type, landgebruik en regenintensiteit minder belangrijk werden. In die situaties oversteeg
het grote volume afstromend water de hoeveelheid, die opgestuwd kan worden tegen de vegetatie-
barrières, en/of die kan worden opgevangen als gevolg van landgebruikactiviteiten en aanwezige
vegetatie op het bovenstrooms gedeelte. Vegetatiebarrières verbeteren de waterconservering en zijn
het meest effectief wanneer ze op korte afstand van elkaar worden aangelegd.
Bij de verschillende barrière types werden grote verschillen in sediment transport gevonden.
Barrières van gras en Natural bleken erg effectief te zijn in het invangen van bodemdeeltjes en
verminderen van het bodemtransport. Effectieve barrières vertragen de stroomsnelheid, stuwen het
water op en bevorderen hiermee de sedimentatie bovenstrooms van en in de barrière. De stroming
van water door de minder effectieve barrières met houtige soorten en succulenten werd maar weinig
vertraagd, hetgeen resulteerde in een hoog sediment transport. Onder gedegradeerde
omstandigheden werd het bodemverlies met behulp van minder effectieve barrières met 50 %
gereduceerd en 70–90 % door de effectieve barrières. Indien aan het begin van het groeiseizoen
lichte grondbewerking werd toegepast, werd het sediment transport met effectieve barrières 40-60
% gereduceerd en met de minder effectieve barrières was een toename van het sediment transport
zien. In het stadium, waarbij het gehele proefperk werd bewerkt (wieden) nam het sediment
transport met 80-90 % af bij de effectieve barrières en met 70 % voor de minder effectieve
barrières. De getransporteerde hoeveelheid sediment kon het best worden voorspeld door de
erosiviteits index, en daaropvolgend door de hoeveelheid afstromend water, direct gevolgd door de
maximum piek intensiteit van de regenbui. Al deze parameters waren gerelateerd aan het volume
afstromend water, nodig om bodemdeeltjes te transporteren.
Jaarlijkse regenhoeveelheden hebben ter plaatse (Gampela) zelden aanleiding gegeven tot
een watertekort voor vegetatiebarrières en sorghum. Daarentegen, hebben gedurende het
groeiseizoen lange droge perioden een grote invloed op het bodemwater, putten het soms uit, en
veroorzaken vertraging van de plantengroei. Waterverlies door bodemverdamping was
verwaarloosbaar onder Andropogon barrières en was aanmerkelijk onder Ziziphus barrières. De
mindere bodemverdamping en het grotere effect op de afname van de afstroming compenseerde de
hoge verdamping van Andropogon. Indien er voldoende bodemwater aanwezig was, consumeerden
de meeste vegetatiebarrières zonder beperking. Alleen Piliostigma beperkte de consumptie in het
tweede deel van het groeiseizoen.
Het gehalte aan bodemwater werd twee keer per week met de TDR-techniek in een transect
loodrecht op de barrière op verschillende bodemdiepten opgenomen. Het onderzochte
vegetatiebarrière systeem leverde ondanks het verschil in effectiviteit tussen de verschillende
barrières en bijbehorende bodemwater dynamiek in de onderscheiden jaren geen opvallende
verschillen in oogst (graan en stro) tussen de verschillende combinaties op. Er was echter wel een
groot verschil tussen de oogsten in de verschillende jaren. Dit verschil was sterk gerelateerd aan de
hoeveelheid en de verdeling van de regen in de verschillende gewasstadia. Zelfs wanneer water
voor het sorghum gewas niet altijd snel opneembaar was, maar als de verdeling van de regen over
het seizoen gunstig was, werden opbrengsten bereikt, die dicht bij het gemiddelde proefstation
206
resultaat lagen. In het droge jaar 1998, was de totale jaarlijkse hoeveelheid neerslag voldoende om
een maximum oogstresultaat te behalen, echter een aantal droogteperioden had een grote invloed op
het resultaat. In 1998 werd ongeveer de helft van de jaarlijkse hoeveelheid neerslag en in 1999
slechts een derde van de hoeveelheid gebruikt voor gewasproductie.
Effectieve vegetatiebarrières conserveerden gedurende droge jaren voldoende water om
tenminste het eigen watergebruik te compenseren en gaven een verhoging van oogstresultaten te
zien tot 6 m bovenstrooms van de barrière. Dichtbij en onder de barrière was het gehalte aan
bodemwater altijd verhoogd. Gunstige bodemwater condities werden echter niet weerspiegeld in de
oogstresultaten. Te natte omstandigheden en schaduwwerking waren belangrijke groeibeperkingen.
De effectiviteit van de minder effectieve Ziziphus barrières was slecht in droge jaren en zelf niet
goed genoeg om het eigen gebruik te compenseren. In droge jaren, was waterconcurrentie op
proefperken met minder effectieve barrières verantwoordelijk voor lagere oogstresultaten dichtbij
de barrière. Gedurende natte jaren werd door deze barrières voldoende water ingevangen om het
eigen gebruik te compenseren en ook genoeg om tot enkele meters bovenstrooms van de barrière
oogstresultaten te verbeteren. Barrières bestaande uit stenen rijen hielden soms teveel water tegen
hetgeen resulteerde in te natte bodemomstandigheden. Zelfs in droge jaren was de werking van
stenen rijen minder goed dan die van de effectieve vegetatiebarrières. Effectieve vegetatiebarrières
functioneerden net iets beter, het verschil met stenen rijen was echter gering.
Om de negatieve invloeden van te natte omstandigheden en overmatig watergebruik door de
barrières te voorkomen moeten onderhoudsactiviteiten worden uitgevoerd. Tijdens droogte moet de
vegetatiebarrière teruggesnoeid worden om concurrentie te voorkomen. Tijdens natte
omstandigheden moeten enkele stenen uit de stenen rij verwijderd worden en bij effectieve
vegetatiebarrières moet een gedeelte van de barrière weggesnoeid worden om het overtollig water
weg te laten vloeien. Op de boerenvelden wordt vaak waargenomen, dat er alleen korte Andropogon
barrières werden toegepast. Klaarblijkelijk is het hun ervaring, dat deze korte stroken in geval van
droogte genoeg water invangen en in geval van overvloed het water er omheen kan stromen.
In gebieden waar regenval grillig en onvoorspelbaar is, kan de beheersing van afstromend
water een van de mogelijkheden zijn om meer water voor de landbouw beschikbaar te krijgen. Voor
ontwerpdoeleinden kunnen uit het Gampela onderzoek afstromingpercentages geschat worden.
Watergebruik van vegetatiebarrières werd gerelateerd aan meteorologische parameters en
bodemwaterbeschikbaarheid en kan volgens de resultaten gezien worden als eenvoudige en
betrouwbare methode om watergebruik te voorspellen.
Onder de geadopteerde bodem- en waterconserveringsmaatregelen in de Sahel, zijn
vegetatiebarrières in termen van arbeid en benodigd materiaal een goedkope optie. Om de actuele
adoptie en onderhoud van vegetatiebarrières te begrijpen, werd de arbeidsbehoefte van reeds
geadopteerde vegetatiebarrière soorten geëvalueerd. De arbeidsbehoefte van 100 m
vegetatiebarrière varieerde van 7-8 dagen wanneer er gebruik werd gemaakt van “direct zaai” tot 15
dagen indien een vegetatiebarrières werd geplant met behulp van containerplanten uit een kwekerij,
uitgezonderd de 8 dagen, die nodig zijn voor het oprichten van een beschermende “dode haag”.
Onderhoud vergt 2-4 dagen per 100 m vegetatiebarrières. Het faseren van de aanleg van
vegetatiebarrières over een aantal jaren is een optie om beperkingen in de arbeidsbeschikbaarheid
op te vangen. Lage arbeidsbehoeftes voor vegetatiebarrières geven geen verklaring voor de lage
adoptie en het armoedige onderhoud van deze barrières. De arbeidsbehoefte voor vegetatiebarrières
aan het begin van het groeiseizoen kan niet gezien worden als een echte beperking. Boeren kiezen
meestal vegetatiebarrière soorten en plantmethoden met een lage arbeidsbehoefte en hebben de
voorkeur voor soorten die aanvullende voordelen bieden, zoals gras voor dakbedekking, olie om
zeep te maken, fruit en diervoeder.
Op het Centraal Plateau kunnen vegetatiebarrières een belangrijke rol spelen bij het
conserveren van bodem en water. Goed onderhouden vegetatiebarrières kunnen een bijdrage
leveren tot een groen Centraal Plateau.
207
Curriculum Vitae
Wim Spaan (1946) is lecturer at the Erosion and Soil & Water Conservation Group of Wageningen
University. In 1972 Wim got his degree at the International Agricultural College Larenstein
(specialisation in soil technology and drainage). He worked for two years at the Public Works
Department of Amsterdam. Since 1974 Wim has worked at the Wageningen University. His keen
interest is on planning and design of soil and water conservation interventions. He has been on
numerous missions to many countries such as Brazil, Indonesia, South Africa, Mozambique,
Botswana, Tunisia, Mali Niger, Burkina Faso, Turkmenistan and Uzbekistan and has participated in
many international conferences. His list of publications covers subjects including land use planning,
wind erosion, water erosion and technical interventions. Recently he coordinated two EU-projects
on water conservation in Central Asian Deserts and on wind erosion in Northern Europe.

208