˘ˇssfn.org.sa/wp-content/uploads/2016/06/volume1-No1.pdf˙˝ ˛ ˆ ˘ ˇ J. Saudi Soc. for Food...
85
Transcript of ˘ˇssfn.org.sa/wp-content/uploads/2016/06/volume1-No1.pdf˙˝ ˛ ˆ ˘ ˇ J. Saudi Soc. for Food...


. ! "#$%& '& ( )*+, ) .- ./ 0 1234)*5 6 .)*78* )+ 9% : !."+ ;/< =>* ) ?*@ & )?/. A<B* + CD/
EFG )B*/ HI*+ J.
)>$& + )JK+ =* )/< !& A<IK& L + M 9 N9+ O3& =*&)A4 ( R> S?>! 02& T U& V$& =*
'& (& ',G& ;8?! ;WK*K<+ .'& ( M 9!& 3R& U*& X% 6 Y3Z[ \+ ] #+ )*9<K+ =*.
& U 6 HI*+ 3 R< ^^ _`! )8*\ > a >Y bc<d SY& V<9e&.
-fY )K?c3 &d g] )/< Kd! :>+& Oe T)+ 9% T#$%& )d% Tbc<d.
! 3i46 #$% d )d& jk% S/ X% )A LF (0!!&
;?!! #$% )8c ; l ;9e ;d& jk% S T >U jk8* 9e jk% S #$+ L\ L8 ?m&)Ak% & (>d )d& >d&
T)3& S n Z?J 3d% R M3& *5 S3&."#) % & '((
o 8p Tf* q 8p T),/ f* qUJ Tf .)rrr(.stD! A<> 37, 'Rp& 3u & eK =* 8d 8vd+ w./
+& .)*x . y*% ).+$))?3 M*.(T):("zr.jk% S \| 0< )U 6& )3 &(>d& >d )d>&
d +& ,d S& ~< .S> >./ d \|?J Lc +)* )% )Z( \ #+ jk% & ) 3!&.
*+ "#),-(KU MR T) .)rrz(. )|B! ?K .y>*% ).+$
. T T/. )*8%T).K )? R."# )*. & ,/ 012– 3 (
Td?*, ..)rz(.<4 6 _89 + I<& :)?d9!& ?8?\_89 )]Y. Pomeranz(.T~> f?c>?8? )?+G)?.8(
'/ g T!K?d+ T)?+G <% .R S3)(."# )*. & ,/ 012(
TSZ3 j .)rr(.)o 'x 6 +&s M I< 6 ~ :Z><J+ Oe& )& I% %& ~ J) .Ak>% .(
. y*% ).+$ T TR> S>3 T).K )?/. )*8%rz".
*+ "#)4( ?. C1J T0q o T8. S?Y/4)<+(.)rrz(.S>v
fK C ?*8& )j?D! K. Melvyn ( .> y>*% ).+$ T T).K )?/. )*8% . R.
5 "# . Tj?* ..T8d \ =* % ?< stD!
s.+ w./& )?/| C * $ 6 M .Ts<K>$+ )>3. y*% ).+$ )rr(.r).
6 %178 ;9e 3& & W5 &d R< ?8*. 3& * )?%. )8c9*)
The World list of Scientific periodicals . M I<K>>! ;?& )dd9% 3R<F ; / )/<\ + TM TS>+ TS L+ )*+\ 8*
S TS\TS7\ TS7*+ TL+ T%... 3&>` #>+ >!4 M>v U f%. )SI(.
%1 "+9: " 6 jR )UK% )d+ U*& +& '& ( ! 02
L?>< )`& ',G& 3R ! =* )*5 ) .0><& L\ j*F S>3& >* R< d S*9/ 3 & L,
LK*K% L.
;< b+* 9e ) S<!IBM-MS Word, latest version
dSimplified Arabic S7U& d/ ?c d.6 > S7U& )R jR<d+y& f,& Hd* C 4 \
& T)?/. )B*/Times New Roman 4 )>B*/ > >\ S7U =* ) ?*@d/ ?c d. > )Bold ( 6
S7U& T)R jR<d+df,& Hd* C .
=5! S/ )*5 i4 W% #? L!:
< ?c3 ).K )?.8( )*x|B*)|B<&
)>>3 & )|G M* )?*\ T. y*% ).+$ .~^ " ).K )?/. )*8%
j!Yzrz- r+\Jzrz-- r+&< / :[email protected]

.. !" ! ! #$
..% $$ ! ! &
.. '(! &
..)* ! + &
.& , ! !
.& !! - !
–
.. !"# $ %%!&% '
)()(
!" "........................... .....................................
! " # $% $% ........................................................................................... '
&'( ( )* +, - . / 0 ) *
* * 1* ) * + , + ,. / .+ ,0& 1% /...................... ...............
2 ($% 3 4 *+ ) %2 / 3....................... ............................................ '
* 5 6 6 7 8, , 6 ")ICP-MS ( 4; 4; 6 0 6 8 <
*= ,4 ,+ + 5 ........................................................... >

J. Saudi Soc. for Food and Nutrition., Vol. 1, No. 1; 2006
١
.
: ! "#$ %$ &' '( ) *+ ' +)'' ,- Citrus sinensis and
Citrus aurantifolia .'/ ) *+ 0+/' 12 )23Ocimum basillicum 2' 2 Melia
azedarach '' 1'( ) *+ 4 , 5"3 '/ '67 , 0+8 9)' ) :+ ;' <.=>/ ;'8 "#$ 1?11@ ! ' '2$AB 2
/ ' 4 C% D'=' >+ 9 -E F'$ ) '6 E= ) ;'/ C$' ':Ulocladium utrum, Trichoderma harzianum, Aspergillus ustus, and Penicillium ducaluxii ' *+ ' )/ ' F''6 '/ "3 4 12+ 2E% 98 ' ) 1' )' CE% U. utrum'A. ustus ' C% >=+ A/ 1)>3 ) / ))6' )
) *+ 5 '( ( 4 "3'/>! 4 0+8 ' D% A/ % J3 '2 )2 , 92E= + K@$< ' )3 @'2 >=+ -% )'' ,- '( / 1
E= ) 3' ,/ L@.' )/ E% P.ducaluxii ) E= A/ ' C% >=+ %>! 4*+ + .
*+ M 4 1>+' D'= N 4 - 2E= ' 2*+ 24 +2 )' 5 '( + + (@+ )/ J3 1,3 E= #= )' 2!
,+A1%>! A + (- 4 E= ' )' '3 ! .
! :+ *E5 '( 11&' '( 1)3 1E= 1.______________________________________________________________

! "#$ $%
J. Saudi Soc. for Food and Nutrition., Vol. 1, No. 1; 2006
٢
" INTRODUCTION
) A' A' #P8Q )F 1 1F'$5' 1P 1(A' ! Q3R) Q - 3–N'- ' (3 ( '' 7+ F! 4 Q
,A))'= 1>3' '- =T 1)'* 1-A ) 174'/ % ' 6=3 '' 1D-(' ,'=' ('A'0+8 Q' 4(R 1', P
A' ;'' 3 6 ) C ,' , )U% 1J' ) 3 6< E3V )1 - '1-*(.
( W ABC( ,3 :* C% 9- J3 C%X 7' 38 3 4 'E 6 # 1* ,*% C% *+ :J3 ,* 4/
YEP/ 7( C% 'E C% '7% 3 E' 4/ / 1E' ,/ / 1'' 7( C% '7% 3' 57( 1E= ' 4 + :'T "#$ 4
C' ,A -3 J',*3 46 )'=' >+D( C % C% N! C% C *R ) ! )6+ FA/' :E- 374 Z' J
E= *+' ' 7A'146 ,*3 '6P 4 - E= )/ T3' '8 9' (V ,<+ ) E= =* 9 , C% ' "#$ '-' 17P7/ N ) 6= 'A >/ [' C$ C ' 6%U E= 1: '
C'3 4 3* 4 'E+ 4 7 A' Q#X ' , 15E% \ ]7E= "#$ )' 1Aspergillus, Penicillium, Fusarium, Claviceps, Myrothecium,
Stachyobotrys, Alternaria and Claviceps ( Wieland, 1986) 1 C% ' Tournas
and Katsoudas (2005)'/ ,-3 C% &'' ' ' ,A 6E D'= J' FA/'/ ,- '/ *3 ]7 9 4 - E= ) ^!' ' 7> '
7'Cladosporium , Fusarium, Penicillium, Rhizopus, Botrytis, Aureobasidium,
Trichoderma, Alternaria and Yeasts "#$' 1 ' )E ,A N8 ) A

J. Saudi Soc. for Food and Nutrition., Vol. 1, No. 1; 2006
٣
* (' ,(' E= "#$ 4 F>-' 4 + E C 7%3* 3 ) ]7 < > 4 6 4 )13(___.(
,4 ' NE 4 :' C( E C% - ' 7= 9' ' )A3 ) A 4 ' 1<+VE '6 )
)' )/ )' 7 Q *+ )/ ' 1'' E= 4 F>- '- ]# 3>'/ >/Charleston et al. ( 2006) +CQ + Melia azedarach 'Azadirachta indica '- 4 Plutella xylostella $P' )%`1 + "#$ C% #*+ Q NT%3 E ' ' 1
+ ) 3,A ':.,-' )' '(Citrus saneness and Citrus aurantifolia : &' : C$'
.E C% ;6'%>! 4'$'( Q#X 74 T=3 4 , C' 'E )1)=' = 9 :4 &' )46 F'377(' 4
E% >(Sharma and Tripathi,2006; Kang et al. ,2006; Wu et al.,2007, Mi et al., 2007)
.)3Ocimum basillicum: )4 4 , D'/X1' >,A Q N 4 5'3'aglycones, linalool and methylchaviol'$P
) (Politeo, et al., 2007)1:47/ E= (Atanda et al., 2006).?. Melia azedarach:( )4 4 3 .'/ # 1( E C% +C
N8 ^<C$' 1' > 5' 7E A' )1)'+a' ,-4_b ( 17'6 )/ 3>'/, 3*' #X 4' 7 .(Rukmini, 1987)
.5 '( shrimp shells: 4 5'3 Z' ) ) )bC! ?@1%>R ! ' '' '1 +' Q < ,*%
74 5 C ) C4 F-R ' ' '' ' +/ < 0)6' C! 7'3 Chetosan )/ J3 7 ) + 4 - ' >
(Lopez-Caballero et al., 2005)
! "#$ $%
J. Saudi Soc. for Food and Nutrition., Vol. 1, No. 1; 2006
٤
0 '$ "#$ ) :7*+ 6 Q)L@()' - E # 4 4 N 9 7E+ '/ "3 E= ) 9/ ' '6
F'7 )J' *3,46 .'V ]# ! + N A 4 ' "#$ + 1]#' 7 A :X C 1A '( 4 ' C M'+ EX 4 ,
)' '3 ! 1+ A <+ =' > E= #= )' ,'3 ]#'+ (- 4 E= 'A .
" # $
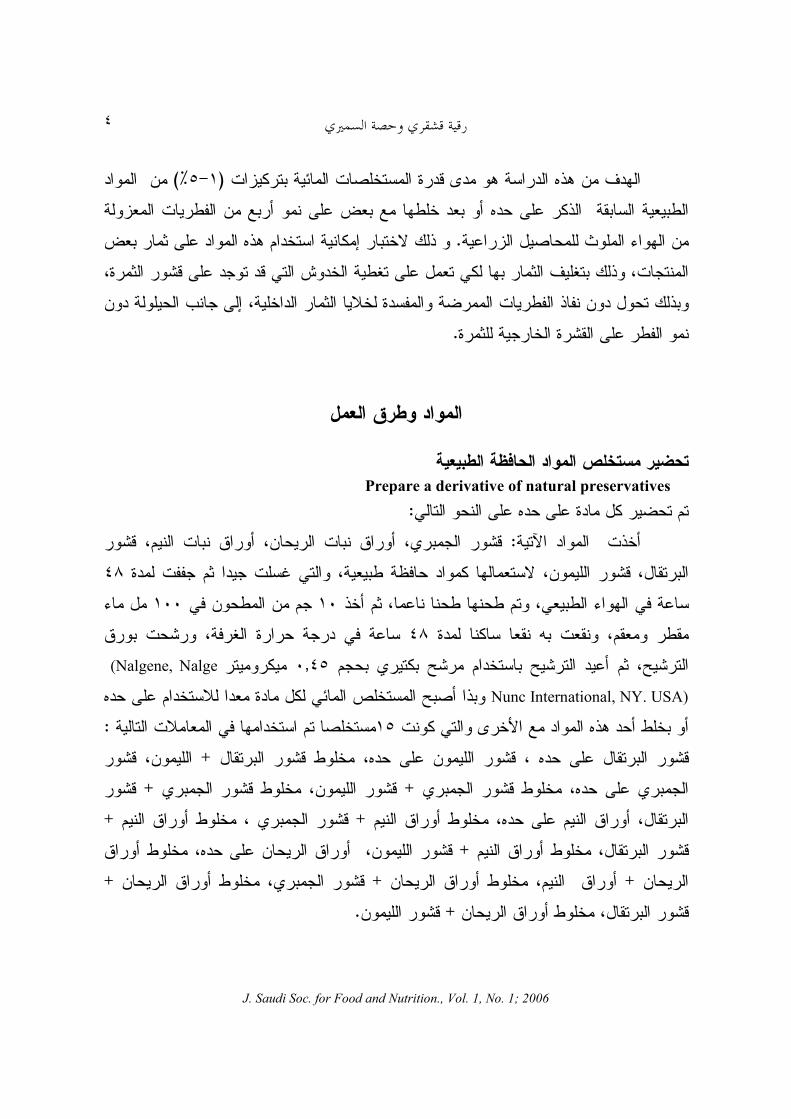
%& " ' Prepare a derivative of natural preservatives
C '3 4 "3 4 , >3 :` ' #+/ :'( 1 .'/ 1)3 .'/ 15 '(
'( 1,- == A P C' 1E T%3 ' 7V 1)'b14 3E 73E ' 1CE F'7 C% 4 A#+/ C% )'3E ) F ,
D -' 1 -' E- - b4 %X 3 C% .' 3(' 1&(1( 4/ A + & 3 5 &(,' (Nalgene, Nalge
Nunc International, NY. USA) "3 4 +< , CQ + &*/ #' ' C' 0+8 9 ' "#$ 3/ E+ '/7+ *+ < C% :
3 4 ,- '( ,- '( E'+ 1"3 4 )' '( 1 " +'( 1)' 5 '( E'+ 1"3 4 5 +5 '( E'+ 1)' '( +'(
"3 4 .'/ 1,- .'/ E'+ 1++ 1 5 '( .'/ E' +,- '( .'/ E'+ 1 ++ 1"3 4 )3 .'/ 1)' '( .'/ E'
)3 + .'/ )3 .'/ E'+ 1+'+ 15 '( )3 .'/ E+,- '( )3 .'/ E'+ 1+)' '(.
J. Saudi Soc. for Food and Nutrition., Vol. 1, No. 1; 2006
٥
()*+ Culture medium a 6' '' +(Sabouraud dextrose agar CM41, Oxoid,UK)
J3 #+/KC% 6$ Q ) 1 #R ' 1E- F ) , EX> 3 + - 67 C% D- ):<''V (4º - .
,#" & - Isolation and identification of study fungi
,64 E= -E +1984) Abdel-Hafez, (E-U8f' E/ C% 5 .)K (' C% D'=' >+ 9 -E F'$ )1
'3Y' Y( 6'' 4 (Glucose -Cazpek’s-Dox) E2' 2(Naguib, 1968):>/' ,6' 7! / ' 9 , (Smith
and Dawson, 1944) 14 .E8 >3 A)b± i( *3/ A 1 / 7= 7 -' (Gilman,1957; Raper and Thom, 1949; Raper and Fennel,
1965; Ellis ,1971, 1976; Sutton et al., 1998) ' +98 E% A8 ( C$':
Ulocladium utrum,, Trichoderma harzianum, Aspergillus ustus, and Penicillium ducaluxii
)*+ ) (& , %& ." Cultivation of fungi in medium contains natural preservatives
+ -E )Bollen, 1972 (]#' %>U+ T%3 $>3 )1?11@("3 4'/ Y= CE ' ) , E+ -1=>/' CQ#X !Sabouraud dextrose agar Y 5Q ]3 9
* ' 1(V 3- A2 - C% A E' %E ' B ;6E=)$4 / (E= ,3 1E> 4 '' 9) +
+ A>3.E8 4 )b± i( ' 1Y3 '-5EE= ' )' /'/ .

! "#$ $%
J. Saudi Soc. for Food and Nutrition., Vol. 1, No. 1; 2006
٦
) ' /! :Test of the water extracts on some fruits and vegetables infected by fungi
,>%/ + Q *+ C% C$')5 '( +7E+ '/ 3 4 +'('( 4 7>+' D'= N 3- A 1
E=+ 41A '( -' +3- >+' '=E= M )' +*+ 1- / %X 3 C% A'*
[Q.()0 #Statistical analysis
1'Q ! [Q ,'3 73 + Q*3! T.test 0 7TR ) 74 ,*3 .'= '<' 0' 4 E> ' ,
1)
,( C% [Q 3>'/)'( '( + )/ +' 5 " 4 ,"3" 5E- ' >=+ J3 + E= 9 ' 4 EA AB '# '
N=+V 6' CA 9 ' >/ 7 , C% E> - %>! % 16 @'@ / , 1Q#X Q ! 7 + 5/ ) + 4 '
5 '( E% C%U. utrum ?,b',@ ' ) CA ' 1 ! N=+ AK,K '?,@C ' ,= AB &>' #$' 19 ' '( 7'3
7' 5))6' ( 4 ,% )6' AB )/ ' J3 1 ' 4 T%3 )6' ,'3 )/ ' 1 4 :>/'] . 4
°' ° ;'/ (Lopez-Caballero et al., 2005;Wang et al., 2006) . 4 / + +6@'@%' N=+ ! 0/ - E% A. ustus
?_,b '?_,_ A ' ) )' @ ! N=+V 6?K, '?,b@ ' 9 1E> - ' / C$' 5'3 #$ )/ :' )'
'/ C%D 4 8 : % 6)(Azadirachtin <+ '> # 7*
J. Saudi Soc. for Food and Nutrition., Vol. 1, No. 1; 2006
٧
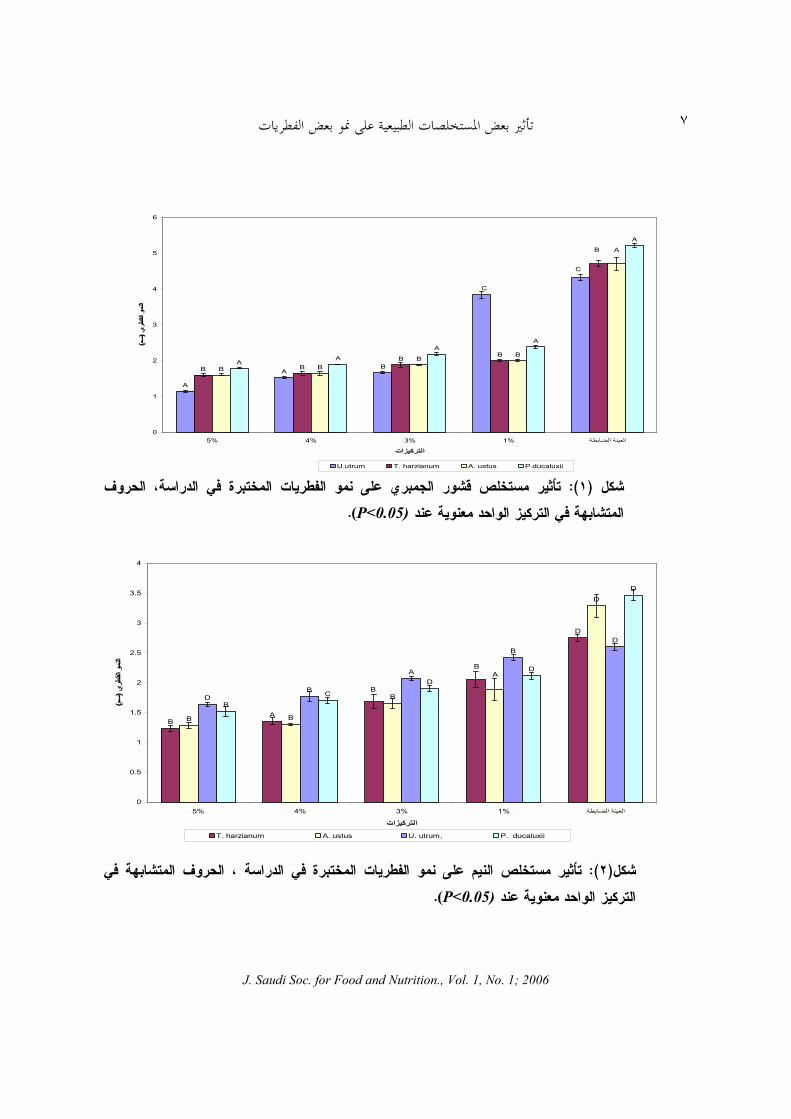
#!)3:(" (& . 5 - 6" " ,! (& 7 (P<0.05).
#!)9:(: " (& . 7 - 6(& " " ,!(P<0.05).
C
BA
A
BB
BB B BB
B
A
A
AA
AA
0
1
2
3
4
5
6
5% 4% 3% 1% ا ا
اآات
(ي(اا
U.utrum T. harzianum A. ustus P.ducaluxii
B
C
D
B
B
AB
D
A
B
BB
D
B
A
BD
D
D
D
C
B
0
0.5
1
1.5
2
2.5
3
3.5
4
5% 4% 3% 1% ا ا
اآات
(ي(اا
T. harzianum A. ustus U. utrum, P. ducaluxii
! "#$ $%
J. Saudi Soc. for Food and Nutrition., Vol. 1, No. 1; 2006
٨
<+ CQ + 4'/ C% 7! l A3 )' 4 Q#P Q C% '7 9 (Gunjan and Srivastva, 2007)' 186)(
/ ! )m Q' ) $P' (3 %` ) ' 4 , D6= (Basak and Chakraborty, 1968) + + )/ '' 1
E% > ' 6= #7% E= ,6P8 ' EAAntifungal )/ :4 J3 1NIM-76 #$ 6 ) .( 9' :E '# > '$ "Y'% >' 5E%' 5
,=E8 ,("(SaiRam et al., 2000) 3>'/ 1Charleston et al. (2006) )/ *R ) N=+ ' (3 Plutella xylostella5' ,(' *8 C% :'= - E>.
+ E= 4 AB A8 )*+ %>! 4')5 '( + + !) (,(?(6 ) , C% N=+V C% 6 '@'@$'' )4
E% ' J3 1"3 4A. ustus ?,@ ! >=+ A CA ' ,@/ 1E% U. utrum ,%?,b@ ! >=+ A ?,K@' 9 '
' [Q.' '(' ,- '( *+ + 4 /)1"3 4 , )3'
5E% C% ' N=+U. utrum 'P. ducaluxii N=+V C% ' ) )' ' CE% C% ' N=+ ]# ) Y 4' 1' ) 9 A. ustus 'T.
harzianum A ' ) CA ' 9 ' C% ' 9=' ' 4 7 .)' E= ' EA ' 4 5'3 )/ ) E ' *+ )/ ) #$'
#$EA AB '- )/ E= N ) J3 '= EA1D3>'/ #$' ,( C% [Q)(5E% )/U. utrum 'P. ducaluxii 4 )' '( + %>! 4
4 "3'@, ' 4/ , 'K,@' 1 ' N=+ / !?,b 'Kb,@1 ]#'2E= C% [Q2 ' N=+ J3 CA 2

J. Saudi Soc. for Food and Nutrition., Vol. 1, No. 1; 2006
٩
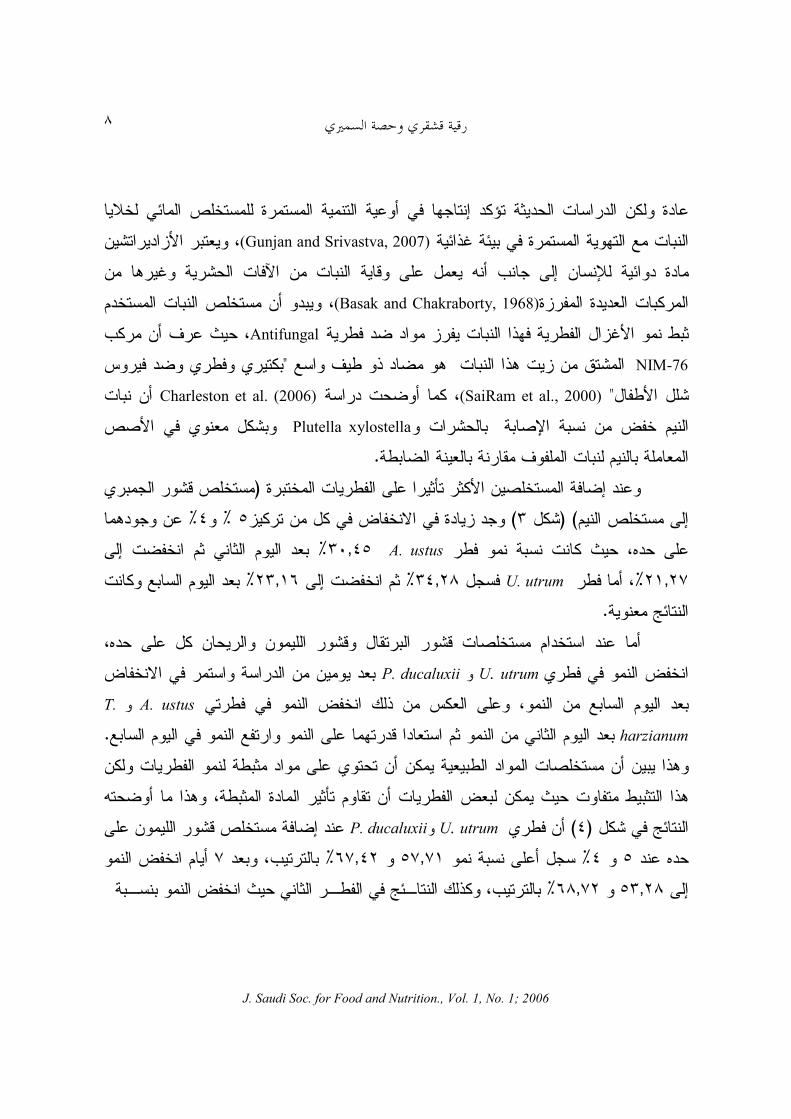
#!);:(: 5 " (& . 6 " ,! (& 7 - "(P<0.05).
#!)<:(= " (& . (& 7 - 6" " ,!(P<0.05).
BB
C
C
D
B
A
B
D
D
B B
C
C
D
B
B
C
C D
0
0.5
1
1.5
2
2.5
3
3.5
4
5% 4% 3% 1% ا ا
اآات
(ي(ا
T. harzianum A. ustus P. ducaluxii U. utrum,
D
B
BA
A
D
B
ABB
D
B
B
B
B
A
AA
A
A
0
1
2
3
4
5
6
5% 4% 3% 1% ا ا
اآات
(ي(اا
U. utrum, T. harzianum A. ustus P. ducaluxii

! "#$ $%
J. Saudi Soc. for Food and Nutrition., Vol. 1, No. 1; 2006
١٠
KK,?',K@ ! N=+V 6 A 1' ) K,_', @ -#$' 1E> ,( C% "3 4 ,- '( + C% >/ )(J3 1,/ ) C% ' E=,'8 )' K,b'Kb,@ ! 9 ' C% N=+V 6 A
_, 'K,@1CA E= C% [Q E4/ ' C% N=+K, 'Kb,K@=+V 6 A 1 ! N,b 'K,b @1 ]# ='Mi et
al.(2007) *+' &' '(- CQ + )/ Citrus unshiu 4 5'3 narirutin 'hesperidin 6 C% +8 "#$' L?E% =$ ' 6=3 )' C% F6
Gigaspora margarita ']# ) Y 4 %) ,- N'3 '( C% '' '6 )B E% 'A.niger ,–? ' /*' Q 6' YEE Q C% ,
4 (Sharma and Tripati, 2006).! 4 %>@'@)"3 4 )3 + )/ ' 1)- )E= >=+
/>1J3,'8 E= ,K, 'K,b @ A ! N=+ ,? '_,b@.', CA E= , ',bb@ ! N=+' ,Kb ',@#$'D( Atanda et
al .( 2006) )/ 3>'/ C%>! )3 6 + @# '3 Q ! F> E= A. parasiticus'V ^! ) ,- ;' ) )'<%(G1+B1)
_,_ @',@.,A D ' #$' linalool and methylchaviol
/ A(Chah et al. 2006) D )3 .'/ )/ C% Z' 5' 5 > ' + D' ,( 4 ./)E=+` )A. ustus 'harzianum T.)# N=+ '$'' ) 7 1' 4 C%)' '( + 1N=+ C% '
E= ,'856 C% @'@ !,bK@',@C% 9= A ! 9 ' K,? 'K,@#' 1 ]C%CA E= 5#N=+ D ' ! K, 'K,b@ A
! 9=b,b 'b,_@1;'/ ,<+ ! 4'%>,- '( + ' )#$ )/ )E=A AB >/ J3 ' >=+ ! ,'8 E= C% K,_ ',b@
J. Saudi Soc. for Food and Nutrition., Vol. 1, No. 1; 2006
١١
' 1 ,*' / ! 'K, ',@E= / 1E> - CA' ,% ,_ ',@ 4 D E= A ! 9=% ' b,b '
b,b@;'/ ,<+ 1"#$ 4'*+ C% ) AB 7 C T%3 ',Q>+ E= ' 4 .
%>! 4' ,)*+,A )' '( + +1,- '( +',- '( + +)3 + )' '( + 1+ +
)3, N=+' ,( 6 C% 5''@'C% 5' P 6 0+8'?@C%9 C% + E= 9 C% ' [Q
64"3 4 7 1A/ )' E= E% >=+ P. ducaluxi ,''?b,@6 C% @)' '( +' ,- '( + C% ) #$'
EA AB)*+ 49 E= 1+ ^3 #$' A/ = ! '2*+ 4 $AB' E ' 7E+ 4 >8 7E(/' '
.' "#$ % 6'J3 0+8 *+ 9 % A8 + :>/
'( + :>/ 5+' )' '( + 5 '( + +5 '( +' ,- '( + +)3 .'/ +>=+%
' + E= 9 ' 0' / ,''$' _,@, 4 @)5 '( + +E% 3 C% )' '( + P. ducaluxii >/.'
,' >=+ A8 ) E= Y= )/?,?b@4 %>! .'/ + +'/ +' ,- '( + .+)' '( + .'/ +'
+)3 .'/ +. C% + E= 9 ' [Q %>! 4 ' V N=+ E T%3 ' *+ ) =+ 6)1?11@(' Q !'
1a 6')'% "3 - '/ 6 "5B "AB 3 +V A/ '$' E' C% Al( 6 6 AB :+ 1;'' 74'' + +

! "#$ $%
J. Saudi Soc. for Food and Nutrition., Vol. 1, No. 1; 2006
١٢
6 )' ' ' + E=@'@ / 1' N=+ @Al ) % 4 3>' .'% ' 1' 4?@n>/ .
17 =< [Q "#$ .E' ,>%B 7=' >+ ) ;'/ N M *+ C$' C% +' 5 '( +"3 4 , '/
%X 3 C% ' )*+ ^61 / '* C% [Q 3>'/5 '( + % ++ @9 7+ !'
J3 146 ,*3"% ' E= ' )' '3' 7EX 4 ,.
J. Saudi Soc. for Food and Nutrition., Vol. 1, No. 1; 2006
١٣
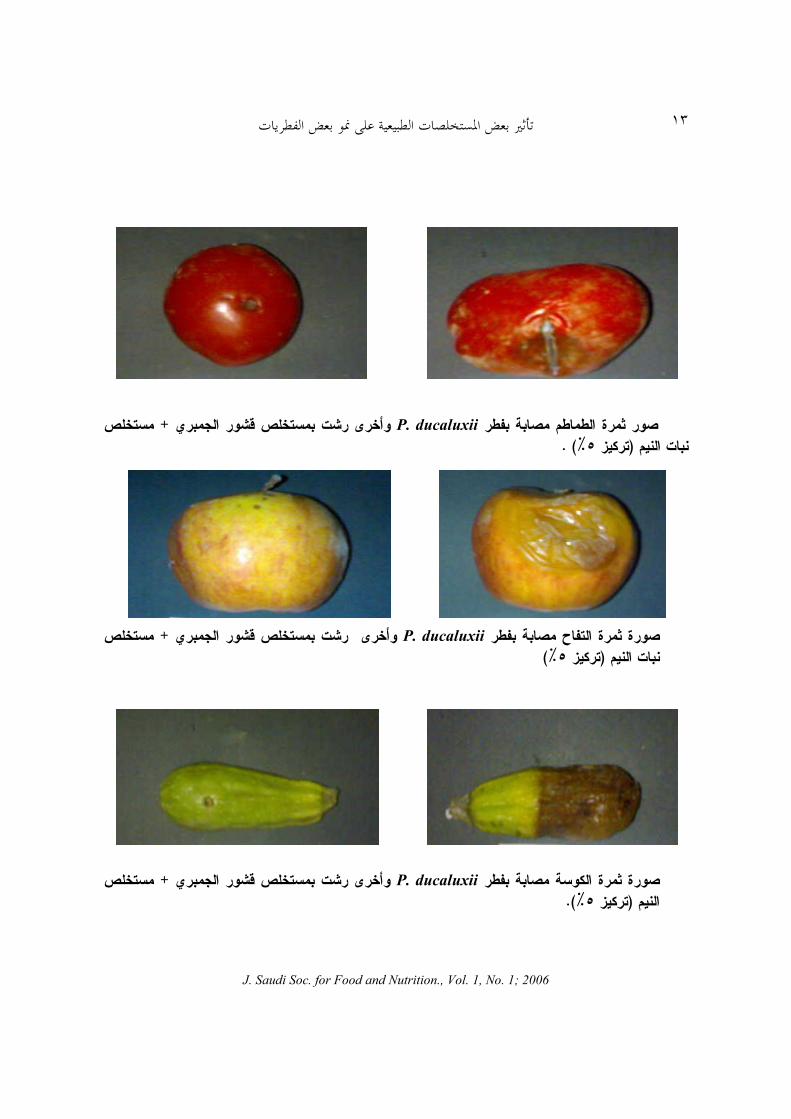
: . P. ducaluxii 5 >? + : ),!A@(.
. B . P. ducaluxii 5 >? + : ),!A@(
. . ! P. ducaluxii 5 >? + :),!A@.(

! "#$ $%
J. Saudi Soc. for Food and Nutrition., Vol. 1, No. 1; 2006
١٤
" !
*23 2 2 2E 74 -' ' 66 4 ] -' (E / J3 C% 5LLb' #$ D ( 5#' 1.
C5 C5 "41D3(.()___.F#X )4 N/ .1$- 1 '8 E 18
* '7.o3 )3 4 1,-4 ' 1 o3 1.E o66 4 3 1C3 o 1
) '*.)_b(.1C(2 E C% ' ! J23 1C' 1N 1-' ' 664 ] .
- C4 1 -.)(.#P8 A' –C [+ ,' C% 9>' .2 #X 1#X CA C l 1#X' F1+ .3 )(Lb C% 1= L_ L)3 .
)3 4 1-*.)(.pC+ )' Y ,' #P8 < )> ) + 1#X CA C l 1#X' F#X .23 1)(_L
_= C% 1L_ L)3 .
5D C5
Abdel-Hafez S. I. (1984)· Survey of airborne fungus spores at Taif, Saudi Arabia. Mycopathol. 88 (1):39-44.
Atanda, O. O. ; Akpan, I. and Oluwafemi, F. (2006)· The potential of some spice essential oils in the control of A. parasiticus CFR 223 and aflatoxin production. Food Con. 18:601-607.

J. Saudi Soc. for Food and Nutrition., Vol. 1, No. 1; 2006
١٥
Basak, S. P. and Chakraborty, D. P. (1968)· Chemical investigation of azadirachta indica leaf (Melia azadirach). J. Indian Chem. Soc. 45 ( 5):466 - 467.
Bollen,G. L. (1972) · A comparison of the vitro antifungal spectra of thiophanates and benomyl. Neth. J. Plant Pathol. 78:5-64.
Chah, K. F.; Eze, C. A.; Emuelosi, C. E. and Esimone, C. O. (2006)· Antibacterial and wound healing properties of methanolic extracts of some Nigerian medicinal plants. J. Ethnopharmaco. 104(1-2):164-167.
Charleston, D. S.; Kfr, R.; Dicke, M. and Louise, E. M. (2006). Impact of botanical extracts derived from Melia azedarach and Azadirachta indica on populations of Plutella xylostella and its natural enemies: A field test of laboratory findings . Biol. Cont. 39( 1):105-114.
Ellis, M. B. (1971)· Dematiaceous Hyphomycetes. Common-Wealth Mycol. Institute, Kew, Surrey, England.
Ellis, M. B. (1976)· More Dematiaceous Hyphomycetes. Common-Wealth Mycol. Institute, Kew, Surrey, England.
Gilman, J. C. (1957)· A manual of soil fungi. Iowa, State Univ. Press. Ames. Iowa, U. S. A.
Gunjan, P. and Srivastva, A. K. (2007)· Azadirachtin production in stirred tank reactors by azadirachta indica suspension culture. Process Biochem. 42:93-97.
Kang, H. J.; Chawla,S. P.; Jo, C.; Kwon, J .H. and Byun, M. W. (2006) · Studies on the development of functional powder from citrus peel. Bior. Technol. 97( 4):614-620.
Lopez-Caballero,M. E.; Goamez-Guillen, M. C.; Perez-Mateos, M. and Montero, E. (2005) ·A functional chitosan-enriched fish sausage treated by high pressure. J. Food Sci. 70 (3):166 – 173.
Mi, R. K.; Won, C. K. ; Do, Y. L. and Chan, W. K. (2007)· Recovery of narirutin by adsorption on a non- ionic polar resin from water extract of Citrus unshiu peels. J. Food Engin.78:27-32.
Naguib, M. I. (1968)· Effect of various nitrogen sources and / or colchicine on the utilization of L-arabinose by Cunninghamella elegans. Acta Biol. Acad. Sci. Hung., 19:437- 444.
Politeo, O.; Jukic, M. and Milos, M. (2007)· Chemical composition and antioxidant capacity of free volatile aglycones from basil (Ocimum basilicum L.) compared with its essential oil. Food Chem. 10 (1):379-385.
Raper, K.B. and Thom, C. 1949· A Manual of the Penicillium. Williams & Wolkins, Baltimore. U.S.A.
Raper, K. B. and Fennell, D. I. (1965 )· The genus Aspergillus. Williams & Wolkins, Blatimore, U. S. A.
Rukmini, C. (1987)· Chemical and nutritional evaluation of neem oil. Food Chem.26 (2): 119-124.
! "#$ $%
J. Saudi Soc. for Food and Nutrition., Vol. 1, No. 1; 2006
١٦
SaiRam, M.; Ilavazhagan, G.; Sharma,S. K.; Dhanraj, S. A.; Suresh, B.; Parida, M. M.; Jana Kumar Devendra, A. M. and Selvamurthy, W. (2000)· Anti-microbial activity of a new vaginal contraceptive NIM-76 from neem oil (Azadirachta indica) J. Ethnopharm. 71(3):377-382.
Sharma, N. and Tripathi, A. (2006)· Effects of Citrus sinensis (L.) Osbeck epicarp essential oil on growth and morphogenesis of Aspergillus niger (L.) Van Tieghem. Microbiol. Res. In Press,
Smith, N. R and Dawson, V. T. (1944)· The bacteriostatic action of rose-bengal in media used for the plate count of soil fungi. Soil Sci. 58:467-471.
Sutton, D. A.; Fothergill, A.W. and Rinaldi, M. G. (1998)· Guide to clinically significants fungi. Williams and Wilkins. Baltimore, Myryland,USA.
Tournas V. H. and Katsoudas, E. (2005)· Mould and yeast flora in fresh berries, grapes and citrus fruits. Int. J. Food Microbiol. 105( 1):11-17 .
Wang, X. ; Du, Y. ; Yang, J. ; Wang, X. ; Shi, X. ; Hu, Y. (2006) · Preparation, characterization and antimicrobial activity of chitosan / layered silicate nanocomposites. Polymer, 47:6738- 6744.
Wieland, T. (1986)· Peptides of poisonous Amanita mushrooms. Springer Verlag, Berlin, Germany.
Wu, T.; Guan, Y. and Ye, J. (2007)· Determination of flavonoids and ascorbic acid in grapefruit peel and juice by capillary electrophoresis with electrochemical detection. Food Chem. 100 (4):1573-1579.

J. Saudi Soc. for Food and Nutrition., Vol. 1, No. 1; 2006
١٧
Effect of someNatural Extracts on the Growth of some Fungi
Rukaia Gashgari and Hessa Al- Semari
Girl’s College of Science Education Jeddah- Saudi Arabia
P.O.Box.45057 Jeddah 21512
ABSTRACT. The Aim of this study was to use materials extracted from the husks citrus orange and lemon (Citrus sinensis and Citrus aurantifolia), extracts from basil (Ocimum basillicum) and neem (Melia azedarach) leaves, and extracts (named chitosan) from the shell of some fish and shrimp. These extracts (used alone and/or mixed) made 15 different treatments. These materials were added at 1, 3, 4, and 5 % to a sabouraud dextrose agar to study the impact on the growth of four types of fungi isolated from the air of the vegetables and fruits markets in the city of Jeddah, Saudi Arabia namely: Ulocladium utrum,, Trichoderma harzianum, Aspergillus ustus, and Penicillium ducaluxii
Data showed that the extracts (alone or mixed) reduced the growth of all four tested fungi, U. utrum and A. ustus growth were decreased the most compared to the other fungi after 7 days of incubation. Chitosan alone or when mixed with other materials was more effective reducing the growth rate of fungi to 60%, followed by Ocimum basillicum and Melia azedarach leaves 40%, and the least reduction 10-20% was observed with Citrus sinensis and Citrus aurantifolia husks. Most inhibition of the growth was found in P. ducaluxii in all used extracts.
When spraying the previous extract (5% of mixed shrimp shell and neem extracts) on some vegetable and fruit, no fungal growth was observed.
Keywords: natural extracts, chitosan, Ocimum basillicum and Melia azedarach, Fungi.
J. Saudi Soc. for Food and Nutrition., Vol. 1, No. 1; 2006
١٨
. ! ""
!:$% & '( )* + ,-. $ )/( 0 12 - $. 1+ /3 $/ 4.+ ,-. 156 4( / 7) 94($ ;<( ( '( ( 2 –
; & 1*+ 12 $ + >1+ 0 4 $ ? 5 $. 4 )?+ 5 7@ * &< 1 @3@ 1+7@ A B &< 1(4 *
C (+ .+ 0 12 $ < + $6 $ ,9E+ $ C ,EF + $G,9E'(H + $ 1* 1< )II,IGE(.*2 & $ '(6 1* 15+1+5 1 12 J @3@ C2B 2+ 1* >?+ * &< 1
J 7@ $ 1* $ 1; 1 .2 3( 5 $ * $ +(+J @ 1+5 J+ $ C $ ?+ J+ $ F $ @3?+ &< 1 A B 7@ .2 3( 5 $ * +( $ F $
?+>2 3( 5 * $ 5 ?( J+ $@3@ 1+5.______________________________________________________________
" + L 1* 4( * M( 4* 7 $ C.& *
- @@ NL O6 @3@ C 6 + $ *+ * 7 P N& $ ?* $*+ J + 9,IE?* 6 P F7 $ C I,E(Al-
Nozha et al., 2005) . + 7 C+ C Q. + < 7 $F. ? 2H J4* (Cole et al., 2000) + C + <$ $ 7 $F. ? 2H
*+ (Abalkhail, 2002). & * E$ 4* 7 0 ? 26 5R $ $ C 6 +(Lobstein et al., 2004) 2B $ '(6 5 4/ S ? 2H

! " #$ %&'( )
J. Saudi Soc. for Food and Nutrition., Vol. 1, No. 1; 2006
١٩
+ 7 $ &1(6F 4.(El-Hazmi and Warsy,2001) + ? N& &? + $+ 7 + $ ? 2H SF $ 7 " I E(Serdula et
al.., 1993)L 2B6 $ $ C + ?@ H $ @ C 4 7 $. ?*(Dietz, 1998; Techernof et al., 1996)L 2B F T
(H (Sturm, 2002).* C 1+5 J+@3@ Triglyceride 1 ?+ B&<7@ ( High-Density LipoproteinF T U C2B ?( $
< $(Castelli, 1992; Manios et al., 2002) . & '( @T ? 2H J + ( $< F $ N&2B6 $< F T L (Tounian et
al., 2001).- (Berenson et al., 1998) T U ;/ C2B ?( $6 ?@ 5 F /6 ? 2H J C5 + ?+ @3@ 4 $. O
+ & 'R 4/ + V .C5 $ $< W 1X $6 $6 2 7 YA1+ M<W $ $6 $ 2 7 ?+
++ 1 ?Z ( (Lenfant and Savage,1995)5 (El-Hazmi
and Warsy, 2001) $ @6 $6 E*+ ? 2H $ $ @6 $EY $- $ $ 4.(6"(5 7 $*F + * 2B T L ?& 5 $<.( 1+ 15+ [+ J 4 ? $. C2B & ,GE
",E7 1- -3 $ (Al-Shehri et al., 2004).& \(Al-
Nuaim et al., 1997)$ @6 NL $ '(H .& ?+ 1+ C < 5 7 - V5 7 !*+ V ]2 .4+5 <W *)$/V
?2 (7 1<W @6 $+ ) / (Dietz and Bellizzi, 1999;
Pisunyer, 2000).4 $. 1+ -% & $ 3* ? 1+ 7 + */ C *+ (EL-Hazmi and Warsy, 1999) '( .56
S $ !; J $. J+ & )/ $*+ NL - $ $% - J 5 Q /F !* $ ! ,4 /7 J+ F ?+

J. Saudi Soc. for Food and Nutrition., Vol. 1, No. 1; 2006
٢٠
2F7 @3@ 1+5 ..6 1 Q-+ ,-. 10 12 '( ( 7–+ 17. 'R '( )* $ 3* -% & <W 4B+
1+ 4+5 $ ? &< 1 @3@ 1+5 ?+ 7 4.
# + 156 7 4( /) 94('( $ $.(6 Y 2 )
+ (0 V6 $;& VH * ]2 ?@ 7 )]< >?<>_ >5 ( 4$.B;<( F2 .2 0 4 4+5 <W +& $ ?
+& -% & & 1* &A?5 )(.
4 ?5.* & \ ) 4+5 <W +& 4+5 &**)+($ 1& ?($ C$ a""II–aa 9, 9," 9," 9,I 9,I – 9 9, 99GG– G" 9," II9,a 9,a –
* WHO (1998)
V5 4"?1 1B 2+ 4 $ )6 S6 F7 *12(C 4 * Q- 25 CA 6 7 1\ & C/ $F& 4B+ (+
)*$H S6 (F 4 5 > ?+Total Cholesterol >@3@ 1+5 >?+ &< 1* 7@ 5 4B+ X ?& /
<. +& Q- 1* C7 5 4F2H ?+ 6 &< 1
! " #$ %&'( )
J. Saudi Soc. for Food and Nutrition., Vol. 1, No. 1; 2006
٢١
7@ A BLow- Density Lipoprotein b& F7 * '( cS + (Friedwald et al.,
1972):7@ A B 1 ?+ = ?+* 1 ?+
7@–)@3@ 1+5 ÷9(1& 1 4B+ + 7_ 1 ; )B< ((5 +& 2+ !* )& +5 1+F + 4 $. 1 >
?* $+ 2+ 2 )4 $. 1+ -% & $ 3* '( )* ( 4B+L ?& f ;&(SPSS.10,1998).
$ %& $ ?5 $ ) ($6, E0B ) 12 $ $. N& ( 76 $
7 12 + 1+ $& 7 ; ; 0+ V $ , $6 $,GE* 76 $ _ F2 $+ $ $. )&!+ (7@ 0*
7 + F2 ,-. ,$6 $& 7, EF2 $2F $ $. * 76 $ ]< )fB &(.V "9,aE76 $ ?F ( ?B * ,GE!- $ $/
B ?B.V + ,-. f; ] + f;)&H >" " . (32 '(0 - 7$ ? S3& .$ 12 (6 1&+ 1+ '(H $12 * ; 7 $*F ,+ .@6 $6 $$G9E
$ ( 76 $//6 ?* N&)1 1(?F ,E13( $//6 ] ,-. 5f; V(Abalkhail and Shawky, 2002) 7 32 '( /+C5 7 0.6
N& $ $ 4* F7 $6 $ G,9EN& ( 76 Sg $ $*5 ,$6 $& 7 ", E1/H $1% @ & $6 $ $X 4* ?H + S,aE
1/h 1% $& 7 $h,GE* 1+ .

J. Saudi Soc. for Food and Nutrition., Vol. 1, No. 1; 2006
٢٢
4 ?5 .(5 ?* * 7_ 1* +& N& ( 76 V
(5 ?* ; + ):V
0B 0+
G "G I
,a , ,
O5 , F2?<
]< 5 _
G a
I,G , ,9 ,G
O5 , ?B: B)$ ?6? (
2+ )I? (( )$ @6I? (
" 9 99
,G " ,9 "9,a
O5 , *+ :–,
–, –, – , –,
G9 "9 I G
9,a , G,9 ,G9,a
O5 , 4H ?(:?*
?* a
,GI,G
O5 , 4H 4* J+:6
6F ; 2+ !@ *5
( 1+
" 9 I
,a, , ,9 ", ,G,G
O5 ,H 4* J+:6
6F ; 2+ !@ *5
( 1+
Ia
,a9,9,, ", G,9a,
O5 ,
! " #$ %&'( )
J. Saudi Soc. for Food and Nutrition., Vol. 1, No. 1; 2006
٢٣
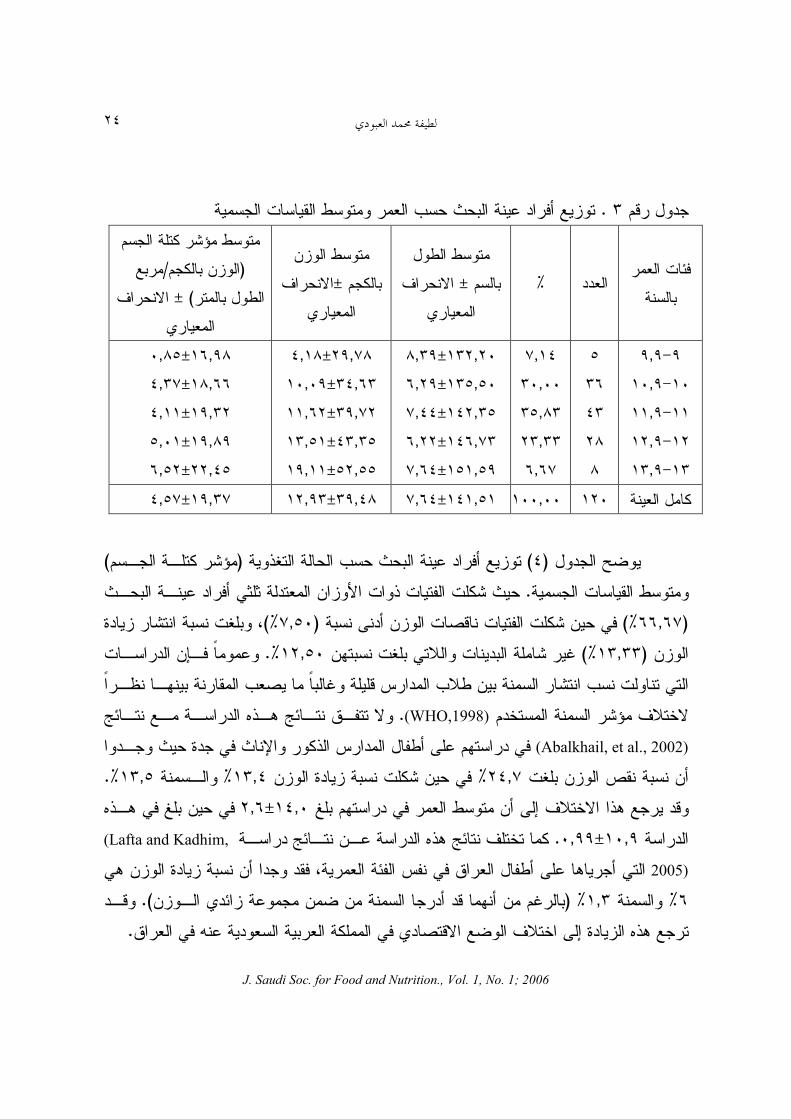
?5 iA)(?2 1+ 2+$ ,* 4+5 <W +
N& * 1;7 +& *2 1* 7 VF /6 * 1+F ,-. $6 $ W ( * ; 7 4+5 < ,+ N& -. 7 $ C 1\& *.5 V 5 ,-. ] ,(Abalkhail et al., 2002) + 7 4/ 32 '(
- 0 C5 7 NL.?5 $ $ )(76 V5 ?2 2+ $6 P N& (",9±G,I" $ 2+ P $& 7 4+ ,"a ± , 45 .
62+ <W P F7 4+5 ,G±",9G .( 1* ,-. ' ,5 (Kavazarakis et al., 2001)0 32 J NL - @6 7 –P N& $ 4/+ 7 ?2 2+ 9,GI±,"4+$ 2+I,±,G 45>6
k7 4+5 <W 4/+ 7 1* $ '6 1* $5+ + ,-. 7 1 $P N& 4/+ 7 ,"±,Ia.7 V+ * J 'R )3B -. V5
32 1< N& 4/+ 12 ( 7 I ,-. 1 $& 7 + '( + * ; + .F ?F 0 ( 7 1 +5,+ $ N& $
,5 ( 4+5 <W)&C& , (7 - $ 32 J ; 0 * .+ 12 <W +5 ; 7 4* 1)>> >
+ (. 7+ ,-+ 7 /( )$&, ($ ? 2H $(>$6 *5 C ,-. & 7 )3B 'R $ $ >$ ? 6 N&
(Romon, et al., 2005; Stametakis, et al., 2005) $ 3( 5 '( < J+ ?B 6 7 C+h !C+H 1 > + J <
? 2H.
J. Saudi Soc. for Food and Nutrition., Vol. 1, No. 1; 2006
٢٤
4 ?5.+5 1+F 2+ * +& N& ( 76 V
* 1;7 +
* E?2 2+
4+ ±)&!*
$ 2+45 ±)&
!*
4+5 <W 2+ )45 $/V
?2(±)&!*
,,, ,,
9I " a a
G," , 9,a , I,IG
, ±a, 9,9±I, " ,9±G,"" "I,G±I, 9,9±G,I"
,Ga±",a ",I±, ,G ±,I ",9±,9 9 ,99±,
I,a±,a9 a,II±",G , ±", ,a±9, ,"9±I,9
* ? ,",9±G,I" ,"a± , ,G±",9G
iA ?5 )"(-% & +& N& ( 76 V)4+5 <W(+5 1+F 2+ .6 @@ * $H 1- 1 1< N& N& ( 7
)II,IGE(+ '6 $ 1 1 1< $& 7)G,9E(>C < + 1% $),E($/+ 1% 3 1 < _ ,9E.(1+ $k7 M
+ < + 1 M_ 0 32 $ * F M\ / + <W )3B 4B+(WHO,1998) . ] f; V + ,-. f;
(Abalkhail, et al., 2002)& C5 7 NL - 0 ? 26 '( 4/+ 7 5 N1% $ F + $6 ",GE$& 7 $ C + 1<,"E+,9E.
V5 7 * 2+ $6 'R )3B -. P 4/+",± ,I,-. 7 P $& 7 +,±,.)B f; $( + ,-. f; + (Lafta and Kadhim,
2005) * ? 26 '( .56 * ; 0 7 ] >5 F7 $ C + $6 .IE+ ,E)/6 $ 4_56 $ !; (5 $A $ +(.
]* 7 [( *+ * 7 ! VA )3B 'R C ,-. V5.

! " #$ %&'( )
J. Saudi Soc. for Food and Nutrition., Vol. 1, No. 1; 2006
٢٥
4 ?5".+5 1+F 2+ -% & +& N& ( 76 V
-% & ) <W
4+5(* E
?2 2+4+ ±
)&!*
$ 2+45 ±
)&!*
4+5 <W 2+ )45 $/?2 V
(±)&!*
$ C; $ * $
9 I a
,9 , II,IG G,9
"a,±G,99"I,"9±,I,a"±G,GI,II±G,G"
I ,G± ,"9,±a, ","9±I, 9,±,99
a,"9±, , "±,9 G,9±,aG ,a ±,"a
* ? , ",9G±a,9,"a± ,,G±",9G
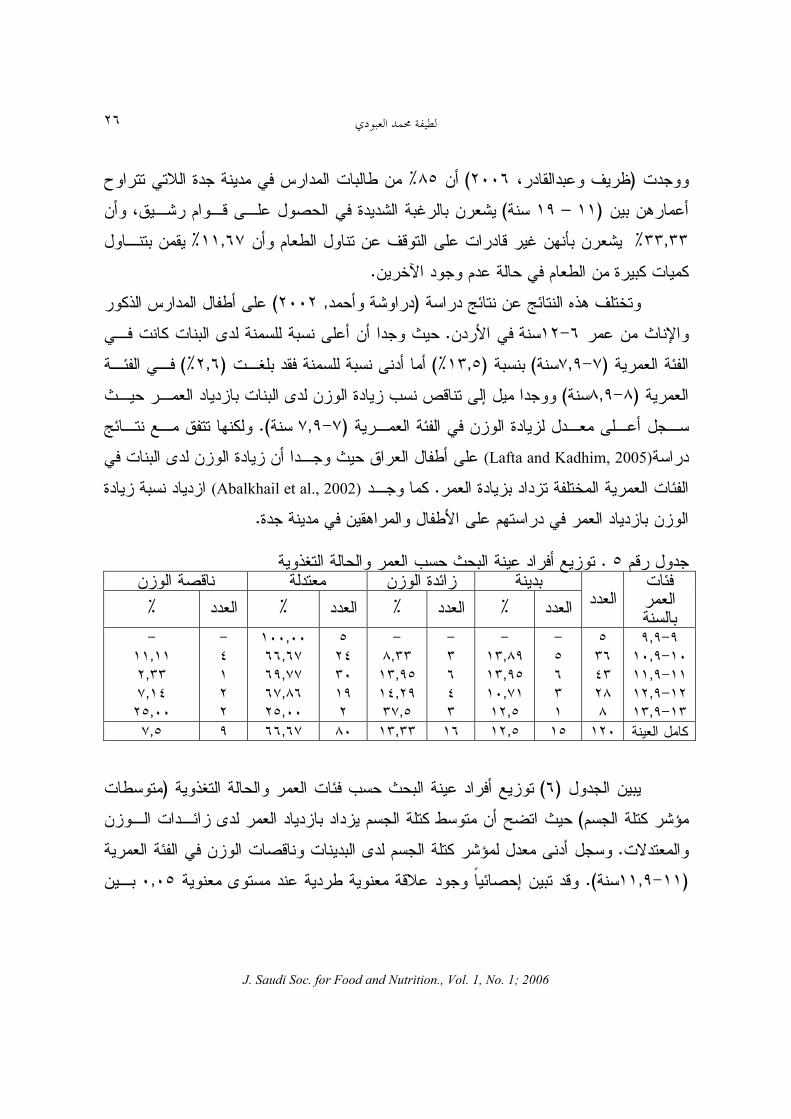
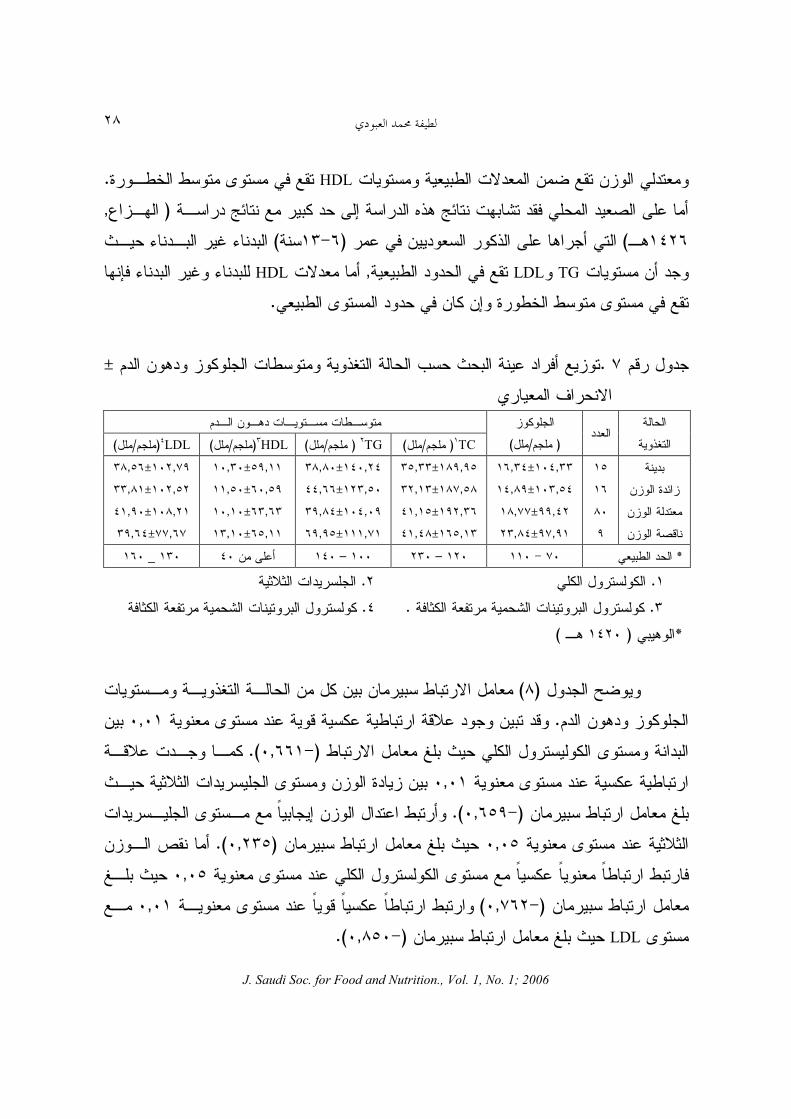
?5 $ $)9( R + '(6 $6 + 1 7 1 J F * 1; ),+ (),+ (7 1 F7 $ C + '(6 6 ;
*),+ (<+ $ 1* 1 1 ( (H V5 7 '(H 7 * ; ),+(.F7 $ F 6 + '6 ?5+ 7 1 J R
* ; ),+ (* ; ) ,+ (+) ,E()G,"E('( .\& MA6 ,5 'R C $* C V ,7 1 V5 1 ; *),+ (!6 ?5+ 4 N& $ 1*6 $ C 6 R F
* ; ,-. 7 $.$ * C V $ 1* + B \& 7 M+ B* ; ),+ (1; 1 + 7 C C ?F 7 $ 1 $.N& 7 1 * 6 * -. R \&3 $/F 4.
$/6 6 + 2%A * ( 4*2 ? & ,5 JB6 +H 6> 5 (AL-Subai, 2000)( [+ 7 ( 7 0 12 '$) – + (7
$6 9,E 7& ? $/2A S-% 19 ,EC $ )B $/ $"E7& ? 7 C< _ $/ ",E4*2 ? * - $*<.
J. Saudi Soc. for Food and Nutrition., Vol. 1, No. 1; 2006
٢٦
15) )\ >F( I ($6a9E 7 0 12 $ Y 3 C5 $ $.(6)–+ (_ $*< 7 C< $6 >]< 4 '( ?&
,E2 ? $( ) '( 1 _ $/T $*< $6 4*,IGE? $F $ C 1$BX 5 4( & 7 4*2.
B + f; $( f; ,-. ))&6 < , (- 0 ? 26 '( ( $ NLI + 7H$ .6 $6 5 N&(+ ' + J 17 1
* ; )GG,+ (+),9E(1% F7 + + '6 6) ,IE(; 7 *)aa,+ (+ 'R ? 5 N& * 1 J $ C
+(6 ?5* ' C ? * ; 7 $)GG,+(.f; V ] / +(Lafta and Kadhim, 2005)5 N& ]* ? 26 '( 7 1 J $ C $6
* 1; * C B .5 (Abalkhail et al., 2002) C + * $ '( 4/+ 7 C5 7 $F. ? 2H.
4 ?59.-% & * +& N& ( 76 V $ C; * $ 1;7
* +
**E*E*E*E,,, ,,
9I " a a
9I
,a ,9 ,G ,9
I"
a, ,9 ", G,9
9 "
, II,IG I,GG IG,aI 9,
"
, , G," 9,
* ? 9 ,9I, aII,IG G,9
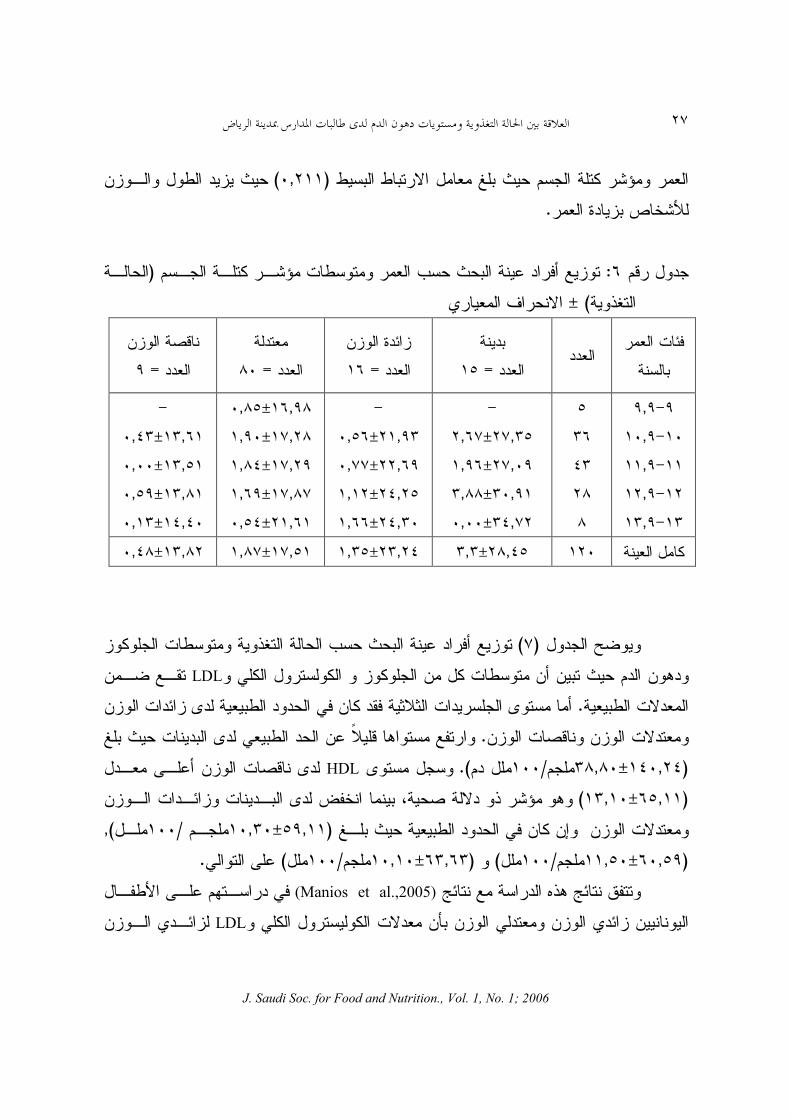
?5 $)I(N& ( 76 V * 1;7 +& -% & )12+ 4+5 <W ( 4+5 2+ $6 iA N& $ 1; J *
1* .'6 ?5+ <W ?* 1 J 4+5 * ; 7 $ 1 ),+(.2 * 3( 5 M;&R $ * J+ (,9 $
! " #$ %&'( )
J. Saudi Soc. for Food and Nutrition., Vol. 1, No. 1; 2006
٢٧
2+ 2 ?* P N& 4+5 <W *), ( N& $ ?2* C B<h.
4 ?5I:4+5 <W 12+ * +& N& ( 76 V)&-%(±!* )&
* 1;7 +
* * =9
$ C; * =I
* * =a
$ * =
,,, ,,
9I " a a
G,9± ,IG G,±,I ,±,aa ",G ±,
,±,9I ,I±,GG ", 9±, ",±,II
I,a±,a9 G, a±, G, ±,a" G,aG±,I ,I±,9"
,I±," ,9±, ,a±,9 ","±,
* ? a,"9±, , "±,9 G,9±,aG ,a ±,"a
?5 iA)G(-% & +& N& ( 76 V 12+ 5 12+ $6 $ N& 4 $. 5 $ ? ?+LDL $A VF
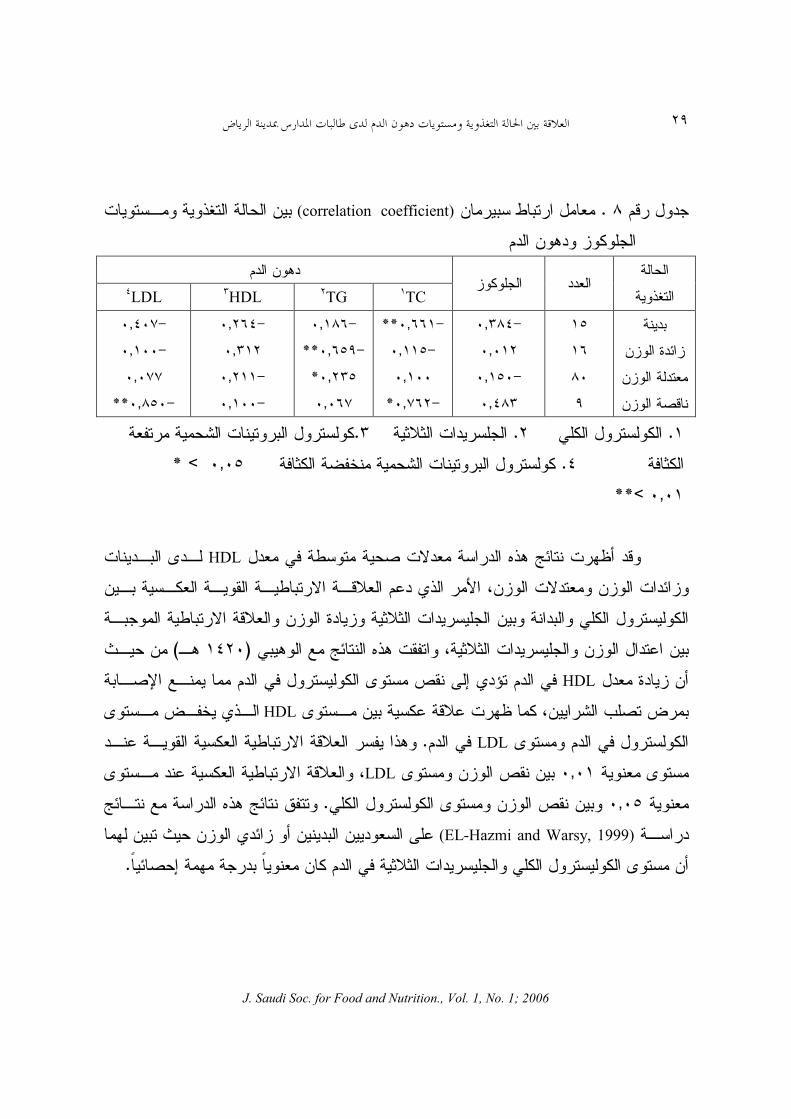
2 1** . J+ 61+5 $ 1; J *2 & 7 $ F7 @3@ $ 1 $ 1* .P N& 1 J *2 & $( M3 .+ V )", "±a,a45/ 4 ?(.?5+ J+ HDL $ 1 J ?* '(6 )I9,±,(. & - <W > $ 1; 1 J B
$ 1* *2 & 7 $ $R P N&)9,±, 45/ ?(,)I,9±,945/? ()I,I±,45/? ('(.
+ ,-. f; ] f; V (Manios et al.,2005) ? 2H '( 4/+ 7 $ * $ !; $ ?+ 1* $TLDL $ !;
J. Saudi Soc. for Food and Nutrition., Vol. 1, No. 1; 2006
٢٨
1+ *2 1* $A VF $ *HDL 2+ J+ 7 VF C2B .6 + ,-. f; 1/< F7 & * '( + f; V & 'R )O/ ,
" I.(( 7 $*+ - '( .56 )I+ (S S _ N& 1+ $6 5TG LDL *2 & 7 VF ,61*HDL /k7 S _ S
7 VFC2B 2+ J+ & 7 $ $RJ+*2.
4 ?5G.4 $. 5 12+ -% & +& N& ( 76 V ± )&!*
+ 12+4 $. 1 &-%
* 5
)45/?(TC)45/?(TG )45/?(HDL)45/?(LDL")45/?(
$ C; $ * $
9 I a
",±I," ,9"±",a ," ±a,GG G,± ,a"
a,9±9, aG,9a± , ,I±",9 I9,±","a
", "±a,a ,9±"",II ",±,a" ,G±I,9
9,±, I,9±,9 I,I±, I9,±,
,G±a,9I ,9 ±,a a, ±", GG,IG±,I"
**2 & G – –" $ '(6" _I . ?+ .@3@ 1+5.1 ?+&< 7@ * .".1 ?+ &<7@ *
*. )" . (
?5 iA)a($+ 2 ?* & $ ? $-% 1+ 4 $. 5 .3( 5 $ * J+ ( +( 2 , $
?+ J+ 2 ?* P N&),II(. 15 3( * J+ ( +( 2, N& @3@ 1+5 J+ $ C $
2 ?* P $+),I9(.6 2 1+5 J+ V M5R $ ?( * J+ ( @3@,9 N& $+ 2 ?* P), 9(.$ F 6
7M2 2 J+ V M+( M* + * J+ ( ?,9 P N& $+ 2 ?*),GI (M2 2 * J+ ( M M+( , V
J+ LDL+ 2 ?* P N& $),a9(.
! " #$ %&'( )
J. Saudi Soc. for Food and Nutrition., Vol. 1, No. 1; 2006
٢٩
4 ?5a.$+ 2 ?* (correlation coefficient) 1+ -% & $
4 $. 5 4 $. &
-% * 5 TCTG HDLLDL"
$ C; $ *$
9 I a
,a" ,
,9 ,"a
,II**,9
, ,GI *
,aI ,I9**
, 9*,IG
, I" ,
, ,
,"G ,
,GG ,a9**
. ?+ .@3@ 1+5 .1 ?+&< * 7@ ".1 ?+&< A B 7@ ,9 <*,<**
?* 7 2+ & 1* + ,-. f; 1/\6 HDL 1 J 4( !- H >$ 1* $ 1; $ +* F 2 3*
$ C @3@ 1+5 $ ?+ 5 2 3* $ $ ?( >@3@ 1+5 . V f; ,-. 1F )" . (N& $
?* C $6HDL F 'R !W 4 7 L V 4 7 ?+ J+ J+ $ +( 3( 1/\ >$< HDL J+ B !-
J+ 4 7 ?+LDL 4 7 .( F +* 2 3* + -. * J+, J+ $ F $ LDL 3* >J+ ( +* 2
*,9 F $ J+ $ ?+ .f; V + ,-. f; ] +(EL-Hazmi and Warsy, 1999) / $ N& $ !; 6 $ $*+ '(
4 7 @3@ 1+5 ?+ J+ $6M;&R / 5 M* $.
J. Saudi Soc. for Food and Nutrition., Vol. 1, No. 1; 2006
٣٠
F+ f; SA '(B ?5 -. 7 1+ $ S5k 7 4 $. 1* C -% & @6 '( )* * 1+ '( 2
( 7H &.
'(
&H + & >$.)" " . .( $. J+ F 0 32 $5/ 4)–+ (S3& 7 .+5 +-% -_H 4( 4+ .( .*+ Q *5.
17 >$&.) (.& $ Sm -% : iG–a.0+ * >N@ 5 >-% S-% * 5>–.
O. >O/.)" I.(.$*+ -3 J F & + ?B–4. n3( 2 $ B .6 !- + & 0+ * SF 7 4
C)G–//" 9..$+ >..)" .(.A / 2 ?&.2 .*5 V2
L. .&C,& ' 2,4& .) (. ;B & 1* ;-% Q3/+
-3 ) V 1 7 ;. * 5 -% S-% ,*0B ,a– .
$* '+ >&6 &6 $+ ><.) (.+ +5 1<W + ( $ 0 ? 26 ( ;-% 1*I– $H 7 + .* 50+ * >N@ 5 >-% S-% > 9 – ".
! " #$ %&'( )
J. Saudi Soc. for Food and Nutrition., Vol. 1, No. 1; 2006
٣١
\ ?B ' >F( o( / >).) I(.2A 1F. J 4*2 ? 1.-% S-% * 5 >*+ + * ><( V >I"–a".
) '((:Abalkhail, B. (2002). Overweight and Obesity among Saudi Arabian children and
adolescents between 1994 and 2000. Eastern Mediterranean Health J. 8 (4/5):470-
479.
Abalkhail, B. and Shawky, S. (2002). Prevalence of daily breakfast intake, iron deficiency
anaemia and awareness of being anamic among Saudi school students. Int. J. Food
Sci. Nutr. 53:519-528.
Abalkhail, B., Shawky, S. And Suliman, N. (2002). Validity of self-reported weight and
height among Saudi school children and adolescents. Saudi Medical J. 23 (7):447 –
453.
Al-Nozha, M.; Al-Mazrou, Y.; Al-Maatouq, M.; Arafah, M.; Khalil, M.; Khan, N.; Al-
Marzouki, Kh.; Abdullah, M.; Al-Khadra, A.; Al-Harthi, S.; Al-Shahid, M.;Al-
Mobeireek, A. and Nouh, M. (2005). Obesity in Saudi Arabia. Saudi Med. J. 26 (5):
824 – 829.
AL-Nuaim, A.; AL-Rubean, KH.; AL-Mazrou, Y.;Al-Attas, O. and Al-Daghari, N.
(1997).Serum total, fractionated cholesterol concentration distribution and prevalence
of hypercholesterolemia in Saudi Arabia, regional variation. Ann. Saudi Med.17 (2):
179-184.
AL-Shehri, S.; Saleh, Z.; Salama, M. and Hassan, Y. (2004). Prevalence of hyperlipidemia
among Saudi school children in Riyadh. Ann. Saudi Med. 24 (1): 6-8.
AL-Subai, A. (2000). Some correlates of dieting behavior in Saudi Schoolgirls. Intl. J.
Eating Disorders.28:242-246.
Berenson, G.; Srinivasan, S.; Bao W.; Newman, W.; Tracy, R. and Wattigney, W. (1998).
Association between multiple cardiovascular risk factors and atherosclerosis in

J. Saudi Soc. for Food and Nutrition., Vol. 1, No. 1; 2006
٣٢
children and young adults. The Bogalusa heart study. New Eng. J. Med. 338:1650-
1656.
Castelli, W. (1992). Epidemiology of triglycerides: a view from Framingham. Am. J.
Cardiol. 70 (19):3H-9H.
Cole, T.; Bellizzi, M.; Flegal, K. and Dietz, W. (2000). Establishing a standard definition
for child over weight and obesity world wide International survey. Bt. Med. J. 320:
1240
Dietz, W. (1998). Health consequences of obesity in youth: childhood predictors of adult
disease. Pediatrics. 101:518-525.
Dietz, W. and Bellizi, M. (1999). Introduction: the use of BMI to assess obesity in
children. Am. J. Clin. Nut. 70 (Suppl):123-5.
El-Hazmi, M. and Warsy, A. (1999). Relationship between Obesity, over weight and
plasma lipids in Saudis. Saudi Med. J. 20(7):521–525.
El-Hazmi, M. and Warsy, A. (2001). prevalence of plasma lipid Abnormalities in Saudi
children . Ann. of Saudi Med.21 (1-2):21-25.
Friedwald, W.; Levy, R. and Fredrickson, D. (1972). Estimation of concentration of low-
density lipoprotein cholesterol in plasma, without use of the preparative
ultracentrifuge. Clin. Chem. 18:499-502.
Kavasarakis, E.; Moustaki, M.; Gourgiotis, D.; Drakatos, A.; Bossios, A.; Zeis, P.;
Xatzidimoula, A. and Karpathios, TH. (2001). Relation of serum leptin levels to lipid
profile in healthy children. Metabolism. 50(9):1091-094.
Lafta, R. and Kadhim, M. (2005). Childhood obesity in Iraq: prevalence and possible risk
factors. Ann. Saudi Med. 25 (5):389-393.
Lenfant, C. and Savage, P. (1995). The early natural history of atherosclerosis and
hypertension and young. National Ins. health Perspectives . Am. J. Med. Sci. (310):
53-57.
Lobstein, T.; Baur, L. and Uauy, R. (2004). Obesity in children and young people: a crisis
in public health. Obes. Rev. 5 (1): 4-85.
! " #$ %&'( )
J. Saudi Soc. for Food and Nutrition., Vol. 1, No. 1; 2006
٣٣
Manios, Y.; Moschandreas, J.; Hatzis, C. and Kafatos, A. (2002). Health and nutrition
education in primary schools of Creat: change in chronic disease risk factors
following a 6-year intervention programme. Br. J. Nutr. 88(3):315-324.
Manios, Y.; Magkos, F.; Christakis, G. and Kafatos, A. (2005). Changing relationships of
obesity and dyslipidemia in Greek children 1982-2002 . Preventive Med. 41:846-851.
Pisunyer, F. (2000). Obesity: criteria and classification. Proc. Nut. Soc. 59:505-509.
Romon, M.; Duhamel, A.; Collient, N. and Weill, J. (2005). Influence of social class on
time trends in BMI distribution in 5- year old French children from 1989 to 1999. Int.
J. Obes. 29:54-59.
Serdula, M.; Collins, E.; Williamson, D.; Anda, R.; Pamuk, E. and Byers, T. (1993).
Weight control practices of U.S adolescents and adults. Ann. Inte. Med. 119 (7pt 2):
667 – 671.
Stamatakis, E.; Primatesta, P.; Chinn, S.; Rona, R. and Falascheti, E. (2005). Overweight
and obesity trends from 1974 to 2003 in English children: what is the role of
socioeconomic factors? Arch. Dis. Child. 90:999-1004.
Sturm, R. (2002). The effect of Obesity, smoking and drinking on medical problems and
costs. Health Affairs. 21(2):245-253.
SPSS. (1998). Statistical Package for Social Science. Computer Software.
Techernof, A.; Lamarche, B.; Prud'homme, D.; Nadeau, A.; Moorjani, S.; Labrie, F.;
Lupien, P. J. And Despres, J. P. (1996). The dense LDL phenotype: association with
plasma lipoprotein levels, visceral Obesity, and hyperinsulinanemia in men. Diabetes
Care. 19(6):629-637.
Tounian, P.; Aggoun, Y.; Dubern, B.; Varille, V.; Guy-Grand, B.; Sidi, D.; Girardet, J. P.
and Bonnet, D. (2001). Presence of increased stiffness of the common carotidartery
and endothelial dysfunction in severely obese children: a prospective study . The
Lancet 358 (929):1400-1404.
WHO. (1998). Preventing and managing the global Epidemic, WHO Geneva.

J. Saudi Soc. for Food and Nutrition., Vol. 1, No. 1; 2006
٣٤
Relationship between Nutritional Status and Blood-Lipids Levels in
School Children in Riyadh City
Latifah M. AL-Oboudi Girls University, College of Education for Home Economics, Department of Nutrition and Food Science,
Riyadh, Saudi Arabia.
ABSTRACT.. The aim of the study was to determine the relationship between nutritional status and plasma lipid levels in school children in Saudi school children (girls) aged 9-13.9 years. The study was conducted on 120 school girls randomly chosen. Height and weight were recorded and Body Mass Index (BMI) was calculated. Nutritional status was measured by (BMI) compared to standard tables. Fasting blood glucose (GLU), total cholesterol (TC), triglyceride (TG), high-density lipoprotein (HDL) and low-density lipoprotein (LDL) were measured. The results showed that the prevalence of obesity and overweight was 12.5% and 13.3%, respectively. The mean of TG was above cutoff points in obese girls. The prevalence of medium-risk values for HDL was recorded among obese, overweight and normal- weight girls. The correlation between obesity and TC was strongly negative and statistically significant. Overweight correlated negatively with level of TG, and underweight correlated negatively with LDL. The statistical significant was strong. The level of TC correlated negatively with under weight. A significant positive correlation was obtained between TG levels in blood and normal weight.


Journal of the Saudi Society for Food & Nutrition
Guidelines for Authors
Description The journal publishes original research and review
papers on any subject in all fields of agricultural sciences. Manuscripts for publication in the Journal, in Arabic or English, and all correspondence relating to manuscripts should be sent to the Editor-in-Chief. The Saudi Society for Food & Nutrition is not responsible for statements and opinions published in the Journal: they represent the views of authors or persons to whom they are accredited and are not necessarily those of the society. The publication of research information by the society does not constitute a recommendation or endorsement of products involved: for general use, label recommend-dations and directions must be followed.
Authors are requested to submit their original manuscript and figures with two copies to the Editor-in-Chief. All papers will be independently refereed. Submission of a manuscript entails that it has not been published previously, that it is not under consideration for publication elsewhere, and that if accepted it will not be published elsewhere in the same form without the written consent of the society.
Contributions should be in the form of original papers; review articles; case studies; short communications and book reviews. Paper Preparation
Papers must be typewritten, double-spaced with wide margins on one side of white paper. Good quality printouts with a font size of 12 or 10 pt are required. The corresponding author should be identified (include a Fax number and E-mail address). Full postal addresses must be given for all co-authors. An electronic copy of the paper on a floppy disk using MS Word 6 or later version. Pages are to be numbered consecutively and are to include all illustrative material, such as tables and figures, in their appropriate places in the text.
Abstracts
Manuscripts should be should be provided with Abstracts of not more than 200 words, in both languages English and Arabic, stating concisely the purpose and the content of the manuscript. Tables and other illustrations
Tables, figures, charts, graphs and plates should be planned to fit the journal's page size (12.6 cm x l8 cm). Line drawings are to be presented on high quality tracing paper using black India ink. Copies are not permitted for use as originals. Line quality is required to be uniform, distinct, and in proportion to the illustration. Photographs may be submitted on glossy print paper in either black and white, or color. Tables and other illustrative material must include headings or titles, as well as credit lines wherever the material is not original. Abbreviations
The names of periodicals should be abbreviated in accordance with The World List of Scientific Periodicals. e.g. J. Food Sci.
The SI system should be used for all scientific and laboratory data; if, in certain instances, it is necessary to quote other units, these should be added
in parentheses. Temperatures should be given in degrees Celsius. For weights and measurements, and where appropriate, abbreviations rather than words are to be used, e.g., cm, mm, m, km, cc, ml, g, mg, kg, min, %, Fig., et al., etc.
References All publications cited in the text should be
presented in a list of references following the text of the manuscript. In the text refer to the author's name (without initials) and year of publication, e.g. "Since Peterson (1993) has shown that..." or "This is in agreement with results obtained later (Kramer, 1994)". The list of references should be arranged alphabetically by authors' names. The manuscript should be carefully checked to ensure that the spelling of authors' names and dates are exactly the same in the text as in the reference list. References should be given in the following form:
a) Abulfatih , H.A. (1979). Vegetation of higher elevation of Asir, Saudi Arabia. Proc. Saudi Biol. Soc. 3: 139-48.
b) Abulfatih , H.A. (1984a). Wild Plants of Abha and Its Surroundings (in English and Arabic). Saudi Publishing and Distributing House, Jeddah, Saudi Arabia.
Proofs
Proofs will be sent to the corresponding author and should be returned within 48 hours of receipt. It is important to ensure that all of your corrections are returned to us in one all-inclusive response. Subsequent corrections will not be possible, so please ensure your first communication is complete. Should you choose to mail your corrections, please return them to the Editor-in-Chief.
Offprints
Twenty five offprints will be supplied free of charge.
Submission of Manuscripts
Authors are requested to submit their original manuscript and figures with two copies to:
The Editor-in-Chief J. Saudi Soc. for Food & Nutrition. College of Food and Agricultural Sciences P.O. Box 2460, Riyadh 11451 Kingdom of Saudi Arabia
Frequency
The Journal of the Saudi Society for Food & Nutrition is published biannually in January and July. Price per issue
SR 10 ($5 including postage)
Subscription and Exchange The Saudi Society for Food & Nutrition, College of Food and Agricultural Sciences P.O. Box 2460, Riyadh 11451 Kingdom of Saudi
Arabia.


Journal of the Saudi Society for Food and Nutrition
Published Biannually By
The Saudi Society for Food and Nutrition
Editorial Board
Prof. H. M. Abu-Tarboush Editor-in-Chief
Prof. H. A. Al-Mana Member Prof. B. H. Hassan Member Prof. M. M. Al-Dagal Member Dr. A. O. Musiger Member Dr. A. S. Bajaber Member
Office Address
Saudi Society for Food and Nutrition King Saud University
College of Food and Agricultural Sciences P.O. Box 2460, Riyadh 11451
Kingdom of Saudi Arabia

Table of Contents Journal of the Saudi Society for
Food and Nutrition Vol. 1, No. 1, 2006
Effect of some Natural Extracts on the Growth of some Fungi
Rukaia Gashgari and Hessa Al- Semari ………………………………………..
1
Relationship between Nutritional Status and Blood-Lipid Levels in School Children in Riyadh City
Latifah M. AL-Oboudi …………………………………………………………..
18 Bile Salts and Acid Tolerance and Cholesterol Removal from Media by some Lactic Acid Bacteria and Bifidobacteria
A. A Al-Saleh; A. A. M. Metwalli and H. M. Abu-Tarboush ………………. 1
Some Nutritional and Functional Characteristics of Mung Bean (Phaseolus aureus) Proteins
Saleh A. Alajaji and Tarek A. El-Adawy ………………………………………. 18
ICP-MS Simultaneous Determination of Some Essential Minerals and Heavy Metals in Some Commercial Drinks Consumed in Riyadh City
Ahmad H. Alghamdi, Ali F. Alghamdi and Abdulrahman A. Alwarthan ….. 31
Bile salts and acid tolerance and cholesterol removal from media ………
J. Saudi Soc. for Food and Nutrition., Vol. 1, No. 1; 2006
1
Bile Salts and Acid Tolerance and Cholesterol Removal from Media by some Lactic Acid Bacteria and Bifidobacteria
A. A Al-Saleh; A. A. M. Metwalli and H. M. Abu-Tarboush
Food Science and nutrition Dept. College of Food Science and Agric. King Saud Univ. Riyadh, Saudi Arabia
ABSTRACT. In this study three strains of Lactobacillus acidophilus (DSM 9126, DSM 20079 and DSM 20242), two strains of Bifidobacteria (infantis DSM 20088 and angulatum DSM 20098) and Streptococcus thermophilus DSM 20617 were tested for acid tolerance, bile salt tolerance, capability to remove cholesterol and to deconjugate sodium taurocholate from the culture medium. Results showed that a considerable variation existed among cultures in their growth viability in the presence of bile salt, deconjugation of sodium taurocholate and assimilation of cholesterol from the medium. Moreover, the two cultures of bifidobacteria (infantis DSM 20088 and angulatum DSM 20098) were shown to be the most bile salts tolerant culture. All bacterial strains tested in this study exhibited sensitivity to acidity at pH 2. However, increasing the pH of the medium to 3 had improved the acid tolerance of all strains except Streptococcus thermophilus. Addition of 1% skim milk powder into medium at pH 2 increased the viability of all strains especially bifidobacteria strains. All tested strains removed less cholesterol from the broth (ranged from 3.08-29.68%) compared to those grown in broth supplemented with 0.2% bile salts (from 36.07-55.43%). Furthermore, considerable amount of cholesterol was precipitated with cells obtained from broth enriched with 0.2% bile salts. Lactobacillus acidophilus DSM 20079 appeared to be more active in deconjugation of sodium taurocholate (2.38 µmol/ ml) compared to the other strains, as well as being able to remove up to 66.61 mg of cholesterol (95.6%) from the culture medium and therefore, is regarded as a suitable candidate probiotic and adjunct culture. _____________________________________________________________
INTRODUCTION
High serum cholesterol concentration is associated with the development of coronary heart disease (Usman and Hosono, 2000). Mann and Spoerry (1974) claimed that the consumption of fermented milk with Lactobacillus acidophilus reduced serum cholesterol level in Massai trip. Since then, the hypocholesterolemic effect of fermented dairy product has been observed in feeding studies either using humans (Harrison and Peat, 1975) or animals (Liong and Shah, 2006 and Daneilson et al., 1989). Many studies have reported the ability of Lactobacillus acidophilus (Gilliland et al., 1985 and Usman and Hosono, 1999) and bifidobacteria (Dambekodi and Gilliland, 1998) to assimilate cholesterol from laboratory media. Thus, both types of bacteria may have the potential to reduce serum cholesterol in humans. However, the ability to assimilate cholesterol from the media varied significantly amongst different bacterial strains. Many attempts have been made to elucidate the mechanism involved in the hypocholesterolemic action of lactic acid bacterial strains. One proposed mechanism is the assimilation of cholesterol by the cell wall during growth (Buck and Gilliland, 1994; Noh et al., 1997). Another mechanism is the deconjugation of bile salts by bacteria producing bile salt hydrolase. Most conjugated bile salts are recirculated through the enterohepatic circulation, while deconjugated bile salts are less soluble and excreted in the feces. The bile salts that are excreted must be replaced by new bile salts, which are formed from cholesterol in the body. Thus, the more bile salts
A. A Al-Saleh; A. A. M. Metwalli and H. M. Abu-Tarboush
J. Saudi Soc. for Food and Nutrition., Vol. 1, No. 1; 2006
2
excreted, the more cholesterol is removed from the body. Furthermore, deconjugated bile salts do not stimulate the absorption of cholesterol and other lipids from the small intestine as well as do conjugated bile salts. Walker and Gilliland (1993) reported that some strains of Lactobacillus can deconjugate bile salts. While, Hill and Drasar (1968) suggested that Lactobacillus is incapable of deconjugated bile salts.
This study was conducted to compare bile salts and acid tolerance, assimilation of cholesterol and deconjugation of bile salts by different strain of lactic acid bacteria and bifidobacteria and to choose the most beneficial strain as adjunct culture in fermented dairy product.
MATERIALS AND METHODS Bacteria
Three strains of Lactobacillus acidophilus (DSM 9126, DSM 20079 and DSM 20242), two strains of Bifidobacterium (infantis DSM 20088 and angulatum DSM 20098)and one strain of Streptococcus thermophilus DSM 20617 were obtained from the Deutsche Sammlung von Mikroorganismen und Zellkulturen Gmbh (DSMZ, Germany). Stock cultures were stored in 40% glycerol at –20°C. The organisms were subcultured 3times before use in sterile de Man, Rogosa, Sharpe (MRS) broth using 1% inoculum and incubation for 20 h at 37°C. Acid Tolerance
Acid tolerance of the cultures was studied by incubating the organisms in MRS broth (in some experiments 1% skim milk powder was added to MRS broth). The pH was adjusted to 2.0 with HCl 1N and the cultures were incubated at 37°C for 3 h. Each of the bacterial strains was subcultured at least 3 times before experimental use MRS broth was inoculated (10% vol/vol) with bacterial strain, and growth was monitored using the plate count method as described by Pereira and Gibson (2002). A 1-mL sample was taken at zero, 1.5 and 3 h, and serial dilutions were made using peptone water diluent. Samples were plated onto MRS agar, and the plates were incubated at 37°C for 48 h in an anaerobic jar (Becton Dickinson Microbiology Systems, Sparks, MD) with a Gas Generating Kit (Oxoid, Ltd., Mitsubishi Gas Chemical Company) except for Streptococcus thermophilus, which was incubated under aerobic condition. Acid tolerance was determined by comparing the plate count after 1.5 and 3h with the initial plate count at 0 h (results were expressed as percentage). The experiments were repeated twice. Bile salts tolerance
Growth rate of bacterial cultures was determined in MRS broth containing different levels (0, 0.1, 0.3, 0.5 and 0.7%) of bile salts (oxgall). Freshly prepared cultures were inoculated (1%) into medium and incubated at 37°C for 24 h under anaerobic condition, except for Streptococcus thermophilus, which was incubated under aerobic condition. Optical densities were measured spectro-photometrically at 620 nm after 0, 3, 5 and 24 h. Cholesterol removal
Cholesterol solution (10 mg/ml in 96% ethyl alcohol) was prepared and filtered sterilized. For each culture to be tested, 70 µl of cholesterol solution was added to 10 of
Bile salts and acid tolerance and cholesterol removal from media ………
J. Saudi Soc. for Food and Nutrition., Vol. 1, No. 1; 2006
3
MRS broth (final cholesterol concentration 70 µg/ml) containing 0.2% bile salts (oxgall) or not containing. To the MRS broth, 1% of freshly grown culture was added and incubated anaerobically at 37°C for 20 h except Streptococcus thermophilus which was incubated under aerobic condition. An uninoculated sample was used as control. After incubation the cells were removed by centrifugation at 10,000 g for 10 min at 4°C and cholesterol was determined in the supernatant using modified Rudel and Morris (1973) method in which three ml of supernatant, 2 ml of 33% (wt/vol) KOH and 3 ml 96% ethanol were placed in a capped test tube, vortexed for 20 second and incubated for 15 min at 60°C in a water bath. After incubation, the mixture was removed and cooled under tap water, then 5 ml of hexane and 3 ml of water were added and vortexed for one min. One milliliter of the hexane layer was transferred into a dry clean test tube and evaporated under nitrogen gas. One milliliters of cholesterol liquicolor enzymatic kit (Human-Gesellschaft fur Biochemica und Diagnostica mbh-Wiesbaden-Germany) was added. The solution was mixed and left for 5-10 min at 37°C and absorbance was measured at 500 nm with a spectrophotometer (LKB Biochrome ultrospec 11, Campridge, England). The ability of bacterial strain to remove cholesterol from media was calculated as percentage from the following equation:
A=100-(B/C)*100
Where A=% of cholesterol removed, B=absorbance of the sample containing the cells and C=absorbance of the sample without cells.
To measure the cholesterol removed with the cells, pellet cells obtained by centrifugation was resuspended in distilled water to the original volume of the culture and cholesterol was determined as mentioned above. Cholesterol remained with the pellet was calculated from the equation:
A= (B/C)*100
Where A= Cholesterol remained with the pellet (as percentage), B= absorbance of the sample containing the cells and C=absorbance of the sample without cells. It was observed that, sample containing no cells has no pellet and cholesterol was determined in the whole system. Deconjugation of bile salts
Deconjugation of bile salts by bacterial strains was tested qualitatively through the plate assay as described by Ahn et al., (2003). To MRS agar containing 0.5 g/l cysteine, 1 mM of sodium taurocholate (Sigma Chemical Co., USA) was added. After autoclaving and solidifying, the plates were incubated anaerobically for 48 h before use. The plates were inoculated with active culture (20 µl) and incubated for 72 h at 37°C. Precipitated cholic acid around colonies were observed. Deconjugation of bile salts was also measured quantitavely by measuring released cholic acid as described by Walker and Gilliland (1993).
A. A Al-Saleh; A. A. M. Metwalli and H. M. Abu-Tarboush
J. Saudi Soc. for Food and Nutrition., Vol. 1, No. 1; 2006
4
RESULTS AND DISCUSSION
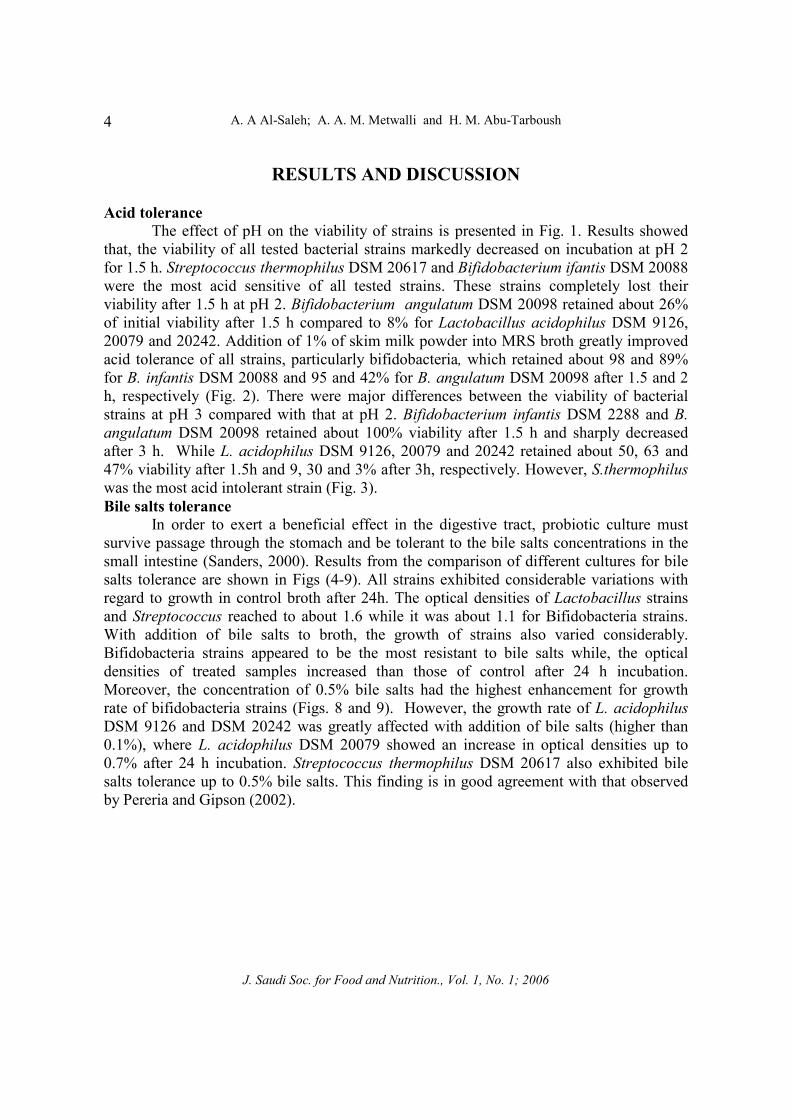
Acid tolerance The effect of pH on the viability of strains is presented in Fig. 1. Results showed
that, the viability of all tested bacterial strains markedly decreased on incubation at pH 2 for 1.5 h. Streptococcus thermophilus DSM 20617 and Bifidobacterium ifantis DSM 20088 were the most acid sensitive of all tested strains. These strains completely lost their viability after 1.5 h at pH 2. Bifidobacterium angulatum DSM 20098 retained about 26% of initial viability after 1.5 h compared to 8% for Lactobacillus acidophilus DSM 9126, 20079 and 20242. Addition of 1% of skim milk powder into MRS broth greatly improved acid tolerance of all strains, particularly bifidobacteria, which retained about 98 and 89% for B. infantis DSM 20088 and 95 and 42% for B. angulatum DSM 20098 after 1.5 and 2 h, respectively (Fig. 2). There were major differences between the viability of bacterial strains at pH 3 compared with that at pH 2. Bifidobacterium infantis DSM 2288 and B. angulatum DSM 20098 retained about 100% viability after 1.5 h and sharply decreased after 3 h. While L. acidophilus DSM 9126, 20079 and 20242 retained about 50, 63 and 47% viability after 1.5h and 9, 30 and 3% after 3h, respectively. However, S.thermophilus was the most acid intolerant strain (Fig. 3). Bile salts tolerance
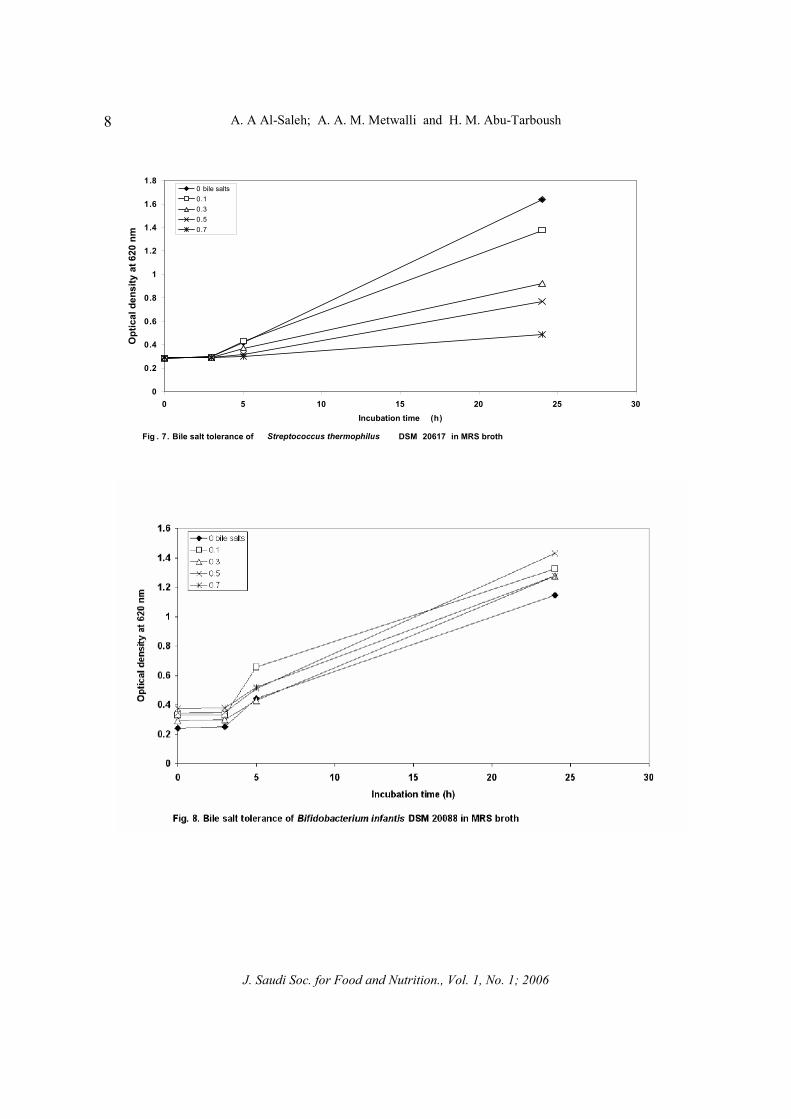
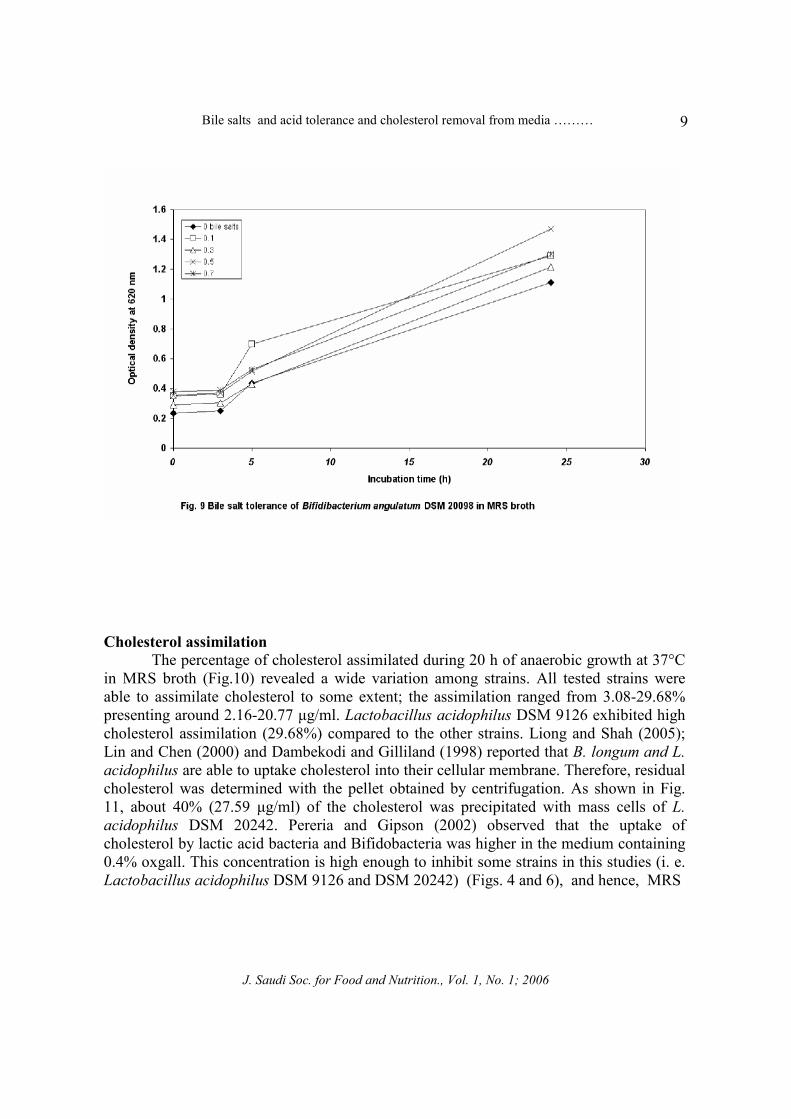
In order to exert a beneficial effect in the digestive tract, probiotic culture must survive passage through the stomach and be tolerant to the bile salts concentrations in the small intestine (Sanders, 2000). Results from the comparison of different cultures for bile salts tolerance are shown in Figs (4-9). All strains exhibited considerable variations with regard to growth in control broth after 24h. The optical densities of Lactobacillus strains and Streptococcus reached to about 1.6 while it was about 1.1 for Bifidobacteria strains. With addition of bile salts to broth, the growth of strains also varied considerably. Bifidobacteria strains appeared to be the most resistant to bile salts while, the optical densities of treated samples increased than those of control after 24 h incubation. Moreover, the concentration of 0.5% bile salts had the highest enhancement for growth rate of bifidobacteria strains (Figs. 8 and 9). However, the growth rate of L. acidophilus DSM 9126 and DSM 20242 was greatly affected with addition of bile salts (higher than 0.1%), where L. acidophilus DSM 20079 showed an increase in optical densities up to 0.7% after 24 h incubation. Streptococcus thermophilus DSM 20617 also exhibited bile salts tolerance up to 0.5% bile salts. This finding is in good agreement with that observed by Pereria and Gipson (2002).

Bile salts and acid tolerance and cholesterol removal from media ………
J. Saudi Soc. for Food and Nutrition., Vol. 1, No. 1; 2006
5
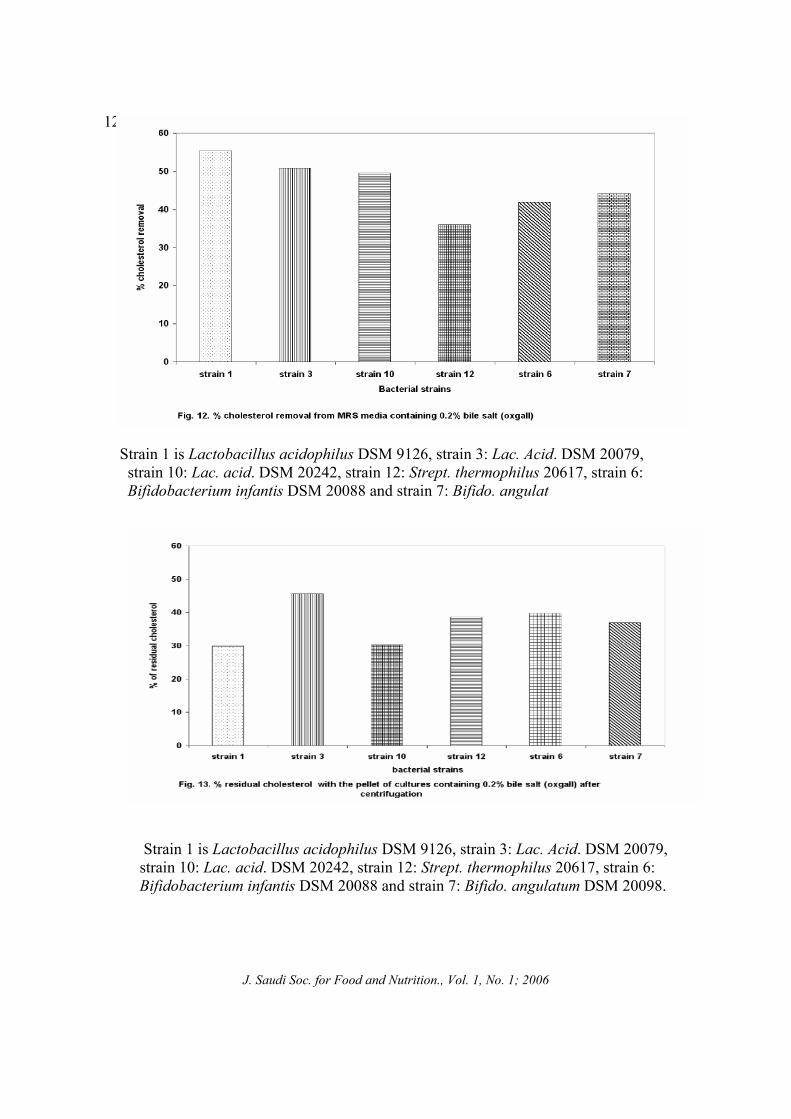
Strain 1 is Lactobacillus acidophilus DSM 9126, strain 3: Lac. Acid. DSM 20079, strain 10: Lac. acid. DSM 20242, strain 12: Strept. thermophilus 20617, strain 6: Bifidobacterium infantis DSM 20088 and strain 7: Bifido. angulatum DSM 20098.
Strain 1 is Lactobacillus acidophilus DSM 9126, strain 3: Lac. Acid. DSM 20079, strain 10: Lac. acid. DSM 20242, strain 12: Strept. thermophilus 20617,strain 6:Bifidobacterium infantis DSM 20088 and strain 7: Bifido. Angulatum DSM 20098.

A. A Al-Saleh; A. A. M. Metwalli and H. M. Abu-Tarboush
J. Saudi Soc. for Food and Nutrition., Vol. 1, No. 1; 2006
6
Strain 1 is Lactobacillus acidophilus DSM 9126, strain 3: Lac. Acid. DSM 20079, strain 10: Lac. acid. DSM 20242, strain 12: Strept. thermophilus 20617, strain 6: Bifidobacterium infantis DSM 20088 and strain 7: Bifido. angulatum DSM 20098.

Bile salts and acid tolerance and cholesterol removal from media ………
J. Saudi Soc. for Food and Nutrition., Vol. 1, No. 1; 2006
7
A. A Al-Saleh; A. A. M. Metwalli and H. M. Abu-Tarboush
J. Saudi Soc. for Food and Nutrition., Vol. 1, No. 1; 2006
8
Fig . 7. Bile salt tolerance of Streptococcus thermophilus DSM 20617 in MRS broth
0
0.2
0.4
0.6
0.8
1
1.2
1.4
1.6
1.8
0 5 10 15 20 25 30Incubation time (h)
Opt
ical
dens
ityat
620
nm
0 bile salts0.10.30.50.7
Bile salts and acid tolerance and cholesterol removal from media ………
J. Saudi Soc. for Food and Nutrition., Vol. 1, No. 1; 2006
9
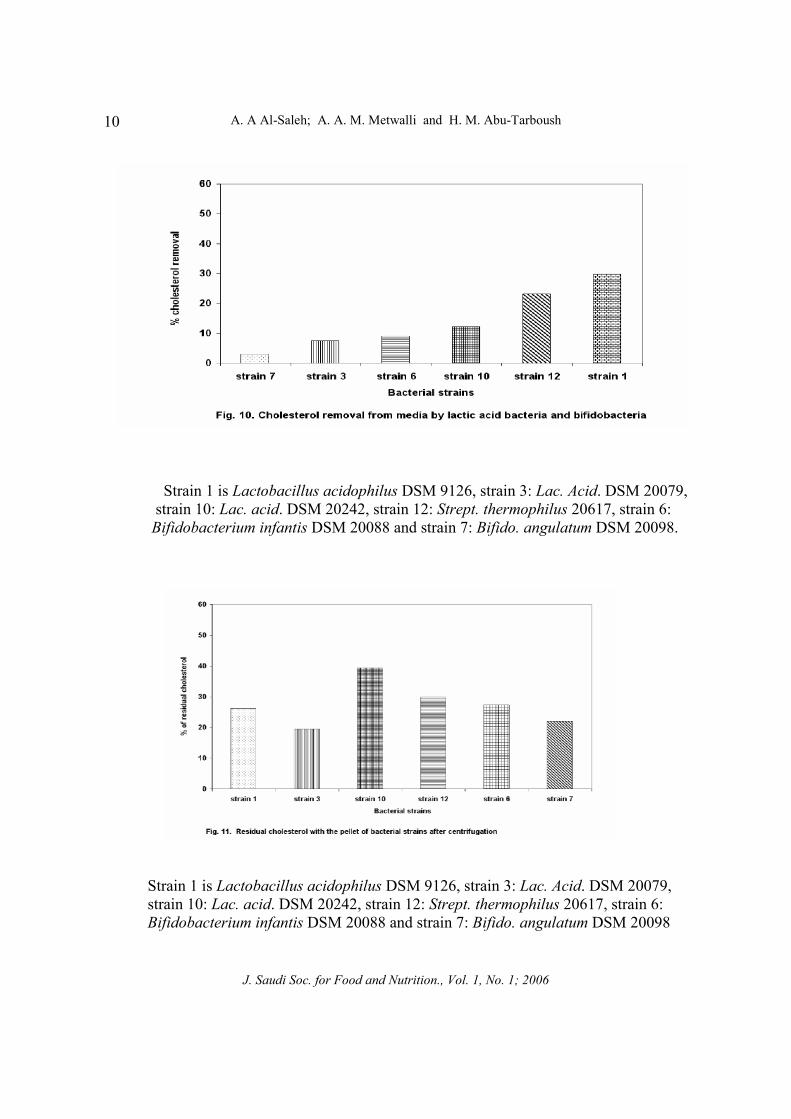
Cholesterol assimilation The percentage of cholesterol assimilated during 20 h of anaerobic growth at 37°C
in MRS broth (Fig.10) revealed a wide variation among strains. All tested strains were able to assimilate cholesterol to some extent; the assimilation ranged from 3.08-29.68% presenting around 2.16-20.77 µg/ml. Lactobacillus acidophilus DSM 9126 exhibited high cholesterol assimilation (29.68%) compared to the other strains. Liong and Shah (2005); Lin and Chen (2000) and Dambekodi and Gilliland (1998) reported that B. longum and L. acidophilus are able to uptake cholesterol into their cellular membrane. Therefore, residual cholesterol was determined with the pellet obtained by centrifugation. As shown in Fig. 11, about 40% (27.59 µg/ml) of the cholesterol was precipitated with mass cells of L. acidophilus DSM 20242. Pereria and Gipson (2002) observed that the uptake of cholesterol by lactic acid bacteria and Bifidobacteria was higher in the medium containing 0.4% oxgall. This concentration is high enough to inhibit some strains in this studies (i. e. Lactobacillus acidophilus DSM 9126 and DSM 20242) (Figs. 4 and 6), and hence, MRS
A. A Al-Saleh; A. A. M. Metwalli and H. M. Abu-Tarboush
J. Saudi Soc. for Food and Nutrition., Vol. 1, No. 1; 2006
10
Strain 1 is Lactobacillus acidophilus DSM 9126, strain 3: Lac. Acid. DSM 20079, strain 10: Lac. acid. DSM 20242, strain 12: Strept. thermophilus 20617, strain 6: Bifidobacterium infantis DSM 20088 and strain 7: Bifido. angulatum DSM 20098.
Strain 1 is Lactobacillus acidophilus DSM 9126, strain 3: Lac. Acid. DSM 20079, strain 10: Lac. acid. DSM 20242, strain 12: Strept. thermophilus 20617, strain 6: Bifidobacterium infantis DSM 20088 and strain 7: Bifido. angulatum DSM 20098

Bile salts and acid tolerance and cholesterol removal from media ………
J. Saudi Soc. for Food and Nutrition., Vol. 1, No. 1; 2006
11
supplemented with 0.2% oxgall was used. Results in Fig. 12 represent the effect of addition of bile salts on the assimilation of cholesterol from the media. Results revealed that addition of bile salts greatly improved the uptake of cholesterol from the media. Lactobacillus acidophilus strains showed the highest activity to assimilate cholesterol from the media and it ranged from 49.57-55.43% (34.70-38.8 µg/ml). Brashwars et al. (1998) reported that L. casei able to assimilate about 16.9-73.3 µg/ml cholesterol in MRS supplemented with 6 mM sodium taurocholate. However, removal by bifidobacteria strains ranged from 41.93-44.19% (29.35-30.93 µg/ml). Removed cholesterol by Streptococcus thermophilus was the lowest (about 36.07% equivalent to 25.25 µg/ml). Moreover, the precipitated cholesterol with the pellet cells was enhanced with addition of bile salts and L. acidophilus DSM 20079 increased the precipitated cholesterol up to 45.70% (31.99 µg/ml) (Fig. 13). Total assimilated and precipitated cholesterol was depicted in Fig. 14. It seems that all tested strains exhibited activity (ranged from 74.7-96.6%) towards assimilation and precipitation of cholesterol. Lactobacillus acidophilus strains DSM 20079 and DSM 9126 were among the most active in removing cholesterol from the growth medium. Deconjugation of bile salts
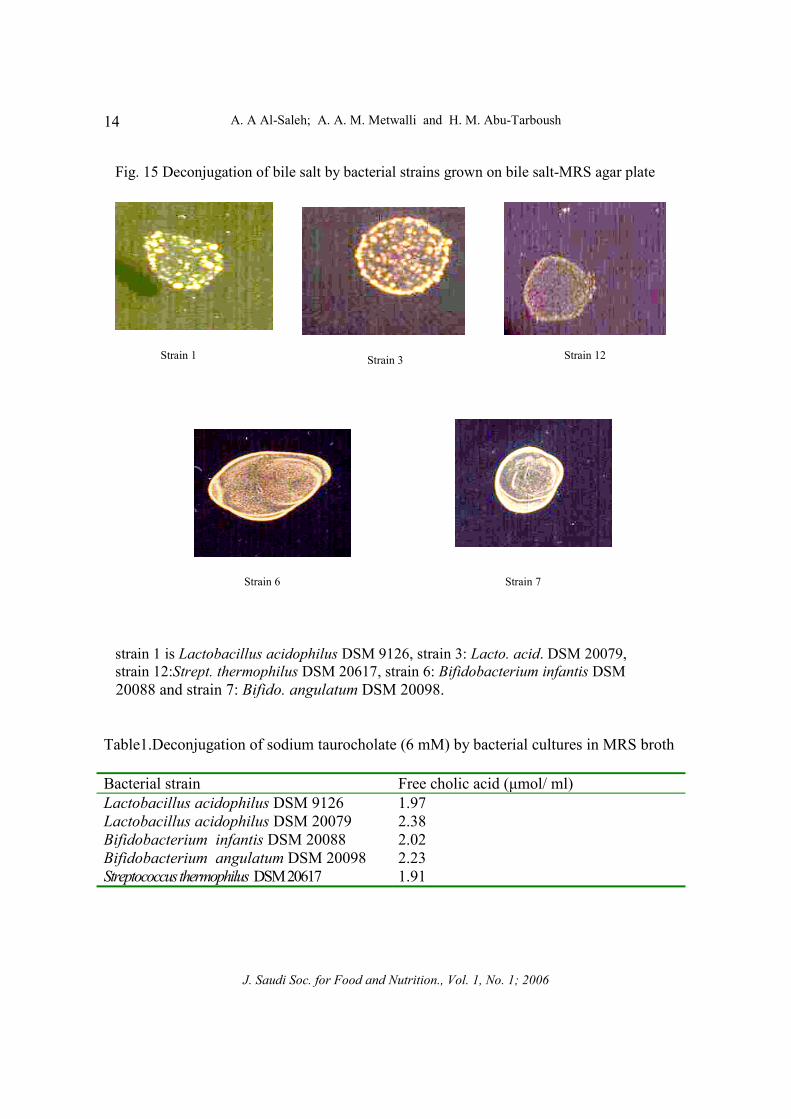
Screening cultures for deconjugation of bile salts is shown in Fig.15. All cultures grown on sodium taurocholat-MRS agar plates formed fine precipitated white granules around and within the colonies to different extent. These white granules have been reported to be related to the solubility of bile salt at different pH (Dashkevicz and Feighner, 1989). The PKa of taurin-conjugated and unconjugated bile salts are 1.9 and 5.0, respectively (Ahn et al., 2003). Thus, at acidic pH, unconjugated bile salts are protonated and precipitated.
The amount of released cholic acid in the broth containing sodium taurocholate was also determined. Data in Table 1 revealed that L. acidophilus DSM 20079 and B. angulatum DSM 20098 and Bifidobacterium infantis DSM 20088 librated more free cholic acid (2.38, 2.23 and 2.02 µmol/ml, respectivly) than did L. acidophilus DSM 9126 and S.thermophilus DSM 20617 (1.97 and 1.91 µmol/ml in order). Pereira et al. (2003) found that release of cholic acid from sodium taurocholate depends on the production of bile salt hydrolase by bacterial strains. Kim et al. (2004) also purified bile salt hydrolase from bifidobacteri strains.
A. A Al-Saleh; A. A. M. Metwalli and H. M. Abu-Tarboush
J. Saudi Soc. for Food and Nutrition., Vol. 1, No. 1; 2006
12
Strain 1 is Lactobacillus acidophilus DSM 9126, strain 3: Lac. Acid. DSM 20079, strain 10: Lac. acid. DSM 20242, strain 12: Strept. thermophilus 20617, strain 6: Bifidobacterium infantis DSM 20088 and strain 7: Bifido. angulat
Strain 1 is Lactobacillus acidophilus DSM 9126, strain 3: Lac. Acid. DSM 20079, strain 10: Lac. acid. DSM 20242, strain 12: Strept. thermophilus 20617, strain 6: Bifidobacterium infantis DSM 20088 and strain 7: Bifido. angulatum DSM 20098.

Bile salts and acid tolerance and cholesterol removal from media ………
J. Saudi Soc. for Food and Nutrition., Vol. 1, No. 1; 2006
13
Strain 1 is Lactobacillus acidophilus DSM 9126, strain 3: Lac. Acid. DSM 20079, strain 10: Lac. acid. DSM 20242, strain 12: Strept. thermophilus 20617, strain 6: Bifidobacterium infantis DSM 20088 and strain 7: Bifido. angulatum DSM 20098.
A. A Al-Saleh; A. A. M. Metwalli and H. M. Abu-Tarboush
J. Saudi Soc. for Food and Nutrition., Vol. 1, No. 1; 2006
14
20088 and strain 7: Bifido. angulatum DSM 20098.
Table1.Deconjugation of sodium taurocholate (6 mM) by bacterial cultures in MRS broth
Bacterial strain Free cholic acid (µmol/ ml) Lactobacillus acidophilus DSM 9126 1.97 Lactobacillus acidophilus DSM 20079 2.38 Bifidobacterium infantis DSM 20088 2.02 Bifidobacterium angulatum DSM 20098 2.23 Streptococcus thermophilus DSM 20617 1.91
Fig. 15 Deconjugation of bile salt by bacterial strains grown on bile salt-MRS agar plate
strain 1 is Lactobacillus acidophilus DSM 9126, strain 3: Lacto. acid. DSM 20079, strain 12:Strept. thermophilus DSM 20617, strain 6: Bifidobacterium infantis DSM
Strain 3Strain 1 Strain 12
Strain 6 Strain 7
Bile salts and acid tolerance and cholesterol removal from media ………
J. Saudi Soc. for Food and Nutrition., Vol. 1, No. 1; 2006
15
REFERENCES Ahn, Y. T., Kim, G. B., Lim, K. S., Baek, Y. J. and Kim, H. U. (2003). Deconjugation of
bile salts by Lactobacillus acidophilus isolates. Int. Dairy J. 13, 303-311. Brashwars, M. M., Gilliland, S. E. and Buck, L. M. (1998). Bile salt deconjugation and
cholesterol removal from media by Lactobacillus casei. J. Dairy Sci. 81:2103-2110. Buck, L. M. and Gilliland, S. E. (1994). Comparison of freshly isolated strains of
Lactobacillus acidophilus of human intestinal origin for ability to assimilate cholesterol during growth. J. Dairy Sci. 77: 2925-2933.
Dashevicz, M. P. and Feighner, S. D. (1989). Development of a differential medium for bile salt hydrolase active Lactobacillus spp. Appl. and Environ. Microbiol. 55, 11-16
Dambekodi, P. C. and Gilliland, S. E (1998). Incorporation of cholesterol into the cellular membrane of Bifidobacterium longum. J. Dairy Sci. 81:1818-1824.
Daneilson, A. D., Peo, E. R., Shahani, K. M., Lewis, A. J., Whalen, P. J. and Amer, M. A. (1989). Anticholesterolemic property of Lactobacillus acidophilus yogurt fed to mature bears. J. Animal Sci. 67: 966.
Gilliland, S. E., Nelson, C. R. and Maxwell, C. (1985). Assimilation of cholesterol by Lactobacillus acidophilus. Appl. Environ. Microbiol. 49: 377-381.
Harrison, V. C. and Peat, G. (1975). Serum cholesterol and bowel flora in the newborn. Am. J. Clin. Nutr. 28: 1351-1355.
Hill, M. J. and Drasar, B. S. (1968). Degradation of bile salts by human intestinal bacteria. Gut. 9:22-27.
Kim, G.-B., Yi, S.-H. and. Lee, B. H. (2004). Purification and characterization of three different types of bile salt Hydrolases from Bifidobacterium strains. J. Dairy Sci. 87:258-266
Lin, M. Y. and Chen, T. W. (2000). Reduction of cholesterol by Lactobacillus acidophilus in culture broth. J. Food Drug Anal. :97-102..
Liong, M. T. and Shah, N. P. (2005). Acid and Bile tolerance and cholesterol removal ability of lactobacilli strains. J. Dairy Sci. 88:55-66
Liong, M. T. and Shah, N. P. (2006). Effects of a Lactobacillus casei synbiotic on serum lipoprotein, intestinal microflora, and organic acids in Rats. J. Dairy Sci. 89:1390-1399
Mann, G. V. and Spoerry, A. (1974). Studies of a surfactant and cholesteremia in the Massai. Am. J. Clin. Nutr. 27: 464-469.
Noh, D. O., Kim, S. H. and Gilliland, S. E. (1997). Incorporation of cholesterol into the cellular membrane of Lactobacillus acidophilus ATTCC 43121. J. Dairy Sci. 80: 3107-3113.
Pereira, D. I. A. and Gibson, G. R. (2002). Cholesterol assimilation by lactic acid bacteria and Bifidobacteria isolated from the human gut. Appl. and Environ. Microbiol. 68, (9) 4689-4693.
Pereira, D. I. A., McCartney, A. L. and Gibson, G. R. (2003). An in vitro study of probiotic potential of a bile salt hydrolyzing Lactobacillus fermentum strain and determination
A. A Al-Saleh; A. A. M. Metwalli and H. M. Abu-Tarboush
J. Saudi Soc. for Food and Nutrition., Vol. 1, No. 1; 2006
16
of its cholesterol-lowering properties. Appl. and Environ. Microbiol. 69, (8) 4743-4752.
Rudel, L. L. and Morris, M. D. (1973). Determination of cholesterol using O-Phthalaldehyde. J. Lipid Res. 14: 364-366.
Sanders, M. E. (2000). Considerations for use of probiotic bacteria to modulate human health. J. Nutr. 130:3854-3905.
Usman, and Hosono, A. (1999). Bile tolerance, taurocholate deconjugation, and binding of cholesterol by lactobacillus gasseri strains. J. Dairy Sci. 82: 243-248.
Usman, and Hosono, A. (2000). Effect of administration of Lactobacillus gasseri on serum lipids and fecal steroids in hypercholesterolemic rats. J. Dairy Sci. 83: 1705-1711.
Walker, D. K. and Gilliland S. E. (1993). Relationships among bile tolerance, bile salt deconjugation and assimilation of cholesterol by Lactobacillus acidophilus. J. Dairy Sci. 76: 956-961.

Bile salts and acid tolerance and cholesterol removal from media ………
J. Saudi Soc. for Food and Nutrition., Vol. 1, No. 1; 2006
17
!
"# $ " ,& &'" ,( ) , , ,
,
*+,' : !" #"$ % &' () Lactobacillus acidophilus (9126, 20079, 2042
DSM) " Bifido (20088, 20098 DSM) *+ "Streptococcus
thermophilus (20617 DSM) ,-) , .% /.- 0"1 2+ ,+ ( 3 #+ 4 () - ! 5 .
47 +21 .% /.- 0"1 2+ 3 + () !" &' 7' 1 8- ! 5 ,-) , . 7 9Bifido 0" "+ !" $1
/.- $: + !" ; $: 4 () 7 72+ (pH) < * 7pH ( = 2+ ,+ ( + !" ; * 7+
Streptococcus thermophilus . -% 2+ ,+ ( * Bifido )29 7 7 >. ) ? +@% 7 4 (pH <&3 2.%7 * 2 847 3B1
/.- 0"1 ( + 4 , .% ( !")=,DE –<G,HE (% ( + 7 <,%.- 0" /)=H,DJ –KK,L= .(%1 847 7
( + "% ; , )2 7'D,<% 7 /.- 0"1"Lactobacillus acidophilus (20079 DSM) ! 5 ,-) ( * + !" $
-)<,=E ,/,(N7 1 "% ; ? / , .% ( (O 4 GK,H%; /P + 7 " &' % (- () Q 4% ? + 7 R79 .
Saleh A. Alajaji and Tarek A. El-Adawy
J. Saudi Soc. for Food and Nutrition., Vol. 1, No. 1; 2006
18
Some Nutritional and Functional Characteristics of Mung Bean (Phaseolus aureus) Proteins
Saleh A. Alajaji and Tarek A. El-Adawy
Food Process Technology Department, Buraydah Collage of Agriculture Technology, P. O. 266, Al-Qassim, Buraydah, Kingdom of Saudi Arabia
ABSTRACT. Mung bean seeds (Phaseolus aureus) were used to prepare flour (F), protein isolate (PI) and protein concentrate (PC). The chemical, nutritional quality and some functional properties of these products were studied. PI had higher (p < 0.05) contents of protein and ash than PC and F; while total fat and fiber contents of both PI and PC were nearly similar. Albumins was the major protein fraction in F. Both PI and PC are completely free from hemagglutinine activity and flatulence factors. Morever, the PI and PC had lower (p < 0.05) contents of tannins, phytic acid and trypsin inhibitor than F. In-vitro protein digestibility of PI and PC was also higher (p < 0.05) than F. PI had a greater proportion of leucine, lysine and tryptophan compared to F and PC. Total aromatic amino acids, leucine and isoleucine were high in globulin, prolamin and glutelin, respectively. Total sulphur amino acids is the first limiting amino acid in all protein products. The protein efficiency ratio of glutelin, prolamin and PI was almost same. The protein solubility pattern of F at different pH's showed a single isoelectric point at pH 4.5 and the solubility increased in both acidic and alkaline pH. Both PC and PI had highest emulsification capacity, oil absorption, foam capacity and stability than F.
Key words: Mung bean flour, protein isolate, protein concentrate, nutritional quality, functional properties.
INTRODUCTION Mung bean (Phaseolus aureus) is one of the edible legumes widely grown in different countries in Asia, Africa and USA. Some countries in the Middle East such as Egypt had been introduced recently mung beans by the Ministry of Agriculture to increase the supply of plants proteins requirement for human consumption. Mung bean contants about 20-27% protein and essential amino acid content comparable to that of soybean and kidney beans (Fan and Sosulski, 1974; Thompson et al., 1976 and Sobihah, 2004). Its low protein efficiency ratio (PER), however, has been attributed to the low methionine content and the presence of trypsin inhibitor (Bunce et al., 1970; Thompson et al., 1976 and El-Adawy et al., 2003).
Mung bean use as a protein supplement is limited by the beany flavor and dark color which it imparts on the final products. This problem was partly overcomed by sufficient dehulling of the beans before milling into flour (Thompson et al., 1976) Protein isolate and concentrate often had improved appearance, taste and nutritive value due to decreasing antinutritive materials compared with the original flour; therefore they can better be used as nutritional and functional ingredients in many food product (Mizrahi et

Some nutritional and functional characteristics of mung bean (Phaseolus aureus) proteins
J. Saudi Soc. for Food and Nutrition., Vol. 1, No. 1; 2006
19
al., 1967). The most widely used procedure to prepare legume and oilseed protein isolate is by isoelectric precipitation (Paredes-López et al., 1988 and Ordorica-Falomir et al., 1989). However, protein concentrate was prepared by extracting the proteins in 0.5% sodium carbonate, then dialyzed against distilled water for 48 hr (Sathe and Salunkhe, 1981). The purpose of the present investigation was to prepare mung bean protein isolate and concentrate and to evaluated some of the nutritional, physico-chemical and functional properties.
MATERIALS AND METHODS Mung bean sample Mature seeds of mung bean (Phaseolus aureus) variety Giza-1 (VC. 2010) were obtained from Agricultural Research Center, Seed Department, Giza, Egypt. The seeds cleaned by hand to remove the foreign materials. Preparation of mung bean flour (F) The seeds were cleaned by hand to remove the foreign materials then ground in an electric mill (Braun, model 1021, Germany) to pass a 80 mesh (British standard screen) nylon screen and referred as mung bean flour (F). Preparation of mung bean protein isolate (PI) The protein was extracted by 0.1N NaOH (pH 9) at room temperature using 1:20 (w/v) flour to solvent ratio, shacked for 1 hr and centrifuged for 15 min at 5000 rpm. Soluble proteins were precipitated from the obtained clear supernatant by adding acid (0.1N HCl) to pH 4.5. The protein isolate was recovered by centrifugation for 15 min at 5000 rpm then washing with distilled water and drying at 50°C for 16 hr in vacuum oven. Preparation of mung bean protein concentrate (PC)
The protein was extracted twice with 0.5% NaCO3 according to Sathe and Salunkhe (1981). The obtained supernatant was dialyzed using dialysis tube cutt-of (Molucular weight 2000 dalton) against distilled water for 72 hr with six changes of distilled water, then dried in vacuum oven at 50°C for 16 hr. Both PI and PC were ground to pass a 80 mesh sieve. Analytical methods Chemical composition Moisture (14.004), fat (14.018), ash (14.006), crude fiber (14.020) and protein N Χ6.25 (14.026) were determined as described by AOAC (1990). Protein fractionations The Osborne classification of protein was done according to the method of Abd El-Aal et al. (1986) using distilled water, 1 M sodium chloride, 70% ethanol and 0.2 M sodium hydroxide solutions to extract albumins, globulins, prolamins and glutelins, respectively. The obtained protein fractions were dried in vacuum oven at 50°C for 16 hr. Kjeldahl method (AOAC, 1990) was used to determine the protein in the extracted flour residue.
Saleh A. Alajaji and Tarek A. El-Adawy
J. Saudi Soc. for Food and Nutrition., Vol. 1, No. 1; 2006
20
Antinutritional factors Total tannins (9.098) were determined calorimetrically as described in AOAC (1990). Phytic acid was determined according to the method of Wheeler and Ferrel (1971). Haemagglutinin activity was estimated according to the method of Liener and Hill (1953). Trypsin inhibitor activity was determined according to the method of Kakade et al. (1969) using benzoyl-DL-arginine-P-nitroanalide hydrochloric as the substrate. Flatulence factors (raffinose and verbascose) were determined according to Tanaka et al. (1975) using thin layer chromatography. Amino acids Amino acids were determined using a Mikrotechna AAA 881 automatic amino acid analyzer (Model 118 /119 CL, Czech Republic) according to method of Moore and Stein (1963). Hydrolysis of the samples was performed in the presence of 6 M HCl at 110°C for 24 hr under a nitrogen atmosphere. Sulfur-containing amino acids were determined after performic acid oxidation. Tryptophan was chemically determined by the method of Miller (1967). In-vitro protein digestibility (IVPD) In- vitro protein digestibility was determined as described by Salgó et al. (1984) by measuring the change in the sample solution pH after incubation at 37°C with trypsin-pancreatin enzyme mixture (Sigma Chem. Co.,St. Louis, Mo., USA) for 10 min. Computation of protein nutritional quality Computation of protein nutritional quality of mung bean products was determined on the basis of amino acid profile. Chemical score of amino acids was calculated using the FAO/WHO (1973) reference pattern. Essential Amino Acid Index (EAAI) was calculated according to Oser (1959) using the amino acid composition of the whole egg protein published by Hidvégi and Békés (1984). Protein efficiency ratio (PER) was estimated using the regression equation proposed by Alsmeyer et al. (1974): PER = - 0.468 + 0.454 (leucine) - 0.105 (tyrosine). Functional properties Protein -pH solubility profile One gram of F was dispersed in 20 ml of aqueous solvent and the pH adjusted in the range of 1 to 12 with 0.5 M HCl or 0.5 M NaOH. The suspension was shaken for 1 hr at room temperature (~ 25°C) then centrifuged at 4000 rpm for 20 min. The pH and nitrogen of clear supernatant were determined. Protein solubility index (PSI) in different solvents PSI was estimated in water at pH 9 and 12, 5%NaCl and 0.02M NaOH as described by Smith et al.(1959). Other functional properties Water and fat absorption were estimated according to the procedure of Sosulski (1962) and Sosulski et al. (1976), respectively. Emulsification capacity (ml oil/ gm protein at pH 9) was determined as described by Beuchat et al. (1975). The method of Lawhon et al. (1972) was used to determine the foam capacity and stability at pH 9.0 using 1% protein
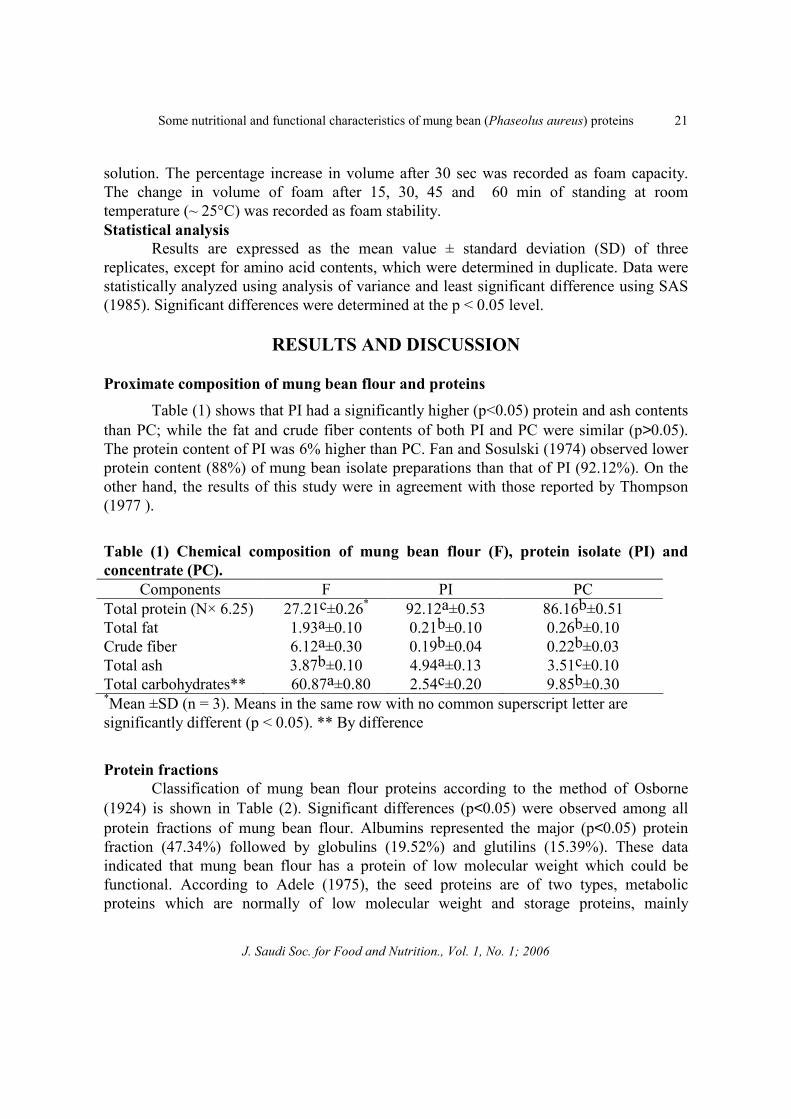
Some nutritional and functional characteristics of mung bean (Phaseolus aureus) proteins
J. Saudi Soc. for Food and Nutrition., Vol. 1, No. 1; 2006
21
solution. The percentage increase in volume after 30 sec was recorded as foam capacity. The change in volume of foam after 15, 30, 45 and 60 min of standing at room temperature (~ 25°C) was recorded as foam stability. Statistical analysis Results are expressed as the mean value ± standard deviation (SD) of three replicates, except for amino acid contents, which were determined in duplicate. Data were statistically analyzed using analysis of variance and least significant difference using SAS (1985). Significant differences were determined at the p < 0.05 level.
RESULTS AND DISCUSSION
Proximate composition of mung bean flour and proteins Table (1) shows that PI had a significantly higher (p<0.05) protein and ash contents than PC; while the fat and crude fiber contents of both PI and PC were similar (p>0.05). The protein content of PI was 6% higher than PC. Fan and Sosulski (1974) observed lower protein content (88%) of mung bean isolate preparations than that of PI (92.12%). On the other hand, the results of this study were in agreement with those reported by Thompson (1977 ).
Table (1) Chemical composition of mung bean flour (F), protein isolate (PI) and concentrate (PC).
Components F PI PC Total protein (N× 6.25) 27.21c±0.26* 92.12a±0.53 86.16b±0.51 Total fat 1.93a±0.10 0.21b±0.10 0.26b±0.10 Crude fiber 6.12a±0.30 0.19b±0.04 0.22b±0.03 Total ash 3.87b±0.10 4.94a±0.13 3.51c±0.10 Total carbohydrates** 60.87a±0.80 2.54c±0.20 9.85b±0.30 *Mean ±SD (n = 3). Means in the same row with no common superscript letter are significantly different (p < 0.05). ** By difference
Protein fractions Classification of mung bean flour proteins according to the method of Osborne (1924) is shown in Table (2). Significant differences (p<0.05) were observed among all protein fractions of mung bean flour. Albumins represented the major (p<0.05) protein fraction (47.34%) followed by globulins (19.52%) and glutilins (15.39%). These data indicated that mung bean flour has a protein of low molecular weight which could be functional. According to Adele (1975), the seed proteins are of two types, metabolic proteins which are normally of low molecular weight and storage proteins, mainly
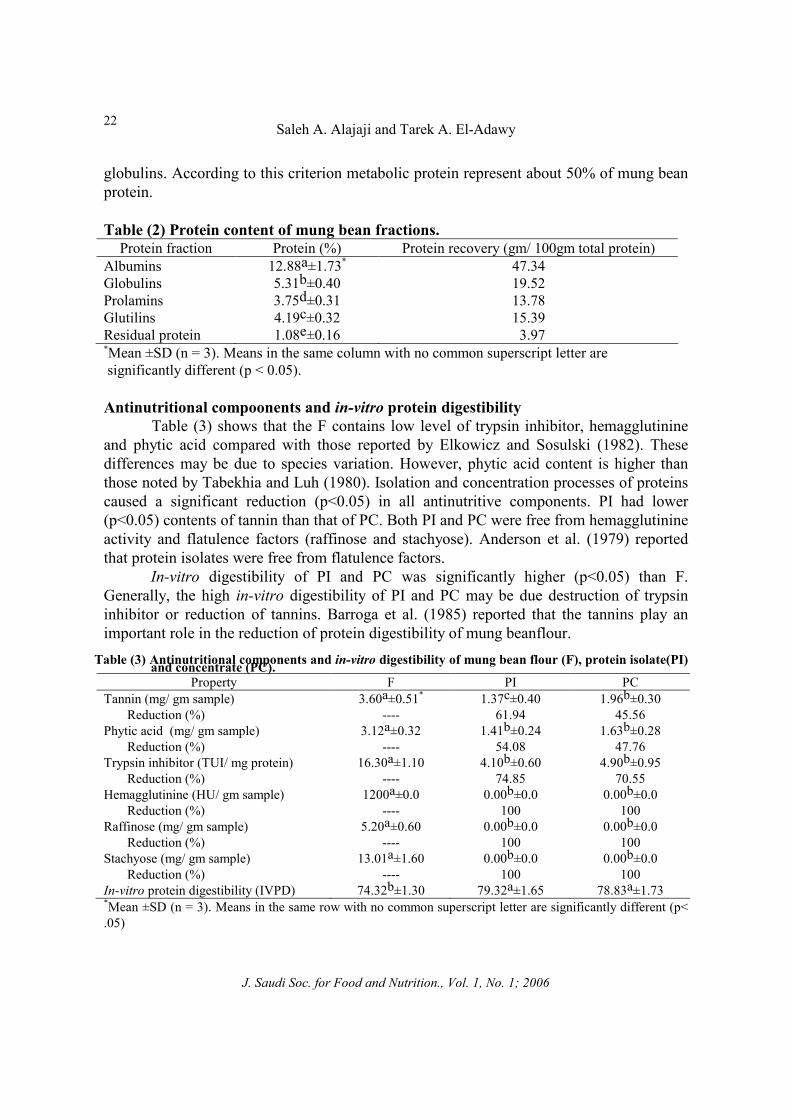
Saleh A. Alajaji and Tarek A. El-Adawy
J. Saudi Soc. for Food and Nutrition., Vol. 1, No. 1; 2006
22
globulins. According to this criterion metabolic protein represent about 50% of mung bean protein. Table (2) Protein content of mung bean fractions.
Protein fraction Protein (%) Protein recovery (gm/ 100gm total protein) Albumins 12.88a±1.73* 47.34 Globulins 5.31b±0.40 19.52 Prolamins 3.75d±0.31 13.78 Glutilins 4.19c±0.32 15.39 Residual protein 1.08e±0.16 3.97 *Mean ±SD (n = 3). Means in the same column with no common superscript letter are significantly different (p < 0.05). Antinutritional compoonents and in-vitro protein digestibility Table (3) shows that the F contains low level of trypsin inhibitor, hemagglutinine and phytic acid compared with those reported by Elkowicz and Sosulski (1982). These differences may be due to species variation. However, phytic acid content is higher than those noted by Tabekhia and Luh (1980). Isolation and concentration processes of proteins caused a significant reduction (p<0.05) in all antinutritive components. PI had lower (p<0.05) contents of tannin than that of PC. Both PI and PC were free from hemagglutinine activity and flatulence factors (raffinose and stachyose). Anderson et al. (1979) reported that protein isolates were free from flatulence factors.
In-vitro digestibility of PI and PC was significantly higher (p<0.05) than F. Generally, the high in-vitro digestibility of PI and PC may be due destruction of trypsin inhibitor or reduction of tannins. Barroga et al. (1985) reported that the tannins play an important role in the reduction of protein digestibility of mung beanflour.
Table (3) Antinutritional components and in-vitro digestibility of mung bean flour (F), protein isolate(PI) and concentrate (PC).
Property F PI PC Tannin (mg/ gm sample) 3.60a±0.51* 1.37c±0.40 1.96b±0.30
Reduction (%) ---- 61.94 45.56 Phytic acid (mg/ gm sample) 3.12a±0.32 1.41b±0.24 1.63b±0.28 Reduction (%) ---- 54.08 47.76 Trypsin inhibitor (TUI/ mg protein) 16.30a±1.10 4.10b±0.60 4.90b±0.95 Reduction (%) ---- 74.85 70.55 Hemagglutinine (HU/ gm sample) 1200a±0.0 0.00b±0.0 0.00b±0.0 Reduction (%) ---- 100 100 Raffinose (mg/ gm sample) 5.20a±0.60 0.00b±0.0 0.00b±0.0 Reduction (%) ---- 100 100 Stachyose (mg/ gm sample) 13.01a±1.60 0.00b±0.0 0.00b±0.0 Reduction (%) ---- 100 100 In-vitro protein digestibility (IVPD) 74.32b±1.30 79.32a±1.65 78.83a±1.73 *Mean ±SD (n = 3). Means in the same row with no common superscript letter are significantly different (p< .05)
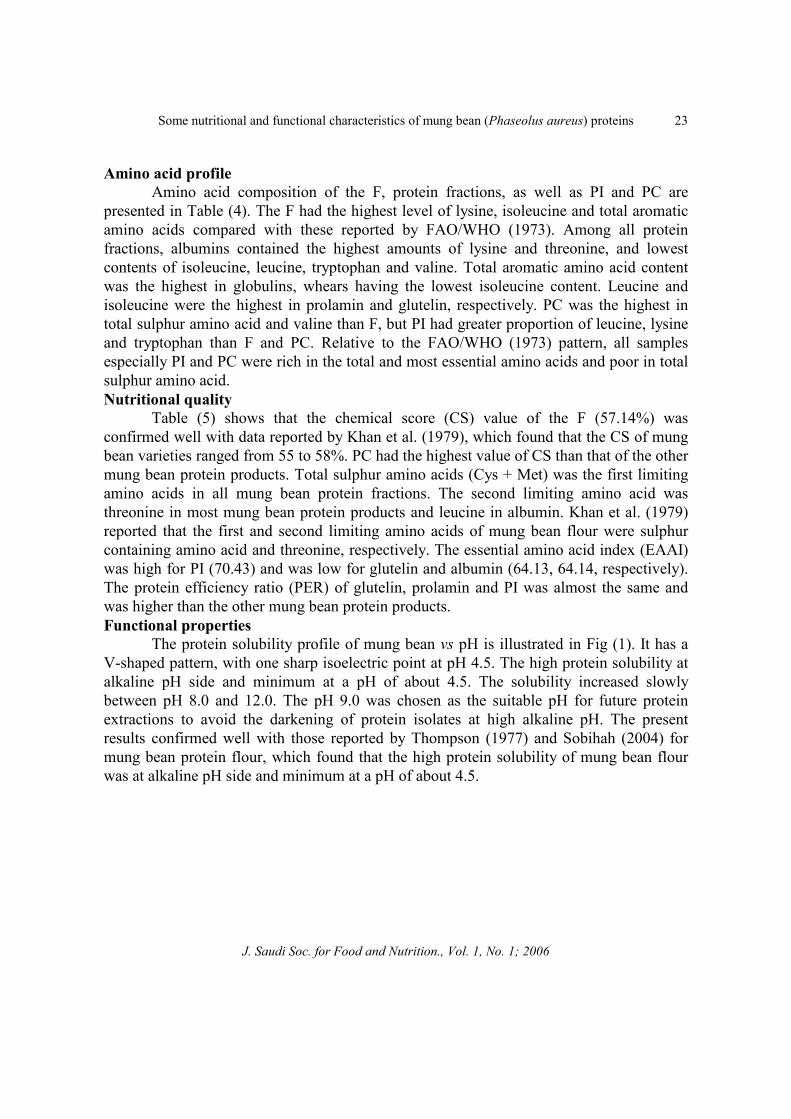
Some nutritional and functional characteristics of mung bean (Phaseolus aureus) proteins
J. Saudi Soc. for Food and Nutrition., Vol. 1, No. 1; 2006
23
Amino acid profile Amino acid composition of the F, protein fractions, as well as PI and PC are presented in Table (4). The F had the highest level of lysine, isoleucine and total aromatic amino acids compared with these reported by FAO/WHO (1973). Among all protein fractions, albumins contained the highest amounts of lysine and threonine, and lowest contents of isoleucine, leucine, tryptophan and valine. Total aromatic amino acid content was the highest in globulins, whears having the lowest isoleucine content. Leucine and isoleucine were the highest in prolamin and glutelin, respectively. PC was the highest in total sulphur amino acid and valine than F, but PI had greater proportion of leucine, lysine and tryptophan than F and PC. Relative to the FAO/WHO (1973) pattern, all samples especially PI and PC were rich in the total and most essential amino acids and poor in total sulphur amino acid. Nutritional quality
Table (5) shows that the chemical score (CS) value of the F (57.14%) was confirmed well with data reported by Khan et al. (1979), which found that the CS of mung bean varieties ranged from 55 to 58%. PC had the highest value of CS than that of the other mung bean protein products. Total sulphur amino acids (Cys + Met) was the first limiting amino acids in all mung bean protein fractions. The second limiting amino acid was threonine in most mung bean protein products and leucine in albumin. Khan et al. (1979) reported that the first and second limiting amino acids of mung bean flour were sulphur containing amino acid and threonine, respectively. The essential amino acid index (EAAI) was high for PI (70.43) and was low for glutelin and albumin (64.13, 64.14, respectively). The protein efficiency ratio (PER) of glutelin, prolamin and PI was almost the same and was higher than the other mung bean protein products. Functional properties
The protein solubility profile of mung bean vs pH is illustrated in Fig (1). It has a V-shaped pattern, with one sharp isoelectric point at pH 4.5. The high protein solubility at alkaline pH side and minimum at a pH of about 4.5. The solubility increased slowly between pH 8.0 and 12.0. The pH 9.0 was chosen as the suitable pH for future protein extractions to avoid the darkening of protein isolates at high alkaline pH. The present results confirmed well with those reported by Thompson (1977) and Sobihah (2004) for mung bean protein flour, which found that the high protein solubility of mung bean flour was at alkaline pH side and minimum at a pH of about 4.5.

Saleh A. Alajaji and Tarek A. El-Adawy
J. Saudi Soc. for Food and Nutrition., Vol. 1, No. 1; 2006
24
Table (4) Amino acid profiles of mung bean flour (F), protein fraction, protein isolate (PI) and concentrate (PC).
Amino acid F PI PC Albumin Globulin Prolamin Glutelin FAO/WHO (1973)
Isoleucine 4.5 4.2 4.2 3.0 3.0 3.9 5.1 4.00 Leucine 7.8 8.0 7.0 5.6 6.7 8.1 8.0 7.00 Lysine 6.3 6.8 6.6 9.1 6.3 6.7 6.8 5.50 Cystine 0.6 0.5 0.9 0.8 0.6 0.8 0.4 - Methionine 1.4 1.7 1.7 1.6 1.5 1.1 1.0 - Total sulfur amino acids
2.0 2.2 2.6 2.4 2.1 1.9 1.4 3.5
Tyrosine 2.9 3.0 3.0 2.8 4.9 3.1 2.4 - Phenylalanine 5.6 5.5 5.5 4.8 5.9 5.4 4.7 - Total aromatic amino acids
8.5 8.5 8.5 7.6 10.8 8.5 7.1 6.00
Threonine 3.0 2.8 3.4 4.5 2.6 2.5 2.7 4.00 Tryptophan 1.0 1.7 0.9 0.9 1.6 1.1 1.1 1.00 Valine 5.0 5.2 5.4 4.5 4.6 4.9 4.9 5.00 Total essential amino acids
38.1 39.4 38.6 37.6 37.7 37.6 37.1 36.00
Histidine 2.6 2.2 2.3 2.1 2.7 3.4 2.4 Arginine 6.8 5.3 6.2 6.6 6.9 8.0 6.4 Aspartic acid 11.3 11.9 10.9 9.6 11.3 10.6 13.6 Glutamic acid 18.6 16.2 15.1 14.4 17.9 19.2 19.9 Serine 4.6 3.9 5.9 5.0 6.2 5.5 4.5 Proline 4.2 6.5 5.2 4.8 4.6 3.3 4.0 Glycine 3.7 3.5 4.9 5.4 3.2 3.8 3.4 Alanine 4.2 6.3 6.6 7.3 4.1 4.5 3.9 Total non- essential amino acids
56.0 55.8 57.1 55.2 56.9 58.3 58.1
Table (5): Nutritional evaluation of mung bean flour (F), protein fraction, protein isolate (PI) and concentrate (PC).
Nutritional parameter F Albumin Globulin Prolamin Glutelin PI PC Chemical Score (CS) 57.14 68.57 60.00 54.29 40.44 62.86 74.29
First limiting amino acid
Cys + Met
Cys + Met
Cys + Met
Cys + Met
Cys + Met
Cys + Met
Cys + Met
Second limiting amino acid
Thr (75) Leu (80) Thr (65) Thr (62.5)
Thr (67.5)
Thr (70) Thr (85)
Essential amino acid index (EAAI)
66.60 64.14 65.66 65.12 64.13 70.43 68.31
Protein efficiency ratio (PER)
2.77 1.78 2.06 2.88 2.91 2.85 2.30
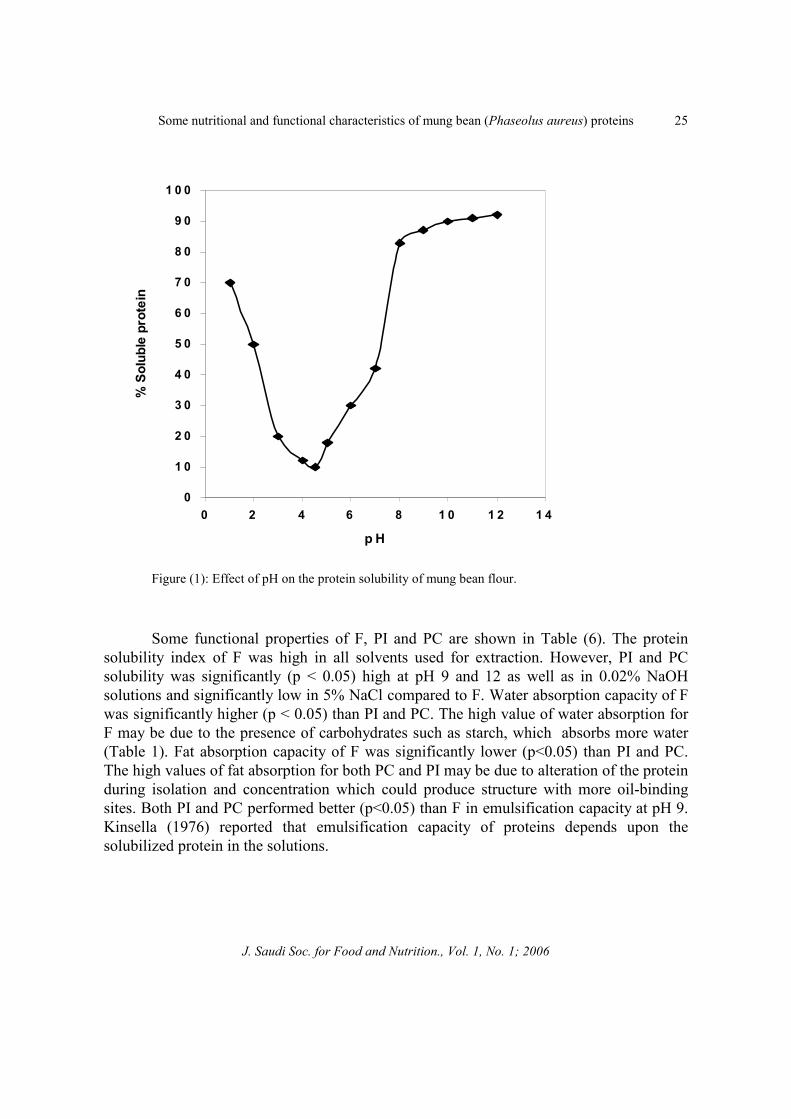
Some nutritional and functional characteristics of mung bean (Phaseolus aureus) proteins
J. Saudi Soc. for Food and Nutrition., Vol. 1, No. 1; 2006
25
0
1 0
2 0
3 0
4 0
5 0
6 0
7 0
8 0
9 0
1 0 0
0 2 4 6 8 1 0 1 2 1 4
p H
%So
lubl
epr
otei
n
Figure (1): Effect of pH on the protein solubility of mung bean flour.
Some functional properties of F, PI and PC are shown in Table (6). The protein solubility index of F was high in all solvents used for extraction. However, PI and PC solubility was significantly (p < 0.05) high at pH 9 and 12 as well as in 0.02% NaOH solutions and significantly low in 5% NaCl compared to F. Water absorption capacity of F was significantly higher (p < 0.05) than PI and PC. The high value of water absorption for F may be due to the presence of carbohydrates such as starch, which absorbs more water (Table 1). Fat absorption capacity of F was significantly lower (p<0.05) than PI and PC. The high values of fat absorption for both PC and PI may be due to alteration of the protein during isolation and concentration which could produce structure with more oil-binding sites. Both PI and PC performed better (p<0.05) than F in emulsification capacity at pH 9. Kinsella (1976) reported that emulsification capacity of proteins depends upon the solubilized protein in the solutions.
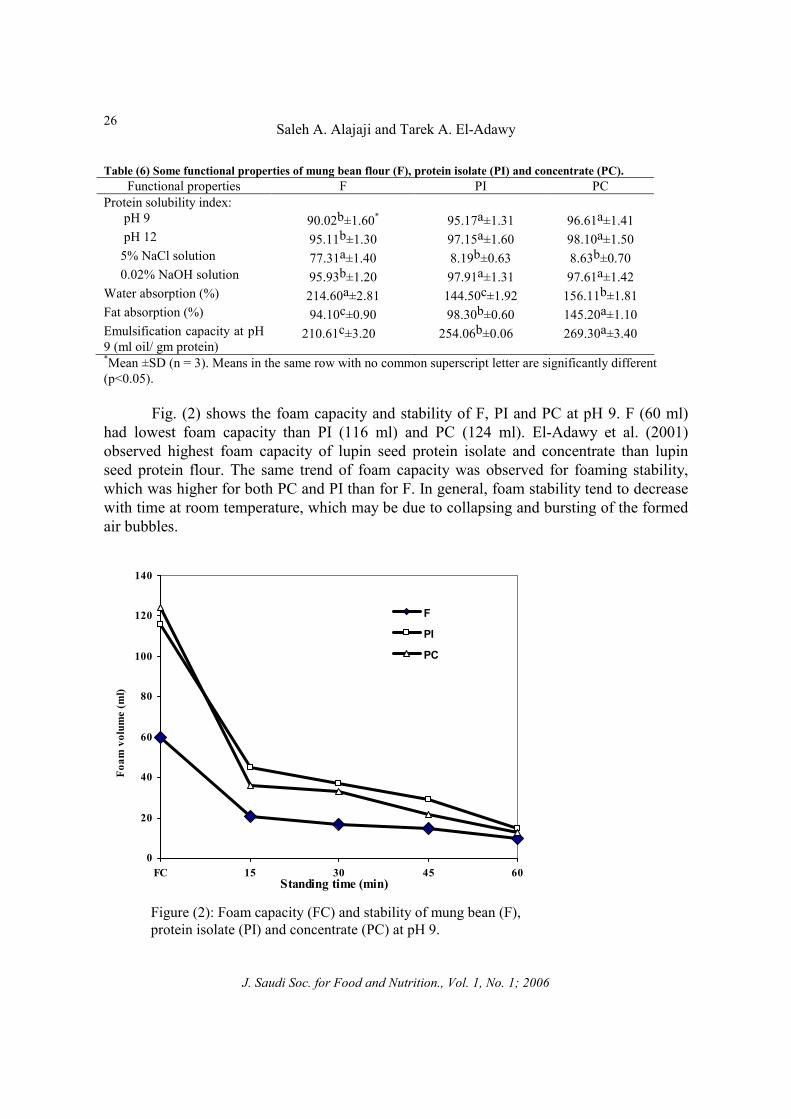
Saleh A. Alajaji and Tarek A. El-Adawy
J. Saudi Soc. for Food and Nutrition., Vol. 1, No. 1; 2006
26
Table (6) Some functional properties of mung bean flour (F), protein isolate (PI) and concentrate (PC). Functional properties F PI PC
Protein solubility index: pH 9 90.02b±1.60* 95.17a±1.31 96.61a±1.41
pH 12 95.11b±1.30 97.15a±1.60 98.10a±1.50 5% NaCl solution 77.31a±1.40 8.19b±0.63 8.63b±0.70 0.02% NaOH solution 95.93b±1.20 97.91a±1.31 97.61a±1.42 Water absorption (%) 214.60a±2.81 144.50c±1.92 156.11b±1.81 Fat absorption (%) 94.10c±0.90 98.30b±0.60 145.20a±1.10 Emulsification capacity at pH 9 (ml oil/ gm protein)
210.61c±3.20 254.06b±0.06 269.30a±3.40
*Mean ±SD (n = 3). Means in the same row with no common superscript letter are significantly different (p<0.05).
Fig. (2) shows the foam capacity and stability of F, PI and PC at pH 9. F (60 ml) had lowest foam capacity than PI (116 ml) and PC (124 ml). El-Adawy et al. (2001) observed highest foam capacity of lupin seed protein isolate and concentrate than lupin seed protein flour. The same trend of foam capacity was observed for foaming stability, which was higher for both PC and PI than for F. In general, foam stability tend to decrease with time at room temperature, which may be due to collapsing and bursting of the formed air bubbles.
0
20
40
60
80
100
120
140
FC 15 30 45 60Standing time (min)
Foam
volu
me
(ml)
F
PI
PC
Figure (2): Foam capacity (FC) and stability of mung bean (F), protein isolate (PI) and concentrate (PC) at pH 9.

Some nutritional and functional characteristics of mung bean (Phaseolus aureus) proteins
J. Saudi Soc. for Food and Nutrition., Vol. 1, No. 1; 2006
27
CONCLUSION This study revealed that both mung bean protein isolate and concentrate had a higher nutritive value due to decreasing the antinutritive materials compared to mung bean flour. The data obtained will be useful for using both mung bean protein isolate and concentrate as nutrient substitution or supplementation and as functional agent in food systems.
REFERENCES Abdel-Aal, M. H.; Hamza, M. A. and Rahma, E. H. (1986). In-vitro-digestibility, physico-
chemical and functional properties of apricot kernel protein. Food Chem. 19: 197-211.
Adele, M. (1975). Biochemistry of legume seed proteins. Ann. Rev. Plant Physiol. 26: 53-62.
Alsmeyer, R. H.; Cunningham, A. E. and Happich, M. L. (1974). Equations predict PER from amino acid analysis. Food Technol. 28: 34-40.
Anderson, R. L.; Rackis, J. J. and Tallent, W. H. (1979). Biologically active substances in soy products. In Soy Protein and Human Nutrition, ed. H. L. Wilcke and D. H. Waggel. Academic press, New York, pp. 209-233.
AOAC (1990). "Official Methods of Analysis," 15th ed. Association of Official Analytical Chemists, Washington, D. C.
Barroga, C. F.; Laurena, A. C. and Mendoza, E. M. T. (1985). Polyphenol in mung bean (Vigna radiata L. Wilczek) determination and removal. J. Agric. Food Chem. 33:1006-1009.
Beuchat, L. R.; Cherry, J. P. and Quinin, M. R. (1975). Physico-chemical properties of peanut flour as affected by proteolysis. J. Agric. Food Chem. 23: 616-620.
Bunce, G. E.; Modie, J. A.; Mirada, C.; Gonzalez, J. and Salon, D. T. (1970). Evaluation of cereal-legume blend to be used in a nutrition improvement program. Nutr. Rep. Inter. 1:325-330.
El-Adawy, T. A.; Rahma, E. H.; El-Bedawey, A. and Gafar, A. (2001). Nutritional potential and functional properties of sweet and bitter lupin seed protein isolates. Food Chem. 74: 455-462.
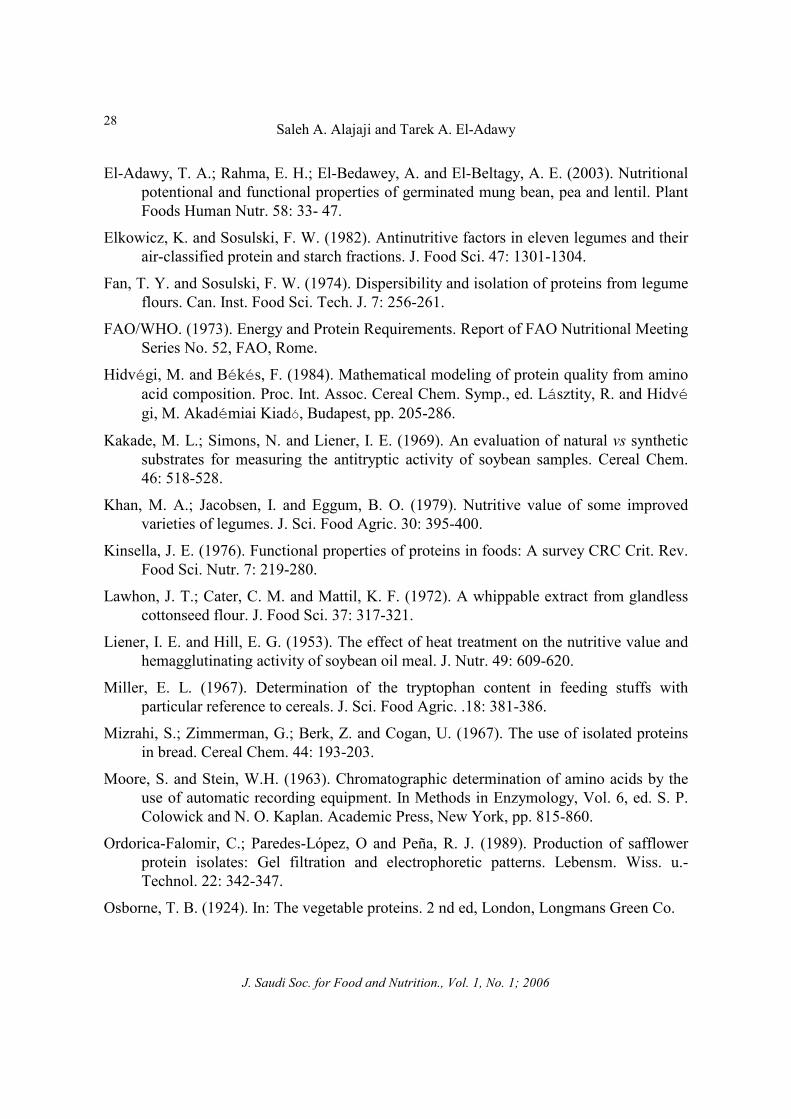
Saleh A. Alajaji and Tarek A. El-Adawy
J. Saudi Soc. for Food and Nutrition., Vol. 1, No. 1; 2006
28
El-Adawy, T. A.; Rahma, E. H.; El-Bedawey, A. and El-Beltagy, A. E. (2003). Nutritional potentional and functional properties of germinated mung bean, pea and lentil. Plant Foods Human Nutr. 58: 33- 47.
Elkowicz, K. and Sosulski, F. W. (1982). Antinutritive factors in eleven legumes and their air-classified protein and starch fractions. J. Food Sci. 47: 1301-1304.
Fan, T. Y. and Sosulski, F. W. (1974). Dispersibility and isolation of proteins from legume flours. Can. Inst. Food Sci. Tech. J. 7: 256-261.
FAO/WHO. (1973). Energy and Protein Requirements. Report of FAO Nutritional Meeting Series No. 52, FAO, Rome.
Hidvégi, M. and Békés, F. (1984). Mathematical modeling of protein quality from amino acid composition. Proc. Int. Assoc. Cereal Chem. Symp., ed. Lásztity, R. and Hidvégi, M. Akadémiai Kiadó, Budapest, pp. 205-286.
Kakade, M. L.; Simons, N. and Liener, I. E. (1969). An evaluation of natural vs synthetic substrates for measuring the antitryptic activity of soybean samples. Cereal Chem. 46: 518-528.
Khan, M. A.; Jacobsen, I. and Eggum, B. O. (1979). Nutritive value of some improved varieties of legumes. J. Sci. Food Agric. 30: 395-400.
Kinsella, J. E. (1976). Functional properties of proteins in foods: A survey CRC Crit. Rev. Food Sci. Nutr. 7: 219-280.
Lawhon, J. T.; Cater, C. M. and Mattil, K. F. (1972). A whippable extract from glandless cottonseed flour. J. Food Sci. 37: 317-321.
Liener, I. E. and Hill, E. G. (1953). The effect of heat treatment on the nutritive value and hemagglutinating activity of soybean oil meal. J. Nutr. 49: 609-620.
Miller, E. L. (1967). Determination of the tryptophan content in feeding stuffs with particular reference to cereals. J. Sci. Food Agric. .18: 381-386.
Mizrahi, S.; Zimmerman, G.; Berk, Z. and Cogan, U. (1967). The use of isolated proteins in bread. Cereal Chem. 44: 193-203.
Moore, S. and Stein, W.H. (1963). Chromatographic determination of amino acids by the use of automatic recording equipment. In Methods in Enzymology, Vol. 6, ed. S. P. Colowick and N. O. Kaplan. Academic Press, New York, pp. 815-860.
Ordorica-Falomir, C.; Paredes-López, O and Peña, R. J. (1989). Production of safflower protein isolates: Gel filtration and electrophoretic patterns. Lebensm. Wiss. u.-Technol. 22: 342-347.
Osborne, T. B. (1924). In: The vegetable proteins. 2 nd ed, London, Longmans Green Co.

Some nutritional and functional characteristics of mung bean (Phaseolus aureus) proteins
J. Saudi Soc. for Food and Nutrition., Vol. 1, No. 1; 2006
29
Oser, B. L. (1959). An integrated essential amino acid index for predicting the biological value of proteins. In Protein and Amino Acid Nutrition, ed. Albanese, A. A. Academic Press, New York, pp. 295-311.
Paredes-López, O.; Ordorica-Falomir, C. and Cárabez-Trejo, A. (1988). Production of safflower protein isolates: Physicochemical characterization. Lebensm. Wiss. u.-Technol. 21: 328-331.
Salgó, A.; Granzler, K. and Jecsai, J. (1984). Simple enzymatic methods for predication of plant protein digestibility. Proc. Int. Assoc. Cereal Chem. Symp., ed. R. Lásztity and M. Hidvégi. Akadémiai Kiadó, Budapest, pp.311-321.
SAS (1985). "SAS Users Guide: Statistics Version 5 ed." SAS Institute Inc., Cary NC.
Sathe, S. K. and Salunkhe, D. K. (1981). Solubilization and electrophoretic characterization of the great northern bean (Phaseolus vulgaris L.) proteins. J. Food Sci. 46: 82-87.
Smith, C. R.; Earle, F. R.; Woleff, I. A. and Jones, Q. (1959). Seed protein solubility:. Comparison of solubility charactericties of selected seeds protein. J. Agric. Food Chem. 7: 133-139.
Sobihah, T. Y. (2004). Chemical characterization, functional properties and nutritional quality of mung bean proteins. Ph. D. Thesis, Faculty of Agriculture, Menofiya University, Shibin El-Kom, Egypt.
Sosulski, F. W. (1962). The centrifugal method for determining flour absorption in hard red spring wheats. Cereal Chem. 39: 344-347.
Sosulski, F. W.; Humbert, E. S.; Bui and Jones, J. D. (1976). Functional properties of rapseed flours, concentrate and isolate. J. Food Sci. 41: 1349-1352.
Tabekhia, M. M. and Luh, B. S. (1980). Effect of germination, cooking and canning on phosphorus and phytate retention in dry beans. J. Food Sci. 45: 406-408.
Tanaka, M.; Thananunkul, D.; Lee, T. C.; and Chichester, C. O. (1975). A simplified method for the quantitative determination of sucrose, raffinose and stachyose in legume seeds .J. Food Sci. 40: 1087-1088.
Thompson, L. U. (1977). Preparation and evaluation of mung bean protein isolates. J. Food Sci. 42: 202-206.
Thompson, L. U.; Hung, L.; Wang, N.; Rasper, V. and Gade, H. (1976). Preparation of mung bean flour and its application in bread making. Can. Inst. Food Sci. Tech. J. 9: 1-7.
Wheeler, E. I. and Ferrel, R. E. (1971). A method for phytic acid determination in wheat and wheat fractions. Cereal Chem. 48: 312-316.
Saleh A. Alajaji and Tarek A. El-Adawy
J. Saudi Soc. for Food and Nutrition., Vol. 1, No. 1; 2006
30
! "# – ! ! ""
$: #$ %& '( )! *"+ , , #," - , . !" - / 0" 1 2! *01 " 34 (5 + .70 *458 . !" - -8
0" #$ " - - 0" - -" 3 &" '9 '0 -0 . ,!" - -" . / &" .:0"" " - $ "0+ ;0< ' -= -" . '9 .1 0" ," -0 -" < -8
'( )! - $ '0< .-" >0"0" -0+ " - . !" - -" . -8 >0%8 1 #?0( @ " *0 A1" 0 0 0" "= &" '9 -%(+ " 0 B A:" C( 2"& *0 0 -"
- .* 0 " . !" - -" . "!" "%4 " -" '8 $, .,1 8-8 >0%, " - 0 > 0" -09 -D #- -" '0 ' / & . !" - '9 $
- , 1 ',9 ,0 * 0 - < - "< 20"&< -8 1 -& -"E , ' - 1 .,"1 '9 &" . < ' "< 2"0& * 0 "< 20"&< -8 5& 0"
- *01 " # * 0 -& '9 0" . !" - -"E - 1 '9 F " 0(" ->0.,5!" ," .,:0" ,(+" % "& *01 ' '( )! $ - -0 ' & " -8 0"
.0! A F -0 0 *0 % "& 1 ' & '4G,I. D&J ! * 0 *,$ 0& '9 F " '8 " . !" - -" . 040: K ! "" .
Ahmad H. Alghamdi, Ali F. Alghamdi and Abdulrahman A. Alwarthan
J. Saudi Soc. for Food and Nutrition., Vol. 1, No. 1; 2007
31
ICP-MS Simultaneous Determination of Some Essential Minerals and Heavy Metals in Some Commercial Drinks Consumed in Riyadh City
Ahmad H. Alghamdi, Ali F. Alghamdi and Abdulrahman A. Alwarthan Department of Chemistry, College of Science, King Saud University
P.O Box 2455, Riyadh- 11451 Tel.: +966-14676001, Fax: +966-14675992.
[email protected] E-mail: ABSTRACT. Concentrations of several essential elements (Ca, Mg, Na, K, Zn, Mn, Fe, Cu, Co, Cr and Mo) and potentially toxic heavy metals (Pb, Cd, As and Sb) in different juice beverages and soft drinks purchased in Riyadh city were measured, primarily to assess whether their daily intakes through the consumption of these drinks comply with the recommended desired levels for essential minerals and permissible levels for toxic metals. These analytical data were obtained via the employment of an Inductively Coupled Plasma/Mass Spectroscopy (ICP-MS) technique. Data reported in the present study reveals that all toxic heavy metals are within or even considerably lower than the maximum authorized levels. Keyword: ICP-MS, Essential and heavy metals. Soft drinks, Fruit juice beverages. _________________________________________________________________________
INTRODUCTION In recent years, there has been a growing demand for evaluating the nutritional value and level of toxic and heavy metal contamination in various foodstuff, practically in soft drinks products, which are becoming customarily displacing other more nutritional food choices in people’s diets such as milk and fruit juice and even water (Calvadini et..al., 2000, Lytle et al., 2000). Accordingly, information on trace element concentrations in various food products is getting increasingly important in order to sustain the human health as well as from the food quality control point of view.
Today, soft drinks and beverages with added fruit juice are widely consumed in the diet by most segments of the population for modern societies. Thus, daily consumption of beverages contributes significantly to the requirements of the human organism of essential elements. Similarly, the daily excessive intakes of these beverages might also contribute to overall exposure (through ingestion) of human body to toxic heavy metals. As a result, the determination of levels of essential minerals and possible heavy metals in different kinds of foodstuffs for assurance of food nutritional quality and safety is becoming of vital importance.
The content levels of several elements in drinks (juice, carbonated soft drink, milk, tea, instant coffee .etc.) has been determined by various analytical techniques such as flame atomic absorption spectroscopy (Tripathi et al.,2002), electrothermal atomic absorption spectroscopy (Tripathi et al., 1999), cathodic stripping voltammetry (Colombo and Van den Berg , 1997), ion chromatography (Trifiro et al.,1996), capillary zone electrophoresis (Luque et al., 2006) and X-ray fluorescence technique (Haswell et al., 1998).
Inductively coupled plasma-mass spectroscopy (ICP-MS) technique can be applied in almost all the analytical chemistry areas. The wide use of this technique for analysis of different kinds of matrices may be attributed to its remarkable sensitivity, multi-elemental
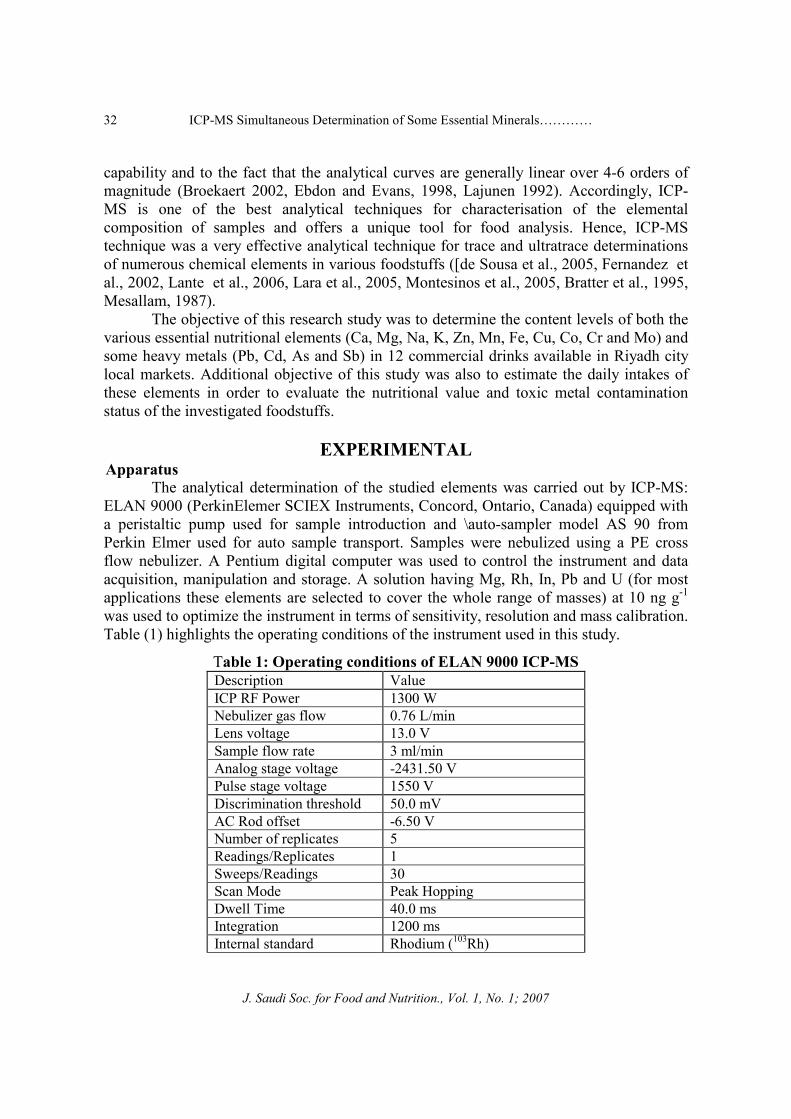
ICP-MS Simultaneous Determination of Some Essential Minerals…………
J. Saudi Soc. for Food and Nutrition., Vol. 1, No. 1; 2007
32
capability and to the fact that the analytical curves are generally linear over 4-6 orders of magnitude (Broekaert 2002, Ebdon and Evans, 1998, Lajunen 1992). Accordingly, ICP-MS is one of the best analytical techniques for characterisation of the elemental composition of samples and offers a unique tool for food analysis. Hence, ICP-MS technique was a very effective analytical technique for trace and ultratrace determinations of numerous chemical elements in various foodstuffs ([de Sousa et al., 2005, Fernandez et al., 2002, Lante et al., 2006, Lara et al., 2005, Montesinos et al., 2005, Bratter et al., 1995, Mesallam, 1987).
The objective of this research study was to determine the content levels of both the various essential nutritional elements (Ca, Mg, Na, K, Zn, Mn, Fe, Cu, Co, Cr and Mo) and some heavy metals (Pb, Cd, As and Sb) in 12 commercial drinks available in Riyadh city local markets. Additional objective of this study was also to estimate the daily intakes of these elements in order to evaluate the nutritional value and toxic metal contamination status of the investigated foodstuffs.
EXPERIMENTAL Apparatus The analytical determination of the studied elements was carried out by ICP-MS: ELAN 9000 (PerkinElemer SCIEX Instruments, Concord, Ontario, Canada) equipped with a peristaltic pump used for sample introduction and \auto-sampler model AS 90 from Perkin Elmer used for auto sample transport. Samples were nebulized using a PE cross flow nebulizer. A Pentium digital computer was used to control the instrument and data acquisition, manipulation and storage. A solution having Mg, Rh, In, Pb and U (for most applications these elements are selected to cover the whole range of masses) at 10 ng g-1 was used to optimize the instrument in terms of sensitivity, resolution and mass calibration. Table (1) highlights the operating conditions of the instrument used in this study.
Table 1: Operating conditions of ELAN 9000 ICP-MS Description Value ICP RF Power 1300 W Nebulizer gas flow 0.76 L/min Lens voltage 13.0 V Sample flow rate 3 ml/min Analog stage voltage -2431.50 V Pulse stage voltage 1550 V Discrimination threshold 50.0 mV AC Rod offset -6.50 V Number of replicates 5 Readings/Replicates 1 Sweeps/Readings 30 Scan Mode Peak Hopping Dwell Time 40.0 ms Integration 1200 ms Internal standard Rhodium (103Rh)
Ahmad H. Alghamdi, Ali F. Alghamdi and Abdulrahman A. Alwarthan
J. Saudi Soc. for Food and Nutrition., Vol. 1, No. 1; 2007
33
Reagents, reference material and samples Analytical reagent grade chemicals were used in this study without further
purification. These include, nitric acid (69% v/v), Super Purity grade from Romil, England. Hydrochloric acid (37% v/v) and hydrofluoric acid (40% v/v) were super pure reagents from Merck, Germany. To evaluate the analytical performance of the utilized analytical technique a Standard Reference Material (SRM), namely SRM 1640 composed of natural fresh water was used. This standard reference material was purchased from the National Institute of Standards and Technology (NIST), Gaithersburg, MD, USA. High purity water (DDW) (specific resistively 18 MΩ.cm-1) obtained from a Millipore Milli-Q water purification system was used throughout the work. Rhodium single element 1000 mg/L in 10% (v/v) HCl certified standard from Perkin Elmer, USA was used as an internal standard.
Different brands of very popular soft drinks and beverages with added fruit juice samples were purchased from local supermarkets in the city of Riyadh. Soft drinks mostly consist of carbonated water, sugar, coloring agents, citric acid, and other food additives such as flavors and preservatives. Beverages with added fruit juice contained the previous ingredients in addition to concentrated syrups, vitamin C, pectin and other additives. The total of 12 beverage samples investigated in this study were categorized as: soft drinks (8 samples) and beverages with added fruit juice (4 samples). Procedure
The analysed soft drinks and beverages with added fruit juices were subjected to mild clean-up procedures such as degassing with ultrasonic bath and paper filtration. For the soft drink samples, after dilution and acidification with nitric acid, part of each diluted solutions were aspirated into ICP-MS instrument for the direct analysis without any further preparation steps such as extraction or concentration. However, for the beverages with added fruit juice a pre-treatment microwave digestion method utilizing acid mixture was applied. All quantitative measurements for the studied elements were repeated five times. All the plastic and glassware were cleaned by soaking in dilute HNO3 and were rinsed with deionized water prior to use.
RESULTS AND DISCUSSION Validity of the applied analytical method Before the applied plasma emission spectroscopic method (ICP-MS) could provide useful analytical information for real samples, it was necessary to demonstrate that it is capable for providing acceptable analytical results. The analytical performance of the applied method can be verified via the evaluation of its precision and accuracy characteristic. The accuracy of the used analytical method was assessed via the analysis of standard reference material SRM 1640 and the obtained analytical results were compared with the certified values. As can be seen from Table (2), the obtained analytical result was generally in good agreement with NIST certified values. The accuracy of these analytical results was also checked via the F statistical test and since the calculated F values are less
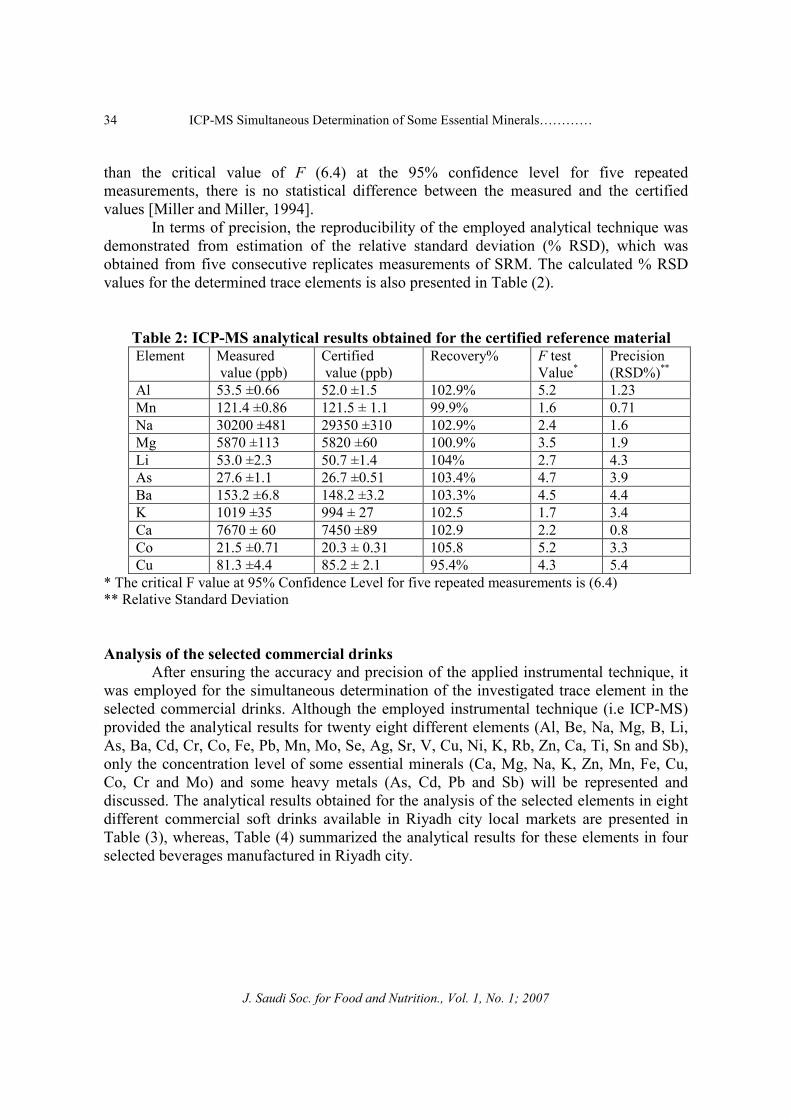
ICP-MS Simultaneous Determination of Some Essential Minerals…………
J. Saudi Soc. for Food and Nutrition., Vol. 1, No. 1; 2007
34
than the critical value of F (6.4) at the 95% confidence level for five repeated measurements, there is no statistical difference between the measured and the certified values [Miller and Miller, 1994]. In terms of precision, the reproducibility of the employed analytical technique was demonstrated from estimation of the relative standard deviation (% RSD), which was obtained from five consecutive replicates measurements of SRM. The calculated % RSD values for the determined trace elements is also presented in Table (2).
Table 2: ICP-MS analytical results obtained for the certified reference material Precision (RSD%)**
F test Value*
Recovery% Certified value (ppb)
Measured value (ppb)
Element
1.23 5.2102.9%52.0 ±1.5 53.5 ±0.66 Al0.71 1.699.9%121.5 ± 1.1 121.4 ±0.86 Mn1.6 2.4102.9%29350 ±310 30200 ±481 Na1.9 3.5100.9%5820 ±60 5870 ±113 Mg4.3 2.7104%50.7 ±1.4 53.0 ±2.3 Li3.9 4.7103.4%26.7 ±0.51 27.6 ±1.1 As4.4 4.5103.3%148.2 ±3.2 153.2 ±6.8 Ba3.4 1.7102.5994 ± 271019 ±35 K0.8 2.2102.97450 ±89 7670 ± 60Ca3.3 5.2105.820.3 ± 0.31 21.5 ±0.71 Co5.4 4.395.4%85.2 ± 2.181.3 ±4.4 Cu
* The critical F value at 95% Confidence Level for five repeated measurements is (6.4) ** Relative Standard Deviation
Analysis of the selected commercial drinks After ensuring the accuracy and precision of the applied instrumental technique, it
was employed for the simultaneous determination of the investigated trace element in the selected commercial drinks. Although the employed instrumental technique (i.e ICP-MS) provided the analytical results for twenty eight different elements (Al, Be, Na, Mg, B, Li, As, Ba, Cd, Cr, Co, Fe, Pb, Mn, Mo, Se, Ag, Sr, V, Cu, Ni, K, Rb, Zn, Ca, Ti, Sn and Sb), only the concentration level of some essential minerals (Ca, Mg, Na, K, Zn, Mn, Fe, Cu, Co, Cr and Mo) and some heavy metals (As, Cd, Pb and Sb) will be represented and discussed. The analytical results obtained for the analysis of the selected elements in eight different commercial soft drinks available in Riyadh city local markets are presented in Table (3), whereas, Table (4) summarized the analytical results for these elements in four selected beverages manufactured in Riyadh city.
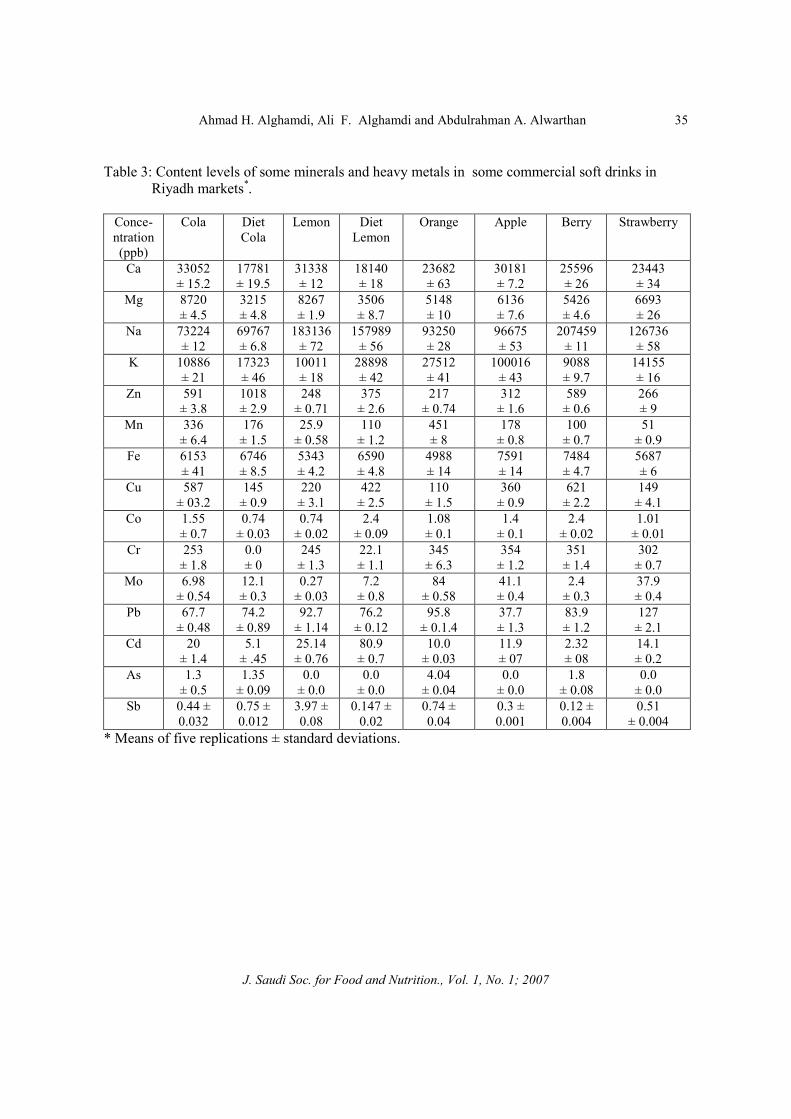
Ahmad H. Alghamdi, Ali F. Alghamdi and Abdulrahman A. Alwarthan
J. Saudi Soc. for Food and Nutrition., Vol. 1, No. 1; 2007
35
Table 3: Content levels of some minerals and heavy metals in some commercial soft drinks in Riyadh markets*.
Strawberry Berry Apple Orange Diet Lemon
Lemon Diet Cola
Cola Conce-ntration (ppb)
23443 ± 34
25596 ± 26
30181 ± 7.2
23682 ± 63
18140 ± 18
31338 ± 12
17781 ± 19.5
33052 ± 15.2
Ca
6693 ± 26
5426 ± 4.6
6136 ± 7.6
5148 ± 10
3506 ± 8.7
8267 ± 1.9
3215 ± 4.8
8720 ± 4.5
Mg
126736 ± 58
207459 ± 11
96675 ± 53
93250 ± 28
157989 ± 56
183136 ± 72
69767 ± 6.8
73224 ± 12
Na
14155 ± 16
9088 ± 9.7
100016 ± 43
27512 ± 41
28898 ± 42
10011 ± 18
17323 ± 46
10886 ± 21
K
266 ± 9
589 ± 0.6
312 ± 1.6
217 ± 0.74
375 ± 2.6
248 ± 0.71
1018 ± 2.9
591 ± 3.8
Zn
51 ± 0.9
100 ± 0.7
178 ± 0.8
451 ± 8
110 ± 1.2
25.9 ± 0.58
176 ± 1.5
336 ± 6.4
Mn
5687 ± 6
7484 ± 4.7
7591 ± 14
4988 ± 14
6590 ± 4.8
5343 ± 4.2
6746 ± 8.5
6153 ± 41
Fe
149 ± 4.1
621 ± 2.2
360 ± 0.9
110 ± 1.5
422 ± 2.5
220 ± 3.1
145 ± 0.9
587 ± 03.2
Cu
1.01 ± 0.01
2.4 ± 0.02
1.4 ± 0.1
1.08 ± 0.1
2.4 ± 0.09
0.74 ± 0.02
0.74 ± 0.03
1.55 ± 0.7
Co
302 ± 0.7
351 ± 1.4
354 ± 1.2
345 ± 6.3
22.1 ± 1.1
245 ± 1.3
0.0 ± 0
253 ± 1.8
Cr
37.9 ± 0.4
2.4 ± 0.3
41.1 ± 0.4
84 ± 0.58
7.2 ± 0.8
0.27 ± 0.03
12.1 ± 0.3
6.98 ± 0.54
Mo
127 ± 2.1
83.9 ± 1.2
37.7 ± 1.3
95.8 ± 0.1.4
76.2 ± 0.12
92.7 ± 1.14
74.2 ± 0.89
67.7 ± 0.48
Pb
14.1 ± 0.2
2.32 ± 08
11.9 ± 07
10.0 ± 0.03
80.9 ± 0.7
25.14 ± 0.76
5.1 ± .45
20 ± 1.4
Cd
0.0 ± 0.0
1.8 ± 0.08
0.0 ± 0.0
4.04 ± 0.04
0.0 ± 0.0
0.0 ± 0.0
1.35 ± 0.09
1.3 ± 0.5
As
0.51 ± 0.004
0.12 ± 0.004
0.3 ± 0.001
0.74 ± 0.04
0.147 ± 0.02
3.97 ± 0.08
0.75 ± 0.012
0.44 ± 0.032
Sb
* Means of five replications ± standard deviations.
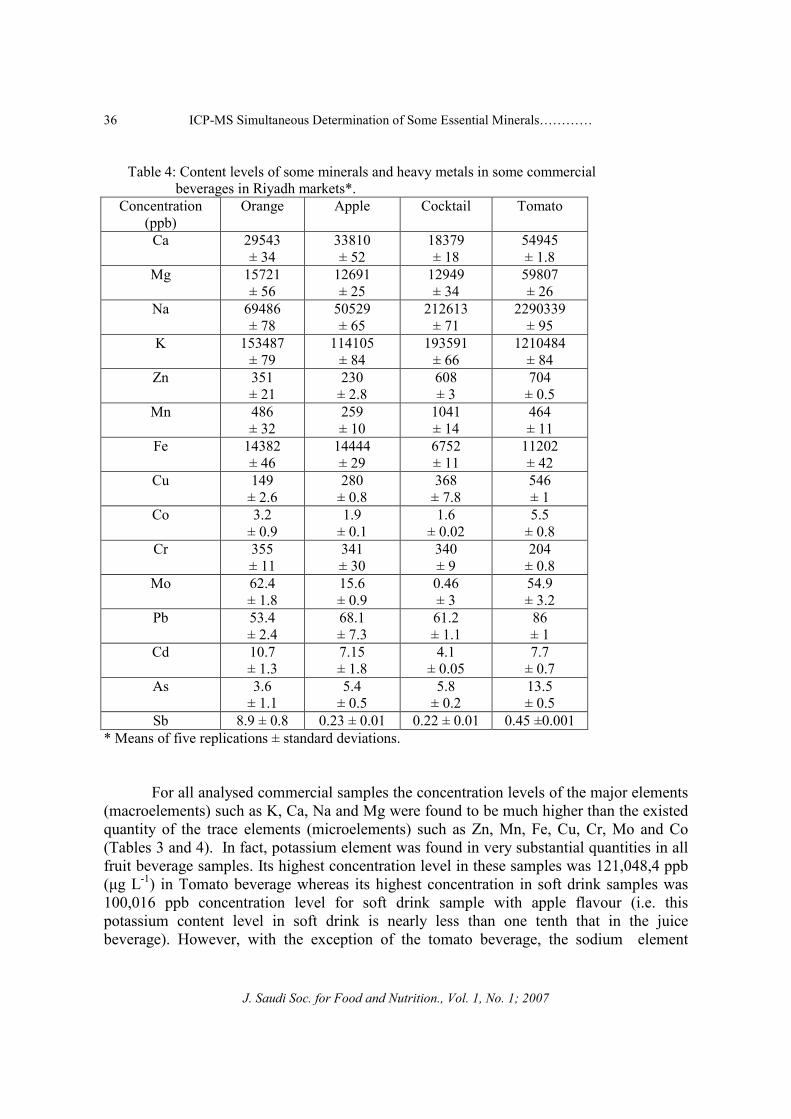
ICP-MS Simultaneous Determination of Some Essential Minerals…………
J. Saudi Soc. for Food and Nutrition., Vol. 1, No. 1; 2007
36
Table 4: Content levels of some minerals and heavy metals in some commercial beverages in Riyadh markets*.
Tomato Cocktail Apple Orange Concentration (ppb)
54945 ± 1.8
18379 ± 18
33810 ± 52
29543 ± 34
Ca
59807 ± 26
12949 ± 34
12691 ± 25
15721 ± 56
Mg
2290339 ± 95
212613 ± 71
50529 ± 65
69486 ± 78
Na
1210484 ± 84
193591 ± 66
114105 ± 84
153487 ± 79
K
704 ± 0.5
608 ± 3
230 ± 2.8
351 ± 21
Zn
464 ± 11
1041 ± 14
259 ± 10
486 ± 32
Mn
11202 ± 42
6752 ± 11
14444 ± 29
14382 ± 46
Fe
546 ± 1
368 ± 7.8
280 ± 0.8
149 ± 2.6
Cu
5.5 ± 0.8
1.6 ± 0.02
1.9 ± 0.1
3.2 ± 0.9
Co
204 ± 0.8
340 ± 9
341 ± 30
355 ± 11
Cr
54.9 ± 3.2
0.46 ± 3
15.6 ± 0.9
62.4 ± 1.8
Mo
86 ± 1
61.2 ± 1.1
68.1 ± 7.3
53.4 ± 2.4
Pb
7.7 ± 0.7
4.1 ± 0.05
7.15 ± 1.8
10.7 ± 1.3
Cd
13.5 ± 0.5
5.8 ± 0.2
5.4 ± 0.5
3.6 ± 1.1
As
0.45 ±0.001 0.22 ± 0.01 0.23 ± 0.018.9 ± 0.8 Sb* Means of five replications ± standard deviations.
For all analysed commercial samples the concentration levels of the major elements (macroelements) such as K, Ca, Na and Mg were found to be much higher than the existed quantity of the trace elements (microelements) such as Zn, Mn, Fe, Cu, Cr, Mo and Co (Tables 3 and 4). In fact, potassium element was found in very substantial quantities in all fruit beverage samples. Its highest concentration level in these samples was 121,048,4 ppb (µg L-1) in Tomato beverage whereas its highest concentration in soft drink samples was 100,016 ppb concentration level for soft drink sample with apple flavour (i.e. this potassium content level in soft drink is nearly less than one tenth that in the juice beverage). However, with the exception of the tomato beverage, the sodium element
Ahmad H. Alghamdi, Ali F. Alghamdi and Abdulrahman A. Alwarthan
J. Saudi Soc. for Food and Nutrition., Vol. 1, No. 1; 2007
37
concentrations in the analyzed foodstuff samples varied less significantly between the fruit beverages (highest value is 212,613 ppb/Cocktail beverage) and soft drinks (highest value is 207,459 ppb/Berry soft drink). Similar concentration pattern was noticed for the concentration levels of calcium major element (highest concentrations were 338,10 ppb and 330,52 ppb for apple juice beverages and Cola soft drinks, respectively). Once again, with the omission of tomato beverage, it was found that the magnesium highest content (157,21 ppb/Orange beverage) in The analytical fruit beverages is nearly twice the highest content of this macroelement in soft drink samples (872,0 ppb/Cola soft drink ). In the case of iron element it was found to endure similar concentration pattern to that observed for Mg element. The iron highest content (144,44 ppb/Apple beverage) in juice beverages is nearly twice the highest content of this metal ion in soft drink samples (759,1 ppb/apple soft drink). With regard to the quantity levels of the trace heavy metals (Zn, Mn, Cu, Co, Cr and Mo) presented in the investigated commercial drinks it was concluded that on the whole there was no significant variation between the highest concentration levels of these heavy metals in fruit beverages and soft drinks. For examples, the highest cupper quantity in juice beverages was found in tomato beverage (546 ppb) whereas the highest copper concentration level in soft drink samples was in berry soft drink (621 ppb). In addition, the variation of the concentration levels of some toxic heavy metals (Pb, Cd, As and Sb) between the different analysed foodstuff sample was also evaluated. From these toxic elements, only Pb element was found to be present at relatively high concentration levels in most of the analysed commercial drinks especially in soft drink samples. The highest Pb content level (127 ppb) was found in Strawberry soft drink sample and the lowest Pb content level was detected in apple soft drink sample (37.7 ppb). For most of the analysed soft drink and juice beverages, Cd toxic metal concentrations were below 20 ppb level. However, both As and Sb were found to be present in very low concentration levels since their highest content level were 13.5 ppb (in tomato beverage) and 8.9 ppb (in orange beverage), respectively. Comparison of obtained results with reported values
In this study, potassium content levels were found in very considerable quantities (in comparison with other essential minerals) in all juice beverages. Similar high concentration levels for potassium mineral were detected in various canned juices commonly produced and consumed in Saudi Arabia (Al-Muhanna et al., 1989, Ewaidah, 1990). Unfortunately, to date few analytical research studies were devoted for evaluating food value for soft drinks in terms of their content levels of essential minerals. In contrary, most of the reported literature aimed to evaluate the extent of contamination of soft drinks and beverages by heavy metals (Al-Howaidy and Mohammed, 1997, Al-Swaidan, 1988, Onianwa, et al., 1999). The concentration levels of some trace heavy metals such as Zn, Fe, Cu, Co and Cr in one of the cocktail beverage brand name sample were previously investigated (Al-Mohemmed, 2001). Due to the differences in the manufacturing dates for the cocktail beverage sample analysed in this study (2004) and the previous study (2001), hence, the food and chemical compositions of the analyzed two samples might be fluctuated slightly. In general, the content levels of these trace heavy metals obtained in
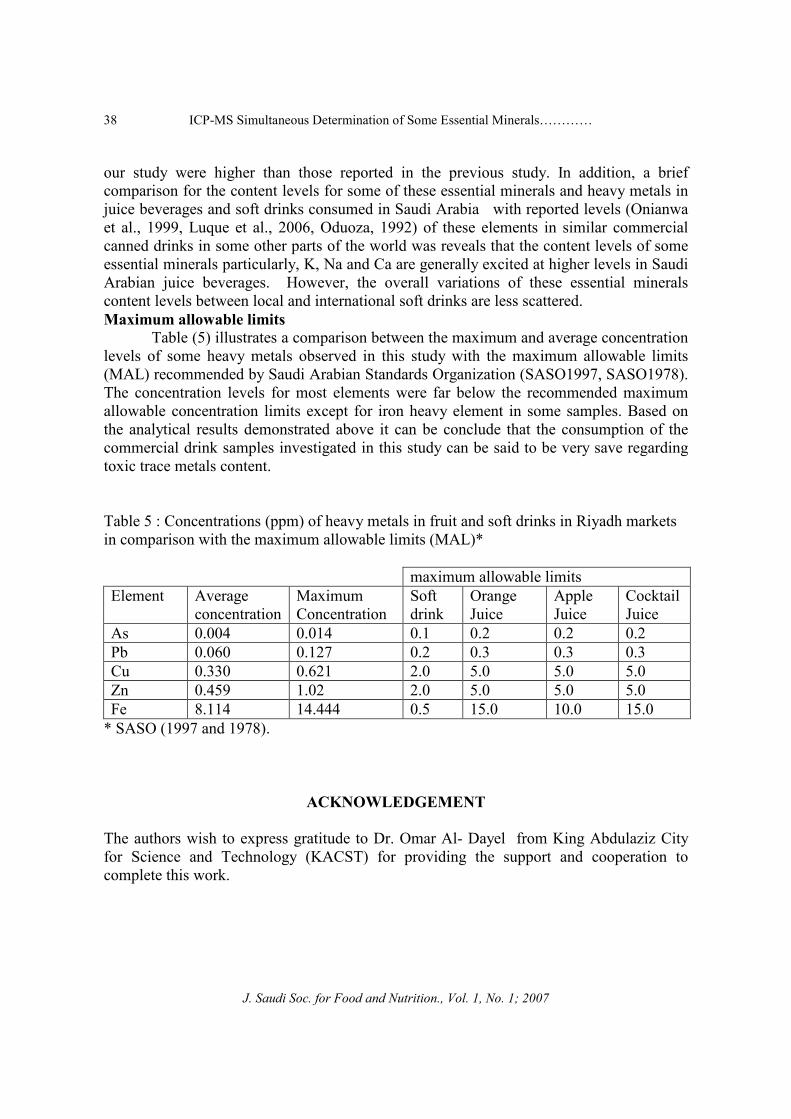
ICP-MS Simultaneous Determination of Some Essential Minerals…………
J. Saudi Soc. for Food and Nutrition., Vol. 1, No. 1; 2007
38
our study were higher than those reported in the previous study. In addition, a brief comparison for the content levels for some of these essential minerals and heavy metals in juice beverages and soft drinks consumed in Saudi Arabia with reported levels (Onianwa et al., 1999, Luque et al., 2006, Oduoza, 1992) of these elements in similar commercial canned drinks in some other parts of the world was reveals that the content levels of some essential minerals particularly, K, Na and Ca are generally excited at higher levels in Saudi Arabian juice beverages. However, the overall variations of these essential minerals content levels between local and international soft drinks are less scattered. Maximum allowable limits
Table (5) illustrates a comparison between the maximum and average concentration levels of some heavy metals observed in this study with the maximum allowable limits (MAL) recommended by Saudi Arabian Standards Organization (SASO1997, SASO1978). The concentration levels for most elements were far below the recommended maximum allowable concentration limits except for iron heavy element in some samples. Based on the analytical results demonstrated above it can be conclude that the consumption of the commercial drink samples investigated in this study can be said to be very save regarding toxic trace metals content.
Table 5 : Concentrations (ppm) of heavy metals in fruit and soft drinks in Riyadh markets in comparison with the maximum allowable limits (MAL)*
maximum allowable limits Cocktail Juice
Apple Juice
Orange Juice
Soft drink
Maximum Concentration
Average concentration
Element
0.2 0.2 0.20.10.0140.004As0.3 0.3 0.30.20.1270.060Pb5.0 5.0 5.02.00.6210.330Cu5.0 5.0 5.02.01.020.459Zn15.0 10.0 15.00.514.4448.114Fe
* SASO (1997 and 1978).
ACKNOWLEDGEMENT The authors wish to express gratitude to Dr. Omar Al- Dayel from King Abdulaziz City for Science and Technology (KACST) for providing the support and cooperation to complete this work.
Ahmad H. Alghamdi, Ali F. Alghamdi and Abdulrahman A. Alwarthan
J. Saudi Soc. for Food and Nutrition., Vol. 1, No. 1; 2007
39
REFERENCES Al-Howaidy, I. H. and Mohammed, M. A. (1997). An atomic absorption
spectrophotometric method for the determination of trace amounts of zinc and iron in canned and bottled soft drinks. Int. J. Chem. 8:31-36.
Al-Mohemmed, A. M. (2001). Multi-Element Determination of Toxic Metals in Various Canned Fruits Juices by ICP-MS, Master Thesis, College of Science, King Saud University, Saudi Arabia.
Al-Muhanna, H. H.; Sadiq, M. and Alam, I. A. (1989). Metal concentrations in canned juices. Proceeding of the 3RD National Meeting of Chemists. p89-98.
Al-Swaidan, H. H. (1988). Analysis of fruit juices by inductively coupled plasma-mass spectroscopy. Anal. Lett. 21:1469-1475.
Bratter, V. N.; Bratter, P.; Schulze, G. R. A. and Alvarez, N. (1995). Determination of essential minerals and trace elements in total diet by ICP atomic emission spectrometry. J. Anal. Atom. Spect. 10:487-490.
Broekaert, J. A.C. (2002). Analytical Atomic Spectroscopy with Flames and Plasmas. Wiley-VCH. Weinheim, Germany.
Calvadini, C.; Siega-Riz, A. M. and Popkin, B. M. (2000). US adolescent food intake trends from 1965 to 1006. Arch. Dis. Child. 83:18-24.
Colombo, C. and Van den Berg, C. M. G. (1997). Simultaneous determination of several trace metals in seawater using cathodic stripping voltammetry. Anal. Chim. Acta. 337:29-40.
De Sousa, R. A.; Silva, J. C.; Baccan, N. and Cadore, S. (2005). Determination of metals in bottled coconut water using an ICP-OES. J Food Comp. Anal. 18:399-408.
Ebdon, L. and Evans, E. H. (1998). An Introduction to Analytical Atomic Spectrometry,Wiley. Chichester.
Ewaidah, E. H. (1989). Studies on commercially canned juices produced locally in Saudi Arabia: part 1. Mineral composition and tin and iron contents during storage. J. Coll. Agric., King Saud Univ., SA. 2:35-47.
Fernandez, P. L.; Pablos, F.; Martin, M. J. and Gonzalez, A. G. (2002). Multi-element analysis of tea beverages by inductively coupled plasma atomic emission spectrometry. Food Chem. 76:483-489.
Haswell, S. J. and Walmsley, A. D. (1998). Multivariate data visualization methods based on multielemental analysis of wines and coffees using total relection X-ray fluorescence. J. Anal. Atom. Spect. 13:131-134.
Lajunen, L. H. J. (1992). Spectrochemical Analysis by Atomic Absorption and Emission. Royal Society of Chemistry. Cambridge.
Lante, A.; Lomolino, G.; Cagnin, M. and Spettoli, P. (2006). Content and characterisation of minerals in milk by ICP-OES. Food Control. 17:229-233.
Lara, R.; Cerutti, S.; Salonia, J. A.; Olsina, R. A. and Martinez, L. D.. (2005). Trace element determination of Argentine wines using ETAAS and USN-ICP-OES. Food Chem. Toxi. 43:293-297.
ICP-MS Simultaneous Determination of Some Essential Minerals…………
J. Saudi Soc. for Food and Nutrition., Vol. 1, No. 1; 2007
40
Luque, S .S.; Mato, I.; Huidobro, J. F. and Lozano, J .S. (2006). Rapid capillary zone electrophoresis method for the determination of metal cations in beverages. Talanta. 68:1143-1147.
Lytle, L. A.; Seifert. S.; Greenstein, J. and McGovern, P. (2000). How do hildren’s eating patterns and food choices change over time?. Am. J. Health Promot. 14:222-228.
Mesallam, A. S. (1987). Heavy metal content of canned orange guice as determined by direct current plasma atomic emission spectrophotometry. Food Chem. 26:47-58.
Miller, M. C. and Miller, J. N. (1994). Statistic For Analytical Chemistry, Ellis Horwood, New York.
Montesinos, P. C.; Cervera, M. L.; Pastor, A. and Guardia, M. (2005). Room temperature acid sonication ICP-MS multielemental analysis of milk. Anal. Chim Acta. 531:111-123.
Oduoza, C. F., (1992). Studies of food value and contaminations in canned foods. Food Chem. 44:9-12.
Onianwa, P. C.; Adetola, I. G.; Iwegbue, C. M. A.; Ojo, M. F. and Tella, O. O. (1999). Trace heavy metals composition of some Nigerian beverages and food drinks. Food Chem. 66:275-279.
Saudi Arabian Standards Organization (SASO). (1997). Maximum allowable limits for metals contamination in food. P3. Riyadh.
Saudi Arabian Standards Organization (SASO). (1978).Orange juice and condense and diluted orange juice. No: 88. p2-3. Riyadh.
Trifiro, A.; Saccani, G.; Zanotti, A.; Gherardi, S.; Cavalh, S. and Reschiotto, C. (1996). Determination of cations in fruit juices and purees by ion chromatography. J. Chromatog. A. 739:175-181
Tripathi, R. M.; Mahapatra, S.; Raghunath, R.; Kumar, A.V. and Sadasivan, S. (2002). Daily intake of aluminium by adult population of Mumbai, India. Sci. Total Environ. 299:73-77.
Tripathi, R. M.; Raghunath, R.; Sastry, V. N. and Krishnamoorthy, T. M. (1999). Daily intake of heavy metals by infants through milk and milk products. Sci. Total Environ.. 277:229-235.

Ahmad H. Alghamdi, Ali F. Alghamdi and Abdulrahman A. Alwarthan
J. Saudi Soc. for Food and Nutrition., Vol. 1, No. 1; 2007
41
)ICP-MS ( !" # $" %" &' %"% (
! !) *+ ) ,*+
.
-. ! " #$ %$& '$ ()* +, $(Ca, Mg, Na K, Zn, Mn, Fe, Cu,
Co, Cr , Mo) '- ! . )Sb, Pb, Cd, As ( 12 +, 3 4.5 . +, .4$. 6$ ' 4.5 ()* 76$ 18 !" 6 9 $ :" & ;6. )
! 6. < %' &. 6$ ' ) 3 ! 6 $. :'- .&$ 4 . =>$ & $ ?' '$. $' @& # #7. '$ A$. 6" B
$ ;8)ICP-MS . ( ! C. C. B2 &2 ! 4. C $ '- D !2 !.$ 6. < &.
. &: '$ ICP-MS &$ > #E 4.5 '- !.


![Dawat-e-Islami · [1/75] ˇ ˆ ˚ˆ !ˆ ˇ ˆ " # ˇ $ ˆ % & ˘ˆ ˇ & ˘ˆ % ˚ '% (˘ˆ ) *ˆ 25 madani pearls of Regional visit for calling people towards righteousness World](https://static.fdocuments.nl/doc/165x107/60327fb4f4ef8307ef5f1f25/dawat-e-islami-175-.jpg)