
SS - 10 min overview
31
Process Analytics
Transcript of SS - 10 min overview
Process Analytics

Steve SeelyBusiness Development ManagerProcess AnalyticsBased in Chicago, [email protected]
Introduction
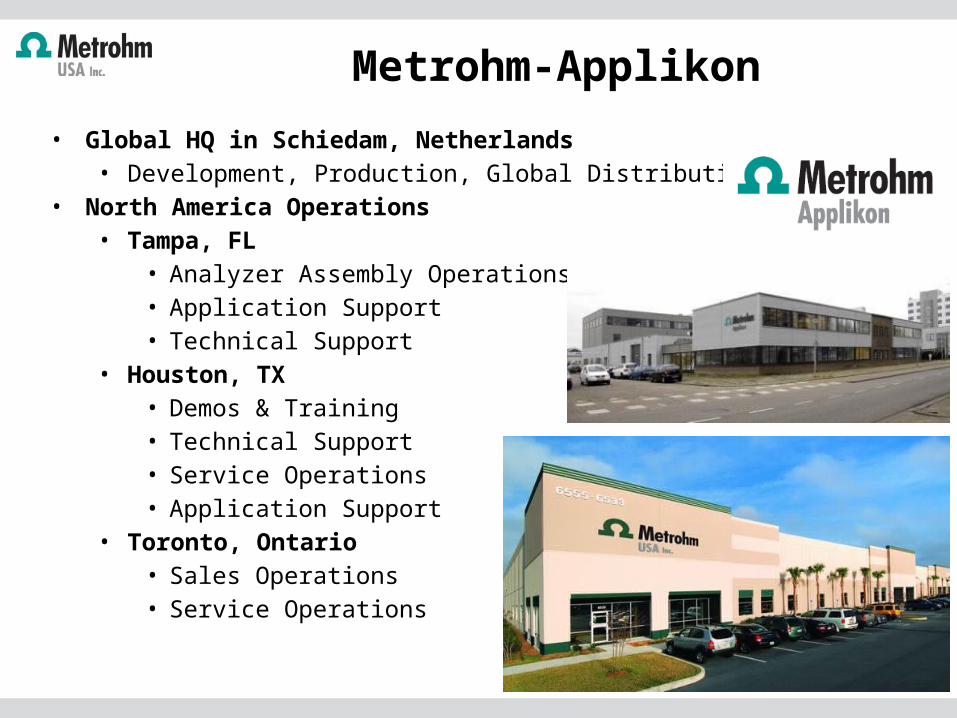
• Global HQ in Schiedam, Netherlands• Development, Production, Global Distribution
• North America Operations• Tampa, FL
• Analyzer Assembly Operations• Application Support• Technical Support
• Houston, TX• Demos & Training• Technical Support• Service Operations• Application Support
• Toronto, Ontario• Sales Operations• Service Operations
Metrohm-Applikon
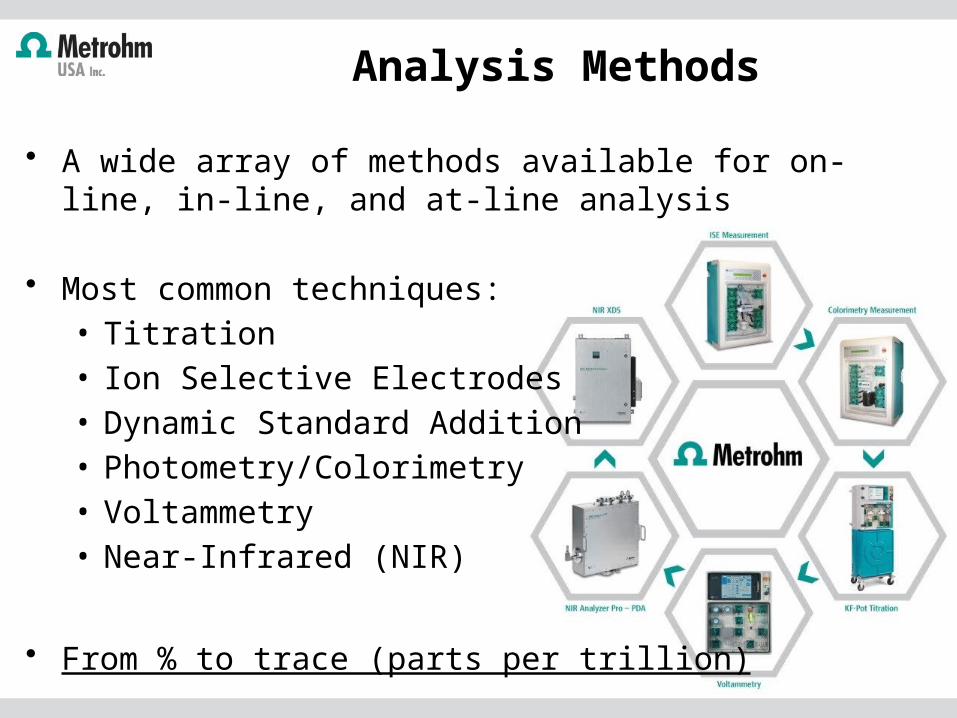
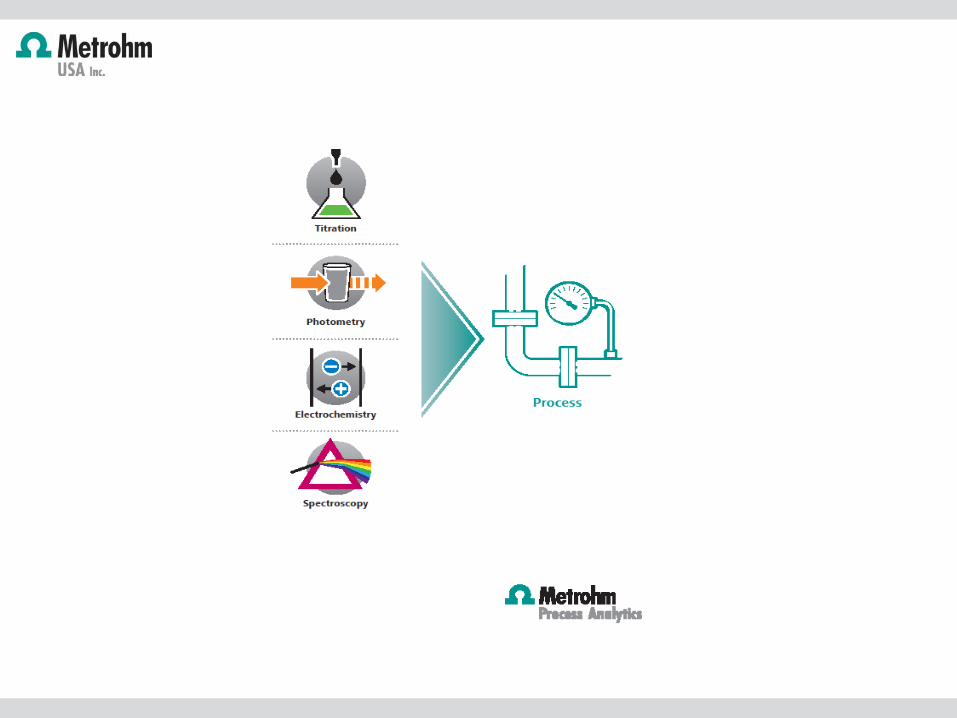
• A wide array of methods available for on-line, in-line, and at-line analysis
• Most common techniques:• Titration• Ion Selective Electrodes• Dynamic Standard Addition• Photometry/Colorimetry• Voltammetry• Near-Infrared (NIR)
• From % to trace (parts per trillion)
Analysis Methods
• Chemical• Petro-Chemical• Textile• Pulp & Paper• Food & Beverages• Mining• Steel/Metal/Galvanic• Semiconductor• Automotive• Pharmaceutical & Biochemical• Utilities & Environmental
• Power Plant (Cooling, High Purity) • Potable Water• Surface Water• Municipal WWTP• Industrial WWTP
Industries
• Petrochem Scrubber Monitoring• Caustic, Carbonate
• Plating process monitoring• Plating baths (Cu, Cr, Ni, Zn, F, Mixed Acids)
• Chlor-Alkali Plants• Hardness in Brine• Hypo/Thio
• Water monitoring• pH and Alkalinity• Chlorine and Ammonia (cooling towers)• Iron and manganese• Wastewater (Ammonia, Phosphate, Sulfate, etc)• Produced Water • Frac Fluid components (e.g. Calcium)• Boiler/Cooler Chemistry (Silica, Sodium, Phosphate, etc)
Typical Industrial Applications
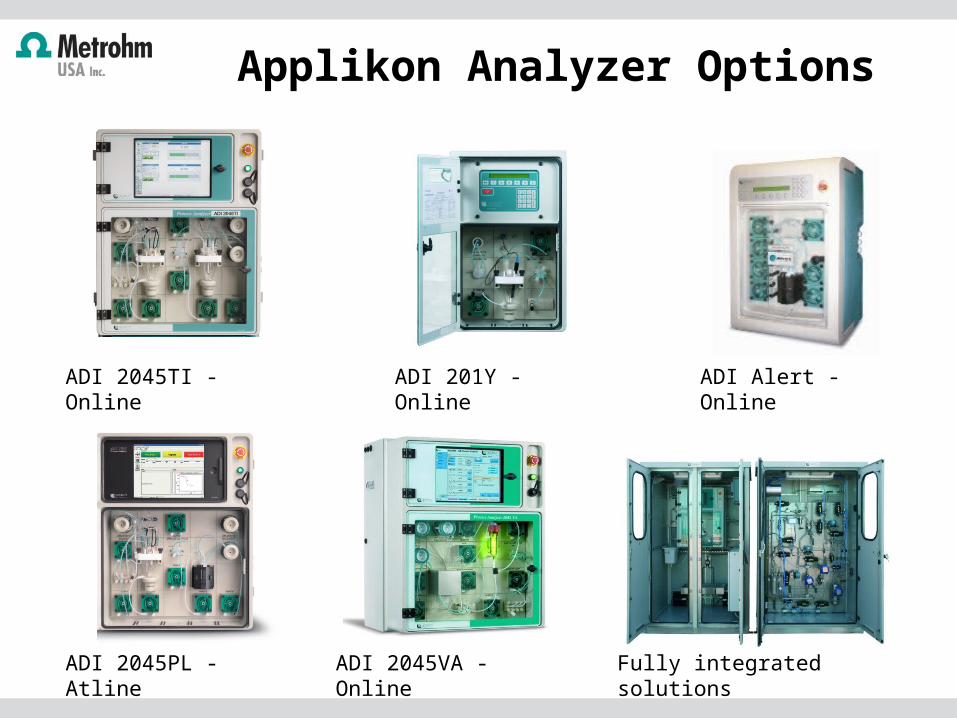
Applikon Analyzer Options
ADI 201Y - Online
ADI 2045VA - Online Fully integrated solutions
ADI 2045TI - Online
ADI 2045PL - Atline
ADI Alert - Online
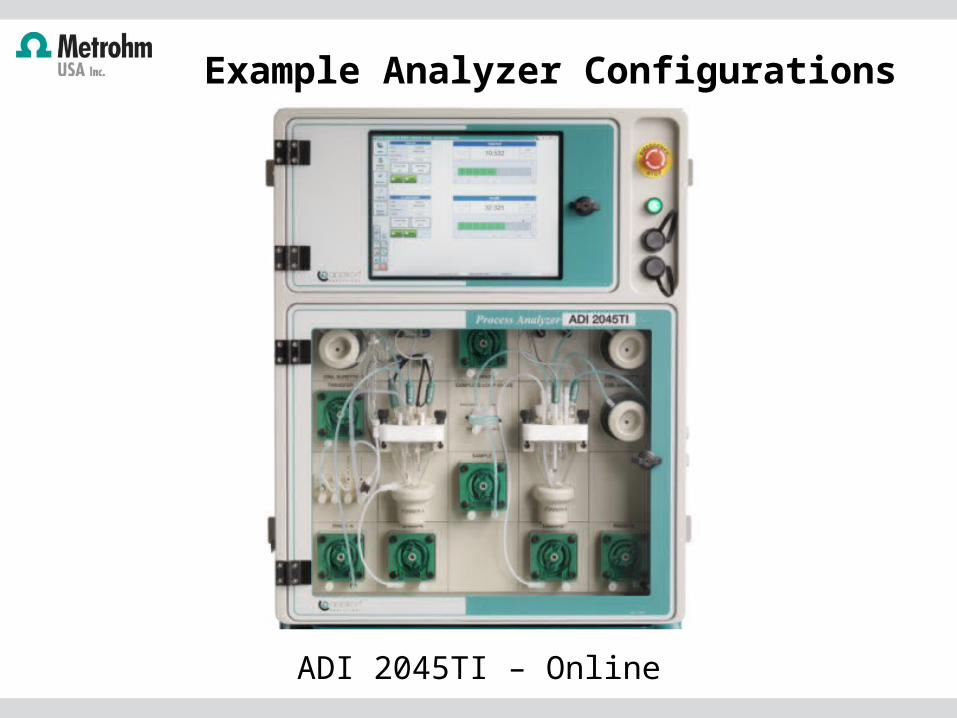
ADI 2045TI – Online
Example Analyzer Configurations
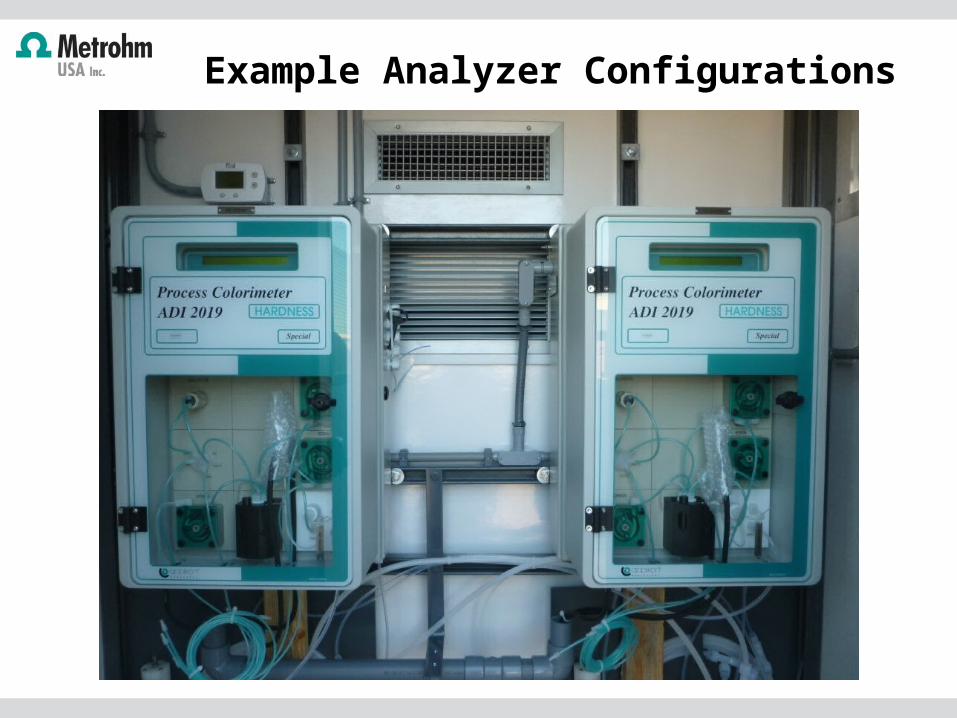
Example Analyzer Configurations
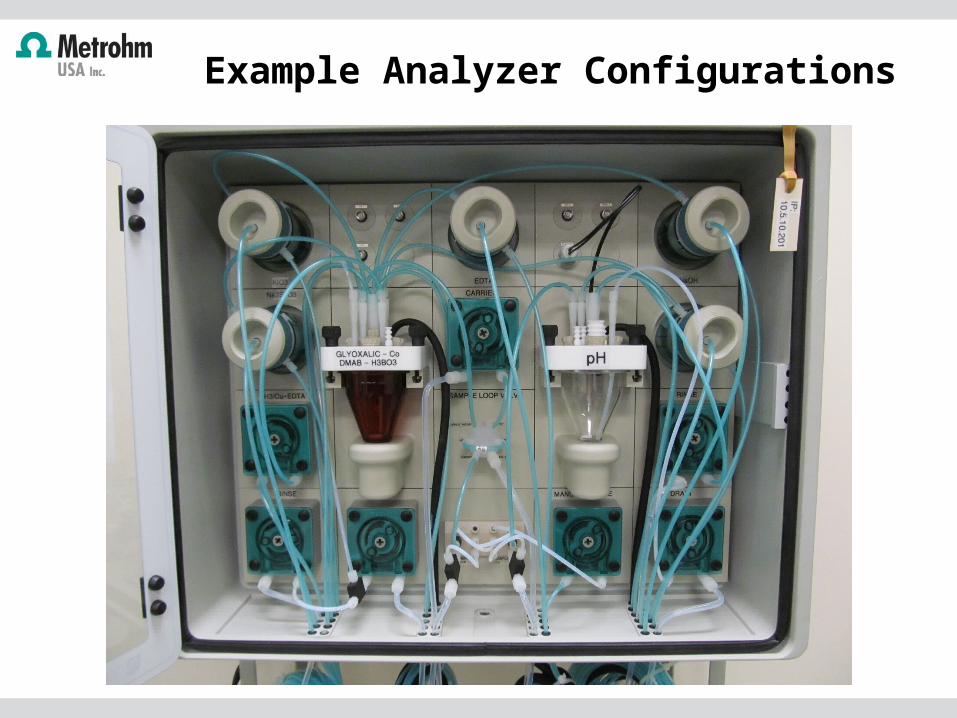
Example Analyzer Configurations
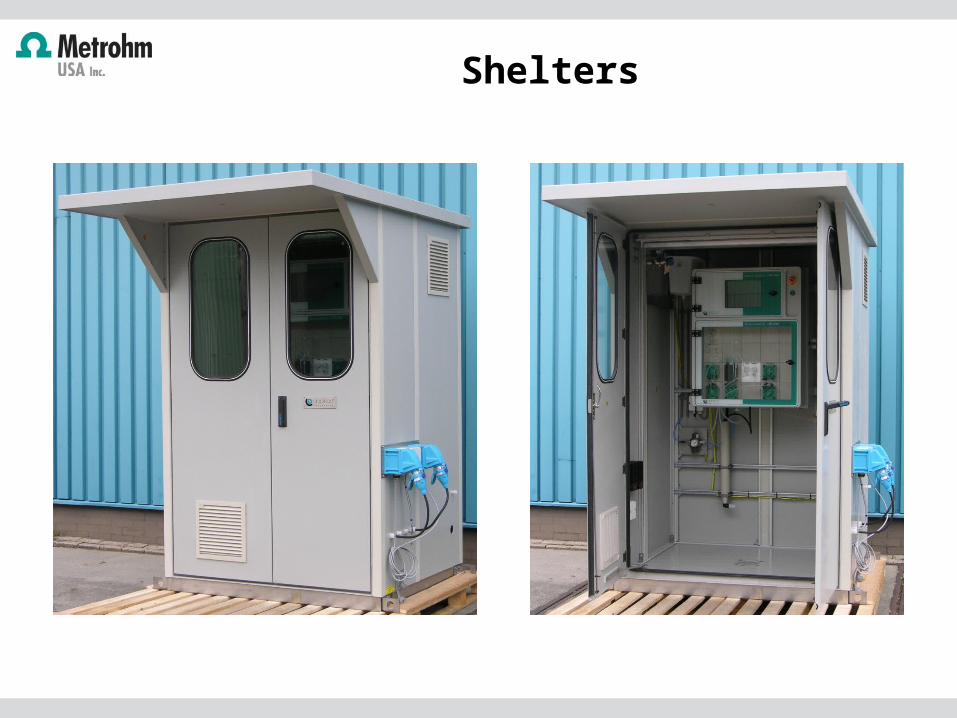
Shelters
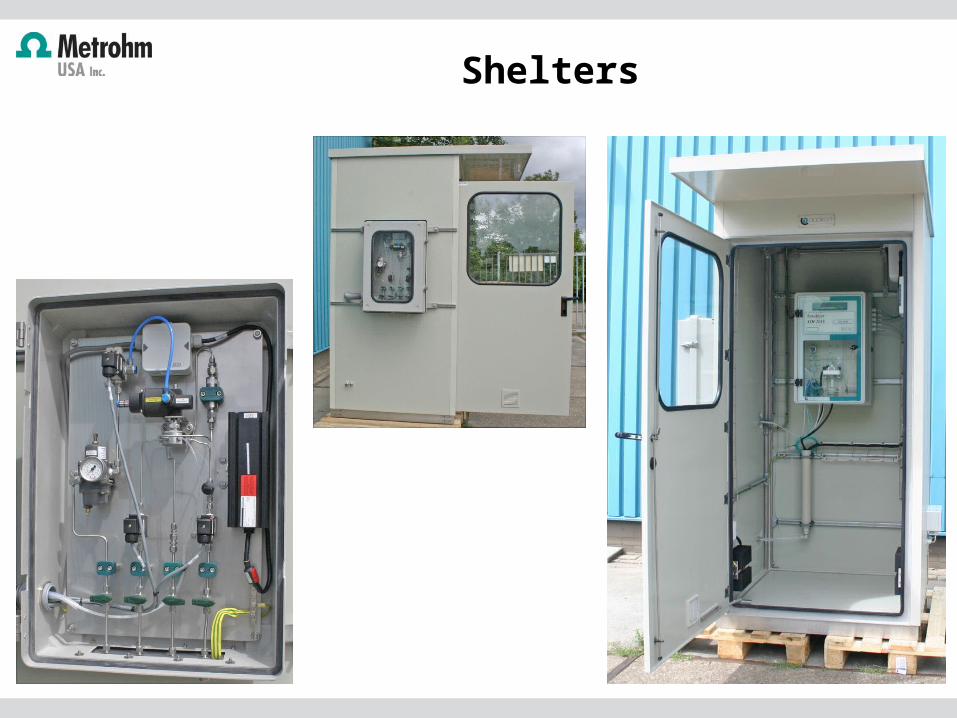
Shelters
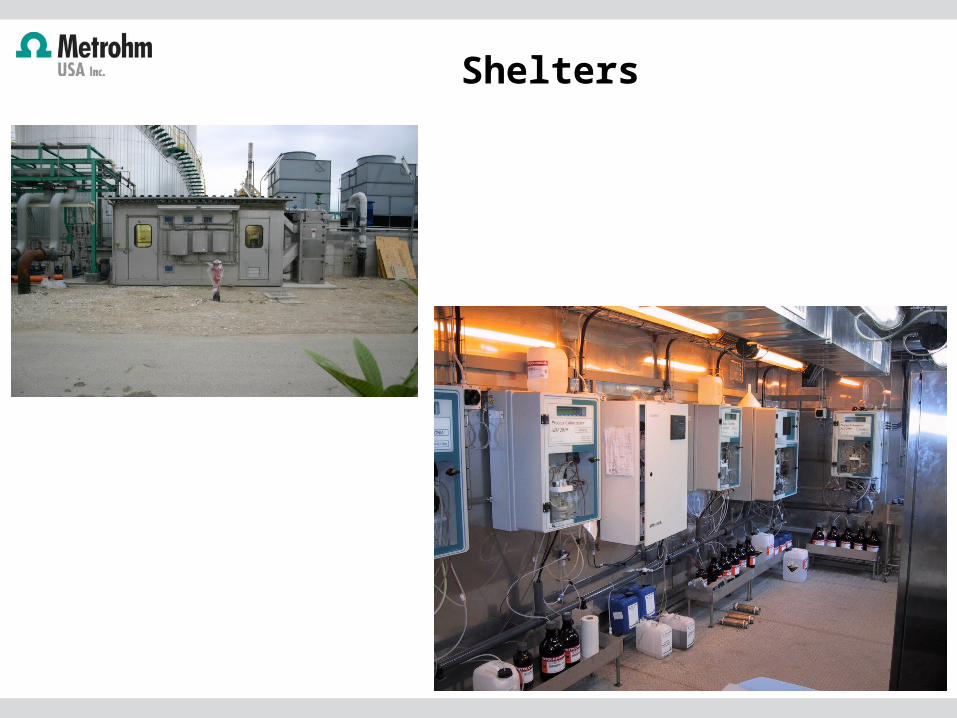
Shelters

Applications

Reasons for Process Analytics
Real World Applications
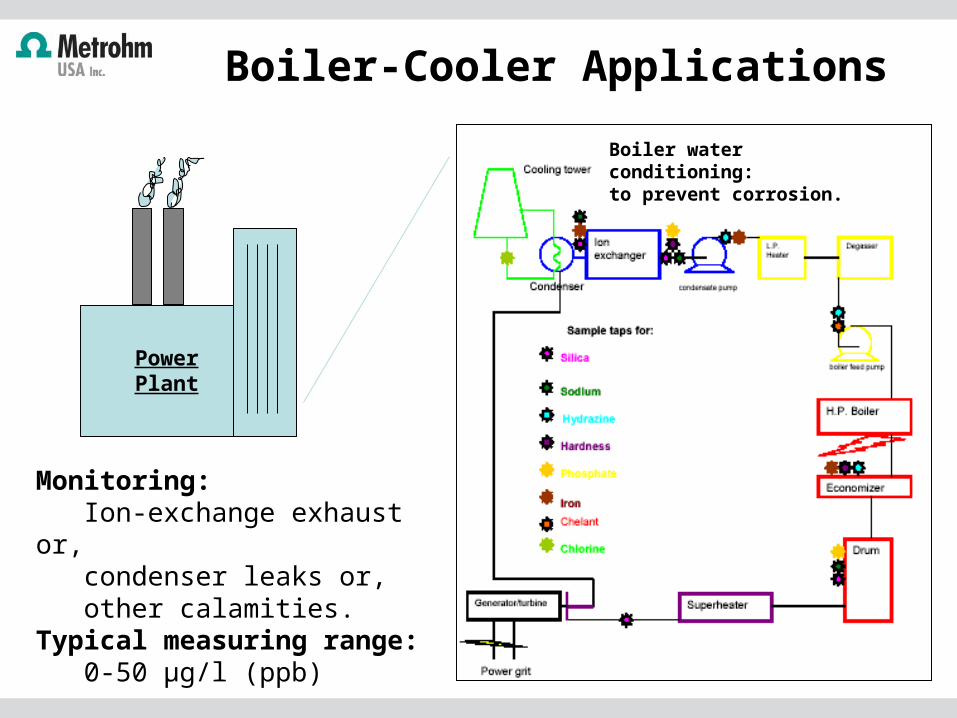
Power Plant
Boiler water conditioning:
to prevent corrosion.
Monitoring: Ion-exchange exhaust or, condenser leaks or, other calamities.Typical measuring range: 0-50 µg/l (ppb)
Boiler-Cooler Applications
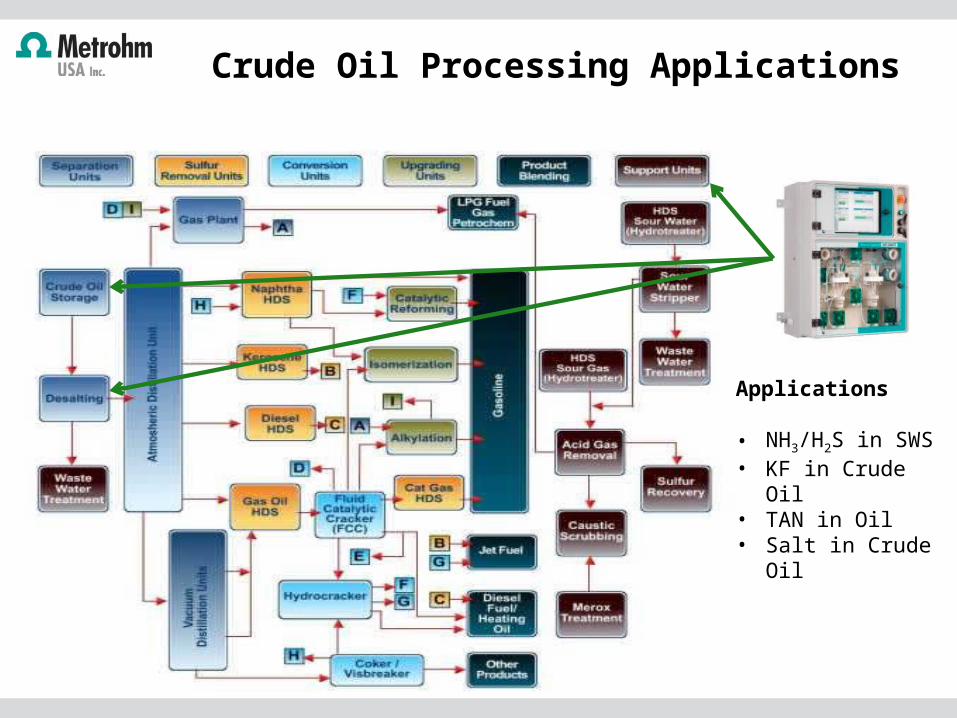
Crude Oil Processing Applications
Applications
• NH3/H2S in SWS• KF in Crude Oil• TAN in Oil• Salt in Crude Oil
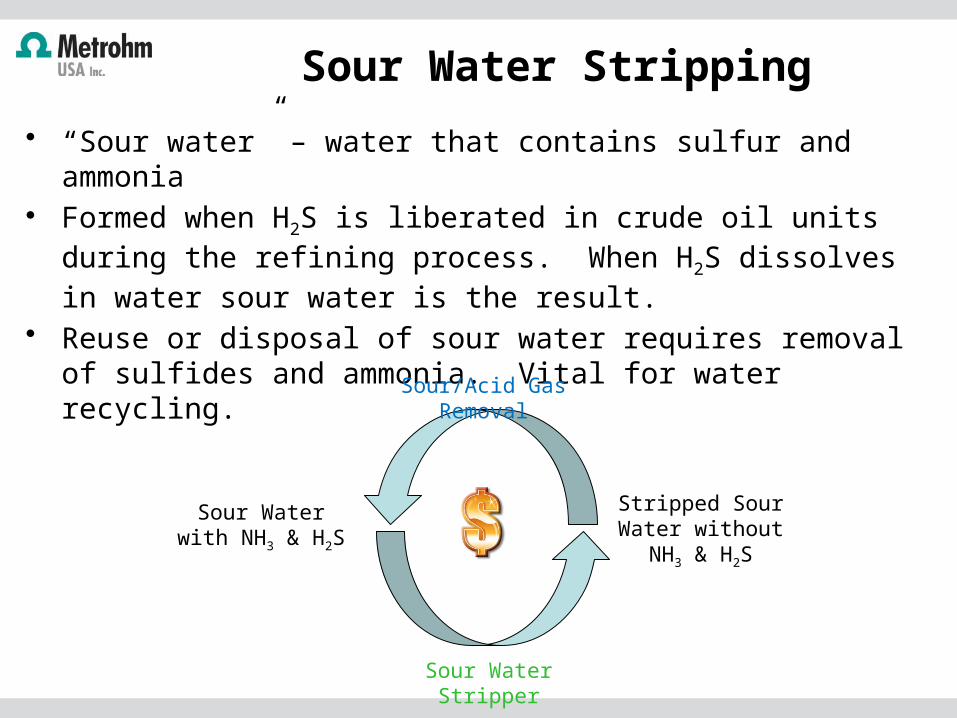
• “Sour water” – water that contains sulfur and ammonia• Formed when H2S is liberated in crude oil units during the
refining process. When H2S dissolves in water sour water is the result.
• Reuse or disposal of sour water requires removal of sulfides and ammonia. Vital for water recycling.
Sour Water Stripping
Sour Water with NH3 & H2S
Stripped Sour Water without
NH3 & H2S
Sour Water Stripper
Sour/Acid Gas Removal
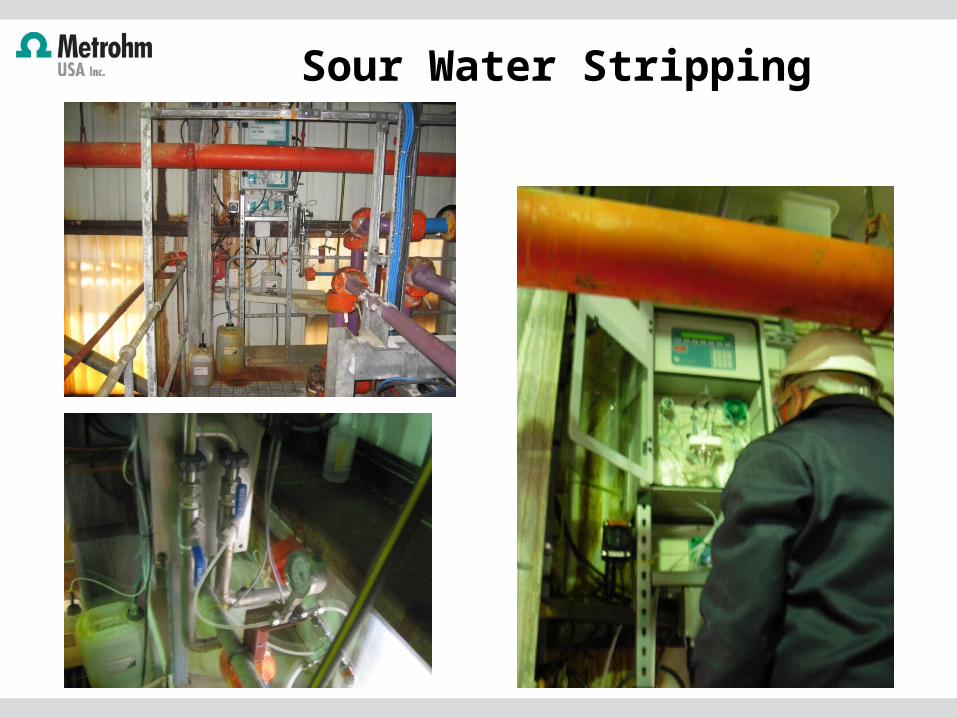
Sour Water Stripping
Process Optimization Example
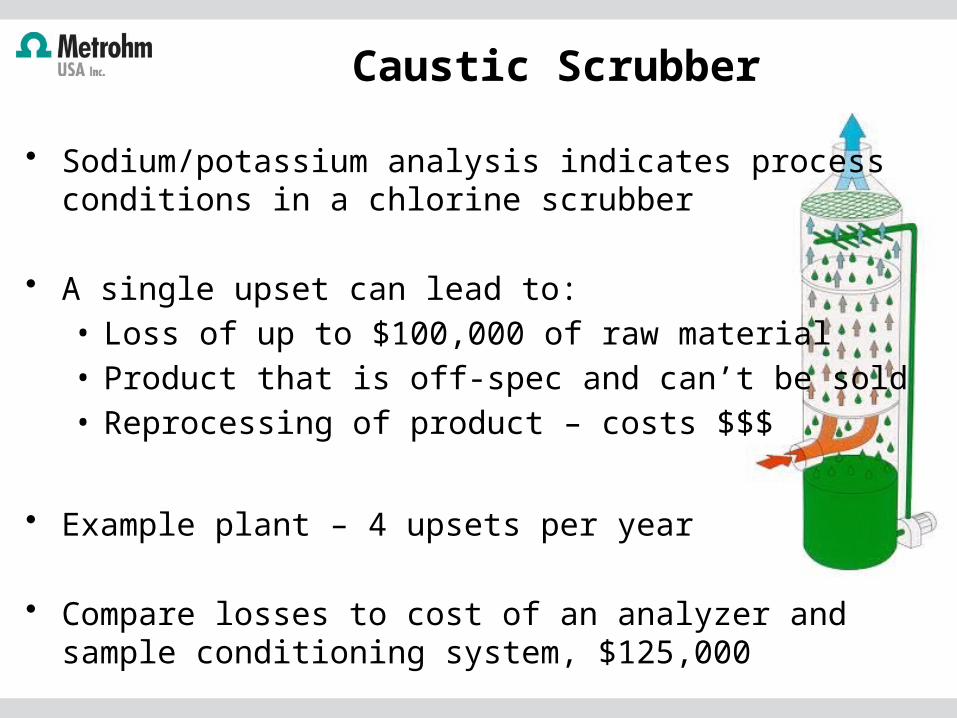
• Sodium/potassium analysis indicates process conditions in a chlorine scrubber
• A single upset can lead to:• Loss of up to $100,000 of raw material• Product that is off-spec and can’t be sold• Reprocessing of product – costs $$$
• Example plant – 4 upsets per year
• Compare losses to cost of an analyzer and sample conditioning system, $125,000
Caustic Scrubber
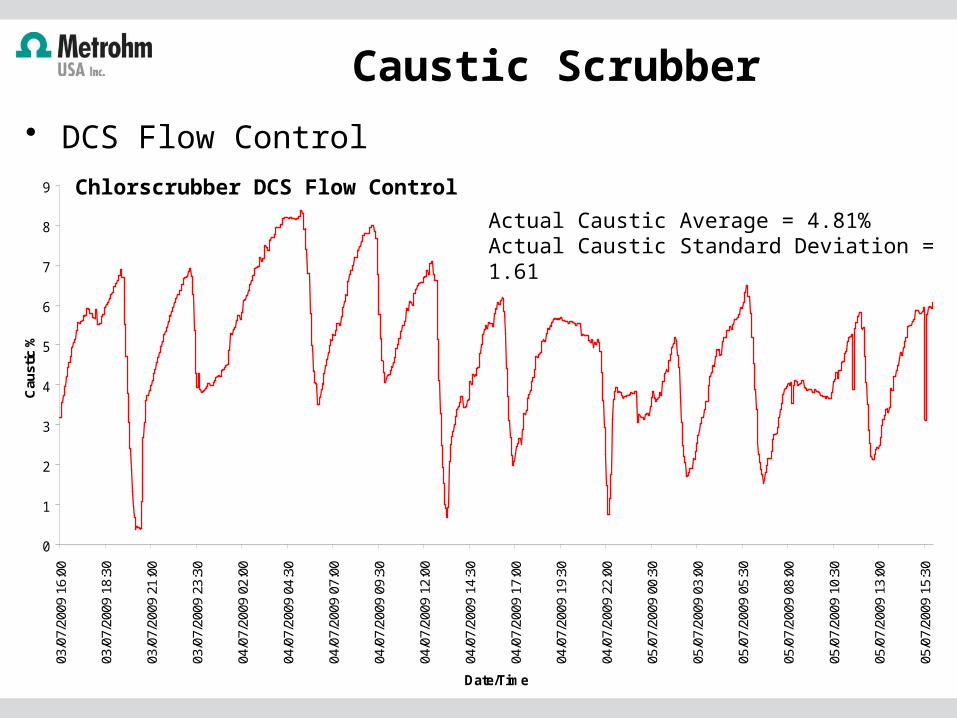
• DCS Flow ControlCaustic Scrubber
0
1
2
3
4
5
6
7
8
9
03/0
7/20
09 1
6:00
03/0
7/20
09 1
8:30
03/0
7/20
09 2
1:00
03/0
7/20
09 2
3:30
04/0
7/20
09 0
2:00
04/0
7/20
09 0
4:30
04/0
7/20
09 0
7:00
04/0
7/20
09 0
9:30
04/0
7/20
09 1
2:00
04/0
7/20
09 1
4:30
04/0
7/20
09 1
7:00
04/0
7/20
09 1
9:30
04/0
7/20
09 2
2:00
05/0
7/20
09 0
0:30
05/0
7/20
09 0
3:00
05/0
7/20
09 0
5:30
05/0
7/20
09 0
8:00
05/0
7/20
09 1
0:30
05/0
7/20
09 1
3:00
05/0
7/20
09 1
5:30
Date/Time
Cau
stic
%
Actual Caustic Average = 4.81% Actual Caustic Standard Deviation = 1.61
Chlorscrubber DCS Flow Control
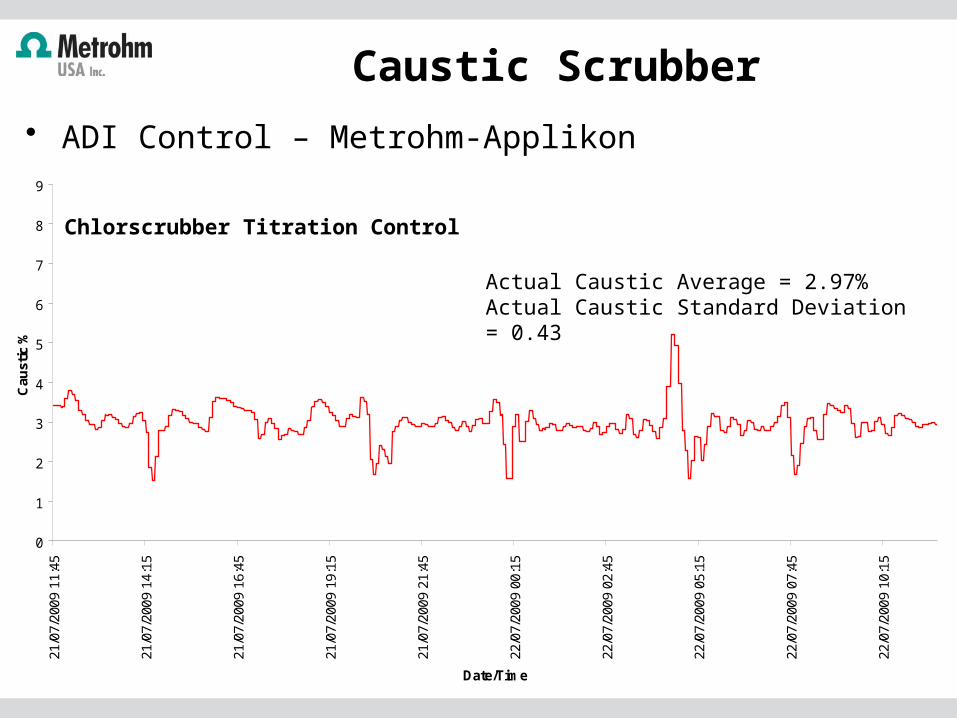
• ADI Control – Metrohm-ApplikonCaustic Scrubber
0
1
2
3
4
5
6
7
8
9
21/0
7/20
09 1
1:45
21/0
7/20
09 1
4:15
21/0
7/20
09 1
6:45
21/0
7/20
09 1
9:15
21/0
7/20
09 2
1:45
22/0
7/20
09 0
0:15
22/0
7/20
09 0
2:45
22/0
7/20
09 0
5:15
22/0
7/20
09 0
7:45
22/0
7/20
09 1
0:15
Date/Time
Cau
stic
%
Actual Caustic Average = 2.97% Actual Caustic Standard Deviation = 0.43
Chlorscrubber Titration Control
Caustic Scrubber
0
1
2
3
4
5
6
7
8
9
Date/Time
Cau
stic
%
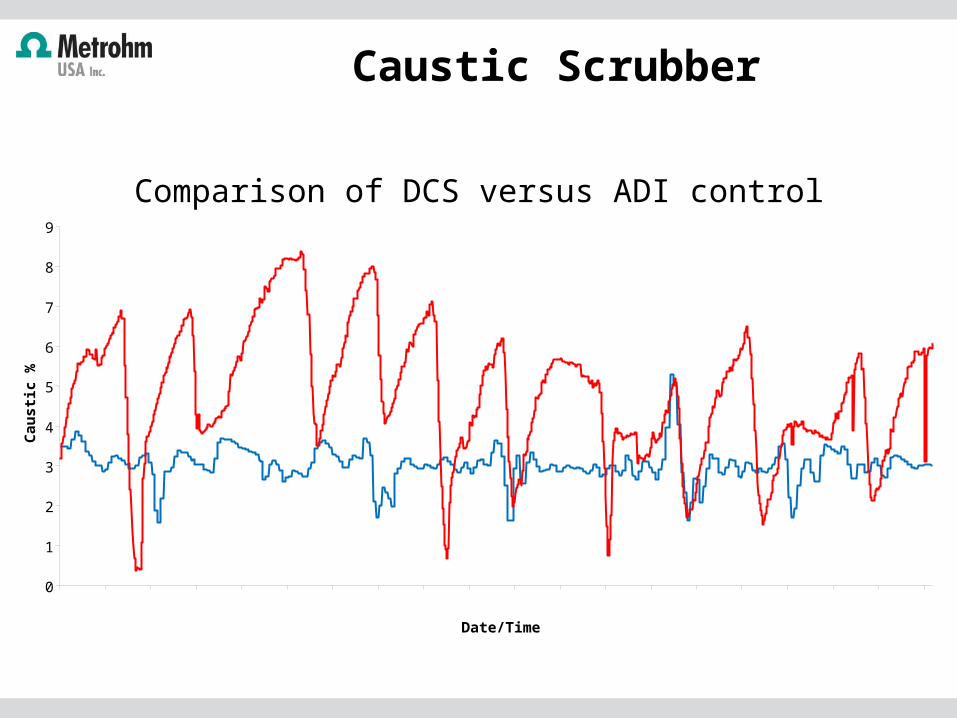
Comparison of DCS versus ADI control
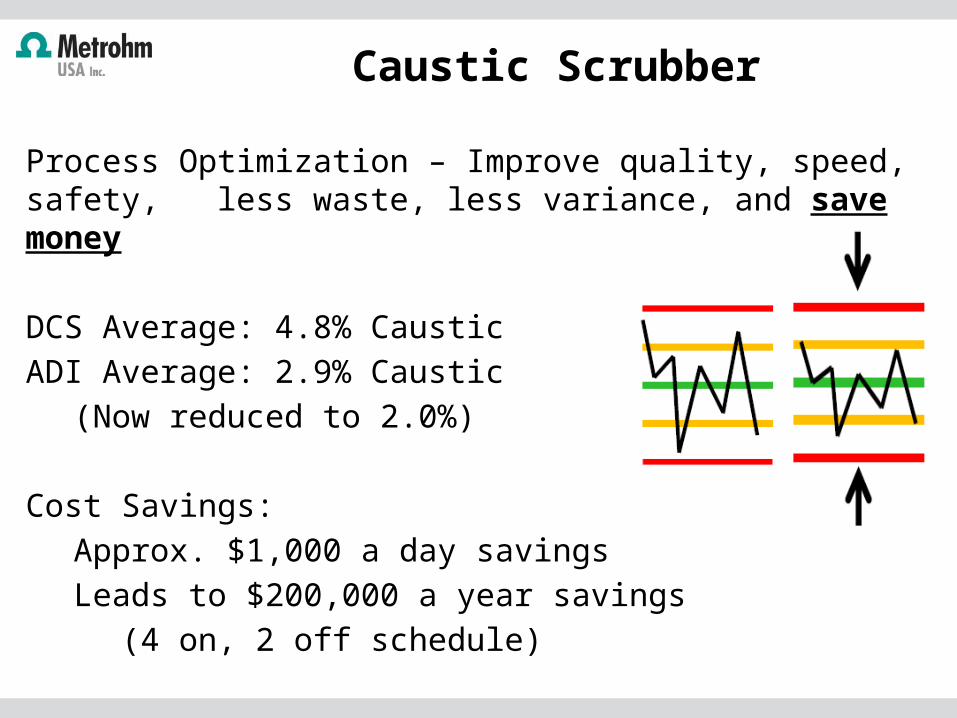
Process Optimization – Improve quality, speed, safety, less waste, less variance, and save money
DCS Average: 4.8% CausticADI Average: 2.9% Caustic
(Now reduced to 2.0%)
Cost Savings:Approx. $1,000 a day savingsLeads to $200,000 a year savings
(4 on, 2 off schedule)
Caustic Scrubber

Safety
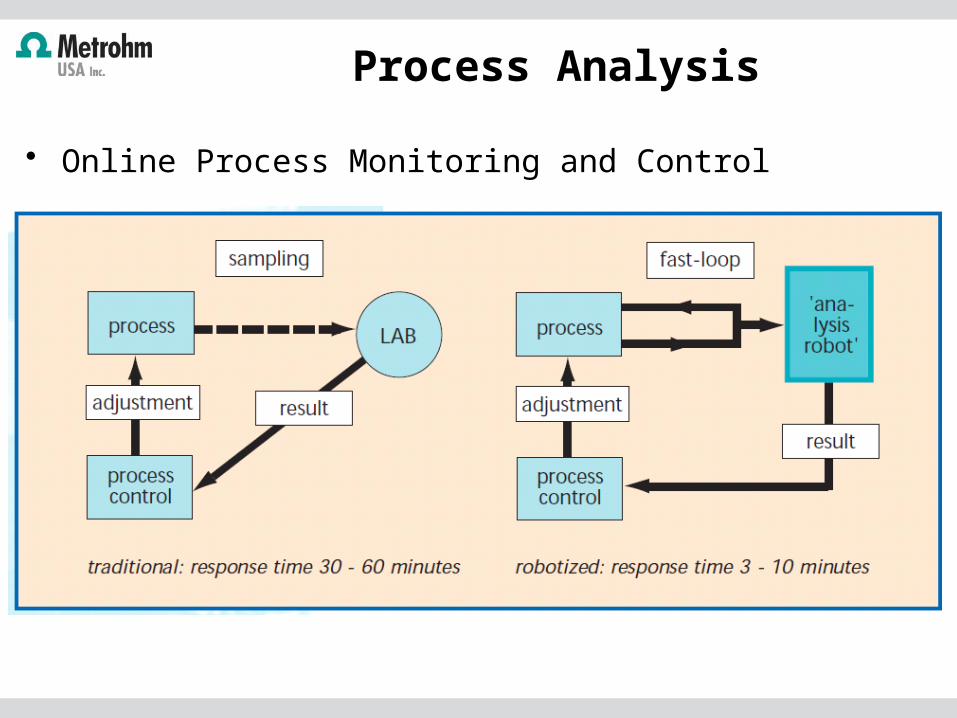
• Online Process Monitoring and Control
Process Analysis
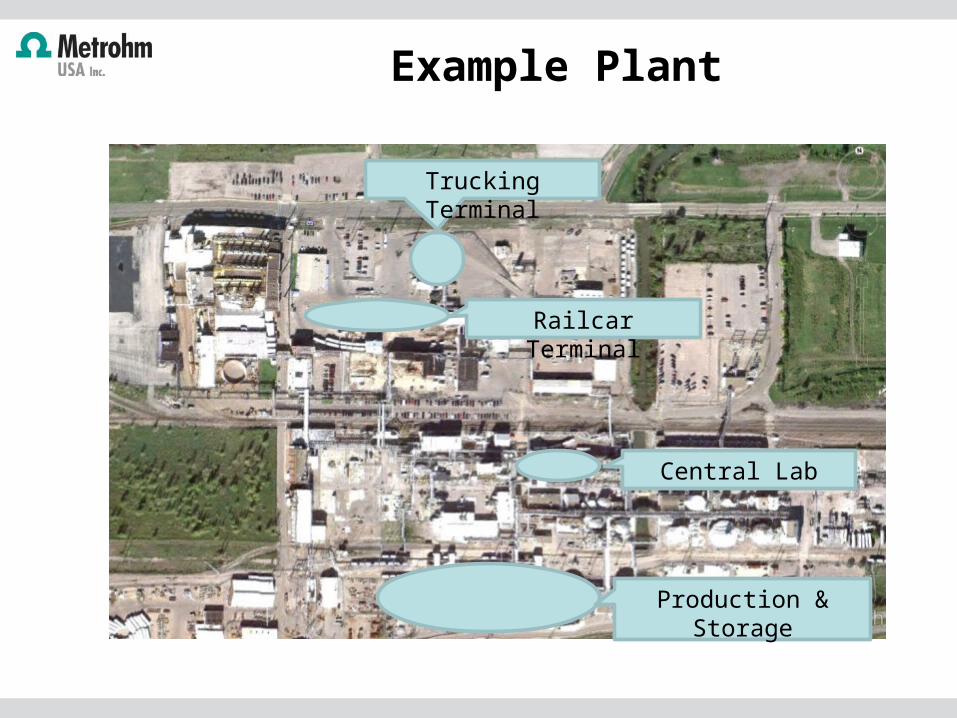
Trucking Terminal
Railcar Terminal
Central Lab
Production & Storage
Example Plant
Safety Improvements• Decrease number and frequency of personnel
crisscrossing the plant• Reduce trip/fall chances• Reduce loss of sample• Improve sample integrity• Improve efficiency
Safety