SNAPSHOT #9 TURIN › wp-content › ... · RANKING ITA 8/7998 TURIN Total ITALIAN MUNICIPALITIES...
20
TURIN SNAPSHOT #9
Transcript of SNAPSHOT #9 TURIN › wp-content › ... · RANKING ITA 8/7998 TURIN Total ITALIAN MUNICIPALITIES...
TURIN
S N A P S H O T # 9
P A G E 2
www.italy2invest.it
TURIN
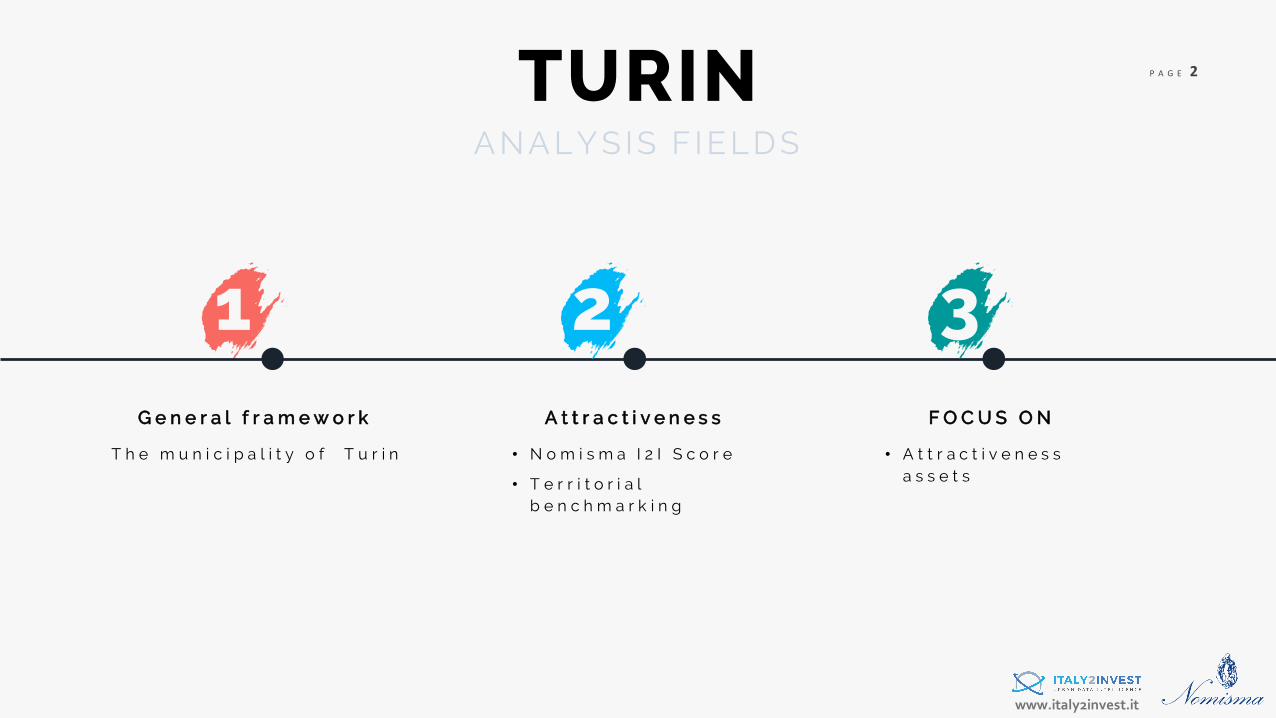
G e n e r a l f r a m e w o r k A t t r a c t i v e n e s s
• N o m i s m a I 2 I S c o r e
• T e r r i t o r i a l b e n c h m a r k i n g
F O C U S O N
• A t t r a c t i v e n e s s a s s e t s
1 2 3
A NA LYS IS F I E LD S
T h e m u n i c i p a l i t y o f T u r i n

GENERAL
FRAMEWORK1
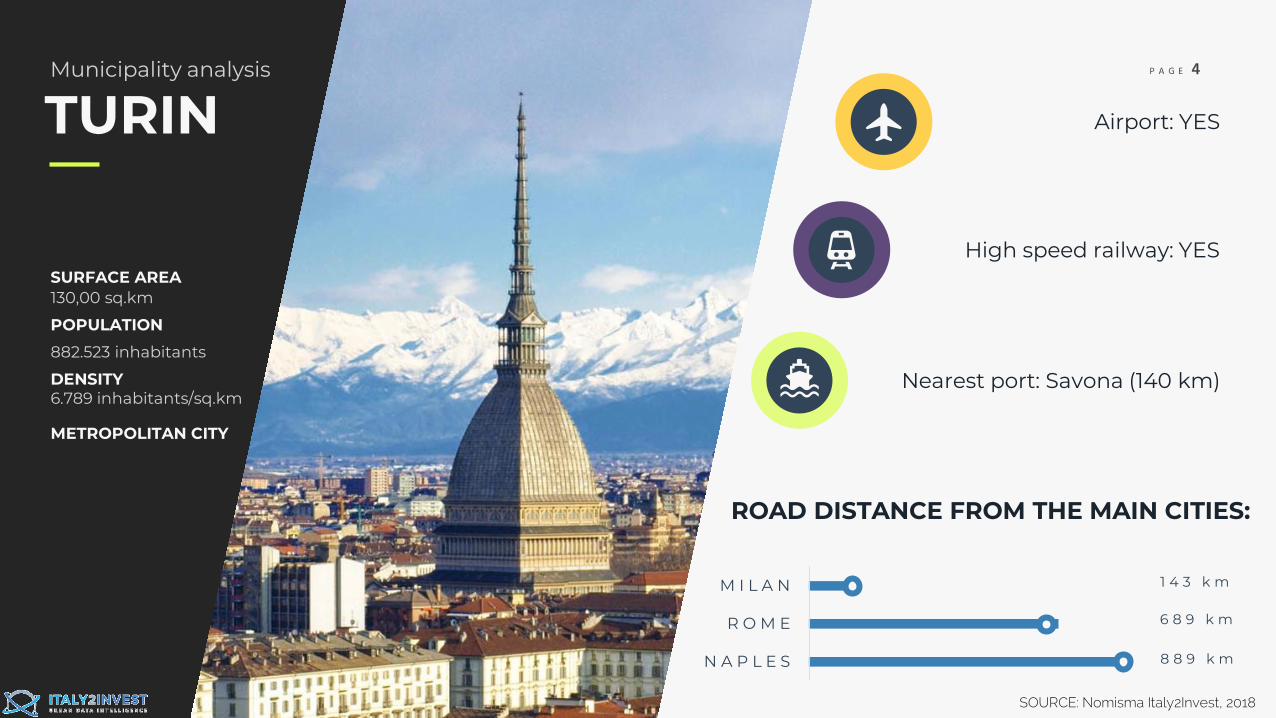
P A G E 4Municipality analysis
TURIN
SURFACE AREA130,00 sq.km
POPULATION
882.523 inhabitants
DENSITY 6.789 inhabitants/sq.km
METROPOLITAN CITY
ROAD DISTANCE FROM THE MAIN CITIES:
Airport: YES
High speed railway: YES
Nearest port: Savona (140 km)
N A P L E S
R O M E
M I L A N 1 4 3 k m
6 8 9 k m
8 8 9 k m
SOURCE: Nomisma Italy2Invest, 2018

2ATTRACTIVENESS
NOMISMA I2I SCORE
P A G E 7
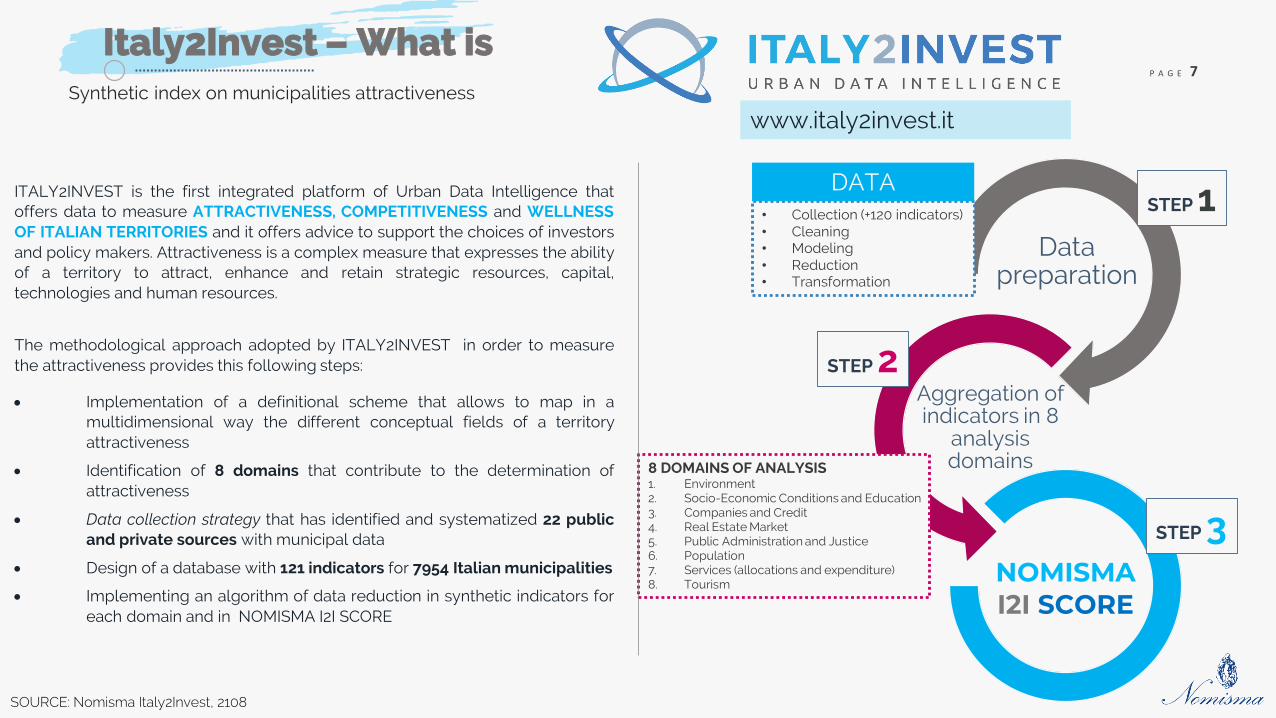
Italy2Invest – What is
SOURCE: Nomisma Italy2Invest, 2108
Synthetic index on municipalities attractiveness
ITALY2INVEST is the first integrated platform of Urban Data Intelligence thatoffers data to measure ATTRACTIVENESS, COMPETITIVENESS and WELLNESSOF ITALIAN TERRITORIES and it offers advice to support the choices of investorsand policy makers. Attractiveness is a complex measure that expresses the abilityof a territory to attract, enhance and retain strategic resources, capital,technologies and human resources.
The methodological approach adopted by ITALY2INVEST in order to measurethe attractiveness provides this following steps:
• Implementation of a definitional scheme that allows to map in amultidimensional way the different conceptual fields of a territoryattractiveness
• Identification of 8 domains that contribute to the determination ofattractiveness
• Data collection strategy that has identified and systematized 22 publicand private sources with municipal data
• Design of a database with 121 indicators for 7954 Italian municipalities
• Implementing an algorithm of data reduction in synthetic indicators foreach domain and in NOMISMA I2I SCORE
www.italy2invest.it
Data preparation
Aggregation of indicators in 8
analysis domains
NOMISMAI2I SCORE
STEP 1
STEP 2
STEP 3
• Collection (+120 indicators)• Cleaning• Modeling • Reduction• Transformation
DATA
8 DOMAINS OF ANALYSIS1. Environment2. Socio-Economic Conditions and Education3. Companies and Credit4. Real Estate Market5. Public Administration and Justice6. Population7. Services (allocations and expenditure)8. Tourism
P A G E 8
www.italy2invest.it
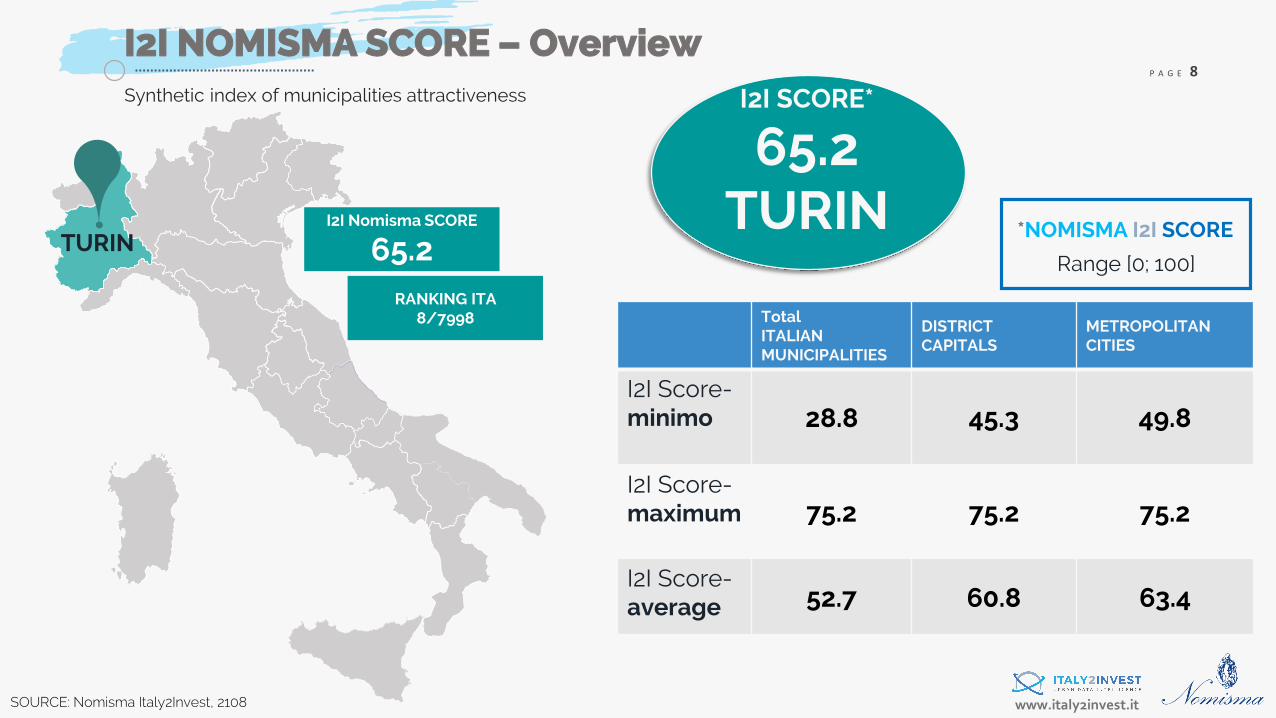
I2I SCORE*
65.2TURINI2I Nomisma SCORE
65.2RANKING ITA
8/7998
TURIN
Total ITALIANMUNICIPALITIES
DISTRICTCAPITALS
METROPOLITANCITIES
I2I Score-minimo 28.8 45.3 49.8
I2I Score-maximum 75.2 75.2 75.2
I2I Score-average 52.7 60.8 63.4
I2I NOMISMA SCORE – OverviewSynthetic index of municipalities attractiveness
*NOMISMA I2I SCORE
Range [0; 100]
SOURCE: Nomisma Italy2Invest, 2108

TERRITORIAL BENCHMARKING
P A G E 10
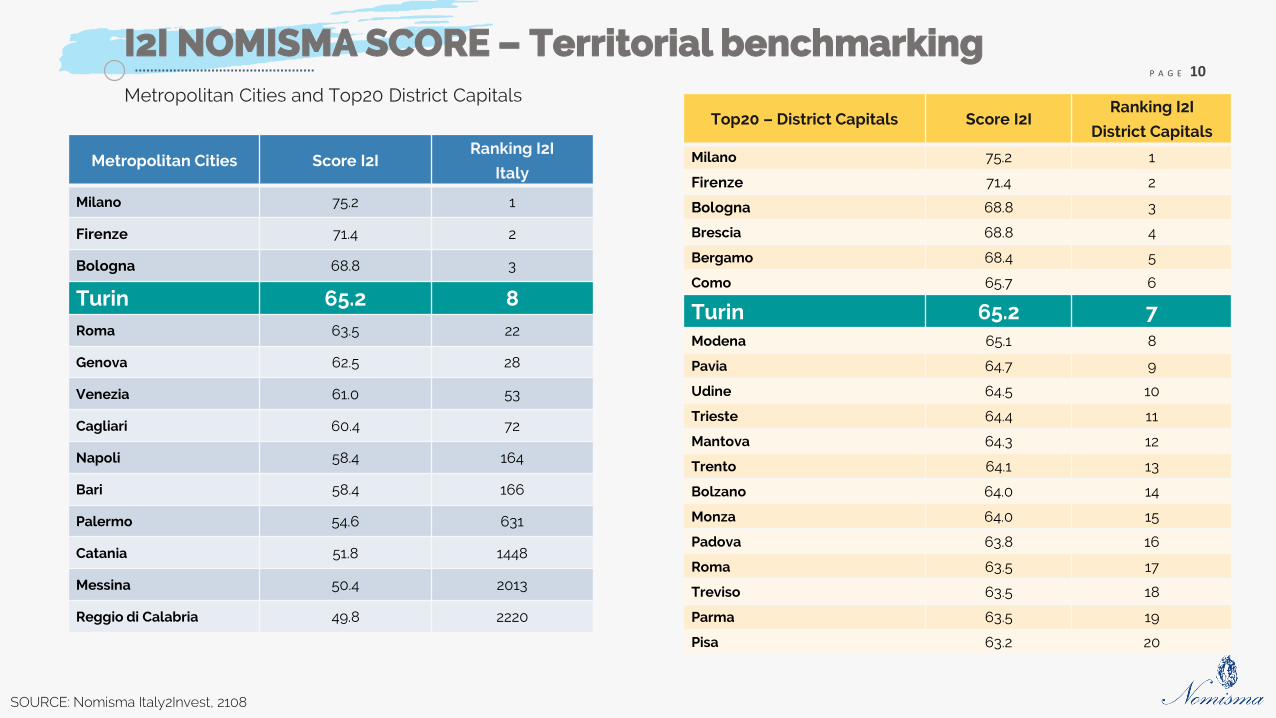
I2I NOMISMA SCORE – Territorial benchmarkingMetropolitan Cities and Top20 District Capitals
Metropolitan Cities Score I2IRanking I2I
Italy
Milano 75.2 1
Firenze 71.4 2
Bologna 68.8 3
Turin 65.2 8Roma 63.5 22
Genova 62.5 28
Venezia 61.0 53
Cagliari 60.4 72
Napoli 58.4 164
Bari 58.4 166
Palermo 54.6 631
Catania 51.8 1448
Messina 50.4 2013
Reggio di Calabria 49.8 2220
Top20 – District Capitals Score I2IRanking I2I
District Capitals
Milano 75.2 1
Firenze 71.4 2
Bologna 68.8 3
Brescia 68.8 4
Bergamo 68.4 5
Como 65.7 6
Turin 65.2 7Modena 65.1 8
Pavia 64.7 9
Udine 64.5 10
Trieste 64.4 11
Mantova 64.3 12
Trento 64.1 13
Bolzano 64.0 14
Monza 64.0 15
Padova 63.8 16
Roma 63.5 17
Treviso 63.5 18
Parma 63.5 19
Pisa 63.2 20
SOURCE: Nomisma Italy2Invest, 2108
P A G E 11
I2I NOMISMA SCORE – Territorial benchmarking
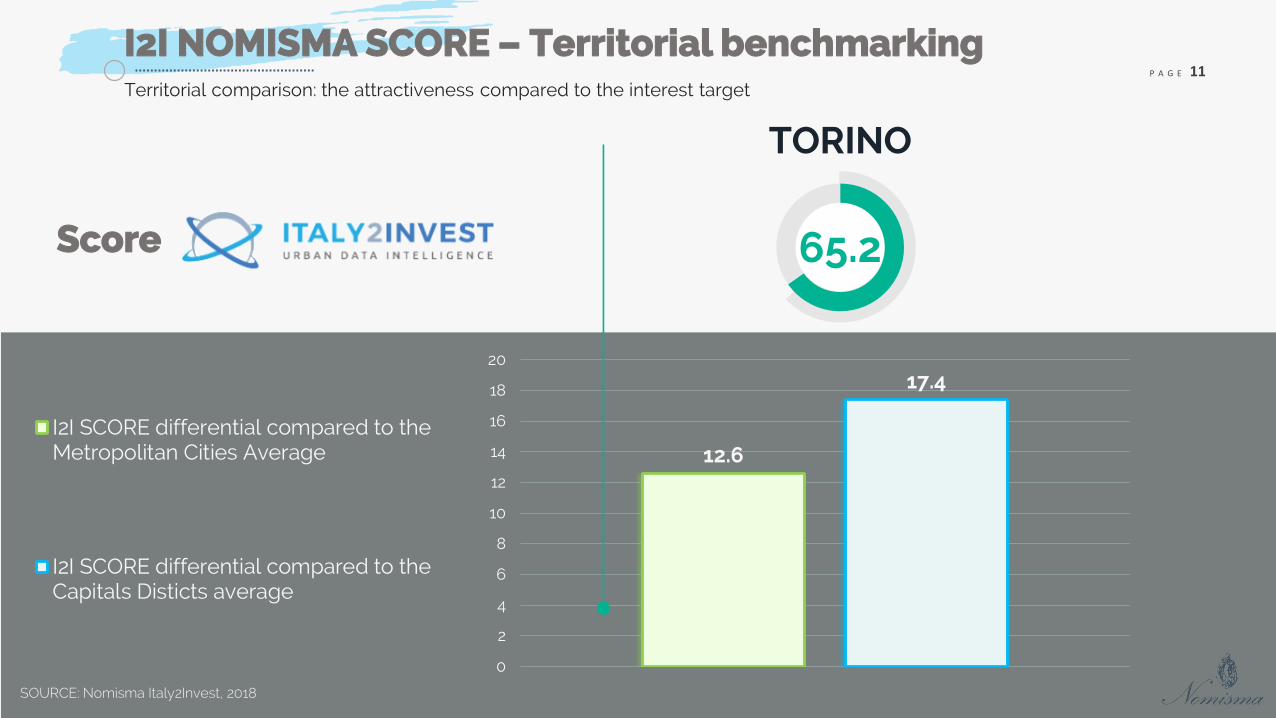
12.6
17.4
0
2
4
6
8
10
12
14
16
18
20
I2I SCORE differential compared to theMetropolitan Cities Average
I2I SCORE differential compared to theCapitals Disticts average
Score 65.2
TORINO
Territorial comparison: the attractiveness compared to the interest target
SOURCE: Nomisma Italy2Invest, 2018

3FOCUS ONAttractiveness assets
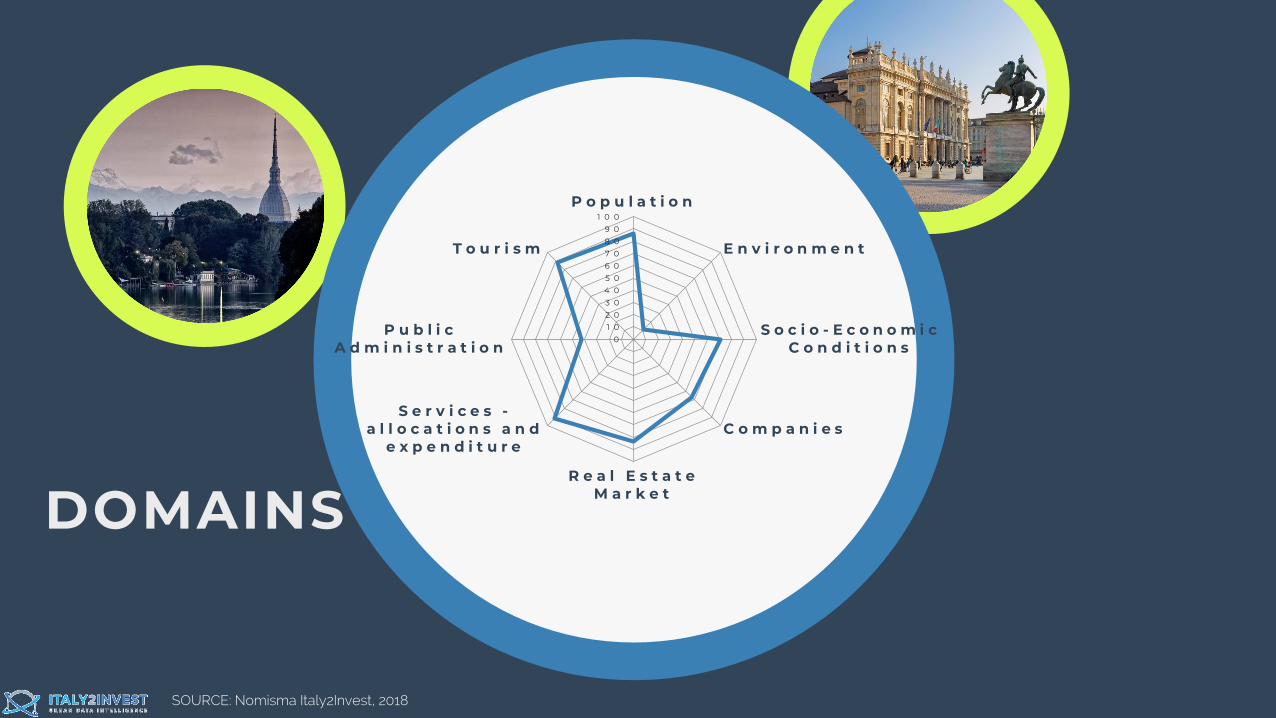
DOMAINS
0
1 0
2 0
3 0
4 0
5 0
6 0
7 0
8 0
9 0
1 0 0
P o p u l a t i o n
E n v i r o n m e n t
S o c i o - E c o n o m i c C o n d i t i o n s
C o m p a n i e s
R e a l E s t a t e M a r k e t
S e r v i c e s -a l l o c a t i o n s a n d
e x p e n d i t u r e
P u b l i c A d m i n i s t r a t i o n
T o u r i s m
SOURCE: Nomisma Italy2Invest, 2018
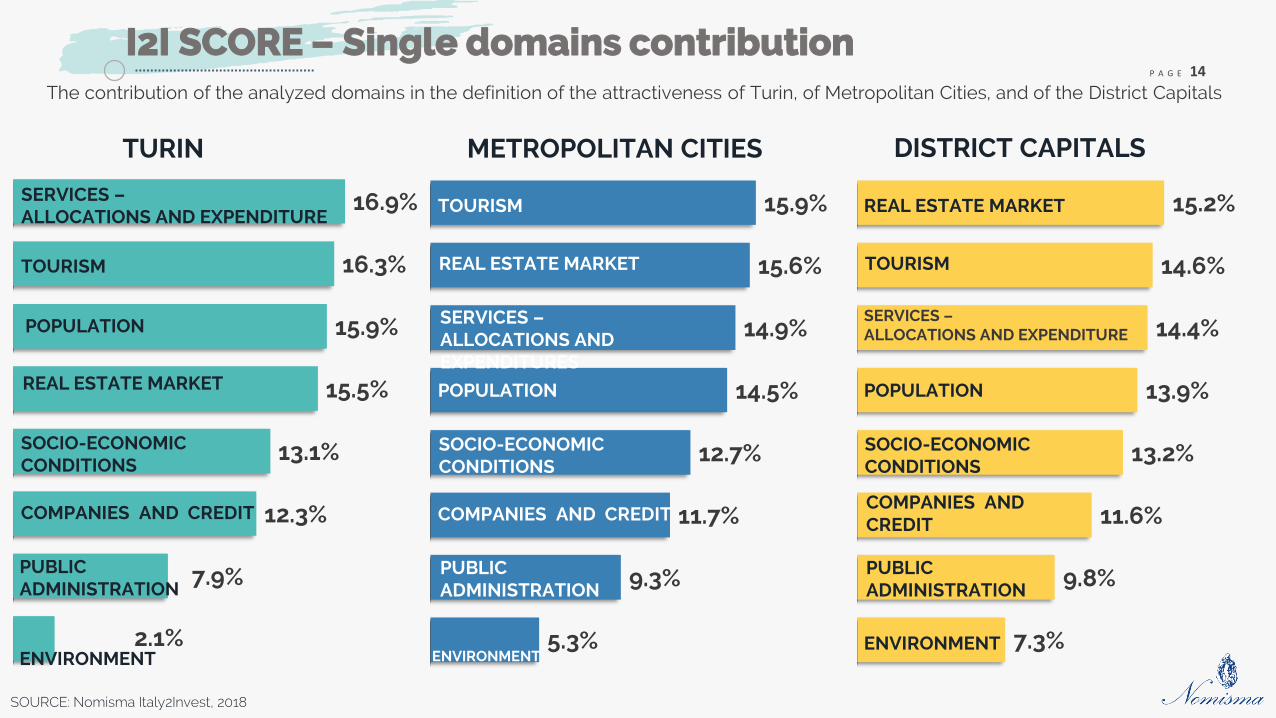
P A G E 14
I2I SCORE – Single domains contributionThe contribution of the analyzed domains in the definition of the attractiveness of Turin, of Metropolitan Cities, and of the District Capitals
TURIN METROPOLITAN CITIES
2.1%
7.9%
12.3%
13.1%
15.5%
15.9%
16.3%
16.9%SERVICES –ALLOCATIONS AND EXPENDITURE
TOURISM
POPULATION
SOCIO-ECONOMIC CONDITIONS
COMPANIES AND CREDIT
PUBLIC ADMINISTRATION
ENVIRONMENT5.3%
9.3%
11.7%
12.7%
14.5%
14.9%
15.6%
15.9%TOURISM
REAL ESTATE MARKET
SERVICES –ALLOCATIONS AND EXPENDITURES
SOCIO-ECONOMIC CONDITIONS
POPULATION
COMPANIES AND CREDIT
PUBLIC ADMINISTRATION
ENVIRONMENT
DISTRICT CAPITALS
7.3%
9.8%
11.6%
13.2%
13.9%
14.4%
14.6%
15.2%REAL ESTATE MARKET
TOURISM
SERVICES –ALLOCATIONS AND EXPENDITURE
SOCIO-ECONOMIC CONDITIONS
POPULATION
COMPANIES AND CREDIT
PUBLIC ADMINISTRATION
ENVIRONMENT
REAL ESTATE MARKET
SOURCE: Nomisma Italy2Invest, 2018
P A G E 15
www.italy2invest.it
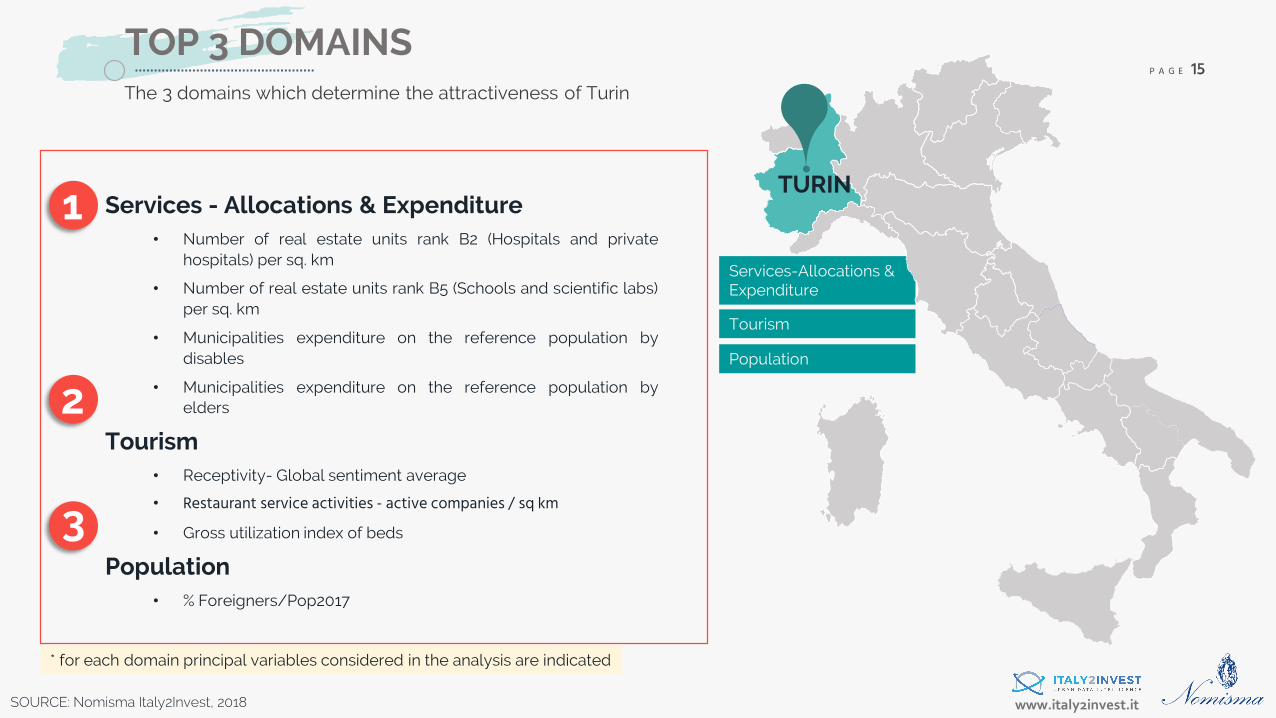
Services-Allocations & Expenditure
Tourism
Population
3
1
2
TOP 3 DOMAINSThe 3 domains which determine the attractiveness of Turin
Services - Allocations & Expenditure• Number of real estate units rank B2 (Hospitals and private
hospitals) per sq. km
• Number of real estate units rank B5 (Schools and scientific labs)per sq. km
• Municipalities expenditure on the reference population bydisables
• Municipalities expenditure on the reference population byelders
Tourism• Receptivity- Global sentiment average
• Restaurant service activities - active companies / sq km• Gross utilization index of beds
Population• % Foreigners/Pop2017
* for each domain principal variables considered in the analysis are indicated
TURIN
SOURCE: Nomisma Italy2Invest, 2018
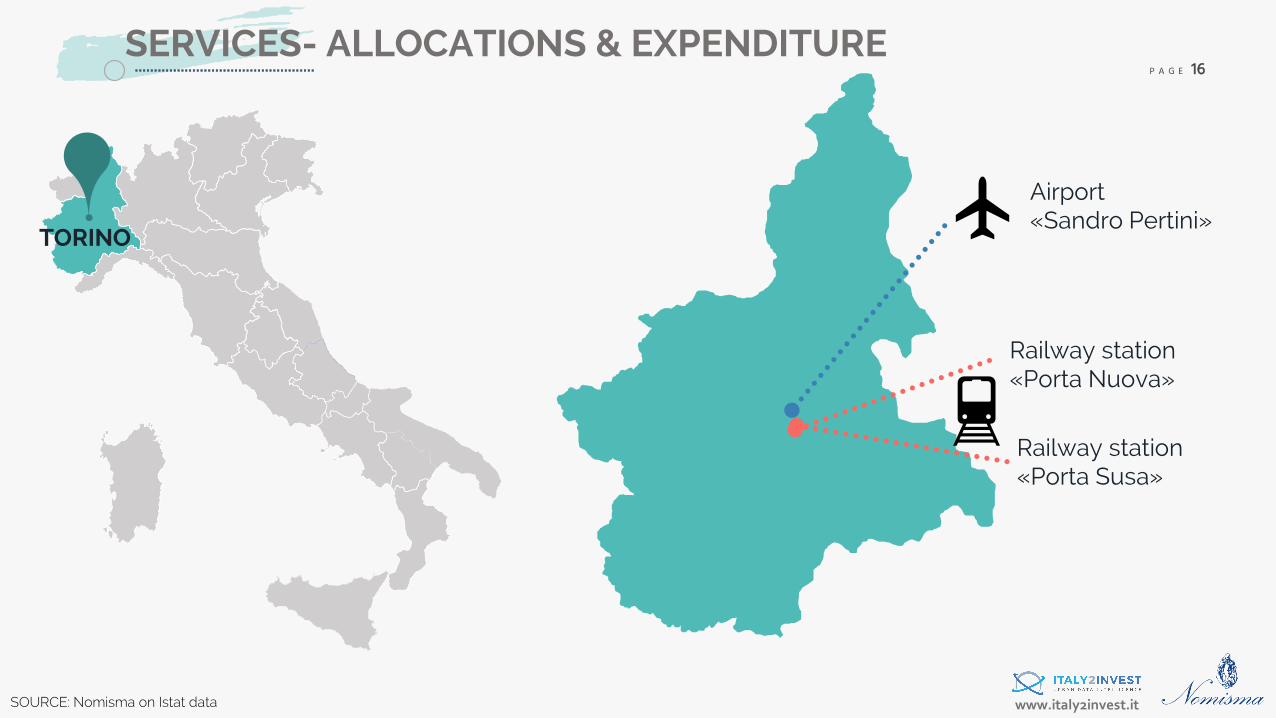
P A G E 16
www.italy2invest.itSOURCE: Nomisma on Istat data
SERVICES- ALLOCATIONS & EXPENDITURE
Airport«Sandro Pertini»
TORINO
Railway station«Porta Nuova»
Railway station«Porta Susa»
P A G E 17
www.italy2invest.it
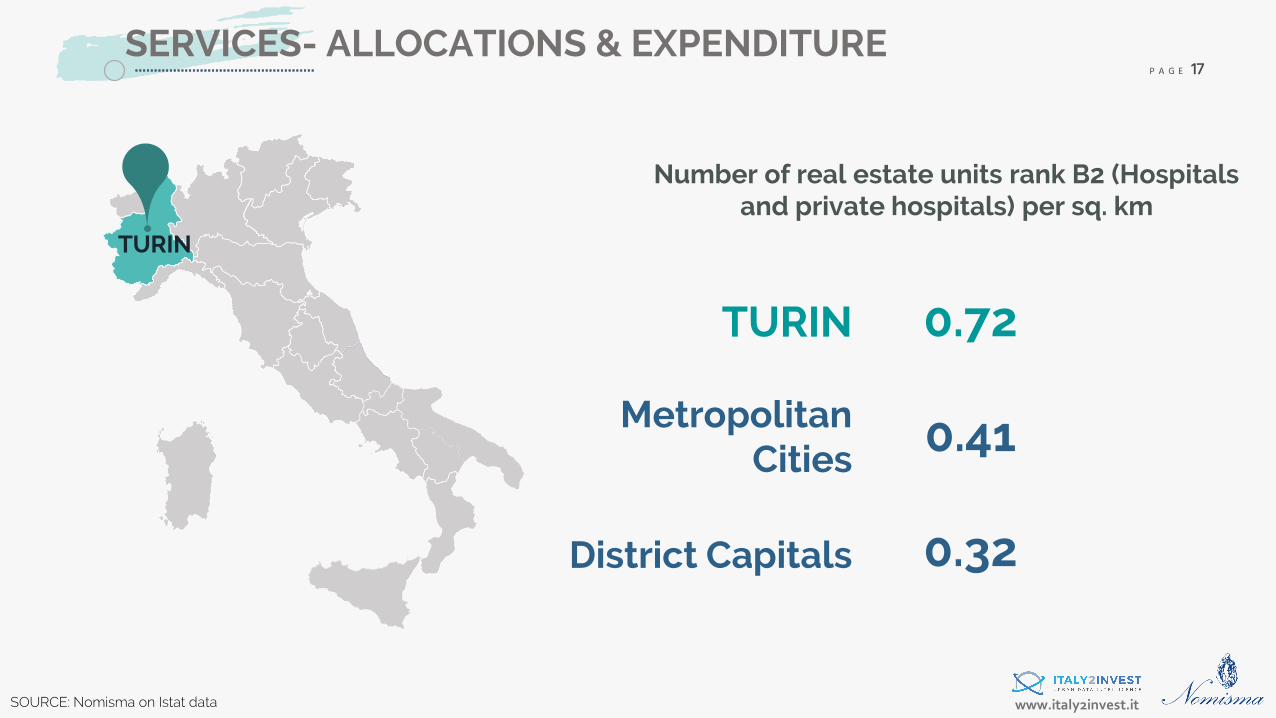
SERVICES- ALLOCATIONS & EXPENDITURE
Number of real estate units rank B2 (Hospitals and private hospitals) per sq. km
TURIN
Metropolitan Cities
District Capitals
0.72
0.41
0.32
TURIN
SOURCE: Nomisma on Istat data
P A G E 18
www.italy2invest.it
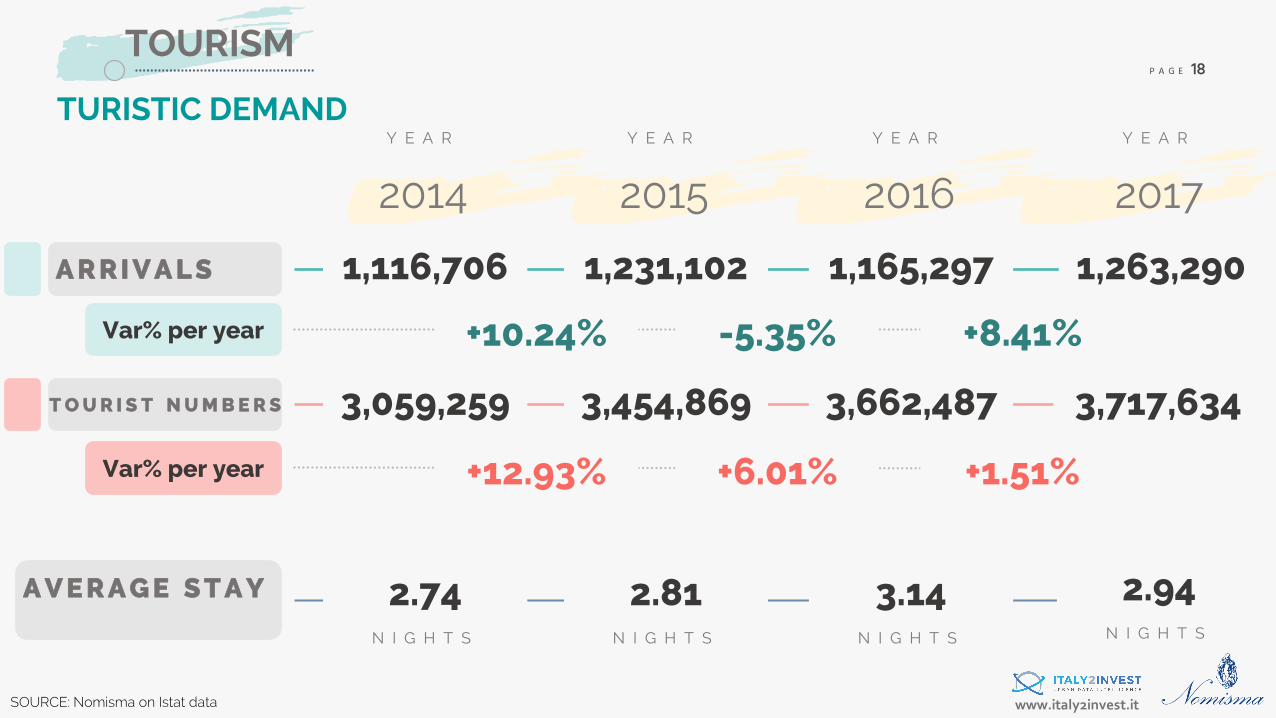
1,263,2901,165,2971,231,1021,116,706
TOURISM
A R R I V A L S
T O U R I S T N U M B E R S 3,717,6343,662,4873,454,8693,059,259
Y E A R
2014
Y E A R
2015
Y E A R
2016
Y E A R
2017
Var% per year +8.41%-5.35%+10.24%
Var% per year +1.51%+6.01%+12.93%
A V E R A G E S T A Y 2.94N I G H T S
3.14N I G H T S
2.81N I G H T S
2.74N I G H T S
TURISTIC DEMAND
SOURCE: Nomisma on Istat data
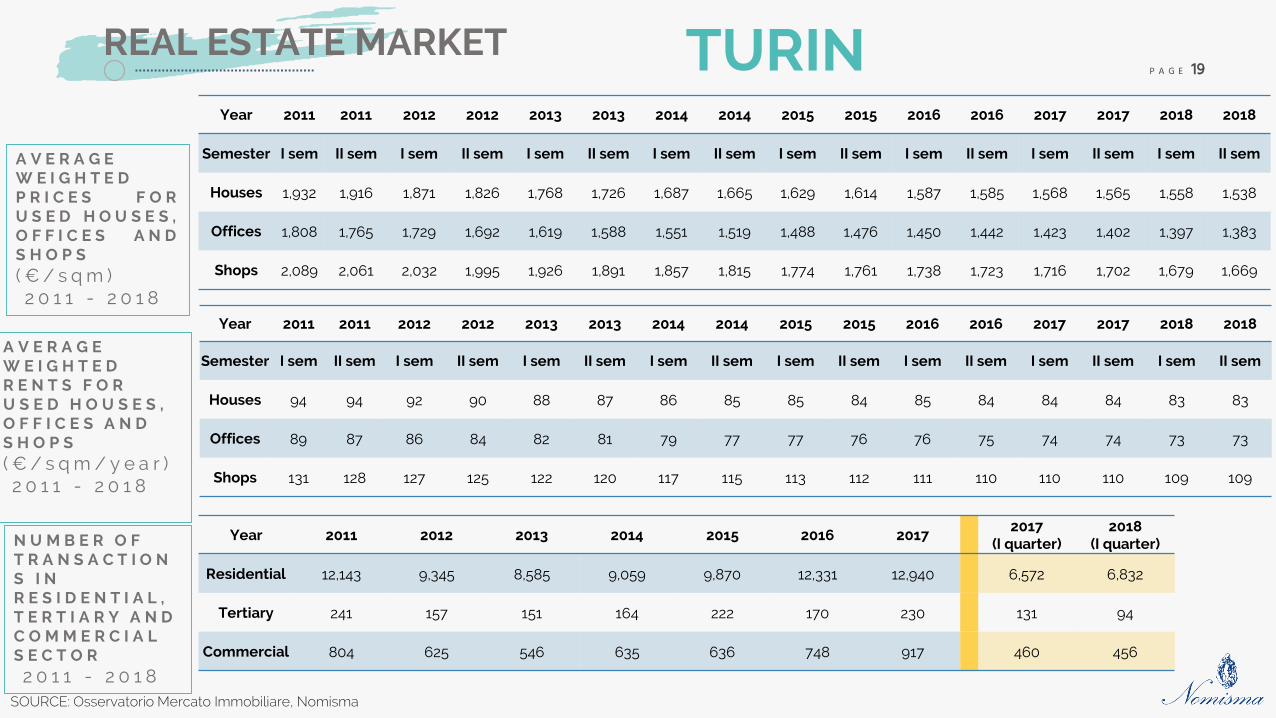
P A G E 19REAL ESTATE MARKET
SOURCE: Osservatorio Mercato Immobiliare, Nomisma
TURIN
A V E R A G EW E I G H T E DP R I C E S F O RU S E D H O U S E S ,O F F I C E S A N DS H O P S( € / s q m )2 0 1 1 - 2 0 1 8
Year 2011 2011 2012 2012 2013 2013 2014 2014 2015 2015 2016 2016 2017 2017 2018 2018
Semester I sem II sem I sem II sem I sem II sem I sem II sem I sem II sem I sem II sem I sem II sem I sem II sem
Houses 1,932 1,916 1,871 1,826 1,768 1,726 1,687 1,665 1,629 1,614 1,587 1,585 1,568 1,565 1,558 1,538
Offices 1,808 1,765 1,729 1,692 1,619 1,588 1,551 1,519 1,488 1,476 1,450 1,442 1,423 1,402 1,397 1,383
Shops 2,089 2,061 2,032 1,995 1,926 1,891 1,857 1,815 1,774 1,761 1,738 1,723 1,716 1,702 1,679 1,669
Year 2011 2011 2012 2012 2013 2013 2014 2014 2015 2015 2016 2016 2017 2017 2018 2018
Semester I sem II sem I sem II sem I sem II sem I sem II sem I sem II sem I sem II sem I sem II sem I sem II sem
Houses 94 94 92 90 88 87 86 85 85 84 85 84 84 84 83 83
Offices 89 87 86 84 82 81 79 77 77 76 76 75 74 74 73 73
Shops 131 128 127 125 122 120 117 115 113 112 111 110 110 110 109 109
A V E R A G E W E I G H T E D R E N T S F O R U S E D H O U S E S , O F F I C E S A N D S H O P S( € / s q m / y e a r )2 0 1 1 - 2 0 1 8
N U M B E R O F T R A N S A C T I O NS I N R E S I D E N T I A L , T E R T I A R Y A N D C O M M E R C I A L S E C T O R2 0 1 1 - 2 0 1 8
Year 2011 2012 2013 2014 2015 2016 20172017
(I quarter)2018
(I quarter)
Residential 12,143 9,345 8,585 9,059 9,870 12,331 12,940 6,572 6,832
Tertiary 241 157 151 164 222 170 230 131 94
Commercial 804 625 546 635 636 748 917 460 456

CONTACTSNomisma SpAw w w . n o m i s ma . i tw w w . i t a l y 2 i nv es t . i t
+ 3 9 0 5 1 6 4 8 3 3 4 5
i n f o @ i t a l y 2 i n ves t . i t