
PRACTICAL OCT-ANGIOGRAPHY · 2017-05-24 · 6 PREFACE Many diseases threatening central vision are...
130
Dr Sylvia Nghiêm-Buffet Sandrine Ayrault Dr Corinne Delahaye-Mazza and Dr Typhaine Grenet Dr Gabriel Quentel Dr Franck Fajnkuchen Pr Salomon Yves Cohen Preface by Pr Eric Souied PRACTICAL OCT-ANGIOGRAPHY Neovascularization, edema, ischemia and degeneration
Transcript of PRACTICAL OCT-ANGIOGRAPHY · 2017-05-24 · 6 PREFACE Many diseases threatening central vision are...
Dr Sylvia Nghiêm-Buffet
Sandrine Ayrault
Dr Corinne Delahaye-Mazza
and
Dr Typhaine Grenet
Dr Gabriel Quentel
Dr Franck Fajnkuchen
Pr Salomon Yves Cohen
Preface by Pr Eric Souied
PRACTICAL OCT-ANGIOGRAPHYNeovascularization, edema, ischemia and degeneration

5
EDITION
EDITED BY
Carl Zeiss Meditec France SAS100 Route de Versailles78160 Marly-le-Roi, FranceTel: +33 (0)1 34 80 21 00 The content of this book presents the authors’ views and does not necessarily reflect the views of the company Carl Zeiss - Meditec France SAS. Design - Realization: Elwood. All translation, adaptation and reproduction rights by any means are reserved for all countries. Any total or partial reproduction or representation, by any means, of the pages published in this book, made without the prior written authorization of the editor is prohibited and illegal and constitutes a counterfeit. Reproductions are strictly reserved for private use and are not intended for collective use; analyzes and short quotes are also justified by the scientific or information of the work in which they are incorporated (Law of March 11, 1957 Art. 40 and 41. and Penal Code art. 425).
6
PREFACE
Many diseases threatening central vision are accompanied by a development of abnormal vessels, intraretinal edema or circulatory failure. It used to be only a dream for retinologists to have the ability to simultaneously visualize the retinal and choroidal circulations without injection of any contrast. Then OCT-Angiography, a method that may be repeated as necessary in all patients, was invented and is now considered an obvious choice. This rapid acquisition of reliable images allows a definite diagnosis and offers significant advantages compared to angiographic imaging.
What is OCT-Angiography? It is based on the en-face OCT technique that reconstructs scans performed multiple times in a vertical plane into a single image shown on a horizontal plane. Schematically, its principle is to highlight only the changes that occur between a time (t1) and a time (t2). For example, it would only highlight the circulatory movements in the image while removing all fixed components. However, this technique has its limitations. Due to the nature of the imaging, it is clearly apparent that we do not visualize the vessel wall, but the flow that circulates inside. For example, depending on the software used to generate the analysis temporal window, a flow that is too rapid or too slow may not be detected by the apparatus. Similarly, the classic elements of the traditional angiographic imaging, such as dye staining, pooling, and leakage, do not appear. The angiographic leakage to which we gave so much importance is also absent from OCT-Angiography images.
Since we are only in the first stages of OCT-Angiography, current limitations of the apparatus will likely be overcome in the future. The 6x6-mm analysis has already been added to the 3x3-mm analysis. 8x8-mm images are now available for broadening the scope of analysis. It is therefore conceivable that in the near future we will have an apparatus that can perform an automatic assembly of the posterior pole and its adjacent mid-periphery.
7
Other limitations of the method include the presence of artifacts related to eye movements (already substantially reduced compared to the first versions available) or related to the superimposition of images from different planes (projection artifacts, which are also disappearing thanks to advances in software). Other artifacts are related to the intrinsic properties of the eye or eye disease. This is the case when severe fluid disorders or intravitreal opacities are present; they will attenuate the signal regardless of the apparatus used. Highly reflective fundus components may also present a sufficient decorrelation between a time (t1) and a time (t2), causing the appearance of false positives. A learning process is therefore necessary to analyze the images obtained, even if their acquisition is increasingly easier with the new instrument and software versions. The use of OCT-Angiography for monitoring currently available therapeutics in retinal diseases will also be refined in the future.
Due to the relatively abundant literature, all fundus disorders may already be explored using this method. This book aims to familiarize readers with the most typical images obtained for the most common issues encountered in retinal diseases: neovascularization, edema, ischemia. However, other chapters are devoted to rarer diseases. Readers will find an annotated, comprehensive bibliography at the end of this book, which they may find useful. Undoubtedly, this book confirms that the teaching skills of the Centre Ophtalmologique d’Imagerie et de Laser team will become one of the most useful references for the analysis of this new exciting semiology.
Professor Eric Souied

8
THE AUTHORS
Sylvia Nghiêm-Buffet AIHP-ACCA, Hospital practitioner at the Avicenne hospital in Bobigny
Corinne Delahaye-Mazza Former practitioner-attaché at the Public Hospitals of Paris
Sandrine Ayrault Orthoptist
Typhaine Grenet AIHP-ACCA Practitioner-attaché at the Avicenne hospital in Bobigny
9
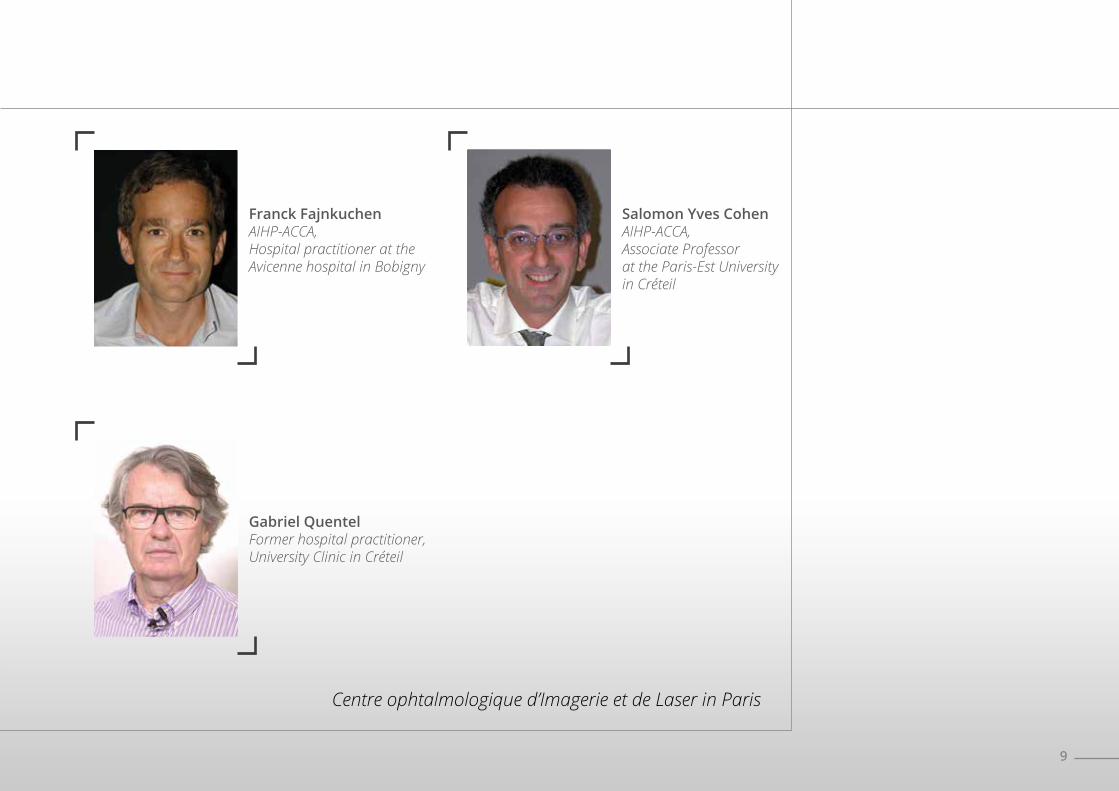
Franck Fajnkuchen AIHP-ACCA, Hospital practitioner at the Avicenne hospital in Bobigny
Salomon Yves Cohen AIHP-ACCA, Associate Professor at the Paris-Est University in Créteil
Gabriel Quentel Former hospital practitioner, University Clinic in Créteil
Centre ophtalmologique d’Imagerie et de Laser in Paris

10
TABLE OF CONTENTS
Preface . . . . . . . . . . . . . . . . . . . . . . . . . . . . . . . . . . . . . . . . . . . . . . . . . . . . . . . . . . . . . . . . . . . . . . . . . . . . . . . . . . . . . . . . . . . . . . . . . . . . . . . . . . . . . . . . . . . . . . . . . . . . . . . . . . . . . . . 6
Presentation of the authors . . . . . . . . . . . . . . . . . . . . . . . . . . . . . . . . . . . . . . . . . . . . . . . . . . . . . . . . . . . . . . . . . . . . . . . . . . . . . . . . . . . . . . . . . . . . . . . . . . . . . . . . . . 8
CHAPTER I: OCT-Angiography technique and overview . . . . . . . . . . . . . . . . . . . . . . . . . . . . . . . . . . . . . . . . . . . . . . . . . . . . . . . . . . . . . . . . . . 13
CHAPTER II: Choroidal neovascularization . . . . . . . . . . . . . . . . . . . . . . . . . . . . . . . . . . . . . . . . . . . . . . . . . . . . . . . . . . . . . . . . . . . . . . . . . . . . . . . . . . . . 17 AMD, classic neovascularization (or type 2) . . . . . . . . . . . . . . . . . . . . . . . . . . . . . . . . . . . . . . . . . . . . . . . . . . . . . . . . . . . . . . . . . . . . . . . . . . . . 18 AMD, occult neovascularization (or type 1) . . . . . . . . . . . . . . . . . . . . . . . . . . . . . . . . . . . . . . . . . . . . . . . . . . . . . . . . . . . . . . . . . . . . . . . . . . . . . 24 AMD, retinal angiomatous proliferation (or type 3) . . . . . . . . . . . . . . . . . . . . . . . . . . . . . . . . . . . . . . . . . . . . . . . . . . . . . . . . . . . . . . . . . . 30 AMD, pigment epithelium detachment . . . . . . . . . . . . . . . . . . . . . . . . . . . . . . . . . . . . . . . . . . . . . . . . . . . . . . . . . . . . . . . . . . . . . . . . . . . . . . . . . . 34 AMD, subretinal fibrosis . . . . . . . . . . . . . . . . . . . . . . . . . . . . . . . . . . . . . . . . . . . . . . . . . . . . . . . . . . . . . . . . . . . . . . . . . . . . . . . . . . . . . . . . . . . . . . . . . . . . . 36 Polypoidal vasculopathy . . . . . . . . . . . . . . . . . . . . . . . . . . . . . . . . . . . . . . . . . . . . . . . . . . . . . . . . . . . . . . . . . . . . . . . . . . . . . . . . . . . . . . . . . . . . . . . . . . . . . 38 Follow-up of treated new vessels . . . . . . . . . . . . . . . . . . . . . . . . . . . . . . . . . . . . . . . . . . . . . . . . . . . . . . . . . . . . . . . . . . . . . . . . . . . . . . . . . . . . . . . . . 42 High myopia . . . . . . . . . . . . . . . . . . . . . . . . . . . . . . . . . . . . . . . . . . . . . . . . . . . . . . . . . . . . . . . . . . . . . . . . . . . . . . . . . . . . . . . . . . . . . . . . . . . . . . . . . . . . . . . . . . . . 48 Multifocal choroiditis . . . . . . . . . . . . . . . . . . . . . . . . . . . . . . . . . . . . . . . . . . . . . . . . . . . . . . . . . . . . . . . . . . . . . . . . . . . . . . . . . . . . . . . . . . . . . . . . . . . . . . . . . 52
CHAPTER III: Edema. . . . . . . . . . . . . . . . . . . . . . . . . . . . . . . . . . . . . . . . . . . . . . . . . . . . . . . . . . . . . . . . . . . . . . . . . . . . . . . . . . . . . . . . . . . . . . . . . . . . . . . . . . . . . . . . . . . . 57 Focal diabetic edema . . . . . . . . . . . . . . . . . . . . . . . . . . . . . . . . . . . . . . . . . . . . . . . . . . . . . . . . . . . . . . . . . . . . . . . . . . . . . . . . . . . . . . . . . . . . . . . . . . . . . . . . . 58 Diffuse diabetic edema . . . . . . . . . . . . . . . . . . . . . . . . . . . . . . . . . . . . . . . . . . . . . . . . . . . . . . . . . . . . . . . . . . . . . . . . . . . . . . . . . . . . . . . . . . . . . . . . . . . . . . 60 Central retinal vein occlusion . . . . . . . . . . . . . . . . . . . . . . . . . . . . . . . . . . . . . . . . . . . . . . . . . . . . . . . . . . . . . . . . . . . . . . . . . . . . . . . . . . . . . . . . . . . . . . 62 Edematous branch retinal vein occlusion. . . . . . . . . . . . . . . . . . . . . . . . . . . . . . . . . . . . . . . . . . . . . . . . . . . . . . . . . . . . . . . . . . . . . . . . . . . . . . . 68

11
CHAPTER IV: Ischemia. . . . . . . . . . . . . . . . . . . . . . . . . . . . . . . . . . . . . . . . . . . . . . . . . . . . . . . . . . . . . . . . . . . . . . . . . . . . . . . . . . . . . . . . . . . . . . . . . . . . . . . . . . . . . . . . . 71 Central retinal artery occlusion . . . . . . . . . . . . . . . . . . . . . . . . . . . . . . . . . . . . . . . . . . . . . . . . . . . . . . . . . . . . . . . . . . . . . . . . . . . . . . . . . . . . . . . . . . . . 72 Branch retinal vein occlusion. . . . . . . . . . . . . . . . . . . . . . . . . . . . . . . . . . . . . . . . . . . . . . . . . . . . . . . . . . . . . . . . . . . . . . . . . . . . . . . . . . . . . . . . . . . . . . . 74 Proliferative diabetic retinopathy . . . . . . . . . . . . . . . . . . . . . . . . . . . . . . . . . . . . . . . . . . . . . . . . . . . . . . . . . . . . . . . . . . . . . . . . . . . . . . . . . . . . . . . . . 76 Ischemic diabetic maculopathy . . . . . . . . . . . . . . . . . . . . . . . . . . . . . . . . . . . . . . . . . . . . . . . . . . . . . . . . . . . . . . . . . . . . . . . . . . . . . . . . . . . . . . . . . . . . 82
CHAPTER V: Degeneration and Atrophy . . . . . . . . . . . . . . . . . . . . . . . . . . . . . . . . . . . . . . . . . . . . . . . . . . . . . . . . . . . . . . . . . . . . . . . . . . . . . . . . . . . . . . . . 85 Atrophic AMD, geographic atrophy . . . . . . . . . . . . . . . . . . . . . . . . . . . . . . . . . . . . . . . . . . . . . . . . . . . . . . . . . . . . . . . . . . . . . . . . . . . . . . . . . . . . . . . 86 Stargardt’s disease . . . . . . . . . . . . . . . . . . . . . . . . . . . . . . . . . . . . . . . . . . . . . . . . . . . . . . . . . . . . . . . . . . . . . . . . . . . . . . . . . . . . . . . . . . . . . . . . . . . . . . . . . . . . 90 Pseudo-vitelliform dystrophy . . . . . . . . . . . . . . . . . . . . . . . . . . . . . . . . . . . . . . . . . . . . . . . . . . . . . . . . . . . . . . . . . . . . . . . . . . . . . . . . . . . . . . . . . . . . . . . 92 Material deposits complicated by choroidal neovascularization . . . . . . . . . . . . . . . . . . . . . . . . . . . . . . . . . . . . . . . . . . . . . . . . . 94 Chloroquine-induced bull’s eye maculopathy . . . . . . . . . . . . . . . . . . . . . . . . . . . . . . . . . . . . . . . . . . . . . . . . . . . . . . . . . . . . . . . . . . . . . . . . . 96
CHAPTER VI: Miscellaneous . . . . . . . . . . . . . . . . . . . . . . . . . . . . . . . . . . . . . . . . . . . . . . . . . . . . . . . . . . . . . . . . . . . . . . . . . . . . . . . . . . . . . . . . . . . . . . . . . . . . . . . . . 99 Central serous chorioretinopathy. . . . . . . . . . . . . . . . . . . . . . . . . . . . . . . . . . . . . . . . . . . . . . . . . . . . . . . . . . . . . . . . . . . . . . . . . . . . . . . . . . . . . . . 100 Macular epiretinal membrane . . . . . . . . . . . . . . . . . . . . . . . . . . . . . . . . . . . . . . . . . . . . . . . . . . . . . . . . . . . . . . . . . . . . . . . . . . . . . . . . . . . . . . . . . . . 108 Retinal angioma . . . . . . . . . . . . . . . . . . . . . . . . . . . . . . . . . . . . . . . . . . . . . . . . . . . . . . . . . . . . . . . . . . . . . . . . . . . . . . . . . . . . . . . . . . . . . . . . . . . . . . . . . . . . . . 110 Coats’ disease . . . . . . . . . . . . . . . . . . . . . . . . . . . . . . . . . . . . . . . . . . . . . . . . . . . . . . . . . . . . . . . . . . . . . . . . . . . . . . . . . . . . . . . . . . . . . . . . . . . . . . . . . . . . . . . . 112 Choroidal nevus . . . . . . . . . . . . . . . . . . . . . . . . . . . . . . . . . . . . . . . . . . . . . . . . . . . . . . . . . . . . . . . . . . . . . . . . . . . . . . . . . . . . . . . . . . . . . . . . . . . . . . . . . . . . . 114 Phototrauma . . . . . . . . . . . . . . . . . . . . . . . . . . . . . . . . . . . . . . . . . . . . . . . . . . . . . . . . . . . . . . . . . . . . . . . . . . . . . . . . . . . . . . . . . . . . . . . . . . . . . . . . . . . . . . . . . 118 Macular telangiectasia type 2 . . . . . . . . . . . . . . . . . . . . . . . . . . . . . . . . . . . . . . . . . . . . . . . . . . . . . . . . . . . . . . . . . . . . . . . . . . . . . . . . . . . . . . . . . . . . 120
Selected and Annotated Bibliography . . . . . . . . . . . . . . . . . . . . . . . . . . . . . . . . . . . . . . . . . . . . . . . . . . . . . . . . . . . . . . . . . . . . . . . . . . . . . . . . . . . . . . . . 122
Acknowledgments . . . . . . . . . . . . . . . . . . . . . . . . . . . . . . . . . . . . . . . . . . . . . . . . . . . . . . . . . . . . . . . . . . . . . . . . . . . . . . . . . . . . . . . . . . . . . . . . . . . . . . . . . . . . . . . . . . . 138

13
CHAPTER 1OCT-ANGIOGRAPHY TECHNIQUE & OVERVIEW
14
CHAPTER 1OCT-ANGIOGRAPHY TECHNIQUE & OVERVIEW
The capacity of OCT (optical coherence tomography) to non-invasively provide high-resolution, high-sensitivity and in-depth visualization of retinal and eye microstructures without contact, has been a key factor in its success since its emergence in the 1990s. Undoubtedly, OCT has proved to be a technological breakthrough in ophthalmology because it provides unprecedented clinically relevant information to assist with the diagnosis and treatment of eye diseases.
Over the last 15 years, the OCT technology has made substantial advances with a continuous improvement in instruments, ease of use, functionality, and data analysis capabilities, providing assistance in patient diagnosis and monitoring. The Spectral Domain OCT (SD-OCT) technology has rapidly been adopted in ophthalmologic imaging applications, both for clinical and research purposes. Unlike clinical imaging techniques, such as fluorescein angiography (FA) and indocyanine green angiography (ICGA), the clinical use of OCT, which offers a non-invasive approach allowing a rapid high-resolution assessment of retinal microstructures, has steadily increased.
OCT-Angiography is a new, non-invasive diagnostic method through which the vascular structures of the retina and choroid may be visualized in three dimensions without the need for contrast agent injection. Through acquisition software and more advanced hardware, OCT-Angiography enables imaging of the retinal vascular flow.
OCT-Angiography is based on the principle of diffractive particle movement detection, such as red blood cells, on sequential OCT B-scans performed repeatedly at the same retina location, therefore showing the presence of blood vessels. OCT-Angiography requires higher imaging speeds than most currently available devices are able to provide for a sufficiently dense volume.
The method is based on differences between the B-scans to generate a movement-related contrast, especially a contrast related to erythrocyte movement in the vascular system.
To generate the image of the retinal microvascularization, each B-scan of the examination pattern is consecutively repeated several times. The contrast comparisons on consecutive B-scans at the same location reveal some areas with a contrast change over time and some areas with a constant contrast. The temporal change in contrast in a specific location is attributed to the movement of erythrocytes, which therefore indicates the location of the vessels.
15
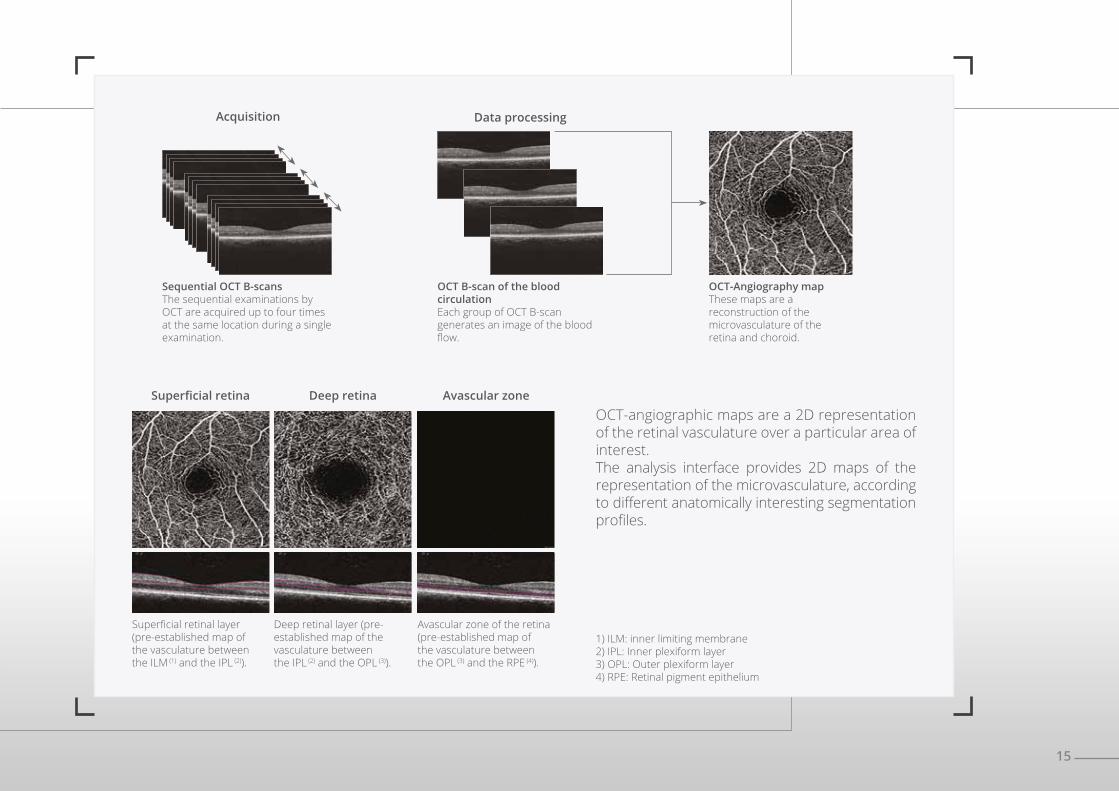
OCT-angiographic maps are a 2D representation of the retinal vasculature over a particular area of interest.The analysis interface provides 2D maps of the representation of the microvasculature, according to different anatomically interesting segmentation profiles.
Superficial retina Deep retina Avascular zone
Superficial retinal layer (pre-established map of the vasculature between the ILM (1) and the IPL (2)).
Deep retinal layer (pre-established map of the vasculature between the IPL (2) and the OPL (3)).
Avascular zone of the retina (pre-established map of the vasculature between the OPL (3) and the RPE (4)).
1) ILM: inner limiting membrane2) IPL: Inner plexiform layer3) OPL: Outer plexiform layer4) RPE: Retinal pigment epithelium
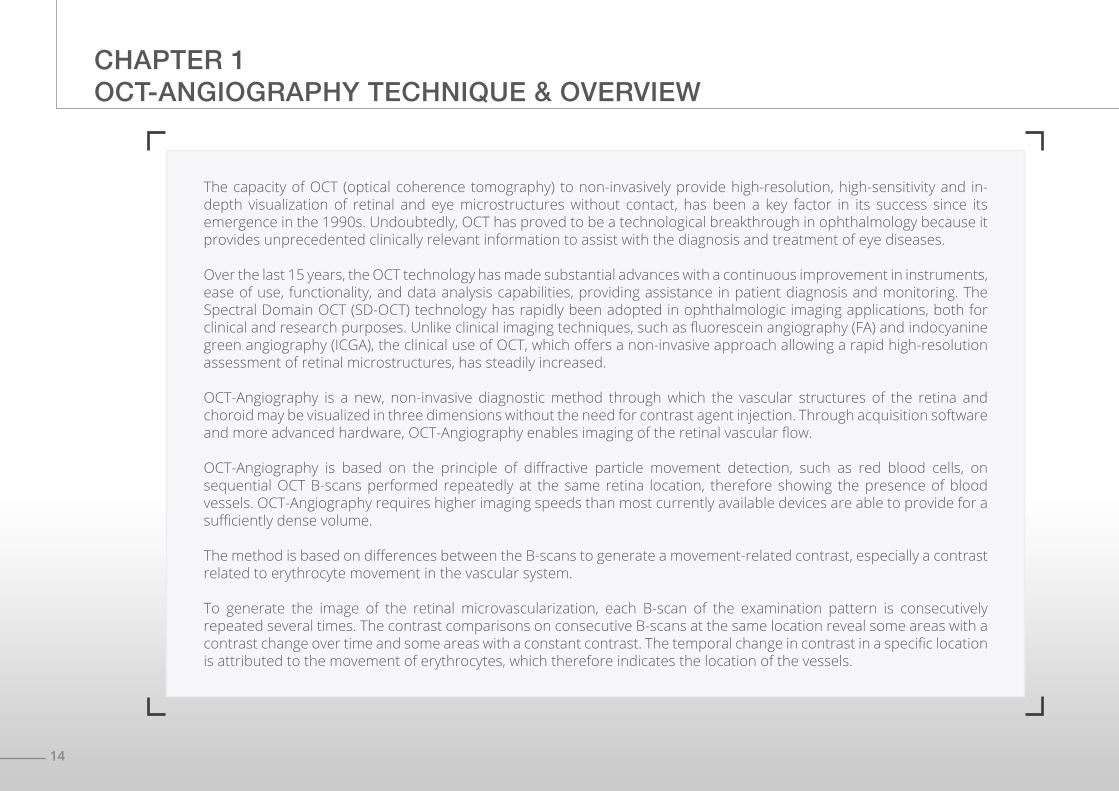
Acquisition
Sequential OCT B-scansThe sequential examinations by OCT are acquired up to four times at the same location during a single examination.
Data processing
OCT B-scan of the blood circulationEach group of OCT B-scan generates an image of the blood flow.
OCT-Angiography mapThese maps are a reconstruction of the microvasculature of the retina and choroid.
17
CHAPTER 2CHOROIDAL NEOVASCULARIZATION
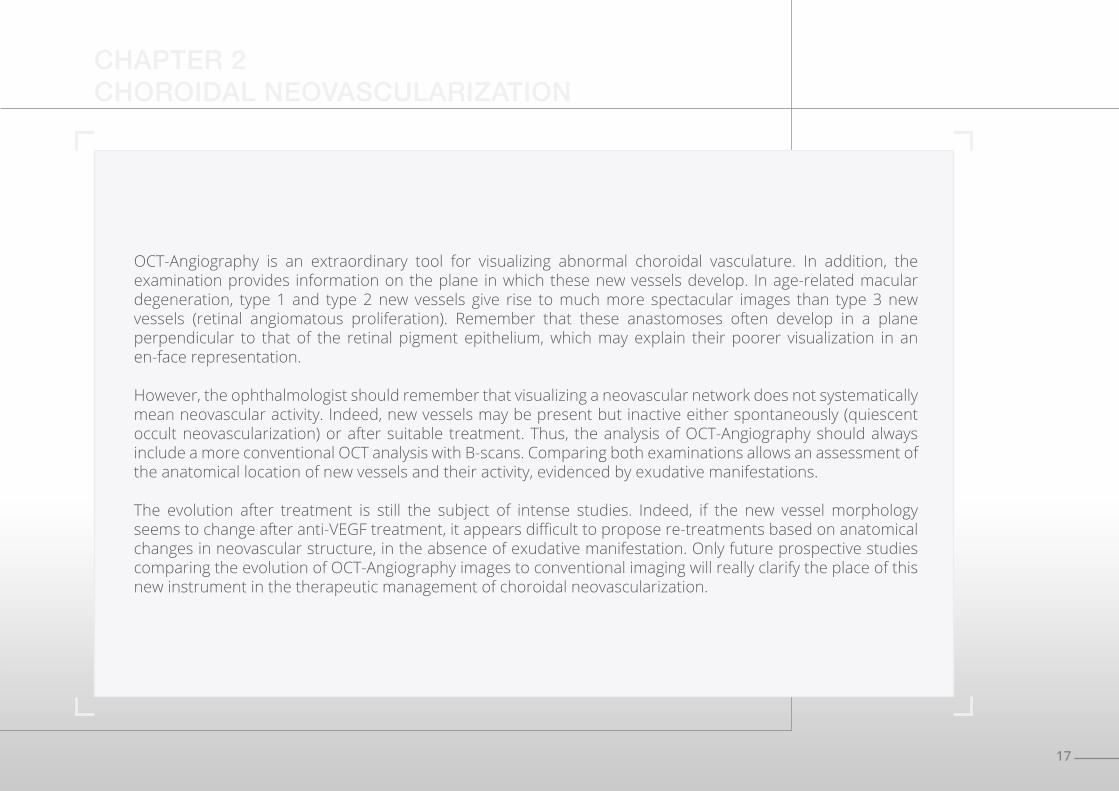
OCT-Angiography is an extraordinary tool for visualizing abnormal choroidal vasculature. In addition, the examination provides information on the plane in which these new vessels develop. In age-related macular degeneration, type 1 and type 2 new vessels give rise to much more spectacular images than type 3 new vessels (retinal angiomatous proliferation). Remember that these anastomoses often develop in a plane perpendicular to that of the retinal pigment epithelium, which may explain their poorer visualization in an en-face representation.
However, the ophthalmologist should remember that visualizing a neovascular network does not systematically mean neovascular activity. Indeed, new vessels may be present but inactive either spontaneously (quiescent occult neovascularization) or after suitable treatment. Thus, the analysis of OCT-Angiography should always include a more conventional OCT analysis with B-scans. Comparing both examinations allows an assessment of the anatomical location of new vessels and their activity, evidenced by exudative manifestations.
The evolution after treatment is still the subject of intense studies. Indeed, if the new vessel morphology seems to change after anti-VEGF treatment, it appears difficult to propose re-treatments based on anatomical changes in neovascular structure, in the absence of exudative manifestation. Only future prospective studies comparing the evolution of OCT-Angiography images to conventional imaging will really clarify the place of this new instrument in the therapeutic management of choroidal neovascularization.
18
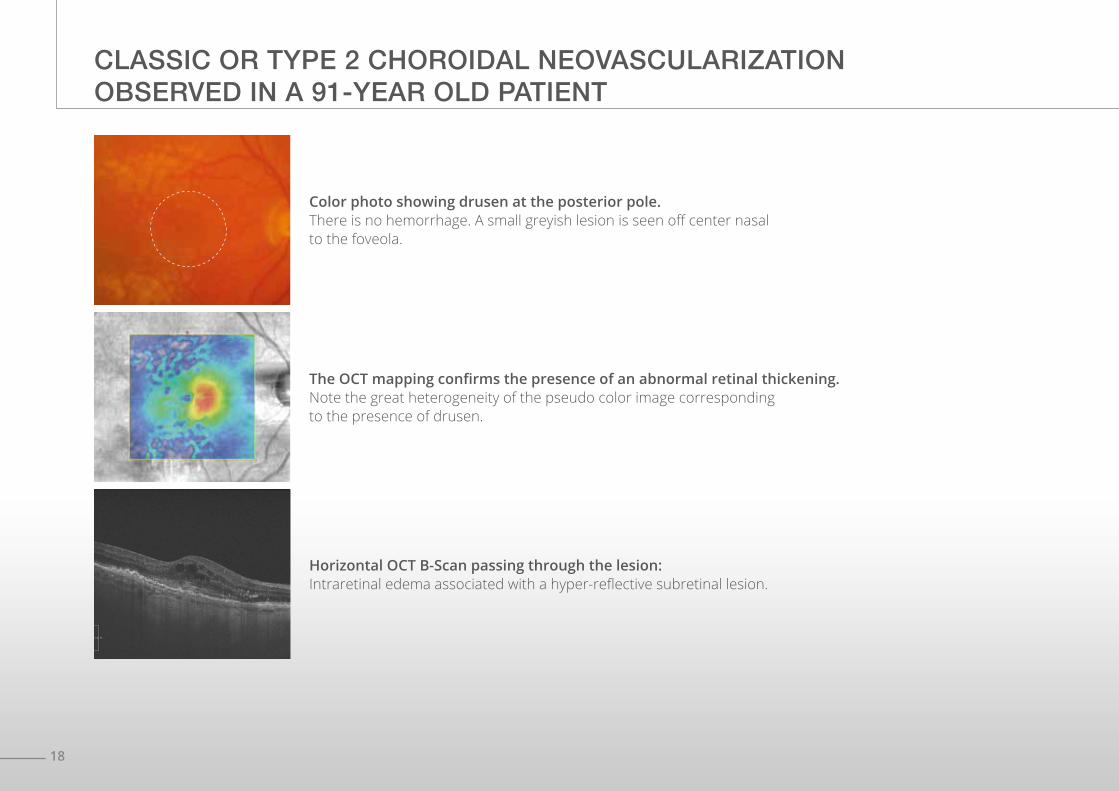
CLASSIC OR TYPE 2 CHOROIDAL NEOVASCULARIZATION OBSERVED IN A 91-YEAR OLD PATIENT
Color photo showing drusen at the posterior pole. There is no hemorrhage. A small greyish lesion is seen off center nasal to the foveola.
The OCT mapping confirms the presence of an abnormal retinal thickening.Note the great heterogeneity of the pseudo color image corresponding to the presence of drusen.
Horizontal OCT B-Scan passing through the lesion:Intraretinal edema associated with a hyper-reflective subretinal lesion.
19
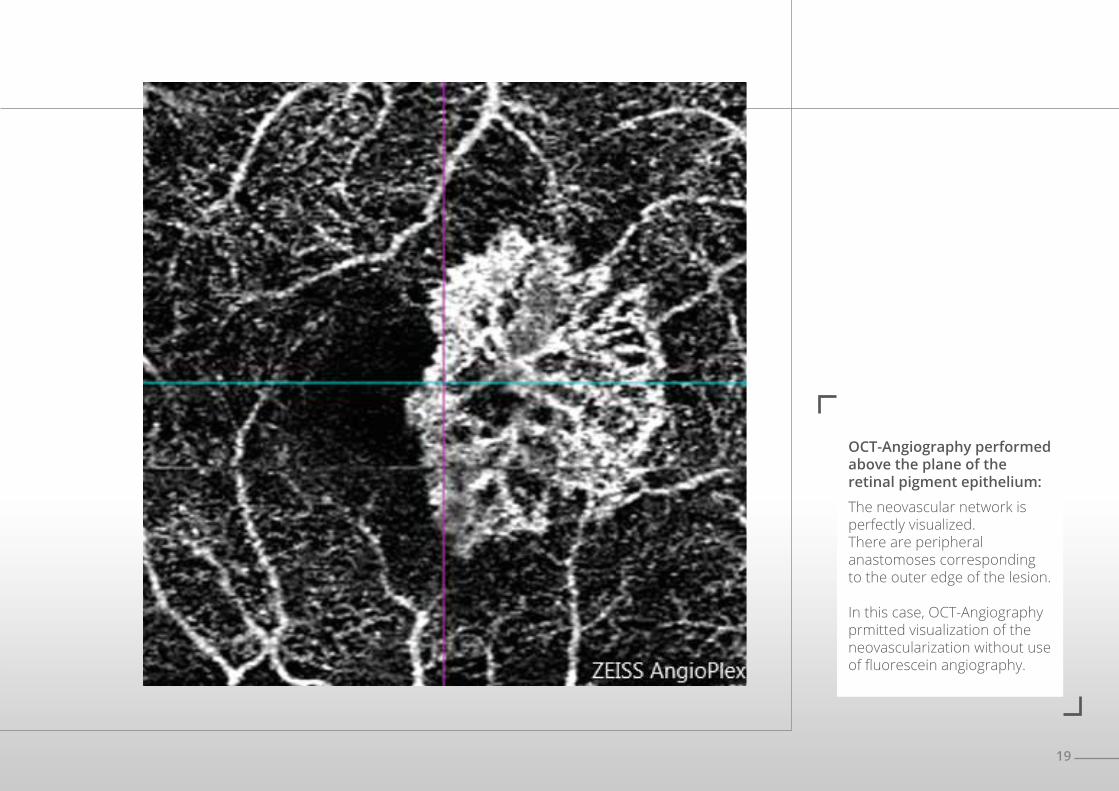
OCT-Angiography performed above the plane of the retinal pigment epithelium:
The neovascular network is perfectly visualized.There are peripheral anastomoses corresponding to the outer edge of the lesion.
In this case, OCT-Angiography prmitted visualization of the neovascularization without use of fluorescein angiography.
20
CLASSIC OR TYPE 2 CHOROIDAL NEOVASCULARIZARION
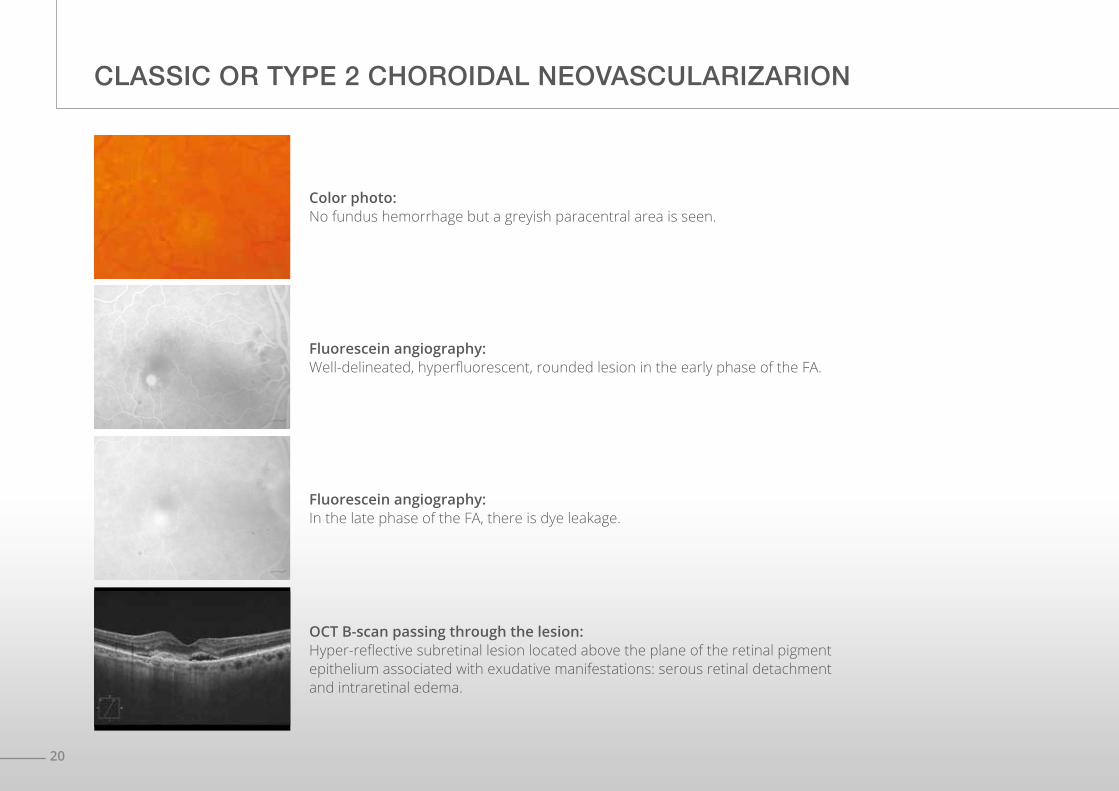
Color photo:No fundus hemorrhage but a greyish paracentral area is seen.
Fluorescein angiography:Well-delineated, hyperfluorescent, rounded lesion in the early phase of the FA.
Fluorescein angiography:In the late phase of the FA, there is dye leakage.
OCT B-scan passing through the lesion:Hyper-reflective subretinal lesion located above the plane of the retinal pigment epithelium associated with exudative manifestations: serous retinal detachment and intraretinal edema.
21
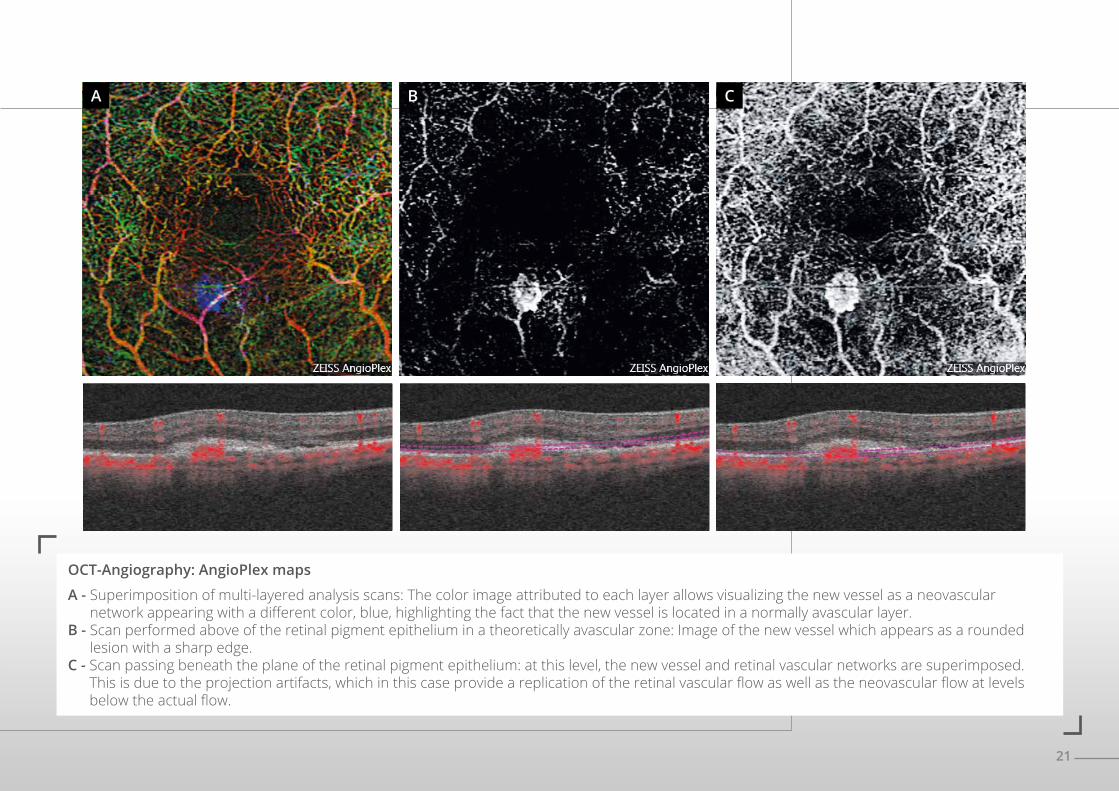
OCT-Angiography: AngioPlex maps
A - Superimposition of multi-layered analysis scans: The color image attributed to each layer allows visualizing the new vessel as a neovascular network appearing with a different color, blue, highlighting the fact that the new vessel is located in a normally avascular layer.
B - Scan performed above of the retinal pigment epithelium in a theoretically avascular zone: Image of the new vessel which appears as a rounded lesion with a sharp edge.
C - Scan passing beneath the plane of the retinal pigment epithelium: at this level, the new vessel and retinal vascular networks are superimposed. This is due to the projection artifacts, which in this case provide a replication of the retinal vascular flow as well as the neovascular flow at levels below the actual flow.
A B C
22
RELAPSE OF CLASSIC OR TYPE 2 CHOROIDAL NEOVASCULARIZATION
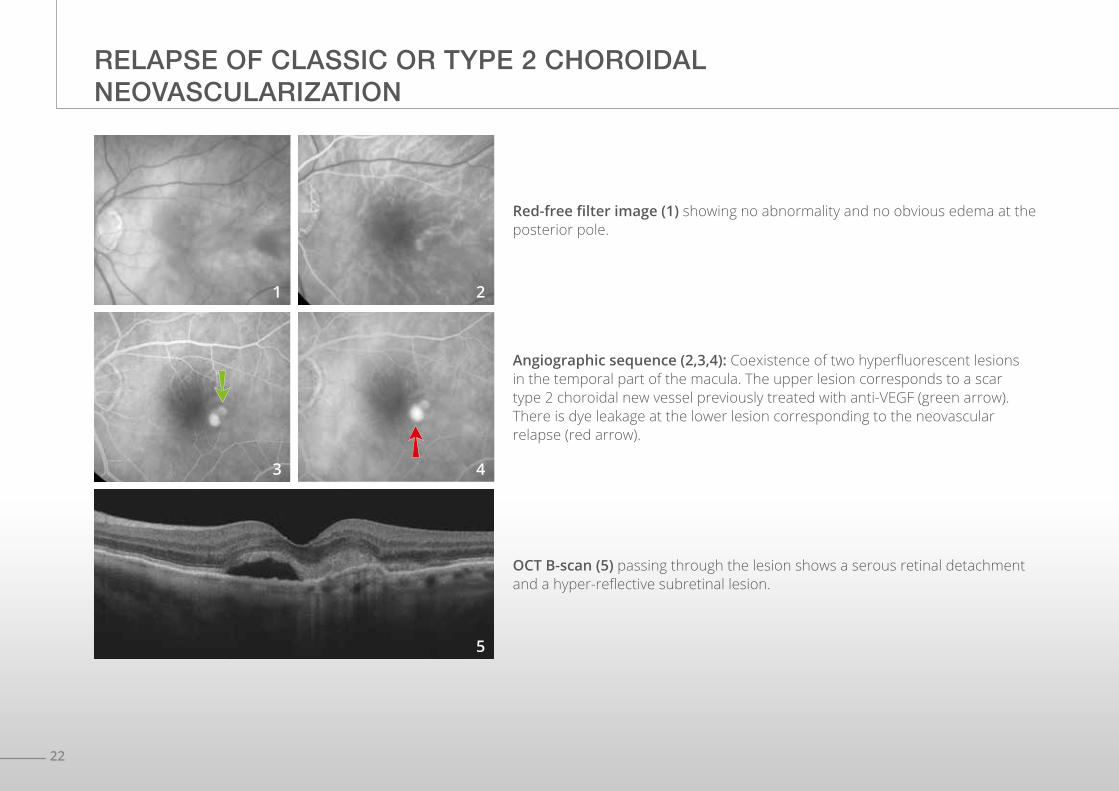
Angiographic sequence (2,3,4): Coexistence of two hyperfluorescent lesions in the temporal part of the macula. The upper lesion corresponds to a scar type 2 choroidal new vessel previously treated with anti-VEGF (green arrow).There is dye leakage at the lower lesion corresponding to the neovascular relapse (red arrow).
OCT B-scan (5) passing through the lesion shows a serous retinal detachment and a hyper-reflective subretinal lesion.
Red-free filter image (1) showing no abnormality and no obvious edema at the posterior pole.
1
3
2
4
5
23
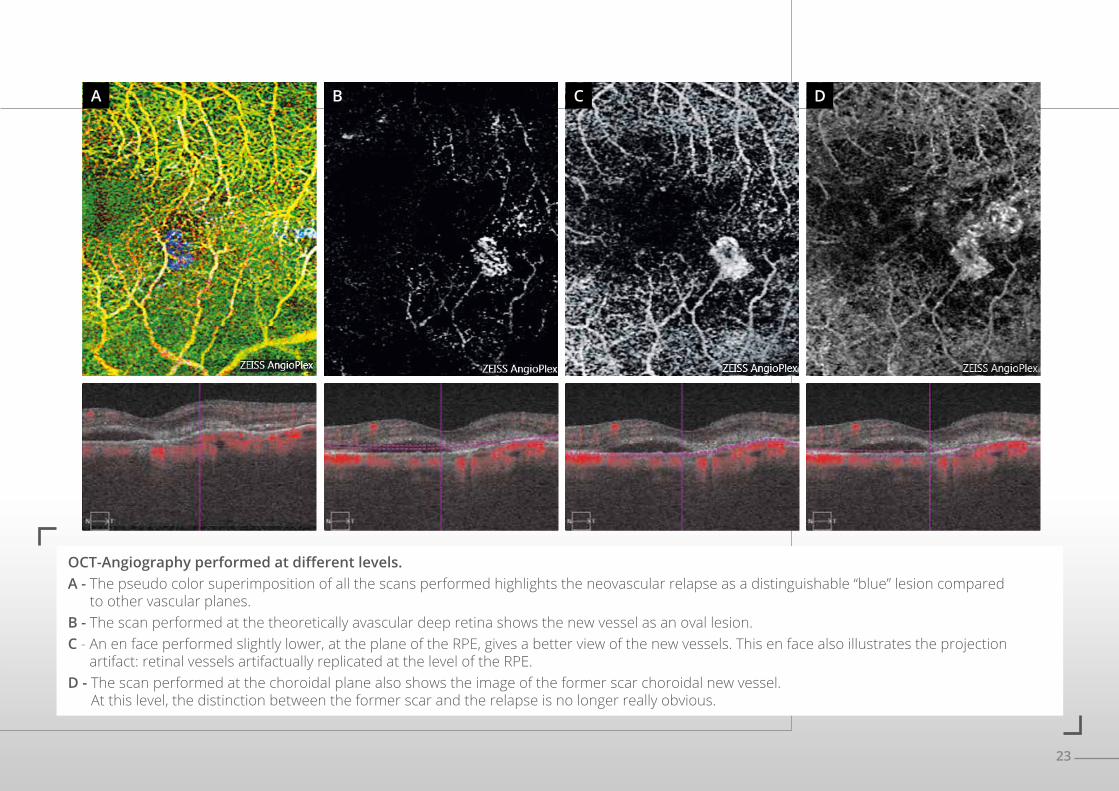
OCT-Angiography performed at different levels. A - The pseudo color superimposition of all the scans performed highlights the neovascular relapse as a distinguishable “blue” lesion compared
to other vascular planes.B - The scan performed at the theoretically avascular deep retina shows the new vessel as an oval lesion.C - An en face performed slightly lower, at the plane of the RPE, gives a better view of the new vessels. This en face also illustrates the projection
artifact: retinal vessels artifactually replicated at the level of the RPE.D - The scan performed at the choroidal plane also shows the image of the former scar choroidal new vessel.
At this level, the distinction between the former scar and the relapse is no longer really obvious.
A B C D
24
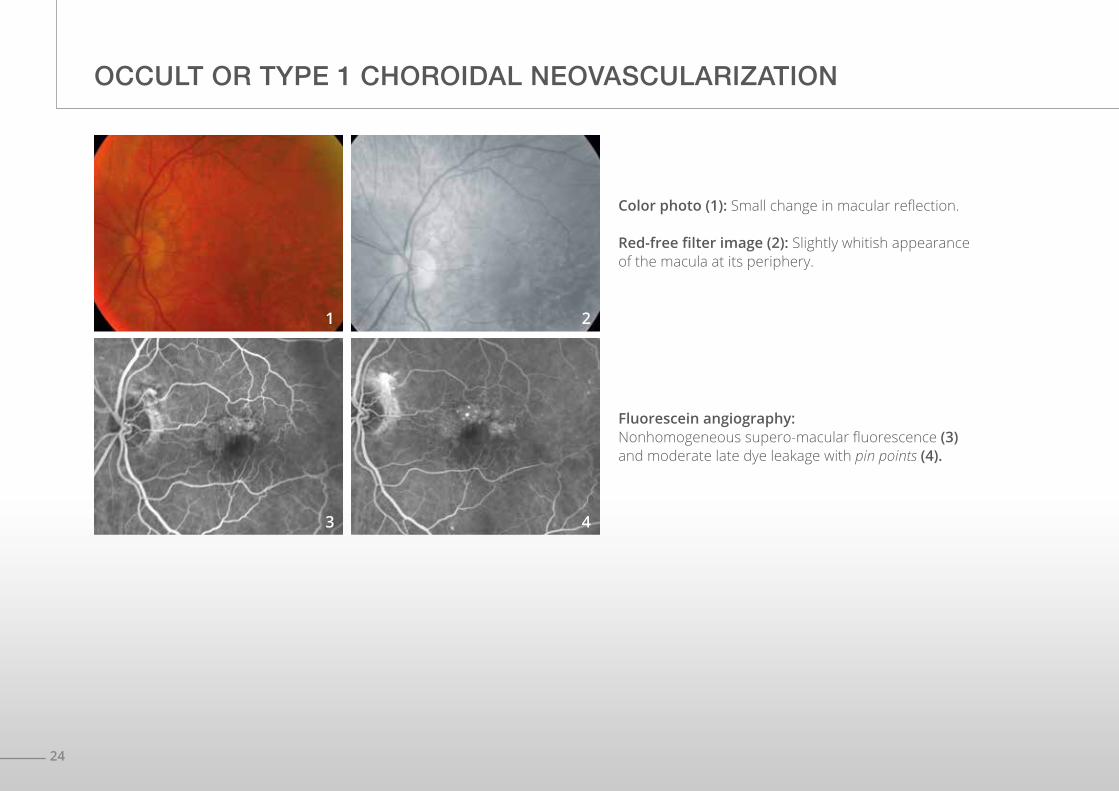
OCCULT OR TYPE 1 CHOROIDAL NEOVASCULARIZATION
Fluorescein angiography:Nonhomogeneous supero-macular fluorescence (3) and moderate late dye leakage with pin points (4).
Color photo (1): Small change in macular reflection.
Red-free filter image (2): Slightly whitish appearance of the macula at its periphery.
1
3
2
4
25
A
B
C
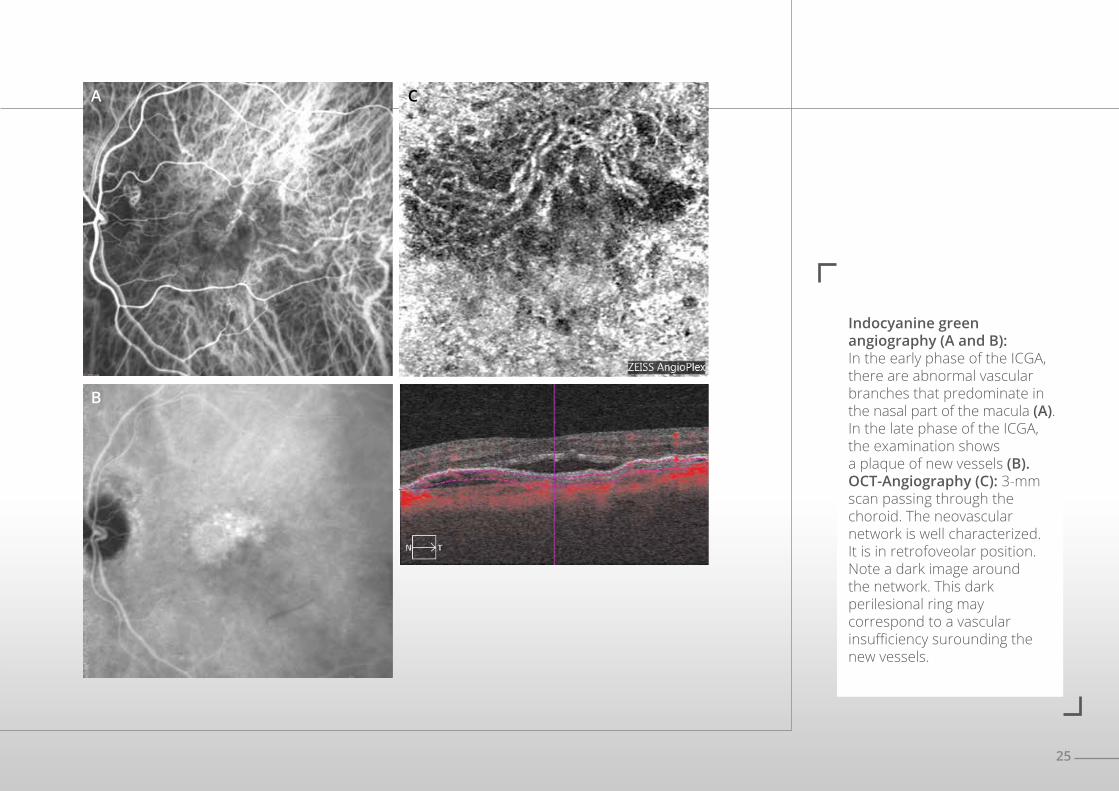
Indocyanine green angiography (A and B): In the early phase of the ICGA, there are abnormal vascular branches that predominate in the nasal part of the macula (A). In the late phase of the ICGA, the examination shows a plaque of new vessels (B).OCT-Angiography (C): 3-mm scan passing through the choroid. The neovascular network is well characterized.It is in retrofoveolar position.Note a dark image around the network. This dark perilesional ring may correspond to a vascular insufficiency surounding the new vessels.
26
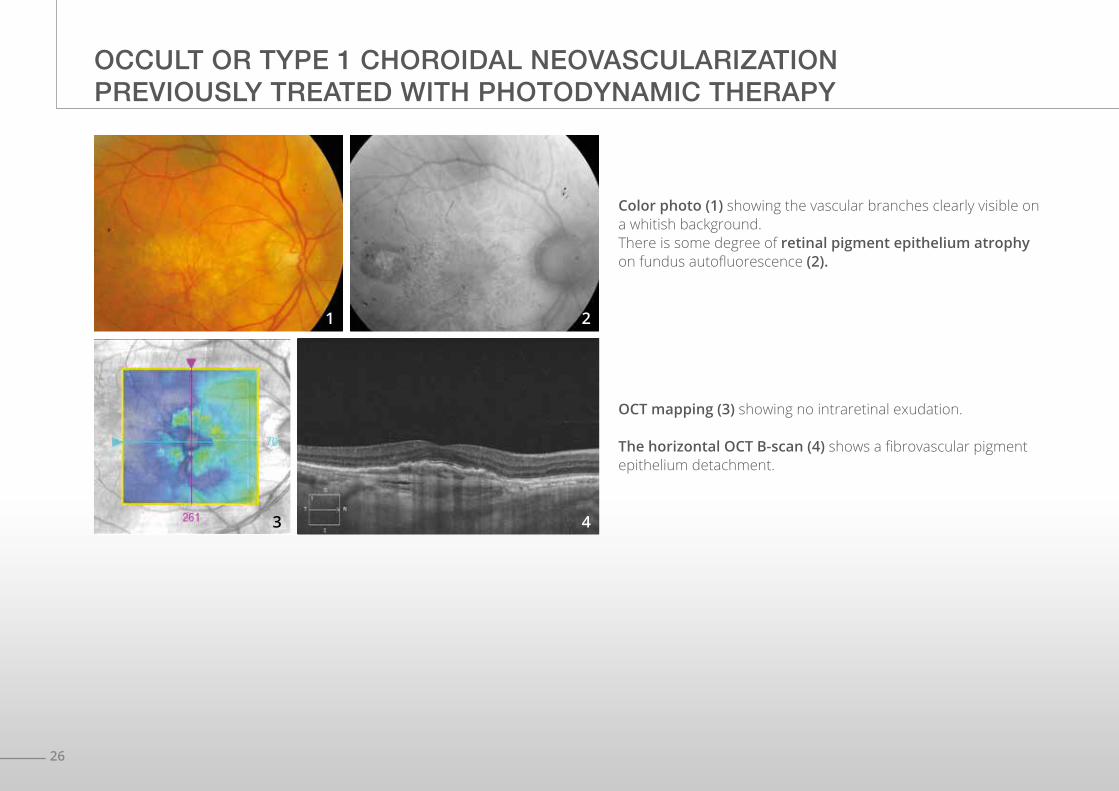
OCCULT OR TYPE 1 CHOROIDAL NEOVASCULARIZATION PREVIOUSLY TREATED WITH PHOTODYNAMIC THERAPY
OCT mapping (3) showing no intraretinal exudation.
The horizontal OCT B-scan (4) shows a fibrovascular pigment epithelium detachment.
Color photo (1) showing the vascular branches clearly visible on a whitish background. There is some degree of retinal pigment epithelium atrophy on fundus autofluorescence (2).
1
3
2
4
27
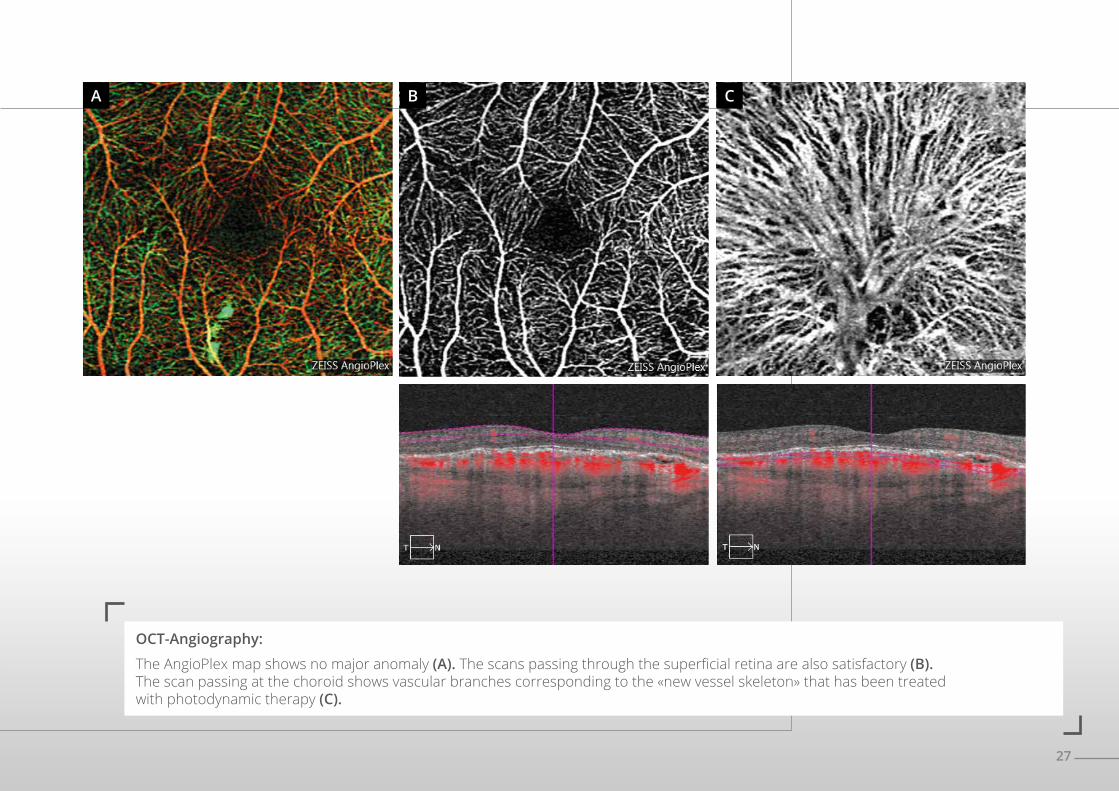
OCT-Angiography:
The AngioPlex map shows no major anomaly (A). The scans passing through the superficial retina are also satisfactory (B). The scan passing at the choroid shows vascular branches corresponding to the «new vessel skeleton» that has been treated with photodynamic therapy (C).
A B C
28
OCCULT OR TYPE 1 CHOROIDAL NEOVASCULARIZATION
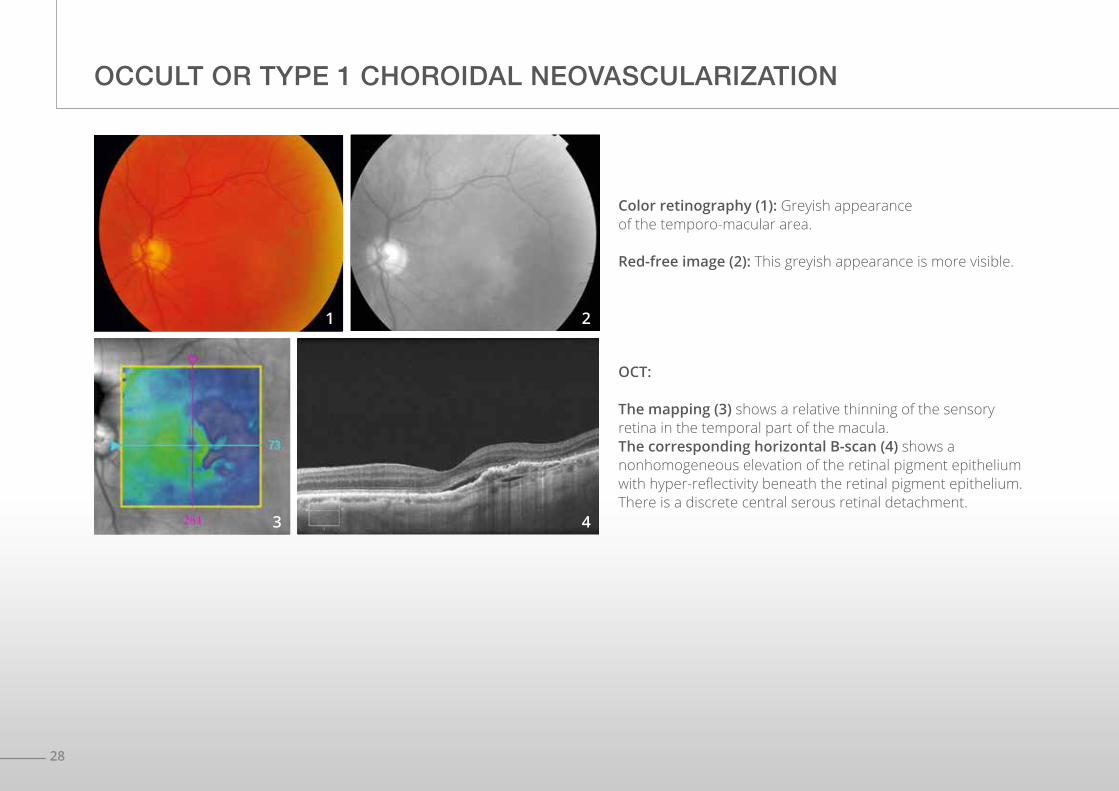
OCT:
The mapping (3) shows a relative thinning of the sensory retina in the temporal part of the macula.The corresponding horizontal B-scan (4) shows a nonhomogeneous elevation of the retinal pigment epithelium with hyper-reflectivity beneath the retinal pigment epithelium.There is a discrete central serous retinal detachment.
Color retinography (1): Greyish appearance of the temporo-macular area.
Red-free image (2): This greyish appearance is more visible.
1
3
2
4
29
A B
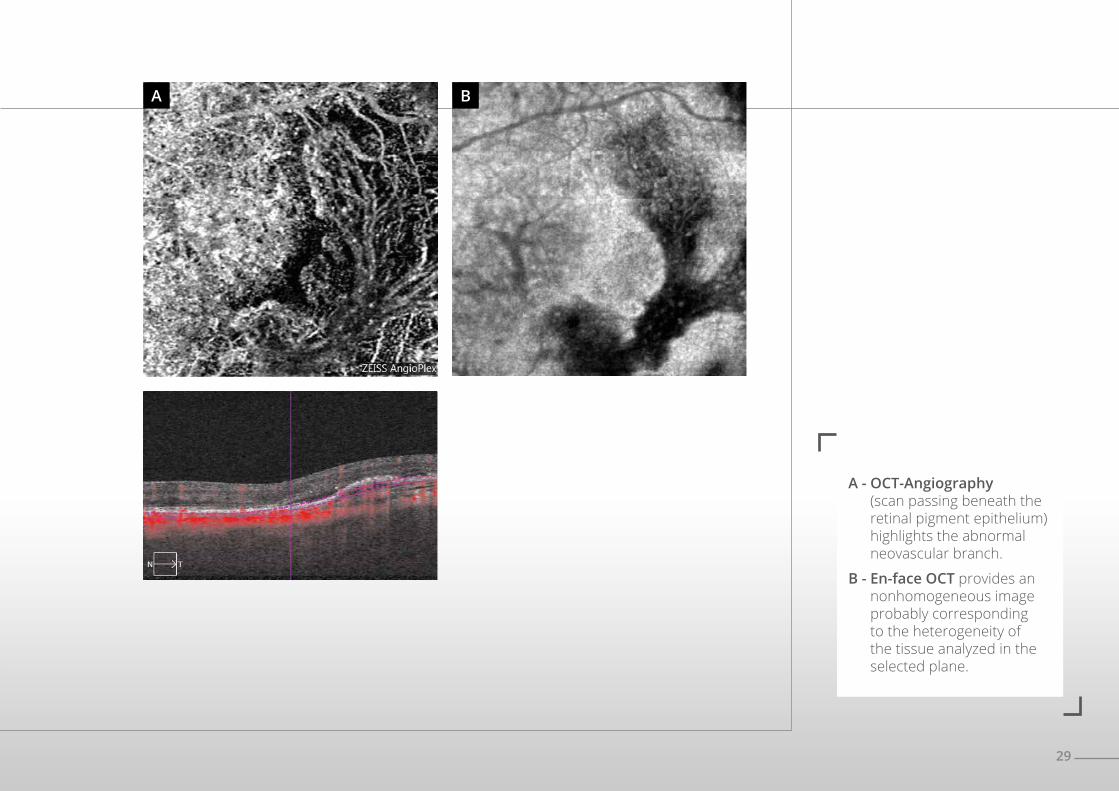
A - OCT-Angiography (scan passing beneath the retinal pigment epithelium) highlights the abnormal neovascular branch.
B - En-face OCT provides an nonhomogeneous image probably corresponding to the heterogeneity of the tissue analyzed in the selected plane.
30
RETINAL ANGIOMATOUS PROLIFERATION
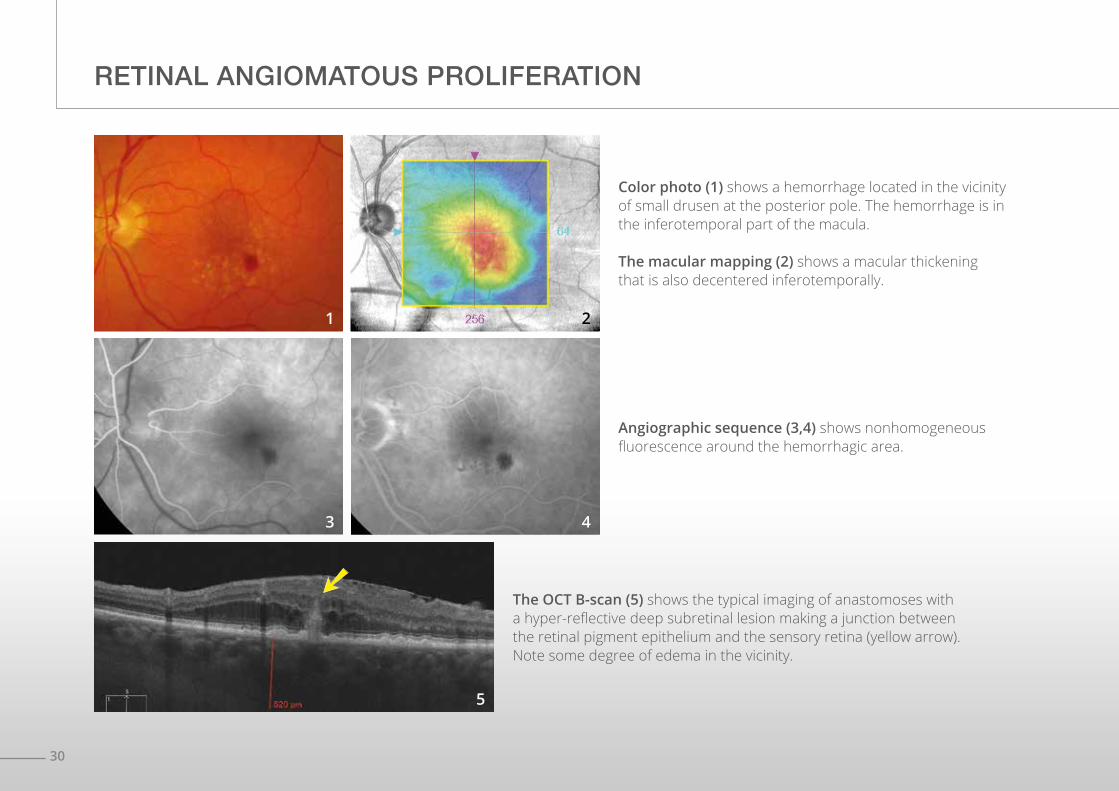
Angiographic sequence (3,4) shows nonhomogeneous fluorescence around the hemorrhagic area.
The OCT B-scan (5) shows the typical imaging of anastomoses with a hyper-reflective deep subretinal lesion making a junction between the retinal pigment epithelium and the sensory retina (yellow arrow). Note some degree of edema in the vicinity.
Color photo (1) shows a hemorrhage located in the vicinity of small drusen at the posterior pole. The hemorrhage is in the inferotemporal part of the macula.
The macular mapping (2) shows a macular thickening that is also decentered inferotemporally.
1
3
2
4
5
31
A B
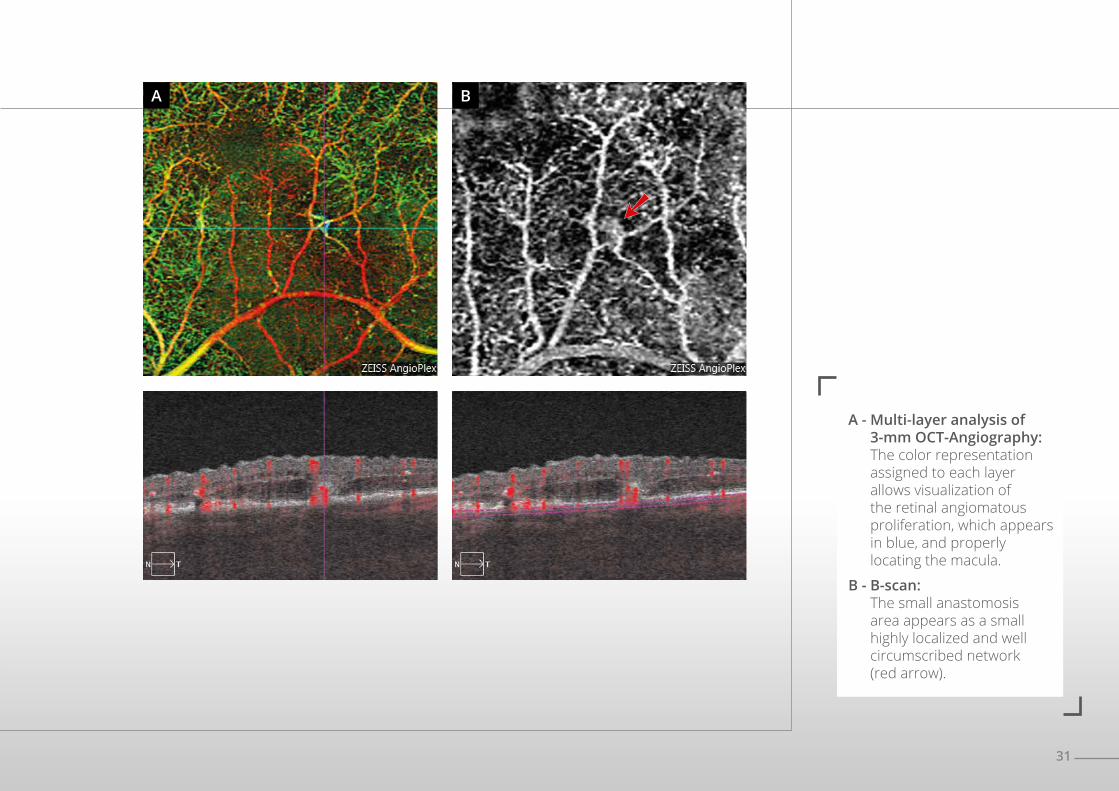
A - Multi-layer analysis of 3-mm OCT-Angiography: The color representation assigned to each layer allows visualization of the retinal angiomatous proliferation, which appears in blue, and properly locating the macula.
B - B-scan: The small anastomosis area appears as a small highly localized and well circumscribed network (red arrow).
32
RETINAL ANGIOMATOUS PROLIFERATION
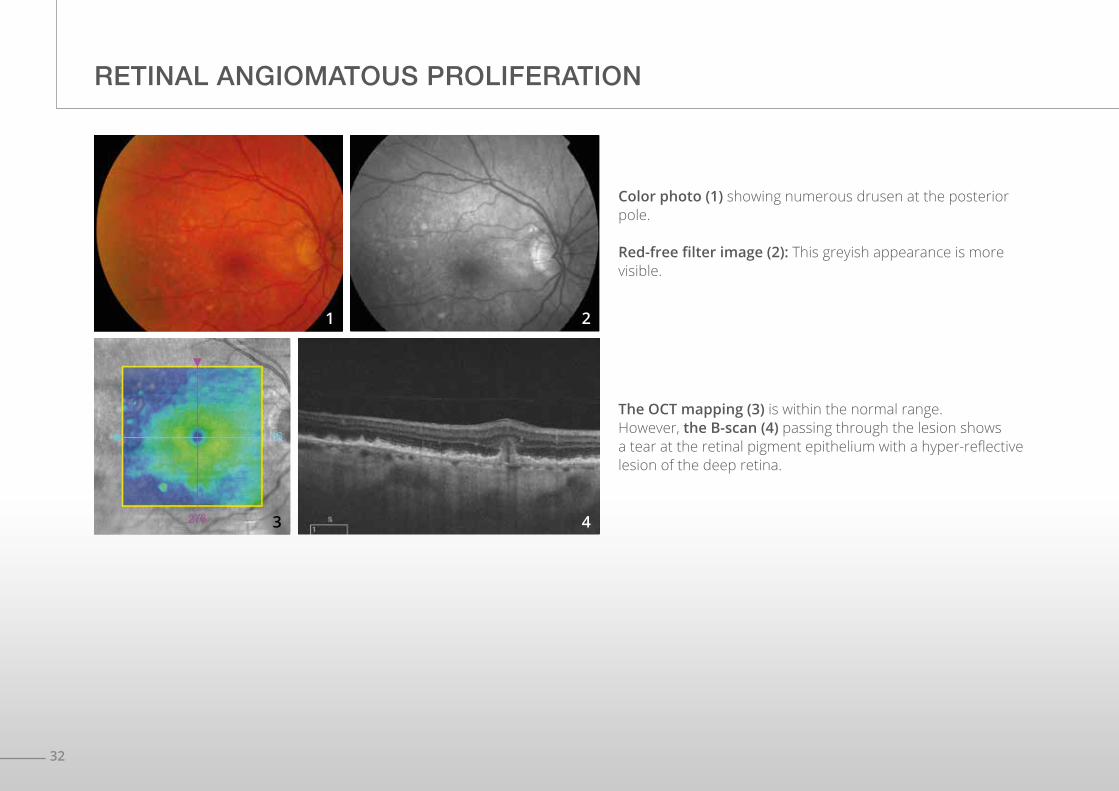
The OCT mapping (3) is within the normal range. However, the B-scan (4) passing through the lesion shows a tear at the retinal pigment epithelium with a hyper-reflective lesion of the deep retina.
Color photo (1) showing numerous drusen at the posterior pole.
Red-free filter image (2): This greyish appearance is more visible.
1
3
2
4
33
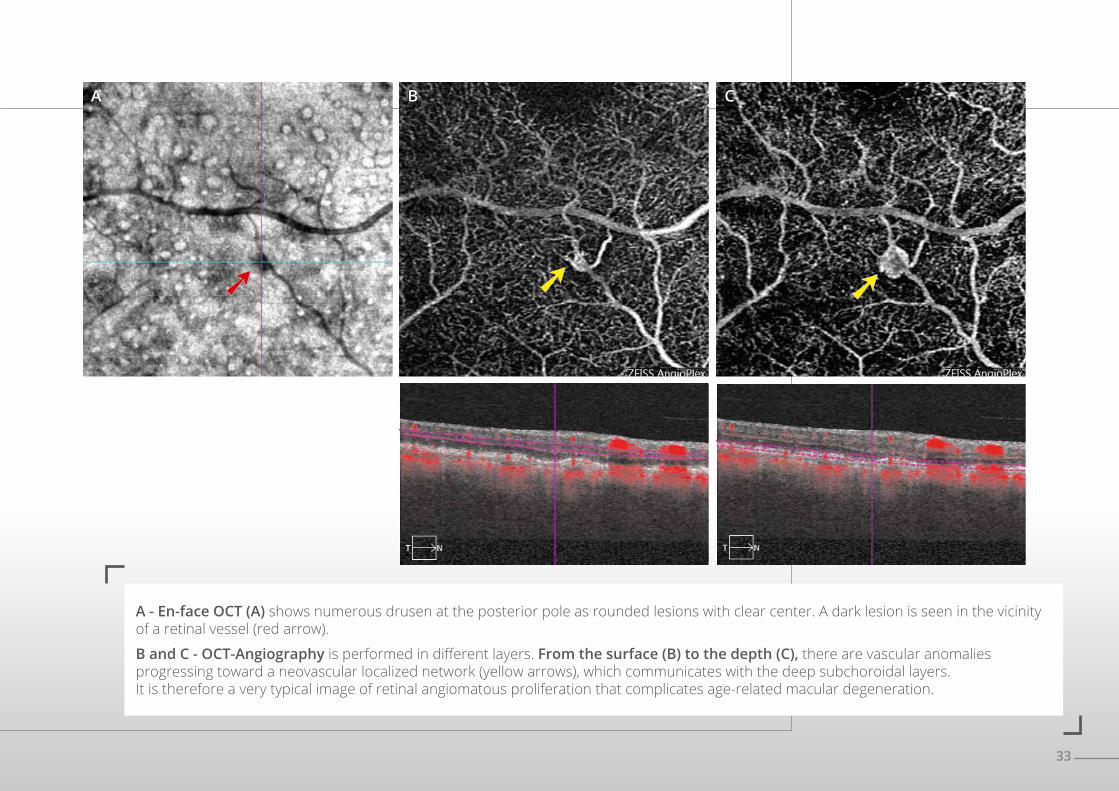
A - En-face OCT (A) shows numerous drusen at the posterior pole as rounded lesions with clear center. A dark lesion is seen in the vicinity of a retinal vessel (red arrow).
B and C - OCT-Angiography is performed in different layers. From the surface (B) to the depth (C), there are vascular anomalies progressing toward a neovascular localized network (yellow arrows), which communicates with the deep subchoroidal layers. It is therefore a very typical image of retinal angiomatous proliferation that complicates age-related macular degeneration.
A B C
34
VASCULARIZED PIGMENT EPITHELIUM DETACHMENT
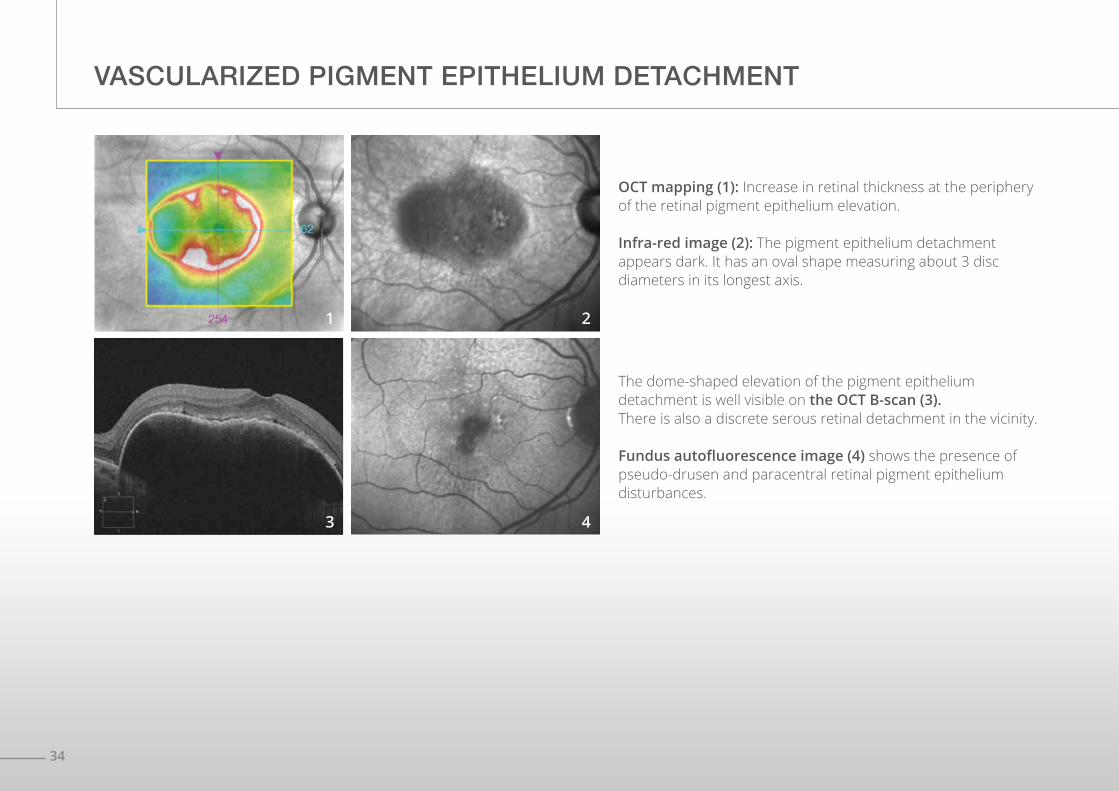
The dome-shaped elevation of the pigment epithelium detachment is well visible on the OCT B-scan (3).There is also a discrete serous retinal detachment in the vicinity.
Fundus autofluorescence image (4) shows the presence of pseudo-drusen and paracentral retinal pigment epithelium disturbances.
OCT mapping (1): Increase in retinal thickness at the periphery of the retinal pigment epithelium elevation.
Infra-red image (2): The pigment epithelium detachment appears dark. It has an oval shape measuring about 3 disc diameters in its longest axis.
1
3
2
4
35
A B
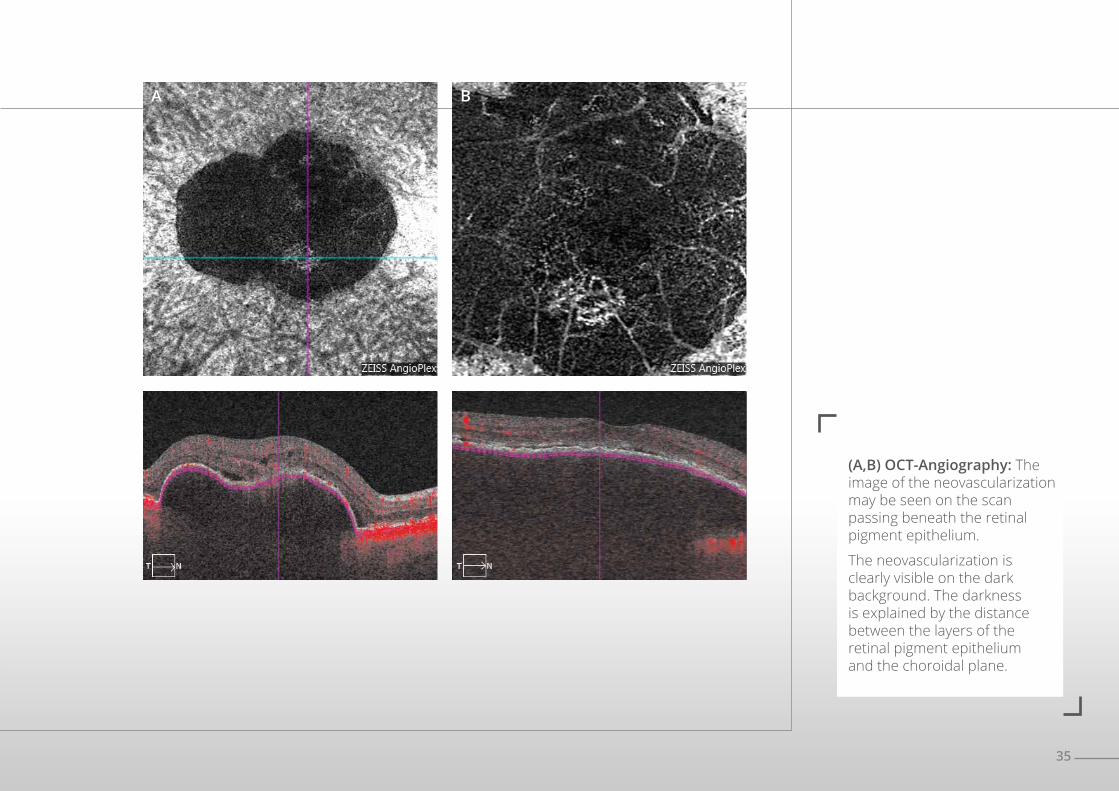
(A,B) OCT-Angiography: The image of the neovascularization may be seen on the scan passing beneath the retinal pigment epithelium.
The neovascularization is clearly visible on the dark background. The darkness is explained by the distance between the layers of the retinal pigment epithelium and the choroidal plane.
36
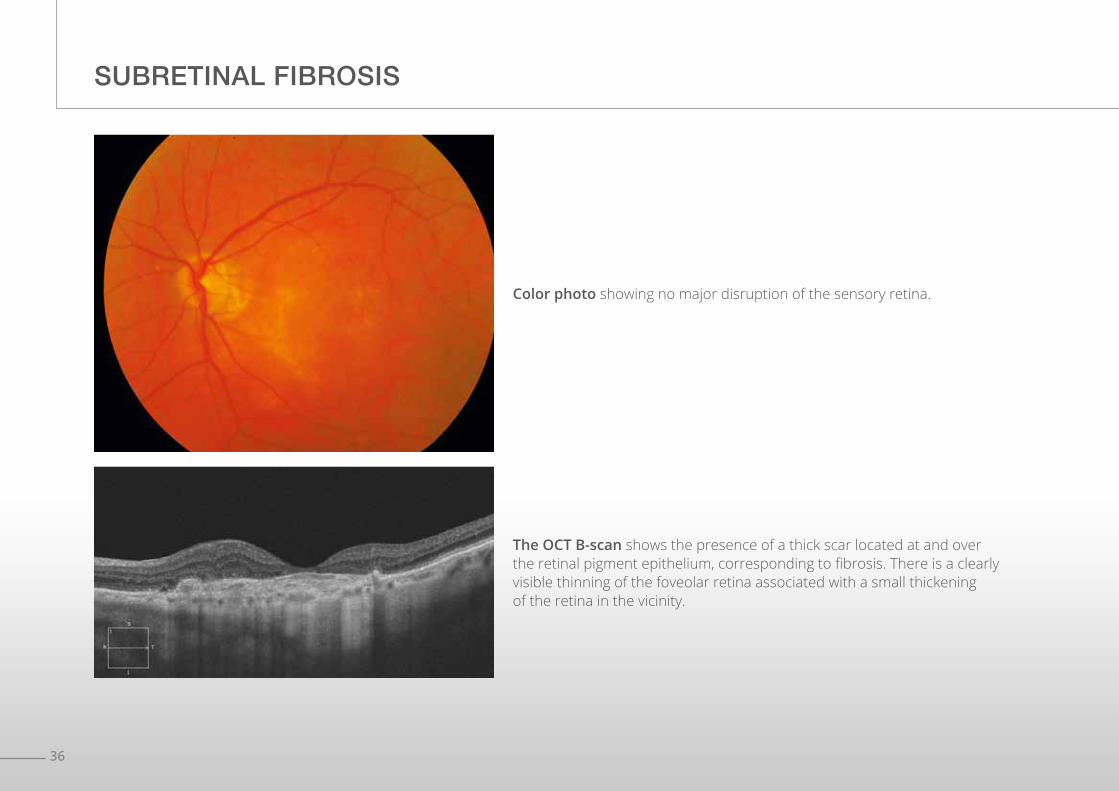
Color photo showing no major disruption of the sensory retina.
The OCT B-scan shows the presence of a thick scar located at and over the retinal pigment epithelium, corresponding to fibrosis. There is a clearly visible thinning of the foveolar retina associated with a small thickening of the retina in the vicinity.
SUBRETINAL FIBROSIS
37
A B
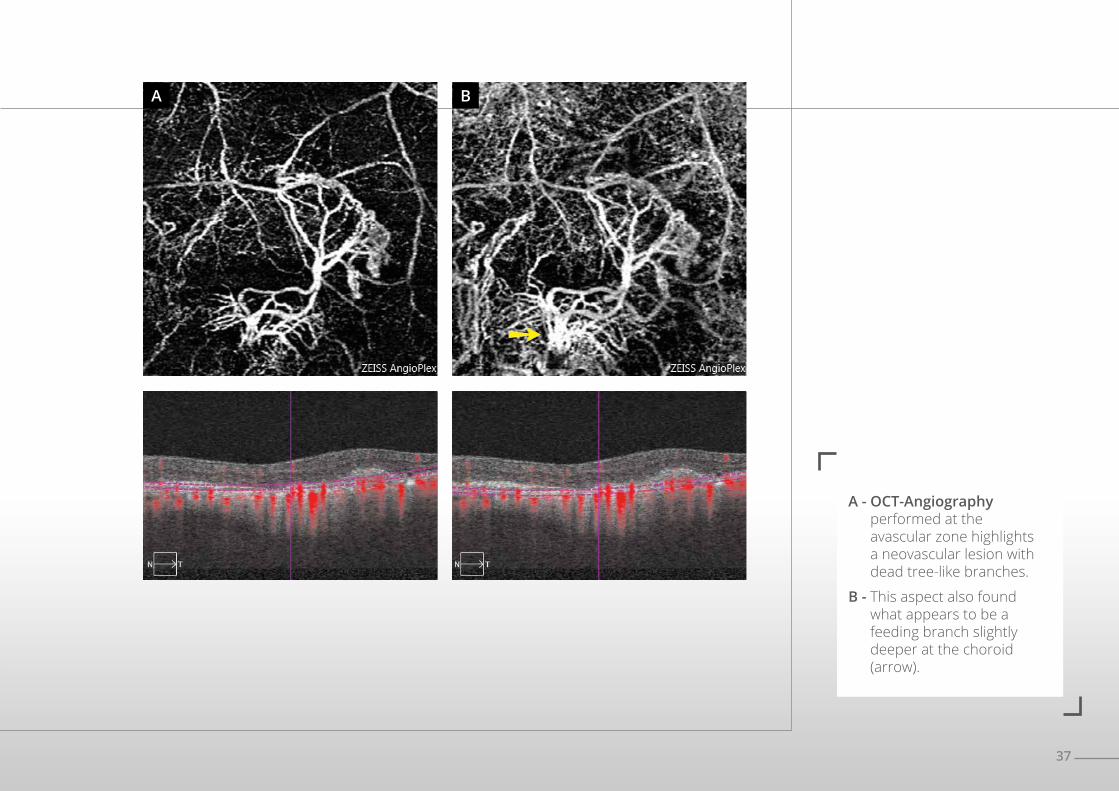
A - OCT-Angiography performed at the avascular zone highlights a neovascular lesion with dead tree-like branches.
B - This aspect also found what appears to be a feeding branch slightly deeper at the choroid (arrow).
38
POLYPOIDAL VASCULOPATHY
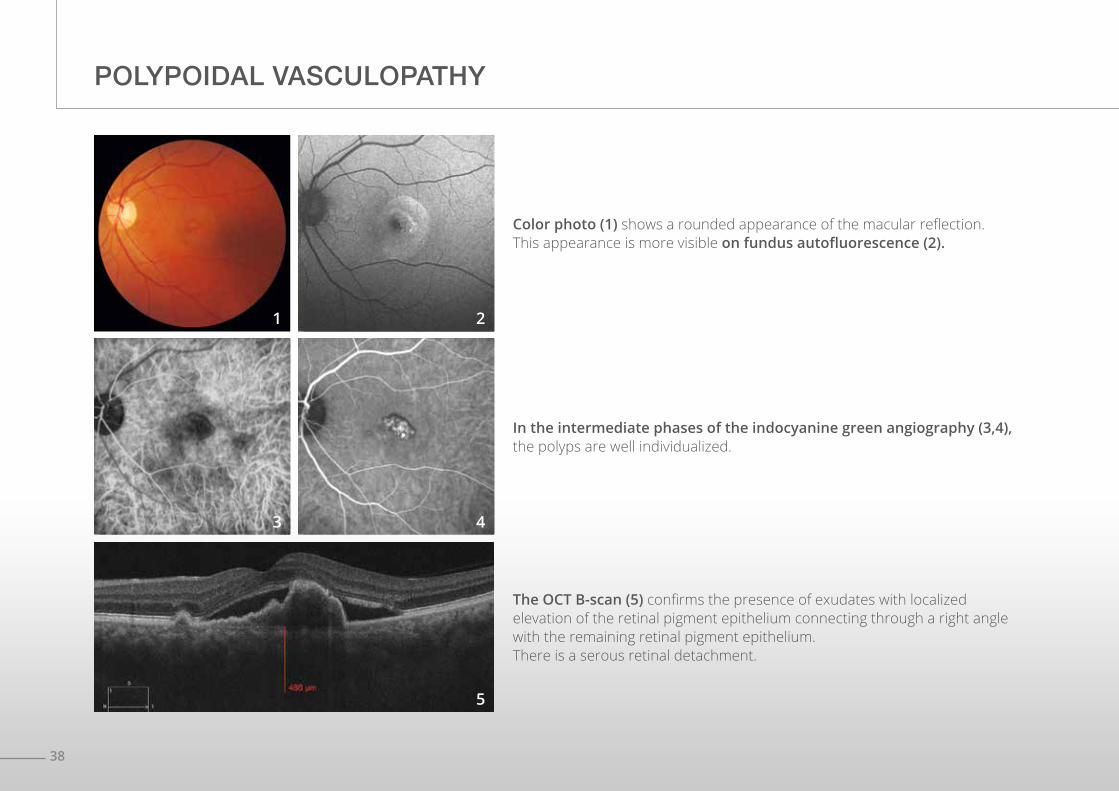
In the intermediate phases of the indocyanine green angiography (3,4), the polyps are well individualized.
The OCT B-scan (5) confirms the presence of exudates with localized elevation of the retinal pigment epithelium connecting through a right angle with the remaining retinal pigment epithelium.There is a serous retinal detachment.
Color photo (1) shows a rounded appearance of the macular reflection. This appearance is more visible on fundus autofluorescence (2).
1
3
2
4
5
39
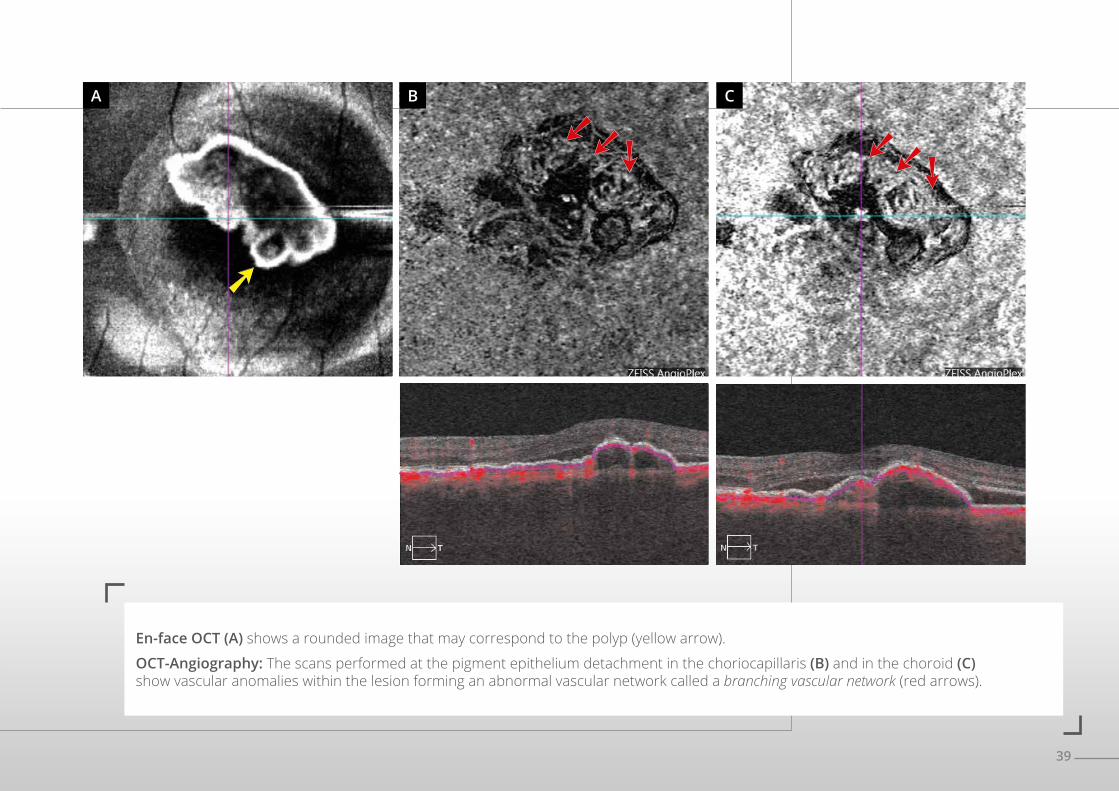
En-face OCT (A) shows a rounded image that may correspond to the polyp (yellow arrow).
OCT-Angiography: The scans performed at the pigment epithelium detachment in the choriocapillaris (B) and in the choroid (C) show vascular anomalies within the lesion forming an abnormal vascular network called a branching vascular network (red arrows).
A B C
40
POLYPOIDAL VASCULOPATHY
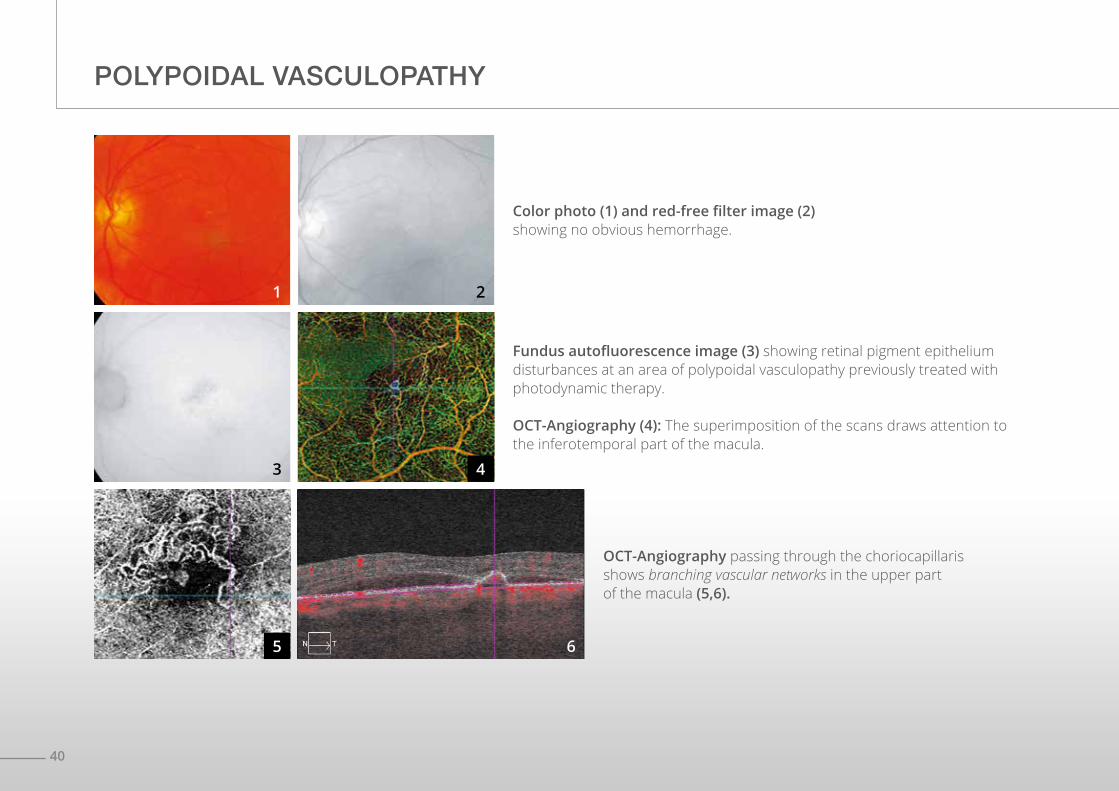
Fundus autofluorescence image (3) showing retinal pigment epithelium disturbances at an area of polypoidal vasculopathy previously treated with photodynamic therapy.
OCT-Angiography (4): The superimposition of the scans draws attention to the inferotemporal part of the macula.
OCT-Angiography passing through the choriocapillaris shows branching vascular networks in the upper part of the macula (5,6).
Color photo (1) and red-free filter image (2) showing no obvious hemorrhage.
1
3
5
2
4
6
41
A
B
C
D
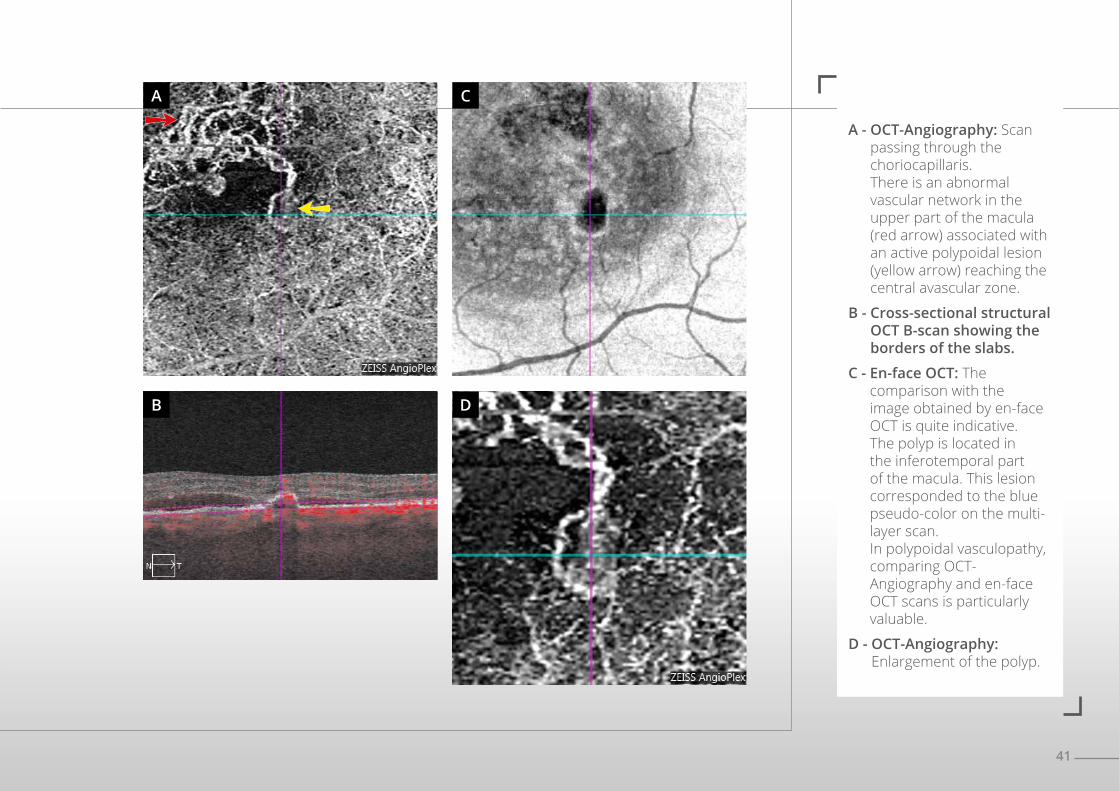
A - OCT-Angiography: Scan passing through the choriocapillaris. There is an abnormal vascular network in the upper part of the macula (red arrow) associated with an active polypoidal lesion (yellow arrow) reaching the central avascular zone.
B - Cross-sectional structural OCT B-scan showing the borders of the slabs.
C - En-face OCT: The comparison with the image obtained by en-face OCT is quite indicative. The polyp is located in the inferotemporal part of the macula. This lesion corresponded to the blue pseudo-color on the multi-layer scan. In polypoidal vasculopathy, comparing OCT-Angiography and en-face OCT scans is particularly valuable.
D - OCT-Angiography: Enlargement of the polyp.
42
FOLLOW-UP OF TREATED CHROIDAL NEOVASCULARIZATION
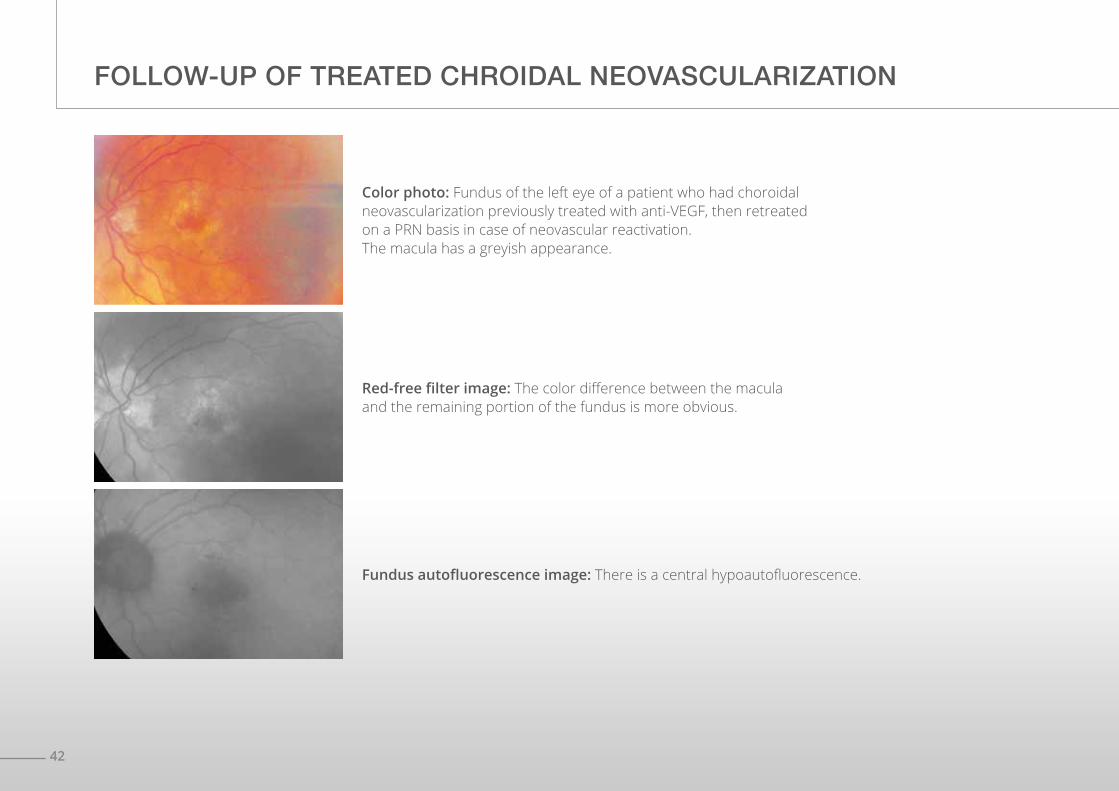
Red-free filter image: The color difference between the macula and the remaining portion of the fundus is more obvious.
Fundus autofluorescence image: There is a central hypoautofluorescence.
Color photo: Fundus of the left eye of a patient who had choroidal neovascularization previously treated with anti-VEGF, then retreated on a PRN basis in case of neovascular reactivation.The macula has a greyish appearance.
43
A
B
C
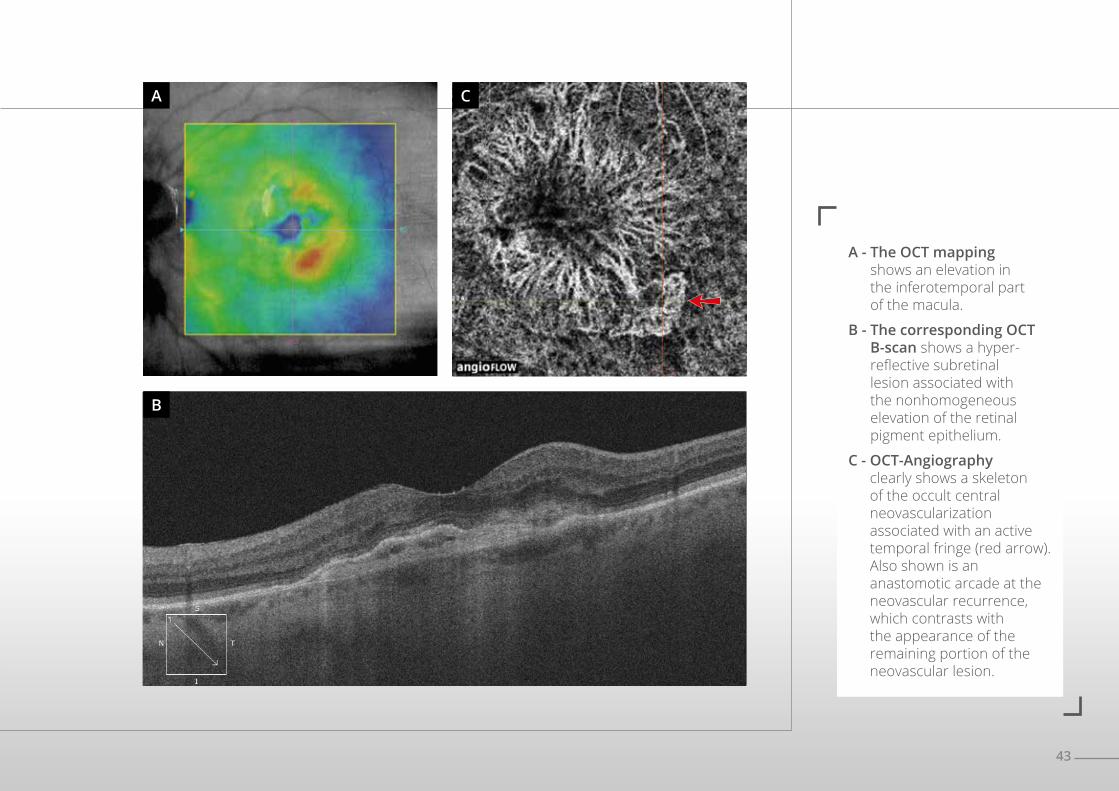
A - The OCT mapping shows an elevation in the inferotemporal part of the macula.
B - The corresponding OCT B-scan shows a hyper-reflective subretinal lesion associated with the nonhomogeneous elevation of the retinal pigment epithelium.
C - OCT-Angiography clearly shows a skeleton of the occult central neovascularization associated with an active temporal fringe (red arrow). Also shown is an anastomotic arcade at the neovascular recurrence, which contrasts with the appearance of the remaining portion of the neovascular lesion.
44
FOLLOW-UP OF TREATED CHOROIDAL NEOVASCULARIZATION (Continued)
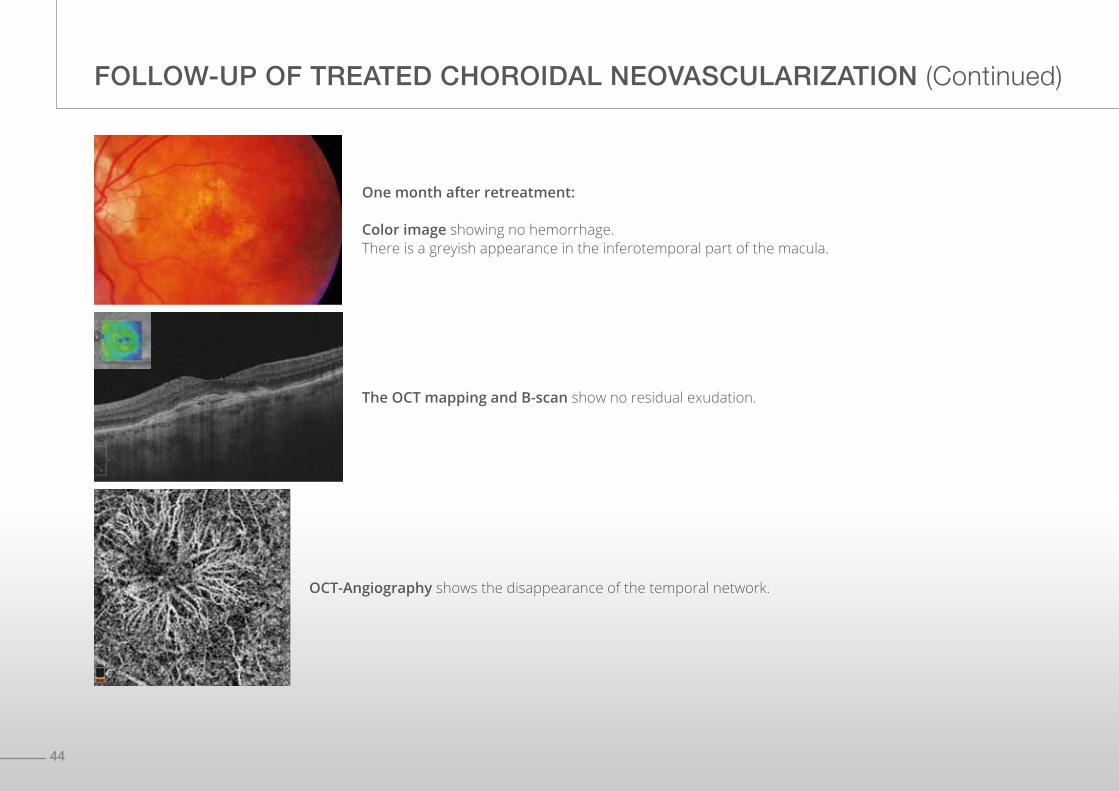
The OCT mapping and B-scan show no residual exudation.
OCT-Angiography shows the disappearance of the temporal network.
One month after retreatment:
Color image showing no hemorrhage.There is a greyish appearance in the inferotemporal part of the macula.
45
D
A B C
E F
3 months 3 months
3 months
3 months
Initial Scan 1 month
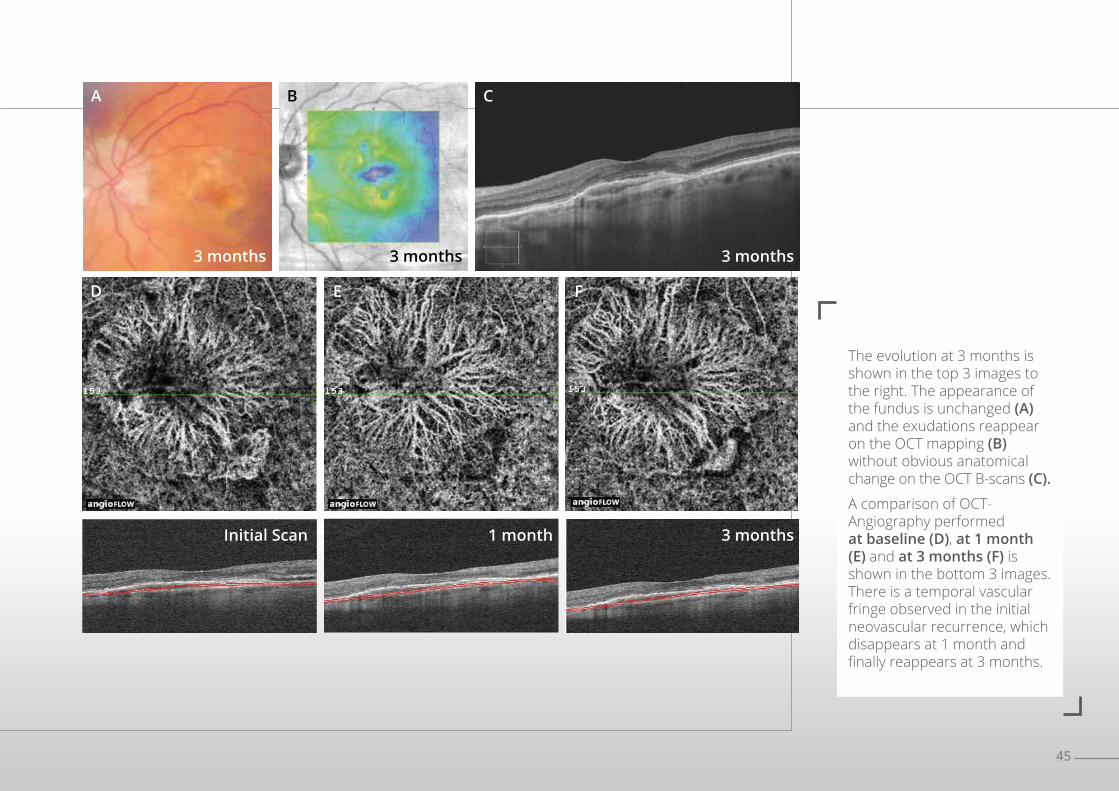
The evolution at 3 months is shown in the top 3 images to the right. The appearance of the fundus is unchanged (A) and the exudations reappear on the OCT mapping (B) without obvious anatomical change on the OCT B-scans (C).
A comparison of OCT-Angiography performed at baseline (D), at 1 month (E) and at 3 months (F) is shown in the bottom 3 images. There is a temporal vascular fringe observed in the initial neovascular recurrence, which disappears at 1 month and finally reappears at 3 months.
46
TREATED TYPE 2 CHOROIDAL NEOVASCULARIZATION
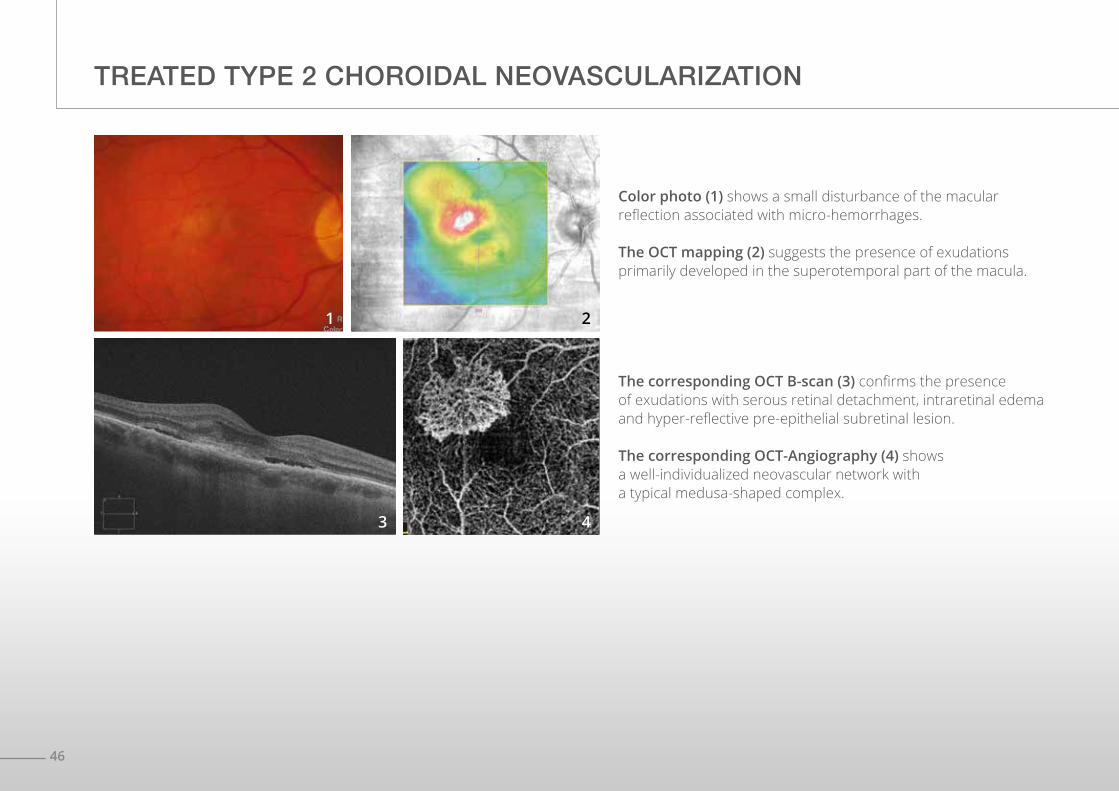
The corresponding OCT B-scan (3) confirms the presence of exudations with serous retinal detachment, intraretinal edema and hyper-reflective pre-epithelial subretinal lesion.
The corresponding OCT-Angiography (4) shows a well-individualized neovascular network with a typical medusa-shaped complex.
Color photo (1) shows a small disturbance of the macular reflection associated with micro-hemorrhages.
The OCT mapping (2) suggests the presence of exudations primarily developed in the superotemporal part of the macula.
1
3
2
4
47
A B
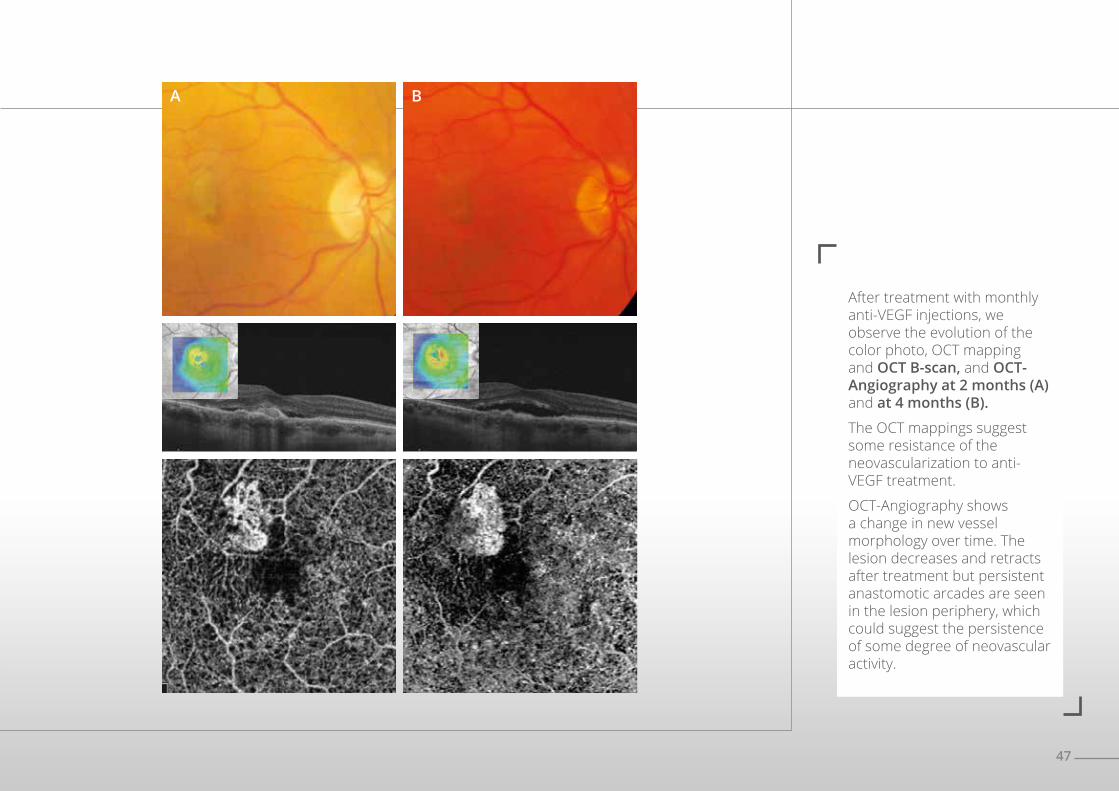
After treatment with monthly anti-VEGF injections, we observe the evolution of the color photo, OCT mapping and OCT B-scan, and OCT-Angiography at 2 months (A) and at 4 months (B).
The OCT mappings suggest some resistance of the neovascularization to anti-VEGF treatment.
OCT-Angiography shows a change in new vessel morphology over time. The lesion decreases and retracts after treatment but persistent anastomotic arcades are seen in the lesion periphery, which could suggest the persistence of some degree of neovascular activity.
48
CHOROIDAL NEOVASCULARIZATION COMPLICATING HIGH MYOPIA
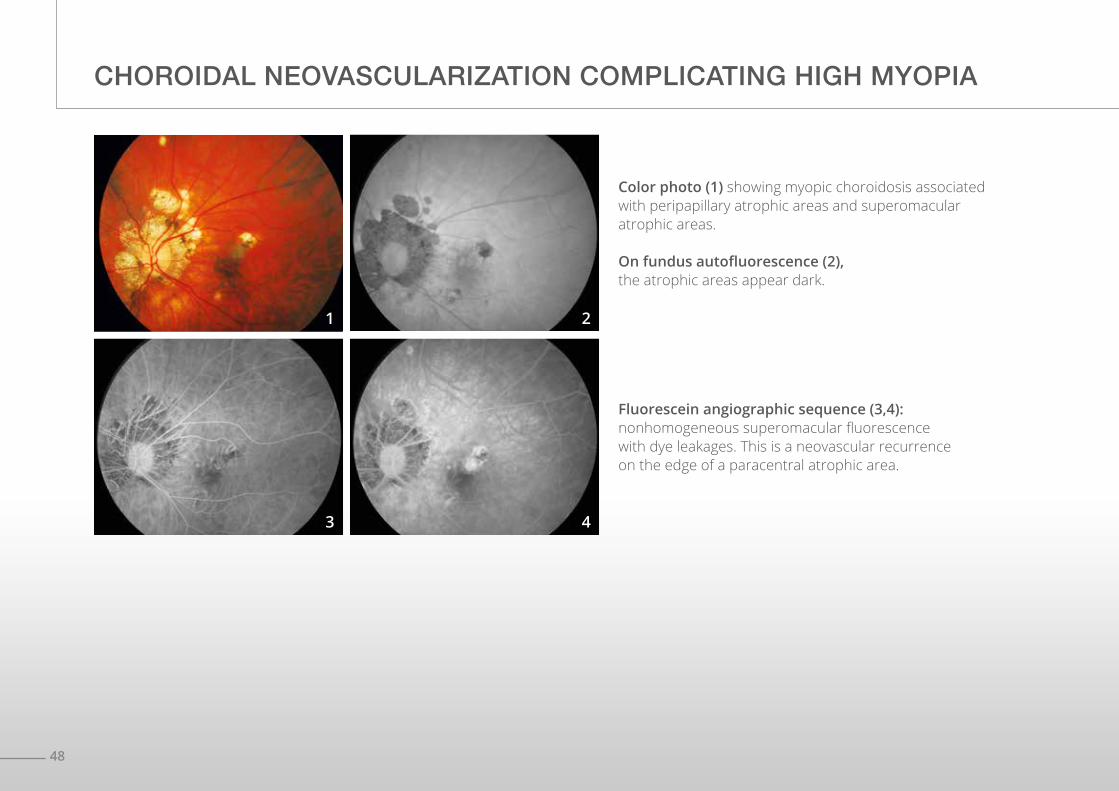
Fluorescein angiographic sequence (3,4):nonhomogeneous superomacular fluorescence with dye leakages. This is a neovascular recurrence on the edge of a paracentral atrophic area.
Color photo (1) showing myopic choroidosis associated with peripapillary atrophic areas and superomacular atrophic areas.
On fundus autofluorescence (2), the atrophic areas appear dark.
1
3
2
4
49
A
B
C
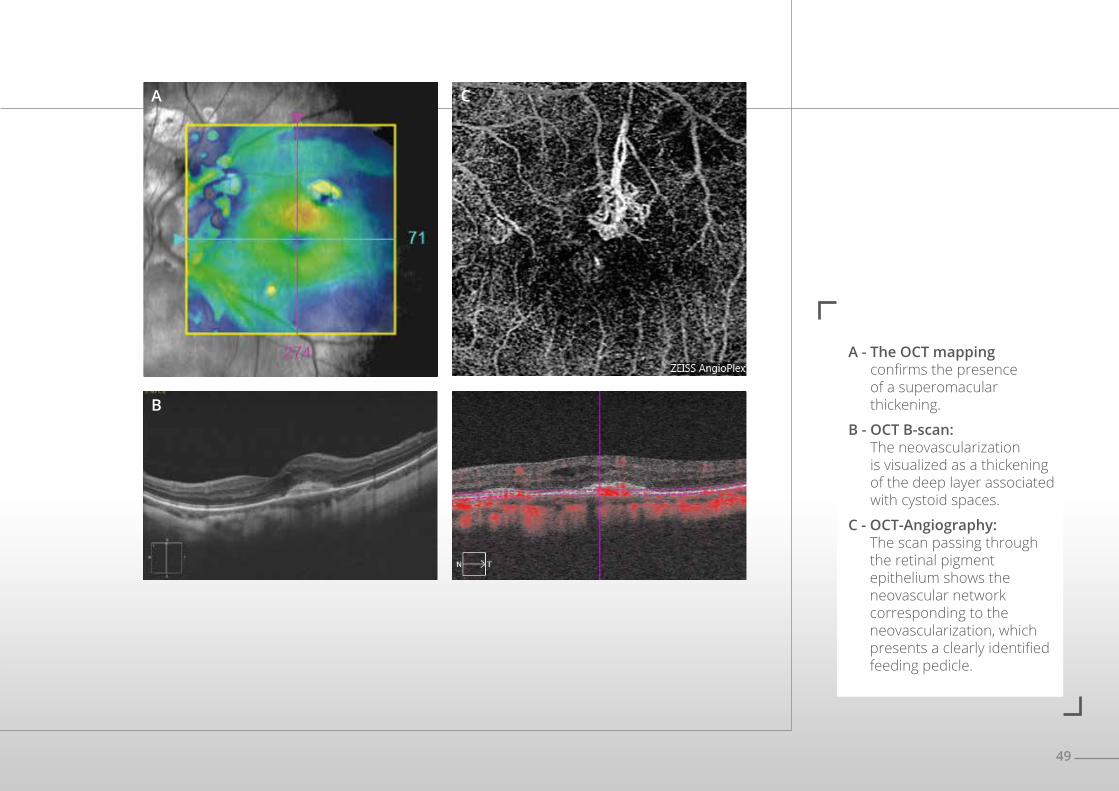
A - The OCT mapping confirms the presence of a superomacular thickening.
B - OCT B-scan: The neovascularization is visualized as a thickening of the deep layer associated with cystoid spaces.
C - OCT-Angiography: The scan passing through the retinal pigment epithelium shows the neovascular network corresponding to the neovascularization, which presents a clearly identified feeding pedicle.
50
CHOROIDAL NEOVASCULARIZATION IN HIGH MYOPIA
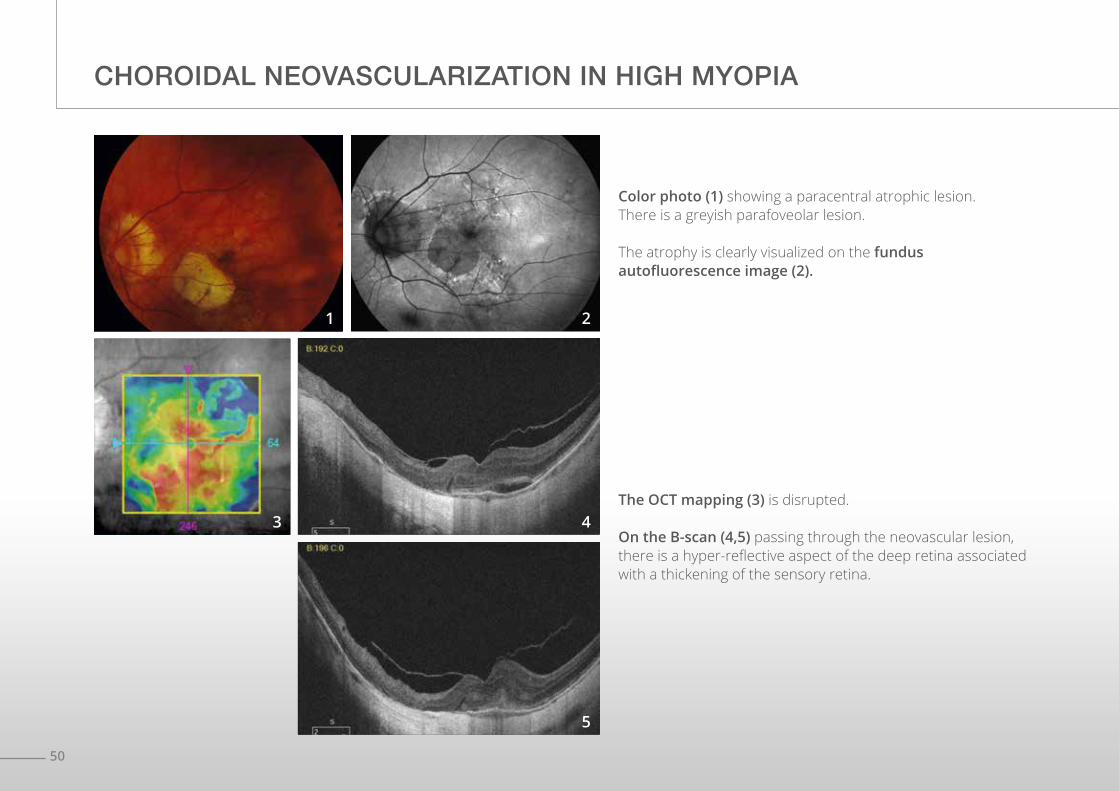
The OCT mapping (3) is disrupted.
On the B-scan (4,5) passing through the neovascular lesion, there is a hyper-reflective aspect of the deep retina associated with a thickening of the sensory retina.
Color photo (1) showing a paracentral atrophic lesion.There is a greyish parafoveolar lesion.
The atrophy is clearly visualized on the fundus autofluorescence image (2).
1 2
5
43
51
A
B
C
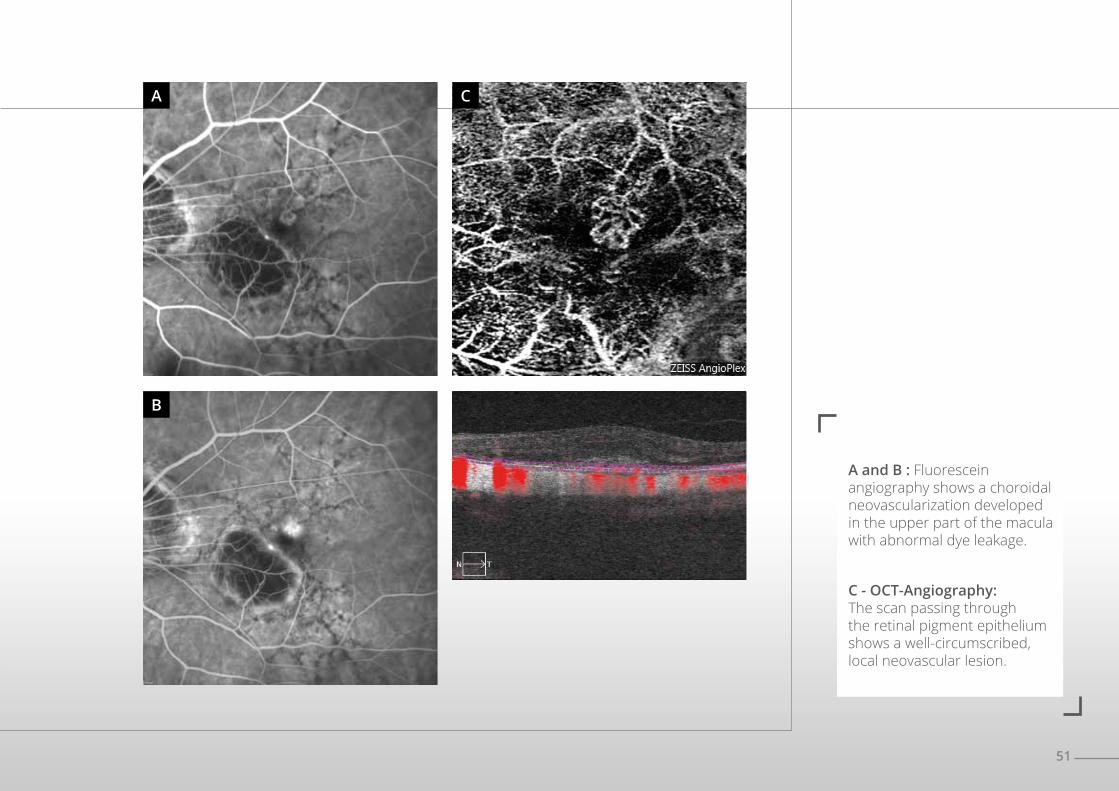
A and B : Fluorescein angiography shows a choroidal neovascularization developed in the upper part of the macula with abnormal dye leakage.
C - OCT-Angiography: The scan passing through the retinal pigment epithelium shows a well-circumscribed, local neovascular lesion.
52
NEOVASCULARIZATION COMPLICATING MULTIFOCAL CHOROIDITIS
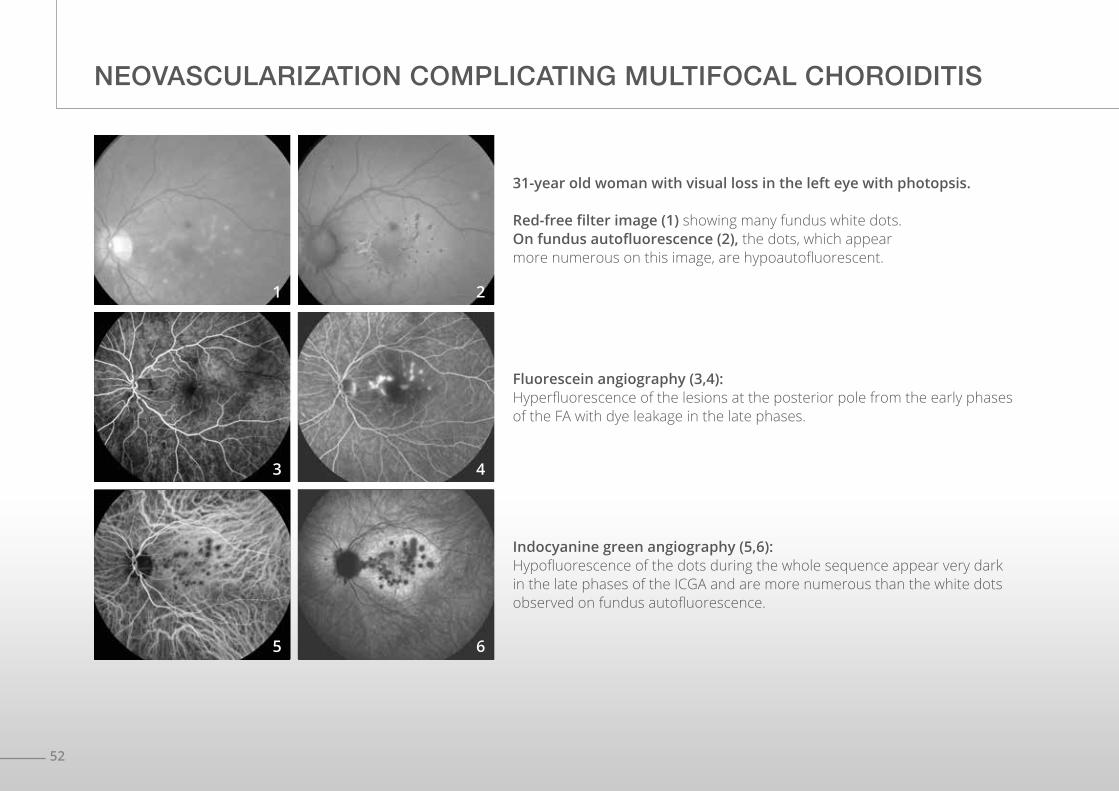
Fluorescein angiography (3,4):Hyperfluorescence of the lesions at the posterior pole from the early phases of the FA with dye leakage in the late phases.
Indocyanine green angiography (5,6):Hypofluorescence of the dots during the whole sequence appear very dark in the late phases of the ICGA and are more numerous than the white dots observed on fundus autofluorescence.
31-year old woman with visual loss in the left eye with photopsis.
Red-free filter image (1) showing many fundus white dots.On fundus autofluorescence (2), the dots, which appear more numerous on this image, are hypoautofluorescent.
1
3
5
2
4
6
53
A
C
B
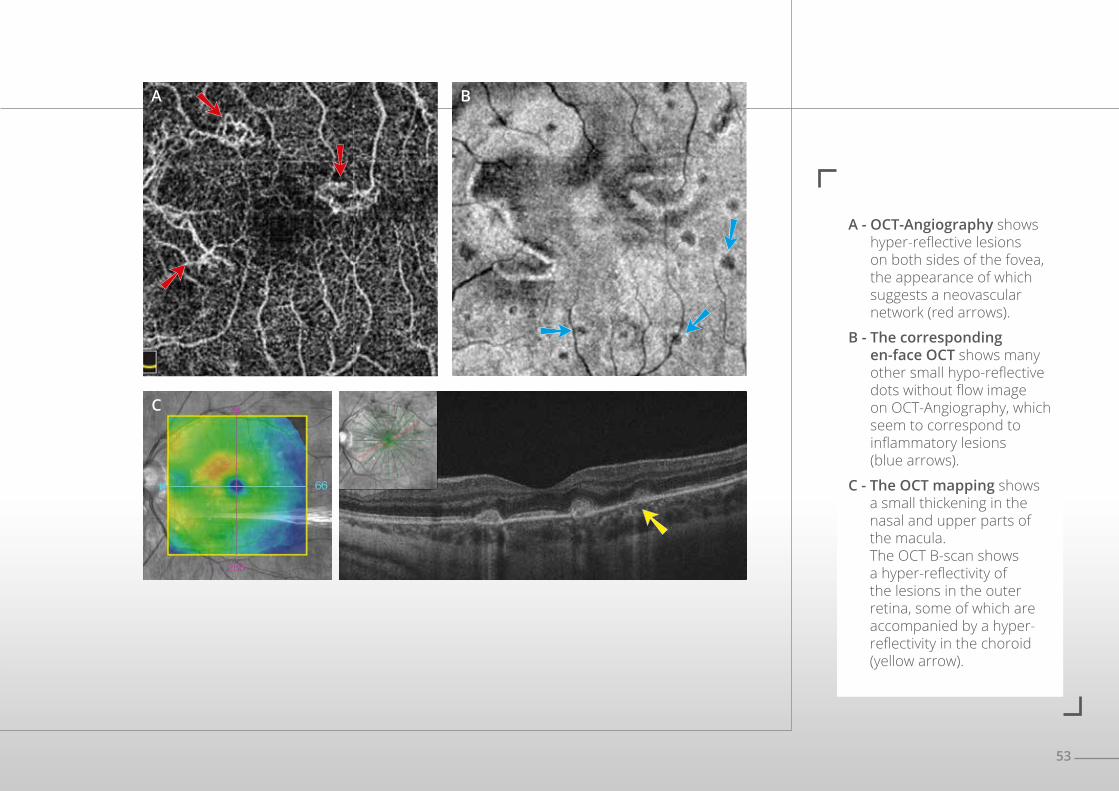
A - OCT-Angiography shows hyper-reflective lesions on both sides of the fovea, the appearance of which suggests a neovascular network (red arrows).
B - The corresponding en-face OCT shows many other small hypo-reflective dots without flow image on OCT-Angiography, which seem to correspond to inflammatory lesions (blue arrows).
C - The OCT mapping shows a small thickening in the nasal and upper parts of the macula. The OCT B-scan shows a hyper-reflectivity of the lesions in the outer retina, some of which are accompanied by a hyper-reflectivity in the choroid (yellow arrow).
54
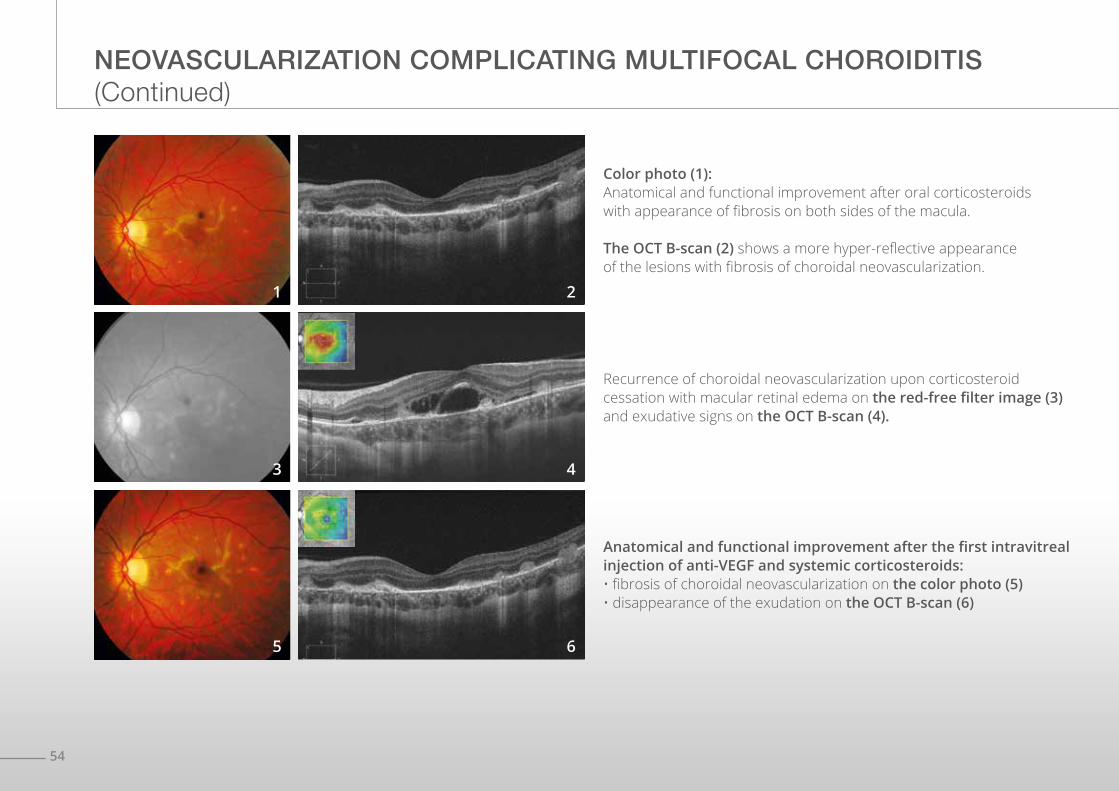
Recurrence of choroidal neovascularization upon corticosteroid cessation with macular retinal edema on the red-free filter image (3) and exudative signs on the OCT B-scan (4).
Anatomical and functional improvement after the first intravitreal injection of anti-VEGF and systemic corticosteroids:• fibrosis of choroidal neovascularization on the color photo (5)• disappearance of the exudation on the OCT B-scan (6)
Color photo (1):Anatomical and functional improvement after oral corticosteroids with appearance of fibrosis on both sides of the macula.
The OCT B-scan (2) shows a more hyper-reflective appearance of the lesions with fibrosis of choroidal neovascularization.
NEOVASCULARIZATION COMPLICATING MULTIFOCAL CHOROIDITIS (Continued)
1
3
5
2
4
6
55
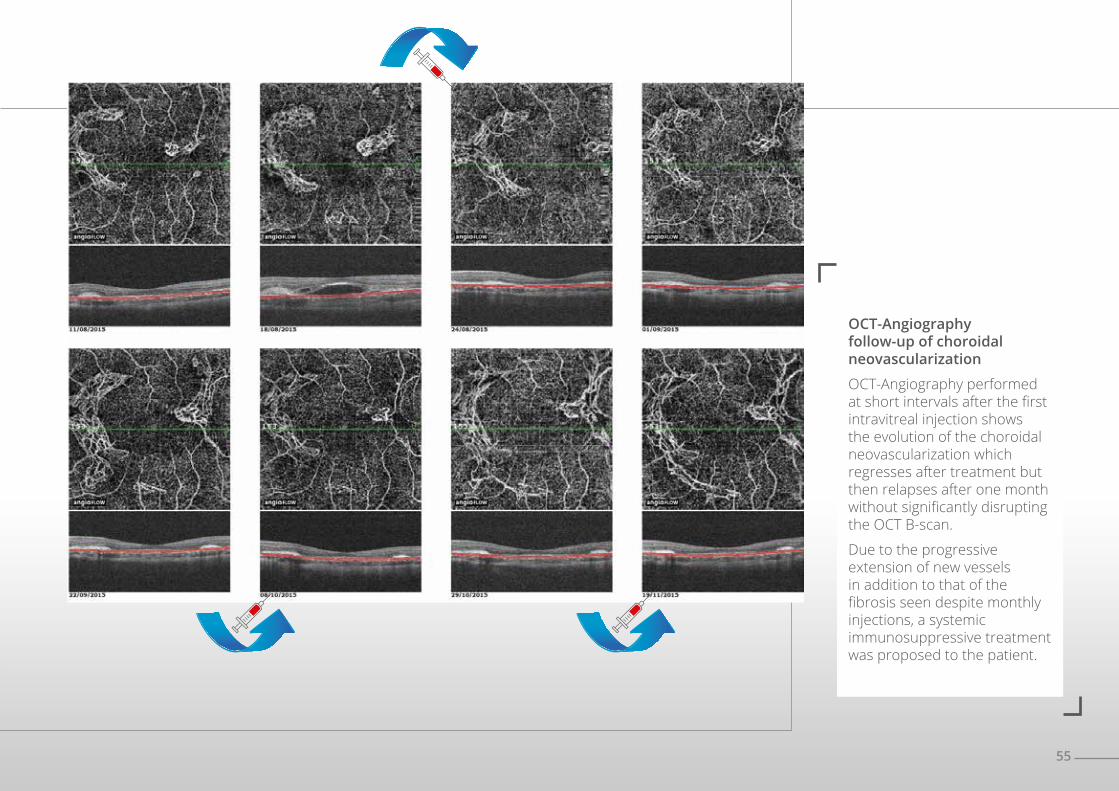
OCT-Angiography follow-up of choroidal neovascularization
OCT-Angiography performed at short intervals after the first intravitreal injection shows the evolution of the choroidal neovascularization which regresses after treatment but then relapses after one month without significantly disrupting the OCT B-scan.
Due to the progressive extension of new vessels in addition to that of the fibrosis seen despite monthly injections, a systemic immunosuppressive treatment was proposed to the patient.
57
CHAPTER 3EDEMA
En-face OCT performs a reasonable morphological analysis of macular edema, especially cystoid macular edema. OCT-Angiography also helps assess vascular anomalies that are sometimes the cause of edema. Therefore, combining both examinations (en-face OCT + OCT-Angiography) is highly valuable.
Since the development of OCT-Angiography, attention has been refocused on the retinal deep capillary plexus. Indeed, the retinal deep capillary plexus had been overlooked since it was not visualized by fluorescein angiography. OCT-Angiography reminded us of this complex circulation (along with the intermediate capillary plexus). The anomalies observed at the deep capillary plexus are at the forefront in the occurrence of cystoid macular edema complicating diabetic maculopathy or vein occlusion. After anti-edematous treatment, the disappearance of cystoid spaces is commonly observed while capillary anomalies persist, which may explain why macular edema tends to recur.
58
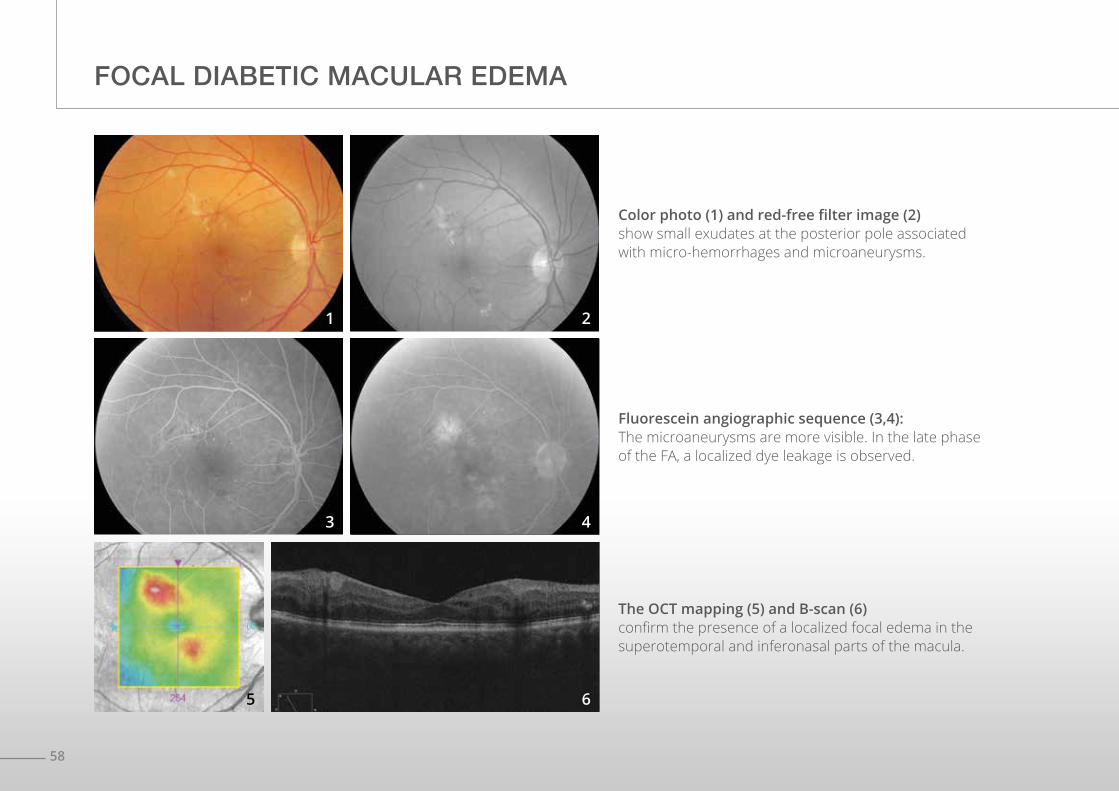
FOCAL DIABETIC MACULAR EDEMA
Fluorescein angiographic sequence (3,4): The microaneurysms are more visible. In the late phase of the FA, a localized dye leakage is observed.
The OCT mapping (5) and B-scan (6)confirm the presence of a localized focal edema in the superotemporal and inferonasal parts of the macula.
Color photo (1) and red-free filter image (2) show small exudates at the posterior pole associated with micro-hemorrhages and microaneurysms.
1
3
2
4
65
59
A B
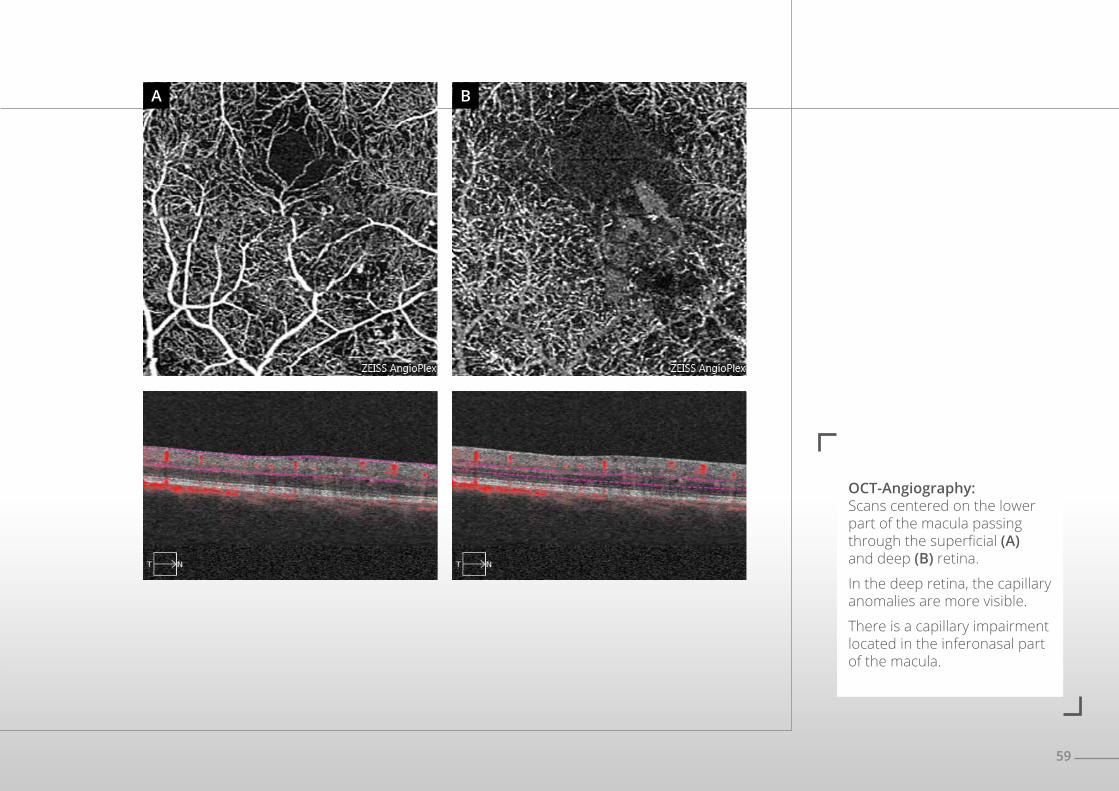
OCT-Angiography: Scans centered on the lower part of the macula passing through the superficial (A) and deep (B) retina.
In the deep retina, the capillary anomalies are more visible.
There is a capillary impairment located in the inferonasal part of the macula.
60
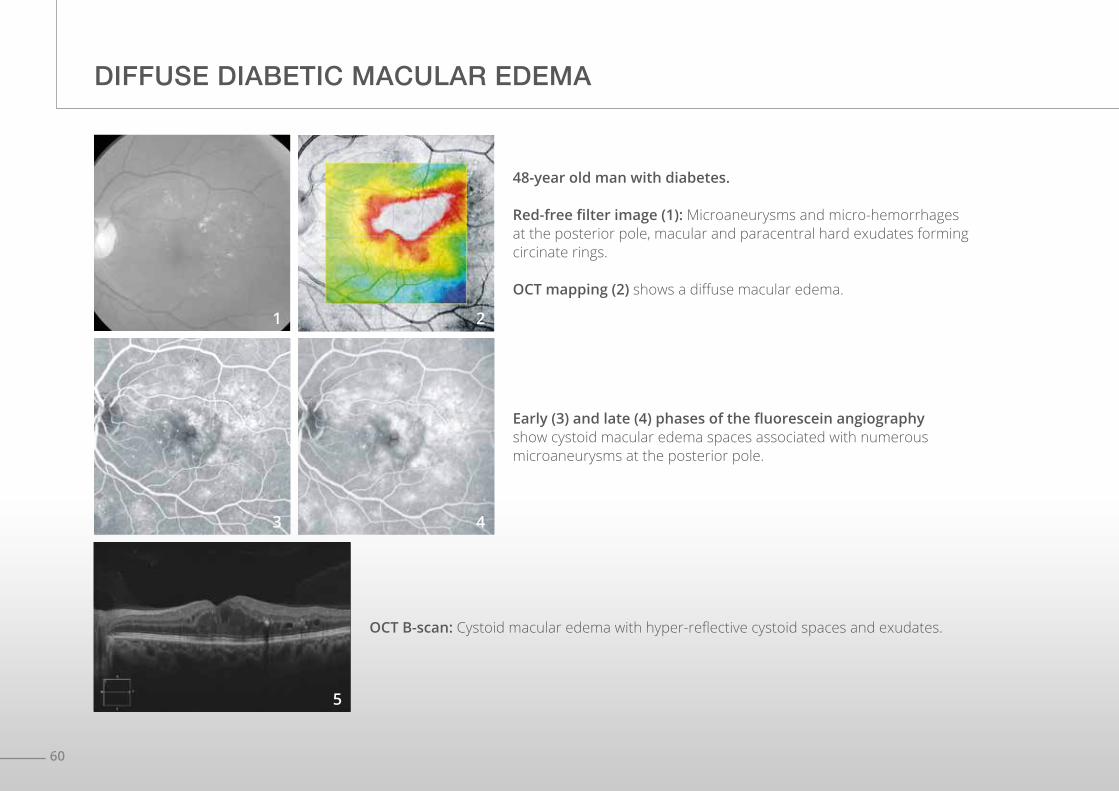
48-year old man with diabetes.
Red-free filter image (1): Microaneurysms and micro-hemorrhages at the posterior pole, macular and paracentral hard exudates forming circinate rings.
OCT mapping (2) shows a diffuse macular edema.
Early (3) and late (4) phases of the fluorescein angiography show cystoid macular edema spaces associated with numerous microaneurysms at the posterior pole.
DIFFUSE DIABETIC MACULAR EDEMA
1 2
4
5
3
OCT B-scan: Cystoid macular edema with hyper-reflective cystoid spaces and exudates.
61
A B
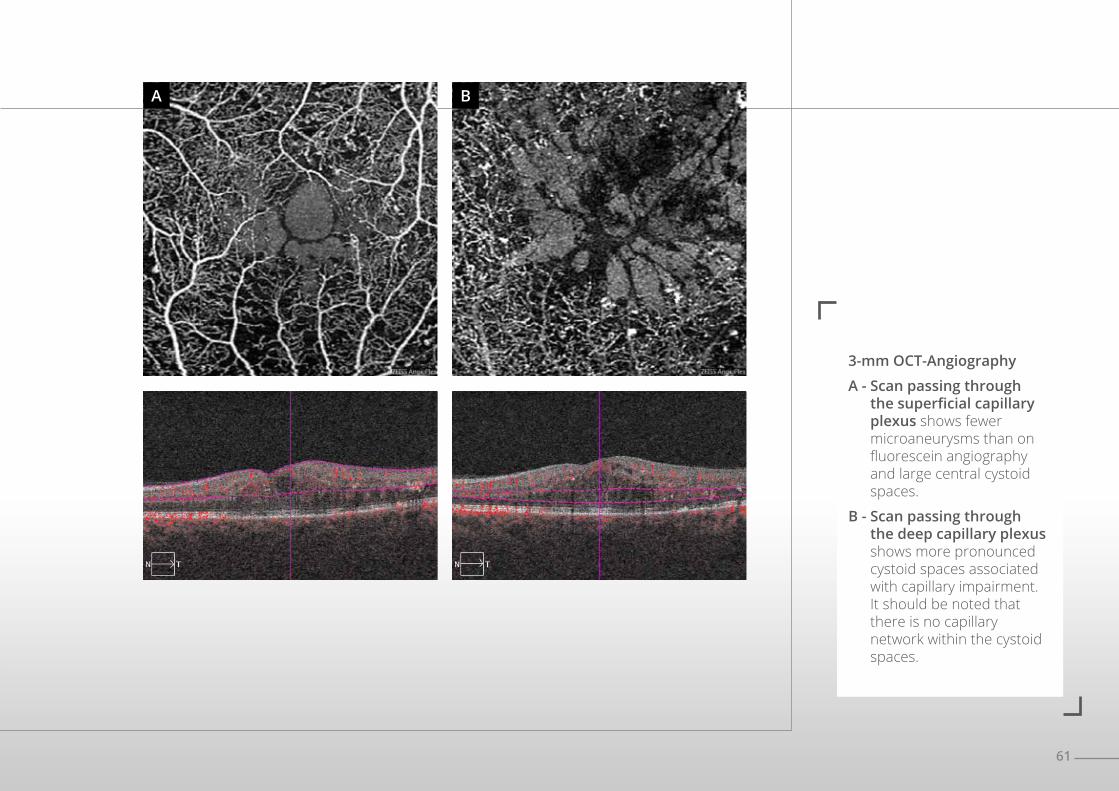
3-mm OCT-Angiography
A - Scan passing through the superficial capillary plexus shows fewer microaneurysms than on fluorescein angiography and large central cystoid spaces.
B - Scan passing through the deep capillary plexus shows more pronounced cystoid spaces associated with capillary impairment. It should be noted that there is no capillary network within the cystoid spaces.
62
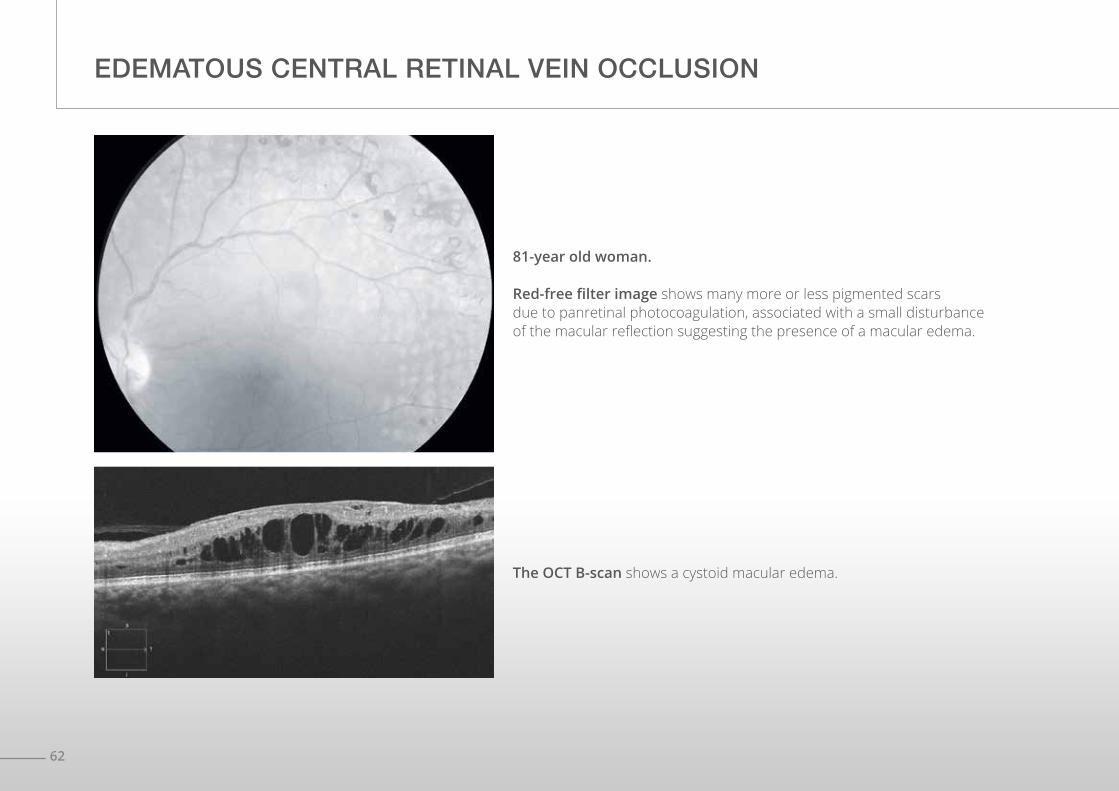
81-year old woman.
Red-free filter image shows many more or less pigmented scars due to panretinal photocoagulation, associated with a small disturbance of the macular reflection suggesting the presence of a macular edema.
The OCT B-scan shows a cystoid macular edema.
EDEMATOUS CENTRAL RETINAL VEIN OCCLUSION
63
A B
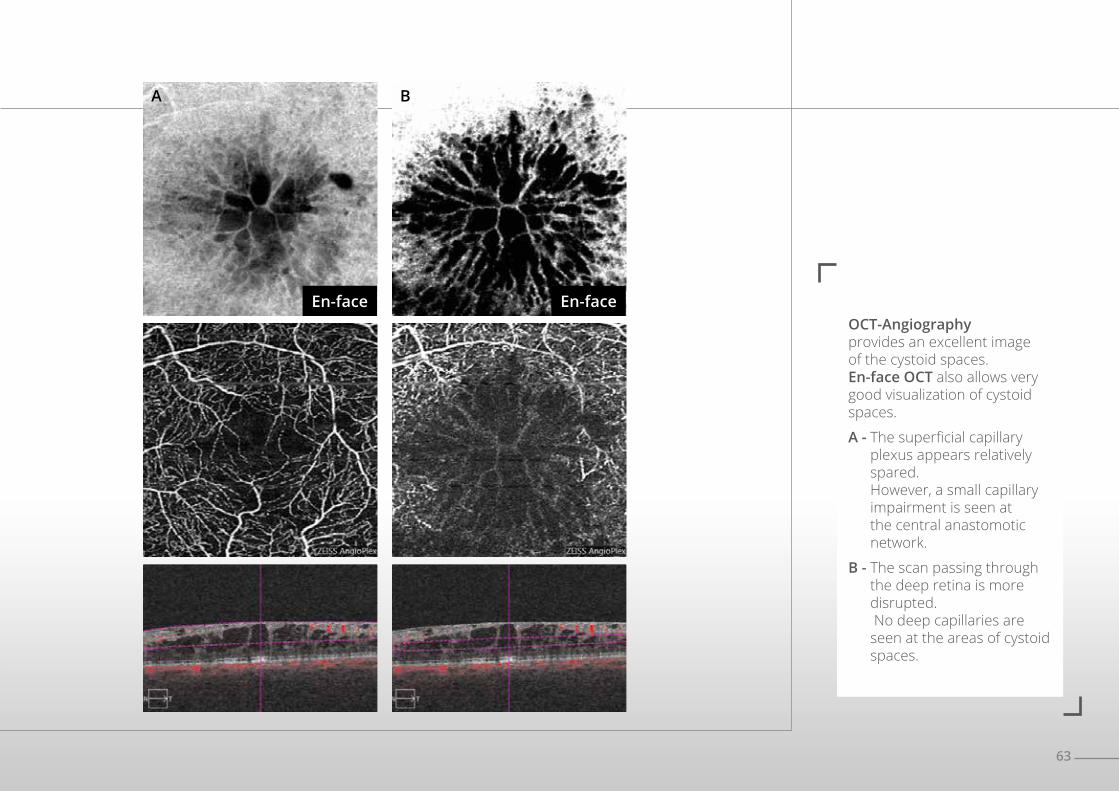
En-face En-faceOCT-Angiography provides an excellent image of the cystoid spaces.En-face OCT also allows very good visualization of cystoid spaces.
A - The superficial capillary plexus appears relatively spared. However, a small capillary impairment is seen at the central anastomotic network.
B - The scan passing through the deep retina is more disrupted. No deep capillaries are seen at the areas of cystoid spaces.
64
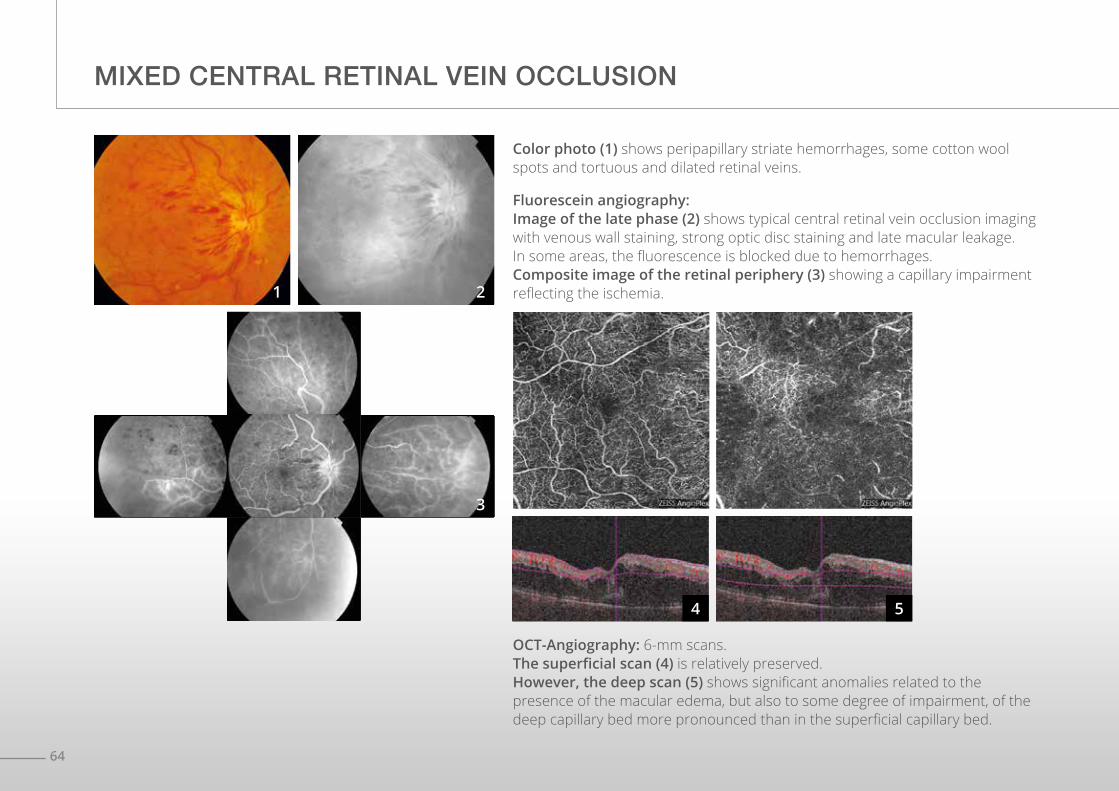
OCT-Angiography: 6-mm scans.The superficial scan (4) is relatively preserved.However, the deep scan (5) shows significant anomalies related to the presence of the macular edema, but also to some degree of impairment, of the deep capillary bed more pronounced than in the superficial capillary bed.
Fluorescein angiography:Image of the late phase (2) shows typical central retinal vein occlusion imaging with venous wall staining, strong optic disc staining and late macular leakage. In some areas, the fluorescence is blocked due to hemorrhages.Composite image of the retinal periphery (3) showing a capillary impairment reflecting the ischemia.
MIXED CENTRAL RETINAL VEIN OCCLUSION
Color photo (1) shows peripapillary striate hemorrhages, some cotton wool spots and tortuous and dilated retinal veins.
1 2
3
4 5
65
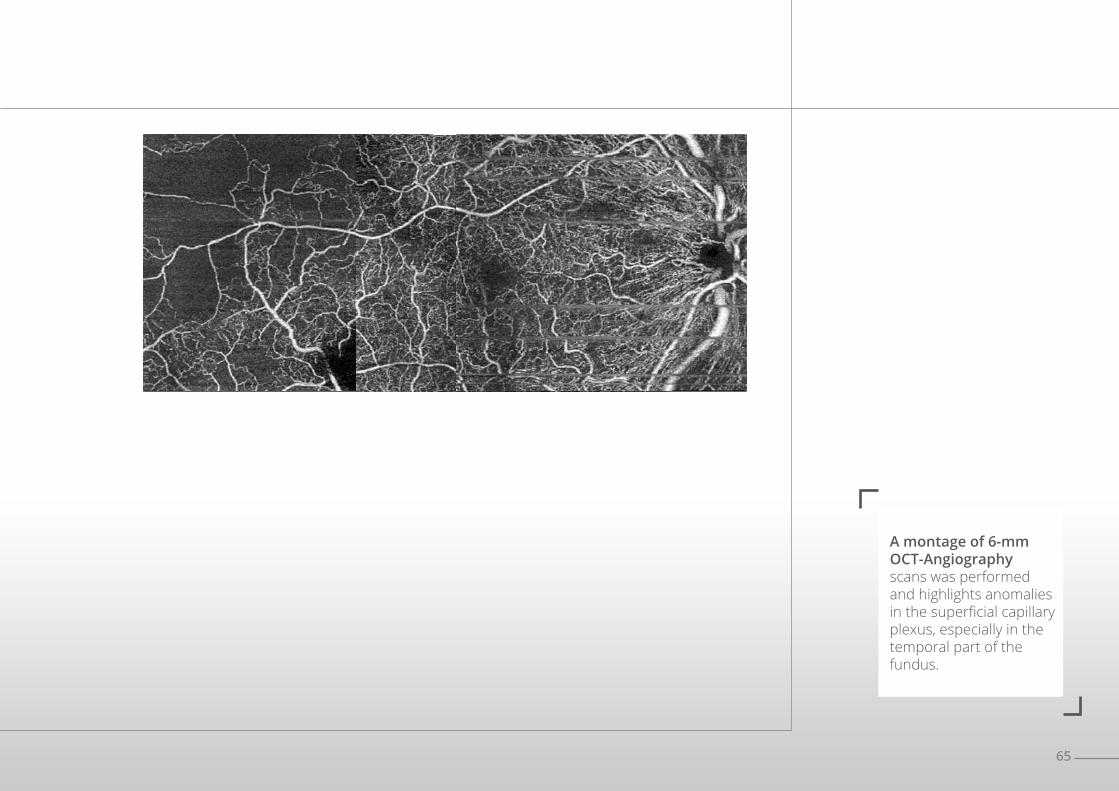
A montage of 6-mm OCT-Angiography scans was performed and highlights anomalies in the superficial capillary plexus, especially in the temporal part of the fundus.
66
FORMER CENTRAL RETINAL VEIN OCCLUSION
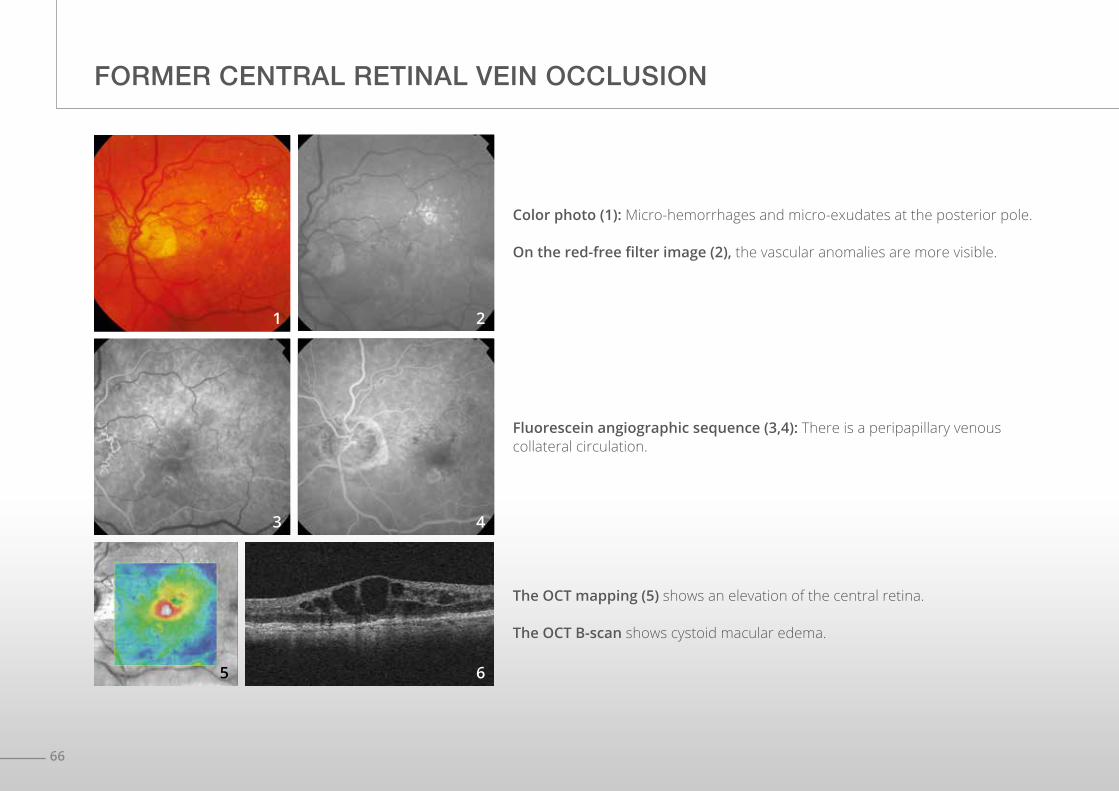
Fluorescein angiographic sequence (3,4): There is a peripapillary venous collateral circulation.
The OCT mapping (5) shows an elevation of the central retina.
The OCT B-scan shows cystoid macular edema.
Color photo (1): Micro-hemorrhages and micro-exudates at the posterior pole.
On the red-free filter image (2), the vascular anomalies are more visible.
1
3
2
4
65
67
A B
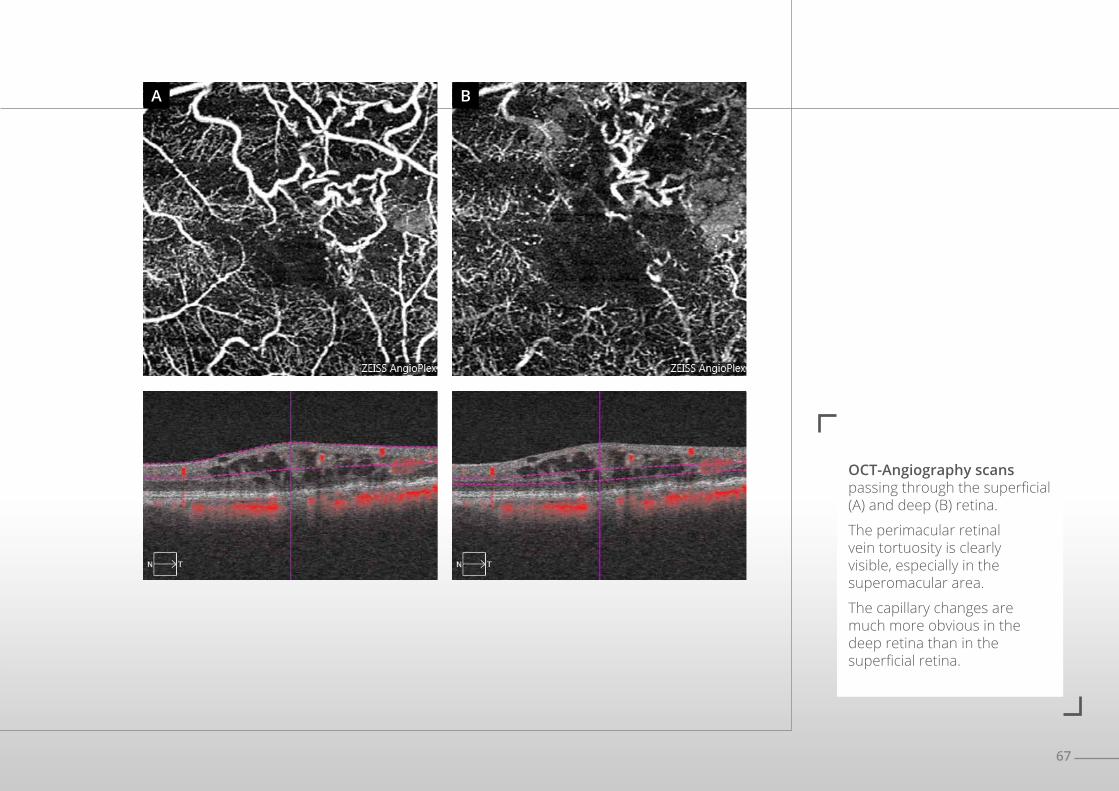
OCT-Angiography scans passing through the superficial (A) and deep (B) retina.
The perimacular retinal vein tortuosity is clearly visible, especially in the superomacular area.
The capillary changes are much more obvious in the deep retina than in the superficial retina.
68
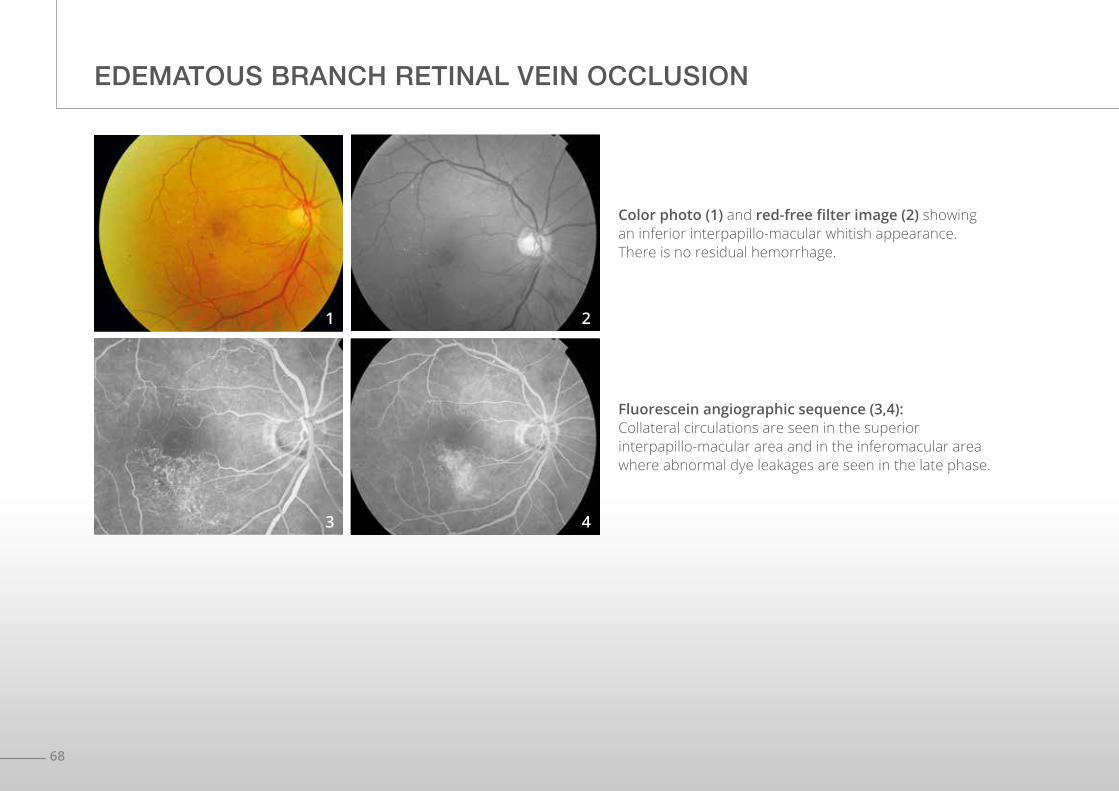
EDEMATOUS BRANCH RETINAL VEIN OCCLUSION
Fluorescein angiographic sequence (3,4):Collateral circulations are seen in the superior interpapillo-macular area and in the inferomacular area where abnormal dye leakages are seen in the late phase.
Color photo (1) and red-free filter image (2) showing an inferior interpapillo-macular whitish appearance.There is no residual hemorrhage.
1
3
2
4
69
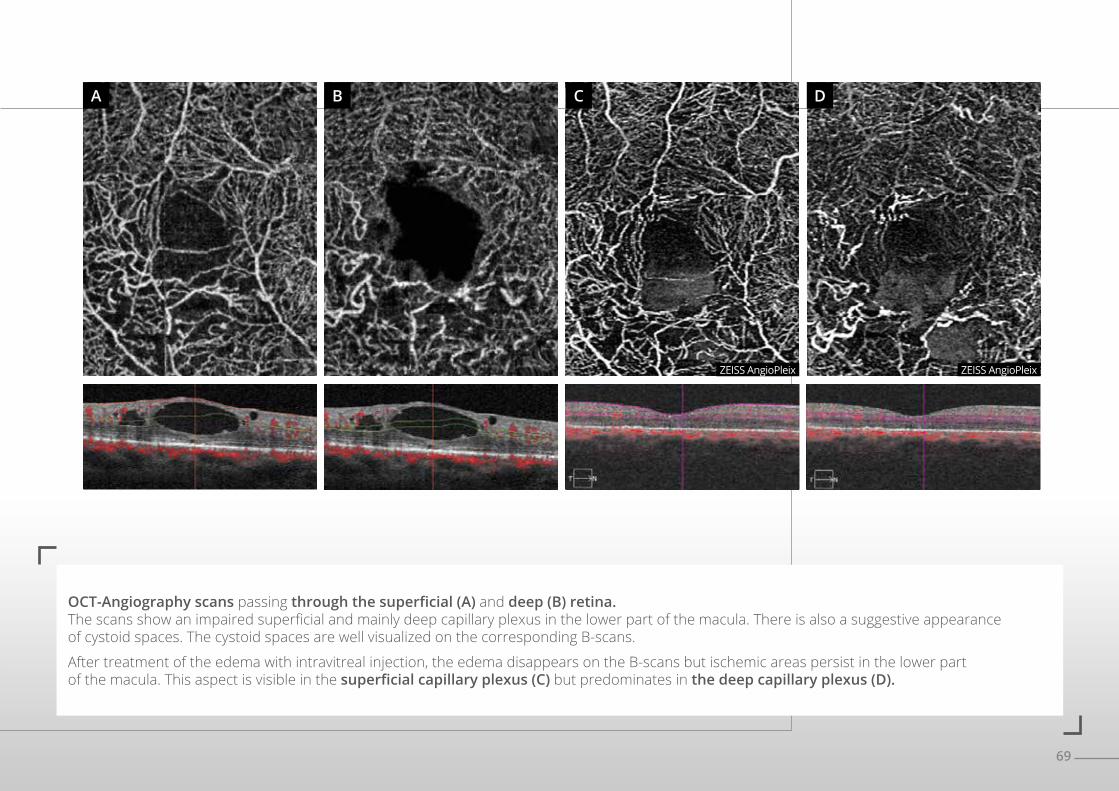
OCT-Angiography scans passing through the superficial (A) and deep (B) retina. The scans show an impaired superficial and mainly deep capillary plexus in the lower part of the macula. There is also a suggestive appearance of cystoid spaces. The cystoid spaces are well visualized on the corresponding B-scans.
After treatment of the edema with intravitreal injection, the edema disappears on the B-scans but ischemic areas persist in the lower part of the macula. This aspect is visible in the superficial capillary plexus (C) but predominates in the deep capillary plexus (D).
A B C D
ZEISS AngioPleix ZEISS AngioPleix
71
CHAPTER 4ISCHEMIA
Ischemia is characterized by vascular occlusions that are easily seen by OCT-Angiography. Ischemia is the cause of the most spectacular images obtained with this method.
OCT-Angiography also allows visualization of changes in the capillary bed following occlusion of a larger vessel, whether it is an artery or a vein.
In contrast, fluorescein angiography is probably more effective than OCT-Angiography to visualize microaneurysms complicating ischemia. Only comparative studies conducted both by OCT-Angiography and fluorescein angiography will allow distinction of their respective roles in the diagnosis and therapeutic monitoring of patients with retinal ischemia.
72
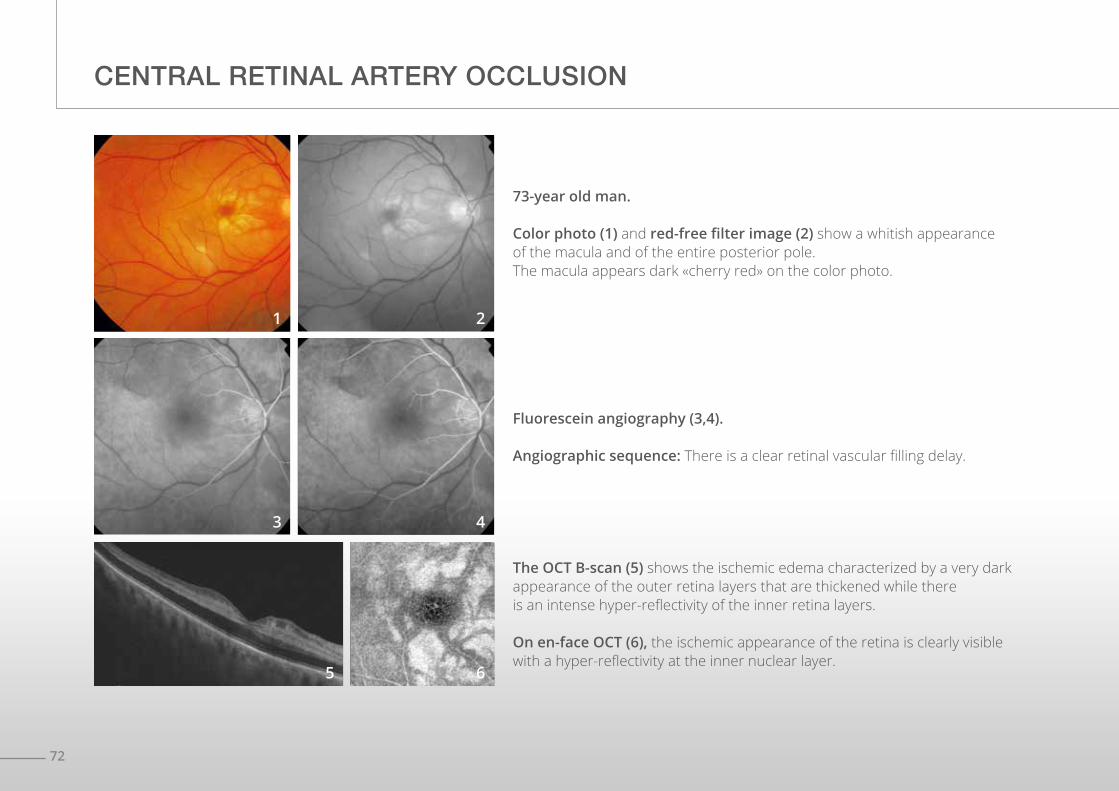
CENTRAL RETINAL ARTERY OCCLUSION
Fluorescein angiography (3,4).
Angiographic sequence: There is a clear retinal vascular filling delay.
73-year old man.
Color photo (1) and red-free filter image (2) show a whitish appearance of the macula and of the entire posterior pole.The macula appears dark «cherry red» on the color photo.
The OCT B-scan (5) shows the ischemic edema characterized by a very dark appearance of the outer retina layers that are thickened while there is an intense hyper-reflectivity of the inner retina layers.
On en-face OCT (6), the ischemic appearance of the retina is clearly visible with a hyper-reflectivity at the inner nuclear layer.
1
3
65
2
4
73
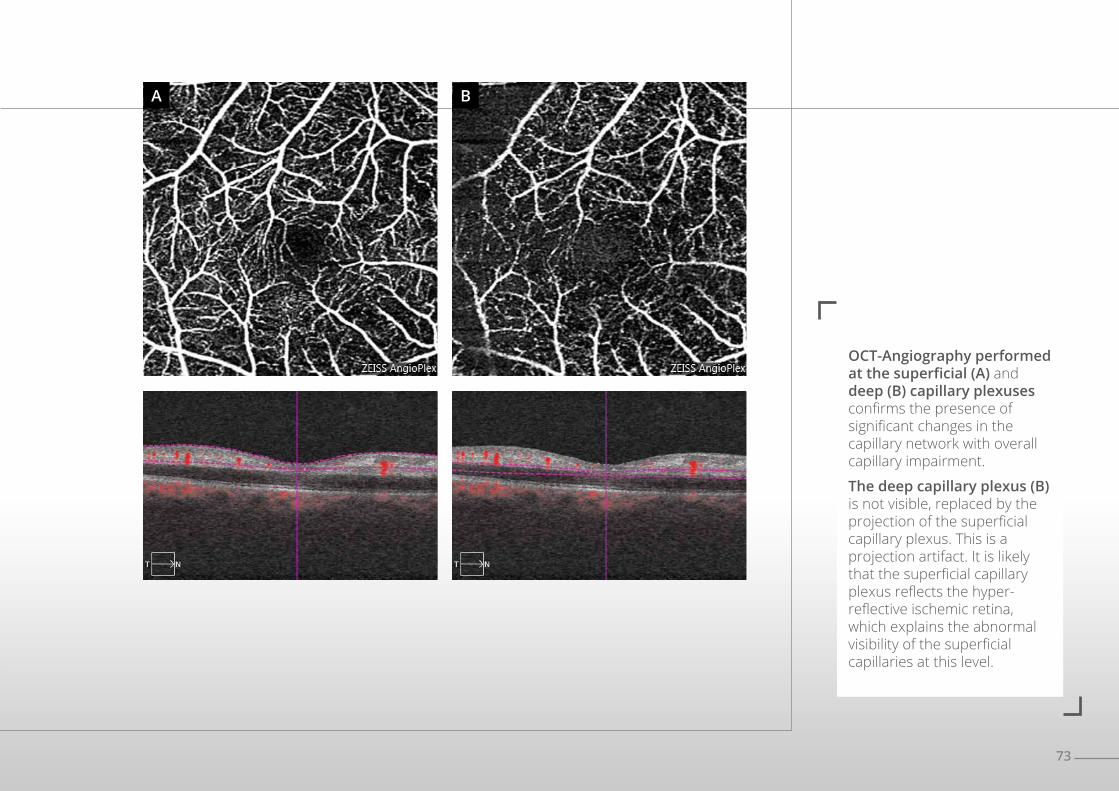
OCT-Angiography performed at the superficial (A) and deep (B) capillary plexuses confirms the presence of significant changes in the capillary network with overall capillary impairment.
The deep capillary plexus (B) is not visible, replaced by the projection of the superficial capillary plexus. This is a projection artifact. It is likely that the superficial capillary plexus reflects the hyper-reflective ischemic retina, which explains the abnormal visibility of the superficial capillaries at this level.
A B
74
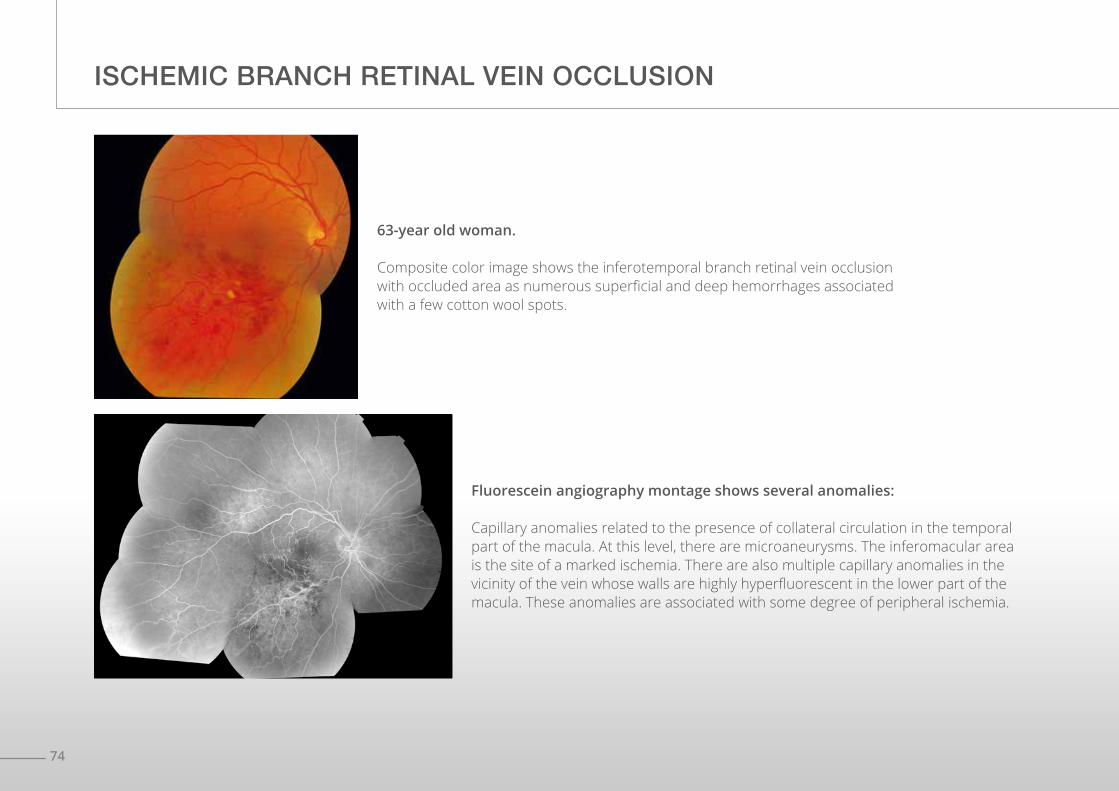
63-year old woman.
Composite color image shows the inferotemporal branch retinal vein occlusion with occluded area as numerous superficial and deep hemorrhages associated with a few cotton wool spots.
Fluorescein angiography montage shows several anomalies:
Capillary anomalies related to the presence of collateral circulation in the temporal part of the macula. At this level, there are microaneurysms. The inferomacular area is the site of a marked ischemia. There are also multiple capillary anomalies in the vicinity of the vein whose walls are highly hyperfluorescent in the lower part of the macula. These anomalies are associated with some degree of peripheral ischemia.
ISCHEMIC BRANCH RETINAL VEIN OCCLUSION
75
C
BA
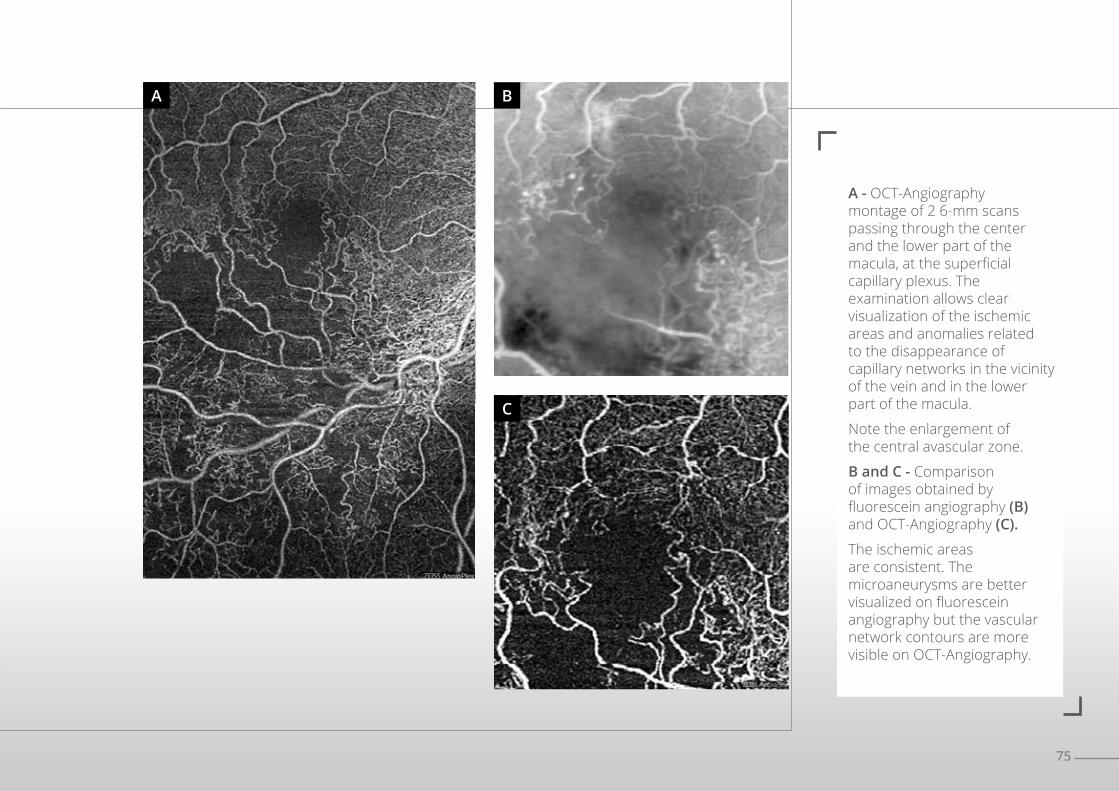
A - OCT-Angiography montage of 2 6-mm scans passing through the center and the lower part of the macula, at the superficial capillary plexus. The examination allows clear visualization of the ischemic areas and anomalies related to the disappearance of capillary networks in the vicinity of the vein and in the lower part of the macula.
Note the enlargement of the central avascular zone.
B and C - Comparison of images obtained by fluorescein angiography (B) and OCT-Angiography (C).
The ischemic areas are consistent. The microaneurysms are better visualized on fluorescein angiography but the vascular network contours are more visible on OCT-Angiography.
76
PROLIFERATIVE DIABETIC RETINOPATHY
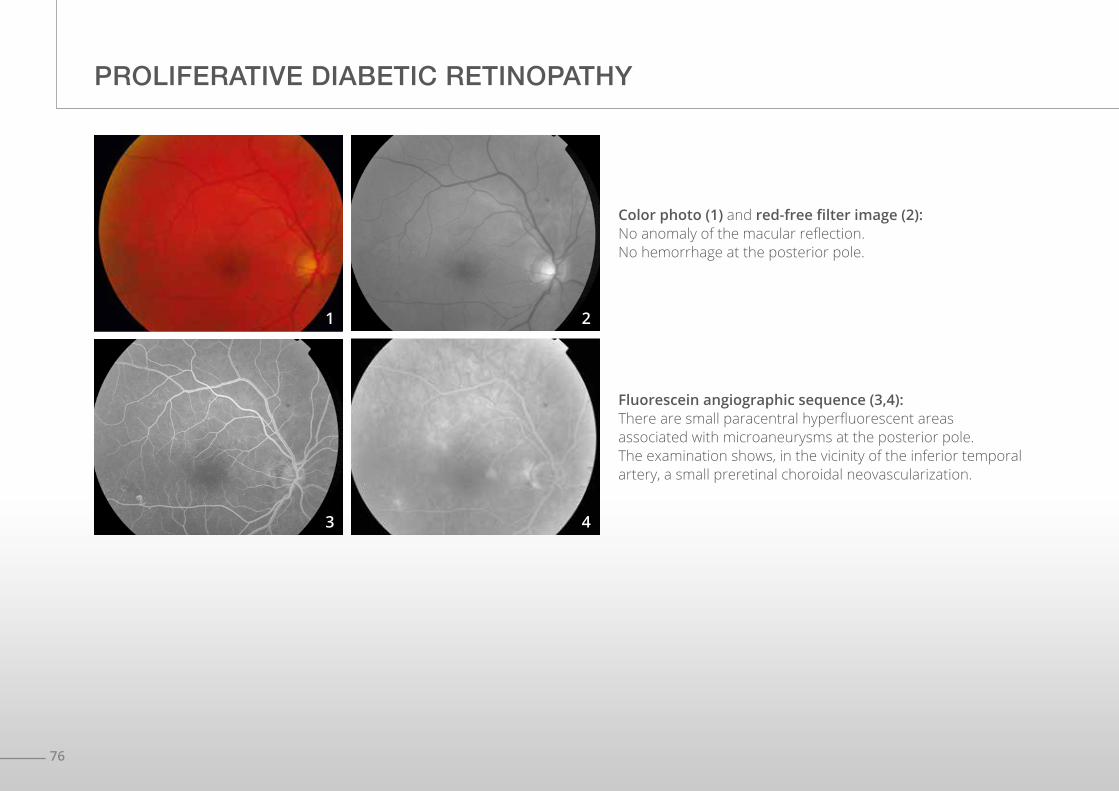
Fluorescein angiographic sequence (3,4):There are small paracentral hyperfluorescent areas associated with microaneurysms at the posterior pole.The examination shows, in the vicinity of the inferior temporal artery, a small preretinal choroidal neovascularization.
Color photo (1) and red-free filter image (2): No anomaly of the macular reflection.No hemorrhage at the posterior pole.
1
3
2
4
77
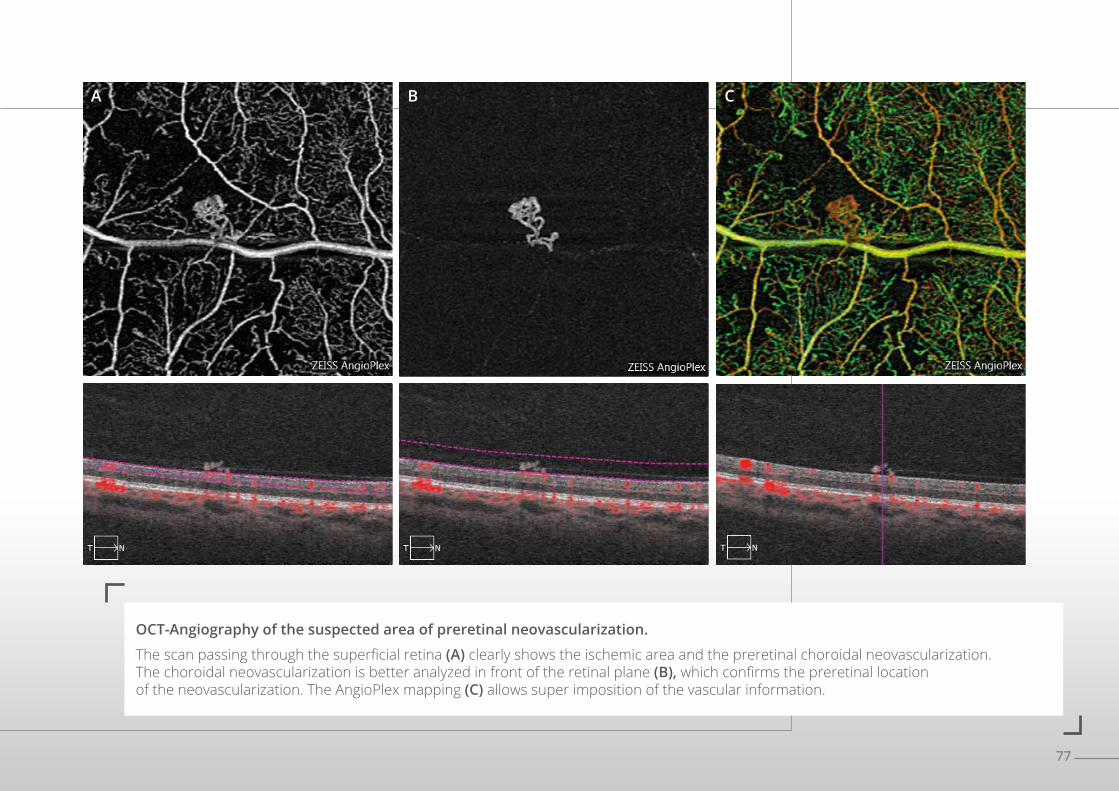
OCT-Angiography of the suspected area of preretinal neovascularization.
The scan passing through the superficial retina (A) clearly shows the ischemic area and the preretinal choroidal neovascularization. The choroidal neovascularization is better analyzed in front of the retinal plane (B), which confirms the preretinal location of the neovascularization. The AngioPlex mapping (C) allows super imposition of the vascular information.
A B C
78
PROLIFERATIVE DIABETIC RETINOPATHY
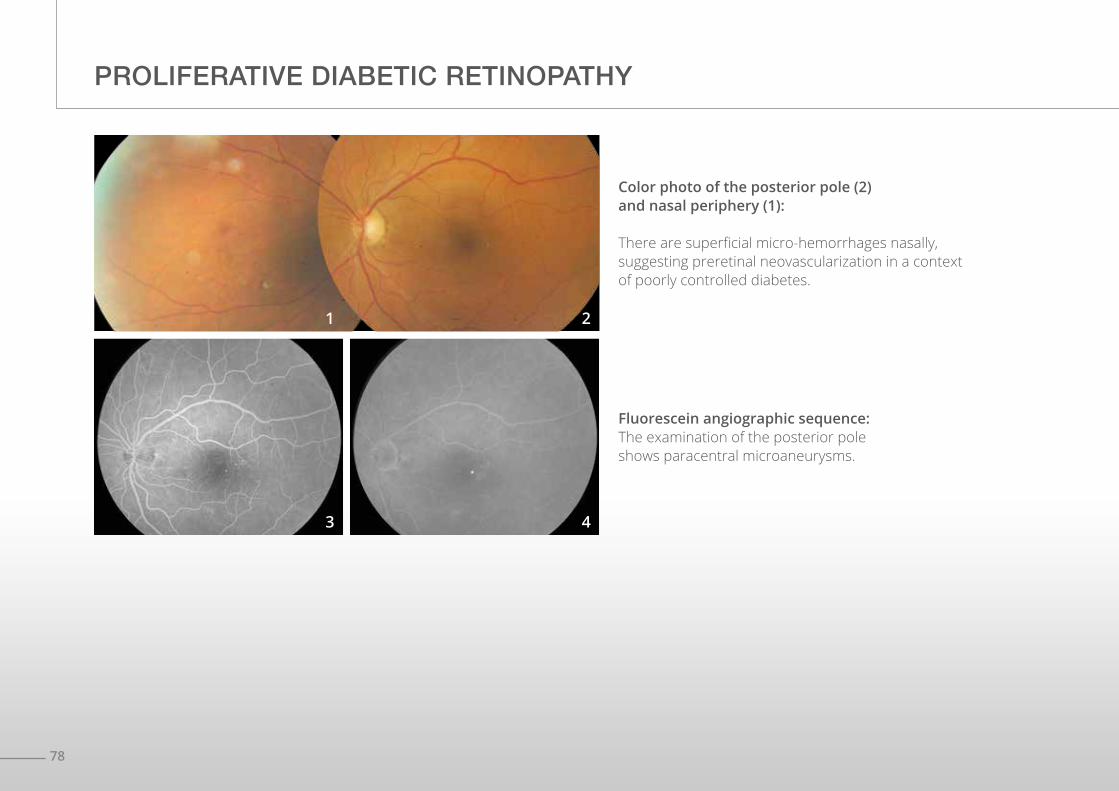
Fluorescein angiographic sequence: The examination of the posterior pole shows paracentral microaneurysms.
Color photo of the posterior pole (2) and nasal periphery (1):
There are superficial micro-hemorrhages nasally, suggesting preretinal neovascularization in a context of poorly controlled diabetes.
1
3
2
4
79
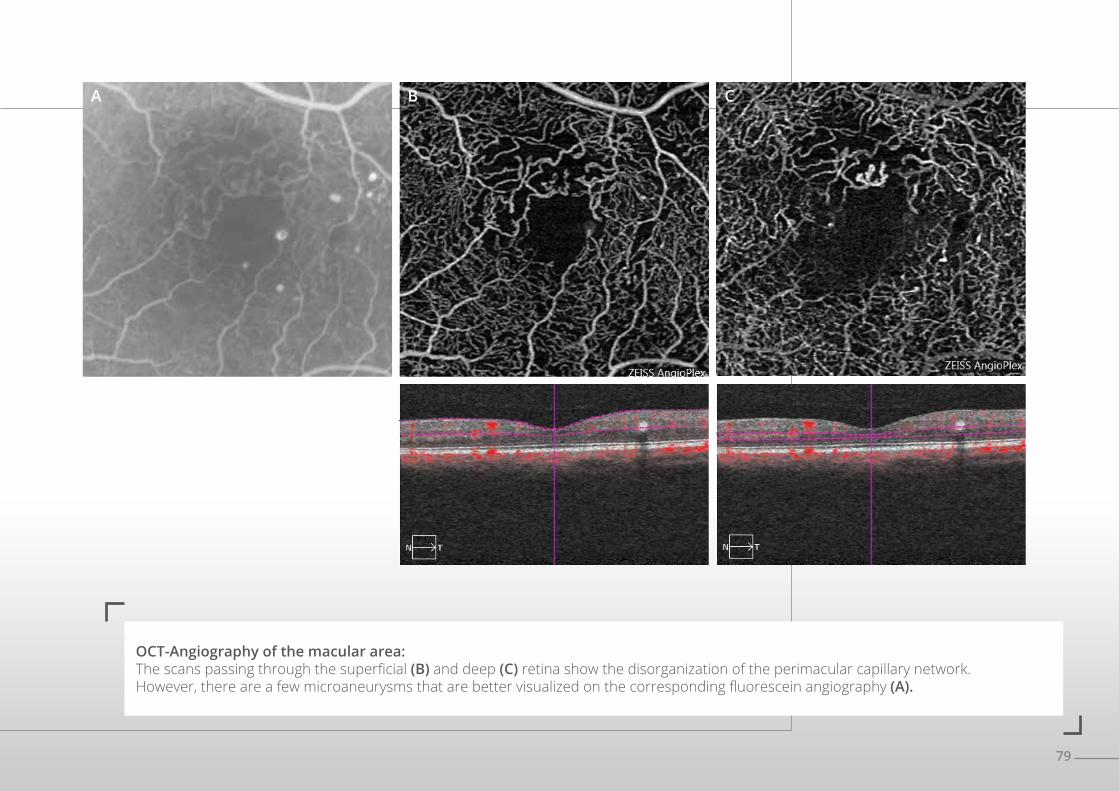
OCT-Angiography of the macular area: The scans passing through the superficial (B) and deep (C) retina show the disorganization of the perimacular capillary network. However, there are a few microaneurysms that are better visualized on the corresponding fluorescein angiography (A).
A B C
80
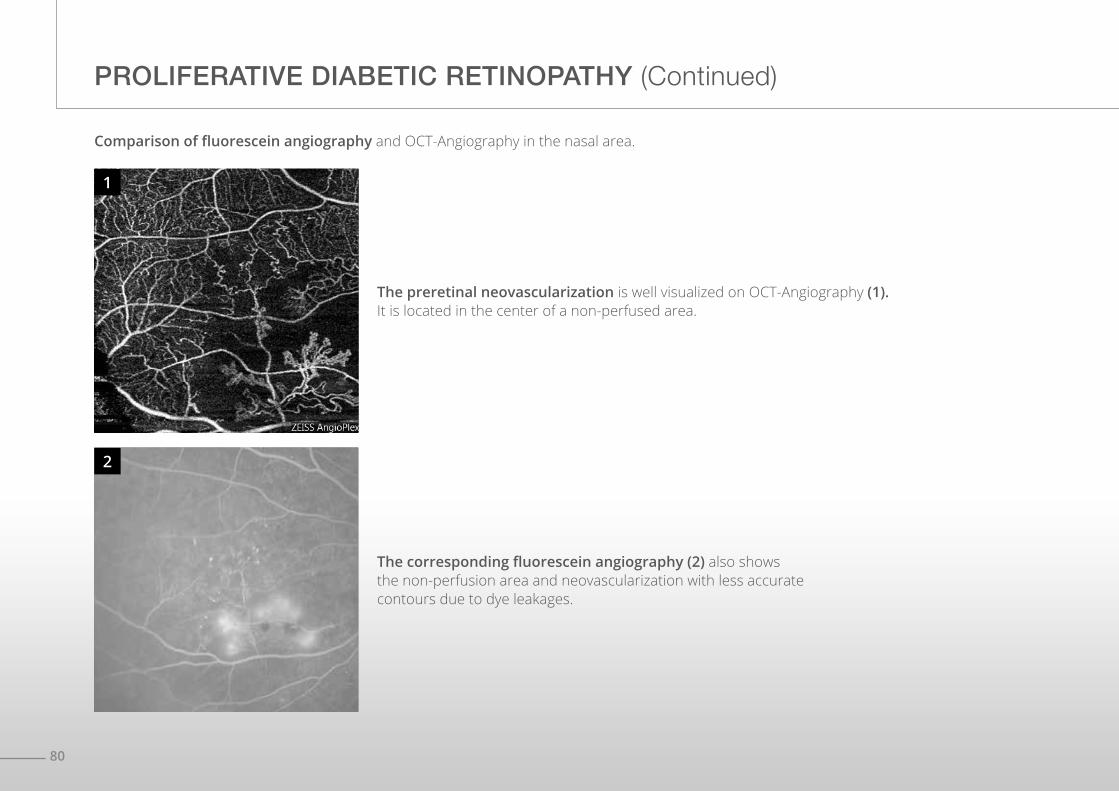
The preretinal neovascularization is well visualized on OCT-Angiography (1).It is located in the center of a non-perfused area.
Comparison of fluorescein angiography and OCT-Angiography in the nasal area.
The corresponding fluorescein angiography (2) also shows the non-perfusion area and neovascularization with less accurate contours due to dye leakages.
PROLIFERATIVE DIABETIC RETINOPATHY (Continued)
1
2
81
A B
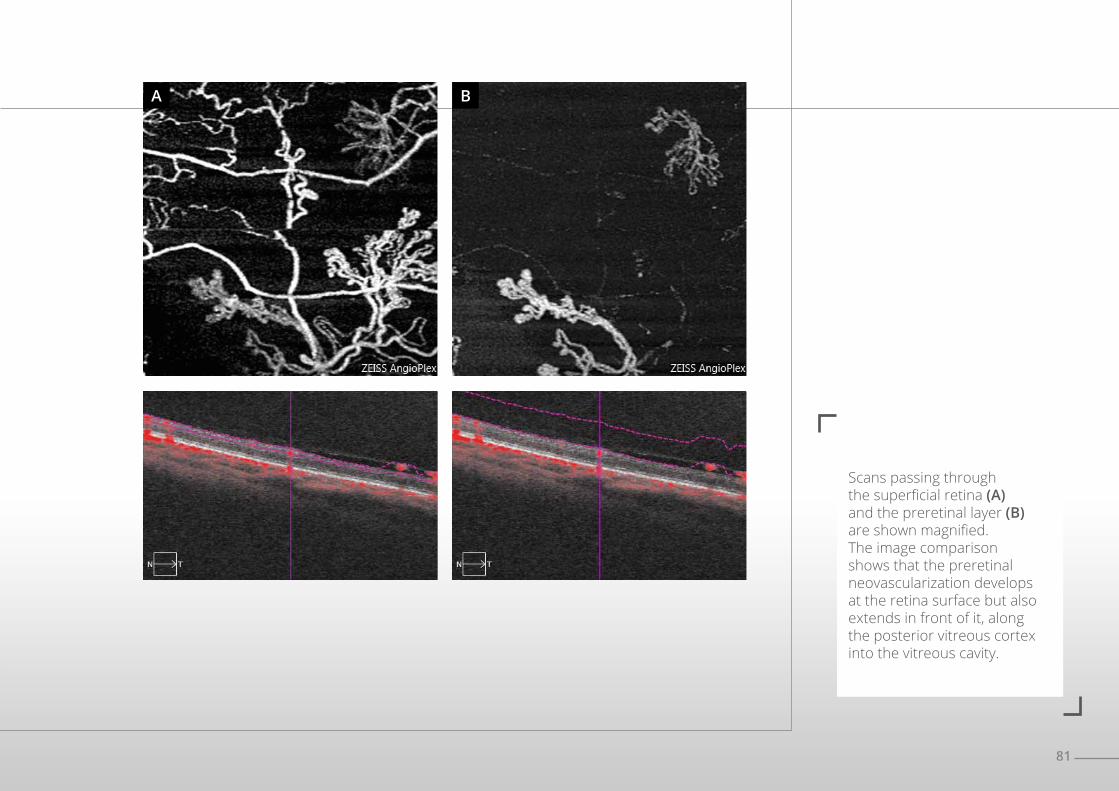
Scans passing through the superficial retina (A) and the preretinal layer (B) are shown magnified. The image comparison shows that the preretinal neovascularization develops at the retina surface but also extends in front of it, along the posterior vitreous cortex into the vitreous cavity.
82
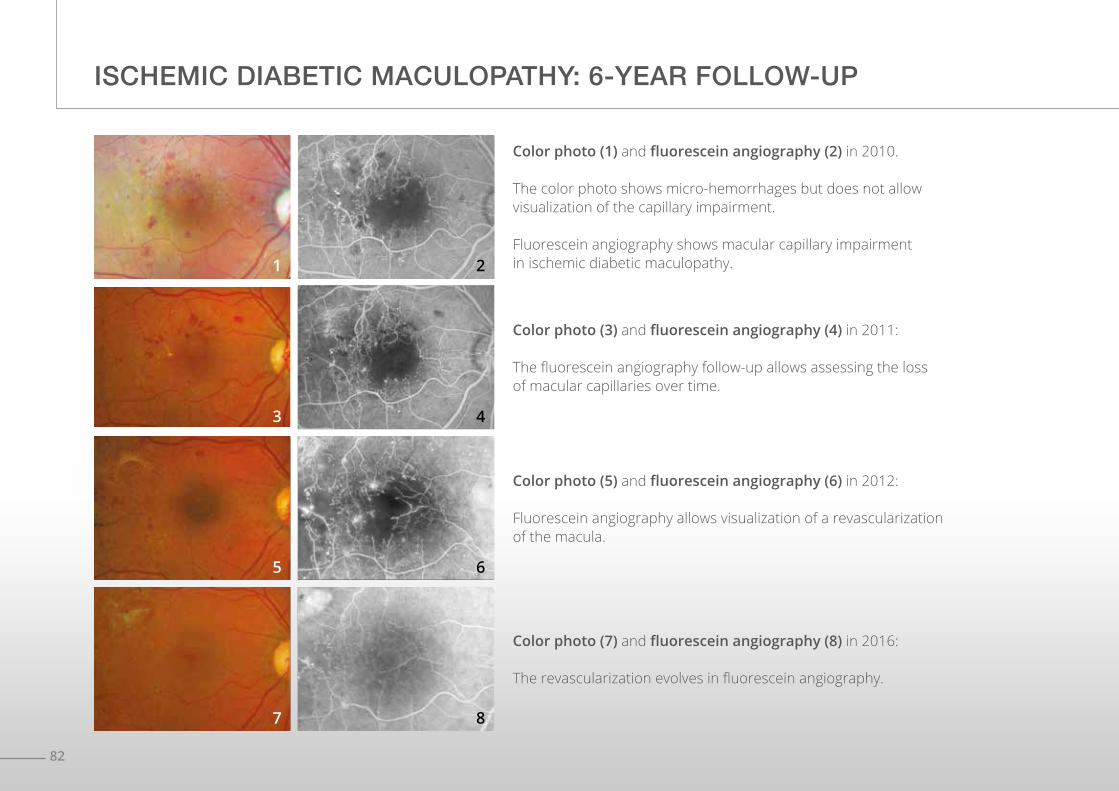
ISCHEMIC DIABETIC MACULOPATHY: 6-YEAR FOLLOW-UP
Color photo (1) and fluorescein angiography (2) in 2010.
The color photo shows micro-hemorrhages but does not allow visualization of the capillary impairment.
Fluorescein angiography shows macular capillary impairment in ischemic diabetic maculopathy.
Color photo (3) and fluorescein angiography (4) in 2011:
The fluorescein angiography follow-up allows assessing the loss of macular capillaries over time.
Color photo (5) and fluorescein angiography (6) in 2012:
Fluorescein angiography allows visualization of a revascularization of the macula.
Color photo (7) and fluorescein angiography (8) in 2016:
The revascularization evolves in fluorescein angiography.
1
3
5
7
2
4
6
8
83
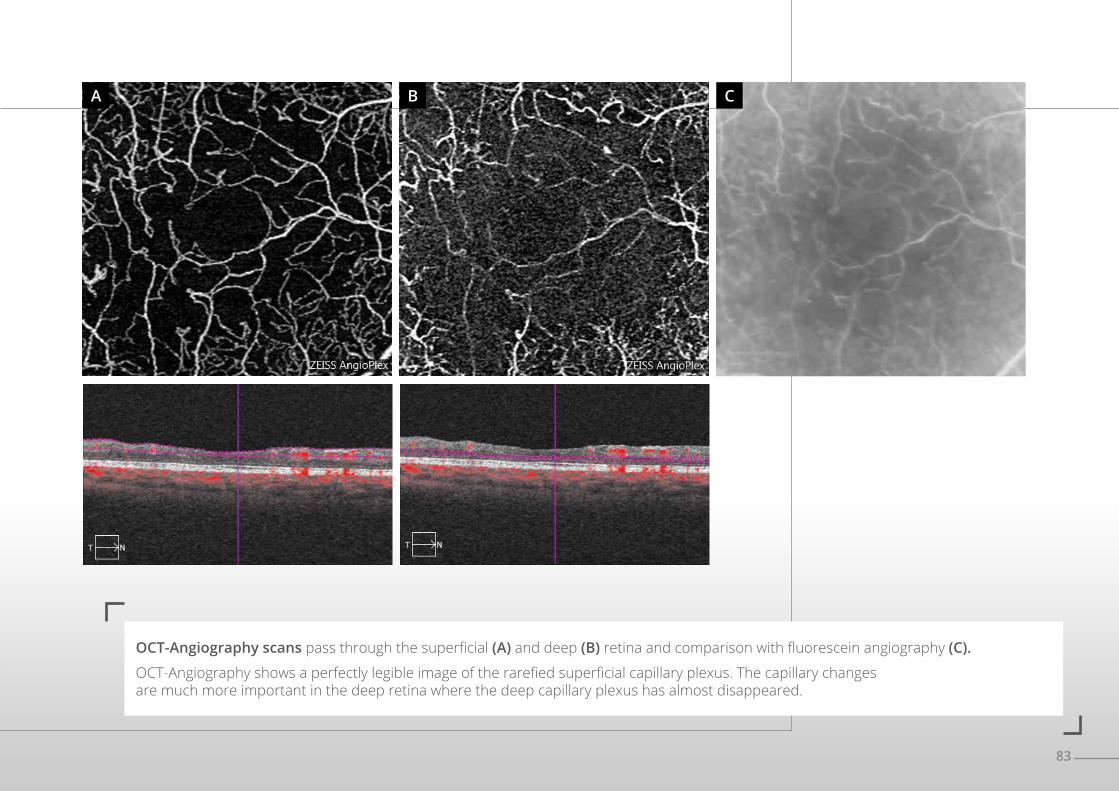
OCT-Angiography scans pass through the superficial (A) and deep (B) retina and comparison with fluorescein angiography (C).
OCT-Angiography shows a perfectly legible image of the rarefied superficial capillary plexus. The capillary changes are much more important in the deep retina where the deep capillary plexus has almost disappeared.
A B C
85
CHAPTER 5 DEGENERATION AND ATROPHY
Retinal degenerations are a very heterogeneous group of disorders. However, they are commonly accompanied, at one stage or another in their evolution, by a localized disappearance of the retinal pigment epithelium, i.e. by atrophy. The images presented here clearly show the potential pitfalls of OCT-Angiography, which allows visualization of abnormal choroid areas (equivalent to angiographic window defect), but can lead to the misdiagnosis of choroidal neovascularization.
It is therefore very important to systematically compare OCT-Angiography images with conventional fundus imaging, in particular color, red-free filter or fundus autofluorescence retinography. An accurate diagnosis of the lesions may only be made after comparing the visualized atrophy from these examinations with OCT-Angiography images.
86
DRY AGE-RELATED MACULAR DEGENERATION OR GEOGRAPHIC ATROPHY
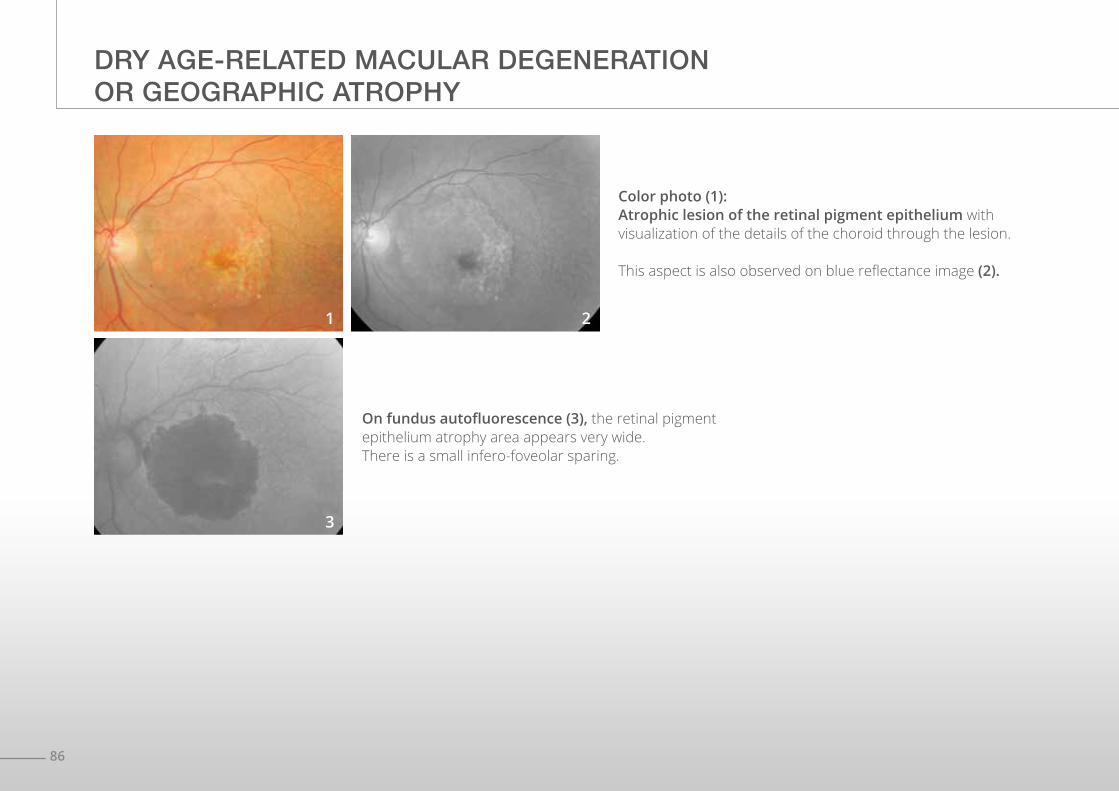
On fundus autofluorescence (3), the retinal pigment epithelium atrophy area appears very wide. There is a small infero-foveolar sparing.
Color photo (1):Atrophic lesion of the retinal pigment epithelium with visualization of the details of the choroid through the lesion.
This aspect is also observed on blue reflectance image (2).
1
3
2
87
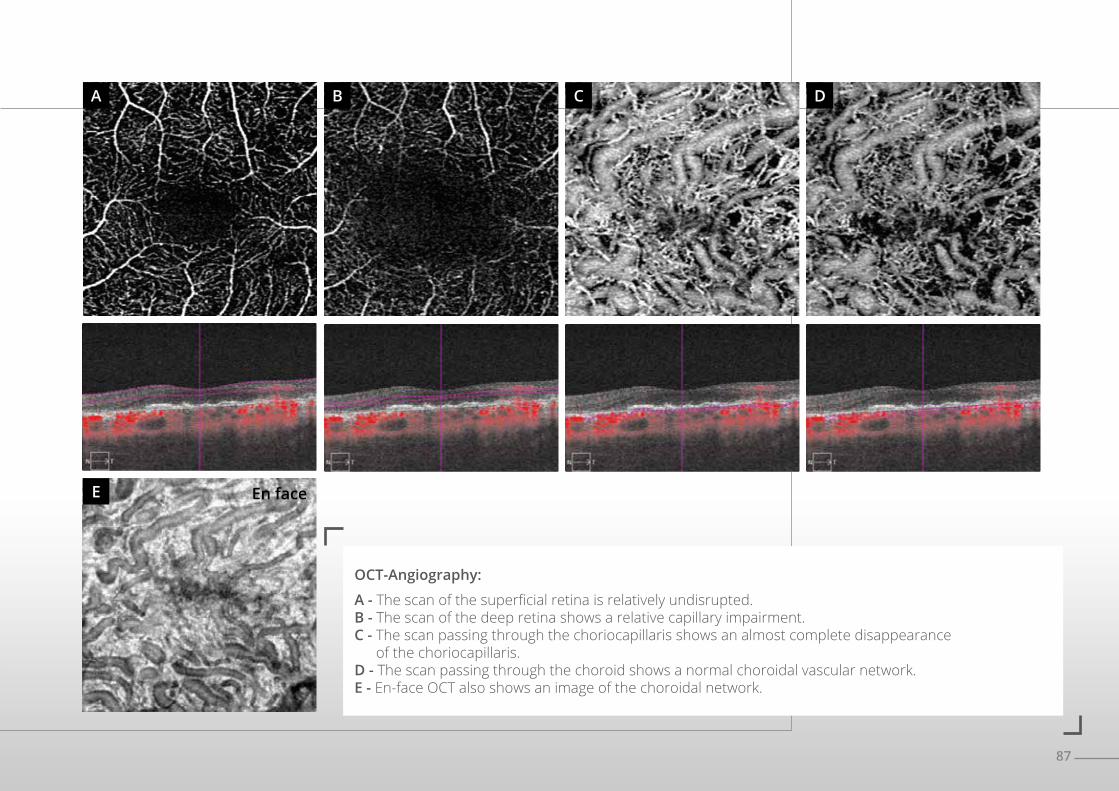
OCT-Angiography:
A - The scan of the superficial retina is relatively undisrupted.B - The scan of the deep retina shows a relative capillary impairment.C - The scan passing through the choriocapillaris shows an almost complete disappearance
of the choriocapillaris.D - The scan passing through the choroid shows a normal choroidal vascular network.E - En-face OCT also shows an image of the choroidal network.
A
E
B C D
En face
88
DRY AGE-RELATED MACULAR DEGENERATION OR GEOGRAPHIC ATROPHY
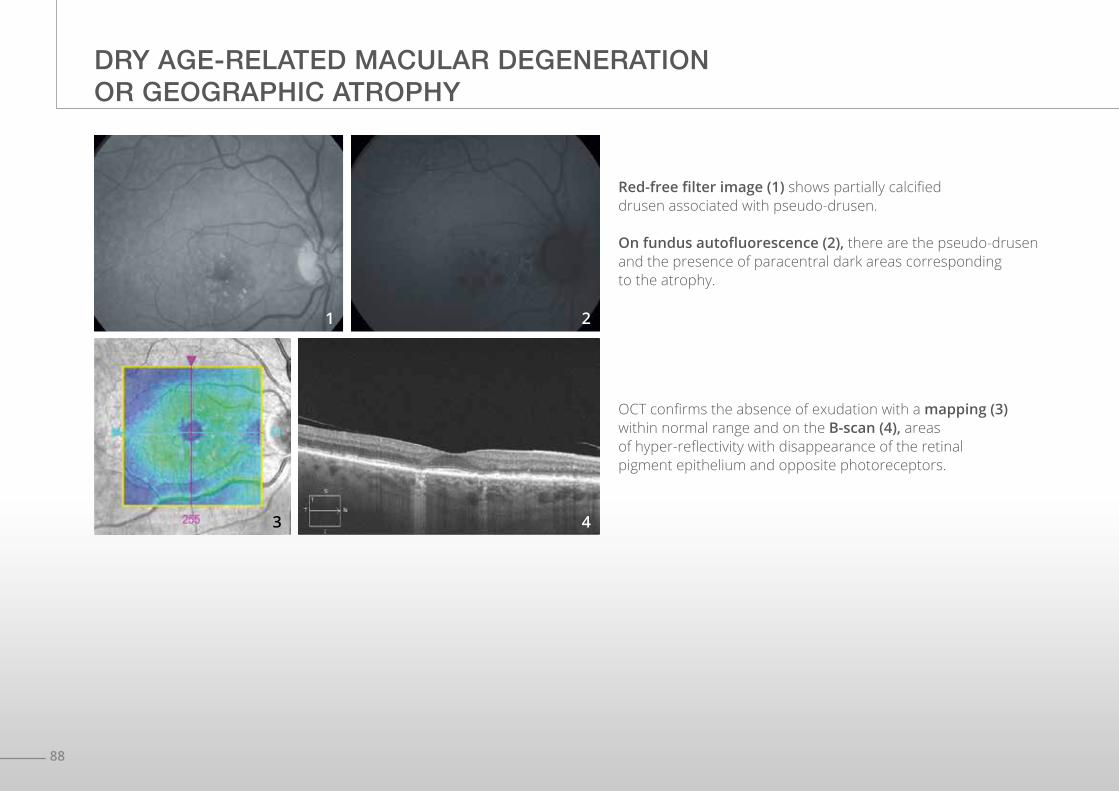
OCT confirms the absence of exudation with a mapping (3) within normal range and on the B-scan (4), areas of hyper-reflectivity with disappearance of the retinal pigment epithelium and opposite photoreceptors.
Red-free filter image (1) shows partially calcified drusen associated with pseudo-drusen.
On fundus autofluorescence (2), there are the pseudo-drusen and the presence of paracentral dark areas corresponding to the atrophy.
1
3
2
4
89
A B
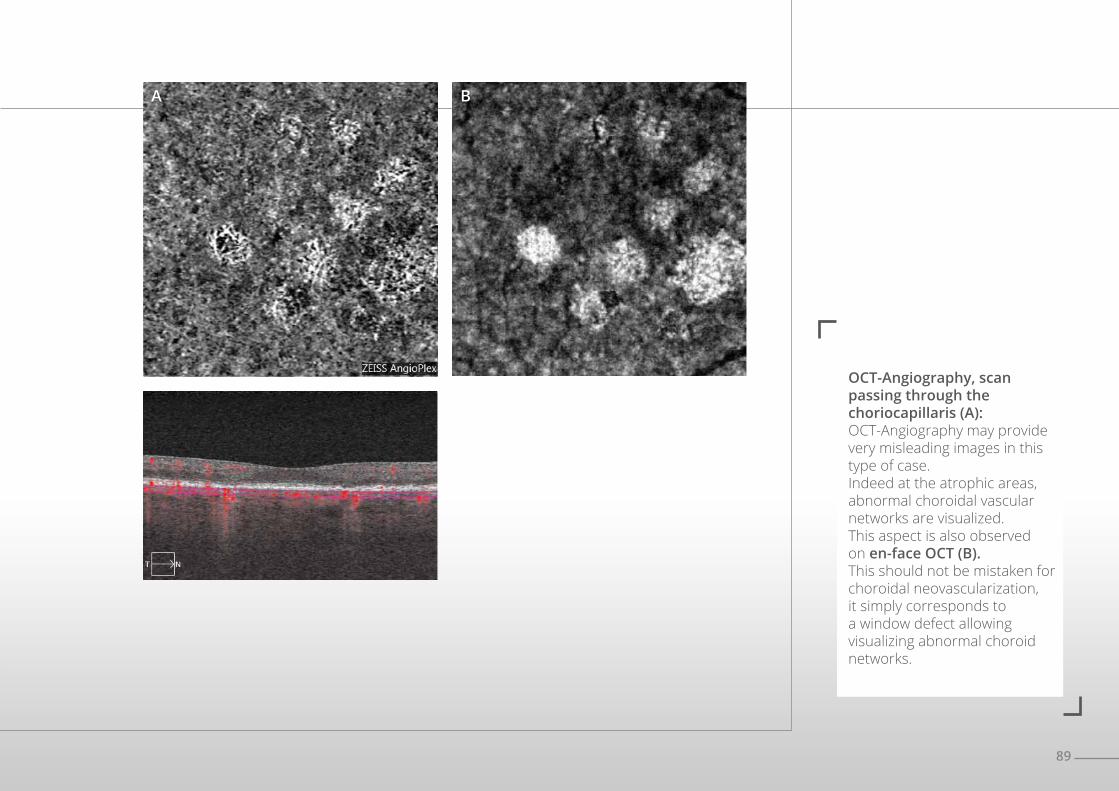
OCT-Angiography, scan passing through the choriocapillaris (A): OCT-Angiography may provide very misleading images in this type of case. Indeed at the atrophic areas, abnormal choroidal vascular networks are visualized.This aspect is also observed on en-face OCT (B). This should not be mistaken for choroidal neovascularization, it simply corresponds to a window defect allowing visualizing abnormal choroid networks.
90
STARGARDT’S DISEASE COMPLICATED BY CHOROIDAL NEOVASCULARIZATION
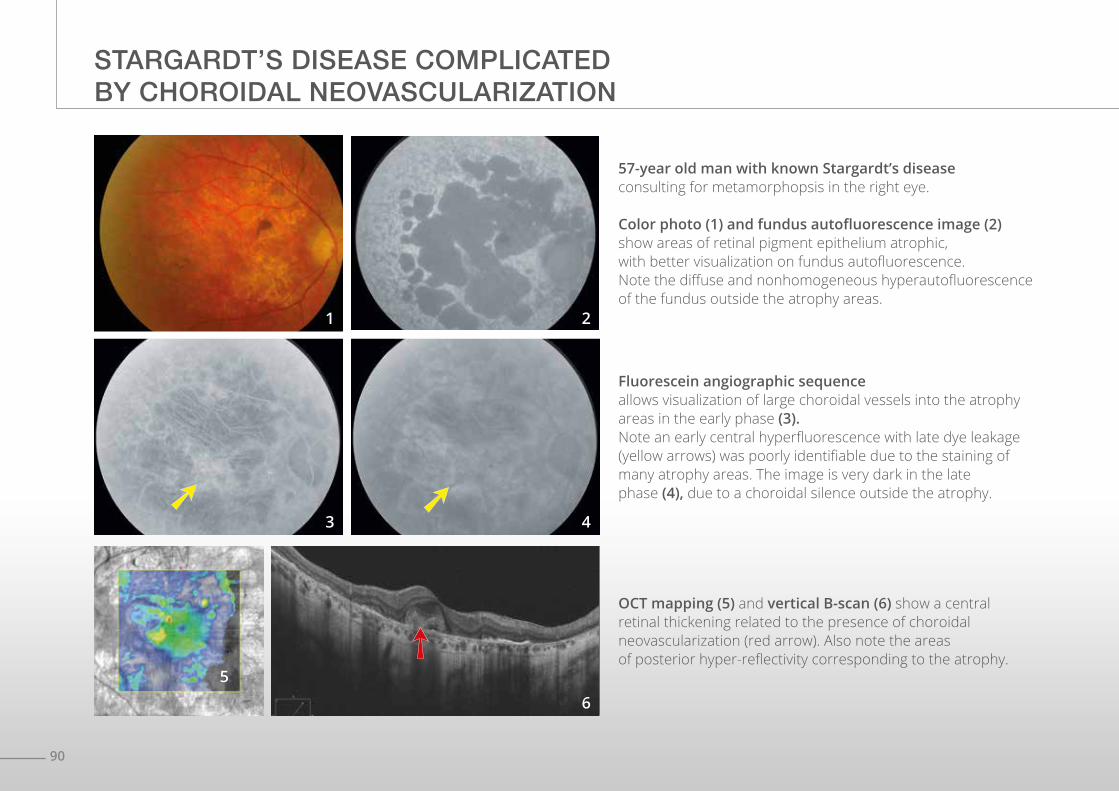
Fluorescein angiographic sequence allows visualization of large choroidal vessels into the atrophy areas in the early phase (3).Note an early central hyperfluorescence with late dye leakage (yellow arrows) was poorly identifiable due to the staining of many atrophy areas. The image is very dark in the late phase (4), due to a choroidal silence outside the atrophy.
OCT mapping (5) and vertical B-scan (6) show a central retinal thickening related to the presence of choroidal neovascularization (red arrow). Also note the areas of posterior hyper-reflectivity corresponding to the atrophy.
57-year old man with known Stargardt’s disease consulting for metamorphopsis in the right eye.
Color photo (1) and fundus autofluorescence image (2) show areas of retinal pigment epithelium atrophic, with better visualization on fundus autofluorescence. Note the diffuse and nonhomogeneous hyperautofluorescence of the fundus outside the atrophy areas.
1
3
2
4
65
91
A B
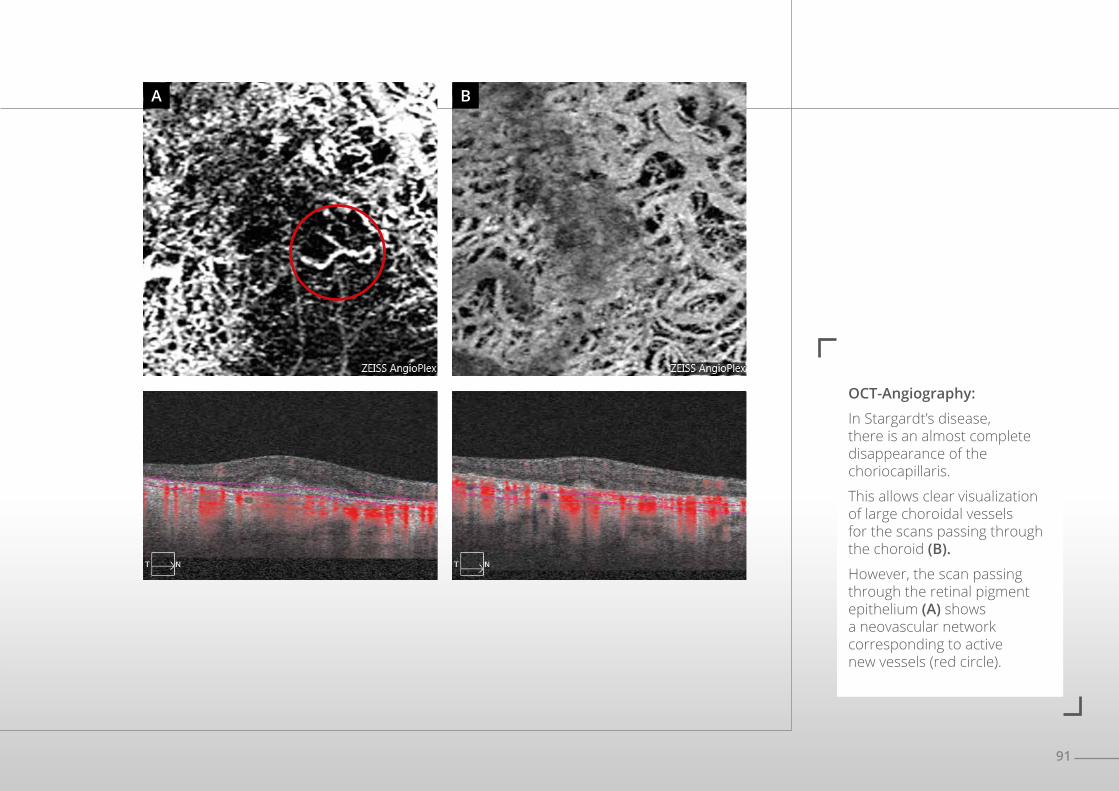
OCT-Angiography:
In Stargardt’s disease, there is an almost complete disappearance of the choriocapillaris.
This allows clear visualization of large choroidal vessels for the scans passing through the choroid (B).
However, the scan passing through the retinal pigment epithelium (A) shows a neovascular network corresponding to active new vessels (red circle).
92
PSEUDOVITELLIFORM DYSTROPHY
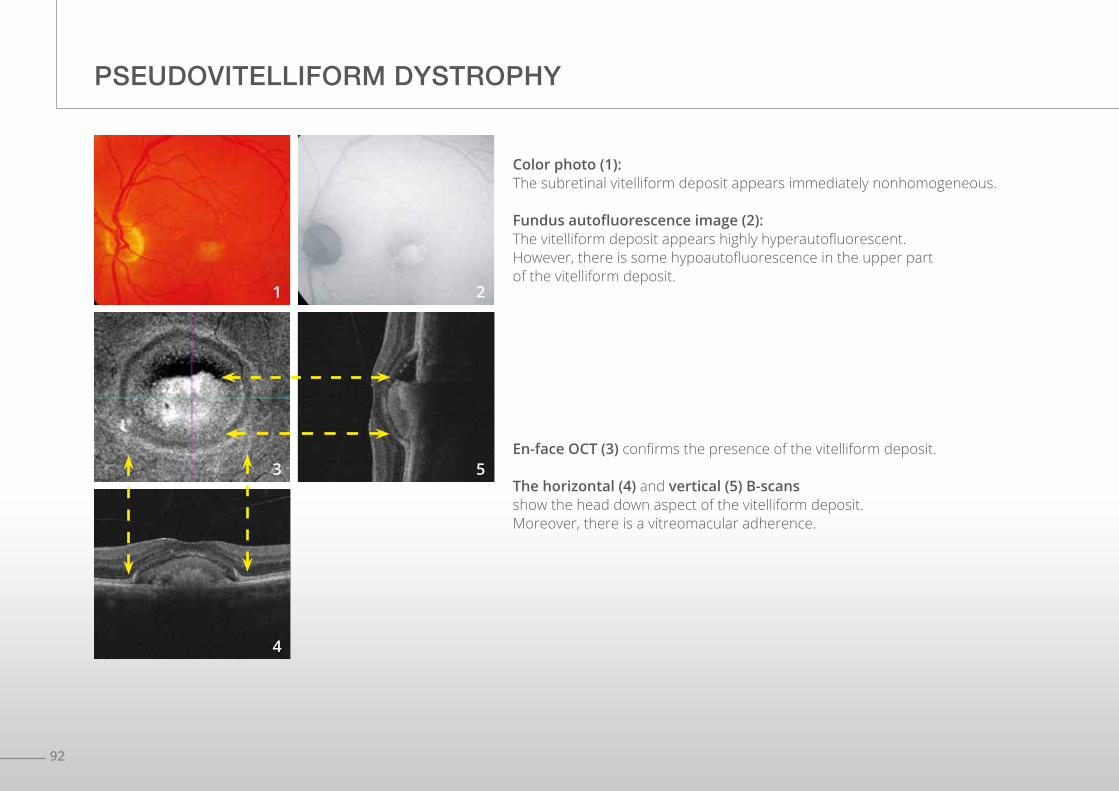
En-face OCT (3) confirms the presence of the vitelliform deposit.
The horizontal (4) and vertical (5) B-scansshow the head down aspect of the vitelliform deposit.Moreover, there is a vitreomacular adherence.
Color photo (1):The subretinal vitelliform deposit appears immediately nonhomogeneous.
Fundus autofluorescence image (2):The vitelliform deposit appears highly hyperautofluorescent. However, there is some hypoautofluorescence in the upper part of the vitelliform deposit.
1
3
4
2
5
93
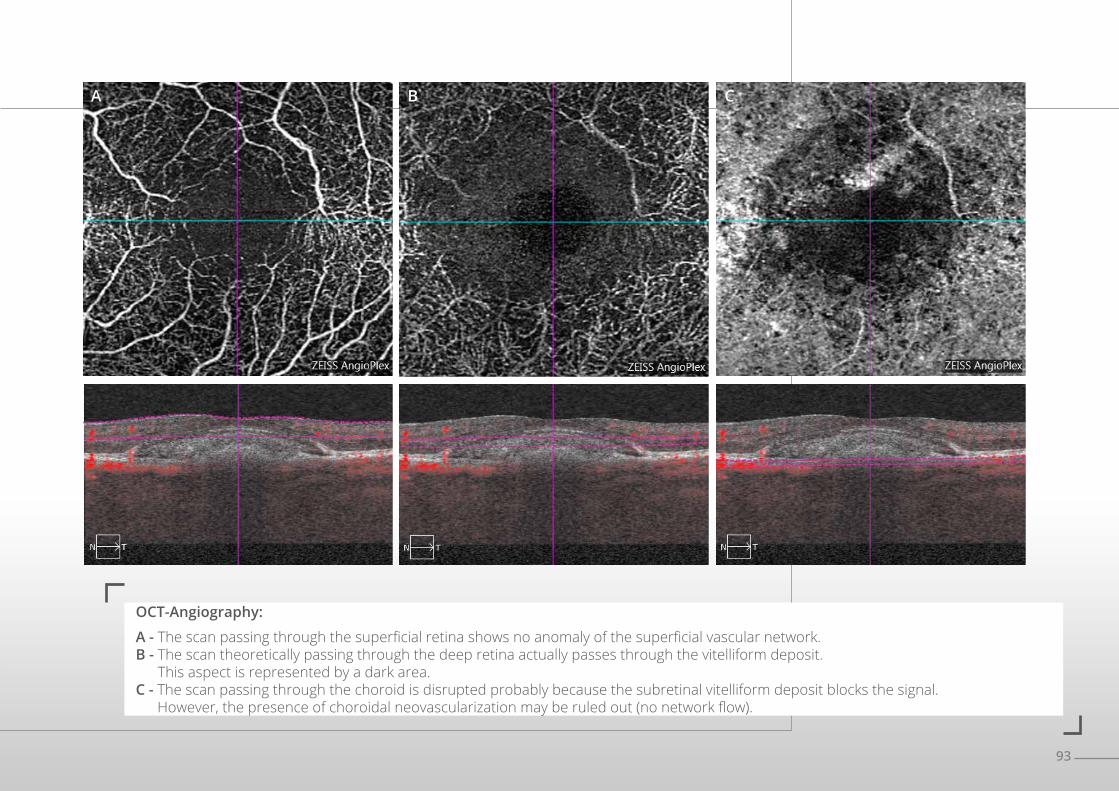
OCT-Angiography:
A - The scan passing through the superficial retina shows no anomaly of the superficial vascular network.B - The scan theoretically passing through the deep retina actually passes through the vitelliform deposit.
This aspect is represented by a dark area.C - The scan passing through the choroid is disrupted probably because the subretinal vitelliform deposit blocks the signal.
However, the presence of choroidal neovascularization may be ruled out (no network flow).
A B C
94
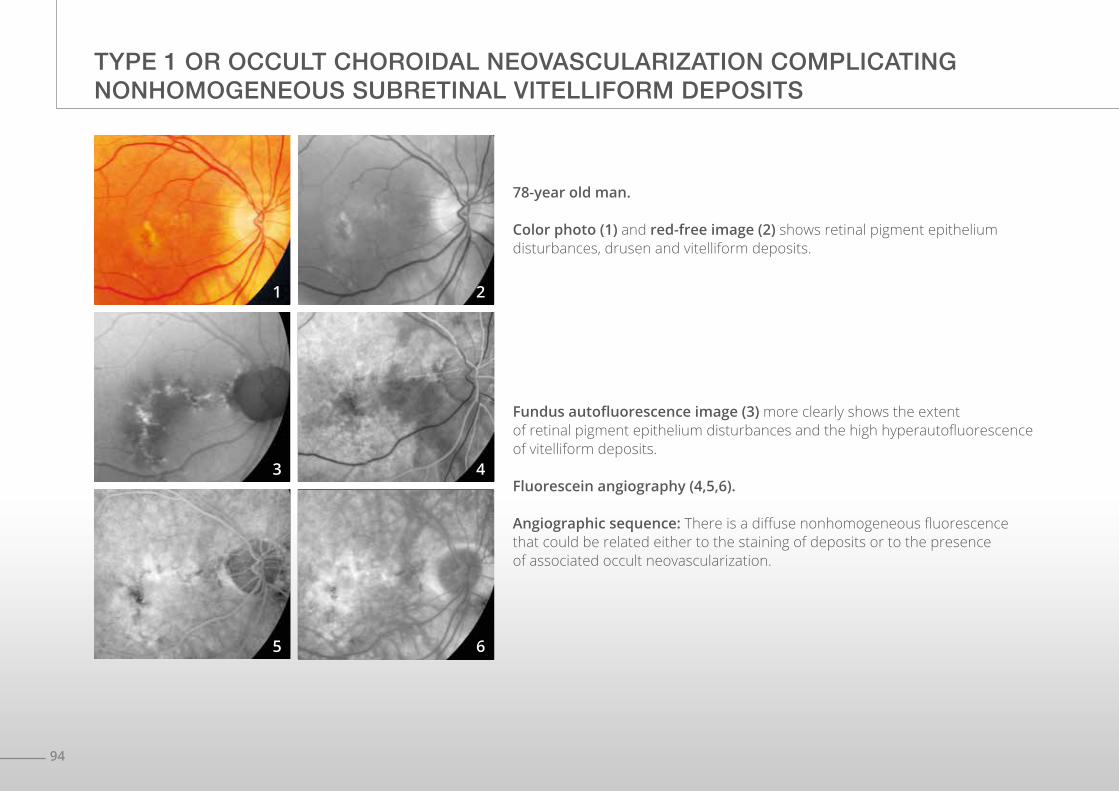
TYPE 1 OR OCCULT CHOROIDAL NEOVASCULARIZATION COMPLICATING NONHOMOGENEOUS SUBRETINAL VITELLIFORM DEPOSITS
Fundus autofluorescence image (3) more clearly shows the extent of retinal pigment epithelium disturbances and the high hyperautofluorescence of vitelliform deposits.
Fluorescein angiography (4,5,6).
Angiographic sequence: There is a diffuse nonhomogeneous fluorescence that could be related either to the staining of deposits or to the presence of associated occult neovascularization.
78-year old man.
Color photo (1) and red-free image (2) shows retinal pigment epithelium disturbances, drusen and vitelliform deposits.
1
3
5
2
4
6
95
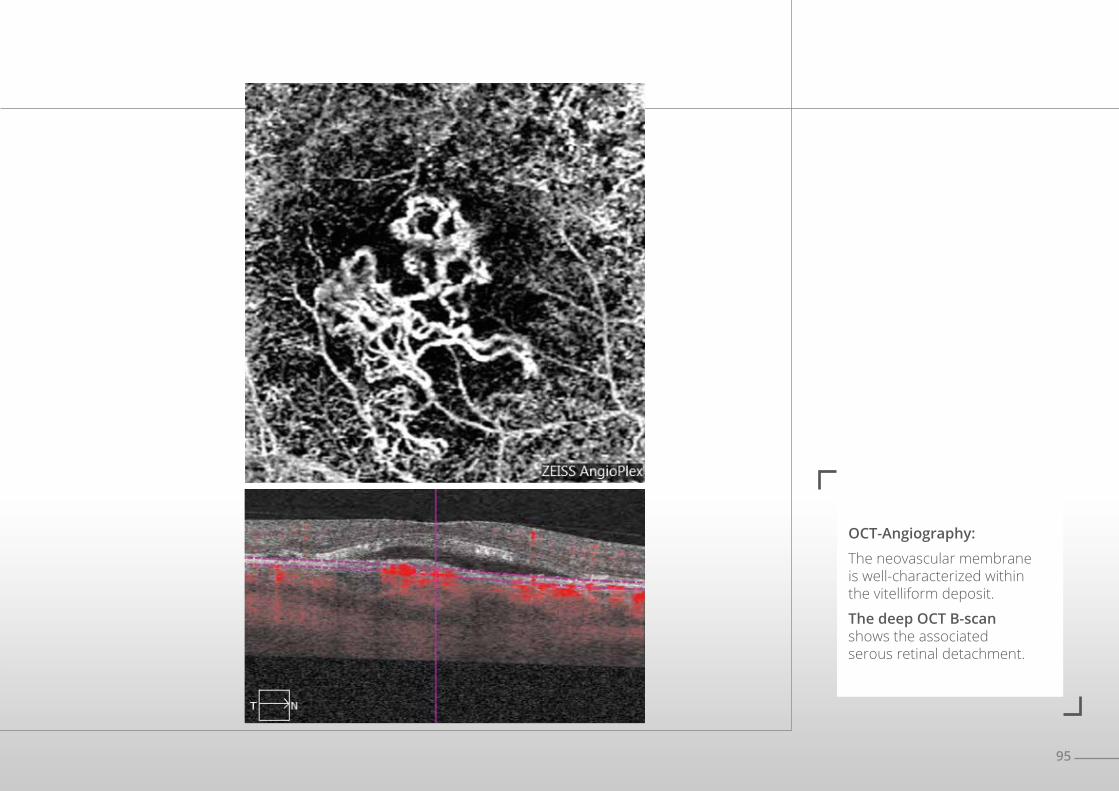
OCT-Angiography:
The neovascular membrane is well-characterized within the vitelliform deposit.
The deep OCT B-scan shows the associated serous retinal detachment.
96
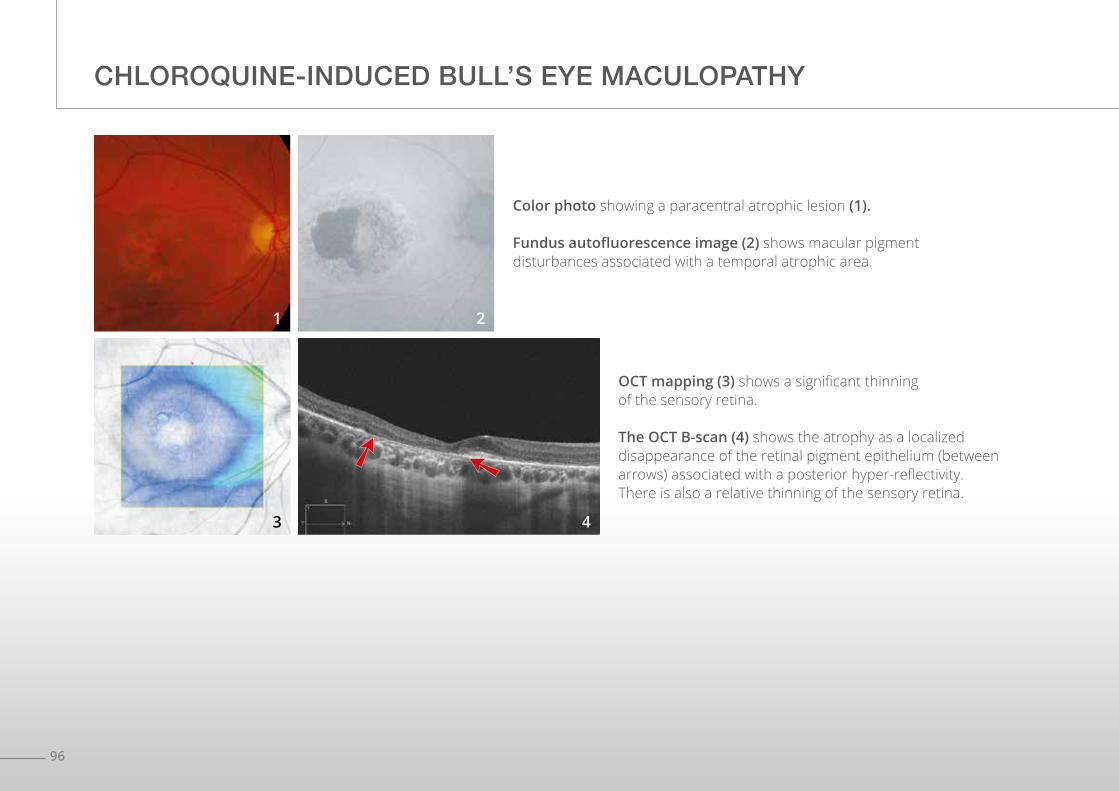
CHLOROQUINE-INDUCED BULL’S EYE MACULOPATHY
OCT mapping (3) shows a significant thinning of the sensory retina.
The OCT B-scan (4) shows the atrophy as a localized disappearance of the retinal pigment epithelium (between arrows) associated with a posterior hyper-reflectivity.There is also a relative thinning of the sensory retina.
Color photo showing a paracentral atrophic lesion (1).
Fundus autofluorescence image (2) shows macular pigment disturbances associated with a temporal atrophic area.
1
3
2
4
97
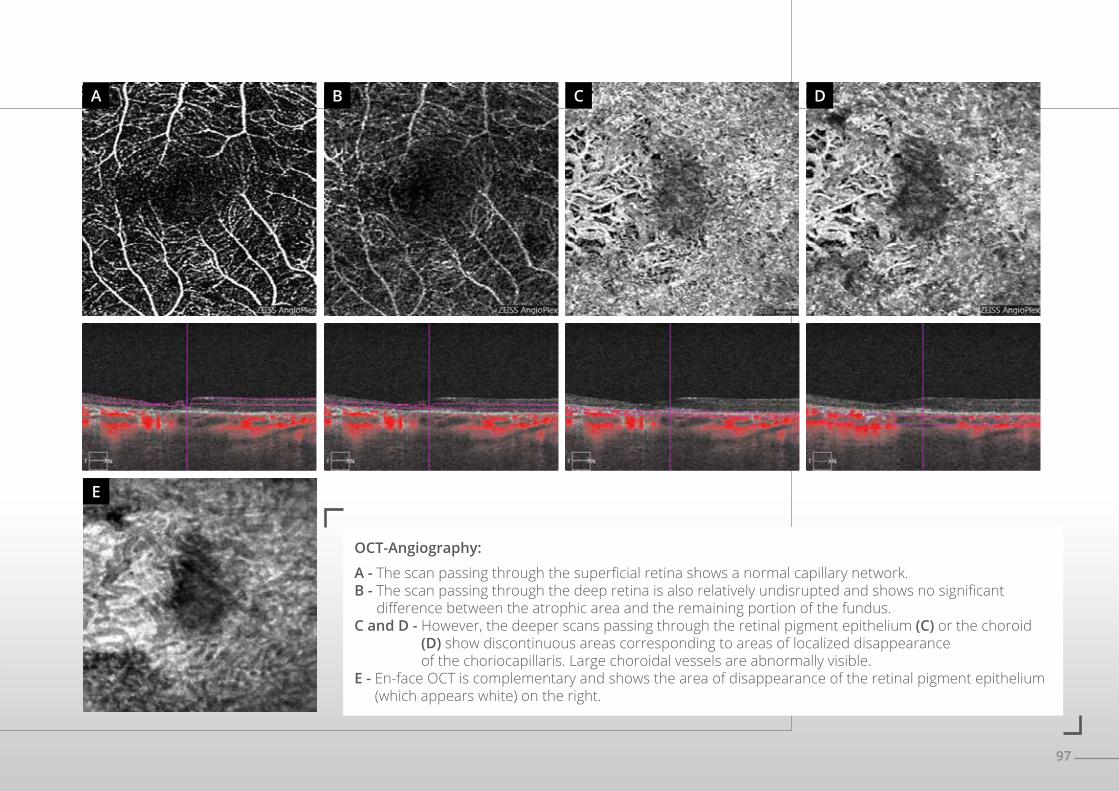
OCT-Angiography:
A - The scan passing through the superficial retina shows a normal capillary network.B - The scan passing through the deep retina is also relatively undisrupted and shows no significant
difference between the atrophic area and the remaining portion of the fundus.C and D - However, the deeper scans passing through the retinal pigment epithelium (C) or the choroid
(D) show discontinuous areas corresponding to areas of localized disappearance of the choriocapillaris. Large choroidal vessels are abnormally visible.
E - En-face OCT is complementary and shows the area of disappearance of the retinal pigment epithelium (which appears white) on the right.
A B C D
E
99
CHAPTER 6MISCELLANEOUS
Various diseases have already been explored by OCT-Angiography, such as macular telangiectasia, some intraocular tumors and central serous chorioretinopathy (CSC).
In chronic CSC, OCT-Angiography has allowed visualization of new vessels in a significant number of doubtful cases of chronic exudation. However, most often the choriocapillaris appears nonhomogeneous, making choroidal vessels visible that should not be mistaken with choroidal new vessels. Therefore, as mentioned before, the learning process for interpreting OCT-Angiography images is ongoing.
100
CENTRAL SEROUS CHORIORETINOPATHY
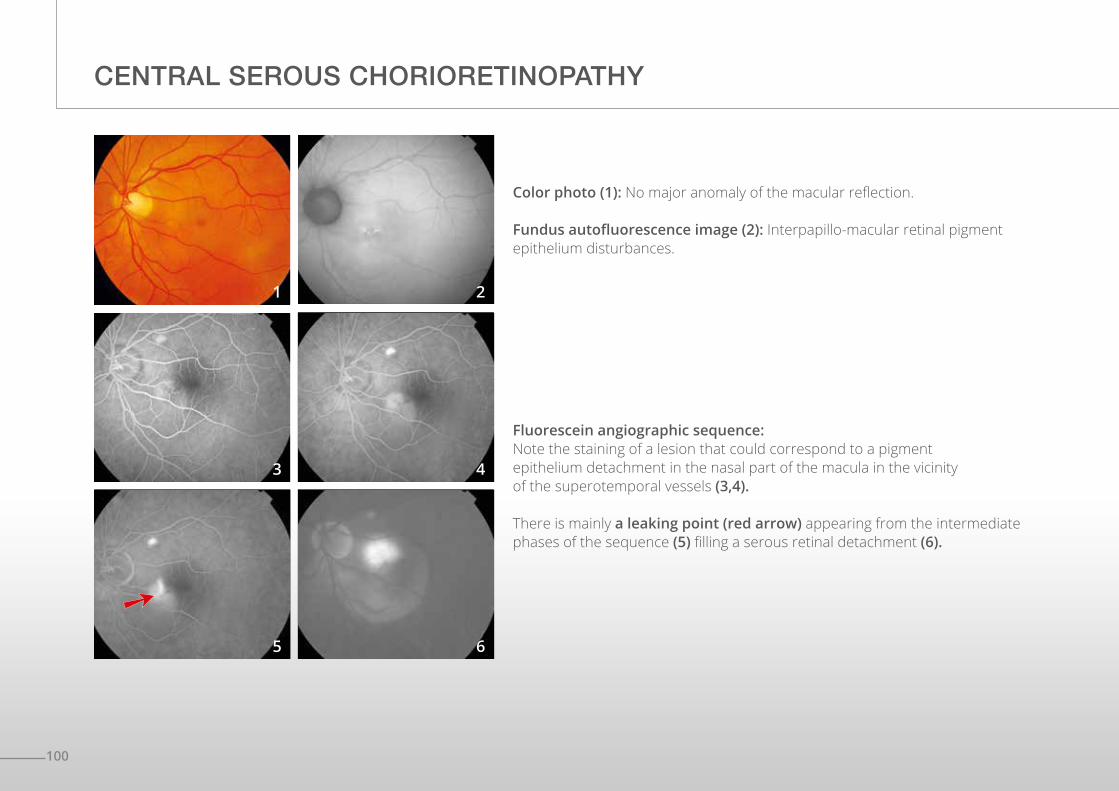
Fluorescein angiographic sequence:Note the staining of a lesion that could correspond to a pigment epithelium detachment in the nasal part of the macula in the vicinity of the superotemporal vessels (3,4).
There is mainly a leaking point (red arrow) appearing from the intermediate phases of the sequence (5) filling a serous retinal detachment (6).
Color photo (1): No major anomaly of the macular reflection.
Fundus autofluorescence image (2): Interpapillo-macular retinal pigment epithelium disturbances.
1
3
5
2
4
6
101
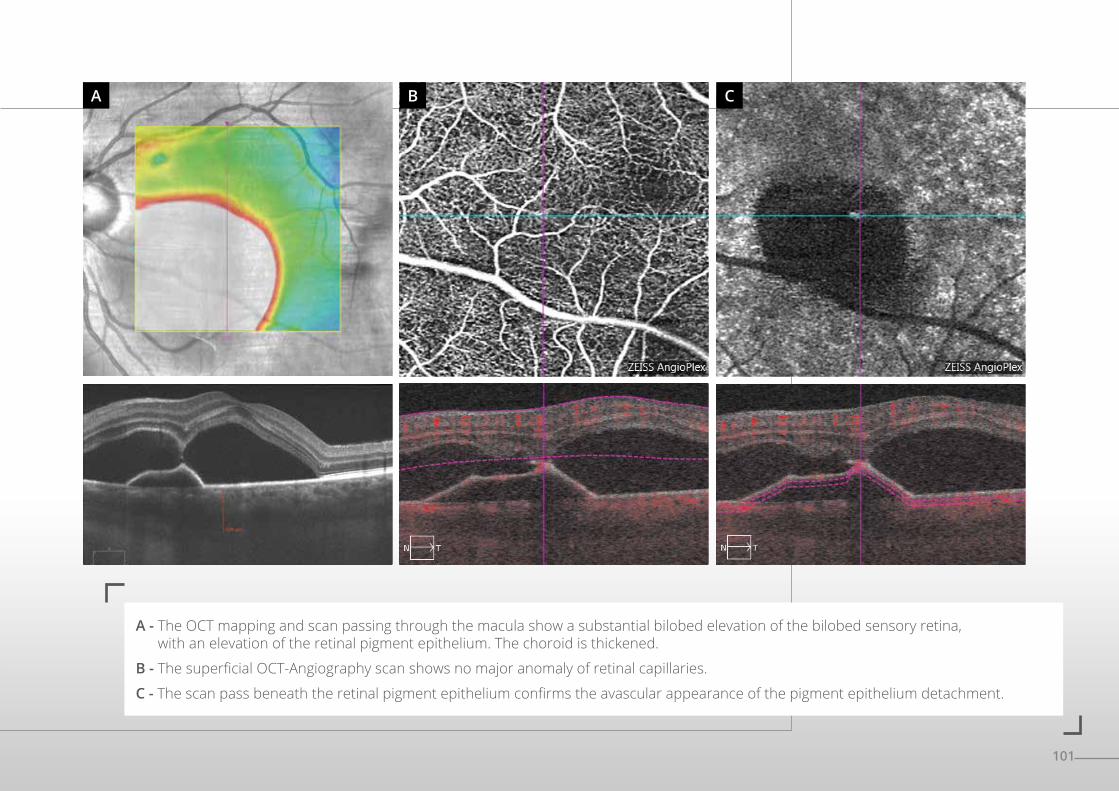
A - The OCT mapping and scan passing through the macula show a substantial bilobed elevation of the bilobed sensory retina, with an elevation of the retinal pigment epithelium. The choroid is thickened.
B - The superficial OCT-Angiography scan shows no major anomaly of retinal capillaries.
C - The scan pass beneath the retinal pigment epithelium confirms the avascular appearance of the pigment epithelium detachment.
A B C
102
CENTRAL SEROUS CHORIORETINOPATHY
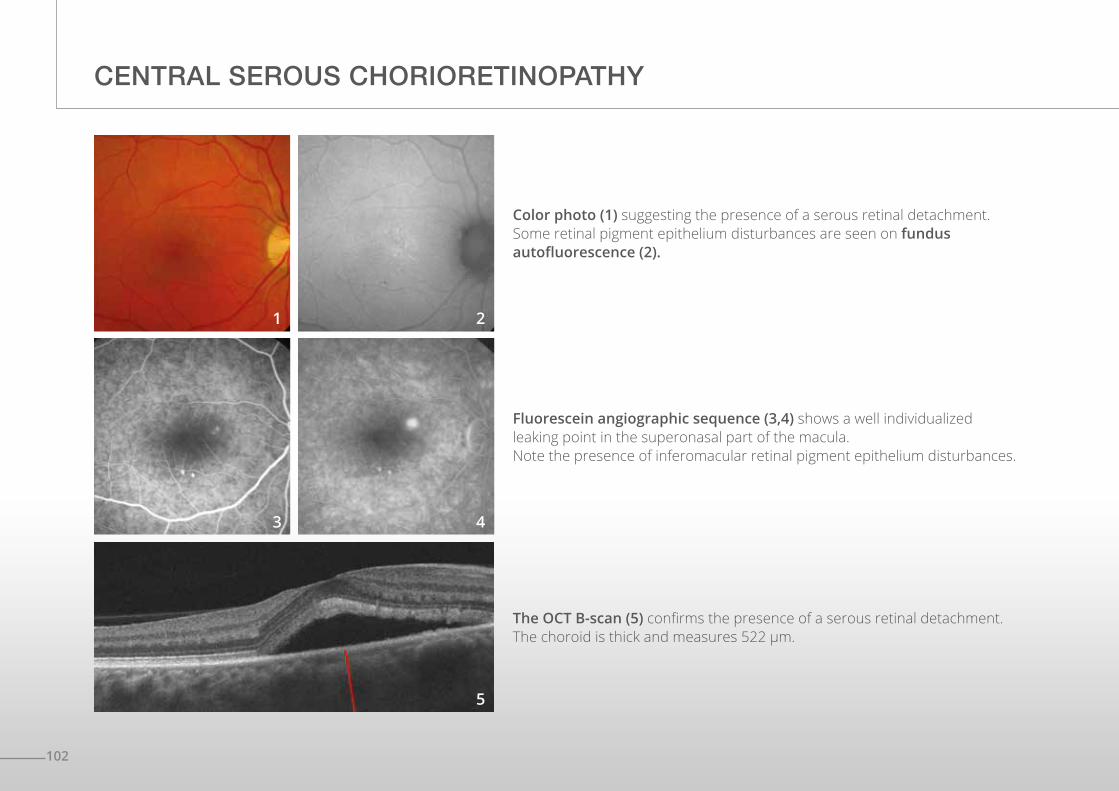
Fluorescein angiographic sequence (3,4) shows a well individualized leaking point in the superonasal part of the macula.Note the presence of inferomacular retinal pigment epithelium disturbances.
The OCT B-scan (5) confirms the presence of a serous retinal detachment. The choroid is thick and measures 522 µm.
Color photo (1) suggesting the presence of a serous retinal detachment. Some retinal pigment epithelium disturbances are seen on fundus autofluorescence (2).
1
3
2
4
5
103
A B
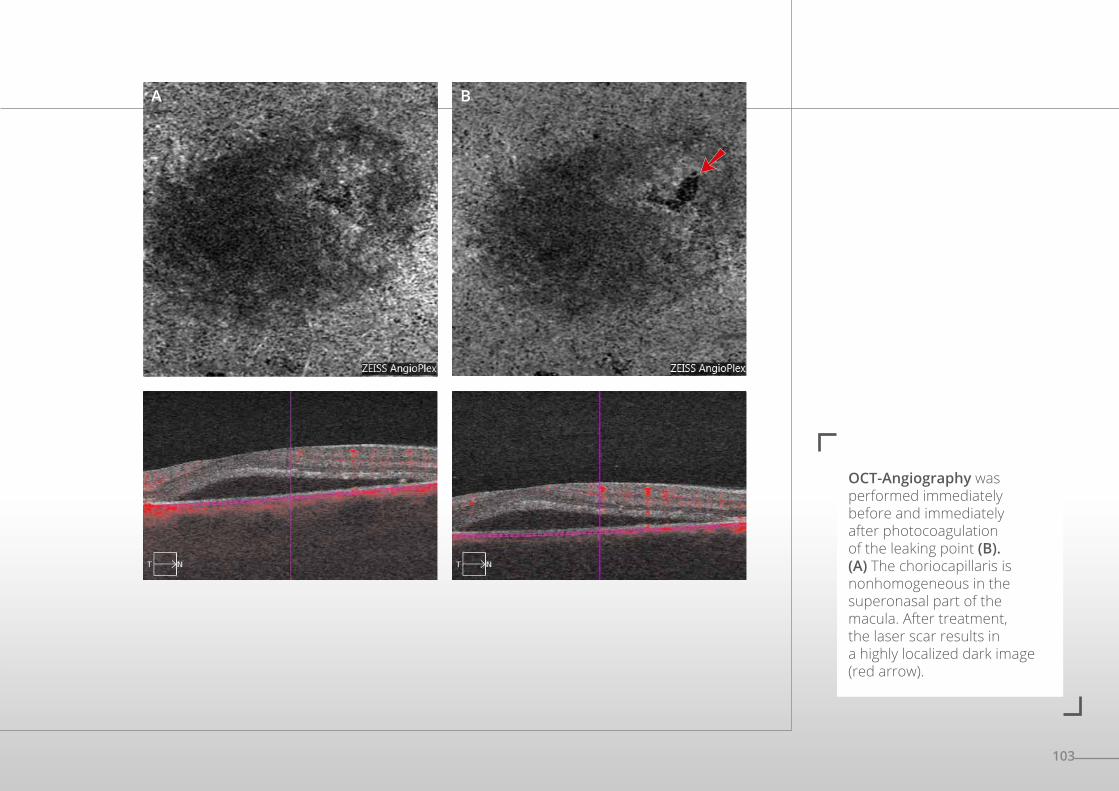
OCT-Angiography was performed immediately before and immediately after photocoagulation of the leaking point (B). (A) The choriocapillaris is nonhomogeneous in the superonasal part of the macula. After treatment, the laser scar results in a highly localized dark image (red arrow).
104
CHRONIC CENTRAL SEROUS CHORIORETINOPATHY (DIFFUSE RETINAL EPITHELIOPATHY)
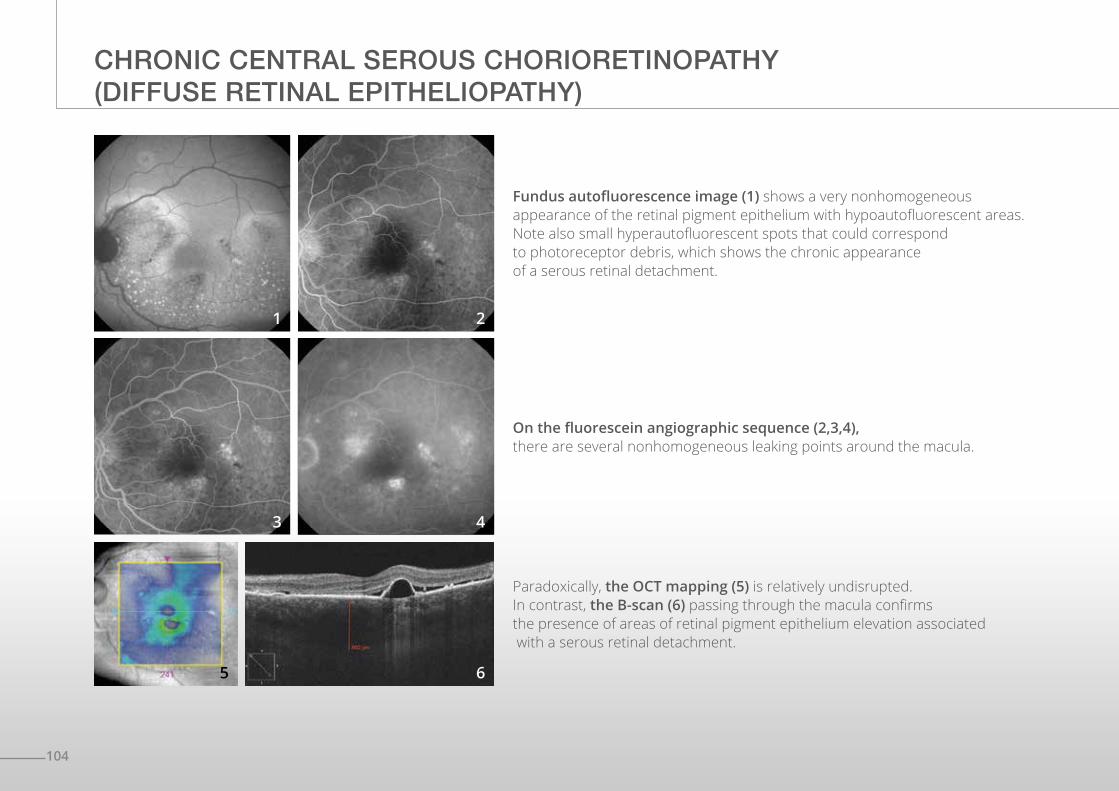
On the fluorescein angiographic sequence (2,3,4),there are several nonhomogeneous leaking points around the macula.
Paradoxically, the OCT mapping (5) is relatively undisrupted.In contrast, the B-scan (6) passing through the macula confirms the presence of areas of retinal pigment epithelium elevation associated with a serous retinal detachment.
Fundus autofluorescence image (1) shows a very nonhomogeneous appearance of the retinal pigment epithelium with hypoautofluorescent areas.Note also small hyperautofluorescent spots that could correspond to photoreceptor debris, which shows the chronic appearance of a serous retinal detachment.
1
3
2
4
65
105
A B
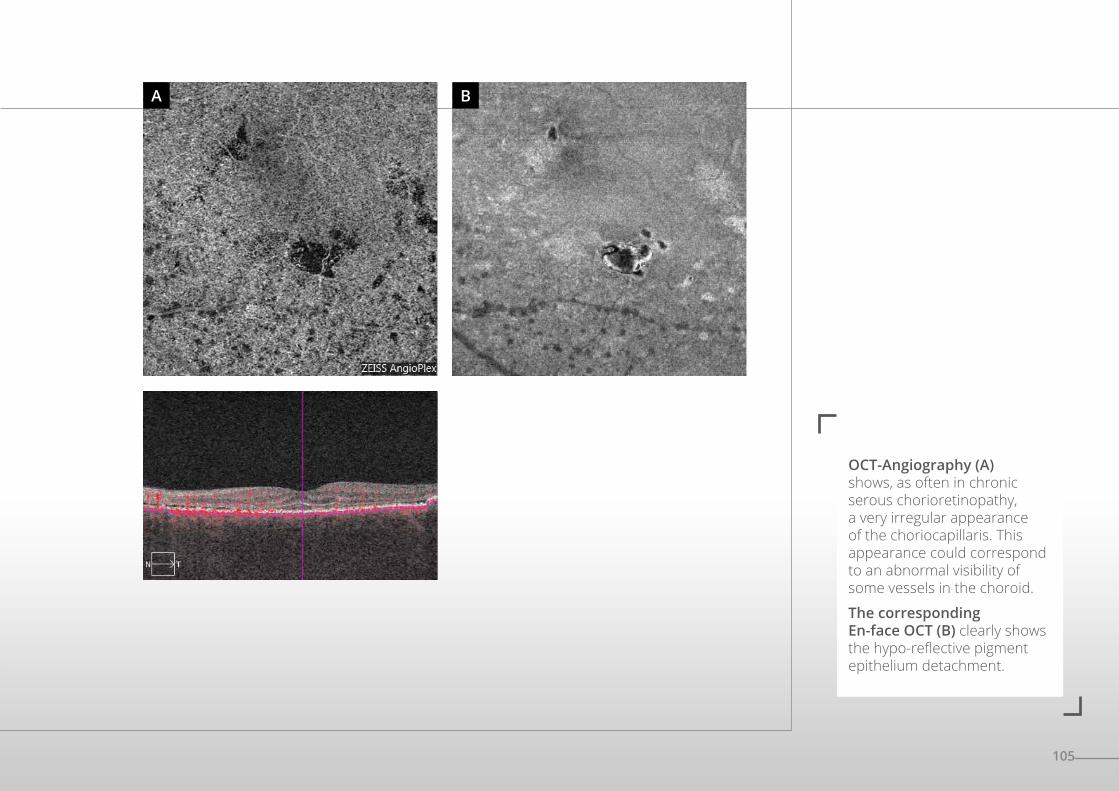
OCT-Angiography (A) shows, as often in chronic serous chorioretinopathy, a very irregular appearance of the choriocapillaris. This appearance could correspond to an abnormal visibility of some vessels in the choroid.
The corresponding En-face OCT (B) clearly shows the hypo-reflective pigment epithelium detachment.
106
CENTRAL SEROUS CHORIORETINOPATHY COMPLICATED BY CHOROIDAL NEOVASCULARIZATION
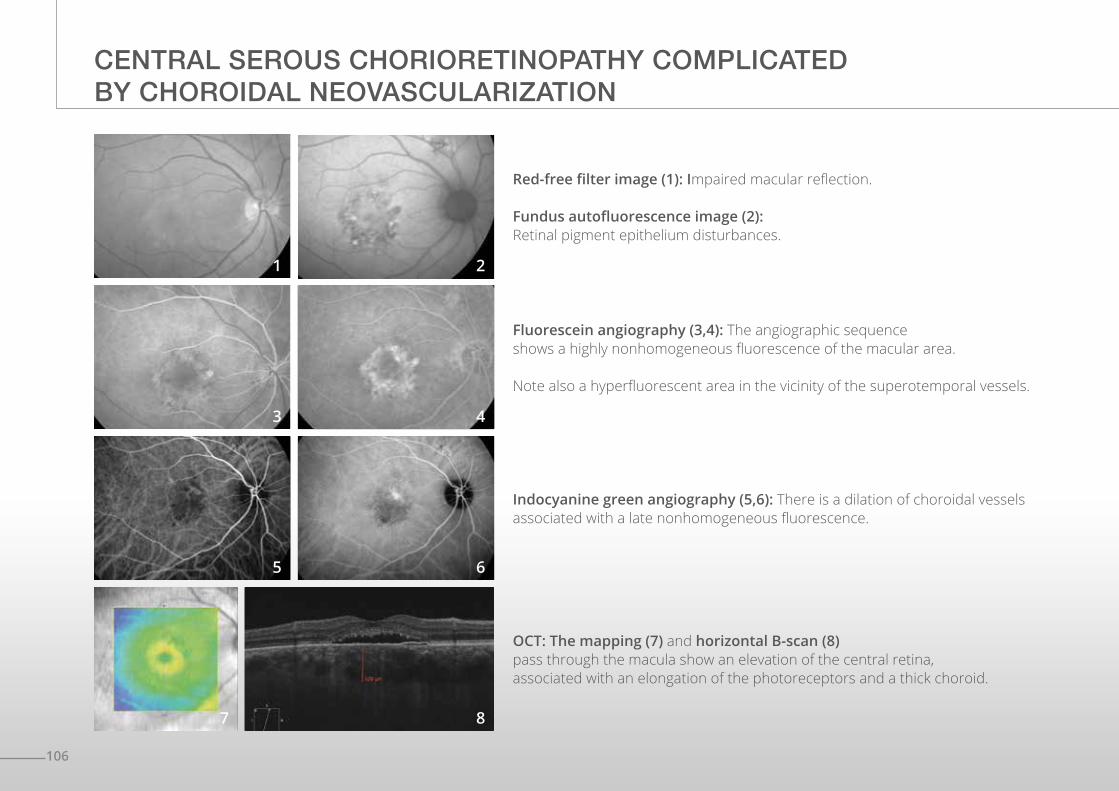
Red-free filter image (1): Impaired macular reflection.
Fundus autofluorescence image (2): Retinal pigment epithelium disturbances.
Fluorescein angiography (3,4): The angiographic sequence shows a highly nonhomogeneous fluorescence of the macular area.
Note also a hyperfluorescent area in the vicinity of the superotemporal vessels.
Indocyanine green angiography (5,6): There is a dilation of choroidal vessels associated with a late nonhomogeneous fluorescence.
OCT: The mapping (7) and horizontal B-scan (8)pass through the macula show an elevation of the central retina, associated with an elongation of the photoreceptors and a thick choroid.
1
3
5
7
2
4
6
8
107
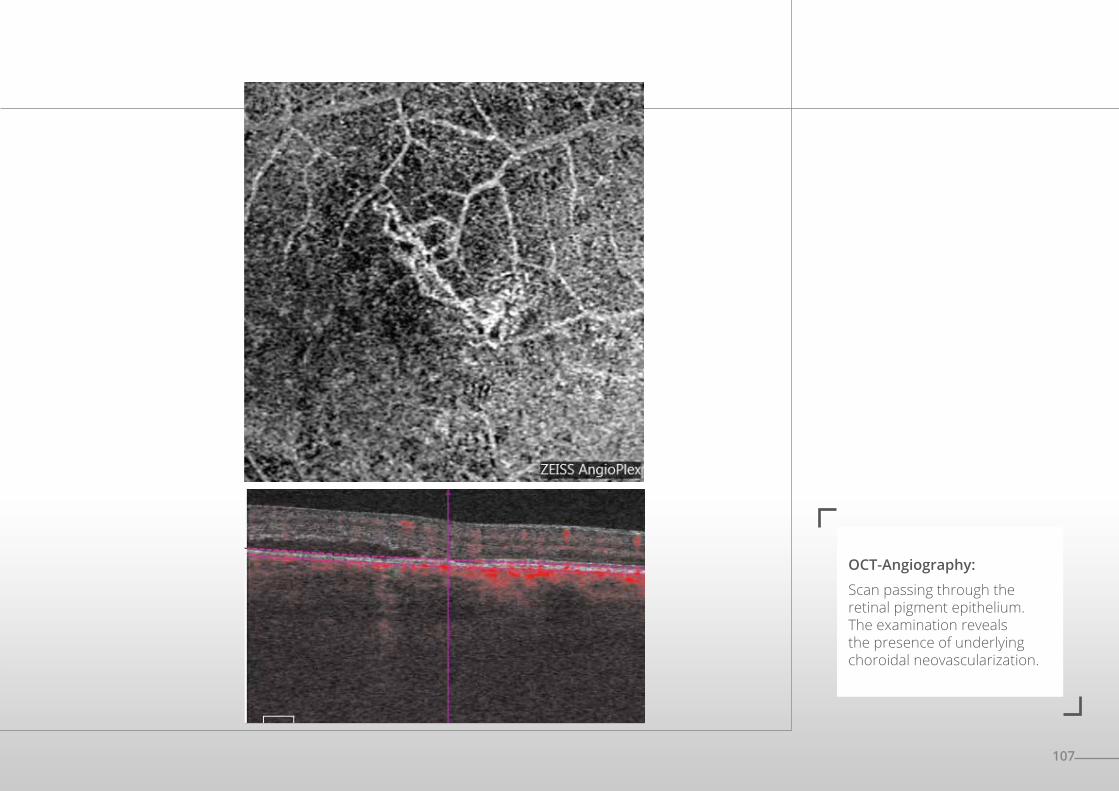
OCT-Angiography:
Scan passing through the retinal pigment epithelium. The examination reveals the presence of underlying choroidal neovascularization.
108
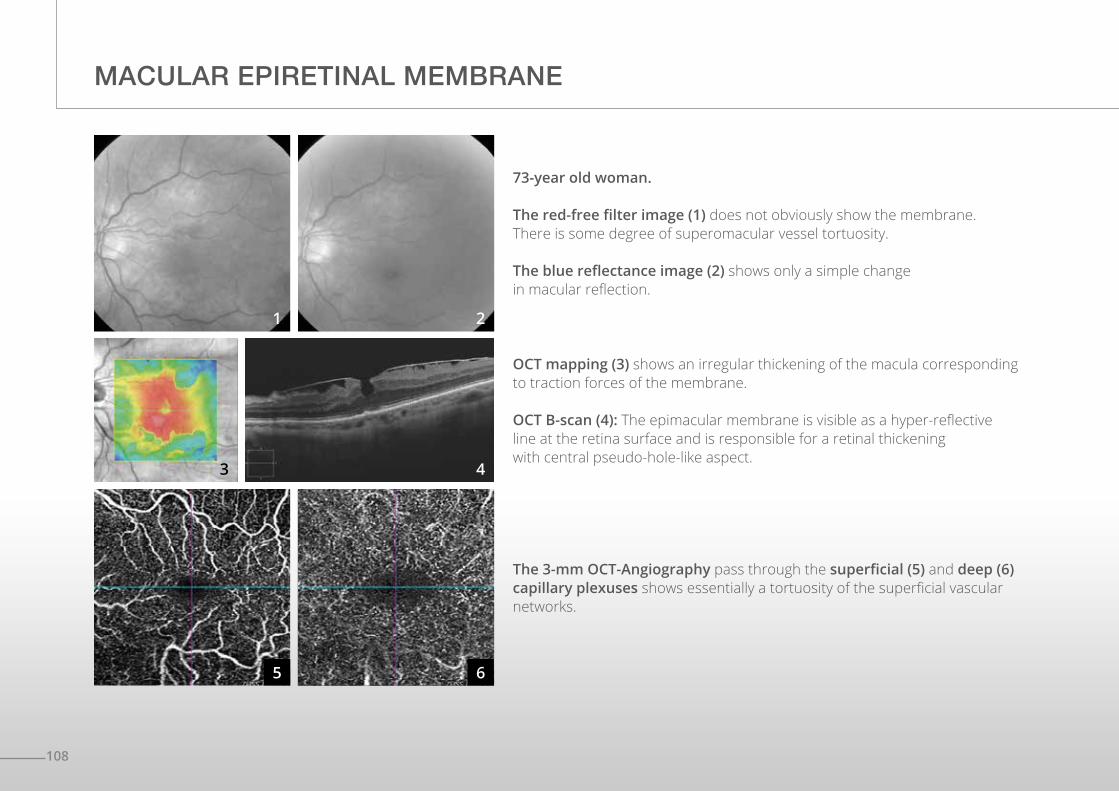
73-year old woman.
The red-free filter image (1) does not obviously show the membrane. There is some degree of superomacular vessel tortuosity.
The blue reflectance image (2) shows only a simple change in macular reflection.
The 3-mm OCT-Angiography pass through the superficial (5) and deep (6) capillary plexuses shows essentially a tortuosity of the superficial vascular networks.
OCT mapping (3) shows an irregular thickening of the macula corresponding to traction forces of the membrane.
OCT B-scan (4): The epimacular membrane is visible as a hyper-reflective line at the retina surface and is responsible for a retinal thickening with central pseudo-hole-like aspect.
MACULAR EPIRETINAL MEMBRANE
1
5
2
6
43
109
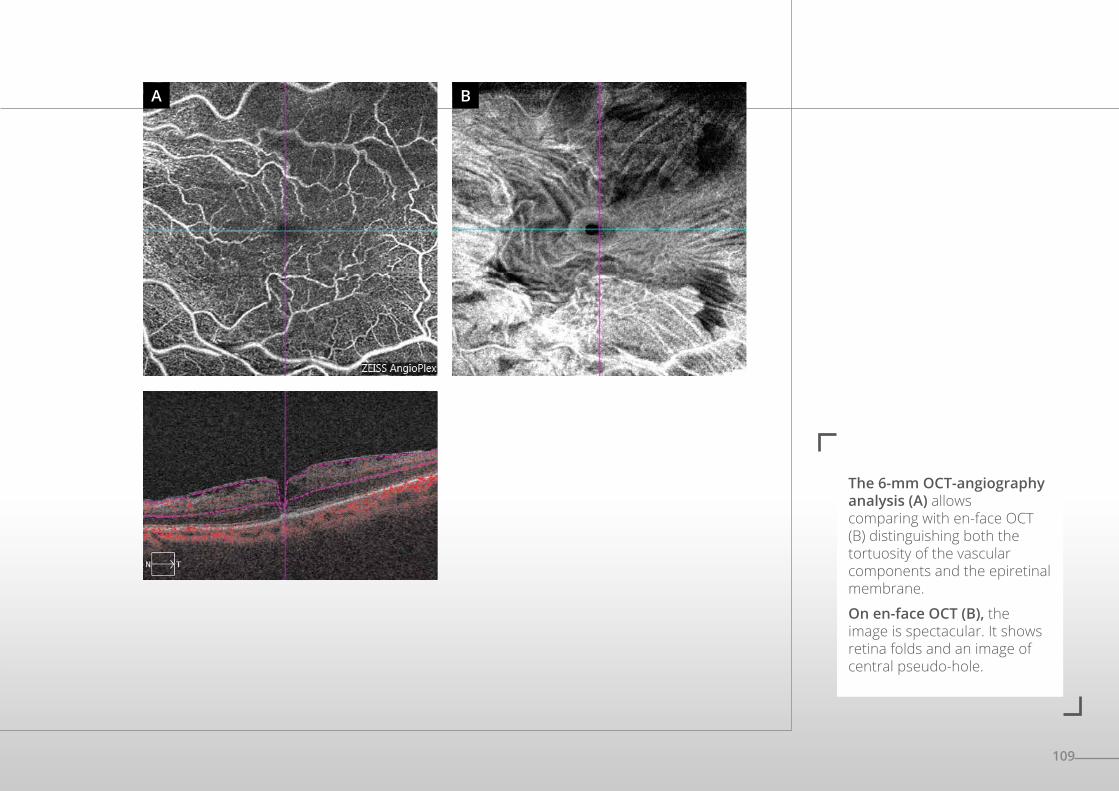
A B
The 6-mm OCT-angiography analysis (A) allows comparing with en-face OCT (B) distinguishing both the tortuosity of the vascular components and the epiretinal membrane.
On en-face OCT (B), the image is spectacular. It shows retina folds and an image of central pseudo-hole.
110
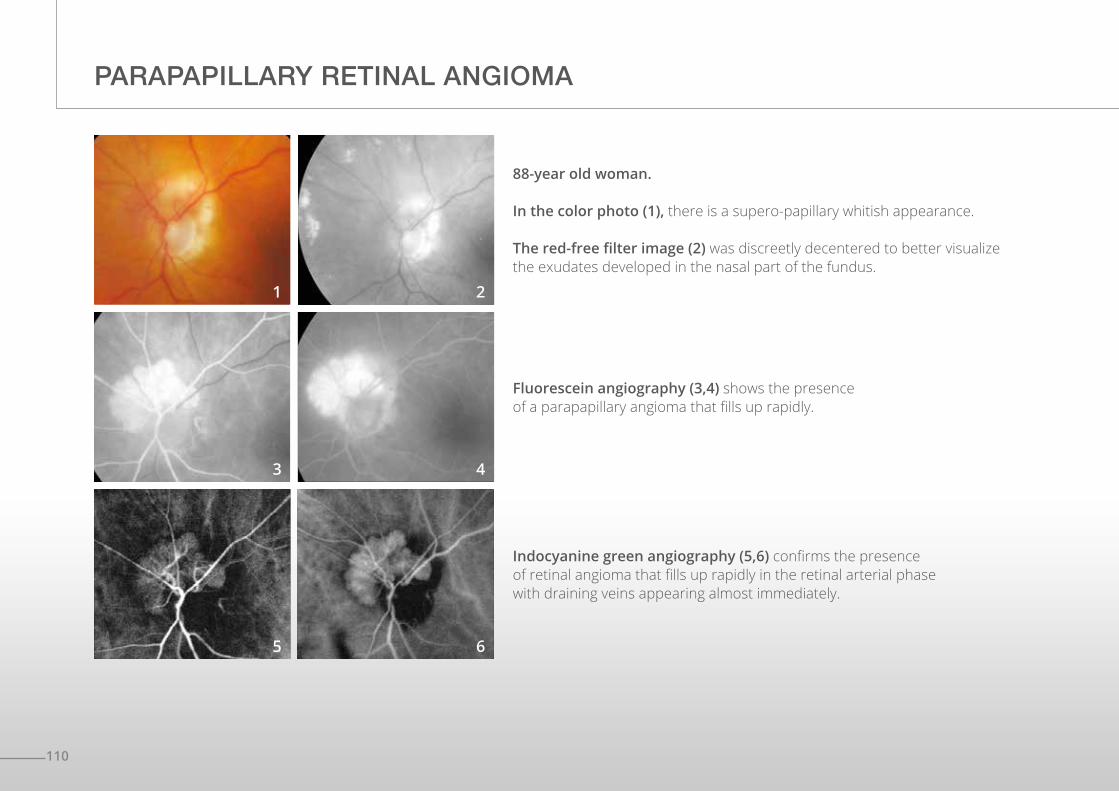
PARAPAPILLARY RETINAL ANGIOMA
Fluorescein angiography (3,4) shows the presence of a parapapillary angioma that fills up rapidly.
Indocyanine green angiography (5,6) confirms the presence of retinal angioma that fills up rapidly in the retinal arterial phase with draining veins appearing almost immediately.
88-year old woman.
In the color photo (1), there is a supero-papillary whitish appearance.
The red-free filter image (2) was discreetly decentered to better visualize the exudates developed in the nasal part of the fundus.
1
3
5
2
4
6
111
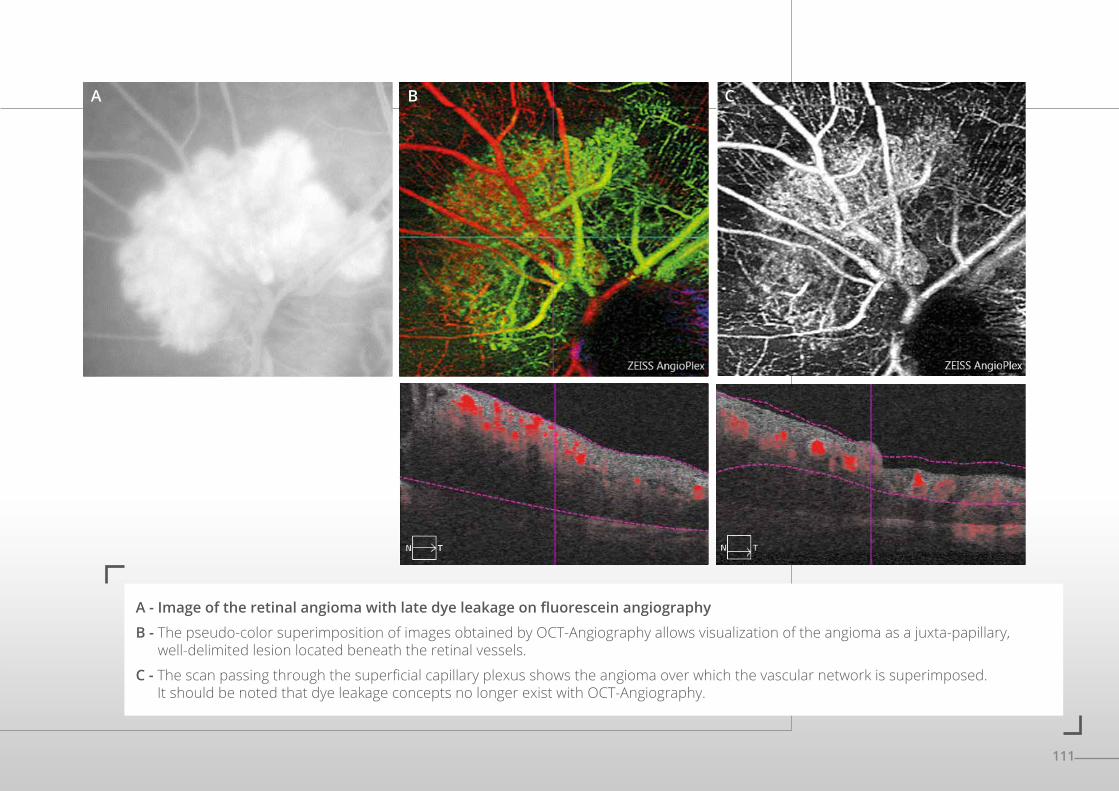
A - Image of the retinal angioma with late dye leakage on fluorescein angiography
B - The pseudo-color superimposition of images obtained by OCT-Angiography allows visualization of the angioma as a juxta-papillary, well-delimited lesion located beneath the retinal vessels.
C - The scan passing through the superficial capillary plexus shows the angioma over which the vascular network is superimposed. It should be noted that dye leakage concepts no longer exist with OCT-Angiography.
A B C
112
COATS’ DISEASE
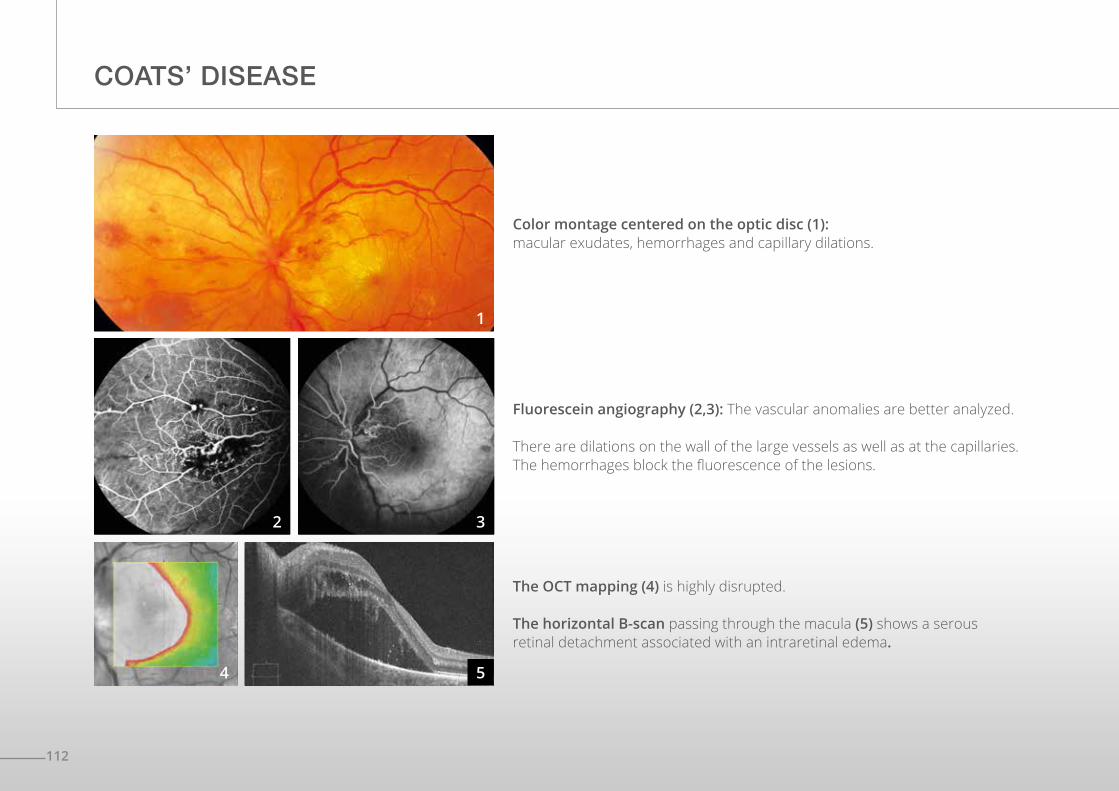
Fluorescein angiography (2,3): The vascular anomalies are better analyzed.
There are dilations on the wall of the large vessels as well as at the capillaries. The hemorrhages block the fluorescence of the lesions.
Color montage centered on the optic disc (1): macular exudates, hemorrhages and capillary dilations.
2
1
3
The OCT mapping (4) is highly disrupted.
The horizontal B-scan passing through the macula (5) shows a serous retinal detachment associated with an intraretinal edema.
4 5
113
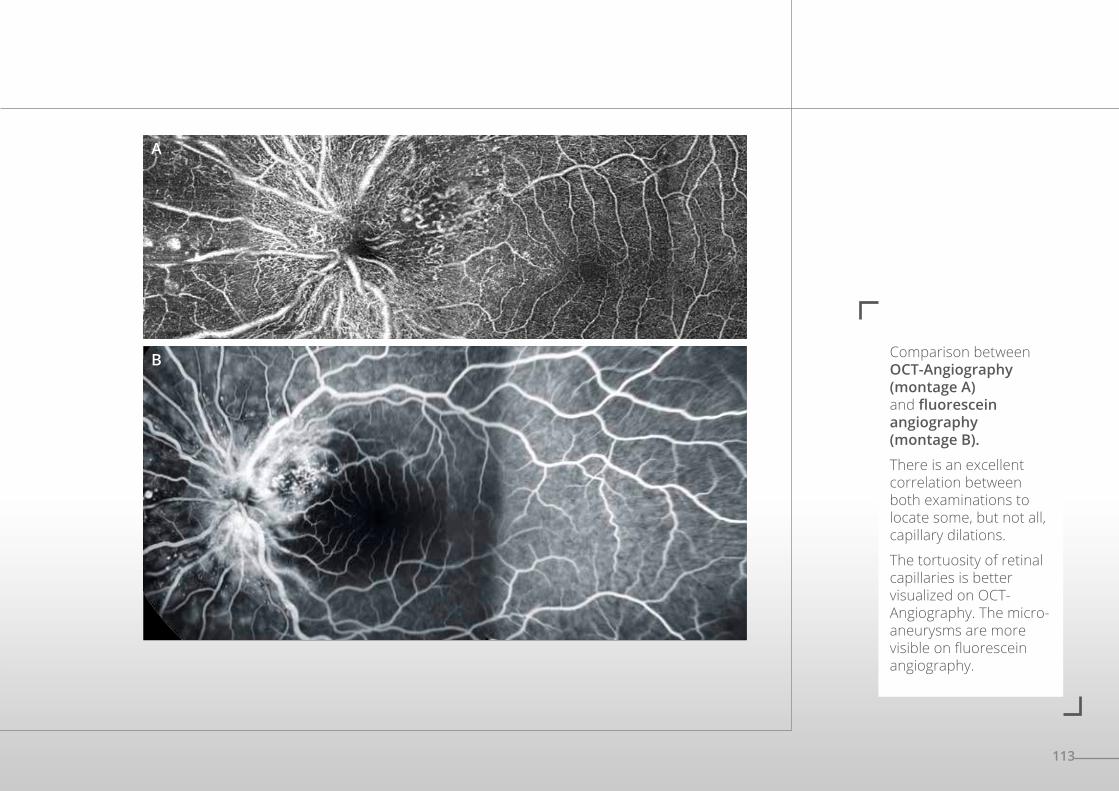
Comparison between OCT-Angiography (montage A) and fluorescein angiography (montage B).
There is an excellent correlation between both examinations to locate some, but not all, capillary dilations.
The tortuosity of retinal capillaries is better visualized on OCT-Angiography. The micro-aneurysms are more visible on fluorescein angiography.
A
B
114
CHOROIDAL NEVUS
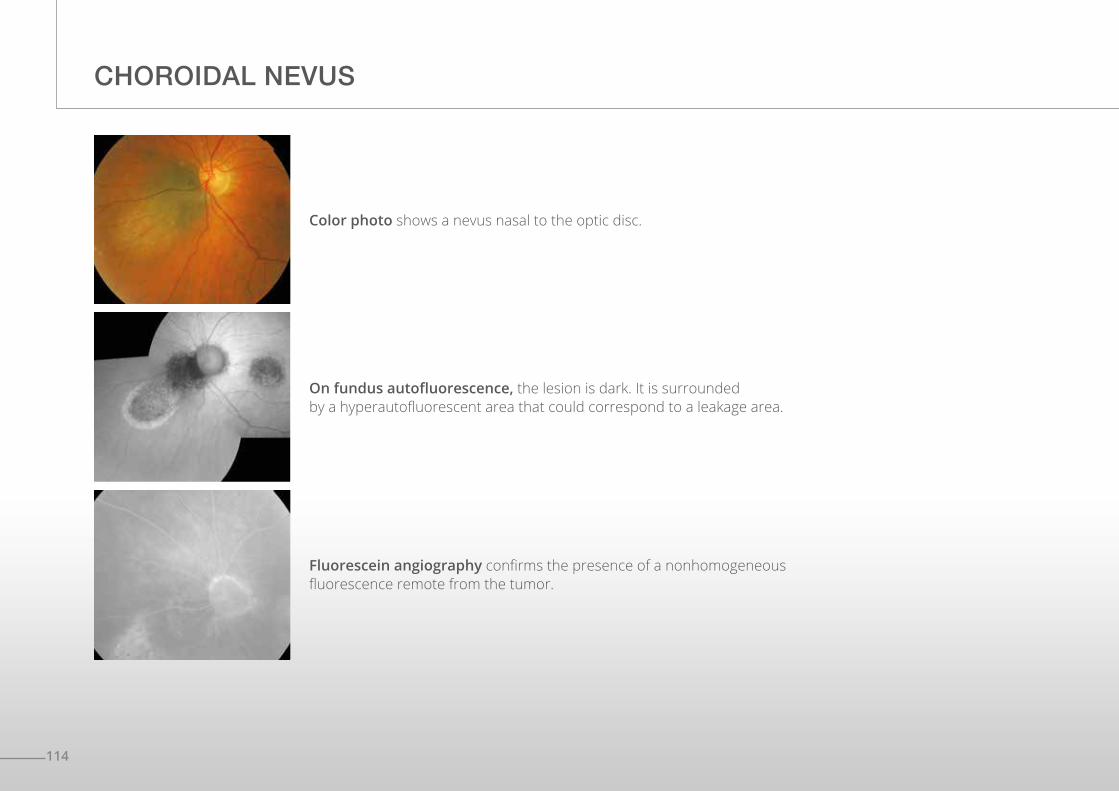
On fundus autofluorescence, the lesion is dark. It is surrounded by a hyperautofluorescent area that could correspond to a leakage area.
Fluorescein angiography confirms the presence of a nonhomogeneous fluorescence remote from the tumor.
Color photo shows a nevus nasal to the optic disc.
115
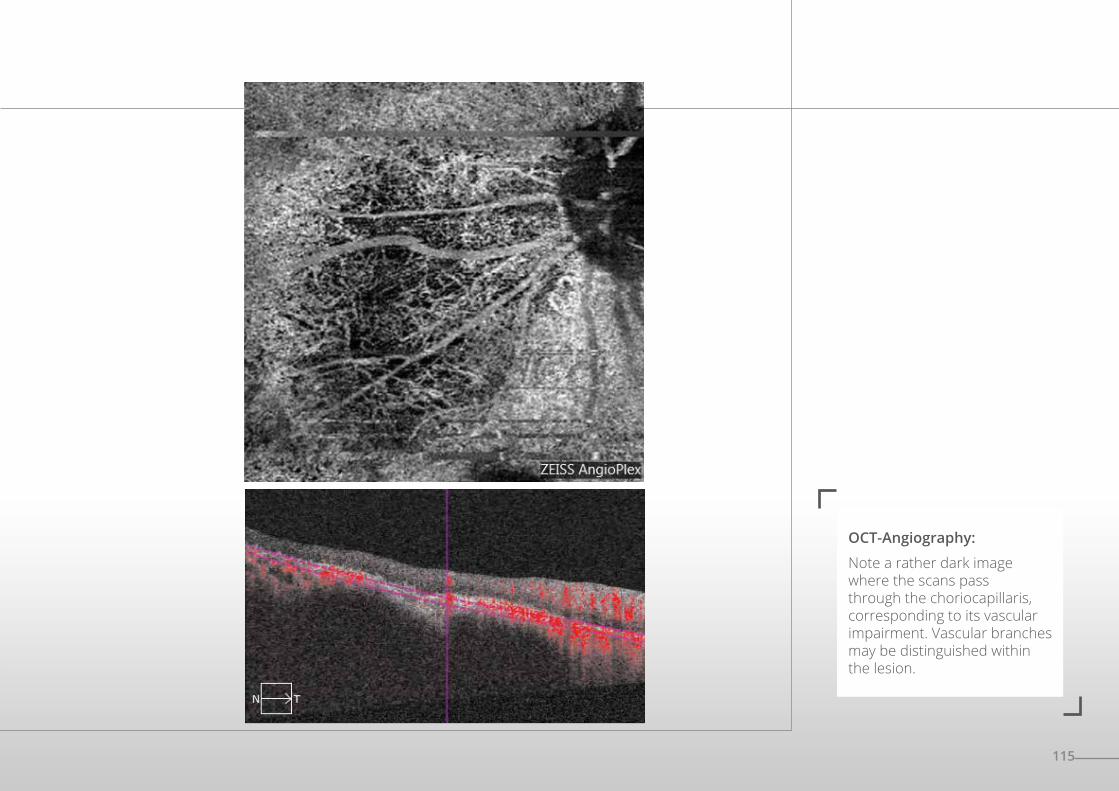
OCT-Angiography:
Note a rather dark image where the scans pass through the choriocapillaris, corresponding to its vascular impairment. Vascular branches may be distinguished within the lesion.
116
SUSPICIOUS PIGMENTED LESION
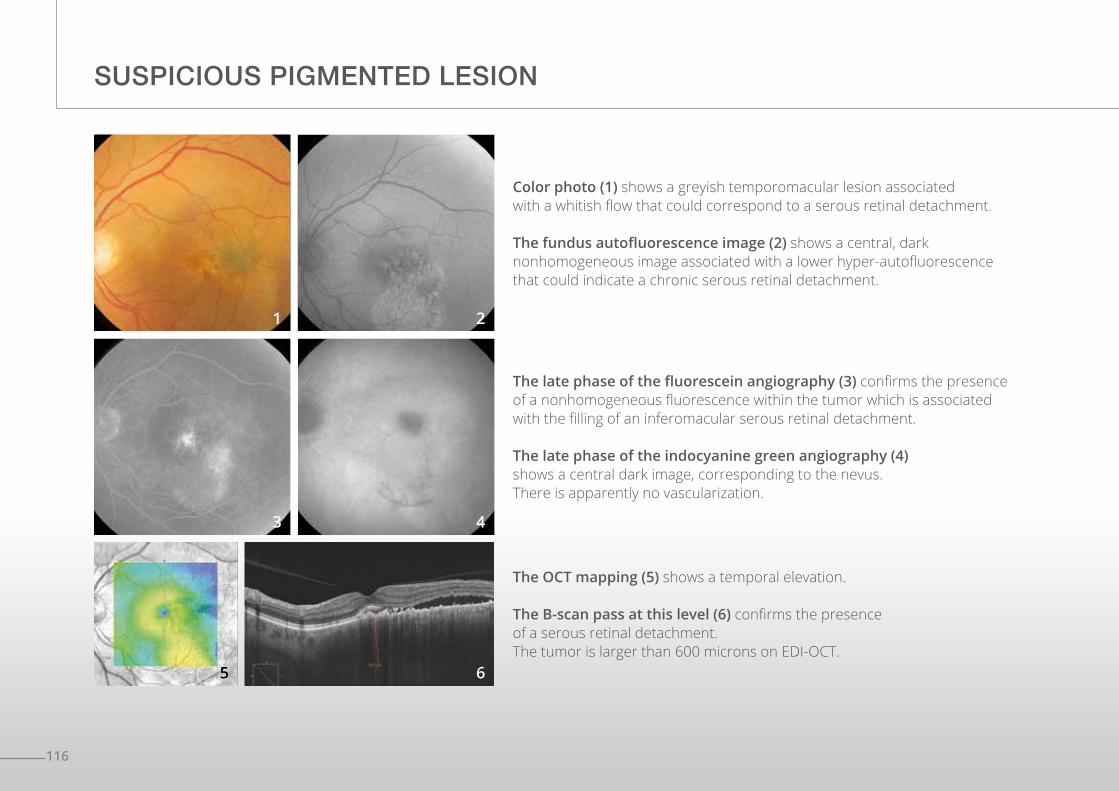
The late phase of the fluorescein angiography (3) confirms the presence of a nonhomogeneous fluorescence within the tumor which is associated with the filling of an inferomacular serous retinal detachment.
The late phase of the indocyanine green angiography (4) shows a central dark image, corresponding to the nevus. There is apparently no vascularization.
Color photo (1) shows a greyish temporomacular lesion associated with a whitish flow that could correspond to a serous retinal detachment.
The fundus autofluorescence image (2) shows a central, dark nonhomogeneous image associated with a lower hyper-autofluorescence that could indicate a chronic serous retinal detachment.
3
1 2
4
The OCT mapping (5) shows a temporal elevation.
The B-scan pass at this level (6) confirms the presence of a serous retinal detachment.The tumor is larger than 600 microns on EDI-OCT.
5 6
117
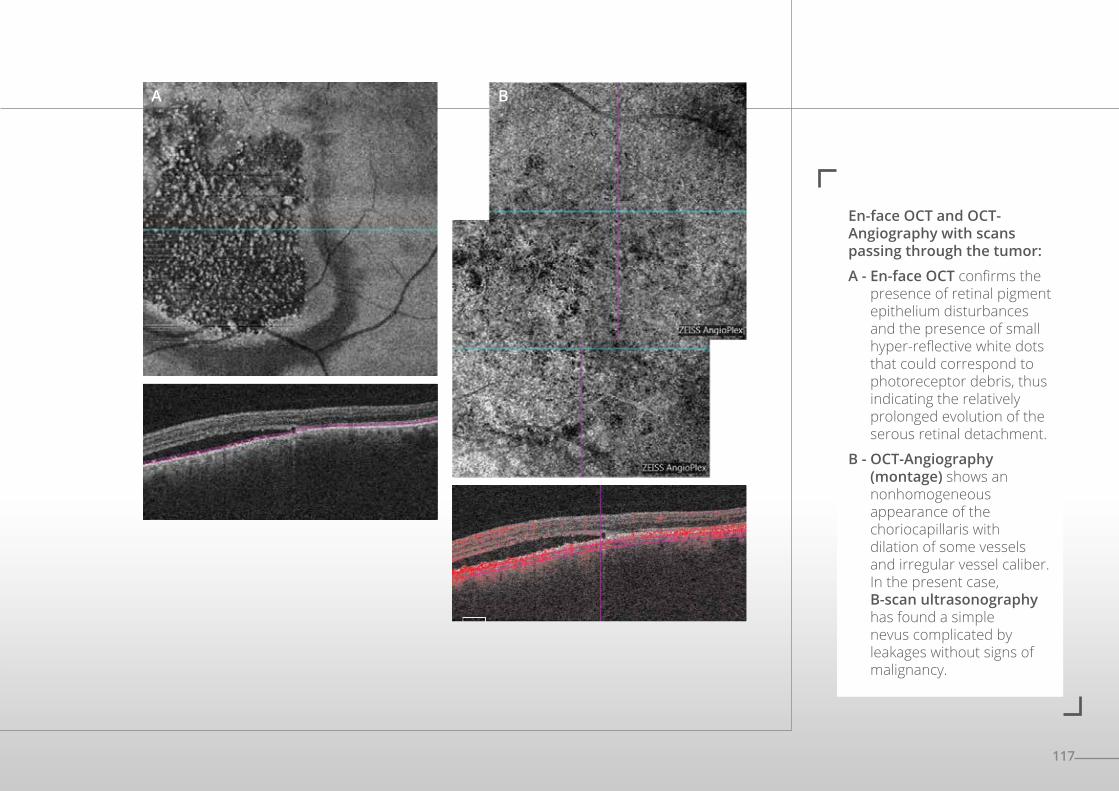
En-face OCT and OCT-Angiography with scans passing through the tumor:
A - En-face OCT confirms the presence of retinal pigment epithelium disturbances and the presence of small hyper-reflective white dots that could correspond to photoreceptor debris, thus indicating the relatively prolonged evolution of the serous retinal detachment.
B - OCT-Angiography (montage) shows an nonhomogeneous appearance of the choriocapillaris with dilation of some vessels and irregular vessel caliber. In the present case, B-scan ultrasonography has found a simple nevus complicated by leakages without signs of malignancy.
A B
118
PHOTOTRAUMA-RELATED MACULAR DEGENERATION
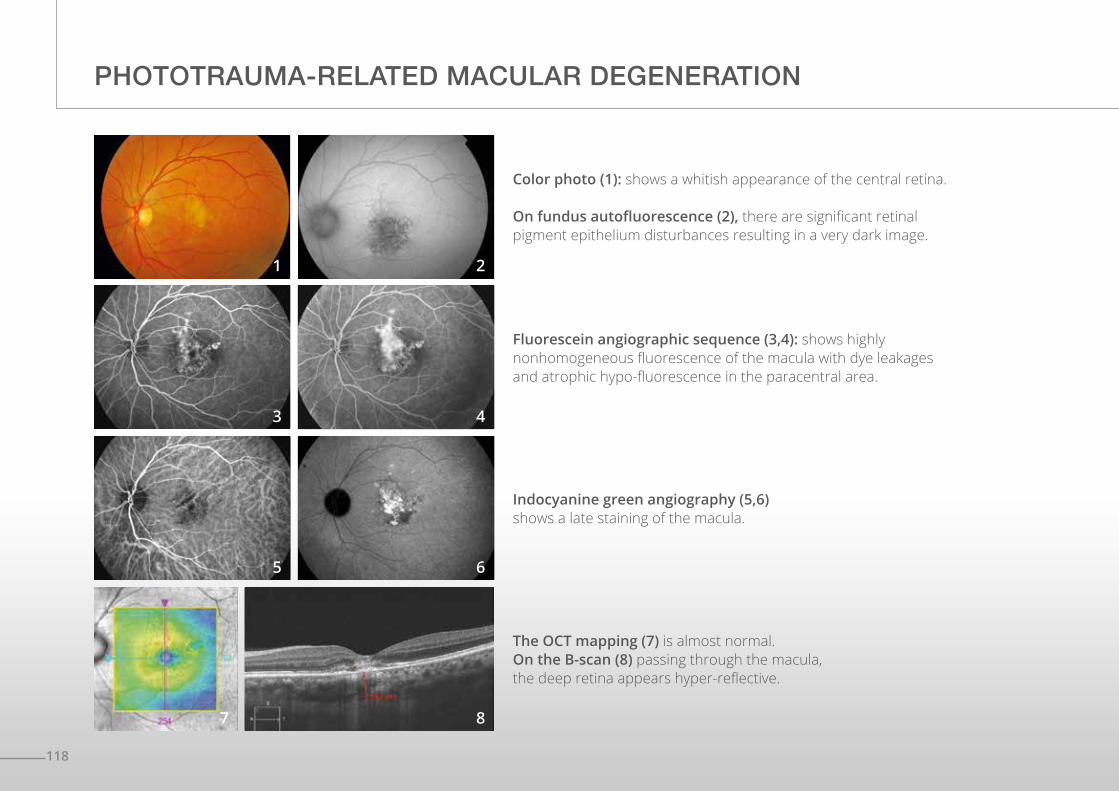
Color photo (1): shows a whitish appearance of the central retina.
On fundus autofluorescence (2), there are significant retinal pigment epithelium disturbances resulting in a very dark image.
Fluorescein angiographic sequence (3,4): shows highly nonhomogeneous fluorescence of the macula with dye leakages and atrophic hypo-fluorescence in the paracentral area.
Indocyanine green angiography (5,6) shows a late staining of the macula.
The OCT mapping (7) is almost normal.On the B-scan (8) passing through the macula, the deep retina appears hyper-reflective.
1
3
5
7
2
4
6
8
119
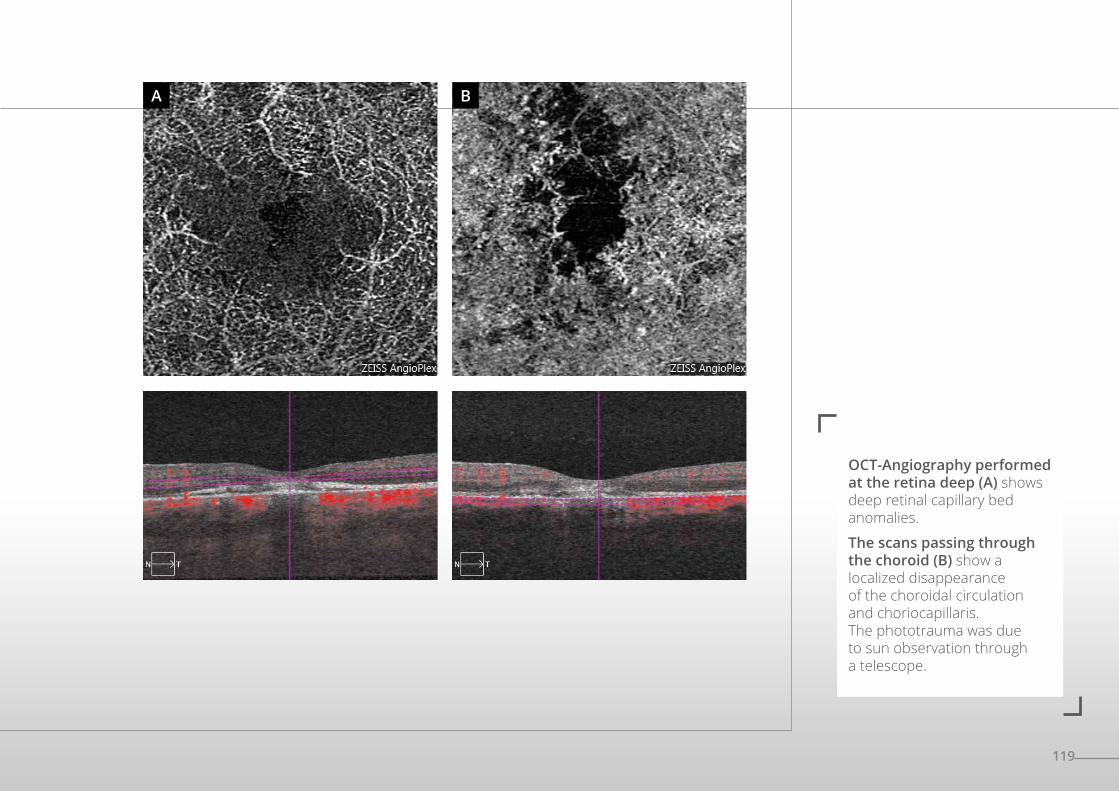
OCT-Angiography performed at the retina deep (A) shows deep retinal capillary bed anomalies.
The scans passing through the choroid (B) show a localized disappearance of the choroidal circulation and choriocapillaris. The phototrauma was due to sun observation through a telescope.
A B
120
MACULAR TELANGIECTASIA TYPE 2
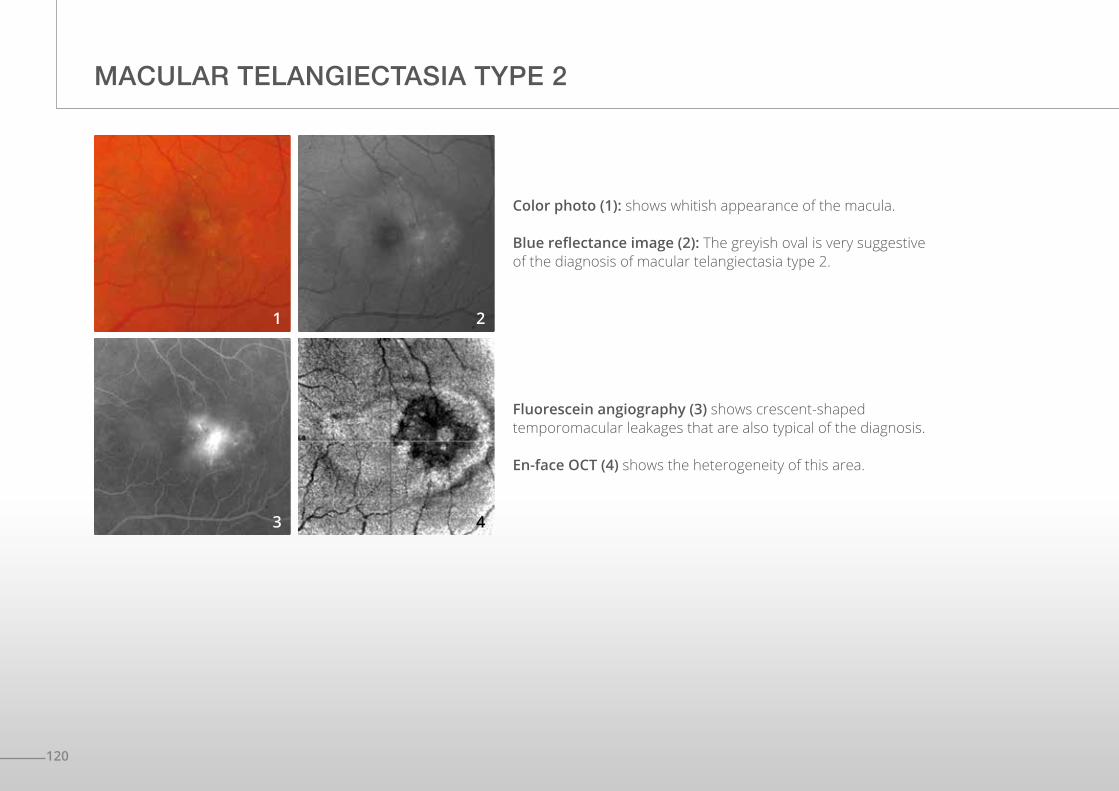
Fluorescein angiography (3) shows crescent-shaped temporomacular leakages that are also typical of the diagnosis.
En-face OCT (4) shows the heterogeneity of this area.
Color photo (1): shows whitish appearance of the macula.
Blue reflectance image (2): The greyish oval is very suggestive of the diagnosis of macular telangiectasia type 2.
1
3
2
4
121
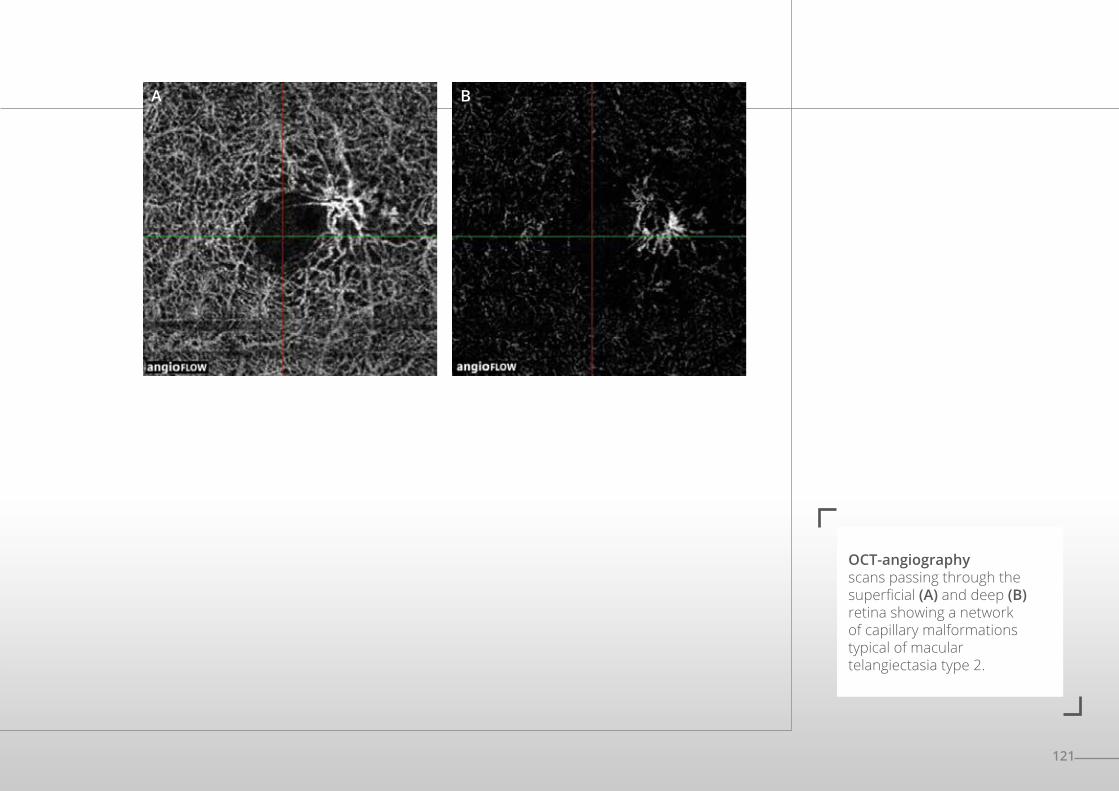
OCT-angiography scans passing through the superficial (A) and deep (B) retina showing a network of capillary malformations typical of macular telangiectasia type 2.
A B
122
SELECTED AND ANNOTATED BIBLIOGRAPHY
I. Choroidal neovascularization
AMD: diagnosis of choroidal neovascularization
Jia Y, Bailey ST, Wilson DJ, et al. Quantitative optical coherence tomography angiography of choroidal neovascularization in age-related macular degeneration. Ophthalmology. 2014 Jul;121(7):1435-44.
Diagnosis of choroidal neovascularization. OCT-Angiography is a powerful examination tool used for visualizing neovascularization, measuring both the neovascular surface and flow. It allows an accurate structural analysis of choroidal neovascularization.
de Carlo TE, Bonini Filho MA, Chin AT, et al. Spectral Domain Optical Coherence tomography angiography of choroidal neovascularization. Ophthalmology. 2015 Jun; 122(6):1228-38.
Diagnosis of choroidal neovascularization. OCT-Angiography examination provides good sensitivity and specificity for detecting choroidal neovascularization compared to fluorescein angiography.
Novais EA, Adhi M, Moult EM, et al. Choroidal neovascularization analyzed on ultrahigh-speed swept-source optical coherence tomography angiography compared to spectral-domain optical coherence tomography angiography. Am J Ophthalmol. 2016 Apr;164:80-8.
Choroidal neovascularization: the comparison of Spectral-Domain OCT-Angiography (SD OCT-A) and Swept-Source OCT-Angiography (SS OCT-A) suggests a superiority of SS OCT-A for the measurement accuracy of the neovascular surface (the surface would be underestimated by SD OCT-A).
123
Moult E, Choi W, Waheed NK, et al. Ultrahigh-speed swept-source OCT angiography in exudative AMD. Ophthalmic Surg Lasers Imaging Retina. 2014 Nov-Dec;45(6):496-505.
Exudative AMD. OCT-Angiography comparison of retinal and choriocapillaris disturbances between patients with exudative AMD and healthy subjects.
AMD: Classic or type 2 neovascularization
El Ameen A, Cohen SY, Semoun O, et al. Type 2 neovscularization secondary to age-related macular degeneration imaged by optical coherence tomography angiography. Retina. 2015 Nov; 35(11): 2212-8.
Classic neovascularization. Description of medusa- or glomerulus-shaped type II neovascularization. Detection by OCT-Angiography shows very good sensitivity.
Kuehlewein L, Sadda SR, Sarraf D. OCT angiography and sequential quantitative analysis of type 2 neovascularization after ranibizumab therapy. Eye. 2015 Jul;29(7):932-5.
Classic neovascularization. Evolution of the size and density (quantitative measurements) of classic neovascularization treated with ranibizumab by OCT-Angiography.

124
SELECTED AND ANNOTATED BIBLIOGRAPHY (Continues)
AMD: Occult or type I neovascularization
Roisman L, Zhang Q, Wang RK, et al. Optical coherence tomography angiography of asymptomatic neovascularization in intermediate age-related macular degeneration. Ophthalmology. 2016 Feb 12.
Occult neovascularization: OCT-Angiography allows early detection of asymptomatic and non-exudative occult neovascularization.
Palejawa NV, Jia Y, Gao SS, et al. Detection of non-exudative choroidal neovascularization in age-related macular degeneration with optical coherence tomography angiography. Retina 2015 Nov; 35(11): 2204-11.
Dormant occult neovascularization may be detected by OCT-Angiography at an asymptomatic and non-exudative stage.
McClintic SM, Kim DY, Fingler J, et al. Detection of pigment epithelial detachment vascularization in age-related macular degeneration using phase-variance OCT angiography. Clin Ophthalmol. 2015 Jul 15;9:1299-305.
Pigment epithelium detachment: Combining OCT-Angiography with the SD-OCT analysis enhances the likelihood of neovascularization detection in cases of pigment epithelium detachment.
Kuehlewein L, Bansal M, Lenis TL, et al. Optical coherence tomography angiography of type 1 neovascularization in age-related macular degeneration. Am J Ophthalmol. 2015 Oct;160(4):739-48.
Occult neovascularization. OCT-Angiography allows an accurate structural analysis of type I (occult) neovascularization. The observation of their evolution under treatment guides therapeutic decisions.
125
AMD: Type III neovascularization or retinal angiomatous proliferation
Miere A, Querques G, Semoun O, et al. Optical coherence tomography angiography in early type 3 neovascularization. Retina. 2015 Nov;35(11): 2236-41.
Retinal angiomatous proliferations appear on OCT-Angiography as a well-delimited network with high flow proliferating in the outer retina.
Polypoidal vasculopathy
Srour M, Querques G, Semoun O, et al. Optical coherence tomography angiography characteristics of polypoidal choroidal vasculopathy. Br J Ophthalmol. 2016 Feb 2.
OCT-Angiography shows the various structures in polypoidal vasculopathy: the neovascular network within which a rounded lesion with a low flow corresponding to the polyp is individualized.
Srour M, Querques G, Souied EH. Optical coherence tomography angiography of idiopathic polypoidal choroidal vasculopathy. Dev Ophthalmol. 2016;56:71-6.
The polyps may be visualized using OCT-Angiography and most often appear as a rounded structure with a low flow compared to the surrounding vascular network.
Inoue M, Balaratnasingam C, Freund KB. Optical coherence tomography angiography of polypoidal choroidal vasculopathy and polypoidal choroidal neovascularization. Retina. 2015 Nov;35(11):2265-74.
In most cases, OCT-Angiography allows detection of polyps, but the sensitivity remains lesser than on the detection by ICG angiography.
126
SELECTED AND ANNOTATED BIBLIOGRAPHY (Continues)
AMD: Neovascularization with fibrotic scar
Miere A, Semoun O, Cohen SY, et al. Optical coherence tomography angiography features of subretinal fibrosis in age- related macular degeneration. Retina. 2015 Nov 35(11): 2275-84.
Fibrotic choroidal neovascularization. Highlight shows a perfused vascular network within the fibrosis associated with changes in outer retinal layers and choriocapillaris in contact with fibrosis.
AMD: Neovascularization treated with anti-VEGF
Spaide RF. Optical coherence tomography angiography shows signs of vascular abnormalization with antiangiogenic therapy for choroidal neovascularization. Am J Ophthalmol 2015 Jul; 160(1): 6-16.
Choroidal neovascularization treated with anti-VEGF. Shows vascular rearrangement under antiangiogenic treatment but there is an absence of normalization.
Coscas G, Lupidi M, Coscas F, et al. Optical coherence tomography angiography during follow-up: qualitative and quantitative analysis of mixed type I and II choroidal neovascularization after vascular endothelial growth factor trap therapy. Ophthalmic Res. 2015;54(2):57-63.
Choroidal neovascularization treated with anti-VEGF. During the follow up, OCT-Angiography allows quantitative and qualitative assessment for the evolution of neovascularization and guides therapeutic decisions.
Lumbroso B, Rispoli M, Savastano MC. Longitudinal optical coherence tomography angiography study of type 2 naive choroidal neovascularization early response after treatment. Retina. 2015 Nov; 35(11): 2242-51.
Choroidal neovascularization treated with anti-VEGF. OCT-Angiography allows continuous visualization of the morphological evolution of the neovascular membrane during the course of anti-VEGF treatment (neovascularization size, density and flow).
127
Muakkassa NW, Chin AT, de Carlo T, et al. Characterizing the effect of anti-vascular endothelial growth factor therapy on treatment-naive choroidal neovascularization using optical coherence tomography angiography. Retina. 2015 Nov;35(11):2252-9
Choroidal neovascularization treated with anti-VEGF. OCT-Angiography allows monitoring therapeutic response through quantitative measurements of neovascular membranes (measurement of the largest linear diameter and neovascularization surface).
Dansingani KK, Freund KB. Optical coherence tomography angiography reveals mature, tangled vascular networks in eyes with neovascular age-related macular degeneration showing resistance to geographic atrophy. Ophthalmic Surg Lasers Imaging Retina. 2015 Oct;46(9):907-12.
Choroidal neovascularization resistant to anti-VEGF: the OCT-Angiography analysis of patients treated with long-term anti-VEGF shows a correlation between the mature appearance of the new vessels and the absence of atrophy development.
128
SELECTED AND ANNOTATED BIBLIOGRAPHY (continues)
Choroidal neovascularization complicating pathologic myopia
Querques G, Corvi F, Querques L, et al. Optical coherence tomography angiography of choroidal neovascularization secondary to pathologic myopia. Dev Ophthalmol. 2016;56:101-6.
Neovascularization in high myopia. OCT-Angiography is used for the detection of neovascularization complication for high myopia, but needs to be integrated into the multimodal imaging assessment (fluorescein angiography and SD-OCT).
Inflammatory choroidal neovascularization
de Carlo TE, Bonini Filho MA, Adhi M, Duker JS. Retinal and choroidal vasculature in birdshot chorioretinopathy analyzed using spectral domain optical coherence tomography angiography. Retina 2015 Nov; 35(11):2392-9.
Diffuse retinal and choroidal vascular abnormalities observed during OCT-Angiography in birdshot chorioretinopathy.
129
II. Edema and ischemia
Diabetic retinopathy and diabetic macular edema
Ishibazawa A, Nagaoka T, Takahashi A, et al. Optical coherence tomography angiography in diabetic retinopathy: a prospective pilot study. Am J Ophthalmol. 2015 Jul;160(1):35-44.
This study is one of the first descriptions of the manifestations of diabetic retinopathy by OCT- Angiography: microaneurysms, nonperfusion areas, analysis of the superficial and deep capillary plexuses, and neovascularization.
Couturier A, Mané V, Bonnin S, et al. Capillary plexus anomalies in diabetic retinopathy on optical coherence tomography angiography. Retina. 2015 Nov; 35(11):2384-91.
OCT-Angiography has a lower capacity to detect microaneurysms than fluorescein angiography, but the capacity to assess the capillary nonperfusion is higher by OCT-Angiography.
de Carlo TE, Bonini Filho MA, Baumal CR, et al. Evaluation of preretinal neovascularization in proliferative diabetic retinopathy using optical coherence tomography angiography. Ophthalmic Surg Lasers Imaging Retina. 2016 Feb 1;47(2):115-9.
Study confirms the good visualization of preretinal neovascularization by OCT-Angiography, and specifies the relationship between the neovascularization and the adjacent retina (site of non-perfusion areas and IRMAs).
de Carlo TE, Chin AT, Joseph T, et al. Distinguishing diabetic macular edema from capillary nonperfusion using optical coherence tomography angiography. Ophthalmic Surg Lasers Imaging Retina. 2016 Feb1;47(2):108-14.
In the case of diabetic macular edema, the cystoid spaces may be distinguished from capillary non-perfusion areas by OCT-Angiography
130
Hwang TS, Gao SS, Liu L, et al. Automated quantification of capillary non-perfusion using optical coherence tomography angiography in diabetic retinopathy. JAMA Ophthalmol. 2016 Jan 21:1-7.
In this small series, the analysis of the macularcapillary non-perfusion using an automated OCT-Angiography method, reliably identified patients with diabetic retinopathy.
Takase N, Nozaki M, Kato A, et al. Enlargement of foveal avascular zone in diabetic eyes evaluated by en face optical coherence tomography angiography. Retina. 2015 Nov; 35 (11):2377-83.
This study suggests that OCT-Angiography can show retinal microcirculation abnormalities in the eyes of diabetic patients even before diabetic retinopathy appears. This examination could be used for the early detection of circulatory anomalies.
Freiberg FJ, Pfau M, Wons J, et al. Optical coherence tomography angiography of the foveal avascular zone in diabetic retinopathy. Graefes Arch Clin Exp Ophthalmol. 2015 Sep 4.
This study stresses the disorganization of the vasculature surrounding the central avascular zone with the presence of more pronounced disturbances at the deep capillary plexus.d.
Vein occlusion
Coscas F, Glacet-Bernard A, Miere A, et al. Optical coherence tomography angiography in retinal vein occlusion: evaluation of superficial and deep capillary plexa. Am J Ophthalmol. 2016 Jan;161:160-171.
This series of 54 patients with vein occlusion, compares OCT-Angiography data to OCT and fluorescein angiography data, and assesses a more pronounced disturbance in the deep capillary plexus than in the superficial capillary plexus.
SELECTED AND ANNOTATED BIBLIOGRAPHY (continues)
131
Sogawa K, Nagaoka T, Ishibazawa A, et al. En-face optical coherence tomography angiography of neovascularization elsewhere in hemicentral retinal vein occlusion. Int Med Case Rep J. 2015 Oct 23;8:263-6
A clinical report that stresses the features of neovascularization that complicate vein occlusion may be analyzed by OCT-Angiography due to the absence of dye leakage.
Mastropasqua R, Di Antonio L, Di Staso S, et al. Optical coherence tomography angiography in retinal vascular diseases and choroidal neovascularization. J Ophthalmol. 2015;2015:343515.
OCT-Angiography allows visualization of non-perfusion areas in branch retinal vein and artery occlusions.
Suzuki N, Hirano Y, Yoshida M, et al. Microvascular abnormalities on optical coherence tomography angiography in macular edema associated with branch retinal vein occlusion. Am J Ophthalmol. 2016 Jan;161:126-132.
This series of 28 patients shows the microvascular anomalies associated with branch retinal vein occlusion (telangiectasia, nonperfusion areas, collateral circulation and microaneurysms) are well, or even better, visualized by OCT-Angiography than by fluorescein angiography.
Rispoli M, Savastano MC, Lumbroso B. Capillary network anomalies in branch retinal vein occlusion on optical coherence tomography angiography. Retina. 2015 Nov;35(11):2332-8.
A series of 10 cases showing branch retinal vein occlusion shows that OCT-Angiography analysis allows detection of capillary anomalies in the foveolar area (decrease in capillary density, microvascular anomalies and vascular congestion) within the various capillary plexuses.
Kashani AH, Lee SY, Moshfeghi A et al. Optical coherence tomography angiography of retinal venous occlusion. Retina. 2015 Nov;35(11):2323-31.
This series of 25 patients shows that OCT-Angiography allows identification of the various anomalies observed on fundus autofluorescence and fluorescein angiography in cases of vein occlusion.

132
Artery occlusion
Philippakis E, Dupas B, Bonnin P, et al. Optical coherence tomography angiography shows deep capillary plexus hypo- perfusion in incomplete central retinal artery occlusion. Retin Cases Brief Rep. 2015 Fall;9(4):333-8.
The reduced flow within the artery primarily affects the deep capillary plexus.
Bonini Filho MA, Adhi M, de Carlo TE, et al. Optical coherence tomography angiography in retinal artery occlusion. Retina. 2015 Nov;35(11):2339-46.
A series of 7 patients that shows in cases of artery occlusion, OCT allows characterizing the evolution of vascular flows and specifying the extent of the macular ischemia.
SELECTED AND ANNOTATED BIBLIOGRAPHY (Continues)

133
III. Degeneration and atrophy
Lupidi M, Coscas G, Cagini C, Coscas F. Optical coherence tomography angiography of a choroidal neovascularization in adult-onset foveomacular vitelliform dystrophy: pearls and pitfalls. Invest Ophthalmol Vis Sci. 2015 Dec 1;56(13): 7638-45.
Pseudo-vitelliform dystrophy cases show the value of OCT-Angiography for the diagnosis of associated choroidal neovascularization.
Querques G, Zambrowski O, Corvi F, et al. Optical coherence tomography angiography in adult-onset foveomacular vitelliform dystrophy. Br J Ophthalmol. 2016 Mar 7.
Pseudo-vitelliform dystrophy: OCT-Angiography reveals a rarefaction in the deep and superficial vascular plexuses and choriocapillaris layer and shows potential neovascular complications, which are difficult to identify on fluorescein angiography due to a shadow effect related to the subretinal vitelliform deposit.
134
IV. Miscellaneous
CSC, DRE and pachychoroid diseases
Costanzo E, Cohen SY, Miere A, et al. Optical coherence tomography angiography in central serous chorioretinopathy. J Ophthalmol. 2015;2015:134783.
In the case of CSC, OCT-Angiography shows dark areas in front of the SRD, dark spots in front of the PED and anomalies of the choroidal vasculature that are not neovascularization in one third of cases.
Quaranta-El Maftouhi M, El Maftouhi A, Eandi CM. Chronic central serous chorioretinopathy imaged by optical coherence tomographic angiography. Am J Ophthalmol. 2015 Sep;160(3):581-587.
In the twelve patients analysed, OCT-Angiography allows a better identification of the presence of neovascularization than other imaging methods.
de Carlo TE, Rosenblatt A, Goldstein M, et al. Vascularization of irregular retinal pigment epithelial detachments in chronic central serous chorioretinopathy evaluated with oct angiography. Ophthalmic Surg Lasers Imaging Retina. 2016 Feb 1;47(2):128-33.
OCT-angiography allows identification of neovascularization associated with irregular elevations of the retinal pigment epithelium in chronic CSC.
Dansingani KK, Balaratnasingam C, Klufas MA, et al. Optical coherence tomography angiography of shallow irregular pigment epithelial detachments in pachychoroid spectrum disease. Am J Ophthalmol. 2015 Dec;160(6):1243-1254.
Of the twenty-two eyes analyzed with pachychoroid disease associated with an elevation of the retinal pigment epithelium, OCT shows type 1 neovascularization in 21/22 cases, a frequency underestimated by traditional imaging.
SELECTED AND ANNOTATED BIBLIOGRAPHY (Continues)

135
Bonini Filho MA, de Carlo TE, Ferrara D, et al. Association of choroidal neovascularization and central serous chorioretinopathy with optical coherence tomography angiography. JAMA Ophthalmol. 2015 Aug;133(8):899-906.
In this series, OCT-Angiography sensitivity and specificity for the detection of neovascularization associated with CSC are 100%.
Idiopathic macular telangiectasia
Gaudric A, Krivosic V, Tadayoni R. Outer retina capillary invasion and ellipsoid zone loss in macular telangiectasia type 2 imaged by optical coherence tomography angiography. Retina. 2015 Nov;35(11):2300-6.
OCT-Angiography identifies capillary proliferation areas in the outer retina in front of ellipsoid interruption areas.
Roisman L, Rosenfeld PJ. Optical coherence tomography angiography of macular telangiectasia Type 2. Dev Ophthalmol. 2016;56:146-58.
A study assessing the various evolutionary stages of idiopathic macular telangiectasia type 2 by using OCT-Angiography.
Chidambara L, Gadde SG, Yadav NK, et al. Characteristics and quantification of vascular changes in macular telangiectasia type 2 on optical coherence tomography angiography. Br J Ophthalmol. 2016 Jan 28
With fifty-six eyes analyzed: all show a decrease in capillary density and development of anastomoses identified by OCT-Angiography.
136
Intraocular tumor
Maloca P, Gyger C, Hasler PW. A pilot study to image the vascular network of small melanocytic choroidal tumors with speckle/noise-free 1050-nm swept source optical coherence tomography (OCT choroidal angiography). Graefes Arch Clin Exp Ophthalmol. 2016 Feb 4.
OCT-Angiography may help visualize the choroidal vasculature in cases of nevus and melanoma.
To learn more about the OCT-Angiography technology:
Huang Y, Zhang Q, Thorell MR, et al. Swept-Source OCT Angiography of the Retinal Vasculature Using Intensity Differentiation- based Optical Microangiography Algorithms. Ophthalmic Surg Lasers Imaging Retina. 2014;45:382-9.
Zhang Q, Huang Y, Zhang T, et al. Wide-field imaging of retinal vasculature using optical coherence tomography-based microangiography provided by motion tracking. J Biomed Opt. 2015 Jun;20(6):066008.
Zhang A, Wang RK. Feature space optical coherence tomography based micro-angiography. (Biomed Opt Express. 2015 Apr 28;6(5):1919-28.
Spaide RF, Klancnik JM Jr, Cooney MJ. Retinal vascular layers imaged by fluorescein angiography and optical coherence tomography angiography JAMA Ophthalmol. 2015 Jan; 133(1): 45-50.
SELECTED AND ANNOTATED BIBLIOGRAPHY (Continues)

138
ACKNOWLEDGMENTS
Our warmest thanks and appreciation to:
Professor Eric Souied for his kind preface and his support.
Professors Alain Gaudric and Gilles Chaine for their friendly support.
Professor Bruno Lumbroso, for his perspicacity, his communicative enthusiasm and the kindness of his welcome.
The whole CIL staff and, in particular, for their involvement in this project:
Christophe Debibié and Noira Fellahi,
The Zeiss’ team for their support and availability.

139
And our team of orthoptists: Lise Dubois, Lise Fontecave, Anna LeGloahec, Bertrand Maloberti, Nathalie Thay, Pauline Dourmad, Lea Galbadon and Clémence Mouries.
Finally, for SN-B from S-YC, this quote of René Char: « Impose ta chance, serre ton bonheur et va vers ton risque. À te regarder, ils s’habitueront. »

141
EDITION
EDITED BY
Carl Zeiss Meditec France SAS100 Route de Versailles78160 Marly-le-Roi, FranceTel: +33 (0)1 34 80 21 00 The content of this book presents the author’s views and does not necessarily reflect the views of the company Carl Zeiss - Meditec France SAS. Design - Realization: Elwood. All translation, adaptation and reproduction rights by any means are reserved for all countries. Any total or partial reproduction or representation, by any means, of the pages published in this book, made without the prior written authorization of the editor is prohibited and illegal and constitutes a counterfeit. On one hand, the reproductions are strictly reserved for the private use of the copier and not intended for collective use, and on the other hand short anlyzes and citations are justified by the scientific or information of the work in which they are incorporated (Law of March 11, 1957 Art. 40 and 41. And Penal Code art. 425).