Physical interactions among plant MADS-box transcription ...
150
Physical interactions among plant MADS-box transcription factors and their biological relevance Isabella Antonia Nougalli Tonaco
Transcript of Physical interactions among plant MADS-box transcription ...
Physical interactions among plant MADS-box transcription factors and
their biological relevance
Isabella Antonia Nougalli Tonaco

Promotoren: Prof.dr. S.C. de Vries Hoogleraar in de Biochemie Wageningen Universiteit
Prof.dr. G.C. Angenent Hoogleraar in het Moleculair genetisch onderzoek van de bloemontwikkeling Radboud Universiteit Nijmegen
Co-promotor: Dr. ir. R.G.H. Immink Onderzoeker, Plant Research International Wageningen
Promotiecomissie: Prof.dr. L.H.W. van der Plas (Wageningen Universiteit) Prof.dr. Th.W.J. Gadella (Universiteit van Amsterdam) Prof.dr. R.E. Koes (Vrije Universiteit, Amsterdam) Dr. E. Russinova (VIB, Ghent, Belgium)
Dit onderzoek is uitgevoerd binnen de onderzoekschool voor Experimented Plantenwetenschappen (EPS)

[ \l .\ i_y U1 ^ l- r <-/ ^
Physical interactions among plant MADS-box transcription factors and
their biological relevance
? | * o f h e e * Wogenlhgen UP/ Forum D«o©venclacil8©8leeg 2 6708H»1Afagenlngen
Isabella Antonia Nougalli Tonaco
Proefschrift ter verkrijging van de graad van doctor
op gezag van de rector magnificus van Wageningen Universiteit,
Prof. dr. M.J. Kropff, in het openbaar te verdedigen op maandag 14 januari 2008
des namiddags te vier uur in de Aula.
L M c ^

Physical interactions among plant MADS-box transcription factors and their biological relevance
Nougalli Tonaco, Isabella A.
PhD thesis, Wageningen University, Wageningen, The Netherlands With references - with summaries in Dutch and English
ISBN 978-90-8504-829-9
0O&ZOI, W3 6 /
Propositions
1. The ability to visualize and monitor physical interactions between proteins in a living cellular environment enables biologists to see the basis of life.
this Thesis
2. FRET-FLIM (Fluorescence Resonance Energy Transfer) - (Fluorescence Lifetime Imaging) has proven to be a very robust method to detect direct physical interaction between molecules of interest.
this Thesis (Gadella ef at 1995, Gadella et a/. 1999, Wallbarbe and Periasamy, 2005)
3. Proteins in living cells work as part of molecular networks that have specific functions, such as gene expression, energy transduction or membrane transport. One of the next objectives of cell biology is to quantify the flow of materials, information and energy through these molecular networks.
Sako and Yanagida (2003) Nature Reviews Molecular Cell Biology
4. Brightness encodes the stoichiometry of protein complexes. Chen and Muller (2007) PNAS
5. Science should be autonomous, but is not value-free. Drenth (2006) Science and Engineering Ethics
6. Most eminent women prefer to be remembered for their achievements rather than their X chromosomes.
Fara (2007) Nature
7. Deadlines are meant to qualify subordinates and not superiors.
8. To be successfully adapted to The Netherlands, one should have a precise watch, a busy agenda and being constantly complaining about the bad weather.
Propositions belonging to the thesis:
"Physical interactions among plant MADS-box transcription factors and their biological relevance" Isabella A Nougalli Tonaco Wageningen, 14 th January, 2008

Contents
Chapter 1 Dynamics of the eukaryotic transcription process
Chapter 2
Chapter 3
Chapter 4
Chapter 5
Chapter 6
Chapter 7
In vivo imaging of MADS-box transcription factor interactions
Physical interactions and dimerization affinity in vivo for MADS-box proteins involved in petal and stamen formation
Competition-FRET: a new method to unravel protein dynamics in living cells
The use of BiFC to detect protein-protein interactions between MADS-box transcription factors
Diffusion of MADS-box proteins and complexes
Concluding remarks and perspectives of lifetime imaging for MADS-box transcription factor complexes
Samenvatting
Summary
Curriculum vitae
List of publications and manuscripts in preparation
Acknowlegments
Education Plan of the Graduate School
Colour Figures
7
27
49
73
95
113
125
137
141
144
145
146
150
l-X
Chapter 1
Dynamics of the eukaryotic transcription
process
Isabella A. Nougalli Tonaco, Gerco C. Angenent and Richard G.H. Immink
Chapter 1
Transcription is universal
Making use of four nucleotides only, the genetic code, which is the greatest
combinatorial matrix of life, defines the majority of the cellular processes existing in
nature. Transcription is basically how organisms are able to read and interpret this
genetic code, and therefore stands at the basis of life. The general mechanism of
transcription is generic among different eukaryotes, and being nevertheless, far more
complex in comparison to prokaryotes. One elementary difference between
prokaryotes and eukaryotes relates to their cellular complexity and organization.
Eukaryotes have their genomic DNA localized within a nucleus, instead of having the
nuclear material spread in the cytoplasm, like prokaryotes. The organization of DNA
within a nucleus makes transcription simple on one hand, because the target DNA
and the proteins involved in the transcription process are kept together at a specified
location; however, on the other hand the tight packaging of DNA within the nucleus
requires a dynamic, complex, and efficient transcription machinery. Since
transcription is universal and an essential process, cell and molecular biologists have
studied it for decades by sophisticated molecular, cellular and micro-spectroscopy
techniques, and made great advances in the understanding how this process works.
Here, we will highlight the recent literature that reports about scientific achievements
in the field of the eukaryotic transcription machinery, with a special focus on
transcriptional dynamics in plants.
The nucleus and its components
Transcription takes place in the nucleus of eukaryotes and in a simplistic
interpretation this organelle can be divided into three main parts: the nuclear
membrane, the nucleolus and the genetic material (DNA). The nuclear membrane, or
nuclear envelope, is formed by two membranes that contain pores, which permit the
flow of transcription factors, chromatin remodeling factors and other molecules into
the nucleus, as well as the transport of ribosomal particles, transcribed mRNA and
other factors from the nucleus into the cytoplasm, where protein synthesis takes
place. Further, it has been recently reviewed by Akhthar and Gasser (2007) that, at
least in yeast, the more active part of the chromatin is physically organized close to
the nuclear pores, whereas most of the heterochromatin is located on the inner
membrane of the nuclear envelope.

Dynamics of the eukaryotic transcription process
The second easily recognizable nuclear structure is the nucleolus, which is involved
in several nuclear functions, like the synthesis of ribosomal RNA (rRNA), assembly of
the ribosomal subunits and finally in the generation of RNAs and RNA polymerases
(reviewed in Raska et al., 2006). Recently, Andersen and colleagues (2005) have
investigated the proteome of the human nucleolus by mass spectrometry, which
provides various perspectives for further investigation of this multifunctional
organelle. Furthermore, in this study the flux of multiple endogenous nucleolar
proteins was followed, making use of GFP-tagged proteins and triggering of cells by
inhibitory compounds that affect nucleolar morphology. This analysis revealed that
the nucleolus is a very dynamic organelle, with significant changes in protein content
over time and in response to various stimuli and growth conditions. In plants, similar
investigations have been done by Pendle and colleagues (2005) and a large number
of nucleolar proteins could be identified. Interestingly, EJC-like (exon-junction
complex) proteins were found, suggesting a possible role for the plant nucleolus in
mRNA processing, since these EJC proteins are suggested to be involved in
processing pre-mRNA in animals (Custodio ef al. 2004). Encouraged by these
findings, Brown and colleagues (2005) established the Arabidopsis nucleolar
proteome database, which is a good starting point for studies within this field.
Last but not least, the cell nucleus contains the genetic material, or DNA. In
eukaryotic cells, the DNA is organized in a very compact manner and is present as
chromatin (reviewed in Pederson, 2004). Nucleosomes are the basic sub-units of
chromatin and are composed of eight histone molecules, around which the DNA is
wrapped. Nuclear regions where the chromatin shows higher density are called
chromosome territories. These chromosome territories and interchromatin
compartments (CT-IT, see Lanctot ef al., 2007) have been identified for the first time
in the 70's in mammalian cells (for review see Cremer and Cremer, 2001).
From genes to the genome and vice-versa
Throughout the cell cycle and developmental stages, DNA is present within the
nucleus at different forms of organization. This organization, which is mediated by
packaging and condensation of chromatin, may be essential not only for genome
replication, but also for the regulation of gene expression, i.e. making parts of the
genome accessible to the transcription machinery when a specific set of genes
needs to be transcribed. Generally, chromatin can be present in two forms; compact,
Chapter 1
condensed and mainly inactive heterochromatin, and the more open and dynamic
euchromatin. Changes in the chromatin state are achieved by chromatin
modifications and chromatin remodeling. During chromatin modifications the changes
are covalent either on DNA, histone tails, or in the histone core, whereas during
remodeling the changes alter DNA-histone interactions, often as reaction on a
modification (Seob Kwon and Wagner, 2007). The best known chromatin
modifications are DNA methylation and histone post-translational modifications
(histone PTM), like (de-)acetylation, (de-)ubiquitination, (de-)phosphorylation, and
(de-) methylation. None of these modifications are unidirectional related to either
activation or repression of gene expression; in contrast, they can cooperate in both
ways, i.e. not only acting as repressor or activator, but also vice-versa (Berger,
2007). For example DNA methylation as well as histone PTM can contribute to the
disruption of DNA-histone interactions, facilitating the assembly of the RNA
polymerase and transcription machinery onto the DNA during gene regulation.
Another remarkable point is that such modifications can occur not only to the core
promoter site and the transcribed regions, but also to other regulatory sites which are
localized distant from the gene locus. Recently, a very elegant experiment has been
published by Zhang and colleagues (2006), to identify methylation sites in the
genome of the model plant Arabidopsis thaliana. In this study, a DNA methylation
map could be obtained for the whole Arabidopsis genome, which provides evidence
that most methylation occurs within coding regions, whereas surprisingly, methylation
of promoter regions appeared to be much less abundant. A nice example of the role
of chromatin modification and its interference in gene regulation of developmental
processes in plants has been described by Perales and Mas (2007), who identified
that histone acetylation and deacetylation of the TOC1 locus (one of the components
of the plant oscillator) is rhythmically controlled by the circadian clock. The current
hypothesis is that all these histone and DNA modifications lead to chromatin
remodeling and that the association or dissociation of DNA-histone complexes
contributes to the movement of nucleosomes and the packaging or release of
genomic DNA, enabling repression or activation of genes, respectively. Recently, an
elegant model for chromatin remodeling has been proposed by Seob Kwon and
Wagner (2007), which includes a description of the SWI/SNF ATPase family of
proteins. These important chromatin remodellers are found in several eukaryote
10
Dynamics of the eukaryotic transcription process
organisms and most likely hold similar functions related to chromatin organization
(Figure 1).
Zooming in at the DNA part of chromatin, genes can be identified that might consist
of exons and introns, long stretches of non-coding DNA that include basic promoter
elements, like the TATA-box binding site, and enhancers (activators), repressor
elements, and insulator sequences that set specific chromatin boundaries (Green,
2000; Wei et a/., 2005). The exact organization of all these regulatory elements within
the genome of eukaryotes plays a significant role in transcription regulation and in
this respect there is a clear difference with prokaryotes. Even though, a lot of
research has been done on genome organization, a great part of the current
information regarding genome size and organization is not yet complete, making
further studies necessary. A nice example of this has been described for human
chromosomes 21 and 22, from which the detectable number of transcribed exons in
some cell lines appeared to be approximately ten times more than the number of
exons that are annotated at the moment (Kapranov et a/., 2002). Like in animals,
plants have similar nuclear organization and compartmentalization and definitely,
research of the plant model species Arabidopsis thaliana has contributed to our
further understanding in this field. Besides many similarities, also differences
between plants and animals have been notified and an interesting feature of the plant
genome structure and organization that differentiates plants from animals, regards
how the non-coding regions are positioned in the chromosomes and how genes are
organized. In animals, as well as in C. elegans, highly transcribed genes contain in
general just a few introns. In contrast, plants, like Arabidopsis and rice for instance,
have their highly transcribed genes in a less compact form (Ren et at., 2006). This
difference in intron size and abundance might be linked to their function in gene
expression, although the relationship between gene regulation and size and number
of introns is currently poorly understood. Further, the existence of introns might be
linked to differences in mRNA stability, even though no strong evidence is found in
this respect for yeast; however, Arabidopsis genes which code for the most unstable
mRNA's appeared to have fewer intronic regions in comparison to other genes
(Wang era/., 2007).
11

Chapter 1
Eukaryotic genome organization and transcription
The eukaryotic genome contains many sets of genes that need to be transcribed
simultaneously and that are under very tight control. Considering that genome
organization plays an important role during gene regulation, the next question that we
can ask ourselves is: "How does the genome make available certain stretches of
DNA, which allows transcription factors to specifically recognize their binding sites
and promote gene expression?" From the discussion above, it is clear that chromatin
modifications and remodeling determine the balance between euchromatin and
heterochromatin, and in this way have an effect on the activation or repression of
genes. A nice example of this has been described by Tessadori and colleagues
(2007), who observed a clear change in chromatin decondensation during the
transition to flowering, mediated by the blue-light receptor CRY2. Recent studies
making use of sophisticated techniques like FISH and chromosome capture (3C)
provided the first experimental basis, how active or inactive genes that are far from
each other in the chromosomal range, are able to come in close contact (reviewed in
Cremer and Cremer 2001; and Cremer ef al. 2005). Another elegant example of this
has been described by Simonis and colleagues (2007), who developed a (4C)
chromosome conformation capture method to investigate the chromosome
surrounding of the mouse (3-globin locus. The method is based on PCR amplification
of DNA fragments, which enables the identification of different loci within the nuclear
environment. With this new technology, they could identify signals from 5 up to 10
Mbp apart from the chromosomic region where the 0-globin locus is present, which
clearly indicates that a set of genes quite distantly located, can be in close contact
during the transcription process and hence, be co-regulated. Further, it has been
shown that chromosome with a large number of very active genes are in general
located in a more interior part of chromosomes territories (Tanabe ef al., 2002).
However, how this is structurally related to the transcriptional activity is unclear at this
moment. In the plant nucleus, the chromosomes are also organized in territories and
these dense regions are surrounded by chromatin loops. In Arabidopsis for instance,
the chromosomes contain the so-called chromocentres. These six to ten clearly
defined regions are generally targeted by DNA methylation and constitute an
organizing center from which chromatin loops emanate (Fransz ef al., 2002). A nice
example of such loops has been found on the small arm of chromosome 4, where a
very large chromatin loop is formed (Fransz ef al., 2002, van Driel and Fransz, 2004).
12

Dynamics of the eukaryotic transcription process
Obviously, all these structural organizations and modifications have an influence on
gene regulation and by this directly affect developmental processes.
From all this work it is clear that genes are able to move outside the chromosome
territories and that the regulation of gene expression goes beyond the chromatin and
requires dynamic rearrangement of chromosomal domains (Shavtal et al.., 2006,
Manderuzzo et al., 2007). Like chromatin, also other parts of the transcription
machinery seem to be in constant movement. Elements like the DNA polymerase
and specific transcription factors appeared to be very mobile, meaning that
transcription is spatially dynamic. In the next paragraph an overview will be given
about the functioning of these trans-factors in the transcription process.
Trans - factors
During transcription, specific transcription factors bind to DNA (cis elements) and in
this way activate or repress genes (Riechmann, 2002) (Fig 1). Transcription factors
are very mobile and can be found associated to so-called transcriptional centers
within the cell nucleus. However, these transcription factors are not immobile at these
transcription centers "waiting for" transcription to occur, but very likely will be
recruited to these centers together with the genomic regions, when transcription
takes place (Jackson, 2003). Besides these transcription centers that are also known
as "transcription factories" (Jackson, 2003), the genome consists of regions where
several transcription factors are bound, and therefore have been termed "hot spots".
The existence of transcription factor "hot spots" has been described by Moorman and
colleagues (2006) based on experiments aiming at the development of a map of in
vivo binding sites for seven different transcriptional regulators using chromatin
immunoprecipitation (ChIP) on the genome of Drosophila melanogaster. So far, it is
not clear why these "hotspots" exist and what specific function these structures have,
nevertheless, three hypotheses were presented in their study. The first model
suggests that the "hot spots" are functioning like "sinks" or "buffers", requesting many
regulatory molecules, which would allow a fast response upon an inducing stimulus.
The second model proposes that these regions may function similar to enhancers
that promote transcription. Finally the third model predicts that the "hot spots" play a
role as mediators of physical interactions between loci that are far away from each
other within the genome. More detailed investigations in the near future will hopefully
shed light on the exact function of these "hot-spots".
13

Chapter 1
General transcription machinery
Core promoter recognition complexes
Chromatin modifying and remodeling complexes
Figure 1. Schematic drawing of the transcription machinery and its components The transcription machine is composed of: RNA polymerase II and its subunits, the core promoter elements, activators (transcription factors), co-regulators and chromatin-modifiers and remodelers (adapted from Isogai and Tjian 2003).
Another important trans factor present in the transcription machinery is RNA
polymerase II, which can be seen as the molecular motor of the transcription
process. Its mobility has been nicely shown by Kimura and colleagues (2007), who
followed up the dynamics of this enzyme in living mammalian cells. For this purpose,
the largest (catalytic) sub-unit of RNA polymerase II was tagged with GFP.
Subsequent, microscopic analyses based on photo bleaching techniques, like FRAP
(Fluorescence Recovery After Photo Bleaching) and FLIP (Fluorescence Loss In
Photo Bleaching), revealed that approximately 75% of the tagged protein is mobile,
meaning that the polymerase is in movement for the largest part of a transcription
cycle. However, following the dynamics of each individual component of the
transcription machinery and monitoring protein-DNA interactions may not be
sufficient to unravel the dynamics of transcription. To get a better understanding of
this aspect, we need to go beyond that and monitor how genome architecture acts in
space and time in conjunction with the main components of the transcription
14
Dynamics of the eukaryotic transcription process
machinery (Jackson, 2003; Cook, 2003). In the next paragraph, we will present and
discuss the present models that explain action at a distance during gene regulation.
Transcription evokes dynamic models
Considering that the genome organization within the chromosome territories is
definitely not random and that the major elements of the transcription machinery such
as RNA polymerase II and transcription factors are very mobile, our next question to
be answered reflects one of the greatest paradigms in molecular genetics: "How do
transcription factors search for their DNA binding sites and finally regulate gene
expression in a dynamic manner?". To answer this question, many studies were
performed and several models have been proposed in order to explain how
regulatory proteins are seeking for their binding sites at distance and further, how
finally DNA-protein and protein-protein interactions are able to regulate gene
expression. Originally, the "looping", "twisting", "sliding", and "oozing" models (Fig. 2)
have been suggested in order to exemplify how transcriptional regulators identify
their binding sites (Ptashne, 1986); and more recently, another model: "hoping" (Fig.
2), has been integrated. In this respect, it is important to emphasize that these
models are not only proposed for gene activation but might also explain the
spreading of chromatin silencing (Talbert and Henikoff, 2006; Phair etal., 2004). The
different models for site-specific DNA-binding proteins can be summarized by the
"facilitated diffusion model", in which non specific DNA-protein interactions mediate
"walking" over the genome in search for specific target sequences {cis elements). In
this overall model, either a one-dimensional or a three-dimensional ('sliding' or
'hoping') diffusion occurs during the search for specific binding-sites. Finally proteins
are able to move between "protein-DNA" binding sites by the formation of loops in
the DNA (Halford and Marko, 2004). To be more precisely, in the looping model,
which is the most favorable for action at distance, distant chromosomic regions are
brought together during gene transcription. Most likely these loops are formed upon
protein-protein interaction and DNA-binding, which mediate the loop formation within
the chromosomes territories. The twisting model requires a conformational change of
DNA for the binding of the regulatory protein and this change may occur either by
direct protein-DNA interactions, or alternatively, by enzymatic action of a protein that
triggers subsequently other protein-DNA binding interactions. Sliding is another
favorite; in this case one protein binds to DNA at one specific site and moves along
15
Chapter 1
the DNA until it reaches a strong binding site or another protein elsewhere on the
genome, which may be an interacting partner. In the 'oozing' model, the binding of
one regulatory protein at a particular site of the DNA mediates the binding of other
proteins in adjacent regions, until the complete protein complex is formed and
transcription can be initiated. Finally, the hoping model, in which the protein moves
from one site to another in a three dimensional space, associating and dissociating
with nearby sites, which could even be another chromosome (reviewed by Halford
and Marko, 2004). From the different models, the looping has been the one which
explains interactions over chromosomal distances and this loop formation gave rise
to the term "molecular ties", which are basically the so-called "transcription factories"
where during transcription, DNA may form a loop around it (Cook, 2003; Manderuzzo
et al., 2007).
Most of the evidence for the above mentioned models comes from studies with fixed
material and up till recently, hardly any real time in vivo experiments have been
described that provide additional proof for any of the proposed models. Although
demonstrated for prokaryotic cells, Elf and colleagues (2007) reported for the first
time the specific DNA binding time, or time of residence, for the Lad transcription
factor and its DNA binding sites in living cells. In this study, the Lad protein was
labeled with the Yellow Fluorescent Protein (YFP) Venus, followed by single
molecule detection FCS (Fluorescence Correlation Spectroscopy). Their experiments
showed that approximately 90% of its life time, the Lad dimer was not specifically
bound to its DNA binding sites, but instead, freely sliding along the DNA, which
directly supports the "sliding" model. Nevertheless, the real situation is probably
reflected the best by a combination of the various proposed models. The
transcriptional mechanism appeared to be based on the cooperative dynamic
association between CIS and TRANS elements. On one hand chromatin loops are
formed within the chromosome territories, which enable distant loci to come in close
contact and in this way facilitate gene regulation, whereas on the other hand
transcription factors and other TRANS elements are able to move freely within the
nucleus.
16
Dynamics of the eukaryotic transcription process
^AVAVA^
I
"^mww — ^mw3
'^MWW - ^ / ^ ^ ^
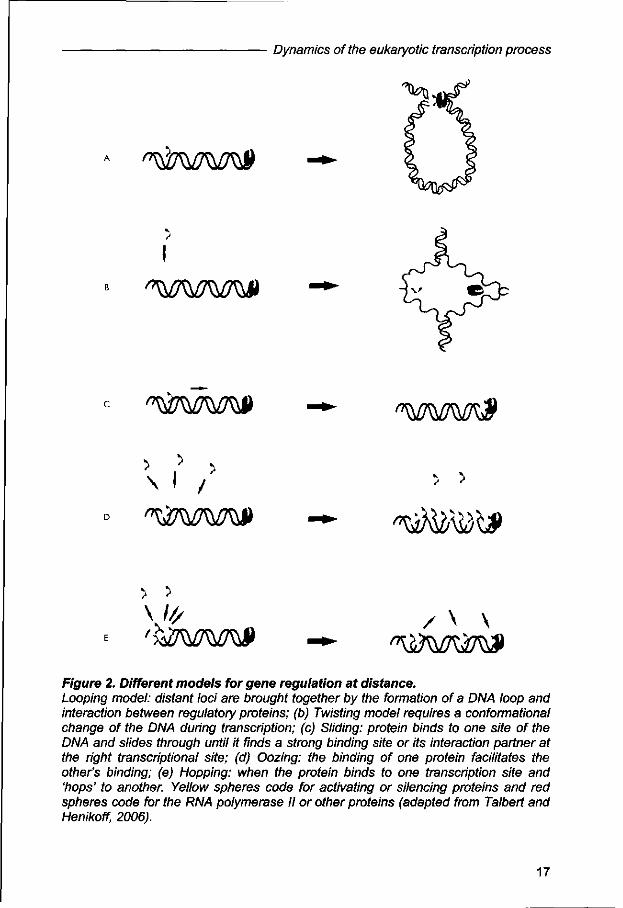
Figure 2. Different models for gene regulation at distance. Looping model: distant loci are brought together by the formation of a DNA loop and interaction between regulatory proteins; (b) Twisting model requires a conformational change of the DNA during transcription; (c) Sliding: protein binds to one site of the DNA and slides through until it finds a strong binding site or its interaction partner at the right transcriptional site; (d) Oozing: the binding of one protein facilitates the other's binding; (e) Hopping: when the protein binds to one transcription site and 'hops' to another. Yellow spheres code for activating or silencing proteins and red spheres code for the RNA polymerase II or other proteins (adapted from Talbert and Henikoff, 2006).
17
Chapter 1
Plant transcription factors: MADS-box family as model to study transcriptional
regulation
In Arabidopsis, around 1800 genes, or approximately 6% of the total number of
genes, encode for transcription factors, which can be subdivided into different
families according to their DNA binding domain (Riechmann, 2002). Among these
transcription factor families in plants, MADS-box proteins are of great importance for
plant architecture and flower development (for review see Ferrario et al., 2004). A
model describing the molecular mode of action for MADS-box transcription factors
was initially proposed based on experiments with Anthirrinium, and additional
supportive evidence came from studies in Arabidopsis and other species. According
to the model, known as "quaternary model", two independent dimers (homo- or
heterodimers) are able to assemble into a higher order complex, which upon specific
DNA binding, bend the DNA and promote the regulation of target genes (Egea-
Cortines et al. 1999; Theiften and Saedler, 2001, Theiften 2001). This direct
interaction and complex formation of transcription factor proteins appeared to be a
general mechanism by which proteins with very similar DNA binding domains
achieve regulatory specificity and regulate transcription (Riechmann and Meyerowitz,
1997). Based on this knowledge, we can hypothesize that the "looping" model is
applicable for MADS-box proteins and that the understanding of how these proteins
interact to each other might elucidate how specificity and proper transcriptional
regulation is organized. MADS-box proteins have shown to dimerize in the
cytoplasm, followed by transport to the nucleus, where probably specific higher order
complexes are assembled (MacGonigle er al, 1996; Immink ef al., 2002; Nougalli-
Tonaco et al., 2006, chapter 2). Whether the assembly occurs on the DNA or
independent from the binding site is not known, although yeast 3- and 4-hybrid
studies demonstrated that higher order complexes can be formed in the absence of
native DNA binding sites. We have demonstrated indirectly the formation of a higher-
order complex between the Petunia hybrida MADS-box proteins FLORAL BINDING
PROTEIN2 (FBP2), FBP11 and FBP24 in living plant cells, by the use of FRET-FLIM
(Fluorescence Resonance Energy Transfer-Fluorescence Lifetime Imaging). In this
study, we analyzed whether the FBP2 protein could function as a ternary factor that
stabilizes the transient interaction between the proteins FBP11 and FBP24 (Nougalli-
Tonaco et al., 2006). FBP11 and FBP24 appeared to interact in sub-nuclear spots
only, whereas interaction between these two proteins could be detected over the
18
Dynamics of the eukaryotic transcription process
whole nucleus after addition of the FBP2 protein, which strongly suggests that FBP2
binds to the transient heterodimer. As discussed before, in mammalian cells
transcription most likely occurs in so-called "transcription factory", regions within the
nucleus where the transcription machinery is present (RNA polymerase II, activators
and other co-factors). From our FRET results we could speculate that the transient
interaction between FBP11 and FBP24 probably occurs at places within the nucleus
where these "transcription factories" are localized (Nougalli-Tonaco et a/., 2006). The
ability of MADS-box proteins to assemble into higher order complexes has been
monitored by several independent methods, and a recently performed gel-filtration
experiment revealed that the FLC (FLOWERING LOCUS C) MADS-box protein is
present in large multimeric complexes in vivo (Helliwell ef a/., 2006). The exact
stochiometry of these complexes is not known, but it becomes more and more clear
that MADS-box proteins are able to interact not only with members of the family but
also with different types of regulatory proteins. One example of this kind of
interactions has been recently shown by Brambilla and colleagues (2007), who were
able to detect interactions between the homeodomain transcription factor BELLI and
the ovule identity MADS-box proteins.
Conclusions
This overview summarizes the latest advances in our understanding of the
transcription machinery in eukaryotes and the dynamic components of this 'machine'.
It is clear that these components are much more mobile and dynamic than has been
thought for many years. This dynamics allows the transcription factor to search for its
specific binding site on the DNA, although it is not known how such a factor
recognizes the right target site. The presence of the target sequence motif (e.g.
CArG box for MADS-box proteins) is not sufficient to explain the specificity of binding,
because these motifs are very abundant in the genome. Probably, small differences
in TF-DNA binding affinities, reflected in the "time of residence", determine whether
transcription occurs or not. A second mode of dynamics in the nucleus concerns the
movement and bending of the DNA (e.g. DNA ties), which allows a close contact
between distant genes in transcription factories, and brings together proteins that are
essential for transcription initiation. Using novel live imaging technologies,
researchers will further endeavor the various aspects of the transcription machinery
that has been laid down in the physical models describing the dynamic interaction
19

Chapter 1
between DNA and protein complexes. These studies will in combination with novel
live imaging technologies, help biologists to solve this complex life's puzzle in the
near future.
Outline of this thesis
As described in this chapter, our understanding of transcriptional regulation and its
dynamics in eukaryotic cells is still fragmentary and we need advanced technologies
to monitor the action of transcription factors in living cells. The goal of the work
described in this thesis was to get a better understanding of the molecular action of
transcription factors in living plant cells and for this we focused on the genetically
well-characterized MADS-box transcription factor family. As a strategy of choice, we
used various non-invasive sophisticated micro spectroscopy techniques, which are
predominantly based on FRET (Fluorescence Resonance Energy Transfer) that
allows the analysis of inter-molecular dynamics in living plant cells.
In chapter 2, we describe the analysis of the interactions between three different
Petunia hybrida MADS-box proteins involved in ovule development, by means of
FRET-FLIM (Fluorescence Resonance Energy Transfer-Fluorescence Lifetime
Imaging). In this chapter, we provide evidence for the formation of stable MADS-box
transcription factor heterodimers in vivo, and the possible stabilization of a weak
dimer by a third protein through the formation of a higher order protein complex.
Furthermore, we speculate about a potential function for the formed complex during
ovule development.
In chapter 3, similar analyses were performed, but now with Arabidopsis thaliana
MADS-box transcription factors involved in petal and stamen formation. Here, we
could demonstrate clear differences in interaction strength between the various
tested homo- and heterodimers and we hypothesized that this must be a crucial
aspect of the partner selection mechanism, finally giving rise to the formation of only
a selective set of specific stable complexes.
The results described in chapter 3 pointed to differences in interaction strength
depending on the pairs of proteins available. A limitation of the pair-wise FRET assay
is that the analysis of competition for dimerization and the formation of higher-order
complexes involving at least three labeled proteins are not possible. Therefore, we
developed a new FRET-based method designated "Competition- FRET", and this
method and the results obtained are described in chapter 4.
20
Dynamics of the eukaryotic transcription process
Furthermore, we tried to implement the BiFC (Bimolecular Fluorescence
Complementation) methodology in plants for the analysis of protein-protein
interactions (chapter 5). In our case, the fluorescent molecule EYFP (Enhanced
Yellow Fluorescent Protein) was divided into two non fluorescence parts and each
part was fused to the MADS-box proteins under study. Upon protein-protein
interactions, the two fluorescent molecules will be brought into close proximity,
leading to the recovery of the fluorescent molecule and hence, a fluorescent signal at
the location of interaction. For this purpose, several constructs were generated and
tested, using different split positions of the YFP molecule, as well as different linker
lengths between the fluorophore domains and the MADS-box proteins. Despite its
theoretical simplicity and easiness, this methodology still needs to be further
developed.
To get a better view on the stoichiometry of the MADS-box protein complexes, we
decided to investigate the diffusion of complexes containing the MADS-box proteins
AGAMOUS (AG) and SEPALLATA 3 (SEP3) by means of FCS (Fluorescence
Correlation Spectroscopy) in vitro (Chapter 6). In these preliminary experiments, we
observed that AGAMOUS diffuses two times slower than SEP 3. Comparison of the
diffusion time with free YFP indicates that the AG protein is able to form multimeric
complexes on its own. Furthermore, the co-translation of both proteins resulted in a
decreased diffusion time, which is probably due to the formation of complexes of high
molecular weight.
Finally, we performed the first experiments but not positive results on the analysis of
direct physical interaction between protein partners in stably transformed plants by
FRET-FLIM analyses (chapter 7). These plants expressed the MADS-box genes
under the control of the endogenous promoters. The experiments revealed that the
state-of- the art in the micro-spectroscopy field is not yet suitable for this type of
experimental set-up. However, with the continuous advances in engineering new
fluorescent molecules and new FRET-couples it is expected that monitoring protein
interactions in planta will be possible in the near future.
21

Chapter 1
ACKNOWLEDGEMENTS
This work has been financially supported by CAPES-Brazil (BEX 0970/01-8).
REFERENCES
Akhtar A and Gasser SM (2007). The nuclear envelope and transcriptional control. Nature Reviews Genetics 8: 507-517.
Andersen JS, Lam YW, Leung AKL, Ong S-E, Lyon CE, Lamond Al, Mann M. (2005). Nucleolar proteome dynamics. Nature 433: 77-83.
Bansal AK and Meyer TE. (2002). Evolutionary analysis by whole-genome comparisons. Journal of Bacteriology 184 (8): 2260-2272.
Berger SL. (2007). The complex language of chromatin regulation during transcription. Nature 8: 407-411.
Brambilla V, Battaglia R, Colombo M, Masiero S, Bencivenga S, Kater MM, Colombo L. (2007). Genetic and molecular interactions between BELLI and MADS-box factors support ovule development in Arabidopsis. Plant Cell, preview.
Brown JWS, Shaw PJ, Shaw P, Marshall DF. (2005). Arabidopsis nucleolar protein database (AtNoPDB). Nucleic Acids Research 33: 633-636.
Cremer T and Cremer C. (2001). Chromosome territories, nuclear archicheture and gene regulation in mammalian cells. Nature Reviews Genetics 2: 292-301.
Cremer T, Cremer M, Dietzel S, Miiller S, Solovei I, Fakan S. (2006). Chromosome territories — a functional nuclear landscape. Current Opinion in Cell Biology 18: 307-316.
Cook PR. (2003). Nongenic transcription, gene regulation and action at a distance. Journal of Cell Science 116: 4483-4491.
Custodio N, Carvalho C, Condado I, Antoniou M, Blencowe BJ, Carmo-Fonseca M.(2004). In vivo recruitment of exon junction complex proteins to transcription sites in mammalian cell nuclei. RNA 10: 622-633.
de Folter S, Immink RGH, Kieffer M, Pafenicova L, Henz S, R, Weigel D, Busscher M, Kooiker M, Colombo L, Kater MM, Davies B, Angenent GC. (2005). Comprehensive interaction map of the arabidopsis MADS-box transcription factors. Plant Cell 17: 1424-1433.
Egea-Cortines M, Saedler H, Sommer H. (1999). Ternary complex formation between the MADS-box proteins SQUAMOSA, DEFICIENS and GLOBOSA is involved in the control of floral architecture in Antirrhinum majus. EMBO Journal 18: 5370-5379.
Elf J , Li G-W, Xie X-S. (2007). Probing Transcription Factor Dynamics at the Single-Molecule Level in a Living Cell. Science 316, 1191-1194.
Ferrario S, Immink RGH, Angenent GC. (2004). Conservation and diversity in flower land. Current Opinion in Plant Biology 7: 84-91.
Fransz P, De Jong JH, Lysak M, Castiglione MR, Schubert I. (2002). Interphase chromosomes in Arabidopsis are organized as well defined chromocentres from which euchromatin loops emanate. Proceedings of the National Academy of Sciences of the United States of America 99: 14584-14589.
Fraser P and Bickmore W. (2007). Nuclear organization of the genome and the potential for gene regulation. Nature 447: 413-417.
22
Dynamics of the eukaryotic transcription process
Green M R. (2000). TBP-associated factors (TAFIIs): multiple, selective transcriptional mediators in common complexes. Trends Biochemical Science 25:59-63.
Halford SE and Marko JF. (2004). How do site-specific DNA-binding proteins find their targets? Nucleic Acids Research 32 (10):3040-3052.
Helliwell CA, Wood CC, Robertson M, Peacock WJ, Dennis ES. (2006). The Arabidopsis FLC protein interacts directly in vivo with SOC1 and FT chromatin and is part of a high-molecular-weight protein complex. Plant Jouma/46(2):183-192.
Honma T and Goto K. (2001). Complexes of MADS-box proteins are sufficient to convert leaves into floral organs. Nature 409: 525-529.
Immink RGH, Gadella TW Jr., Ferrario S, Busscher M, Angenent GC. (2002). Analysis of MADS-box protein-protein interactions in living plant cells. Proceedings of the National Academy of Sciences of the United States of America 99: 2416-2421.
Isogai Y and Tjian R. (2003). Targeting genes and transcription factors to segregate nuclear compartments. Current Opinion Biology 15(3):296-303.
Jackson DA. (2003). The anatomy of transcription sites. Current Opinion in Cell Biology 15:311-317.
Kapranov P, Cawley SE, Drenkow J, Bekiranov S, Strausberg RL, Fodor SP, Gingeras TR. (2002). Large-scale transcriptional activity in chromosomes 21 and 22. Science 296: 916-919.
Kimura H, Sugaya K, Cook PR. (2002). The transcription cycle of RNA polymerase II in living cells. Journal of Cell Biology159(5): 777-782.
Lanctot C, Cheutin T, Cremer M, Cavalli G, Cremer T. (2007). Dynamic genome architecture in the nuclear space: regulation of gene expression in three dimensions. Nature Reviews Genetics 8: 104-115.
Lysak MA, Fransz PF, Ali HB, Schubert I. (2001). Chromossome painting in Arabidopsis thaliana. Plant Journal 28: 689- 697.
Marenduzzo D, Faro-Trindade I and Cook PR. (2007). What are the molecular ties that maintain genomic loops? TRENDS in Genetics 23 (3): 126-133.
McGonigle B, Bouhidel K, Irish V F. (1996). Nuclear localization of the Arabidopsis APETALA3 and PISTILLATA homeotic gene products depends on their simultaneous expression. Genes & Development 10: 1812-1821.
Moorman C, Sun LV, Wang J, Wit Ed, Talhout W, Ward LD, Greil F, Lu X-J, White KP, Bussemaker HJ, van Steensel B. (2006). Hotspots of transcription factor co localization in the genome of Drosophila melanogaster. Proceedings of the National Academy of Sciences of the United States of America 103 (32): 12027-12032.
Nougalli-Tonaco I A, Borst JW, de Vries SC, Angenent GC, Immink RGH. (2006). In vivo imaging of MADS-box transcription factors interactions. Journal of Experimental Botany 57: 33-42.
Pafenicova L, de Folter S, Kieffer M, Horner DS, Favalli C, Busscher J, Cook HE, Ingran RM, Kater MM, Davies B, Angenent GC, Colombo L. (2003). Molecular and phylogenetic analyses of the complete MADS-box transcription factor family in Arabidopsis: New openings to the MADS world. Plant Cell 15: 1538-1551.
Pederson, T. (2004). The spatial organization of the genome in mammalian cells. Current Opinion in Genetics and Development 14: 203-209.
23

Chapter 1
Pendle AF, Clark GP, Boon R, Lewandowska D, Lam YW, Andersen J, Mann M, Lamond Al, Brown JWS, and Shaw PJ. (2005). Proteomic analysis of the Arabidopsis nucleolus suggests novel nucleolar functions. Molecular Biology of the Cell 16: 260-269.
Perales M and Mas P. (2007). A Functional link between rhythmic changes in chromatin structure and the Arabidopsis biological clock. Plant Cell, preview.
Phair RD, Scaffidi P, Elbi C, Vecerova J, Dey A, Okato K, Brown DT, Hager G, Bustin M, Misteli T. (2004). Global nature of dynamic protein-chromatin interactions in vivo: three-dimensional genome scanning and dynamic interaction networks of chromatin proteins. Molecular Cellular Biology 24:6393-6402.
Raska I, Shaw PJ, Cmarko D. (2006). Structure and function of the nucleolus in the spotlight. Current Opinion in Cell Biology 18: 325-334.
Ren X-Y, Vorst O, Fiers M WEJ, Stiekema W J, Nap J-P. (2006). In plants, highly expressed genes are the least compact. TRENDS in Genetics 22(10): 528-5.
Riechmann JL and Meyerowitz EM. (1997). MADS domain proteins in plant development. Journal of Biological Chemistry 378: 1079-1101.
Riechmann J.L (2002). Transcriptional Regulation: a Genomic Overview. The Arabidopsis Book . American Society of Plant Biologists.
Seob Kwon C and Wagner D.(2007). Unwinding chromatin for development and growth: a few genes at a time. TRENDS in Genetics 23 (8): 403-412.
Simonis M, Klous P, Splinter E, Moshkin Y, Willemsen R, de Wit E , van Steensel B, de Laat W. (2006). Nuclear organization of active and inactive chromatin domains uncovered by chromosome conformation capture-on-chip (4C). Nature Genetics 38 (11): 1348-1354.
Shav-Tal Y, Darzacq X, Singer RH. (2006). Gene expression within a dynamic nuclear landscape. EMBO Journal 25: 3469-3479.
Talbert PB and Henikoff S. (2006). Spreading of silent chromatin: inaction at a distance. Nature Reviews Genetics 7: 793-803.
Tanabe H, Muller S, Neusser M, von Hase J, Calcagno E, Cremer M, Solovei I, Cremer C, Cremer T. (2002). Evolutionary conservation of chromosome territory arrangements in cell nuclei from higher primates. Proceedings of the National Academy of Sciences of the United States of America 99:4424-4429.
Tessadori F, Kees Schulkes R, van Driel R, Fransz P. (2007). Light-regulated large-scale reorganization of chromatin during the floral transition in Arabidopsis. Plant Journal (preview).
Theilien G. (2001). Development of floral organ identity: stories from the MADS house. Current Opinion in Plant Biology 4: 75-85.
TheiBen G and Saedler H. (2001). Floral quartets. Nature 409: 469-471. van Driel R and Fransz P. (2004). Nuclear architecture and genome functioning in
plants and animals: what can we learn from both ? Experimental Cell Research 296: 86- 90.
Wang H-F, Feng L, Niu D-K. (2007). Relationship between mRNA stability and intron presence. Biochemical and Biophysical research Communications 354: 203-208.
Wei G H, Liu DP, Liang CC. (2005). Chromatin domain boundaries: insulators and beyond. Cell Research 15(4):292-300.
24

Dynamics of the eukaryotic transcription process
Zhang X, Yazaki J, Sundaresan A, Cokus S, Chan S W-L, Chen H, Henderson IR, Shinn P, Pellegrini M, Jacobsen SE, Ecker JR.(2006). Genome-wide high-resolution mapping and functional analysis of DNA methylation in Arabidopsis. Ce//126: 1189-1201.
25

Chapter 2
In vivo imaging of MADS-box transcription
factor interactions
Isabella A. Nougalli Tonaco, Jan Willem Borst, Sacco C. de Vries, Gerco C. Angenent and Richard G.H. Immink
Published as:
Nougalli-Tonaco, IA; Borst, JW; de Vries, SC; Angenent, GC; Immink, RGH. (2006). In
vivo imaging of MADS-box transcription factors interactions. J. Exp. Bot. 57, 33-42.

Chapter 2
ABSTRACT
MADS-box transcription factors are major regulators of development in flowering
plants. The factors act in a combinatorial manner either as homo- or heterodimers
and they control floral organ formation and identity and many other developmental
processes, through a complex network of protein-protein and protein-DNA
interactions. Despite the fact that many studies have been done to elucidate MADS-
box protein dimerisation by yeast systems, only little information is available on the
behaviour of these molecules in planta. Here we provide evidence for specific
interactions between the petunia MADS-box proteins FBP2, FBP11 and FBP24 in
vivo. The yeast identified dimers for the ovule specific FBP24 protein have been
confirmed in living plant cells by means of Fluorescence Resonance Energy Transfer
(FRET)-Fluorescence Lifetime Imaging Microscopy (FLIM) and in addition, some,
most likely, less stable homo- and heterodimers were identified. The followed in vivo
approach revealed that particular dimers could only be formed in specific sub-nuclear
domains. Moreover, we provided evidence for the in planta assembly of these ovule-
specific MADS-box transcription factors into higher-order complexes.
28

In vivo imaging ofMADS-box transcription factor interactions
INTRODUCTION
MADS-box genes represent a large multigene family in flowering plants and are
involved in numerous developmental processes. In angiosperms, many of the genes
belonging to this transcription factor family are involved in flower development, most
notably in the determination of floral meristem and floral organ identity (Ferrario etal.,
2004a; Riechmann and Meyerowitz, 1997). The complete Arabidopsis genome
sequence revealed the existence of over 100 MADS-box genes (Paienicova ef a/.,
2003; Martinez-Castilla and Alvarez-Buylla, 2003; Kofuji ef a/., 2003; de Bodt ef a/.,
2003). During the last decade many members of the family have been subject to
genetic studies in various plant species, which has led to the robust 'ABC model as
the paradigm for flower development in angiosperms. In addition, the functional
characterization of a number of MADS-box genes has revealed regulatory roles for
other MADS-box genes in flower induction, meristem formation and fruit
development. In contrast to the enormous effort that has been put into this kind of
analyses over the last decade, giving rise to detailed knowledge about MADS-box
gene functions, virtually nothing is known about the molecular mode of action of the
encoded proteins.
Analyses of MADS-box proteins have been mainly restricted to the MIKC type, which
has a characteristic modular structure. From the N to the C terminus of the protein,
four domains can be identified: the MADS-box (M), intervening (I), keratin-like (K),
and C-terminal domains (Riechmann and Meyerowitz, 1997). The M-domain is the
most conserved among all domains and consists of approximately 56-58 amino
acids. It plays an important role in DNA binding and probably a minor role in
dimerization. The l-domain is less conserved, varies in length, and is important for
determining the dimerization specificity (Riechmann and Meyerowitz, 1997). The K-
domain (-80 amino acids) contains several heptad repeats that most likely fold into
amphipathic a-helices, which mediates dimerization (Yang ef a/., 2003). The C-
terminal domain is the least conserved and it has been shown that it is able to act as
a transactivation motif for some of the plant MADS-box proteins and furthermore, it
appears to be involved in higher-order complex formation (Egea-Cortines ef a/.,
1999; Honma and Goto, 2001, Yang and Jack, 2004).
The first studies aiming at the elucidation of the molecular mechanisms underlying
MADS-box protein functioning using in vitro DNA binding approaches revealed that
these transcription factors form specific dimers (Schwarz-Sommer ef a/., 1992; Krizek
29

Chapter 2
and Meyerowitz, 1996; Riechmann et al., 1996; West et al., 1998; Egea-Cortines ef
al., 1999). In addition, the yeast two-hybrid system has been adopted very frequently,
to obtain information about MADS-box protein-protein interactions. Comprehensive
matrix based screens for petunia and Arabidopsis MADS-box transcription factor
interactions have shown that these factors form specific homo- and heterodimers and
that these interactions are conserved between different plant species (Immink ef al.,
2003; de Folter et al., 2005). A further complexity was proposed based on results
obtained with Antirrhinum and Arabidopsis MADS-box proteins in yeast experiments
(Egea-Cortines et al., 1999; Honma and Goto, 2001). These experiments revealed
that additional MADS-box proteins may bind to a dimer at the C-terminus forming a
ternary or quaternary complex. Like dimerisation, this complex formation seems to be
conserved, because similar complexes could be identified for Petunia, Arabidopsis
and Chrysanthemum MADS-box proteins using yeast three- and four-hybrid
screenings (Ferrario et al., 2003; Favaro et al., 2003; Shchennikova et al., 2004).
This ability of MADS-box proteins to form multimeric complexes suggests that they
are active in a combinatorial manner and based on these findings the "quartet model"
for MADS-box transcription factor functioning was hypothesized. According to this
model, two dimers within a higher-order tetrameric complex recognize two different
binding sites in the DNA sequence, which are brought into close proximity by DNA
bending. Pursue on this model the control of floral organ identity is supposed to be
driven by four different tetrameric transcription factor complexes composed of the
"ABC" - MADS-box proteins (Theifcen, 2001; Theilien and Saedler, 2001).
Despite that the yeast screenings can be performed in a high-throughput manner and
offer a first glimpse on dimerization patterns and complex formation, they have many
drawbacks, specially when it concerns transcription factors that often contain intrinsic
transcriptional activation domains. Because of this, yeast methods give rise to false-
positive and false-negative results and therefore, should be verified by in-planta
studies (Immink and Angenent, 2002). Moreover, the ability to visualize and follow
molecules and events in living cells has become an important aspect in cell biology
(Lippincott-Schwartz and Patterson, 2003). Recently, innovative micro spectroscopic
approaches have been developed in order to combine the high spatial resolution of
microscopy with spectroscopic techniques to obtain information about the dynamical
behavior of molecules (Gadella ef al., 1999; Hink et al., 2002). Fluorescence
Resonance Energy Transfer (FRET) based methods have become a key for the
30

In vivo imaging ofMADS-box transcription factor interactions
detection of protein-protein interactions in living cells. In its principle, excited-state
energy is transferred non-radioactively through space from a donor to an acceptor
molecule. This energy transfer takes place only, if emission and excitation spectra of
the fluorophore pair are overlapping and if the distance between the molecules is
very small (within ~1 to ~10nm of each other). Hence, protein-protein interactions can
be studied by fusing the proteins of interest to two fluorescent molecules with the
right characteristics (Gadella ef al., 1999; Hink et a/., 2002). The combination of cyan
(CFP) and yellow (YFP) fluorescent proteins has proven to be the best marriage for
m-planta FRET studies (Immink et al., 2002; Russinova et a/., 2004). FRET can be
quantified by observing changes in the fluorescence lifetime of the donor using
Fluorescence Lifetime Imaging Microscopy (FLIM) (Gadella et. al., 1993; Borst et al.,
2003). In case of a protein-protein interaction, FRET will occur and the fluorescence
lifetime of the donor molecule will decrease. The advantages of FLIM for the
detection of FRET are that it is not dependent on changes in probe concentration,
and that it is less sensitive to photo bleaching and other factors that limit intensity
based steady state analyses (Chen and Periasamy, 2004).
With respect to MADS-box transcription factors, protein interactions in living cells
have been shown only for a few petunia MADS-box proteins by means of FRET-
Spectral Photo Imaging Microscopy (SPIM) and FRET-FLIM analyses (Immink ef al.,
2002). The ovule specific FLORAL BINDING PROTEIN11 (FBP11) appeared to
interact specifically with three closely related proteins, FBP2, FBP5 and FBP9 that
belong all to the SEPALLATA clade of MADS-box proteins (Ferrario ef al., 2003).
Recently, another ovule specific MADS-box gene ABS (Arabidopsis B-sister gene,
Becker ef al., 2002) has been described, formerly known as AGL32 and TT16
(Transparent Testa16, Nesi ef al., 2002). The abs mutant is affected in seed coat
pigmentation and probably to some extent in the integrity of the entire inner
integument. The petunia FLORAL BINDING PROTEIN24 (FBP24) gene appeared to
be very close in sequence to ABS and is expressed in ovules, specifically (de Folter
and Immink, unpublished results). Currently, it is unknown how the ovule specific
FBP24 protein is acting at the molecular level and to which protein complexes it
contributes. Therefore, we performed yeast two- and three-hybrid analysis to study
FBP24 protein-protein interactions. Subsequently, FBP24 and its putative interacting
partners were tagged with fluorescent proteins and expressed in protoplasts, which
allowed the analysis of cellular localization and \n-planta interactions using FRET-
31
Chapter 2
FLIM imaging techniques. The obtained results improve our knowledge about plant
MADS-box transcription factor functioning at the molecular level and provide
information about their dynamics in living plant cells.
MATERIAL AND METHODS
Plant Material
The Petunia hybrida line W115 and Cowpea Black Eye California variety were grown
under normal greenhouse conditions (16/8 hr light/dark, 20°C for petunia and 28°C
for cowpea).
Plasmids construction
All the clonings were done following the Gateway™ system from Invitrogen
(Carlsbad, CA). The complete ORFs of the MADS-box genes were PCR amplified
using specific primers yielding entry clones. Vectors containing Cyan Fluorescent
Protein (ECFP) and Yellow Fluorescent Protein (EYFP) under control of the CaMV
35S promoter (Immink etai, 2002) were made Gateway compatible according to the
Invitrogen manual. In addition, the coding region of the monomeric Red Fluorescent
Protein (mRFP) (Campbell et a/., 2002) was cloned in the same vector backbone.
Finally, expression vectors encoding the various MADS-box transcription factors
tagged with a C-terminal fused fluorescent protein were obtained by an LR reaction.
Yeast two- and three-hybrid experiments
Two-hybrid analyses using the CytoTrap and the GAL4 system were performed as
described previously (Immink etal., 2003). For this purpose the entire FBP24 coding
region was cloned in-frame in the pMYR, pSOSnes, and pADGAL4 and pBDGAL4
vectors. FBP24 was screened against 14 petunia MADS-box proteins in the GAL4
system (FBP2, FBP4, FBP5, FBP9, FBP23, pMADS12, FBP6, FBP7, pMADS3,
FBP11, FBP26, FBP29, PFG, FBP24). Selection for interaction was performed, using
the Histidine marker in combination with two diferent concentrations of 3 Amino-
Triazole (3AT, 1 mM and 5mM), and by the Adenine marker. The three-hybrid
experiments were done with a modified yeast two-hybrid GAL4 system as described
by Ferrario et al. (2003).
32
In vivo imaging of MADS-box transcription factor interactions
Transient expression in Cowpea and Petunia protoplasts
Cowpea protoplasts were prepared and transfected according to Shah et al. (2002).
Petunia protoplasts were obtained from W115 petunia leaves and transfected as
described by Immink et al. (2002). Protoplasts were incubated overnight in protoplast
medium at 25°C in the light for Cowpea, and in the dark for Petunia and
subsequently imaged for fluorescence.
Localization studies in living cells
The imaging of the fluorescent fusion proteins was done by a Confocal Laser
Scanning Microscope 510 (Carl Zeiss, Jena, Germany). Protoplasts were excited by
458 and 514 nm Ar laser lines for CFP and YFP, respectively. In addition, a 543 nm
He laser line was used to excite mRFP. The pinholes were set at one Airy unit which
corresponds to a theoretical thickness (full width at half-maximum) of l^m. Images
and data analyses were performed with Zeiss LSM510 software (version 3.2).
Fluorescence Lifetime-Imaging Microscopy
For FRET-FLIM analyses, cowpea protoplasts were analysed as described by
Russinova et al. (2004), using a Bio-Rad Radiance 2100 MP system (Hercules, CA)
in combination with a Nikon TE 300 inverted microscope (Tokyo, Japan). Two-
photon excitation pulses were generated by a Ti:-Sapphire laser (Coherent Mira) that
was pumped by a 5-W Coherent Verdi laser. The excitation light was directly coupled
to the microscope and focused to the sample by the use of a CFI Plan Apochromat
60x water immersion objective lens (N.A. 1.2).
The heterodimer between FBP2 and FBP11 and the combination FBP2 and PFG
(Petunia Flowering Gene) were used as positive and negative controls, respectively
(Imminkera/., 2002).
In this study, a two-photon set-up was used and the donor fluorescence lifetime
values were measured pixel by pixel. In all cases measurements were done for the
central part of the nucleus where the fluorescence lifetime is not influenced by the
auto fluorescence from chloroplasts. For each analysis at least ten representative
cells were measured, expressing either a single CFP labeled MADS-box protein, or a
combination of a CFP and an YFP labeled protein.
33

Chapter 2
Images with a frame size of 64 X 64 pixels were acquired using the Becker and
HickH SPC 830 module, and for the data analysis, the SPCimage 2.8 software was
used.
RESULTS
Yeast two- and three-hybrid analyses
To get a first impression about putative FBP24 interaction partners and to select
candidates for future in-vivo studies yeast two- and three-hybrid analyses were
performed. Initially, FBP24 has been tested for dimerization with the 23 known
petunia MADS-box proteins (Immink ef a/., 2003) in the CytoTrap two hybrid system.
Remarkably, none of the tested couples resulted in growth of the yeast at 37°C,
suggesting that a putative FBP24 heterodimerization partner is not present in the
collection. Alternatively, FBP24 is able to interact weakly with one of the known
MADS-box factors but it just can not be detected by the yeast CytoTrap system, due
to the relative high assay temperature in this system. Therefore, FBP24 dimerization
was tested in the yeast two-hybrid GAL4 system at room temperature. This analysis
revealed that FBP24 interacts specifically with FBP2 and FBP4 and is neither able to
dimerize in yeast with the ovule specific and very closely related FBP7 and FBP11 D-
type proteins (Angenent et al., 1995), nor the putative C-type proteins FBP6 and
pMADS3 (Kater etal., 1998).
Taking into account that for some MADS-box proteins higher-order complexes have
been identified, we were wondering whether FBP24 may interact with the ovule
specific D-type proteins in a higher-order complex. To test this ability a yeast three-
hybrid analysis was performed. In this screen the FBP2 protein lacking the C-terminal
domain (FBP2AC) was used, because FBP2 contains an intrinsic transcriptional
activation domain in this region (Ferrario ef al., 2003). Although, the detected
interactions were very weak and could be detected at room temperature and low
concentrations of 3 Amino-Triazole (3AT) only, the combinations FBP24-FBP11-
FBP2 and FBP24-FBP7-FBP2 gave clearly growth of yeast in comparison to the
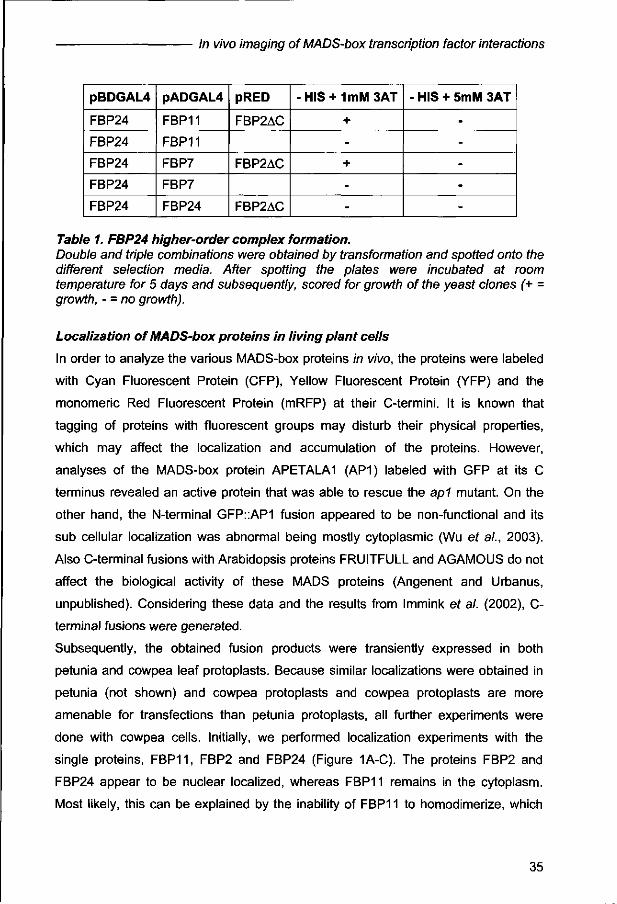
controls (Table 1).
34
In vivo imaging of MADS-box transcription factor interactions
pBDGAL4
FBP24
FBP24
FBP24
FBP24
FBP24
pADGAL4
FBP11
FBP11
FBP7
FBP7
FBP24
pRED
FBP2AC
FBP2AC
FBP2AC
-HIS + 1mM3AT
+
•
+
-
-
- HIS + 5mM 3AT
-
-
-
-
-
Table 1. FBP24 higher-order complex formation. Double and triple combinations were obtained by transformation and spotted onto the different selection media. After spotting the plates were incubated at room temperature for 5 days and subsequently, scored for growth of the yeast clones (+ = growth, - = no growth).
Localization of MADS-box proteins in living plant cells
In order to analyze the various MADS-box proteins in vivo, the proteins were labeled
with Cyan Fluorescent Protein (CFP), Yellow Fluorescent Protein (YFP) and the
monomeric Red Fluorescent Protein (mRFP) at their C-termini. It is known that
tagging of proteins with fluorescent groups may disturb their physical properties,
which may affect the localization and accumulation of the proteins. However,
analyses of the MADS-box protein APETALA1 (AP1) labeled with GFP at its C
terminus revealed an active protein that was able to rescue the ap1 mutant. On the
other hand, the N-terminal GFP::AP1 fusion appeared to be non-functional and its
sub cellular localization was abnormal being mostly cytoplasmic (Wu et al., 2003).
Also C-terminal fusions with Arabidopsis proteins FRUITFULL and AGAMOUS do not
affect the biological activity of these MADS proteins (Angenent and Urbanus,
unpublished). Considering these data and the results from Immink et al. (2002), C-
terminal fusions were generated.
Subsequently, the obtained fusion products were transiently expressed in both
petunia and cowpea leaf protoplasts. Because similar localizations were obtained in
petunia (not shown) and cowpea protoplasts and cowpea protoplasts are more
amenable for transfections than petunia protoplasts, all further experiments were
done with cowpea cells. Initially, we performed localization experiments with the
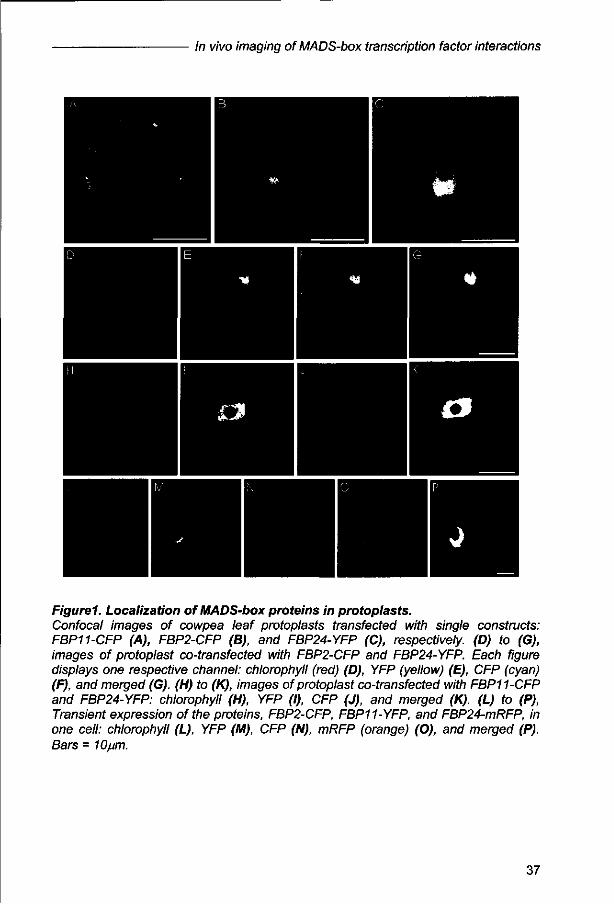
single proteins, FBP11, FBP2 and FBP24 (Figure 1A-C). The proteins FBP2 and
FBP24 appear to be nuclear localized, whereas FBP11 remains in the cytoplasm.
Most likely, this can be explained by the inability of FBP11 to homodimerize, which
35

Chapter 2
seems to be a prerequisite for movement into the nucleus (Immink et a/., 2002).
Surprisingly, both FBP24 and FBP2, for which no homodimerization could be
detected by the yeast two-hybrid experiments, were nuclear localized. FRET-FLIM
analyses performed in the past for FBP2, revealed that this protein is able to
homodimerize in protoplasts and hence, transported into the nucleus (Immink ef a/.,
2002).
In the next step, cells co-transfected with two labeled proteins, for which either
dimerizaton or no interaction could be detected in yeast two-hybrid experiments,
were analyzed. Nuclear co-localization has already been described for the partners
FBP2 and FBP11 (Immink era/., 2002). The combination FBP2 and FBP24 appeared
to result in nuclear co-localization as well (Fig1D-G). Surprisingly, both proteins
FBP11 and FBP24 were present in the nucleus in the double transfected cells (Fig H-
K), while the single FBP11 protein was localized in the cytoplasm (Fig 1A). Taken
into account the hypothesis that dimerization is essential for transport into the
nucleus (Immink et al., 2002), their co-localization suggests heterodimerization.
Finally, all three proteins were imaged simultaneously by transient expression of
FBP11, FBP2 and FBP24, labeled with different fluorescent molecules. In this case,
all three proteins were present in the nucleus (Fig 1L-P).
36
In vivo imaging of MADS-box transcription factor interactions
Figurel. Localization of MADS-box proteins in protoplasts. Confocal images of cowpea leaf protoplasts transfected with single constructs: FBP11-CFP (A), FBP2-CFP (B), and FBP24-YFP (C), respectively. (D) to (G), images of protoplast co-transfected with FBP2-CFP and FBP24-YFP. Each figure displays one respective channel: chlorophyll (red) (D), YFP (yellow) (E), CFP (cyan) (F), and merged (G). (H) to (K), images of protoplast co-transfected with FBP11-CFP and FBP24-YFP: chlorophyll (H), YFP (I), CFP (J), and merged (K). (L) to (P), Transient expression of the proteins, FBP2-CFP, FBP11-YFP, and FBP24-mRFP, in one cell: chlorophyll (L), YFP (M), CFP (N), mRFP (orange) (O), and merged (P). Bars = 10/im.
37

Chapter 2
FRET-FLIM analyses reveal differences between dimers
Although sub-cellular co-localization may suggest dimerization and complex
formation in living cells, evidence for physical interaction between proteins can only
be obtained after application of an appropriate methodology. Therefore, we used
FRET-FLIM analyses for the detection of homodimerization and heterodimerization of
the ovule-specific MADS-box transcription factors described above. To calculate the
fluorescence lifetime of CFP in the absence of the YFP acceptor, the single proteins
FBP2 and FBP24 labeled with the donor molecule CFP were used for protoplast
transfections. The obtained fluorescence lifetime values and distribution over the
nucleus were used as reference for values obtained with the various double
transfections. Cells transfected with either FBP2-CFP or FBP24-CFP show a limited
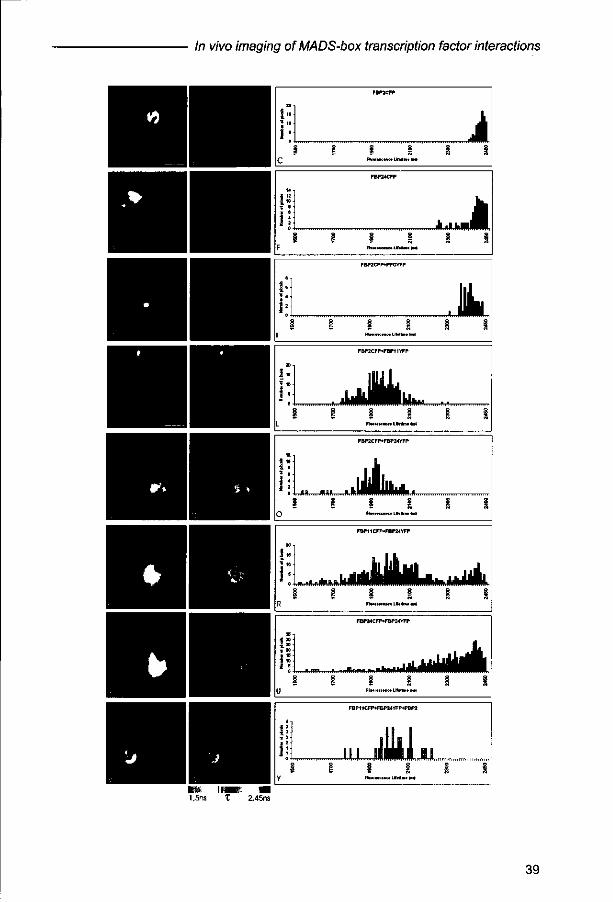
variation in fluorescence lifetime values, with an average around 2,45 ns (Fig 2A-F).
The fluorescence lifetime for the negative control, the combination of FBP2 and PFG,
appeared to be in the same range, however, the variation in lifetime values for
different cells is slightly larger (Fig 2G-I). For the positive control (FBP2-FBP11), the
fluorescence lifetime drops to about 1,9-2,0 ns on average, which can be measured
throughout the nucleus (Fig 2J-L).
Figure 2. Monitoring Fluorescence Resonance Energy Transfer (FRET) by Fluorescence Lifetime Imaging Microscopy (FLIM). FRET-FLIM analyses of transfected cowpea leaf protoplasts, expressing single and various combinations of MADS-box proteins fused to CFP and YFP, respectively. (A) to (C) FLIM analysis on protoplast transiently expressing FBP2-CFP. In (A) the fluorescence intensity image of the nucleus of a representative cell is shown, in (B) the fluorescence lifetime image of the same nucleus (by a false color code), and in (C) a histogram representing the distribution of fluorescence lifetime values over the nucleus. FLIM analysis forFBP24-CFP (D) to (F); for FBP2-CFP+PFG-YFP (G) to (I); for FBP2-CFP+FBP11YFP (J) to (L); for FBP2-CFP+FBP24-YFP (M) to (O); for FBP11-CFP+FBP24-YFP (P) to (R); for FBP24-CFP+FBP24-YFP (S) to (U); and for FBP11-CFP+FBP24-YFP+FBP2 (V) to (Y). The fluorescence intensity is always shown in the left panel, the fluorescence lifetime in the middle panel and the distribution of fluorescence lifetime values in the right panel. Bars-10jum.
38
In vivo imaging of MADS-box transcription factor interactions
A S 10
niWiHWrM^W
H H I W H U U M O H «nt
FBP2CFP+PFGYFP
JLL FBP2CFP+FBP11YFP
^JUk fcwu, g § § g
15: „BH BUB B,
FBP2CFP*FBP24YFP
iLi. ? i
Fhi*r«u*» Uf.Hm. lint
20 -.
1" • 10 I
1 R
i
FBP11CFP+FBP24YFP
1900
2100
FhtinuMt Lifeihn* IM
| 1
3S !
I IE
± E
§
u g
FBP24CFP+FBP24YFP
1900
2100
Fhioinctnca LH.rlm* (iM
ikJil §
* i
• * II4K • 1,5ns T 2.45ns
39

Chapter 2
Subsequently, the combination FBP2-CFP and FBP24-YFP was analyzed. For this
combination, heterodimerization was detected in yeast and co-localization of the
proteins was observed in living plant cells (Fig 1D-G). The FLIM data depicted in
Figures 2M-0 show that this combination gives a strong reduction in fluorescence
lifetime, demonstrating that these proteins interact in living plant cells. The reciprocal
combination (FBP24-CFP and FBP2-YFP) has been tested as well and gave the
same result (data not shown). Surprisingly, in the case of the combination FBP11-
FBP24 a distribution of different fluorescence lifetime values over the nucleus was
observed (Fig 2P-R), suggesting that there are sub-nuclear regions with and without
interaction between the two proteins. Finally, we analyzed cells transfected with both
FBP24-CFP and FBP24-YFP, in order to determine whether this protein is able to
homodimerize. Interestingly, the same variation of fluorescence lifetime values
distributed over the nucleus was found as described for FBP11-FBP24 (Fig 2S-U).
Stability of protein-protein interactions and higher-order complex formation
It has been proposed that MADS-box proteins are active as multimeric complexes,
such as ternary or quaternary complexes (Egea-Cortines ef a/., 1999). Information
about the stability of the dimeric interactions and the influence of additional factors is
limited to yeast experiments and is completely lacking for in plants interactions. Our
FRET-FLIM analyses clearly revealed differences between dimers with respect to
distribution over the nucleus and stability of interaction. Some combinations interact
all over the nucleus while others interact, most likely in a more transient manner, in
sub nuclear regions only. To get a possible explanation for this difference in
distribution and stability of dimers, FLIM studies were done using a non-labelled third
factor (FBP2) in combination with FBP11-CFP and FBP24-YFP. This experiment
revealed a reduction in fluorescence lifetime with a more uniform distribution over the
nucleus for the triple combination (Fig.2V-Y vs. Fig.2P-R).
DISCUSSION
During the last decade, many studies have been performed to identify the genes
involved in regulation of important steps in plant development. Transcription factors
belonging to the MADS-box family appeared to play pivotal roles in these processes
and can be considered as the main regulators of plant development. Nevertheless,
little is known about their behavior in plant cells at the molecular level and the
40

In vivo imaging of MADS-box transcription factor interactions
dynamic process of gene regulation in the nucleus. It has been hypothesized that the
MADS-box proteins form specific dimers, which are further assembled into tetrameric
complexes (reviewed in Theifien and Saedler, 2001). Intriguing questions remain
whether these complexes are actually formed and how stable these complexes are.
In this study, we have followed an in vivo approach to investigate the dynamics of
MADS-box transcription factor interactions in a plant cell environment. For this
purpose, the Petunia MADS-box proteins FBP11, FBP2 and FBP24 that are
supposed to be involved in ovule development, were selected as object.
Surprisingly, no dimerization partner could be detected for FBP24 in the yeast
CytoTrap two-hybrid system. In this system the selection for protein-protein
interactions is based on the Ras signal transduction cascade and due to this the
temperature sensitive yeast strain is able to growth at a relative high temperature of
37°C upon a protein-protein interaction (Aronheim et a/., 1997). A temperature
dependent interaction has been reported for the class B proteins PISTILLATA and
APETALA3 from Arabidopsis (Kohalmi et a/., 1996), which can be stabilized by the
presence of additional MADS-box factors. FBP24 has been designated as a "B-
sister" gene (Becker ef a/., 2002), based on its evolutionary relationship with the
class B proteins. Our yeast two-hybrid results also point to weak and temperature
sensitive interactions between FBP24 and other MADS-box proteins such as FBP2
and FBP11 and furthermore, a third protein facilitates the formation of a more stable
dimer.
It has been hypothesized that dimerization is a prerequisite for nuclear localization of
plant MADS-box transcription factors (Immink ef a/., 2002; Ferrario et al., 2004b). In
line with this, FBP11 that is not able to homodimerize is localized in the cytoplasm,
whereas FBP2 molecules form homodimers and are subsequently transported to the
nucleus. Despite that FBP24 did not show homodimerization in yeast, it appeared to
be nuclear localized in plant cells. FRET-FLIM analyses in living plant cells
demonstrated however that in contrast to the yeast two-hybrid results,
homodimerization could be detected for this protein. Like FBP24, homodimerization
of FBP2, FBP5 and FBP9 (Immink et al., 2002) could only be detected in planta, but
not by a traditional yeast two-hybrid system, demonstrating the importance of \n-vivo
protein-protein interaction studies. Furthermore, it suggests that plant MADS-box
transcription factor homodimers are in general less stable than heterodimers. The
fact that only five homodimers have been identified in a large-scale yeast two-hybrid
41

Chapter 2
screening with over 100 Arabidopsis MADS-box transcription factors (de Folter et al.,
2005) supports this observation.
For the putative FBP2-FBP24 heterodimer the yeast result were confirmed by the in
planta analysis. A relative low fluorescence lifetime with little variation was observed
for this combination, suggesting the formation of a "stable" heterodimer. On the other
hand, the proteins FBP11 and FBP24 that are not interacting in yeast seem to
interact in sub-nuclear regions in plant cells. A similar kind of fluorescence lifetime
distribution over the nucleus, with regions with relatively low fluorescence lifetime
values visualizing an interaction and regions with high fluorescence lifetime values
representing no interaction, was observed for the FBP24 homodimer. Most likely, in
these cases the proteins associate into dimers and dissociate all over the nucleus,
but their interaction is stabilized in the specific sub-nuclear spots. At this moment it is
not clear what these sub-nuclear regions represent. The stronger FRET signal in the
sub nuclear spots is at least not due to a higher concentration of the fluorescence
proteins at these places, because fluorescence intensity measurements showed a
more or less equal distribution of signal over the nucleus. A number of studies
indicate that homo- and/or heterodimerization facilitate the binding to specific DNA
sequences (Pellegrini et al., 1995: Shore and Sharrocks, 1995) and that higher-order
complex formation of MADS-box transcription factors is stabilized by specific DNA
binding (Egea-Cortines et al., 1999). It might be possible that the sub-nuclear regions
represent places where the chromatin is available for transcription and to which the
transcription factors are recruited, resulting in stabilization of the less stable or
"transient" interactions.
The triple transfection experiment that has been performed in this study, suggests
that an instable dimer can be stabilized by a third factor, because addition of a non-
labeled FBP2 to the combination FBP11-CFP + FBP24-YFP resulted in a drop in
fluorescence lifetime values. Based on differences in FRET signal that were obtained
for the individual dimers (FBP2-FBP2, FBP24-FBP24, FBP2-FBP11, FBP2-FBP24
and FBP11-FBP24), we assumed that competition for dimerization between the
individual proteins will occur, when more than two factors are co-expressed. In the
case that competition for dimerization is the only aspect that plays a role, addition of
the non-labeled FBP2 to the combination FBP11-CFP + FBP24-YFP will result in less
or no dimerization between FBP11 and FBP24 and hence, an increase in
fluorescence lifetime. However, the fluorescence lifetime was decreased for this
42

In vivo imaging of MADS-box transcription factor interactions
specific triple combination demonstrating that FBP11 and FBP24 are still in one and
the same complex. This observation and the results of the yeast three-hybrid
experiments, suggest that higher-order complex formation plays a role. Considering
these results, some hypotheses can be drawn about complex formation that probably
occurs in vivo for the ovule specific MADS-box transcription factors (Fig.3). For
example, a ternary complex might be formed between the monomers FBP24, FBP11
and FBP2. However, both FBP24 and FBP2 are able to homodimerize and hence a
quaternary complex involving a heterodimer in combination with either a FBP2 or
FBP24 homodimer could theoretically be formed. Nevertheless, the yeast and FRET-
FLIM analyses suggest that these homodimers are less stable than the FBP2-FBP11
and FBP2-FBP24 heterodimers. Taken this into account, we hypothesize that it is
more likely that in vivo a quaternary complex is formed by the two very stable dimers
FBP24-FBP2 and FBP2-FBP11. A putative quaternary complex like this would fit
perfectly in the proposed 'quartet model' of MADS-box transcription factor functioning
(Egea-Cortines era/., 1999; Honma and Goto, 2001, TheiUen and Saedler, 2001).
BP111N
Figure 3 Putative higher-order complexes formed between the ovule specific MADS-box proteins. Schematic representation of putative complexes. On the left a ternary complex formed by the monomer FBP2, and a heterodimer between FBP24 and FBP11. In the middle, a quaternary complex formed by the homodimer FBP2- FBP2 and the heterodimer FBP24-FBP11; and on the right a quaternary complex formed by the stable dimers FBP24-FBP2 and FBP2-FBP11. The dotted lines represent the interactions at the C-termini between monomers and dimers and the continuous lines indicate dimerization. For less stable dimers double continuous lines were used, and for stable dimers three lines were drawn.
43

Chapter 2
In conclusion, this report demonstrated that the in vivo analyses provide more
detailed and reliable information about protein-protein interactions than the yeast
systems. Even though, the proteins are transiently expressed at relatively high-levels
in plant cells, the experiments performed here give a first glimpse about the native
behavior of MADS-box transcription factors in plant cells. Certainly, more analyses
are required to get a final proof for higher-order complex formation between plant
MADS-box transcription factors and to understand the exact stoichiometry of these
kind of complexes in the plant tissue where they are active. Remains the question,
what the biological function is of the complex involving FBP2, FBP11 and FBP24. As
mentioned before, FBP24 has a high sequence similarity with ABS from Arabidopsis,
which is supposed to play a role in seed coat pigmentation and probably is essential
for the formation or maintenance of the endothelial cells (Nesi era/., 2002). Probably,
the petunia homolog FBP24 is required for late ovule development as well, in
combination with FBP2 and FBP11. This suggests that FBP11 plays a dual role in
ovule development, being involved in the initiation of ovules (Colombo et a/., 1995;
1997) and in late ovule development. The higher order complex identified between
FBP11, FBP2 and FBP6 (unpublished results Immink and Angenent) and their
Arabidopsis orthologs SEEDSTICK (STK), SEPALLATA3 (SEP3) and AGAMOUS
(AG) (Favaro et a/., 2003), respectively, are supposed to be involved in the early
ovule function, while the complex between FBP11, FBP2 and FBP24 identified in this
study, might be responsible for the late ovule function.
A CKNOWLEDGEMENTS
We are very grateful to Roger Tsien who kindly provided mRFP, to Stefan de Folter
for helpful comments and suggestions on this manuscript, Ronny Joosen for help
with the statistical analyses and graphs and Mark Hink during microscopy analyses.
This work has been financially supported by CAPES-Brazil (BEX 0970/01-8), the
Netherlands Proteomics Centre (NPC) and a NWO-VENI grant to R.G.H.I.
44
REFERENCES
In vivo imaging of MADS-box transcription factor interactions
Angenent GC, Franken J, Busscher M, Van Dijken A, van Went J, Dons HJM, van Tunen AJ. (1995). A novel class of MADS-box genes is involved in ovule development in petunia. Plant Cell 7, 1569-1582.
Aronheim A, Zandi E, Hennemann H, Elledge SJ, Karin M. (1997). Isolation of an AP-1 repressor by a novel method for detecting protein-protein interactions. Molecular and Cellular Biology 17,3094-3102.
Becker A, Kaufmann K, Freialdenhoven A, Vincent C, Li M-A, Saedler H, Theiften G. (2002). A novel MADS-box gene subfamily with a sister-group relationship to class B floral homeotic genes. Molecular Genetics and Genomics 266, 942-950.
Borst JW, Hink M, Van Hoek A, Visser AJWG. (2003). Multiphoton microspectroscopy in living plant cells. In Proceedings of SPIE, Vol. 4963: Multiphoton Microscopy in the Biomedical Sciences III, A. Periasamy and P.T. So, eds (Bellingham, WA: SPIE), pp. 231-238.
Campbell RE, Tour O, Palmer AE, Steinbach PA, Baird GS, Zacharias DA, Tsien RY. (2002). A monomeric red fluorescent protein. Proceedings of the National Academy of Sciences of the United States of America 99, 7877-7882.
Chen Y, Periasamy A. (2004). Characterization of Two-photon Excitation Fluorescence Lifetime Imaging Microscopy for Protein Localization. Microscopy Research and Technique 63, 72-80.
Colombo L, Franken J, van der Krol AR, Wittich PE, Dons HJM, Angenent GC. (1997). Downregulation of ovule-specific MADS-box genes from petunia results in maternally controlled defects in seed development. Plant Cell 9, 703-715.
de Bolt S, Raes J, Florquin K, Rombauts S, Rouze P, Theiften G, van de Peer Y. (2003). Genomewide structural annotation and evolutionary analysis of the type I MADS-box genes in plants. Journal of Molecular Evolution 56, 573-586.
de Folter S, Immink RGH, Kieffer M, Pafenicova L, Henz S, R, Weigel D, Busscher M, Kooiker M, Colombo L, Kater MM, Davies B, Angenent GC. (2005). Comprehensive interaction map of the arabidopsis MADS-box transcription factors. Plant Cell 17, 1424-1433.
Egea-Cortines M, Saedler H, Sommer H. (1999). Ternary complex formation between the MADS-box proteins SQUAMOSA, DEFICIENS and GLOBOSA is involved in the control of floral architecture in Antirrhinum majus. EMBO Journal 18, 5370-5379.
Favaro R, Pinyopich A, Battaglia R, Kooiker M, Borghi L, Ditta G, Yanofsky MF, Kater MM, Colombo L. (2003). MADS-Box Protein Complexes Control Carpel and Ovule Development in Arabidopsis. Plant Cell 15, 2603-2611.
Ferrario S, Immink RGH, Shchennikova A, Busscher-Lange J, Angenent GC. (2003). The MADS-box gene FBP2 is required for SEPALLATA function in petunia. Plant Cell 15, 914-925.
Ferrario S, Immink RGH, Angenent GC. (2004a). Conservation and diversity in flower land. Current Opinion in Plant Biology 7, 84-91.
Ferrario S, Busscher J, Franken J, Gerats T, Vandenbussche M, Angenent GC, Immink RGH. (2004b). Ectopic expression of the petunia MADS-box gene UNSHAVEN accelerates flowering and confers leaf-like characteristics to floral organs in a dominant-negative manner. Plant Cell 16, 1490-1505.
45

Chapter 2
Gadella TW Jr., Jovin TM, Clegg RM. (1993). Fluorescence lifetime imaging microscopy (FLIM) - spatial resolution of microstructures on the nanosecond time-scale. Biophysical Chemistry 48, 221-239.
Gadella TW Jr., Van der Krogt GNM, Bisseling T. (1999). GFP-based FRET microscopy in living plant cells. Trends in Plant Science 4, 287-291.
Hink MA, Bisseling T, Visser AJWG. (2002). Imaging protein-protein interactions in living cells. Plant Molecular Biology 50, 871-883.
Honma T and Goto K. (2001). Complexes of MADS-box proteins are sufficient to convert leaves into floral organs. Nature 409, 525-529.
Immink RGH, Gadella TW Jr., Ferrario S, Busscher M, Angenent GC. (2002). Analysis of MADS-box protein-protein interactions in living plant cells. Proceedings of the National Academy of Sciences of the United States of America 99,2416-2421.
Immink RGH, Angenent GC. (2002). Transcription Factors do it together: how and why studying protein-protein interactions? Trends in Plant Science 7, 531-534.
Immink RGH, Ferrario S, Busscher-Lange J, Kooiker M, Busscher M, Angenent GC. (2003). Analysis of the petunia MADS-box transcription factor family. Molecular Genetics and Genomics 268, 598-606.
Kater MM, Colombo L, Franken J, Busscher M, Masiero S, Van Lookeren Campagne MM, Angenent GC. (1998). Multiple AGAMOUS homologs from cucumber and petunia differe in their ability to induce reproductive organ fate. Plant Cell 10,171-182.
Kofugi R, Sumikawa N, Yamasaki M, Kondo K, Ueda K, Ito M, Hasebe M. (2003). Evolution and divergence of the MADS-box gene family based on genome-wide expression analyses. Molecular Biology and Evolution 20, 1963-1977.
Kohalmi SE, Nowak J, Crosby WL. (1996). In a the yeast two-hybrid system, recovery of protein-protein interactions involving PISTILLATA is temperature-dependent. 7th International Conference on Arabidopsis Research, June 23-27, Norwich, UK.
Krizek BA, Meyerowitz EM. (1996). Mapping the protein regions responsible for the functional specificities of the Arabidopsis MADS domain organ-identity proteins. Proceedings of the National Academy of Sciences of the United States of America 93, 4063-4070.
Lippincott-Schwartz J, Patterson GH. (2003). Development and Use of Fluorescent Protein Markers in Living Cells. Science 300, 87-91.
Martinez-Castilla LP, Alvarez-Buylla ER. (2003). Adaptative evolution in the Arabidopsis MADS-box gene family inferred from its complete resolved phylogeny. Proceedings of the National Academy of Sciences of the United States of America 100, 13407-13412.
Nesi N, Debeaujon I, Jond C, Stewart AJ, Jenkins Gl, Caboche M, Lepiniec L. (2002). The TRANSPARENT TESTA16 locus encodes the Arabidopsis B SISTER MADS domain protein and is required for proper development and pigmentation of the seed coat. Plant Cell 14, 2463-2479.
Parenicova L, de Folter S, Kieffer M, Horner DS, Favalli C, Busscher J, Cook H. E, Ingran RM, Kater MM, Davies B, Angenent GC, Colombo L. (2003). Molecular and phylogenetic analyses of the complete MADS-box transcription factor family in Arabidopsis: New openings to the MADS world. Plant Cell 15, 1538-1551.
46
In vivo imaging of MADS-box transcription factor interactions
Pellegrini L, Tan S, Richmond TJ. (1995). Structure of serum response factor core bound to DNA. Nature 376, 490-498.
Riechmann JL, Krizek BA, Meyerowitz EM. (1996). Dimerization specificity of Arabidopsis MADS domain homeotic proteins APETALA1, APETALA3, PISTILLATA, and AGAMOUS. Proceedings of the National Academy of Sciences of the United States of America 93, 4793-4798.
Riechmann JL, Meyerowitz EM. (1997). MADS domain proteins in plant development. Journal of Biological Chemistry 378, 1079-1101.
Russinova E, Borst J-W, Kwaaitaal M, Cano-Delgado A, Yin Y, Chory J, de Vries, SC. (2004). Heterodimerization and Endocytosis of Arabidopsis Brassinosteroid Receptors BRI1 and AtSERK3 (BAK1). Plant Cell 16, 3216-329.
Schwarz-Sommer Z, Hue,I, Huijser P, Flor P, Hansen R, Tetens F, Lonnig W, Saedler H, Sommer H. (1992). Characterization of the Antirrhinum floral homeotic MADS-box gene deficiens: Evidence for DNA binding and autoregulation of its persistent expression throughout flower development. EMBO Journal 11, 251-263.
Shah K, Gadella TW Jr., Van Erp H, Hecht V, De Vries SC. (2001). Subcellular localization and dimerization of the Arabidopsis thaliana somatic embryogenesis receptor kinase 1 protein. Journal of Molecular Biology 309, 641-655.
Shchennikova AV, Shulga OA, Immink R, Skryabin KG, Angenent GC. (2004). Identification and characterization of four Chrysanthemum MADS-box genes, belonging to the APETALA1/FRUITFULL and SEPALLATA3 subfamilies. Plant Physiology 134, 1-10.
Shore P and Sharrocks AD. (1995). The MADS-box family of transcription factors. European Journal of Biochemistry 229, 1-13.
Theifien G. (2001). Development of floral organ identity: stories from the MADS house. Current Opinion in Plant Biology 4, 75-85.
Theifien G, Saedler H. (2001). Floral quartets. Nature 409, 469-471. West AG, Causier BE, Davies B, Sharocks AD. (1998). DNA binding and
dimerisation determinants of Antirrhinum majus MADS-box transcription factors. Nucleic Acids Research 26, 5277-5287.
Wu X, Dinneny JR, Crawford KM, Rhee Y, Citovsky V, Zambryski PC, Weigel D. (2003). Modes of intercellular transcription factor movement in the Arabidopsis apex. Development, 130, 3735-3745.
Yang Y, Fanning L, Jack T. (2003). The K domain mediates heterodimerization of the Arabidopsis floral organ identity proteins APETALA3 and PISTILLATA. Plant Journal 33, 47-59.
Yang Y, Jack T. (2004). Defining subdomains of the K domain important for protein-protein interactions of plant MADS proteins. Plant Molecular Biology 55, 45-59.
47
Chapter 3
Physical interactions and dimerization affinity
in vivo for MADS-box proteins
involved in petal and stamen formation
Isabella A. Nougalli Tonaco, Jan Willem Borst, Sacco C. de Vries,
Gerco C. Angenent and Richard G.H. Immink

Chapter 3
ABSTRACT
MADS-box transcription factors are required for floral organ identity specification and
based on genetic analyses the well known ABC-model for floral development has
been established. For instance, stamen formation in Arabidopsis is driven by the
MADS-box proteins PISTILLATA and APETALA3 (PI and AP3, B-function),
SEPALLATA 3 (SEP3, E-function), and AGAMOUS (AG, C-function), whereas a
similar combination is involved in petal formation, but with a role for APETALA1
(AP1, A-function) instead of AG. Yeast two-, three- and four-hybrid studies revealed
that these MADS-box proteins are able to form specific hetero- and homodimers and
furthermore, can assemble into higher-order complexes. Our goal was to
characterize the physical interactions between these proteins in living plant cells. For
this purpose, the various MADS-box proteins were labeled with the Green
Fluorescent Protein (GFP) variants Cyan Fluorescent Protein (CFP) or Yellow
Fluorescent Protein (YFP), followed by transient expression in leaf protoplasts.
Subsequently, Confocal Laser Scanning Microscopy (CLSM) was used to determine
the localization of the various proteins, while the physical interactions were studied
by Fluorescence Lifetime Imaging Microscopy (FLIM) measurements in order to
monitor Fluorescence Resonance Energy Transfer (FRET). This study revealed a
clear difference in homodimerization capacity for the MADS-box proteins involved in
stamen development. SEP3 and AG appear to homodimerize efficiently and a FRET
signal was observed in the entire nucleus, whereas PI and AP3 display
homodimerization only in specific sub-nuclear regions. Remarkably,
homodimerization can not be detected for any of these proteins by the yeast two-
hybrid system, which shows the sensitivity of the FRET technology. Furthermore,
differences in FRET signal strength were detected between the various tested
heterodimers, and this probably reflects differences in interaction affinity. As a
consequence of this, most likely only a subset of all possible dimer combinations will
be formed at a certain moment during petal and stamen development. The obtained
results give new insights in the functioning of plant MADS-box transcription factors at
the molecular level in their native environment.
50

Physical interactions and dimerization affinity in vivo for MADS-box proteins
INTRODUCTION
For flowering plants, Arabidopsis thaliana has become the model species for the
analyses of developmental processes. For instance, the extensive use of genetics
and the morphological and molecular studies on mutants have extended our
understanding about flower formation and architecture enormously. The Arabidopsis
flower consists of four concentric whorls of organs, from outside to inside: sepals,
petals, stamens and carpels, and the initiation of their identity is driven by specific
homeotic genes. More than a decade ago, genetic analyses of homeotic floral
mutants have led to the postulation of the elegant and widely accepted ABC model,
in which different classes of genes (A, B, C) determine the identity of the floral organs
(Coen and Meyerowitz, 1991). With these studies, many of the questions about the
"metamorphosis" raised by Goethe could be answered finally. He postulated that
unknown factors are required for the transformation of the vegetative leaves into
floral organs.
In Arabidopsis, the different functions of the ABC model are mainly defined by genes
belonging to the MADS-box transcription factor family. 107 members of this family
have been identified and many of them play a role as major regulators during floral
organ formation (Parenicova et al., 2003). The combination of different genes results
in specific organ formation: the A-function is defined by APETALA1 (AP1) and
APETALA2 (AP2), B-function by APETALA3 (AP3) and PISTILLATA (PI), and the C-
function by AGAMOUS (AG). Later on, the model has been expanded, when D-
function (Colombo et al., 1995) and E-function (Pelaz et al., 2000) were described,
and added to the existing model. The E-function represented by the SEPALLATA
(SEP) genes was considered as "the missing" factor for the complete homeotic
change from leaves into floral organs, and vice versa (Goto et al., 2001).
Within the ABC model, the B-type genes AP3 and PI are involved in specifying petal
and stamen identity in Arabidopsis, and their mutants cause alterations in the two
middle whorls, with sepals instead of petals in the second whorl and carpels instead
of stamens in the third whorl, respectively (Jack ef al., 1992; Goto and Meyerowitz,
1994). At the molecular level, AP3 and PI have shown to heterodimerize and auto-
regulate their own expression (Goto and Meyerowitz, 1994). Furthermore, Honma
and Goto (2001) nicely demonstrated that simultaneous ectopic expression of PI,
AP3, SEP3, and AG is sufficient to convert cauline leaves into staminoid organs. In
addition, their yeast results refined and extended the molecular model for functioning
51
Chapter 3
of these proteins, in which SEP3 interacts with the AP3-PI heterodimer and can also
act as an intermediate partner for the interaction with AG in the quaternary stamen
identity complex, AG-SEP3-AP3-PI. For the specification of the petal identity, it was
supposed that SEP3 interacts with AP1 in the petal complex: AP1-SEP3-AP3-PI.
In addition to protein-protein interactions, specific protein-DNA interactions have also
proven to be essential for the proper functioning of these homeotic transcription
factors. In the last decade several biochemical experiments contributed to the
identification of specific DNA target sequences that are bound by the MADS-box
proteins. For instance, Riechmann and colleagues (1996a,b) demonstrated in an
elegant way that various dimers can be formed in vitro and specifically bind to so
called CArG-boxes, the consensus target sequence for MADS-box transcription
factors. In these experiments it was clearly demonstrated that "partner specificity"
plays a role in selective DNA-binding, which shed light on the possible mechanisms
behind target gene selection. However, important questions remain to be answered.
How the formation of the various dynamic protein complexes occurs in vivo, and how
this facilitates specific DNA-binding and subsequent regulation of target genes
remain to be elucidated. Here we report a study, aiming the understanding of MADS-
box proteins partner selection.
Our strategy of choice to address these questions was to analyze the homo- and
heterodimerization capacity for the MADS-box proteins involved in determination of
stamen and petal identity, in living cells. Fluorescence Lifetime Imaging (FLIM) in
order to monitor FRET (Fluorescence Resonance Energy Transfer) was used in this
study. FRET is a physical phenomenon that can occur when two fluorophores come
into close proximity (less then 10A) and energy is transferred from the excited donor
fluorophore to a suitable acceptor fluorophore. When proteins of interest are fused to
these fluorophores, the physical interaction between the proteins can be detected by
FRET. The lifetime of a fluorophore is the average time it stays in the excited state
before it falls back to the ground state and is decreased when FRET occurs
(Lakowicz, 1999). For our FRET-FLIM analyses, we labeled the MADS-box proteins
AP1, AP3, PI, AG, and SEP3 with Cyan Fluorescence Protein (CFP) and Yellow
Fluorescence Protein (YFP), one of the best couples available for FRET studies.
Subsequently, the single labeled proteins and several combinations were transiently
expressed in Arabidopsis leaf protoplasts for localization and interaction analyses.
The obtained results reveal that there is a clear difference in interaction affinity for the
52
Physical interactions and dimerization affinity in vivo for MADS-box proteins
analyzed proteins and that FRET-FLIM allows the detection of these differences in
living cells. We hypothesize that these differences in interaction affinity are relevant
for the functioning of the MADS-box proteins and that the dimer combination
determines to a great extent their transcriptional activity in plants.
MATERIAL AND METHODS
Plant material
Protoplasts were obtained from Arabidopsis thaliana ColO leaves, which were grown
under normal greenhouse conditions (16/8h light /dark), 22°C, according to Aker et
ai, 2006.
Plasmid constructions
The coding region of the MADS-box genes APETALA1 (AP1), APETALAZ (AP3),
PISTILLATA (PI), AGAMOUS (AG), SEPALLATA3 (SEP3) and SEPALLATA3 lacking
the C-domain, were cloned as entry clones lacking stop codons in order to allow C-
terminal fusions. For the SEPALLATA3 lacking the C-domain, the reverse primer was
designed just after the K-box eliminating the C-terminal domain (80 aa in total),
including part of the putative last alpha helical structure. The entry clones were
recombined into the Gateway compatible vectors pARC971 and pARC428, from
which, expression is driven by the constitutive CaMV35S promoter and that contains
the coding regions of the different fluorophores, Enhanced Cyan Fluorescent Protein
(ECFP) and Enhanced Yellow Fluorescent Protein (EYFP), respectively (Nougalli-
Tonaco et al., 2006). Furthermore, N- terminal fusions were made for AP3 and PI. In
this case, the destination vector was the pK7WGY2,0 from the VIB collection,
containing the EYFP molecule. AP3 and PI entry clones including stop codons were
taken from the REGIA collection (Parenicova et al., 2003; de Folter et al., 2005). LR
reactions were done according to the protocols provided by Invitrogen. All plasmids
were controlled by sequence analyses (DETT sequence kit, from Amersham).
Fluorescence microscopy in living cells
Arabidopsis leaf protoplasts were transfected as described by Aker and colleagues
(2006). 15 -30 ug of plasmid DNA was used and the protoplasts were incubated
overnight at 25°C before imaging. Images were made using a confocal laser
53

Chapter 3
microscope 510 (Carl Zeiss, Jena, Germany). The Argon laser was used to excite at
458 and 514nm for CFP and YFP, respectively. Fluorescence was detected through
a band pass filter of 470-500nm for CFP and 535-590nm for YFP.
FRET-FLIM measurements in living cells
FRET-FLIM analyses were done in Arabidopsis protoplasts according to Nougalli-
Tonaco et al., 2006 and Russinova et al., 2004. As described previously, the donor
fluorescence lifetime was measured on the central part of the nucleus of each single
cell, pixel by pixel, and at least 10 cells were analyzed per combination. We fixed the
donor lifetime at 2, 6 ns for further analyses. Images were acquired by using the
"Becker and Hickl 1 SPC 830" module, and SPC image 2.8 software was used for the
data analyses.
RESULTS
Localization of Arabidopsis MADS-box proteins involved in stamen
development in living plant cells
To investigate the protein behavior in living cells, localization studies were performed.
For this purpose, fusions were made between the proteins of interest and Enhanced
Cyan Fluorescent Protein (ECFP) or Enhanced Yellow Fluorescent Protein (EYFP).
Initially, the fluorophores were linked to the C-terminus of the MADS-box proteins,
followed by transient expression of the fusion proteins in Arabidopsis leaf protoplasts.
First, the Arabidopsis MADS-box proteins AP3, PI, AG, and SEP3 were expressed
individually, and subsequently, double co-transfections have been analyzed. The
single MADS-box protein transfections resulted in nuclear localization of the
fluorescence in the majority of the analyzed cells (Fig 1A to D). Surprisingly, AP3 was
mostly present in the nucleus, but also observed in the nucleus and cytoplasm in
some cells, whereas PI was almost completely nuclear localized, when transfected
individually. These results are not in accordance with previously results obtained with
the same proteins in the work of MacGonigle and colleagues (1996). They observed
that nuclear localization only occurs when both proteins are simultaneously
expressed. However, in their case, the GUS reporter was used and N-terminally
fused to the MADS-box protein, which may be the reason for the observed
differences. We have shown previously that fusion of GFP-like fluorophores to the N-
54

Physical interactions and dimerization affinity in vivo for MADS-box proteins
terminus of MADS-box proteins can influence their nuclear import (Nougalli-Tonaco
et al., 2006). Therefore, we decided to analyze whether there is a difference between
N- and C-terminal labeling with respect to localization. For this, we labeled AP3 and
PI with YFP at the N-terminus and when the individual proteins YFP-AP3, or YFP-PI
were transfected, most of the signal was localized in the cytoplasm (Fig. 1E), which is
in accordance to the results of MacGonigle and colleagues (1996). Subsequently, we
performed co-transfections using an N-terminal fusion for either AP3 or PI, and a C-
terminal labeling for the other protein. Then, both proteins were mainly localized in
the cell nucleus (Fig. 1F). Similar results were obtained by MacGonigle era/., (1996)
when they co-expressed one of the two B-type proteins labeled at the N-terminus
and the other one without any fusion. Co-transfection with N-terminal fusions for both
proteins resulted in an almost exclusive nuclear localized signal (Fig. 1G). In addition,
we co-expressed various other combinations of the MADS-box proteins under study,
and observed only nuclear localized signal (data not shown).
55

Chapter 3
Figure 1. Localization of MADS-box proteins in Arabidopsis leaf protoplasts.
The figure displays the different MADS-box proteins fused to CFP or YFP and transiently expressed in protoplasts. (A) SEP3-CFP, (B) AP3-YFP, (C) AG-YFP, (D) PI-CFP, (E) YFP-AP3, (F) YFP-AP3+PI-CFP, (G)YFP-AP3+YFP-PI. Bar=10pM
Homodimerization of MADS-box proteins in living cells
Previous studies provided evidence for the hypothesis that dimerization is a
prerequisite for import of MADS-box proteins into the cell nucleus (MacGonigle et a/.,
1996; Immink et a/., 2002). In line with this paradigm, all proteins that show nuclear
localization when expressed on their own, should be able to homodimerize, or
alternatively, interact efficiently with an endogenous factor. Based solely on
localization experiments, we cannot elucidate the exact mechanism underlying the
obtained nuclear localization of the analyzed proteins. Therefore, we used FLIM to
determine FRET, to test for homodimerization of the MADS-box proteins under study.
For the estimation of donor lifetime we used single transfections of the MADS-box
proteins labeled with CFP only, like is depicted in Fig 2A. The combinations "SEP3-
CFP + SEP3-YFP", "AG-CFP + AG-YFP", "AP3-CFP + AP3-YFP" and, "PI-CFP + Pl-
YFP" were analyzed for homodimerization and interestingly, a remarkable difference
was detected among these proteins for their capacity to homodimerize. Clear
homodimerization could be detected for two out of the four analyzed proteins. Both
SEP3 and AG revealed a drop in fluorescent lifetime in the entire nucleus, suggesting
efficient homodimerization (Fig 2A and 2B). In contrast, PI homodimerizes in some
56

Physical interactions and dimerization affinity in vivo for MADS-box proteins
specific regions within the nucleus (Fig 2E), while AP3 seems to form very weak or
transient homodimers showing interactions in certain specific spots, only (Fig 2D).
S Fluorescence Lifetime (ps)
SEP3-CFP+SEP3-YFP
m Fluorescence Lifetime (ps)
AG-CFP+AG-YFP
Muorescence Lifetime (ps)
AP3-CFP+AP3-YFP
I :|AA \A AW Hill . . 1 1 1
Fluorescence Lifetime (ps)
PI-CFP+PI-YFP
^tA'K Fluorescence Lifetime (ps)
1,5ns x 2,6ns
Figure 2. Detection of Fluorescence Energy Transfer (FRET) by Fluorescence Lifetime Imaging Microscopy (FLIM) for different MADS-box protein homodimers combinations The analysis of transfected Arabidopsis leaf protoplasts, co-expressing MADS-box proteins fused to either CFP or YFP. One representative protoplast is shown for each combination. The left panels display the intensity channel, the middle panels show the fluorescence lifetime image of the same nucleus in a false color code, and the right panels depict histograms representing the distribution of fluorescence lifetime values within the nucleus. (A) FLIM analysis on a protoplast transiently expressing PI-CFP (donor only), (B) SEP3-CFP+SEP3-YFP; (C) AG-CFP+AG-YFP; (D) AP3-CFP+AP3-YFP; (E) and PI-CFP+PI-YFP. Bars=10jum.
57
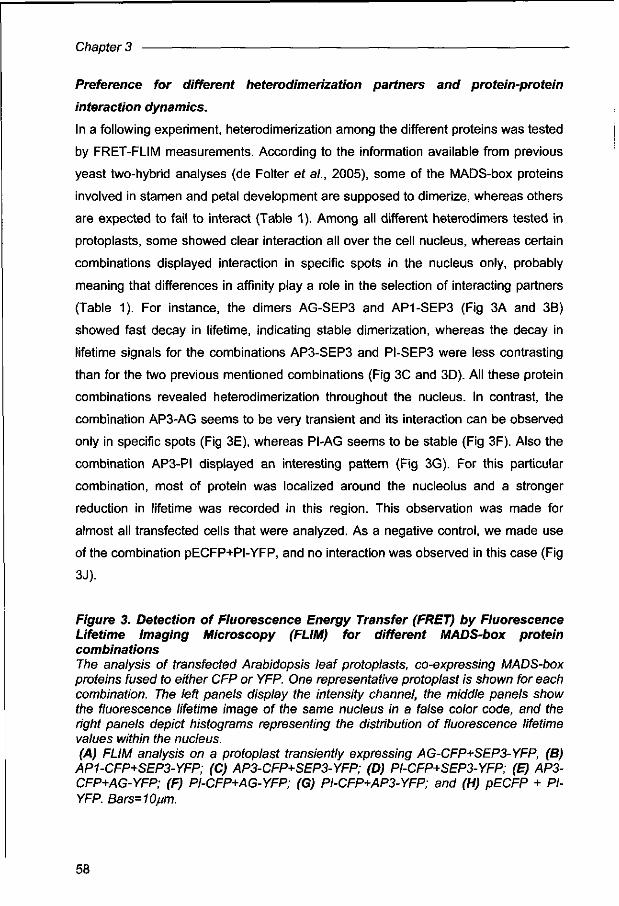
Chapter 3
Preference for different heterodimerization partners and protein-protein
interaction dynamics.
In a following experiment, heterodimerization among the different proteins was tested
by FRET-FLIM measurements. According to the information available from previous
yeast two-hybrid analyses (de Folter et al., 2005), some of the MADS-box proteins
involved in stamen and petal development are supposed to dimerize, whereas others
are expected to fail to interact (Table 1). Among all different heterodimers tested in
protoplasts, some showed clear interaction all over the cell nucleus, whereas certain
combinations displayed interaction in specific spots in the nucleus only, probably
meaning that differences in affinity play a role in the selection of interacting partners
(Table 1). For instance, the dimers AG-SEP3 and AP1-SEP3 (Fig 3A and 3B)
showed fast decay in lifetime, indicating stable dimerization, whereas the decay in
lifetime signals for the combinations AP3-SEP3 and PI-SEP3 were less contrasting
than for the two previous mentioned combinations (Fig 3C and 3D). All these protein
combinations revealed heterodimerization throughout the nucleus. In contrast, the
combination AP3-AG seems to be very transient and its interaction can be observed
only in specific spots (Fig 3E), whereas PI-AG seems to be stable (Fig 3F). Also the
combination AP3-PI displayed an interesting pattern (Fig 3G). For this particular
combination, most of protein was localized around the nucleolus and a stronger
reduction in lifetime was recorded in this region. This observation was made for
almost all transfected cells that were analyzed. As a negative control, we made use
of the combination pECFP+PI-YFP, and no interaction was observed in this case (Fig
3J).
Figure 3. Detection of Fluorescence Energy Transfer (FRET) by Fluorescence Lifetime Imaging Microscopy (FLIM) for different MADS-box protein combinations The analysis of transfected Arabidopsis leaf protoplasts, co-expressing MADS-box proteins fused to either CFP or YFP. One representative protoplast is shown for each combination. The left panels display the intensity channel, the middle panels show the fluorescence lifetime image of the same nucleus in a false color code, and the right panels depict histograms representing the distribution of fluorescence lifetime values within the nucleus. (A) FLIM analysis on a protoplast transiently expressing AG-CFP+SEP3-YFP, (B)
AP1-CFP+SEP3-YFP; (C) AP3-CFP+SEP3-YFP; (D) PI-CFP+SEP3-YFP; (E) AP3-CFP+AG-YFP; (F) PI-CFP+AG-YFP; (G) PI-CFP+AP3-YFP; and (H) pECFP + Pl-YFP. Bars=10ftm.
58
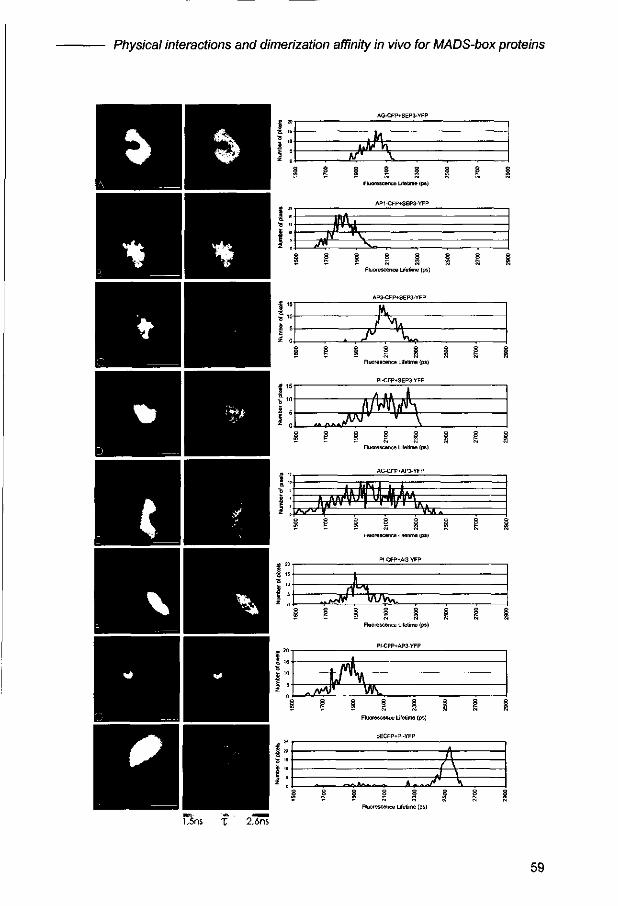
Physical interactions and dimerization affinity in vivo for MADS-box proteins
AG-CFP+SEP3-YFP
1,5ns T 2.6ns
59
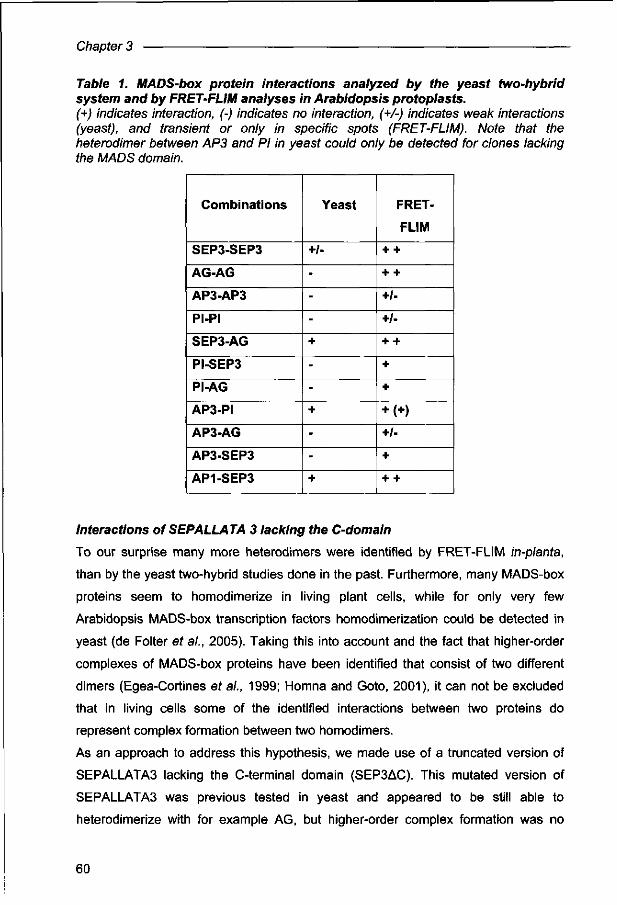
Chapter 3
Table 1. MADS-box protein interactions analyzed by the yeast two-hybrid system and by FRET-FLIM analyses in Arabidopsis protoplasts. (+) indicates interaction, (-) indicates no interaction, (+/-) indicates weak interactions (yeast), and transient or only in specific spots (FRET-FLIM). Note that the heterodimer between AP3 and PI in yeast could only be detected for clones lacking the MADS domain.
Combinations
SEP3-SEP3
AG-AG
AP3-AP3
PI-PI
SEP3-AG
PI-SEP3
PI-AG
AP3-PI
AP3-AG
AP3-SEP3
AP1-SEP3
Yeast
+/-
-
-
-
+
-
-
+
-
-
+
FRET-
FLIM
+ +
+ +
+/-
+/-
+ +
+
+
+ (+) +/-
+
+ +
Interactions of SEPALLATA 3 lacking the C-domain
To our surprise many more heterodimers were identified by FRET-FLIM in-planta,
than by the yeast two-hybrid studies done in the past. Furthermore, many MADS-box
proteins seem to homodimerize in living plant cells, while for only very few
Arabidopsis MADS-box transcription factors homodimerization could be detected in
yeast (de Folter et a/., 2005). Taking this into account and the fact that higher-order
complexes of MADS-box proteins have been identified that consist of two different
dimers (Egea-Cortines et al., 1999; Homna and Goto, 2001), it can not be excluded
that in living cells some of the identified interactions between two proteins do
represent complex formation between two homodimers.
As an approach to address this hypothesis, we made use of a truncated version of
SEPALLATA3 lacking the C-terminal domain (SEP3AC). This mutated version of
SEPALLATA3 was previous tested in yeast and appeared to be still able to
heterodimerize with for example AG, but higher-order complex formation was no
60

Physical interactions and dimerization affinity in vivo for MADS-box proteins
longer obtained, when SEEDSTICK (STK) was added to the AG-SEP3AC dimer
(Immink, R.G.H. & Angenent, G.C., unpublished results). In contrast, the dimer
between AG and the full-length SEP3 protein forms a strong higher-order complex
with the STK protein (Favaro et a/., 2003). Starting from this point, the following
combinations were tested: SEP3AC+AP1, SEP3AC+AP3, SEP3AC+PI,
SEP3AC+AG and SEP3AC+SEP3 (homodimerization). In the case of SEP3AC+AG
and SEP3AC+AP1, a strong decay of lifetime could be observed in the entire nucleus
for most of the analyzed cells (Figs. 4B and 4D), indicating heterodimerization as was
also shown with the full length SEP3 protein (Figs 4A and 4C). In contrast, when the
combinations SEP3AC+AP3 and SEP3AC+PI were tested, deletion of the C-terminal
domain of SEP3 seems to have a major effect (Fig 4F and 4H). The interaction was
almost completely abolished, except for a few specific spots. Finally, we tested
SEP3AC+SEP3, which displayed a similar result as SEP3AC+AP3 and SEP3AC+PI,
i.e. no interaction anymore (Fig 4J). This suggests that the FRET signal observed for
the combination SEP3-CFP and SEP3-YFP (Fig 41) is in fact due to the formation of
a higher order complex that is no longer formed when the C-terminus is deleted.
61
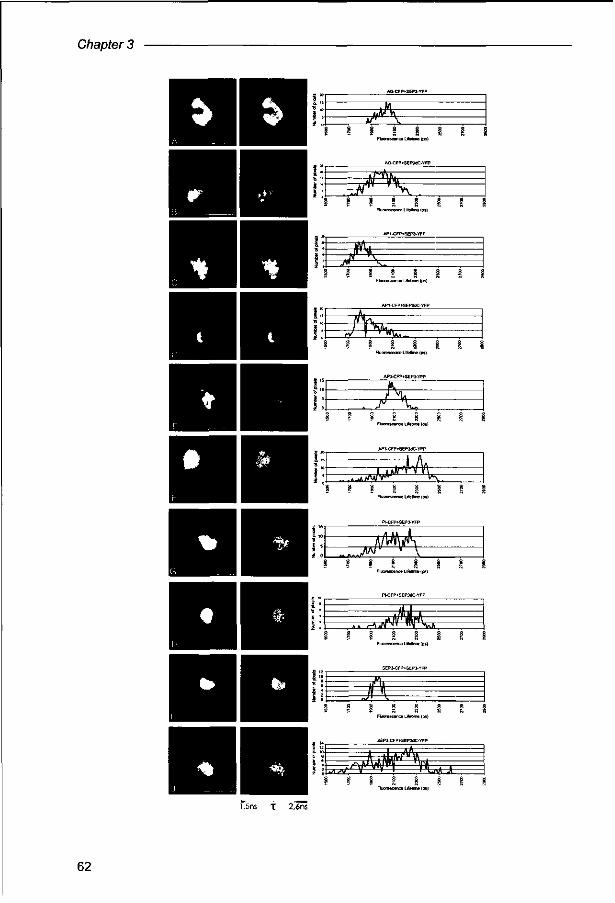
Chapter 3
AG-CFP*SEP3-YFP
^ 1 I I 1 I I 1
Fluorescence Lifetime (ps)
AG-CFP+SEP3<5C-YFP
^ ^ § § I
AP1-CFP+SEP3-YFP
M 5 s s
AP1 -CFP+SE P3dC-YFP
= ^ Fluorescence Lifetime (ps)
AP3-CFP'SEP3-YFP
^ S I
Fluorescence Lifetime (ps)
AP3-C FP*SEP3UC-Y FP
z^W^ »*fttf Fluorescence Lifetime (ps|
PI-CFP*SEP3-YI
^P^ I 1
Fluorescence Lifetime (ps)
PI-CFP+SEP3dC-YFP
E2? ̂ ^ :luore9cenca Lifetime (ps)
SEP3-CFP»SEP3-YFP
m % § § i i
Fluorescence Lifetime (ps)
S£P3-CFP*SEP3dC-YI
I I
* : ! I I I 1
Fluorescence Lifetime (ps)
1.5ns X 2,6ns
62

Physical interactions and dimerization affinity in vivo for MADS-box proteins
Figure 4. Interactions ofSEPALLATA 3 lacking the C domain The analysis of transfected Arabidopsis leaf protoplasts, co-expressing MADS-box
proteins fused to either CFP or YFP. One representative protoplast is shown for each combination. The left panels display the intensity channel, the middle panels show the fluorescence lifetime image of the same nucleus in a false color code, and the right panels depict histograms representing the distribution of fluorescence lifetime values within the nucleus.(A) FLIM analysis on a protoplast transiently expressing AG-CFP+SEP3-YFP, (B) AG-CFP+ SEP3AC-YFP; (C) AP1-CFP+SEP3-YFP; (D) AP1-CFP+SEP3AC-YFP; (E) AP3-CFP+SEP3-YFP; (F)AP3-CFP+SEP3AC-YFP; (G) PI-CFP+SEP3-YFP; (H) PI-CFP+SEP3AC -YFP; (I) SEP3-CFP+SEP3-YFP; (J) SEP3-CFP+ SEP3AC-YFP. Bars=10jum.
APETALA3-PISTILLATA and SEPALLATA3 are able to form a higher-order
complex in vivo
As described previously, the dimer between the B-type proteins AP3 and PI could not
be identified in yeast with the full length proteins, but there is a clear interaction
between the full-length proteins in living cells (Fig. 3G). In previous studies the AP3-
Pl couple showed to be interacting with SEP3 as a ternary factor (Honma and Goto,
2001), suggesting that this protein can mediate and stabilize the interaction between
the two full-length B-type proteins.
Our results (Figs. 3C and 3D) revealed that the interactions between SEP3-AP3 and
SEP3-PI are weaker when compared to SEP3-AG and SEP3-AP1 (Figs. 3A and 3B),
whereas the dimer PI-AP3 (Figs. 3G and 5A) showed a strong decay in lifetime in
some specific areas of the nucleus only. Furthermore, upon co-transfection of PI and
AP3 a reproducible localization of these proteins around the nucleolus was observed
(Figs 3G and 5A). So far, it is not clear whether this localization has any biological
relevance.
To verify if the protein complex involving AP3, PI and SEP3 can be stably formed in
living cells we performed FRET-FLIM analysis between PI -CFP and SEP3 -YFP in
the presence of a non labeled AP3 protein. As expected based on the yeast results,
the weak or transient interaction between SEP3 and PI turns into a more stable
interaction. Remarkably, also in this case a preference for localization around the
nucleolus was observed (Fig 5C).
63
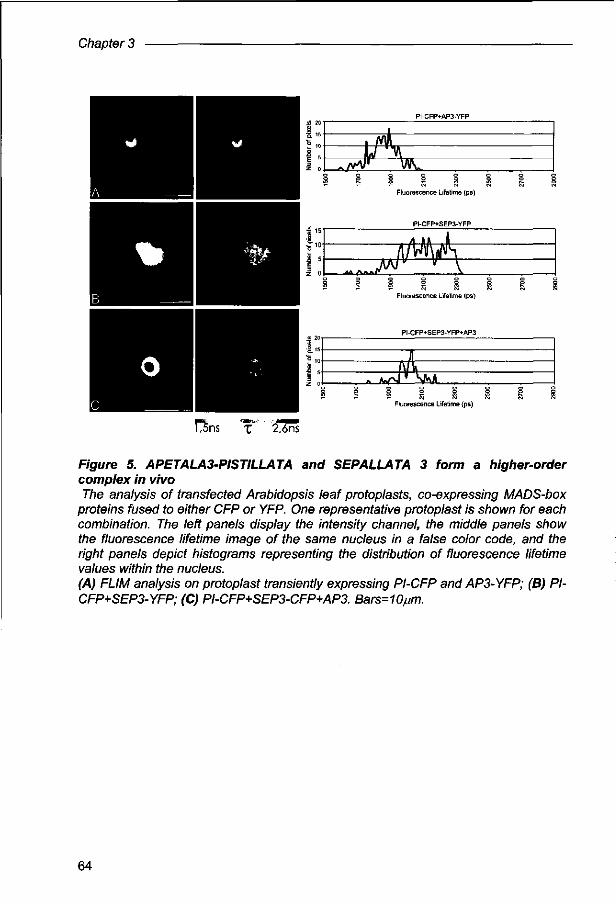
Chapter 3
Figure 5. APETALA3-PISTILLATA and SEPALLATA 3 form a higher-order complex in vivo The analysis of transfected Arabidopsis leaf protoplasts, co-expressing MADS-box
proteins fused to either CFP or YFP. One representative protoplast is shown for each combination. The left panels display the intensity channel, the middle panels show the fluorescence lifetime image of the same nucleus in a false color code, and the right panels depict histograms representing the distribution of fluorescence lifetime values within the nucleus. (A) FLIM analysis on protoplast transiently expressing PI-CFP and AP3-YFP; (B) Pl-CFP+SEP3-YFP; (C) PI-CFP+SEP3-CFP+AP3. Bars=10jum.
64

Physical interactions and dimerization affinity in vivo for MADS-box proteins
DISCUSSION
MADS-box transcription factors play essential roles during development in flowering
plants. Their functioning and specificity are mainly determined by direct physical
protein-protein and protein-DNA interactions. Although, many genetic studies have
yielded a wealth of information about how members of this family act in flower
architecture, there is a lack of knowledge concerning their molecular functioning and
mechanisms of regulation. In order to shed light on the mode of action, we have
made use of the sophisticated micro spectroscopy technique FRET-FLIM
(Fluorescence Resonance Energy Transfer-Fluorescence Lifetime Imaging
Microscopy), to analyze protein-protein interactions in living cells. This technique
enables measurements of molecular distances between two fluorophores that are in
close proximity, and in this way gives a good indication for dynamic protein complex
formation.
Initially, localization studies were done for the MADS-box proteins AP3, PI, AG and
SEP3, and for all of them nuclear localization was observed. The result for AP3 and
PI was in disagreement with the results previously obtained by MacGonigle et al.,
1996, but we showed that the reason for the obtained differences is in the labeling of
the proteins at either the C- or N-terminus. Our results indicate that N-terminal
labeling of the B-type MADS-box proteins can indeed affect their localization. The
same was observed for the MADS-box protein AP1 upon N-terminal labeling with
GFP, and additional functional analysis revealed that the N-terminal fusion was
unable to rescue the ap1-15 mutant (Wu ef al., 2003). When C-terminal fusions were
used, all proteins were localized in the nucleus and homodimerization was detected
for all tested proteins, which is in line with the hypothesis that dimerization is needed
for nuclear localization (MacGonigle ef al., 1996; Immink ef al., 2002. Nevertheless,
AP3 and PI showed homodimerization only in specific spots, suggesting that the
interactions are very weak or very transient. This may also explain why we failed to
detect many homodimers of MADS-box proteins in yeast 2-hybrid screenings (de
Folter ef al., 2005), where probably some other important cellular components, for
instance protein modifiers, that might contribute to the direct interactions are not
present when compared to experiments done in living cells, for example. Currently, it
is still unclear whether these very transient interactions are biologically relevant.
However, the ability of B-type proteins to homodimerize is supposed to be the
ancestral status, which afterwards evolved in obligatory heterodimerization in the
65
Chapter 3
core eudicots (Winter et al., 2002). In line with this, it could well be that these very
transient interactions identified for the individual Arabidopsis B-type proteins are
remnants of their former ability to homodimerize that has been partly lost during
evolution. Apparently, this remnant potential to homodimerize can only be detected
by a very sensitive method like FRET-FLIM.
Besides homodimers, various heterodimers were identified. As expected, the
combinations that were positive in yeast two-hybrid screens and by co-
immunoprecipitations (de Folter ef al., 2005; Honma and Goto, 2001), such as for
example SEP3-AG and SEP3-AP1, showed a strong decay in lifetime, indicating an
interaction between the MADS-box proteins. Furthermore, the well-studied
heterodimer AP3-PI (Honma and Goto, 2001) was clearly detected by FRET-FLIM.
Remarkably, this heterodimerization could not be detected in yeast when the full
length proteins were used (Yang et al., 2003; de Folter et al., 2005). In the FRET-
FLIM experiments, the AP3-PI heterodimer was specifically observed around the
nucleolus. Although we have observed this reproducible localization in all transfected
cells, it is not clear whether this interaction pattern has any biological relevance; even
though the protein localization is clear it might be possible that the observed
interactions could be stabilized by co-factors that are present around the nucleolus
only. Furthermore, we observed that when both AP3 and PI were present in the
same cell, the fluorescent signals increased enormously in comparison with single
transfections of the same proteins. This strongly suggests that heterodimerization
stabilizes the B-type proteins. Besides the expected dimers discussed above, several
combinations that were not interacting in yeast, were tested for heterodimerization in
plant cells, like: SEP3-AP3, SEP3-PI, AG-AP3, and AG-PI. To our surprise, SEP3
and AG interacted with all tested floral organ identity proteins in vivo, but
interestingly, there was a clear preference for some specific partners. SEP3 seems to
interact weakly with both AP3 and PI for example, while AG prefers PI to AP3. This
preference has also been demonstrated by co-immunoprecipitations in earlier
experiments by Riechmann et al., (1996). Besides that, AG could partially substitute
for AP3 in the nuclear localization of PI-GUS, suggesting that AG is able to interact
with PI (MacGonigle et al., 1996). Strikingly, PI is expressed at very early
developmental stages in the centre of the floral meristem during carpel development,
where also AG is present (Goto and Meyerowitz, 1994). Taking this all into account,
66
Physical interactions and dimerization affinity in vivo for MADS-box proteins
PI may have a function together with AG in the fourth floral whorl and hence, the
detected interaction could be of biological relevance.
For some combinations, e.g. AG-AP3, the FRET analysis revealed a spotty pattern in
the nucleus, probably representing a weak and/or dynamic interaction. One could
speculate that these spots mark areas in the nucleus where these interactions are
stabilized, e.g. by DNA binding. Alternatively, these sub-nuclear spots are so called
'hot-spots', where transcription factors and co-factors are stored while still associated
to the DNA (Moorman and colleagues, 2006). At this point, it is essential to perform
experiments that would shed light on the specific interaction between MADS-box
proteins and genomic DNA in vivo. An approach would be to perform in-situ FLIM
measurements according to Cremazy et al., 2005; however in this case, the cells
need to be fixed, which will exclude the detection of dynamic, or more transient
interactions.
Another aspect of the MADS-box protein interactions concerns the exact composition
of the complexes for the various identified positive combinations. Could some of the
unexpected interactions be explained by higher-order complex formation between
two homodimers for example? To test this possibility, a mutated version of SEP3
lacking the C-domain (SEP3AC) was generated. It is known that the C-region of the
MADS-box proteins is the domain which presents a large degree of variation and this
variation may drive the specificity for partner affinity in higher-order complex
formation (Vandebussche etal., 2003; Lamb and Irish, 2003). Therefore, the use of a
mutated version of the SEP3 protein that lacks ternary interaction capacity in yeast
would provide us with evidence for this hypothesis. When using SEP3AC, we
expected that only real heterodimers would give a clear FRET signal. In line with our
expectations, deletion of the SEP3 C-terminus had hardly any effect on the
interactions with AG and AP1. These results give strong evidence for
heterodimerization between SEP3 and AG, and SEP3 and AP1, without the
interference of a third factor. The SEP3-AG interaction is supposed to be involved in
determination of carpel and stamen identity and according to the "quaternary model"
(Theilien & Saedler, 2001) two of these dimers form a higher-order complex for
carpel development. Based on our results we can not rule out that AG and SEP3
associate into higher-order complexes, but our results suggest that at least stable
heterodimers can be formed in planta. The same holds for SEP3 and A P I In
contrast, and very interestingly, were the results obtained for the combinations
67
Chapter 3
SEP3AC-AP3 and SEP3AC-PI. These interactions were strongly affected when
compared to the combinations with the full length SEP3 protein. Based on these
observations, we hypothesize that in the case of SEP3-AP3 and SEP3-PI, a FRET
signal is obtained because of higher-order complex formation between two
homodimers. Whether these kinds of complexes between two homodimers are
functional in plants is not known at the moment. However, in eudicots, only
homodimerization of the B-type proteins seems not to be sufficient for their homeotic
functions in petal and stamen development (Winter et al., 2002). Although they are
not sufficient for complete homeotic changes (Jack et al., 1994; Goto and
Meyerowitz, 1994) it can not rule out that the complexes between homodimers fulfill
some more subtle functions in floral organ development.
In conclusion, our results revealed that the physical interactions between MADS-box
proteins show partner selectivity and affinity. It is likely that only very stable dimers
will be assembled into multimeric complexes in an in vivo environment; however,
some of the transient and very dynamic interactions might be biologically relevant,
but on the other hand difficult to be detected by conventional techniques. Thus, the
next challenging step to broaden our understanding on the molecular mechanisms of
transcription activity will be to unravel the interaction affinities and competition effects
that play a role during transcription in plant cells.
ACKNOWLEDGEMENTS
We are very thankful to Jose Aker for the help with transient expression in
Arabidopsis protoplasts and fruitful discussions. This work has been financially
supported by CAPES-Brazil (BEX 0970/01-8), the Netherlands Proteomics Centre
(NPC) and a NWO-VENI grant to R.G.H.I.
68
Physical interactions and dimerization affinity in vivo for MADS-box proteins
REFERENCES
Aker J, Borst J-W, Karlova R,de Vries SC. (2006). The Arabidopsis thaliana AAA protein CDC48A interacts in vivo with the somatic embryogenesis receptor-like kinase 1 receptor at the plasma membrane. Journal of Structural Biology 156(1): 62-71.
de Folter S, Immink RGH, Kieffer M, Paienicova L, Henz S, R, Weigel D, Busscher M, Kooiker M, Colombo L, Kater MM, Davies B, Angenent GC. (2005). Comprehensive interaction map of the arabidopsis MADS-box transcription factors. Plant Cell 17: 1424-1433.
Egea-Cortines M, Saedler H, Sommer H. (1999). Ternary complex formation between the MADS-box proteins SQUAMOSA, DEFICIENS and GLOBOSA is involved in the control of floral architecture in Antirrhinum majus. EMBO Journal 18: 5370-5379.
Favaro R, Pinyopich A, Battaglia R, Kooiker M, Borghi L, Ditta G, Yanofsky MF, Kater MM, Colombo L. (2003). MADS-box protein complexes control carpel and ovule development in Arabidopsis. Plant Cell 15: 2603-2611.
Gadella TW Jr., Jovin TM, Clegg RM. (1993). Fluorescence lifetime imaging microscopy (FLIM) - spatial resolution of microstructures on the nanosecond time-scale. Biophysical Chemistry 48: 221-239.
Goto K and Meyerowitz E.M. (1994). Function and regulation of the Arabidopsis floral homeotic gene PISTILLATA. Genes & Developments: 1548-1560.
Honma T and Goto K. (2001). Complexes of MADS-box proteins are sufficient to convert leaves into floral organs. Nature 409: 525-529.
Immink RGH, Gadella TW Jr., Ferrario S, Busscher M, Angenent GC. (2002). Analysis of MADS-box protein-protein interactions in living plant cells. Proceedings of the National Academy of Sciences of the United States of America 99:2416-2421.
Immink RGH, Ferrario S, Busscher-Lange J, Kooiker M, Busscher M, Angenent GC. (2003). Analysis of the petunia MADS-box transcription factor family. Molecular Genetics and Genomics 268: 598-606.
Jack T, Fox GL, Meyerowitz EM. (1994). Arabidopsis homeotic gene APETALA3 ectopic expression: Transcriptional and posttranscriptional regulation determines floral organ identity. Cell 76: 703-716.
Krizek BA and Meyerowitz EM. (1996). Mapping the protein regions responsible for the functional specificities of the Arabidopsis MADS domain organ-identity proteins. Proceedings of the National Academy of Sciences of the United States of America 93: 4063-4070.
Lakowicz, JR. (1999). Principles of fluorescence spectroscopy. 2nd ed. Plenum Press, New York.
McGonigle B, Bouhidel K, Irish VF. (1996) Nuclear localization of the Arabidopsis floral homeotic APETALA3 and PISTILLATA gene products depends on their simultaneous expression.Genes & Development 10: 1812-1821.
Martinez-Castilla LP, Alvarez-Buylla ER. (2003). Adaptative evolution in the Arabidopsis MADS-box gene family inferred from its complete resolved phylogeny. Proceedings of the National Academy of Sciences of the United States of America 100, 13407-13412.
Nougalli-Tonaco IA, Borst JW, de Vries SC; Angenent GC, Immink RGH. (2006). In vivo imaging of MADS-box transcription factors interactions. Journal of Experimental Botany 57: 33-42.
69

Chapter 3
Pafenicova L, de Folter S, Kieffer M, Horner DS, Favalli C, Busscher J, Cook H. E, Ingran RM, Kater MM, Davies B, Angenent GC, Colombo L. (2003). Molecular and phylogenetic analyses of the complete MADS-box transcription factor family in Arabidopsis: New openings to the MADS world. Plant Cell 15: 1538-1551.
Riechmann JL, Krizek BA, Meyerowitz EM. (1996a). Dimerization specificity of Arabidopsis MADS domain homeotic proteins APETALA1, APETALA3, PISTILLATA, and AGAMOUS. Proceedings of the National Academy of Sciences of the United States of America 93: 4793-4798.
Riechmann JL, Wang M, Meyerowitz EM. (1996b). DNA-binding properties of Arabidopsis MADS domain homeotic proteins APETALA1, APETALA3, PISTILLATA and AGAMOUS. Nucleic Acids Research 24: 3134-3141.
Russinova E, Borst J-W, Kwaaitaal M, Cano-Delgado A, Yin Y, Chory J, de Vries, SC. (2004). Heterodimerization and Endocytosis of Arabidopsis Brassinosteroid Receptors BRI1 and AtSERK3 (BAK1). Plant Cell 16: 3216-3229.
Theilien G. (2001). Development of floral organ identity: stories from the MADS house. Current Opinion in Plant Biology 4: 75-85.
Theilien G and Saedler H. (2001). Floral quartets. Nature 409: 469-471. Wu X, Dinneny JR, Crawford KM, Rhee Y, Citovsky V, Zambryski PC, Weigel D.
(2003). Modes of intercellular transcription factor movement in the Arabidopsis apex. Development 130: 3735-3745.
Yang Y, Fanning L, Jack T. (2003). The K domain mediates heterodimerization of the Arabidopsis floral organ identity proteins APETALA3 and PISTILLATA. Plant Journal 33: 47-59.
70
Chapter 4
Competition-FRET: a new method to unravel
protein dynamics in living cells
Isabella A. Nougalli Tonaco, Richard G.H. Immink, Gerco C. Angenent and
Theodorus W. Gadella Jr.

Chapter 4
ABSTRACT
In the cell, various dynamic processes are determined by physical interactions
among proteins, interactions between proteins and other molecules and post-
translational modifications of proteins, like glycosylation and phosphorylation.
Together, these interactions and modifications are key components of the regulatory
mechanisms that allow a rapid response to adjacent cells or environmental signals.
Currently, our knowledge about various cellular paradigms increases substantially
due to the use of sophisticated microscopic techniques and the great choice of
different fluorophores to label and follow molecules in space and time. FRET
(Fluorescence Resonance Energy Transfer) based methods, for example, allow the
visualization of temporal and spatial cellular processes on a nanometer and
nanosecond scale. Nevertheless, the use of FRET based techniques has been
restricted for monitoring direct protein-protein interactions and was never applied to
analyze competition for interaction or protein dynamics in an intact cellular
environment. In this study, we developed a new method based on the FRET
principle, "Competition - FRET", which can be used to monitor competition and/or
higher-order complex formation in living cells. To allow unidirectional FRET
measurements, we monitored FLIM (Fluorescence Lifetime Imaging) between EYFP
and mRFP (donor-acceptor pair) in the presence of a third molecule labeled with
ECFP (competitor or ternary factor). We applied the novel method to detect
competition for the formation of homo-, heterodimers or higher-order complexes for
the MADS-box transcription factor proteins SEPALLATA3 and AGAMOUS; which are
key players during floral organ development in the model plant species Arabidopsis
thaliana.
74
Competition-FRET
INTRODUCTION
Physical interactions between proteins play a key regulatory role in the coordination
of cellular processes. Fluorescent tagging in combination with a number of
sophisticated micro spectroscopic techniques allows the non-invasive visualization
and monitoring of cellular processes at spatial and temporal scales (Lippincott-
Schwartz and Patterson, 2003). Among several techniques, FRET-FLIM
(Fluorescence Resonance Energy Transfer) - (Fluorescence Lifetime Imaging) has
proven to be a very robust method to detect direct physical interaction between
molecules of interest (Gadella et al 1995; Gadella et al. 1999; Wallbarbe and
Periasamy, 2005).
FRET is based on the physical phenomenon that energy can be transferred from a
fluorescent molecule to another chromophore that is in close proximity through a
dipole-dipole coupling (Stryer, 1978). In such case, upon excitation of the donor,
energy will be transferred to the acceptor in the nanometer range. Prerequisites for
the occurrence of FRET are an overlap between the emission spectrum of the donor
and the absorbance spectrum of the acceptor, satisfactory quantum yield for the
donor, and the right spatial orientation and proximity of the two fluorescence
molecules (Gadella et al., 1999). FRET has become a general tool to identify protein
interactions in mammalian cells, but this technique is still not commonly used in plant
studies (Immink et al., 2002; Shah ef al., 2000; Russinova et al., 2004, Nougalli-
Tonaco ef al., 2006). Possibly high implementation costs and high level of expertise
to operate such a sophisticated micro spectroscopic set-up hampered general
introduction into the plant sciences. The usage of FRET has been restricted to
analyze the interaction between two labeled proteins only, whereas it would be
extremely interesting to study the interaction and competition among more molecules
at a time. The possibility of using a 3-chromophore FRET has been demonstrated by
Galperin and colleagues (2004). In their case, FRET was monitored by the donor-
acceptor couples ECFP-EYFP and EYFP-mRFP. However, when all three molecules
are present, FRET efficiency between ECFP-EYFP increases (From £=0.42 to
£=0.46). This increase in FRET efficiency is due to the fact that also direct FRET
occurs between ECFP and mRFP, although at lower efficiency. This interferes with
the measurement of the interaction between the ECFP and EYFP tagged proteins
and hence the analysis of competition with a third protein. Only a few studies are
known, where they have used FRET as a method to detect possible higher order
75

Chapter 4
protein complexes. One example of its use for this purpose has been described
recently by our group (Nougalli-Tonaco ef a/., 2006). However, in this case a third
non-labeled protein has been used for the detection of possible ternary or quaternary
complex formation between plant MADS-box proteins. Hence it is not possible to
study the expression level of this third protein, preceding quantitative analyses. As an
attempt to address these kinds of questions, we developed a new method based on
FRET, "Competition-FRET"; in which dynamics of partner's selection, competition
among protein partners, and eventually the formation of higher-order complexes can
be monitored in living cells. In our concept competition will cause a reduction in
FRET signal, i.e. an increase in donor fluorescence lifetime upon the presence of the
donor-acceptor pair and a competing molecule.
In the plant model species Arabidopsis thaliana, the MADS-box transcription factor
family consists of 107 members and functional analyses revealed important roles for
these proteins in the regulation of flower development and plant architecture
(Parenicova ef al., 2003). Their functioning is dependent on direct physical protein-
protein and protein-DNA interactions, to tightly regulate target gene expression in a
temporal and spatial manner. Recently, a network of protein interactions has been
established for this family of transcription factors by a matrix-based yeast two-hybrid
approach and surprisingly, out of the 274 dimers obtained, only 5 are homodimers
(de Folter et al., 2005). Recent in vivo analyses demonstrated that in a plant cell
environment homodimerization occurs much more frequently than could be
monitored by the yeast two-hybrid system (Nougalli-Tonaco et al., 2006). Out of the
107 members of the MADS-box family, two transcription factors, AGAMOUS (AG)
and SEPALLATA3 (SEP3) were selected, which are important players involved in the
development of reproductive floral organs, and the genes encoding these two
proteins have been studied extensively (Yanofsky ef al., 1990; Pelaz ef al., 2000).
Furthermore, these two proteins have been proposed to act in a higher-order
complex for the determination of carpel identity (Theifien and Saedler, 2001). In
yeast, these proteins heterodimerize, but no homodimerization could be detected for
either of them (de Folter et al., 2005). Interestingly, in vivo studies have shown that
these proteins are able to form homodimers besides heterodimers, but most likely
with different interaction affinities (Chapter 3; Nougalli-Tonaco I .A. and Immink
R.G.H. unpublished results). Based on this, we hypothesized that partner selection
and specificity plays an important role in defining which complexes will be formed
76

Competition-FRET
and hence, what the final developmental outcome will be. Nevertheless, virtually
nothing is known about the mechanism for the selection of different homo- or
heterodimerization partners in vivo. In line with all these findings we selected these
two proteins as a model for the development of the "Competition-FRET method".
To set-up the system and verify the broad usefulness of this technique, we made
fusion proteins consisting of the two MADS-box proteins of interest (AGAMOUS and
SEPALLATA3) and fluorescent molecules (ECFP, EYFP and mRFP). Subsequently,
we transiently expressed the generated fusion constructs in Arabidopsis leaf
protoplasts and analysed for competition between homo- and heterodimerization, or
alternatively higher-order complex formation, in-vivo. Based on the experiments we
concluded that there is a strong preference for homodimerization of AG, whereas
SEPALLATA3 seems to prefer to heterodimerize with AGAMOUS. Furthermore, the
results obtained, suggest differences in specific homo- and heterodimerization
protein-protein interaction domains for AGAMOUS and SEPALLATA3.
MATERIAL AND METHODS
Plant material
Leaf protoplasts were obtained from Arabidopsis thaliana ColO leaves, which were
grown under normal greenhouse conditions (16/8h light /dark), 22°C, according to
Aker et at., 2006.
Plasmid constructions
The coding regions of the MADS-box genes AGAMOUS (AG) and SEPALLATAZ
(SEP3) were cloned as Gateway entry clones lacking stop codons in order to allow
C-terminal fusions. The entry clones have been recombined into Gateway compatible
pGD120 vectors, from which expression is driven by the constitutive CaMV35S
promoter, and that contain either the coding region of Enhanced Cyan Fluorescent
Protein (ECFP), Enhanced Yellow Fluorescent Protein (EYFP), or Monomeric RFP
(mRFP), respectively (Nougalli-Tonaco ef a/., 2006). All plasmids were controlled by
sequencing analyses (DETT sequence kit, from Amersham).
77

Chapter 4
Fluorescence microscopy in living cells
Protoplasts obtained from Arabidopsis thaliana leaves were transfected with the
plasmids (38|jg final concentration) and incubated overnight at 25°C in light before
imaging as described by Aker and colleagues (2006).
FLIM acquisition
Fluorescence lifetime imaging was performed using the wide-field frequency domain
approach on a home-build instrument (Van Munster and Gadella, 2004a) using a RF-
modulated image intensifier (Lambert Instruments II18MD) coupled to a CCD camera
(Photometries HQ) as detector. A 40x objective (Plan Apochromat NA 1.3 oil) was
used for all measurements. The modulation frequency was set to 75.1 MHz. Twelve
phase images with an exposure time of 50-100 ms seconds were acquired in a
random recording order to minimize artifacts due to photo bleaching (van Munster
and Gadella, 2004b). An argon-ion laser was used for excitation at 514 nm, passed
onto the sample by a 525DCXR dichroic (Chroma Inc., Rockingham, VT, USA) and
emission light was filtered by a Chroma HQ545/30 nm emission filter. All components
are controlled by self written macros and c-code in the Matlab (the Mathworks,
Natick, MA, USA), running on a PC under Windows 98 (Microsoft, Redmond, WA,
USA). Each FLIM measurement is calibrated by a reference measurement of the
reflected laser light using a modified filter cube (Van Munster and Gadella, 2004a) for
correcting the phase and modulation drift of the excitation light. The reference is
calibrated by averaging three to five FLIM measurements of a freshly prepared 1
mg/ml solution of erythrosine B (cat # 198269, Sigma-Aldrich, Zwijndrecht, The
Netherlands) in H20, which has a known short fluorescence lifetime of 0.086 ns
(Bastiaens ef a/., 1992; van Munster and Gadella, 2004b). This extra calibration
corrects for path-length differences and possible optics-related reflections that are
different between the FLIM and reference measurements.
From the phase sequence an intensity (DC) image and phase and modulation
lifetime image are calculated using Matlab macros. For the latter two images a 3x3
pixel averaging operation was performed on the original phase sequence images.
The three resulting images were processed for display using the Image J macro
'Iifetimes6'. This macro generates false color lifetime maps, 1 and 2 D histograms
and intensity-weighted lifetime maps.
78

Competition-FRET
Next to taking lifetime images, 3 additional wide-field images were taken of the same
specimen. Here, the mercury lamp was used as excitation source and the same
modulated detector was used. The following filter settings (excitation, dichroic,
emission) were used for the 3 images: 'CFP'-image (D436/20 nm, 455DCLP,
D480/40), 'YFP'-image (HQ500/20, 525 DCXR, HQ545/30) and RFP (D546/10 nm,
600DCXR, 600FS20-25). All filters were from Chroma Inc. (Rockingham, VT, USA)
except for the last filter, which was from Andover corp. (Salem, NH, USA). The 3
images were collected automatically (with equal exposure times (approx. 20-100 ms
duration each)) and background fluorescence (excitation off) was subtracted, all
controlled by a Matlab macro 'take_CYR'.
Image processing
For quantitative analysis, the 3 lifetime images (DC, Tau(phi) and Tau(mod)) and the
3 'CFP', 'YFP', and 'RFP' images were concatenated into a single image stack of 6
images and were further processed in Image J. The background fluorescence was
subtracted from the DC image and from the CFP, YFP, RFP images using a rolling
ball algorithm (15 pixels diameter). Then a threshold was applied to the DC image,
and this image was subsequently thresholded to 15% of the maximum intensity of the
image. Then a mask was created for all pixels with higher intensities for identifying
objects in the image (labeled nuclei). This mask was applied to all 6 images in the
stack. Typically 5-20 nuclei could be identified for each image stack. For each object
with a size larger than (50 pixels), the average intensity in the DC image, the average
phase lifetime, modulation lifetime and the average 'CFP', 'YFP' and 'RFP' intensity
were determined. These average values were exported to Microsoft Excel for further
calculation. In Excel the 'CFP', 'YFP' and 'RFP' intensities were corrected for relative
brightness of the fluorophores and differences in detection efficiencies based on a
calibration experiment with purified proteins. In the calibration experiment, the three
fluorescent proteins (ECFP, EYFP, and mRFP1) were loaded at identical
concentrations in 3 microcuvettes. They were subsequently imaged with the three
filter settings and their relative intensities were quantified. At identical concentration
the detected brightness was 11.76 for ECFP, 4.05 for EYFP and 0.553 for mRFPL
The differences in the values are most determined by the microscope optics and
presence/absence of mercury lamp emission lines. The corrected 'CFP', 'YFP' and
'RFP' intensity values (using division by the above mentioned numbers) were used
79

Chapter 4
for calculating the fraction of acceptor to donor (RFP/(YFP+RFP)) and the fraction of
competitor to acceptor (CFP/(CFP+RFP)). These fractions were plotted against the
average lifetime being the square root of the phase lifetime times the modulation
lifetime.
ECFP and EYFP were purified as described (Kremers et a/., 2006). Recombinant
mRFP1 (cDNA kindly provided by dr. R.Y. Tsien) was isolated and purified from E
coli transformed cultures essentially using the same protocol and kindly provided by
dr. Ir. J. Goedhart (UvA, Amsterdam).
RESULTS
The principle of Competition-FRET
Like other FRET (Fluorescence Resonance Energy Transfer) based methods,
Competition-FRET is based on the energy transfer principle of Forster. Our strategy
for monitoring FRET was to make use of FLIM (Fluorescence Lifetime Imaging). In
this case, the decay of the donor fluorescence lifetime is monitored in the presence
of the acceptor molecule with or without competitor molecules. In our set-up we
made use of EYFP (Enhanced Yellow Fluorescent Protein) as donor and mRFP
(monomeric Red Fluorescent Protein) (Campbell et al., 2002) as acceptor, and the
competitor molecule was labeled with ECFP (Enhanced Cyan Fluorescent Protein)
(Figure 1). The basic difference between FRET and Competition-FRET is that a third
molecule, which is also labeled with a fluorophore, cannot function as an acceptor
molecule for the donor; however it is either able to compete out one of the protein
partners of the dimer, or alternatively, it is able to assemble into a higher-order
complex together with the donor and acceptor molecules. Normally, in case of
dimerization between donor and acceptor molecules, a reduction in fluorescence
lifetime of the donor molecule can be detected. Once a third molecule is added that
can compete out one of the protein partners, the reduction of the fluorescence
lifetime will diminish (less FRET) or completely disappear. In contrast, upon higher-
order complex formation, a dimer is probably stabilized and hence, a stronger
reduction in fluorescence lifetime will be detected instead (increased FRET). Figure 1
shows a schematical representation of the Competition-FRET principle.
80
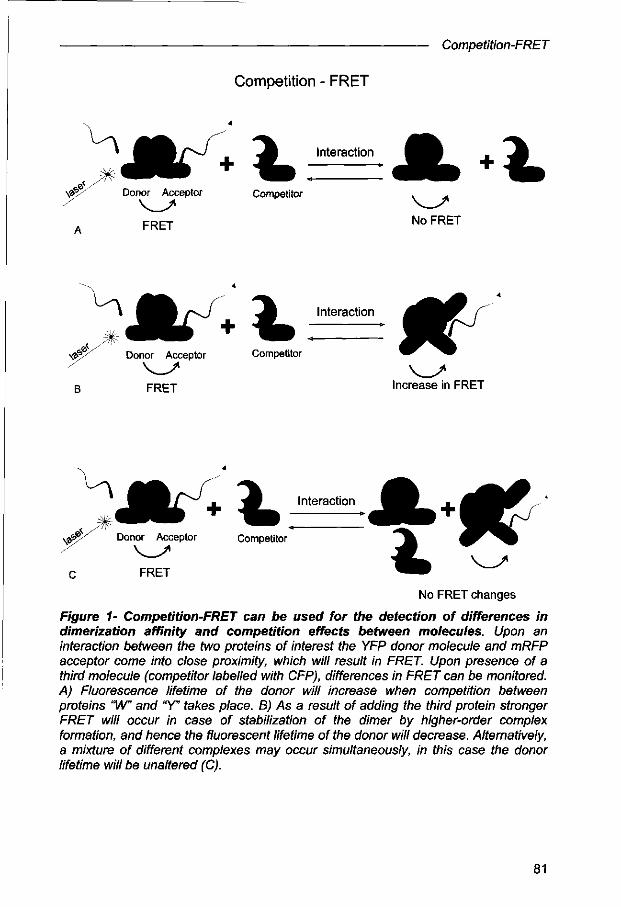
Competition-FRET
Competition - FRET
4
\ j £ / Donor Acceptor Competitor . ..
FRET N o F R E T
^
• f r + ^ 1 ^ Donor Acceptor Competitor ^ ^ ^ ^
FRET Increase in FRET
Donor Acceptor Competitor
Interaction
c FRET
No FRET changes
Figure 1- Competition-FRET can be used for the detection of differences in dimerization affinity and competition effects between molecules. Upon an interaction between the two proteins of interest the YFP donor molecule and mRFP acceptor come into close proximity, which will result in FRET. Upon presence of a third molecule (competitor labelled with CFP), differences in FRET can be monitored. A) Fluorescence lifetime of the donor will increase when competition between proteins "W" and "Y" takes place. B) As a result of adding the third protein stronger FRET will occur in case of stabilization of the dimer by higher-order complex formation, and hence the fluorescent lifetime of the donor will decrease. Alternatively, a mixture of different complexes may occur simultaneously, in this case the donor lifetime will be unaltered (C).
81

Chapter 4
FRET does not occur in the EYFP- ECFP direction
The novel technique explained above can work only, when no energy can be
transferred between the donor (EYFP) and the competitor (ECFP); this can be easily
achieved and verified by a lack of overlap between the donor emission spectrum and
the competitor absorbance spectrum. For EYFP and ECFP, respectively, this is the
case. To further demonstrate the lack of FRET for EYFP to ECFP in our system, we
started our analysis by testing the possibility of energy transfer from EYFP to ECFP,
when EYFP is excited as donor molecule. For that, we analysed a few combinations
of labelled MADS-box proteins, for which previously interaction has been detected in
living plant cells by FRET-FLIM measurements (Chapter 3). The combinations
AGAMOUS-EYFP + AGAMOUS-ECFP and AGAMOUS-EYFP + SEPALLATA3-
ECFP were analysed and in both cases, the fluorescence lifetime (Tau) of the donor,
in this case AGAMOUS-EYFP, was not reduced in the presence of the proteins fused
to ECFP. Average values of 2.5ns for Tau phi (phase) and 2.7ns for Tau mod
(modulation) were found for the pool of cells that co-expressed the EYFP and ECFP
fusion proteins. These values are identical to the values found when the single EYFP
labelled proteins were expressed and subsequently, analysed (Fig 2).
82
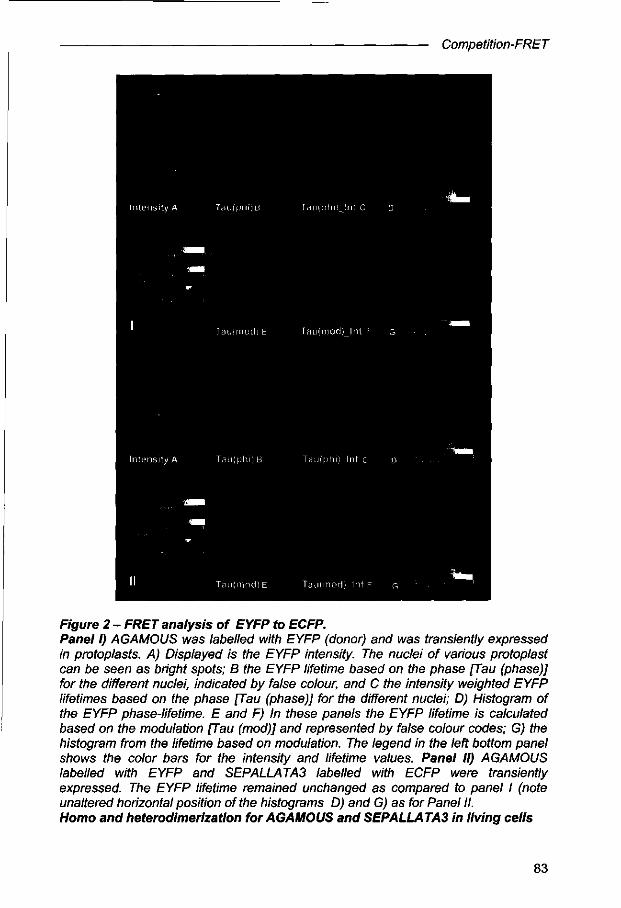
Competition-FRET
Figure 2 - FRET analysis of EYFP to ECFP. Panel I) AGAMOUS was labelled with EYFP (donor) and was transiently expressed in protoplasts. A) Displayed is the EYFP intensity. The nuclei of various protoplast can be seen as bright spots; B the EYFP lifetime based on the phase [Tau (phase)] for the different nuclei, indicated by false colour, and C the intensity weighted EYFP lifetimes based on the phase [Tau (phase)] for the different nuclei; D) Histogram of the EYFP phase-lifetime. E and F) In these panels the EYFP lifetime is calculated based on the modulation [Tau (mod)] and represented by false colour codes; G) the histogram from the lifetime based on modulation. The legend in the left bottom panel shows the color bars for the intensity and lifetime values. Panel II) AGAMOUS labelled with EYFP and SEPALLATA3 labelled with ECFP were transiently expressed. The EYFP lifetime remained unchanged as compared to panel I (note unaltered horizontal position of the histograms D) and G) as for Panel II. Homo and heterodimerization for AGAMOUS and SEPALLATA3 in living cells
83

Chapter 4
Since no FRET could be detected from EYFP to ECFP when EYFP was excited as
donor molecule, the next step was the identification of homo- and heterodimers
between AGAMOUS (AG) and SEPALLATA3 (SEP3) using EYFP-mRFP as donor-
acceptor FRET pair. By means of these experiments, we should detect
homodimerization for both AG and SEP3, as well as heterodimerization between
these two MADS-box proteins, in a similar way as has been reported before (Chapter
3), where we made use of ECFP-EYFP as donor-acceptor FRET couple. For all three
combinations the donor fluorescence lifetime dropped on average from 2,5ns to
2,0ns for Tau phi and from 2,7ns to 2,4ns for Tau mod, confirming the expected
homo- and heterodimerization.
AGAMOUS homodimer can not be competed out by SEPALLATA 3 protein
Once that homodimerization could be detected for both AGAMOUS and
SEPALLATA3, as well as heterodimerization in the case that both proteins are
present, the next question to be addressed is if there is a possible preference for
either homo- or heterodimer formation inside living cells for the AGAMOUS and
SEPALLATA3 proteins? For this, the competition-FRET method was applied and we
screened for FRET changes when the competitor (i.e., heterodimer partner) is
simultaneously transfected with the homodimer acceptor-donor combination. For
accuracy in the data analysis, we combined the intensity values for the three
fluorophores, and the two different lifetimes, Tau phase and Tau modulation, into
relative fractions, fraction of acceptor to donor: [acceptor/(acceptor + donor)] and
fraction of the competitor to the acceptor: [competitor/(competitor + acceptor)] against
an average of the lifetimes. For this quantitative analysis, the transfected
combinations: "donor" only, "donor - acceptor", and "donor- acceptor - competitor",
were combined.
• 1500
A
0.00 0.20 0.40 0.60 0.80 1.00
(RFP/ (RFPtYFP))
^ 2000 a)
» 1500
B
r>^rxtem&% 0.40 0.60 0.80
(CFP/(CFP+RFP))
1.00
84

Competition-FRET
Figure 3. AGAMOUS homodimer can not be competed out by SEPALLATA 3 protein. The graphs display all data points obtained from 200 up to 400 different cells that have been analysed with the combinations AG-EYFP + AG-mRFP, AG-EYFP+AG-mRFP + SEP3-ECFP, and AG-EYFP alone. A) The square root of Tau phase and Tau modulation is plotted against the acceptor-donor fraction. B) An average of Tau phase and Tau modulation lifetimes is plotted against the competitor-acceptor fraction.
For the first competition experiment, we tested whether the homodimer formed by
AGAMOUS protein could be competed out by its heterodimeric partner
SEPALLATA3. Surprisingly, the homodimerization of AGAMOUS (Fig 3A) was not
affected by its heterodimerization partner SEPALLATA3 (Fig 3B). Neither competition
(increase in lifetime), nor clear higher-order complex formation (decrease in lifetime)
could be detected in this case.
AGAMOUS can compete out the SEPALLATA3 homodimer and the heterodimer
AGAMOUS-SEPALLATA3
The following competition experiment was designed to investigate whether the
homodimer formed by SEPALLATA3 could be competed by the AGAMOUS protein.
For this purpose, AGAMOUS-ECFP was co-transfected in combination with
SEPALLATA3-EYFP and SEPALLATA3-mRFP. In contrast to what has been seen
for the AGAMOUS homodimer, in this experiment a major competition effect could be
observed between the heterodimer partner AGAMOUS and the SEPALLATA3
homodimer (Fig 4A and 4B), reflected by an increase in SEPALLATA3-EYFP
fluorescence lifetime when the competitor (AGAMOUS-ECFP) was added.
Additionally, we tested if AGAMOUS is able to compete the heterodimer AGAMOUS-
SEPALLATA3. In this case, a clear competition was shown by a strong increase in
fluorescence lifetime upon co-transfection with the competitor (Fig 4C-D), indicating
that an AGAMOUS homodimer is preferred over an AGAMOUS-SEPALLATA3
heterodimer.
85

Chapter 4
0.40 0.60 0.80 1.00
(RFP/ (RFP+YFP))
0.20 0.40 0.60 0.80 1.00
(CFP/(CFP+RFP))
E 3500
0.20 0.40 0.60 0.8
(RFP/ (RFP+YFP))
0.40 0.60 0.80
(CFP/(CFP+RFP))
Figure 4. AGAMOUS protein can compete out the homodimer formed by SEPALLATA3 and the heterodimer AGAMOUS-SEPALLATA3. The graphs display the following combinations A, and B: SEP3-EYFP, SEP3-mRFP and competitor AG-ECFP; and C and D: AG-EYFP, SEP3-mRFP and competitor AG-ECFP. A and C show the square root of Tau phase and Tau modulation plotted against the acceptor-donor fraction. B and D graphs display an average of Tau phase and Tau modulation lifetimes plotted against the competitor-acceptor fraction.
The role of the SEPALLATA 3 C-terminus in complex formation
The C domain of MADS-box proteins has been reported to be a mediator of higher-
order complex formation between proteins of this transcription factor family (Egea
Cortines et al., 1999; Honma and Goto, 2001), whereas the last part of the MADS
domain, the l-region and the K-box are supposed to be involved in determining
dimerization specificity (Yang et al., 2003 and Yang and Jack, 2004). Taking this into
account, we tried to monitor differences in dimerization preference for a SEPALLATA
3 protein with a truncation of the C-terminal tail (SEP3AC). Analysis of this truncated
protein by the yeast two-hybrid system revealed that it is still able to form a
heterodimer with AGAMOUS, but that in contrast to the full-length SEPALLATA3, it
lacks the capacity to form a higher-order complex with AGAMOUS (AG) and
SEEDSTICK (STK) (Immink and Angenent, unpublished results). In this experiment
86

Competition-FRET
we monitored FRET changes between the homodimer formed by SEPALLATA3 upon
presence of a third full-length SEPALLATA3 protein, or the SEPALLATA3AC protein
labeled with ECFP. As depicted in Fig 5A and 5C, we were able to detect clear
reduction of fluorescence lifetime, i.e. homodimerization of SEPALLATA3 (SEP3-
Y+SEP3-R); however, upon addition of the third SEPALLATA3 molecule
(competitor), competition among SEPALLATA3 molecules takes place (Fig 5B),
which results in an increase of the lifetime. This suggests that a dimer rather than a
ternary complex is preferred. Similar results were obtained when SEPALLATA3AC
as competitor was used instead, indicating that the C-terminal domain is not involved
in homodimerization of this protein (Fig 5D).
I J 3000
« 1500
A
0.40 0.60 0.80
(RFP/ (RFP+YFP))
0.40 0.60 o.e
(CFP/(CFP+RFP»
: 2000
» 1500
c
S§*£l ^sfc.*. '^r^r*
„ * •
^
-
,i-^ ^ * .
'" **
• • •
f * . > •
% • '_'
• -
.Lk* ftMBp
r̂ *̂
— < _ .
E*~~ l l h l l ^
* 0.00 0.20 0.40 0.60 o.e
(RFP/ (RFP+YFP))
0.40 0.60 0.80
(CFP/(CFP+RFP))
Figure 5. The role of the C-terminus of SEPALLATA3 in homodimerization. A and B: SEP3-EYFP, SEP3-EYFP + SEP3-mRFP, SEP3-EYFP + SEP3-mRFP + SEP3-ECFP; and C and D: SEP3-EYFP, SEP3-EYFP + SEP3-mRFP, SEP3-EYFP + SEP3-mRFP +SEP3AC-ECFP. SEP3AC encodes for SEPALLATA3 lacking the C domain. Graphs A and C show the square root of Tau phase and Tau modulation plotted against the acceptor-donor fraction. B and D graphs display an average of Tau phase and Tau modulation lifetimes plotted against the competitor-acceptor fraction
87
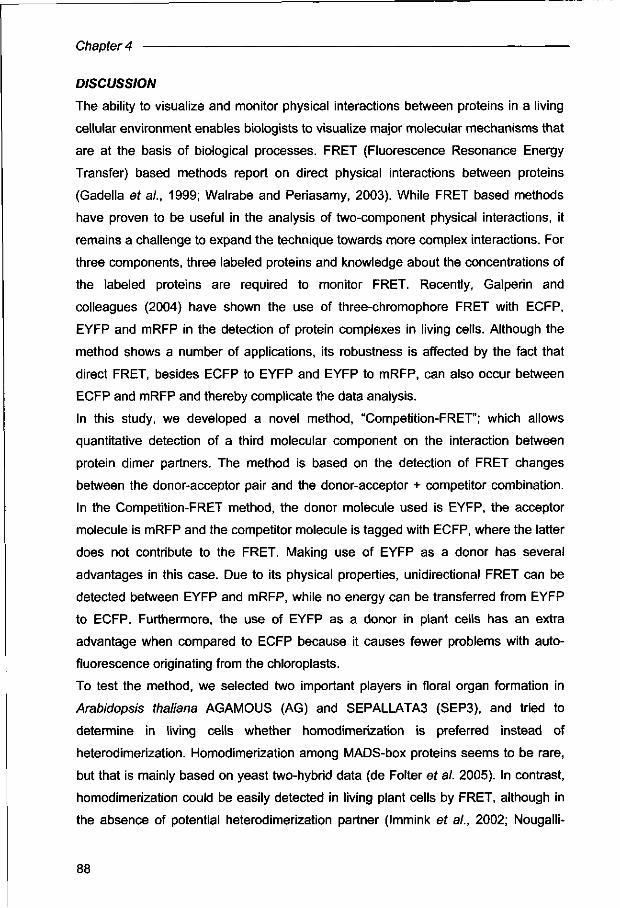
Chapter 4
DISCUSSION
The ability to visualize and monitor physical interactions between proteins in a living
cellular environment enables biologists to visualize major molecular mechanisms that
are at the basis of biological processes. FRET (Fluorescence Resonance Energy
Transfer) based methods report on direct physical interactions between proteins
(Gadella et a/., 1999; Walrabe and Periasamy, 2003). While FRET based methods
have proven to be useful in the analysis of two-component physical interactions, it
remains a challenge to expand the technique towards more complex interactions. For
three components, three labeled proteins and knowledge about the concentrations of
the labeled proteins are required to monitor FRET. Recently, Galperin and
colleagues (2004) have shown the use of three-chromophore FRET with ECFP,
EYFP and mRFP in the detection of protein complexes in living cells. Although the
method shows a number of applications, its robustness is affected by the fact that
direct FRET, besides ECFP to EYFP and EYFP to mRFP, can also occur between
ECFP and mRFP and thereby complicate the data analysis.
In this study, we developed a novel method, "Competition-FRET"; which allows
quantitative detection of a third molecular component on the interaction between
protein dimer partners. The method is based on the detection of FRET changes
between the donor-acceptor pair and the donor-acceptor + competitor combination.
In the Competition-FRET method, the donor molecule used is EYFP, the acceptor
molecule is mRFP and the competitor molecule is tagged with ECFP, where the latter
does not contribute to the FRET. Making use of EYFP as a donor has several
advantages in this case. Due to its physical properties, unidirectional FRET can be
detected between EYFP and mRFP, while no energy can be transferred from EYFP
to ECFP. Furthermore, the use of EYFP as a donor in plant cells has an extra
advantage when compared to ECFP because it causes fewer problems with auto-
fluorescence originating from the chloroplasts.
To test the method, we selected two important players in floral organ formation in
Arabidopsis thaliana AGAMOUS (AG) and SEPALLATA3 (SEP3), and tried to
determine in living cells whether homodimerization is preferred instead of
heterodimerization. Homodimerization among MADS-box proteins seems to be rare,
but that is mainly based on yeast two-hybrid data (de Folter ef al. 2005). In contrast,
homodimerization could be easily detected in living plant cells by FRET, although in
the absence of potential heterodimerization partner (Immink et al., 2002; Nougalli-
88

Competition-FRET
Tonaco ef a/., 2006). Our results reported here demonstrate the formation of both
homo and heterodimers for the AGAMOUS and SEPALLATA3 proteins, but
interestingly, we could detect preference for homodimerization for the AGAMOUS
protein above heterodimerization with SEPALLATA3. This result is surprising, since
in yeast no homodimer could be detected for the AGAMOUS MADS-box protein and
it is generally believed that homodimers interact weakly (de Folter ef a/., 2005). In
contrast, SEP3 prefers to form a heterodimer with AGAMOUS, because AGAMOUS
was able to compete out the SEPALLATA3 homodimer. In a similar experiment,
AGAMOUS could compete out the heterodimer AG-SEP3, although in this case we
could not distinguish whether the AGAMOUS competitor is titrating out the
AGAMOUS donor or the SEPALLATA3 acceptor, since AGAMOUS is able to homo-
and heterodimerize with both proteins. However, taking into account the strong
homodimer formation of AGAMOUS molecules, it is most likely that AGAMOUS-
AGAMOUS homodimers are formed.
We also studied the formation of a ternary complex between a dimer and a third
molecule. According to the quartet model for MADS-box proteins (TheiUen and
Saedler), MADS-box proteins are able to form higher order complexes composed of
three molecules or two dimers. In previous FRET-FLIM experiments (Nougalli-
Tonaco ef a/., 2006), we were able to detect a stabilization of a dimer when a third
protein was added. This strongly indicated (in an indirect way) that a higher order
complex was formed in living plant cells, although we could not monitor the third
protein because it was not tagged by a fluorescence protein. Here we labelled
SEPALLATA3 with three chromophores and we did not observe an indication for
higher order complex formation by this protein on its own. Addition of SEPALLATA3
competitor disturbed the donor-acceptor homodimer, by titrating out the donor or
acceptor and hence diminishing FRET. When avoiding higher order complex
formation by deleting the C-terminal domain, a similar reduction in FRET was
observed when compared to full-length SEPALLATA3. All together, it is tempting to
conclude that there is a preference to form a dimer rather than a ternary complex.
However, we can not exclude that certain ternary complexes and/or dimers can be
formed that can not be detected as a FRET couple, because of unfavourable
distance/orientation of the chromophores. Furthermore, it is possible that tagging of
all three proteins at the C-terminus with a fluorescent protein prevents the formation
of a ternary complex.
89

Chapter 4
Based on genetic and yeast n-hybrid studies it was shown (Pelaz et at., 2000;
Honma and Goto, 2001) that both SEPALLATA3 and AGAMOUS are in one and the
same complex that is responsible for the identity specification of the fourth whorl. It
was assumed (for review, see Ferrario et al., 2006) that such a complex is composed
of two heterodimers AG-SEP3; however based on the results presented here, it is
more likely that an AGAMOUS homodimer is an essential component of such a
complex. What the role of SEPALLATA3 is in this complex and whether it forms a
homodimer as well, or binds as a single molecule in a ternary complex structure,
remain to be elucidated. .
In conclusion, the novel method developed here, reveals to be a robust method for
the detection of protein interaction dynamics and competition between proteins in
living cells.
A CKNOWLEDGEMENTS
The authors would like to thanks Dr. Roger Tsien for the mRFP construct. This work
has been financially supported by CAPES-Brazil (BEX 0970/01-8) with a fellowship to
I.A.N.T, and a NWO-VENI grant to R.G.H.I.
REFERENCES
Aker J, Borst J-W, Karlova R , de Vries SC. (2006). The Arabidopsis thaliana AAA protein CDC48A interacts in vivo with the somatic embryogenesis receptor-like kinase 1 receptor at the plasma membrane. Journal of Structural Biology 156(1): 62-71.
Campbell RE, Tour O, Palmer AE, Steinbach PA, Baird GS, Zacharias DA, Tsien RY. (2002). A monomeric red fluorescent protein. Proceedings of the National Academy of Sciences of the United States of America 99: 7877-7882.
de Folter S, Immink RGH, Kieffer M, Pafenicova L, Henz S, R, Weigel D, Busscher M, Kooiker M, Colombo L, Kater MM, Davies B, Angenent GC. (2005). Comprehensive interaction map of the arabidopsis MADS-box transcription factors. Plant Ceim: 1424-1433.
Egea-Cortines M, Saedler H, Sommer H. (1999). Ternary complex formation between the MADS-box proteins SQUAMOSA, DEFICIENS and GLOBOSA is involved in the control of floral architecture in Antirrhinum majus. EMBO Journal 18: 5370-5379.
Ferrario S, Shchennikova AV, Franken J, Immink RG, Angenent GC. (2006).Control of floral meristem determinacy in petunia by MADS-box transcription factors. Plant Physiology 140 (3):890-8.
Gadella TW Jr., Jovin TM, Clegg RM. (1995). Fluorescence lifetime imaging microscopy (FLIM) - spatial resolution of microstructures on the nanosecond time-scale. Biophysical Chemistry 48: 221-239.
90
Competition-FRET
Gadella TW Jr., Van der Krogt GNM, Bisseling T. (1999). GFP-based FRET microscopy in living plant cells. Trends in Plant Science 4: 287-29
Galperin E, Verkhusha W , Sorkirt, A. (2004).Three-chromophore FRET microscopy to anlyse multiprotein interactions in living cells. Nature Methods 1:209-217.
Honma T and Goto K. (2001). Complexes of MADS-box proteins are sufficient to convert leaves into floral organs. Nature 409: 525-529.
Immink RGH, Gadella TW Jr., Ferrario S, Busscher M, Angenent GC. (2002). Analysis of MADS-box protein-protein interactions in living plant cells. Proceedings of the National Academy of Sciences of the United States of America 99:2416-2421.
Kremers GJ, Goedhart J, van Munster EB, Gadella TW Jr. (2006). Cyan and Yellow Super Fluorescent Proteins with Improved Brightness, Protein Folding, and FRET Forster Radius. Biochemistry 45, 6570-80.
Lippincott-Schwartz J and Patterson GH. (2003). Development and Use of Fluorescent Protein Markers in Living Cells. Science 300: 87-91.
Nougalli-Tonaco IA, Borst JW, de Vries SC; Angenent GC, Immink RGH. (2006). In vivo imaging of MADS-box transcription factors interactions. Journal of Experimental Botany 57: 33-42.
Pafenicova L, de Folter S, Kieffer M, Horner DS, Favalli C, Busscher J, Cook H. E, Ingran RM, Kater MM, Davies B, Angenent GC, Colombo L. (2003). Molecular and phylogenetic analyses of the complete MADS-box transcription factor family in Arabidopsis: New openings to the MADS world. Plant Cell 15: 1538-1551.
Pelaz S, Ditta GS, Baumann E, Wisman E, and Yanofsky, MF (2000). B and C floral organ identity functions require SEPALLATA MADS-box genes. Nature 405: 200-203.
Russinova E, Borst J-W, Kwaaitaal M, Cano-Delgado A, Yin Y, Chory J, de Vries, SC. (2004). Heterodimerization and Endocytosis of Arabidopsis Brassinosteroid Receptors BRI1 and AtSERK3 (BAK1). Plant Cell 16, 3216-329.
Shah K, Gadella TW Jr., Van Erp H, Hecht V, de Vries SC. (2001). Subcellular localization and dimerization of the A. thaliana somatic embryogenesis receptor kinase 1 protein. Journal of Molecular Biology 309: 641-655.
Stryer L. (1978). Fluorescence Energy Transfer as a spectroscopy ruler. Annual Review of Biochemistry 47: 819-846.
TheiRen G and Saedler H. (2001). Floral quartets. Nature 409: 469-471. van Munster EB and Gadella TW Jr. (2004a). phiFLIM: a new method to avoid
aliasing in frequency-domain fluorescence lifetime imaging microscopy. Journal of Microscopy 213: 29-38.
van Munster EB and Gadella TW Jr. (2004b). Suppression of photobleaching-induced artifacts in frequency-domain FLIM by permutation of the recording order. Cytometry 58: 185-94.
Wallrabe H and Periasamy A. (2005). FRET-FLIM microscopy and spectroscopy in the biomedical sciences. Current Opinion in Biotechnology 16: 19-27.
Yang Y, Fanning L, Jack T. (2003). The K domain mediates heterodimerization of the Arabidopsis floral organ identity proteins APETALA3 and PISTILLATA. Plant Journal 33: 47-59.
91

Chapter 4
Yang Y and Jack T. (2004). Defining subdomains of the K domain important for protein-protein interactions of plant MADS proteins. Plant Molecular Biology 55: 45-59.
Yanofsky MF, Ma H, Bowman JL, Drews GN, Feldmann KA, Meyerowitz EM. (1990). The protein encoded by the Arabidopsis homeotic gene AGAMOUS resembles transcription factors. Nature 346: 35-39.
92

Chapter 5
The use of BiFC to detect protein-protein
interactions between MADS-box transcription
factors
Isabella A. Nougalli Tonaco, Sacco C. de Vries,
Gerco C. Angenent and Richard G.H. Immink

Chapter 5
ABSTRACT
The investigation of cellular behavior as well as dynamic processes such as protein-
protein interactions with spatial and temporal resolution has become an important
issue in biology. To follow these processes and mechanisms, preferably in a living
cell environment, an enormous variety of imaging techniques has been developed in
the last few years. Among several methods, the most robust technologies to detect
protein-protein interactions in living cells are based on the FRET (Fluorescence
Resonance Energy Transfer) principle, although they are very laborious and require
sophisticated and expensive equipment. Here, we implemented the BiFC
(Bimolecular Fluorescence Complementation) assay as a method to detect protein-
protein interactions in living plant cells, which is a more simple way. We made use of
the well studied heterodimer FBP2 - FBP11 as a strategy of choice to set-up the
method. These two petunia MADS-box proteins have been characterized as physical
interacting proteins in living plant cells by FRET-FLIM (Fluorescence Lifetime
Imaging Microscopy) and FRET-SPIM (Spectral Imaging Microscopy). A dozen of
different constructs were made, based on the fragmentation of the Yellow
Fluorescence Protein (YFP) into two non-fluorescent parts, and tested by transient
expression in cowpea and Arabidopsis protoplasts. Many different variations were
tested, such as changing the split position of the YFP molecule, making use of
various peptide sequences as linkers, and finally, different incubation temperatures
for the transfected protoplasts. Furthermore, we explored the possibilities to use the
method in combination with FRET to detect higher-order complex formation for
MADS-box proteins. Our results demonstrate that although the BiFC approach is
simple and can be broadly used, the method has limitations and therefore, some
important aspects of experimental design should be considered. Finally, we
concluded that for MADS-box proteins, this method seem to be sensitive to different
experimental conditions and hence, FRET based methods provide more robust data.
96

BiFC in plant cells
INTRODUCTION
Knowledge about the dynamics of the cell and its processes has become a crucial
point for many biologists in recent years. Methods to observe the main processes
inside a living cell, and preferable in intact tissues and under native conditions, will
provide the key to understand regulatory processes and pathways. Substantial
improvements have been accomplished by the use of sophisticated imaging
techniques, which allow an appropriate spatial and temporal observation of the
cellular components and their behavior. In addition, the use of fluorescent proteins
such as GFP (Green Fluorescent Protein) and its variants had a tremendous impact
on cell biology. GFP allows studying biological processes in vivo, such as trafficking
of molecules, protein-protein interactions, and expression of genes (Chudakov ef a/.,
2005). The microscopic techniques based on FRET (Fluorescence Resonance
Energy Transfer) provide elegant ways to determine physical interactions between
fluorescently labeled molecules (Gadella ef a/., 1999). Despite the fact that these
novel technologies such as acceptor photo bleaching, FLIM (Fluorescence Lifetime
Imaging), and SPIM (Spectral Imaging Microscopy) are very powerful and reliable, an
expensive microscopy set-up, as well as laborious data analyses are required
(Gadella era/., 1993; Immink era/., 2002; Nougalli-Tonaco ef a/., 2006).
Recently, a novel technology has been established to identify protein-protein
interactions in living cells in a more simple way. This approach, called BiFC
(Bimolecular Fluorescence Complementation) uses the complementation of two
"split" parts of any variant of the Green Fluorescence Protein (GFP) for the
detection of protein-protein interactions (Ghosh ef a/., 2000; Hu ef a/., 2002). In
case of Yellow Fluorescent Protein (YFP) for instance, the molecule is split into two
non-fluorescent and complementary fragments: YFP/N and YFP/C. Fusion proteins
are generated by cloning the genes encoding for the proteins of interest in-frame with
either the YFP/N or the YFP/C encoding parts. The two fragments of YFP are not
fluorescent on their own, but upon protein-protein interaction between the proteins of
interest, the two parts of YFP are brought together, followed by reassembly of the
protein and recovery of fluorescence (Hu ef a/., 2002). This method has been
successfully used for the determination of protein-protein interactions in various living
cells. This has been demonstrated repeatedly for interactions between transcription
factors in mammalian cells, e.g.the interaction of bZIP and Rel family transcription
factors (Hu ef a/., 2002; Hu and Kerpolla, 2003). Subsequently, the method was
97
Chapter 5
further developed into multicolor BiFC to demonstrate dimerization and competition
for interaction between Myc/Max/Mad family members (Grinberg et al., 2004). More
recently, a few examples were reported on the use of this technology in living plant
cells (Bracha-Drori et al., 2004; Walter ef al., 2004; Bhat ef al., 2006), indicating that
this technology can be broadly used for many organisms.
MADS-box proteins are very important players in the regulation of various
developmental processes in higher land plants. At the molecular level, they interact
physically and form dimers and higher-order complexes that are supposed to
regulate specifically different pathways. Over 100 members of the MADS-box family
have been identified in the Arabidopsis genome (Parenicova ef al., 2003), and
recently, a comprehensive network of Arabidopsis MADS-box protein-protein
interactions has been established by yeast 2-hybrid studies (de Folter ef al., 2005).
Furthermore, studies using FRET-SPIM and FRET-FLIM have been performed for
some petunia MADS-box proteins and revealed physical interactions in living plant
cells (Immink et al., 2002; Nougalli-Tonaco et al., 2006).
In this study, we aimed to establish the BiFC technology to study dimerization and
higher-order complex formation for plant MADS-box transcription factors in vivo. A
tool to better study the behavior of these transcription factors in vivo will provide new
insights in the functioning of these proteins in their natural context. Advantages and
drawbacks of the use of this technique for MADS-box proteins will be discussed.
MATERIAL AND METHODS
Plant material
Leaf protoplasts were obtained from the cowpea variety Black Eye California and
from young Arabidopsis thaliana wild type plants (ColO, rosette stage). Both were
grown under normal greenhouse conditions (16/8h light /dark), at 28°C (cowpea) and
22°C (Arabidopsis) according to Nougalli-Tonaco ef al., 2006 and Aker ef al., 2006,
respectively.
98

BiFC in plant cells
Plasmid construction for BiFC analysis in living plant cells
For the BiFC analysis in living plant cells, different sets of constructs have been
tested and a schematic representation of them is provided in Figure 1. Initially, the
coding sequence of the Enhanced Yellow Fluorescence Protein (EYFP) was
fragmented into two parts, encoding for an N-terminal 154 amino acids fragment
(YFP/N154) and for a C-terminal 84 amino acids fragment (YFP/C84), respectively
(Figure 1 and 2). Four different fragments have been cloned separately into the
pGD120 high copy plasmid under control of the CaMV35S promoter (Nougalli-
Tonaco et a/., 2006), two for N-terminal fusions without stop codons and two for C-
terminal fusions with stop codons, for both YFP/N and YFP/C. Subsequently, the
vectors were made Gateway compatible by introducing the RFB Gateway cassette
from Invitrogen (Carlsbad) into the BamHI (for N-terminal fusions) and Xba1-BamH\
(for C-terminal fusions) digested and blunted vectors. In addition, the Open Reading
Frames (ORFs) of the MADS-box genes FBP2 and FBP11 were cloned as Gateway
entry clones in pDONOR207 (Invitrogen) with and without stop codon, in order to
allow N- and C-terminal fusions with the YFP fragments, respectively. Finally,
expression vectors have been obtained by LR reactions following the Gateway
protocol.
Besides this, another set of clones has been made by restriction enzyme based
cloning. However, in this case the fragmentation of the fluorescent molecule was
made one amino acid downstream, yielding a 155 amino acids YFP/N encoding
fragment (YFP/N 155) and an 83 amino acids YFP/C encoding fragment, designated
YFP/C83 (Figure 2). For N-terminal fusions, the coding sequences of the YFP
fragments (YFP/N155 and YFP/C83) were cloned into the BamHI digested pGD120
vector as Bgl ll-BamHI fragments. For C-terminal fusions of YFP/N155 and YFP/C83
to the genes of interest, the YFP fragments were cloned into the same vector but
using BamHI and Xho\. For these constructs, we used two peptide sequences as
linkers, RSIAT and KQKVMNH, according to the work of Hu and collegues (2002).
The RSIAT linker sequence was used between the YFP/N 155 fragments and the
protein of interest, while KQKVMNH was used in combination with YFP/C83. Both
linker sequences were introduced during the PCR step by using primers with the
specific extensions. In addition, the complete ORF sequences of the MADS-box
genes FBP2 and FBP11 without stop codon, and with a 5' Xba\ site and a 3' BamHI
site, were obtained by PCR with PFU proofreading polymerase, and subsequently
99

Chapter 5
cloned into the pGEM-T easy vector (Promega). In a next step these ORFs were
cloned as Xba\-BamH\ fragments into the generated BiFC vector set for C-terminal
fusions. The ORFs of both MADS-box genes including the stop codon were cloned
before (Immink et al, 2003) and these were isolated as SamHI-Sa/l fragments and
introduced into the generated BiFC vector set for N-terminal fusions.
Finally, we also tested the plant vectors kindly provided by Walter and co-workers
(2004). These vectors were named pSPYNE and pSPYCE (SPlit YFP N-terminal/C-
terminal fragment expression). The pSPYNE vector contains a Multiple Cloning Site
(MCS) in front of a fragment encoding for the first 155 amino acids of EYFP, whereas
the pSPYCE vector contains a MCS in front of a fragment encoding for the last 83
amino acids of EYFP. The MADS-box genes FBP2 and FBP11 as well as
AGAMOUS and SEPALLATA3 were cloned into these vectors making use of
restriction enzymes, as mentioned previously for the C-terminal fusion constructs.
Furthermore the ORFs of SEEDSTICK (STK) and APETALA1 (AP1) were cloned
without stop codon as Gateway entry clones and recombined with ECFP destination
vector according to Nougalli-Tonaco et al., 2006 to allow our SPLIT-FRET studies.
All generated constructs have been checked by sequencing using the DETT
sequencing kit (Amersham).
100

BiFC in plant cells
CaMV 35S
CaMV 35S
CaMV 35S
CaMV 35S
NOST
NOST
YFP/C 84 NOST
CaMV 35S
CaMV 35S
CaMV 35S
CaMV 35S
NOST
NOST
NOST
NOST
Figure 1. Schematic representation of the constructs made for BiFC in plants. CaMV 35S is the constitutive 35S Cauliflower Mosaic Virus promoter; GOI is the gene of interest; YFP/N 154 and YFP/N 155 encode for the N-terminal parts of the fragmented YFP molecule and the numbers refer to the number of aa residues of each respective fragment; YFP/C 83 and YFP/C 84 encode for the C-terminal fragments of the YFP molecule and the meaning of the numbers is as mentioned for YFP/N; the different lines between GOI and the fragments of YFP represent the different linker sequences used. The tiny dashed line represents the Gateway sequence as a linker and the broader dashed line represent the linkers RSI AT for fusions to YFP/N and KQKVMNH for fusions to YFP/C. NOST is the Nopaline Synthase terminator sequence.
101
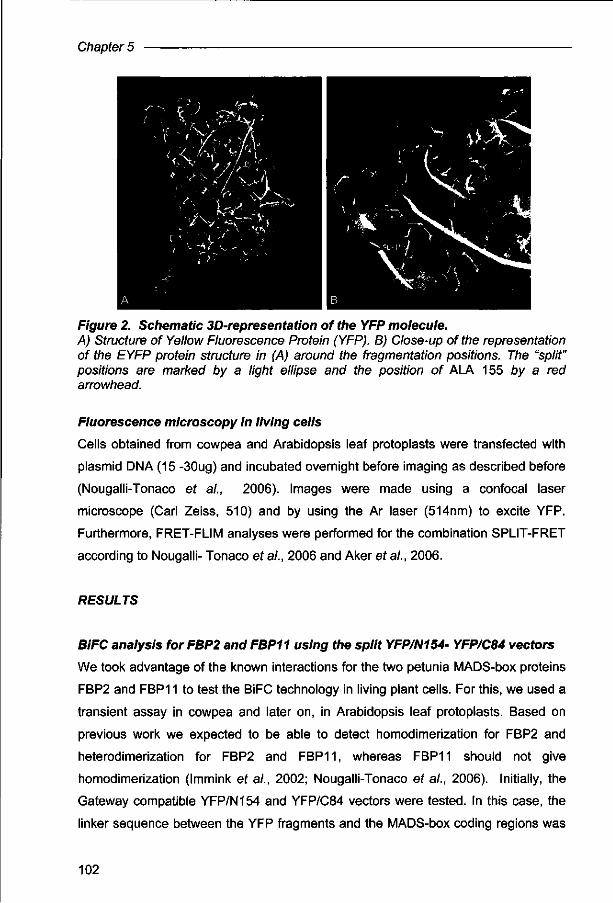
Chapter 5
Figure 2. Schematic 3D-representation of the YFP molecule. A) Structure of Yellow Fluorescence Protein (YFP). B) Close-up of the representation of the EYFP protein structure in (A) around the fragmentation positions. The "split" positions are marked by a light ellipse and the position of ALA 155 toy a red arrowhead.
Fluorescence microscopy in living cells
Cells obtained from cowpea and Arabidopsis leaf protoplasts were transfected with
plasmid DNA (15 -30ug) and incubated overnight before imaging as described before
(Nougalli-Tonaco et al., 2006). Images were made using a confocal laser
microscope (Carl Zeiss, 510) and by using the Ar laser (514nm) to excite YFP.
Furthermore, FRET-FLIM analyses were performed for the combination SPLIT-FRET
according to Nougalli- Tonaco ef al., 2006 and Aker ef al., 2006.
RESULTS
BiFC analysis for FBP2 and FBP11 using the split YFP/N154- YFP/C84 vectors
We took advantage of the known interactions for the two petunia MADS-box proteins
FBP2 and FBP11 to test the BiFC technology in living plant cells. For this, we used a
transient assay in cowpea and later on, in Arabidopsis leaf protoplasts. Based on
previous work we expected to be able to detect homodimerization for FBP2 and
heterodimerization for FBP2 and FBP11, whereas FBP11 should not give
homodimerization (Immink et al., 2002; Nougalli-Tonaco et al., 2006). Initially, the
Gateway compatible YFP/N154 and YFP/C84 vectors were tested. In this case, the
linker sequence between the YFP fragments and the MADS-box coding regions was
102

BiFC in plant cells
originated from the Gateway cloning procedure. For this experiment, both N- and C-
terminal fusions of the YFP fragments to FBP2 and FBP11 were used (N-N; C-C;
and, N-C combinations). The putative FBP2 homodimer and FBP2-FBP11
heterodimer were tested, and the expected lack of FBP11 homodimerization was
used as negative control. For each transfection experiment, the construct pGD120-
FBP2-YFP (Nougalli-Tonaco et al., 2006) was used as a control to determine the
transfection efficiency. All combinations were analyzed in both cowpea and
Arabidopsis leaf protoplasts. After transfection the cells were incubated overnight at
28°C, followed by analysis using the confocal microscope. Surprisingly, no
fluorescence was detected for any of the various tested combinations, although, the
control transfection was giving strong nuclear localized fluorescent signal in a high
percentage of analyzed cells, as expected.
One of the reasons for the lack of a positive result could be that we fragmented the
EYFP molecule after amino acid (aa) residue 154, whereas Hu et al., 2002, Walter et
al., (2004), and, Bracha-Drori and colleagues (2004) split the EYFP molecule at aa
position 155. Because of this, we decided to follow a different strategy in line with the
published work.
BiFC analysis for FBP2 and FBP11 using the split YFP/N155-YFP/C83 vectors.
The following approach was to test the BiFC technology, using the split of the EYFP
molecule after aa position 155. Furthermore, for these vectors different peptide
sequences were used as linkers between the fragments of YFP and the proteins of
interest, to determine whether this influences the reconstitution of the fluorescent
molecule. Vector sets were made to allow both N- and C- terminal fusions, and with
the RSIAT sequence for YFP/N155 and the KQKVMNH linker for the fragment
YFP/C83, according to Hu and colleagues (2002). As before, the petunia FBP2 and
FBP11 proteins were chosen as proteins of interest to test the vectors. All possible
homo- and heterodimer combinations with both C- and N-terminal fusions to the YFP
fragments were tested in cowpea and Arabidopsis protoplasts. After transfection, the
protoplasts were incubated overnight at 28°C. Despite the usage of constructs that
are very similar to the ones that were successfully used by Hu et al (2002), once
more no fluorescence was detected except for the control transfection.
Because all expression cassettes have been sequenced and no mistakes were
found, the lack of fluorescent signal could not be explained by a possible mistake
103

Chapter 5
during plasmid constructions. Nevertheless, we decided to extend our analyses,
using a set of vectors that were successfully used in plants. In this way, it could be
verified whether the problems are caused either by the specific MADS-box proteins
analyzed, or due to an unexpected problem with the set of vectors generated by us.
BiFC analysis for FBP2 and FBP11 using pSPYNE and pSPYCE vectors.
As an alternative to verify whether the system could be applied for MADS-box
proteins, we decided to test the plant vectors pSPYNE and pSPYCE (Walter ef a/.,
2004) that were kindly provided by Karin Shumacher and Klaus Harter. These
vectors were successfully used for the detection of homodimerization of the
Arabidopsis basic leucine zipper (bZIP) transcription factor bZIP63 and the zinc
finger protein Lesion Simulating Disease 1 (LSD1). For the construction of these
vectors the split position was made after aa 155 and the linker sequences used
between the fluorescent fragment and the protein of interest consisted of a 24 aa
long HA tag for YFP/C and a 26 aa long c-myc tag for YFP/N. FBP2 and FBP11 were
cloned into both vectors and a couple of combinations were tested in Arabidopsis
protoplasts that were after transfection incubated overnight at 28°C. Surprisingly, we
were able to observe emission of YFP for the combination pSPYNE-FBP2/pSPYCE-
FBP11 and for pSPYNE-FBP2/pSPYCE-FBP2 (Figure 3A and B). Nevertheless, we
also detected some fluorescent signal, most likely due to protein aggregates for the
combination pSPYNE-FBP11/pSPYCE-FBP11 (Figure 3C). This signal was observed
in a few cells only.
104
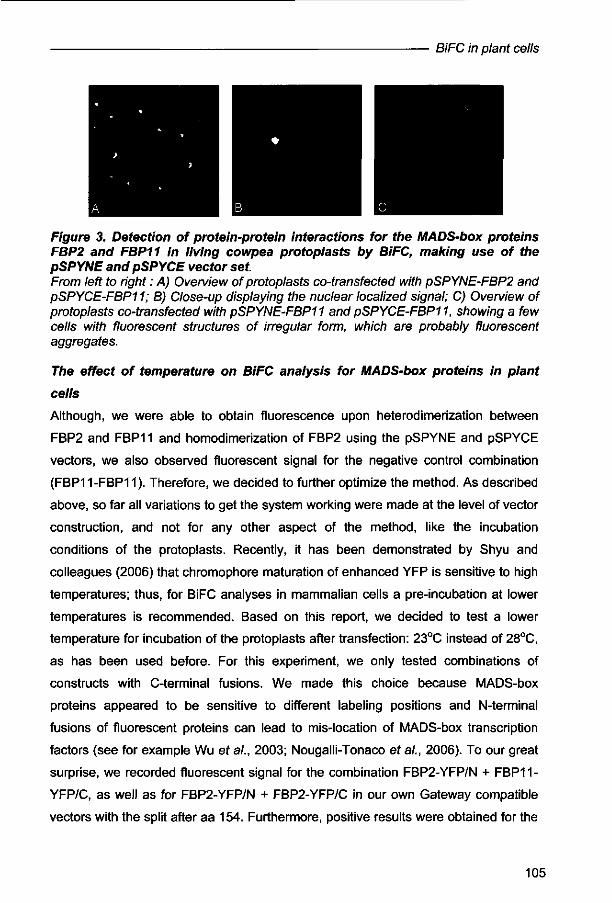
BiFC in plant cells
Figure 3. Detection of protein-protein interactions for the MADS-box proteins FBP2 and FBP11 in living cowpea protoplasts by BiFC, making use of the pSPYNE and pSPYCE vector set. From left to right: A) Overview of protoplasts co-transfected with pSPYNE-FBP2 and pSPYCE-FBP11; B) Close-up displaying the nuclear localized signal; C) Overview of protoplasts co-transfected with pSPYNE-FBP11 and pSPYCE-FBP11, showing a few cells with fluorescent structures of irregular form, which are probably fluorescent aggregates.
The effect of temperature on BiFC analysis for MADS-box proteins in plant
cells
Although, we were able to obtain fluorescence upon heterodimerization between
FBP2 and FBP11 and homodimerization of FBP2 using the pSPYNE and pSPYCE
vectors, we also observed fluorescent signal for the negative control combination
(FBP11-FBP11). Therefore, we decided to further optimize the method. As described
above, so far all variations to get the system working were made at the level of vector
construction, and not for any other aspect of the method, like the incubation
conditions of the protoplasts. Recently, it has been demonstrated by Shyu and
colleagues (2006) that chromophore maturation of enhanced YFP is sensitive to high
temperatures; thus, for BiFC analyses in mammalian cells a pre-incubation at lower
temperatures is recommended. Based on this report, we decided to test a lower
temperature for incubation of the protoplasts after transfection: 23°C instead of 28°C,
as has been used before. For this experiment, we only tested combinations of
constructs with C-terminal fusions. We made this choice because MADS-box
proteins appeared to be sensitive to different labeling positions and N-terminal
fusions of fluorescent proteins can lead to mis-location of MADS-box transcription
factors (see for example Wu ef a/., 2003; Nougalli-Tonaco et al., 2006). To our great
surprise, we recorded fluorescent signal for the combination FBP2-YFP/N + FBP11-
YFP/C, as well as for FBP2-YFP/N + FBP2-YFP/C in our own Gateway compatible
vectors with the split after aa 154. Furthermore, positive results were obtained for the
105
Chapter 5
combination FBP2-FBP11 in the pSPYNE/pSPYCE vectors, as before. No
fluorescence was observed when we tested for FBP11 homodimerization (negative
control) with these vectors at this lower incubation temperature, which is in line with
previous experiences from our lab (Immink ef al., 2002; Immink et al., 2003). Similar
positive results were obtained when the Arabidopsis MADS-box proteins AGAMOUS
(AG) and SEPALATA3 (SEP3) were tested in the pSPYNE/pSPYCE vectors, two
proteins for which heterodimerization has been shown by the yeast two-hybrid
system (de Folter et al., 2005).
Combination of BiFC and FRET approaches to detect higher-order complex
formation for MADS-box proteins.
Egea-Cortines and colleagues reported in 1999 for the first time that Antirrhinum
MADS-box proteins can form higher-order complexes. Shortly after, this
phenomenon was also discovered for MADS-box proteins from Arabidopsis and
petunia (Honma and Goto, 2000; Favaro et al., 2003, Ferrario ef al., 2003) and
hence, it seems to be a common and conserved feature of these proteins. However,
almost all the evidence for higher-order complex formation originated from yeast
three- and four-hybrid assays. Recently, we provided indirect evidence for higher-
order complex formation in living plant cells and the stabilization of a dimer by a third
MADS-box protein (Nougalli-Tonaco ef al., 2006). Nevertheless, the state-of-art of
the FRET method at that moment did not allow direct detection of interaction
between three proteins. The positive results obtained for BiFC with MADS-box
proteins prompted us to further extend its use into a combinatorial assay with the
FRET-FLIM methodology for the detection of higher-order complexes in plant cells. In
this case, two out of the three proteins have their interaction monitored by the BiFC
method, resulting in the recovery of the YFP molecule, while the third protein partner
is labeled with the fluorophore CFP, which is a suitable FRET donor for the
recovered YFP molecule. To test the proposed BiFC-FRET method, a third CFP-
labeled MADS-box protein has been co-transfected with the before mentioned
SEPALLATA3 and AGAMOUS BiFC constructs. The SEP3-YFP/N and AG-YFP/C
constructs were combined with pCaMV35S::SEEDST/CK (STK)-CFP and
pCaMV35S::>4P£LAM7 (AP1)-CFP (not shown). The combination AG-SEP3-STK
should be positive according to Favaro ef al. (2003) and the ternary complex AG-
106
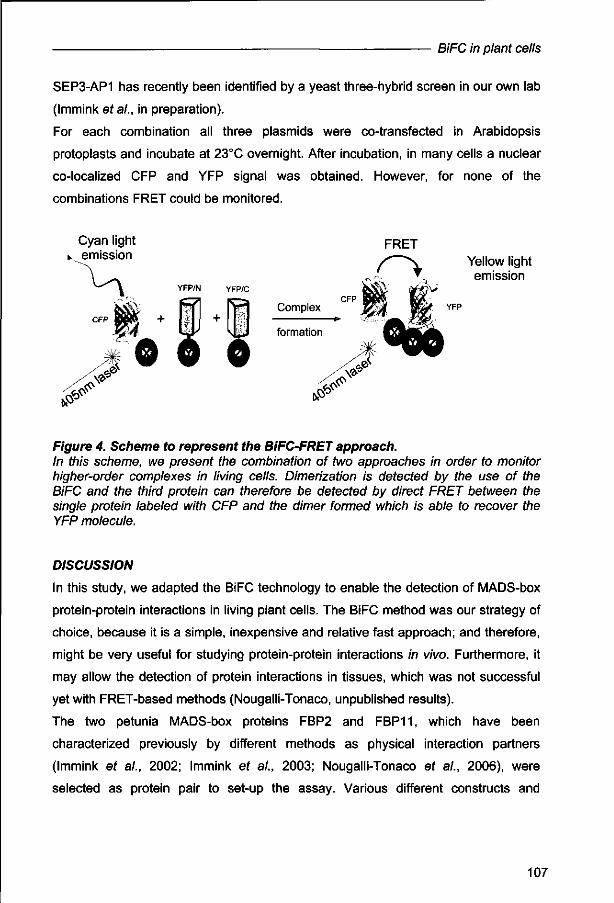
BiFC in plant cells
SEP3-AP1 has recently been identified by a yeast three-hybrid screen in our own lab
(Immink etal., in preparation).
For each combination all three plasmids were co-transfected in Arabidopsis
protoplasts and incubate at 23°C overnight. After incubation, in many cells a nuclear
co-localized CFP and YFP signal was obtained. However, for none of the
combinations FRET could be monitored.
Cyan light • emission
YFP/N YFP/C
FRET Yellow light emission
Figure 4. Scheme to represent the BiFC-FRET approach. In this scheme, we present the combination of two approaches in order to monitor higher-order complexes in living cells. Dimerization is detected by the use of the BiFC and the third protein can therefore be detected by direct FRET between the single protein labeled with CFP and the dimer formed which is able to recover the YFP molecule.
DISCUSSION
In this study, we adapted the BiFC technology to enable the detection of MADS-box
protein-protein interactions in living plant cells. The BiFC method was our strategy of
choice, because it is a simple, inexpensive and relative fast approach; and therefore,
might be very useful for studying protein-protein interactions in vivo. Furthermore, it
may allow the detection of protein interactions in tissues, which was not successful
yet with FRET-based methods (Nougalli-Tonaco, unpublished results).
The two petunia MADS-box proteins FBP2 and FBP11, which have been
characterized previously by different methods as physical interaction partners
(Immink et al., 2002; Immink et al., 2003; Nougalli-Tonaco et al., 2006), were
selected as protein pair to set-up the assay. Various different constructs and
107

Chapter 5
experimental conditions were tested and pointed to important criteria that should be
considered for the experimental design.
We have used two different positions for the fragmentation of EYFP: after aa MET
154 and after aa ALA155. Initially, it seemed that all our own constructs were not
successful for MADS-box proteins, irrespective of the split position. However, when
the pSPYNE and pSPYCE vectors were used, which were fragmented at position
ALA155, we could detect interactions for the same proteins and at lower protoplasts
incubation temperatures the Gateway compatible vectors with the fragmentation after
aa 154 were also working. Furthermore, these Gateway compatible vectors
(YFP/154-84) have been used successfully to detect protein interactions for several
CDK's proteins (E. Russinova, VIB Ghent, personal communication). In addition,
other groups have used different positions of fragmentation for various variants of
GFP based fluorescent molecules (Ghosh ef a/., 1999; Hu and Kerppola, 2003;
Grinberg ef a/., 2004). Thus it appeared that the used fragmentation positions for the
EYFP molecule does not have a major effect on refolding of the fluorescence
molecule upon a protein-protein interaction event.
A second aspect that is different between the vector sets used, is the peptide linker
sequence. In the Gateway compatible YFP/154-84 vectors the linkers were
originated from the Gateway recombination sites, while the vectors YFP/155-83 have
the peptide linker sequence as suggested by Hu and colleagues in 2002. But no
interaction could be detected at all in this case. In contrast, however, a positive result
was obtained at this relatively high temperature with the pSPYNE and pSPYCE
vectors. For these vectors, the peptide linker sequences consist of a recognition tag
and part of the multiple cloning sites, which results in very long peptide sequences of
24-26 aa residues. Besides this difference in size, all linkers encode for a complete
different aa sequence. Based on these observations, we suggest that the peptide
linker sequence may have an affect on refolding of the fluorescent protein, or
alternatively on the stability of the generated fusion proteins.
Another important aspect concerns the sensitivity of the method to high
temperatures. Our results demonstrated that the temperature could have a strong
effect on the proper refolding of the fluorescence molecule, as well as on the
specificity of the signal. The positive results obtained for our own Gateway
compatible vectors with incubation of the protoplasts at 23°C were striking.
Furthermore the specificity of the fluorescent signal increased, when the pSPYNE
108

BiFC in plant cells
and pSPYCE vectors were used at this lower temperature. The supposed aggregates
formed in the case of the test for homodimerization of FBP11 at 28°C, which
according to yeast two-hybrid and FRET-FLIM analyses should not occur (Immink ef
al., 2002), disappeared at 23°C. The question remains what is the reason for all
these obtained effects? For EYFP it has been described that the maturation of the
chromophore is very sensitive to higher temperatures (Tsien, 1998). Furthermore, in
2006 Shyu and colleagues clearly demonstrated that pre-incubation of cells at 30°C,
4 hours before imaging, after 24 hours at 37°C (normal temperature conditions for
mammalian cells), increases significantly the BiFC signal for EYFP fragments. This
all, clearly points towards temperature dependence on the properties of the EYFP
molecule. To circumvent problems due to this temperature sensitivity, Shyu ef al
(2006) proposed the use of alternative chromophores, like the Venus and the Citrine,
which are less sensitive to higher temperatures and also show higher specificity and
faster refolding.
Another important aspect that needs to be taken into account when this method is
selected for the analysis of protein-protein interactions in vivo is the fact that transient
interactions are most likely stabilized by the recovery of the fluorescent molecule.
This means that after recovery of YFP, the process is irreversible, and due to this the
method is less suitable to investigate transient or dynamic interactions in cells. In
these cases, the use of FRET based methods would most likely result in more
reliable data sets and therefore, should be the method of choice.
As a novelty, we also tried to implement the BiFC-FRET method, in order to
monitored higher order complexes in living cells. Despite the recovery of YFP by the
dimer and co- localization with the third protein labeled with CFP, no FRET signal
could be obtained. For MADS-box proteins, the C domain has shown to be involved
in higher-order complex formation (Egea-Cortines ef al., 1999). Probably, when two
partners are fixed at their C-terminal tails by the recovered YFP molecule, it will lead
to steric hindrance towards the third protein, which will prevent higher-order complex
formation. Alternatively, complex formation occurs, but the CFP and YFP fluorescent
groups will remain too far from each others to allow energy transfer. Although we
were not successful, it would still be very interesting to test BiFC-FRET with other
proteins that have a different structure, or that are labeled at different positions.
Even though the BiFC assay still shows some technical limitations that should be
overcome, it is a powerful and simple approach to analyze protein-protein
109

Chapter 5
interactions in vivo. In combination with the usage of plant specific promoters the
technology may enable to study interactions in intact tissues in the near future.
ACKNOWLEDGEMENTS
We are very grateful to Karin Schumacher and Klaus Harter for the pSPYNE and
pSPYCE vectors and to Jenny Russinova for communicating unpublished results.
This work has been financially supported by CAPES-Brazil (BEX 0970/01-8), the
Netherlands Proteomics Centre (NPC) and a NWO-VENI grant to R.G.H.I.
REFERENCES
Aker J, Borst J-W, Karlova R , de Vries SC. (2006). The Arabidopsis thaliana AAA protein CDC48A interacts in vivo with the somatic embryogenesis receptor-like kinase 1 receptor at the plasma membrane. Journal of Structural Biology 156(1), 62-71.
Bhat RA, Lahaye T, Panstruga R. (2006).The visible touch: in planta visualization of protein-protein interactions by fluorophore-based methods. Plant Methods 2, 12.
Bracha-Drori K, Shichrur K, Katz A, Oliva M, Angelovici R., Yalovsky S. Ohad N. (2004). Detection of protein-protein interactions in plants using bimolecular fluorescence complementation. Plant Journal 40, 419-427.
de Folter S, Immink RGH, Kieffer M, Parenicova L, Henz S, R, Weigel D, Busscher M, Kooiker M, Colombo L, Kater MM, Davies B, Angenent GC. (2005). Comprehensive interaction map of the arabidopsis MADS-box transcription factors. Plant Cell 17', 1424-1433.
de Folter S, Shchennikova A V, Franken J, Busscher M, Baskar R, Grossniklaus U, Angenent GC, Immink RHG. (2006). A Bsister MADS-box gene involved in ovule and seed development in petunia and Arabidopsis. Plant Journal 47,934-946.
Egea-Cortines M, Saedler H, Sommer H. (1999). Ternary complex formation between the MADS-box proteins SQUAMOSA, DEFICIENS and GLOBOSA is involved in the control of floral architecture in Antirrhinum majus. EMBO Journal 18, 5370-5379.
Favaro R, Pinyopich A, Battaglia R, Kooiker M, Borghi L, Ditta G,.Yanofsky MF, Kater MM, Colombo L. (2003) MADS-Box protein complexes control carpel and ovule development in Arabidopsis. Plant Cell 15, 2603-2611.
Ferrario S, Immink RGH, Shchennikova A, Busscher-Lange J, Angenent GC. (2003). The MADS-box gene FBP2 is required for SEPALLATA function in petunia. Plant Cell 15, 914-925.
Gadella TW Jr., Jovin TM, Clegg RM. (1993). Fluorescence lifetime imaging microscopy (FLIM) - spatial resolution of microstructures on the nanosecond time-scale. Biophysical Chemistry 48, 221-239.
Gadella TW Jr., van der Krogt GNM, Bisseling T. (1999). GFP-based FRET microscopy in living plant cells. Trends in Plant Science 4, 287-291.
110
BiFC in plant cells
Grinberg AV, Hu CD, Kerppola TK. (2004) Visualization of Myc/Max/Mad family dinners and the competition for dimerization in living cells. Molecular and Cellular Biology 24: 4294-4308.
Honma T and Goto K. (2001). Complexes of MADS-box proteins are sufficient to convert leaves into floral organs. Nature 409, 525-529.
Hu CD and Kerppola TK. (2003). Simultaneous visualization of multiple protein interactions in living cells using multicolor fluorescence complementation analysis. Nature Biotechnology 21: 539-545.
Hu CD, Chinenov Y, Kerppola TK. (2002). Visualization of interactions among bZIP and Rel family proteins in living cells using bimolecular fluorescence complementation. Molecular Cell 9: 789-798
Immink RGH, Gadella TW Jr., Ferrario S, Busscher M, Angenent GC. (2002). Analysis of MADS-box protein-protein interactions in living plant cells. Proceedings of the National Academy of Sciences of the United States of America 99,2416-2421.
Immink RGH, Ferrario S, Busscher-Lange J, Kooiker M, Busscher M, Angenent GC. (2003). Analysis of the petunia MADS-box transcription factor family. Molecular Genetics and Genomics 268, 598-606.
Nougalli-Tonaco I A, Borst JW, de Vries SC, Angenent GC, Immink, RGH. (2006). In vivo imaging of MADS-box transcription factors interactions. Journal of Experimental Botany 57, 33-42.
Pafenicova L, De Folter S, Kieffer M, Horner DS, Favalli C, Busscher J, Cook H. E, Ingran RM, Kater MM, Davies B, Angenent GC, Colombo L. (2003). Molecular and phylogenetic analyses of the complete MADS-box transcription factor family in Arabidopsis: New openings to the MADS world. Plant Cell 15, 1538-1551.
Walter M, Chaban C, Schutze K, Batistic O, Weckermann K, Nake C, Blazevic D.,Grefen C, Schumacher K, Oecking C, Harter K, Kudla J. (2004).Visualization of protein interactions in living plant cells using bimolecular fluorescence complementation. Plant Journal 40, 428-438.
Wu X, Dinneny JR, Crawford KM, Rhee Y, Citovsky V, Zambryski PC, Weigel D. (2003). Modes of intercellular transcription factor movement in the Arabidopsis apex. Development 130, 3735-3745.
111

Chapter 6
Diffusion of MADS-box proteins and complexes
Isabella A Nougalli Tonaco, Kerstin Kaufmann, Mark Hink, Ruchira Engel,
Sacco C. de Vries, Gerco C. Angenent and Richard G.H Immink

Chapter 6
ABSTRACT
MADS-box transcription factors are key regulators of various plant developmental
processes. Their molecular mode of action is dependent on the formation of dimers
(homo and/or heterodimers) followed by the assembly into higher-order complexes
that regulate target gene expression. We have previously analyzed a dozen of
protein-protein interactions involving MADS-box transcription factors in living plant
cells by means of Fluorescence Resonance Energy Transfer-Fluorescence Lifetime
Imaging Microscopy (FRET-FLIM). Differences in affinity and interaction specificity
play an important role for the selection of interaction partners and formation of
multimeric complexes in vivo. These complexes determine to a large extent how
these MADS-box proteins select their target genes for transcriptional control. To
further investigate the dynamics of the MADS-box transcription factor protein
complexes, we made use of Fluorescence Correlation Spectroscopy (FCS). FCS
measurements enable the analysis of diffusion time at single molecule level. The well
known and thoroughly studied MADS-box proteins AGAMOUS (AG) and
SEPALLATA3 (SEP3) were selected to investigate the diffusion time of these
proteins in plant cells and in vitro by the FCS technology. For this purpose, the two
MADS-box proteins were labeled with the fluorescent molecule Enhanced Yellow
Fluorescence Protein (EYFP). The in vitro experiments showed that the AG protein
diffuses two times slower than SEP3 and in addition, the co-translation of both
transcription factors suggests the formation of high molecular weight complexes.
114

Diffusion of MADS-box proteins and complexes
INTRODUCTION
Plant MADS-box transcription factors are important regulators of flower development
and plant architecture in higher eudicots. In the model plant species Arabidopsis
thaliana, at least 107 members of this family could be identified (Parenicova et al.,
2003) and many of them have been functionally characterized. Insight in the
molecular mode of action of plant MADS-box proteins has been gained from several
yeast two- and three-hybrid studies, and more recently by the use of FRET
(Fluorescence Resonance Energy Transfer) based methods to determine their
protein-protein interaction patterns in plant cells (Egea-Cortines et al., 1999; Honma
and Goto, 2001; Immink et al., 2002; Nougalli-Tonaco et al., 2006). Based on these
experiments, it has been hypothesized that their molecular mode of action relies
strongly on their ability to homo- or heterodimerize and to assemble into higher-order
protein complexes (TheiUen and Saedler, 2001). The formation of these kinds of
multimeric complexes seems to be very dynamic and differences in affinity and
partner selection are most likely important determinants of the final interaction
network. Although, FRET based methods have provided a realistic overview of
MADS-box protein complex formation and protein interaction preferences in vivo, the
number of molecules involved in such complexes cannot be determined by these
methods. In order to address some of these questions, Fluorescence Fluctuation
Spectroscopy (FFS) techniques can be applied (Hink ef al., 2002; Aker et al., 2007).
With FFS, the detection of physical parameters of fluorescent molecules is feasible at
high spatial and temporal resolution, allowing the visualization of protein dynamics
and the estimation of stoichiometry of molecule complexes. By means of
Fluorescence Correlation Spectroscopy (FCS) for example, the diffusion time of
excited single molecules can be monitored within a determined observation volume
(Hess ef al., 2002; Hink ef al., 2002). We decided to use FCS as our strategy of
choice, in order to determine the approximate diffusion time for individual and
combinations of MADS-box proteins. AGAMOUS (AG) and SEPALLATA3 (SEP3)
were selected for these studies. These two proteins are able to homo and
heterodimerize in vivo (Chapter 3) and clearly show differences in preferences for
homo- or heterodimerization (Chapter 4). For the in vitro FCS analyses, the two
MADS-box proteins were labeled with the Enhanced Yellow Fluorescent Protein
(EYFP) and synthesized by in vitro transcription/translation. Further, we performed
gel filtration chromatography analysis for the SEP3 protein, in order to verify the
115

Chapter 6
molecular size of the complex formed by this protein. Our results revealed significant
differences in protein diffusion for AG-EYFP compared to SEP3-EYFP. In
combination with the observations from the gel-filtration experiment, the obtained
FCS results give a first indication about the stoichiometry of AG and SEP3
complexes in vitro.
MATERIAL AND METHODS
Plasmids construction
For the in vitro FCS experiments, the full length ORFs of SEP3 and AG, fused to the
ORF of the Enhanced Yellow Protein (EYFP), were cloned behind the T7 promoter in
the pSPUTK vector, by introducing A/col and SamHI sites according to Kaufmann et
al., 2005. For the controls, we cloned the ORF of EYFP into this vector, as described
previously.
FCS measurements set-up
FCS measurements were performed using the CLSM (Confocal Laser Scanning
Microscope) LSM510, from Carl Zeiss (Germany), equipped with a C-Apochromat
water immersive lens 63X with a numerical aperture of 1.2. To calibrate the pinhole
settings, Rhodamine green (R6G) 10nM (Invitrogen) was used. Rhodamine green
and EYFP, as well as the fusion proteins SEPALLATA3-EYFP and AGAMOUS-
EYFP, were excited by the 514 nm Argon laser, followed by detection of emission
between 530 and 560nm. Laser power excitation intensity was ~ 2uW.
Measurements were acquired during 120 seconds. At least ten measurements were
performed for each combination, in five independent experiments, including the
controls Rhodamine and EYFP in solution. For the data analysis we used the FCS-
data processor software version 1.5 from Scientific Software Technologies Software
Centre Belarus, according to Skakun et al (2005). The autocorrelation curves were
adjusted using an autocorrelation function (eq 1) assuming a three-dimensional
116
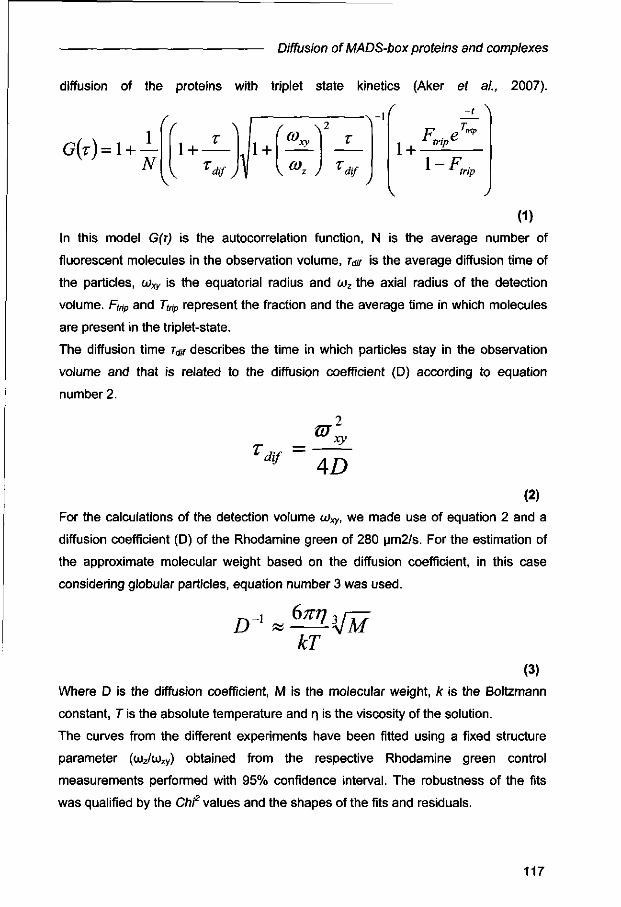
Diffusion of MADS-box proteins and complexes
diffusion of the proteins with triplet state kinetics (Aker et al., 2007).
f -t \ r
G{T) = \ + • N
r \
1 f
1 + •dif J
(O Y -\ - i
*y
\°>z J 'dif
1 F P
T"-'p 1 trip^
(1)
In this model G(T) is the autocorrelation function, N is the average number of
fluorescent molecules in the observation volume, r*/ is the average diffusion time of
the particles, (oxy is the equatorial radius and OJZ the axial radius of the detection
volume. Ftrip and Ttrip represent the fraction and the average time in which molecules
are present in the triplet-state.
The diffusion time r^ describes the time in which particles stay in the observation
volume and that is related to the diffusion coefficient (D) according to equation
number 2.
.2 tu
Tdif -xy
4D (2)
For the calculations of the detection volume aixy, we made use of equation 2 and a
diffusion coefficient (D) of the Rhodamine green of 280 um2/s. For the estimation of
the approximate molecular weight based on the diffusion coefficient, in this case
considering globular particles, equation number 3 was used.
kT (3)
Where D is the diffusion coefficient, M is the molecular weight, k is the Boltzmann
constant, T is the absolute temperature and n, is the viscosity of the solution.
The curves from the different experiments have been fitted using a fixed structure
parameter (u)z/(jdxy) obtained from the respective Rhodamine green control
measurements performed with 95% confidence interval. The robustness of the fits
was qualified by the Chi2 values and the shapes of the fits and residuals.
117

Chapter 6
In vitro protein synthesis
For the protein production, we subjected the above described plasmids to in vitro
transcription and translation using the TNT Quick Coupled Transcription/Translation
System, according to the manufacturer's instructions (Promega, Madison, Wl). One
microgram of template DNA was used in a 50ul reaction volume and the reaction
mixture was incubated at 30°C for 75 min. Finally, 50 ul of the obtained mixture has
been used for the FCS measurements.
Gel filtration chromatography analysis
The in vitro produced SEP3 protein has been loaded onto a Sephadex 200 gel
filtration column (50 pi reaction product). The column running buffer was sodium
phosphate buffer pH 7.5, 150 mM NaCI. The fractions obtained from the column were
analyzed by Western blot analysis using a SEP3 specific peptide antibody
(Eurogentec).
RESULTS
Diffusion ofAGAMOUS and SEPALLATA3 proteins in vitro
Our goal was to determine protein diffusion of MADS-box proteins AGAMOUS (AG),
SEPALLATA3 (SEP3), and the dimer combination of AG and SEP3, by FCS. The
determination of diffusion time for these proteins could provide indications about their
complex sizes, i.e whether the single proteins are able to associate into homodimers
or higher-order complexes. Differences in diffusion time would imply the presence of
different numbers of molecules in the complexes formed by these two proteins and
hence, differences in oligomerization capacity for SEP3 and AG. Initially, we tried to
perform the experiments in Arabidopsis leaf protoplasts upon transient expression of
the labeled MADS-box genes. Although, nuclear fluorescent signals were obtained
as expected (see Chapter 3), we failed to obtain reproducible data from these in vivo
FCS measurements (data not shown), probably because of too high expression
levels that could not be circumvented by pre-bleaching prior to the measurements.
Further, we obtained very low diffusion times for both expressed proteins (around 3
ms in both cases), which could be related to the association of these transcription
factors to other elements in the nucleus, or simply due to the formation of
aggregates. Therefore, it was decided to perform in vitro experiments and for this
purpose, the single AG-EYFP and SEP3-EYFP fusion proteins and a mixture of co-
118

Diffusion of MADS-box proteins and complexes
translated proteins were generated. From the obtained results, we calculated the
average diffusion coefficients of the possible heterogenic complexes formed between
these two proteins. As controls, FCS measurements for the free EYFP protein were
performed, which showed a similar behaviour as reported in literature (diffusion
coefficient ~ 80 um2/s. Widengren et al., 1999; Jung et al., 2000). Interestingly, the
diffusion coefficients obtained for the two individual MADS-box proteins showed a
clear difference. AG-EYFP appeared to diffuse twice as slow as SEP3-EYFP, while
when both proteins were co-translated the diffusion time obtained was four times
slower than for SEP3-EYFP (Fig 1). Considering that the diffusion coefficient is
approximately inversely proportional to the cubic root of the mass (eq 3), and
supposing that only one type of complex will be formed in each case, the possible
complex formed by AG-EYFP is eight times bigger than the SEP3-YFP complex,
whilst the complex formed by the combination of the two proteins is even much larger
(-64 times).
1.00B03i
ijj 1.00BO2
3
5 LOOEKM
1
83.4
T
2Z3
1
11.2
YFP SB=3-Y AG-Y
I S4
SE33V7AG-Y
Figure 1. Diffusion coefficients forAGAMOUS and SEPALLATA3 determined by FCS. The graph shows the diffusion coefficient for EYFP, SEP3-EYFP, AG-EYFP, and the co-translated SEP3-EYFP+AG-EYFP proteins in solution.
Gel filtration chromatography of the SEPALLATA3 protein
In order to estimate the molecular sizes of the complexes formed by the MADS-box
proteins based on the obtained FCS data, it is essential to have a good reference
point. In theory, the FCS data obtained for the free EYFP can be used as reference,
assuming that this molecule is present as a monomer in solution. However, it would
119

Chapter 6
be much more accurate to estimate complex sizes based on experimental data from
a particular MADS-box transcription factor complex obtained by an alternative
method. Therefore, we decided to perform gel filtration chromatography analysis for
the in vitro produced SEP3 protein. The obtained fractions were subjected to
Western blot analysis using a SEP3 specific antibody (figure 2). The expected mass
of a single SEP3 molecule is 30 kD. Interestingly, we observed that SEP3 is present
both as a dimer (fraction 2 1 , - 6 0 kD) and in a higher molecular weight form of
around 500 kD (fraction 10). The complex present with a molecular weight of more
then 600 kD (fraction 6) is most likely an agregate due to e.g. the association of the
SEP3 protein with the ribosome units in the in vitro transcription/translation mixture.
Based on solely these data we can not exclude that the same holds for the before
mentioned complex of approximately 500 kD. void 670 kD 500 kD 90 kD
5 6 7 8 9 10 11 12 13 14 15 16 17 18 19 20 21 22 23
3 0 ~ ~Wm " - « » * • — SEP3
Figure 2. Gel filtration analyses reveal that SEPALLATA3 is present in solution as dimer and in a large complex of approximately 500 kD
DISCUSSION
MADS-box proteins form dimers and are most likely assembled into higher-order
complexes. According to the quartet model (Theiften and Saedler, 2001), these
transcription factors act as tetrameric complexes. However, this model is based on
yeast studies, which do not give any information about the stoichiometry of the
complexes. Therefore, we used Fluorescence Correlation Spectroscopy (FCS)
analyses for the Arabidopsis MADS-box proteins AGAMOUS (AG) and
SEPALLATA3 (SEP3) to get insight about the sizes of the complexes formed by
these proteins. Our preliminary data showed that AG-YFP diffuses two times slower
than SEP3-YFP in vitro and that the two proteins together diffuse four fold slower
than SEP3-YFP. Based on a comparison of the diffusion time for the EYFP labelled
MADS-box proteins a comparative estimation of the various complex sizes can be
made in theory. To do so, a reference size is needed and therefore, we tried to
estimate the molecular size of the SEP3 protein complex using a gel filtration
chromatography assay. According to the gel filtration analysis, it is likely to assume
120

Diffusion of MADS-box proteins and complexes
that SEP3 is present in its dimeric form and as a high molecular weight complex. We
can not rule out that the observed large complex is not biological relevant and an
artifact due to the usage of in vitro transcription/translation. Based on the results for
SEP3, we may also speculate that the AG-EYFP protein, which diffuses twice as
slow as SEP3-EYFP, assembles preferably into higher order complexes. When upon
co-translation of both proteins only separate AG and SEP3 complexes would be
formed, an intermediate diffusion coefficient was expected, but in contrast a strong
additive effect was obtained. This suggests that large complexes are formed, which
contain both SEP3 and AG molecules. Unfortunately, calculation of the exact size of
a complex composed of SEP3 and AG proteins is difficult by FCS. That is because
more complexes of various sizes are formed simultaneously, e.g. AG complexes and
higher order complexes containing both SEP3 and AG. Furthermore, the in vitro
produced proteins might not be folded properly due to the lack of co-factors. When
the proteins are unfolded in a formed complex, it will result in very slow diffusion
coefficients, which not necessarily correlate with a higher molecular weight. The
situation in a plant cell is even far more complex, simply because more competing
MADS-box proteins can be present in different concentrations (see also chapter 4). It
is clear that for a complete overview, information from different types of experiments
should be combined. Recently, the power of FCS measurements in combination with
FRET-FLIM and biochemical approaches has been nicely illustrated by Aker and
colleagues (2007). They were able to show that the CDC48A protein is present not
only in its hexameric form, but rather in a larger protein complex in living plant cells.
Reverting to MADS-box transcription factors, alternative and preferably in vivo
methods are needed for the appropriate measurements of the exact number of
molecules in a complex. An option could be PCH (Photo Counting Histogram), in
which the molecular brightness of individual molecules and protein complexes can be
determined. However the PCH technology is not completely established yet and only
a few reports have shown its application so far (Chen et al., 1999; Chen et al., 2004).
Furthermore, structural data from the proteins under study would also facilitate a
better understanding of the assembly of MADS-box proteins into complexes.
Regardless the limitations of FCS for the exact size of protein complexes, the
obtained data provide the first indication about the stoichiometry of particular MADS
protein complexes. According to the quartet model MADS-box transcription factors
121

Chapter 6
are active as tetramers (Theiden and Saedler, 2001), however, our data suggest that
larger complexes are formed by these proteins in vitro.
ACKNOWLEDGEMENTS
We are very thankful to Jose Aker for fruitful discussions during the FCS
measurements and data analysis; and Adrie Westphal for the help and advice with
the gel filtration analysis. This work has been financially supported by CAPES-Brazil
(BEX 0970/01-8), the Netherlands Proteomics Centre (NPC) and a NWO-VENI grant
to R.G.H.I.
REFERENCES
Aker J, Hesselink R, Engel, R, Karlova R, Borst J-W, Visser AJWC, de Vries SC. (2007). In vivo hexamerization and characterization of the Arabidopsis thaliana AAA ATPase CDC48A complex using FRET-FLIM and FCS. Plant Physiology Preview.
Chen Y, Tekmen M, Hillesheim L, Skinner J, Wu B and Miiller J D. (2005). Dual-Color Photon-Counting Histogram. Biophysical Journal, 88:2177-2192
de Folter S, Immink RGH, Kieffer M, Pafenicova L, Henz S, R, Weigel D, Busscher M, Kooiker M, Colombo L, Kater MM, Davies B, Angenent GC. (2005). Comprehensive interaction map of the arabidopsis MADS-box transcription factors. Plant Cell 17: 1424-1433.
Egea-Cortines M, Saedler H, Sommer H. (1999). Ternary complex formation between the MADS-box proteins SQUAMOSA, DEFICIENS and GLOBOSA is involved in the control of floral architecture in Antirrhinum majus. EMBO Journal 18: 5370-5379.
Ferrario S, Immink RGH, Angenent GC. (2004). Conservation and diversity in flower land. Current Opinion in Plant Biology 7, 84-91.
Helliwell CA, Wood CC, Robertson M, Peacock WJ, Dennis ES. (2006). The Arabidopsis FLC protein interacts directly in vivo with SOC1 and FT chromatin and is part of a high-molecular-weight protein complex. Plant Journal 46:2, 183-192.
Hess ST, Huang S, Heikal AA, Webb WW. (2002). Biological and chemical applications of fluorescence correlation spectroscopy: a review. Biochemistry 41:697-705.
Hink MA, Bisseling T, Visser AJWG. (2002). Imaging protein-protein interactions in living cells. Plant Molecular Biology 50, 871-883.
Honma T and Goto K. (2001). Complexes of MADS-box proteins are sufficient to convert leaves into floral organs. Nature 409, 525-529.
Immink RGH, Gadella TW Jr., Ferrario S, Busscher M, Angenent GC. (2002). Analysis of MADS-box protein-protein interactions in living plant cells. Proceedings of the National Academy of Sciences of the United States of America 99,2416-2421.
122

Diffusion of MADS-box proteins and complexes
Jung G, Mais S, Zumbusch A, Brauchle C. (2000). The role of dark states in the photodynamics of the green fluorescent protein examined with two-color fluorescence excitation spectroscopy. Journal of Physical Chemistry A 104:873-877.
Kaufmann K, Anfang N, Saedler H, TheiRen G. (2005). Mutant analysis, protein-protein interactions and subcellular localization of the Arabidopsis B sister (ABS) protein. Molecular Genetics Genomics 274(2):103-18.
Nougalli-Tonaco IA, Borst JW, de Vries SC; Angenent GC, Immink RGH. (2006). In vivo imaging of MADS-box transcription factors interactions. Journal of Experimental Botany 57: 33-42.
Pafenicova L, De Folter S, Kieffer M, Horner DS, Favalli C, Busscher J, Cook H. E, Ingran RM, Kater MM, Davies B, Angenent GC, Colombo L. (2003). Molecular and phylogenetic analyses of the complete MADS-box transcription factor family in Arabidopsis: New openings to the MADS world. Plant Cell 15, 1538-1551.
Skakun W , Hink MA, Digris AV, Engel R, Novikov EG, Apanasovich W , Visser, AJWG. (2005) Global analysis of fluorescence fluctuation data. European Biophysical Journal 34, 323-334.
TheiRen G and Saedler H. (2001). Floral quartets. Nature 409, 469-471. Widengren J, Terry B, Rigler R (1999). Protonation kinetics of GFP and FITC
investigated by FCS: aspects of the use of fluorescent indicators for measuring pH. Chemical Physics 249:259-271.
123

Chapter 7
Concluding remarks and perspectives of
lifetime imaging for MADS-box transcription
factor complexes
Isabella A. Nougalli Tonaco, Susan L. Urbanus, Sacco C. de Vries,
Gerco C. Angenent and Richard G. H. Immink.

Chapter 7
MADS-box transcription factors
In this thesis, we attempted to unravel the molecular mechanisms behind plant
MADS-box transcription factor functioning in the model species petunia and
Arabidopsis making use of fluorescent microscopy techniques. Over 100 members of
this family have been identified in Arabidopsis thaliana and many of them have been
functionally characterized (Kofugi et al., 2003; de Bodt et al., 2003; Parenicova et al.,
2003). As part of complex genetic networks that underlie plant development, they
play essential roles in a plethora of developmental processes, such as:
embryogenesis (e.g. AGL15; Perry et al., 1996); repression of flowering (e.g. FLC;
Burn et al., 1993); transition to flowering (e.g. SOC1; Simon et al., 1996), floral
meristem determination (e.g.API; Mandel et al., 1992) and last but not least, floral
organ identity specification (reviewed in Ferrario et al., 2004). In the early 90's
genetic studies that made use of various floral homeotic mutants elegantly provided
evidence for the concept model in flower development, called the "ABC-model" that,
a few years later, was extended with the D- and E-functions (Coen and Meyerowitz,
1992); Colombo et al., 1995 and Pelaz et al., 2000). Subsequently, biochemical and
yeast 2-hybrid studies have shown that MADS-box proteins are physically interacting,
forming dimers and most likely, are functional in large protein complexes (Egea-
Cortines et al., 1999; Honma and Goto, 2001). The 'quartet model' for MADS-box
transcription factor functioning proposes that at least two dimers assemble and direct
the oriented and specific bending and binding to the DNA target sequences that
regulates transcriptional activity (TheiRen & Saedler, 2001). In line with these findings
and the proposed molecular model, the objective of this thesis was to get a better
understanding of the molecular mechanism behind MADS-box transcription factor
functioning by analyzing their behavior and protein-protein interactions in a living cell
environment.
Methods to analyze protein-protein interactions in living cells
At the start of this thesis research, many putative MADS-box transcription factor
dimers were known based on in vitro and yeast two-hybrid experiments, however for
only a very few combinations the interaction has been confirmed in living plant cells
(Immink et al., 2002). Therefore, we invested in the further development and
implementation of sophisticated micro-spectroscopy techniques, which enable to
visualize physical interactions and their dynamics in planta. In this work, several
126

Concluding remarks and perspectives of lifetime imaging
methodologies were described such as: Fluorescence Resonance Energy Transfer -
Fluorescence Lifetime Imaging (FRET-FLIM), Fluorescence Correlation
Spectroscopy (FCS), and Bimolecular Fluorescence Complementation (BiFC), each
with their specific advantages and drawbacks. FRET based methods are very reliable
techniques, even though they may require extensive imaging analysis and a
sophisticated set up. From different FRET based methods, FRET-FLIM is the most
robust since it is independent of concentration; nevertheless its application in intact
plant tissues that express an endogenous amount of the protein under study is not
yet possible. FCS is another powerful technique which enables the monitoring of
protein dynamics and by that may provide a first indication about protein complexes
stoichiometry. It is a very sensitive and sophisticate approach, but just few examples
of its use are available so far, being still under development. Another method that
has been recently adopted to detect protein-protein interactions in living plant cells is
called "Split-YFP" or bimolecular fluorescence complementation (BiFC). In this case,
the Yellow Fluorescent Protein (YFP) is split into two domains that themselves are
not fluorescent. These two inactive molecules are fused to two proteins of interest
and upon interaction; the two halves of YFP come together and refold into a
functional molecule. Only in case of an interaction a yellow signal will be visible and
this can be monitored easily with a simple fluorescence microscope. Although, this
method is relatively simple when compared with the other methods described above,
it seems very much dependent on the structure and stability of the proteins under
study.
Besides these methods mentioned above, several other techniques have been
described in literature. For instance, the BRET (bioluminescence resonance energy
transfer) method is very similar to the FRET based techniques but uses
LUCIFERASE as donor molecule. BRET is predominantly used for in vitro
experiments, but has been established in plants recently (Xu et al., 2007). A big
advantage of BRET is the simplicity of the method that does not require laborious
imaging analysis like in the case of FRET. Furthermore, this method can be applied
using a simple luminometer and does not require a very expensive and sophisticated
set up.
In our work, we have demonstrated protein interactions and dynamics in leaf
protoplasts, making use of confocal laser scanning microscopy, FRET-FLIM, split-
YFP and FCS. Our results revealed that FLIM (Fluorescence Lifetime Imaging
127
Chapter 7
Microscopy) is the most robust method to analyze protein interactions in a biological
sample so far, even though the use of the split-YFP can be easily applicable.
Furthermore, FCS demonstrates to be a very promising technique to answer dynamic
processes; nevertheless its use in vivo it is not so trivial yet.
Perspectives for real time imaging of MADS-box protein interactions
In this thesis, we have identified several complexes in living cells that are involved in
floral organ formation and we were able to formulate some hypotheses about the
molecular mechanisms of MADS-box protein functioning. For flowering plants,
Arabidopsis thaliana is the best model species for studying organ development and a
wealth of genetic data is available. In addition, in vitro biochemical studies and yeast
two-, three- and four-hybrid analyses provided information about the molecular action
and interactions between the MADS-box proteins. The ABC (DE) model for floral
organ formation was initially a genetic model (for review see: Ferrario et a/., 2004),
but has been translated into the quartet model that describes the formation of
tetrameric MADS-box complexes (Theifien 2000). Our in vivo results suggested that
several of these complexes, for instance: A+E (AP1 and SEP3), B+C+E
(AP3+PI+AG+SEP3) and C+E (AG and SEP3), are very stable and could be the
basis for floral organ formation. Nevertheless, it must be said that most of these
results were obtained using a transient assay system (protoplasts) and the
constitutive 35 CaMV promoter to achieve high expression levels. A next improving
step would be to analyze protein-protein interactions in tissues with native expression
levels of the proteins. There are currently several ways to identify in vivo protein-
protein interactions. A promising technique is the 'split-YFP' (BiFC) method (Hu ef a/.,
2002), although it has several drawbacks: (i) the proteins of interest fused to the YFP
parts can not be detected by fluorescence, (ii) the interaction between the proteins of
interest can be stabilized by the reassembly of the YFP molecules, which makes it
not the best approach for studying dynamic processes, (iii) the reassembly of the
YFP molecule depends on the conformation of the attached proteins. Nevertheless,
positive results were obtained in mammalian and plant cells where different types of
protein have been tested in different conditions (Hu et al., 2003; Grienberg et al.,
2004 and Walter ef al., 2004). The studies mentioned above showed that progress
has been made in the isolation and characterization of protein complexes under
native circumstances. However, methods that can be used to monitor physical
128

Concluding remarks and perspectives of lifetime imaging
interactions in intact living tissues of plants by direct observation under the
microscope remain to be optimized. In mammalian systems, progress has been
made in the detection of protein interactions by FRET assays (Chen era/., 2003) but,
up till now, the only proof that FRET measurements can be successfully performed in
intact plant tissues was recently described by Deuschle et al., 2006. In their studies,
several FRET nanosensors were developed in order to monitor glucose metabolism
in Arabidopsis plants. However, these nanosensors contain both CFP and YFP within
a single molecule and are expressed from the strong constitutive Cauliflower Mosaic
Virus 35S promoter.
As an approach to evaluate the feasibility of live cell imaging for protein-protein
interactions, we performed donor lifetime measurements for the MADS-box protein
AGAMOUS (AG) fused to GFP in intact tissues. As a control measurement, we
transiently expressed the AGAMOUS protein fused to GFP under the control of the
35S promoter in Arabidopsis leaf protoplasts, following the protocols described in
chapter 3 of this thesis. For the intact tissues, we made use of homozygous
transgenic lines (T2 generation) in which the construct pAG::AG-GFP was introduced
in Arabidopsis thaliana ecotype ColO (Columbia) by Agrobacterium mediated
transformation (Urbanus ef al., in preparation). These lines have a clear nuclear
localization of AG-GFP in the young floral organ primordia of the inner two whorls,
which is in accordance with in situ data of AG expression (Bowman ef al., 1991).
Besides that, we used the transgenic lines MSG 1 (meristem - specific GFP), kindly
provided by Patricia Zambryski (see Kim ef al., 2005), as an additional control. These
plants have very bright GFP expression in young meristematic tissues. Flower buds
from the transgenic plants were dissected and their meristematic tissues, as well as
ovules, were analyzed by using a Bio-Rad Radiance 2100 MP system (Hercules, CA)
in combination with a Nikon TE 300 inverted microscope (Tokyo, Japan). The FLIM
measurements to detect the donor lifetime of GFP in these samples were done as
described in chapters 2 and 3 of this thesis.
The analyses of the protoplasts, constitutively expressing AG fused to GFP, revealed
donor fluorescence lifetime values which were similar to those obtained by Peter ef
al. (2005) with the same technical settings (Fig 1A). Subsequently, we performed
analyses of young floral meristems and intact ovules from the transgenic plants,
containing pAG::AG-GFP, as well as for meristematic tissues from the control line
with soluble GFP (MSG 1). An important issue was the proper fixation of the flower
129
Chapter 7
buds, in such a way that it would be possible to visualize at least the first two cell
layers of the floral meristem, where AG is expressed, without damaging the tissue
and keeping the material in focus. For that, we tried to immobilize the tissue by using
low concentrations (0.08-0.2%) of agar. A concentration of 0.08% agar appeared to
be the best and gave a sharper view from the tissue. To get a better resolution of the
images, we also tried different objectives (20X, 40X and 60X) with different numerical
apertures For the final analysis a 20X dry lens and 60X water lens were chosen.
After the optimalization of the imaging procedure we performed the donor lifetime
measurements. For that, we analyzed the control plants MSG1 and a good decay
curve and a satisfactory number of photo counts were obtained (Fig 1C). In contrast,
we were not able to measure donor lifetime in the pAG::AG-GFP transgenic plants,
most likely due to the lower number of photo counts and the signal-to-noise ratio (Fig
1B).
Taken these preliminary data together, we may conclude that the expression level of
AG:GFP under the control of the endogenous promoter was too low for FRET-FLIM
measurements. These results were disappointing, since good confocal images could
be made indicating that the expression levels were high enough for imaging
(Urbanus et al., in preparation). Usage of the constitutive 35S promoter is no option
to solve the problem, because it would not reflect the native behavior of this MADS-
box protein.
Another important aspect is the choice of the appropriate fluorescent protein that
should be in accordance with the technique and type of instrument that will be used.
For our experiments described in chapter 4, we made use of a triple fluorescent set
up in order to detect FRET-FLIM. The combination YFP —> mRFP as FRET couple
eliminates substantial signal-noise problems due to the autofluorescence from the
chloroplasts, and that is because of the use of the YFP as donor molecule instead of
CFP, which has a lower quantum yield. Based on this, the combination YFP-mRFP
may have more potential for in planta interaction analyses of proteins expressed from
the endogenous promoters. Furthermore, several new FP's have been engineered
recently (Giepmans et al., 2006) and many putative new FRET couples are currently
tested.
Finally, it is worthwhile to mention that autofluorescence depend on the tissues
analyzed. In some tissues, e.g. ovules in our case, the signal-to-noise ratio is very
low, which requires substantial technical improvements to enable reliable
130

Concluding remarks and perspectives of lifetime imaging
measurements. Using other tissues or imaging of interactions in epidermal or sub
epidermal cell layers combined with new FRET couples will be the next step in
developing in planta protein interaction methods. Once established, these methods
will open avenues to study protein behavior and interaction dynamics in intact plants
under native conditions.
131

Chapter 7
— Bj ») Jil
2,45ns
Figurel. FLIM measurements in Arabidopsis protoplasts, ovules and Intact flower buds. Left panels: Fluorescence Intensity Image, middle panels: Fluorescence Lifetime Image (by a false color code) and right panels: histograms presenting the distribution of fluorescence lifetime values.. A) FLIM measurements for donor lifetime of 35S::AG:GFP in Arabidopsis protoplasts; B) FLIM measurements for donor lifetime of ovules obtained from the plants transformed with the construct pAG::AG-GFP; C) FLIM measurement for flower buds expressing 1X free GFP (MSG 1). The picture shows the intensity and lifetime of the central region of a stage one of the flower meristem. Bars=10/im
132
Concluding remarks and perspectives of lifetime imaging
ACKNOWLEDGEMENTS
We are very thankful to Patricia Zambryski for the MSG 1 line and to Jan Willen Borst
for the technical support advices for the microscopy set up. This work has been
financially supported by CAPES-Brazil (BEX 0970/01-8), the Netherlands Proteomics
Centre (NPC) and a NWO-VENI grant to R.G.H.I.
REFERENCES
Bowman JL, Drews GN, Meyerowitz EM. (1991). Expression of the Arabidopsis floral homeotic gene AGAMOUS is restricted to specific cell types late in flower development. Plant Cell. 3: 749-758.
Burn JB, Smyth DR, Peacock WJ, Dennis ES. (1993). Genes conferring late flowering in Arabidopsis thaliana. Genetica 90:147-155.
Chen Y, Mills J D, Periasamy A. (2003).Protein localization in living cells and tissues using FRET and FLIM. Differentiation 71: 528-541.
Colombo L, Franken J, Koetje E, van Went JL, Dons HJM, Angenent GC, van Tunen AJ. (1995). The petunia MADS-box gene FBP11 determines ovule identity. Plant Cell 7:1859-1868.
de Bolt S, Raes J, Florquin K, Rombauts S, Rouze P, Theifien G, Van de Peer Y. (2003). Genomewide structural annotation and evolutionary analysis of the type I MADS-box genes in plants. Journal of Molecular Evolution 56:573-586.
de Folter S, Immink RGH, Kieffer M, Pafenicova L, Henz S, R, Weigel D, Busscher M, Kooiker M, Colombo L, Kater MM, Davies B, Angenent GC. (2005). Comprehensive interaction map of the arabidopsis MADS-box transcription factors. Plant Cell 17: 1424-1433.
Deuschle K, Chaudhuri B, Okumoto S, Lager I, Sylvie Lalonde S, Frommer WB. (2006). Rapid metabolism of glucose detected with FRET glucose nanosensors in epidermal cells and intact roots of Arabidopsis RNA-Silencing mutants. Plant Cell 18:2314-2325.
Egea-Cortines M, Saedler H, Sommer H. (1999). Ternary complex formation between the MADS-box proteins SQUAMOSA, DEFICIENS and GLOBOSA is involved in the control of floral architecture in Antirrhinum majus. EMBO Journal 18: 5370-5379.
Ferrario S, Immink RGH, Angenent GC. (2004). Conservation and diversity in flower land. Current Opinion in Plant Biology 7: 84-91.
Giepmans BN, Adams SR, Ellisman MH, Tsien RY. (2006). The fluorescent toolbox for assessing protein location and function. Science 312:217-24.
Grinberg AV, Hu CD, Kerppola TK. (2004) Visualization of Myc/Max/Mad family dimers and the competition for dimerization in living cells. Molecular and Cellular Biology 24: 4294^*308.
Helliwell CA, Wood CC, Robertson M, Peacock WJ, Dennis ES. (2006) The Arabidopsis FLC protein interacts directly in vivo with SOC1 and FT chromatin and is part of a high-molecular-weight protein complex. Plant Journal 46(2): 183-192.
Honma T and Goto K. (2001). Complexes of MADS-box proteins are sufficient to convert leaves into floral organs. Nature 409: 525-529.
133

Chapter 7
Hu CD and Kerppola TK. (2003). Simultaneous visualization of multiple protein interactions in living cells using multicolor fluorescence complementation analysis. Nature Biotechnology 21: 539-545.
Hu CD, Chinenov Y, Kerppola TK. (2002). Visualization of interactions among bZIP and Rel family proteins in living cells using bimolecular fluorescence complementation. Molecular Cell 9: 789-798
Immink RGH, Gadella TW Jr., Ferrario S, Busscher M, Angenent GC. (2002). Analysis of MADS-box protein-protein interactions in living plant cells. Proceedings of the National Academy of Sciences of the United States of America 99: 2416-2421.
Kim I, Cho E, Crawford K, Hempel FD, Zambryski P. (2005) Cell-to-cell movement of GFP during Arabidopsis embryogenesis and early seedling development. Proceedings of the National Academy of Sciences of the United States of America^ 02: 2227-2231.
Kofugi R, Sumikawa N, Yamasaki M, Kondo K, Ueda K, Ito M, Hasebe M. (2003). Evolution and divergence of the MADS-box gene family based on genome-wide expression analyses. Molecular Biology and Evolution 20: 1963-1977.
Mandel MA, Gustason-Brown C, Savidge B, Yanofsky MF. (1992). Molecular characterization of the Arabidopsis floral homeotic gene APETALA1. Nature 360:273-277.
Pafenicova L, de Folter S, Kieffer M, Horner DS, Favalli C, Busscher J, Cook H. E, Ingran RM, Kater MM, Davies B, Angenent GC, Colombo L. (2003). Molecular and phylogenetic analyses of the complete MADS-box transcription factor family in Arabidopsis: New openings to the MADS world. Plant Cell 15: 1538-1551.
Pelaz S, Ditta GS, Baumann E, Wisman E, Yanofsky, MF. (2000). B and C floral organ identity functions require SEPALLATA MADS-box genes. Nature 405: 200-203.
Perry SE, Nichols KW, Fernandez DE. (1996). The MADS domain protein AGL15 localizes to the nucleus during early stages of seed development. Plant Cell 8: 1977-1989.
Peter M, Ameer-Beg S M, Hughes M K Y, Keppler M D, Prag S, Marsh M, , Vojnovic B, Ng T .(2005). Multiphoton-FLIM quantification of the EGFP-mRFP1 FRET pair for localization of membrane receptor-kinase interactions. Biophysical Journal 88: 1224-1237.
Riechmann JL and Meyerowitz EM. (1997). MADS domain proteins in plant development. Biological. Chemistry 378: 1079-1101.
Simon R, Igeho Ml, Coupland G. (1996). Activation of floral meristem identity genes in Arabidopsis. Nature 384:59-62.
Theilien G and Saedler H. (2001). Floral quartets. Nature 409: 469-471. Walter M, Chaban C, Schutze K, Batistic O, Weckermann K, Nake C, Blazevic D,
Grefen C, Schumacher K, Oecking C, Harter K, and Kudla J. (2004).Visualization of protein interactions in living plant cells using bimolecular fluorescence complementation. Plant Journal 40: 428-438.
Xu X, Soutto M, Xie Q, Servick S, Subramanian C, von Arnim AG, Johnson CH. (2007). Imaging protein interactions with bioluminescence resonance energy transfer (BRET) in plant and mammalian cells and tissues. Proceedings of the National Academy of Sciences of the United States of America 104:1264-1269.
134
Samenvattina De biologische interpretatie van net genoom begint met het aflezen van het DNA, het
zogenaamde transcriptie proces. Dit belangrijke biologische proces is vaak een
onderdeel van signaal transductie routes en kan verschillende externe of interne
signalen integreren tot de juiste respons. In het proces van transcriptie spelen
transcriptiefactoren een essentiele en belangrijke rol en in hogere eukaryoten zijn
zeker tweeduizend verschillende transcriptiefactoren aanwezig, die op basis van o.a.
hun geconserveerde DNA bindingsdomein geclassificeerd kunnen worden in
verschillende families. De MADS box familie is een van de belangrijke families van
transcriptiefactoren voor planten en genetische analyses hebben uitgewezen dat
deze eiwitten betrokken zijn bij verschillende ontwikkelingsprocessen, zoals de
inductie van bloei, de vorming van bloemorganen en de vruchtzetting. In
tegenstelling tot de gedegen kennis betreffende de functie van de verschillende
MADS box transcriptiefactoren, is er weinig bekend over het werkingsmechanisme
van deze klasse van eiwitten op moleculair niveau. Biochemische experimenten en
analyses in gist hebben aangetoond dat MADS box eiwitten onderling aan elkaar
kunnen binden en gebaseerd op deze bevindingen is het zogenaamde "quartemary
model" ontwikkeld dat beschrijft hoe MADS box eiwitten mogelijk werken. Volgens dit
model vormen MADS box eiwitten dimeren, die vervolgens aan elkaar binden zodat
een complex van vier eiwitmoleculen ontstaat. Dit quarternaire complex kan dan aan
DNA binden op specifieke plaatsen in het genoom en bepaalde "target genen" aan-
of uitschakelen. Ondanks dat dit een aannemelijk model is voor het moleculaire
werkingsmechanisme van MADS box transcriptiefactoren, is er geen enkel
experimenteel bewijs voor aanwezig.
In dit proefschrift wordt beschreven hoe fysische interacties tussen verschillende
MADS box transcriptiefactoren van Petunia hybrida en de model plant Arabidopsis
thaliana (zandraket) zijn bestudeerd in levende plantencellen. Om dit te
bewerkstelligen zijn een aantal nieuwe geavanceerde microspectroscopische
technieken ontwikkeld en uitgetest. In het eerste hoofdstuk wordt in detail ingegaan
op het transcriptieproces in eukaryote organismen en de rol van transcriptiefactoren
hierin. De centrale vraag die gesteld wordt, is hoe transcriptiefactoren in staat zijn om
hun specifieke bindingsplaats, de zogenaamde cis-elementen, te vinden in de
enorme hoeveelheid en wirwar van DNA in de celkern. De verschillende
137

voorgestelde mechanismen hiervoor, zoals "looping" en "sliding" worden besproken,
evenals het belang van interacties tussen transcriptiefactoren voor hun functioneren.
Vervolgens wordt in hoofdstuk twee ingegaan op een eerste set experimented die
zijn uitgevoerd om interacties tussen verschillende combinaties van petunia MADS
box eiwitten aan te tonen in levende plantencellen. Om dit te bewerkstelligen zijn de
betreffende MADS box eiwitten gelabeld met verschillende kleur varianten van het
groen fluorescerend eiwit GFP. Deze gelabelde eiwitten zijn tot expressie gebracht in
blad protoplasten, die vervolgens zijn geanalyseerd met behulp van FRET-FLIM
(Fluorescence Resonance Energy Transfer-Fluorescence Lifetime Imaging)
microspectroscopie om een fysische interactie aan te tonen tussen de gelabelde
eiwitten. Het bleek goed mogelijk om met deze methode dimerisatie aan te tonen
voor de MADS box transcriptiefactoren en daarnaast is het eerste bewijs verkregen
voor de vorming van complexen van MADS box eiwitten bestaande uit meer dan
twee moleculen. Uit dit laatst genoemde experiment is gebleken dat de MADS box
eiwitten Floral Binding Protein2 (FBP2), FBP11, en FBP24, die gezamenlijk tot
expressie komen in zaadknoppen, een complex kunnen vormen in levende
plantencellen. Vergelijkbare analyses in blad protoplasten, voor Arabidopsis MADS
box eiwitten die betrokken zijn bij de vorming van kroonbladeren en meeldraden,
lieten zien dat er een duidelijk verschil is in bindingssterkte tussen verschillende
MADS box eiwitten (Hoofdstuk 3). Verder bleek uit deze experimenten dat veel
Arabidopsis MADS box eiwitten in staat zijn om met zichzelf te interacteren en
zogenaamde homodimeren kunnen vormen. Deze homodimeren konden echter niet
worden aangetoond met behulp van de analyses in gist. Uit deze analyses blijkt dus
dat de FRET technologie een gevoelige methode is en ook zeer zwakke binding kan
aantonen. Verder kan verondersteld worden dat in een plantencel, waar vaak
meerdere verschillende MADS box eiwitten aanwezig zijn, mogelijk alleen de sterkste
interacties plaats vinden en er dus competitie is voor binding tussen de verschillende
aanwezige eiwitten. Om dit soort effecten beter te kunnen bestuderen is er een
nieuwe technologie ontwikkeld, die beschreven staat in Hoofdstuk 4. Deze
ontwikkelde "Competition-FRET" methode maakt het mogelijk om de hiervoor
genoemde competitie effecten zichtbaar te maken. Daarnaast is het ook mogelijk om
met deze methode aan te tonen of de vorming van multimere complexen optreedt in
plaats van competitie voor dimerisatie. De ontwikkelde methode is uiteindelijk
gebruikt om te bepalen of de Arabidopsis MADS box eiwitten SEPALLATA3 (SEP3)
138
en AGAMOUS (AG) de voorkeur geven aan interactie met zichzelf
(homodimerisatie), interactie met elkaar (heterodimerisatie) of de vorming van een
groot complex van meerdere moleculen.
Alle hiervoor beschreven experimenten voor het aantonen van eiwit-eiwit interacties
zijn gebaseerd op FRET. Voor deze technologie zijn geavanceerde en dure
microscopische opstellingen nodig. Om deze reden is ervoor gekozen om een
alternatieve, goedkopere en theoretisch eenvoudiger methode te ontwikkelen en te
testen, die in het verleden goede resultaten heeft opgeleverd voor het aantonen van
eiwitinteracties in dierlijke cellen. De methode wordt BiFC (Bimolecular Fluorescence
Complementation) genoemd of "Split-YFP" en is gebaseerd op het opsplitsen van
een fluorescerend molecuul in twee inactieve delen. Deze delen worden vervolgens
gefuseerd aan de twee eiwitten van interesse. Indien de twee eiwitten aan elkaar
binden komen de twee helften van het fluorescerende molecuul samen en kunnen
hervouwen tot een actief eiwit wat een lichtsignaal zal geven. In onze studie hebben
we gebruik gemaakt van het geel fluorescerende eiwit YFP en zijn we er in geslaagd
om de al bekende interactie tussen AG en SEP3 aan te tonen in de kern van
Arabidopsis blad protoplasten (Hoofdstuk 5). Net als de FRET methode geeft deze
techniek dus inzicht in de specifieke interacties tussen eiwitten in levende planten
cellen. Geen van de beide technieken kan echter duidelijk aangeven hoe een
gevormd complex is opgebouwd en hoeveel moleculen er daadwerkelijk aanwezig
zijn in een complex. Een mogelijke manier om meer inzicht te krijgen in de grootte
van een gevormd complex is om bijvoorbeeld naar de diffusie van complexen te
kijken. In theorie zal een complex bestaande uit meerdere eiwitten groter zijn en zich
langzamer bewegen in een oplossing of eel. Deze diffusie van eiwit complexen kan
gemeten worden met FCS (Fluorescence Correlation Spectroscopy) en dit is in deze
studie gedaan voor de door middel van in vitro transcriptie/translatie geproduceerde
AG-YFP en SEP3-YFP fusie-eiwitten (Hoofdstuk 6). De verkregen resultaten
suggereren dat SEP3 mogelijk homodimeren vormt, terwijl AG in staat is om grotere
complexen te vormen. Indien beide eiwitten tegelijk in oplossing werden gebracht,
bleek er een complex gevormd te worden met een zeer lage diffusie snelheid, wat
suggereert dat een groot multimeer complex gevormd wordt. Of in een plantencel
vergelijkbare complexen gevormd worden blijft de vraag, want alle gegevens zijn
verkregen met in vitro geproduceerde eiwitten.
139
In het laatste afsluitende hoofdstuk worden de voor- en nadelen van alle hiervoor
beschreven technieken voor het aantonen van eiwit-eiwit interacties in levende
plantencellen op een rijtje gezet. Hieruit blijkt duidelijk dat iedere techniek zijn eigen
plus- en minpunten heeft. Daarnaast blijkt duidelijk dat een volgende stap in het
onderzoek is om de bindingscapaciteit van MADS box eiwitten te testen in gehele
weefsels of planten, waarbij de eiwitten in normale concentraties aanwezig zijn. Om
de mogelijkheden hiervoor te testen is in een pilot experiment gedaan om de FRET-
FLIM technologie toe te passen op groeipunten van Arabidopsis planten. Hieruit blijkt
duidelijk dat de techniek op dit moment nog niet gevoelig genoeg is. Echter op basis
van de resultaten behaald in deze studie en de snelle vooruitgang in de wereld van
de fluorescerende eiwitten en microspectroscopie is te voorspellen dat dit zeer
waarschijnlijk tot de mogelijkheden gaat behoren in de nabije toekomst.
140
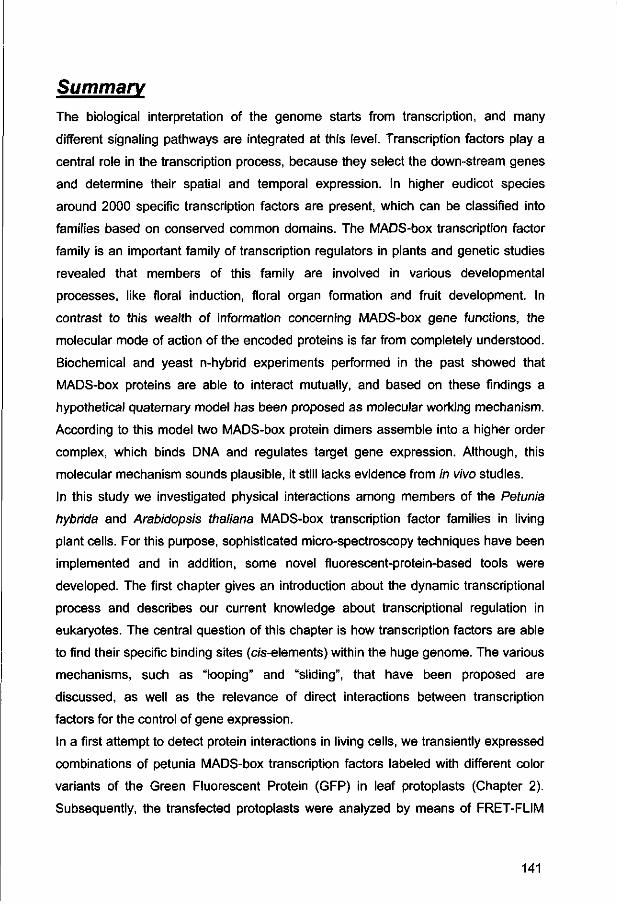
Summary The biological interpretation of the genome starts from transcription, and many
different signaling pathways are integrated at this level. Transcription factors play a
central role in the transcription process, because they select the down-stream genes
and determine their spatial and temporal expression. In higher eudicot species
around 2000 specific transcription factors are present, which can be classified into
families based on conserved common domains. The MADS-box transcription factor
family is an important family of transcription regulators in plants and genetic studies
revealed that members of this family are involved in various developmental
processes, like floral induction, floral organ formation and fruit development. In
contrast to this wealth of information concerning MADS-box gene functions, the
molecular mode of action of the encoded proteins is far from completely understood.
Biochemical and yeast n-hybrid experiments performed in the past showed that
MADS-box proteins are able to interact mutually, and based on these findings a
hypothetical quaternary model has been proposed as molecular working mechanism.
According to this model two MADS-box protein dimers assemble into a higher order
complex, which binds DNA and regulates target gene expression. Although, this
molecular mechanism sounds plausible, it still lacks evidence from in vivo studies.
In this study we investigated physical interactions among members of the Petunia
hybrida and Arabidopsis thaliana MADS-box transcription factor families in living
plant cells. For this purpose, sophisticated micro-spectroscopy techniques have been
implemented and in addition, some novel fluorescent-protein-based tools were
developed. The first chapter gives an introduction about the dynamic transcriptional
process and describes our current knowledge about transcriptional regulation in
eukaryotes. The central question of this chapter is how transcription factors are able
to find their specific binding sites (c/s-elements) within the huge genome. The various
mechanisms, such as "looping" and "sliding", that have been proposed are
discussed, as well as the relevance of direct interactions between transcription
factors for the control of gene expression.
In a first attempt to detect protein interactions in living cells, we transiently expressed
combinations of petunia MADS-box transcription factors labeled with different color
variants of the Green Fluorescent Protein (GFP) in leaf protoplasts (Chapter 2).
Subsequently, the transfected protoplasts were analyzed by means of FRET-FLIM
141
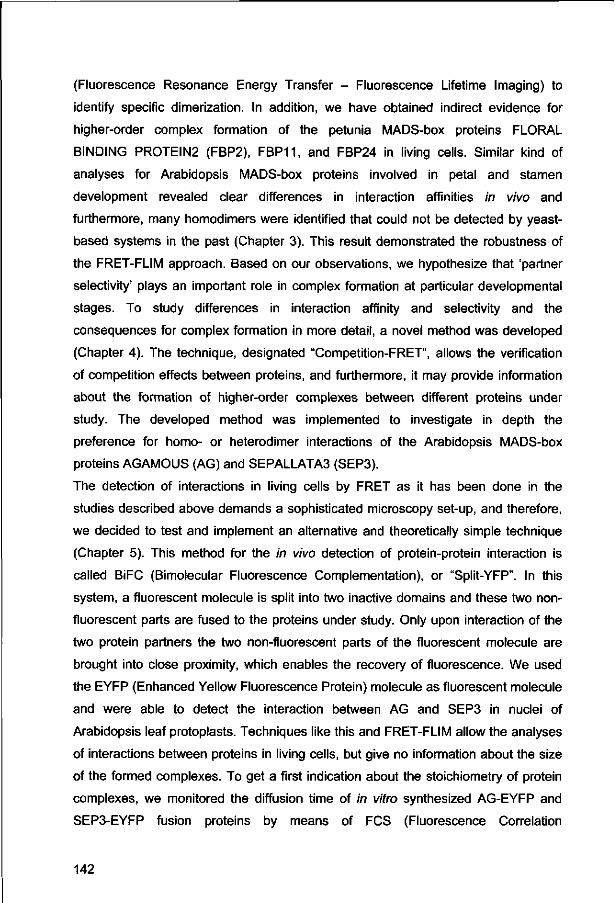
(Fluorescence Resonance Energy Transfer - Fluorescence Lifetime Imaging) to
identify specific dimerization. In addition, we have obtained indirect evidence for
higher-order complex formation of the petunia MADS-box proteins FLORAL
BINDING PROTEIN2 (FBP2), FBP11, and FBP24 in living cells. Similar kind of
analyses for Arabidopsis MADS-box proteins involved in petal and stamen
development revealed clear differences in interaction affinities in vivo and
furthermore, many homodimers were identified that could not be detected by yeast-
based systems in the past (Chapter 3). This result demonstrated the robustness of
the FRET-FLIM approach. Based on our observations, we hypothesize that 'partner
selectivity' plays an important role in complex formation at particular developmental
stages. To study differences in interaction affinity and selectivity and the
consequences for complex formation in more detail, a novel method was developed
(Chapter 4). The technique, designated "Competition-FRET", allows the verification
of competition effects between proteins, and furthermore, it may provide information
about the formation of higher-order complexes between different proteins under
study. The developed method was implemented to investigate in depth the
preference for homo- or heterodimer interactions of the Arabidopsis MADS-box
proteins AGAMOUS (AG) and SEPALLATA3 (SEP3).
The detection of interactions in living cells by FRET as it has been done in the
studies described above demands a sophisticated microscopy set-up, and therefore,
we decided to test and implement an alternative and theoretically simple technique
(Chapter 5). This method for the in vivo detection of protein-protein interaction is
called BiFC (Bimolecular Fluorescence Complementation), or "Split-YFP". In this
system, a fluorescent molecule is split into two inactive domains and these two non-
fluorescent parts are fused to the proteins under study. Only upon interaction of the
two protein partners the two non-fluorescent parts of the fluorescent molecule are
brought into close proximity, which enables the recovery of fluorescence. We used
the EYFP (Enhanced Yellow Fluorescence Protein) molecule as fluorescent molecule
and were able to detect the interaction between AG and SEP3 in nuclei of
Arabidopsis leaf protoplasts. Techniques like this and FRET-FLIM allow the analyses
of interactions between proteins in living cells, but give no information about the size
of the formed complexes. To get a first indication about the stoichiometry of protein
complexes, we monitored the diffusion time of in vitro synthesized AG-EYFP and
SEP3-EYFP fusion proteins by means of FCS (Fluorescence Correlation
142

Spectroscopy). From these experiments described in Chapter 6, we could speculate
that SEP3 is present as a dimer and also as a higher order complex, whilst AG on its
own is able to assemble into larger complexes. The diffusion time of the product
formed upon co-translation of both AG and SEP3, suggests that a multimeric protein
complex with a high molecular weight is formed upon interaction between AG and
SEP3. Even though FCS is a powerful technique, these interpretations should be
taken cautiously, mainly because these experiments were done in vitro instead of in
living cells. Finally, in the last chapter we discuss the various methods that have
been implemented and developed to monitor protein-protein interactions and
complex formation of MADS-box transcription factors in living plant cells.
Furthermore, we made a first step to monitor interactions in intact tissues under
endogenous expression levels, and the preliminary results obtained from these in
planta FRET-FLIM measurements are discussed.
143

Curriculum Vitae Isabella Antonia Nougalli Tonaco was born on the 25th of April 1977 in Sao Paulo,
Brazil. From 1995-2000, she studied Agronomy at Federal University of Lavras
(UFLA), located at Minas Gerais state, Brazil. After her degree, she gave
continuation on her studies following a Masters degree on Genetics and Plant
Breeding at the same University. During her Master thesis, she studied the genetic
mechanism controlling a natural existent mutant affecting flower development in
Eucalyptus trees, where she got her first interest in developmental genetics. With this
interest, she contacted Prof. dr. Gerco Angenent at Plant Research International
(PRI) for the possibility to perform her PhD study in The Netherlands. At the end of
the year 2002, she obtained a Brazilian grant (CAPES) to follow up her PhD study
abroad. In December of the same year she moved to Wageningen, to do her PhD
within the group of Prof. dr. Gerco Angenent (PRI), in collaboration with Prof. dr.
Sacco de Vries from the Biochemistry department at Wageningen University. The
present thesis is the result of her research within this collaboration.
144

List of publications and manuscripts in preparation
Nougalli-Tonaco IA, Immink RGH, de Vries SC, Angenent GC and Gadella TW Jr.
Competition-FRET: a new method to monitor protein-protein interactions in living
cells. In preparation.
Nougalli-Tonaco IA, Borst JW, de Vries SC, Angenent GC and Immink RGH.
Physical interactions and dimerization affinity in vivo for MADS-box proteins
involved in petal and stamen formation. In preparation.
Nougalli-Tonaco IA, Kaufmann K, Hink M, Engel R, de Vries SC, Angenent GC and
Immink RGH. Diffusion of MADS-box proteins and complexes. In preparation.
Ciannamea S, Kaufmann K, Frau M, Nougalli-Tonaco IA, Petersen K, Nielsen KK,
Angenent GC and Immink RGH. (2006). Protein features of MADS box
transcription factors involved in flowering in Lolium perenne. J.Exp.Bot. 57, 3419-
3431.
Borst JW, Nougalli-Tonaco IA, Hink MA, Hoek AV Immink RGH and Visser AJWG.
(2006). Protein-protein interactions in vivo: Use of Biosensors based on FRET In:
Reviews in Fluorescence 2006 / Geddes, CD., Lakowicz, J.R. - New York:
Kluwer Academic/Plenum Publishers, - p. 341 - 355.
Nougalli-Tonaco IA, Borst JW, de Vries SC, Angenent GC and Immink RGH.
(2006). In vivo imaging of MADS-box transcription factors interactions. J. Exp.
Bot. 57, 33-42.
145

Acknowledgements Five years ago I came to the Netherlands aiming to do my PhD. During this time I
have collected a number of good memories and unforgettable moments. It was my
first time abroad and things were certainly very challenging for me. I had a good
combination of feelings, as every foreigner elsewhere in the world. Lovely memories
combined with tough periods, which gave me personal strength and a better
understanding of myself.
Since doing a PhD thesis comprises not only an intellectual training, but also a
personal achievement I would like to thank those, who I shared a great time during
my stay in the Netherlands.
Brazilians are by default very communicative, and these communication skills helped
me to get in touch oversea with Antonio Chalfun. Antonio, I would like to thank you
very much for the great support that you and your family gave me before and after I
did arrive in Wageningen.
Antonio was a PhD student in the group of Prof. dr. Gerco Angenent at Plant
Research International (PRI) and helped me to get in touch with Gerco, from whom I
got promptly help and support for my application as PhD fellow in his lab. I would like
to thank you, Gerco, for this opportunity, the challenging project you suggested to me
and the nice discussions during my PhD time. I have learned a lot from you and your
group and this experience will definitely be very important for my professional
development, thanks a lot!
In Gerco's group, I was supervised by Dr. Richard Immink, with whom I also shared
my office and the lab bench. I have very good memories from the time we spent
working together and I would like to thank you very much for your support, guidance,
discussions and good atmosphere. I guess the office is less loud and more organized
since I left, as counterpart I am finally able to use my agenda very efficiently and I
quite often catch myself eating while working in front of the PC.
I also would like to thank all my colleagues from PRI: John, Marco and Jacqueline,
Stefan and Nayelli, Jeroen, Ruud, Silvia, Patricia, Guadong, Martijin, Kim, Wilco,
Chun Ming, Ronny, Michiel, Jan, Jannie and many visiting scientists that I had the
opportunity to meet and exchange experiences with. Thank you all for the nice
environment and good moments.
146

I would like to especially thank Susan and Kerstin for the nice time we spent
together: working, eating and talking ... Thanks to both of you for being very nice and
supportive friends. I really enjoy our friendship and I hope we keep in touch!
Just to make things a little bit more challenging, going abroad was in a certain way
not enough for me; therefore I had to have a new subject as well, something quite
different than I was used to, with this idea in mind I immediately accepted my PhD
project which had several novel techniques such as FLIM and FCS as approaches to
better understand the molecular mechanisms of plant MADS-box transcription
factors. I really liked my project, and even though things did not always work so
easily at the beginning I could keep my enthusiasm throughout the years. This
exciting project put me in direct collaboration with several other people, with whom I
shared a great time at the scientific and personal level as well.
To start with, I would like to thank Prof. dr. Dorus Gadella Jr., with whom I had the
opportunity to work closely together while developing the Competition-FRET method.
I would like to thank you Dorus for being a very inspiring and motivating scientist to
me. It was a great pleasure for me to have worked directly with you, thanks a lot!
I would like to sincerely thank my promotor Prof. dr. Sacco de Vries, of the
Biochemistry department at Wageningen University. I would like to thank you Sacco
for giving me the nice opportunity to join your group as your student as well. I felt
very supported by you and your group during these years. Further, I would like to
thank you for your input and the nice discussions we had, and of course for the good
scientific opportunities that you encouraged me to take and to follow in order to train
and develop myself. Thank you so much!
Biochemistry has been my other nice working environment and there I also met a
couple of nice people that I would like to thank.
I spent a very long time at the basement of Biochemistry doing my FLIM and FCS
measurements. During this time I have been very supported and helped by Jan
Willem, whom I would like to especially thank! I have learned a lot from you and I
really enjoyed the time we worked together. Thanks for being always very helpful and
a very good friend during these years.
I also would like to thank Mark Hink and Ruchira for the FCS measurements. I really
learned a lot from both of you and I appreciate very much our discussions and your
help.
147

I also spent quite some time at Biochemistry either preparing my samples, running up
and down the stairs or during the embryo work discussions, for this I would like to
thank many people that I had the opportunity to meet: Jacques, Adrie and Simon
(thanks a lot for the gel filtration analysis!), Sanne, Jenny, Cathy, Dolf, Mark and
Sofia (obrigada pelo apoio e muitas risadas em varios dias cinzentos!)
I would like to especially thank Rumyana and Jose for the nice friendship and good
times that we had together, I wish for both of you happy days and lots of success and
I hope we keep in touch in the future.
I also had a great chance to meet many foreigners outside work...From this
community I would like to especially thank: Rafaela, Asaph, Teun, Tetti, Salva,
Mazel, Rumyana and Nicolai, Alessandra, Cinzia, Rada, Radi, Giulia, Shital, Vassilis,
Arjen (thanks a lot for helping me moving my stuff around every now and then!),
Anna Shchennikova (my sister! Oh! ahahaa) and finally to Stefano (thanks a lot for
your friendship, I wish you all the best).
But Wageningen has been quite tropical during these years, with many dinners,
parties and get-togethers of the brazilian community. I would like to thank many
brazilian friends that I met in Wageningen as well: Joana e Pirn (obrigada pela sua
amizade e carinho durante estes anos, fico muito feliz por voces!), Gilma, Paulo e
Vera, JM e Cia, Wagner, Simone e Cristiano, Mario e Ana, Nilvanira, Marcia,
Luciana, inesquecivel Tania, amigao querido Flavio, Anabele e turma, Michael,
Ulisses (vulgo Juju, ahahaha), Saulo, Vanja, and many other friends that I met during
this time. Thanks for the nice time together. And of course the unforgettable family
from the Bomesesteeg 16+18 floor: Odair, Glaciela e Valentin (obrigada pelo carinho
e atencao durante estes anos, adoro vcs!), Celso (ermao) e Ritinha (cunhada), Rubia
(querida), Anderson (fala ai irmao...ahaha).
Tambem gostaria de agradecer meus familiares e amigos do Brazil, pelo apoio e
suporte durante estes anos. Em especial, Fabio e familia, prof. Lisete (Lavras) e prof.
Magno (Lavras), pelo grande apoio e incentivo durante minha vinda e meus estudos.
Minha tese nao teria sido a mesma sem o constante apoio das queridas amigas
Eunice e Rose! Muito obrigada pelo carinho, atencao e amizade, durante nossas
interminaveis conversas telefonicas nestes cinco anos. Sem voces este doutorado
teria sido muito mais dificil, muito obrigada por tudo!
148

My deepest thanks to Eike. Your love, care and truly friendship made me strong and
confident again. From you I have learned that true love makes everything possible.
Finally I would like to thank my parents for giving me the necessary strength that I
need to go on in my lifes dreams, even though physically separated I will always
keep you both with me.
149
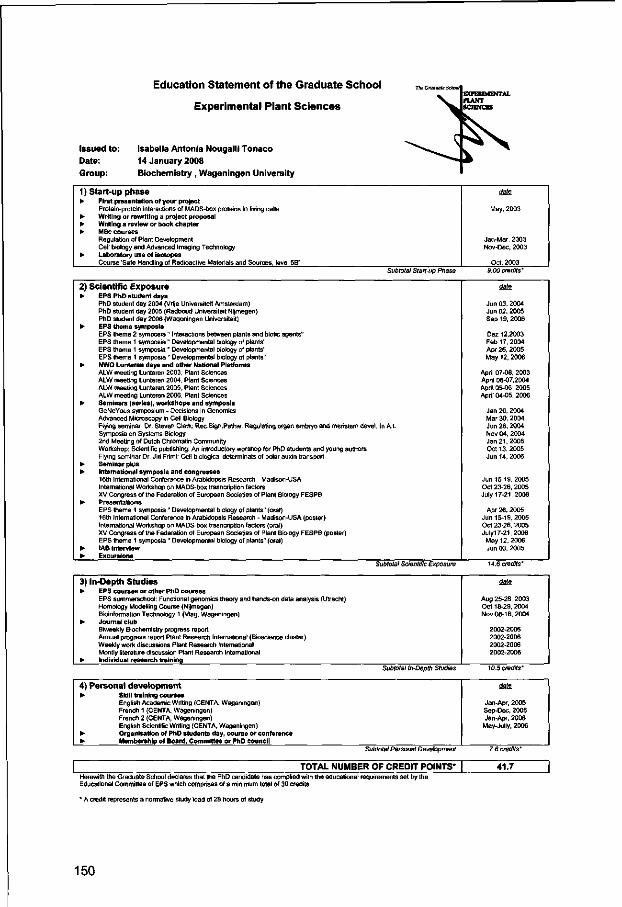
Issued to: Date: Group:
Education Statement of the Graduate School n,r0r^,ri,t„.!\
Experimental Plant Sciences
Isabella Antonia Nougalli Tonaco 14 January 2008 Biochemistry, Wageningen University
1) Start-up phase • First presentation of your project
Protein-protein interactions of MADS-box proteins in living cells • Writing or rewriting a project proposal • Writing a review or book chapter • MSc courses
Regulation of Plant Development Cell biology and Advanced Imaging Technology
• Laboratory use of isotopes Course 'Safe Handling of Radioactive Materials and Sources, level 5B'
date
May, 2003
Jan-Mar, 2003 Nov-Dec, 2003
Oct, 2003 Subtotal Start-up Phase
2) Scientific Exposure • EPS PhD student days
PhD student day 2004 (Vrije Universiteit Amsterdam) PhD student day 2005 (Radboud Universiteit Nijmegen) PhD student day 2006 (Wageningen Universiteit)
• EPS theme symposia EPS theme 2 symposia " Interactions between plants and biotic agents" EPS theme 1 symposia " Developmental biology of plants" EPS theme 1 symposia " Developmental biology of plants" EPS theme 1 symposia " Developmental biology of plants"
• NWO Lunteren days and other National Platforms ALW meeting Lunteren 2003, Plant Sciences ALW meeting Lunteren 2004, Plant Sciences ALW meeting Lunteren 2005, Plant Sciences ALW meeting Lunteren 2006, Plant Sciences
• Seminars (series), workshops and symposia GeNeYous symposium - Decisions in Genomics Advanced Microscopy in Cell Biology Flying seminar Dr. Steven Clark: Rec.Sign.Pathw. Regulating organ embryo and meristem devel. In A.t. Symposia on Systems Biology 2nd Meeting of Dutch Chromatin Community Workshop: Scientific publishing: An introductory worshop for PhD students and young authors Flying seminar Dr. Jiri Friml: Cell biological determinats of polar auxin transport
• Seminar plus • International symposia and congresses
16th International Conference in Arabidopsis Research - Madison-USA International Workshop on MADS-box trasncription factors XV Congress of the Federation of European Societies of Plant Biology FESPB
• Presentations EPS theme 1 symposia " Developmental biology of plants" (oral) 16th International Conference in Arabidopsis Research - Madison-USA (poster) International Workshop on MADS-box trasncription factors (oral) XV Congress of the Federation of European Societies of Plant Biology FESPB (poster) EPS theme 1 symposia " Developmental biology of plants" (oral)
• IAB interview *• Excursions
date
Jun 03, 2004 Jun 02, 2005 Sep 19. 2006
Dez 12,2003 Feb 17,2004 Apr 26. 2005 May 12, 2006
April 07-08, 2003 April 06-07,2004 April 05-06, 2005 April 04-05. 2006
Jan 20, 2004 Mar 30, 2004 Jun 28, 2004 Nov 04, 2004 Jan 21, 2005 Oct 13, 2005 Jun 14, 2006
Jun 15-19, 2005 Oct 23-26, 2005 July 17-21, 2006
Apr 26, 2005 Jun 15-19, 2005 Oct 23-26, 2005 July17-21,2006
May 12, 2006 Jun 03, 2005
Subtotal Scientific Exposure
3) In-Depth Studies • EPS courses or other PhD courses
EPS summerschool: Functional genomics:theory and hands-on data analysis (Utrecht) Homology Modelling Course (Nijmegen) Bioinformation Technology 1 (Vlag, Wageningen)
• Journal club Biweekly Biochemistry progress report Annual progress report Plant Research International (Bioscience cluster) Weekly work discussions Plant Research International Montly literature discussion Plant Research International
•• Individual research training
date
Aug 25-28, 2003 Oct 18-29. 2004 Nov 08-16. 2004
2002-2006 2002-2006 2002-2006 2002-2006
Subtotal ln~Depth Studies
4) Personal development • Skill training courses
English Academic Writing (CENTA, Wageningen) French 1 (CENTA, Wageningen) French 2 (CENTA, Wageningen) English Scientific Writing (CENTA, Wageningen)
• Organisation of PhD students day, course or conference • Membership of Board, Committee or PhD council
date
Jan-Apr, 2005 Sep-Dec, 2005 Jan-Apr, 2006
May-Jully, 2006
Subtotal Personal Development
TOTAL NUMBER OF CREDIT POINTS* 41.7 Herewith the Graduate School declares that the PhD candidate has complied with the educational requirements set by the Educational Committee of EPS which comprises of a minimum total of 30 credits
* A credit represents a normative study load of 28 hours of study
150
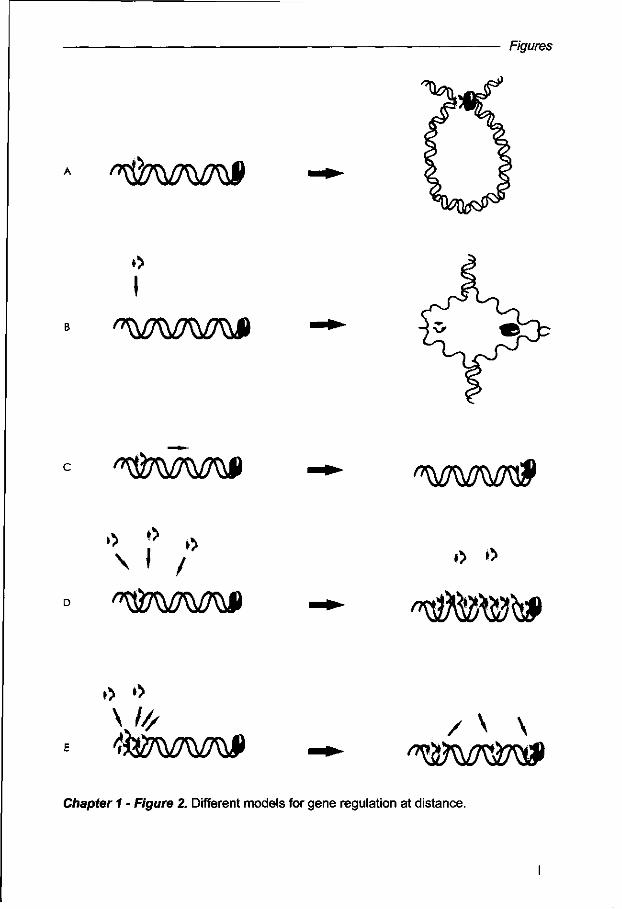
Figures
^AVAVAJ
I
'WMMW
"^7MM^D "^AiZfiUfif
» Y »>
Chapter 1 - Figure 2. Different models for gene regulation at distance.

Figures
Chapter 2 - Figure 1. Localization of MADS-box proteins in protoplasts.
Chapter 3 - Figure 1. Localization of MADS-box proteins in Arabidopsis leaf
protoplasts.

Figures
I 1
I , !1
i i HniniMu Latum* M
•AwHMIM
FBP2CFP+PFGVFP
JILL
!«
FBP2CFP*fBP11YFP
^JkL lm„,
FkMitKtnc* LHriin* |i
,»» M l H,
1 I !
FBP2CFP*FBP24YFP
.iii^ FBPt1CFP*FBP2JYFP
• i # r * M M k w MHw
FhwiMusc* LMfcBt »
FBP24CFP*FBP24YFP
0 JTwJVTflTn W.ifinWuiWHiHiiffiW^
8 § MmM
i 1
FBP11CFP+PBP24YFP+W2
! =
1,5ns T 2,45ns
Chapter 2 - Figure 2. Monitoring Fluorescence Resonance Energy Transfer (FRET) by Fluorescence Lifetime Imaging Microscopy (FLIM).

Figures
^ l I I l I i l
SEPW*P*SEP3-YFP
m i I
AW*P»AG-VFP
^ 8 I
AP3-CFP*APJ-YFP
^TjJT AyviV g^ ? I I I
Pt-CFPtpl-VFP
„..^K •ns x 2.6ns
! I
I ! I I I 1 I I Fkcnwanc* UMtna (pa)
Chapter 3 - Figure 2. Detection of Fluorescence Energy Transfer (FRET) by Fluorescence Lifetime Imaging Microscopy (FLIM) for different MADS-box protein homodimers combinations
P 1 - C F P « A P 3 - Y F P
1,5ns X 2,6i
Chapter 3 - Figure 5. APETALA3-PISTILLATA and SEPALLATA 3 form a higher-order complex in vivo
IV

Figures
AG-CFP+SEP3-YFP
2?E I 1 I 1 I I
Fluorescence lifetime (pa)
AP1-CFP*SEP3-YFP m s § g 8 8 8
Fluorescence Lifetime (ps)
AP3-CFP+SEP3-YFP
^ E I I
Fluorescence Lifetime (ps)
PI-CFP*SEP3-YFP
^A 1 I
Fluorescence Lifetime (ps)
AG-CFP+AP3-YFP
iiji/MWy Fluorescence Lnaome (psj
PI-CFP+AG-YFP
r<^"AA/wr Fluorescence Lifetime (ps)
PI-CFP»AP3-YFP
n*F V. Fluorescence Litetime (ps)
m Fluorescence Lifetime (ps)
2.4ns
Chapter 3 - Figure 3. Detection of Fluorescence Energy Transfer (FRET) by Fluorescence Lifetime Imaging Microscopy (FLIM) for different MADS-box protein combinations.
V

Figures
i: ^
I ! I I 1 1
1:F Ag-CfP+SEPMC-YFP
l ^SP ! ! I I I I
*P1-CFP»S6P3-YFP
^ £ ! 1 I I 1 I I
FluorMcanca LHallmt (pt)
AP1-CFP+8EPMC-YFP
5 ^ I ! 8 I I 8 I 8
AP3-CFP»S£PJ.YFP
^ I S 1 I
AP3-CfP+SEP3dC-rFP
l:l ^*M* v4W^ ? ! f I 8 8 I
PI-CFP«BGP3-VFP
^ « ^ 8 I i
PhCFP*lKPSdC-VFP
rJLA C^.tfJ ^ t e ? 8 I I S 8 I 8
MPJ.gP»8eP3-VFP
^ I I 8 I 8 8 1 S
8tP3-CFP»BEPMC-YFP
1 1 1 8 8 8 8 8
1,5ns X 2,6ns
Chapter 3- Figure 4. Interactions of SEPALLATA 3 lacking the C domain
VI

Figures
Competition - FRET
A
-P Donor Acceptor
FRET
Competitor
v^1
No FRET
\j»% Donor Acceptor Competitor
Interaction
FRET
AT Increase in FRET
«aP
A
Donor Acceptor Competitor ^ ^ ^ ^ ^ ^ Donor Acceptor
FRET 4 V_^
No FRET changes
Chapter 4- Figure 1. Competition-FRET can be used for the detection of differences in dimerization affinity and competition effects between molecules
VII
Figures
Chapter 4- Figure 2. FRET analysis of EYFPtoECFP.
VIII

Figures
Chapter 5 - Figure 2. Schematic 3D-representation of the YFP molecule
Chapter 5 Figure 3. Detection of protein-protein interactions for the MADS-box proteins FBP2 and FBP11 in living cowpea protoplasts by BiFC, making use of the pSPYNE and pSPYCE vector set.
Cyan light emission
YFP/N YFP/C
CFP
i • ** <**
v ^ \tf=
Yellow light emission
Chapter 5 - Figure 4. Scheme to represent the BiFC-FRET approach.
IX

Figures
el slwl
1,5ns T 2,45ns
Chapter 7 - Figure 1. FLIM measurements in Arabidopsis protoplasts, ovules and intact flower buds.
This work has been financially supported by CAPES Brazil. BEX 0970/01-8