Phoebe Runciman Prof. Wayne Derman Dr. Suzanne Ferreira Dr. … · 2019-01-30 · Phoebe Runciman 1...
14
Phoebe Runciman 1 Prof. Wayne Derman 1 Dr. Suzanne Ferreira 2 Dr. Yumna Albertus-Kajee 1 Dr. Ross Tucker 1 1 University of Cape Town 2 Stellenbosch University
Transcript of Phoebe Runciman Prof. Wayne Derman Dr. Suzanne Ferreira Dr. … · 2019-01-30 · Phoebe Runciman 1...
Phoebe Runciman1
Prof. Wayne Derman1
Dr. Suzanne Ferreira2
Dr. Yumna Albertus-Kajee1
Dr. Ross Tucker1
1University of Cape Town2Stellenbosch University
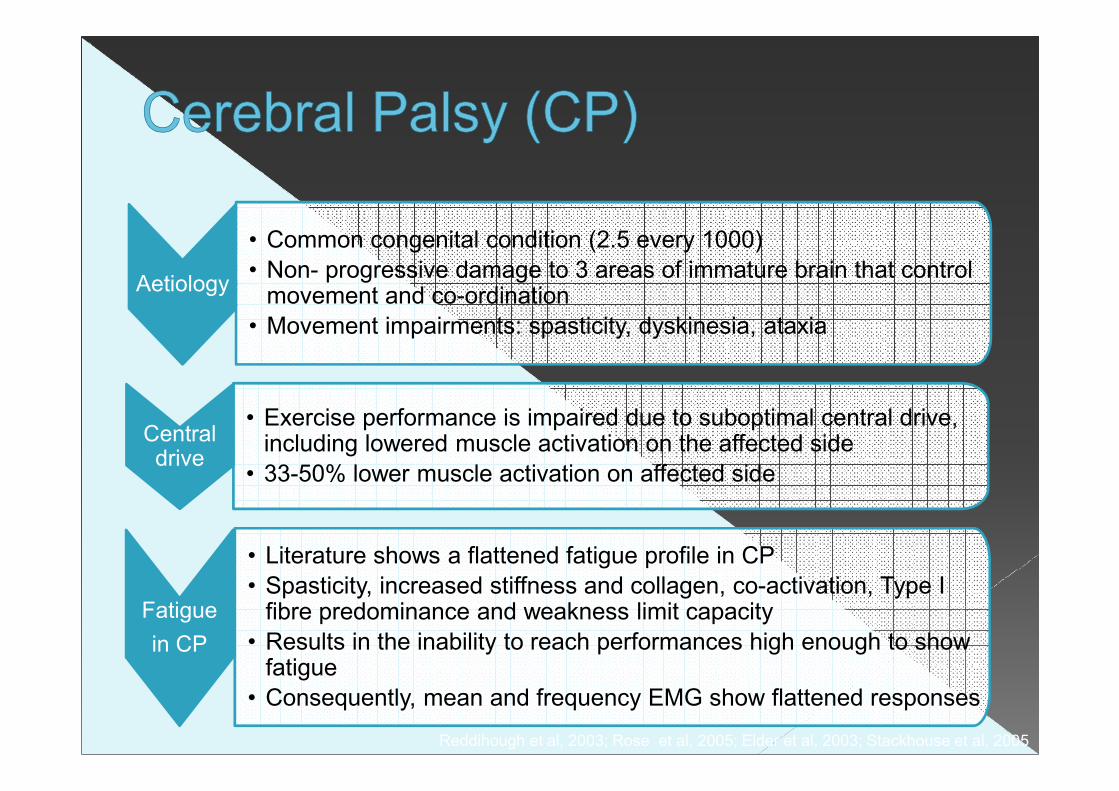
Aetiology
• Common congenital condition (2.5 every 1000)
• Non- progressive damage to 3 areas of immature brain that control movement and co-ordination
• Movement impairments: spasticity, dyskinesia, ataxia
• Exercise performance is impaired due to suboptimal central drive, including lowered muscle activation on the affected side
• 33-50% lower muscle activation on affected side
Fatigue
in CP
• Literature shows a flattened fatigue profile in CP
• Spasticity, increased stiffness and collagen, co-activation, Type I fibre predominance and weakness limit capacity
• Results in the inability to reach performances high enough to show fatigue
• Consequently, mean and frequency EMG show flattened responses
Reddihough et al, 2003; Rose et al, 2005; Elder et al, 2003; Stackhouse et al, 2005
Central drive
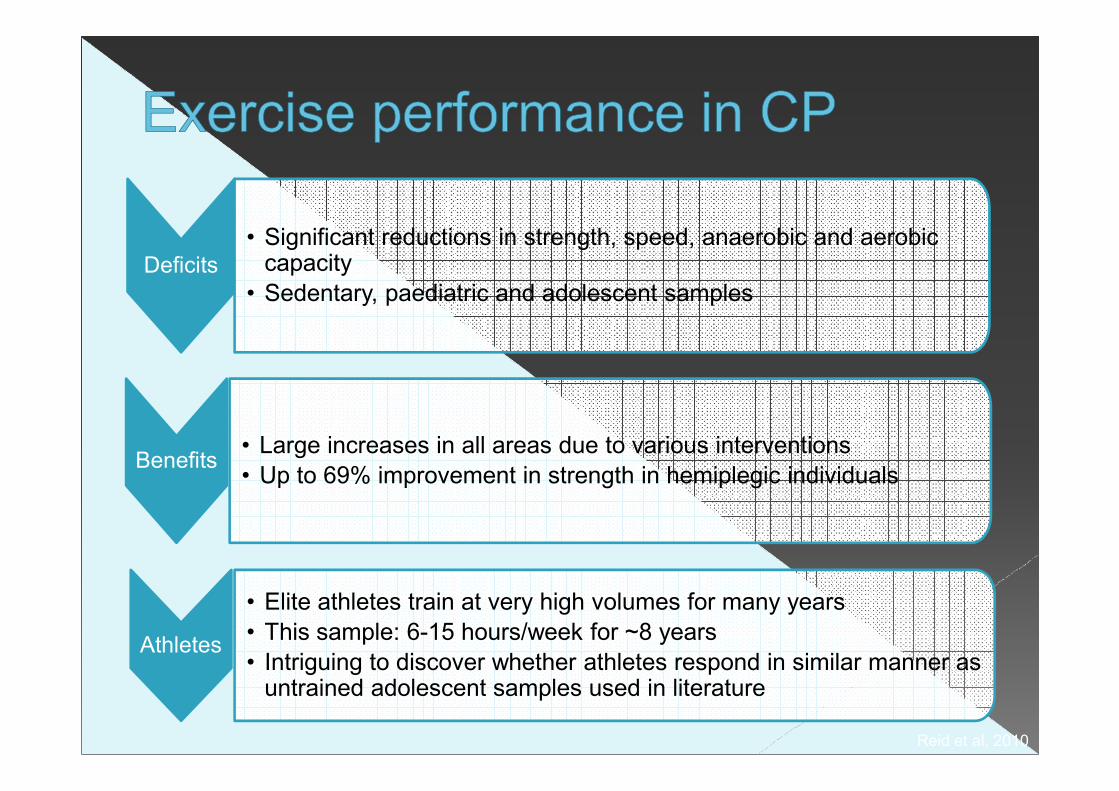
Deficits
• Significant reductions in strength, speed, anaerobic and aerobic capacity
• Sedentary, paediatric and adolescent samples
Benefits• Large increases in all areas due to various interventions
• Up to 69% improvement in strength in hemiplegic individuals
Athletes
• Elite athletes train at very high volumes for many years
• This sample: 6-15 hours/week for ~8 years
• Intriguing to discover whether athletes respond in similar manner as untrained adolescent samples used in literature
Reid et al, 2010

Aim
� To describe sprint cycling performance and neuromuscular
characteristics in elite athletes with CP, compared to well-trained
sprint-matched able-bodied (AB) athletes
Hypothesis
� Athletes with CP will demonstrate lower power output and a
maintenance of EMG activation over the trial (flat fatigue profile),
similar to the response found in untrained, paediatric samples
15 min restWarm-up period –
5 min
Warm-down
period
Measurement of EMG activity
used for normalization
Ensure maximal effort in WIN30
WIN 30WIN 10
Maximal sprint cycling trials
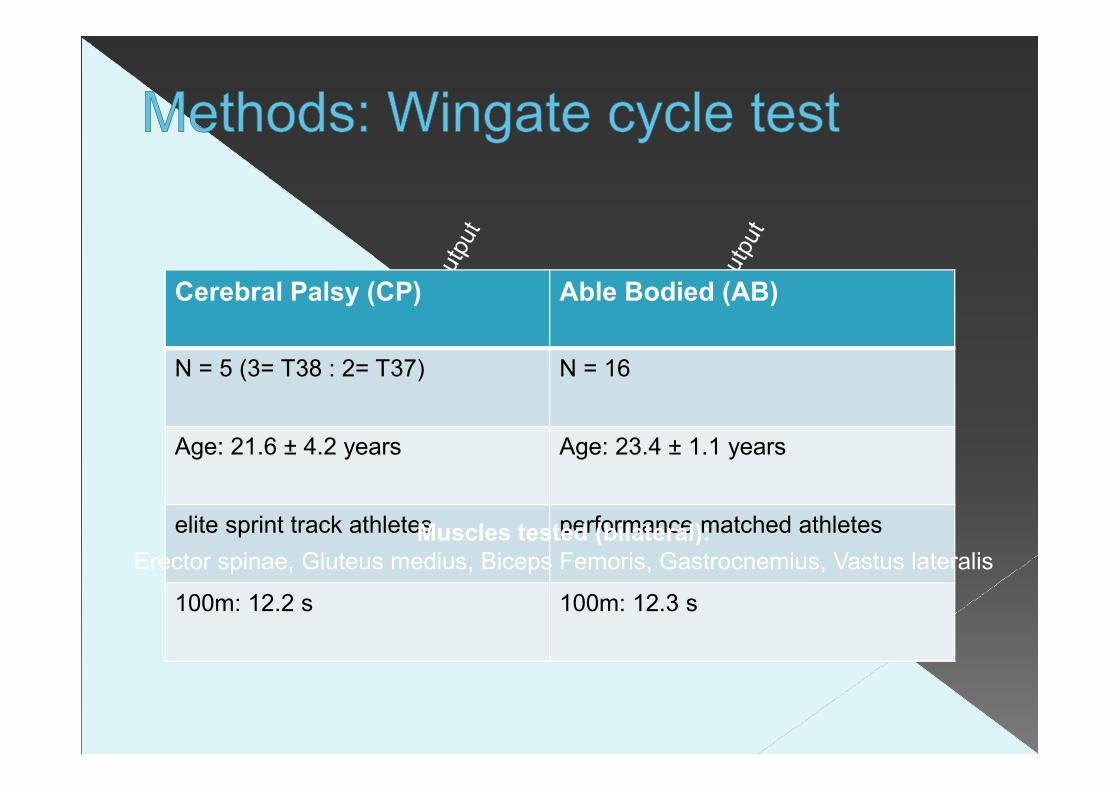
Cerebral Palsy (CP) Able Bodied (AB)
N = 5 (3= T38 : 2= T37) N = 16
Age: 21.6 ± 4.2 years Age: 23.4 ± 1.1 years
elite sprint track athletes performance matched athletes
100m: 12.2 s 100m: 12.3 s
Muscles tested (bilateral):
Erector spinae, Gluteus medius, Biceps Femoris, Gastrocnemius, Vastus lateralis
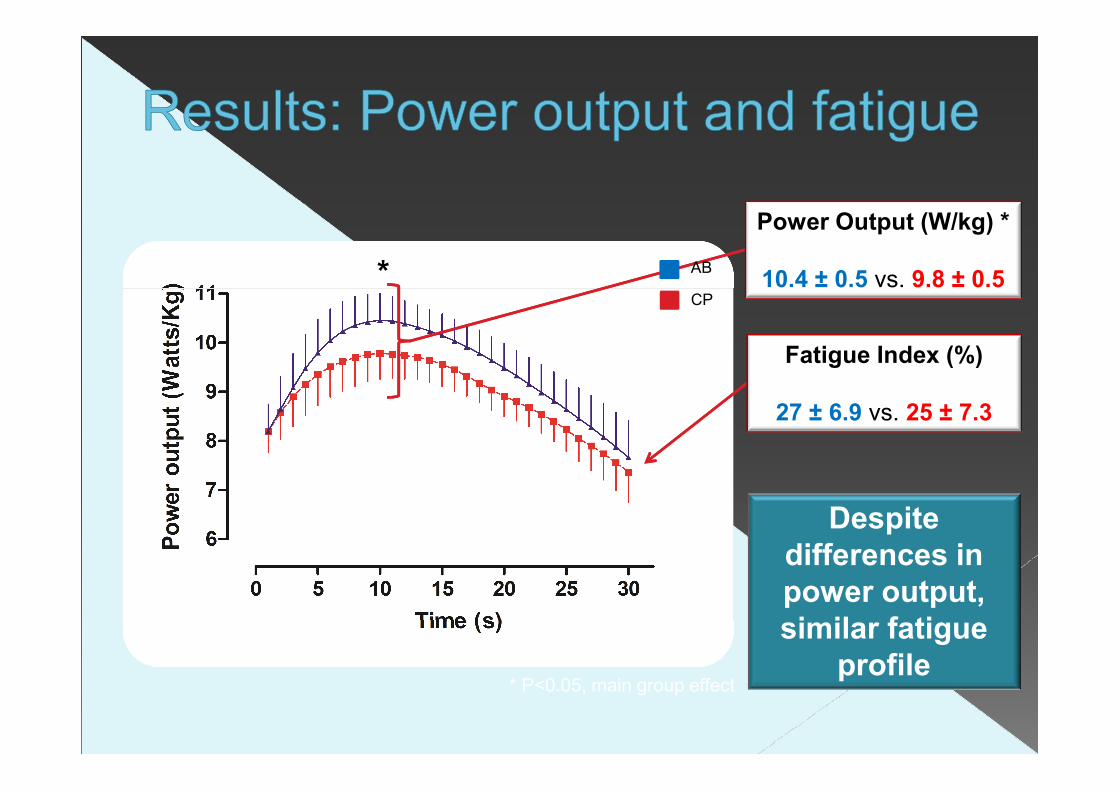
*
Fatigue Index (%)
27 ± 6.9 vs. 25 ± 7.3
Power Output (W/kg) *
10.4 ± 0.5 vs. 9.8 ± 0.5
Despite
differences in
power output,
similar fatigue
profile
AB
CP
* P<0.05, main group effect
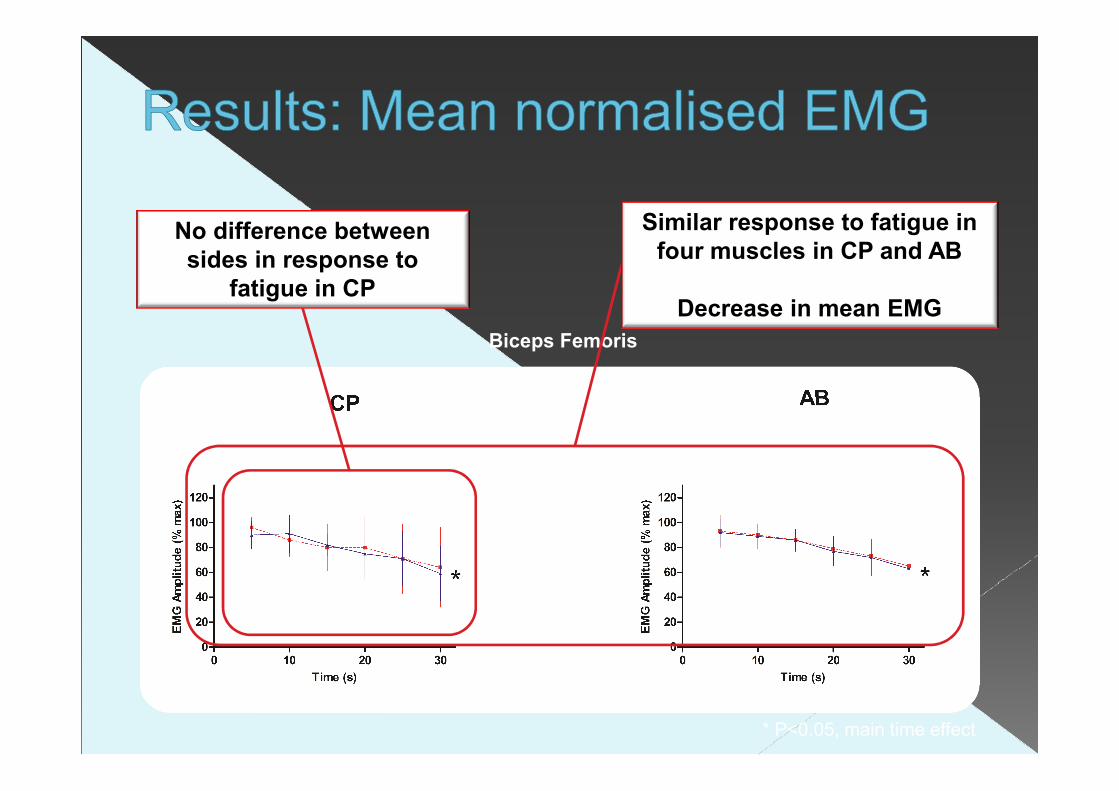
Biceps Femoris
Similar response to fatigue in
four muscles in CP and AB
Decrease in mean EMG
No difference between
sides in response to
fatigue in CP
* P<0.05, main time effect

Similar response to fatigue in VLO
muscles in CP and AB
Maintained EMG
Vastus Lateralis
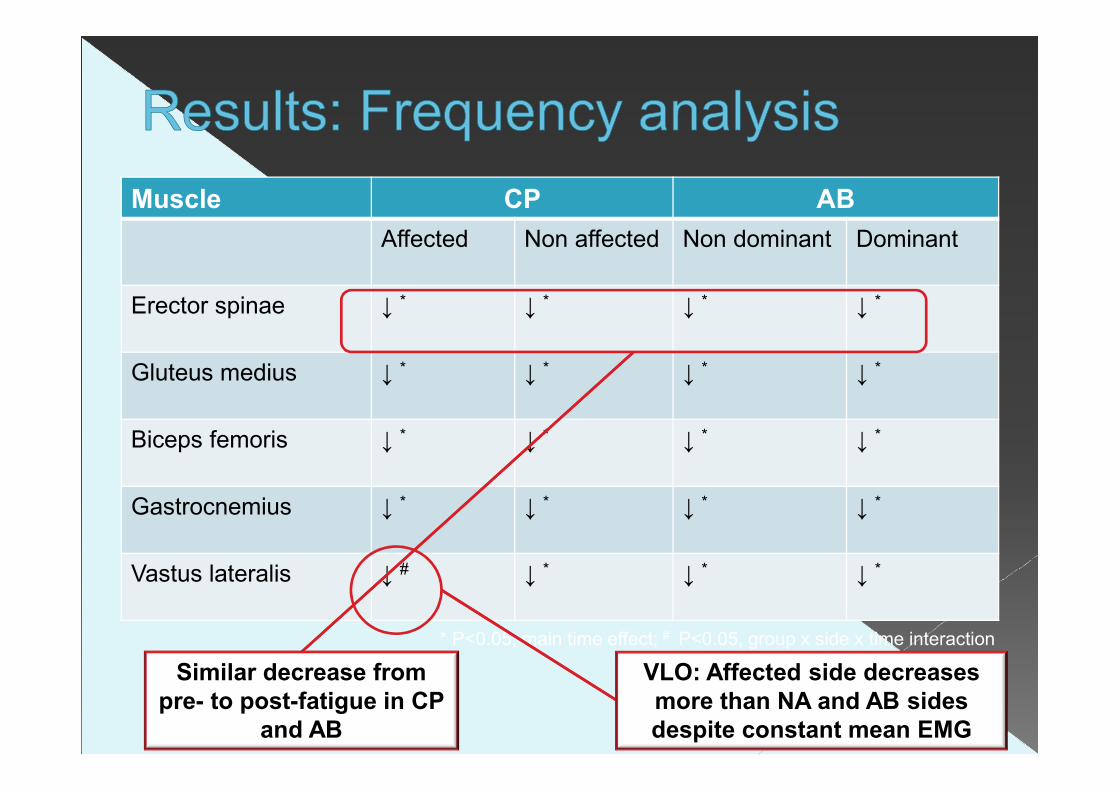
* P<0.05, main time effect; # P<0.05, group x side x time interaction
Muscle CP AB
Affected Non affected Non dominant Dominant
Erector spinae ↓ * ↓ * ↓ * ↓ *
Gluteus medius ↓ * ↓ * ↓ * ↓ *
Biceps femoris ↓ * ↓ * ↓ * ↓ *
Gastrocnemius ↓ * ↓ * ↓ * ↓ *
Vastus lateralis ↓ # ↓ * ↓ * ↓ *
Similar decrease from
pre- to post-fatigue in CP
and AB
VLO: Affected side decreases
more than NA and AB sides
despite constant mean EMG

Analyzed Signals / Periods
500
0
1000LT LUMBAR ES, uV RT LUMBAR ES
500
0
1000LT VLO, uV RT VLO
14.514.0 15.0s
Periods 1 Begin
Markers 1 Marker
Analyzed Signals / Periods
500
0
1000LT LUMBAR ES, uV RT LUMBAR ES
500
0
1000LT VLO, uV RT VLO
12.011.5 12.5s
Periods 1 Begin
Markers 1 Marker
Affected Affected
ES
VLO
ES
VLO
Bilateral co-activation
per pedal stroke
Lack of activation on
affected pedal strokeCP
AB
Analyzed Signals / Periods
500
0
1000LT BICEPS FEM., uV RT BICEPS FEM.
500
0
1000LT VLO, uV RT VLO
13.012.5 13.5s
Periods 1 Begin
Markers 1 Marker
Affected Affected Affected
VLO
BF
Analyzed Signals / Periods
500
0
1000LT BICEPS FEM., uV RT BICEPS FEM.
500
1000
1500
2000
0
2500LT VLO, uV RT VLO
13.012.5 13.5s
Periods 1 Pre-event
Markers 1 Marker
VLO
BF
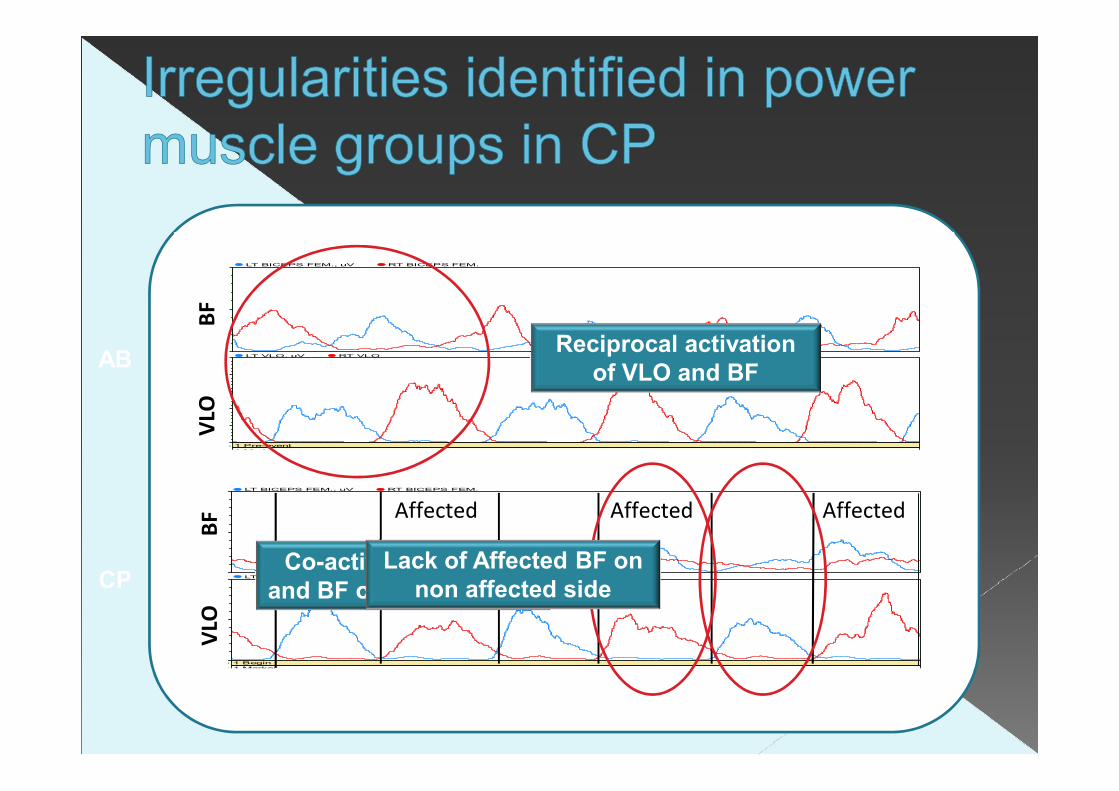
Co-activation of VLO
and BF on affected side
Reciprocal activation
of VLO and BF
Lack of Affected BF on
non affected sideCP
AB
Analyzed Signals / Periods
500
0
1000LT BICEPS FEM., uV RT BICEPS FEM.
500
0
1000LT VLO, uV RT VLO
12.512.0 13.0s
Periods 1 Begin
Markers 1 Marker
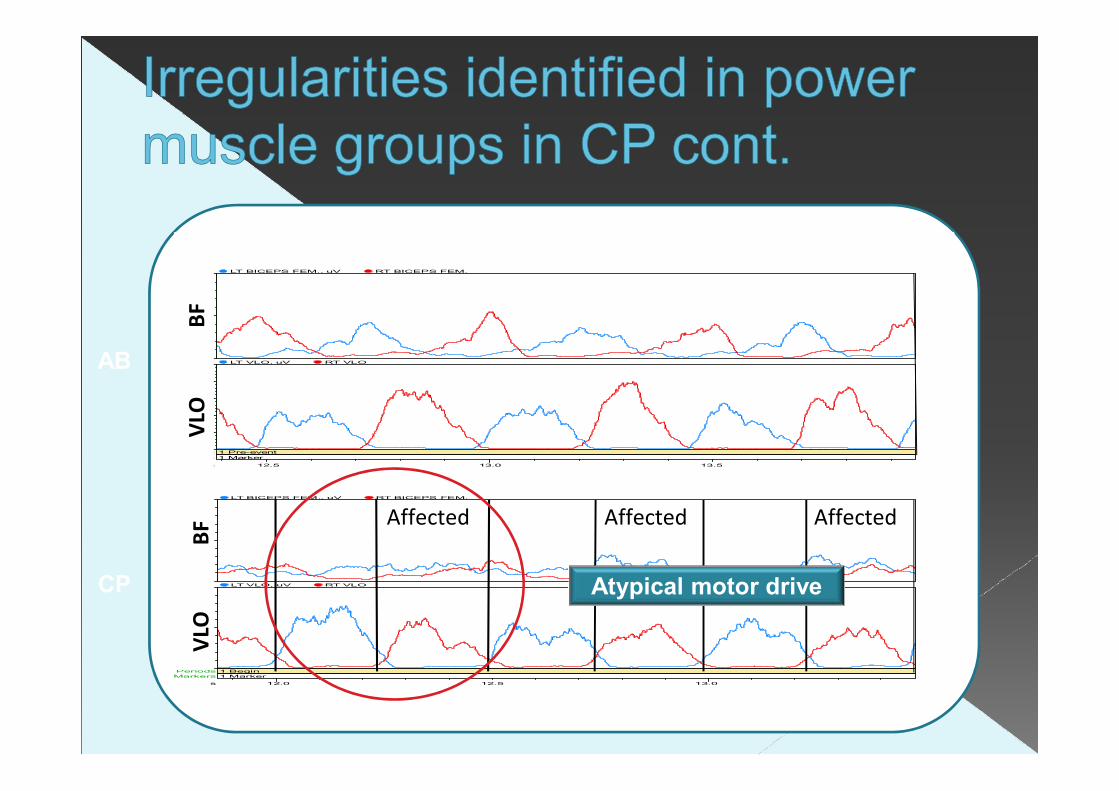
Affected Affected Affected
VLO
BF
Atypical motor drive
Analyzed Signals / Periods
500
0
1000LT BICEPS FEM., uV RT BICEPS FEM.
500
1000
1500
2000
0
2500LT VLO, uV RT VLO
13.012.5 13.5s
Periods 1 Pre-event
Markers 1 Marker
VLO
BF
CP
AB

No difference in neuromuscular fatigue, despite lower PO
This is contrary to existing literature which indicates a flat fatigue profile in CP, due to Type I muscle fibre predominance
Interesting to speculate: 1) athletes have a mild form of CP or 2) long-term high-level training may have changed Type I predominance
We identified irregularities in supporting and power muscles, associated with CP
Studies using running are required to further investigate findings of current study
Acknowledgements
UCT ESSM
David Karpul
NRF/DAAD
- Doctoral Funding
- DAAD In-Country Short-Term
Research Grant to Germany
International Paralympic Committee
- Medical and Scientific Internship
Contact
Boundary Road, Newlands
Cape Town, South Africa
7700
+2779 074 0097
+4979 3522 450