PDF GHI 2013
66
– – – – – – – – – – – – – – – – – – – – – – – – – – – – – – – – – – – – – – – – – – – – GLOBAL HUNGER INDEX THE CHALLENGE OF HUNGER: BUILDING RESILIENCE TO ACHIEVE FOOD AND NUTRITION SECURITY 2013
-
Upload
panam-post -
Category
Documents
-
view
243 -
download
0
Transcript of PDF GHI 2013
7/27/2019 PDF GHI 2013
http://slidepdf.com/reader/full/pdf-ghi-2013 1/66
–
–
–
–
–
––
–
–
–
–
–
–
–
–
–
–
–
–
–
–
–
–
–
–
–
–
–
–
–
–
–
–
–
–
–
–
–
–
–
–
–
–
–
GLOBAL HUNGER INDEXTHE CHALLENGE OF HUNGER: BUILDING RESILIENCE
TO ACHIEVE FOOD AND NUTRITION SECURITY
2013

7/27/2019 PDF GHI 2013
http://slidepdf.com/reader/full/pdf-ghi-2013 2/66

7/27/2019 PDF GHI 2013
http://slidepdf.com/reader/full/pdf-ghi-2013 3/66
GLOBAL HUNGER INDEXTHE CHALLENGE OF HUNGER: BUILDING RESILIENCE
TO ACHIEVE FOOD AND NUTRITION SECURITY
2013
International Food Policy Research Institute:
Klaus von Grebmer, Derek Headey, Tolulope Olonbiyi,
Doris Wiesmann, Heidi Fritschel, Sandra Yin,
Yisehac Yohannes
Concern Worldwide:
Connell Foley
Welthungerhile:
Constanze von Oppeln, Bettina Iseli
Institute o Development Studies:
Christophe Béné, Lawrence Haddad
Bonn / Washington, DC / Dublin
October 2013
7/27/2019 PDF GHI 2013
http://slidepdf.com/reader/full/pdf-ghi-2013 4/66
2 Name des Teilbereich | Chapter 1 | 2013 Global Hunger Index
Resilient livelihoods are critical for the world’s most vulnerable people to
achieve freedom from hunger – one of the most basic human rights.
–––––––––
–––––––––––
–––––––––––
–––––––––––
–––––––––
––––
7/27/2019 PDF GHI 2013
http://slidepdf.com/reader/full/pdf-ghi-2013 5/66
2013 Global Hunger Index | Foreword 3
A crisis is an opportunity riding the dangerous wind.
—Chinese proverb
In 2012 Tropical Storm Isaac and Hurricane Sandy battered Haiti, dam-
aging harvests, swelling rivers, fooding roads, and blocking access to
communities. As ood prices rose and debts mounted, poor Haitians
took extreme measures. Some migrated. Others made ends meet by
eating ewer meals per day and selling o their land or livestock. Every
summer, Haitians ear nature’s wrath.
Whether it’s storms like these, or a drought, like the one in2012 that let 18 million people in the Sahel hungry, other extreme
weather, surging ood prices, or prolonged political unrest, crises or
shocks continue to buet the poor and most vulnerable. All too oten,
those who are unable to cope nd themselves more deeply entrenched
in poverty, acing malnutrition and hunger.
It has become clear that it is not enough to help the poor and
vulnerable survive short-term shocks. Because they are among those
hit hardest by shocks and least able to cope, the constant exposure to
manmade or natural shocks means they nd it hard to improve their
lot. Poor and vulnerable populations need more resilience, and a vital
part o building resilience involves boosting ood and nutrition securi-ty. Given that access to enough healthy ood is a basic human right, it
is critical that governments and nongovernmental and international
organizations take steps to build resilience in a way that increases their
ood and nutrition security.
Resilience is the central theme o the 2013 Global Hunger
Index report, published jointly by the International Food Policy
Research Institute (IFPRI), Concern Worldwide, and Welthungerhile.
Given that world hunger remains “serious,” according to the index,
with 19 countries suering rom levels o hunger that are either
“alarming” or “extremely alarming,” resilience-building eorts are
much needed to boost ood and nutrition security.Chapter 03 describes a ramework or resilience that could
change how the development and humanitarian sectors design and
implement interventions. It also oers examples o resilience-building
programs that combine relie and development and explores indicators
FOREWORD
Dr. Shenggen Fan Director General
International Food Policy
Research Institute
Dominic MacSorleyChie Executive
Concern Worldwide
Dr. Wolgang JamannSecretary General and
Chairperson
Welthungerhile
or measuring resilience in relation to ood and nutrition security. Chap-
ter 04 spotlights lessons learned rom several programs carried out by
Concern Worldwide and Welthungerhile that were designed to build
resilience in communities.
This is the eighth year that the International Food Policy
Research Institute has calculated the Global Hunger Index (GHI) and
analyzed this multidimensional measure o global hunger. This series
o reports records the state o hunger worldwide, by region and by coun-
try, spotlighting the countries and regions where action is most needed.
It should be noted that this report paints a picture o the recentpast, not the present. The 2013 GHI refects the most recent data avail-
able rom governments and international agencies. Because o time
lags and the dearth o up-to-the-minute data on global hunger, it does
not, however, refect the impact o the latest events. We hope that gov-
ernments and international institutions will collaborate to gather more
timely and comprehensive data on hunger in the near uture.
The world has made some progress in reducing hunger since
the early 1990s. I the recent slowdown can be reversed, the Millenni-
um Development Goal target o halving the share o hungry people in
the world between 1990 and 2015 may be within reach. But we are
not on track to meet the 1996 World Food Summit’s more ambitiousgoal o halving the number o hungry people in the same time period.
In 1990–1992, 1 billion went hungry. Today, about 870 million, or 1
in 8 people worldwide, still suer rom hunger. This is no time or com-
placency. In 2012 during the Rio+20 conerence, to build upon the
work started by Millennium Development Goal 1, United Nations Sec-
retary-General Ban Ki-moon proposed a more ambitious goal, the glob-
al “Zero Hunger Challenge” to end hunger in our lietime. As long as
people go hungry, the ght against hunger must continue.
Many o the shocks and stresses to which poor and hungry peo-
ple are exposed are caused by the actions o more afuent regions and
countries. We hope that this report will serve as a reminder to all ous—in industrialized countries, as well as in emerging economies and
developing countries—to assume responsibility and to act together to
reduce risk and build resilience to ood and nutrition insecurity at the
community, national, and international levels.
7/27/2019 PDF GHI 2013
http://slidepdf.com/reader/full/pdf-ghi-2013 6/66
4 Contents | 2013 Global Hunger Index
CONTENTS
SUMMARY 5
CHAPTER
01 The Concept o the Global Hunger Index 6
02 Global, Regional, and National Trends 10
03 Understanding Resilience or Food and Nutrition Security 18
04 Building Community Resilience to Undernutrition: Learning rom the Past to Inorm the Future 32
05 Policy Recommendations 46
APPENDIXES
A Data Sources and Calculation o the 1990, 1995, 2000, 2005, and 2013 Global Hunger Index Scores 50
B Data Underlying the Calculation o the 1990, 1995, 2000, 2005, and 2013 Global Hunger Index Scores 51
C Country Trends or the 1990, 1995, 2000, 2005, and 2013 Global Hunger Index Scores 53
BIBLIOGRAPHY 57
PARTNERS 61
CHAPTER 01 CHAPTER 02 CHAPTER 03 CHAPTER 04 CHAPTER 05
7/27/2019 PDF GHI 2013
http://slidepdf.com/reader/full/pdf-ghi-2013 7/66
2013 Global Hunger Index | Summary 5
The 2013 Global Hunger Index (GHI), which refects data rom the
period 2008–2012, shows that global hunger has improved since
1990, alling by one-third. Despite the progress made, the level o
hunger in the world remains “serious,” with 870 million people going
hungry, according to estimates by the Food and Agriculture Organiza-
tion o the United Nations.
Across regions and countries, GHI scores vary considerably.
South Asia and Arica south o the Sahara are home to the highest GHI
scores. South Asia signicantly lowered its GHI score between 1990 and
1995, mainly thanks to a large decline in underweight in children, butwas not able to maintain its ast progress. Social inequality and the low
nutritional, educational, and social status o women continue to contrib-
ute to the high prevalence o underweight in children under ve.
Arica south o the Sahara did not advance as much as South
Asia in the 1990s. Since the turn o the millennium, however, Arica
south o the Sahara has shown real progress, and its GHI score is now
lower than South Asia’s. More political stability in countries earlier aect-
ed by civil wars in the 1990s and 2000s meant economic growth could
resume. Advances in the ght against HIV and AIDS, a decrease in the
prevalence o malaria, and higher immunization rates contributed to a
reduction in child mortality.Since 1990, 23 countries made signicant progress, reducing
their GHI scores by 50 percent or more. Twenty-seven countries moved
out o the “extremely alarming” and “alarming” categories. In terms o
absolute progress, the top ten countries in terms o improvements in
GHI scores since 1990 were Angola, Bangladesh, Cambodia, Ethiopia,
Ghana, Malawi, Niger, Rwanda, Thailand, and Vietnam.
Levels o hunger are still “alarming” or “extremely alarming” in
19 countries. Those that ell into the “extremely alarming” category—
Burundi, Comoros, and Eritrea—are all in Arica south o the Sahara.
Increased hunger since 1990 in Burundi and Comoros can be attribut-
ed to prolonged confict and political instability. The Democratic Repub-lic o Congo was listed as “extremely alarming” in the 2011 Global Hun-
ger Index report, but since then, not enough data have been available to
calculate its GHI score. Current and reliable data are urgently needed to
assess the country’s situation and to calculate the GHI scores o other
likely hunger hot spots, such as Aghanistan and Somalia.
It is not surprising that many o the countries with “alarming” or
“extremely alarming” scores have not been among the most stable. High-
er GHI scores tend to be typical o countries that experience social or
political unrest or are perennially exposed to shocks such as foods and
droughts. Natural and manmade disasters can directly aect the ood
and nutrition security o people and communities that are particularly vul-nerable or lacking resilience. By extension, a critical part o building resil-
ience is ensuring ood and nutrition security; and conversely, eorts to
build ood and nutrition security must be designed with a resilience lens.
SUMMARY
Poor people have long been vulnerable to “hunger seasons,” droughts, and
other natural and manmade disasters. In recent years, this vulnerability
has been exacerbated by ood and nancial crises and large-scale human-
itarian crises such as the recurring droughts in the Sahel and the Horn o
Arica. These short-term shocks have long-term consequences.
Policymakers and practitioners across the development and relie
communities now recognize the need to build the resilience o vulnera-
ble populations. More resilience will help them climb out o poverty,
remain out o poverty, or avoid slipping into it in the rst place. Concep-
tually, resilience has been expanded to include the capacity not only toabsorb mild shocks, but also to learn rom and adapt to moderate shocks
and to transorm economic, social, and ecological structures in response
to severe shocks.
This ramework or understanding resilience could help expand
the dialogue between the relie and development sectors, which have
traditionally operated in separate silos. Linking interrelated short-term
shocks and long-term systemic change provides a more complete view
o the actors that lead people to drit into poverty or ood and nutrition
insecurity. The resilience ramework also ocuses more attention on
understanding the welare and behavioral dynamics o vulnerable popu-
lations. It rearms the importance o identiying and strengthening localstructures and organizations and supporting them to perorm their roles
eectively and to work together.
Yet, while the underlying rationale or ocusing on resilience
building is strong, adopting a resilience ramework is challenging. Experts
in development and humanitarian circles have yet to agree on a common
denition o resilience. And resilience, vulnerability, and coping behav-
iors are dicult phenomena to measure. Shocks are by denition oten
short-term unpredictable events, they oten occur in remote places and
populations, and resilience to shocks involves complex coping or adap-
tive behaviors.
According to Concern and Welthungerhile, resilience-buildingeorts at the community level can deliver results. They describe lessons
learned rom their own programs ghting undernutrition in mostly rural
communities. Despite continuing shocks and stresses and a system that
is set up to avor large-scale armers and not smallholders, households
in Haiti’s North-West region managed to improve their ood security by
continuously addressing the underlying structural causes o vulnerabili-
ty and using fexible, accurately targeted emergency unding to address
capacity gaps. Lessons rom the Sahel and the Horn o Arica point to
some o the necessary preconditions or building resilience at the com-
munity level and helping people escape extreme poverty and hunger.
The policy recommendations in this report oer a path orwardor the international development, humanitarian, and donor communi-
ties; or country-level policymakers in ood-insecure countries; and or
development and humanitarian practitioners.
7/27/2019 PDF GHI 2013
http://slidepdf.com/reader/full/pdf-ghi-2013 8/66
6 Name des Teilbereich | Chapter 1 | 2013 Global Hunger Index
01–––
–––––––––––
–––––––––––
––––
–––
–––––––––––
––––––
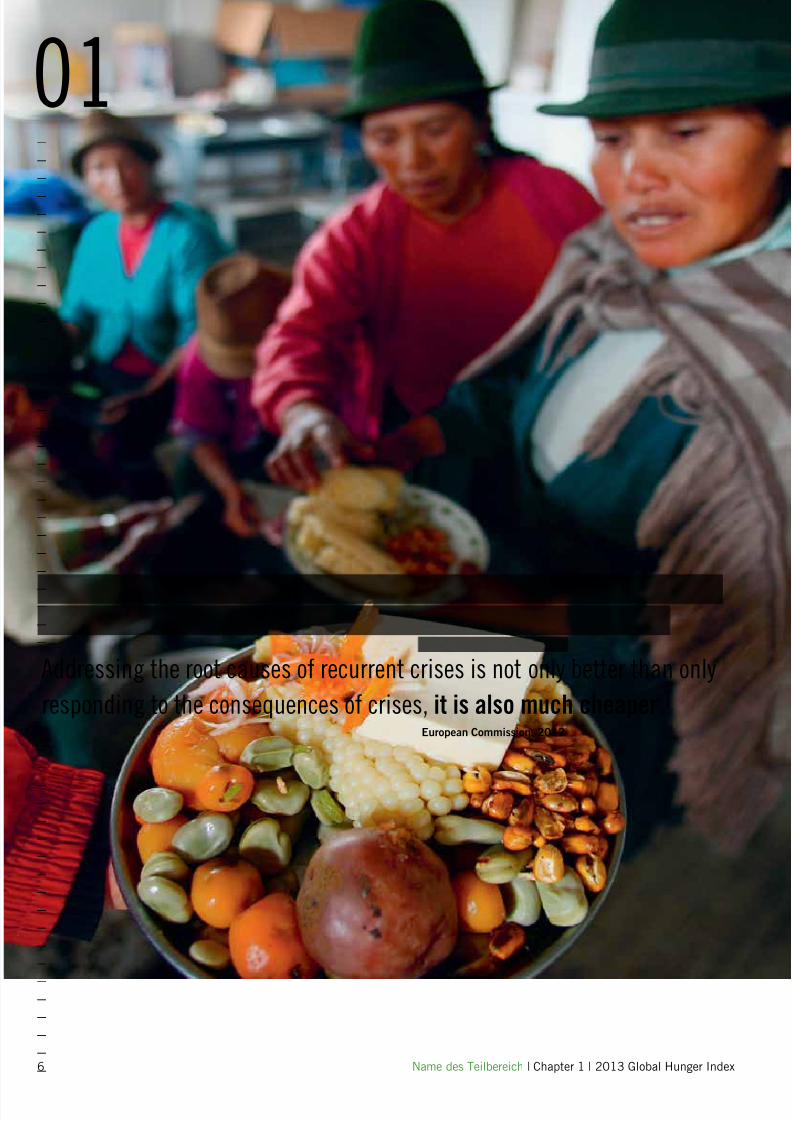
Addressing the root causes of recurrent crises is not only better than only
responding to the consequences of crises, it is also much cheaper.
European Commission, 2012
7/27/2019 PDF GHI 2013
http://slidepdf.com/reader/full/pdf-ghi-2013 9/66
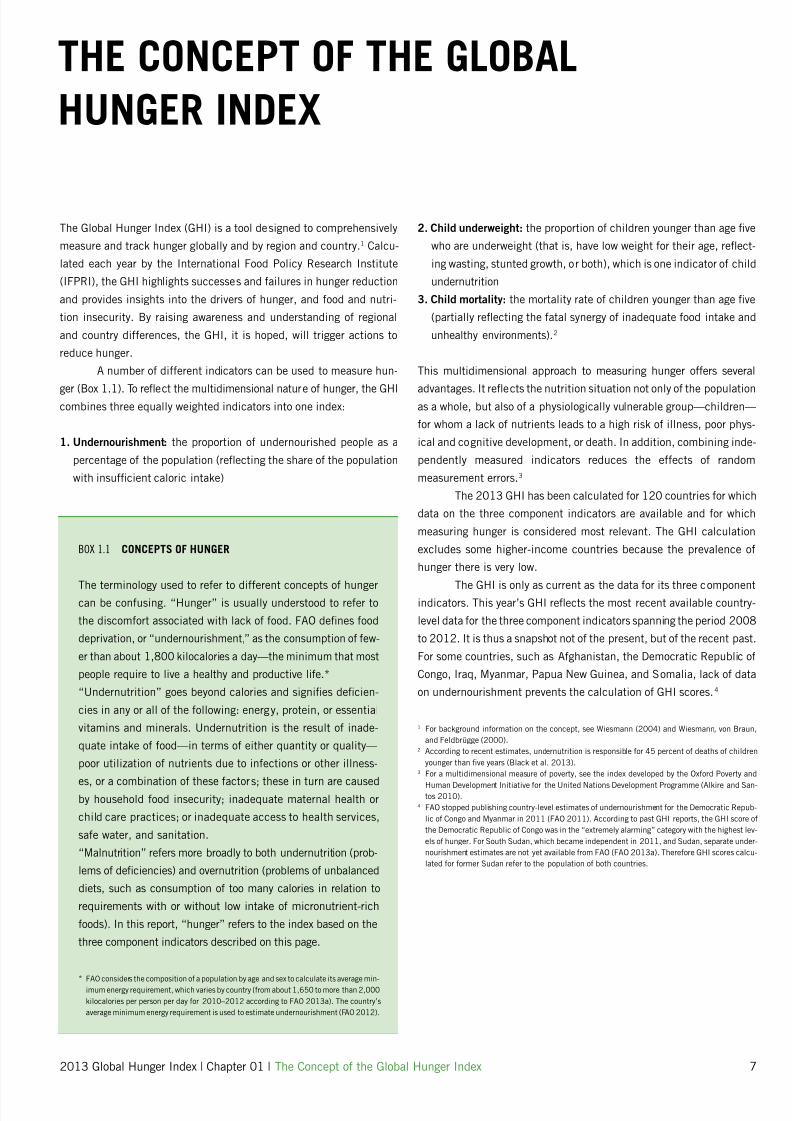
BOX 1.1 CONCEPTS OF HUNGER
The terminology used to reer to dierent concepts o hungercan be conusing. “Hunger” is usually understood to reer to
the discomort associated with lack o ood. FAO denes ood
deprivation, or “undernourishment,” as the consumption o ew-
er than about 1,800 kilocalories a day—the minimum that most
people require to live a healthy and productive lie.*
“Undernutrition” goes beyond calories and signies decien-
cies in any or all o the ollowing: energy, protein, or essential
vitamins and minerals. Undernutrition is the result o inade-
quate intake o ood—in terms o either quantity or quality—
poor utilization o nutrients due to inections or other illness-
es, or a combination o these actors; these in turn are causedby household ood insecurity; inadequate maternal health or
child care practices; or inadequate access to health services,
sae water, and sanitation.
“Malnutrition” reers more broadly to both undernutrition (prob-
lems o deciencies) and overnutrition (problems o unbalanced
diets, such as consumption o too many calories in relation to
requirements with or without low intake o micronutrient-rich
oods). In this report, “hunger” reers to the index based on the
three component indicators described on this page.
* FAO considers the composition o a population by age and sex to calculate its average min-imum energy requirement, which varies by country (rom about 1,650 to more than 2,000
kilocalories per person per day or 2010–2012 according to FAO 2013a). The country’s
average minimum energy requirement is used to estimate undernourishment (FAO 2012).
2013 Global Hunger Index | Chapter 01 | The Concept o the Global Hunger Index 7
The Global Hunger Index (GHI) is a tool designed to comprehensively
measure and track hunger globally and by region and country.1 Calcu-
lated each year by the International Food Policy Research Institute
(IFPRI), the GHI highlights successes and ailures in hunger reduction
and provides insights into the drivers o hunger, and ood and nutri-
tion insecurity. By raising awareness and understanding o regional
and country dierences, the GHI, it is hoped, will trigger actions to
reduce hunger.
A number o dierent indicators can be used to measure hun-
ger (Box 1.1). To refect the multidimensional nature o hunger, the GHIcombines three equally weighted indicators into one index:
1. Undernourishment: the proportion o undernourished people as a
percentage o the population (refecting the share o the population
with insucient caloric intake)
THE CONCEPT OF THE GLOBAL
HUNGER INDEX
1 For background inormation on the concept, see Wiesmann (2004) and Wiesmann, von Braun,
and Feldbrügge (2000).2 According to recent estimates, undernutrition is responsible or 45 percent o deaths o children
younger than ve years (Black et al. 2013).3 For a multidimensional measure o poverty, see the index developed by the Oxord Poverty and
Human Development Initiative or the United Nations Development Programme (Alkire and San-tos 2010).
4 FAO stopped publishing country-level estimates o undernourishment or the Democratic Repub-
lic o Congo and Myanmar in 2011 (FAO 2011). According to past GHI reports, the GHI score o
the Democratic Republic o Congo was in the “extremely alarming” category with the highest lev-
els o hunger. For South Sudan, which became independent in 2011, and Sudan, separate under-
nourishment estimates are not yet available rom FAO (FAO 2013a). Thereore GHI scores calcu-
lated or ormer Sudan reer to the population o both countries.
2. Child underweight: the proportion o children younger than age ve
who are underweight (that is, have low weight or their age, refect-
ing wasting, stunted growth, or both), which is one indicator o child
undernutrition
3. Child mortality: the mortality rate o children younger than age ve
(partially refecting the atal synergy o inadequate ood intake and
unhealthy environments).2
This multidimensional approach to measuring hunger oers several
advantages. It refects the nutrition situation not only o the populationas a whole, but also o a physiologically vulnerable group—children—
or whom a lack o nutrients leads to a high risk o illness, poor phys-
ical and cognitive development, or death. In addition, combining inde-
pendently measured indicators reduces the eects o random
measurement errors.3
The 2013 GHI has been calculated or 120 countries or which
data on the three component indicators are available and or which
measuring hunger is considered most relevant. The GHI calculation
excludes some higher-income countries because the prevalence o
hunger there is very low.
The GHI is only as current as the data or its three componentindicators. This year’s GHI refects the most recent available country-
level data or the three component indicators spanning the period 2008
to 2012. It is thus a snapshot not o the present, but o the recent past.
For some countries, such as Aghanistan, the Democratic Republic o
Congo, Iraq, Myanmar, Papua New Guinea, and Somalia, lack o data
on undernourishment prevents the calculation o GHI scores.4
7/27/2019 PDF GHI 2013
http://slidepdf.com/reader/full/pdf-ghi-2013 10/66
8 The Concept o the Global Hunger Index | Chapter 01 | 2013 Global Hunger Index
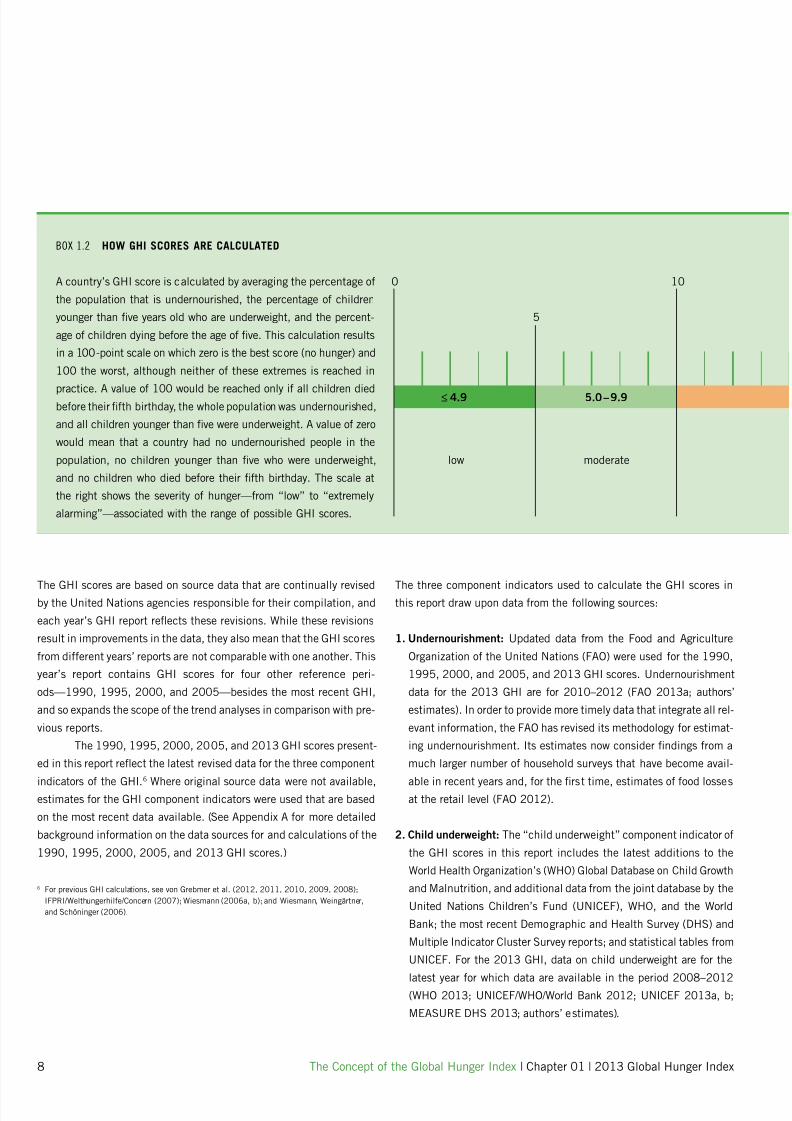
low
≤ 4.9 5.0 – 9.9
moderate
10
5
0
BOX 1.2 HOW GHI SCORES ARE CALCULATED
A country’s GHI score is calculated by averaging the percentage o
the population that is undernourished, the percentage o children
younger than ve years old who are underweight, and the percent-
age o children dying beore the age o ve. This calculation results
in a 100-point scale on which zero is the best score (no hunger) and
100 the worst, although neither o these extremes is reached in
practice. A value o 100 would be reached only i all children diedbeore their th birthday, the whole population was undernourished,
and all children younger than ve were underweight. A value o zero
would mean that a country had no undernourished people in the
population, no children younger than ve who were underweight,
and no children who died beore their th birthday. The scale at
the right shows the severity o hunger—rom “low” to “extremely
alarming”—associated with the range o possible GHI scores.
The GHI scores are based on source data that are continually revisedby the United Nations agencies responsible or their compilation, and
each year’s GHI report refects these revisions. While these revisions
result in improvements in the data, they also mean that the GHI scores
rom dierent years’ reports are not comparable with one another. This
year’s report contains GHI scores or our other reerence peri-
ods—1990, 1995, 2000, and 2005—besides the most recent GHI,
and so expands the scope o the trend analyses in comparison with pre-
vious reports.
The 1990, 1995, 2000, 2005, and 2013 GHI scores present-
ed in this report refect the latest revised data or the three component
indicators o the GHI.6
Where original source data were not available,estimates or the GHI component indicators were used that are based
on the most recent data available. (See Appendix A or more detailed
background inormation on the data sources or and calculations o the
1990, 1995, 2000, 2005, and 2013 GHI scores.)
The three component indicators used to calculate the GHI scores inthis report draw upon data rom the ollowing sources:
1. Undernourishment: Updated data rom the Food and Agriculture
Organization o the United Nations (FAO) were used or the 1990,
1995, 2000, and 2005, and 2013 GHI scores. Undernourishment
data or the 2013 GHI are or 2010–2012 (FAO 2013a; authors’
estimates). In order to provide more timely data that integrate all rel-
evant inormation, the FAO has revised its methodology or estimat-
ing undernourishment. Its estimates now consider ndings rom a
much larger number o household surveys that have become avail-
able in recent years and, or the rst time, estimates o ood lossesat the retail level (FAO 2012).
2. Child underweight: The “child underweight” component indicator o
the GHI scores in this report includes the latest additions to the
World Health Organization’s (WHO) Global Database on Child Growth
and Malnutrition, and additional data rom the joint database by the
United Nations Children’s Fund (UNICEF), WHO, and the World
Bank; the most recent Demographic and Health Survey (DHS) and
Multiple Indicator Cluster Survey reports; and statistical tables rom
UNICEF. For the 2013 GHI, data on child underweight are or the
latest year or which data are available in the period 2008–2012(WHO 2013; UNICEF/WHO/World Bank 2012; UNICEF 2013a, b;
MEASURE DHS 2013; authors’ estimates).
6 For previous GHI calculations, see von Grebmer et al. (2012, 2011, 2010, 2009, 2008);
IFPRI/Welthungerhile/Concern (2007); Wiesmann (2006a, b); and Wiesmann, Weingärtner,
and Schöninger (2006).
7/27/2019 PDF GHI 2013
http://slidepdf.com/reader/full/pdf-ghi-2013 11/66
2013 Global Hunger Index | Chapter 01 | The Concept o the Global Hunger Index 9
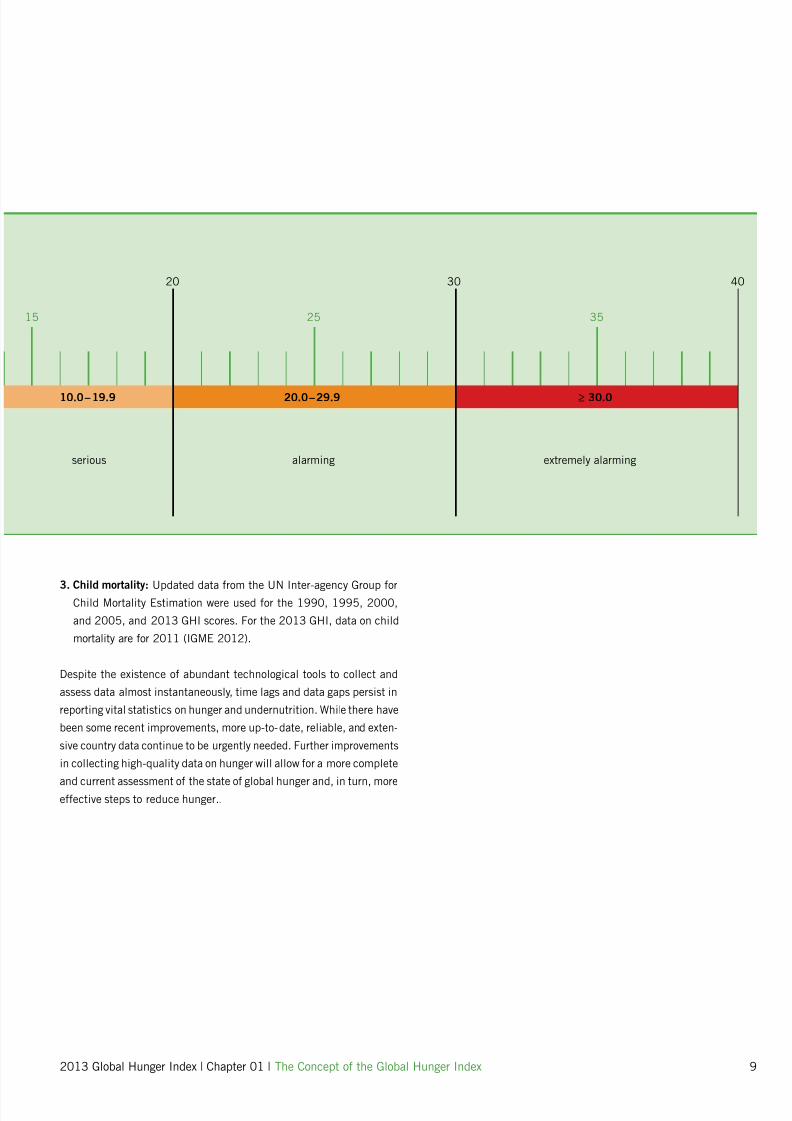
10.0 – 19.9 20.0 – 29.9 ≥ 30.0
serious alarming extremely alarming
4030
15 25 35
20
3. Child mortality: Updated data rom the UN Inter-agency Group orChild Mortality Estimation were used or the 1990, 1995, 2000,
and 2005, and 2013 GHI scores. For the 2013 GHI, data on child
mortality are or 2011 (IGME 2012).
Despite the existence o abundant technological tools to collect and
assess data almost instantaneously, time lags and data gaps persist in
reporting vital statistics on hunger and undernutrition. While there have
been some recent improvements, more up-to-date, reliable, and exten-
sive country data continue to be urgently needed. Further improvements
in collecting high-quality data on hunger will allow or a more complete
and current assessment o the state o global hunger and, in turn, moreeective steps to reduce hunger..
7/27/2019 PDF GHI 2013
http://slidepdf.com/reader/full/pdf-ghi-2013 12/66
10 Name des Teilbereich | Chapter 1 | 2013 Global Hunger Index
02
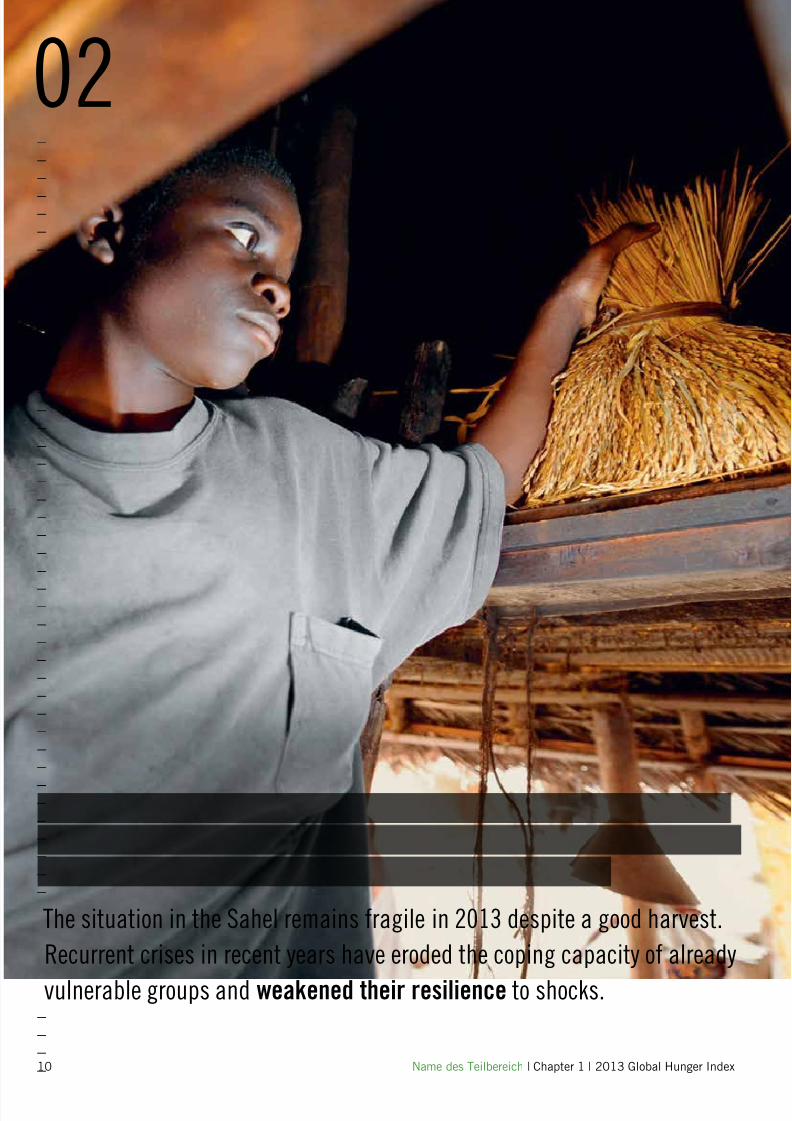
The situation in the Sahel remains fragile in 2013 despite a good harvest.
Recurrent crises in recent years have eroded the coping capacity of already
vulnerable groups and weakened their resilience to shocks.
–––
–––––––––––
–––––––––––
–––––––––––
–––––––
––––
7/27/2019 PDF GHI 2013
http://slidepdf.com/reader/full/pdf-ghi-2013 13/66
2013 Global Hunger Index | Chapter 02 | Global, Regional, and National Trends 11
GLOBAL, REGIONAL, AND NATIONAL
TRENDS
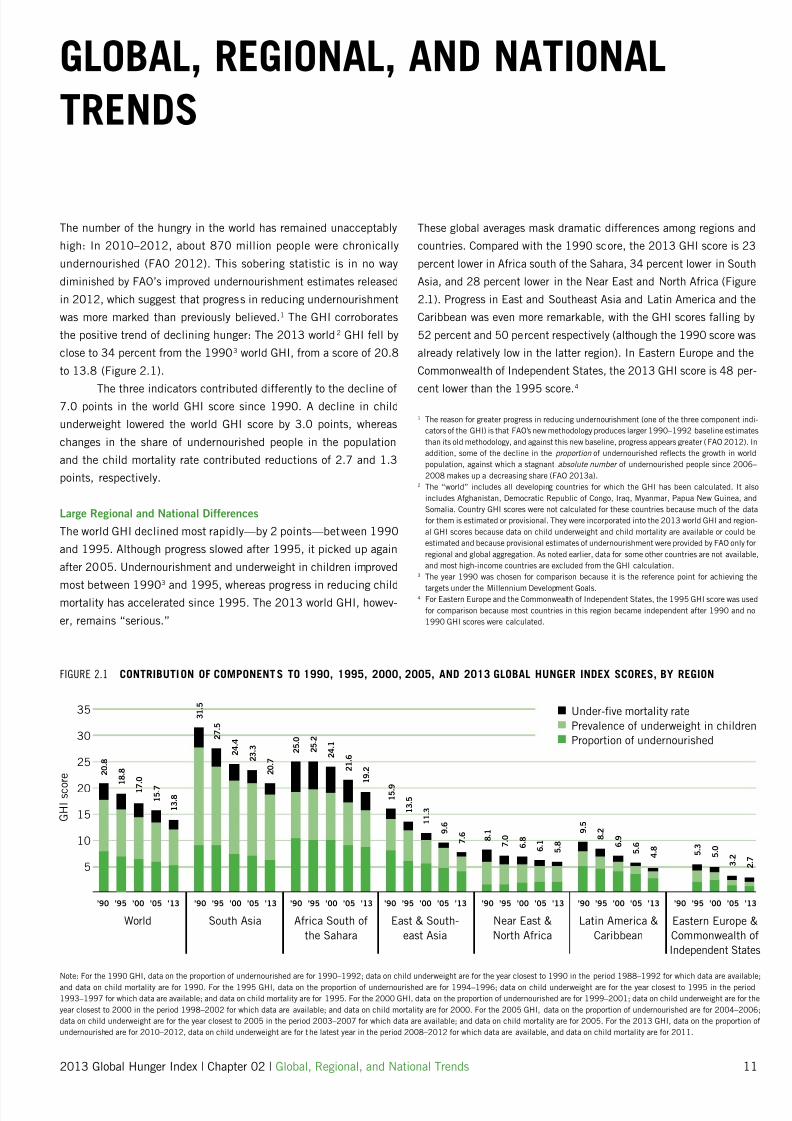
The number o the hungry in the world has remained unacceptably
high: In 2010–2012, about 870 million people were chronically
undernourished (FAO 2012). This sobering statistic is in no way
diminished by FAO’s improved undernourishment estimates released
in 2012, which suggest that progress in reducing undernourishment
was more marked than previously believed.1 The GHI corroborates
the positive trend o declining hunger: The 2013 world2 GHI ell by
close to 34 percent rom the 19903 world GHI, rom a score o 20.8
to 13.8 (Figure 2.1).
The three indicators contributed dierently to the decline o7.0 points in the world GHI score since 1990. A decline in child
underweight lowered the world GHI score by 3.0 points, whereas
changes in the share o undernourished people in the population
and the child mortality rate contributed reductions o 2.7 and 1.3
points, respectively.
Large Regional and National Dierences
The world GHI declined most rapidly—by 2 points—between 1990
and 1995. Although progress slowed ater 1995, it picked up again
ater 2005. Undernourishment and underweight in children improved
most between 19903
and 1995, whereas progress in reducing childmortality has accelerated since 1995. The 2013 world GHI, howev-
er, remains “serious.”
These global averages mask dramatic dierences among regions and
countries. Compared with the 1990 score, the 2013 GHI score is 23
percent lower in Arica south o the Sahara, 34 percent lower in South
Asia, and 28 percent lower in the Near East and North Arica (Figure
2.1). Progress in East and Southeast Asia and Latin America and the
Caribbean was even more remarkable, with the GHI scores alling by
52 percent and 50 percent respectively (although the 1990 score was
already relatively low in the latter region). In Eastern Europe and the
Commonwealth o Independent States, the 2013 GHI score is 48 per-
cent lower than the 1995 score.4
Note: For the 1990 GHI, data on the proportion o undernourished are or 1990–1992; data on child underweight are or the year closest to 1990 in the period 1988–1992 or which data are available;
and data on child mortality are or 1990. For the 1995 GHI, data on the proportion o undernourished are or 1994–1996; data on child underweight are or the year closest to 1995 in the period
1993–1997 or which data are available; and data on child mortality are or 1995. For the 2000 GHI, data on the proportion o undernourished are or 1999–2001; data on child underweight are or the
year closest to 2000 in the period 1998–2002 or which data are available; and data on child mortality are or 2000. For the 2005 GHI, data on the proportion o undernourished are or 2004–2006;
data on child underweight are or the year closest to 2005 in the period 2003–2007 or which data are available; and data on child mortality are or 2005. For the 2013 GHI, data on the proportion o
undernourished are or 2010–2012, data on child underweight are or the latest year in the period 2008–2012 or which data are available, and data on child mortality are or 2011.
’90 ’95 ’00 ’05 ’13
World
’90 ’95 ’00 ’05 ’13
South Asia
’90 ’95 ’00 ’05 ’13
Arica South o
the Sahara
’90 ’95 ’00 ’05 ’13
East & South-
east Asia
’90 ’95 ’00 ’05 ’13
Near East &
North Arica
’90 ’95 ’00 ’05 ’13
Latin America &
Caribbean
FIGURE 2.1 CONTRIBUTION OF COMPONENTS TO 1990, 1995, 2000, 2005, AND 2013 GLOBAL HUNGER INDEX SCORES, BY REGION
Under-ve mortality rate
Prevalence o underweight in children
Proportion o undernourished
5
10
15
20
25
30
35
2 . 7
3 . 2
5 . 0
5 . 3
4 . 8 5
. 6 6 . 9
8 . 2 9
. 5
5 . 8
6 . 1 6
. 8 7 . 0 8
. 1
7 . 6
9 . 6
1 1 . 3 1
3 . 5
1 5 . 9
1 9 . 2
2 1 . 6
2 4 . 1
2 5 . 2
2 5 . 0
2 0 . 7
2 3 . 3
2 4 . 4
2 7 . 5
3 1 . 5
1 3 . 8 1
5 . 7 1
7
. 0
2 0 . 8
’90 ’95 ’00 ’05 ’13
Eastern Europe &
Commonwealth o
Independent States
G H I s c o
r e
1 The reason or greater progress in reducing undernourishment (one o the three component indi-
cators o the GHI) is that FAO’s new methodology produces larger 1990–1992 baseline estimates
than its old methodology, and against this new baseline, progress appears greater (FAO 2012). In
addition, some o the decline in the proportion o undernourished refects the growth in world
population, against which a stagnant absolute number o undernourished people since 2006–
2008 makes up a decreasing share (FAO 2013a).2 The “world” includes all developing countries or which the GHI has been calculated. It also
includes Aghanistan, Democratic Republic o Congo, Iraq, Myanmar, Papua New Guinea, and
Somalia. Country GHI scores were not calculated or these countries because much o the data
or them is estimated or provisional. They were incorporated into the 2013 world GHI and region-
al GHI scores because data on child underweight and child mortality are available or could be
estimated and because provisional estimates o undernourishment were provided by FAO only or
regional and global aggregation. As noted earlier, data or some other countries are not available,
and most high-income countries are excluded rom the GHI calculation.3 The year 1990 was chosen or comparison because it is the reerence point or achieving the
targets under the Millennium Development Goals.4 For Eastern Europe and the Commonwealth o Independent States, the 1995 GHI score was used
or comparison because most countries in this region became independent ater 1990 and no
1990 GHI scores were calculated.
1 8 . 8

7/27/2019 PDF GHI 2013
http://slidepdf.com/reader/full/pdf-ghi-2013 14/66
12 Global, Regional, and National Trends | Chapter 02 | 2013 Global Hunger Index
East and Southeast Asia and Latin America and the Caribbean haveexperienced a airly consistent drop in GHI scores since 1990. In the
Near East and North Arica, the GHI scores barely declined between
1995 and 2000 and ater 2005, and reductions in other periods were
small. In South Asia and Arica south o the Sahara—the two regions
with the highest GHI scores, at 20.7 and 19.2 respectively—the rates
o progress have also been uneven.
Among the regions, South Asia has the highest 2013 GHI score,
although it witnessed the steepest absolute decline in GHI scores since
1990, amounting to almost 11 points. South Asia reduced its GHI score
by 4 points between 1990 and 1995—mainly through a 10-percentage-
point decline in underweight in children—but this rapid progress didnot persist. In the ollowing ve-year periods and ater 2005, the
decrease in GHI scores slowed down to 1–3 points despite strong eco-
nomic growth. Social inequality and the low nutritional, educational,
and social status o women are major causes o child undernutrition in
this region that have impeded improvements in the GHI score.
Though Arica south o the Sahara made less progress than
South Asia in the 1990s, it has caught up since the turn o the millen-
nium and surpassed it, with a 2013 GHI score that ell below that o
South Asia. However South Asia’s overall decline was greater, as Ari-
ca south o the Sahara began with a lower GHI score in 1990. The lat-
ter’s GHI score increased marginally between 1990 and 1995, ellslightly until 2000, and declined more markedly thereater, by almost
5 points overall, until the period refected in the 2013 GHI score. The
large-scale civil wars o the 1990s and 2000s ended, and countries
earlier beset by confict became more politically stable. Economicgrowth resumed on the continent, and advances in the ght against
HIV and AIDS contributed to a reduction in child mortality in the coun-
tries most aected by the epidemic.
Since 2000, mortality rates or children under age ve have
declined in Arica south o the Sahara. A key actor behind the improved
rates seems to be the decrease in the prevalence o malaria, which
coincided with the increased use o insecticide-treated bed nets and
other antimalarial interventions (Demombynes and Trommlerová 2012).
Other actors that may have helped cut mortality rates include higher
immunization rates and a greater share o births in medical centers;
improved antenatal care and access to clean water and sanitation acil-ities; and increasing levels o income, leading to better nutrition and
access to medical care.
The situation in the Sahel, however, remains ragile in 2013
despite a good harvest. Recurrent crises in recent years—a combination
o sporadic rainall, locust inestation, crop shortages, and high and vol-
atile ood prices—have negatively aected ood and nutrition security in
the region, eroded the coping capacity o already vulnerable groups, and
weakened their resilience to shocks. In addition, livestock—an impor-
tant asset or pastoralists—have become vulnerable to diseases because
o inadequate eeding. The confict in northern Mali, growing insecurity
in northern Nigeria, and migration pressure have exacerbated the situa-tion. In Mali, thousands o people have fed their homes and at the time
o writing are living in reugee camps or with host amilies in Mali and in
neighboring countries (FAO 2013b).
Zimbabwe
Zambia
Yemen
Vietnam
Venezuela
Uzbekistan
Uruguay
United Statesof America
U.A.E.
Ukraine
Uganda
TurkmenistanTurkey
Tunisia
Trinidad & TobagoTogo
Thailand
Tanzania
Tajikistan
Syria
Sweden
Swaziland
Suriname
Sudan
Sri Lanka
Spain
SouthAfrica
Somalia
Sierra Leone
Senegal
Saudi Arabia
Rw.
Russian Federation
Qatar
Portugal
Philippines
Peru
Paraguay
PapuaNewGuinea
Panama
Pakistan
Oman
Norway
Nigeria
Niger
Nicaragua
Nepal
Namibia
Mozambique
Morocco
Mongolia
co
Mauritius
Mauritania Mali
Malaysia
Malawi
Madagascar
Libya
Liberia
Lesotho
Lebanon
LaoPDR
Kyrgyz Rep.
Kuwait
S. Korea
N. Korea
Kenya
Kazakhstan
Japan
Jamaica
Israel Iraq Iran
Indonesia
India
Iceland
HondurasHaiti
Guyana
Guinea-BissauGuinea
Guatemala
Greece
Ghana
Georgia
The Gambia
Gabon
French Guiana
France
Finland
Ethiopia
Eritrea
Equatorial Guinea
El Salvador
Egypt
Ecuador
Timor-Leste
Dominican Rep.
Djibouti
Cyprus
Cuba
Côted'Ivoire
Costa Rica
Congo,Rep. Congo,
Dem. Rep.
Colombia
China
Chile
Chad
Central AfricanRepublicCameroon
Cambodia
Bur.
Myanmar
Burkina Faso
Brunei
Brazil
Botsw.
Bolivia
Bhutan
Benin
Belize
Bangladesh
Azerb.
Australia
Armenia
Argentina
Angola
Algeria
Afghanistan
Western SaharaBahrain
Comoros
Jordan
GermanyUnitedKingdom
da
Ireland
Denmark
Switz.Slov.
Poland
LithuaniaLatvia
Estonia
Czech Rep.
Aust.
Bos. & Herz.
Neth.
Bel.Lux.
Slova.
Mace.
Hung.
Belarus
Alb.
Serb.Mont.
Cro.
Italy
Rom.
Mold.
Bulg.
Note: An increase in the GHI indicates a worsening o a country's hunger situation.
A decrease in the GHI indicates an improvement in a country's hunger situation.
GHI scores were not calculated or countries with very small populations. GHI scores and the
rate o progress since 1990 could only be calculated or ormer Sudan, because separate
undernourishment estimates or 2010–2012 and earlier were not available or South Sudan,
which became independent in 2011, and Sudan.
FIGURE 2.2 COUNTRY PROGRESS IN REDUCING GHI SCORES
Percentage change in 2013 GHI compared with 1990 GHI
Increase
Decrease o 0.0–24.9%
Decrease o 25.0–49.9%
Decrease o 50% or more
Striped countries have 1990
and 2013 GHI o less than 5
No data
Industrialized country
7/27/2019 PDF GHI 2013
http://slidepdf.com/reader/full/pdf-ghi-2013 15/66
2013 Global Hunger Index | Chapter 02 | Global, Regional, and National Trends 13
5 The numbers in these rst three sentences reer to the 88 countries or which (1) data or the
1990 and 2013 GHI scores are available and (2) either or both o those scores is greater than 5.
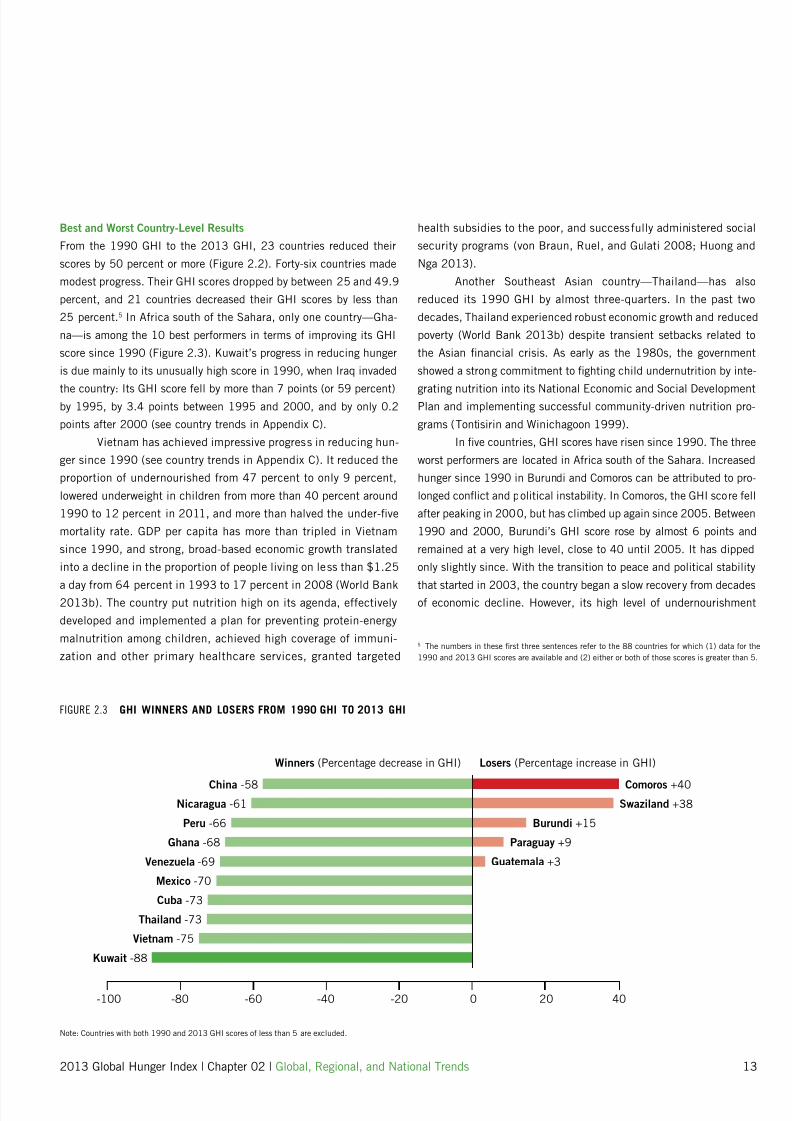
FIGURE 2.3 GHI WINNERS AND LOSERS FROM 1990 GHI TO 2013 GHI
China -58
Nicaragua -61
Peru -66
Ghana -68
Venezuela -69
Mexico -70
Cuba -73
Thailand -73
Vietnam -75
Kuwait -88
Comoros +40
Swaziland +38
Burundi +15
Paraguay +9
Guatemala +3
0 20 40-20-40-60-80-100
Winners (Percentage decrease in GHI) Losers (Percentage increase in GHI)
Note: Countries with both 1990 and 2013 GHI scores o less than 5 are excluded.
Best and Worst Country-Level Results
From the 1990 GHI to the 2013 GHI, 23 countries reduced their
scores by 50 percent or more (Figure 2.2). Forty-six countries made
modest progress. Their GHI scores dropped by between 25 and 49.9
percent, and 21 countries decreased their GHI scores by less than
25 percent.5 In Arica south o the Sahara, only one country—Gha-
na—is among the 10 best perormers in terms o improving its GHI
score since 1990 (Figure 2.3). Kuwait’s progress in reducing hunger
is due mainly to its unusually high score in 1990, when Iraq invaded
the country: Its GHI score ell by more than 7 points (or 59 percent)by 1995, by 3.4 points between 1995 and 2000, and by only 0.2
points ater 2000 (see country trends in Appendix C).
Vietnam has achieved impressive progress in reducing hun-
ger since 1990 (see country trends in Appendix C). It reduced the
proportion o undernourished rom 47 percent to only 9 percent,
lowered underweight in children rom more than 40 percent around
1990 to 12 percent in 2011, and more than halved the under-ve
mortality rate. GDP per capita has more than tripled in Vietnam
since 1990, and strong, broad-based economic growth translated
into a decline in the proportion o people living on less than $1.25
a day rom 64 percent in 1993 to 17 percent in 2008 (World Bank2013b). The country put nutrition high on its agenda, eectively
developed and implemented a plan or preventing protein-energy
malnutrition among children, achieved high coverage o immuni-
zation and other primary healthcare services, granted targeted
health subsidies to the poor, and successully administered social
security programs (von Braun, Ruel, and Gulati 2008; Huong and
Nga 2013).
Another Southeast Asian country—Thailand—has also
reduced its 1990 GHI by almost three-quarters. In the past two
decades, Thailand experienced robust economic growth and reduced
poverty (World Bank 2013b) despite transient setbacks related to
the Asian nancial crisis. As early as the 1980s, the government
showed a strong commitment to ghting child undernutrition by inte-
grating nutrition into its National Economic and Social DevelopmentPlan and implementing successul community-driven nutrition pro-
grams (Tontisirin and Winichagoon 1999).
In ve countries, GHI scores have risen since 1990. The three
worst perormers are located in Arica south o the Sahara. Increased
hunger since 1990 in Burundi and Comoros can be attributed to pro-
longed confict and political instability. In Comoros, the GHI score ell
ater peaking in 2000, but has climbed up again since 2005. Between
1990 and 2000, Burundi’s GHI score rose by almost 6 points and
remained at a very high level, close to 40 until 2005. It has dipped
only slightly since. With the transition to peace and political stability
that started in 2003, the country began a slow recovery rom decadeso economic decline. However, its high level o undernourishment
7/27/2019 PDF GHI 2013
http://slidepdf.com/reader/full/pdf-ghi-2013 16/66
14 Global, Regional, and National Trends | Chapter 02 | 2013 Global Hunger Index
remains a serious issue. The proportion o undernourished people has
continued to rise since 1990. The prevalence o child underweight has
declined since 2000, but it remains one o the highest in Arica.
Burundi’s child mortality rate has been improving, mainly since 1995
(see the table with underlying data in Appendix B).
In Swaziland, the HIV and AIDS epidemic, along with high
income inequality, has severely undermined ood security despite
growth in national income. Swaziland’s adult HIV prevalence in 2011
was estimated at 26 percent—the highest in the world (UNAIDS 2012).
The country’s GHI score worsened until 1995, then declined slightlyuntil 2005, but has increased again since then. Swaziland and sever-
al other Arican countries have made great strides in preventing mother-
to-child transmission o HIV, and child mortality rates have dropped
ater peaking around 2005 (UNAIDS 2010; IGME 2012). However, the
proportion o people who are undernourished increased dramatically in
Swaziland ater 2004–2006 (FAO 2013a). Because o drought, more
than one-quarter o the population depended on emergency ood aid
in 2006–2007, and the country's GDP per capita declined between
2007 and 2010 (CIA 2013; World Bank 2013b). High unemployment,
overgrazing, soil depletion, and the risk o uture droughts and foods
pose persistent challenges (CIA 2013).Some countries achieved noteworthy absolute progress in
improving their GHI scores. Comparing the 1990 GHI and the 2013 GHI,
Angola, Bangladesh, Cambodia, Ethiopia, Ghana, Malawi, Niger, Rwan-
da, Thailand, and Vietnam saw the largest improvements—with decreas-
es in their scores ranging between 15 and 23 points (Table 2.1).
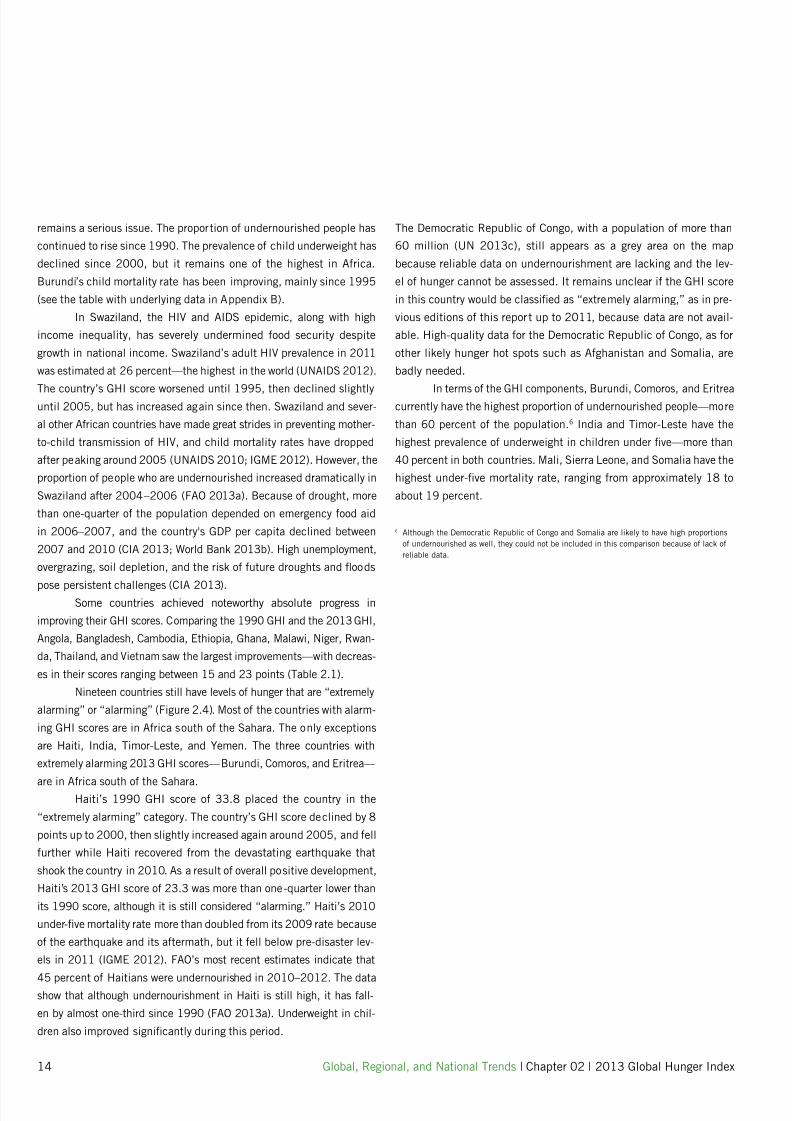
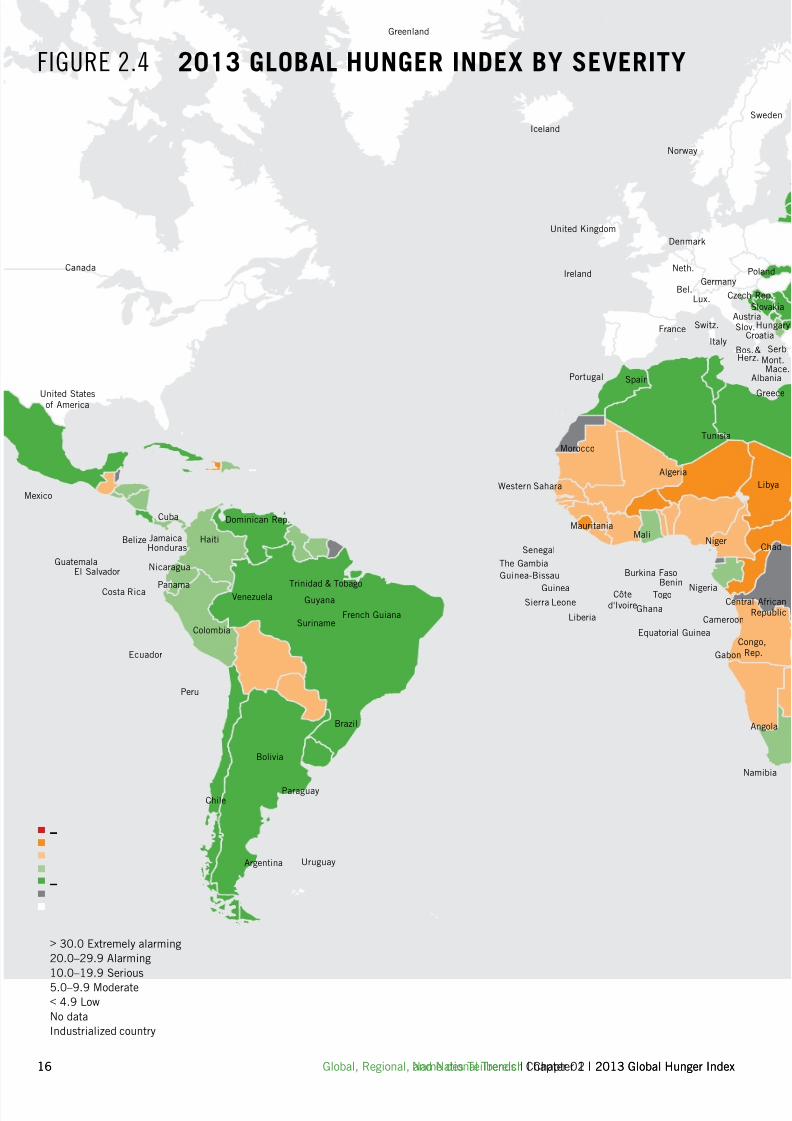
Nineteen countries still have levels o hunger that are “extremely
alarming” or “alarming” (Figure 2.4). Most o the countries with alarm-
ing GHI scores are in Arica south o the Sahara. The only exceptions
are Haiti, India, Timor-Leste, and Yemen. The three countries with
extremely alarming 2013 GHI scores—Burundi, Comoros, and Eritrea—
are in Arica south o the Sahara.Haiti’s 1990 GHI score o 33.8 placed the country in the
“extremely alarming” category. The country’s GHI score declined by 8
points up to 2000, then slightly increased again around 2005, and ell
urther while Haiti recovered rom the devastating earthquake that
shook the country in 2010. As a result o overall positive development,
Haiti’s 2013 GHI score o 23.3 was more than one-quarter lower than
its 1990 score, although it is still considered “alarming.” Haiti’s 2010
under-ve mortality rate more than doubled rom its 2009 rate because
o the earthquake and its atermath, but it ell below pre-disaster lev-
els in 2011 (IGME 2012). FAO’s most recent estimates indicate that
45 percent o Haitians were undernourished in 2010–2012. The datashow that although undernourishment in Haiti is still high, it has all-
en by almost one-third since 1990 (FAO 2013a). Underweight in chil-
dren also improved signicantly during this period.
The Democratic Republic o Congo, with a population o more than
60 million (UN 2013c), still appears as a grey area on the map
because reliable data on undernourishment are lacking and the lev-
el o hunger cannot be assessed. It remains unclear i the GHI score
in this country would be classied as “extremely alarming,” as in pre-
vious editions o this report up to 2011, because data are not avail-
able. High-quality data or the Democratic Republic o Congo, as or
other likely hunger hot spots such as Aghanistan and Somalia, are
badly needed.
In terms o the GHI components, Burundi, Comoros, and Eritreacurrently have the highest proportion o undernourished people—more
than 60 percent o the population.6 India and Timor-Leste have the
highest prevalence o underweight in children under ve—more than
40 percent in both countries. Mali, Sierra Leone, and Somalia have the
highest under-ve mortality rate, ranging rom approximately 18 to
about 19 percent.
6 Although the Democratic Republic o Congo and Somalia are likely to have high proportions
o undernourished as well, they could not be included in this comparison because o lack o
reliable data.

7/27/2019 PDF GHI 2013
http://slidepdf.com/reader/full/pdf-ghi-2013 17/66
2013 Global Hunger Index | Chapter 02 | Global, Regional, and National Trends 15
TABLE 2.1 COUNTRY GLOBAL HUNGER INDEX SCORES BY RANK, 1990 GHI, 1995 GHI, 2000 GHI, 2005 GHI, AND 2013 GHI
Rank Country 1990 1995 2000 2005 2013
1 Albania 9.2 6.0 7.8 6.1 5.2
1 Mauritius 8.5 7.6 6.5 5.9 5.2
3 Uzbekistan – 8.3 9.3 6.6 5.3
4 Panama 11.6 10.8 11.4 9.0 5.4
4 South Arica 7.2 6.5 7.4 7.7 5.4
6 China 13.0 10.4 8.4 6.7 5.5
6 Malaysia 9.5 7.1 6.9 5.8 5.5
6 Peru 16.3 12.3 10.5 9.9 5.5
9 Thailand 21.3 17.1 10.2 6.6 5.8
10 Colombia 10.4 8.0 6.8 6.9 5.9
11 Guyana 14.3 10.2 8.2 8.0 6.6
12 Suriname 11.3 9.9 11.1 8.9 6.7
13 El Salvador 10.9 8.7 7.4 6.4 6.8
14 Dominican Republic 14.9 11.7 9.7 8.8 7.0
15 Gabon 9.7 8.0 7.8 6.9 7.2
16 Vietnam 30.9 25.1 18.1 13.7 7.7
17 Honduras 14.2 13.6 10.8 8.5 7.918 Ghana 25.5 19.6 15.6 10.7 8.2
19 Ecuador 14.0 11.6 12.3 10.1 8.5
20 Moldova – 7.7 8.8 7.3 9.2
21 Georgia – 16.6 9.2 11.3 9.3
22 Nicaragua 24.1 19.9 15.4 11.5 9.5
23 Indonesia 19.7 16.9 15.5 14.6 10.1
23 Paraguay 9.3 7.5 6.5 6.3 10.1
25 Mongolia 19.7 23.6 18.5 14.1 10.8
26 Bolivia 18.8 16.9 14.2 13.8 11.2
27 Lesotho 13.2 14.6 14.6 14.9 12.9
28 Mauritania 22.7 16.2 17.2 14.6 13.2
28 Philippines 19.9 17.4 17.7 14.0 13.2
30 Benin 22.5 20.5 17.3 15.2 13.3
31 Senegal 18.1 19.8 19.2 13.7 13.8
32 Botswana 16.8 17.0 17.8 16.3 13.9
33 Gambia, The 19.1 20.4 16.1 15.6 14.0
34 Guinea-Bissau 21.7 20.8 20.6 17.7 14.3
35 Swaziland 10.4 12.9 12.7 12.5 14.4
36 Cameroon 23.7 23.8 20.3 16.3 14.5
37 Togo 23.0 19.1 20.4 18.2 14.7
38 Mali 27.4 26.9 24.3 20.7 14.8
39 Nigeria 25.3 22.6 17.9 16.3 15.0
40 Malawi 30.6 27.6 21.6 18.7 15.1
41 Rwanda 30.8 37.3 29.0 23.6 15.3
42 Guatemala 15.0 16.1 17.0 17.0 15.5
43 Sri Lanka 22.3 20.7 17.8 16.9 15.6
44 Côte d'Ivoire 16.3 16.5 17.3 16.4 16.1
45 Tajikistan – 21.2 22.6 19.0 16.3
46 Zimbabwe 20.0 22.0 21.7 20.5 16.5
47 Cambodia 32.2 30.7 27.8 20.9 16.8
48 Guinea 21.4 21.2 22.4 18.2 16.9
49 Nepal 28.0 27.3 25.3 22.3 17.3
50 Liberia 23.4 28.2 24.7 20.6 17.9
51 Kenya 21.4 21.0 20.5 20.2 18.0
51 North Korea 18.8 22.6 22.5 20.0 18.053 Namibia 22.1 21.9 17.5 17.1 18.4
54 Lao PDR 33.4 30.3 28.0 23.7 18.7
55 Angola 39.5 38.5 31.6 22.7 19.1
Rank Country 1990 1995 2000 2005 2013
56 Uganda 21.4 22.9 19.9 18.6 19.2
57 Pakistan 25.9 22.8 21.6 21.2 19.3
58 Bangladesh 36.7 35.1 24.0 20.2 19.4
59 Djibouti 33.5 28.5 27.7 24.0 19.5
60 Niger 36.4 34.6 30.3 25.6 20.3
61 Congo, Rep. 23.7 23.9 19.3 18.4 20.5
62 Tanzania 23.4 26.9 26.1 20.5 20.6
63 India 32.6 27.1 24.8 24.0 21.3
64 Mozambique 36.0 32.0 28.5 25.1 21.5
65 Burkina Faso 26.9 22.7 26.1 26.6 22.2
66 Sierra Leone 31.3 29.5 30.0 28.4 22.8
67 Central Arican Rep. 30.7 29.4 28.0 28.5 23.3
67 Haiti 33.8 31.7 25.7 27.0 23.3
69 Zambia 24.9 24.5 26.3 25.3 24.1
70 Madagascar 25.5 24.6 25.9 24.4 25.2
71 Ethiopia 42.3 42.7 37.1 31.0 25.7
72 Yemen, Rep. 29.8 27.7 26.9 27.9 26.573 Chad 38.8 34.9 29.8 29.7 26.9
74 Sudan (ormer) 31.1 25.7 27.2 24.7 27.0
75 Timor-Leste – – – 26.0 29.6
76 Comoros 24.0 27.5 33.3 29.8 33.6
77 Eritrea – 40.6 40.2 39.3 35.0
78 Burundi 33.8 38.1 39.5 39.5 38.8
Country ’90 ’95 ’00 ’05 ’13
Algeria 7.0 7.7 5.3 <5 <5
Argentina <5 <5 <5 <5 <5
Armenia – 10.2 8.2 <5 <5
Azerbaijan – 14.5 11.9 5.4 <5
Belarus – <5 <5 <5 <5
Bosnia & Herzegovina – <5 <5 <5 <5
Brazil 8.7 7.6 6.4 <5 <5
Bulgaria <5 <5 <5 <5 <5
Chile <5 <5 <5 <5 <5
Costa Rica <5 <5 <5 <5 <5
Croatia – 5.4 <5 <5 <5
Cuba 5.5 7.4 <5 <5 <5
Egypt, Arab Rep. 7.0 6.2 5.2 <5 <5
Estonia – <5 <5 <5 <5
Fiji 5.8 5.1 <5 <5 <5
Iran, Islamic Rep. 8.5 7.4 6.1 <5 <5
Jamaica 5.9 5.0 <5 <5 <5
Jordan 5.1 5.2 <5 <5 <5
Kazakhstan – <5 5.3 <5 <5
Kuwait 12.4 5.1 <5 <5 <5
Kyrgyz Republic – 9.3 8.8 5.3 <5
Country ’90 ’95 ’00 ’05 ’13
Latvia – <5 <5 <5 <5
Lebanon <5 <5 <5 <5 <5
Libya <5 <5 <5 <5 <5
Lithuania – <5 <5 <5 <5
Macedonia, FYR – 5.8 <5 <5 <5
Mexico 7.4 5.8 <5 <5 <5
Montenegro – – – – <5
Morocco 7.8 6.9 6.2 6.5 <5
Romania <5 <5 <5 <5 <5
Russian Fed. – <5 <5 <5 <5
Saudi Arabia 6.5 6.4 <5 <5 <5
Serbia – – – – <5
Slovak Rep. – <5 <5 <5 <5
Syrian Arab Rep. 7.7 6.1 <5 5.1 <5
Trinidad & Tobago 8.4 8.6 6.9 7.0 <5
Tunisia <5 <5 <5 <5 <5
Turkey <5 5.0 <5 <5 <5
Turkmenistan – 10.3 8.6 6.6 <5
Ukraine – <5 <5 <5 <5
Uruguay 5.5 <5 <5 <5 <5
Venezuela, RB 7.8 7.7 7.2 5.2 <5
COUNTRIES WITH 2013 GHI SCORES LESS THAN 5
Note: Ranked according to 2013 GHI scores. Countries with a 2013 GHI score o less than
5 are not included in the ranking, and dierences between their scores are minimal. Countries
that have identical 2013 GHI scores are given the same ranking (or example, Albania andMauritius both rank rst). The ollowing countries could not be included because o lack o
data: Aghanistan, Bahrain, Bhutan, Democratic Republic o Congo, Iraq, Myanmar, Oman,
Papua New Guinea, Qatar, and Somalia.
7/27/2019 PDF GHI 2013
http://slidepdf.com/reader/full/pdf-ghi-2013 18/66
16 Name des Teilbereich | Chapter 1 | 2013 Global Hunger Index
Venezuela
Uruguay
United Statesof America
United Kingdom
Tunisia
Trinidad & Tobago
Togo
Sweden
Suriname
Spain
Sierra Leone
Senegal
Portugal
Peru
Paraguay
Panama
Norway
Nigeria
Niger
Nicaragua
Namibia
Morocco
Mexico
MauritaniaMali
Libya
Liberia
Jamaica
Italy
Ireland
Iceland
HondurasHaiti
Guyana
Guinea-Bissau
Guinea
Guatemala
Greenland
Greece
Bos. &Herz.
Slov.Croatia
Ghana
Germany
The Gambia
Gabon
French Guiana
France
Equatorial Guinea
El Salvador
Ecuador
Denmark
Cuba
Côte
d'Ivoire
Costa Rica
Congo,Rep.
Colombia
Chile
Chad
Central AfricanRepublic
Canada
Cameroon
Burkina Faso
Brazil
Bolivia
Benin
Belize
Argentina
Angola
Algeria
Western Sahara
Mace.Albania
Serb.
Mont.
Slovakia
Poland
Czech Rep.
AustriaSwitz.
Neth.
Lux.
Hungary
Bel.
Dominican Rep.
> 30.0 Extremely alarming
20.0–29.9 Alarming
10.0–19.9 Serious
5.0–9.9 Moderate
< 4.9 Low
No data
Industrialized country
FIGURE 2.4 2013 GLOBAL HUNGER INDEX BY SEVERITY
16 Global, Regional, and National Trends | Chapter 02 | 2013 Global Hunger Index
7/27/2019 PDF GHI 2013
http://slidepdf.com/reader/full/pdf-ghi-2013 19/66
2013 Global Hunger Index | Chapter 1 | Name des Teilbereich 17
Zimbabwe
mbia
Yemen
Vietnam
Uzbekistan
U.A.E.
Ukraine
Uganda
TurkmenistanTurkey
Thailand
Tanzania
Tajikistan
Syria
Swaziland
Sudan
Sri Lanka
th
ca
Somalia
Saudi Arabia
Rw.
Russian Federation
Qatar
Philippines
Papua
New Guinea
Pakistan
Oman
Nepal
Mozambique
Mongolia
Mauritius
Malaysia
Malawi
Madagascar
Lesotho
Lebanon
LaoPDR
Kyrgyz Rep.
Kuwait
S. Korea
N. Korea
Kenya
Kazakhstan
Jordan
Japan
IsraelIraq
Iran
Indonesia
India
Georgia
nland
Ethiopia
Eritrea
Egypt
Timor-Leste
Djibouti
Cyprus
go,
. Rep.
China
Cambodia
Bur.
Myanmar
Brunei
swana
Bhutan
Bangladesh
Azerb.
Australia
Armenia
Afghanistan
Bahrain
Comoros
mania
Mold.
huania
tvia
tonia
garia
Belarus
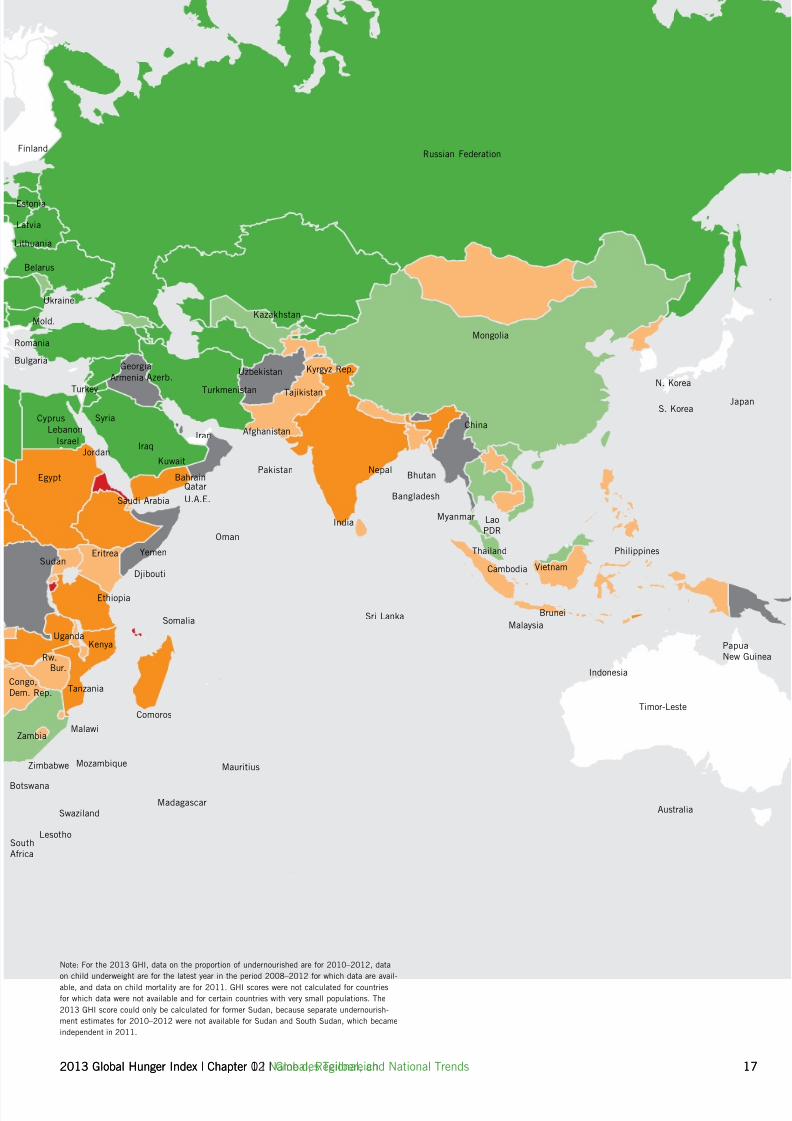
Note: For the 2013 GHI, data on the proportion o undernourished are or 2010–2012, data
on child underweight are or the latest year in the period 2008–2012 or which data are avail-
able, and data on child mortality are or 2011. GHI scores were not calculated or countries
or which data were not available and or certain countries with very small populations. The
2013 GHI score could only be calculated or ormer Sudan, because separate undernourish-
ment estimates or 2010–2012 were not available or Sudan and South Sudan, which became
independent in 2011.
2013 Global Hunger Index | Chapter 02 | Global, Regional, and National Trends 17
7/27/2019 PDF GHI 2013
http://slidepdf.com/reader/full/pdf-ghi-2013 20/66
18 Name des Teilbereich | Chapter 1 | 2013 Global Hunger Index
03–––
–––––––––––
–––––––––––
––––––––––
––––––––
––––––
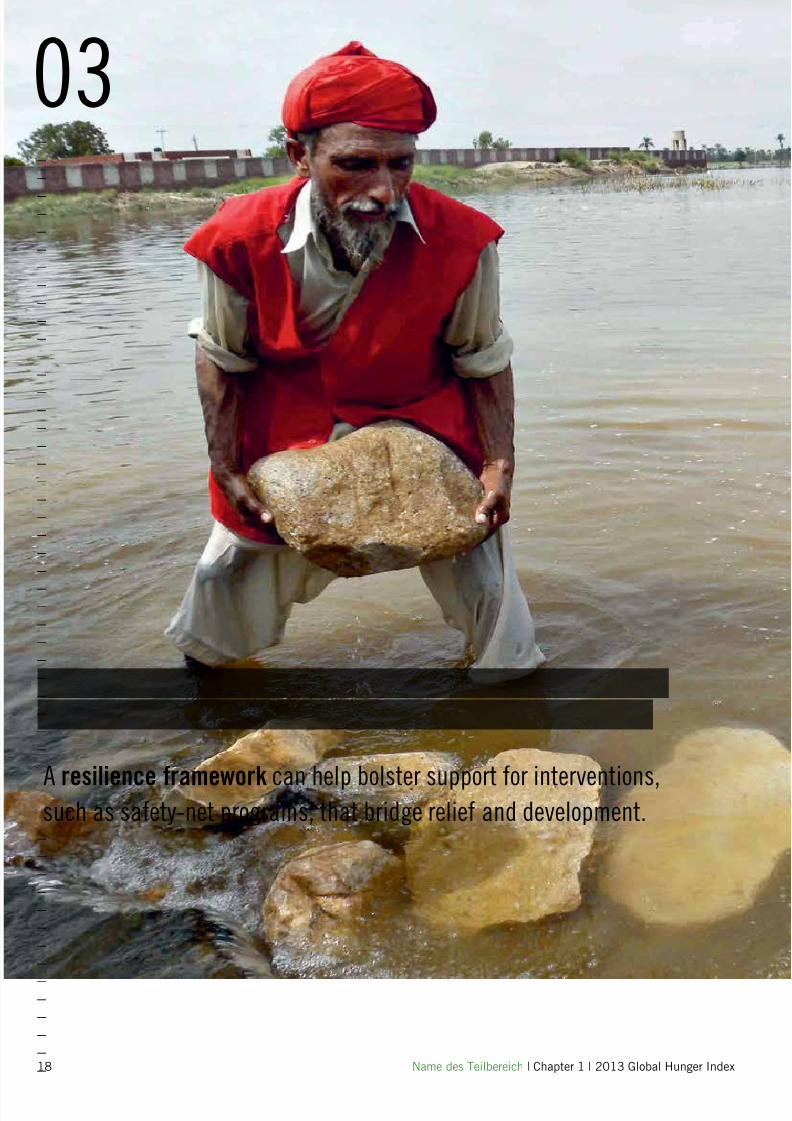
A resilience framework can help bolster support for interventions,such as safety-net programs, that bridge relief and development.
7/27/2019 PDF GHI 2013
http://slidepdf.com/reader/full/pdf-ghi-2013 21/66
2013 Global Hunger Index | Chapter 03 | Understanding Resilience or Food and Nutrition Security 19
Several decades ago, short-term shocks were only o peripheral con-
cern to most development experts. Helping people survive natural
disasters, like foods and droughts, or manmade ones like civil unrest,
was considered the responsibility o humanitarian aid organizations.
Conversely, humanitarian agencies have historically ocused mainly
on relie rather than on the kinds o longer-term development-orient-
ed interventions that might reduce exposure or vulnerability to
shocks.
Since then our understanding o the role o short-term shocks
has evolved substantially. Even temporary shocks and stressors canhave long-term consequences. A poor harvest that reduces a child’s
ood intake, even temporarily, can have serious eects on her longer-
term cognitive and physical development and thereore uture earning
capacity. A severe drought that leads a amily to sell o its most pro-
ductive assets, such as its land or livestock, can plunge that amily into
permanent poverty. It is thereore now widely recognized that a central
reason why it is so dicult or poor people to escape poverty is their
sheer inability to avoid or cope with shocks and stressors. Yet, at the
same time, relie eorts, important though they are, do not typically
address the underlying structural vulnerabilities o a population. Rec-
ognizing these realities, both the humanitarian and development com-munities have arrived at a common conclusion: Poor and vulnerable
populations need greater resilience, and in order to achieve it, these
communities need to work together.
A critical part o building resilience involves boosting ood
and nutrition security. Poor people have always been vulnerable to
“hunger seasons,” droughts, foods, and other natural and man-
made disasters (Box 3.1). In recent years, this perennial vulnerabil-
ity has been exacerbated by ood price and nancial crises, and
large-scale humanitarian crises such as the recurring droughts and
amines in the Sahel and the Horn o Arica. Several recent crises
have even spurred the creation o large-scale programs that explic-itly aim to build resilience, including the Global Alliance or Action
or Drought Resilience and Growth in the Horn o Arica backed by
USAID and the Global Alliance or Resilience in the Sahel (AGIR-
Sahel) unded by the European Union (EU). Dozens o other inter-
national development projects are being created all over the world
to strengthen people’s resilience to shocks and improve their ood
and nutrition security.
While there is no consensus on the best ingredients or resil-
ience or even its denition, the development and relie communities
are clearly moving toward a loosely dened resilience ramework that
oers the potential or traditionally compartmentalized sectors todesign and implement more eective and more integrated interven-
tions. Nevertheless, this emerging resilience ramework presents chal-
lenges—conceptually, empirically, and practically.
UNDERSTANDING RESILIENCE
FOR FOOD AND NUTRITION SECURITY
The Concept o Resilience
Resilience has roots in the Latin word resilio , meaning “to jump back”
(Klein, Nicholls, and Thomalla 2003). Much o the resilience literature
broadly denes the term as a return to an original state. In ecology,
resilience has long been concerned with a system’s ability to absorb
changes and still persist (Holling 1973). Other resilience studies have
ocused on the gap between original states and less than ideal condi-
tions. In the 1940s and 1950s, or instance, psychologists studied the
negative eects o exclusion, poverty, and traumatic stressors on vul-
nerable individuals, especially children (Glantz and Johnson 1999). Theconcept was later adopted in other disciplines, including physics and
disaster risk management, with a similar ocus on recovery rom shocks,
or even adverse trends such as rapid population growth.
In the development community, the concept o resilience has
been urther adapted and elaborated. When applied to complex adaptive
systems, resilience is not just about resistance to change and going back
to how things were (Folke 2006). It can involve making adjustments to
respond to new stresses or even making considerable changes to a sys-
tem, be it a household, community, or country. Resilience here consists
o three capacities that respond to dierent degrees o change or shocks
(Berkes, Colding, and Folke 2003; Walker et al. 2004):
1. Absorptive capacity covers the coping strategies individuals, house-
holds, or communities use to moderate or buer the impacts o
shocks on their livelihoods and basic needs.
2. Adaptive capacity is the ability to learn rom experience and adjust
responses to changing external conditions, yet continue operating.
3. Transormative capacity is the capacity to create a undamentally
new system when ecological, economic, or social structures make
the existing system untenable.
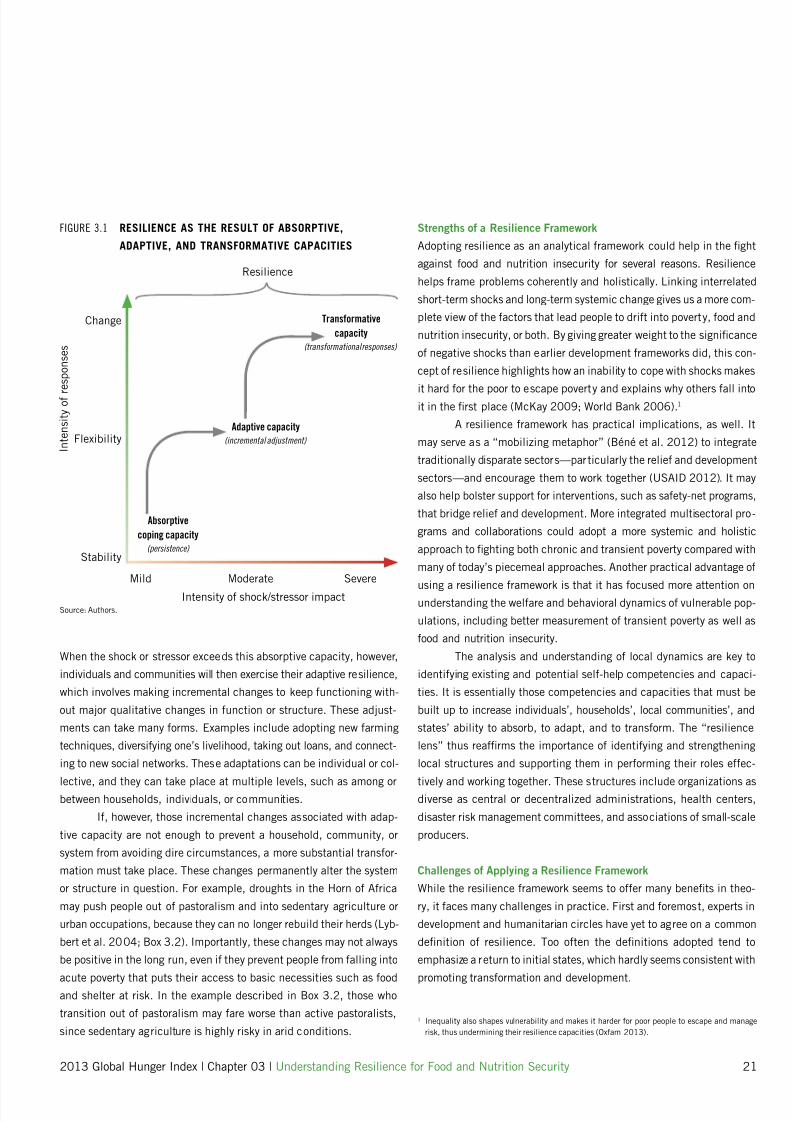
According to this broader denition, resilience is the result o not just
one, but all three capacities. Each capacity leads to a dierent out-
come: (1) absorptive capacity leads to endurance (or continuity); (2)
adaptive capacity leads to incremental adjustments or changes; and
(3) transormative capacity leads to transormational, system-changing
responses (Figure 3.1).
These three dierent responses can be linked to dierent inten-
sities o shock or change in a broadly hierarchical manner. The lower
the intensity o the shock, the more likely the household, community,
or system will be able to resist it eectively, absorbing its impacts with-out changing its unction, status, or state. For example, a amily would
be better able to deal with a short-term ood price hike—without mak-
ing drastic changes—than a tsunami that levels its village.
7/27/2019 PDF GHI 2013
http://slidepdf.com/reader/full/pdf-ghi-2013 22/66
20 Understanding Resilience or Food and Nutrition Security | Chapter 03 | 2013 Global Hunger Index
Quadrant 1: Less vulnerable and less exposed to shocksQuadrant 3: Vulnerable but less exposed to shocks
Quadrant 2: Less vulnerable but exposed to shocksQuadrant 4: Highly vulnerable and highly exposed to shocks
5
10
15
20
25
30
35
40
2 0 1
3 G H I s c o r e
Average share o population aected by weather shocks, 1990–2009 (%)
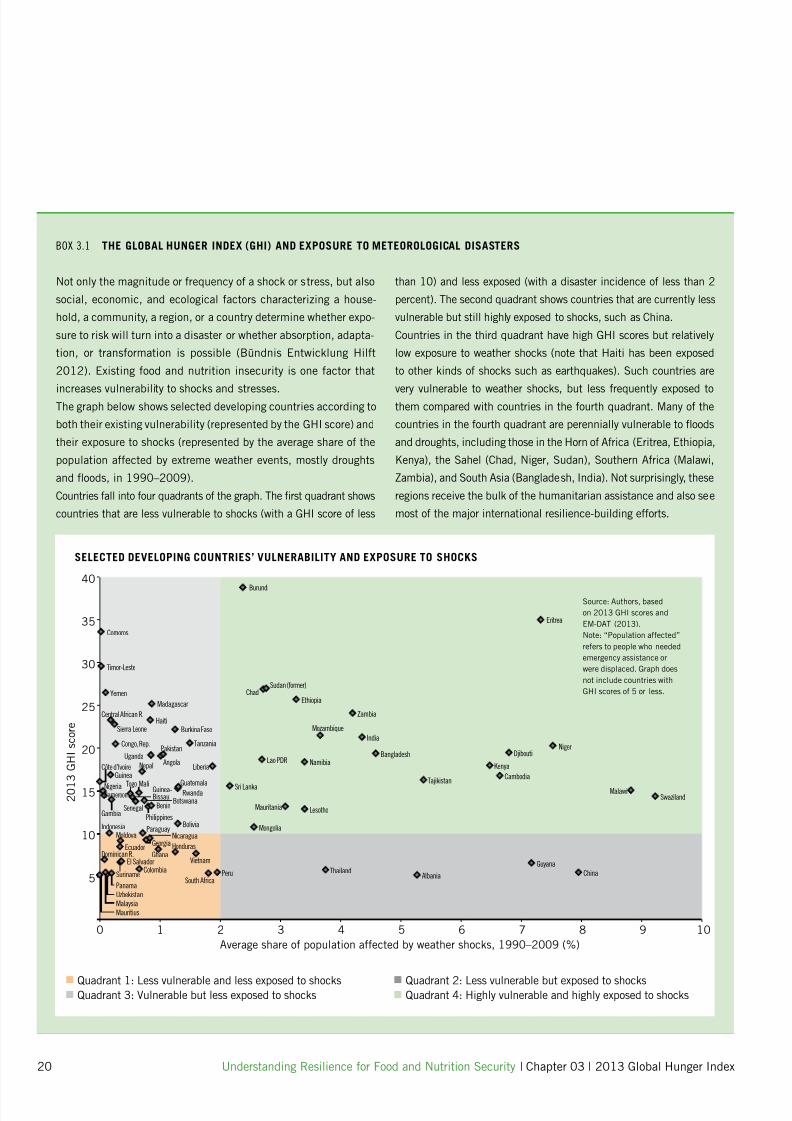
Not only the magnitude or requency o a shock or stress, but also
social, economic, and ecological actors characterizing a house-
hold, a community, a region, or a country determine whether expo-
sure to risk will turn into a disaster or whether absorption, adapta-
tion, or transormation is possible (Bündnis Entwicklung Hilt
2012). Existing ood and nutrition insecurity is one actor that
increases vulnerability to shocks and stresses.The graph below shows selected developing countries according to
both their existing vulnerability (represented by the GHI score) and
their exposure to shocks (represented by the average share o the
population aected by extreme weather events, mostly droughts
and foods, in 1990–2009).
Countries all into our quadrants o the graph. The rst quadrant shows
countries that are less vulnerable to shocks (with a GHI score o less
than 10) and less exposed (with a disaster incidence o less than 2
percent). The second quadrant shows countries that are currently less
vulnerable but still highly exposed to shocks, such as China.
Countries in the third quadrant have high GHI scores but relatively
low exposure to weather shocks (note that Haiti has been exposed
to other kinds o shocks such as earthquakes). Such countries are
very vulnerable to weather shocks, but less requently exposed tothem compared with countries in the ourth quadrant. Many o the
countries in the ourth quadrant are perennially vulnerable to foods
and droughts, including those in the Horn o Arica (Eritrea, Ethiopia,
Kenya), the Sahel (Chad, Niger, Sudan), Southern Arica (Malawi,
Zambia), and South Asia (Bangladesh, India). Not surprisingly, these
regions receive the bulk o the humanitarian assistance and also see
most o the major international resilience-building eorts.
BOX 3.1 THE GLOBAL HUNGER INDEX (GHI) AND EXPOSURE TO METEOROLOGICAL DISASTERS
SELECTED DEVELOPING COUNTRIES’ VULNERABILITY AND EXPOSURE TO SHOCKS
Comoros
Timor-Leste
Yemen
Madagascar
Central African R.
Sierra LeoneHaiti
Congo, Rep.
Burkina Faso
Tanzania
UgandaPakistan
AngolaLiberia
GuatemalaRwanda
Nepal
GuineaCôte d’lvoire
NigeriaCameroon
Gambia
Togo Guinea-Bissau
Senegal
Mali
BotswanaBenin
PhilippinesBoliviaIndonesia Paraguay
Moldova
Ecuador
NicaraguaGeorgia
GhanaHonduras
VietnamDominican R.
El Salvador
Suriname
Mauritius
Malaysia
Colombia
Uzbekistan
PanamaSouth Africa
Peru
Burundi
Sudan (former)Chad
Ethiopia
Mozambique
Zambia
India
Bangladesh
Tajikistan
NamibiaLao PDR
Sri Lanka
Mauritania Lesotho
Mongolia
Eritrea
NigerDjibouti
Kenya
Cambodia
MalawiSwaziland
ThailandAlbania
Guyana
China
0 1 2 3 4 5 6 7 8 9 10
Source: Authors, based
on 2013 GHI scores and
EM-DAT (2013).
Note: “Population aected”
reers to people who needed
emergency assistance or
were displaced. Graph does
not include countries with
GHI scores o 5 or less.
7/27/2019 PDF GHI 2013
http://slidepdf.com/reader/full/pdf-ghi-2013 23/66
When the shock or stressor exceeds this absorptive capacity, however,
individuals and communities will then exercise their adaptive resilience,
which involves making incremental changes to keep unctioning with-
out major qualitative changes in unction or structure. These adjust-
ments can take many orms. Examples include adopting new arming
techniques, diversiying one’s livelihood, taking out loans, and connect-
ing to new social networks. These adaptations can be individual or col-
lective, and they can take place at multiple levels, such as among orbetween households, individuals, or communities.
I, however, those incremental changes associated with adap-
tive capacity are not enough to prevent a household, community, or
system rom avoiding dire circumstances, a more substantial transor-
mation must take place. These changes permanently alter the system
or structure in question. For example, droughts in the Horn o Arica
may push people out o pastoralism and into sedentary agriculture or
urban occupations, because they can no longer rebuild their herds (Lyb-
bert et al. 2004; Box 3.2). Importantly, these changes may not always
be positive in the long run, even i they prevent people rom alling into
acute poverty that puts their access to basic necessities such as oodand shelter at risk. In the example described in Box 3.2, those who
transition out o pastoralism may are worse than active pastoralists,
since sedentary agriculture is highly risky in arid conditions.
1 Inequality also shapes vulnerability and makes it harder or poor people to escape and manage
risk, thus undermining their resilience capacities (Oxam 2013).
Strengths o a Resilience Framework
Adopting resilience as an analytical ramework could help in the ght
against ood and nutrition insecurity or several reasons. Resilience
helps rame problems coherently and holistically. Linking interrelated
short-term shocks and long-term systemic change gives us a more com-
plete view o the actors that lead people to drit into poverty, ood and
nutrition insecurity, or both. By giving greater weight to the signicance
o negative shocks than earlier development rameworks did, this con-
cept o resilience highlights how an inability to cope with shocks makes
it hard or the poor to escape poverty and explains why others all intoit in the rst place (McKay 2009; World Bank 2006).1
A resilience ramework has practical implications, as well. It
may serve as a “mobilizing metaphor” (Béné et al. 2012) to integrate
traditionally disparate sectors—particularly the relie and development
sectors—and encourage them to work together (USAID 2012). It may
also help bolster support or interventions, such as saety-net programs,
that bridge relie and development. More integrated multisectoral pro-
grams and collaborations could adopt a more systemic and holistic
approach to ghting both chronic and transient poverty compared with
many o today’s piecemeal approaches. Another practical advantage o
using a resilience ramework is that it has ocused more attention onunderstanding the welare and behavioral dynamics o vulnerable pop-
ulations, including better measurement o transient poverty as well as
ood and nutrition insecurity.
The analysis and understanding o local dynamics are key to
identiying existing and potential sel-help competencies and capaci-
ties. It is essentially those competencies and capacities that must be
built up to increase individuals’, households’, local communities’, and
states’ ability to absorb, to adapt, and to transorm. The “resilience
lens” thus rearms the importance o identiying and strengthening
local structures and supporting them in perorming their roles eec-
tively and working together. These structures include organizations asdiverse as central or decentralized administrations, health centers,
disaster risk management committees, and associations o small-scale
producers.
Challenges o Applying a Resilience Framework
While the resilience ramework seems to oer many benets in theo-
ry, it aces many challenges in practice. First and oremost, experts in
development and humanitarian circles have yet to agree on a common
denition o resilience. Too oten the denitions adopted tend to
emphasize a return to initial states, which hardly seems consistent with
promoting transormation and development.
FIGURE 3.1 RESILIENCE AS THE RESULT OF ABSORPTIVE,
ADAPTIVE, AND TRANSFORMATIVE CAPACITIES
Source: Authors.
I n t e n s i t y o f r
e s p o n s e s
Intensity o shock/stressor impact
Mild Moderate Severe
Change
Flexibility
Stability
Absorptive
coping capacity
(persistence)
Adaptive capacity
(incremental adjustment)
Transformative
capacity
(transformational responses)
Resilience
2013 Global Hunger Index | Chapter 03 | Understanding Resilience or Food and Nutrition Security 21
7/27/2019 PDF GHI 2013
http://slidepdf.com/reader/full/pdf-ghi-2013 24/66
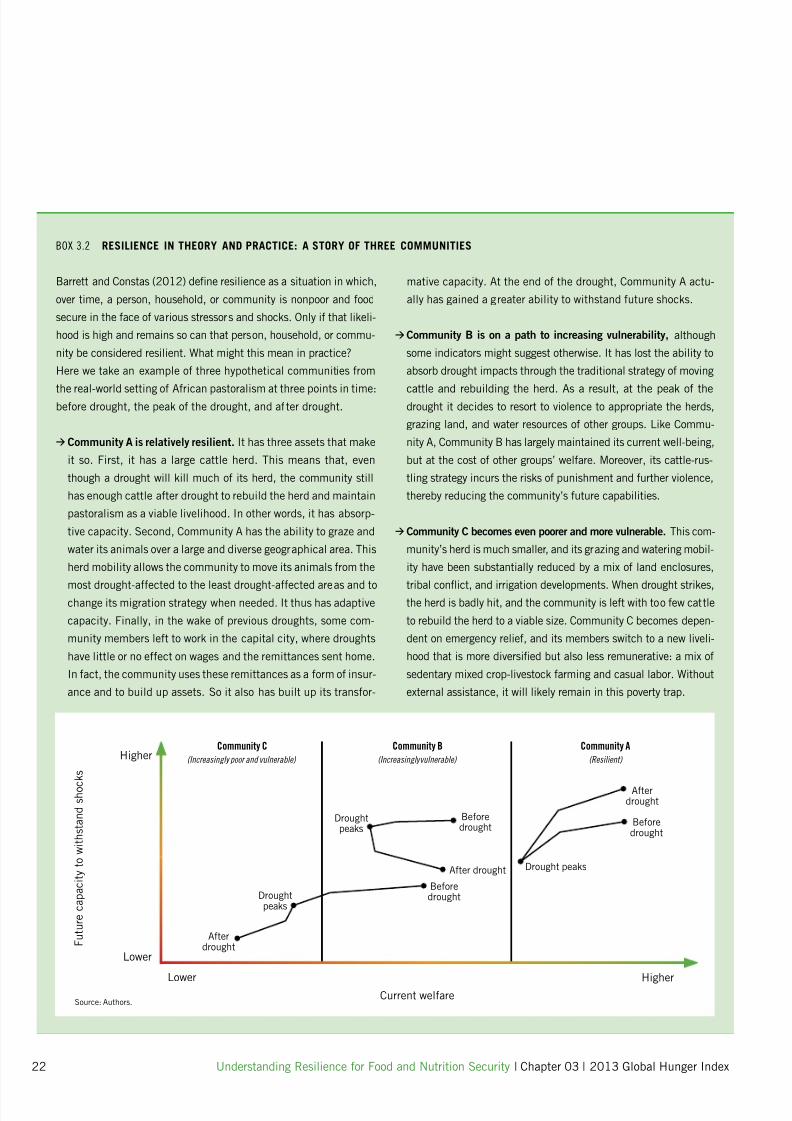
Barrett and Constas (2012) dene resilience as a situation in which,
over time, a person, household, or community is nonpoor and ood
secure in the ace o various stressors and shocks. Only i that likeli-
hood is high and remains so can that person, household, or commu-
nity be considered resilient. What might this mean in practice?
Here we take an example o three hypothetical communities rom
the real-world setting o Arican pastoralism at three points in time:beore drought, the peak o the drought, and ater drought.
> Community A is relatively resilient. It has three assets that make
it so. First, it has a large cattle herd. This means that, even
though a drought will kill much o its herd, the community still
has enough cattle ater drought to rebuild the herd and maintain
pastoralism as a viable livelihood. In other words, it has absorp-
tive capacity. Second, Community A has the ability to graze and
water its animals over a large and diverse geographical area. This
herd mobility allows the community to move its animals rom the
most drought-aected to the least drought-aected areas and tochange its migration strategy when needed. It thus has adaptive
capacity. Finally, in the wake o previous droughts, some com-
munity members let to work in the capital city, where droughts
have little or no eect on wages and the remittances sent home.
In act, the community uses these remittances as a orm o insur-
ance and to build up assets. So it also has built up its transor-
BOX 3.2 RESILIENCE IN THEORY AND PRACTICE: A STORY OF THREE COMMUNITIES
F u t u r e c a p a c i t y t o w i t h s t a n d s h o c
k s
Current welareLower Higher
Higher
Lower
Community C
(Increasingly poor and vulnerable)
Community B
(Increasingly vulnerable)
Community A
(Resilient)
Droughtpeaks
Beoredrought
Aterdrought
Drought peaks
Aterdrought
mative capacity. At the end o the drought, Community A actu-
ally has gained a greater ability to withstand uture shocks.
>Community B is on a path to increasing vulnerability, although
some indicators might suggest otherwise. It has lost the ability to
absorb drought impacts through the traditional strategy o moving
cattle and rebuilding the herd. As a result, at the peak o thedrought it decides to resort to violence to appropriate the herds,
grazing land, and water resources o other groups. Like Commu-
nity A, Community B has largely maintained its current well-being,
but at the cost o other groups’ welare. Moreover, its cattle-rus-
tling strategy incurs the risks o punishment and urther violence,
thereby reducing the community’s uture capabilities.
> Community C becomes even poorer and more vulnerable. This com-
munity’s herd is much smaller, and its grazing and watering mobil-
ity have been substantially reduced by a mix o land enclosures,
tribal confict, and irrigation developments. When drought strikes,the herd is badly hit, and the community is let with too ew cattle
to rebuild the herd to a viable size. Community C becomes depen-
dent on emergency relie, and its members switch to a new liveli-
hood that is more diversied but also less remunerative: a mix o
sedentary mixed crop-livestock arming and casual labor. Without
external assistance, it will likely remain in this poverty trap.
Droughtpeaks
Beoredrought
Beoredrought
Ater drought
Source: Authors.
22 Understanding Resilience or Food and Nutrition Security | Chapter 03 | 2013 Global Hunger Index
7/27/2019 PDF GHI 2013
http://slidepdf.com/reader/full/pdf-ghi-2013 25/66
Some critics have also suggested that resilience is a concept that does
not translate well rom ecological settings to social settings. They argue
that the resilience model does not pay enough attention to social
dynamics in general, and to issues o agency and power in particular.2
However, NGOs and other practitioners increasingly challenge this view.
They emphasize the resilience-enhancing role played by social process-
es, such as community cohesion, good leadership, and individual sup-
port o collective action (Twigg 2007; Boyd et al. 2008; Schwarz et al.
2011; VFL 2011). A rigorous assessment o the literature shows, how-
ever, that the number o these analyses is still low and the evidencethin (Béné et al. 2012).
Others ear that the resilience agenda may be pushed too ar,
threatening or diluting the impact o more traditional relie activities.
I the relie sector’s perormance is benchmarked against its contribu-
tion to resilience building, many wor thwhile but more narrowly ocused
relie eorts could lose resources. Enthusiasm or resilience building
thereore needs to be tempered by an appreciation or the need or core
relie activities and the benets o specialization.
Finally, while resilience usually has positive connotations and
is the goal o many programs and projects, the large majority do not
consider its possible downsides. Some coping strategies, such as pros-titution or begging, may strengthen resilience, but to the detriment o
well-being and sel-esteem. Other coping activities, such as crime, may
increase the resilience o one group to the detriment o another per-
son’s well-being.3 Moreover, when dened as the rapid return to an ini-
tial state, resilience may be counterproductive in the long run. Resil-
ience as “stickiness,” “stubbornness,” or “resistance to change” is
clearly not a desirable quality in many circumstances.
These concerns are by no means academic. Populations high-
ly exposed to climate change, such as Arican pastoralists, are the sub-
ject o substantial debate over whether herd recovery or diversication
out o pastoralism is the best long-term objective. Similarly, the argu-ment that saety-net programs impede out-migration rom drought-
prone rural areas is relevant. In such a case, resilience without trans-
ormation, in response to a stressor as signicant as climate change,
could be an undesirable quality in the long run.
Resilience-Enhancing Interventions
As implied, a signicant challenge or a resilience ramework is to
dene exactly what value it adds to the current way o doing things.
In principle, a resilience ramework could add value in two ways. At
a strategic level, a resilience ramework could encourage governments
and development partners to mainstream resilience as a policy andprogrammatic objective, and to coordinate dierence agencies and
sectors to achieve that objective. In this strategic sense, it is not obvi-
ous that new policy or program instruments are needed to achieve
2 As examples, see Leach (2008); Hornborg (2009); Davidson (2010); Duit, Galaz, and Eckerberg
(2010).3 Some o these livelihood strategies may be short-term “negative” coping strategies; others clear-
ly involve longer-term maladaptations that cannot be considered simply survival coping behaviors.
“Negative” orms o resilience are thus possible and oten empirically observed (Sapountzaki
2007).4 Moreover, the mobility o pastoralist populations makes the range o xed public works projects,
such as the construction o roads and crop inrastructure, more limited, though they are still pos-
sible, particularly in more sedentary agro-pastoralist settings.
resilience since improved coordination and prioritization could be su-
cient in themselves. However, one might also expect a resilience
ocus to encourage adoption o programs or policies that innovatively
bridge the relie and development sectors (as opposed to specializing
in one sector or the other).
This raises a question: What types o interventions might build
this bridge between relie and development? An obvious example would
be saety-net programs, which meet the criteria or providing social pro-
tection, or “relie,” and contributing to development, or “longer-term
resilience building.” Social protection typically takes the orm o ood,cash, or voucher transers, but the development component is more
varied. Transers that are conditional oten incorporate explicit devel-
opment objectives, such as raising school attendance, expanding voca-
tional training or adult schooling, increasing nutritional knowledge, and,
quite commonly, building inrastructure through public works programs.
A very relevant example is the Productive Saety Net Program in
Ethiopia (Box 3.3). This program was an innovative solution to two
major problems: (1) the ad hoc, uneven, and unpredictable nature o
traditional transer programs and (2) the widely held view that exces-
sive ocus on relie was inhibiting sustainable rural development. By
combining social protection with public asset building, the ProductiveSaety Net Program clearly contributes to both relie and longer-term
development. In that sense, it is a resilience-oriented program.
Related programs in Ethiopia and elsewhere (such as BRAC’s
graduation model in Bangladesh) also ocus on helping individuals
and households build up business and nancial skills as well as con-
dence and a sense o empowerment. These programs are based on
the assumption that providing temporary saety rom shocks is a key
step toward building up assets that provide a more permanent resil-
ience to shocks.
The Pastoralist Livelihoods Initiative is a quite dierent exam-
ple o a relie-and-development intervention rom Ethiopia (Box 3.3).While productive saety-net programs are well suited to sedentary crop
or crop-livestock systems, pastoralists ace unique challenges. Like
crops, livestock are highly vulnerable to drought. But unlike annual
crops, they are a perennial asset, like land.4 This makes the death o
livestock during droughts potentially very costly. In extreme situations,
a household may drop out o pastoralism, simply because it cannot
rebuild its herd ater a drought.
2013 Global Hunger Index | Chapter 03 | Understanding Resilience or Food and Nutrition Security 23

7/27/2019 PDF GHI 2013
http://slidepdf.com/reader/full/pdf-ghi-2013 26/66
24 Understanding Resilience or Food and Nutrition Security | Chapter 03 | 2013 Global Hunger Index
The Pastoralist Livelihoods Initiative is a tightly ocused resilience-
building program that switches between relie and development, rath-
er than trying to address both at the same time, as the Productive Sae-
ty Net Program does. It oers one clear practical way to address the
disconnect between relie and development activities. But while sae-
ty-net programs have been widely researched all over the world, more
experimentation, learning, and evaluation are required or these kinds
o switching programs.
Measuring ResilienceWith mounting interest in resilience as a conceptual ramework comes
increased demand or empirical knowledge o resilience. Govern-
ments, nongovernmental organizations, international donors, and oth-
ers are interested in using the best available indicators and survey
instruments to identiy dierences across space and time and to diag-
nose sources o vulnerability and design programs to address weak-
nesses. To diagnose the problems and develop the best responses, it
is important to measure resilience by gauging the impacts o both
shocks and the mitigating infuences on these shocks, such as cop-
ing behaviors and outside interventions (Frankenberger and Nelson
2013). In short, good measurement should drive diagnosis andresponse (Barrett 2010).
A better understanding o resilience will require collecting
data on the causes and consequences o a wide range o negative
shocks. However, resilience, vulnerability, and coping behaviors are
dicult phenomena to measure, because (1) shocks, by denition,
are oten short-term unpredictable events, implying the need or
requent data (or example, bi-monthly); (2) negative shocks oten
occur in remote places and populations, such as pastoralists in the
Sahel or the Horn o Arica; and (3) resilience to shocks involves com-
plex coping or adaptive behaviors, which are diverse and may involve
thresholds and qualitative shits.As such, the unpredictable nature o shocks and responses
to them makes measuring vulnerability and resilience much more di-
cult than measuring chronic welare measures like poverty, child
malnutrition, or inant mortality. For chronic measures, occasional
snapshots rom household surveys usually suce to paint a general
picture o poverty across regions and countries and to determine
basic trends. These standard household surveys are not requent
enough, however, to assess the consequences o shocks except by
coincidence, and large panel surveys in developing countries are still
relatively rare. While many standard economic or health and nutri-
tion surveys might measure important aspects o vulnerability andresilience, they are unlikely to measure all relevant behavioral
responses. This suggests that measuring vulnerability and resilience
requires a dierent approach.
“In 2012 we were beset by several crises: a nutritionsecurity crisis, a politics and security crisis, and at the
same time a humanitarian crisis. It was the rst time
we in Mali had to endure such a time o instability.
Civil servants abandoned their oces, and the people
in occupied areas had no one to turn to or help....”
“To prepare or the uture, one has to consider that
Mali is located in the Sahel, which is aected
by climate change. The majority o the population
depends on the wet season to ensure their ood
security. To improve their situation, they mustpursue long-term activities to improve their pro-
duction systems, to equip them with the necessary
inormation, and to diversiy their diet.”
Maïga MahamaneEmployee o Welthungerhile, Mali
“I children cannot eat enough ood, it can be stressul
to attend daily classes, study, and concentrate. Thecurrent ood scarcity in the region will aect children’s
concentration in school and could, i it continues, lead
to a higher dropout rate rom school.”
Bosco OgwangLira District, Uganda
7/27/2019 PDF GHI 2013
http://slidepdf.com/reader/full/pdf-ghi-2013 27/66
2013 Global Hunger Index | Chapter 03 | Understanding Resilience or Food and Nutrition Security 25
Ethiopia is notoriously vulnerable to large-scale droughts, in both
the sedentary mixed crop-livestock areas o the highlands and the
mostly pastoralist lowlands. In the 1980s and 1990s, droughts let
Ethiopia constantly scrambling or unpredictable humanitarian
relie, particularly ood aid. By the 2000s, experts agreed that this
inecient approach could leave the Ethiopian poor even worse o.
It became clear that the cycle o crisis and relie was not helpingthe poor escape chronic poverty. They needed more help to spur
the country’s longer-term economic development. Over the next
decade, Ethiopia’s government and many international development
partners experimented with new programs that mixed both relie
and development elements. Two such programs were the Produc-
tive Saety Net Program and the Pastoralist Livelihoods Initiative.
THE PRODUCTIVE SAFETY NET PROGRAM. In 2005, the Productive
Saety Net Program set out to achieve multiple objectives. On the
relie side, it aimed to improve the targeting o benets to the most
vulnerable and increase the consistency and predictability o oodand cash transers. On the development end, it ocused on build-
ing community assets through a public works program or all but
the most labor-constrained households. A linked Household Asset
Building Program ocuses on building assets at the household lev-
el. Both internationally and in Ethiopia, many consider the Produc-
tive Saety Net Program successul. Its key strengths are its cov-
erage o 7–9 million recipients, or about 13 percent o the rural
population; its unique inter-institutional coordination; its strong
monitoring and evaluation and capacity to improve itsel through
eedback loops; and its clear impact on ood and nutrition securi-
ty indicators. Despite these benets, questions about resilience-related aspects o the Productive Saety Net Program persist. Is
the program climate-prooed? Should it cover urban areas? Does it
inhibit migration out o unsustainably low-potential regions? And
are the Productive Saety Net Program and Household Asset Build-
ing Program really graduating people out o chronic poverty?
THE PASTORALIST LIVELIHOODS INITIATIVE. Though recently extend-
ed to the pastoralist lowlands, “conventional” saety net programs
such as the Productive Saety Net Program are dicult to apply to
pastoralist settings because o the dominance o livestock-based
livelihoods, and the greater dispersion and mobility o pastoralistpopulations. On a smaller scale than the Productive Saety Net Pro-
gram, the Pastoralist Livelihoods Initiative adopts a unique approach
to combining relie and development activities in a pastoralist set-
ting. Severe drought is a act o lie in the arid lowlands o the Horn
o Arica and has always led to cyclical booms and busts in herd
sizes. Yet there is evidence o a long-term decline in herd sizes
because pastoralists are unable to rebuild herds ater droughts.
While some debate the reasons or this trend, mounting evidence
suggests that it is ar more cost-eective to limit herd deaths inthe rst place or to ensure that pastoralists slaughter or sell their
animals or cash rather than see them die o starvation or disease.
Nongovernmental organizations working in pastoralist areas echoed
the same complaints that spurred the development o the Produc-
tive Saety Net Program. Emergency unding and resources were
too slow to mobilize at the onset o drought, leading to inecient
relie activities. The Pastoralist Livelihoods Initiative implemented
two innovative approaches to resilience building. First, it ocused
on development activities in normal years (largely or livestock
activities to grow herds). Second, it built in a “crisis modier”
approach that allowed implementing agencies to quickly reallocateresources to relie activities i a drought set in.
How does this work? The Pastoralist Livelihoods Initiative eatures
built-in triggers to switch between relie and development. In the
rst phase o the initiative, agencies could set aside and access 10
percent o their allocated unds i drought triggered the crisis mod-
ier. In the second phase, the main implementing agency (USAID/
Ethiopia) developed an agreement with USAID’s relie agency to
allow implementing agencies to quickly and seamlessly get more
unds when the crisis modier was triggered.
The Pastoralist Livelihoods Initiative’s “relie” strategy went
beyond the normal approach to relie by protecting livelihoods—not just lives. The relie included emergency destocking and
slaughter, provision o eed and water (including improved eeds
to support animal milk production and child nutrition during
drought), and emergency veterinary care. Like the Productive
Saety Net Program, the Pastoralist Livelihoods Initiative also con-
tained a strong ocus on evaluation and adjustment. Evaluations
revealed that some interventions were ar more cost-eective and
sustainable than others.
BOX 3.3 TWO EXAMPLES OF RELIEF-AND-DEVELOPMENT PROGRAMS FROM ETHIOPIA
Sources: Personal interviews with John Graham, USAID, and Matthew Hobson, World Bank.
For academic discussions o these issues, see Gilligan, Hoddinott, and Taesse (2009) and
Berhane et al. (2011) or impact evaluations o the Productive Saety Net Program and House-hold Asset Building Program. See Lybbert et al. (2004) or a discussion o pastoralist herd
dynamics, as well as Headey, Taesse, and You (2012, orthcoming) or a review o pastoral-
ist livelihood issues in the Horn o Arica.
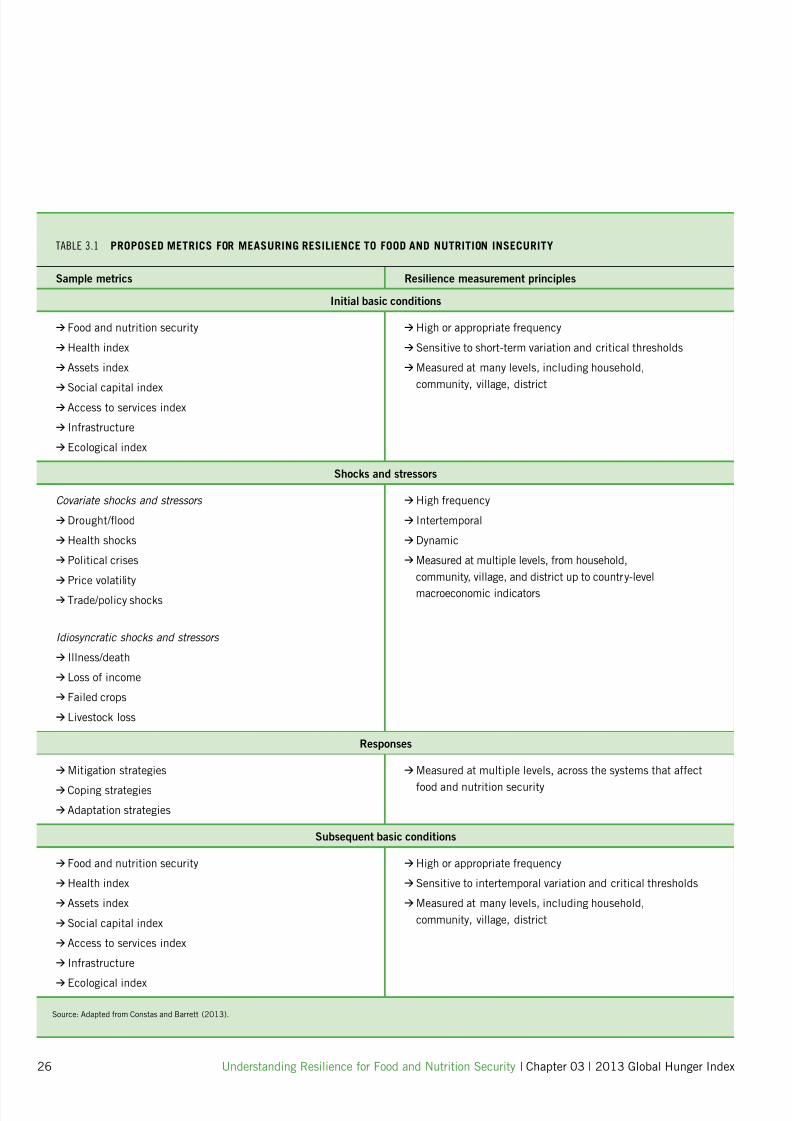
7/27/2019 PDF GHI 2013
http://slidepdf.com/reader/full/pdf-ghi-2013 28/66
26 Understanding Resilience or Food and Nutrition Security | Chapter 03 | 2013 Global Hunger Index
TABLE 3.1 PROPOSED METRICS FOR MEASURING RESILIENCE TO FOOD AND NUTRITION INSECURITY
Sample metrics Resilience measurement principles
Initial basic conditions
> Food and nutrition security
>Health index
> Assets index
>
Social capital index> Access to services index
> Inrastructure
> Ecological index
>High or appropriate requency
> Sensitive to short-term variation and critical thresholds
>Measured at many levels, including household,
community, village, district
Shocks and stressors
Covariate shocks and stressors
>Drought/food
>Health shocks
> Political crises
> Price volatility
> Trade/policy shocks
Idiosyncratic shocks and stressors
> Illness/death
> Loss o income
> Failed crops
> Livestock loss
>High requency
> Intertemporal
>Dynamic
>Measured at multiple levels, rom household,
community, village, and district up to country-level
macroeconomic indicators
Responses
>Mitigation strategies
> Coping strategies
> Adaptation strategies
>Measured at multiple levels, across the systems that aect
ood and nutrition security
Subsequent basic conditions
> Food and nutrition security
>Health index
> Assets index
> Social capital index
> Access to services index
> Inrastructure
> Ecological index
>High or appropriate requency
> Sensitive to intertemporal variation and critical thresholds
>Measured at many levels, including household,
community, village, district
Source: Adapted rom Constas and Barrett (2013).

7/27/2019 PDF GHI 2013
http://slidepdf.com/reader/full/pdf-ghi-2013 29/66
2013 Global Hunger Index | Chapter 03 | Understanding Resilience or Food and Nutrition Security 27
What, then, are the key issues that arise when one tries to measure
resilience in the context o ood and nutrition insecurity? A distinguish-
ing eature o resilience and vulnerability is the potential or complex
dynamics. In vulnerable socioeconomic environments, individuals,
households, and communities are likely to experience dynamic fuctu-
ations in well-being, including a mix o long-term trends, cyclical and
seasonal shocks, and major covariate shocks. Moreover, the transitions
rom one state, such as chronic poverty, into either better or worse
states are likely to be characterized by a range o threshold eects or
tipping points, such as when a drought reduces herd sizes below athreshold o recovery (Box 3.2; Lybbert et al. 2004).
Finally, resilience requires a multilevel or systemic measure-
ment approach. This includes measurement at dierent levels—indi-
vidual, household, community, (eco)system—and among dierent
socioeconomic and ethnic groups. This also requires an understanding
o how these dierent identities and actors interact. Beyond the house-
hold level, systemic actors, such as health conditions, social and polit-
ical relationships, culture, agroecological actors, and macroeconomic
conditions, may aect resilience.
These basic principles have important implications or mea-
surement in practice. Table 3.1 provides a general list o proposed indi-cators that could be used to measure resilience or ood and nutrition
security. Perhaps the most important prerequisite or resilience mea-
surement is higher-requency surveys (Barrett 2010; Headey and Eck-
er 2013). Though still surprisingly rare, high-requency measurement
is a necessary condition or understanding vulnerability and resilience,
because it helps identiy (1) “dynamic initial states,” such as season-
ality, cyclicality, and exposure to idiosyncratic shocks; (2) dierences
between pre-shock and post-shock states; (3) the complex dynamics
o coping and adaptation mechanisms; and (4) the key thresholds that
may arise in the transitions between initial and subsequent states (Bar-
rett and Constas 2012). The more standard program evaluation basedon two to three rounds o a survey (typically conducted several years
apart) will rarely i ever suce to make sense o the complexities o
highly vulnerable people's lives.
The most pertinent examples o high-requency resilience sur-
veys are the nutritional surveillance system surveys conducted by Hel-
en Keller International (HKI) in Bangladesh and Indonesia.5 The World
Food Programme (WFP) also uses the nutritional surveillance system
approach in some o its high-priority countries, such as South Sudan.
These surveys are typically conducted every two months—more oten
than standard household surveys—in order to pick up the eects o
both seasonal shocks and “one-time” natural disasters. Moreover, while
“I started with a project to rehabilitate the springs and
creeks by setting stones around them to protect themrom animal excrement and the drying sun, and by plant-
ing putaqa [Peruvian plant], which is a species that
catches water well. At the community level, we have im-
plemented the legal guidelines to protect our water
sources. For example, we prohibit the drawing o water
with dirty utensils or the use o soap in the water hole.”
Guillermo PacotaypeChuschi District, Peru
“We have been living in orests or generations, but our
rights to the land have yet to be registered. The act
that we do not have legal ownership over much o the
land on which we have been living and depend on or
our ood and livelihood makes us eel insecure. The
lack o proper demarcation o the plots o land allocat-
ed to us … is leading to the shrinking o our land un-
der cultivation in the orest....”
Villagers of DukumRayagada District, India
5 See Bloem, Moench-Panner, and Panagides (2003) and Shoham, Watson, and Dolan (2001)
or an introduction to the approach.
7/27/2019 PDF GHI 2013
http://slidepdf.com/reader/full/pdf-ghi-2013 30/66
28 Understanding Resilience or Food and Nutrition Security | Chapter 03 | 2013 Global Hunger Index
BOX 3.4 HELEN KELLER INTERNATIONAL’S NUTRITIONAL SURVEIL-
LANCE PROJECTS IN BANGLADESH AND INDONESIA
Helen Keller International (HKI) set up nutritional surveillance
systems in Bangladesh and Indonesia to document the eects o
crises on the well-being o the poor. In Bangladesh, the system mon-
itored the eect o disasters such as foods. In Indonesia, it was
designed to monitor the eect o the Asian economic crisis o the
late 1990s on nutrition and health. Over the years, these nutrition-al surveillance systems evolved into comprehensive, yet fexible,
inormation systems providing timely, accurate, and important data
or policy and program planning, nationally and internationally.
The indicators in HKI’s surveillance systems are based on
UNICEF’s conceptual ramework o the causes o malnutrition and
cover areas such as the nutrition and health status o mothers
and children, socioeconomic status, ood production and con-
sumption, and health service use. In Bangladesh, the nutritional
surveillance project originally collected data in disaster-prone sub-
districts, but in 1998 the sampling procedure was revised to be
nationally and divisionally representative. Data collection takesplace every two months to capture seasonal changes in nutrition
and health, which allows the impact o disasters to be distin-
guished rom seasonal eects. For example, as the top chart
shows, the share o households that borrowed to cope with the
1998 foods in Bangladesh spiked to more than 50 percent rom
less than 10 percent over a 5-month period.
In 1998, Bangladesh experienced one o the worst episodes o
fooding on record. The nutritional surveillance project was
instrumental in drawing attention to the plight o food-aected
areas and in helping target public responses to populations in
need. The surveillance data also showed that child wasting morethan doubled rom the surplus season to the lean season. Reduc-
ing such harmul eects o seasonality is an important part o
building resilience.
the nutritional surveillance system surveys ocus heavily on nutrition
indicators, they also look at a wide range o household characteristics
and coping behaviors (Box 3.4).
Beyond the need to use higher-requency surveys, resilience
measurement aces additional challenges in terms o the breadth o
the resilience concept. Resilience is a highly multidimensional concept
with numerous causes and maniestations. Moreover, some actors may
be considered not only causes or sources o resilience, but also indi-
cators o resilience. For example, a non-exhaustive list o actors that
are simultaneously considered as “contributors” to and “results” oresilience includes: technological capacity, appropriate skills and edu-
cation, gender empowerment, sustainable natural resource manage-
ment, adequate livelihood assets, good governance, and access to inra-
structure (Alinovi et al. 2010; USAID 2012; Tulane and UEH 2012;
Vaitla et al. 2012). This clouding o the distinction between cause and
eect limits our ability to compare or reute specic hypotheses (Fran-
kenberger and Nelson 2013).
In addition, this diverse and extensive list o actors poses
some serious challenges to both measurement and scientic analy-
sis. Some o these actors are inherently dicult to measure, such
as governance, natural resource management, and gender empower-ment. Many must be measured qualitatively rather than quantitative-
ly. Some indicators must be measured at the individual or household
level, but others need to be measured at the community level or even
higher. Finally, some actors—as well as the denition o resilience
itsel—are likely to be context- and shock-specic, thereby limiting
comparability across survey sites. Some actors all under one disci-
pline, such as economics, while others all under very dierent dis-
ciplines (ecology, political science, sociology). As already emphasized,
most—i not all—o these actors ought to be measured in high-re-
quency surveys. Thus the practical challenges to eectively monitor-
ing and measuring resilience are considerable. Yet collecting such anextensive set o data to measure resilience could help shape more
inormed responses to a wide range o crises.
Looking Back
The complexity o the concept o resilience and the challenges o
measuring and promoting it may paint a somewhat daunting picture
or policymakers and development practitioners. Indeed, some vul-
nerable countries and regions have ound themselves mired or
decades in poverty and ood and nutrition insecurity in the ace o
shocks. Other highly vulnerable countries, though, have seemingly
become more resilient. Much can be learned rom the varied experi-ences o these groups o countries.
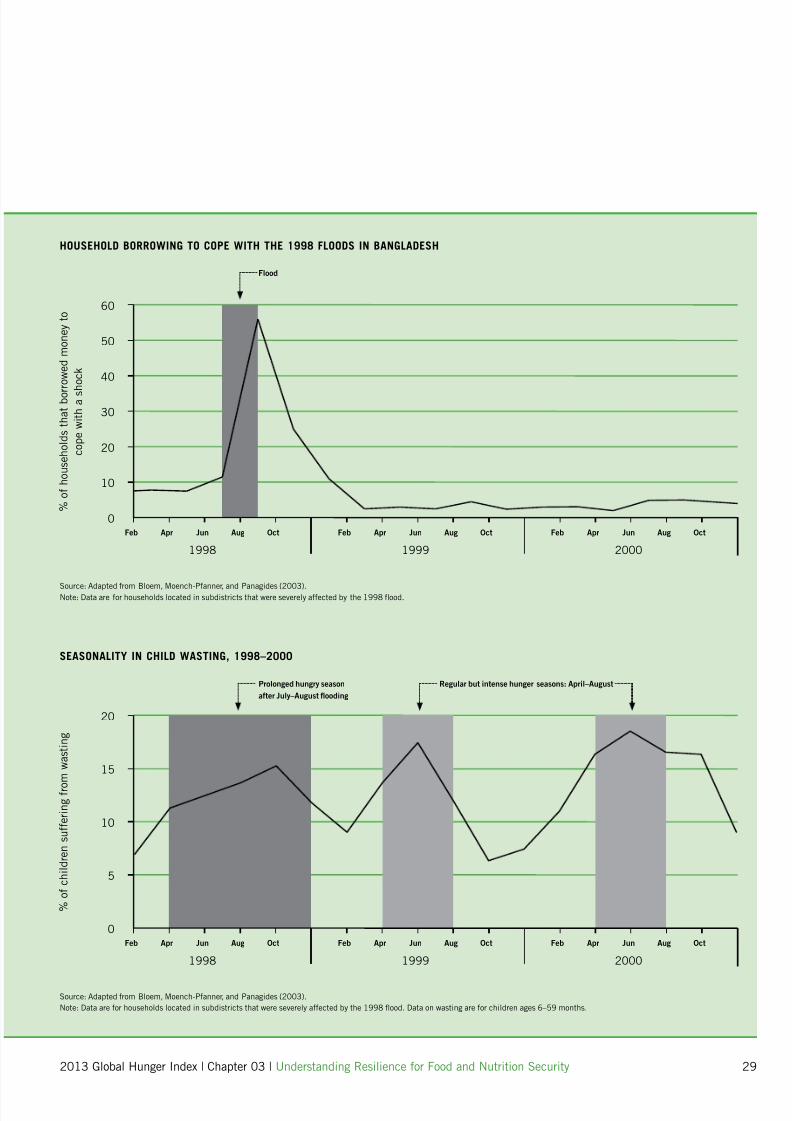
7/27/2019 PDF GHI 2013
http://slidepdf.com/reader/full/pdf-ghi-2013 31/66
2013 Global Hunger Index | Chapter 03 | Understanding Resilience or Food and Nutrition Security 29
HOUSEHOLD BORROWING TO COPE WITH THE 1998 FLOODS IN BANGLADESH
SEASONALITY IN CHILD WASTING, 1998–2000
Source: Adapted rom Bloem, Moench-Panner, and Panagides (2003).Note: Data are or households located in subdistricts that were severely aected by the 1998 food.
Source: Adapted rom Bloem, Moench-Panner, and Panagides (2003).
Note: Data are or households located in subdistricts that were severely aected by the 1998 food. Data on wasting are or children ages 6–59 months.
Feb
Feb
Feb
Feb
Feb
Feb
Apr
Apr
Apr
Apr
Apr
Apr
Jun
Jun
Jun
Jun
Jun
Jun
Aug
Aug
Aug
Aug
Aug
Aug
Oct
Oct
Oct
Oct
Oct
Oct
1998
1998
1999
1999
2000
2000
60
20
50
40
15
30
20
5
10
10
0
0
% o
f h o u s e h o l d s t h a t b o r r o w e d m o n e y t o
c o p e w i t h a s h o c k
% o
f c h i l d r e n s u f f e r i n g f r o
m w a s t i n g
Flood
Prolonged hungry season
ater July–August ooding
Regular but intense hunger seasons: April–August
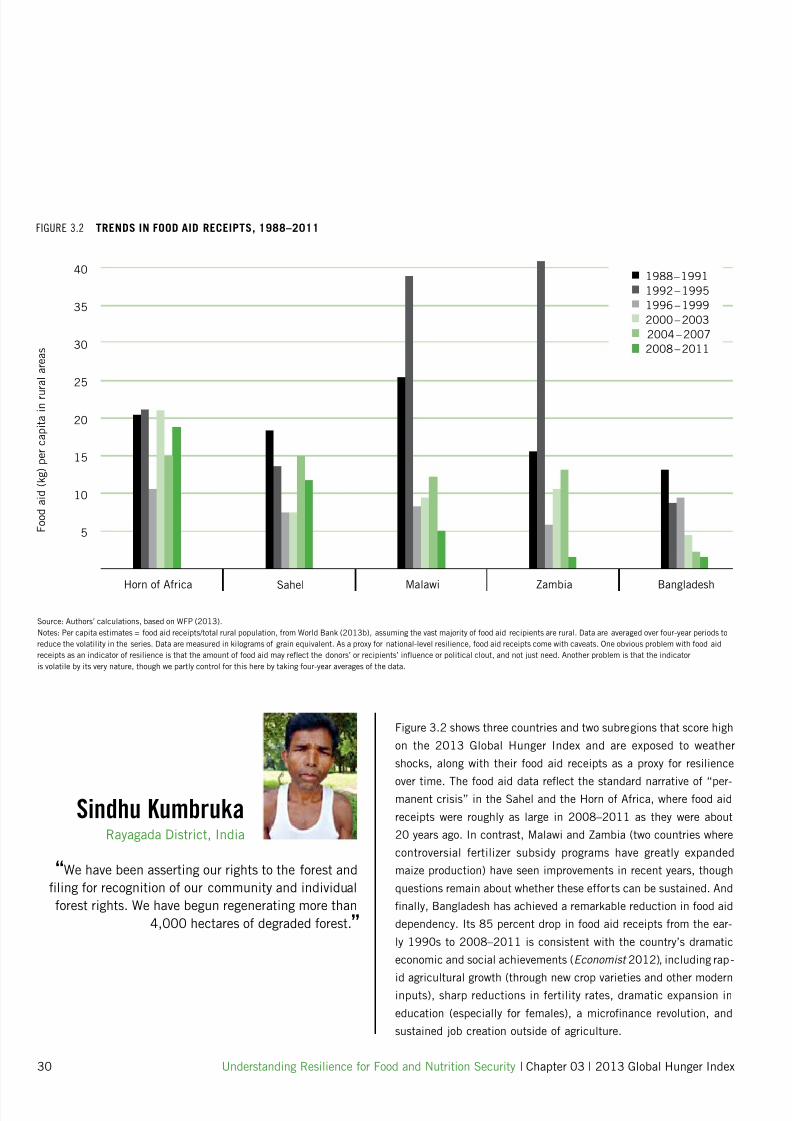
7/27/2019 PDF GHI 2013
http://slidepdf.com/reader/full/pdf-ghi-2013 32/66
30 Understanding Resilience or Food and Nutrition Security | Chapter 03 | 2013 Global Hunger Index
Figure 3.2 shows three countries and two subregions that score high
on the 2013 Global Hunger Index and are exposed to weather
shocks, along with their ood aid receipts as a proxy or resilience
over time. The ood aid data refect the standard narrative o “per-manent crisis” in the Sahel and the Horn o Arica, where ood aid
receipts were roughly as large in 2008–2011 as they were about
20 years ago. In contrast, Malawi and Zambia (two countries where
controversial ertilizer subsidy programs have greatly expanded
maize production) have seen improvements in recent years, though
questions remain about whether these eorts can be sustained. And
nally, Bangladesh has achieved a remarkable reduction in ood aid
dependency. Its 85 percent drop in ood aid receipts rom the ear-
ly 1990s to 2008–2011 is consistent with the country’s dramatic
economic and social achievements (Economist 2012), including rap-
id agricultural growth (through new crop varieties and other moderninputs), sharp reductions in ertility rates, dramatic expansion in
education (especially or emales), a micronance revolution, and
sustained job creation outside o agriculture.
“We have been asserting our rights to the orest and
ling or recognition o our community and individual
orest rights. We have begun regenerating more than
4,000 hectares o degraded orest.”
Sindhu KumbrukaRayagada District, India
FIGURE 3.2 TRENDS IN FOOD AID RECEIPTS, 1988–2011
Source: Authors’ calculations, based on WFP (2013).
Notes: Per capita estimates = ood aid receipts/total rural population, rom World Bank (2013b), assuming the vast majority o ood aid recipients are rural. Data are averaged over our-year periods to
reduce the volatility in the series. Data are measured in kilograms o grain equivalent. As a proxy or national-level resilience, ood aid receipts come with caveats. One obvious problem with ood aid
receipts as an indicator o resilience is that the amount o ood aid may refect the donors’ or recipients’ infuence or political clout, and not just need. Another problem is that the indicator
is volatile by its very nature, though we partly control or this here by taking our-year averages o the data.
5
10
15
20
25
30
35
40
Horn o Arica Sahel ZambiaMalawi Bangladesh
1988 – 1991
1992 – 1995
1996 – 1999
2000 – 2003
2004 – 2007
2008 – 2011
F o o d a i d ( k g ) p e r c a p i t a i n r u
r a l a r e a s
7/27/2019 PDF GHI 2013
http://slidepdf.com/reader/full/pdf-ghi-2013 33/66
2013 Global Hunger Index | Chapter 03 | Understanding Resilience or Food and Nutrition Security 31
There is more to learn about why some vulnerable regions have made
so little progress, while some shock-prone countries seem to have
turned themselves around. Success stories like Bangladesh, Malawi,
and Zambia, however, show that building individual, community, and
national resilience within a generation is a real possibility.
Looking Ahead
The importance o considering the building blocks o resilience is
becoming more apparent to the development and relie communities,
both o which have long struggled to understand why some peopleare better than others when conronting stresses or shocks. Resil-
ience is a challenging concept that has evolved across an unusually
wide range o disciplines. Its increasing adoption in development cir-
cles is understandable given the mounting evidence o the close inter-
actions between short-term shocks and longer-term development.
But while the underlying rationale or ocusing on resilience
building is strong, adopting a resilience ramework aces many chal-
lenges. Conceptually, consensus is needed on what resilience is and
what it is not; on whether resilience is desirable by denition, or
whether it might include detrimental behaviors; on whether it only
means bouncing back, or whether it also includes adaptive and trans-ormative behaviors.
Empirically, measuring and monitoring resilience and its
causes is not easy. Far more than chronic poverty, resilience is a
dynamic concept requiring high-requency surveys, at the very least
in those countries and regions perennially exposed to severe shocks
and stressors. No less challenging is the multidimensional nature o
resilience and what that implies or the detailed work o survey design
and scientic collaboration.
Finally on the policy and programmatic ront, the resilience
paradigm needs to demonstrate that it oers something substantial-
ly new, both in terms o an expanded dialogue between the tradition-ally disconnected relie and development sectors and in terms o inno-
vative new programs that address both humanitarian and development
objectives.
In summary, to achieve ood and nutrition security, more eort
is needed to protect and improve poor and vulnerable people’s abili-
ty to respond to changes and shocks. Much work needs to be done
beore we know whether a resilience ramework is the most useul
tool or building this resilience. What is sure however is that there is
a growing consensus on the need to break down barriers between
actors, sectors, and disciplines and that this consensus must now be
converted into eective policies and practices that strengthen theresilience o the poorest and most vulnerable people.
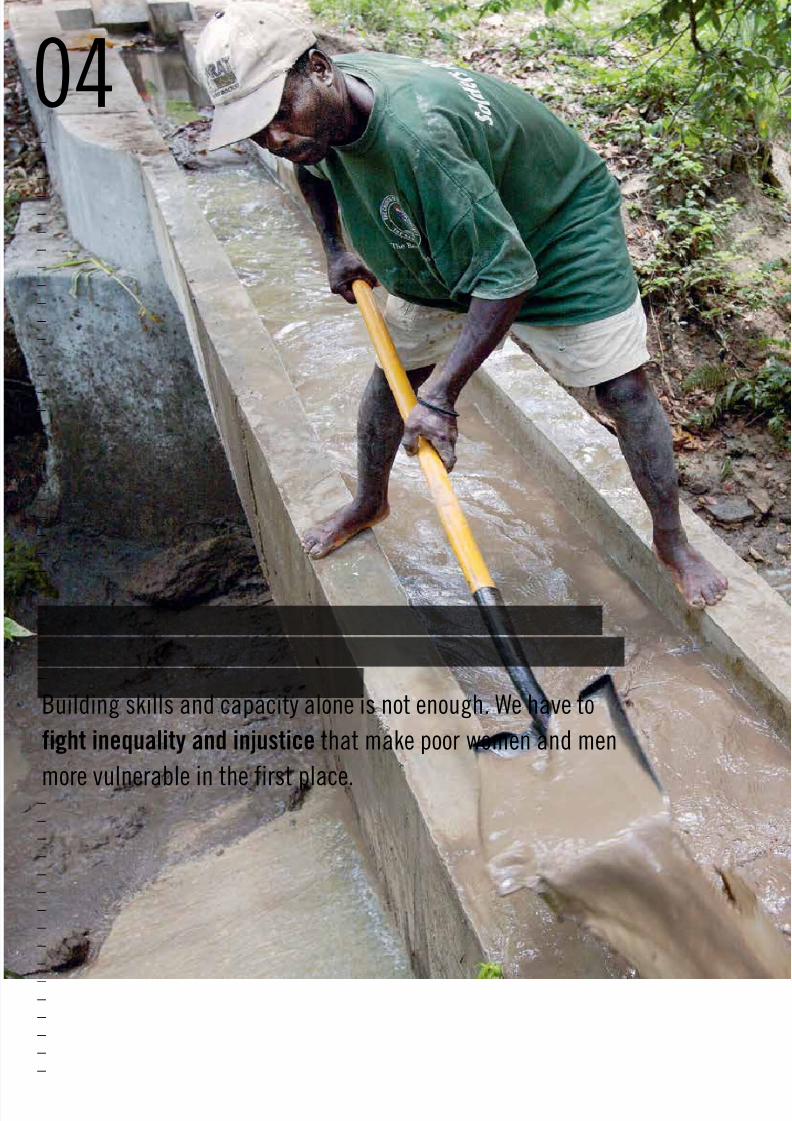
7/27/2019 PDF GHI 2013
http://slidepdf.com/reader/full/pdf-ghi-2013 34/66
04
Building skills and capacity alone is not enough. We have to
fight inequality and injustice that make poor women and men
more vulnerable in the first place.
–––
–––––––––––
–––––––––––
––––––
––––––––––
––––––
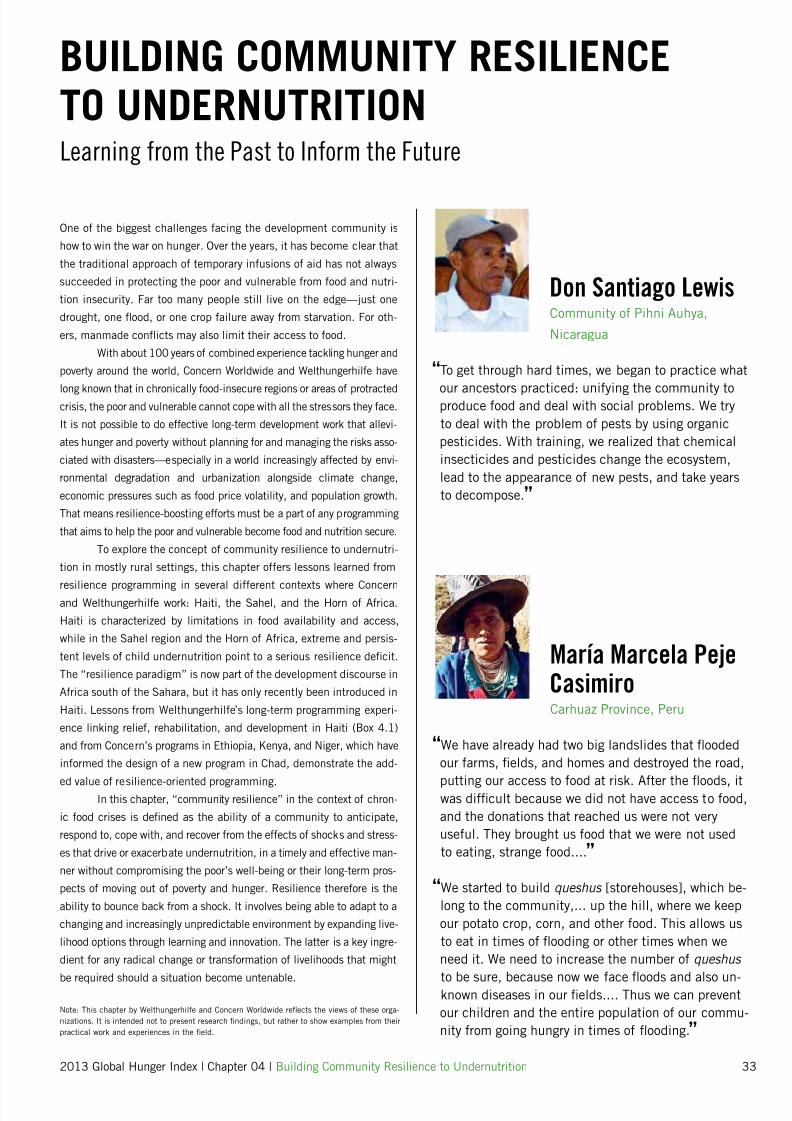
7/27/2019 PDF GHI 2013
http://slidepdf.com/reader/full/pdf-ghi-2013 35/66
2013 Global Hunger Index | Chapter 04 | Building Community Resilience to Undernutrition 33
BUILDING COMMUNITY RESILIENCETO UNDERNUTRITIONLearning from the Past to Inform the Future
One o the biggest challenges acing the development community is
how to win the war on hunger. Over the years, it has become clear that
the traditional approach o temporary inusions o aid has not always
succeeded in protecting the poor and vulnerable rom ood and nutri-
tion insecurity. Far too many people still live on the edge—just one
drought, one food, or one crop ailure away rom starvation. For oth-
ers, manmade conficts may also limit their access to ood.
With about 100 years o combined experience tackling hunger and
poverty around the world, Concern Worldwide and Welthungerhile have
long known that in chronically ood-insecure regions or areas o protractedcrisis, the poor and vulnerable cannot cope with all the stressors they ace.
It is not possible to do eective long-term development work that allevi-
ates hunger and poverty without planning or and managing the risks asso-
ciated with disasters—especially in a world increasingly aected by envi-
ronmental degradation and urbanization alongside climate change,
economic pressures such as ood price volatility, and population growth.
That means resilience-boosting eorts must be a part o any programming
that aims to help the poor and vulnerable become ood and nutrition secure.
To explore the concept o community resilience to undernutri-
tion in mostly rural settings, this chapter oers lessons learned rom
resilience programming in several dierent contexts where Concernand Welthungerhile work: Haiti, the Sahel, and the Horn o Arica.
Haiti is characterized by limitations in ood availability and access,
while in the Sahel region and the Horn o Arica, extreme and persis-
tent levels o child undernutrition point to a serious resilience decit.
The “resilience paradigm” is now part o the development discourse in
Arica south o the Sahara, but it has only recently been introduced in
Haiti. Lessons rom Welthungerhile’s long-term programming experi-
ence linking relie, rehabilitation, and development in Haiti (Box 4.1)
and rom Concern’s programs in Ethiopia, Kenya, and Niger, which have
inormed the design o a new program in Chad, demonstrate the add-
ed value o resilience-oriented programming.In this chapter, “community resilience” in the context o chron-
ic ood crises is dened as the ability o a community to anticipate,
respond to, cope with, and recover rom the eects o shocks and stress-
es that drive or exacerbate undernutrition, in a timely and eective man-
ner without compromising the poor’s well-being or their long-term pros-
pects o moving out o poverty and hunger. Resilience thereore is the
ability to bounce back rom a shock. It involves being able to adapt to a
changing and increasingly unpredictable environment by expanding live-
lihood options through learning and innovation. The latter is a key ingre-
dient or any radical change or transormation o livelihoods that might
be required should a situation become untenable.
Note: This chapter by Welthungerhile and Concern Worldwide refects the views o these orga-
nizations. It is intended not to present research ndings, but rather to show examples rom their
practical work and experiences in the eld.
“To get through hard times, we began to practice what
our ancestors practiced: uniying the community toproduce ood and deal with social problems. We try
to deal with the problem o pests by using organic
pesticides. With training, we realized that chemical
insecticides and pesticides change the ecosystem,
lead to the appearance o new pests, and take years
to decompose.”
“We have already had two big landslides that fooded
our arms, elds, and homes and destroyed the road,
putting our access to ood at risk. Ater the foods, itwas dicult because we did not have access to ood,
and the donations that reached us were not very
useul. They brought us ood that we were not used
to eating, strange ood....”
“We started to build queshus [storehouses], which be-
long to the community,... up the hill, where we keep
our potato crop, corn, and other ood. This allows us
to eat in times o fooding or other times when we
need it. We need to increase the number o queshus
to be sure, because now we ace foods and also un-known diseases in our elds.... Thus we can prevent
our children and the entire population o our commu-
nity rom going hungry in times o fooding.”
Don Santiago LewisCommunity o Pihni Auhya,
Nicaragua
María Marcela PejeCasimiroCarhuaz Province, Peru
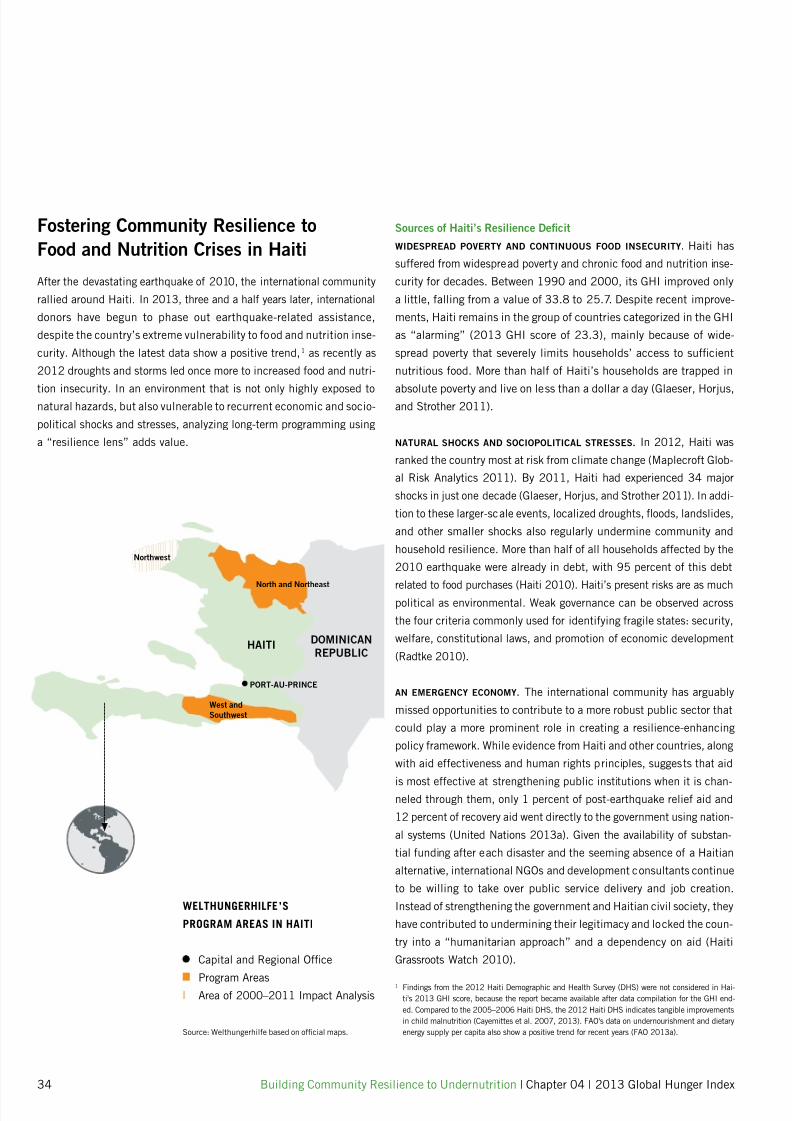
7/27/2019 PDF GHI 2013
http://slidepdf.com/reader/full/pdf-ghi-2013 36/66
HAITIDOMINICAN
REPUBLIC
PORT-AU-PRINCE
North and Northeast
Northwest
West and
Southwest
34 Building Community Resilience to Undernutrition | Chapter 04 | 2013 Global Hunger Index
Sources o Haiti’s Resilience Defcit
WIDESPREAD POVERTY AND CONTINUOUS FOOD INSECURITY. Haiti has
suered rom widespread poverty and chronic ood and nutrition inse-
curity or decades. Between 1990 and 2000, its GHI improved only
a little, alling rom a value o 33.8 to 25.7. Despite recent improve-
ments, Haiti remains in the group o countries categorized in the GHI
as “alarming” (2013 GHI score o 23.3), mainly because o wide-
spread poverty that severely limits households’ access to sucient
nutritious ood. More than hal o Haiti’s households are trapped in
absolute poverty and live on less than a dollar a day (Glaeser, Horjus,and Strother 2011).
NATURAL SHOCKS AND SOCIOPOLITICAL STRESSES. In 2012, Haiti was
ranked the country most at risk rom climate change (Maplecrot Glob-
al Risk Analytics 2011). By 2011, Haiti had experienced 34 major
shocks in just one decade (Glaeser, Horjus, and Strother 2011). In addi-
tion to these larger-scale events, localized droughts, foods, landslides,
and other smaller shocks also regularly undermine community and
household resilience. More than hal o all households aected by the
2010 earthquake were already in debt, with 95 percent o this debt
related to ood purchases (Haiti 2010). Haiti’s present risks are as muchpolitical as environmental. Weak governance can be observed across
the our criteria commonly used or identiying ragile states: security,
welare, constitutional laws, and promotion o economic development
(Radtke 2010).
AN EMERGENCY ECONOMY. The international community has arguably
missed opportunities to contribute to a more robust public sector that
could play a more prominent role in creating a resilience-enhancing
policy ramework. While evidence rom Haiti and other countries, along
with aid eectiveness and human rights principles, suggests that aid
is most eective at strengthening public institutions when it is chan-neled through them, only 1 percent o post-earthquake relie aid and
12 percent o recovery aid went directly to the government using nation-
al systems (United Nations 2013a). Given the availability o substan-
tial unding ater each disaster and the seeming absence o a Haitian
alternative, international NGOs and development consultants continue
to be willing to take over public service delivery and job creation.
Instead o strengthening the government and Haitian civil society, they
have contributed to undermining their legitimacy and locked the coun-
try into a “humanitarian approach” and a dependency on aid (Haiti
Grassroots Watch 2010).
Source: Welthungerhile based on ocial maps.
WELTHUNGERHILFE ’S
PROGRAM AREAS IN HAITI
Capital and Regional Oce
Program AreasArea o 2000–2011 Impact Analysis
Fostering Community Resilience to
Food and Nutrition Crises in Haiti
Ater the devastating earthquake o 2010, the international community
rallied around Haiti. In 2013, three and a hal years later, international
donors have begun to phase out earthquake-related assistance,
despite the country’s extreme vulnerability to ood and nutrition inse-
curity. Although the latest data show a positive trend,1 as recently as
2012 droughts and storms led once more to increased ood and nutri-
tion insecurity. In an environment that is not only highly exposed tonatural hazards, but also vulnerable to recurrent economic and socio-
political shocks and stresses, analyzing long-term programming using
a “resilience lens” adds value.
1 Findings rom the 2012 Haiti Demographic and Health Survey (DHS) were not considered in Hai-
ti's 2013 GHI score, because the report became available ater data compilation or the GHI end-
ed. Compared to the 2005–2006 Haiti DHS, the 2012 Haiti DHS indicates tangible improvements
in child malnutrition (Cayemittes et al. 2007, 2013). FAO's data on undernourishment and dietary
energy supply per capita also show a positive trend or recent years (FAO 2013a).

7/27/2019 PDF GHI 2013
http://slidepdf.com/reader/full/pdf-ghi-2013 37/662013 Global Hunger Index | Chapter 04 | Building Community Resilience to Undernutrition 35
Source: World Bank (2013a).Notes: Cereal yield, measured as kilograms per hectare o harvested land, includes wheat, rice, maize, barley, oats, rye, millet, sorghum, buckwheat, and mixed grains. Production data on cereals
relate to crops harvested or dry grain only. Cereal crops harvested or hay or harvested green or ood, eed, or silage and those used or grazing are excluded. The FAO allocates production data
to the calendar year in which the bulk o the harvest took place.
TABLE 4.1 AVERAGE CEREAL YIELDS IN CUBA, DOMINICAN REPUBLIC, AND HAITI, 1993–2011
2 Out o 100 people who cannot meet their basic needs, 77 are in rural areas, 9 are in the greater Port-
au-Prince metropolitan area, and 14 are in other urban areas. A 2007 Comprehensive Food Security
and Vulnerability Assessment ound that rural households bought 68 percent o their ood. These pur-
chases equal 59 percent o their total expenditures (Glaeser, Horjus, and Strother 2011).
multiple heirs share an interest in their land, which leads to continu-
ing ragmentation o land holdings and weak land tenure. These con-
ditions have made it easy or large-scale armers as well as industrial
and mining companies to acquire ertile lands (Cadre de Liaison Inter-
ONG Haiti 2013).
Given the poor quality o their holdings and the constant
exposure to environmental and climatic hazards, most peasants
ocus on reducing risk rather than maximizing production as a strat-
egy or survival and ood security. To manage risk and spread out
harvest cycles, they actively diversiy land portolios and croppingpatterns. At the same time, demographic pressure and poverty orce
the rural population to engage in activities, such as deorestation,
which increase its vulnerability to risk. The deorestation leads to
environmental degradation, soil erosion, and water shortage. Fur-
thermore, because o land shortages, armers increasingly arm on
steep slopes with particularly ragile soils—a practice that leads to
urther erosion and land degradation.
Besides the declining size o land holdings and the high lev-
el o risk they are exposed to, small-scale producers are also con-
strained by a lack o investment leading to low levels o agricultural
technology and inadequate inrastructure, strong migration out orural areas, diculties in accessing appropriate markets, and weak
representation in policy debates.
Average cereal yields (kilograms / hectare)
Country 1993–1997 1998–2002 2003–2007 2008–2011
Cuba 1,859 2,632 2,874 2,325
Dominican Republic 3,832 4,073 4,052 3,299
Haiti 947 912 947 941
Agriculture’s Role in Community Resilience
Most o the poor and ood insecure live in rural areas. Smallholder
armers ace dicult structural limitations, and still need to buy most
o their ood (Glaeser, Horjus, and Strother 2011).2 Thus, agricultur-
al policies must play a key role in strengthening community resilience
to hunger.
LOW PRODUCTIVITY, FRAGMENTED LAND HOLDINGS, UNSUSTAINABLEPRACTICES. Despite Haiti’s avorable growing climate, average cereal
yields are much lower in Haiti than in its Caribbean neighbors Cuba
and the Dominican Republic (Table 4.1).
What explains Haitian armers’ relatively low cereal yields? Most
armers in Haiti are mountain peasants with small arms comprising
several dispersed plots o land. Under Haiti´s land inheritance laws,
BOX 4.1 WELTHUNGERHILFE IN HAITI
For almost 40 years, Welthungerhile has been active in Haiti, sup-
porting partners and projects in the areas o agroorestry and water-
shed management, improvement o rural inrastructure (irrigation
and roads), disaster preparedness, and strengthening civil society.
In 2011, the organization commissioned an external impact anal-
ysis o 10 years’ programming in Haiti’s North-West Department,
one o the most ood-insecure regions in the country.
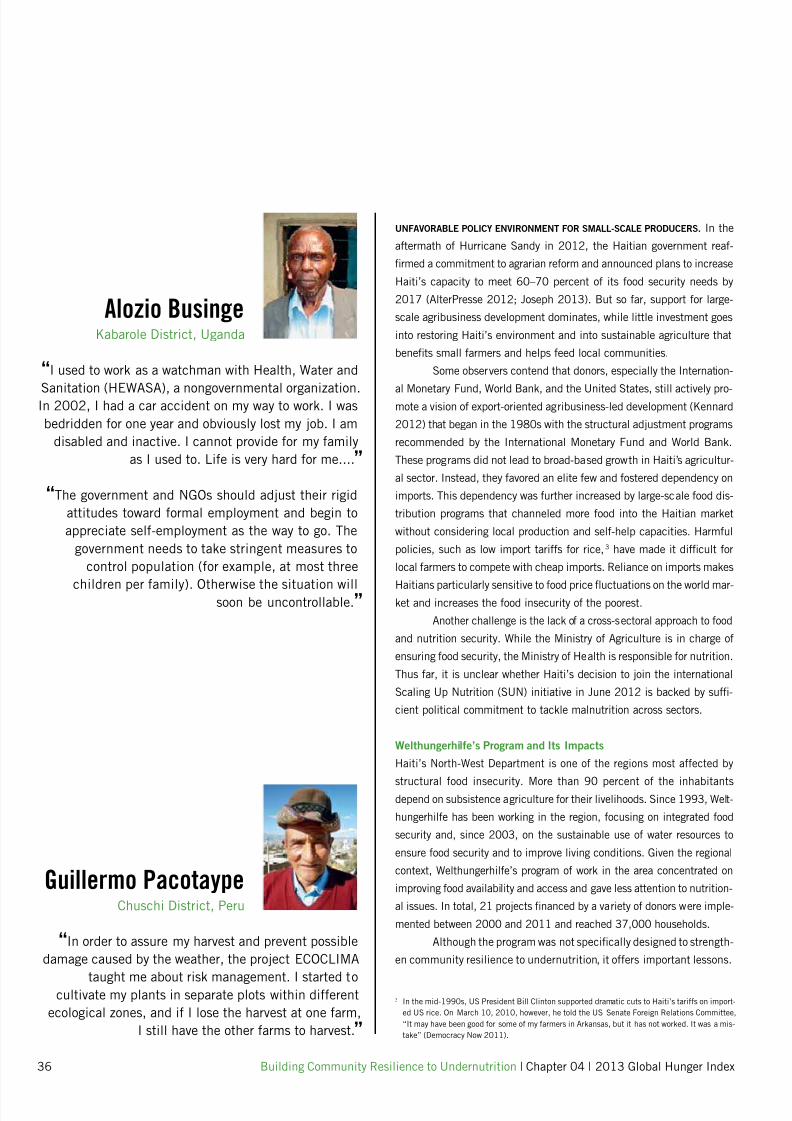
7/27/2019 PDF GHI 2013
http://slidepdf.com/reader/full/pdf-ghi-2013 38/66
36 Building Community Resilience to Undernutrition | Chapter 04 | 2013 Global Hunger Index
UNFAVORABLE POLICY ENVIRONMENT FOR SMALL-SCALE PRODUCERS. In the
atermath o Hurricane Sandy in 2012, the Haitian government rea-
rmed a commitment to agrarian reorm and announced plans to increase
Haiti’s capacity to meet 60–70 percent o its ood security needs by
2017 (AlterPresse 2012; Joseph 2013). But so ar, support or large-
scale agribusiness development dominates, while little investment goes
into restoring Haiti’s environment and into sustainable agriculture that
benets small armers and helps eed local communities.
Some observers contend that donors, especially the Internation-
al Monetary Fund, World Bank, and the United States, still actively pro-mote a vision o export-oriented agribusiness-led development (Kennard
2012) that began in the 1980s with the structural adjustment programs
recommended by the International Monetary Fund and World Bank.
These programs did not lead to broad-based growth in Haiti’s agricultur-
al sector. Instead, they avored an elite ew and ostered dependency on
imports. This dependency was urther increased by large-scale ood dis-
tribution programs that channeled more ood into the Haitian market
without considering local production and sel-help capacities. Harmul
policies, such as low import taris or rice,3 have made it dicult or
local armers to compete with cheap imports. Reliance on imports makes
Haitians particularly sensitive to ood price fuctuations on the world mar-ket and increases the ood insecurity o the poorest.
Another challenge is the lack o a cross-sectoral approach to ood
and nutrition security. While the Ministry o Agriculture is in charge o
ensuring ood security, the Ministry o Health is responsible or nutrition.
Thus ar, it is unclear whether Haiti’s decision to join the international
Scaling Up Nutrition (SUN) initiative in June 2012 is backed by su-
cient political commitment to tackle malnutrition across sectors.
Welthungerhile’s Program and Its Impacts
Haiti’s North-West Department is one o the regions most aected by
structural ood insecurity. More than 90 percent o the inhabitantsdepend on subsistence agriculture or their livelihoods. Since 1993, Welt-
hungerhile has been working in the region, ocusing on integrated ood
security and, since 2003, on the sustainable use o water resources to
ensure ood security and to improve living conditions. Given the regional
context, Welthungerhile’s program o work in the area concentrated on
improving ood availability and access and gave less attention to nutrition-
al issues. In total, 21 projects nanced by a variety o donors were imple-
mented between 2000 and 2011 and reached 37,000 households.
Although the program was not specically designed to strength-
en community resilience to undernutrition, it oers important lessons.
3 In the mid-1990s, US President Bill Clinton supported dramatic cuts to Haiti’s taris on import-
ed US rice. On March 10, 2010, however, he told the US Senate Foreign Relations Committee,
“It may have been good or some o my armers in Arkansas, but it has not worked. It was a mis-
take” (Democracy Now 2011).
“I used to work as a watchman with Health, Water and
Sanitation (HEWASA), a nongovernmental organization.In 2002, I had a car accident on my way to work. I was
bedridden or one year and obviously lost my job. I am
disabled and inactive. I cannot provide or my amily
as I used to. Lie is very hard or me....”
“The government and NGOs should adjust their rigid
attitudes toward ormal employment and begin to
appreciate sel-employment as the way to go. The
government needs to take stringent measures to
control population (or example, at most three
children per amily). Otherwise the situation willsoon be uncontrollable.”
“In order to assure my harvest and prevent possible
damage caused by the weather, the project ECOCLIMA
taught me about risk management. I started tocultivate my plants in separate plots within dierent
ecological zones, and i I lose the harvest at one arm,
I still have the other arms to harvest.”
Alozio BusingeKabarole District, Uganda
Guillermo Pacotaype Chuschi District, Peru

7/27/2019 PDF GHI 2013
http://slidepdf.com/reader/full/pdf-ghi-2013 39/66
Food and nutrition security
2013 Global Hunger Index | Chapter 04 | Building Community Resilience to Undernutrition 37
FIGURE 4.1 IMPACT CHAIN OF 10 YEARS OF PROGRAMMING IN HAITI’S NORTH-WEST DEPARTMENT
Source: Adapted rom Kundermann, Excéus, and Almqvist (2012).
Note: CFW = cash or work. FFW = ood or work. These programs also contributed to temporary income. The arrow color indicates the intensity o proven impact.
Impact
Outputs
and
activities
Strengthening community-based committeesCollaborating with local government and national ministries
>Water pipelines> Rainwater collection
Protection o water-sheds and lowlands(through CFW and
FFW programs)
> Irrigation systems> Reservoirs
Rural roads
(through CFW andFFW projects)
> Storage acilities> Food processing
Flexible emergencyinterventions
HealthStabilization o environment
Disaster risk reductionIncome
Commercialization
Access to markets
Outcomes
Food productionWater or domestic
and agricultural use
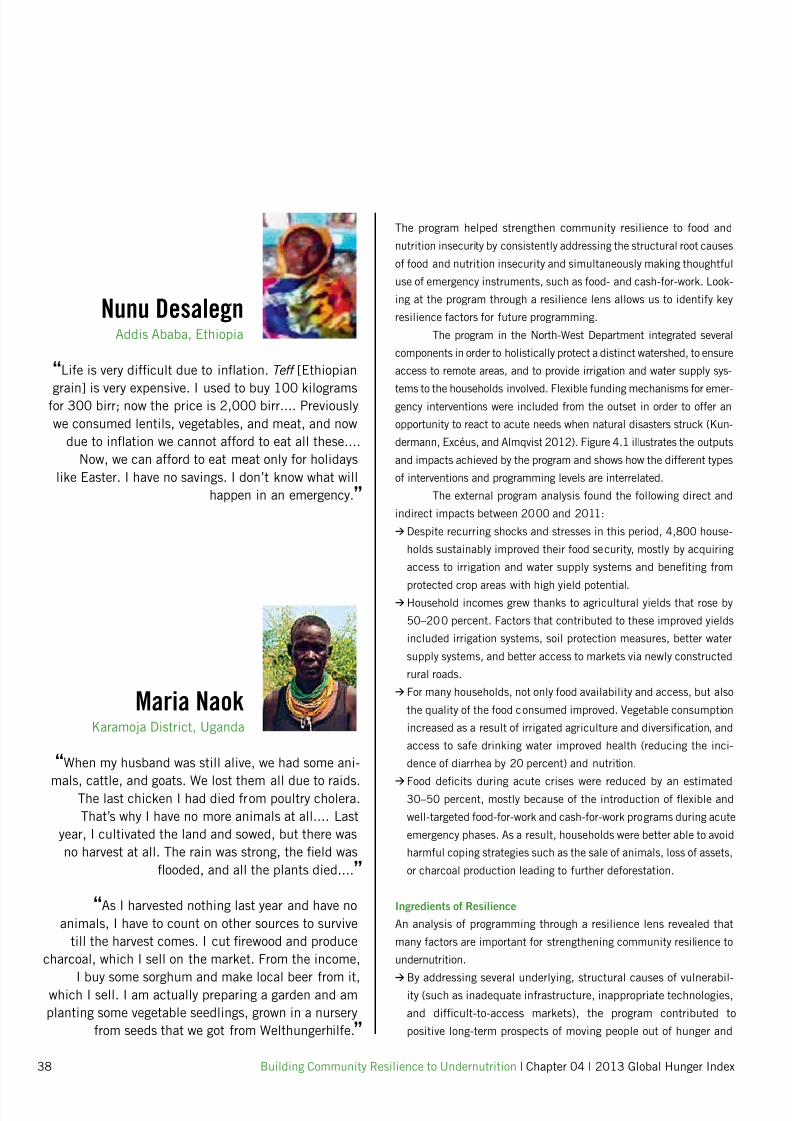
7/27/2019 PDF GHI 2013
http://slidepdf.com/reader/full/pdf-ghi-2013 40/66
38 Building Community Resilience to Undernutrition | Chapter 04 | 2013 Global Hunger Index
The program helped strengthen community resilience to ood and
nutrition insecurity by consistently addressing the structural root causes
o ood and nutrition insecurity and simultaneously making thoughtul
use o emergency instruments, such as ood- and cash-or-work. Look-
ing at the program through a resilience lens allows us to identiy key
resilience actors or uture programming.
The program in the North-West Department integrated several
components in order to holistically protect a distinct watershed, to ensure
access to remote areas, and to provide irrigation and water supply sys-
tems to the households involved. Flexible unding mechanisms or emer-gency interventions were included rom the outset in order to oer an
opportunity to react to acute needs when natural disasters struck (Kun-
dermann, Excéus, and Almqvist 2012). Figure 4.1 illustrates the outputs
and impacts achieved by the program and shows how the dierent types
o interventions and programming levels are interrelated.
The external program analysis ound the ollowing direct and
indirect impacts between 2000 and 2011:
>Despite recurring shocks and stresses in this period, 4,800 house-
holds sustainably improved their ood security, mostly by acquiring
access to irrigation and water supply systems and beneting rom
protected crop areas with high yield potential.>Household incomes grew thanks to agricultural yields that rose by
50–200 percent. Factors that contributed to these improved yields
included irrigation systems, soil protection measures, better water
supply systems, and better access to markets via newly constructed
rural roads.
> For many households, not only ood availability and access, but also
the quality o the ood consumed improved. Vegetable consumption
increased as a result o irrigated agriculture and diversication, and
access to sae drinking water improved health (reducing the inci-
dence o diarrhea by 20 percent) and nutrition.
>
Food decits during acute crises were reduced by an estimated30–50 percent, mostly because o the introduction o fexible and
well-targeted ood-or-work and cash-or-work programs during acute
emergency phases. As a result, households were better able to avoid
harmul coping strategies such as the sale o animals, loss o assets,
or charcoal production leading to urther deorestation.
Ingredients o Resilience
An analysis o programming through a resilience lens revealed that
many actors are important or strengthening community resilience to
undernutrition.
>
By addressing several underlying, structural causes o vulnerabil-ity (such as inadequate inrastructure, inappropriate technologies,
and dicult-to-access markets), the program contributed to
positive long-term prospects o moving people out o hunger and
“Lie is very dicult due to infation. Teff [Ethiopian
grain] is very expensive. I used to buy 100 kilogramsor 300 birr; now the price is 2,000 birr.... Previously
we consumed lentils, vegetables, and meat, and now
due to infation we cannot aord to eat all these....
Now, we can aord to eat meat only or holidays
like Easter. I have no savings. I don’t know what will
happen in an emergency.”
“When my husband was still alive, we had some ani-
mals, cattle, and goats. We lost them all due to raids.The last chicken I had died rom poultry cholera.
That’s why I have no more animals at all.... Last
year, I cultivated the land and sowed, but there was
no harvest at all. The rain was strong, the eld was
fooded, and all the plants died....”
“As I harvested nothing last year and have no
animals, I have to count on other sources to survive
till the harvest comes. I cut rewood and produce
charcoal, which I sell on the market. From the income,
I buy some sorghum and make local beer rom it,which I sell. I am actually preparing a garden and am
planting some vegetable seedlings, grown in a nursery
rom seeds that we got rom Welthungerhile.”
Nunu Desalegn Addis Ababa, Ethiopia
Maria Naok Karamoja District, Uganda
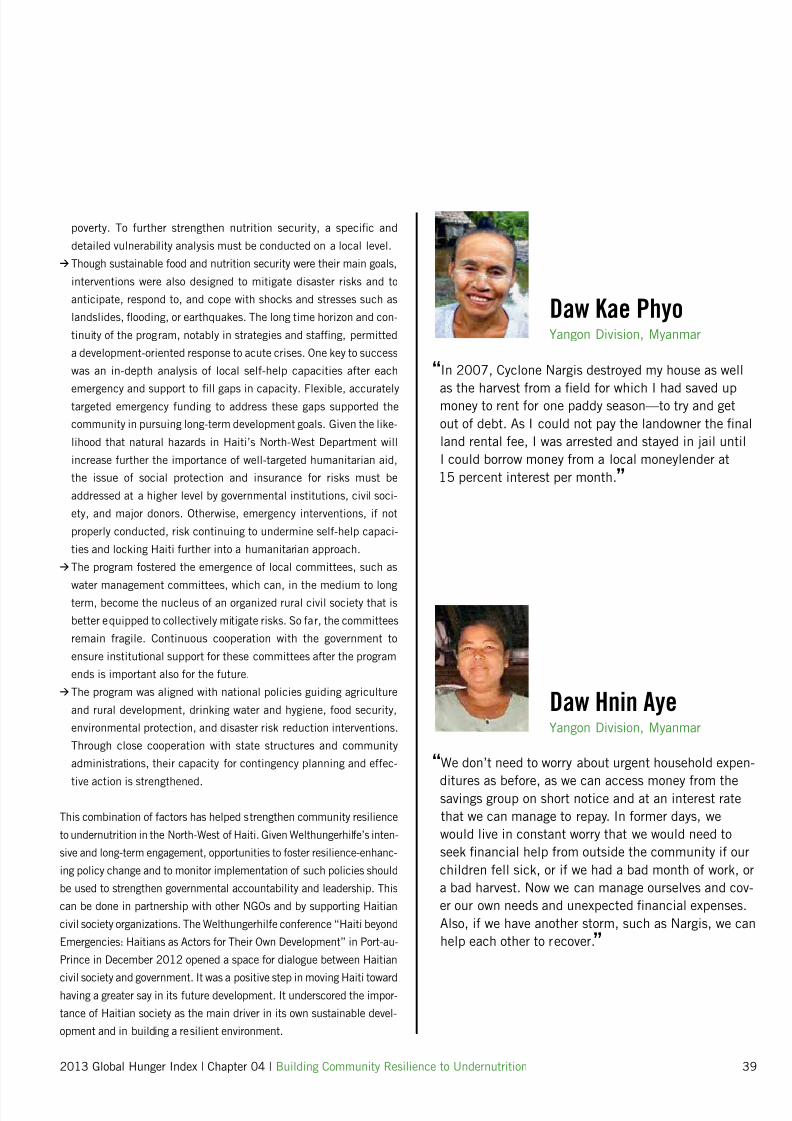
7/27/2019 PDF GHI 2013
http://slidepdf.com/reader/full/pdf-ghi-2013 41/66
2013 Global Hunger Index | Chapter 04 | Building Community Resilience to Undernutrition 39
poverty. To urther strengthen nutrition security, a specic and
detailed vulnerability analysis must be conducted on a local level.
> Though sustainable ood and nutrition security were their main goals,
interventions were also designed to mitigate disaster risks and to
anticipate, respond to, and cope with shocks and stresses such as
landslides, fooding, or earthquakes. The long time horizon and con-
tinuity o the program, notably in strategies and stang, permitted
a development-oriented response to acute crises. One key to success
was an in-depth analysis o local sel-help capacities ater each
emergency and support to ll gaps in capacity. Flexible, accuratelytargeted emergency unding to address these gaps supported the
community in pursuing long-term development goals. Given the like-
lihood that natural hazards in Haiti’s North-West Department will
increase urther the importance o well-targeted humanitarian aid,
the issue o social protection and insurance or risks must be
addressed at a higher level by governmental institutions, civil soci-
ety, and major donors. Otherwise, emergency interventions, i not
properly conducted, risk continuing to undermine sel-help capaci-
ties and locking Haiti urther into a humanitarian approach.
> The program ostered the emergence o local committees, such as
water management committees, which can, in the medium to longterm, become the nucleus o an organized rural civil society that is
better equipped to collectively mitigate risks. So ar, the committees
remain ragile. Continuous cooperation with the government to
ensure institutional support or these committees ater the program
ends is important also or the uture.
> The program was aligned with national policies guiding agriculture
and rural development, drinking water and hygiene, ood security,
environmental protection, and disaster risk reduction interventions.
Through close cooperation with state structures and community
administrations, their capacity or contingency planning and eec-
tive action is strengthened.
This combination o actors has helped strengthen community resilience
to undernutrition in the North-West o Haiti. Given Welthungerhile’s inten-
sive and long-term engagement, opportunities to oster resilience-enhanc-
ing policy change and to monitor implementation o such policies should
be used to strengthen governmental accountability and leadership. This
can be done in partnership with other NGOs and by supporting Haitian
civil society organizations. The Welthungerhile conerence “Haiti beyond
Emergencies: Haitians as Actors or Their Own Development” in Port-au-
Prince in December 2012 opened a space or dialogue between Haitian
civil society and government. It was a positive step in moving Haiti towardhaving a greater say in its uture development. It underscored the impor-
tance o Haitian society as the main driver in its own sustainable devel-
opment and in building a resilient environment.
“In 2007, Cyclone Nargis destroyed my house as well
as the harvest rom a eld or which I had saved upmoney to rent or one paddy season—to try and get
out o debt. As I could not pay the landowner the nal
land rental ee, I was arrested and stayed in jail until
I could borrow money rom a local moneylender at
15 percent interest per month.”
“We don’t need to worry about urgent household expen-
ditures as beore, as we can access money rom thesavings group on short notice and at an interest rate
that we can manage to repay. In ormer days, we
would live in constant worry that we would need to
seek nancial help rom outside the community i our
children ell sick, or i we had a bad month o work, or
a bad harvest. Now we can manage ourselves and cov-
er our own needs and unexpected nancial expenses.
Also, i we have another storm, such as Nargis, we can
help each other to recover.”
Daw Kae PhyoYangon Division, Myanmar
Daw Hnin AyeYangon Division, Myanmar
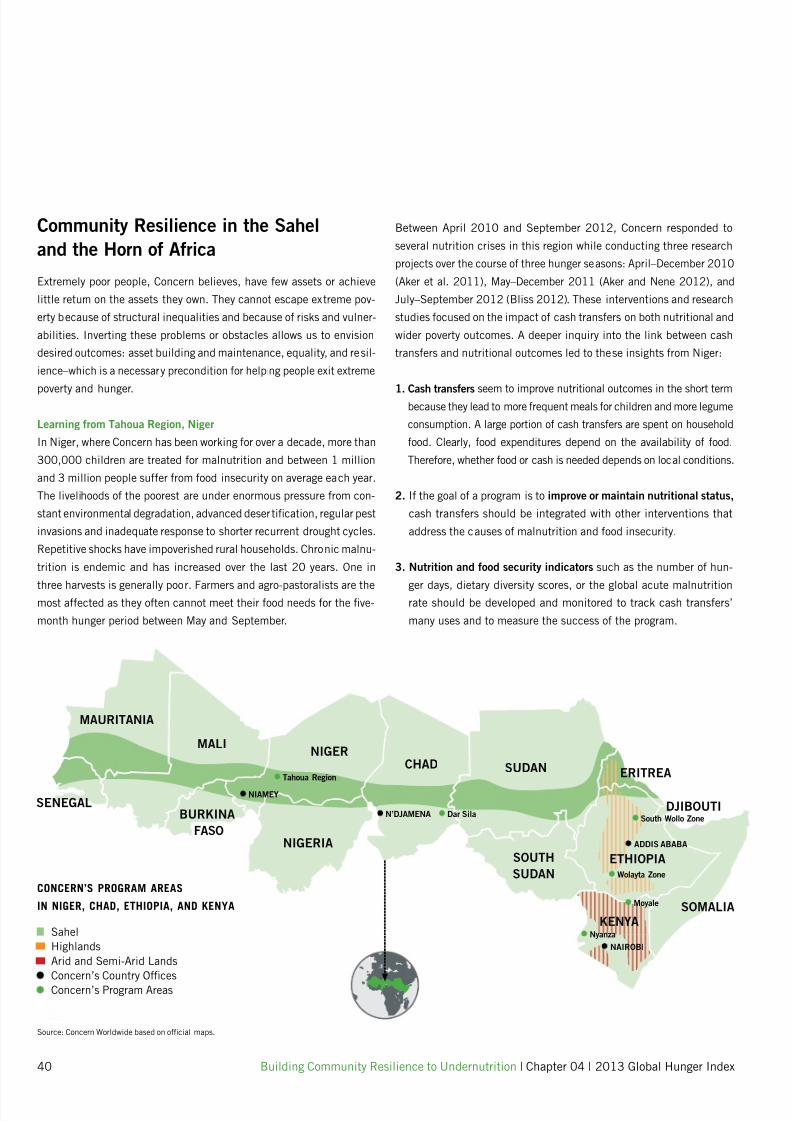
7/27/2019 PDF GHI 2013
http://slidepdf.com/reader/full/pdf-ghi-2013 42/66
40 Building Community Resilience to Undernutrition | Chapter 04 | 2013 Global Hunger Index
Between April 2010 and September 2012, Concern responded to
several nutrition crises in this region while conducting three research
projects over the course o three hunger seasons: April–December 2010
(Aker et al. 2011), May–December 2011 (Aker and Nene 2012), and
July–September 2012 (Bliss 2012). These interventions and research
studies ocused on the impact o cash transers on both nutritional and
wider poverty outcomes. A deeper inquiry into the link between cash
transers and nutritional outcomes led to these insights rom Niger:
1. Cash transfers seem to improve nutritional outcomes in the short termbecause they lead to more requent meals or children and more legume
consumption. A large portion o cash transers are spent on household
ood. Clearly, ood expenditures depend on the availability o ood.
Thereore, whether ood or cash is needed depends on local conditions.
2. I the goal o a program is to improve or maintain nutritional status,
cash transers should be integrated with other interventions that
address the causes o malnutrition and ood insecurity.
3. Nutrition and ood security indicators such as the number o hun-
ger days, dietary diversity scores, or the global acute malnutritionrate should be developed and monitored to track cash transers’
many uses and to measure the success o the program.
Community Resilience in the Sahel
and the Horn o Arica
Extremely poor people, Concern believes, have ew assets or achieve
little return on the assets they own. They cannot escape extreme pov-
erty because o structural inequalities and because o risks and vulner-
abilities. Inverting these problems or obstacles allows us to envision
desired outcomes: asset building and maintenance, equality, and resil-
ience–which is a necessary precondition or helping people exit extreme
poverty and hunger.
Learning rom Tahoua Region, Niger
In Niger, where Concern has been working or over a decade, more than
300,000 children are treated or malnutrition and between 1 million
and 3 million people suer rom ood insecurity on average each year.
The livelihoods o the poorest are under enormous pressure rom con-
stant environmental degradation, advanced desertication, regular pest
invasions and inadequate response to shorter recurrent drought cycles.
Repetitive shocks have impoverished rural households. Chronic malnu-
trition is endemic and has increased over the last 20 years. One in
three harvests is generally poor. Farmers and agro-pastoralists are themost aected as they oten cannot meet their ood needs or the ve-
month hunger period between May and September.
MAURITANIA
MALI
BURKINA
FASO
NIGER
NIGERIA
CHAD SUDAN
SOUTH
SUDAN
ETHIOPIA
ERITREA
DJIBOUTI
SOMALIA
KENYA
SENEGAL
NAIROBI
ADDIS ABABA
NIAMEY
Moyale
South Wollo Zone
Wolayta Zone
Nyanza
N’DJAMENA
Tahoua Region
Dar Sila
Sahel
Highlands
Arid and Semi-Arid Lands
Concern’s Country Oces
Concern’s Program Areas
CONCERN’S PROGRAM AREAS
IN NIGER, CHAD, ETHIOPIA, AND KENYA
Source: Concern Worldwide based on ocial maps.
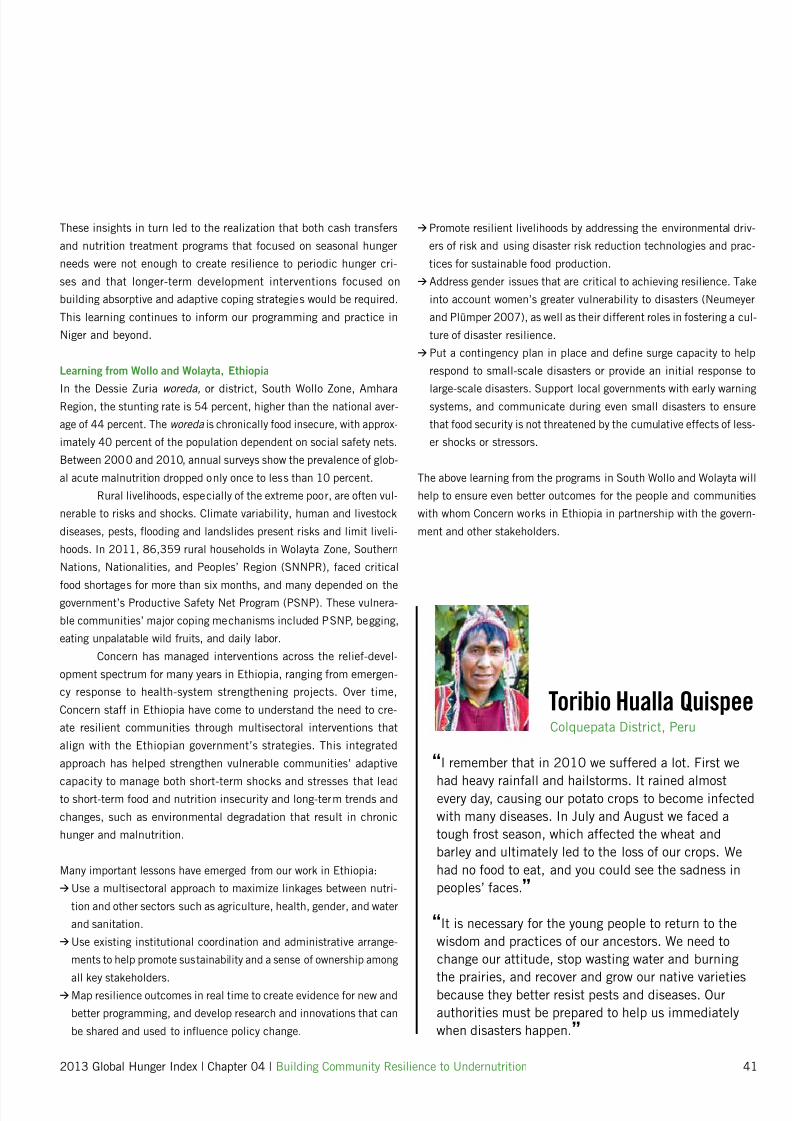
7/27/2019 PDF GHI 2013
http://slidepdf.com/reader/full/pdf-ghi-2013 43/66
2013 Global Hunger Index | Chapter 04 | Building Community Resilience to Undernutrition 41
These insights in turn led to the realization that both cash transers
and nutrition treatment programs that ocused on seasonal hunger
needs were not enough to create resilience to periodic hunger cri-
ses and that longer-term development interventions ocused on
building absorptive and adaptive coping strategies would be required.
This learning continues to inorm our programming and practice in
Niger and beyond.
Learning rom Wollo and Wolayta, Ethiopia
In the Dessie Zuria woreda, or district, South Wollo Zone, AmharaRegion, the stunting rate is 54 percent, higher than the national aver-
age o 44 percent. The woreda is chronically ood insecure, with approx-
imately 40 percent o the population dependent on social saety nets.
Between 2000 and 2010, annual surveys show the prevalence o glob-
al acute malnutrition dropped only once to less than 10 percent.
Rural livelihoods, especially o the extreme poor, are oten vul-
nerable to risks and shocks. Climate variability, human and livestock
diseases, pests, fooding and landslides present risks and limit liveli-
hoods. In 2011, 86,359 rural households in Wolayta Zone, Southern
Nations, Nationalities, and Peoples’ Region (SNNPR), aced critical
ood shortages or more than six months, and many depended on thegovernment’s Productive Saety Net Program (PSNP). These vulnera-
ble communities’ major coping mechanisms included PSNP, begging,
eating unpalatable wild ruits, and daily labor.
Concern has managed interventions across the relie-devel-
opment spectrum or many years in Ethiopia, ranging rom emergen-
cy response to health-system strengthening projects. Over time,
Concern sta in Ethiopia have come to understand the need to cre-
ate resilient communities through multisectoral interventions that
align with the Ethiopian government’s strategies. This integrated
approach has helped strengthen vulnerable communities’ adaptive
capacity to manage both short-term shocks and stresses that leadto short-term ood and nutrition insecurity and long-term trends and
changes, such as environmental degradation that result in chronic
hunger and malnutrition.
Many important lessons have emerged rom our work in Ethiopia:
>Use a multisectoral approach to maximize linkages between nutri-
tion and other sectors such as agriculture, health, gender, and water
and sanitation.
>Use existing institutional coordination and administrative arrange-
ments to help promote sustainability and a sense o ownership among
all key stakeholders.>Map resilience outcomes in real time to create evidence or new and
better programming, and develop research and innovations that can
be shared and used to infuence policy change.
>Promote resilient livelihoods by addressing the environmental driv-
ers o risk and using disaster risk reduction technologies and prac-
tices or sustainable ood production.
> Address gender issues that are critical to achieving resilience. Take
into account women’s greater vulnerability to disasters (Neumeyer
and Plümper 2007), as well as their dierent roles in ostering a cul-
ture o disaster resilience.
> Put a contingency plan in place and dene surge capacity to help
respond to small-scale disasters or provide an initial response to
large-scale disasters. Support local governments with early warningsystems, and communicate during even small disasters to ensure
that ood security is not threatened by the cumulative eects o less-
er shocks or stressors.
The above learning rom the programs in South Wollo and Wolayta will
help to ensure even better outcomes or the people and communities
with whom Concern works in Ethiopia in partnership with the govern-
ment and other stakeholders.
“I remember that in 2010 we suered a lot. First we
had heavy rainall and hailstorms. It rained almostevery day, causing our potato crops to become inected
with many diseases. In July and August we aced a
tough rost season, which aected the wheat and
barley and ultimately led to the loss o our crops. We
had no ood to eat, and you could see the sadness in
peoples’ aces.”
“It is necessary or the young people to return to the
wisdom and practices o our ancestors. We need to
change our attitude, stop wasting water and burning
the prairies, and recover and grow our native varietiesbecause they better resist pests and diseases. Our
authorities must be prepared to help us immediately
when disasters happen.”
Toribio Hualla QuispeeColquepata District, Peru
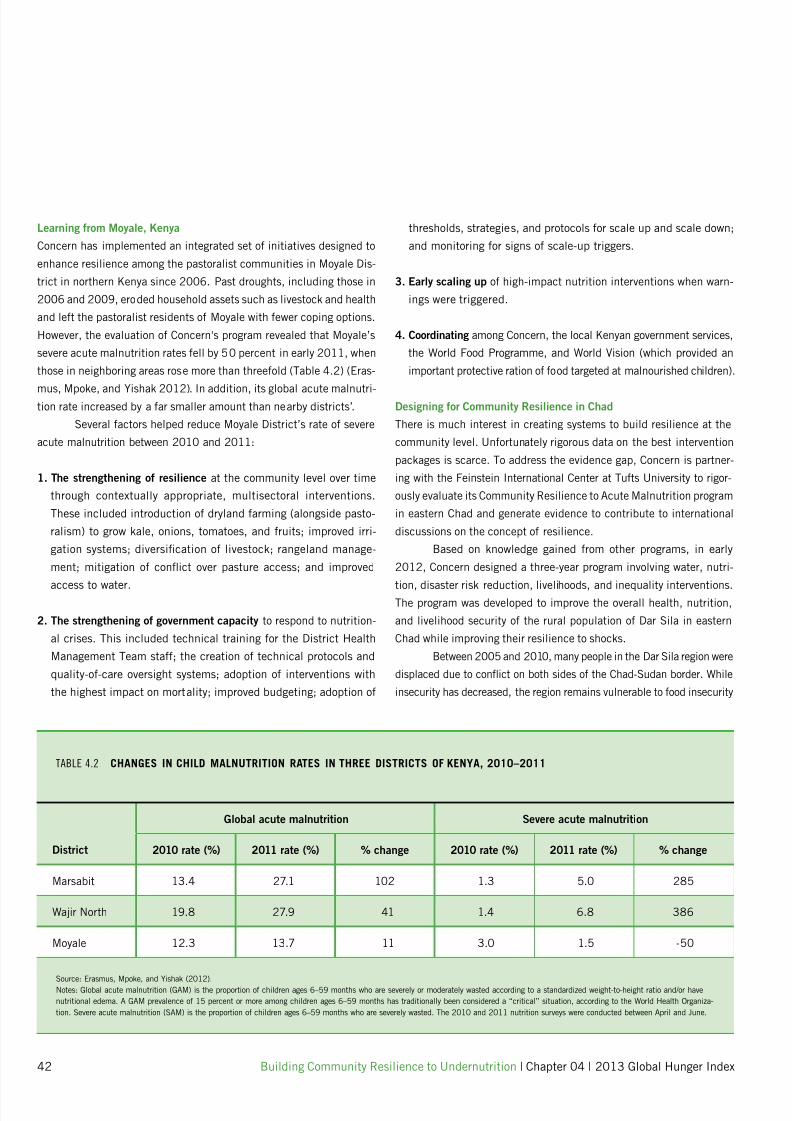
7/27/2019 PDF GHI 2013
http://slidepdf.com/reader/full/pdf-ghi-2013 44/66
42 Building Community Resilience to Undernutrition | Chapter 04 | 2013 Global Hunger Index
thresholds, strategies, and protocols or scale up and scale down;
and monitoring or signs o scale-up triggers.
3. Early scaling up o high-impact nutrition interventions when warn-
ings were triggered.
4. Coordinating among Concern, the local Kenyan government services,
the World Food Programme, and World Vision (which provided an
important protective ration o ood targeted at malnourished children).
Designing or Community Resilience in Chad
There is much interest in creating systems to build resilience at the
community level. Unortunately rigorous data on the best intervention
packages is scarce. To address the evidence gap, Concern is partner-
ing with the Feinstein International Center at Tuts University to rigor-
ously evaluate its Community Resilience to Acute Malnutrition program
in eastern Chad and generate evidence to contribute to international
discussions on the concept o resilience.
Based on knowledge gained rom other programs, in early
2012, Concern designed a three-year program involving water, nutri-
tion, disaster risk reduction, livelihoods, and inequality interventions.The program was developed to improve the overall health, nutrition,
and livelihood security o the rural population o Dar Sila in eastern
Chad while improving their resilience to shocks.
Between 2005 and 2010, many people in the Dar Sila region were
displaced due to confict on both sides o the Chad-Sudan border. While
insecurity has decreased, the region remains vulnerable to ood insecurity
Learning rom Moyale, Kenya
Concern has implemented an integrated set o initiatives designed to
enhance resilience among the pastoralist communities in Moyale Dis-
trict in northern Kenya since 2006. Past droughts, including those in
2006 and 2009, eroded household assets such as livestock and health
and let the pastoralist residents o Moyale with ewer coping options.
However, the evaluation o Concern's program revealed that Moyale’s
severe acute malnutrition rates ell by 50 percent in early 2011, when
those in neighboring areas rose more than threeold (Table 4.2) (Eras-
mus, Mpoke, and Yishak 2012). In addition, its global acute malnutri-tion rate increased by a ar smaller amount than nearby districts’.
Several actors helped reduce Moyale District’s rate o severe
acute malnutrition between 2010 and 2011:
1. The strengthening of resilience at the community level over time
through contextually appropriate, multisectoral interventions.
These included introduction o dryland arming (alongside pasto-
ralism) to grow kale, onions, tomatoes, and ruits; improved irri-
gation systems; diversication o livestock; rangeland manage-
ment; mitigation o confict over pasture access; and improved
access to water.
2. The strengthening of government capacity to respond to nutrition-
al crises. This included technical training or the District Health
Management Team sta; the creation o technical protocols and
quality-o-care oversight systems; adoption o interventions with
the highest impact on mortality; improved budgeting; adoption o
Source: Erasmus, Mpoke, and Yishak (2012).Notes: Global acute malnutrition (GAM) is the proportion o children ages 6–59 months who are severely or moderately wasted according to a standardized weight-to-height ratio and/or have
nutritional edema. A GAM prevalence o 15 percent or more among children ages 6–59 months has traditionally been considered a “critical” situation, according to the World Health Organiza-
tion. Severe acute malnutrition (SAM) is the proportion o children ages 6–59 months who are severely wasted. The 2010 and 2011 nutrition surveys were conducted between April and June.
TABLE 4.2 CHANGES IN CHILD MALNUTRITION RATES IN THREE DISTRICTS OF KENYA, 2010–2011
Global acute malnutrition Severe acute malnutrition
District 2010 rate (%) 2011 rate (%) % change 2010 rate (%) 2011 rate (%) % change
Marsabit 13.4 27.1 102 1.3 5.0 285
Wajir North 19.8 27.9 41 1.4 6.8 386
Moyale 12.3 13.7 11 3.0 1.5 -50
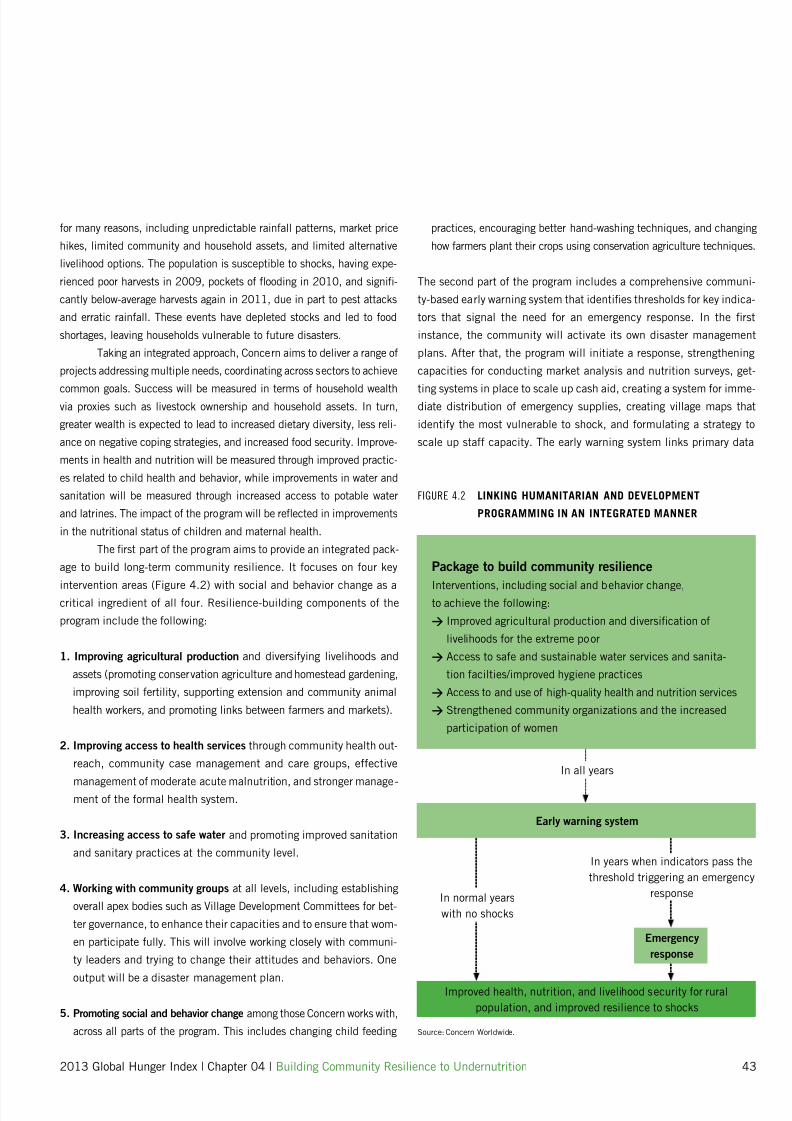
7/27/2019 PDF GHI 2013
http://slidepdf.com/reader/full/pdf-ghi-2013 45/66
2013 Global Hunger Index | Chapter 04 | Building Community Resilience to Undernutrition 43
or many reasons, including unpredictable rainall patterns, market price
hikes, limited community and household assets, and limited alternative
livelihood options. The population is susceptible to shocks, having expe-
rienced poor harvests in 2009, pockets o fooding in 2010, and signi-
cantly below-average harvests again in 2011, due in part to pest attacks
and erratic rainall. These events have depleted stocks and led to ood
shortages, leaving households vulnerable to uture disasters.
Taking an integrated approach, Concern aims to deliver a range o
projects addressing multiple needs, coordinating across sectors to achieve
common goals. Success will be measured in terms o household wealthvia proxies such as livestock ownership and household assets. In turn,
greater wealth is expected to lead to increased dietary diversity, less reli-
ance on negative coping strategies, and increased ood security. Improve-
ments in health and nutrition will be measured through improved practic-
es related to child health and behavior, while improvements in water and
sanitation will be measured through increased access to potable water
and latrines. The impact o the program will be refected in improvements
in the nutritional status o children and maternal health.
The rst part o the program aims to provide an integrated pack-
age to build long-term community resilience. It ocuses on our key
intervention areas (Figure 4.2) with social and behavior change as acritical ingredient o all our. Resilience-building components o the
program include the ollowing:
1. Improving agricultural production and diversiying livelihoods and
assets (promoting conservation agriculture and homestead gardening,
improving soil ertility, supporting extension and community animal
health workers, and promoting links between armers and markets).
2. Improving access to health services through community health out-
reach, community case management and care groups, eective
management o moderate acute malnutrition, and stronger manage-ment o the ormal health system.
3. Increasing access to sae water and promoting improved sanitation
and sanitary practices at the community level.
4. Working with community groups at all levels, including establishing
overall apex bodies such as Village Development Committees or bet-
ter governance, to enhance their capacities and to ensure that wom-
en participate ully. This will involve working closely with communi-
ty leaders and trying to change their attitudes and behaviors. One
output will be a disaster management plan.
5. Promoting social and behavior change among those Concern works with,
across all parts o the program. This includes changing child eeding
practices, encouraging better hand-washing techniques, and changing
how armers plant their crops using conservation agriculture techniques.
The second part o the program includes a comprehensive communi-
ty-based early warning system that identies thresholds or key indica-
tors that signal the need or an emergency response. In the rst
instance, the community will activate its own disaster management
plans. Ater that, the program will initiate a response, strengthening
capacities or conducting market analysis and nutrition surveys, get-
ting systems in place to scale up cash aid, creating a system or imme-diate distribution o emergency supplies, creating village maps that
identiy the most vulnerable to shock, and ormulating a strategy to
scale up sta capacity. The early warning system links primary data
Package to build community resilience
Interventions, including social and behavior change,to achieve the ollowing:
> Improved agricultural production and diversication o
livelihoods or the extreme poor
> Access to sae and sustainable water services and sanita-
tion acilties/improved hygiene practices
> Access to and use o high-quality health and nutrition services
> Strengthened community organizations and the increased
participation o women
Early warning system
In normal years
with no shocks
In years when indicators pass the
threshold triggering an emergency
response
FIGURE 4.2 LINKING HUMANITARIAN AND DEVELOPMENT
PROGRAMMING IN AN INTEGRATED MANNER
Emergency
response
Improved health, nutrition, and livelihood security or rural
population, and improved resilience to shocks
Source: Concern Worldwide.
In all years

7/27/2019 PDF GHI 2013
http://slidepdf.com/reader/full/pdf-ghi-2013 46/66
FIGURE 4.3 CONCERN WORLDWIDE’S APPROACH TO IMPROVING COMMUNITY RESILIENCE
Source: Authors.
Note: The selected early warning indicator could be, or example, the Coping Strategies Index or the price o a key staple crop.
1 4 8 12 16 20 24 28 32 36 40 44 48 52
Week
S e l e c t e d
e a r l y w a r n i n g I n d i c a t o r
Response threshold
Control area
Normal yearTreatment area
44 Building Community Resilience to Undernutrition | Chapter 04 | 2013 Global Hunger Index
rom the household level and local and regional markets with rainall
and vegetation data rom the Famine Early Warning Systems Network,
a provider o inormation on ood security. Data will include the Rain-
all Estimation and Normalized Dierence Vegetation Index (FEWS NET
2013), which is updated every 10 days. Existing health acility data,
such as case incidence and admission rates, will also be used.
Primary data will be collected on key ood crop prices rom a
selection o markets and rom a Coping Strategies Index that will be
calculated on the basis o a sample o households. This will be based
on our kinds o locally relevant coping strategies (Maxwell and Caldwell2008): (1) dietary change; (2) short-term measures to increase house-
hold ood availability; (3) short-term measures, such as ostering
arrangements or sending children to relatives, to decrease the number
o people a household must eed; and (4) rationing, or managing the
shortall.
This program will be implemented in 53 o the 88 villages o
Kimiti. Thirty-ve o these will receive the same package o services and
will be rigorously monitored to test the success o the program. Eighteen
will receive various elements o the program, in some instances as part
o a pilot or new interventions. The remaining 35 villages will receive
the benets o the strengthened government health system in the areaand will be included in the early warning system. They will also be sur-
veyed to demonstrate that the intervention has worked. I these villages
pass the emergency response threshold, Concern will intervene.
When early warning indicator values, which include rainall and vegeta-
tion measures, exceed a threshold level, an emergency response is trig-
gered. The goal o Concern’s resilience-building package is to minimize
the impact o the shock by reducing the number o hunger days, reduc-
ing the number o people with global acute malnutrition, and speeding
up recovery time. The provision o an integrated package should have
a positive impact on child and maternal nutrition in a “normal” year but
also in those years when the region experiences comprehensive weath-
er-related shocks. This happens about once every three years.
Figure 4.3 shows the expected impact o this program. The redline represents the values or one o Concern’s early warning indicators
in a normal year. This indicator fuctuates on a seasonal basis and may
come close to the intervention threshold, represented by the dashed
line. Once this threshold is exceeded (probably about once every three
years), an emergency intervention is considered. The value o the indi-
cator may spike in the control area (orange line), but Concern’s resil-
ience-building package should reduce the magnitude and duration o
the spike in the treatment area (green line).
Collaborative Resilience Programming
When designing programs to build community resilience to undernu-trition, context is everything. It is important to use a ramework or a
set o principles that can be applied to each context that ensures
that interventions are responsive to environmental idiosyncrasies as
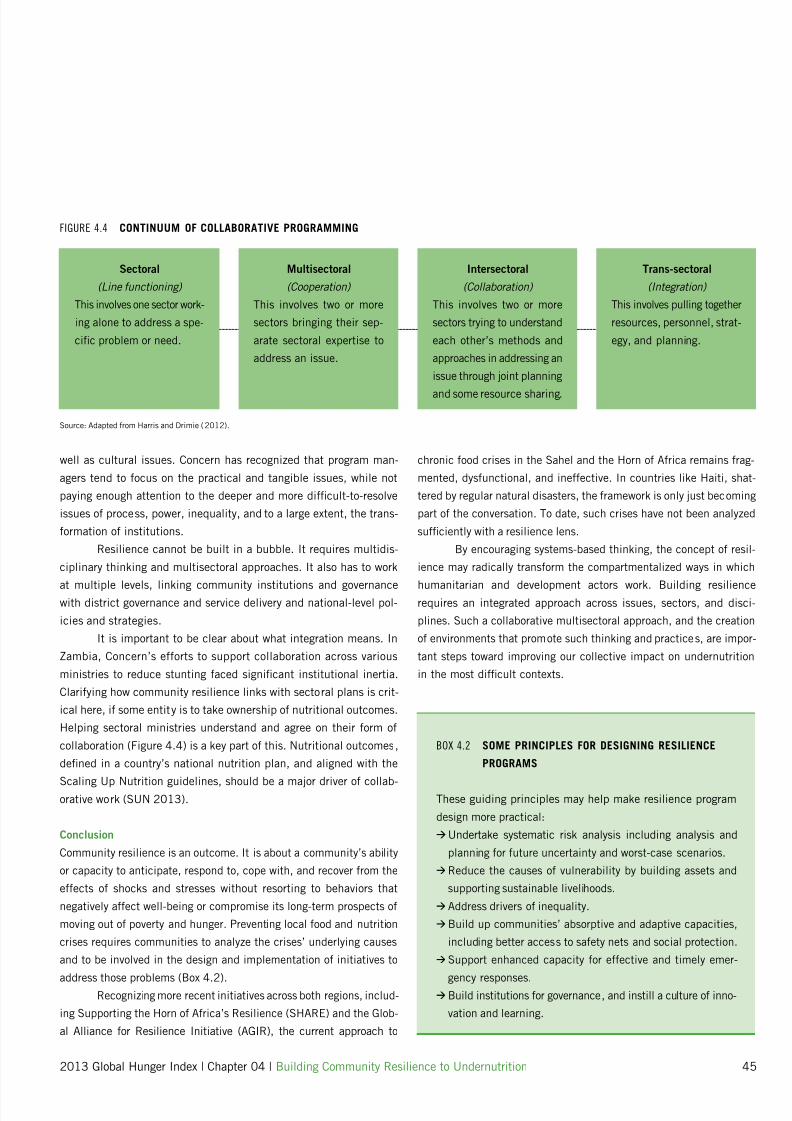
7/27/2019 PDF GHI 2013
http://slidepdf.com/reader/full/pdf-ghi-2013 47/66
well as cultural issues. Concern has recognized that program man-
agers tend to ocus on the practical and tangible issues, while not
paying enough attention to the deeper and more dicult-to-resolve
issues o process, power, inequality, and to a large extent, the trans-
ormation o institutions.
Resilience cannot be built in a bubble. It requires multidis-
ciplinary thinking and multisectoral approaches. It also has to work
at multiple levels, linking community institutions and governancewith district governance and service delivery and national-level pol-
icies and strategies.
It is important to be clear about what integration means. In
Zambia, Concern’s eorts to support collaboration across various
ministries to reduce stunting aced signicant institutional inertia.
Clariying how community resilience links with sectoral plans is crit-
ical here, i some entity is to take ownership o nutritional outcomes.
Helping sectoral ministries understand and agree on their orm o
collaboration (Figure 4.4) is a key part o this. Nutritional outcomes,
dened in a country’s national nutrition plan, and aligned with the
Scaling Up Nutrition guidelines, should be a major driver o collab-orative work (SUN 2013).
Conclusion
Community resilience is an outcome. It is about a community’s ability
or capacity to anticipate, respond to, cope with, and recover rom the
eects o shocks and stresses without resorting to behaviors that
negatively aect well-being or compromise its long-term prospects o
moving out o poverty and hunger. Preventing local ood and nutrition
crises requires communities to analyze the crises’ underlying causes
and to be involved in the design and implementation o initiatives to
address those problems (Box 4.2).Recognizing more recent initiatives across both regions, includ-
ing Supporting the Horn o Arica’s Resilience (SHARE) and the Glob-
al Alliance or Resilience Initiative (AGIR), the current approach to
chronic ood crises in the Sahel and the Horn o Arica remains rag-
mented, dysunctional, and ineective. In countries like Haiti, shat-
tered by regular natural disasters, the ramework is only just becoming
part o the conversation. To date, such crises have not been analyzed
suciently with a resilience lens.
By encouraging systems-based thinking, the concept o resil-
ience may radically transorm the compartmentalized ways in which
humanitarian and development actors work. Building resiliencerequires an integrated approach across issues, sectors, and disci-
plines. Such a collaborative multisectoral approach, and the creation
o environments that promote such thinking and practices, are impor-
tant steps toward improving our collective impact on undernutrition
in the most dicult contexts.
2013 Global Hunger Index | Chapter 04 | Building Community Resilience to Undernutrition 45
BOX 4.2 SOME PRINCIPLES FOR DESIGNING RESILIENCE
PROGRAMS
These guiding principles may help make resilience program
design more practical:
>Undertake systematic risk analysis including analysis and
planning or uture uncertainty and worst-case scenarios.
>Reduce the causes o vulnerability by building assets and
supporting sustainable livelihoods.
> Address drivers o inequality.
>Build up communities’ absorptive and adaptive capacities,
including better access to saety nets and social protection.
> Support enhanced capacity or eective and timely emer-
gency responses.>Build institutions or governance, and instill a culture o inno-
vation and learning.
FIGURE 4.4 CONTINUUM OF COLLABORATIVE PROGRAMMING
Source: Adapted rom Harris and Drimie (2012).
Sectoral
(Line functioning)
This involves one sector work-
ing alone to address a spe-
cic problem or need.
Multisectoral
(Cooperation)
This involves two or more
sectors bringing their sep-
arate sectoral expertise to
address an issue.
Trans-sectoral
(Integration)
This involves pulling together
resources, personnel, strat-
egy, and planning.
Intersectoral
(Collaboration)
This involves two or more
sectors trying to understand
each other’s methods and
approaches in addressing an
issue through joint planning
and some resource sharing.
7/27/2019 PDF GHI 2013
http://slidepdf.com/reader/full/pdf-ghi-2013 48/66
46 Name des Teilbereich | Chapter 1 | 2013 Global Hunger Index
05
Building resilience and reducing inequalities need to become national
priorities and be embedded in national development plansOxam, 2013
–––
–––––––––––
–––––––––––
–––––––––––
–––––
––
––––––
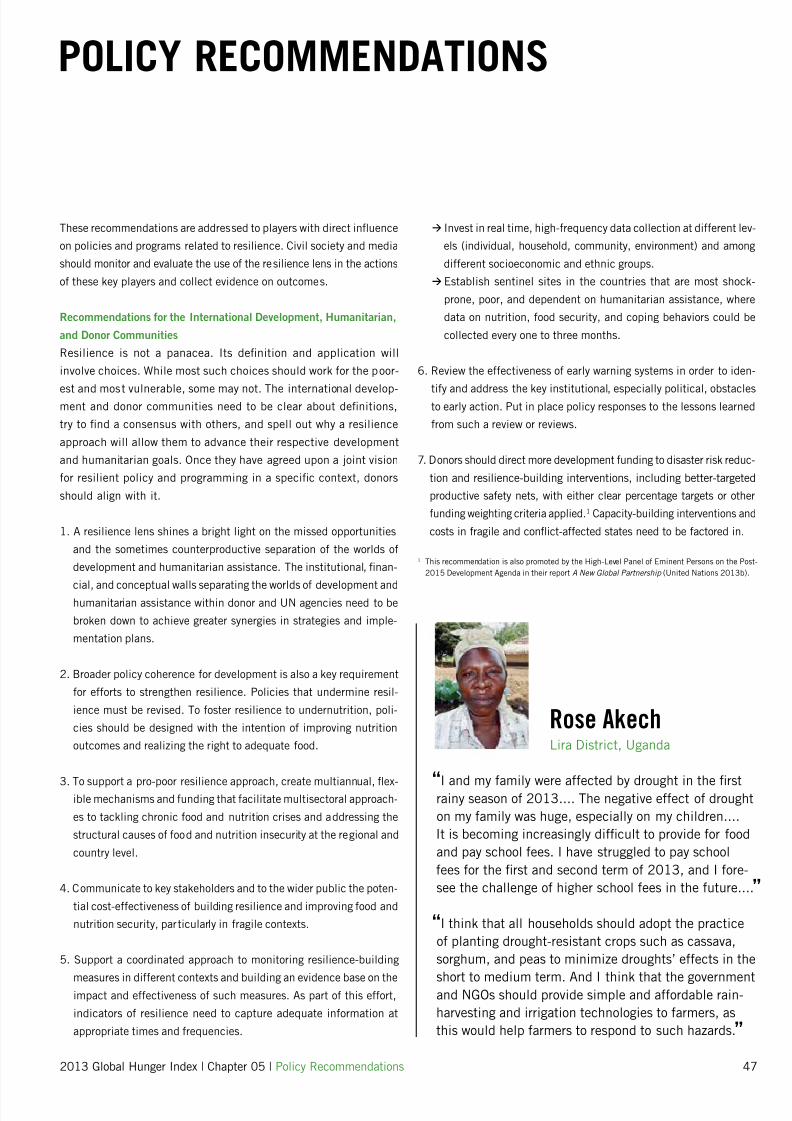
7/27/2019 PDF GHI 2013
http://slidepdf.com/reader/full/pdf-ghi-2013 49/66
2013 Global Hunger Index | Chapter 05 | Policy Recommendations 47
POLICY RECOMMENDATIONS
These recommendations are addressed to players with direct infuence
on policies and programs related to resilience. Civil society and media
should monitor and evaluate the use o the resilience lens in the actions
o these key players and collect evidence on outcomes.
Recommendations or the International Development, Humanitarian,
and Donor Communities
Resilience is not a panacea. Its denition and application will
involve choices. While most such choices should work or the poor-
est and most vulnerable, some may not. The international develop-ment and donor communities need to be clear about denitions,
try to nd a consensus with others, and spell out why a resilience
approach will allow them to advance their respective development
and humanitarian goals. Once they have agreed upon a joint vision
or resilient policy and programming in a specic context, donors
should align with it.
1. A resilience lens shines a bright light on the missed opportunities
and the sometimes counterproductive separation o the worlds o
development and humanitarian assistance. The institutional, nan-
cial, and conceptual walls separating the worlds o development andhumanitarian assistance within donor and UN agencies need to be
broken down to achieve greater synergies in strategies and imple-
mentation plans.
2. Broader policy coherence or development is also a key requirement
or eorts to strengthen resilience. Policies that undermine resil-
ience must be revised. To oster resilience to undernutrition, poli-
cies should be designed with the intention o improving nutrition
outcomes and realizing the right to adequate ood.
3. To support a pro-poor resilience approach, create multiannual, fex-ible mechanisms and unding that acilitate multisectoral approach-
es to tackling chronic ood and nutrition crises and addressing the
structural causes o ood and nutrition insecurity at the regional and
country level.
4. Communicate to key stakeholders and to the wider public the poten-
tial cost-eectiveness o building resilience and improving ood and
nutrition security, particularly in ragile contexts.
5. Support a coordinated approach to monitoring resilience-building
measures in dierent contexts and building an evidence base on theimpact and eectiveness o such measures. As part o this eort,
indicators o resilience need to capture adequate inormation at
appropriate times and requencies.
> Invest in real time, high-requency data collection at dierent lev-
els (individual, household, community, environment) and among
dierent socioeconomic and ethnic groups.
>Establish sentinel sites in the countries that are most shock-
prone, poor, and dependent on humanitarian assistance, where
data on nutrition, ood security, and coping behaviors could be
collected every one to three months.
6. Review the eectiveness o early warning systems in order to iden-
tiy and address the key institutional, especially political, obstaclesto early action. Put in place policy responses to the lessons learned
rom such a review or reviews.
7. Donors should direct more development unding to disaster risk reduc-
tion and resilience-building interventions, including better-targeted
productive saety nets, with either clear percentage targets or other
unding weighting criteria applied.1 Capacity-building interventions and
costs in ragile and confict-aected states need to be actored in.
1 This recommendation is also promoted by the High-Level Panel o Eminent Persons on the Post-
2015 Development Agenda in their report A New Global Partnership (United Nations 2013b).
“I and my amily were aected by drought in the rstrainy season o 2013.... The negative eect o drought
on my amily was huge, especially on my children....
It is becoming increasingly dicult to provide or ood
and pay school ees. I have struggled to pay school
ees or the rst and second term o 2013, and I ore-
see the challenge o higher school ees in the uture....”
“I think that all households should adopt the practice
o planting drought-resistant crops such as cassava,
sorghum, and peas to minimize droughts’ eects in the
short to medium term. And I think that the governmentand NGOs should provide simple and aordable rain-
harvesting and irrigation technologies to armers, as
this would help armers to respond to such hazards.”
Rose AkechLira District, Uganda

7/27/2019 PDF GHI 2013
http://slidepdf.com/reader/full/pdf-ghi-2013 50/66
48 Policy Recommendations | Chapter 05 | 2013 Global Hunger Index
Recommendations or Country-Level Policymakers in
Food-Insecure Countries
8. Develop national approaches to ood and nutrition security that
are resilient to shocks and other stresses. Ensure that external
and international actors buy into those approaches and support
them. External actors should work with national actors to devel-
op context-specic tools or analyzing, measuring, and assess-
ing resilience.
9. Encourage and acilitate a multisectoral approach to resilience(as the Scaling Up Nutrition movement encourages a multisec-
toral approach to nutrition, or example), coordinating plans and
programs across line ministries. Evaluate national sectoral strat-
egies and action plans using disaster-proong and resilience-
building lenses.
10. Put in place policies that strengthen resilience to undernutrition,
such as tenure security or smallholder armers, and adjust poli-
cies and strategies that undermine the resilience o poor and vul-
nerable groups, such as the low import taris or the structural
neglect o smallholder agriculture in Haiti.
11. Ensure that policies and programs draw on a wide range o exper-
tise such as collaborative, multiagency, and multisectoral problem
analysis. National governments should support the emergence o
multistakeholder platorms and make active use o such orums.
In particular, people suering rom a lack o resilience to shocks
and stresses that aect their ood and nutrition security should
be consulted. It is essential that wherever possible, eorts to
strengthen resilience should build on the empowering mechanisms
and institutions they suggest.
Recommendations or Development and Humanitarian Practitioners
12. A resilience perspective can encourage development program-
ming that actors in uncertainty and volatility and humanitarian
programming that works toward sustainable development. Some
programs can incorporate both objectives by (1) rst providing
relie, and then seeking to gradually build individual, household,
and community assets or by (2) building assets in normal times
but incorporating nancial and operational fexibility into pro-
grams to allow them to switch quickly to relie operations when
shocks hit.
“Ater the death o my husband, my in-laws divided the
land among themselves, and I was given a very smallpiece—yet I had eight children to look ater.... My
sisters-in-law sold o their shares and returned to their
homes or they were married. The last two seasons
were not good. My crops were destroyed by the dry sea-
son, and the banana plantation was badly aected by
the heavy storm....”
“The government should have zero tolerance or corrup-
tion. Grants have never been distributed airly. Items
like goats and cows are given to those who are rich and
known to those distributing them, especially politicians.That is very annoying to people like me who deserve
such items.”
Adrona KyalimpaKabarole District, Uganda
“Beore the implementation o the rice policy, the price
was high at 300 Rwandan rancs (RWF) per kilo, but
now the price has been xed by the Ministry o Com-
merce at 255 RWF per kilo. In addition, training inplanning and budgeting, as well as in creating business
plans, in all supported cooperatives is important to in-
crease yield per hectare and handle the market price.”
Jonathan NturoEmployee o Welthungerhile,
Rwanda

7/27/2019 PDF GHI 2013
http://slidepdf.com/reader/full/pdf-ghi-2013 51/66
2013 Global Hunger Index | Chapter 05 | Policy Recommendations 49
13. Development programs aiming to enhance resilience should build
local capacities and strengthen local structures. It is those struc-
tures that have the potential to provide the most eective and time-
ly support when shocks and stresses strike. Emergency programs
should not work in parallel with these structures, but rather work
with and build on them to avoid locking communities and coun-
tries into a humanitarian approach.
14. Support positive coping mechanisms that people already use. For
example, strengthen community-level saving networks or banksthat play a large role in promoting development and providing relie
rom shocks.
15. Nongovernmental organizations and their national partners should
use their long-term experience in development programming more
proactively to lobby or resilience-enhancing policy change.
16. Poor nutrition in early childhood (especially during the 1,000 days
rom conception through age two) reduces resilience because it
can have long-term and irreversible eects on the cognitive and
physical development o children and their uture earning capaci-ty as adults. The humanitarian and development communities
should thus ocus on improving maternal and child nutrition in
developing regions, with both nutrition-specic interventions to
address the immediate causes o undernutrition and nutrition-sen-
sitive interventions to address the underlying causes. Nutrition
indicators as specied by the World Health Assembly targets
should be used to assess nutrition-specic and nutrition-sensitive
programs and unding schemes.2
2 These recommendations ollow rom the ndings presented in a special issue o The Lancet on
maternal and child nutrition (June 2013).
“I suggest that the government put emphasis on con-
trolling population growth since it has a direct eecton how much land can be cultivated and the amount
o ood available during a ood crisis. Households with
4–5 members are more manageable during a ood
crisis than those with 8–15 members.”
“Our crop diversity increased rom 14 to 42 due to the
revival o millet-based mixed cropping. It strengthens
our resilience to climate change. We rejected non-
renewable hybrid seeds and synthetic chemical inputs,
provided or ree by the government … and NGOs.
We reduced our dependence on external agricultural
inputs.... We are watching our debts go down and the
net yield o our arm increase.”
“For my children to have a better uture, we need to raise
their awareness and educate them on disaster mitigation
and management. I believe that community conficts overorests, agricultural land, and misuse o natural resourc-
es led to disasters like foods. I want to resolve them and
show a commitment to controlling deorestation.”
Ernestina AmwonLira District, Uganda
Raimati KadrakaRayagada District, India
Muhammad AminOld Mankial Swat Village, Pakistan
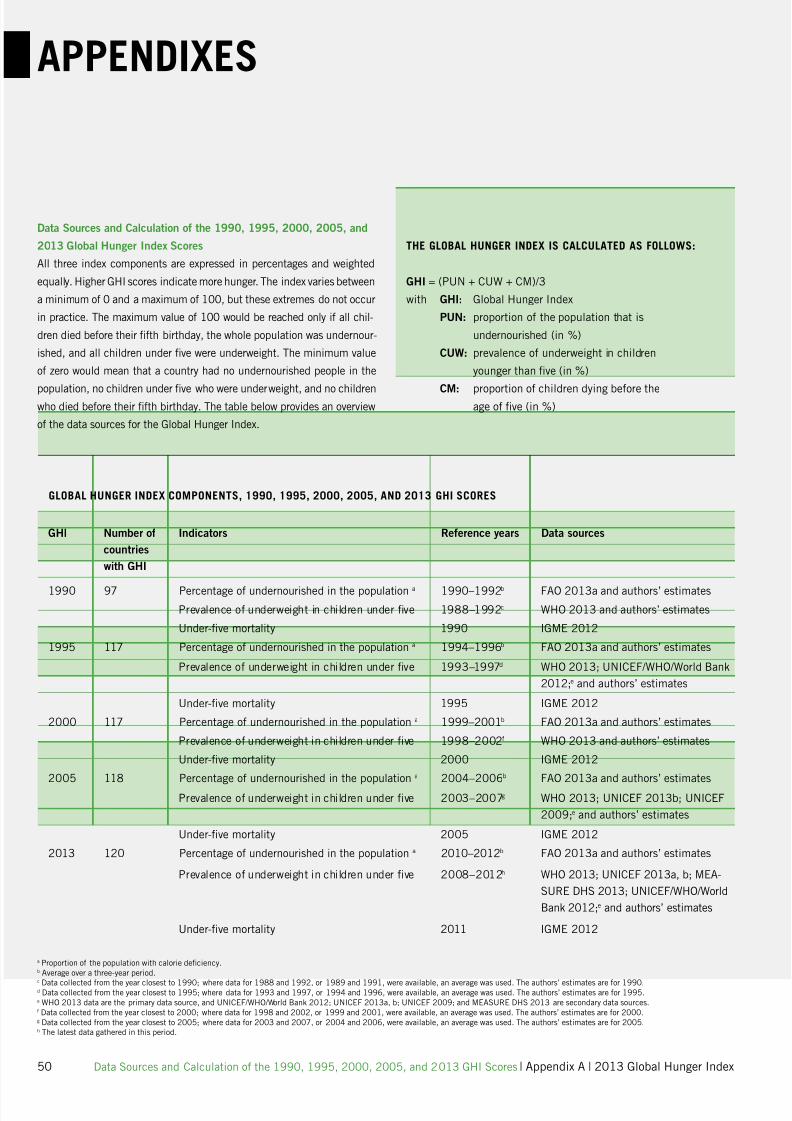
7/27/2019 PDF GHI 2013
http://slidepdf.com/reader/full/pdf-ghi-2013 52/66
50 Data Sources and Calculation o the 1990, 1995, 2000, 2005, and 2013 GHI Scores | Appendix A | 2013 Global Hunger Index
APPENDIXES
Data Sources and Calculation o the 1990, 1995, 2000, 2005, and
2013 Global Hunger Index Scores
All three index components are expressed in percentages and weighted
equally. Higher GHI scores indicate more hunger. The index varies between
a minimum o 0 and a maximum o 100, but these extremes do not occur
in practice. The maximum value o 100 would be reached only i all chil-
dren died beore their th birthday, the whole population was undernour-
ished, and all children under ve were underweight. The minimum value
o zero would mean that a country had no undernourished people in the
population, no children under ve who were underweight, and no childrenwho died beore their th birthday. The table below provides an overview
o the data sources or the Global Hunger Index.
THE GLOBAL HUNGER INDEX IS CALCULATED AS FOLLOWS:
GHI = (PUN + CUW + CM)/3
with GHI: Global Hunger Index
PUN: proportion o the population that is
undernourished (in %)
CUW: prevalence o underweight in children
younger than ve (in %)
CM: proportion o children dying beore theage o ve (in %)
GLOBAL HUNGER INDEX COMPONENTS, 1990, 1995, 2000, 2005, AND 2013 GHI SCORES
GHI Number o
countries
with GHI
Indicators Reerence years Data sources
1990 97 Percentage o undernourished in the population a 1990–1992b FAO 2013a and authors’ estimates
Prevalence o underweight in children under ve 1988–1992c WHO 2013 and authors’ estimates
Under-ve mortality 1990 IGME 2012
1995 117 Percentage o undernourished in the population a 1994–1996b FAO 2013a and authors’ estimates
Prevalence o underweight in children under ve 1993–1997d WHO 2013; UNICEF/WHO/World Bank
2012;e and authors’ estimates
Under-ve mortality 1995 IGME 2012
2000 117 Percentage o undernourished in the population a 1999–2001b FAO 2013a and authors’ estimates
Prevalence o underweight in children under ve 1998–2002 WHO 2013 and authors’ estimates
Under-ve mortality 2000 IGME 2012
2005 118 Percentage o undernourished in the population a 2004–2006b FAO 2013a and authors’ estimates
Prevalence o underweight in children under ve 2003–2007g WHO 2013; UNICEF 2013b; UNICEF
2009;e and authors’ estimates
Under-ve mortality 2005 IGME 2012
2013 120 Percentage o undernourished in the population a 2010–2012b FAO 2013a and authors’ estimates
Prevalence o underweight in children under ve 2008–2012h WHO 2013; UNICEF 2013a, b; MEA-
SURE DHS 2013; UNICEF/WHO/World
Bank 2012;e and authors’ estimates
Under-ve mortality 2011 IGME 2012
a Proportion o the population with calorie deciency.b Average over a three-year period.
c Data collected rom the year closest to 1990; where data or 1988 and 1992, or 1989 and 1991, were available, an average was used. The authors’ estimates are or 1990.d Data collected rom the year closest to 1995; where data or 1993 and 1997, or 1994 and 1996, were available, an average was used. The authors’ estimates are or 1995.e WHO 2013 data are the primary data source, and UNICEF/WHO/World Bank 2012; UNICEF 2013a, b; UNICEF 2009; and MEASURE DHS 2013 are secondary data sources. Data collected rom the year closest to 2000; where data or 1998 and 2002, or 1999 and 2001, were available, an average was used. The authors’ estimates are or 2000.g Data collected rom the year closest to 2005; where data or 2003 and 2007, or 2004 and 2006, were available, an average was used. The authors’ estimates are or 2005.h The latest data gathered in this period.

7/27/2019 PDF GHI 2013
http://slidepdf.com/reader/full/pdf-ghi-2013 53/66
2013 Global Hunger Index | Appendix B | Data Underlying the Calculation o the 1990, 1995, 2000, 2005, and 2013 GHI Scores 51
BDATA UNDERLYING THE CALCULATION OF THE 1990, 1995, 2000, 2005, AND 2013 GLOBAL HUNGER INDEX SCORES
Country Proportion o undernourished in the
population (%)
Prevalence o underweight in
children under fve years (%)
Under-fve mortality
rate (%)
GHI
’90–’92 ’94–’96 ’99–’01 ’04–’06 ’10–’12 ’88–’92 ’93–’97 ’98–’02 ’03–’07 ’08–’12 1990 1995 2000 2005 2011 1990 1995 2000 2005 2013
with data rom
1988–92 1993–97 1998–02 2003–07 2008–12
Aghanistan – – – – – – 44.9 31.3 * 32.8 25.0 19.2 15.8 13.6 11.9 10.1 – – – – –
Albania 9.0 * 2.4 * 3.8 * 9.7 * 7.8 * 14.5 * 12.1 * 17.0 6.6 6.3 4.1 3.5 2.6 2.0 1.4 9.2 6.0 7.8 6.1 5.2
Algeria 5.2 6.4 5.8 5.0 * 3.7 * 9.2 11.3 5.4 3.7 5.7 * 6.6 5.5 4.6 3.8 3.0 7.0 7.7 5.3 <5 <5
Angola 63.9 56.4 47.5 35.1 27.4 30.4 * 37.0 27.5 15.1 14.1 * 24.3 22.2 19.9 17.9 15.8 39.5 38.5 31.6 22.7 19.1
Argentina 2.1 * 1.2 * 0.9 * 1.9 * 4.0 * 3.5 * 3.2 2.3 * 2.3 1.8 * 2.8 2.3 2.0 1.7 1.4 <5 <5 <5 <5 <5
Armenia – 21.3 19.0 5.4 3.0 * – 5.4 * 2.6 4.2 5.3 – 3.8 3.0 2.3 1.8 – 10.2 8.2 <5 <5
Azerbaijan – 26.3 14.7 2.2 * 1.5 * – 8.8 14.0 8.4 3.3 * – 8.4 6.9 5.7 4.5 – 14.5 11.9 5.4 <5
Bahrain – – – – – 6.3 7.6 5.6 * 6.3 * 6.6 * 2.1 1.6 1.2 1.1 1.0 – – – – –
Bangladesh 34.6 36.3 18.4 15.1 16.8 61.5 58.0 45.3 39.2 36.8 13.9 11.1 8.4 6.4 4.6 36.7 35.1 24.0 20.2 19.4
Belarus – 1.1 * 2.3 * 2.8 * 0.4 * – 1.5 * 1.0 * 1.3 0.9 * – 1.7 1.4 0.9 0.6 – <5 <5 <5 <5
Benin 22.4 18.7 16.4 13.1 8.1 27.3 * 26.8 21.5 20.2 21.2 * 17.7 15.9 14.0 12.3 10.6 22.5 20.5 17.3 15.2 13.3
Bhutan – – – – – 34.0 26.1 * 14.1 14.6 * 12.8 13.8 11.2 8.9 7.1 5.4 – – – – –
Bolivia 34.6 30.7 28.7 29.1 24.1 9.7 10.0 5.9 5.9 4.5 12.0 10.0 8.1 6.5 5.1 18.8 16.9 14.2 13.8 11.2
Bosnia & Herzegovina – 6.4 * 6.3 * 2.1 * 2.8 * – 4.1 * 4.2 1.6 1.6 – 1.3 1.0 0.9 0.8 – <5 <5 <5 <5
Botswana 27.4 29.3 34.5 32.9 27.9 17.8 * 15.1 10.7 11.4 * 11.2 5.3 6.5 8.1 4.6 2.6 16.8 17.0 17.8 16.3 13.9
Brazil 14.9 13.5 12.1 8.7 6.9 5.3 4.5 3.6 * 3.0 3.0 * 5.8 4.8 3.6 2.5 1.6 8.7 7.6 6.4 <5 <5
Bulgaria 3.5 * 7.8 * 7.0 * 7.9 * 6.9 * 2.1 * 2.6 * 2.3 * 2.2 1.6 * 2.2 2.3 2.1 1.6 1.2 <5 <5 <5 <5 <5
Burkina Faso 22.9 18.6 26.4 25.8 25.9 36.9 * 29.6 33.7 37.6 26.2 20.8 19.9 18.2 16.5 14.6 26.9 22.7 26.1 26.6 22.2
Burundi 49.0 58.4 63.0 67.9 73.4 34.2 * 38.3 * 38.9 35.2 29.1 18.3 17.7 16.5 15.3 13.9 33.8 38.1 39.5 39.5 38.8
Cambodia 39.9 37.7 33.8 27.4 17.1 44.9 * 42.6 39.5 28.4 29.0 11.7 11.9 10.2 6.9 4.3 32.2 30.7 27.8 20.9 16.8
Cameroon 38.7 37.3 29.1 19.5 15.7 18.0 20.0 * 17.8 15.9 15.1 14.5 14.1 14.0 13.6 12.7 23.7 23.8 20.3 16.3 14.5
Central Arican Rep. 49.5 50.6 45.1 40.6 30.0 25.7 * 20.4 21.8 28.0 23.5 16.9 17.3 17.2 17.0 16.4 30.7 29.4 28.0 28.5 23.3
Chad 61.1 50.5 41.0 37.3 33.4 34.6 * 34.3 29.4 33.9 30.3 20.8 19.8 18.9 18.0 16.9 38.8 34.9 29.8 29.7 26.9
Chile 8.1 5.6 4.4 * 3.2 * 3.7 * 1.0 * 0.8 0.7 0.6 0.5 1.9 1.4 1.1 0.9 0.9 <5 <5 <5 <5 <5
China 21.4 15.9 14.4 13.1 11.5 12.6 10.7 7.4 4.5 3.4 4.9 4.6 3.5 2.4 1.5 13.0 10.4 8.4 6.7 5.5
Colombia 19.1 14.7 13.0 13.6 12.6 8.8 6.3 4.9 5.1 3.4 3.4 2.9 2.5 2.1 1.8 10.4 8.0 6.8 6.9 5.9
Comoros 43.5 49.1 64.8 58.1 70.0 16.2 22.3 25.0 22.1 22.8 * 12.2 11.0 10.0 9.1 7.9 24.0 27.5 33.3 29.8 33.6
Congo, Dem. Rep. – – – – – 21.4 * 30.7 33.6 28.2 24.2 18.1 18.1 18.1 18.1 16.8 – – – – –
Congo, Rep. 42.8 44.7 30.1 32.9 37.4 16.4 * 15.8 * 17.0 * 11.8 14.1 * 11.9 11.3 10.9 10.4 9.9 23.7 23.9 19.3 18.4 20.5
Costa Rica 4.0 * 5.0 4.4 * 5.0 * 6.5 2.5 3.2 1.6 * 1.3 * 1.1 1.7 1.5 1.3 1.1 1.0 <5 <5 <5 <5 <5
Croatia – 14.6 * 11.6 * 2.1 * 1.5 * – 0.5 0.5 * 0.3 * 0.3 * – 1.0 0.8 0.7 0.5 – 5.4 <5 <5 <5
Cuba 11.5 16.1 2.8 * 1.1 * 0.6 * 3.6 * 5.0 * 3.4 3.5 3.3 * 1.3 1.1 0.9 0.7 0.6 5.5 7.4 <5 <5 <5
Côte d'Ivoire 13.7 14.0 19.9 19.6 21.4 20.0 * 20.9 18.2 16.7 15.4 15.1 14.6 13.9 12.8 11.5 16.3 16.5 17.3 16.4 16.1
Djibouti 68.0 58.1 47.1 32.6 19.8 20.2 16.0 25.4 29.6 29.8 12.2 11.3 10.6 9.8 9.0 33.5 28.5 27.7 24.0 19.5
Dominican Republic 30.4 25.7 21.6 18.6 15.4 8.4 4.7 3.5 4.6 3.1 * 5.8 4.7 3.9 3.2 2.5 14.9 11.7 9.7 8.8 7.0
Ecuador 24.5 18.5 20.9 21.4 18.3 12.2 * 12.0 * 12.5 6.2 5.0 * 5.2 4.2 3.4 2.8 2.3 14.0 11.6 12.3 10.1 8.5
Egypt, Arab Rep. 2.0 * 1.6 * 1.5 * 2.2 * 1.6 * 10.5 10.8 9.8 5.4 6.8 8.6 6.2 4.4 3.2 2.1 7.0 6.2 5.2 <5 <5
El Salvador 15.6 14.2 9.2 10.6 12.3 11.1 7.2 9.6 6.1 6.6 6.0 4.7 3.4 2.4 1.5 10.9 8.7 7.4 6.4 6.8
Eritrea – 71.8 76.2 74.8 65.4 – 38.3 34.5 34.8 * 32.8 * – 11.6 9.8 8.3 6.8 – 40.6 40.2 39.3 35.0
Estonia – 6.4 * 4.3 * 4.3 * 3.2 * – 1.0 * 1.0 * 0.9 * 2.3 * – 1.5 1.1 0.7 0.4 – <5 <5 <5 <5
Ethiopia 68.0 67.2 55.3 47.7 40.2 39.2 43.9 * 42.0 34.6 29.2 19.8 17.0 13.9 10.7 7.7 42.3 42.7 37.1 31.0 25.7
Fiji 6.2 5.7 4.8 * 2.9 * 3.8 * 8.1 * 6.9 5.6 * 4.0 * 5.8 * 3.0 2.6 2.2 2.0 1.6 5.8 5.1 <5 <5 <5
Gabon 10.1 7.5 6.3 5.8 6.5 9.7 * 7.8 * 8.8 7.2 * 8.6 * 9.4 8.7 8.2 7.7 6.6 9.7 8.0 7.8 6.9 7.2
Gambia, The 19.5 23.2 19.8 19.3 14.4 21.3 * 23.2 15.4 15.8 17.4 16.5 14.7 13.0 11.6 10.1 19.1 20.4 16.1 15.6 14.0
Georgia – 42.3 21.5 28.9 24.7 – 3.5 * 2.7 2.3 1.1 – 4.0 3.3 2.6 2.1 – 16.6 9.2 11.3 9.3
Ghana 40.5 22.7 16.6 9.5 3.4 * 24.0 25.1 20.3 13.9 13.4 12.1 10.9 9.9 8.8 7.8 25.5 19.6 15.6 10.7 8.2
Guatemala 16.2 20.5 26.5 29.9 30.4 21.1 * 21.7 19.6 17.3 * 13.0 7.8 6.0 4.8 3.9 3.0 15.0 16.1 17.0 17.0 15.5
Guinea 18.4 22.1 20.6 17.0 17.3 23.0 * 21.2 29.1 22.5 20.8 22.8 20.2 17.5 15.0 12.6 21.4 21.2 22.4 18.2 16.9
Guinea-Bissau 22.0 23.1 21.4 18.5 8.7 22.0 * 19.4 * 21.9 17.4 18.1 21.0 19.9 18.6 17.3 16.1 21.7 20.8 20.6 17.7 14.3
Guyana 19.7 11.9 7.9 9.0 5.1 17.0 * 13.2 11.9 10.8 11.1 6.3 5.6 4.9 4.3 3.6 14.3 10.2 8.2 8.0 6.6
Haiti 63.5 59.1 53.0 53.5 44.5 23.7 24.0 13.9 18.9 18.4 * 14.3 12.1 10.2 8.6 7.0 33.8 31.7 25.7 27.0 23.3
Honduras 21.4 18.6 16.3 14.2 9.6 15.8 17.7 12.5 8.6 12.1 * 5.5 4.4 3.5 2.8 2.1 14.2 13.6 10.8 8.5 7.9
India 26.9 25.2 21.3 20.9 17.5 59.5 45.9 44.4 43.5 40.2 * 11.4 10.1 8.8 7.5 6.1 32.6 27.1 24.8 24.0 21.3
Indonesia 19.9 15.2 17.8 15.1 8.6 31.0 28.9 23.3 24.4 18.6 8.2 6.5 5.3 4.2 3.2 19.7 16.9 15.5 14.6 10.1
Iran, Islamic Rep. 3.4 * 3.5 * 4.3 * 5.8 5.0 * 16.0 * 13.8 9.5 4.6 4.1 * 6.1 4.9 4.4 3.4 2.5 8.5 7.4 6.1 <5 <5
Iraq – – – – – 10.4 – 12.9 7.6 8.5 4.6 4.5 4.3 4.1 3.8 – – – – –
Jamaica 9.0 8.1 6.9 7.0 8.7 5.2 4.0 3.8 3.4 3.2 3.5 3.0 2.6 2.2 1.8 5.9 5.0 <5 <5 <5
Jordan 6.7 8.6 6.1 2.9 * 3.7 * 4.8 3.8 3.6 1.9 * 1.9 3.7 3.2 2.8 2.4 2.1 5.1 5.2 <5 <5 <5
Kazakhstan – 0.8 * 8.0 1.0 * 0.5 * – 6.7 3.8 4.9 3.7 – 5.1 4.2 3.5 2.8 – <5 5.3 <5 <5
Kenya 35.6 31.9 32.8 32.9 30.4 18.7 * 19.8 17.5 18.4 16.4 9.8 11.2 11.3 9.4 7.3 21.4 21.0 20.5 20.2 18.0
Kuwait 28.7 4.8 * 1.6 * 0.9 * 1.6 * 6.7 * 9.2 2.2 2.7 1.7 1.7 1.4 1.3 1.2 1.1 12.4 5.1 <5 <5 <5
Kyrgyz Republic – 13.8 15.8 9.4 6.4 – 8.2 5.8 * 2.7 3.5 * – 5.8 4.7 3.9 3.1 – 9.3 8.8 5.3 <5
Lao PDR 44.6 44.1 39.5 33.4 27.8 40.9 * 35.9 36.4 31.6 24.2 * 14.8 11.0 8.1 6.0 4.2 33.4 30.3 28.0 23.7 18.7
Latvia – 2.0 * 5.6 * 3.2 * 4.1 * – 0.7 * 1.2 * 1.0 * 2.6 * – 2.3 1.7 1.3 0.8 – <5 <5 <5 <5
Lebanon 3.5 * 4.0 * 3.5 * 3.3 * 3.1 * 5.9 * 3.5 4.0 * 4.2 2.8 * 3.3 2.6 1.9 1.4 0.9 <5 <5 <5 <5 <5
* IFPRI estimates.
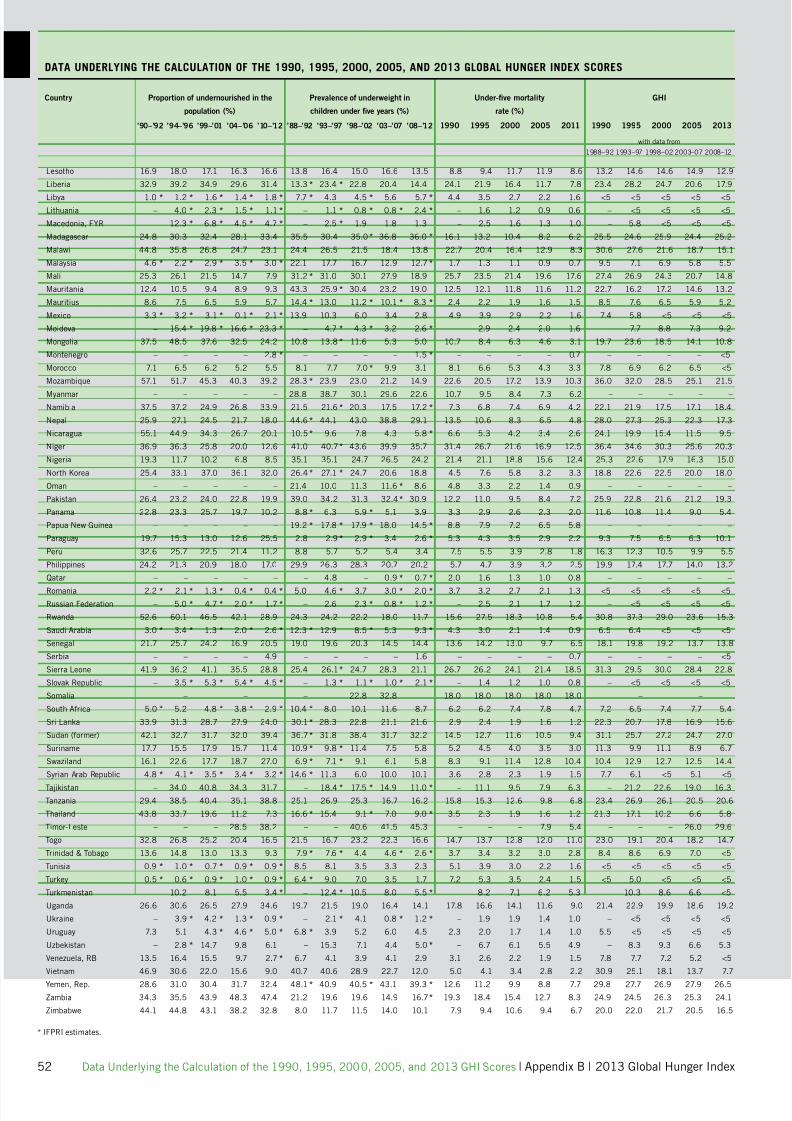
7/27/2019 PDF GHI 2013
http://slidepdf.com/reader/full/pdf-ghi-2013 54/66
52 Data Underlying the Calculation o the 1990, 1995, 2000, 2005, and 2013 GHI Scores | Appendix B | 2013 Global Hunger Index
* IFPRI estimates.
DATA UNDERLYING THE CALCULATION OF THE 1990, 1995, 2000, 2005, AND 2013 GLOBAL HUNGER INDEX SCORES
Country Proportion o undernourished in the
population (%)
Prevalence o underweight in
children under fve years (%)
Under-fve mortality
rate (%)
GHI
’90–’92 ’94–’96 ’99–’01 ’04–’06 ’10–’12 ’88–’92 ’93–’97 ’98–’02 ’03–’07 ’08–’12 1990 1995 2000 2005 2011 1990 1995 2000 2005 2013
with data rom
1988–92 1993–97 1998–02 2003–07 2008–12
Lesotho 16.9 18.0 17.1 16.3 16.6 13.8 16.4 15.0 16.6 13.5 8.8 9.4 11.7 11.9 8.6 13.2 14.6 14.6 14.9 12.9
Liberia 32.9 39.2 34.9 29.6 31.4 13.3 * 23.4 * 22.8 20.4 14.4 24.1 21.9 16.4 11.7 7.8 23.4 28.2 24.7 20.6 17.9
Libya 1.0 * 1.2 * 1.6 * 1.4 * 1.8 * 7.7 * 4.3 4.5 * 5.6 5.7 * 4.4 3.5 2.7 2.2 1.6 <5 <5 <5 <5 <5
Lithuania – 4.0 * 2.3 * 1.5 * 1.1 * – 1.1 * 0.8 * 0.8 * 2.4 * – 1.6 1.2 0.9 0.6 – <5 <5 <5 <5
Macedonia, FYR – 12.3 * 6.8 * 4.5 * 4.7 * – 2.5 * 1.9 1.8 1.3 – 2.5 1.6 1.3 1.0 – 5.8 <5 <5 <5
Madagascar 24.8 30.3 32.4 28.1 33.4 35.5 30.4 35.0 * 36.8 36.0 * 16.1 13.2 10.4 8.2 6.2 25.5 24.6 25.9 24.4 25.2
Malawi 44.8 35.8 26.8 24.7 23.1 24.4 26.5 21.5 18.4 13.8 22.7 20.4 16.4 12.9 8.3 30.6 27.6 21.6 18.7 15.1
Malaysia 4.6 * 2.2 * 2.9 * 3.5 * 3.0 * 22.1 17.7 16.7 12.9 12.7 * 1.7 1.3 1.1 0.9 0.7 9.5 7.1 6.9 5.8 5.5
Mali 25.3 26.1 21.5 14.7 7.9 31.2 * 31.0 30.1 27.9 18.9 25.7 23.5 21.4 19.6 17.6 27.4 26.9 24.3 20.7 14.8
Mauritania 12.4 10.5 9.4 8.9 9.3 43.3 25.9 * 30.4 23.2 19.0 12.5 12.1 11.8 11.6 11.2 22.7 16.2 17.2 14.6 13.2
Mauritius 8.6 7.5 6.5 5.9 5.7 14.4 * 13.0 11.2 * 10.1 * 8.3 * 2.4 2.2 1.9 1.6 1.5 8.5 7.6 6.5 5.9 5.2
Mexico 3.3 * 3.2 * 3.1 * 0.1 * 2.1 * 13.9 10.3 6.0 3.4 2.8 4.9 3.9 2.9 2.2 1.6 7.4 5.8 <5 <5 <5
Moldova – 15.4 * 19.8 * 16.6 * 23.3 * – 4.7 * 4.3 * 3.2 2.6 * – 2.9 2.4 2.0 1.6 – 7.7 8.8 7.3 9.2
Mongolia 37.5 48.5 37.6 32.5 24.2 10.8 13.8 * 11.6 5.3 5.0 10.7 8.4 6.3 4.6 3.1 19.7 23.6 18.5 14.1 10.8
Montenegro – – – – 2.8 * – – – – 1.5 * – – – – 0.7 – – – – <5
Morocco 7.1 6.5 6.2 5.2 5.5 8.1 7.7 7.0 * 9.9 3.1 8.1 6.6 5.3 4.3 3.3 7.8 6.9 6.2 6.5 <5
Mozambique 57.1 51.7 45.3 40.3 39.2 28.3 * 23.9 23.0 21.2 14.9 22.6 20.5 17.2 13.9 10.3 36.0 32.0 28.5 25.1 21.5
Myanmar – – – – – 28.8 38.7 30.1 29.6 22.6 10.7 9.5 8.4 7.3 6.2 – – – – –
Namibia 37.5 37.2 24.9 26.8 33.9 21.5 21.6 * 20.3 17.5 17.2 * 7.3 6.8 7.4 6.9 4.2 22.1 21.9 17.5 17.1 18.4
Nepal 25.9 27.1 24.5 21.7 18.0 44.6 * 44.1 43.0 38.8 29.1 13.5 10.6 8.3 6.5 4.8 28.0 27.3 25.3 22.3 17.3
Nicaragua 55.1 44.9 34.3 26.7 20.1 10.5 * 9.6 7.8 4.3 5.8 * 6.6 5.3 4.2 3.4 2.6 24.1 19.9 15.4 11.5 9.5
Niger 36.9 36.3 25.8 20.0 12.6 41.0 40.7 * 43.6 39.9 35.7 31.4 26.7 21.6 16.9 12.5 36.4 34.6 30.3 25.6 20.3
Nigeria 19.3 11.7 10.2 6.8 8.5 35.1 35.1 24.7 26.5 24.2 21.4 21.1 18.8 15.6 12.4 25.3 22.6 17.9 16.3 15.0
North Korea 25.4 33.1 37.0 36.1 32.0 26.4 * 27.1 * 24.7 20.6 18.8 4.5 7.6 5.8 3.2 3.3 18.8 22.6 22.5 20.0 18.0
Oman – – – – – 21.4 10.0 11.3 11.6 * 8.6 4.8 3.3 2.2 1.4 0.9 – – – – –
Pakistan 26.4 23.2 24.0 22.8 19.9 39.0 34.2 31.3 32.4 * 30.9 12.2 11.0 9.5 8.4 7.2 25.9 22.8 21.6 21.2 19.3
Panama 22.8 23.3 25.7 19.7 10.2 8.8 * 6.3 5.9 * 5.1 3.9 3.3 2.9 2.6 2.3 2.0 11.6 10.8 11.4 9.0 5.4
Papua New Guinea – – – – – 19.2 * 17.8 * 17.9 * 18.0 14.5 * 8.8 7.9 7.2 6.5 5.8 – – – – –
Paraguay 19.7 15.3 13.0 12.6 25.5 2.8 2.9 * 2.9 * 3.4 2.6 * 5.3 4.3 3.5 2.9 2.2 9.3 7.5 6.5 6.3 10.1
Peru 32.6 25.7 22.5 21.4 11.2 8.8 5.7 5.2 5.4 3.4 7.5 5.5 3.9 2.8 1.8 16.3 12.3 10.5 9.9 5.5
Philippines 24.2 21.3 20.9 18.0 17.0 29.9 26.3 28.3 20.7 20.2 5.7 4.7 3.9 3.2 2.5 19.9 17.4 17.7 14.0 13.2
Qatar – – – – – – 4.8 – 0.9 * 0.7 * 2.0 1.6 1.3 1.0 0.8 – – – – –
Romania 2.2 * 2.1 * 1.3 * 0.4 * 0.4 * 5.0 4.6 * 3.7 3.0 * 2.0 * 3.7 3.2 2.7 2.1 1.3 <5 <5 <5 <5 <5
Russian Federation – 5.0 * 4.7 * 2.0 * 1.7 * – 2.6 2.3 * 0.8 * 1.2 * – 2.5 2.1 1.7 1.2 – <5 <5 <5 <5
Rwanda 52.6 60.1 46.5 42.1 28.9 24.3 24.2 22.2 18.0 11.7 15.6 27.5 18.3 10.8 5.4 30.8 37.3 29.0 23.6 15.3
Saudi Arabia 3.0 * 3.4 * 1.3 * 2.0 * 2.6 * 12.3 * 12.9 8.5 * 5.3 9.3 * 4.3 3.0 2.1 1.4 0.9 6.5 6.4 <5 <5 <5
Senegal 21.7 25.7 24.2 16.9 20.5 19.0 19.6 20.3 14.5 14.4 13.6 14.2 13.0 9.7 6.5 18.1 19.8 19.2 13.7 13.8
Serbia – – – – 4.9 – – – – 1.6 – – – – 0.7 – – – – <5
Sierra Leone 41.9 36.2 41.1 35.5 28.8 25.4 26.1 * 24.7 28.3 21.1 26.7 26.2 24.1 21.4 18.5 31.3 29.5 30.0 28.4 22.8
Slovak Republic – 3.5 * 5.3 * 5.4 * 4.5 * – 1.3 * 1.1 * 1.0 * 2.1 * – 1.4 1.2 1.0 0.8 – <5 <5 <5 <5
Somalia – – – – – – – 22.8 32.8 – 18.0 18.0 18.0 18.0 18.0 – – – – –
South Arica 5.0 * 5.2 4.8 * 3.8 * 2.9 * 10.4 * 8.0 10.1 11.6 8.7 6.2 6.2 7.4 7.8 4.7 7.2 6.5 7.4 7.7 5.4
Sri Lanka 33.9 31.3 28.7 27.9 24.0 30.1 * 28.3 22.8 21.1 21.6 2.9 2.4 1.9 1.6 1.2 22.3 20.7 17.8 16.9 15.6
Sudan (ormer) 42.1 32.7 31.7 32.0 39.4 36.7 * 31.8 38.4 31.7 32.2 14.5 12.7 11.6 10.5 9.4 31.1 25.7 27.2 24.7 27.0
Suriname 17.7 15.5 17.9 15.7 11.4 10.9 * 9.8 * 11.4 7.5 5.8 5.2 4.5 4.0 3.5 3.0 11.3 9.9 11.1 8.9 6.7
Swaziland 16.1 22.6 17.7 18.7 27.0 6.9 * 7.1 * 9.1 6.1 5.8 8.3 9.1 11.4 12.8 10.4 10.4 12.9 12.7 12.5 14.4
Syrian Arab Republic 4.8 * 4.1 * 3.5 * 3.4 * 3.2 * 14.6 * 11.3 6.0 10.0 10.1 3.6 2.8 2.3 1.9 1.5 7.7 6.1 <5 5.1 <5
Tajikistan – 34.0 40.8 34.3 31.7 – 18.4 * 17.5 * 14.9 11.0 * – 11.1 9.5 7.9 6.3 – 21.2 22.6 19.0 16.3
Tanzania 29.4 38.5 40.4 35.1 38.8 25.1 26.9 25.3 16.7 16.2 15.8 15.3 12.6 9.8 6.8 23.4 26.9 26.1 20.5 20.6
Thailand 43.8 33.7 19.6 11.2 7.3 16.6 * 15.4 9.1 * 7.0 9.0 * 3.5 2.3 1.9 1.6 1.2 21.3 17.1 10.2 6.6 5.8
Timor-Leste – – – 28.5 38.2 – – 40.6 41.5 45.3 – – – 7.9 5.4 – – – 26.0 29.6
Togo 32.8 26.8 25.2 20.4 16.5 21.5 16.7 23.2 22.3 16.6 14.7 13.7 12.8 12.0 11.0 23.0 19.1 20.4 18.2 14.7
Trinidad & Tobago 13.6 14.8 13.0 13.3 9.3 7.9 * 7.6 * 4.4 4.6 * 2.6 * 3.7 3.4 3.2 3.0 2.8 8.4 8.6 6.9 7.0 <5
Tunisia 0.9 * 1.0 * 0.7 * 0.9 * 0.9 * 8.5 8.1 3.5 3.3 2.3 5.1 3.9 3.0 2.2 1.6 <5 <5 <5 <5 <5
Turkey 0.5 * 0.6 * 0.9 * 1.0 * 0.9 * 6.4 * 9.0 7.0 3.5 1.7 7.2 5.3 3.5 2.4 1.5 <5 5.0 <5 <5 <5
Turkmenistan – 10.2 8.1 5.5 3.4 * – 12.4 * 10.5 8.0 5.5 * – 8.2 7.1 6.2 5.3 – 10.3 8.6 6.6 <5
Uganda 26.6 30.6 26.5 27.9 34.6 19.7 21.5 19.0 16.4 14.1 17.8 16.6 14.1 11.6 9.0 21.4 22.9 19.9 18.6 19.2
Ukraine – 3.9 * 4.2 * 1.3 * 0.9 * – 2.1 * 4.1 0.8 * 1.2 * – 1.9 1.9 1.4 1.0 – <5 <5 <5 <5
Uruguay 7.3 5.1 4.3 * 4.6 * 5.0 * 6.8 * 3.9 5.2 6.0 4.5 2.3 2.0 1.7 1.4 1.0 5.5 <5 <5 <5 <5
Uzbekistan – 2.8 * 14.7 9.8 6.1 – 15.3 7.1 4.4 5.0 * – 6.7 6.1 5.5 4.9 – 8.3 9.3 6.6 5.3
Venezuela, RB 13.5 16.4 15.5 9.7 2.7 * 6.7 4.1 3.9 4.1 2.9 3.1 2.6 2.2 1.9 1.5 7.8 7.7 7.2 5.2 <5
Vietnam 46.9 30.6 22.0 15.6 9.0 40.7 40.6 28.9 22.7 12.0 5.0 4.1 3.4 2.8 2.2 30.9 25.1 18.1 13.7 7.7
Yemen, Rep. 28.6 31.0 30.4 31.7 32.4 48.1 * 40.9 40.5 * 43.1 39.3 * 12.6 11.2 9.9 8.8 7.7 29.8 27.7 26.9 27.9 26.5
Zambia 34.3 35.5 43.9 48.3 47.4 21.2 19.6 19.6 14.9 16.7 * 19.3 18.4 15.4 12.7 8.3 24.9 24.5 26.3 25.3 24.1
Zimbabwe 44.1 44.8 43.1 38.2 32.8 8.0 11.7 11.5 14.0 10.1 7.9 9.4 10.6 9.4 6.7 20.0 22.0 21.7 20.5 16.5
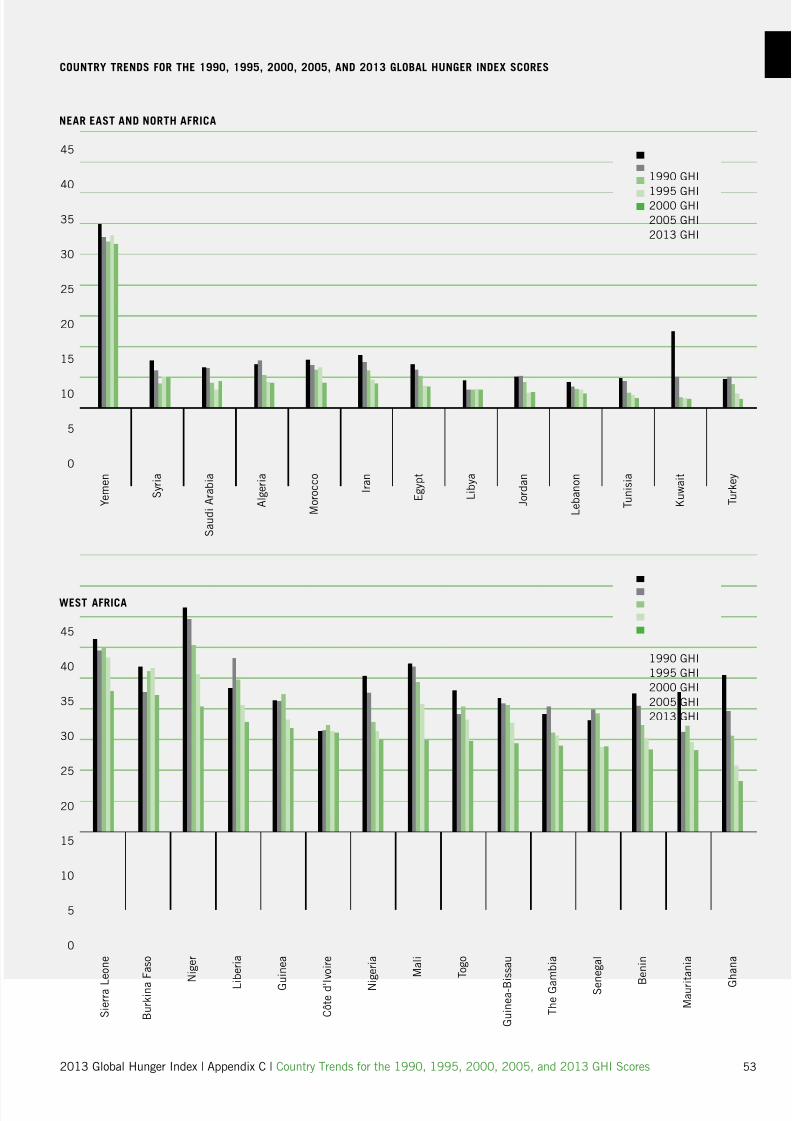
7/27/2019 PDF GHI 2013
http://slidepdf.com/reader/full/pdf-ghi-2013 55/66
2013 Global Hunger Index | Appendix C | Country Trends or the 1990, 1995, 2000, 2005, and 2013 GHI Scores 53
COUNTRY TRENDS FOR THE 1990, 1995, 2000, 2005, AND 2013 GLOBAL HUNGER INDEX SCORES C
NEAR EAST AND NORTH AFRICA
Y e m e n
0
5
10
15
20
25
45
30
35
40
S y r i a
S a u d i A r a b i a
A l g e r i a
M o r o c c o
I r a n
E g y p t
L i b y a
J o r d a n
L e b a n o n
T u n i s i a
K u w a i t
T u r k e y
WEST AFRICA
S i e r r a L
e o n e
0
5
10
15
20
25
45
30
35
40
B u r k i n a
F a s o
N i g e r
L i
b e r i a
G u
i n e a
C ô t e d ' I
v o i r e
N i
g e r i a
M a l i
T o g o
G u i n e a - B i s s a u
T h e G a m b i a
S e n e g a l
B
e n i n
M a u r i t a n i a
G
h a n a
1990 GHI
1995 GHI2000 GHI
2005 GHI
2013 GHI
1990 GHI
1995 GHI
2000 GHI
2005 GHI
2013 GHI
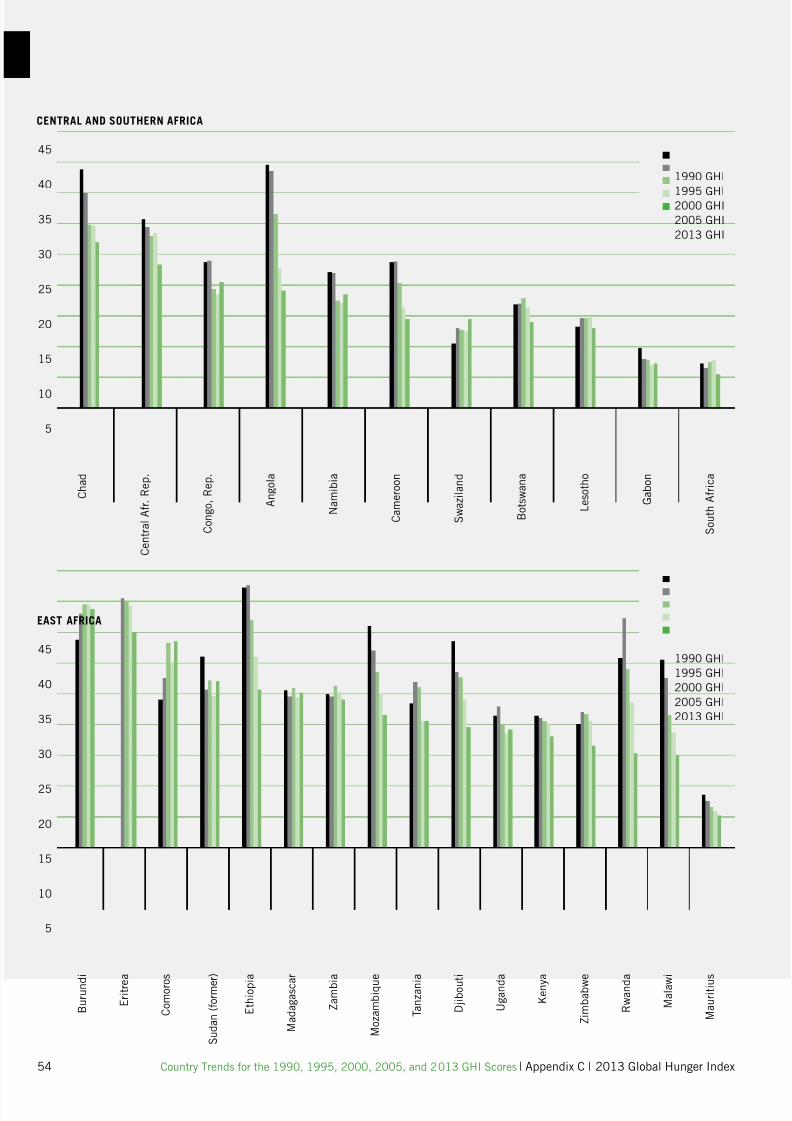
7/27/2019 PDF GHI 2013
http://slidepdf.com/reader/full/pdf-ghi-2013 56/66
54 Country Trends or the 1990, 1995, 2000, 2005, and 2013 GHI Scores| Appendix C | 2013 Global Hunger Index
CENTRAL AND SOUTHERN AFRICA
C h a d
5
10
15
20
25
45
30
35
40
C e n t r a l A f r . R e p .
C o n g o , R e p .
A n g o l a
N a m i b i a
C a m e r o o n
S w a z i l a n d
B o t s w a n a
L e s o t h o
G a b o n
S o u t h A f r i c a
EAST AFRICA
B u r u n d
i
5
10
15
20
25
45
30
35
40
E r i t r e
a
C o m o r o
s
S u d a n ( f o r m e r )
E t h i o p i
a
M a d a g a s c a
r
Z a m b i
a
M o z a m b i q u
e
T a n z a n i
a
D j i b o u t i
U g a n d
a
K e n y
a
Z i m b a b w
e
R w a n d
a
M a u r i t i u
s
M a l a w
i
1990 GHI
1995 GHI2000 GHI
2005 GHI
2013 GHI
1990 GHI
1995 GHI
2000 GHI
2005 GHI
2013 GHI
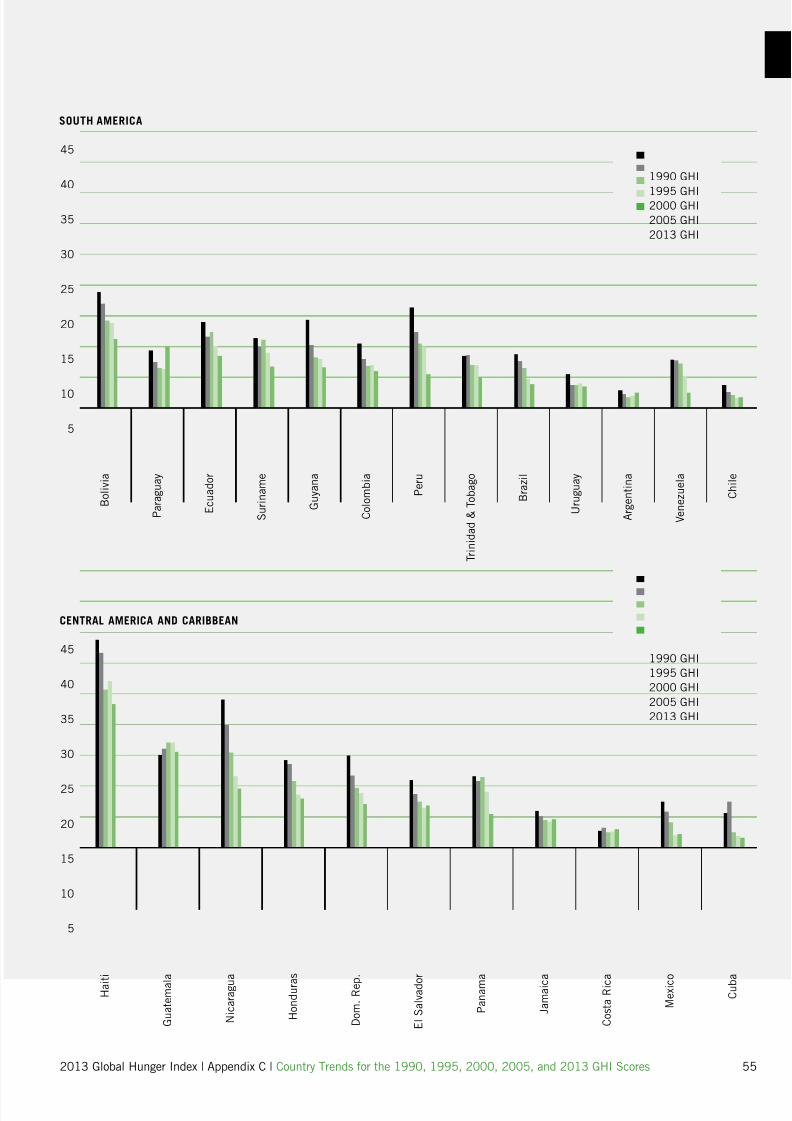
7/27/2019 PDF GHI 2013
http://slidepdf.com/reader/full/pdf-ghi-2013 57/66
2013 Global Hunger Index | Appendix C | Country Trends or the 1990, 1995, 2000, 2005, and 2013 GHI Scores 55
SOUTH AMERICA
B o l i v i a
5
10
15
20
25
45
30
35
40
P a r a g u a y
E c u a d o r
S u r i n a m e
G u y a n a
C o l o m b i a
P e r u
T r i n i d a d & T o b a g o
B r a z i l
U r u g u a y
A r g e n t i n a
V e n e z u e l a
CENTRAL AMERICA AND CARIBBEAN
H a i t i
5
10
15
20
25
45
30
35
40
G u a t e m a l
a
N i c a r a g u
a
H o n d u r a
s
D o m . R e p
.
E l S a l v a d o
r
P a n a m
a
J a m a i c
a
C o s t a R i c
a
M e x i c
o
C h i l e
C u b
a
C
1990 GHI
1995 GHI2000 GHI
2005 GHI
2013 GHI
1990 GHI
1995 GHI
2000 GHI
2005 GHI
2013 GHI
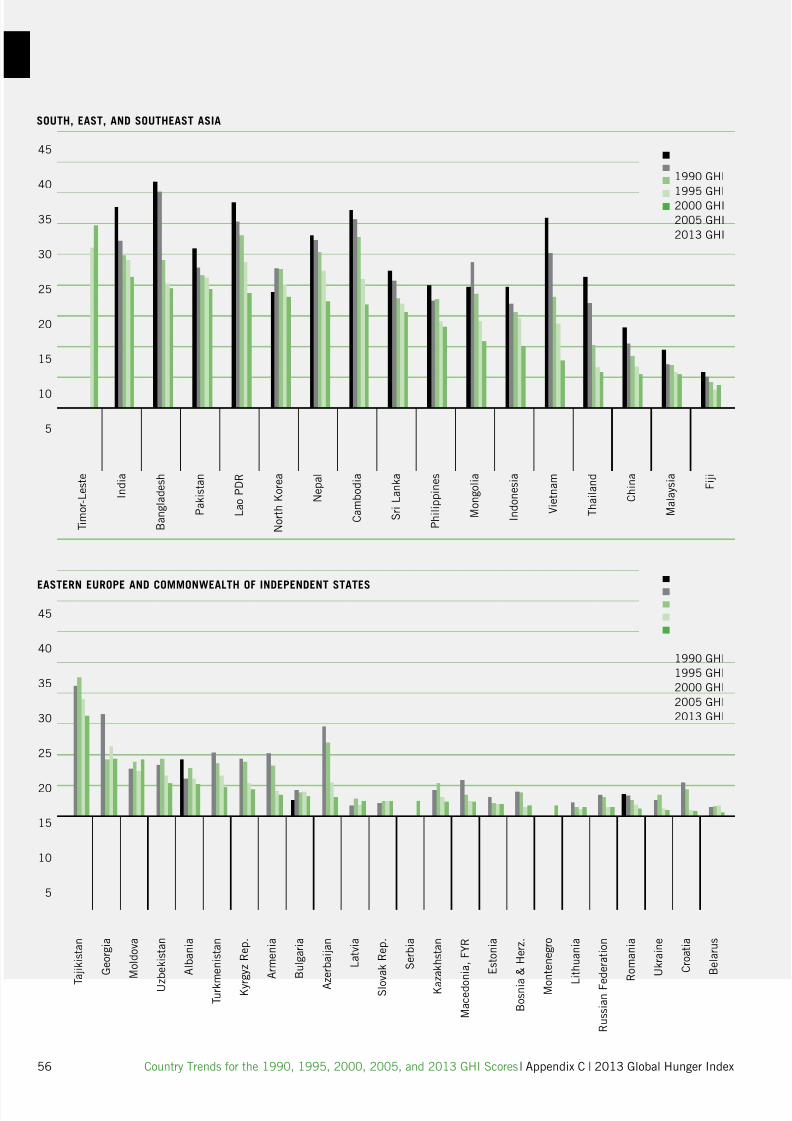
7/27/2019 PDF GHI 2013
http://slidepdf.com/reader/full/pdf-ghi-2013 58/66
56 Country Trends or the 1990, 1995, 2000, 2005, and 2013 GHI Scores | Appendix C | 2013 Global Hunger Index
SOUTH, EAST, AND SOUTHEAST ASIA
5
10
15
20
25
45
30
35
40
EASTERN EUROPE AND COMMONWEALTH OF INDEPENDENT STATES
T
a j i k i s t a n
5
10
15
20
25
45
30
35
40
G e o r g i a
M o l d o v a
U z
b e k i s t a n
A l b a n i a
T u r k m
e n i s t a n
K y r g y z R e p .
A r m e n i a
B u l g a r i a
A z
e r b a i j a n
L a t v i a
S l o v a k R e p .
S e r b i a
K a z a k h s t a n
E s t o n i a
M a c e d o n i a , F Y R
T i m o r - L e s t e
I n d i a
B a n g l a d e s h
P a k i s t a n
L a o P D R
N o r t h K o r e a
N e p a l
C a m b o d i a
S r i L a n k a
P h i l i p p i n e s
M o n g o l i a
I n d o n e s i a
T h a i l a n d
V i e t n a m
C h i n a
M a l a y s i a
F i j i
B o s n i a
& H e r z .
M o n t e n e g r o
L
i t h u a n i a
R u s s i a n F e
d e r a t i o n
R o m a n i a
U k r a i n e
C r o a t i a
B e l a r u s
1990 GHI
1995 GHI2000 GHI
2005 GHI
2013 GHI
1990 GHI
1995 GHI
2000 GHI
2005 GHI
2013 GHI
7/27/2019 PDF GHI 2013
http://slidepdf.com/reader/full/pdf-ghi-2013 59/66
2013 Global Hunger Index | Bibliography 57
BIBLIOGRAPHY
AAker, J. C., R. Boumnijel, A. McClelland, and N. Tierney. 2011. Zap It to Me: The Short-Term
Impacts o a Mobile Cash Transer Program.CGD Working Paper 268. Washington, DC: Center or
Global Development.
Aker, J. C., and M. Nene. 2012. Cash Transers, Nutrition and Household Well-Being in Niger.An
Operations Research Report or Concern Worldwide. Dublin and Medord, MA, US: Concern World-
wide and Tuts University.
Alinovi, L., M. D’Errico, E. Mane, and D. Romano. 2010. Livelihoods Strategies and Household
Resilience to Food Insecurity: An Empirical Analysis to Kenya. Paper presented at conerence orga-
nized by the European Report o Development, Dakar, Senegal, June 28–30.
Alkire, S., and M. E. Santos . 2010. Multidimensional Poverty Index: 2010 Data. Oxord, UK: Oxord
Poverty and Human Development Initiative, University o Oxord. www.ophi.org.uk/policy/multidi-
mensional-poverty-index/.
AlterPresse. 2012. Haiti-Agriculture: Martelly, de Retour du Japon, Afrme Disposer d’un Nou-
veau Plan d’Autosufsance Alimentaire. December 12.
www.alterpresse.org/spip.php?article13824#.UZdhqx0Yrg.
BBarrett, C. B. 2010. Measuring Food Insecurity. Science 327 (5967): 825–828.
Barrett, C. B., and M. Constas. 2012. Resilience to Avoid and Escape Chronic Poverty: Theoreti-
cal Foundations and Measurement Principles. Paper presented at a roundtable discussion on resil-
ience at CARE, Washington, DC, December 11.
Béné, C., R. Godrey-Wood, A. Newsham, and M. Davies. 2012. Resilience: New Utopia or New
Tyranny?: Reection about the Potentials and Limits o the Concept o Resilience in Relation to
Vulnerability Reduction Programmes. IDS Working Paper 405. Brighton, UK: Institute o Develop-
ment Studies.
Berhane, G., J. Hoddinott, N. Kumar, and A. S. Taesse. 2011. The Impact o Ethiopia’s Produc-
tive Saety Nets and Household Asset Building Programme: 2006–2010. IFPRI Discussion Paper
839. Washington, DC: International Food Policy Research Institute.
Berkes, F., J. Colding, and C. Folke. 2003. Navigating Social-Ecological Systems: Building Resil-
ience or Complexity and Change. Cambridge, UK: Cambridge University Press.
Berkes, F., and C. Folke, ed. 1998. Linking Social and Ecological Systems Management Pract ic-
es and Social Mechanisms or Building Resilience. Cambridge, UK: Cambridge University Press.
Bhutta, Z. A., J. K. Das, A . Rizmi, M. F. Gahhey, N. Walker, S. Horton, P. Webb, A. La rtey, R. E.
Black, the Lancet Nutrition Interventions Review Group, and the Maternal and Children Nutrition
Study Group. 2013. Evidence-Based Interventions or Improvement o Maternal and Child Nutri-
tion: What Can Be Done and at What Cost? The Lancet (June): 452–477.
Black, R. E., C. G. Victora, S. P. Walker, Z. A. Bhutta, P. Christian, M. de Onis, M. Ezzati, S.
Grantham-McGregor, J. Katz, R. Martorell, R. Uauy, and the Maternal and Child Nutrition Study
Group. 2013. Maternal and Child Undernutrition and Overweight in Low-Income and Middle-
Income Countries. The Lancet (June): 15–29.
Bliss, J. R. 2012. The Impact o Cash Transers on Nutrition and Dietary Practices o Children
6–24 Months o Age in the District o Tahoua, Niger. Concern Worldwide and Cornell University,
Division o Nutritional Sciences, Dublin and Ithaca, NY, US. Unpublished.
Bloem, M. W., R. Moench-Panner, and D. Panagides, ed. 2003. Health and Nutritional Surveil-
lance or Development. Singapore: Helen Keller Worldwide.
Boyd, E., H. Osbahr, P. Ericksen, E. Tompkins, M. C. Lemos, and F. Miller. 2008. Resilience and
‘Climatizing’ Development: Examples and Policy Implications. Development 51 (3): 390–396.
Bündnis Entwicklung Hilt (Alliance Development Works). 2012. World Risk Report 2012. Berlin.
www.worldriskreport.com/uploads/media/WRR_2012_en_online.pd.
CCadre de Liaison Inter-ONG Haiti. 2013. Prévenir une Crise Alimentaire Imminente en Haïti: Les
Organisations Signataires Encouragent le Gouvernement et ses Partenaires à Prendre des Actions
Immédiates et Durables. http://bit.ly/15PIlhC.
Cayemittes, M., M. F. Placide, S. Mariko, B. Barrère, B. Sévère, and C. A lexandre. 2007. Enquête
Mortalité, Morbidité et Utilisation des Services, Haïti, 2005–2006.Calverton, MD, US: Ministère
de la Santé Publique et de la Population, Institut Haïtien de l’Enance, et Macro International Inc.
Cayemittes, M., M. Fatuma Busangu, J. de Dieu Bizimana, B. Barrè re, B. Sévère, V. Cayemittes,
and E. Charles. 2013. Enquête Mortalité, Morbidité et Utilisation des Services, Haïti, 2012.Cal-
verton, MD, US: Ministère de la Santé Publique et de la Population, Institut Haïtien de l’Enance,
and ICF International.
CIA (Central Intelligence Agency). 2013. The World Factbook. Washington, DC.
www.cia.gov/library/publications/the-world-actbook/.
Constas, M., and C. Barrett . 2013.Principles of Resilience Measurement for Food Insecurity: Met-
rics, Mechanisms, and Implementation Plans. Paper presented at the Expert Consultation on Resil-
ience Measurement Related to Food Security sponsored by the Food and Agriculture Organization
and World Food Programme, Rome, February 20.
DDavidson, D. J. 2010. The Applicability o the Concept o Resilience to Social Systems: Some
Sources o Optimism and Nagging Doubts. Society and Natural Resources 23 (12): 1135–1149.
Democracy Now. 2011. Dr. Paul Farmer on Bill Clinton’s Apology or Devastating Haitian Rice
Farming: A Great Relief. Accessed July 31, 2013. www.democracynow.org/2011/7/14/
dr_paul_armer_on_bill_clintons.
Demombynes, G., and S. F. Trommlerová. 2012. What Has Driven the Decline o Inant Mortality
in Kenya? World Bank Policy Research Working Paper 6057. Washington, DC: World Bank.
Duit, A., V. Galaz, and K. Eckerbe rg. 2010. Governance, Complexity, and Resilience. Global Envi-
ronmental Change 20 (3): 363–368.
EEconomist. 2012. Bangladesh and Development: The Path through t he Fields.November 3.
EM-DAT (Emergency Events Database). 2013. EM-DAT: The International Disaster Database.
Accessed July 5. www.em-dat.net.
Erasmus, W., L. Mpoke, and Y. Yishak. March 2012. Mitigating the Impact o Drought in Moyale
District, Northern Kenya. Humanitarian Exchange Magazine. Accessed July 18, 2013. http://www.
odihpn.org/humanitarian-exchange-magazine/issue-53/mitigating-the-impact-o-drought-in
-moyale-district-northern-kenya.
FFAO (Food and Agriculture Organization o the United Nations). 2011. The State of Food Insecuri-
ty in the World 2011. Rome.
7/27/2019 PDF GHI 2013
http://slidepdf.com/reader/full/pdf-ghi-2013 60/66
58 Bibliography | 2013 Global Hunger Index
———. 2012. The State o Food Insecurity in the World 2012.Rome.
———. 2013a. Food Security Indicators. http://www.ao.org/economic/ess/ess-s/s-data/en/.
———. 2013b. Situation Update: The Sahel Crisis. July 1. Rome. http://www.ao.org/leadmin/
user_upload/emergencies/docs/SITUATION%20UPDATE%20Sahel%201%2007%202013.pd.
FAO, WFP (World Food Programme), and UNICEF. 2012. Building Resilience: Rethinking Aid Strat-
egy for Somalia: A FAO-WFP-UNICEF Joint Strategy on Building Resilience against Shocks for
Somalia. Rome and New York. Unpublished.
FEWS NET (Famine Early Warning Systems Network). 2013. Agro-Climatic Monitoring.www.ews
.net/Pages/imageryhome.aspx?l=en.
Folke, C. 2006. Resilience: The Emergence o a Perspective or Social-ecological Systems Anal-
yses. Global Environmental Change 16 (3): 253–267.
Frankenberger, T., and S. Nelson. 2013. Summary o the Expert Consultation on Resilience Mea-
surement or Food Security. Paper presented at the Expert Consultation on Resilience Measure-
ment Related to Food Security sponsored by the Food and Agriculture Organization and World Food
Programme, Rome, February 19–21.
GGilligan, D., J. Hoddinott, and A. Seyoum Taesse. 2009. The Impact o Ethiopia’s Productive Sae-
ty Net Programme and Its Linkages. Journal o Development Studies 45 (10): 1684–1706.
Glaeser, L. M., P. Horjus, and S. Strother. 2011. Haiti Prospective Food Security Assessment. Wash-
ington, DC: FANTA-2 Bridge (Food and Nutrition Technical Assistance)/FHI 360. http://www.
antaproject.org/downloads/pds/Haiti_Prospective_FoodSecurity_Assessment_Nov2011.pd.
Glantz, M. D., and J. L. Johnson, ed. 1999. Resilience and Development. New York: Kluwer Academic.
HHaiti. 2010. Haiti Earthquake PDNA (Post-Disaster Needs Assessment): Assessment o Damage,
Losses, General and Sectoral Needs: Annex to the Action Plan or National Recovery and Devel-
opment o Haiti. http://bit.ly/18XMPky.
Haiti Grassroots Watch. 2010. The Pitalls o Cash or Work.Originally published in Haiti Liberté.
November 3–9. http://canadahaitiaction.ca/content/pitalls-cash-work.
Harris, J., and S. Drimie. 2012. Toward an Integrated Approach or Addressing Malnutrition in
Zambia: A Literature Review and Institutional Analysis. IFPRI Discussion Paper 1200. Washing-
ton, DC: International Food Policy Research Institute.
Headey, D., and O. Ecker. 2013. Rethinking the Measurement o Food Security: From First Prin-
ciples to Best Practice. Food Security 5 (3): 327–343.
Headey, D., A. Seyoum Taesse, and L. You. 2012. Enhancing Resilience in the Horn o Arica:
An Exploration into Alternative Investment Options. IFPRI Discussion Paper 1176. Washington,
DC : International Food Policy Research Institute.
Headey, D., A. Seyoum Taesse, and L. You. Forthcoming. Diversifcation and Development in
Pastoralist Ethiopia. World Development.
Holling, C. S. 1973. Resilience and Stability o Ecological Systems.Annual Review o Ecology and
Systematics 4: 2–23.
Hornborg, A. 2009. Zero-Sum World: Challenges in Conceptualizing Environmental Load Displace-
ment and Ecologically Unequal Exchange in the World-System. International Journal o Compar-
ative Sociology 50 (3–4): 237–262. Accessed August 11, 2012. www.lucid.lu.se/ Hornborg
__2009__zero_sum_world.pd.
Huong, L. T., and V. T. T. Nga. 2013. Nutritional Practices among Ethnic Minorities and Child Mal-
nutrition in Mountainous Areas o Central Vietnam.Food and Nutrition Sciences 4 (1): 82–89.
IIFPRI (International Food Policy Research Institute)/Welthungerhile/Concern. 2007. The Chal-
lenge o Hunger 2007: Global Hunger Index: Facts, Determinants, and Trends.Washington, DC,
Bonn, and Dublin.
IGME (Inter-agency Group or Child Mortality Estimation). 2012. CME Ino Database. New York.
www.childmortality.org/index.
JJoseph, M. V. 2013. Allocution du Secretaire d’Etat a la Relance Agricole, M. Vernet Joseph, Che
de la Delegation Haitienne à la 38e Session de la Conerence de la FAO. Accessed July 31, 2013.
www.ao.org/leadmin/user_upload/bodies/Conerence_2013/Statements/Haiti.pd.
KKennard, M. 2012. Haiti and the Shock Doctrine. Open Democracy, August 14.
www.opendemocracy.net/matt-kennard/haiti-and-shock-doctrine.
Klein, R. J. T., R. J. Nicholls, and F. Thomalla. 2003. Resilience to Natural Hazards: How Useul
Is This Concept? Environmental Hazards 5 (1–2): 35–45.
Kundermann, B. , R. Excéus, and O. Almqvist. 2012. Etude des Eets et Impacts du Programme
Nord-Ouest 2000—2011 de la Welthungerhile en Haïti (Impact Study o the Welthungerhile Pro-
gram in North-Western Haiti rom 2000 to 2011). Unpublished, Welthungerhile, Bonn.
LLancet. 2013. Maternal and Child Nutrition. www.thelancet.com/series/maternal-and-child-
nutrition.
Leach, M. 2008. Re-raming Resilience: A Symposium Report. STEPS Working Paper 13. Brigh-
ton, UK: Institute o Development Studies.
Lybbert, T. J., C. B. Barrett, S. Desta, and D. L. Coppock. 2004. Stochastic Wealth Dynamics and
Risk Management among a Poor Population. Economic Journal 114 (498): 750–777.
MMaplecrot Global Risk Analytics. 2011. World’s Fastest Growing Populations Increasingly Vulner-
able to the Impacts o Climate Change – 4th Global Atlas Reports.October 26. http://maplecrot
.com /about/news/ccvi_2012.html.
Maxwell, D., and R. Caldwell. 2008. The Coping Strategies Index: A Tool or Rapid Measurement
o Household Food Security and the Impact o Food Aid Programs in Humanitarian Emergencies.

7/27/2019 PDF GHI 2013
http://slidepdf.com/reader/full/pdf-ghi-2013 61/66
2013 Global Hunger Index | Bibliography 59
Field Methods Manual. 2d ed. Atlanta: CARE International. http://home.wp.org/stellent/groups
/public/documents/manual_guide_proced/w p211058.pd.
McKay, A. 2009. Assets and Chronic Poverty: Background Paper. Working Paper 100. Manches-
ter, UK: Chronic Poverty Research Centre, University o Manchester.
MEASURE DHS. 2013. Demographic and Health Surveys. Calverton, MD, USA.
www.measuredhs.com.
NNeumeyer, E., and T. Plümper. 2007. The Gendered Nature o Natural Disasters: The Impact o
Catastrophic Events on the Gender Gap in Lie Expectancy, 1981–2002. Annals o the Associa-
tion o American Geographers 97 (3): 551–566.
OOxam. 2013. No Accident: Resilience and the Inequality o Risk. Oxam Brieng Paper. Oxord,
UK. www.oxam.org/sites/www.oxam.org/les/bp172-no-accident-resilience-inequality-o-risk
-210513-en_1.pd.
RRadtke, K. 2010. Welthungerhile in Fragile States. Policy Paper 3. Bonn: Welthungerhile.
Ruel, M. T., H. Alderman, and the Maternal and Child Nutrition Study Group. 2013. Nutrition-Sen-
sitive Interventions and Programmes: How Can They Help to Accelerate Progress in Improving
Maternal and Child Nutrition? The Lancet (June): 536–551.
SSapountzaki, K. 2007. Social Resilience to Environmental Risks: A Mechanism of Vulnerability Trans-
er? Management o Environmental Quality: An International Journal 18 (3): 274–297.
Schwarz, A. M., C. Béné, G. Benne tt, D. Boso, Z. Hilly, C. Paul, R. Posala, S. Sibiti, and N. Andrew.
2011. Vulnerability and Resilience o Rural Remote Communities to Shocks and Global Changes:
Empirical Analysis rom the Solomon Islands. Global Environmental Change 21 (3): 1128–1140.
Shoham, J., F. Watson, and C. Dolan. 2001. The Use of Nutritional Indicators in Surveillance. Lon-
don: Overseas Development Institute.
SUN (Scaling Up Nutrition). 2013. SUN Countries: Policies and Plans. http://scalingupnutrition.org
/resources-archive/country-resources/sun-countries-policies-and-plans.
TTontisirin, K., and P. Winichagoon. 1999. Community-Based Programmes: Success Factors or
Public Nutrition Derived from the Experience of Thailand. Food and Nutrition Bulletin 20 (3): 315–
322.
Tulane University and UEH (State University o Haiti). 2012. Haiti Humanitarian Assistance Eval-
uation: From a Resilience Perspective. New Orleans: Disaster Resilience Leadership Academy,
Tulane University.
Twigg, J. 2007. Characteristics of a Disaster-Resilient Community: A Guidance Note to the
DFID Disaster Risk Reduction Interagency Coordination Group. http://practicalaction.org/
reducing-vulnerability/docs/ia1/community-characteristics-en-lowres.pd.
UUN (United Nations) 2011. Has Aid Changed? Channelling Assistance to Haiti beore and ater the
Earthquake. New York: United Nations Oce o the Special Envoy or Haiti. http://relieweb.int
/sites/relieweb.int/les /resources/has_aid_changed_en.pd.
———. 2013a. Analysis Shows 56.0 Percent Disbursement Rate or Haiti Recovery among Pub-
lic Sector Donors. Press release, January 8. New York: United Nations Oce o the Secretary-
General’s Special Adviser. www.lessonsromhaiti.org/press-and-media/press-releases/public
-sector-disbursement-as-o/.
———. 2013b. A New Global Partnership: Eradicate Poverty and Transorm Economies through
Sustainable Development: The Report o the High-Level Panel o Eminent Persons on the Post-
2015 Development Agenda. New York.
———. 2013c. World Population Prospects: The 2012 Revision. CD-ROM. New York: United
Nations, Department o Economic and Social Aairs, Population Division.
UNAIDS (Joint United Nations Programme on HIV/AIDS). 2010. Global Report: UNAIDS Report
on the Global AIDS Epidemic 2010. Geneva.
———. 2012. Global Report: UNAIDS Report on the Global AIDS Epidemic 2012. Geneva.
UNICEF (United Nations Children's Fund). 2009. Childinfo: Underweight: Nutritional Status Accord-
ing to the NCHS/WHO/CDC Reference. Accessed May 4, 2011. www.childino.org/undernutrition
_underweight.php.
———. 2013a. Childinfo: Nutritional Status. Accessed June 13, 2013. www.childino.org
/ malnutrition_nutritional_status.php.
———. 2013b. Childino: Multiple Indicator Cluster Surveys (MICS).Accessed June 21, 2013.
www.childino.org/mics_available.html.
UNICEF/WHO (World Health Organization)/World Bank. 2012. Levels and Trends in Child Malnu-
trition: UNICEF-WHO-The World Bank Joint Child Malnutrition Estimates.New York, Geneva, and
Washington, DC.
USAID (US Agency or International Development). 2012. Building Resilience to Recurrent Crisis:
USAID Policy and Program Guidance. Washington, DC.
VVaitla, B., G. Tesay, M. Rounseville, and D. Maxwell. 2012. Resilience and Livelihoods Change in
Tigray, Ethiopia. Somerville, MA: Tuts Universit y, Feinstein International Center.
VFL (Views rom the Front Line). 2011. I We Do Not Join Hands. Middlesex, UK: Global Network
or Civil Society Organizations or Disaster Reduction.
von Braun, J., M. Ruel, and A. Gulati. 2008. Accelerating Progress toward Reducing Malnutrition
in India: A Concept or Action. Washington, DC: International Food Policy Research Institute.
von Grebmer, K., H. Fritschel, B. Nestorova, T. Olonbiyi, R. Pandya-Lorch, and Y. Yohannes.
2008. Global Hunger Index: The Challenge o Hunger 2008. Bonn, Washington, DC, and Dublin:
Deutsche Welthungerhile, International Food Policy Research Institute, and Concern Worldwide.
von Grebmer, K., B. Nestorova, A. Quisumbing, R. Fertziger, H. Fritschel, R. Pandya-Lorch, and
Y. Yohannes. 2009. 2009 Global Hunger Index: The Challenge o Hunger: Focus on Financial Cri-
sis and Gender Inequality. Bonn, Washington, DC, and Dublin: Deutsche Welthungerhile, Inter-
national Food Policy Research Institute, and Concern Worldwide.
7/27/2019 PDF GHI 2013
http://slidepdf.com/reader/full/pdf-ghi-2013 62/66
60 Bibliography | 2013 Global Hunger Index
von Grebmer, K., M. T. Ruel, P. Menon, B. Nestorova, T. Olonbiyi, H. Fritschel, Y. Yohannes, C.
von Oppeln, O. Towey, K. Golden, and J. Thompson. 2010. 2010 Global Hunger Index: The Chal-
lenge o Hunger: Focus on the Crisis o Child Undernutrition.Bonn, Washington, DC, and Dublin:
Deutsche Welthungerhile, International Food Policy Research Institute, and Concern Worldwide.
von Grebmer, K., M. Torero, T. Olonbiyi, H. Fritschel, D. Wiesmann, Y. Yohannes, L. Schoeld,
and C. von Oppeln. 2011. 2011 Global Hunger Index: The Challenge of Hunger: Taming Price
Spikes and Excessive Food Price Volatility. Bonn, Washington, DC, and Dublin: Deutsche Welthun-
gerhile, International Food Policy Research Institute, and Concern Worldwide.
von Grebmer, K., C. Ringler, M. W. Rosegrant, T. Olonbiyi, D. Wiesmann, H. Fritschel, O. Badi-
ane, M. Torero, Y. Yohannes, J. Thompson, C. von Oppeln, and J. Rahall. 2012. 2012 Global Hun-
ger Index: The Challenge o Hunger: Ensuring Sustainable Food Security under Land, Water, and
Energy Stresses. Bonn, Washington, DC, and Dublin: Welthungerhile, International Food Policy
Research Institute, and Concern Worldwide.
WWalker, B., C. S. Holling, S. R. Carpenter, and A. Kinzig. 2004. Resilience, Adaptability and Trans-
ormability in Social-ecological Systems. Ecology and Society 9 (2): 5.
WFP (World Food Programme). 2013. Food Aid Quantity Reporting Database. Accessed
July 5, 2013. www.wp.org/ais/quantity-reporting.
WHO (World Health Organization). 2013. Global Database on Child Growth and Malnutrition.
www.who.int/nutgrowthdb/en/.
Wiesmann, D. 2004. An International Nutrition Index: Concept and Analyses o Food Insecurity
and Undernutrition at Country Levels. Development Economics and Policy Series 39. Frankurt:
Peter Lang.
———. 2006a. 2006 Global Hunger Index: A Basis or Cross-Country Comparisons. Washington,
DC: International Food Policy Research Institute.
———. 2006b. A Global Hunger Index: Measurement Concept, Ranking o Countries, and Trends.
Food Consumption and Nutrition Division Discussion Paper 212. Washington, DC: International
Food Policy Research Institute.
Wiesmann, D., J. von Braun, and T. Feldbrügge. 2000. An International Nutrition Index: Success-
es and Failures in Addressing Hunger and Malnutrition. ZEF Discussion Papers on Development
Policy No. 26. Bonn, Germany: Zentrum ür Entwicklungsorschung (ZEF) [Center or Development
Research].
Wiesmann, D., L. Weingärtner, and I. Schöninger. 2006. The Challenge o Hunger: Global Hunger
Index: Facts, Determinants, and Trends. Bonn and Washington, DC: Deutsche Welthungerhile and
International Food Policy Research Institute.
World Bank. 2006. Repositioning Nutrition as Central to Development: A Strategy or Large-Scale
Action. Washington, DC.
———. 2013a. Cereal Yield (kg per hectare). http://data.worldbank.org/indicator/AG.YLD.CREL.KG.
———. 2013b. World Development Indicators Online. http://data.worldbank.org/products/wdi.
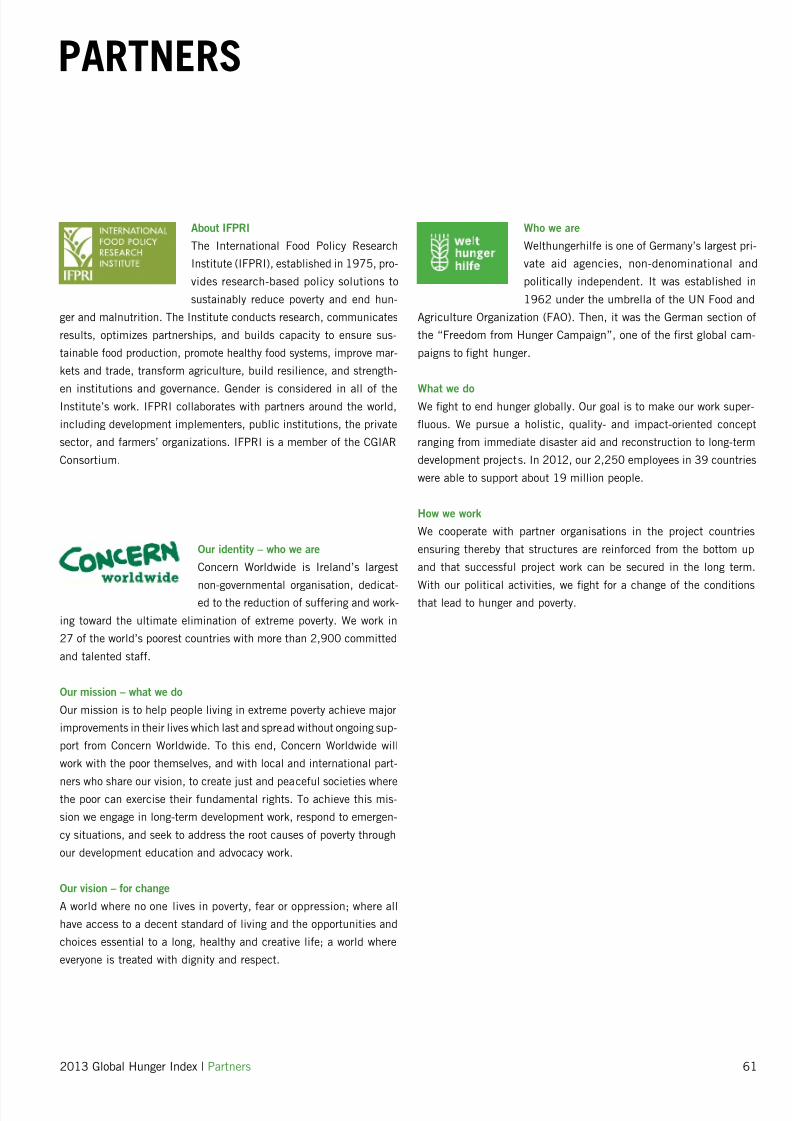
7/27/2019 PDF GHI 2013
http://slidepdf.com/reader/full/pdf-ghi-2013 63/66
2013 Global Hunger Index | Partners 61
PARTNERS
About IFPRI
The International Food Policy Research
Institute (IFPRI), established in 1975, pro-
vides research-based policy solutions to
sustainably reduce poverty and end hun-
ger and malnutrition. The Institute conducts research, communicates
results, optimizes partnerships, and builds capacity to ensure sus-
tainable ood production, promote healthy ood systems, improve mar-
kets and trade, transorm agriculture, build resilience, and strength-
en institutions and governance. Gender is considered in all o theInstitute’s work. IFPRI collaborates with partners around the world,
including development implementers, public institutions, the private
sector, and armers’ organizations. IFPRI is a member o the CGIAR
Consortium.
Our identity – who we are
Concern Worldwide is Ireland’s largest
non-governmental organisation, dedicat-ed to the reduction o suering and work-
ing toward the ultimate elimination o extreme poverty. We work in
27 o the world’s poorest countries with more than 2,900 committed
and talented sta.
Our mission – what we do
Our mission is to help people living in extreme poverty achieve major
improvements in their lives which last and spread without ongoing sup-
port rom Concern Worldwide. To this end, Concern Worldwide will
work with the poor themselves, and with local and international part-
ners who share our vision, to create just and peaceul societies wherethe poor can exercise their undamental rights. To achieve this mis-
sion we engage in long-term development work, respond to emergen-
cy situations, and seek to address the root causes o poverty through
our development education and advocacy work.
Our vision – or change
A world where no one lives in poverty, ear or oppression; where all
have access to a decent standard o living and the opportunities and
choices essential to a long, healthy and creative lie; a world where
everyone is treated with dignity and respect.
Who we are
Welthungerhile is one o Germany’s largest pri-
vate aid agencies, non-denominational and
politically independent. It was established in
1962 under the umbrella o the UN Food and
Agriculture Organization (FAO). Then, it was the German section o
the “Freedom rom Hunger Campaign”, one o the rst global cam-
paigns to ght hunger.
What we doWe ght to end hunger globally. Our goal is to make our work super-
fuous. We pursue a holistic, quality- and impact-oriented concept
ranging rom immediate disaster aid and reconstruction to long-term
development projects. In 2012, our 2,250 employees in 39 countries
were able to support about 19 million people.
How we work
We cooperate with partner organisations in the project countries
ensuring thereby that structures are reinorced rom the bottom up
and that successul project work can be secured in the long term.
With our political activities, we ght or a change o the conditionsthat lead to hunger and poverty.
7/27/2019 PDF GHI 2013
http://slidepdf.com/reader/full/pdf-ghi-2013 64/66
8 YEARS OF TRACKING WORLD HUNGER
Scan this QR code to go to the
2013 GHI website
http://www.ipri.org/publication/
2013-global-hunger-index
Since 2006, the Global Hunger Index has been reporting on the state of
hunger globally, by region, and by country.
The vicious circle o
hunger and poverty
Measures being taken to
reduce acute
undernourishment and
chronic hunger
Case studies in the post-
conict countries o
Aghanistan and Sierra
Leone
Financial crisis and
gender inequality
The crisis o
child undernutrition
Taming price spikes and
excessive ood price
volatility
Ensuring sustainable
ood security under land,
water, and energy
stresses
–––
–––––––––––––––––––––––––––––––––––––––––
GLOBAL HUNGER INDEXTHECHALLENGEOF HUNGER:BUILDING RESILIENCE
TO ACHIEVEFOOD AND NUTRITION SECURITY 1
L
L H U
E
I
E
2013
u tsch lthun rh ilf . V .
F r i r i c h -E r t - t r.
7 n n , r m n
l . - -
F x - -
. l t hu n r h i l f .
C n c r n rl i
- L r m n tr t
u l i n , I r l n
l . - 7 - 77
F x - 7 - 7
. c n c r n .n t
I n t r n t i n l l i c
s r ch In s titu t
t r t ,
h in t n , - , U
l . - -
F x - 7 -
. i f r i . r
c n t hi c t
t t h H I i t
h tt : / / . i f ri . r /
u l ic t in / - l l -
h un r -i n x
F i h t i n i nt r -
n t i n l u c t i n c m i n
r un l l i nc n
u rt th Eur n
m m i i n .
Building resilience to
achieve ood and
nutrition security
The report and related materials are available through a ree IFPRI mobile app.
You can also download the report on Google Play, Google Books, Amazon, and iTunes.
Global Hunger Index or Mobile Devices
7/27/2019 PDF GHI 2013
http://slidepdf.com/reader/full/pdf-ghi-2013 65/66
Deutsche Welthungerhilfe e. V.
Friedrich-Ebert-Str. 1
53173 Bonn, Germany
Tel. +49 228-2288-0
Fax +49 228-2288-333
www.welthungerhilfe.de
Secretary General and Chairperson:
Dr. Wolfgang Jamann
International Food Policy Research Institute (IFPRI)
2033 K Street, NW
Washington, DC 20006-1002, USA
Tel. +1 202-862-5600
Fax +1 202-467-4439www.ifpri.org
Director General:
Dr. Shenggen Fan
Concern Worldwide
52-55 Lower Camden Street
Dublin 2, Ireland
Tel. +353 1-417-7700
Fax +353 1-475-7362
www.concern.net
Chief Executive:
Dominic MacSorley
Editors:Constanze von Oppeln (Food Security Policy, Welthungerhilfe),
Marius Labahn (Public Affairs and External Relations, Welthungerhilfe),
Olive Towey (Head of Advocacy – Ireland & EU, Concern Worldwide),
Klaus von Grebmer (Research Fellow Emeritus, IFPRI)
Recommended citation:
von Grebmer, K., D. Headey, C. Béné, L. Haddad, T. Olofinbiyi, D. Wiesmann, H.
Fritschel, S. Yin, Y. Yohannes, C. Foley, C. von Oppeln, and B. Iseli. 2013. 2013 Glo-
bal Hunger Index: The Challenge of Hunger: Building Resilience to Achieve Food and
Nutrition Security. Bonn, Washington, DC, and Dublin: Welthungerhilfe, International
Food Policy Research Institute, and Concern Worldwide.
Design, Arrangement, and Production:
Tobias Heinrich, Anna-Maria Süß, Anne Dittrich
(muehlhausmoers corporate communications gmbh, Cologne,Germany)
Printing:
DFS Druck, Cologne, Germany, [email protected]
IMPRINT
Authors:
International Food Policy Research Institute: Klaus von Grebmer (Research Fellow
Emeritus), Derek Headey (Research Fellow), Tolulope Olofinbiyi (Research Ana-
lyst), Doris Wiesmann (Independent Consultant), Heidi Fritschel (Editor), Sandra
Yin (Editor), Yisehac Yohannes (Research Analyst)
Institute of Development Studies: Christophe Béné (Research Fellow), Lawrence
Haddad (Director)
Concern Worldwide: Connell Foley (Director of Strategy, Advocacy & Learning)
Welthungerhilfe: Constanze von Oppeln (Food Security Policy), Bettina Iseli (Desk
Officer Haiti)
Ordering number:
460-9415
ISBN:978-0-89629-951-1
DOI:
http://dx.doi.org/10.2499/9780896299511
Picture credits:
Cover photography: Abbie Trayler-Smith/Panos, Chad, Guerra Region, a woman searches
for food in the dry and barren landscape near the village of Luga. With food scarce, wo-
men have begun to break apart anthills to look for grain stored by ants, 2012; page 2:
Bernhard Huber/Welthungerhilfe, Mozambique, Mabote District, a girl waters a plant as
part of a school project that supports hygiene, water, and plant cultivation in Bovanane
Village, 2013; page 6: Thomas Lohnes/Welthungerhilfe, Ecuador, in San Andres district,
women of the potato platform cook a meal made of cream cheese, broad beans, corn, po-
tatoes, and roasted corn kernels before a meeting of the organization in Huapante Chico.
About 150 farmers from the region are part of the platform, a collaborative that helps far-
mers improve the quality of their potatoes, enhance their negotiating power, and sell di-
rectly to bigger markets, instead of through middlemen. The women’s experience shows
that it is possible to permanently raise a community’s living conditions by strengthening
livelihoods, 2006. San Andres, in the central highlands of Ecuador, is one of Welthunger-
hilfe’s 15 Millennium villages; page 10: Thomas Lohnes/Welthungerhilfe, Sierra Leone,
Bo District, a boy takes rice from a newly built storehouse, which protects grain from
pests that destroyed half of the rice before in Vengema, 2009; page 18: Matiullah Achak-
zai/EPA, Pakistan, Punjab Province, after water began to recede, workers repair a road
damaged by the floods in Mehmood Kot, 2010; page 32: Daniel Rosenthal, Haiti, North-
West, a farmer and member of the committee clears an irrigation canal of sediment in
Vieille Place. The irrigation canal system helps farmers produce an adequate harvest de-
spite little rain and grow crops like tomatoes and eggplant, 2013; page 48: Florian Kopp/
Welthungerhilfe, Pakistan, Punjab Province, Hajran Mai in Moza Sabogat village harvests
okra grown from seeds Welthungerhilfe distributed after a flood with support from its
partner CADI, 2011. Portraits: The portraits were taken by staff from Welthungerhilfe.
Disclaimer:
The boundaries and names shown and the designations used on the maps herein do
not imply official endorsement or acceptance by the International Food Policy
Research Institute (IFPRI), Welthungerhilfe, or Concern Worldwide.

7/27/2019 PDF GHI 2013
http://slidepdf.com/reader/full/pdf-ghi-2013 66/66
Deutsche Welthungerhilfe e. V.
Friedrich-Ebert-Str. 1
53173 Bonn, Germany
Tel. +49 228-22 88-0
Fax +49 228-22 88-333
www.welthungerhilfe.de
Concern Worldwide
52-55 Lower Camden Street
Dublin 2, Ireland
Tel. +353 1-417-7700
Fax +353 1-475-7362
www.concern.net
International Food Policy
Research Institute
2033 K Street, NW
Washington, DC 20006-1002, USA
Tel. +1 202-862-5600
Fax +1 202-467-4439
www.ifpri.org
Scan this QR code to go
to the 2013 GHI website
http://www.ifpri.org/
publication/2013-global-
hunger-index
Food Right Now is an inter-
national education campaign
run by Alliance2015 and
supported by the European
Commission.