
Lychee Flavour
58
UNIVERSITEIT GENT FACULTEIT FARMACEUTISCHE WETENSCHAPPEN Erasmus onderzoeksstage Geneesmiddelenleer Faculty of Pharmacy, University of Camerino Laboratory of Food Chemistry Academiejaar 2008-2009 GC Volatile Components Analysis of Different Parts of Litchi chinesis. Ysaure Custers Eerste Master in de Farmaceutische Zorg Ugent Promotor Prof. dr. apr. S. Van Calenbergh Camerino Promotor Prof. S. Vittori Commissarissen Prof. dr. apr.B. De Spiegeleer Prof. dr.apr. S. De Saeger
-
Upload
shishir-kumar-singh -
Category
Documents
-
view
9 -
download
0
description
ychee flavour.pdf
Transcript of Lychee Flavour
UNIVERSITEIT GENT FACULTEIT FARMACEUTISCHE WETENSCHAPPEN
Erasmus onderzoeksstage
Geneesmiddelenleer
Faculty of Pharmacy, University of Camerino Laboratory of Food Chemistry
Academiejaar 2008-2009
GC Volatile Components Analysis of Different
Parts of Litchi chinesis.
Ysaure Custers Eerste Master in de Farmaceutische Zorg
Ugent Promotor Prof. dr. apr. S. Van Calenbergh
Camerino Promotor
Prof. S. Vittori
Commissarissen Prof. dr. apr.B. De Spiegeleer
Prof. dr.apr. S. De Saeger

UNIVERSITEIT GENT FACULTEIT FARMACEUTISCHE WETENSCHAPPEN
Erasmus onderzoeksstage
Geneesmiddelenleer
Faculty of Pharmacy, University of Camerino Laboratory of Food Chemistry
Academiejaar 2008-2009
GC Volatile Components Analysis of Different Parts of Litchi chinesis.
Ysaure Custers Eerste Master in de Farmaceutische Zorg
Ugent Promotor
Prof. dr. apr. S. Van Calenbergh
Camerino Promotor Prof. S. Vittori
Commissarissen Prof. dr. apr.B. De Spiegeleer
Prof. dr.apr. S. De Saeger
AUTEURSRECHT “De auteur en de promotor geven de toelating deze masterproef voor consultatie beschikbaar te stellen en delen ervan te kopiëren voor persoonlijk gebruik. Elk ander gebruik valt onder de beperkingen van het auteursrecht, in het bijzonder met betrekking tot de verplichting uitdrukkelijk de bron te vermelden bij het aanhalen van de resultaten uit deze masterproef.” 25 mei 2009 Promotor Auteur Prof. dr.apr. Serge Van Calenbergh Ysaure Custers

Acknowledgements
The material in this paper could not have been developed without my internship in the
laboratory of the department of Food Chemistry in Camerino, Italy. It has been immensely
enjoyable to have been learning about other cultures at the same time as I was completing
my master test at the university of Camerino.
Thanks to Fabrizio Papa for giving me professional direction during my research and for
providing me with the opportunity to learn new scientific techniques. Thanks to Prof. Sauro
Vittori for being my tutor and for reviewing the editing of my results. Thanks to Yangting Zuo
for giving me moral support and company during my long days in the laboratory. Thanks
also to all of them for all the Chinese food and delicious Italian desserts which they shared
with me to keep me going.
I would also like to thank Prof. Serge Van Calenbergh for reviewing the final result of my
research abroad.
A last thank you goes out to all the friends I made during my Erasmus term in Camerino who
helped me keep the balance between pleasure and work.
TABLE OF CONTENTS
1. INTRODUCTION......................................................................................................... 1
2. OBJECTIVES ............................................................................................................... 6
3.1 FRUIT MATERIAL ................................................................................................. 7
3.3 HYDRODISTILLATION......................................................................................... 8
3.4 SPME FIBER SCREENING .................................................................................. 10
3.5 HS-SPME................................................................................................................ 10
3.6 HEADSPACE GAS-CHROMATOGRAPHY ....................................................... 13
3.7 GC-FID CONDITIONS.......................................................................................... 14
3.8 GC-MS CONDITIONS .......................................................................................... 15
3.9 IDENTIFICATION AND QUANTIFICATION OF VOLATILE COMPOUNDS.
....................................................................................................................................... 16
4. RESULTS AND DISCUSSION ................................................................................. 21
4.1 HEADSPACE-GAS CHROMATOGRAPHY ....................................................... 21
4.2 HS-SPME ANALYSIS........................................................................................... 22
4.3 ESSENTIAL OIL ANALYSIS............................................................................... 33
4.3 ESSENTIAL OIL ANALYSIS OF COMMERCIAL SAMPLE............................ 45
5.CONCLUSIONS .......................................................................................................... 48
References ........................................................................................................................ 49
1
1. INTRODUCTION
The lychee (Litchi Chinesis) is the sole member of the genus Litchi in the soapberry
family Sapindaceae. It is native from China, but it is also grown in few other tropical
areas such as India, Madagascar, Nepal, Bangladesh, Pakistan, southern Taiwan, northern
Vietnam, Indonesia, Thailand, the Philippines, and Southern Africa.
It is a tropical medium-sized evergreen fruit tree, 9 to 20 m tall and equally broad, with
alternate pinnate leaves. Each leaf is 15–25 cm long, with 2-8 lateral leaflets 5–10 cm
long and the terminal leaflet is absent. They are somewhat leathery, smooth and glossy.
The flowers are small, greenish-white or yellowish-white, produced in panicles up to 30
cm long.
http://www.lycheesonline.com/lycheedescription.cfm
http://www.hort.purdue.edu/newcrop/morton/lychee.html
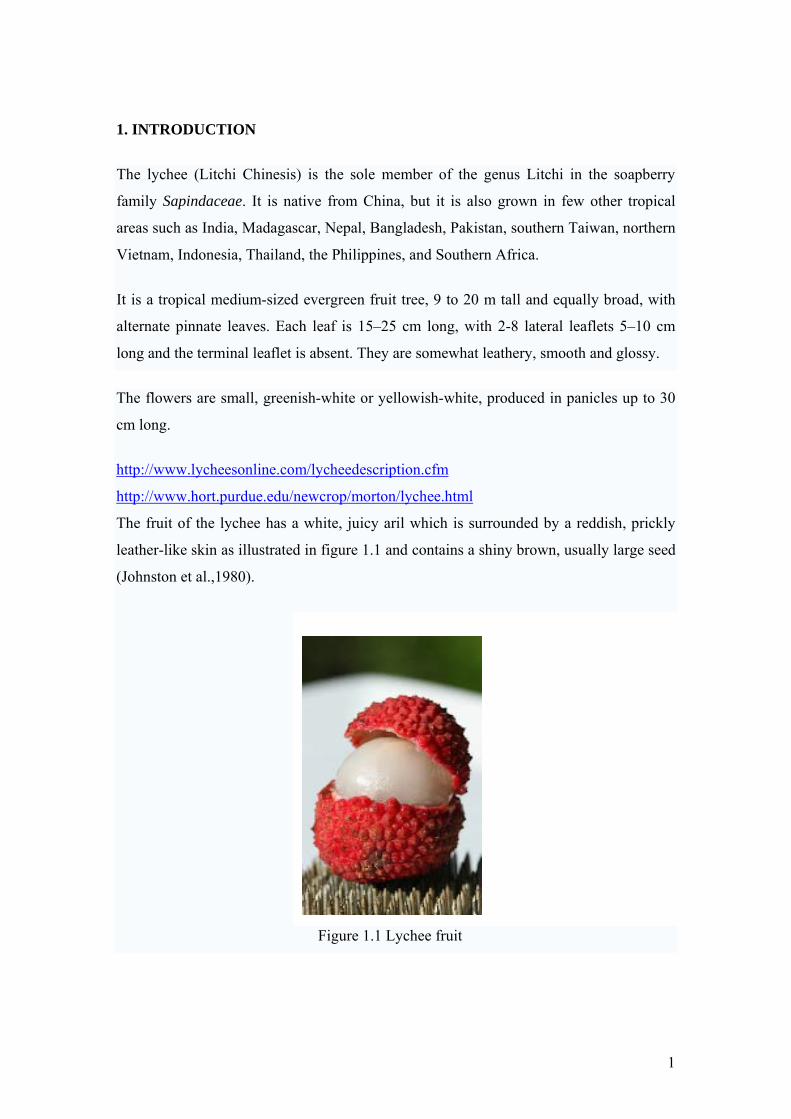
The fruit of the lychee has a white, juicy aril which is surrounded by a reddish, prickly
leather-like skin as illustrated in figure 1.1 and contains a shiny brown, usually large seed
(Johnston et al.,1980).
Figure 1.1 Lychee fruit
2
Because there is only a short production period and the fruit has a short shelf life, the
fresh fruit is only available during a few months. However, there are canned lychees
available all year but they have a different taste.
There have been studies about the antioxidant effects of compounds in the fruit and the
flowers of the lychee, the improvement of the storage and cultivation and possible
involvement of lychees in food allergies. However, the amount of studies that identifies
and quantifies the volatile compounds in the different parts of the lychee is limited.
To the best of our knowledge only four other studies have been reported in which the
volatile fraction in the lychee has been examined.
Johnston et al. in 1980; Ong, Acree in 1998; Chyau et al. in 2003 and Mahattanatawee et
al. in 2007. The study by Johnston et al. only identified the volatile compounds in the
fresh fruit and demonstrated that the citrus note of the lychee is due to the presence of
limonene, geranial and neral and that it owes its floral character to β-phenethyl alcohol .
The second study performed a Gas Chromatography/Olfactory analysis of the volatile
compounds in the fresh fruit and the juice of lychee. They confirmed the origin of the
citric and floral character and determined that the aroma of the lychee is due to the
interaction between compounds with floral, nutty, citrus and fruity aromas (Ong, Acree,
1998). Chyau et al. made a comparison between free and glycosidically bound aroma
compounds and obtained similar volatile profiles. An important difference between the
two fractions was that the free volatile fraction had a fresh-fruity, lychee-like aroma
whereas the glycosylated fraction was odorless. The forth study compared three major
lychee cultivars and found twenty-four common volatile compounds (Mahattanatawee et
al., 2007). However, it is important to clarify that the previous studies used different
extraction methods and solvents than those employed in the current study.
The purpose of this study is not only to examine the volatile compounds in the edible
parts (pulp and juice) of the lychee but, in particular, also the other parts that are
considered waste, like the peel and seed.
No significant medicinal effects are demonstrated yet for any part of the lychee. The fruit
and juice contain a high level of vitamin C, plus calcium, iron, and vitamin B.
http://www.groentenfruit.nl/index_product.asp?pg=2&cpg=15&p=102&r=9
3
Obviously, it would be interesting to identify some volatile compounds in the peel or the
seed that could be of any use.
Two different samples will be analyzed, namely fresh and dried sample, using headspace,
headspace-solid-phase microextraction and hydrodistillation for the identification of
essential oils, followed by gas chromatography-flame ionization detector (GC-FID) and
gas chromatography-mass spectrometry (GC-MS).
Essential oils, also know as ethereal or volatile oils, are very complex, usually good-
smelling, mixtures with low solubility in water and soluble in organic solvents.
They are predominated by fenylpropanoids and terpenoids, but also other classes of
compounds, like sulfur containing compounds, are frequently found.
Plants rich of essential oils (0.01-10% dry weight) are found in about 30% of plant
families, namely Apiaceae, Laminaceae, Lauraceae, Myrtacea and Rutaceae.
The essential oils can be located in many different parts of the plants, like in special oil
cells, elimination channels, glandular hairs or flowers.
Insulation is usually performed by steam distillation or hydrodistillation, extraction with
organic solvents or supercritical carbon dioxide. In this project we used hydrodistillation.
Plants that contain essential oils are of great economic importance, for example for
applications in the perfume industry, cosmetics, food industry and pharmaceutical
industry.
In alternative medicine aroma therapy, based on essential oils, is important, while in the
pharmaceutical industry the oils are used to improve the smell and taste of the medicine.
As mentioned above, essential oils are composed of a very complex mixture
of hundreds (sometimes thousands) different substances.
Many of the components of an essential oil are multiple derived from the hydrocarbon
isoprene, the structure of which is shown in figure 1.2.
CH2
CH2
CH3
FIGURE 1.2 structure of isoprene
4
The components of an essential oil can be roughly classified into the following different
types: terpens (monoterpens and sesquiterpens), oxygenated compounds, alcohols,
phenols, aldehydes, ketons, esters, coumarines, lactons, ethers and oxides.
Monoterpens contain ten carbon atoms (formed by two isoprene units) and at least one
double bound. Some terpens are thought to exhibit different medicinal properties, like
anti-inflammatory, antiseptic, antiviral, antibacterial and analgesic.
Sesquiterpens normally contain fifteen carbon atoms and are considered to have very
complex pharmacological activity. An example is shown in figure 1.3.
CH3
CH2
CH3 CH3 CH3
FIGURE 1.3 Farnesene
The monoterpene alcohols, for example alpha Terpineol (fig. 1.4), have antiseptic,
antiviral and antifungal properties and are claimed to have an energizing impact on the
user.
CH3
CH3CH3
OH
FIGURE 1.4 α-Terpineol Sesuiterpene alcohols are rarely found in essential oils but, like bisabolol (fig. 1.5), they
are antiallergen, anti-inflammatory, and can also act as liver and glandular stimulants.
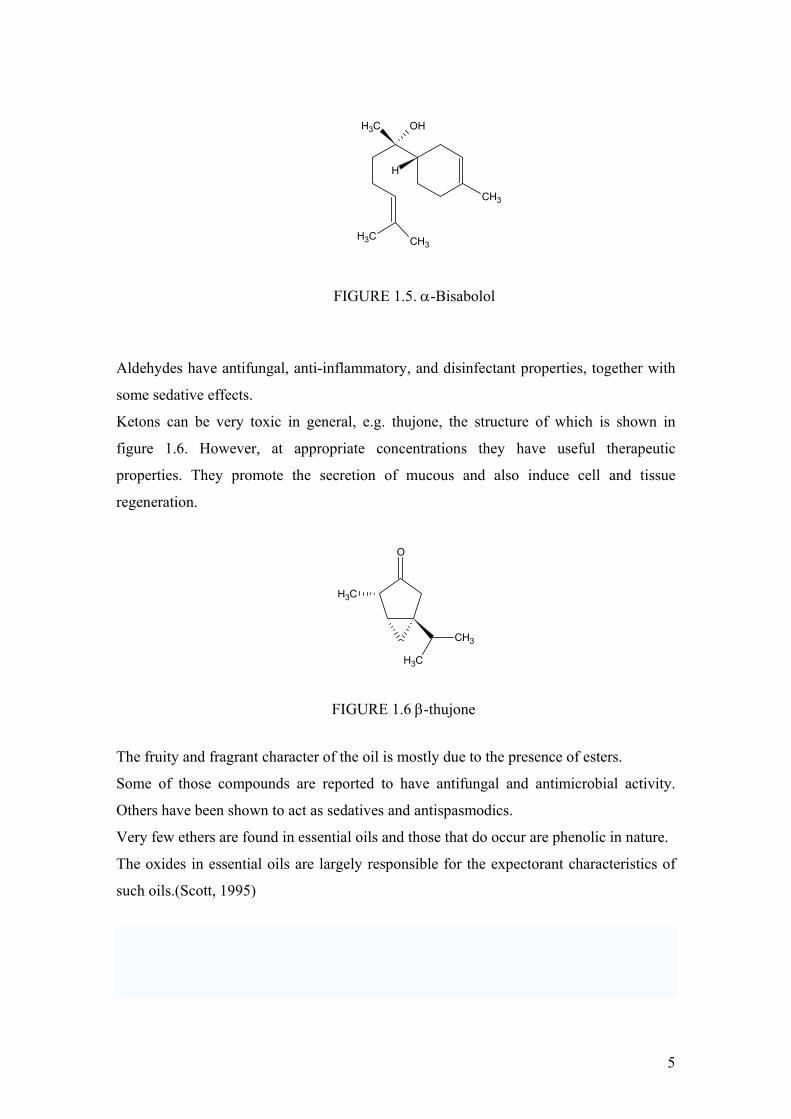
5
CH3
CH3 CH3
CH3 OH
H
FIGURE 1.5. α-Bisabolol
Aldehydes have antifungal, anti-inflammatory, and disinfectant properties, together with
some sedative effects.
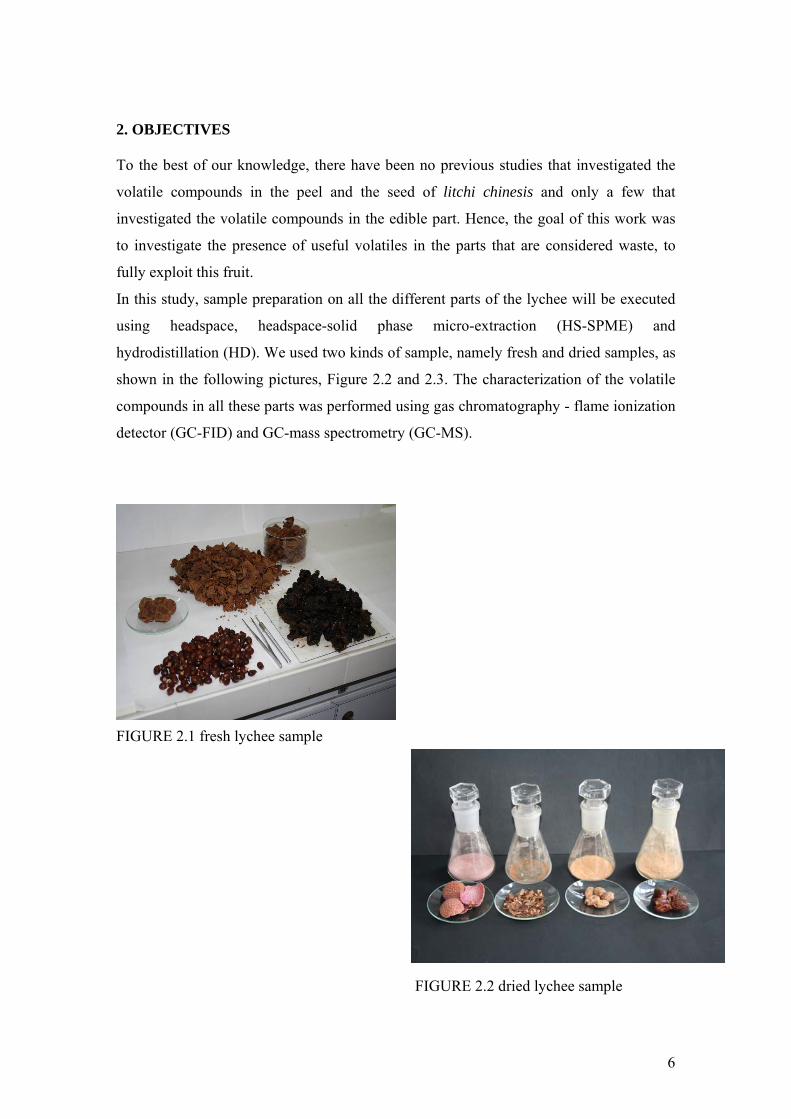
Ketons can be very toxic in general, e.g. thujone, the structure of which is shown in
figure 1.6. However, at appropriate concentrations they have useful therapeutic
properties. They promote the secretion of mucous and also induce cell and tissue
regeneration.
CH3
CH3
O
CH3
FIGURE 1.6 β-thujone The fruity and fragrant character of the oil is mostly due to the presence of esters.
Some of those compounds are reported to have antifungal and antimicrobial activity.
Others have been shown to act as sedatives and antispasmodics.
Very few ethers are found in essential oils and those that do occur are phenolic in nature.
The oxides in essential oils are largely responsible for the expectorant characteristics of
such oils.(Scott, 1995)
6
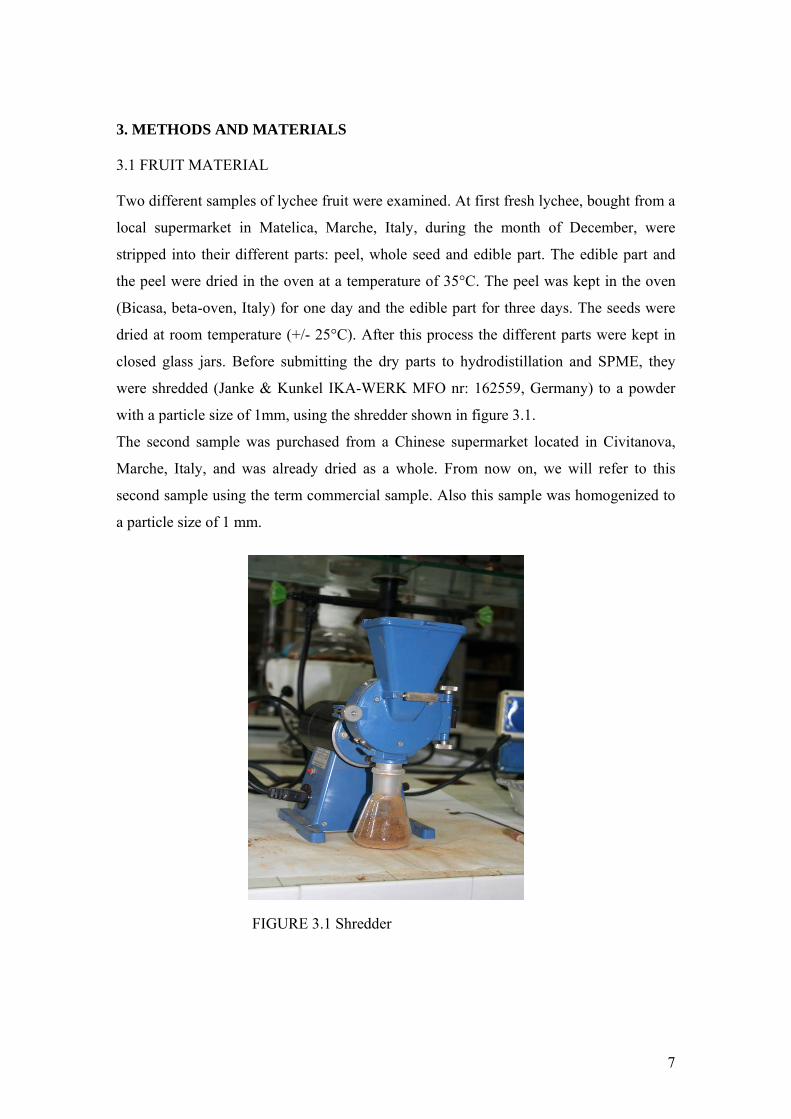
2. OBJECTIVES To the best of our knowledge, there have been no previous studies that investigated the
volatile compounds in the peel and the seed of litchi chinesis and only a few that
investigated the volatile compounds in the edible part. Hence, the goal of this work was
to investigate the presence of useful volatiles in the parts that are considered waste, to
fully exploit this fruit.
In this study, sample preparation on all the different parts of the lychee will be executed
using headspace, headspace-solid phase micro-extraction (HS-SPME) and
hydrodistillation (HD). We used two kinds of sample, namely fresh and dried samples, as
shown in the following pictures, Figure 2.2 and 2.3. The characterization of the volatile
compounds in all these parts was performed using gas chromatography - flame ionization
detector (GC-FID) and GC-mass spectrometry (GC-MS).
FIGURE 2.1 fresh lychee sample FIGURE 2.2 dried lychee sample
7
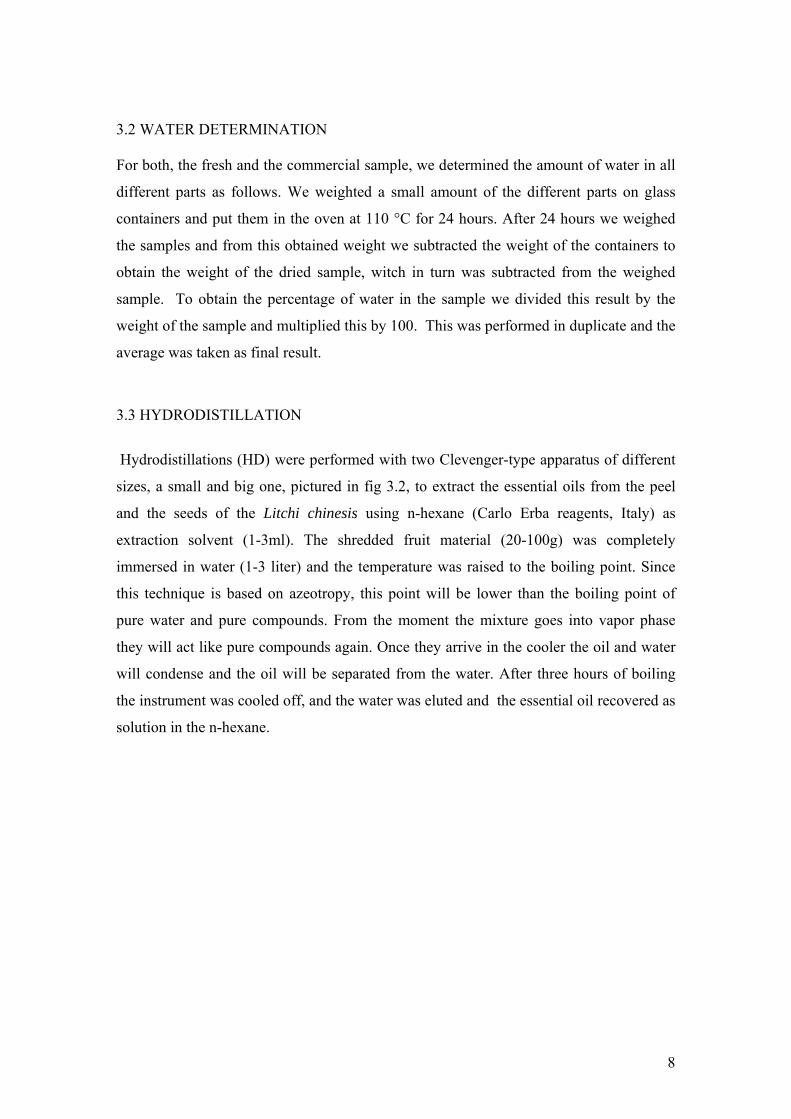
3. METHODS AND MATERIALS 3.1 FRUIT MATERIAL Two different samples of lychee fruit were examined. At first fresh lychee, bought from a
local supermarket in Matelica, Marche, Italy, during the month of December, were
stripped into their different parts: peel, whole seed and edible part. The edible part and
the peel were dried in the oven at a temperature of 35°C. The peel was kept in the oven
(Bicasa, beta-oven, Italy) for one day and the edible part for three days. The seeds were
dried at room temperature (+/- 25°C). After this process the different parts were kept in
closed glass jars. Before submitting the dry parts to hydrodistillation and SPME, they
were shredded (Janke & Kunkel IKA-WERK MFO nr: 162559, Germany) to a powder
with a particle size of 1mm, using the shredder shown in figure 3.1.
The second sample was purchased from a Chinese supermarket located in Civitanova,
Marche, Italy, and was already dried as a whole. From now on, we will refer to this
second sample using the term commercial sample. Also this sample was homogenized to
a particle size of 1 mm.
FIGURE 3.1 Shredder
8
3.2 WATER DETERMINATION For both, the fresh and the commercial sample, we determined the amount of water in all
different parts as follows. We weighted a small amount of the different parts on glass
containers and put them in the oven at 110 °C for 24 hours. After 24 hours we weighed
the samples and from this obtained weight we subtracted the weight of the containers to
obtain the weight of the dried sample, witch in turn was subtracted from the weighed
sample. To obtain the percentage of water in the sample we divided this result by the
weight of the sample and multiplied this by 100. This was performed in duplicate and the
average was taken as final result.
3.3 HYDRODISTILLATION
Hydrodistillations (HD) were performed with two Clevenger-type apparatus of different
sizes, a small and big one, pictured in fig 3.2, to extract the essential oils from the peel
and the seeds of the Litchi chinesis using n-hexane (Carlo Erba reagents, Italy) as
extraction solvent (1-3ml). The shredded fruit material (20-100g) was completely
immersed in water (1-3 liter) and the temperature was raised to the boiling point. Since
this technique is based on azeotropy, this point will be lower than the boiling point of
pure water and pure compounds. From the moment the mixture goes into vapor phase
they will act like pure compounds again. Once they arrive in the cooler the oil and water
will condense and the oil will be separated from the water. After three hours of boiling
the instrument was cooled off, and the water was eluted and the essential oil recovered as
solution in the n-hexane.
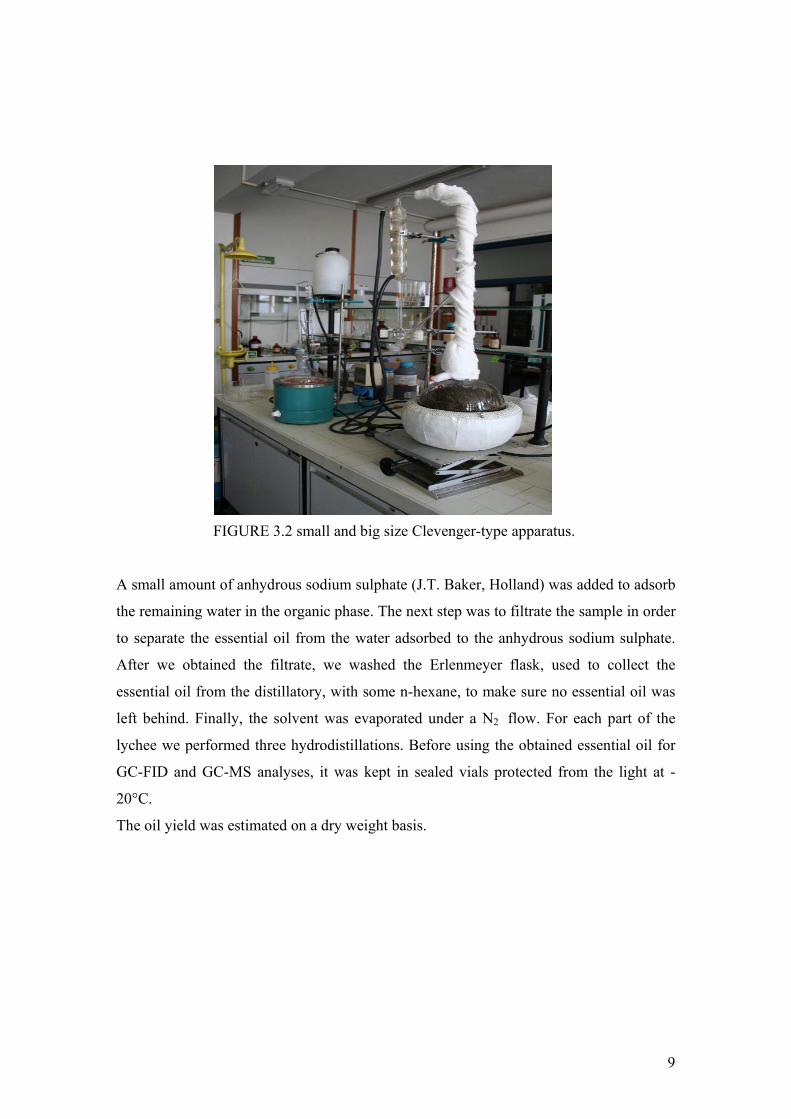
9
FIGURE 3.2 small and big size Clevenger-type apparatus.
A small amount of anhydrous sodium sulphate (J.T. Baker, Holland) was added to adsorb
the remaining water in the organic phase. The next step was to filtrate the sample in order
to separate the essential oil from the water adsorbed to the anhydrous sodium sulphate.
After we obtained the filtrate, we washed the Erlenmeyer flask, used to collect the
essential oil from the distillatory, with some n-hexane, to make sure no essential oil was
left behind. Finally, the solvent was evaporated under a N2 flow. For each part of the
lychee we performed three hydrodistillations. Before using the obtained essential oil for
GC-FID and GC-MS analyses, it was kept in sealed vials protected from the light at -
20°C.
The oil yield was estimated on a dry weight basis.
10
3.4 SPME FIBER SCREENING
Before starting the analysis with the extraction technique SPME, it is necessary to do a
fiber screening in order to choose the fiber with the most appropriate affinity for the
volatile compounds in Litchi chinesis.
Three fibers with different coatings of different polarities were screened:
polydimethylsiloxane (PDMS, 100 µm), polydimethylsiloxane-divinylbenzene (PDMS-
DVB, 65 µm) and Stableflex divinylbenzene-carboxen-polydimethylsiloxane (DVB-
CAR-PDMS, 50/30 µm), with PDMS-DVB being the most apolar, DVB-CAR-PDMS the
most polar and PDMS being of intermediate polarity. The silica fibers and the manual
SPME holder were purchased from Supelco (Bellefonte, PA, USA). The coating of all
fibers was 1 cm long.
3.5 HS-SPME Solid phase microextraction (SPME) is a fast and solvent free sample preparation method
in which coated fibers are used to isolate and concentrate analytes. After extraction, the
fibers are transferred to an analytical instrument for separation and quantification of the
target analytes (Pawliszyn, 1997).
Headspace Solid Phase Microextraction (SPME) utilizes a short, thin, solid rod of fused
silica, coated with an adsorbent polymer. The extraction technique consists of two
processes: (1) the partition between fiber and sample, and (2) the desorption of the
concentrated analytes from the coated fiber to the analytical instrument. (Pawliszyn,
1997)
The sample, dry and fresh fruit materials (5 mg of ground peel, whole seed, internal part
of the seed, external part of the seed and 100-150 mg of pulp and juice), was put in a 4 ml
vial closed by a polypropylene hole cap and PTFE/silicone septum (Supelco, Bellefonte,
PA, USA). To perform the extraction, we manually pierced the septum with the
protective shear of the SPME fiber and subsequently lower the plunger in order to expose
the fiber to the sample headspace, as shown in figure 3.4.
11
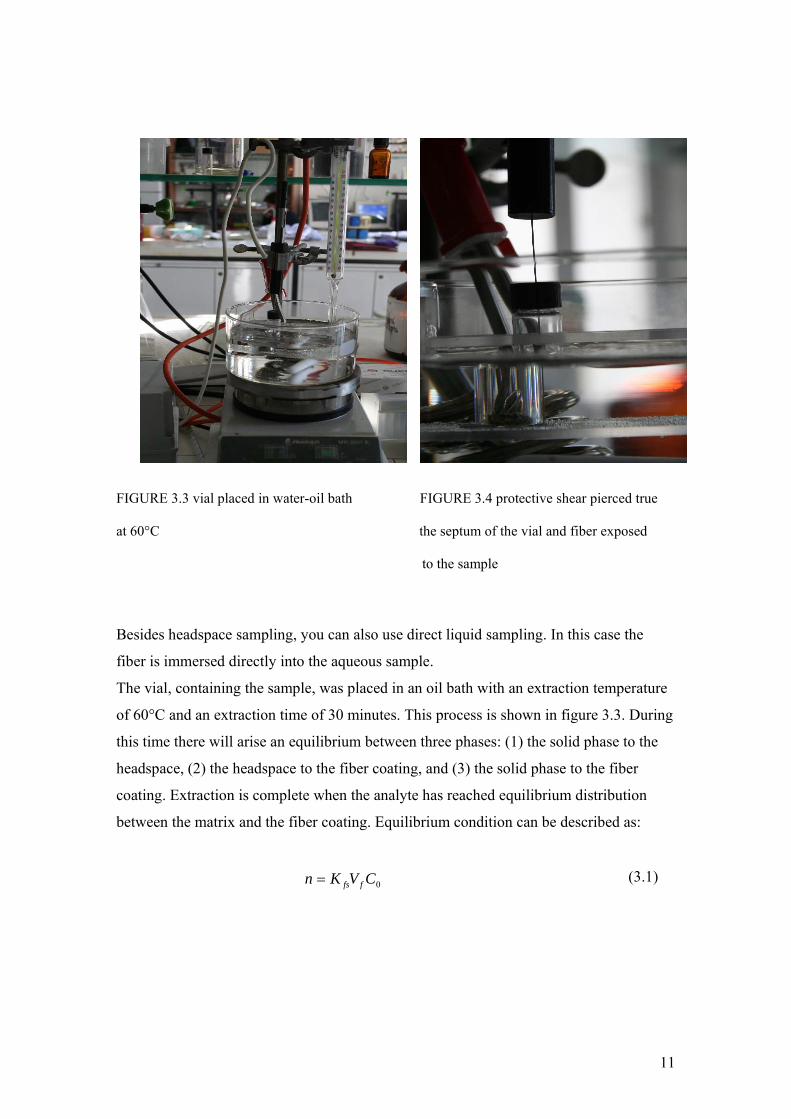
FIGURE 3.3 vial placed in water-oil bath FIGURE 3.4 protective shear pierced true at 60°C the septum of the vial and fiber exposed to the sample Besides headspace sampling, you can also use direct liquid sampling. In this case the
fiber is immersed directly into the aqueous sample.
The vial, containing the sample, was placed in an oil bath with an extraction temperature
of 60°C and an extraction time of 30 minutes. This process is shown in figure 3.3. During
this time there will arise an equilibrium between three phases: (1) the solid phase to the
headspace, (2) the headspace to the fiber coating, and (3) the solid phase to the fiber
coating. Extraction is complete when the analyte has reached equilibrium distribution
between the matrix and the fiber coating. Equilibrium condition can be described as:
0CVKn ffs= (3.1)
12
where: n : amount of compounds extracted by the coating
Kfs: distribution coefficient between the fiber coating and the sample matrix
Vf : volume of the fiber coating
C0 : initial concentration of analyte in the sample
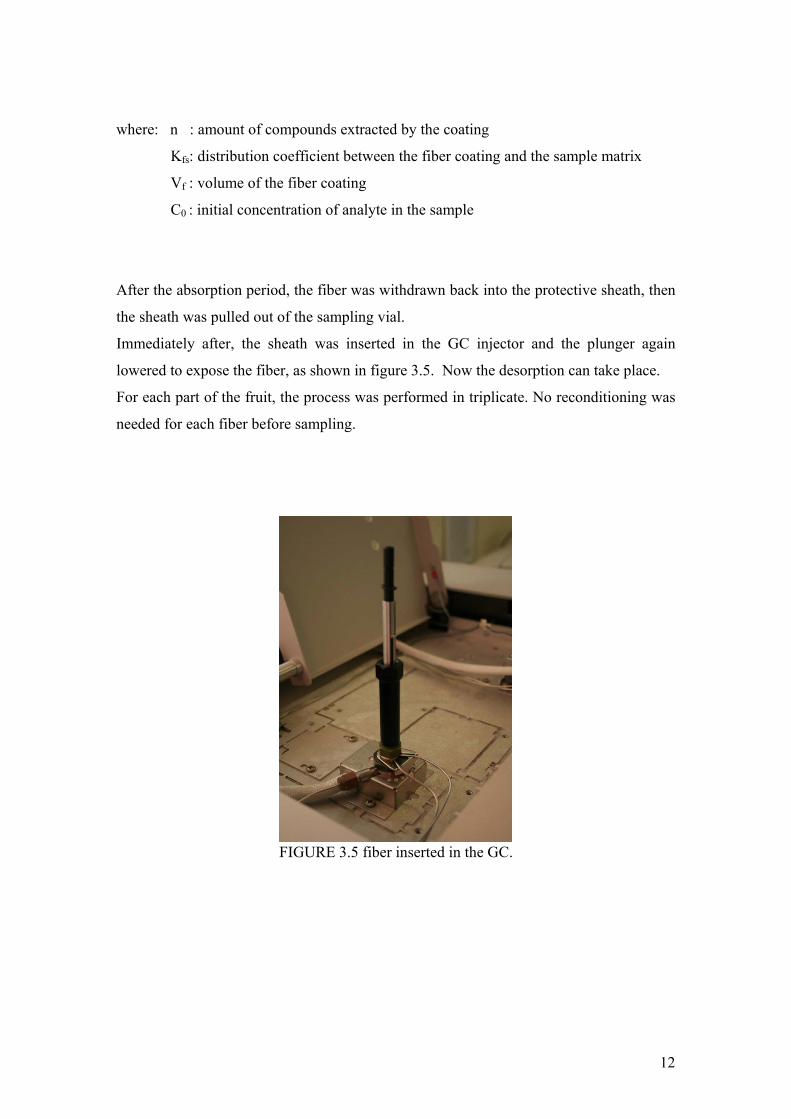
After the absorption period, the fiber was withdrawn back into the protective sheath, then
the sheath was pulled out of the sampling vial.
Immediately after, the sheath was inserted in the GC injector and the plunger again
lowered to expose the fiber, as shown in figure 3.5. Now the desorption can take place.
For each part of the fruit, the process was performed in triplicate. No reconditioning was
needed for each fiber before sampling.
FIGURE 3.5 fiber inserted in the GC.
13
3.6 HEADSPACE GAS-CHROMATOGRAPHY A third method we used in terms of extraction was static headspace gas-chromatography
(HD-GC).
Analyses were performed using an Agilent 7694E head sampler (California, USA).
This method consists of two steps. First, the sample, in our case solid, with a gas phase
above it is put in a closed vial (60ml). Secondly, the vial is warmed up to a constant
temperature until equilibrium is reached between the two phases. When equilibrium is
reached an aliquot of the gas phase is carried away by a gas stream towards the column of
the gas chromatographer, where the volatile compounds are analyzed (Kolb, Ettre, 1997).
This method is based on the same principles as HS-SPME. The most important
differences are: 1) In HS-GC there is only one equilibrium that takes place instead of
three, namely between the solid sample and the gas phase above the sample. 2) The
analytes are not captured by a fiber in HS-GC but they are directly transferred to the gas
chromatographer by the transfer line between both instruments. In other words, no
selection process related to the polarity takes place in HS-GC. This ensures that we will
obtain a high number of compounds using the HS-GC, but they will be less concentrated
than when obtained by HS-SPME.
The temperature program to follow: 60°C for the vial, 70°C for the loop and 90°C for the
transfer line. The vial equilibration time was set at 30 min, pressurization time was 0.20
min, loop fill time at 0.20 min, loop equilibration time at 0.05 min and injection time of
1 min.
In combination with the headspace sampler we used GC equipped with an Innowax
column (0.32 mm i.d., 0.25 µm film thickness). The inlet and detector temperature were
set at 250°C. The temperature program was the following: 60 °C for 3 min, then ramp at
10 °C/min to 220 °C, then 20°C/min up to 240 °C, held for 20 min.
14
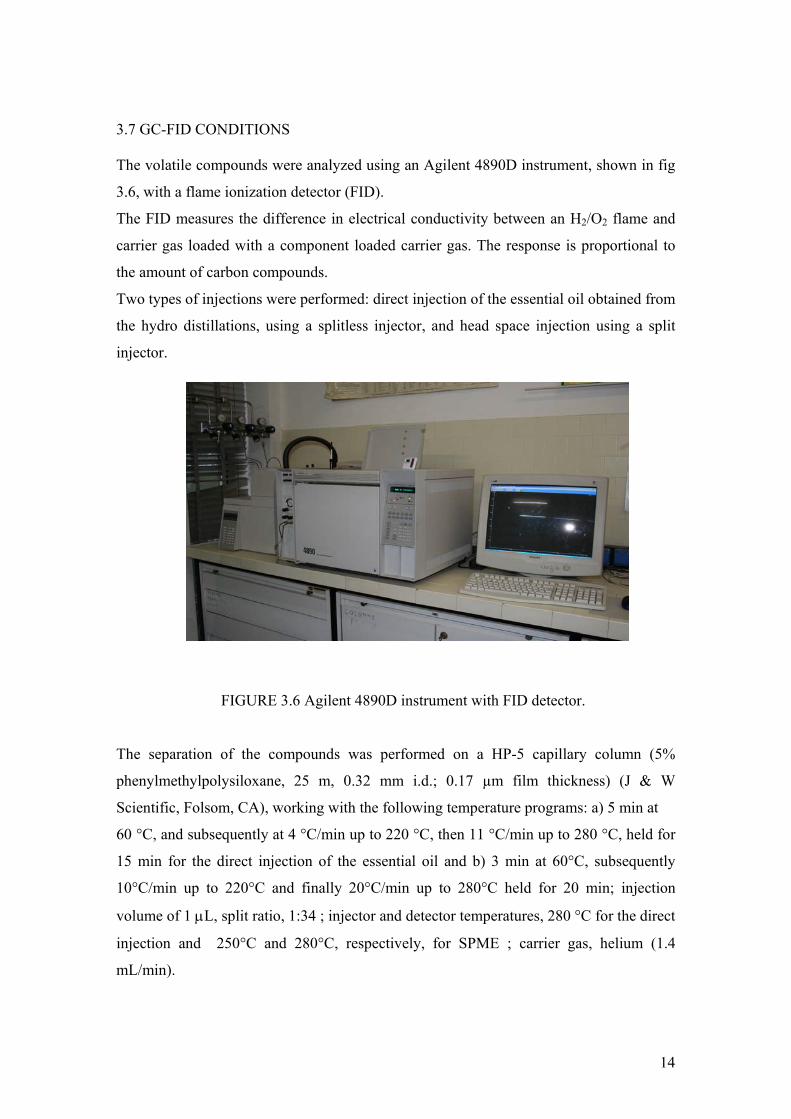
3.7 GC-FID CONDITIONS The volatile compounds were analyzed using an Agilent 4890D instrument, shown in fig
3.6, with a flame ionization detector (FID).
The FID measures the difference in electrical conductivity between an H2/O2 flame and
carrier gas loaded with a component loaded carrier gas. The response is proportional to
the amount of carbon compounds.
Two types of injections were performed: direct injection of the essential oil obtained from
the hydro distillations, using a splitless injector, and head space injection using a split
injector.
FIGURE 3.6 Agilent 4890D instrument with FID detector.
The separation of the compounds was performed on a HP-5 capillary column (5%
phenylmethylpolysiloxane, 25 m, 0.32 mm i.d.; 0.17 µm film thickness) (J & W
Scientific, Folsom, CA), working with the following temperature programs: a) 5 min at
60 °C, and subsequently at 4 °C/min up to 220 °C, then 11 °C/min up to 280 °C, held for
15 min for the direct injection of the essential oil and b) 3 min at 60°C, subsequently
10°C/min up to 220°C and finally 20°C/min up to 280°C held for 20 min; injection
volume of 1 µL, split ratio, 1:34 ; injector and detector temperatures, 280 °C for the direct
injection and 250°C and 280°C, respectively, for SPME ; carrier gas, helium (1.4
mL/min).
15
In order to calculate the retention indices (as Kovats indices) of each compound extracted
with HS-SPME or hydrodistillation, a mixture of aliphatic hydrocarbons (C8-C30)
(Sigma, Milan, Italy) in hexane was directly injected into the GC injector or loaded onto
the SPME fiber and injected under the above temperature program.
3.8 GC-MS CONDITIONS GC-MS analysis was performed on a Agilent 6890N gas chromatograph, equipped with a
HP-5MS capillary column (5% phenylmethylpolysiloxane, 30 m, 0.25 mm i.d., 0.1 µm
film thickness), coupled to a 5973N mass spectrometer (MS) (J & W Scientific, Folsom).
The temperature program for the direct injection was the following: 60 °C for 5 min, then
ramp at 4 °C/min to 220 °C, then 11 °C/min up to 280 °C held for 15 min, finally 11
°C/min up to 300 °C, held for 5 min; the program for head space injection: 60°C for 3
min, then ramp at 10°C/min up to 220°C, directly after another ramp at 20°C/min up to
280°C, held for 20 min; carrier gas: helium; flow rate: 1.0 mL/min; injector and transfer
line temperatures for direct injection and headspace injection: 280°C-250°C; injection
volume: 2 µL; split ratio: 1:50; scan time: 75 min; acquisition mass range: 29-400 m/z.
The direct injection was performed in split, while the headspace injection in splitless
mode.
The first step in an MS – analysis is the formation of ions in an ionization process. In our
study the ionization and fragmentation was executed in electron impact (EI) mode with
an ionization voltage of 70 eV. After the formation of the molecular ion and the
fragmentation of the molecule to fragment ions, the ions are separated according to
mass/charge (also referred to as m/z). The final steps are the detection of the ions using
an electron multiplier and the registration of the relative quantity of each type of ion
present.
Since the nature and number of formed ions is a characteristic of the composition and
structure of the organic molecule, one can argue that the mass spectrum is its fingerprint.
This is the reason why mass spectrometry is a very useful technique for structural
clarification and confirmation.
16
3.9 IDENTIFICATION AND QUANTIFICATION OF VOLATILE COMPOUNDS.
The identification of the volatile compounds was performed through retention indices
calculated with the Kovats method using equation (3.2) for compounds extracted with
HS-SPME as for the compounds present in the essential oil obtained from the hydro
distillation.
‘The Kovats retention index is a logarithmic scale on which the adjusted retention time of
a peak is compared with those of linear n-alkanes as reference compounds.’
http://www.chromtech.net.au/kovats_ri.cfm
True the Kovats indices the retention values become independent from the GC conditions
(Adams, 1989).
⎥⎦
⎤⎢⎣
⎡−−
−+=)('log)('log)('log)('log)(100
ntNtntxtnNnI
rr
rr (3.2)
where : I : Kovats index
n : number of carbon atoms in the smaller alkane
N : number of carbon atoms in the larger alkane
t’r (n) : the adjusted retention time of the smaller alkane
t’r (N) : the adjusted retention time of the larger alkane
t’r (x) : the adjusted retention time of the unknown compound
After the calculation of the indices the chromatogram obtained with GC-FID was
compared with the chromatogram obtained with GC-MS since it is possible that some
compounds only produce a signal in either one detector.
Thereafter, for each peak present in the mass chromatogram, we examined the mass
spectra using specific computer software.
These mass spectra and calculated retention indices (RI) were compared with other
spectra found in commercially available libraries, such as NIST05, WILEY275 and
ADAMS. These are non-specialized collections of spectra, mainly taken from the
literature. Adams library is dedicated to the essential oil field using an ion trap mass
analyzer (Scott, 1995).
17
For the quantification, we calculated the relative amount, expressed as percentages, of
each volatile compound, using FID peak area normalization. Usually the response factor
is calculated using only one concentration of each compound using following equation:
IS
IS
analyte
analyte C
AAC
RF ⋅
⎟⎟⎠
⎞⎜⎜⎝
⎛= (3.3)
where Canalyte is the concentration of the different analytes, Aanalyte its absolute peak area,
Ais is the absolute peak area of one alkane and Cis its concentration.
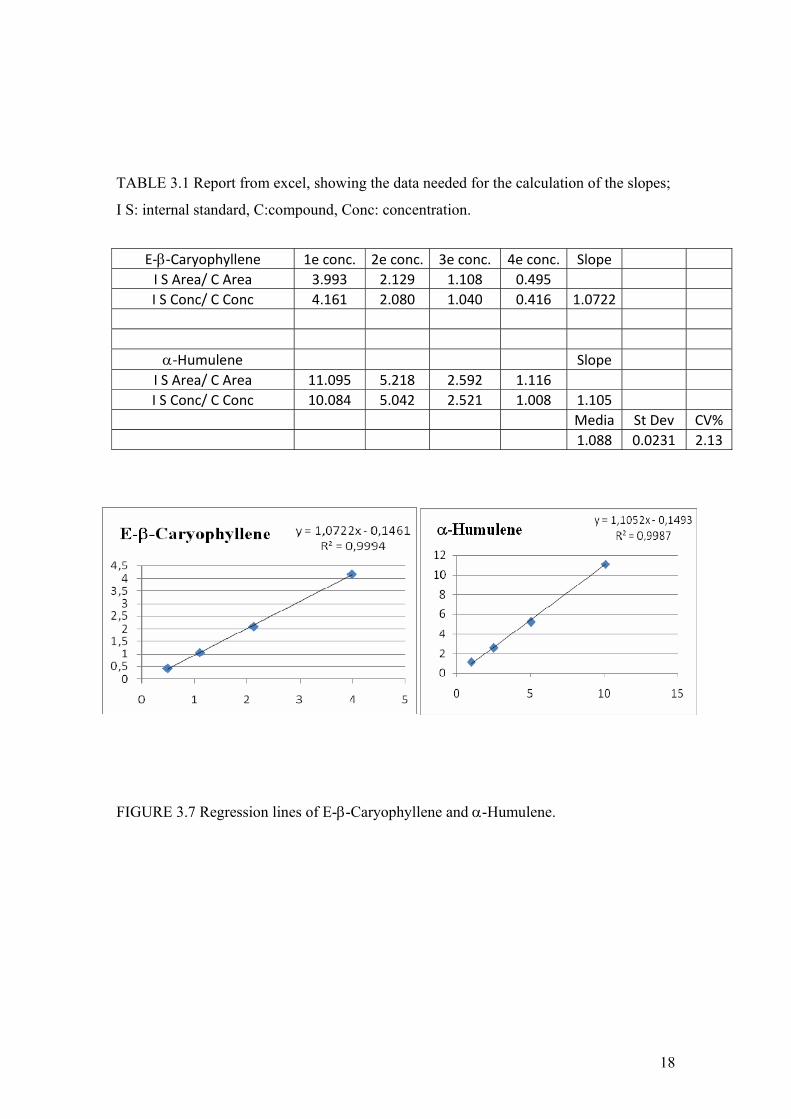
We on the other hand calculated the response factor (RF) from the FID analyses of eight
different classes of volatiles, as shown in table 3.2. These eight different classes
correspond to the different classes of volatiles identified. Owing to the large number of
compounds present and the non-availability of commercial standards of many of them,
compounds of each of the eight classes were assumed to have the same quantitative GC
correction factor. For each class, more than one standard was considered in order to
improve the reliability. Five replicates of mixtures, each prepared with four different
concentrations (0.04-0.08-0.16-0.4 mg/ml) with equal amounts of two internal standards
(octane and octadecane) and representative compounds were prepared; taking into
account the purity determined for each of them at GC-FID. Compounds used as
references were purchased from Sigma-Aldrich (Milan, Italy). We calculated the slopes
for each compound using regression lines, as shown below in figure 3.7 for E-β-
Caryphyllene and α-Humulene, belonging to the class of sesquiterpens hydrocarbons. In
order to obtain the slopes we calculated the ratio’s shown in table 3.1. For the compounds
that could not be divided into any of these classes, we considered the correction factor of
octane until the compounds that contain thirteen carbons, and in case they contain more
carbons we used the correction factor of octadecane.
18
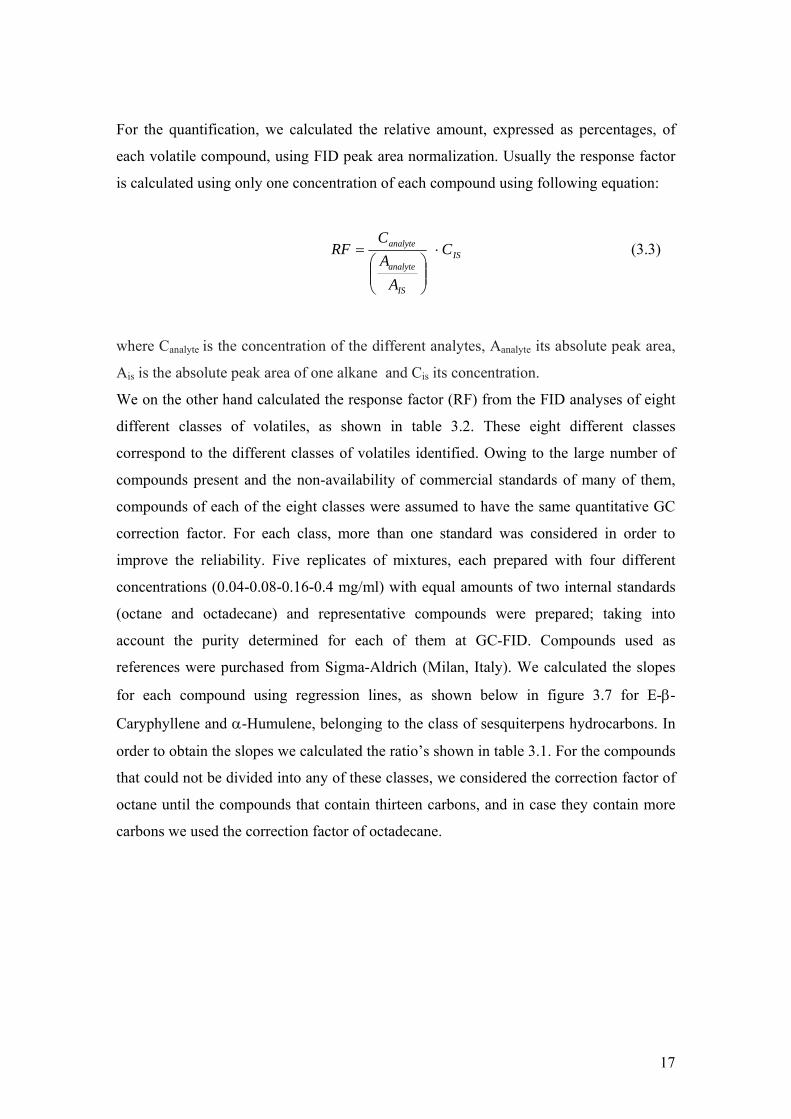
TABLE 3.1 Report from excel, showing the data needed for the calculation of the slopes;
I S: internal standard, C:compound, Conc: concentration.
FIGURE 3.7 Regression lines of E-β-Caryophyllene and α-Humulene.
E‐β‐Caryophyllene 1e conc. 2e conc. 3e conc. 4e conc. Slope I S Area/ C Area 3.993 2.129 1.108 0.495 I S Conc/ C Conc 4.161 2.080 1.040 0.416 1.0722
α‐Humulene Slope I S Area/ C Area 11.095 5.218 2.592 1.116 I S Conc/ C Conc 10.084 5.042 2.521 1.008 1.105
Media St Dev CV% 1.088 0.0231 2.13
19
TABLE 3.2. Determinations of response factor (RF) for different classes of volatiles
occurring in Lychee
Grouped compounds Mean ± SD RF
Terpenoids
Monoterpenes hydrocarbons
β-pinene 1.04±0.01
limonene 1.15±0.01
γ-terpinene 1.04±0.01
p-cymene 1.14±0.01
1.09±0.06
Oxygenated monoterpenes
1,8-cineole 1.29±0.01
linalool 1.33±0.01
camphor 1.32±0.01
terpinen-4-ol 1.29±0.01
verbenone 1.42±0.01
nerol 1.53±0.01
carvone 1.35±0.01
1.36±0.09
Sesquiterpenes hydrocarbons
(E)-caryophyllene 1.07±0.01
α-humulene 1.08±0.01 1.10±0.02
Oxygenated sesquiterpenes
caryophyllene oxide 1.20±0.01 1.20±0.00
Aliphatics
Alkanes
octane
octadecane
0.91±0.01 1.35±0.01
1.13±0.01
1-octen-3-ol 1.30±0.01
dodecanol 1.45±0.01 1.38±0.11
Esters
isobornyl acetate 1.39±0.01
isobornyl isovalerate 1.38±0.01 1.39±0.01

20
Aldehydes
octanal 1.50±0.01
dodecanal 1.47±0.01 1.49±0.03
Aromatics
benzaldehyde 1.28±0.01 p-vinylanisole 1.36±0.01
1.32±0.05
21
4. RESULTS AND DISCUSSION In this study, three methods were considered for the extraction of the volatiles
compounds from lychee chinesis: headspace, HS-SPME and HD. In particular, SPME
was performed on all different parts of the lychee fruit, while HD only on the whole seed
and the peel.
4.1 HEADSPACE-GAS CHROMATOGRAPHY
We started the analysis using this technique for the extraction of the volatile compounds,
but, as shown in figure 4.1, this technique gives us good results for the peel but not for
the seed. As for the peel, we started with hundred milligrams for the seed, but we only
observed relatively small peaks for selected compounds. Increasing the amount to five
hundred milligrams, did not really improve the result. Based on those facts, we moved
forward using HS-SPME.
FIGURE 4.1 HS-GC chromatograms; from top to bottom: peel and seed.
22
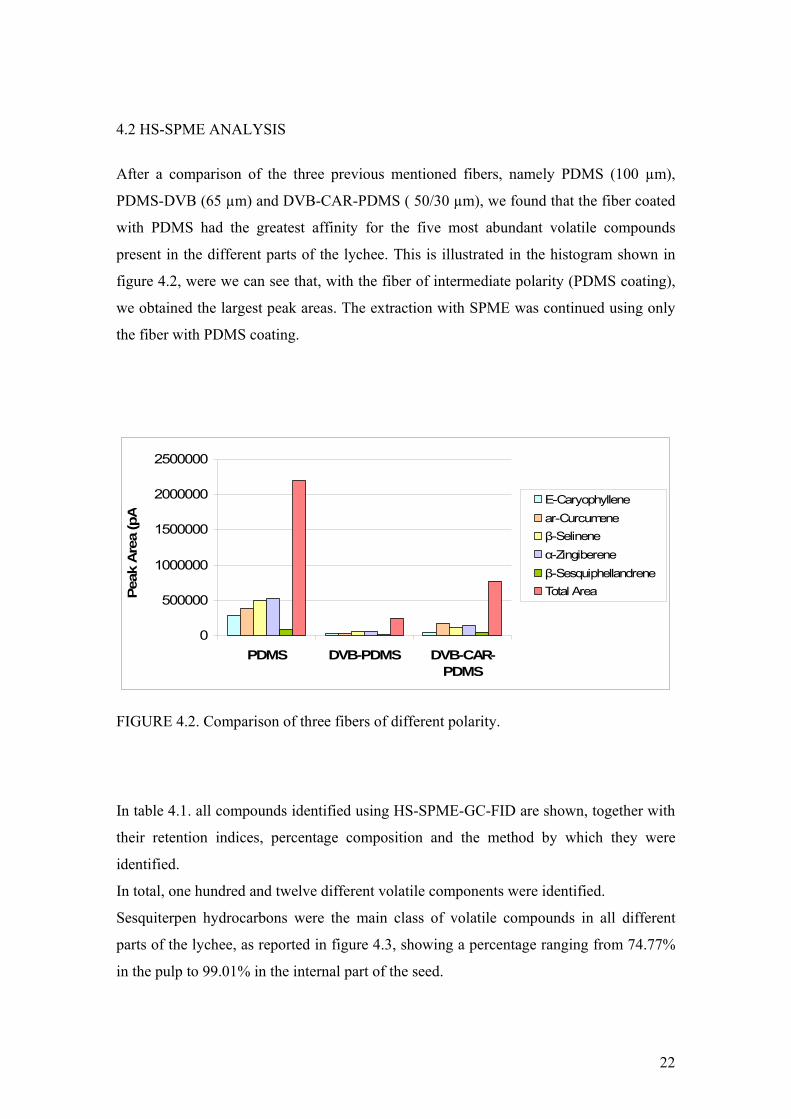
4.2 HS-SPME ANALYSIS
After a comparison of the three previous mentioned fibers, namely PDMS (100 µm),
PDMS-DVB (65 µm) and DVB-CAR-PDMS ( 50/30 µm), we found that the fiber coated
with PDMS had the greatest affinity for the five most abundant volatile compounds
present in the different parts of the lychee. This is illustrated in the histogram shown in
figure 4.2, were we can see that, with the fiber of intermediate polarity (PDMS coating),
we obtained the largest peak areas. The extraction with SPME was continued using only
the fiber with PDMS coating.
0
500000
1000000
1500000
2000000
2500000
PDMS DVB-PDMS DVB-CAR-PDMS
Peak
Are
a (p
A
E-Caryophyllenear-Curcumeneβ-Selineneα-Zingibereneβ-SesquiphellandreneTotal Area
FIGURE 4.2. Comparison of three fibers of different polarity. In table 4.1. all compounds identified using HS-SPME-GC-FID are shown, together with
their retention indices, percentage composition and the method by which they were
identified.
In total, one hundred and twelve different volatile components were identified.
Sesquiterpen hydrocarbons were the main class of volatile compounds in all different
parts of the lychee, as reported in figure 4.3, showing a percentage ranging from 74.77%
in the pulp to 99.01% in the internal part of the seed.
23
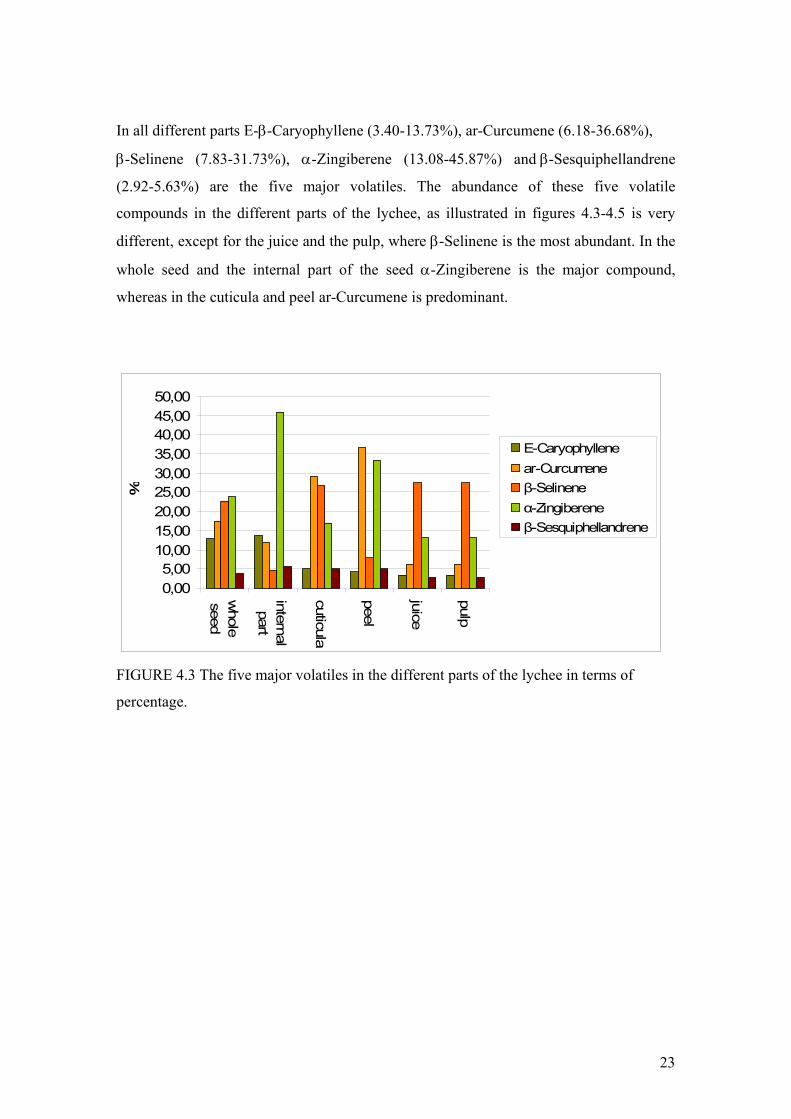
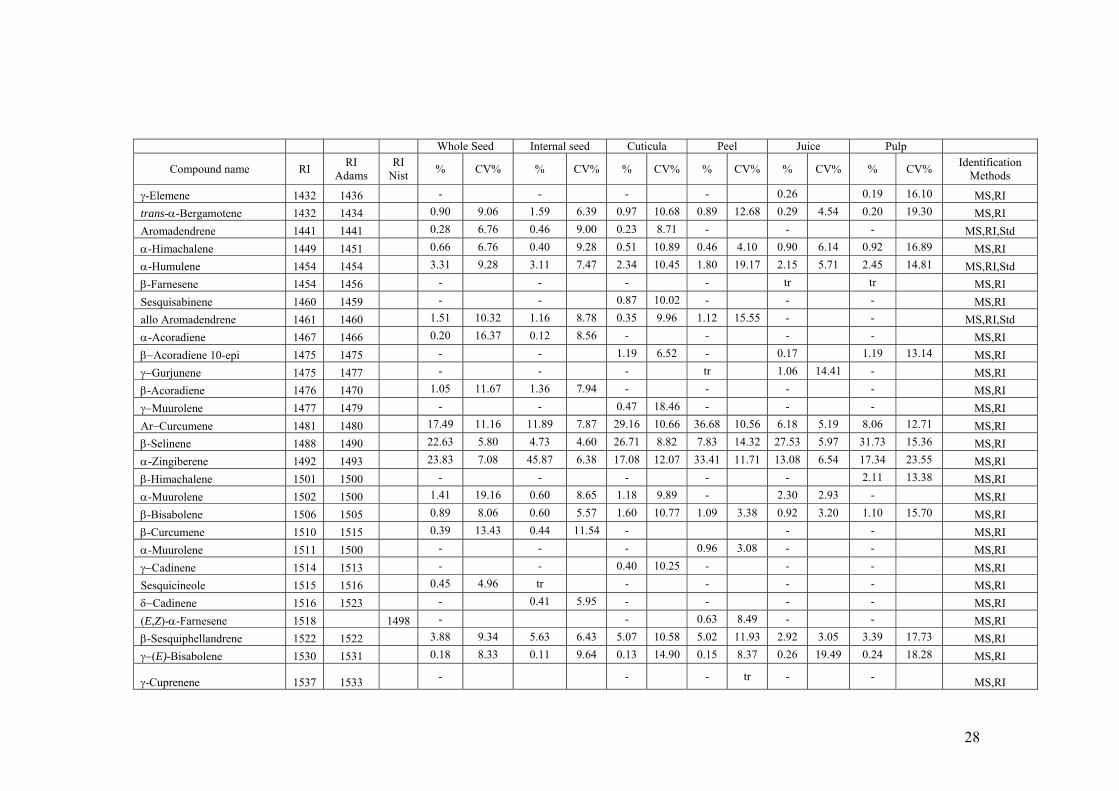
In all different parts E-β-Caryophyllene (3.40-13.73%), ar-Curcumene (6.18-36.68%),
β-Selinene (7.83-31.73%), α-Zingiberene (13.08-45.87%) and β-Sesquiphellandrene
(2.92-5.63%) are the five major volatiles. The abundance of these five volatile
compounds in the different parts of the lychee, as illustrated in figures 4.3-4.5 is very
different, except for the juice and the pulp, where β-Selinene is the most abundant. In the
whole seed and the internal part of the seed α-Zingiberene is the major compound,
whereas in the cuticula and peel ar-Curcumene is predominant.
0,005,00
10,0015,0020,0025,0030,0035,0040,0045,0050,00
whole
seed
internalpart
cuticula
peel
juice
pulp
%
E-Caryophyllenear-Curcumeneβ-Selineneα-Zingibereneβ-Sesquiphellandrene
FIGURE 4.3 The five major volatiles in the different parts of the lychee in terms of
percentage.
24
0
2000000
4000000
6000000
8000000
10000000
12000000
14000000
whole Seed internal part cuticula Peel juice pulp
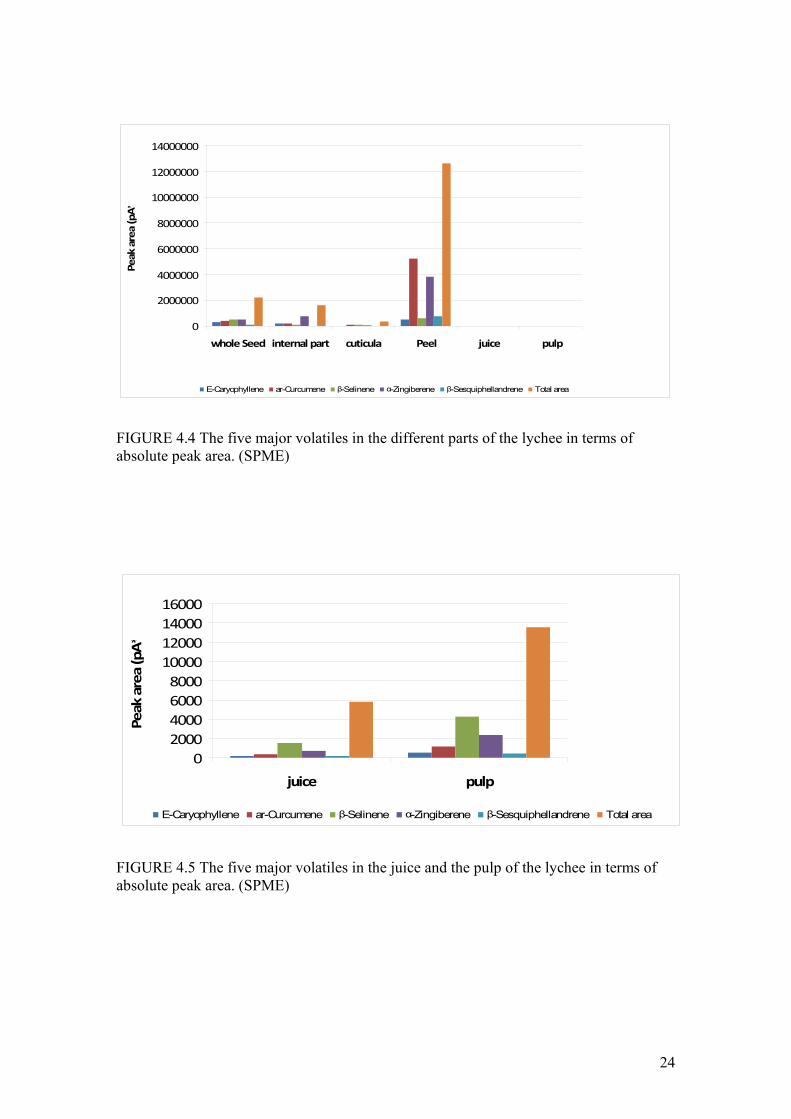
Peak area (pA*
E-Caryophyllene ar-Curcumene β-Selinene α-Zingiberene β-Sesquiphellandrene Total area FIGURE 4.4 The five major volatiles in the different parts of the lychee in terms of absolute peak area. (SPME)
FIGURE 4.5 The five major volatiles in the juice and the pulp of the lychee in terms of absolute peak area. (SPME)
0200040006000800010000120001400016000
juice pulp
Peak area (pA*
E-Caryophyllene ar-Curcumene β-Selinene α-Zingiberene β-Sesquiphellandrene Total area
25
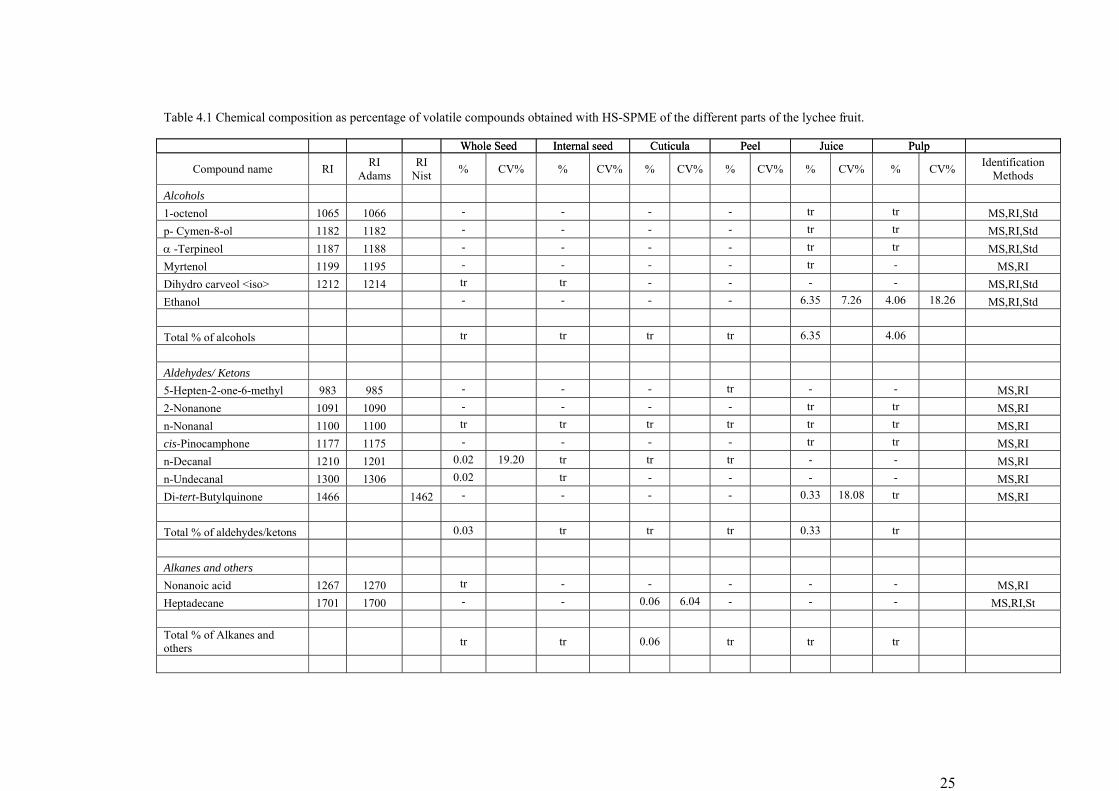
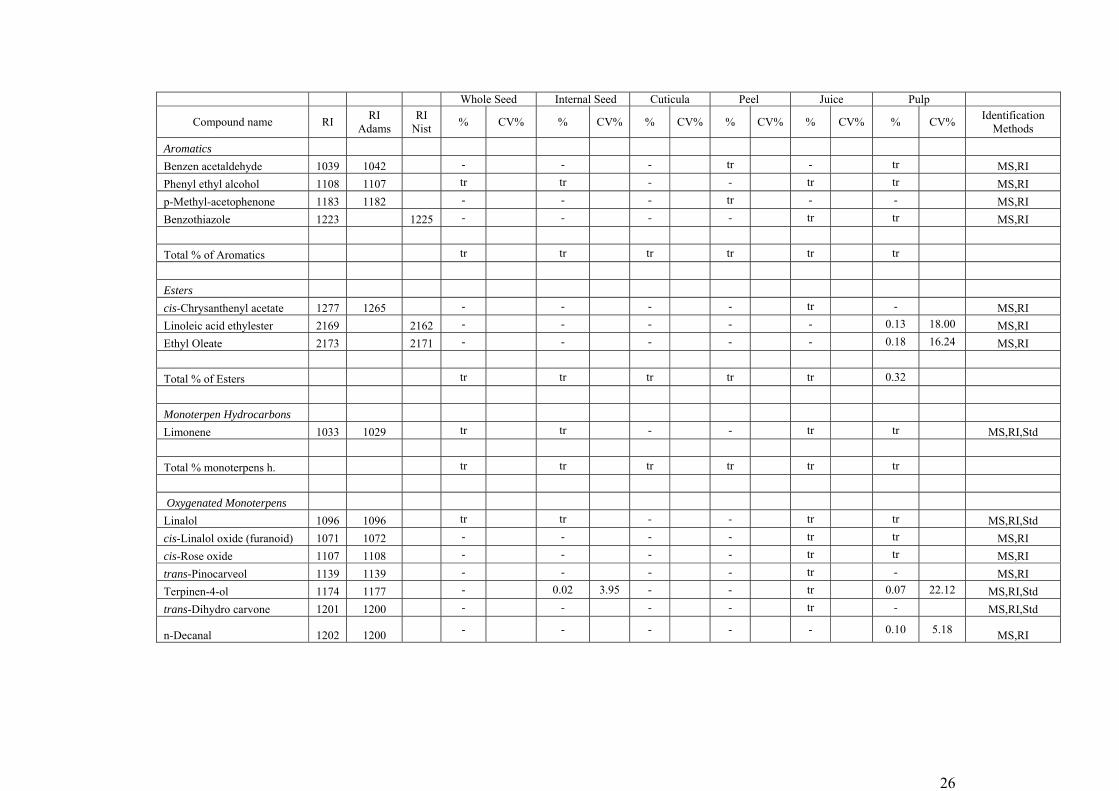
Table 4.1 Chemical composition as percentage of volatile compounds obtained with HS-SPME of the different parts of the lychee fruit.
Whole Seed Internal seed Cuticula Peel Juice Pulp
Compound name RI RI Adams
RI Nist % CV% % CV% % CV% % CV% % CV% % CV% Identification
Methods
Alcohols 1-octenol 1065 1066 - - - - tr tr MS,RI,Std p- Cymen-8-ol 1182 1182 - - - - tr tr MS,RI,Std α -Terpineol 1187 1188 - - - - tr tr MS,RI,Std Myrtenol 1199 1195 - - - - tr - MS,RI Dihydro carveol <iso> 1212 1214 tr tr - - - - MS,RI,Std Ethanol - - - - 6.35 7.26 4.06 18.26 MS,RI,Std Total % of alcohols tr tr tr tr 6.35 4.06 Aldehydes/ Ketons 5-Hepten-2-one-6-methyl 983 985 - - - tr - - MS,RI 2-Nonanone 1091 1090 - - - - tr tr MS,RI n-Nonanal 1100 1100 tr tr tr tr tr tr MS,RI cis-Pinocamphone 1177 1175 - - - - tr tr MS,RI n-Decanal 1210 1201 0.02 19.20 tr tr tr - - MS,RI n-Undecanal 1300 1306 0.02 tr - - - - MS,RI Di-tert-Butylquinone 1466 1462 - - - - 0.33 18.08 tr MS,RI Total % of aldehydes/ketons 0.03 tr tr tr 0.33 tr Alkanes and others Nonanoic acid 1267 1270 tr - - - - - MS,RI Heptadecane 1701 1700 - - 0.06 6.04 - - - MS,RI,St Total % of Alkanes and others tr tr 0.06 tr tr tr
Whole Seed Internal seed Cuticula Peel Juice Pulp
26
Whole Seed Internal Seed Cuticula Peel Juice Pulp
Compound name RI RI Adams
RI Nist % CV% % CV% % CV% % CV% % CV% % CV% Identification
Methods
Aromatics Benzen acetaldehyde 1039 1042 - - - tr - tr MS,RI Phenyl ethyl alcohol 1108 1107 tr tr - - tr tr MS,RI p-Methyl-acetophenone 1183 1182 - - - tr - - MS,RI Benzothiazole 1223 1225 - - - - tr tr MS,RI Total % of Aromatics tr tr tr tr tr tr Esters cis-Chrysanthenyl acetate 1277 1265 - - - - tr - MS,RI Linoleic acid ethylester 2169 2162 - - - - - 0.13 18.00 MS,RI Ethyl Oleate 2173 2171 - - - - - 0.18 16.24 MS,RI Total % of Esters tr tr tr tr tr 0.32 Monoterpen Hydrocarbons Limonene 1033 1029 tr tr - - tr tr MS,RI,Std Total % monoterpens h. tr tr tr tr tr tr Oxygenated Monoterpens Linalol 1096 1096 tr tr - - tr tr MS,RI,Std cis-Linalol oxide (furanoid) 1071 1072 - - - - tr tr MS,RI cis-Rose oxide 1107 1108 - - - - tr tr MS,RI trans-Pinocarveol 1139 1139 - - - - tr - MS,RI Terpinen-4-ol 1174 1177 - 0.02 3.95 - - tr 0.07 22.12 MS,RI,Std trans-Dihydro carvone 1201 1200 - - - - tr - MS,RI,Std
n-Decanal 1202 1200 - - - - - 0.10 5.18 MS,RI
27
Whole Seed Internal seed Cuticula Peel Juice Pulp
Compound name RI RI Adams
RI Nist % CV% % CV% % CV% % CV% % CV% % CV% Identification
Methods
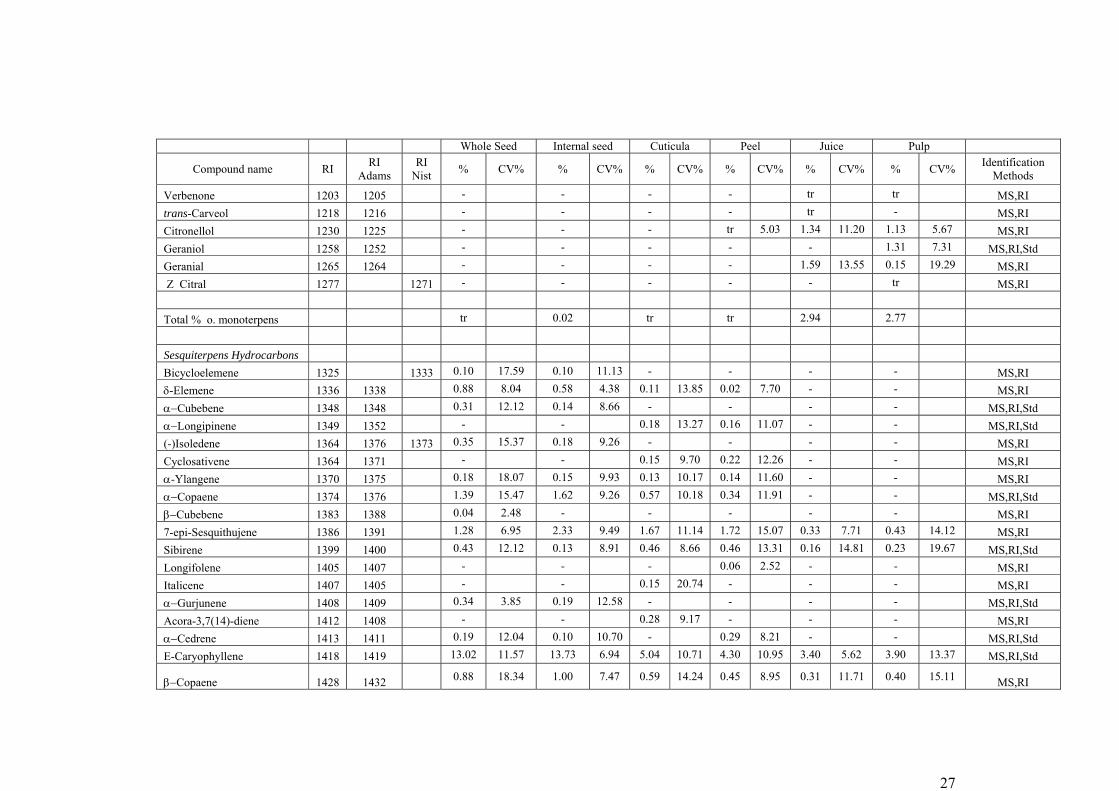
Verbenone 1203 1205 - - - - tr tr MS,RI trans-Carveol 1218 1216 - - - - tr - MS,RI Citronellol 1230 1225 - - - tr 5.03 1.34 11.20 1.13 5.67 MS,RI Geraniol 1258 1252 - - - - - 1.31 7.31 MS,RI,Std Geranial 1265 1264 - - - - 1.59 13.55 0.15 19.29 MS,RI Z Citral 1277 1271 - - - - - tr MS,RI Total % o. monoterpens tr 0.02 tr tr 2.94 2.77 Sesquiterpens Hydrocarbons Bicycloelemene 1325 1333 0.10 17.59 0.10 11.13 - - - - MS,RI δ-Elemene 1336 1338 0.88 8.04 0.58 4.38 0.11 13.85 0.02 7.70 - - MS,RI α−Cubebene 1348 1348 0.31 12.12 0.14 8.66 - - - - MS,RI,Std α−Longipinene 1349 1352 - - 0.18 13.27 0.16 11.07 - - MS,RI,Std (-)Isoledene 1364 1376 1373 0.35 15.37 0.18 9.26 - - - - MS,RI Cyclosativene 1364 1371 - - 0.15 9.70 0.22 12.26 - - MS,RI α-Ylangene 1370 1375 0.18 18.07 0.15 9.93 0.13 10.17 0.14 11.60 - - MS,RI α−Copaene 1374 1376 1.39 15.47 1.62 9.26 0.57 10.18 0.34 11.91 - - MS,RI,Std β−Cubebene 1383 1388 0.04 2.48 - - - - - MS,RI 7-epi-Sesquithujene 1386 1391 1.28 6.95 2.33 9.49 1.67 11.14 1.72 15.07 0.33 7.71 0.43 14.12 MS,RI Sibirene 1399 1400 0.43 12.12 0.13 8.91 0.46 8.66 0.46 13.31 0.16 14.81 0.23 19.67 MS,RI,Std Longifolene 1405 1407 - - - 0.06 2.52 - - MS,RI Italicene 1407 1405 - - 0.15 20.74 - - - MS,RI α−Gurjunene 1408 1409 0.34 3.85 0.19 12.58 - - - - MS,RI,Std Acora-3,7(14)-diene 1412 1408 - - 0.28 9.17 - - - MS,RI α−Cedrene 1413 1411 0.19 12.04 0.10 10.70 - 0.29 8.21 - - MS,RI,Std E-Caryophyllene 1418 1419 13.02 11.57 13.73 6.94 5.04 10.71 4.30 10.95 3.40 5.62 3.90 13.37 MS,RI,Std
β−Copaene 1428 1432 0.88 18.34 1.00 7.47 0.59 14.24 0.45 8.95 0.31 11.71 0.40 15.11 MS,RI
28
Whole Seed Internal seed Cuticula Peel Juice Pulp
Compound name RI RI Adams
RI Nist % CV% % CV% % CV% % CV% % CV% % CV% Identification
Methods
γ-Elemene 1432 1436 - - - - 0.26 0.19 16.10 MS,RI trans-α-Bergamotene 1432 1434 0.90 9.06 1.59 6.39 0.97 10.68 0.89 12.68 0.29 4.54 0.20 19.30 MS,RI Aromadendrene 1441 1441 0.28 6.76 0.46 9.00 0.23 8.71 - - - MS,RI,Std α-Himachalene 1449 1451 0.66 6.76 0.40 9.28 0.51 10.89 0.46 4.10 0.90 6.14 0.92 16.89 MS,RI α-Humulene 1454 1454 3.31 9.28 3.11 7.47 2.34 10.45 1.80 19.17 2.15 5.71 2.45 14.81 MS,RI,Std β-Farnesene 1454 1456 - - - - tr tr MS,RI Sesquisabinene 1460 1459 - - 0.87 10.02 - - - MS,RI allo Aromadendrene 1461 1460 1.51 10.32 1.16 8.78 0.35 9.96 1.12 15.55 - - MS,RI,Std α-Acoradiene 1467 1466 0.20 16.37 0.12 8.56 - - - - MS,RI β−Acoradiene 10-epi 1475 1475 - - 1.19 6.52 - 0.17 1.19 13.14 MS,RI γ−Gurjunene 1475 1477 - - - tr 1.06 14.41 - MS,RI β-Acoradiene 1476 1470 1.05 11.67 1.36 7.94 - - - - MS,RI γ−Muurolene 1477 1479 - - 0.47 18.46 - - - MS,RI Ar−Curcumene 1481 1480 17.49 11.16 11.89 7.87 29.16 10.66 36.68 10.56 6.18 5.19 8.06 12.71 MS,RI β-Selinene 1488 1490 22.63 5.80 4.73 4.60 26.71 8.82 7.83 14.32 27.53 5.97 31.73 15.36 MS,RI α-Zingiberene 1492 1493 23.83 7.08 45.87 6.38 17.08 12.07 33.41 11.71 13.08 6.54 17.34 23.55 MS,RI β-Himachalene 1501 1500 - - - - - 2.11 13.38 MS,RI α-Muurolene 1502 1500 1.41 19.16 0.60 8.65 1.18 9.89 - 2.30 2.93 - MS,RI β-Bisabolene 1506 1505 0.89 8.06 0.60 5.57 1.60 10.77 1.09 3.38 0.92 3.20 1.10 15.70 MS,RI β-Curcumene 1510 1515 0.39 13.43 0.44 11.54 - - - MS,RI α-Muurolene 1511 1500 - - - 0.96 3.08 - - MS,RI γ−Cadinene 1514 1513 - - 0.40 10.25 - - - MS,RI Sesquicineole 1515 1516 0.45 4.96 tr - - - - MS,RI δ−Cadinene 1516 1523 - 0.41 5.95 - - - - MS,RI (E,Z)-α-Farnesene 1518 1498 - - 0.63 8.49 - - MS,RI β-Sesquiphellandrene 1522 1522 3.88 9.34 5.63 6.43 5.07 10.58 5.02 11.93 2.92 3.05 3.39 17.73 MS,RI γ−(E)-Bisabolene 1530 1531 0.18 8.33 0.11 9.64 0.13 14.90 0.15 8.37 0.26 19.49 0.24 18.28 MS,RI
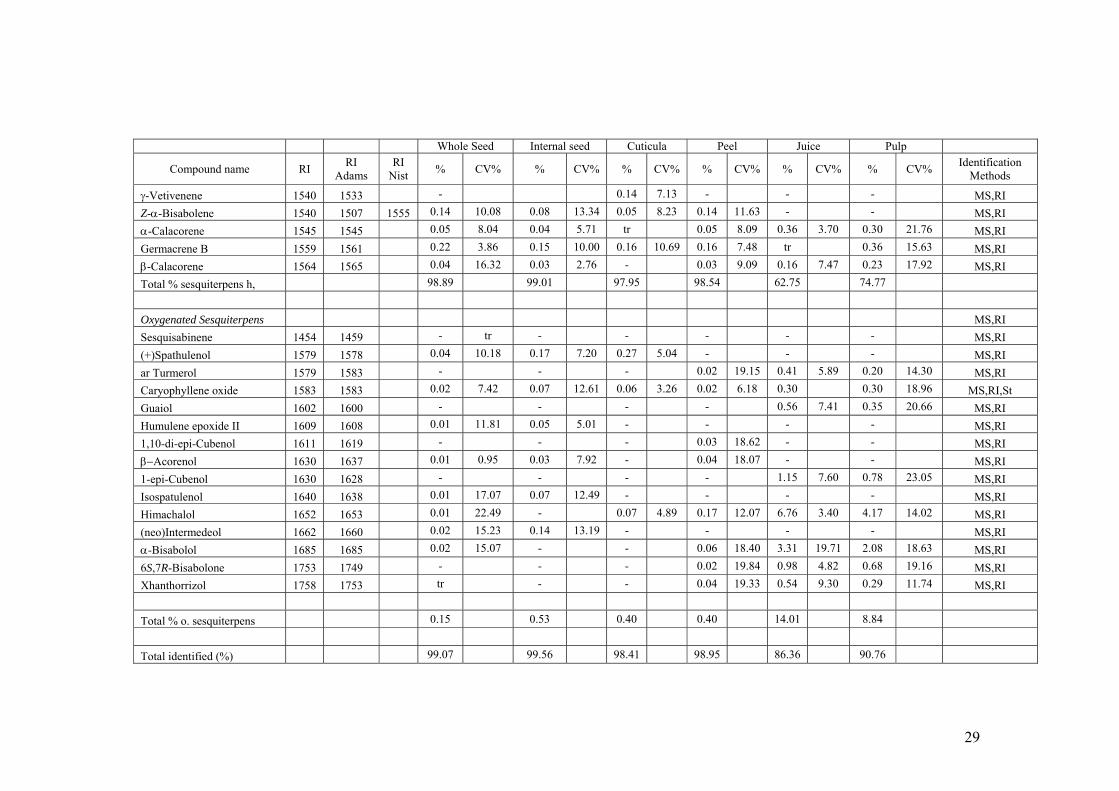
γ-Cuprenene 1537 1533 - - - tr - - MS,RI
29
Whole Seed Internal seed Cuticula Peel Juice Pulp
Compound name RI RI Adams
RI Nist % CV% % CV% % CV% % CV% % CV% % CV% Identification
Methods
γ-Vetivenene 1540 1533 - 0.14 7.13 - - - MS,RI Z-α-Bisabolene 1540 1507 1555 0.14 10.08 0.08 13.34 0.05 8.23 0.14 11.63 - - MS,RI α-Calacorene 1545 1545 0.05 8.04 0.04 5.71 tr 0.05 8.09 0.36 3.70 0.30 21.76 MS,RI Germacrene B 1559 1561 0.22 3.86 0.15 10.00 0.16 10.69 0.16 7.48 tr 0.36 15.63 MS,RI β-Calacorene 1564 1565 0.04 16.32 0.03 2.76 - 0.03 9.09 0.16 7.47 0.23 17.92 MS,RI Total % sesquiterpens h, 98.89 99.01 97.95 98.54 62.75 74.77 Oxygenated Sesquiterpens MS,RI Sesquisabinene 1454 1459 - tr - - - - - MS,RI (+)Spathulenol 1579 1578 0.04 10.18 0.17 7.20 0.27 5.04 - - - MS,RI ar Turmerol 1579 1583 - - - 0.02 19.15 0.41 5.89 0.20 14.30 MS,RI Caryophyllene oxide 1583 1583 0.02 7.42 0.07 12.61 0.06 3.26 0.02 6.18 0.30 0.30 18.96 MS,RI,St Guaiol 1602 1600 - - - - 0.56 7.41 0.35 20.66 MS,RI Humulene epoxide II 1609 1608 0.01 11.81 0.05 5.01 - - - - MS,RI 1,10-di-epi-Cubenol 1611 1619 - - - 0.03 18.62 - - MS,RI β−Acorenol 1630 1637 0.01 0.95 0.03 7.92 - 0.04 18.07 - - MS,RI 1-epi-Cubenol 1630 1628 - - - - 1.15 7.60 0.78 23.05 MS,RI Isospatulenol 1640 1638 0.01 17.07 0.07 12.49 - - - - MS,RI Himachalol 1652 1653 0.01 22.49 - 0.07 4.89 0.17 12.07 6.76 3.40 4.17 14.02 MS,RI (neo)Intermedeol 1662 1660 0.02 15.23 0.14 13.19 - - - - MS,RI α-Bisabolol 1685 1685 0.02 15.07 - - 0.06 18.40 3.31 19.71 2.08 18.63 MS,RI 6S,7R-Bisabolone 1753 1749 - - - 0.02 19.84 0.98 4.82 0.68 19.16 MS,RI Xhanthorrizol 1758 1753 tr - - 0.04 19.33 0.54 9.30 0.29 11.74 MS,RI Total % o. sesquiterpens 0.15 0.53 0.40 0.40 14.01 8.84 Total identified (%) 99.07 99.56 98.41 98.95 86.36 90.76
30
a Values are means of three determinations. They were obtained at FID by peak area normalization calculating the relative response factor (see Table 3.1). b Compounds belonging to each class are listed in order of their elution from a HP-5 column. c RI, retention indices as determined on HP-5 column using homologous series of C8-C30 alkanes. d Identification methods: MS, by comparison of the mass spectrum with those of the computer mass libraries Wiley, NIST 05 and ADAMS; RI, by comparison of RI with those reported from Adams (2007) and NIST 05 (2005); std, by comparison of the retention time, mass spectrum and retention index of authentic standard. etr, traces (mean value below 0.01%).
31
The highest contribution of identified volatiles, in terms of the sum of SPME-GC-FID
peak areas, was given by the peel, as reported in figure 4.6, that proved the richest in
sesquiterpenes hydrocarbons (98.89%) (figure 4.7).
Parts Lychee
0100000020000003000000400000050000006000000700000080000009000000
10000000
wholeseed
internalpart
cuticula peel juice pulp
Peak
are
a (p
A*
FIGURE 4.6 Comparison of identified volatiles in parts of lychee in terms of peak areas.
Among all parts of the investigated fruit, the juice and the pulp (edible part) were the
richest in oxygenated monoterpens, oxygenated sesquiterpens and alcohols, with
respectively Citronellol ( 1.34-1.13%), Himachalol ( 6.76-4.17%) and Ethanol (6.35-
4.06%) being the major components; on the other hand, they do not contain any alkane
(figure 4.7).
Esters were only found in the pulp in very small amounts; Linoleic acid ethyl ester
(0.13%) and Ethyl oleate (0.18%) were the most abundant.
32
FIGURE 4.7 Classes of compounds found in all different parts of the lychee;
M.H.:monoterpen hydrocarbons; M.O.: oxygenated monoterpens; S.H.: sesquiterpens
hydrocarbons; S.O.: oxygenated sesquiterpens
Noteworthy is the fact that in some cases we identified compounds in the internal part of
the seed or in the cuticula that were not found in the whole seed. This was the case for
Heptadecane (0.06%), α-Longipinene (0.18%), Cyclosativene (0.15%), Italicene
(0.15%), Acora-3,7(14)-diene (0.28%), Sesquisabinene (0.87%), β-Acoradiene 10- epi
(1.19%), γ-Muurolene (0.47%) and γ-Cadinene (0.40%) that were found in the cuticula;
Terpinen-4-ol (0.02%) and δ-Cadinene (0.41%) were instead found in the internal part of
the seed. The reverse also occurred, namely that we identified compounds in the whole
seed, i.e. Nonanoic acid (trace), β-Cubebene (0.04 %) and α-Bisabolol (0.02%), that did
not appear, neither in the internal part of the seed nor in the cuticula. The cause of this
phenomenon can be, in some cases, small contaminations caused by the contact between
the seed and the peel or fruit.
0,00
20,00
40,00
60,00
80,00
100,00
wholeseed
internalpart
cuticula peel juice pulp
%
AlcoholsAldehydesAlkanesAromaticsEstersM.H.M.O.S.H.S.O.
33
4.3 ESSENTIAL OIL ANALYSIS.
The mean percentages of essential oil obtained with hydrodistillation and calculated on a
dry weight basis of the peel and the whole seed of the lychee, together with the
percentage of water calculated in all different parts, are shown in table 4.2.
TABLE 4.2. percentage of essential oil (HD) and percentage of water.
The percentage composition of the components identified in the essential oil, obtained
from the whole seed and the peel using GC-MS, is shown together with their retention
indices, in table 4.3.
The percentage composition of each compound is calculated from nine peak areas, which
are the result of three hydrodistillations of both the whole seed and the peel, whereof each
obtained essential oil was analyzed in triplicate.
Part % essential oil % water fresh peel 0.34 26.03
cuticula ‐ 22.32 internal part ‐ 18.30 whole seed 0.04 19.50
pulp ‐ 79.07 juice ‐ 80.95
commercial peel 0.54 13.07 seed 0.04 9.23
34
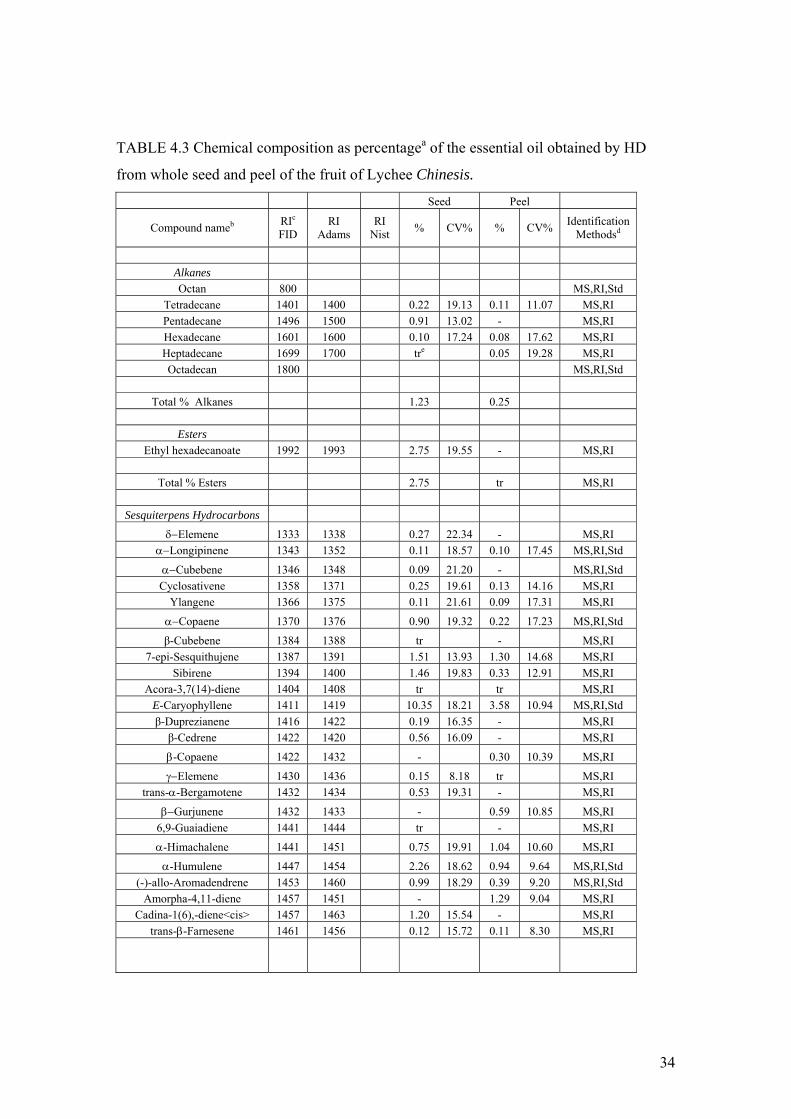
TABLE 4.3 Chemical composition as percentagea of the essential oil obtained by HD
from whole seed and peel of the fruit of Lychee Chinesis.
Seed Peel
Compound nameb RIc FID
RI Adams
RI Nist % CV% % CV% Identification
Methodsd
Alkanes Octan 800 MS,RI,Std
Tetradecane 1401 1400 0.22 19.13 0.11 11.07 MS,RI Pentadecane 1496 1500 0.91 13.02 - MS,RI Hexadecane 1601 1600 0.10 17.24 0.08 17.62 MS,RI Heptadecane 1699 1700 tre 0.05 19.28 MS,RI Octadecan 1800 MS,RI,Std
Total % Alkanes 1.23 0.25
Esters
Ethyl hexadecanoate 1992 1993 2.75 19.55 - MS,RI
Total % Esters 2.75 tr MS,RI
Sesquiterpens Hydrocarbons
δ−Elemene 1333 1338 0.27 22.34 - MS,RI α−Longipinene 1343 1352 0.11 18.57 0.10 17.45 MS,RI,Std
α−Cubebene 1346 1348 0.09 21.20 - MS,RI,Std Cyclosativene 1358 1371 0.25 19.61 0.13 14.16 MS,RI
Ylangene 1366 1375 0.11 21.61 0.09 17.31 MS,RI
α−Copaene 1370 1376 0.90 19.32 0.22 17.23 MS,RI,Std
β-Cubebene 1384 1388 tr - MS,RI 7-epi-Sesquithujene 1387 1391 1.51 13.93 1.30 14.68 MS,RI
Sibirene 1394 1400 1.46 19.83 0.33 12.91 MS,RI Acora-3,7(14)-diene 1404 1408 tr tr MS,RI
E-Caryophyllene 1411 1419 10.35 18.21 3.58 10.94 MS,RI,Std β-Duprezianene 1416 1422 0.19 16.35 - MS,RI β-Cedrene 1422 1420 0.56 16.09 - MS,RI
β-Copaene 1422 1432 - 0.30 10.39 MS,RI
γ−Elemene 1430 1436 0.15 8.18 tr MS,RI trans-α-Bergamotene 1432 1434 0.53 19.31 - MS,RI
β−Gurjunene 1432 1433 - 0.59 10.85 MS,RI 6,9-Guaiadiene 1441 1444 tr - MS,RI
α-Himachalene 1441 1451 0.75 19.91 1.04 10.60 MS,RI
α-Humulene 1447 1454 2.26 18.62 0.94 9.64 MS,RI,Std (-)-allo-Aromadendrene 1453 1460 0.99 18.29 0.39 9.20 MS,RI,Std
Amorpha-4,11-diene 1457 1451 - 1.29 9.04 MS,RI Cadina-1(6),-diene<cis> 1457 1463 1.20 15.54 - MS,RI
trans-β-Farnesene 1461 1456 0.12 15.72 0.11 8.30 MS,RI
35
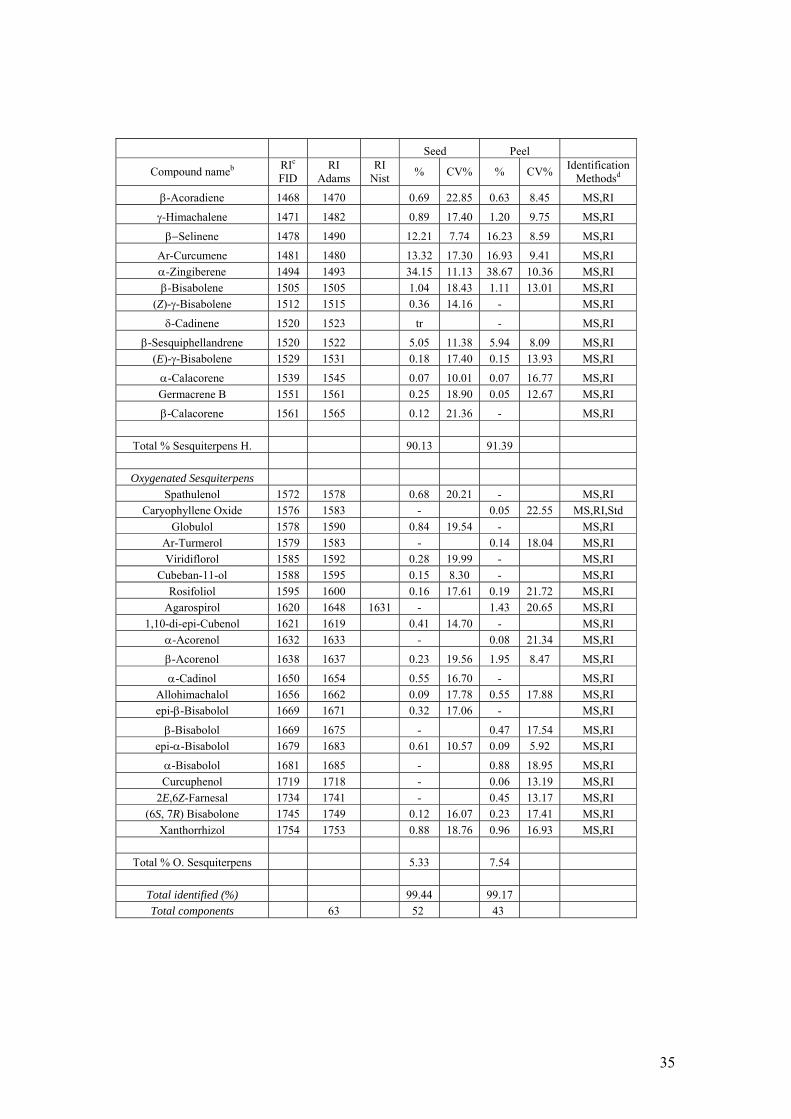
Seed Peel
Compound nameb RIc FID
RI Adams
RI Nist % CV% % CV% Identification
Methodsd
β-Acoradiene 1468 1470 0.69 22.85 0.63 8.45 MS,RI
γ-Himachalene 1471 1482 0.89 17.40 1.20 9.75 MS,RI
β−Selinene 1478 1490 12.21 7.74 16.23 8.59 MS,RI
Ar-Curcumene 1481 1480 13.32 17.30 16.93 9.41 MS,RI α-Zingiberene 1494 1493 34.15 11.13 38.67 10.36 MS,RI β-Bisabolene 1505 1505 1.04 18.43 1.11 13.01 MS,RI
(Z)-γ-Bisabolene 1512 1515 0.36 14.16 - MS,RI
δ-Cadinene 1520 1523 tr - MS,RI
β-Sesquiphellandrene 1520 1522 5.05 11.38 5.94 8.09 MS,RI (E)-γ-Bisabolene 1529 1531 0.18 17.40 0.15 13.93 MS,RI
α-Calacorene 1539 1545 0.07 10.01 0.07 16.77 MS,RI Germacrene B 1551 1561 0.25 18.90 0.05 12.67 MS,RI
β-Calacorene 1561 1565 0.12 21.36 - MS,RI
Total % Sesquiterpens H. 90.13 91.39
Oxygenated Sesquiterpens Spathulenol 1572 1578 0.68 20.21 - MS,RI
Caryophyllene Oxide 1576 1583 - 0.05 22.55 MS,RI,Std Globulol 1578 1590 0.84 19.54 - MS,RI
Ar-Turmerol 1579 1583 - 0.14 18.04 MS,RI Viridiflorol 1585 1592 0.28 19.99 - MS,RI
Cubeban-11-ol 1588 1595 0.15 8.30 - MS,RI Rosifoliol 1595 1600 0.16 17.61 0.19 21.72 MS,RI
Agarospirol 1620 1648 1631 - 1.43 20.65 MS,RI 1,10-di-epi-Cubenol 1621 1619 0.41 14.70 - MS,RI
α-Acorenol 1632 1633 - 0.08 21.34 MS,RI
β-Acorenol 1638 1637 0.23 19.56 1.95 8.47 MS,RI
α-Cadinol 1650 1654 0.55 16.70 - MS,RI Allohimachalol 1656 1662 0.09 17.78 0.55 17.88 MS,RI epi-β-Bisabolol 1669 1671 0.32 17.06 - MS,RI
β-Bisabolol 1669 1675 - 0.47 17.54 MS,RI epi-α-Bisabolol 1679 1683 0.61 10.57 0.09 5.92 MS,RI
α-Bisabolol 1681 1685 - 0.88 18.95 MS,RI Curcuphenol 1719 1718 - 0.06 13.19 MS,RI
2E,6Z-Farnesal 1734 1741 - 0.45 13.17 MS,RI (6S, 7R) Bisabolone 1745 1749 0.12 16.07 0.23 17.41 MS,RI
Xanthorrhizol 1754 1753 0.88 18.76 0.96 16.93 MS,RI
Total % O. Sesquiterpens 5.33 7.54
Total identified (%) 99.44 99.17 Total components 63 52 43
36
a Values are means of three determinations. b Compounds belonging to each class are listed in order of their elution from a HP-5 column. c RI, retention indices as determined on HP-5 column using homologous series of C8-C30 alkanes. d Identification methods: MS, by comparison of the mass spectrum with those of the computer mass libraries Wiley, NIST 05 and ADAMS; RI, by comparison of RI with those reported from Adams (2007) and NIST 05 (2005); std, by comparison of the retention time, mass spectrum and retention index of authentic standard
etr, traces (mean value below 0.01%).
We identified a total of sixty-three compounds, whereof fifty in the whole seed and forty-
two in the peel, representing 99.17-99.44% of the oils under study (table 4.3). The
amount of compounds identified in the whole seed and peel are comparable with the
amounts found with SPME, where we found fifty-one different compounds in the whole
seed and forty-five in the peel.
The sesquiterpene hydrocarbons are in the essential oil the major fraction of identified
compounds, with 90.13-91.39% of the total percentage identified. The major components
were E-β-Caryophyllene (3.58-10.35%), β-Selinene (12.21-16.23%), ar-Curcumene
(13.32-16.93%), α-Zingiberene (34.15-38.67%) and β-Sesquiphellandrene (5.05-5.94%).
Figure 4.8 is an illustration of the sequence of the major volatiles in the chromatograms
obtained with GC-FID for HS-SPME and essential oil with HP-5column and essential oil
with innowax column.
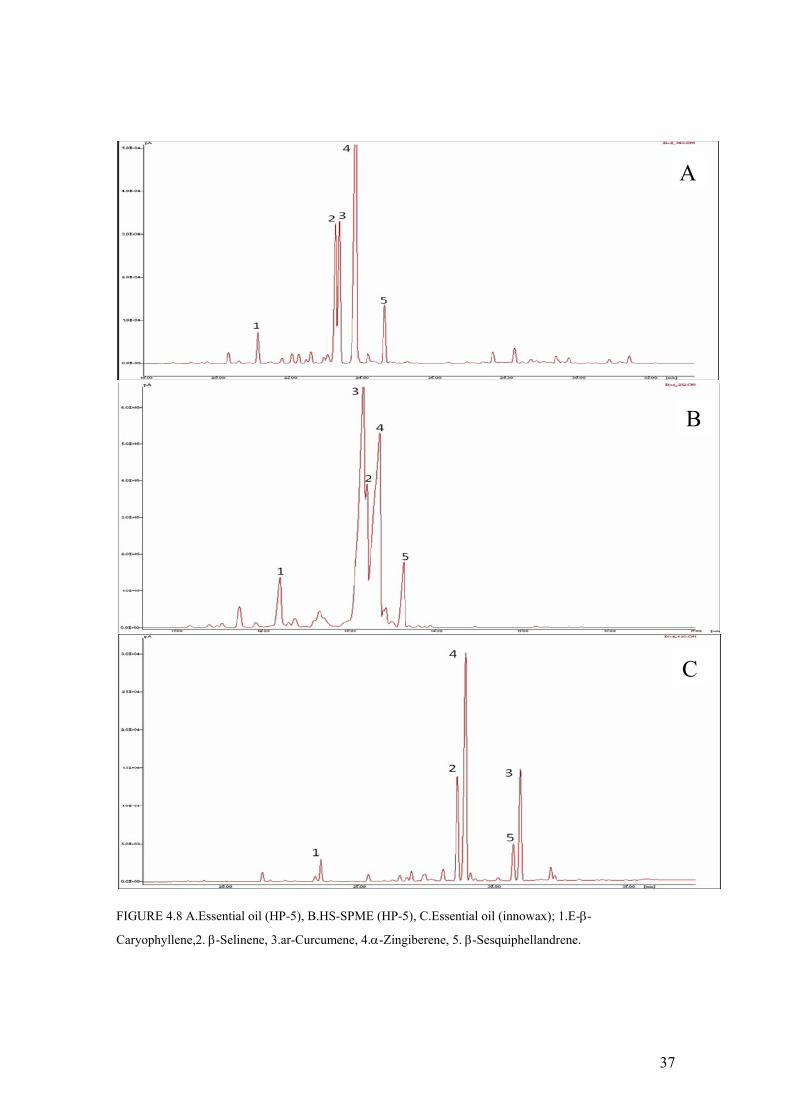
37
FIGURE 4.8 A.Essential oil (HP-5), B.HS-SPME (HP-5), C.Essential oil (innowax); 1.E-β-
Caryophyllene,2. β-Selinene, 3.ar-Curcumene, 4.α-Zingiberene, 5. β-Sesquiphellandrene.
A
C
B
38
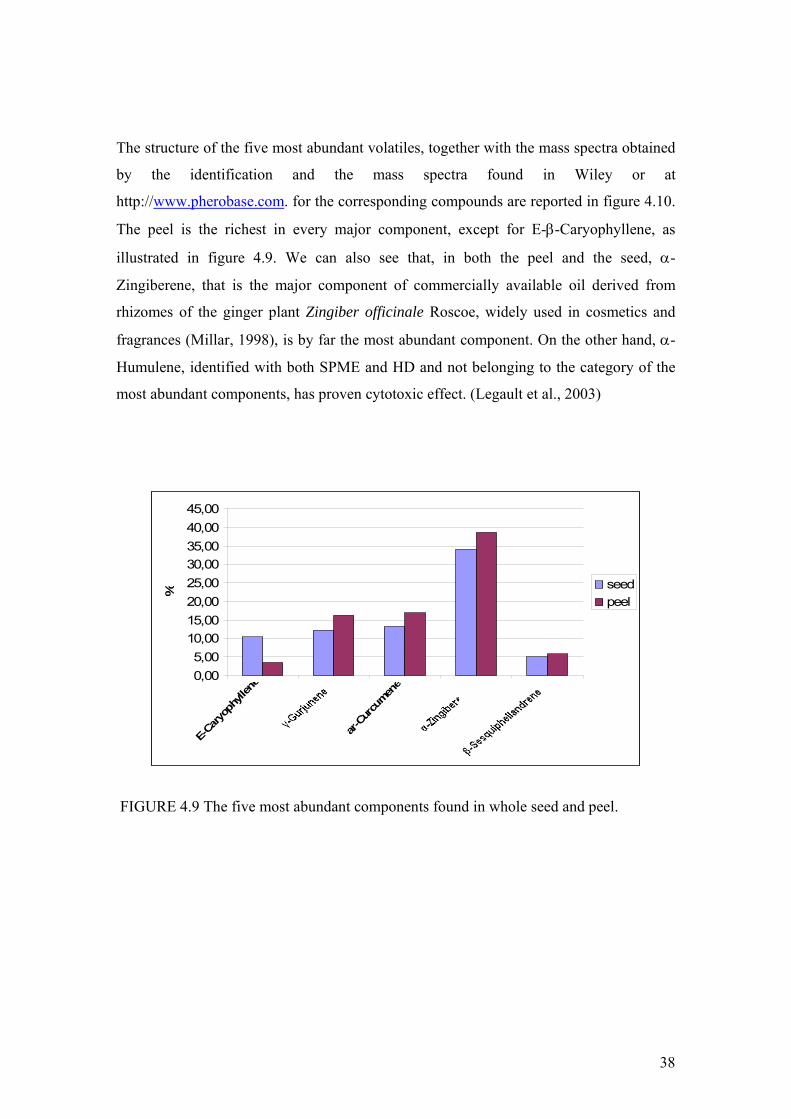
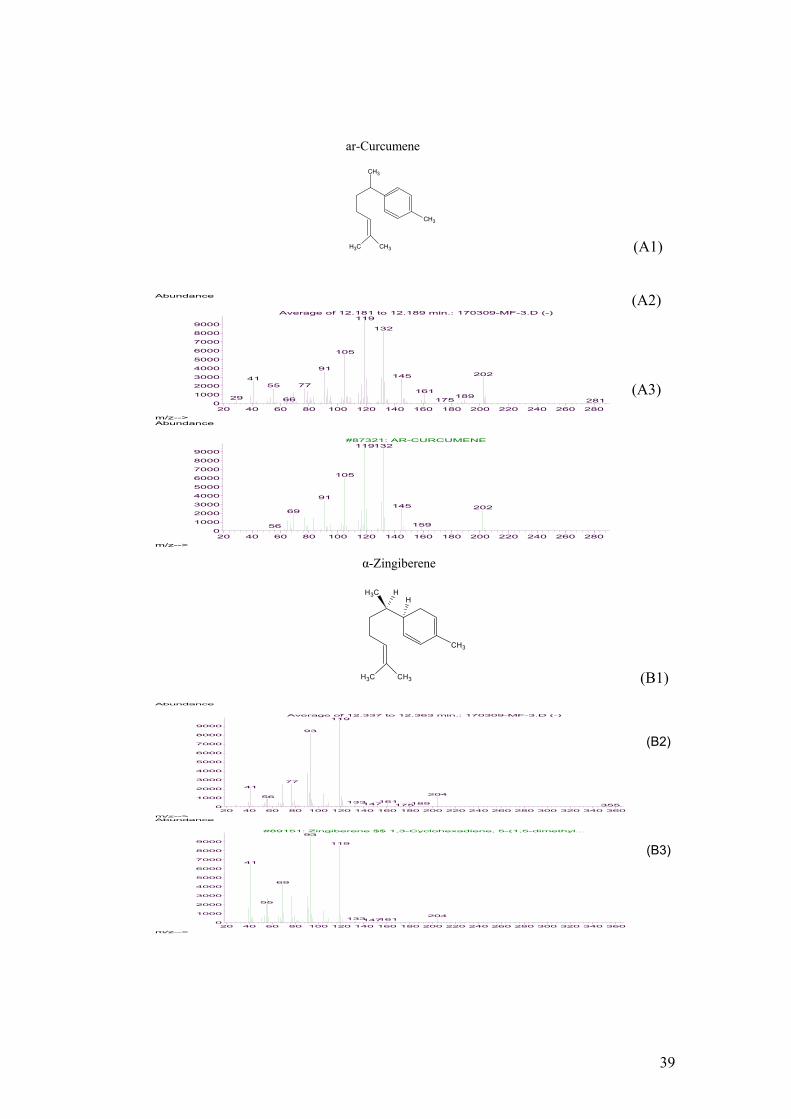
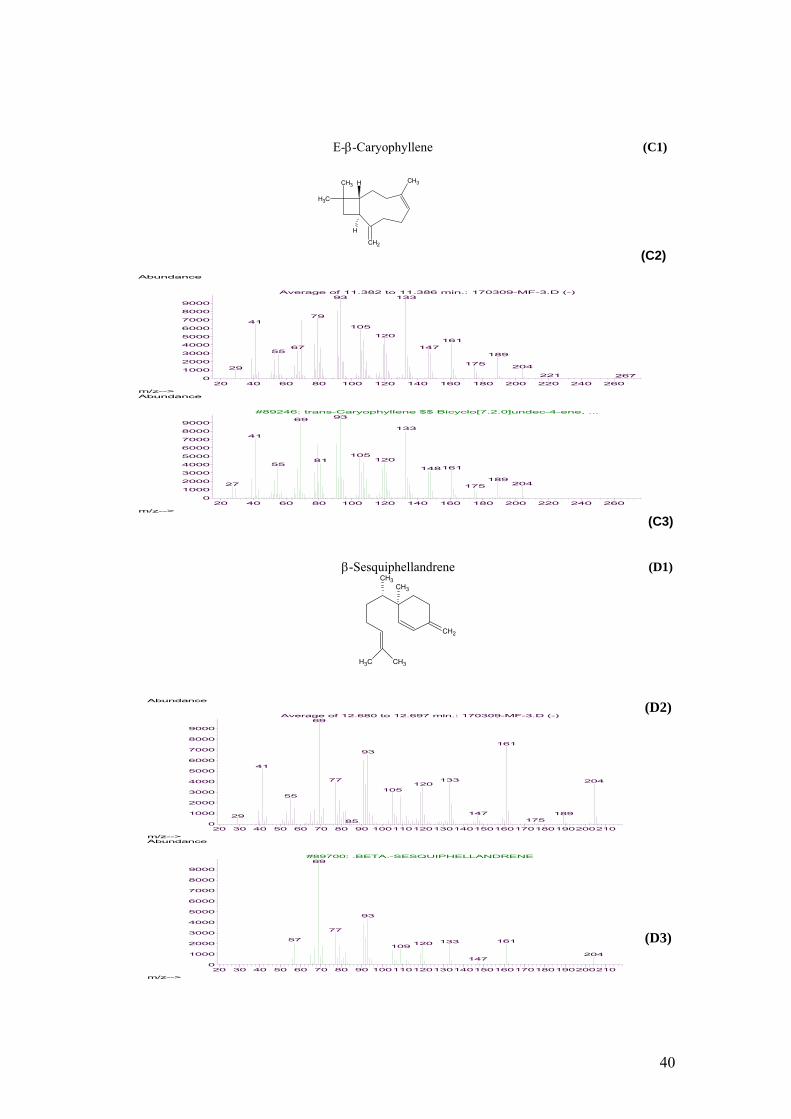
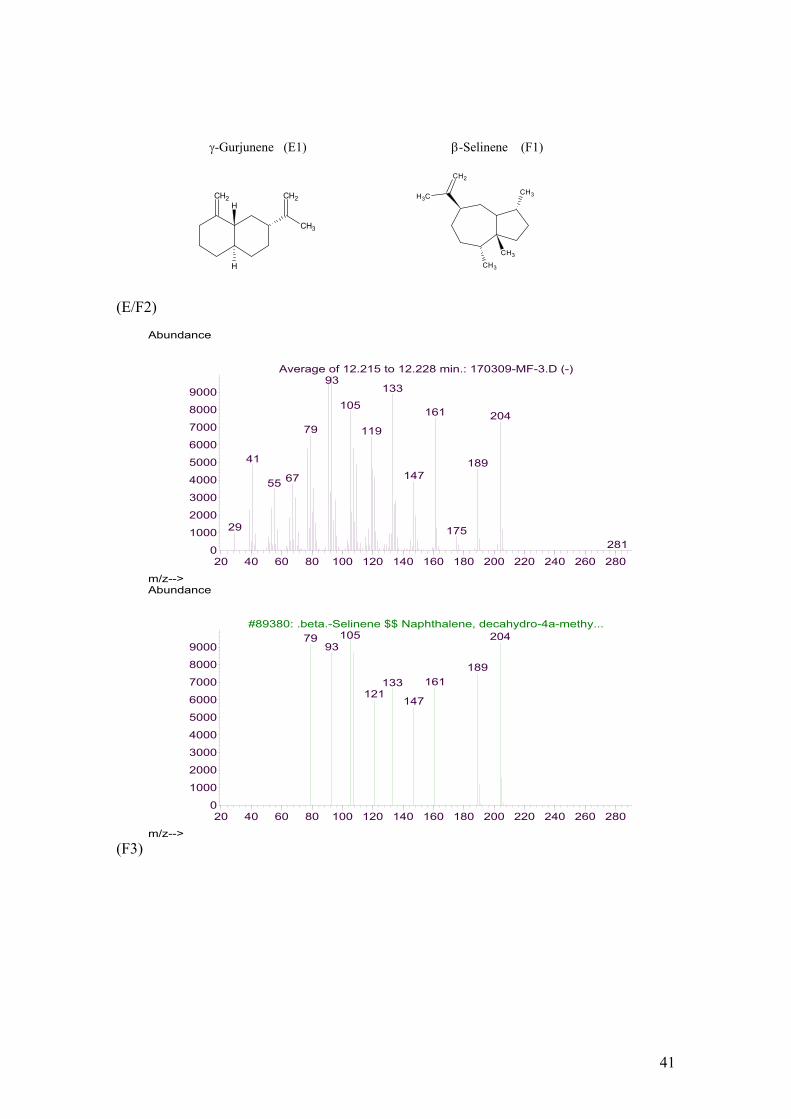
The structure of the five most abundant volatiles, together with the mass spectra obtained
by the identification and the mass spectra found in Wiley or at
http://www.pherobase.com. for the corresponding compounds are reported in figure 4.10.
The peel is the richest in every major component, except for E-β-Caryophyllene, as
illustrated in figure 4.9. We can also see that, in both the peel and the seed, α-
Zingiberene, that is the major component of commercially available oil derived from
rhizomes of the ginger plant Zingiber officinale Roscoe, widely used in cosmetics and
fragrances (Millar, 1998), is by far the most abundant component. On the other hand, α-
Humulene, identified with both SPME and HD and not belonging to the category of the
most abundant components, has proven cytotoxic effect. (Legault et al., 2003)
FIGURE 4.9 The five most abundant components found in whole seed and peel.
0,005,00
10,0015,0020,0025,0030,0035,0040,0045,00
E-Ca
ryoph
yllen
e
ar-Cu
rcumen
e
% seedpeel
39
ar-Curcumene
CH3
CH3 CH3
CH3
(A1)
(A2)
(A3) α-Zingiberene
CH3
CH3 CH3
CH3 HH
(B1)
(B2)
(B3)
20 40 60 80 100 120 140 160 180 200 220 240 260 2800
1000
2000
3000
4000
5000
6000
7000
8000
9000
m/z-->
Abundance
Average of 12.181 to 12.189 min.: 170309-MF-3.D (-)119
132
105
9120214541
7755161
18929 66 175 281
20 40 60 80 100 120 140 160 180 200 220 240 260 2800
1000
2000
3000
4000
5000
6000
7000
8000
9000
m/z-->
Abundance
#87321: AR-CURCUMENE119132
105
91
145 20269
15956
20 40 60 80 100 120 140 160 180 200 220 240 260 280 300 320 340 3600
1000
2000
3000
4000
5000
6000
7000
8000
9000
m/z-->
Abundance
Average of 12.337 to 12.363 min.: 170309-MF-3.D (-)119
93
7741
20456
161133 189147 175 355
20 40 60 80 100 120 140 160 180 200 220 240 260 280 300 320 340 3600
1000
2000
3000
4000
5000
6000
7000
8000
9000
m/z-->
Abundance
#89151: Zingiberene $$ 1,3-Cyclohexadiene, 5-(1,5-dimethyl...93
119
41
69
55
204133 161147
40
E-β-Caryophyllene (C1)
CH3
CH3CH3
CH2
H
H
(C2)
(C3) β-Sesquiphellandrene (D1)
CH2
CH3 CH3
CH3CH3
(D2) (D3)
20 30 40 50 60 70 80 90 1001101201301401501601701801902002100
1000
2000
3000
4000
5000
6000
7000
8000
9000
m/z-->
Abundance
Average of 12.680 to 12.697 min.: 170309-MF-3.D (-)69
161
93
41
13377 204120
10555
147 1892917585
20 30 40 50 60 70 80 90 1001101201301401501601701801902002100
1000
2000
3000
4000
5000
6000
7000
8000
9000
m/z-->
Abundance
#89700: .BETA.-SESQUIPHELLANDRENE69
93
77
57 161133120109
204147
20 40 60 80 100 120 140 160 180 200 220 240 2600
1000
2000
3000
4000
5000
6000
7000
8000
9000
m/z-->
Abundance
Average of 11.382 to 11.386 min.: 170309-MF-3.D (-)13393
7941
105
120161
1476755
189
175 20429221 267
20 40 60 80 100 120 140 160 180 200 220 240 2600
1000
2000
3000
4000
5000
6000
7000
8000
9000
m/z-->
Abundance
#89246: trans-Caryophyllene $$ Bicyclo[7.2.0]undec-4-ene, ...9369
13341
10512081
55161148
18920427 175
41
γ-Gurjunene (E1) β-Selinene (F1)
CH2 CH2
CH3
H
H
CH2
CH3CH3
CH3
CH3
(E/F2)
(F3)
20 40 60 80 100 120 140 160 180 200 220 240 260 2800
1000
2000
3000
4000
5000
6000
7000
8000
9000
m/z-->
Abundance
Average of 12.215 to 12.228 min.: 170309-MF-3.D (-)93
133
105161 204
79 119
41 1891476755
29 175281
20 40 60 80 100 120 140 160 180 200 220 240 260 2800
1000
2000
3000
4000
5000
6000
7000
8000
9000
m/z-->
Abundance
#89380: .beta.-Selinene $$ Naphthalene, decahydro-4a-methy...105 20479
93
189161133
121147
42
γ-Gurjunene (E4)
β-Selinene (F4)
FIGURE 4.10 structure (A1- E1); mass spectra obtained by our identification (A2-F2),
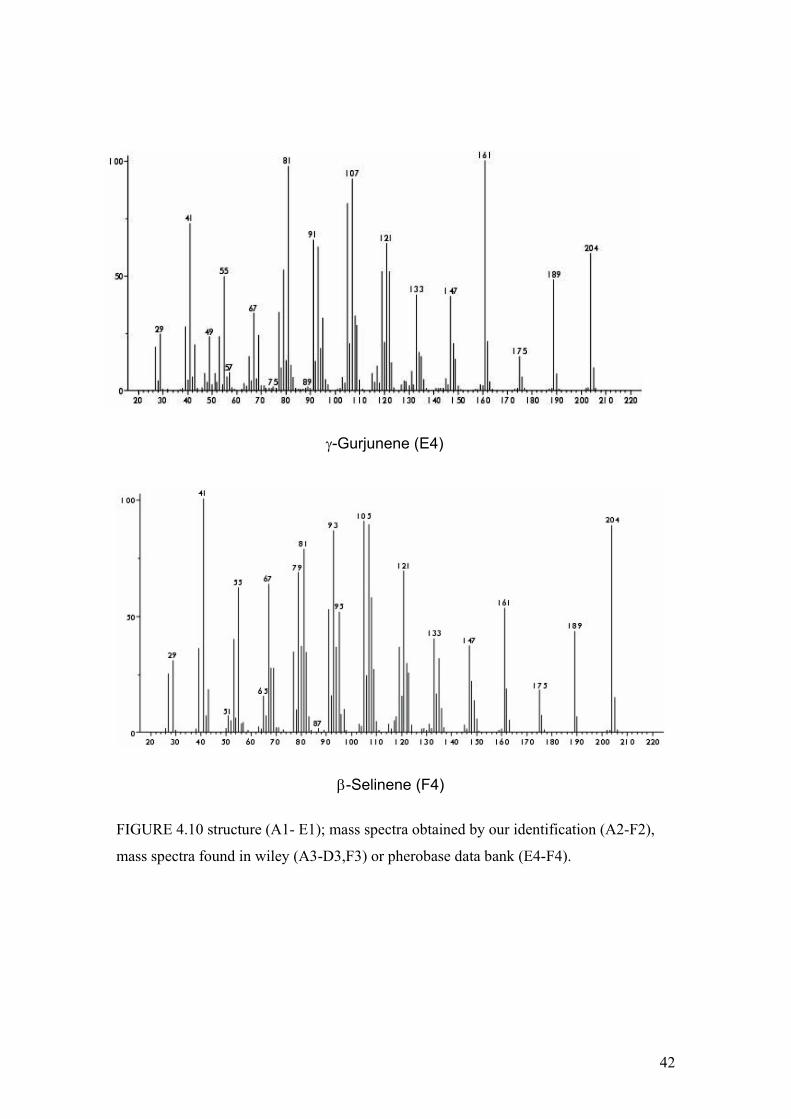
mass spectra found in wiley (A3-D3,F3) or pherobase data bank (E4-F4).
43
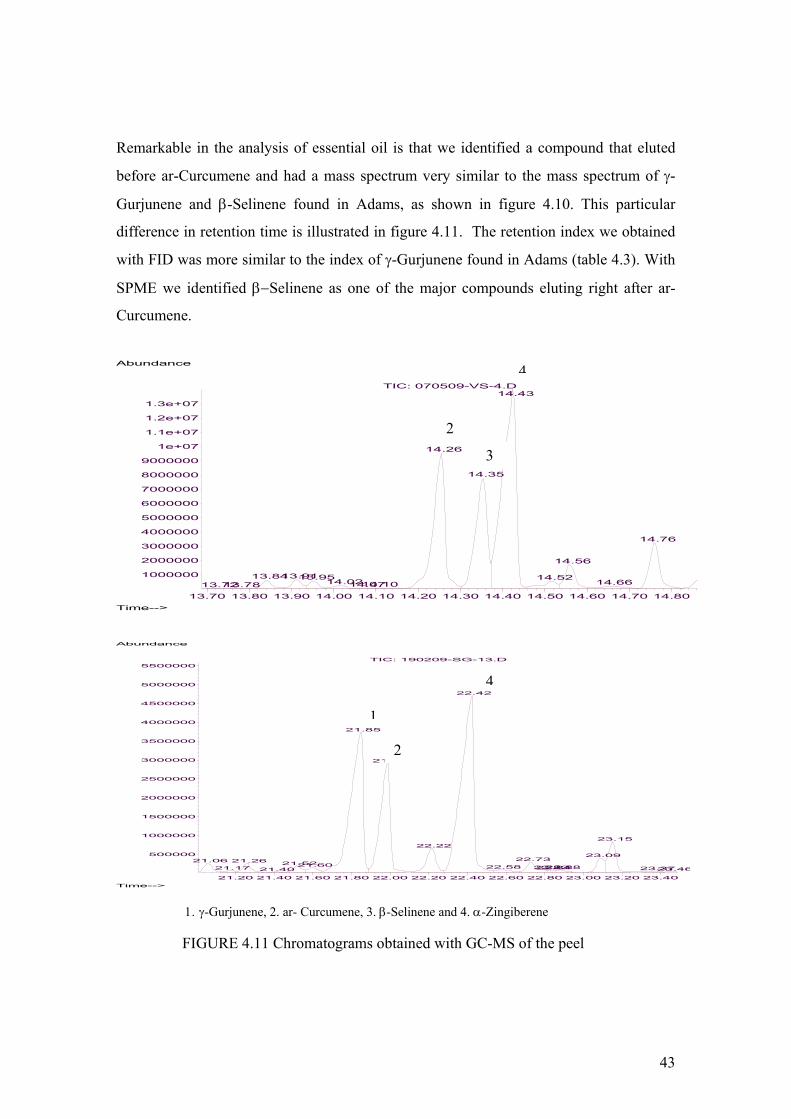
Remarkable in the analysis of essential oil is that we identified a compound that eluted
before ar-Curcumene and had a mass spectrum very similar to the mass spectrum of γ-
Gurjunene and β-Selinene found in Adams, as shown in figure 4.10. This particular
difference in retention time is illustrated in figure 4.11. The retention index we obtained
with FID was more similar to the index of γ-Gurjunene found in Adams (table 4.3). With
SPME we identified β−Selinene as one of the major compounds eluting right after ar-
Curcumene.
13.70 13.80 13.90 14.00 14.10 14.20 14.30 14.40 14.50 14.60 14.70 14.80
1000000
2000000
3000000
4000000
5000000
6000000
7000000
8000000
9000000
1e+07
1.1e+07
1.2e+07
1.3e+07
Time-->
Abundance
TIC: 070509-VS-4.D
13.72 13.78 13.84 13.91 13.95
14.02 14.07 14.10
14.26
14.35
14.43
14.52
14.56
14.66
14.76
21.20 21.40 21.60 21.80 22.00 22.20 22.40 22.60 22.80 23.00 23.20 23.40
500000
1000000
1500000
2000000
2500000
3000000
3500000
4000000
4500000
5000000
5500000
Time-->
Abundance
TIC: 190209-SG-13.D
21.06 21.17
21.26
21.40 21.52 21.60
21.85
21.99
22.22
22.42
22.58 22.73
22.82 22.84 22.88
23.09
23.15
23.37 23.46
1. γ-Gurjunene, 2. ar- Curcumene, 3. β-Selinene and 4. α-Zingiberene FIGURE 4.11 Chromatograms obtained with GC-MS of the peel
2
3
1
2
4
4
44
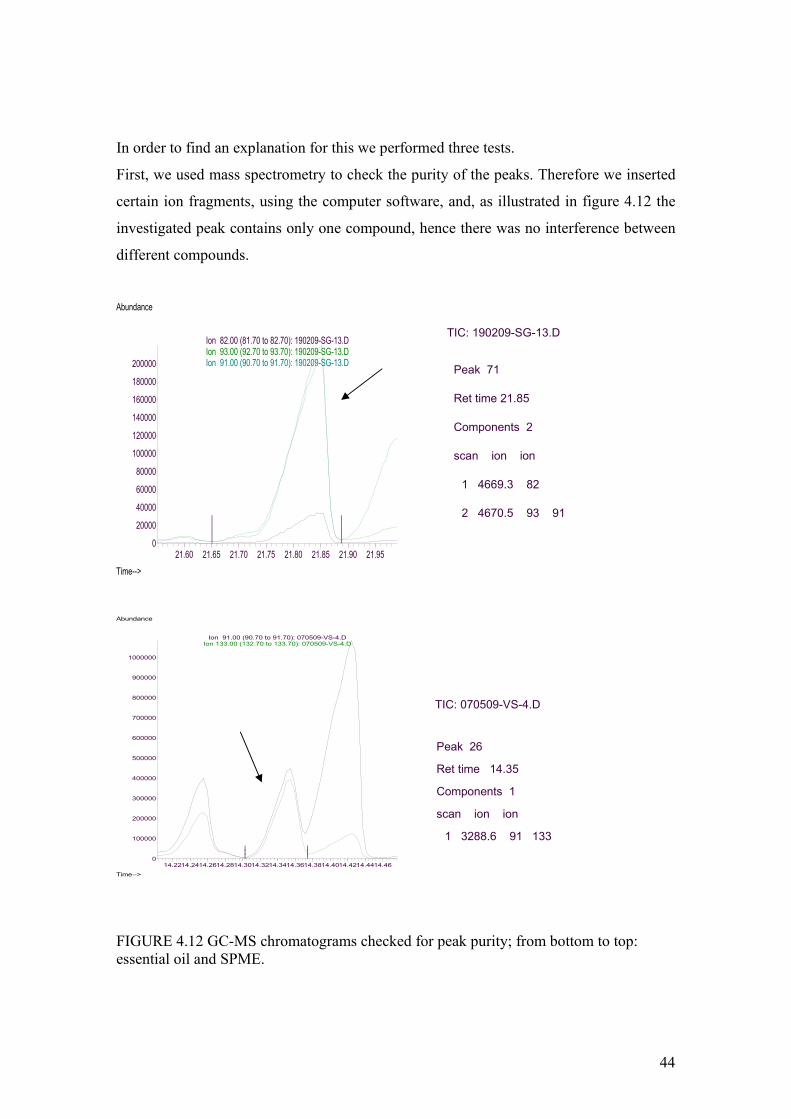
In order to find an explanation for this we performed three tests.
First, we used mass spectrometry to check the purity of the peaks. Therefore we inserted
certain ion fragments, using the computer software, and, as illustrated in figure 4.12 the
investigated peak contains only one compound, hence there was no interference between
different compounds.
FIGURE 4.12 GC-MS chromatograms checked for peak purity; from bottom to top: essential oil and SPME.
TIC: 070509-VS-4.D
1 3288.6 91 133
scan ion ion
Components 1
Ret time 14.35
Peak 26
TIC: 190209-SG-13.D
2 4670.5 93 91
1 4669.3 82
scan ion ion
Components 2
Ret time 21.85
Peak 71
21.60 21.65 21.70 21.75 21.80 21.85 21.90 21.950
20000
40000
60000
80000
100000
120000
140000
160000
180000
200000
Time-->
Abundance
Ion 82.00 (81.70 to 82.70): 190209-SG-13.D
|||
|||
Ion 93.00 (92.70 to 93.70): 190209-SG-13.DIon 91.00 (90.70 to 91.70): 190209-SG-13.D
14.2214.2414.2614.2814.3014.3214.3414.3614.3814.4014.4214.4414.460
100000
200000
300000
400000
500000
600000
700000
800000
900000
1000000
Time-->
Abundance
Ion 91.00 (90.70 to 91.70): 070509-VS-4.D
|||
|||
Ion 133.00 (132.70 to 133.70): 070509-VS-4.D
45
Secondly, we performed SPME using essential oil as a sample, in order to check the
possibility that SPME inverted the order of the elution of compounds. Based on the
chromatograms obtained from this analysis, we can say that the SPME could invert the
eluting order of compounds.
For our last investigation, we changed the column of the GC to a more polar one, namely
innowax. This analysis, as illustrated in figure 4.8C, showed us that peak 2 can be
identified as β-Selinene instead of γ-Gurjunene. This considering the very similar
retention index obtained, namely 1710 obtained with FID against 1711 found in the
pherobase data bank.
4.3 ESSENTIAL OIL ANALYSIS OF COMMERCIAL SAMPLE.
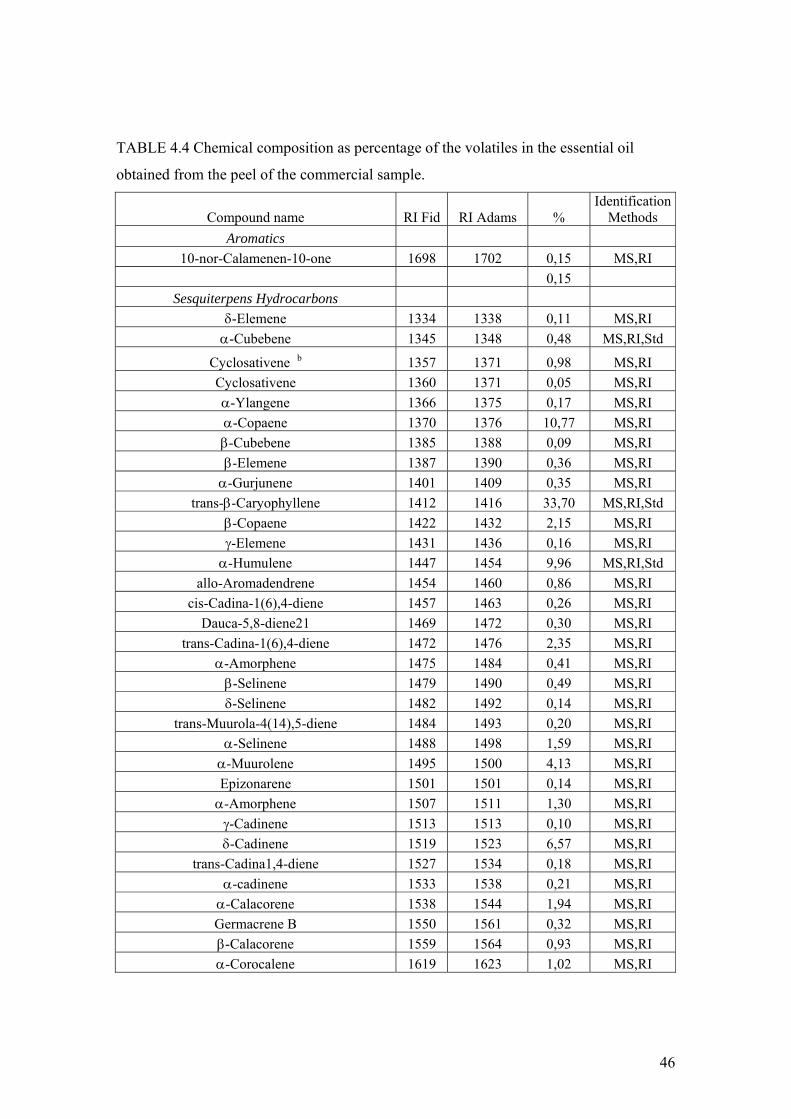
As a last research activity, we decided to do an ultimate analysis on the peel of the
commercial sample that has already been mentioned in chapter 3.1. To our surprise, we
identified different volatiles compared to those identified in the fresh sample. All
identified compounds are reported in table 4.4. The four major volatiles in this sample are
α-Copaene (10.77%), trans-β−Caryophyllene (33.70%), α-Humulene (9.96%) and δ-
Cadinene (6.57%). α-Zingiberene, β-Sesquiphellandrene and ar-Curcumene, three of the
major compounds found in the fresh sample cannot be found in this sample. β-Selinene is
identified, but is only present in very small amount. To explain this discrepancy further
research is needed.
46
TABLE 4.4 Chemical composition as percentage of the volatiles in the essential oil
obtained from the peel of the commercial sample.
Compound name RI Fid RI Adams % Identification
Methods Aromatics
10-nor-Calamenen-10-one 1698 1702 0,15 MS,RI 0,15
Sesquiterpens Hydrocarbons δ-Elemene 1334 1338 0,11 MS,RI
α-Cubebene 1345 1348 0,48 MS,RI,Std
Cyclosativene b 1357 1371 0,98 MS,RI Cyclosativene 1360 1371 0,05 MS,RI α-Ylangene 1366 1375 0,17 MS,RI α-Copaene 1370 1376 10,77 MS,RI β-Cubebene 1385 1388 0,09 MS,RI β-Elemene 1387 1390 0,36 MS,RI
α-Gurjunene 1401 1409 0,35 MS,RI trans-β-Caryophyllene 1412 1416 33,70 MS,RI,Std
β-Copaene 1422 1432 2,15 MS,RI γ-Elemene 1431 1436 0,16 MS,RI
α-Humulene 1447 1454 9,96 MS,RI,Std allo-Aromadendrene 1454 1460 0,86 MS,RI
cis-Cadina-1(6),4-diene 1457 1463 0,26 MS,RI Dauca-5,8-diene21 1469 1472 0,30 MS,RI
trans-Cadina-1(6),4-diene 1472 1476 2,35 MS,RI α-Amorphene 1475 1484 0,41 MS,RI
β-Selinene 1479 1490 0,49 MS,RI δ-Selinene 1482 1492 0,14 MS,RI
trans-Muurola-4(14),5-diene 1484 1493 0,20 MS,RI α-Selinene 1488 1498 1,59 MS,RI
α-Muurolene 1495 1500 4,13 MS,RI Epizonarene 1501 1501 0,14 MS,RI
α-Amorphene 1507 1511 1,30 MS,RI γ-Cadinene 1513 1513 0,10 MS,RI δ-Cadinene 1519 1523 6,57 MS,RI
trans-Cadina1,4-diene 1527 1534 0,18 MS,RI α-cadinene 1533 1538 0,21 MS,RI
α-Calacorene 1538 1544 1,94 MS,RI Germacrene B 1550 1561 0,32 MS,RI β-Calacorene 1559 1564 0,93 MS,RI α-Corocalene 1619 1623 1,02 MS,RI
47
Compound name RI Fid RI Adams % Identification
Methods Cadalene 1671 1676 1,19 MS,RI
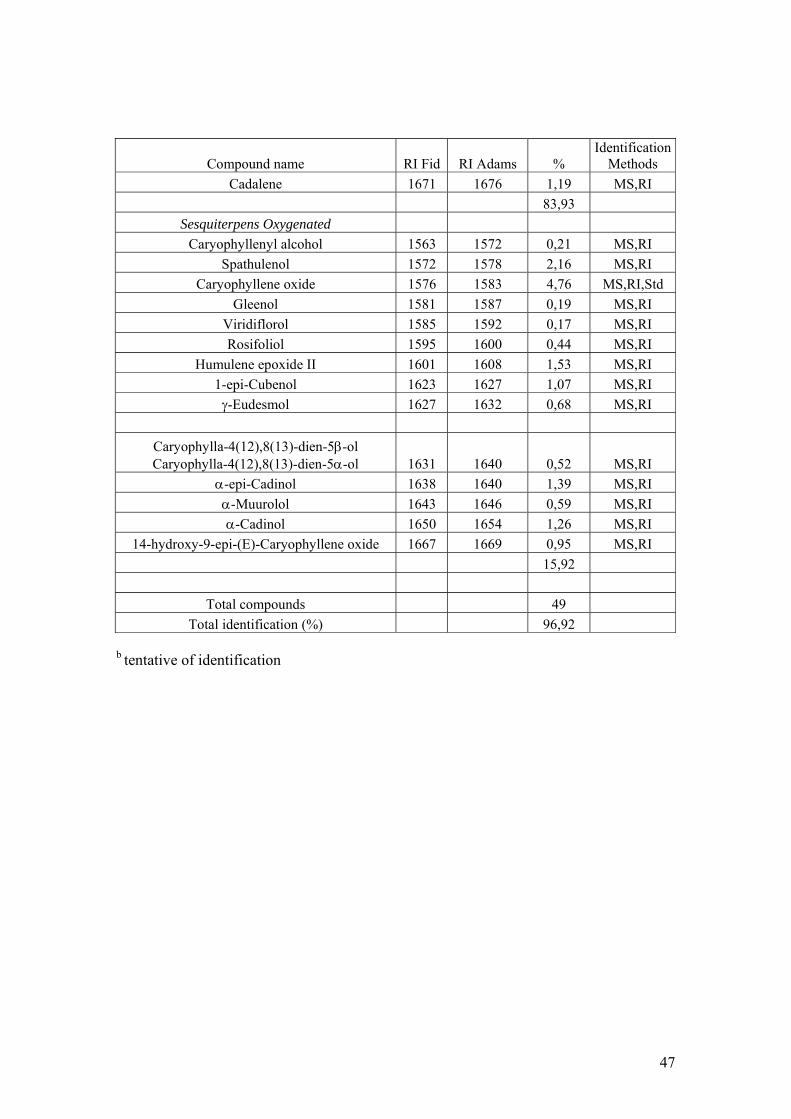
83,93 Sesquiterpens Oxygenated
Caryophyllenyl alcohol 1563 1572 0,21 MS,RI Spathulenol 1572 1578 2,16 MS,RI
Caryophyllene oxide 1576 1583 4,76 MS,RI,Std Gleenol 1581 1587 0,19 MS,RI
Viridiflorol 1585 1592 0,17 MS,RI Rosifoliol 1595 1600 0,44 MS,RI
Humulene epoxide II 1601 1608 1,53 MS,RI 1-epi-Cubenol 1623 1627 1,07 MS,RI
γ-Eudesmol 1627 1632 0,68 MS,RI
Caryophylla-4(12),8(13)-dien-5β-ol Caryophylla-4(12),8(13)-dien-5α-ol 1631 1640 0,52 MS,RI
α-epi-Cadinol 1638 1640 1,39 MS,RI α-Muurolol 1643 1646 0,59 MS,RI α-Cadinol 1650 1654 1,26 MS,RI
14-hydroxy-9-epi-(E)-Caryophyllene oxide 1667 1669 0,95 MS,RI 15,92
Total compounds 49 Total identification (%) 96,92
b tentative of identification
48
5.CONCLUSIONS The volatile compounds in the different parts of the litchi chinesis fruit were identified
and a comparison between identification with HS-SPME and HD was made.
For both extraction methods a high percentage of identification was obtained, i.e. 86.39-
99.56% with HS-SPME and 99.17-99.44% with HD. The five major volatiles, E-β-
Caryophyllene, ar-Curcumene, β-Selinene, α-Zingiberene and β-Sesquiphellandrene,
were the same for both extraction methods and also the amount of different compounds
identified in the whole seed and the peel were comparable, 51-49 with SPME and 52-43
with HD, respectively. Another similarity between both extraction methods was that the
highest percentage of identified volatiles belonging to the class of sesquiterpene
hydrocarbons. In the analysis with SPME we saw that the whole seed gave the highest
contribution of identified volatiles and the lowest contribution was given by the edible
part. The highest contribution of oxygenated sesquiterpens was identified in the juice and
the pulp. In general, the percentage of oxygenated sesquiterpens was higher upon
hydrodistillation.
Since the peel and the seed are richer in volatile compounds than the edible part and since
they contain several interesting volatile compounds, like α-Zingiberene and α-Humulene
they could be of great potential for the perfumery and pharmaceutical industry.
The commercial sample contains a high concentration of volatiles different from those
identified in the fresh sample. There, the four major volatiles are α-Copaene, trans-β-
Caryophyllene, α-Humulene and δ-Cadinene. Further investigation is needed to explain
the difference between the two samples and to unravel the biochemical processes that
might be responsible changes in the composition of volatile compounds.
49
References Adams, R. P. (2007). Identification of essential oil components by gas
chromatography/mass spectrometry. Carol Stream, Illinois: Allured Publishing
Corporation.
Blanc, M-C.; Bradesi, P.; Gonçalves, M.J. ; Salgueiro L. ; Cassanova, J.(2006).
Essential oil of Dittrichia viscosa ssp.viscosa : analysis by 13C-NMR and antimicrobial
activity. Flavour Fragr. J., 21, 324-332.
Chowdhury,J.U.; Nandi, N.C.; Bhuiyan, N.I.; Mobarok, M.H.(2008). Essential oil
constitituents of the rhizomes of two types of Curcuma longa of Bangladesh. Bangladesh
J. Sci. Ind. Res, 43(2), 259-266.
Chyau, C.C.; Ko, P.T.; Chang, C.H.; Mau, J.L.(2003). Free and glycosidically bound
aroma compounds in lychee (litchi chinesis Sonn.). Food Chem., 80, 387-392.
http://www.chromtech.net.au/kovats_ri.cfm http://www.groentenfruit.nl/index_product.asp?pg=2&cpg=15&p=102&r=9 http://www.hort.purdue.edu/newcrop/morton/lychee.html http://www.lycheesonline.com/lycheedescription.cfm http://www.pherobase.com http://www.springerlink.com/content/h72xx3624q122085/fulltext.pdf Johnston, J.C.; Welch, R.C.; Hunter, G.L.K. (1980). Volatile Constituents of Litchi
(Litchi chinesis Sonn.). J.Agric. Food Chem., 28, 859-861.
Kingston, F.G.; Larsen, B.S.; McEwen, C.N. (1996). Gas Chromatography and Mass
Spectrometry: A practical Guide ,Academic Press, London, UK.

50
Kolb, B.; Ettre, L.S.(1997).General Introduction; Theoretical Background of Headspace –
Gas Chromatography and Its Applications. In: Static Headspace-Gas Chromatography:
Theory and Practice, Wiley-VCH, Inc., New York, USA, pp.1-7, 13-16.
Legault, J.; Dahl,W.; Debiton, E.; Pichette, A.; Madelmont,J.C.(2003). Antitumor activity
of balsam fir oil: production of reactive oxygen species induced by alpha-humulene as
possible mechanism of action. Planta-Med, 69(5): 402-7.
Mahattanatawee, K.; Perez-Cacho, P.R.; Davenport, T.; Rouseff, R.(2007). Comparison
of three lychee cultivar odor profiles using gas chromatography-olfactometry and gas
chromatography-sulfur detection. J.Agric. Food Chem., 55, 1939-1944.
Millar, J. G. (1998). Rapid and Simple Isolation of Zingiberene from Ginger Essential
Oil. Journal of Natural Products, 61, 1025-1026.
NIST 05. (2005). Mass spectral library (NIST/EPA/NIH). Gaithersburg, USA: National
Institute of Standards and Technology.
Ong, P.K.C.; Acree, T.E. (1998). Gas Chromatography/Olfactory Analysis of Lychee
(Litchi chinesis Sonn.). J.Agric. Food Chem., 46, 2282-2286.
Pawliszyn, J.(1997). Solid Phase Microextraction Theory and Practice, Wiley-VCH.Inc.,
New York, USA.
Sakata,S.K.;Taniguchi, S.; Rodrigues,D.F.; Urano, M.E.; Wandermüren, M.E.; Pellizari,
V.H.; Comasseto, J.V.(2004). Development of a static headspace gas
chromatographic/mass spectrometric method to analyze the level of volatile contaminants
biodegradation.Journal of Chromatography, 10.1016/j.chroma.2004.07.021.
Scheppers Wercinski, S.A. (1999). Solid Phase Microextraction, CRC Press, Taylor and
Francis Group, Florida, USA.

51
Scott, R.P.W. (1995). Principles and practice of chromatography, CRC Press, Taylor and
Francis Group, Florida, USA.
Zhang, C.; Qi, M.; Shao, Q.; Zhou, S. ; Fu, R.(2007). Analysis of volatile compounds
Ligusticum chuanxiong Hort. using HS-SPME-GC-MS. J. Pharm. and Biomed. Analysis,
44, 464-470.

52