Les 8 - informatie visualisatie
46
Informatie visualisatie: Les 8 Joris Klerkx - Erik Duval http://hci.cs.kuleuven.be [email protected] Human-Computer Interaction Dept. Computerwetenschappen KU Leuven 1
-
Upload
joris-klerkx -
Category
Education
-
view
293 -
download
2
Transcript of Les 8 - informatie visualisatie
Informatie visualisatie: Les 8
Joris Klerkx - Erik Duval http://hci.cs.kuleuven.be [email protected]
Human-Computer InteractionDept. ComputerwetenschappenKU Leuven
1

Paper
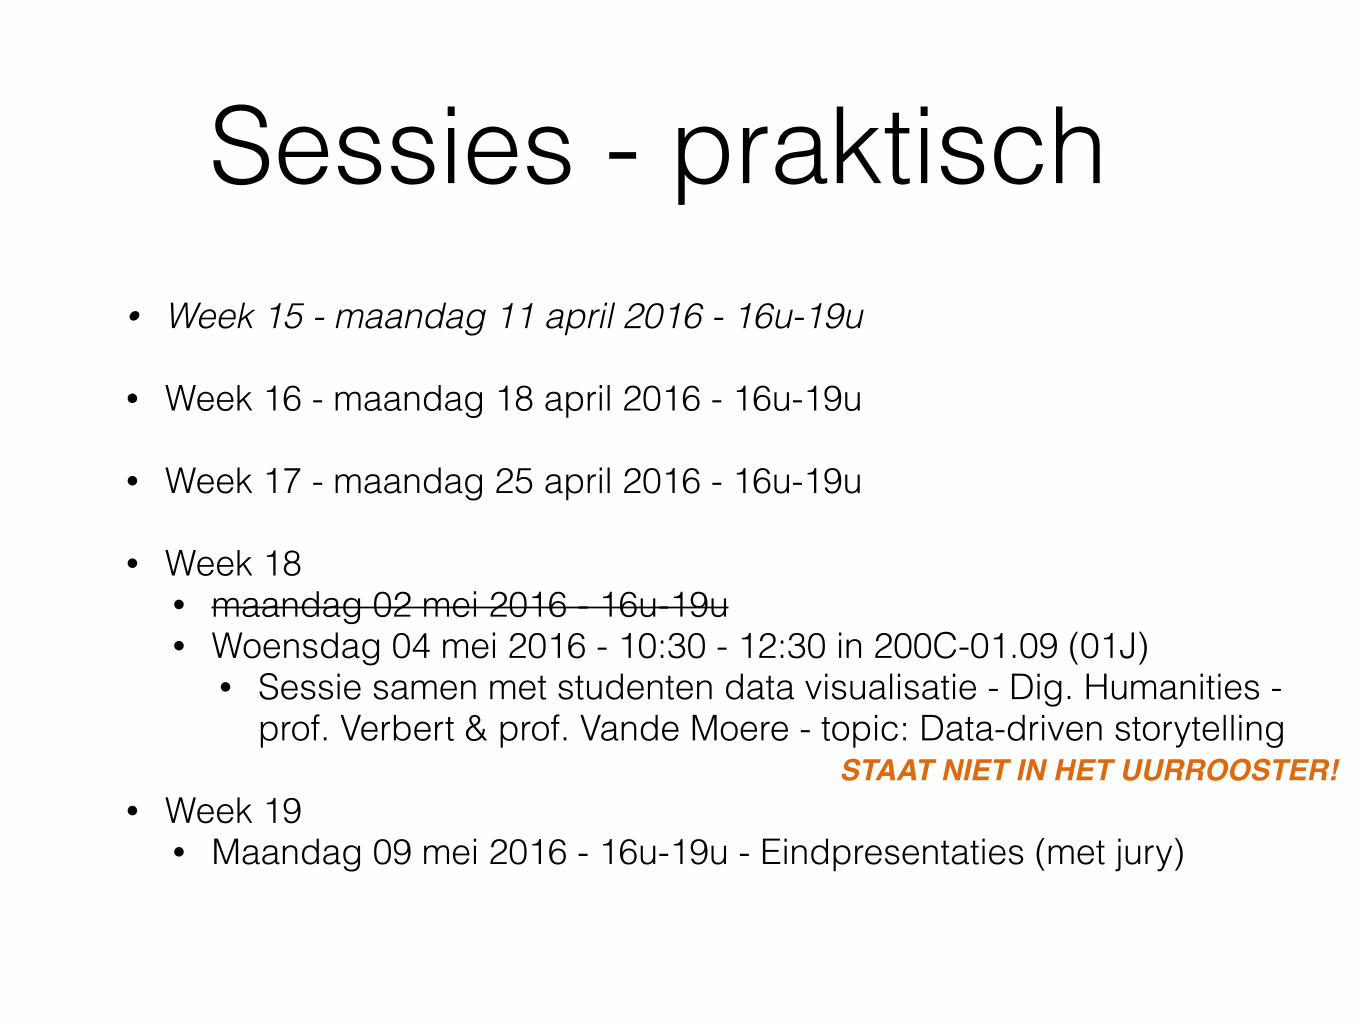
Sessies - praktisch • Week 15 - maandag 11 april 2016 - 16u-19u
• Week 16 - maandag 18 april 2016 - 16u-19u
• Week 17 - maandag 25 april 2016 - 16u-19u
• Week 18 • maandag 02 mei 2016 - 16u-19u • Woensdag 04 mei 2016 - 10:30 - 12:30 in 200C-01.09 (01J)
• Sessie samen met studenten data visualisatie - Dig. Humanities - prof. Verbert & prof. Vande Moere - topic: Data-driven storytelling
• Week 19 • Maandag 09 mei 2016 - 16u-19u - Eindpresentaties (met jury)
STAAT NIET IN HET UURROOSTER!
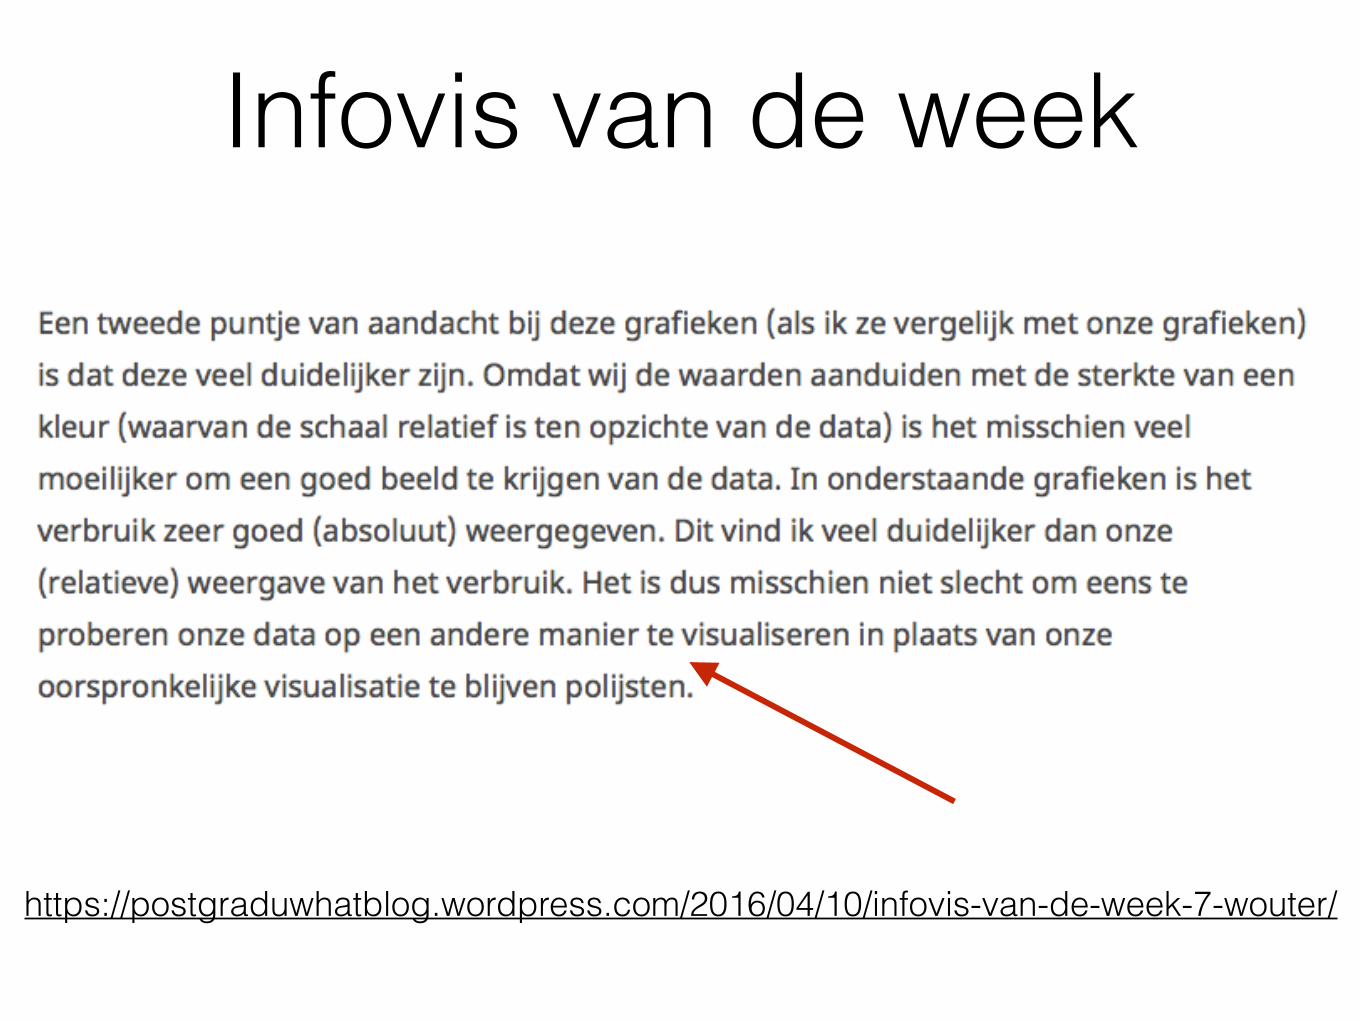
https://postgraduwhatblog.wordpress.com/2016/04/10/infovis-van-de-week-7-wouter/
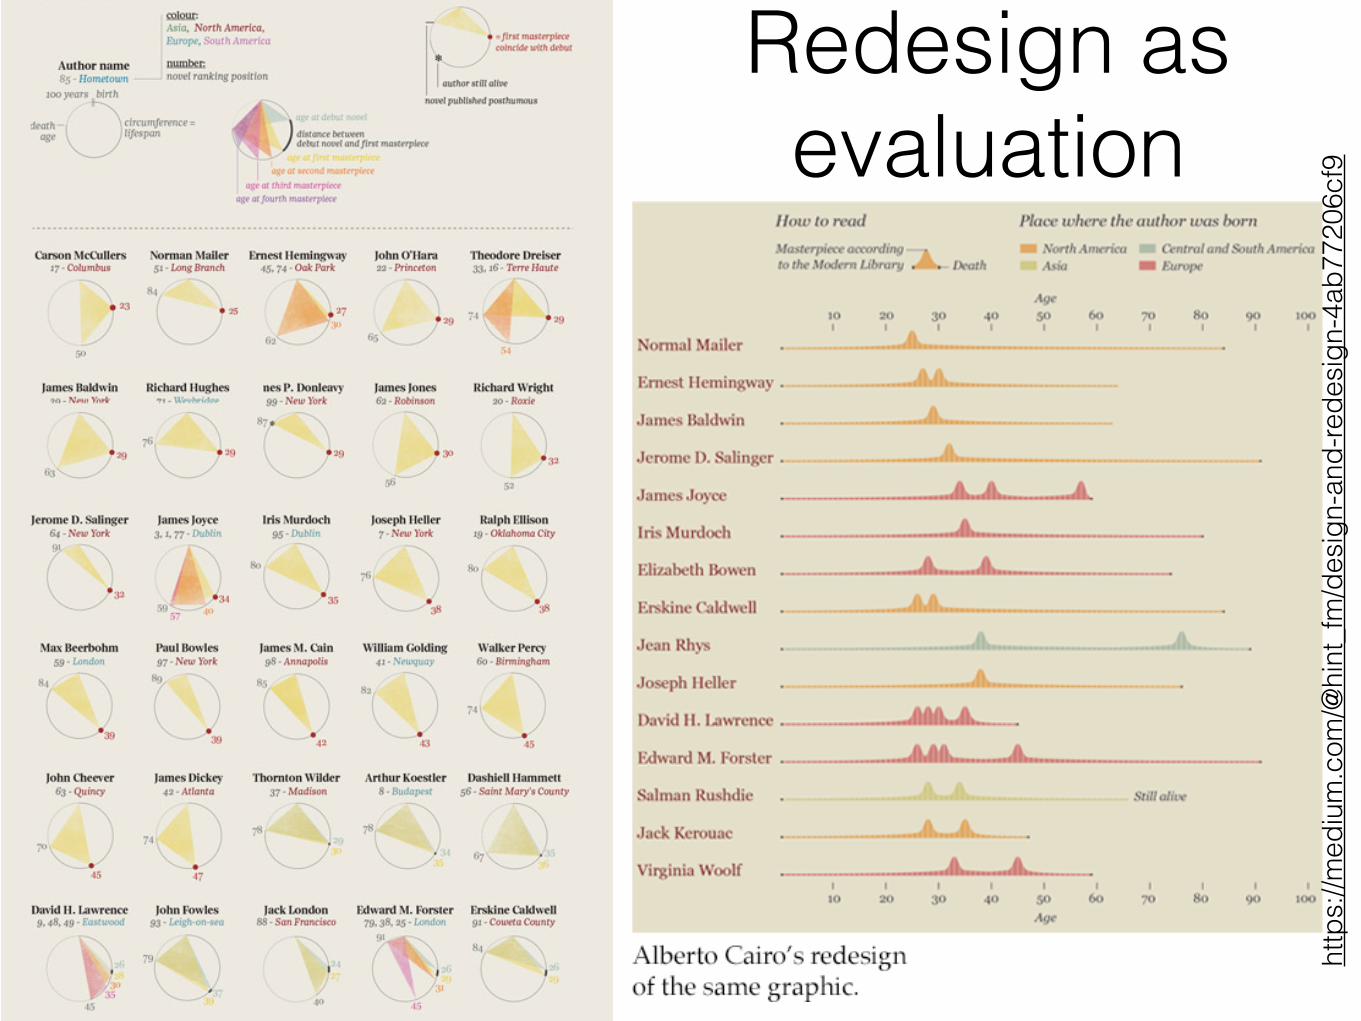
Infovis van de week
http
s://m
ediu
m.c
om/@
hint
_fm
/des
ign-
and-
rede
sign
-4ab
7720
6cf9
Redesign as evaluation
Vandaag• (Data-ink) Design Principles (ik)
• Show-and-Tell (jullie)
• 5 mins + 5 mins ‘design-critique’
• Quick feedback per groep
• Opdracht tegen volgende keer (ik)
6
Data-Ink Design Principles
7
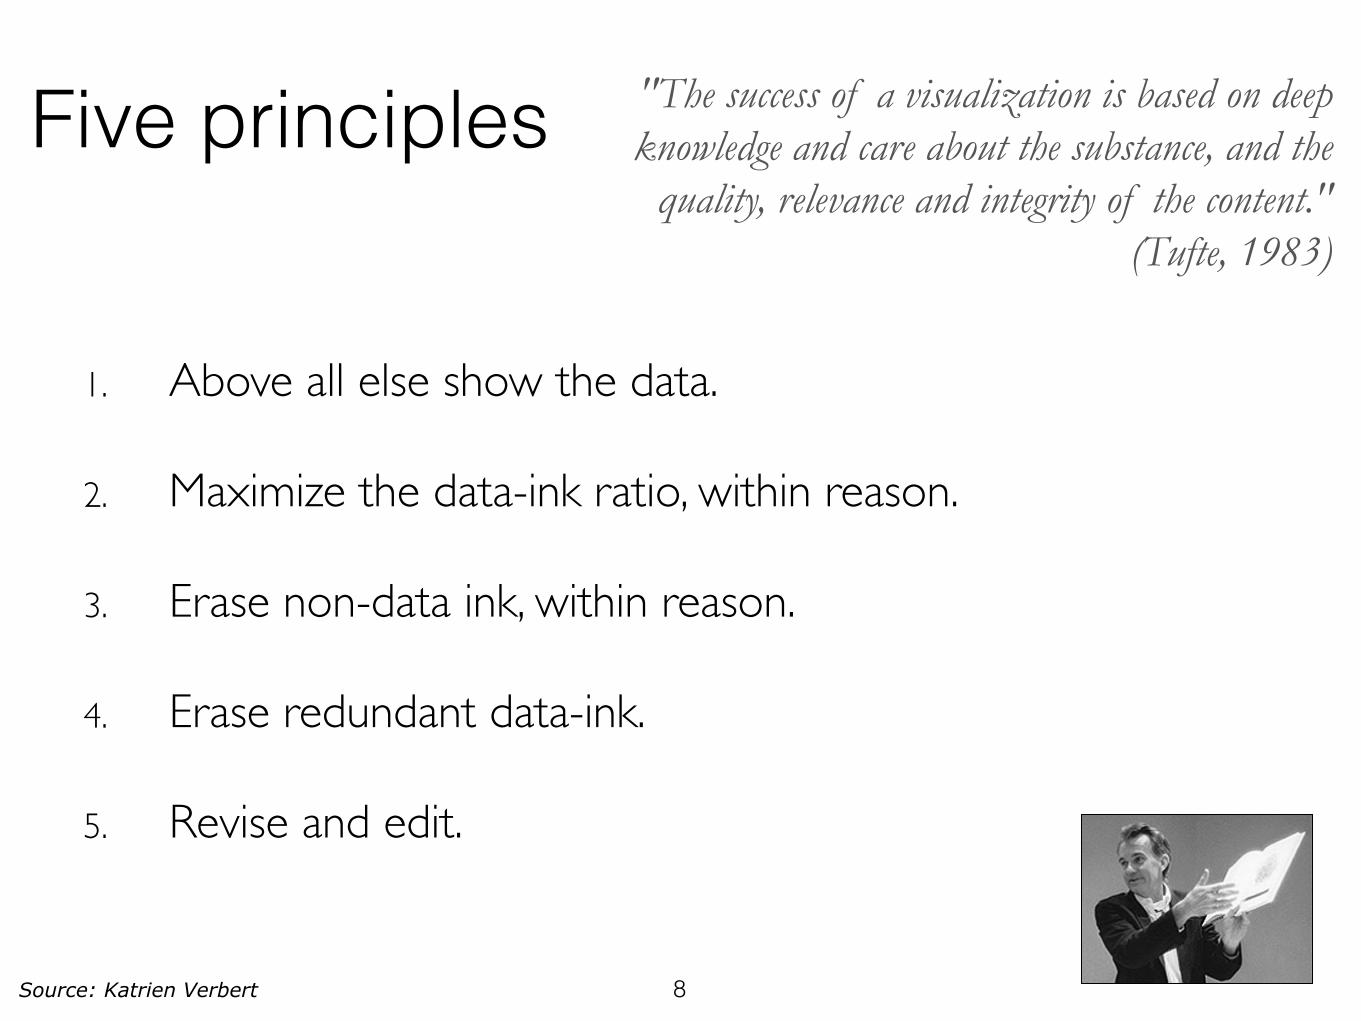
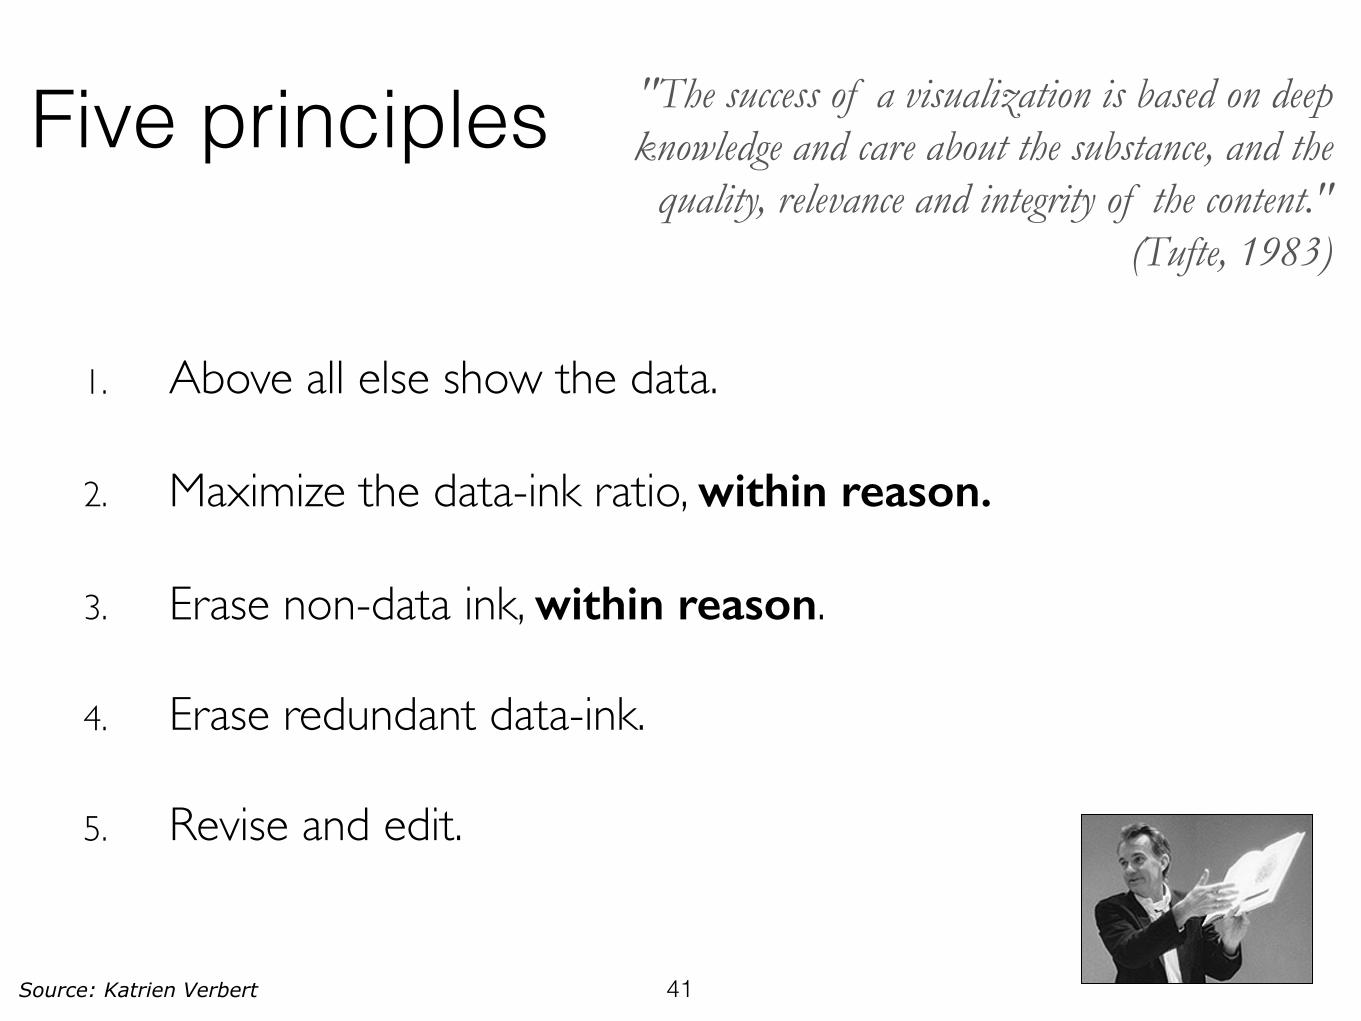
Five principles
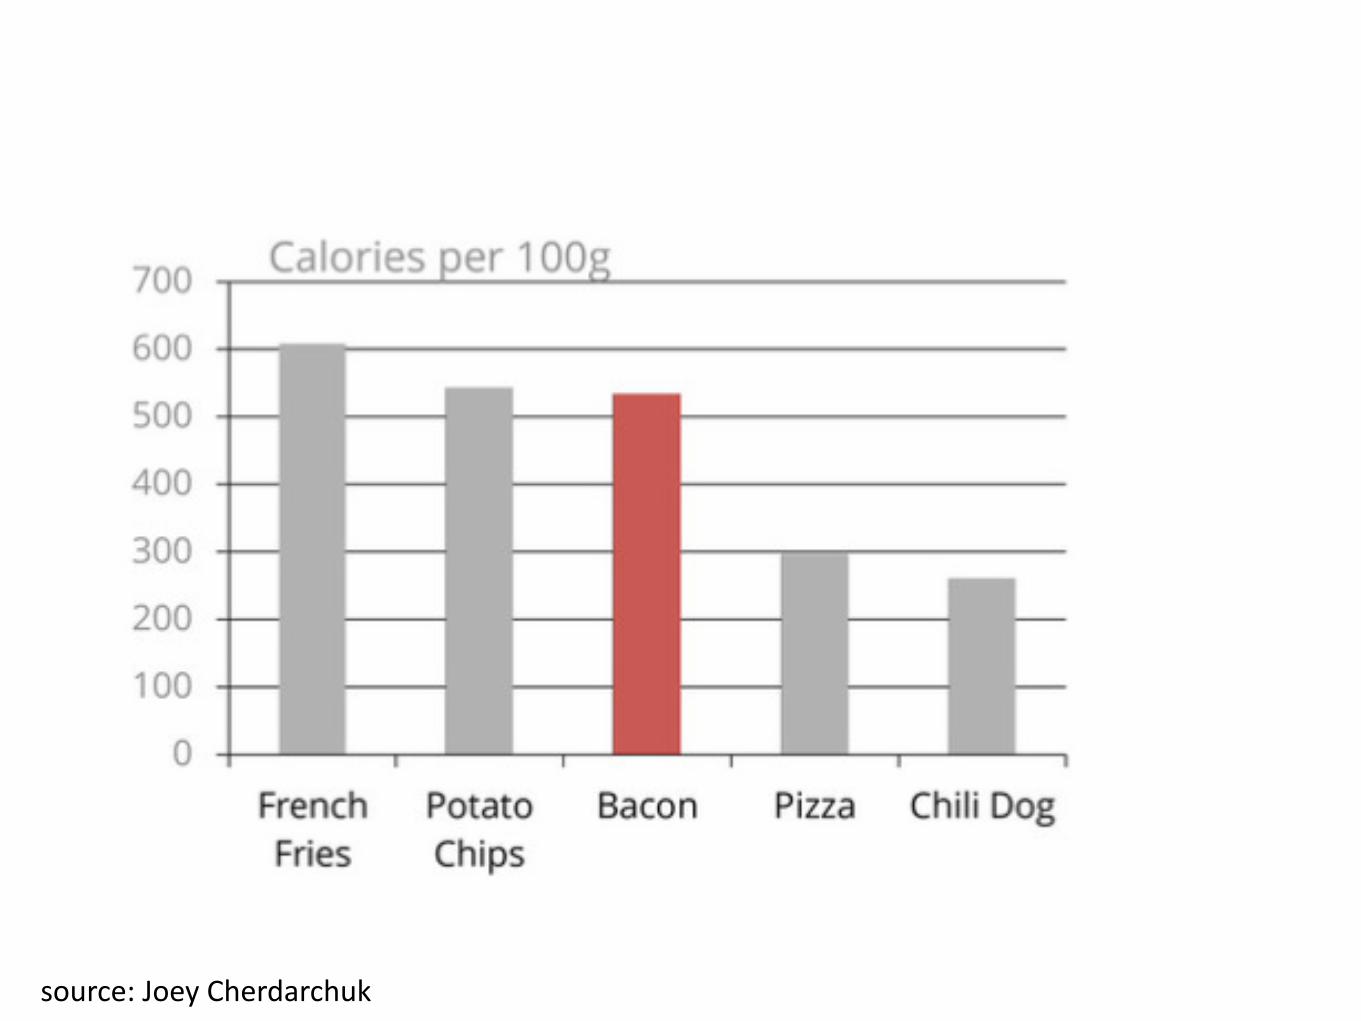
1. Above all else show the data.
2. Maximize the data-ink ratio, within reason.
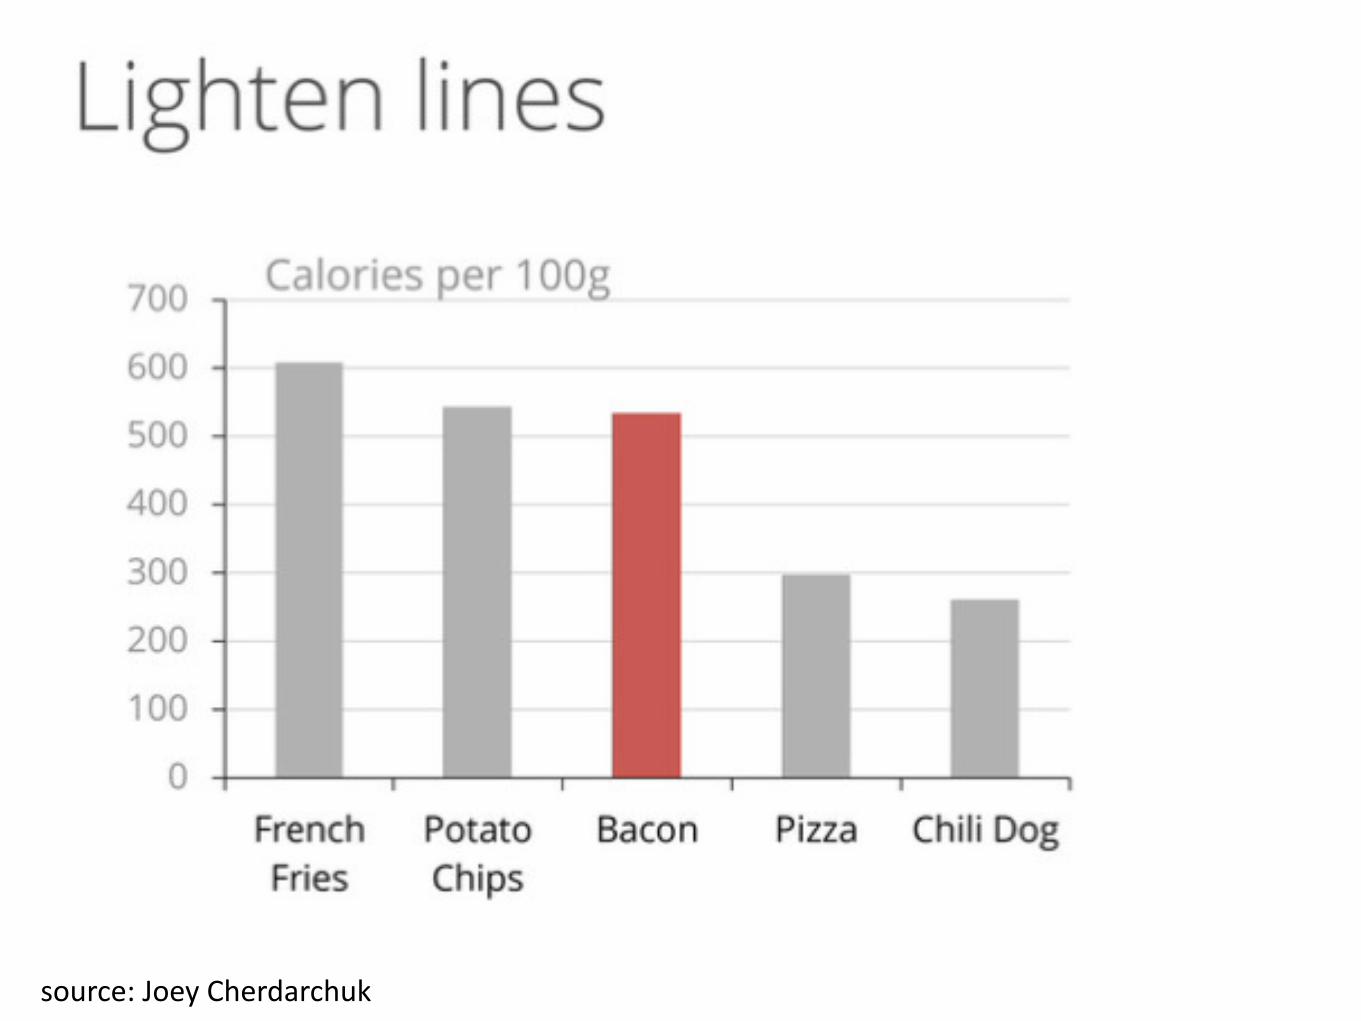
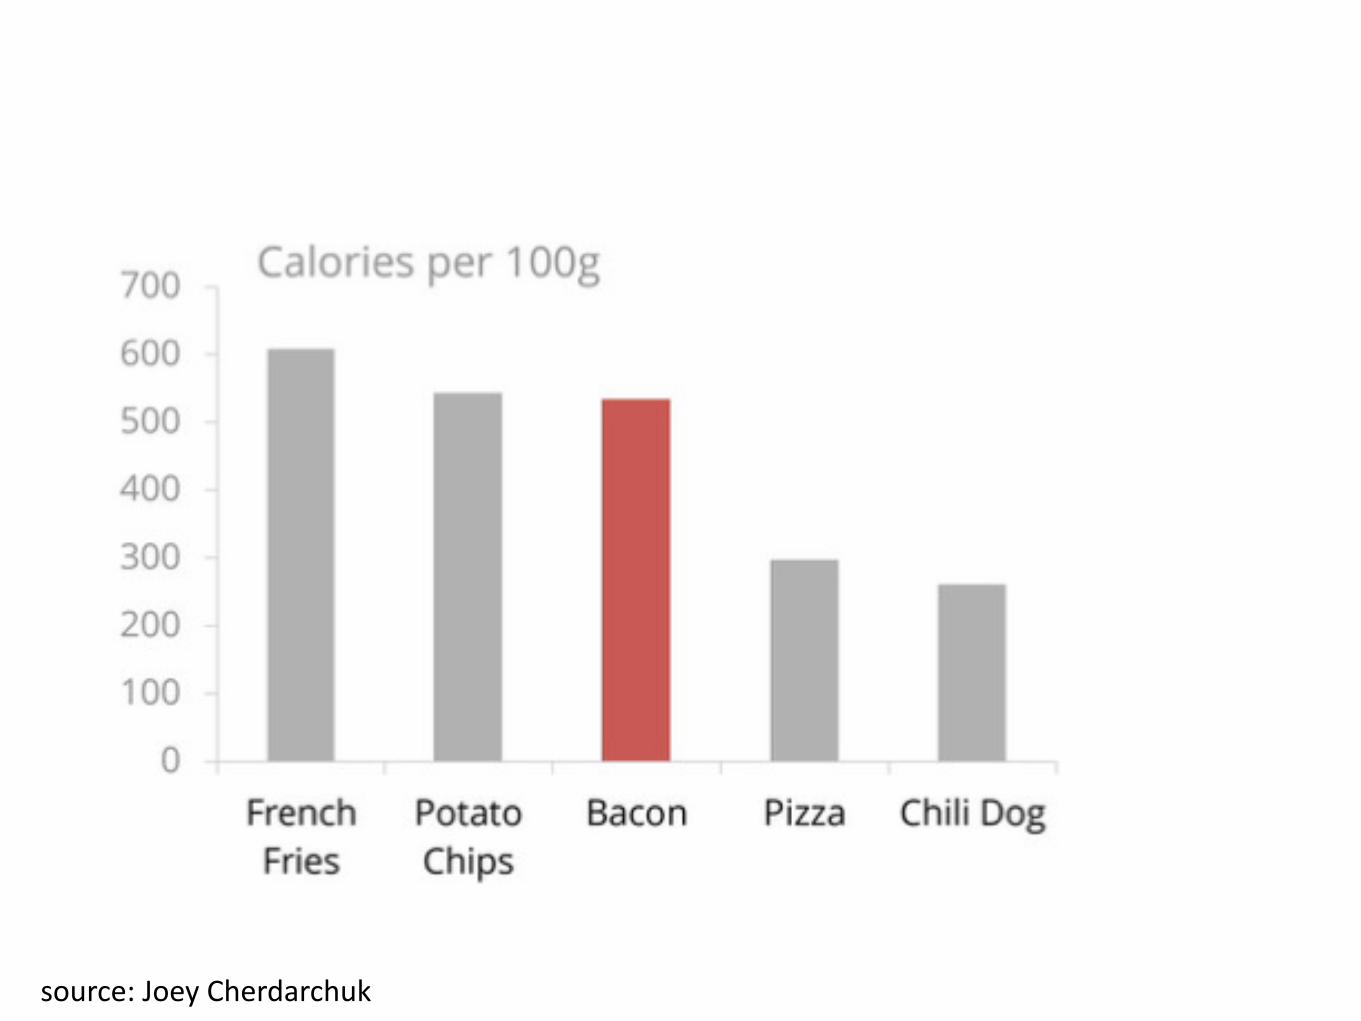
3. Erase non-data ink, within reason.
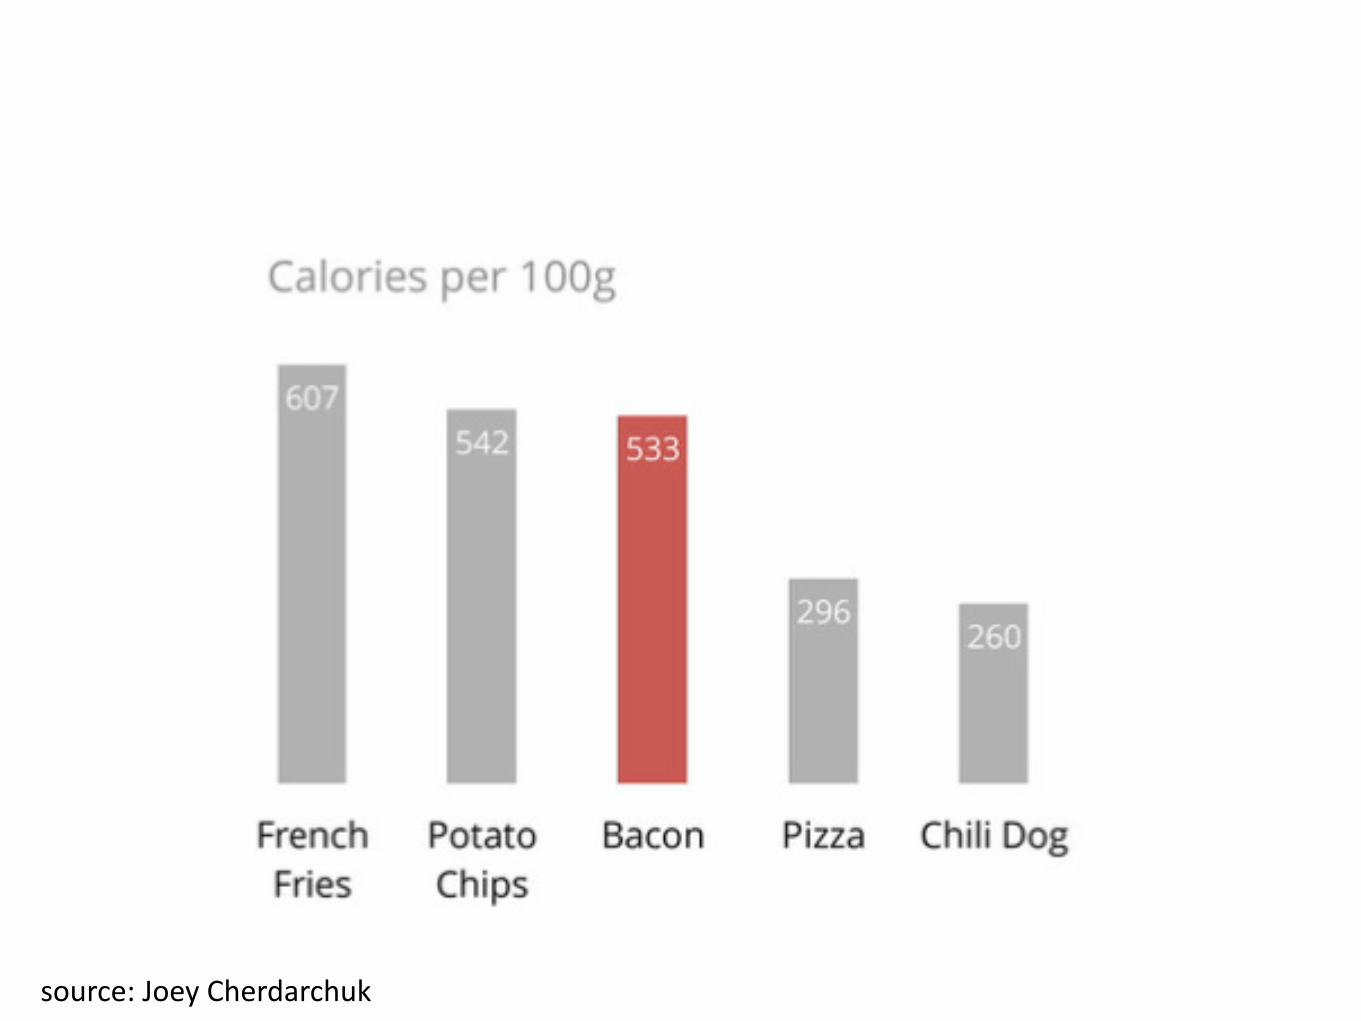
4. Erase redundant data-ink.
5. Revise and edit.
Source: Katrien Verbert
"The success of a visualization is based on deep knowledge and care about the substance, and the
quality, relevance and integrity of the content." (Tufte, 1983)
8
Data-ink
A large share of ink on a graphic should present data Information, the ink changing as the data change.
Data-ink is the non-erasable core of a graphic...
(Tufte, 1983)
9
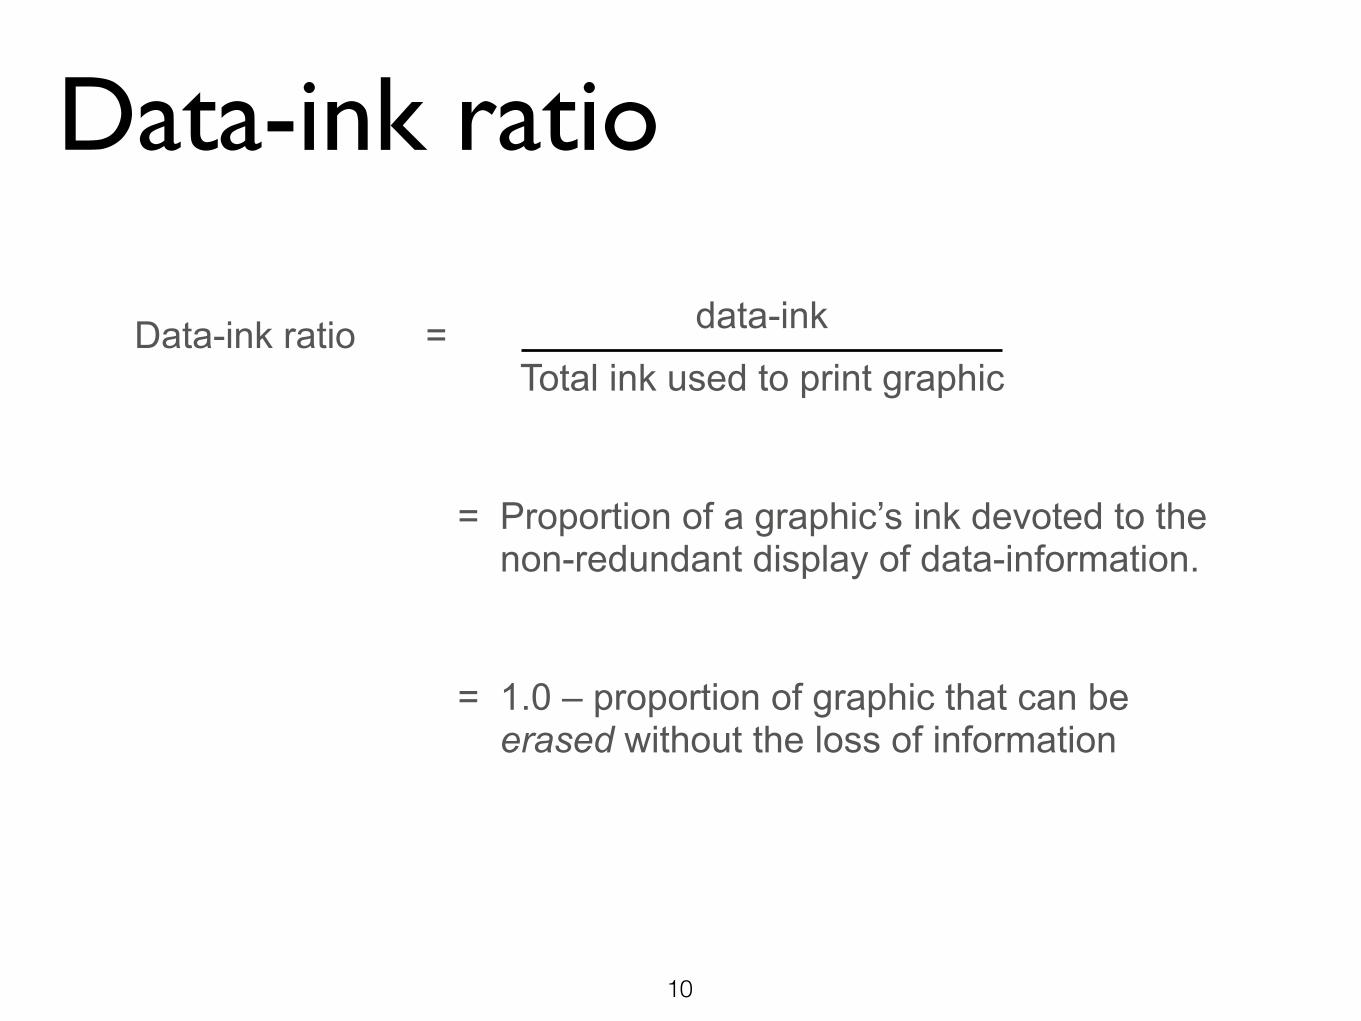
Data-ink ratio = data-ink
Total ink used to print graphic
= Proportion of a graphic’s ink devoted to the non-redundant display of data-information.
= 1.0 – proportion of graphic that can be erased without the loss of information
Data-ink ratio
10
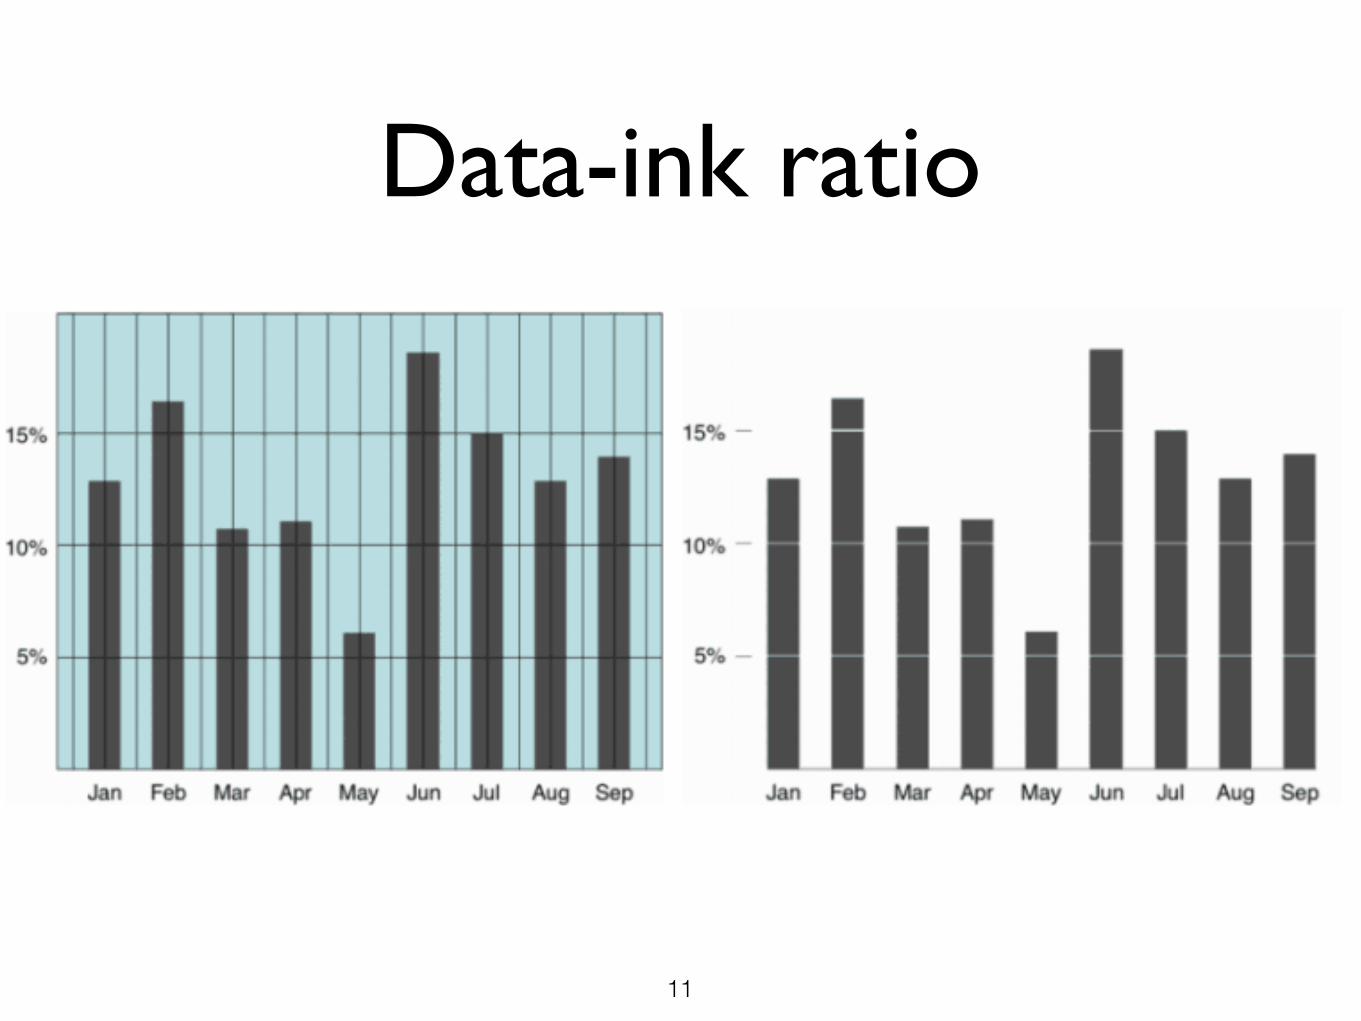
Data-ink ratio
11
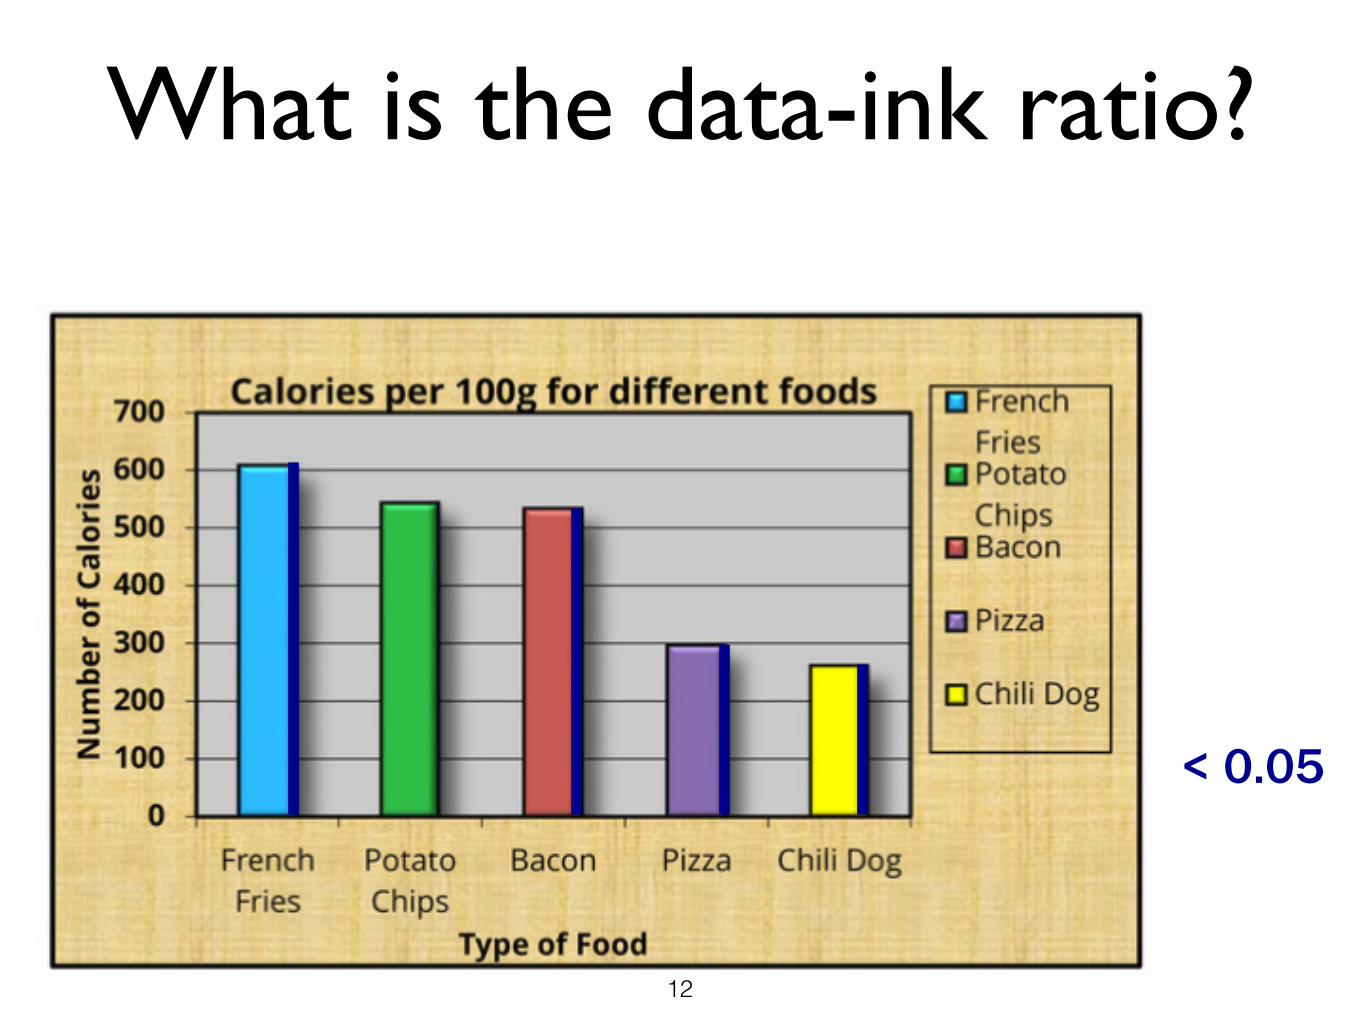
What is the data-ink ratio?
< 0.05
12
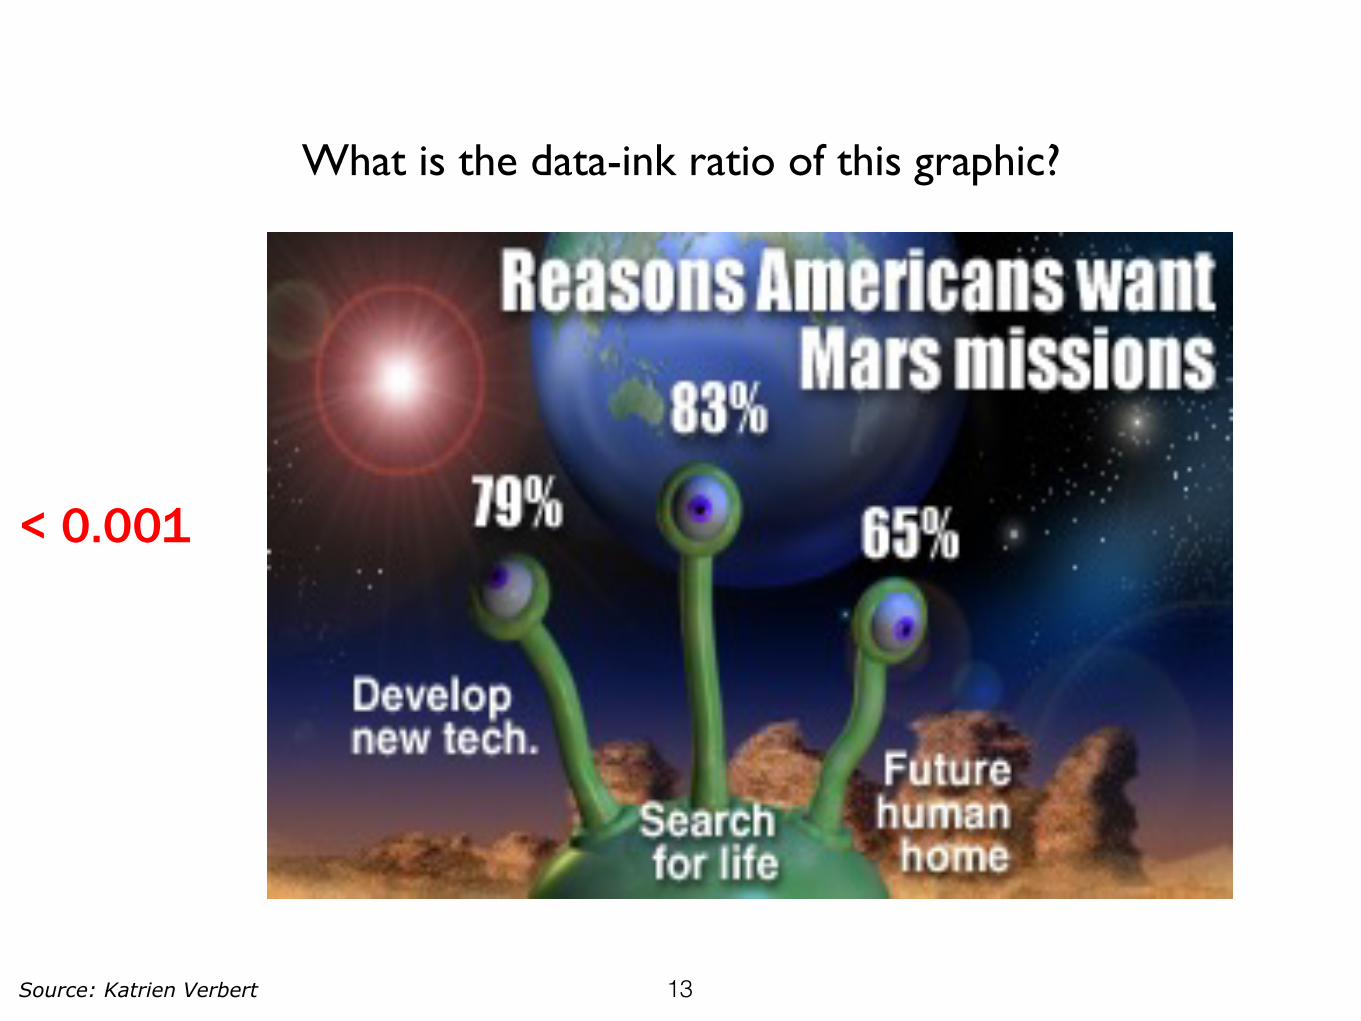
What is the data-ink ratio of this graphic?
< 0.001
Source: Katrien Verbert 13
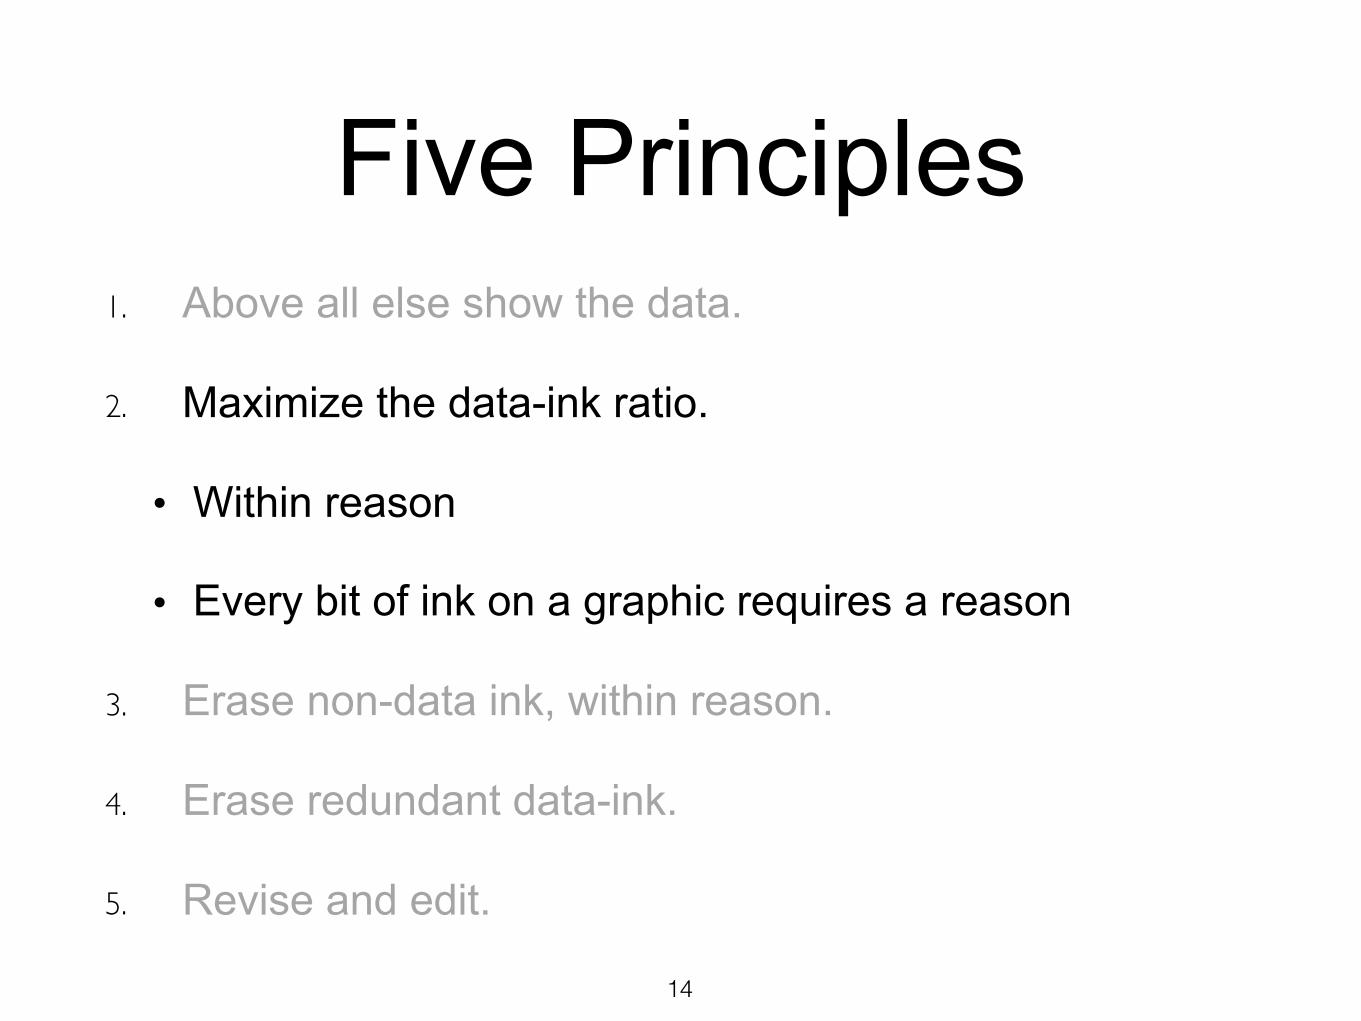
Five Principles1. Above all else show the data.
2. Maximize the data-ink ratio.
• Within reason
• Every bit of ink on a graphic requires a reason
3. Erase non-data ink, within reason.
4. Erase redundant data-ink.
5. Revise and edit.
14
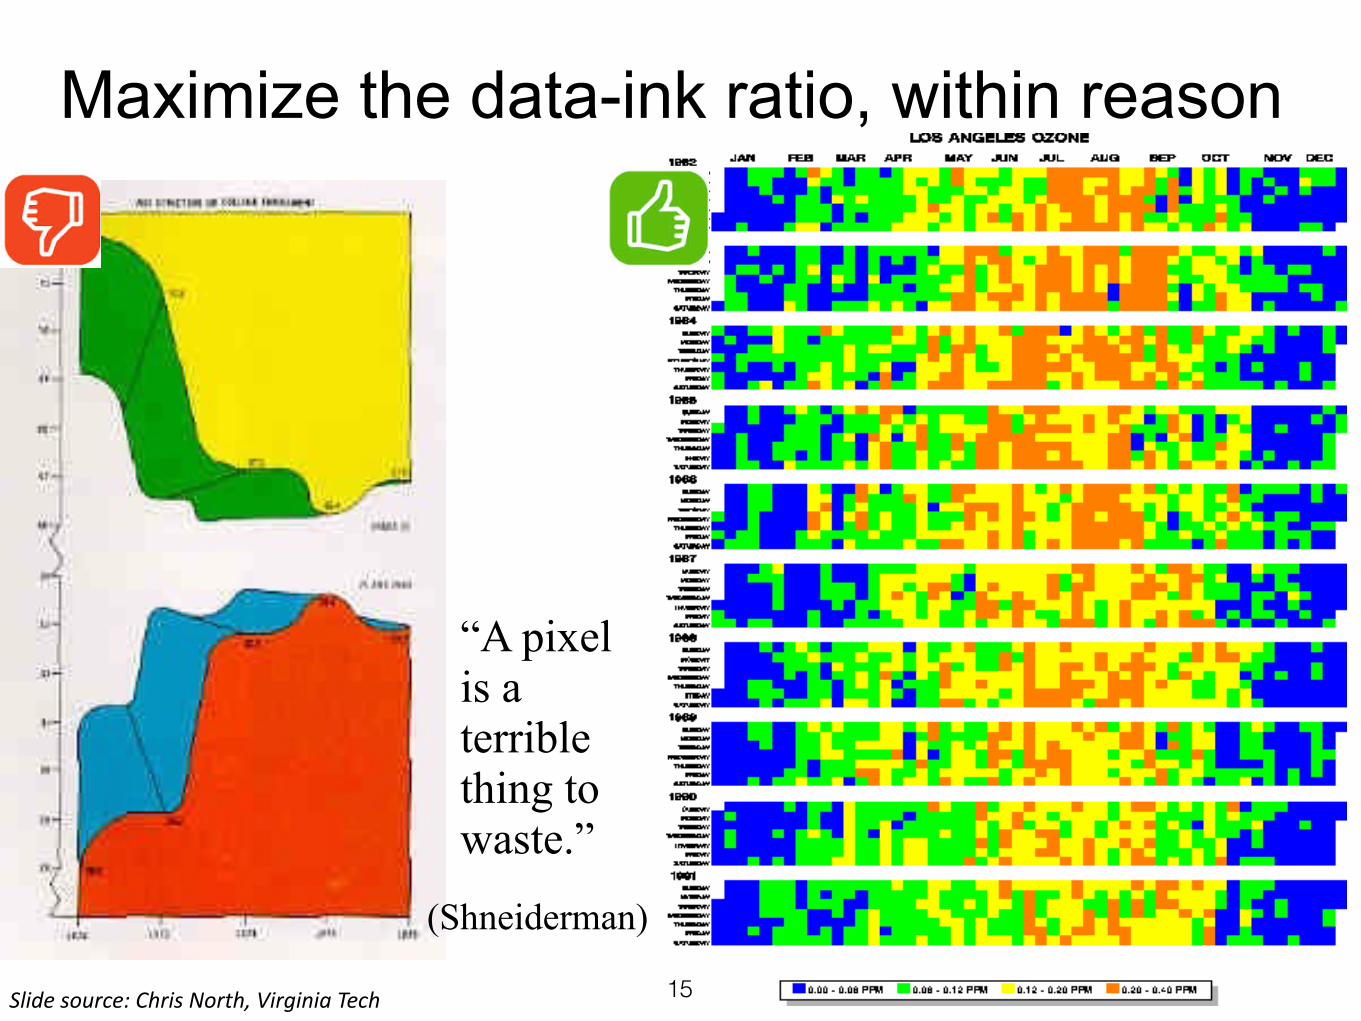
Maximize the data-ink ratio, within reason
“A pixel is a terrible thing to waste.”
(Shneiderman)
Slidesource:ChrisNorth,VirginiaTech 15
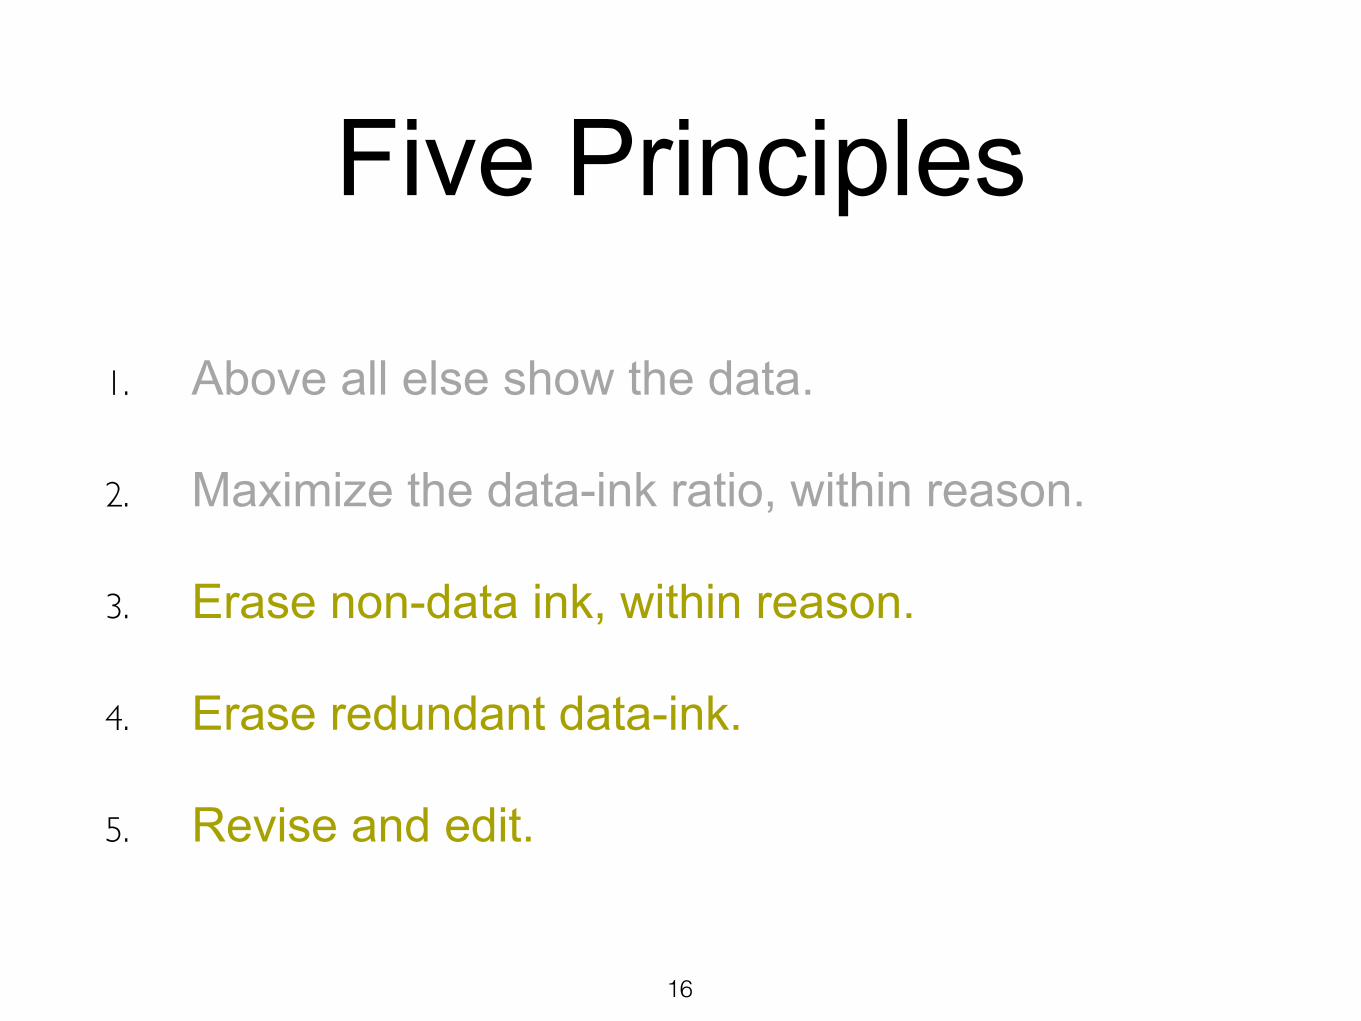
Five Principles
1. Above all else show the data.
2. Maximize the data-ink ratio, within reason.
3. Erase non-data ink, within reason.
4. Erase redundant data-ink.
5. Revise and edit.
16
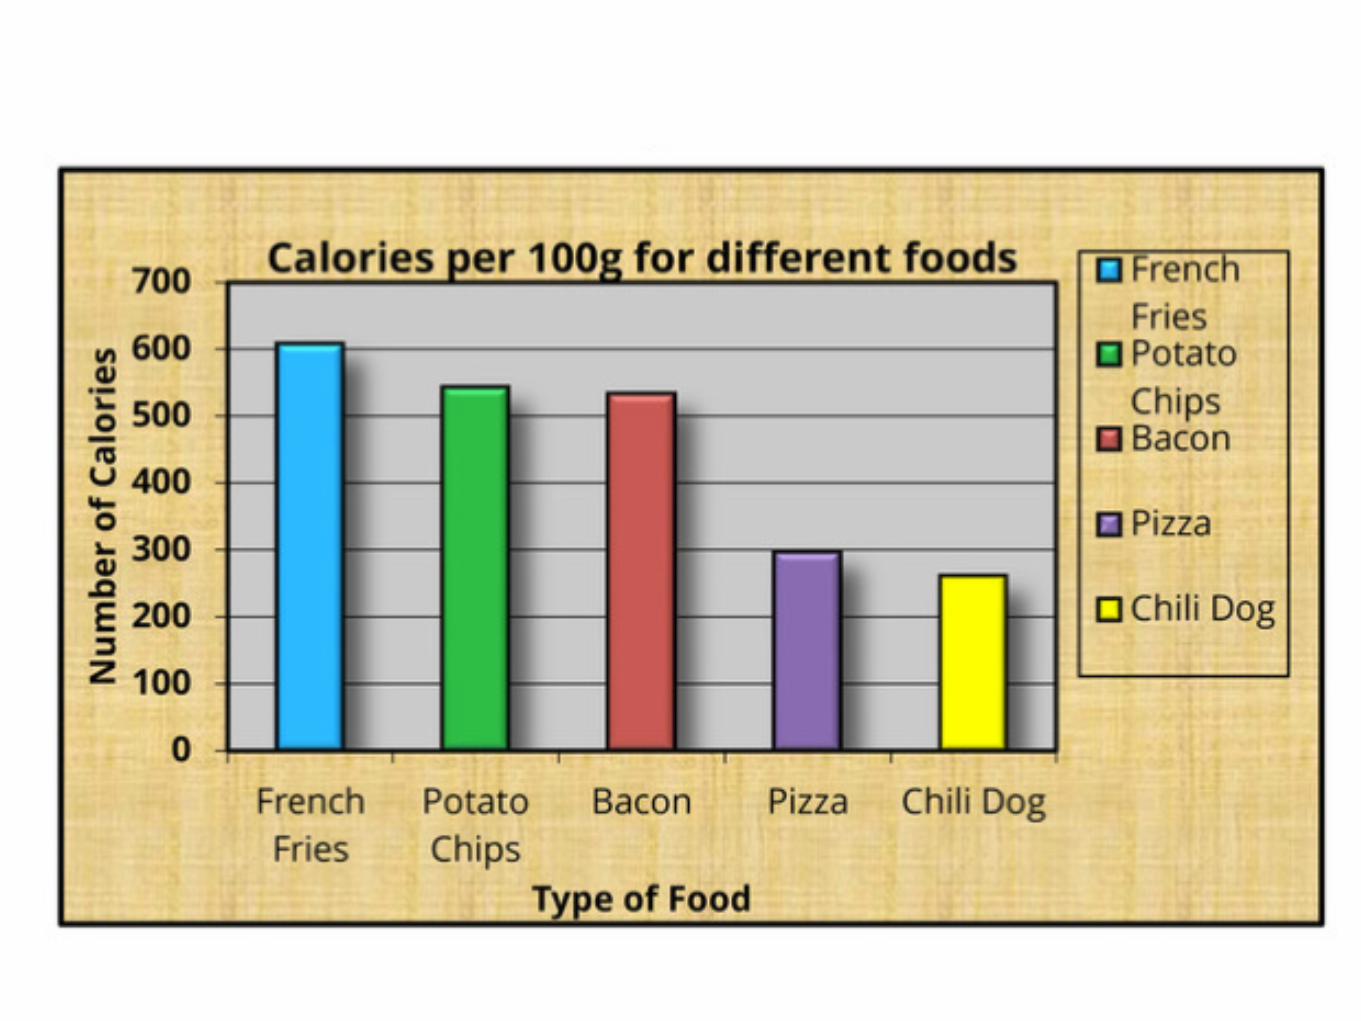
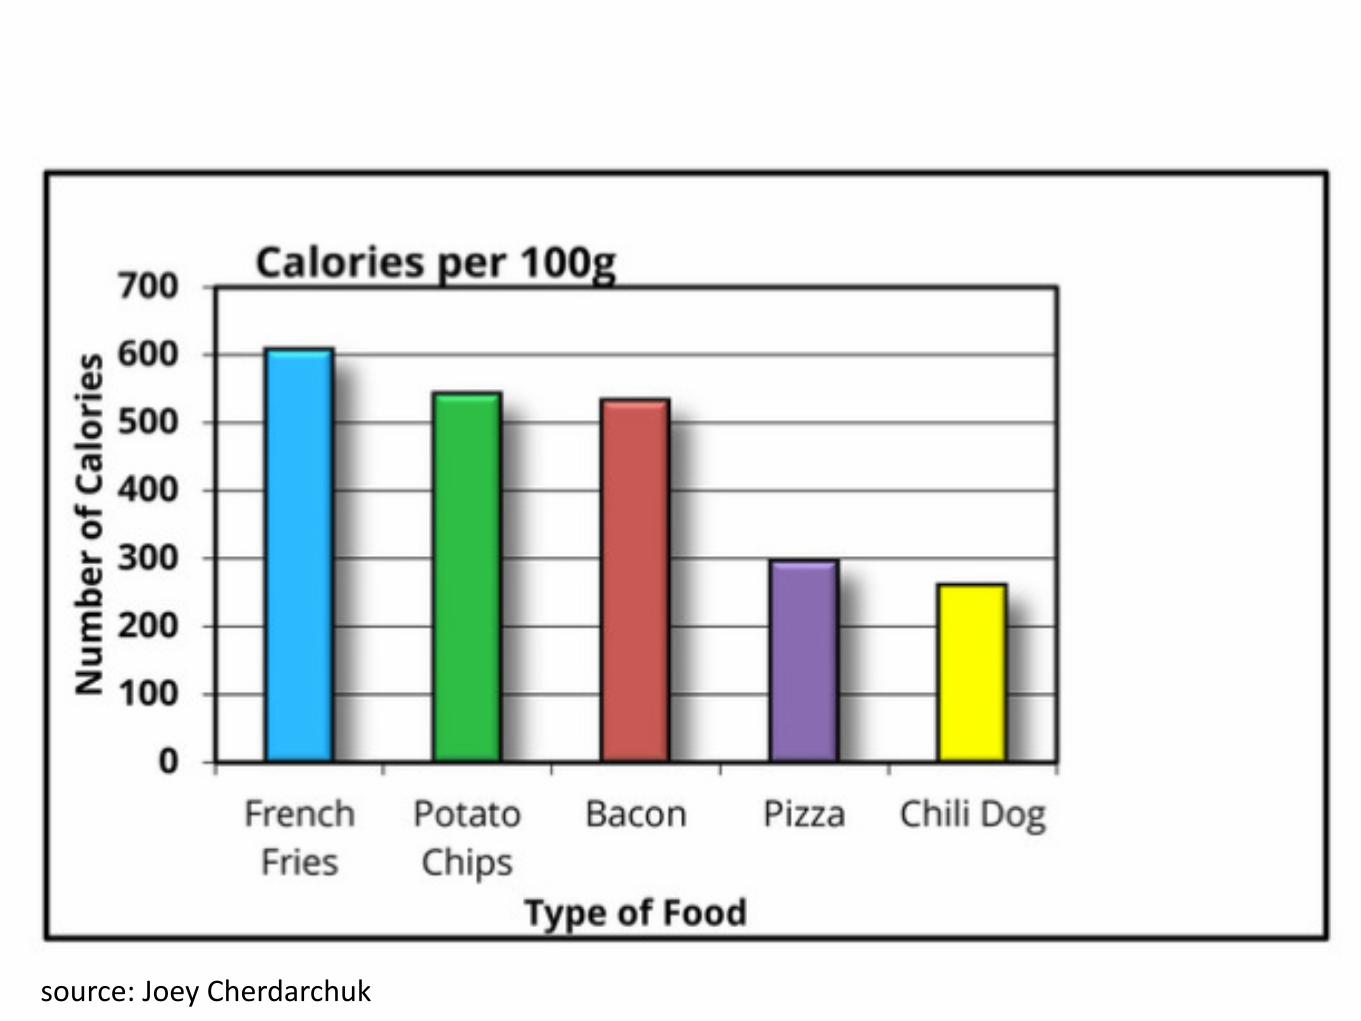
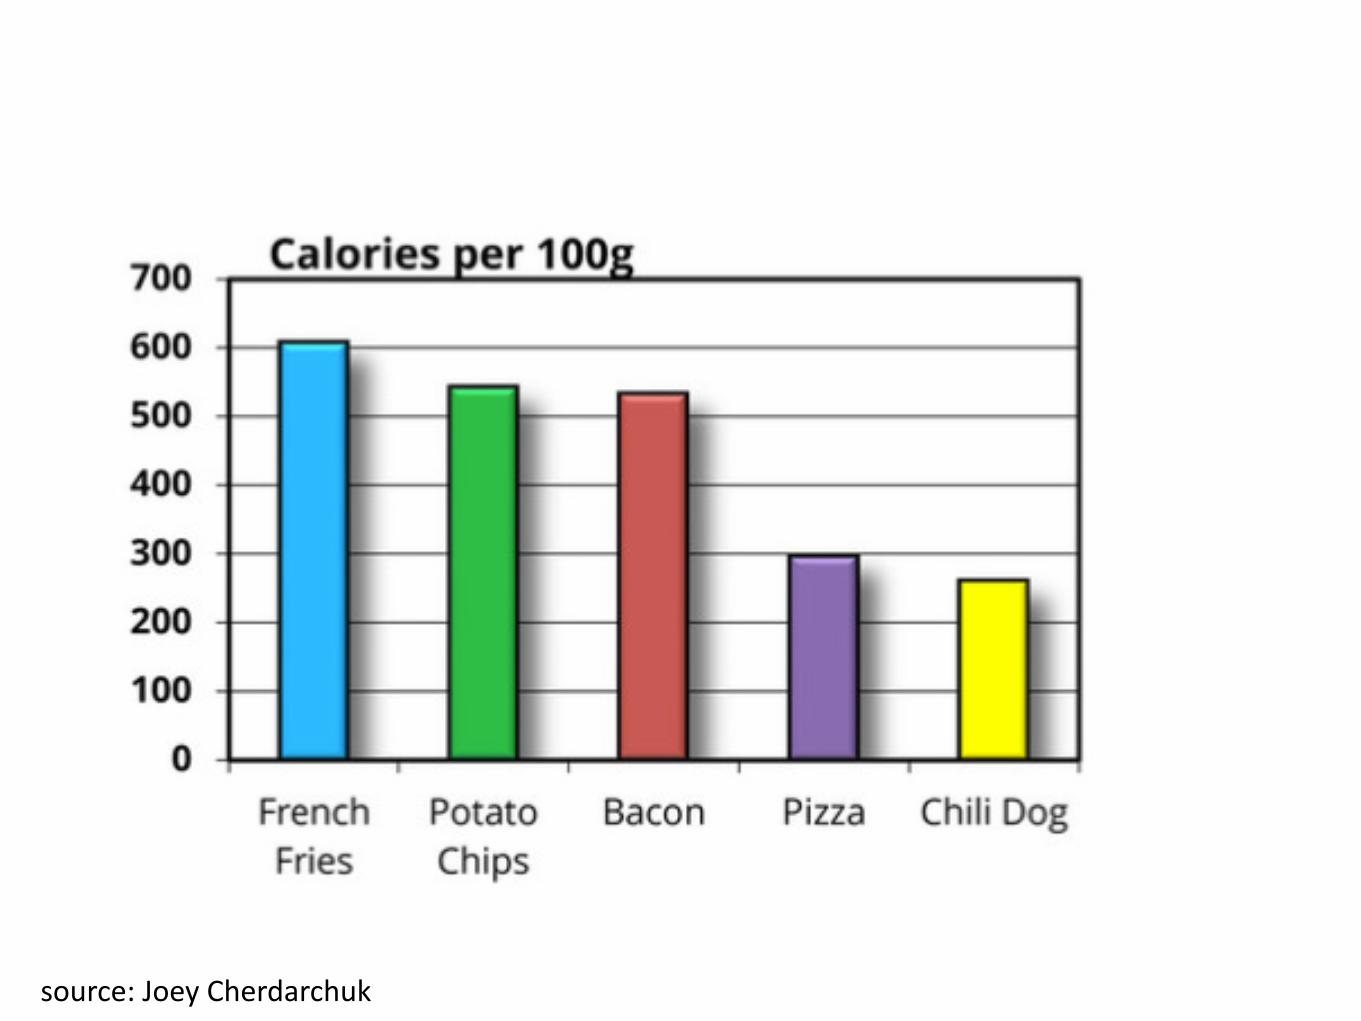
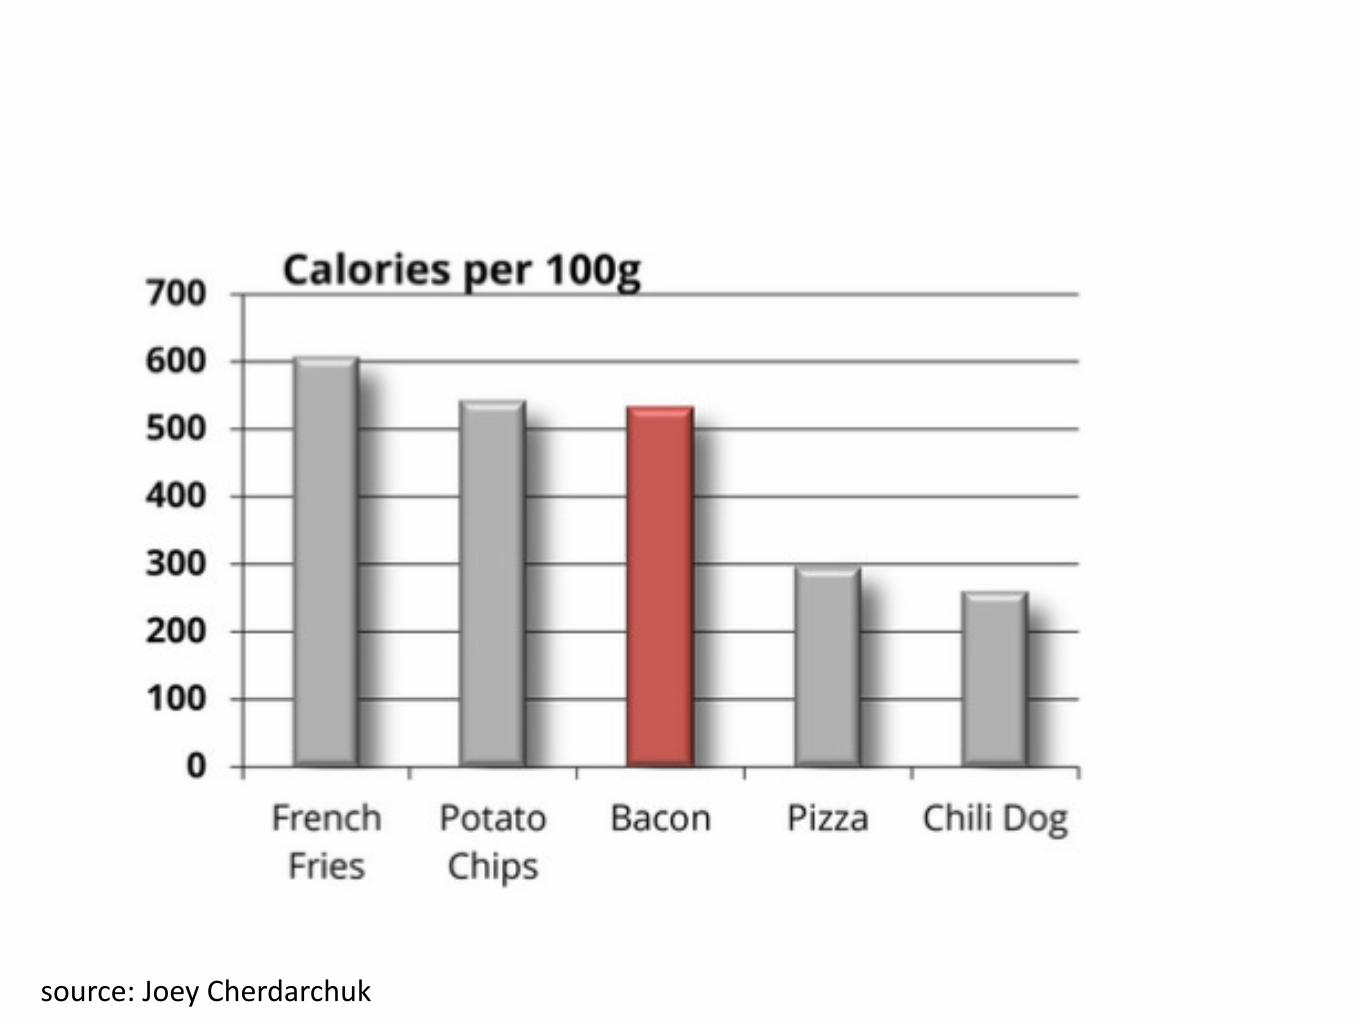
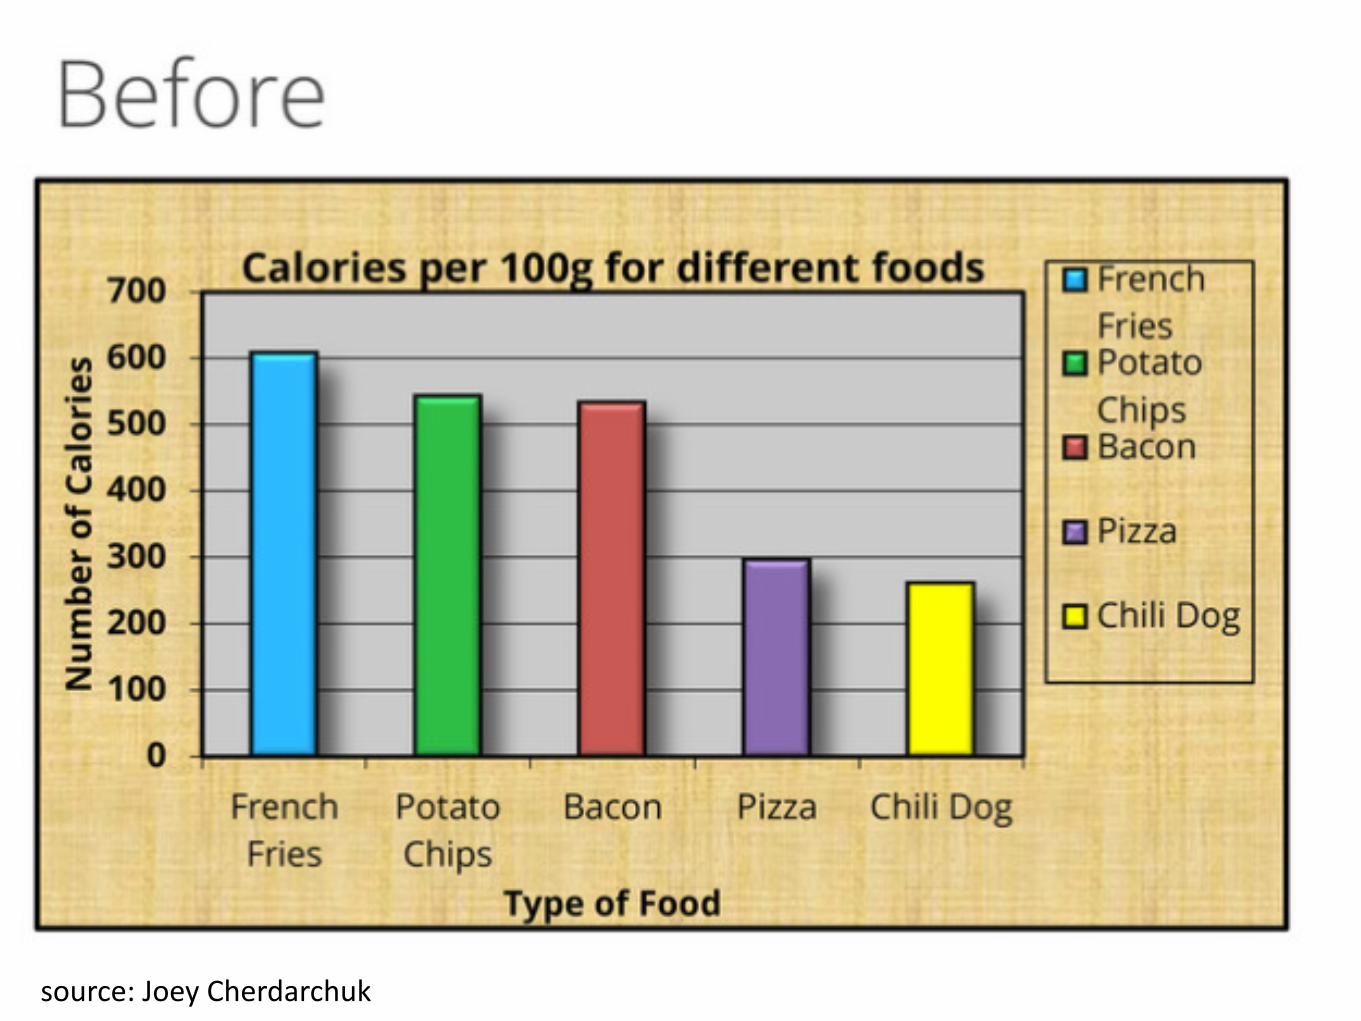
17source:JoeyCherdarchuk
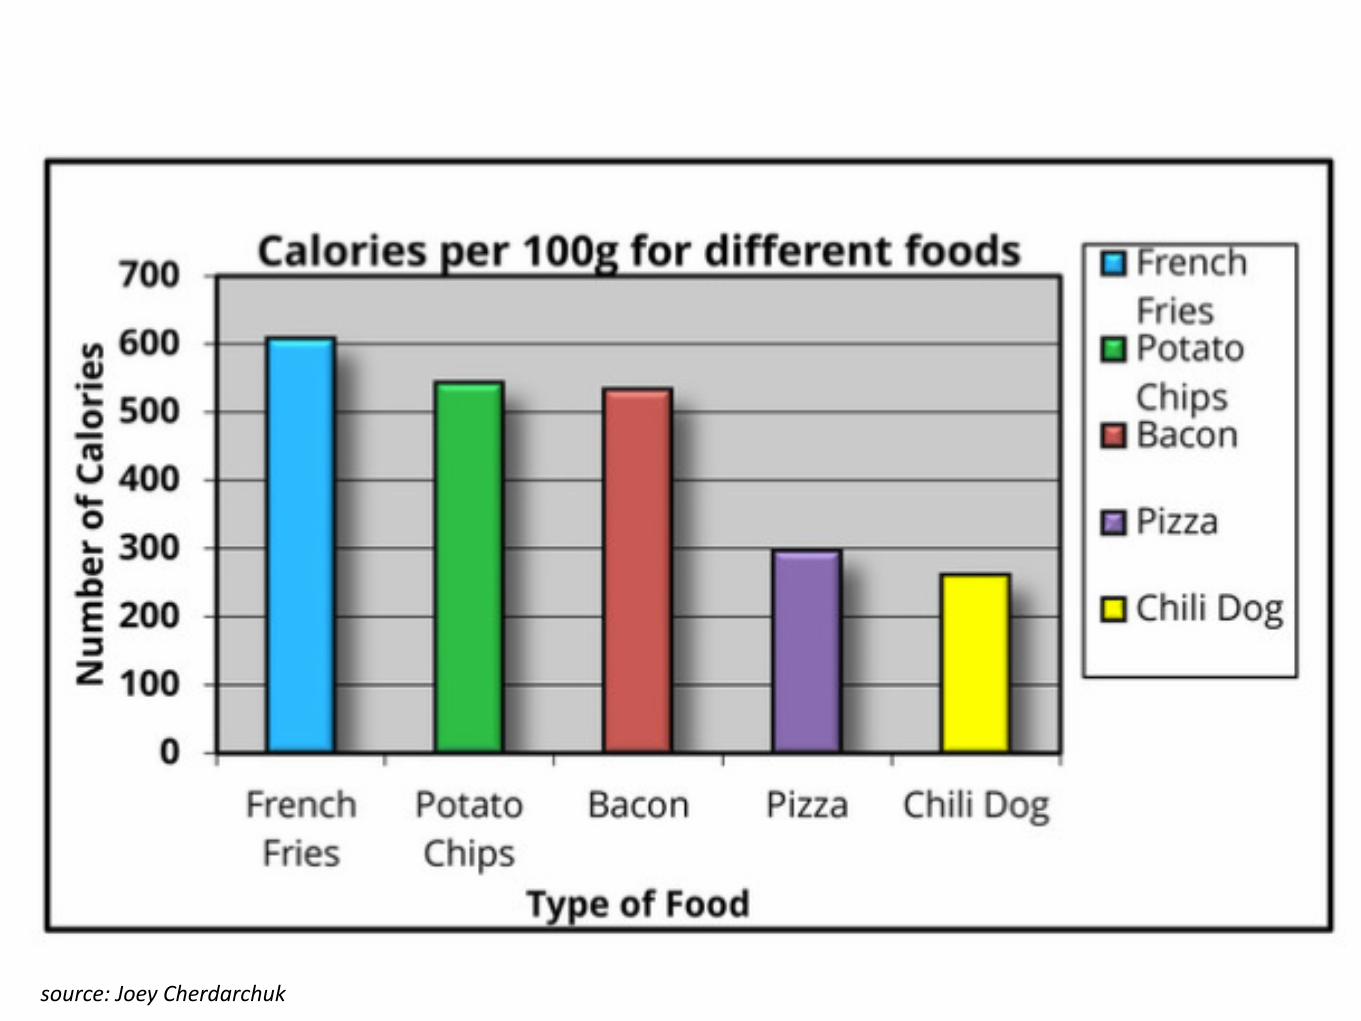
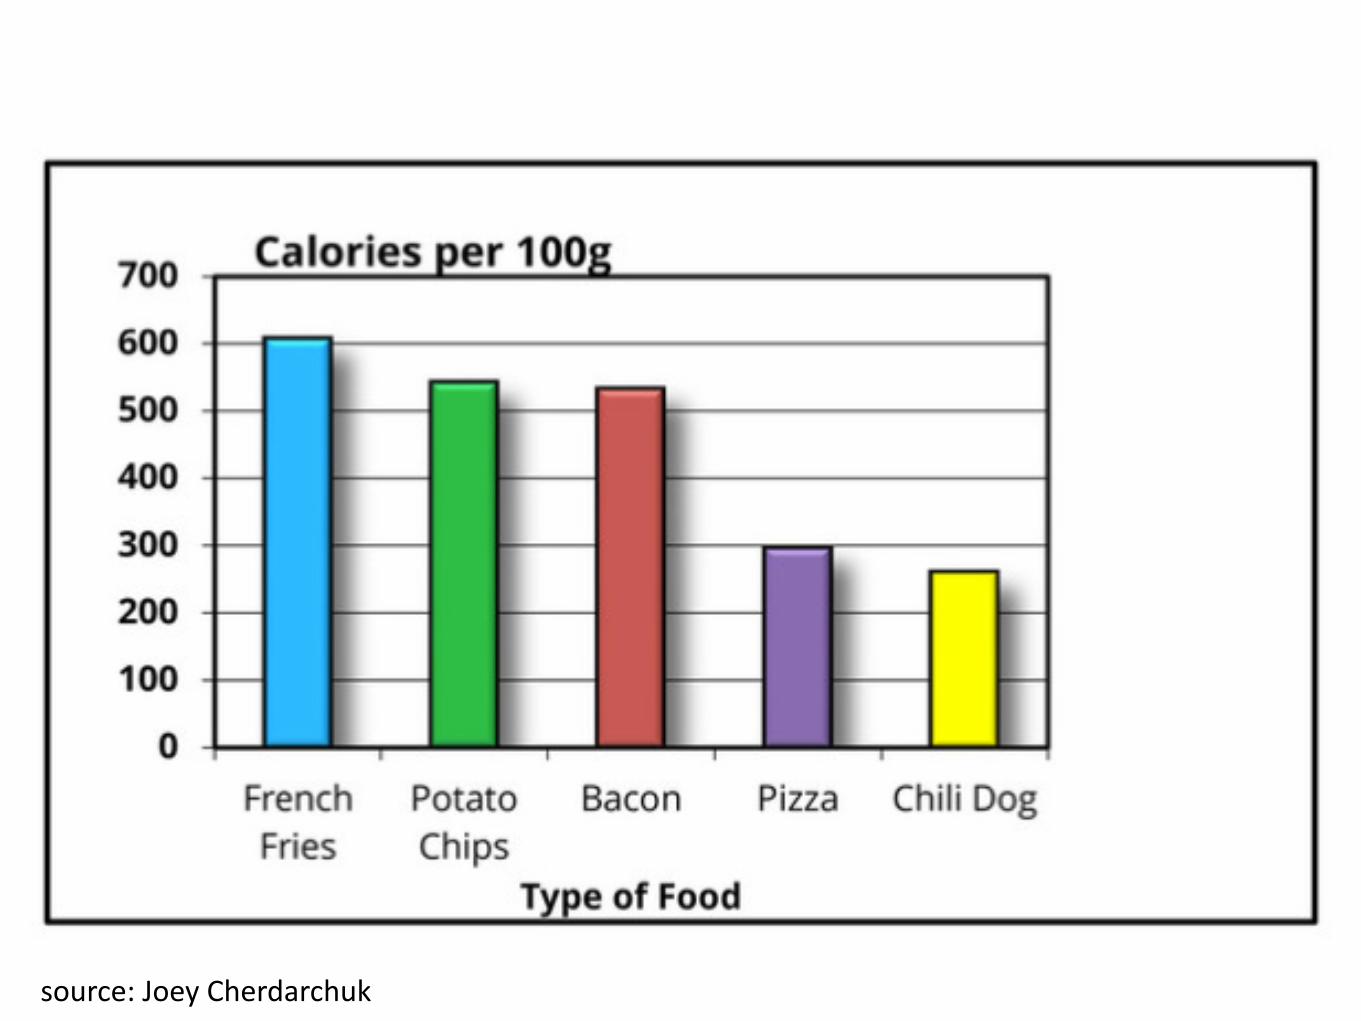
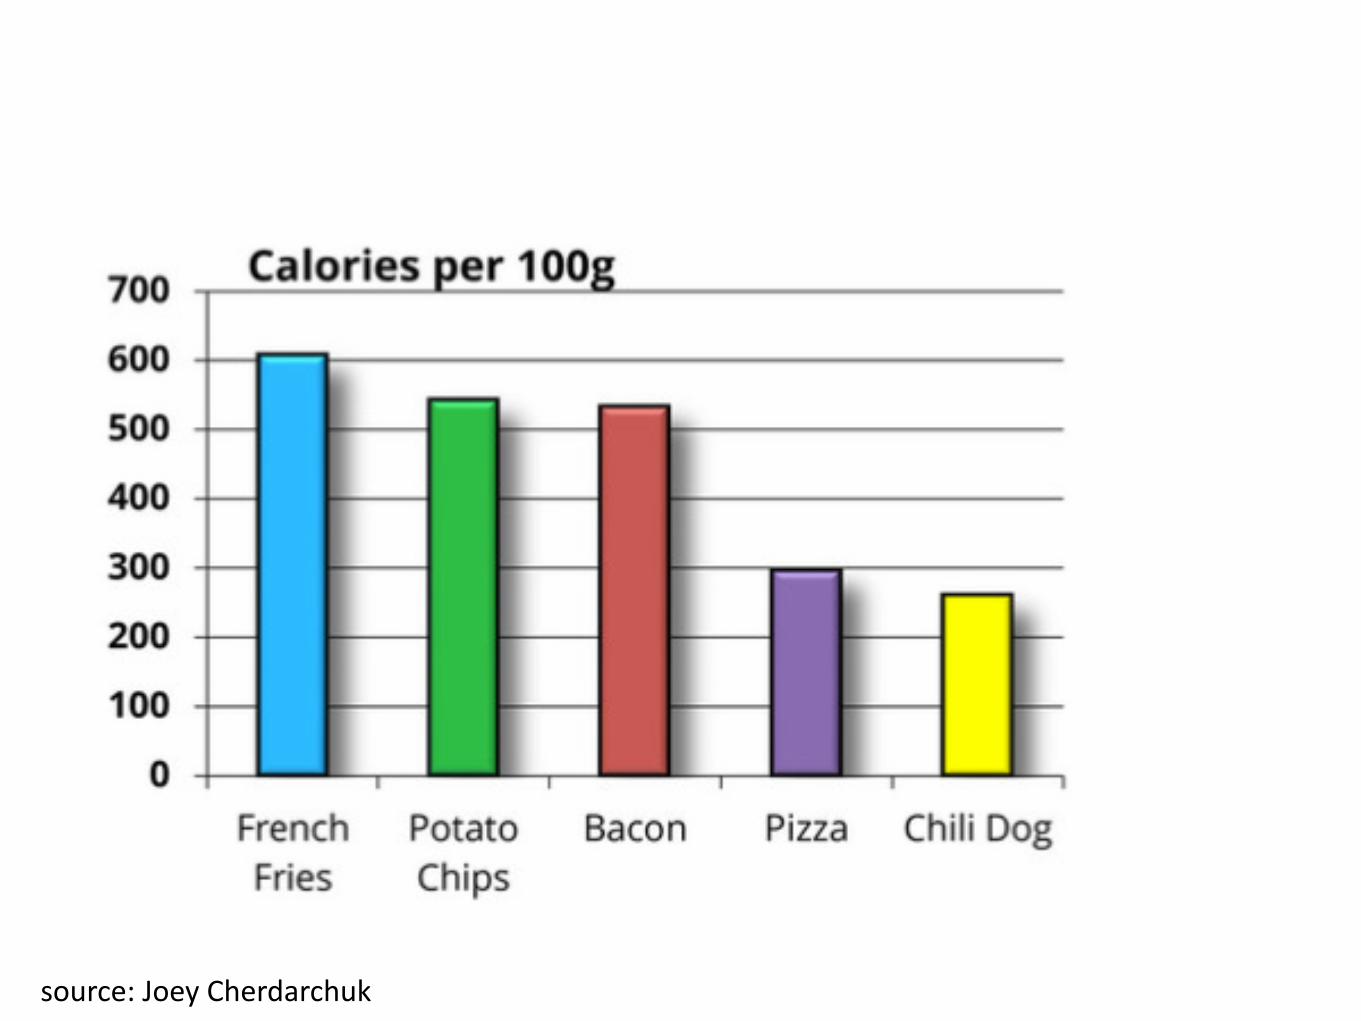
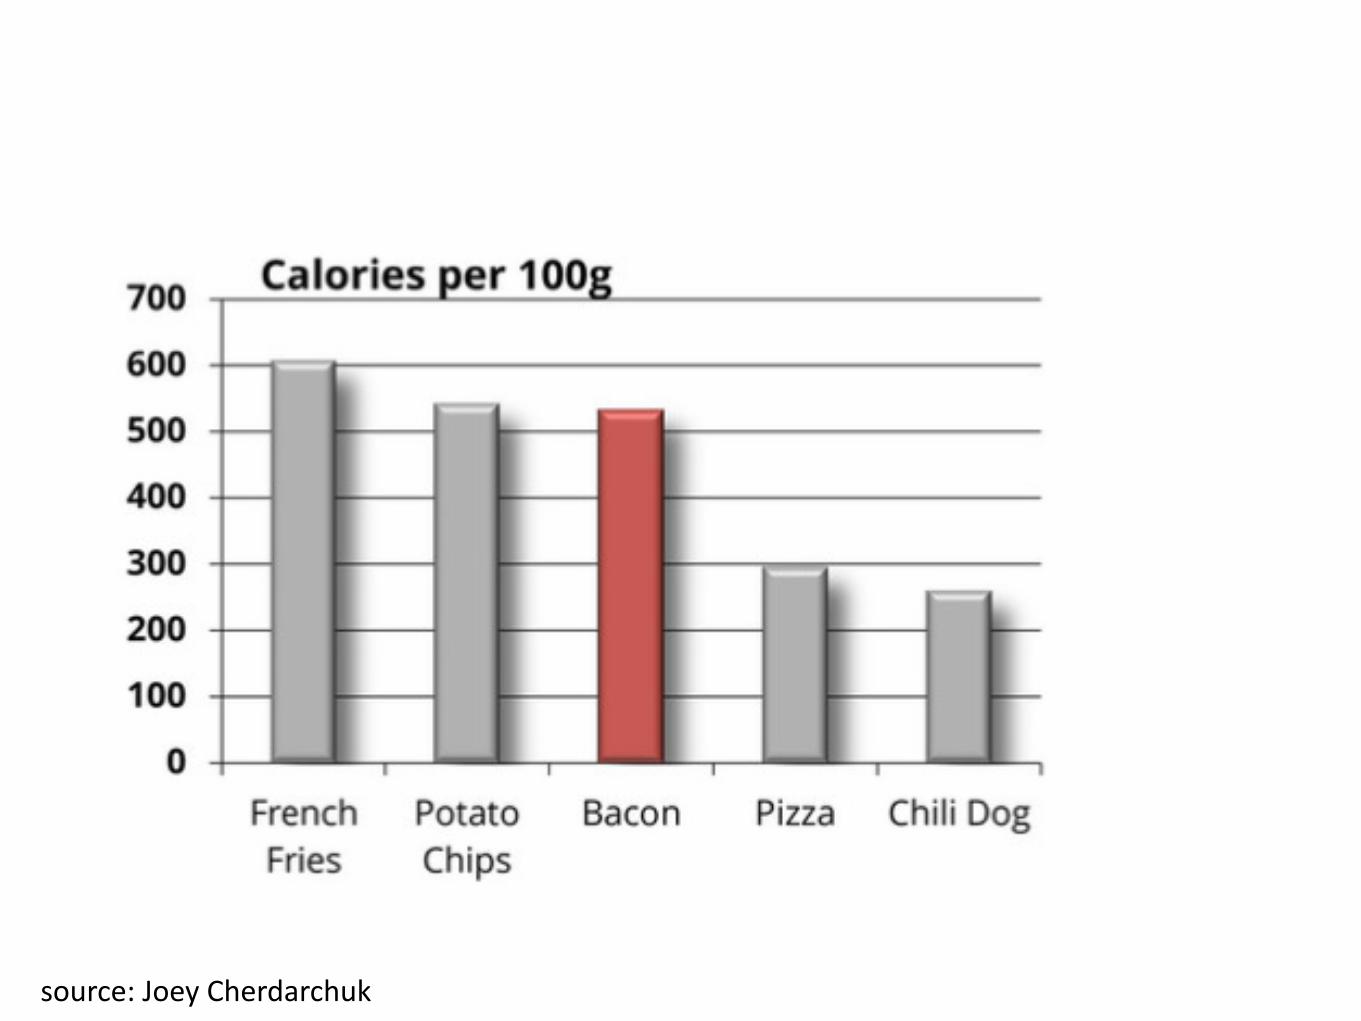
18source:JoeyCherdarchuk
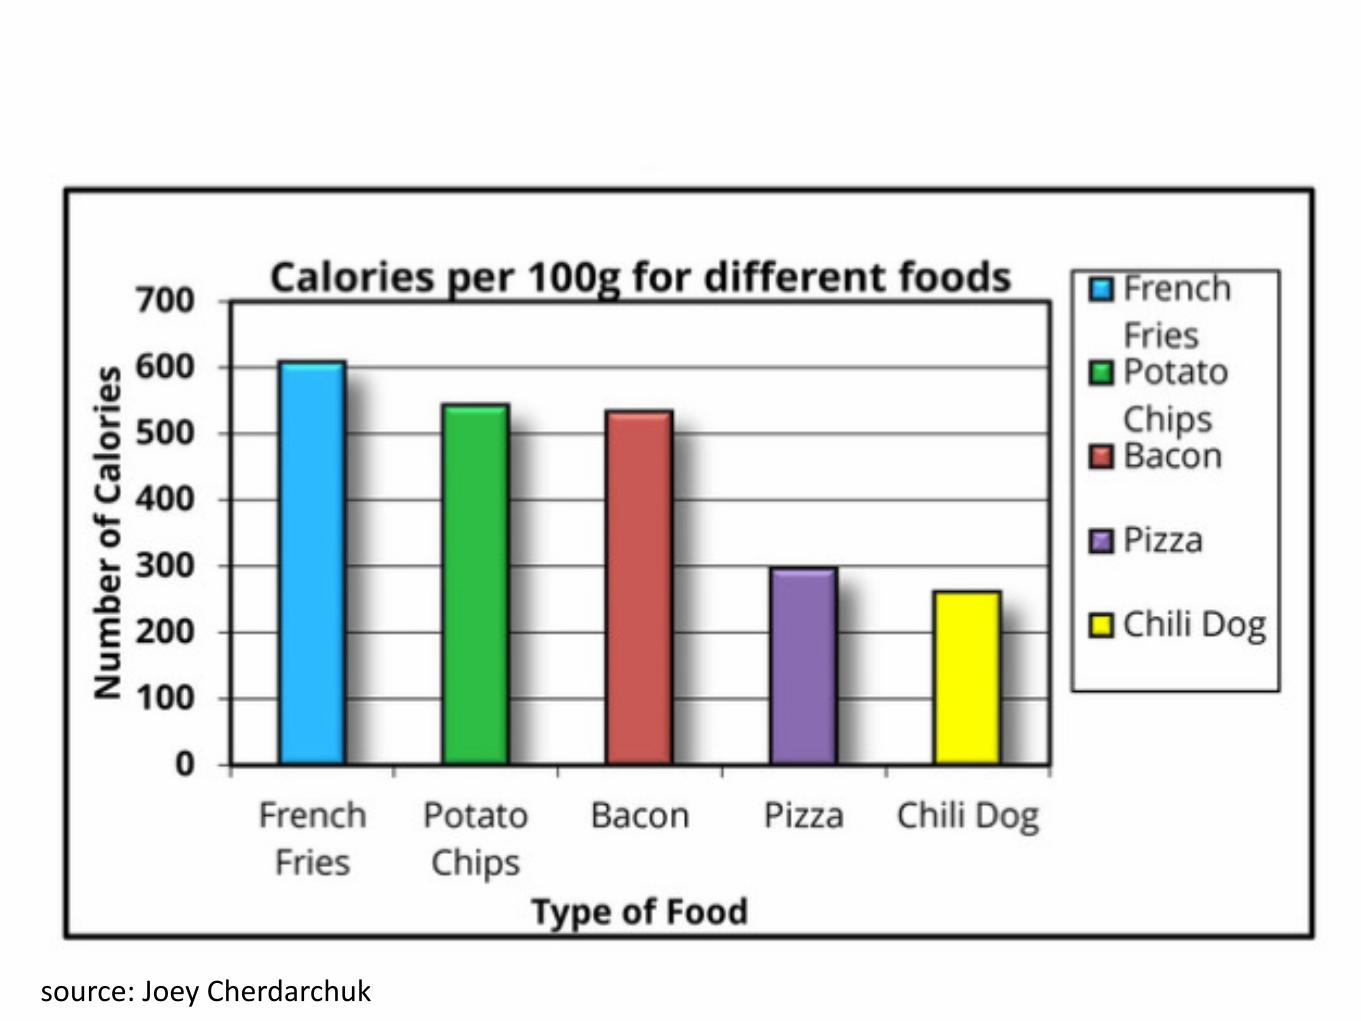
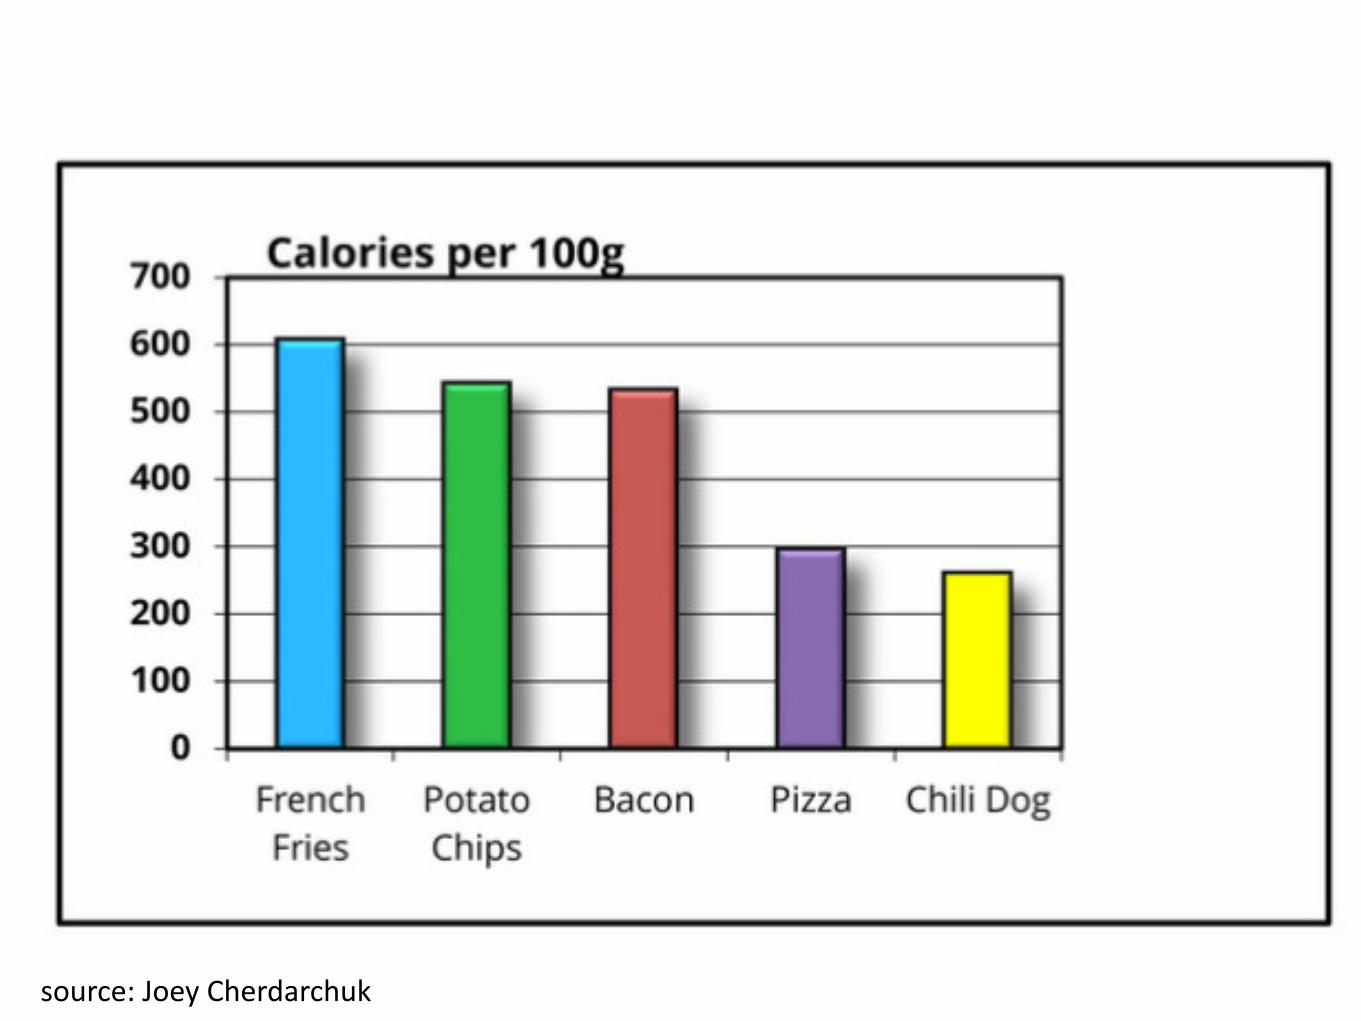
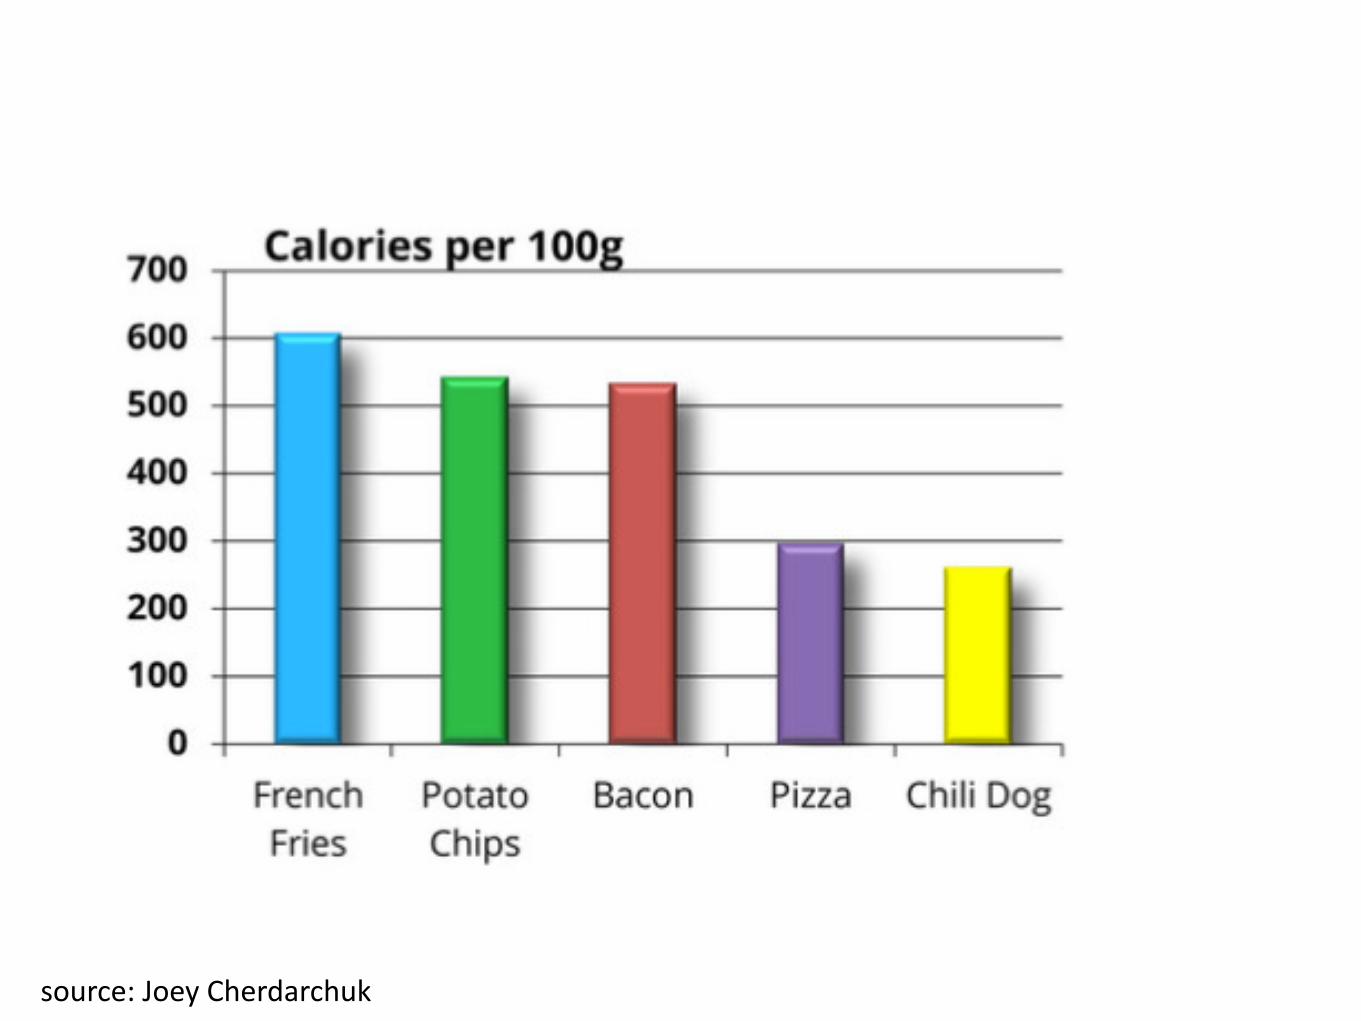
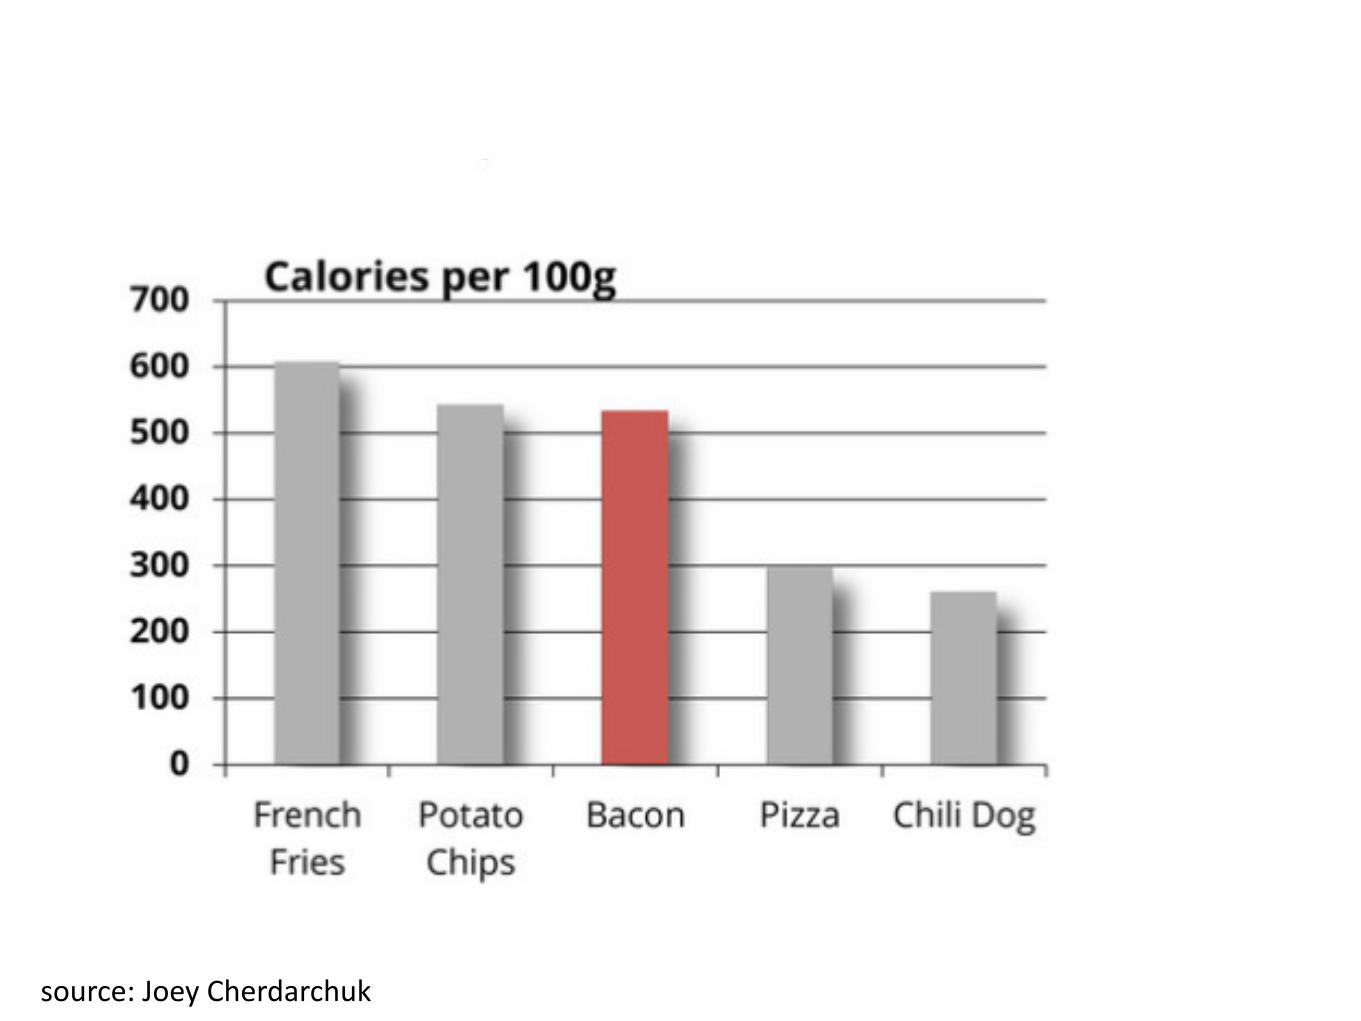
19source:JoeyCherdarchuk
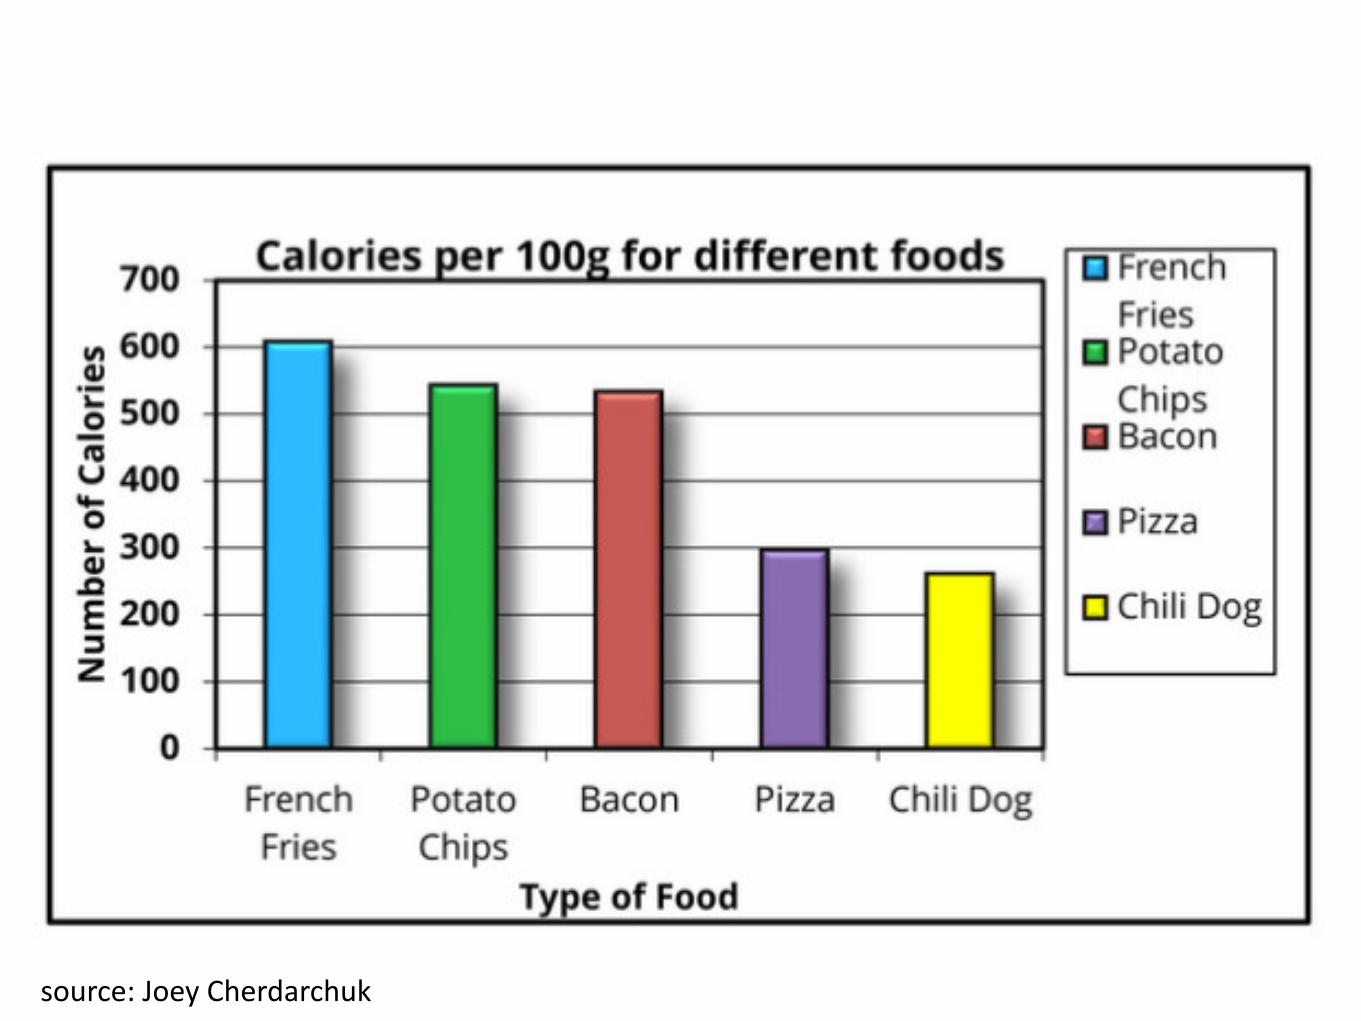
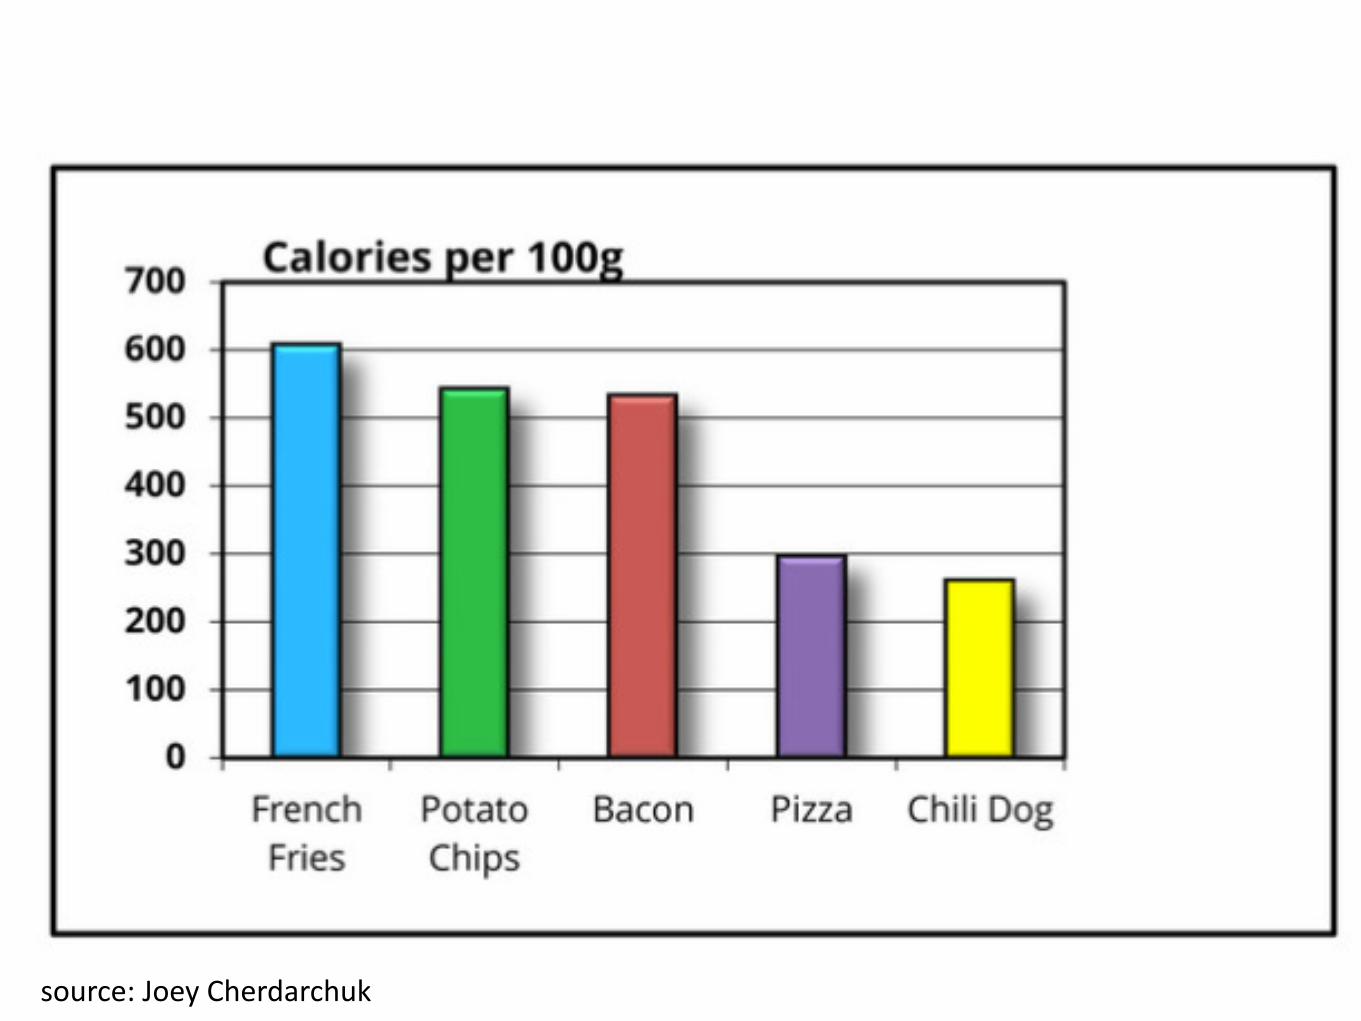
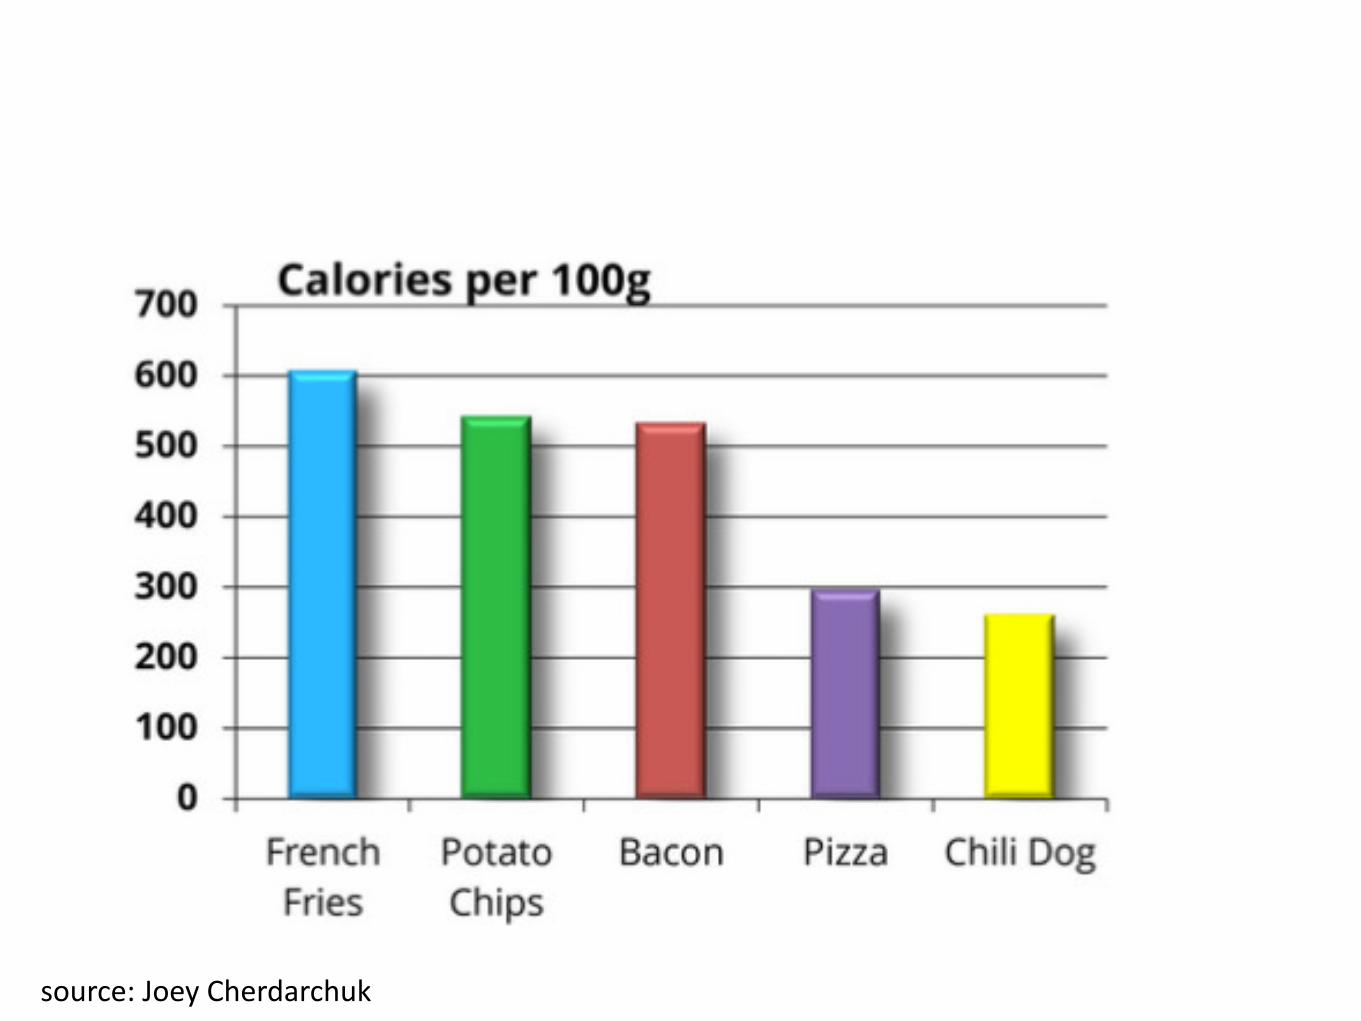
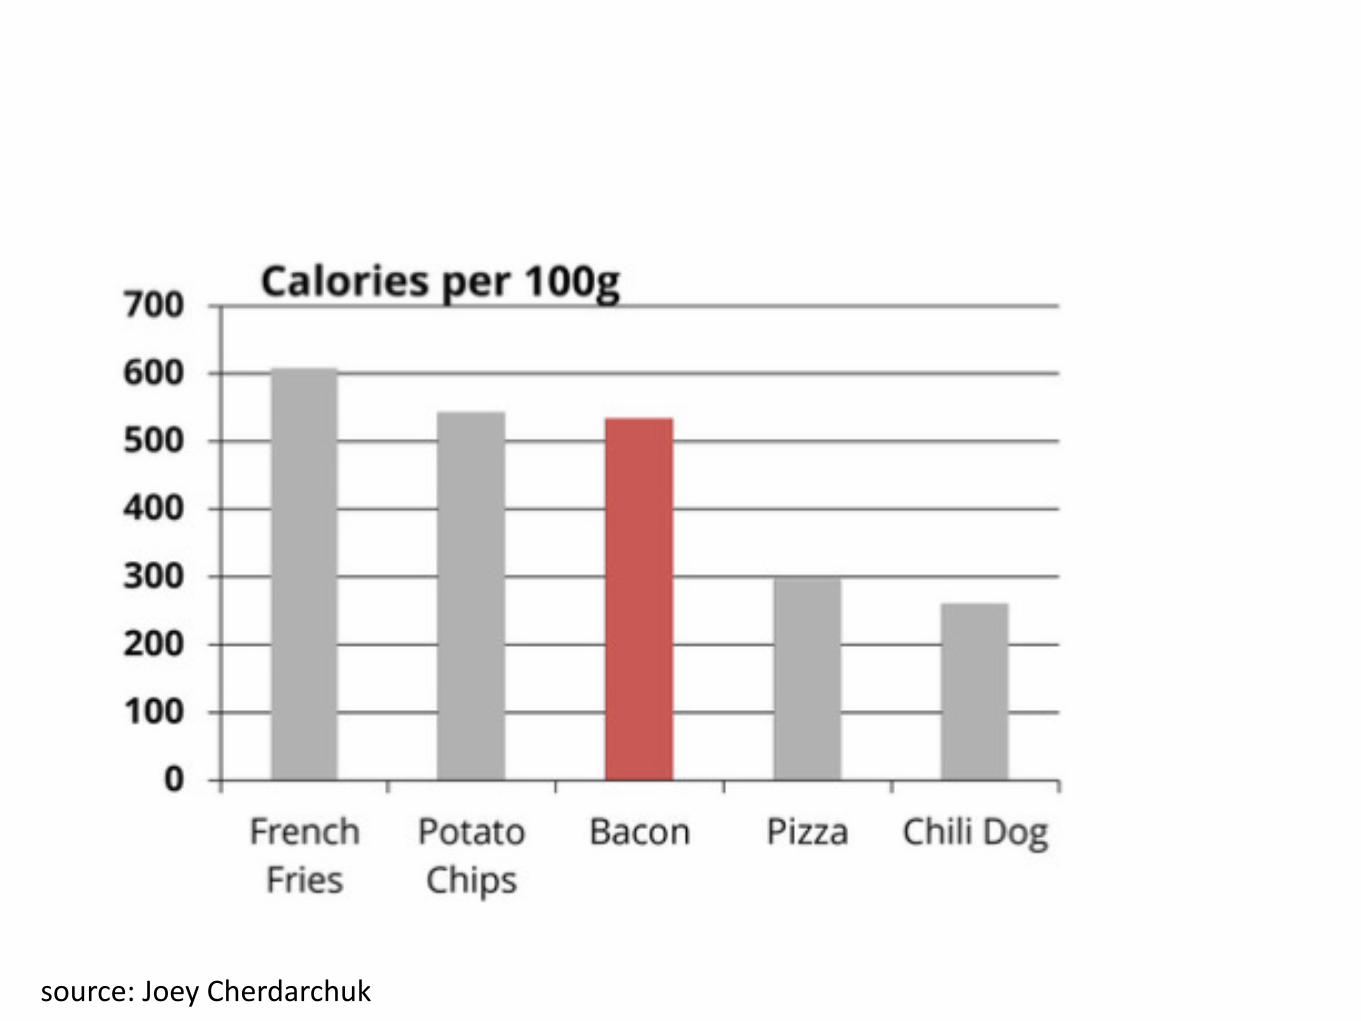
20source:JoeyCherdarchuk
21source:JoeyCherdarchuk
22source:JoeyCherdarchuk
23source:JoeyCherdarchuk
24source:JoeyCherdarchuk
25source:JoeyCherdarchuk
26source:JoeyCherdarchuk
27source:JoeyCherdarchuk
28source:JoeyCherdarchuk
29source:JoeyCherdarchuk
30source:JoeyCherdarchuk
31source:JoeyCherdarchuk
32source:JoeyCherdarchuk
33source:JoeyCherdarchuk
34source:JoeyCherdarchuk
35source:JoeyCherdarchuk
36source:JoeyCherdarchuk
37source:JoeyCherdarchuk
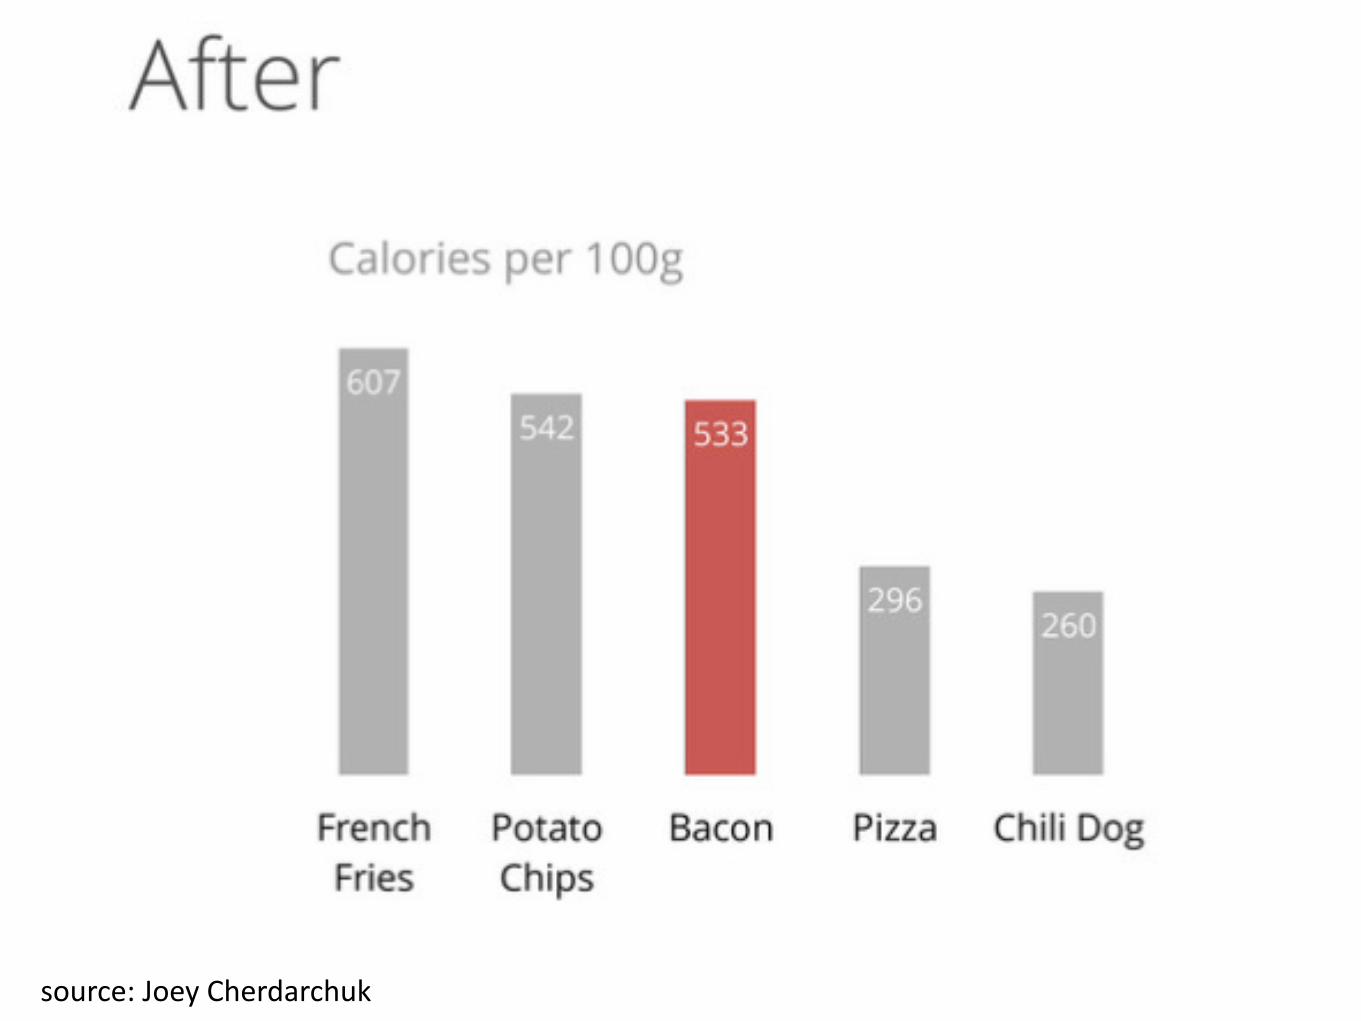
38source:JoeyCherdarchuk
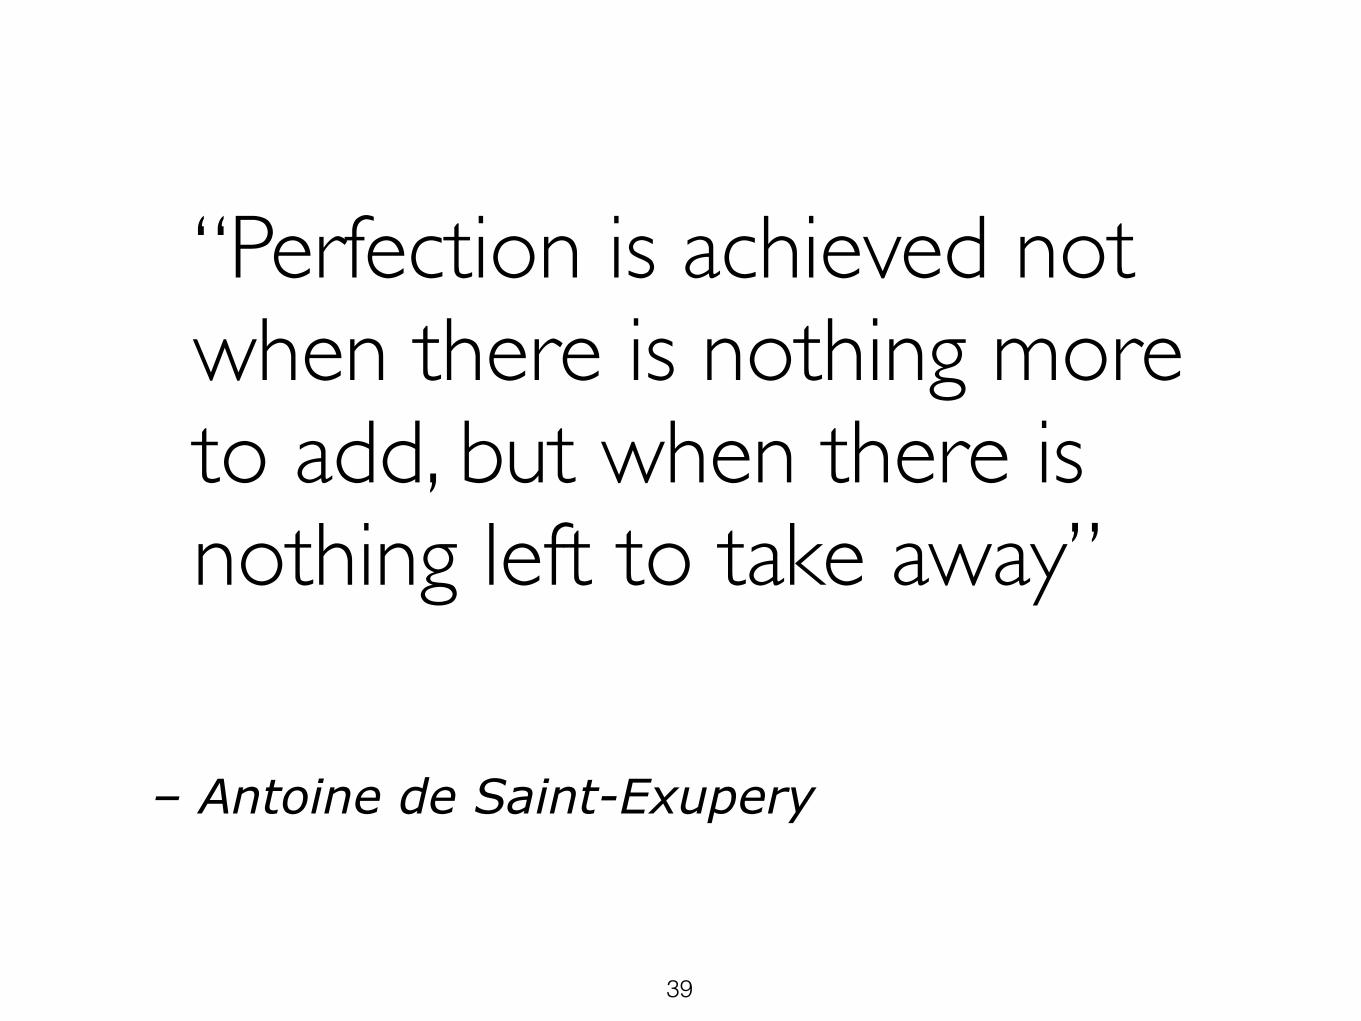
“Perfection is achieved not when there is nothing more to add, but when there is nothing left to take away”
– Antoine de Saint-Exupery
39

Five principles
1. Above all else show the data.
2. Maximize the data-ink ratio, within reason.
3. Erase non-data ink, within reason.
4. Erase redundant data-ink.
5. Revise and edit.
Source: Katrien Verbert
"The success of a visualization is based on deep knowledge and care about the substance, and the
quality, relevance and integrity of the content." (Tufte, 1983)
40
Five principles
1. Above all else show the data.
2. Maximize the data-ink ratio, within reason.
3. Erase non-data ink, within reason.
4. Erase redundant data-ink.
5. Revise and edit.
Source: Katrien Verbert
"The success of a visualization is based on deep knowledge and care about the substance, and the
quality, relevance and integrity of the content." (Tufte, 1983)
41
“A visualization should first-of-all inform, but if the visualization fails to reach the target audience, it never reaches the point that it can inform”
Informative + Attractive ?
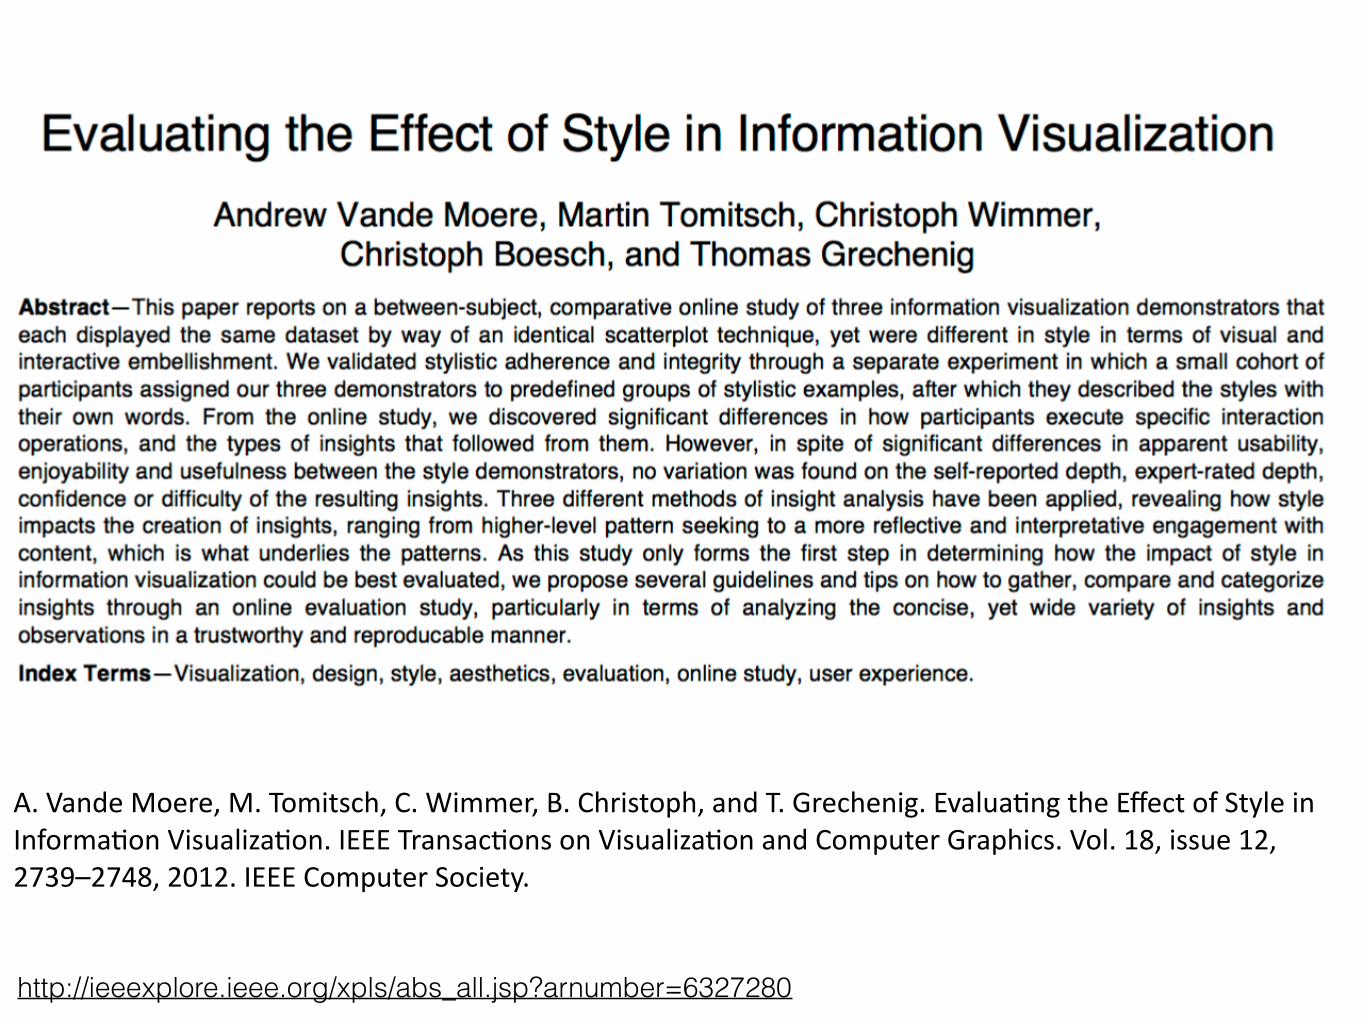
A.VandeMoere,M.Tomitsch,C.Wimmer,B.Christoph,andT.Grechenig.EvaluaCngtheEffectofStyleinInformaConVisualizaCon.IEEETransacConsonVisualizaConandComputerGraphics.Vol.18,issue12,2739–2748,2012.IEEEComputerSociety.
http://ieeexplore.ieee.org/xpls/abs_all.jsp?arnumber=6327280

?44
Vandaag• (Data-ink) Design Principles (ik)
• Show-and-Tell (jullie)
• 5 mins + 5 mins ‘design-critique’
• Quick feedback per groep
• Opdracht tegen volgende keer (ik)
45
Tegen volgende les • Individueel: - Spreadsheet
• Team:
• Vervolg implementatie
• Draft Paper!
• Blog post
• Vooruitgang - wat geleerd vandaag
• Wat vond je van feedback sessie?
• Show-and-Tell - design critique (eventueel weerleggen wat je gehoord hebt vandaag)
46