
Innovatie door waardecreatie met leveranciers - Facto.nl 2010 - presentatie D1 innovatie... ·...
30
Ruimte voor eventueel een bedrijfslogo 22 juni 2010 Stroom A ‘Verbeter uw (interne) samenwerking’ | Workshop 1A STROOM D | WORKSHOP D1 Innovatie door waardecreatie met leveranciers Hans Dijkhuis, Procurement Manager, ASML Wouter Crul, Managing Director, Purspective
Transcript of Innovatie door waardecreatie met leveranciers - Facto.nl 2010 - presentatie D1 innovatie... ·...

Ruimte voor eventueel
een bedrijfslogo
22 juni 2010 Stroom A ‘Verbeter uw (interne) samenwerking’ | Workshop 1A
STROOM D | WORKSHOP D1
Innovatie door
waardecreatie met
leveranciers
Hans Dijkhuis, Procurement Manager, ASML
Wouter Crul, Managing Director, Purspective

www.purspective.com
Porter 5 forces (1979)

www.purspective.com
Kraljic Matrix (1983)
Balance
Balance
Leverage
products
Strategic
products
Routine
products
Bottleneck
products
Competitive
BiddingPer-
formance based
partnership
e-Procurement
solutions
Secure supply +
search for
alternatives
Low
Low High
High
Impact on
financial
results
Supply-risk
Balance of power in in purchasing portfolio

www.purspective.com
MSU model (1991)
DevelopCommodity/Article Group
Strategies
II
Integrate Suppliersinto the new Product/ProcessDev. Process
V
Integrate Suppliersinto the Order
FulfillmentProcess
VI
Establish andLeverage a world-class Supply Base
III
Insourcing/Outsourcing
I
Develop andManage Supplier
Relationships
IV
SupplierDevelopment
and QualityMgt
VII
Manage Costsstrategically acrossthe Supply Chain
VIII
critical integratedsupply chain processes
INTEGRATED,ALIGNED AND
GLOBAL
Source: Robert.M. Monczka, Ph.D.
DeployGlobalization
III
Establish globallyintegrated and alignedpurchasing and supply
chain Strategies + Plans
I
Develop Organization and
Teaming strategies
II
Develop purchasing and supply chain Measurements
IV
Establish HumanResource develop-ment and training
VI
VDevelop and
implement enablingIS / IT systems
INTEGRATED,ALIGNED AND
GLOBAL
Source: Robert.M. Monczka, Ph.D.
www.purspective.com
The Purchasing Czar (1992-93)
www.purspective.com
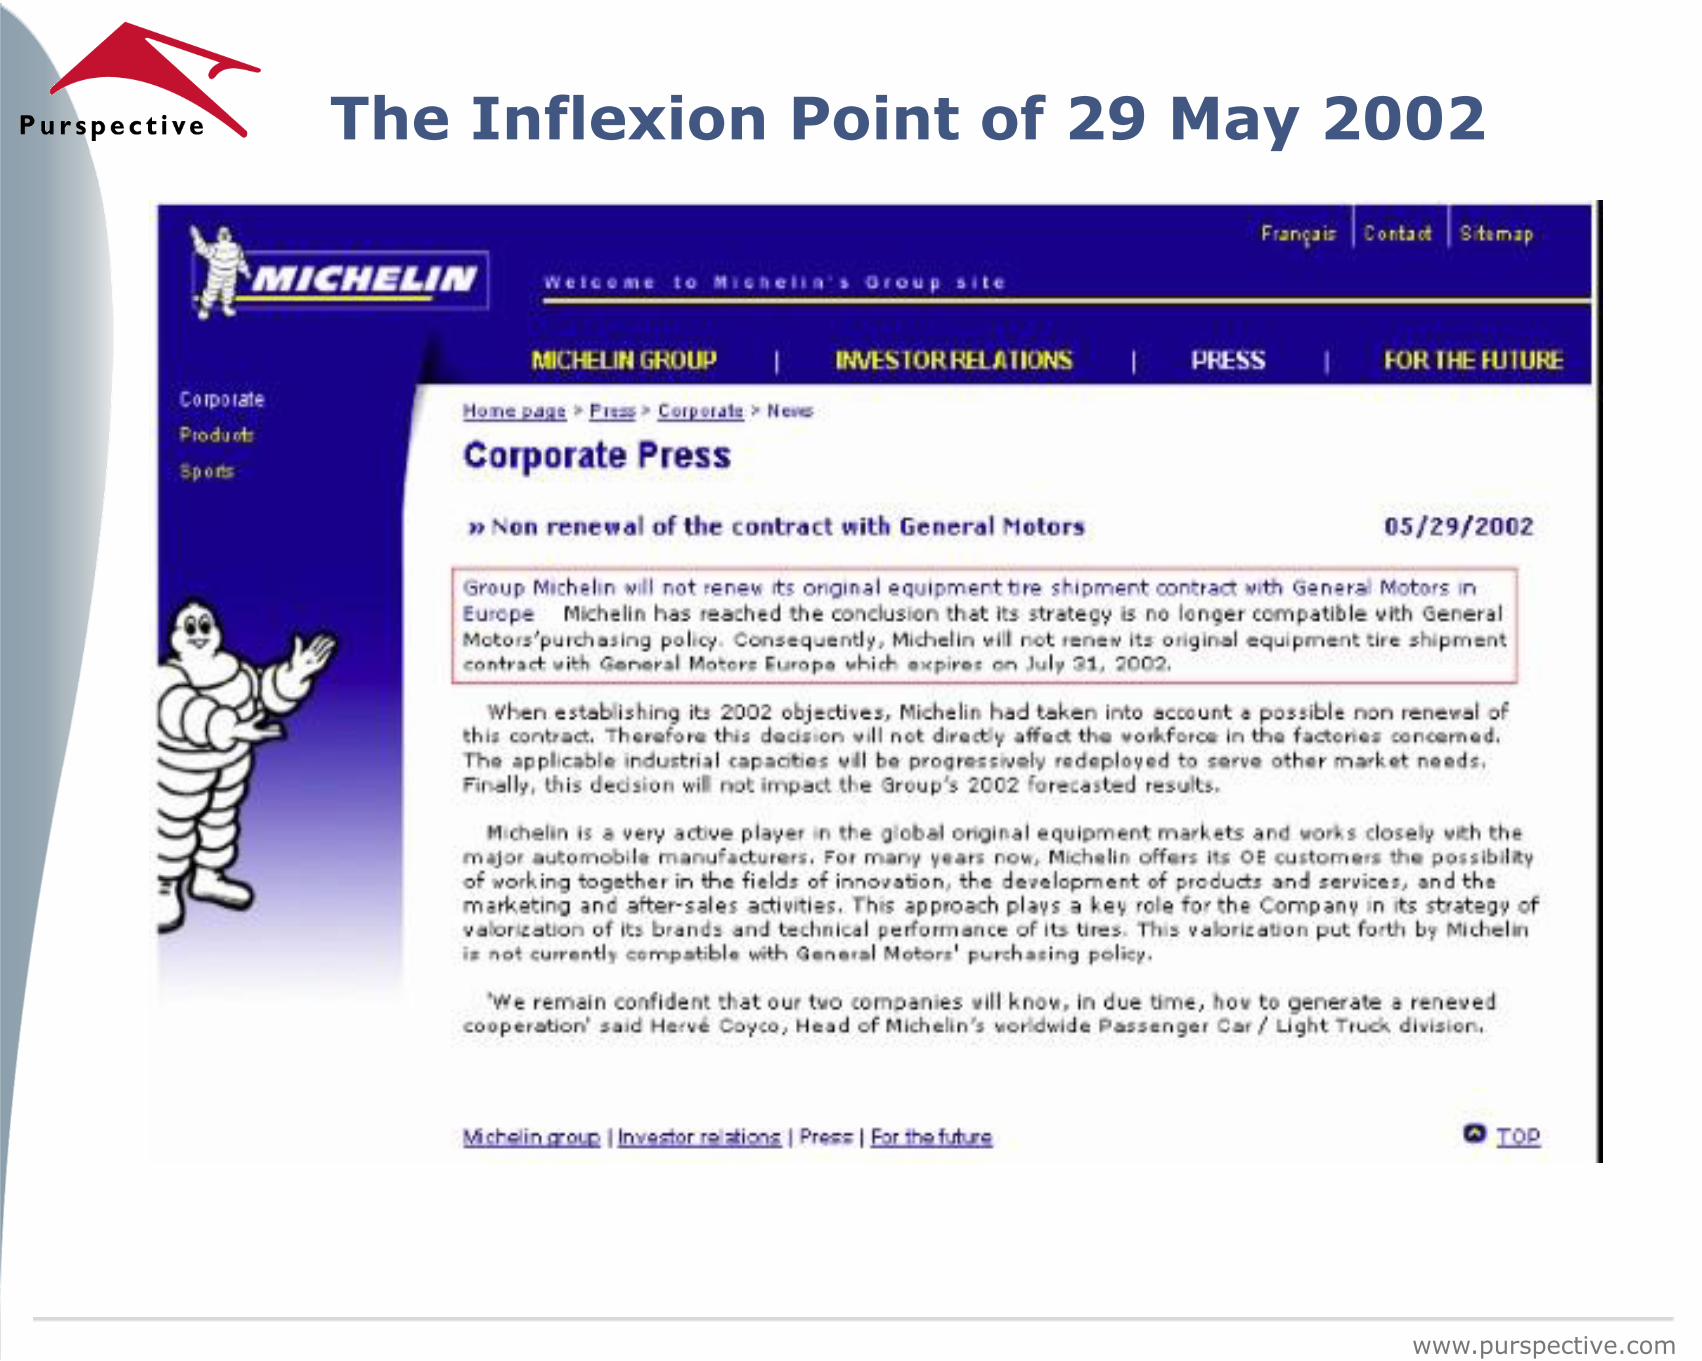
The Inflexion Point of 29 May 2002
www.purspective.com
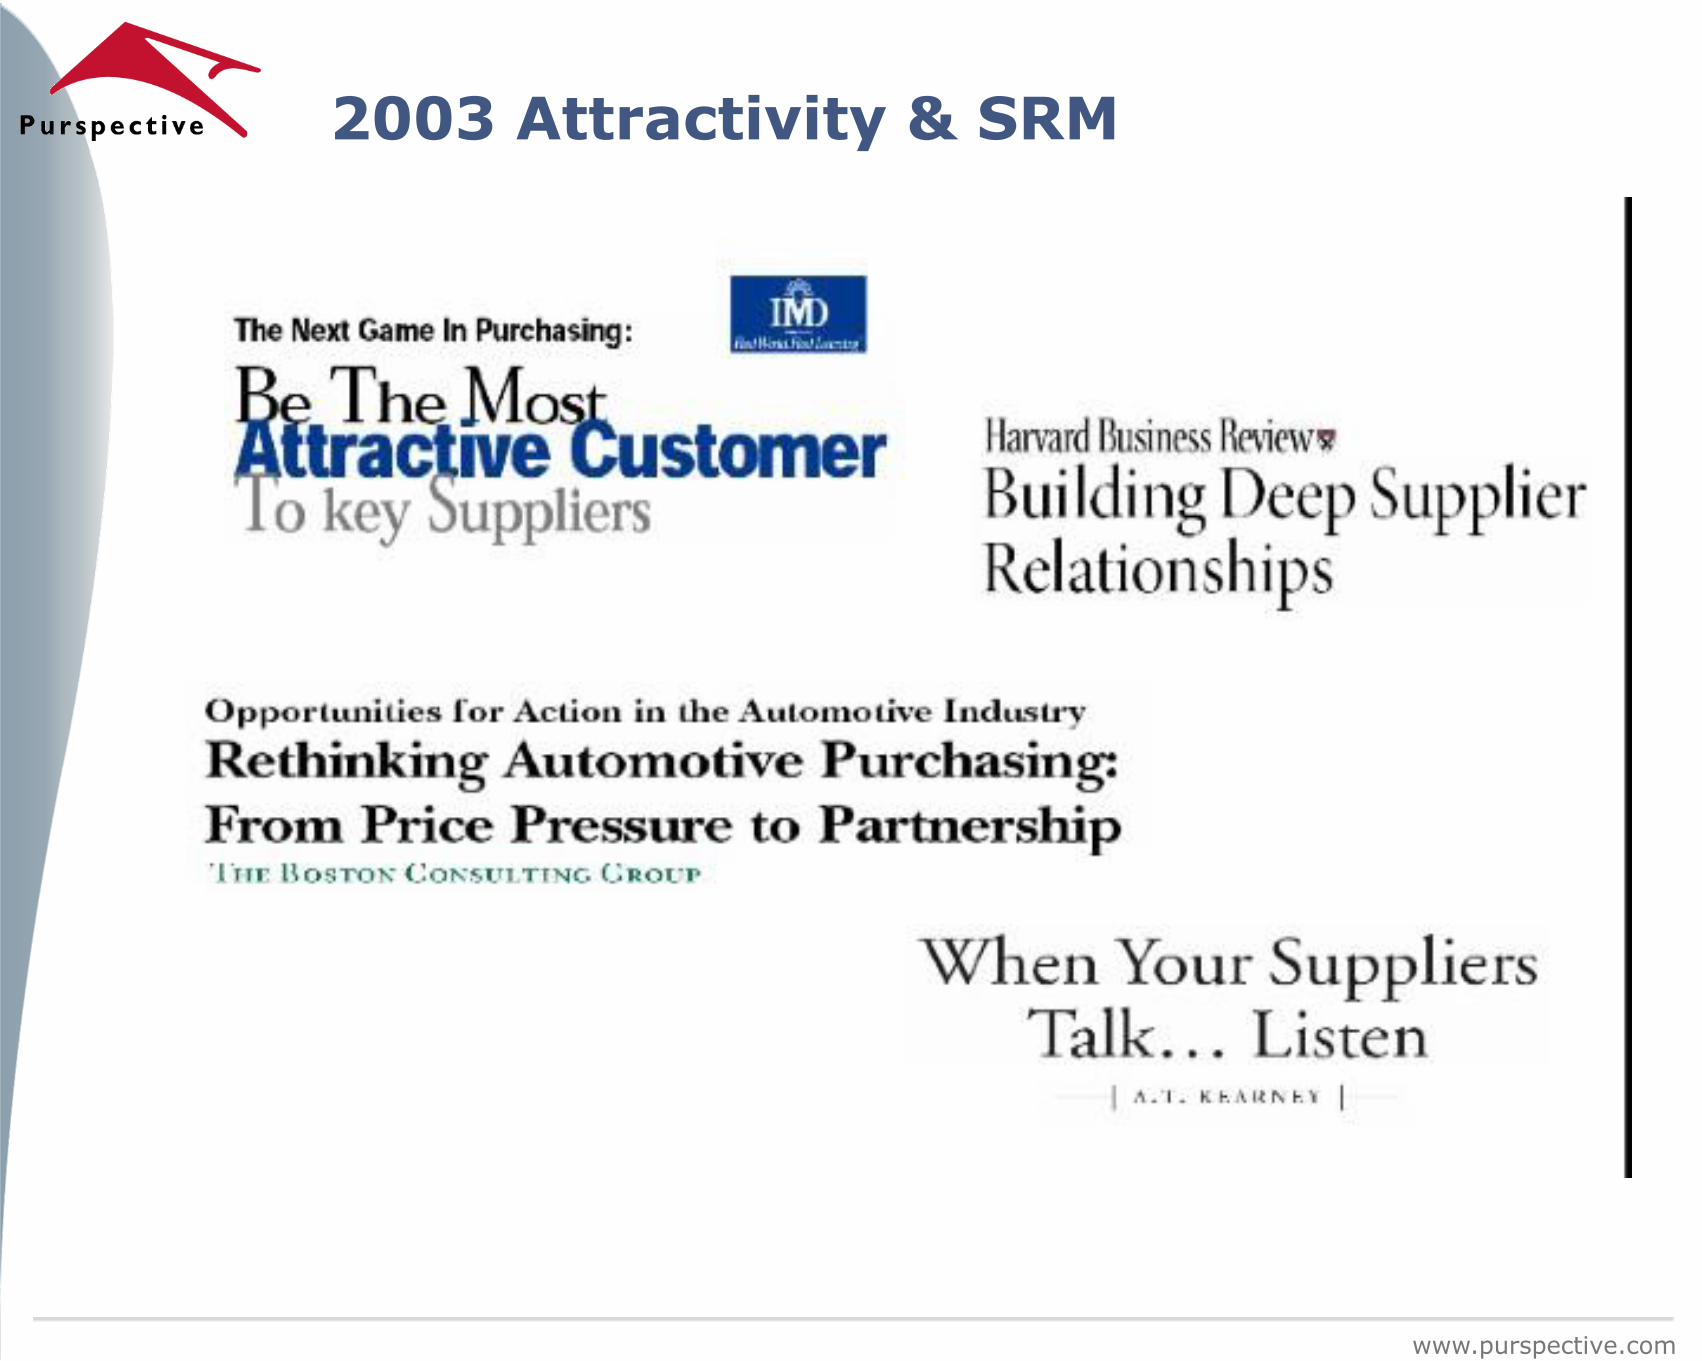
2003 Attractivity & SRM
www.purspective.com
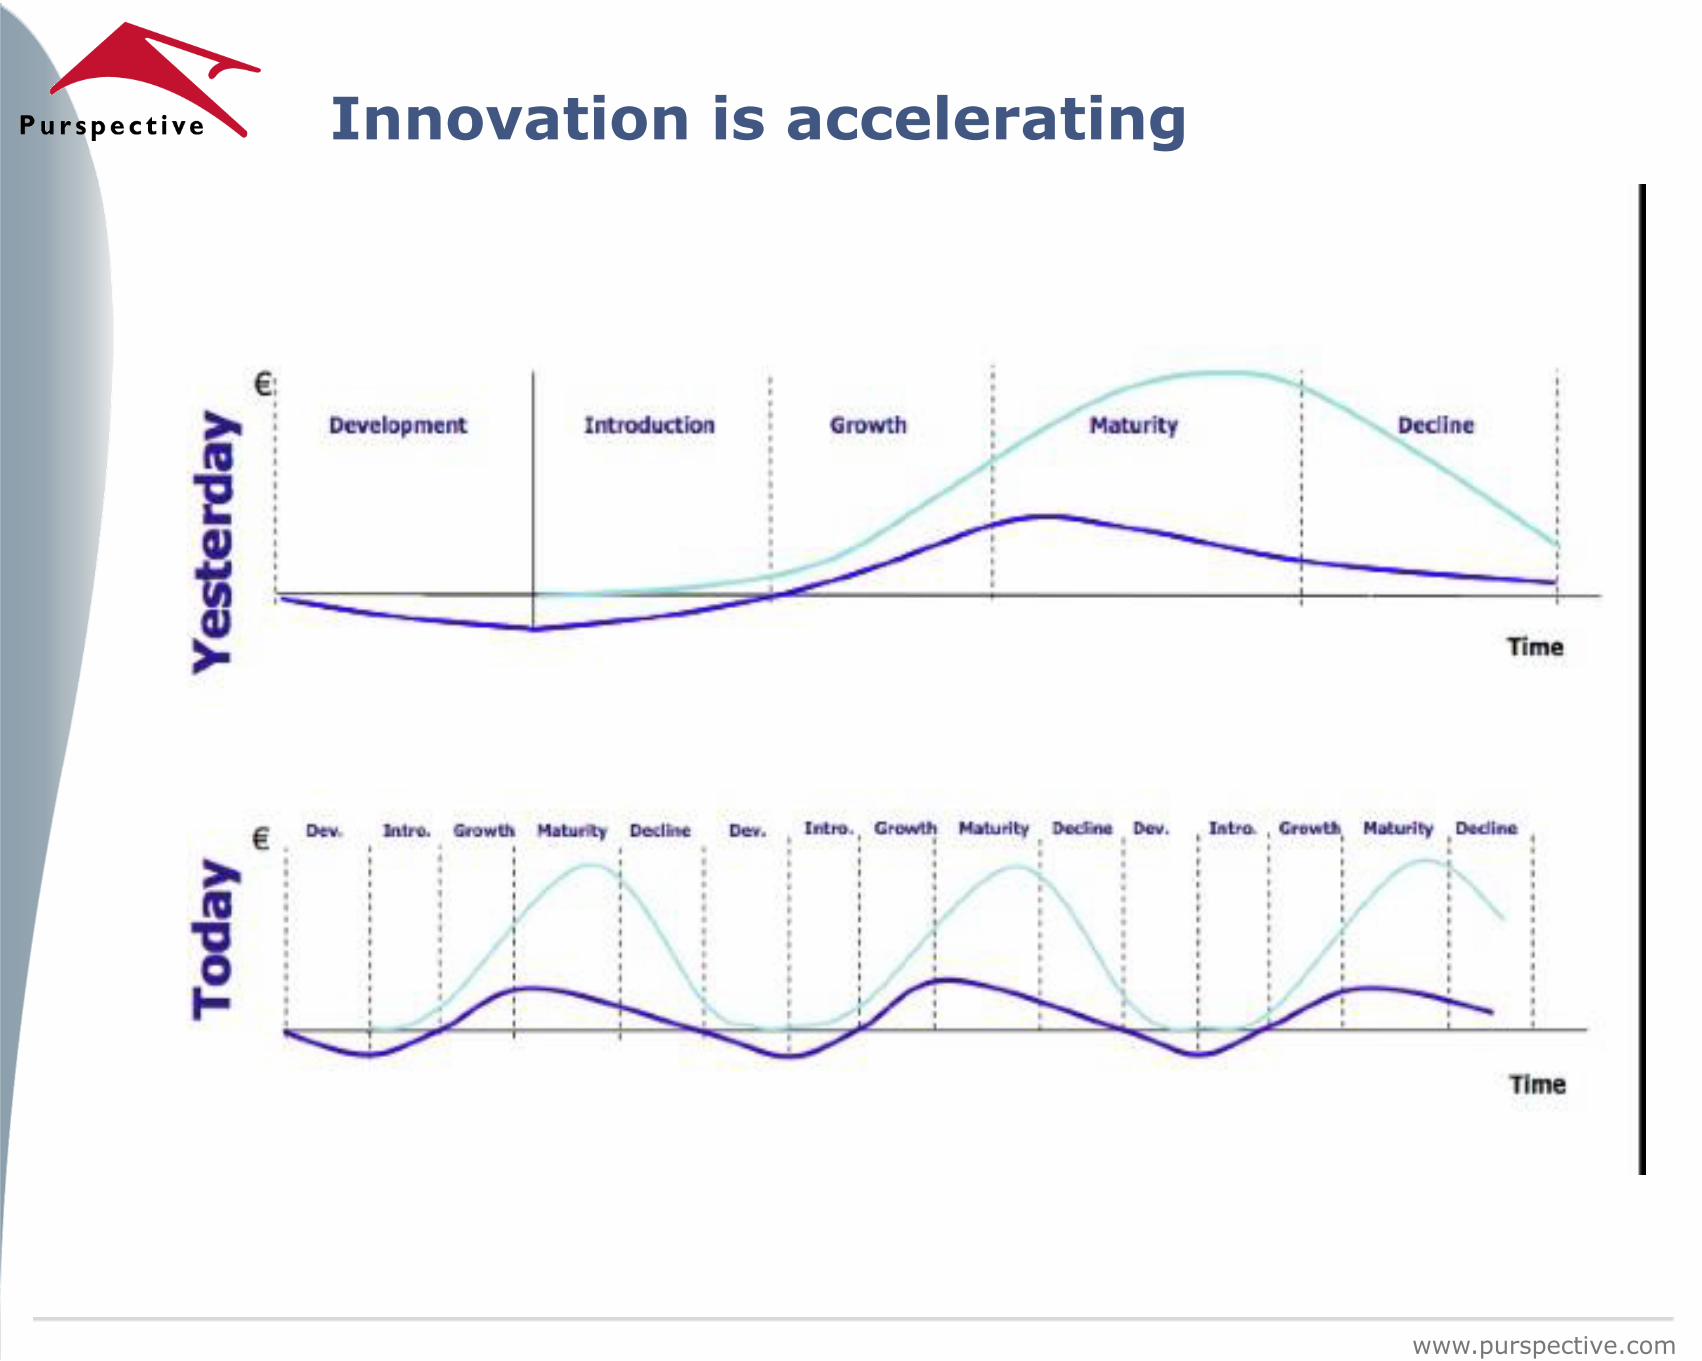
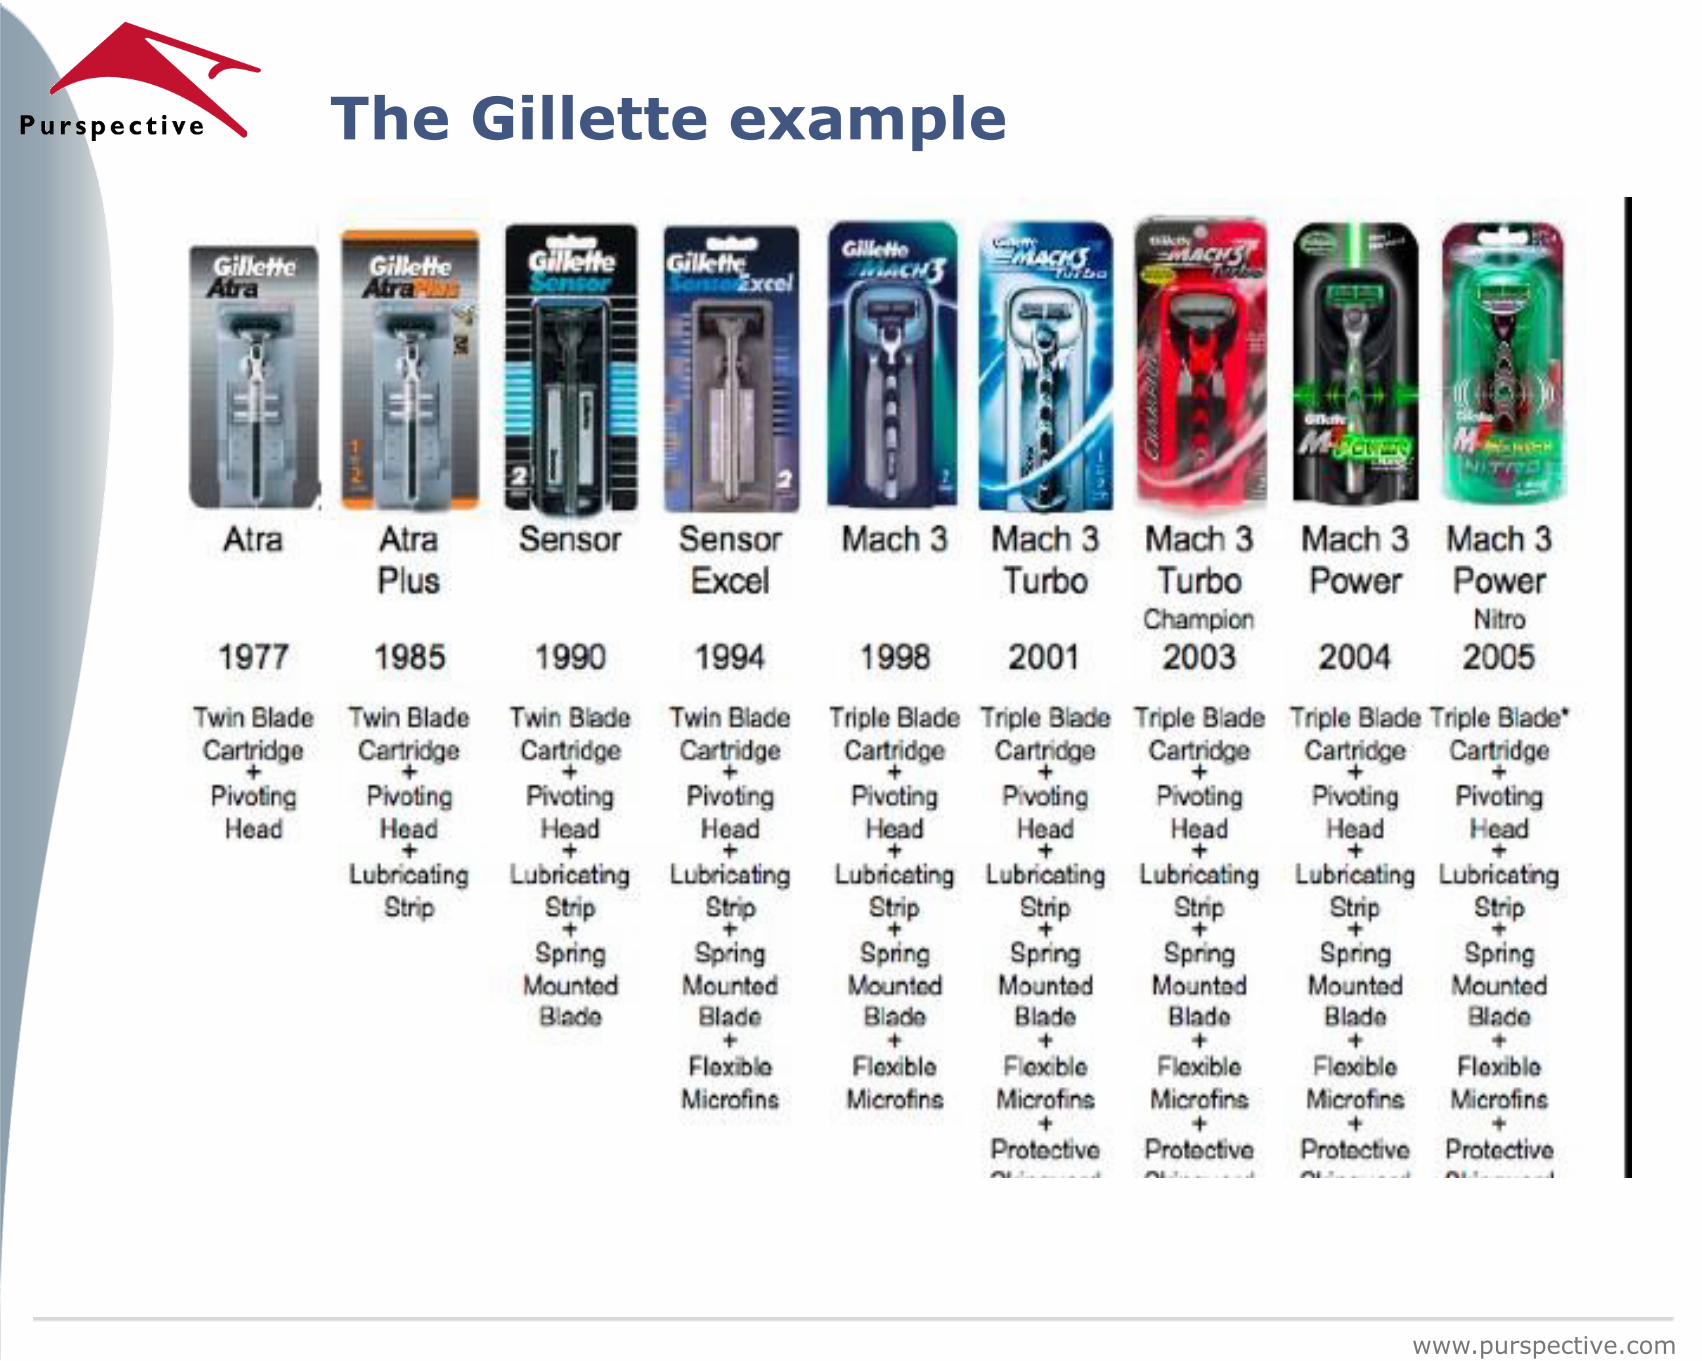
Innovation is accelerating
www.purspective.com
The Gillette example
www.purspective.com
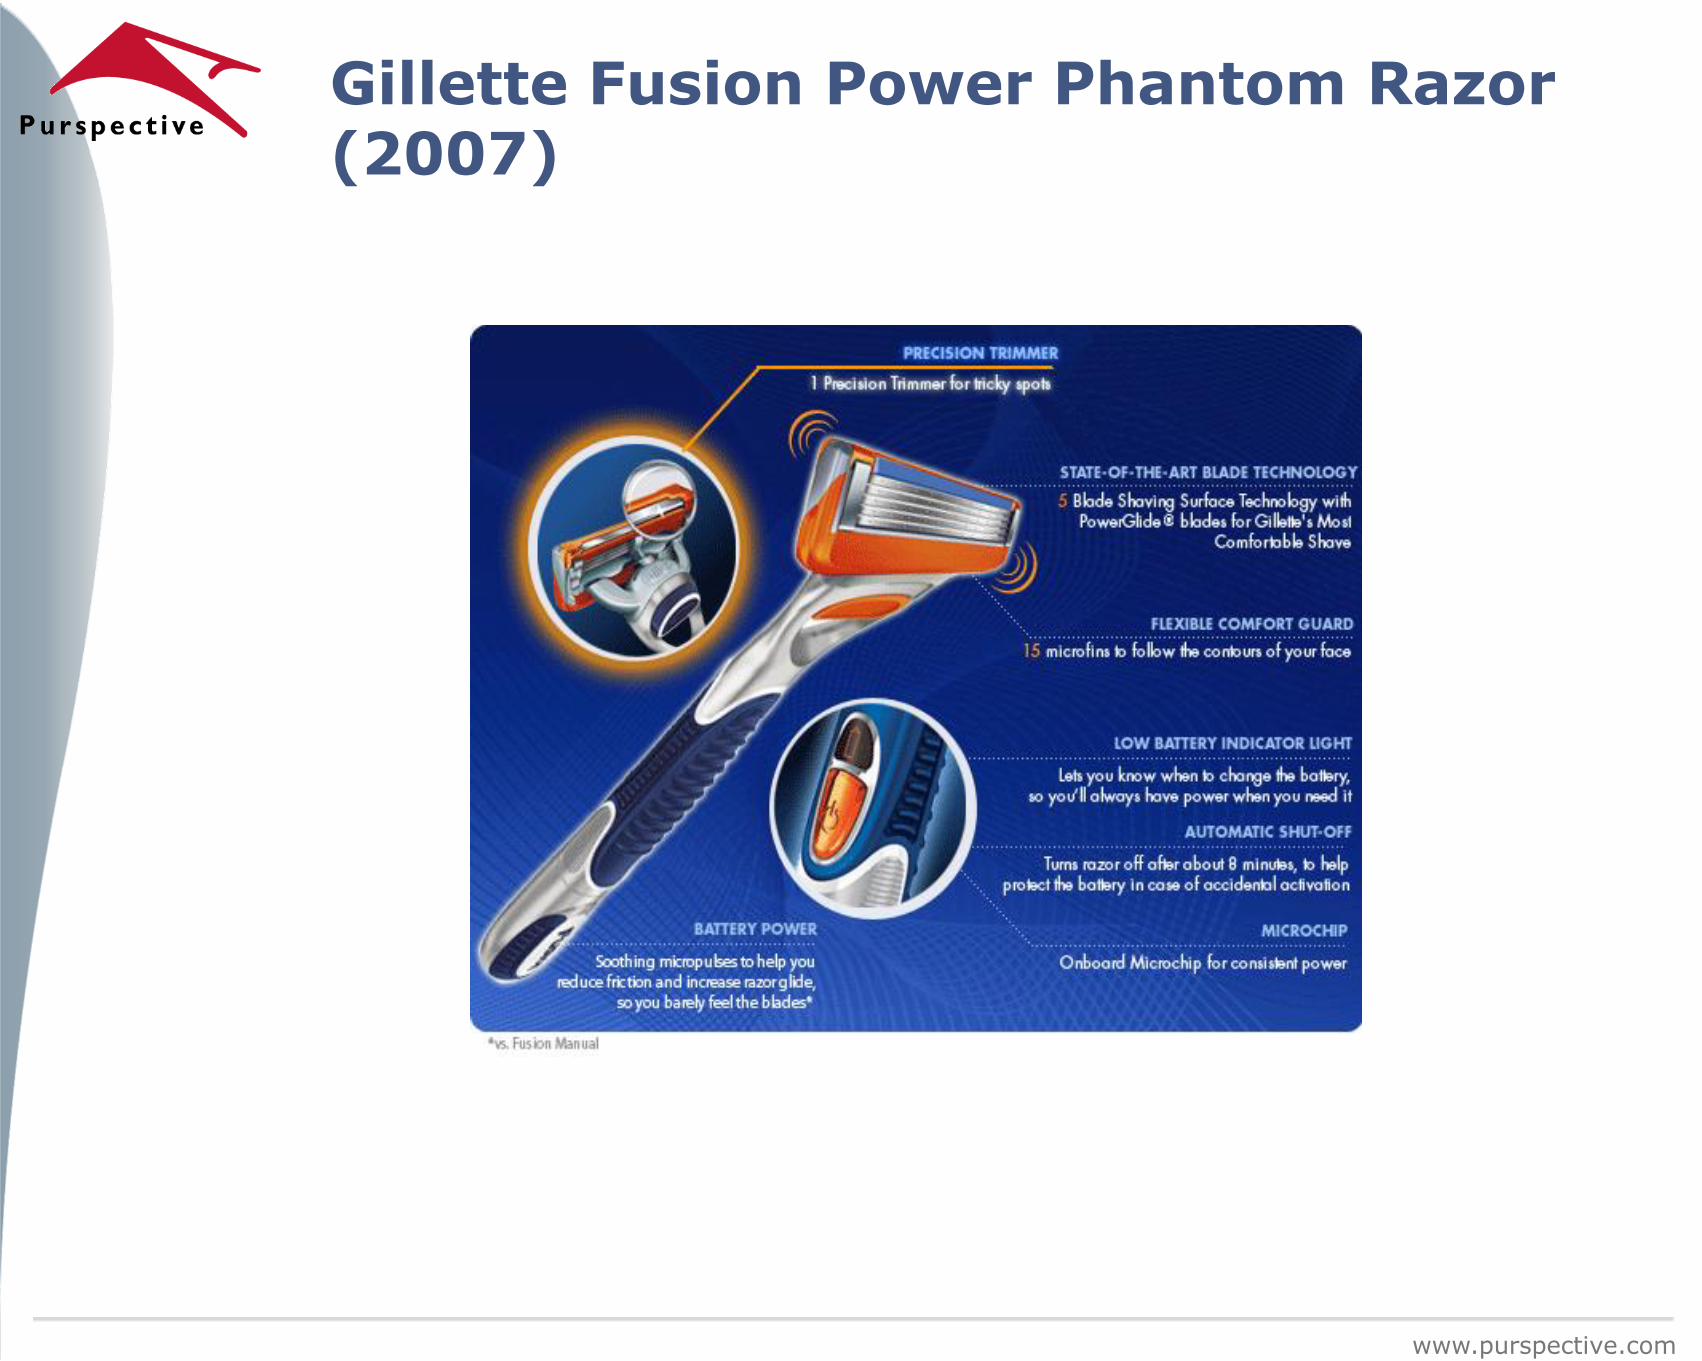
Gillette Fusion Power Phantom Razor (2007)
/ Slide 11
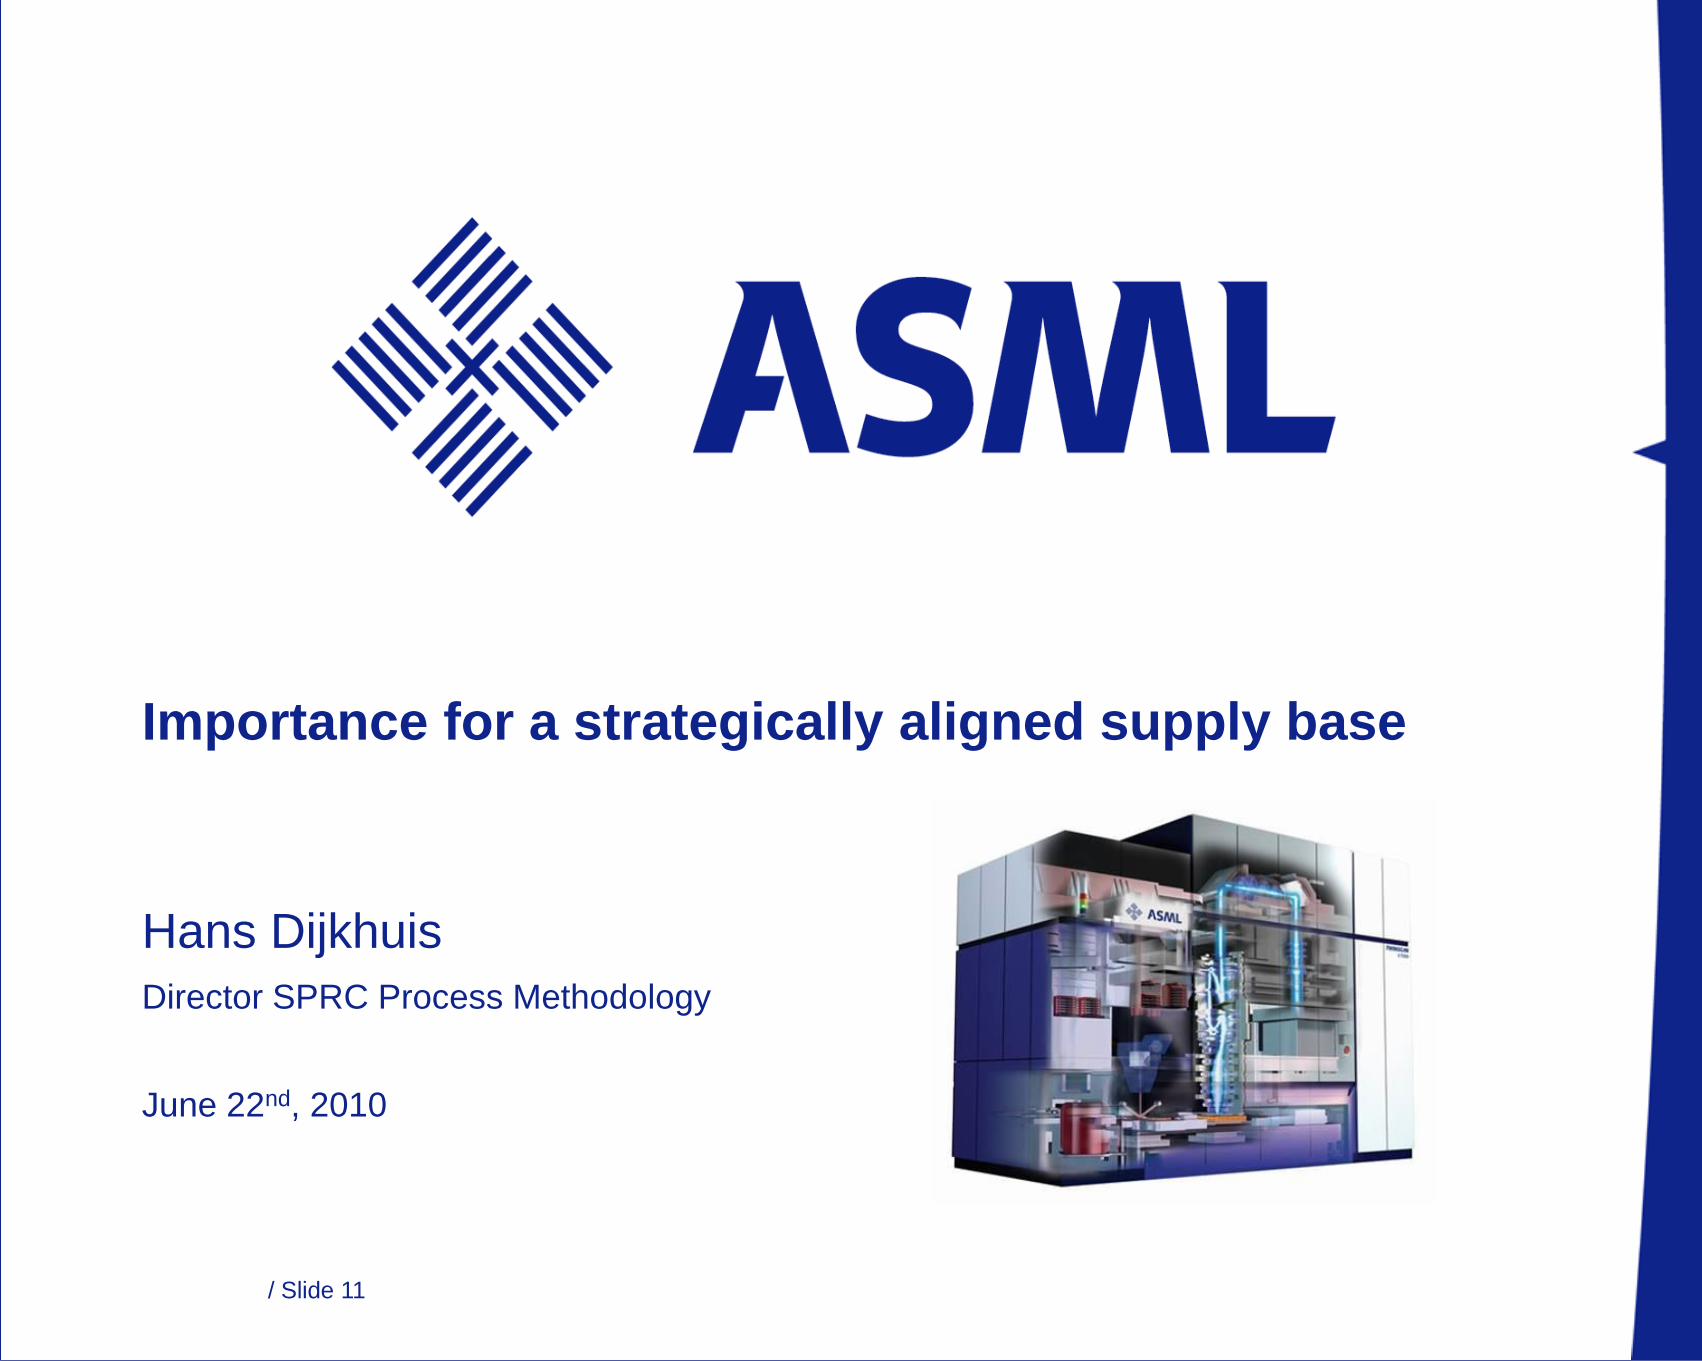
Importance for a strategically aligned supply base
Hans Dijkhuis
Director SPRC Process Methodology
June 22nd, 2010

Nevi June 22nd, 2010/ Slide 12
Chips have many forms and functions
“I won’t even try to predict what things will be important 25 years from now,
but I bet we’ll have enabled some of them”
Martin van den Brink, Executive Vice President of Marketing and Technology
Freefloating sensors(Holst Centre)
MRAM (Magnetic RAM)
Micromirrors for beamers (TI) Accelerometer in
the iPhone (Apple)
Gyroscope ( UC Irvine)
40Watt Energy Harvester (IMEC)
Accelerometer ( IC Mechanics)
DNA analysis (Affymetrix)
Lab on a Chip (LOC) for counting red blood cells
Camera pill with camera, transmitter and computer
QuadCore Microprocessor(AMD)
64 Gbit memory(Samsung)
Harddisk read/write head (Western Digital)
Nevi June 22nd, 2010/ Slide 13
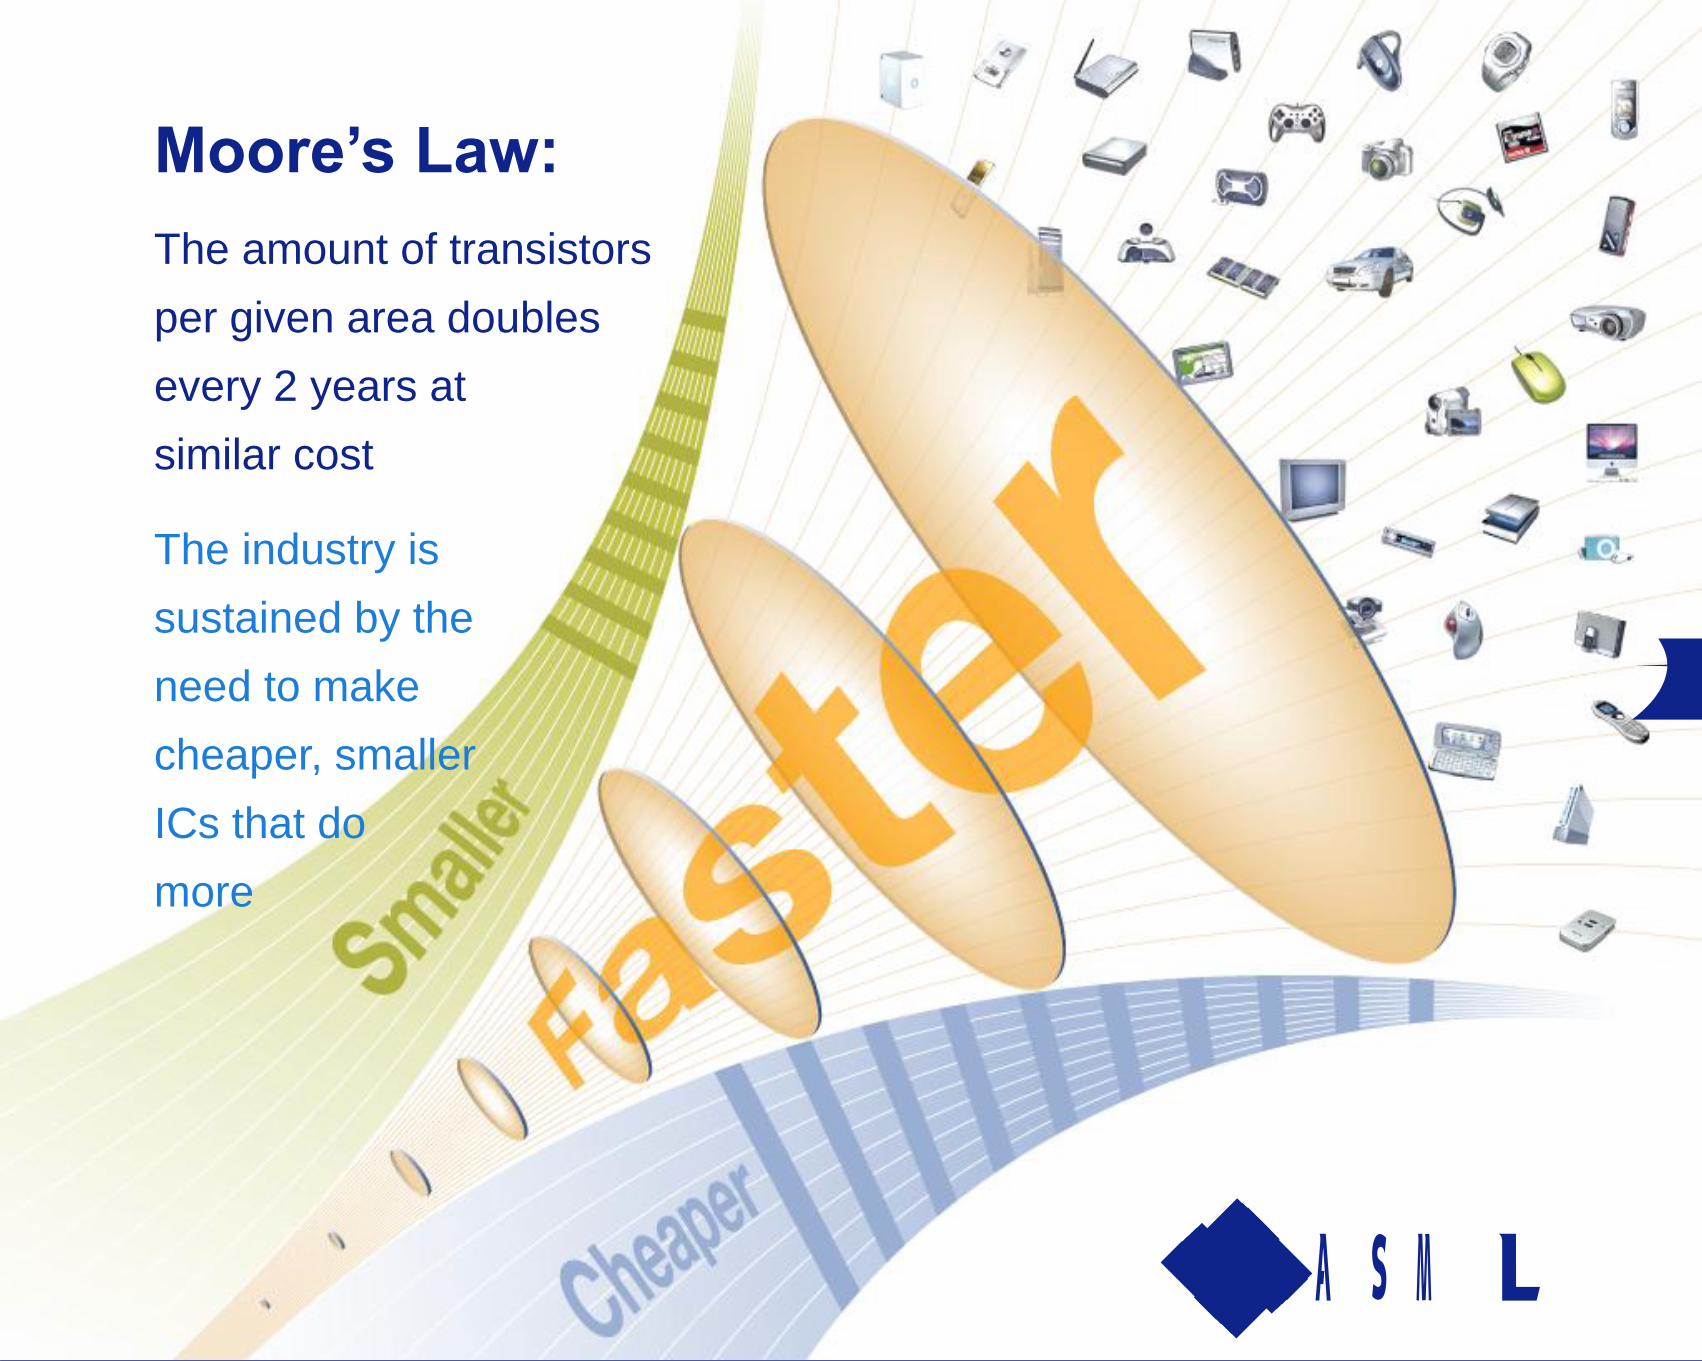
Moore’s Law:
The amount of transistors
per given area doubles
every 2 years at
similar cost
The industry is
sustained by the
need to make
cheaper, smaller
ICs that do
more
Nevi June 22nd, 2010/ Slide 14
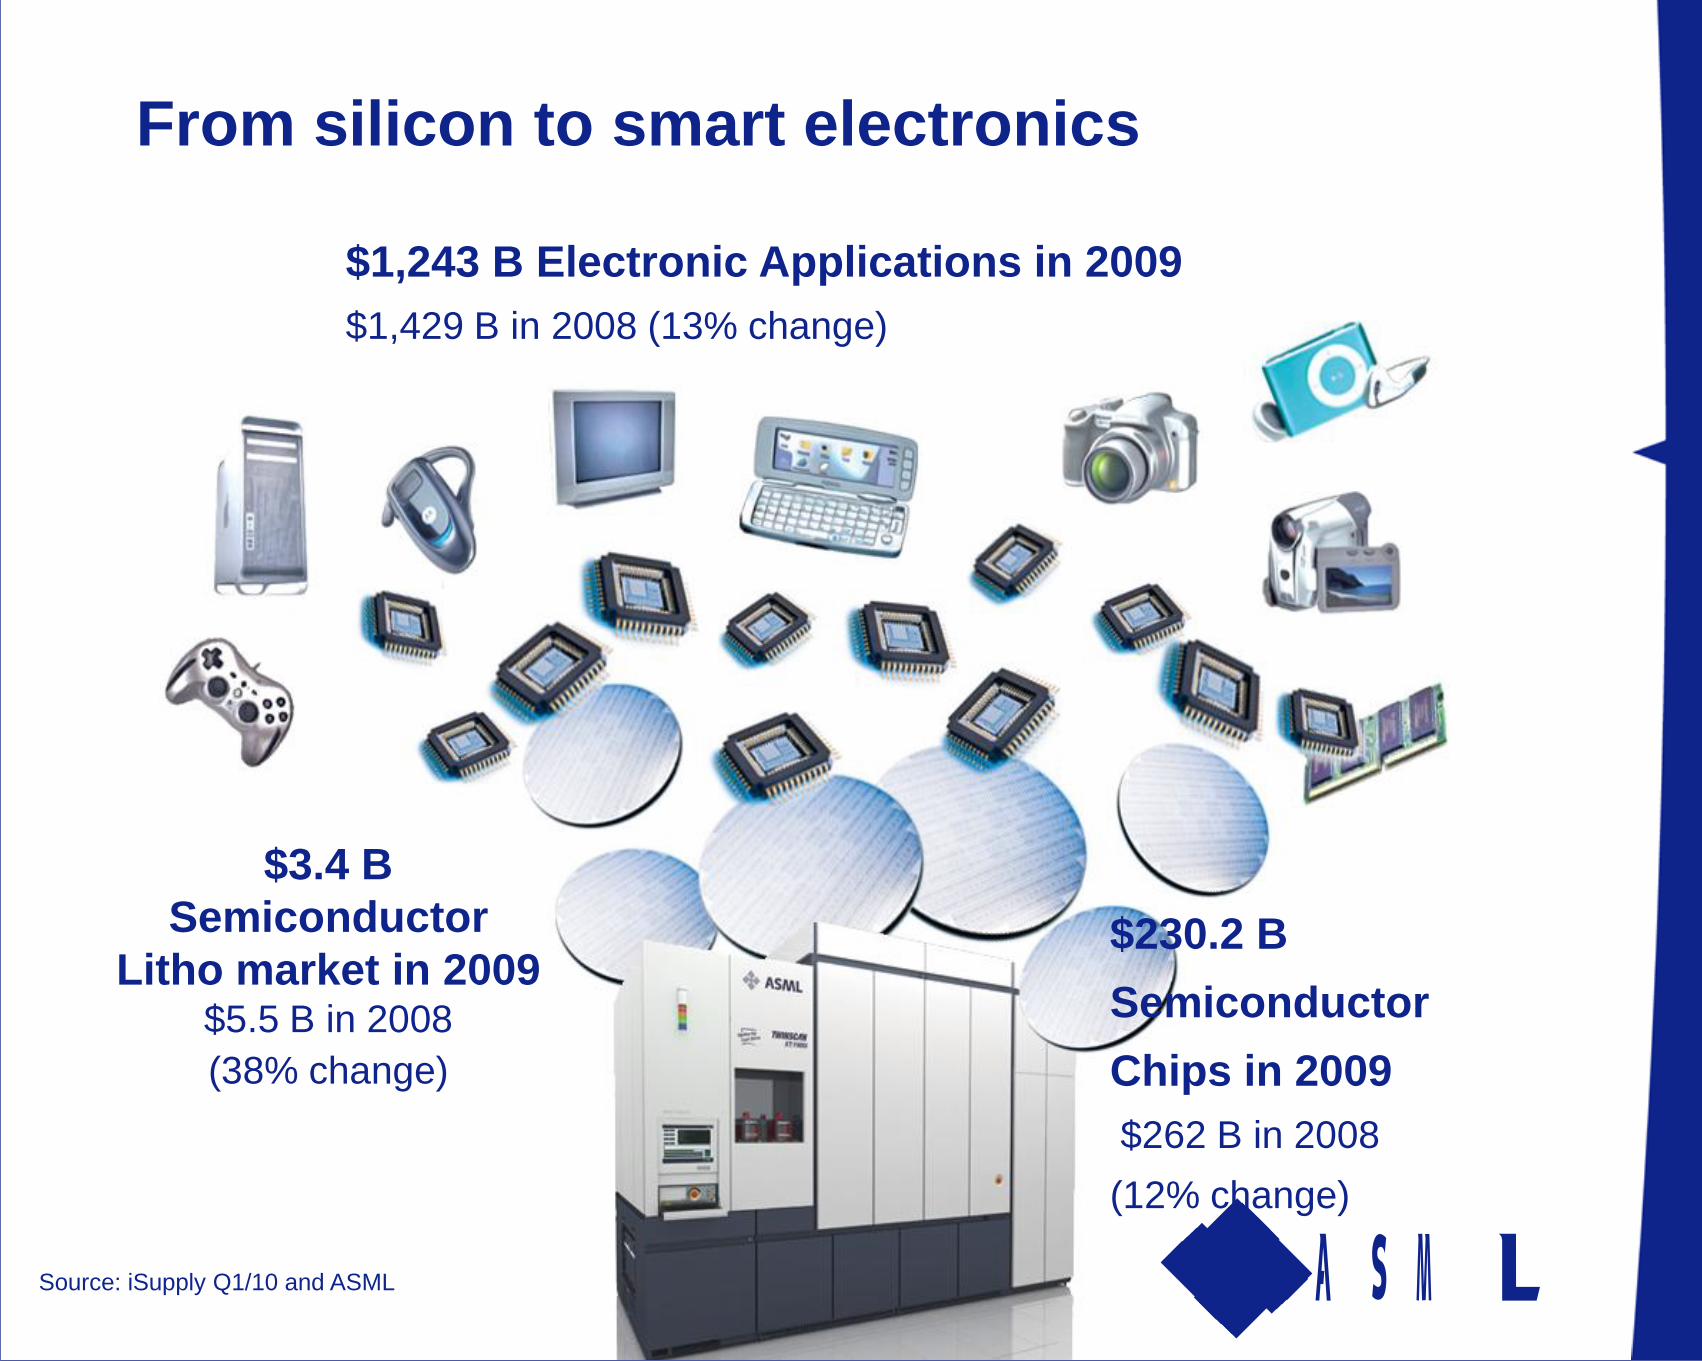
$230.2 B
Semiconductor
Chips in 2009
$262 B in 2008
(12% change)
$1,243 B Electronic Applications in 2009
$1,429 B in 2008 (13% change)
$3.4 B
Semiconductor
Litho market in 2009$5.5 B in 2008
(38% change)
Source: iSupply Q1/10 and ASML
From silicon to smart electronics
Nevi June 22nd, 2010/ Slide 15
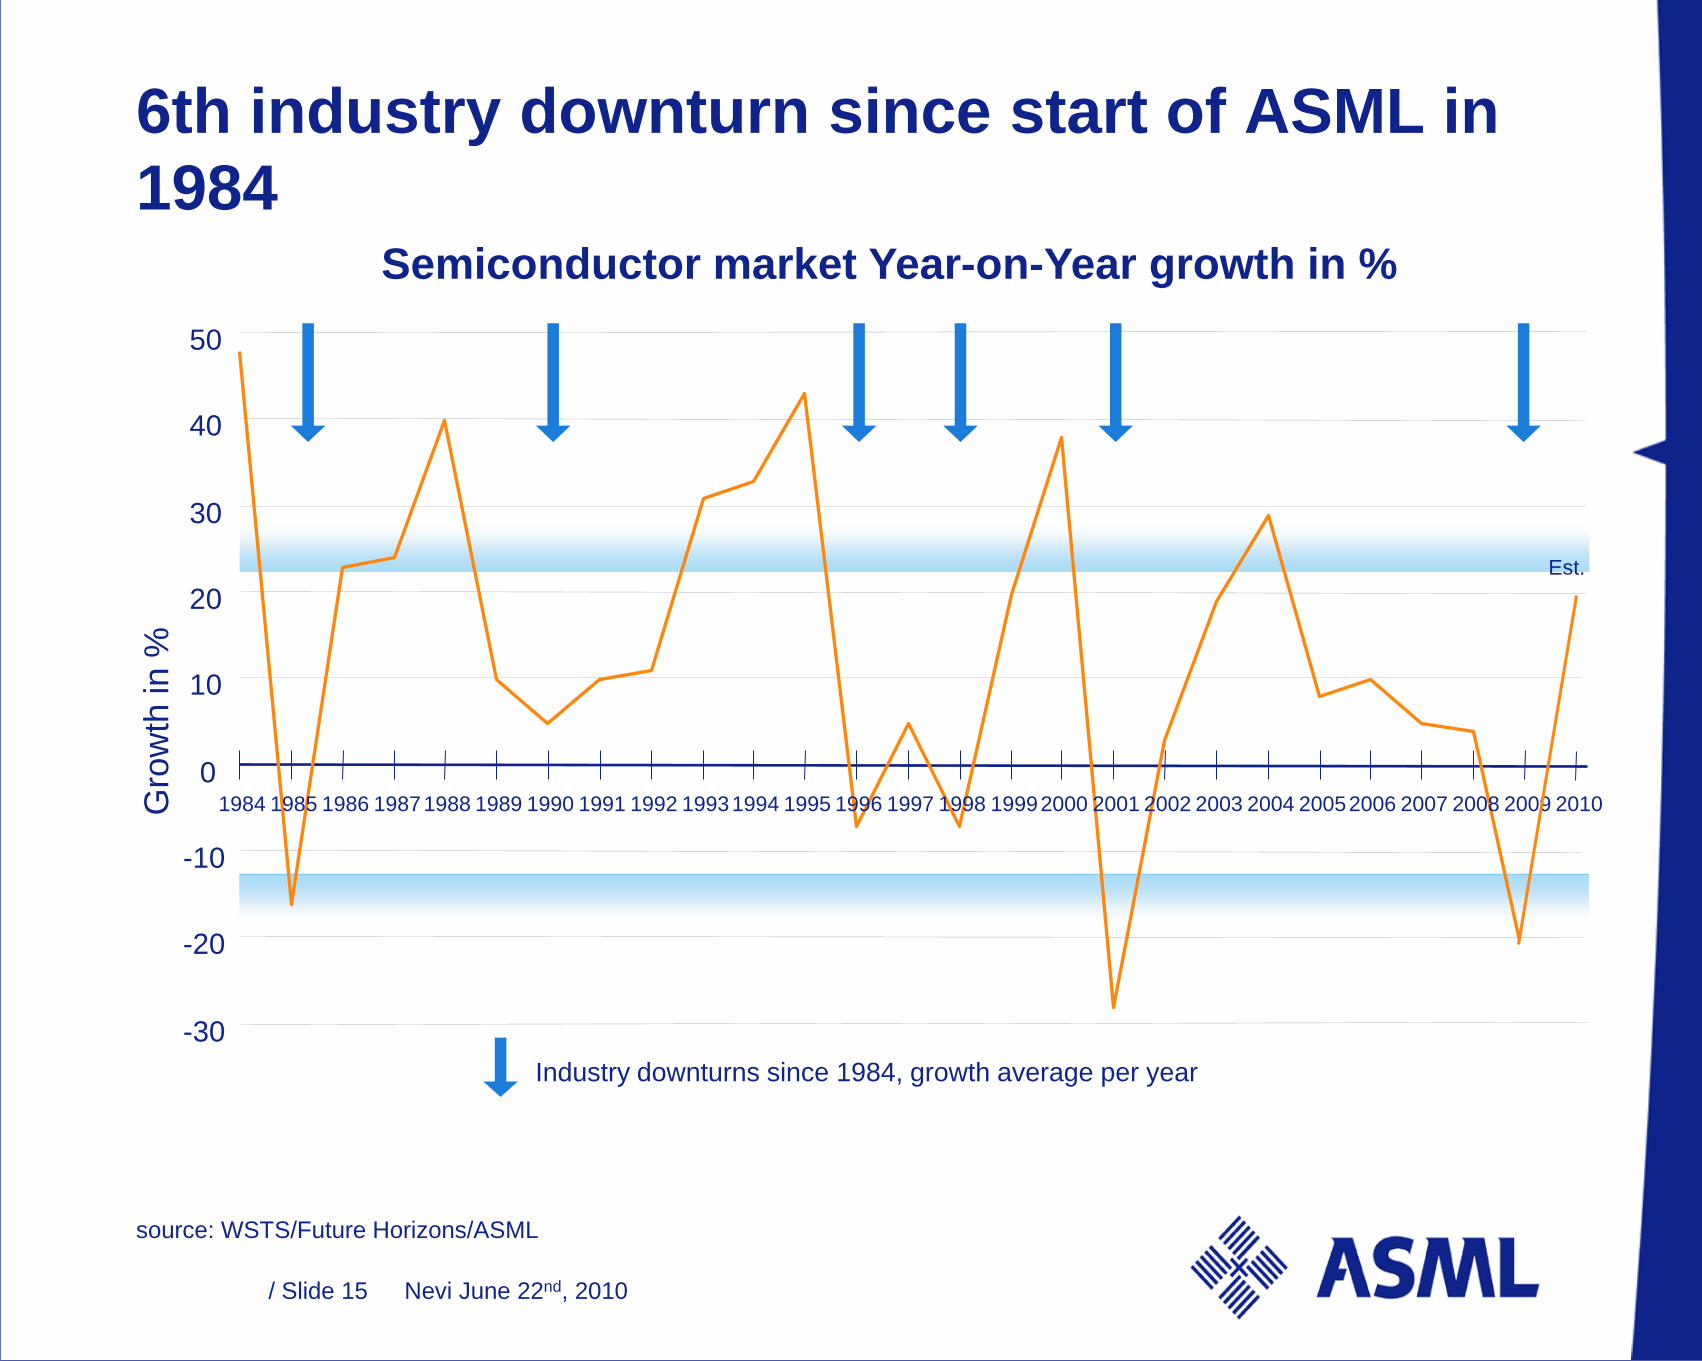
6th industry downturn since start of ASML in
1984
source: WSTS/Future Horizons/ASML
Semiconductor market Year-on-Year growth in %
-30
-20
-10
0
10
20
30
40
50
1984 1985 1986 19871988 1989 1990 1991 1992 19931994 1995 1996 1997 1998 19992000 2001 2002 2003 2004 20052006 2007 2008 2009Gro
wth
in %
Industry downturns since 1984, growth average per year
2010
Est.
Nevi June 22nd, 2010/ Slide 16
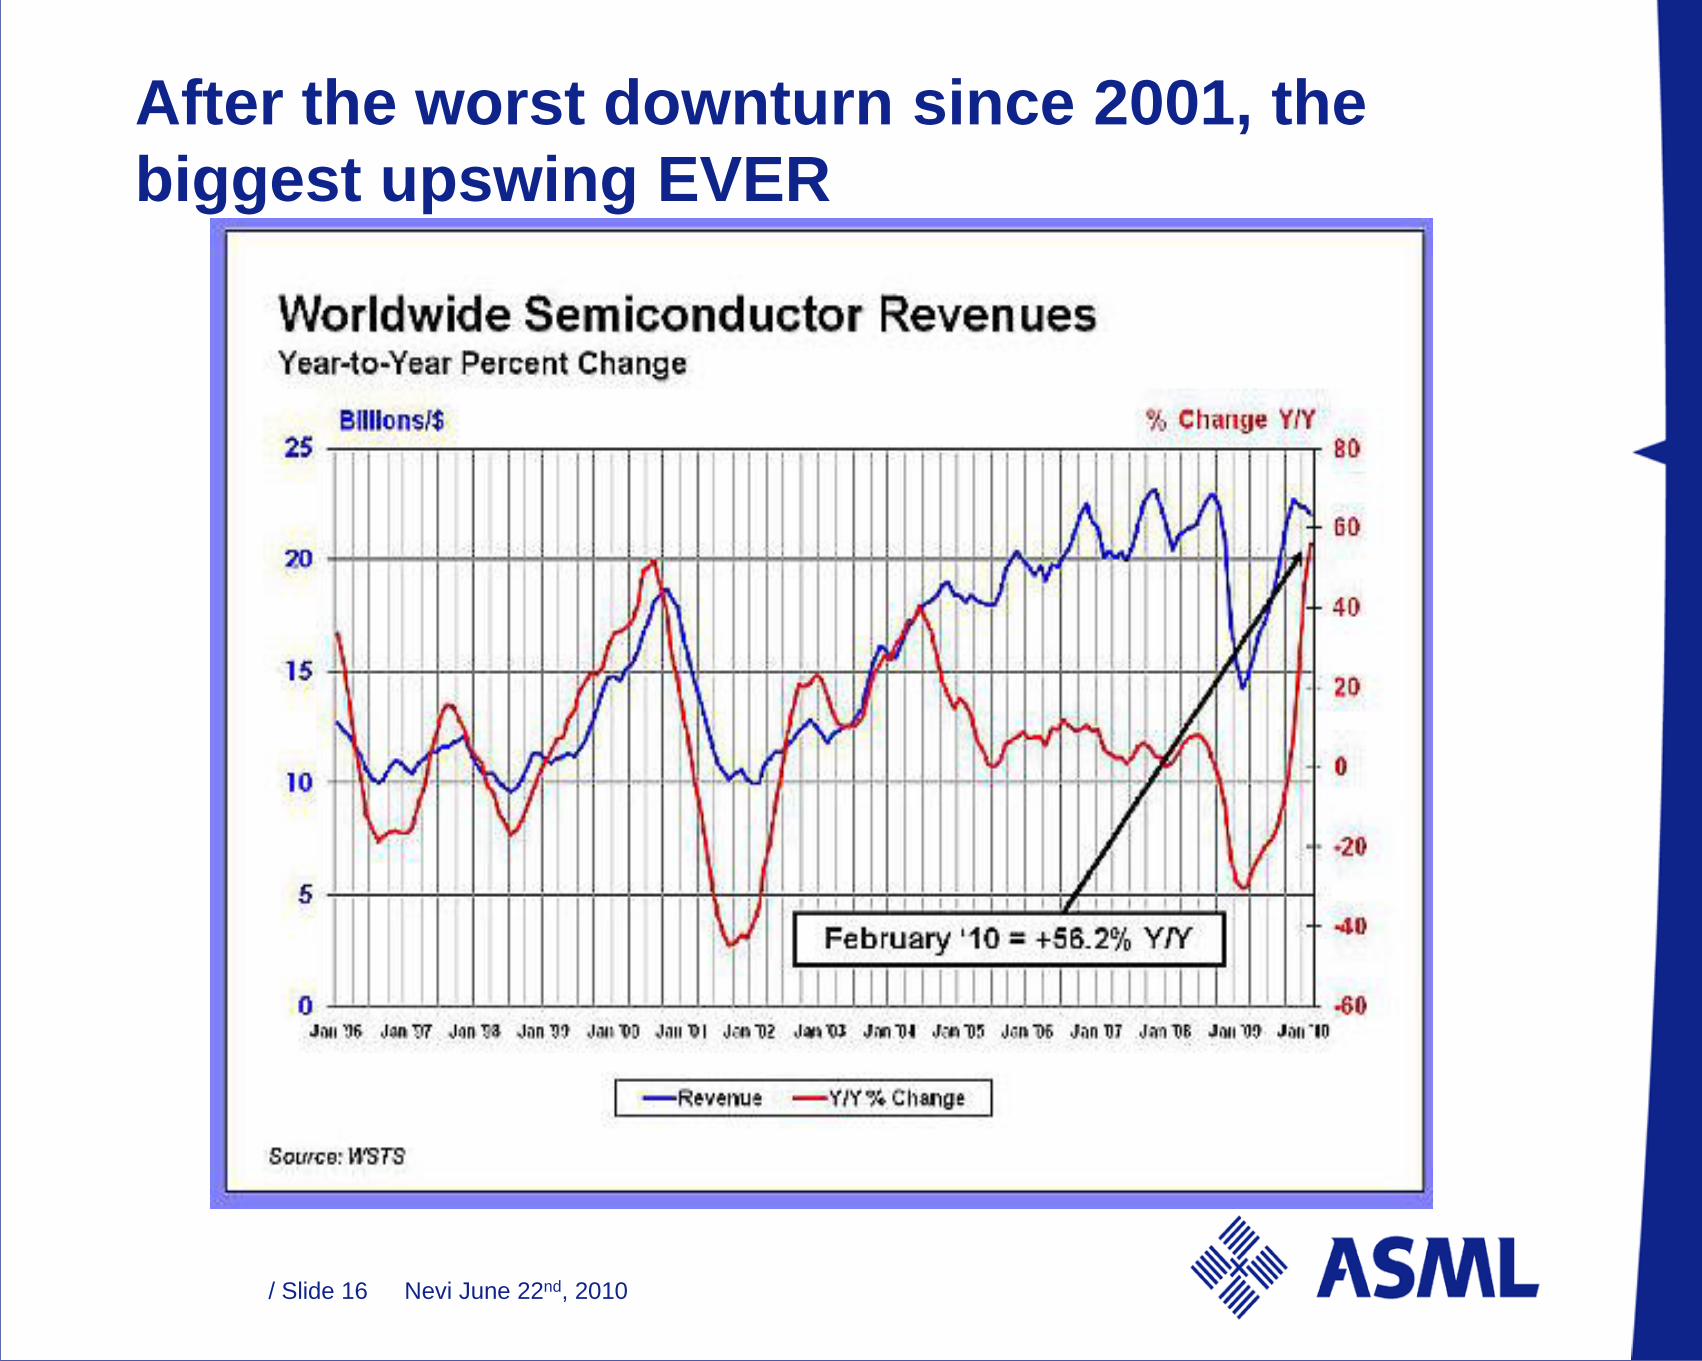
After the worst downturn since 2001, the
biggest upswing EVER
Nevi June 22nd, 2010/ Slide 17
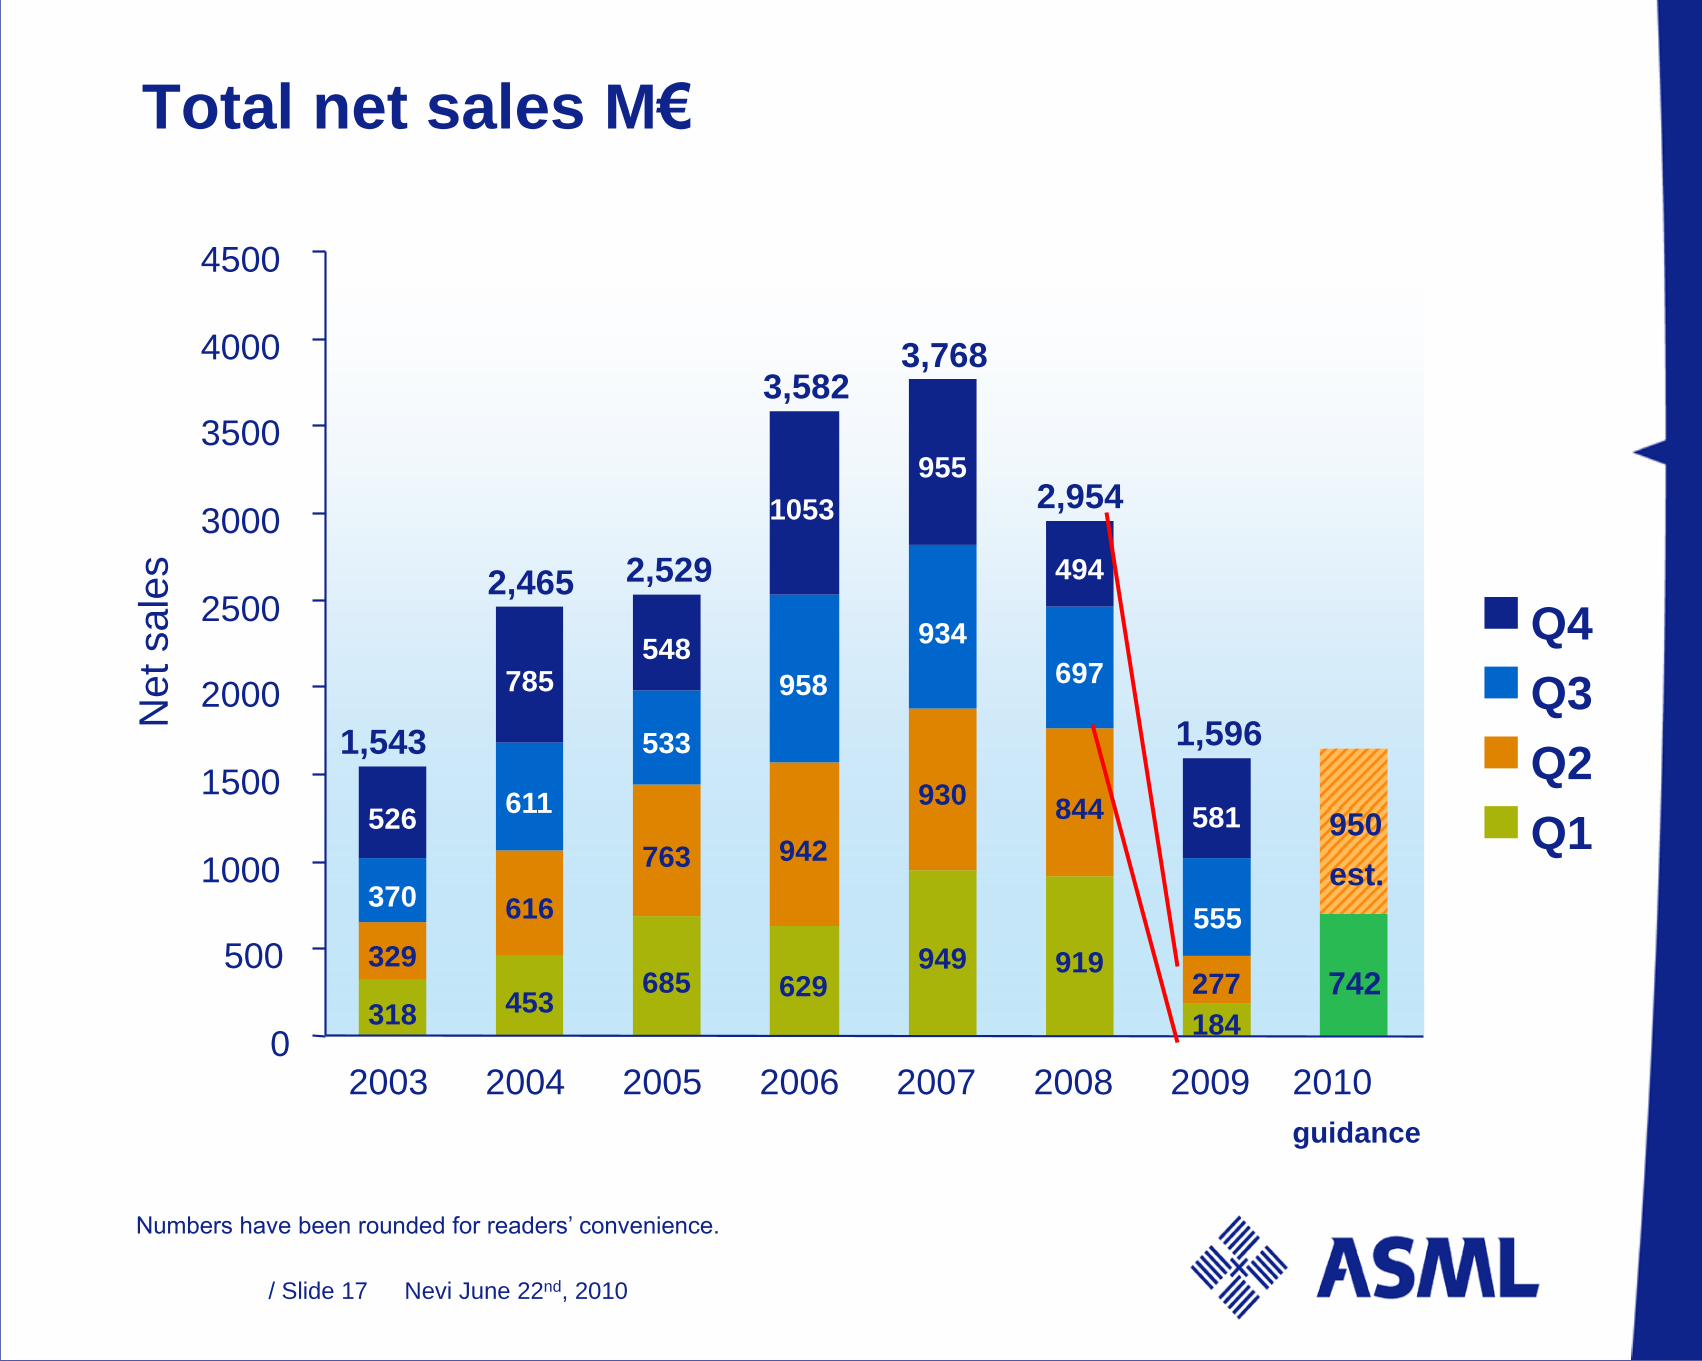
Total net sales M€
Numbers have been rounded for readers’ convenience.
1,543
2,465 2,529
3,5823,768
2,954
1,596
318 453685 629
949 919
184
329
616
763 942
930844
277
370
611
533
958
934
697
555
526
785548
1053
955
494
581
742
950
est.
0
500
1000
1500
2000
2500
3000
3500
4000
4500
2003 2004 2005 2006 2007 2008 2009 2010
guidance
Net sale
s
Q4
Q3
Q2
Q1

Nevi June 22nd, 2010/ Slide 18
January 2009
and for scenario’s for the coming years:
Nevi June 22nd, 2010/ Slide 19
Source: ASML Marketing (Q1/09)
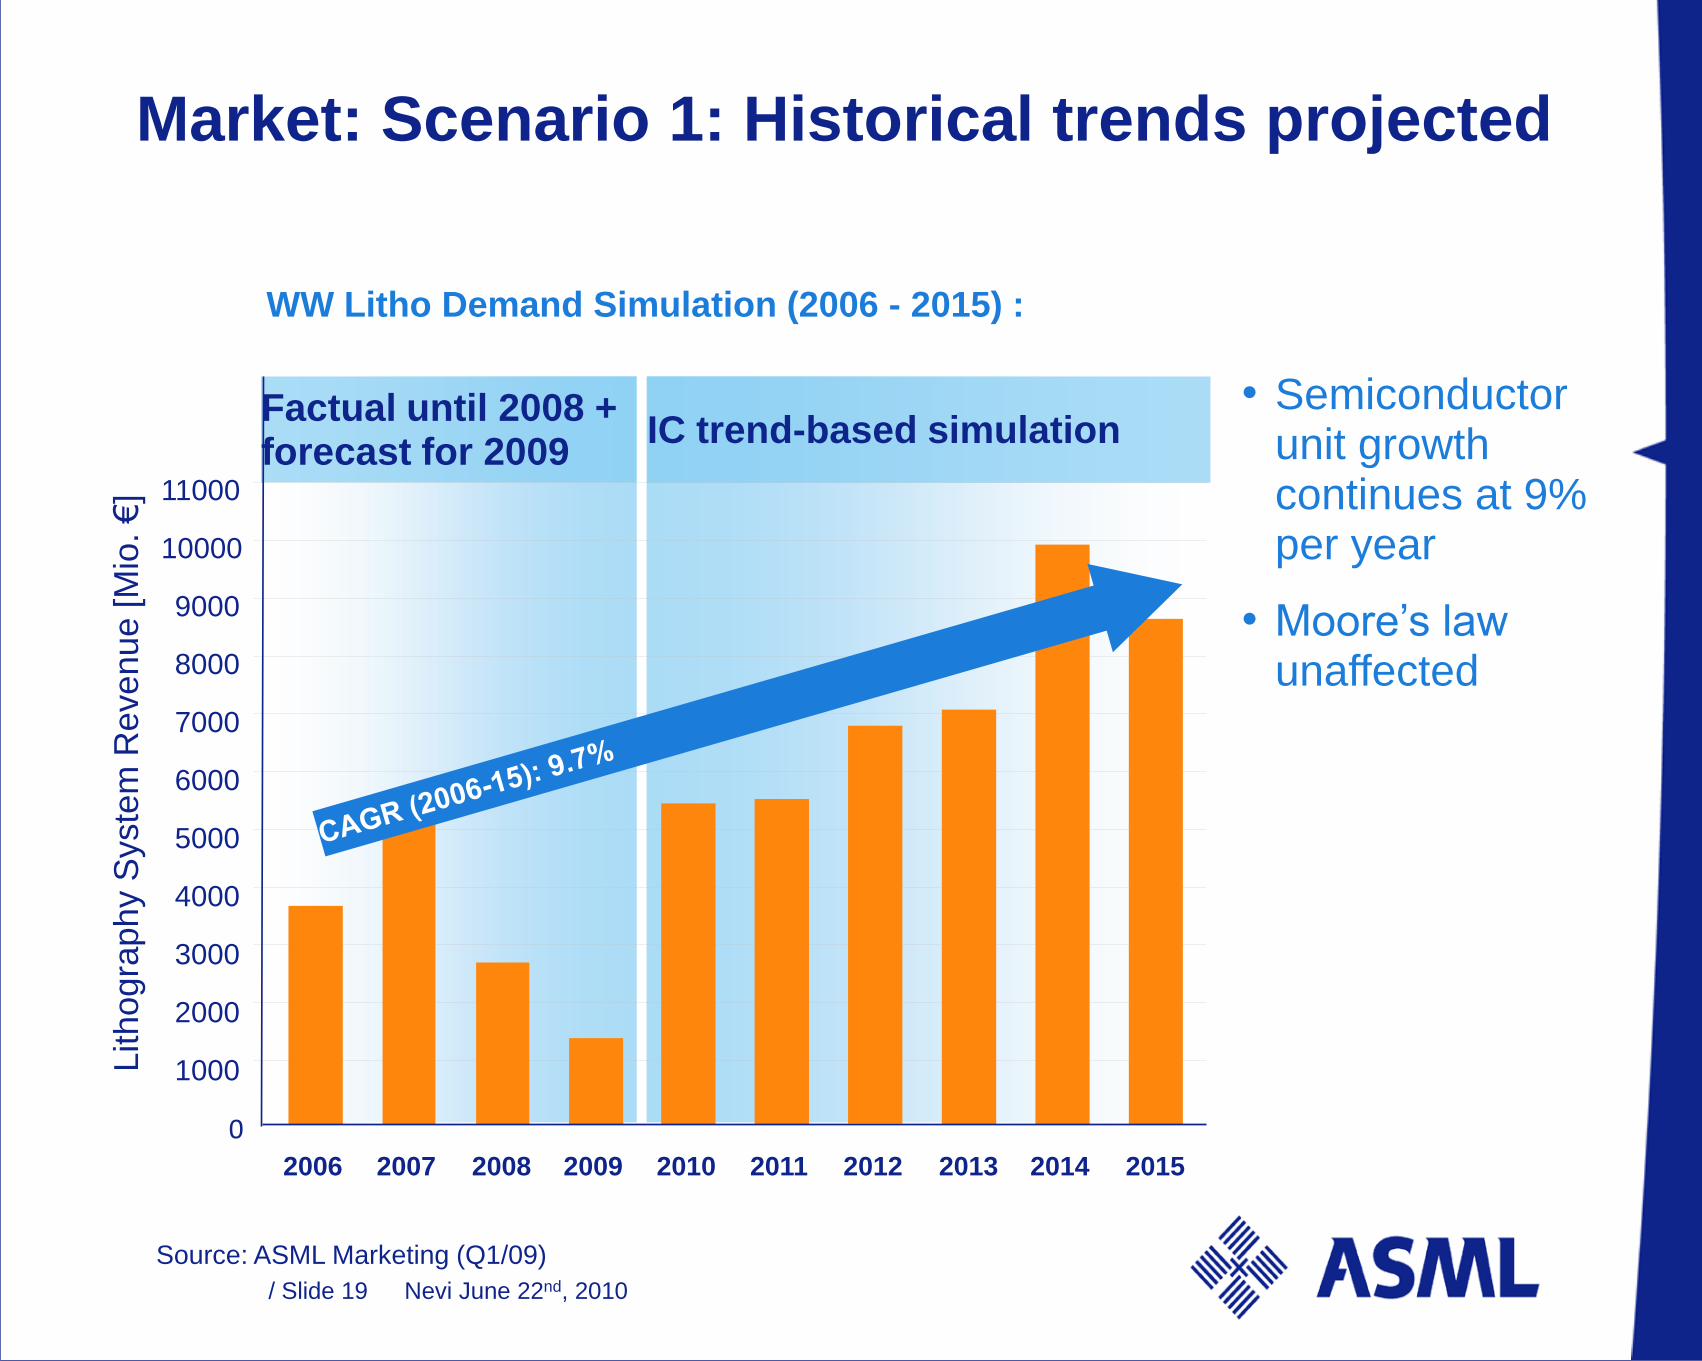
Market: Scenario 1: Historical trends projected
Factual until 2008 + forecast for 2009
IC trend-based simulation
0
1000
2000
3000
4000
5000
6000
7000
8000
9000
10000
11000
2006 2007 2008 2009 2010 2011 2012 2013 2014 2015
WW Litho Demand Simulation (2006 - 2015) :
Lith
og
rap
hy S
yste
m R
eve
nu
e [M
io.
€]
• Semiconductor unit growth continues at 9% per year
• Moore’s law unaffected
Nevi June 22nd, 2010/ Slide 20
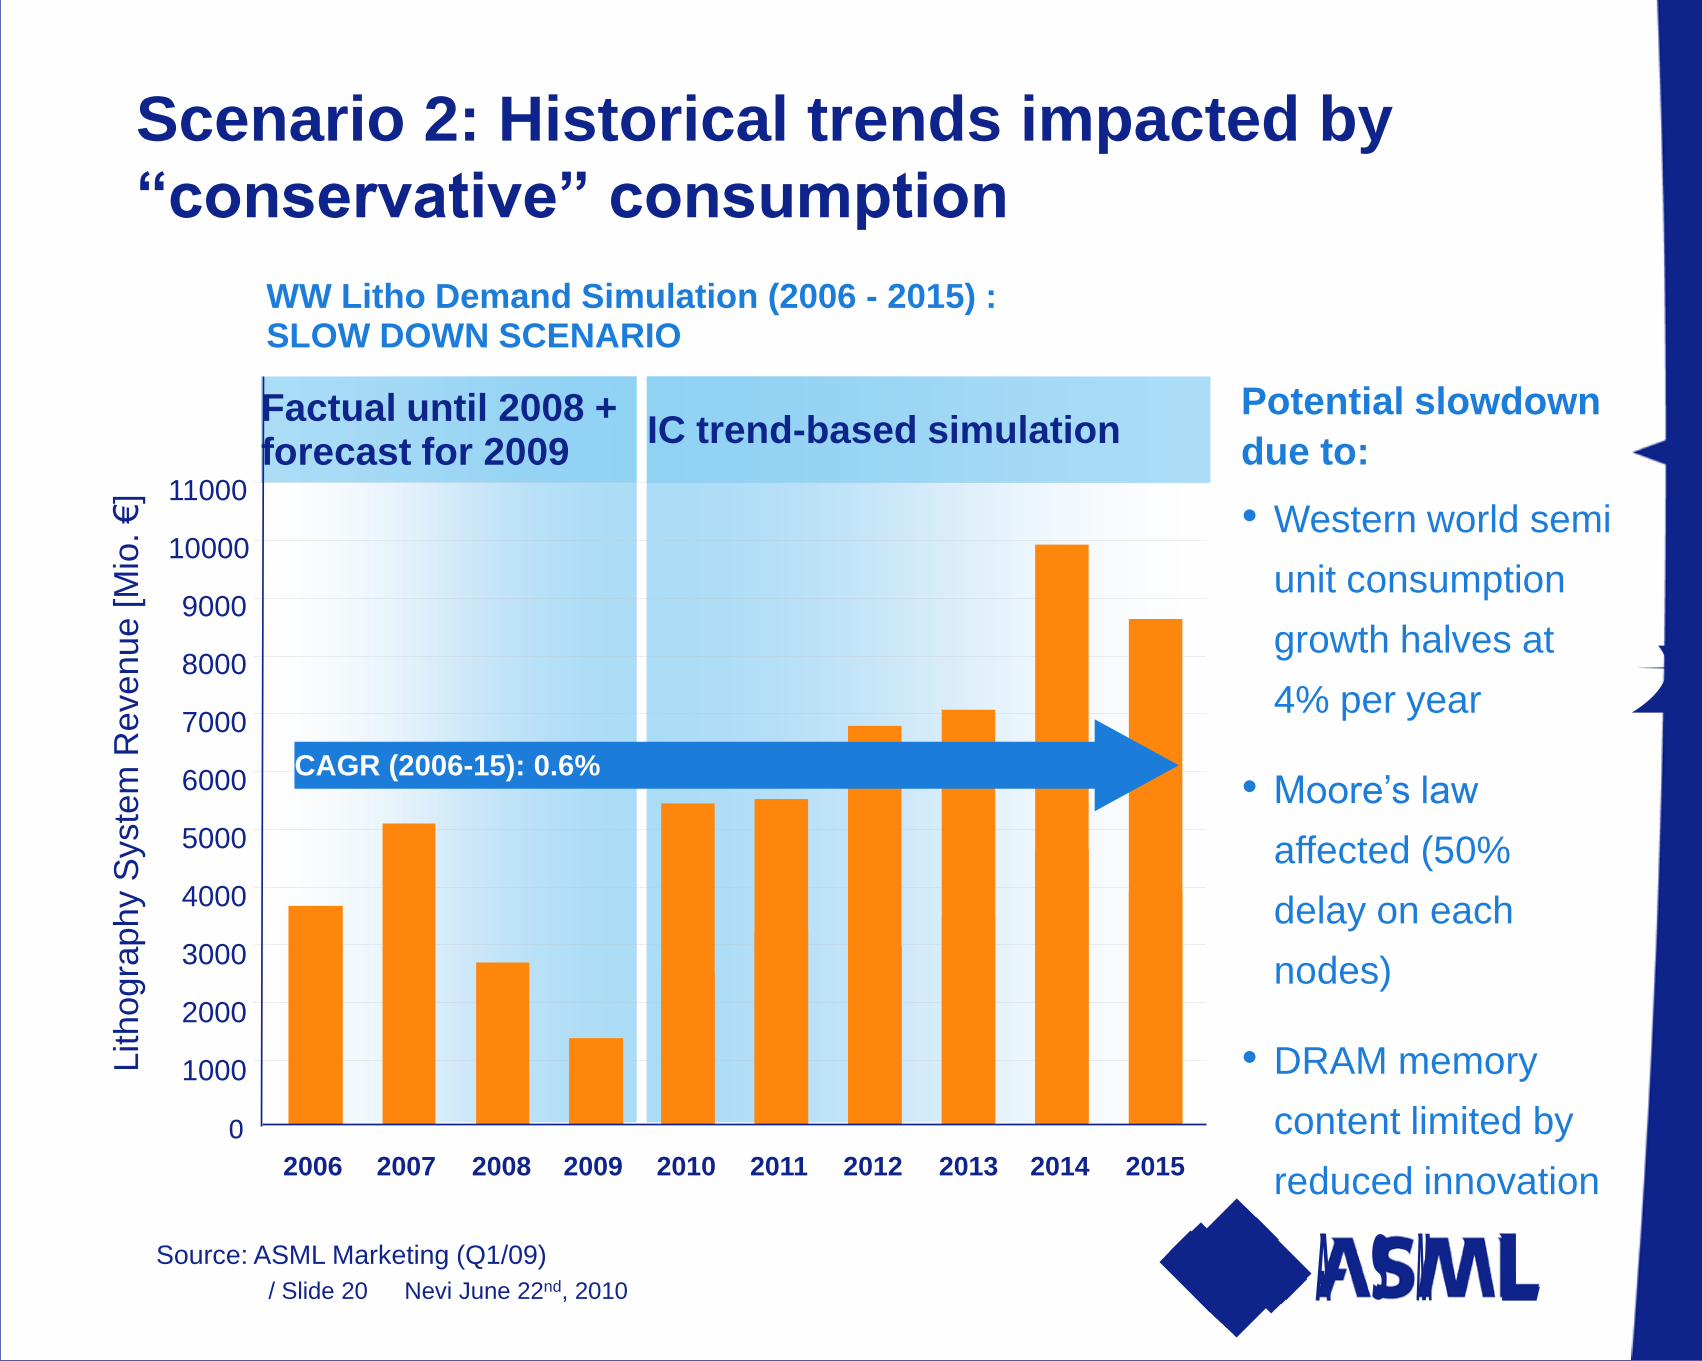
Scenario 2: Historical trends impacted by
“conservative” consumption
Factual until 2008 + forecast for 2009
IC trend-based simulation
0
1000
2000
3000
4000
5000
6000
7000
8000
9000
10000
11000
2006 2007 2008 2009 2010 2011 2012 2013 2014 2015
WW Litho Demand Simulation (2006 - 2015) : SLOW DOWN SCENARIO
Lith
og
rap
hy S
yste
m R
eve
nu
e [M
io.
€]
CAGR (2006-15): 0.6%
Potential slowdown
due to:
• Western world semi
unit consumption
growth halves at
4% per year
• Moore’s law
affected (50%
delay on each
nodes)
• DRAM memory
content limited by
reduced innovation
Source: ASML Marketing (Q1/09)
Nevi June 22nd, 2010/ Slide 21
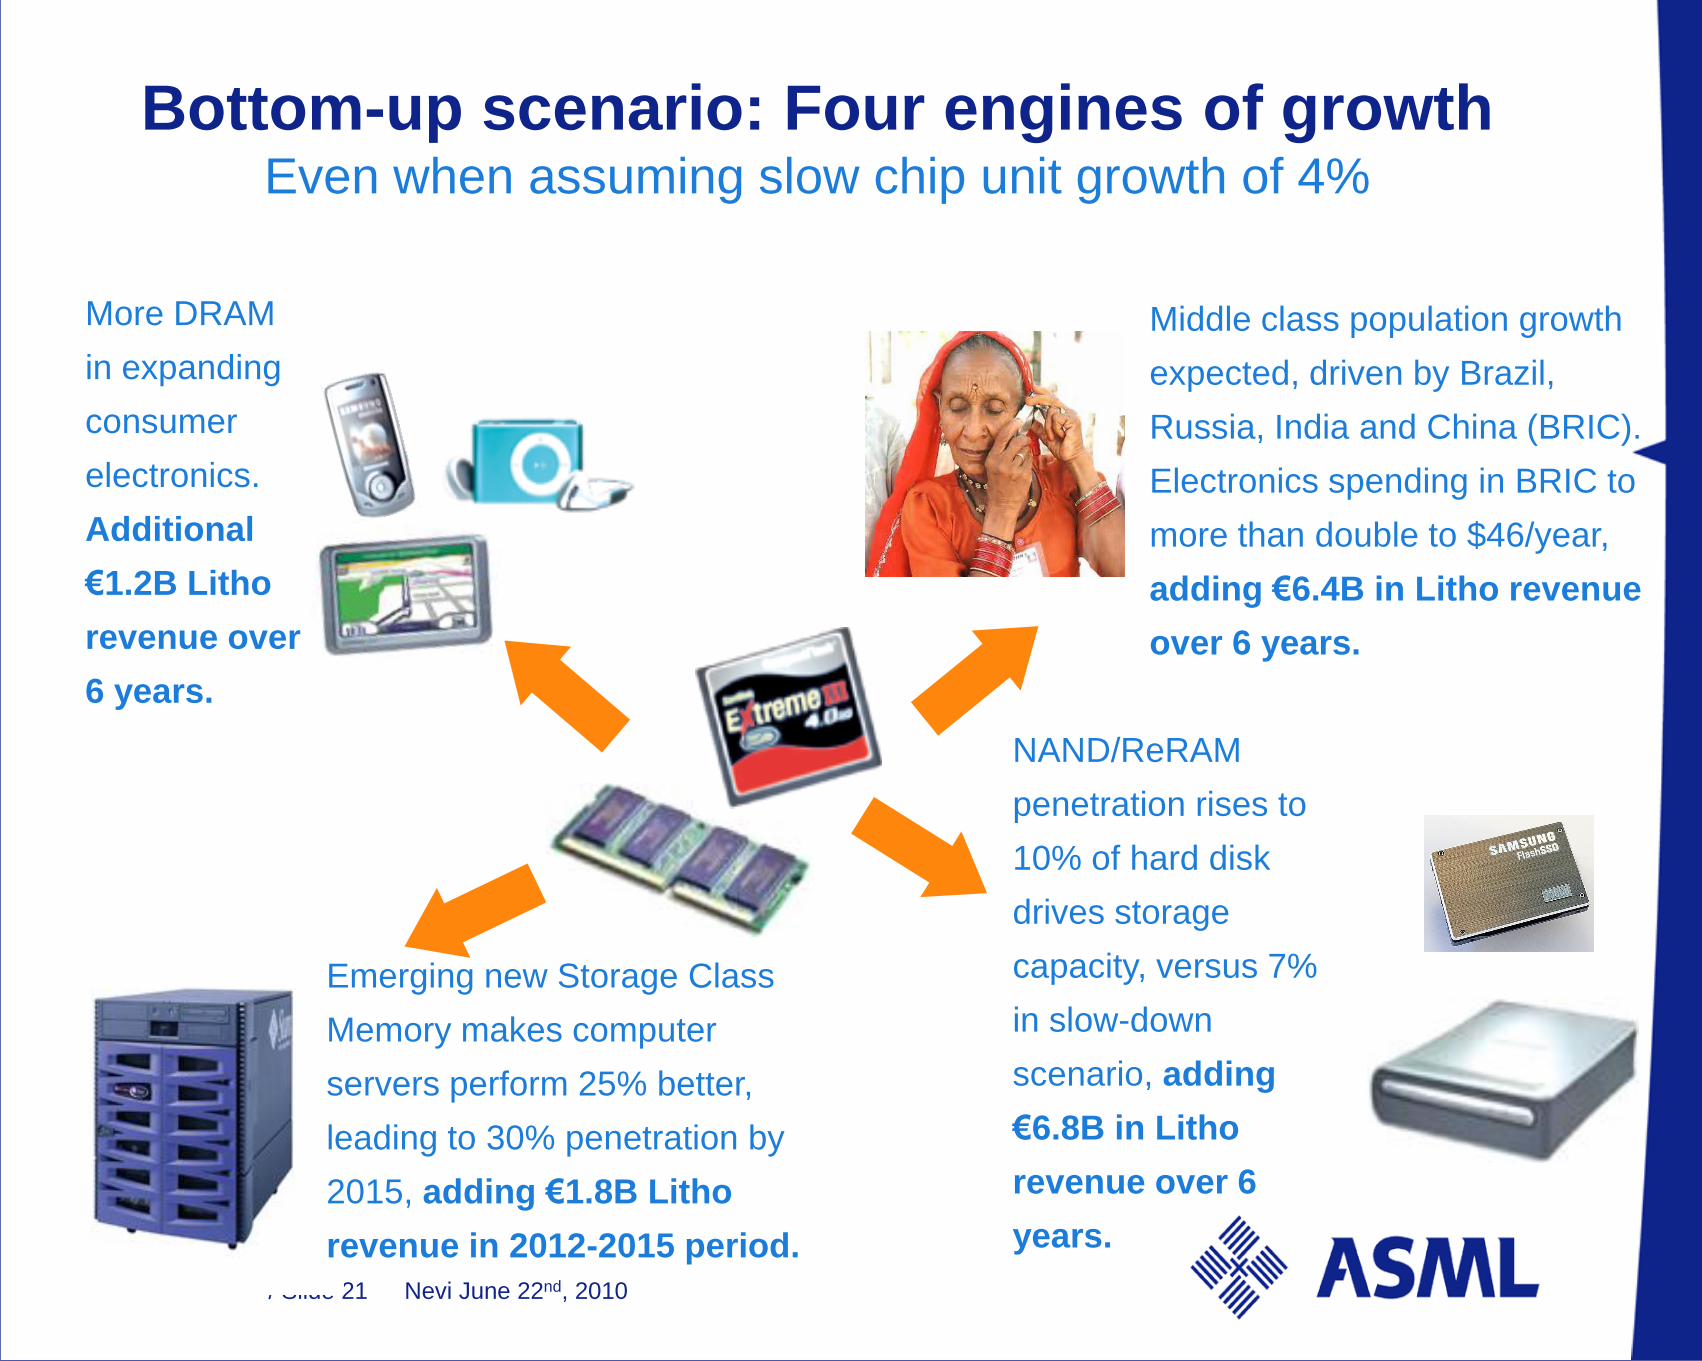
Bottom-up scenario: Four engines of growthEven when assuming slow chip unit growth of 4%
More DRAM
in expanding
consumer
electronics.
Additional
€1.2B Litho
revenue over
6 years.
Emerging new Storage Class
Memory makes computer
servers perform 25% better,
leading to 30% penetration by
2015, adding €1.8B Litho
revenue in 2012-2015 period.
Middle class population growth
expected, driven by Brazil,
Russia, India and China (BRIC).
Electronics spending in BRIC to
more than double to $46/year,
adding €6.4B in Litho revenue
over 6 years.
NAND/ReRAM
penetration rises to
10% of hard disk
drives storage
capacity, versus 7%
in slow-down
scenario, adding
€6.8B in Litho
revenue over 6
years.
Nevi June 22nd, 2010/ Slide 22
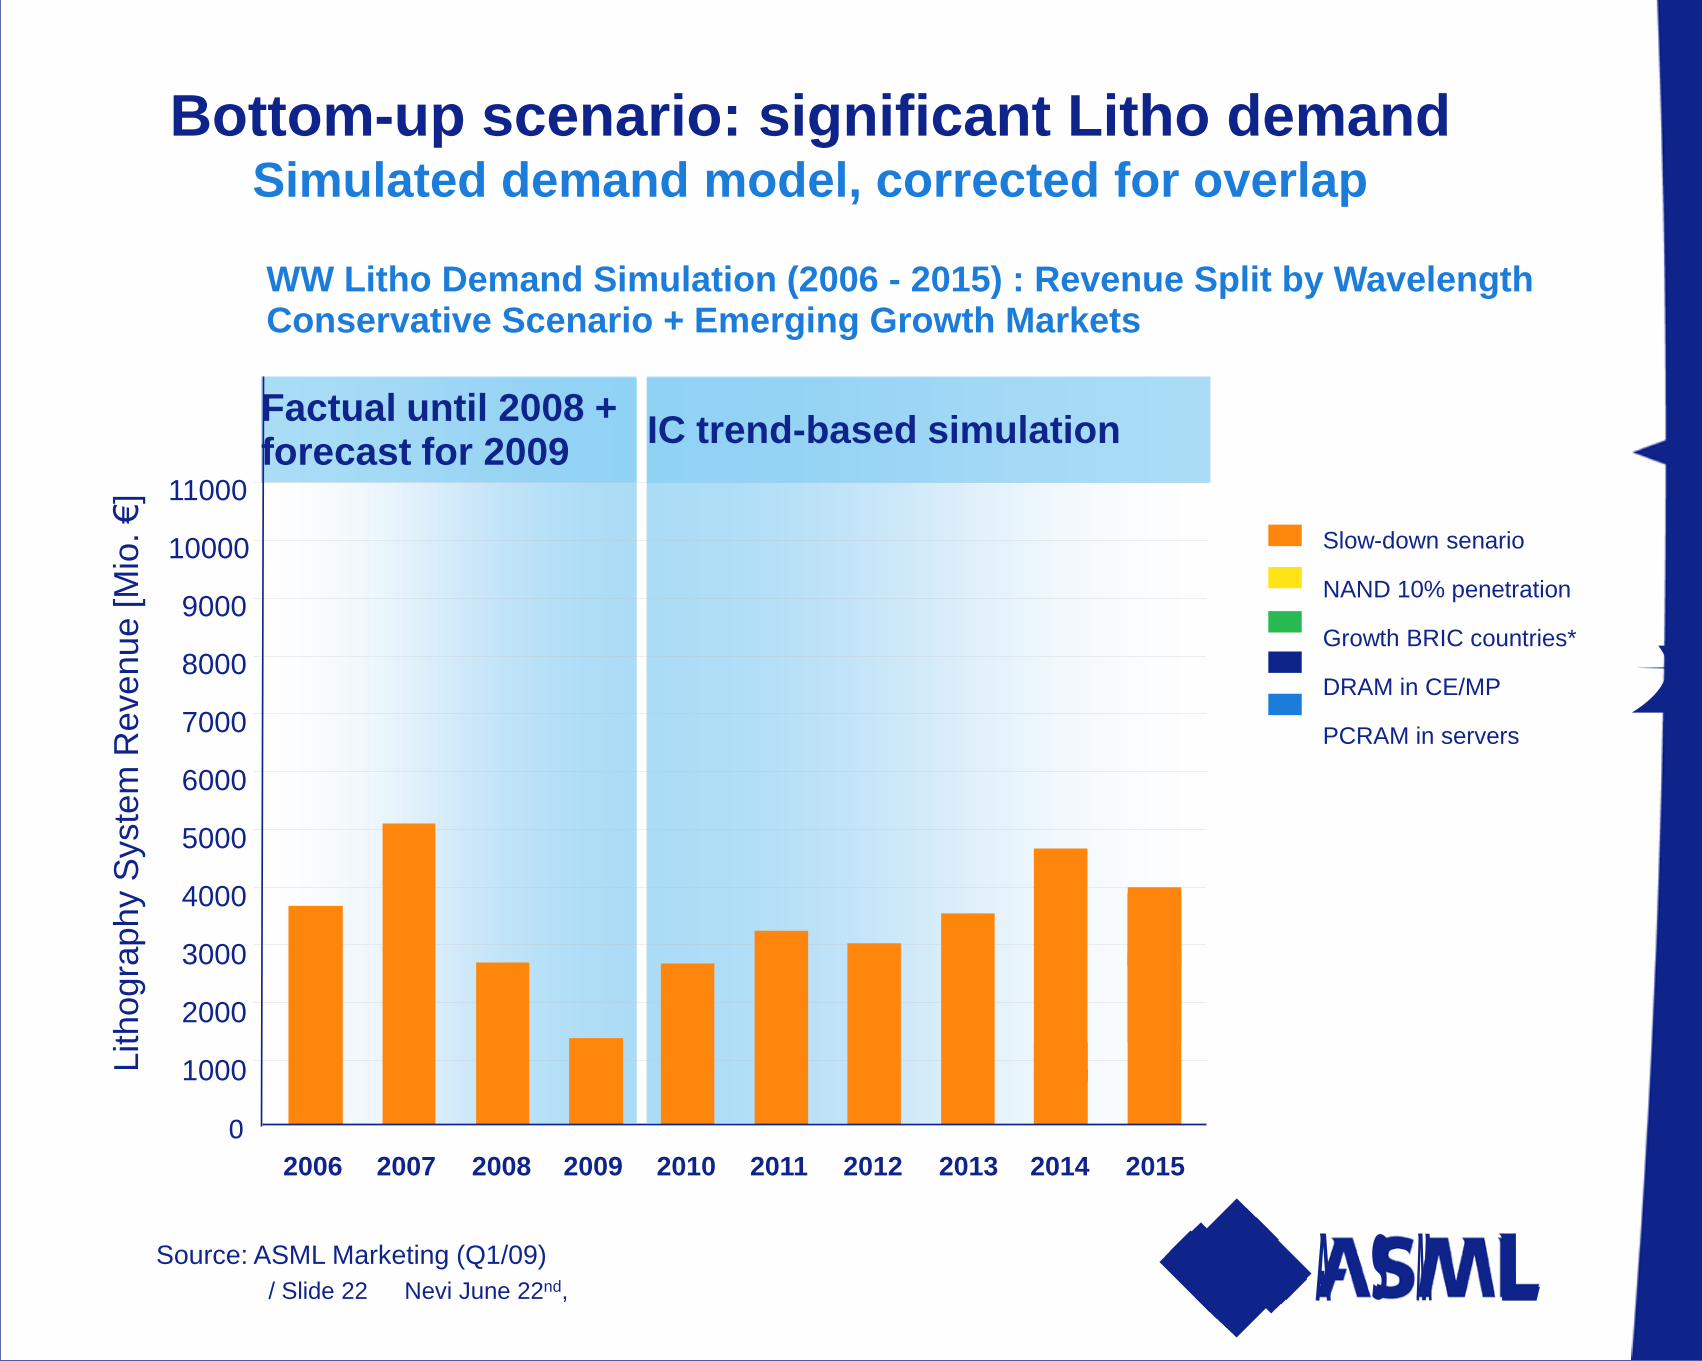
Bottom-up scenario: significant Litho demandSimulated demand model, corrected for overlap
Factual until 2008 + forecast for 2009
IC trend-based simulation
0
1000
2000
3000
4000
5000
6000
7000
8000
9000
10000
11000
2006 2007 2008 2009 2010 2011 2012 2013 2014 2015
WW Litho Demand Simulation (2006 - 2015) : Revenue Split by WavelengthConservative Scenario + Emerging Growth Markets
Lith
og
rap
hy S
yste
m R
eve
nu
e [M
io.
€]
Slow-down senario
NAND 10% penetration
Growth BRIC countries*
DRAM in CE/MP
PCRAM in servers
Source: ASML Marketing (Q1/09)
Nevi June 22nd, 2010/ Slide 23
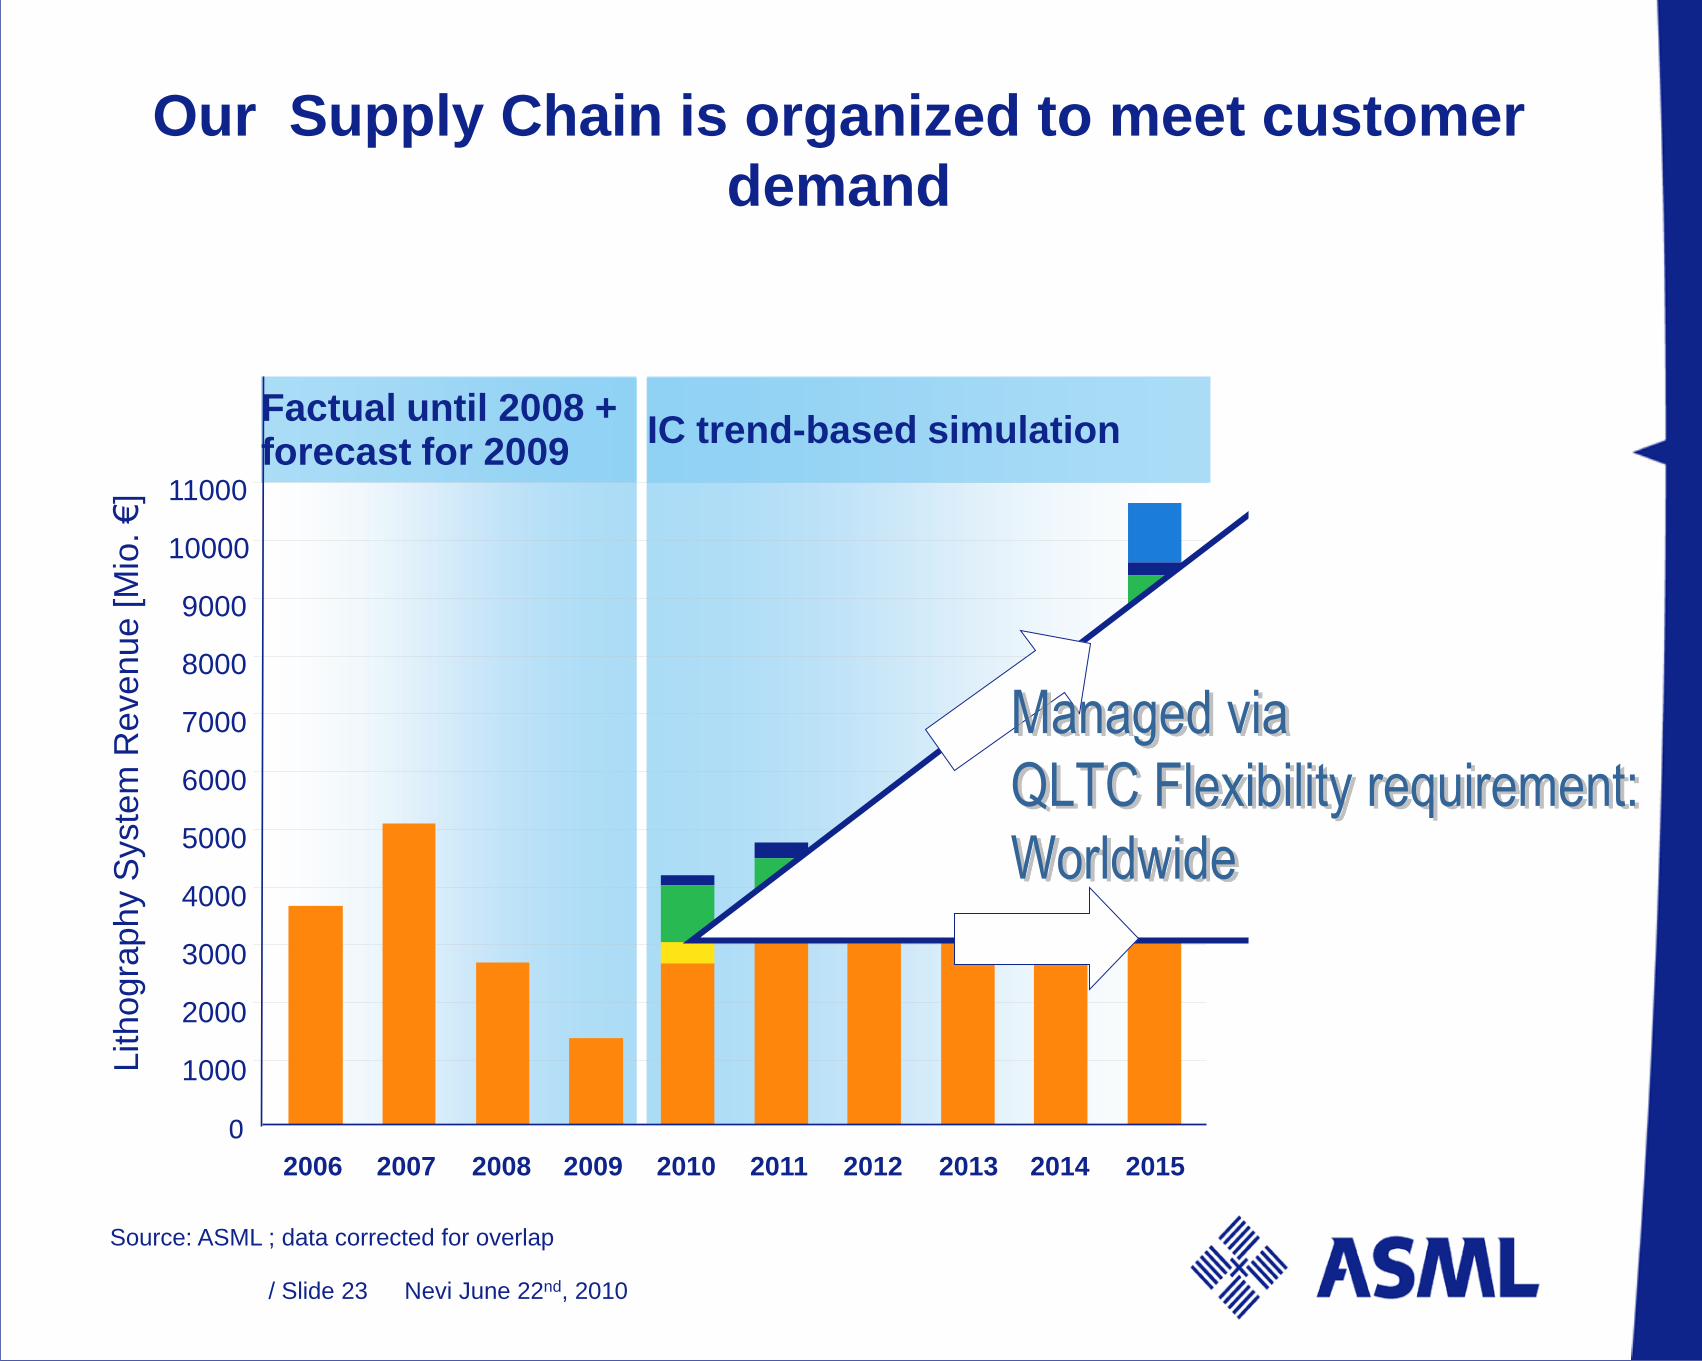
Source: ASML ; data corrected for overlap
Factual until 2008 + forecast for 2009
IC trend-based simulation
0
1000
2000
3000
4000
5000
6000
7000
8000
9000
10000
11000
2006 2007 2008 2009 2010 2011 2012 2013 2014 2015
Lith
og
rap
hy S
yste
m R
eve
nu
e [M
io.
€]
Our Supply Chain is organized to meet customer
demand
/ Slide 24
Value Sourcing
Nevi June 22nd, 2010/ Slide 25
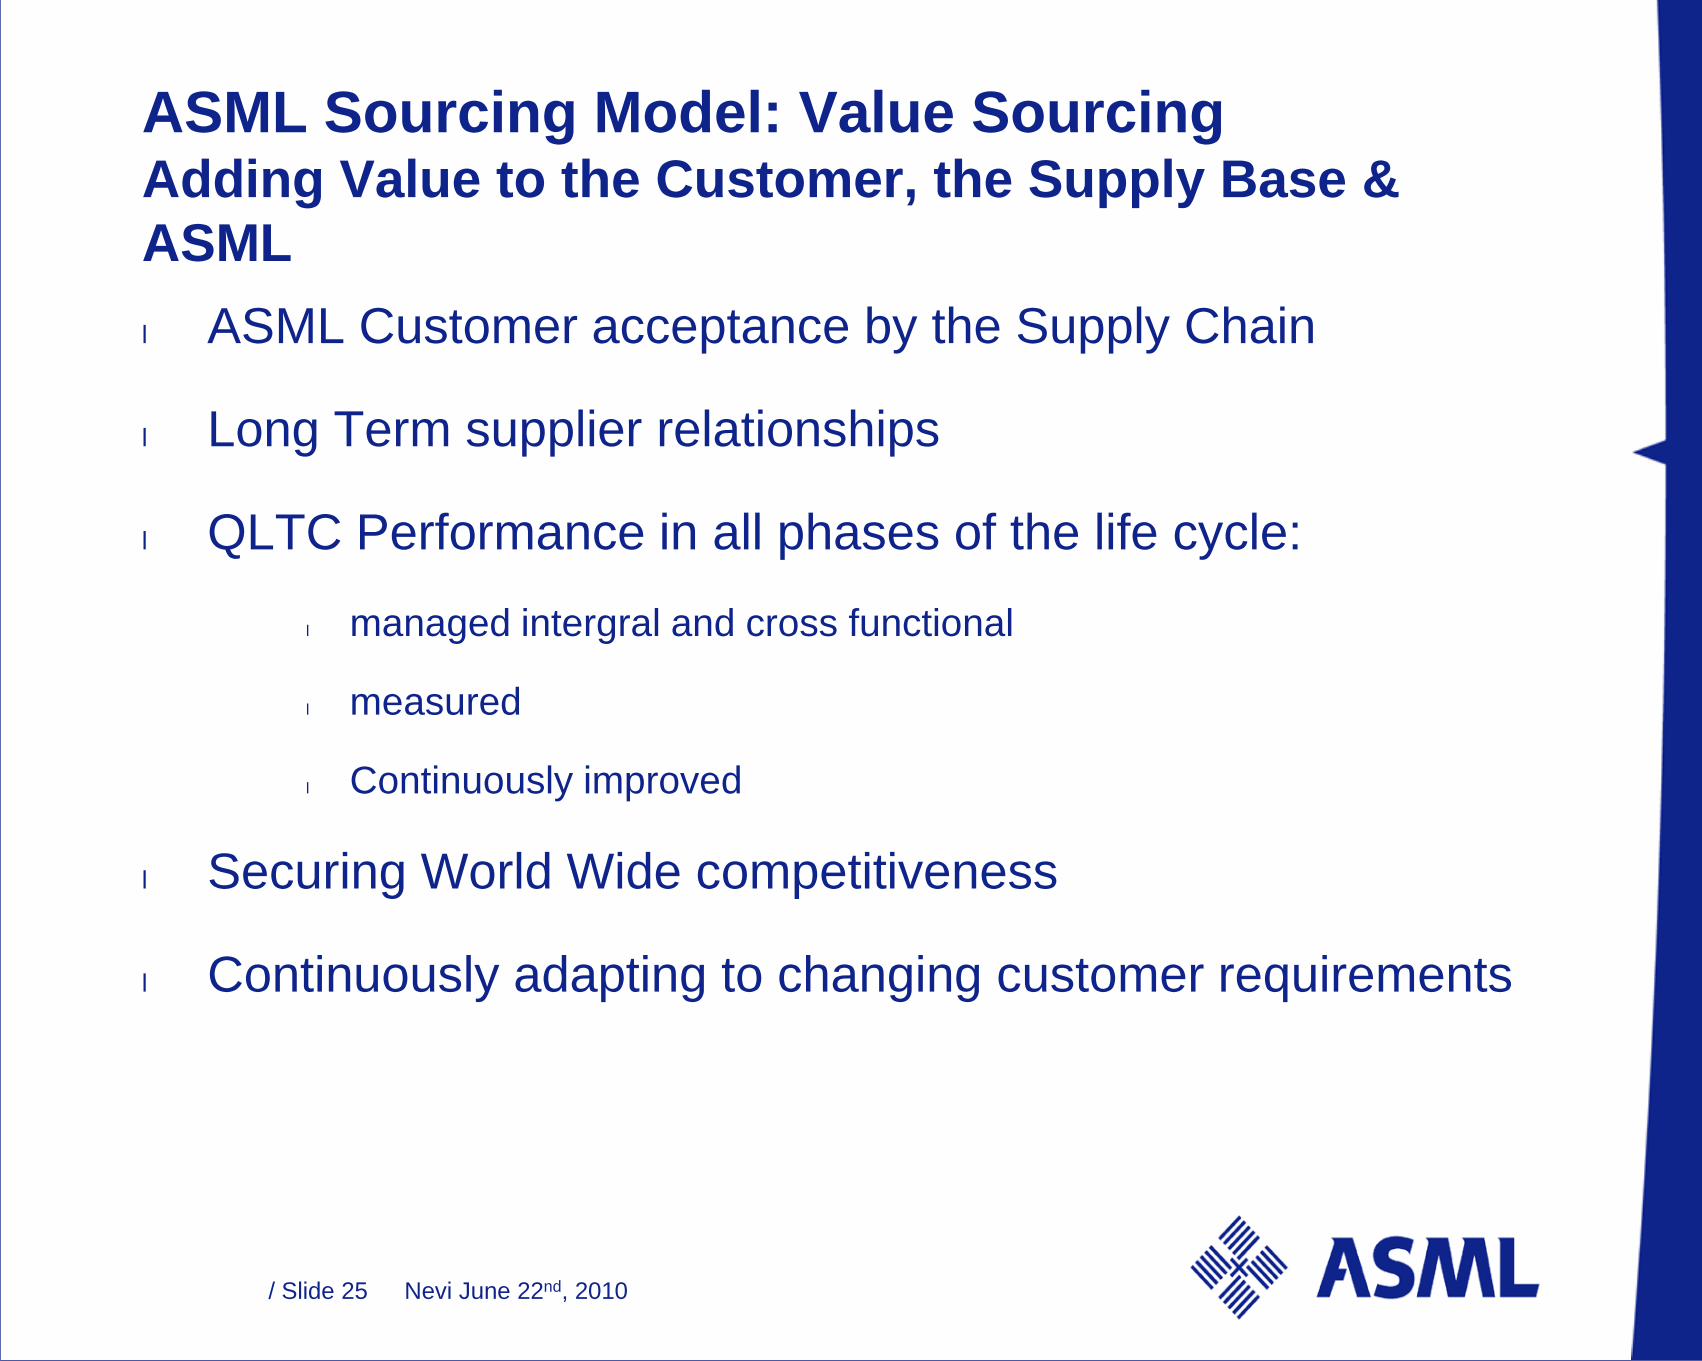
ASML Sourcing Model: Value SourcingAdding Value to the Customer, the Supply Base &
ASML
l ASML Customer acceptance by the Supply Chain
l Long Term supplier relationships
l QLTC Performance in all phases of the life cycle:
l managed intergral and cross functional
l measured
l Continuously improved
l Securing World Wide competitiveness
l Continuously adapting to changing customer requirements
Nevi June 22nd, 2010/ Slide 26
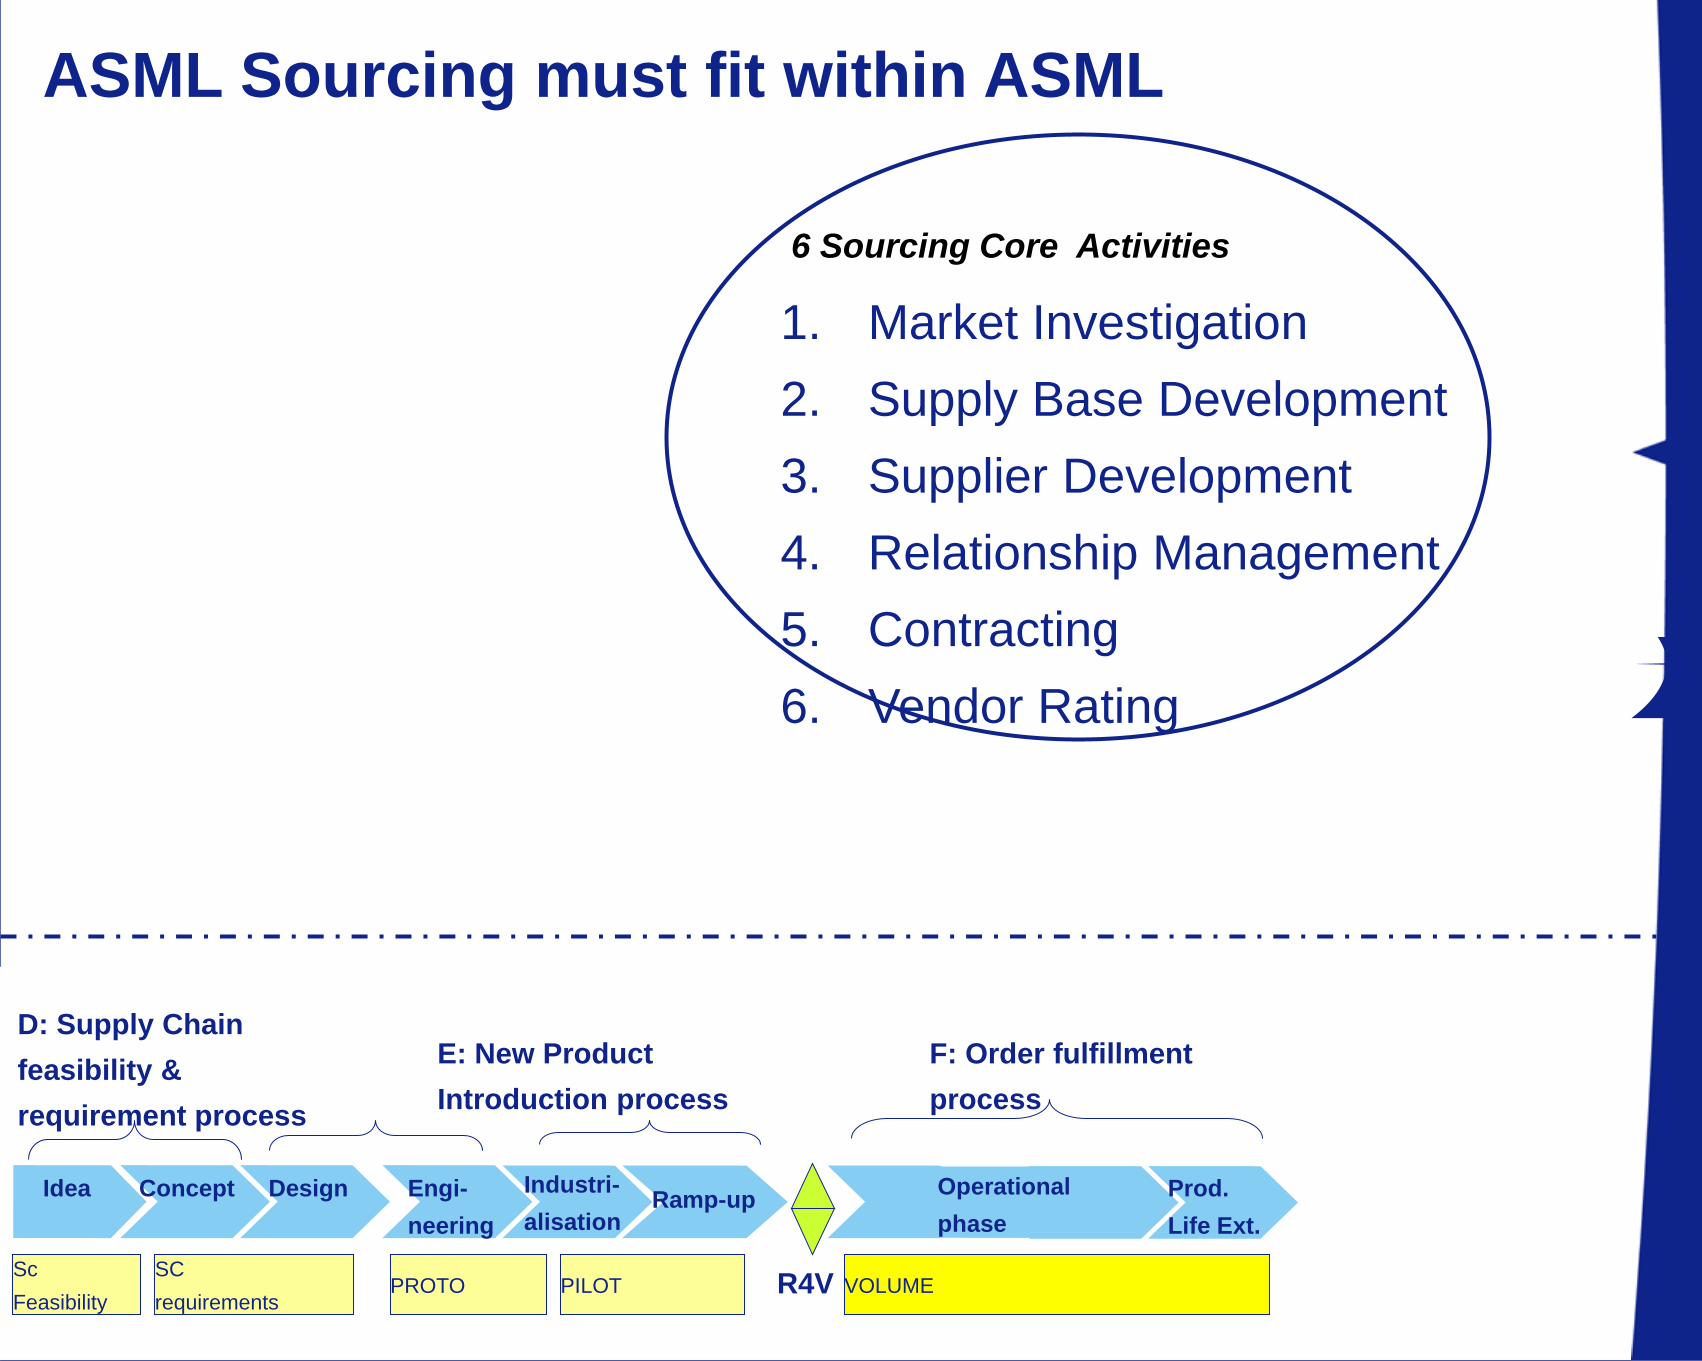
ASML Sourcing must fit within ASML
1. Market Investigation
2. Supply Base Development
3. Supplier Development
4. Relationship Management
5. Contracting
6. Vendor Rating
6 Sourcing Core Activities
D: Supply Chain
feasibility &
requirement process
F: Order fulfillment
process
E: New Product
Introduction process
PROTO PILOT VOLUMESC
requirements
Sc
Feasibility
Idea Concept Operational
phaseRamp-up
Industri-
alisation
Engi-
neering
Design Prod.
Life Ext.
R4V
Nevi June 22nd, 2010/ Slide 27
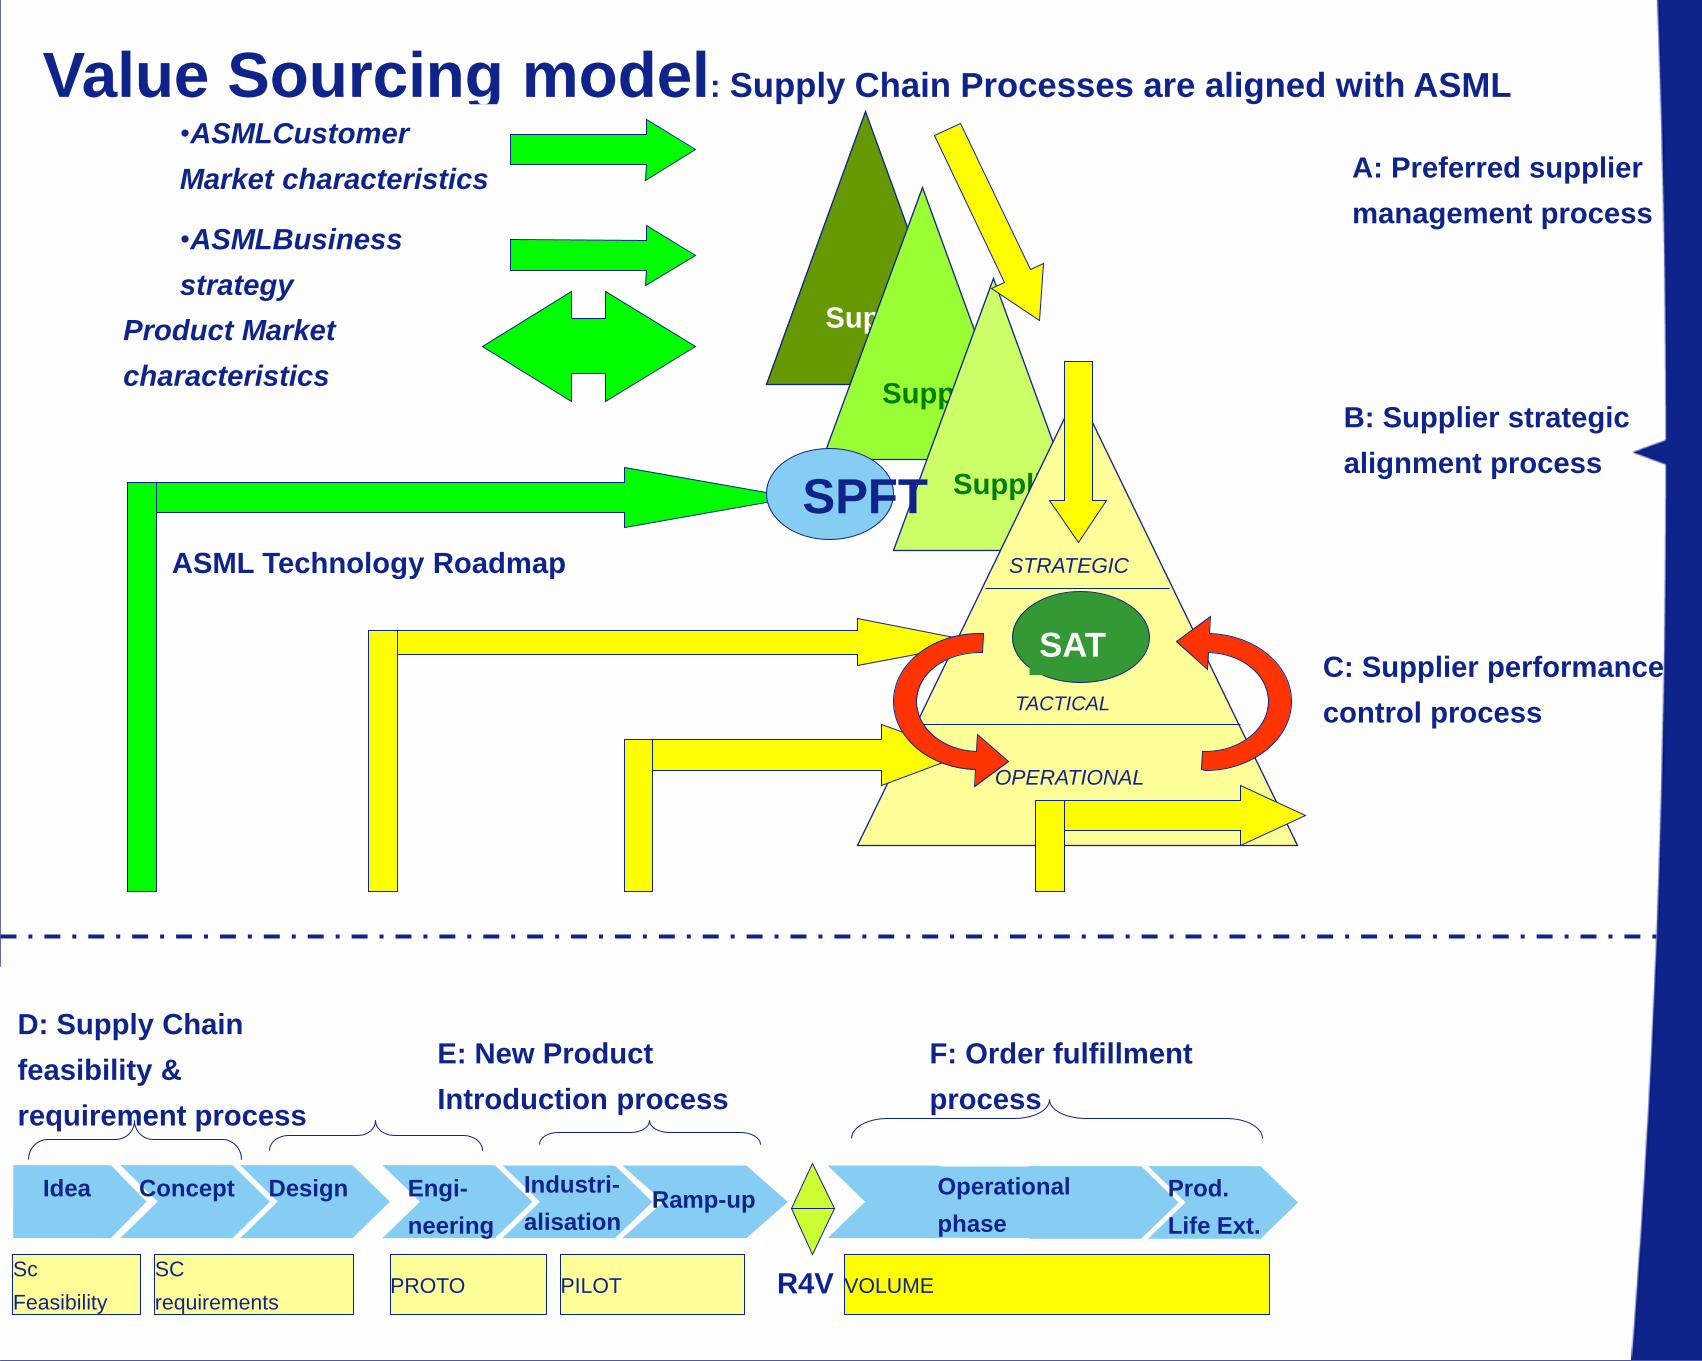
Supplier
Supplier
Supplier
Supplier
OPERATIONAL
TACTICAL
STRATEGIC
A: Preferred supplier
management process
Value Sourcing model: Supply Chain Processes are aligned with ASML
D: Supply Chain
feasibility &
requirement process
ASML Technology Roadmap
F: Order fulfillment
process
E: New Product
Introduction process
•ASMLCustomer
Market characteristics
Product Market
characteristics
SATC: Supplier performance
control process
B: Supplier strategic
alignment process
SPFT
PROTO PILOT VOLUMESC
requirements
Sc
Feasibility
Idea Concept Operational
phaseRamp-up
Industri-
alisation
Engi-
neering
Design Prod.
Life Ext.
R4V
•ASMLBusiness
strategy

Nevi June 22nd, 2010/ Slide 28
Supplier
Supplier
Supplier
Supplier
OPERATIONAL
TACTICAL
STRATEGIC
Value Sourcing model: 6 Core activities of procurement
D: Supply Chain
feasibility &
requirement process
ASML Technology Roadmap
F: Order fulfillment
process
E: New Product
Introduction process
SAT
SPFT
PROTO PILOT VOLUMESC
requirements
Sc
Feasibility
Idea Concept Operational
phaseRamp-up
Industri-
alisation
Engi-
neering
Design Prod.
Life Ext.
R4V
Nevi June 22nd, 2010/ Slide 29
Commitment to QLTC

Ruimte voor eventueel
een bedrijfslogo
22 juni 2010 Stroom A ‘Verbeter uw (interne) samenwerking’ | Workshop 1A
Bedankt voor uw
aandacht!