Fm-599 Main Proj
51
1 EXEXUTIVE SUMMARY Investment can be defined the commitment of funds to one or more assets that will be held over for some future time period. The field of investment traditionally divided into security analysis and portfolio management. The heart of security analysis is valuation of financial assets. A portfolio is a bundle or a combination of individual assets or securities. The portfolio theory provides a normative approach to investors to make decisions to invest their wealth in assets or securi ties under risk. It is based after the assumption that investors are risk- averse. This implies that investors hold well div ersified portfoli o instead of inve sting their entire wealth in a single or a few ass ets. One impo rtant conclusion of the portfolio theory is that if the investor of the portfolio theory is that if the investor holds a well-diversified portfolio of assets then their concerns should be the expected rate of return and risk of the portfolio, rather than individual assets and the contribution of individual asset to the portfolio risk. The second assumption of the portfolio theory is that the returns of assets are normally distributed. This means that the mean and variance analysis is the foundation of t he portfolio decisions. Sharpe‘s model states that an individual securities has relationship with one common parameter of the market, i.e. index of the market. According to Sharpe‘s concept, different securities in the market do not have any kind of direct relation with each other; instead, these have a link with the index of the market, which is representative of the entire market. There are stocks(shares) in the market, which show an upward movement as soon as market moves up and vice – versa. Certain shares in the market have an opposite relationship with the whole market. This association of individual securities with the market is through the stock index of the market Stock index (SENSEX) is representative of the market and every security has a relationship with this Index. This relationship can help in estimating and representing the returns of these securities. Unlike Markowitz, Sharpe does not believe in one to one relationship of individual securities. Sharpe was of the opinion that each security has an association with the market portfolio and the return of security find an association with the return of such portfolio. In the absence of market portfolio, a representative index of the market (like BSE Sensex or Nifty)
-
Upload
satyajeet-moha -
Category
Documents
-
view
220 -
download
0
Transcript of Fm-599 Main Proj
7/31/2019 Fm-599 Main Proj
http://slidepdf.com/reader/full/fm-599-main-proj 1/51
1
EXEXUTIVE SUMMARY
Investment can be defined the commitment of funds to one or more assets that will be held
over for some future time period. The field of investment traditionally divided into security
analysis and portfolio management. The heart of security analysis is valuation of financial
assets.
A portfolio is a bundle or a combination of individual assets or securities. The portfolio
theory provides a normative approach to investors to make decisions to invest their wealth in
assets or securities under risk. It is based after the assumption that investors are risk-
averse. This implies that investors hold well diversified portfolio instead of investing
their entire wealth in a single or a few assets. One important conclusion of the
portfolio theory is that if the investor of the portfolio theory is that if the investor holds a
well-diversified portfolio of assets then their concerns should be the expected rate of return
and risk of the portfolio, rather than individual assets and the contribution of individual asset
to the portfolio risk. The second assumption of the portfolio theory is that the returns of
assets are normally distributed. This means that the mean and variance analysis is the
foundation of the portfolio decisions.
Sharpe‘s model states that an individual securities has relationship with one common
parameter of the market, i.e. index of the market. According to Sharpe‘s concept, different
securities in the market do not have any kind of direct relation with each other; instead, these
have a link with the index of the market, which is representative of the entire market. There
are stocks(shares) in the market, which show an upward movement as soon as market moves
up and vice – versa. Certain shares in the market have an opposite relationship with the whole
market. This association of individual securities with the market is through the stock index of
the market
Stock index (SENSEX) is representative of the market and every security has a relationship
with this Index. This relationship can help in estimating and representing the returns of these
securities. Unlike Markowitz, Sharpe does not believe in one to one relationship of individual
securities. Sharpe was of the opinion that each security has an association with the market
portfolio and the return of security find an association with the return of such portfolio. In the
absence of market portfolio, a representative index of the market (like BSE Sensex or Nifty)

7/31/2019 Fm-599 Main Proj
http://slidepdf.com/reader/full/fm-599-main-proj 2/51
2
may be used. The changes in the return of a security due to this association are termed as
slope of the curve when plotted on a graph. This association is represented with the help of
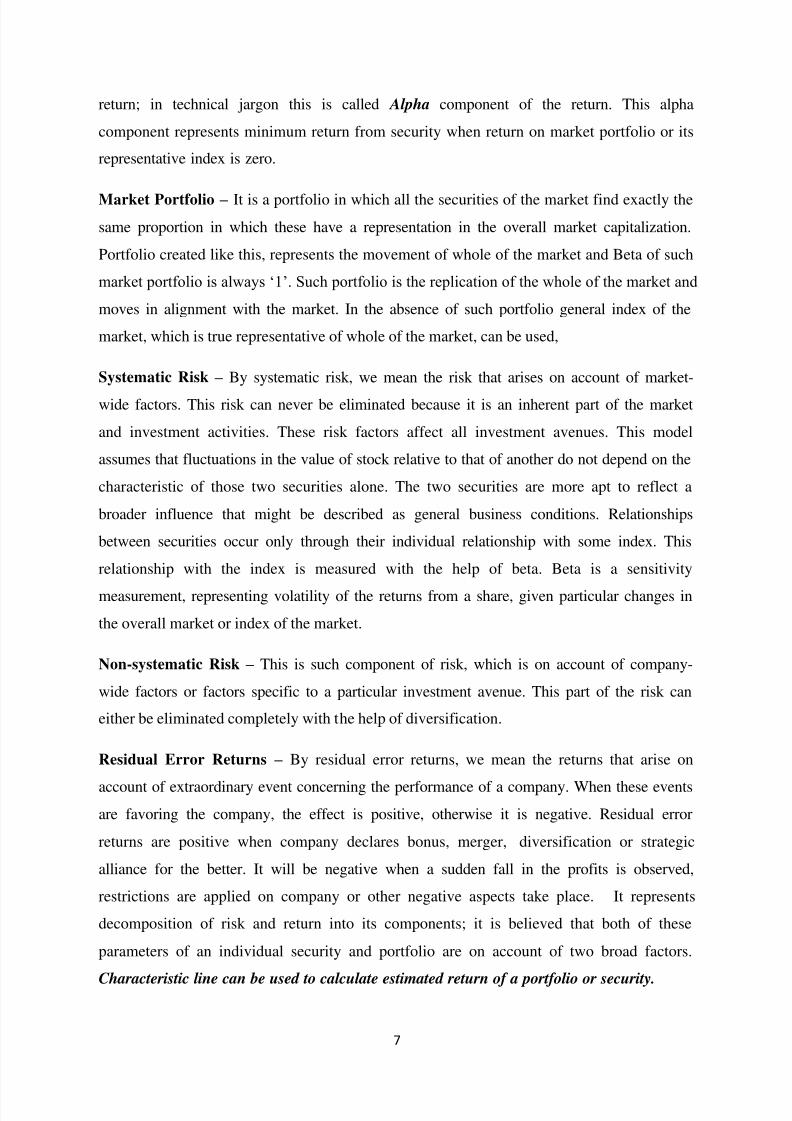
Beta. At the same time, each security has returns on account of the performance of the
company and such returns are called non-systematic component of return; in technical jargon
this is called Alpha component of the return. This alpha component represents minimum
return from security when return on market portfolio or its representative index is zero.

7/31/2019 Fm-599 Main Proj
http://slidepdf.com/reader/full/fm-599-main-proj 3/51
3
INTRODUCTION
CHAPTER I
7/31/2019 Fm-599 Main Proj
http://slidepdf.com/reader/full/fm-599-main-proj 4/51
4
INTRODUCTION TO TOPIC OF STUDY
Shape‘s Index model states that when market index rises the stock prices also rises and vice
versa. The stock price is related to market index so this relationship can be used to estimate
the return on stocks. In Sharpe's model association of individual securities/shares with the
index of market is given importance, instead of correlation between securities. Only those
securities are desirable in the portfolio, which have positive excess return over risk free
return, All the securities for which excess return to beta ratio is more than the overall cut-off
point-are included in the portfolio. Such portfolio is the efficient portfolio and generates the
optimum returns.
STATEMENT OF PROBLEM
This projects major focuses are on observing the trends change due to market index and
constructing efficient portfolio based on Shape‘s Index model.
LITERATURE REVIEW
Portfolio is a combination of securities such as stocks, bonds and money market instruments
Portfolio returns come in the form of current income and capital gains. Current
income includes dividends on stocks and interest payments on bonds. A capitalgain or capital loss results when a security is sold, and is equal to the amount of the sale price
minus the purchase price. The return of the portfolio is equal to the net of the capital gains or
losses plus the current income for the holding period. Unrealized capital gains or losses on
securities still held are also added to the return to evaluate the holding period return of the
portfolio. The portfolio return is adjusted for the addition of funds and the withdrawal of
funds to the portfolio, and is time-weighted according to the number of months that the funds
were in the portfolio.
A ratio developed by Nobel laureate William F. Sharpe, is the ratio of a portfolio‘s total
return minus the risk-free rate divided by the standard deviation of the portfolio, which is a
measure of its risk. The Sharpe ratio is simply the risk premium per unit of risk, which is
quantified by the standard deviation of the portfolio.
Risk Premium = Total Portfolio Return – Risk-free Rate
Sharpe Ratio = Risk Premium / Standard Deviation of Portfolio

7/31/2019 Fm-599 Main Proj
http://slidepdf.com/reader/full/fm-599-main-proj 5/51
5
The risk-free rate is subtracted from the portfolio return because a risk-free asset, often
exemplified by the T-bill, has no risk premium since the return of a risk-free asset is certain.
Therefore, if a portfolio‘s return is equal to or less than the risk -free rate, then it makes no
sense to invest in the risky assets.
Hence, the Sharpe ratio is a measure of the performance of the portfolio compared to the risk
taken — the higher the Sharpe ratio, the better the performance and the greater the profits for
taking on additional risk.
SHARPE‟S SINGLE INDEX MODEL:
Sharpe‘s model favors that an individual securities has relationship with one common
parameter of the market, i.e. index of the market. According to Sharpe‘s concept, different
securities in the market do not have any kind of direct relation with each other; instead, these
have a link with the index of the market, which is representative of the entire market. There
are stocks(shares) in the market, which show an upward movement as soon as market moves
up and vice – versa. Certain shares in the market have an opposite relationship with the whole
market. This association of individual securities with the market is through the stock index of
the market. Stock index (SENSEX) is representative of the market and every security has a
relationship with this Index. This relationship can help in estimating and representing the
returns of these securities. Unlike Markowitz, Sharpe does not believe in one to one
relationship of individual securities.
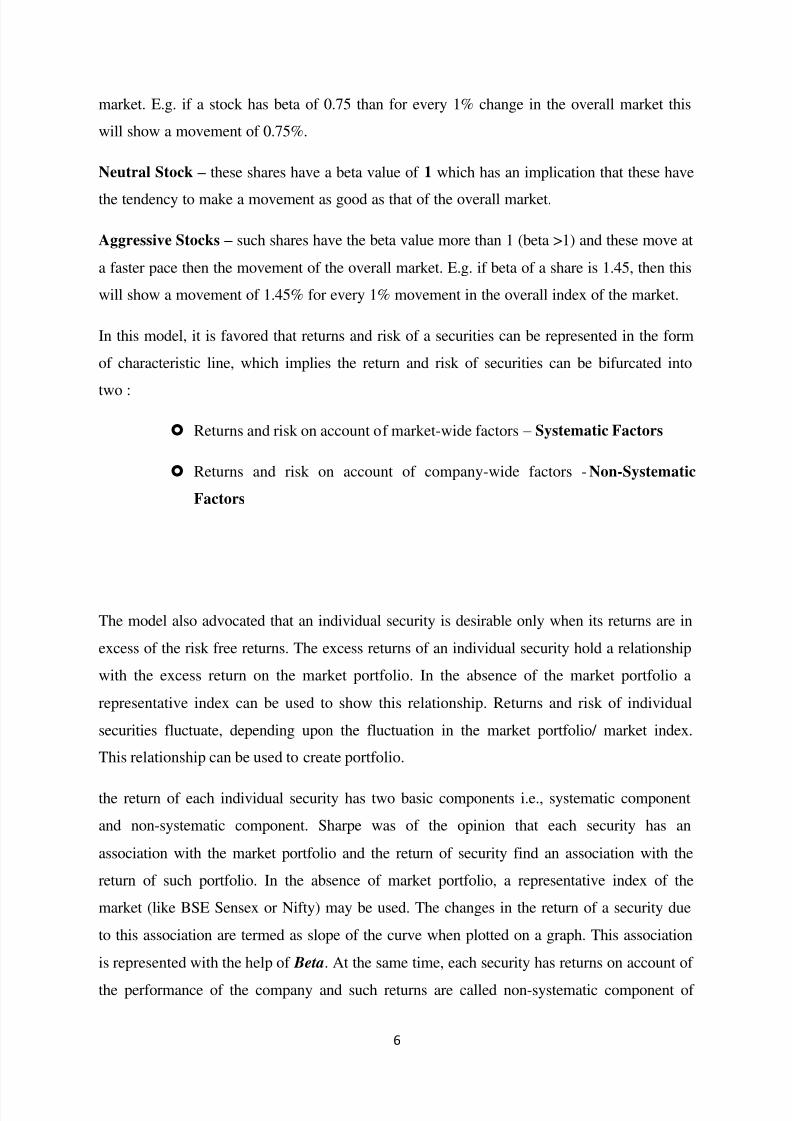
This association of individual securities with the index is represented with the help of beta
and depending on the Beta value of the securities, these get classified into following three
types :
Defensive stock (shares) i.e. beta < 1
Neutral stock (shares) i.e. beta = 1
Aggressive stock (shares) i.e. beta >1
Defensive stock – these are the shares that have beta value less than 1, which implies that
these show a movement in the return at a slow pace as compared to the movement of overall
7/31/2019 Fm-599 Main Proj
http://slidepdf.com/reader/full/fm-599-main-proj 6/51
6
market. E.g. if a stock has beta of 0.75 than for every 1% change in the overall market this
will show a movement of 0.75%.
Neutral Stock – these shares have a beta value of 1 which has an implication that these have
the tendency to make a movement as good as that of the overall market.
Aggressive Stocks – such shares have the beta value more than 1 (beta >1) and these move at
a faster pace then the movement of the overall market. E.g. if beta of a share is 1.45, then this
will show a movement of 1.45% for every 1% movement in the overall index of the market.
In this model, it is favored that returns and risk of a securities can be represented in the form
of characteristic line, which implies the return and risk of securities can be bifurcated into
two :
Returns and risk on account of market-wide factors – Systematic Factors
Returns and risk on account of company-wide factors -Non-Systematic
Factors
The model also advocated that an individual security is desirable only when its returns are in
excess of the risk free returns. The excess returns of an individual security hold a relationship
with the excess return on the market portfolio. In the absence of the market portfolio a
representative index can be used to show this relationship. Returns and risk of individual
securities fluctuate, depending upon the fluctuation in the market portfolio/ market index.
This relationship can be used to create portfolio.
the return of each individual security has two basic components i.e., systematic component
and non-systematic component. Sharpe was of the opinion that each security has an
association with the market portfolio and the return of security find an association with the
return of such portfolio. In the absence of market portfolio, a representative index of the
market (like BSE Sensex or Nifty) may be used. The changes in the return of a security due
to this association are termed as slope of the curve when plotted on a graph. This association
is represented with the help of Beta. At the same time, each security has returns on account of
the performance of the company and such returns are called non-systematic component of
7/31/2019 Fm-599 Main Proj
http://slidepdf.com/reader/full/fm-599-main-proj 7/51
7
return; in technical jargon this is called Alpha component of the return. This alpha
component represents minimum return from security when return on market portfolio or its
representative index is zero.
Market Portfolio – It is a portfolio in which all the securities of the market find exactly the
same proportion in which these have a representation in the overall market capitalization.
Portfolio created like this, represents the movement of whole of the market and Beta of such
market portfolio is always ‗1‘. Such portfolio is the replication of the whole of the market and
moves in alignment with the market. In the absence of such portfolio general index of the
market, which is true representative of whole of the market, can be used,
Systematic Risk – By systematic risk, we mean the risk that arises on account of market-
wide factors. This risk can never be eliminated because it is an inherent part of the market
and investment activities. These risk factors affect all investment avenues. This model
assumes that fluctuations in the value of stock relative to that of another do not depend on the
characteristic of those two securities alone. The two securities are more apt to reflect a
broader influence that might be described as general business conditions. Relationships
between securities occur only through their individual relationship with some index. This
relationship with the index is measured with the help of beta. Beta is a sensitivity
measurement, representing volatility of the returns from a share, given particular changes in
the overall market or index of the market.
Non-systematic Risk – This is such component of risk, which is on account of company-
wide factors or factors specific to a particular investment avenue. This part of the risk can
either be eliminated completely with the help of diversification.
Residual Error Returns – By residual error returns, we mean the returns that arise on
account of extraordinary event concerning the performance of a company. When these events
are favoring the company, the effect is positive, otherwise it is negative. Residual error
returns are positive when company declares bonus, merger, diversification or strategic
alliance for the better. It will be negative when a sudden fall in the profits is observed,
restrictions are applied on company or other negative aspects take place. It represents
decomposition of risk and return into its components; it is believed that both of these
parameters of an individual security and portfolio are on account of two broad factors.
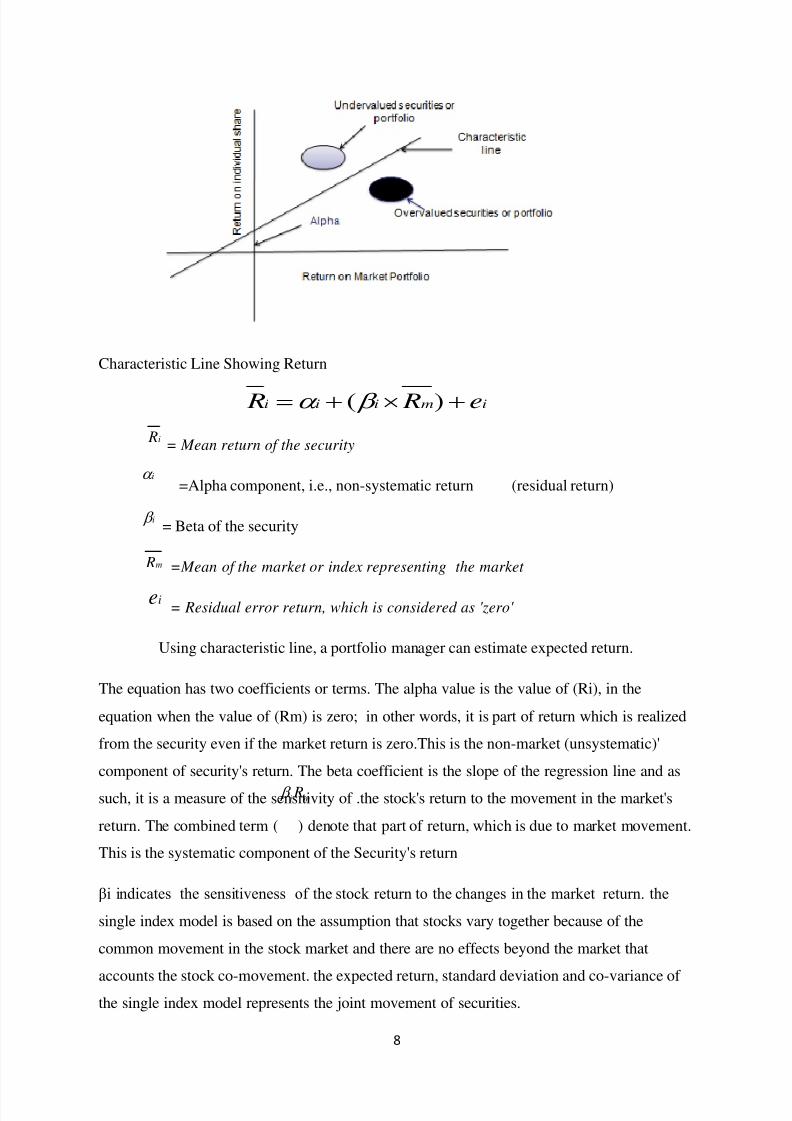
Characteristic line can be used to calculate estimated return of a portfolio or security.
7/31/2019 Fm-599 Main Proj
http://slidepdf.com/reader/full/fm-599-main-proj 8/51
8
Characteristic Line Showing Return
= Mean return of the security
=Alpha component, i.e., non-systematic return (residual return)
= Beta of the security
=Mean of the market or index representing the market
= Residual error return, which is considered as 'zero'
Using characteristic line, a portfolio manager can estimate expected return.
The equation has two coefficients or terms. The alpha value is the value of (Ri), in the
equation when the value of (Rm) is zero; in other words, it is part of return which is realized
from the security even if the market return is zero.This is the non-market (unsystematic)'
component of security's return. The beta coefficient is the slope of the regression line and as
such, it is a measure of the sensitivity of .the stock's return to the movement in the market's
return. The combined term ( ) denote that part of return, which is due to market movement.
This is the systematic component of the Security's return
βi indicates the sensitiveness of the stock return to the changes in the market return. the
single index model is based on the assumption that stocks vary together because of the
common movement in the stock market and there are no effects beyond the market that
accounts the stock co-movement. the expected return, standard deviation and co-variance of the single index model represents the joint movement of securities.
imiii e R R )(
i R
i
i
m R
ie
mi R
7/31/2019 Fm-599 Main Proj
http://slidepdf.com/reader/full/fm-599-main-proj 9/51
9
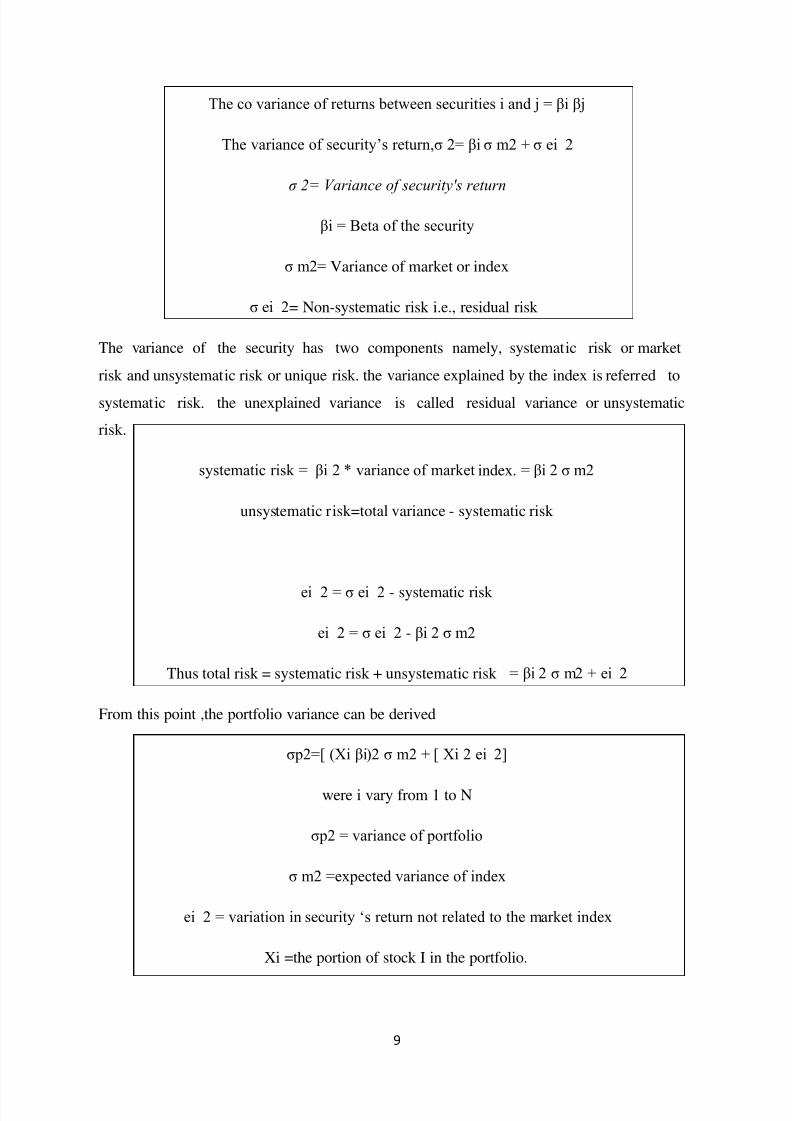
The co variance of returns between securities i and j = βi βj
The variance of security‘s return,σ 2= βi σ m2 + σ ei 2
σ 2= Variance of security's return
βi = Beta of the security
σ m2= Variance of market or index
σ ei 2= Non-systematic risk i.e., residual risk
The variance of the security has two components namely, systematic risk or market
risk and unsystematic risk or unique risk. the variance explained by the index is referred to
systematic risk. the unexplained variance is called residual variance or unsystematic
risk.
systematic risk = βi 2 * variance of market index. = βi 2 σ m2
unsystematic risk=total variance - systematic risk
ei 2 = σ ei 2 - systematic risk
ei 2 = σ ei 2 - βi 2 σ m2
Thus total risk = systematic risk + unsystematic risk = βi 2 σ m2 + ei 2
From this point ,the portfolio variance can be derived
σp2=[ (Xi βi)2 σ m2 + [ Xi 2 ei 2]
were i vary from 1 to N
σp2 = variance of portfolio
σ m2 =expected variance of index
ei 2 = variation in security ‗s return not related to the market index
Xi =the portion of stock I in the portfolio.
7/31/2019 Fm-599 Main Proj
http://slidepdf.com/reader/full/fm-599-main-proj 10/51
10
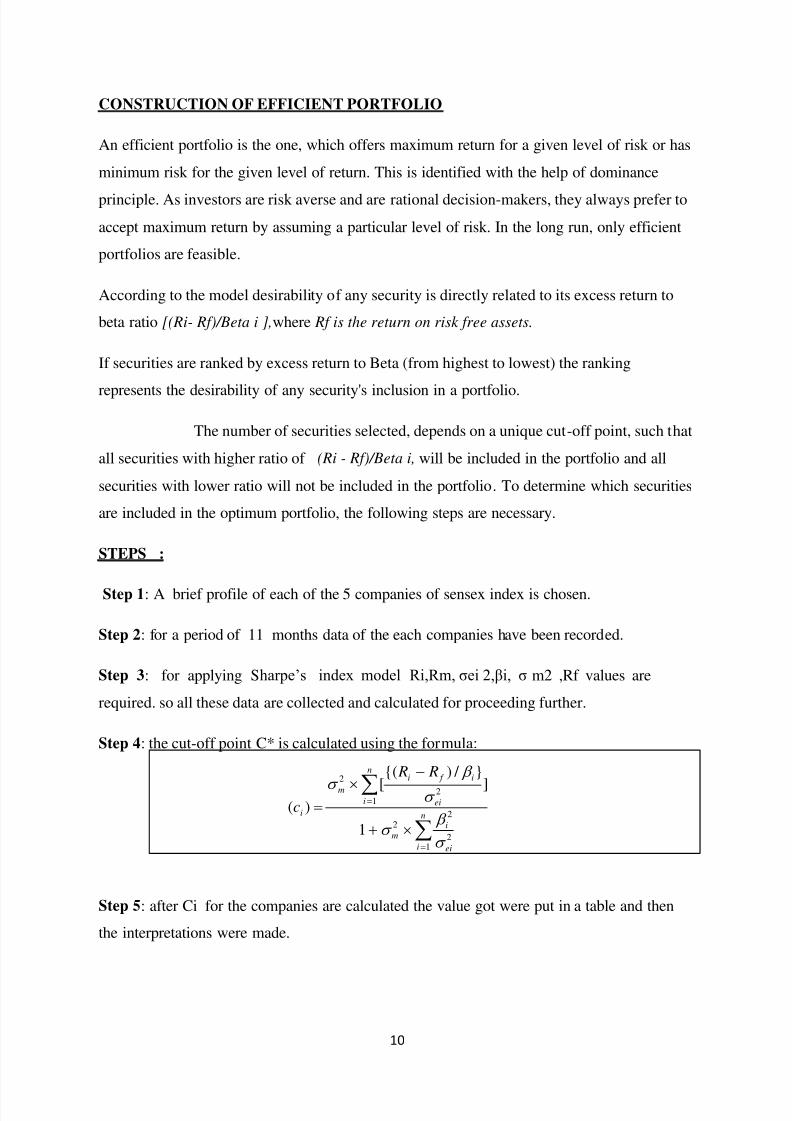
CONSTRUCTION OF EFFICIENT PORTFOLIO
An efficient portfolio is the one, which offers maximum return for a given level of risk or has
minimum risk for the given level of return. This is identified with the help of dominance
principle. As investors are risk averse and are rational decision-makers, they always prefer to
accept maximum return by assuming a particular level of risk. In the long run, only efficient
portfolios are feasible.
According to the model desirability of any security is directly related to its excess return to
beta ratio [(Ri- Rf)/Beta i ],where Rf is the return on risk free assets.
If securities are ranked by excess return to Beta (from highest to lowest) the ranking
represents the desirability of any security's inclusion in a portfolio.
The number of securities selected, depends on a unique cut-off point, such that
all securities with higher ratio of (Ri - Rf)/Beta i, will be included in the portfolio and all
securities with lower ratio will not be included in the portfolio . To determine which securities
are included in the optimum portfolio, the following steps are necessary.
STEPS :
Step 1: A brief profile of each of the 5 companies of sensex index is chosen.
Step 2: for a period of 11 months data of the each companies have been recorded.
Step 3: for applying Sharpe‘s index model Ri,Rm, σei 2,βi, σ m2 ,Rf values are
required. so all these data are collected and calculated for proceeding further.
Step 4: the cut-off point C* is calculated using the formula:
Step 5: after Ci for the companies are calculated the value got were put in a table and then
the interpretations were made.
n
i ei
i
m
n
i ei
i f i
m
i
R R
c
12
2
2
12
2
1
]
} / ){(
[)(

7/31/2019 Fm-599 Main Proj
http://slidepdf.com/reader/full/fm-599-main-proj 11/51
11
Step 6: the Ci values go on increasing up to a certain point and then start decreasing. the
highest point is called cut-off point(C*).the securities which are above C* point are
chosen to the portfolio.
Step 7:Once the securities for portfolio are chosen, the proportion in which they should be
invested is to be determined. this can be done using a formula where Xi denotes the
proportion,
Xi=Zi / ∑Zi
Where
Step 8:Return on portfolio can be made known with the formula
Rp=∑XiRi
Step 9: σp2 gives the risk associated with portfolio.
Sharpe's Model is convenient as compared to the model of Harry Markowitz. It helps in the
creation of portfolio with less number of calculations as compared to any other model. In
Sharpe's model association of individual securities/shares with the index of market is given
importance, instead of correlation between securities. Only those securities are desirable in
the portfolio, which have positive excess return over risk free return, All the securities for
which excess return to beta ratio is more than the overall cut-off point-are included in the
portfolio. Such portfolio is the efficient portfolio and generates the optimum returns
OBJECTIVE OF THE STUDY:
Observe the movement of stock market and the effect of it on individual companies
Observation of share pattern change of different companies due to change in SENSEX
Observing the best performed company in their sector in the year 2011
Construction of Portfolio based on Sharpe‘s index model
METHODOLOGY AND RESEARCH DESIGN:
In the study secondary data is used
Movement of SENSEX is noted
]}[{*
2c
R R Z
i
f i
ei
ii
7/31/2019 Fm-599 Main Proj
http://slidepdf.com/reader/full/fm-599-main-proj 12/51
7/31/2019 Fm-599 Main Proj
http://slidepdf.com/reader/full/fm-599-main-proj 13/51
13
CHAPTER TWO
INDUSTRY, COMPANY AND PRODUCT PROFILES
7/31/2019 Fm-599 Main Proj
http://slidepdf.com/reader/full/fm-599-main-proj 14/51
14
INDUSTRY PROFILE
The Indian broking industry is one of the oldest trading industries that has been around
even before the establishment of the BSE in 1875. Despite passing through a number of
changes in the post liberalisation period, the industry has found its way towards
sustainable growth. With the purpose of gaining a deeper understanding about the role of
the Indian stock broking industry in the country‘s economy, we present in this section
some of the industry insights gleaned from analysis of data received through primary
research.
For the broking industry, we started with an initial database of over 1,800 broking firms
that were contacted, from which 464 responses were received. The list was further short
listed based on the number of terminals and the top 210 were selected for profiling. 394
responses, that provided more than 85% of the information sought have been included
for this analysis presented here as insights. All the data for the study was collected
through responses received directly from the broking firms. The insights have been
arrived at through an analysis on various parameters, pertinent to the equity broking
industry, such as region, terminal, market, branches, sub brokers, products and growth
areas.
Moreover the Indian retail brokerage industry taking into account the health of the
capital markets and the intensity of competition among the brokerage companies
Though the Indian brokerage industry has been consolidating steadily over the last 10
years, the share of the top 10 brokers has risen to only around one-fourth of the total
industry revenues. In this fragmented market, leading players like ICICI Direct, Kotak
Securities, Indiabulls, Sharekhan, and 5 Paisa, apart from many small players, compete
on the basis of low brokerage fees and customer service.
Some key characteristics of the firms are:
On the basis of geographical concentration, the West region has the maximum
representation of 52%. Around 24% firms are located in the North, 13% in the
South and 10% in the East
3% firms started broking operations before 1950, 65% between 1950-1995 and
32% post
1995
On the basis of terminals, 40% are located at Mumbai, 12% in Delhi, 8% in
7/31/2019 Fm-599 Main Proj
http://slidepdf.com/reader/full/fm-599-main-proj 15/51
15
Ahmedabad, 7% in Kolkata, 4% in Chennai and 29% are from other cities
From this study, we find that almost 36% firms trade in cash and derivatives
and 27% are into cash markets alone. Around 20% trade in cash, derivatives
and commoditiesIn the cash market, around 34% firms trade at NSE, 14% at BSE and 52%
trade at both exchanges. In the derivative segment, 48% trade at NSE, 7% at
BSE and 45% at both, whereas in the debt market, 31% trade at NSE, 26% at
BSE and 43% at both exchanges
Majority of branches are located in the North, i.e. around 40%. West has 31%,
24% are located in South and 5% in East
In terms of sub-brokers, around 55% are located in the South, 29% in West,
11% in North and 4% in East
Trading, IPOs and Mututal Funds are the top three products offered with 90%
firms offering trading, 67% IPOs and 53% firms offering mutual fund
transactions
In terms of various areas of growth, 84% firms have expressed interest in
expanding their institutional clients, 66% firms intend to increase FII clients
and 43% are interested in setting up JV in India and abroad
In terms of IT penetration, 62% firms have provided their website and around
94% firms have email facility
Terminals
Almost 52% of the terminals in the sample are based in the Western region of India,
followed by 25% in the North, 13% in the South and 10% in the East. Mumbai has got
the maximum representation from the West, Chennai from the South, New Delhi from
the North and Kolkata from the East.
Mumbai also has got the maximum representation in having the highest number of
terminals. 40% terminals are located in Mumbai while 12% are from Delhi, 8% from
Ahmedabad, 7% from Kolkata, 4% from Chennai and 29% are from other cities in
India.
Branches & Sub-Brokers
The maximum concentration of branches is in the North, with as many as 40% of all
branches located there, followed by the Western region, with 31% branches. Around24% branches are located in the South and East constitutes for 5% of the total branches
7/31/2019 Fm-599 Main Proj
http://slidepdf.com/reader/full/fm-599-main-proj 16/51
16
of the total sample.
In case of sub-brokers, almost 55% of them are based in the South. West and North
follow, with 30% and 11% sub-brokers respectively, whereas East has around 4% of
total sub-brokers.
Financial Markets
The financial markets have been classified as cash market, derivatives market, debt
market and commodities market. Cash market, also known as spot market, is the most
sought after amongst investors. Majority of the sample broking firms are dealing in the
cash market, followed by derivative and commodities. 27% firms are dealing only in the
cash market, whereas 35% are into cash and derivatives. Almost 20% firms trade in
cash, derivatives and commodities market. Firms that are into cash, derivatives and debt
are 7%. On the other hand, firms into cash and commodities are 3%, cash & debt market
and commodities alone are 2%. 4% firms trade in all the markets.
In the cash market, around 34% firms trade at NSE, 14% at BSE and 52% trade at both
exchanges. In the equity derivative market, 48% of the sampled broking houses are
members of NSE and 7% trade at BSE, while 45% of the sample operate in both stock
exchanges. Around 43% of the broking houses operating in the debt market, trade at
both exchanges with 31% and 26% firms uniquely at NSE and BSE respectively. Of the
brokers operating in the commodities market, 57% firms operate at NCDEX and
MCX. Around 20% and 21% firms are solely in NCDEX and MCX respectively,
whereas 2% firms trade in NCDEX, MCX and NMCE.
PEST ANALYSIS
POLITICAL ENVIRONMENT
Less control of Government of India on retail brokerage industry as it is
regulated by SEBI.
Constructive decisions taken by SEBI for protecting investors and regulating
stock market.
Right now Government of India is stable and market is also booming
7/31/2019 Fm-599 Main Proj
http://slidepdf.com/reader/full/fm-599-main-proj 17/51
17
Government policies and income tax exemption can affect investors‘ interest
on equity market.
ECONOMIC ENVIRONMENT
As the stock market is booming there is a good opportunity of growth of the
Industry.
Increasing income of Indian people encourage them to invest into stock
Market.
The retail brokerage industry has given employment to a large no of people.
SOCIAL ENVIRONMENT
Increasing awareness among Indian population in equity investment options.
Corporate frauds like Satyam and Harshadh Mehta scam may discourage
People from investing in stock market.
TECHNOLOGICAL ENVIRONMENT
User friendly software for doing online trading.
Technological change - creates opportunities for new products and product
Improvements and of course new marketing techniques
PORTER‟S 5 FORCE ANALYSIS
Buyer Power:
Lack of Expertise reduce Bargaining Power
Retail investors often lack the knowledge and expertise in the financial sector
that calls them to approach the broking houses.
Low Product Differentiation Proves Beneficial
The retail broking service provided by the various companies is homogeneous with
very low product differentiation. This allows customers to enjoy a greater bargaining
power.Increasing investment preferences in equity market among Indian population.
7/31/2019 Fm-599 Main Proj
http://slidepdf.com/reader/full/fm-599-main-proj 18/51
18
To tap this opportunity company should come out with more product features
and benefits.
HNI/high volume traders are the major sources of revenue for the company
and they should provide competitive brokerage to them.
Supplier Power:
Increased Dependence on IPOs/FPOs
There is a growing dependence of corporate on broking houses with the rising
number of IPO‘s coming to the market.
Intensity of Rivalry:
Move towards consolidation Lot of brokerage companies are moving towards
consolidation with the smaller ones becoming either franchisees for the larger brokers or
closing operations.
Increased Focus of Banks in Retail Broking
Various foreign banks like ABN Amro and others are planning to enter the
Indian retail brokerage industry.
Online Trading Competes with Traditional Brokerage
There is an increasing demand for online trading due to consumer‘s growing
preference for internet as compared to approaching the brokers.
Threat of New Entrants:
Entry of Foreign Players
New forms of trading including T+2 settlement system, dematerialization etc are
Strengthening the retail brokerage market and attracting foreign companies to enter
the Indian industry.
Entry of financial institution.
Threat of Substitutes:
Alternative Investment Options Various alternative forms of investment including fixed
deposits with banks and post offices etc act as substitutes to retail broking products and
services.
7/31/2019 Fm-599 Main Proj
http://slidepdf.com/reader/full/fm-599-main-proj 19/51
19
COMPANY PROFILE:
The four chartered accountants founded Karvy Consultants Limited in 1982. A group
of Hyderabad based practicing Chartered Accountants started Karvy taxation services
initially. Later, it forayed in to the register and share transfer activities and subsequently into
financial services. All along Karvy‘s strong work ethics and professional background
leveraged with information technology enabled it to deliver quality to the individual.
A decade of commitments, professional integrity and vision helped Karvy achieve a
leadership position in its field when it handled the largest number of issue ever handled in the
history of the Indian Stock market in a year. Therefore, Karvy made in roads into a host of
capital market services corporate and retail, which proved to be a sound business synergy.
Today Karvy has access to million of shareholder, beside companies, banks, financial
institution and regulatory agencies. Over the past one and half decade, Karvy has involved as
a veritable link between industries, finance and people. In January 1998, Karvy became the
first Depository participants in Andhra Pradesh. As ISO: 9002 Company,
Karvy ranks among the top player in almost all the fields it operates. Karvy
Computershare Limited is India‘s largest Registrar and Transfer Agent with a client base of
nearly 500 blue chip corporate, managing over 2 crore accounts. Karvy Stock Brokers
Limited, member of National Stock Exchange of India and the Bombay Stock Exchange,
ranks among the top 5 stock brokers in India. With over 6, 00,000 active accounts, it ranks
among the top 5 Depositary Participant in India, registered with NSDL and CDSL. Karvy
Comtrade, Member of NCDEX and MCX ranks among the top 3 commodity brokers in the
country. Karvy Insurance Brokers is registered as a Broker with IRDA and ranks among the
top 5 insurance agent in the country. Registered with AMFI as a corporate Agent, Karvy is
also among the top Mutual Fund mobilize with over Rs. 5,000 crores under management.
Karvy Realty Services, which started in 2006, has quickly established itself as a broker who
adds value, in the realty sector. Karvy Global offers niche off shoring services to clients in
the US. Karvy has 575 offices over 375 locations across India and overseas at Dubai and
New York. Over 9,000 highly qualified people staff Karvy.
7/31/2019 Fm-599 Main Proj
http://slidepdf.com/reader/full/fm-599-main-proj 20/51
20
Mission Statement of „Karvy‟
An organization exists to accomplish something or achieve something. The mission
statement indicates what an organization wants to achieve. The mission statement may be
changed periodically to take advantage of new opportunities or respond to new market
conditions. Karvy‘s mission statement is “To Bring Industry, Finance and People
together.” Karvy is work as intermediary between industry and people. Karvy work as
investment advisor and helps people to invest their money same way Karvy helps industry in
achieving finance from people by issuing shares, debentures, bonds, mutual funds, fixed
deposits etc.Company‘s mission statement is clear and thoughtful which guide geographically
dispersed employees to work independently yet collectively towards achieving the
organization‘s goals.
Vision of Karvy
Company‘s vision is crystal clear and mind frame very directed. “To be pioneering
financial services company. And continue to grow at a healthy pace, year after year,
decade after decade.” Company‘s foray into IT-enabled services and internet business has
provided an opportunity to explore new frontiers and business solutions. To build a corporate
that sets benchmarks for others to follow.
ORGANISATION
Karvy was started by a group of five chartered accountants in 1979. The partners decided to
offer, other than the audit services, value added services like corporate advisory services to
their clients. The first firm in the group, Karvy Consultants Limited was incorporated on 23rd
July, 1983. In a very short period, it became the largest Registrar and Transfer Agent in India.
This business was spun off to form a separate joint venture with Computer share of Australia,
in 2005. Karvy‘s foray into stock broking began with marketing IPO‘s, in 1993. Within a few
years, Karvy began topping the IPO procurement league tables and it has consistently
maintained its position among the top 5. Karvy was among the first few members of National
Stock Exchange, in 1994 and became a member of The Stock Exchange, Mumbai in 2001.
Dematerialization of shares gathered pace in mid-90s and Karvy was in the forefront
educating investors on the advantages of dematerializing their shares. Today Karvy is among
the top 5 Depositary Participant in India.
7/31/2019 Fm-599 Main Proj
http://slidepdf.com/reader/full/fm-599-main-proj 21/51
21
While the registry business is a 50:50 Joint Venture with Computer share of Australia,
we have equity participation by ICICI Ventures Limited and Barings Asia Limited, in Karvy
Stock Broking Limited. Karvy has always believed in adding value to services it offers to
clients. A top-notch research team based in Mumbai and Hyderabad supports its employees to
advise clients on their investment needs. With the information overload today, Karvy‘s team
of analysts help investors make the right calls, be it equities, mf, insurance. On a typical
working day Karvy:
* Has more than 25,000 investors visiting our 575 offices
* Publishes / broadcasts at least 50 buy / sell calls
* Attends to 10,000+ telephone calls
* Mails 25,000 envelopes, containing Annual Reports,
Dividend cheques/ advises, allotment / refund advises
* Executes 150,000+ trades on NSE / BSE
* Executes 50,000 debit / credit in the depositary accounts
* Advises 3,000+ clients on the investments in mutual funds
First ISO - 9001: 2000 Certified Registrar in India
KARVY GROUP
Karvy group comprises the following:-
KARVY CONSULTANTS LIMITED –
As the flagship company of the Karvy Group, Karvy Consultant Limited has always
remained at the helm of organization affairs, pioneering business policies, works ethic and
7/31/2019 Fm-599 Main Proj
http://slidepdf.com/reader/full/fm-599-main-proj 22/51
22
channels of progress. Karvy as a leader in the registry business now transferred this business
into a join venture with Computer share Limited of Australia, the world‘s largest registrar.
Today, we service over 6 lacks customer accounts in this business spread across over 250
cities/towns in India and are ranked amongst the largest Depository Participant in the country,
Deal in Register and investment services. We are rated as India's "Most Admired Registrar"
for overall excellence in volume management, quality processes and technology driven
services. Our services include Initial Public Offers (IPO‘s) processing, share holder servicing,
effecting corporate actions, investor information services and host of technology enabled
services to facilitate efficient and effective service delivery.
KARVY STOCK BROKING LIMITED –
They offer trading on a vast platform – National Stock Exchange, Bombay Stock
Exchange and Hyderabad Stock Exchange. Information is given as a constant feedback to
karvy customers, through daily reports delivered thrice Daily- The Pre- session Report, where
market scenario for the day is predicated, the Mid- session Report, times to arrive during
lunch break, where the market forecast for the rest of the day is given and the Post- session
Report, the final report for the day, where the market and the report itself is reviewed. To add
to this repository of information, we publish a monthly magazine ―Karvy------ The Finapolis‖
Which analyzes the latest stock market trends and takes a close look at the various investment
options, and product available in the market while a weekly report, called ―Karvy Bazaar
Baatein‖ keeps you more informed on the immediate trends in the stock market. In addition,
our specific industry reports give comprehensive information on various industries. Beside
this, we also offer special portfolio analysis packages that provide daily technical advice on
scrip‘s for successful portfolio management and provide customized advisory services to help
you make the right financial moves that are specifically suited to your portfolio.
The institutional broking arm of KARVY Stock Broking offers corporate houses and
institutions dealing capabilities on India leading stock exchanges (NSE and BSE) in the cash
and derivatives segments. This unit has devised a process driven approach to address the
needs of institutional investors who have unique and specialized investment needs.
7/31/2019 Fm-599 Main Proj
http://slidepdf.com/reader/full/fm-599-main-proj 23/51
23
The institutional broking services desk is a specialized business unit at KARVY that
operates out of Mumbai, the financial capital of India and is staffed with best-of-industry
equity market professionals and highly skilled dealers. KARVY also supports institutional
traders through their institutional sales and research teams with information and insightful
reports on stocks, sectors and industry verticals. KARVY‘s institutional broking clientele
include some major domestic Mutual Funds, Insurance Companies, Banks and FII‘s in India.
KARVY INVESTORY SERVICES LIMITED –
Karvy Investor Services Limited, a SEBI registered Merchant Banker is a 100%
subsidiary of Karvy Consultants Limited and is among the top 10 merchant Bankers in India
today. The parent Company i.e. Karvy Consultants Limited was founded by a group of
professionals in 1982 and today it has evolved as integrated financial services company of
repute, offering various financial services to suit every requirement/need of our customers.
By virtue of its access to millions of Indian Shareholders, in addition to companies, banks
and financial institutions, Karvy has in the process built up a positive reputation with
regulatory authorities and other government agencies. It emphasis on the quality of the
services, we offer, has been instrumental in helping us to attain the leadership in the financial
services sector.
Karvy has a track record of handling 70 public/rights issues as Merchant Bankers.
During the last two years we have handled the share buyback issues of TTK LIG Limited,
Sirpur Paper Mills Limited, Bhagyanagar Metals Limited, A V Thomas Group-Nelliampathy
Tea and Produce Company Limited, Chordia Food Products Limited, Heritage Foods (India)
Limited, Titanor Components Ltd, Punjab Communications Limited, etc. to name a few.
Karvy has also handled/are handling the Rights/Public issues of Dhanalakshmi Bank,
Dhandapani Finance, Moschip, Karur Vysya Bank, Lux Hosiery Industries Ltd, Sah
Petroleums Limited, Paradyne InfoTech Limited, Yash Papers Limited, SPL Industries
Limited, Provogue (I) Limited, Tulip IT Services Limited, Gati Limited as lead managers to
name a few. We have also been appointed as advisor to some of the GOI disinvestments. It
has actively marketed bond issues of corporations from the States of Maharashtra, Karnataka
& Gujarat and debt issues of all the Financial Institutions like IDBI, ICICI, IFCI, REC, PFC,
SIDBI, etc.
7/31/2019 Fm-599 Main Proj
http://slidepdf.com/reader/full/fm-599-main-proj 24/51
24
As an Investment Banker, Karvy provides;
• Management of Capital Issues
• Management of Buybacks, Takeovers and Delisting offers
• Private Placement of Debt and Equity
• Mergers and Amalgamations, • Loan Syndication
KARVY COMMODITIES BROKING PRIVATE LIMITED-
Focused on taking commodities trading to new dimensions of reliability and
profitability. We have made commodities trading, an essentially age-old practice, into a
sophisticated and scientific investment option.
Here we enable trade in all goods and products of agricultural and mineral origin that
include lucrative commodities like gold and silver and popular items like oil, pulses and
cotton through a well-systematized trading platform. Our technological and infrastructuralstrengths and especially our street-smart skills make us an ideal broker.
Our service matrix is holistic with a gamut of advantages, the first and foremost being
our legacy of human resources, technology and infrastructure that comes from being part of
the Karvy Group.
Karvy‘s wide national network, spanning the length and breadth of India, further
supports these advantages. Regular trading workshops and seminars are conducted to hone
trading strategies to perfection. Every move made is a calculated one, based on reliable
research that is converted into valuable information through daily, weekly and monthly
newsletters, calls and intraday alerts. Further, personalized service is provided here by a
dedicated team committed to giving hassle-free service while the brokerage rates offered are
extremely competitive. Our commitment to excel in this sector stems from the immense
importance those commodities broking has to a cross-section of investors, farmers, exporters,
importers, manufacturers and the Government of India itself. Visit karvy at
www.karvycomtrade.com
7/31/2019 Fm-599 Main Proj
http://slidepdf.com/reader/full/fm-599-main-proj 25/51
25
KARVY MUTUAL FUND SERVICES
Investment is the stepping stone to achieving one's financial dreams. Mutual funds offer
an opportune way to long-term wealth creation. However, with more and more funds
flooding the market, the task of selecting the most suitable scheme gets even more
complicated. Mutual Fund Advisory Service at Karvy guides you through this maze and
ensures that your investments are backed by our quality research. We, at Karvy help you to
reach your goals by offering:
* Products of 33 AMCs
* Research reports (existing funds & NFOs; strategy reports etc.)
* Customized mutual fund portfolios
* Portfolio revision (depending on changing market outlook and evolving trends)
* Access to online consolidated portfolio statement
IPO INTRODUCTION PVT LTD
An Initial Public Offer (IPO) is a means of collecting money from the public by a company
for the first time in the market to fund its projects. In return, the company gives the share to
the investors in the company.
In an IPO, the Lead managers decide the price of the issue. In a book building offer, the
syndicate members decide the indicative price range and the investors decide the price of the
issue through a tender method.
A draft prospectus provides the information on the financials of the company,
promoters, background, tentative issue price etc. It is filed by the Lead Managers with the
Securities & Exchange Board of India (SEBI) to provide issue details. Overview of the draft
7/31/2019 Fm-599 Main Proj
http://slidepdf.com/reader/full/fm-599-main-proj 26/51
26
prospectus can be seen on www.sebi.gov.in (SEBI's web site click here). The final prospectus
is printed after obtaining the clearance from SEBI and the Registrar of Companies (ROC).
KARVY FIXED INCOME SECURITYIES & TRADING (K-FIST)
It was started in December 2002 with a roll out from 7 dedicated centers of Karvy. The
Retail Debt Market division which is centralized at the HO in Hyderabad provides fixed
income products to its clients and is primarily a fund based activity. The deal sizes vary from
Rs.10,000 to Rs.5 cores.
Products - Central Government securities, State Development Loans, State Guaranteed
bonds, Public Sector Undertaking Bonds, Financial Institution Bonds, and Bank bonds of
SLR/Non-SLR category, both taxable and tax-free.
Target clients - Provident Fund Trusts, Educational & Religious trusts, charitable trusts,
and Co-operative banks, Regional Rural Banks, Corporate, and High Net worth Individuals
Standard Operating Procedures - Based on the specific needs of the prospects Quotes of all
categories of bonds are sent. The selection of instrument is done and post negotiation (if any)
the settlement date is finalized. Contract notes are exchanged and written confirmations are
obtained before initiating the trade settlement. On the agreed settlement date, the funds and
securities are exchanged between the parties. Primarily all the trades are in the electronic
mode only. The Wholesale Debt Market division is centralized at Mumbai and is a voice
based order matching activity which is fee based. The deal size is a minimum of Rs.5 cr. And
the reporting is done on the NSE.
Products - Central Government securities, State Development Loans, State Guaranteed
bonds, Public Sector Undertaking Bonds, Financial Institution Bonds, and Bank bonds of
SLR/Non-SLR category, both taxable and tax-free.
Target clients - Co-operative banks, commercial banks, Corporate, Financial
Institutions, Insurance companies and Asset Management Companies.
Standard Operating Procedures - The dealers generate 2-way quotes during the trading
hours and match the institutional buyers and sellers. The deal contract notes are generated
7/31/2019 Fm-599 Main Proj
http://slidepdf.com/reader/full/fm-599-main-proj 27/51
27
and exchanged between the 2 parties. The fees are collected by raising debit notes on a
monthly basis.
KARVY REALITY (INDIA) LIMITED –
(KRIL) is promoted by the KARVY Group, India‘s largest integrated financial services
group. The group carries forward its legacy of trust and excellence in investor and customer
services delivered with a passion for services and the highest level of quality that align with
global standards. KRIL is engaged in the business of real estate and property services.
* Buying/ selling/ renting of properties
* Identifying valuable investments opportunities in the real estate sector
* Facilitating financial support for real estate and investments in properties
* Real estate portfolio advisory services.
KRIL is your personal real estate advisor guiding and hand holding you through real
estate transactions and offering valuable investment opportunities.
Building on the KARVY brand as a leading industry benchmark for world class
customer servicing and quality standards, KRIL brings to investors a reputation of reliability,
dependability and honesty. Our understanding of the needs and preferences of our clients and
our teams of qualified realty professionals help us to establish fruitful relationships with
buyers and sellers of properties alike.
A single stop shop for realty services offering:
* Transacting Options: Choose to buy, sell or rent properties (residential and
commercial)
* Investing Options: Give your investments a good opportunity with properties
marketed by KRIL.
* Financing Options: Get unmatched deals for financing your investment
* Research Options: Karvy undertake valuation and feasibility studies, area analysis and
customized analysis on behalf of clients.
7/31/2019 Fm-599 Main Proj
http://slidepdf.com/reader/full/fm-599-main-proj 28/51
28
KRIL has ongoing relations with builders and developers across the country which will
help you place your investments in the most genuine properties for a good value appreciation
at the right place and at the right price. KRIL is committed to the guiding principles of
quality, timely service delivery, fair pricing, transparency and integrity.
KARVY INSURANCE BROKING PRIVATE LIMITED –
At Karvy Insurance Broking (P) Ltd. it provide both life and non-life insurance
products to retail individuals, high net-worth clients and corporate. With the opening up of
the insurance sector and with a large number of private players in the business, we are in a
position to provide tailor made policies for different segments of customers. In our journey to
emerge as a personal finance advisor, we will be better positioned to leverage our
relationships with the product providers and place the requirements of our customers
appropriately with the product providers. With Indian markets seeing a sea change, both in
terms of investment pattern and attitude of investors, insurance is no more seen as only a tax
saving product but also as an investment product. By setting up a separate entity, we would
be positioned to provide the best of the products available in this business to karvy‘s
customers.
Karvy‘s wide national network, spanning the length and breadth of India, further
supports these advantages. Further, personalized service is provided here by a dedicated team
committed in giving hassle-free service to the clients.
KARVY PORTFOLIO MANAGEMENT SERVICE LIMITED –
KARVY is a premier integrated financial services provider, and ranked among the top
five in the country in all its business segments. KARVY owes its success to its professionally
managed team of experts, who have been chosen from some of the most reputed institutions
and firms across India.
In today's intricate and volatile market your investment requires constant monitoring
and attention. The demand made on your time and energy by other business may not leave
you with capacity to attend to your personal portfolio with the degree of care you deem
appropriate. We at KARVY understand your situation and offer PMS services taking thesame level of care and attention you would devote to monitoring your portfolio.
7/31/2019 Fm-599 Main Proj
http://slidepdf.com/reader/full/fm-599-main-proj 29/51
29
Green Wallet is an Endeavour specially designed by Karvy to enhance the wealth of a
niche segment of investors. This service primarily meant for HNIs (High Net worth
Individuals) offers customers a wide range of schemes. These unique schemes seek to
achieve higher returns through broad based participation in equity markets. This is achieved
by creating a diversified equity portfolio of small, medium and large capitalized companies.
KARVY DEPOSITORY SERVICES LIMITED –
Stock Broking Limited provides depository services to investors as a Depository
Participant with the National Securities Depository Limited (NSDL) and Central Depository
Services (India) Limited (CDSL). The Depository system in India links Issuers, National
level Depositories, Depository Participants and Clearing Houses / Clearing Corporation of
Stock Exchanges. Our demat services are accessible through any of our network of over 575
branches / investor service centers located in over 375 cities and towns across the country.
Our demat services business has the distinction of having all its operations ISO 9001:
2000 certified with state-of-the-art technology and operations capabilities. Our demat
services has innovated over time and we provide online access to account statements and
transaction alerts through SMS to its clients.
KARVY‘s Demat services offer you a secure, convenient and paperless way to keep
track of your investments in shares and other security instruments over time, without the
hassle of handling paper based transcripts.
Karvy provide the following services:
* Dematerialization of Shares
* Transfer of Shares
* Pledging of Shares
* Electronic Custodial Services
* Maintenance of Beneficial Holdings
* Electronic Credit against Corporate Actions
7/31/2019 Fm-599 Main Proj
http://slidepdf.com/reader/full/fm-599-main-proj 30/51
30
QUALITY POLICY OF THE COMPANY:-
To achieve and retain leadership, Karvy shall aim for complete customer satisfaction,
by combining its human and technological resources, to provide superior quality financial
service, in the process, Karvy will strive to exceed customer‘s expectation.
Quality Objectives:-
As per the quality policy, Karvy will:
Build-in-house processes that will insure transparent and harmonious relationship with its
clients and investor to provide high quality of services.
Establish a partner relationship with its investors service agent and vendors that will help in
keeping up it commitments to the customers.
Provide high quality of work life for all its employees and equip them with adequate
knowledge and skills so as to respond to customer‘s needs.
Continue to uphold the values of honesty and integrity and strive to establish unparalleled
standard and business ethics.
Use state-of-the art information technology in developing new and innovative financial
products and services to meet the changing needs of investors and clients.
Strive to be a reliable source of value-edit products and services and constantly guide the
individuals and institutions in making judicious choices of same.
Strive to keep all stakeholders (share holders, clients, investors, employees, suppliers and
regulatory authorities) proud and satisfy.
STRATEGY OF THE COMPANY:-
Karvy believes that the foremost ingredient for success in the has been the co-operation
ability to continuously evolve both organizational structure and product offerings, thereby
remaining on the cutting financial services.
Karvy believes that three capitals viz., financial, human and technology, would drive the
financials services sector in the future and draw the boundaries for achieving leadership.
7/31/2019 Fm-599 Main Proj
http://slidepdf.com/reader/full/fm-599-main-proj 31/51
31
Karvy believes that customized solutions are now the key drivers for market share and profit
margins.
DEVELOPMENT ACTIVITIES:-
Karvy has sought to broaden the scope of its activities by examining all sectors of the
economy and by introduction new concepts, new instruments and in some cases new
institution to response to perceived needs. In this regards, karvy developmental activities
have encompassed such diverse areas as financial investment, insurance, depository
participant‘s services, skill development activities etc.
It has also been a pioneer in setting up PAN. TAN services, and also setting up specialized
institution in certain key sections.
1. TIN facilitation centre.
2. Stock broking centre.
3. Financial centre.
4. Banking centre.
5. Registrar of the issues.
A separate department is present with the sole intent of providing financial services to various
charitable, educational and social welfare organizations.
ACHIEVEMENTS:-
Largest mobilize of funds as per PRIME DATABASE.
First ISO- 9002 certified Registrar in India.
A category- 1- Merchant banker.
A category- 1- Registrar to public issues.
Ranked as ―the most admired Registrar‖ by MARG
Handled the largest – ever public issue-IDBI.
7/31/2019 Fm-599 Main Proj
http://slidepdf.com/reader/full/fm-599-main-proj 32/51
32
Handled over 500 public issues as Registrars.
Handling the reliance account, this accounts for nearly 10 million account holders.
First depository participants in Andhra Pradesh.
Major issues managed as arrangers:
o Kerala state Electricity Board.
o Power Finance Corporation.
o A.P. water resources development corporation
o A.P. state electricity board.
o Haldia petrochemicals Ltd.
Major issues managed as co-managers.
o Indus land Bank Ltd.
o ICICI Bonds-March97.
o ICICI Bonds-dec.97.
o ICICI safety Bonds-April 98, July98, Oct.98, Dec.98, Jan.99.
o The Jammu & Kashmir BankLtd.
Major issues handled and registrar to issues.
o IDBI equity
o Morgan Stanley mutual fund
o Bank of Baroda
o Bank of Punjab Ltd.
o Corporation Bank.
o Indus land Bank Ltd.
o Jammu & Kashmir Bank Ltd.
7/31/2019 Fm-599 Main Proj
http://slidepdf.com/reader/full/fm-599-main-proj 33/51
33
o Housing and Urban development corporation (HODCO) Ltd.
o Madras Refineries Ltd.
o BPL Ltd.
o Birla 3M Ltd.
o Essar shipping Ltd.
o Essar stels Ltd.
o Hindustan Petroleum Corporation Ltd.
o Infosys technologies Ltd.
o Jindal Vijay Nagar Steels Ltd.
o Nagarjun fertilizers and chemicals Ltd.
o Rajshree Polyfil LTD.
KARVY SECURITIES LTD
Karvy has secured over Rs. 500 crore in the following debt issues
Andhra Pradesh Road Development Corporation Ltd.
ICICI Bonds ( Private placement )
ICICI Bonds-96.
ICICI Bonds- 97-I
ICICI Bonds-97-II.
ICICI Safety Bond-March 98.
ICICI Bond 96.
7/31/2019 Fm-599 Main Proj
http://slidepdf.com/reader/full/fm-599-main-proj 34/51
34
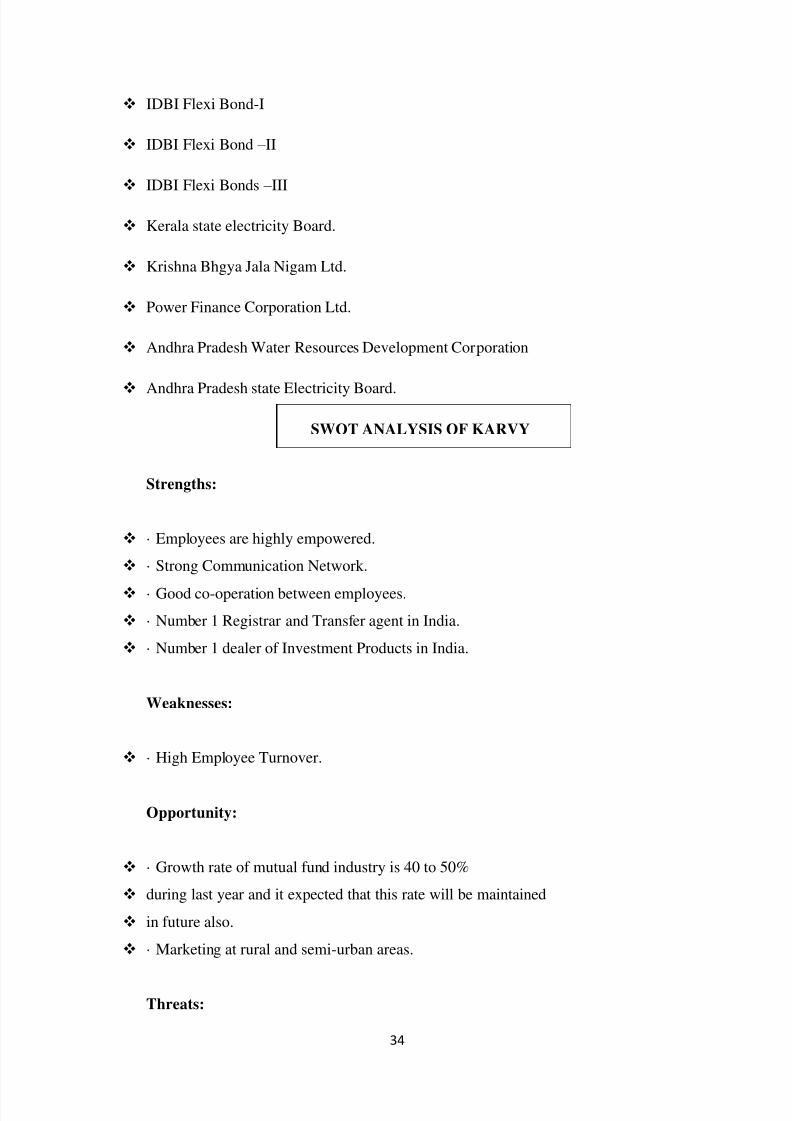
IDBI Flexi Bond-I
IDBI Flexi Bond – II
IDBI Flexi Bonds – III
Kerala state electricity Board.
Krishna Bhgya Jala Nigam Ltd.
Power Finance Corporation Ltd.
Andhra Pradesh Water Resources Development Corporation
Andhra Pradesh state Electricity Board.
SWOT ANALYSIS OF KARVY
Strengths:
· Employees are highly empowered.
· Strong Communication Network.
· Good co-operation between employees.
· Number 1 Registrar and Transfer agent in India.
· Number 1 dealer of Investment Products in India.
Weaknesses:
· High Employee Turnover.
Opportunity:
· Growth rate of mutual fund industry is 40 to 50%
during last year and it expected that this rate will be maintained
in future also.
· Marketing at rural and semi-urban areas.
Threats:

7/31/2019 Fm-599 Main Proj
http://slidepdf.com/reader/full/fm-599-main-proj 35/51
35
· Increasing number of local players.
· Past image of Mutual Fund
7/31/2019 Fm-599 Main Proj
http://slidepdf.com/reader/full/fm-599-main-proj 36/51
36
Chapter Three
ANALYSIS AND INTERPRETATION
7/31/2019 Fm-599 Main Proj
http://slidepdf.com/reader/full/fm-599-main-proj 37/51
37
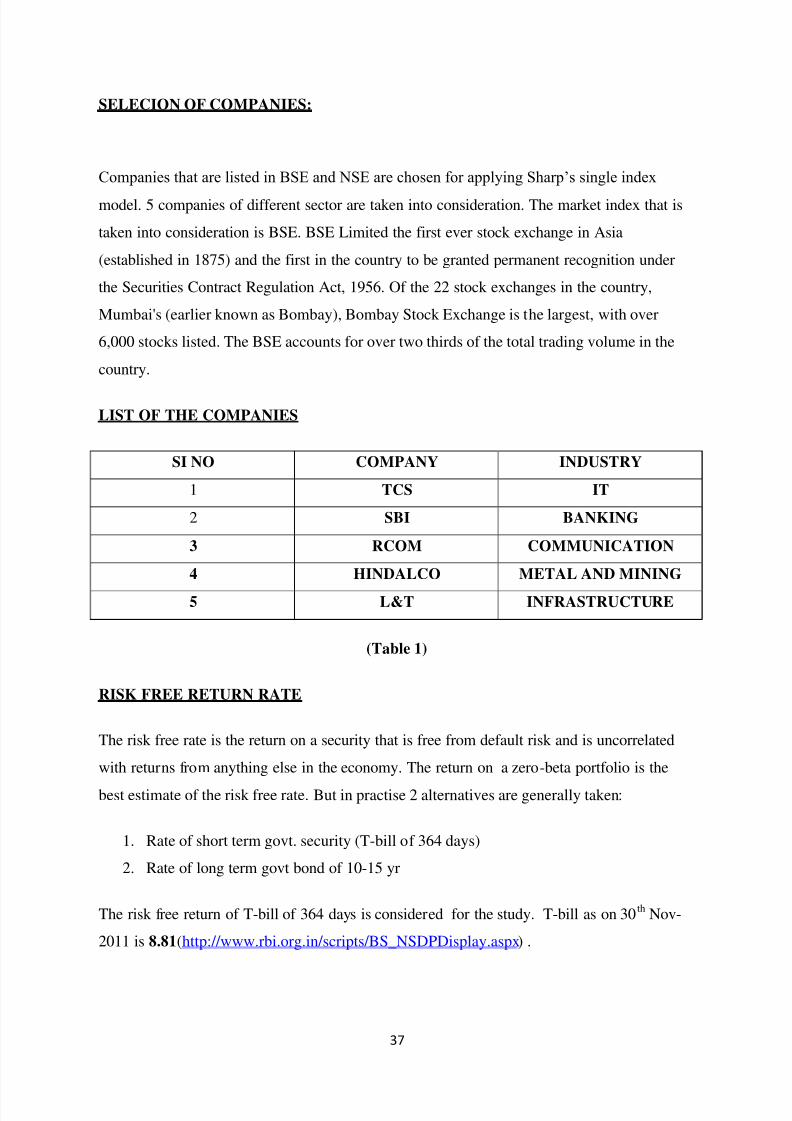
SELECION OF COMPANIES:
Companies that are listed in BSE and NSE are chosen for applying Sharp‘s single index
model. 5 companies of different sector are taken into consideration. The market index that is
taken into consideration is BSE. BSE Limited the first ever stock exchange in Asia
(established in 1875) and the first in the country to be granted permanent recognition under
the Securities Contract Regulation Act, 1956. Of the 22 stock exchanges in the country,
Mumbai's (earlier known as Bombay), Bombay Stock Exchange is the largest, with over
6,000 stocks listed. The BSE accounts for over two thirds of the total trading volume in the
country.
LIST OF THE COMPANIES
SI NO COMPANY INDUSTRY
1 TCS IT
2 SBI BANKING
3 RCOM COMMUNICATION
4 HINDALCO METAL AND MINING
5 L&T INFRASTRUCTURE
(Table 1)
RISK FREE RETURN RATE
The risk free rate is the return on a security that is free from default risk and is uncorrelated
with returns from anything else in the economy. The return on a zero-beta portfolio is the
best estimate of the risk free rate. But in practise 2 alternatives are generally taken:
1. Rate of short term govt. security (T-bill of 364 days)
2. Rate of long term govt bond of 10-15 yr
The risk free return of T-bill of 364 days is considered for the study. T-bill as on 30th
Nov-
2011 is 8.81(http://www.rbi.org.in/scripts/BS_NSDPDisplay.aspx) .
7/31/2019 Fm-599 Main Proj
http://slidepdf.com/reader/full/fm-599-main-proj 38/51
38
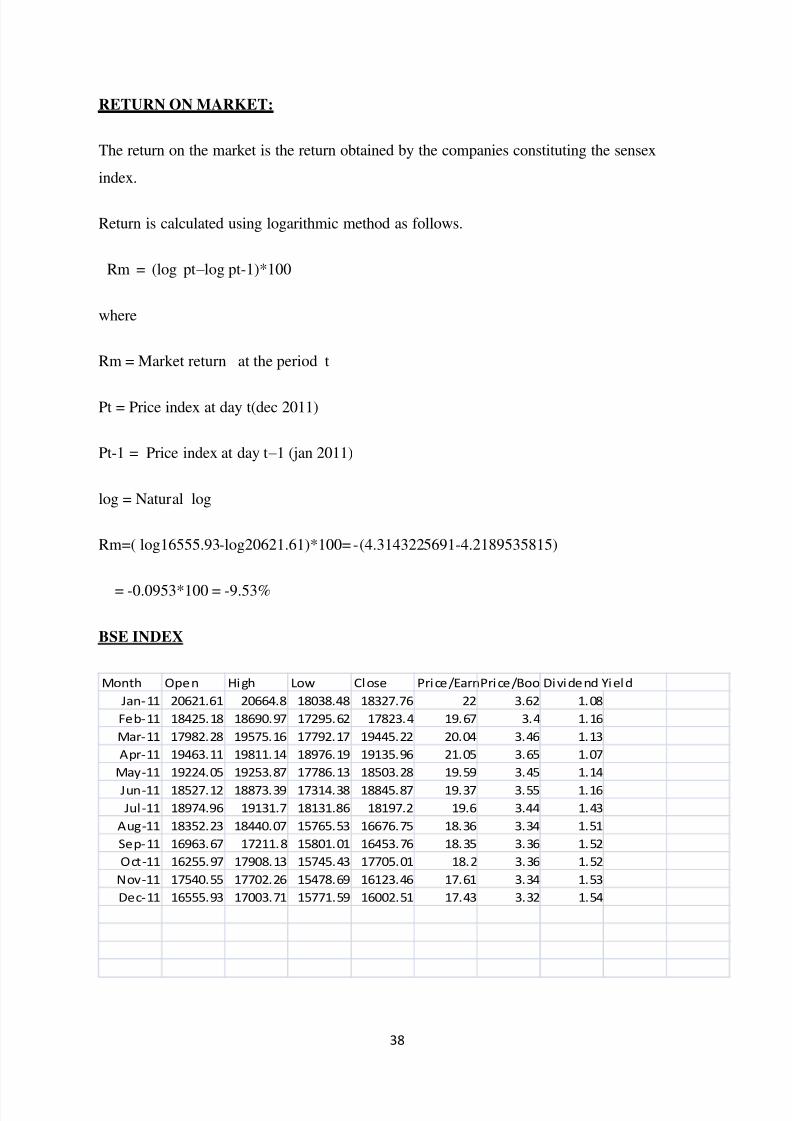
RETURN ON MARKET:
The return on the market is the return obtained by the companies constituting the sensex
index.
Return is calculated using logarithmic method as follows.
Rm = (log pt – log pt-1)*100
where
Rm = Market return at the period t
Pt = Price index at day t(dec 2011)
Pt-1 = Price index at day t – 1 (jan 2011)
log = Natural log
Rm=( log16555.93-log20621.61)*100= -(4.3143225691-4.2189535815)
= -0.0953*100 = -9.53%
BSE INDEX
Month Open High Low Close Price/EarnPrice/Boo Dividend Yield
Jan-11 20621.61 20664.8 18038.48 18327.76 22 3.62 1.08
Feb-11 18425.18 18690.97 17295.62 17823.4 19.67 3.4 1.16
Mar-11 17982.28 19575.16 17792.17 19445.22 20.04 3.46 1.13
Apr-11 19463.11 19811.14 18976.19 19135.96 21.05 3.65 1.07
May-11 19224.05 19253.87 17786.13 18503.28 19.59 3.45 1.14
Jun-11 18527.12 18873.39 17314.38 18845.87 19.37 3.55 1.16
Jul-11 18974.96 19131.7 18131.86 18197.2 19.6 3.44 1.43
Aug-11 18352.23 18440.07 15765.53 16676.75 18.36 3.34 1.51
Sep-11 16963.67 17211.8 15801.01 16453.76 18.35 3.36 1.52
Oct-11 16255.97 17908.13 15745.43 17705.01 18.2 3.36 1.52
Nov-11 17540.55 17702.26 15478.69 16123.46 17.61 3.34 1.53
Dec-11 16555.93 17003.71 15771.59 16002.51 17.43 3.32 1.54
7/31/2019 Fm-599 Main Proj
http://slidepdf.com/reader/full/fm-599-main-proj 39/51
39
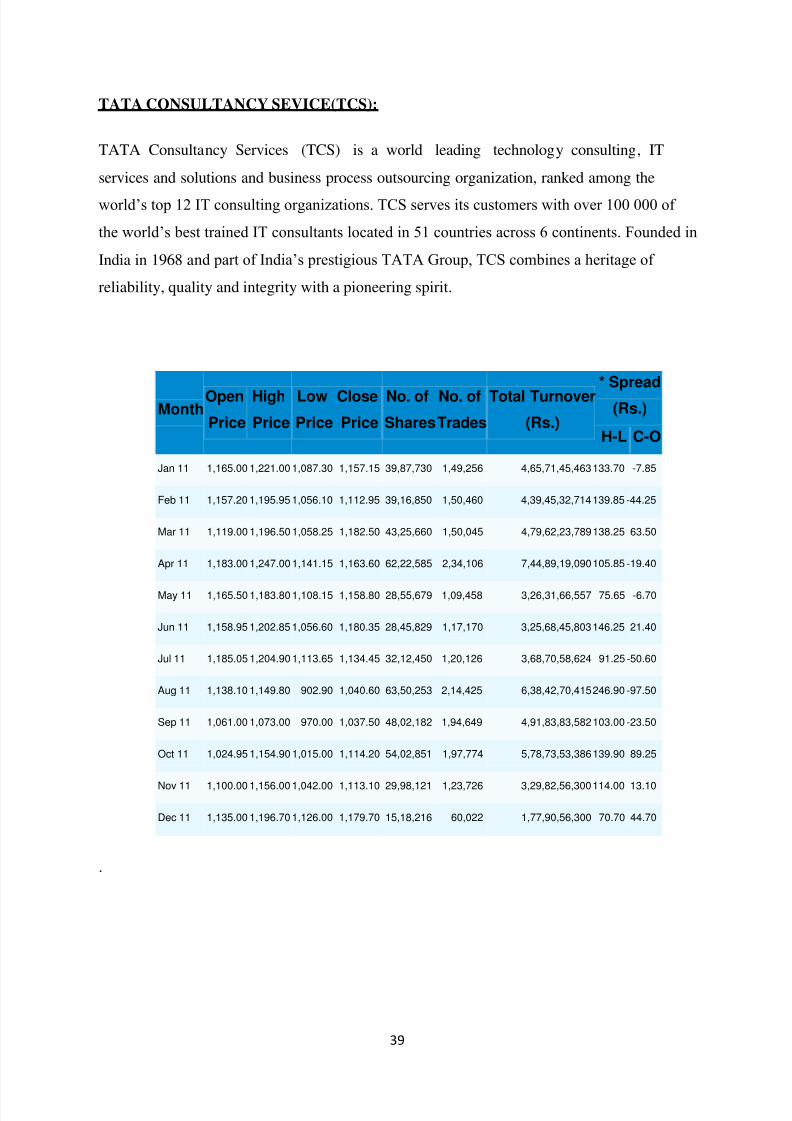
TATA CONSULTANCY SEVICE(TCS):
TATA Consultancy Services (TCS) is a world leading technology consulting, IT
services and solutions and business process outsourcing organization, ranked among the
world‘s top 12 IT consulting organizations. TCS serves its customers with over 100 000 of
the world‘s best trained IT consultants located in 51 countries across 6 continents. Founded in
India in 1968 and part of India‘s prestigious TATA Group, TCS combines a heritage of
reliability, quality and integrity with a pioneering spirit.
MonthOpen
Price
High
Price
Low
Price
Close
Price
No. of
Shares
No. of
Trades
Total Turnover
(Rs.)
* Spread
(Rs.)
H-L C-O
Jan 11 1,165.00 1,221.00 1,087.30 1,157.15 39,87,730 1,49,256 4,65,71,45,463 133.70 -7.85
Feb 11 1,157.20 1,195.95 1,056.10 1,112.95 39,16,850 1,50,460 4,39,45,32,714 139.85 -44.25
Mar 11 1,119.00 1,196.50 1,058.25 1,182.50 43,25,660 1,50,045 4,79,62,23,789 138.25 63.50
Apr 11 1,183.00 1,247.00 1,141.15 1,163.60 62,22,585 2,34,106 7,44,89,19,090 105.85 -19.40
May 11 1,165.50 1,183.80 1,108.15 1,158.80 28,55,679 1,09,458 3,26,31,66,557 75.65 -6.70
Jun 11 1,158.95 1,202.85 1,056.60 1,180.35 28,45,829 1,17,170 3,25,68,45,803 146.25 21.40
Jul 11 1,185.05 1,204.90 1,113.65 1,134.45 32,12,450 1,20,126 3,68,70,58,624 91.25 -50.60
Aug 11 1,138.10 1,149.80 902.90 1,040.60 63,50,253 2,14,425 6,38,42,70,415 246.90 -97.50
Sep 11 1,061.00 1,073.00 970.00 1,037.50 48,02,182 1,94,649 4,91,83,83,582 103.00 -23.50
Oct 11 1,024.95 1,154.90 1,015.00 1,114.20 54,02,851 1,97,774 5,78,73,53,386 139.90 89.25
Nov 11 1,100.00 1,156.00 1,042.00 1,113.10 29,98,121 1,23,726 3,29,82,56,300 114.00 13.10
Dec 11 1,135.00 1,196.70 1,126.00 1,179.70 15,18,216 60,022 1,77,90,56,300 70.70 44.70
.
7/31/2019 Fm-599 Main Proj
http://slidepdf.com/reader/full/fm-599-main-proj 40/51
40
SHARPE INDEX CALCULATION:-
Quart
er
(2011)
Cls
price
Return(
Ri)
(cl-op)
Cls
mkt
price
Mkt
return(R
m) (cl-
op)
Ri-Ri‟ Rm-
Rm‟
(Ri-Ri‟)^2 (Rm-
Rm‟)^2
1(jan-
mar))
1182.
5
17.5 19445.
22
-1175.78 20.92
8
-21.3 437.981184 453.69
2(apr-
jun)
1180.
35
-2.65 18845.
87
-599.35 0.778 555.1
3
0.605284 308136.0
1
3(jul-
sept)
1037.
5
-147.5 16453.
76
-2392.11 -
144.0
7
-
1237.
6
20756.1649 1531653.
76
4(sept-
dec)
1179.
7
118.7 16002.
51
-450.49 122.1
28
704.4
8
14915.2483
84
496179.3
6
total -13.93 -4617.93
Ri‘= total (Ri)/4
= -3.428
Rm‘=total(Rm)/4
=-1154.48
7/31/2019 Fm-599 Main Proj
http://slidepdf.com/reader/full/fm-599-main-proj 41/51
41
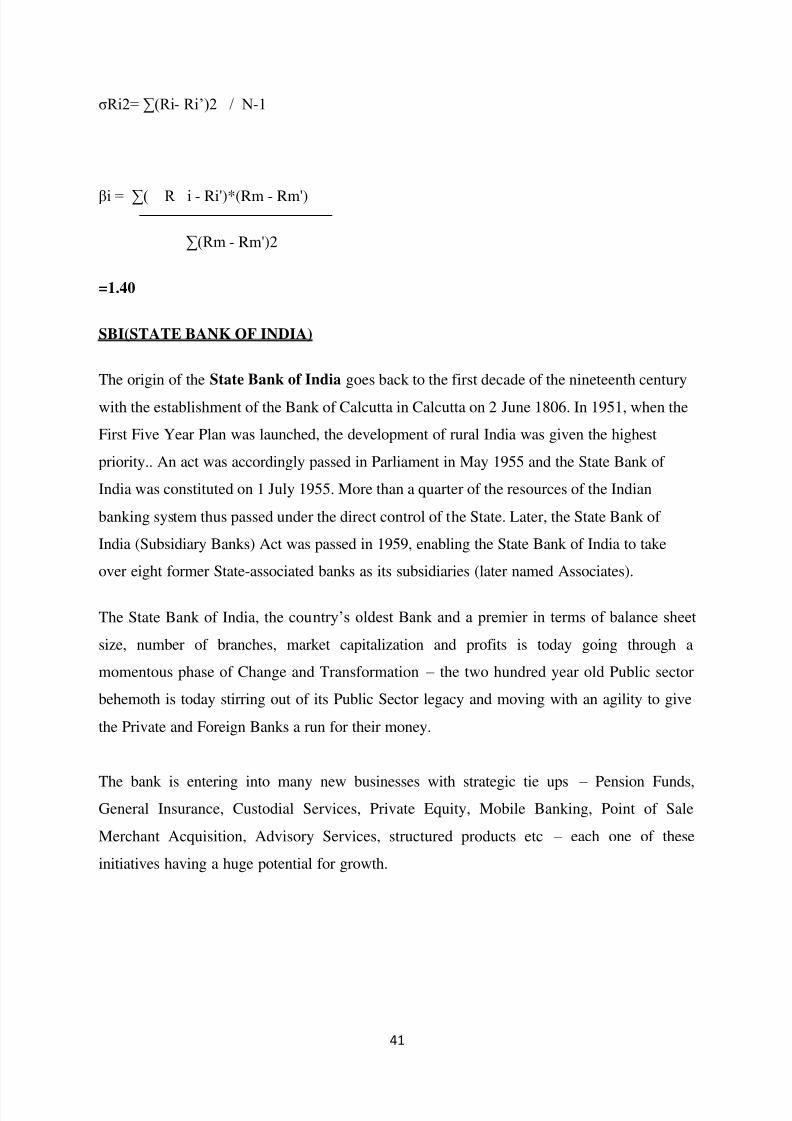
σRi2= ∑(Ri- Ri‘)2 / N-1
βi = ∑( R i - Ri')*(Rm - Rm')
∑(Rm - Rm')2
=1.40
SBI(STATE BANK OF INDIA)
The origin of the State Bank of India goes back to the first decade of the nineteenth century
with the establishment of the Bank of Calcutta in Calcutta on 2 June 1806. In 1951, when the
First Five Year Plan was launched, the development of rural India was given the highest
priority.. An act was accordingly passed in Parliament in May 1955 and the State Bank of
India was constituted on 1 July 1955. More than a quarter of the resources of the Indian
banking system thus passed under the direct control of the State. Later, the State Bank of
India (Subsidiary Banks) Act was passed in 1959, enabling the State Bank of India to take
over eight former State-associated banks as its subsidiaries (later named Associates).
The State Bank of India, the country‘s oldest Bank and a premier in terms of balance sheet
size, number of branches, market capitalization and profits is today going through a
momentous phase of Change and Transformation – the two hundred year old Public sector
behemoth is today stirring out of its Public Sector legacy and moving with an agility to give
the Private and Foreign Banks a run for their money.
The bank is entering into many new businesses with strategic tie ups – Pension Funds,General Insurance, Custodial Services, Private Equity, Mobile Banking, Point of Sale
Merchant Acquisition, Advisory Services, structured products etc – each one of these
initiatives having a huge potential for growth.
7/31/2019 Fm-599 Main Proj
http://slidepdf.com/reader/full/fm-599-main-proj 42/51
42
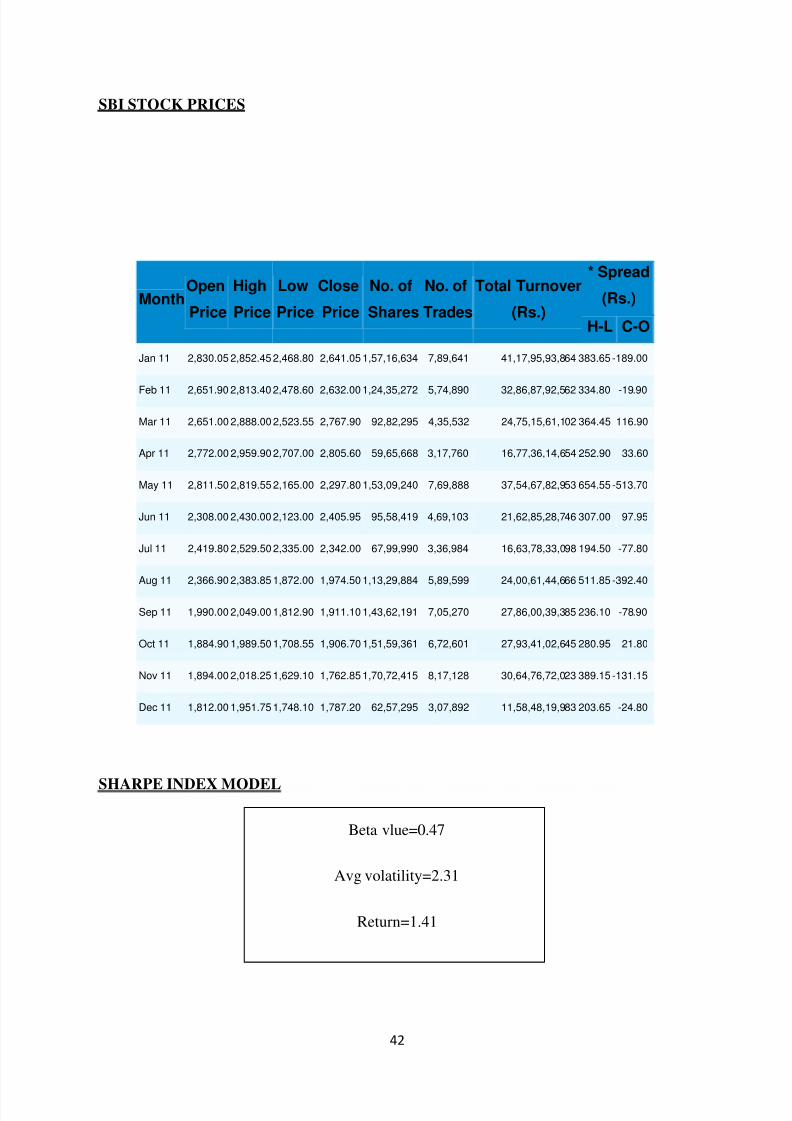
SBI STOCK PRICES
MonthOpen
Price
High
Price
Low
Price
Close
Price
No. of
Shares
No. of
Trades
Total Turnover
(Rs.)
* Spread
(Rs.)
H-L C-O
Jan 11 2,830.05 2,852.45 2,468.80 2,641.05 1,57,16,634 7,89,641 41,17,95,93,864 383.65 -189.00
Feb 11 2,651.90 2,813.40 2,478.60 2,632.00 1,24,35,272 5,74,890 32,86,87,92,562 334.80 -19.90
Mar 11 2,651.00 2,888.00 2,523.55 2,767.90 92,82,295 4,35,532 24,75,15,61,102 364.45 116.90
Apr 11 2,772.00 2,959.90 2,707.00 2,805.60 59,65,668 3,17,760 16,77,36,14,654 252.90 33.60
May 11 2,811.50 2,819.55 2,165.00 2,297.80 1,53,09,240 7,69,888 37,54,67,82,953 654.55 -513.70
Jun 11 2,308.00 2,430.00 2,123.00 2,405.95 95,58,419 4,69,103 21,62,85,28,746 307.00 97.95
Jul 11 2,419.80 2,529.50 2,335.00 2,342.00 67,99,990 3,36,984 16,63,78,33,098 194.50 -77.80
Aug 11 2,366.90 2,383.85 1,872.00 1,974.50 1,13,29,884 5,89,599 24,00,61,44,666 511.85 -392.40
Sep 11 1,990.00 2,049.00 1,812.90 1,911.10 1,43,62,191 7,05,270 27,86,00,39,385 236.10 -78.90
Oct 11 1,884.90 1,989.50 1,708.55 1,906.70 1,51,59,361 6,72,601 27,93,41,02,645 280.95 21.80
Nov 11 1,894.00 2,018.25 1,629.10 1,762.85 1,70,72,415 8,17,128 30,64,76,72,023 389.15 -131.15
Dec 11 1,812.00 1,951.75 1,748.10 1,787.20 62,57,295 3,07,892 11,58,48,19,983 203.65 -24.80
SHARPE INDEX MODEL
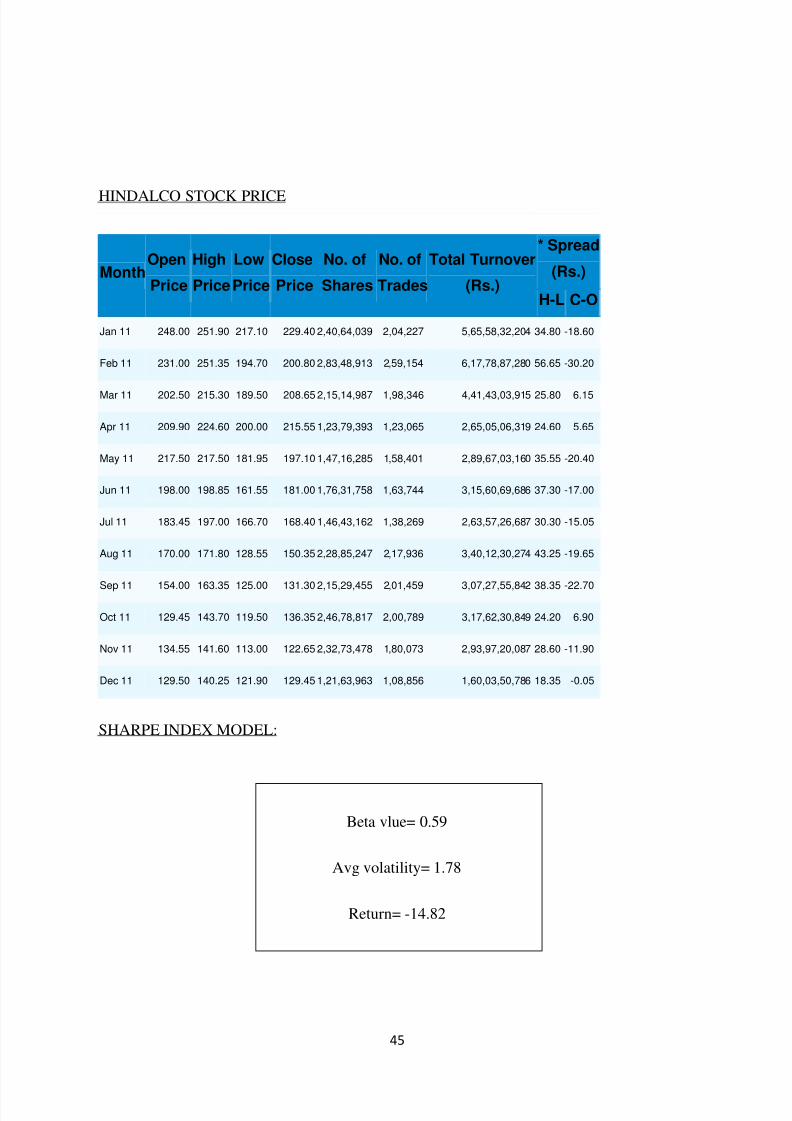
Beta vlue=0.47
Avg volatility=2.31
Return=1.41
7/31/2019 Fm-599 Main Proj
http://slidepdf.com/reader/full/fm-599-main-proj 43/51
43
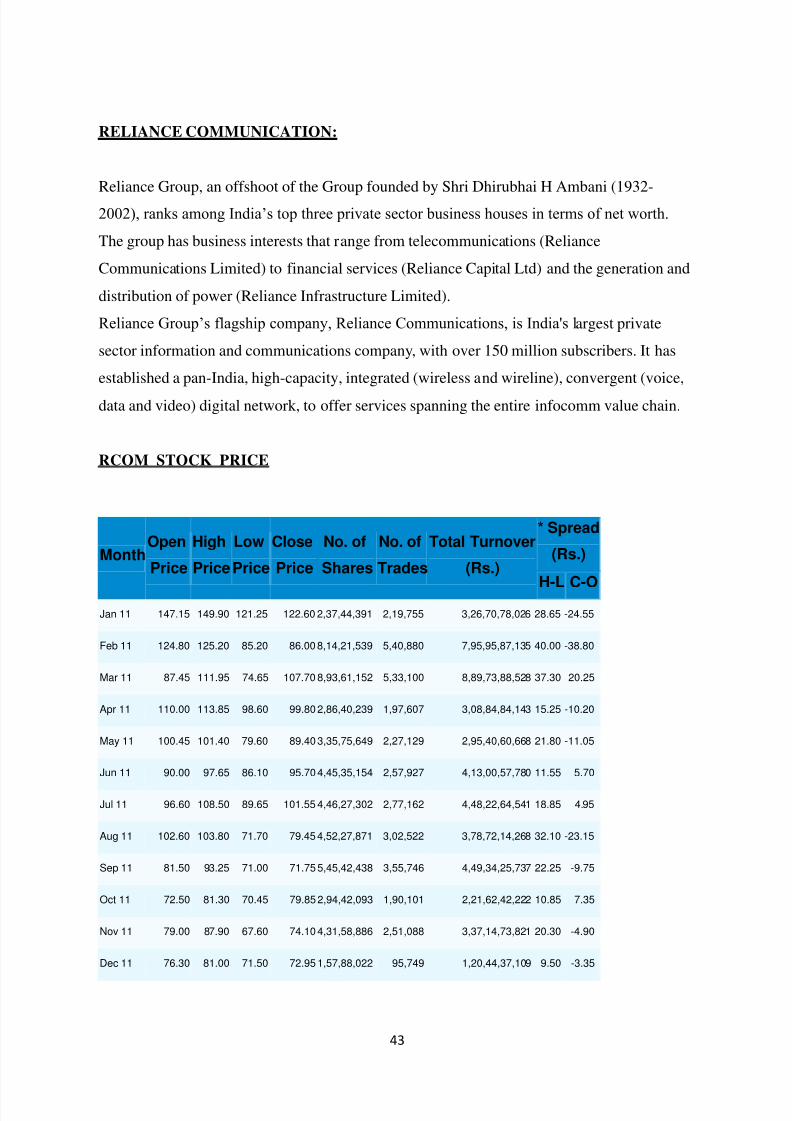
RELIANCE COMMUNICATION:
Reliance Group, an offshoot of the Group founded by Shri Dhirubhai H Ambani (1932-
2002), ranks among India‘s top three private sector business houses in terms of net worth.
The group has business interests that range from telecommunications (Reliance
Communications Limited) to financial services (Reliance Capital Ltd) and the generation and
distribution of power (Reliance Infrastructure Limited).
Reliance Group‘s flagship company, Reliance Communications, is India's largest private
sector information and communications company, with over 150 million subscribers. It has
established a pan-India, high-capacity, integrated (wireless and wireline), convergent (voice,
data and video) digital network, to offer services spanning the entire infocomm value chain.
RCOM STOCK PRICE
MonthOpen
Price
High
Price
Low
Price
Close
Price
No. of
Shares
No. of
Trades
Total Turnover
(Rs.)
* Spread
(Rs.)
H-L C-OJan 11 147.15 149.90 121.25 122.60 2,37,44,391 2,19,755 3,26,70,78,026 28.65 -24.55
Feb 11 124.80 125.20 85.20 86.00 8,14,21,539 5,40,880 7,95,95,87,135 40.00 -38.80
Mar 11 87.45 111.95 74.65 107.70 8,93,61,152 5,33,100 8,89,73,88,528 37.30 20.25
Apr 11 110.00 113.85 98.60 99.80 2,86,40,239 1,97,607 3,08,84,84,143 15.25 -10.20
May 11 100.45 101.40 79.60 89.40 3,35,75,649 2,27,129 2,95,40,60,668 21.80 -11.05
Jun 11 90.00 97.65 86.10 95.70 4,45,35,154 2,57,927 4,13,00,57,780 11.55 5.70
Jul 11 96.60 108.50 89.65 101.55 4,46,27,302 2,77,162 4,48,22,64,541 18.85 4.95
Aug 11 102.60 103.80 71.70 79.45 4,52,27,871 3,02,522 3,78,72,14,268 32.10 -23.15
Sep 11 81.50 93.25 71.00 71.75 5,45,42,438 3,55,746 4,49,34,25,737 22.25 -9.75
Oct 11 72.50 81.30 70.45 79.85 2,94,42,093 1,90,101 2,21,62,42,222 10.85 7.35
Nov 11 79.00 87.90 67.60 74.10 4,31,58,886 2,51,088 3,37,14,73,821 20.30 -4.90
Dec 11 76.30 81.00 71.50 72.95 1,57,88,022 95,749 1,20,44,37,109 9.50 -3.35
7/31/2019 Fm-599 Main Proj
http://slidepdf.com/reader/full/fm-599-main-proj 44/51
44
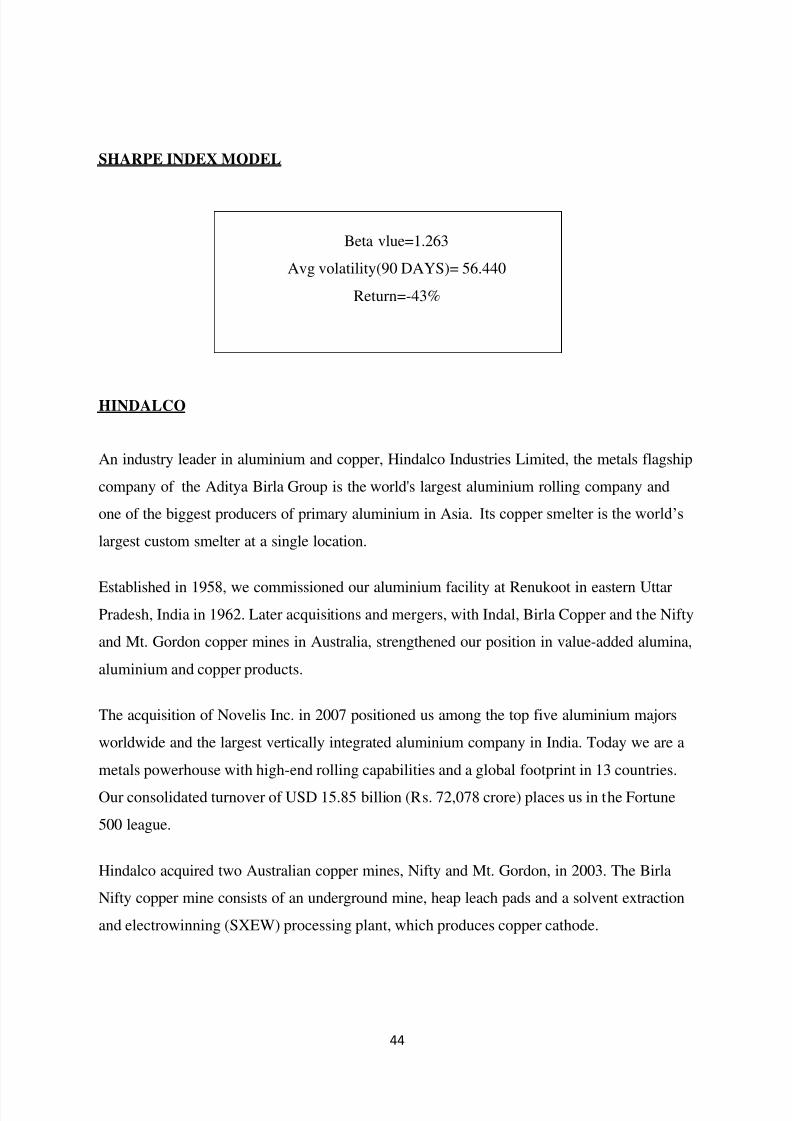
SHARPE INDEX MODEL
Beta vlue=1.263
Avg volatility(90 DAYS)= 56.440
Return=-43%
HINDALCO
An industry leader in aluminium and copper, Hindalco Industries Limited, the metals flagship
company of the Aditya Birla Group is the world's largest aluminium rolling company and
one of the biggest producers of primary aluminium in Asia. Its copper smelter is the world‘s
largest custom smelter at a single location.
Established in 1958, we commissioned our aluminium facility at Renukoot in eastern Uttar
Pradesh, India in 1962. Later acquisitions and mergers, with Indal, Birla Copper and the Nifty
and Mt. Gordon copper mines in Australia, strengthened our position in value-added alumina,
aluminium and copper products.
The acquisition of Novelis Inc. in 2007 positioned us among the top five aluminium majors
worldwide and the largest vertically integrated aluminium company in India. Today we are a
metals powerhouse with high-end rolling capabilities and a global footprint in 13 countries.
Our consolidated turnover of USD 15.85 billion (Rs. 72,078 crore) places us in the Fortune
500 league.
Hindalco acquired two Australian copper mines, Nifty and Mt. Gordon, in 2003. The Birla
Nifty copper mine consists of an underground mine, heap leach pads and a solvent extraction
and electrowinning (SXEW) processing plant, which produces copper cathode.
7/31/2019 Fm-599 Main Proj
http://slidepdf.com/reader/full/fm-599-main-proj 45/51
45
HINDALCO STOCK PRICE
MonthOpen
Price
High
Price
Low
Price
Close
Price
No. of
Shares
No. of
Trades
Total Turnover
(Rs.)
* Spread
(Rs.)
H-L C-O
Jan 11 248.00 251.90 217.10 229.40 2,40,64,039 2,04,227 5,65,58,32,204 34.80 -18.60
Feb 11 231.00 251.35 194.70 200.80 2,83,48,913 2,59,154 6,17,78,87,280 56.65 -30.20
Mar 11 202.50 215.30 189.50 208.65 2,15,14,987 1,98,346 4,41,43,03,915 25.80 6.15
Apr 11 209.90 224.60 200.00 215.55 1,23,79,393 1,23,065 2,65,05,06,319 24.60 5.65
May 11 217.50 217.50 181.95 197.10 1,47,16,285 1,58,401 2,89,67,03,160 35.55 -20.40
Jun 11 198.00 198.85 161.55 181.00 1,76,31,758 1,63,744 3,15,60,69,686 37.30 -17.00
Jul 11 183.45 197.00 166.70 168.40 1,46,43,162 1,38,269 2,63,57,26,687 30.30 -15.05
Aug 11 170.00 171.80 128.55 150.35 2,28,85,247 2,17,936 3,40,12,30,274 43.25 -19.65
Sep 11 154.00 163.35 125.00 131.30 2,15,29,455 2,01,459 3,07,27,55,842 38.35 -22.70
Oct 11 129.45 143.70 119.50 136.35 2,46,78,817 2,00,789 3,17,62,30,849 24.20 6.90
Nov 11 134.55 141.60 113.00 122.65 2,32,73,478 1,80,073 2,93,97,20,087 28.60 -11.90
Dec 11 129.50 140.25 121.90 129.45 1,21,63,963 1,08,856 1,60,03,50,786 18.35 -0.05
SHARPE INDEX MODEL:
Beta vlue= 0.59
Avg volatility= 1.78
Return= -14.82
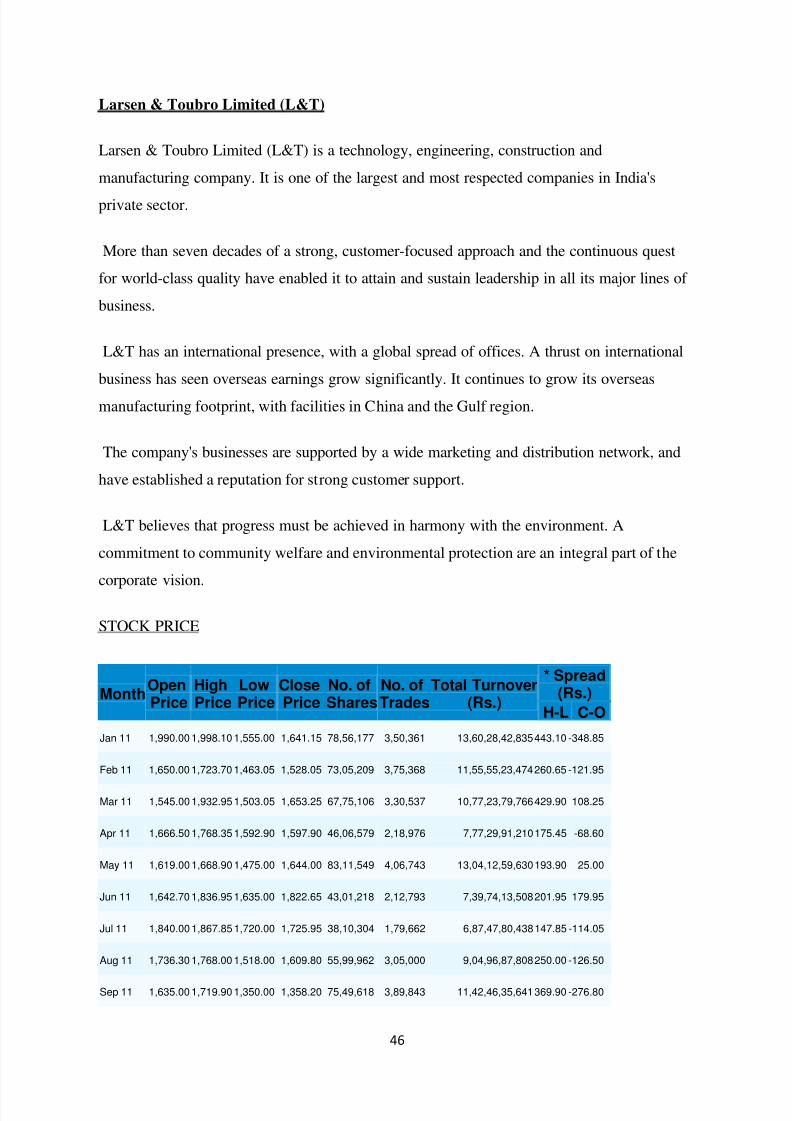
7/31/2019 Fm-599 Main Proj
http://slidepdf.com/reader/full/fm-599-main-proj 46/51
46
Larsen & Toubro Limited (L&T)
Larsen & Toubro Limited (L&T) is a technology, engineering, construction and
manufacturing company. It is one of the largest and most respected companies in India's
private sector.
More than seven decades of a strong, customer-focused approach and the continuous quest
for world-class quality have enabled it to attain and sustain leadership in all its major lines of
business.
L&T has an international presence, with a global spread of offices. A thrust on international
business has seen overseas earnings grow significantly. It continues to grow its overseas
manufacturing footprint, with facilities in China and the Gulf region.
The company's businesses are supported by a wide marketing and distribution network, and
have established a reputation for strong customer support.
L&T believes that progress must be achieved in harmony with the environment. A
commitment to community welfare and environmental protection are an integral part of the
corporate vision.
STOCK PRICE
MonthOpenPrice
HighPrice
LowPrice
ClosePrice
No. ofShares
No. ofTrades
Total Turnover(Rs.)
* Spread(Rs.)
H-L C-O
Jan 11 1,990.00 1,998.10 1,555.00 1,641.15 78,56,177 3,50,361 13,60,28,42,835 443.10 -348.85
Feb 11 1,650.00 1,723.70 1,463.05 1,528.05 73,05,209 3,75,368 11,55,55,23,474 260.65 -121.95
Mar 11 1,545.00 1,932.95 1,503.05 1,653.25 67,75,106 3,30,537 10,77,23,79,766 429.90 108.25
Apr 11 1,666.50 1,768.35 1,592.90 1,597.90 46,06,579 2,18,976 7,77,29,91,210 175.45 -68.60
May 11 1,619.00 1,668.90 1,475.00 1,644.00 83,11,549 4,06,743 13,04,12,59,630 193.90 25.00
Jun 11 1,642.70 1,836.95 1,635.00 1,822.65 43,01,218 2,12,793 7,39,74,13,508 201.95 179.95
Jul 11 1,840.00 1,867.85 1,720.00 1,725.95 38,10,304 1,79,662 6,87,47,80,438 147.85 -114.05
Aug 11 1,736.30 1,768.00 1,518.00 1,609.80 55,99,962 3,05,000 9,04,96,87,808 250.00 -126.50
Sep 11 1,635.00 1,719.90 1,350.00 1,358.20 75,49,618 3,89,843 11,42,46,35,641 369.90 -276.80
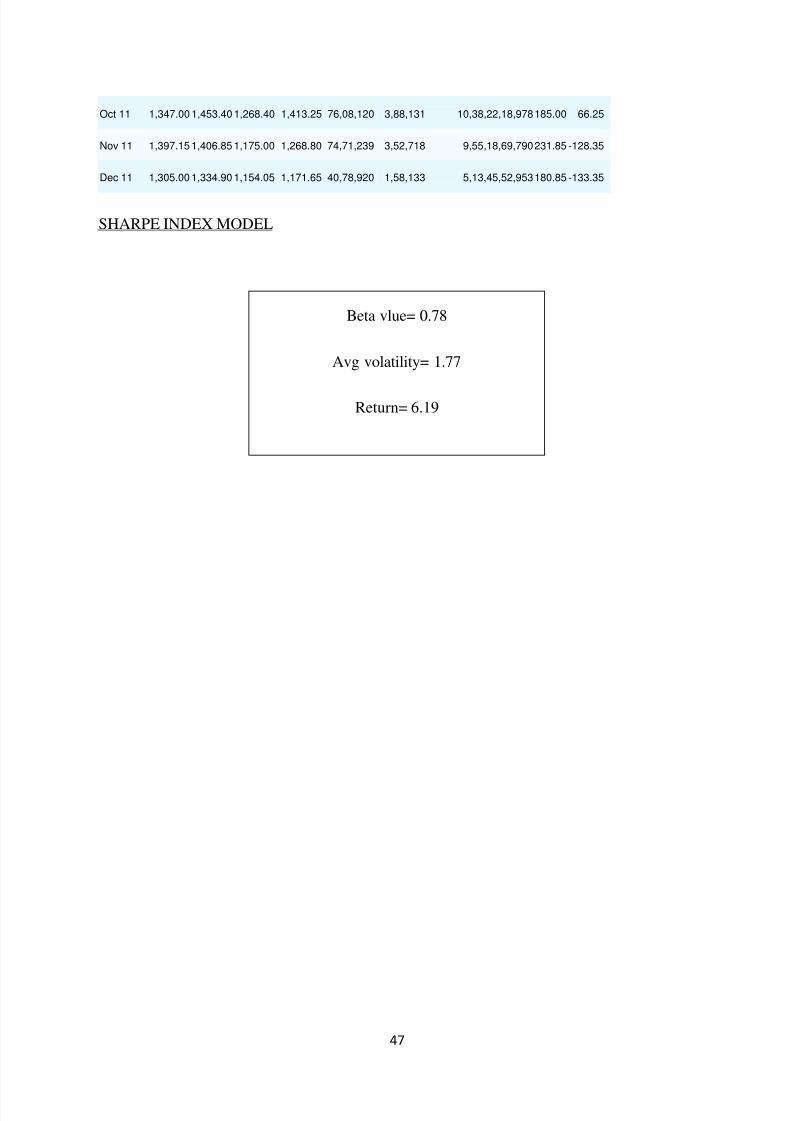
7/31/2019 Fm-599 Main Proj
http://slidepdf.com/reader/full/fm-599-main-proj 47/51
47
Oct 11 1,347.00 1,453.40 1,268.40 1,413.25 76,08,120 3,88,131 10,38,22,18,978 185.00 66.25
Nov 11 1,397.15 1,406.85 1,175.00 1,268.80 74,71,239 3,52,718 9,55,18,69,790 231.85 -128.35
Dec 11 1,305.00 1,334.90 1,154.05 1,171.65 40,78,920 1,58,133 5,13,45,52,953 180.85 -133.35
SHARPE INDEX MODEL
Beta vlue= 0.78
Avg volatility= 1.77
Return= 6.19

7/31/2019 Fm-599 Main Proj
http://slidepdf.com/reader/full/fm-599-main-proj 48/51
48
CHAPTER FOUR
SUMMARY OF FINDINGS AND SUGGESTIONS
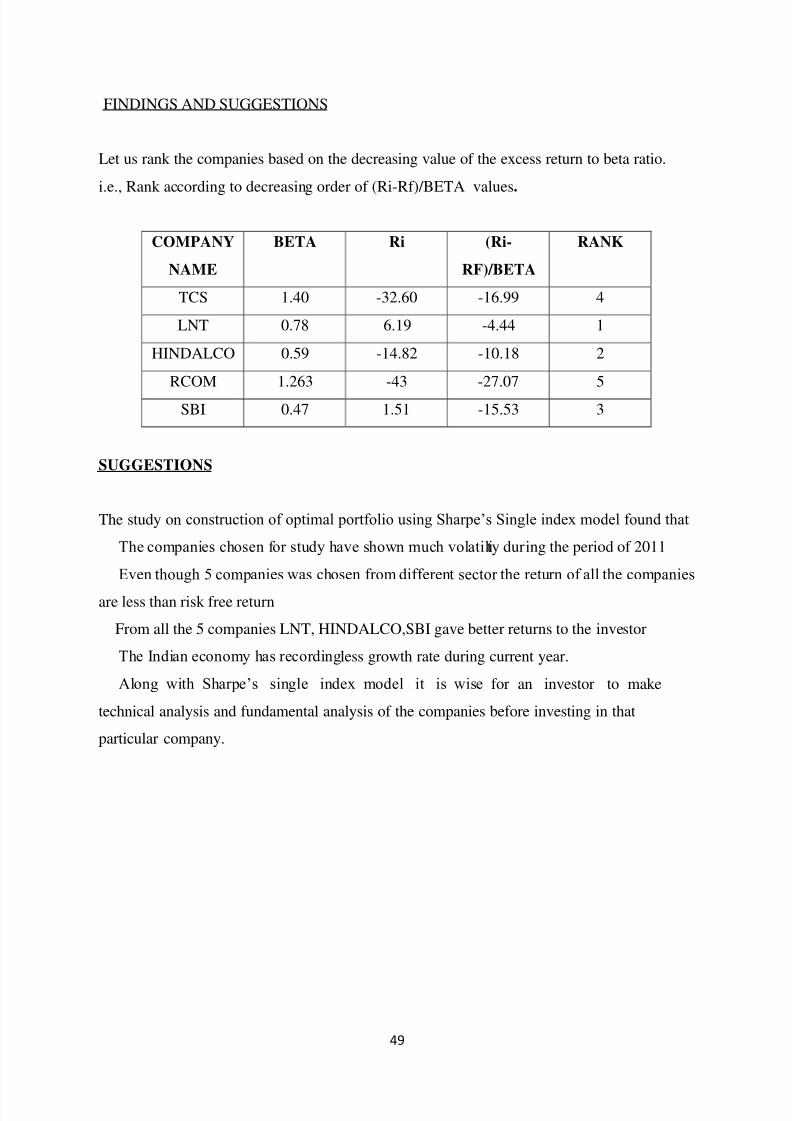
7/31/2019 Fm-599 Main Proj
http://slidepdf.com/reader/full/fm-599-main-proj 49/51
49
FINDINGS AND SUGGESTIONS
Let us rank the companies based on the decreasing value of the excess return to beta ratio.
i.e., Rank according to decreasing order of (Ri-Rf)/BETA values.
COMPANY
NAME
BETA Ri (Ri-
RF)/BETA
RANK
TCS 1.40 -32.60 -16.99 4
LNT 0.78 6.19 -4.44 1
HINDALCO 0.59 -14.82 -10.18 2
RCOM 1.263 -43 -27.07 5
SBI 0.47 1.51 -15.53 3
SUGGESTIONS
The study on construction of optimal portfolio using Sharpe‘s Single index model found that
The companies chosen for study have shown much volatility during the period of 2011
Even though 5 companies was chosen from different sector the return of all the companies
are less than risk free return
From all the 5 companies LNT, HINDALCO,SBI gave better returns to the investor
The Indian economy has recordingless growth rate during current year.
Along with Sharpe‘s single index model it is wise for an investor to make
technical analysis and fundamental analysis of the companies before investing in that
particular company.
7/31/2019 Fm-599 Main Proj
http://slidepdf.com/reader/full/fm-599-main-proj 50/51
50
CONCLUSION
The returns obtained by each of the companies and ßi, the sensitiveness of the stock return
to the changes in the market returns is observed as shown in the above table. Also the
portion in which the securities be invested to obtain optimum return is also calculated
and represented. Portfolio returns and Portfolio Risk It is being assumed that casual
observation of the stock prices over a period of time reveals that most of the stock
prices move the market index. When the sensex increases, stock prices also tend to
increase and vice-verse. This indicates that some underlying factors affect the market
index as well as the stock prices. Stock prices are related to the market index and this
relationship could be used to estimate the return on stock. Keeping all these assumption in
mind this portfolio has been constructed giving due consideration to the past 1 years
performance of some of the the sensex companies.
7/31/2019 Fm-599 Main Proj
http://slidepdf.com/reader/full/fm-599-main-proj 51/51
BIBLIOGRAPHY
Reference Books:
1. Prasanna Chandra,―Investment Analysis and Portfolio Management‖,3rd edition,Tata
Mcgrahill,pp
2. V. A. Avadhani,―Security Analysis and Portfolio Management‖,4th
edition,Himalaya publication,pp
3. S. Kelvin, ―Portfolio Management‖, 1st edition,pp
4. ―Security Analysis‖ – Icfai University,pp
Websites:
1. www.bseindia.com
2. www.nseindia.com
3. www.brokers.com
4. www.ndtvprofit.com
5. www.esnips.com
6. www.answers.com
7. www.karvy.com
8. www.moneycontrol.com