FC Brochure & Insert
10
-
Upload
michael-atkins -
Category
Documents
-
view
22 -
download
0
Transcript of FC Brochure & Insert

HIGH PERFORMANCE DATA ANALYTICS
2
WHO WE ARE
FedCentric Technologies, LLC is a Service Disabled Veteran Owned Small Business (SDVOSB) founded in 2005 with a simple focus: to provide solutions to the most difficult business applications, those that exceed the capabilities of traditional approaches. Our primary objective is meeting and exceeding
the clients’ requirements. We place customers at the center of what we do. We provide enabling technology, and expertise, including; High Density Computing, Memory Centric Processing and GPU processing, to solve the most demanding problem sets. Requirements that can be satisfied with traditional approaches, in-house teams and current relationships, are simply not our focus.
FedCentric pioneered the use of In Memory DataBase (IMDB) software using large memory systems, back in the 2005 / 2006 timeframe at Fort Meade. FedCentric deployed a 6 TB system using Oracle TimesTen, for enterprise-wide use at the United States Postal Service back in 2007. Today, FedCentric continues to lead the way, deploying large memory systems with: Graph Database, No SQL Database, General Purpose Graphic Processor Units (GP GPUs), GPU Database and Machine Learning.
BIG DATAFedCentric Specializes in Solving the most Difficult “Big Data” RequirementsOur competitors define Big Data as Volume, Velocity and Variety. We define Big Data as applications that exceed the capacity of traditional approaches. International Data Corporation (IDC) has coined a term for our market, High Performance Data Analysis (HPDA) (see box at right).
FedCentric Subscribes to the 80 / 20 RuleFedCentric believes that 80% of all requirements can be satisfied using traditional approaches, in house staff, and systems integrators. This market is crowded and therefore difficult to penetrate, influence, and differentiate. This market is NOT our focus.
20% of all requirements exceed the capabilities of existing approaches, staffs, and system integration companies
This market is forward thinking and requires unique architectures and techniques. This is the market space where we thrive.
INNOVATION WITHIN STANDARDS FIT IN BUT STAND OUTFIT IN: FedCentric solutions feature a total commitment to commodity products and SW standards, i.e., RedHat or Novell Linux, Intel x86 Processors, PCIe 3 interconnects. Your current IT staff is familiar with our environment and we are compatible with your current custom developed codes and 3rd party application software.
STAND OUT: However our systems feature Disruptive Integration, i.e., scale in three dimensions; Processor Core Count (up to 4000 cores), System RAM (Up to 64TBs) and IO (Up to 100 GBytes per second Cross Section Bandwidth) in a single instance of Linux; Oracle Compatible Memory Centric DataBase and hardware accelerated GeoSpatial capabilities.
H igh Performance Data Analysis (HPDA) refers to workloads that
are daunting enough to require HPC technology. The primary factors driving the HPDA trend are the complexity and time criticality of the most challenging big-data workloads. HPC can enable organizations to aim more complex questions at their data infrastructures and obtain answers faster, even with more variables included. IDC forecasts the global market for HPDA servers and external storage will grow robustly from $1.4 billion in 2013 to $4.3 billion in 2018.
The USPS case history is instructive. Each HPC generation employed by the USPS has been based on an SGI UV supercomputer provided by prime contractor FedCentric Technologies. The USPS embrace of HPC exemplifies an important, accelerating IT trend: Leading organizations in the private and public sectors are increasingly turning to high-performance computing to tackle challenging big data analytics workloads that traditional enterprise IT technology alone cannot handle effectively.
Notably the FedCentric /SGI solution employed by the USPS is unusually adept at ingesting very large, complex HPDA problems and processing them entirely in memory. Enterprise IT technology alone was unable to keep pace with the Postal Service’s rapidly growing daily volumes of batch-submitted data. HPC technology has enabled the USPS not only to achieve near-real-time response rates on this expanding data but also to begin exploiting mission-critical competitive opportunities.
Steve Conway, IDC, May 5, 2015http://www.enterprisetech.com/2015/ 05/05/hpc-for-advanced-analytics-at-t he-usps/

HIGH PERFORMANCE DATA ANALYTICS
3
WHAT WE DOFEDCENTRIC CORE COMPETENCIES
FedCentric has core competencies in: 1) architecting and servicing in-memory HPC hardware; 2) writing, coding, and implementing high performance data analytics (HPDA); and, 3) developing interdisciplinary teams that
customize hardware and HPDA solutions for our clients.
HARDWAREFedCentric owns substantial compute resources within FedCentric Labs. Current systems include:n SGI UV2000 w/ 8TB RAM and 256 Coren SGI UV300 w/ 12TB RAM and 192 Coren Multiple 16 Lane PCIE per chassisn NVIDIA 8 K40’s / 8 K80’sn Magma Chassis (Qty 5)n Intel Corp
n 2 Phi Coprocessors 7120P n 14 PCIE Model 910 SSDs n 4 DC P3700 SSD’s
n SANdisk / Fusion IO 50TB Total SSDn 300 TB HDDn 48 Port Brocaden Arista 10G Ethernet 24 Port
HIGH PERFORMANCE DATA ANALYTICS HPDAWe are Subject Matter Experts in the following technologies: 1. Memory Centric Architectures 2. In-Memory Database Technologies 3. High Density Computing 4. Graph Analytics 5. Machine Learning 6. Applied math and predictive analytics.
INTERDISCIPLINARY TEAMSOur interdisciplinary teams (see Page 7) focus on the following areas:1. Biosciences 2. Fraud Prevention, Detection and Investigation 3. Cyber Security 4. Document Discovery
FedCentric
INTERDISCIPLINARYTEAMS
Customized Solutions
HPDAImprovements in
Speed & Performance
HARDWAREHigh Performance
Computing
On Site &RemoteSupport
AdvancedAnalytics
In-MemoryProcessing

HIGH PERFORMANCE DATA ANALYTICS
4
Background
The past decade has seen a significant increase in high-throughput experimental studies that catalog variant datasets using massively parallel sequencing experiments. New insights of biological significance can be gained by this information with multiple genomic locations based annotations. However, efforts to obtain this information by integrating and mining variant data have had limited success so far and there has yet to be a method developed that can be scalable, practical and applied to millions of variants and their related annotations. We explored the use of graph data structures as a proof of concept for scalable interpretation of the impact of variant related data.
Introduction
Traditional approaches of data mining and integration in the research field have relied on relational databases or programming for deriving dynamic insights from research related data. However, as more next generation sequencing (NGS) becomes available, these approaches limit the exploration of certain hypothesis. One such limitation is the mining of variant data from publicly available databases such as the 1000 genomes project and TCGA.
Although there are applications available for quickly finding the public data with a certain set of variants or for finding minor allele frequencies, there is no such application that can be applied generically across all the projects allowing researchers to globally mine and find patterns that would be applicable to their specific research interests.
In this pilot project, we have investigated whether graph database structures are applicable for mining variants from individuals and populations in a scalable manner and understanding their impact by integrating with known annotations.
Fig. 1: Graphs handle data complexity intuitively and interactively
Methods and Materials
Data
• SNPs from 1000 genomes project • Phenotype conditions from ClinVar • Gene mappings & mRNA transcripts from Entrez Gene • Amino acid changes from UniProt
The Graph
• Variants and annotations mapped to reference genomic locations (Fig. 3) • Includes all chromosomes and genomic locations • 180 million nodes and 12 billion edges.
Graph Architecture
• Sparsity Technologies’ Sparsity Graph database • API supports C, C++, C#, Python, and Java • Implements graph and its attributes as maps and sparse bitmap structures • Allows it to scale with very limited memory requirements.
Hardware
• FedCentric Labs’ SGI UV300 system: x86/Linux system, scales up to 1,152 cores & 64TB of memory • Data in memory, very low latency, high performance (Fig. 2)
Fig. 2: Latency matters
Fig. 3: The Graph Model
Leveraging Graph Data Structures for Variant Data and Related Annotations Chris Zawora1, Jesse Milzman1, Yatpang Cheung1, Akshay Bhushan1, Michael S. Atkins
1Georgetown University, Washington, DC, 2FedCentric Technologies, LLC, Fairfax, VA,

HIGH PERFORMANCE DATA ANALYTICS
5
Data in memory, very low latency, high performance (Fig. 2)
Results Phase I: As an initial evaluation of the graph structures we ran several simple queries, also feasible through a relational architecture, and measured performance speeds.
Simple Query Examples • Get all information for a single variant • Find annotations within a range of genomic locations • Find variants associated with specific clinical phenotypes
Performance speeds • Query times in milliseconds • Better or equal to relational database query times
Queries • Developed a new SQL-like query language called SparkQL • Eases writing queries for non-programmatic users
Ingestion Times • Slower than expected • Sparksee is a multi-thread single write database • Writes one node/edge at a time • Each write involves creating connections with existing nodes • Slows down as the graph size increases
Solution: Implement multi-threaded insertions in combination with internal data structures to efficiently find nodes and create edges
High Degree Vertices: • Nodes with millions of edges • Stored in a non-distributed list like format • Searches for a specific edge might be slow
Example: nodes representing individuals with millions of variants Solution: Explore other graph clustering approaches that can essentially condense the information presented
Phase II: We explored complex patterns and clusters inside the graph and spectral clustering queries that were not feasible through the relational architecture. Complex Query Examples • Compare variant profiles and find individuals that are closely related • Compare annotation profiles to find clusters of populations
Phase II Results • Eight populations with 25 individuals from each population • Strong eigenvalue support (near zero) for 3 main clusters • Cluster pattern supported by population genetics (Fig. 4)
Performance speeds • Spectral clustering took ca. 2 minutes
.
Conclusion
References The 1000 Genomes Project Consortium. (2010). A map of human genome variation from population-scale sequencing. Nature, 467, 1061–1073.
Gregg, B. (2014). Systems performance: enterprise and the cloud. Pearson Hall: Upper Saddle River, NJ.
Acknowledgments FedCentric acknowledges Frank D’Ippolito, Shafigh Mehraeen, Margreth Mpossi, Supriya Nittoor, and Tianwen Chu for their invaluable assistance with this project.
This project has been funded in whole or in part with federal funds from the National Cancer Institute, National Institutes of Health, under contract HHSN261200800001E. The content of this publication does not necessarily reflect the views or policies of the Department of Health and Human Services, nor does mention of trade names, commercial products, or organizations imply endorsement by the U.S. Government.
Contract HHSN261200800001E - Funded by the National Cancer Institute
DEPARTMENT OF HEALTH AND HUMAN SERVICES • National Institutes of Health • National Cancer Institute
Frederick National Laboratory is a Federally Funded Research and Development Center operated by Leidos Biomedical Research, Inc., for the National Cancer Institute
Our results indicate that a graph database, run on an in-memory machine, can be a very powerful and useful tool for cancer research. Performance using the graph database for finding details on specific nodes or a list of nodes is better or equal to a well-architected relational database. We also see promising initial results for identifying correlations between genetic changes and specific phenotype conditions.
We conclude that an in-memory graph database would allow researchers to run known queries while also providing the opportunity to develop algorithms to explore complex correlations. Graph models are useful for mining complex data sets and could prove essential in the development and implementation of tools aiding precision medicine.
Fig. 4: Results of spectral clustering of 1000 Genomes data
Leveraging Graph Data Structures for Variant Data and Related Annotations Bhushan1, Michael S. Atkins2, Hue Vuong3, F. Pascal Girard2, Uma Mudunuri3
FedCentric Technologies, LLC, Fairfax, VA, 3Frederick National Laboratory for Cancer Research, Frederick, MD
HIGH PERFORMANCE DATA ANALYTICS
6
USE CASESNATIONAL CANCER INSTITUTE/FREDERICK NATIONAL LABORATORY FOR CANCER RESEARCH
FedCentric completed a proof of concept with the Frederick National Laboratory for Cancer Research (FNLCR) to develop High-Performance Data Analytics (HPDA) to improve cancer research (Pages 4 and 5). The
past decade has seen a significant increase in high-throughput DNA sequencing resulting in very large datasets containing the entire genomes of thousands of people. “New knowledge and insights into cancer research and treatments can be learned from this data, but efforts to process such large datasets in real time have had limited success. Most data mining technologies have simply not been feasible at this scale,” said Uma Mudunuri, lead bioinformatician at FNLCR.FedCentric and FNLCR explored the application of graph database analytics as a proof of concept for scalable interpretation of these massive genomic datasets. In this pilot effort we used genetic variant and population data from several open source public databases. A model was developed using graph database technology to query variant data and assess performance. All the data sets were parsed into a graph database with 180 million nodes and nearly 12 billion edges. In phase I of the project, the graph was used for retrieval of all relevant information for single variants. In phase II, we explored complex queries to identify clusters and patterns within individuals based on their differences with respect to a reference human genome.
The proof of concept showed that for single, variant-based annotation searches, the speed and performance of the graph model was similar to a well-architected relational database. However, the graph model also allowed us to test complex queries for identifying variant patterns that FNLCR was unable to run using the relational architecture. The FC/FNLCR/GU poster displayed on Pages 4 and 5 won the third place best poster award at a major biomedical symposium at Georgetown University in October 2015.
PRECISION MEDICINE/PHARMACEUTICALSFedCentric is deploying in-memory graph analytics and machine learning technologies to help medical professionals extract knowledge and insight from large, complex genomic databases to improve Precision Medicine for a number of diseases. For example, in-memory graph analytics is a very powerful tool for
cancer researchers to determine relationships between genetic variants and specific types of cancer. Traditional analytical approaches currently used by researchers are too slow to reveal useful information. FedCentric’s in-memory graph analytics and machine learning technologies enable medical professional to visualize and mine connected data to develop Precision Medicine in ways that are orders of magnitude faster and more intuitive than traditional methods.
FedCentric is using high performance data analytics (HPDA) for microarray imaging under NDA with a pharmaceutical partner in Silicon Valley. Our HPDA for microarray imaging and analysis has broad application in biometrics, including gene expression in cancer research. FedCentric mathematicians and data scientists can utilize the BRB-ArrayTools package for Excel and are also able to code more complex analytical algorithms in Mathematica, R, C++, and Java. Our deep technical expertise allows FedCentric to extend and customize HPDA for its clients while maintaining their ability to interface in the user-friendly BRB platform.
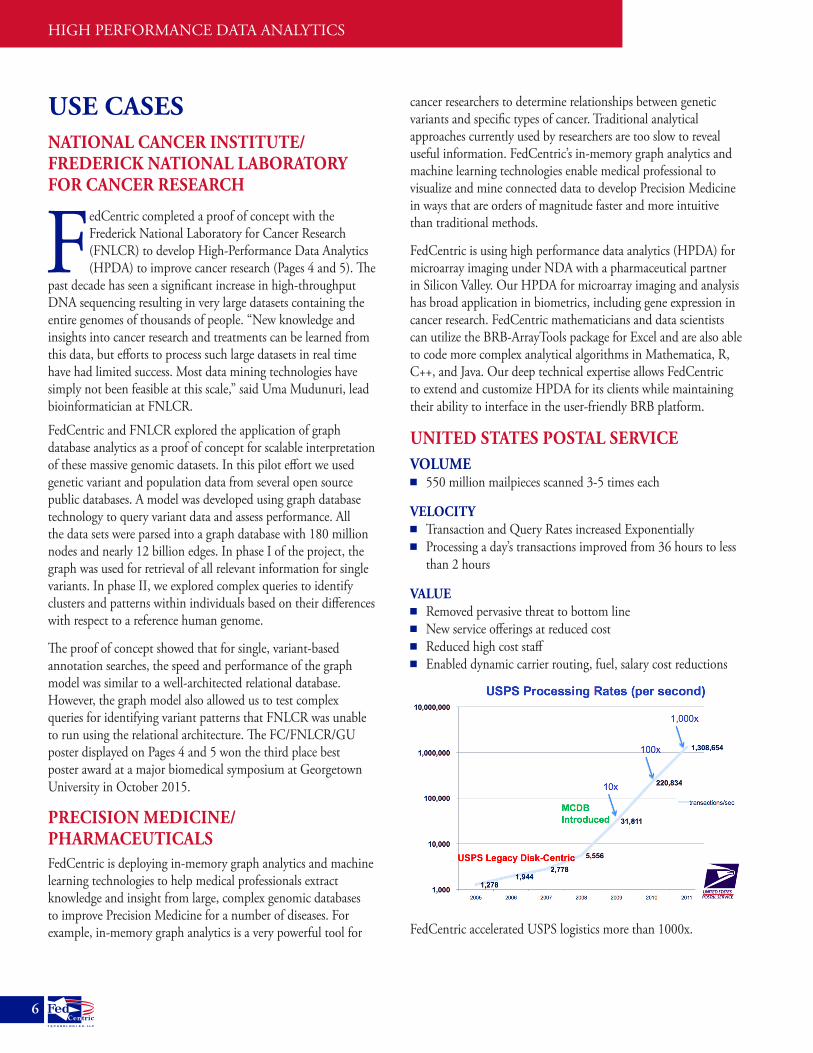
UNITED STATES POSTAL SERVICEVOLUMEn 550 million mailpieces scanned 3-5 times each
VELOCITYn Transaction and Query Rates increased Exponentiallyn Processing a day’s transactions improved from 36 hours to less
than 2 hours
VALUEn Removed pervasive threat to bottom linen New service offerings at reduced costn Reduced high cost staffn Enabled dynamic carrier routing, fuel, salary cost reductions
FedCentric accelerated USPS logistics more than 1000x.
HIGH PERFORMANCE DATA ANALYTICS
7
NATIONAL SCIENCE FOUNDATIONOn November 2 2015, the National Science Foundation awarded a major contract to the Georgia Institute of Technology and the University of North Carolina’s Renaissance Computing Institute (RENCI) to co-direct a new, national effort serving as a Big Data Regional Innovation Hub for 16 Southern states and the District of Columbia. Among the 29 Senior Personnel chosen to lead the South Region, FedCentric’s Chief Evangelist, Pascal Girard, was one of only two scientists selected to represent private industry. Also selected was Professor Alexander Szalay of Johns Hopkins University.
Mr. Girard and Professor Szalay have already begun assessing how to design and build read alignment systems that can sustain the throughput rates required by Next Generation Sequencers. Specifically, the team is looking at how FedCentric could leverage their High Performance Data Analytics (HPDA) platform which includes large memory and high cpu count along with NVidia CUDA technology to deliver orders of magnitude improvement using Johns Hopkins’ latest GPU-accelerated read alignment sequencing algorithms (e.g. ARIOC).
PEOPLE ARE OUR MOST IMPORTANT RESOURCEMANAGEMENTGerry Kolosvary, CEO Robert Gaskins, Director, Cyber Pascal Girard, CTE Steve Heibein, VP Engineering Thomas Van de Merlen, Director, Fraud Neil Reilly, Principle Architect Michael Atkins, Director, BioScience Joseph Conway, CTO
INTERDISCIPLINARY TEAMAKSHAY BHUSHAN is a graduate from Georgetown University’s School of Foreign Service, where he graduated magna cum laude in International Politics. Akshay led a team of data scientists as a Product Manager for the Biosciences division and oversaw the development of a large graph database for bioinformaticians at the National Cancer Institute.YATPANG CHEUNG is a computer science student at Georgetown University. A Georgetown 1776 Scholar, Yatpang received a full scholarship to study at the university. He created the programming language bioinformaticians used to interact with FedCentric’s graph database.TIANWEN CHU graduated from Carnegie Mellon University with a Master Degree in Computer Science. Tianwen works on the development and implementation of graph database analytics.FRANK D’IPPOLITO is an applied mathematician with many years of industry and software development experience. He has designed and implemented applications of mathematics and algorithms across diverse domains including cryptography and speech recognition. Along with algorithmic and mathematical expertise, he brings to the FedCentric team a programming background that includes C++ and Python. His undergraduate education in mathematics was from the University of Waterloo and he did graduate studies in applied mathematics at MIT.SHAFIGH MEHRAEEN is a postdoctoral fellow at MIT. He received his PhD in Mechanical Engineering at Stanford University, working on DNA biophysics, and protein self-assembly. Dr. Mehraeen develops machine learning, data mining, big data analyses, statistical methods, and stochastic differential equations, processes, and optimization at FedCentric.JESSE MILZMAN is a PhD Candidate in Mathematics at the University of Maryland. He is a recent graduate of Georgetown
University, where he majored in Mathematics and was the recipient of the 2015 Leslie Award, which serves to honor the top student in the Mathematics department. While working with the National Cancer Institute, Jesse created advanced mathematical clustering methods to analyze data in our graph databases.MARGRETH MPOSSI completed a master degree in computational biology at Stanford University. She has spent two and a half years studying RNA structure by computational and biochemical methods. She previously designed an RNA structure prediction algorithm using machine learning to increase efficiency of energy minimization (using R and C++). At FedCentric, Margreth develops computational solutions to big biological problems. SUPRIYA NITTOOR holds a master degree in Information Systems from Carnegie Mellon University (CMU) and has developed a keen interest in Data Science. Supriya works as a data scientist at FedCentric .JOHN PURTILO has a BS in computer science from the University of Maryland, College Park. He has experience with developing software in areas including artificial intelligence, computer vision, combinatorics, and numerical analysis at both UMD and the Naval Research Laboratory. At FedCentric, John evaluates the latest graph and in-memory database systems available today.NICHOLAS ROSSOMANDO has a BS in aerospace engineering from the University of Maryland, College Park. Nick brings several years of software engineering experience in C++ and Python to FedCentric.CHRIS ZAWORA is senior at Georgetown University studying Computer Science. While studying at Georgetown he completed coursework in algorithms, programming languages, and data science. At FedCentric he works with big memory, high performance machines to design and implement a large-scale graph databases.

HIGH PERFORMANCE DATA ANALYTICS
8
A SERVICE DISABLED VETERAN OWNED SMALL BUSINESS SDVOSBA HUBZone Business (pending SBA approval in 2016)
OUR PRINCIPAL OFFICE IS LOCATED AT: OTHER FedCentric OFFICES:
College Park/University of Maryland FedCentric Technologies, LLC FedCentric LabsFedCentric Technologies, LLC 8315 Lee Hwy, Suite 500 Eagan, Minnesota4511 Knox Road, Suite 300 Fairfax, VA 22031College Park, MD 20740 Phone: (301) 263-0030Phone: (301) 263-0030 Fax: (301) 263-0032Fax: (301) 263-0032
OUR COLLEGE PARK/UNIVERSITY OF MARYLAND OFFICE:1. Provides access to exceptionally talented graduate and undergraduate students at both the University of Maryland and
Johns Hopkins University.2. Is in an Historically Underutilized Business Zone (HUB Zone) as classified by the Small Business Administration.3. Makes it easier for U.S. Government customers to contract with us.
CUSTOMERS AND PARTNERS
nCONTINENTAL RESOURCES
n 50YEARS
�

Updated 07/01/2016HIGH PERFORMANCE DATA ANALYTICS – GENOMICS
LATEST USE CASES (07/01/2016)
Cancer AnalyticsThe Cancer Analytics Team is focusing on two projects currently both incorporating a graph-structure database to store millions and even billions of nodes and edges. The first project focuses on incorporating all open-access cancer research data available to the public through various websites such as TCGA, GDC, and TARGET. This data includes clinical data, treatment, gene expression, mutations, DNA methylation, and more for over twenty diseases across tens of thousands of patients. With this data, we are building a graph database linking disease, gene expression, and clinical data to provide invaluable insights and relationships to the causes of cancer on a genetic level. The second project is an extension of the previous summer’s FNL graph database that incorporates VCF files from the 1000 Genome’s Project. Upon approval for access to over 90,000 VCF cancer files from the NIH, we are going to incorporate them into the same model from last summer to allow us to compare mutations in both healthy people from the 1000 Genome’s Project against people with various different cancers and diseases. With this graph database in both instances, we will be able to make complex queries within seconds that allow us to learn from our data in ways that most researchers cannot.
Virus Analytics The Virus Analytics Team is building a graph database & analysis tool that contains genomic & proteomic data of Zika & other flaviviruses. The graph can be queried for nucleotide and amino acid sequence information, calculate genetic similarities, and export data into Matlab to build alternative phylogenetic tree topologies. The tree-building capability is built into the program itself and is based on established algorithms and hypothesis testing programs. Everything is packaged together into an interactive web app hosted on the FedCentric website. Our current graph holds 77 Zika sequences and we are ramping that up to ~9000 Zika & flavivirus sequences by August 2016.
Next Generation Sequencing Workflow BenchmarkFedCentric has teamed with SGI and Intel to perform a Next Generation Sequencing (NGS) Workflow Benchmark comparing an SGI UV300 scale up configuration against an AWS standard cluster. All three
companies see great opportunity in selling large HPC servers into the genomics space and believe there is a measurable advantage to using large socket-count, scale-up systems that leverage commodity memory and Intel Xeon processors, like the SGI UV300 in combination with Intel P3700 NVMe storage and Intel Phi co-processors. We have seen customer resistance due to the lack of hard evidence. Measured performance data exists for genomic codes on the Amazon Cloud, IBM Power systems, and the Edico Genome Dragen FPGA processor. Generating benchmark performance data for genomic applications on the Intel/SGI platform will provide fact-based information needed to convince customers of the merits of this innovative aproach.
Performing the benchmarks first on the current production releases of the genomics pipeline (BWA 0.7.15, Picard 2.4.1 and GATK 3.6) and then re-running with the latest pre-release version of GATK 4 will demonstrate the agility of a standards based system relative to proprietary solutions and FPGAs.This benchmark will be run on two different platform architectures. A single large SMP SGI UV300 system and an AWS EC2 cluster. The AWS cluster will be sized to match the core count of the UV300 configuration.
PEOPLE ARE OUR MOST IMPORTANT RESOURCESGI HPC SYSTEMSDAVE WRIGHT
Architectures, Unix/Linux Internals, Training, and Instruction, Shared Memory Multiprocessing, Performance Analysis and Tuning.
JIM ZIMMER
Brian Furtaw Former SGI Solution Architect experienced device
driver developer for GP GPUs, input devices, radar control, video drives, custom real-time Linux kernels, NVIDIA Cuda, Python

Updated 07/01/2016HIGH PERFORMANCE DATA ANALYTICS – GENOMICS
WHY SCALE UP?I. Intent a. To Build High Throughput, Low Latency Pipeline for
Genomic Analysis
II. Innovation a. Fit In: Use commodity based hardware and Open Source
Software Stack b. Stand Out: Exploit Scale Up System Attributes i. Minimize the performance bottlenecks introduced by
Scale Out systems, i.e. Network and Disk I/O
III. Scale Up Overview a. High Performance Data Analytics (HPDA) i. Highly Scalable Hardware: Huge Nodes in a
Linux Single System Image (SSI) – One OS managing all resources
1. Tightly integrated large x86 core count (up to 4096 core)
a. Eliminates network latency and intermodal communications
b. No sub-dividing problem to fit hardware 2. Large monolithic memory (up to 64TB RAM)
a. Enables large in-memory data structures b. Shared Memory vs distributed memory
programming model c. Named pipes eliminate intermediate file IO d. Deploy RAM disk when IO cannot be
reduced ii. Open Source Software stack: Linux, Apache Spark 1. In Memory Graph Analytics and Machine
Learning 2. Apache Parquet columnar storage format 3. In Memory Database for Persistence and
SQL query 4. Containers for Scale Out Capability without
Scale Out limits
TOM RUWART
DOE, ONRL, and other HPC facilities LUSTRE technology Expert
JOE CONWAY
on SGI platforms at the NRL
Ten on the SGI Altix platform
application SW at USPS
STEVE HEIBEIN
targeting system, designed TByte storage for NSA, created Telemedicine prototype for Navy BUMED
2000 systems at USPS
BIOSCIENCESMICHAEL ATKINS
MATHEMATICSVICTORIA RAYSKIN
FRANK D’IPPOLITO
DATA SCIENCETIANWEN CHU
CHRIS ZAWORA