Effects of biofloc under different carbon sources and ...
15
Effects of biofloc under different carbon sources and protein levels on water quality, growth performance and immune responses in black tiger shrimp Penaeus monodon (Fabricius, 1978) Sujeet Kumar 1 , Panantharayil S Shyne Anand 1,2 , Debasis De 1 , Ashutosh D Deo 1 , Tapas K Ghoshal 1 , Jitendra K Sundaray 1,3 , Alphis G Ponniah 2 , Karingalakkandy Poochirian Jithendran 2 , Ramalingam Ananda Raja 1,2 , Gouranga Biswas 1 & Natarajan Lalitha 2 1 Kakdwip Research Centre, Central Institute of Brackishwater Aquaculture (ICAR), Kakdwip, West Bengal, India 2 Central Institute of Brackishwater Aquaculture, Chennai, India 3 Central Institute of Freshwater Aquaculture, Bhubaneswar, India Correspondence: S Kumar, Kakdwip Research Centre, Central Institute of Brackishwater Aquaculture, Kakdwip, South 24 Parganas, West Bengal 743347, India. E-mail: [email protected] Abstract A 75-day 2 9 3 factorial experiment was con- ducted to evaluate the effect of two levels of diet- ary protein (32 and 40%) and two different carbon sources (rice flour–R and molasses-M), and without carbohydrate (control–C) in black tiger shrimp Penaeus monodon juveniles (3.37 0.04 g) at 100 nos. m 3 in 100 L fibre reinforced plastic tanks. Biofloc volume and total suspended solid were higher in molasses added groups (32 + M and 40 + M) followed by rice flour (32 + R and 40 + R) and controls (32C and 40C). Molasses and rice flour addition significantly reduced (P < 0.01) the total ammonia–N compared to con- trols. The highest Vibrio, Bacillus and Lactobacillus counts were recorded in 40 + M, 32 + M and 32 + R respectively. Among the treatments, signif- icantly higher (P < 0.01) final body weight was recorded in 40 + R (8.5 0.3 g), 40 + M (7.8 0.3 g) and 32 + R (7.5 0.4 g) compared to control groups, 32C (6.1 0.3 g), 40C (6.4 0.3 g) and molasses added group, 32 + M (5.7 0.4 g). Rice flour supplementation signifi- cantly increased (P < 0.01) the total haemocyte count (910 6 cells mL 1 ) in 32 + R (45.7 3.7) and 40 + R (44.3 3.1) compared to controls, 32C (27.3 3.4) and 40C (25.8 0.9). Simi- larly, higher superoxide dismutase, catalase, serum protein and glucose were recorded in the rice flour added groups, 40 + R followed by 32 + R. Among the treatments, the highest level of prophenoloxi- dase (OD 490 nm, 0.3 0.0) and survival after challenge with Vibrio harveyi (55.6%) was observed in 32 + R. The study elucidates that rice flour addition produces optimum level of biofloc with better growth and immune responses com- pared to molasses and control. Furthermore, rice flour addition at 32% protein level could replace 40% protein feed. Keywords: biofloc technology, black tiger shrimp, carbohydrate supplementation, growth performance, immune response, Penaeus monodon Introduction Shrimp farming is the major commercial aquacul- ture activity in many Asian and South American countries (FAO 2012). In developing countries like India, shrimp culture is mostly export-oriented and plays a major role in economic growth of coastal communities (Hein 2002). Despite the huge suc- cess, penaeid shrimp culture is plagued with dis- eases of viral and bacterial origin. Diseases such as early mortality syndrome, white spot disease, Taura syndrome etc. have been reported in many Asian countries causing catastrophic mortality with severe economic losses (Karunasagar & Otta 1998; Lightner, Redman, Pantoja, Noble & Tran 2012). Ecological sustainability of shrimp farming is another major challenge as cultured shrimp © 2015 John Wiley & Sons Ltd 1 Aquaculture Research, 2015, 1–15 doi: 10.1111/are.12958
Transcript of Effects of biofloc under different carbon sources and ...
Effects of biofloc under different carbon sources and
protein levels on water quality, growth performance
and immune responses in black tiger shrimp Penaeus
monodon (Fabricius, 1978)
Sujeet Kumar1, Panantharayil S Shyne Anand1,2, Debasis De1, Ashutosh D Deo1,
Tapas K Ghoshal1, Jitendra K Sundaray1,3, Alphis G Ponniah2, Karingalakkandy Poochirian
Jithendran2, Ramalingam Ananda Raja1,2, Gouranga Biswas1 & Natarajan Lalitha2
1Kakdwip Research Centre, Central Institute of Brackishwater Aquaculture (ICAR), Kakdwip, West Bengal, India2Central Institute of Brackishwater Aquaculture, Chennai, India3Central Institute of Freshwater Aquaculture, Bhubaneswar, India
Correspondence: S Kumar, Kakdwip Research Centre, Central Institute of Brackishwater Aquaculture, Kakdwip, South 24
Parganas, West Bengal 743347, India. E-mail: [email protected]
Abstract
A 75-day 2 9 3 factorial experiment was con-
ducted to evaluate the effect of two levels of diet-
ary protein (32 and 40%) and two different
carbon sources (rice flour–R and molasses-M), and
without carbohydrate (control–C) in black tiger
shrimp Penaeus monodon juveniles (3.37 � 0.04 g)
at 100 nos. m�3 in 100 L fibre reinforced plastic
tanks. Biofloc volume and total suspended solid
were higher in molasses added groups (32 + M
and 40 + M) followed by rice flour (32 + R and
40 + R) and controls (32C and 40C). Molasses
and rice flour addition significantly reduced
(P < 0.01) the total ammonia–N compared to con-
trols. The highest Vibrio, Bacillus and Lactobacillus
counts were recorded in 40 + M, 32 + M and
32 + R respectively. Among the treatments, signif-
icantly higher (P < 0.01) final body weight was
recorded in 40 + R (8.5 � 0.3 g), 40 + M
(7.8 � 0.3 g) and 32 + R (7.5 � 0.4 g) compared
to control groups, 32C (6.1 � 0.3 g), 40C
(6.4 � 0.3 g) and molasses added group, 32 + M
(5.7 � 0.4 g). Rice flour supplementation signifi-
cantly increased (P < 0.01) the total haemocyte
count (9106 cells mL�1) in 32 + R (45.7 � 3.7)
and 40 + R (44.3 � 3.1) compared to controls,
32C (27.3 � 3.4) and 40C (25.8 � 0.9). Simi-
larly, higher superoxide dismutase, catalase, serum
protein and glucose were recorded in the rice flour
added groups, 40 + R followed by 32 + R. Among
the treatments, the highest level of prophenoloxi-
dase (OD 490 nm, 0.3 � 0.0) and survival after
challenge with Vibrio harveyi (55.6%) was
observed in 32 + R. The study elucidates that rice
flour addition produces optimum level of biofloc
with better growth and immune responses com-
pared to molasses and control. Furthermore, rice
flour addition at 32% protein level could replace
40% protein feed.
Keywords: biofloc technology, black tiger
shrimp, carbohydrate supplementation, growth
performance, immune response, Penaeus monodon
Introduction
Shrimp farming is the major commercial aquacul-
ture activity in many Asian and South American
countries (FAO 2012). In developing countries like
India, shrimp culture is mostly export-oriented and
plays a major role in economic growth of coastal
communities (Hein 2002). Despite the huge suc-
cess, penaeid shrimp culture is plagued with dis-
eases of viral and bacterial origin. Diseases such as
early mortality syndrome, white spot disease,
Taura syndrome etc. have been reported in many
Asian countries causing catastrophic mortality
with severe economic losses (Karunasagar & Otta
1998; Lightner, Redman, Pantoja, Noble & Tran
2012). Ecological sustainability of shrimp farming
is another major challenge as cultured shrimp
© 2015 John Wiley & Sons Ltd 1
Aquaculture Research, 2015, 1–15 doi:10.1111/are.12958
retains only 20–30% of feed nutrients and remain-
ing 70–80% accumulates in aquatic system
(Funge-Smith & Briggs 1998). This leads to deteri-
oration of water quality resulting in stress and dis-
ease outbreaks (Kautsky, R€onnb€ack, Tedengren &
Troell 2000). These issues demand sustainable
shrimp farming system that have better nutrient
recycling, low impact on the environment and free
from disease outbreaks.
In recent years, manipulation of C:N ratio in
feed has shown promising results in aquaculture
(Avnimelech 2012). The C:N ratio can be manipu-
lated by the application of various carbohydrate
sources such as molasses, rice flour, tapioca pow-
der etc. (De Schryver, Crab, Defoirdt, Boon & Ver-
straete 2008; Crab, Defoirdt, Bossier & Verstraete
2012). Similarly, it can be manipulated by chang-
ing the protein levels in the feed (Azim, Little &
Bron 2008; Ballester, Abreu, Cavalli, Emerenciano,
de Abreu & Wasielesky 2010). At high C:N ratio,
heterotrophic bacteria immobilize the ammonium
ions for production of biofloc. This helps to reduce
toxic ammonia‒N in aquatic system (Avnimelech
1999). Biofloc based system found to improve
growth performance and digestive enzyme activity
in cultured shrimps (Xu & Pan 2012; Anand,
Kohli, Kumar, Sundaray, Dam Roy, Venkatesh-
warlu, Sinha & Pailan 2014).
Biofloc technology is based on microbial manip-
ulation within the aquaculture system. Biofloc par-
ticles contain beneficial bacteria like Bacillus,
Lactobacillus (Anand et al. 2014) and bioactive
compounds like carotenoids (Ju, Forster, Conquest,
Dominy, Kuo & David Horgen 2008). These are
known for probiotics and immunostimulant prop-
erties. Recently, Xu and Pan (2013) reported that
biofloc enhanced the haemocyte count and antiox-
idant status of white leg shrimp, Litopenaeus van-
namei. Similarly, biofloc improved the disease
resistance in brine shrimp, Artemia franciscana
against Vibrio harveyi (Crab, Lambert, Defoirdt,
Bossier & Verstraete 2010). It has been reported
that nature of the carbon source affects the nutri-
tional composition of biofloc (Crab, Chielens, Wille,
Bossier & Verstraete 2010). However, there is a
dearth of information with respect to carbon
source and protein levels in the feed over growth
performance and immune response in penaeid
shrimps. In this context, this study aims to investi-
gate the interaction effects of different carbon
sources and protein levels on water quality,
growth performance and immune responses in
black tiger shrimp Penaeus monodon cultured under
experimental yard condition.
Materials and methods
Experimental design and set up
An on-station yard trial was conducted in tripli-
cates as 2 9 3 factorial design. The two levels of
dietary protein (32 and 40%) served as first factor
and two carbohydrate sources (rice flour‒R and
molasses-M), and without carbohydrate as control
(C) as second factor. The treatments with carbohy-
drate supplementation are referred to as 32 + M,
32 + R, 40 + M and 40 + R, and without carbo-
hydrate supplementation as 32C and 40C which
served as controls.
The experiment was carried out for a period of
75 days during September to November, 2012 at
Kakdwip Research Centre, Central Institute of
Brackishwater Aquaculture, Kakdwip (21°510 N
and 88°110 E), West Bengal, India. Experiment
was conducted in 100 L fibre reinforced plastic
(FRP) tanks. Tanks were filled with water from the
nearby brackishwater source. The fine meshed
nylon filter bag (10 l mesh size) was used to pre-
vent the entry of unwanted materials and sus-
pended particles into the tanks. Healthy juvenile
shrimps, P. monodon, tested negative for white spot
syndrome virus by polymerase chain reaction,
were obtained from a commercial shrimp farm
(South 24 Parganas, West Bengal, India). Shrimps
were acclimatized for a period of 14 days and fed
with control diet (40% crude protein) two times
daily, before the start of the experiment. One hun-
dred and eighty P. monodon juveniles
(3.37 � 0.04 g) were randomly distributed into
18 FRP tanks at 100 nos. m�3 following a com-
pletely randomized design.
Experimental diets
Two experimental diets with 32 and 40% crude
protein levels representing the C:N ratio of 10:1
and 7.5:1 respectively were prepared. The compo-
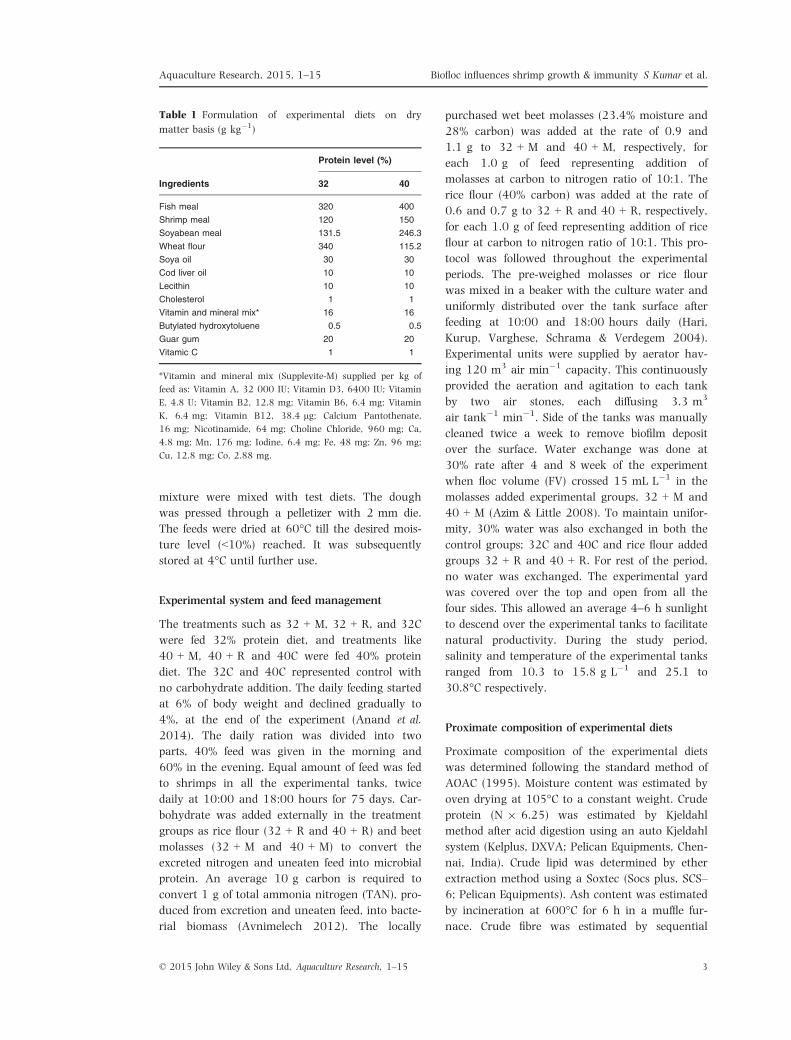
sitions of experimental diets are presented in
Table 1. Ingredients like wheat flour, fish meal,
soyabean, shrimp meal, guar gum and lecithin
were mixed with water to make dough. The dough
was steam cooked for 20 min in a pressure cooker
at 69 kPa. After cooling, additives like cholesterol,
butylated hydroxytoluene, oil and vitamin–mineral
© 2015 John Wiley & Sons Ltd, Aquaculture Research, 1–152
Biofloc influences shrimp growth & immunity S Kumar et al. Aquaculture Research, 2015, 1–15
mixture were mixed with test diets. The dough
was pressed through a pelletizer with 2 mm die.
The feeds were dried at 60°C till the desired mois-
ture level (<10%) reached. It was subsequently
stored at 4°C until further use.
Experimental system and feed management
The treatments such as 32 + M, 32 + R, and 32C
were fed 32% protein diet, and treatments like
40 + M, 40 + R and 40C were fed 40% protein
diet. The 32C and 40C represented control with
no carbohydrate addition. The daily feeding started
at 6% of body weight and declined gradually to
4%, at the end of the experiment (Anand et al.
2014). The daily ration was divided into two
parts, 40% feed was given in the morning and
60% in the evening. Equal amount of feed was fed
to shrimps in all the experimental tanks, twice
daily at 10:00 and 18:00 hours for 75 days. Car-
bohydrate was added externally in the treatment
groups as rice flour (32 + R and 40 + R) and beet
molasses (32 + M and 40 + M) to convert the
excreted nitrogen and uneaten feed into microbial
protein. An average 10 g carbon is required to
convert 1 g of total ammonia nitrogen (TAN), pro-
duced from excretion and uneaten feed, into bacte-
rial biomass (Avnimelech 2012). The locally
purchased wet beet molasses (23.4% moisture and
28% carbon) was added at the rate of 0.9 and
1.1 g to 32 + M and 40 + M, respectively, for
each 1.0 g of feed representing addition of
molasses at carbon to nitrogen ratio of 10:1. The
rice flour (40% carbon) was added at the rate of
0.6 and 0.7 g to 32 + R and 40 + R, respectively,
for each 1.0 g of feed representing addition of rice
flour at carbon to nitrogen ratio of 10:1. This pro-
tocol was followed throughout the experimental
periods. The pre-weighed molasses or rice flour
was mixed in a beaker with the culture water and
uniformly distributed over the tank surface after
feeding at 10:00 and 18:00 hours daily (Hari,
Kurup, Varghese, Schrama & Verdegem 2004).
Experimental units were supplied by aerator hav-
ing 120 m3 air min�1 capacity. This continuously
provided the aeration and agitation to each tank
by two air stones, each diffusing 3.3 m3
air tank�1 min�1. Side of the tanks was manually
cleaned twice a week to remove biofilm deposit
over the surface. Water exchange was done at
30% rate after 4 and 8 week of the experiment
when floc volume (FV) crossed 15 mL L�1 in the
molasses added experimental groups, 32 + M and
40 + M (Azim & Little 2008). To maintain unifor-
mity, 30% water was also exchanged in both the
control groups; 32C and 40C and rice flour added
groups 32 + R and 40 + R. For rest of the period,
no water was exchanged. The experimental yard
was covered over the top and open from all the
four sides. This allowed an average 4–6 h sunlight
to descend over the experimental tanks to facilitate
natural productivity. During the study period,
salinity and temperature of the experimental tanks
ranged from 10.3 to 15.8 g L�1 and 25.1 to
30.8°C respectively.
Proximate composition of experimental diets
Proximate composition of the experimental diets
was determined following the standard method of
AOAC (1995). Moisture content was estimated by
oven drying at 105°C to a constant weight. Crude
protein (N 9 6.25) was estimated by Kjeldahl
method after acid digestion using an auto Kjeldahl
system (Kelplus, DXVA; Pelican Equipments, Chen-
nai, India). Crude lipid was determined by ether
extraction method using a Soxtec (Socs plus, SCS–6; Pelican Equipments). Ash content was estimated
by incineration at 600°C for 6 h in a muffle fur-
nace. Crude fibre was estimated by sequential
Table 1 Formulation of experimental diets on dry
matter basis (g kg�1)
Ingredients
Protein level (%)
32 40
Fish meal 320 400
Shrimp meal 120 150
Soyabean meal 131.5 246.3
Wheat flour 340 115.2
Soya oil 30 30
Cod liver oil 10 10
Lecithin 10 10
Cholesterol 1 1
Vitamin and mineral mix* 16 16
Butylated hydroxytoluene 0.5 0.5
Guar gum 20 20
Vitamic C 1 1
*Vitamin and mineral mix (Supplevite-M) supplied per kg of
feed as: Vitamin A, 32 000 IU; Vitamin D3, 6400 IU; Vitamin
E, 4.8 U; Vitamin B2, 12.8 mg; Vitamin B6, 6.4 mg; Vitamin
K, 6.4 mg; Vitamin B12, 38.4 lg; Calcium Pantothenate,
16 mg; Nicotinamide, 64 mg; Choline Chloride, 960 mg; Ca,
4.8 mg; Mn, 176 mg; Iodine, 6.4 mg; Fe, 48 mg; Zn, 96 mg;
Cu, 12.8 mg; Co, 2.88 mg.
© 2015 John Wiley & Sons Ltd, Aquaculture Research, 1–15 3
Aquaculture Research, 2015, 1–15 Biofloc influences shrimp growth & immunity S Kumar et al.

digestion with H2SO4 and NaOH using Fibertec
(Foss Tecator 2022, Hoganas, Sweden). The car-
bon content in the molasses and rice flour was
determined by the formula of Hart, Lovis, Schulen-
berg and Urquhart (2007).
Carbon ¼ 0:80� Lipidþ 0:53� Proteinþ 0:42� Carbohydrateþ 0:42� Fibre
Determination of water quality parameters
The water quality parameters measured at fort-
night intervals between 09:00 and 10:00 hours.
Salinity, pH and dissolved oxygen (DO) were mea-
sured with conductivity probe (CDC401), pH probe
(PHC281) and luminescent DO probe, respectively,
using Hach multiparameter kit (HQ30D; Hach,
Loveland, CO, USA). The DO reduction h�1 was
measured in the experimental tanks on the 5th
and 9th week of experiment. The air supply was
turned off for 2 h after measuring the initial DO.
Subsequently, DO was measured after 60 and
120 min without disturbing the water column.
Floc volume was determined by sampling
1000 mL water sample into a series of Imhoff
cones (Tarson, Kolkata, India). The volume of the
floc plug accumulated at the bottom of the cone
was determined after 20 min (Avnimelech 2012).
The total suspended solid (TSS) was determined
based on the methods of Aouidi, Gannoun, Ben
Othman, Ayed and Hamdi (2009) with slight
modification. In brief, 50 mL water sample, col-
lected after proper mixing, was centrifuged at
1500 g for 15 min in a pre-dried and pre-weighed
centrifuge tube. The settled solid was dried over-
night at 105°C. The difference in weight was mul-
tiplied by 20 and expressed as TSS L�1.
To determine chlorophyll a concentration, col-
lected floc materials were immediately transferred
to centrifuge tubes containing 10 mL of 90% ace-
tone. The tubes were sealed and stored overnight
in a refrigerator. The samples were homogenized
with a tissue grinder and then centrifuged for
10 min at 270 g. The supernatant was carefully
transferred to a 3.5 mL glass cuvette. The absor-
bance was measured at 750, 664, 647 and
630 nm using a spectrophotometer (UV2310;
Techcomp, Shanghai, China). Chlorophyll a con-
centration was calculated using the trichromatic
equation given in APHA (1998).
Total alkalinity was determined by titrimetric
methods. The TAN, nitrite–N, nitrate–N, and
phosphate–P were analysed spectrophotometrically
following the protocols of APHA (1998).
Growth performance and survival
At the end of the experiment, the final weight of
the shrimps was recorded and growth performance
parameters were calculated by following formulae:
Feed conversion ratio (FCR)¼ feed applied=live weight gain
Protein efficiency ratio (PER)¼ Gain in body mass=protein applied
Specific growth rate (SGR)¼ ðln final weight� ln initial weightÞ
� 100=days of experiment
Survival % ¼ðTotal number of shrimps
survived=Total number of shrimps
stocked�100
Estimation of biofloc microbial community
Total heterotrophic bacteria (THB), Vibrio, Bacillus
and Lactobacillus counts in water samples were
recorded at fortnight intervals. Samples were pro-
cessed as per the earlier described methods
(Kumar, Anand, De, Sundaray, Raja, Biswas, Pon-
niah, Ghoshal, Deo, Panigrahi & Muralidhar
2014) with minor modification. In brief, 200 mL
of water sample was homogenized in a kitchen
blender for 30 s at high speed equivalent to
12 000 rpm to separate the flocculated microbes.
Subsequently, tenfold serial dilution prepared in
normal saline solution. A 0.1 mL of appropriate
dilution plated on tryptone soya agar (1.0% w/v
NaCl) for THB, TCBS agar for Vibrio, Bacillus cereus
agar for Bacillus and Lactobacillus MRS agar for
Lactobacillus counts. The Lactobacillus MRS agar
plates were incubated in microaerophillic condition
and other plates in aerobic condition at 28°C for
72 h. The colony in the range of 30–300 counted
and expressed as colony forming unit (CFU mL�1).
Media procured from HiMedia, (Mumbai, India)
was used for the above work.
Collection of haemolymph and serum preparation
After completion of the feeding experiment, nine
inter-moult shrimps from each treatment group
© 2015 John Wiley & Sons Ltd, Aquaculture Research, 1–154
Biofloc influences shrimp growth & immunity S Kumar et al. Aquaculture Research, 2015, 1–15
(three from each replicate randomly) were
anesthetized with clove oil (50 lL L�1). The inter-
moult stage was determined by the setal develop-
ment of the uropod using stereomicroscope (Dall,
Hill, Rothlisberg & Sharples 1990). A 50 lL hae-
molymph was collected from the ventral sinus of
each shrimp using 26 Gauge 1–mL tuberculin syr-
inge and mixed with 450 lL cooled anticoagulant
(30 mM tri-sodium citrate, 388 mM sodium chlo-
ride, 0.12 M glucose, 10 mM ethylene diamine
tetra-acetic acid (EDTA), 780 mOsm/kg osmolality,
and pH 7.55). To collect serum, haemolymph
without anticoagulant was allowed to clot at 4°Cfor overnight in refrigerator. The supernatant was
collected as serum after centrifugation at 600 g for
5 min at 4°C (5417R; Eppendorf, Hamburg, Ger-
many). It was aliquot and stored immediately at
�40°C.
Total haemocyte count
Haemolymph (150 lL) was collected from three
randomly selected shrimp per replicate/treatment in
1350 lL cooled anticoagulant solution. After gentle
mixing, haemocytes were counted in improved Neu-
bauer bright-line chamber under 4009 magnifica-
tions in phase contrast microscope (Carl Zeiss, Jena,
Germany). The cells were differentiated into granu-
locyte and hyaline cells based upon the granular
content and size of the cells (Le Moullac & Haffner
2000; Ananda Raja, Kumar, Sundaray, De, Biswas
& Ghoshal 2012). Cells were expressed as total
haemocyte count mL�1, total granulocyte
count mL�1 and total hyaline cells count mL�1.
Estimation of immunological and biochemical
parameters
Prophenoloxidase (proPO) activity was measured
spectrophotometrically by recording the formation
of dopachrome from L-3,4-dihydroxyphenylalanine
(L-DOPA) (Hern�andez-L�opez, Gollas-Galv�an & Var-
gas-Albores 1996). Briefly, 50 lL serum was incu-
bated for 10 min at 25°C with 50 lL 0.1% trypsin
in cacodylate citrate (CAC) buffer (0.45 M sodium
chloride, 0.10 M tri-sodium citrate, 0.01 M
sodium cacodylate, pH 7.0). Subsequently, 50 lLL-DOPA (0.3% in CAC buffer) was added and incu-
bated for 5 min at 25°C. Then, 800 lL-CAC buffer
was added and further incubated at 25°C for
3 min. The optical density (OD) was recorded at
490 nm against the blank (50 lL of L-DOPA,
50 lL 0.1% trypsin and 850 lL CAC buffer). The
OD at 490 nm was expressed as proPO activity
representing dopachrome formation in 50 lL of
serum.
The superoxide dismutase (SOD) activity was
determined according to the method of Beau-
champ and Fridovich (1971) and Krishnan, Chat-
topadhyay, Kundu and Chaudhuri (2002). The
2.5 mL reaction mixture contained 13 mM
methionine, 75 lM NBT, 2 lM riboflavin, 0.1 mM
EDTA in 50 mM phosphate buffer (pH 7.8) along
with 0–100 lL serum. Reaction started by adding
riboflavin and run for 20 min in tubes of uniform
thickness under fluorescent light (20 W). The
reaction was stopped by switching-off the fluores-
cent light and covering the tubes with black cloth.
The absorbance at 560 nm was recorded in UV–VIS spectrophotometer (model UV2310; Tech-
comp). A non-irradiated mixture run in parallel
with no colour development, served as control.
The SOD unit was calculated by using the formula
(Krishnan et al. 2002).
SOD unit mL�1 ¼ ½ðV=vÞ � 0:973�� dilution factor
V = Rate of change of OD in absence of SOD,
v = Rate of change of OD in presence of SOD.
The catalase activity was determined following
the method of Takahara, Hamilton, Neel, Kobara,
Ogura and Nishimura (1960). In brief, 50 lLserum was added in 1.2 mL phosphate buffer
(0.05 M, pH 7). The reaction was initiated by
addition of 1 mL H2O2 substrate (30 mM in phos-
phate buffer). The decrease in OD at 240 nm was
recorded for 3 min and expressed as lmoles of
H2O2 decomposed/min/mg protein.
Serum protein was estimated by Lowry’s method
(Lowry, Rosebrough, Farr & Randall 1951) using
bovine serum albumin as standard. Serum glucose
was quantified by 3,5-dinitrosalicylic acid method
(Miller 1959).
Challenge test
After 75 days of feeding trial, shrimps were chal-
lenged with virulent strain of Vibrio harveyi iso-
lated on TCBS agar from disease affected shrimp
pond. It was further characterized on Vibrio har-
veyi agar and by biochemical tests (Harris, Owens
& Smith 1996). Bacterium was inoculated in tryp-
tic soya broth (1% w/v NaCl) for 18 h at 28°C.
© 2015 John Wiley & Sons Ltd, Aquaculture Research, 1–15 5
Aquaculture Research, 2015, 1–15 Biofloc influences shrimp growth & immunity S Kumar et al.
The culture was washed and re-suspended in
NSS at 107 CFU mL�1. Shrimp was challenged
intramuscularly by 20 lL of bacterial suspension
resulting in 2 9 105 CFU per shrimp. A blank
control group received 20 lL of NSS without bac-
terium. The challenge dose was decided based on
50% mortality within 24 h in P. monodon juve-
niles. All the challenged shrimps were released
back into their respective tanks and observed for
mortality for 10 days. No water was exchanged
during the period. The result was presented as sur-
vival post challenge over the time periods.
Statistical analysis
Water quality, microbial count, growth perfor-
mance and immune response parameters were
analysed by factorial ANOVA to find out the interac-
tion effects between dietary protein levels and vari-
ous carbon sources. If the main effect was
significant, the ANOVA was followed by Tukey’s test.
Level of significance was made at 99% and 95%
probability levels. Before analysis, data were
checked for normality by probability plots and
homogeneity of variances by Levene’s test. All
analyses were performed using statistical software
package SAS v.9.2 program (SAS Institute, Cary,
NC, USA).
Results
Nutrient composition of diet and carbon
supplements
Proximate composition of the experimental diets
and carbohydrate sources are presented in
Table 2. The protein content was 31.8 � 0.4 and
40.5 � 0.3% in 32% and 40% experimental diets
respectively. Molasses and rice flour used as car-
bon sources and contained 28% and 40% carbon
and 54.9% and 81.1% nitrogen free extract
respectively.
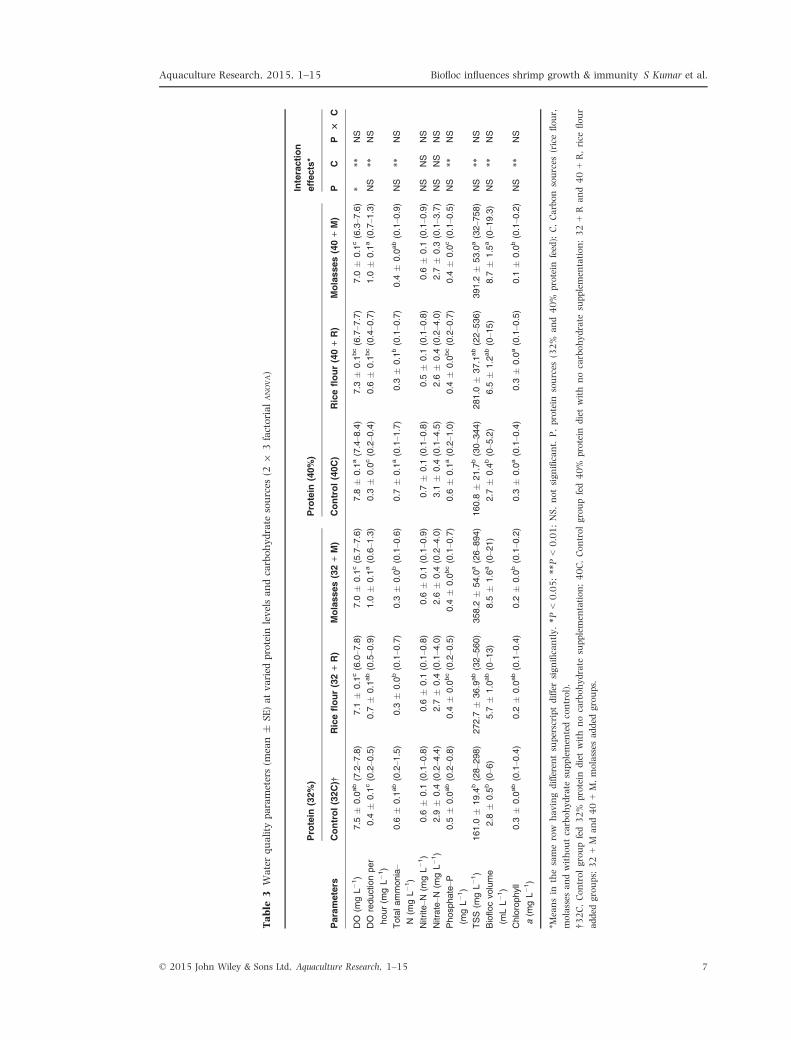
Water quality parameters
Water quality parameters of the experimental
groups are presented in Table 3 and Fig. 1. Salin-
ity and temperature during the study period ran-
ged between 10.3 to 15.8 g L�1 and 25.3–30.8°Crespectively. Supplementation of carbohydrate
reduced the TAN by 43–57% with higher level of
TAN reduction observed in 32 + R, 40 + R and
32 + M groups. The maximum TAN reduction
was observed in the initial 30 days of carbohy-
drate addition (data not shown). However, no sig-
nificant difference (P > 0.05) in nitrite–N and
nitrate–N were noticed among the treatments.
Supplementation of Carbohydrate significantly
reduced (P < 0.01) the level of DO in treatment
groups. Moreover, addition of molasses (32 + M
and 40 + M) recorded the lower DO and higher
levels of DO reduction per hour compared to other
treatments. The chlorophyll a level was higher in
32C, 40C and 40 + R (each 0.3 � 0.0 mg L�1)
while the lowest level was observed in 32 + M
(0.1 � 0.0 mg L�1).
Biofloc was quantified in terms of FV and TSS.
Addition of molasses and rice flour increased the
FV by 122–143% and 69–75% respectively com-
pared to controls, 32C and 40C. Similarly,
molasses added groups recorded the higher level of
TSS compared to other treatments. The highest
Table 2 Proximate composition (%) of experimental diets and carbon supplements (mean � SD)
Nutrients
Experimental diets Carbon supplements
32% protein 40% protein Rice flour Beet molasses
Moisture 6.2 � 0.2 6.5 � 0.1 7.5 � 0.1 23.4 � 0.1
Crude protein 31.8 � 0.4 40.5 � 0.3 8.1 � 0.0 7.4 � 0.1
Crude lipid 5.8 � 0.6 6.0 � 0.5 0.8 � 0.0 1.2 � 0.1
Crude fibre 12.1 � 0.1 12.4 � 0.1 1.5 � 0.1 0.7 � 0.0
Total ash 13.7 � 0.2 15.2 � 0.1 1.0 � 0.0 12.3 � 0.3
Acid insoluble ash 2.4 � 0.1 3.1 � 0.0 0.3 � 0.0 0.6 � 0.0
Nitrogen free extract* 30.5 � 0.1 19.6 � 1.1 81.1 � 0.2 54.9 � 0.8
Gross energy (MJ kg�1 diet)† 17.1 � 0.1 17.4 � 0.1 16.4 � 0.0 11.8 � 0.1
*Nitrogen free extract = 100 � (Crude protein + Crude fat + Crude fibre + Ash + Moisture).
†Gross energy (MJ kg�1 diet) was calculated assuming 23.7, 39.5, 17.2 and 17.2 MJ kg�1 of protein, lipids, fibre and nitrogen free
extract respectively.
© 2015 John Wiley & Sons Ltd, Aquaculture Research, 1–156
Biofloc influences shrimp growth & immunity S Kumar et al. Aquaculture Research, 2015, 1–15
Table
3Waterquality
parameters(m
ean�
SE)atvaried
protein
levelsandcarbohydrate
sources
(29
3factorialANOVA)
Parameters
Protein
(32%)
Protein
(40%)
Interaction
effects*
Control(32C)†
Riceflour(32+R)
Molasses(32+M)
Control(40C)
Riceflour(40+R)
Molasses(40+M)
PC
P3
C
DO
(mgL�1)
7.5
�0.0
ab(7.2–7
.8)
7.1
�0.1
c(6.0–7
.8)
7.0
�0.1
c(5.7–7
.6)
7.8
�0.1
a(7.4–8
.4)
7.3
�0.1
bc(6.7–7
.7)
7.0
�0.1
c(6.3–7
.6)
***
NS
DO
reductionper
hour(m
gL�1)
0.4
�0.1
c(0.2–0
.5)
0.7
�0.1
ab(0.5–0
.9)
1.0
�0.1
a(0.6–1
.3)
0.3
�0.0
c(0.2–0
.4)
0.6
�0.1
bc(0.4–0
.7)
1.0
�0.1
a(0.7–1
.3)
NS
**NS
Totalammonia–
N(m
gL�1)
0.6
�0.1
ab(0.2–1
.5)
0.3
�0.0
b(0.1–0
.7)
0.3
�0.0
b(0.1–0
.6)
0.7
�0.1
a(0.1–1
.7)
0.3
�0.1
b(0.1–0
.7)
0.4
�0.0
ab(0.1–0
.9)
NS
**NS
Nitrite–N
(mgL�1)
0.6
�0.1
(0.1–0
.8)
0.6
�0.1
(0.1–0
.8)
0.6
�0.1
(0.1–0
.9)
0.7
�0.1
(0.1–0
.8)
0.5
�0.1
(0.1–0
.8)
0.6
�0.1
(0.1–0
.9)
NS
NS
NS
Nitrate–N
(mgL�1)
2.9
�0.4
(0.2–4
.4)
2.7
�0.4
(0.1–4
.0)
2.6
�0.4
(0.2–4
.0)
3.1
�0.4
(0.1–4
.5)
2.6
�0.4
(0.2–4
.0)
2.7
�0.3
(0.1–3
.7)
NS
NS
NS
Phosphate–P
(mgL�1)
0.5
�0.0
ab(0.2–0
.8)
0.4
�0.0
bc(0.2–0
.5)
0.4
�0.0
bc(0.1–0
.7)
0.6
�0.1
a(0.2–1
.0)
0.4
�0.0
bc(0.2–0
.7)
0.4
�0.0
c(0.1–0
.5)
NS
**NS
TSS
(mgL�1)
161.0
�19.4
b(28–2
98)
272.7
�36.9
ab(32–5
60)
358.2
�54.0
a(26–8
94)
160.8
�21.7
b(30–3
44)
281.0
�37.1
ab(22–5
36)
391.2
�53.0
a(32–7
58)
NS
**NS
Bioflocvolume
(mLL�1)
2.8
�0.5
b(0–6
)5.7
�1.0
ab(0–1
3)
8.5
�1.6
a(0–2
1)
2.7
�0.4
b(0–5
.2)
6.5
�1.2
ab(0–1
5)
8.7
�1.5
a(0–1
9.3)
NS
**NS
Chlorophyll
a(m
gL�1)
0.3
�0.0
ab(0.1–0
.4)
0.2
�0.0
ab(0.1–0
.4)
0.2
�0.0
b(0.1–0
.2)
0.3
�0.0
a(0.1–0
.4)
0.3
�0.0
a(0.1–0
.5)
0.1
�0.0
b(0.1–0
.2)
NS
**NS
*Meansin
thesamerow
havingdifferentsuperscriptdiffersignificantly.*P
<0.05;**P<0.01;NS,notsignificant.P,protein
sources
(32%
and40%
protein
feed);C,Carbonsources
(riceflour,
molasses
andwithoutcarbohydrate
supplemen
tedcontrol).
†32C,Controlgroupfed32%
protein
dietwithnocarbohydrate
supplemen
tation;40C,Controlgroupfed40%
protein
dietwithnocarbohydrate
supplemen
tation;32+R
and40+R,rice
flour
added
groups;32+M
and40+M,molasses
added
groups.
© 2015 John Wiley & Sons Ltd, Aquaculture Research, 1–15 7
Aquaculture Research, 2015, 1–15 Biofloc influences shrimp growth & immunity S Kumar et al.
value of TSS (894 mg L�1) and FV (21 mL) was
recorded in 32 + M group during the 8th week of
experimental period.
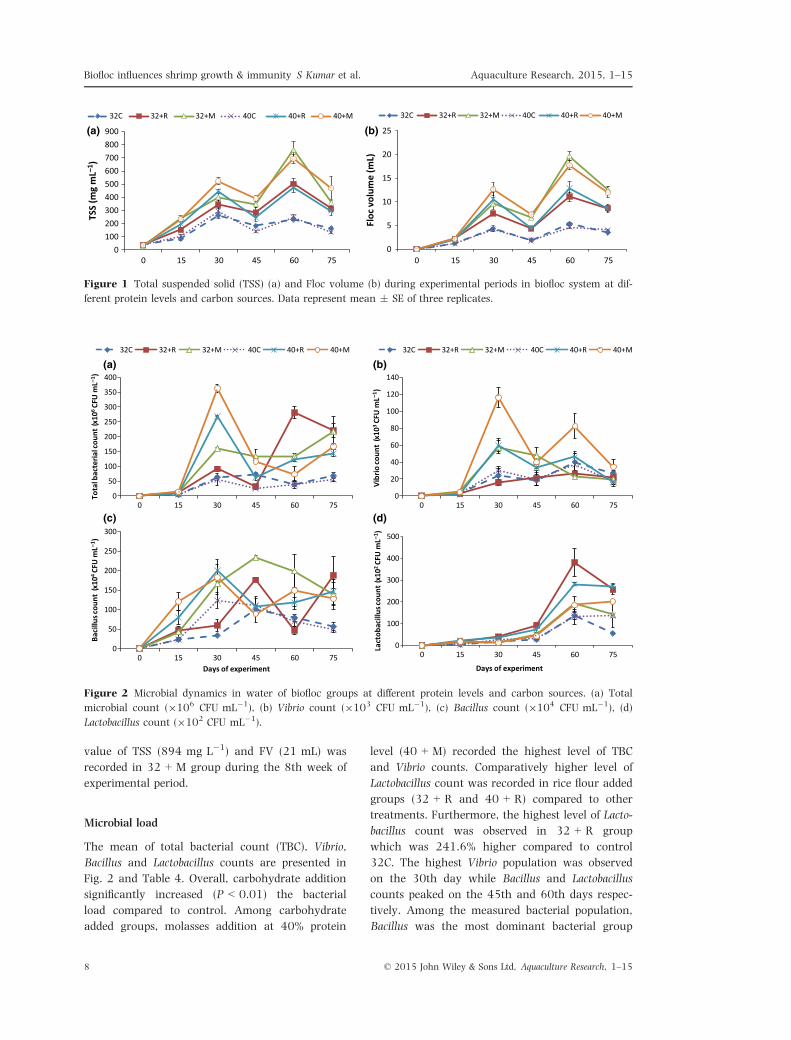
Microbial load
The mean of total bacterial count (TBC), Vibrio,
Bacillus and Lactobacillus counts are presented in
Fig. 2 and Table 4. Overall, carbohydrate addition
significantly increased (P < 0.01) the bacterial
load compared to control. Among carbohydrate
added groups, molasses addition at 40% protein
level (40 + M) recorded the highest level of TBC
and Vibrio counts. Comparatively higher level of
Lactobacillus count was recorded in rice flour added
groups (32 + R and 40 + R) compared to other
treatments. Furthermore, the highest level of Lacto-
bacillus count was observed in 32 + R group
which was 241.6% higher compared to control
32C. The highest Vibrio population was observed
on the 30th day while Bacillus and Lactobacillus
counts peaked on the 45th and 60th days respec-
tively. Among the measured bacterial population,
Bacillus was the most dominant bacterial group
0100200300400500600700800900
0 15 30 45 60 75
TSS
(mg
mL–1
)
32C 32+R 32+M 40C 40+R 40+M
0
5
10
15
20
25
0 15 30 45 60 75
Floc
vol
ume
(mL)
32C 32+R 32+M 40C 40+R 40+M
(a) (b)
Figure 1 Total suspended solid (TSS) (a) and Floc volume (b) during experimental periods in biofloc system at dif-
ferent protein levels and carbon sources. Data represent mean � SE of three replicates.
0
50
100
150
200
250
300
350
400
0 15 30 45 60 75
Tota
l bac
teria
l cou
nt (x
106
CFU
mL–1
)
32C 32+R 32+M 40C 40+R 40+M
0
20
40
60
80
100
120
140
0 15 30 45 60 75
Vibr
io co
unt
(x10
3 CF
U m
L–1)
32C 32+R 32+M 40C 40+R 40+M
0
50
100
150
200
250
300
0 15 30 45 60 75
Baci
llus c
ount
(x10
4 CF
U m
L–1)
Days of experiment
0
100
200
300
400
500
0 15 30 45 60 75
Lact
obac
illus
coun
t (x
102
CFU
mL–1
)
Days of experiment
(a) (b)
(c) (d)
Figure 2 Microbial dynamics in water of biofloc groups at different protein levels and carbon sources. (a) Total
microbial count (9106 CFU mL�1), (b) Vibrio count (9103 CFU mL�1), (c) Bacillus count (9104 CFU mL�1), (d)
Lactobacillus count (9102 CFU mL�1).
© 2015 John Wiley & Sons Ltd, Aquaculture Research, 1–158
Biofloc influences shrimp growth & immunity S Kumar et al. Aquaculture Research, 2015, 1–15
(58.2–141.7 9 104 CFU mL�1) throughout the
experimental periods.
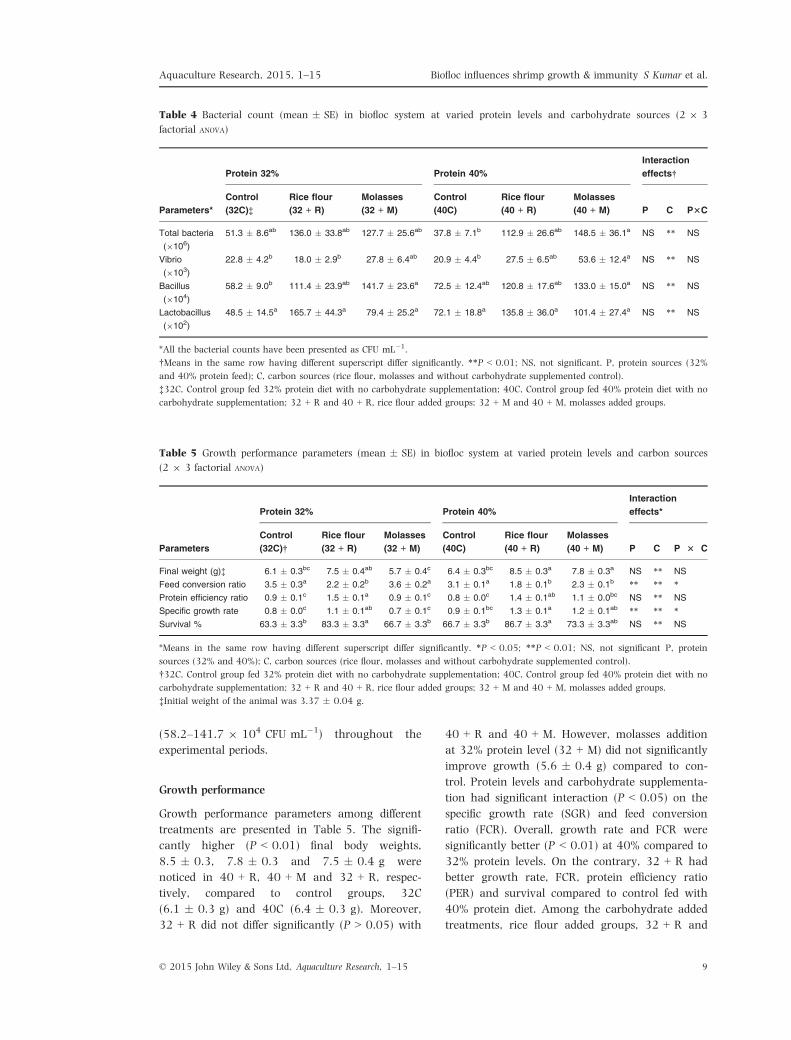
Growth performance
Growth performance parameters among different
treatments are presented in Table 5. The signifi-
cantly higher (P < 0.01) final body weights,
8.5 � 0.3, 7.8 � 0.3 and 7.5 � 0.4 g were
noticed in 40 + R, 40 + M and 32 + R, respec-
tively, compared to control groups, 32C
(6.1 � 0.3 g) and 40C (6.4 � 0.3 g). Moreover,
32 + R did not differ significantly (P > 0.05) with
40 + R and 40 + M. However, molasses addition
at 32% protein level (32 + M) did not significantly
improve growth (5.6 � 0.4 g) compared to con-
trol. Protein levels and carbohydrate supplementa-
tion had significant interaction (P < 0.05) on the
specific growth rate (SGR) and feed conversion
ratio (FCR). Overall, growth rate and FCR were
significantly better (P < 0.01) at 40% compared to
32% protein levels. On the contrary, 32 + R had
better growth rate, FCR, protein efficiency ratio
(PER) and survival compared to control fed with
40% protein diet. Among the carbohydrate added
treatments, rice flour added groups, 32 + R and
Table 4 Bacterial count (mean � SE) in biofloc system at varied protein levels and carbohydrate sources (2 9 3
factorial ANOVA)
Parameters*
Protein 32% Protein 40%
Interaction
effects†
Control
(32C)‡
Rice flour
(32 + R)
Molasses
(32 + M)
Control
(40C)
Rice flour
(40 + R)
Molasses
(40 + M) P C P3C
Total bacteria
(9106)
51.3 � 8.6ab 136.0 � 33.8ab 127.7 � 25.6ab 37.8 � 7.1b 112.9 � 26.6ab 148.5 � 36.1a NS ** NS
Vibrio
(9103)
22.8 � 4.2b 18.0 � 2.9b 27.8 � 6.4ab 20.9 � 4.4b 27.5 � 6.5ab 53.6 � 12.4a NS ** NS
Bacillus
(9104)
58.2 � 9.0b 111.4 � 23.9ab 141.7 � 23.6a 72.5 � 12.4ab 120.8 � 17.6ab 133.0 � 15.0a NS ** NS
Lactobacillus
(9102)
48.5 � 14.5a 165.7 � 44.3a 79.4 � 25.2a 72.1 � 18.8a 135.8 � 36.0a 101.4 � 27.4a NS ** NS
*All the bacterial counts have been presented as CFU mL�1.
†Means in the same row having different superscript differ significantly. **P < 0.01; NS, not significant. P, protein sources (32%
and 40% protein feed); C, carbon sources (rice flour, molasses and without carbohydrate supplemented control).
‡32C, Control group fed 32% protein diet with no carbohydrate supplementation; 40C, Control group fed 40% protein diet with no
carbohydrate supplementation; 32 + R and 40 + R, rice flour added groups; 32 + M and 40 + M, molasses added groups.
Table 5 Growth performance parameters (mean � SE) in biofloc system at varied protein levels and carbon sources
(2 9 3 factorial ANOVA)
Parameters
Protein 32% Protein 40%
Interaction
effects*
Control
(32C)†
Rice flour
(32 + R)
Molasses
(32 + M)
Control
(40C)
Rice flour
(40 + R)
Molasses
(40 + M) P C P 3 C
Final weight (g)‡ 6.1 � 0.3bc 7.5 � 0.4ab 5.7 � 0.4c 6.4 � 0.3bc 8.5 � 0.3a 7.8 � 0.3a NS ** NS
Feed conversion ratio 3.5 � 0.3a 2.2 � 0.2b 3.6 � 0.2a 3.1 � 0.1a 1.8 � 0.1b 2.3 � 0.1b ** ** *
Protein efficiency ratio 0.9 � 0.1c 1.5 � 0.1a 0.9 � 0.1c 0.8 � 0.0c 1.4 � 0.1ab 1.1 � 0.0bc NS ** NS
Specific growth rate 0.8 � 0.0c 1.1 � 0.1ab 0.7 � 0.1c 0.9 � 0.1bc 1.3 � 0.1a 1.2 � 0.1ab ** ** *
Survival % 63.3 � 3.3b 83.3 � 3.3a 66.7 � 3.3b 66.7 � 3.3b 86.7 � 3.3a 73.3 � 3.3ab NS ** NS
*Means in the same row having different superscript differ significantly. *P < 0.05; **P < 0.01; NS, not significant P, protein
sources (32% and 40%); C, carbon sources (rice flour, molasses and without carbohydrate supplemented control).
†32C, Control group fed 32% protein diet with no carbohydrate supplementation; 40C, Control group fed 40% protein diet with no
carbohydrate supplementation; 32 + R and 40 + R, rice flour added groups; 32 + M and 40 + M, molasses added groups.
‡Initial weight of the animal was 3.37 � 0.04 g.
© 2015 John Wiley & Sons Ltd, Aquaculture Research, 1–15 9
Aquaculture Research, 2015, 1–15 Biofloc influences shrimp growth & immunity S Kumar et al.
40 + R recorded the higher SGR, PER and lower
FCR compared to other groups. Similarly, better
survival was recorded (P < 0.05) in rice flour
added groups, 40 + R (86.7) and 32 + R (83.3%),
compared to other treatments.
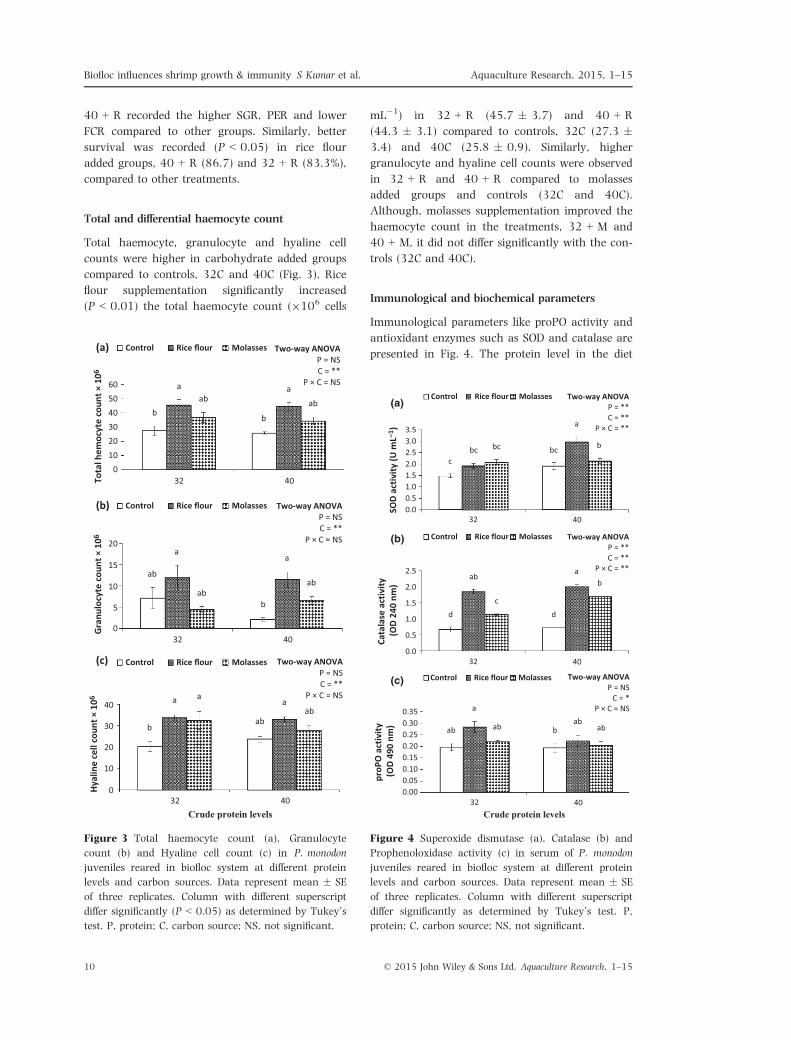
Total and differential haemocyte count
Total haemocyte, granulocyte and hyaline cell
counts were higher in carbohydrate added groups
compared to controls, 32C and 40C (Fig. 3). Rice
flour supplementation significantly increased
(P < 0.01) the total haemocyte count (9106 cells
mL�1) in 32 + R (45.7 � 3.7) and 40 + R
(44.3 � 3.1) compared to controls, 32C (27.3 �3.4) and 40C (25.8 � 0.9). Similarly, higher
granulocyte and hyaline cell counts were observed
in 32 + R and 40 + R compared to molasses
added groups and controls (32C and 40C).
Although, molasses supplementation improved the
haemocyte count in the treatments, 32 + M and
40 + M, it did not differ significantly with the con-
trols (32C and 40C).
Immunological and biochemical parameters
Immunological parameters like proPO activity and
antioxidant enzymes such as SOD and catalase are
presented in Fig. 4. The protein level in the diet
ab
a20
15
10
5
0
abb
a
ab
Two-way ANOVAP = NSC = **
P × C = NS
(b)
b
a605040302010
032 40
32 40
ab
b
aab
Two-way ANOVAControl Rice flour Molasses
Control Rice flour Molasses
Control Rice flour Molasses
P = NSC = **
P × C = NS
(a)
b
a a
ab
aab
Two-way ANOVAP = NSC = **
P × C = NS
(c)
Crude protein levels32 40
40
30
20
10
0Hyal
ine
cell
coun
t × 1
06G
ranu
locy
te c
ount
× 1
06To
tal h
emoc
yte
coun
t × 1
06
Figure 3 Total haemocyte count (a), Granulocyte
count (b) and Hyaline cell count (c) in P. monodon
juveniles reared in biofloc system at different protein
levels and carbon sources. Data represent mean � SE
of three replicates. Column with different superscript
differ significantly (P < 0.05) as determined by Tukey’s
test. P, protein; C, carbon source; NS, not significant.
d
ab
cd
ab
Two-way ANOVAP = **C = **
P × C = **
cbc
3.53.02.52.01.51.00.50.0
2.5
2.0
1.5
1.0
0.5
0.0
32 40
32 40
bc bc
a
b
TwoControlSO
D ac
tivity
(U m
L–1)
Rice flour Molasses
Control Rice flour Molasses
Control Rice flour Molasses
-way ANOVAP = **C = **
P × C = **
(a)
(b)
(c)
ab
a
ab bab
ab
Two-way ANOVAP = NS
C = *P × C = NS
Crude protein levels32 40
0.350.300.250.200.150.100.050.00
proP
O a
ctiv
ity (O
D 49
0 nm
)Ca
tala
se a
ctiv
ity (O
D 24
0 nm
)
Figure 4 Superoxide dismutase (a), Catalase (b) and
Prophenoloxidase activity (c) in serum of P. monodon
juveniles reared in biofloc system at different protein
levels and carbon sources. Data represent mean � SE
of three replicates. Column with different superscript
differ significantly as determined by Tukey’s test. P,
protein; C, carbon source; NS, not significant.
© 2015 John Wiley & Sons Ltd, Aquaculture Research, 1–1510
Biofloc influences shrimp growth & immunity S Kumar et al. Aquaculture Research, 2015, 1–15

had significant effect (P < 0.01) on SOD and cata-
lase activity with higher level recorded at 40%
compared to 32% protein diet. Among the treat-
ments, the highest serum proPO activity (OD
490 nm) was observed in 32 + R (0.3 � 0.0).
The catalase activity was significantly higher
(P < 0.01) in shrimps reared under rice flour sup-
plementation (32 + R and 40 + R) compared to
control groups, 32C and 40C. Similarly, the high-
est SOD activity was recorded in rice flour supple-
mented group, 40 + R (3.0 � 0.2 U mL�1).
Although immunological parameters like proPO
activity and SOD were comparatively higher in
molasses added groups, 32 + M and 40 + M, they
did not differ significantly with their respective
controls 32C and 40C.
Serum biochemical parameters like protein and
glucose levels are presented in Table 6. The pro-
tein level in the feed significantly influenced
(P < 0.01) the serum protein and glucose levels
with higher values recorded at 40% compared to
32% protein diet. The serum protein levels
(mg mL�1) were significantly higher (P < 0.01) in
40 + R (18.04 � 0.46), 32 + R (13.97 � 0.25)
and 40 + M (13.56 � 0.37) groups compared to
other treatments. The similar trend was observed
for serum glucose with the highest level recorded
in rice flour added group followed by molasses and
control.
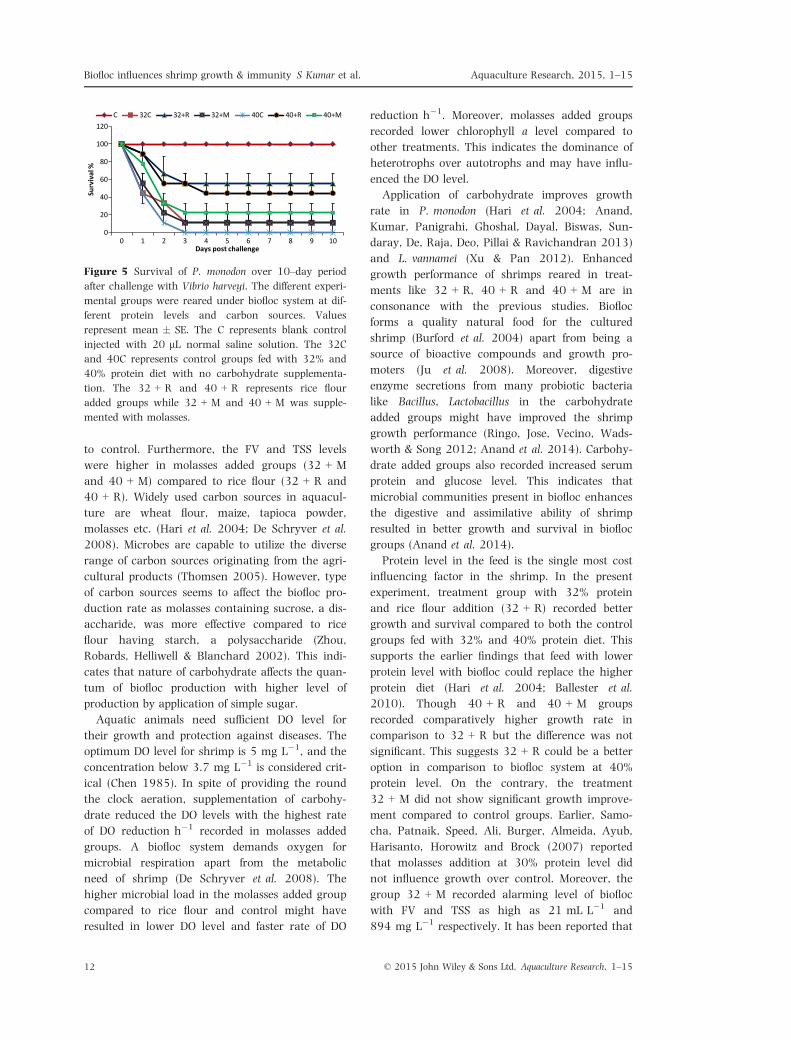
Survival post challenge
The survival among different treatment groups
after challenge with V. harveyi is presented in
Fig. 5. A significantly higher (P < 0.05) survival
was recorded in 32 + R (55.5) and 40 + R
(44.4%) compared to controls 32C (11.1%) and
40C (0) while molasses supplemented group had
survival between 11.1% and 22.2%.
Discussion
In this study, experimental diets contained 32%
and 40% protein equivalent to C:N ratio 10:1 and
7.5:1 (Avnimelech 1999; Hari et al. 2004).
Manipulation of C:N ratio by reducing the protein
level in the feed (Azim et al. 2008) or addition of
external carbohydrate helps in biofloc production
(Burford, Thompson, McIntosh, Bauman & Pear-
son 2004; Hari et al. 2004). In this study molasses
and rice flour were used as carbon sources at the
C:N ratio 10:1 to augment microbial growth.
The recorded water quality parameters across
the treatments were within the acceptable ranges
for brackishwater shrimp culture (Chen 1985). In
this study, carbohydrate addition significantly
reduced the TAN level in the water column. This
is in line with the earlier findings, where the addi-
tion of carbohydrate reported to reduce the TAN
concentration in tilapia (Azim & Little 2008),
L. vannamei (Wasielesky, Atwood, Stokes & Browdy
2006) and P. monodon culture (Hari et al. 2004;
Kumar et al. 2014). It has been reported that bac-
teria utilizes TAN and added carbon for the pro-
duction of microbial floc within the culture system
(Avnimelech 1999; Azim & Little 2008). The
reduced TAN levels, overall, helped to maintain
better water quality in carbohydrate added groups.
Floc volume and TSS are the true indicators of
biofloc formation (Avnimelech 2012). In the pre-
sent experiment, carbohydrate added groups
recorded significantly higher FV and TSS compared
Table 6 Serum biochemical parameters (mean � SE) in biofloc system at varied protein levels and carbon sources
(2 9 3 factorial ANOVA)
Parameters
Protein 32% Protein 40%
Interaction
effects*
Control
(32C)†
Rice flour
(32 + R)
Molasses
(32 + M)
Control
(40C)
Rice flour
(40 + R)
Molasses
(40 + M) P C P 3 C
Protein
(mg L�1)
5.98 � 0.27d 13.97 � 0.25b 10.62 � 0.54c 10.43 � 0.30c 18.04 � 0.46a 13.56 � 0.37b ** ** NS
Glucose
(mg L�1)
1.79 � 0.02c 2.06 � 0.02b 1.87 � 0.02c 1.90 � 0.02c 2.48 � 0.03a 2.14 � 0.04b ** ** **
*Means in the same row having different superscript differ significantly. **P < 0.01; NS, not significant. P, protein sources (32%
and 40% protein feed); C, carbon sources (rice flour, molasses and without carbohydrate supplemented control).
†32C, Control group fed 32% protein diet with no carbohydrate supplementation; 40C, Control group fed 40% protein diet with no
carbohydrate supplementation; 32 + R and 40 + R, rice flour added groups; 32 + M and 40 + M, molasses added groups.
© 2015 John Wiley & Sons Ltd, Aquaculture Research, 1–15 11
Aquaculture Research, 2015, 1–15 Biofloc influences shrimp growth & immunity S Kumar et al.
to control. Furthermore, the FV and TSS levels
were higher in molasses added groups (32 + M
and 40 + M) compared to rice flour (32 + R and
40 + R). Widely used carbon sources in aquacul-
ture are wheat flour, maize, tapioca powder,
molasses etc. (Hari et al. 2004; De Schryver et al.
2008). Microbes are capable to utilize the diverse
range of carbon sources originating from the agri-
cultural products (Thomsen 2005). However, type
of carbon sources seems to affect the biofloc pro-
duction rate as molasses containing sucrose, a dis-
accharide, was more effective compared to rice
flour having starch, a polysaccharide (Zhou,
Robards, Helliwell & Blanchard 2002). This indi-
cates that nature of carbohydrate affects the quan-
tum of biofloc production with higher level of
production by application of simple sugar.
Aquatic animals need sufficient DO level for
their growth and protection against diseases. The
optimum DO level for shrimp is 5 mg L�1, and the
concentration below 3.7 mg L�1 is considered crit-
ical (Chen 1985). In spite of providing the round
the clock aeration, supplementation of carbohy-
drate reduced the DO levels with the highest rate
of DO reduction h�1 recorded in molasses added
groups. A biofloc system demands oxygen for
microbial respiration apart from the metabolic
need of shrimp (De Schryver et al. 2008). The
higher microbial load in the molasses added group
compared to rice flour and control might have
resulted in lower DO level and faster rate of DO
reduction h�1. Moreover, molasses added groups
recorded lower chlorophyll a level compared to
other treatments. This indicates the dominance of
heterotrophs over autotrophs and may have influ-
enced the DO level.
Application of carbohydrate improves growth
rate in P. monodon (Hari et al. 2004; Anand,
Kumar, Panigrahi, Ghoshal, Dayal, Biswas, Sun-
daray, De, Raja, Deo, Pillai & Ravichandran 2013)
and L. vannamei (Xu & Pan 2012). Enhanced
growth performance of shrimps reared in treat-
ments like 32 + R, 40 + R and 40 + M are in
consonance with the previous studies. Biofloc
forms a quality natural food for the cultured
shrimp (Burford et al. 2004) apart from being a
source of bioactive compounds and growth pro-
moters (Ju et al. 2008). Moreover, digestive
enzyme secretions from many probiotic bacteria
like Bacillus, Lactobacillus in the carbohydrate
added groups might have improved the shrimp
growth performance (Ringo, Jose, Vecino, Wads-
worth & Song 2012; Anand et al. 2014). Carbohy-
drate added groups also recorded increased serum
protein and glucose level. This indicates that
microbial communities present in biofloc enhances
the digestive and assimilative ability of shrimp
resulted in better growth and survival in biofloc
groups (Anand et al. 2014).
Protein level in the feed is the single most cost
influencing factor in the shrimp. In the present
experiment, treatment group with 32% protein
and rice flour addition (32 + R) recorded better
growth and survival compared to both the control
groups fed with 32% and 40% protein diet. This
supports the earlier findings that feed with lower
protein level with biofloc could replace the higher
protein diet (Hari et al. 2004; Ballester et al.
2010). Though 40 + R and 40 + M groups
recorded comparatively higher growth rate in
comparison to 32 + R but the difference was not
significant. This suggests 32 + R could be a better
option in comparison to biofloc system at 40%
protein level. On the contrary, the treatment
32 + M did not show significant growth improve-
ment compared to control groups. Earlier, Samo-
cha, Patnaik, Speed, Ali, Burger, Almeida, Ayub,
Harisanto, Horowitz and Brock (2007) reported
that molasses addition at 30% protein level did
not influence growth over control. Moreover, the
group 32 + M recorded alarming level of biofloc
with FV and TSS as high as 21 mL L�1 and
894 mg L�1 respectively. It has been reported that
0
20
40
60
80
100
120
0 1 2 3 4 5 6 7 8 9 10
Surv
ival
%
Days post challenge
C 32C 32+R 32+M 40C 40+R 40+M
Figure 5 Survival of P. monodon over 10–day period
after challenge with Vibrio harveyi. The different experi-
mental groups were reared under biofloc system at dif-
ferent protein levels and carbon sources. Values
represent mean � SE. The C represents blank control
injected with 20 lL normal saline solution. The 32C
and 40C represents control groups fed with 32% and
40% protein diet with no carbohydrate supplementa-
tion. The 32 + R and 40 + R represents rice flour
added groups while 32 + M and 40 + M was supple-
mented with molasses.
© 2015 John Wiley & Sons Ltd, Aquaculture Research, 1–1512
Biofloc influences shrimp growth & immunity S Kumar et al. Aquaculture Research, 2015, 1–15
higher level of suspended particles reduces visibil-
ity, which lead to lower food intake and poor
growth performance (Azim & Little 2008; Ray,
Lewis, Browdy & Leffler 2010). In the present
experiment, decision for water exchange was
taken based on the FV measurement at weekly
intervals. This allowed reaching the FV at alarming
level of 21 mL�1 in molasses added groups. On the
basis of the present experimental data, we suggest
to measure FV every day with periodical removal
of unutilized floc particles. Earlier, combination of
wheat bran and molasses has been reported to give
a better growth in pink shrimp Farfantepenaeus
paulensis (Ballester et al. 2010) and F. brasiliensis
(Emerenciano, Ballester, Cavalli & Wasielesky
2012). The present results suggest that rice flour
had steady rate compared to rapid biofloc produc-
tion by molasses. Therefore, the combination of
rice flour or wheat flour with molasses should be
tested to further optimize the biofloc system.
Shrimps like other crustaceans lack adaptive
immune system and rely entirely on the non-spe-
cific immune mechanism (Bach�ere 2000). The
circulating haemocytes and proPO activity plays
key role in defence mechanism of crustaceans
(Rodrıguez & Le Moullac 2000). On the other
hand, antioxidant enzymes like SOD and catalase
protect the cells from oxidative stress during host
pathogen interaction (Holmblad & S€oderh€all
1999). In this study, carbohydrate supplemented
groups such as 32 + R, 40 + R and 40 + M eli-
cited a better immune response in terms of
haemocyte, granulocyte count, and proPO activity
and antioxidant enzymes such as SOD and cata-
lase compared with controls (32C and 40C).
Increased level of haemocyte and antioxidant sta-
tus had been noticed after dietary supplementa-
tion of probiotics (Li, Tan & Mai 2009) and
immunostimulant like b-glucan in shrimp (Lopez,
Cuzon, Gaxiola, Taboada, Valenzuela, Pascual,
Sanchez & Rosas 2003). Recently, Xu and Pan
(2013) reported increased haemocyte count and
antioxidant status in L. vannamei in biofloc based
system. Ju et al. (2008) reported that bioflocs
contains many bioactive compounds such as car-
otenoids, chlorophylls, phytosterols, bromophenols
and amino sugars which could exert immuno-sti-
mulatory effect on shrimp. It is also possible that
presence of beneficial bacteria such as Bacillus
spp. and Lactobacillus in the ingested biofloc might
have improved their colonization in the gastroin-
testinal tract leading to better digestive enzyme
activity and immune mechanism (Xu & Pan
2013). This necessitates the further characteriza-
tion of beneficial microbial communities in biofloc
and to investigate their role in shrimp immune
mechanism.
In the present experiment, immunological param-
eters like haemocyte count and proPO activity did
not differ significantly between the groups fed with
32 and 40% protein diet. Moreover, the group
32 + R recorded the highest level of proPO activity
and survival after challenge with V. harveyi.
Recently, Xu & Pan (2014) observed no significant
difference in L. vannamei immunological parameters
among the diet with 20–35% protein level with bio-
floc. This reflects the tremendous potential of biofloc
in replacing the dietary protein level along with
improving the shrimp growth and immune
responses. The experiment revealed that nature of
carbohydrate source applied for biofloc production
affects the immune responses. For example, treat-
ment with rice flour addition like 32 + R and
40 + R exhibited better immune response compared
to molasses added groups (32 + M and 40 + M). It
seems that higher level of suspended particles and
lower DO in molasses added groups led to lower
immune response compared to rice flour based bio-
floc system (Le Moullac & Haffner 2000). This fur-
ther suggests that molasses as carbon source needs
cautious application with routine monitoring on
the level of biofloc production and shrimp health.
Conclusion
Present study confirms the importance of biofloc in
controlling toxic ammonia nitrogen, and enhanc-
ing the growth and immune response in black
tiger shrimp, P. monodon. Both, molasses and rice
flour addition significantly reduced the total
ammonia–N compared to controls. The nature of
carbon sources influenced the amount of biofloc
generation as molasses was more effective com-
pared to rice flour. However, better growth and
immune responses were observed in rice flour
added groups compared to molasses. Moreover,
rice flour added group at 32% protein had better
growth and immune response compared to control
at 40% protein diet. Further research is required
to understand the responses of probiotic bacteria
like Bacillus and Lactobacillus in biofloc system.
Optimum utilization of suspended particles and
their efficient control in biofloc based system is
also a matter of further research.
© 2015 John Wiley & Sons Ltd, Aquaculture Research, 1–15 13
Aquaculture Research, 2015, 1–15 Biofloc influences shrimp growth & immunity S Kumar et al.
Acknowledgments
The authors are grateful to the Director, Central
Institute of Brackishwater Aquaculture, Chennai
for providing the required facilities to conduct this
study. Support and help received from the labora-
tory staffs of Kakdwip Research Centre of CIBA are
also duly acknowledged.
References
Anand P.S.S., Kumar S., Panigrahi A., Ghoshal T.K.,
Dayal J.S., Biswas G., Sundaray J.K., De D., Raja R.A.,
Deo A.D., Pillai S.M. & Ravichandran P. (2013) Effects
of C: N ratio and substrate integration on periphyton
biomass, microbial dynamics and growth of Penaeus
monodon juveniles. Aquaculture International 21, 511–
524.
Anand P.S.S., Kohli M.P.S., Kumar S., Sundaray J.K.,
Dam Roy S., Venkateshwarlu G., Sinha A. & Pailan
G.H. (2014) Effect of dietary supplementation of biofloc
on growth performance and digestive enzyme activities
in Penaeus monodon. Aquaculture 418, 108–115.
Ananda Raja R., Kumar S., Sundaray J.K., De D., Biswas
G. & Ghoshal T.K. (2012) Hematological parameters in
relation to sex, morphometric characters and incidence
of white spot syndrome virus in tiger shrimp Penaeus
monodon Fabricius (1798) from Sunderban, West Ben-
gal. Indian Journal of Fisheries 59, 169–174.
AOAC (1995) Official Methods of Analysis (ed. by K. Hel-
rich), pp. 1094. Association of Official Analytical Che-
mists, Virginia, Washington DC, USA.
Aouidi F., Gannoun H., Ben Othman N., Ayed L. &
Hamdi M. (2009) Improvement of fermentative decol-
orization of olive mill wastewater by Lactobacillus para-
casei by cheese whey’s addition Process. Biochemistry
44, 597–601.
APHA (1998) Standard Methods for the Examination of
Water and Wastewater (ed. by L.S. Clesceri, A.E. Green-
berg & A.D. Eaton). American Public Health Associa-
tion, American Water Works Association and Water
Environment Federation, United Book Press, Washing-
ton DC, USA.
Avnimelech Y. (1999) Carbon/nitrogen ratio as a control
element in aquaculture systems. Aquaculture 176,
227–235.
Avnimelech Y. (2012) Biofloc Technology–A Practical
Guide Book (2nd edn), pp. 272. The World Aquacul-
ture Society, Baton Rouge, LA, USA.
Azim M.E. & Little D.C. (2008) The biofloc technology
(BFT) in indoor tanks: water quality, biofloc composition,
and growth and welfare of Nile tilapia (Oreochromis
niloticus). Aquaculture 283, 29–35.
Azim M.E., Little D.C. & Bron J.E. (2008) Microbial pro-
tein production in activated suspension tanks manipu-
lating C: N ratio in feed and the implications for fish
culture. Bioresource Technology 99, 3590–3599.
Bach�ere E. (2000) Shrimp immunity and disease control.
Aquaculture 191, 3–11.
Ballester E.L.C., Abreu P.C., Cavalli R.O., Emerenciano
M., de Abreu L. & Wasielesky J.W. (2010) Effect of
practical diets with different protein levels on the per-
formance of Farfantepenaeus paulensis juveniles nursed
in a zero exchange suspended microbial flocs intensive
system. Aquaculture Nutrition 16, 163–172.
Beauchamp C. & Fridovich I. (1971) Superoxide dismu-
tase: improved assays and an assay applicable to acry-
lamide gels. Analytical Biochemistry 44, 276–287.
Burford M.A., Thompson P.J., McIntosh R.P., Bauman
R.H. & Pearson D.C. (2004) The contribution of floccu-
lated material to shrimp (Litopenaeus vannamei) nutri-
tion in a high-intensity, zero-exchange system.
Aquaculture 232, 525–537.
Chen H.C. (1985) Water quality criteria for farming the
grass shrimp, Penaeus monodon. First international con-
ference on the culture of penaeid prawns/shrimps.
Aquaculture Department. SEAFDEC, pp. 165.
Crab R., Lambert A., Defoirdt T., Bossier P. & Verstraete
W. (2010) The application of bioflocs technology to
protect brine shrimp (Artemia franciscana) from patho-
genic Vibrio harveyi. Journal of Applied Microbiology
109, 1643–1649.
Crab R., Chielens B., Wille M., Bossier P. & Verstraete W.
(2010) The effect of different carbon sources on the nutri-
tional value of bioflocs, a feed for Macrobrachium rosen-
bergii postlarvae. Aquaculture Research 41, 559–567.
Crab R., Defoirdt T., Bossier P. & Verstraete W. (2012)
Biofloc technology in aquaculture: beneficial effects
and future challenges. Aquaculture 356, 351–356.
Dall W., Hill B.J., Rothlisberg P.C. & Sharples D.J. (1990)
The biology of the penaeidae. In: Advances in Marine Biol-
ogy, Vol. 27 (ed. by J.H.S. Blaxter & A.J. Southward), pp.
213–240. Academic Press, San Diego, CA, USA.
De Schryver P., Crab R., Defoirdt T., Boon N. & Ver-
straete W. (2008) The basics of bio–flocs technology:
the added value for aquaculture. Aquaculture 277,
125–137.
Emerenciano M., Ballester E.L., Cavalli R.O. & Wasielesky
W. (2012) Biofloc technology application as a food
source in a limited water exchange nursery system for
pink shrimp Farfantepenaeus brasiliensis (Latreille
1817). Aquaculture Research 43, 447–457.
FAO (2012) The State of World Fisheries and Aquaculture.
FAO, Rome, Italy.
Funge-Smith S.J. & Briggs M.R. (1998) Nutrient budgets
in intensive shrimp ponds: implications for sustainabil-
ity. Aquaculture 164, 117–133.
Hari B., Kurup B.M., Varghese J.T., Schrama J.W. & Ver-
degem M.C.J. (2004) Effects of carbohydrate addition
on production in extensive shrimp culture systems.
Aquaculture 241, 179–194.
© 2015 John Wiley & Sons Ltd, Aquaculture Research, 1–1514
Biofloc influences shrimp growth & immunity S Kumar et al. Aquaculture Research, 2015, 1–15
Harris L., Owens L. & Smith S. (1996) A selective and
differential medium for Vibrio harveyi. Applied and Envi-
ronmental Microbiology 62, 3548–3550.
Hart J.P., Lovis W.A., Schulenberg J.K. & Urquhart G.R.
(2007) Paleodietary implications from stable carbon
isotope analysis of experimental cooking residues. Jour-
nal of Archaeological Science 34, 804–813.
Hein L. (2002) Toward improved environmental and
social management of Indian shrimp farming. Environ-
mental Management 29, 349–359.
Hern�andez-L�opez J., Gollas-Galv�an T. & Vargas-Albores F.
(1996) Activation of the prophenoloxidase system of
the brown shrimp Penaeus californiensis (Holmes). Com-
parative Biochemistry and Physiology Part C: Pharmacol-
ogy, Toxicology and Endocrinology 113, 61–66.
Holmblad T. & S€oderh€all K. (1999) Cell adhesion mole-
cules and antioxidative enzymes in a crustacean, possi-
ble role in immunity. Aquaculture 172, 111–123.
Ju Z.Y., Forster I.P., Conquest L., Dominy W., Kuo W.C.
& David Horgen F. (2008) Determination of microbial
community structures of shrimp floc cultures by
biomarkers and analysis of floc amino acid profiles.
Aquaculture Research 39, 118–133.
Karunasagar I. & Otta S.K. (1998) Disease problems
affecting cultured penaeid shrimp in India. Fish Pathol-
ogy 33, 413–419.
Kautsky N., R€onnb€ack P., Tedengren M. & Troell M. (2000)
Ecosystem perspectives on management of disease in
shrimp pond farming. Aquaculture 191, 145–161.
Krishnan N., Chattopadhyay S., Kundu J.K. & Chaudhuri
A. (2002) Superoxide dismutase activity in haemocytes
and haemolymph of Bombyx mori following bacterial
infection. Current Science 83, 321–325.
Kumar S., Anand P.S.S., De D., Sundaray J.K., Raja R.A.,
Biswas G., Ponniah A.G., Ghoshal T.K., Deo A.D., Pani-
grahi A. & Muralidhar M. (2014) Effects of carbohydrate
supplementation on water quality, microbial dynamics
and growth performance of giant tiger prawn (Penaeus
monodon). Aquaculture International 22, 901–912.
Le Moullac G. & Haffner P. (2000) Environmental factors
affecting immune responses in Crustacea. Aquaculture
191, 121–131.
Li J., Tan B. & Mai K. (2009) Dietary probiotic Bacillus
OJ and oligosaccharides influence the intestine micro-
bial populations, immune responses and resistance to
white spot syndrome virus in shrimp (Litopenaeus van-
namei). Aquaculture 291, 35–40.
Lightner D.V., Redman R.M., Pantoja C.R., Noble B.I. &
Tran L. (2012) Early mortality syndrome affects
shrimp in Asia. Global Aquaculture Advocate Magazine
40, (Jan/Feb).
Lopez N., Cuzon G., Gaxiola G., Taboada G., Valenzuela
M., Pascual C., Sanchez A. & Rosas C. (2003) Physio-
logical, nutritional and immunological role of dietary
[beta] 1-3 glucan and ascorbic acid 2-monophosphate
in Litopenaeus vannamei juveniles. Aquaculture 224,
223–243.
Lowry O.H., Rosebrough N.J., Farr A.L. & Randall R.J.
(1951) Protein measurement with the Folin phenol
reagent. Journal of Biological Chemistry 193, 265–275.
Miller G.L. (1959) Modified DNS method for reducing
sugars. Analytical Chemistry 31, 426–428.
Ray A.J., Lewis B.L., Browdy C.L. & Leffler J.W. (2010)
Suspended solids removal to improve shrimp (Litope-
naeus vannamei) production and an evaluation of a
plant-based feed in minimal-exchange, super intensive
culture systems. Aquaculture 299, 89–98.
Ringo E., Jose R.E.O., Vecino L.G., Wadsworth S. & Song
S. (2012) Use of immunostimulants and nucleotides in
aquaculture: a review. Journal of Marine Science
Research Development 2, 1–22.
Rodrıguez J. & Le Moullac G. (2000) State of the art of
immunological tools and health control of penaeid
shrimp. Aquaculture 191, 109–119.
Samocha T.M., Patnaik S., Speed M., Ali A.M., Burger
J.M., Almeida R.V., Ayub Z., Harisanto M., Horowitz
A. & Brock D.L. (2007) Use of molasses as carbon
source in limited discharge nursery and grow–out sys-
tems for Litopenaeus vannamei. Aquaculture Engineering
36, 184–191.
Takahara S., Hamilton H.B., Neel J.V., Kobara T.Y.,
Ogura Y. & Nishimura E.T. (1960) Hypocatalasemia: a
new genetic carrier state. Journal of Clinical Investigation
39, 610–619.
Thomsen M.H. (2005) Complex media from processing of
agricultural crops for microbial fermentation. Applied
Microbiology and Biotechnology 68, 598–606.
Wasielesky W. Jr, Atwood H., Stokes A. & Browdy C.L.
(2006) Effect of natural production in a zero exchange
suspended microbial floc based super-intensive culture
system for white shrimp Litopenaeus vannamei. Aquacul-
ture 258, 396–403.
Xu W.J. & Pan L.Q. (2012) Effects of bioflocs on growth
performance, digestive enzyme activity and body com-
position of juvenile Litopenaeus vannamei in zero-water
exchange tanks manipulating C/N ratio in feed. Aqua-
culture 357, 147–152.
Xu W.J. & Pan L.Q. (2013) Enhancement of immune
response and antioxidant status of Litopenaeus vannamei
juvenile in biofloc-based culture tanks manipulating
high C/N ratio of feed input. Aquaculture 412, 117–124.
Xu W.J. & Pan L.Q. (2014) Evaluation of dietary protein
level on selected parameters of immune and antioxi-
dant systems, and growth performance of juvenile Lito-
penaeus vannamei reared in zero-water exchange
biofloc-based culture tanks. Aquaculture 426, 181–
188.
Zhou Z., Robards K., Helliwell S. & Blanchard C. (2002)
Composition and functional properties of rice. Interna-
tional Journal of Food Science & Technology 37, 849–868.
© 2015 John Wiley & Sons Ltd, Aquaculture Research, 1–15 15
Aquaculture Research, 2015, 1–15 Biofloc influences shrimp growth & immunity S Kumar et al.