HEMODYNAMIC EFFECTS OF PEEP - Erasmus University … Johannes Jacobus.pdf · hemodynamic effects of...
86
HEMODYNAMIC EFFECTS OF PEEP (HEMODYNAMISCHE EFFECTEN VAN PEEP) PROEFSCHRIFT TER VERKRIJGING VAN DE GRAAD VAN DOCTOR IN DE GENEESKUNDE AAN DE ERASMUS UNIVERSITEIT ROTTERDAM OP GEZAG VAN DE RECTOR MAGNIFICUS PROF.DR. M.W. VAN HOF EN VOLGENS BESLUIT VAN HET COLLEGE VAN DEKANEN. DE OPENBARE VERDEDIGING ZAL PLAATSVINDEN OP WOENSDAG 15 ME! 1985 TE 14.00 UUR DOOR JOHANNESJACOBUSSCHREUDER GEBOREN TE OUDE NIEDORP AMSTERDAM 1985
Transcript of HEMODYNAMIC EFFECTS OF PEEP - Erasmus University … Johannes Jacobus.pdf · hemodynamic effects of...
HEMODYNAMIC EFFECTS OF PEEP
(HEMODYNAMISCHE EFFECTEN VAN PEEP)
PROEFSCHRIFT
TER VERKRIJGING VAN DE GRAAD VAN DOCTOR IN DE
GENEESKUNDE
AAN DE ERASMUS UNIVERSITEIT ROTTERDAM OP GEZAG VAN DE RECTOR MAGNIFICUS
PROF.DR. M.W. VAN HOF
EN VOLGENS BESLUIT VAN HET COLLEGE VAN DEKANEN. DE OPENBARE VERDEDIGING ZAL PLAATSVINDEN OP
WOENSDAG 15 ME! 1985 TE 14.00 UUR
DOOR
JOHANNESJACOBUSSCHREUDER GEBOREN TE OUDE NIEDORP
AMSTERDAM 1985

BEGELEIDINGSCOMMISSIE
PROMOTOR : PROF.DR. A. VERSPRILLE OVERIGE LEDEN : PROF.DR. J.G. BOVILL
PROF.DR. C. HIL VERING
PROF.DR. F. KREUZER
CONTENTS
CHAPTER I INTRODUCTION 7
CHAPTER II THERMODILUTION TECHNIQUE FOR MEASURE-MENT OF CARDIAC OUTPUT DURING ART!-FICIAL VENTILATION 16
CHAPTER Ill HEMODYNAMIC EFFECTS OF POSITIVE END-EXPIRATORY PRESSURE APPLIED AS A RAMP 31
CHAPTER IV CONTRIBUTION OF LUNG STRETCH DEPRESSOR REFLEX TO NONLINEAR FALL IN CARDIAC OUT-PUT DURING PEEP 51
CHAPTER V HEMODYNAMIC EFFECTS OF PEEP APPLIED AS A RAMP IN NORMO-, HYPER- AND HYPOVOLEMIA 62
CHAPTER VI CONCLUSIONS 78
CHAPTER VII SUMMARY 80
SAMENV ATTING 83

CHAPTER I
Introduction
A positive pressure applied to the airway during either spontaneous or mechanical ventilation is usually called positive end-expiratory pressure (PEEP). The clinical term for PEEP application during spontaneous breathing is continuous positive airway pressure or CPAP. PEEP applied during intermittent positive pressure ventilation (IPPV) is also called continuous positive pressure ventilation (CPPV). PEEP is a well established therapy for patients with respiratory distress syndrome (RDS). in adults (ARDS) as well as in the newborn. Barach et al. (5) described in 1938 the rapid clearance of acute pulmonary edema as the result of continuous application of positive pressure during the respiratory cycle. Application of PEEP during mechanical ventilation was reintroduced as a therapy for ARDS in 1969 by Ashbaugh et al. (1). CPAP was introduced into pediatric practice by Gregory et al. (26) in 1971 for the treatment of RDS in the newborn.
ARDS is the general term for a syndrome characterized by lung defects resulting from severe injury to the gas exchanging units (the alveoli) and their associated capillary beds. ARDS occurs following a variety of catastrophic insults or risk factors (e.g. sepsis. shock. trauma. aspiration. burn, inhaled toxins. infection, emboli; drugs). Respiratory distress and systemic hypoxemia refractory to increases in inspired oxygen concentration are hallmarks of ARDS (1. 45. 46, 49, 55). In addition ARDS- is associated with reduced lung volumes and reduced lung compliance (17, 36, 43, 47, 48, 50, 51). These alterations in the mechanical and gas exchanging properties result directly from injury to the alveolar epithelium and/or pulmonary capillary bed.
The highest incidence occurs after direct pulmonary injury such as aspiration of gastric contents. The incidence increases sharply when several risk factors are present (24). Extrapolation of the 150.000 ARDS cases each year estimated to occur in the United States (19) would predict the occurrence of about 7.500 cases per year in the Netherlands. Most reports indicate a mortality rate of about 65% (24, 37, 50, 68).
RDS in infants is usually associated with hyaline membrane disease in newborn infants (18). A major difference between ARDS and newborn RDS is that surfactant deficiency, due to immaturity, is thought to be a primary factor in the newborn
7
syndrome {2, 18), whereas in ARDS surfactant in-activation might be a secondary factor resulting from acute lung injury and capillary leakage (48, 49).
Because PEEP is commonly used during the treatment of ARDS and CPAP in infant RDS. this introduction wifl deal mainly w1th ARDS. Nevertheless several
clinical findings are similar for both syndromes.
Clinical Aspects of ARDS
Usually there is a latent period of 12-48 h following the primary insult, after which clinical symptoms of tachypnea, dyspnea and cyanosis develop (46). Chest radiographs may show initially little or no abnormality up to 24 hours after the onset of the clinical syndrome (35). When clinical symptoms of respiratory insufficiency progress, radiographic changes become apparent, firstly diffuse and rapidly progressive bilateral pulmonary infiltration, which will increase and coalesce. producing an alveolar pattern (35). The earliest, subtle signs of ARDS are detected by blood-gas analysis (55). Arterial oxygen tension (Pa02) will be lower than predicted for the inspired oxygen concentration (FI02) and is refractory to increases in FI02.
Increases in the arterial carbon dioxide tension (PaC02), usually are not present in the early phase of ARDS ( 49). In infant RDS. however. increases in PaC02 are a main problem (18). Other early signs in ARDS are decreases in pulmonary compliance and functional residual capacity (FRC) and increases in venous admixture and physiologic deadspace ( 49). Pulmonary hemodynamics within the early phase of ARDS can be normal despite serious impairment of pulmonary gas exchange (25. 65). With progression of time and the disease. pulmonary arterial hypertension is a common finding in ARDS (37. 68).
Although different pathogenic factors are known to induce ARDS, pathological studies have revealed that the pulmonary responses to acute lung injury follow a rather uniform pattern. This pattern has been described in three phases (3, 19. 52). Firstly, an early exudative phase characterized by alveolar and septal edema. microatelectasis. capillary congestion. infiltration and enlargement of the interstitium by erythrocytes. leucocytes and platelets. Alveolar spaces are irregularly filled with a proteinaceous fluid containing a variety of cells and cell debris. Capillary endothelium may remain relatively normal. Microthrombi and capillary plugging by leucocytes are frequently observed. Secondly, the proliferative phase. occurring after 3-7 days, is characterized by a thickening of the epithelium by proliferating alveolar type II cells. enlargement of the interstitium by edema. leucocytes, fibroblasts and a decrease in the number of capillaries. This is followed. after one or two weeks. by the third fibrotic phase, characterized by the deposition of fibrous tissue in the alveolar septae and hyaline membranes.
Pulmonary Effects of PEEP
The improvement in arterial oxygenation during PEEP therapy in ARDS patients
8
has been well documented (32) and attributed to increases in functional residual capacity (FRC) and alveolar recruitment (17, 36, 43. 49. 50. 51).
Dantzker et a!. (13) showed that in patients with AROS, PEEP decreased the pulmonary right to left shunt and increased the areas of adequately ventilated and perfused units. PEEP has not been shown to decrease extravascular lung water in animal studies (31. 41. 59. 67). Malo et a!. (41) suggested that PEEP reduced intrapulmonary shunting by inflating previously flooded and collapsed air spaces and by redistributing the excess alveolar water into the compliant perivascular space.
Cardiovascular Effects of PEEP
The main advantage of PEEP therapy in ARDS is improvement of arterial oxygen content, with an increased oxygen delivery to the issues. 0 2 delivery is calculated as the product of arterial oxygen content and cardiac output. However. in general PEEP has a negative effect on cardiac output (50). Because of the negative effect of PEEP on cardiac output. which counteracts its positive effect on arterial oxygen content. a knowledge of the cardiovascular responses to PEEP is of the utmost importance.
The general theme of this thesis is concerned with the analyses of the mechanisms underlying the effects of PEEP on the cardiovascular system.
A variety of hypotheses about the mechanisms of cardiac output decrease during PEEP have been described. They can be understood as mechanisms affecting venous return either directly by intrathoracic pressure rise or indirectly via changes in cardiac function by an increase in afterload, a decrease in contractility and/or a decrease in ventricular distensibility.
Intrathoracic Pressure
During insufflation lung volume, airway and intrathoracic pressure will be increased. When intrathoracic pressure is changed, pressures in the heart and intrathoracic vessels change accordingly. Humphreys et al. (33) suggested in 1937 that cardiac output decrease during continuous inflation of the lungs is directly related to the pressure to which the heart and great vessels are subjected, impeding the filling of the heart rather than to a direct effect on the blood flow through the lungs. In recent studies on acute cardiac tamponade it has been demonstrated that the impaired hemodynamics are not due to compression of the ventricles but are the consequence of compression of the atria and/or the central veins (16. 23). Barach et al. (4) demonstrated that cardiac output reduction due to positive pressure ventilation was proportional to mean airway pressure.
Cournand et al. (12). using pleural pressure measurements for calculating the transmural pressures, demonstrated that the reduction in cardiac output during IPPV and CPPV in man correlated with a decrease in right ventricular filling pressure. This provided evidence for the concept that the decrease in cardiac output
9
during positive airway pressure is a result of a reduction in venous return to the right heart due to the increase in central venous pressure caused by the increased
intrathoracic pressure. Several studies. using a variety of techniques. have demonstrated decreases in both
right and left ventricular end-diastolic volumes during PEEP in animals (8, 20, 21, 22. 56. 58) and in patients with ARDS (9, 53, 56, 64). The general conclusion from these studies is that PEEP reduces cardiac preload by the increase in intrathoracic pressure. impeding venous return.
Right Ventricular Afterload
Several reports have attributed the decrease in cardiac output with PEEP to an increase in pulmonary vascular resistance (30. 51). i.e. an increase in right ventricular afterload. It was suggested that this would lead to secondary increases in right ventricular end-diastolic pressure and therefore. central venous pressure and thus a negative effect on venous return. Studies evaluating the effect of a raised impedance to right ventricular outflow (60. 61) have shown that right ventricular function tends to be preserved even at high levels of pulmonary arterial pressure. Moreover. it can be concluded from results of Harinck (28) and Versprille et a!. (63) in piglets, that right ventricular filling pressure does not increase significantly during increases in pulmonary artery pressure up to 25 rnrnHg when blood flow is constant.
Ventricular Interdependence
Increases in right ventricular afterload that result in an increased right ventricular end-diastolic pressure. can secondarily alter left ventricular end-diastolic pressure and geometry (6, 28, 63). This phenomenon is called ventricular interdependence. Laver et a!. (38) suggested that this mechanism was also operative during PEEP. Jardin et a!. (34), using echocardiography, demonstrated a leftward shift of the interventricular septum in patients with ARDS during PEEP. and concluded that decreased cardiac output was due to restriction of left ventricular filling. Such a displacement of the septum was not observed during PEEP in animal studies (I 0. 56). Both in animal (20, 58) and patient studies (64) similar decreases in right and left ventricular end-diastolic volumes have been shown to occur during PEEP. This implies that the decrease in cardiac output cannot be explained by ventricular interdependence.
Cardiac Contractility
Much confusion has been raised by studies calculating transmural cardiac filling pressures using esophageal balloon pressure measurements. These studies (I L 54) showed unchanged or elevated left ventricular net filling pressures in the presence of
decreases in cardiac outppt during PEEP. Such observations suggest the possibility of
10
a decrease in cardiac contractility as a basic mechanism for the decrease in cardiac output during PEEP. Several mechanisms were suggested as being responsible for a decrease in cardiac contractility, including subendocardial ischemia (40). reflex (II) or humorally (27) mediated depression due to lung hyperinflation.
There are, however. serious doubts about the reliability of the observed decreases in cardiac contractility described above. Marini et a!. ( 42) demonstrated that esophageal balloon measurements underestimate the pericardia! pressure increments during the application of PEEP both in animals and in man in the supine position. Moreover. using pericardia! pressure measurements, decreases in transmural right and left ventricular end-diastolic pressures were demonstrated (20. 2L 22, 29, 56) indicating a decrease in cardiac preload.
Most indices for measuring changes in cardiac contractility are sensitive to changes in preload. Comparison of indices of contractility at ZEEP and at PEEP after restoring circulatory volume. did not reveal any difference in ejection fractions of either ventricle (8, 58). nor in force-velocity pressure rise relations (14, 15, 57).
Ventricular Distensibility
Ventricular distensibility, a diastolic property of the ventricle, is defined by relating changes in ventricular volume to changes in transmural pressure, and is a function of the distensibility of the ventricular muscle itself. as well as the thickness and geometry of the ventricular walls (7). Lung insufflation might affect ventricular geometry and therefore ventricular distensibility (10, 14).
A decrease in ventricular distensibility implies a higher filling pressure for the same volume (causing an increase in right or left atrial pressure). In several studies (14, 29, 66), using pericardia! pressure measurements for calculation of transmural ventricular pressure. a decrease in ventricular distensibility was observed during PEEP. However, according to Wise eta!. (66) such a decrease should be present only above a PEEP of 15 cmH20. Indeed. Fewell eta!. (22) demonstrated that no change in ventricular distensibility occurred during PEEP up to 12 cmH20.
Cardiovascular Control Mechanisms
A striking similarity in all the animal and human studies on PEEP is the lack of attention to cardiovascular control mechanisms. whereas in most reports decreases in cardiac output and systemic arterial pressure were evident. Decreases in cardiac output and arterial pressures comparable with the decreases caused by PEEP, but induced by hemorrhage or acute cardiac tamponade. lead to considerable increases in heart rate (39, 44, 62). In a minority of PEEP studies (29. 34) only small increases in heart rate were observed, whereas in the majority no changes were reported (8. I L 14, 15. 22, 64, 66). Even decreases in heart rate during PEEP have been found (9, 27, 56). Therefore. additional mechanisms influencing the cardiovascular control me-
11
chanisms might be evoked by PEEP. This hypothesis is one of the main subjects of
this thesis.
Objectives of the Study
In most of the previously mentioned studies., hemodynamics were compared between zero end-expiratory pressure (ZEEP) and one or two distinct levels of PEEP. Linear relations between cardiac output and PEEP were often assumed and hemodynamic analyses were based on them.
In our studies hemodynamics were analysed at all levels of PEEP between 0 and 15 cmH20 except for cardiac output which was measured at intervals of 0.33 cmH,O. For this study PEEP was applied as a ramp. i.e. as a slow and continuous rise.
We performed initially a methodological study which compared two thermodilution techniques for the estimation of cardiac output during IPPV and PEEP (Chapter II). Subsequently the hemodynamic changes to PEEP applied as a ramp were analysed to evaluate the mechanisms influencing cardiac output (Chapter Ill).
In Chapter IV a hypothesis suggested by the first PEEP study was tested. The hypothesis was that a lung stretch depressor reflex was involved as an additional mechanism in the negative cardiac output responses to PEEP. In Chapter V the contribution of the lung stretch depressor reflex and cardiovascular compensatory mechanisms was studied at different levels of circulatory load.
REFERENCES
I. Asbaugh. D.G .. T.L. Petty, D.B. Bigelow. and T.M. Harris. Continuous positive-pressure breathing (CPPB) in adult respiratory distress syndrome. J. Thorac. Cardiovasc. Surg. 57: 31-41. 1969.
2. Avery, M.E .. and J. Mead. Surface properties in relation to atelectasis and hyaline membrane disease. J. Diseases Children 97: 517-523. 1959.
3. Bach of en M .. and E.R. Weibel. Alterations of the gas exchange apparatus in adult respiratory insufficiency associated w1th septicemia. Am. Rev. Resp. Dis. 116: 589-615. 1977.
4. Bara..:h. A.L. M. Eckman. E. Ginsburg. C. C. Rumsey. I. Korr, I. Eckman. and G. Besson. Studies on positive pressure respiration. J. Aviation Med. 17: 290-356. 1946.
5. Barach. A.L.. J. Martin. and M. Eckman. Positive pressure respiration and its application to the treatment of acute pulmonary edema. Ann. Intern. Med. 12: 754-795. 1938.
6. Bemis. C.E., J.R. Serur. D. Borkenhagen. E. H. Sonnenblick. and C.W. Urschel. Influence of right ventricular filling pressure on left ventricular pressure and dimension. Circ. Res. 34:498-504. 1974.
7. Braunwald. E. Contraction of the normal heart. In: Heart Disease: a textbook of cardiovascular medicine. ed. by Braunwald. E. Philadelphia: W.B. Saunders. 1980.
8. Brown. D.R.. M.G. Baz.aral. P.H. Nath. and D.J. Delaney. Canine left ventricular volume response to mechanical ventilation with PEEP. Anesthesiol. 54: 409-412. 1981.
9. Calvin, J.E .. A.A. Driedger. and W.J. Sibbald Positive end-expiratory pressure (PEEP) does not depress left ventricular function in patients with pulmonary edema. Am. Rev. Respir. Dis. 124: 121-128. 1981.
10. Cassidy, S.S .. and M. Ramanathan. Dimensional analysis of the left ventricle during PEEP: relative septal and lateral wall displacements. Am. J. Physiol. 246: H792-H805, 1984.
12
II. Cassidy. S.S .. C.H. Robertson. Jr.. A.K. Pierce and R.L Johnson. Jr. Cardiovascular effects of positive end-expiratory pressure in dogs. J. Appl. Physiol.: Respirat. Environ. Exercise Physiol. 44: 743-750. 1978.
12. Cournand. A.. H.L Motley, L WerkO. and D.W. Richards. Jr. Physiological studies of the effects of intermittent positive-pressure breathing on cardiac output in man. Am. J. Physiol. 152: 162-174. 1948.
13. Dantzker. D.R.. C.J. Brook. P. Dehart, J.P. Lynch and J.G. Weg. Ventilation-perfusion distributions in the adult respiratory distress syndrome. Am. Rev. Resp. Med. 120: 1039-1052, 1979.
14. Darsee. J.R.. J.R. Mikolick. P.F. Walter. and R.C. Schlant. Paradoxical rise in left ventricular filling pressure in the dog during positive end-expiratory pressure ventilation. Circ. Res. 49: 1017-1028. 1981.
15. Dhainaut. J.F .. C. Bricard, F.J. Monsallier, 0. Salmon. J. Bons, V. Fourestie. B. Schlemmer, and A. Carli. Left ventricular contractility using isovolemic phase indices during PEEP in ARDS patients. Crit. Care Med. 10: 631-635, 1982.
16. Ditchey. R .. R. Engler. M. Le Wimer. R. Pavelac. V. Bhargava. J. Covell. W. Moores. and R. Shabetai. The role of the right heart in acute cardiac tamponade in dogs. Circ. Res. 48: 701-710. 1981.
17. Falke. K.J .. H. Pontoppidan. A. Kumar. D.E. Leith. B. Geffin. and M.B. Laver. Ventilation with end-expiratory pressure in acute lung disease. J. C!in. Invest. 51: 2315-2323. 1972.
18. Farrell. P.M .. and M.E. Avery. Hyaline membrane disease. Am. Rev. Resp. Dis. 111: 657-688. 1975.
19. Fein. A.M .. S.K. Goldberg. M.L. Lippmann. R. Fischer. and L. Morgan. Adult respiratory distress syndrome. Br. J. Anaesrh. 54: 723-736. 1982.
20. Fewell. J.E .. D.R. Abendschein. C.J. Carlson. J.F. Murray. and E. Rapaport. Continuous positive-pressure ventilation decreases right and left ventricular end-diastolic volumes in the dog. Circ. Res. 46: 125-132. 1980.
21. Fewell. J.E .. D.R. Abendschein, C.J. Carlson. E. Rapaport, and J.F. Murray. Mechanism of decreased right and left ventricular end--diastolic volumes during continuous positive-pressure ventilation in dogs. Circ. Res. 47: 467-472. 1980.
22. Fewell. J.E .. D.R. Abendschein, C.J. Carlson, E. Rapaport, and J.F. Murray. Continuous positive-pressure ventilation does not alter ventricular pressure-volume relationship. Am. J. Physiol. 240: H821-H826. 1981.
23. Fowler. N.O .. and M. Gabel. The hemodynamic effects of cardiac tamponade: mainly the result of atrial. not ventricular compression. Circulation 71: 154-157. 1985.
24. Fowler. A.A., R.F. Hamman. J.T. Good. K.N. Benson. M. Baird. D.J. Eberle, T.L Petty. and T.M. Hyers. Adult Respiratory Distress Syndrome: risk with common predispositions. Ann. Intern. Med. 98: 593C597. 1983.
25. Gel b. A. F .. and E. Klein. Hemodynamic and alveolar protein studies in noncardiac pulmonary edema. Am. Rev. Resp. Dis. 114: 831-835. 1976.
26. Gregory. G.A.. J.A. Kitterman. R.H. Phibbs. W.H. Tooley. and W.K. Hamilton. Treatment of the idiopathic respiratory distress syndrome with continuous positive airway pressure. N. Engl. J. Med. 284: 1333-1340. 1971.
27. Grindlinger. G.A.. J. Manny. R. Justice. B. Dunham. D. Shepro. and H.B. Hechtman. Presence of negative inotropic agents in canine plasma during positive end-expiratory pressure. Circ. Res. 45: 460-467. 1979.
28. Harinck, E. Interaction of the right and left side of the heart and postnatal changes thereof. M.D. Thesis. Leiden. 1974.
29. Haynes. J.B., S.D. Carson. W.P. Whitney. G.O. Zerbe. T.M. Hyers. and P. Steele. Positive end-expiratory pressure shifts left ventricular diastolic pressure-area curves. J. Appl. Physiol.: Respirat. Environ. Exercise Physiol. 48: 670-676. 1980.
30. Hobelmann. C.F.. Jr .. D.E. Smith, R.W. Virgilio. A.R. Shapiro. and R.M. Peters. Hemodynamic alterations with positive end-expiratory pressure: the contribution of the pulmonary vasculature. J. Trauma IS: 951-958. 1975.
31. Hopewell, P.C. Failure of positive end-expiratory pressure to decrease lung water content in alloxan-induced pulmonary edema. Am. Rev. Resp. Dis. 120: 813-819. 1979.
13
32. Hudson. L.D. Ventilatory management of patients with adult respiratory distress syndrome. Sem. Resp. Med. II: 128-139, 1981.
33. Humphreys. G.H .. R.L. Moore. H.C. Maier. and V. Apgar. Studies of the cardiac output of anesthetized dogs during continuous and intermittent inflation of the lungs. J. Thorac. Surg. 7: 438-451. 1937/1938.
34. Jardin, F .• J-C. Farcot. L. Boisante. N. Curien, A. Margairaz. and J-P. Bourdarias. Influence of positive end-expiratory pressure on left ventricular performance. N. Engl. J Med. 304: 387-392, !981.
35. Joffe. N. The addult respiratory distress syndrome. Am. J. Roentgenol. 122: 719-732. 1974. 36. Kumar. A.. K.l. Falke. B. Geffin, C.F. Aldredge. M.B. Laver. E. Lowenstein. and H.
Pontoppidan. Continuous positive-pressure ventilation in acute respiratory failure. N. Engl. J. Med. 283: 1430-1436, 1970.
37. Lamy. M., R.J. Fallat. E. Koeniger. H-J. Dietrich. J.L. Ratcliff, R.C. Eberhart, H.J. Tucker, and J.D. Hill. Pathologic features and mechanisms of hypoxemia in adult respiratory distress syndrome. Am. Rev. Respir. Dis. 114: 267-284. 1976.
38. Laver. M.B.. H.W. Strauss. and G.M. Pohost. Right and left ventricular geometry: adjustments during acute respiratory failure. Crit. Care Med. 7: 509-519. 1979.
39. Le Winter. M.M .. J.S. Karliner. and J.W. CovelL Alteration in heart rate response to hemorrhage in conscious dogs with volume overload. Am. J. Physiol. 235: H422-H428. 1978.
40. Lozman, J .• S.R. Powers. Jr.. T. Older. R.E. Datton. R.J. Roy. M. English. D. Marco, and C. Eckert. Correlation of pulmonary wedge and left atrial pressures. Arch. Surg. 109: 270--276. 1974.
41. Malo. J .. J. Ali. and L.D.H. Wood. How does positive end-expiratory pressure reduce intrapulmonary shunt in canine pulmonary edema. J. Appl. Physiol.: Respirat. Environ. Physiol. 57: 1002-1010. 1984.
42. Marini. J.J .. R. O'Quin. B.H. Culver. and J. Butler. Estimation of transmural cardiac pressures during ventilation with PEEP. J. Appl. Physio/.: Respirat. Environ. Exercise Physiol. 53: 384-391, 1982.
43. Mcintyre, R.W .. A.K. Laws. and P.R. Ramachandran. Positive expiratory pressure plateau. Can. Anaes. Soc. J. 16: 477-486. 1969.
44. MOller. C.T .. C. G. Schoonbee, and C. Rosendorff. Haemodynamics of cardiac tamponade during various modes of ventilation. Br. J. Anaesth. 51: 409-415. 1979.
45. Petty. T.L.. and D.G. Ashbaugh. The addult respiratory distress syndrome. Chest 60:233-239. 1971.
46. Petty. T.L.. and A.A. Fowler. Another look at ARDS. Chest 82: 98-104. 1982. 47. Petty. T.L.. O.K. Reiss. G.W. Paul. G.W. Silvers. and N.D. Elkins. Characteristics of
pulmonary surfactant in adult respiratory distress syndrome associated with trauma and shock. Am. Rev. Resp. Dis. 115: 531-536. 1977.
48. Petty. T.L.. G.W. Silvers. G.W. Paul. and R.E. Stanford. Abnormalities in lung elastic properties and surfactant function in adult respiratory distress syndrome. Chest 75: 571-574, 1979.
49. Pontoppidan. H .. B. Geffin. and E. Lowenstein. Acute respiratory failure in the adult. N. Engl. J. Med. 287: 690-698. 743-752. 799-806, 1972.
50. Pontoppidan. H .. R.S. Wilson. M.A. Rie. and R.C. Schneider. Respiratory intensive care. Anesthesia!. 47: 96-116. 1977.
51. Powers. S.R., R. Manna!. M. Neclerio, M. English. C. Marr. R. Leather. H. Ueda. G. Williams. W. Custead. and R. Dutton. Physiologic consequences of positive end-expiratory pressure (PEEP) ventilation. Ann. Surg. 178: 265-271. 1973.
52. Pratt. P.C.. R.T. Vollmer. J.D. Shelburne. and J.D. Crapo. Pulmonary morphology in a multihospital collaborative extracorporeal membrane oxygenation project. Am. J Path. 95: 191-208. 1979.
53. Prewitt. R.M .. L. Oppenheimer. J.B. Sutherland, and L.D.H. Wood. Effects of positive endexpiratory pressure on left ventricular mechanics in patients with hypoxemic respiratory failure. Anesthesia!. 55: 409-415. 1981.
54. Prewitt. R.M .. and L.D.H. Wood. Effect of positive end-expiratory pressure on ventricular function in dogs. Am. J. Physiol. 236: H534-H544. 1979.
14
55. Ralph. D .. and H.T. Robertson. Respiratory gas exchange in adult respiratory distress syndrome. Sem. Respir. Med. 2: 114-122. 1981.
56. Rankin. J.S .. G.O. Olsen. C.E. Arentzen et al. The effect of ainvay pressure on cardiac function in intact dogs and man. Circulation 66: 108-120, 1982.
57. Robotham. J.L.. W. Lixfeld. L. Holland. D. MacGregor. B. Bromberger-Barnea. S. Permutt. and J.L. Rabson. The effects of positive end-expiratory pressure on right and left ventricular performance. Am. Rev. Resp. Dis. 121: 677-683. 1980.
58. Santamore. W.P .. A.A. Bove. and J.L. Heckman. Right and left ventricular pressure-volume response to positive end-expiratory pressure. Am. J. Physiol. 246: HI 14-H119. 1984.
59. Staub, N.C. Pulmonary edema. Chest 74: 559-564. 1978. 60. Stool. E.W .. C.B. Mullins. S.J. Leshin. and J.H. Mitchell. Dimensional changes of the left
ventricle during acute pulmonary arterial hypertension in dogs. Am. J. Cardiol. 33: 868-875. 1974.
61. Taguini. A. C.. J.D. Fermoso. and P. Aramendia. Behavior of the right ventricle following acute constriction of the pulmonary artery. Circ. Res. 8: 315-318. 1960.
62. Vatner. S.F .. and D.H. Boettcher. Regulation of cardiac output by stroke volume and heart rate in conscious dogs. Circ. Res. 42: 557-56 I. 1978.
63. Versprille. A .. E. Harinck. C.J. van Nie. and J.R.C. Jansen. Functional interaction of both ventricles at birth and the changes during the neonatal period in relation to the changes of geometry. In: Fetal and Newborn Cardiovascular Physiology. vol. 1: Developmental aspects. ed. by L.D. Longo and D.D. Renau. Garland STPM Press. New York. Ch. 16: 399-413. 1978.
64. Viquerat. C.E .. A. Righetti. and P.M. Suter. Biventricular volumes and function in patients with adult respiratory distress syndrome ventilated with PEEP. Chest 83: 509-514. 1983.
65. Warshaw. A.L.. P.B. Lesser, M. Rie, and D.J. Culler. The pathogenesis of pulmonary edema in acute pancreatitis. Ann. Surg. 182: 505-509. 1975.
66. Wise. R.A .• J.L. Robotham. B. Bromberger-Barnea. and S. Permutt. Effect of PEEP on left ventricular function in right-heart-bypassed dogs. J. Appl. Physiol.: Respirai. Environ. Exercise Phys;oi. 51: 541-546. !981.
67. Woolverton. W.C .. K.L. Brigham. and N.C. Staub. Effects of positive pressure breathing on lung lymph flow and water content in sheep. Circ. Res. 42: 550-556. 1978.
68. Zapol. W.M .. and M.T. Snider. Pulmonary hypertension in severe acute respiratory failure. N. Engl. J. Med. 296: 476-480, !977.
15
CHAPTER II
Thermodilution technique for measurement of cardiac output during artificial ventilation
Jos R.C. Jansen, Jan J. Schreuder, Jan M. Bogaard, Willem van Rooyen and Adrian Versprille (With the Technical Assistance of Arnold Drop)
Pathophysiological Laboratory, Departmenl of Pulmonary Diseases. Erasmus University. 3000 DR Rotterdam, The Netherlands J.Appl.Physiol.: Respirat. Environ. Exercise Physiol. 51:584-591, 1981
Continuous or frequent monitoring of hemodynamic and respiratory variables during artificial ventilation is important for optimal management of critically ill patients as well as for physiological studies. One of the main variables. cardiac output, can be measured by the thermodilution technique introduced by Fegler (3). The feasibility of this method has been demonstrated in animals (5, 8, 18, 21) and humans (L 4, 12). The method is easy to perform and can be repeated almost without limitations at very short time intervals. However, a few important requirements must be fulfilled: complete mixing ( 15), no loss of indicator (6, 20, 22), and constant blood flow during the period of measurement (2, 17).
During artificial ventilation. i.e., intermittent and continuous positive-pressure breathing (IPPV and CPPV), a significant modulation of cardiac output. i.e .. stroke volume, occurs with each respiratory cycle (10, II). Except for our preliminary report (7) we are not aware of any investigation concerning the influence of this fluctuation on the estimate of mean cardiac output with the thermodilution technique.
The purpose of the present study was to estimate the error in the cardiac output measured by thermodilution in anesthetized closed-chest pigs during different phases of the respiratory cycle so as to determine the most appropriate moment of injection. Additionally. the effect of mean cardiac output on the errors were studied by changing the end-expiratory pressure. It is known that positive end-expiratory pressure (PEEP) decreases cardiac output (10) but increases its modulation (7). This study was carried out on both sides of the heart. The output of the left side of the heart was measured in order to avoid the influence of nonindicator blood temperature changes during each respiratory cycle (22) and to minimize the errors due to loss
16
of indicator under circumstances of low cardiac output levels (21, 22). Since routine measurements of cardiac output using thermodilution techniques in
clinical medicine are performed by administering the injectate in the right atrium and detecting the thermal changes in the pulmonary artery. we have also included comparable measurements in the present study.
METHODS
Surgical Procedure
Yorkshire pigs (5-7 wk old. weighing 7-ll kg) were anesthetized with pentobarbital sodium (30 mg·kg- 1ip). The body temperature was maintained at about 38°C by placing the animals on a thermocontrolled operating table. After tracheostomy all pigs were connected to a Fleisch pneumotachograph head (type 0. Godart) and were allowed to breath spontaneously. Two catheters were inserted into the right common carotid artery: a double-walled injection catheter was placed 2.5-3 em beyond the aortic valves into the left ventricle; the tip of the other, with a thermistor. was positioned in the aortic arch near the origin of the brachiocephalic artery. The length of the intracorporeal part of the injection catheter was 12-15 em. A four-lumen catheter was inserted via the right internal jugular vein into the superior vena cava to the level of the right atrium. One lumen was used for measuring central venous pressure. and the others were used for infusions. In animals where the output of the right heart was measured. a double-walled injection catheter and a Swan-Ganz 5F catheter with thermistor were placed via the right external jugular vein into the right atrium and the pulmonary artery, respectively. After the experiments the position of each catheter was confirmed at autopsy.
Anesthesia was maintained by a continuous infusion of pentobarbital (7.5 mg·kg-l.h - 1 iv). After completion of surgical procedures the animals were paralyzed with d-tubocurarine hydrochloride (0.1 mg·kg- 1 loading dose). administered over a period of 3 min, followed by a continuous infusion of 0.2 mg·kg-1·h-1 to avoid spontaneous breathing during the experimental procedures. The animals were ventilated with room air with a constant~volume Starling ventilator (BraunMelsingen) at a rate of 10 cycles/min. Inflation lasted 44% of the ventilatory cycle and was followed by a spontaneous expiration against a water seal from 0 up to 15 cmH20. The ventilation volume was adjusted to maintain arterial carbon dioxide tension (PC00 ) between 38 and 44 Torr. When the arterial PC02 was stabilized between these values the tidal volume was not changed further.
Measurements
Fick method. When blood pressures. heart rate. end tidal and arterial PC02 and peak tracheal pressure were stable. cardiac output (COFickl was measured by the direct Fick method for oxygen ( 19). Arterial and mixed venous blood and expiratory
17
air from a gas mixing box were sampled over a period of 3 min. The respiratory gases were measured with a mass spectrometer (Perkin-Elmer MGA 1100). The oxygen uptake (Vo,.ml·s- 1 STPD) was corrected for the differences between inspired and expired volumes by assuming no volume change of nitrogen (14). The oxygen content of mixed venous blood from the pulmonary artery and that of the arterial blood from the aorta was calculated from the directly measured oxygen saturation and hemoglobin (Hb) values (Radiometer OSM 2) and from the physically dissolved oxygen as determined by the P02 values. Acid-base values were measured with an automatic analyzer (Radiometer ABL 1). A value of 1.39 ml 0, STPD·Hb- 1 was used as the oxygen binding capacity (International Committee for Standardization in Haemotology. 1965).
VENTILATOR -· 100 HOLES
PNEUMATIC
CYLINDER
INJECTATE
START STOP
CONTROL UNIT
PHASE n VENT. n SHOT$ ADJ. ADJ. ADJ.
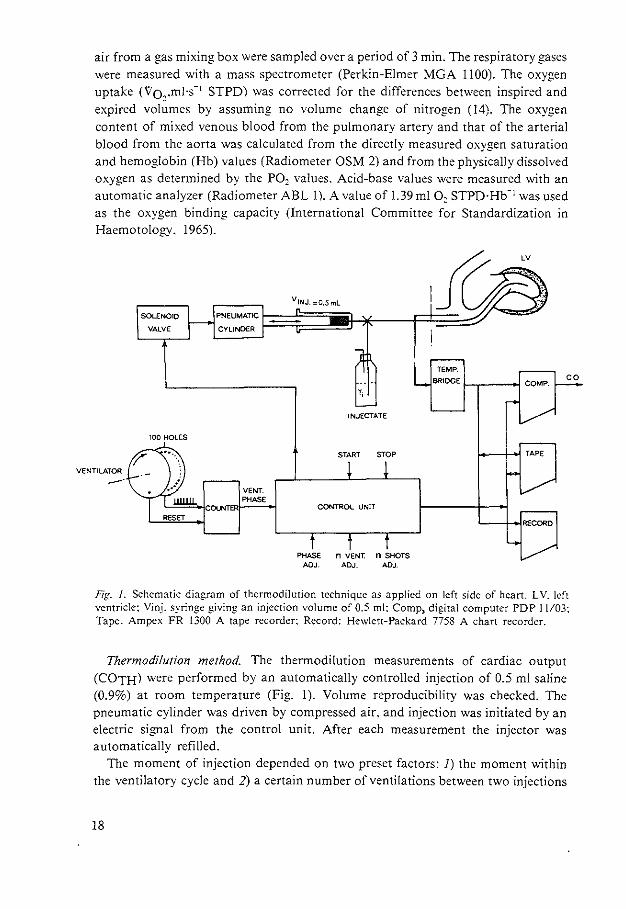
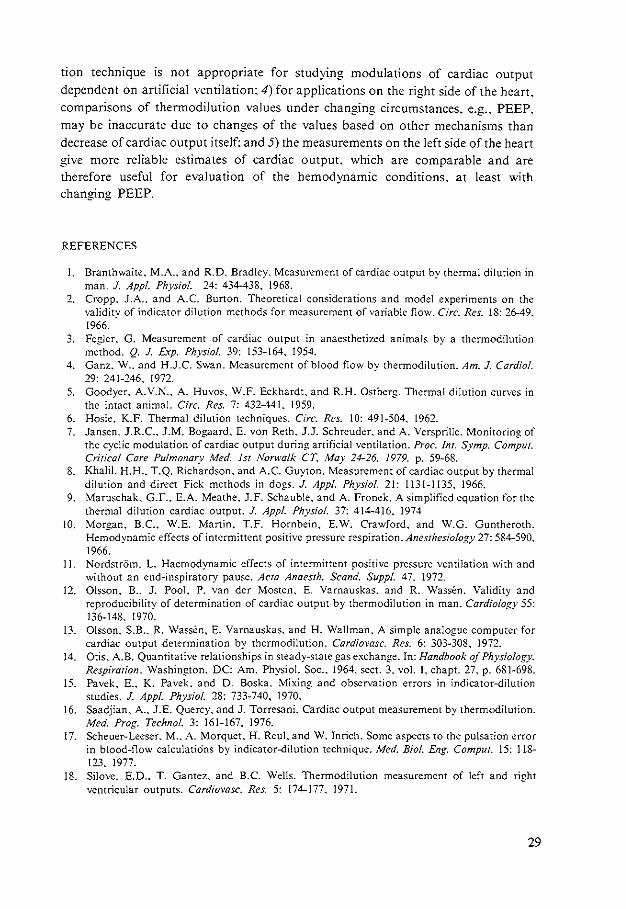
Fig. J. Schematic diagram of thermodilution technique as applied on left side of heart. LV. left ventricle: Vinj. syringe giving an injection volume of 0.5 ml: Comp, digital computer PDP I I/03: Tape. Ampex FR 1300 A tape recorder: Record: Hewlett-Packard 7758 A chart recorder.
Thermodilution method. The thermodilution measurements of cardiac output (COTH) were performed by an automatically controlled injection of 0.5 ml saline (0.9%) at room temperature (Fig. 1). Volume reproducibility was checked. The pneumatic cylinder was driven by compressed air. and injection was initiated by an electric signal from the control unit. After each measurement the injector was automatically refilled.
The moment of injection depended on two preset factors: I) the moment within the ventilatory cycle and 2) a certain number of ventilations between two injections
18
(in our experiments this number was 5). The moment of injection within the ventilatory cycle was derived from two discs on the axis of the Starling ventilator. one with 100 holes and the other with 1 hole. The disc with 1 hole was used to reset the counter at the start of the inspiration. The disc with 100 holes divided a ventilatory cycle in percentages. The control unit controlled the moment of the injection and signaled the computer to start the integration of the temperature-time curve derived from the temperature bridge. The thermistor had the following characteristics: diameter 0.5 rom. resistance at 37°C 5.000 Q. It was mounted at the tip of a polyethylene catheter (1.14 mm ID. 1.57 mm OD) and had a 90% thermal response time of approximately 0.2 s. The voltage across the thermistor was kept low to avoid influences due to changes in the velocity of blood. When the bridge was balanced at blood temperature. the voltage-temperature characteristic of the bridge gave a satisfactory linearity within the range of measurements (37-39°C) (4. 9. 13).
Data Acquisition and Analysis
Electrocardiogram (ECG). aortic. pulmonary arterial. and central venous pressures. ventilatory pressure and flow. and thermodilution signals were simultaneously recorded on a Hewlett-Packard 7758 A chart recorder and an Ampex FR 1300 A tape recorder and analyzed on-line with a digital computer PDP 11103. The sample frequency was 200 Hz for the ECG and blood pressures and 50 Hz for the thermodilution curve. ventilatory pressure. and airflow.
Cardiac output (CO) by thermodilution was calculated according to
where
and
CO= QJpbSb(Ji; [Tb(t)- Tb,]dt- A}
Q, = p,S,V,(Tb,- T,) - Cki(Tb,- T,)
A = (Tbz- Tb,) (tz- t,)/2
Tb1 = Ji:•" T"(t)dt/M
Tbz = J;;+>' T"(t)dt/M
A is the area under the temperature-time curve due to the leakage of heat from the injection catheter (see dashed area in Fig. 5): Oi is the effective amount of indicator. cal~ Vi is the injectate volume. ml: Ti is the temperature of injectate. oc~ Tb is the temperature of blood at the detection site. oe; Si and Sb are specific heat of injectate (0.997) and blood (0.870). respectively. cal·g- 1
: P•i and Pb are specific gravity of injectate (1.005) and blood (1.045). respectively, g·mr 1: Ck is the caloric value of injection catheter plus remaining injectate. m - 1·°C-1
: I is the length of the intracorporeal part of the injection catheter: t 1 - t2 is the integration intervaL 9s: and .6.t is the heart interval.
T b and Ti were determined immediately before and after each series of measurements. Tb - T·i is the difference between the blood temperature measured with the
19
thermistor and the temperature of the injectate measured with a mercury thermometer. The thermistor had been calibrated against the mercury thermometer. The 99% thermal response time of the double-walled injection catheter was about 26 s. Therefore. an interval of five ventilatory cycles between two injections was used.
Experimental Procedures
Five pigs were used in which the output of the left side of the heart was measured by administering the injectate into the left ventricle and detecting temperature changes in the aortic arch. At four levels of PEEP [0 (ZEEP). 5. 10. and 15 cmH,O]. series of 50 thermodilution measurements were carried out under steady-state conditions at all even phases of the ventilatory cycle (2. 4 ..... 100%). The sequence of the phases was chosen at random (PDP II random generator). To evaluate the steady-state throughout a series. not only heart rate and blood pressures. as mentioned. were measured but also cardiac output by the direct Fick method for oxygen. Three such measurements of cardiac output were done before as well as after each series. The measurement of cardiac output from the right side of the heart was performed in a separate group of six animals. The experimental protocol was almost identical to that described above. but. in addition to injections in the right atrium. an extra series of 50 measurements at the left side with a PEEP of 5 cmH20 was performed for comparison.
RESULTS
Assessment of Steady State
After all series of observations at four levels of PEEP the hemodynamic variables returned to the initial baseline levels at ZEEP. Mean values (±SO) for aortic pressure (94 ± 6 Torr). pulmonary artery pressure ( 19 ± 5 Torr). and central venous pressure (0.6 ± 0.4 Torr) indicated no deterioration in the animal model.
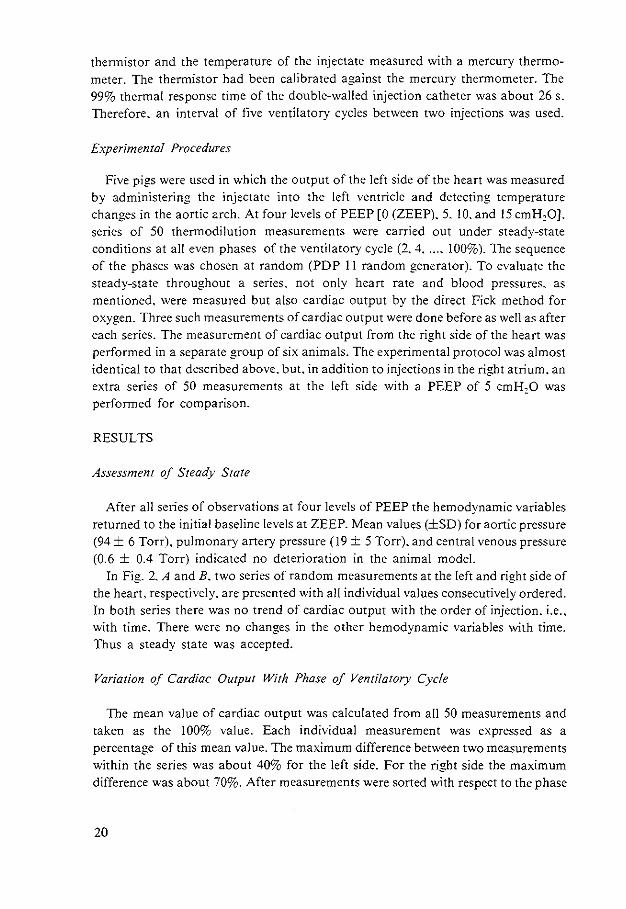
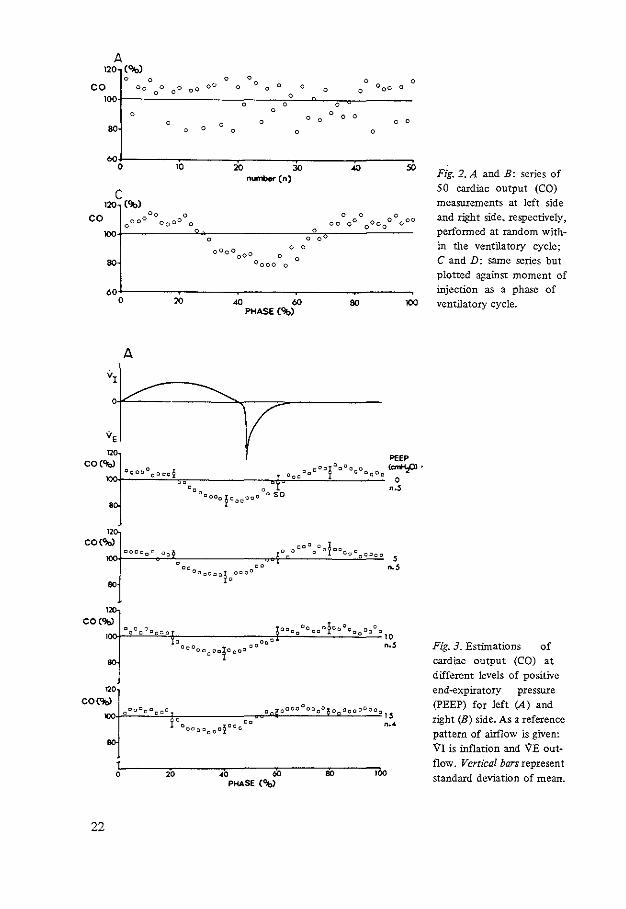
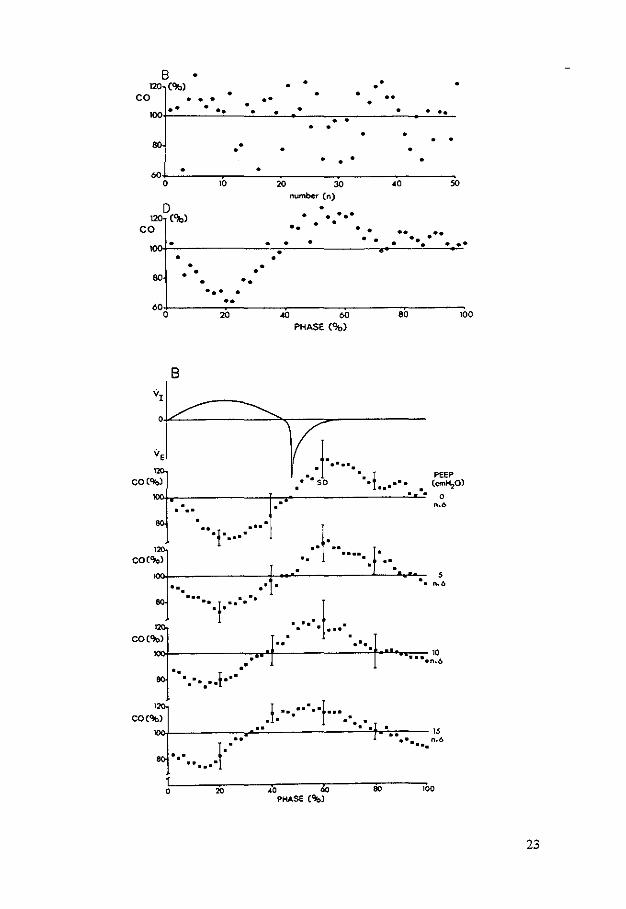
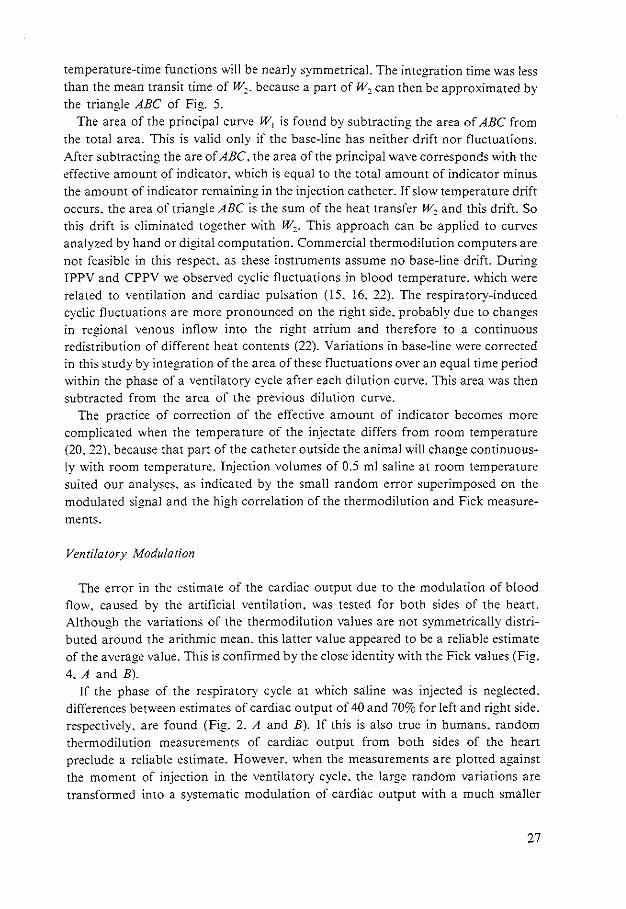
In Fig. 2. A and B. two series of random measurements at the left and right side of the heart. respectively. are presented with all individual values consecutively ordered. In both series there was no trend of cardiac output with the order of injection. i.e .. with time. There were no changes in the other hemodynamic variables with time. Thus a steady state was accepted.
Variation of Cardiac Output With Phase of Ventilatory Cycle
The mean value of cardiac output was calculated from all 50 measurements and taken as the 100% value. Each individual measurement was expressed as a percentage of this mean value. The maximum difference between two measurements within the series was about 40% for the left side. For the right side the maximum difference was about 70%. After measurements were sorted with respect to the phase
20
of the ventilatory cycle at the moment of injection, a cyclic modulation of the values appeared (Fig. 2, C and D). On this modulation a random error was superimposed. In Fig. 3, A and B, all results for left and right sides were then averaged. At a PEEP level of 15 cmH,O the results of only four animals were used for the study on the left side. The results from the fifth animal were rejected since the steady state was not present. The average curve of the series of measurements at a PEEP of 5 em H20 performed at the left side of the heart during the study of cardiac output measured from the right side did not show any difference with the corresponding series of the study on the left side (Fig. 3A).
The cyclic modulation at the left side. estimated with thermodilution, does not change with PEEP. During the inflation a decrease of flow was measured with recovery to a plateau with the onset of spontaneous expiration. Also at the right side the amount of the modulation did not significantly change with PEEP, although Fig. 3B suggests a slight decrease. However. the pattern of modulation shifts with PEEP.
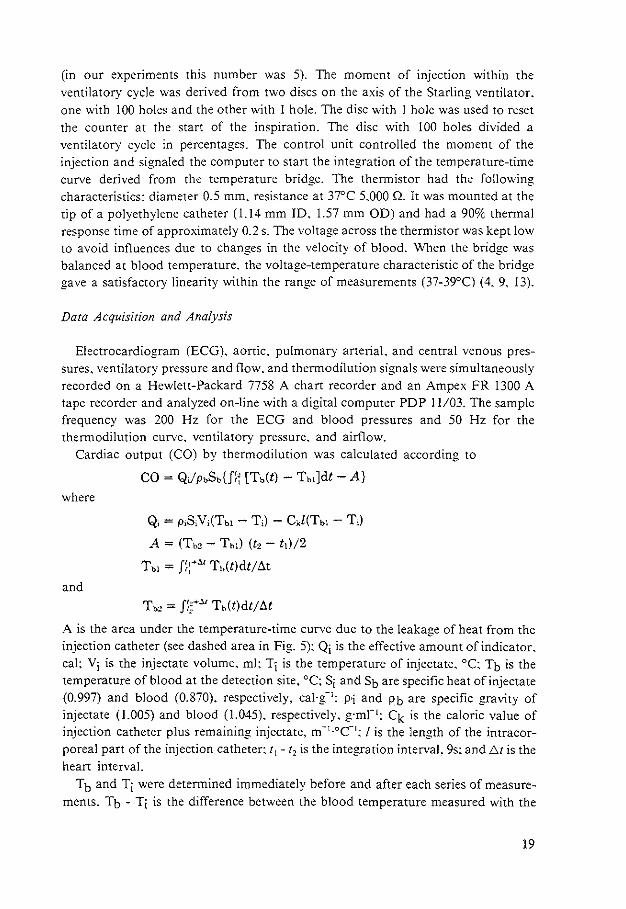
Table 1.
Averaged values of cardiac output estimates related to PEEP
COFick• COTH, COTH• COTH COTH PEEP, ml.s-1• mLs-1 • %COTH (60%), (90%),
cmH20 n kg-1 kg-1 at ZEEP %COTH %COTH
Left :ide of heart
0 5 2.75 ±0,57 2.64 ± 0.66 100 ±O 98.8 ±4,6 106.5 ±5,7
5 5 2,25 ±0.37 2,08 ±0.31 82 ±7 99.5 ± 3.4 104.9 ±3,8
10 5 1.59 ± 0.28 1.62 ±0.21 59 ±4 101.1 ± 6.0 106,0 ±3.2
15 4 1.44 ±0.27 1.41 ±0.34 s1 ±s 101.4 ± 3.2 103.2 ±4,7
Right side of heart
0 6 2,08 ± 0.34 2.12 ± 0.23 100 ±O 114,0 ± 6,0
5 6 1.78 ± 0.34 1.85 ±0.44 88 ±23 102.3 ±7.5
10 6 1.33 ±0,14 1.46 ± 0.20 68 ±7 97.3±8.2
15 6 1.05 ± 0,13 1.12 ±0,07 54±5 91.0 ±5.4
Values are means ± SD. PEEP, positive end...expiratory pressure; n, no. of animals; COFick• mean cardiac output estimated with the Fick method from 3 measurements before and 3 after each series of 50 thermodilution measurements; COTH• mean cardiac output estimated from 50 measurements with the thermodilution method; ZEEP, PEEP at 0 cmH20; COTH(60%) and COrn(90%), cardiac output measurements at 60 and 90% phase of ventilatory cycle.
21
A 120 (%)
0 0 0 0 0 0 0 co oo 0 00 oO
oo 0 0 0 0
0 0 oo 0
0 0 0
100 0 0 0
0 0 0
0 0 0 0 0 0 0 0 0
80 0 0 0 0 0
60 0 10 20 30 .., 50
number (n)
c 120 {'Jb)
co
80
60+-------~------~------~------~------~
"• 120
CON
a
" CO(~
80
"0 CO('lb)
""'
0
1 0
22
20
A
20
40 60 80 PHASE ('Jb)
PEEP
'''!"""" 0 ~. Ooc"" c "o"o 0
"·'
OOo 0 .5
"·'
•O 60 80 PHASE(~
Flg. 2. A and B: series of 50 cardiac output (CO) measurements at left side and rlght side. respectively, perfonned at random within the ventilatory cycle; C and D: same series but plotted against moment of injection as a phase of ventilatory cycle.
Fig. 3. Estimations of cardiac output (CO) at different levels of positive end-expiratory pressure (PEEP) for left (A) and right (B) side. As a reference pattern of airflow is given: VI is inflation and 'IE outflow. Vertical bars represent standard deviation of mean.
8 120 (%)
co • • • • .. • •
• • • ••
•
• >OO·'!·~·~----·_!·~·c_ ___ •!_ __ ,.c_"'•:_ ____ ~----------~·:__._!•_!•"•c_ '1 ••
80 . •
•
• • •
• • •
60+--"C------.------·C--------------.----------------------o W W ~ AO ~
number (n)
D • ... 1 C'lbl • • co .. • • •• • • •• . •• • • • • . •••
80
60 0
v,
•
B
• • • • •
..
• •• ... • ••
20
. . •• •j• •••• ...
. ·. . . ... .. I .. · ... . .
• •
"" 60 80 PHASE ('Jb)
!· .... . : .. I • so • • •• . . .. .·
··I· .. . ... .. . . ..
: ... · .j ... ·.
·.
100
PfEP (em~O)
0 ..•
5 •. n.o
.. ···. ,~L------------n~------------~~~~~10 •••• .,.6 . .. . . ! .... . . . ·. .!. ··.·····f··· .· ..
uxH--------------.A!·~·c_ ________________ •!-••r."·'"·------ 15 ••• n.o ... I .. .. . ...
. .. f'------~~------~-------z~------;,------" t ~ ~ & ~ ~
PHASE (~)
23
Estimation of Cardiac Output Under Changing Circumstances
During application of PEEP the cardiac output decreased with respect to the mean value at ZEEP. The absolute and the relative decrease of cardiac output with PEEP is shown in Table 1 for all series. The largest fall was observed between 5 and 10 cmH20 of PEEP. At 60% of the respiratory cycle the estimates of cardiac output at the left side are not significantly different from the mean of all 50 thermodilution measurements at all levels of PEEP; at 90% a systematic overestimation of about 6% was observed with a standard deviation of about 5%.
For the right side of the heart the smallest change of cardiac output with PEEP was at about the 90% phase of the ventilatory cycle. Due to the shift of the modulated curve with PEEP this change of the average value varied from 14% overestimation at ZEEP to 9% underestimation at the PEEP of 15cmH20.
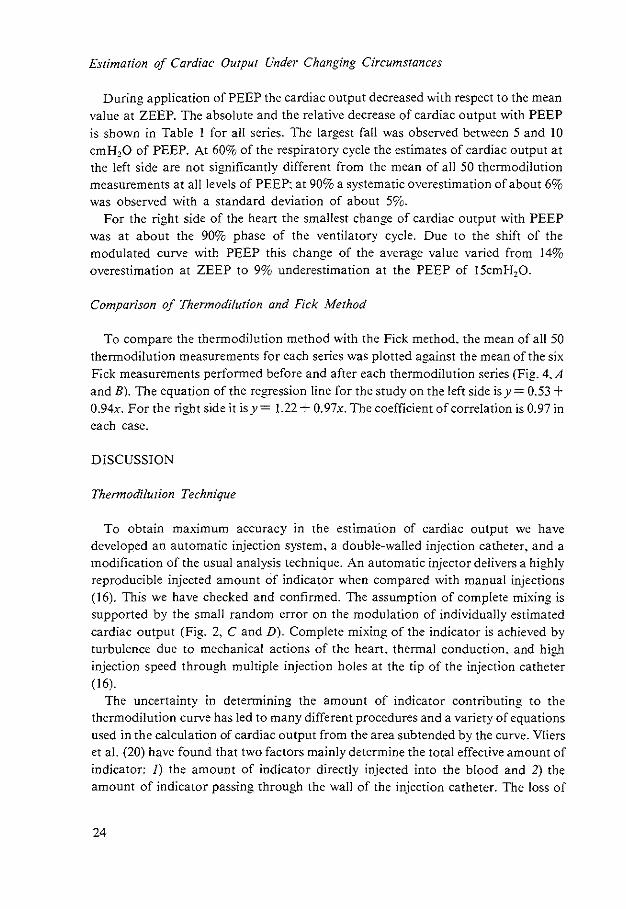
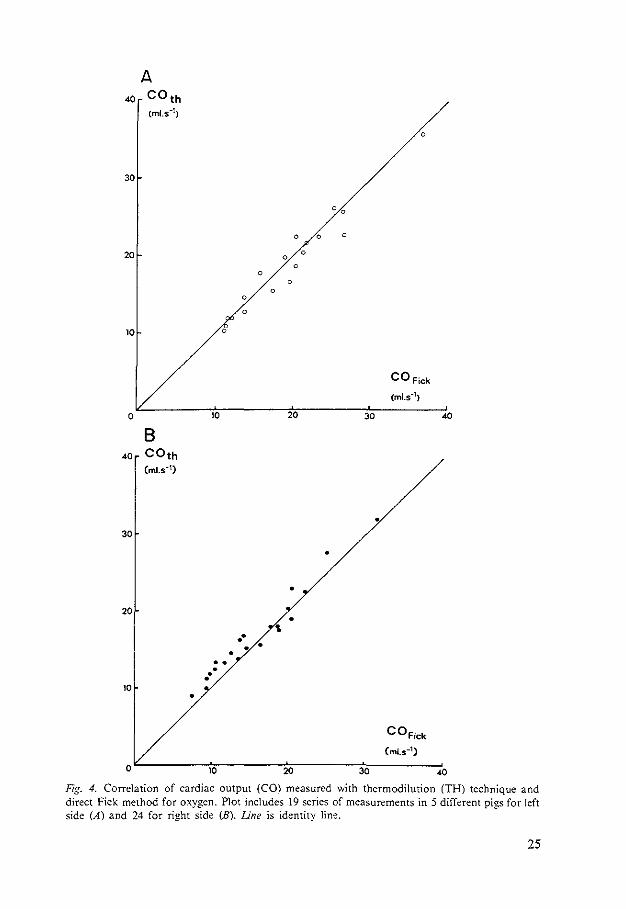
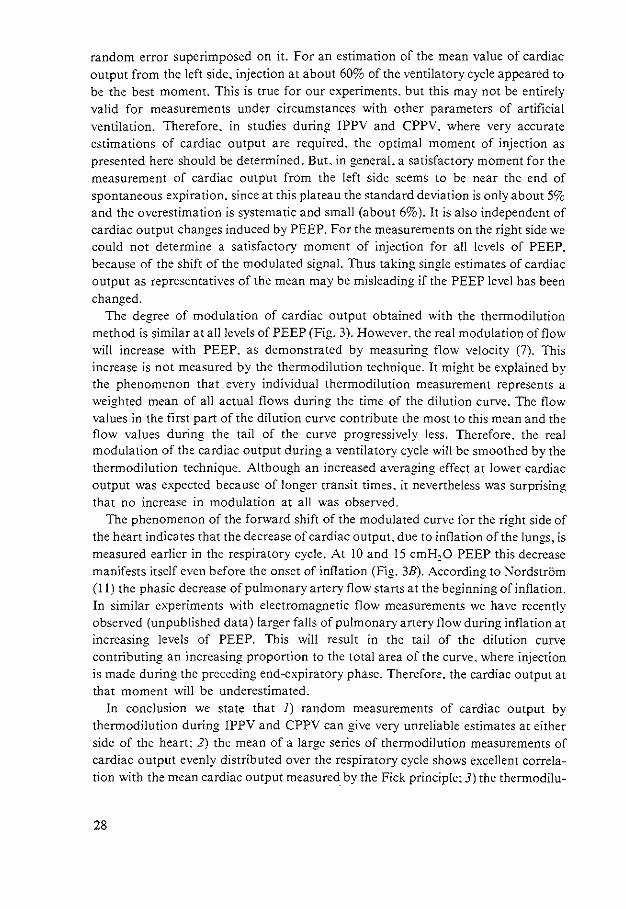
Comparison of Thermodilution and Fick Method
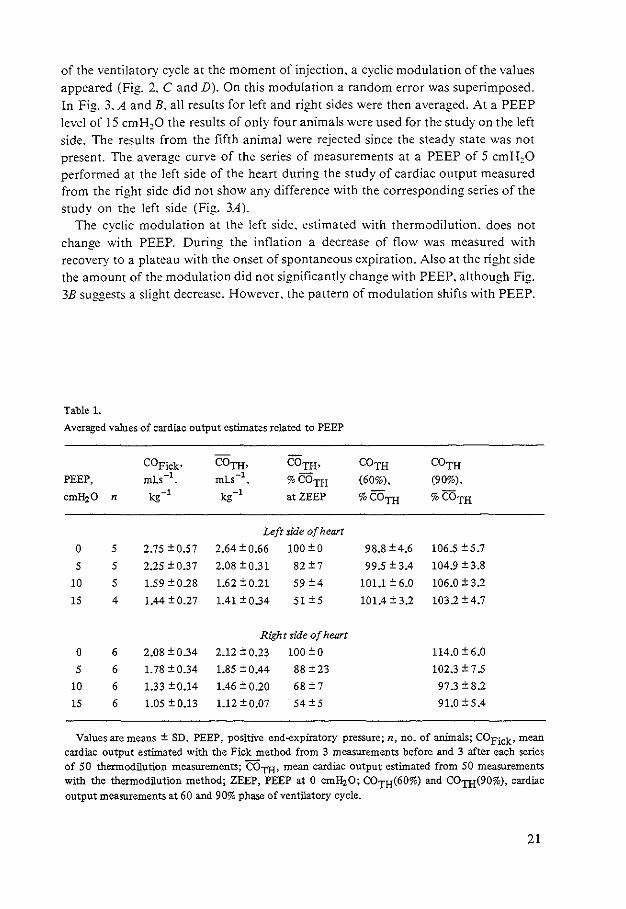
To compare the thermodilution method with the Fick method. the mean of all 50 thermodilution measurements for each series was plotted against the mean of the six Fick measurements performed before and after each thermodilution series (Fig. 4.A and B). The equation of the regression line for the study on the left side is y = 0.53 + 0.94x. For the right side it is y = 1.22 + 0.97x. The coefficient of correlation is 0.97 in each case.
DISCUSSION
Thermodilution Technique
To obtain maximum accuracy in the estimation of cardiac output we have developed an automatic injection system, a double-walled injection catheter. and a modification of the usual analysis technique. An automatic injector delivers a highly reproducible injected amount of indicator when compared with manual injections (16). This we have checked and confirmed. The assumption of complete mixing is supported by the small random error on the modulation of individually estimated cardiac output (Fig. 2. C and D). Complete mixing of the indicator is achieved by turbulence due to mechanical actions of the heart. thermal conduction. and high injection speed through multiple injection holes at the tip of the injection catheter (16).
The uncertainty in determining the amount of indicator contributing to the thermodilution curve has led to many different procedures and a variety of equations used in the calculation of cardiac output from the area subtended by the curve. Vliers eta!. (20) have found that two factors mainly determine the total effective amount of indicator: I) the amount of indicator directly injected into the blood and 2) the amount of indicator passing through the wall of the injection catheter. The loss of
24
30
20 \
•• • •
10
•
•
•
•
COFick
(ml.s-1)
o~--------~,~o--------~20~------~3~0----------.o
Fig. 4. Correlation of cardiac output (CO) measured with thermodilution (TH) technique and direct Fick method for oxygen. Plot includes 19 series of measurements in 5 different pigs for left side (A) and 24 for right side (B). Line is identity lin'!.
25
indicator between the site of injection and the site of detection appeared to be negligible (2, 4, 20, 21, 22).
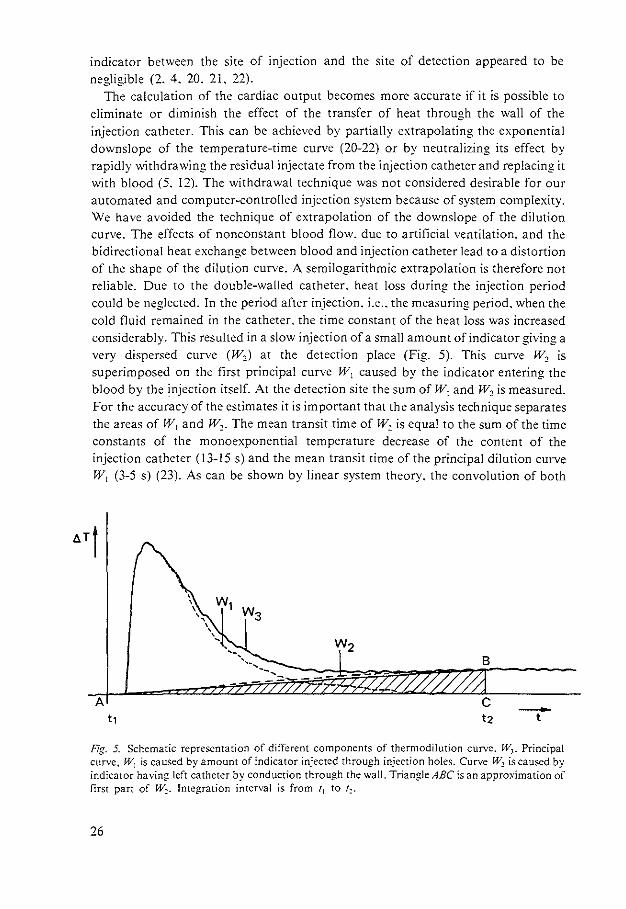
The calculation of the cardiac output becomes more accurate if it is possible to eliminate or diminish the effect of the transfer of heat through the wall of the injection catheter. This can be achieved by partially extrapolating the exponential downslope of the temperature-time curve (20-22) or by neutralizing its effect by rapidly withdrawing the residual injectate from the injection catheter and replacing it with blood (5, 12). The withdrawal technique was not considered desirable for our automated and computer-controlled injection system because of system complexity. We have avoided the technique of extrapolation of the downslope of the dilution curve. The effects of nonconstant blood flow. due to artificial ventilation. and the bidirectional heat exchange between blood and injection catheter lead to a distortion of the shape of the dilution curve. A semilogarithmic extrapolation is therefore not reliable. Due to the double-walled catheter, heat loss during the injection period could be neglected. In the period after injection. i.e .. the measuring period. when the cold fluid remained in the catheter. the rime constant of the heat loss was increased considerably. This resulted in a slow injection of a small amount of indicator giving a very dispersed curve (W0 ) at the detection place (Fig. 5). This curve w, is superimposed on the first principal curve rV1 caused by the indicator entering the blood by the 1njection itself. At the detection site the sum of W1 and W1 is measured. For the accuracy of the estimates it is important that the analysis technique separates the areas of W1 and W1 • The mean transit time of W1 is equal to the sum of the time constants of the monoexponential temperature decrease of the content of the injection catheter (13-15 s) and the mean transit time of the principal dilution curve W1 (3-5 s) (23). As can be shown by linear system theory, the convolution of both
A -t
Fig. 5. Schematic representation of different components of thermodilution curve. W,. Principal curve. W1 is caused by amount of indicator injected through injection holes. Curve W~ is caused by indicator having left catheter by conduction through the wall. Triangle ABC is an approximation of first part of w~. Integration interval is from 'I to !;_.
26
temperature-time functions will be nearly symmetrical. The integration time was less than the mean transit time of w2. because a part of w2 can then be approximated by the triangle ABC of Fig. 5.
The area of the principal curve W1 is found by subtracting the area of ABC from the total area. This is valid only if the base-line has neither drift nor fluctuations. After subtracting the are of ABC, the area of the principal wave corresponds with the effective amount of indicator, which is equal to the total amount of indicator minus the amount of indicator remaining in the injection catheter. If slow temperature drift occurs. the area of triangle ABC is the sum of the heat transfer w, and this drift. So this drift is eliminated together with W2• This approach can be applied to curves analyzed by hand or digital computation. Commercial thermodilution computers are not feasible in this respect, as these instruments assume no base-line drift. During IPPV and CPPV we observed cyclic fluctuations in blood temperature. which were related to ventilation and cardiac pulsation (15. 16. 22). The respiratory-induced cyclic fluctuations are more pronounced on the right side. probably due to changes in regional venous inflow into the right atrium and therefore to a continuous redistribution of different heat contents (22). Variations in base-line were corrected in this study by integration of the area of these fluctuations over an equal time period within the phase of a ventilatory cycle after each dilution curve. This area was then subtracted from the area of the previous dilution curve.
The practice of correction of the effective amount of indicator becomes more complicated when the temperature of the injectate differs from room temperature (20. 22). because that part of the catheter outside the animal will change continuously with room temperature. Injection volumes of 0.5 ml saline at room temperature suited our analyses, as indicated by the small random error superimposed on the modulated signal and the high correlation of the thermodilution and Fick measure
ments.
Ventilatory Modulation
The error in the estimate of the cardiac output due to the modulation of blood flow. caused by the artificial ventilation. was tested for both sides of the heart. Although the variations of the thermodilution values are nor symmetrically distributed around the arithmic mean. this latter value appeared to be a reliable estimate of the average value. This is confirmed by the close identity with the Fick values (Fig.
4. A and B). If the phase of the respiratory cycle at which saline was injected is neglected,
differences between estimates of cardiac output of 40 and 70% for left and right side. respectively. are found (Fig. 2. A and B). If this is also true in humans. random thermodilution measurements of cardiac output from both sides of the heart preclude a reliable estimate. However. when the measurements are plotted against the moment of injection in the ventilatory cycle. the large random variations are transformed into a systematic modulation of cardiac output with a much smaller
27
random error superimposed on it. For an estimation of the mean value of cardiac output from the left side. injection at about 60% of the ventilatory cycle appeared to be the best moment. This is true for our experiments. but this may not be entirely valid for measurements under circumstances with other parameters of artificial ventilation. Therefore. in studies during IPPV and CPPV. where very accurate estimations of cardiac output are required. the optimal moment of injection as presented here should be determined. But. in general. a satisfactory moment for the measurement of cardiac output from the left side seems to be near the end of spontaneous expiration. since at this plateau the standard deviation is only about 5% and the overestimation is systematic and small (about 6% ). It is also independent of cardiac output changes induced by PEEP. For the measurements on the right side we could not determine a satisfactory moment of injection for all levels of PEEP. because of the shift of the modulated signal. Thus taking single estimates of cardiac output as representatives of the mean may be misleading if the PEEP level has been changed.
The degree of modulation of cardiac output obtained with the thermodilution method is similar at all levels of PEEP (Fig. 3). However. the real modulation of flow will increase with PEEP. as demonstrated by measuring flow velocity (7). This increase is not measured by the thermodilution technique. It might be explained by the phenomenon that every individual thermodilution measurement represents a weighted mean of all actual flows during the time of the dilution curve. The flow values in the first part of the dilution curve contribute the most to this mean and the flow values during the tail of the curve progressively less. Therefore. the real modulation of the cardiac output during a ventilatory cycle will be smoothed by the thermodilution technique. Although an increased averaging effect at lower cardiac output was expected because of longer transit times. it nevertheless was surprising that no increase in modulation at all was observed.
The phenomenon of the forward shift of the modulated curve for the right side of the heart indicates that the decrease of cardiac output, due to inflation of the lungs, is measured earlier in the respiratory cycle. At 10 and 15 cmH20 PEEP this decrease manifests itself even before the onset of inflation (Fig. 3B). According to NordstrOm (ll) the phasic decrease of pulmonary artery flow starts at the beginning of inflation. In similar experiments with electromagnetic flow measurements we have recently observed (unpublished data) larger falls of pulmonary artery flow during inflation at increasing levels of PEEP. This will result in the tail of the dilution curve contributing an increasing proportion to the total area of the curve. where injection is made during the preceding end-expiratory phase. Therefore. the cardiac output at that moment will be underestimated.
In conclusion we state that 1) random measurements of cardiac output by thermodilution during IPPV and CPPV can give very unreliable estimates at either side of the heart: 2) the mean of a large series of thermodilution measurements of cardiac output evenly distributed over the respiratory cycle shows excellent correlation with the mean cardiac output measured by the Fick principle: 3) the thermodilu-
28
tion technique is not appropriate for studying modulations of cardiac output dependent on artificial ventilation; 4) for applications on the right side of the heart. comparisons of thermodilution values under changing circumstances, e.g .. PEEP. may be inaccurate due to changes of the values based on other mechanisms than decrease of cardiac output itself; and 5) the measurements on the left side of the heart give more reliable estimates of cardiac output. which are comparable and are therefore useful for evaluation of the hemodynamic conditions. at least with changing PEEP.
REFERENCES
I. Branthwaite. M.A.. and R.D. Bradley. Measurement of cardiac output by thermal dilution in man. J. Appl. Physiol. 24: 434-438. 1968.
2. Cropp, J.A .. and A.C. Burton. Theoretical considerations and model experiments on the validity of indicator dilution methods for measurement of variable flow. Circ. Res. 18:26-49, 1966.
3. Fegler. G. Measurement of cardiac output in anaesthetized animals by a thermodilution method. Q. J. Exp. Physiol. 39: 153-164. 1954.
4. Ganz. W., and H.J.C. Swan. Measurement of blood flow by thermodilution. Am. J. Cardiol. 29: 241-246, 1972.
5. Goodyer. A.V.N., A. Huvos. W.F. Eckhardt. and R.H. Ostberg. Thermal dilution curves in the intact animal. Circ. Res. 7: 432-441. 1959.
6. Hosie. K.F. Thermal dilution techniques. Circ. Res. 10: 491-504, 1962. 7. Jansen, J.R.C.. J.M. Bogaard. E. von Reth. J.J. Schreuder. and A. Versprille. Monitoring of
the cyclic modulation of cardiac output during artificial ventilation. Proc. Int. Symp. Comput. Critical Care Pulmonary Med. 1st Norwalk CT. May 24-26. 1979. p. 59-68.
8. Khalil. H.H .. T.Q. Richardson. and A. C. Guyton. Measurement of cardiac output by thermal dilution and direct Fick methods in dogs. J. Appl. Physiol. 21: 1131-1135. 1966.
9. Maruschak. G.F .. E.A. Meathe. J.F. Schauble, and A. Fronek. A simplified equation for the thermal dilution cardiac output. J. Appl. Physiol. 37: 414-416. 1974
10. Morgan. B.C.. W.E. Martin. T.F. Hornbein, E.W. Crawford. and W.G. Guntheroth. Hemodynamic effects of intermittent positive pressure respiration. Anesthesiology 27:584-590. 1966.
11. NordstrOm. L Haemodynamic effects of intermittent positive pressure ventilation with and without an end-inspiratory pause. Acta Anaesth. Scand. Suppl. 47. 1972.
12. Olsson. B., J. Pool. P. van der Mosten. E. Varnauskas, and R. Wassen. Validity and reproducibility of determination of cardiac output by thermodilution in man. Cardiology 55: !36-148. 1970.
13. Olsson. S.B .. R. Wassen, E. Varnauskas. and H. Wallman, A simple analogue computer for cardiac output determination by thermodilution. Cardiovasc. Res. 6: 303-308, 1972.
14. Otis. A.B. Quantitative relationships in steady-state gas exchange. In: Handbook of Physiology. Respiration. Washington, DC: Am. Physiol. Soc .. 1964. sect. 3. vol. I. chapt. 27. p. 681-698.
15. Pavek. E .. K. Pavek. and D. Boska. Mixing and observation errors in indicator-dilution studies. J. Appl. Physiol. 28: 733-740, 1970.
16. Saadjian. A.. J.E. Quercy. and J. Torresani. Cardiac output measurement by thermodilution. Med. Prog. Techno/. 3: 161-167. 1976.
17. Scheuer-Leeser. M .. A. Morquet. H. Reul. and W. Inrich. Some aspects to the pulsation error in blood-flow calculatiOns by indicator-dilution technique. Med. Bioi. Eng. Comput. 15: 118-123. 1977.
18. Silove. E.D .. T. Gantez. and B.C. Wells. Thermodilution measurement of left and right ventricular outputs. Cardiovasc. Res. 5: 174-177. 1971.
29

19. Stow. R.W. Systematic errors in flow determinations by the Fick method. Minn. Med. 37: 30. 1954
20. VJiers. A.C.A.P., K.R. Visser. and W.G. Zijlstra. Analysis of indicator distribution in the determination of cardiac output by thermodilution. Cardiovasc. Res. 7: 125-132. 1973.
21. Warren. D.J .. and J.G.G. Ledingham. Cardiac output in the conscious rabbit; an analysis of the thermodilution technique. J. Appl. _Physiol. 36: 246-251. 1974.
22. Wessel. H.U .. M.H. Paul. G.W. James. and A.R. Grahn. Limitations of thermal dilution curves for cardiac output determinations. J. Appl. Physio/. 30: 643-652. 1971.
23. Zierler, K.L. Circulation times and·the theory of indicator-dilution methods for determining blood flow and volume. In: Handbook of Physiology. Circulation. Washington. DC: Am. Physiol. Soc., 1962. sect. L vol. I. chapt. 18. p. 585-615.
30
CHAPTER III
Hemodynamic effects of positive end-expiratory pressure applied as a ramp
Jan J. Schreuder. Jos R.C. Jansen. Jan M. Bogaard and Adrian Versprille (With the Technical Assistance of Arnold Drop)
Pathophysiological Laborarory. Departmenr of Pulmonary Diseases, Erasmus University, 3000 DR Rotrerdam, The Netherlands
J. Appl. Physiol.: Rcspirat. Environ. Exercise Physiol. 53: 1239-1247, 1982
Positive end-expiratory pressure (PEEP) was reintroduced by Ashbaugh eta!. (I) as a therapy for the adult respiratory distress syndrome (ARDS) to improve arterial oxygenation. In animal studies PEEP generally has a negative effect .on cardiac output under physiological circumstances (5. 10. II. 17. 20. 24, 25. 28) and also during experimentally induced pulmonary edema (5). Clinical studies have shown a decrease in cardiac output with PEEP (7. 14, 16. 21). However. in some studies of patients with severe ARDS or mitral valve disease. no change (14, 2"3. 30) and even a rise (9) were reported.
In the literature several hypotheses have been proposed for the reduction in cardiac output due to PEEP. One of these hypotheses. which is generally accepted, is an increase of intrathoracic pressure. causing an increase of central venous pressure and therefore preventing normal venous return (7. 19, 30). Another suggestion is an increase of pulmonary arterial pressure. causing a higher afterload for the right ventricle (16. 23. 24. 28). Furthermore it has been suggested that PEEP may have a depressive action on ventricular function (21) by a tamponade effect (17). a release of vasoactive substances from the lung (20). or reflex effects (5). Both latter effects were ascribed to stretching of lung tissues. Lung-inflation studies (4. 8. 12. 26) have demonstrated that stretching of lung tissues causes vasodepressive effects.
There is no agreement on the validity or the quantitative contribution of these hypotheses._ A reason might be that most studies were performed at discrete levels of PEEP after stepwise changes and stabilization of the hemodynamic variables. Under these steady-state circumstances all time dependencies of the hemodynamic regulations are eliminated.
31
To be maximally informed on the hemodynamic changes due to PEEP at all levels between 0 and 15 cmH20 an appropriate method could be the application of PEEP as a continuous input function. We therefore monitored the hemodynamic variables continuously during a linear rise of PEEP except for cardiac output. which was sampled semicontinuously (18). Additionally the use of a ramp input function allowed differentiation between the mechanisms having a corresponding time constant with cardiac output regulation and those having larger time constants, especially during periods of ramp arrest at several levels of PEEP.
METHODS
Forty-seven Yorkshire pigs (5-7 wk old. 7-11 kg) were anesthetized with pentobarbital sodium (30-37.5 mg·kg- 1 ip) and placed in the supine position. Rectal temperature was maintained at 3SOC on a thermocontrolled operating table. Anesthesia was maintained by -a continuous infusion of pentobarbital (7.5 mg·kg- 1·h- 1 iv). The animals were paralyzed with d-tubocurarine (0.1 mg·kg-1)
administered over a period of 3 min followed by a continuous infusion of 0.2 mg·kg- 1·h- 1 to avoid spontaneous breathing during the experimental procedures.
A tracheostomy was performed between the second and third tracheal ring. Two catheters were inserted into the right common carotid artery: one, a double-walled injection catheter (1.14 mm !D). was placed with the tip 2.5-3 em beyond the aortic valve into the left ventricle; the other (l.14 mm !D) with a thermistor at its tip was positioned in the aortic arch near the origin of the brachiocephalic artery. A SwanGanz catheter (5-F) was inserted via the right external jugular vein in the pulmonary artery. A Swan-Ganz four-lumen catheter (7-F) was placed through the right internal jugular vein in the superior caval vein at the level of the right atrium. Loss of blood was compensated for with 6% Macrodex. After all experiments the positions of catheters were confirmed at autopsy.
The animals were ventilated with room air by use of a Braun constant-volume respirator with an inspiration-expiration time ratio of 4:5. The respiratory rate was standardized at 10·min - 1
• and the ventilatory (tidal) volume (VT) was adjusted to maintain the arterial C02 tension (Paco2) between 38 and 45 Torr. Once that the Paco2 was stabilized VT remained fixed throughout the experimental procedures. Heparin (125 IU·kg-1
) was administered intermittently each hour.
Measurements
The electrocardiogram (ECG) was recorded for checking ectopic beats during catheterization. measuring heart rate, and defining the period in order to calculate mean blood pressures over one cardiac cycle. Airway pressure was measured in the trachea cannula with a gas pressure transducer (Hewlett-Packard HP 270); airflow and VT were measured with a flow transducer (Fleisch type 0) and pneumotachograph (Godart). Systemic arterial pressure (Pao ). pulmonary arterial pressure (Ppa).
32
and central venous pressure (Pcv) were measured with Statham transducers (P23De). All these variables were continuously monitored.
Cardiac output was measured by both the thermodilution technique and the direct Fick method for 0, (18). For the estimation by thermodilution. 0.5 ml saline at room temperature was injected automatically into the left ventricle through the doublewalled catheter. The injection was given at a fixed moment in the ventilation cycle about at the end of the spontaneous expiration (i.e .. 60%· of the cycle from the beginning of inspiration). This provides for any level of PEEP a representative estimate of the mean cardiac output. For the direct Fick method the CO, production and 0 2 consumption were calculated from the ventilatory variables and the inspired and mixed expired C02 and 0 2 concentrations. C02 and- 0 2 concentrations in air were measured with a mass spectrometer (Perkin-Elmer type MGA 1100). PO,. PC02• pH. and metabolic acid-base variables were measured in arterial and mixed venous blood samples of 1.5 ml by means of an automatic blood gas analyzer (Radiometer ABL 1). O, saturation and hemoglobin values were measured with an oximeter (Instrumentation Laboratory IL 182).
Experimental Procedure
After a stabilization period of 30 min cardiac output was measured by both methods. With thermodilution cardiac output was taken as the mean of five successive measurements. Immediately after these control measurements at zero endexpiratory pressure (ZEEP). the end-expiratory pressure was continuously increased by moving the expiratory line at constant speed into a water seal down to 15 cmH20 in 22.5 min. Thus PEEP was applied as a positive ramp with a velocity of 0.67 cmH,O·min- 1
• A numbered subscript indicates the levels of PEEP; e.g .. a PEEP of 5 cmH20 is PEEP5 • During a ramp procedure thermodilution measurements were performed at intervals of 30 s. At the same time the mean vascular pressures over one cardiac cycle and other variables were also determined at peak inflation and at end expiration. The same procedures were carried out during the reversed ramp of PEEP. This reversed ramp was applied with the same speed. The interval between the positive and the reversed ramp was 8 min. During this interval the Fick and thermodilution measurements were performed again.
Additional Observations
!) In all animals blood gases. acid-base status, and hemodynamic variables were measured at ZEEP-1 before-the positive ramp of PEEP. at PEEP15 during the 8-min intervaL and at ZEEP-2 after the reversed ramp.
2) In seven animals pentobarbital plasma concentrations were measured during the experimental procedures at ZEEP and PEEP15 by means of a gas chromatographic analysis (Pye Unicam S 100). In these experiments the ramp procedure was performed twice.
33
3) In five animals the ramp was arrested for 60 min at PEEP5, PEEP10 and PEEP15 • respectively (interrupted PEEP). Vascular and airway pressures were continuously monitored~ cardiac output was also monitored, again with intervals of 30 s.
4) In seven experiments the changes of Pcv were compared with the changes of intrathoracic pressure (Pit) caused by PEEP. These observations were additionally performed at the end of some experiments because of the risks of peumothorax. For measuring changes in Pit a fluid-filled catheter (0.6 mm ID) was placed airtight via a needle through the right fourth intercostal space into the intrapleural space. The presence of an air-fluid interface was avoided. Pcv and Pit were measured with Statham P23De transducers. In animals that developed pneumothorax the pleural pressure measurements were discarded. Because pneumothorax often occurred at high levels of PEEP (e.g .. PEEP15), the highest level used was PEEP1,.
5) In ll animals left ventricular end-diastolic pressure (PL VED) was measured intermittently between the thermodilution measurements during the positive PEEP ramp by means of the injection catheter in the left ventricle and a Statham P23De transducer.
Data Analyses and Statistics
ECG, pressures, airflow. and the thermodilution curve were recorded simultaneously on a Hewlett-Packard HP 7758A chart recorder and an Ampex Fr l300A tape recorder and analyzed by means of a PDP 11/03 computer.
During each individual experiment all pressures were recorded with respect to a zero level at the manubrium sterni corresponding with the level of the right atrium of the pig. Because of interindividual differences between the level of the right atrium and that of the manubrium sterni we have chosen a new zero level. The endexpiratory value of the mean Pcv of each individual experiment during ZEEP ventilation in the initial control phase was reset to zero. All other measured pressures were then adjusted.
With the objective of data reduction, cardiac output and the other variables corresponding in time plotted against PEEP are the means of three successive measurements unless otherwise indicated. Because the measurements were per~ formed each 0.5 min and the velocity of the PEEP ramp was 0.67 cmH,O·min-1,
these mean values represent a 1-cm PEEP interval. Statistical analyses were done with the Student's r test for paired variates. A statistical program Timvar (2) was used to test for a linear relationship between the change in cardiac output with PEEP. This program investigates a regression over time. Because PEEP increased linear with time. cardiac output responses could be tested against PEEP.
34
RESULTS
Control and Additional Observations
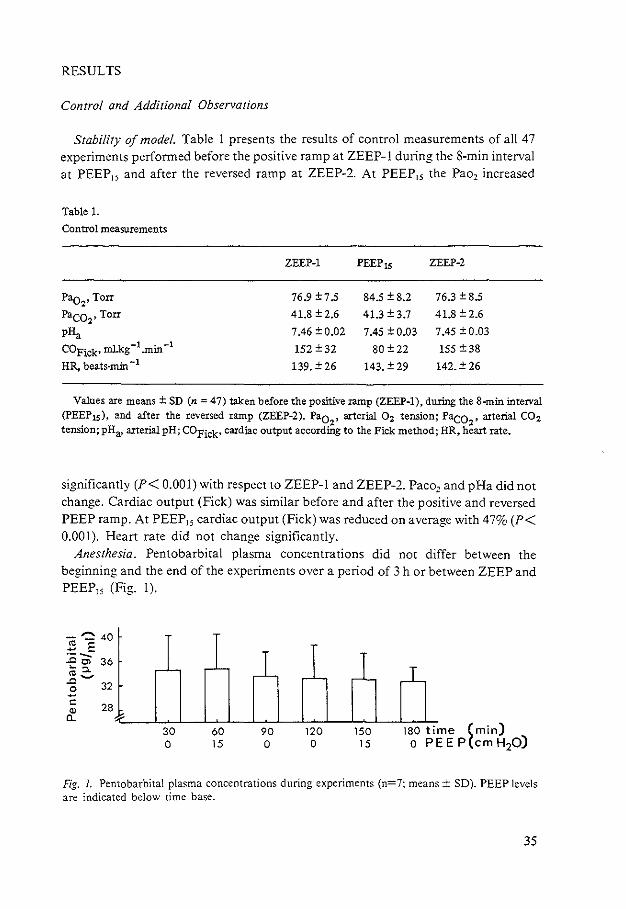
Stability of model. Table I presents the results of control measurements of all 47 experiments performed before the positive ramp at ZEEP-1 during the 8-min interval at PEEP15 and after the reversed ramp at ZEEP-2. At PEEP15 the Pao2 increased
Table 1.
Control measurements
ZEEP-1 PEEP 15 ZEEP-2
Pao2, Torr 76.9±7.5 84.5 ± 8.2 76.3 ± 8.5
Paco,• Torr 41.8 ± 2.6 41.3±3.7 41.8 ± 2.6
pHa 7.46 ± 0.02 7.45 ± 0.03 7.45 ±0.03
COFick• mlkg -1 .min -1 152 ± 32 80±22 155 ± 38 HR, beats-min -l 139. ± 26 143. ± 29 142. ± 26
Values are means± SD (n = 47) taken before the positive ramp (ZEEP-1), during the 8-min interval (PEEP Is), and after the reversed ramp (ZEEP-2). Pao
2, arterial 0 2 tension; Paco
2, arterial CO:z
tension; pHa, arterial pH; COFick• cardiac output according to the Pick method; HR, heart rate.
significantly (P< 0.001) with respect to ZEEP-1 and ZEEP-2. Paco2 and pHa did not change. Cardiac output (Fick) was similar before and after the positive and reversed PEEP ramp. At PEEP15 cardiac output (Fick) was reduced on average with 47% (P< 0.001). Heart rate did not change significantly.
Anesthesia. Pentobarbital plasma concentrations did not differ between the beginning and the end of the experiments over a period of 3 h or between ZEEP and PEEP15 (Fig. 1).
-~ 40 2 E ·--..0 C) 36 ~"'-~~ 0 32 -c:
" a_ 28
30 0
60 15
90 0
120 0
150 15
180 time (min) o PEE P(cm H20)
Fig. 1. Pentobarbital plasma concentrations during experiments (n=7; means± SD). PEEP levels are indicated below time base.
35
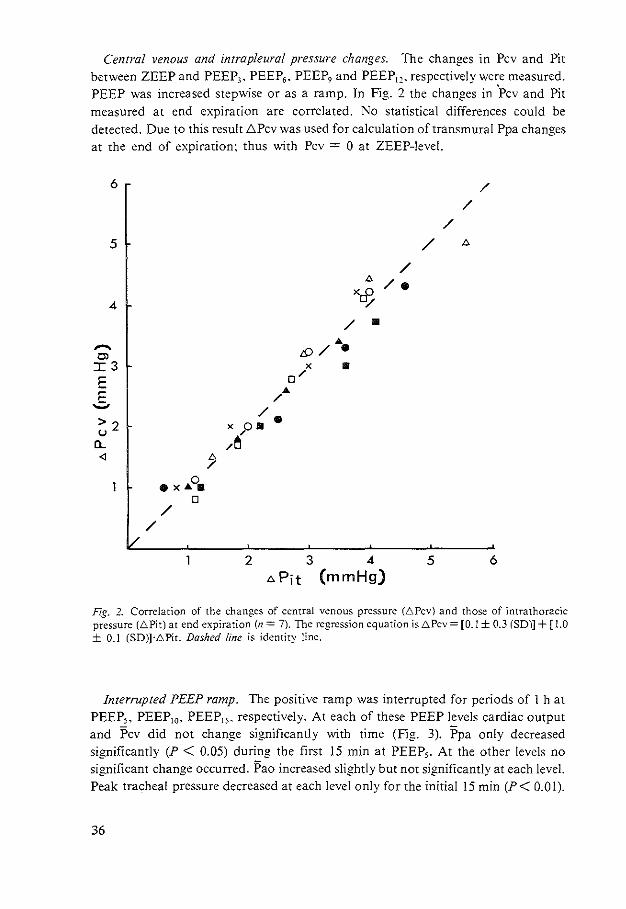
Central venous and intrapleural pressure changes. The changes in Pcv and Pit between ZEEP and PEEP3 • PEEP6 • PEEP, and PEEP1,. respectively were measured. PEEP was increased stepwise or as a ramp. In Fig. 2 the changes in 'Pcv and Pit measured at end expiration are correlated. No statistical differences could be detected. Due to this result .t;Pcv was used for calculation of transmural Ppa changes at the end of expiration: thus with Pcv = 0 at ZEEP-level.
6
5
4
,...... tll I3 E
_§. >2 '-'
[l_
<l [).
/ 0 •x"'• 0
/ /
/
/
/
/ [).
/ [). /. Xrf: y
/ • ... /{) / . X • 0/ ...
/ /
x o• • /
/~
2 3 4 5 6 [).Pit (mmHg)
Fig. 2. Correlation of the changes of central venous pressure (6Pcv) and those of intrathoracic pressure (6Pit) at end expiration (n = 7). The regression equation is 6Pcv = [0.1 ± 0.3 (SD)] + [ l.O ± 0.1 (SD)]·6Pit. Dashed line is identity line.
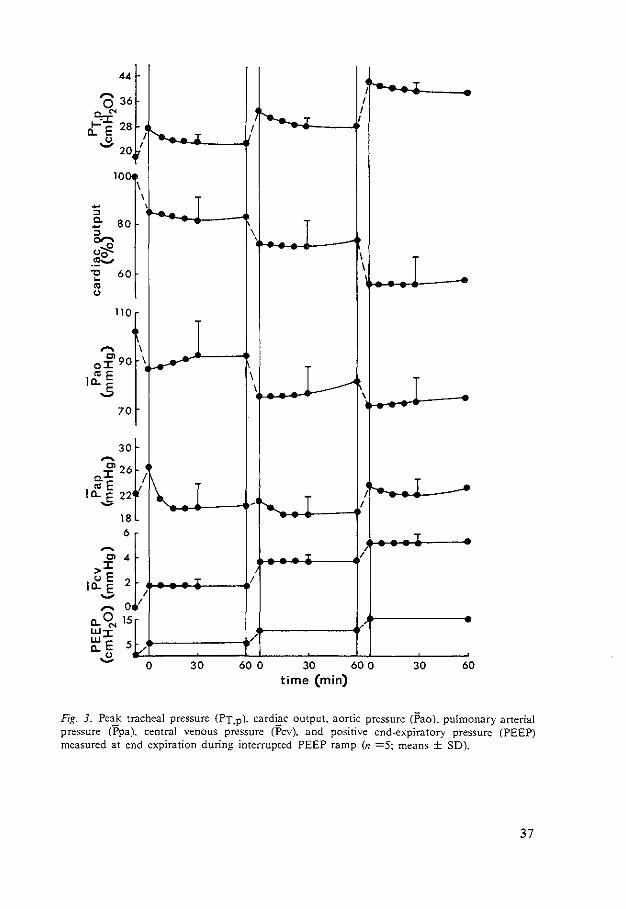
Interrupted PEEP ramp. The positive ramp was interrupted for periods of 1 h at PEEP,, PEEP10• PEEP15 , respectively. At each of these PEEP levels cardiac output and Pcv did not change significantly with time (Fig. 3). Ppa only decreased significantly (P < 0.05) during the first 15 min at PEEP,. At the other levels no significant change occurred. Pao increased slightly but not significantly at each level. Peak tracheal pressure decreased at each level only for the initial 15 min (P< 0.01).
36
44
0 36
::;:.r." 28 t~. E
" ,_, 20
-" 10
fr 80
" "'6 <>Cf'-~ 1:: 60
"' "
......
110
C> o::r:: 90
Jci:: E .s
~
70
30
C> 26 c.::r:: coE
It~. E 22 ~
,......_ I
\ \
'~
I
I~
t/ 1\ ~
18 6
C> 4 >::r:: <>E it~. E 2 i, ,_,
,.... 0 (L q, 15 w::r:: ~E 5
...:> L/ 0
r
T
I
T
T
30
I~ T
I
'e...._ I "T I
I
\ I I
I I ~
\ I___.--' I I \ ....
I ,- I ....
- r-.._ I
T /
:r /
I
/
/
60 0 30 60 0 30 60 time (min)
Fig. J_ Pe~ tracheal pressure (PT.p). card~c output. aortic pressure (Pao), pulmonary arterial pressure (Ppa). central venous pressure (Pcv). and positive end-expiratory pressure (PEEP) measured at end expiration during interrupted PEEP ramp (n =5~ means ± SD).
37
Ramp Procedures
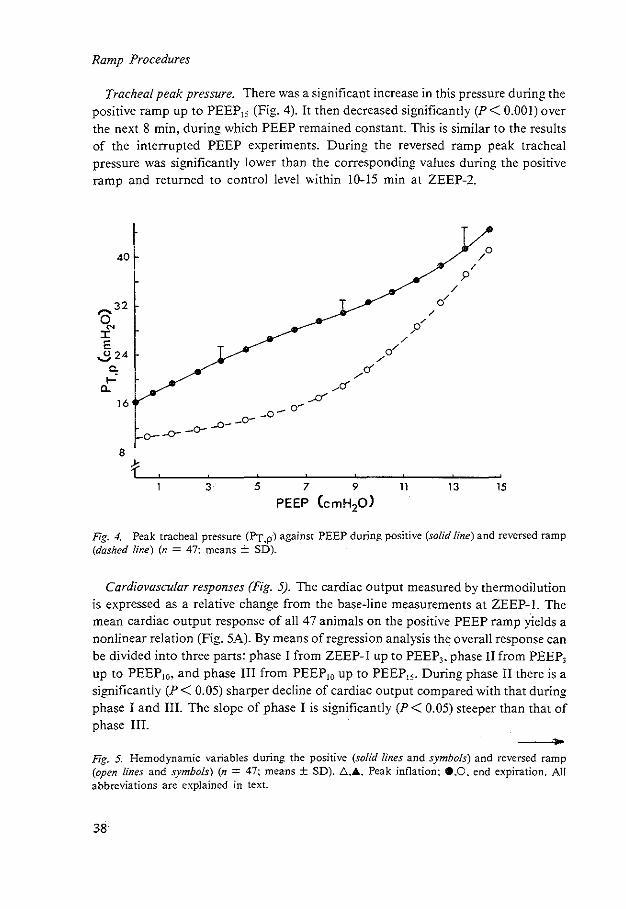
Tracheal peak pressure. There was a significant increase in this pressure during the positive ramp up to PEEP15 (Fig. 4). It then decreased significantly (P < 0.001) over the next 8 min. during which PEEP remained constant. This is similar to the results of the interrupted PEEP experiments. During the reversed ramp peak tracheal pressure was significantly lower than the corresponding values during the positive ramp and returned to control level within 10-15 min at ZEEP-2.
40
~32 :c E
.,3.24 c.
...... 0..
16
3
/
9
5 7 9 11 13 15
PEEP CcmH20)
Fig. 4. Peak tracheal pressure (Py_p) against PEEP during positive (solid line) and reversed ramp (dashed line) (n = 47: means ± SD).
Cardiovascular responses (Fig. 5). The cardiac output measured by thermodilution is expressed as a relative change from the base-line measurements at ZEEP-1. The mean cardiac output response of all 47 animals on the positive PEEP ramp yields a nonlinear relation (Fig. 5A). By means of regression analysis the overall response can be divided into three parts: phase I from ZEEP-1 up to PEEP,. phase II from PEEP, up to PEEP10• and phase Ill from PEEP10 up to PEEP15• During phase II there is a significantly (P< 0.05) sharper decline of cardiac output compared with that during phase I and Ill. The slope of phase I is significantly (P < 0.05) steeper than that of phase Ill.
Fig. 5. Hemodynamic variables during the positive (solid lines and symbols) and reversed ramp (open lines and symbols) (n = 47: mea-ns ± SD). l:::...Ji.. Peak inflation: e.O. end expiration. All abbreviations are explained in text.
38
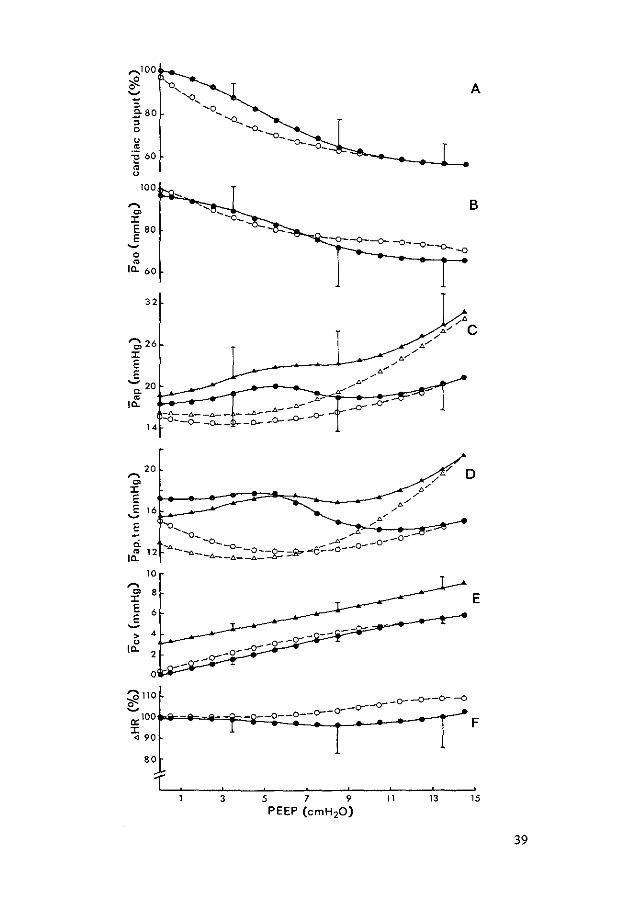
'""'1 00
<f. ~
:; .e- 80
" 0
u m
=§ 60 m u
,... C>
0:: E 80 E ~
0 m
Ia. 60
32
-.6- -.t.-
14 -o--O-~=
ci. I~ 12
10 ,... "' 8 0:: E 6 E ~
> 4
I~
3
A
B
7 D
5 7
PEEP (cmH20l " 13 15
39
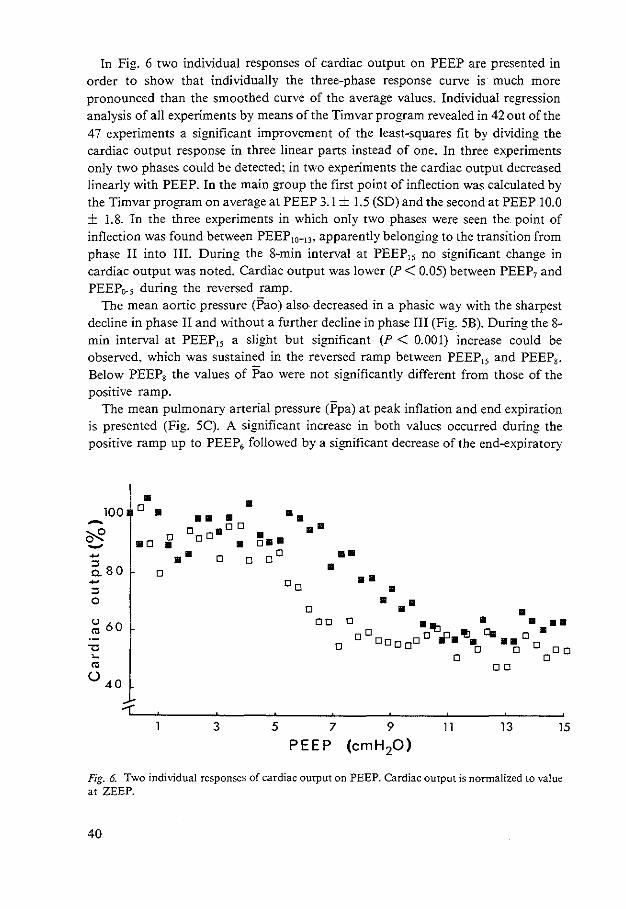
In Fig. 6 two individual responses of cardiac output on PEEP are presented in order to show that individually the three-phase response curve is much more pronounced than the smoothed curve of the average values. Individual regression analysis of all experiments by means of the Timvar program revealed in 42 out of the 47 experiments a significant improvement of the least-squares fit by dividing the cardiac output response in three linear parts instead of one. In three experiments only two phases could be detected; in two experiments the cardiac output decreased linearly with PEEP. In the main group the first point of inflection was calculated by the Timvar program on average at PEEP 3.1 ± 1.5 (SO) and the second at PEEP 10.0 ± I. 8. In the three experiments in which only two phases were seen the point of inflection was found between PEEP10- 13 , apparently belonging to the transition from phase II into III. During the 8-min interval at PEEP15 no significant change in cardiac output was noted. Cardiac output was lower (P < 0.05) between PEEP7 and PEEP0• 5 during the reversed ramp.
The mean aortic pressure CPao) also decreased in a phasic way with the sharpest decline in phase II and without a further decline in phase III (Fig. 5B). During the 8-min interval at PEEP15 a slight but significant (P < 0.001) increase could be observed, which was sustained in the reversed ramp between PEEP15 and PEEP8•
Below PEEP8 the values of Pao were not significantly different from those of the positive ramp.
The mean pulmonary arterial pressure (Ppa) at peak inflation and end expiration is presented (Fig. 5C). A significant increase in both values occurred during the positive ramp up to PEEP, followed by a significant decrease of the end-expiratory
• • 100 D • • • •• • - o aDo •• ~ •o
D oD
~-· ....... • • ~ •• D D oo •• ~80 • D •• ~ Do ::> • 0 • •• D • u 60 DO D
o •o 'I:J ,p '!J • • •• "' Cil D •
D o Do a aD • •a •• 'U 0 ° 0 0 ~ D D
"' DO
() 40
3 5 7 9 11 13 15
PEEP (em H20)
Fig. 6. Two individual responses of cardiac output on PEEP. Cardiac output is normalized to value at ZEEP.
40

value (P < 0.0!) between PEEP6 and PEEP10 • During the 8-min interval at PEEP15
no significant changes in both values could be detected whereas below PEEP10
during the reversed ramp both values of Ppa were lower (P < 0.01) than the corresponding values of the positive ramp.
'Transmural pulmonary arterial pressure (Ppa.tm) at end expiration (Fig. 50) did not change up to PEEP6 followed by a significant decrease up to and a significant (P, 0.05) increase above PEEP10 • Ppa,tm at peak inflation increased up to PEEP6 and between PEEP10 and PEEP15 •
Central venous pressure (Pcv) at both end expiration and peak inflation increased linearly up to PEEP, (Fig. 5E). Above this value the end-expiratory value showed a downward inflection and the peak inflatory pressure an upward inflection. No changes occurred during the 8-min interval at PEEP15 . During the reversed ramp the end-expiratory value of Pcv was significantly higher (P < 0.05) between PEEP8 and ZEEP~2 than the corresponding values during the positive ramp.
-100 -.!2 0 ...... -~80 :; 0
0
"' 60 " ~ "' () T
8 ~
0> :c E E 6 .......
" "' > CL
4
> It!: 2
3 5 7 9 PEEP (cmHp)
11 13 15
Fig. 7. Cardiac output, ICft ventricular end--diastolic pressure (PL VED. 0-0). and central venous pressure (P cv. e-e) against PEEP at end expiration (n = 11: means ± SD).
41
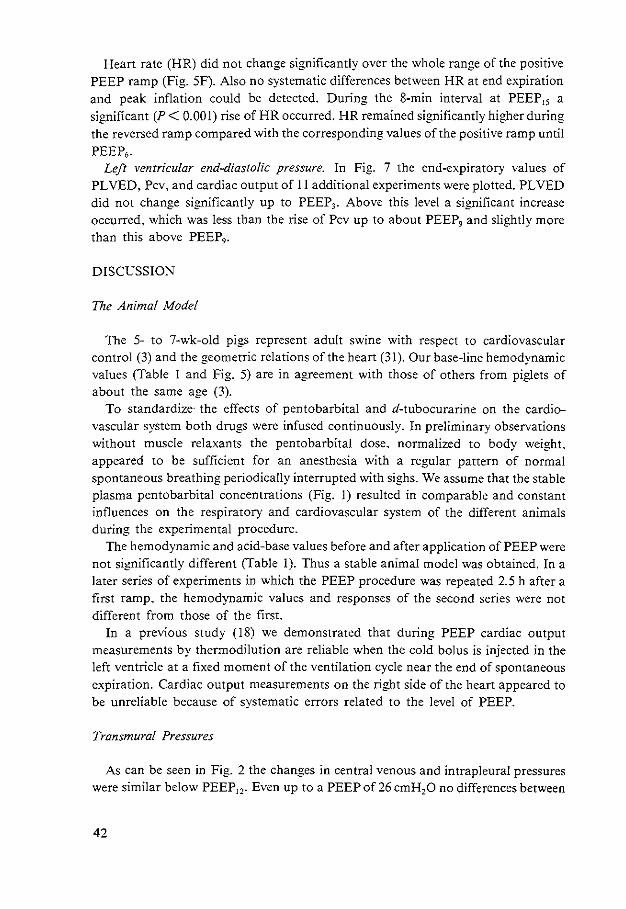
Heart rate (HR) did not change significantly over the whole range of the positive PEEP ramp (Fig. SF). Also no systematic differences between HR at end expiration and peak inflation could be detected. During the 8-min interval at PEEP 15 a significant (P < 0.001) rise of HR occurred. HR remained significantly higher during the reversed ramp compared with the corresponding values of the positive ramp until PEEP6•
Left ventricular end-diastolic pressure. In Fig. 7 the end-expiratory values of PL VED. Pcv. and cardiac output of II additional experiments were plotted. PL VED did not change significantly up to PEEP3. Above this level a significant increase occurred. which was less than the rise of Pcv up to about PEEP, and slightly more than this above PEEP9•
DISCUSSION
The Animal Model
The 5- to 7-wk-old pigs represent adult swine with respect to cardiovascular control (3) and the geometric relations of the heart (31). Our base-line hemodynamic values (Table I and Fig. 5) are in agreement with those of others from piglets of about the same age (3).
To standardize· the effects of pentobarbital and d-tubocurarine on the cardiovascular system both drugs were infused continuously. In preliminary observations without muscle relaxants the pentobarbital dose. normalized to body weight. appeared to be sufficient for an anesthesia with a regular pattern of normal spontaneous breathing periodically interrupted with sighs. We assume that the stable plasma pentobarbital concentrations (Fig. I) resulted in comparable and constant influences on the respiratory and cardiovascular system of the different animals during the experimental procedure.
The hemodynamic and acid-base values before and after application of PEEP were not significantly different (Table I). Thus a stable animal model was obtained. In a later series of experiments in which the PEEP procedure was repeated 2.5 h after a first ramp. the hemodynamic values and responses of the second series were not different from those of the first.
In a previous study (18) we demonstrated that during PEEP cardiac output measurements by thermodilution are reliable when the cold bolus is injected in the left ventricle at a fixed moment of the ventilation cycle near the end of spontaneous expiration. Cardiac output measurements on the right side of the heart appeared to be unreliable because of systematic errors related to the level of PEEP.
Transmural Pressures
As can be seen in Fig. 2 the changes in central venous and intrapleural pressures were similar below PEEP12 • Even up to a PEEP of 26 cmH20 no differences between
42
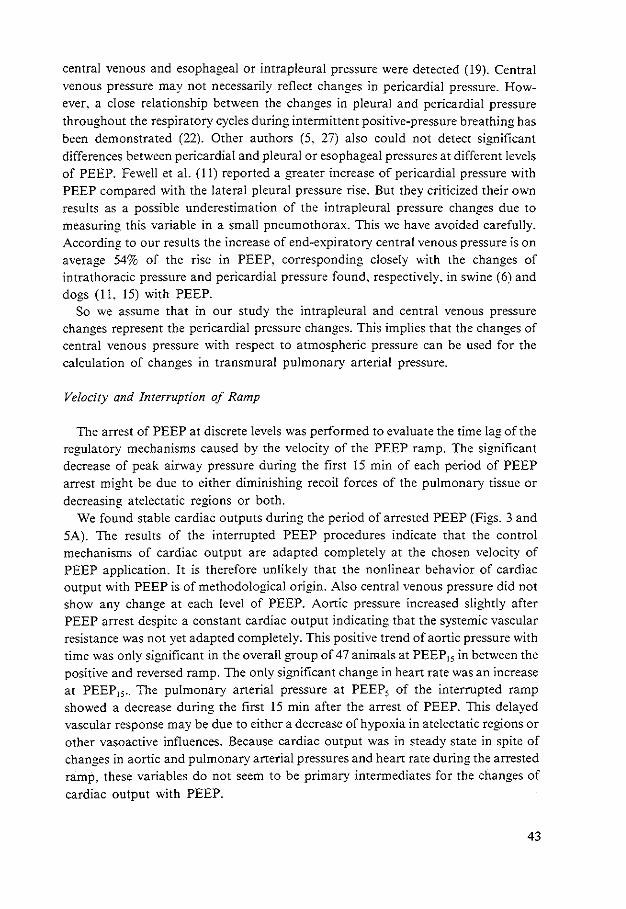
central venous and esophageal or intrapleural pressure were detected (19). Central venous pressure may not necessarily reflect changes in pericardia} pressure. However. a close relationship between the changes in pleural and pericardia! pressure throughout the respiratory cycles during intermittent positive-pressure breathing has been demonstrated (22). Other authors (5. 27) also could not detect significant differences between pericardia! and pleural or esophageal pressures at different levels of PEEP. Fewell et al. (I I) reported a greater increase of pericardia! pressure with PEEP compared with the lateral pleural pressure rise. But they criticized their own results as a possible underestimation of the intrapleural pressure changes due to measuring this variable in a small pneumothorax. This we have avoided carefully. According to our results the increase of end-expiratory central venous pressure is on average 54% of the rise in PEEP. corresponding closely with the changes of intrathoracic pressure and pericardia} pressure found. respectively. in swine (6) and dogs (II. I 5) with PEEP.
So we assume that in our study the intrapleural and central venous pressure changes represent the pericardia} pressure changes. This implies that the changes of central venous pressure with respect to atmospheric pressure can be used for the calculation of changes in transmural pulmonary arterial pressure.
Velocity and Interruption of Ramp
The arrest of PEEP at discrete levels was performed to evaluate the time lag of the regulatory mechanisms caused by the velocity of the PEEP ramp. The significant decrease of peak airway pressure during the first I 5 min of each period of PEEP arrest might be due to either diminishing recoil forces of the pulmonary tissue or decreasing atelectatic regions or both.
We found stable cardiac outputs during the period of arrested PEEP (Figs. 3 and SA). The results of the interrupted PEEP procedures indicate that the control mechanisms of cardiac output are adapted completely at the chosen velocity of PEEP application. It is therefore unlikely that the nonlinear behavior of cardiac output with PEEP is of methodological origin. Also central venous pressure did not show any change at each level of PEEP. Aortic pressure increased slightly after PEEP arrest despite a constant cardiac output indicating that the systemic vascular resistance was not yet adapted completely. This positive trend of aortic pressure with time was only significant in the overall group of 47 animals at PEEP15 in between the positive and reversed ramp. The only significant change in heart rate was an increase at PEEP15 • The pulmonary arterial pressure at PEEP5 of the interrupted ramp showed a decrease during the first 15 min after the arrest of PEEP. This delayed vascular response may be due to either a decrease of hypoxia in atelectatic regions or other vasoactive· influences. Because cardiac output was in steady state in spite of changes in aortic and pulmonary arterial pressures and heart rate during the arrested ramp, these variables do not seem to be primary intermediates for the changes of cardiac output with PEEP.
43
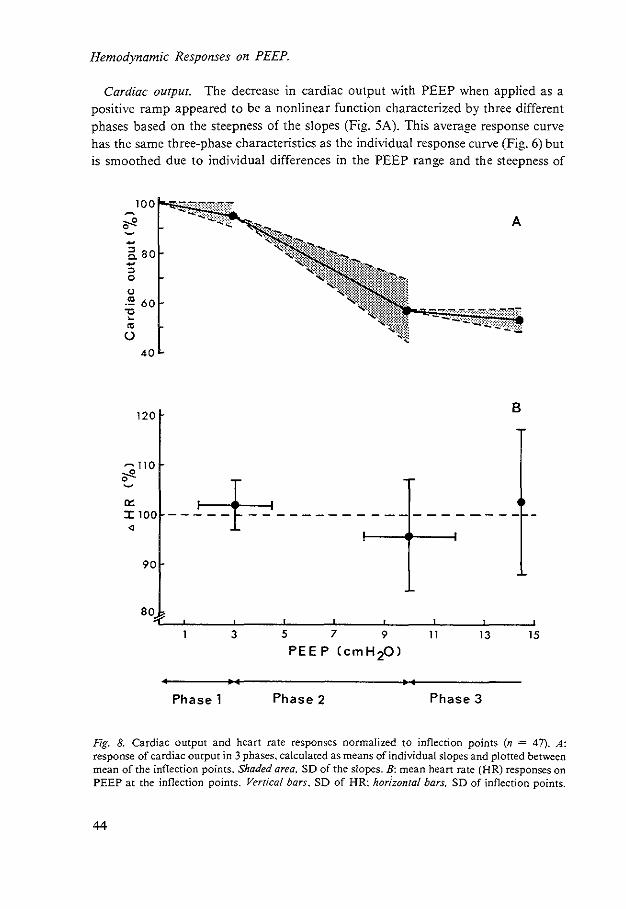
Hemodynamic Responses on PEEP.
Cardiac output. The decrease in cardiac output with PEEP when applied as a positive ramp appeared to be a nonlinear function characterized by three different phases based on the steepness of the slopes (Fig. 5A). This average response curve has the same three-phase characteristics as the individual response curve (Fig. 6) but is smoothed due to individual differences in the PEEP range and the steepness of
-a so -::> 0
(J
"'60 -o ~
"' ()
40
120
-110 ~ 0
"' :X: 100 ~
90
so
B
---+-------------------3 5 7 9 11 13 15
PEEP CcmH20J
Phase 1 Phase 2 Phase 3
Fig. 8. Cardiac output and heart rate responses normalized to inflection points (n = 47). A: response of cardiac output in 3 phases, calculated as means of individual slopes and plotted between mean of the inflection points. Shaded area, SD of the slopes. B: mean heart rate (HR) responses on PEEP at the inflection points. Vertical bars. SD of HR: horizontal bars. SD of inflection points.
44
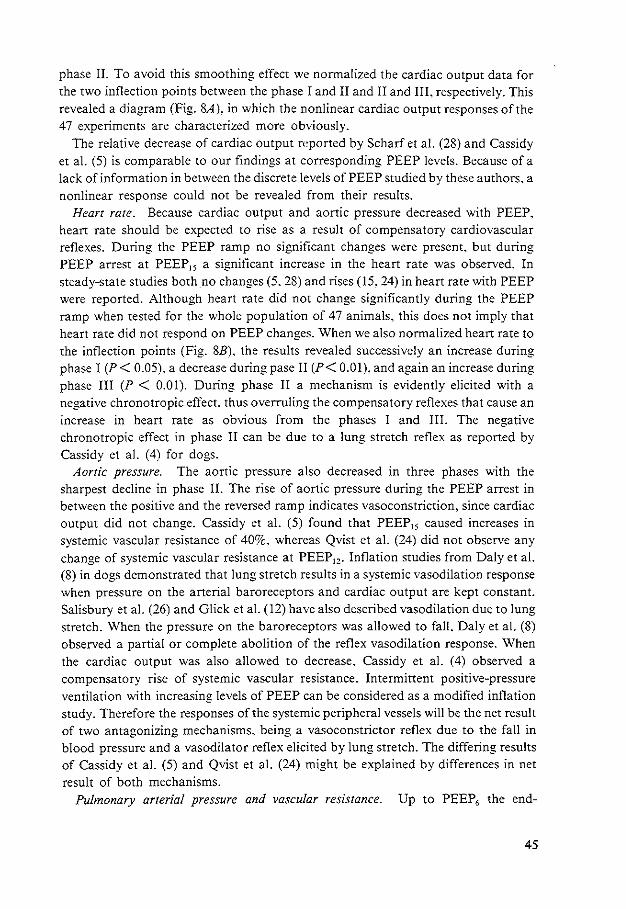
phase II. To avoid this smoothing effect we normalized the cardiac output data for the two inflection points between the phase I and II and II and III. respectively. This revealed a diagram (Fig. 8A). in which the nonlinear cardiac output responses of the 47 experiments are characterized more obviously.
The relative decrease of cardiac output n'ported by Scharf et al. (28) and Cassidy et al. (5) is comparable to our findings at corresponding PEEP levels. Because of a lack of information in between the discrete levels of PEEP studied by these authors. a nonlinear response could not be revealed from their results.
Heart rate. Because cardiac output and aortic pressure decreased with PEEP. heart rate should be expected to rise as a result of compensatory cardiovascular reflexes. During the PEEP ramp no significant changes were present. but during PEEP arrest at PEEP15 a significant increase in the heart rate was observed. In steady-state studies both no changes (5. 28) and rises (15. 24) in heart rate with PEEP were reported. Although heart rate did not change significantly during the PEEP ramp when tested for the whole population of 47 animals, this does not imply that heart rate did not respond on PEEP changes. When we also normalized heart rate to the inflection points (Fig. 8B), the results revealed successively an increase during phase I (P < 0.05). a decrease during pase II (P< 0.01). and again an increase during phase III (P < 0.01). During phase II a mechanism is evidently elicited with a negative chronotropic effect, thus overruling the compensatory reflexes that cause an increase in heart rate as obvious from the phases I and III. The negative chronotropic effect in phase II can be due to a lung stretch reflex as reported by Cassidy et al. ( 4) for dogs.
Aortic pressure. The aortic pressure also decreased in three phases with the sharpest decline in phase II. The rise of aortic pressure during the PEEP arrest in between the positive and the reversed ramp indicates vasoconstriction. since cardiac output did not change. Cassidy et al. (5) found that PEEP15 caused increases in systemic vascular resistance of 40%. whereas Qvist et al. (24) did not observe any change of systemic vascular resistance at PEEP12 • Inflation studies from Daly et al. (8) in dogs demonstrated that lung stretch results in a systemic vasodilation response when pressure on the arterial baroreceptors and cardiac output are kept constant. Salisbury et al. (26) and Glick et al. (12) have also described vasodilation due to lung stretch. When the pressure on the baroreceptors was allowed to fall. Daly et al. (8) observed a partial or complete abolition of the reflex vasodilation response. When the cardiac output was also allowed to decrease. Cassidy et al. (4) observed a compensatory rise of systemic vascular resistance. Intermittent positive-pressure ventilation with increasing levels of PEEP can be considered as a modified inflation study. Therefore the responses of the systemic peripheral vessels will be the net result of two antagonizing mechanisms, being a vasoconstrictor reflex due to the fall in blood pressure and a vasodilator reflex elicited by lung stretch. The differing results of Cassidy et al. (5) and Qvist et al. (24) might be explained by differences in net result of both mechanisms.
Pulmonary arterial pressure and vascular resistance. Up to PEEP6 the end-
45
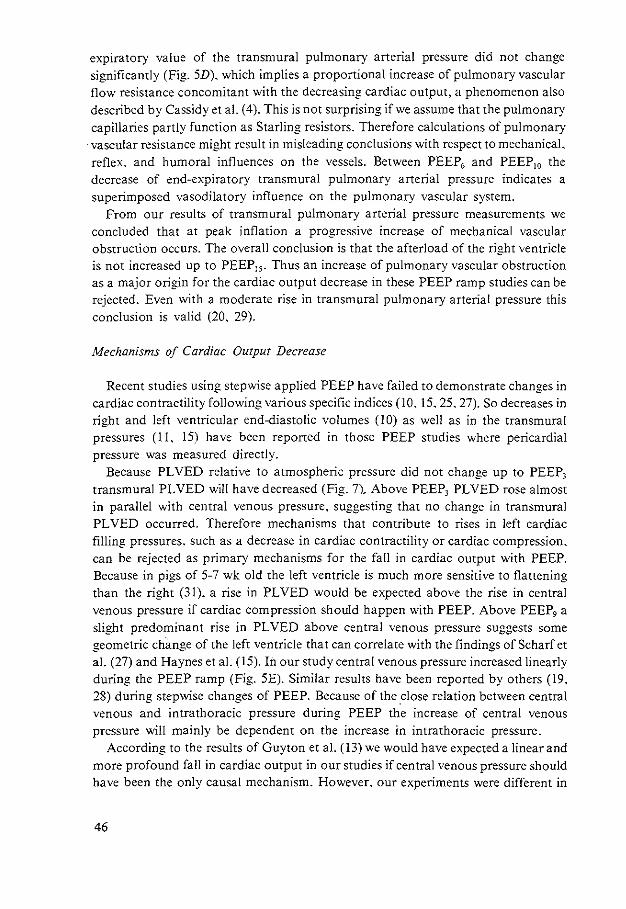
expiratory value of the transmural pulmonary arterial pressure did not change significantly (Fig. 5D). which implies a proportional increase of pulmonary vascular flow resistance concomitant with the decreasing cardiac output. a phenomenon also described by Cassidy eta!. (4). This is not surprising if we assume that the pulmonary capillaries partly function as Starling resistors. Therefore calculations of pulmonary
·vascular resistance might result in misleading conclusions with respect to mechanical. reflex. and humoral influences on the vessels. Between PEEP6 and PEEP10 the decrease of end-expiratory transmural pulmonary arterial pressure indicates a superimposed vasodilatory influence on the pulmonary vascular system.
From our results of transmural pulmonary arterial pressure measurements we concluded that at peak inflation a progressive increase of mechanical vascular obstruction occurs. The overall conclusion is that the afterload of the right ventricle is not increased up to PEEP15 • Thus an increase of pulmonary vascular obstruction as a major origin for the cardiac output decrease in these PEEP ramp studies can be rejected. Even with a moderate rise in transmural pulmonary arterial pressure this conclusion is valid (20. 29).
Mechanisms of Cardiac Output Decrease
Recent studies using stepwise applied PEEP have failed to demonstrate changes in cardiac contractility following various specific indices (10. 15. 25. 27). So decreases in right and left ventricular end-diastolic volumes (10) as well as in the transmural pressures (II. 15) have been reported in those PEEP studies where pericardia! pressure was measured directly.
Because PL VED relative to atmospheric pressure did not change up to PEEP, transmural PL VED will have decreased (Fig. 7). Above PEEP, PL VED rose almost in parallel with central venous pressure. suggesting that no change in transmural PL VED occurred. Therefore mechanisms that contribute to rises in left cardiac filling pressures. such as a decrease in cardiac contractility or cardiac compression. can be rejected as primary mechanisms for the fall in cardiac output with PEEP. Because in pigs of 5-7 wk old the left ventricle is much more sensitive to flattening than the right (31 ). a rise in PL VED would be expected above the rise in central venous pressure if cardiac compression should happen with PEEP. Above PEEP, a slight predominant rise in PL VED above central venous pressure suggests some geometric ch3.nge of the left ventricle that can correlate with the findings of Scharf et a!. (27) and Haynes eta!. (15). In our study central venous pressure increased linearly during the PEEP ramp (Fig. 5E). Similar results have been reported by others (19. 28) during stepwise changes of PEEP. Because of the close relation between central venous and intrathoracic pressure during PEEP the increase of central venous pressure will mainly be dependent on the increase in intrathoracic pressure.
According to the results of Guyton eta!. (13) we would have expected a linear and more profound fall in cardiac output in our studies if central venous pressure should have been the only causal mechanism. However. our experiments were different in
46
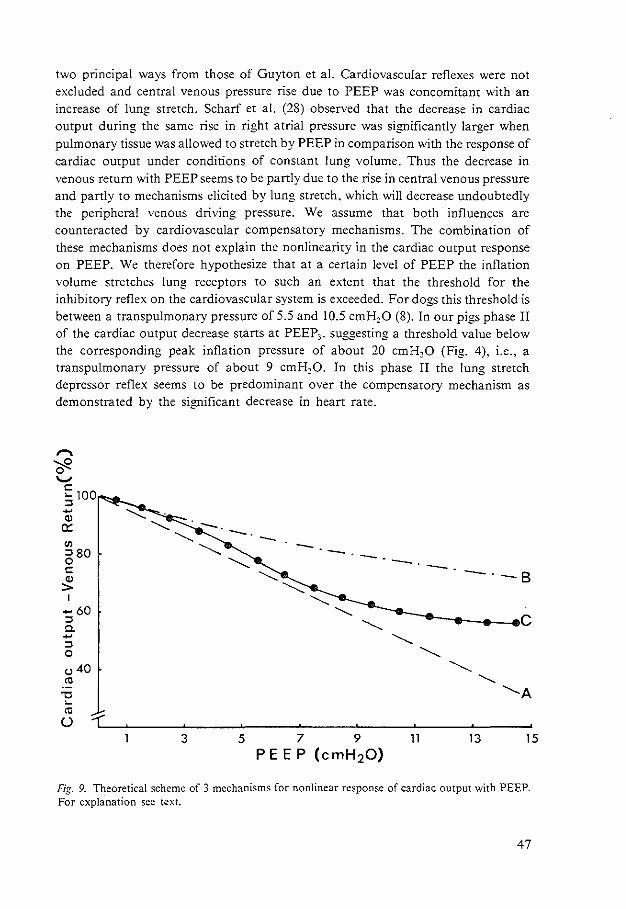
two principal ways from those of Guyton et al. Cardiovascular reflexes were not excluded and central venous pressure rise due to PEEP was concomitant with an increase of lung stretch. Scharf et a!. (28) observed that the decrease in cardiac output during the same rise in right atrial pressure was significantly larger when pulmonary tissue was allowed to stretch by PEEP in comparison with the response of cardiac output under conditions of constant lung volume. Thus the decrease in venous return with PEEP seems to be partly due to the rise in central venous pressure and partly to mechanisms elicited by lung stretch, which will decrease undoubtedly the peripheral venous driving pressure. We assume that both influences are counteracted by cardiovascular compensatory mechanisms. The combination of these mechanisms does not explain the nonlinearity in the cardiac output response on PEEP. We therefore hypothesize that at a certain level of PEEP the inflation volume stretches lung receptors to such an extent that the threshold for the inhibitory reflex on the cardiovascular system is exceeded. For dogs this threshold is between a transpulmonary pressure of 5.5 and 10.5 cmH20 (8). In our pigs phase II of the cardiac output decrease starts at PEEP3, suggesting a threshold value below the corresponding peak inflation pressure of about 20 cmH20 (Fig. 4), i.e., a transpulmonary pressure of about 9 cmH20. In this phase II the lung stretch depressor reflex seems to be predominant over the compensatory mechanism as demonstrated by the significant decrease in heart rate.
,..., Cf2 ._,
c ,_ 100 ::> -"' 0::
"' ::>80 0 c
:!!: I
-60 ::> a. -::> 0
(.) 40
"' -o ,_
"' 0
Fig. 9. Theoretical scheme of 3 mechanisms for nonlinear response of cardiac output with PEEP. For explanation sec t~xt.
47
Many responses on the reversed ramp were significantly different from those on the positive ramp. Presumably the hysteresis in lung compliance. i.e .. of tracheal peak pressure at constant ventilatory volume. influences the hemodynamic responses. We suppose that the higher lung compliance during the reversed ramp results in higher end-expiratory lung volumes. Thus the higher lung stretch and higher central venous pressure in the reversed ramp can be the origin of the different hemodynamic responses compared with corresponding levels of PEEP during the positive ramp.
In conclusion we suggest that three main mechanisms contribute to the nonlinear cardiac output decrease due to PEEP applied in a ramp (Fig. 9).
First. according to the venous return curve of Guyton et al. ( 13) the linear rise in central venous pressure with PEEP will decrease cardiac output linearly over the whole range of PEEP (Fig. 9. line A). Line A was calculated from the decrease of cardiac output with the rise in central venous pressure according to Guyton et al. for the rise in central venous pressure with PEEP found in our study.
Second. this decrease in cardiac output will decrease aortic pressure and therefore elicit compensatory mechanisms through the baroreceptors. which flatten the slope of the venous return curve (line B). This implies the response that occurs when lung stretch is eliminated (28).
Finally. above PEEP3 the lung stretch reflex is elicited, which counteracts the compensatory mechanisms resulting in a lower venous return for a similar central venous pressure during phase II and a concomitant decrease in heart rate (line C). This response curve is the result of our experiments.
REFERENCES
I. Ashbaugh. D. G .. T.L. Petty, D.B. Bigelow and T.M. Harris. Continuous positive-pressure breathing (CPPB) in adult respiratory distress syndrome. J. Thorac. Cardiovasc. Surg. 57: 31-41. 1969.
2. Brown, R.L.. J. Durbin. and J.M. Evans. Techniques for testing the constancy of regression relationships over time. J. R. Sratist. Soc. Ser. B 37: 149-163: 1975.
3. Buckley. N.M .. P.M. Gootman. E.L. Yellin. and P. Brazeau. Age-related cardiovascular effects of catecholamines in anesthetized piglets. Circ. Res. 45: 282-292. 1979.
4. Cassidy. S.S .. W.L. Eschenbacher. and R.L. Johnson. Jr. Reflex cardiovascular depression during unilateral lung hyperinflation in the dog. J. Clin. Invest. 64: 620-626. 1979.
5. Cassidy. S.S .. C.H. Robertson. Jr., A.K. Pierce. and R.L. Johnson. Jr. Cardiovascular effects of positive end-expiratory pressure in dogs. J. Appl. Physiol.: Respirat. Environ. Exercise Physiol. 44: 743-750. 1978.
6. Chapin. J.C.. J.B. Downs. M.E. Douglas. E.J. Murphy. and B.C. Ruiz. Lung expansion. airway pressure transmission and positive end-expiratory pressure. Arch. Surg. 114: 1193-1197. 1979.
7. Cournand. A.. H.L. Motley. L. Werk6. and D.W. Richards. Jr. Physiological studies of the effects· of intermittent positive-pressure breathing on cardiac output in man. Am. J. Physiol. 152: 162-174. 1948.
8. Daly. M. de B., J.L. Hazzledine. and A. Ungar. The reflex effects of alterations in lung volume on systemic vascular resistance in the dog. J. Physiol. London 188: 331-351, 1967.
9. Falke. K.J .. H. Pontoppidan. A. Kumar. D.E. Leith. B. Geffin. and M.B. Laver. Ventilation with end-expiratory pressure in acute lung disease. J. Clin. Invest. 51: 2315-2323. 1972.
48
10. Fewell. J.E .. D.R. Abendschein, C.J. Carlson, J.F. Murray. and E. Rapaport. Continuous positive-pressure ventilation decreases right and left ventricular end-diastolic volumes in the dog. Circ. Res. 46: 125-132. 1980.
11. Fewell. J.E.. D.R. Abendschein. C.J. Carlson. E. Rapaport. and J.F. Murray. Mechanism of decreased right and left ventricular end-diastolic volumes during continuous positive-pressure ventilation in dogs. Circ. Res. 47: 467-472. 1980.
12. Glick. G .. A.S. Wechsler. and S.E. Epstein. Reflex cardiovascular depression produced by stimulation of pulmonary stretch receptors in the dog. J. Clin. Invest. 48: 467-473. 1968.
13. Guyton. A. C.. A.W. Lindsey. B. Abernathy. and T. Richardson. Venous returns at various right atrial pressures and the normal venous return curve. Am. J. Physiol. 189: 609-615. 1957.
14. Harboe, S .. O.W. Levang. and E.S. Hysing. The effect of positive end-expiratory pressure after three types of open heart sui-gery. Acta Anaesthesiol. Scand. 23: 165-176. 1979.
15. Haynes. J.B .. S.D. Carson. W.P. Whitney. G.O. Zerbe. T.M. Hyers and P. Steele. Positive endexpiratory pressure shifts left ventricle diastolic pressure-area curves. J. Appl. Physiol.: Respirat. Environ. Exercise Physiol. 48: 670-676. 1980.
16. Hobelmann. C. F .. Jr.. D.E. Smith, R.W. Virgilio. A.R. Shapiro. and R.M. Peters. Hemodynamic alterations with positive end-expiratory pressure: the contribution of the pulmonary vasculature. J. Trauma 15: 951-958. 1975.
17. Humphreys. G.H .. R.L. Moore. H.C. Maier. and V. Apgar. Studies of the cardiac output of anesthetized dogs during continuous and intermittent inflation of the lung...;;.J. Thorac. Surg. 7: 438-451. 1937/38.
18. Jansen. J.R.C.. J.J. Schreuder. J.M. Bogaard, W. van Rooyen. and A Versprille. The thermodilution technique for the measurement of cardiac output during artificial ventilation. J. Appl. Physiol.: Respirat. Environ. Exercise Physiol. 51: 584-591. 1981.
19. Lenfant. C.. and B.J. Howell. Cardiovascular adjustments in dogs during continuous pressure breathing. J. Appl. Physiol. !5: 425-428. 1960.
20. Liebman. P.R .. M.T. Patten. J. Manny. D. Shepro. and H. B. Hechtman. The mechanism of depressed cardiac output on positive end-expiratory pressure (PEEP). Surgery 83: 594-598. 1978.
21. Lozman. J .. S.R. Powers. Jr.. T. Older. R.E. Datton. R.J. Roy. M. English. D. Marco. and C. Eckert. Correlation of pulmonary wedge and left atrial pressures. Arch. Surg. 109: 270-276. 1974.
22. Morgan. B.C.. W.G. Guntheroth and D.H. Dillard. Relationship of pericardia! to pleural pressure during quiet respiration and cardiac tamponade. Circ. Res. 16: 493-498. 1965.
23. Powers. S.R.. R. Manna!. M. Neclerio. M. English. C. Marr. R. Leather. H. Ueda. G. Willems. W. Custead. and R. Dutton. Physiologic consequences of positive end-expiratory pressure (PEEP) ventilation. Ann. Surg. 178: 265-271, 1973.
24. Qvist. J .. H. Pontoppidan. R.S. Wilson. E. Lowenstein, and M.B. Laver. Hemodynamic responses to mechanical ventilation with PEEP; the effect of hypervolemia. Anesthesiology 42: 45-55. 1975.
25. Robotham. J.L.. W. Lixfield. L Holland. D. MacGregor. B. Bromberger-Barnea. S. Permutt. and J.L. Rabson. The effects of positive end-expiratory pressure on right and left ventricular performance. Am. Rev. Respir. Dis. 121: 677-683. 1980.
26. Salisbury. P.F .• P.M. Galletti. R.J;- -Lewin. and P.A. Rieben. Stretch reflexes from the dog's lung to the systemic circulation. Circ. Res. 7: 62-67, 1958.
27. Scharf. S.M .. R. Brown. N. Saunders. L.H. Green. and R.H. Ingram. Jr. Changes in canine left ventricular size and configuration with positive end-expiratory pressure. Circ. Res. 44: 672-678. 1979.
28. Scharf. S.M .. P. Caldini. and R.H. Ingram. Jr. Cardiovascular effects of increasing airway pressure in the dog. Am. J. P.hysiol. 232 (Heart Circ. Physiol. 1): H35-H43. 1977.
29. Stool. E.W .. C.B. Mullins. S.J. Leshin. and J.H. Mitchell. Dimensional changes of the left ventricle during acute pulmonary arterial hypertension in dogs. Am. J. Physiol. 33: 868-875. 1974.
30. Sugerman. H.J .. K.B. Olofsson. T.W. Pollock. R.F. Agnew. R.M. Rogers. and L.D. Miller.
49

Continuous positive end-expiratory pressure ventilation {PEEP) for the treatment of diffuse interstitial pulmonary oedema. J. Trauma 12: 263-273. 1972.
31. Versprille. A.. E. Harinck. C.J. van Nie. and J.R.C. Jansen. Functional interaction of both ventricles at birth and the changes during the neonatal period in relation to the changes of geometry. In: Feral and Newborn Cardiovascular Physiology. Fetal and Newborn Circulation. edited L.D. Longo and D.D. Reneau. New York: Garland STPM. 1978, vol. 2.
50
CHAPTER IV
Contribution of lung stretch depressor reflex to nonlinear fall in cardiac output during PEEP
Jan J. Schreuder. Jos R.C. Jansen. and Adrian Versprille (With the Technical Assistance of Arnold Drop)
Pathophysiological Laboratory, Department of Pulmonary Diseases, Erasmus University, 3000 DR Rotrerdam. The Netherlands J.Appl.Physiol.: Respirat. Environ. Exercise Physic\. 56: 1578-1582, 1984
In a previous paper (13) we described a nonlinear fall in cardiac output during positive end-expiratory pressure (PEEP). We hypothesized that the occurrence of the sharpest fall between 3 and 10 cmH20 of PEEP was due to a lung stretch depressor reflex. This extra fall was thought to superimpose on a linear decrease in cardiac output due to the rise in central venous pressure. which was partly compensated for by cardiovascular reflex mechanisms elicited by the decrease in aortic pressure. In the present study the involvement of the lung stretch depressor reflex in the cardiac output response to PEEP was tested. The existence of such a reflex was demonstrated by Daly et al. (4, 5). They reported that besides static levels dynamic changes in lung stretch also initiate a vasodepressor effect and that a threshold must be exceeded.
If the steepest part of the cardiac output fall is indeed due to a lung stretch depressor reflex. it would be expected that during continuous positive-pressure ventilation (CPPV) with small tidal volumes, a higher level of PEEP would be necessary for this part of the response than during ventilation with large tidal volumes. Therefore we compared the hemodynamic responses to PEEP applied as a ramp using two different tidal volumes. To separate any effect of the lung stretch reflex from the mechanical effect of a rise in central venous pressure, we also related cardiac output to central venous pressure in both series. Similar responses would disprove our hypothesis.
METHODS
The methods have been previously described (10. 13). Therefore only the essentials of the technique and the .modifications will be given here.
Nine Yorkshire pigs (5-7 wk old, 7-11 kg) were anesthetized with pentobarbital
51
sodium (30-37.5 mg·kg-1 ip) and ventilated (inspiratory-to-expiratory ratio 4:5) with room air in the supine position. Rectal temperature was kept at 38°C by use of a thennocontrolled operating table. Anesthesia was maintained by a continuous infusion of pentobarbital (7.5 mg·kg-l.h- 1 iv).
Animals were paralyzed with d-tubocurarine (0.1 mg·kg-1) administered over a period of 3 min. followed by a continuous infusion of 0.2 mg·kg- 1·h- 1• Heparin (125 IU·k{1) was administered intermittently each hour. Catheters were placed in the pulmonary artery. superior caval vein at the level of the right atrium. left ventricle and aorta near the brachiocephalic artery. The last of these had a thermistor at its tip. Loss of blood was compensated for with 6% dextran. Cardiac output was measured by both the thermodilution technique and the direct Fick method for 0 2 to establish base-line values but by thermodilution alone during the ramp procedures. For the thermodilution method 0.5 ml saline at room temperature was injected automatically into the left ventricle at 60% of the ventilatory cycle.
Experimental Procedures.
PEEP was applied up to 15 cmH20 (PEEP15 ) as a positive ramp with a velocity of 0.67 cmH20·min- 1• After an interval of 8 min PEEP was returned to zero (ZEEP) in a reversed ramp with the same speed. The combined effects of tidal volume (VT) and PEEP on hemodynamics were studied in three successive series in each animal. In series I and 3 respiratory rate (RR) was 10 breaths·min-1• in series 2. 20 breaths· min-1• VT was adjusted to achieve an arterial C02 tension (PaC02 ) of 40 Torr (Table I) before each series using a stabilization period of 30 min. Immediately before and after each series the direct Fick method and five successive thermodilution measurements were performed.
Electrocardiogram. pressures. and expiratory C02 concentration were continuously recorded during each experiment. Cardiac output was monitored each 30 s during the PEEP ramp with the thermodilution technique. Mean vascular pressures over one heart cycle, heart rate, and airway pressure were measured at peak insufflation and end expiration simultaneously with the estimations of cardiac output.
Data Analysis and Statistics.
Although thermodilution estimates of cardiac output performed at the left side of the heart at 60% of the ventilatory cycle had been found to be near the mean value of the whole ventilatory cycle (10). they could nevertheless deviate slightly but proportionally from this mean. We have therefore presented the base-line values of cardiac output in absolute terms as estimated by the Fick method and the relative changes as estimated by the thermodilution technique.
For comparison, the end-expiratory value of the mean central venous pressure at
52
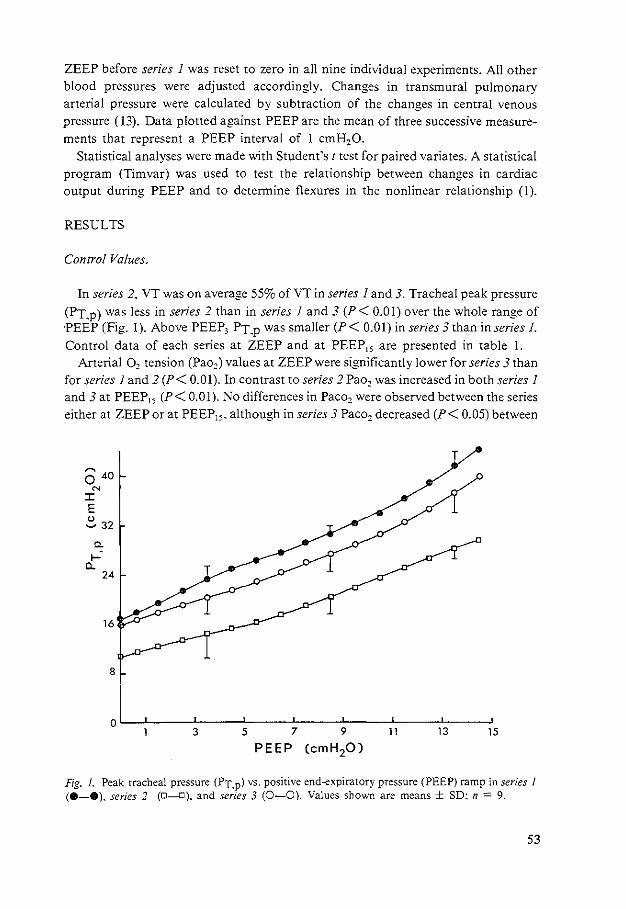
ZEEP before series I was reset to zero in all nine individual experiments. All other blood pressures were adjusted accordingly. Changes in transmural pulmonary arterial pressure were calculated by subtraction of the changes in central venous pressure ( 13). Data plotted against PEEP are the mean of three successive measurements that represent a PEEP interval of I cmH20.
Statistical analyses were made with Student's t test for paired variates. A statistical program (Timvar) was used to test the relationship between changes in cardiac output during PEEP and to determine flexures in the nonlinear relationship (!).
RESULTS
Control Values.
In series 2. VT was on average 55% of VT in series I and 3. Tracheal peak pressure (PT.p) was less in series 2 than in series I and 3 (P< 0.01) over the whole range of 'PEEP (Fig. 1). Above PEEP3 PT.p was smaller (P< 0.01) in series 3 than in series!.
Control data of each series at ZEEP and at PEEP15 are presented in table I. Arterial 0 2 tension (Pao,) values at ZEEP were significantly lower for series 3 than
for series I and 2 (P< 0.01). In contrast to series 2 Pao2 was increased in both series I and 3 at PEEP15 (P< 0.01). No differences in Paco2 were observed between the series either at ZEEP or at PEEP15 • although in series 3 Paco2 decreased (P< 0.05) between
~
0 40 N
:c E ~ 32
a. .....
Cl.. 24
16
8
oL-~--~-----L----~---L----~--~----~ 3 5 7 9 11 13 15
PEEP (cmH20)
Fig. 1. Peak tracheal pressure (PT.p) vs. positive end-expiratory pressure (PEEP) ramp in series 1 (8-e), series 2 (D-D). and series 3 (0-0}. Values shown are means ± SD: n = 9.
53
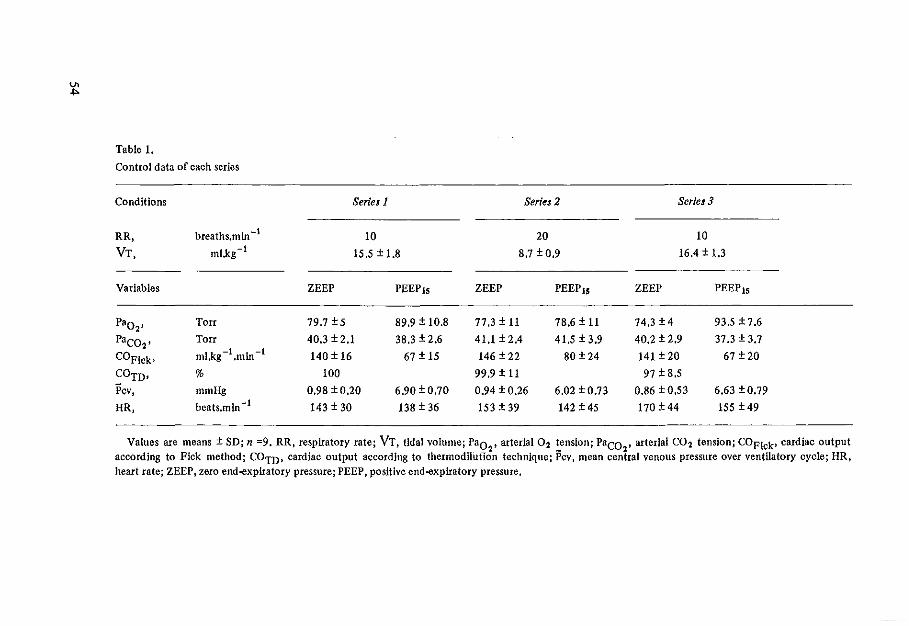
V>
"'
Table 1.
Control data of each series
Conditions
RR,
VT,
Variables
Paol'
Paco2' COF!ck•
COTD•
Pcv, HR,
breaths.min -t ml.kg -!
Torr
Torr
ml.kg -I .min -I
%
mmHg beats.min -t
Seriul
10
15,5±1.8
ZEEP PEEP1s
79.7 ± 5 89.9 ± 10.8
40.3 ± 2.1 38.3 ± 2.6
140 ± 16 67 ± 15
100
0.98 ±0.20 6.90 ±0.70
143 ± 30 138 ± 36
Series 2
20
8.7 ± 0.9
ZEEP PEEP15
77.3 ± 11 78.6 ± 11
41.1±2,4 41.5 ± 3.9
146 ± 22 80 ±24
99.9 ± 11
0.94 ± 0.26 6.02 ± 0.73
153 ± 39 142 ± 45
Series 3
10
16.4 ± 1,3
ZEEP PEEP15
74.3 ± 4 93.5 ±7.6
40.2 ± 2.9 37.3 ± 3.7
141 ± 20 67 ± 20
97 ± 8,5
0.86 ± 0.53 6.63 ±0.79
170 ± 44 155 ± 49
Values are means± SD; n =9. RR, respiratory rate; VT, tidal volume; Pao , axterlal 02 tension; Paco , arterial C02 tension; COF!ck• cardiac output 2 - 2
according to Pick method; COm, cardiac output according to thermodilution technique; Pcv, mean central venous pressure over ventilatory cycle; HR, heart rate; ZEEP, zero end-expiratory pressure; PEEP, positive end-expiratory pressure.
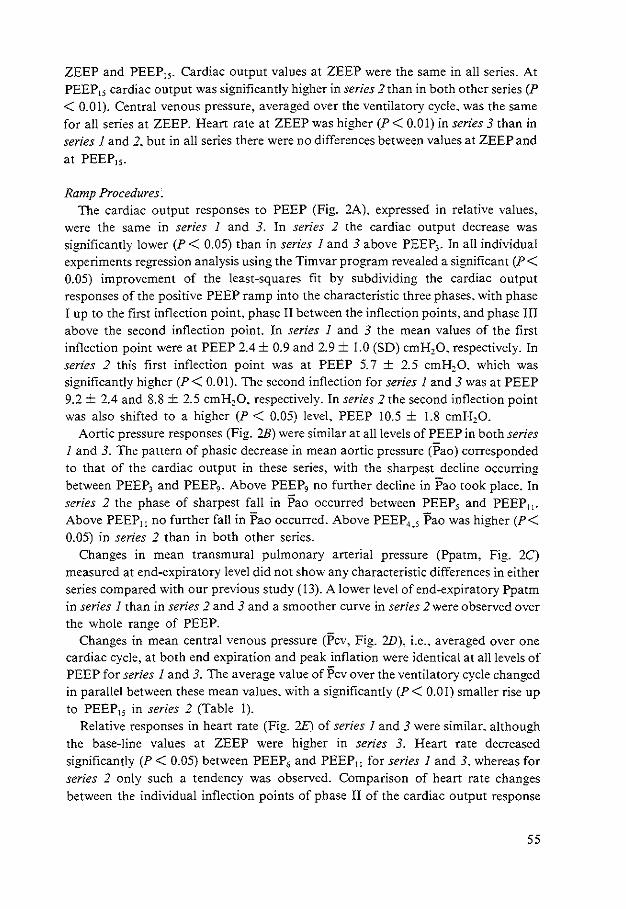
ZEEP and PEEP15 • Cardiac output values at ZEEP were the same in all series. At PEEP15 cardiac output was significantly higher in series 2 than in both other series (P < 0.01). Central venous pressure, averaged over the ventilatory cycle. was the same for all series at ZEEP. Heart rate at ZEEP was higher (P< 0.01) in series 3 than in series I and 2. but in all series there were no differences between values at ZEEP and at PEEP15 •
Ramp Procedures. The cardiac output responses to PEEP (Fig. 2A). expressed in relative values.
were the same in series 1 and 3. In series 2 the cardiac output decrease was significantly lower (P < 0.05) than in series I and 3 above PEEP3 • In all individual experiments regression analysis using the Timvar program revealed a significant (P< 0.05) improvement of the !east-squares fit by subdividing the cardiac output responses of the positive PEEP ramp into the characteristic three phases. with phase I up to the first inflection point. phase II between the inflection points. and phase III above the second inflection point. In series I and 3 the mean values of the first inflection point were at PEEP 2.4 ± 0.9 and 2.9 ± 1.0 (SO) cmH20. respectively. In series 2 this first inflection point was at PEEP 5. 7 ± 2.5 cmH20. which was significantly higher (P< 0.01). The second inflection for series I and 3 was at PEEP 9.2 ± 2.4 and 8.8 ± 2.5 cmH20. respectively. In series 2 the second inflection point was also shifted to a higher (P < 0.05) level. PEEP 10.5 ± 1.8 cmH20.
Aortic pressure responses (Fig. 2B) were similar at all levels of PEEP in both series I and 3. The pattern of phasic decrease in mean aortic pressure (Pao) corresponded to that of the cardiac output in these series, with the sharpest decline occurring between PEEP3 and PEEP,. Above PEEP9 no further decline in Pao took place. In series 2 the phase of sharpest fall in Pao occurred between PEEP, and PEEP11 •
Above PEEP11 no further fall in Pao occurred. Above PEEP4 • 5 Pao was higher (P< 0.05) in series 2 than in both other series.
Changes in mean transmural pulmonary arterial pressure (Ppatm. Fig. 2C) measured at end-expiratory level did not show any characteristic differences in either series compared with our previous study (13). A lower level of end-expiratory Ppatm in series 1 than in series 2 and 3 and a smoother curve in series 2 were observed over the whole range of PEEP.
Changes in mean central venous pressure (Pcv. Fig. 2D), i.e .. averaged over one cardiac cycle. at both end expiration and peak inflation were identical at all levels of PEEP for series I and 3. The average value of Pcv over the ventilatory cycle changed in parallel between these mean values. with a significantly (P< 0.01) smaller rise up to PEEP15 in series 2 (Table 1).
Relative responses in heart rate (Fig. 2E) of series I and 3 were similar. although the base-line values at ZEEP were higher in series 3. Heart rate decreased significantly (P < 0.05) between PEEP6 and PEEP11 for series I and 3. whereas for series 2 only such a tendency was observed. Comparison of heart rate changes between the individual inflection points of phase II of the cardiac output response
55
_100
~ 0 ~
'5 80 c. ~
0
u 60 ~
't; ~
~
(.) 40
100
B C>
J: 80 E E
0 60
~
IO..
22
~ c
C> J: E 18
5
" ci 14
E
~ c. 10
0..
D 10
~
C> J: 8 E
5 6
> 4 u
10.. 2
0
" E ;; 0::
100 -~ " 0 J:
3 5 7 9 11 13 15 PEEP (em H 20)
56
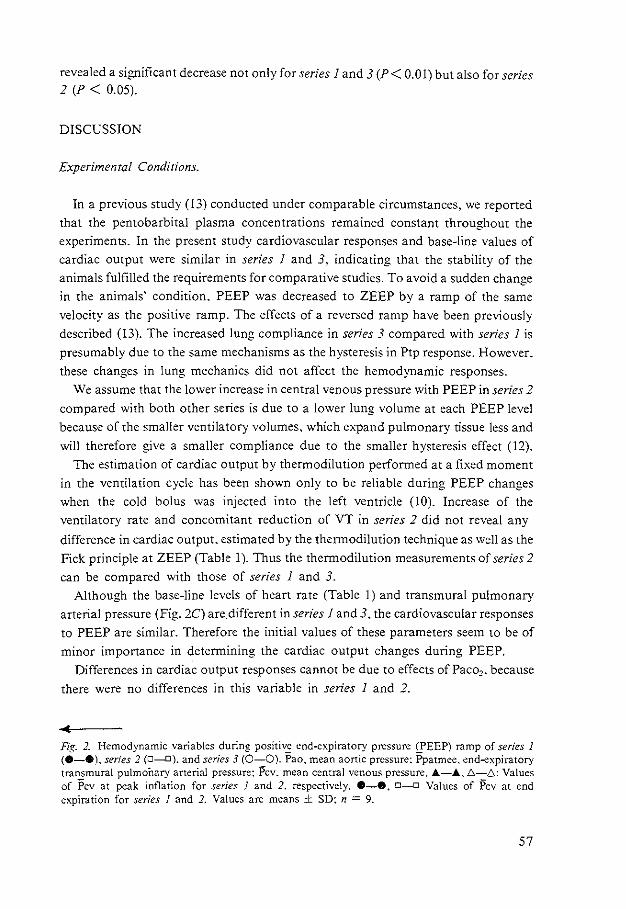
revealed a significant decrease not only for series I and 3 (P< 0.01) but also for series 2 (P < 0.05).
DISCUSSION
Experimental Conditions.
In a previous study (13) conducted under comparable circumstances. we reported
that the pentobarbital plasma concentrations remained constant throughout the
experiments. In the present study cardiovascular responses and base·line values of
cardiac output were similar in series I and 3. indicating that the stability of the
animals fulfilled the requirements for comparative studies. To avoid a sudden change
in the animals' condition. PEEP was decreased to ZEEP by a ramp of the same
velocity as the positive ramp. The effects of a reversed ramp have been previously
described (13). The increased lung compliance in series 3 compared with series 1 is
presumably due to the same mechanisms as the hysteresis in Ptp response. However.
these changes in lung mechanics did not affect the hemodynamic responses.
We assume that the lower increase in central venous pressure with PEEP in series 2
compared with both other series is due to a lower lung volume at each PEEP level
because of the smaller ventilatory volumes, which expand pulmonary tissue less and
will therefore give a smaller compliance due to the smaller hysteresis effect (12).
The estimation of cardiac output by thermodilution performed at a fixed moment
in the ventilation cycle has been shown only to be reliable during PEEP changes when the cold bolus was injected into the left ventricle (10). Increase of the
ventilatory rate and concomitant reduction of VT in series 2 did not reveal any
difference in cardiac output. estimated by the thermodilution technique as well as the
Fick principle at ZEEP (Table I). Thus the thermodilution measurements of series 2
can be compared with those of series 1 and 3. Although the base-line levels of heart rate (Table I) and transmural pulmonary
arterial pressure (Fig. 2C) are_different in series 1 and 3. the cardiovascular responses
to PEEP are similar. Therefore the initial values of these parameters seem to be of
minor importance in determining the cardiac output changes during PEEP.
Differences in cardiac output responses cannot be due to effects ofPaco2 • because
there were no differences in this variable in series 1 and 2.
Fig. 2. Hemodynamic variables during positive end-expiratory pressure (PEEP) ramp of series I (8-e). ser;es 2 (0-D). and series 3 (0-0). Pao. mean aortic pressure: i>patmee, end-expiratory transmural pulmoflary arterial pressure: Pcv. mean central venous pressure. A-A.!::.-!::.: Values of Pcv at peak inflation for series I and 2, respectively. 8-e, 0-0 Values of Pcv at end expiration for series I and 2. Values are means ± SD: n = 9.
57
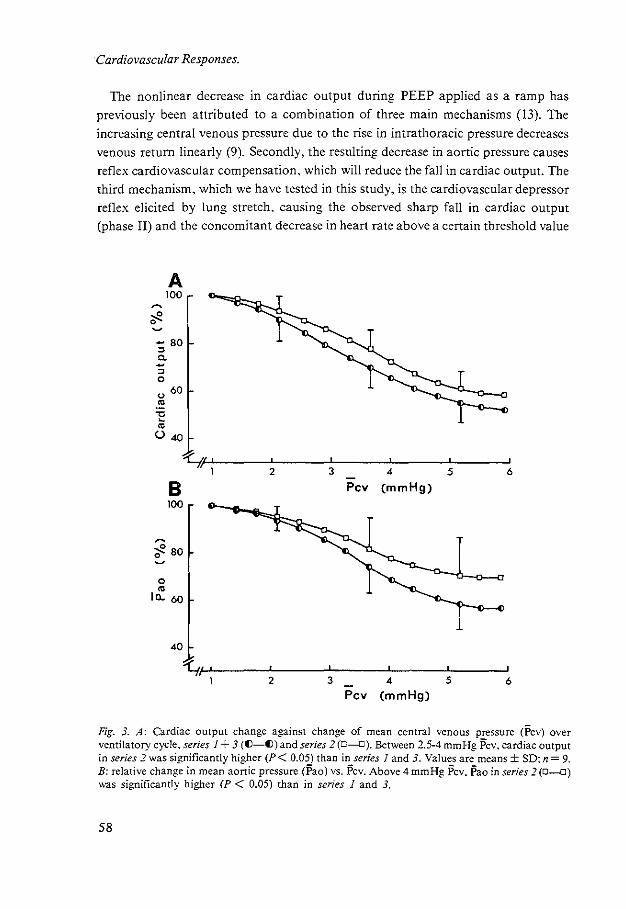
·Cardiovascular Responses.
The nonlinear decrease m cardiac output during PEEP applied as a ramp has
previously been attributed to a combination of three main mechanisms (13). The
increasing central venous pressure due to the rise in intrathoracic pressure decreases
venous return linearly (9). Secondly. the resulting decrease in aortic pressure causes
reflex cardiovascular compensation. which will reduce the fall in cardiac output. The
third mechanism. which we have tested in this study. is the cardiovascular depressor
reflex elicited by lung stretch. causing the observed sharp fall in cardiac output
(phase II) and the concomitant decrease in heart rate above a certain threshold value
A 100
- 80
" c. -" 0
" 60
"' -o -"' (.) 40
~W---~---7--~----~--~ 2 3 4 5 6
B 100
;e 80 0
0
"' Ia.. 60
40
Pcv (mmHg)
~P---~--~--~--~~~ 2 3 4 5 6
Pcv (mmHg)
Fig. 3. A: Cardiac output change against change of mean central venous pressure (Pcv) over ventilatory cycle. series 1 + 3 (()-())and series 2 (D-D). Between 2.5-4 mmHg Pcv. cardiac output in series 2 was significantly higher (P< 0.05) than in series I and 3. Values are means± SD; n= 9. B: relative change in mean aortic pressure (Pao) vs. Pcv. Above 4 mmHg Pcv. Pao in series 2(0-D) was significantly higher (P < 0.05) than in series 1 and 3.
58
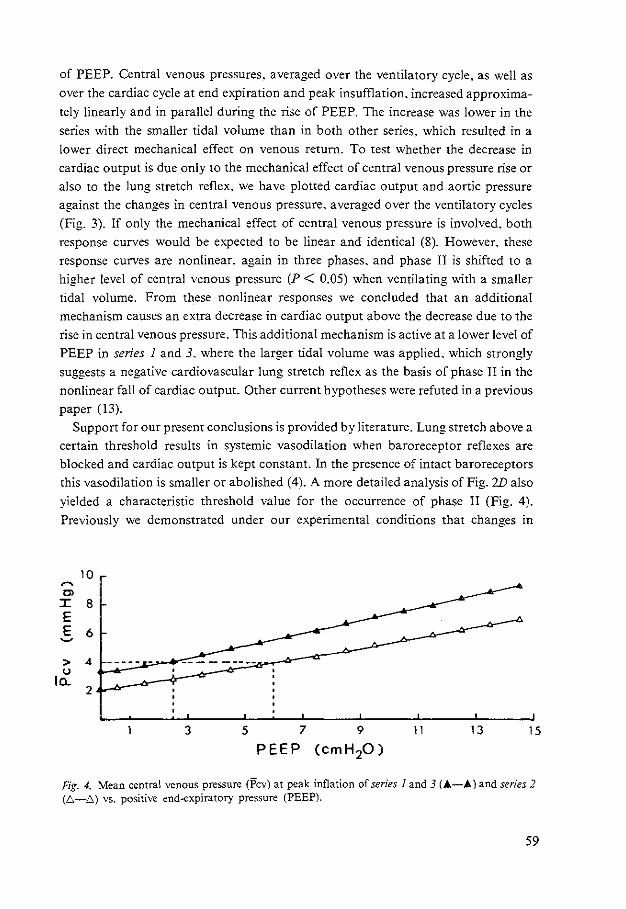
of PEEP. Central venous pressures. averaged over the ventilatory cycle. as well as
over the cardiac cycle at end expiration and peak insufflation. increased approxima
tely linearly and in parallel during the rise of PEEP. The increase was lower in the
series with the smaller tidal volume than in both other series. which resulted in a
lower direct mechanical effect on venous return. To test whether the decrease in
cardiac output is due only to the mechanical effect of central venous pressure rise or
also to the lung stretch reflex. we have plotted cardiac output and aortic pressure
against the changes in central venous pressure. averaged over the ventilatory cycles
(Fig. 3). If only the mechanical effect of central venous pressure is involved. both
response curves would be expected to be linear and identical (8). However. these
response curves are nonlinear. again in three phases. and phase II is shifted to a
higher level of central venous pressure (P < 0.05) when ventilating with a smaller
tidal volume. From these nonlinear responses we concluded that an additional
mechanism causes an extra decrease in cardiac output above the decrease due to the
rise in central venous pressure. This additional mechanism is active at a lower level of
PEEP in series I and 3. where the larger tidal volume was applied, which strongly suggests a negative cardiovascular lung stretch reflex as the basis of phase II in the
nonlinear fall of cardiac output. Other current hypotheses were refuted in a previous
paper (13).
Support for our present conclusions is provided by literature. Lung stretch above a
certain threshold results in systemic vasodilation when baroreceptor reflexes are
blocked and cardiac output is kept constant. In the presence of intact baroreceptors
this vasodilation is smaller or abolished (4). A more detailed analysis of Fig. 2D also
yielded a characteristic threshold value for the occurrence of phase II (Fig. 4).
Previously we demonstrated under our experimental conditions that changes in
10 ~
C> I 8 E E 6 ~
> 4 ----- -u
Ia.. 2
3 5 7 11 13 15
PEEP
Fig. 4. Mean central venous pressure (Pcv) at peak inflation of series I and 3 (A-A) and series 2 (6-~) vs. positive end-expiratory pressure (PEEP).
59
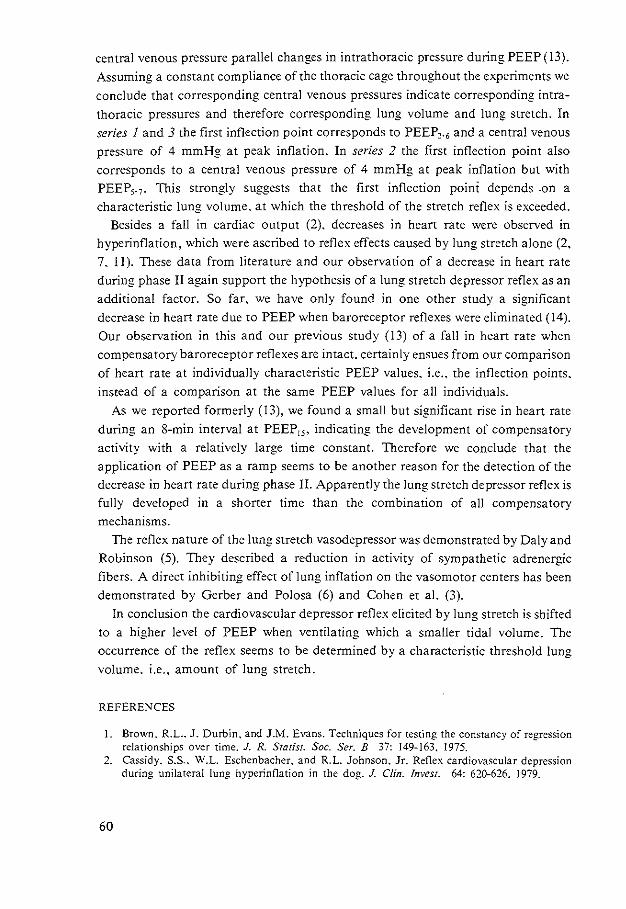
central venous pressure parallel changes in intrathoracic pressure during PEEP (13).
Assuming a constant compliance of the thoracic cage throughout the experiments we
conclude that corresponding central venous pressures indicate corresponding intra
thoracic pressures and therefore corresponding lung volume and lung stretch. In series 1 and 3 the first inflection point corresponds to PEEP2 •6 and a central venous
pressure of 4 mmHg at peak inflation. In series 2 the first inflection point also
corresponds to a central venous pressure of 4 mmHg at peak inflation but with
PEEP5• 7 • This strongly suggests that the first inflection poini depends ,on a
characteristic lung volume. at which the threshold of the stretch reflex is exceeded.
Besides a fall in cardiac output (2). decreases in bean rate were observed in
hyperinflation. which were ascribed to reflex effects caused by lung stretch alone (2.
7. 11). These data from literature and our observation of a decrease in heart rate
during phase II again support the hypothesis of a lung stretch depressor reflex as an
additional factor. So far. we have only found in one other study a significant
decrease in heart rate due to PEEP when baroreceptor reflexes were eliminated ( 14).
Our observation in this and our previous study (13) of a fall in heart rate when
compensatory baroreceptor reflexes are intact. certainly ensues from our comparison
of heart rate at individually characteristic PEEP values. i.e .. the inflection points.
instead of a comparison at the same PEEP values for all individuals.
As we reported formerly (13). we found a small but significant rise in heart rate
during an 8-min interval at PEEP15 • indicating the development of compensatory
activity with a relatively large time constant. Therefore we conclude that the
application of PEEP as a ramp seems to be another reason for the detection of the
decrease in heart rate during phase II. Apparently the lung stretch depressor reflex is
fully developed in a shorter time than the combination of all compensatory
mechanisms.
The reflex nature of the lung stretch vasodepressor was demonstrated by Daly and
Robinson (5). They described a reduction in activity of sympathetic adrenergic
fibers. A direct inhibiting effect of lung inflation on the vasomotor centers has been
demonstrated by Gerber and Polosa (6) and Cohen et a!. (3).
In conclusion the cardiovascular depressor reflex elicited by lung stretch is shifted
to a higher level of PEEP when ventilating which a smaller tidal volume. The
occurrence of the reflex seems to be determined by a characteristic threshold lung
volume. i.e., amount of lung stretch.
REFERENCES
I. Brown. R.L. J. Durbin. and J.M. Evans. Techniques for testing the constancy of regression relationships over time. J. R. Swrist. Soc. Ser. B 37: 149-163. 1975.
2. Cassidy. S.S .. W.L. Eschenbacher. and R.L. Johnson. Jr. Reflex cardiovascular depression during unilateral lung hyperinflation in the dog. J. Clin. Jnvesr. 64: 620-626. 1979.
60
3. Cohen. M.L P.M. Gootman. and J.L. Feldman. Inhibition of sympathetic discharge by lung inflation. In: Arterial Baroreceprors and Hypenension. edited by P. Sleight. London: Oxford Univ. Press. 1980, p. 161-167.
4. Daly, M. de B .. J.L. Hazzledine. and A. Ungar. The reflex effects of alterations in lung volume on systemic vascular resistance in the dog. J. Physiol. London 188: 331-351. 1967.
5. Daly. M. de. B .. and B.H Robinson. An analysis of the reflex systemic vasodilator response elicited by lung inflation in the dog. J. Physiol. London 195: 387-406, 1968.
6. Gerber. U .. and C. Polosa. Effects of pulmonary stretch receptor afferent stimulation on sympathetic preganglionic neuron firing. Can. J. Physiol. Pharmacal. 56: 191-198, 1978.
7. Glick. G., A.S. Wechsler. and S.A. Epstein. Reflex cardiovascular depression produced by stimulation of pulmonary stretch receptors in the dog. J. Clin. Invest. 48: 467-473. 1968.
8. Guyton. A. C.. C.E. Jones. and T.G. Coleman. In: Circulatory Physiology: Cardiac Output and Its Regulation. Philadelphia. PA: Saunders. 1973.
9. Guyton. A. C.. A.W. Lindsey. B. Abernathy. and T. Richardson. Venous return at various right atrial pressures and the normal venous return curve. Am-. J. Physiol. 189: 609-615. 1957.
10. Jansen. J.R.C .. J.J. Schreuder. J.M .Bogaard. W. van Rooyen.and A. VCrS·p-fille. -Thermodilution technique for measurement of cardiac output during artificial ventilation. J. Appl. Physiol.: Respirat. Environ. Exercise Physiol. 51: 584-59 L 1981.
I I. Kaufman. M.P .. G.A. Iwamoto. J.H. Ashton. and S.S. Cassidy. Responses to inflation of vagal afferents with endings in the lung of dogs. Circ. Res. 51: 525-531. 1982.
12. Mead. J .• and C. Collier. Relation of volume history of lungs to respiratory mechanics in anesthetized dogs. J. Appl. Physiol. 14: 669-678. 1959.
13. Schreuder. J.J .. J.R.C. Jansen. J.M. Bogaard. and A. Versprille. Hemodynamic effects of positive end-expiratory pressure applied as a ramp. J. Appl. Physiol.: Respirar. Environ. Exercise Physiol. 53: 1239-1247. 1982.
14. Stinnet, H.O .. and F.J. Sepc. Rabbit cardiovascular responses during PEEP before and after vagotomy. Proc. Soc. Exp. Bioi. Med. 162: 485-494. 1979.
61
CHAPTER V
Hemodynamic effects of PEEP as a ramp in normo-, hyperand hypovolemia
Jan J. Schreuder. Jos R.C. Jansen. Adrian Versprille (with the technical assistance of Arnold Drop)
Pathophysiological laboratory. Department of pulmonary diseases. Erasmus Universiry, 3000 DR Rouerdam, The Netherlands
In previous studies (19. 20) the hemodynamic responses to positive end-expiratory pressure (PEEP) were found to be nonlinear. Cardiac output and aortic pressure decreased in three phases. with the sharpest decline (phase II) between a PEEP of 3 to 10 em H20. These nonlinear responses were attributed to a combination of three
mechanisms: 1. a rise in central venous pressure. due to the rise in intrathoracic pressure with
PEEP. decreasing venous return linearly 2. a concomitant fall in arterial pressure evoking cardiovascular compensatory
mechanisms 3. a lung stretch depressor reflex occurring during phase II. inducing a systemic
vasodilatation and decrease in heart rate. The lung stretch depressor reflex can explain the incomplete compensation of arterial blood pressure by cardiovascular control mechanisms during the cardiac output decrease by PEEP (4. 19. 20). Antagonizing interactions between blood pressure and lung stretch were demonstrated in experiments in which PEEP modified blood pressure reflex responses to changes in isolated carotid pressure (21). Such an interaction might explain the absence of rises in heart rate or even a decrease in heart rate during PEEP when arterial pressure falls and lung stretch increases (4. 7. 17. 18). whereas similar decreases in blood pressure by hemorrhage without a change in lung stretch elicit considerable increases in heart rate (24).
Daly et a!. (5) demonstrated that the effects of lung stretch decreased when preexisting vasomotor tone was lowered. We suppose that the contribution of each of the three mechanisms. and therefore the effects of PEEP. depend on the preexisting hemodynamic condition. because prior volume loading antagonizes the negative influences of PEEP (23. 28).
62
To test this supposition we have investigated the effects of altering blood volume on the hemodynamic responses to PEEP. Application of PEEP as a ramp allowed us to analyse the relative contribution of the mechanisms at corresponding levels of PEEP as well as their changes over the investigated range.
METHODS
The methods have been described previously (10. 19). Therefore. only the essentials of the technique and the modifications will be given here. Eight Yorkshire pigs (5-7 wk old. 7-11 kg) were anesthetized with pentobarbital sodium (30-37.5 mg.kg- 1 ip) and ventilated (inspiratory-to-expiratory ratio 4:5) with room air in the supine position. The ventilation rate was standardized at 10 min- 1 and the tidal volume (VT) was adjusted to maintain arterial C02 tension (PaC02 ) between 38 and 45 Torr. Rectal temperature was kept at approximately 38°C. Anesthesia was maintained by a continuous intravenous infusion of pentobarbital (7.5 mg.kg- 1h- 1 iv).
The animals were paralyzed with d-tubocurarine (0.1 mg.kg-1• iv) followed by a
continuous infusion of 0.2 mg.kg- 1h-1• Heparin (125 IU kg- 1 iv) was administered intermittently each hour. Catheters were placed in the pulmonary artery. the superior caval vein at the level of the right atrium, the left ventricle and the aorta near the brachiocephalic artery. The last of these had a thermistor at its tip. Loss of blood was compensated for with 6% Dextran.
Cardiac output was measured by both the thermodilution technique and the direct Fick method for 0 2 • For the thermodilution method 0.5 ml saline at room temperature was injected automatically into the left ventricle at 60% of the ventilatory cycle. Both techniques were used during base-line measurements. During the PEEP application. only the thermodilution method was used. Electrocardiogram, airway pressure and blood pressures were recorded continuously and measured simultaneously with cardiac output every 30 s during PEEP application.
Experimental Procedures
PEEP was applied as a positive ramp with a velocity of 0.67 cmH20 min- 1 up to 15 cmH20 (PEEP15 ) in four successive series in each animal. Series 1. served as the baseline series under normovolemic conditions. Series 2 was performed during a hypervolemic state. achieved by infusing 15 ml.kg- 1 of 6% Dextran within 2.5 min. In series 3 the animals were returned to the normovolemic state by withdrawal of 15 ml.kg- 1 blood to compare the effects of PEEP under normal and diluted conditions of blood. Series 4 was done in a hypovolemic state after a further withdrawal of 15 ml.kg- 1• This latter series was performed in 7 out of the 8 animals. A stabilization period of 30 min was allowed before each series was started. except for the hypervolemic state when an I h period was used. When necessary VT was slightly adjusted to maintain PaC02 between 38 and 45 Torr. All base-line measurements during zero end-expiratory pressure (ZEEP) were performed 5 times and averaged.
63
except for the Fick method, which was done once. After these measurements the PEEP ramp was started. During an 8 minutes interval at PEEP15 the measurements were repeated. After this interval PEEP was returned to ZEEP in a reversed ramp of the same velocity.
Data Analysis and Statistics
For reasons of comparison the end-expiratory value of the mean central veno.us pressure at ZEEP prior to series 1 was reset to zero in all eight individual experiments. All other intravascular pressures were adjusted accordingly. In a previous study (19) we demonstrated a parallel increase of central venous pressure and intrathoracic pressure in normovolemic animals. Changes in transmural pulmonary arterial pressure at end expiration in all series were estimated by subtracting the changes in central venous pressure of the normovolemic series 3 from the absolute pulmonary arterial pressures. The data plotted against PEEP are mean values of three successive measurements which represent a PEEP interval of 1 cmH10. The lines in the Figures 2-5 are drawn by eye through the average points.
Statistical analyses were done by Student's t-test for paired variates. A statistical program (Timvar) was used to test nonlinearities in the changes of cardiac,output with PEEP and to determine inflection points of the nonlinear response curves. These inflection points (point of change from constancy). were obtained by moving regressions together with their mean square predictions errors. and by Quandt's loglikelihood ratio(!).
RESULTS
Control Values
In Table I the base-line values at ZEEP and the values at PEEP15 of all series are presented. Although minor changes in VT were necessary to keep PaC02 within the settled range these changes did not lead to significant differences in VT within the 4 series. Peak tracheal pressure (PT.peak) at ZEEP was higher (P < 0.05) in series 1 and 2 compared to sen"es 3 and 4. At PEEP15 PT, peak was higher (P< 0.01) in series 1 compared to the other series. In all series the mean values of PaC02 did not change between ZEEP and PEEP15 • The PaC02 at ZEEP was slightly lower in series 4 (P < 0.05) compared to all other series. all other PaC02 values were not significantly different in all series at ZEEP and PEEP15 • The Pa02 values at ZEEP were similar in all series. In all series the Pa02 was significantly (P < 0.05) increased at PEEP15 with a smaller rise in series 1 compared to the other series (P < 0.05).
Hemoglobin concentration and hematocrit decreased (P< 0.01) due to the hemodilution by 6% Dextran performed directly after series 1. There were no differences m hemoglobin concentration or hematocrit between series 2. 3 and 4.
At ZEEP both the Fick and thermodilution method revealed similar values for
64
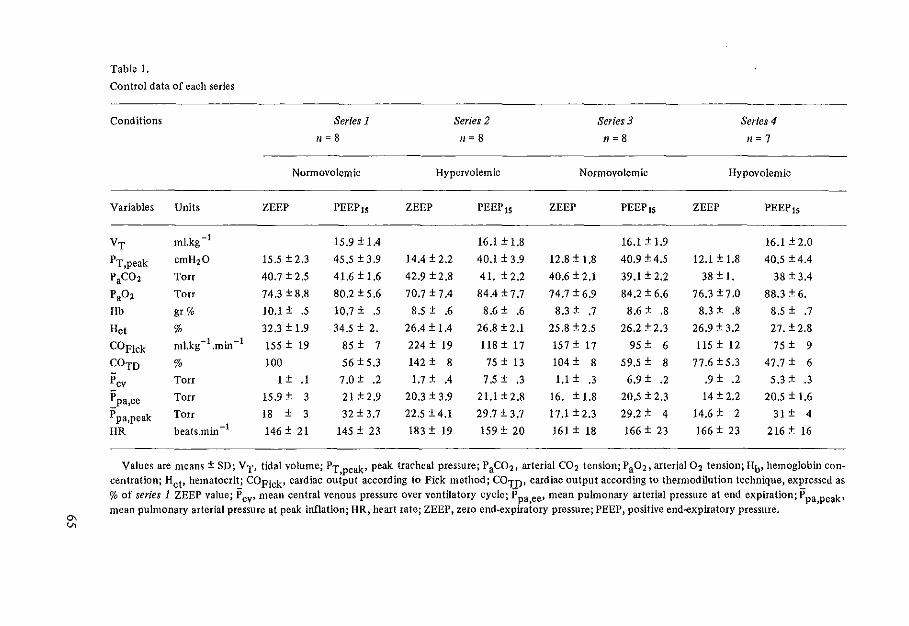
"' v.
Table 1.
Control data of each series
Conditions Series 1 Series 2 Series 3 Series 4
11 = 8 n=B n=B n=7
Normovolemic Hypervolemic Normovolemic Hypovolemic
Variables Units ZEEP PEEP1s ZEEP PEEP 15 ZEEP PEEP1s ZEEP PEEP 15
VT ml.kg -I 15.9 ± 1.4 16.1 ± 1,8 16.1 ± 1.9 16.1 ± 2.0
PT,peak em H20 15.5 ± 2.3 45,5±3.9 14.4 ± 2.2 40.1±3.9 12.8 ± 1.8 40.9 ± 4.5 12.1 ± 1.8 40.5 ± 4.4
P3C02 Torr 40.7 ± 2.5 41.6 ±1.6 42.9 ± 2.8 41. ±2.2 40.6 ± 2.1 39.1 ± 2.2 38 ± l. 38 ± 3.4
P302 Torr 74.3 ± 8.8 80.2±5.6 70.7 ± 7.4 84.4 ±7.7 74.7 ± 6.9 84.2 ± 6.6 76.3 ±7.0 88.3 ± 6.
Hb gr% 10.1 ± .5 10.7 ± .5 8.5 ± .6 8.6 ± .6 8.3 ± .7 8.6 ± .8 8.3 ± .8 8.5 ± .7
Hct % 32.3 ± 1.9 34.5 ± 2. 26.4 ± 1.4 26.8 ± 2.1 25.8 ± 2.5 26.2 ± 2.3 26.9 ± 3.2 27.±2.8
COF!ck ml.kg- 1.min-1 155 ± 19 85 ± 7 224 ± 19 118 ± 17 157 ± 17 95 ± 6 115 ± 12 75 ± 9
COTD % 100 56± 5.3 142 ± 8 75 ± 13 104 ± 8 59.5 ± 8 77.6±5.3 47.7 ± 6
Pcv Torr 1 ± .1 7.0 ± .2 1.7±.4 7.5 ± .3 1,1 ± .3 6.9 ± .2 .9 ± .2 5.3 ± .3
~pa,ee Torr 15.9 ± 3 21±2.9 20.3 ± 3.9 21.1±2.8 16. ± 1.8 20.5 ± 2.3 14 ± 2.2 20.5 ± 1.6
Ppa,peak Torr 18 ± 3 32 ± 3.7 22.5 ± 4.1 29.7 ± 3.7 17.1 ±2.3 29.2 ± 4 14.6 ± 2 31 ± 4
HR beats.min -I 146 ± 21 145 ± 23 183 ± 19 159 ± 20 161 ± 18 166 ± 23 166 ± 23 216 ± 16
Values are means ± SD; VT, tidal volume; PT,peak• peak tracheal pressure; P 3C02 , arterial C02 tension; P 302, arterial 02 tension; Hb, hemoglobin concentration; Hct• hematocrit; COFick• cardiac output according to Pick method; COTD• cardiac output according to thermodilution technique, expressed as %of series 1 ZEEP value; P cv• mean central venous pressure over ventilatory cycle; P pa,ee• mean pulmonary arterial pressure at end expiration; P pa,peak• mean pulmonary arterial pressure at peak inflation; HR, heart rate; ZEEP, zero end-expiratory pressure; PEEP, positive end-expiratory pressure.
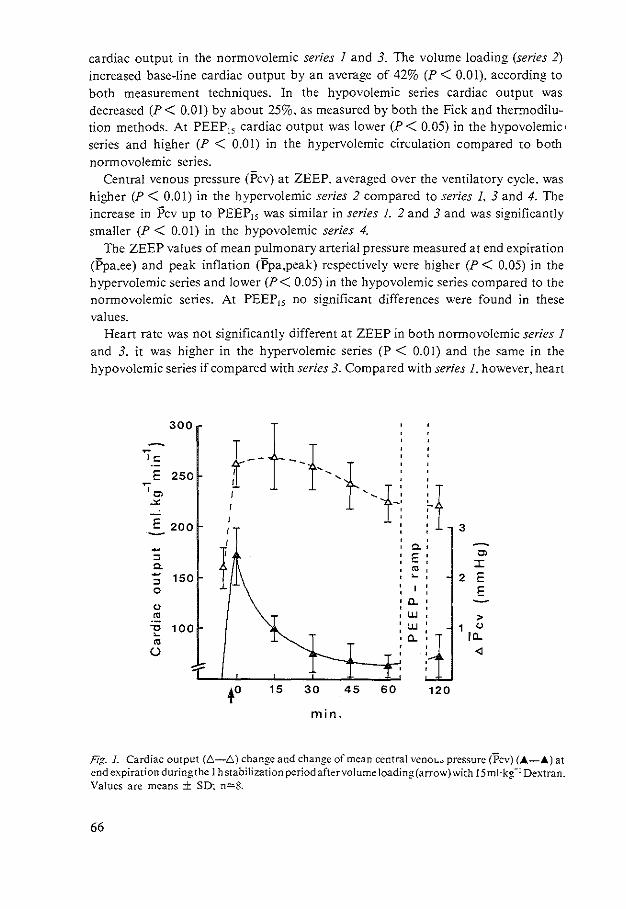
cardiac output in the normovolemic series I and 3. The volume loading (series 2)
increased base-line cardiac output by an average of 42% (P < 0.01). according to both measurement techniques. In the hypovolemic series cardiac output was decreased (P < 0.01) by about 25%. as measured by both the Fick and ther!llodilution methods. At PEEP15 cardiac output was lower (P < 0.05) in the hypovolemic' series and higher (P < 0.01) in the hypervolemic circulation compared to both normovolemic series.
Central venous pressure (Pcv) at ZEEP. averaged over the ventilatory cycle. was higher (P < 0.01) in the hypervolemic series 2 compared to series I. 3 and 4. The increase in Pcv up to PEEP15 was similar in series 1, 2 and 3 and was significantly smaller (P < 0.01) in the hypovolemic series 4.
The ZEEP values of mean pulmonary arterial pressure measured at end expiration (Ppa.ee) and peak inflation (Ppa.peak) respectively were higher (P < 0.05) in the hypervolemic series and lower (P< 0.05) in the hypovolemic series compared to the normovolemic series. At PEEP15 no significant differences were found in these values.
Heart rate was not significantly different at ZEEP in both normovolemic series 1 and 3. it was higher in the hypervolemic series (P < 0.01) and the same in the hypovolemic series if compared with series 3. Compared with series 1, however, heart
300
r-++-t i
'
lc ' '
E 250 ' '
'"' I ',1' tf "' I -: -I : E 200 3 I '
I ' - I 0.•
:J E "' a. "' ::c
150 ~ 2 E :J 0 ' E 0 :a. "' ,w >
"0 100 :w 1 0 ~ ,a_ 10. "' () <I
to 15 30 45 60 120
min.
Fig. I. Cardiac output (.6.-6) change and change of mean central venot.., pressure (Pcv) (.4.-.4.) at end expiration during the 1 hstabilization period after volume loading(arrow)with 15ml·kg-1 Dextran. Values are means ± SD: n=S.
66
rate in the hypovolemic series was significantly higher (P < 0.05) Heart rate at PEEP15 was not different from ZEEP values in both normovolemic series 1 and 3, but was significantly decreased (P< 0.05) in the hypervolemic series 2 and increased (P < 0.01) in the hypovolemic series 4.
In Fig. I the control values of cardiac output (Fick) and the change in Pcv during the I hour stabilization period following the dextran infusion and the values after the PEEP-ramp procedures of series 2 are presented. Cardiac output increased by 60% at 15 min after volume loading followed by a gradual decrease. Central venous pressure increased rapidly after the Dextran infusion followed by a sharp decline to a stable value after 60 min. Pre- and post PEEP ramp values of cardiac output and Pcv were similar.
Ramp Procedures
The cardiac output responses to PEEP in all series are expressed as relative changes from baseline values at ZEEP of the normovolemic series 1 (Fig. 2A). The initial value of cardiac output and its responses to PEEP in the normovolemic series 3 were similar to those of series 1. Both were characterized by a triphasic decrease, as reported previously (19.20). Again regression analysis by the Timvarprogram revealed a significant improvement of the least-squares fit by subdividing the cardiac output response of both series into the three phases. with phase I up to the first inflection point. phase II ,between the inflection points and phase III above the second inflection point. In both normovolemic series 1 and 3 the first inflection point was at PEEP 2.8± 1.5 (SD) and at PEEP 2.6± 1.0 (SD) respectively and the second inflection point at PEEP 9.7 ± 2.4 (SD) and PEEP 8.1 ± 1.9 (SD). In the hypervolemic series the first inflection point has been shifted to a higher PEEP-level (P< 0.01) of 5.8 cmH20± 2.8 (SD). A second inflection point was found in only 4ofthe 8 experiments by the statistical Timvar program. The cardiac output response of the hypovolemic series 4 was not different from a linear decrease in 4 experiments. In 3 experiments a biphasic decrease was observed with an inflection point characterizing the transition from phase II into phase III at PEEP levels between 2.5-4.5 cmH20.
The response of mean aortic pressure (Pao) in both normovolemic series was also characterized by a triphasic decrease, (Fig. 2B). The values were almost similar for both series with a statistical exception at PEEP4. 5 , where Pao was lower in series 3 (P < 0.05). The response in the hypervolemic series 2 was biphasic with the beginning of phase II at a mean value of PEEP of 5.5 cmH20. From ZEEP to PEEP11 the Pao was higher (P < 0.05) than in both normovolemic series 1 and 3. In the hypovolemic series Pao decreased slightly UfY to PEEP3 (P < 0.05) and remained constant above this value. Between ZEEP and PEEP7 Pao was lower (P < 0.05) than in the normovolemic series. and up to PEEP12 lower (P < 0.05) than in the hypervolemic series.
The relative responses in heart rate (Fig. 2C) were equal for both normovolemic series. Comparison of heart rate changes between the individual inflection points
67
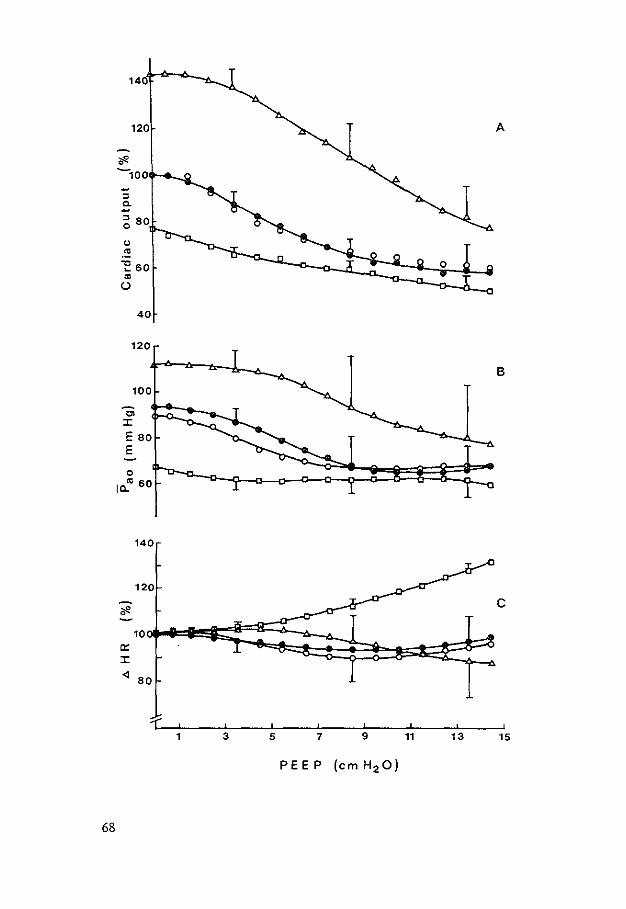
14
120 A
1f'. -100 ~
" Q. ~
~ 80
" "' "'E 60
"' (..)
40
120
B
100
Cl ::c E 80 E
0
10.."' 60
140
120
1f'. c
10 lr ::c <l 80
1 3 5 7 9 11 13 15
68
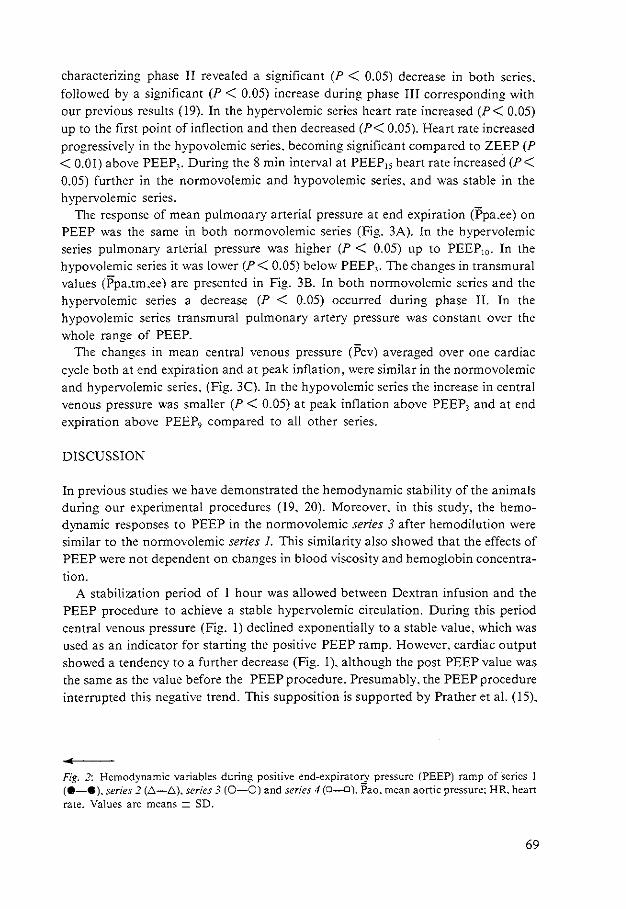
characterizing phase II revealed a significant (P < 0.05) decrease in both series. followed by a significant (P < 0.05) increase during phase Ill corresponding with our previous results (19). In the hypervolemic series heart rate increased (P< 0.05) up to the first point of inflection and then decreased (P< 0.05). Heart rate increased progressively in the hypovolemic series. becoming significant compared to ZEEP (P < 0.01) above PEEP,. During the 8 min interval at PEEP15 heart rate increased (P< 0.05) further in the normovolemic and hypovolemic series, and was stable in the hypervolemic series.
The response of mean pulmonary arterial pressure at end expiration (Ppa.ee) on PEEP was the same in both normovolemic series (Fig. 3A). In the hypervolemic series pulmonary arterial pressure was higher (P < 0.05) up to PEEP10 • In the hypovolemic series it was lower (P< 0.05) below PEEP3 . The changes in transmural values (Ppa,tm,ee) are presented in Fig. 3B. In both normovolemic series and the hypervolemic series a decrease (P < 0.05) occurred during phase II. In the hypovolemic series transmural pulmonary artery pressure was constant over the whole range of PEEP.
The changes in mean central venous pressure CPcv) averaged over one cardiac cycle both at end expiration and at peak inflation. were similar in the normovolemic and hypervolemic series. (Fig. 3C). In the hypovolemic series the increase in central venous pressure was smaller (P < 0.05) at peak inflation above PEEP3 and at end expiration above PEEP9 compared to all other series.
DISCUSSION
In previous studies we have demonstrated the hemodynamic stability of the animals during our experimental procedures (19, 20). Moreover. in this study, the hemodynamic responses to PEEP in the normovolemic series 3 after hemodilution were similar to the normovolemic series I. This similarity also showed that the effects of PEEP were not dependent on changes in blood viscosity and hemoglobin concentration.
A stabilization period of I hour was allowed between Dextran infusion and the PEEP procedure to achieve a stable hypervolemic circulation. During this period central venous pressure (Fig. I) declined exponentially to a stable value, which was used as an indicator for starting the positive PEEP ramp. However. cardiac output showed a tendency to a further decrease (Fig. l), although the post PEEP value was the same as the value before the PEEP procedure. Presumably, the PEEP procedure interrupted this negative trend. This supposition is supported by Prather et al. ( 15).
Fi~. 2: Hemodynamic variables during positive end-expiratory pressure (PEEP) ramp of Series 1 (•-•). series 2 (.6-.6). series 3 (0-0) and series 4 (0-0). Pao. mean aortic pressure: HR. heart rate. Values are means ± SD.
69
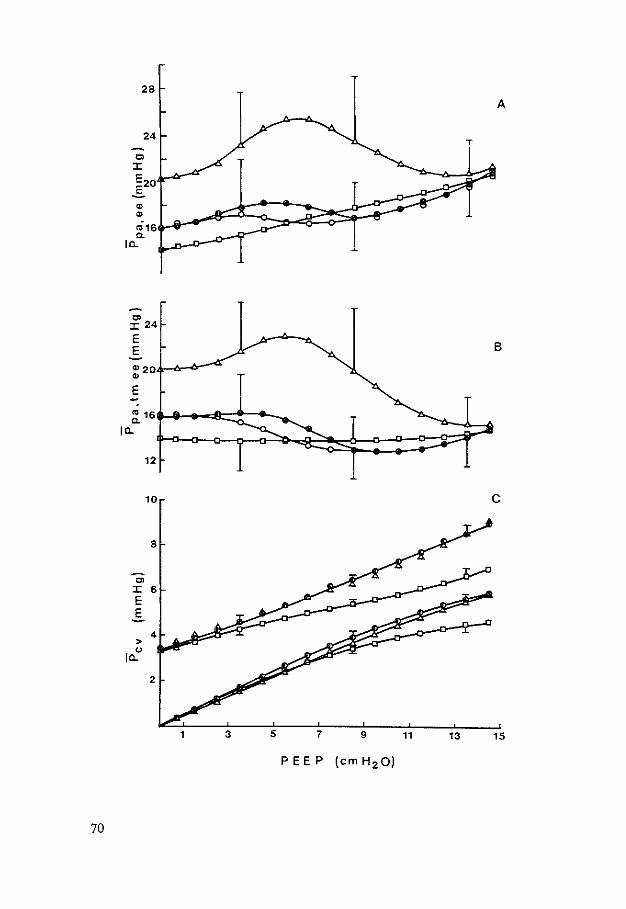
28
A
24
Ol :X:
E2o ..§.
" " <016 Q.
I"-
"' :X: 24
E B E
"20 " E --~16
I"-
12
10 c
8
"' :X: 6 E .s
4 >
" I"-
2
15
70
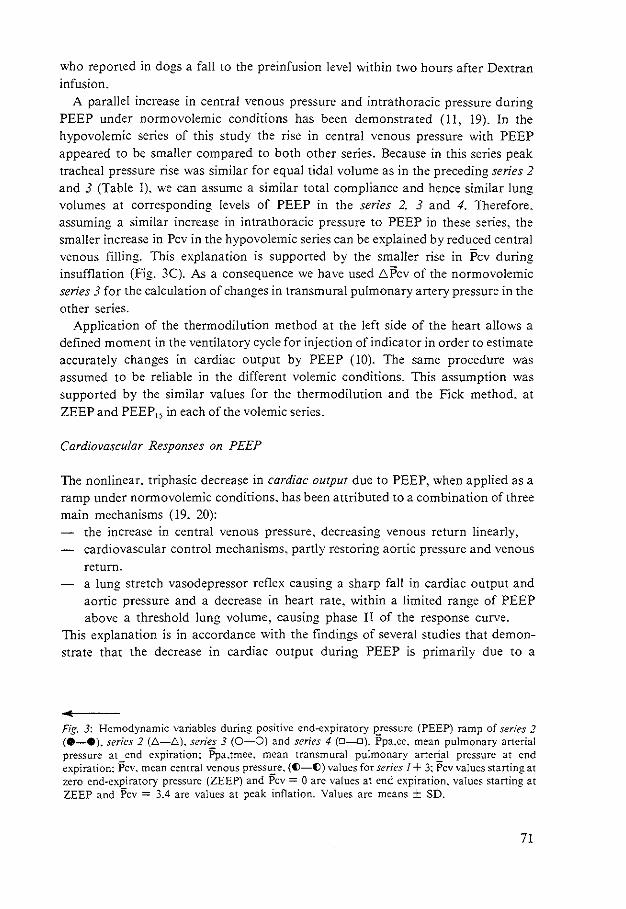
who reported in dogs a fall to the preinfusion level within two hours after Dextran infusion.
A parallel increase in central venous pressure and intrathoracic pressure during PEEP under normovolemic conditions has been demonstrated (I L 19). In the hypovolemic series of this study the rise in central venous pressure with PEEP appeared to be smaller compared to both other series. Because in this series peak tracheal pressure rise was similar for equal tidal volume as in the preceding series 2 and 3 (Table I). we can assume a similar total compliance and hence similar lung volumes at corresponding levels of PEEP in the series 2. 3 and 4. Therefore. assuming a similar increase in intrathoracic pressure to PEEP in these series. the smaller increase in Pcv in the hypovolemic series can be explained by reduced central venous filling. This explanation is supported by the smaller rise in Pcv during insufflation (Fig. 3C). As a consequence we have used .6Pcv of the normovolemic series 3 for the calculation of changes in transmural pulmonary artery pressure in the other series.
Application of the thermodilution method at the left side of the heart allows a defined moment in the ventilatory cycle for injection of indicator in order to estimate accurately changes in cardiac output by PEEP (10). The same procedure was assumed to be reliable in the different volemic conditions. This assumption was supported by the similar values for the thermodilution and the Fick method. at ZEEP and PEEP15 in each of the volemic series.
Cardiovascular Responses on PEEP
The nonlinear. triphasic decrease in cardiac output due to PEEP. when applied as a ramp under normovolemic conditions. has been attributed to a combination of three main mechanisms (19. 20):
the increase in central venous pressure, decreasing venous return linearly. cardiovascular control mechanisms. partly restoring aortic pressure and venous
return. a lung stretch vasodepressor reflex causing a sharp fall in cardiac output and aortic pressure and a decrease in heart rate. within a limited range of PEEP above a threshold lung volume, causing phase II of the response curve.
This explanation is in accordance with the findings of several studies that demonstrate that the decrease in cardiac output during PEEP is primarily due to a
Fig. 3: Hemodynamic variables during positive end-expiratory pressure (PEEP) ramp of series 2 (0-0). series 2 (.6.-.6.). series 3 (0-0) and series 4 (D-O). Ppa,ee. mean pulmonary arterial pressure at end expiration: Ppa.tmee. mean transmural pulmonary arterial pressure at end expiration: Pcv. mean central venous press~e. (t:l-()) values for series I+ 3: Pcv values starting at zero end-expiratory pressure (ZEEP) and Pcv:::;: 0 arc values at end expiration. values starting at ZEEP and Pcv :::;: 3.4 are values at peak inflation. Values are means ± SD.
71
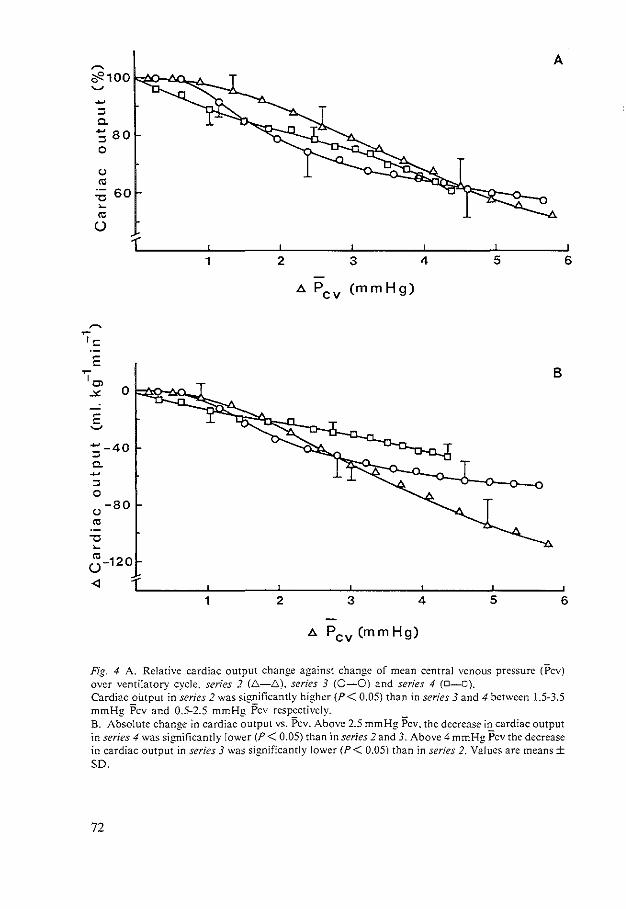
A ~
*100 ~ -:::: 0. -80 :::: 0
(.)
"' "U 60 ~
"' (.)
1 2 3 4 5 6
"' pcv (mm Hg)
~ ~
'<= E
'Ol B
-"' 0
E ~
;-40 0. -:::: 0
(.) -80
"' "U ~
"' u-120
-<l
1 2 3 4 5 6
"' Pcv (mm Hg)
Fig. 4 A. Relative cardiac output change against change of mean central venous pressure ('Pcv) over ventilatory cycle, series 2 (.6.-.6.). series 3 (0-0) and series 4 (D-O). Cardiac oUtput in series 2 was significantly higher (P< 0.05) than in series 3 and 4 between 1.5-3.5 mmHg Pcv and 0.5-2.5 mmHg Pcv respectively. B. Absolute change in cardiac output vs. Pcv. Above 2.5 mmHg Pcv. the decrease in cardiac output in series 4 was significantly lower (P < 0.05) than in series 2 and 3. Above 4 mmHg Pcv the decrease in cardiac output in series 3 was significantly lower (P< 0.05) than in series 2. Values are means± so.
72
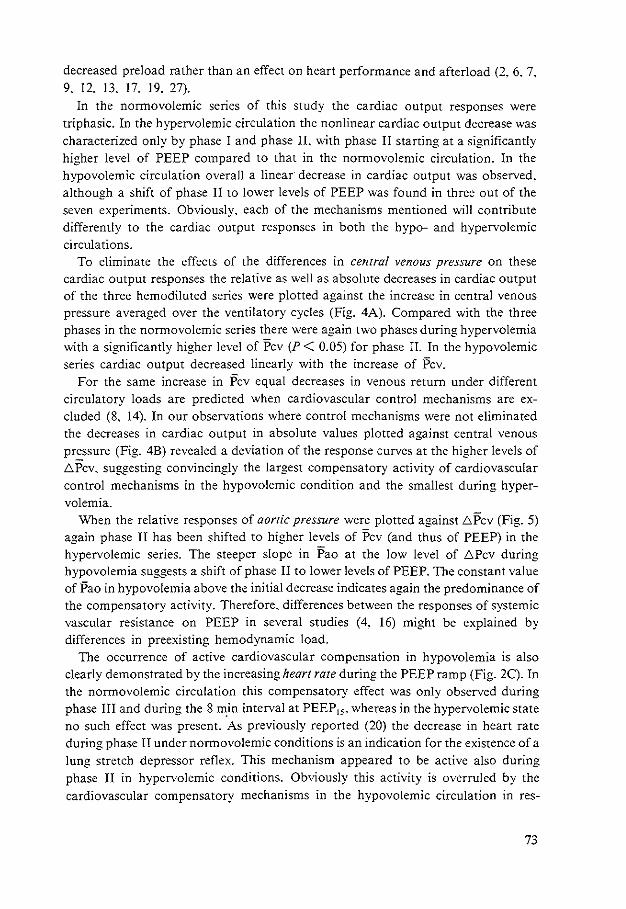
decreased preload rather than an effect on heart performance and afterload (2. 6. 7. 9. 12. 13. 17. 19. 27).
In the normovolemic series of this study the cardiac output responses were triphasic. In the hypervolemic circulation the nonlinear cardiac output decrease was characterized only by phase I and phase II. with phase II starting at a significantly higher level of PEEP compared to that in the normovolemic circulation. In the hypovolemic circulation overall a linear· decrease in cardiac output was observed. although a shift of phase lito lower levels of PEEP was found in three out of the seven experiments. Obviously. each of the mechanisms mentioned will contribute differently to the cardiac output responses in both the hypo- and hypervolemic circulations.
To eliminate the effects of the differences in central venous pressure on these cardiac output responses the relative as well as absolute decreases in cardiac output of the three hemodiluted series were plotted against the increase in central venous pressure averaged over the ventilatory cycles (Fig. 4A). Compared with the three phases in the normovolemic series there were again two phases during hypervolemia with a significantly higher level of Pcv (P < 0.05) for phase II. In the hypovolemic series cardiac output decreased linearly with the increase of Pcv.
For the same increase in Pcv equal decreases in venous return under different circulatory loads are predicted when cardiovascular control mechanisms are excluded (8. 14). In our observations where control mechanisms were not eliminated the decreases in cardiac output in absolute values plotted against central venous pressure (Fig. 4B) revealed a deviation of the response curves at the higher levels of ~Pcv, suggesting convincingly the largest compensatory activity of cardiovascular control mechanisms in the hypovolemic condition and the smallest during hypervolemia.
When the relative responses of aortic pressure were plotted against ~Pcv (Fig. 5) again phase II has been shifted to higher levels of Pcv (and thus of PEEP) in the hypervolemic series. The steeper slope in Pao at the low level of ~Pcv during hypovolemia suggests a shift of phase II to lower levels of PEEP. The constant value of Pao in hypovolemia above the initial decrease indicates again the predominance of the compensatory activity. Therefore, differences between the responses of systemic vascular resistance on PEEP in several studies ( 4, 16) might be explained by differences in preexisting hemodynamic load.
The occurrence of active cardiovascular compensation in hypovolemia is also clearly demonstrated by the increasing heart rate during the PEEP ramp (Fig. 2C). In the normovolemic circulation this compensatory effect was only observed during phase III and during the 8 m_in interval at PEEP15 • whereas in the hypervolemic state no such effect was present. As previously reported (20) the decrease in heart rate during phase II under normovolemic conditions is an indication for the existence of a lung stretch depressor reflex. This mechanism appeared to be active also during phase II in hypervolemic conditions. Obviously this activity is overruled by the cardiovascular compensatory mechanisms in the hypovolemic circulation in res-
73
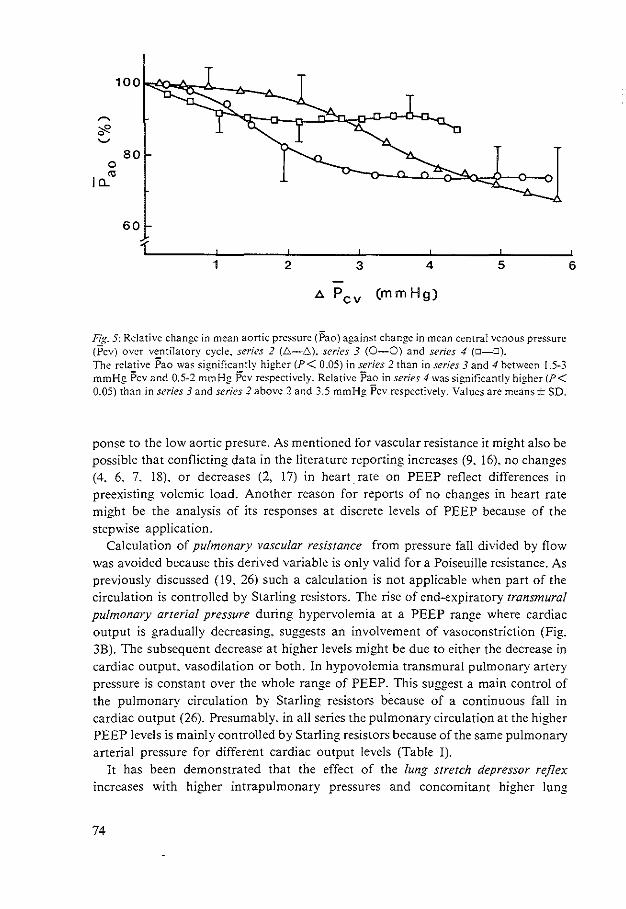
0
"' I C..
80
60
1 2 3 4 5
1>. Pcv (mm Hg)
Fig. 5: Relative change in mean aortic pressure (Pao) against change in mean central venous pressure (Pcv) over ventilatory cycle. series 2 (.6.-.6). series 3 (0-0) and series 4 (D-D).
The relative Pao was significantly higher (P< 0.05) in series 2 than in series 3 and 4 between 1.5-3 mmHg Pcv and 0.5-2 mmHg Pcv respectively. Relative Pao in series 4 was significantly higher (P< 0.05) than in series 3 and series 2 above 2 and 3.5 mmHg Pcv respectively. Values are means± SD.
ponse to the low aortic presure. As mentioned for vascular resistance it might also be possible that conflicting data in the literature reporting increases (9. 16). no changes (4. 6. 7. 18). or decreases (2. 17) in heartrate on PEEP reflect differences in preexisting volemic load. Another reason for reports of no changes in heart rate might be the analysis of its responses at discrete levels of PEEP because of the stepwise application.
Calculation of pulmonary vascular resistance from pressure fall divided by flow was avoided because this derived variable is only valid for a Poiseuille resistance. As previously discussed (19. 26) such a calculation is not applicable when part of the circulation is controlled by Starling resistors. The rise of end-expiratory transmural pulmonary arterial pressure during hypervolemia at a PEEP range where cardiac output is gradually decreasing. suggests an involvement of vasoconstriction (Fig. 3B). The subsequent decrease at higher levels might be due to either the decrease in cardiac output. vasodilation or both. In hypovolemia transmural pulmonary artery pressure is constant over the whole range of PEEP. This suggest a main control of the pulmonary circulation by Starling resistors because of a continuous fall in cardiac output (26). Presumably. in all series the pulmonary circulation at the higher PEEP levels is mainly controlled by Starling resistors because of the same pulmonary arterial pressure for different cardiac output levels (Table I).
It has been demonstrated that the effect of the lung stretch depressor reflex increases with higher intrapulmonary pressures and concomitant higher lung
74
6
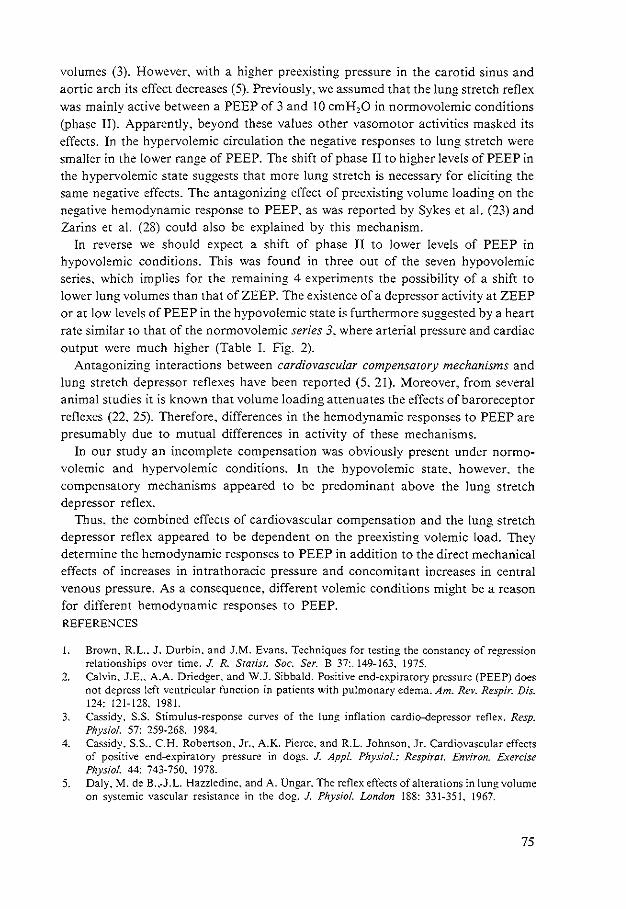
volumes (3). However, with a higher preexisting pressure in the carotid sinus and aortic arch its effect decreases (5). Previously, we assumed that the lung stretch reflex was mainly active between a PEEP of 3 and 10 cmH20 in nonmovolemic conditions (phase II). Apparently. beyond these values other vasomotor activities masked its effects. In the hypervolemic circulation the negative responses to lung stretch were smaller in the lower range of PEEP. The shift of phase II to higher levels of PEEP in the hypervolemic state suggests that more lung stretch is necessary for eliciting the same negative effects. The antagonizing effect of preexisting volume loading on the negative hemodynamic response to PEEP. as was reported by Sykes et al. (23) and Zarins et al. (28) could also be explained by this mechanism.
In reverse we should expect a shift of phase II to lower levels of PEEP in hypovolemic conditions. This was found in three out of the seven hypovolemic series, which implies for the remaining 4 experiments the possibility of a shift to lower lung volumes than that of ZEEP. The existence of a depressor activity at ZEEP or at low levels of PEEP in the hypovolemic state is furthermore suggested by a heart rate similar to that of the normovolemic series 3, where arterial pressure and cardiac output were much higher (Table I. Fig. 2).
Antagonizing interactions between cardiovascular compensatory mechanisms and lung stretch depressor reflexes have been reported (5. 21). Moreover. from several animal studies it is known that volume loading attenuates the effects of baroreceptor reflexes (22. 25). Therefore. differences in the hemodynamic responses to PEEP are presumably due to mutual differences in activity of these mechanisms.
In our study an incomplete compensation was obviously present under normovolemic and hypervolemic conditions. In the hypovolemic state. however, the compensatory mechanisms appeared to be predominant above the lung stretch depressor reflex.
Thus, the combined effects of cardiovascular compensation and the lung stretch depressor reflex appeared to be dependent on the preexisting volemic load. They determine the hemodynamic responses to PEEP in addition to the direct mechanical effects of increases in intrathoracic pressure and concomitant increases in central venous pressure. As a consequence. different volemic conditions might be a reason for different hemodynamic responses to PEEP. REFERENCES
1. Brown, R.L.. J. Durbin. and J.M. Evans. Techniques for testing the constancy of regression relationships over time. J. R. Srarist. Soc. Ser. B 37:.149-163. 1975.
2. Calvin. J.E .. A.A. Driedger, and W.J. Sibbald. Positive end-expiratory pressure (PEEP) does not depress left ventricular function in patients with pulmonary edema. Am. Rev. Respir. Dis. 124: 121-128. 1981.
3. Cassidy, S.S. Stimulus-response curves of the lung inflation cardia-depressor reflex. Resp. Physio!. 57: 259-268. 1984.
4. Cassidy. S.S .. C. H. Robertson. Jr.. A.K. Pierce. and R.L. Johnson, Jr. Cardiovascular effects of positive end-expiratory pressure in dogs. J. Appl. Physiol.: Respirot. Environ. Exercise Physiol. 44: 743-750. 1978.
5. Daly. M. de B.,.J.L. Hazzledine. and A. Ungar. The reflex effects of alterations in lung volume on systemic vascular resistance in the dog. J. Physiol. London 188: 331-351, 1967.
75
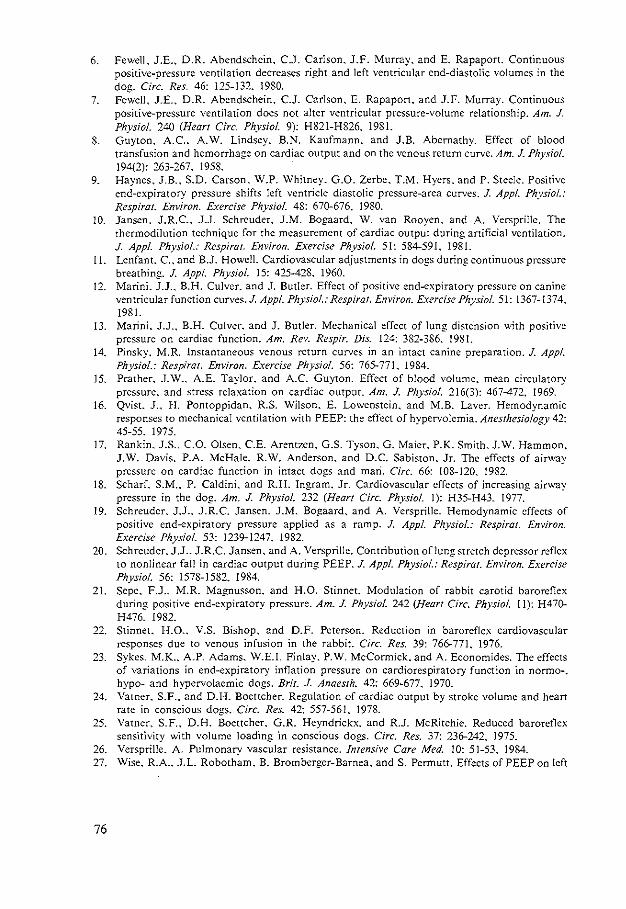
6. FewelL J.E., D.R. Abendschein. C.J. Carlson. J.F. Murray. and E. Rapaport. Continuous positive-pressure ventilation decreases right and left ventricular end-diastolic volumes in the dog. Circ. Res. 46: 125-132. 1980.
7. FewelL J.E .. D.R. Abendschein. C.J. Carlson. E. Rapaport. and J.F. Murray. Continuous positive-pressure ventilation does not alter ventricular pressure-volume relationship. Am. J. Physiol. 240 (Heart Circ. Physio/. 9): H821-H826. 1981.
8. Guyton. A. C.. A. W. Lindsey. B.N. Kaufmann. and J.B. Abernathy. Effect of blood transfusion and hemorrhage on cardiac output and on the venous return curve. Am. J. Physio/. 194(2): 263-267. 1958.
9. Haynes. J.B.. S.D. Carson. W.P. Whitney. G.O. Zerbe. T.M. Hyers. and P. Steele. Positive end-expiratory pressure shifts left ventricle diastolic pressure-area curves. J. Appl. Physiol.: Respirat. Environ. Exercise Physiol. 48: 670-676. 1980.
IO. Jansen. J.R.C.. J.J. Schreuder. J.M. Bog:aard. W. van Rooyen, and A. Versprille. The thermodilution technique for the measurement of cardiac output during artificial ventilation. J. Appl. Physio/.: Respirat. Environ. Exercise Physiol. 51: 584-591. 1981.
11. Lenfant. C.. and B.J. Howell. Cardiovascular adjustments in dogs during continuous pressure breathing. J. Appl. Physiol. 15: 425-428. 1960.
12. Marini. J.J .. B.H. Culver. and J. Butler. Effect of positive end-expiratory pressure on canine ventricular function curves. J. Appl. Physiol.: Respirat. Environ. Exercise Physiol. 51: 1367-1374. 1981.
13. Marini. J.J .. B.H. Culver. and J. Butler. Mechanical effect of lung distension with positive pressure on cardiac function. Am. Rev. Respir. Dis. 124: 382-386. l98I.
14. Pinsky. M.R. Instantaneous venous return curves in an intact canine preparation. J. Appl. Physiol.: Respirar. Environ. Exercise Physiol. 56: 765-771. 1984.
15. Prather. J.W .. A.E. Taylor. and A. C. Guyton. Effect of blood volume. mean circulatory pressure. and stress relaxation on cardiac output. Am. J. Physiol. 216(3): 467-472. 1969.
16. Qvist. J .. H. Pontoppidan. R.S. Wilson. E. Lowenstein. and M.B. Laver. Hemodynamic responses to mechanical ventilation with PEEP: the effect of hypervolemia. Anesthesiology 42: 45-55. 1975.
17. Rankin. J.S .. C.O. Olsen. C.E. Arentzen. G.S. Tyson. G. Maier. P.K. Smith. J.W. Hammon, J.W. Davis. P.A. McHale. R.W. Anderson. and D.C. Sabisron. Jr. The effects of airway pressure on cardiac function in intact dogs and mari. Circ. 66: 108-120. 1982.
18. Scharf. S.M .. P. Caldini. and R.H. Ingram. Jr. Cardiovascular effects of increasing airway pressure in the dog. Am. J. Physiol. 232 (Heart Circ. Physiol. I): H35-H43. 1977.
19. Schreuder. J.J .. J.R.C. Jansen. J.M. Bogaard. and A. Versprille. Hemodynamic effects of positive end-expiratory pressure applied as a ramp. J. Appl. Physiol.: Respirat. Environ. Exercise Physiol. 53: 1239-1247. 1982.
20. Schreuder. J .J .• J .R.C. Jansen. and A. Versprille. Contribution oflung stretch depressor reflex to nonlinear fall in cardiac output during PEEP. J. App!. Physiol.: Respirat. Environ. Exerdse Physiol. 56: 1578-1582, !984.
21. Sepe. F.J., M.R. Magnusson. and H.O. Stinnet. Modulation of rabbit carotid baroreflex
22.
24.
25.
26. 27.
76
during positive end-expiratory pressure. Am. J. Physiol. 242 (Heart Circ. Physiol. I 1): H470-H476. 1982. Stinnet. H.O .. V.S. Bishop. and D.F. Peterson. Reduction in baroreflex cardiovascular responses due to venous infusion in the rabbit. Circ. Res. 39: 766-771. 1976. Sykes. M.K .. A.P. Adams. W.E.I. Finlay, P.W. McCormick. and A. Economides. The effects of variations in end-expiratory inflation pressure on cardiorespiratory function in normo-. hypo- and hypervolaemic dogs. Brit. J. Anaesrh. 42: 669-677. 1970. Vatner. S.F .. and D.H. Boettcher. Regulation of cardiac output by stroke volume and heart rate in conscious dogs. Circ. Res. 42: 557-561. 1978. Vatner. S.F .• D.H. Boettcher. G.R. Heyndrickx. and R.J. McRitchie. Reduced baroreflex sensitivity with volume loading in conscious dogs. Circ. Res. 37: 236-242. 1975. Versprille. A. Pulmonary vascular resistance. Inrensive Care Med. 10: 51-53. 1984. Wise. R.A.. J.L. Robotham. B. Brombergcr-Barnea. and S. Permutt. Effects of PEEP on left

ventricular function in right-heart-bypassed dogs. J. Appl. Physiol.: Respirar. Environ. Exercise Physiol. 51: 541-546. !981.
28. Zarins, C.K .. R.W. Virgilio. D.E. Smith, and R.M. Peters. The effect of vascular volume on positive end-expiratory pressure-induced cardiac output depression and wedge-left atrial pressure discrepancy. J. Surg. Res. 23: 348-360, 1977.
Submitted to J. Appl. Physiol.: Respirat. Environ. Exercise Physiol.
77
CHAPTER VI
Conclusions
Current hypotheses on cardiac output decrease during PEEP were described in Chapter I. Our studies were concerned with an evaluation of these hypotheses as well as with the search for other mechanisms which might be involved. The studies were carried out in healthy piglets.
A decrease in preload on the heart during PEEP was confirmed by the response of left ventricular end-diastolic pressure (Ch. Ill). This decrease appeared to be due mainly to an impediment of venous return by intrathoracic pressure rise and a vasodepressor effect of a lung stretch reflex (Ch.lll and IV). These mechanisms were partly compensated by cardiovascular control mechanisms elicited by a concomitant decrease in arterial pressure during PEEP (Ch. V).
An increase of right ventricular afterload, or ventricular interdependence as mechanisms for the decrease in cardiac output during PEEP as a ramp were not substantiated in these healthy piglets.
Neither did we find any evidence for decreases in cardiac contractility during PEEP. Even during phase IL where the largest effect of the lung stretch depressor reflex was assumed to be present such a decrease was not observed (Ch. Ill).
A decrease in left ventricular distensibility could not be excluded during phase IlL when the rise in left ventricular end-diastolic pressure exceeded the rise in central venous pressure. However. cardiac output and aortic pressure decreased only slightly during this phase. Therefore no major hemodynamic effect could be attributed to a decrease in ventricular distensibility (Ch. Ill).
Our studies revealed mechanisms additional to the current hypotheses on the hemodynamic responses to PEEP when applied as a ramp: a lung stretch vasodepressor reflex and cardiovascular compensatory mechanisms.
The existence of the lung stretch depressor reflex during PEEP was tested and verified (Ch. IV). This stretch depressor reflex causes a decrease in heart rate and a vasodilation of systemic vessels. This dilatory effect might imply an increase in the volume of the venous system. According to Guyton's theory on venous return such an effect decreases mean systemic filling pressure and therefore contributes to the decrease in venous return (Ch. Ill and IV).
78
The involvement of cardiovascular compensatory control mechanisms. elicited by decreases in blood pressure and cardiac output was suggested by the first PEEP study (Ch. Ill). An evaluation of their contribution to PEEP responses during different circulatory volumes was tested (Ch. V). In normovolemia the contribution of these compensatory effects seemed to be predominant over the negative effects of the lung stretch reflex in phases I and III. whereas in phase II the reverse seemed to occur. The absence of a phase II in the hemodynamic responses on PEEP during hypovolemia suggested a preponderance of the cardiovascular compensation over the stretch reflex for the whole range of PEEP.
In the hypervolemic circulation a relatively low activity of the compensatory mechanisms was assumed to be present resulting in a low vasomotor tone. Then dilatory effects may have small influences. explaining a relatively small effect of the lung stretch reflex. This was presumably the reason for a shift of phase II to higher PEEP levels.
Although one cannot directly extrapolate our results. obtained in healthy piglets under steady state anesthesia and muscle relaxation. to pathologic circumstances in patients. the numerous observations of incomplete cardiovascular compensation during compromised hemodynamics due to PEEP in ARDS patients suggest that the lung stretch depressor reflex might also be operative in these patients. However. the contribution of the mechanisms mentioned above may be altered in ARDS. A lower rise in intrathoracic pressure will be present during PEEP e.g. due to the decrease in lung compliance. In this situation we would predict that the passive mechanical impediment to venous return will be less than in a healthy subject.
When severe pulmonary arterial hypertension is present. right ventricular dysfunction and possibly ventricular interdependence could be involved in the specific effects on the hemodynamics when PEEP is applied.
Although our results are not valid for pathological conditions, we performed these studies to obtain a "'physiological"" model for future studies on experimental pathological circumstances.
79
CHAPTER VII
Summary
Ch. I.
Clinical aspects of the adult respiratory distress syndrome and the beneficial effects of PEEP are summarized. Current hypotheses about the negative effects of PEEP on cardiac output are described as mechanisms affecting venous return directly by intrathoracic pressure rise, or indirectly via changes in either ventricular afterload, ventricular contractility. or ventricular distensibility. or a combination.
Ch. II
The feasibility of using the thermodilution method to monitor cardiac output during artificial ventilation was studied in anesthetized pigs. Normal saline (0.5 ml) at room temperature was injected into the left ventricle or the right atrium. The dilution curves were detected in the aortic arch and the pulmonary artery. respectively. The ventilation rate was 10 cycles/min at end-expiratory pressures of 0. 5. 10 and 15 cmH20. For each level. 50 measurements of cardiac output were performed at regular intervals over the ventilatory cycle. The order of measurements were randomly selected. The average of each series of ?O measurements showed excellent correlation with the estimates of cardiac output based on the direct Fick method for oxygen. The maximum difference between the values of cardiac output randomly measured by the thermodilution method was 40% for the left side of the heart and 70% for the right side. However. when the values of cardiac output were sorted according to the specific phases of the respiratory cycle, there was a systemic variation with a small random error. For the left side of the heart. a satisfactory moment of injection for estimation of mean cardiac output appeared to be at the end of the spontaneous expiration. On the other hand. the analysis of cardiac output values at the ·right side did not reveal any satisfactory moment for injectate administration under changing circumstances. e.g .. positive end-expiratory pressure.
Ch. III
Hypotheses on the decrease in cardiac output due to positive end-expiratory pressure
80
(PEEP) were tested during positive-pressure ventilation by application of PEEP from 0 to 15 cmH2 0 as a ramp input function, i.e .. a continuous rise. Yorkshire pigs (n=
47, 5-7 wk old) were used under steady-state anesthesia (pentobarbital) and muscle relaxation. Cardiac output decreased nonlinearly in three distinct phases. I up to PEEP 3 cmH20, II from 3 to 10 cmH,O. and III above 10 cmH20, with the sharpest decline occurring in phase II. This three~phase cardiac output decrease was more pronounced when the individual responses were normalized to the inflection points between the phases. Heart rate did nor change when related to PEEP, but when normalized to the inflection pointS a significant increase was observed in the phase I and IlL whereas in phase II a decrease was evident. Based on a diversity of hemodynamic responses myocardial depression and right ventricular afterload were rejected as major causal mechanisms for the decrease of cardiac output. We hypothesized that the nonlinear response of cardiac output on PEEP is due to a combination of three types of mechanisms. First. the rise of central venous pressure with PEEP decreases cardiac output linearly. Second. the concomitant fall of arterial pressure elicits compensatory mechanisms. which flatten the slope of this venous return curve. Finally, above 3 cmH20 PEEP a lung stretch reflex is elicited, which performs an inhibitory effect on the circulation, causing the steeper fall in cardiac output as well as the decrease in heart rate in phase II.
Ch. IV
The hypothesis that lung stretch reflexes elicit negative cardiovascular effects during positive end-expiratory pressure (PEEP) application in a ramp procedure up to 15 cmH20 was tested in piglets under steady-state anesthesia and muscle relaxation. The effects of lung stretch on hemodynamics were studied by comparing the differences in responses during PEEP application with two different tidal volumes. In both ventilatory conditions cardiac output and aortic pressure decreased nonlinearly in three phases with the rise of PEEP: a gradual decrease in phase La sharp decrease in phase II. and again a more gradual decrease in phase III. Heart rate decreased significantly in phase II. In the series with the larger tidal volume. implying more lung stretch during insufflation, phase II was between a PEEP of 2.6 and 9 cmH20. In the series with the smaller tidal volume, phase II occurred between 5.7 and 10.5 cmH20. To assess the contribution of lung stretch reflexes to the decrease in cardiac output we also related cardiac output to the changes in central venous pressure. Again a nonlinear response was observed, indicating that an additional effect besides the rise in mean central venous pressure was involved in the decrease in cardiac output. During ventilation with the smaller tidal volume, phase II of the decrease in cardiac output ~as also shifted to higher values of mean central venous pressure. which only could be ascribed to the differences in lung stretch at insufflation. It appeared that under circumstances of artificial ventilation the onset of the reflex is determined by a characteristic threshold of lung stretch. In addition to the mechanical effects of intrathoracic pressure on venous return and secondary
81
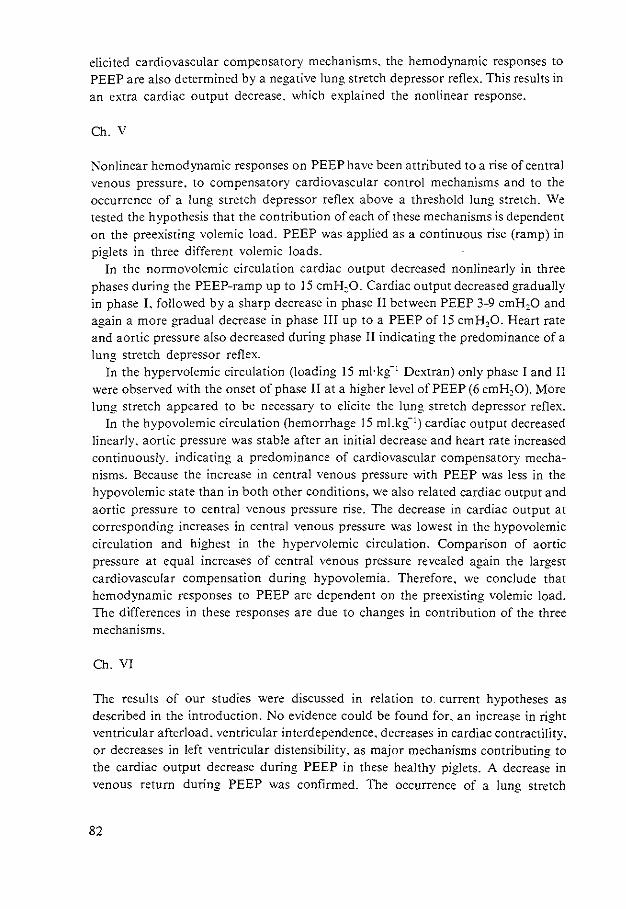
elicited cardiovascular compensatory mechanisms. the hemodynamic responses to PEEP are also determined by a negative lung stretch depressor reflex. This results in an extra cardiac output decrease. which explained the nonlinear response.
Ch. V
Nonlinear hemodynamic responses on PEEP have been attributed to a rise of central venous pressure. to compensatory cardiovascular control mechanisms and to the occurrence of a lung stretch depressor reflex above a threshold lung stretch. We tested the hypothesis that the contribution of each of these mechanisms is dependent on the preexisting volemic load. PEEP was applied as a continuous rise (ramp) in piglets in three different volemic loads.
In the normovolemic circulation cardiac output decreased nonlinearly in three phases during the PEEP-ramp up to 15 cmH,O. Cardiac output decreased gradually in phase I. followed by a sharp decrease in phase II between PEEP 3-9 cmH,O and again a more gradual decrease in phase III up to a PEEP of 15 cmH,O. Heart rate and aortic pressure also decreased during phase II indicating the predominance of a lung stretch depressor reflex.
In the hypervolemic circulation (loading 15 ml·kg-1 Dextran) only phase I and II were observed with the onset of phase II at a higher level of PEEP (6 cmH,O). More lung stretch appeared to be necessary to elicite the lung stretch depressor reflex.
In the hypovolemic circulation (hemorrhage 15 ml.kg- 1) cardiac output decreased
linearly. aortic pressure was stable after an initial decrease and heart rate increased continuously. indicating a predominance of cardiovascular compensatory mechanisms. Because the increase in central venous pressure with PEEP was less in the hypovolemic state than in both other conditions. we also related cardiac output and aortic pressure to central venous pressure rise. The decrease in cardiac output at corresponding increases in central venous pressure was lowest in the hypovolemic circulation and highest in the hypervolemic circulation. Comparison of aortic pressure at equal increases of central venous pressure revealed again the largest cardiovascular compensation during hypovolemia. Therefore, we conclude that hemodynamic responses to PEEP are dependent on the preexisting volemic load. The differences in these responses are due to changes in contribution of the three mechanisms.
Ch. VI
The results of our studies were discussed in relation to. current hypotheses as described in the introduction. No evidence could be found for. an increase in right ventricular afterload, ventricular interdependence. decreases in cardiac contractility. or decreases in left ventricular distensibility, as major mechanisms contributing to the cardiac output decrease during PEEP in these healthy piglets. A decrease in venous return during PEEP was confirmed. The occurrence of a lung stretch
82
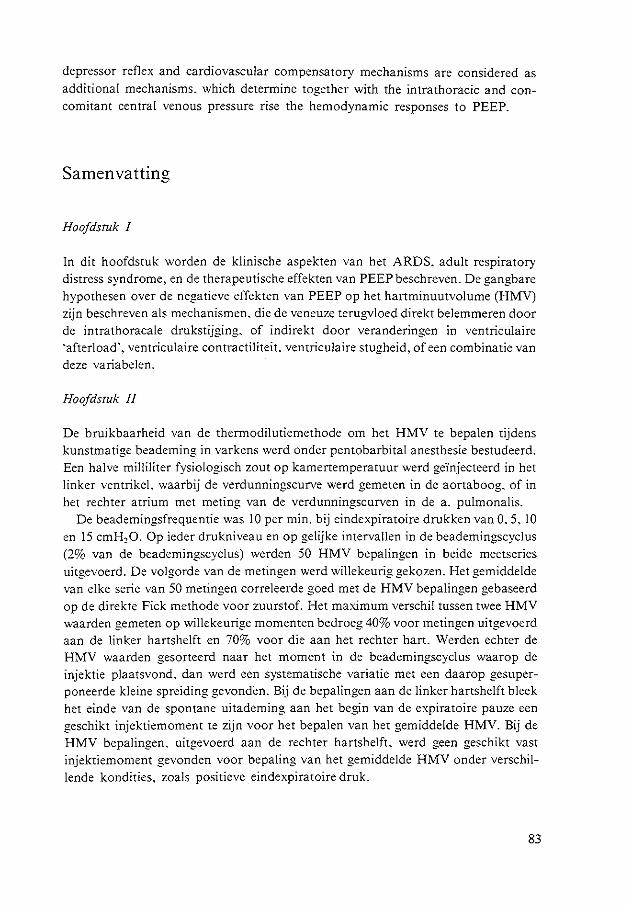
depressor reflex and cardiovascular compensatory mechanisms are considered as additional mechanisms. which determine together with the intrathoracic and con· comitant central venous pressure rise the hemodynamic responses to PEEP.
Samenvatting
Hoofdstuk I
In dit hoofdstuk worden de klinische aspekten van het ARDS. adult respiratory distress syndrome. en de therapeutische effekten van PEEP beschreven. De gangbare hyporhesen over de negatieve effekren van PEEP op her hartminuutvolume (HMV) zijn beschreven als mechanismen. die de veneuze terugvloed direkt belemmeren door de intrathoracale drukstijging. of indirekt door veranderingen in ventriculaire "afterload', ventriculaire contractiliteit. ventriculaire stugheid. of een combinatie van deze variabelen.
Hoofdsruk II
De bruikbaarheid van de thermodilutiemerhode om het HMV te bepalen tijdens kunstmatige beademing in varkens werd onder pentobarbital anesthesie bestudeerd. Een halve milliliter fysiologisch zout op kamertemperatuur werd ge"injecteerd in bet linker ventrikel. waarbij de verdunningscurve werd gemeten in de aortaboog. of in bet rechter atrium met meting van de verdunningscurven in de a. pulmonalis.
De beademingsfrequentie was 10 per min. bij eindexpiratoire drukken van 0. 5, IO en 15 cmH10. Op ieder drukniveau en op gelijke intervallen in de beademingscyclus (2% van de beademingscyclus) werden 50 HMV bepalingen in beide meerseries uitgevoerd. De volgorde van de metingen werd willekeurig gekozen. Het gemiddelde van elke serie van 50 metingen correleerde goed met de HMV bepalingen gebaseerd op de direkte Fick methode voor zuurstof. Het maximum verschil tussen twee HMV waarden gemeten op willekeurige momenten bedroeg 40% voor metingen uitgevoerd aan de linker hartshelft en 70% voor die aan het rechter hart. Werden echter de HMV waarden gesorteerd naar het moment in de beademingscyclus waarop de injektie plaatsvond, dan werd een systematische variatie met een daarop gesuperponeerde kleine spreiding gevonden. Bij de bepalingen aan de linker hartshelfr bleek bet einde van de spontane uitademing aan bet begin van de expiratoire pauze een geschikr injektiemoment re zijn voor her bepalen van het gemiddelde HMV. Bij de HMV bepalingen. uitgevoerd aan de rechter hartshelft, werd geen geschikt vast injektiemoment gevonden voor bepaling van het gemiddelde HMV onder verschillende kondities, zoals positieve eindexpiratoire druk.
83
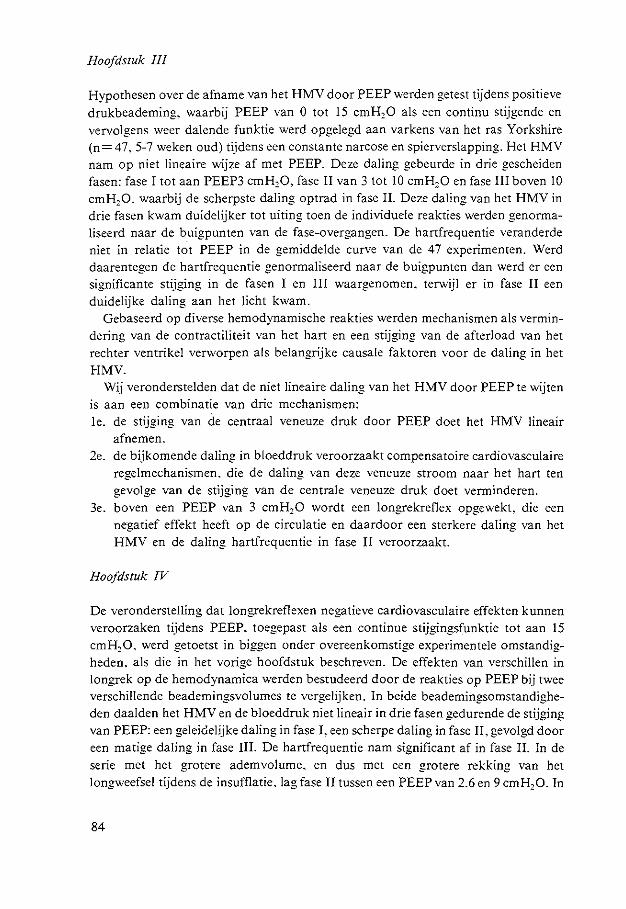
Hoofdsruk Ill
Hypothesen over de afname van het HMV door PEEP werden getest tijdens positieve drukbeademing. waarbij PEEP van 0 tot 15 cmH,O als een continu stijgende en vervolgens weer dalende funktie werd opgelegd aan varkens van bet ras Yorkshire (n = 47. 5-7 we ken oud) tijdens een constante narcose en spierverslapping. Het HMV nam op niet lineaire wijze af met PEEP. Deze daling gebeurde in drie gescheiden fasen: fase I tot aan PEEP3 cmH,O. fase II van 3 tot 10 cmH,O en fase III boven 10 cmH,O. waarbij de scherpste daling optrad in fase II. Deze daling van het HMV in drie fasen kwam duidelijker tot uiting toen de individuele reakties werden genormaliseerd naar de buigpunten van de fase-overgangen. De hartfrequentie veranderde niet in relatie tot PEEP in de gemiddelde curve van de 47 experimenteD. Werd daarentegen de hartfrequentie genormaliseerd naar de buigpunten dan werd er een significante stijging in de fasen I en III waargenomen. terwijl er in fase II een duidelijke daling aan het Iicht kwam.
Gebaseerd op diverse hemodynamische reakties werden mechanismen als vermindering van de contractiliteit van het hart en een stijging van de afterload van het rechter ventrikel verworpen als belangrijke causale faktoren voor de daling in het HMV.
Wij veronderstelden dat de niet lineaire daling van het HMV door PEEP te wijten is aan een combinatie van drie mechanismen: !e. de stijging van de centraal veneuze druk door PEEP doet het HMV lineair
afnemen. 2e. de bijkomende daling in bloeddruk veroorzaakt compensatoire cardiovasculaire
regelmechanismen. die de daling van deze veneuze stroom naar het hart ten gevolge van de stijging van de centrale veneuze druk doet verminderen.
3e. boven een PEEP van 3 cmH20 wordt een longrekreflex opgewekt. die een negatief effekt heeft op de circulatie en daardoor een sterkere daling van het HMV en de daling hartfrequentie in fase II veroorzaakt.
Hoofdsruk IV
De veronderstelling dat longrekreflexen negatieve cardiovasculaire effekten kunnen veroorzaken tijdens PEEP, toegepast als een continue stijgingsfunktie tot aan 15 cmH20, werd getoetst in biggen onder overeenkomstige experimentele omstandigheden. als die in het vorige hoofdstuk beschreven. De effekten van verschillen in longrek op de hemodynamica werden bestudeerd door de reakties op PEEP bij twee verschillende beademingsvolumes te vergelijken. In beide beademingsomstandigheden daa!den het HMV en de bloeddruk niet lineair in drie fasen gedurende de stijging van PEEP: een geleiclelijke daling in fase I. een scherpe daling in fase II. gevolgd door een matige daling in fase IlL De hartfrequentie nam significant af in fase II. In de serie met het grotere ademvolume, en dus met een grotere rekking van bet longweefsel tijdens de insufflatie. lag fase II tussen een PEEP van 2.6 en 9 cmH,O. In
84
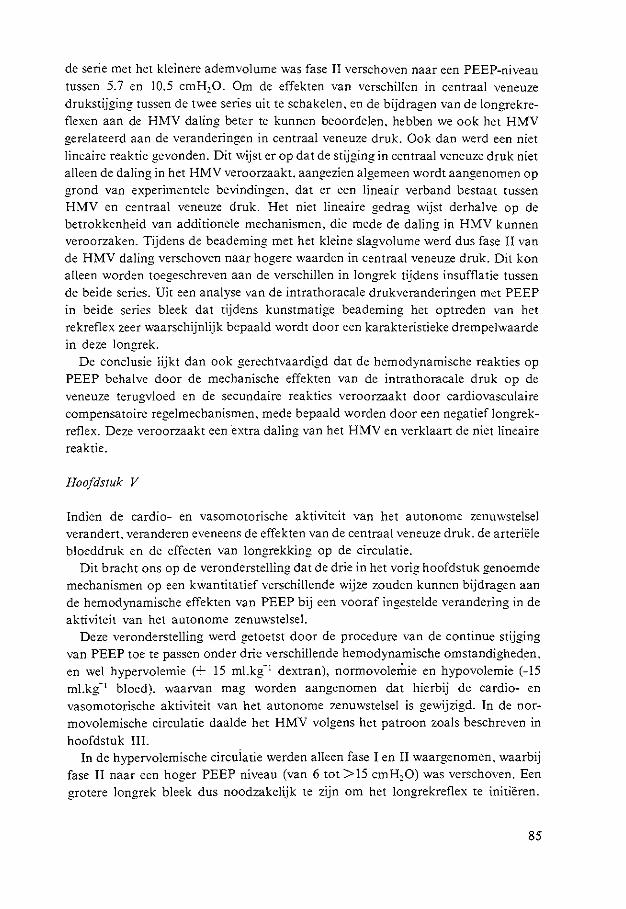
de serie met het kleinere ademvolume was fase II verschoven naar een PEEP-niveau tussen 5.7 en 10.5 cmH20. Om de effekten van verschillen in centraal veneuze drukstijging tussen de twee series uit te schakelen, en de bijdragen van de longrekreflexen aan de HMV daling beter te kunnen beoordelen. hebben we ook het HMV gerelateerd aan de veranderingen in centraal veneuze druk. Ook dan werd een niet lineaire reaktie gevonden. Dit wijst er op dat de stijging in centraal veneuze druk niet aileen de daling in het HMV veroorzaakt, aangezien algemeen wordt aangenomen op grand van experimentele bevindingen. dat er een lineair verband bestaat tussen HMV en centraal veneuze druk. Het niet lineaire gedrag wijst derhalve op de betrokkenheid van additionele mechanismen. die mede de daling in HMV kunnen veroorzaken. Tijdens de beademing met her kleine slagvolume werd dus fase II van de HMV daling verschoven naar hogere waarden in centraal veneuze druk. Dit kon aileen worden toegeschreven aan de verschillen in Iongrek tijdens insufflatie tussen de beide series. Uit een analyse van de inrrathoracale drukveranderingen met PEEP in beide series bleek dat tijdens kunstmatige beademing het optreden van her rekreflex zeer waarschijnlijk bepaald wordt door een karakteristieke drempelwaarde in deze longrek.
De conclusie lijkt dan ook gerechtvaardigd dat de hemodynamische reakties op PEEP behalve door de mechanische effekten van de intrathoracale druk op de veneuze terugvloed en de secondaire reakties veroorzaakt door cardiovasculaire compensatoire regelmechanismen. mede bepaald worden door een negatief longrekreflex. Deze veroorzaakt een extra daling van het HMV en verklaart de niet lineaire reaktie.
Hoo[dstuk V
Indien de cardio- en vasomotorische aktiviteit van het autonome zenuwstelsel verandert, veranderen eveneens de effekten van de centraal veneuze druk. de arteriele bloeddruk en de effecten van longrekking op de circulatie.
Dit bracht ons op de veronderstelling dat de drie in het vorig hoofdstuk genoemde mechanismen op een kwanritatief verschillende wijze zouden kunnen bijdragen aan de hemodynamische effekten van PEEP bij een vooraf ingestelde verandering in de aktiviteit van het autonome zenuwstelsel.
Deze veronderstelling werd getoetst door de procedure van de continue stijging van PEEP toe te passen onder drie verschillende hemodynamische omstandighed~n. en we! hypervolemie (+ 15 ml.kg- 1 dextran). normovolemie en hypovolemie (-15 ml.kg- 1 bloed), waarvan mag worden aangenomen dat hierbij de cardio- en vasomotorische aktiviteit van het autonome zenuwstelsel is gewijzigd. In de normovolemische circulatie daalde het HMV volgens het patroon zoals beschreven in hoofdstuk Ill.
In de hypervolemische circuiatie werden aileen fase I en II waargenomen. waarbij fase II naar een hoger PEEP niveau (van 6 tot> 15 em H20) was verschoven. Een grotere longrek bleek dus noodzakelijk te zijn om bet longrekreflex te initieren.
85
In de hypovolemische circulatie daalde het HMV lineair en was de bloeddruk stabiel na een aanvankelijke daling en steeg de hartfrequentie continu, hetgeen op een overwegende invloed van cardiovasculaire compensatoire mechanismen duidt. Daar de stijging van de centraal veneuze druk kleiner was in de hypovolemische circulatie vergeleken met de beide andere condities. werden bet HMV en de bloeddruk ook gerelateerd aan de centraal veneuze drukstijging.
Op overeenkomstige stijgingen in de centraal veneuze druk was de daling in HMV bet laagst in de hypovolemische circulatie en het hoogst in de hypervolemische circulatie. Naast de veranderingen in de hartfrequentie toonden ook de veranderingen van de bloeddruk bij overeenkomstige stijgingen van de centraal veneuze druk een overwegende invloed van de cardiovasculaire compensatoire regelmechanismen aan tijdens hypovolemie. Daarom concluderen wij dat de verschillen in hemodynamische reakties op PEEP bij verschillende circulatoire vullingscondities te wijten zijn aan veranderingen in de bijdrage van elk van de drie mechanismen.
Hoofdstuk VI
De resultaten van ons onderzoek werden besproken in relatie tot de gangbare hypothesen, zoals die beschreven zijn in de inleiding (hoofdstuk I).
Ten aanzien van de daling in HMV tijdens PEEP in deze gezonde varkens. konden wij niet veel anders concluderen dan voor een preload verlaging. Het optreden van een negatief werkend longrekreflex en cardiovasculaire compensatoire regelmechanismen worden daarbij beschouwd als additionele mechanismen op de intrathoraca~ le. c.q. centraal veneuze drukstijging. die mede de hemodynamische reakties op PEEP bepalen.
86
Acknowledgements
The above thesis could not have been done without the cooperation. help and advice of many others. These people I would like to thank. Leny Molenaar-Hebly who. without complaint. typed the many initial and the final versions of the manuscript. Arnold Drop who gave indispensable and highly skilled biotechnical help in the experiments and graphics. Jos Jansen did not only create most of the sophisticated technical instruments and computer programs but also was co-author. I would especially like to express my gratitude to the person behind the project. Prof. Dr. Adrian Versprille who was its managing director. promotor and co-author. I also wish to thank the other co-authors Jan M. Bogaard and Willem van Rooyen for their contributions. Prof. James G. Bovill I have to thank for all his advice and criticism during the progression of the manuscript. and Prof. Dr. P.R. Saxena for his comments on Chapter II. Prof. Dr. J. van Goo! and Prof. Dr. L. Deen I want to thank for their advice. In the conduction of the experiments the enthusiastic support of Hans Groenevelt. Hans van der Meer and Aad Zeelen was much appreciated. Technical assistance was also given by Dr. J.W. Meilink who performed the measurements on the pentobarbital concentrations. Lastly. I am grateful to all the members of the Department of Anesthesiology. Academic Medical Centre. for their loyal support of my escapism.
87
Curriculum Vitae
Jan J. Schreuder was born in 1948. Oude Niedorp. The Netherlands. 1965 Hbs-b certificate. Canisius College. Nijmegen. 1970 Research assistant at the Pathophysiological Laboratory of the Depart
ment of General Medicine. head Prof. Dr. J. van Goo!. Wilhelmina Gasthuis, University of Amsterdam.
1975 Medical degree. University of Amsterdam. 1976 Research fellow at the Pathophysiological Laboratory. head Prof. Dr.
A. Versprille. of the Department of Pulmonary Diseases. head Prof. Dr. C. Hilvering, Erasmus University, Rotterdam.
1983 Registered as anesthesiologist. trained by Prof. D.M.E. Vermeulen-Cranch C.B.E .. F.F.A.R.C.S .. Academic Medical Centre. University of Amsterdam.
Presently Cardioanesthetist at the Academic Medical Centre. University of Am~ sterdam.
88