Dr Dominic Hogg Director Eunomia Research & Consulting · 2016-03-30 · 24t RCV 0.0199 0.0057...
37
Dr Dominic Hogg Director Eunomia Research & Consulting
Transcript of Dr Dominic Hogg Director Eunomia Research & Consulting · 2016-03-30 · 24t RCV 0.0199 0.0057...
Dr Dominic HoggDirector
Eunomia Research & Consulting
� Work with European partners for theEuropean Commission� LDK (Greece)� ZREU (Germany)� HDRA (UK)� Scuola Agraria del Parco di Monza (Italia)
� Role of Cost / Benefit Analysis in Policy /Decision-making
� Costs And Benefits Of Separate Collection
� Effectively Comparing With Other Options(for Landfill Diversion)
� Composting Analysis �Under-developed�
� Looks at Net Private Costs of Changes�� And Seeks to Monetise the Impacts,
Positive and Negative, for the Environment� Then� You Add Them Up� It�s Easy�..� NO IT�S NOT
� The Following are ALWAYS True� Science is Never �Certain� in All Aspects� Methodological Approach Questionable on
Epistemological Grounds� The Move From �Impact� to �Monetised
Impacts is Fraught With Difficulty� External Costs are Never �Certain�, Always
Incomplete and Usually Plagued WithUncertainty (though this is not alwaysacknowledged)
� The Following is True� The Net Costs of the Same Facility in Different
Countries Varies, and not Just Because ofVariation in Costs of Labour, (Capital,) Land
� Policies, Regulatory and Otherwise, Affect theCosts and Revenues Associated WithTreatments
� Costs are Member State Specific� Full Analysis of �European� CBA Has to
Compromise Between �Local� Diversity andManageability of Study
� The Proliferation in Economic Instruments�for the Environment��
� and� The Member State-specific Nature of
These�� Makes it Increasingly Difficult to
Distinguish Between Costs Which arePrivate and Costs Which are External
COST-BENEFIT ANALYSIS WASNEVER EASY AND IT�S GETTINGMORE DIFFICULT
� Private Costs� See Ricci (forthcoming)� Also, ask yourselves � It�s Not Rocket Science
� External Costs� Lots and Lots of Transport� But�..
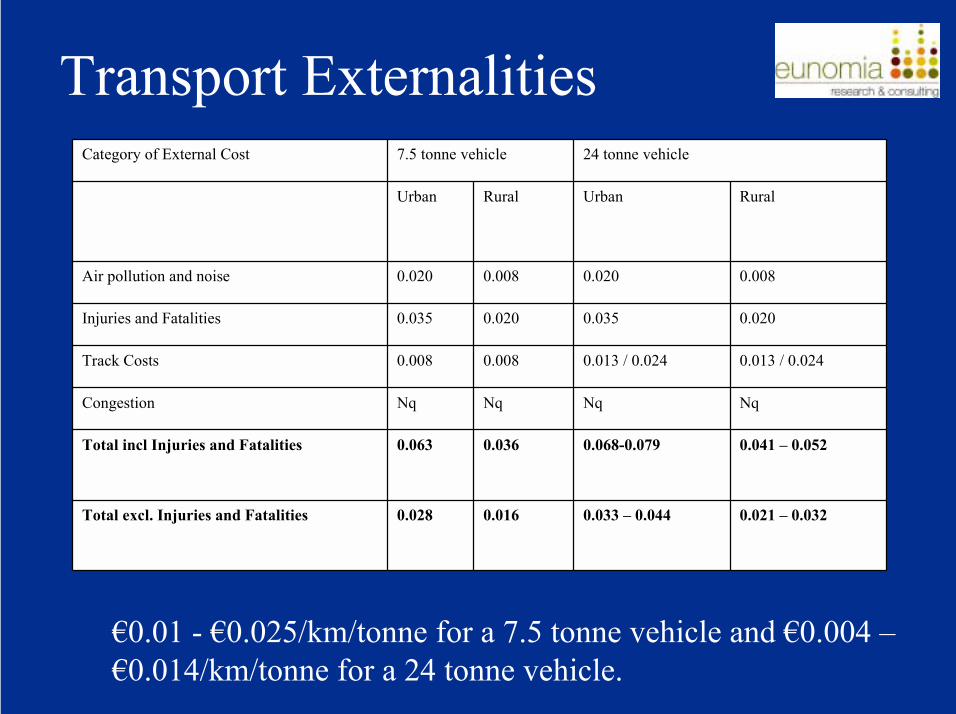
0.021 � 0.0320.033 � 0.0440.0160.028Total excl. Injuries and Fatalities
0.041 � 0.0520.068-0.0790.0360.063Total incl Injuries and Fatalities
NqNqNqNqCongestion
0.013 / 0.0240.013 / 0.0240.0080.008Track Costs
0.0200.0350.0200.035Injuries and Fatalities
0.0080.0200.0080.020Air pollution and noise
RuralUrbanRuralUrban
24 tonne vehicle7.5 tonne vehicleCategory of External Cost
�0.01 - �0.025/km/tonne for a 7.5 tonne vehicle and �0.004 ��0.014/km/tonne for a 24 tonne vehicle.
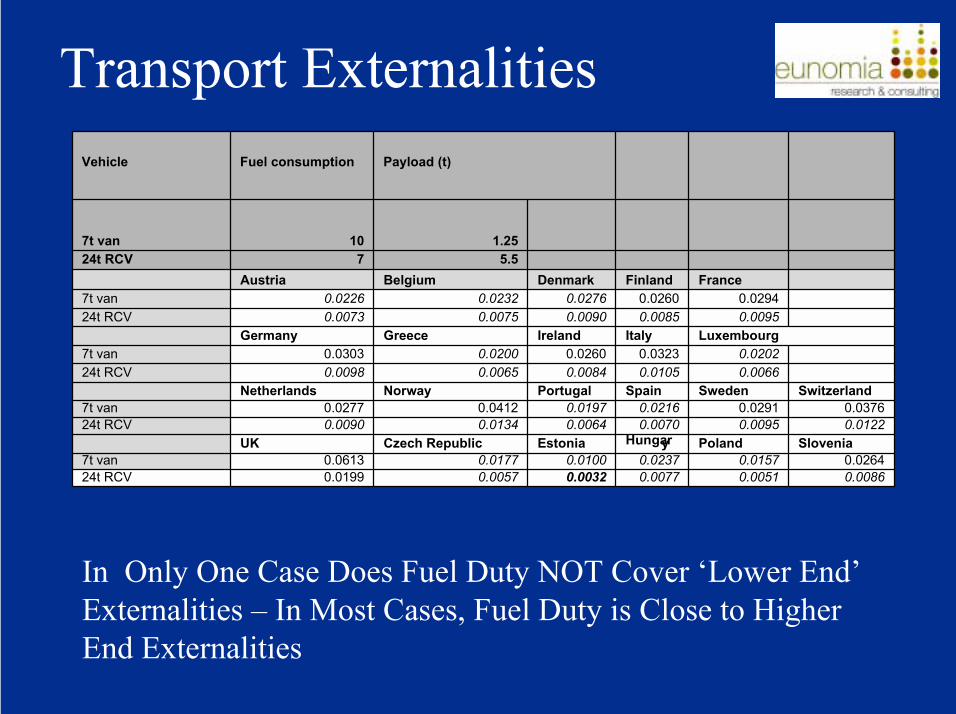
0.00860.00510.00770.00320.00570.019924t RCV0.02640.01570.02370.01000.01770.06137t van
SloveniaPolandHungaryEstoniaCzech RepublicUK0.01220.00950.00700.00640.01340.009024t RCV0.03760.02910.02160.01970.04120.02777t van
SwitzerlandSwedenSpainPortugalNorwayNetherlands0.00660.01050.00840.00650.009824t RCV0.02020.03230.02600.02000.03037t van
LuxembourgItalyIrelandGreeceGermany0.00950.00850.00900.00750.007324t RCV0.02940.02600.02760.02320.02267t van
FranceFinlandDenmarkBelgiumAustria5.5724t RCV
1.25107t van
Payload (t)Fuel consumptionVehicle
In Only One Case Does Fuel Duty NOT Cover �Lower End�Externalities � In Most Cases, Fuel Duty is Close to HigherEnd Externalities
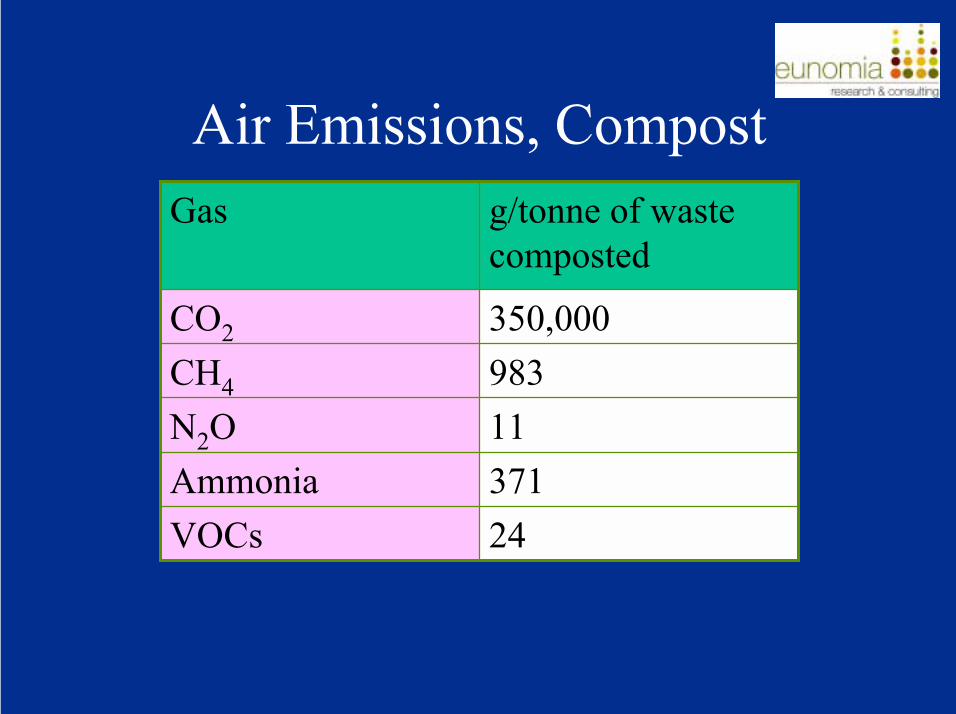
24VOCs371Ammonia11N2O983CH4
350,000CO2
g/tonne of wastecomposted
Gas
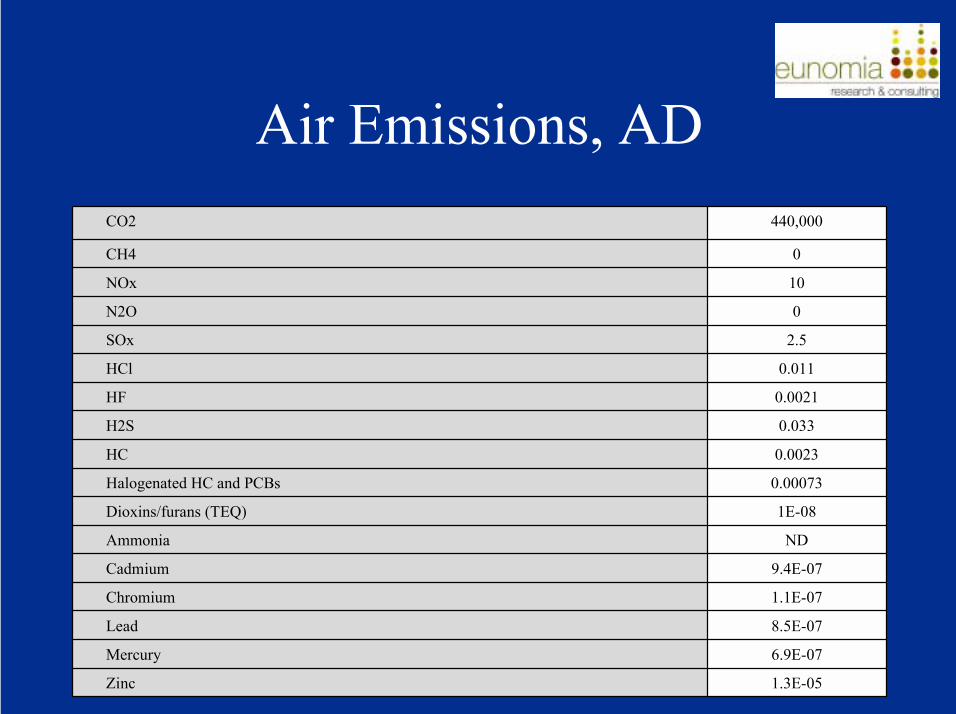
1.3E-05 Zinc
6.9E-07 Mercury
8.5E-07 Lead
1.1E-07 Chromium
9.4E-07 Cadmium
ND Ammonia
1E-08 Dioxins/furans (TEQ)
0.00073 Halogenated HC and PCBs
0.0023 HC
0.033 H2S
0.0021 HF
0.011 HCl
2.5 SOx
0 N2O
10 NOx
0 CH4
440,000 CO2
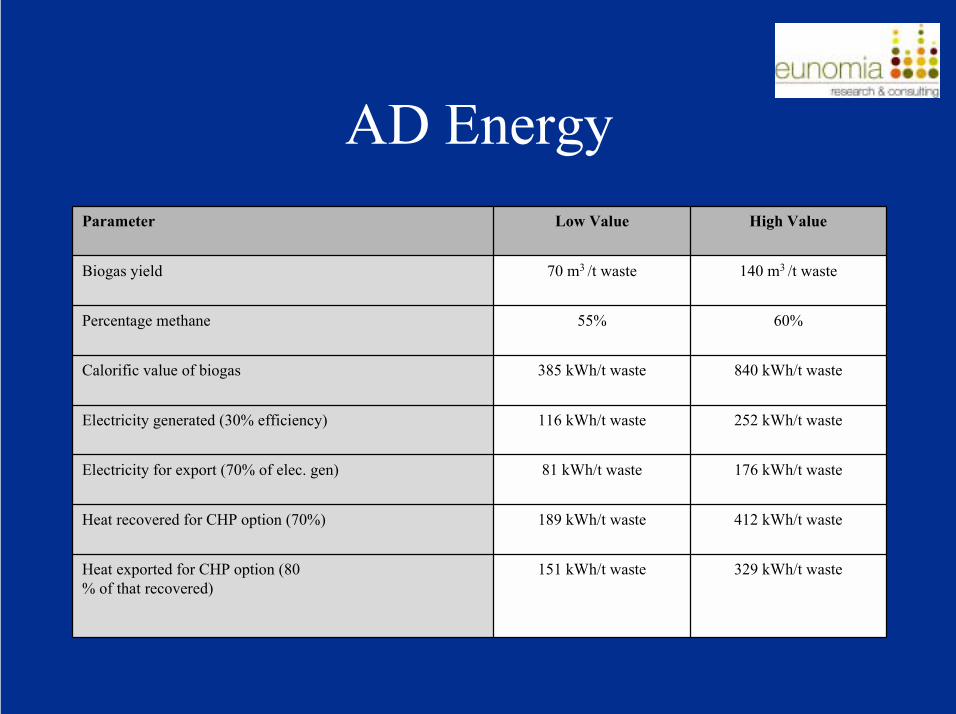
329 kWh/t waste151 kWh/t wasteHeat exported for CHP option (80% of that recovered)
412 kWh/t waste189 kWh/t wasteHeat recovered for CHP option (70%)
176 kWh/t waste81 kWh/t wasteElectricity for export (70% of elec. gen)
252 kWh/t waste116 kWh/t wasteElectricity generated (30% efficiency)
840 kWh/t waste385 kWh/t wasteCalorific value of biogas
60%55%Percentage methane
140 m3 /t waste70 m3 /t wasteBiogas yield
High ValueLow ValueParameter
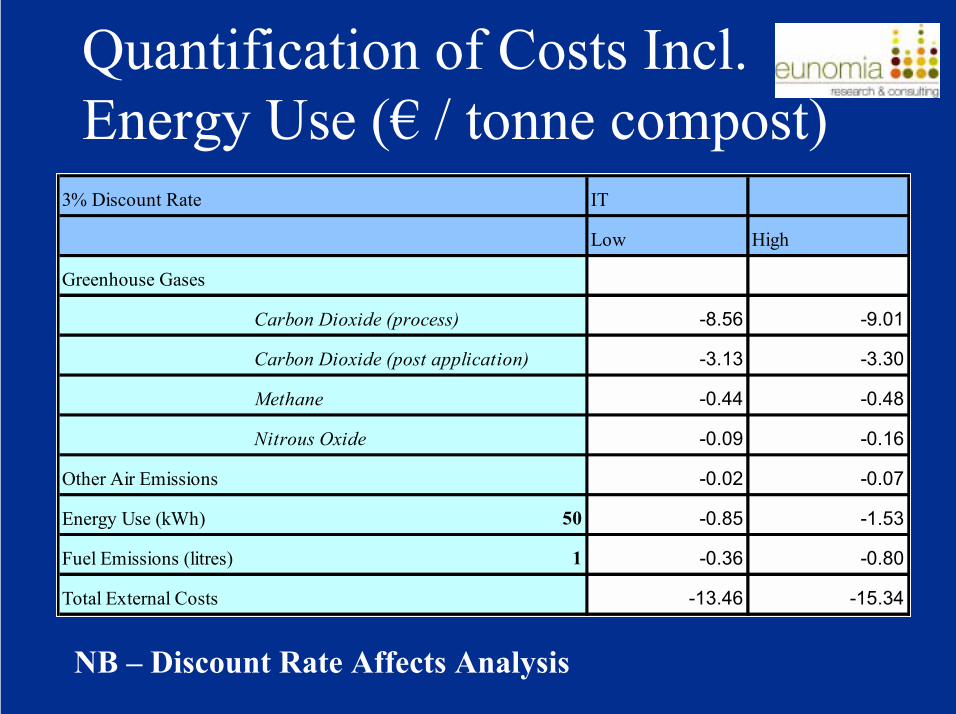
3% Discount Rate IT
Low High
Greenhouse Gases
Carbon Dioxide (process) -8.56 -9.01
Carbon Dioxide (post application) -3.13 -3.30
Methane -0.44 -0.48
Nitrous Oxide -0.09 -0.16
Other Air Emissions -0.02 -0.07
Energy Use (kWh) 50 -0.85 -1.53
Fuel Emissions (litres) 1 -0.36 -0.80
Total External Costs -13.46 -15.34
NB � Discount Rate Affects Analysis
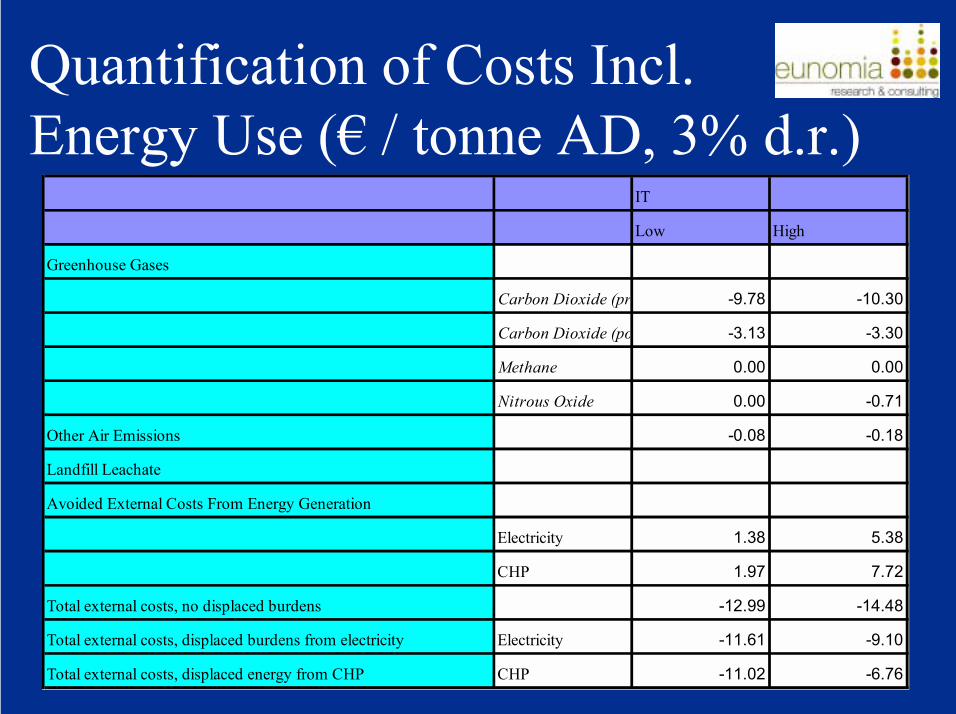
IT
Low High
Greenhouse Gases
Carbon Dioxide (pr -9.78 -10.30
Carbon Dioxide (po -3.13 -3.30
Methane 0.00 0.00
Nitrous Oxide 0.00 -0.71
Other Air Emissions -0.08 -0.18
Landfill Leachate
Avoided External Costs From Energy Generation
Electricity 1.38 5.38
CHP 1.97 7.72
Total external costs, no displaced burdens -12.99 -14.48
Total external costs, displaced burdens from electricity Electricity -11.61 -9.10
Total external costs, displaced energy from CHP CHP -11.02 -6.76
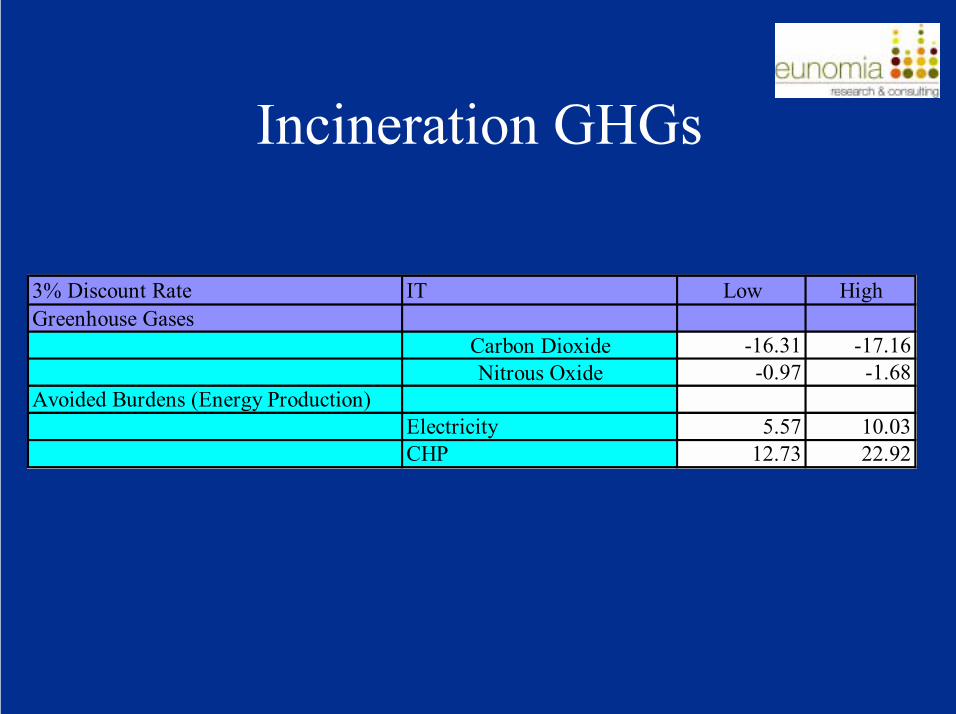
3% Discount Rate IT Low HighGreenhouse Gases
Carbon Dioxide -16.31 -17.16Nitrous Oxide -0.97 -1.68
Avoided Burdens (Energy Production)Electricity 5.57 10.03CHP 12.73 22.92
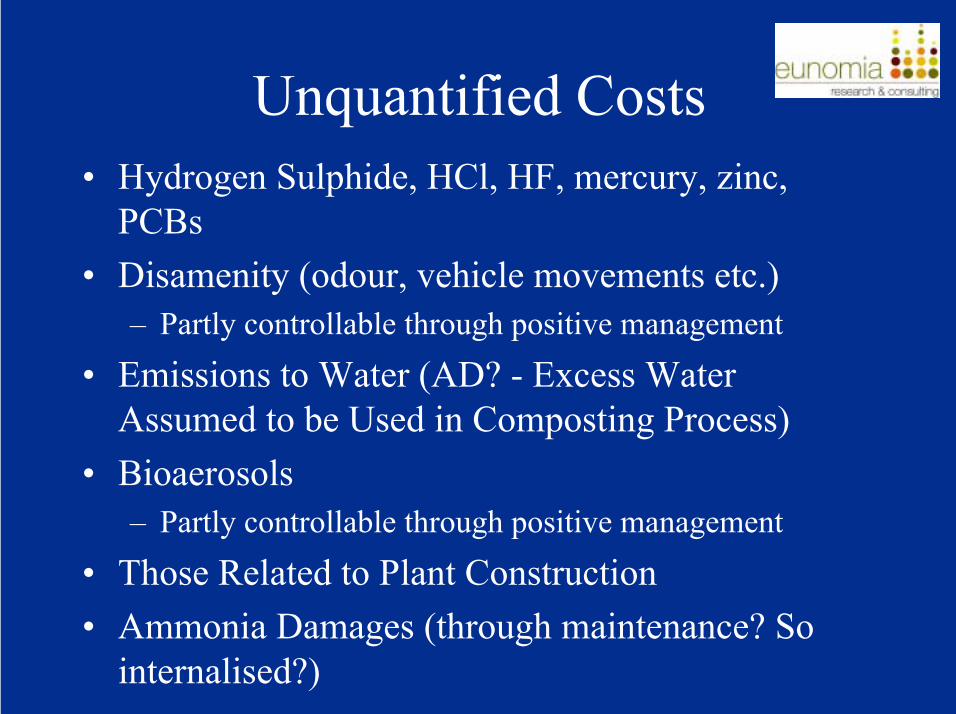
� Hydrogen Sulphide, HCl, HF, mercury, zinc,PCBs
� Disamenity (odour, vehicle movements etc.)� Partly controllable through positive management
� Emissions to Water (AD? - Excess WaterAssumed to be Used in Composting Process)
� Bioaerosols� Partly controllable through positive management
� Those Related to Plant Construction� Ammonia Damages (through maintenance? So
internalised?)
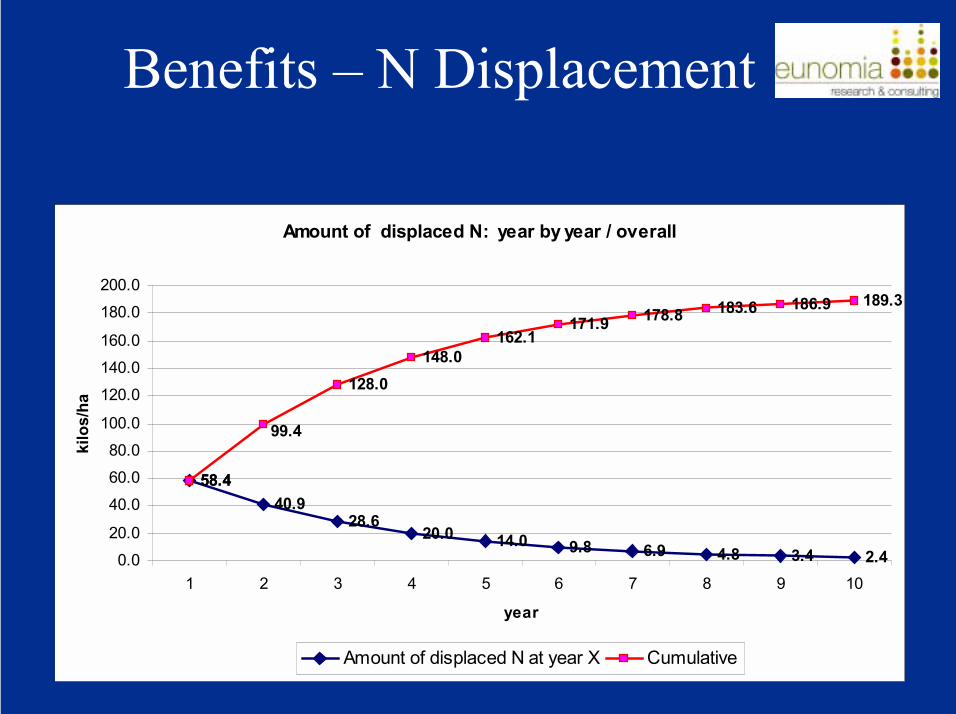
Amount of displaced N: year by year / overall
58.440.9
28.620.0 14.0 9.8 6.9 4.8 3.4 2.4
58.4
128.0148.0
162.1171.9 178.8 183.6 186.9 189.3
99.4
0.020.0
40.060.080.0
100.0
120.0140.0160.0
180.0200.0
1 2 3 4 5 6 7 8 9 10
year
kilo
s/ha
Amount of displaced N at year X Cumulative
2
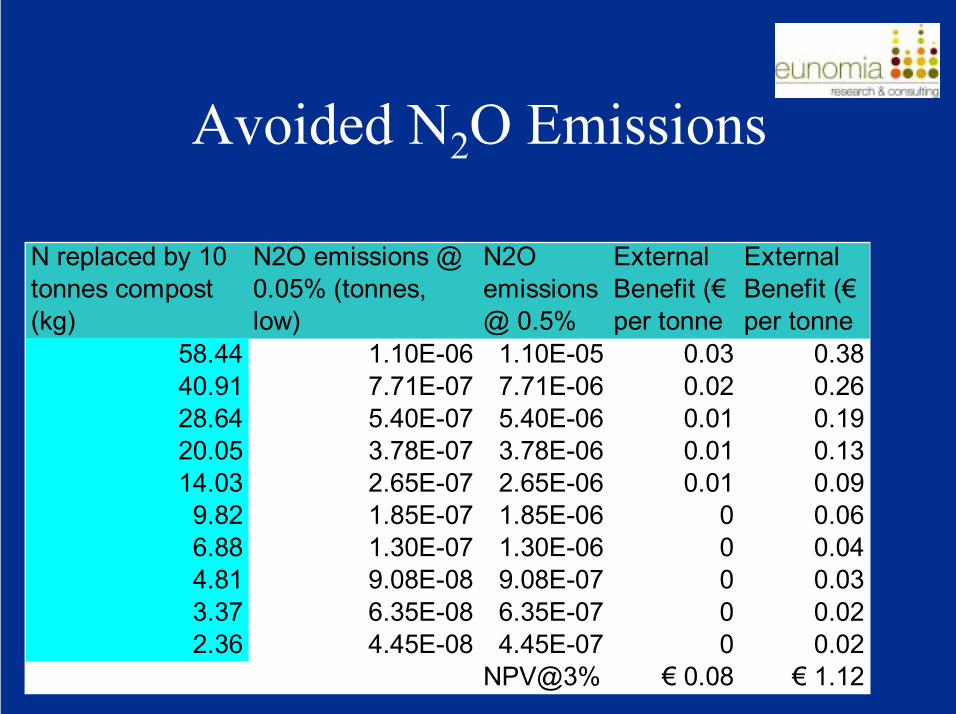
N replaced by 10 tonnes compost (kg)
N2O emissions @ 0.05% (tonnes, low)
N2O emissions @ 0.5%
External Benefit (� per tonne
External Benefit (� per tonne
58.44 1.10E-06 1.10E-05 0.03 0.3840.91 7.71E-07 7.71E-06 0.02 0.2628.64 5.40E-07 5.40E-06 0.01 0.1920.05 3.78E-07 3.78E-06 0.01 0.1314.03 2.65E-07 2.65E-06 0.01 0.099.82 1.85E-07 1.85E-06 0 0.066.88 1.30E-07 1.30E-06 0 0.044.81 9.08E-08 9.08E-07 0 0.033.37 6.35E-08 6.35E-07 0 0.022.36 4.45E-08 4.45E-07 0 0.02
NPV@3% � 0.08 � 1.12
� Phosphorous and Potassium (benefits notfully quantified)
� Also, Phosphogypsum and ProcessWastewater Disposal (benefits crudelyquantified)
� Also, Issue of N-leaching � N More TightlyBound In Humified Compost (benefits notquantified)
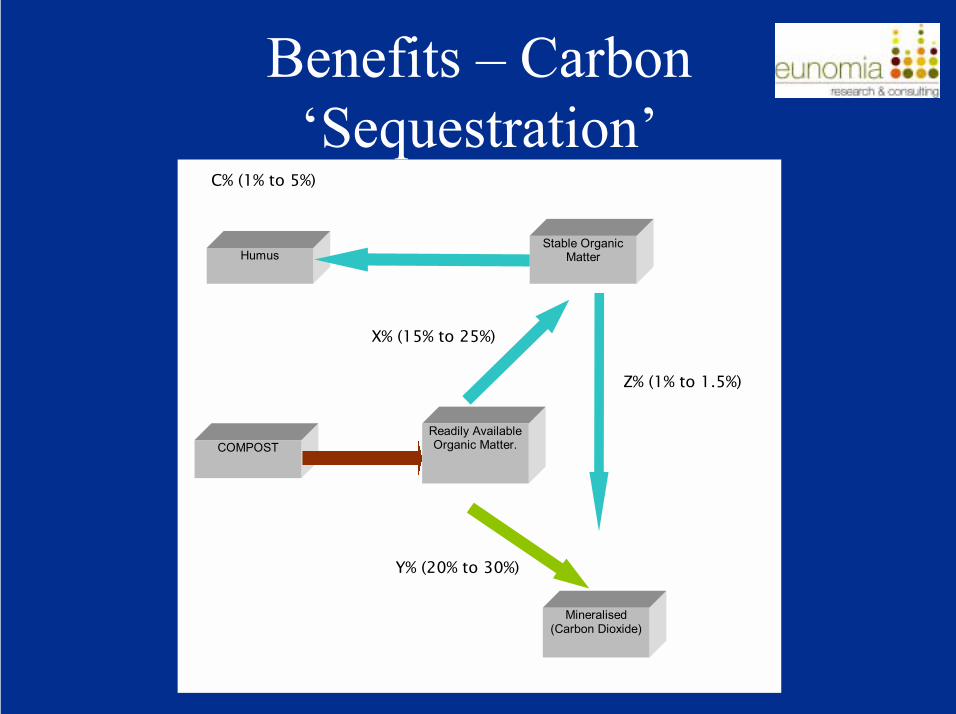
Y% (20% to 30%)
X% (15% to 25%)
Mineralised (Carbon Dioxide)
COMPOST
Humus Stable Organic
Matter
Readily Available Organic Matter.
C% (1% to 5%)
Z% (1% to 1.5%)
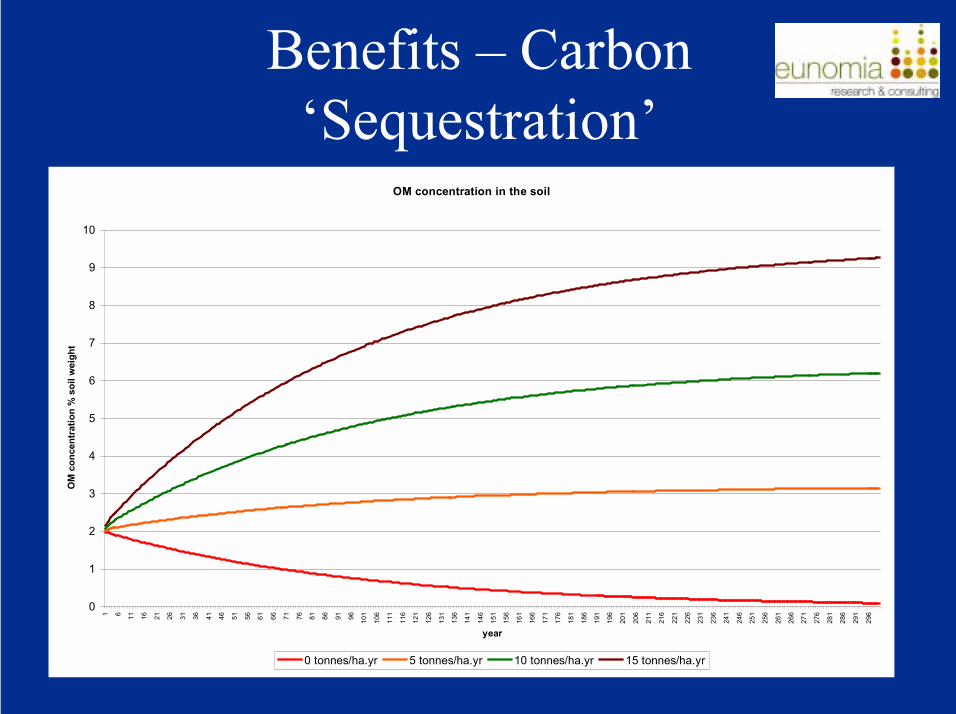
OM concentration in the soil
0
1
2
3
4
5
6
7
8
9
10
1 6 11 16 21 26 31 36 41 46 51 56 61 66 71 76 81 86 91 96 101
106
111
116
121
126
131
136
141
146
151
156
161
166
171
176
181
186
191
196
201
206
211
216
221
226
231
236
241
246
251
256
261
266
271
276
281
286
291
296
year
OM
con
cent
ratio
n %
soi
l wei
ght
0 tonnes/ha.yr 5 tonnes/ha.yr 10 tonnes/ha.yr 15 tonnes/ha.yr
0%
10%
20%
30%
40%
50%
60%
70%
80%
90%
100%
1 3 5 7 9 11 13 15 17 19 21 23 25 27 29 31 33 35 37 39 41 43 45 47 49
Year
Frac
tion
of T
otal
Car
bon
Min
eral
ised
/ R
emai
ning
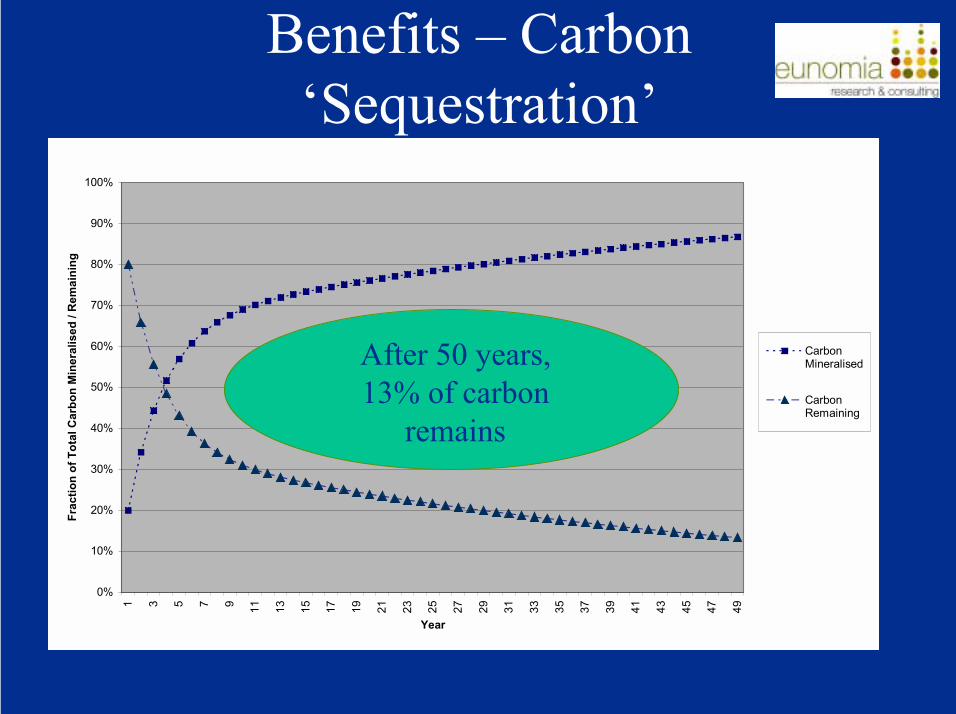
CarbonMineralised
CarbonRemaining
After 50 years,13% of carbon
remains
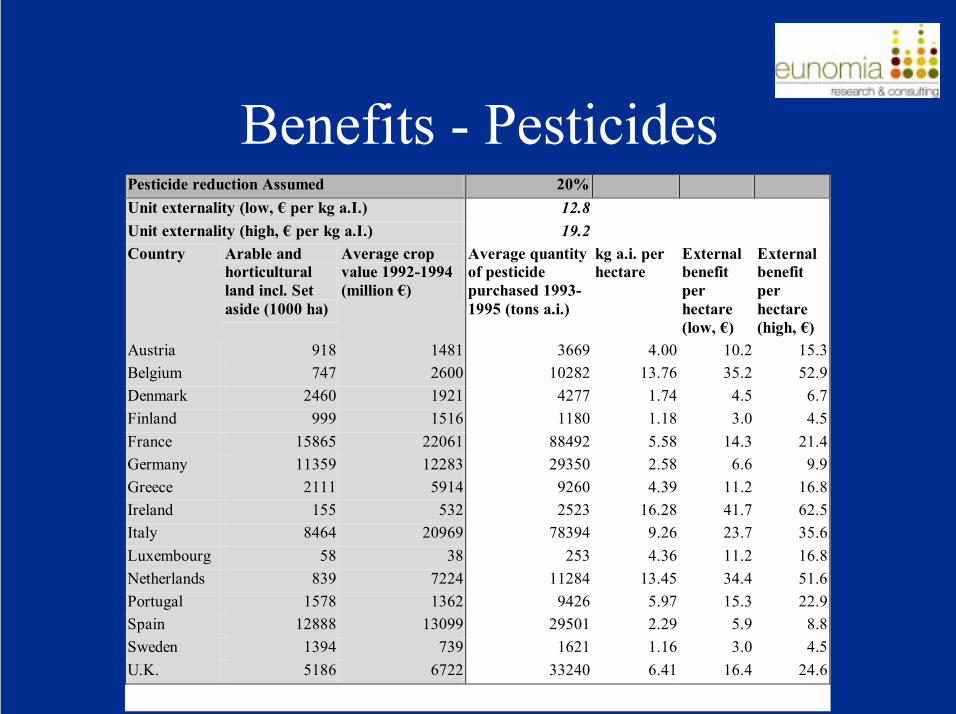
Pesticide reduction Assumed 20%Unit externality (low, � per kg a.I.) 12.8Unit externality (high, � per kg a.I.) 19.2Country Arable and
horticultural land incl. Set aside (1000 ha)
Average crop value 1992-1994 (million �)
Average quantity of pesticide purchased 1993-1995 (tons a.i.)
kg a.i. per hectare
External benefit per hectare (low, �)
External benefit per hectare (high, �)
Austria 918 1481 3669 4.00 10.2 15.3Belgium 747 2600 10282 13.76 35.2 52.9Denmark 2460 1921 4277 1.74 4.5 6.7Finland 999 1516 1180 1.18 3.0 4.5France 15865 22061 88492 5.58 14.3 21.4Germany 11359 12283 29350 2.58 6.6 9.9Greece 2111 5914 9260 4.39 11.2 16.8Ireland 155 532 2523 16.28 41.7 62.5Italy 8464 20969 78394 9.26 23.7 35.6Luxembourg 58 38 253 4.36 11.2 16.8Netherlands 839 7224 11284 13.45 34.4 51.6Portugal 1578 1362 9426 5.97 15.3 22.9Spain 12888 13099 29501 2.29 5.9 8.8Sweden 1394 739 1621 1.16 3.0 4.5U.K. 5186 6722 33240 6.41 16.4 24.6
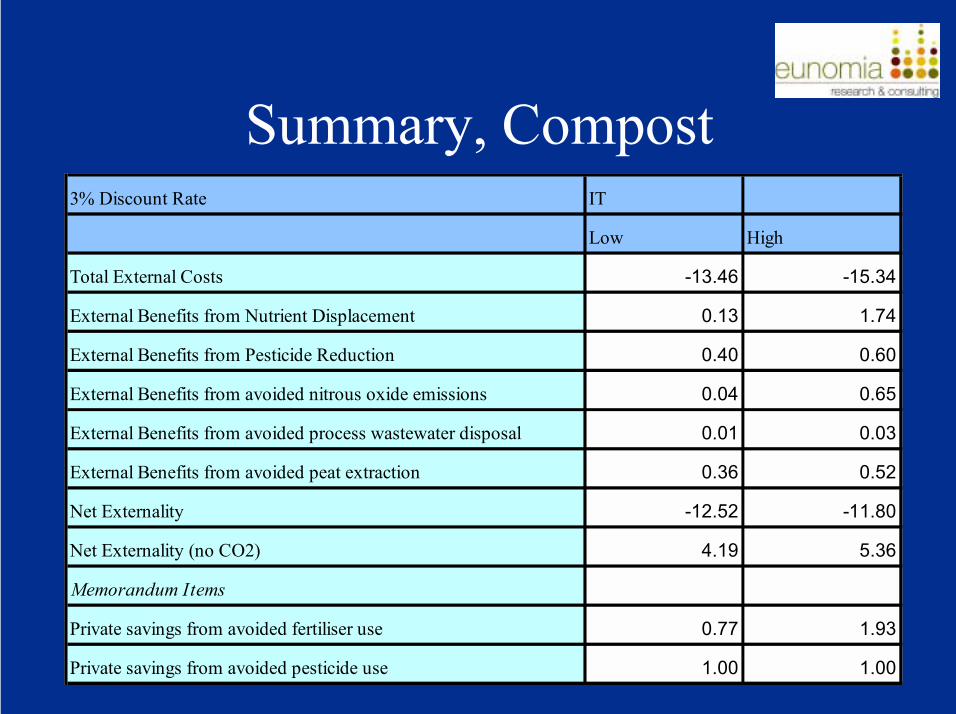
3% Discount Rate IT
Low High
Total External Costs -13.46 -15.34
External Benefits from Nutrient Displacement 0.13 1.74
External Benefits from Pesticide Reduction 0.40 0.60
External Benefits from avoided nitrous oxide emissions 0.04 0.65
External Benefits from avoided process wastewater disposal 0.01 0.03
External Benefits from avoided peat extraction 0.36 0.52
Net Externality -12.52 -11.80
Net Externality (no CO2) 4.19 5.36
Memorandum Items
Private savings from avoided fertiliser use 0.77 1.93
Private savings from avoided pesticide use 1.00 1.00
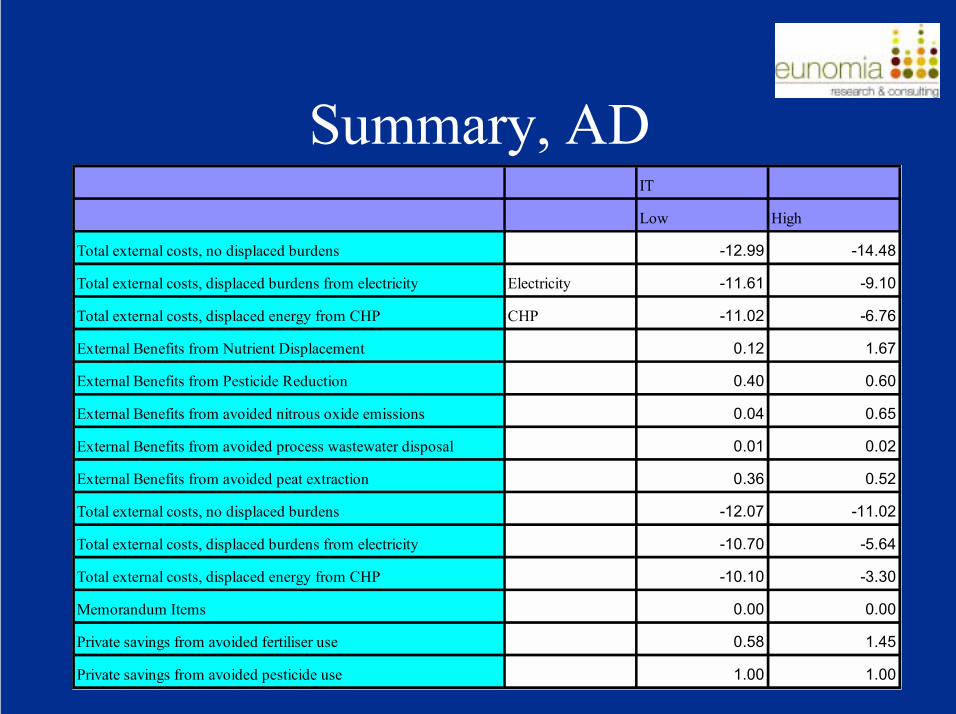
IT
Low High
Total external costs, no displaced burdens -12.99 -14.48
Total external costs, displaced burdens from electricity Electricity -11.61 -9.10
Total external costs, displaced energy from CHP CHP -11.02 -6.76
External Benefits from Nutrient Displacement 0.12 1.67
External Benefits from Pesticide Reduction 0.40 0.60
External Benefits from avoided nitrous oxide emissions 0.04 0.65
External Benefits from avoided process wastewater disposal 0.01 0.02
External Benefits from avoided peat extraction 0.36 0.52
Total external costs, no displaced burdens -12.07 -11.02
Total external costs, displaced burdens from electricity -10.70 -5.64
Total external costs, displaced energy from CHP -10.10 -3.30
Memorandum Items 0.00 0.00
Private savings from avoided fertiliser use 0.58 1.45
Private savings from avoided pesticide use 1.00 1.00
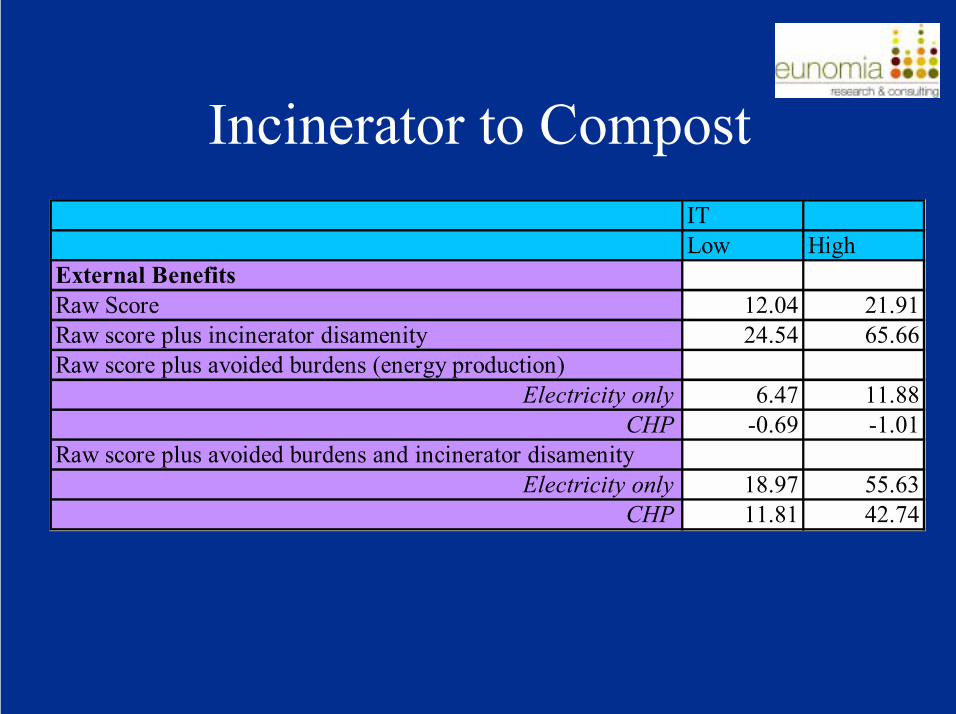
ITLow High
External BenefitsRaw Score 12.04 21.91Raw score plus incinerator disamenity 24.54 65.66Raw score plus avoided burdens (energy production)
Electricity only 6.47 11.88CHP -0.69 -1.01
Raw score plus avoided burdens and incinerator disamenityElectricity only 18.97 55.63
CHP 11.81 42.74
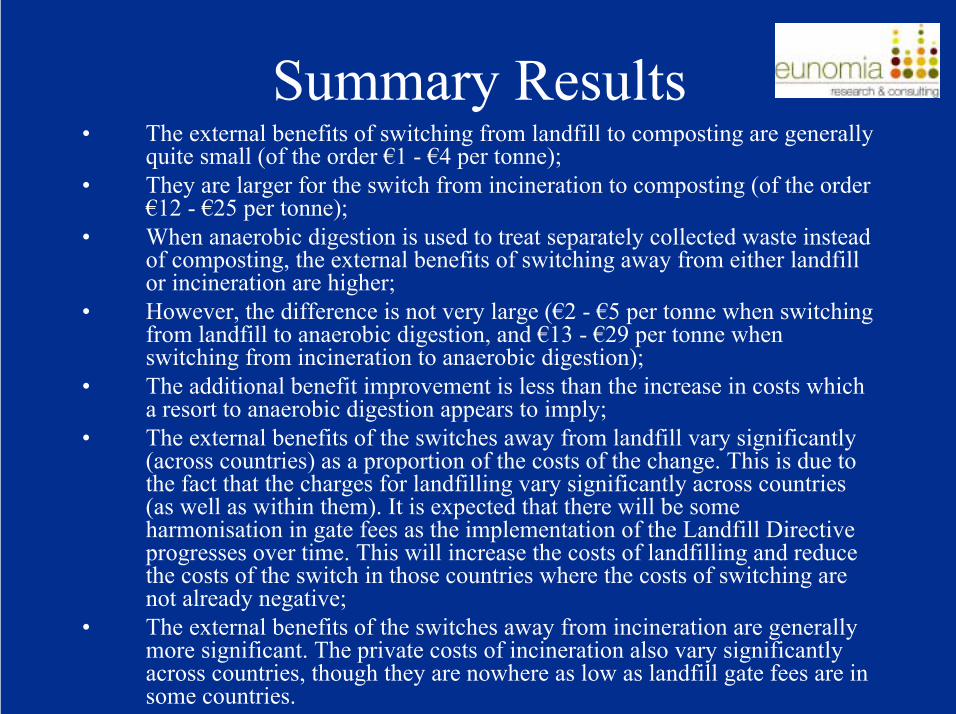
� The external benefits of switching from landfill to composting are generallyquite small (of the order �1 - �4 per tonne);
� They are larger for the switch from incineration to composting (of the order�12 - �25 per tonne);
� When anaerobic digestion is used to treat separately collected waste insteadof composting, the external benefits of switching away from either landfillor incineration are higher;
� However, the difference is not very large (�2 - �5 per tonne when switchingfrom landfill to anaerobic digestion, and �13 - �29 per tonne whenswitching from incineration to anaerobic digestion);
� The additional benefit improvement is less than the increase in costs whicha resort to anaerobic digestion appears to imply;
� The external benefits of the switches away from landfill vary significantly(across countries) as a proportion of the costs of the change. This is due tothe fact that the charges for landfilling vary significantly across countries(as well as within them). It is expected that there will be someharmonisation in gate fees as the implementation of the Landfill Directiveprogresses over time. This will increase the costs of landfilling and reducethe costs of the switch in those countries where the costs of switching arenot already negative;
� The external benefits of the switches away from incineration are generallymore significant. The private costs of incineration also vary significantlyacross countries, though they are nowhere as low as landfill gate fees are insome countries.
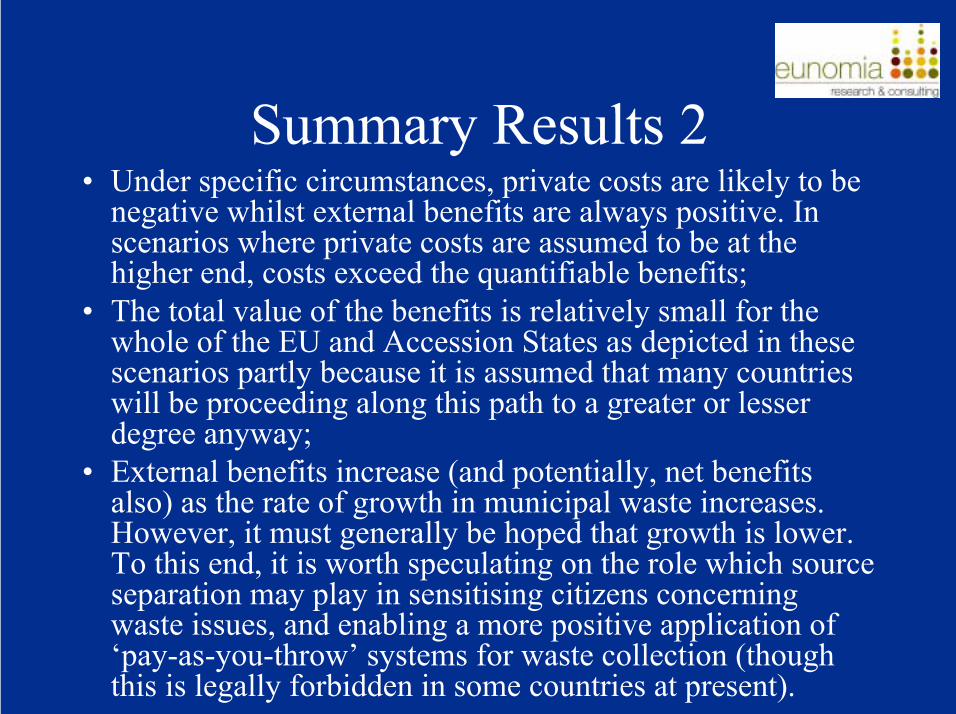
� Under specific circumstances, private costs are likely to benegative whilst external benefits are always positive. Inscenarios where private costs are assumed to be at thehigher end, costs exceed the quantifiable benefits;
� The total value of the benefits is relatively small for thewhole of the EU and Accession States as depicted in thesescenarios partly because it is assumed that many countrieswill be proceeding along this path to a greater or lesserdegree anyway;
� External benefits increase (and potentially, net benefitsalso) as the rate of growth in municipal waste increases.However, it must generally be hoped that growth is lower.To this end, it is worth speculating on the role which sourceseparation may play in sensitising citizens concerningwaste issues, and enabling a more positive application of�pay-as-you-throw� systems for waste collection (thoughthis is legally forbidden in some countries at present).
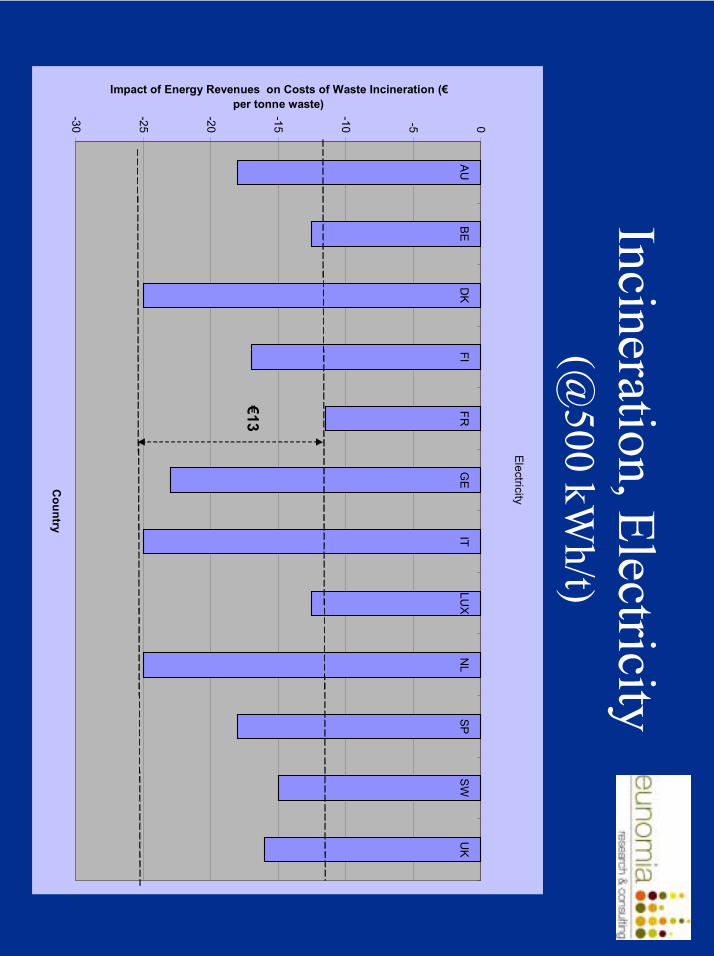
(@500 kW
h/t)Electricity
-30
-25
-20
-15
-10 -5 0AU
BED
KFI
FRG
EIT
LUX
NL
SPSW
UK
Country
Impact of Energy Revenues on Costs of Waste Incineration (� per tonne waste)
�13
-10000
-8000
-6000
-4000
-2000
0
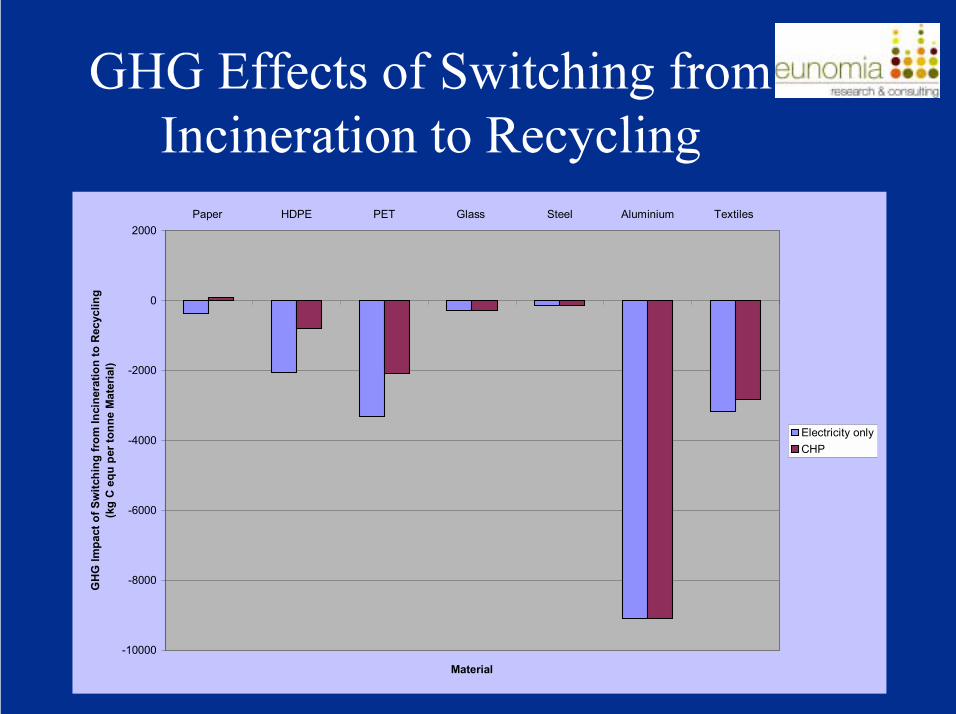
2000Paper HDPE PET Glass Steel Aluminium Textiles
Material
GHG
Impa
ct o
f Sw
itchi
ng fr
om In
cine
ratio
n to
Rec
yclin
g (k
g C
equ
per t
onne
Mat
eria
l)
Electricity onlyCHP
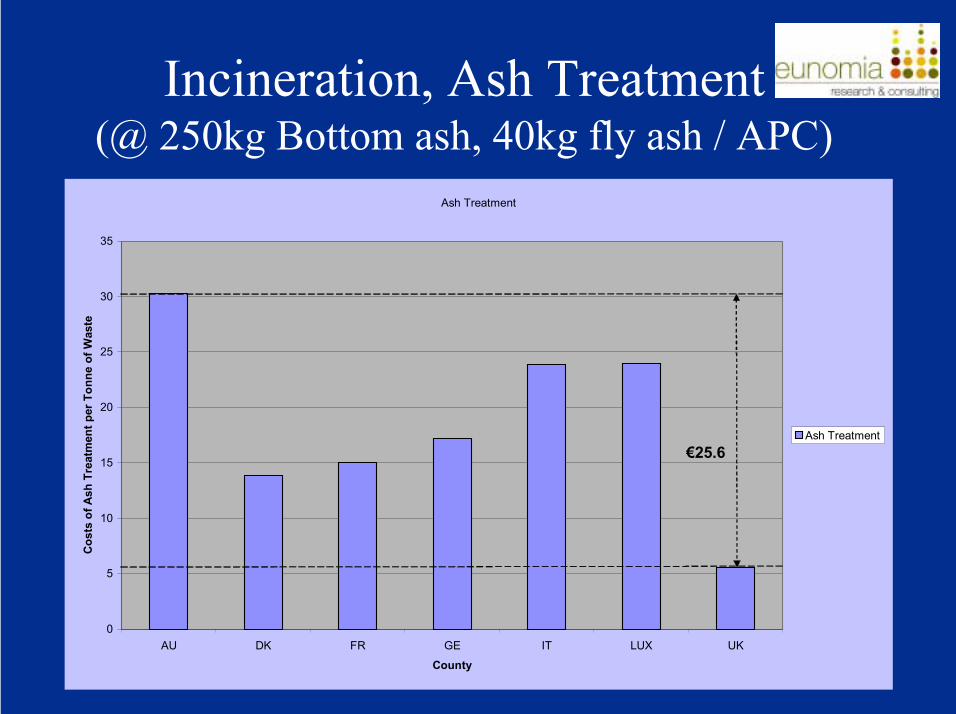
Ash Treatment
0
5
10
15
20
25
30
35
AU DK FR GE IT LUX UK
County
Cos
ts o
f Ash
Tre
atm
ent p
er T
onne
of W
aste
Ash Treatment�25.6
(@ 250kg Bottom ash, 40kg fly ash / APC)
0
20
40
60
80
100
120
140
160
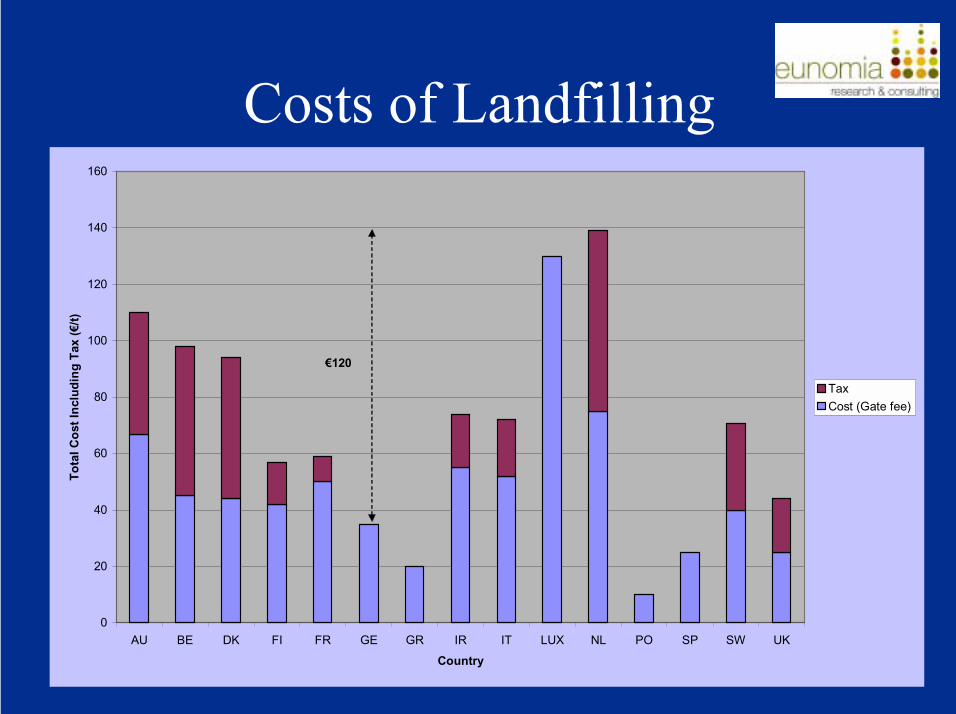
AU BE DK FI FR GE GR IR IT LUX NL PO SP SW UK
Country
Tota
l Cos
t Inc
ludi
ng T
ax (�
/t)
TaxCost (Gate fee)
�120
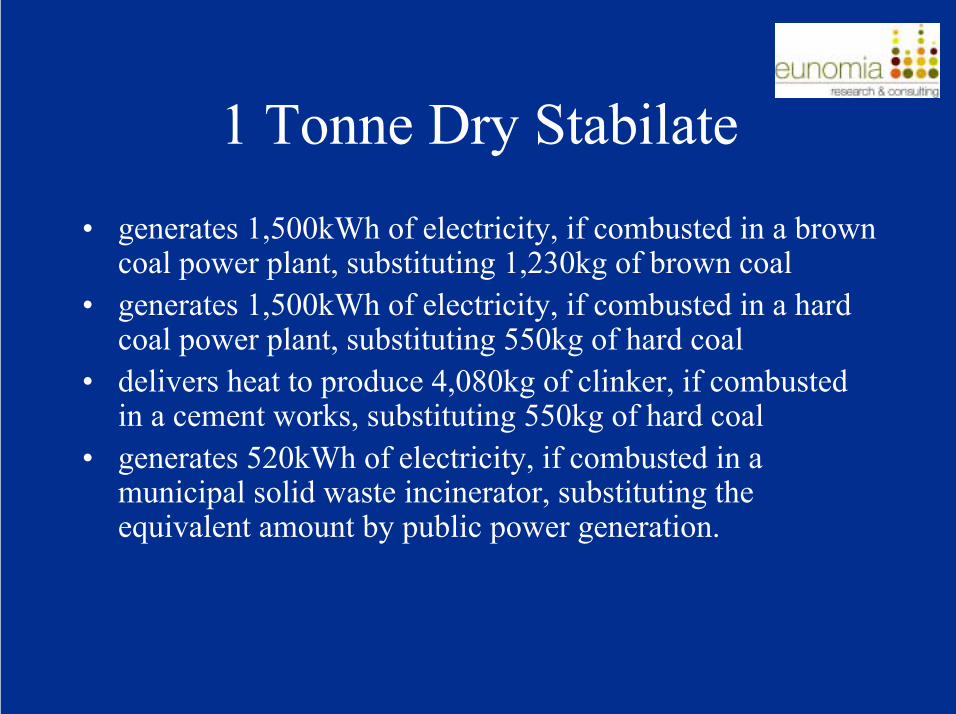
� generates 1,500kWh of electricity, if combusted in a browncoal power plant, substituting 1,230kg of brown coal
� generates 1,500kWh of electricity, if combusted in a hardcoal power plant, substituting 550kg of hard coal
� delivers heat to produce 4,080kg of clinker, if combustedin a cement works, substituting 550kg of hard coal
� generates 520kWh of electricity, if combusted in amunicipal solid waste incinerator, substituting theequivalent amount by public power generation.
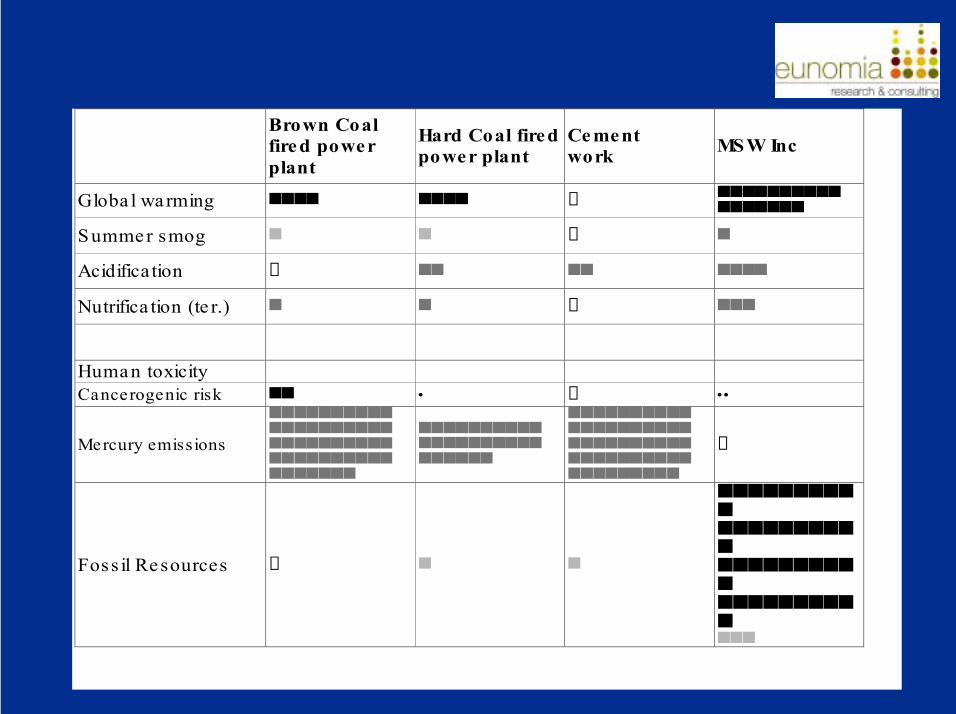
Brown Coal fire d power plant
Hard Coal fired power plant
Ce ment work MSW Inc
Globa l warming ■■■■ ■■■■ ① ■■■■■■■■■■ ■■■■■■■
Summer smog ■ ■ ① ■
Acidifica tion ① ■■ ■■ ■■■■
Nutrifica tion (te r.) ■ ■ ① ■■■
Human toxicity
Cancerogenic risk ■■ • ① ••
Mercury emissions
■■■■■■■■■■ ■■■■■■■■■■ ■■■■■■■■■■ ■■■■■■■■■■ ■■■■■■■
■■■■■■■■■■ ■■■■■■■■■■ ■■■■■■
■■■■■■■■■■ ■■■■■■■■■■ ■■■■■■■■■■ ■■■■■■■■■■ ■■■■■■■■■
①
Foss il Resources ① ■ ■
■■■■■■■■■■ ■■■■■■■■■■ ■■■■■■■■■■ ■■■■■■■■■■ ■■■
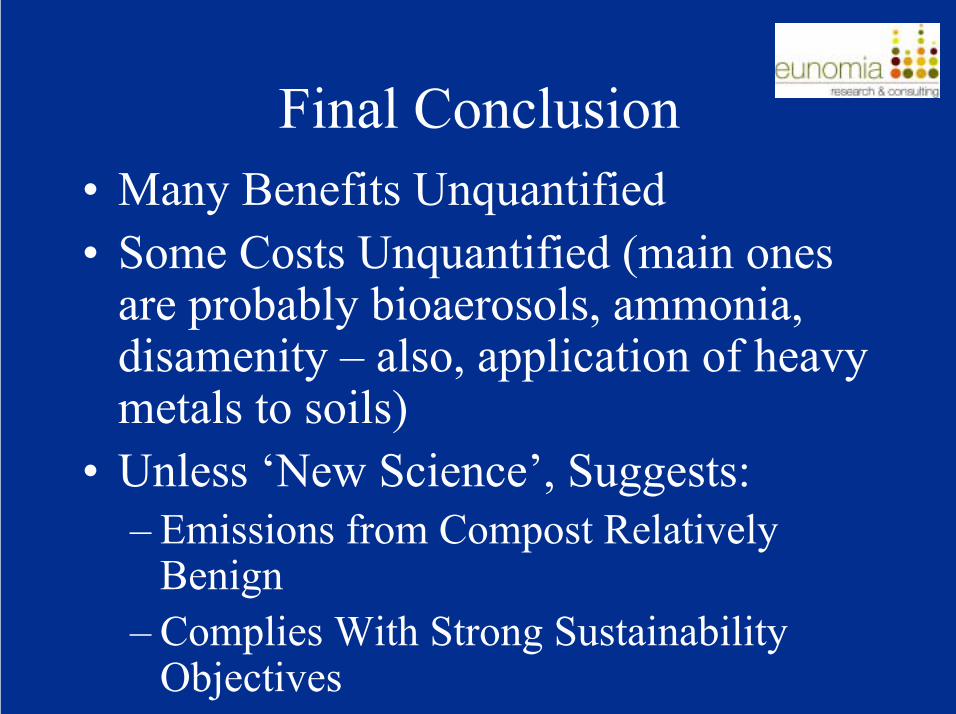
� Many Benefits Unquantified� Some Costs Unquantified (main ones
are probably bioaerosols, ammonia,disamenity � also, application of heavymetals to soils)
� Unless �New Science�, Suggests:� Emissions from Compost Relatively
Benign� Complies With Strong Sustainability
Objectives

Contact:Dominic Hogg
Eunomia Research & Consulting120 Cotham Bow
CothamBristol
BS6 6ARUK
![C' ii • 7 · 2018. 8. 8. · v. = -;_-, l I\! ~· ~T 317/2 1"7t.'].7 1 7 .ZE I'-' . s 5 u i•P?S@. g·-'fifit I I j'\i"~1>\.l~.~Nil\'G "-lt"'1TT':'7-~~"!~TTTVE" H'TfLLT,r..E~!C:_~](https://static.fdocuments.nl/doc/165x107/6019f08424b2ad699e280ad1/c-ii-a-7-2018-8-8-v-l-i-t-3172-17t7-1-7-ze-i-.jpg)

![5 4 t9y} ZE Frsamidare.jp/sikumi/box/kiminonawa6.pdf · 2018. 1. 19. · rjC § ze Ŭ C®Å¶ Ť «¿A M C Õê_2018 H rtg tan Õ w rbr 24t gau]> u > 8k S H ¢ 5{> } bp í> X](https://static.fdocuments.nl/doc/165x107/60bcb777f8906f48904ac5cd/5-4-t9y-ze-2018-1-19-rjc-ze-c-a-m-c-2018-h-rtg.jpg)

![7T[b º6ëí Gb $ª) 9 ?}>+.../² W*å$U [>&>F º v>|>F º v>' /² W*å $ª) Ý>& @ U>/ç v 0Û o>' ]b 5 c(Ù >#_1u} S W*å$a) lbΠܾ« @ Uc M W+c'½ p _/ b@ M+á $×[6 Ò Gb$U](https://static.fdocuments.nl/doc/165x107/5f21955f60e4b515954b09dc/7tb-6-gb-9-wu-f-vf-.jpg)