Cristina Ocañaa,b b,c b d a b*
17
1 A novel electrochemical aptamer-antibody sandwich assay for lysozyme detection Cristina Ocaña a,b , AkhtarHayat b,c , RupeshMishra b , Alina Vasilescu d , Manel del Valle a , Jean-Louis Marty b* a Sensors and Biosensors Group, Department of Chemistry, UniversitatAutònoma de Barcelona, 08193 Bellaterra, Spain b Université de Perpignan, Laboratoire IMAGES, EA 4218, 52 avenue Paul Alduy, bât. S, Perpignan cedex 66860, France c Interdisciplinary Research Centre in Biomedical Materials (IRCBM), COMSATS Institute of Information Technology (CIIT), Lahore, Pakistan d International Centre of Biodynamics, 1B IntrareaPortocalelor, sector 6, 060101, Bucharest, Romania * Corresponding author: [email protected] Abstract In this paper, we reported a novel electrochemical aptamer-antibody based sandwich biosensor for the detection of lysozyme. In the sensing strategy, Anti-lysozyme aptamer was immobilized onto the carbon electrode surface by covalent binding via diazonium salt chemistry. After incubating with the target protein (lysozyme), a biotinylated antibody was used to complete the sandwich format. The subsequent additions of avidin-alkaline phosphatase as enzyme label, and 1-napthyl phosphate substrate (1-NPP) allowed to determine the concentration of lysozyme (Lys) via Differential Pulse Voltammetry (DPV) of the generated enzyme reaction product, 1- napthol. Using this strategy, a wide detection range from 1fM to 5nM was obtained for target lysozyme, with a detection limit of 4.3fM. The control experiments were also carried out by using albumin (BSA), cytochrome c and casein. The results showed that the proposed biosensor had good specificity, stability and reproducibility for lysozyme analysis. In addition, the biosensor was applied for detecting lysozyme in spiked wine samples, very good recovery rates were obtained in the range from 96.67 to 102% for lysozyme detection. This implies that the proposed sandwich biosensor is a promising analytical tool for the analysis of lysozyme in real samples. Keywords: aptamer-antibody sandwich, biosensor, lysozyme detection, differential pulse voltammetry, wine sample Analyst 1 2 3 4 5 6 7 8 9 10 11 12 13 14 15 16 17 18 19 20 21 22 23 24 25 26 27 28 29 30 31 32 33 34 35 36 37 38 39 40 41 42 43 44 45 46 47 48 49 50 51 52 53 54 55 56 57 58 59 60
Transcript of Cristina Ocañaa,b b,c b d a b*
1
A novel electrochemical aptamer-antibody sandwich assay for lysozyme detection
Cristina Ocañaa,b, AkhtarHayatb,c, RupeshMishrab, Alina Vasilescud, Manel del Vallea, Jean-Louis Martyb*
aSensors and Biosensors Group, Department of Chemistry, UniversitatAutònoma de
Barcelona, 08193 Bellaterra, Spain
bUniversité de Perpignan, Laboratoire IMAGES, EA 4218, 52 avenue Paul Alduy, bât.
S, Perpignan cedex 66860, France
cInterdisciplinary Research Centre in Biomedical Materials (IRCBM), COMSATS
Institute of Information Technology (CIIT), Lahore, Pakistan
dInternational Centre of Biodynamics, 1B IntrareaPortocalelor, sector 6, 060101,
Bucharest, Romania
*Corresponding author: [email protected]
Abstract
In this paper, we reported a novel electrochemical aptamer-antibody based sandwich
biosensor for the detection of lysozyme. In the sensing strategy, Anti-lysozyme
aptamer was immobilized onto the carbon electrode surface by covalent binding via
diazonium salt chemistry. After incubating with the target protein (lysozyme), a
biotinylated antibody was used to complete the sandwich format. The subsequent
additions of avidin-alkaline phosphatase as enzyme label, and 1-napthyl phosphate
substrate (1-NPP) allowed to determine the concentration of lysozyme (Lys) via
Differential Pulse Voltammetry (DPV) of the generated enzyme reaction product, 1-
napthol. Using this strategy, a wide detection range from 1fM to 5nM was obtained for
target lysozyme, with a detection limit of 4.3fM. The control experiments were also
carried out by using albumin (BSA), cytochrome c and casein. The results showed that
the proposed biosensor had good specificity, stability and reproducibility for lysozyme
analysis. In addition, the biosensor was applied for detecting lysozyme in spiked wine
samples, very good recovery rates were obtained in the range from 96.67 to 102% for
lysozyme detection. This implies that the proposed sandwich biosensor is a promising
analytical tool for the analysis of lysozyme in real samples.
Keywords: aptamer-antibody sandwich, biosensor, lysozyme detection, differential pulse voltammetry, wine sample
Analyst
123456789101112131415161718192021222324252627282930313233343536373839404142434445464748495051525354555657585960
0001292
Cuadro de texto
Post-print of: Ocaña, C. et al “A novel electrochemical aptamer-antibody sandwich assay for lysozyme detection” in The analyst (Ed. RSC), vol. 140, issue 12 (June 2015), p. 4148-4153. The final version is available at: DOI 10.1039/c5an00243e
2
1. Introduction
Nowadays, use of biosensors for detection and quantification of proteins plays a
vital role in research1, clinical applications2 and food industry3. Biosensors are
analytical devices which incorporate a biomolecule to provide specific recognition for
an analyte together with transduction technology to detect and quantify the binding
taking place between analyte and detector molecule4. Traditionally, enzymes, antibodies
and proteins have been employed in biosensors as biorecognition species. Since their
discovery in 19905, aptamers have attracted considerable attention in biosensor
development6. Aptamers are artificial DNA or RNA oligonucleotides selected in vitro
which have the ability to bind to proteins, small molecules or even whole cells, with
high affinity and specificity7. They offer many advantages over antibodies such as
relatively easy production, highly affinity and specificity, easy chemical modification
and high stability8. Thanks to these excellent properties, a number of aptamer-based
sensors have been developed using different transducer techniques 9, 10. Among different
types of biosensors, electrochemical biosensing is of particular interest due to its
remarkable sensitivity, simple instrumentation, fast response, low cost and portability11.
Lysozyme (Lys) is a relatively small protein (14.3 kDa) consisting of only 129
amino acid residues, and is widely distributed in the nature12. It has an isoelectric point
of 11.0 and constitutes 3.5% of egg white protein. It is clear that lysozyme’s relatively
small size and simplicity makes it an excellent model analyte for novel methods in
protein detection. This protein is also known as N-acetylmuramide glycan hydrolase
due to its property to destroy bacterial cellular membranes by catalyzing the hydrolysis
of glycosidic bonds between N-acetylmuramic acid and N-acetylglucosaminein
peptidoglycan residues of Gram-positive bacteria cell walls 13. Moreover, the
monitoring of lysozyme level is used as a marker of some health problems such as
Analyst
123456789101112131415161718192021222324252627282930313233343536373839404142434445464748495051525354555657585960
3
bronchopulmonary dysplasia in newborns14 , conjunctivitis, kidney problems15 and
leukemia16. Additionally, Lys has been widely used as an antimicrobial agent in the
production of wine17, cheese18, beers19 and as well as to prolong the shelf-life of shrimp,
surimi products and sausages20. Specifically, in wine-making, Lys has been used since
1990 to prevent or mitigate heterolactic fermentation17. The maximum permitted level
of lysozyme in wine samples is 500 mg/L (~ 35µM)21. Being an egg-protein, lysozyme
is considered as an allergen; therefore developing new, rapid, cheap and sensitive
methods for the detection of Lys is of great significance.
Presently, the available analytical methods for the detection of lysozyme include
conventional methods like chromatographic or immunosensing techniques based on
ELISA, which have high sensitivity, but high cost and experimental complexity. Thus,
numerous sensors have been presented as alternatives to overcome these limitations
based on mainly electrochemical and optical detection 22. In this work, we report a novel
electrochemical aptamer-antibody sandwich assay for the detection of Lys. Differential
Pulse Voltammetry (DPV) technique was used to detect Lys via 1-naphtol oxidation
signal changes. For this purpose, the aptamer was immobilized onto the electrode
surface by covalent binding via diazonium salt. After incubating with lysozyme, a
biotinylated antibody was used to form the sandwich format. The addition of avidin
modified alkaline phosphatase and the 1-NPP enzymatic substrate allowed to detect
lysozyme based on the electrochemical oxidation signals of 1-naphtol. Results showed
that this novel biosensor can be used for accurate quantification of the concentration of
Lys in spiked wine samples. The developed biosensor is simple, sensitive, specific and
fast for the detection of Lys.
2. Experimental
2.1. Chemicals and materials
Analyst
123456789101112131415161718192021222324252627282930313233343536373839404142434445464748495051525354555657585960
4
Potassium dihydrogen phosphate, sodium monophosphate, bovine serum alumina
(BSA), lysozyme (Lys), avidin–labeled alkaline phosphatase (Av-ALP), casein, biotin-
labeled rabbit anti-chicken Lys antibody (AbLysBio), magnesium chloride, potassium
chloride, sodium chloride, ethanolamine, diethanolamine (DEA), N-
hydroxysuccinimide (NHS), N-(3-dimethylaminopropyle)-N’-ethyle-carbodiimide
hydrochloride (EDC), 4-aminobenzoic acid (ABA), 1-naphtyl phosphate (1-NP) and
sodium nitrite were purchased from Sigma (St. Louis, MO, USA). All reagents were
analytical reagent grade. The aptamer used was:
AptLys23
5’-NH2-GCA GCT AAG CAG GCG GCT CAC AAA ACC ATT CGC ATG CGG C-3’
and was provided by Eurogenetic (France)
All solutions were made up using MilliQ water. The buffers employed were: binding
buffer (BB) (1mM MgCL2, 2.7mMKCl, 140mMNaCl, 0.1mM Na2HPO4 and
1.8mMKH2PO4 pH 7.4), 10% DEA buffer (pH 9.5) and 100mM MES buffer containing
0.09%NaCl.
2.2. Equipment
The electrochemical measurements were performed using an Autolab PGSTAT100
potentiostat/galvanostat (Eco Chimie, Netherlands) controlled by General Purpose
Electrochemical System software (GPES) (4.9) for voltammetry. Screen printed carbon
electrodes (SPCEs) were fabricated using a DEK 248 screen-printing system. The SPCE
consists of conventional three electrode configuration with graphite as working (4-mm
diameter disk) and counter (16 mm × 1.5 mm curved line) electrode, and Ag/AgCl (16
mm ×1.5 mm straight line) as pseudo reference electrode.
2.3. Experimental protocol
Analyst
123456789101112131415161718192021222324252627282930313233343536373839404142434445464748495051525354555657585960
5
2.3.1. Electrochemical SPE pretreatment
SPE was subjected to electrochemical pretreatment by 10 cyclic potential scans between
1.0 and -1.5V at scan rate of 0.2V/s in 0.5M H2SO4 and 0.1M KCl. Then, the electrodes
were rinsed with water.
2.3.2. Immobilization of AptLys onto the electrode surface
In detail, the diazonium cation was synthesized by in situ reaction of 2µL of 1M
NaNO2and 1mL of 2mM ABA prepared in 0.5M HCl. The mixture was left to react for
5 min at room temperature. 100µL of this mixture and 100µL of 0.5M HCl were
deposited onto the electrode surface and the electrochemical modification was
performed by linear sweep voltammetry from 0.6 to -0.8V. After modification, the
electrode was rinsed three times with distilled water. The carboxylic groups onto the
electrode surface were activated with 100 µL of 100mM EDC and 25mM NHS in
100mM MES buffer for 1 hour. After rinsing three times with distilled water, 30µL of
10µM solution of Apt were incubated onto the electrode surface for 1 hour. After that,
the electrodes were washed three times with BB to remove the unbound aptamer. In
order to deactivate the remaining succinimide groups, the electrodes were incubated
with 30 µL of 1M ethanolamine solution. After washing three times with BB, the
electrodes were incubated with 30µL of 5% BSA solution for 1h to avoid nonspecific
adsorption. The modified electrodes can be used directly or stored dry at 4ºC for several
days without decrease in the sensitivity.
2.3.3. Aptamer-antibody sandwich assay
The electrodes were incubated with different concentrations of Lys for 15 min. Then,
the electrodes were washed three times with BB.In order to achieve the aptamer-
antibody sandwich, the electrodes were incubated with 30 µL of anti-Lys antibody from
a 1/1500 dilution of the stock solution in BB buffer. The incubation took place for 1 h.
Analyst
123456789101112131415161718192021222324252627282930313233343536373839404142434445464748495051525354555657585960
6
This was followed by three washing steps using BB. Then, 30 µL of av-ALP, from
1/12500 dilution from the stock solution of enzyme, were deposited on the electrodes
for 1 h. After that, the electrodes were washed three times with BB.
2.3.4. Electrochemical detection
90 µL of 10% DEA buffer and 10 µL of 1-NPP 5mg·mL-1 were added on the electrode
surface and incubated for2 min at room temperature. Electrochemical detection was
performed by DPV. A modulation time of 2s, interval time of 0.2 s, initial potential of
0.1V, end potential of 0.4V, step potential of 0.01V, modulation amplitude of 0.06V
and stand- by potential of 0 V were applied.The height of the resulting oxidation peak
was recorded and plotted against Lys concentration to give a calibration curve.
2.3.5. Wine samples preparation
Wine samples were prepared following a protocol from a previous study24. Briefly, 1
mL of wine sample was spiked with 200µM of Lys and allowed to stand for 3min. Next,
200µL of a 5M NaCl solution containing 5% Tween-20 surfactant were added to 200µL
of lysozyme–wine mixture and diluted to a final volume of 1mL using 20mM MES
buffer pH 6 with 1mM MgCl2. This mixture was further centrifuged at 5000rpm for
5min and diluted using the buffer aforesaid to obtain the desired concentration of Lys.
3. Results and discussion
3.1. Principle of the aptamer-antibody sandwich assay
Figure 1 illustrates the different steps involved in the fabrication of biosensor for the
detection of Lys based on its specific recognition by aptamer-antibody assay. As
described in Section 2.3, the aptamer was covalently immobilized through EDC/NHS
chemistry via diazonium salt on the SPE surface. This step was followed by a blocking
step with BSA to avoid non-specific adsorption on the transducer surface. Then, Anti-
Analyst
123456789101112131415161718192021222324252627282930313233343536373839404142434445464748495051525354555657585960
7
Lys antibody was incubated on the sensing platform to obtain sandwich type detection.
Thereafter, a solution of avidin modified-ALP was deposited onto the electrode surface
to achieve coupling to the antibody through biotin-avidin affinity. Finally, the biosensor
was immersed in DEA buffer solution of pH 9.5 containing 1-NPP as ALP substrate,
and Lys was determined by differential pulse voltammetry of the generated 1-naphtol as
the enzyme reaction product.
<Figure 1>
3.2. Optimization of the working experimental conditions
In order to achieve the improved analytical characteristics of a proposed biosensor, it is
of vital importance to optimize the different experimental parameters. In this context,
several parameters including concentrations of anti-Lys antibody and avidin modified
enzyme, and their incubation time with Lys were optimized prior to perform
concentration dependence response of the proposed sandwich assay. Figure 2a shows
the voltammetric peak response of 1-NPP in the presence of different concentrations of
Anti-Lys antibody (1/3000 from to 1/500, dilutions from stock solution of antibody). As
can be observed, the current response increased rapidly with increasing concentration of
Anti-Lys antibody, with a maximal electrochemical output signal at 1/1500. Similarly,
Figure 2b shows that peak current increased with increasing concentration of avidin
modified ALP till 1/12500 (dilution from stock enzyme solution), which was followed
by a decrease in response for subsequent increasing concentration, indicating the
saturation point of enzyme label is reached. Thus, 1/1500 and1/12500 were chosen as
the optimal dilutions for Anti-Lys antibody and avidin modified-ALP respectively.
The effect of the incubation time of Lys on the current response of the biosensor
was also studied. As can be seen from Figure 2c, the maximum peak current of 1-NPP
Analyst
123456789101112131415161718192021222324252627282930313233343536373839404142434445464748495051525354555657585960
8
was observed for an incubation period of 15 min. For longer incubation times, the peak
current was decreased. Thus, according to the experimental results, an incubation time
period of 15 min was selected to perform the further experiments.
<Figure 2>
3.3. Analytical performance of the aptamer-antibody sandwich biosensor
In order to perform the quantitative analysis, the designed biosensor was incubated with
different concentrations of Lys under the optimal conditions, and the DPV responses
were recorded to draw a calibration curve. As shown in the Figure 3a, the oxidation
peak current increased with the increasing concentration of Lys. The peak current was
plotted against the concentration of Lys, and the calibration plots (Figure 3b) exhibited
a good linear correlation between the peak current and the logarithm of Lys
concentrations in the range from 5fM to 5nM with a correlation coefficient of 0.998.
The calculated limit of detection (LOD) for Lys was 4.3fM. The reproducibility of the
method showed a relative standard deviation (RSD) of 5.5%, obtained from a series of 3
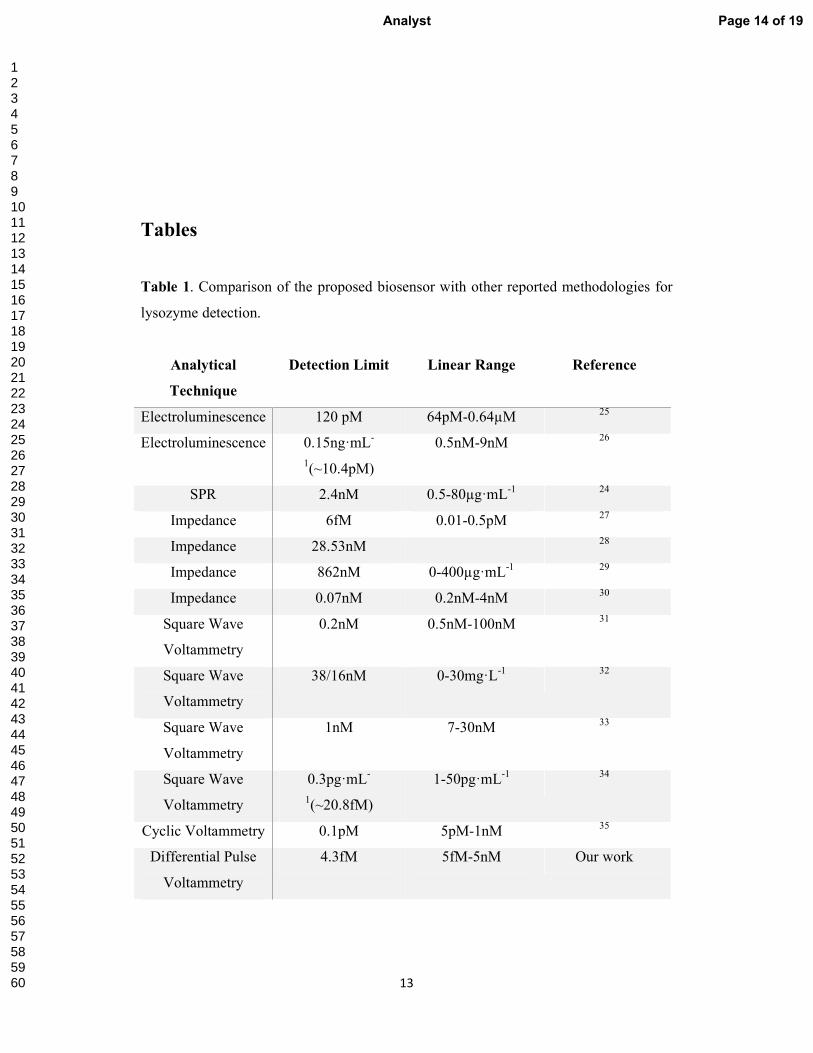
experiments carried out in a concentration of 5nM of Lys. Table 1 provides a
comparison of different biosensors reported in the literature for Lys detection. The data
in Table 1 indicates the lowest limit of detection of our proposed sandwich biosensor as
compared to the LOD of previously reported biosensors for Lys detection. In addition,
the linear range was greatly improved, being much wider than for other biosensors.
<Figure 3>
<Table 1>
3.4. Selectivity of the biosensor
In order to establish the specificity and selectivity of the designed biosensors, different
proteins including casein, BSA and cytochrome c were incubated on the biosensor
Analyst
123456789101112131415161718192021222324252627282930313233343536373839404142434445464748495051525354555657585960
9
surface and DPV measurements were carried out under the same experimental
conditions as those described for Lys analysis. As shown in Figure 4, the presence of
these proteins exhibited a negligible response compared with that of Lys, even in the
case of cytochrome c which is structurally similar to Lys. Therefore, the results
demonstrated that the developed strategy could be used to identify Lys with high
specificity.
<Figure 5>
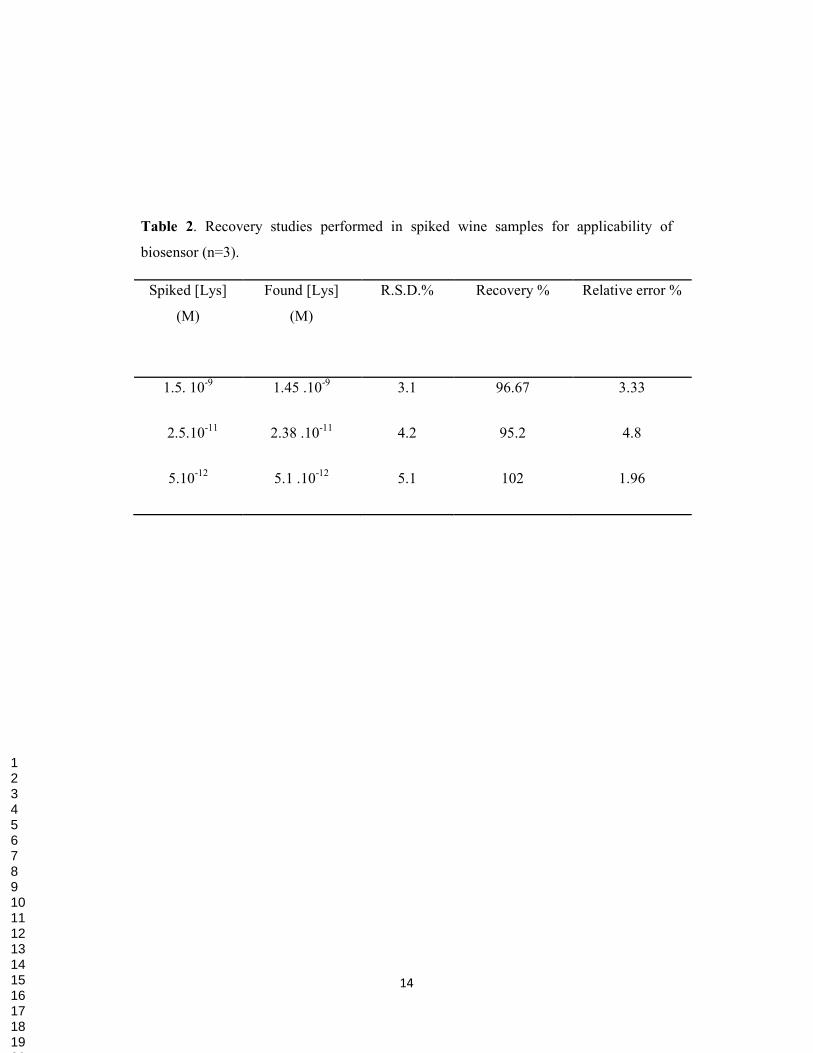
3.5. Application of the biosensor for the detection of Lys in spiked wine sample
In order to demonstrate the analytical reliability and applicability of the method for real
sample matrix, analysis of wine samples were performed by spiking at three different
concentrations of Lys (1.5 nM-5 pM). The recovery values were determined in
accordance with the calibration curve performed in buffer. The obtained Lys
concentrations were in consistent with the spiked values, indicating the suitability of
method for real sample analysis. The recovery results along with other analytical
characteristic for the proposed biosensors are presented in the table 2.
<Table 2>
Conclusions
In conclusion, a novel electrochemical biosensor has been successfully developed for
the detection of lysozyme protein based on a hybrid sandwich protocol. Differential
Pulse Voltammetry was used to detect Lys via the changes in 1-naphthol oxidation
signals. The described biosensor showed a lower detection limit (4.3fM) as compared to
the previously reported biosensors for lysozyme detection (Table1), wide linear range
for lysozyme detection from 5 fM to 5nM, high sensitivity and selectivity. In addition,
the biosensor was used for detecting lysozyme in spiked wine samples and very
Analyst
123456789101112131415161718192021222324252627282930313233343536373839404142434445464748495051525354555657585960
10
promising recovery values were obtained, indicating the great potential of proposed
methodology for detecting lysozyme in wines and possibly other food matrices.
Acknowledgement
Prof Dr Jean Louis Marty and Dr Alina Vasilescu would like to thanks BRANCUSI
Project.
References
1. T. F. McGrath, J. Buijs, A. C. Huet, P. Delahaut, C. T. Elliott and M. H. Mooney, Sensors and Actuators B: Chemical, 2013, 186, 423-430.
2. P. D'Orazio, Clinica Chimica Acta, 2011, 412, 1749-1761. 3. V. Scognamiglio, F. Arduini, G. Palleschi and G. Rea, TrAC Trends in
Analytical Chemistry, 2014, 62, 1-10. 4. G. D. Griffin, D. N. Stratis-Cullum and T. E. McKnight, in Reference Module in
Biomedical Sciences, Elsevier, 2014. 5. A. D. Ellington and J. W. Szostak, Nature, 1990, 346, 818-822. 6. E. Luzi, M. Minunni, S. Tombelli and M. Mascini, TrAC Trends in Analytical
Chemistry, 2003, 22, 810-818. 7. K. A. Davis, B. Abrams, Y. Lin and S. D. Jayasena, Nucleic Acids Res., 1996,
24, 702-706. 8. S. Tombelli, M. Minunni and M. Mascini, Biomolecular Engineering, 2007, 24,
191-200. 9. A. Hayat, A. Sassolas, J. L. Marty and A. E. Radi, Talanta, 2013, 103, 14-19. 10. L. Zhang, P. Cui, B. Zhang and F. Gao, Chemistry - A European Journal, 2013,
19, 9242-9250. 11. N. J. Ronkainen, H. B. Halsall and W. R. Heineman, Chem. Soc. Rev., 2010, 39,
1747-1763. 12. M. Schindler, Y. Assaf, N. Sharon and D. M. Chipman, Biochemistry, 1977, 16,
423-431. 13. L. E. H. Smith, L. H. Mohr and M. A. Raftery, Journal of the American
Chemical Society, 1973, 95, 7497-7500. 14. M. E. Revenis and M. A. Kaliner, The Journal of Pediatrics, 1992, 121, 262-
270. 15. B. Porstmann, K. Jung, H. Schmechta, U. Evers, M. Pergande, T. Porstmann,
H.-J. Kramm and H. Krause, Clinical Biochemistry, 1989, 22, 349-355. 16. R. S. Pascual, J. B. L. Gee and S. C. Finch, New England Journal of Medicine,
1973, 289, 1074-1076. 17. C. Lasanta, A. Roldán, I. Caro, L. Pérez and V. Palacios, Food Control, 2010,
21, 1442-1447. 18. M. Kondeková, V. Maier, P. Ginterová, J. Marák and J. Ševčík, Food
Chemistry, 2014, 153, 398-404. 19. C. Chen, X.-M. Sun and B.-H. Li, Chinese Journal of Analytical Chemistry,
2011, 39, 91-94.
Analyst
123456789101112131415161718192021222324252627282930313233343536373839404142434445464748495051525354555657585960
11
20. R. Chander and N. Lewis, European J. Appl. Microbiol. Biotechnol., 1980, 10, 253-258.
21. I. O. o. V. a. Wine, 2013. 22. A. Vasilescu, S. Gaspar, I. Mihai, A. Tache and S. C. Litescu, Analyst, 2013,
138, 3530-3537. 23. D. T. Tran, K. P. Janssen, J. Pollet, E. Lammertyn, J. Anne, A. Van Schepdael
and J. Lammertyn, Molecules (Basel, Switzerland), 2010, 15, 1127-1140. 24. I. Mihai, A. Vezeanu, C. Polonschii, C. Albu, G.-L. Radu and A. Vasilescu,
Sensors and Actuators B: Chemical, 2015, 206, 198-204. 25. Y. Li, H. Qi, Q. Gao and C. Zhang, Biosens. Bioelectron., 2011, 26, 2733-2736. 26. H. Wang, W. Gong, Z. Tan, X. Yin and L. Wang, Electrochim. Acta, 2012, 76,
416-423. 27. Y. Xiao, Y. Wang, M. Wu, X. Ma and X. Yang, Journal of Electroanalytical
Chemistry, 2013, 702, 49-55. 28. A. Erdem, E. Eksin and M. Muti, Colloids and Surfaces B: Biointerfaces, 2014,
115, 205-211. 29. F. Rohrbach, H. Karadeniz, A. Erdem, M. Famulok and G. Mayer, Anal.
Biochem., 2012, 421, 454-459. 30. Y. Peng, D. Zhang, Y. Li, H. Qi, Q. Gao and C. Zhang, Biosens. Bioelectron.,
2009, 25, 94-99. 31. Y. Xia, S. Gan, Q. Xu, X. Qiu, P. Gao and S. Huang, Biosens. Bioelectron.,
2013, 39, 250-254. 32. M. C. Rodríguez and G. A. Rivas, Talanta, 2009, 78, 212-216. 33. Z. Chen and J. Guo, Electrochim. Acta, 2013, 111, 916-920. 34. D. Xie, C. Li, L. Shangguan, H. Qi, D. Xue, Q. Gao and C. Zhang, Sensors and
Actuators B: Chemical, 2014, 192, 558-564. 35. Z. Chen, L. Li, Y. Tian, X. Mu and L. Guo, Biosens. Bioelectron., 2012, 38, 37-
42.
Analyst
123456789101112131415161718192021222324252627282930313233343536373839404142434445464748495051525354555657585960
12
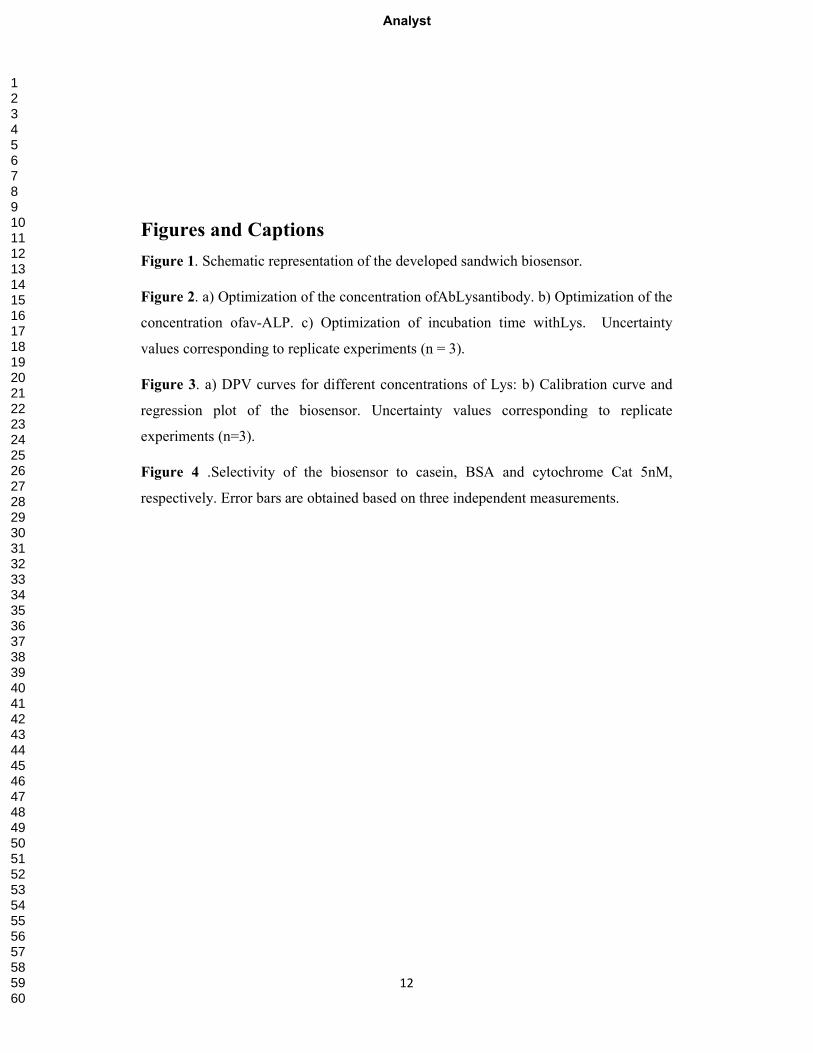
Figures and Captions
Figure 1. Schematic representation of the developed sandwich biosensor.
Figure 2. a) Optimization of the concentration ofAbLysantibody. b) Optimization of the
concentration ofav-ALP. c) Optimization of incubation time withLys. Uncertainty
values corresponding to replicate experiments (n = 3).
Figure 3. a) DPV curves for different concentrations of Lys: b) Calibration curve and
regression plot of the biosensor. Uncertainty values corresponding to replicate
experiments (n=3).
Figure 4 .Selectivity of the biosensor to casein, BSA and cytochrome Cat 5nM,
respectively. Error bars are obtained based on three independent measurements.
Analyst
123456789101112131415161718192021222324252627282930313233343536373839404142434445464748495051525354555657585960
13
Tables
Table 1. Comparison of the proposed biosensor with other reported methodologies for
lysozyme detection.
Analytical
Technique
Detection Limit Linear Range Reference
Electroluminescence 120 pM 64pM-0.64µM 25
Electroluminescence 0.15ng·mL-
1(~10.4pM)
0.5nM-9nM 26
SPR 2.4nM 0.5-80µg·mL-1 24
Impedance 6fM 0.01-0.5pM 27
Impedance 28.53nM 28
Impedance 862nM 0-400µg·mL-1 29
Impedance 0.07nM 0.2nM-4nM 30
Square Wave
Voltammetry
0.2nM 0.5nM-100nM 31
Square Wave
Voltammetry
38/16nM 0-30mg·L-1 32
Square Wave
Voltammetry
1nM 7-30nM 33
Square Wave
Voltammetry
0.3pg·mL-
1(~20.8fM)
1-50pg·mL-1 34
Cyclic Voltammetry 0.1pM 5pM-1nM 35
Differential Pulse
Voltammetry
4.3fM 5fM-5nM Our work
Page 14 of 19Analyst
123456789101112131415161718192021222324252627282930313233343536373839404142434445464748495051525354555657585960
14
Table 2. Recovery studies performed in spiked wine samples for applicability of
biosensor (n=3).
Spiked [Lys]
(M)
Found [Lys]
(M)
R.S.D.% Recovery % Relative error %
1.5. 10-9 1.45 .10-9 3.1 96.67 3.33
2.5.10-11 2.38 .10-11 4.2 95.2 4.8
5.10-12 5.1 .10-12 5.1 102 1.96
123456789101112131415161718192021222324252627282930313233343536373839404142434445464748495051525354555657585960
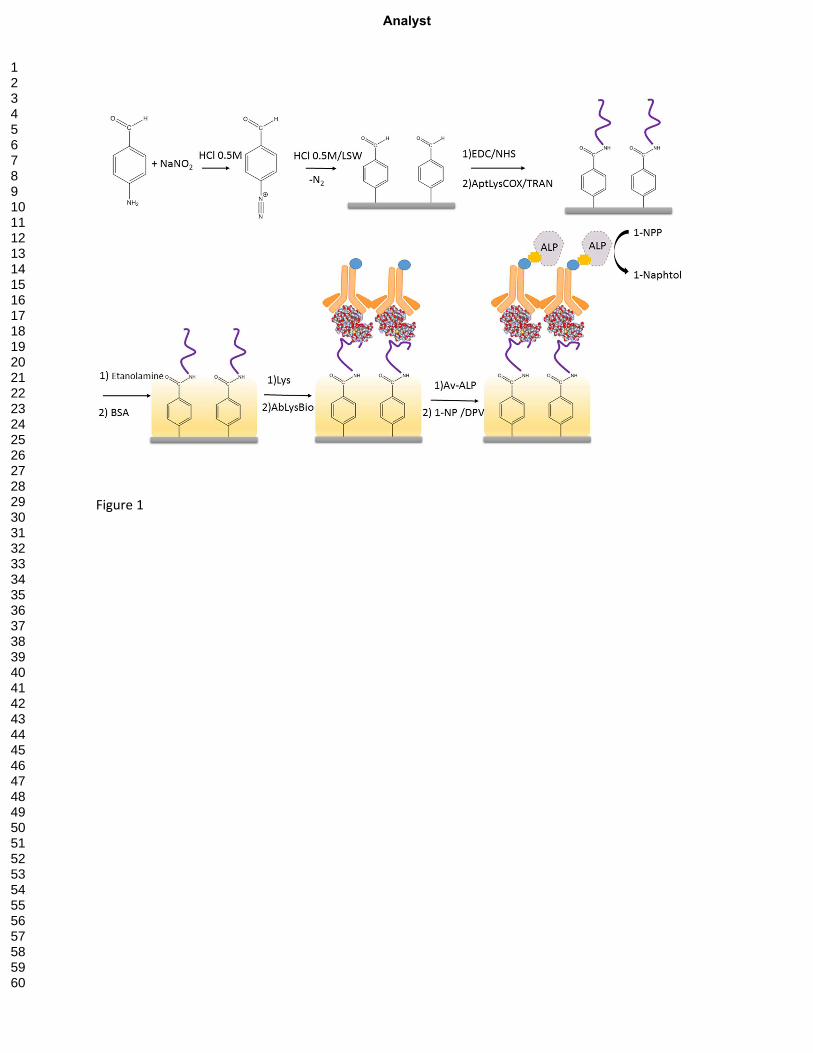
Figure 1
Analyst
123456789101112131415161718192021222324252627282930313233343536373839404142434445464748495051525354555657585960
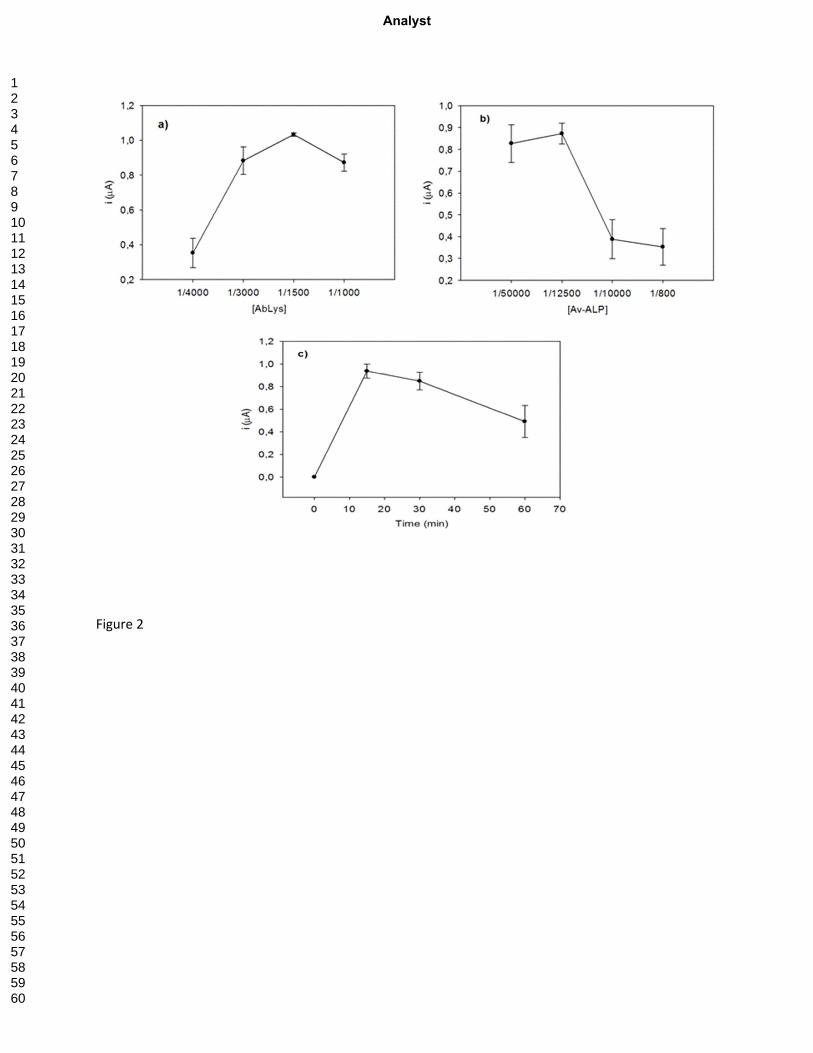
Figure 2
Analyst
123456789101112131415161718192021222324252627282930313233343536373839404142434445464748495051525354555657585960
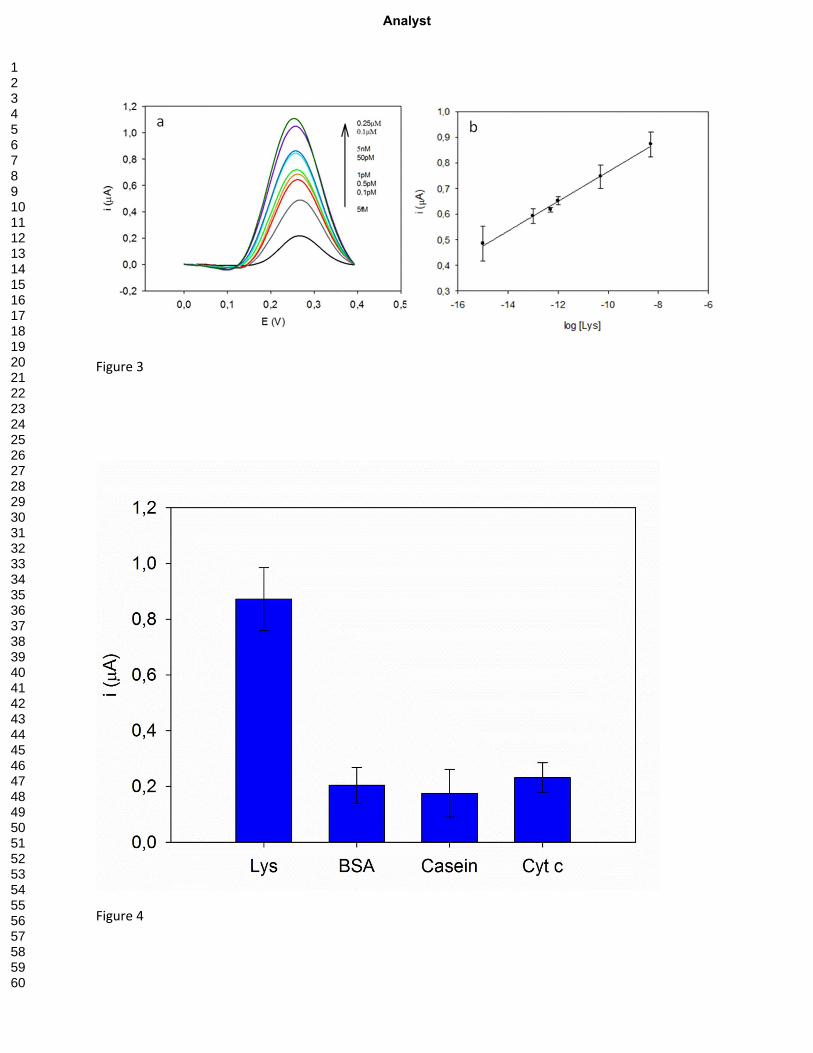
Figure 3
Figure 4
Analyst
123456789101112131415161718192021222324252627282930313233343536373839404142434445464748495051525354555657585960