Community Forest Ecosystem Services (CFES) INDONESIA · 2017-04-10 · Improving agroforestry...
23
Innovative conservation since 1903 Community Forest Ecosystem Services (CFES) INDONESIA Fauna & Flora International – Indonesia Programme
Transcript of Community Forest Ecosystem Services (CFES) INDONESIA · 2017-04-10 · Improving agroforestry...
Innovative conservation since 1903
Community Forest Ecosystem Services
(CFES)
INDONESIA
Fauna & Flora International – Indonesia Programme
Innovative conservation since 1903
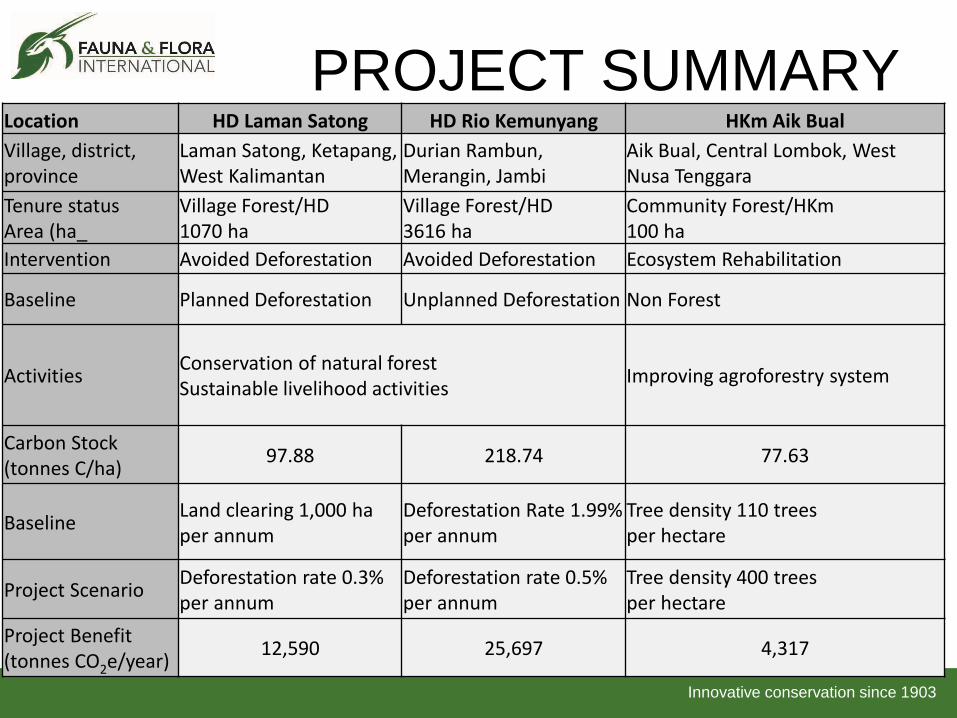
PROJECT SUMMARY Location HD Laman Satong HD Rio Kemunyang HKm Aik Bual
Village, district, province
Laman Satong, Ketapang, West Kalimantan
Durian Rambun, Merangin, Jambi
Aik Bual, Central Lombok, West Nusa Tenggara
Tenure status Area (ha_
Village Forest/HD 1070 ha
Village Forest/HD 3616 ha
Community Forest/HKm 100 ha
Intervention Avoided Deforestation Avoided Deforestation Ecosystem Rehabilitation
Baseline Planned Deforestation Unplanned Deforestation Non Forest
Activities Conservation of natural forest Sustainable livelihood activities
Improving agroforestry system
Carbon Stock (tonnes C/ha)
97.88 218.74 77.63
Baseline Land clearing 1,000 ha per annum
Deforestation Rate 1.99% per annum
Tree density 110 trees per hectare
Project Scenario Deforestation rate 0.3% per annum
Deforestation rate 0.5% per annum
Tree density 400 trees per hectare
Project Benefit (tonnes CO2e/year)
12,590 25,697 4,317
Innovative conservation since 1903
Avoided Planned Deforestation
Hutan Desa Laman Satong
Ketapang District, West Kalimantan
Innovative conservation since 1903
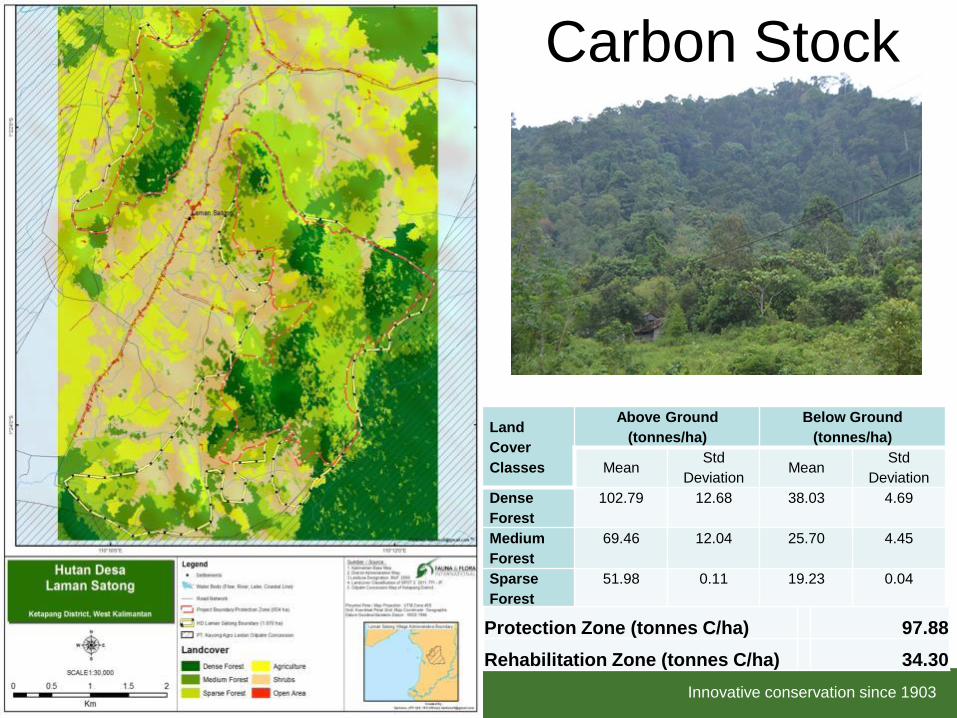
Carbon Stock
Land
Cover
Classes
Above Ground
(tonnes/ha)
Below Ground
(tonnes/ha)
Mean Std
Deviation Mean
Std
Deviation
Dense
Forest
102.79 12.68 38.03 4.69
Medium
Forest
69.46 12.04 25.70 4.45
Sparse
Forest
51.98 0.11 19.23 0.04
Protection Zone (tonnes C/ha) 97.88
Rehabilitation Zone (tonnes C/ha) 34.30
Innovative conservation since 1903
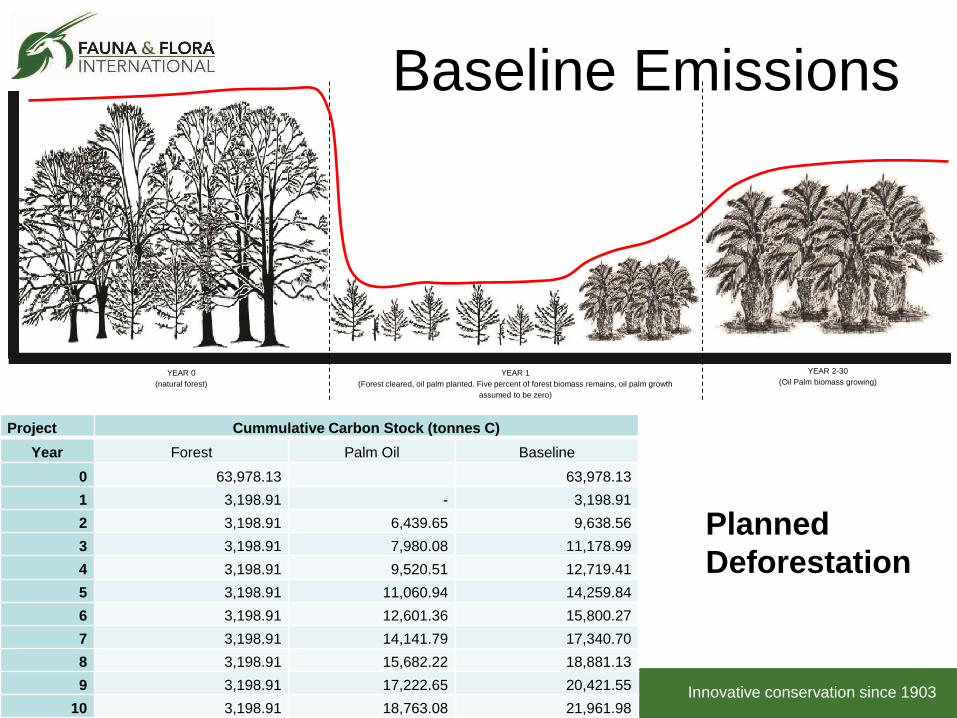
Baseline Emissions
YEAR 0
(natural forest)
YEAR 1
(Forest cleared, oil palm planted. Five percent of forest biomass remains, oil palm growth
assumed to be zero)
YEAR 2-30
(Oil Palm biomass growing)
Project Cummulative Carbon Stock (tonnes C)
Year Forest Palm Oil Baseline
0 63,978.13 63,978.13
1 3,198.91 - 3,198.91
2 3,198.91 6,439.65 9,638.56
3 3,198.91 7,980.08 11,178.99
4 3,198.91 9,520.51 12,719.41
5 3,198.91 11,060.94 14,259.84
6 3,198.91 12,601.36 15,800.27
7 3,198.91 14,141.79 17,340.70
8 3,198.91 15,682.22 18,881.13
9 3,198.91 17,222.65 20,421.55
10 3,198.91 18,763.08 21,961.98
Planned
Deforestation
Innovative conservation since 1903
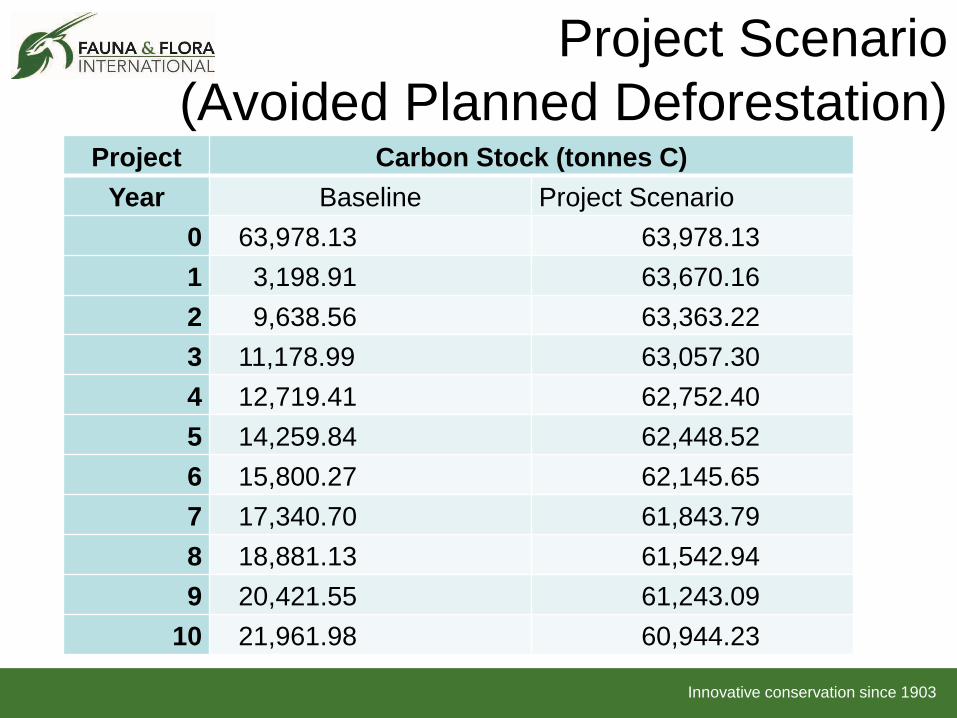
Project Scenario
(Avoided Planned Deforestation) Project Carbon Stock (tonnes C)
Year Baseline Project Scenario
0 63,978.13 63,978.13
1 3,198.91 63,670.16
2 9,638.56 63,363.22
3 11,178.99 63,057.30
4 12,719.41 62,752.40
5 14,259.84 62,448.52
6 15,800.27 62,145.65
7 17,340.70 61,843.79
8 18,881.13 61,542.94
9 20,421.55 61,243.09
10 21,961.98 60,944.23
Innovative conservation since 1903
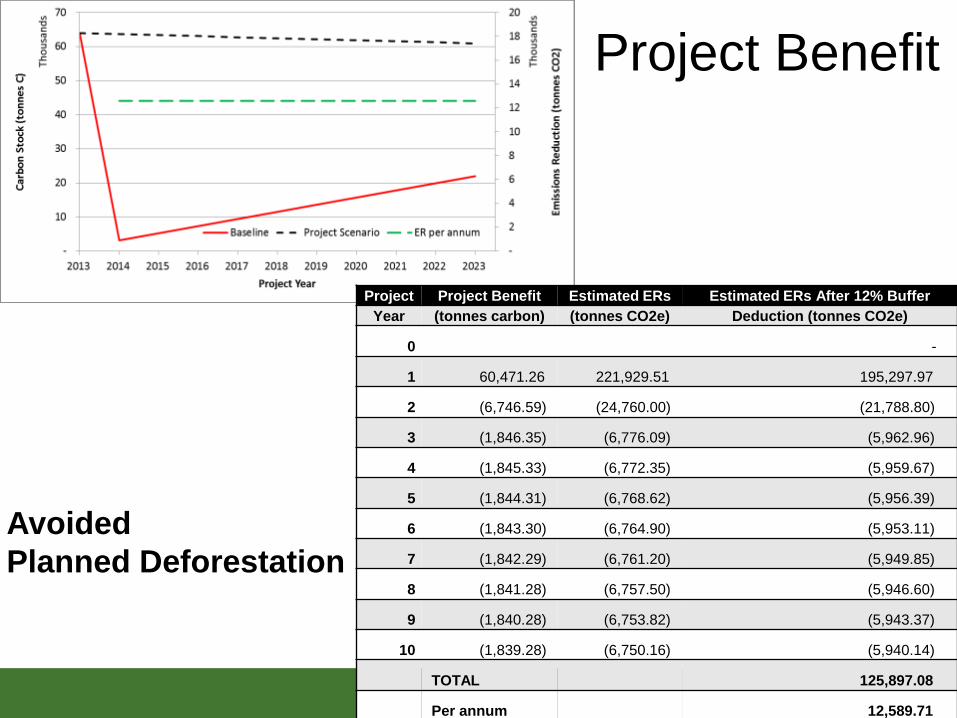
Project Benefit
Project Project Benefit Estimated ERs Estimated ERs After 12% Buffer
Year (tonnes carbon) (tonnes CO2e) Deduction (tonnes CO2e)
0 -
1 60,471.26 221,929.51 195,297.97
2 (6,746.59) (24,760.00) (21,788.80)
3 (1,846.35) (6,776.09) (5,962.96)
4 (1,845.33) (6,772.35) (5,959.67)
5 (1,844.31) (6,768.62) (5,956.39)
6 (1,843.30) (6,764.90) (5,953.11)
7 (1,842.29) (6,761.20) (5,949.85)
8 (1,841.28) (6,757.50) (5,946.60)
9 (1,840.28) (6,753.82) (5,943.37)
10 (1,839.28) (6,750.16) (5,940.14)
TOTAL 125,897.08
Per annum 12,589.71
Avoided
Planned Deforestation
Innovative conservation since 1903
Avoided Unplanned Deforestation
Hutan Desa Rio Kemunyang
Durian Rambun, Merangin District,
Jambi
Innovative conservation since 1903
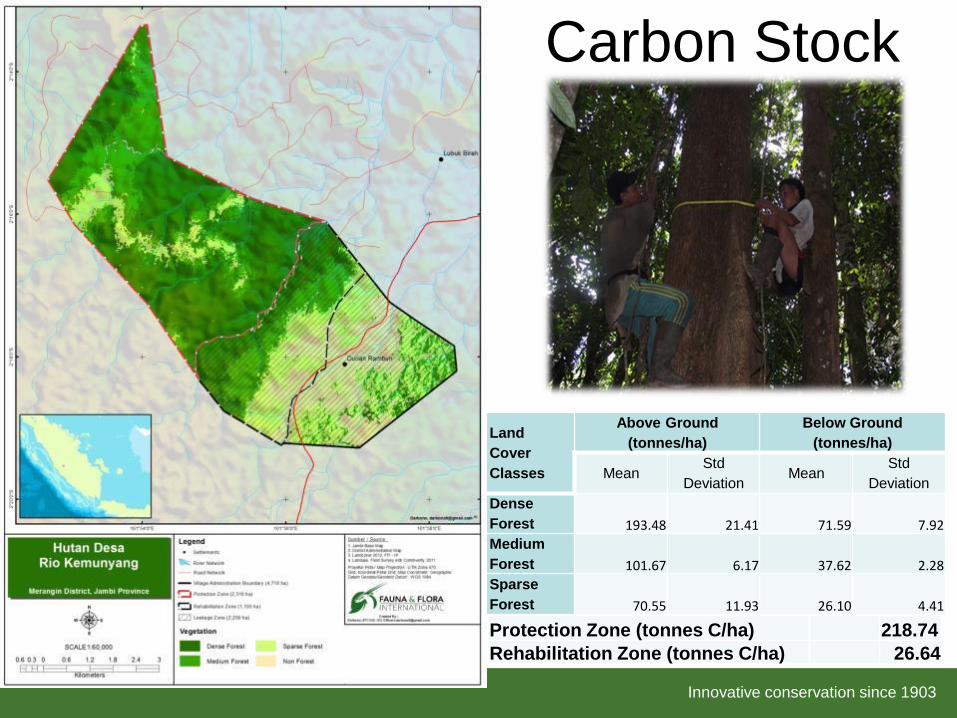
Carbon Stock
Land
Cover
Classes
Above Ground
(tonnes/ha)
Below Ground
(tonnes/ha)
Mean Std
Deviation Mean
Std
Deviation
Dense
Forest 193.48 21.41 71.59 7.92
Medium
Forest 101.67 6.17 37.62 2.28
Sparse
Forest 70.55 11.93 26.10 4.41
Protection Zone (tonnes C/ha) 218.74
Rehabilitation Zone (tonnes C/ha) 26.64
Innovative conservation since 1903
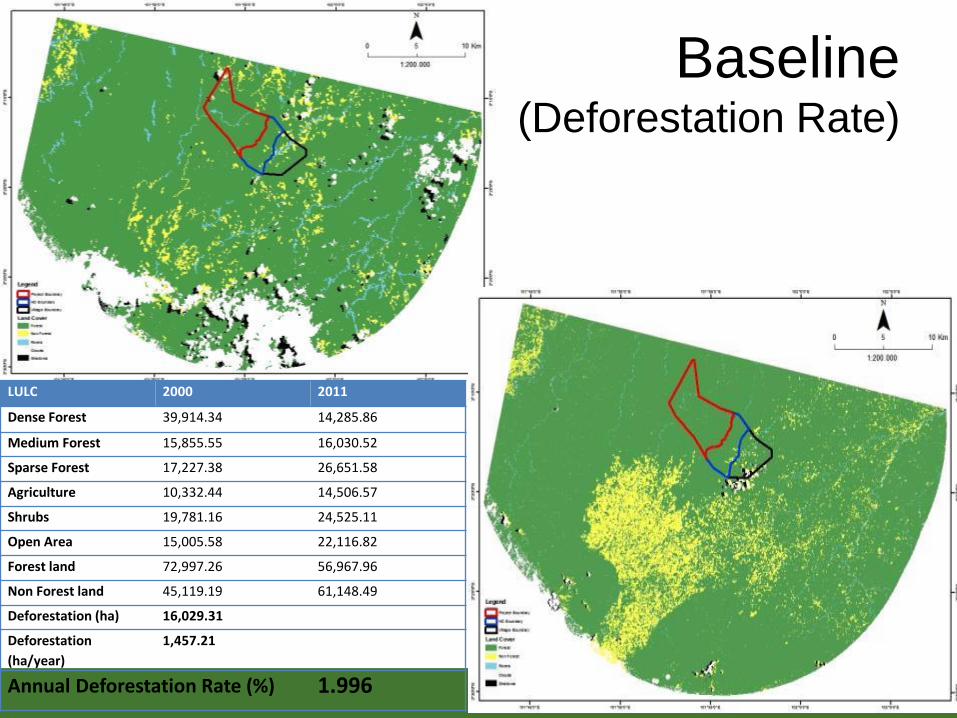
Baseline (Deforestation Rate)
LULC 2000 2011
Dense Forest 39,914.34 14,285.86
Medium Forest 15,855.55 16,030.52
Sparse Forest 17,227.38 26,651.58
Agriculture 10,332.44 14,506.57
Shrubs 19,781.16 24,525.11
Open Area 15,005.58 22,116.82
Forest land 72,997.26 56,967.96
Non Forest land 45,119.19 61,148.49
Deforestation (ha) 16,029.31
Deforestation
(ha/year)
1,457.21
Annual Deforestation Rate (%) 1.996
Innovative conservation since 1903
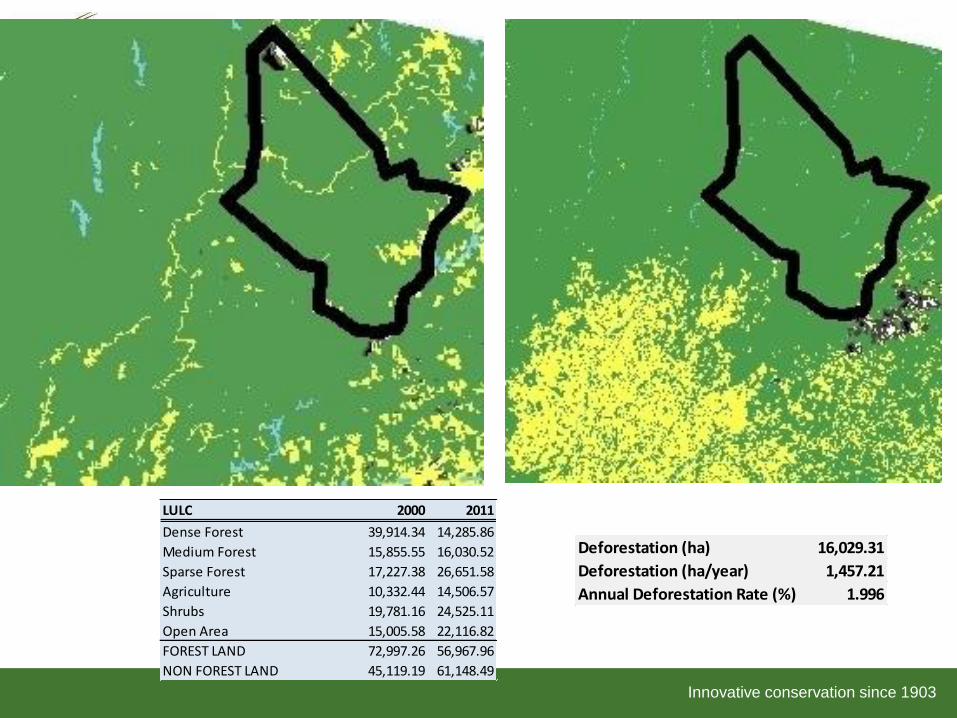
LULC 2000 2011
Dense Forest 39,914.34 14,285.86
Medium Forest 15,855.55 16,030.52
Sparse Forest 17,227.38 26,651.58
Agriculture 10,332.44 14,506.57
Shrubs 19,781.16 24,525.11
Open Area 15,005.58 22,116.82
FOREST LAND 72,997.26 56,967.96
NON FOREST LAND 45,119.19 61,148.49
Deforestation (ha) 16,029.31
Deforestation (ha/year) 1,457.21
Annual Deforestation Rate (%) 1.996
Innovative conservation since 1903
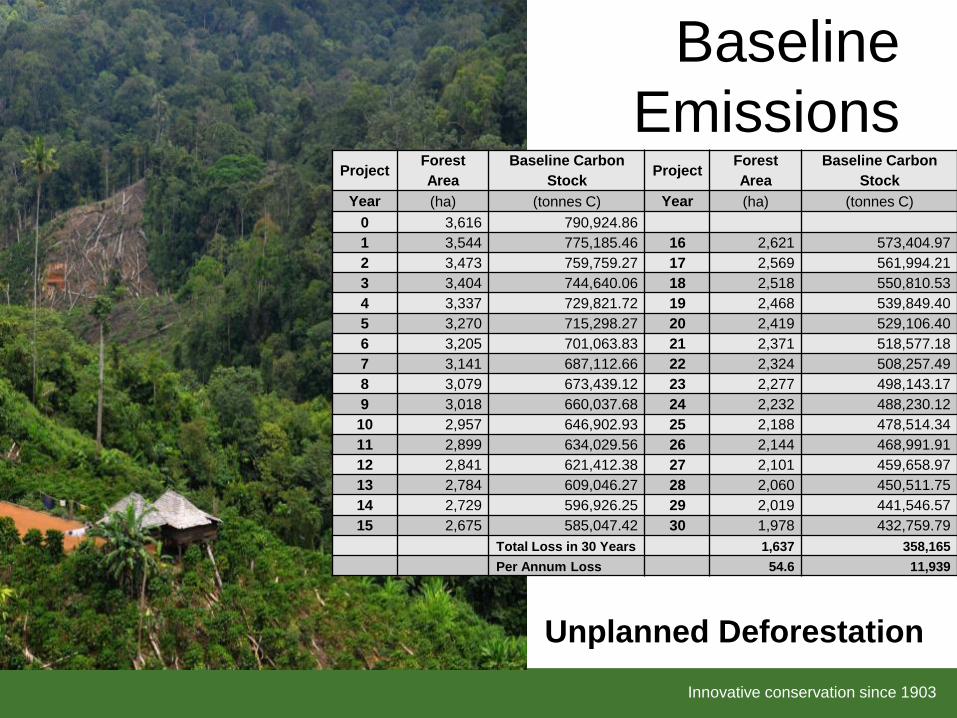
Baseline
Emissions Project
Forest
Area
Baseline Carbon
Stock Project
Forest
Area
Baseline Carbon
Stock
Year (ha) (tonnes C) Year (ha) (tonnes C)
0 3,616 790,924.86
1 3,544 775,185.46 16 2,621 573,404.97
2 3,473 759,759.27 17 2,569 561,994.21
3 3,404 744,640.06 18 2,518 550,810.53
4 3,337 729,821.72 19 2,468 539,849.40
5 3,270 715,298.27 20 2,419 529,106.40
6 3,205 701,063.83 21 2,371 518,577.18
7 3,141 687,112.66 22 2,324 508,257.49
8 3,079 673,439.12 23 2,277 498,143.17
9 3,018 660,037.68 24 2,232 488,230.12
10 2,957 646,902.93 25 2,188 478,514.34
11 2,899 634,029.56 26 2,144 468,991.91
12 2,841 621,412.38 27 2,101 459,658.97
13 2,784 609,046.27 28 2,060 450,511.75
14 2,729 596,926.25 29 2,019 441,546.57
15 2,675 585,047.42 30 1,978 432,759.79
Total Loss in 30 Years 1,637 358,165
Per Annum Loss 54.6 11,939
Unplanned Deforestation
Innovative conservation since 1903
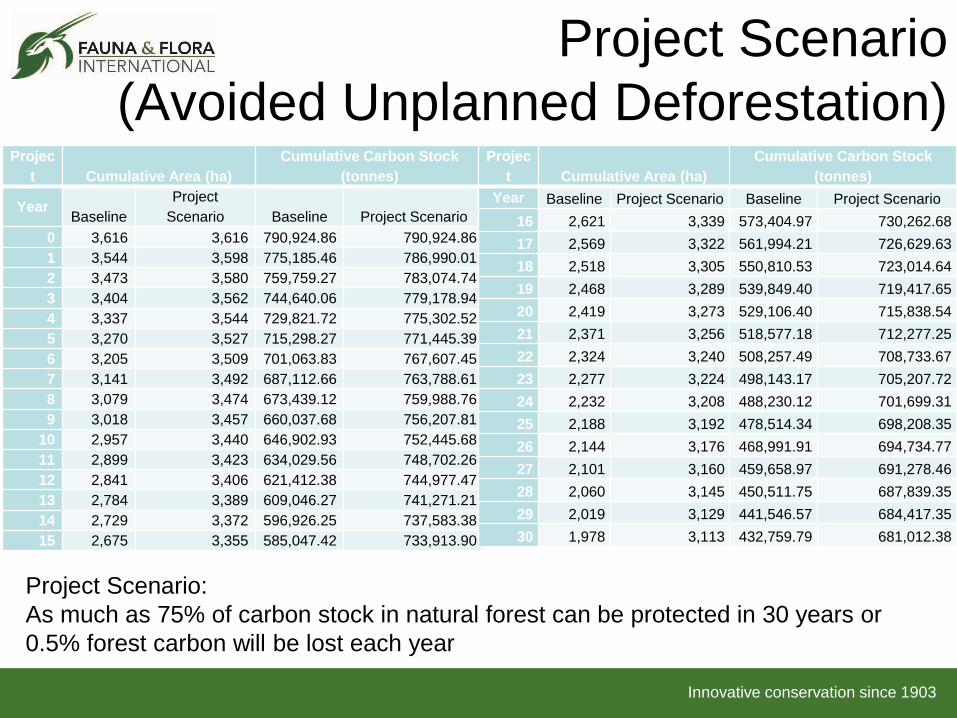
Projec
t Cumulative Area (ha)
Cumulative Carbon Stock
(tonnes)
Year Baseline
Project
Scenario Baseline Project Scenario
0 3,616 3,616 790,924.86 790,924.86
1 3,544 3,598 775,185.46 786,990.01
2 3,473 3,580 759,759.27 783,074.74
3 3,404 3,562 744,640.06 779,178.94
4 3,337 3,544 729,821.72 775,302.52
5 3,270 3,527 715,298.27 771,445.39
6 3,205 3,509 701,063.83 767,607.45
7 3,141 3,492 687,112.66 763,788.61
8 3,079 3,474 673,439.12 759,988.76
9 3,018 3,457 660,037.68 756,207.81
10 2,957 3,440 646,902.93 752,445.68
11 2,899 3,423 634,029.56 748,702.26
12 2,841 3,406 621,412.38 744,977.47
13 2,784 3,389 609,046.27 741,271.21
14 2,729 3,372 596,926.25 737,583.38
15 2,675 3,355 585,047.42 733,913.90
Projec
t Cumulative Area (ha)
Cumulative Carbon Stock
(tonnes)
Year Baseline Project Scenario Baseline Project Scenario
16 2,621 3,339 573,404.97 730,262.68
17 2,569 3,322 561,994.21 726,629.63
18 2,518 3,305 550,810.53 723,014.64
19 2,468 3,289 539,849.40 719,417.65
20 2,419 3,273 529,106.40 715,838.54
21 2,371 3,256 518,577.18 712,277.25
22 2,324 3,240 508,257.49 708,733.67
23 2,277 3,224 498,143.17 705,207.72
24 2,232 3,208 488,230.12 701,699.31
25 2,188 3,192 478,514.34 698,208.35
26 2,144 3,176 468,991.91 694,734.77
27 2,101 3,160 459,658.97 691,278.46
28 2,060 3,145 450,511.75 687,839.35
29 2,019 3,129 441,546.57 684,417.35
30 1,978 3,113 432,759.79 681,012.38
Project Scenario:
As much as 75% of carbon stock in natural forest can be protected in 30 years or
0.5% forest carbon will be lost each year
Project Scenario
(Avoided Unplanned Deforestation)
Innovative conservation since 1903
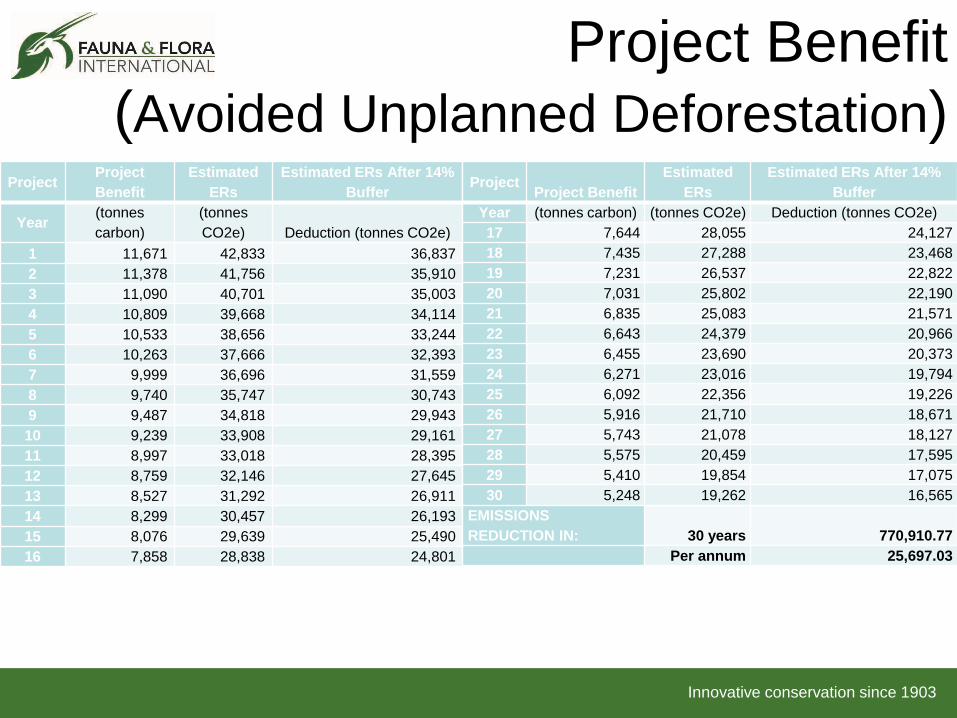
Project Benefit
(Avoided Unplanned Deforestation) Project
Project
Benefit
Estimated
ERs
Estimated ERs After 14%
Buffer
Year (tonnes
carbon)
(tonnes
CO2e) Deduction (tonnes CO2e)
1 11,671 42,833 36,837
2 11,378 41,756 35,910
3 11,090 40,701 35,003
4 10,809 39,668 34,114
5 10,533 38,656 33,244
6 10,263 37,666 32,393
7 9,999 36,696 31,559
8 9,740 35,747 30,743
9 9,487 34,818 29,943
10 9,239 33,908 29,161
11 8,997 33,018 28,395
12 8,759 32,146 27,645
13 8,527 31,292 26,911
14 8,299 30,457 26,193
15 8,076 29,639 25,490
16 7,858 28,838 24,801
Project Project Benefit
Estimated
ERs
Estimated ERs After 14%
Buffer
Year (tonnes carbon) (tonnes CO2e) Deduction (tonnes CO2e)
17 7,644 28,055 24,127
18 7,435 27,288 23,468
19 7,231 26,537 22,822
20 7,031 25,802 22,190
21 6,835 25,083 21,571
22 6,643 24,379 20,966
23 6,455 23,690 20,373
24 6,271 23,016 19,794
25 6,092 22,356 19,226
26 5,916 21,710 18,671
27 5,743 21,078 18,127
28 5,575 20,459 17,595
29 5,410 19,854 17,075
30 5,248 19,262 16,565
EMISSIONS
REDUCTION IN: 30 years 770,910.77
Per annum 25,697.03
Innovative conservation since 1903
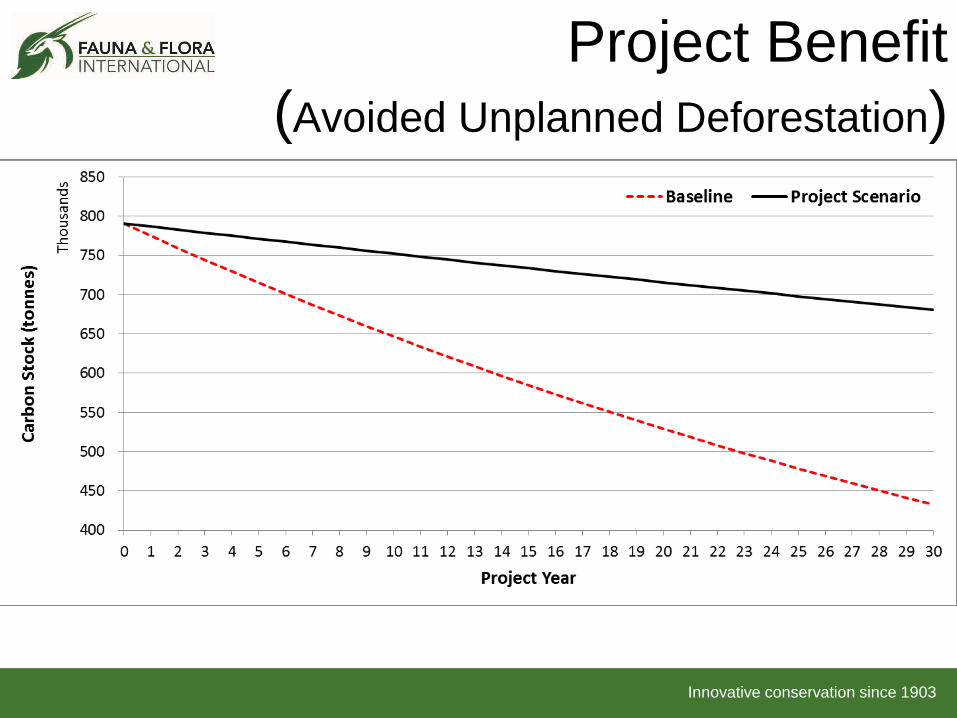
Project Benefit
(Avoided Unplanned Deforestation)
Innovative conservation since 1903
Ecosystem Rehabilitation
Hutan Kemasyarakatan Aik Bual
Central Lombok District, Lombok Island

Innovative conservation since 1903
Carbon Stock
Plot
Name
Dominant
Species
Tree
Density
(trees/ha)
Total
Carbon
Stock
(t C/ha)
Total
SD
ABI.I Erythrina sp 120 89.46 3.85
ABI.II Swietenia
mahagoni 132 214.45 3.15
AB.II Coffea
robusta 120 84.71 2.59
AB.III Swietenia
mahagoni 84 97.17 3.24
AB.IV Erythrina sp 92 45.94 1.44
Purposive
BareLand
Swietenia
mahagoni 39 79.73 6.42
Purposive
Mahoni
Swietenia
mahagoni 181 253.26 2.3
Innovative conservation since 1903
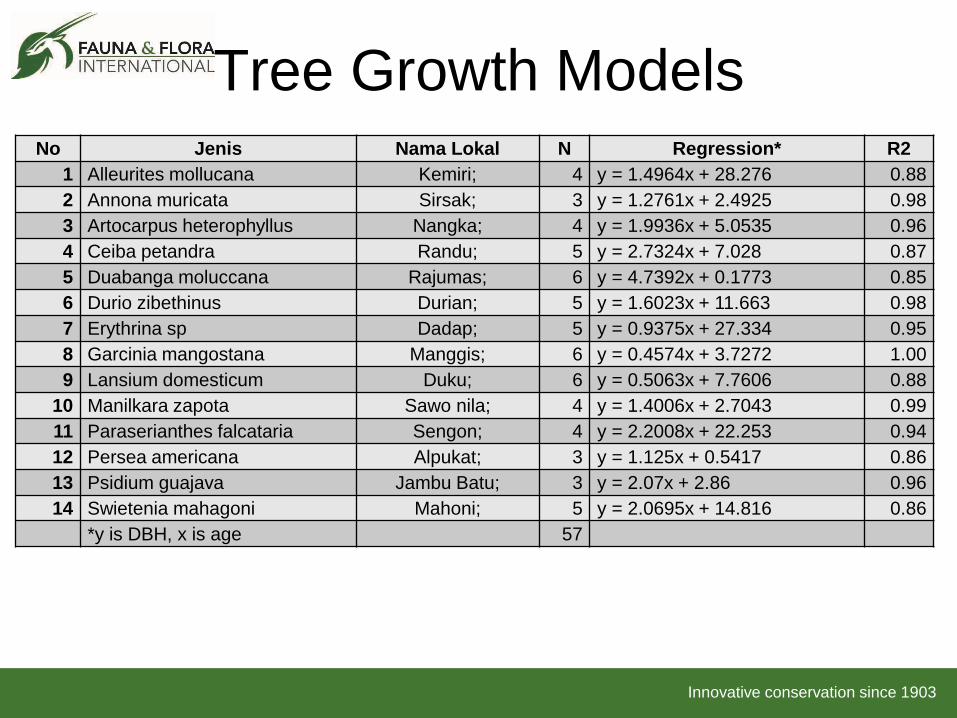
Tree Growth Models No Jenis Nama Lokal N Regression* R2
1 Alleurites mollucana Kemiri; 4 y = 1.4964x + 28.276 0.88
2 Annona muricata Sirsak; 3 y = 1.2761x + 2.4925 0.98
3 Artocarpus heterophyllus Nangka; 4 y = 1.9936x + 5.0535 0.96
4 Ceiba petandra Randu; 5 y = 2.7324x + 7.028 0.87
5 Duabanga moluccana Rajumas; 6 y = 4.7392x + 0.1773 0.85
6 Durio zibethinus Durian; 5 y = 1.6023x + 11.663 0.98
7 Erythrina sp Dadap; 5 y = 0.9375x + 27.334 0.95
8 Garcinia mangostana Manggis; 6 y = 0.4574x + 3.7272 1.00
9 Lansium domesticum Duku; 6 y = 0.5063x + 7.7606 0.88
10 Manilkara zapota Sawo nila; 4 y = 1.4006x + 2.7043 0.99
11 Paraserianthes falcataria Sengon; 4 y = 2.2008x + 22.253 0.94
12 Persea americana Alpukat; 3 y = 1.125x + 0.5417 0.86
13 Psidium guajava Jambu Batu; 3 y = 2.07x + 2.86 0.96
14 Swietenia mahagoni Mahoni; 5 y = 2.0695x + 14.816 0.86
*y is DBH, x is age 57
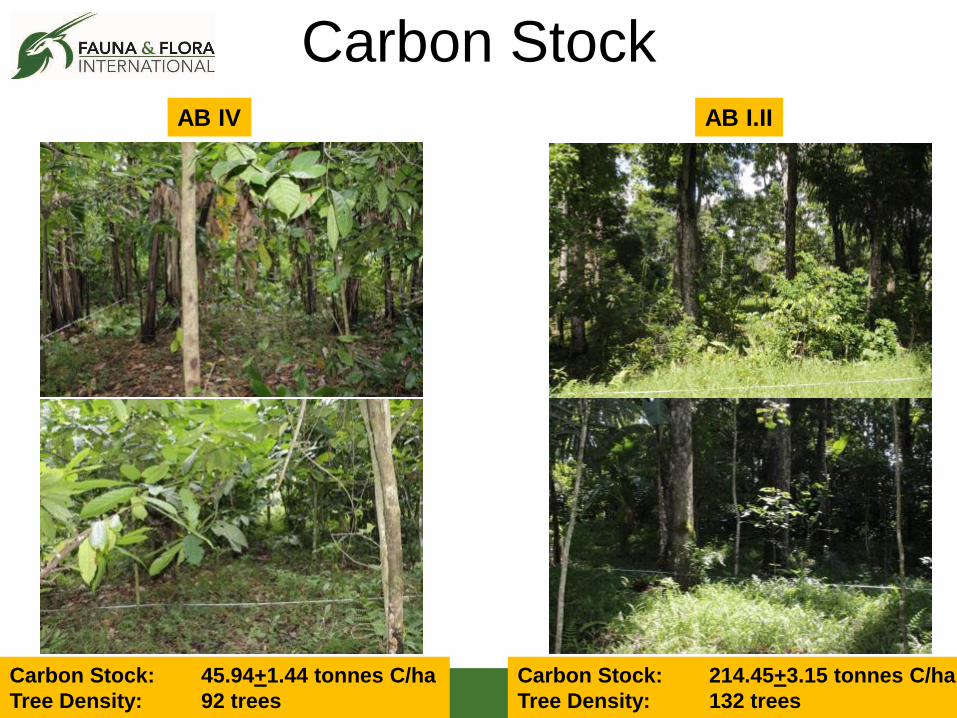
Innovative conservation since 1903 Carbon Stock: 45.94+1.44 tonnes C/ha
Tree Density: 92 trees
AB IV
Carbon Stock: 214.45+3.15 tonnes C/ha
Tree Density: 132 trees
AB I.II
Carbon Stock
Innovative conservation since 1903
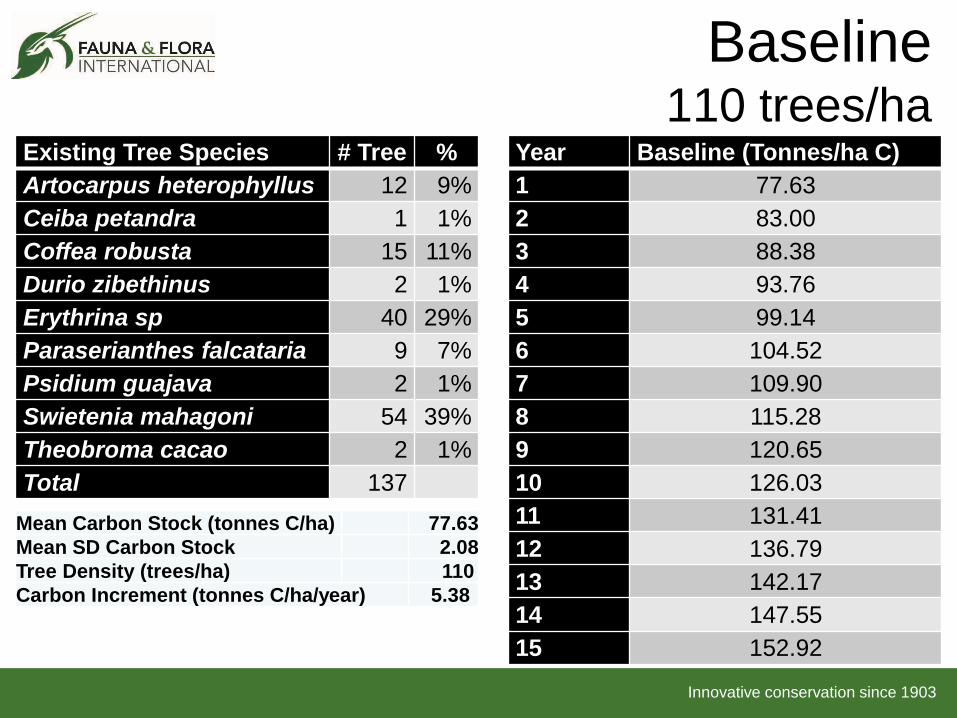
Baseline 110 trees/ha
Existing Tree Species # Tree %
Artocarpus heterophyllus 12 9%
Ceiba petandra 1 1%
Coffea robusta 15 11%
Durio zibethinus 2 1%
Erythrina sp 40 29%
Paraserianthes falcataria 9 7%
Psidium guajava 2 1%
Swietenia mahagoni 54 39%
Theobroma cacao 2 1%
Total 137
Year Baseline (Tonnes/ha C)
1 77.63
2 83.00
3 88.38
4 93.76
5 99.14
6 104.52
7 109.90
8 115.28
9 120.65
10 126.03
11 131.41
12 136.79
13 142.17
14 147.55
15 152.92
Mean Carbon Stock (tonnes C/ha) 77.63 Mean SD Carbon Stock 2.08 Tree Density (trees/ha) 110 Carbon Increment (tonnes C/ha/year) 5.38
Innovative conservation since 1903
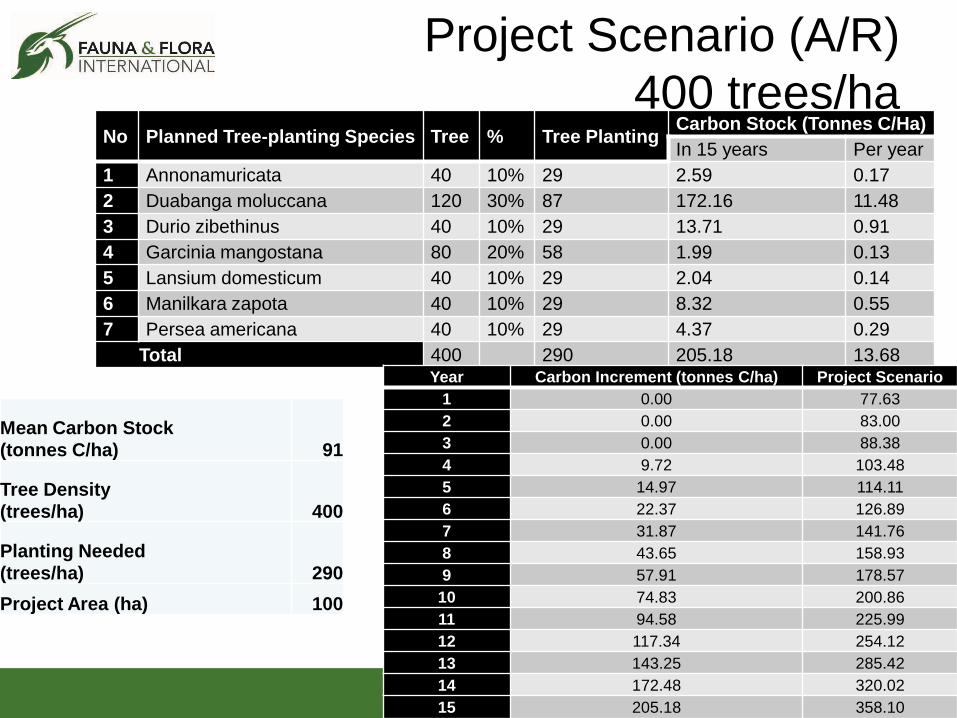
Project Scenario (A/R)
400 trees/ha No Planned Tree-planting Species Tree % Tree Planting
Carbon Stock (Tonnes C/Ha)
In 15 years Per year
1 Annonamuricata 40 10% 29 2.59 0.17
2 Duabanga moluccana 120 30% 87 172.16 11.48
3 Durio zibethinus 40 10% 29 13.71 0.91
4 Garcinia mangostana 80 20% 58 1.99 0.13
5 Lansium domesticum 40 10% 29 2.04 0.14
6 Manilkara zapota 40 10% 29 8.32 0.55
7 Persea americana 40 10% 29 4.37 0.29
Total 400 290 205.18 13.68 Year Carbon Increment (tonnes C/ha) Project Scenario
1 0.00 77.63
2 0.00 83.00
3 0.00 88.38
4 9.72 103.48
5 14.97 114.11
6 22.37 126.89
7 31.87 141.76
8 43.65 158.93
9 57.91 178.57
10 74.83 200.86
11 94.58 225.99
12 117.34 254.12
13 143.25 285.42
14 172.48 320.02
15 205.18 358.10
Mean Carbon Stock
(tonnes C/ha)
91
Tree Density
(trees/ha)
400
Planting Needed
(trees/ha)
290
Project Area (ha) 100
Innovative conservation since 1903
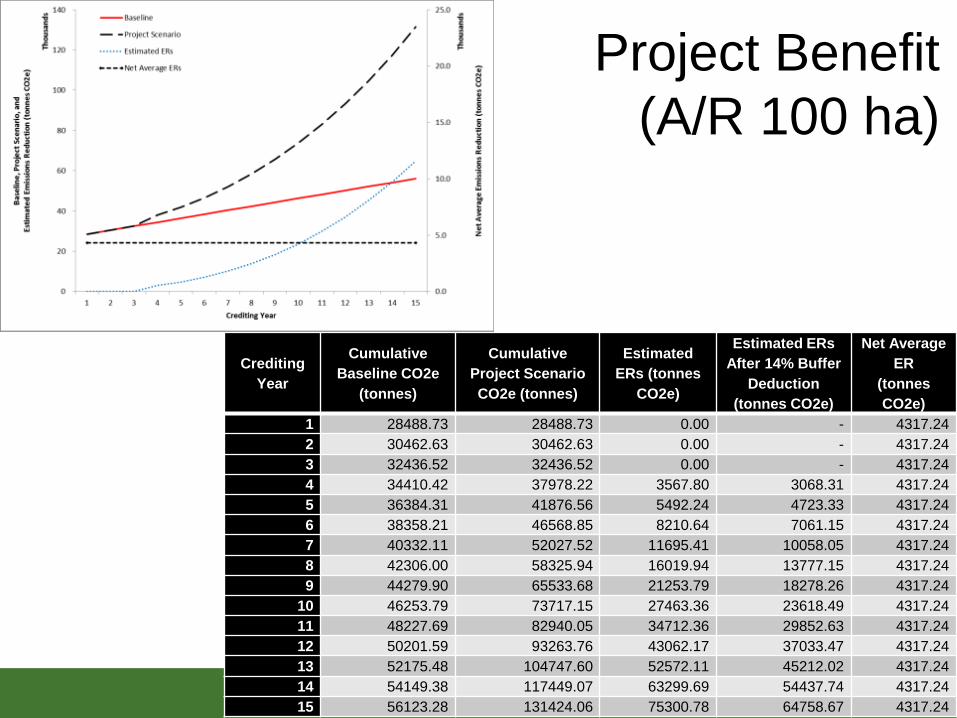
Project Benefit
(A/R 100 ha)
Crediting
Year
Cumulative
Baseline CO2e
(tonnes)
Cumulative
Project Scenario
CO2e (tonnes)
Estimated
ERs (tonnes
CO2e)
Estimated ERs
After 14% Buffer
Deduction
(tonnes CO2e)
Net Average
ER
(tonnes
CO2e)
1 28488.73 28488.73 0.00 - 4317.24
2 30462.63 30462.63 0.00 - 4317.24
3 32436.52 32436.52 0.00 - 4317.24
4 34410.42 37978.22 3567.80 3068.31 4317.24
5 36384.31 41876.56 5492.24 4723.33 4317.24
6 38358.21 46568.85 8210.64 7061.15 4317.24
7 40332.11 52027.52 11695.41 10058.05 4317.24
8 42306.00 58325.94 16019.94 13777.15 4317.24
9 44279.90 65533.68 21253.79 18278.26 4317.24
10 46253.79 73717.15 27463.36 23618.49 4317.24
11 48227.69 82940.05 34712.36 29852.63 4317.24
12 50201.59 93263.76 43062.17 37033.47 4317.24
13 52175.48 104747.60 52572.11 45212.02 4317.24
14 54149.38 117449.07 63299.69 54437.74 4317.24
15 56123.28 131424.06 75300.78 64758.67 4317.24
Innovative conservation since 1903
Next steps: Result-based payment trials for Laman Satong & Durian
Rambun (2014)
Tree nursery and planting - 400 trees/ha (2014) in Aik Bual
Lombok
PDD submission & 3rd party audit
ERPA/PES agreement, result based-incentive (from 2015)