
Accepted Manuscript Silvia D’Alessio, Silvio Danese · 2018-02-15 · T D ACCEPTED MANUSCRIPT 1...
51
Accepted Manuscript MFSD2A Promotes Endothelial Generation of Inflammation-resolving Lipid Mediators and Reduces Colitis in Mice Federica Ungaro, Carlotta Tacconi, Luca Massimino, Paola Antonia Corsetto, Carmen Correale, Philippe Fonteyne, Andrea Piontini, Valeria Garzarelli, Francesca Calcaterra, Silvia Della Bella, Antonino Spinelli, Michele Carvello, Angela Maria Rizzo, Stefania Vetrano, Luciana Petti, Gionata Fiorino, Federica Furfaro, Domenico Mavilio, Krishna Rao Maddipati, Alberto Malesci, Laurent Peyrin-Biroulet, Silvia D’Alessio, Silvio Danese PII: S0016-5085(17)35988-7 DOI: 10.1053/j.gastro.2017.07.048 Reference: YGAST 61348 To appear in: Gastroenterology Accepted Date: 30 July 2017 Please cite this article as: Ungaro F, Tacconi C, Massimino L, Corsetto PA, Correale C, Fonteyne P, Piontini A, Garzarelli V, Calcaterra F, Della Bella S, Spinelli A, Carvello M, Rizzo AM, Vetrano S, Petti L, Fiorino G, Furfaro F, Mavilio D, Maddipati KR, Malesci A, Peyrin-Biroulet L, D’Alessio S, Danese S, MFSD2A Promotes Endothelial Generation of Inflammation-resolving Lipid Mediators and Reduces Colitis in Mice, Gastroenterology (2017), doi: 10.1053/j.gastro.2017.07.048. This is a PDF file of an unedited manuscript that has been accepted for publication. As a service to our customers we are providing this early version of the manuscript. The manuscript will undergo copyediting, typesetting, and review of the resulting proof before it is published in its final form. Please note that during the production process errors may be discovered which could affect the content, and all legal disclaimers that apply to the journal pertain.
Transcript of Accepted Manuscript Silvia D’Alessio, Silvio Danese · 2018-02-15 · T D ACCEPTED MANUSCRIPT 1...
Accepted Manuscript
MFSD2A Promotes Endothelial Generation of Inflammation-resolving LipidMediators and Reduces Colitis in Mice
Federica Ungaro, Carlotta Tacconi, Luca Massimino, Paola Antonia Corsetto,Carmen Correale, Philippe Fonteyne, Andrea Piontini, Valeria Garzarelli, FrancescaCalcaterra, Silvia Della Bella, Antonino Spinelli, Michele Carvello, Angela MariaRizzo, Stefania Vetrano, Luciana Petti, Gionata Fiorino, Federica Furfaro,Domenico Mavilio, Krishna Rao Maddipati, Alberto Malesci, Laurent Peyrin-Biroulet,Silvia D’Alessio, Silvio Danese
PII: S0016-5085(17)35988-7DOI: 10.1053/j.gastro.2017.07.048Reference: YGAST 61348
To appear in: GastroenterologyAccepted Date: 30 July 2017
Please cite this article as: Ungaro F, Tacconi C, Massimino L, Corsetto PA, Correale C, Fonteyne P,Piontini A, Garzarelli V, Calcaterra F, Della Bella S, Spinelli A, Carvello M, Rizzo AM, Vetrano S, PettiL, Fiorino G, Furfaro F, Mavilio D, Maddipati KR, Malesci A, Peyrin-Biroulet L, D’Alessio S, Danese S,MFSD2A Promotes Endothelial Generation of Inflammation-resolving Lipid Mediators and ReducesColitis in Mice, Gastroenterology (2017), doi: 10.1053/j.gastro.2017.07.048.
This is a PDF file of an unedited manuscript that has been accepted for publication. As a service toour customers we are providing this early version of the manuscript. The manuscript will undergocopyediting, typesetting, and review of the resulting proof before it is published in its final form. Pleasenote that during the production process errors may be discovered which could affect the content, and alllegal disclaimers that apply to the journal pertain.

MANUSCRIP
T
ACCEPTED
ACCEPTED MANUSCRIPT
1
MFSD2A Promotes Endothelial Generation of Inflammation-resolving Lipid Mediators
and Reduces Colitis in Mice
Federica Ungaro1,2, Carlotta Tacconi3, Luca Massimino4, Paola Antonia Corsetto5, Carmen
Correale1, Philippe Fonteyne1, Andrea Piontini1,2, Valeria Garzarelli1, Francesca Calcaterra6,7,
Silvia Della Bella6,7, Antonino Spinelli2,8, Michele Carvello8, Angela Maria Rizzo5, Stefania
Vetrano1,2, Luciana Petti1,7, Gionata Fiorino1, Federica Furfaro1, Domenico Mavilio6,7, Krishna
Rao Maddipati9, Alberto Malesci7,10, Laurent Peyrin-Biroulet11, Silvia D’Alessio1,7,* and Silvio
Danese1,2,*
1 IBD Center, Laboratory of Gastrointestinal Immunopathology, Humanitas Clinical and
Research Center, Rozzano, Milan, Italy 2 Department of Biomedical Sciences, Humanitas University, Rozzano, Milan, Italy 3 Institute of Pharmaceutical Sciences, Pharmacogenomics, Swiss Federal Institute of
Technology (ETH) Zurich, Switzerland 4 School of medicine and surgery, University of Milan-Bicocca, Milan, Italy 5 Department of Pharmacology and Biomolecular Science, University of Milan 6 Laboratory of Clinical and Experimental Immunology, Humanitas Clinical and Research
Center, Rozzano, Milan, Italy 7 Department of Medical Biotechnologies and Translational Medicine, University of Milan, Italy 8 Colon and Rectal Surgery Unit, Humanitas Clinical and Research Center, Rozzano, Milan,
Italy 9 Department of Pathology, Lipdomics Core Facility, Wayne State University, Detroit, USA 10 Department of Gastroenterology, Humanitas Clinical and Research Center, Rozzano,
Milan, Italy. 11 Institut National de la Santé et de la Recherche Médicale U954 and Department of
Gastroenterology, Nancy University Hospital, Lorraine University, France.
* These authors share co-senior authorship.
Grant Support
MANUSCRIP
T
ACCEPTED
ACCEPTED MANUSCRIPT
2
This study was supported by grants from the Broad Medical Research Program (510262) to
S.D.; the Italian Ministry of Health (RBFR12VP3Q_002) to S.D. ; the Innovative Medicines
Initiative (IMI) Joint Undertaking BTCure (115142) to S.D.; The work was conducted in the
context, and with the support, of the Fondazione Humanitas per la Ricerca (Rozzano, Italy).
Abbreviations
Inflammatory Bowel Disease, IBD; Crohn’s Disease, CD; Ulcerative Colitis, UC; Major
Facilitator Superfamily Domain Containing 2A, MFSD2A; docosahexaenoic acid, DHA;
circulating endothelial colony-forming cells, ECFCs; human intestinal microvascular
endothelial cells, HIMECs; overexpressing, -OE; polyunsaturated fatty acids, PUFAs;
cytochrome P-450, CYP450; Arachidonic Acid, AA; Dihomo-γ-linolenic Acid, DGLA; Linoleic
Acid, LA; Eicosapentaenoic Acid, EPA; Linolenic Acid, LNA; Principal components analysis;
PCA; Liquid Chromatography tandem mass spectrometry, LC-MS/MS; cyclooxygenases,
COX; lipoxygenases, LOX; epoxydocosapentaenoic acids, EpDPEs; Plasmalemmal vesicle-1,
PV1.
Corresponding authors
Silvio Danese, Humanitas Clinical and Research Center, Laboratory of Gastrointestinal
Immunopathology, Via Manzoni 113, 20089 Rozzano (MI), Italy; TEL. +390282244771; FAX:
+390282245101. Email: [email protected].
Silvia D’Alessio, Humanitas Clinical and Research Center, Laboratory of Gastrointestinal
Immunopathology, Via Manzoni 113, 20089 Rozzano (MI), Italy; TEL. +390282245146; FAX:
+390282245101. Email: [email protected]
Disclosure
The authors disclose no conflicts
Author Contributions
Conceptualization, F.U. and S.DA.; Methodology, F.U. and S.DA.; Formal Analysis, F.U. and
L.M.; Investigation, F.U., S.DA., C.T., P.A.C., C.C., P.F., A.P., V.G., A.M.R., and K.R.M.

MANUSCRIP
T
ACCEPTED
ACCEPTED MANUSCRIPT
3
Resources, F.C., S.DB., A.S., M.C., G.F., F.F. and D.M.; Writing – Original Draft, S.DA. and
F.U.; Writing – Review & Editing, C.T., C.C., P.A.C., A.M.R., S.V., L.P., K.R.M., A.M., L.PB.
and S.D.; Visualization, F.U. and S.DA.; Supervision, S.DA.; Project Administration, S.DA.;
Funding Acquisition, S.D.
MANUSCRIP
T
ACCEPTED
ACCEPTED MANUSCRIPT
4
Abstract:
Background & Aims: Alterations in signaling pathways that regulate resolution of
inflammation (resolving pathways) contribute to pathogenesis of ulcerative colitis (UC). The
resolution process is regulated by lipid mediators, such as those derived from the ω-3
docosahexaenoic acid (DHA), whose esterified form is transported by the major facilitator
superfamily domain containing 2A (MFSD2A) through the endothelium of brain, retina, and
placenta. We investigated if and how MFSD2A regulates lipid metabolism of gut endothelial
cells to promote resolution of intestinal inflammation.
Methods: We performed lipidomic and functional analyses of MFSD2A in mucosal biopsies
and primary human intestinal microvascular endothelial cells (HIMECs) isolated from surgical
specimens from patients with active, resolving UC and healthy individuals without UC
(controls). MFSD2A was knocked down in HIMECss with small hairpin RNAs or
overexpressed from a lentiviral vector. Human circulating endothelial progenitor cells that
overexpress MFSD2A were transferred to CD1 nude mice with dextran sodium sulfate-
induced colitis, with or without oral administration of DHA.
Results: Colonic biopsies from patients with UC had reduced levels of inflammation-resolving
DHA-derived epoxy metabolites compared to healthy colon tissues or tissues with resolution
of inflammation. Production of these metabolites by HIMECs required MFSD2A, which is
required for DHA retention and metabolism in the gut vasculature. In mice with colitis,
transplanted endothelial progenitor cells that overexpressed MFSD2A not only localized to the
inflamed mucosa but also restored the ability of the endothelium to resolve intestinal
inflammation, compared to mice with colitis that did not receive MFSD2A-overexpressing
endothelial progenitors
Conclusions: Levels of DHA-derived epoxides are lower in colon tissues from patients with
UC than healthy and resolving mucosa. Production of these metabolites by gut endothelium
requires MFSD2A; endothelial progenitor cells that overexpress MFSD2A reduce colitis in
mice. This pathway might be induced to resolve intestinal inflammation in patients with colitis.
MANUSCRIP
T
ACCEPTED
ACCEPTED MANUSCRIPT
5
Key words
inflammatory bowel disease, IBD, gut vasculature, angiogenesis
Introduction
Ulcerative colitis (UC) is a long-term idiopathic inflammatory disorder affecting the colon and
rectum, whose prevalence and incidence is rapidly increasing worldwide, and whose medical
treatments have only been mildly successful1. For many years, dysregulations in inflammatory
pathways have been considered as the basis of UC pathogenesis; nevertheless, the simple
targeting of infiltrating immune cells and their products to control inflammation does not
always lead to remission. New evidences indicate that a failure in resolving pathways might
also contribute to the pathogenesis of this disease2,3. Indeed, only recently the resolution of
inflammation has been conclusively recognized as an active process orchestrated by
resolving lipid mediators, which dampen inflammation-sustaining events, such as
angiogenesis, release of inflammatory cytokines, clearance of apoptotic cells and
microorganisms4,5. Among these resolving molecules, those derived from essential ω-3-
polyunsaturated fatty acids (PUFAs), have been shown to exert beneficial effects on a wide
range of human inflammatory disorders, including UC6. In particular, epoxy metabolites of
docosahexaenoic acid (DHA), generated by cytochrome P-450 (CYP450) enzymes, promote
potent biological activities in the regulation of vascular, pulmonary, cardiac and intestinal
functions7,8.
The progression of chronic intestinal inflammation is not only orchestrated by immune cells,
but also non-immune cells, and particularly by endothelial cells. In fact, UC patients are
characterized by increased vascularization and excessive release of angiogenic factors9. The
ability of endothelial cells to secrete anti-inflammatory mediators, which help to coordinate
leukocyte trafficking and maintain barrier function, renders them crucial players in the
resolution of inflammation10. Seminal studies have pointed out the pro-resolving beneficial
effects of ω-3 DHA on endothelial cells under inflammatory conditions8,11. Although the
endothelium plays a major role in resolution of inflammation, the exact mechanisms behind
this process are still unknown, particularly in the gastrointestinal tract. The endothelial
lysophosphatidylcholine transporter, namely the major facilitator superfamily domain
MANUSCRIP
T
ACCEPTED
ACCEPTED MANUSCRIPT
6
containing 2A (MFSD2A), has recently been shown to be essential for DHA uptake in the
blood brain barrier, eye and placenta12–14. Here we elucidate a significant role for MFSD2A in
the maintenance of the balance between inflammatory and resolving epoxy metabolites of
DHA in intestinal microvasculature and how this could be used for the development of novel
therapeutic strategies to treat UC.
Material and methods
Detailed protocols are provided in the Supplementary Material and Methods.
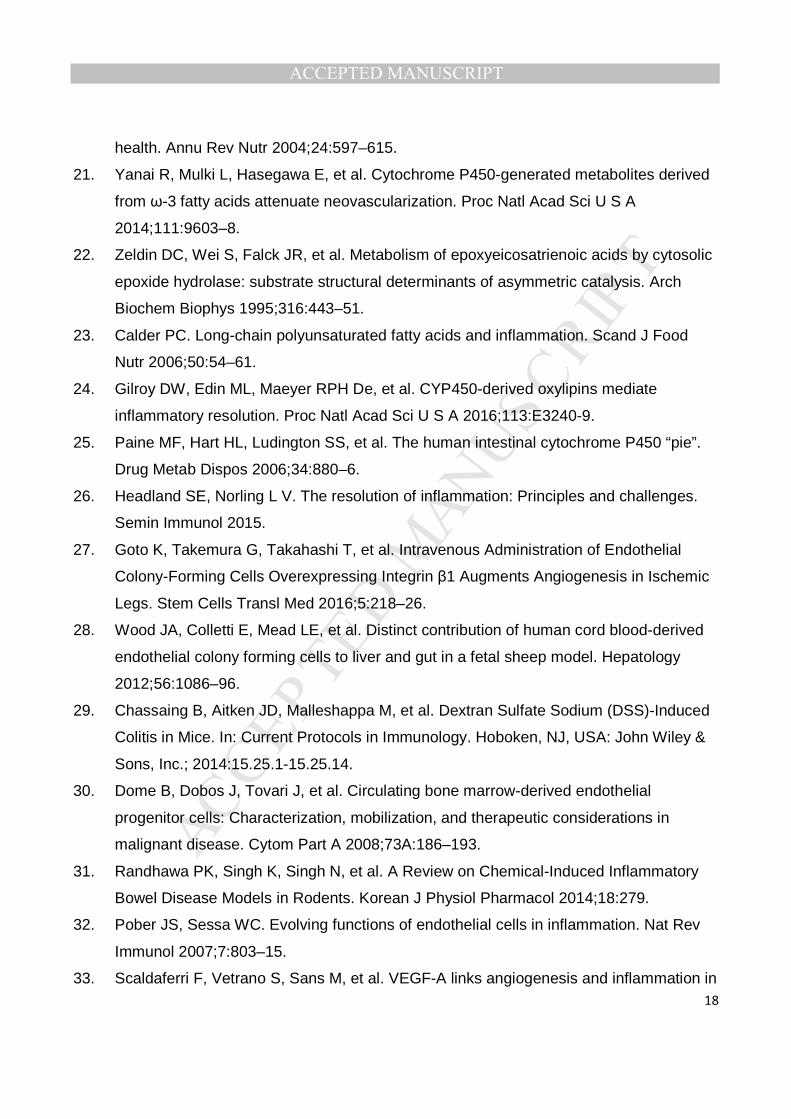
Results
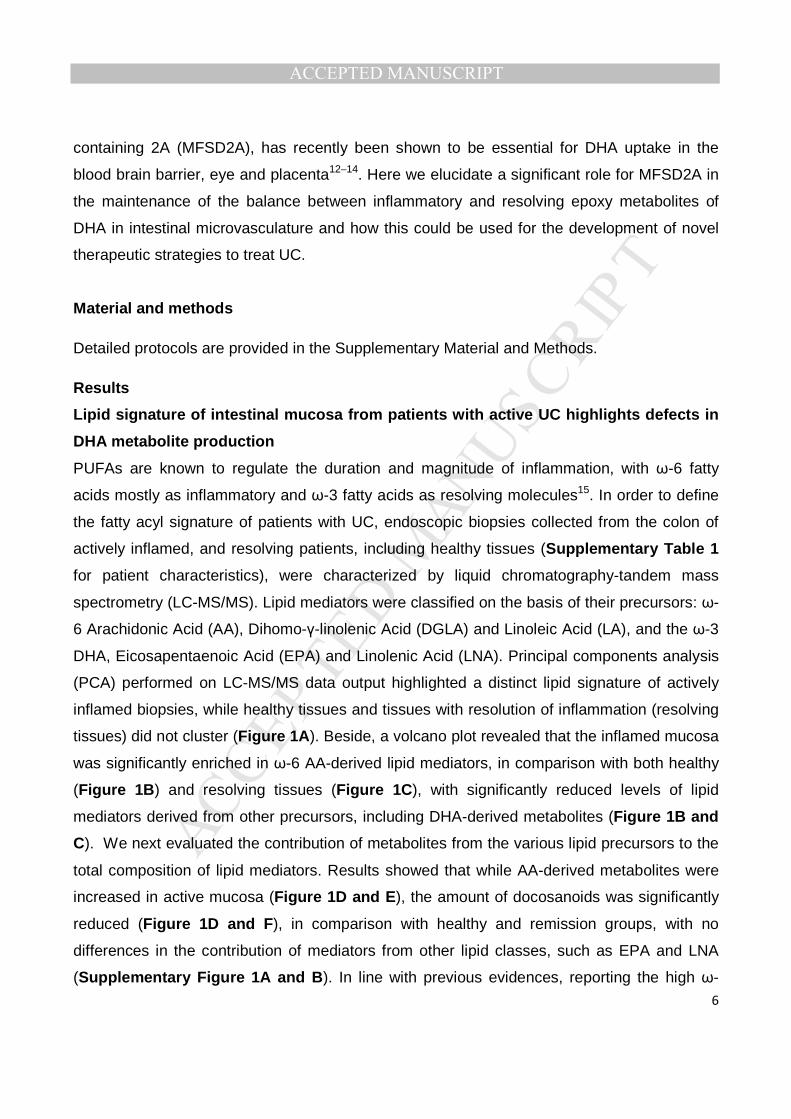
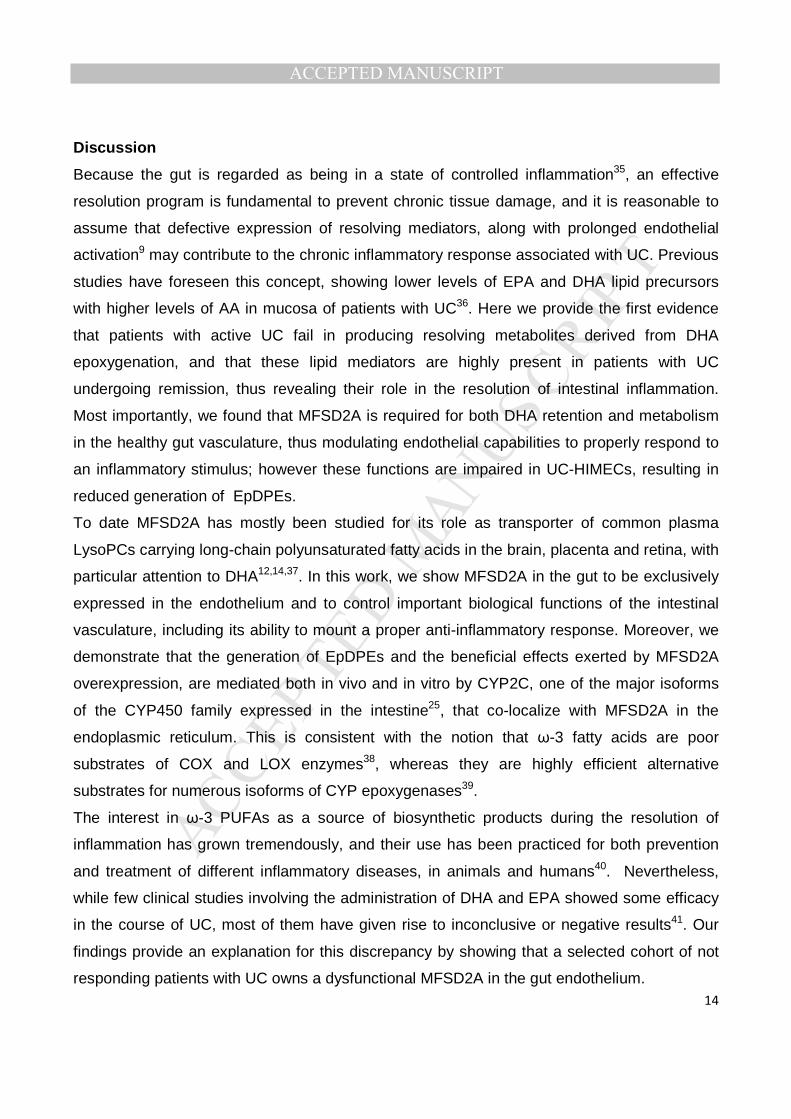
Lipid signature of intestinal mucosa from patients with active UC highlights defects in
DHA metabolite production
PUFAs are known to regulate the duration and magnitude of inflammation, with ω-6 fatty
acids mostly as inflammatory and ω-3 fatty acids as resolving molecules15. In order to define
the fatty acyl signature of patients with UC, endoscopic biopsies collected from the colon of
actively inflamed, and resolving patients, including healthy tissues (Supplementary Table 1
for patient characteristics), were characterized by liquid chromatography-tandem mass
spectrometry (LC-MS/MS). Lipid mediators were classified on the basis of their precursors: ω-
6 Arachidonic Acid (AA), Dihomo-γ-linolenic Acid (DGLA) and Linoleic Acid (LA), and the ω-3
DHA, Eicosapentaenoic Acid (EPA) and Linolenic Acid (LNA). Principal components analysis
(PCA) performed on LC-MS/MS data output highlighted a distinct lipid signature of actively
inflamed biopsies, while healthy tissues and tissues with resolution of inflammation (resolving
tissues) did not cluster (Figure 1A). Beside, a volcano plot revealed that the inflamed mucosa
was significantly enriched in ω-6 AA-derived lipid mediators, in comparison with both healthy
(Figure 1B) and resolving tissues (Figure 1C), with significantly reduced levels of lipid
mediators derived from other precursors, including DHA-derived metabolites (Figure 1B and
C). We next evaluated the contribution of metabolites from the various lipid precursors to the
total composition of lipid mediators. Results showed that while AA-derived metabolites were
increased in active mucosa (Figure 1D and E), the amount of docosanoids was significantly
reduced (Figure 1D and F), in comparison with healthy and remission groups, with no
differences in the contribution of mediators from other lipid classes, such as EPA and LNA
(Supplementary Figure 1A and B). In line with previous evidences, reporting the high ω-
MANUSCRIP
T
ACCEPTED
ACCEPTED MANUSCRIPT
7
6/ω-3 fatty acid ratio to be an important player in the pathogenesis of many chronic
diseases15,16, we found the ratio of ω-6/ω-3 PUFA-derived metabolites significantly increased
in active patients, versus healthy and resolving biopsies (Figure 1G), thus confirming their
inflammatory state. Overall, these results point out an impaired ω-3 pro-resolving metabolism
in the inflamed mucosa, mainly due to a reduction in docosanoids.
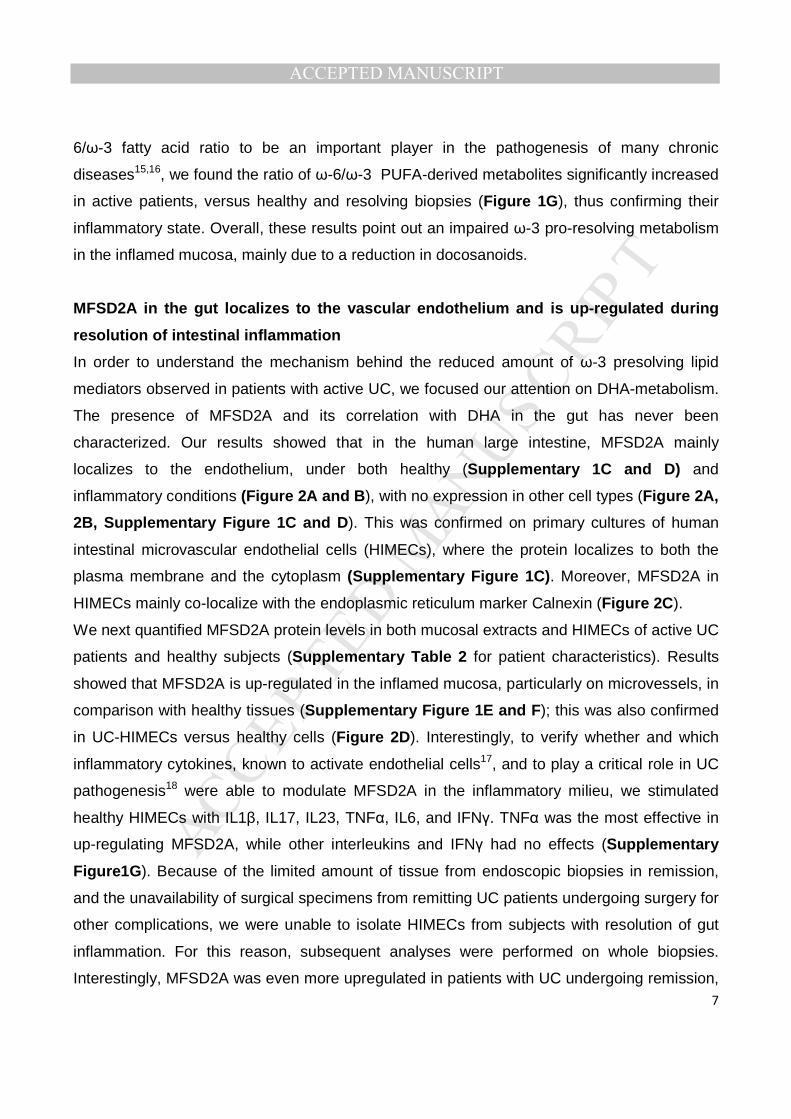
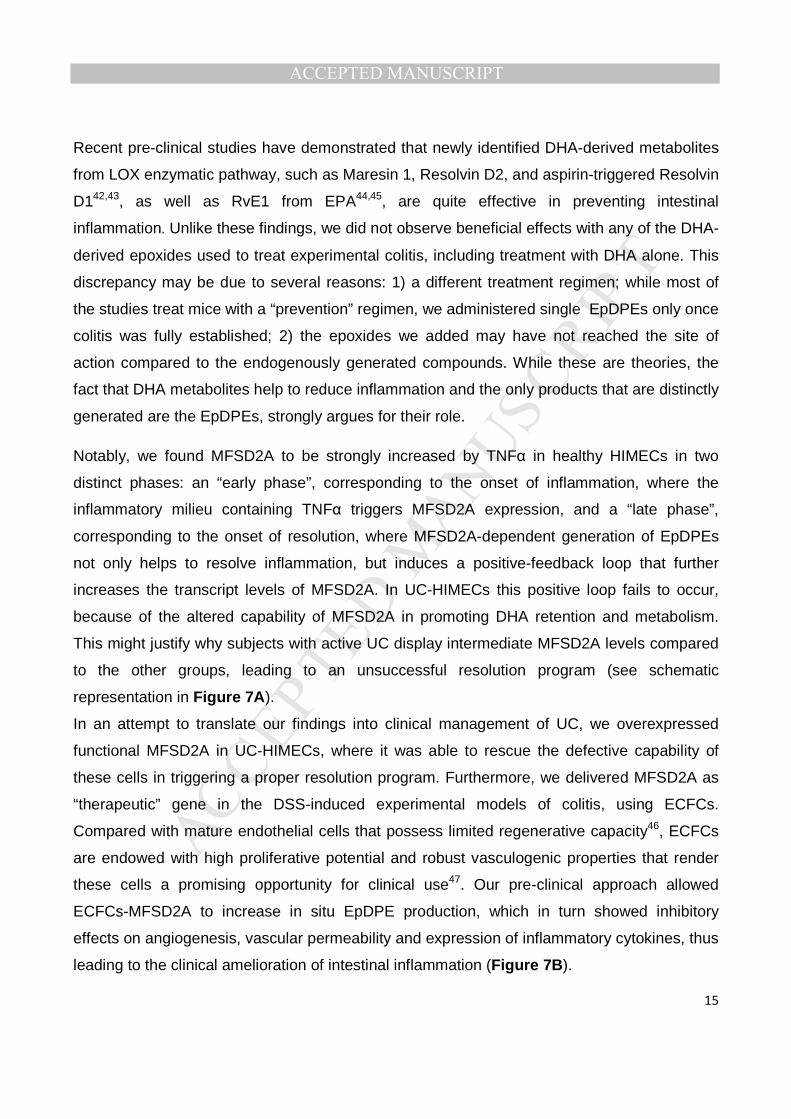
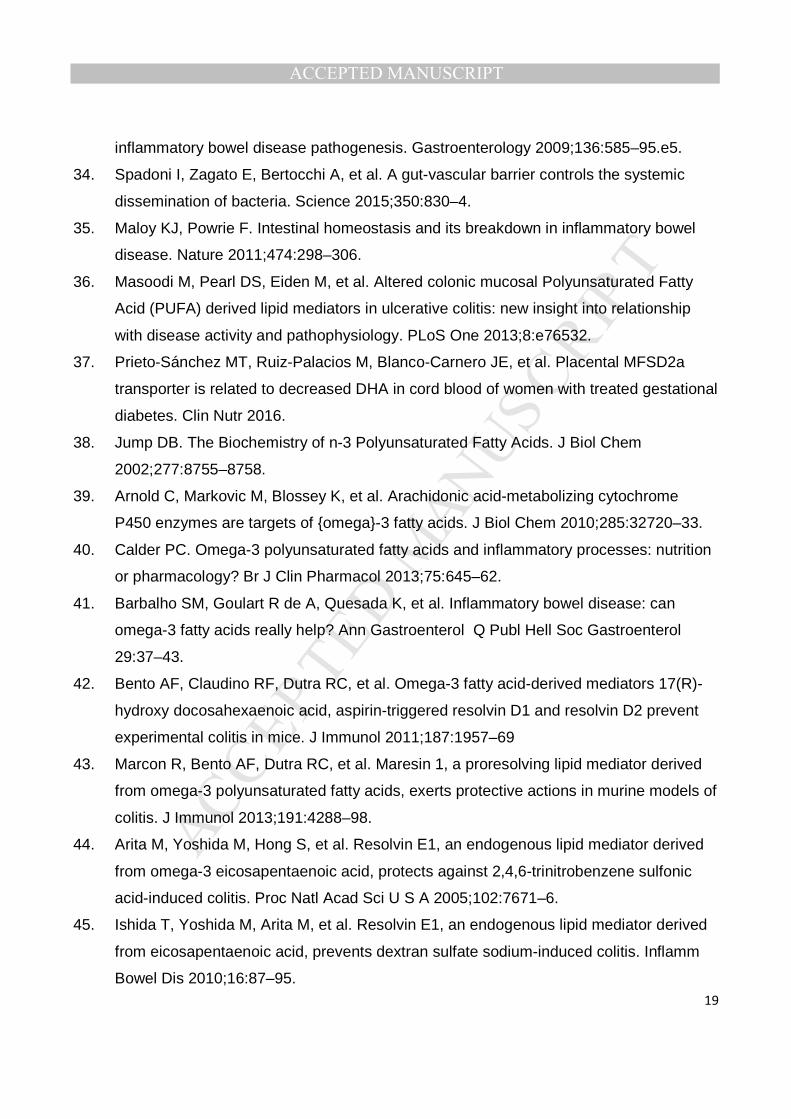
MFSD2A in the gut localizes to the vascular endothelium and is up-regulated during
resolution of intestinal inflammation
In order to understand the mechanism behind the reduced amount of ω-3 presolving lipid
mediators observed in patients with active UC, we focused our attention on DHA-metabolism.
The presence of MFSD2A and its correlation with DHA in the gut has never been
characterized. Our results showed that in the human large intestine, MFSD2A mainly
localizes to the endothelium, under both healthy (Supplementary 1C and D) and
inflammatory conditions (Figure 2A and B), with no expression in other cell types (Figure 2A,
2B, Supplementary Figure 1C and D). This was confirmed on primary cultures of human
intestinal microvascular endothelial cells (HIMECs), where the protein localizes to both the
plasma membrane and the cytoplasm (Supplementary Figure 1C). Moreover, MFSD2A in
HIMECs mainly co-localize with the endoplasmic reticulum marker Calnexin (Figure 2C).
We next quantified MFSD2A protein levels in both mucosal extracts and HIMECs of active UC
patients and healthy subjects (Supplementary Table 2 for patient characteristics). Results
showed that MFSD2A is up-regulated in the inflamed mucosa, particularly on microvessels, in
comparison with healthy tissues (Supplementary Figure 1E and F); this was also confirmed
in UC-HIMECs versus healthy cells (Figure 2D). Interestingly, to verify whether and which
inflammatory cytokines, known to activate endothelial cells17, and to play a critical role in UC
pathogenesis18 were able to modulate MFSD2A in the inflammatory milieu, we stimulated
healthy HIMECs with IL1β, IL17, IL23, TNFα, IL6, and IFNγ. TNFα was the most effective in
up-regulating MFSD2A, while other interleukins and IFNγ had no effects (Supplementary
Figure1G). Because of the limited amount of tissue from endoscopic biopsies in remission,
and the unavailability of surgical specimens from remitting UC patients undergoing surgery for
other complications, we were unable to isolate HIMECs from subjects with resolution of gut
inflammation. For this reason, subsequent analyses were performed on whole biopsies.
Interestingly, MFSD2A was even more upregulated in patients with UC undergoing remission,
MANUSCRIP
T
ACCEPTED
ACCEPTED MANUSCRIPT
8
in comparison with healthy and active tissues (Figure 2E). This suggests an involvement of
MFSD2A in the resolving phase of intestinal inflammation and raises the question of why
MFSD2A displays an intermediate expression levels in active tissues, when compared to
healthy and patients in remission.
To answer this question, transcript levels of MFSD2A were measured at 2 time points in both
healthy and UC-HIMECs, upon treatment with TNFα. Results showed that while in healthy
endothelium MFSD2A is progressively upregulated by TNFα, in UC-HIMECs the transcript
levels reached a peak at 8 hours that dropped off after 24 hours of stimulation
(Supplementary Figure 1H).
These findings demonstrate not only that inflammatory cytokines such as TNFα directly
regulate MFSD2A expression, but most importantly that UC-HIMECs display a defect in the
proper TNFα-dependent modulation of this protein.
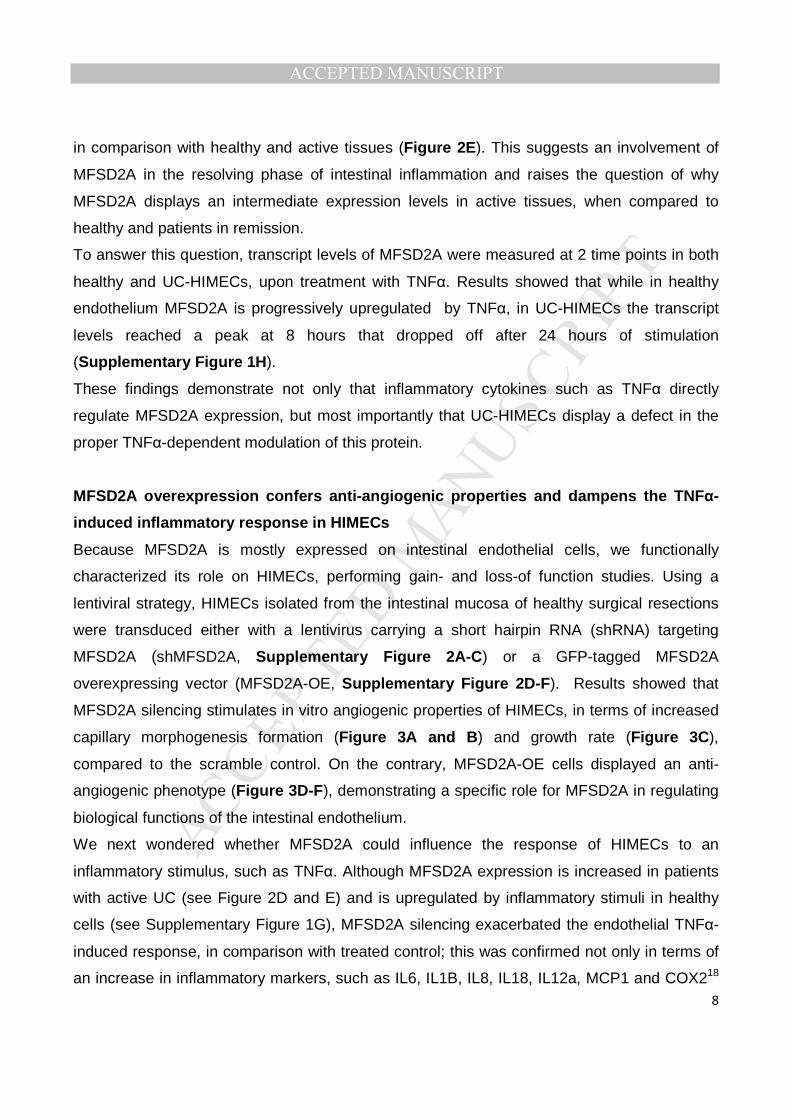
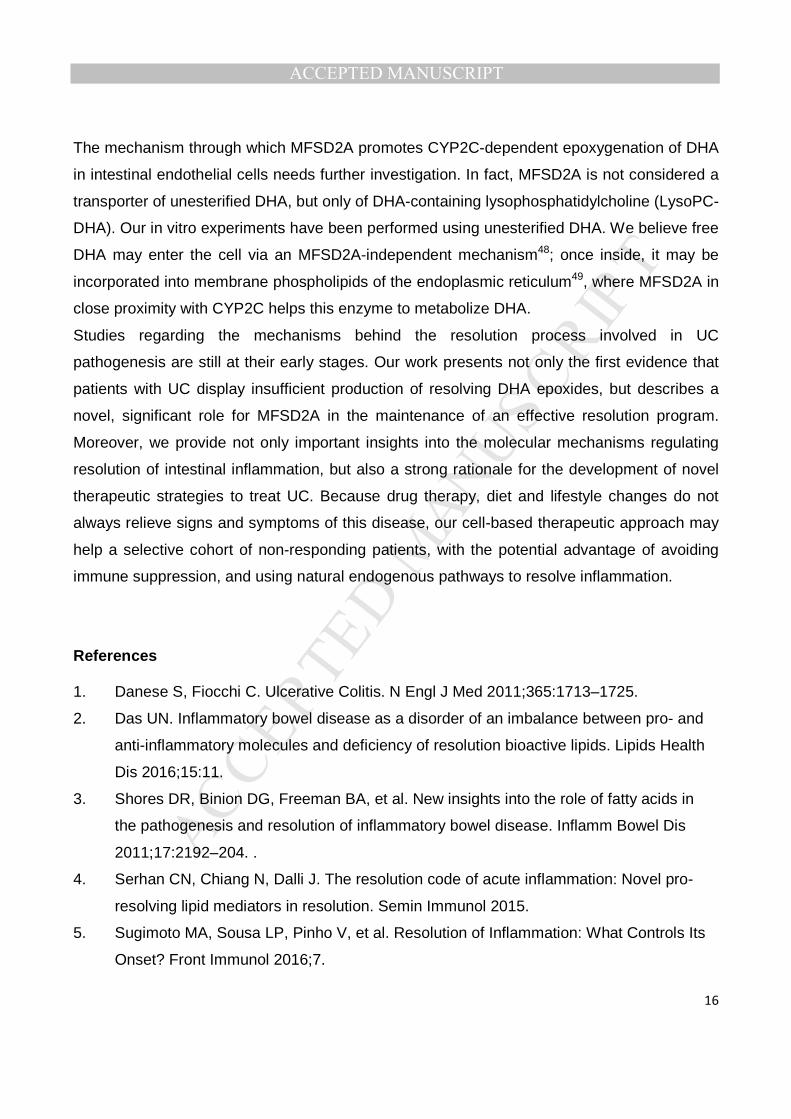
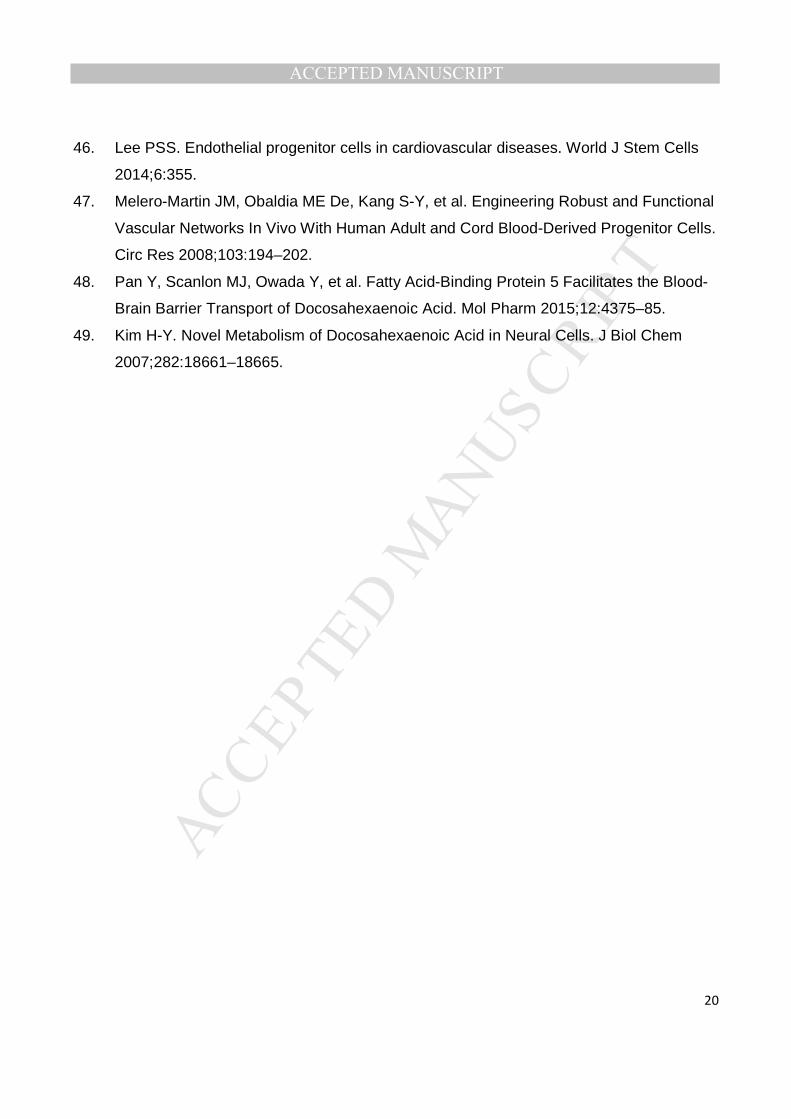
MFSD2A overexpression confers anti-angiogenic properties and dampens the TNFα-
induced inflammatory response in HIMECs
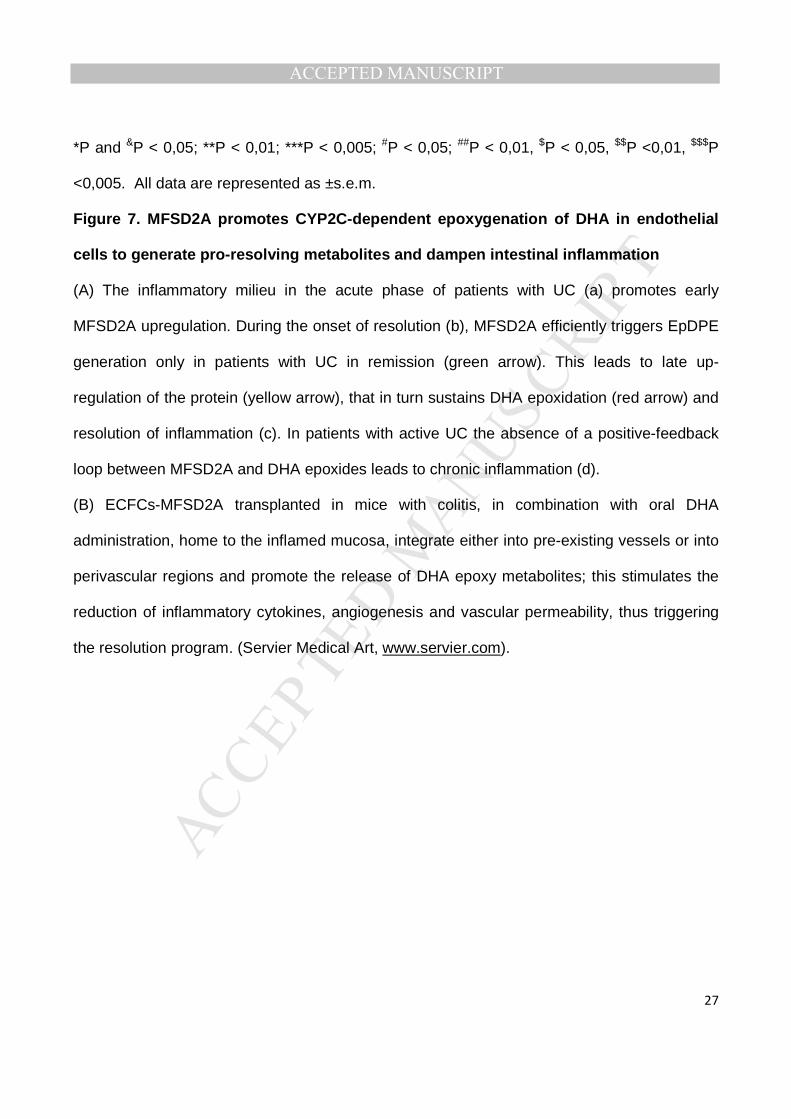
Because MFSD2A is mostly expressed on intestinal endothelial cells, we functionally
characterized its role on HIMECs, performing gain- and loss-of function studies. Using a
lentiviral strategy, HIMECs isolated from the intestinal mucosa of healthy surgical resections
were transduced either with a lentivirus carrying a short hairpin RNA (shRNA) targeting
MFSD2A (shMFSD2A, Supplementary Figure 2A-C) or a GFP-tagged MFSD2A
overexpressing vector (MFSD2A-OE, Supplementary Figure 2D-F). Results showed that
MFSD2A silencing stimulates in vitro angiogenic properties of HIMECs, in terms of increased
capillary morphogenesis formation (Figure 3A and B) and growth rate (Figure 3C),
compared to the scramble control. On the contrary, MFSD2A-OE cells displayed an anti-
angiogenic phenotype (Figure 3D-F), demonstrating a specific role for MFSD2A in regulating
biological functions of the intestinal endothelium.
We next wondered whether MFSD2A could influence the response of HIMECs to an
inflammatory stimulus, such as TNFα. Although MFSD2A expression is increased in patients
with active UC (see Figure 2D and E) and is upregulated by inflammatory stimuli in healthy
cells (see Supplementary Figure 1G), MFSD2A silencing exacerbated the endothelial TNFα-
induced response, in comparison with treated control; this was confirmed not only in terms of
an increase in inflammatory markers, such as IL6, IL1B, IL8, IL18, IL12a, MCP1 and COX218
MANUSCRIP
T
ACCEPTED
ACCEPTED MANUSCRIPT
9
(Supplementary Figure 2G), but also as increased translocation of the P65 subunit of NF-κB
into the nucleus19 (Supplementary Figure 2H-J). On the contrary, overexpression of
MFSD2A abated the TNFα-induced inflammatory response, when compared to HIMECs
carrying the control GFP plasmid (Figure 3G-J). Furthermore, we observed MFSD2A
modulation to affect in vitro HIMEC permeability, as assessed by transendothelial electrical
resistance (TEER) measurements (Figure 3K and 3L). Of note, either MFSD2A silencing or
overexpression did not modify levels of inflammatory cytokines, NF-κB translocation into the
nucleus and TEER in untreated HIMECs (Figure 3G-L and Supplementary Figure 2G-J).
Altogether, this data demonstrates that MFSD2A controls the intestinal endothelial response
to an inflammatory stimulus.
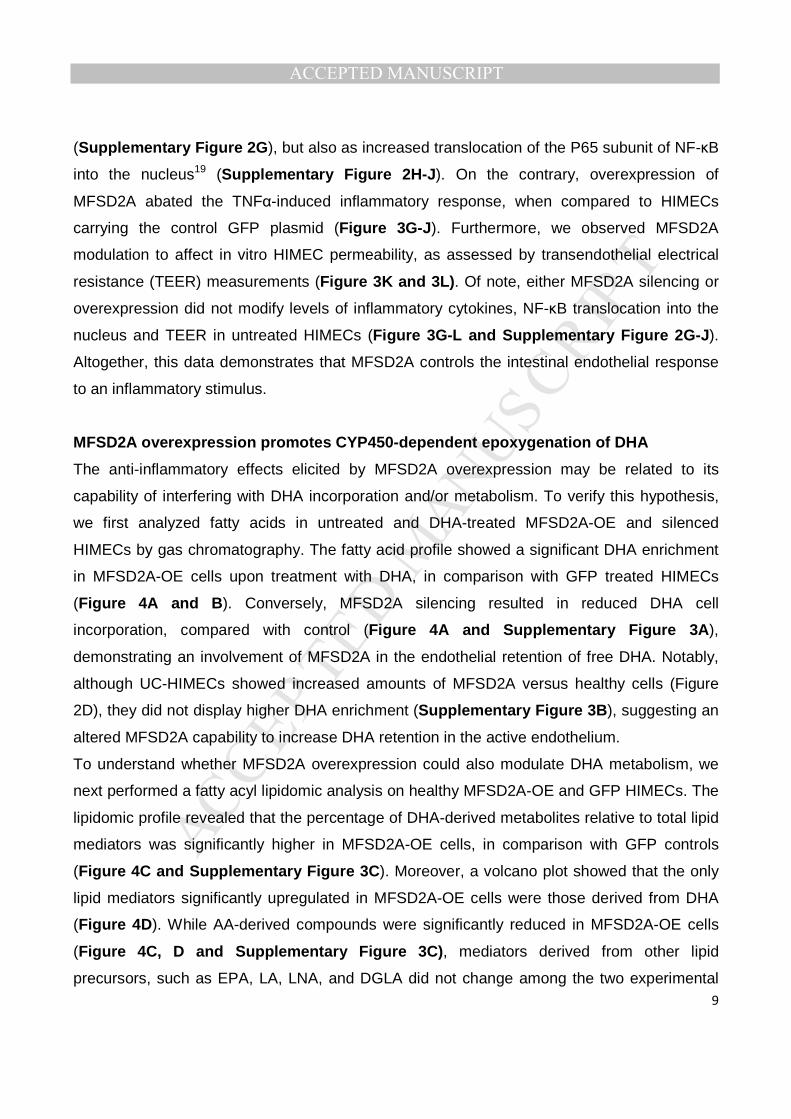
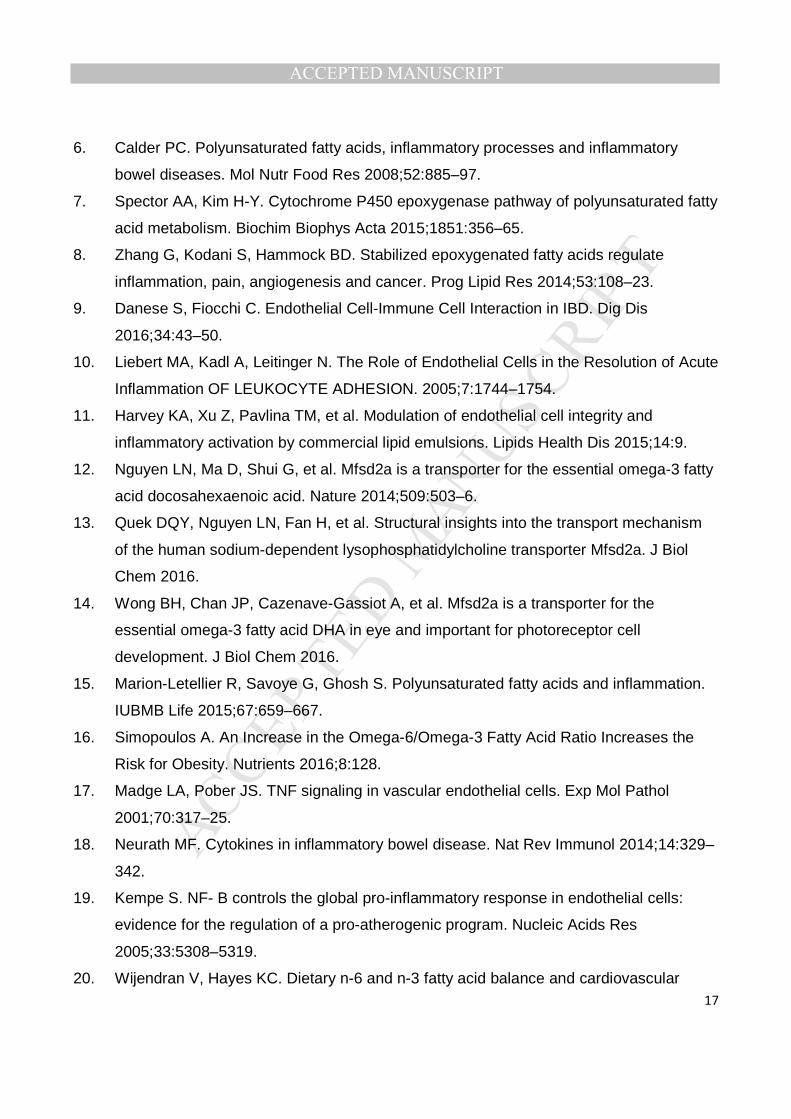
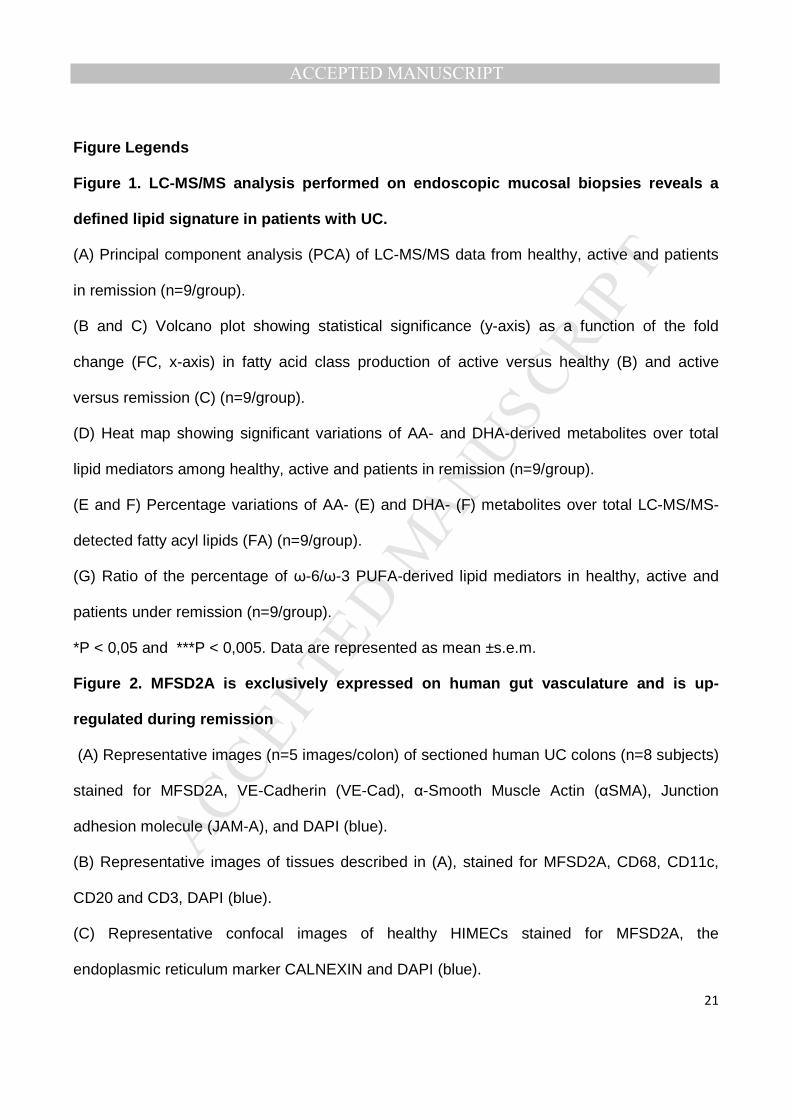
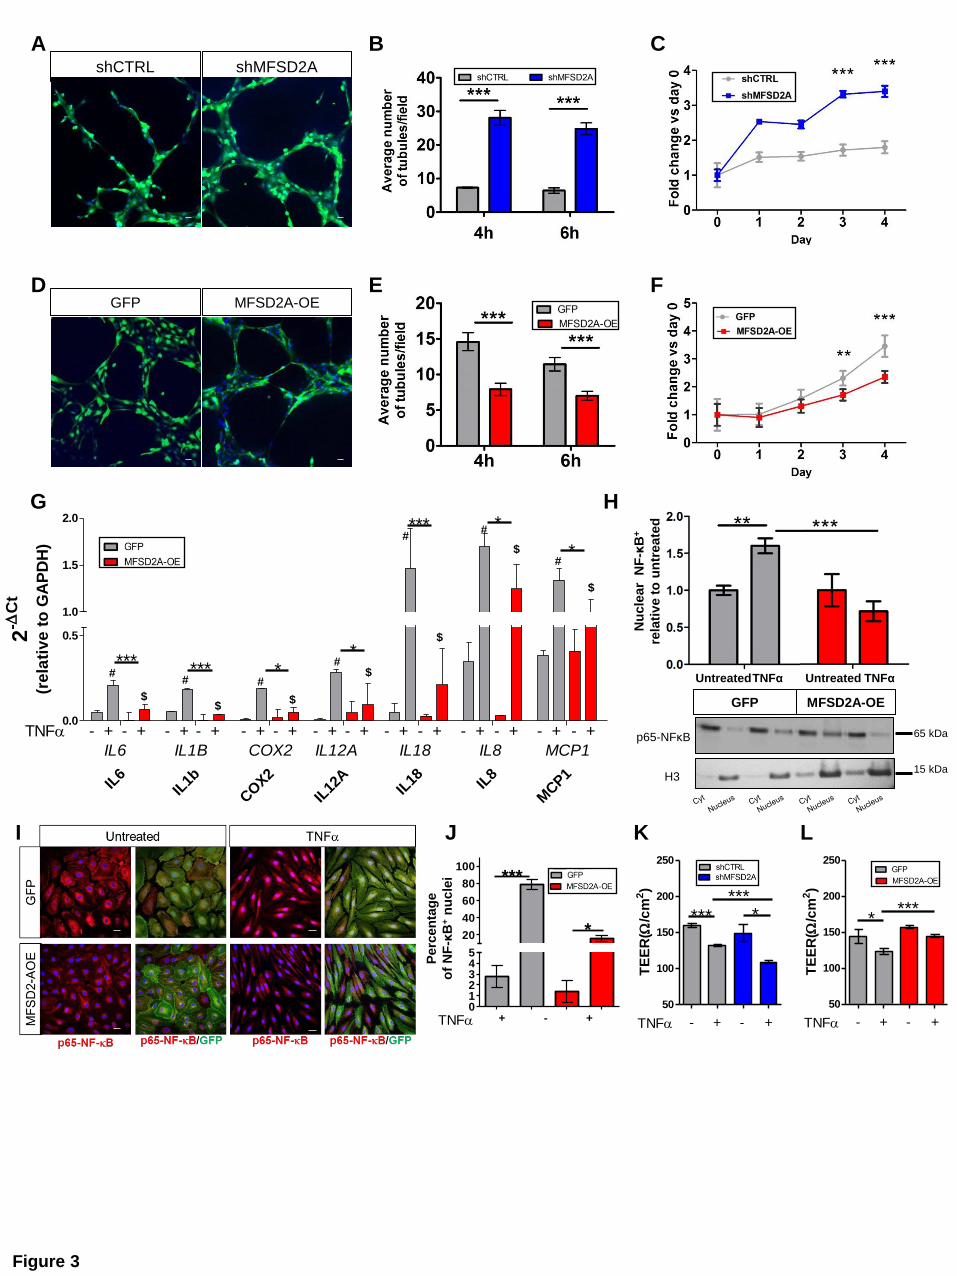
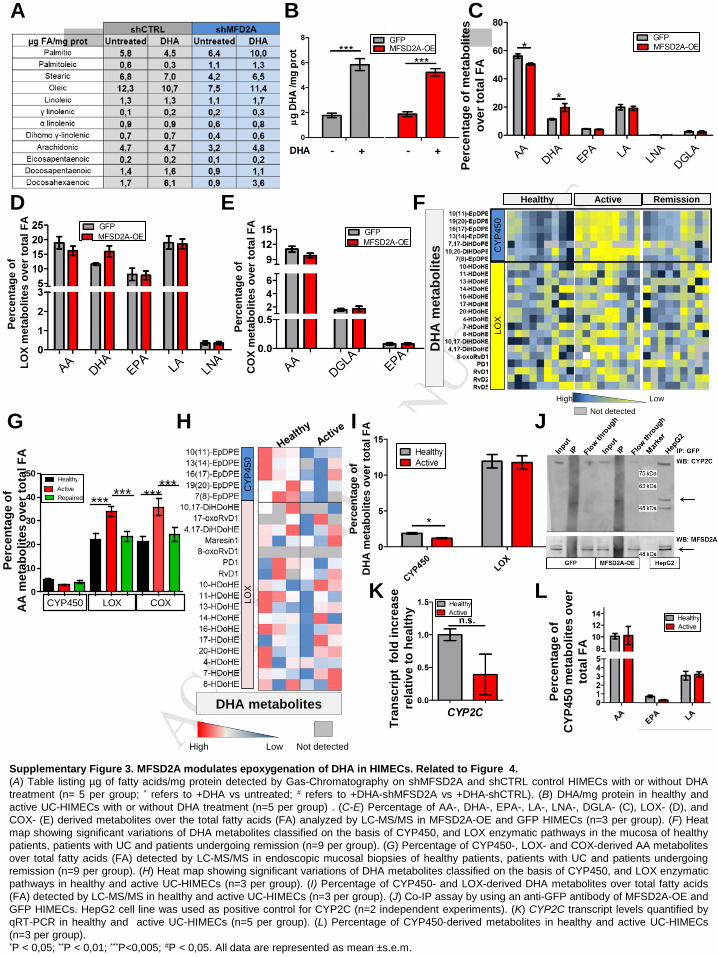
MFSD2A overexpression promotes CYP450-dependent epoxygenation of DHA
The anti-inflammatory effects elicited by MFSD2A overexpression may be related to its
capability of interfering with DHA incorporation and/or metabolism. To verify this hypothesis,
we first analyzed fatty acids in untreated and DHA-treated MFSD2A-OE and silenced
HIMECs by gas chromatography. The fatty acid profile showed a significant DHA enrichment
in MFSD2A-OE cells upon treatment with DHA, in comparison with GFP treated HIMECs
(Figure 4A and B). Conversely, MFSD2A silencing resulted in reduced DHA cell
incorporation, compared with control (Figure 4A and Supplementary Figure 3A),
demonstrating an involvement of MFSD2A in the endothelial retention of free DHA. Notably,
although UC-HIMECs showed increased amounts of MFSD2A versus healthy cells (Figure
2D), they did not display higher DHA enrichment (Supplementary Figure 3B), suggesting an
altered MFSD2A capability to increase DHA retention in the active endothelium.
To understand whether MFSD2A overexpression could also modulate DHA metabolism, we
next performed a fatty acyl lipidomic analysis on healthy MFSD2A-OE and GFP HIMECs. The
lipidomic profile revealed that the percentage of DHA-derived metabolites relative to total lipid
mediators was significantly higher in MFSD2A-OE cells, in comparison with GFP controls
(Figure 4C and Supplementary Figure 3C). Moreover, a volcano plot showed that the only
lipid mediators significantly upregulated in MFSD2A-OE cells were those derived from DHA
(Figure 4D). While AA-derived compounds were significantly reduced in MFSD2A-OE cells
(Figure 4C, D and Supplementary Figure 3C), mediators derived from other lipid
precursors, such as EPA, LA, LNA, and DGLA did not change among the two experimental
MANUSCRIP
T
ACCEPTED
ACCEPTED MANUSCRIPT
10
groups (Supplementary Figure 3C). These data indicate that MFSD2A overexpression
modulates not only DHA retention in HIMECs, but also modifies its metabolism, thus
mimicking the lipid mediator profile of resolving UC (Figure 1).
ω-3 DHA, ω-6 AA and other PUFAs can be metabolized by cyclooxygenases (COX),
lipoxygenases (LOX) and cytochrome P450 (CYP) enzymes to a vast array of biologically
active oxygenated lipid mediators8,20. The lipidomic profile of healthy MFSD2A-OE and GFP
HIMECs revealed that among all oxylipins, only CYP450 epoxygenase-derived metabolites of
DHA and AA were modulated in MFSD2A-OE versus GFP control cells (Figure 4E, F and
Supplementary Figure 3D and E). CYP450 converts PUFAs to epoxy lipid mediators
including epoxyeicosatrienoic acids (EpETrEs) derived from AA and epoxydocosapentaenoic
acids (EpDPEs) from DHA7,8,21. MFSD2A-OE HIMECs showed a decrease in the CYP450-
derived EpETrEs of AA, in comparison with control cells, including their respective hydrolysis
metabolites, the diols (DiHETrE), which are known to be biologically inactive22 (Figure 4E
and F). Most importantly we found a significant burst of resolving EpDPEs from DHA in
MFSD2A-OE cells, compared to GFP controls (Figure 4E and F), indicating that high levels
of MFSD2A promote CYP450 epoxygenation of DHA and relative resolving oxylipins. Of note,
the effects of MFSD2A overexpression resembled the conditions observed in the resolving
mucosa, where the amount of EpDPEs were increased compared to inflamed tissues (Figure
4G and Supplementary Figure 3F); vice versa, patients with active UC showed a significant
increase in inflammatory COX- and LOX-derived AA metabolites23, with no changes in CYP-
derived lipid mediators, compared to healthy and patients in remission (Supplementary
Figure 3G), being consistent with the inflammatory milieu of damaged mucosa.
Reduced levels of DHA-derived epoxides in active mucosal biopsies compared to healthy
controls were also observed in UC-HIMECs versus healthy cells (Supplementary Figure 3H
and I), revealing a selective defect in the endothelial production of EpDPEs. Importantly, this
defect was not dependent on reduced basal levels of intracellular DHA (see Supplementary
Figure 3B). Altogether, these findings reveal not only a specific role for MFSD2A in promoting
DHA accretion and metabolism to EpDPEs in the gut endothelium, but also that these
capabilities are impaired in the vasculature of active UC patients.
The resolving effects of MFSD2A-OE HIMECs are mediated by the production of
CYP2C-derived DHA oxylipins
MANUSCRIP
T
ACCEPTED
ACCEPTED MANUSCRIPT
11
The main PUFA-metabolizing CYPs belong to the CYP2 family, in particular the CYP2J and
CYP2C subfamilies, all localized in the endoplasmic reticulum (ER)24. The CYP2C subfamily
represents one of the two major pieces of the intestinal P450 pie25. To verify whether the
beneficial effects exerted by MFSD2A overexpression on HIMECs depends on its capability to
promote CYP2C-derived metabolites of DHA, we first analyzed whether MFSD2A and CYP2C
co-localized within the endoplasmic reticulum. The two proteins were indeed found in close
proximity (Figure 4H), but did not physically interact, as shown by co-immunoprecipitation
studies (Supplementary Figure 3J). We next inhibited CYP2C enzymes in MFSD2A-OE
healthy HIMECs using Proadifen hydrochloride, a chemical agent known to be highly
selective for the CYP-epoxygenase pathway24. Proadifen was able to abate the resolving
effects exerted by MFSD2A overexpression in TNFα-treated HIMECs, in terms of increased
TEER (Figure 4I), and higher production of inflammatory cytokines and markers of
endothelium activation (Figure 4J). Importantly, the reduced amount of EpDPEs observed in
UC-HIMECs is not due to reduced expression levels of CYP2C (Supplementary Figure 3K),
or to its enzymatic activity. In fact, epoxy metabolites derived from other lipid precursors, did
not change between the two groups (Supplementary Figure 3L). Collectively, this data
demonstrates that MFSD2A controls angiogenic and resolving properties of the gut
vasculature through modulation of CYP2C-dependent DHA epoxygenation. Consistently,
when overexpressed in UC-HIMECs, MFSD2A restored not only the defective capability of
these cells to promote DHA epoxygenation (Supplementary Figure 4A), but also exerted
anti-inflammatory effects, in terms of reduced in vitro capillary formation (Supplementary
Figure 4B) and production of inflammatory/angiogenic markers (Supplementary Figure 4C).
We finally reasoned whether the limited amount of EpDPEs could be responsible for the
hampered increase of TNFα-induced MFSD2A expression in UC-HIMECs. Experiments
performed with healthy HIMECs in the presence or absence of Proadifen at 8 and 24 hours of
TNFα stimulation demonstrated that CYP2C-dependent DHA epoxygenation controls the
sustained levels of MFSD2A transcripts at later phases (24 hours), whereas is not responsible
for the early upregulation (8 hours) (Supplementary Figure 4D).
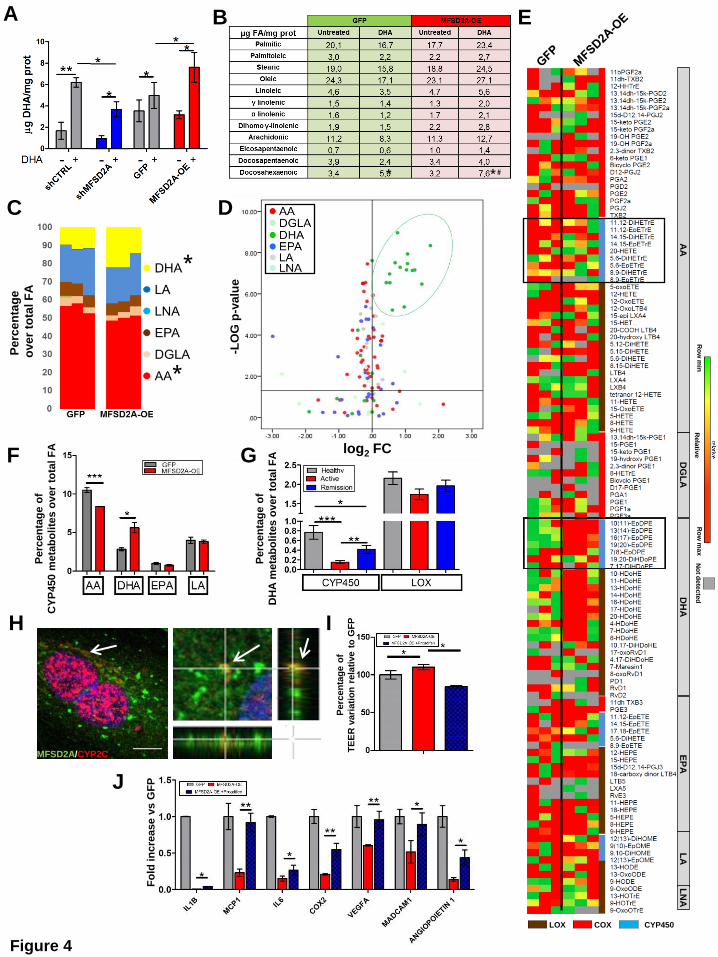
Transplantation of MFSD2A-OE ECFC in combination with DHA administration
ameliorates DSS-induced acute colitis via CYP2C-dependent EpDPE production
MANUSCRIP
T
ACCEPTED
ACCEPTED MANUSCRIPT
12
The resolution process occurs during the acute phase of inflammation26. For this reason, to
establish whether MFSD2A overexpression on endothelial cells could promote in vivo the
resolution of intestinal inflammation, we choose the Dextran Sodium Sulfate (DSS)-induced
model of acute colitis. Moreover, we took advantage of the capability of human endothelial
colony-forming cells (ECFCs), to be recruited to ischemic or inflamed tissues27, where they
remodel the vascular compartment28. We transduced mCherry-tagged human ECFCs with
MFSD2A-GFP-carrying lentiviral particles (ECFCs-MFSD2A) or GFP-expressing ECFCs
(ECFCs-GFP), as control. CD1 nude mice undergoing DSS treatment for 6 days were then
intravenously injected at day 5 with genetically modified ECFCs and monitored for the next 5
days. To enhance the potential of MFSD2A in promoting resolution of inflammation, parallel
groups, of either ECFCs-GFP or -MFSD2A transplanted mice were gavaged with ethyl ester
of DHA or water daily.
We first verified whether these cells were able to distribute from the peripheral blood to the
inflamed mucosa of DSS-induced colitic mice29. Intravenously injected mCherry-positive
human ECFCs (Figure 5A) were indeed shown to home to the inflamed colon of
immunedeficient mice with colitis (Figure 5B and Supplementary 4E), with cells integrating
either into pre-existing vessels (Figure 5C) or into perivascular regions (Figure 5D), as
previously reported for other organs30. Interestingly, ECFCs were found to integrate only into
blood vessels, and not into lymphatics (Supplementary Figure 4F). Notably, no cell
engraftment was observed in the intestine of healthy animals (Supplementary Figure 4G).
FACS analysis on large and small intestines, and on unrelated organs, revealed that while
ECFCs were detectable at low levels also in the small intestine as well as the liver 2 weeks
after transplantation, with a progressive decrease at later time points (Supplementary Figure
5A and B), no cells were found in other unrelated organs at any time point (Supplementary
Figure 5B). ECFCs were still detectable 6 weeks after injection only in the colon in a small
percentage (Supplementary Figure 5A and B), indicating that their half-life is limited and
could be used as a safe therapy. The transduction efficiency was confirmed by increased
transcript levels of MFSD2A in ECFCs-MFSD2A cells compared to controls (Supplementary
Figure 5C).
Only delivery of ECFCs-MFSD2A in combination with DHA significantly reduced the severity
of colitis, in comparison with the control group (only DSS); this was confirmed in terms of
Disease Activity Index (DAI)31 (Figure 5E), endoscopic evaluation (Figure 5F and
MANUSCRIP
T
ACCEPTED
ACCEPTED MANUSCRIPT
13
Supplementary Figure 5D), colon length (Supplementary Figure 5E), decreased
inflammatory markers (Supplementary Figure 5F), and reduced infiltration of neutrophils
(Supplementary Figure 5G) .
Angiogenesis, increased expression of adhesion molecules (e.g. VCAM1, MadCam1),
angiogenic markers (VEGFA, Nos2, Angiopoietin 1), and altered vascular permeability are all
features of an activated endothelium32, which are also observed during intestinal
inflammation33. Only delivery of ECFCs-MFSD2A in combination with DHA administration was
able to reduce the expression levels of these markers (Figure 5G), and only this experimental
group showed reduced vascular permeability, as revealed by decreased fluorescence
intensity of Plasmalemmal vesicle-1 (PV1) on endothelial cells34 (Figure 5H and
Supplementary Figure 5H), and reduced size of hematic vessels (Supplementary Figure
5I).
Finally, lipidomic analysis performed on the colons of all experimental groups, showed a
significant up-regulation of docosanoids only in DHA-fed mice transplanted with ECFCs-
MFSD2A (Supplementary Figure 6A). In these mice, only EpDPEs were found significantly
increased among all DHA metabolites, with no major modifications for oxylipins derived from
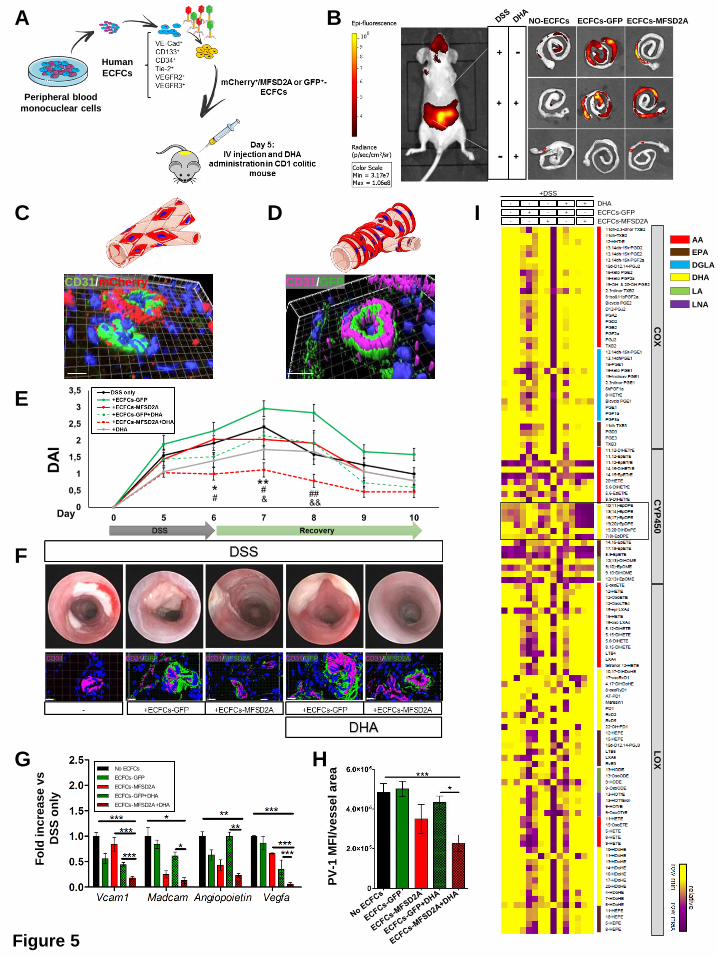
other PUFAs (Figure 5I and Supplementary Figure 6B-D). Treating mice with Proadifen in
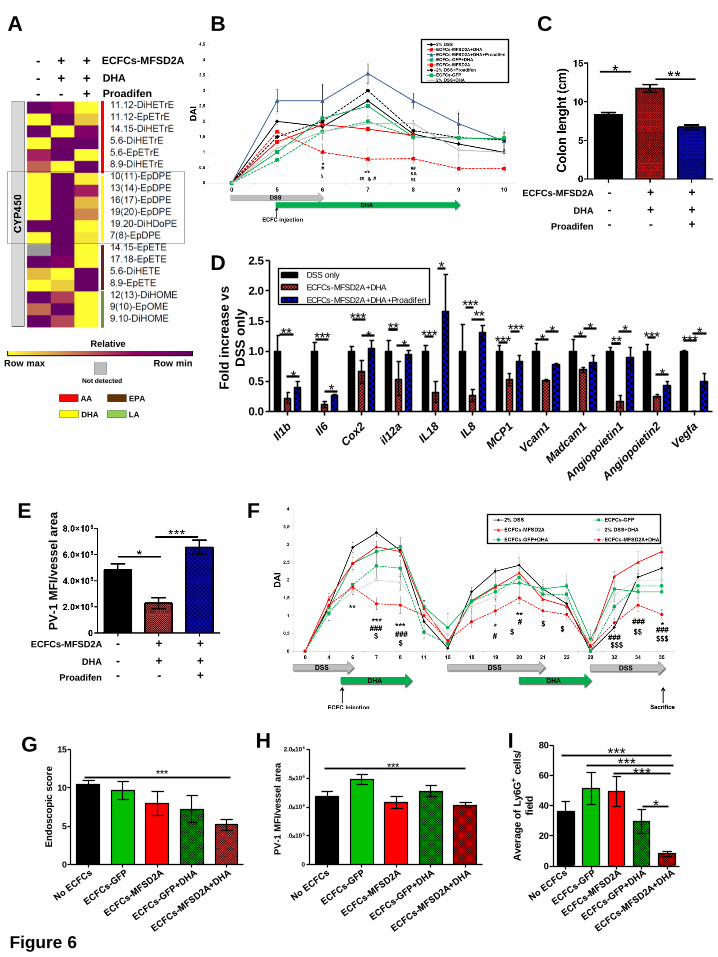
order to inhibit the production of resolving EpDPEs (Figure 6A and Supplementary Figure
6E), resulted in the reversion of clinical parameters (Figure 6B and 6C), and anti-angiogenic
phenotype (Figure 6D and E). Notably, beneficial effects of ECFCs-MFSD2A in DHA-fed
transplanted mice were retained also in the DSS-induced chronic model of colitis, in terms of
reduced DAI (Figure 6F), endoscopic score (Figure 6G), low PV-1 expression on endothelial
cells (Figure 6H) and diminished recruitment of neutrophils in the inflamed colon (Figure 6I),
compared to the other groups. This is consistent with the fact that ECFCs were still detected 4
weeks after injection (see Supplementary Figure 5A and B) and support the significance of a
long-lived effect of ECFCs-MFSD2A cargo on the course of colitis.
Overall, these findings show that delivery of MFSD2A through a cell-based therapy in
combination with DHA oral supplementation dampens both acute and chronic colitis via
production of CYP2C-dependent resolving EpDPEs. Remarkably, administration of single
EpDPEs did not show any beneficial effects on mice with colitis (Supplementary Figure 7A
and B).
MANUSCRIP
T
ACCEPTED
ACCEPTED MANUSCRIPT
14
Discussion
Because the gut is regarded as being in a state of controlled inflammation35, an effective
resolution program is fundamental to prevent chronic tissue damage, and it is reasonable to
assume that defective expression of resolving mediators, along with prolonged endothelial
activation9 may contribute to the chronic inflammatory response associated with UC. Previous
studies have foreseen this concept, showing lower levels of EPA and DHA lipid precursors
with higher levels of AA in mucosa of patients with UC36. Here we provide the first evidence
that patients with active UC fail in producing resolving metabolites derived from DHA
epoxygenation, and that these lipid mediators are highly present in patients with UC
undergoing remission, thus revealing their role in the resolution of intestinal inflammation.
Most importantly, we found that MFSD2A is required for both DHA retention and metabolism
in the healthy gut vasculature, thus modulating endothelial capabilities to properly respond to
an inflammatory stimulus; however these functions are impaired in UC-HIMECs, resulting in
reduced generation of EpDPEs.
To date MFSD2A has mostly been studied for its role as transporter of common plasma
LysoPCs carrying long-chain polyunsaturated fatty acids in the brain, placenta and retina, with
particular attention to DHA12,14,37. In this work, we show MFSD2A in the gut to be exclusively
expressed in the endothelium and to control important biological functions of the intestinal
vasculature, including its ability to mount a proper anti-inflammatory response. Moreover, we
demonstrate that the generation of EpDPEs and the beneficial effects exerted by MFSD2A
overexpression, are mediated both in vivo and in vitro by CYP2C, one of the major isoforms
of the CYP450 family expressed in the intestine25, that co-localize with MFSD2A in the
endoplasmic reticulum. This is consistent with the notion that ω-3 fatty acids are poor
substrates of COX and LOX enzymes38, whereas they are highly efficient alternative
substrates for numerous isoforms of CYP epoxygenases39.
The interest in ω-3 PUFAs as a source of biosynthetic products during the resolution of
inflammation has grown tremendously, and their use has been practiced for both prevention
and treatment of different inflammatory diseases, in animals and humans40. Nevertheless,
while few clinical studies involving the administration of DHA and EPA showed some efficacy
in the course of UC, most of them have given rise to inconclusive or negative results41. Our
findings provide an explanation for this discrepancy by showing that a selected cohort of not
responding patients with UC owns a dysfunctional MFSD2A in the gut endothelium.
MANUSCRIP
T
ACCEPTED
ACCEPTED MANUSCRIPT
15
Recent pre-clinical studies have demonstrated that newly identified DHA-derived metabolites
from LOX enzymatic pathway, such as Maresin 1, Resolvin D2, and aspirin-triggered Resolvin
D142,43, as well as RvE1 from EPA44,45, are quite effective in preventing intestinal
inflammation. Unlike these findings, we did not observe beneficial effects with any of the DHA-
derived epoxides used to treat experimental colitis, including treatment with DHA alone. This
discrepancy may be due to several reasons: 1) a different treatment regimen; while most of
the studies treat mice with a “prevention” regimen, we administered single EpDPEs only once
colitis was fully established; 2) the epoxides we added may have not reached the site of
action compared to the endogenously generated compounds. While these are theories, the
fact that DHA metabolites help to reduce inflammation and the only products that are distinctly
generated are the EpDPEs, strongly argues for their role.
Notably, we found MFSD2A to be strongly increased by TNFα in healthy HIMECs in two
distinct phases: an “early phase”, corresponding to the onset of inflammation, where the
inflammatory milieu containing TNFα triggers MFSD2A expression, and a “late phase”,
corresponding to the onset of resolution, where MFSD2A-dependent generation of EpDPEs
not only helps to resolve inflammation, but induces a positive-feedback loop that further
increases the transcript levels of MFSD2A. In UC-HIMECs this positive loop fails to occur,
because of the altered capability of MFSD2A in promoting DHA retention and metabolism.
This might justify why subjects with active UC display intermediate MFSD2A levels compared
to the other groups, leading to an unsuccessful resolution program (see schematic
representation in Figure 7A).
In an attempt to translate our findings into clinical management of UC, we overexpressed
functional MFSD2A in UC-HIMECs, where it was able to rescue the defective capability of
these cells in triggering a proper resolution program. Furthermore, we delivered MFSD2A as
“therapeutic” gene in the DSS-induced experimental models of colitis, using ECFCs.
Compared with mature endothelial cells that possess limited regenerative capacity46, ECFCs
are endowed with high proliferative potential and robust vasculogenic properties that render
these cells a promising opportunity for clinical use47. Our pre-clinical approach allowed
ECFCs-MFSD2A to increase in situ EpDPE production, which in turn showed inhibitory
effects on angiogenesis, vascular permeability and expression of inflammatory cytokines, thus
leading to the clinical amelioration of intestinal inflammation (Figure 7B).
MANUSCRIP
T
ACCEPTED
ACCEPTED MANUSCRIPT
16
The mechanism through which MFSD2A promotes CYP2C-dependent epoxygenation of DHA
in intestinal endothelial cells needs further investigation. In fact, MFSD2A is not considered a
transporter of unesterified DHA, but only of DHA-containing lysophosphatidylcholine (LysoPC-
DHA). Our in vitro experiments have been performed using unesterified DHA. We believe free
DHA may enter the cell via an MFSD2A-independent mechanism48; once inside, it may be
incorporated into membrane phospholipids of the endoplasmic reticulum49, where MFSD2A in
close proximity with CYP2C helps this enzyme to metabolize DHA.
Studies regarding the mechanisms behind the resolution process involved in UC
pathogenesis are still at their early stages. Our work presents not only the first evidence that
patients with UC display insufficient production of resolving DHA epoxides, but describes a
novel, significant role for MFSD2A in the maintenance of an effective resolution program.
Moreover, we provide not only important insights into the molecular mechanisms regulating
resolution of intestinal inflammation, but also a strong rationale for the development of novel
therapeutic strategies to treat UC. Because drug therapy, diet and lifestyle changes do not
always relieve signs and symptoms of this disease, our cell-based therapeutic approach may
help a selective cohort of non-responding patients, with the potential advantage of avoiding
immune suppression, and using natural endogenous pathways to resolve inflammation.
References 1. Danese S, Fiocchi C. Ulcerative Colitis. N Engl J Med 2011;365:1713–1725.
2. Das UN. Inflammatory bowel disease as a disorder of an imbalance between pro- and
anti-inflammatory molecules and deficiency of resolution bioactive lipids. Lipids Health
Dis 2016;15:11.
3. Shores DR, Binion DG, Freeman BA, et al. New insights into the role of fatty acids in
the pathogenesis and resolution of inflammatory bowel disease. Inflamm Bowel Dis
2011;17:2192–204. .
4. Serhan CN, Chiang N, Dalli J. The resolution code of acute inflammation: Novel pro-
resolving lipid mediators in resolution. Semin Immunol 2015.
5. Sugimoto MA, Sousa LP, Pinho V, et al. Resolution of Inflammation: What Controls Its
Onset? Front Immunol 2016;7.
MANUSCRIP
T
ACCEPTED
ACCEPTED MANUSCRIPT
17
6. Calder PC. Polyunsaturated fatty acids, inflammatory processes and inflammatory
bowel diseases. Mol Nutr Food Res 2008;52:885–97.
7. Spector AA, Kim H-Y. Cytochrome P450 epoxygenase pathway of polyunsaturated fatty
acid metabolism. Biochim Biophys Acta 2015;1851:356–65.
8. Zhang G, Kodani S, Hammock BD. Stabilized epoxygenated fatty acids regulate
inflammation, pain, angiogenesis and cancer. Prog Lipid Res 2014;53:108–23.
9. Danese S, Fiocchi C. Endothelial Cell-Immune Cell Interaction in IBD. Dig Dis
2016;34:43–50.
10. Liebert MA, Kadl A, Leitinger N. The Role of Endothelial Cells in the Resolution of Acute
Inflammation OF LEUKOCYTE ADHESION. 2005;7:1744–1754.
11. Harvey KA, Xu Z, Pavlina TM, et al. Modulation of endothelial cell integrity and
inflammatory activation by commercial lipid emulsions. Lipids Health Dis 2015;14:9.
12. Nguyen LN, Ma D, Shui G, et al. Mfsd2a is a transporter for the essential omega-3 fatty
acid docosahexaenoic acid. Nature 2014;509:503–6.
13. Quek DQY, Nguyen LN, Fan H, et al. Structural insights into the transport mechanism
of the human sodium-dependent lysophosphatidylcholine transporter Mfsd2a. J Biol
Chem 2016.
14. Wong BH, Chan JP, Cazenave-Gassiot A, et al. Mfsd2a is a transporter for the
essential omega-3 fatty acid DHA in eye and important for photoreceptor cell
development. J Biol Chem 2016.
15. Marion-Letellier R, Savoye G, Ghosh S. Polyunsaturated fatty acids and inflammation.
IUBMB Life 2015;67:659–667.
16. Simopoulos A. An Increase in the Omega-6/Omega-3 Fatty Acid Ratio Increases the
Risk for Obesity. Nutrients 2016;8:128.
17. Madge LA, Pober JS. TNF signaling in vascular endothelial cells. Exp Mol Pathol
2001;70:317–25.
18. Neurath MF. Cytokines in inflammatory bowel disease. Nat Rev Immunol 2014;14:329–
342.
19. Kempe S. NF- B controls the global pro-inflammatory response in endothelial cells:
evidence for the regulation of a pro-atherogenic program. Nucleic Acids Res
2005;33:5308–5319.
20. Wijendran V, Hayes KC. Dietary n-6 and n-3 fatty acid balance and cardiovascular
MANUSCRIP
T
ACCEPTED
ACCEPTED MANUSCRIPT
18
health. Annu Rev Nutr 2004;24:597–615.
21. Yanai R, Mulki L, Hasegawa E, et al. Cytochrome P450-generated metabolites derived
from ω-3 fatty acids attenuate neovascularization. Proc Natl Acad Sci U S A
2014;111:9603–8.
22. Zeldin DC, Wei S, Falck JR, et al. Metabolism of epoxyeicosatrienoic acids by cytosolic
epoxide hydrolase: substrate structural determinants of asymmetric catalysis. Arch
Biochem Biophys 1995;316:443–51.
23. Calder PC. Long-chain polyunsaturated fatty acids and inflammation. Scand J Food
Nutr 2006;50:54–61.
24. Gilroy DW, Edin ML, Maeyer RPH De, et al. CYP450-derived oxylipins mediate
inflammatory resolution. Proc Natl Acad Sci U S A 2016;113:E3240-9.
25. Paine MF, Hart HL, Ludington SS, et al. The human intestinal cytochrome P450 “pie”.
Drug Metab Dispos 2006;34:880–6.
26. Headland SE, Norling L V. The resolution of inflammation: Principles and challenges.
Semin Immunol 2015.
27. Goto K, Takemura G, Takahashi T, et al. Intravenous Administration of Endothelial
Colony-Forming Cells Overexpressing Integrin β1 Augments Angiogenesis in Ischemic
Legs. Stem Cells Transl Med 2016;5:218–26.
28. Wood JA, Colletti E, Mead LE, et al. Distinct contribution of human cord blood-derived
endothelial colony forming cells to liver and gut in a fetal sheep model. Hepatology
2012;56:1086–96.
29. Chassaing B, Aitken JD, Malleshappa M, et al. Dextran Sulfate Sodium (DSS)-Induced
Colitis in Mice. In: Current Protocols in Immunology. Hoboken, NJ, USA: John Wiley &
Sons, Inc.; 2014:15.25.1-15.25.14.
30. Dome B, Dobos J, Tovari J, et al. Circulating bone marrow-derived endothelial
progenitor cells: Characterization, mobilization, and therapeutic considerations in
malignant disease. Cytom Part A 2008;73A:186–193.
31. Randhawa PK, Singh K, Singh N, et al. A Review on Chemical-Induced Inflammatory
Bowel Disease Models in Rodents. Korean J Physiol Pharmacol 2014;18:279.
32. Pober JS, Sessa WC. Evolving functions of endothelial cells in inflammation. Nat Rev
Immunol 2007;7:803–15.
33. Scaldaferri F, Vetrano S, Sans M, et al. VEGF-A links angiogenesis and inflammation in
MANUSCRIP
T
ACCEPTED
ACCEPTED MANUSCRIPT
19
inflammatory bowel disease pathogenesis. Gastroenterology 2009;136:585–95.e5.
34. Spadoni I, Zagato E, Bertocchi A, et al. A gut-vascular barrier controls the systemic
dissemination of bacteria. Science 2015;350:830–4.
35. Maloy KJ, Powrie F. Intestinal homeostasis and its breakdown in inflammatory bowel
disease. Nature 2011;474:298–306.
36. Masoodi M, Pearl DS, Eiden M, et al. Altered colonic mucosal Polyunsaturated Fatty
Acid (PUFA) derived lipid mediators in ulcerative colitis: new insight into relationship
with disease activity and pathophysiology. PLoS One 2013;8:e76532.
37. Prieto-Sánchez MT, Ruiz-Palacios M, Blanco-Carnero JE, et al. Placental MFSD2a
transporter is related to decreased DHA in cord blood of women with treated gestational
diabetes. Clin Nutr 2016.
38. Jump DB. The Biochemistry of n-3 Polyunsaturated Fatty Acids. J Biol Chem
2002;277:8755–8758.
39. Arnold C, Markovic M, Blossey K, et al. Arachidonic acid-metabolizing cytochrome
P450 enzymes are targets of {omega}-3 fatty acids. J Biol Chem 2010;285:32720–33.
40. Calder PC. Omega-3 polyunsaturated fatty acids and inflammatory processes: nutrition
or pharmacology? Br J Clin Pharmacol 2013;75:645–62.
41. Barbalho SM, Goulart R de A, Quesada K, et al. Inflammatory bowel disease: can
omega-3 fatty acids really help? Ann Gastroenterol Q Publ Hell Soc Gastroenterol
29:37–43.
42. Bento AF, Claudino RF, Dutra RC, et al. Omega-3 fatty acid-derived mediators 17(R)-
hydroxy docosahexaenoic acid, aspirin-triggered resolvin D1 and resolvin D2 prevent
experimental colitis in mice. J Immunol 2011;187:1957–69
43. Marcon R, Bento AF, Dutra RC, et al. Maresin 1, a proresolving lipid mediator derived
from omega-3 polyunsaturated fatty acids, exerts protective actions in murine models of
colitis. J Immunol 2013;191:4288–98.
44. Arita M, Yoshida M, Hong S, et al. Resolvin E1, an endogenous lipid mediator derived
from omega-3 eicosapentaenoic acid, protects against 2,4,6-trinitrobenzene sulfonic
acid-induced colitis. Proc Natl Acad Sci U S A 2005;102:7671–6.
45. Ishida T, Yoshida M, Arita M, et al. Resolvin E1, an endogenous lipid mediator derived
from eicosapentaenoic acid, prevents dextran sulfate sodium-induced colitis. Inflamm
Bowel Dis 2010;16:87–95.
MANUSCRIP
T
ACCEPTED
ACCEPTED MANUSCRIPT
20
46. Lee PSS. Endothelial progenitor cells in cardiovascular diseases. World J Stem Cells
2014;6:355.
47. Melero-Martin JM, Obaldia ME De, Kang S-Y, et al. Engineering Robust and Functional
Vascular Networks In Vivo With Human Adult and Cord Blood-Derived Progenitor Cells.
Circ Res 2008;103:194–202.
48. Pan Y, Scanlon MJ, Owada Y, et al. Fatty Acid-Binding Protein 5 Facilitates the Blood-
Brain Barrier Transport of Docosahexaenoic Acid. Mol Pharm 2015;12:4375–85.
49. Kim H-Y. Novel Metabolism of Docosahexaenoic Acid in Neural Cells. J Biol Chem
2007;282:18661–18665.
MANUSCRIP
T
ACCEPTED
ACCEPTED MANUSCRIPT
21
Figure Legends
Figure 1. LC-MS/MS analysis performed on endoscopic mucosal biopsies reveals a
defined lipid signature in patients with UC.
(A) Principal component analysis (PCA) of LC-MS/MS data from healthy, active and patients
in remission (n=9/group).
(B and C) Volcano plot showing statistical significance (y-axis) as a function of the fold
change (FC, x-axis) in fatty acid class production of active versus healthy (B) and active
versus remission (C) (n=9/group).
(D) Heat map showing significant variations of AA- and DHA-derived metabolites over total
lipid mediators among healthy, active and patients in remission (n=9/group).
(E and F) Percentage variations of AA- (E) and DHA- (F) metabolites over total LC-MS/MS-
detected fatty acyl lipids (FA) (n=9/group).
(G) Ratio of the percentage of ω-6/ω-3 PUFA-derived lipid mediators in healthy, active and
patients under remission (n=9/group).
*P < 0,05 and ***P < 0,005. Data are represented as mean ±s.e.m.
Figure 2. MFSD2A is exclusively expressed on human gut vasculature and is up-
regulated during remission
(A) Representative images (n=5 images/colon) of sectioned human UC colons (n=8 subjects)
stained for MFSD2A, VE-Cadherin (VE-Cad), α-Smooth Muscle Actin (αSMA), Junction
adhesion molecule (JAM-A), and DAPI (blue).
(B) Representative images of tissues described in (A), stained for MFSD2A, CD68, CD11c,
CD20 and CD3, DAPI (blue).
(C) Representative confocal images of healthy HIMECs stained for MFSD2A, the
endoplasmic reticulum marker CALNEXIN and DAPI (blue).
MANUSCRIP
T
ACCEPTED
ACCEPTED MANUSCRIPT
22
(D, top) Western blot analysis of protein extracts from healthy and UC-HIMECs (active)
(n=5/group). (D, bottom) Representative blots.
(E, top) Western blot analysis of protein extracts from endoscopic biopsies of healthy (n=4),
active (n=8) and (n=7) remitting (remission) patients.
*P < 0,05; **P < 0,01. Scale bars, 50 µm for tissues, and 10 µm for HIMECs. All data are
represented as mean ±s.e.m.
Figure 3. MFSD2A modulates angiogenic properties and TNFα-induced response of
HIMECs
(A and D) Representative immunofluorescence of transduced HIMECs forming tubules
stained for DAPI (blue) and GFP (green). Scale bars, 20 µm.
(B and E) Tubule quantification of shMFSD2A, MFSD2A-OE and relative control HIMECs at 4
and 6 hours after plating. n=3 replicates/condition/time point of 3 independent experiments.
(C and F) Proliferation of shMFSD2A, MFSD2A-OE and relative control HIMECs represented
as optical density versus day 0, at the indicated time points. n=6 replicates/group of 3
independent experiments.
(G) Expression profile of inflammatory markers in untreated and TNFα-stimulated MFSD2A-
OE and relative control HIMECs by qRT-PCR (n=3 replicates/condition of 5 independent
experiments; # refers to untreated GFP vs TNFα-treated GFP; $ refers to untreated MFSD2A-
OE vs TNFα-treated MFSD2A-OE).
(H, top) Western blot quantification of NF-κB-p65 subunit in nuclear and cytosolic protein
extracts of unstimulated and TNFα-treated MFSD2A-OE and GFP HIMECs (n=3
replicates/condition of 3 independent experiments).
(H, bottom) Representative blots.
MANUSCRIP
T
ACCEPTED
ACCEPTED MANUSCRIPT
23
(I) Representative immunofluorescence of untreated and TNFα-stimulated MFSD2A-OE and
GFP control HIMECs stained for NF-κB p65, GFP, and DAPI (blue). Scale bars, 20 µm.
(J) Quantification of NF-κB p65+ nuclei expressed as percentage over total nuclei (n=3
replicates/condition of 3 independent experiments).
(K and L) TEER measurements of TNFα-stimulated shCTRL and shMFSD2A (K) and GFP
and MFSD2A-OE (L) HIMECs (n=5 replicates/condition of 2 independent experiments).
*P < 0,05; **P < 0,01; ***P < 0,005; #P < 0,005; $P; < 0,005; &P < 0,005; £P < 0,005. All data
are represented as mean ±s.e.m.
Figure 4. MFSD2A overexpression promotes DHA retention and DHA epoxygenation in
healthy HIMECs
(A) Graph representing µg of DHA/mg protein in shMFSD2A, MFSD2A-OE and relative
control HIMECs with or without DHA treatment (n=3 replicates/condition of 2 independent
experiments).
(B) Table listing µg of fatty acids/mg protein detected by gas-chromatography of MFSD2A-OE
and GFP HIMECs with or without DHA (n=3 replicates/condition of 2 independent
experiments;* refers to DHA-treated vs untreated; # refers to DHA-treated MFSD2A-OE vs
DHA-treated GFP).
(C) Lipid composition by LC-MS/MS expressed in percentage of PUFA-derived lipid mediators
over total fatty acids (FA) in MFSD2A-OE and GFP HIMECs (n=3/group).
(D) Volcano plot showing statistical significance (y-axis) as a function of the fold change (FC,
x-axis) in PUFA-derived metabolites of MFSD2A-OE versus GFP HIMECs analyzed by LC-
MS/MS (n=3/group).
MANUSCRIP
T
ACCEPTED
ACCEPTED MANUSCRIPT
24
(E) Heat map showing variations of PUFA-derived metabolites analyzed by LC-MS/MS in
MFSD2A-OE and GFP control HIMECs (n=3/group). Empty squares represent CYP450-
derived metabolites of AA and DHA.
(F) Percentage of CYP450-derived metabolites of AA, DHA, EPA and LA over total fatty acids
(FA) in MFSD2A-OE and GFP HIMECs (n=3/group).
(G) Percentage of CYP450- and LOX-derived metabolites of DHA over total fatty acids (FA)
detected by LC-MS/MS in endoscopic mucosal biopsies of healthy, active and remitting
patients (n=9/group).
(H) Representative confocal images of healthy HIMECs stained for MFSD2A, CYP2C, and
DAPI (blue). White arrows indicate co-localization of MFSD2A with CYP2C. Scale bar, 10 µm.
(I) TEER measurements of TNFα-stimulated MFSD2A-OE and GFP HIMECs with or without
Proadifen (n=5 replicates of 2 independent experiments).
(J) Inflammatory cytokine and angiogenic factor expression profile of TNFα-stimulated
MFSD2A-OE and GFP HIMECs with or without Proadifen by qRT-PCR (n=3 replicates for 2
independent experiments).
*P < 0,05; **P < 0,01; ***P < 0,005; #P <0,05. All data are represented as mean ±s.e.m.
Figure 5. Human ECFCs overexpressing MFSD2A promote in vivo DHA epoxygenation
and ameliorates DSS-induced experimental colitis
(A) ECFCs isolated from human blood, and transduced with MFSD2A-OE/mCherry or
GFP/mCherry control lentiviruses were intravenously injected in CD1 nude mice with colitis.
(B) Representative pictures of live imaging of a mouse with colitis (left) and isolated colons
(right) at the indicated conditions one week after injection (n=2 independent experiments with
5 mice/group).

MANUSCRIP
T
ACCEPTED
ACCEPTED MANUSCRIPT
25
(C and D) 3D reconstruction of immunofluorescence (bottom) of frozen colons from ECFCs-
GFP/mCherry-injected colitic mice one week after injection, stained for murine CD31 and
visualized for mCherry (C) and GFP (D). (Top, red cells) Schematic representations of ECFCs
integrated into mouse pre-existing vessels (C) and perivascular regions (D) (n=2 independent
experiments with 5 mice/group).
(E) DAI of ECFCs-MFSD2A-injected DHA-fed colitic mice and control groups (n=2
independent experiments with 5 mice/group). (* refers to DSS only vs ECFCs-MFSD2A+DHA;
# refers to ECFCs-MFSD2A vs ECFCs-MFSD2A+DHA; & refers to ECFCs-GFP+DHA vs
ECFCs-MFSD2A+DHA).
(F) Representative endoscopic images (top) and 3D reconstruction of immunofluorescence of
colons (bottom) stained for murine CD31, GFP-tagged MFSD2A, and DAPI (blue), from
ECFCs-MFSD2A-injected DHA-fed colitic mice at the indicated conditions 5 days after ECFC
transplantation. Scale bars, 10 µm (n=2 independent experiments with 5 mice/group).
(G and H) Quantification of angiogenic factors by qRT-PCR (G) and PV-1 mean fluorescence
intensity (MFI)/vessel area (µm2) (H) in colons of ECFCs-MFSD2A-injected DHA-fed colitic
mice at the indicated conditions, 5 days after injection (n=2 independent experiments with 5
mice/group).
(I) Heat map showing variation of PUFA-derived lipid mediators detected by LC-MS/MS in
colon tissues of ECFCs-MFSD2A-injected DHA-fed colitic mice at the indicated conditions 3
days after ECFC injection (n=3 mice/group representative of 2 independent experiments).
Empty square indicates CYP450-derived metabolites of DHA.
*P < 0,05; **P < 0,01; ***P < 0,005; #P < 0,05; ##P < 0,01; &P < 0,05; &&P < 0,01. All data are
represented as mean ±s.e.m.
MANUSCRIP
T
ACCEPTED
ACCEPTED MANUSCRIPT
26
Figure 6. CYP2C inhibition abolishes resolving effects of human ECFCs-MFSD2A
transplantation during experimental colitis
(A) Heat map showing variations of CYP450-derived metabolites, detected by LC-MS/MS in
colons of ECFCs-MFSD2A-injected DHA-fed colitic mice at the indicated conditions 3 days
after injection (n=3 mice/group for 2 independent experiments). Empty square indicates DHA
epoxides.
(B) DAI of ECFCs-MFSD2A-injected DHA-fed colitic mice and control groups with or without
Proadifen administration (n=2 independent experiments with 5 mice per group; * refers to
DSS only vs ECFCs-MFSD2A+DHA; # refers to ECFCs-MFSD2A vs ECFCs-MFSD2A+DHA;
& refers to ECFCs-GFP+DHA vs ECFCs-MFSD2A+DHA; $ refers to ECFCs-MFSD2A+DHA
vs ECFCs-MFSD2A+DHA with Proadifen.
(C-E) Colon length (C), inflammatory and angiogenic expression profile by qRT-PCR (D) and
quantification of PV-1 mean fluorescence intensity (MFI)/vessel area (µm2) (E) of colons from
ECFCs-MFSD2A-injected DHA-fed colitic mice at the indicated conditions 5 days after ECFC
injection (n=2 independent experiments with 5 mice/group).
(F) DAI of ECFCs-MFSD2A-injected DHA-fed colitic mice and control groups in a DSS-
induced chronic model of colitis. n=2 independent experiments with 5 mice/group; * refers to
DSS only vs ECFCs-MFSD2A+DHA; # refers to ECFCs-MFSD2A vs ECFCs-MFSD2A+DHA;
$ refers to ECFCs-GFP+DHA vs ECFCs-MFSD2A+DHA.
(G-I) Endoscopic score (G), quantification of PV-1 mean fluorescence intensity (MFI)/vessel
area (µm2) (H) and Ly6G+ cell infiltration (neutrophils) (I) of colons isolated from ECFCs-
MFSD2A-injected DHA-fed colitic mice at the indicated conditions (n=2 independent
experiments with 5 mice/group).
MANUSCRIP
T
ACCEPTED
ACCEPTED MANUSCRIPT
27
*P and &P < 0,05; **P < 0,01; ***P < 0,005; #P < 0,05; ##P < 0,01, $P < 0,05, $$P <0,01, $$$P
<0,005. All data are represented as ±s.e.m.
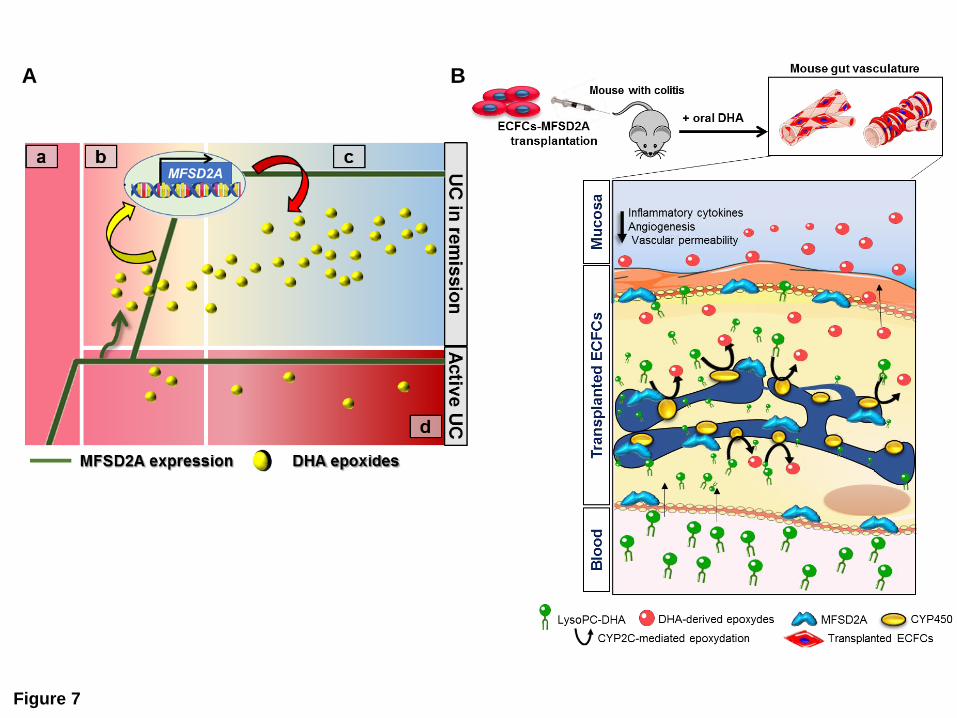
Figure 7. MFSD2A promotes CYP2C-dependent epoxygenation of DHA in endothelial
cells to generate pro-resolving metabolites and dampen intestinal inflammation
(A) The inflammatory milieu in the acute phase of patients with UC (a) promotes early
MFSD2A upregulation. During the onset of resolution (b), MFSD2A efficiently triggers EpDPE
generation only in patients with UC in remission (green arrow). This leads to late up-
regulation of the protein (yellow arrow), that in turn sustains DHA epoxidation (red arrow) and
resolution of inflammation (c). In patients with active UC the absence of a positive-feedback
loop between MFSD2A and DHA epoxides leads to chronic inflammation (d).
(B) ECFCs-MFSD2A transplanted in mice with colitis, in combination with oral DHA
administration, home to the inflamed mucosa, integrate either into pre-existing vessels or into
perivascular regions and promote the release of DHA epoxy metabolites; this stimulates the
reduction of inflammatory cytokines, angiogenesis and vascular permeability, thus triggering
the resolution program. (Servier Medical Art, www.servier.com).

MANUSCRIP
T
ACCEPTED
ACCEPTED MANUSCRIPT
AA
me
tab
oli
tes
D
HA
me
tab
oli
tes
Not detected
-LO
G p
-valu
e A
cti
ve/H
ealt
hy
-LO
G p
-valu
e A
cti
ve/R
em
issio
n B C
Healthy
Active
Remission
Healthy Active D
Up Down Up Down
Low High
log2 FC Active/Healthy log2 FC Active/Remission
A
Figure 1
G
F
Remission E
Pe
rce
nta
ge
of
AA
me
tab
olite
s
ove
r to
tal fa
tty a
cid
s
Pe
rce
nta
ge
of
DH
A m
eta
bo
lite
s
ove
r to
tal fa
tty a
cid
s
Hea
lthy
Act
ive
Rem
issi
on
0
2
4
6
****
*
% o
f D
HA
-de
riv
ed
me
tab
olite
s
ov
er
the
to
tal P
UF
As
Hea
lthy
Act
ive
Rem
issi
on
20
40
60
80
100
******
% o
f A
A-d
eri
ve
d m
eta
bo
lite
s
ov
er
the
to
tal P
UF
As
Hea
lthy
Act
ive
Rem
issi
on
0
10
20
30
40
****
-6
/-3

MANUSCRIP
T
ACCEPTED
ACCEPTED MANUSCRIPTA B
~50 kDa
42 kDa
MFSD2A
β-ACTIN
MFSD2A
β-ACTIN
Healthy Active
Figure 2
~50 kDa
42 kDa
D E
C
Merge CALNEXIN MFSD2A
MANUSCRIP
T
ACCEPTED
ACCEPTED MANUSCRIPT
sh c
trl
shct
rl+t
nfa
shm
fsd2a
shm
fsd2a
+tnf
50
100
150
200
250
- + - +
******
TNF
*
TE
ER
(/c
m2)
GFP
UT
GFP
MFS
D2A
-OE U
T
MFS
D2A
-OE
012345
20
40
60
80
100
MFSD2A-OE
GFP
TNF
*
***
+ - + -
%o
f N
F
B+
nu
cle
i
shCTRL shMFSD2A
p65-NFκB
H3
65 kDa
15 kDa
Figure 3
GFP MFSD2A-OE
GFP MFSD2A-OE
Untreated TNFα Untreated TNFα
Perc
en
tag
e
of
NF
-κB
+ n
ucle
i
A C B
D F E
J I K L
H G
Nu
cle
ar
NF
-κB
+
rela
tiv
e t
o u
ntr
eate
d
IL6
IL1b
COX2
IL12
AIL
18 IL8
MCP1
0.0
0.5
1.0
1.5
2.0
TNF - + - + - + - + - + - +
IL6 IL1B MCP1COX2
*** *** **
***
*
IL12A IL18 IL8
- + - + - + - + - + - +
#
$$
$
$
$
$
# #
#
#
#
*
$
#
- + - +
2-
Ct
(re
lati
ve
to
GA
PD
H)
GFP
GFP
+tNfa
MFS
D2A
-OE
MFS
D2A
-OE+t
nf
50
100
150
200
250
- + - +
****
TNF
GFP MFSD2A-OE
TE
ER
(/c
m2)
sh c
trl
shct
rl+t
nfa
shm
fsd2a
shm
fsd2a
+tnf
50
100
150
200
250
- + - +
******
TNF
*
TE
ER
(/c
m2)
MANUSCRIP
T
ACCEPTED
ACCEPTED MANUSCRIPTP
erc
en
tag
e
ove
r to
tal F
A
Up
Down
*
*
Ro
w m
in
Rela
tive
No
t dete
cte
d
Ro
w m
ax
Up
Down
COX CYP450 LOX
DG
LA
D
HA
E
PA
L
A
AA
L
NA
* * #
MFSD2A/CYP2C
-LO
G p
-va
lue
log2 FC
C D
H
E A B
J
F
Figure 4
Perc
en
tag
e o
f
TE
ER
vari
ati
on
rela
tive t
o G
FP
Perc
en
tag
e o
f
CY
P450 m
eta
bo
lite
s o
ver
tota
l F
A
Perc
en
tag
e o
f
DH
A m
eta
bo
lite
s o
ver
tota
l F
A
G
I
Fo
ld in
cre
ase v
s G
FP
MANUSCRIP
T
ACCEPTED
ACCEPTED MANUSCRIPTA
C D
F
E
I
Figure 5
CD31/mCherry CD31/GFP
+DSS
AA
DGLA
EPA
DHA
LA
LNA
Fo
ld in
cre
as
e v
s
DS
S o
nly
ECFCs-GFP
ECFCs-MFSD2A
-
-
-
-
+
-
-
-
+
+ +
+ -
- +
DHA
CO
X
CY
P450
L
OX
G
PV
-1 M
FI/
ve
ss
el a
rea
NO-ECFCs ECFCs-GFP ECFCs-MFSD2A B
Human
ECFCs
Peripheral blood
monocuclear cells
H
1 2 3 4 5 6 7
0
1
2
3
ECFCs-MFSD2A
No ECFCs
ECFCs-GFP
ECFCs-GFP+DHA
ECFCs-MFSD2A+DHA
***
***
***
***
*
*
****
***
****
***
******
COX2
*
**
Il12a Il1b Il6 Il18 Il8 MCP1
Fo
ld in
cre
ase
rela
tive t
o D
SS
-tre
ate
d m
ice
MANUSCRIP
T
ACCEPTED
ACCEPTED MANUSCRIPT
- - -
-
- +
+ +
+
+
Proadifen
DHA
ECFCs-MFSD2A
- - -
-
- +
+ +
+
+
Proadifen
DHA
E
AA EPA
DHA LA
Proadifen
DHA
- -
- +
+ +
Row min
Relative
Not detected
Row max
PV
-1 M
FI/
ve
ss
el a
rea
Figure 6
D
G
Fo
ld in
cre
ase v
s
DS
S o
nly
ECFCs-MFSD2A
F
PV-1
G1
G2
G3
G6
G7
0
5.0105
1.0106
1.5106
2.0106
***
MF
I/v
es
se
l a
rea
I
En
do
sco
pic
sco
re
2% D
SS
ECFC
s-GFP
ECFC
s-M
FSD2A
ECFC
s-GFP
+DHA
ECFC
s-M
FSD2A
+DHA
0
5
10
15
***
ECFCs-MFSD2A - + +
A B C
H
Il1b Il6
Cox2
il12a
IL18 IL
8
MCP1
Vca
m1
Mad
cam
1
Angio
poietin
1
Angio
poietin
2
Veg
fa
0.0
0.5
1.0
1.5
2.0
2.5DSS only
ECFCs-MFSD2A+DHA
ECFCs-MFSD2A+DHA+Proadifen
*
*****
*
*****
***
*
*
***
*
***
****** *
** **
* *** ****
*Fo
ld in
cre
as
e
rela
tiv
e t
o D
SS
-tre
ate
d m
ice
PV
-1 M
FI/vessel
are
a
2% D
SSG2
G3
G6
EFC
s-M
FSD2A
+DHA
0
20
40
60
80***
******
*
Avera
ge o
f L
y6G
+ c
ell
s/
field
MANUSCRIP
T
ACCEPTED
ACCEPTED MANUSCRIPT
Figure 7
A B
MANUSCRIP
T
ACCEPTED
ACCEPTED MANUSCRIPT
Perc
enta
ge o
f EP
A m
etab
olite
s ov
er to
tal F
A
MFS
D2A
M
FI/v
esse
l are
a
A B
C D
2-ΔC
t
(rel
ativ
e to
GA
PDH
Perc
enta
ge o
f LN
A m
etab
olite
s ov
er to
tal F
A
MFS
D2A
leve
l re
lativ
e to
the
untr
eate
d E F H G
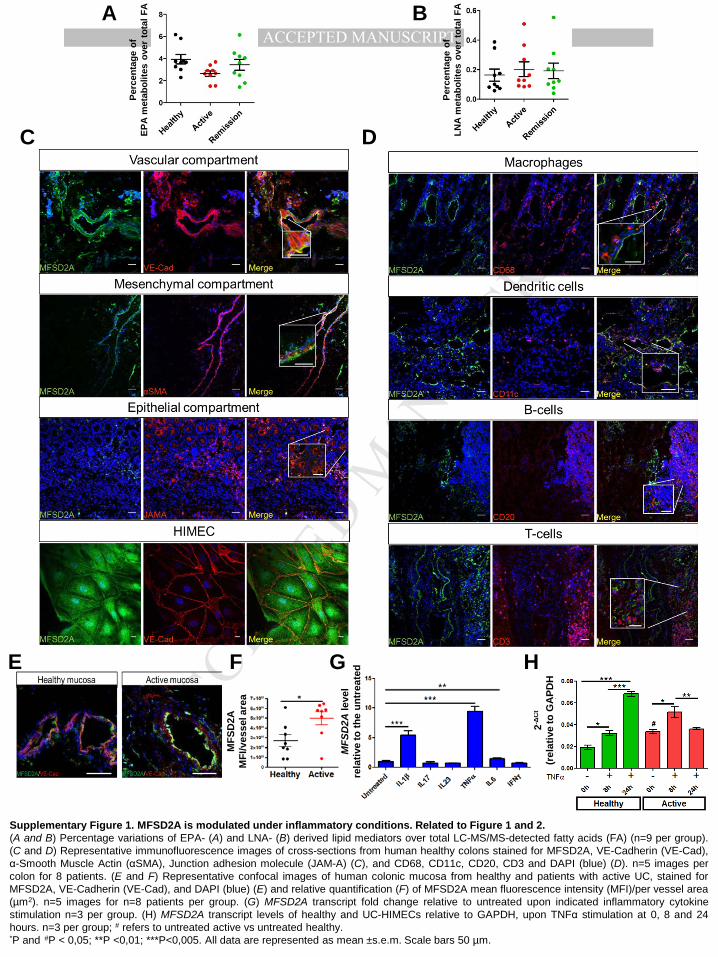
Supplementary Figure 1. MFSD2A is modulated under inflammatory conditions. Related to Figure 1 and 2. (A and B) Percentage variations of EPA- (A) and LNA- (B) derived lipid mediators over total LC-MS/MS-detected fatty acids (FA) (n=9 per group). (C and D) Representative immunofluorescence images of cross-sections from human healthy colons stained for MFSD2A, VE-Cadherin (VE-Cad), α-Smooth Muscle Actin (αSMA), Junction adhesion molecule (JAM-A) (C), and CD68, CD11c, CD20, CD3 and DAPI (blue) (D). n=5 images per colon for 8 patients. (E and F) Representative confocal images of human colonic mucosa from healthy and patients with active UC, stained for MFSD2A, VE-Cadherin (VE-Cad), and DAPI (blue) (E) and relative quantification (F) of MFSD2A mean fluorescence intensity (MFI)/per vessel area (µm2). n=5 images for n=8 patients per group. (G) MFSD2A transcript fold change relative to untreated upon indicated inflammatory cytokine stimulation n=3 per group. (H) MFSD2A transcript levels of healthy and UC-HIMECs relative to GAPDH, upon TNFα stimulation at 0, 8 and 24 hours. n=3 per group; # refers to untreated active vs untreated healthy. *P and #P < 0,05; **P <0,01; ***P<0,005. All data are represented as mean ±s.e.m. Scale bars 50 µm.
MANUSCRIP
T
ACCEPTED
ACCEPTED MANUSCRIPTA
D
kDa
15
TNFα UN TNFα UN
I
G H
B shMFSD2A#
F
~50
42
1 2 3 4 -
MFSD2A
VE-Cad/GFP VE-Cad/GFP
VE-Cad/MFSD2A VE-Cad/MFSD2A shCTRL shMFSD2A
GFP MFSD2A-OE
β-ACTIN
~50
42
*** ** **
MFSD2A
kDa
C
β-ACTIN
MFSD2A
kDa
*
65 p65NFκB
H3
E
J
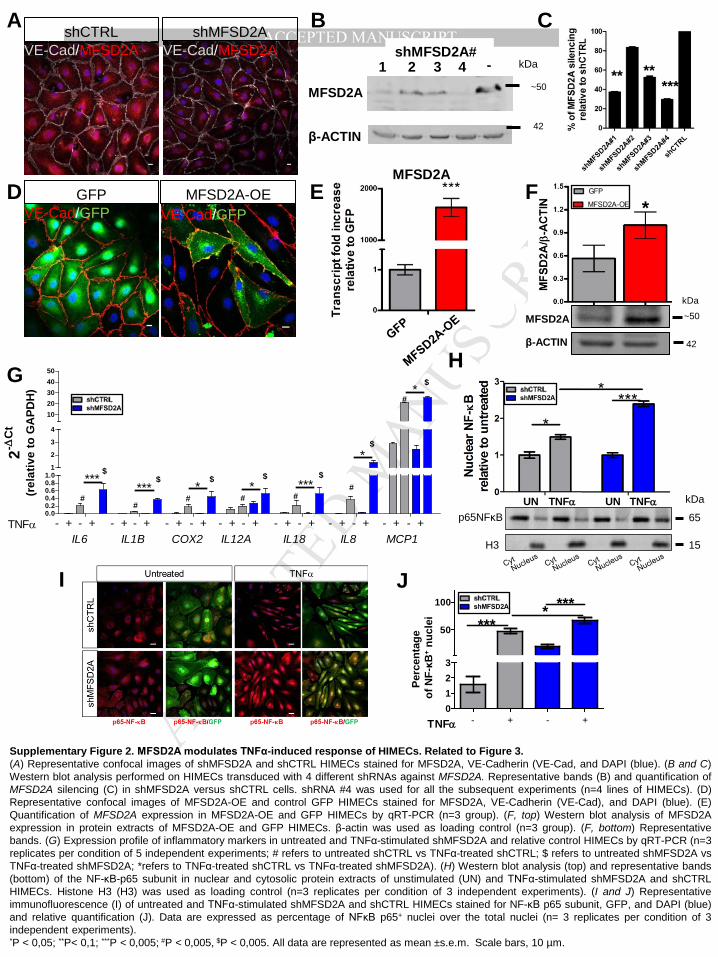
Supplementary Figure 2. MFSD2A modulates TNFα-induced response of HIMECs. Related to Figure 3. (A) Representative confocal images of shMFSD2A and shCTRL HIMECs stained for MFSD2A, VE-Cadherin (VE-Cad, and DAPI (blue). (B and C) Western blot analysis performed on HIMECs transduced with 4 different shRNAs against MFSD2A. Representative bands (B) and quantification of MFSD2A silencing (C) in shMFSD2A versus shCTRL cells. shRNA #4 was used for all the subsequent experiments (n=4 lines of HIMECs). (D) Representative confocal images of MFSD2A-OE and control GFP HIMECs stained for MFSD2A, VE-Cadherin (VE-Cad), and DAPI (blue). (E) Quantification of MFSD2A expression in MFSD2A-OE and GFP HIMECs by qRT-PCR (n=3 group). (F, top) Western blot analysis of MFSD2A expression in protein extracts of MFSD2A-OE and GFP HIMECs. β-actin was used as loading control (n=3 group). (F, bottom) Representative bands. (G) Expression profile of inflammatory markers in untreated and TNFα-stimulated shMFSD2A and relative control HIMECs by qRT-PCR (n=3 replicates per condition of 5 independent experiments; # refers to untreated shCTRL vs TNFα-treated shCTRL; $ refers to untreated shMFSD2A vs TNFα-treated shMFSD2A; *refers to TNFα-treated shCTRL vs TNFα-treated shMFSD2A). (H) Western blot analysis (top) and representative bands (bottom) of the NF-κB-p65 subunit in nuclear and cytosolic protein extracts of unstimulated (UN) and TNFα-stimulated shMFSD2A and shCTRL HIMECs. Histone H3 (H3) was used as loading control (n=3 replicates per condition of 3 independent experiments). (I and J) Representative immunofluorescence (I) of untreated and TNFα-stimulated shMFSD2A and shCTRL HIMECs stained for NF-κB p65 subunit, GFP, and DAPI (blue) and relative quantification (J). Data are expressed as percentage of NFκB p65+ nuclei over the total nuclei (n= 3 replicates per condition of 3 independent experiments). *P < 0,05; **P< 0,1; ***P < 0,005; #P < 0,005, $P < 0,005. All data are represented as mean ±s.e.m. Scale bars, 10 µm.
0.00.20.40.60.81.0
1
2
3
4
1020304050
TNFα - + - + - + - + - + - +IL6 IL1B MCP1COX2
****** * * ***
*
IL12A IL18 IL8- + - + - + - + - + - +
#
$$ $ $ $
$
## # #
#
*$
#
- + - +
2-∆C
t
(rel
ativ
e to
GA
PDH
)
Perc
enta
ge
of N
F-κB
+ nuc
lei
0123
50
100
TNFα
*******
- + - +
MANUSCRIP
T
ACCEPTED
ACCEPTED MANUSCRIPT
LOX
CYP
450
Healthy Active Remission
Low High
D ** * #
E
DH
A m
etab
olite
s
F Pe
rcen
tage
of
CO
X m
etab
olite
s ov
er to
tal F
A
Perc
enta
ge o
f LO
X m
etab
olite
s ov
er to
tal F
A
High Low Not detected
DHA metabolites
LOX
CYP
450
G
Perc
enta
ge o
f C
YP45
0 m
etab
olite
s ov
er
tota
l FA
Tran
scrip
t fo
ld in
crea
se
rela
tive
to h
ealth
y
K
0
10
20
30
40
50
CYP450 LOX COX
*** *** ******
L
Perc
enta
ge o
f D
HA
met
abol
ites
over
tota
l FA
Active
Perc
enta
ge o
f A
A m
etab
olite
s ov
er to
tal F
A
Not detected H J I
A C B
Supplementary Figure 3. MFSD2A modulates epoxygenation of DHA in HIMECs. Related to Figure 4. (A) Table listing µg of fatty acids/mg protein detected by Gas-Chromatography on shMFSD2A and shCTRL control HIMECs with or without DHA treatment (n= 5 per group; * refers to +DHA vs untreated; # refers to +DHA-shMFSD2A vs +DHA-shCTRL). (B) DHA/mg protein in healthy and active UC-HIMECs with or without DHA treatment (n=5 per group) . (C-E) Percentage of AA-, DHA-, EPA-, LA-, LNA-, DGLA- (C), LOX- (D), and COX- (E) derived metabolites over the total fatty acids (FA) analyzed by LC-MS/MS in MFSD2A-OE and GFP HIMECs (n=3 per group). (F) Heat map showing significant variations of DHA metabolites classified on the basis of CYP450, and LOX enzymatic pathways in the mucosa of healthy patients, patients with UC and patients undergoing remission (n=9 per group). (G) Percentage of CYP450-, LOX- and COX-derived AA metabolites over total fatty acids (FA) detected by LC-MS/MS in endoscopic mucosal biopsies of healthy patients, patients with UC and patients undergoing remission (n=9 per group). (H) Heat map showing significant variations of DHA metabolites classified on the basis of CYP450, and LOX enzymatic pathways in healthy and active UC-HIMECs (n=3 per group). (I) Percentage of CYP450- and LOX-derived DHA metabolites over total fatty acids (FA) detected by LC-MS/MS in healthy and active UC-HIMECs (n=3 per group). (J) Co-IP assay by using an anti-GFP antibody of MFSD2A-OE and GFP HIMECs. HepG2 cell line was used as positive control for CYP2C (n=2 independent experiments). (K) CYP2C transcript levels quantified by qRT-PCR in healthy and active UC-HIMECs (n=5 per group). (L) Percentage of CYP450-derived metabolites in healthy and active UC-HIMECs (n=3 per group). *P < 0,05; **P < 0,01; ***P<0,005; #P < 0,05. All data are represented as mean ±s.e.m.
Repaired
Healthy
Perc
enta
ge o
f met
abol
ites
over
tota
l FA
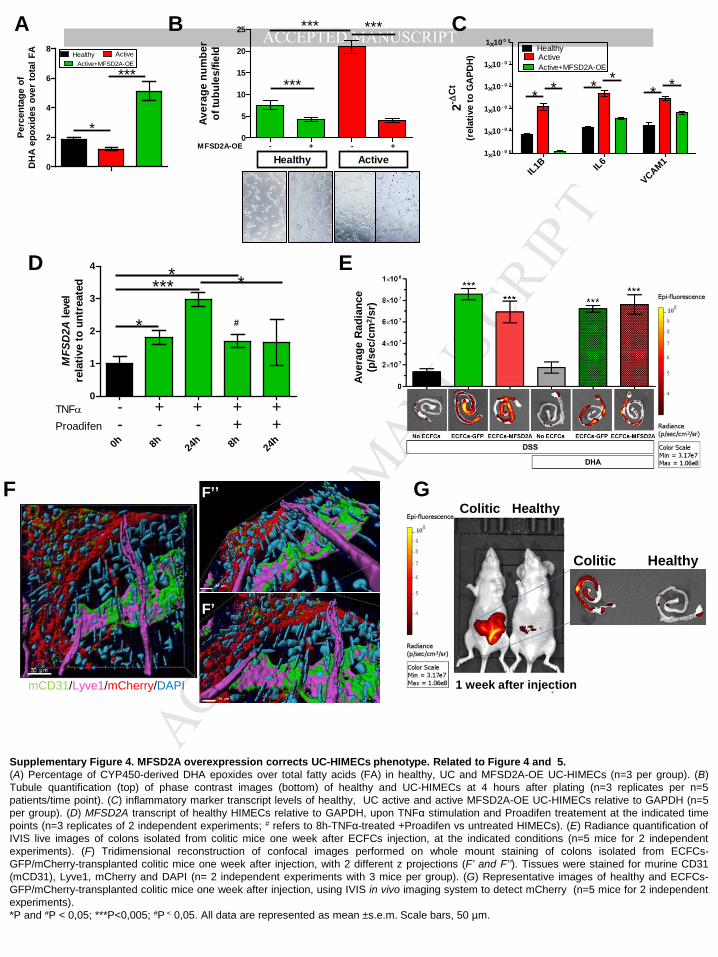
MANUSCRIP
T
ACCEPTED
ACCEPTED MANUSCRIPTB A C
0
5
10
15
20
25
MFSD2A-OE
Healthy Active
***
*** ***
Aver
age
num
ber
of tu
bule
s/fie
ld
- + - +
D
0
2
4
6
8
*
***
IL1B IL6
VCAM11×10 - 0 5
1×10 - 0 4
1×10 - 0 3
1×10 - 0 2
1×10 - 0 1
1×10 0 0
**** **
2- ∆C
t
(rel
ativ
e to
GA
PDH
)
MFS
D2A
leve
lre
lativ
e to
unt
reat
ed
0h 8h 24h 8h 24
h
0
1
2
3
4
*
**** *
TNFαProadifen
--
+-
++ +- + +
#
G
E
Aver
age
Rad
ianc
e (p
/sec
/cm
2 /sr)
F’
F’’
mCD31/Lyve1/mCherry/DAPI
F
Colitic Healthy
Colitic Healthy
1 week after injection
Perc
enta
ge o
f D
HA
epo
xide
s ov
er to
tal F
A
Supplementary Figure 4. MFSD2A overexpression corrects UC-HIMECs phenotype. Related to Figure 4 and 5. (A) Percentage of CYP450-derived DHA epoxides over total fatty acids (FA) in healthy, UC and MFSD2A-OE UC-HIMECs (n=3 per group). (B) Tubule quantification (top) of phase contrast images (bottom) of healthy and UC-HIMECs at 4 hours after plating (n=3 replicates per n=5 patients/time point). (C) inflammatory marker transcript levels of healthy, UC active and active MFSD2A-OE UC-HIMECs relative to GAPDH (n=5 per group). (D) MFSD2A transcript of healthy HIMECs relative to GAPDH, upon TNFα stimulation and Proadifen treatement at the indicated time points (n=3 replicates of 2 independent experiments; # refers to 8h-TNFα-treated +Proadifen vs untreated HIMECs). (E) Radiance quantification of IVIS live images of colons isolated from colitic mice one week after ECFCs injection, at the indicated conditions (n=5 mice for 2 independent experiments). (F) Tridimensional reconstruction of confocal images performed on whole mount staining of colons isolated from ECFCs-GFP/mCherry-transplanted colitic mice one week after injection, with 2 different z projections (F’ and F’’). Tissues were stained for murine CD31 (mCD31), Lyve1, mCherry and DAPI (n= 2 independent experiments with 3 mice per group). (G) Representative images of healthy and ECFCs-GFP/mCherry-transplanted colitic mice one week after injection, using IVIS in vivo imaging system to detect mCherry (n=5 mice for 2 independent experiments). *P and #P < 0,05; ***P<0,005; #P < 0,05. All data are represented as mean ±s.e.m. Scale bars, 50 µm.
Active
Active+MFSD2A-OE
Healthy
Active
Active+MFSD2A-OEHealthy
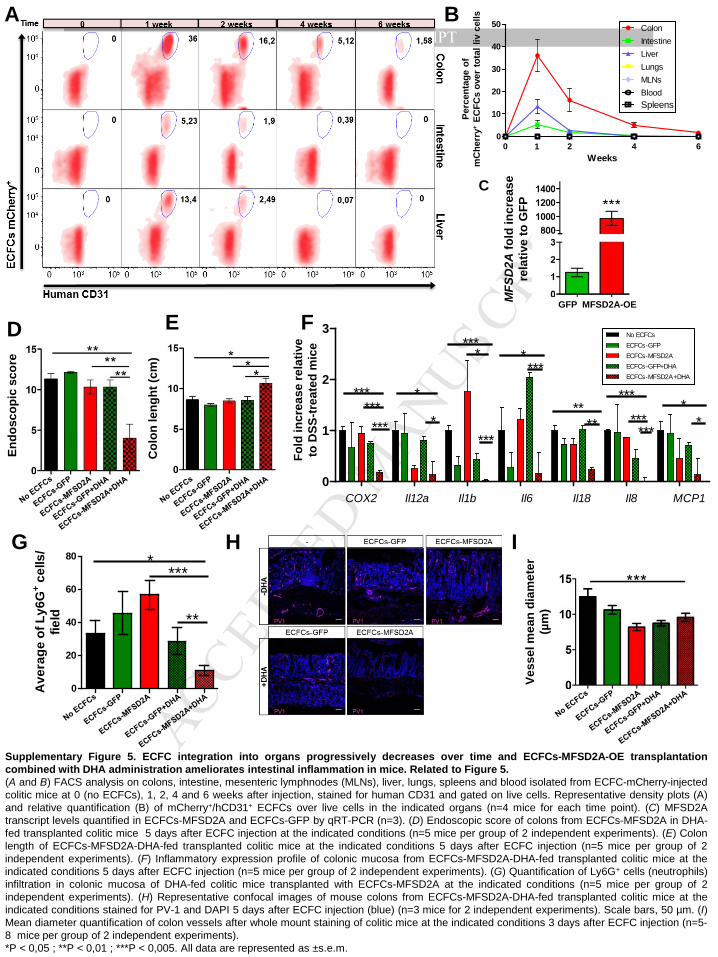
MANUSCRIP
T
ACCEPTED
ACCEPTED MANUSCRIPT
MFS
D2A
fold
incr
ease
re
lativ
e to
GFP
Col
on le
nght
(cm
)
Endo
scop
ic s
core
A
E
B
D
Vess
el m
ean
diam
eter
(µ
m)
Fold
incr
ease
rela
tive
to D
SS-tr
eate
d m
ice
F
C
G I
GFP MFSD2A-OE
H
Perc
enta
ge o
f m
Che
rry+
ECFC
s ov
er to
tal l
iv c
ells
Weeks
o
e to
ta
e ce
s
0 2 4 60
10
20
30
40
50 ColonIntestineLiverLungsMLNsBlood
1
Spleens
Supplementary Figure 5. ECFC integration into organs progressively decreases over time and ECFCs-MFSD2A-OE transplantation combined with DHA administration ameliorates intestinal inflammation in mice. Related to Figure 5. (A and B) FACS analysis on colons, intestine, mesenteric lymphnodes (MLNs), liver, lungs, spleens and blood isolated from ECFC-mCherry-injected colitic mice at 0 (no ECFCs), 1, 2, 4 and 6 weeks after injection, stained for human CD31 and gated on live cells. Representative density plots (A) and relative quantification (B) of mCherry+/hCD31+ ECFCs over live cells in the indicated organs (n=4 mice for each time point). (C) MFSD2A transcript levels quantified in ECFCs-MFSD2A and ECFCs-GFP by qRT-PCR (n=3). (D) Endoscopic score of colons from ECFCs-MFSD2A in DHA-fed transplanted colitic mice 5 days after ECFC injection at the indicated conditions (n=5 mice per group of 2 independent experiments). (E) Colon length of ECFCs-MFSD2A-DHA-fed transplanted colitic mice at the indicated conditions 5 days after ECFC injection (n=5 mice per group of 2 independent experiments). (F) Inflammatory expression profile of colonic mucosa from ECFCs-MFSD2A-DHA-fed transplanted colitic mice at the indicated conditions 5 days after ECFC injection (n=5 mice per group of 2 independent experiments). (G) Quantification of Ly6G+ cells (neutrophils) infiltration in colonic mucosa of DHA-fed colitic mice transplanted with ECFCs-MFSD2A at the indicated conditions (n=5 mice per group of 2 independent experiments). (H) Representative confocal images of mouse colons from ECFCs-MFSD2A-DHA-fed transplanted colitic mice at the indicated conditions stained for PV-1 and DAPI 5 days after ECFC injection (blue) (n=3 mice for 2 independent experiments). Scale bars, 50 µm. (I) Mean diameter quantification of colon vessels after whole mount staining of colitic mice at the indicated conditions 3 days after ECFC injection (n=5-8 mice per group of 2 independent experiments). *P < 0,05 ; **P < 0,01 ; ***P < 0,005. All data are represented as ±s.e.m.
0
1
2
3
***
******
***
*
*
****
***
****
*********
COX2
*
**
Il12a Il1b Il6 Il18 Il8 MCP1
0
20
40
60
80 ****
**
Ave
rage
of L
y6G
+ cel
ls/
field
ECFCs-MFSD2A
No ECFCsECFCs-GFP
ECFCs-GFP+DHAECFCs-MFSD2A+DHA
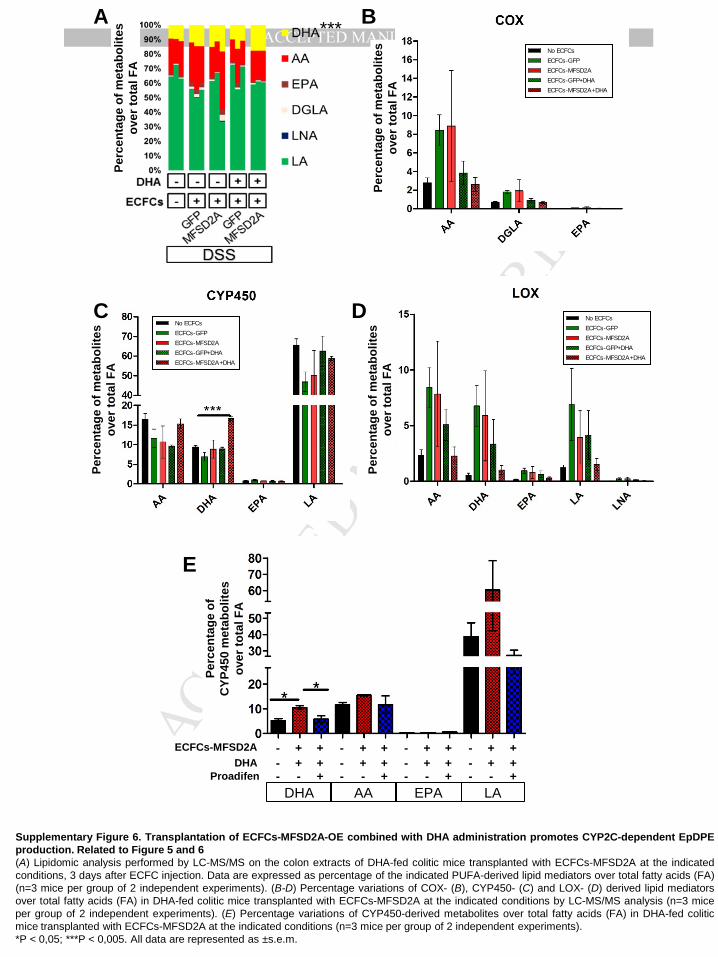
MANUSCRIP
T
ACCEPTED
ACCEPTED MANUSCRIPT***
E
B
C
Perc
enta
ge o
f met
abol
ites
ov
er to
tal F
A
- -
- - +
+ + + + - -
- - +
+ + + + - -
- + + +
+
+ ECFCs-MFSD2A
Proadifen DHA - + +
- -
- - +
+ + + +
DHA AA EPA LA
A
D
Perc
enta
ge o
f met
abol
ites
ov
er to
tal F
A
Perc
enta
ge o
f met
abol
ites
ov
er to
tal F
A
Perc
enta
ge o
f met
abol
ites
ov
er to
tal F
A
Perc
enta
ge o
f C
YP45
0 m
etab
olite
s
over
tota
l FA
Supplementary Figure 6. Transplantation of ECFCs-MFSD2A-OE combined with DHA administration promotes CYP2C-dependent EpDPE production. Related to Figure 5 and 6 (A) Lipidomic analysis performed by LC-MS/MS on the colon extracts of DHA-fed colitic mice transplanted with ECFCs-MFSD2A at the indicated conditions, 3 days after ECFC injection. Data are expressed as percentage of the indicated PUFA-derived lipid mediators over total fatty acids (FA) (n=3 mice per group of 2 independent experiments). (B-D) Percentage variations of COX- (B), CYP450- (C) and LOX- (D) derived lipid mediators over total fatty acids (FA) in DHA-fed colitic mice transplanted with ECFCs-MFSD2A at the indicated conditions by LC-MS/MS analysis (n=3 mice per group of 2 independent experiments). (E) Percentage variations of CYP450-derived metabolites over total fatty acids (FA) in DHA-fed colitic mice transplanted with ECFCs-MFSD2A at the indicated conditions (n=3 mice per group of 2 independent experiments). *P < 0,05; ***P < 0,005. All data are represented as ±s.e.m.
ECFCs-MFSD2A
No ECFCsECFCs-GFP
ECFCs-GFP+DHAECFCs-MFSD2A+DHA
ECFCs-MFSD2A
No ECFCsECFCs-GFP
ECFCs-GFP+DHAECFCs-MFSD2A+DHA
ECFCs-MFSD2A
No ECFCsECFCs-GFP
ECFCs-GFP+DHAECFCs-MFSD2A+DHA
MANUSCRIP
T
ACCEPTED
ACCEPTED MANUSCRIPTA B
Supplementary Figure 7. Administration of single EpDPEs does not ameliorate intestinal inflammation. Related to Figure 6 (A and B) DAI (A) and colon length (B) of colitic mice intraperitoneally injected with racemic mixture of the indicated EpDPEs every day starting from day 5 after DSS treatmentt (n=of 5 mice per group for 3 independent experiments). *P < 0,05; **P < 0,01; ***P<0,005. All data are represented as mean ±s.e.m.
MANUSCRIP
T
ACCEPTED
ACCEPTED MANUSCRIPT Supplementary Tables
Supplementary Table 1. Characteristics of patients with active UC, UC in remission and healthy controls enrolled for endoscopic biopsy collection. Correlation between age/gender and disease status was not statistically significant (age-disease linear correlation: r2=0,05421; F=1,433; p-value=0,2425; gender-disease linear correlation: r2=0,001168; F= 0,02924; p-value=0,8656).
Supplementary Table 2. Characteristics of patients with active UC not responding to any treatment and control subjects enrolled for immunofluorescence analyses and HIMEC isolation from surgical biopsies. Correlation between age/gender and disease status was not statistically significant (age-disease linear correlation: r2=0,2200; F=4,230; p-value=0,0575; gender-disease linear correlation: r2
=0,003086; F=
0,04644; p-value=0,8323).
Sex Age Endoscopic Mayo score Riley index Duration of disease (years) Extent of colitis Therapy in useF 34 2 3 9 Descending colon, sigma, rectum SteroidsF 56 2 3 N/A Pancolitis MesalazineM 33 3 4 9 Pancolitis Anti-JakM 49 3 4 18 Descending colon, sigma, rectum MesalazineM 40 2 3 5 Pancolitis Mesalazine/AzathioprineM 42 2 3 16 Descending colon, sigma, rectum MesalazineF 68 2 3 12 Descending colon, sigma, rectum MesalazineM 52 3 4 24 Descending colon, sigma, rectum MesalazineM 57 3 4 12 Descending colon, sigma, rectum Anti-JAKF 57 0 0 21 Descending colon, sigma, rectum MesalazineM 20 0 0 1 Descending colon, sigma, rectum anti-MAdCAM/AzathioprineF 56 0 0 N/A Pancolitis MesalazineM 37 0 0 4 Pancolitis Mesalazine; Infliximab M 43 0 0 8 Pancolitis MesalazineM 52 0 0 13 Descending colon, sigma, rectum InfliximabF 30 0 0 15 Descending colon, sigma, rectum MesalazineF 70 0 0 26 Descending colon, sigma, rectum Mesalazine/AzathioprineM 48 0 0 N/A Pancolitis MesalazineM 56 / / / Healthy No treatment
M 55 / / / Healthy No treatment
M 39 / / / Healthy No treatment
M 77 / / / Healthy No treatment
F 59 / / / Healthy No treatment
M 79 / / / Healthy No treatment
M 56 / / / Healthy No treatment
M 42 / / / Healthy No treatment
F 45 / / / Healthy No treatment
Act
ive
Rem
issi
onH
ealth
y
En
do
scop
ic bio
psies
Sex Age Duration of disease (years) Extent of colitis Therapy DiseaseM 46 18 Pancolitis Steroids/Azathioprine/Mesalazin/Infliximab UCM 43 20 Descending colon, sigma, rectum Steroids/Azathioprine/Mesalazin/Infliximab UCM 51 9 Descending colon, sigma, rectum Steroids/Azathioprine/Mesalazin/Infliximab UCF 68 9 Descending colon, sigma, rectum Steroids/Azathioprine/Mesalazin/Infliximab UCM 57 7 Pancolitis Steroids/Azathioprine/Mesalazin/Infliximab/Vedulizimab UCF 70 9 Descending colon, sigma, rectum Steroids/Azathioprine/Mesalazina UCF 27 3 Descending colon, sigma, rectum Steroids/Infliximab/Azathioprine UCF 24 4 Descending colon, sigma, rectum Steroids/Mesalazina/Azathioprine UCM 79 / / No anti-inflammatory therapy Colon cancerF 73 / / No anti-inflammatory therapy Colon cancerF 38 / / No anti-inflammatory therapy Colon cancerM 71 / / No anti-inflammatory therapy Colon cancerF 73 / / No anti-inflammatory therapy Colon cancerM 58 / / No anti-inflammatory therapy Colon cancerM 56 / / No anti-inflammatory therapy DiverticulosisF 58 / / No anti-inflammatory therapy PolypsM 61 / / No anti-inflammatory therapy Diverticulosis
Hea
lthy
Su
rgical sp
ecimen
s
Act
ive
MANUSCRIP
T
ACCEPTED
ACCEPTED MANUSCRIPT
Forward 5'-3' Reverse 5'-3'
Hum
an
IL1B AGGAGAATGACCTGAGCACC AGCCTCGTTATCCCATGTGTC IL18 TTGCATCAACTTTGTGGCA GCCAAAGTAATCTGATTCC IL12A CCTTGCACTTCTGAAGAGATTGA ACAGGGCCATCATAAAAGAGGT IL6 AACAAATTCGGTACATCCTCG GCTTTCACACATGTTACTCTTG IL8 AACCCTCTGCACCCAGTTTTC TTTTGCCAAGGAGTGCTAAAGA COX2 TGGAACGTTGTGAATAACATT GTAAGTTGGTGGACTGTCAATC MCP1 AGTCTCTGCCGCCCTTCT GTGACTGGGGCATTGATTG CYP2C GAAAGAGCTAACAGAGGATTTG AAAGTGGGATCACAGGGTGAGG MFSD2A ACACGCCTTGTTTCCAGGAC GCCAGCAGGTATGCCTTTTG MADCAM1 GGGGGCCGCACCTTCCAGCA GTACAGGCCACCTCCGGGTCACC GAPDH CATGAGAAGTATGACAACAGC AGTCCTTCCACGATACCAAAG
Mou
se
Angiopoietin 1 TCAGCCTTTGCACTAAAGAAGG ACAGTCTCGAAATGGTTTCTCT Il18 AGCAGTCCCAACTAAGCAGTA CAGCCAGTAGAGGATGCTGA Angiopoietin 2 GGAAACTGACTGATGTGGAAG GAGTCTTGTCGTGTTTAG Madcam1 TTCACTGCCAGGTCACCATG GTGAGGTCTGGCTCTGTAG Il8 TCGAGACCATTTACTGCAACAG CATTGCCGGTGGAAATTCCTT COX2 CACCCTGACATAGACAGTGAAAG CTGGGTCACGTTGGATGAGG Vcam1 TGGTGAAATGGAATCTGAACC CCCAGATGGTGGTTTCCTT N o s 2 GTTCTCAGCCCAACAATACAAG GTGGACGGGTCGATGTCAC
Vegfa TTTACTGCTGTACCTCCACCA ATCTCTCCTATGTGCTGGCTTT Il1b AGTTGACGGACCCCAAAA AGCTGGATGCTCTCATCAGG Il6 TAGTCCTCCCTACCCCAATTTC TTGGTCCTTAGCCACTCCTTC Il12a TCAGAATCACAACCATCAGCA CGCCATTATGATTCAGAGACTG Gapdh CGTGTTCCTACCCCCAATGT TGTCATCATACTTGGCAGGTTTCT
Table S3. List of primers used for qRT-PCR
MANUSCRIP
T
ACCEPTED
ACCEPTED MANUSCRIPTSupplemental Experimental Procedures Patients For endoscopic biopsies undergoing lipidomic, RNA and protein expression analyses, patients with UC undergoing endoscopy were diagnosed by physicians based on clinical, endoscopic and histological criteria. Endoscopic activities were assessed using the endoscopic Mayo score (normal: 0=inactive disease; erythema/decreased vascular pattern/mild friability/erosions: 1=mild disease; marked erythema/lack of vascular pattern/friability: 2=moderate disease; spontaneous bleeding/ulceration: 3=severe disease1, and the Riley histological scoring system 2. Active mucosal biopsies were defined by endoscopic Mayo score ≥2 and Riley Index≥3; biopsies under remission were defined by Mayo score=0 and Riley Index ≤1. Healthy endoscopic biopsies were obtained from patients undergoing routine check-up for non-IBD related diseases. Inclusion criteria were: 1) treatment with thiopurines (azathioprine± steroids), monoclonal antibodies and enzyme inhibitors (infliximab, vedolizumab, anti-MadCam, anti-JAK); 2) with a balanced mixed Western and Mediterranean diet; 2) with moderate or severe illness and decreased food intake. Exclusion criteria were: 1) age less than 16 or greater than 80 years; 2) patients taking trace elements (vitamins, fish oil), hypolipemiant drugs, or non-steroidal anti-inflammatory drugs in the previous 3 months; 3) patients with associated acute or chronic diseases other than IBD that could disturb fatty acid pattern; 4) patients with previous intestinal resection; 5) refusal to undergo endoscopic evaluation. All mucosal biopsy samples were snap-frozen and stored at –80°C until use (see Supplementary Table 1 for patient characteristics). For HIMECs isolation and immunofluorescence analysis, intestinal tissues from involved areas were obtained from surgical specimens of patients with active UC not responding to any treatment. Healthy tissues from the large intestine of patients admitted for bowel resection due to colon cancer, polyps, or diverticulosis were used as controls (see Supplementary Table 2 for patient characteristics). Inclusion and exclusion criteria were the same used for endoscopic biopsy selection. Samples were not randomized and allocation and evaluation of clinical disease parameters were not blinded. The study was approved by the Humanitas Research Hospital ethics committee (Protocol number CE Humanitas ex D.M.8/2/2013-183/14). All subjects provided written informed consent.
Mice CD1 nude mice (Charles River Laboratories) were maintained in our specific-pathogen free (SPF) animal facility and used at 8 weeks of age. All experiments were performed in accordance with the guidelines established in the Principle of Laboratory Animal Care (directive 86/609/EEC) and were approved by the Italian Ministry of Health. Housing was temperature controlled, with a 12-hour light/12-hour dark cycle. Procedures involving mice were conformed to institutional guidelines in agreement with national and international law and were approved by the ethics committee of the Humanitas Research Hospital. On the basis of our experience with animal models and according to animal-welfare policy (directive 86/609/EEC), which strongly suggests the use of a limited number of animals, we estimated that two experiments with n = 5 mice per group would allow us to reach statistical significance. Mice were not randomized and both experimental mice allocation and evaluation of clinical disease parameters were not blinded.
Liquid Chromatography tandem mass spectrometry (LC-MS/MS) analysis
Sample preparation. Endoscopic biopsies collected from the colonic mucosa of patients with active UC (n=9), UC in remission (n=9), and healthy subjects admitted for routine check-up not due to IBD-related symptoms (n=9), were snap frozen in dry ice. HIMECs were maintained in culture for 16 hours with phenol red-free DMEM and 0,4% BSA. Cells were then scraped, collected with the respective medium and snap-frozen in dry ice. For mouse colons, distal and proximal segments, were collected 3 days after ECFC injection and immediately snap frozen for lipid extraction. LC-MS/MS and Lipidomic analysis. Tissue samples and cells were homogenized in phosphate buffer using a bead homogenizer (Precellys, Bertin Technologies), with a typical 1:9 ratio of solid sample to buffer. Samples (adjusted to a maximum volume of 1-2 ml) were spiked with a mixture of internal standards consisting of 15(S)-HETE-d8, Leukotriene B4-d4, Resolvin D2-d5, 14(15)-EpETrE-d11, and prostaglandin E1-d4 (5 ng each) for recovery and quantitation, and mixed thoroughly. The samples were then extracted for PUFA metabolites using C18 extraction columns, as described earlier 3–6. Briefly, the internal standard spiked samples were applied to conditioned C18 cartridges, washed with water followed by hexane and dried under vacuum. The cartridges were eluted with 0.5 ml methanol. The eluate was then dried under a gentle stream of nitrogen. The residue was re-dissolved in 50 µl methanol-25 mM aqueous ammonium acetate (1:1) and subjected to LC-MS analysis. HPLC was performed on a Prominence XR system (Shimadzu) using Luna C18 (3µ, 2.1x150 mm) column. The mobile phase consists of a gradient between A: methanol-water-acetonitrile
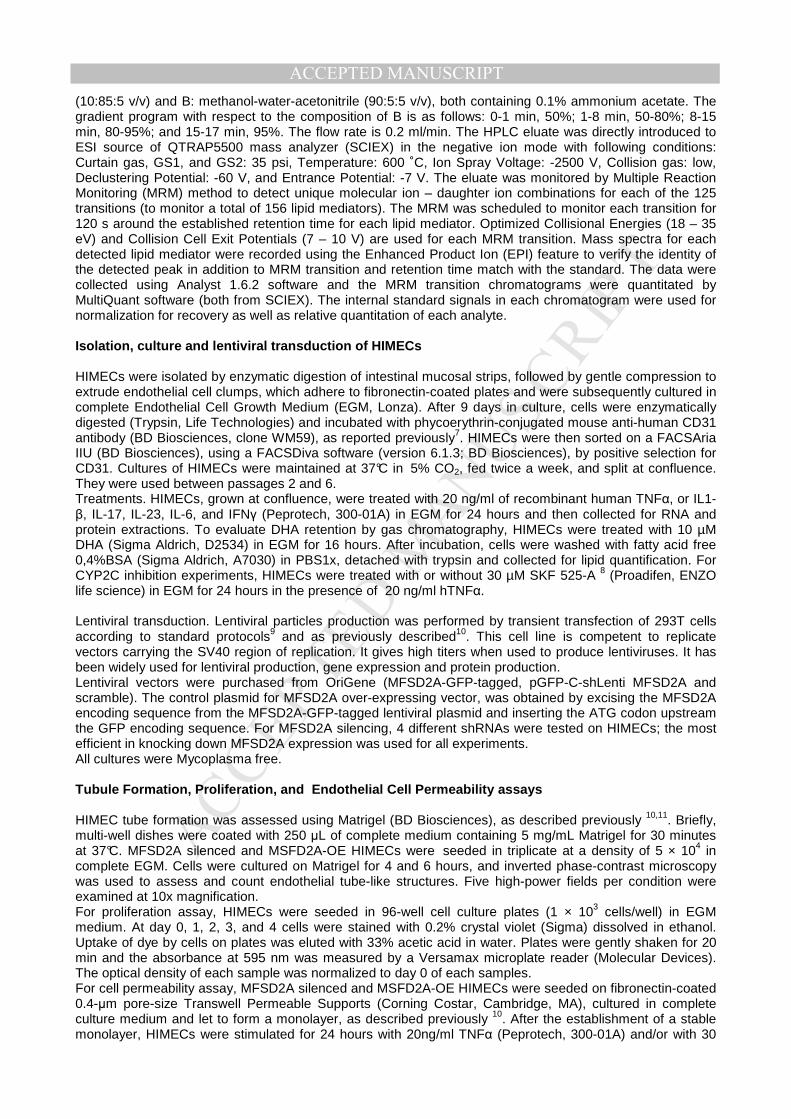
MANUSCRIP
T
ACCEPTED
ACCEPTED MANUSCRIPT(10:85:5 v/v) and B: methanol-water-acetonitrile (90:5:5 v/v), both containing 0.1% ammonium acetate. The gradient program with respect to the composition of B is as follows: 0-1 min, 50%; 1-8 min, 50-80%; 8-15 min, 80-95%; and 15-17 min, 95%. The flow rate is 0.2 ml/min. The HPLC eluate was directly introduced to ESI source of QTRAP5500 mass analyzer (SCIEX) in the negative ion mode with following conditions: Curtain gas, GS1, and GS2: 35 psi, Temperature: 600 ˚C, Ion Spray Voltage: -2500 V, Collision gas: low, Declustering Potential: -60 V, and Entrance Potential: -7 V. The eluate was monitored by Multiple Reaction Monitoring (MRM) method to detect unique molecular ion – daughter ion combinations for each of the 125 transitions (to monitor a total of 156 lipid mediators). The MRM was scheduled to monitor each transition for 120 s around the established retention time for each lipid mediator. Optimized Collisional Energies (18 – 35 eV) and Collision Cell Exit Potentials (7 – 10 V) are used for each MRM transition. Mass spectra for each detected lipid mediator were recorded using the Enhanced Product Ion (EPI) feature to verify the identity of the detected peak in addition to MRM transition and retention time match with the standard. The data were collected using Analyst 1.6.2 software and the MRM transition chromatograms were quantitated by MultiQuant software (both from SCIEX). The internal standard signals in each chromatogram were used for normalization for recovery as well as relative quantitation of each analyte. Isolation, culture and lentiviral transduction of HIMECs HIMECs were isolated by enzymatic digestion of intestinal mucosal strips, followed by gentle compression to extrude endothelial cell clumps, which adhere to fibronectin-coated plates and were subsequently cultured in complete Endothelial Cell Growth Medium (EGM, Lonza). After 9 days in culture, cells were enzymatically digested (Trypsin, Life Technologies) and incubated with phycoerythrin-conjugated mouse anti-human CD31 antibody (BD Biosciences, clone WM59), as reported previously7. HIMECs were then sorted on a FACSAria IIU (BD Biosciences), using a FACSDiva software (version 6.1.3; BD Biosciences), by positive selection for CD31. Cultures of HIMECs were maintained at 37°C in 5% CO2, fed twice a week, and split at confluence. They were used between passages 2 and 6. Treatments. HIMECs, grown at confluence, were treated with 20 ng/ml of recombinant human TNFα, or IL1-β, IL-17, IL-23, IL-6, and IFNγ (Peprotech, 300-01A) in EGM for 24 hours and then collected for RNA and protein extractions. To evaluate DHA retention by gas chromatography, HIMECs were treated with 10 µM DHA (Sigma Aldrich, D2534) in EGM for 16 hours. After incubation, cells were washed with fatty acid free 0,4%BSA (Sigma Aldrich, A7030) in PBS1x, detached with trypsin and collected for lipid quantification. For CYP2C inhibition experiments, HIMECs were treated with or without 30 µM SKF 525-A 8 (Proadifen, ENZO life science) in EGM for 24 hours in the presence of 20 ng/ml hTNFα. Lentiviral transduction. Lentiviral particles production was performed by transient transfection of 293T cells according to standard protocols9 and as previously described10. This cell line is competent to replicate vectors carrying the SV40 region of replication. It gives high titers when used to produce lentiviruses. It has been widely used for lentiviral production, gene expression and protein production. Lentiviral vectors were purchased from OriGene (MFSD2A-GFP-tagged, pGFP-C-shLenti MFSD2A and scramble). The control plasmid for MFSD2A over-expressing vector, was obtained by excising the MFSD2A encoding sequence from the MFSD2A-GFP-tagged lentiviral plasmid and inserting the ATG codon upstream the GFP encoding sequence. For MFSD2A silencing, 4 different shRNAs were tested on HIMECs; the most efficient in knocking down MFSD2A expression was used for all experiments. All cultures were Mycoplasma free. Tubule Formation, Proliferation, and Endothelial Cell Permeability assays HIMEC tube formation was assessed using Matrigel (BD Biosciences), as described previously 10,11. Briefly, multi-well dishes were coated with 250 µL of complete medium containing 5 mg/mL Matrigel for 30 minutes at 37°C. MFSD2A silenced and MSFD2A-OE HIMECs were seeded in triplicate at a density of 5 × 10⁴ in complete EGM. Cells were cultured on Matrigel for 4 and 6 hours, and inverted phase-contrast microscopy was used to assess and count endothelial tube-like structures. Five high-power fields per condition were examined at 10x magnification. For proliferation assay, HIMECs were seeded in 96-well cell culture plates (1 × 10³ cells/well) in EGM medium. At day 0, 1, 2, 3, and 4 cells were stained with 0.2% crystal violet (Sigma) dissolved in ethanol. Uptake of dye by cells on plates was eluted with 33% acetic acid in water. Plates were gently shaken for 20 min and the absorbance at 595 nm was measured by a Versamax microplate reader (Molecular Devices). The optical density of each sample was normalized to day 0 of each samples. For cell permeability assay, MFSD2A silenced and MSFD2A-OE HIMECs were seeded on fibronectin-coated 0.4-µm pore-size Transwell Permeable Supports (Corning Costar, Cambridge, MA), cultured in complete culture medium and let to form a monolayer, as described previously 10. After the establishment of a stable monolayer, HIMECs were stimulated for 24 hours with 20ng/ml TNFα (Peprotech, 300-01A) and/or with 30
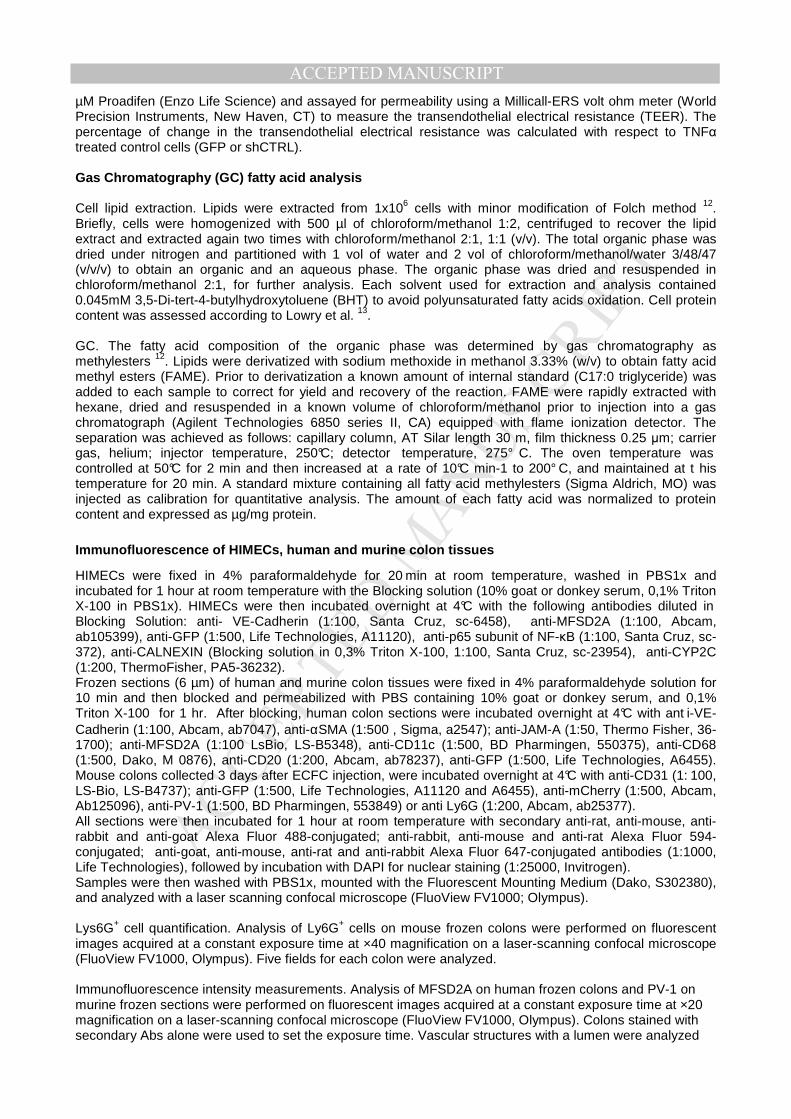
MANUSCRIP
T
ACCEPTED
ACCEPTED MANUSCRIPTµM Proadifen (Enzo Life Science) and assayed for permeability using a Millicall-ERS volt ohm meter (World Precision Instruments, New Haven, CT) to measure the transendothelial electrical resistance (TEER). The percentage of change in the transendothelial electrical resistance was calculated with respect to TNFα treated control cells (GFP or shCTRL). Gas Chromatography (GC) fatty acid analysis Cell lipid extraction. Lipids were extracted from 1x10⁶ cells with minor modification of Folch method 12. Briefly, cells were homogenized with 500 µl of chloroform/methanol 1:2, centrifuged to recover the lipid extract and extracted again two times with chloroform/methanol 2:1, 1:1 (v/v). The total organic phase was dried under nitrogen and partitioned with 1 vol of water and 2 vol of chloroform/methanol/water 3/48/47 (v/v/v) to obtain an organic and an aqueous phase. The organic phase was dried and resuspended in chloroform/methanol 2:1, for further analysis. Each solvent used for extraction and analysis contained 0.045mM 3,5-Di-tert-4-butylhydroxytoluene (BHT) to avoid polyunsaturated fatty acids oxidation. Cell protein content was assessed according to Lowry et al. 13. GC. The fatty acid composition of the organic phase was determined by gas chromatography as methylesters 12. Lipids were derivatized with sodium methoxide in methanol 3.33% (w/v) to obtain fatty acid methyl esters (FAME). Prior to derivatization a known amount of internal standard (C17:0 triglyceride) was added to each sample to correct for yield and recovery of the reaction. FAME were rapidly extracted with hexane, dried and resuspended in a known volume of chloroform/methanol prior to injection into a gas chromatograph (Agilent Technologies 6850 series II, CA) equipped with flame ionization detector. The separation was achieved as follows: capillary column, AT Silar length 30 m, film thickness 0.25 µm; carrier gas, helium; injector temperature, 250°C; detector temperature, 275° C. The oven temperature was controlled at 50°C for 2 min and then increased at a rate of 10°C min-1 to 200° C, and maintained at t his temperature for 20 min. A standard mixture containing all fatty acid methylesters (Sigma Aldrich, MO) was injected as calibration for quantitative analysis. The amount of each fatty acid was normalized to protein content and expressed as µg/mg protein.
Immunofluorescence of HIMECs, human and murine colon tissues
HIMECs were fixed in 4% paraformaldehyde for 20 min at room temperature, washed in PBS1x and incubated for 1 hour at room temperature with the Blocking solution (10% goat or donkey serum, 0,1% Triton X-100 in PBS1x). HIMECs were then incubated overnight at 4°C with the following antibodies diluted in Blocking Solution: anti- VE-Cadherin (1:100, Santa Cruz, sc-6458), anti-MFSD2A (1:100, Abcam, ab105399), anti-GFP (1:500, Life Technologies, A11120), anti-p65 subunit of NF-κB (1:100, Santa Cruz, sc-372), anti-CALNEXIN (Blocking solution in 0,3% Triton X-100, 1:100, Santa Cruz, sc-23954), anti-CYP2C (1:200, ThermoFisher, PA5-36232). Frozen sections (6 µm) of human and murine colon tissues were fixed in 4% paraformaldehyde solution for 10 min and then blocked and permeabilized with PBS containing 10% goat or donkey serum, and 0,1% Triton X-100 for 1 hr. After blocking, human colon sections were incubated overnight at 4°C with ant i-VE-Cadherin (1:100, Abcam, ab7047), anti-αSMA (1:500 , Sigma, a2547); anti-JAM-A (1:50, Thermo Fisher, 36-1700); anti-MFSD2A (1:100 LsBio, LS-B5348), anti-CD11c (1:500, BD Pharmingen, 550375), anti-CD68 (1:500, Dako, M 0876), anti-CD20 (1:200, Abcam, ab78237), anti-GFP (1:500, Life Technologies, A6455). Mouse colons collected 3 days after ECFC injection, were incubated overnight at 4°C with anti-CD31 (1: 100, LS-Bio, LS-B4737); anti-GFP (1:500, Life Technologies, A11120 and A6455), anti-mCherry (1:500, Abcam, Ab125096), anti-PV-1 (1:500, BD Pharmingen, 553849) or anti Ly6G (1:200, Abcam, ab25377). All sections were then incubated for 1 hour at room temperature with secondary anti-rat, anti-mouse, anti-rabbit and anti-goat Alexa Fluor 488-conjugated; anti-rabbit, anti-mouse and anti-rat Alexa Fluor 594-conjugated; anti-goat, anti-mouse, anti-rat and anti-rabbit Alexa Fluor 647-conjugated antibodies (1:1000, Life Technologies), followed by incubation with DAPI for nuclear staining (1:25000, Invitrogen). Samples were then washed with PBS1x, mounted with the Fluorescent Mounting Medium (Dako, S302380), and analyzed with a laser scanning confocal microscope (FluoView FV1000; Olympus). Lys6G+ cell quantification. Analysis of Ly6G+ cells on mouse frozen colons were performed on fluorescent images acquired at a constant exposure time at ×40 magnification on a laser-scanning confocal microscope (FluoView FV1000, Olympus). Five fields for each colon were analyzed. Immunofluorescence intensity measurements. Analysis of MFSD2A on human frozen colons and PV-1 on murine frozen sections were performed on fluorescent images acquired at a constant exposure time at ×20 magnification on a laser-scanning confocal microscope (FluoView FV1000, Olympus). Colons stained with secondary Abs alone were used to set the exposure time. Vascular structures with a lumen were analyzed
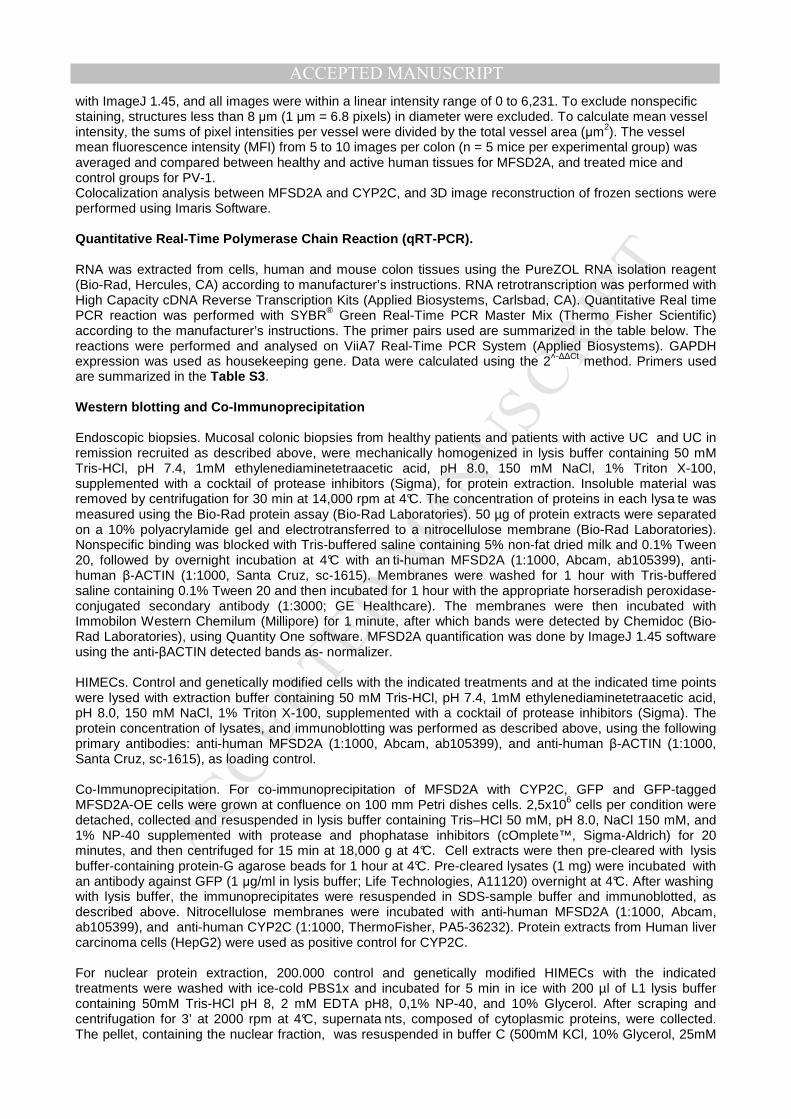
MANUSCRIP
T
ACCEPTED
ACCEPTED MANUSCRIPTwith ImageJ 1.45, and all images were within a linear intensity range of 0 to 6,231. To exclude nonspecific staining, structures less than 8 µm (1 µm = 6.8 pixels) in diameter were excluded. To calculate mean vessel intensity, the sums of pixel intensities per vessel were divided by the total vessel area (µm2). The vessel mean fluorescence intensity (MFI) from 5 to 10 images per colon (n = 5 mice per experimental group) was averaged and compared between healthy and active human tissues for MFSD2A, and treated mice and control groups for PV-1. Colocalization analysis between MFSD2A and CYP2C, and 3D image reconstruction of frozen sections were performed using Imaris Software. Quantitative Real-Time Polymerase Chain Reaction (qRT-PCR). RNA was extracted from cells, human and mouse colon tissues using the PureZOL RNA isolation reagent (Bio-Rad, Hercules, CA) according to manufacturer’s instructions. RNA retrotranscription was performed with High Capacity cDNA Reverse Transcription Kits (Applied Biosystems, Carlsbad, CA). Quantitative Real time PCR reaction was performed with SYBR® Green Real-Time PCR Master Mix (Thermo Fisher Scientific) according to the manufacturer’s instructions. The primer pairs used are summarized in the table below. The reactions were performed and analysed on ViiA7 Real-Time PCR System (Applied Biosystems). GAPDH expression was used as housekeeping gene. Data were calculated using the 2˄-∆∆Ct method. Primers used are summarized in the Table S3. Western blotting and Co-Immunoprecipitation Endoscopic biopsies. Mucosal colonic biopsies from healthy patients and patients with active UC and UC in remission recruited as described above, were mechanically homogenized in lysis buffer containing 50 mM Tris-HCl, pH 7.4, 1mM ethylenediaminetetraacetic acid, pH 8.0, 150 mM NaCl, 1% Triton X-100, supplemented with a cocktail of protease inhibitors (Sigma), for protein extraction. Insoluble material was removed by centrifugation for 30 min at 14,000 rpm at 4°C. The concentration of proteins in each lysa te was measured using the Bio-Rad protein assay (Bio-Rad Laboratories). 50 µg of protein extracts were separated on a 10% polyacrylamide gel and electrotransferred to a nitrocellulose membrane (Bio-Rad Laboratories). Nonspecific binding was blocked with Tris-buffered saline containing 5% non-fat dried milk and 0.1% Tween 20, followed by overnight incubation at 4°C with an ti-human MFSD2A (1:1000, Abcam, ab105399), anti-human β-ACTIN (1:1000, Santa Cruz, sc-1615). Membranes were washed for 1 hour with Tris-buffered saline containing 0.1% Tween 20 and then incubated for 1 hour with the appropriate horseradish peroxidase-conjugated secondary antibody (1:3000; GE Healthcare). The membranes were then incubated with Immobilon Western Chemilum (Millipore) for 1 minute, after which bands were detected by Chemidoc (Bio-Rad Laboratories), using Quantity One software. MFSD2A quantification was done by ImageJ 1.45 software using the anti-βACTIN detected bands as- normalizer. HIMECs. Control and genetically modified cells with the indicated treatments and at the indicated time points were lysed with extraction buffer containing 50 mM Tris-HCl, pH 7.4, 1mM ethylenediaminetetraacetic acid, pH 8.0, 150 mM NaCl, 1% Triton X-100, supplemented with a cocktail of protease inhibitors (Sigma). The protein concentration of lysates, and immunoblotting was performed as described above, using the following primary antibodies: anti-human MFSD2A (1:1000, Abcam, ab105399), and anti-human β-ACTIN (1:1000, Santa Cruz, sc-1615), as loading control. Co-Immunoprecipitation. For co-immunoprecipitation of MFSD2A with CYP2C, GFP and GFP-tagged MFSD2A-OE cells were grown at confluence on 100 mm Petri dishes cells. 2,5x10⁶ cells per condition were detached, collected and resuspended in lysis buffer containing Tris–HCl 50 mM, pH 8.0, NaCl 150 mM, and 1% NP-40 supplemented with protease and phophatase inhibitors (cOmplete™, Sigma-Aldrich) for 20 minutes, and then centrifuged for 15 min at 18,000 g at 4°C. Cell extracts were then pre-cleared with lysis buffer-containing protein-G agarose beads for 1 hour at 4°C. Pre-cleared lysates (1 mg) were incubated with an antibody against GFP (1 µg/ml in lysis buffer; Life Technologies, A11120) overnight at 4°C. After washing with lysis buffer, the immunoprecipitates were resuspended in SDS-sample buffer and immunoblotted, as described above. Nitrocellulose membranes were incubated with anti-human MFSD2A (1:1000, Abcam, ab105399), and anti-human CYP2C (1:1000, ThermoFisher, PA5-36232). Protein extracts from Human liver carcinoma cells (HepG2) were used as positive control for CYP2C. For nuclear protein extraction, 200.000 control and genetically modified HIMECs with the indicated treatments were washed with ice-cold PBS1x and incubated for 5 min in ice with 200 µl of L1 lysis buffer containing 50mM Tris-HCl pH 8, 2 mM EDTA pH8, 0,1% NP-40, and 10% Glycerol. After scraping and centrifugation for 3’ at 2000 rpm at 4°C, supernata nts, composed of cytoplasmic proteins, were collected. The pellet, containing the nuclear fraction, was resuspended in buffer C (500mM KCl, 10% Glycerol, 25mM
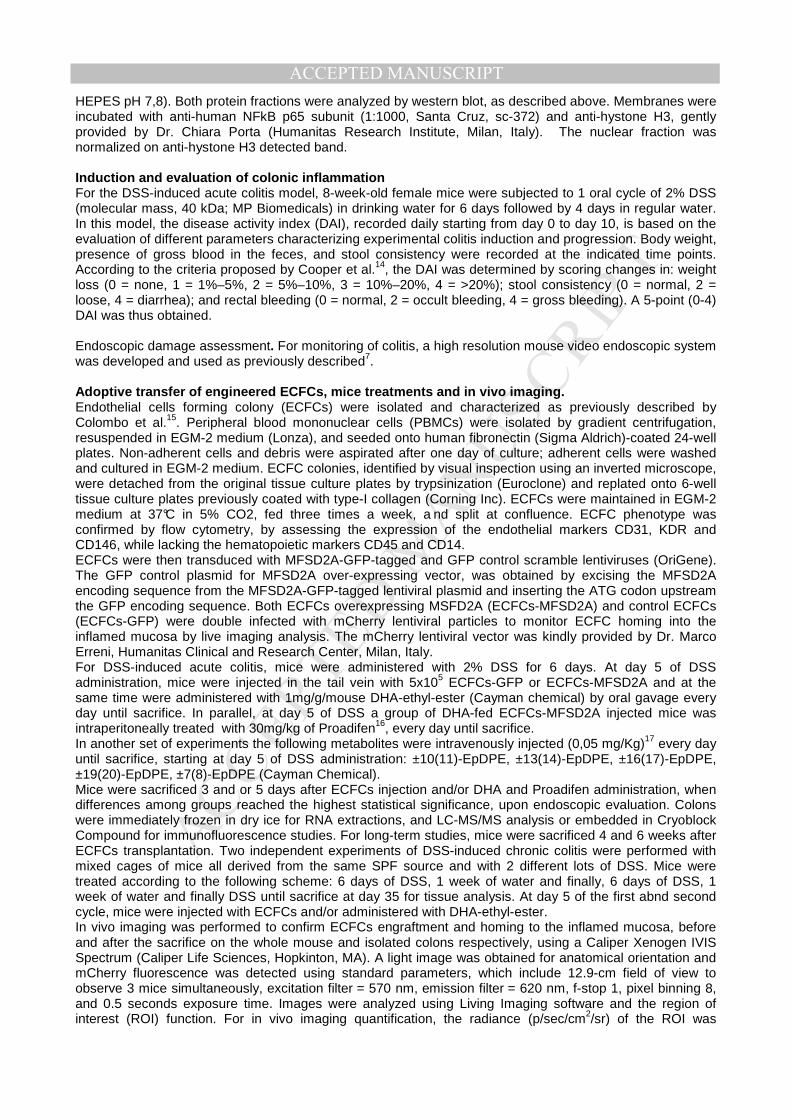
MANUSCRIP
T
ACCEPTED
ACCEPTED MANUSCRIPTHEPES pH 7,8). Both protein fractions were analyzed by western blot, as described above. Membranes were incubated with anti-human NFkB p65 subunit (1:1000, Santa Cruz, sc-372) and anti-hystone H3, gently provided by Dr. Chiara Porta (Humanitas Research Institute, Milan, Italy). The nuclear fraction was normalized on anti-hystone H3 detected band. Induction and evaluation of colonic inflammation For the DSS-induced acute colitis model, 8-week-old female mice were subjected to 1 oral cycle of 2% DSS (molecular mass, 40 kDa; MP Biomedicals) in drinking water for 6 days followed by 4 days in regular water. In this model, the disease activity index (DAI), recorded daily starting from day 0 to day 10, is based on the evaluation of different parameters characterizing experimental colitis induction and progression. Body weight, presence of gross blood in the feces, and stool consistency were recorded at the indicated time points. According to the criteria proposed by Cooper et al.14, the DAI was determined by scoring changes in: weight loss (0 = none, 1 = 1%–5%, 2 = 5%–10%, 3 = 10%–20%, 4 = >20%); stool consistency (0 = normal, 2 = loose, 4 = diarrhea); and rectal bleeding (0 = normal, 2 = occult bleeding, 4 = gross bleeding). A 5-point (0-4) DAI was thus obtained. Endoscopic damage assessment. For monitoring of colitis, a high resolution mouse video endoscopic system was developed and used as previously described7. Adoptive transfer of engineered ECFCs, mice treatments and in vivo imaging. Endothelial cells forming colony (ECFCs) were isolated and characterized as previously described by Colombo et al.15. Peripheral blood mononuclear cells (PBMCs) were isolated by gradient centrifugation, resuspended in EGM-2 medium (Lonza), and seeded onto human fibronectin (Sigma Aldrich)-coated 24-well plates. Non-adherent cells and debris were aspirated after one day of culture; adherent cells were washed and cultured in EGM-2 medium. ECFC colonies, identified by visual inspection using an inverted microscope, were detached from the original tissue culture plates by trypsinization (Euroclone) and replated onto 6-well tissue culture plates previously coated with type-I collagen (Corning Inc). ECFCs were maintained in EGM-2 medium at 37°C in 5% CO2, fed three times a week, a nd split at confluence. ECFC phenotype was confirmed by flow cytometry, by assessing the expression of the endothelial markers CD31, KDR and CD146, while lacking the hematopoietic markers CD45 and CD14. ECFCs were then transduced with MFSD2A-GFP-tagged and GFP control scramble lentiviruses (OriGene). The GFP control plasmid for MFSD2A over-expressing vector, was obtained by excising the MFSD2A encoding sequence from the MFSD2A-GFP-tagged lentiviral plasmid and inserting the ATG codon upstream the GFP encoding sequence. Both ECFCs overexpressing MSFD2A (ECFCs-MFSD2A) and control ECFCs (ECFCs-GFP) were double infected with mCherry lentiviral particles to monitor ECFC homing into the inflamed mucosa by live imaging analysis. The mCherry lentiviral vector was kindly provided by Dr. Marco Erreni, Humanitas Clinical and Research Center, Milan, Italy. For DSS-induced acute colitis, mice were administered with 2% DSS for 6 days. At day 5 of DSS administration, mice were injected in the tail vein with 5x10⁵ ECFCs-GFP or ECFCs-MFSD2A and at the same time were administered with 1mg/g/mouse DHA-ethyl-ester (Cayman chemical) by oral gavage every day until sacrifice. In parallel, at day 5 of DSS a group of DHA-fed ECFCs-MFSD2A injected mice was intraperitoneally treated with 30mg/kg of Proadifen16, every day until sacrifice. In another set of experiments the following metabolites were intravenously injected (0,05 mg/Kg)17 every day until sacrifice, starting at day 5 of DSS administration: ±10(11)-EpDPE, ±13(14)-EpDPE, ±16(17)-EpDPE, ±19(20)-EpDPE, ±7(8)-EpDPE (Cayman Chemical). Mice were sacrificed 3 and or 5 days after ECFCs injection and/or DHA and Proadifen administration, when differences among groups reached the highest statistical significance, upon endoscopic evaluation. Colons were immediately frozen in dry ice for RNA extractions, and LC-MS/MS analysis or embedded in Cryoblock Compound for immunofluorescence studies. For long-term studies, mice were sacrificed 4 and 6 weeks after ECFCs transplantation. Two independent experiments of DSS-induced chronic colitis were performed with mixed cages of mice all derived from the same SPF source and with 2 different lots of DSS. Mice were treated according to the following scheme: 6 days of DSS, 1 week of water and finally, 6 days of DSS, 1 week of water and finally DSS until sacrifice at day 35 for tissue analysis. At day 5 of the first abnd second cycle, mice were injected with ECFCs and/or administered with DHA-ethyl-ester. In vivo imaging was performed to confirm ECFCs engraftment and homing to the inflamed mucosa, before and after the sacrifice on the whole mouse and isolated colons respectively, using a Caliper Xenogen IVIS Spectrum (Caliper Life Sciences, Hopkinton, MA). A light image was obtained for anatomical orientation and mCherry fluorescence was detected using standard parameters, which include 12.9-cm field of view to observe 3 mice simultaneously, excitation filter = 570 nm, emission filter = 620 nm, f-stop 1, pixel binning 8, and 0.5 seconds exposure time. Images were analyzed using Living Imaging software and the region of interest (ROI) function. For in vivo imaging quantification, the radiance (p/sec/cm2/sr) of the ROI was
MANUSCRIP
T
ACCEPTED
ACCEPTED MANUSCRIPTautomatically calculated by the Caliper Xenogen IVIS Spectrum Software. Three ROIs for each colon where used for calculating the average of radiance. FACS analysis of mCherry-ECFCs-injected colitic mice Nude CD1 colitic mice were injected with 5x10⁵ mCherry transduced ECFCs at day 5 of 2% DSS treatment. Not-injected colitic mice were used as controls. Mice were sacrificed 1, 2 4 and 6 weeks after ECFC injection. Organs were isolated and processed for the FACS. Lungs, livers and lymphnodes were disrupted through a 70 µm filter (BD Falcon) with a 1 ml syringe plunger and washed with 10 ml of RPMI medium supplemented with 10% foetal calf serum and 20 mM Hepes. Lungs and livers were then centrifuged at 800 rpm for 10 minutes to discard debris. Ammonium-Chloride-Potassium (ACK) lysis buffer was used directly on pellets to remove red blood cells. All samples were washed with RPMI medium and centrifuged. Samples were then suspended in PBS and counted. Colon and small intestines were cleaned with HBSS solution containing antibiotics and Hepes, and cut in small pieces. The epithelial layer was removed by incubating the intestine fragments with HBSS and EDTA solution at 37°C under gentle agitation. Intestine fragments deprived from epithelial cells were chopped and digested with HBSS containing 5% foetal calf serum, Hepes, CaCl2, dispase and collagenase (Roche) and DNase at 37°C under agitation. Digested fragments w ere further disrupted through a 100 µm filter (BD Falcon) with a 1 ml syringe plunger and washed with 10 ml of RPMI medium supplemented with 10% foetal calf serum and 20 mM Hepes. Single cell suspension was further filtered over a 70 µm filter (BD Falcon).
Blood was collected from mouse cheeks and collected in EDTA tubes (Greiner Mini Collect). 100 µl of blood was briefly lysed with 500 µl of ACK lysis buffer and washed with 1ml RPMI medium supplemented with 10% foetal calf serum and 20 mM Hepes.
Cell suspension from all organs were stained with LIVE/DEAD® Cell Stain Kit (Life Technologies), washed in PBS and analyzed by FACS (BD FACSCanto™ II - BD Biosciences). Data analysis was performed by FlowJo v10 software.
Whole Mount Staining and morphometric analysis of colonic vessels Three days after ECFC injection, mice were anesthetized with 100 mg/kg ketamine and 50 mg/kg xylazine, and 10 mL of 1% paraformaldehyde fixative solution was perfused into the heart. Colons were removed from untreated and injected mice with the indicated treatments, and immersed in 1% paraformaldehyde fixative solution, overnight at 4°C. Tissues were then washe d and incubated with hamster anti-CD31 (1:500; Millipore, MAB1398Z), rabbit anti-Lyve1 (1:500, Abcam, ab14917), rat anti-mCherry (1:500, ThermoFisher Scientific, M11217) antibodies diluted in PBS containing 0.3% Triton X-100, 2% bovine serum albumin, 5% goat serum, 0.01% glycine, and 0.1% sodium azide, overnight at 4°C. Anti-hamster Alexa Fluor 488, anti -rabbit Alexa Fluor 647 (1:500; Molecular Probes) and anti-rat Alexa Fluor 594 (1:500; Molecular Probes) were used as secondary antibodies, and incubated overnight at 4°C. Samples were then mounted with Vectashield (Vector Laboratories, Burlingame, CA) and imaged with a laser scanning confocal microscope (Fluoview FV1000; Olympus). Fluorescent images were acquired at a constant exposure time at 20× or 60× magnification on a laser scanning confocal microscope (FluoView FV1000; Olympus). Morphometric analysis of colon whole mounts was performed by 3D visualization of both hematic and lymphatic vessels. Images were taken as a z series stack using a ×10 objective and analyzed by Imaris Bitplane software, thus allowing visualization of the vessels in the submucosal and serosal-muscular layers. For each colon analyzed (n = 5–8 mice for each experimental group), both hematic and lymphatic vessel size were measured in 10 randomly chosen regions covered by vessels (each 1.0 mm2 in area) and were represented as the mean value of diameters (µm). Statistics The sample size was calculated on the basis of the effect size derived from preliminary data. Normal distribution and source of variation were calculated automatically for every statistical comparison. Mean comparisons were calculated accordingly. Statistical analyses were performed with either Microsoft Excel or IBM SPSS and Graph Pad 5-Prism statistical packages. Data were represented as means ±s.e.m. Mean comparisons between two experimental conditions were analyzed with 2-tailed unpaired Student’s t test. For three or more conditions, One-way ANOVA with Bonferroni’s correction was used. Two-way ANOVA with Bonferroni’s correction was used for the statistical analysis of DAI (in DSS-induced colitis experiments). P-values lower than or equal to 0.05 were considered statistically significant. Heatmap of data distributions were displayed with GENE-E software from Broad Institute (https://software.broadinstitute.org/GENE-E/).

MANUSCRIP
T
ACCEPTED
ACCEPTED MANUSCRIPT Supplemental References 1. Schroeder KW, Tremaine WJ, Ilstrup DM. Coated oral 5-aminosalicylic acid therapy for mildly to
moderately active ulcerative colitis. A randomized study. N Engl J Med 1987;317:1625–9.
2. Riley S a, Mani V, Goodman MJ, et al. Microscopic activity in ulcerative colitis: what does it mean? Gut 1991;32:174–8.
3. Maddipati KR, Zhou S-L. Stability and analysis of eicosanoids and docosanoids in tissue culture media. Prostaglandins Other Lipid Mediat 2011;94:59–72.
4. Maddipati KR, Romero R, Chaiworapongsa T, et al. Eicosanomic profiling reveals dominance of the epoxygenase pathway in human amniotic fluid at term in spontaneous labor. FASEB J 2014;28:4835–46.
5. Maddipati KR, Romero R, Chaiworapongsa T, et al. Lipidomic analysis of patients with microbial invasion of the amniotic cavity reveals up-regulation of leukotriene B4. FASEB J 2016;30:3296–3307.
6. Maddipati KR, Romero R, Chaiworapongsa T, et al. Clinical chorioamnionitis at term: the amniotic fluid fatty acyl lipidome. J Lipid Res 2016;57:1906–1916.
7. D’Alessio S, Correale C, Tacconi C, et al. VEGF-C-dependent stimulation of lymphatic function ameliorates experimental inflammatory bowel disease. J Clin Invest 2014;124:3863–78.
8. Brandon EFA, Meijerman I, Klijn JS, et al. In-vitro cytotoxicity of ET-743 (Trabectedin, Yondelis), a marine anti-cancer drug, in the Hep G2 cell line: influence of cytochrome P450 and phase II inhibition, and cytochrome P450 induction. Anticancer Drugs 2005;16:935–43.
9. Dull T, Zufferey R, Kelly M, et al. A third-generation lentivirus vector with a conditional packaging system. J Virol 1998;72:8463–71.
10. Tacconi C, Correale C, Gandelli A, et al. Vascular endothelial growth factor C disrupts the endothelial lymphatic barrier to promote colorectal cancer invasion. Gastroenterology 2015;148:1438–1451.e8.
11. D’Alessio S, Correale C, Tacconi C, et al. VEGF-C-dependent stimulation of lymphatic function ameliorates experimental inflammatory bowel disease. J Clin Invest 2014;124:3863–3878.
12. Corsetto PA, Cremona A, Montorfano G, et al. Chemical-physical changes in cell membrane microdomains of breast cancer cells after omega-3 PUFA incorporation. Cell Biochem Biophys 2012;64:45–59.
13. LOWRY OH, ROSEBROUGH NJ, FARR AL, et al. Protein measurement with the Folin phenol reagent. J Biol Chem 1951;193:265–75.
14. Cooper HS, Murthy SN, Shah RS, et al. Clinicopathologic study of dextran sulfate sodium experimental murine colitis. Lab Invest 1993;69:238–49.
15. Colombo E, Calcaterra F, Cappelletti M, et al. Comparison of Fibronectin and Collagen in Supporting the Isolation and Expansion of Endothelial Progenitor Cells from Human Adult Peripheral Blood. PLoS One 2013;8.
16. Gilroy DW, Edin ML, Maeyer RPH De, et al. CYP450-derived oxylipins mediate inflammatory resolution. Proc Natl Acad Sci U S A 2016;113:E3240-9.
17. Zhang G, Panigrahy D, Mahakian LM, et al. Epoxy metabolites of docosahexaenoic acid (DHA) inhibit angiogenesis, tumor growth, and metastasis. Proc Natl Acad Sci U S A 2013;110:6530–5.
![EPJ manuscript No.arxiv.org/pdf/1409.0865.pdf · arXiv:1409.0865v2 [hep-ex] 30 Nov 2016 EPJ manuscript No. (will be inserted by the editor) Experimental access to Transition Distribution](https://static.fdocuments.nl/doc/165x107/60749f488109f338a26306b7/epj-manuscript-noarxivorgpdf14090865pdf-arxiv14090865v2-hep-ex-30-nov.jpg)


![Photodynamic Therapy Head and Neck Cancerdownloads.hindawi.com/journals/dte/1996/183560.pdf · 2018-11-12 · 42 T.YOSHIDAetal. procedure has becomeincreasingly accepted, espe- ciallyinlungcancer[3]](https://static.fdocuments.nl/doc/165x107/5f5062e5d6d4e23e8667153d/photodynamic-therapy-head-and-neck-2018-11-12-42-tyoshidaetal-procedure-has.jpg)