3D Displays in Cars: Exploring the User Performance …...3D Displays in Cars: Exploring the User...
9
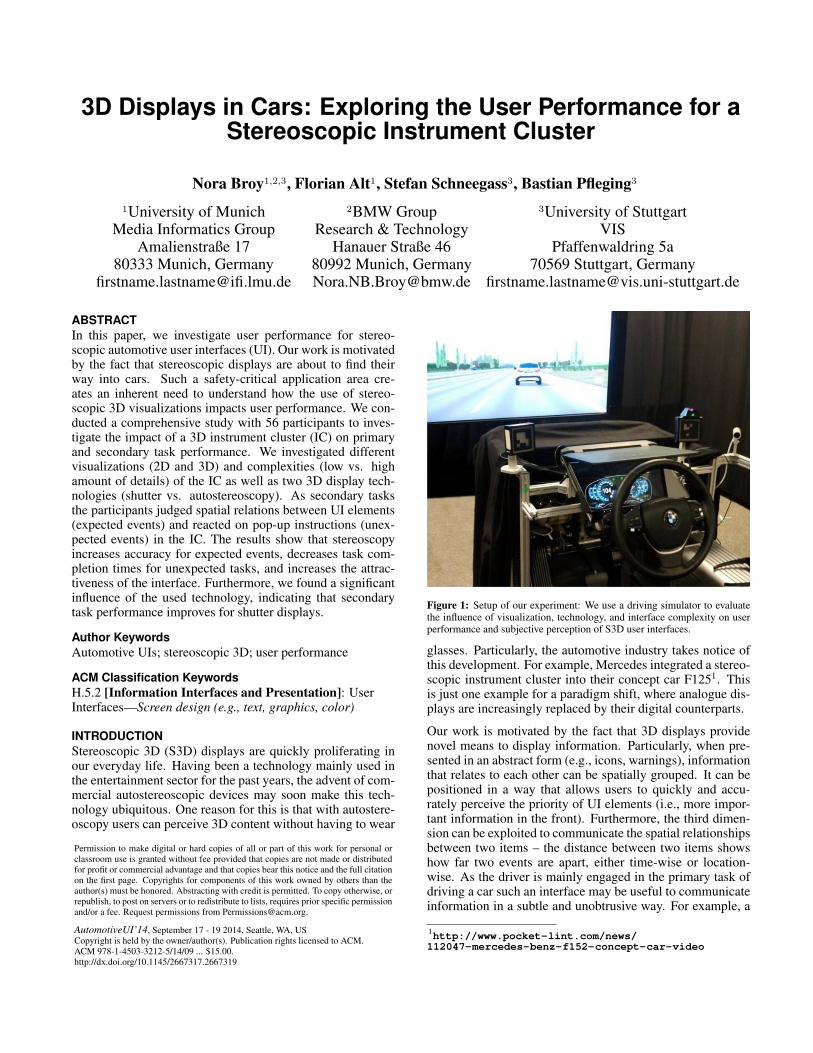
3D Displays in Cars: Exploring the User Performance for a Stereoscopic Instrument Cluster Nora Broy 1,2,3 , Florian Alt 1 , Stefan Schneegass 3 , Bastian Pfleging 3 1 University of Munich 2 BMW Group 3 University of Stuttgart Media Informatics Group Research & Technology VIS Amalienstraße 17 Hanauer Straße 46 Pfaffenwaldring 5a 80333 Munich, Germany 80992 Munich, Germany 70569 Stuttgart, Germany firstname.lastname@ifi.lmu.de [email protected] fi[email protected] ABSTRACT In this paper, we investigate user performance for stereo- scopic automotive user interfaces (UI). Our work is motivated by the fact that stereoscopic displays are about to find their way into cars. Such a safety-critical application area cre- ates an inherent need to understand how the use of stereo- scopic 3D visualizations impacts user performance. We con- ducted a comprehensive study with 56 participants to inves- tigate the impact of a 3D instrument cluster (IC) on primary and secondary task performance. We investigated different visualizations (2D and 3D) and complexities (low vs. high amount of details) of the IC as well as two 3D display tech- nologies (shutter vs. autostereoscopy). As secondary tasks the participants judged spatial relations between UI elements (expected events) and reacted on pop-up instructions (unex- pected events) in the IC. The results show that stereoscopy increases accuracy for expected events, decreases task com- pletion times for unexpected tasks, and increases the attrac- tiveness of the interface. Furthermore, we found a significant influence of the used technology, indicating that secondary task performance improves for shutter displays. Author Keywords Automotive UIs; stereoscopic 3D; user performance ACM Classification Keywords H.5.2 [Information Interfaces and Presentation]: User Interfaces—Screen design (e.g., text, graphics, color) INTRODUCTION Stereoscopic 3D (S3D) displays are quickly proliferating in our everyday life. Having been a technology mainly used in the entertainment sector for the past years, the advent of com- mercial autostereoscopic devices may soon make this tech- nology ubiquitous. One reason for this is that with autostere- oscopy users can perceive 3D content without having to wear Permission to make digital or hard copies of all or part of this work for personal or classroom use is granted without fee provided that copies are not made or distributed for profit or commercial advantage and that copies bear this notice and the full citation on the first page. Copyrights for components of this work owned by others than the author(s) must be honored. Abstracting with credit is permitted. To copy otherwise, or republish, to post on servers or to redistribute to lists, requires prior specific permission and/or a fee. Request permissions from [email protected]. AutomotiveUI’14, September 17 - 19 2014, Seattle, WA, US Copyright is held by the owner/author(s). Publication rights licensed to ACM. ACM 978-1-4503-3212-5/14/09 ... $15.00. http://dx.doi.org/10.1145/2667317.2667319 Figure 1: Setup of our experiment: We use a driving simulator to evaluate the influence of visualization, technology, and interface complexity on user performance and subjective perception of S3D user interfaces. glasses. Particularly, the automotive industry takes notice of this development. For example, Mercedes integrated a stereo- scopic instrument cluster into their concept car F125 1 . This is just one example for a paradigm shift, where analogue dis- plays are increasingly replaced by their digital counterparts. Our work is motivated by the fact that 3D displays provide novel means to display information. Particularly, when pre- sented in an abstract form (e.g., icons, warnings), information that relates to each other can be spatially grouped. It can be positioned in a way that allows users to quickly and accu- rately perceive the priority of UI elements (i.e., more impor- tant information in the front). Furthermore, the third dimen- sion can be exploited to communicate the spatial relationships between two items – the distance between two items shows how far two events are apart, either time-wise or location- wise. As the driver is mainly engaged in the primary task of driving a car such an interface may be useful to communicate information in a subtle and unobtrusive way. For example, a 1 http://www.pocket-lint.com/news/ 112047-mercedes-benz-f152-concept-car-video
Transcript of 3D Displays in Cars: Exploring the User Performance …...3D Displays in Cars: Exploring the User...
3D Displays in Cars: Exploring the User Performance for aStereoscopic Instrument Cluster
Nora Broy1,2,3, Florian Alt1, Stefan Schneegass3, Bastian Pfleging3
1University of Munich 2BMW Group 3University of StuttgartMedia Informatics Group Research & Technology VIS
Amalienstraße 17 Hanauer Straße 46 Pfaffenwaldring 5a80333 Munich, Germany 80992 Munich, Germany 70569 Stuttgart, Germany
[email protected] [email protected] [email protected]
ABSTRACTIn this paper, we investigate user performance for stereo-scopic automotive user interfaces (UI). Our work is motivatedby the fact that stereoscopic displays are about to find theirway into cars. Such a safety-critical application area cre-ates an inherent need to understand how the use of stereo-scopic 3D visualizations impacts user performance. We con-ducted a comprehensive study with 56 participants to inves-tigate the impact of a 3D instrument cluster (IC) on primaryand secondary task performance. We investigated differentvisualizations (2D and 3D) and complexities (low vs. highamount of details) of the IC as well as two 3D display tech-nologies (shutter vs. autostereoscopy). As secondary tasksthe participants judged spatial relations between UI elements(expected events) and reacted on pop-up instructions (unex-pected events) in the IC. The results show that stereoscopyincreases accuracy for expected events, decreases task com-pletion times for unexpected tasks, and increases the attrac-tiveness of the interface. Furthermore, we found a significantinfluence of the used technology, indicating that secondarytask performance improves for shutter displays.
Author KeywordsAutomotive UIs; stereoscopic 3D; user performance
ACM Classification KeywordsH.5.2 [Information Interfaces and Presentation]: UserInterfaces—Screen design (e.g., text, graphics, color)
INTRODUCTIONStereoscopic 3D (S3D) displays are quickly proliferating inour everyday life. Having been a technology mainly used inthe entertainment sector for the past years, the advent of com-mercial autostereoscopic devices may soon make this tech-nology ubiquitous. One reason for this is that with autostere-oscopy users can perceive 3D content without having to wear
Permission to make digital or hard copies of all or part of this work for personal orclassroom use is granted without fee provided that copies are not made or distributedfor profit or commercial advantage and that copies bear this notice and the full citationon the first page. Copyrights for components of this work owned by others than theauthor(s) must be honored. Abstracting with credit is permitted. To copy otherwise, orrepublish, to post on servers or to redistribute to lists, requires prior specific permissionand/or a fee. Request permissions from [email protected].
AutomotiveUI’14, September 17 - 19 2014, Seattle, WA, USCopyright is held by the owner/author(s). Publication rights licensed to ACM.ACM 978-1-4503-3212-5/14/09 ... $15.00.http://dx.doi.org/10.1145/2667317.2667319
Figure 1: Setup of our experiment: We use a driving simulator to evaluatethe influence of visualization, technology, and interface complexity on userperformance and subjective perception of S3D user interfaces.
glasses. Particularly, the automotive industry takes notice ofthis development. For example, Mercedes integrated a stereo-scopic instrument cluster into their concept car F1251. Thisis just one example for a paradigm shift, where analogue dis-plays are increasingly replaced by their digital counterparts.
Our work is motivated by the fact that 3D displays providenovel means to display information. Particularly, when pre-sented in an abstract form (e.g., icons, warnings), informationthat relates to each other can be spatially grouped. It can bepositioned in a way that allows users to quickly and accu-rately perceive the priority of UI elements (i.e., more impor-tant information in the front). Furthermore, the third dimen-sion can be exploited to communicate the spatial relationshipsbetween two items – the distance between two items showshow far two events are apart, either time-wise or location-wise. As the driver is mainly engaged in the primary task ofdriving a car such an interface may be useful to communicateinformation in a subtle and unobtrusive way. For example, a
1http://www.pocket-lint.com/news/112047-mercedes-benz-f152-concept-car-video
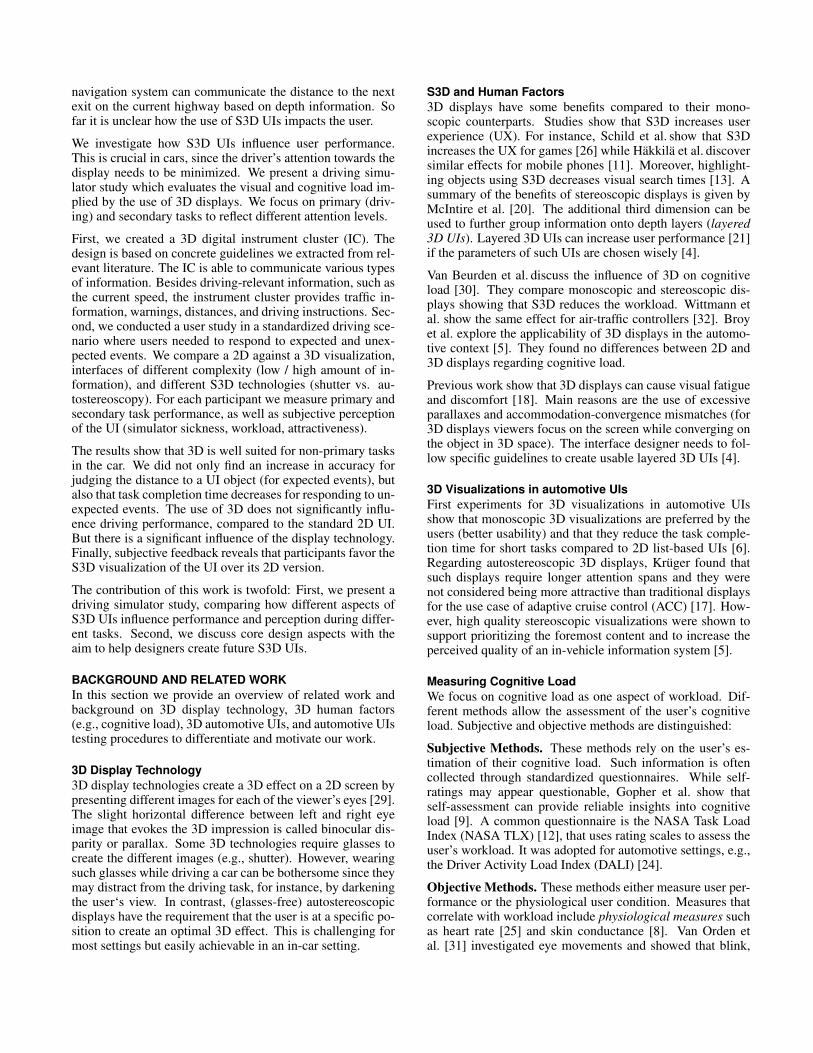
navigation system can communicate the distance to the nextexit on the current highway based on depth information. Sofar it is unclear how the use of S3D UIs impacts the user.
We investigate how S3D UIs influence user performance.This is crucial in cars, since the driver’s attention towards thedisplay needs to be minimized. We present a driving simu-lator study which evaluates the visual and cognitive load im-plied by the use of 3D displays. We focus on primary (driv-ing) and secondary tasks to reflect different attention levels.
First, we created a 3D digital instrument cluster (IC). Thedesign is based on concrete guidelines we extracted from rel-evant literature. The IC is able to communicate various typesof information. Besides driving-relevant information, such asthe current speed, the instrument cluster provides traffic in-formation, warnings, distances, and driving instructions. Sec-ond, we conducted a user study in a standardized driving sce-nario where users needed to respond to expected and unex-pected events. We compare a 2D against a 3D visualization,interfaces of different complexity (low / high amount of in-formation), and different S3D technologies (shutter vs. au-tostereoscopy). For each participant we measure primary andsecondary task performance, as well as subjective perceptionof the UI (simulator sickness, workload, attractiveness).
The results show that 3D is well suited for non-primary tasksin the car. We did not only find an increase in accuracy forjudging the distance to a UI object (for expected events), butalso that task completion time decreases for responding to un-expected events. The use of 3D does not significantly influ-ence driving performance, compared to the standard 2D UI.But there is a significant influence of the display technology.Finally, subjective feedback reveals that participants favor theS3D visualization of the UI over its 2D version.
The contribution of this work is twofold: First, we present adriving simulator study, comparing how different aspects ofS3D UIs influence performance and perception during differ-ent tasks. Second, we discuss core design aspects with theaim to help designers create future S3D UIs.
BACKGROUND AND RELATED WORKIn this section we provide an overview of related work andbackground on 3D display technology, 3D human factors(e.g., cognitive load), 3D automotive UIs, and automotive UIstesting procedures to differentiate and motivate our work.
3D Display Technology3D display technologies create a 3D effect on a 2D screen bypresenting different images for each of the viewer’s eyes [29].The slight horizontal difference between left and right eyeimage that evokes the 3D impression is called binocular dis-parity or parallax. Some 3D technologies require glasses tocreate the different images (e.g., shutter). However, wearingsuch glasses while driving a car can be bothersome since theymay distract from the driving task, for instance, by darkeningthe user‘s view. In contrast, (glasses-free) autostereoscopicdisplays have the requirement that the user is at a specific po-sition to create an optimal 3D effect. This is challenging formost settings but easily achievable in an in-car setting.
S3D and Human Factors3D displays have some benefits compared to their mono-scopic counterparts. Studies show that S3D increases userexperience (UX). For instance, Schild et al. show that S3Dincreases the UX for games [26] while Hakkila et al. discoversimilar effects for mobile phones [11]. Moreover, highlight-ing objects using S3D decreases visual search times [13]. Asummary of the benefits of stereoscopic displays is given byMcIntire et al. [20]. The additional third dimension can beused to further group information onto depth layers (layered3D UIs). Layered 3D UIs can increase user performance [21]if the parameters of such UIs are chosen wisely [4].
Van Beurden et al. discuss the influence of 3D on cognitiveload [30]. They compare monoscopic and stereoscopic dis-plays showing that S3D reduces the workload. Wittmann etal. show the same effect for air-traffic controllers [32]. Broyet al. explore the applicability of 3D displays in the automo-tive context [5]. They found no differences between 2D and3D displays regarding cognitive load.
Previous work show that 3D displays can cause visual fatigueand discomfort [18]. Main reasons are the use of excessiveparallaxes and accommodation-convergence mismatches (for3D displays viewers focus on the screen while converging onthe object in 3D space). The interface designer needs to fol-low specific guidelines to create usable layered 3D UIs [4].
3D Visualizations in automotive UIsFirst experiments for 3D visualizations in automotive UIsshow that monoscopic 3D visualizations are preferred by theusers (better usability) and that they reduce the task comple-tion time for short tasks compared to 2D list-based UIs [6].Regarding autostereoscopic 3D displays, Kruger found thatsuch displays require longer attention spans and they werenot considered being more attractive than traditional displaysfor the use case of adaptive cruise control (ACC) [17]. How-ever, high quality stereoscopic visualizations were shown tosupport prioritizing the foremost content and to increase theperceived quality of an in-vehicle information system [5].
Measuring Cognitive LoadWe focus on cognitive load as one aspect of workload. Dif-ferent methods allow the assessment of the user’s cognitiveload. Subjective and objective methods are distinguished:
Subjective Methods. These methods rely on the user’s es-timation of their cognitive load. Such information is oftencollected through standardized questionnaires. While self-ratings may appear questionable, Gopher et al. show thatself-assessment can provide reliable insights into cognitiveload [9]. A common questionnaire is the NASA Task LoadIndex (NASA TLX) [12], that uses rating scales to assess theuser’s workload. It was adopted for automotive settings, e.g.,the Driver Activity Load Index (DALI) [24].
Objective Methods. These methods either measure user per-formance or the physiological user condition. Measures thatcorrelate with workload include physiological measures suchas heart rate [25] and skin conductance [8]. Van Orden etal. [31] investigated eye movements and showed that blink,
fixation frequency, and pupil diameter correlate with cogni-tive load. For performance-based measures two subclassescan be distinguished [23]: First, the user performance for theprimary task can be measured. Popular metrics include taskcompletion time or detection rates [7]. Commonly used tasksinclude solving mathematical problems [22]. Second, the per-formance of a secondary, concurrently performed task, can bemeasured, e.g., the peripheral detection task [15].
To provide a comprehensive assessment of cognitive load weuse subjective as well as objective methods in our work.
User Performance in a Driving SimulatorSince the driver always needs to share attention between theprimary task of driving the car and secondary tasks (e.g.,interacting with in-vehicle systems), additional measures tocontrol the primary task performance need to be taken into ac-count. This comprises information about lateral control (e.g.,lane deviation, steering wheel activity), longitudinal control(e.g., maintaining speed, braking behavior), and driver reac-tion (e.g., recognition time for unexpected incidents) [3].
The evaluation of an automotive UI therefore often combinesmeasuring the task performance of a secondary task as wellas its influence on the primary task performance. Such evalu-ations can be done either with abstract primary tasks in a lab(e.g., occlusion tests to measure visual demand [14]), in driv-ing simulator setups (e.g., Lane Change Task (LCT) [19]), orin real-world experiments. We focus on simulator studies asthese allow for a detailed control of environmental conditions.
We chose the following headway test as proposed in the AAMGuidelines [1] as this test is supposed to provide a good trade-off between a realistic driving situation and a controlled envi-ronment. The idea is to test the impact of solving a secondary(interaction) task on the primary driving task by directly as-sessing concurrent driving performance under dynamic con-ditions in a simulated environment. The performance is thencompared to the performance of accepted reference tasks. Asa primary task the driver shall follow a lead vehicle whilemaintaining a constant distance to this vehicle.
HYPOTHESESWe focus on three main hypotheses that concern the influ-ence of visualization, technology, and interface complexityon primary and secondary task performance, gaze behavior,and subjective measures, including UX, driver activity load,and simulator sickness.
H1: Influence of 3D Visualization. First, we explore dif-ferences inferred by the 3D visualization chosen for present-ing the UI. Usually, UI designers need to make a choicewhether to create a monoscopic (2D) or a stereoscopic (3D)visualization – independent of how it is later presented tech-nically. We hypothesize that a 3D visualization has a posi-tive effect on secondary task performance as well as on UX.At the same time, we expect an influence on the primarytask performance, the time users take their eyes off the roadand on the driver activity load. However, it is uncertain ifthis influence is positive or negative. On one hand, 3D dis-plays may support the driver in the primary driving task by
making relevant information easier perceivable and, thus, de-crease the load for assessing the information. On the otherhand, accommodation-convergence mismatches and visualartifacts, can affect the cognitive load, the driver’s conditionand hence the primary driving task.
H2: Influence of Technology. Second, we investigate the in-fluence of the used display technology. Whereas we considera 2D screen, today commonly found for digital dashboards,as a baseline, we are particularly interested in comparing twoS3D technologies: glass-based technologies (i.e., active shut-ter) and glasses-free technologies (i.e., autostereoscopic dis-plays). We hypothesize autostereoscopy to decrease UX andsecondary task performance since autostereoscopic technolo-gies lack in 3D quality compared to shutter. In contrast, wethink that shutter has a negative impact on the driver activ-ity load and the primary task performance since the requiredglasses are disturbing and darken the view.
H3: Influence of Complexity. Third, we investigate thecomplexity of the UI. Whereas in traditional dashboards mostelements are hard-wired which limited the way in which theavailable space could be used, digital displays allow for dis-playing any information available in the car. Hence, designersof future car UIs may be intrigued to display as much infor-mation as possible. However, we hypothesize that this over-load leads to a decrease in the UX, primary and secondarytask performance, and increases the time users do not look onthe road as well as the driver activity load.
APPARATUSTo evaluate our hypotheses, we developed an apparatus in theform of an instrument cluster (IC).
HardwareTo be able to compare the effect of different modalities, wefirst created an apparatus compatible with different displaytechnologies. To test a glass-free technology, we used thelenticular autostereoscopic display built in a Toshiba Note-book P855-107. The 15.6” display has a resolution of 1366 x768 in 3D mode and 1920 x 1080 in 2D mode. The display isequipped with a tracking unit that adjusts the perfect viewingangle based on the viewer’s position. For a glass-based tech-nology, we used the shutter display of an ASUS notebookG75VW equipped with Nvidia 3D Vision. This display has ascreen size of 17.3” and a resolution of 1920 x 1080.
To track the user’s gaze path for our study we use the Er-goneers Dikablis2 glasses-based eye-tracker. We use Unity3
with C# as scripting language to build our interactive UI.
User InterfaceTo reflect the potential of future UIs, we do not only employstandard UI elements commonly used in current instrumentclusters for the purpose of our study, but integrate elementsthat take advantage of 3D space. This includes elementsexploiting the spatial relationship between objects (e.g., a2Ergoneers Dikablis: http://www.ergoneers.com/en/products/dlab-dikablis/overview.html3Unity 3D - www.unity.com
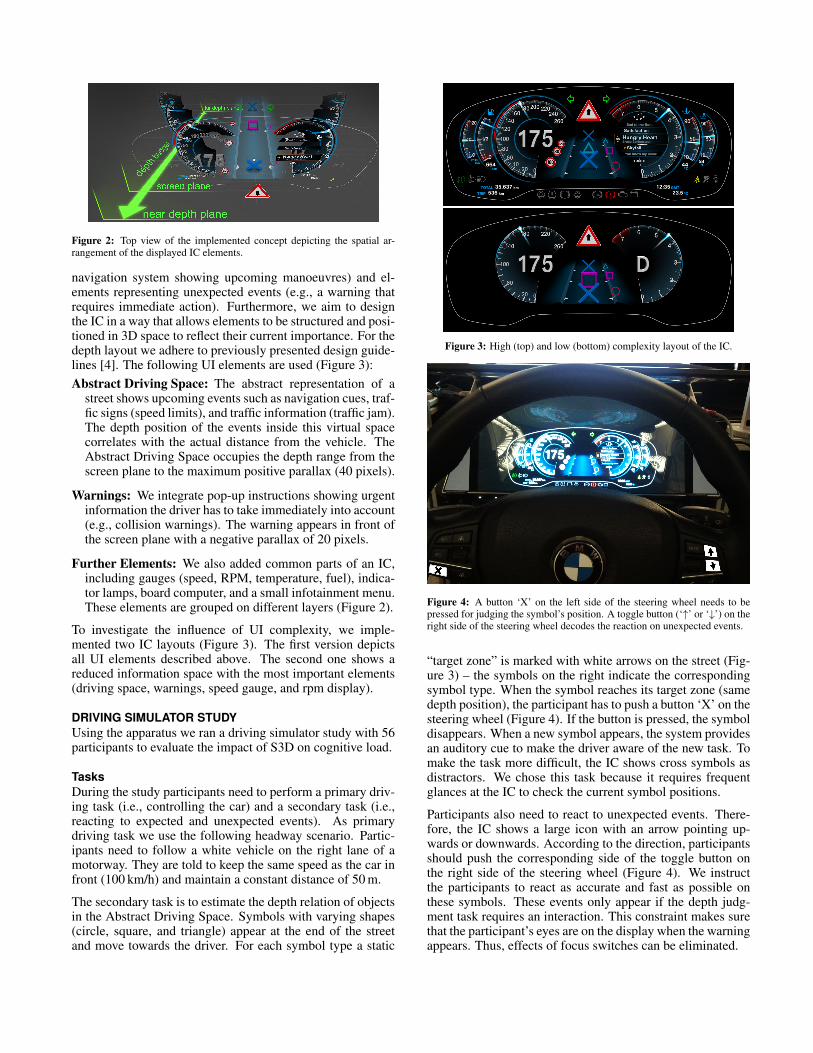
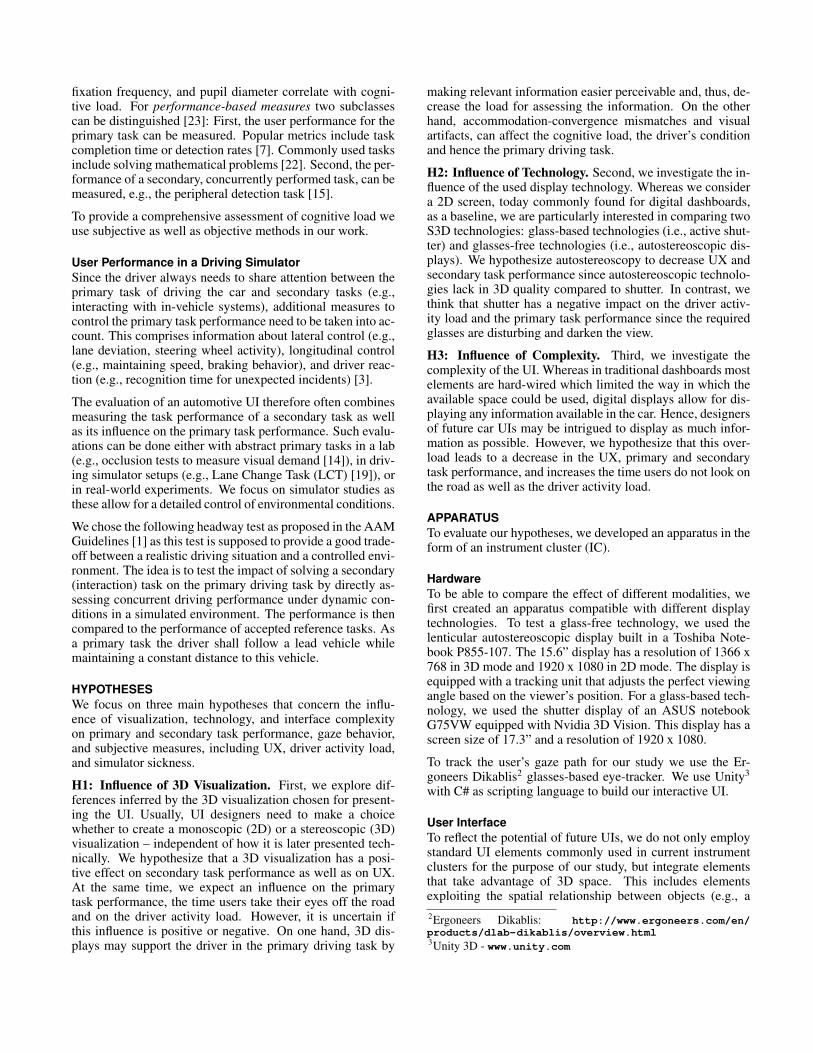
Figure 2: Top view of the implemented concept depicting the spatial ar-rangement of the displayed IC elements.
navigation system showing upcoming manoeuvres) and el-ements representing unexpected events (e.g., a warning thatrequires immediate action). Furthermore, we aim to designthe IC in a way that allows elements to be structured and posi-tioned in 3D space to reflect their current importance. For thedepth layout we adhere to previously presented design guide-lines [4]. The following UI elements are used (Figure 3):Abstract Driving Space: The abstract representation of a
street shows upcoming events such as navigation cues, traf-fic signs (speed limits), and traffic information (traffic jam).The depth position of the events inside this virtual spacecorrelates with the actual distance from the vehicle. TheAbstract Driving Space occupies the depth range from thescreen plane to the maximum positive parallax (40 pixels).
Warnings: We integrate pop-up instructions showing urgentinformation the driver has to take immediately into account(e.g., collision warnings). The warning appears in front ofthe screen plane with a negative parallax of 20 pixels.
Further Elements: We also added common parts of an IC,including gauges (speed, RPM, temperature, fuel), indica-tor lamps, board computer, and a small infotainment menu.These elements are grouped on different layers (Figure 2).
To investigate the influence of UI complexity, we imple-mented two IC layouts (Figure 3). The first version depictsall UI elements described above. The second one shows areduced information space with the most important elements(driving space, warnings, speed gauge, and rpm display).
DRIVING SIMULATOR STUDYUsing the apparatus we ran a driving simulator study with 56participants to evaluate the impact of S3D on cognitive load.
TasksDuring the study participants need to perform a primary driv-ing task (i.e., controlling the car) and a secondary task (i.e.,reacting to expected and unexpected events). As primarydriving task we use the following headway scenario. Partic-ipants need to follow a white vehicle on the right lane of amotorway. They are told to keep the same speed as the car infront (100 km/h) and maintain a constant distance of 50 m.
The secondary task is to estimate the depth relation of objectsin the Abstract Driving Space. Symbols with varying shapes(circle, square, and triangle) appear at the end of the streetand move towards the driver. For each symbol type a static
Figure 3: High (top) and low (bottom) complexity layout of the IC.
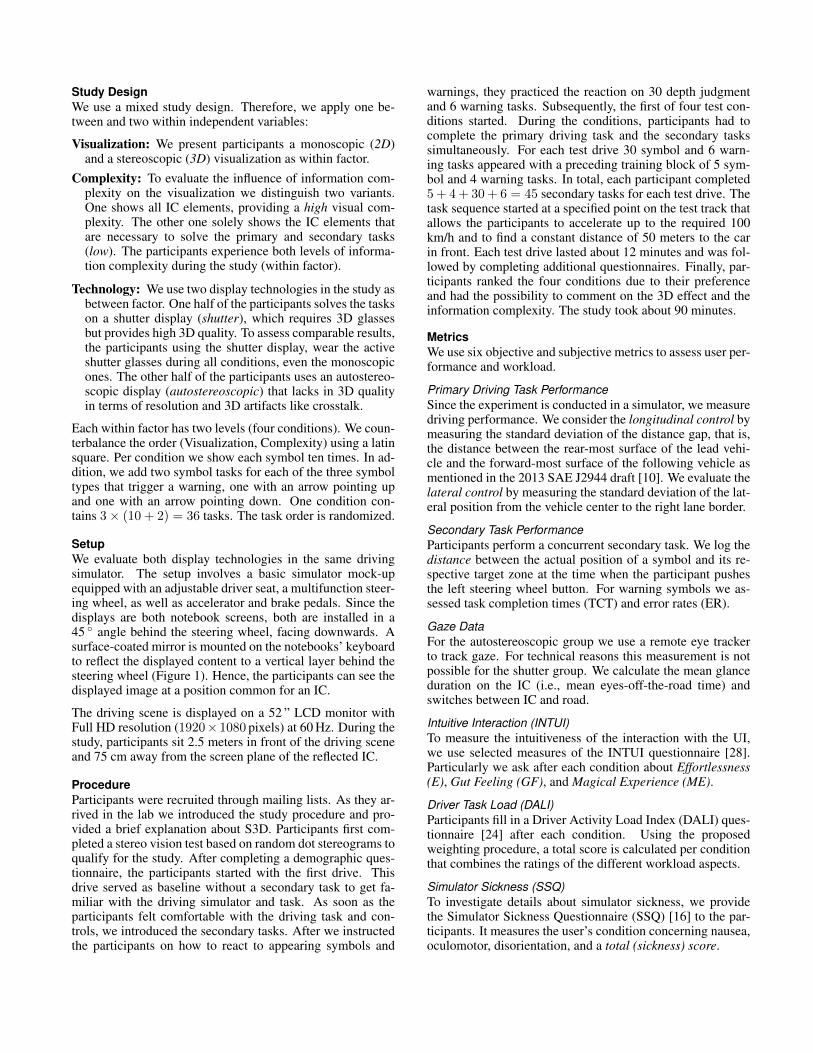
Figure 4: A button ‘X’ on the left side of the steering wheel needs to bepressed for judging the symbol’s position. A toggle button (‘↑’ or ‘↓’) on theright side of the steering wheel decodes the reaction on unexpected events.
“target zone” is marked with white arrows on the street (Fig-ure 3) – the symbols on the right indicate the correspondingsymbol type. When the symbol reaches its target zone (samedepth position), the participant has to push a button ‘X’ on thesteering wheel (Figure 4). If the button is pressed, the symboldisappears. When a new symbol appears, the system providesan auditory cue to make the driver aware of the new task. Tomake the task more difficult, the IC shows cross symbols asdistractors. We chose this task because it requires frequentglances at the IC to check the current symbol positions.
Participants also need to react to unexpected events. There-fore, the IC shows a large icon with an arrow pointing up-wards or downwards. According to the direction, participantsshould push the corresponding side of the toggle button onthe right side of the steering wheel (Figure 4). We instructthe participants to react as accurate and fast as possible onthese symbols. These events only appear if the depth judg-ment task requires an interaction. This constraint makes surethat the participant’s eyes are on the display when the warningappears. Thus, effects of focus switches can be eliminated.
Study DesignWe use a mixed study design. Therefore, we apply one be-tween and two within independent variables:
Visualization: We present participants a monoscopic (2D)and a stereoscopic (3D) visualization as within factor.
Complexity: To evaluate the influence of information com-plexity on the visualization we distinguish two variants.One shows all IC elements, providing a high visual com-plexity. The other one solely shows the IC elements thatare necessary to solve the primary and secondary tasks(low). The participants experience both levels of informa-tion complexity during the study (within factor).
Technology: We use two display technologies in the study asbetween factor. One half of the participants solves the taskson a shutter display (shutter), which requires 3D glassesbut provides high 3D quality. To assess comparable results,the participants using the shutter display, wear the activeshutter glasses during all conditions, even the monoscopicones. The other half of the participants uses an autostereo-scopic display (autostereoscopic) that lacks in 3D qualityin terms of resolution and 3D artifacts like crosstalk.
Each within factor has two levels (four conditions). We coun-terbalance the order (Visualization, Complexity) using a latinsquare. Per condition we show each symbol ten times. In ad-dition, we add two symbol tasks for each of the three symboltypes that trigger a warning, one with an arrow pointing upand one with an arrow pointing down. One condition con-tains 3× (10 + 2) = 36 tasks. The task order is randomized.
SetupWe evaluate both display technologies in the same drivingsimulator. The setup involves a basic simulator mock-upequipped with an adjustable driver seat, a multifunction steer-ing wheel, as well as accelerator and brake pedals. Since thedisplays are both notebook screens, both are installed in a45 ◦ angle behind the steering wheel, facing downwards. Asurface-coated mirror is mounted on the notebooks’ keyboardto reflect the displayed content to a vertical layer behind thesteering wheel (Figure 1). Hence, the participants can see thedisplayed image at a position common for an IC.
The driving scene is displayed on a 52 ” LCD monitor withFull HD resolution (1920× 1080 pixels) at 60 Hz. During thestudy, participants sit 2.5 meters in front of the driving sceneand 75 cm away from the screen plane of the reflected IC.
ProcedureParticipants were recruited through mailing lists. As they ar-rived in the lab we introduced the study procedure and pro-vided a brief explanation about S3D. Participants first com-pleted a stereo vision test based on random dot stereograms toqualify for the study. After completing a demographic ques-tionnaire, the participants started with the first drive. Thisdrive served as baseline without a secondary task to get fa-miliar with the driving simulator and task. As soon as theparticipants felt comfortable with the driving task and con-trols, we introduced the secondary tasks. After we instructedthe participants on how to react to appearing symbols and
warnings, they practiced the reaction on 30 depth judgmentand 6 warning tasks. Subsequently, the first of four test con-ditions started. During the conditions, participants had tocomplete the primary driving task and the secondary taskssimultaneously. For each test drive 30 symbol and 6 warn-ing tasks appeared with a preceding training block of 5 sym-bol and 4 warning tasks. In total, each participant completed5 + 4+ 30 + 6 = 45 secondary tasks for each test drive. Thetask sequence started at a specified point on the test track thatallows the participants to accelerate up to the required 100km/h and to find a constant distance of 50 meters to the carin front. Each test drive lasted about 12 minutes and was fol-lowed by completing additional questionnaires. Finally, par-ticipants ranked the four conditions due to their preferenceand had the possibility to comment on the 3D effect and theinformation complexity. The study took about 90 minutes.
MetricsWe use six objective and subjective metrics to assess user per-formance and workload.
Primary Driving Task PerformanceSince the experiment is conducted in a simulator, we measuredriving performance. We consider the longitudinal control bymeasuring the standard deviation of the distance gap, that is,the distance between the rear-most surface of the lead vehi-cle and the forward-most surface of the following vehicle asmentioned in the 2013 SAE J2944 draft [10]. We evaluate thelateral control by measuring the standard deviation of the lat-eral position from the vehicle center to the right lane border.
Secondary Task PerformanceParticipants perform a concurrent secondary task. We log thedistance between the actual position of a symbol and its re-spective target zone at the time when the participant pushesthe left steering wheel button. For warning symbols we as-sessed task completion times (TCT) and error rates (ER).
Gaze DataFor the autostereoscopic group we use a remote eye trackerto track gaze. For technical reasons this measurement is notpossible for the shutter group. We calculate the mean glanceduration on the IC (i.e., mean eyes-off-the-road time) andswitches between IC and road.
Intuitive Interaction (INTUI)To measure the intuitiveness of the interaction with the UI,we use selected measures of the INTUI questionnaire [28].Particularly we ask after each condition about Effortlessness(E), Gut Feeling (GF), and Magical Experience (ME).
Driver Task Load (DALI)Participants fill in a Driver Activity Load Index (DALI) ques-tionnaire [24] after each condition. Using the proposedweighting procedure, a total score is calculated per conditionthat combines the ratings of the different workload aspects.
Simulator Sickness (SSQ)To investigate details about simulator sickness, we providethe Simulator Sickness Questionnaire (SSQ) [16] to the par-ticipants. It measures the user’s condition concerning nausea,oculomotor, disorientation, and a total (sickness) score.
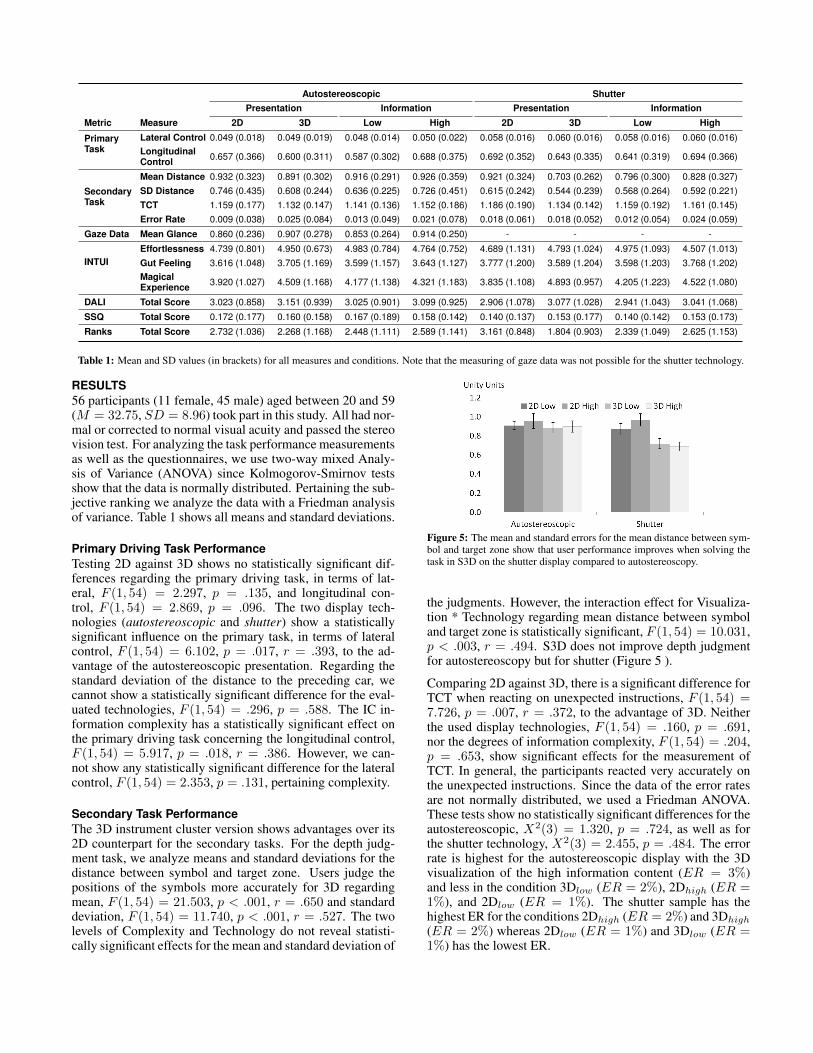
Autostereoscopic ShutterPresentation Information Presentation Information
Metric Measure 2D 3D Low High 2D 3D Low High
PrimaryTask
Lateral Control 0.049 (0.018) 0.049 (0.019) 0.048 (0.014) 0.050 (0.022) 0.058 (0.016) 0.060 (0.016) 0.058 (0.016) 0.060 (0.016)LongitudinalControl 0.657 (0.366) 0.600 (0.311) 0.587 (0.302) 0.688 (0.375) 0.692 (0.352) 0.643 (0.335) 0.641 (0.319) 0.694 (0.366)
SecondaryTask
Mean Distance 0.932 (0.323) 0.891 (0.302) 0.916 (0.291) 0.926 (0.359) 0.921 (0.324) 0.703 (0.262) 0.796 (0.300) 0.828 (0.327)SD Distance 0.746 (0.435) 0.608 (0.244) 0.636 (0.225) 0.726 (0.451) 0.615 (0.242) 0.544 (0.239) 0.568 (0.264) 0.592 (0.221)TCT 1.159 (0.177) 1.132 (0.147) 1.141 (0.136) 1.152 (0.186) 1.186 (0.190) 1.134 (0.142) 1.159 (0.192) 1.161 (0.145)Error Rate 0.009 (0.038) 0.025 (0.084) 0.013 (0.049) 0.021 (0.078) 0.018 (0.061) 0.018 (0.052) 0.012 (0.054) 0.024 (0.059)
Gaze Data Mean Glance 0.860 (0.236) 0.907 (0.278) 0.853 (0.264) 0.914 (0.250) - - - -
INTUIEffortlessness 4.739 (0.801) 4.950 (0.673) 4.983 (0.784) 4.764 (0.752) 4.689 (1.131) 4.793 (1.024) 4.975 (1.093) 4.507 (1.013)Gut Feeling 3.616 (1.048) 3.705 (1.169) 3.599 (1.157) 3.643 (1.127) 3.777 (1.200) 3.589 (1.204) 3.598 (1.203) 3.768 (1.202)MagicalExperience 3.920 (1.027) 4.509 (1.168) 4.177 (1.138) 4.321 (1.183) 3.835 (1.108) 4.893 (0.957) 4.205 (1.223) 4.522 (1.080)
DALI Total Score 3.023 (0.858) 3.151 (0.939) 3.025 (0.901) 3.099 (0.925) 2.906 (1.078) 3.077 (1.028) 2.941 (1.043) 3.041 (1.068)
SSQ Total Score 0.172 (0.177) 0.160 (0.158) 0.167 (0.189) 0.158 (0.142) 0.140 (0.137) 0.153 (0.177) 0.140 (0.142) 0.153 (0.173)
Ranks Total Score 2.732 (1.036) 2.268 (1.168) 2.448 (1.111) 2.589 (1.141) 3.161 (0.848) 1.804 (0.903) 2.339 (1.049) 2.625 (1.153)
Table 1: Mean and SD values (in brackets) for all measures and conditions. Note that the measuring of gaze data was not possible for the shutter technology.
RESULTS56 participants (11 female, 45 male) aged between 20 and 59(M = 32.75, SD = 8.96) took part in this study. All had nor-mal or corrected to normal visual acuity and passed the stereovision test. For analyzing the task performance measurementsas well as the questionnaires, we use two-way mixed Analy-sis of Variance (ANOVA) since Kolmogorov-Smirnov testsshow that the data is normally distributed. Pertaining the sub-jective ranking we analyze the data with a Friedman analysisof variance. Table 1 shows all means and standard deviations.
Primary Driving Task PerformanceTesting 2D against 3D shows no statistically significant dif-ferences regarding the primary driving task, in terms of lat-eral, F (1, 54) = 2.297, p = .135, and longitudinal con-trol, F (1, 54) = 2.869, p = .096. The two display tech-nologies (autostereoscopic and shutter) show a statisticallysignificant influence on the primary task, in terms of lateralcontrol, F (1, 54) = 6.102, p = .017, r = .393, to the ad-vantage of the autostereoscopic presentation. Regarding thestandard deviation of the distance to the preceding car, wecannot show a statistically significant difference for the eval-uated technologies, F (1, 54) = .296, p = .588. The IC in-formation complexity has a statistically significant effect onthe primary driving task concerning the longitudinal control,F (1, 54) = 5.917, p = .018, r = .386. However, we can-not show any statistically significant difference for the lateralcontrol, F (1, 54) = 2.353, p = .131, pertaining complexity.
Secondary Task PerformanceThe 3D instrument cluster version shows advantages over its2D counterpart for the secondary tasks. For the depth judg-ment task, we analyze means and standard deviations for thedistance between symbol and target zone. Users judge thepositions of the symbols more accurately for 3D regardingmean, F (1, 54) = 21.503, p < .001, r = .650 and standarddeviation, F (1, 54) = 11.740, p < .001, r = .527. The twolevels of Complexity and Technology do not reveal statisti-cally significant effects for the mean and standard deviation of
Figure 5: The mean and standard errors for the mean distance between sym-bol and target zone show that user performance improves when solving thetask in S3D on the shutter display compared to autostereoscopy.
the judgments. However, the interaction effect for Visualiza-tion * Technology regarding mean distance between symboland target zone is statistically significant, F (1, 54) = 10.031,p < .003, r = .494. S3D does not improve depth judgmentfor autostereoscopy but for shutter (Figure 5 ).
Comparing 2D against 3D, there is a significant difference forTCT when reacting on unexpected instructions, F (1, 54) =7.726, p = .007, r = .372, to the advantage of 3D. Neitherthe used display technologies, F (1, 54) = .160, p = .691,nor the degrees of information complexity, F (1, 54) = .204,p = .653, show significant effects for the measurement ofTCT. In general, the participants reacted very accurately onthe unexpected instructions. Since the data of the error ratesare not normally distributed, we used a Friedman ANOVA.These tests show no statistically significant differences for theautostereoscopic, X2(3) = 1.320, p = .724, as well as forthe shutter technology, X2(3) = 2.455, p = .484. The errorrate is highest for the autostereoscopic display with the 3Dvisualization of the high information content (ER = 3%)and less in the condition 3Dlow (ER = 2%), 2Dhigh (ER =1%), and 2Dlow (ER = 1%). The shutter sample has thehighest ER for the conditions 2Dhigh (ER = 2%) and 3Dhigh
(ER = 2%) whereas 2Dlow (ER = 1%) and 3Dlow (ER =1%) has the lowest ER.

Figure 6: The mean and standard errors for the dimension Magical Experi-ence show that the shutter technology provides greater scores for 3D visual-izations than the autostereoscopic display.
Gaze BehaviorFor gaze behavior we measure the mean glance duration ontothe IC for the autostereoscopic sample. The visualizationlevels do not show a significant influence on gaze behaviorconcerning the mean glance duration, F (1, 27) = 3.691,p = .065. However, there is a statistically significant ef-fect of the different levels of information complexity for themean glance duration on the IC, F (1, 27) = 9.645, p = .004r = .486, to the benefit of the low information level.
Intuitive InteractionEffortlessness is statistically significant for information com-plexity, to the benefit of the low complexity level, F (1, 54) =15.296, p < .001, r = .581, but not for Visualization,F (1, 54) = 3.536, p = .065, and the Technology, F (1, 54) =.251, p = .618. Gut Feeling does not reveal any signifi-cances for the tested variables. In contrast, Magical Expe-rience shows significant effects for Visualization, F (1, 54) =65.236, p < .001 r = .835 , Complexity, F (1, 54) = 5.618,p = .021, r = .364, and the interaction of Visualization *Technology, F (1, 54) = 5.282, p = .025, r = .376. Figure 6illustrates that 3D is superior to 2D and that the high informa-tion density gains advantage over the low information degreefor this dimension. Moreover, the 3D effect of the shuttertechnology provides larger scores than autostereoscopy.
Driver Task LoadThe DALI reveals statistically significant differences for Vi-sualization, F (1, 54) = 7.795, p = .007, r = .967, to thebenefit of 2D. The results show no statistically significant dif-ferences for Technology and information load.
Simulator SicknessThe results of the SSQ are not statistically significant forthe Visualization, F (1, 54) = .002, p = .967, Technology,F (1, 54) = .251, p = .618, and Complexity, F (1, 54) =.002, p = .956.
RankingsA Friedman test for the rankings of the different conditionsis not statistically significant for the autostereoscopic sam-ple, X2(3) = 4.929, p = .177, but for the shutter sample,X2(3) = 33.347, p < .001. Pairwise Wilcoxon tests withBonferroni corrections show that the participants rate all 3Dconditions significantly better than 2D, p < .006.
DISCUSSIONThe study reveals insights into the influence of visualization,technology, and complexity when introducing 3D displays toautomotive UIs. In the following, we discuss the findings.
H1: Influence of VisualizationThe findings from our study yield – at a first glance – no in-fluence of an S3D visualization on the primary driving task.We assume that two contradicting effects may have super-imposed each other and, hence, obscure a potential main ef-fect. On one hand, our log data shows that S3D increasesthe user’s secondary task performance, which, in turn, al-lows more attention to be directed towards the primary driv-ing task. Participants feel supported in filtering the relevantinformation due to the 3D effect. They state that the spatialarrangement of the items “clarifies priorities”, “fosters thedisplay‘s structure”, and provides an “intuitive understand-ing of spatial relations”. On the other hand, 3D artifacts andthe accommodation-convergence mismatches can induce eyestrain, dizziness, or headache that can negatively affect theprimary driving task. But the results of the SSQ do not showa significant effect on the drivers‘ condition. However, par-ticipants subjectively rate S3D as more distracting than 2D.The participants‘ comments justify the perceived distractionthrough the “fascinating” character of S3D and induced vi-sual load. However, our gaze measures do not show a signifi-cant increase of the visual load.
With regard to the secondary driving task, the 3D visualiza-tion supports depth judgments and decreases TCT for warn-ings. The shutter sample reveals an average decrease of 53 msfor highlighting the warning with binocular disparity. Thismeans, the breaking distance can be reduced by 1.4 m. For-mer research already shows that binocular highlighting, de-creases search times [13].
Furthermore, S3D has a positive influence on attractiveness,UX, and acceptance. Participants state the 3D effect to be“stylish”, “attractive”, “fascinating and innovative”. Thisconforms to former comparisons of 2D/3D presentations forgaming [26], automotive [5], and mobile applications [27].
H2: Influence of TechnologyAs our results show, the use of autostereoscopy has a positiveimpact on the primary driving task. Yet, participants statethat the glasses are “annoying”. The decrease in driving per-formance for shutter is attributable to the flickering and thedecrease in brightness while wearing the active glasses.
The shutter technology increases secondary task performancein terms of the accuracy in making depth judgments. This re-sult corresponds to the findings of Alpaslan et al. [2] showingbetter task performances for shutter compared to autostereo-scopic displays. We assume that the reduced quality of theautostereoscopic display decreases the accuracy of judgingdepth as applied in our study. Since the used autostereoscopicdisplay shows artifacts like crosstalk, particularly tasks thatrequire the perception of higher parallaxes are affected as it isthe case for the depth judgment task. A second reason is thereduced resolution of the autostereoscopic technology, thatprobably affects the accuracy in judging depth.
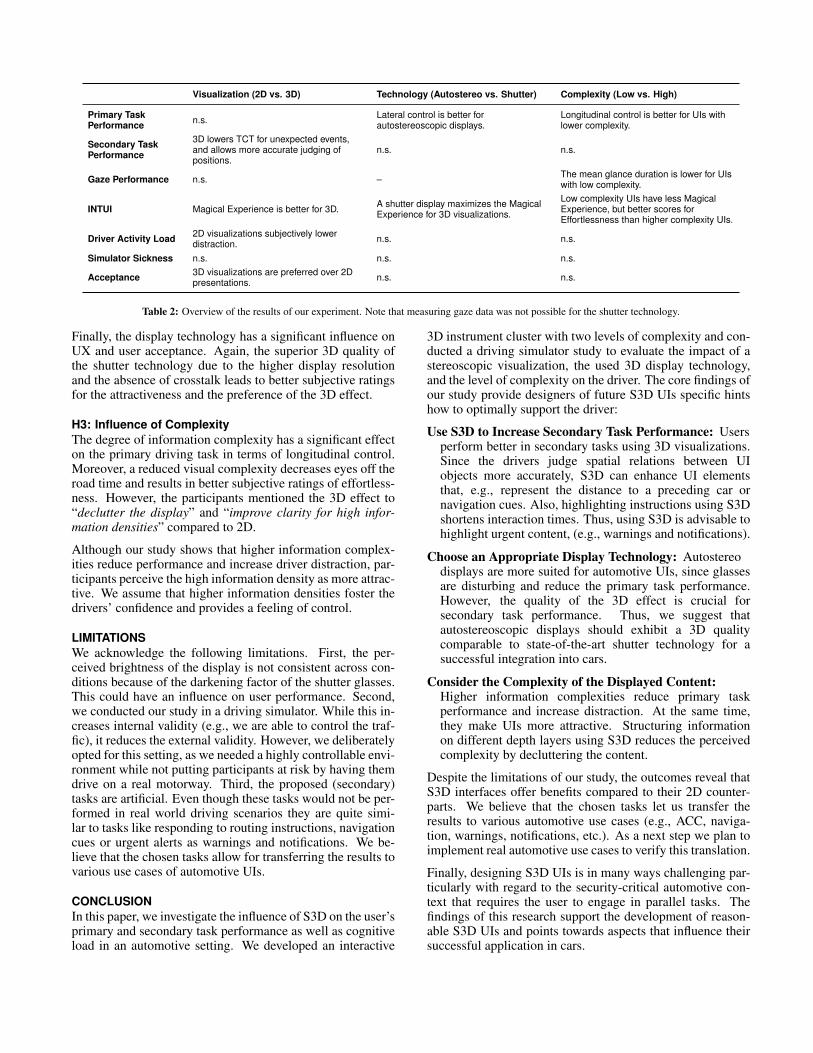
Visualization (2D vs. 3D) Technology (Autostereo vs. Shutter) Complexity (Low vs. High)
Primary TaskPerformance n.s. Lateral control is better for
autostereoscopic displays.Longitudinal control is better for UIs withlower complexity.
Secondary TaskPerformance
3D lowers TCT for unexpected events,and allows more accurate judging ofpositions.
n.s. n.s.
Gaze Performance n.s. – The mean glance duration is lower for UIswith low complexity.
INTUI Magical Experience is better for 3D. A shutter display maximizes the MagicalExperience for 3D visualizations.
Low complexity UIs have less MagicalExperience, but better scores forEffortlessness than higher complexity UIs.
Driver Activity Load 2D visualizations subjectively lowerdistraction. n.s. n.s.
Simulator Sickness n.s. n.s. n.s.
Acceptance 3D visualizations are preferred over 2Dpresentations. n.s. n.s.
Table 2: Overview of the results of our experiment. Note that measuring gaze data was not possible for the shutter technology.
Finally, the display technology has a significant influence onUX and user acceptance. Again, the superior 3D quality ofthe shutter technology due to the higher display resolutionand the absence of crosstalk leads to better subjective ratingsfor the attractiveness and the preference of the 3D effect.
H3: Influence of ComplexityThe degree of information complexity has a significant effecton the primary driving task in terms of longitudinal control.Moreover, a reduced visual complexity decreases eyes off theroad time and results in better subjective ratings of effortless-ness. However, the participants mentioned the 3D effect to“declutter the display” and “improve clarity for high infor-mation densities” compared to 2D.
Although our study shows that higher information complex-ities reduce performance and increase driver distraction, par-ticipants perceive the high information density as more attrac-tive. We assume that higher information densities foster thedrivers’ confidence and provides a feeling of control.
LIMITATIONSWe acknowledge the following limitations. First, the per-ceived brightness of the display is not consistent across con-ditions because of the darkening factor of the shutter glasses.This could have an influence on user performance. Second,we conducted our study in a driving simulator. While this in-creases internal validity (e.g., we are able to control the traf-fic), it reduces the external validity. However, we deliberatelyopted for this setting, as we needed a highly controllable envi-ronment while not putting participants at risk by having themdrive on a real motorway. Third, the proposed (secondary)tasks are artificial. Even though these tasks would not be per-formed in real world driving scenarios they are quite simi-lar to tasks like responding to routing instructions, navigationcues or urgent alerts as warnings and notifications. We be-lieve that the chosen tasks allow for transferring the results tovarious use cases of automotive UIs.
CONCLUSIONIn this paper, we investigate the influence of S3D on the user’sprimary and secondary task performance as well as cognitiveload in an automotive setting. We developed an interactive
3D instrument cluster with two levels of complexity and con-ducted a driving simulator study to evaluate the impact of astereoscopic visualization, the used 3D display technology,and the level of complexity on the driver. The core findings ofour study provide designers of future S3D UIs specific hintshow to optimally support the driver:
Use S3D to Increase Secondary Task Performance: Usersperform better in secondary tasks using 3D visualizations.Since the drivers judge spatial relations between UIobjects more accurately, S3D can enhance UI elementsthat, e.g., represent the distance to a preceding car ornavigation cues. Also, highlighting instructions using S3Dshortens interaction times. Thus, using S3D is advisable tohighlight urgent content, (e.g., warnings and notifications).
Choose an Appropriate Display Technology: Autostereodisplays are more suited for automotive UIs, since glassesare disturbing and reduce the primary task performance.However, the quality of the 3D effect is crucial forsecondary task performance. Thus, we suggest thatautostereoscopic displays should exhibit a 3D qualitycomparable to state-of-the-art shutter technology for asuccessful integration into cars.
Consider the Complexity of the Displayed Content:Higher information complexities reduce primary taskperformance and increase distraction. At the same time,they make UIs more attractive. Structuring informationon different depth layers using S3D reduces the perceivedcomplexity by decluttering the content.
Despite the limitations of our study, the outcomes reveal thatS3D interfaces offer benefits compared to their 2D counter-parts. We believe that the chosen tasks let us transfer theresults to various automotive use cases (e.g., ACC, naviga-tion, warnings, notifications, etc.). As a next step we plan toimplement real automotive use cases to verify this translation.
Finally, designing S3D UIs is in many ways challenging par-ticularly with regard to the security-critical automotive con-text that requires the user to engage in parallel tasks. Thefindings of this research support the development of reason-able S3D UIs and points towards aspects that influence theirsuccessful application in cars.
ACKNOWLEDGEMENTSWe thank Robert Wilde for his support in this project.
REFERENCES1. Alliance of Automobile Manufacturers. Statement of
principles, criteria and verification procedures on driverinteractions with advanced in-vehicle information andcommunication systems, 2006.
2. Alpaslan, Z., Yeh, S., Rizzo, A., and Sawchuk, A.Quantitative comparison of interaction with shutterglasses and autostereoscopic displays. In Proc. SPIE(2005).
3. Bach, K., Jæger, M., Skov, M., and Thomassen, N. Inter-acting with in-vehicle systems: Understanding,measuring, and evaluating attention. In Proc. HCI ’09,BCS (2009).
4. Broy, N., Alt, F., Schneegass, S., Henze, N., andSchmidt, A. Perceiving layered information on 3Ddisplays using binocular disparity. In Proc. PerDis ’13,ACM (2013).
5. Broy, N., Andre, E., and Schmidt, A. Is stereoscopic 3Da better choice for information representation in the car?In Proc. AutomotiveUI ’12, ACM (2012).
6. Broy, V., Althoff, F., and Klinker, G. iflip: a metaphorfor in-vehicle info systems. In Proc. AVI’06, ACM(2006).
7. Brunken, R., Plass, J. L., and Leutner, D. Directmeasure- ment of cognitive load in multimedia learning.Edu. Psych. 38, 1 (2003).
8. Collet, C., Delhomme, G., and Dittmar, A. Subjectiveaspects of mental workload in air-traffic control, 2003.
9. Gopher, D., and Braune, R. On the psychophysics ofworkload. Human Factors 26, 5 (1984).
10. Green, P. Standard definitions for driving measures andstatistics: Overview and status of recommended practiceJ2944. In Proc. AutomotiveUI ’13, ACM (2013).
11. Hakkila, J., Posti, M., Koskenranta, O., andVenta-Olkkonen, L. Design and evaluation of mobilephonebook apps with stereoscopic 3D user interface. InCHI ’13 EA, ACM (2013).
12. Hart, S. G., and Stavenland, L. E. Development ofNASA-TLX: Results of empirical and theoreticalresearch. In Hum. Ment. Workl. Elsevier, 1988.
13. Huhtala, J., Karukka, M., Salmimaa, M., and Hakkila, J.Evaluating depth illusion as method of adding emphasisin s3d mobile displays. In Proc. MobileHCI ’11, ACM(2011).
14. International Organization for Standardization. ISO16673: Road vehicle – ergonomic aspects of transportinformation and control systems-occlusion method toassess visual demand due to the use ofin-vehicle-systems, 2007.
15. Jahn, G., Oehme, A., Krems, J. F., and Gelau, C.Peripheral detection as a workload measure in driving:Effects of traffic complexity and route guidance systemuse in a driving study. Tran. Res. Part F 8, 3 (2005).
16. Kennedy, R. S., Lane, N. E., Berbaum, K. S., andLilienthal, M. G. Simulator sickness questionnaire: Anenhanced method for quantifying simulator sickness.IJAP 3, 3 (1993).
17. Kruger, K. Nutzen und Grenzen von 3D-Anzeigen inFahrzeugen. PhD thesis, HU Berlin, 2007.
18. Lambooij, M., Fortuin, M., Heynderickx, I., andIJsselsteijn, W. Visual discomfort and visual fatigue ofstereoscopic displays: a review. Journal of ImagingScience (2009).
19. Mattes, S. The lane-change-task as a tool for driverdistraction evaluation. Most (2003).
20. McIntire, J. P., Havig, P. R., and Geiselman, E. E. Whatis 3D good for? a review of human performance onstereoscopic 3D displays. vol. 8383 (2012).
21. Mizobuchi, S., Terasaki, S., Hakkinen, J., Heinonen, E.,Bergquist, J., and Chignell, M. The effect ofstereoscopic viewing in a word-search task with alayered background. Journal of the Society forInformation Display 16, 11 (2008).
22. Mousavi, S. Y., Low, R., and Sweller, J. Reducingcognitive load by mixing auditory and visualpresentation modes. Journal of Edu. Psy. 87, 2 (1995).
23. Paas, F., Tuovinen, J. E., Tabbers, H., and Van Gerven,P. W. Cognitive load measurement as a means toadvance cognitive load theory. Edu. Psych. 38, 1 (2003).
24. Pauzie, A. A method to assess the driver mentalworkload: The driving activity load index (DALI).Humanist 2 (2008).
25. Roscoe, A. H. Heart rate as a psychophysiologicalmeasure for in-flight workload assessment. Ergonomics36, 9 (1993).
26. Schild, J., LaViola, J., and Masuch, M. Understandingux in stereoscopic 3D games. In Proc. CHI ’12, ACM(2012).
27. Sunnari, M., Arhippainen, L., Pakanen, M., and Hickey,S. Studying ux of autostereoscopic 3D menu on touchscreen mobile device. In Proc. OzCHI ’12, ACM (2012).
28. Ullrich, D., and Diefenbach, S. Intui. exploring thefacets of intuitive interaction. In Proc. M&C (2010).
29. Urey, H., Chellappan, K., Erden, E., and Surman, P.State of the art in stereoscopic and autostereoscopicdisplays. Proc. IEEE 99, 4 (2011).
30. Van Beurden, M. H., Ijsselsteijn, W. A., and de Kort,Y. A. Evaluating stereoscopic displays. vol. 7863 (2011).
31. Van Orden, K. F., Limbert, W., Makeig, S., and Jung,T.-P. Eye activity correlates of workload during avisuospatial memory task. Human Factors 43, 1 (2001).
32. Wittmann, D., Baier, A., Neujahr, H., Petermeier, B.,Sandl, P., Vernaleken, C., and Vogelmeier, L.Development and evaluation of stereoscopic situationdisplays for air traffic control. Proc. Innovation inMechanical Engineering (2011).