


Talen
Pages
Wettelijk


2014•2015FACULTEIT INDUSTRIËLE INGENIEURSWETENSCHAPPENmaster in de industriële wetenschappen: elektronica-ICT
MasterproefEEG signaal analyse
Promotor :Prof. dr. ir. Bart VANRUMSTE
Promotor :prof. dr. ir. JOS KLAPS
Frederik Vreys Scriptie ingediend tot het behalen van de graad van master in de industriëlewetenschappen: elektronica-ICT
Gezamenlijke opleiding Universiteit Hasselt en KU Leuven
2014•2015Faculteit Industriëleingenieurswetenschappenmaster in de industriële wetenschappen: elektronica-ICT
MasterproefEEG signaal analyse
Promotor :Prof. dr. ir. Bart VANRUMSTE
Promotor :prof. dr. ir. JOS KLAPS
Frederik Vreys Scriptie ingediend tot het behalen van de graad van master in de industriëlewetenschappen: elektronica-ICT
Preface
This project started with the request to improve the time resolution precision of an existing
measurement system for sleep-EEG(electroencephalogram) signals. Not only does this lead
to very precise showings of the EEG signals but more importantly to software defined trigger
points.
It turned out that improving the existing system was impossible due to encrypted signals and
since the manufacturer did not share the decryption the improvement lead to an end. Instead
this project became the start of the development of a new sleep-EEG measuring system one
which fulfils al the demands and is the first in its kind of EEG measuring systems usable at
home while still a very accurate for diagnosis.
At the first stage of this project a simulation program and hardware setup was built in order
to prove that the concept was possible. However, putting this concept into a product felt like
the real challenge provided that the sensor needed to be wireless and that the software setup
and part of the hardware setup needed to be embedded into the sensor.
Knowing that this project is just in its infancy and that it comprises software in multiple
languages and hardware development, following it up in a master thesis when given the
opportunity to do so expands the field of knowledge in more than one direction.
The project was started by Dr. ir. J. Klaps. Through his knowledge of sleep-EEG patterns,
diagnosis and studies he devised the goals for this project. The methods of J. Klaps’s
acquaintances in the field of brain research served as the blueprint for the properties of the
EEG measurement system. Furthermore, his support in lab material made the production
and testing of the EEG-sensor optimal and efficient.
Prof. Dr. ir. R. Thoelen was assigned by FIIW (Faculteit Industriële Ingenieurs
Wetenschappen) as the internal promotor. His knowledge and experience of data acquisition
in microcontrollers and LabView directed the design into the right directions. Because he
shared his resources, e.g. for making device cases, the project developed quickly.
Louis Lenearts is thanked for loaning his material and practical knowledge.

Table of Contents
Abstract ................................................................................................................................................. 13
Abstract in het Nederlands.................................................................................................................... 15
1 Introduction ....................................................................................................................................... 17
1.1 BACKGROUND............................................................................................................................................. 17
1.2 PROBLEM DEFINITION................................................................................................................................... 18
1.3 OBJECTIVES ................................................................................................................................................ 19
1.4 METHODS AND MATERIALS............................................................................................................................ 20
1.5 OUTLINE.................................................................................................................................................... 21
2 Literature Study .................................................................................................................................. 23
2.1 THE ORIGIN OF EEG SIGNALS ......................................................................................................................... 23
2.1.1 Neural Activities .............................................................................................................................. 23
2.1.2 Measureable EEG Signals ................................................................................................................ 25
2.2 THE BRAINWAVES ........................................................................................................................................ 26
2.3 CONDITIONING AND DIGITIZING ...................................................................................................................... 27
2.4 POSITIONING AND RECORDING MODES ............................................................................................................ 27
3 The Sensor .......................................................................................................................................... 29
3.1 ELECTRODE PLACEMENT ................................................................................................................................ 29
3.2 COMPONENTS ............................................................................................................................................ 31
3.2.1 Battery ............................................................................................................................................ 31
3.2.2 Battery charger/booster .................................................................................................................. 32
3.2.3 Negative power: Charge pump +5V to -5V ....................................................................................... 33
3.2.4 Conditioning the Analogue Signal .................................................................................................... 33
3.2.5 The Bluetooth Modem ..................................................................................................................... 39
3.2.6 The Microcontroller ......................................................................................................................... 40
3.2.7 Extra: Temperature Measurement .................................................................................................. 43
3.3 HOOKING UP .............................................................................................................................................. 44
3.4 MICROCONTROLLER SOFTWARE ...................................................................................................................... 46
3.4.1 The Flow Step-by-step ..................................................................................................................... 46
3.4.2 Building the Transmitted String. ...................................................................................................... 47
3.4.3 Libraries .......................................................................................................................................... 49
3.4.4 Program: flowchart ......................................................................................................................... 50
4 Real-time NI Model myRIO ................................................................................................................. 51
4.1 MXP PROTOBOARD ..................................................................................................................................... 51
4.2 USB AS A STORAGE DEVICE ........................................................................................................................... 51
4.3 SHARED VARIABLES ...................................................................................................................................... 52
4.4 SOME MINOR ISSUES ................................................................................................................................... 54
5 Processing with LabVIEW ................................................................................................................... 55
5.1 MYRIO SOFTWARE ...................................................................................................................................... 55
5.1.1 The Shared Variables Loop .............................................................................................................. 55
5.1.2 The Registration Loop ..................................................................................................................... 55
5.1.3 The Finite-state Machine ................................................................................................................. 56
5.1.4 The Finite-state Machine: Flowchart ............................................................................................... 58
5.2 INTERFACE SOFTWARE .................................................................................................................................. 59
5.2.1 The Shared Variables Loop .............................................................................................................. 59
5.2.2 The EEG Data Loop .......................................................................................................................... 59
5.2.3 The Event Structure Loop................................................................................................................. 59
6 Results ................................................................................................................................................ 61
6.1 BEHAVIOUR OF THE SENSOR ........................................................................................................................... 61
6.1.1 Hardware ........................................................................................................................................ 61
6.1.2 Software ......................................................................................................................................... 61
6.2 DATA FILES ................................................................................................................................................. 63
6.2.1 Spontaneous Ratings ....................................................................................................................... 63
6.2.2 Triggered Ratings ............................................................................................................................ 63
6.2.3 Setting Files ..................................................................................................................................... 63
6.2.4 Measurement Files .......................................................................................................................... 63
6.3 INTERFACES ................................................................................................................................................ 64
6.3.1 Rating Registration Interface........................................................................................................... 64
6.3.2 The Physician’s Real-time Interface ................................................................................................. 66
6.3.3 Deployed Settings ........................................................................................................................... 67
6.3.4 Adjust Deployed Settings ................................................................................................................. 68
6.3.5 Create New Settings ........................................................................................................................ 69
6.3.6 Connect ........................................................................................................................................... 70
6.3.7 Livefeed........................................................................................................................................... 71
6.4 LIST OF SETTINGS ......................................................................................................................................... 72
6.4.1 Sleeper’s Settings ............................................................................................................................ 72
6.4.2 The Physician’s Settings................................................................................................................... 72
7 Conclusion & Future Work ................................................................................................................. 75
7.1 CONCLUSION .............................................................................................................................................. 75
7.2 CURRENT ISSUES ......................................................................................................................................... 76
7.2.1 Time and Date Setup ....................................................................................................................... 76
7.2.2 Duration of the Temperature Measurement .................................................................................... 76
7.3 TOWARDS 19 ELECTRODES ............................................................................................................................ 76
7.4 PROCESSING WITH A SMARTPHONE .................................................................................................................. 76
References ............................................................................................................................................. 77
Attachments .......................................................................................................................................... 79

List of Tables
Table 1: The 5 different kind of brainwaves ............................................................................. 26
Table 2: Battery specifications ..................................................................................................31
Table 3: INA114 specifications ................................................................................................. 35
Table 4: Impedance values for low pass Sallen-Key ................................................................ 39
Table 5: Bluetooth modem settings ......................................................................................... 40

List of Figures
Figure 1: Personal sleep monitor MyZEO ................................................................................ 18
Figure 2: An action potential ................................................................................................... 24
Figure 3: Nerve cell with IPSP depicted in in the bottom graph ............................................. 24
Figure 4: The three layers of the brain ..................................................................................... 25
Figure 5: Example of a measurement of 4 different kind of brainwaves ................................. 26
Figure 6: Electrode positioning consistent with the 10-20 system .......................................... 28
Figure 7: Electrodes made of silver coated fabric .................................................................... 29
Figure 8: Positions used for this project .................................................................................. 30
Figure 9: The plastic snap buttons of the headband ................................................................ 30
Figure 10: The polymer lithium ion battery ..............................................................................31
Figure 11: All-in-one battery charger booster .......................................................................... 32
Figure 12: Connection of TC7660, a charge pump DC-to-DC converter ................................. 33
Figure 13: High frequency filter and ESD/patient protection circuit ...................................... 35
Figure 14: Schematic representation of INA114, right: the gain formula ................................ 35
Figure 15: The common-mode output...................................................................................... 36
Figure 16: The Right leg driver circuit ..................................................................................... 37
Figure 17: Second order Sallen-Key Low pass filter ................................................................. 38
Figure 18: Bluetooth Modem BlueSMiRF Silver ...................................................................... 39
Figure 19: Microcontroller Teensy 3.1 ...................................................................................... 41
Figure 20: Teensy 3.1 pin assignments .................................................................................... 41
Figure 21: Range transformer .................................................................................................. 42
Figure 22: DS18B20 temperature sensor ................................................................................. 43
Figure 23: DS18B20 connection .............................................................................................. 43
Figure 24: The first PCB ........................................................................................................... 44
Figure 25: Flowchart of the microcontroller program ............................................................. 50
Figure 26: Components of MXP board ..................................................................................... 51
Figure 27: Update sequence ..................................................................................................... 52
Figure 28: Separate host buffers .............................................................................................. 53
Figure 29: The real-time clock module .................................................................................... 54
Figure 30: The finite-state machine flowchart......................................................................... 58
Figure 31: Registration interface .............................................................................................. 64
Figure 32: Registration interface unable to connect to myRIO ............................................... 65
Figure 33: The welcome tab ..................................................................................................... 66
Figure 34: Deployed settings tab.............................................................................................. 67
Figure 35: Adjustment tab of the deployed settings ................................................................ 68
Figure 36: Tab to create entirely new settings ......................................................................... 69
Figure 37: Connection tab ........................................................................................................ 70
Figure 38: The Livefeed tab ...................................................................................................... 71
Figure 39: Final product .......................................................................................................... 75

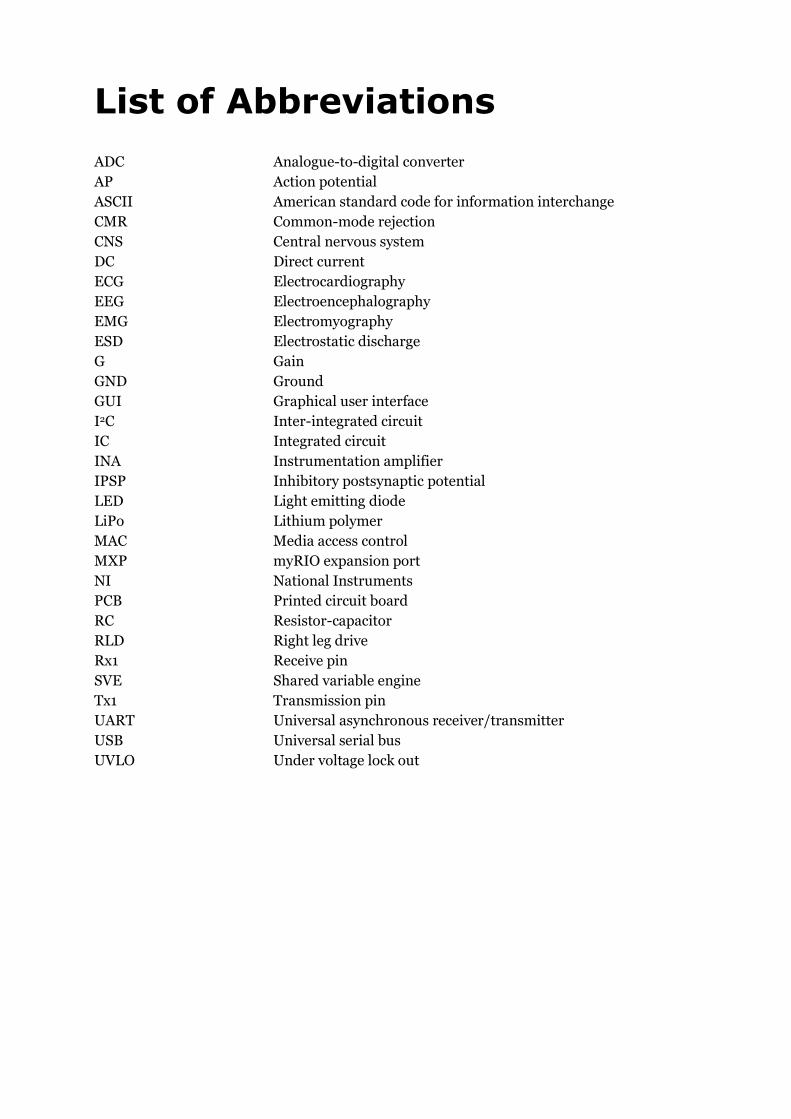
List of Abbreviations
ADC Analogue-to-digital converter
AP Action potential
ASCII American standard code for information interchange
CMR Common-mode rejection
CNS Central nervous system
DC Direct current
ECG Electrocardiography
EEG Electroencephalography
EMG Electromyography
ESD Electrostatic discharge
G Gain
GND Ground
GUI Graphical user interface
I2C Inter-integrated circuit
IC Integrated circuit
INA Instrumentation amplifier
IPSP Inhibitory postsynaptic potential
LED Light emitting diode
LiPo Lithium polymer
MAC Media access control
MXP myRIO expansion port
NI National Instruments
PCB Printed circuit board
RC Resistor-capacitor
RLD Right leg drive
Rx1 Receive pin
SVE Shared variable engine
Tx1 Transmission pin
UART Universal asynchronous receiver/transmitter
USB Universal serial bus
UVLO Under voltage lock out

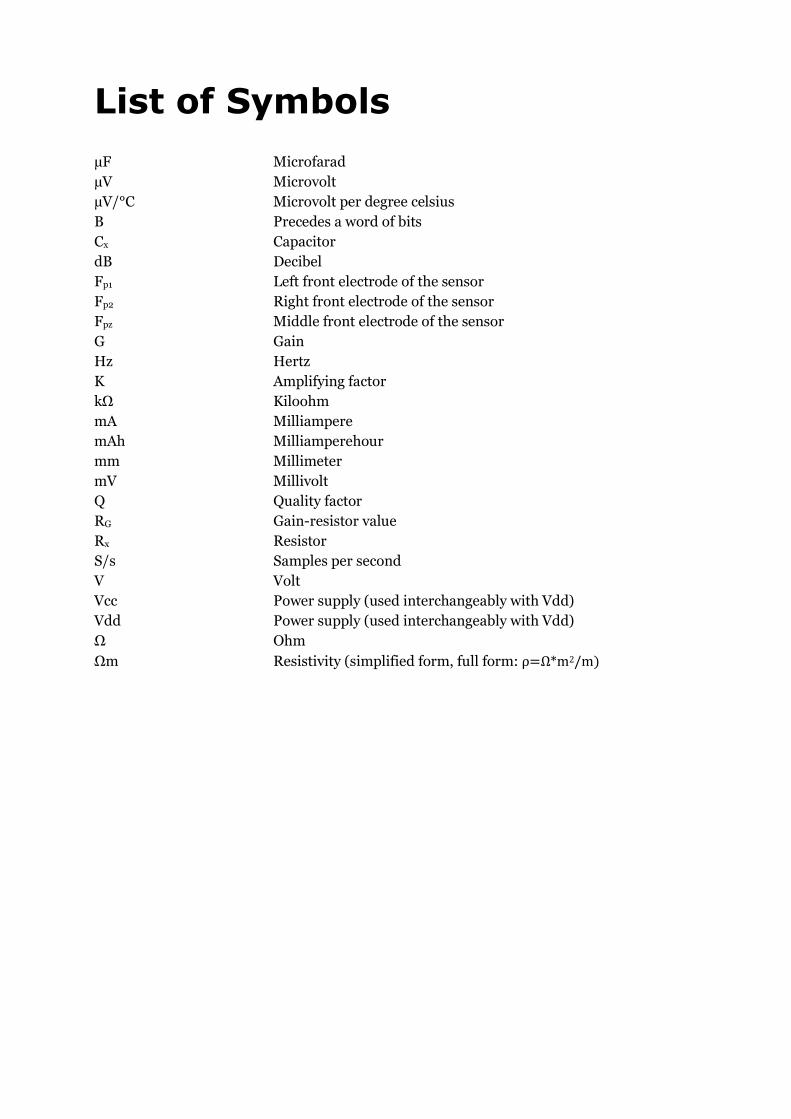
List of Symbols
µF Microfarad
µV Microvolt
µV/°C Microvolt per degree celsius
B Precedes a word of bits
Cx Capacitor
dB Decibel
Fp1 Left front electrode of the sensor
Fp2 Right front electrode of the sensor
Fpz Middle front electrode of the sensor
G Gain
Hz Hertz
K Amplifying factor
kΩ Kiloohm
mA Milliampere
mAh Milliamperehour
mm Millimeter
mV Millivolt
Q Quality factor
RG Gain-resistor value
Rx Resistor
S/s Samples per second
V Volt
Vcc Power supply (used interchangeably with Vdd)
Vdd Power supply (used interchangeably with Vdd)
Ω Ohm
Ωm Resistivity (simplified form, full form: ρ=Ω*m2/m)


Abstract
The mission of this project is to build a system with a high time resolution to investigate the
common neurophysiological mechanism of abnormal brain functioning clustering groups of
pathologies with EEG-recorded parameters in conjunction with subjective parameters which
are acquired after software defined forced awakes during the sleepcycli.
Most sleep-EEG measurement systems at home are not built for diagnostics but mainly for
personal interests, hence a low time resolution for these systems is sufficient. However,
having a low time resolution makes these systems far from ideal as medical diagnostic
sensors.
The unavailability of diagnostic home measurement systems lead to the design of a wireless
EEG-sensor which transmits the measured signals towards the real-time device ‘NI myRIO’
from National Instruments where the signals are processed. The EEG-sensor exists out of a
microcontroller, amplifier, low pass filter and RN-42 Bluetooth module which also resides on
the ‘NI myRIO’. The microcontroller samples synchronously the amplified and filtered EEG
signals and transmits them immediately. In LabView the signals are filtered into different
kinds of brainwaves and processed. If certain conditions of the brainwaves are met they will
be acted upon.
This EEG measurement system is, not only because of its high time resolution and
conditional actions, an excellent medical sensor. It also creates many opportunities for future
applications such as EEG processing smartphone applications thanks to its flexible software.


Abstract in het Nederlands
De doelstelling van dit project is een systeem met een hoge tijdschaalresolutie te bouwen om
zo het neurofysiologische mechanisme te analyseren van abnormale brein functionerende
clustering groepen en de pathologieën met EEG-metingen en subjectieve parameters, bij een
geforceerd ontwaak, tijdens de slaapcycli.
Bestaande EEG-meetsystemen voor thuisgebruik zijn niet gebouwd voor medisch onderzoek
maar voor persoonlijke interesse en hebben daardoor voldoende aan een lage
tijdschaalresolutie. Dit is echter niet voldoende voor medisch onderzoek.
Het ontbreken van EEG-meetsystemen voor medisch onderzoek leidde tot het ontwerp van
een draadloze EEG-sensor die de gemeten signalen doorstuurt naar ‘NI MyRIO’, een real-
time toestel van National Instruments, waar de signalen worden verwerkt. De EEG-sensor
bestaat uit een microprocessor, een versterker, een laagdoorlaat filter en een RN-42
Bluetooth module. Op ‘NI MyRIO’ bevindt zich dezelfde Bluetooth module. De
microprocessor samplet de versterkte en gefilterde signalen synchroon en verzendt ze.
Vervolgens worden de signalen in LabView gefilterd in verschillende soorten hersensignalen
en verwerkt, zodat er op gereageerd kan worden indien de hersensignalen aan een bepaalde
toestand voldoen.
Dit EEG-systeem is, niet alleen door zijn hoge tijdsresolutie en mogelijkheid tot interactie op
specifieke hersenactiviteit een volwaardig medisch systeem. Het creëert ook ruimte voor
toekomstige smartphone applicaties omwille van de flexibele software.

1 Introduction
This chapter starts by discussing the vindication of this project by giving background
information. The chapter thereafter describes the problem succinct. This problem definition
is then translated into practical objectives in the following section. The methods and
materials that are used to accomplish these objectives are summarized in the fourth section.
Finally, a short outline of the thesis is provided.
1.1 Background
Everybody who listens to the news has heard it, top sports people failing in their activity. The
conclusion is always the same, the cause could have been prevented if a better medical trail
had been made. However, top sports people nowadays have received descent medical trails
before the starting of their official career. This leads to the conclusion that one medical trail is
far from enough meaning that the results from the trail have been false-positive. There is only
one solution and it is the prolonged supervision only then you can be sure that you will once
measure the abnormality. For cardiac supervision the Insertible Cardiac Monitor[1] is used.
It measures the ECG signals (electrocardiography).
The same story accounts for sleep-disorders. For a prolonged period of time the medical
science has used EEG signals as a diagnostic tool for patients with sleep disorders. However,
today patients still have to sleep in the hospital while being watched and logically speaking
you cannot have a patient sleep for more than a week in the infirmary. If the abnormality
would not happen or if the different sleep environment and supervision feeling takes the
overhand during that night sleep this could lead to false-positive results or even inconclusive
results. The physician would then probably give the wrong medication and usually they just
prescribe the usual. This renders the trial at the hospital useless altogether.
Sleep examinations take place in a sleep laboratory at an infirmary and doctors need to be
permanently present. The main reason for this is the operation of the device, it needs trained
personal because it is a difficult apparatus. But in the end the measuring apparatus used in
laboratories produce very precise results. Subjective parameters are also denoted and
acquired through the use of an intentional awakening and subsequently a question which is
most of the time of a rating from 0-4.
Personal interest in sleep data has increased a lot over the last few years. The market
responded with personal sleep monitors. Doctors’ interest in these monitors is also
increasing because of the monitors’ ability to be used at home. Indeed, the physician does not
have to be present all the time anymore.
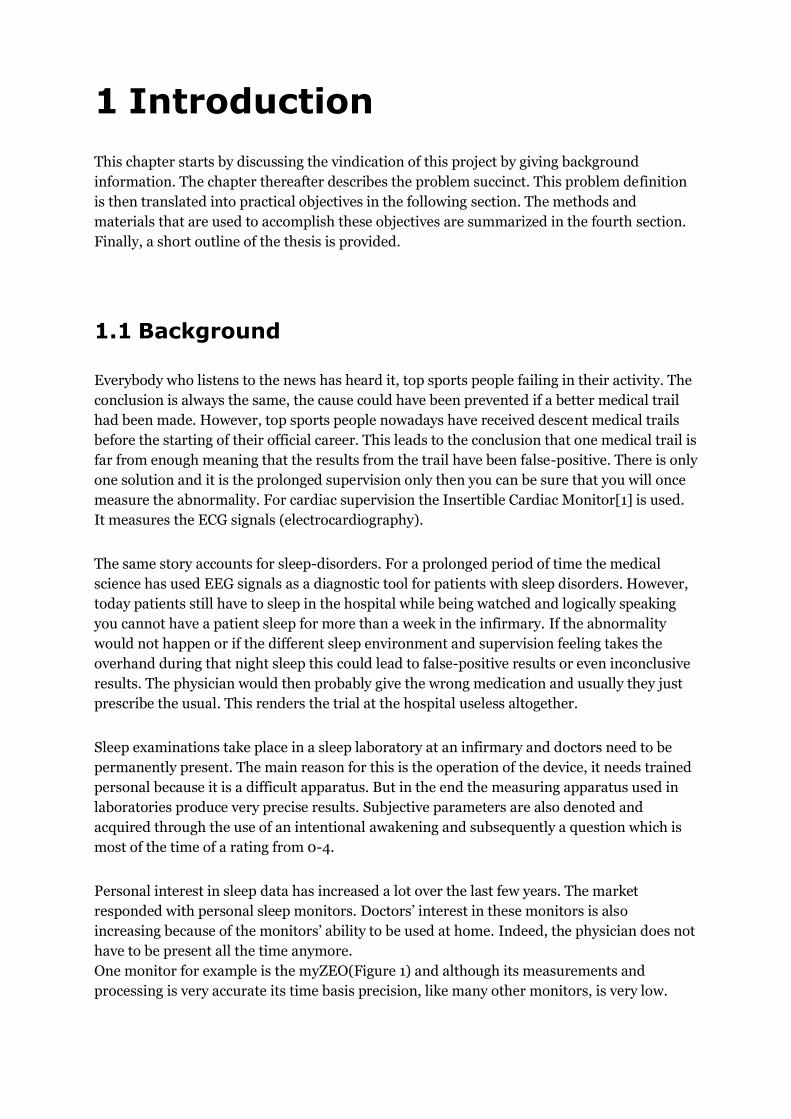
One monitor for example is the myZEO(Figure 1) and although its measurements and
processing is very accurate its time basis precision, like many other monitors, is very low.
18
Figure 1: Personal sleep monitor MyZEO
MyZEO in particular has a minimum time basis unit of 5 minutes which is enough to
differentiate between different sleep phases and complete cycli. However it is far too ample
for medical diagnostics, because the important EEG signals take place at the transition
between sleep phases. Nevertheless personal monitors have an advantage over sleep
laboratories in being usable at home. In case of a sleep laboratory the patient is going to be
examined in a different bed, environment and under nonstop supervision. It is very likely
that the patient will exhibit a different sleep behaviour which will lead to a wrong diagnosis.
Also, current laboratories measure with inconvenient leads. With a diagnostic system at
home the patient does not experience these discomforts and will exhibit the normal sickly
sleep behaviour and even though it does not happen that often, with prolonged supervision it
is almost certain that it will be measured one day.
The EEG monitor developed in this thesis will be the first to experiment with a prolonged
supervision of sleep disorders by measuring the EEG signals.
1.2 Problem Definition
A universal EEG measurement system does not exist. The fact that there are various ways of
defining the spectrums for brain-waves makes certain systems ideal for some and useless for
others.
Furthermore you have the examination in a sleep laboratory that contains the problem of the
‘Big Brother is watching you’ feeling of the patient. Also, these examinations are performed
by using non-wireless equipment which is uneasy for the patient. The current technology also
requires trained personal to operate it.
The personal sleep monitor at home which has a problem with the very low time resolution.
Because, these are the only two different kind of systems available on the market a diagnosis
will always experience one or more of these problems.
Thus, the ward concerned with sleep disorders is in need of a highly adjustable home EEG
measurement system with the assets of both the measurement system used at a sleep
laboratory and the personal sleep monitors that can be used at home.
19
1.3 Objectives1
The system should have two operable ways. One of the two is the use as a bedside system and
the other is the use as a real-time system.
For starters, the bedside mode should require as few interaction from the user as possible.
Ideally the user should only have to pick up the sensor and wear it during the sleep. One
exception, the sleeper has to register a rating at certain important points in the sleep cycle.
The sensor itself should be wireless, small and comfortable.
The real-time system still requires the patient’s interaction to be minimal but this mode also
ought to enable the doctor to interact with the system. The interaction includes being able to
view the signals in real-time, waking up the patient on demand, changing the spectrums that
should be measured and in addition be able to create settings for future days when the
bedside mode will be used.
Subjective data is required when a certain state in the sleep has occurred. These states have
to be detected programmatically. In addition these states should have the following
parameters:
the spectrums that need to be measured and saved;
specific frequencies that need to be measured and saved;
the conditions to wake a patient;
o the amplitude of the signal,
o the duration the signal has to be above that amplitude;
o in which part of the night,
o how many times the patient should be woken for the same conditions;
the rating range.
Consequently, when it is detected the patient should be woken up.
Last but not least and certainly not least important, the data should be stored onto a
USB(Universal Serial Bus) flash drive.
1 Regarding the CE-marking, this device will be used as a research use only device. Therefore the rules to receive a CE-marking are not fulfilled. However, several components with a CE-marking are already used. Would it one day be desired to receive the marking, the CE-marked components will make the adaptations of the sensor less tedious.
20
1.4 Methods and Materials
This project already had the National Instruments (NI) myRIO[2] at its disposal. It is a real-
time device capable of connecting to a network, but more importantly it can run stand-alone-
applications and thus fulfils the bedside mode requirement. It will be used as the central
processing unit and since it is a National Instruments product it should be programmed in
LabView. To make the program easy and readable by people who did not program it, finite-
state machines and producer-consumer loops have been used. These structures also make it
more easy to add code.
The ability to connect the myRIO to a wireless network allows it to publish network shared
variables[3]. A personal computer on the same network is then able to access these shared
variables. They can be written to or read from. Hence they can serve to make the system
interactive. Moreover shared variables are also accessible with the Data Dashboard for
Labview application (AppStore, googlePLAY) from National Instruments[4]. Therefore a
smart device can be used to register subjective parameters from the patient.
The sensor measures the EEG signals by means of an analogue amplifier and filter circuit.
Subsequently it will be digitized by an analogue-to-digital converter (ADC). In the last step it
will be wirelessly transmitted to the myRIO. The sensor contains a tiny microcontroller called
Teensy 3.1[5] in order to control the ADC and transmission.
The sensor also contains a temperature sensor.
The sensor will be made to be safely rechargeable meaning that it can stay on the charging
station without supervision.
The charging station will be made on the myRIO expansion port(MXP) protoboard
connector. That way the myRIO can sense whether the sensor is in use or not.
Moreover, the MXP connector also exhibits a Universal Asynchronous Receiver/Transmitter
(UART) port. This comes in handy for the wireless communication. Indeed, it enables us to
use Bluetooth modems that can be accessed through UART. A Bluetooth module will then be
connected to the myRIO and one can be connected to the microcontroller residing on the
sensor which also has a built in UART port. The Bluetooth modem that is used is called the
BlueSMiRF Silver.[6]
Bluetooth is the most suitable form of wireless transmission for the sensor. It does not nearly
use as much power as Wi-Fi does and the connection does not rely on a network as is the case
with Wi-Fi.
To make this system as flexible as possible regarding the bedside system mode and real-time
mode the program will not differentiate between these two. That way on whatever point in
time there can be switched between these modes.
21
1.5 Outline
Chapter 2
To enlighten the reader what the sensor measures and to which extent this paper starts with
the secondary research that explains the biological and diagnostic background of this project.
The biological events and diagnostic purposes justify the design choices and process methods
which were made. Hence they should be explained thorough.
Chapter 3
This chapter focuses on the design of the sensor. It is designed so that every Bluetooth
enabled device is able to connect to it and able to process the transmitted measured signals.
It is made user-friendly meaning that no trained personnel is needed to operate the sensor.
Chapter 4
Chapter 4 describes the functions of the myRIO which matter the most for this project.
Shared variables in particular serve a very important function. Moreover, if they did not exist
the graphical user interface would not be as efficient as it is.
Chapter 5
The interface software and the myRIO software will be explained separately. Keep in mind
that the program was built in such a way that it does not differentiate between bedside mode
and real-time mode. Therefore interaction with the program is possible at many places, but is
not necessary as the program is able to continue on its own.
Unlike most programming languages, LabView is a graphical programming language. This
makes it difficult and unclear to attach the code to the thesis through the use of screenshots.
Therefore a compact disc is attached to the last page which contains all the code.
Chapter 6
This chapter summarizes as much as possible what the results are a physician can expect
when using the system.
Chapter 7
This chapter concludes the result of the thesis and summarizes what has been achieved.
Furthermore, unsolved problems are discussesd as well as several suggestions for ongoing
development of this system

22
23
2 Literature Study
Before the technology of the sensor and the technique of the processing of the signals is
discussed, this chapter will cover the biological and medical aspects of EEG.
First of all the origin of EEG signals will be explained followed by the discussion of the
different kind of brainwaves.
Finally the last two sections discuss the general characteristics an EEG measurement system
should have.
The theory discussed is based on the first chapter of EEG signal processing by Saeid Sanei
and Jonathon Chambers[7].
2.1 The origin of EEG Signals
2.1.1 Neural Activities
The central nervous system (CNS) mainly consists of nerve cells and glia cell located between
neurons. The nerve cells consists of axons, dendrites and cell bodies. The activities in the CNS
are related to the synaptic currents transferred between axons and dendrites or between just
between two dendrites. A nerve cell typically has a negative potential of 60-70 mV in
reference to extracellular environment.[7]
When a nerve cell is fired an action potential (AP) travels along a fibre. The action potential
can be seen as the information transmission of a nerve cell. It is initiated in the cell body and
travels in one direction. After the nerve cell fires the membrane potential depolarizes and
becomes positive or at least more positive. Next, it will repolarize. It becomes more negative
than the resting potential of the membrane and eventually will rise till it reaches the resting
potential where it will stay till the next AP. The depolarization and repolarization take place
within 1 millisecond, hence it appears as a spike. The total refactor period in which no other
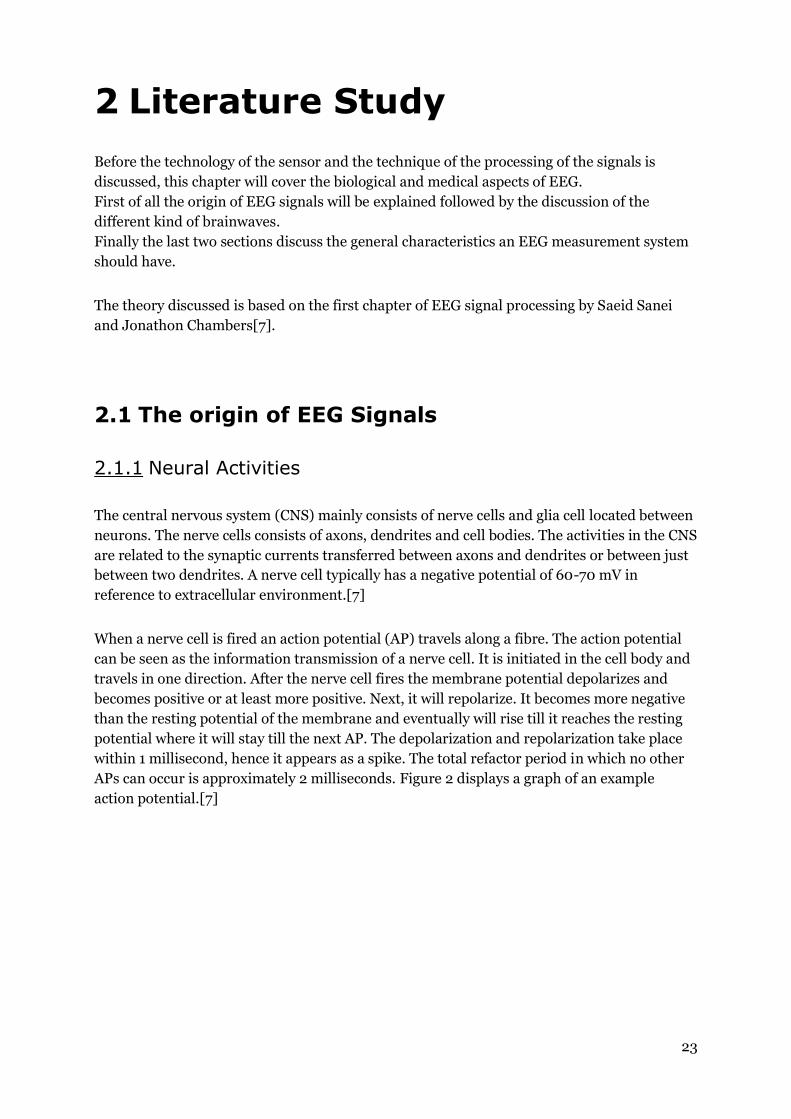
APs can occur is approximately 2 milliseconds. Figure 2 displays a graph of an example
action potential.[7]
24
Figure 2: An action potential [7]
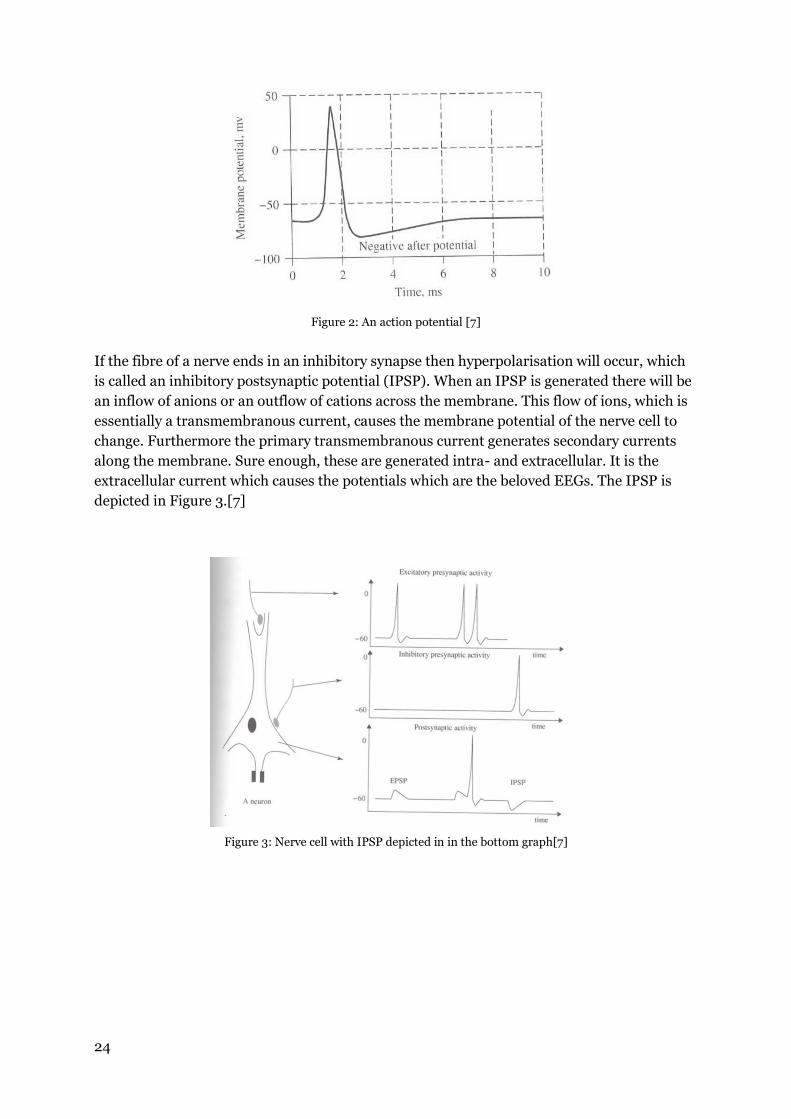
If the fibre of a nerve ends in an inhibitory synapse then hyperpolarisation will occur, which
is called an inhibitory postsynaptic potential (IPSP). When an IPSP is generated there will be
an inflow of anions or an outflow of cations across the membrane. This flow of ions, which is
essentially a transmembranous current, causes the membrane potential of the nerve cell to
change. Furthermore the primary transmembranous current generates secondary currents
along the membrane. Sure enough, these are generated intra- and extracellular. It is the
extracellular current which causes the potentials which are the beloved EEGs. The IPSP is
depicted in Figure 3.[7]
Figure 3: Nerve cell with IPSP depicted in in the bottom graph[7]
25
2.1.2 Measureable EEG Signals
An EEG signal is a measurement of summed secondary electrical fields caused by primal
currents that flow during synaptic excitations of the dendrites located in many pyramidal
neurons in the cerebral cortex.
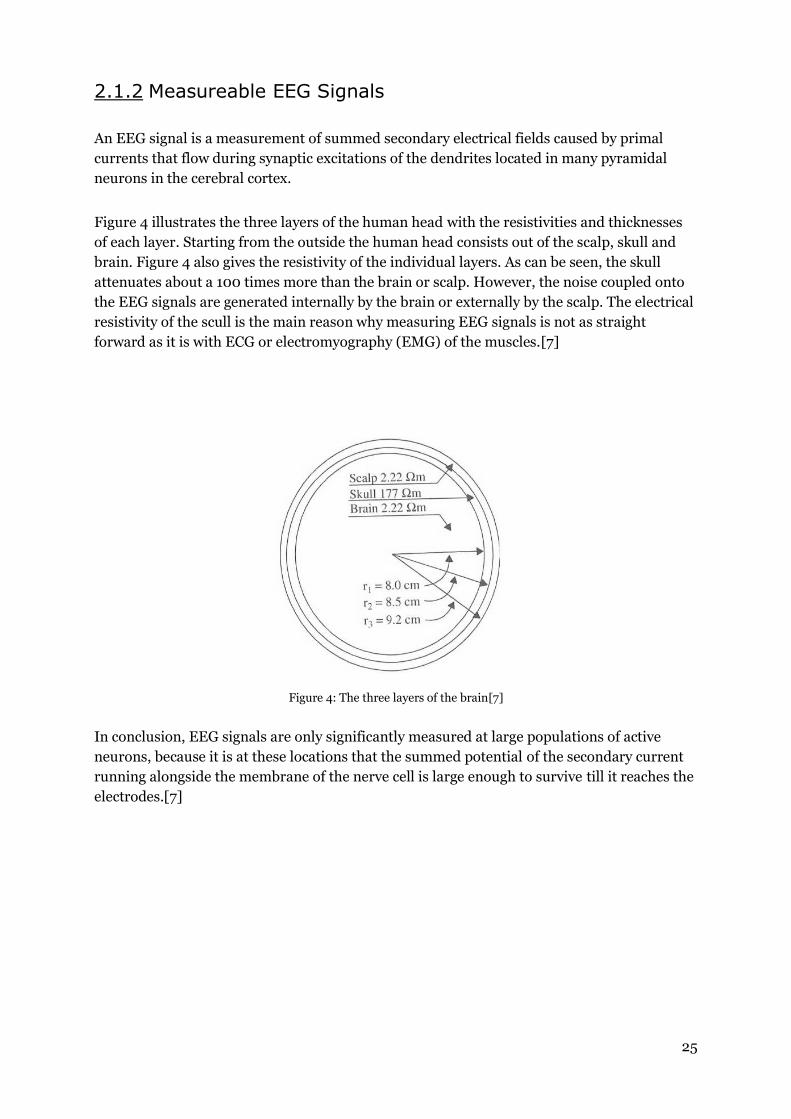
Figure 4 illustrates the three layers of the human head with the resistivities and thicknesses
of each layer. Starting from the outside the human head consists out of the scalp, skull and
brain. Figure 4 also gives the resistivity of the individual layers. As can be seen, the skull
attenuates about a 100 times more than the brain or scalp. However, the noise coupled onto
the EEG signals are generated internally by the brain or externally by the scalp. The electrical
resistivity of the scull is the main reason why measuring EEG signals is not as straight
forward as it is with ECG or electromyography (EMG) of the muscles.[7]
Figure 4: The three layers of the brain[7]
In conclusion, EEG signals are only significantly measured at large populations of active
neurons, because it is at these locations that the summed potential of the secondary current
running alongside the membrane of the nerve cell is large enough to survive till it reaches the
electrodes.[7]
26
2.2 The Brainwaves
In total there are 5 different kind of brainwaves which can be defined by the frequency
ranges. From low to high frequency ranges, Table 1 depicts them.
Table 1: The 5 different kind of brainwaves
Name Lower frequency (Hz) Higher frequency (Hz) Delta(δ) waves 0.5 4 Theta(θ) waves 4 7.5 Alpha(α) waves 8 13 Beta(β) waves 14 26 Gamma(γ) waves 30 45
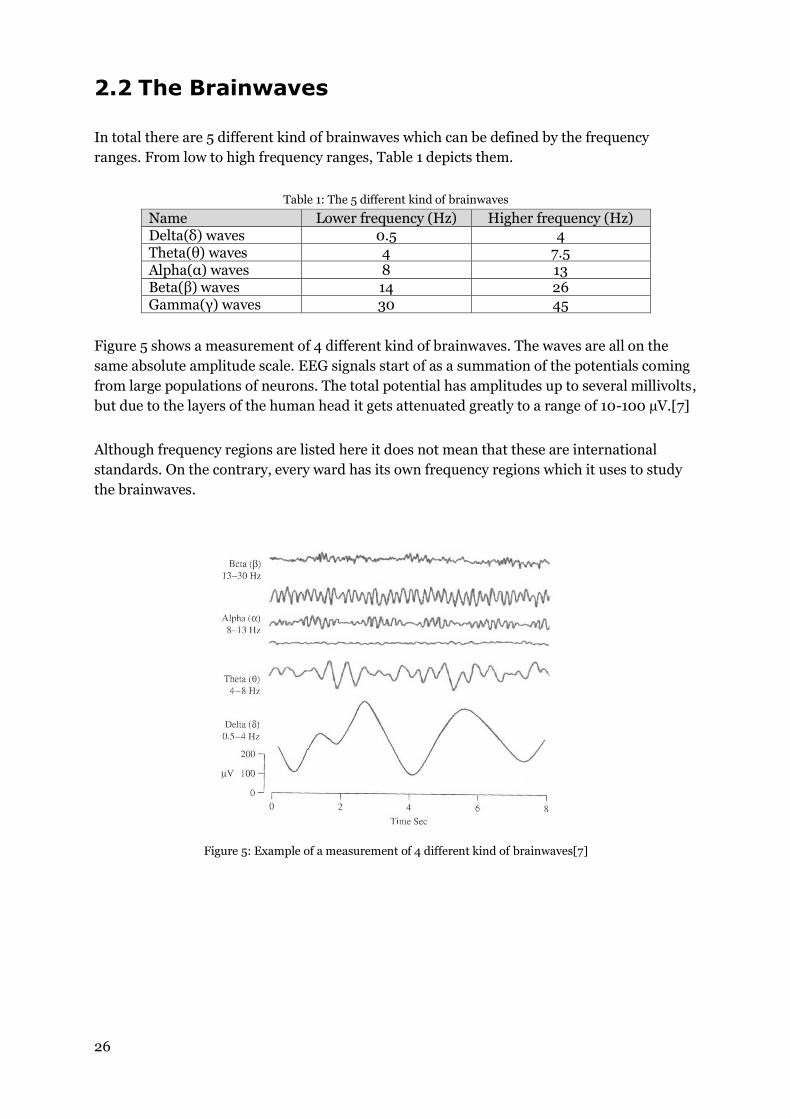
Figure 5 shows a measurement of 4 different kind of brainwaves. The waves are all on the
same absolute amplitude scale. EEG signals start of as a summation of the potentials coming
from large populations of neurons. The total potential has amplitudes up to several millivolts,
but due to the layers of the human head it gets attenuated greatly to a range of 10-100 µV.[7]
Although frequency regions are listed here it does not mean that these are international
standards. On the contrary, every ward has its own frequency regions which it uses to study
the brainwaves.
Figure 5: Example of a measurement of 4 different kind of brainwaves[7]
27
2.3 Conditioning and Digitizing
Raw EEG signals have a magnitude in the order of µV which is, like previously stated, the
consequence of the electrical resistivity of the scull. In order to get more specific
measurements the signals are amplified and filtered before they are digitized by the ADC.
Most filters consist of a high pass filter and a low pass filter with cut-off frequencies of 0.5 Hz
and 100Hz respectively. The high pass filter removes unwanted DC (Direct Current) and low
frequency components such as breathing. Obviously, since EEG signals have a maximum
frequency of 100Hz, signals beyond that frequency are considered noise and therefore
filtered out of the analogue signal. What follows is the amplification of the signal. It usually
starts with a differential amplification follow by one or more amplifications. This is also the
last step. The signal is now ready to be digitized.[7]
In order to digitize analogue signals analogue-to-digital converters must be used. This
converter measures the analogue signal so many times per second. This is expressed in
samples per second (S/s). The most EEG signal measurements measure frequencies up to
100 Hertz (Hz). According to the Nyquist sampling criterion a signal should be sampled with
a frequency at least twice the highest frequency of interest in order to determine the
amplitude and frequency of the signal that was sampled. So as it turns out, a sample
frequency of 200S/s is enough, but higher sample rates are also possible and several
commonly used frequencies are 100, 250, 500, 1000 and 2000S/s. Furthermore, the
quantization of EEG signals consists typically of 216 levels, hence one sample is represented
as a 16bit binary number.[7]
To have a good recording of EEG signals the electrodes should have an impedance less than 5
kΩ. In addition they should also be balanced to within 1 kΩ of each other.[7]
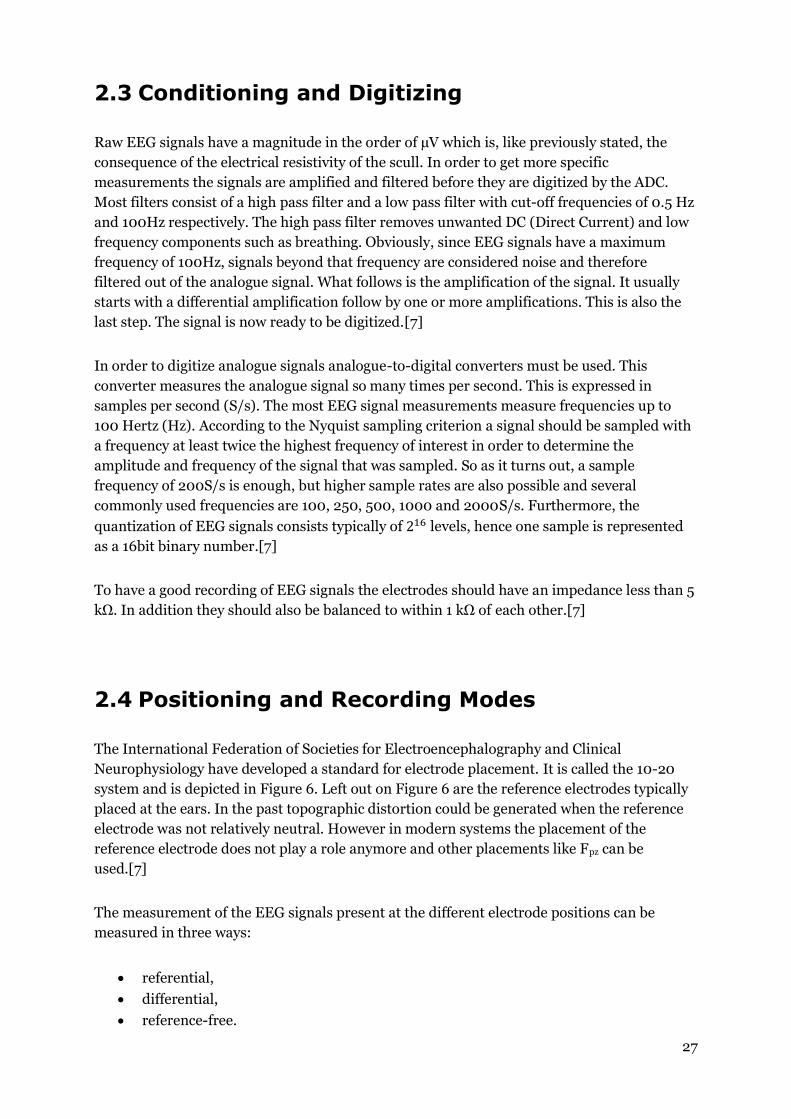
2.4 Positioning and Recording Modes
The International Federation of Societies for Electroencephalography and Clinical
Neurophysiology have developed a standard for electrode placement. It is called the 10-20
system and is depicted in Figure 6. Left out on Figure 6 are the reference electrodes typically
placed at the ears. In the past topographic distortion could be generated when the reference
electrode was not relatively neutral. However in modern systems the placement of the
reference electrode does not play a role anymore and other placements like Fpz can be
used.[7]
The measurement of the EEG signals present at the different electrode positions can be
measured in three ways:
referential,
differential,
reference-free.
28
Figure 6: Electrode positioning consistent with the 10-20 system[7]
By measuring referential at a certain electrode one of the two inputs of the differential
amplifier is the reference electrode. When measuring differential the inputs of the differential
amplifier come from two different electrodes between which the difference signal is being
measured. In the last method a signal is measured in reference to the average of the signal
itself.[7]
According to [8] the differential approach has a benefit over the referential approach because
it amplifies the minute difference of the signals between neighbouring electrodes which eases
the difficult subsequent stages of amplification and data conversion.
29
3 The Sensor
This chapter fully describes the sensor. It commences by discussing the placement of the
electrodes. Next, all the components are discussed. When all the components are discussed
the part thereafter will try to explain how to connect the components.
The final part describes the program of the microcontroller. The format of the data that is
being send is described separately. The different steps the program goes through is visually
aided with a flowchart which can be found in section 3.4.4
3.1 Electrode Placement
As previously stated in section 2.1.2 an EEG signal originates from the cerebral cortex.
Looking at predecessors (myZEO), sleep EEG is being measured at the frontal lobe or
prefrontal cortex and frontal pole to be correct. Of course this is not blindfoldedly accepted
but also [9] stated that experimental data indicates that the prefrontal cortex plays a role in
mediating normal sleep physiology, dreaming and sleep-deprivation phenomena. Fortunately
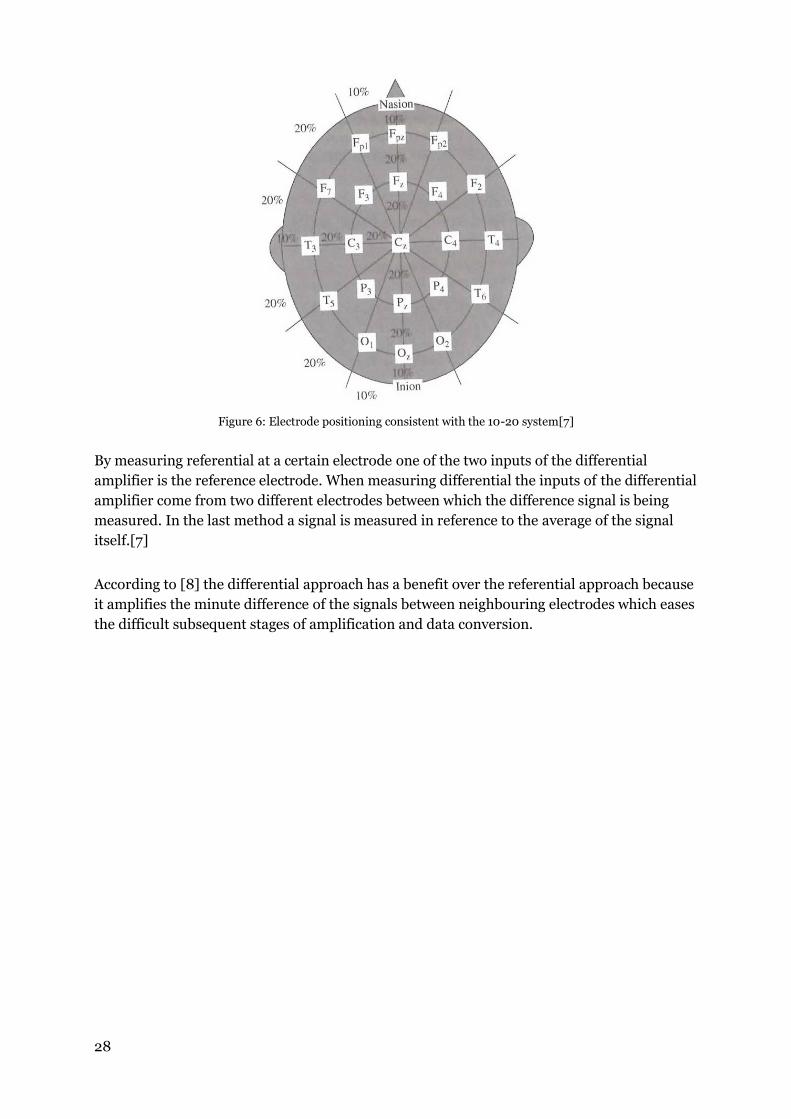
this is also the most comfortable place on the head and since myZEO already developed a
very comfortable headband, as can be seen in Figure 7,it was used for the electrodes of this
project. The electrodes consist of highly conductive and very soft silver-coated fabric.
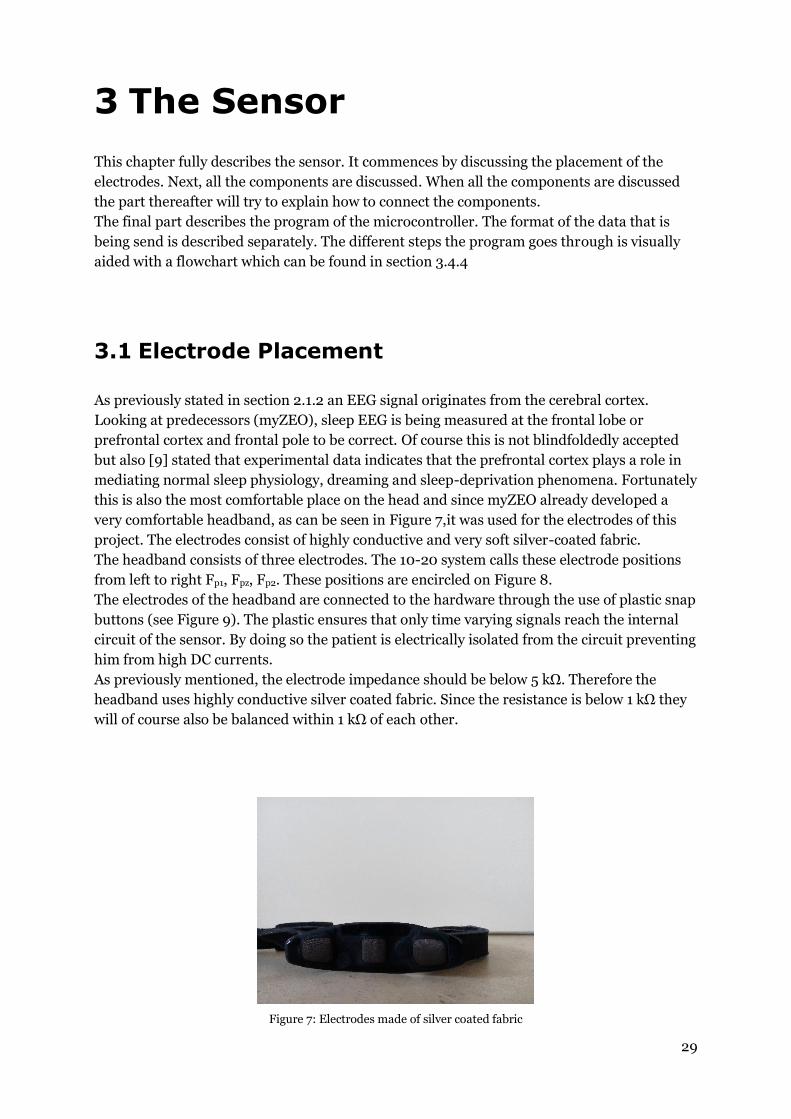
The headband consists of three electrodes. The 10-20 system calls these electrode positions
from left to right Fp1, Fpz, Fp2. These positions are encircled on Figure 8.
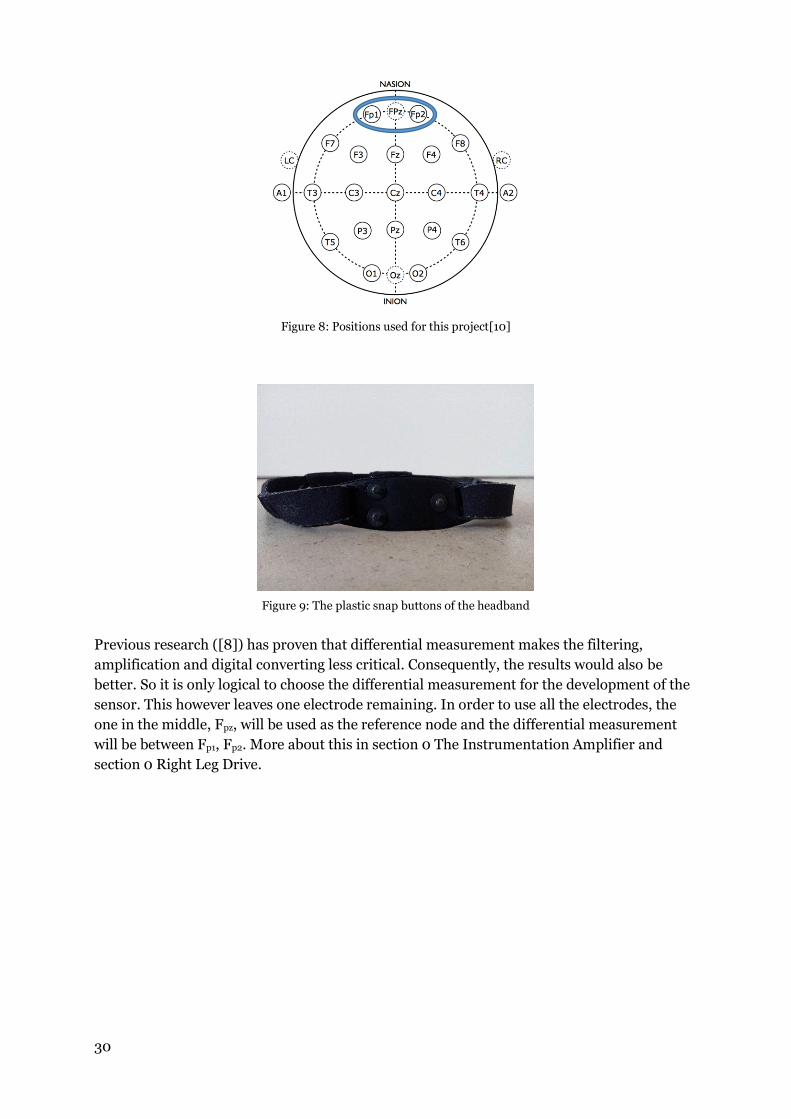
The electrodes of the headband are connected to the hardware through the use of plastic snap
buttons (see Figure 9). The plastic ensures that only time varying signals reach the internal
circuit of the sensor. By doing so the patient is electrically isolated from the circuit preventing
him from high DC currents.
As previously mentioned, the electrode impedance should be below 5 kΩ. Therefore the
headband uses highly conductive silver coated fabric. Since the resistance is below 1 kΩ they
will of course also be balanced within 1 kΩ of each other.
Figure 7: Electrodes made of silver coated fabric
30
Figure 8: Positions used for this project[10]
Figure 9: The plastic snap buttons of the headband
Previous research ([8]) has proven that differential measurement makes the filtering,
amplification and digital converting less critical. Consequently, the results would also be
better. So it is only logical to choose the differential measurement for the development of the
sensor. This however leaves one electrode remaining. In order to use all the electrodes, the
one in the middle, Fpz, will be used as the reference node and the differential measurement
will be between Fp1, Fp2. More about this in section 0 The Instrumentation Amplifier and
section 0 Right Leg Drive.
31
3.2 Components2
3.2.1 Battery
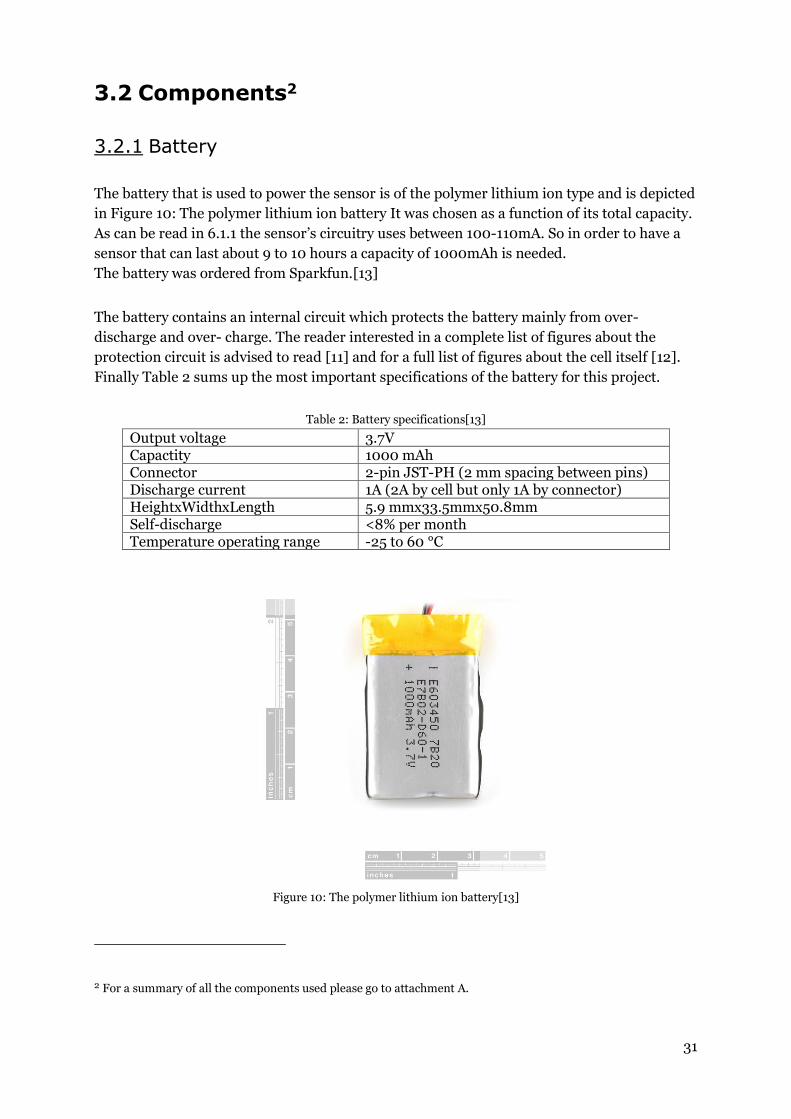
The battery that is used to power the sensor is of the polymer lithium ion type and is depicted
in Figure 10: The polymer lithium ion battery It was chosen as a function of its total capacity.
As can be read in 6.1.1 the sensor’s circuitry uses between 100-110mA. So in order to have a
sensor that can last about 9 to 10 hours a capacity of 1000mAh is needed.
The battery was ordered from Sparkfun.[13]
The battery contains an internal circuit which protects the battery mainly from over-
discharge and over- charge. The reader interested in a complete list of figures about the
protection circuit is advised to read [11] and for a full list of figures about the cell itself [12].
Finally Table 2 sums up the most important specifications of the battery for this project.
Table 2: Battery specifications[13]
Output voltage 3.7V Capactity 1000 mAh Connector 2-pin JST-PH (2 mm spacing between pins) Discharge current 1A (2A by cell but only 1A by connector) HeightxWidthxLength 5.9 mmx33.5mmx50.8mm Self-discharge <8% per month Temperature operating range -25 to 60 °C
Figure 10: The polymer lithium ion battery[13]
2 For a summary of all the components used please go to attachment A.
32
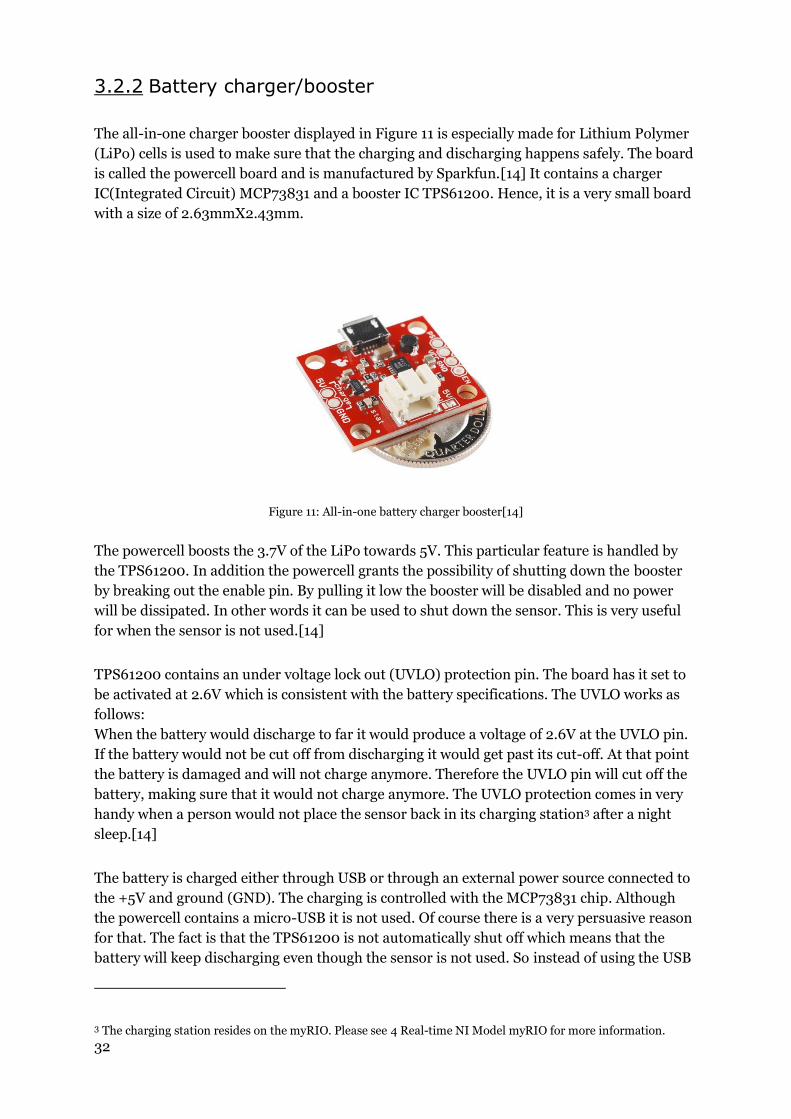
3.2.2 Battery charger/booster
The all-in-one charger booster displayed in Figure 11 is especially made for Lithium Polymer
(LiPo) cells is used to make sure that the charging and discharging happens safely. The board
is called the powercell board and is manufactured by Sparkfun.[14] It contains a charger
IC(Integrated Circuit) MCP73831 and a booster IC TPS61200. Hence, it is a very small board
with a size of 2.63mmX2.43mm.
Figure 11: All-in-one battery charger booster[14]
The powercell boosts the 3.7V of the LiPo towards 5V. This particular feature is handled by
the TPS61200. In addition the powercell grants the possibility of shutting down the booster
by breaking out the enable pin. By pulling it low the booster will be disabled and no power
will be dissipated. In other words it can be used to shut down the sensor. This is very useful
for when the sensor is not used.[14]
TPS61200 contains an under voltage lock out (UVLO) protection pin. The board has it set to
be activated at 2.6V which is consistent with the battery specifications. The UVLO works as
follows:
When the battery would discharge to far it would produce a voltage of 2.6V at the UVLO pin.
If the battery would not be cut off from discharging it would get past its cut-off. At that point
the battery is damaged and will not charge anymore. Therefore the UVLO pin will cut off the
battery, making sure that it would not charge anymore. The UVLO protection comes in very
handy when a person would not place the sensor back in its charging station3 after a night
sleep.[14]
The battery is charged either through USB or through an external power source connected to
the +5V and ground (GND). The charging is controlled with the MCP73831 chip. Although
the powercell contains a micro-USB it is not used. Of course there is a very persuasive reason
for that. The fact is that the TPS61200 is not automatically shut off which means that the
battery will keep discharging even though the sensor is not used. So instead of using the USB
3 The charging station resides on the myRIO. Please see 4 Real-time NI Model myRIO for more information.
33
port to charge while pulling enable low it is much more user friendly to make a charging
station which charges the battery through +5V and GND and pulls enable low eliminating the
need of the USB charger.[14]
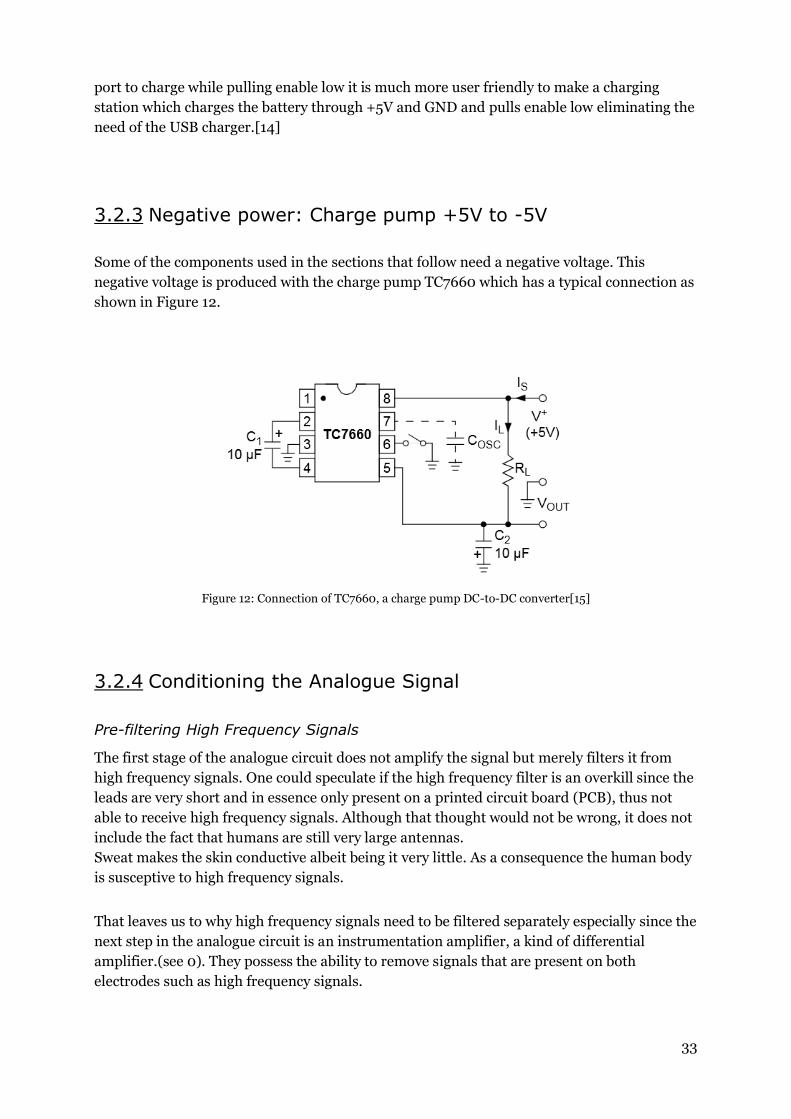
3.2.3 Negative power: Charge pump +5V to -5V
Some of the components used in the sections that follow need a negative voltage. This
negative voltage is produced with the charge pump TC7660 which has a typical connection as
shown in Figure 12.
Figure 12: Connection of TC7660, a charge pump DC-to-DC converter[15]
3.2.4 Conditioning the Analogue Signal
Pre-filtering High Frequency Signals
The first stage of the analogue circuit does not amplify the signal but merely filters it from
high frequency signals. One could speculate if the high frequency filter is an overkill since the
leads are very short and in essence only present on a printed circuit board (PCB), thus not
able to receive high frequency signals. Although that thought would not be wrong, it does not
include the fact that humans are still very large antennas.
Sweat makes the skin conductive albeit being it very little. As a consequence the human body
is susceptive to high frequency signals.
That leaves us to why high frequency signals need to be filtered separately especially since the
next step in the analogue circuit is an instrumentation amplifier, a kind of differential
amplifier.(see 0). They possess the ability to remove signals that are present on both
electrodes such as high frequency signals.
34
James Bryant (ADI Europe) with Herman Gelbach (The Boeing Company)
(www.analog.com/library/analogDialogue/Anniversary/14.html) describe the reason as
follows:
“An important factor is that, in instrumentation amplifiers, common-mode rejection
decreases with increasing frequency, starting to roll off at quite low frequencies-and
distortion increases with frequency. Thus, not only are high frequency common-mode
signals not rejected; they are distorted, producing offsets”.[16]
Furthermore James Bryant (ADI Europe) et al. (2014) explain that if the signal bandwidth is
only a few Hz wide a simple RC(Resistor-Capacitor) low pass filter will remove the high
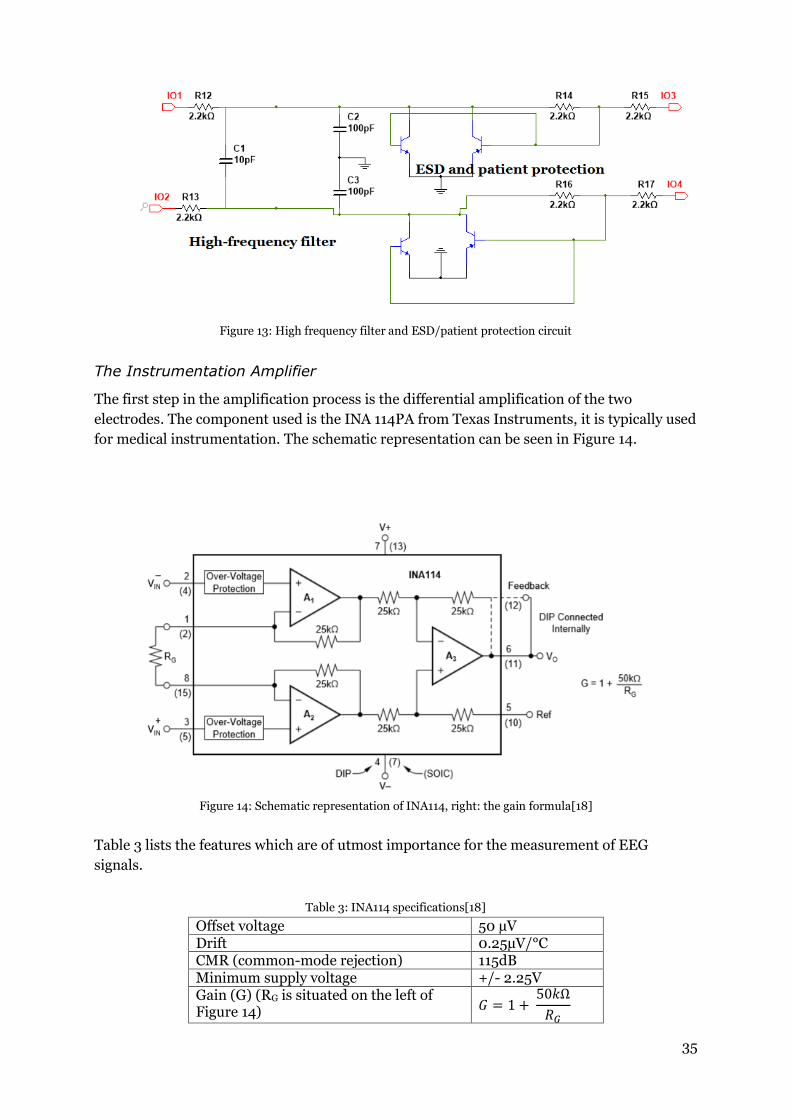
frequency signals. Thank goodness EEG signals only have a small signal bandwidth. Figure 13
shows the implementation of the low pass filter. It consists out of three RC circuits. Two
common-mode RC filters R12 * C2 and R13 * C3 which make sure the unwanted signals are
filtered, and normal-mode RC filter (R12 + R13) * C1 which removes the unwanted high
frequency signals from only one of the inputs.[16]
OpenEEG (http://openeeg.sourceforge.net/) is a website with open source information about
an EEG system. They have developed a high frequency RC low pass filter as demonstrated by
James Bryant (ADI Europe) with Herman Gelbach (The Boeing Company) (2014). The values
of the resistors and capacitors obviously need to be the same since the bandwidth is the same,
hence these values were used in the development of the sensor.[17]
Another feature of the protection circuit is the removal of high normal-mode voltages which
are produced due to possible charge building on the sensors, they could also be produced by
electrostatic discharges (ESD). In case these charges would not be dealt with a DC charge
would amplified. Worst case scenario, the amplifier saturates leaving no room for EEG
signals. Moreover, not only do these charges mess with the EEG measurement they could
harm the circuit and more importantly the patient4. This feature is acquired through the use
of transistors. However they could just as well be diodes. They operate as follows: if the
voltage becomes higher than 0.7V they start to conduct. Consequently, the charge will flow
away. The resulting circuit is depicted in Figure 13.
4 That is in case someone would use electrodes which allow DC to pass.
35
Figure 13: High frequency filter and ESD/patient protection circuit
The Instrumentation Amplifier
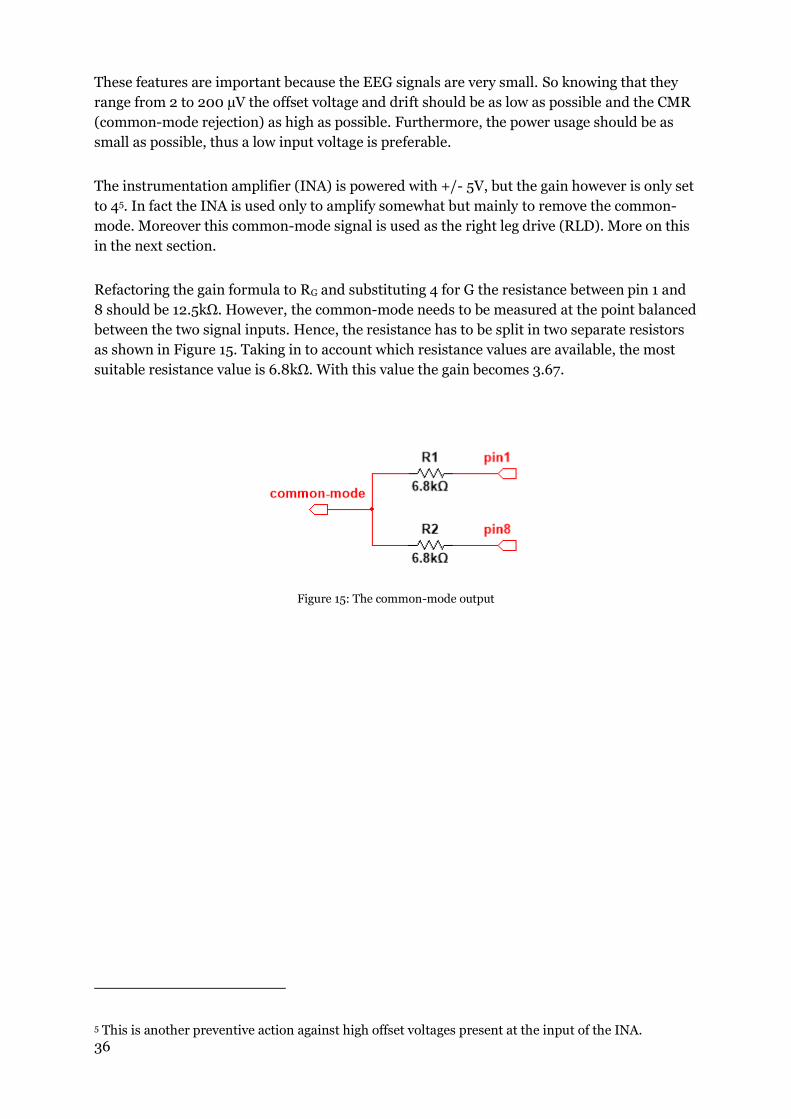
The first step in the amplification process is the differential amplification of the two
electrodes. The component used is the INA 114PA from Texas Instruments, it is typically used
for medical instrumentation. The schematic representation can be seen in Figure 14.
Figure 14: Schematic representation of INA114, right: the gain formula[18]
Table 3 lists the features which are of utmost importance for the measurement of EEG
signals.
Table 3: INA114 specifications[18]
Offset voltage 50 µV Drift 0.25µV/°C CMR (common-mode rejection) 115dB Minimum supply voltage +/- 2.25V Gain (G) (RG is situated on the left of Figure 14) 𝐺 = 1 +
50𝑘Ω
𝑅𝐺
36
These features are important because the EEG signals are very small. So knowing that they
range from 2 to 200 µV the offset voltage and drift should be as low as possible and the CMR
(common-mode rejection) as high as possible. Furthermore, the power usage should be as
small as possible, thus a low input voltage is preferable.
The instrumentation amplifier (INA) is powered with +/- 5V, but the gain however is only set
to 45. In fact the INA is used only to amplify somewhat but mainly to remove the common-
mode. Moreover this common-mode signal is used as the right leg drive (RLD). More on this
in the next section.
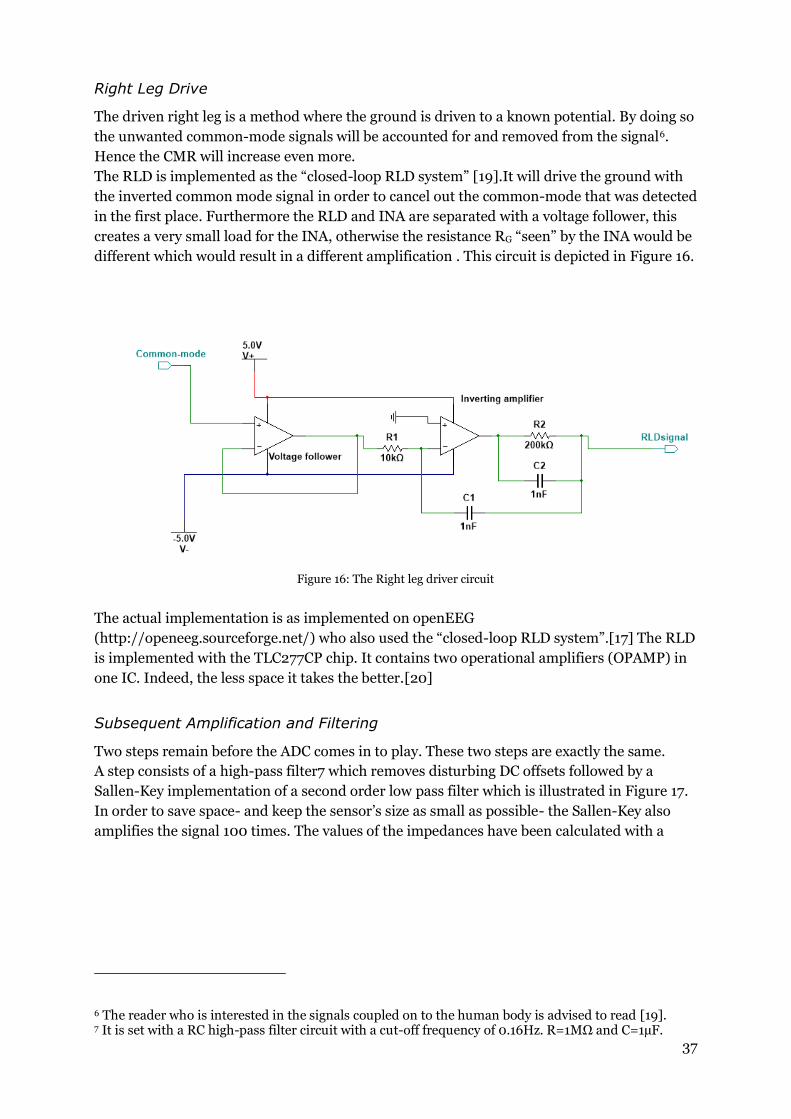
Refactoring the gain formula to RG and substituting 4 for G the resistance between pin 1 and
8 should be 12.5kΩ. However, the common-mode needs to be measured at the point balanced
between the two signal inputs. Hence, the resistance has to be split in two separate resistors
as shown in Figure 15. Taking in to account which resistance values are available, the most
suitable resistance value is 6.8kΩ. With this value the gain becomes 3.67.
Figure 15: The common-mode output
5 This is another preventive action against high offset voltages present at the input of the INA.
37
Right Leg Drive
The driven right leg is a method where the ground is driven to a known potential. By doing so
the unwanted common-mode signals will be accounted for and removed from the signal6.
Hence the CMR will increase even more.
The RLD is implemented as the “closed-loop RLD system” [19].It will drive the ground with
the inverted common mode signal in order to cancel out the common-mode that was detected
in the first place. Furthermore the RLD and INA are separated with a voltage follower, this
creates a very small load for the INA, otherwise the resistance RG “seen” by the INA would be
different which would result in a different amplification . This circuit is depicted in Figure 16.
Figure 16: The Right leg driver circuit
The actual implementation is as implemented on openEEG
(http://openeeg.sourceforge.net/) who also used the “closed-loop RLD system”.[17] The RLD
is implemented with the TLC277CP chip. It contains two operational amplifiers (OPAMP) in
one IC. Indeed, the less space it takes the better.[20]
Subsequent Amplification and Filtering
Two steps remain before the ADC comes in to play. These two steps are exactly the same.
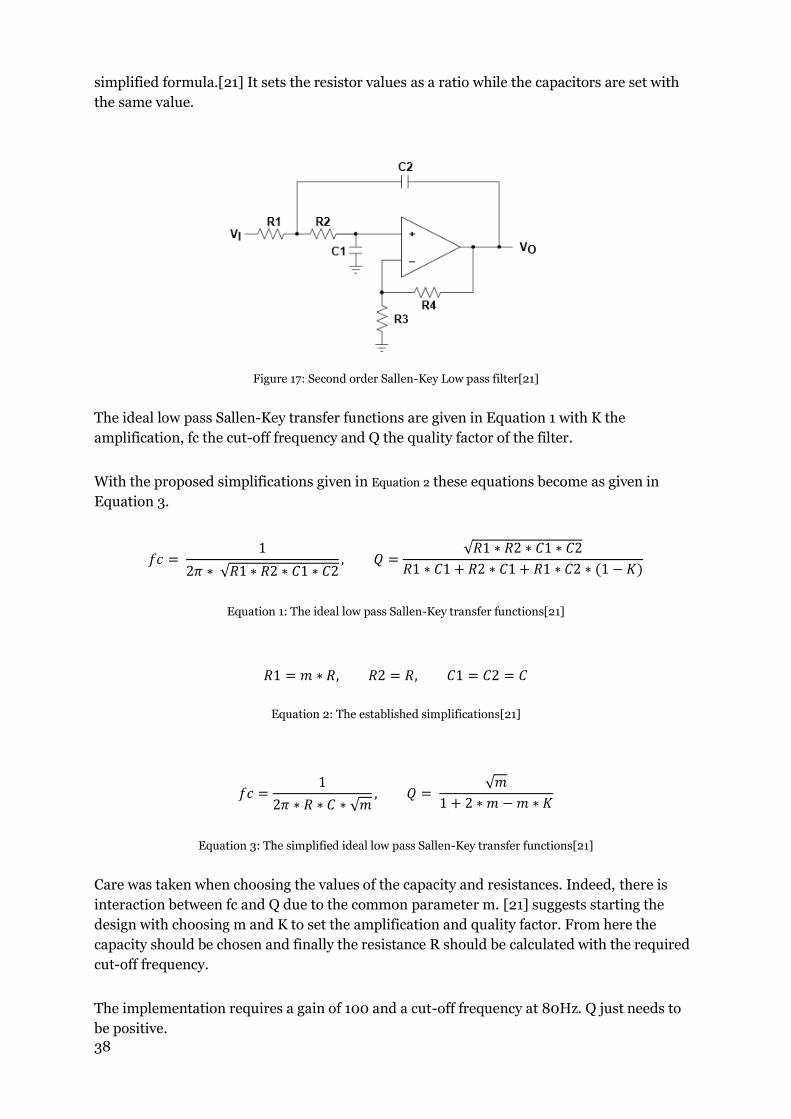
A step consists of a high-pass filter7 which removes disturbing DC offsets followed by a
Sallen-Key implementation of a second order low pass filter which is illustrated in Figure 17.
In order to save space- and keep the sensor’s size as small as possible- the Sallen-Key also
amplifies the signal 100 times. The values of the impedances have been calculated with a
6 The reader who is interested in the signals coupled on to the human body is advised to read [19]. 7 It is set with a RC high-pass filter circuit with a cut-off frequency of 0.16Hz. R=1MΩ and C=1µF.
38
simplified formula.[21] It sets the resistor values as a ratio while the capacitors are set with
the same value.
Figure 17: Second order Sallen-Key Low pass filter[21]
The ideal low pass Sallen-Key transfer functions are given in Equation 1 with K the
amplification, fc the cut-off frequency and Q the quality factor of the filter.
With the proposed simplifications given in Equation 2 these equations become as given in
Equation 3.
𝑓𝑐 = 1
2𝜋 ∗ √𝑅1 ∗ 𝑅2 ∗ 𝐶1 ∗ 𝐶2, 𝑄 =
√𝑅1 ∗ 𝑅2 ∗ 𝐶1 ∗ 𝐶2
𝑅1 ∗ 𝐶1 + 𝑅2 ∗ 𝐶1 + 𝑅1 ∗ 𝐶2 ∗ (1 − 𝐾)
Equation 1: The ideal low pass Sallen-Key transfer functions[21]
𝑅1 = 𝑚 ∗ 𝑅, 𝑅2 = 𝑅, 𝐶1 = 𝐶2 = 𝐶
Equation 2: The established simplifications[21]
𝑓𝑐 =1
2𝜋 ∗ 𝑅 ∗ 𝐶 ∗ √𝑚, 𝑄 =
√𝑚
1 + 2 ∗ 𝑚 − 𝑚 ∗ 𝐾
Equation 3: The simplified ideal low pass Sallen-Key transfer functions[21]
Care was taken when choosing the values of the capacity and resistances. Indeed, there is
interaction between fc and Q due to the common parameter m. [21] suggests starting the
design with choosing m and K to set the amplification and quality factor. From here the
capacity should be chosen and finally the resistance R should be calculated with the required
cut-off frequency.
The implementation requires a gain of 100 and a cut-off frequency at 80Hz. Q just needs to
be positive.
39
The complete calculation is quite lengthy, therefore it has been moved to attachment B.
Computing the values of the impedances and taking the availability into account, the results
are as presented in Table 4.
Table 4: Impedance values for low pass Sallen-Key
Physical quantity Value R1 100Ω R2 82kΩ R3 150Ω R4 15kΩ C1 0.68µF C2 0.68µF K 100 fc 81.73Hz Q 0.034
Notice that Q is relatively small. Therefore care should be taken with the deviations of the
impedances. If these become too large, it could get the system to oscillate.
The two OPAMPs needed are also implemented with the TLC277CP chip.[20]
The signal is now ready to be converted into a digital signal and send to the central
processing unit. The Bluetooth modem will be enlightened first.
3.2.5 The Bluetooth Modem
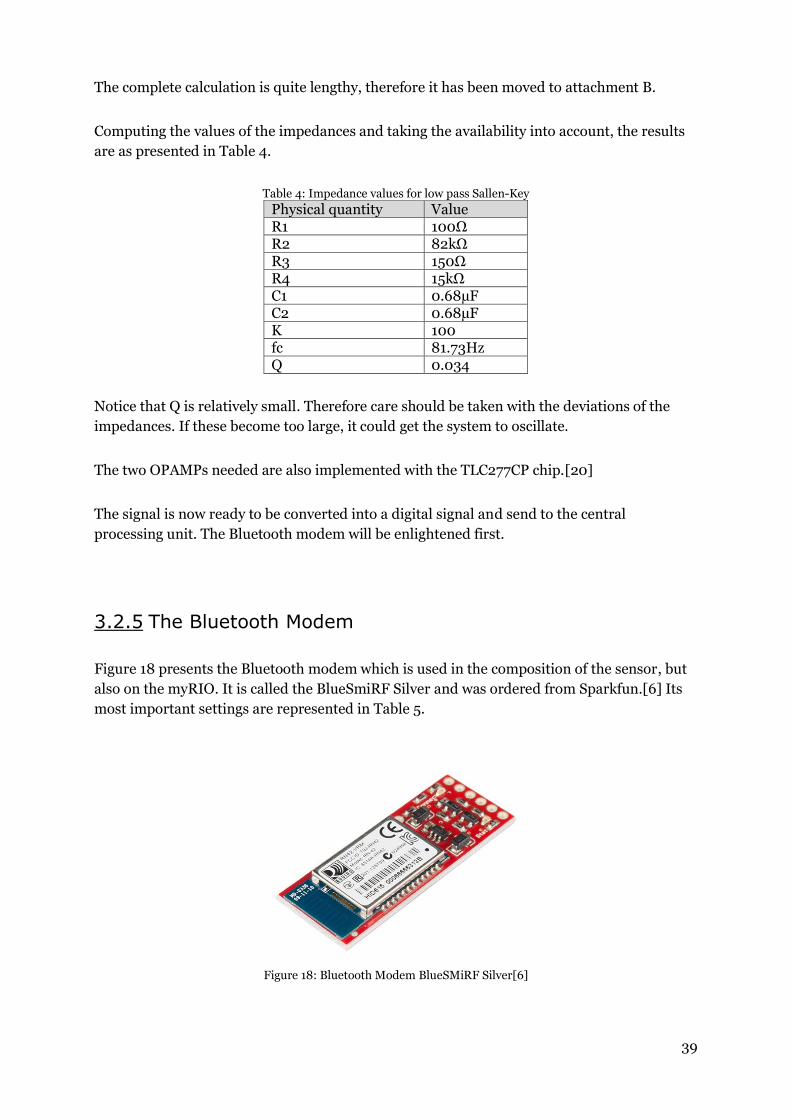
Figure 18 presents the Bluetooth modem which is used in the composition of the sensor, but
also on the myRIO. It is called the BlueSmiRF Silver and was ordered from Sparkfun.[6] Its
most important settings are represented in Table 5.
Figure 18: Bluetooth Modem BlueSMiRF Silver[6]
40
When a connection is made to another Bluetooth device this Bluetooth modem will send a
string over UART saying that is connected successfully. That way the microcontroller as well
as the myRIO is able to tell that a connection was established by reading this string.
Same thing for when the device disconnects. Then it will send a string indicating that it has
lost its connection.
Table 5: Bluetooth modem settings
Feature Setting Bluetooth address 000666715B10 Bluetooth name MyRIOBt Baud rate 115200 Data rate 8 bits Parity None Stop bits 1 Status string %ESC
In order to send the measured EEG signals the microcontroller has to write the data in the
form of strings to the Bluetooth modem and of course the myRIO has to read data strings
from the Bluetooth in order to receive the EEG signals.
No level shifter is needed for the pins as they are all 3-6V tolerant.[6]
3.2.6 The Microcontroller
The microcontroller used in the sensor is called the Teensy 3.1 and was ordered from
Sparkfun.[22][5] There is not a single downside to using this microcontroller. It is small, has a
lot of RAM (Random Access Memory) and has a built in UART port. It is programmable in C
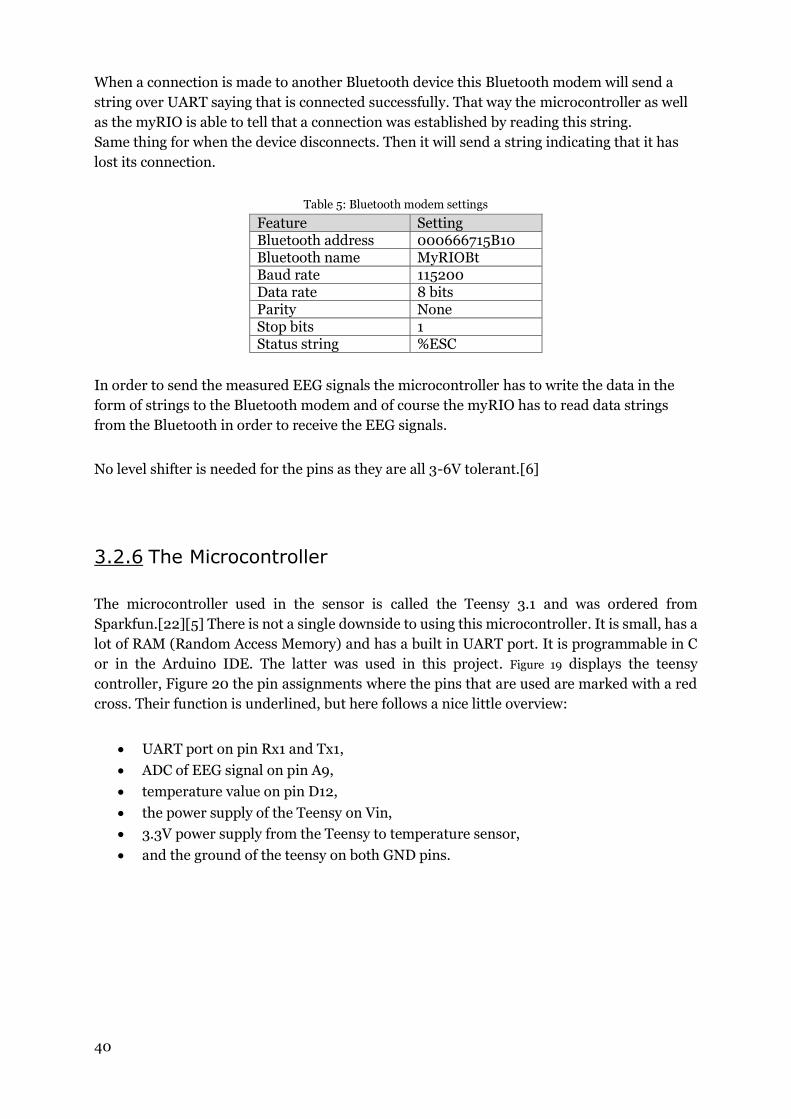
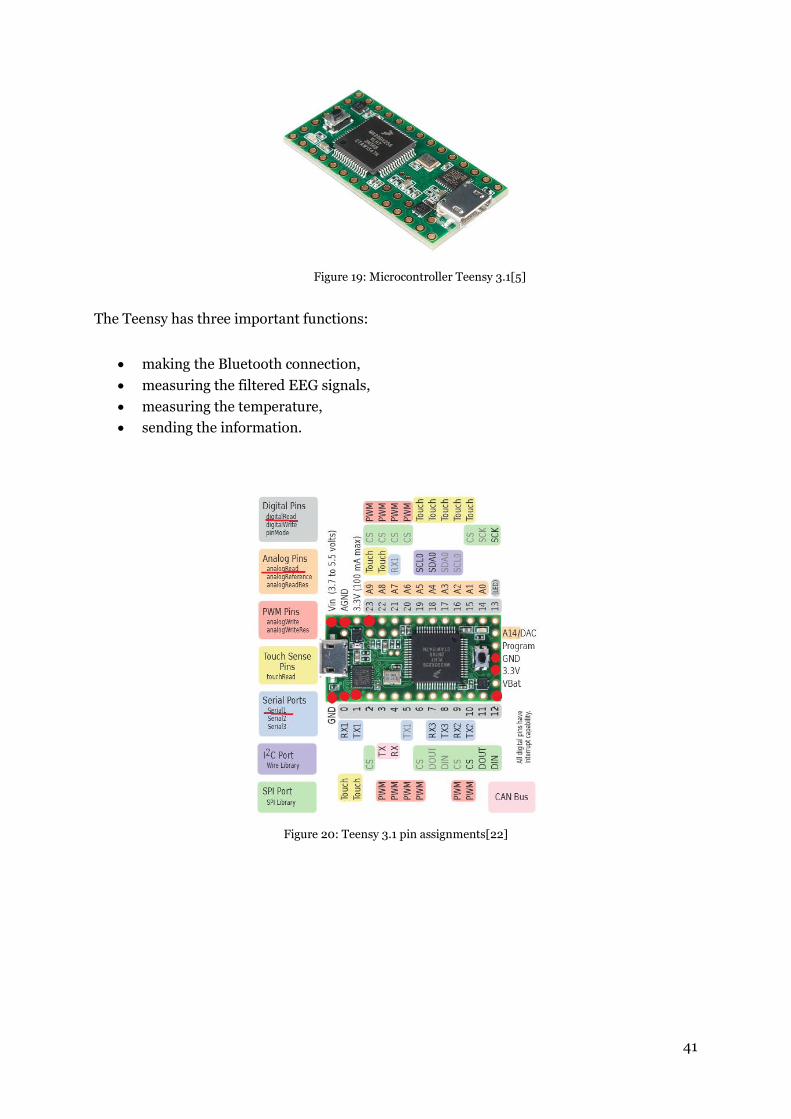
or in the Arduino IDE. The latter was used in this project. Figure 19 displays the teensy
controller, Figure 20 the pin assignments where the pins that are used are marked with a red
cross. Their function is underlined, but here follows a nice little overview:
UART port on pin Rx1 and Tx1,
ADC of EEG signal on pin A9,
temperature value on pin D12,
the power supply of the Teensy on Vin,
3.3V power supply from the Teensy to temperature sensor,
and the ground of the teensy on both GND pins.
41
Figure 19: Microcontroller Teensy 3.1[5]
The Teensy has three important functions:
making the Bluetooth connection,
measuring the filtered EEG signals,
measuring the temperature,
sending the information.
Figure 20: Teensy 3.1 pin assignments[22]
42
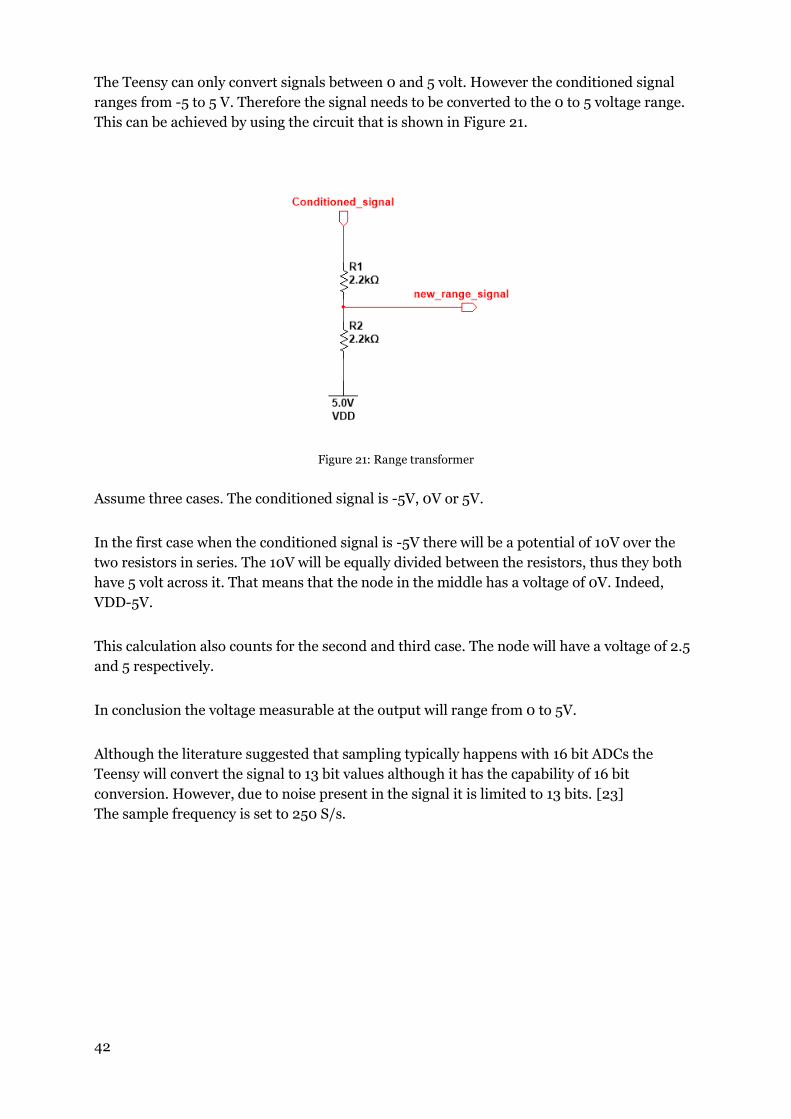
The Teensy can only convert signals between 0 and 5 volt. However the conditioned signal
ranges from -5 to 5 V. Therefore the signal needs to be converted to the 0 to 5 voltage range.
This can be achieved by using the circuit that is shown in Figure 21.
Figure 21: Range transformer
Assume three cases. The conditioned signal is -5V, 0V or 5V.
In the first case when the conditioned signal is -5V there will be a potential of 10V over the
two resistors in series. The 10V will be equally divided between the resistors, thus they both
have 5 volt across it. That means that the node in the middle has a voltage of 0V. Indeed,
VDD-5V.
This calculation also counts for the second and third case. The node will have a voltage of 2.5
and 5 respectively.
In conclusion the voltage measurable at the output will range from 0 to 5V.
Although the literature suggested that sampling typically happens with 16 bit ADCs the
Teensy will convert the signal to 13 bit values although it has the capability of 16 bit
conversion. However, due to noise present in the signal it is limited to 13 bits. [23]
The sample frequency is set to 250 S/s.
43
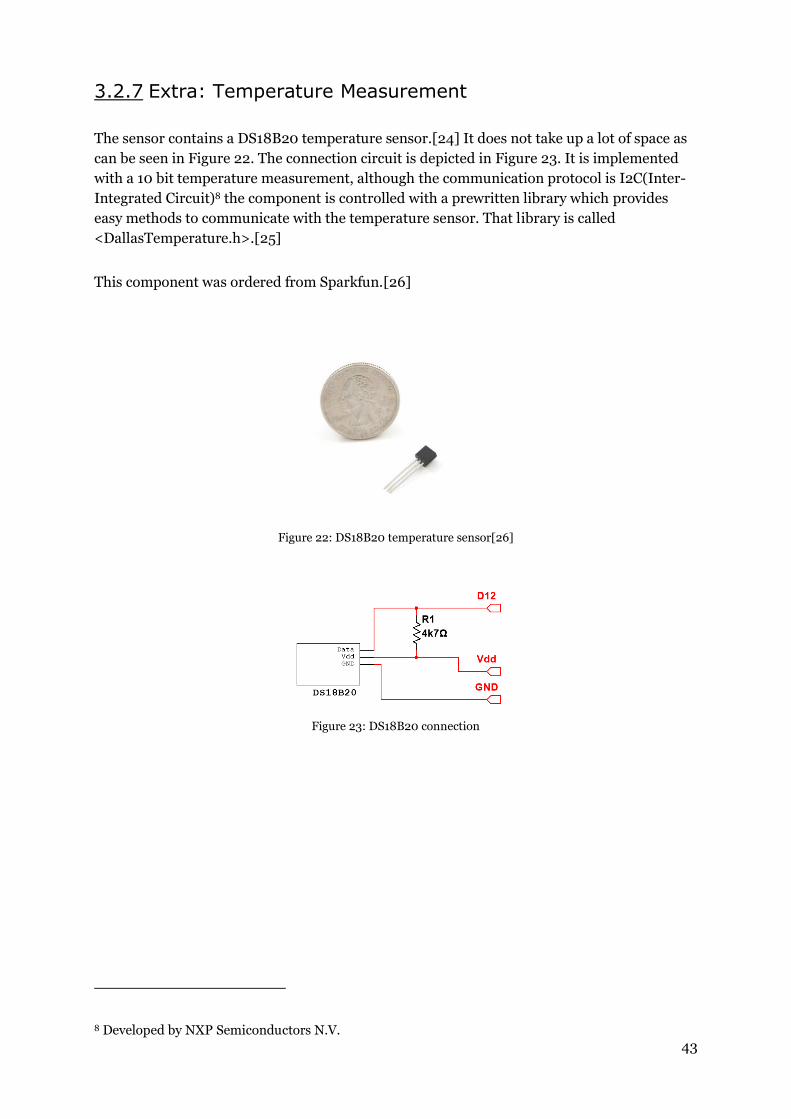
3.2.7 Extra: Temperature Measurement
The sensor contains a DS18B20 temperature sensor.[24] It does not take up a lot of space as
can be seen in Figure 22. The connection circuit is depicted in Figure 23. It is implemented
with a 10 bit temperature measurement, although the communication protocol is I2C(Inter-
Integrated Circuit)8 the component is controlled with a prewritten library which provides
easy methods to communicate with the temperature sensor. That library is called
<DallasTemperature.h>.[25]
This component was ordered from Sparkfun.[26]
Figure 22: DS18B20 temperature sensor[26]
Figure 23: DS18B20 connection
8 Developed by NXP Semiconductors N.V.
44
3.3 Hooking up
The sensor consists of two single sided printed circuit boards (PCBs) which have the Teensy
and LiPo powercell sandwiched in between. On the first PCB resides:
the BlueSMiRF Bluetooth module,
the Teensy,
the charge-pump,
and the powercell.
This PCB than connects at several points with the other PCB which contains the rest of the
hardware, which is the analogue circuit. This PCB can be seen in attachment C.
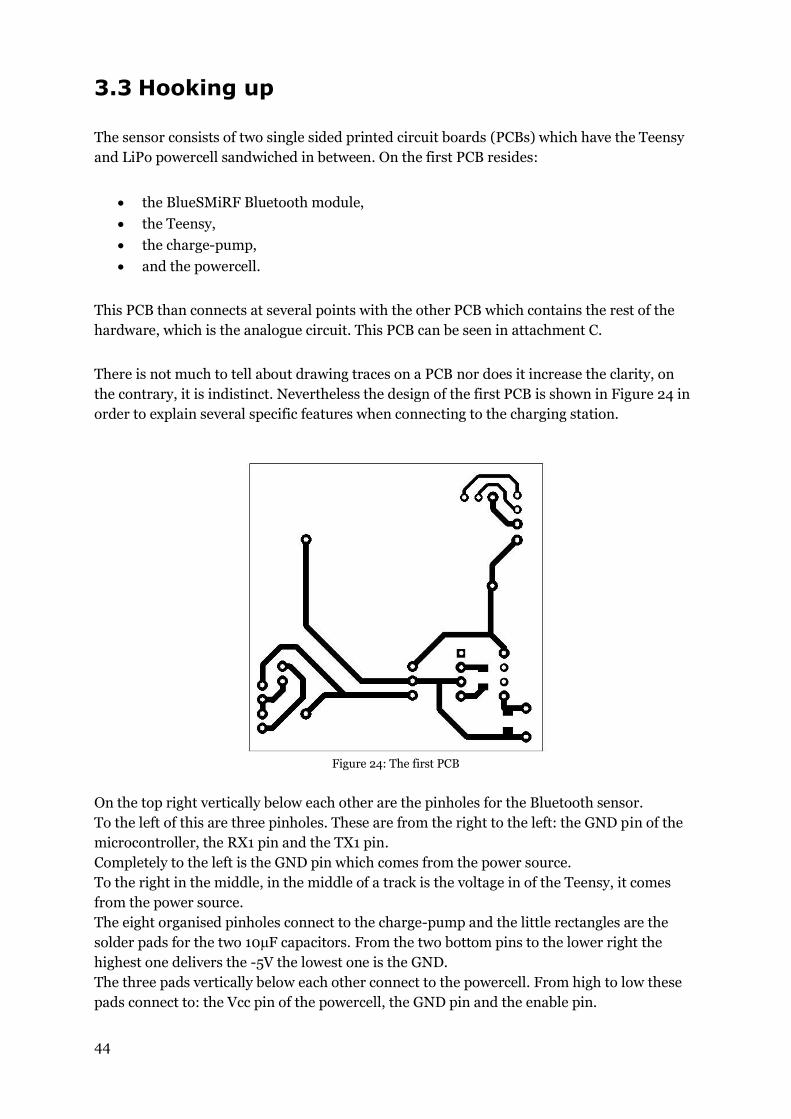
There is not much to tell about drawing traces on a PCB nor does it increase the clarity, on
the contrary, it is indistinct. Nevertheless the design of the first PCB is shown in Figure 24 in
order to explain several specific features when connecting to the charging station.
Figure 24: The first PCB
On the top right vertically below each other are the pinholes for the Bluetooth sensor.
To the left of this are three pinholes. These are from the right to the left: the GND pin of the
microcontroller, the RX1 pin and the TX1 pin.
Completely to the left is the GND pin which comes from the power source.
To the right in the middle, in the middle of a track is the voltage in of the Teensy, it comes
from the power source.
The eight organised pinholes connect to the charge-pump and the little rectangles are the
solder pads for the two 10µF capacitors. From the two bottom pins to the lower right the
highest one delivers the -5V the lowest one is the GND.
The three pads vertically below each other connect to the powercell. From high to low these
pads connect to: the Vcc pin of the powercell, the GND pin and the enable pin.
45
Finally now comes the interesting and important feature when connecting to the charging
station.9
On the lower left there are 4 pads. The lowest one is connected to an external 5V source and
the copper track leads it towards the 5V charging source of the powercell.
One pad higher is the external GND. It goes to the next pad above it. This pad goes to the
GND charging pin of the powercell.
On the same horizontal level as the external GND pinhole another pad can be seen to the
right. This one also connects to the external GND. It connects to the enable of the powercell
making sure that it does not dissipate power.
However this would only work if the myRIO was powered, otherwise the battery would still
discharge. To prevent this the upper pad on the lower left is connected to the one below it
when the sensor is placed onto the charging station. Consequently the enable would be
connected to the GND charging pin. And since this ground is always active the powercell
would pull its own enable pin low thus shutting it off.
9 People who skipped 3.2.2Battery charger/booster are advised to read it in order to understand the specific feature explained.
46
3.4 Microcontroller Software
This section gives an overview of the software that is written for the microcontroller. It will be
explained through the use of a flowchart. However, the formation of the string that contains
the data and which will be send will be explained individually. Readers interested in the
complete code can find it in attachment D.
3.4.1 The Flow Step-by-step
This section will explain every step in the program. For a visual aid the reader can go to
section 3.4.4 where Figure 25 the flowchart of the microcontroller software is situated.
Initialise
The program applies some general settings which do not change during the program.
Therefore they only need to be set once.
Connect
Once the general settings have been applied the program waits for an incoming connection.
The acknowledge the program is waiting for is the string ESC%CONNECT,MACADDRESS,0.
Once this acknowledge has been received the MAC (Media Access Control) address will be
stored and the program moves on.
Wait for Setup
As soon as a connection has been established the program is waiting to receive the setup from
the myRIO. If the microcontroller has not received the setup before the watchdog timer10
goes of the sensor disconnects itself and goes back to waiting for a new incoming connection.
If the setup was received the settings are applied and the program continues to the main
loop.
Currently the physician can only choose whether to also measure the temperature or not.
10 Watchdog timer: A timer that induces a specific action if it flows over. It can be reset before it flows over in order to prevent the action from being induced.
47
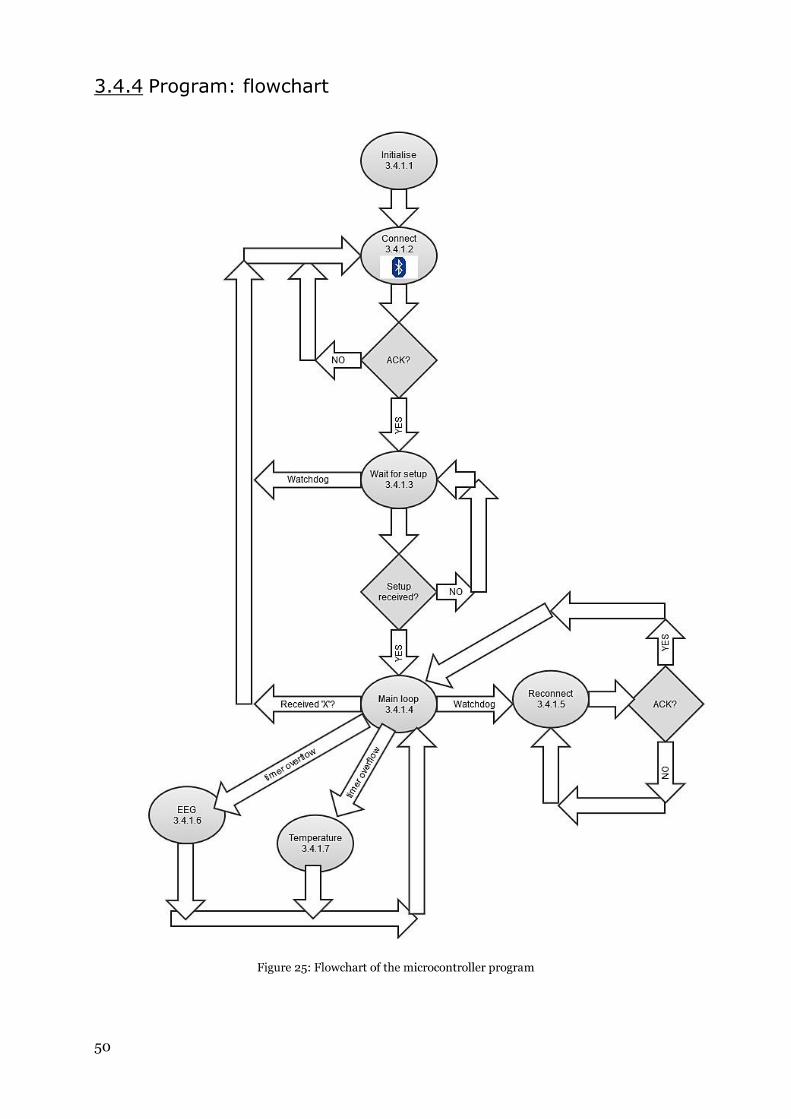
Main Loop
In the main loop 4 things are being monitored:
a watchdog timer that resets when signals are received;
a timer that starts an EEG measurement when it flows over;
a timer that start a temperature measurement when it flows over;
if the char ‘X’ is received.
This can be seen on the flowchart in Figure 25 where 4 arrows are leaving the main loop
state.
In case the X is received the sensor gets reset and returns to the connect state. It is than able
to connect with another device.
Reconnect
The microcontroller goes into this state when the watchdog timer in the main loop went off.
It is not the microcontroller itself that is trying to reconnect. The microcontroller merely
waits for an incoming connection of the myRIO which is of course also trying to reconnect.
The MAC address incorporated into the acknowledge is compared to the one stored. If it is
not the same than the sensor will try to disconnect from this device and it will not send any
signals to it.
EEG
This state measures and sends the EEG signals. A measurement is taken every 4 millisecond,
hence the frequency is 250Hz. For more information about how the data is transmitted
please go to 3.4.2.
Temperature
This state measures and sends the EEG signals. A measurement is taken every minute. For
more information about how the data is transmitted please go to 3.4.2.
3.4.2 Building the Transmitted String.
The measurements made by the ADC are formatted in to a string and send to the Bluetooth
module that sends them to the myRIO.
In the first step measured data is split into two parts: the two highest digits and the two
lowest digits. Immediately after that the current millisecond timer value is stored. It consists
out of 8 digits and is split into 4 groups.
48
In the following step all these groups consisting out of two digits are converted to bytes.
Right before the data is send it gets a header and a trailer. The header is a byte that tells
whether the data is a temperature measurement or EEG measurement. The trailer is the
delimiter which tells myRIO that the string is complete.
These bytes are send as ASCII (American Standard Code for Information Interchange)
characters. As a consequence the data could contain the same ASCII character which defines
the delimiter. Therefore the most significant bit of the data bytes are set to one; after all that
bit is never used since two digits can only go up to 99 and that means that 7 bits are enough
rendering the last bit unused. By setting the most significant bit high the delimiter value of
000 0013 is never reached, thus solving our problem.
The following section gives an overview of the bytes that are send.
Format of the String
THLM4M3M2M1\n
T: Specifies whether this string contains temperature data or EEG data.
B01101101 for EEG data
B01111010 for temperature data
H: The highest two digits of the measured data.
L: The lowest two digits of the measured data.
M4: The highest two digits of the millisecond timer.
M3: The third and fourth highest digits of the millisecond timer.
M2: The fifth and sixth highest digits of the millisecond timer.
M1: The lowest two digits of the millisecond timer.
\n: This is the delimiter which specifies that the data has been fully received.
Example of a Formatted String
An example will clarify things up. Keep in mind that this example shows the data before it is
decoded into bytes.
m320310254616
m= B01101101 thus EEG data
H=32
L=03
M4=10
M3=25
M2=46
M1=16
49
3.4.3 Libraries
Three different libraries were used. They will shortly be described.
<OneWire.h>:
The library that facilitates the communication with one wire protocol sensors. This
library is only used by the <DallasTemperature.h> library.[27]
<DallasTemperature.h>
The library that communicates specifically with the DS18B20.[25]
<TimedAction.h>
Library that triggers an event every X milliseconds. In this case the measuring of the
temperature or EEG.[28]
50
3.4.4 Program: flowchart
Figure 25: Flowchart of the microcontroller program
51
4 Real-time NI Model myRIO
This chapter discusses the properties of the myRIO that are most important to this project.
The first part explains how components can interact with the myRIO.
The second part discusses the storing of data onto a USB flash drive.
The third part discusses the use and working principle of network shared variables.
The last part discusses some minor inconveniences of the myRIO.
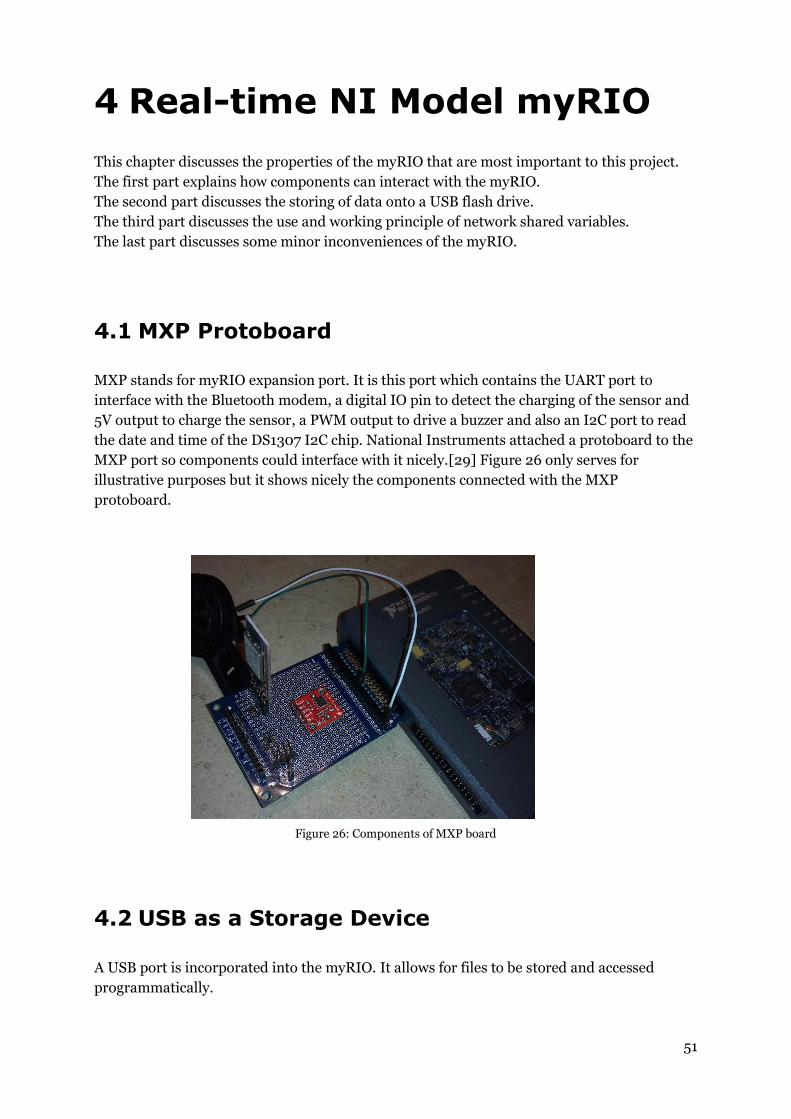
4.1 MXP Protoboard
MXP stands for myRIO expansion port. It is this port which contains the UART port to
interface with the Bluetooth modem, a digital IO pin to detect the charging of the sensor and
5V output to charge the sensor, a PWM output to drive a buzzer and also an I2C port to read
the date and time of the DS1307 I2C chip. National Instruments attached a protoboard to the
MXP port so components could interface with it nicely.[29] Figure 26 only serves for
illustrative purposes but it shows nicely the components connected with the MXP
protoboard.
Figure 26: Components of MXP board
4.2 USB as a Storage Device
A USB port is incorporated into the myRIO. It allows for files to be stored and accessed
programmatically.
52
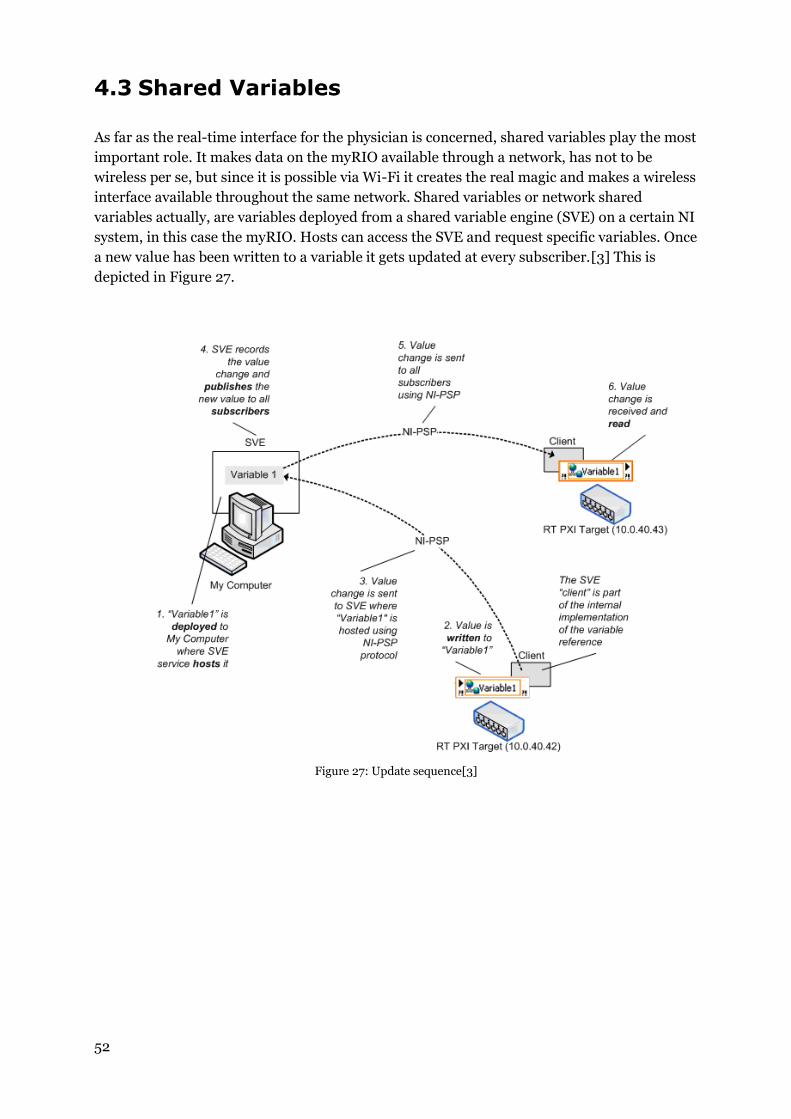
4.3 Shared Variables
As far as the real-time interface for the physician is concerned, shared variables play the most
important role. It makes data on the myRIO available through a network, has not to be
wireless per se, but since it is possible via Wi-Fi it creates the real magic and makes a wireless
interface available throughout the same network. Shared variables or network shared
variables actually, are variables deployed from a shared variable engine (SVE) on a certain NI
system, in this case the myRIO. Hosts can access the SVE and request specific variables. Once
a new value has been written to a variable it gets updated at every subscriber.[3] This is
depicted in Figure 27.
Figure 27: Update sequence[3]
53
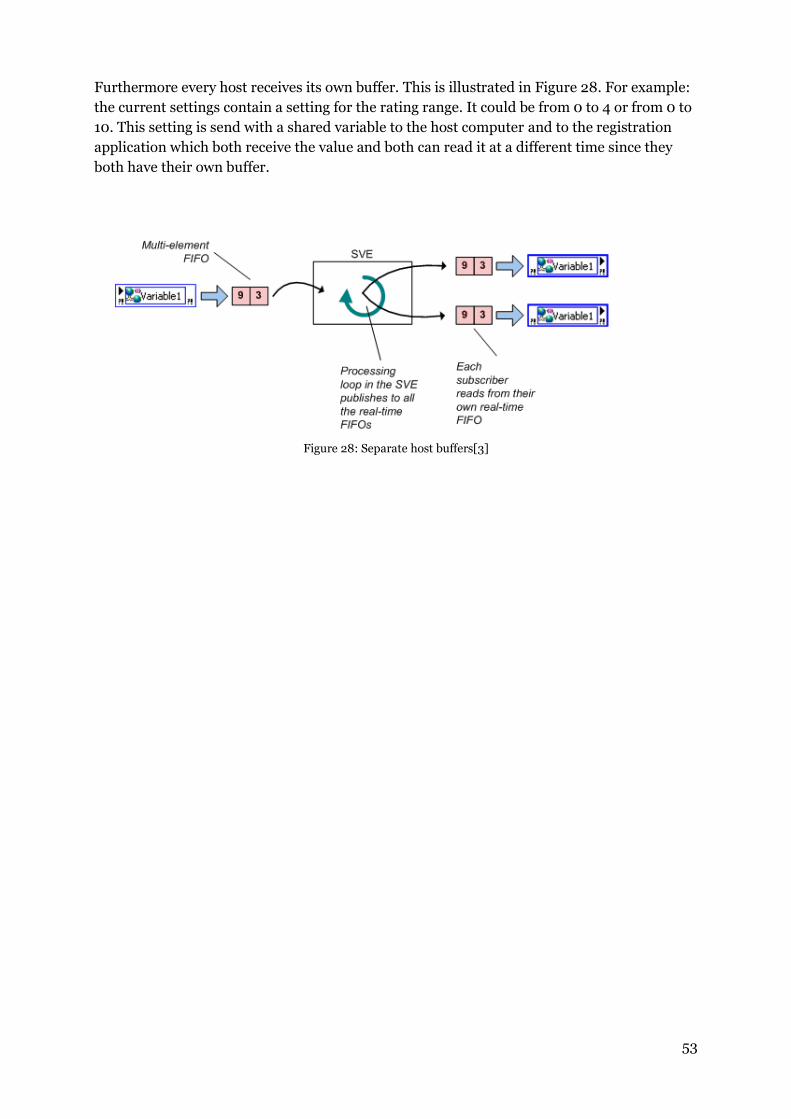
Furthermore every host receives its own buffer. This is illustrated in Figure 28. For example:
the current settings contain a setting for the rating range. It could be from 0 to 4 or from 0 to
10. This setting is send with a shared variable to the host computer and to the registration
application which both receive the value and both can read it at a different time since they
both have their own buffer.
Figure 28: Separate host buffers[3]
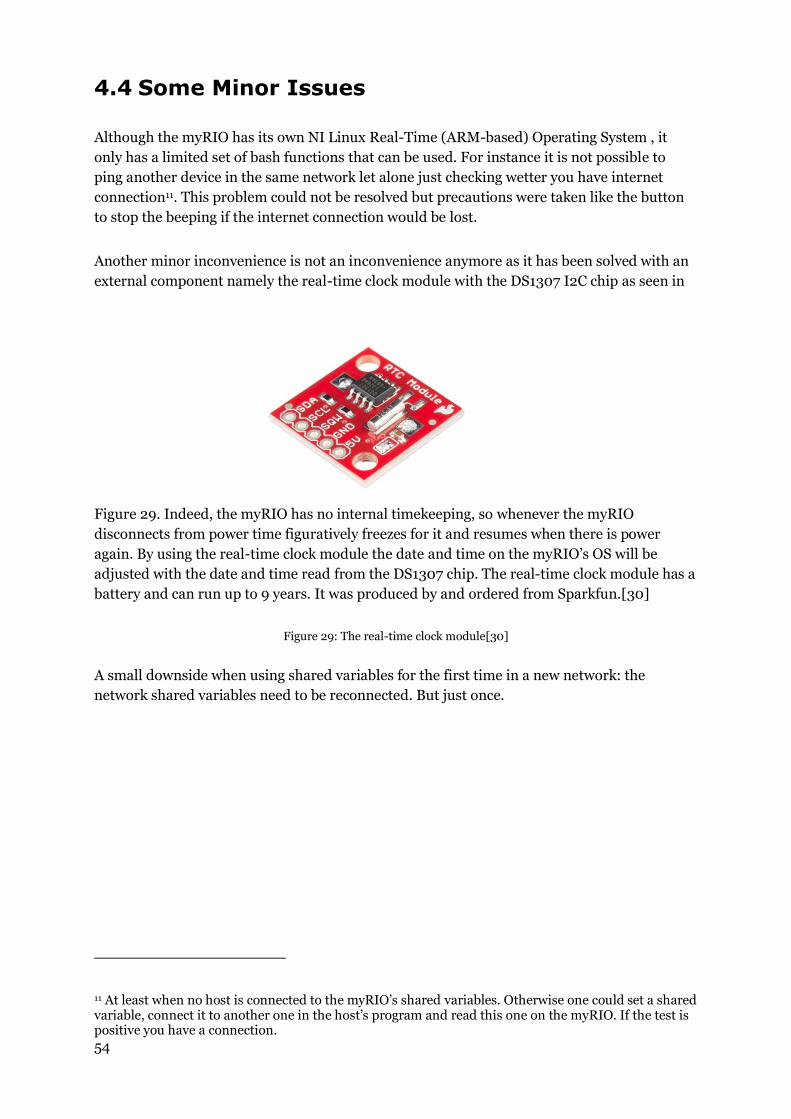
54
4.4 Some Minor Issues
Although the myRIO has its own NI Linux Real-Time (ARM-based) Operating System , it
only has a limited set of bash functions that can be used. For instance it is not possible to
ping another device in the same network let alone just checking wetter you have internet
connection11. This problem could not be resolved but precautions were taken like the button
to stop the beeping if the internet connection would be lost.
Another minor inconvenience is not an inconvenience anymore as it has been solved with an
external component namely the real-time clock module with the DS1307 I2C chip as seen in
Figure 29. Indeed, the myRIO has no internal timekeeping, so whenever the myRIO
disconnects from power time figuratively freezes for it and resumes when there is power
again. By using the real-time clock module the date and time on the myRIO’s OS will be
adjusted with the date and time read from the DS1307 chip. The real-time clock module has a
battery and can run up to 9 years. It was produced by and ordered from Sparkfun.[30]
Figure 29: The real-time clock module[30]
A small downside when using shared variables for the first time in a new network: the
network shared variables need to be reconnected. But just once.
11 At least when no host is connected to the myRIO’s shared variables. Otherwise one could set a shared variable, connect it to another one in the host’s program and read this one on the myRIO. If the test is positive you have a connection.
55
5 Processing with LabVIEW
This chapter describes the LabView software. There are two programs written in LabView:
the graphical user interface and the program on the myRIO.
The graphical user interface software is described in the last part and is not all that large and
is therefore described in only a few sections.
The program on the myRIO however contains several programming structures. Their
purpose will be explained in full in the first section.
The main finite-state machine is visually aided with a flowchart that can be found in section
5.1.4.
5.1 myRIO Software
The software consists out of three parallel loops. That way multiple processes can run at the
same time. The simultaneous running of these processes are necessary because the myRIO
should be able to receive data from the sensor and the registration interface at the same time.
If this would be implemented in the same while loop as the measurements, the
measurements would stop once a rating is requested and only recommence once the rating
has been given.
5.1.1 The Shared Variables Loop
This loop is a collection of the shared variables that are being used in the main finite-state
machine. By placing them into a separate while loop they will be continuously updated.
5.1.2 The Registration Loop
This loop receives all incoming data from the rating registration. It is able to differentiate
between intentional awakenings and spontaneous awakenings. Furthermore it is also able to
detected whether the sleeper has given an out of range value. This could occur when the
sleeper enters a 6 when the rating is only from 0 to 4.
It is also this loop that controls the beeper.
56
5.1.3 The Finite-state Machine
The finite-state machine can be interpreted as the heart of the whole system. In 5.1.4(Figure
30) the finite-state machine is presented. Notice that every state could go to the end state in
the next state. This happens in case of an error, reboot or docking of the sensor, which
basically means the end of the program.
In total there are 7 states, they will now be explained individually.
Set Date and Time
As previously mentioned the myRIO has no internal timekeeping so as soon as power is lost
time freezes. Indeed, the system should set its internal clock when power is applied. The
correct time is read from the RTC module[30]. The protocol used to read the date and time is
I2C.
Settings
In the settings state several steps occur. In the first step the presence of a USB device is
checked and in the next the settings file present on the USB is read. If no settings file is found
a standard file will be generated. From these settings the size of the generated data from one
night is estimated plus they are send to the graphical user interface (GUI). If it is larger than
the available space on the USB device the program will not start. If there is enough room left,
the myRIO waits for the user to start the program. This can either be done by picking up the
sensor, pushing the button on the myRIO or via the start button on the GUI. When the
program is started the myRIO goes immediately to the next state connection.
Some additional features are:
LED1(light emitting diode) on the myRIO indicates if there is no USB present;
LED2 indicates if the available space on the USB device is insufficient;
as long as the program is not started the settings can be changed;
the hold button on the GUI can prevent the program from starting as long as the
button is set to true;
creation of the file that saves ratings that were given spontaneously.
Connection
When the myRIO is in the connecting state it depends on the connection mode setting what
this state will perform.
If it is the choose mode the myRIO will first look for every available EEG sensor. The myRIO
connects very briefly with them to see whether they send “EEGD” which is an acknowledge of
being a EEG measuring device.
All devices that pass the test are send to the GUI so that the user is able to choose one of
them. Then in the next iteration of the while loop in this state the myRIO will try to connect
57
to the chosen device. If the connection cannot be established the myRIO sends an error
report and sends a new list of available devices.
In auto mode the myRIO performs the same process as in choosing mode, but instead of
letting the user chose the myRIO will connect to the first device in the list. If this connection
would fail then the program will try the next device and so on until all the devices have been
tried. Then an error message will be sent.
In both choosing and automatic mode an error message will be sent if no compatible devices
have been found in the first place.
Of course when the bedside mode is intended to be used than the connection mode should
never be set to choose otherwise the program will get stuck from the moment the myRIO
expects a device to be chosen.
Finally the last connection mode is the previous mode. In this mode the myRIO connects to
the last device that was successfully connected. This MAC address is stored onto the flash-
memory of the Bluetooth module.
When errors occur in the bedside mode the program just keeps retrying with the selected
connection mode.
Setup
If a successful connection was established the program goes to the next state, the setup.
In this state a file that saves all measurements and a file that saves all ratings from
intentional awakenings is created.
Parallel to that the setup for the EEG sensor is being send.
Measuring
This state consists out of a producer consumer loop. The producer loop receives the data and
decodes it back to the original signal. Finally the decoded sample is enqueued. Furthermore
the time between subsequent incoming data is monitored. Should this time exceed some kind
of limit than the myRIO considers this connection broken and the myRIO goes into the
reconnect state.
The consumer dequeues the samples and adds them to a FIFO register. The different
spectrums that were requested are formed and saved into a csv file. In parallel to that the
trigger points are also monitored and acted upon if the conditions are fulfilled. Acted upon
means that the trigger point is saved. The subsequent rating from the sleeper is saved in the
registration loop. Should however the sleeper not react in time then the consumer loop will
add “No rating received!” to the last trigger point.
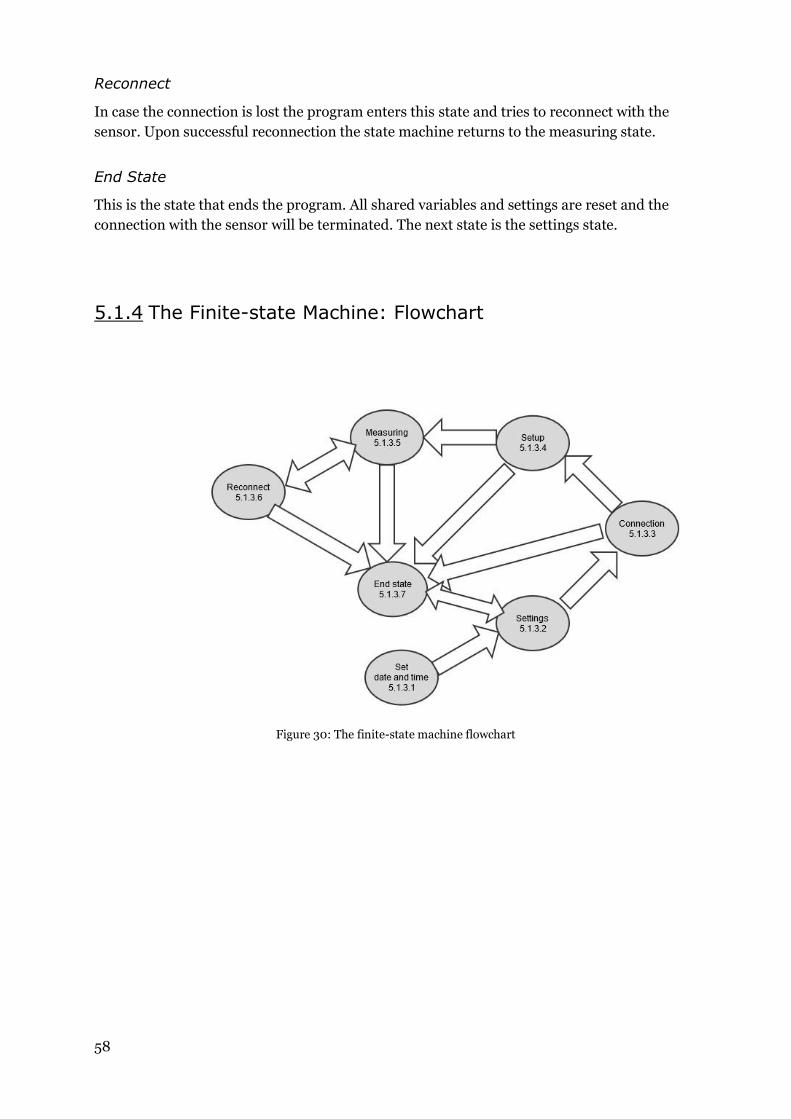
58
Reconnect
In case the connection is lost the program enters this state and tries to reconnect with the
sensor. Upon successful reconnection the state machine returns to the measuring state.
End State
This is the state that ends the program. All shared variables and settings are reset and the
connection with the sensor will be terminated. The next state is the settings state.
5.1.4 The Finite-state Machine: Flowchart
Figure 30: The finite-state machine flowchart
59
5.2 Interface Software
This software consists out of three parallel while loops. This is necessary in order to read the
received data from the sensor continuously apart from what the other loop, which contains
an event structure that reacts to events from the user, is doing. The remaining loop contains a
collection of the shared variables that are used.
5.2.1 The Shared Variables Loop
This loop contains all the shared variables that need to be continuously updated. For
instance, if a trigger point would be activated this should also be visible on the user interface
and since an activated trigger point is important it should happen immediately.
5.2.2 The EEG Data Loop
The displaying of the EEG data should happen continuously. Imagine that this would not be
the case. Then the EEG data would be read in one of the event cases. If then another event
would occur apart from changing the tabs12 the graphs would not be updated anymore
although they are still visible.
5.2.3 The Event Structure Loop
This loop handles the interaction with the user. The events that are being monitored are:
the activity on the tabs,
pressing the connect button to connect to a specific sensor;
buttons that go through the listed trigger points and spectrums;
saving and updating settings,
the deleting of trigger point and spectrum entries;
and the selection of the spectrum to be shown.
12 For more information about the interface go to 6.3.2The Physician’s Real-time Interface.

60
61
6 Results
This chapter displays all the results starting with the behaviour of the sensor. The next
section summarizes all the files that are being generated.
And finally the last section shows all the possibilities of the real-time interface as well as all
the possibilities of the rating registration app.
6.1 Behaviour of the Sensor
6.1.1 Hardware
The sensor uses between 100 and 110mA when in use. That means that the sensor would last
about 9 to 10 hours with the battery of 1000mAh that is used.
6.1.2 Software
The software on the sensor was tested with simulated signals.
Sometimes the connection failed and needed to be restarted but this should be handled by
the myRIO.
The following test were performed and were positive:
Rebooting the sensor,
Loss of connection,
Sending data,
Trying to connect the sensor with another device during loss of connection (this is not
allowed);
Sending the valid connection char.
62
The following is an example of the received data that was transmitted.
m\C6\D0\80\97\9F\CF\n
m\C8\A8\80\97\9F\D3\n
m\C8\D8\80\97\9F\D7\n
m\C8\84\80\97\9F\DB\n
m\C9\B5\80\97\9F\DF\n
m\C9\CB\80\97\9F\E3\n
m\C8\9D\80\97\A0\83\n
m\C6\B2\80\97\A0\87\n
z\80\80\80\97\9E\B6\n
m\C7\9F\80\97\A0\8B\n
m\C7\E2\80\97\A0\8F\n
m\C7\CD\80\97\A0\93\n
m\C8\C4\80\97\A0\97\n
m\C7\DC\80\97\A0\9B\n
m\C6\94\80\97\A0\9F\n
m\C7\BD\80\97\A0\A3\n
It always consists of 8 chars what was expected. The m is the type byte of EEG data and the z
for temperature data.
63
6.2 Data files
The name of these files represent the day and time they were made.
6.2.1 Spontaneous Ratings
This file saves:
the time,
the rating,
and the comment (if one was given).
6.2.2 Triggered Ratings
This file saves:
the conditions that were set,
the time,
the rating,
and the comment (if one was given).
6.2.3 Setting Files
This file saves all the settings for a specific day. For a list of all possible settings, please got to
6.4.2.
6.2.4 Measurement Files
This file saves data in a csv file the following way:
the start of the measurement,
the value of the millisecond timer is saved in one column,
one column always contains the raw data,
every frequency spectrum and single frequency is saved in a separate column.
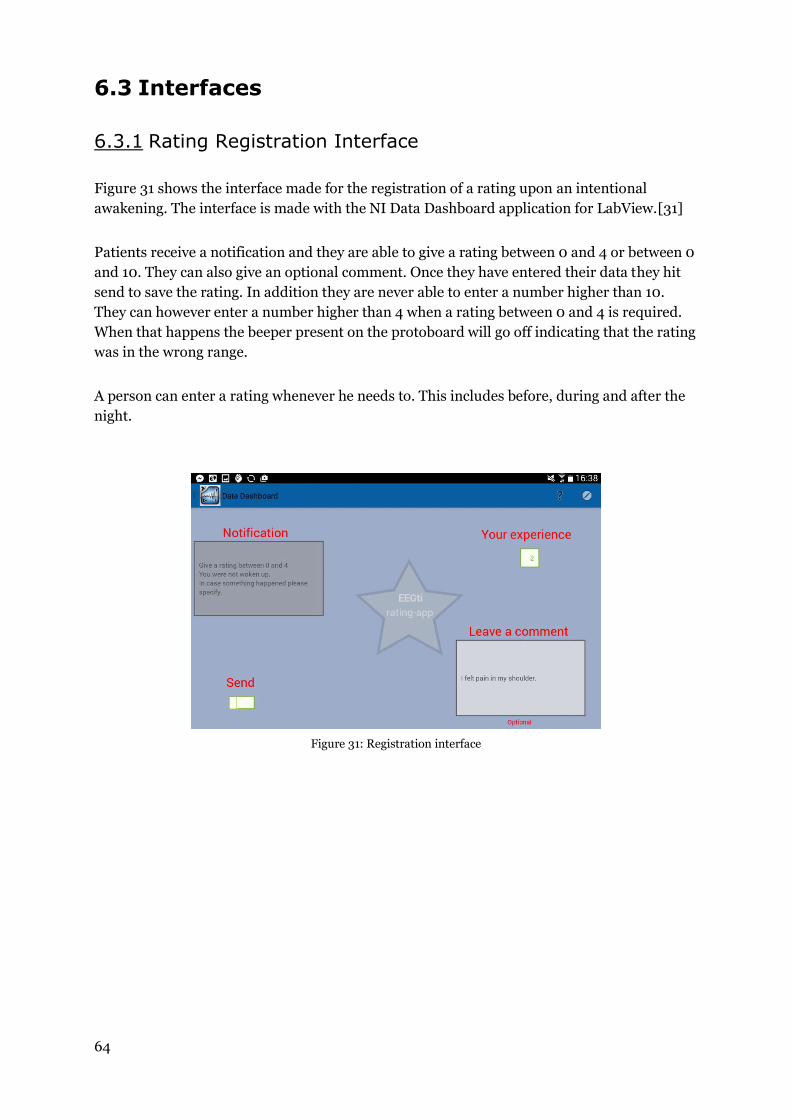
64
6.3 Interfaces
6.3.1 Rating Registration Interface
Figure 31 shows the interface made for the registration of a rating upon an intentional
awakening. The interface is made with the NI Data Dashboard application for LabView.[31]
Patients receive a notification and they are able to give a rating between 0 and 4 or between 0
and 10. They can also give an optional comment. Once they have entered their data they hit
send to save the rating. In addition they are never able to enter a number higher than 10.
They can however enter a number higher than 4 when a rating between 0 and 4 is required.
When that happens the beeper present on the protoboard will go off indicating that the rating
was in the wrong range.
A person can enter a rating whenever he needs to. This includes before, during and after the
night.
Figure 31: Registration interface
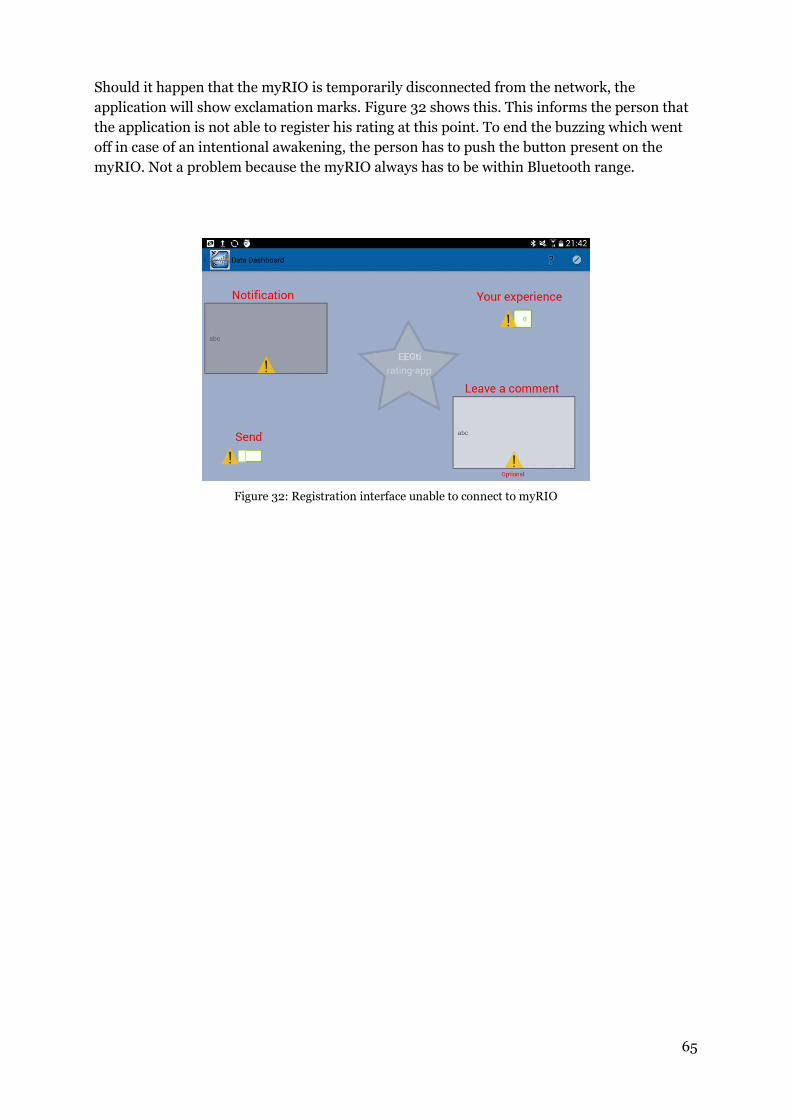
65
Should it happen that the myRIO is temporarily disconnected from the network, the
application will show exclamation marks. Figure 32 shows this. This informs the person that
the application is not able to register his rating at this point. To end the buzzing which went
off in case of an intentional awakening, the person has to push the button present on the
myRIO. Not a problem because the myRIO always has to be within Bluetooth range.
Figure 32: Registration interface unable to connect to myRIO
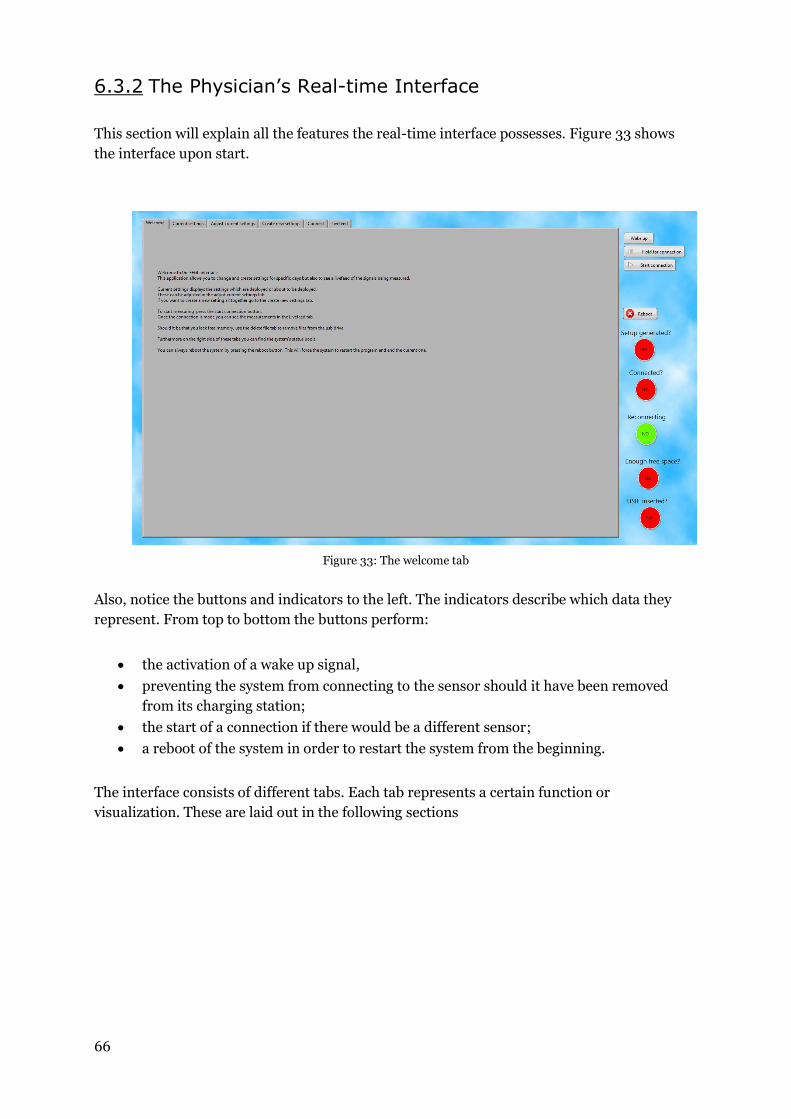
66
6.3.2 The Physician’s Real-time Interface
This section will explain all the features the real-time interface possesses. Figure 33 shows
the interface upon start.
Figure 33: The welcome tab
Also, notice the buttons and indicators to the left. The indicators describe which data they
represent. From top to bottom the buttons perform:
the activation of a wake up signal,
preventing the system from connecting to the sensor should it have been removed
from its charging station;
the start of a connection if there would be a different sensor;
a reboot of the system in order to restart the system from the beginning.
The interface consists of different tabs. Each tab represents a certain function or
visualization. These are laid out in the following sections
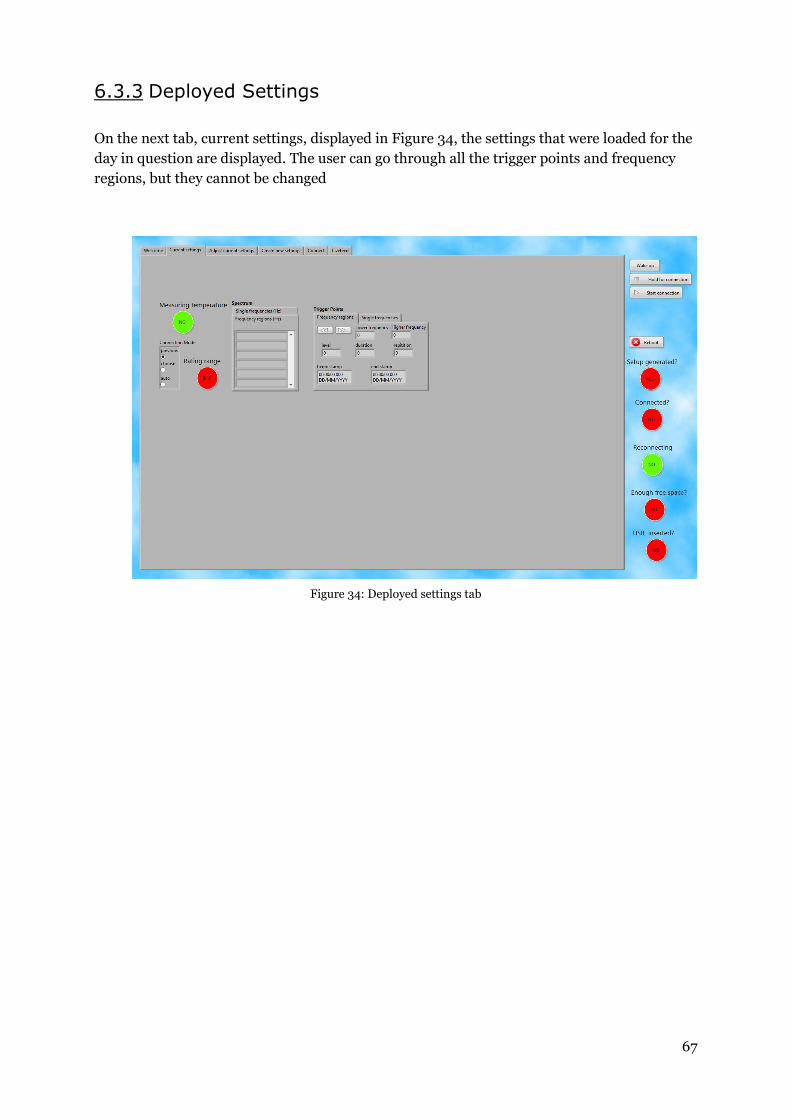
67
6.3.3 Deployed Settings
On the next tab, current settings, displayed in Figure 34, the settings that were loaded for the
day in question are displayed. The user can go through all the trigger points and frequency
regions, but they cannot be changed
Figure 34: Deployed settings tab
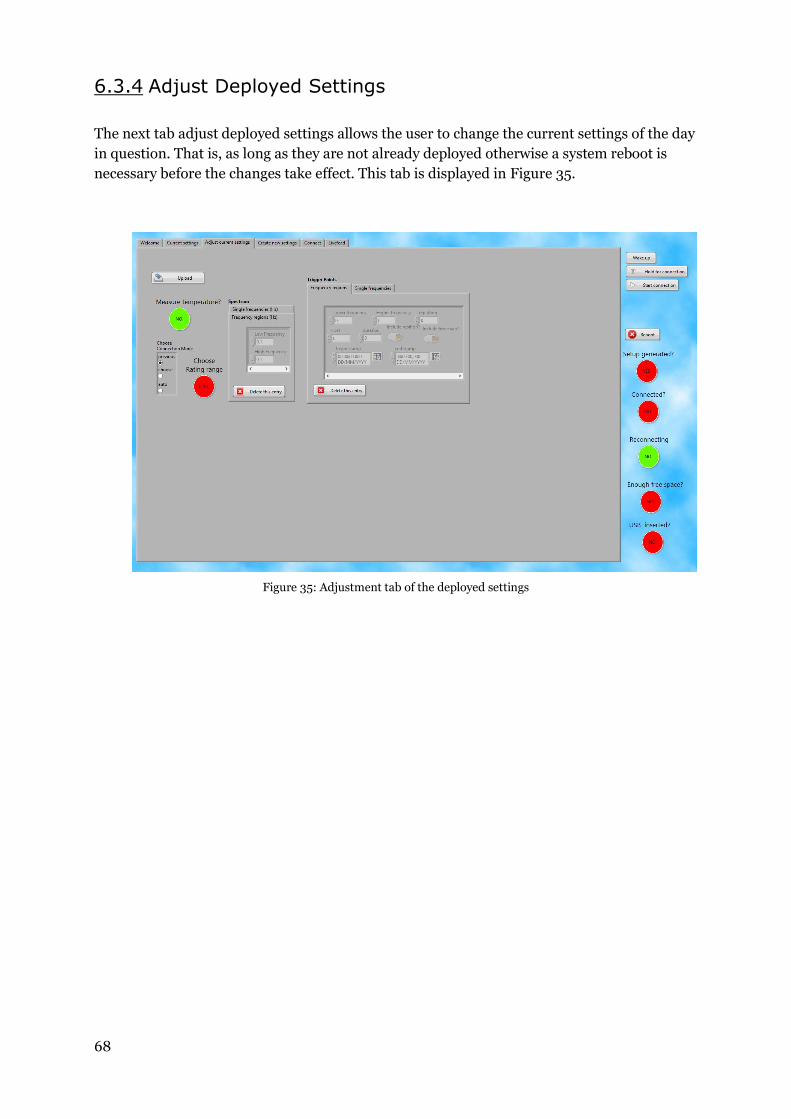
68
6.3.4 Adjust Deployed Settings
The next tab adjust deployed settings allows the user to change the current settings of the day
in question. That is, as long as they are not already deployed otherwise a system reboot is
necessary before the changes take effect. This tab is displayed in Figure 35.
Figure 35: Adjustment tab of the deployed settings
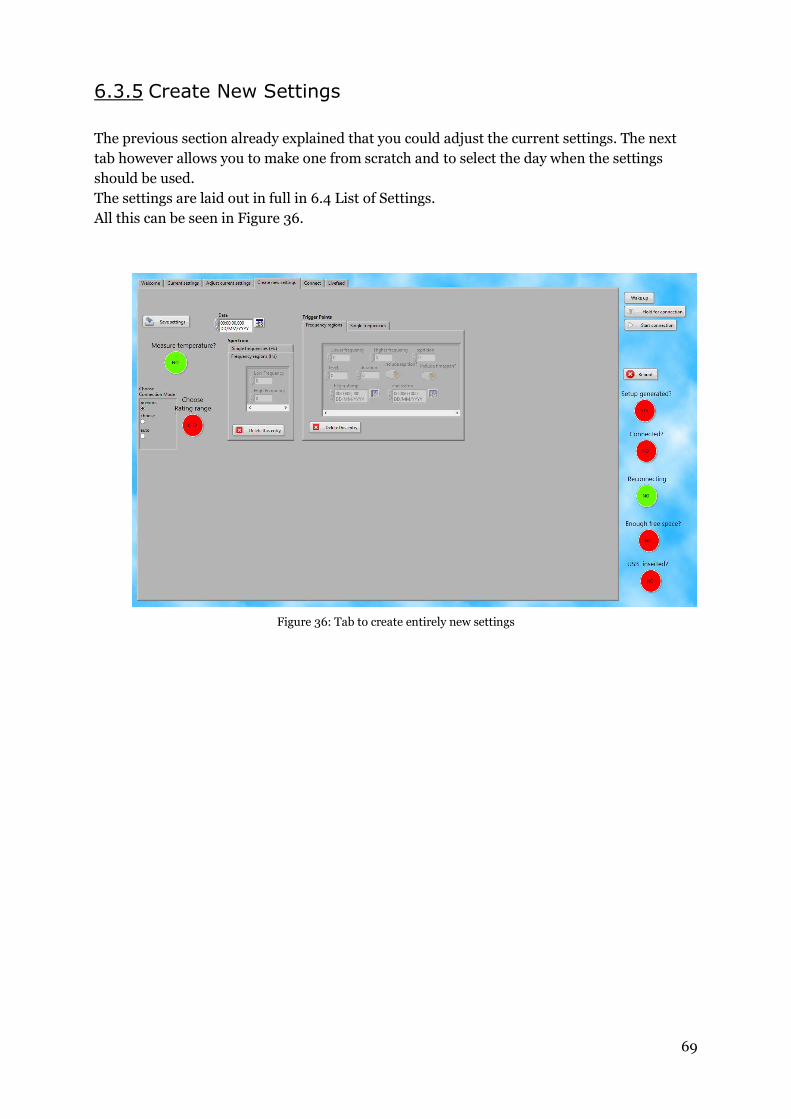
69
6.3.5 Create New Settings
The previous section already explained that you could adjust the current settings. The next
tab however allows you to make one from scratch and to select the day when the settings
should be used.
The settings are laid out in full in 6.4 List of Settings.
All this can be seen in Figure 36.
Figure 36: Tab to create entirely new settings
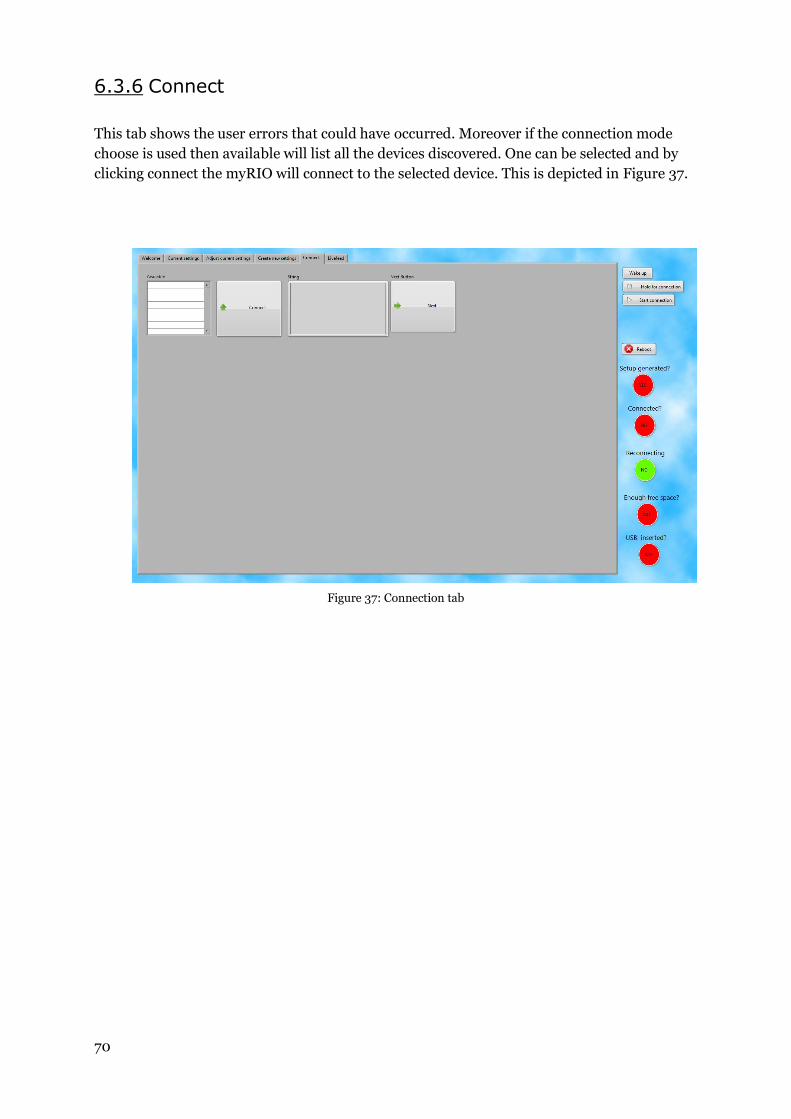
70
6.3.6 Connect
This tab shows the user errors that could have occurred. Moreover if the connection mode
choose is used then available will list all the devices discovered. One can be selected and by
clicking connect the myRIO will connect to the selected device. This is depicted in Figure 37.
Figure 37: Connection tab
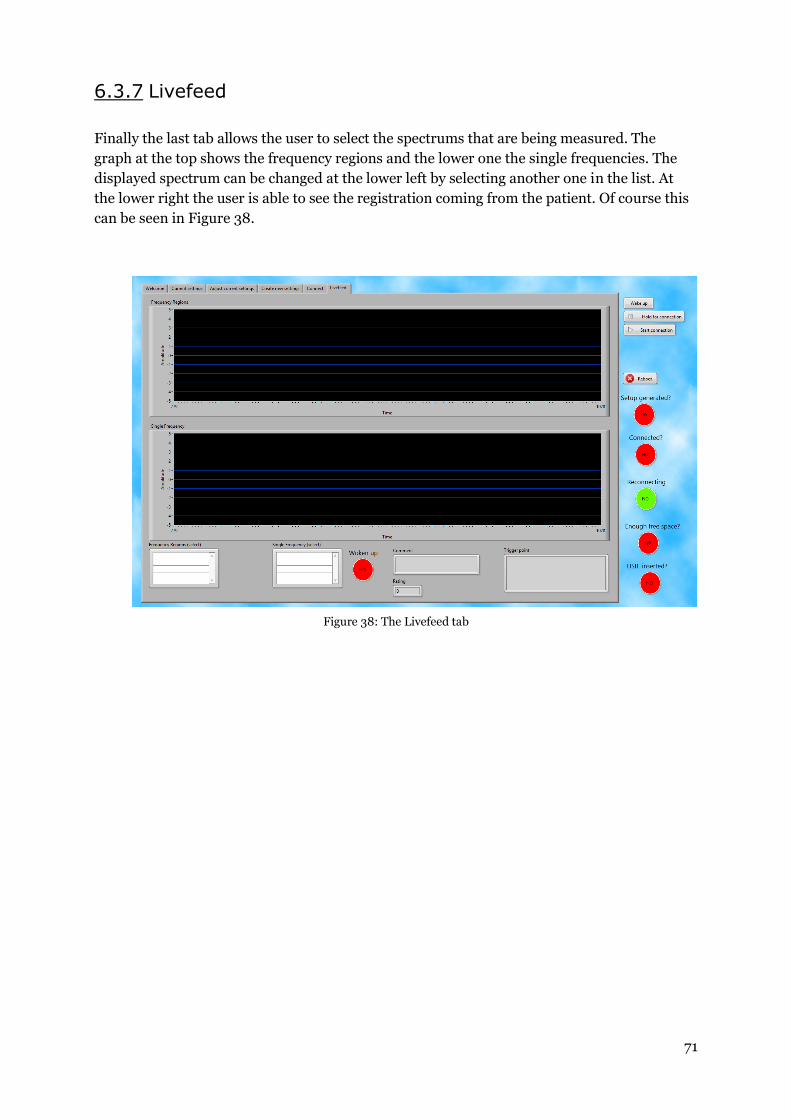
71
6.3.7 Livefeed
Finally the last tab allows the user to select the spectrums that are being measured. The
graph at the top shows the frequency regions and the lower one the single frequencies. The
displayed spectrum can be changed at the lower left by selecting another one in the list. At
the lower right the user is able to see the registration coming from the patient. Of course this
can be seen in Figure 38.
Figure 38: The Livefeed tab
72
6.4 List of Settings
This section will give a nice overview of all the settings that are available for the sleeper and
the physician.
6.4.1 Sleeper’s Settings
Leave a comment:
An optional field where the user can leave a comment about the awakening.
Your experience:
The rating from 0 to 4 or from 0 to 10 the user has to enter.
6.4.2 The Physician’s Settings
Choose connection mode:
o Auto: myRIO searches for EEG sensors and connects to the first one it finds.
o Choose: The user can select an EEG sensor from a list of sensors the myRIO
has detected.
o Previous: The myRIO connects to the last sensor it has successfully connected
to.
Measure temperature?:
If set to YES the sensor will also measure the sleepers temperature.
Choose Rating Range:
Can be set to be between 0 and 4 or between 0 and 10.
Spectrum Frequency regions:
Defines the region that will be measured. Multiple regions can be stored.
o Low Frequency: the lower frequency of the region.
o High Frequency: the higher frequency of the region.
Single frequencies:
Defines a single frequency that will be measured. Multiple frequencies can be
measured.
73
Trigger points for frequency regions:
Defines the conditions for an intentional awakening that tracks a frequency region.
o Low frequency: The lower frequency of the region.
o High frequency: The higher frequency of the region.
o Repetition: How many times the trigger goes off if it occurs multiple times in
one night.
o Level: The minimum value the signal needs to be.
o Duration: How long the signal needs to be above the value set in level.
o Timespan: During which part of the night the trigger will be evaluated.
o Include repetition?: If not set than the trigger will ignore the repetition value
and will keep repeating.
o Include timespan?: If not set than the trigger will ignore the timespan value
and the whole night will be evaluated.
Trigger points for single frequencies:
Defines the conditions for an intentional awakening that tracks a single frequency.
o Frequency: The frequency that is being tracked.
o Repetition: How many times the trigger goes off if it occurs multiple times in
one night.
o Level: The minimum value the signal needs to be.
o Duration: How long the signal needs to be above the value set in level.
o Timespan: During which part of the night the trigger will be evaluated.
o Include repetition?: If not set than the trigger will ignore the repetition value
and will keep repeating.
o Include timespan?: If not set than the trigger will ignore the timespan value
and the whole night will be evaluated.

74
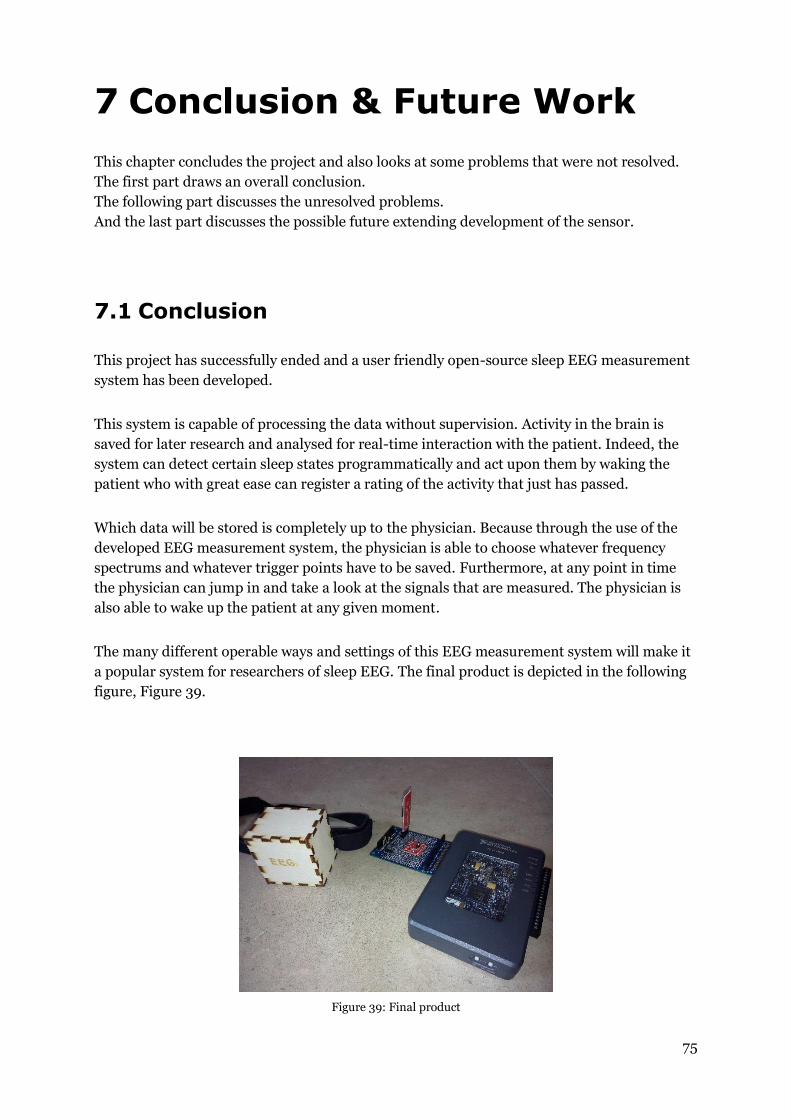
75
7 Conclusion & Future Work
This chapter concludes the project and also looks at some problems that were not resolved.
The first part draws an overall conclusion.
The following part discusses the unresolved problems.
And the last part discusses the possible future extending development of the sensor.
7.1 Conclusion
This project has successfully ended and a user friendly open-source sleep EEG measurement
system has been developed.
This system is capable of processing the data without supervision. Activity in the brain is
saved for later research and analysed for real-time interaction with the patient. Indeed, the
system can detect certain sleep states programmatically and act upon them by waking the
patient who with great ease can register a rating of the activity that just has passed.
Which data will be stored is completely up to the physician. Because through the use of the
developed EEG measurement system, the physician is able to choose whatever frequency
spectrums and whatever trigger points have to be saved. Furthermore, at any point in time
the physician can jump in and take a look at the signals that are measured. The physician is
also able to wake up the patient at any given moment.
The many different operable ways and settings of this EEG measurement system will make it
a popular system for researchers of sleep EEG. The final product is depicted in the following
figure, Figure 39.
Figure 39: Final product
76
7.2 Current Issues
7.2.1 Time and Date Setup
Although the RTC module has been mentioned and the setting of the date and time. This has
not yet been implemented in the program due to late discovery of the absence of time keeping
of the myRIO.
This is only requires a small vi, hence the implementation should not take long and not be
difficult at all to integrate in the current code.
7.2.2 Duration of the Temperature Measurement
It should be noted that the temperature measurement takes 200 milliseconds to complete.
Having a sample interval of 4 milliseconds there are 50 samples lost. Since the temperature
measurement only takes place every minute this can be neglected.
However the trigger point monitoring depends on it. Indeed, during the temperature
measurement the loss of samples need to be circumvented by freezing the duration timer.
This is a solution, but it will certainly be better to have faster temperature sensor. Preferable
one that is faster than 4ms. That way a temperature measurement is taken between two EEG
samples and no EEG sample is ever lost.
7.3 Towards 19 Electrodes
Currently the sensor consists out of 3 electrodes. However the need for more electrodes has
risen. This will increase the spatial resolution of the EEG measurement. It will also generate a
lot more data. But this should hardly be a problem since USB devices of varying memories
can be plugged into the myRIO.
7.4 Processing with a Smartphone
It has been mentioned several times that the sensor was built in such a way that almost any
Bluetooth device can connect with it and use it as an EEG sensor.
Therefore a great opportunity arises to create a smartphone application that is able to do the
same processing as the myRIO. Moreover, this project has already been confirmed to be a
bachelors thesis in 2015-2016.
77
References
[1] “Insertable Cardiac Monitor (ICM) – Heart Rhythms and Unexplained Fainting.” [Online]. Available: http://www.medtronic.com/patients/fainting/device/. [Accessed: 18-May-2015].
[2] “NI myRIO - National Instruments.” [Online]. Available: http://www.ni.com/myrio/. [Accessed: 30-May-2015].
[3] “Using the LabVIEW Shared Variable - National Instruments.” [Online]. Available: http://www.ni.com/white-paper/4679/en/. [Accessed: 2-Februari-2015].
[4] “Data Dashboard for LabVIEW - Android-apps op Google Play.” [Online]. Available: https://play.google.com/store/apps/details?id=com.ni.labview.SharedVariableViewer. [Accessed: 30-December-2014].
[5] “Teensy 3.1 - Sparkfun” [Online]. Available: https://www.sparkfun.com/products/12646. [Accessed: 12-October-2014].
[6] “SparkFun Bluetooth Modem - BlueSMiRF Silver - Sparkfun” [Online]. Available: https://www.sparkfun.com/products/12577. [Accessed: 18-October-2014].
[7] S. Saeid and J. Chambers, “EEG Signal Processing,” in EEG Signal Processing, 2007, p. 289.
[8] S. F. Yen, D. Schoonover, J. C. Sanchez, J. C. Principe, and J. G. Harris, “Differential EEG,” 2009 4th Int. IEEE/EMBS Conf. Neural Eng. NER ’09, pp. 18–21, 2009.
[9] A. Muzur, E. F. Pace-Schott, and J. A. Hobson, “The prefrontal cortex in sleep,” Trends Cogn. Sci., vol. 6, no. 11, pp. 475–481, 2002.
[10] “Brain training report - Month #3 - Effective Brain.” [Online]. Available: http://www.effectivebrain.com/brain-training-month-3/. [Accessed: 21-May-2015].
[11] G. Power and B. Co, “P-1s5045bc (技术性文案),” 2012.
[12] L. B. Packs, “Type:063450 1000mAh,” 2006.
[13] “Polymer Lithium Ion Battery - 1000mAh - Sparkfun” [Online]. Available: https://www.sparkfun.com/products/339. [Accessed: 25-November-2014].
[14] “SparkFun Power Cell - LiPo Charger/Booster - Sparkfun” [Online]. Available: https://www.sparkfun.com/products/11231. [Accessed: 25-November-2014].
[15] Microchip Technology Inc., “TC7660 Charge Pump DC-to-DC Voltage Converter Data Sheet,” 2011.
[16] “Analog Devices: Analog Dialogue: Ask The Applications Engineer - 14.” [Online]. Available: http://www.analog.com/library/analogDialogue/Anniversary/14.html. [Accessed: 30-September-2014].
[17] “The OpenEEG project.” [Online]. Available: http://openeeg.sourceforge.net/. [Accessed: 30-Septemer-2014].
78
[18] L. O. W. O. Voltage, L. O. W. Drift, L. O. W. Input, B. Current, H. Cmr, I. P. To, W. S. Range, L. O. W. Q. Current, P. I. N. P. Dip, T. Ina, B. Amplifier, T. Amplifier, R. T. D. S. Amplifier, M. Instrumentation, and D. Acquisition, “Precision , Low Power INSTRUMENTATION AMPLIFIER q DATA ACQUISITION,” vol. 6133, no. 520, 1994.
[19] V. Acharya, “Improving Common-Mode Rejection Using the Right-Leg Drive Amplifier,” Ti, no. July, pp. 1–11, 2011.
[20] S. Operation, C. I. V. Range, O. Voltage, R. Includes, S. P. O. Also, and D. L. Immunity, “LinCMOS TM PRECISION DUAL OPERATIONAL AMPLIFIERS,” no. August, pp. 1–36, 1994.
[21] J. Karki, “Analysis of the Sallen-Key Architecture Application Report,” no. July, pp. 1–14, 1999.
[22] “Teensy USB Development Board.” [Online]. Available: https://www.pjrc.com/teensy/. [Accessed: 20-October-2014].
[23] “Teensy 3.0 ADC details.” [Online]. Available: https://forum.pjrc.com/threads/407-Teensy-3-0-ADC-details. [Accessed: 25-Februari-2015].
[24] Maxim Integrated, “DS18B20 Programmable Resolution 1-Wire Digital Thermometer,” System, vol. 92, pp. 1–22, 2008.
[25] “Arduino-Temperature-Control-Library” [Online]. Available: https://github.com/milesburton/Arduino-Temperature-Control-Library. [Accessed: 25-Februari-2015].
[26] “One Wire Digital Temperature Sensor - DS18B20 - Sparkfun” [Online]. Available: https://www.sparkfun.com/products/245. [Accessed: 30-December-2014].
[27] “Arduino Playground - OneWire.” [Online]. Available: http://playground.arduino.cc/Learning/OneWire. [Accessed: 27-March-2015].
[28] “Arduino Playground - TimedAction Library.” [Online]. Available: http://playground.arduino.cc/Code/TimedAction. [Accessed: 25-Februari-2015].
[29] U. Guide, “NI myRIO-1900,” 1900.
[30] “SparkFun Real Time Clock Module - Sparkfun” [Online]. Available: https://www.sparkfun.com/products/12708. [Accessed: 18-May-2015].
[31] “Mobile Technology for Measurement and Control.” [Online]. Available: https://www.ni.com/mobile/. [Accessed: 21-May-2015].

79
Attachments
Attachment A: List of Components
Attachment B: Sallen-Key Low Pass Filter Calculation
Attachment C: The Second PCB
Attachment D: The Microcontroller Code

80
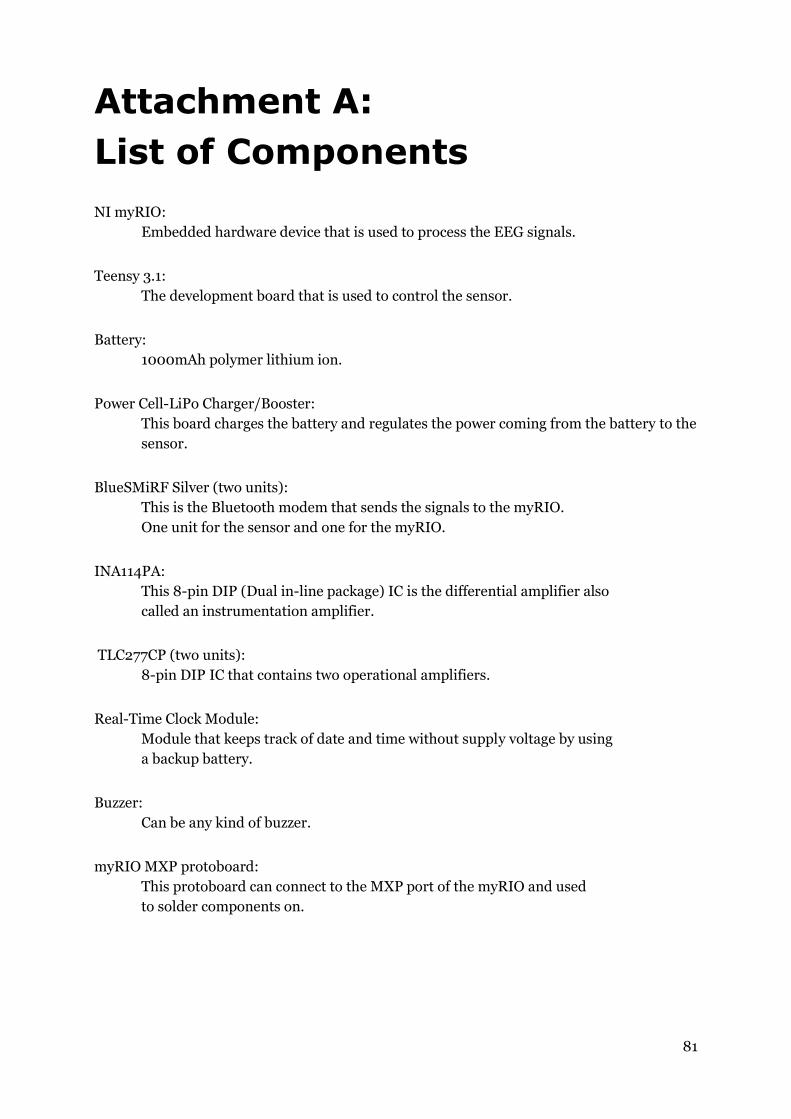
81
Attachment A:
List of Components
NI myRIO:
Embedded hardware device that is used to process the EEG signals.
Teensy 3.1:
The development board that is used to control the sensor.
Battery:
1000mAh polymer lithium ion.
Power Cell-LiPo Charger/Booster:
This board charges the battery and regulates the power coming from the battery to the
sensor.
BlueSMiRF Silver (two units):
This is the Bluetooth modem that sends the signals to the myRIO.
One unit for the sensor and one for the myRIO.
INA114PA:
This 8-pin DIP (Dual in-line package) IC is the differential amplifier also
called an instrumentation amplifier.
TLC277CP (two units):
8-pin DIP IC that contains two operational amplifiers.
Real-Time Clock Module:
Module that keeps track of date and time without supply voltage by using
a backup battery.
Buzzer:
Can be any kind of buzzer.
myRIO MXP protoboard:
This protoboard can connect to the MXP port of the myRIO and used
to solder components on.
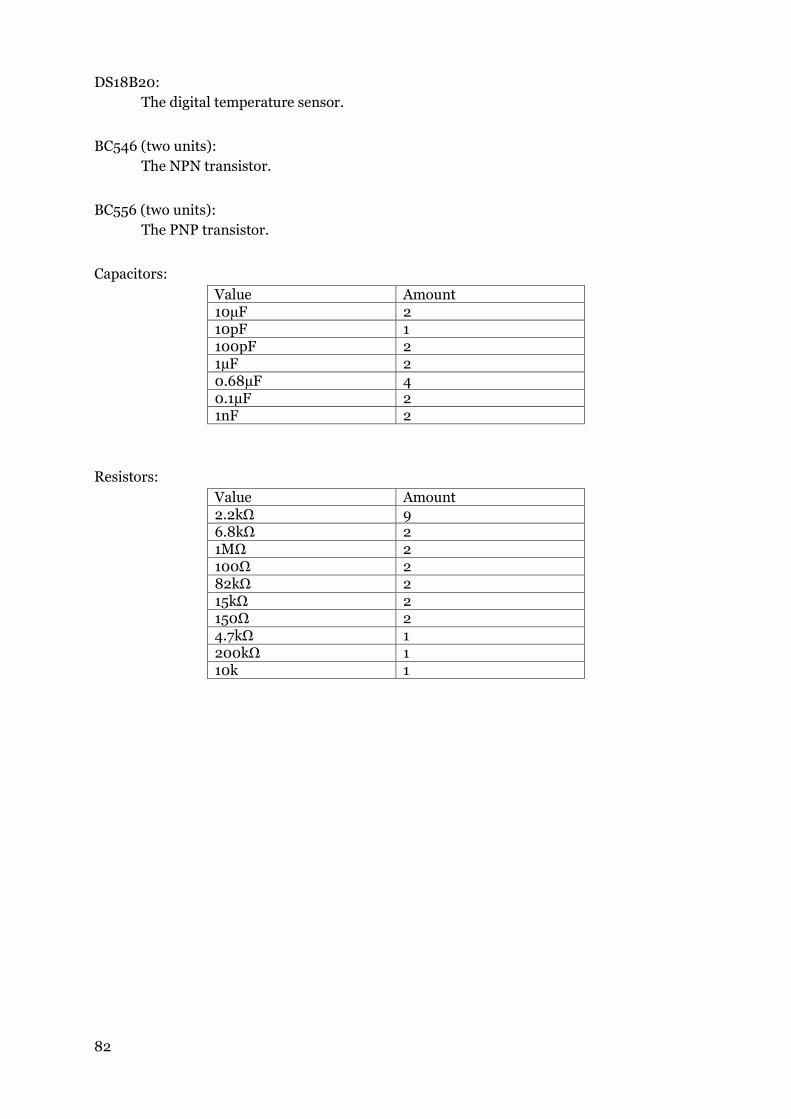
82
DS18B20:
The digital temperature sensor.
BC546 (two units):
The NPN transistor.
BC556 (two units):
The PNP transistor.
Capacitors:
Value Amount 10µF 2 10pF 1 100pF 2 1µF 2 0.68µF 4 0.1µF 2 1nF 2
Resistors:
Value Amount 2.2kΩ 9 6.8kΩ 2 1MΩ 2 100Ω 2 82kΩ 2 15kΩ 2 150Ω 2 4.7kΩ 1 200kΩ 1 10k 1

83
Attachment B:
Sallen-Key Low Pass Filter
calculation
The general equations for the cut off frequency and quality factor of a Sallen-Key low pass
filter are these[21]:
𝑓𝑐 = 1
2𝜋 ∗ √𝑅1 ∗ 𝑅2 ∗ 𝐶1 ∗ 𝐶2, (𝐴. 1)
𝑄 =√𝑅1 ∗ 𝑅2 ∗ 𝐶1 ∗ 𝐶2
𝑅1 ∗ 𝐶1 + 𝑅2 ∗ 𝐶1 + 𝑅1 ∗ 𝐶2 ∗ (1 − 𝐾)(𝐴. 2)
To make the calculation of the values easier the capacitors will be set to the same value and
the resistors will be set as a ratio[21]. Thus,
𝑅1 = 𝑚 ∗ 𝑅 (𝐴. 3)
𝑅2 = 𝑅(𝐴. 4)
𝐶1 = 𝐶2 = 𝐶(𝐴. 5)
Substituting this into the general equation (A.1) and (A.2) leads to:
𝑓𝑐 =1
2𝜋 ∗ 𝑅 ∗ 𝐶 ∗ √𝑚(𝐴. 6)
𝑄 = √𝑚
1 + 2 ∗ 𝑚 − 𝑚 ∗ 𝐾(𝐴. 7)
In order to have a stable low pass filter Q should always be greater than zero. Furthermore, K
has to be 100. The nominator of (A.7) will be greater than zero for whatever value of m or K.
Thus,
𝑄 > 0
1 + 2 ∗ 𝑚 − 𝑚 ∗ 𝐾 > 0
1 + 2 ∗ 𝑚 − 𝑚 ∗ 100 > 0
1 − 98 ∗ 𝑚 > 0
1 > 98 ∗ 𝑚 1
98> 𝑚
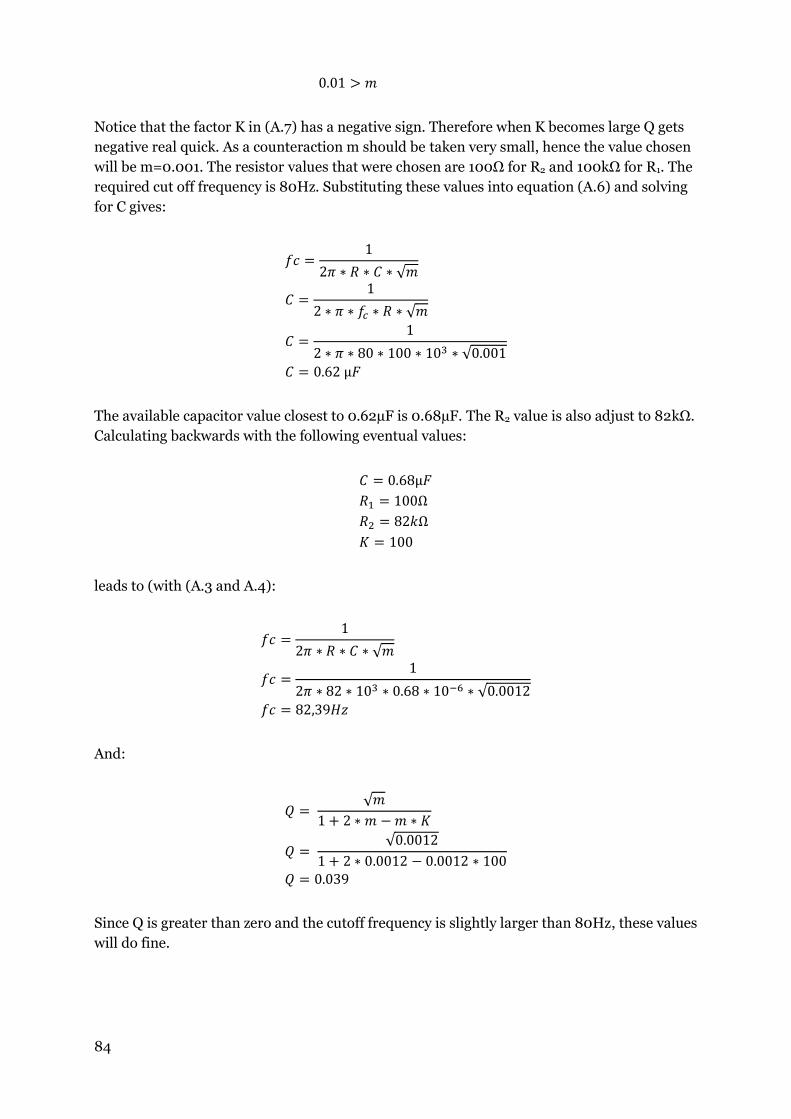
84
0.01 > 𝑚
Notice that the factor K in (A.7) has a negative sign. Therefore when K becomes large Q gets
negative real quick. As a counteraction m should be taken very small, hence the value chosen
will be m=0.001. The resistor values that were chosen are 100Ω for R2 and 100kΩ for R1. The
required cut off frequency is 80Hz. Substituting these values into equation (A.6) and solving
for C gives:
𝑓𝑐 =1
2𝜋 ∗ 𝑅 ∗ 𝐶 ∗ √𝑚
𝐶 =1
2 ∗ 𝜋 ∗ 𝑓𝑐 ∗ 𝑅 ∗ √𝑚
𝐶 =1
2 ∗ 𝜋 ∗ 80 ∗ 100 ∗ 103 ∗ √0.001
𝐶 = 0.62 µ𝐹
The available capacitor value closest to 0.62µF is 0.68µF. The R2 value is also adjust to 82kΩ.
Calculating backwards with the following eventual values:
𝐶 = 0.68µ𝐹
𝑅1 = 100Ω
𝑅2 = 82𝑘Ω
𝐾 = 100
leads to (with (A.3 and A.4):
𝑓𝑐 =1
2𝜋 ∗ 𝑅 ∗ 𝐶 ∗ √𝑚
𝑓𝑐 =1
2𝜋 ∗ 82 ∗ 103 ∗ 0.68 ∗ 10−6 ∗ √0.0012
𝑓𝑐 = 82,39𝐻𝑧
And:
𝑄 = √𝑚
1 + 2 ∗ 𝑚 − 𝑚 ∗ 𝐾
𝑄 = √0.0012
1 + 2 ∗ 0.0012 − 0.0012 ∗ 100
𝑄 = 0.039
Since Q is greater than zero and the cutoff frequency is slightly larger than 80Hz, these values
will do fine.
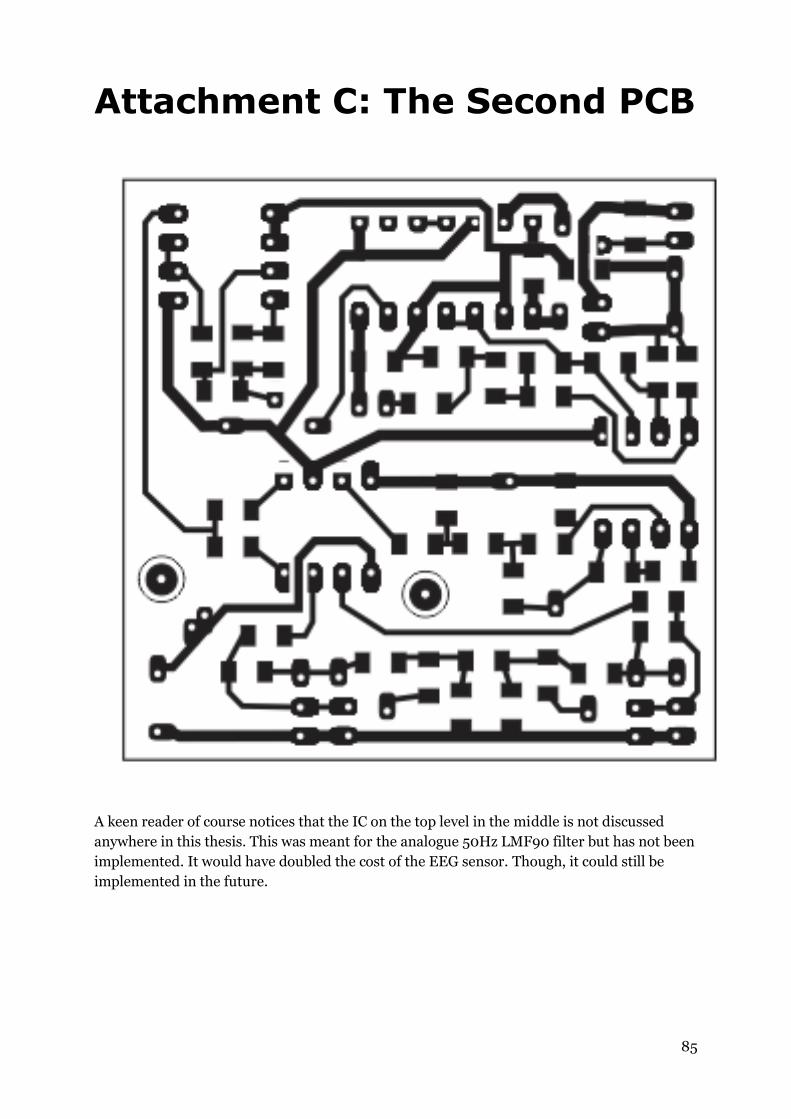
85
Attachment C: The Second PCB
A keen reader of course notices that the IC on the top level in the middle is not discussed
anywhere in this thesis. This was meant for the analogue 50Hz LMF90 filter but has not been
implemented. It would have doubled the cost of the EEG sensor. Though, it could still be
implemented in the future.

86
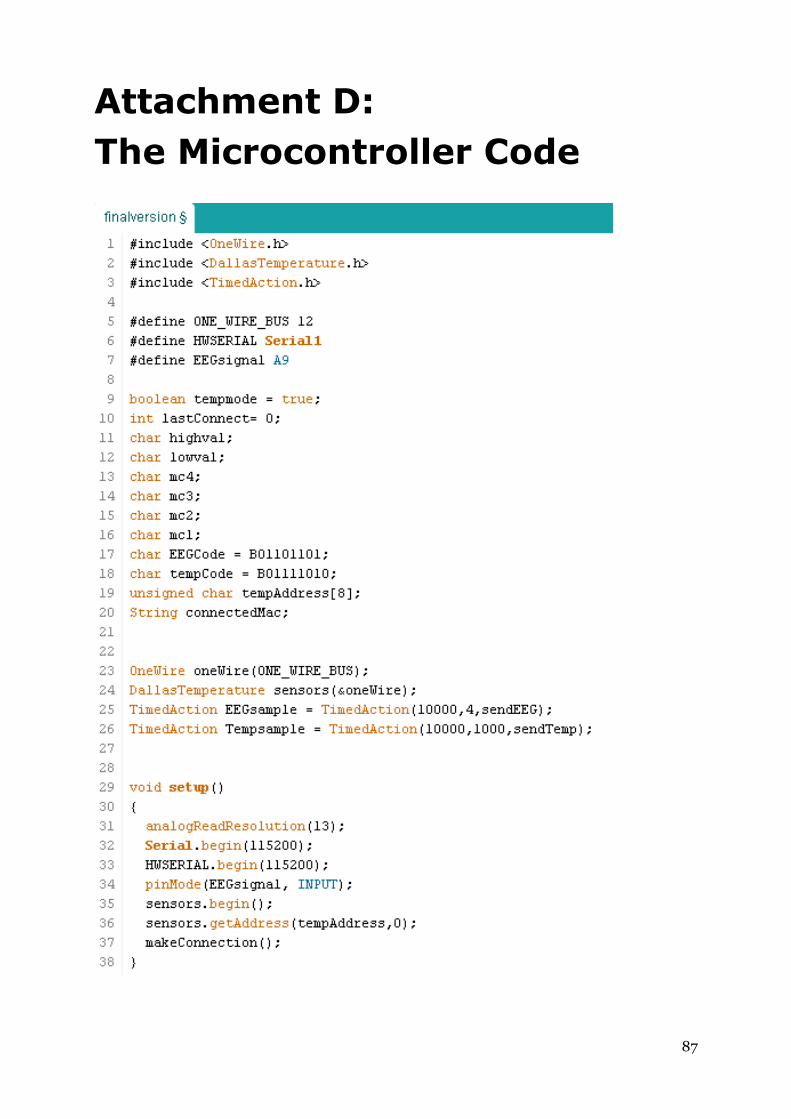
87
Attachment D:
The Microcontroller Code
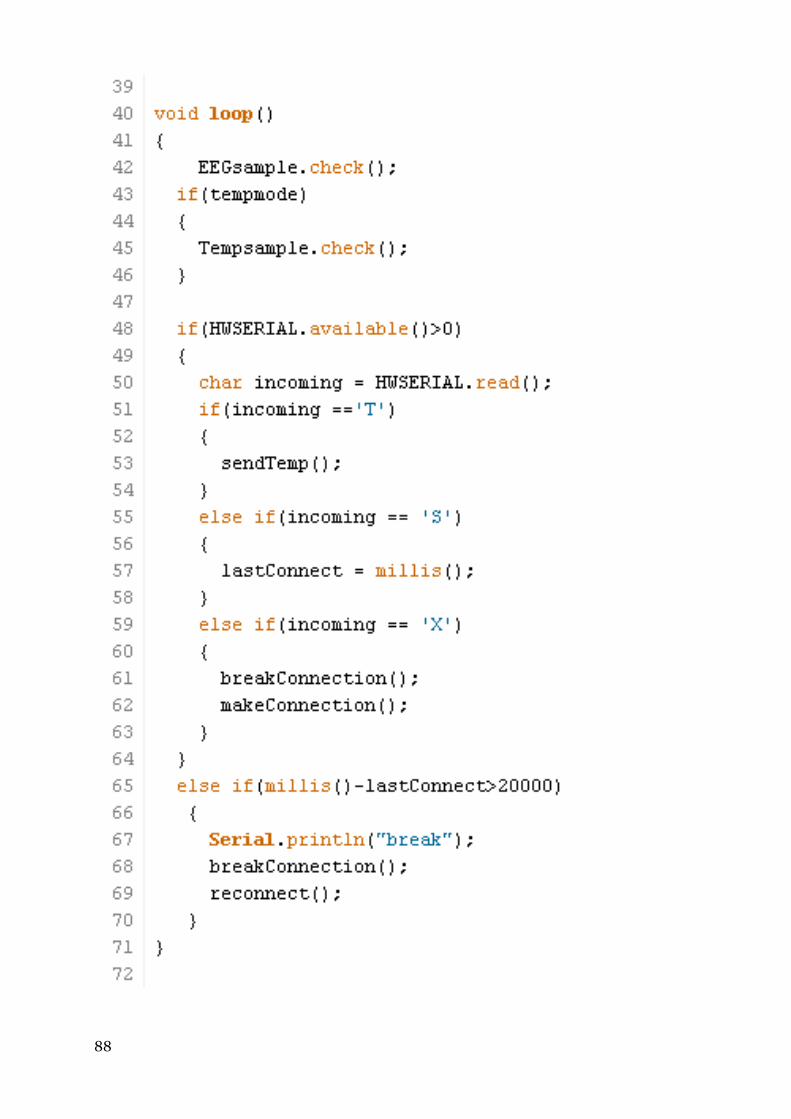
88
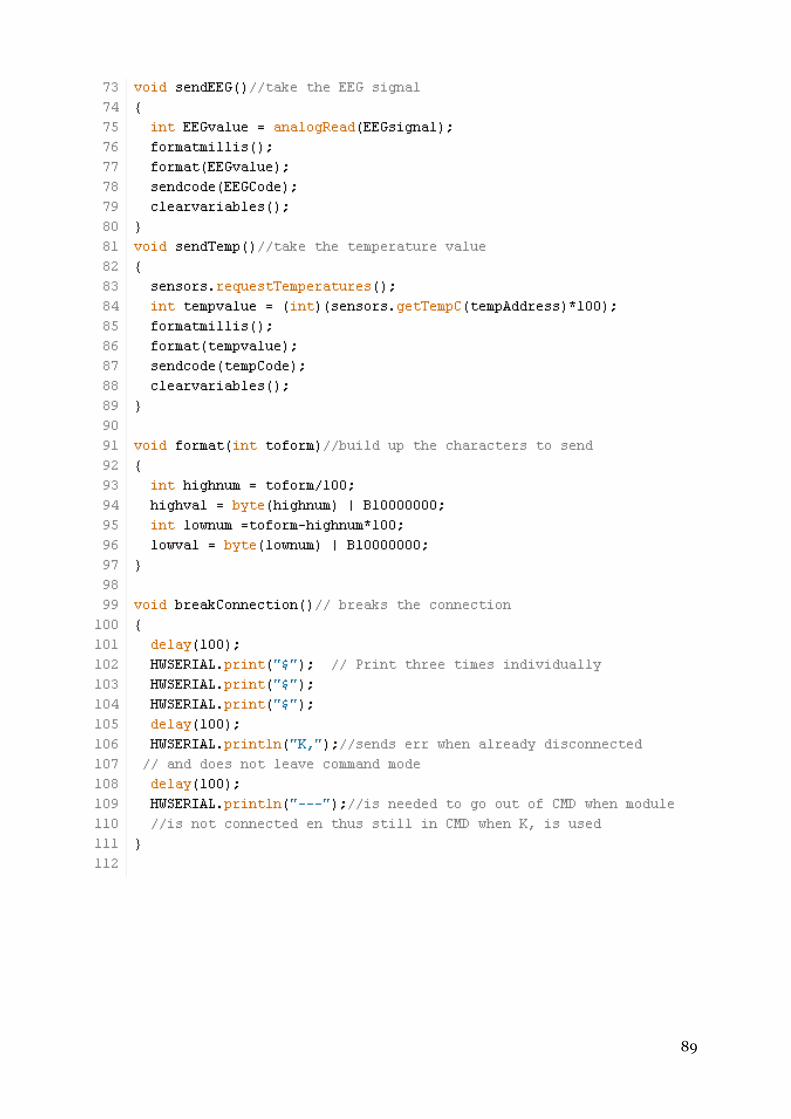
89
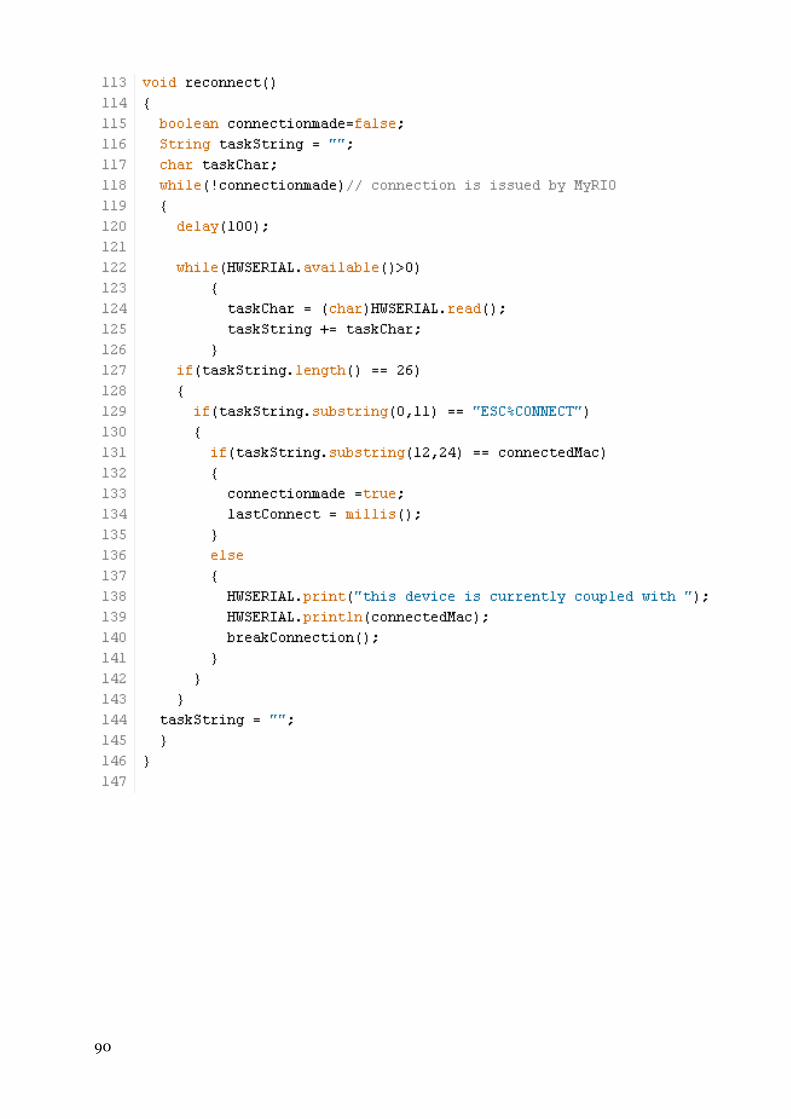
90
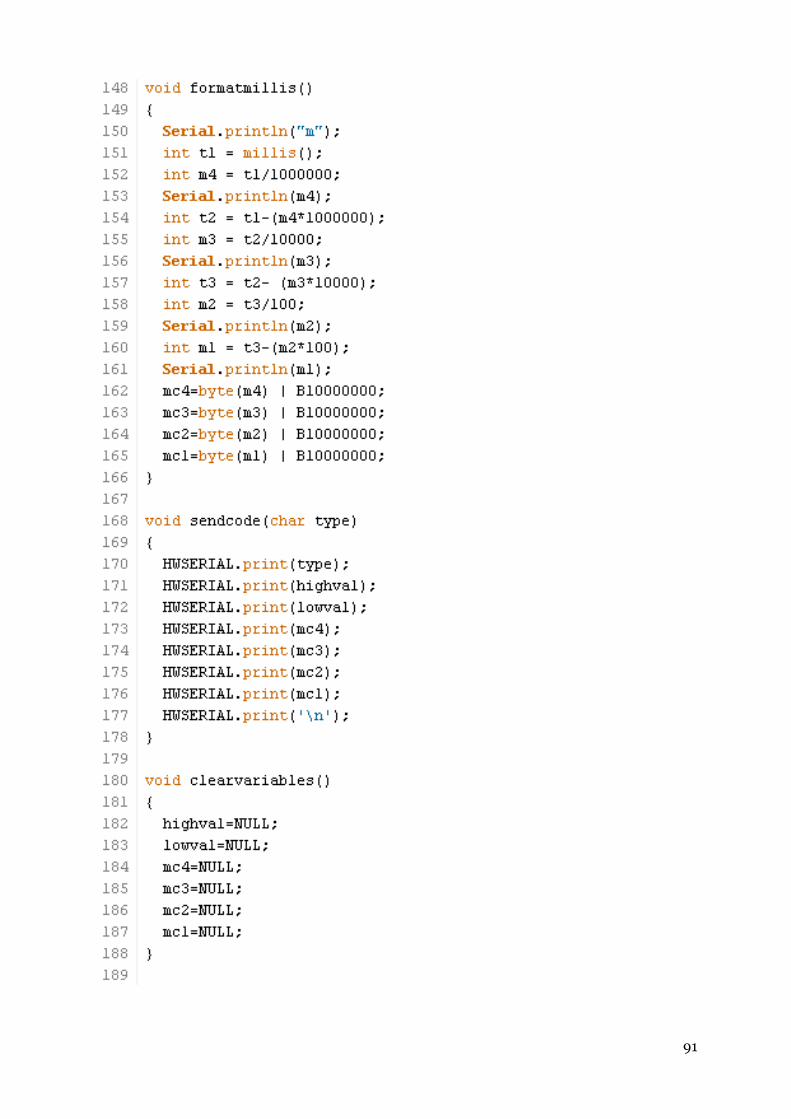
91
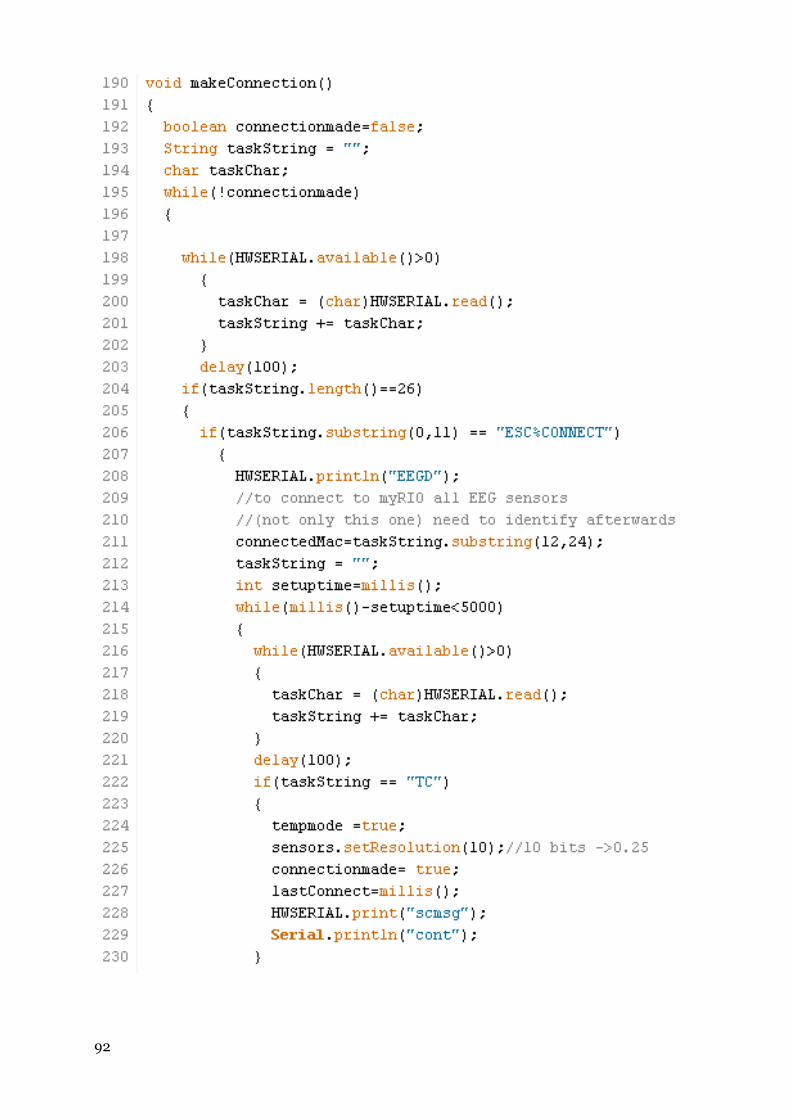
92
93

Auteursrechtelijke overeenkomst
Ik/wij verlenen het wereldwijde auteursrecht voor de ingediende eindverhandeling:
EEG signaal analyse
Richting: master in de industriële wetenschappen: elektronica-ICT
Jaar: 2015
in alle mogelijke mediaformaten, - bestaande en in de toekomst te ontwikkelen - , aan de
Universiteit Hasselt.
Niet tegenstaand deze toekenning van het auteursrecht aan de Universiteit Hasselt
behoud ik als auteur het recht om de eindverhandeling, - in zijn geheel of gedeeltelijk -,
vrij te reproduceren, (her)publiceren of distribueren zonder de toelating te moeten
verkrijgen van de Universiteit Hasselt.
Ik bevestig dat de eindverhandeling mijn origineel werk is, en dat ik het recht heb om de
rechten te verlenen die in deze overeenkomst worden beschreven. Ik verklaar tevens dat
de eindverhandeling, naar mijn weten, het auteursrecht van anderen niet overtreedt.
Ik verklaar tevens dat ik voor het materiaal in de eindverhandeling dat beschermd wordt
door het auteursrecht, de nodige toelatingen heb verkregen zodat ik deze ook aan de
Universiteit Hasselt kan overdragen en dat dit duidelijk in de tekst en inhoud van de
eindverhandeling werd genotificeerd.
Universiteit Hasselt zal mij als auteur(s) van de eindverhandeling identificeren en zal geen
wijzigingen aanbrengen aan de eindverhandeling, uitgezonderd deze toegelaten door deze
overeenkomst.
Voor akkoord,
Vreys, Frederik
Datum: 1/06/2015
Top Related