Zhao' 07
11
JOURNAL OF CELLULAR PHYSIOLOGY 210:111 –121 (2007) Distinctive Gene Expression of Prostatic Stromal Cells Cultured From Diseased Versus Normal Tissues HONGJUAN ZHAO, 1 CRISTIANE F. RAMOS, 2 JAMES D. BROOKS, 1 AND DONNA M. PEEHL 1 * 1 Department of Urology, Stanford University, Stanford, California 2 Urogenital Research Unit, State University of Rio de Janeiro, Brazil To obtain a compr ehens ive view of the transcript ional programs in prost atic stromal cells of differ ent histologic al/path ologic al origin, we profiled 18 adult human stromal cell cultures from normal transition zone (TZ), normal peripheral zone (PZ), benign prostatic hyperplasia (BPH), and prostate cancer (CA) using cDNA microarrays. A hierarchical clustering analysis of 714 named uniquegenes who se expression var ied at lea st thr eefo ld fro m the ove ral l mean abu nda ncein at lea st thr ee sample s in all 18 sample s demons tra ted tha t cell s of dif fer ent origin dis pla yed dis tinct gene expression pro file s. Man y of the dif fer ent iall y expres sed genes are involved in biological processes known to be important in the development of prostatic diseases including cell proliferation and apopto sis, cell a dhesio n, and immune respons e. Sig nifican ce Analys is of Mi croar rays (SAM) analys is identi fied g enes that showe d differential expression with statistical significance including 24 genes between cells from TZ versus BPH, 34 between BPH versus CA, and 101 between PZ versus CA. S100A4 and SULF1, the most up- and downregulated genes in BPH versus TZ, respectively, sho wed expression at the protein leve l consistent wit h microarray ana lys is. In add ition, sul fat aseassay sho wed tha t BPH cell s hav e lower SULF1 activity compared to TZ cells. Quantitative real-time polymerase chain reaction (qRT-PCR) analysis confirmed dif fer enti al expression of ENP P2/ auto tox in and six other genes bet ween PZ versusCA,as wel l as dif fer ent ial expr ess ion of six genes bet wee nBPHversus CA.Our res ult s sup por t thehypot hes is tha t prosta tic stroma l cel ls of diff ere nt ori ginhave uni quetrans cri pti ona l progr ams and point tow ards gene s involved in actio ns of stromal cell s in BPH and CA. J. Cell. Physi ol. 210: 111–121, 2007. ß 2006 Wiley-Liss, Inc. Stromal cells of the prostate are known to regulate epi the lia l grow th as wel l as support and mai nta in epithelial function. Classic rodent studies have shown that stroma is a major inducer of epithelial cell growth and differentiation in prostate development by mediat- ing and rogen act ion s (Cunha, 198 4; Cun ha et al. , 1987). These experiments demonstrated that prostatic devel- opmentonly occurs when emb ryon ic str oma(Uroge nit al Sin us Mes enc hyme (UGM), an and rogen rece pto r- positive, mesodermally derived tissue) and epithelium (Urogenital Sinus Epithelium (UGE), an endodermally der ive d tis sue ) are reco mbi ned bef ore implantation under the renal capsule of experimental animals, but not when impl anted separat ely (Chun g and Cunha, 1983; Cunha et al., 1983b). In addition, while wild-type UGM can ind uce urinary bladder epithe liu m to under go a complete redifferentiation to a prostatic phenotype, androgen-insensitive UGM (which lacks the androgen rece pto r) fai ls to inducepro static dif fere ntiation of UGE (Cunha et al., 1980; Cunha et al., 1983a). The st roma al so pl ays an impo rt ant role in the pathogenesis of prostate diseases (Cunha et al., 2002; Lee and Peehl, 2004; Chung et al., 2005). For instance, the earliest manifestation of benign prostatic hyperpla- sia (BPH) is the appearance of the mesen chyme in periurethral nodules, which has similar morphology to the prostati c mesenc hyme duri ng embryogenesis (McNeal, 1978). In later stages of BPH development, glandula r bud din g and branch ing toward a central focus leads to further nodule growth (McNeal, 1978). Suc h mor pho logica l evidence sug ges ts tha t BPH is intri nsica lly a mesen chymal disease that resul ts from a reawak eni ng of embryo nic induc tiv e int eractions between the pr ostatic stroma and epit he li um. In prostate cancer, the stroma generated by the recruiting signal s rel eas ed from ade noc arc ino ma cel ls, cal led ‘‘reactive stroma,’’ is similar to the stroma at the sites of woun d repai r both histologi cally and molec ularl y (Tuxho rn et al. , 2001; Cha ng et al. , 2004; Condon , 200 5). Reacti ve str oma fro m pro state cancer has bee n sho wn to stimulate cancer cell growth and migration and to pro- mote angiogenesis by altering the balance of angiogen- esis activators and inhibitors (Tuxhorn et al., 2002a,b). In addition, reactive stroma has been associated with the clinical course of prostate cancer, with increased reactive stroma predicting progression and worse out- come (Ayala et al., 2003). Finally, reactive stroma is capable of trans formi ng a non-t umori genic prostatic epi the lial cel l lin e (BPH-1) to a mal ignantone (Haywa rd etal.,2001).Itbecomes cl ear that the st romain pr ostate cancer not only provi des a supp ortivemicroenvir onmen t that promotes tumor progression, but also is a critical determinant of benign versus malignant growth. Despite the importance of stromal cells in prostate devel opment, funct ion and disea se, a compr ehens ive view of the transcriptional programs in stromal cells of dif ferent his tol ogi cal and pat hol ogi cal ori gin is currently lacking. Such information may provide not only new insights into the biology of prostate pathogen- esi s, but also novel the rap eut ic str ate gies aimed at pre venting the gen eration of str oma import ant for disea se development and progression. For insta nce, genes comprisi ng a stereot ypical gene expression program in response to serum exposure by fibroblasts from 10 different anatomic sites have been shown to be coordinately regulated in many human tumors includ- ing prostate cancer (Chang et al., 2004). This transcrip- tional signature of the response of fibroblasts to serum ß 2006 WILEY-LISS, INC. Contract grant sponsor: Department of Defense; Contract grant number: W81XWH-04-1-0810. *Correspondence to: Donna M. Peehl, Department of Urology, Stanford Medical Center, Stanford, CA 94305-5118. E-mail: [email protected] Received 31 January 2006; Accepted 17 July 2006 DOI: 10.1002/jcp.208 28
-
Upload
javier-cerda-infante -
Category
Documents
-
view
220 -
download
0
Transcript of Zhao' 07
7/31/2019 Zhao' 07
http://slidepdf.com/reader/full/zhao-07 1/11
JOURNAL OF CELLULAR PHYSIOLOGY 210:111 –121 (2007)
Distinctive Gene Expression of Prostatic Stromal CellsCultured From Diseased Versus Normal Tissues
HONGJUAN ZHAO,1
CRISTIANE F. RAMOS,2
JAMES D. BROOKS,1
AND DONNA M. PEEHL1
*1Department of Urology, Stanford University, Stanford, California
2 Urogenital Research Unit, State University of Rio de Janeiro, Brazil
To obtain a comprehensive view of the transcriptional programs in prostatic stromal cells of different histological/pathologicalorigin, we profiled 18 adult human stromal cell cultures from normal transition zone (TZ), normal peripheral zone (PZ), benignprostatic hyperplasia (BPH), and prostate cancer (CA) using cDNA microarrays. A hierarchical clustering analysis of 714 nameduniquegenes whose expression varied at least threefold from the overall mean abundance in at least three samples in all 18 samplesdemonstrated that cells of different origin displayed distinct gene expression profiles. Many of the differentially expressed genes areinvolved in biological processes known to be important in the development of prostatic diseases including cell proliferation andapoptosis, cell adhesion, and immune response. Significance Analysis of Microarrays (SAM) analysis identified genes that showeddifferential expression with statistical significance including 24 genes between cells from TZ versus BPH, 34 between BPH versusCA, and 101 between PZ versus CA. S100A4 and SULF1, the most up- and downregulated genes in BPH versus TZ, respectively,showed expression at the protein level consistent with microarray analysis. In addition, sulfatase assay showed that BPH cells have
lower SULF1 activity compared to TZ cells. Quantitative real-time polymerase chain reaction (qRT-PCR) analysis confirmeddifferential expression of ENPP2/autotoxin and six other genes between PZ versus CA, as well as differential expression of six genesbetween BPHversus CA.Our results support thehypothesis that prostatic stromal cells of different originhave uniquetranscriptionalprograms and point towards genes involved in actions of stromal cells in BPH and CA. J. Cell. Physiol. 210: 111–121, 2007.ß 2006 Wiley-Liss, Inc.
Stromal cells of the prostate are known to regulateepithelial growth as well as support and maintainepithelial function. Classic rodent studies have shownthat stroma is a major inducer of epithelial cell growthand differentiation in prostate development by mediat-ing androgen actions (Cunha, 1984; Cunha et al., 1987).These experiments demonstrated that prostatic devel-opment only occurs when embryonic stroma (UrogenitalSinus Mesenchyme (UGM), an androgen receptor-positive, mesodermally derived tissue) and epithelium(Urogenital Sinus Epithelium (UGE), an endodermallyderived tissue) are recombined before implantationunder the renal capsule of experimental animals, butnot when implanted separately (Chung and Cunha,1983; Cunha et al., 1983b). In addition, while wild-typeUGM can induce urinary bladder epithelium to undergoa complete redifferentiation to a prostatic phenotype,androgen-insensitive UGM (which lacks the androgenreceptor) fails to induce prostatic differentiation of UGE(Cunha et al., 1980; Cunha et al., 1983a).
The stroma also plays an important role in thepathogenesis of prostate diseases (Cunha et al., 2002;Lee and Peehl, 2004; Chung et al., 2005). For instance,
the earliest manifestation of benign prostatic hyperpla-sia (BPH) is the appearance of the mesenchyme inperiurethral nodules, which has similar morphology tothe prostatic mesenchyme during embryogenesis(McNeal, 1978). In later stages of BPH development,glandular budding and branching toward a centralfocus leads to further nodule growth (McNeal, 1978).Such morphological evidence suggests that BPH isintrinsically a mesenchymal disease that results froma reawakening of embryonic inductive interactionsbetween the prostatic stroma and epithelium. Inprostate cancer, the stroma generated by the recruiting signals released from adenocarcinoma cells, called‘‘reactive stroma,’’ is similar to the stroma at the sitesof wound repair both histologically and molecularly
(Tuxhorn et al., 2001; Chang et al., 2004; Condon, 2005).Reactive stroma from prostate cancer has been shown to
stimulate cancer cell growth and migration and to pro-mote angiogenesis by altering the balance of angiogen-esis activators and inhibitors (Tuxhorn et al., 2002a,b).In addition, reactive stroma has been associated withthe clinical course of prostate cancer, with increasedreactive stroma predicting progression and worse out-come (Ayala et al., 2003). Finally, reactive stroma iscapable of transforming a non-tumorigenic prostaticepithelial cell line (BPH-1) to a malignantone (Haywardet al., 2001). It becomes clear that the stroma in prostatecancernot onlyprovides a supportivemicroenvironmentthat promotes tumor progression, but also is a criticaldeterminant of benign versus malignant growth.
Despite the importance of stromal cells in prostatedevelopment, function and disease, a comprehensiveview of the transcriptional programs in stromal cellsof different histological and pathological origin iscurrently lacking. Such information may provide notonly new insights into the biology of prostate pathogen-esis, but also novel therapeutic strategies aimed atpreventing the generation of stroma important fordisease development and progression. For instance,genes comprising a stereotypical gene expression
program in response to serum exposure by fibroblastsfrom 10 different anatomic sites have been shown to becoordinately regulated in many human tumors includ-ing prostate cancer (Chang et al., 2004). This transcrip-tional signature of the response of fibroblasts to serum
ß 2006 WILEY-LISS, INC.
Contract grant sponsor: Department of Defense; Contract grantnumber: W81XWH-04-1-0810.
*Correspondence to: Donna M. Peehl, Department of Urology,Stanford Medical Center, Stanford, CA 94305-5118.E-mail: [email protected]
Received 31 January 2006; Accepted 17 July 2006
DOI: 10.1002/jcp.20828
7/31/2019 Zhao' 07
http://slidepdf.com/reader/full/zhao-07 2/11
has also been shown to be a powerful predictor of theclinical course in several common carcinomas.
Although prostatic stromal cells cultured fromdifferent histological and pathological origins aresimilar in certain phenotypic features including theirmorphology, population doubling time, cell cycle dis-tribution, and response to genotoxic and chemotoxicagents, they differ in a number of aspects (San Francisco
et al., 2004). First, carcinoma-associated fibroblasts(CAF) exhibit an increased potential to undergo ancho-rage-independent growth in soft agar compared tofibroblasts cultured from normal human prostate(NHPF) (San Francisco et al., 2004). Second, stromalcells from BPH (BPHF) and cancer tissues showdifferent capability in inducing the growth of BPH-1epithelial cells in tissue recombinant experiments(Barclay et al., 2005). BPH-1 recombinants with BPHFproduced small grafts with similar histology to BPH. Incontrast, CAF produced aggressive prostatic tumorswhen recombined with BPH-1 cells (Barclay et al.,2005). Finally, a number of molecules have been shownto be differentially expressed by stromal cells of differenthistology or pathology. For example, transforming growth factor (TGF)-b1 is expressed in higher concen-trations in CAF than NHPF, which may contribute tothe higher capability of CAF to form colonies in soft agarandthe ability of CAF to promote malignantprogressionof prostate epithelial cells (San Francisco et al., 2004). Inaddition, a number of growth factors and cytokines arereportedly overexpressed in BPH stroma including fibroblast growth factor (FGF)-2, FGF-7, insulin-likegrowth factor (IGF)-1, IGF-2, and interleukin (IL)-1a(Lee and Peehl, 2004). Based on these observations, wehypothesize that prostatic stromal cells of differenthistological and pathological origins have distincttranscriptional programs. To test this hypothesis, weprofiled 18 human stromal cell cultures from normaltransition zone (TZ), normal peripheral zone (PZ), BPH,and cancer (CA) tissues using cDNA microarrayscontaining 24,473 unique genes. We compared geneexpression profiles of BPH cells to normal TZ cellsbecause the TZ is the main site of origin of BPH.Similarly, we compared gene expression profiles of CA cells to normal PZ cells because the majority of prostatecancer arises in the PZ.
MATERIALS AND METHODSCell culture
Primary cultures of human prostatic stromal cells wereestablished from histologically confirmed normal, BPH, or CA tissues according to previously described methods (Peehl andSellers, 2000). The primary cell cultures used in this study arelisted in Table 1. Thepresence of contaminating epithelial cellswas ruled out by the absence of staining with antibodiesagainst epithelial keratins 5 and 18 (Enzo Life Sciences, Inc.,Farmingdale, NY). The stromal cell cultures were 100% pureby passage 2 under ourculture conditions. These cultures wereserially passaged in SCGMTM (Cambrex, East Rutherford, NJ)supplemented with 5 mg/ml insulin, 1 ng/ml FGF-2, 5% fetalbovine serum (FBS), and100 mg/ml of gentamycin. At passages4–17, cells were seeded on 100-mm cell culture dishes with1 million cells/dish. Twenty-four hours later, cells wereswitched to MCDB 105 (Sigma-Aldrich, St. Louis, MO) with100 mg/ml of gentamycin. Total RNA was isolated another 24 hlater. MCF-7 cells were cultured in DMEM (InvitrogenTM,Carlsbad,CA) supplemented with10% FBS and MCF-10A cellswere cultured in DMEM/F12 (InvitrogenTM) supplementedwith 15 mM HEPES buffer, 5% horse serum, 10 mg/ml insulin,
20 ng/ml epidermal growth factor (EGF), 100 ng/ml choleratoxin, and 0.5 mg/ml hydrocortisone.
RNA isolation and microarray hybridization
Total RNA was isolated using TRIzol solution (Invitro-genTM) according to manufacturer’s instructions. Fluores-cently labeled DNA probes were prepared from 50 to 70 mg total RNA isolated from prostatic stromal cells (Cy5-labeled)and Universal Human Reference RNA (Stratagene, La Jolla,CA) (Cy3-labeled) by reverse transcription using an Oligo dTprimer 50-TTTTTTTTTTTTTTT-30 (Qiagen, Valencia, CA) asdescribed previously (Zhao et al., 2005). Labeled probes fromeach stromal cell RNA and reference RNA were mixed andhybridized overnight at 658C to spotted cDNA microarrayswith 41,126 elements (Stanford Functional Genomics Facility,Stanford, CA). Microarray slides were then washed to removeunbound probe and scanned with a GenePix 4000B scanner(Axon Instruments, Inc., Union City, CA).
Data processing and analysis
The acquired fluorescence intensities for each fluoroprobewere analyzed with GenePix Pro 5.0 software (Axon Instru-
ments, Inc.). Spots of poor quality were removed from furtheranalysis by visual inspection. Data files containing fluores-cence ratios were entered into the Stanford MicroarrayDatabase (SMD) where biological data were associated withfluorescenceratios and geneswere selected for further analysis(Sherlock et al., 2001). Hierarchical clustering was performedby first retrieving only spots with a signal intensity >150%above background in either Cy5- or Cy3 channels in at least70% of the microarray experiments from SMD. We selectedclones whose expression levels varied at least threefold in atleast three of the samples from the mean abundance across allsamples. The genes and arrays in the resulting data tableswere ordered by their patterns of gene expression using hierarchical clustering analysis, and visualized using Tree-view software (http://rana.lbl.gov/EisenSoftware.htm). Geneswith potentially significant differential expression in stromal
cells from different histological/pathological origins wereidentified using the Significance Analysis of Microarrays(SAM) procedure, which computes a two-sample T-statistic(e.g., for BPH vs. TZ cells) for the normalized log ratios of geneexpression levels for each gene (Tusher et al., 2001). Theprocedure thresholds the T-statistics to provide a ‘‘significant’’gene list and provides an estimate of the false discovery rate(the percentage of genes identified by chance alone). We used aselection threshold that gives a relatively low false discoveryrate and identifies a relatively high number of significantgenes.
Quantitative real-time PCR (qRT-PCR)
Total RNA from stromal cells was reverse transcribed asdescribed above. cDNA product wasthen mixed with DyNAmoSYBR1Green master mix (Biolabs, Ipswich, MA) and primers
of choice in the subsequent polymerase chain reaction (PCR)using a DNA Engine Opticon1 2 Continuous Fluorescence
TABLE 1. Summary of cell cultures used in the study
Name Age of donor Passage number Histology
F-BPH-1 63 10 BPHF-BPH-2 55 11 BPHF-BPH-3 65 14 BPHF-BPH-4 58 8 BPHF-TZ-1 43 16 Normal TZF-TZ-2 62 14 Normal TZ
F-CA-1 57 11 CA 4/3F-CA-2 69 10 CA 3/4F-CA-3 58 10 CA 3/4F-CA-4 59 14 CA 3/3F-CA-5 65 14 CA 4/3F-PZ-1 67 15 Normal PZF-PZ-2 58 16 Normal PZF-PZ-3 66 11 Normal PZF-PZ-4 66 4 Normal PZF-PZ-5 59 11 Normal PZF-PZ-6 66 15 Normal PZF-PZ-7 59 17 Normal PZ
112 ZHAO ET AL.
Journal of Cellular Physiology DOI 10.1002/jcp
7/31/2019 Zhao' 07
http://slidepdf.com/reader/full/zhao-07 3/11
Detection System (MJ Research, Hercules, CA) according tomanufacturer’s instructions. Each reaction was done intriplicate to minimize the experimental variations (standarddeviation was calculated for each reaction). Transcriptlevels of TATA box binding protein (TBP) were assayed simultaneouslywith each of the 35 genes selected for validation as an internalcontrol to normalize their transcript levels. A list of the primersequences used is available at http://genome-www5.stanford.edu/cgi-bin/tools/display/listMicroArrayData.pl?tableName ¼
publication.
Immunochemistry
F-TZ-1 and F-BPH-4 cells cultured on 8-well chamber slideswere fixed in 2% paraformaldehyde and permeabilized in 95%ice-cold ethanol. Horse serum (10% in phosphate-bufferedsaline (PBS)) was used to block non-specific binding of antibodies. The slide was then incubated at room temperature(RT) for 30 min in the primary antibody. A mouse monoclonalantibody against human SULF1 (CBI PGA antibody core,Tempe, Arizona) and a rabbit polyclonal antibody againstS100A4 (Santa CruzBiotechnology, Inc., SantaCruz, CA) wereused at a 1:50 dilution. The slides were then washedand incubated in a biotinylated secondary antibody at RT for30 min, washed and incubated again at RT for another 30 minin peroxidase-conjugated streptavidin. Color was developed
with30
,30
diaminobenzidine (DAB) (DakoCytomation California,Inc., Carpinteria, CA). Counter staining was performed withhematoxylin. A similar procedure was used for tissue sections,except that tissues were first deparaffinized in xylene, andhydrated in a graded series of alcohol. Slides were thenincubated in 0.3% hydrogen peroxide in methanol for 15 minand 10% horse serum for 20 min at RT before incubation in theprimary antibody at 48C overnight.
Western blotting
Cells were lysed with lysis buffer (pH 7.5, 50 mM HEPES,0.5% NP-40, 0.25% Na-deoxycholate, 0.1 mM sodium vana-date, 50 mM NaCl, 1 mM EDTA, 1 mM phenylmethylsulfonylfluoride (PMSF)). Protein concentration was determined using the Bradford assay (Bio-Rad, Hercules, CA). Twenty micro-grams of protein were separated using a 10% NuPAGE1 10%
Bis-Tris Gel (Invitrogen) and transferred to a Hybond-Pmembrane (Amersham Life Sciences, Arlington Heights, IL).S100A4 was detected with a rabbit polyclonal anti-humanantibody A5114 (DakoCytomation) and visualized with anECL Plus kit (Amersham Biosciences, Piscataway, NJ).Glyceraldehyde-3-phosphate dehydrogenase (GAPDH) wasdetected with a monoclonal mouse anti-rabbit antibody, MoAb6C5, whichreacts with humanGAPDH (Research Diagnostics,Flanders,NJ). S100A4 andGAPDH signal intensities werequan-tified with a Scion Image software (http://www.meyerinst.com/ html/scion/scion_image_windows.htm).
In situ hybridization
In situ hybridization of tissue sections was performed basedon a protocol published previously (West et al., 2004). Briefly,digoxigenin (DIG)-labeled sense and anti-sense RNA probeswere generated by in vitro transcription using templatesproduced by PCRamplification of a 498-bpproduct with the T7promoter incorporated into the primers. In vitro transcriptionwas performed with a DIG RNA-labeling kit and T7 polymer-ase according to the manufacturer’s protocol (Roche Diagnos-tics, Indianapolis, IN). Tissue sections (5 mm) from paraffinblocks were digested in 10 mg/ml of proteinase K at 378C for30 min and hybridized overnight at 558C with either sense oranti-sense riboprobes at 200 ng/ml dilution in mRNA hybridi-zation buffer (DAKO). The following day, sections wereincubated with a 1:35 dilution of RNase A cocktail (Ambion, Austin, TX) for 30 min at 378C, followed by stringent washing.For signal amplification, a HRP-conjugated rabbit anti-DIGantibody (DAKO) was used to catalyze the deposition of biotinyl tyramide, followed by secondary streptavidin complex(GenPoint kit; DAKO). The final signal was developedwith DAB (GenPoint kit; DAKO). For sense RNA probe, the
primer sequences were 50
CTAATACGACTCACTATAGGGAT ACTCGGCAGACACGTTCC30 and50CCTCCTTGAATGGGTG
AAGA30. Foranti-sense RNAprobe, theprimer sequenceswere50CTAATACGACTCACTATAGGGCCTCCTTGAATGGGTGA- AGA30 and 50 ATACTCGGCAGACACG TTCC30.
Sulfatase assay
F-TZ-1 or F-BPH-4cells werecultured as described above andthe assay was performed according to previously publishedprotocols with modifications (Lai et al., 2004a). After 24 h in
serum-free medium, cells werewashedin ice-coldPBS andlysedin SIE buffer (250 mM sucrose, 3 mM imidazole, pH 7.4, 1%ethanol) containing 1% (w/v) Nonidet P-40 and 1 mM PMSF.Protein concentration was determined as described above. Thetotal cellular protein (20 mg) was pre-incubated with 10 mMestrone-3-O-sulfamate (Sigma-Aldrich)at 378C for 1 h toinhibitsteroid sulfatases. 4-methylumbelliferyl sulfate was thenaddedto a final concentration of 7.5 mM in a total volume of 200 ml. After incubation for 24 h at 378C, the reaction was terminatedby addition of 1 ml of 0.5 M Na2CO3 /NaHCO3, pH 10.7. Thefluorescence of the liberated 4-methylumbelliferone wasmeasured using excitation and emission wavelengths of 355 and 460 nm, respectively. MCF-7 and MCF-10A cells wereused as positive and negative controls, respectively. Eachreaction was performed in triplicate and standard deviationwas calculated. The enzymatic activities of SULF1 in MCF-7,
F-TZ-1, and F-BPH-4 cells were normalized against that inMCF-10A.
RESULTSGene expression profiles in
prostatic stromal cells
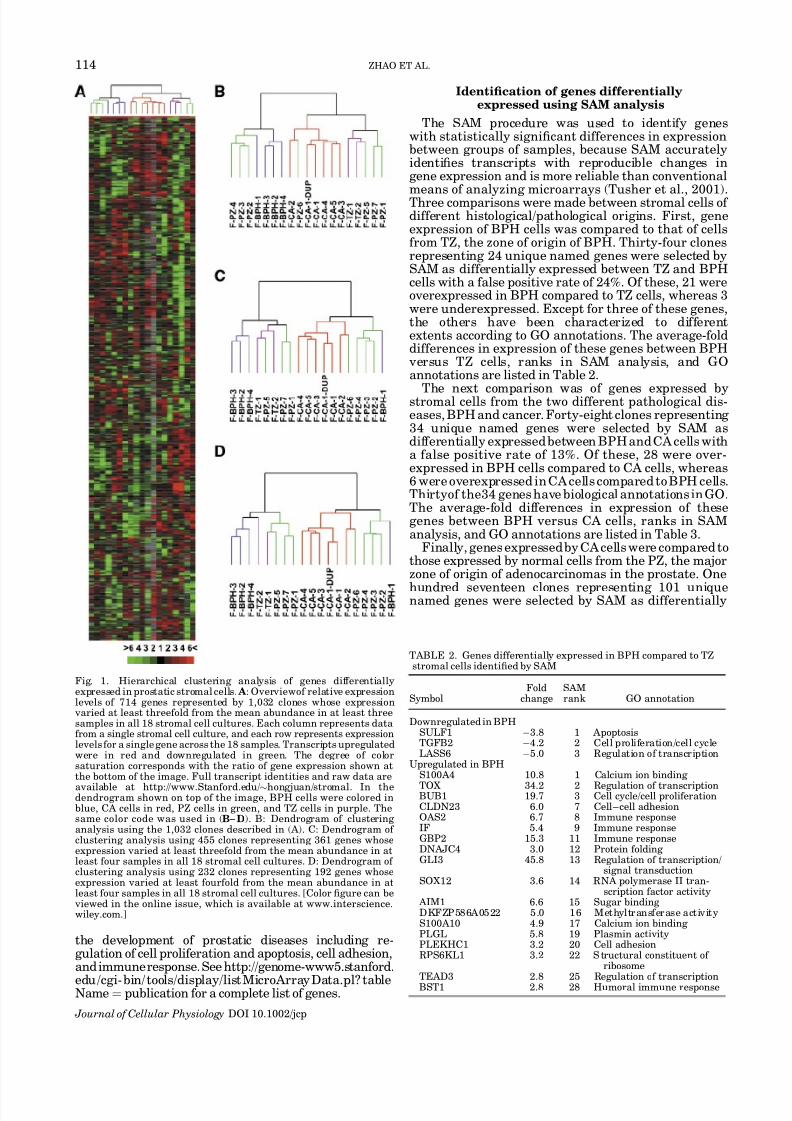
We profiled gene expression of 18 stromal cell culturesincluding4fromBPH,2fromnormalTZ,5fromCA,and7from normal PZ (Table 1). In order to standardize cultureconditions at the time of analysis, 1 million cells wereinoculated into each of seven 100-mm dishes containing SCGMTM. Twenty-four hours later, cells were changedtoserum-free medium, then RNA was isolated 24 h later.This would allow the cells to enter a stationary, non-cycling, or resting state, and minimize the differentialgene expression due to different distributions of cells ateachcell cycle phase.A hierarchical clustering analysis of 714 named unique genes represented by 1,032 cloneswhose expression varied at least threefold from theoverallmean abundancein at least three samplesin all18samples tested is shownin Figure 1A. In the dendrogram(Fig. 1B), BPH stromal cells were separated from normalTZ stromal cells, demonstrating that prostate stromalcells from normal TZ and BPH tissues have distinct geneexpression patterns. CA stromal cells were grouped in atight cluster away from cells from other histological/ pathological origins except for one PZ stromal cellculture, indicating a unique transcriptional programassociated with cancer-derived stromal cells. Note that
two duplicate hybridizations of F-CA-1 clustered next toeach other, showing a high reproducibility of the method.Interestingly, the PZ cultures showed heterogeneity intheir gene expression profiles, as they were broken intothree groups by theclusteringalgorithm. F-PZ-1,-5,and-7 were similar to each other in their expression patterns,where as F-PZ-2, -3, and -4 were alike. F-PZ-6, on theother hand, showed a similar expression profile to CA cells for reasons other than misdiagnosis since thehistology of the area of tissue where the cells came fromwas confirmed as normal. In addition, varying geneselection criteria did not change the association of samples significantly (Fig. 1C,D), suggesting a robustclustering. Of the named genes, more than 80% havesome biological annotations associated according to
Gene Ontology (GO). Many of them are involved inbiological processes that are known to be important in
GENE EXPRESSION IN PROSTATIC STROMAL CELLS 113
Journal of Cellular Physiology DOI 10.1002/jcp
7/31/2019 Zhao' 07
http://slidepdf.com/reader/full/zhao-07 4/11
the development of prostatic diseases including re-gulation of cell proliferation and apoptosis, cell adhesion,and immuneresponse.See http://genome-www5.stanford.
edu /cgi- bin/ tools/display/list MicroArray Data.pl? tableName ¼ publication for a complete list of genes.
Identification of genes differentially expressed using SAM analysis
The SAM procedure was used to identify geneswith statistically significant differences in expressionbetween groups of samples, because SAM accuratelyidentifies transcripts with reproducible changes ingene expression and is more reliable than conventionalmeans of analyzing microarrays (Tusher et al., 2001).Three comparisons were made between stromal cells of different histological/pathological origins. First, geneexpression of BPH cells was compared to that of cellsfrom TZ, the zone of origin of BPH. Thirty-four clonesrepresenting 24 unique named genes were selected bySAM as differentially expressed between TZ and BPHcells with a false positive rate of 24%. Of these, 21 wereoverexpressed in BPH compared to TZ cells, whereas 3were underexpressed. Except for three of these genes,the others have been characterized to differentextents according to GO annotations. The average-folddifferences in expression of these genes between BPHversus TZ cells, ranks in SAM analysis, and GOannotations are listed in Table 2.
The next comparison was of genes expressed bystromal cells from the two different pathological dis-eases, BPH and cancer. Forty-eight clones representing 34 unique named genes were selected by SAM asdifferentially expressed between BPH and CA cells witha false positive rate of 13%. Of these, 28 were over-expressed in BPH cells compared to CA cells, whereas6 were overexpressed in CA cells compared to BPH cells.Thirtyof the34 genes have biological annotations in GO.The average-fold differences in expression of thesegenes between BPH versus CA cells, ranks in SAManalysis, and GO annotations are listed in Table 3.
Finally, genes expressed by CA cells were compared tothose expressed by normal cells from the PZ, the majorzone of origin of adenocarcinomas in the prostate. One
hundred seventeen clones representing 101 uniquenamed genes were selected by SAM as differentially
Fig. 1. Hierarchical clustering analysis of genes differentiallyexpressed in prostatic stromal cells. A: Overviewof relative expressionlevels of 714 genes represented by 1,032 clones whose expressionvaried at least threefold from the mean abundance in at least threesamples in all 18 stromal cell cultures. Each column represents datafrom a single stromal cell culture, and each row represents expressionlevels for a single gene across the 18 samples. Transcripts upregulatedwere in red and downregulated in green. The degree of colorsaturation corresponds with the ratio of gene expression shown atthe bottom of the image. Full transcript identities and raw data are
available at http://www.Stanford.edu/ $hongjuan/stromal. In thedendrogram shown on top of the image, BPH cells were colored inblue, CA cells in red, PZ cells in green, and TZ cells in purple. Thesame color code was used in (B– D). B: Dendrogram of clustering analysis using the 1,032 clones described in (A). C: Dendrogram of clustering analysis using 455 clones representing 361 genes whoseexpression varied at least threefold from the mean abundance in atleast four samples in all 18 stromal cell cultures. D: Dendrogram of clustering analysis using 232 clones representing 192 genes whoseexpression varied at least fourfold from the mean abundance in atleast four samples in all 18 stromal cell cultures. [Color figure can beviewed in the online issue, which is available at www.interscience.wiley.com.]
TABLE 2. Genes differentially expressed in BPH compared to TZstromal cells identified by SAM
SymbolFold
changeSAMrank GO annotation
Downregulated in BPHSULF1 À3.8 1 ApoptosisTGFB2 À4.2 2 Cell proliferation/cell cycleLASS6 À5.0 3 Regulation of transcription
Upregulated in BPHS100A4 10.8 1 Calcium ion binding
TOX 34.2 2 Regulation of transcriptionBUB1 19.7 3 Cell cycle/cell proliferationCLDN23 6.0 7 Cell–cell adhesionOAS2 6.7 8 Immune responseIF 5.4 9 Immune responseGBP2 15.3 11 Immune responseDNAJC4 3.0 12 Protein folding GLI3 45.8 13 Regulation of transcription/
signal transductionSOX12 3.6 14 RNA polymerase II tran-
scription factor activity AIM1 6.6 15 Sugar binding DKFZP586A0522 5.0 16 Methyltransferase activityS100A10 4.9 17 Calcium ion binding PLGL 5.8 19 Plasmin activityPLEKHC1 3.2 20 Cell adhesionRPS6KL1 3.2 22 S tructural constituent of
ribosomeTEAD3 2.8 25 Regulation of transcriptionBST1 2.8 28 Humoral immune response
114 ZHAO ET AL.
Journal of Cellular Physiology DOI 10.1002/jcp
7/31/2019 Zhao' 07
http://slidepdf.com/reader/full/zhao-07 5/11
expressed between PZ and CA stromal cells with a falsepositive rate of 12%, all of which were overexpressed inCA compared to PZ cells. Sixty-eight genes that havebiological annotations are listed in Table 4. The falsepositive rates of SAM analysis were relatively high,possibly due to the small sample sizes.
Validation of microarray data by qRT-PCR
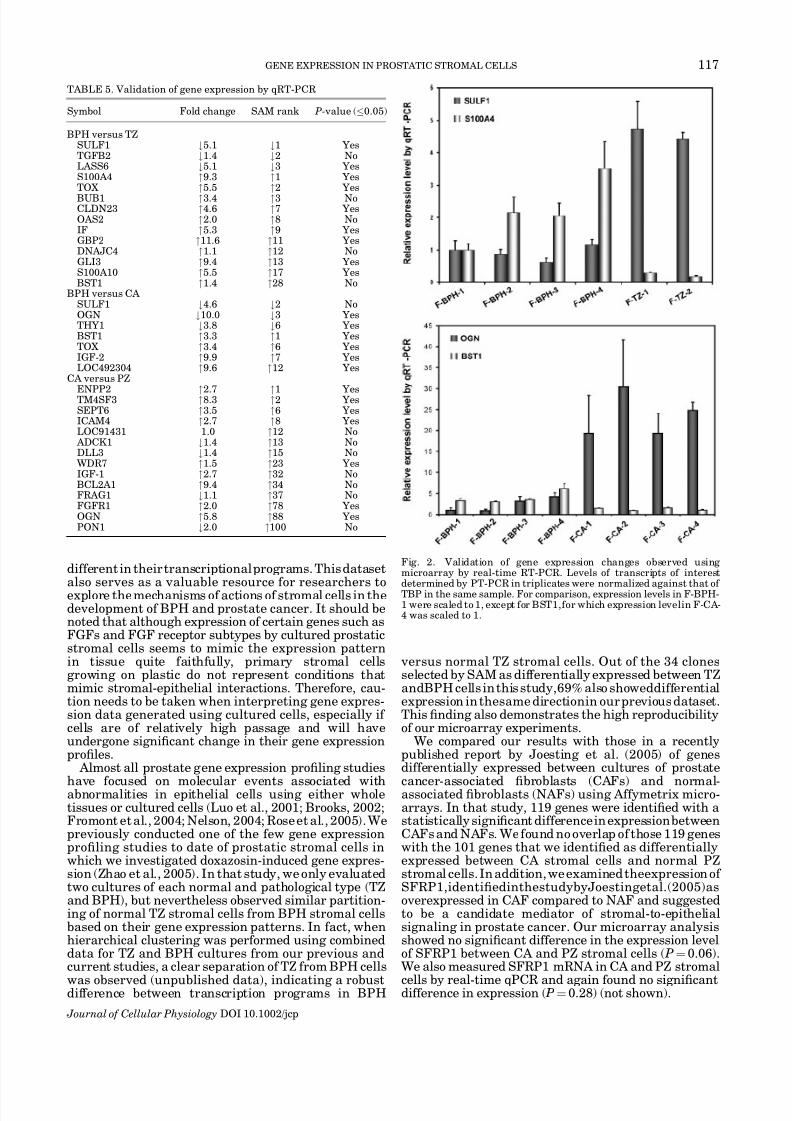
To confirm the gene expression changes observed bymicroarray analysis, real-time RT-PCR was performedon selected genes identified by SAM analysis. We testeda total of 35 genes (14 for BPH vs. TZ, 7 for BPH vs. CA,and 14 for CA vs. PZ) using qRT-PCR, and determinedthe significance of differential expression by t-test(Table 5). We chose these genes because their knownbiological functions indicate that they may play a role inprostate pathogenesis. Nine of 14 genes (64%) werevalidatedfortheBPHversusTZcomparison,6of7genes(86%) for BPH versusCA, and 7 of 14genes (50%) for CA versus PZ. As an example, relative expression levels of SULF1 and S100A4, the most under- and overexpressedgenes in BPH versus TZ cells, respectively, are shown inFigure 2. Expression of the top most differentially
expressed genes in CA cells versus BPH cells, BST1and OGN, were also confirmed (Fig. 2). These results
demonstrated that the gene expression differencesdiscovered by microarray analysis are reliable, espe-cially for BPH versus TZ and BPH versus CA. Thedisagreement between qPCR and microarray data maybe, in part, due to the differences in statistical methods(SAM vs. t-test).
SULF1 and S100A4 proteins are differentially
expressed in BPH and TZ cellsSULF1 and S100A4 were the most under- or over-
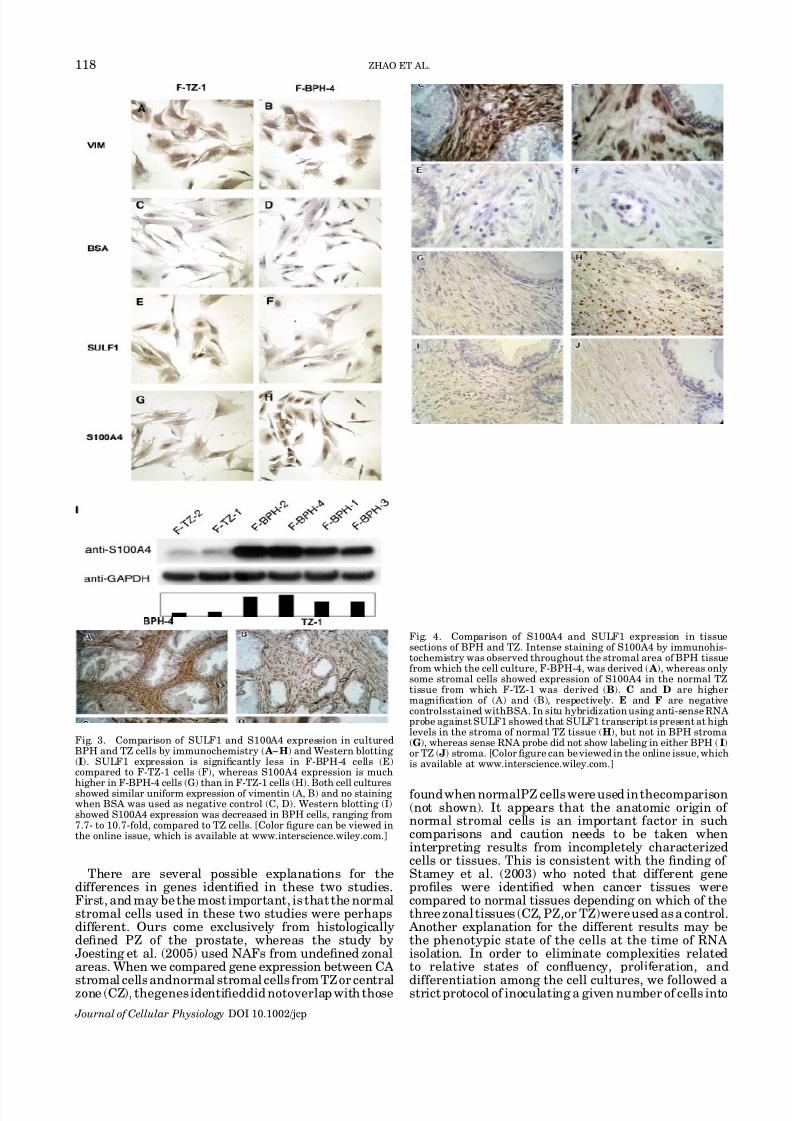
expressed genes in BPH compared to TZ cells, respec-tively, and have biological functions that indicate apossible role in disease development. To determinewhether SULF1 and S100A4 were differentiallyexpressed at the protein level, we performed immuno-chemistry on cultured BPH and TZ stromal cells. Asshown in Figure 3, SULF1 expression was significantlyless in F-BPH-4 compared to F-TZ-1 cells (Fig. 3E,F),whereas S100A4 expression was much higher in F-BPH-4 than in F-TZ-1 cells (Fig. 3G,H). Both cellcultures showed similar uniform expression of vimentin(Fig. 3A,B) and no staining when bovine serum albumin(BSA) was used as negative control (Fig. 3C,D). Theseresultsdemonstrated that cultured BPH andTZ stromalcells differentially expressed these two genes not only atthe transcript level, but also at the protein level.
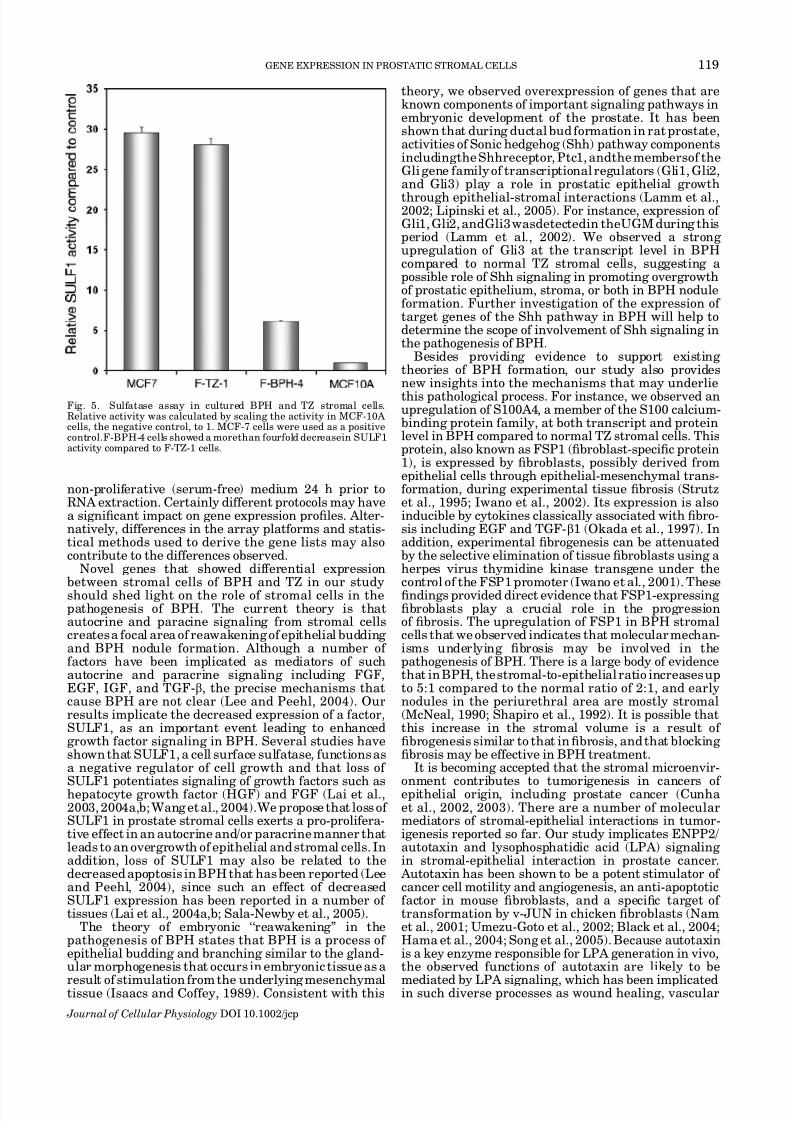
Western blotting was performed to quantify thedifferences in S100A4 protein expression betweencultured BPH and TZ stromal cells (Fig. 3I). A uniformupregulation of S100A4 protein expression in BPH cellswas observed, ranging from 7.7- to 10.7-fold, comparedto that in TZ cells. Moreover, protein expression of S100A4 was also increased in the stroma of BPHtissue (Fig. 4). Immunohistochemistry using paraffin-embedded tissue sections revealed intense staining of S100A4 throughout the stroma in the tissue of origin of F-BPH-4 cells (Fig. 4A,C), whereas only some stromalcells showed expression of S100A4 in tissue from whichF-TZ-1 cells were cultured (Fig. 4B,D). These resultsshowed that stromal cells cultured from BPH faithfullyretained the high level of expression of S100A4 that waspresent in the tissue of origin.
Expression of SULF1 transcripts in tissue sectionswere examined by in situ hybridization since antibodyagainst SULF1 protein did not work on paraffin-embedded tissues. TZ stroma displayed strong expres-sion of SULF1 shown by anti-sense RNA probe staining (Fig. 4H), whereas little expression of SULF1 wasdetected in BPH stroma hybridized with the same probe(Fig.4G).NostainingwasobservedinthestromaofBPH(Fig. 4I) or TZ (Fig. 4J) tissue when sense RNA probewas used. These results confirmed our findings from
microarray and real-time qPCR analyses and show thatSULF1 is downregulated in BPH tissue as well as instromal cells cultured from BPH.
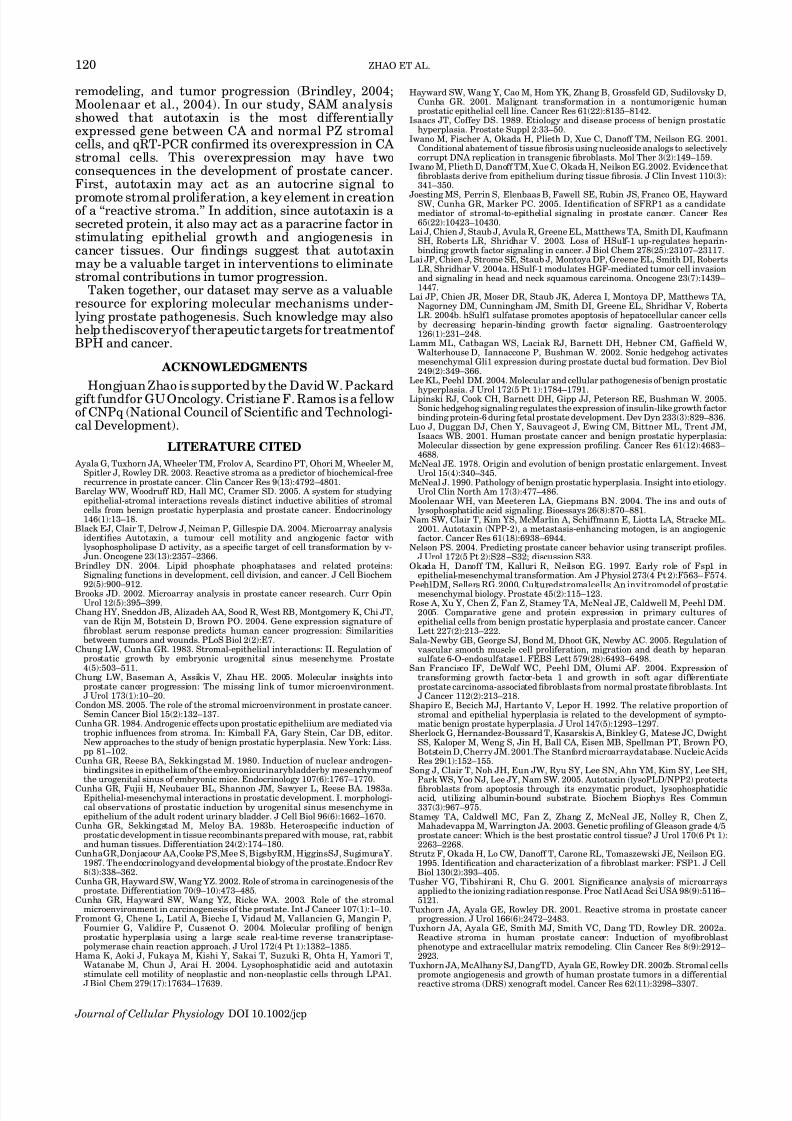
SULF1 enzymatic activity isdownregulated in BPH cells
To evaluate SULF1 protein activity in BPH and TZstromal cells, we performed a functional assay todetermine the enzymatic activity of SULF1 in wholecell lysates. The relative activity of SULF1 in TZ andBPH cells was calculated by normalization to theactivity in the negative control, MCF-10A cells, in whichno SULF1 transcript is detectable. MCF-7 cells, pre-viously shown to possessSULF1 activity, were used as apositive control. A more than fourfold decrease in
SULF1 activity wasobservedin F-BPH-4 cells comparedto F-TZ-1 cells (Fig. 5), consistent with the decrease in
TABLE 3. Genes differentially expressed in BPH compared to CA stromal cells identified by SAM
SymbolFold
changeSAMrank GO annotation
Upregulated in CA BACE2 5.0 1 Peptide hormone processing SULF1 4.4 2 ApoptosisOGN 7.1 3 Growth factor activity
MGP 2.3 4 Cell differentiationDOCK10 4.4 5 Guanyl-nucleotide exchange
factor activityTHY1 3.4 6 Cell surface antigen
Upregulated in BPHBST1 4.2 1 Humoral immune response
ARHGAP28 3.8 2 Viral releaseOLR1 2.3 3 Proteolysis and peptidolysisCOL4A5 5.0 4 Extracellular matrix structural
constituentTOX 5.0 6 Regulation of transcriptionIGF-2 10.2 7 Cell proliferation/regulation of
cell cycleSLC6A6 6.1 8 Taurine:sodium s ymporter activityTEK 6.4 9 Cell –cell signaling/signal trans-
ductionKMO 2.5 10 Electron transportC11orf30 2.0 11 DN A repair/regulation of tran-
scriptionLOC492304 6.7 12 Insulin-like growth factor binding TBL1X 2.5 14 Regulation of transcriptionCHN1 3.7 15 GTPase activator activitySLC4A4 5.7 16 Sodium:bicarbonate symporter
activityMFHAS1 2.3 17 S mall GTPase mediated signal
transductionTERF1 2.0 18 Cell cycle/regulation of
transcriptionFARP1 2.1 19 Rho guanyl-nucleotide exchange
factor activityMPP3 3.5 20 Guanylate kinase activity/signal
transduction VAMP5 2.8 21 Cell differentiation/
vesicle-mediated transportSSH2 2.2 22 Protein amino acid
dephosphorylationGTF2E1 1.9 24 Regulation of transcription
SIPA1L2 2.6 27 GTPase activator activityNRG2 6.4 28 Anti-apoptosis/cell – cell signaling MYO6 2.0 29 ATPase activity/structural
constituent of muscle
GENE EXPRESSION IN PROSTATIC STROMAL CELLS 115
Journal of Cellular Physiology DOI 10.1002/jcp
7/31/2019 Zhao' 07
http://slidepdf.com/reader/full/zhao-07 6/11
SULF1 transcript inF-BPH-4 cells shown by microarrayandqRT-PCR. These results demonstrate that SULF1 isdownregulated in BPH cells at both transcript andprotein function levels.
DISCUSSION
Prostatic stromal cells cultured from tissues of different histological and pathological origins displayed
distinct gene expression profiles. Many of the differen-tially expressed genes are involved in biological pro-
cesses known to be important in the development of prostatic diseases including regulation of cell prolifera-tion andapoptosis, cell adhesion, and immune response.SAM analysis identified genes that showed differentialexpression with statistical significance between twoclasses of samples with relevant histopathology. Ourresults provide a comprehensive evaluation of the geneexpression profiles of cultured prostatic stromal cells,
and support the hypothesis that prostatic stromal cellsof different histological/pathological origins are indeed
TABLE 4. Genes upregulated in CA compared to PZ stromal cells identified by SAM
Symbol Fold change SAM rank GO annotation
ENPP2 7.4 1 Chemotaxis/transcription factor binding TM4SF3 3.6 2 Signal transducer activitySEPT6 3.7 6 Cell cycleICAM4 2.3 8 Cell–cell adhesionLOC91431 1.8 12 Zinc ion binding
ADCK1 2.4 13 Protein amino acid phosphorylation
DLL3 3.3 15 Cell fate determinationCMRF35 2.9 16 Cellular defense responseP2RY1 1.8 18 G-protein signaling LRRC7 2.0 19 Protein binding DYRK2 1.9 21 Protein amino acid phosphorylationLOC400713 1.9 22 Regulation of transcription
WDR7 2.2 23 Cell cycle/apoptosisNAGA 2.9 25 Carbohydrate metabolismNF1 2.3 27 Ras protein signal transduction/cell cycleC16orf34 2.4 28 Regulation of transcriptionHSPD1 2.0 29 Response to unfolded proteinMICAL2 2.3 30 Electron transportC6orf68 2.4 31 Metabolism|transferase activityIGF-1 1.9 32 Positive regulation of cell proliferationBCL2A1 2.5 34 Anti-apoptosisCRY1 2.1 36 DNA repair/G-protein coupled photoreceptor activityFRAG1 1.6 37 Receptor activityNISCH 1.7 38 Intracellular signaling cascade
FBXW8 2.1 39 Ubiquitin cycleTRIM33 1.7 40 Regulation of transcription/ubiquitin-protein ligase activityPDE3B 2.0 41 Signal transductionLMO2 4.4 42 Zinc ion binding SLC5A8 1.8 45 Transporter activityUGT2B7 4.2 49 Lipid metabolismMCM5 2.6 51 Regulation of cell cycle/regulation of transcriptionTAC1 2.7 52 Cell–cell signaling SPRY3 2.0 54 Regulation of signal transductionLTB4R 1.8 55 Inflammatory response/signal transductionPKIB 3.7 56 cAMP-dependent protein kinase inhibitor activityKCTD13 1.8 59 Voltage-gated potassium channel activity
ATF6 1.8 64 Regulation of transcription/signal transductionEBF 1.9 65 Regulation of transcriptionMARCH-I 2.2 66 Protein ubiquitinationPANX2 1.7 67 Gap junctionFLJ22405 2.2 68 Protein amino acid dephosphorylationLGR4 1.9 69 G-protein coupled receptor protein signaling pathway
XAB1 2.3 71 Small GTPase mediated signal transduction
CA12 2.7 72 One-carbon compound metabolismMUC5B 1.9 74 Cell adhesionRERG 1.9 75 Cell proliferation/signal transductionLOC126295 1.7 76 Regulation of transcriptionGATA6 3.7 77 Regulation of transcriptionFGFR1 1.9 78 Cell growth/FGF receptor signaling pathway
ARGBP2 2.1 79 Structural constituent of muscleERBB2 1.8 81 Cell proliferationCOL4A2 1.9 83 Cell adhesionNUP160 2.0 84 mRNA-nucleus exportLIMS3 3.2 85 Zinc ion binding
AKR1B10 2.1 86 Aldehyde metabolism/electron transporterOGN 1.9 88 Growth factor activityNRK 1.9 89 Small GTPase regulator activityRPL27A 1.8 91 Structural constituent of ribosomeTRPM3 1.7 92 Calcium ion transportDCAMKL1 5.8 93 Cell differentiationKCNIP4 1.7 94 Calcium ion binding
KCNC4 3.8 95 Cation transportIGSF10 1.9 97 Vascular endothelial growth factor receptor activityGSTZ1 1.8 98 Tyrosine catabolismZNF367 2.1 99 Nucleic acid binding PON1 5.8 100 Aryldialkylphosphatase activityHSPB6 3.0 101 Response to unfolded protein
116 ZHAO ET AL.
Journal of Cellular Physiology DOI 10.1002/jcp
7/31/2019 Zhao' 07
http://slidepdf.com/reader/full/zhao-07 7/11
different in theirtranscriptional programs. This datasetalso serves as a valuable resource for researchers toexplore the mechanisms of actions of stromal cells in thedevelopment of BPH and prostate cancer. It should benoted that although expression of certain genes such asFGFs and FGF receptor subtypes by cultured prostaticstromal cells seems to mimic the expression patternin tissue quite faithfully, primary stromal cellsgrowing on plastic do not represent conditions thatmimic stromal-epithelial interactions. Therefore, cau-tion needs to be taken when interpreting gene expres-sion data generated using cultured cells, especially if cells are of relatively high passage and will haveundergone significant change in their gene expressionprofiles.
Almost all prostate gene expression profiling studies
have focused on molecular events associated withabnormalities in epithelial cells using either wholetissues or cultured cells (Luo et al., 2001; Brooks, 2002;Fromont et al., 2004; Nelson, 2004; Rose et al., 2005). Wepreviously conducted one of the few gene expressionprofiling studies to date of prostatic stromal cells inwhich we investigated doxazosin-induced gene expres-sion (Zhao et al., 2005). In that study, we only evaluatedtwo cultures of each normal and pathological type (TZand BPH), but nevertheless observed similar partition-ing of normal TZ stromal cells from BPH stromal cellsbased on their gene expression patterns. In fact, whenhierarchical clustering was performed using combineddata for TZ and BPH cultures from our previous andcurrent studies, a clear separation of TZ from BPH cells
was observed (unpublished data), indicating a robustdifference between transcription programs in BPH
versus normal TZ stromal cells. Out of the 34 clonesselected by SAM as differentially expressed between TZandBPH cells in this study,69% also showeddifferentialexpression in thesame directionin our previous dataset.This finding also demonstrates the high reproducibilityof our microarray experiments.
We compared our results with those in a recentlypublished report by Joesting et al. (2005) of genesdifferentially expressed between cultures of prostate
cancer-associated fibroblasts (CAFs) and normal-associated fibroblasts (NAFs) using Affymetrix micro-arrays. In that study, 119 genes were identified with astatistically significant differencein expression betweenCAFs and NAFs. We found no overlap of those 119 geneswith the 101 genes that we identified as differentiallyexpressed between CA stromal cells and normal PZstromal cells. In addition, we examined theexpression of SFRP1,identifiedinthestudybyJoestingetal.(2005)asoverexpressed in CAF compared to NAF and suggestedto be a candidate mediator of stromal-to-epithelialsignaling in prostate cancer. Our microarray analysisshowed no significant difference in the expression levelof SFRP1 between CA and PZ stromal cells ( P¼0.06).
We also measured SFRP1 mRNA in CA and PZ stromal
cells by real-time qPCR and again found no significantdifference in expression ( P¼0.28) (not shown).
TABLE 5. Validation of gene expression by qRT-PCR
Symbol Fold change SAM rank P-value (0.05)
BPH versus TZSULF1 #5.1 #1 YesTGFB2 #1.4 #2 NoLASS6 #5.1 #3 YesS100A4 "9.3 "1 YesTOX "5.5 "2 Yes
BUB1 "3.4 "3 NoCLDN23 "4.6 "7 YesOAS2 "2.0 "8 NoIF "5.3 "9 YesGBP2 "11.6 "11 YesDNAJC4 "1.1 "12 NoGLI3 "9.4 "13 YesS100A10 "5.5 "17 YesBST1 "1.4 "28 No
BPH versus CA SULF1 #4.6 #2 NoOGN #10.0 #3 YesTHY1 #3.8 #6 YesBST1 "3.3 "1 YesTOX "3.4 "6 YesIGF-2 "9.9 "7 YesLOC492304 "9.6 "12 Yes
CA versus PZ
ENPP2 "2.7 "1 YesTM4SF3 "8.3 "2 YesSEPT6 "3.5 "6 YesICAM4 "2.7 "8 YesLOC91431 1.0 "12 No
ADCK1 #1.4 "13 NoDLL3 #1.4 "15 No
WDR7 "1.5 "23 YesIGF-1 "2.7 "32 NoBCL2A1 "9.4 "34 NoFRAG1 #1.1 "37 NoFGFR1 "2.0 "78 YesOGN "5.8 "88 YesPON1 #2.0 "100 No
Fig. 2. Validation of gene expression changes observed using microarray by real-time RT-PCR. Levels of transcripts of interestdetermined by PT-PCR in triplicates were normalized against that of TBP in the same sample. For comparison, expression levels in F-BPH-1 were scaled to 1, except for BST1,for which expression levelin F-CA-4 was scaled to 1.
GENE EXPRESSION IN PROSTATIC STROMAL CELLS 117
Journal of Cellular Physiology DOI 10.1002/jcp
7/31/2019 Zhao' 07
http://slidepdf.com/reader/full/zhao-07 8/11
There are several possible explanations for thedifferences in genes identified in these two studies.First, and may be the most important, is that the normalstromal cells used in these two studies were perhapsdifferent. Ours come exclusively from histologicallydefined PZ of the prostate, whereas the study by
Joesting et al. (2005) used NAFs from undefined zonalareas. When we compared gene expression between CA
stromal cells andnormal stromal cells from TZ or centralzone (CZ), thegenes identifieddid notoverlap with those
found when normalPZ cells were used in thecomparison(not shown). It appears that the anatomic origin of normal stromal cells is an important factor in suchcomparisons and caution needs to be taken wheninterpreting results from incompletely characterizedcells or tissues. This is consistent with the finding of Stamey et al. (2003) who noted that different geneprofiles were identified when cancer tissues werecompared to normal tissues depending on which of thethree zonal tissues (CZ, PZ,or TZ)were used as a control.
Another explanation for the different results may bethe phenotypic state of the cells at the time of RNA isolation. In order to eliminate complexities relatedto relative states of confluency, proliferation, and
differentiation among the cell cultures, we followed astrict protocol of inoculating a given number of cells into
Fig. 3. Comparison of SULF1 and S100A4 expression in culturedBPH and TZ cells by immunochemistry ( A– H) and Western blotting (I). SULF1 expression is significantly less in F-BPH-4 cells (E)compared to F-TZ-1 cells (F), whereas S100A4 expression is much
higher in F-BPH-4 cells (G) than in F-TZ-1 cells (H). Both cell culturesshowed similar uniform expression of vimentin (A, B) and no staining when BSA was used as negative control (C, D). Western blotting (I)showed S100A4 expression was decreased in BPH cells, ranging from7.7- to 10.7-fold, compared to TZ cells. [Color figure can be viewed inthe online issue, which is available at www.interscience.wiley.com.]
Fig. 4. Comparison of S100A4 and SULF1 expression in tissuesections of BPH and TZ. Intense staining of S100A4 by immunohis-tochemistry was observed throughout the stromal area of BPH tissuefrom which the cell culture, F-BPH-4, was derived ( A), whereas onlysome stromal cells showed expression of S100A4 in the normal TZtissue from which F-TZ-1 was derived (B). C and D are highermagnification of (A) and (B), respectively. E and F are negativecontrolsstained withBSA. In situ hybridization using anti-sense RNA probe against SULF1 showed that SULF1 transcript is present at highlevels in the stroma of normal TZ tissue (H), but not in BPH stroma(G), whereas sense RNA probe did not show labeling in either BPH ( I)or TZ (J) stroma. [Color figure can be viewed in the online issue, whichis available at www.interscience.wiley.com.]
118 ZHAO ET AL.
Journal of Cellular Physiology DOI 10.1002/jcp
7/31/2019 Zhao' 07
http://slidepdf.com/reader/full/zhao-07 9/11
non-proliferative (serum-free) medium 24 h prior toRNA extraction. Certainly different protocols may havea significant impact on gene expression profiles. Alter-natively, differences in the array platforms and statis-tical methods used to derive the gene lists may alsocontribute to the differences observed.
Novel genes that showed differential expressionbetween stromal cells of BPH and TZ in our studyshould shed light on the role of stromal cells in thepathogenesis of BPH. The current theory is thatautocrine and paracine signaling from stromal cellscreates a focal area of reawakening of epithelial budding and BPH nodule formation. Although a number of factors have been implicated as mediators of suchautocrine and paracrine signaling including FGF,EGF, IGF, and TGF-b, the precise mechanisms thatcause BPH are not clear (Lee and Peehl, 2004). Ourresults implicate the decreased expression of a factor,SULF1, as an important event leading to enhancedgrowth factor signaling in BPH. Several studies haveshown that SULF1, a cell surface sulfatase, functions asa negative regulator of cell growth and that loss of
SULF1 potentiates signaling of growth factors such ashepatocyte growth factor (HGF) and FGF (Lai et al.,2003, 2004a,b; Wang et al., 2004).We propose that loss of SULF1 in prostate stromal cells exerts a pro-prolifera-tive effect in an autocrine and/or paracrine manner thatleads to an overgrowth of epithelial and stromal cells. Inaddition, loss of SULF1 may also be related to thedecreased apoptosis in BPH that has been reported (Leeand Peehl, 2004), since such an effect of decreasedSULF1 expression has been reported in a number of tissues (Lai et al., 2004a,b; Sala-Newby et al., 2005).
The theory of embryonic ‘‘reawakening’’ in thepathogenesis of BPH states that BPH is a process of epithelial budding and branching similar to the gland-ular morphogenesis that occurs in embryonic tissue as a
result of stimulation from the underlying mesenchymaltissue (Isaacs and Coffey, 1989). Consistent with this
theory, we observed overexpression of genes that areknown components of important signaling pathways inembryonic development of the prostate. It has beenshown that during ductal bud formation in rat prostate,activities of Sonic hedgehog (Shh) pathway componentsincludingthe Shhreceptor, Ptc1, andthe membersof theGli gene family of transcriptional regulators (Gli1, Gli2,and Gli3) play a role in prostatic epithelial growth
through epithelial-stromal interactions (Lamm et al.,2002; Lipinski et al., 2005). For instance, expression of Gli1, Gli2, andGli3 wasdetectedin theUGM during thisperiod (Lamm et al., 2002). We observed a strong upregulation of Gli3 at the transcript level in BPHcompared to normal TZ stromal cells, suggesting apossible role of Shh signaling in promoting overgrowthof prostatic epithelium, stroma, or both in BPH noduleformation. Further investigation of the expression of target genes of the Shh pathway in BPH will help todetermine the scope of involvement of Shh signaling inthe pathogenesis of BPH.
Besides providing evidence to support existing theories of BPH formation, our study also providesnew insights into the mechanisms that may underliethis pathological process. For instance, we observed anupregulation of S100A4, a member of the S100 calcium-binding protein family, at both transcript and proteinlevel in BPH compared to normal TZ stromal cells. Thisprotein, also known as FSP1 (fibroblast-specific protein1), is expressed by fibroblasts, possibly derived fromepithelial cells through epithelial-mesenchymal trans-formation, during experimental tissue fibrosis (Strutzet al., 1995; Iwano et al., 2002). Its expression is alsoinducible by cytokines classically associated with fibro-sis including EGF and TGF-b1 (Okada et al., 1997). Inaddition, experimental fibrogenesis can be attenuatedby the selective elimination of tissue fibroblasts using aherpes virus thymidine kinase transgene under thecontrol of the FSP1 promoter (Iwano et al., 2001). Thesefindings provided direct evidence that FSP1-expressing fibroblasts play a crucial role in the progressionof fibrosis. The upregulation of FSP1 in BPH stromalcells that we observed indicates that molecular mechan-isms underlying fibrosis may be involved in thepathogenesis of BPH. There is a large body of evidencethat in BPH, the stromal-to-epithelial ratio increases upto 5:1 compared to the normal ratio of 2:1, and earlynodules in the periurethral area are mostly stromal(McNeal, 1990; Shapiro et al., 1992). It is possible thatthis increase in the stromal volume is a result of fibrogenesis similar to that in fibrosis, and that blocking fibrosis may be effective in BPH treatment.
It is becoming accepted that the stromal microenvir-
onment contributes to tumorigenesis in cancers of epithelial origin, including prostate cancer (Cunhaet al., 2002, 2003). There are a number of molecularmediators of stromal-epithelial interactions in tumor-igenesis reported so far. Our study implicates ENPP2/ autotaxin and lysophosphatidic acid (LPA) signaling in stromal-epithelial interaction in prostate cancer.
Autotaxin has been shown to be a potent stimulator of cancer cell motility and angiogenesis, an anti-apoptoticfactor in mouse fibroblasts, and a specific target of transformation by v-JUN in chicken fibroblasts (Namet al., 2001; Umezu-Goto et al., 2002; Black et al., 2004;Hama et al., 2004; Song et al., 2005). Because autotaxinis a key enzyme responsible for LPA generation in vivo,the observed functions of autotaxin are likely to be
mediated by LPA signaling, which has been implicatedin such diverse processes as wound healing, vascular
Fig. 5. Sulfatase assay in cultured BPH and TZ stromal cells.Relative activity was calculated by scaling the activity in MCF-10A cells, the negative control, to 1. MCF-7 cells were used as a positivecontrol.F-BPH-4 cells showed a morethan fourfold decreasein SULF1activity compared to F-TZ-1 cells.
GENE EXPRESSION IN PROSTATIC STROMAL CELLS 119
Journal of Cellular Physiology DOI 10.1002/jcp
7/31/2019 Zhao' 07
http://slidepdf.com/reader/full/zhao-07 10/11
remodeling, and tumor progression (Brindley, 2004;Moolenaar et al., 2004). In our study, SAM analysisshowed that autotaxin is the most differentiallyexpressed gene between CA and normal PZ stromalcells, and qRT-PCR confirmed its overexpression in CA stromal cells. This overexpression may have twoconsequences in the development of prostate cancer.First, autotaxin may act as an autocrine signal to
promote stromal proliferation, a key element in creationof a ‘‘reactive stroma.’’ In addition, since autotaxin is asecreted protein, it also may act as a paracrine factor instimulating epithelial growth and angiogenesis incancer tissues. Our findings suggest that autotaxinmay be a valuable target in interventions to eliminatestromal contributions in tumor progression.
Taken together, our dataset may serve as a valuableresource for exploring molecular mechanisms under-lying prostate pathogenesis. Such knowledge may alsohelp thediscoveryof therapeutic targets for treatmentof BPH and cancer.
ACKNOWLEDGMENTS
Hongjuan Zhao is supported by the David W. Packardgift fundfor GU Oncology. Cristiane F. Ramos is a fellowof CNPq (National Council of Scientific and Technologi-cal Development).
LITERATURE CITED
Ayala G, Tuxhorn JA, Wheeler TM, Frolov A, Scardino PT, Ohori M, Wheeler M,Spitler J, Rowley DR. 2003. Reactive stroma as a predictor of biochemical-freerecurrence in prostate cancer. Clin Cancer Res 9(13):4792–4801.
Barclay WW, Woodruff RD, Hall MC, Cramer SD. 2005. A system for studying epithelial-stromal interactions reveals distinct inductive abilities of stromalcells from benign prostatic hyperplasia and prostate cancer. Endocrinology146(1):13–18.
Black EJ, Clair T, Delrow J, Neiman P, Gillespie DA. 2004. Microarray analysisidentifies Autotaxin, a tumour cell motility and angiogenic factor withlysophospholipase D activity, as a specific target of cell transformation by v- Jun. Oncogene 23(13):2357–2366.
Brindley DN. 2004. Lipid phosphate phosphatases and related proteins:Signaling functions in development, cell division, and cancer. J Cell Biochem92(5):900–912.
Brooks JD. 2002. Microarray analysis in prostate cancer research. Curr OpinUrol 12(5):395–399.
Chang HY, Sneddon JB, Alizadeh AA, Sood R, West RB, Montgomery K, Chi JT,van de Rijn M, Botstein D, Brown PO. 2004. Gene expression signature of fibroblast serum response predicts human cancer progression: Similaritiesbetween tumors and wounds. PLoS Biol 2(2):E7.
Chung LW, Cunha GR. 1983. Stromal-epithelial interactions: II. Regulation of prostatic growth by embryonic urogenital sinus mesenchyme. Prostate4(5):503–511.
Chung LW, Baseman A, Assikis V, Zhau HE. 2005. Molecular insights intoprostate cancer progression: The missing link of tumor microenvironment. J Urol 173(1):10–20.
Condon MS. 2005. The role of the stromal microenvironment in prostate cancer.Semin Cancer Biol 15(2):132–137.
Cunha GR. 1984. Androgenic effects upon prostatic epitheliium are mediated viatrophic influences from stroma. In: Kimball FA, Gary Stein, Car DB, editor.New approaches to the study of benign prostatic hyperplasia. New York: Liss.pp 81–102.
Cunha GR, Reese BA, Sekkingstad M. 1980. Induction of nuclear androgen-bindingsites in epithelium of the embryonicurinarybladderby mesenchymeof the urogenital sinus of embryonic mice. Endocrinology 107(6):1767–1770.
Cunha GR, Fujii H, Neubauer BL, Shannon JM, Sawyer L, Reese BA. 1983a.Epithelial-mesenchymal interactions in prostatic development. I. morphologi-cal observations of prostatic induction by urogenital sinus mesenchyme inepithelium of the adult rodent urinary bladder. J Cell Biol 96(6):1662–1670.
Cunha GR, Sekkingstad M, Meloy BA. 1983b. Heterospecific induction of prostatic development in tissue recombinants prepared with mouse, rat, rabbitand human tissues. Differentiation 24(2):174–180.
CunhaGR,Donjacour AA,Cooke PS,Mee S, BigsbyRM, HigginsSJ, SugimuraY.1987. The endocrinologyand developmental biology of the prostate.Endocr Rev8(3):338–362.
Cunha GR, Hayward SW, Wang YZ. 2002. Role of stroma in carcinogenesis of theprostate. Differentiation 70(9–10):473–485.
Cunha GR, Hayward SW, Wang YZ, Ricke WA. 2003. Role of the stromalmicroenvironment in carcinogenesis of the prostate. Int J Cancer 107(1):1–10.
Fromont G, Chene L, Latil A, Bieche I, Vidaud M, Vallancien G, Mangin P,Fournier G, Validire P, Cussenot O. 2004. Molecular profiling of benignprostatic hyperplasia using a large scale real-time reverse transcriptase-polymerase chain reaction approach. J Urol 172(4 Pt 1):1382–1385.
Hama K, Aoki J, Fukaya M, Kishi Y, Sakai T, Suzuki R, Ohta H, Yamori T, Watanabe M, Chun J, Arai H. 2004. Lysophosphatidic acid and autotaxinstimulate cell motility of neoplastic and non-neoplastic cells through LPA1.
J Biol Chem 279(17):17634–17639.
Hayward SW, Wang Y, Cao M, Hom YK, Zhang B, Grossfeld GD, Sudilovsky D,Cunha GR. 2001. Malignant transformation in a nontumorigenic humanprostatic epithelial cell line. Cancer Res 61(22):8135–8142.
Isaacs JT, Coffey DS. 1989. Etiology and disease process of benign prostatichyperplasia. Prostate Suppl 2:33–50.
Iwano M, Fischer A, Okada H, Plieth D, Xue C, Danoff TM, Neilson EG. 2001.Conditional abatement of tissue fibrosis using nucleoside analogs to selectivelycorrupt DNA replication in transgenic fibroblasts. Mol Ther 3(2):149–159.
Iwano M, Plieth D, Danoff TM, Xue C, Okada H, Neilson EG.2002. Evidence thatfibroblasts derive from epithelium during tissue fibrosis. J Clin Invest 110(3):341–350.
Joesting MS, Perrin S, Elenbaas B, Fawell SE, Rubin JS, Franco OE, HaywardSW, Cunha GR, Marker PC. 2005. Identification of SFRP1 as a candidatemediator of stromal-to-epithelial signaling in prostate cancer. Cancer Res65(22):10423–10430.
Lai J, Chien J, Staub J, Avula R, Greene EL, Matthews TA, Smith DI, KaufmannSH, Roberts LR, Shridhar V. 2003. Loss of HSulf-1 up-regulates heparin-binding growth factor signaling in cancer. J Biol Chem 278(25):23107–23117.
Lai JP, Chien J, Strome SE, Staub J, Montoya DP, Greene EL, Smith DI, RobertsLR, Shridhar V. 2004a. HSulf-1 modulates HGF-mediated tumor cell invasionand signaling in head and neck squamous carcinoma. Oncogene 23(7):1439– 1447.
Lai JP, Chien JR, Moser DR, Staub JK, Aderca I, Montoya DP, Matthews TA,Nagorney DM, Cunningham JM, Smith DI, Greene EL, Shridhar V, RobertsLR. 2004b. hSulf1 sulfatase promotes apoptosis of hepatocellular cancer cellsby decreasing heparin-binding growth factor signaling. Gastroenterology126(1):231–248.
Lamm ML, Catbagan WS, Laciak RJ, Barnett DH, Hebner CM, Gaffield W, Walterhouse D, Iannaccone P, Bushman W. 2002. Sonic hedgehog activatesmesenchymal Gli1 expression during prostate ductal bud formation. Dev Biol249(2):349–366.
Lee KL, Peehl DM. 2004. Molecular and cellular pathogenesis of benign prostatic
hyperplasia. J Urol 172(5 Pt 1):1784–1791.Lipinski RJ, Cook CH, Barnett DH, Gipp JJ, Peterson RE, Bushman W. 2005.Sonic hedgehog signaling regulates the expression of insulin-like growth factorbinding protein-6 during fetal prostate development. Dev Dyn 233(3):829–836.
Luo J, Duggan DJ, Chen Y, Sauvageot J, Ewing CM, Bittner ML, Trent JM,Isaacs WB. 2001. Human prostate cancer and benign prostatic hyperplasia:Molecular dissection by gene expression profiling. Cancer Res 61(12):4683– 4688.
McNeal JE. 1978. Origin and evolution of benign prostatic enlargement. InvestUrol 15(4):340–345.
McNeal J. 1990. Pathology of benign prostatic hyperplasia. Insight into etiology.Urol Clin North Am 17(3):477–486.
Moolenaar WH, van Meeteren LA, Giepmans BN. 2004. The ins and outs of lysophosphatidic acid signaling. Bioessays 26(8):870–881.
Nam SW, Clair T, Kim YS, McMarlin A, Schiffmann E, Liotta LA, Stracke ML.2001. Autotaxin (NPP-2), a metastasis-enhancing motogen, is an angiogenicfactor. Cancer Res 61(18):6938–6944.
Nelson PS. 2004. Predicting prostate cancer behavior using transcript profiles. J Urol 172(5 Pt 2):S28 –S32; discussion S33.
Okada H, Danoff TM, Kalluri R, Neilson EG. 1997. Early role of Fsp1 inepithelial-mesenchymal transformation. Am J Physiol 273(4 Pt 2):F563– F574.
PeehlDM, Sellers RG.2000. Culturedstromalcells: An invitromodel of prostaticmesenchymal biology. Prostate 45(2):115–123.
Rose A, Xu Y, Chen Z, Fan Z, Stamey TA, McNeal JE, Caldwell M, Peehl DM.2005. Comparative gene and protein expression in primary cultures of epithelial cells from benign prostatic hyperplasia and prostate cancer. CancerLett 227(2):213–222.
Sala-Newby GB, George SJ, Bond M, Dhoot GK, Newby AC. 2005. Regulation of vascular smooth muscle cell proliferation, migration and death by heparansulfate 6-O-endosulfatase1. FEBS Lett 579(28):6493–6498.
San Francisco IF, DeWolf WC, Peehl DM, Olumi AF. 2004. Expression of transforming growth factor-beta 1 and growth in soft agar differentiateprostate carcinoma-associated fibroblasts from normal prostate fibroblasts. Int J Cancer 112(2):213–218.
Shapiro E, Becich MJ, Hartanto V, Lepor H. 1992. The relative proportion of stromal and epithelial hyperplasia is related to the development of sympto-matic benign prostate hyperplasia. J Urol 147(5):1293–1297.
Sherlock G, Hernandez-Boussard T, Kasarskis A, Binkley G, Matese JC, DwightSS, Kaloper M, Weng S, Jin H, Ball CA, Eisen MB, Spellman PT, Brown PO,Botstein D, Cherry JM. 2001.The Stanford microarraydatabase. Nucleic AcidsRes 29(1):152–155.
Song J, Clair T, Noh JH, Eun JW, Ryu SY, Lee SN, Ahn YM, Kim SY, Lee SH,Park WS, Yoo NJ, Lee JY, Nam SW. 2005. Autotaxin (lysoPLD/NPP2) protectsfibroblasts from apoptosis through its enzymatic product, lysophosphatidicacid, utilizing albumin-bound substrate. Biochem Biophys Res Commun337(3):967–975.
Stamey TA, Caldwell MC, Fan Z, Zhang Z, McNeal JE, Nolley R, Chen Z,Mahadevappa M, Warrington JA. 2003. Genetic profiling of Gleason grade 4/5prostate cancer: Which is the best prostatic control tissue? J Urol 170(6 Pt 1):2263–2268.
Strutz F, Okada H, Lo CW, Danoff T, Carone RL, Tomaszewski JE, Neilson EG.1995. Identification and characterization of a fibroblast marker: FSP1. J CellBiol 130(2):393–405.
Tusher VG, Tibshirani R, Chu G. 2001. Significance analysis of microarraysapplied to the ionizing radiation response. Proc Natl Acad Sci USA 98(9):5116– 5121.
Tuxhorn JA, Ayala GE, Rowley DR. 2001. Reactive stroma in prostate cancerprogression. J Urol 166(6):2472–2483.
Tuxhorn JA, Ayala GE, Smith MJ, Smith VC, Dang TD, Rowley DR. 2002a.Reactive stroma in human prostate cancer: Induction of myofibroblastphenotype and extracellular matrix remodeling. Clin Cancer Res 8(9):2912– 2923.
Tuxhorn JA, McAlhany SJ, DangTD, Ayala GE, Rowley DR. 2002b. Stromal cellspromote angiogenesis and growth of human prostate tumors in a differential
reactive stroma (DRS) xenograft model. Cancer Res 62(11):3298–3307.
120 ZHAO ET AL.
Journal of Cellular Physiology DOI 10.1002/jcp

7/31/2019 Zhao' 07
http://slidepdf.com/reader/full/zhao-07 11/11
Umezu-Goto M, Kishi Y, Taira A, Hama K, Dohmae N, Takio K, Yamori T, MillsGB, Inoue K, Aoki J, Arai H. 2002. Autotaxin has lysophospholipase D activityleading to tumor cell growth and motility by lysophosphatidic acid production. J Cell Biol 158(2):227–233.
Wang S, Ai X, Freeman SD, Pownall ME, Lu Q, Kessler DS, Emerson CP, Jr.2004. QSulf1, a heparan sulfate 6-O-endosulfatase, inhibits fibroblast growthfactor signaling in mesoderm induction and angiogenesis. Proc Natl Acad SciUSA 101(14):4833–4838.
West RB, Corless CL, Chen X, Rubin BP, Subramanian S, Montgomery K, Zhu S,Ball CA, Nielsen TO, Patel R, Goldblum JR, Brown PO, Heinrich MC, van deRijn M. 2004. The novel marker, DOG1, is expressed ubiquitously ingastrointestinal stromal tumors irrespective of KIT or PDGFRA mutationstatus. Am J Pathol 165(1):107–113.
Zhao H, Lai F, Nonn L, Brooks JD, Peehl DM. 2005. Moleculartargets of doxazosin in human prostatic stromal cells. Prostate 62(4):400– 410.
GENE EXPRESSION IN PROSTATIC STROMAL CELLS 121
Journal of Cellular Physiology DOI 10.1002/jcp