
Wilde Carlin Geochem Modelling PMD-CRC 2006
39
predictive mineral discovery COOPERATIVE RESEARCH CENTRE Great Basin Mineral Systems Geochemical modelling of Carlin style Au deposit Project G10 Andy Wilde Diagrams showing initial porosity (x axis) versus fluid flow (Kg, y axis) and various parameters.
Transcript of Wilde Carlin Geochem Modelling PMD-CRC 2006
predictive mineral discoveryCOOPERATIVE RESEARCH CENTRE
Great Basin Mineral Systems
Geochemical modelling ofCarlin style Au deposit
Project G10
Andy Wilde
Diagrams showing initial porosity (x axis) versus fluid flow (Kg, y axis) and various parameters.
PROJECT G10: GREAT BASIN MINERAL SYSTEMS
GEOCHEMICAL MODELLING OF CARLIN-STYLE Au DEPOSITS
Andy Wilde
3 June 2006
pmd*CRC Report – Geochemical modeling of Carlin style Au-deposits (Project G10)
1
TABLE OF CONTENTS
KEY FINDINGS 2
INTRODUCTION 3
PUBLISHED GEOCHEMICAL MODELLING 4
COOLING 4
WALL-ROCK REACTION 5
WALL-ROCK REACTION & COOLING 7
MIXING 8
MIXING COMBINED WITH COOLING & FLUID-ROCK REACTION 8
PRESSURE CHANGE AND UNMIXING 9
NEW REACTION PATH MODELLING 10
THERMODYNAMIC DATA 10
CONSTRAINTS ON TEMPERATURE AND PRESSURE 10
CHANGES IN MINERALOGY & BULK COMPOSITION 11
HYDROTHERMAL FLUID COMPOSITION 12
WALLROCK REACTION & THE IMPORTANCE OF ROCKTYPE 15
WALLROCK REACTION WITH COOLING 23
MIXING OF HYDROTHERMAL FLUID AND VARIOUS SURFACE WATERS 26
WHAT CAUSED CALCITE DISSOLUTION? 28
REACTIVE TRANSPORT MODELLING 30
DISCUSSION AND CONCLUSIONS 36
REFERENCES 37
pmd*CRC Report – Geochemical modeling of Carlin style Au-deposits (Project G10)
2
KEY FINDINGS This report presents the results of chemical reaction path and reactive transport modelling of gold depositional processes in Carlin-type gold systems. Key uncertainties include the nature of the gold, hydrothermal fluid compositional range and thermodynamic data for arsenian pyrite. Various depositional scenarios have been modeled by this and by previous studies, including cooling, wall-rock reaction and fluid mixing. The most likely depositional process appears to be wall-rock reaction, namely sulphidation involving iron in the host limestone (a conclusion also reached by previous studies). Neither mixing nor temperature change appear to be significant processes although both might be important in generating quartz-vein hosted deposits. Therefore, most rocks in Nevada could potentially host ore-grade gold (since most contain some iron and buffer redox at below the sulphide-sulphate buffer) provided that the requisite porosity and permeability existed during ore formation. Thus, the behaviour of the host-rocks during deformation could be more important than chemical processes. Carbonate dissolution, however, is a defining characteristic of Carlin-type gold deposits and is generally thought to be a product of acid attack by the same hydrothermal fluid that introduced gold. In this study it is suggested that the dissolution would be countered by precipitation of new phases (e.g. jasperoid & drusy quartz) and that the most probable origin is by meteoric fluid flow, perhaps related to topographic drive from the emerging Ruby Mountains. The interplay of a transient upwards flow of hot hydrothermal fluid and “background” laterally-flowing cool meteoric fluid could explain many other facets of the ore mineralogy. As the hydrothermal pulse becomes dominant, perhaps reflecting a faulting episode, the higher temperature minerals and gold would be deposited. As the pulse wanes mixing with horizontally-flowing cooler fluid would generate assemblages typical of the late stages including orpiment, realgar and barite. Reactive transport modelling should test this proposed scenario and its implications for the distribution of gold and alteration phases. The modelling presented herein has not addressed the origin of the hydrothermal fluid which has a composition substantially out of equilibrium with the host rocks. Advocates of a magmatic origin would argue that the fluid is of magmatic origin, however absence of substantial intrusive bodies of magmatic rock of the appropriate age tends to suggest that this is not the case in many Carlin-type deposits. An alternative is in boiling of a fluid derived by metamorphic devolatilization or deeply circulated fluid due to elevated thermal gradient and rapid flow to a low pressure portion of the crust. Flow and subsequent condensation of the vapour phase might generate a highly acidic hydrothermal fluid (as appears to be the case in epithermal deposits). Further reactive transport models should examine this process.
pmd*CRC Report – Geochemical modeling of Carlin style Au-deposits (Project G10)
3
INTRODUCTION The chemical processes that formed Carlin-type gold systems remain uncertain despite several previous studies (Hofstra et al. 1991; Ilchik & Barton, 1997; Woitsekhowskaya & Peters, 1998). It was the objective of this work to investigate possible gold depositional mechanisms and the implications that this might have for discovery of new resources. Some key questions for exploration are:
• What chemical process or processes caused gold to precipitate? The chemical depositional process will influence exploration strategy at the tenement or prospect scale. If cooling is the main mechanism then presumably specific host-rocks are irrelevant. Similarly mixing. If wall-rock reaction is the main mechanism then what rock-types could make suitable (chemical) hosts? In all likelihood, however, these depositional mechanisms are not independent.
• To what extent is chemical dissolution necessary to generate the anomalous porosity and
permeability required for ore formation? Indeed, carbonate dissolution appears to be one of the defining features of Carlin-type deposits. But there is also ample evidence of fracturing and deformation generally during ore formation.
• Can we model the sequence and characteristics of hydrothermal alteration associated with gold
deposition and use this in predictive exploration?
• Is a magmatic source required for fluids and/or heat? Thus, should exploration be limited to areas with magmatic rocks of a given age and to the vicinity of substantial intrusions. There is no evidence that the major Betze-Post deposit (for example) is temporally related to the adjacent Goldstrike intrusion. The author has argued that Carlin-type deposits in SW China cannot be related to magmatism given the absence of any magmatic bodies (Wilde, 2003). Conversely it has been proposed that the Barney's Canyon and Melco deposits in Utah are coeval with intrusion of the Bingham Canyon porphyry.
• If an amagmatic scenario is invoked then how can the very unusual hydrothermal fluid composition
be generated? Can boiling of a fluid equilibrated with rocks beneath the level of the deposits be modelled? What implications does such a process have for the thermal regime at the time of ore formation?
In attempting to answer these questions, I first review published reaction path calculations work and present a series of new calculations using the Geochemist's Workbench. The final part of this report concerns preliminary reactive transport calculations using a new code developed by Peter Hornby of CSIRO. Data files used in the modelling are presented in the CD-ROM attached to this report.
pmd*CRC Report – Geochemical modeling of Carlin style Au-deposits (Project G10)
4
PUBLISHED GEOCHEMICAL MODELLING
Previous geochemical modelling is that of Hofstra et al. (1991), Ilchik & Barton (1997) and Woitsekhowskaya & Peters (1998). An assumption common to these studies is that the solubility of gold was controlled by aqueous bisulphide complexes. Thus solubility depends on temperature, pH, oxidation state and sulphur activity among others. The pressure sensitivity of gold solubility is as yet poorly understood. Furthermore, there are no experimental data on the partitioning of gold between coexisting vapour and aqueous phases. Ilchik & Barton (1997) did not state the software that they used, so presumably wrote it themselves. It used an “iterative matrix inversion method” and a database of 39 ions and complexes. As, Sb and Hg were not considered in the calculations. Hofstra et al. (1991) used the software Chiller and the hydrothermal fliud composition tabulated below (Table 2). Woitsekhowskaya & Peters (1998) used the software HCh and an incomplete definition of the fluid phase (also tabulated in Table 2).
COOLING
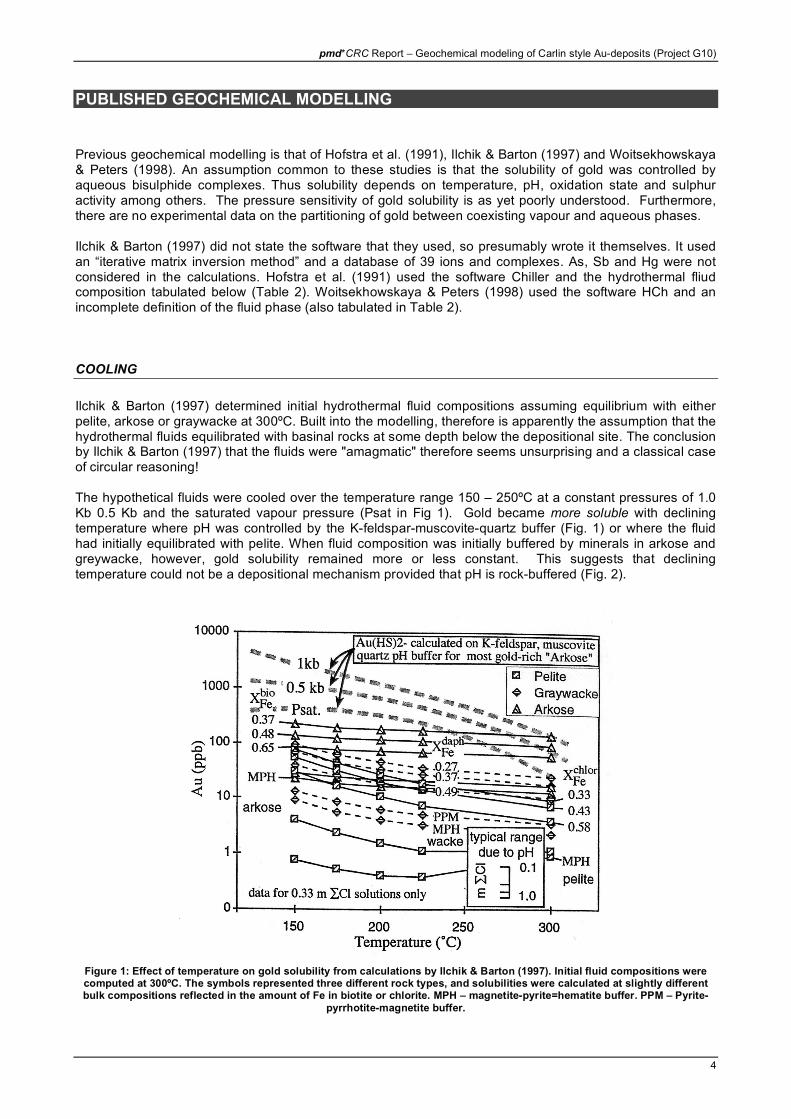
Ilchik & Barton (1997) determined initial hydrothermal fluid compositions assuming equilibrium with either pelite, arkose or graywacke at 300ºC. Built into the modelling, therefore is apparently the assumption that the hydrothermal fluids equilibrated with basinal rocks at some depth below the depositional site. The conclusion by Ilchik & Barton (1997) that the fluids were "amagmatic" therefore seems unsurprising and a classical case of circular reasoning! The hypothetical fluids were cooled over the temperature range 150 – 250ºC at a constant pressures of 1.0 Kb 0.5 Kb and the saturated vapour pressure (Psat in Fig 1). Gold became more soluble with declining temperature where pH was controlled by the K-feldspar-muscovite-quartz buffer (Fig. 1) or where the fluid had initially equilibrated with pelite. When fluid composition was initially buffered by minerals in arkose and greywacke, however, gold solubility remained more or less constant. This suggests that declining temperature could not be a depositional mechanism provided that pH is rock-buffered (Fig. 2).
Figure 1: Effect of temperature on gold solubility from calculations by Ilchik & Barton (1997). Initial fluid compositions were computed at 300ºC. The symbols represented three different rock types, and solubilities were calculated at slightly different bulk compositions reflected in the amount of Fe in biotite or chlorite. MPH – magnetite-pyrite=hematite buffer. PPM – Pyrite-
pyrrhotite-magnetite buffer.
pmd*CRC Report – Geochemical modeling of Carlin style Au-deposits (Project G10)
5
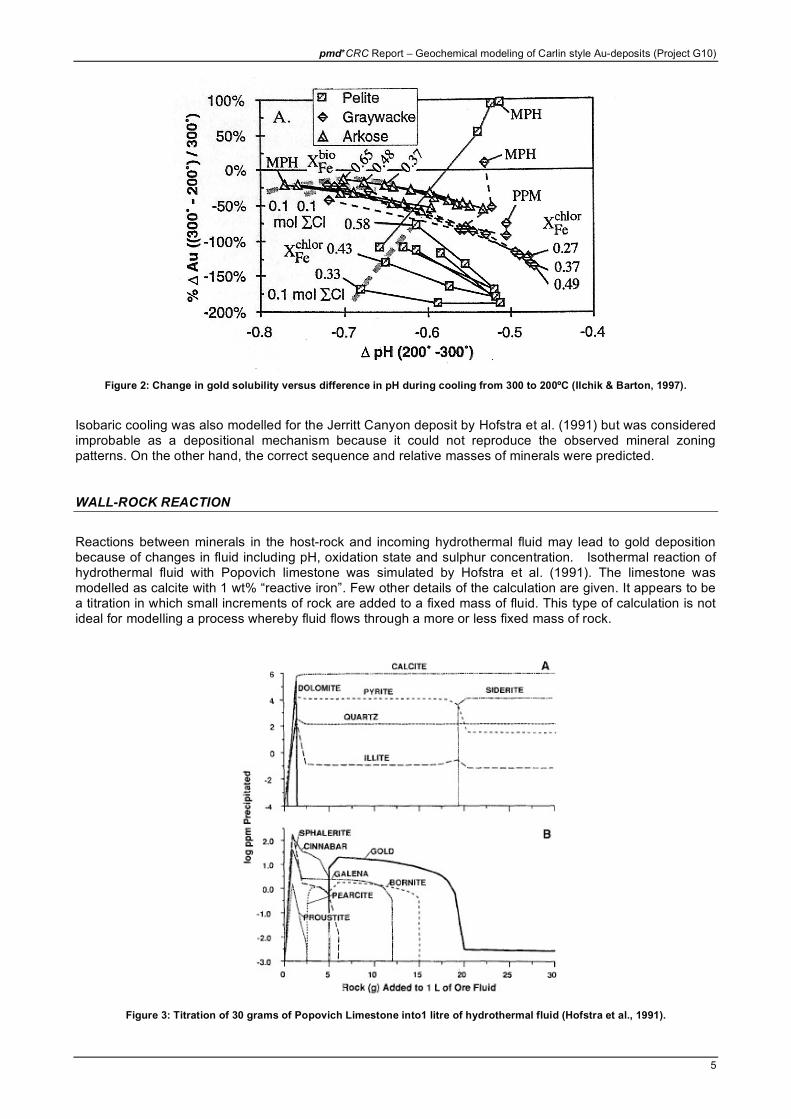
Figure 2: Change in gold solubility versus difference in pH during cooling from 300 to 200ºC (Ilchik & Barton, 1997).
Isobaric cooling was also modelled for the Jerritt Canyon deposit by Hofstra et al. (1991) but was considered improbable as a depositional mechanism because it could not reproduce the observed mineral zoning patterns. On the other hand, the correct sequence and relative masses of minerals were predicted.
WALL-ROCK REACTION
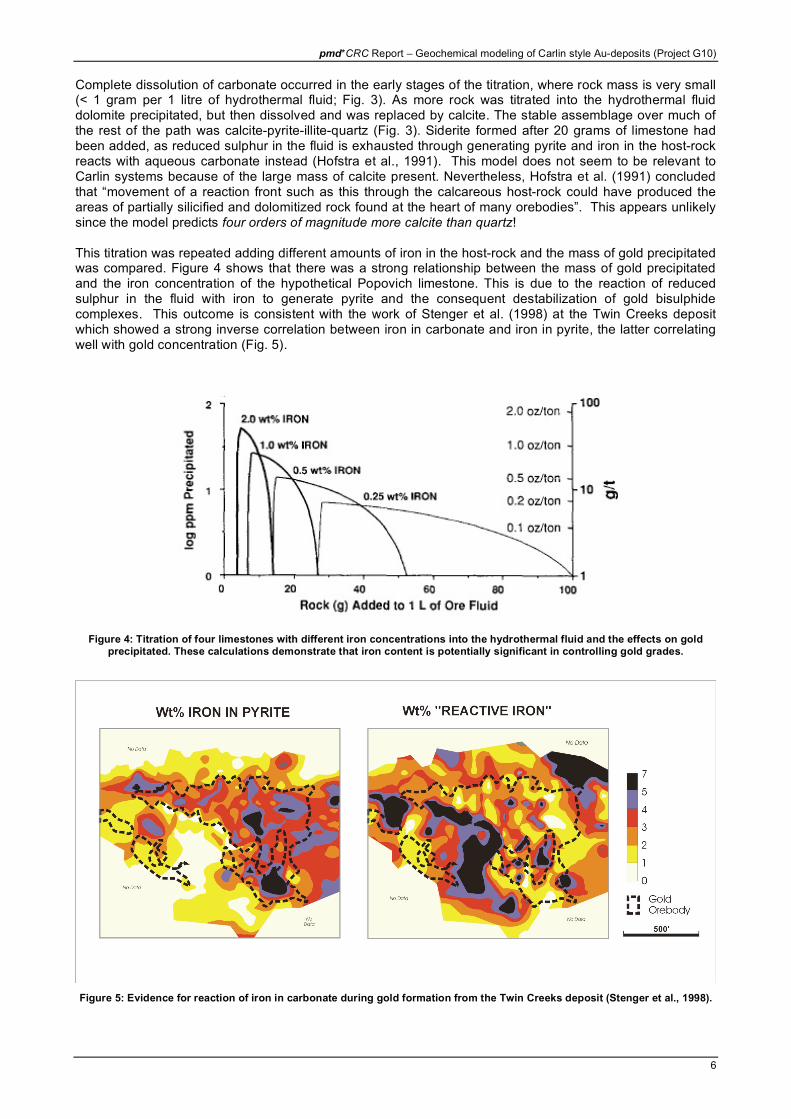
Reactions between minerals in the host-rock and incoming hydrothermal fluid may lead to gold deposition because of changes in fluid including pH, oxidation state and sulphur concentration. Isothermal reaction of hydrothermal fluid with Popovich limestone was simulated by Hofstra et al. (1991). The limestone was modelled as calcite with 1 wt% “reactive iron”. Few other details of the calculation are given. It appears to be a titration in which small increments of rock are added to a fixed mass of fluid. This type of calculation is not ideal for modelling a process whereby fluid flows through a more or less fixed mass of rock.
Figure 3: Titration of 30 grams of Popovich Limestone into1 litre of hydrothermal fluid (Hofstra et al., 1991).
pmd*CRC Report – Geochemical modeling of Carlin style Au-deposits (Project G10)
6
Complete dissolution of carbonate occurred in the early stages of the titration, where rock mass is very small (< 1 gram per 1 litre of hydrothermal fluid; Fig. 3). As more rock was titrated into the hydrothermal fluid dolomite precipitated, but then dissolved and was replaced by calcite. The stable assemblage over much of the rest of the path was calcite-pyrite-illite-quartz (Fig. 3). Siderite formed after 20 grams of limestone had been added, as reduced sulphur in the fluid is exhausted through generating pyrite and iron in the host-rock reacts with aqueous carbonate instead (Hofstra et al., 1991). This model does not seem to be relevant to Carlin systems because of the large mass of calcite present. Nevertheless, Hofstra et al. (1991) concluded that “movement of a reaction front such as this through the calcareous host-rock could have produced the areas of partially silicified and dolomitized rock found at the heart of many orebodies”. This appears unlikely since the model predicts four orders of magnitude more calcite than quartz! This titration was repeated adding different amounts of iron in the host-rock and the mass of gold precipitated was compared. Figure 4 shows that there was a strong relationship between the mass of gold precipitated and the iron concentration of the hypothetical Popovich limestone. This is due to the reaction of reduced sulphur in the fluid with iron to generate pyrite and the consequent destabilization of gold bisulphide complexes. This outcome is consistent with the work of Stenger et al. (1998) at the Twin Creeks deposit which showed a strong inverse correlation between iron in carbonate and iron in pyrite, the latter correlating well with gold concentration (Fig. 5).
Figure 4: Titration of four limestones with different iron concentrations into the hydrothermal fluid and the effects on gold precipitated. These calculations demonstrate that iron content is potentially significant in controlling gold grades.
Figure 5: Evidence for reaction of iron in carbonate during gold formation from the Twin Creeks deposit (Stenger et al., 1998).
pmd*CRC Report – Geochemical modeling of Carlin style Au-deposits (Project G10)
7
WALL-ROCK REACTION & COOLING
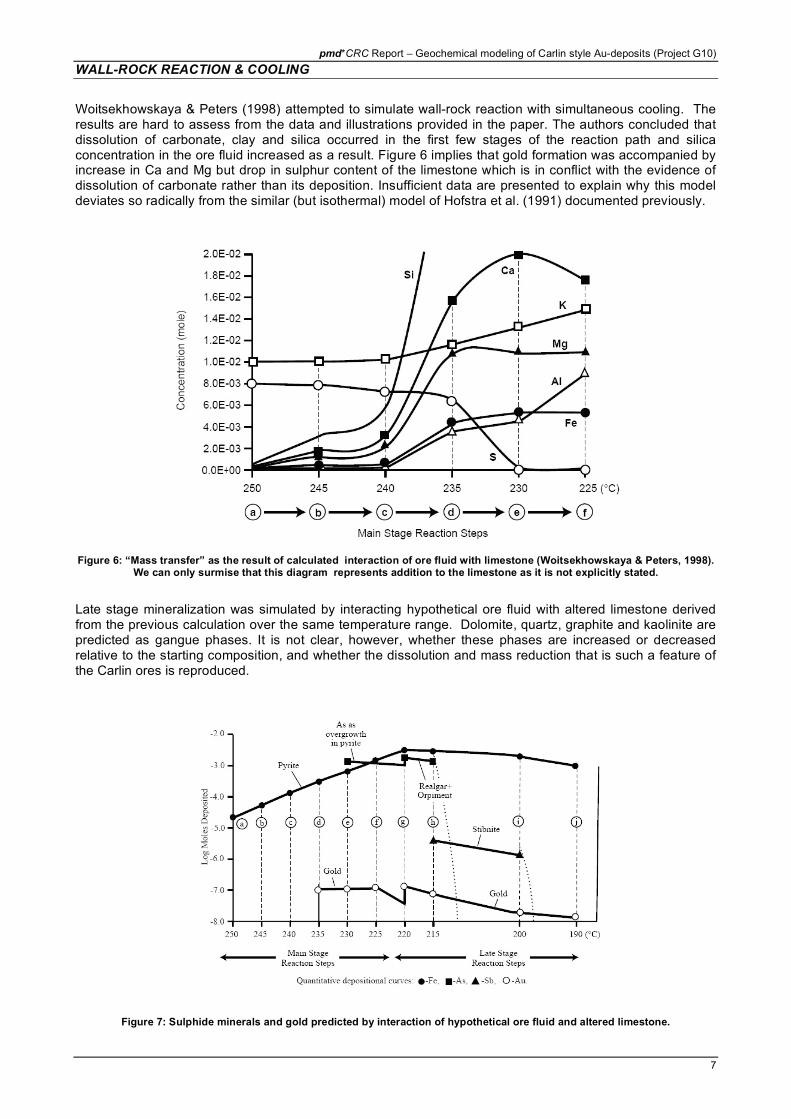
Woitsekhowskaya & Peters (1998) attempted to simulate wall-rock reaction with simultaneous cooling. The results are hard to assess from the data and illustrations provided in the paper. The authors concluded that dissolution of carbonate, clay and silica occurred in the first few stages of the reaction path and silica concentration in the ore fluid increased as a result. Figure 6 implies that gold formation was accompanied by increase in Ca and Mg but drop in sulphur content of the limestone which is in conflict with the evidence of dissolution of carbonate rather than its deposition. Insufficient data are presented to explain why this model deviates so radically from the similar (but isothermal) model of Hofstra et al. (1991) documented previously.
Figure 6: “Mass transfer” as the result of calculated interaction of ore fluid with limestone (Woitsekhowskaya & Peters, 1998). We can only surmise that this diagram represents addition to the limestone as it is not explicitly stated.
Late stage mineralization was simulated by interacting hypothetical ore fluid with altered limestone derived from the previous calculation over the same temperature range. Dolomite, quartz, graphite and kaolinite are predicted as gangue phases. It is not clear, however, whether these phases are increased or decreased relative to the starting composition, and whether the dissolution and mass reduction that is such a feature of the Carlin ores is reproduced.
Figure 7: Sulphide minerals and gold predicted by interaction of hypothetical ore fluid and altered limestone.
pmd*CRC Report – Geochemical modeling of Carlin style Au-deposits (Project G10)
8
Neither are the key controls on metal solubility explored, although pH remains constant at 4.7 – 4.8 throughout. The absence of dolomite in the high temperature portion of the reaction (or calcite) path suggests that the presence of carbonate is not buffering pH in these models. Woitsekhowskaya & Peters (1998) suggest that cooling caused Au precipitation in figure 10. However, there is not a linear relation between gold and temperature (note the inflection at 220ºC) suggesting another factor is important. They also suggest that “sulfidation” of the limestone is important (the limestone samples used contain up to 1.4% FeO). Figure 7 above, however, shows that gold abundance decreases as pyrite increases, thus the model do not support this assertion. The lack of detail in Woitsekhowskaya & Peters (1998) does not allow a rigorous assessment of these models. The authors do not appear to have satisfactorily explored the key controls on Au, As and Sb precipitation. The models are therefore of very limited significance. The models appear to predict gain in the mass of dolomite, calcite and quartz (at least in the early stage alteration) that is inconsistent with observations of nature.
MIXING
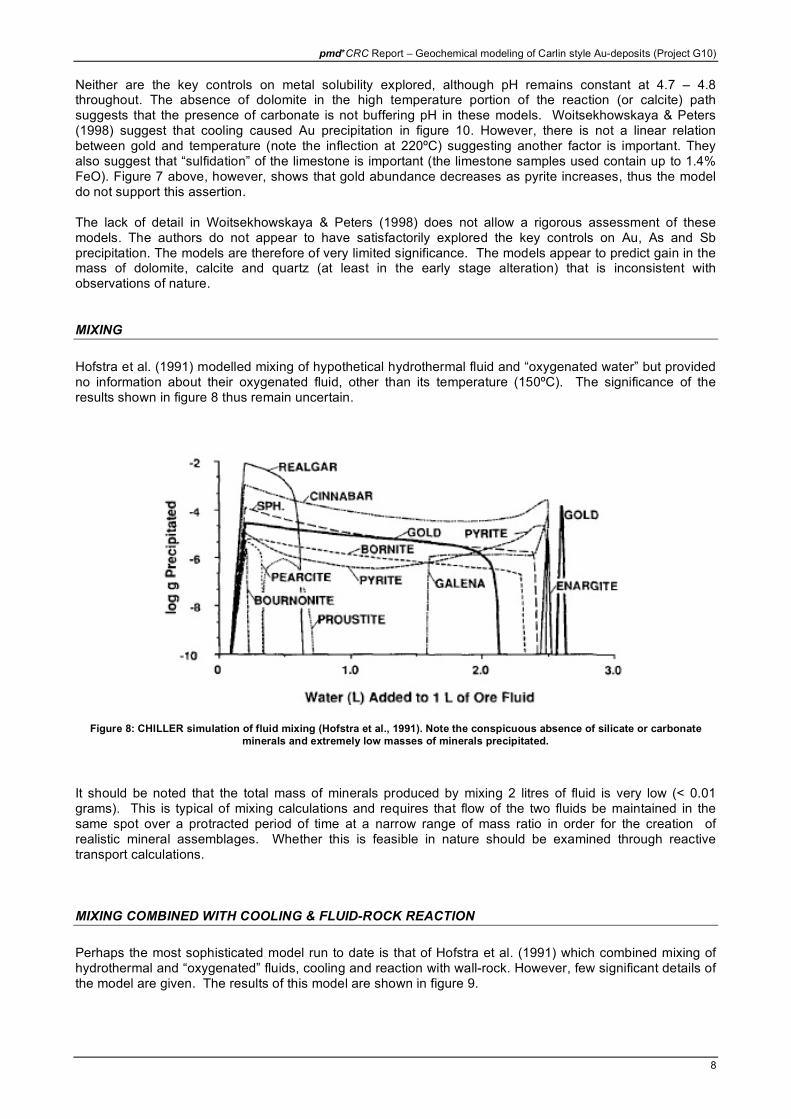
Hofstra et al. (1991) modelled mixing of hypothetical hydrothermal fluid and “oxygenated water” but provided no information about their oxygenated fluid, other than its temperature (150ºC). The significance of the results shown in figure 8 thus remain uncertain.
Figure 8: CHILLER simulation of fluid mixing (Hofstra et al., 1991). Note the conspicuous absence of silicate or carbonate
minerals and extremely low masses of minerals precipitated.
It should be noted that the total mass of minerals produced by mixing 2 litres of fluid is very low (< 0.01 grams). This is typical of mixing calculations and requires that flow of the two fluids be maintained in the same spot over a protracted period of time at a narrow range of mass ratio in order for the creation of realistic mineral assemblages. Whether this is feasible in nature should be examined through reactive transport calculations.
MIXING COMBINED WITH COOLING & FLUID-ROCK REACTION
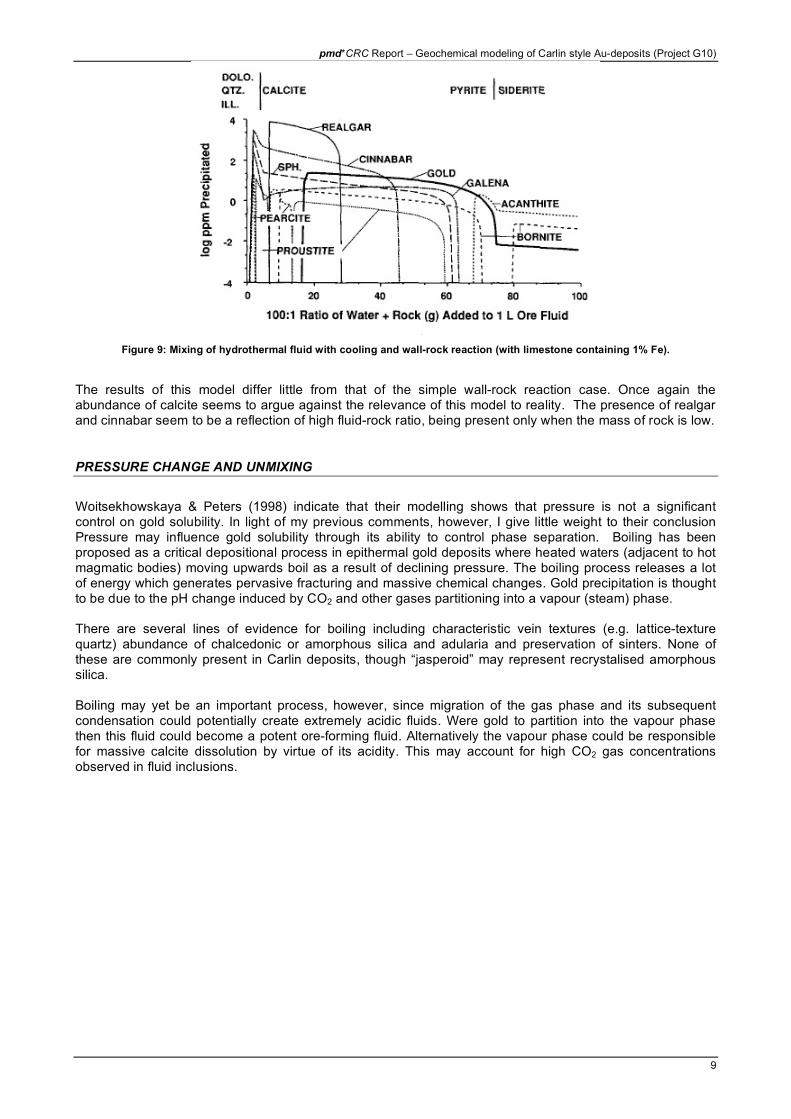
Perhaps the most sophisticated model run to date is that of Hofstra et al. (1991) which combined mixing of hydrothermal and “oxygenated” fluids, cooling and reaction with wall-rock. However, few significant details of the model are given. The results of this model are shown in figure 9.
pmd*CRC Report – Geochemical modeling of Carlin style Au-deposits (Project G10)
9
Figure 9: Mixing of hydrothermal fluid with cooling and wall-rock reaction (with limestone containing 1% Fe).
The results of this model differ little from that of the simple wall-rock reaction case. Once again the abundance of calcite seems to argue against the relevance of this model to reality. The presence of realgar and cinnabar seem to be a reflection of high fluid-rock ratio, being present only when the mass of rock is low.
PRESSURE CHANGE AND UNMIXING
Woitsekhowskaya & Peters (1998) indicate that their modelling shows that pressure is not a significant control on gold solubility. In light of my previous comments, however, I give little weight to their conclusion Pressure may influence gold solubility through its ability to control phase separation. Boiling has been proposed as a critical depositional process in epithermal gold deposits where heated waters (adjacent to hot magmatic bodies) moving upwards boil as a result of declining pressure. The boiling process releases a lot of energy which generates pervasive fracturing and massive chemical changes. Gold precipitation is thought to be due to the pH change induced by CO2 and other gases partitioning into a vapour (steam) phase. There are several lines of evidence for boiling including characteristic vein textures (e.g. lattice-texture quartz) abundance of chalcedonic or amorphous silica and adularia and preservation of sinters. None of these are commonly present in Carlin deposits, though “jasperoid” may represent recrystalised amorphous silica. Boiling may yet be an important process, however, since migration of the gas phase and its subsequent condensation could potentially create extremely acidic fluids. Were gold to partition into the vapour phase then this fluid could become a potent ore-forming fluid. Alternatively the vapour phase could be responsible for massive calcite dissolution by virtue of its acidity. This may account for high CO2 gas concentrations observed in fluid inclusions.
pmd*CRC Report – Geochemical modeling of Carlin style Au-deposits (Project G10)
10
NEW REACTION PATH MODELLING
New reaction path modelling was undertaken to further test some of the scenarios discussed above. The software used for these calculations was the Geochemist's Workbench. This software offers some advantages over HCh and Chiller, in that it allows fluid flow through rock tobe better simulated using "flush" methodology (Bethke, 19). This methodology also allows definition of porosity and an assessment can therefore be made of the importance of chemical processes in increasing porosity. For simulating mixing GWB has the “flash" option which allows mixing of two end-member fluids in all possible combinations. A temperature gradient can be employed in both flush and flash models.
THERMODYNAMIC DATA
Available thermodynamic data were reviewed and a modified database was created. This database is the default Laurence Livermore National Laboratory dataset modified as follows:
• Arsenic data from Cleverley et al. (2003) were added
• Au data from UNITHERM were added
• Cu data from Liu et al. (2002) were added (by Bear McPhail)
• Data for Zn and Cu bisulphide complexes were added (by Bear McPhail)
• Data for actinolite were corrected (by the author) Details of Au and As species that have been changed are given in the following table:
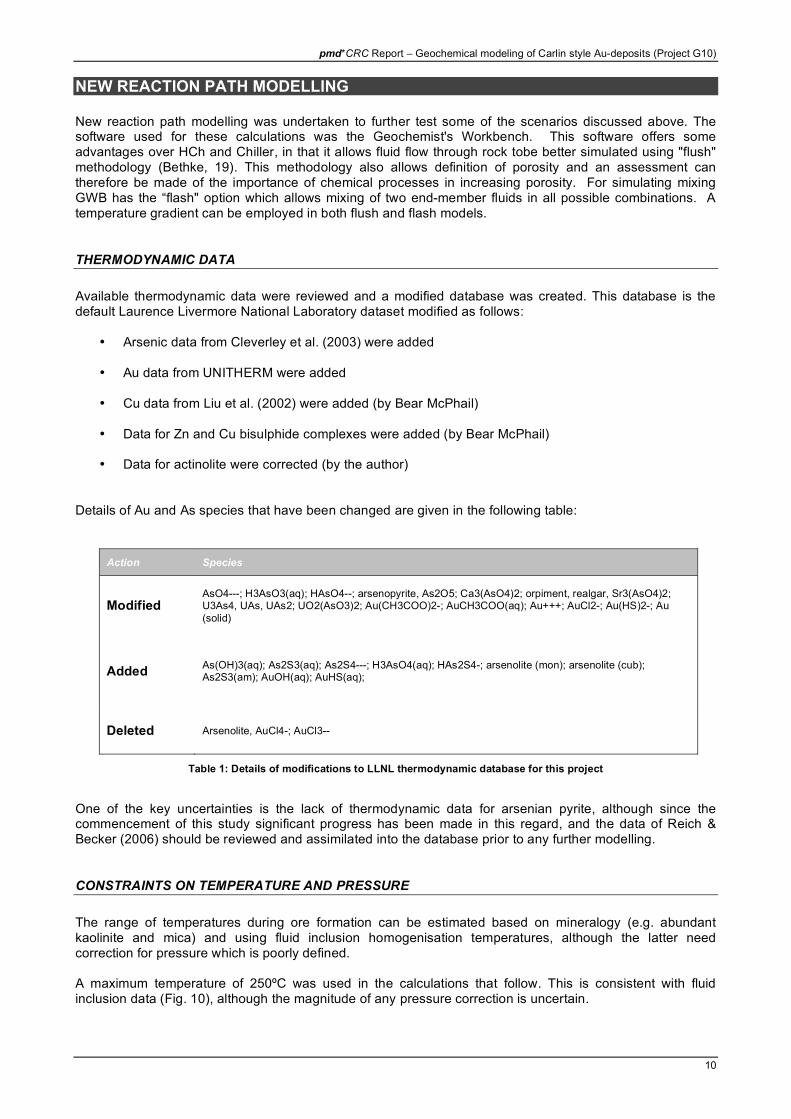
Action Species
Modified AsO4---; H3AsO3(aq); HAsO4--; arsenopyrite, As2O5; Ca3(AsO4)2; orpiment, realgar, Sr3(AsO4)2; U3As4, UAs, UAs2; UO2(AsO3)2; Au(CH3COO)2-; AuCH3COO(aq); Au+++; AuCl2-; Au(HS)2-; Au
(solid)
Added As(OH)3(aq); As2S3(aq); As2S4---; H3AsO4(aq); HAs2S4-; arsenolite (mon); arsenolite (cub); As2S3(am); AuOH(aq); AuHS(aq);
Deleted Arsenolite, AuCl4-; AuCl3--
Table 1: Details of modifications to LLNL thermodynamic database for this project
One of the key uncertainties is the lack of thermodynamic data for arsenian pyrite, although since the commencement of this study significant progress has been made in this regard, and the data of Reich & Becker (2006) should be reviewed and assimilated into the database prior to any further modelling.
CONSTRAINTS ON TEMPERATURE AND PRESSURE
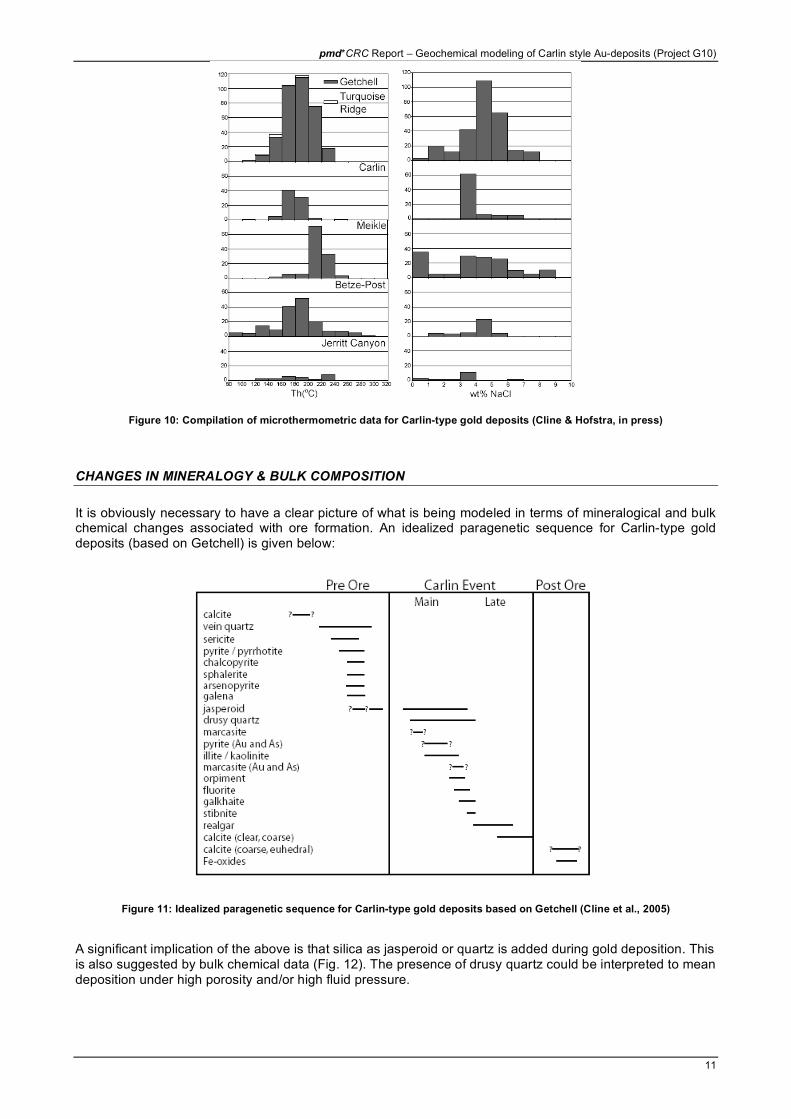
The range of temperatures during ore formation can be estimated based on mineralogy (e.g. abundant kaolinite and mica) and using fluid inclusion homogenisation temperatures, although the latter need correction for pressure which is poorly defined. A maximum temperature of 250ºC was used in the calculations that follow. This is consistent with fluid inclusion data (Fig. 10), although the magnitude of any pressure correction is uncertain.
pmd*CRC Report – Geochemical modeling of Carlin style Au-deposits (Project G10)
11
Figure 10: Compilation of microthermometric data for Carlin-type gold deposits (Cline & Hofstra, in press)
CHANGES IN MINERALOGY & BULK COMPOSITION
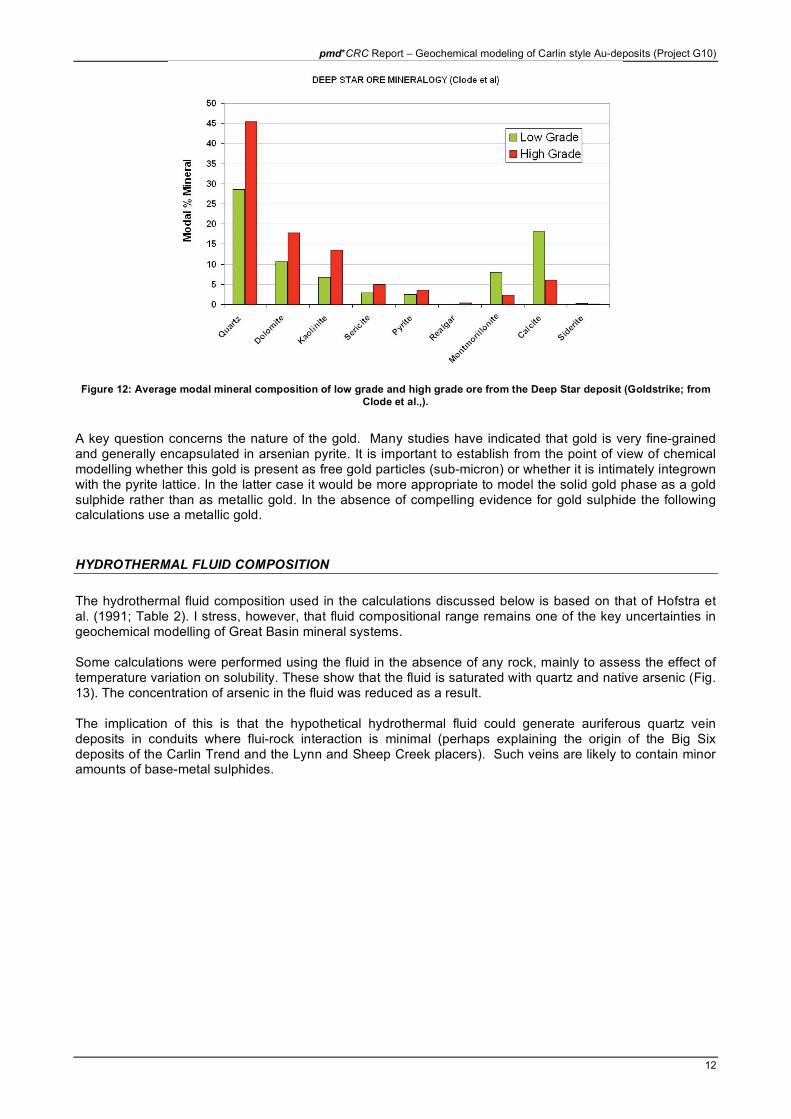
It is obviously necessary to have a clear picture of what is being modeled in terms of mineralogical and bulk chemical changes associated with ore formation. An idealized paragenetic sequence for Carlin-type gold deposits (based on Getchell) is given below:
Figure 11: Idealized paragenetic sequence for Carlin-type gold deposits based on Getchell (Cline et al., 2005)
A significant implication of the above is that silica as jasperoid or quartz is added during gold deposition. This is also suggested by bulk chemical data (Fig. 12). The presence of drusy quartz could be interpreted to mean deposition under high porosity and/or high fluid pressure.
pmd*CRC Report – Geochemical modeling of Carlin style Au-deposits (Project G10)
12
Figure 12: Average modal mineral composition of low grade and high grade ore from the Deep Star deposit (Goldstrike; from
Clode et al.,).
A key question concerns the nature of the gold. Many studies have indicated that gold is very fine-grained and generally encapsulated in arsenian pyrite. It is important to establish from the point of view of chemical modelling whether this gold is present as free gold particles (sub-micron) or whether it is intimately integrown with the pyrite lattice. In the latter case it would be more appropriate to model the solid gold phase as a gold sulphide rather than as metallic gold. In the absence of compelling evidence for gold sulphide the following calculations use a metallic gold.
HYDROTHERMAL FLUID COMPOSITION
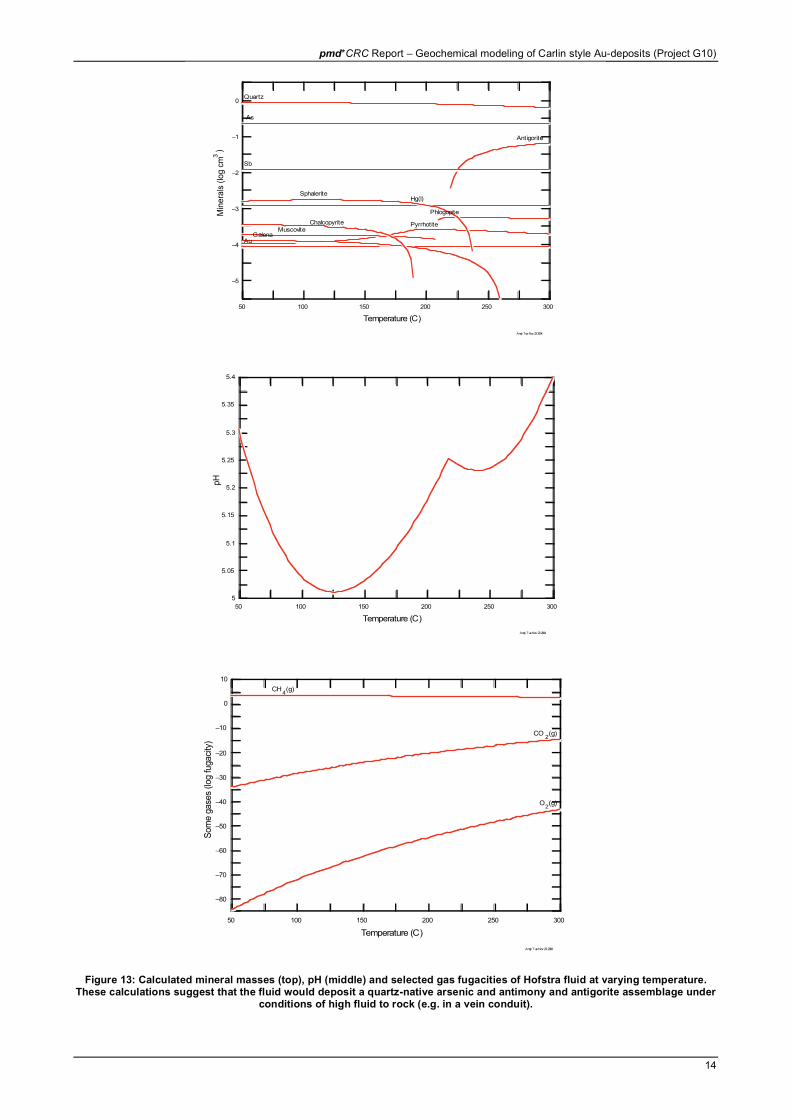
The hydrothermal fluid composition used in the calculations discussed below is based on that of Hofstra et al. (1991; Table 2). I stress, however, that fluid compositional range remains one of the key uncertainties in geochemical modelling of Great Basin mineral systems. Some calculations were performed using the fluid in the absence of any rock, mainly to assess the effect of temperature variation on solubility. These show that the fluid is saturated with quartz and native arsenic (Fig. 13). The concentration of arsenic in the fluid was reduced as a result. The implication of this is that the hypothetical hydrothermal fluid could generate auriferous quartz vein deposits in conduits where flui-rock interaction is minimal (perhaps explaining the origin of the Big Six deposits of the Carlin Trend and the Lynn and Sheep Creek placers). Such veins are likely to contain minor amounts of base-metal sulphides.
pmd*CRC Report – Geochemical modeling of Carlin style Au-deposits (Project G10)
13
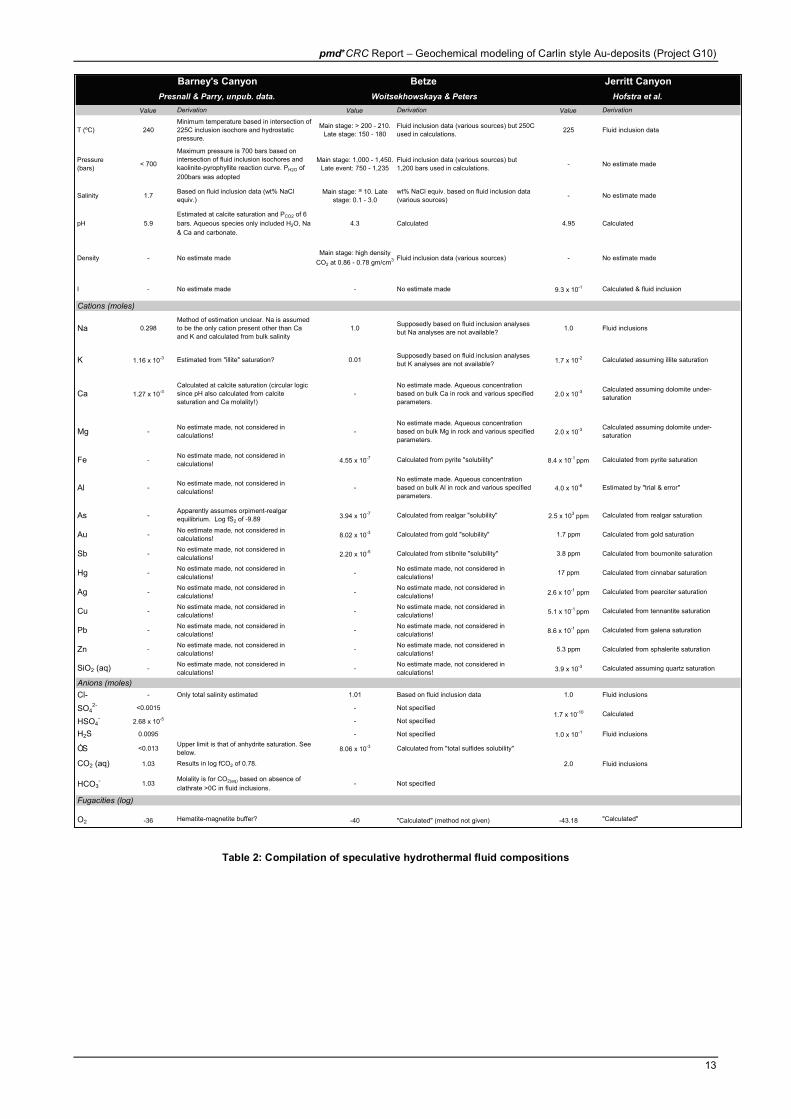
Table 2: Compilation of speculative hydrothermal fluid compositions
Barney's Canyon Betze Jerritt Canyon
Presnall & Parry, unpub. data. Woitsekhowskaya & Peters Hofstra et al.
Value Derivation Value Derivation Value Derivation
T (ºC) 240Minimum temperature based in intersection of 225C inclusion isochore and hydrostatic pressure.
Main stage: > 200 - 210. Late stage: 150 - 180
Fluid inclusion data (various sources) but 250C used in calculations.
225 Fluid inclusion data
Pressure (bars)
< 700
Maximum pressure is 700 bars based on intersection of fluid inclusion isochores and kaolinite-pyrophyllite reaction curve. PH2O of
200bars was adopted
Main stage: 1,000 - 1,450. Late event: 750 - 1,235
Fluid inclusion data (various sources) but 1,200 bars used in calculations.
- No estimate made
Salinity 1.7Based on fluid inclusion data (wt% NaCl equiv.)
Main stage: 10. Late stage: 0.1 - 3.0
wt% NaCl equiv. based on fluid inclusion data (various sources)
- No estimate made
pH 5.9
Estimated at calcite saturation and PCO2 of 6
bars. Aqueous species only included H2O, Na
& Ca and carbonate.
4.3 Calculated 4.95 Calculated
Density - No estimate madeMain stage: high density
CO2 at 0.86 - 0.78 gm/cm3 Fluid inclusion data (various sources) - No estimate made
I - No estimate made - No estimate made 9.3 x 10⁻¹ Calculated & fluid inclusion
Cations (moles)
Na 0.298Method of estimation unclear. Na is assumed to be the only cation present other than Ca and K and calculated from bulk salinity
1.0Supposedly based on fluid inclusion analyses but Na analyses are not available?
1.0 Fluid inclusions
K 1.16 x 10⁻³ Estimated from "illite" saturation? 0.01Supposedly based on fluid inclusion analyses but K analyses are not available? 1.7 x 10⁻² Calculated assuming illite saturation
Ca 1.27 x 10⁻³Calculated at calcite saturation (circular logic since pH also calculated from calcite saturation and Ca molality!)
-No estimate made. Aqueous concentration based on bulk Ca in rock and various specified parameters.
2.0 x 10⁻³ Calculated assuming dolomite under-saturation
Mg -No estimate made, not considered in calculations!
-No estimate made. Aqueous concentration based on bulk Mg in rock and various specified parameters.
2.0 x 10⁻³ Calculated assuming dolomite under-saturation
Fe -No estimate made, not considered in calculations! 4.55 x 10⁻⁷ Calculated from pyrite "solubility" 8.4 x 10⁻¹ ppm Calculated from pyrite saturation
Al -No estimate made, not considered in calculations!
-No estimate made. Aqueous concentration based on bulk Al in rock and various specified parameters.
4.0 x 10⁻⁶ Estimated by "trial & error"
As -Apparently assumes orpiment-realgar equilibrium. Log fS2 of -9.89 3.94 x 10⁻⁷ Calculated from realgar "solubility" 2.5 x 10³ ppm Calculated from realgar saturation
Au -No estimate made, not considered in calculations! 8.02 x 10⁻³ Calculated from gold "solubility" 1.7 ppm Calculated from gold saturation
Sb -No estimate made, not considered in calculations! 2.20 x 10⁻⁵ Calculated from stibnite "solubility" 3.8 ppm Calculated from bournonite saturation
Hg -No estimate made, not considered in calculations!
-No estimate made, not considered in calculations!
17 ppm Calculated from cinnabar saturation
Ag -No estimate made, not considered in calculations!
-No estimate made, not considered in calculations! 2.6 x 10⁻¹ ppm Calculated from pearciter saturation
Cu -No estimate made, not considered in calculations!
-No estimate made, not considered in calculations! 5.1 x 10⁻¹ ppm Calculated from tennantite saturation
Pb -No estimate made, not considered in calculations!
-No estimate made, not considered in calculations! 8.6 x 10⁻¹ ppm Calculated from galena saturation
Zn -No estimate made, not considered in calculations!
-No estimate made, not considered in calculations!
5.3 ppm Calculated from sphalerite saturation
SiO2 (aq) -No estimate made, not considered in calculations!
-No estimate made, not considered in calculations! 3.9 x 10⁻³ Calculated assuming quartz saturation
Anions (moles)
Cl- - Only total salinity estimated 1.01 Based on fluid inclusion data 1.0 Fluid inclusions
SO42- <0.0015 - Not specified
HSO4-
2.68 x 10⁻⁵ - Not specified
H2S 0.0095 - Not specified 1.0 x 10⁻¹ Fluid inclusions
ÓS <0.013Upper limit is that of anhydrite saturation. See below. 8.06 x 10⁻³ Calculated from "total sulfides solubility"
CO2 (aq) 1.03 Results in log fCO2 of 0.78. 2.0 Fluid inclusions
HCO3- 1.03
Molality is for CO2(aq) based on absence of
clathrate >0C in fluid inclusions. - Not specified
Fugacities (log)
O2 -36 Hematite-magnetite buffer? -40 "Calculated" (method not given) -43.18 "Calculated"
1.7 x 10⁻¹⁰ Calculated
pmd*CRC Report – Geochemical modeling of Carlin style Au-deposits (Project G10)
14
Andy Tue Nov 23 2004
50 100 150 200 250 300
–5
–4
–3
–2
–1
0
Temperature (C)
Min
era
ls (
log c
m3
)
As
Phlogopite
Antigorite
Quartz
Au
Sb
Pyrrhotite
Hg(l)
Galena
Sphalerite
MuscoviteChalcopyrite
Andy Tue Nov 23 2004
50 100 150 200 250 300
5
5.05
5.1
5.15
5.2
5.25
5.3
5.35
5.4
Temperature (C)
pH
Andy Tue Nov 23 2004
50 100 150 200 250 300
–80
–70
–60
–50
–40
–30
–20
–10
0
10
Temperature (C)
Som
e g
ase
s (log fugaci
ty)
CH4(g)
CO2(g)
O2(g)
Figure 13: Calculated mineral masses (top), pH (middle) and selected gas fugacities of Hofstra fluid at varying temperature.
These calculations suggest that the fluid would deposit a quartz-native arsenic and antimony and antigorite assemblage under conditions of high fluid to rock (e.g. in a vein conduit).
pmd*CRC Report – Geochemical modeling of Carlin style Au-deposits (Project G10)
15
WALLROCK REACTION & THE IMPORTANCE OF ROCKTYPE
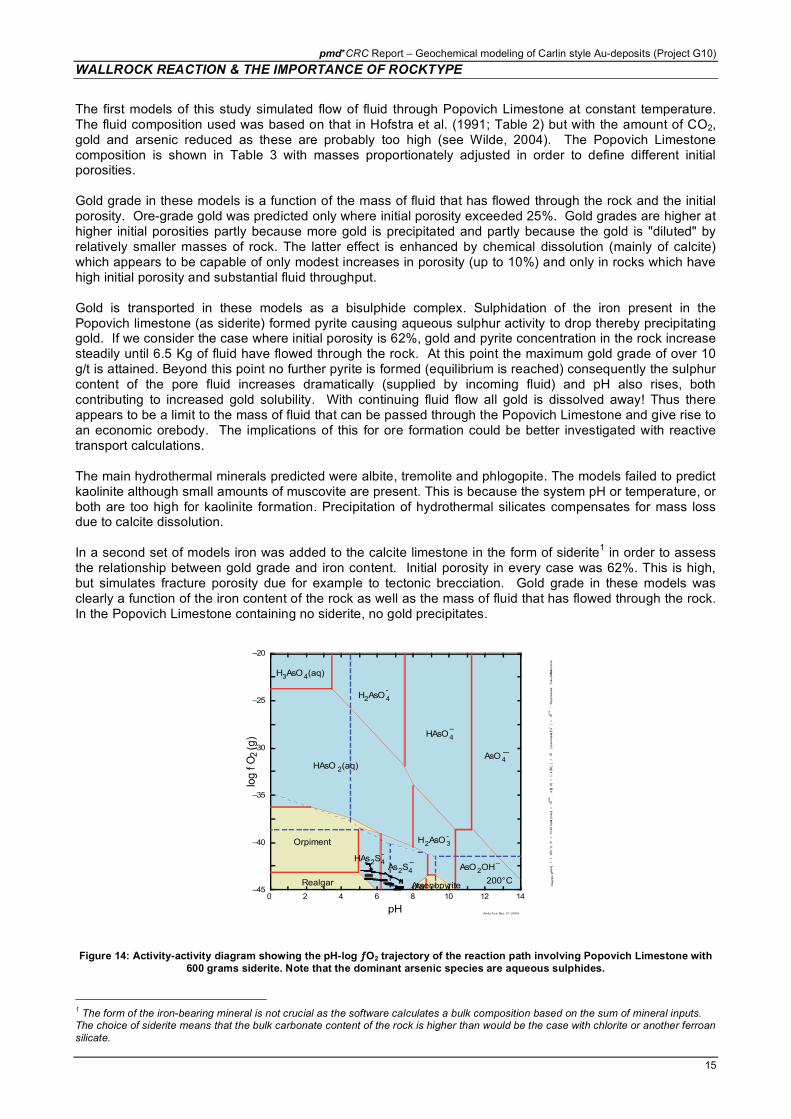
The first models of this study simulated flow of fluid through Popovich Limestone at constant temperature. The fluid composition used was based on that in Hofstra et al. (1991; Table 2) but with the amount of CO2, gold and arsenic reduced as these are probably too high (see Wilde, 2004). The Popovich Limestone composition is shown in Table 3 with masses proportionately adjusted in order to define different initial porosities. Gold grade in these models is a function of the mass of fluid that has flowed through the rock and the initial porosity. Ore-grade gold was predicted only where initial porosity exceeded 25%. Gold grades are higher at higher initial porosities partly because more gold is precipitated and partly because the gold is "diluted" by relatively smaller masses of rock. The latter effect is enhanced by chemical dissolution (mainly of calcite) which appears to be capable of only modest increases in porosity (up to 10%) and only in rocks which have high initial porosity and substantial fluid throughput. Gold is transported in these models as a bisulphide complex. Sulphidation of the iron present in the Popovich limestone (as siderite) formed pyrite causing aqueous sulphur activity to drop thereby precipitating gold. If we consider the case where initial porosity is 62%, gold and pyrite concentration in the rock increase steadily until 6.5 Kg of fluid have flowed through the rock. At this point the maximum gold grade of over 10 g/t is attained. Beyond this point no further pyrite is formed (equilibrium is reached) consequently the sulphur content of the pore fluid increases dramatically (supplied by incoming fluid) and pH also rises, both contributing to increased gold solubility. With continuing fluid flow all gold is dissolved away! Thus there appears to be a limit to the mass of fluid that can be passed through the Popovich Limestone and give rise to an economic orebody. The implications of this for ore formation could be better investigated with reactive transport calculations. The main hydrothermal minerals predicted were albite, tremolite and phlogopite. The models failed to predict kaolinite although small amounts of muscovite are present. This is because the system pH or temperature, or both are too high for kaolinite formation. Precipitation of hydrothermal silicates compensates for mass loss due to calcite dissolution. In a second set of models iron was added to the calcite limestone in the form of siderite
1 in order to assess
the relationship between gold grade and iron content. Initial porosity in every case was 62%. This is high, but simulates fracture porosity due for example to tectonic brecciation. Gold grade in these models was clearly a function of the iron content of the rock as well as the mass of fluid that has flowed through the rock. In the Popovich Limestone containing no siderite, no gold precipitates.
0 2 4 6 8 10 12 14–45
–40
–35
–30
–25
–20
pH
log f O
2(g
)
________________________________________________________________________________________________________________________________________________________________________________
H2AsO4
-
H2AsO3-
AsO2OH--
AsO4---
As2S4
--
HAsO 2(aq)
HAsO4
--
HAs2S4-
Orpiment
ArsenopyriteAsRealgar
H3AsO4(aq)
200°C
Andy Tue Dec 21 2004
Dia
gra
m H2
AsO 4-
, T
=
2
00
°C
, P
=
1
5.4
6 b
ars, a
[m
ain]
=
1
0–2.6
99
, a
[H2
O]
=
1,
a [S
O4-
-]
=
1
0–1
(sp
ecia
tes)
, a
[Fe++
] =
1
0–10.3
8;
Su
pp
resse
d:
Cla
ud
eti
te,
Ars
en
olite
Figure 14: Activity-activity diagram showing the pH-log ƒO2 trajectory of the reaction path involving Popovich Limestone with
600 grams siderite. Note that the dominant arsenic species are aqueous sulphides.
1 The form of the iron-bearing mineral is not crucial as the software calculates a bulk composition based on the sum of mineral inputs.
The choice of siderite means that the bulk carbonate content of the rock is higher than would be the case with chlorite or another ferroan
silicate.
pmd*CRC Report – Geochemical modeling of Carlin style Au-deposits (Project G10)
16
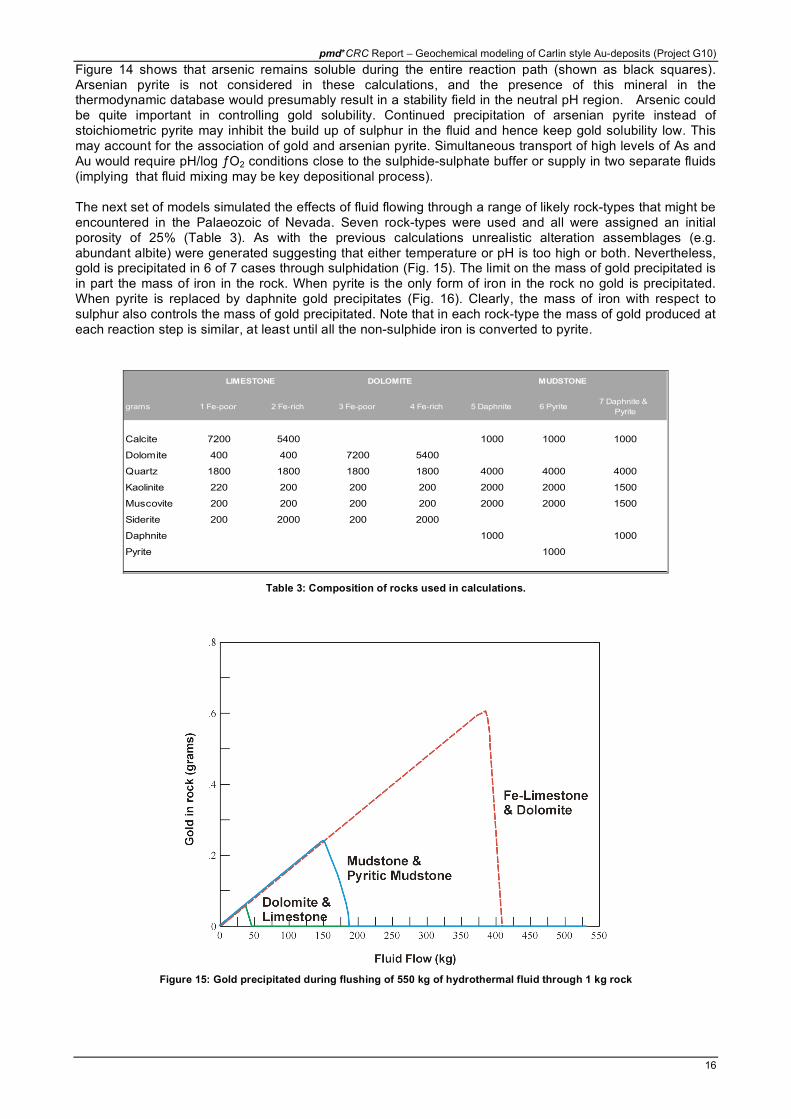
Figure 14 shows that arsenic remains soluble during the entire reaction path (shown as black squares). Arsenian pyrite is not considered in these calculations, and the presence of this mineral in the thermodynamic database would presumably result in a stability field in the neutral pH region. Arsenic could be quite important in controlling gold solubility. Continued precipitation of arsenian pyrite instead of stoichiometric pyrite may inhibit the build up of sulphur in the fluid and hence keep gold solubility low. This may account for the association of gold and arsenian pyrite. Simultaneous transport of high levels of As and Au would require pH/log ƒO2 conditions close to the sulphide-sulphate buffer or supply in two separate fluids (implying that fluid mixing may be key depositional process). The next set of models simulated the effects of fluid flowing through a range of likely rock-types that might be encountered in the Palaeozoic of Nevada. Seven rock-types were used and all were assigned an initial porosity of 25% (Table 3). As with the previous calculations unrealistic alteration assemblages (e.g. abundant albite) were generated suggesting that either temperature or pH is too high or both. Nevertheless, gold is precipitated in 6 of 7 cases through sulphidation (Fig. 15). The limit on the mass of gold precipitated is in part the mass of iron in the rock. When pyrite is the only form of iron in the rock no gold is precipitated. When pyrite is replaced by daphnite gold precipitates (Fig. 16). Clearly, the mass of iron with respect to sulphur also controls the mass of gold precipitated. Note that in each rock-type the mass of gold produced at each reaction step is similar, at least until all the non-sulphide iron is converted to pyrite.
grams 1 Fe-poor 2 Fe-rich 3 Fe-poor 4 Fe-rich 5 Daphnite 6 Pyrite7 Daphnite &
Pyrite
Calcite 7200 5400 1000 1000 1000
Dolomite 400 400 7200 5400
Quartz 1800 1800 1800 1800 4000 4000 4000
Kaolinite 220 200 200 200 2000 2000 1500
Muscovite 200 200 200 200 2000 2000 1500
Siderite 200 2000 200 2000
Daphnite 1000 1000
Pyrite 1000
LIMESTONE DOLOMITE MUDSTONE
Table 3: Composition of rocks used in calculations.
Figure 15: Gold precipitated during flushing of 550 kg of hydrothermal fluid through 1 kg rock
pmd*CRC Report – Geochemical modeling of Carlin style Au-deposits (Project G10)
17
0 50 100 150 200 250 300 350 400 450 500 550
-4
-3
-2
-1
0
1
2
3
Mass reacted (kg)
Some minerals
3)
Daphnite-14A
Au
Pyrite
Minnesotaite
Annite
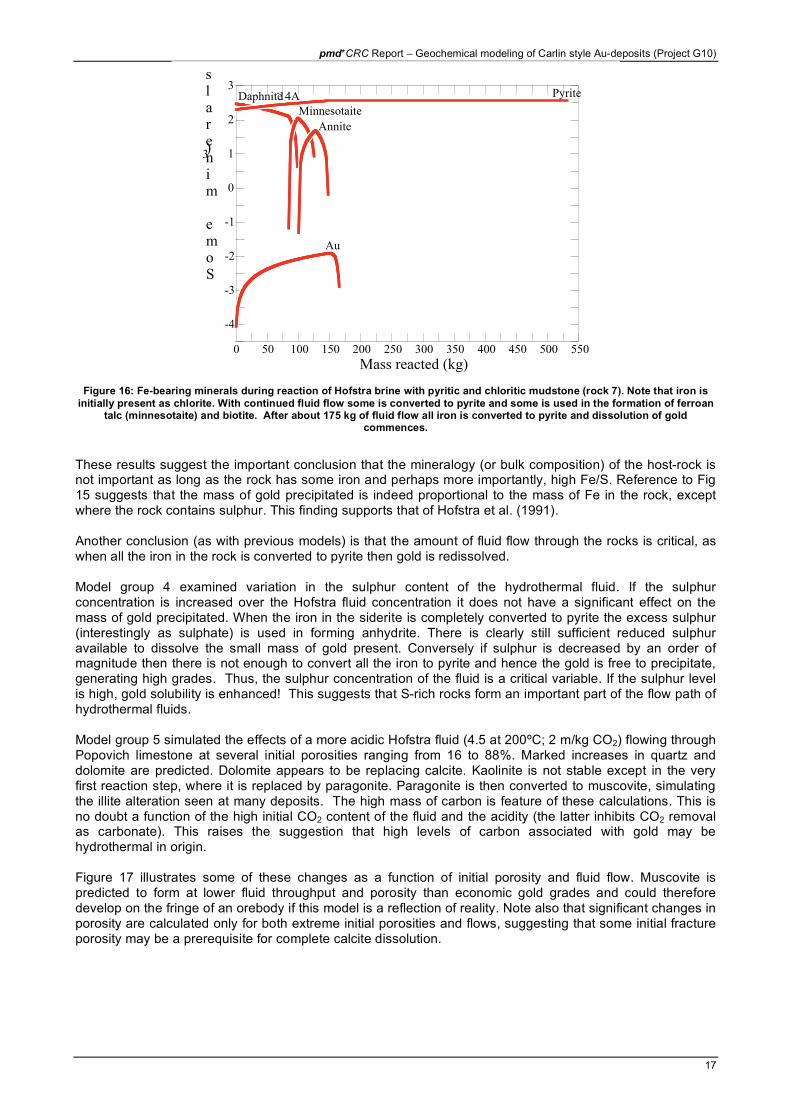
Figure 16: Fe-bearing minerals during reaction of Hofstra brine with pyritic and chloritic mudstone (rock 7). Note that iron is
initially present as chlorite. With continued fluid flow some is converted to pyrite and some is used in the formation of ferroan talc (minnesotaite) and biotite. After about 175 kg of fluid flow all iron is converted to pyrite and dissolution of gold
commences.
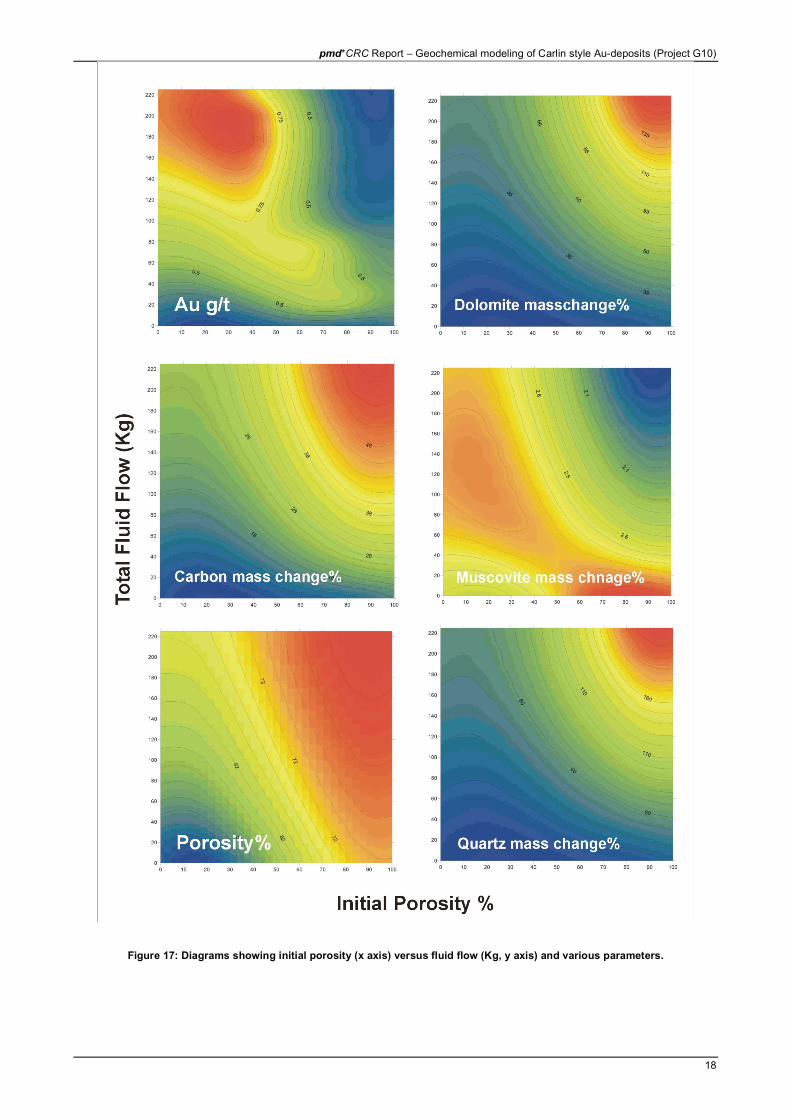
These results suggest the important conclusion that the mineralogy (or bulk composition) of the host-rock is not important as long as the rock has some iron and perhaps more importantly, high Fe/S. Reference to Fig 15 suggests that the mass of gold precipitated is indeed proportional to the mass of Fe in the rock, except where the rock contains sulphur. This finding supports that of Hofstra et al. (1991). Another conclusion (as with previous models) is that the amount of fluid flow through the rocks is critical, as when all the iron in the rock is converted to pyrite then gold is redissolved. Model group 4 examined variation in the sulphur content of the hydrothermal fluid. If the sulphur concentration is increased over the Hofstra fluid concentration it does not have a significant effect on the mass of gold precipitated. When the iron in the siderite is completely converted to pyrite the excess sulphur (interestingly as sulphate) is used in forming anhydrite. There is clearly still sufficient reduced sulphur available to dissolve the small mass of gold present. Conversely if sulphur is decreased by an order of magnitude then there is not enough to convert all the iron to pyrite and hence the gold is free to precipitate, generating high grades. Thus, the sulphur concentration of the fluid is a critical variable. If the sulphur level is high, gold solubility is enhanced! This suggests that S-rich rocks form an important part of the flow path of hydrothermal fluids. Model group 5 simulated the effects of a more acidic Hofstra fluid (4.5 at 200ºC; 2 m/kg CO2) flowing through Popovich limestone at several initial porosities ranging from 16 to 88%. Marked increases in quartz and dolomite are predicted. Dolomite appears to be replacing calcite. Kaolinite is not stable except in the very first reaction step, where it is replaced by paragonite. Paragonite is then converted to muscovite, simulating the illite alteration seen at many deposits. The high mass of carbon is feature of these calculations. This is no doubt a function of the high initial CO2 content of the fluid and the acidity (the latter inhibits CO2 removal as carbonate). This raises the suggestion that high levels of carbon associated with gold may be hydrothermal in origin. Figure 17 illustrates some of these changes as a function of initial porosity and fluid flow. Muscovite is predicted to form at lower fluid throughput and porosity than economic gold grades and could therefore develop on the fringe of an orebody if this model is a reflection of reality. Note also that significant changes in porosity are calculated only for both extreme initial porosities and flows, suggesting that some initial fracture porosity may be a prerequisite for complete calcite dissolution.
pmd*CRC Report – Geochemical modeling of Carlin style Au-deposits (Project G10)
18
Figure 17: Diagrams showing initial porosity (x axis) versus fluid flow (Kg, y axis) and various parameters.
pmd*CRC Report – Geochemical modeling of Carlin style Au-deposits (Project G10)
19
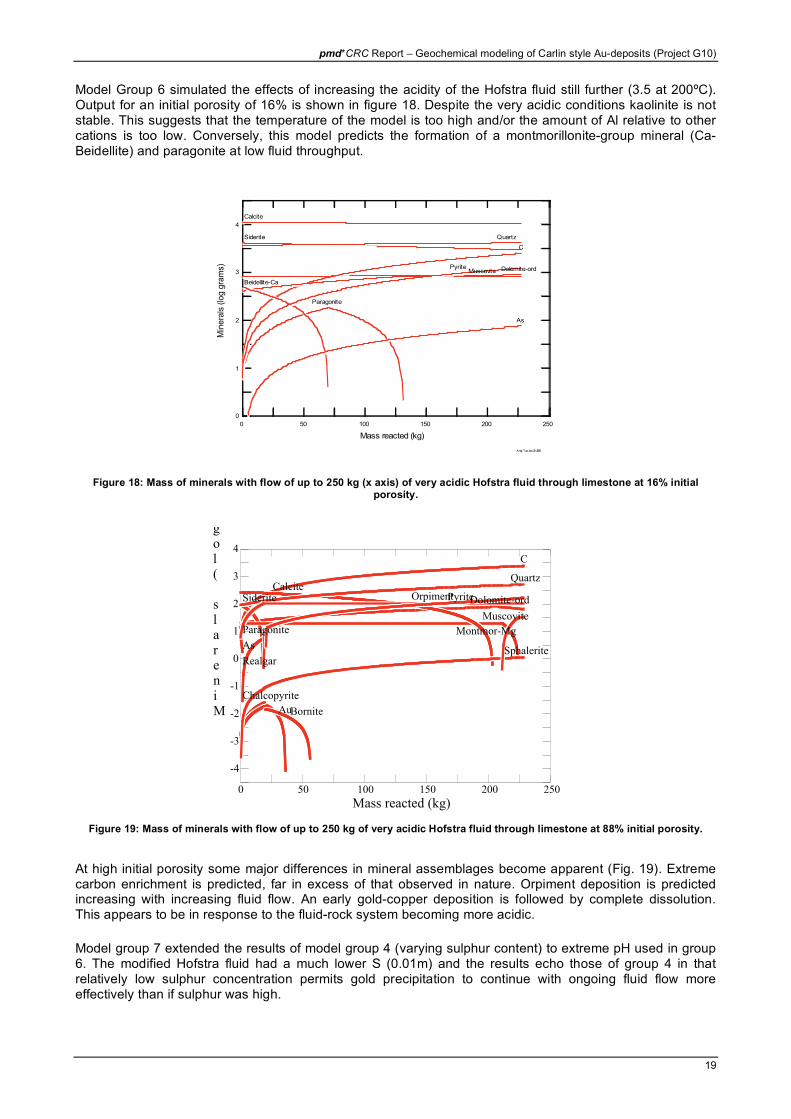
Model Group 6 simulated the effects of increasing the acidity of the Hofstra fluid still further (3.5 at 200ºC). Output for an initial porosity of 16% is shown in figure 18. Despite the very acidic conditions kaolinite is not stable. This suggests that the temperature of the model is too high and/or the amount of Al relative to other cations is too low. Conversely, this model predicts the formation of a montmorillonite-group mineral (Ca-Beidellite) and paragonite at low fluid throughput.
Andy Tue Jan 25 2005
0 50 100 150 200 250
0
1
2
3
4
Mass reacted (kg)
Min
era
ls (
log g
ram
s) Dolomite-ord
Calcite
C
Paragonite
Muscovite
Siderite Quartz
Beidellite-Ca
Pyrite
As
Figure 18: Mass of minerals with flow of up to 250 kg (x axis) of very acidic Hofstra fluid through limestone at 16% initial porosity.
0 50 100 150 200 250
-4
-3
-2
-1
0
1
2
3
4
Mass reacted (kg)
Minerals (log
Dolomite-ord
Chalcopyrite
C
Paragonite
Siderite
Muscovite
CalciteQuartz
Au
Pyrite
SphaleriteAs
Realgar
Bornite
Orpiment
Montmor-Mg
Figure 19: Mass of minerals with flow of up to 250 kg of very acidic Hofstra fluid through limestone at 88% initial porosity.
At high initial porosity some major differences in mineral assemblages become apparent (Fig. 19). Extreme carbon enrichment is predicted, far in excess of that observed in nature. Orpiment deposition is predicted increasing with increasing fluid flow. An early gold-copper deposition is followed by complete dissolution. This appears to be in response to the fluid-rock system becoming more acidic.
Model group 7 extended the results of model group 4 (varying sulphur content) to extreme pH used in group 6. The modified Hofstra fluid had a much lower S (0.01m) and the results echo those of group 4 in that relatively low sulphur concentration permits gold precipitation to continue with ongoing fluid flow more effectively than if sulphur was high.
pmd*CRC Report – Geochemical modeling of Carlin style Au-deposits (Project G10)
20
0 50 100 150 200 250-2
-1
0
1
2
3
4
Mass reacted (kg)
Minerals (log
Dolomite-ord
Chalcopyrite
C
Paragonite
Siderite
Muscovite
CalciteQuartz
Au
Pyrite
Sphalerite
As
Realgar
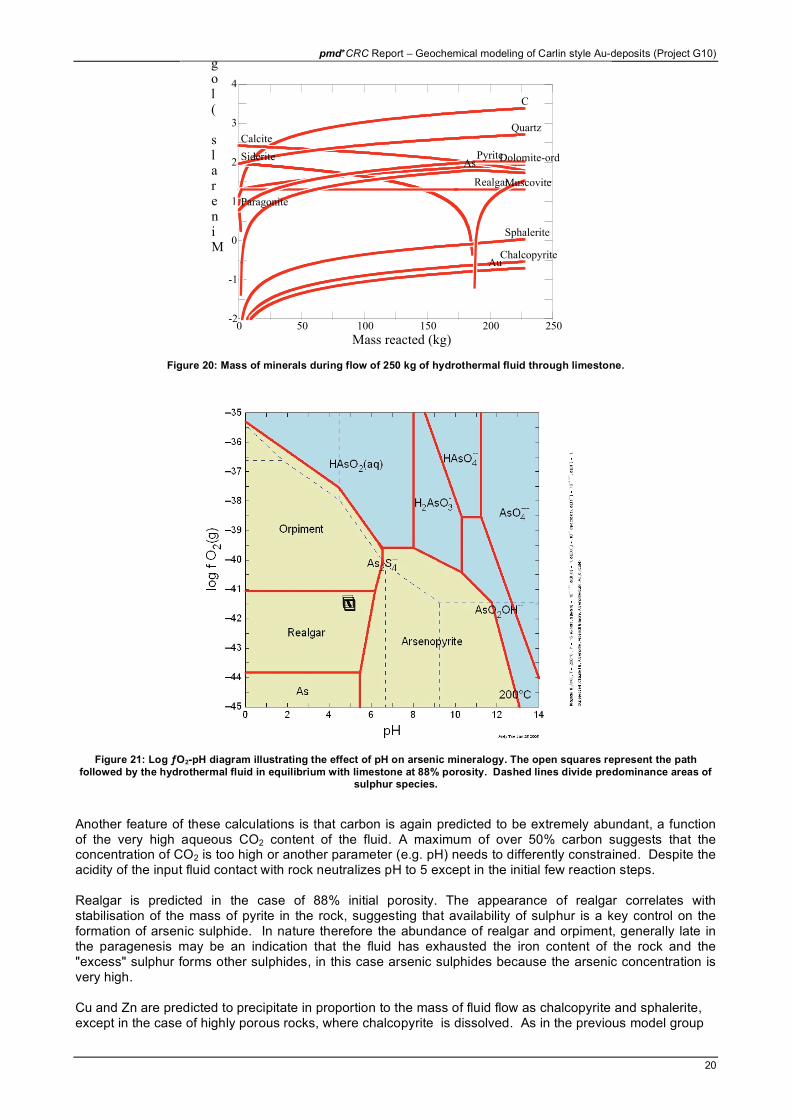
Figure 20: Mass of minerals during flow of 250 kg of hydrothermal fluid through limestone.
Figure 21: Log ƒO2-pH diagram illustrating the effect of pH on arsenic mineralogy. The open squares represent the path
followed by the hydrothermal fluid in equilibrium with limestone at 88% porosity. Dashed lines divide predominance areas of sulphur species.
Another feature of these calculations is that carbon is again predicted to be extremely abundant, a function of the very high aqueous CO2 content of the fluid. A maximum of over 50% carbon suggests that the concentration of CO2 is too high or another parameter (e.g. pH) needs to differently constrained. Despite the acidity of the input fluid contact with rock neutralizes pH to 5 except in the initial few reaction steps. Realgar is predicted in the case of 88% initial porosity. The appearance of realgar correlates with stabilisation of the mass of pyrite in the rock, suggesting that availability of sulphur is a key control on the formation of arsenic sulphide. In nature therefore the abundance of realgar and orpiment, generally late in the paragenesis may be an indication that the fluid has exhausted the iron content of the rock and the "excess" sulphur forms other sulphides, in this case arsenic sulphides because the arsenic concentration is very high. Cu and Zn are predicted to precipitate in proportion to the mass of fluid flow as chalcopyrite and sphalerite, except in the case of highly porous rocks, where chalcopyrite is dissolved. As in the previous model group
pmd*CRC Report – Geochemical modeling of Carlin style Au-deposits (Project G10)
21
this suggests a mechanism whereby Zn-rich and Cu-rich altered limestones can be generated by differing amounts of fluid flow.
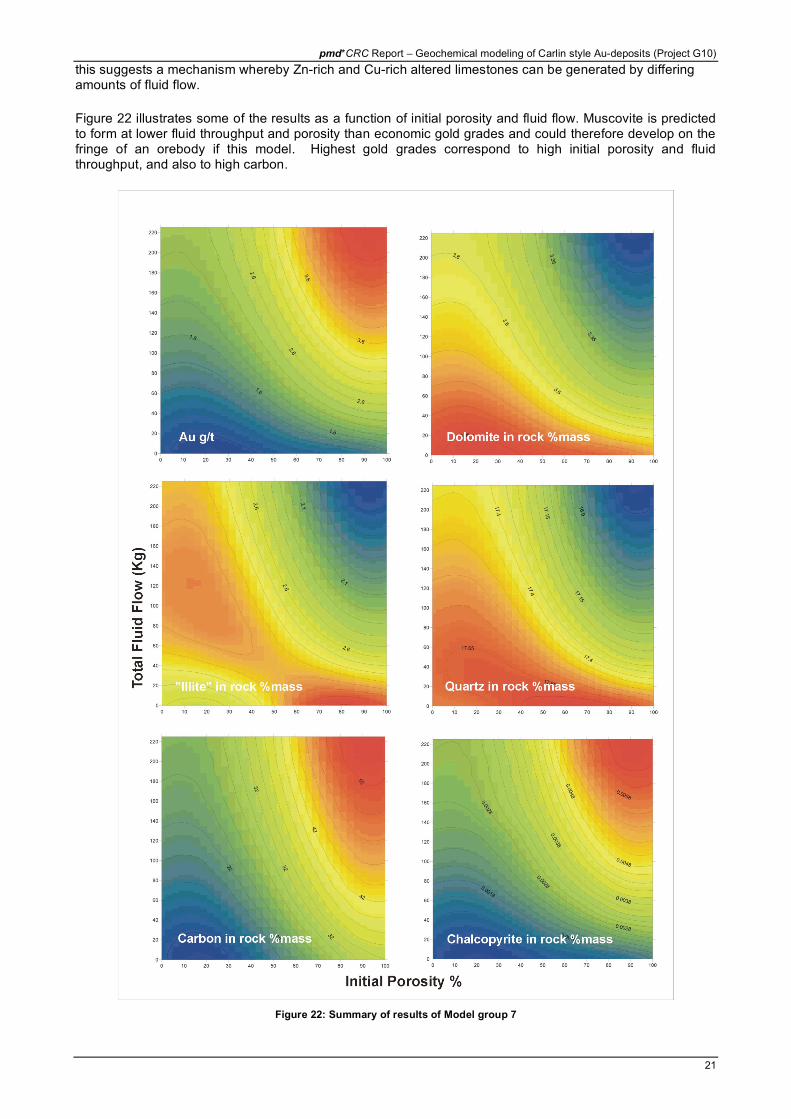
Figure 22 illustrates some of the results as a function of initial porosity and fluid flow. Muscovite is predicted to form at lower fluid throughput and porosity than economic gold grades and could therefore develop on the fringe of an orebody if this model. Highest gold grades correspond to high initial porosity and fluid throughput, and also to high carbon.
Figure 22: Summary of results of Model group 7
pmd*CRC Report – Geochemical modeling of Carlin style Au-deposits (Project G10)
22
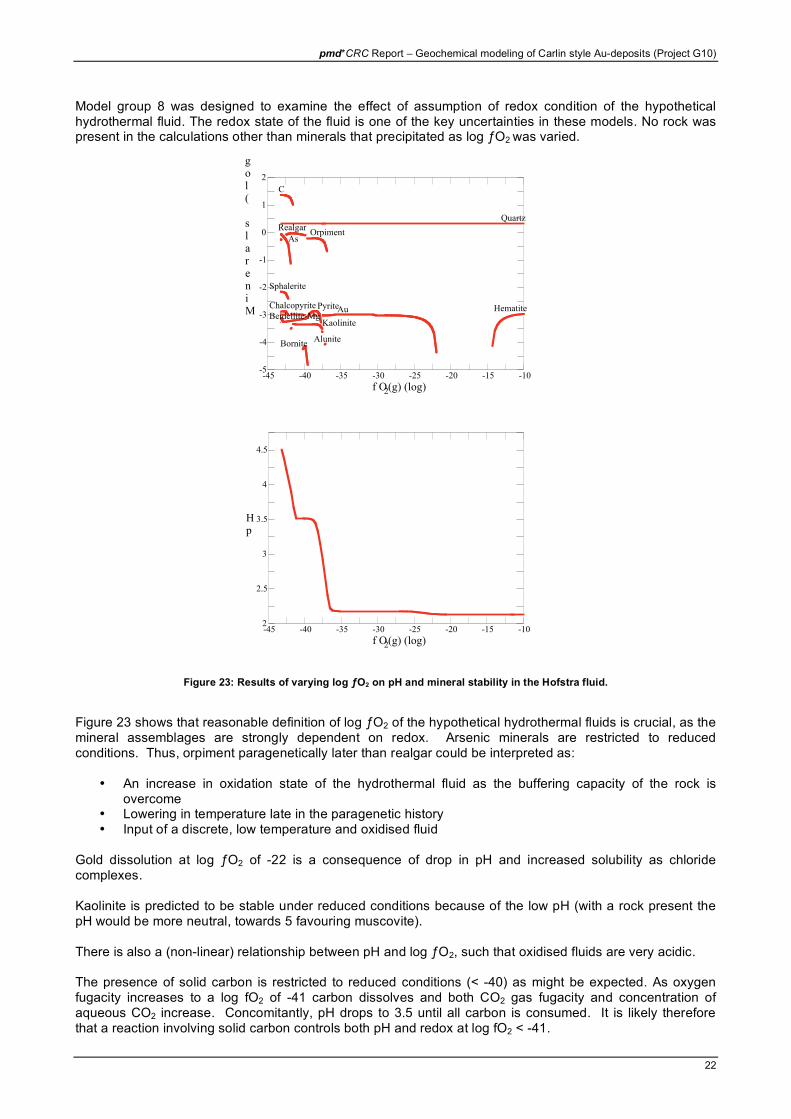
Model group 8 was designed to examine the effect of assumption of redox condition of the hypothetical hydrothermal fluid. The redox state of the fluid is one of the key uncertainties in these models. No rock was present in the calculations other than minerals that precipitated as log ƒO2 was varied.
-45 -40 -35 -30 -25 -20 -15 -10-5
-4
-3
-2
-1
0
1
2
f O2(g) (log)
Minerals (log
Realgar
C
Beidellite-Mg
Quartz
Au
As
Pyrite
Sphalerite
Chalcopyrite
Bornite
Kaolinite
Orpiment
Alunite
Hematite
-45 -40 -35 -30 -25 -20 -15 -102
2.5
3
3.5
4
4.5
f O2(g) (log)
pH
Figure 23: Results of varying log ƒO2 on pH and mineral stability in the Hofstra fluid.
Figure 23 shows that reasonable definition of log ƒO2 of the hypothetical hydrothermal fluids is crucial, as the mineral assemblages are strongly dependent on redox. Arsenic minerals are restricted to reduced conditions. Thus, orpiment paragenetically later than realgar could be interpreted as:
• An increase in oxidation state of the hydrothermal fluid as the buffering capacity of the rock is overcome
• Lowering in temperature late in the paragenetic history • Input of a discrete, low temperature and oxidised fluid
Gold dissolution at log ƒO2 of -22 is a consequence of drop in pH and increased solubility as chloride complexes. Kaolinite is predicted to be stable under reduced conditions because of the low pH (with a rock present the pH would be more neutral, towards 5 favouring muscovite). There is also a (non-linear) relationship between pH and log ƒO2, such that oxidised fluids are very acidic. The presence of solid carbon is restricted to reduced conditions (< -40) as might be expected. As oxygen fugacity increases to a log fO2 of -41 carbon dissolves and both CO2 gas fugacity and concentration of aqueous CO2 increase. Concomitantly, pH drops to 3.5 until all carbon is consumed. It is likely therefore that a reaction involving solid carbon controls both pH and redox at log fO2 < -41.
pmd*CRC Report – Geochemical modeling of Carlin style Au-deposits (Project G10)
23
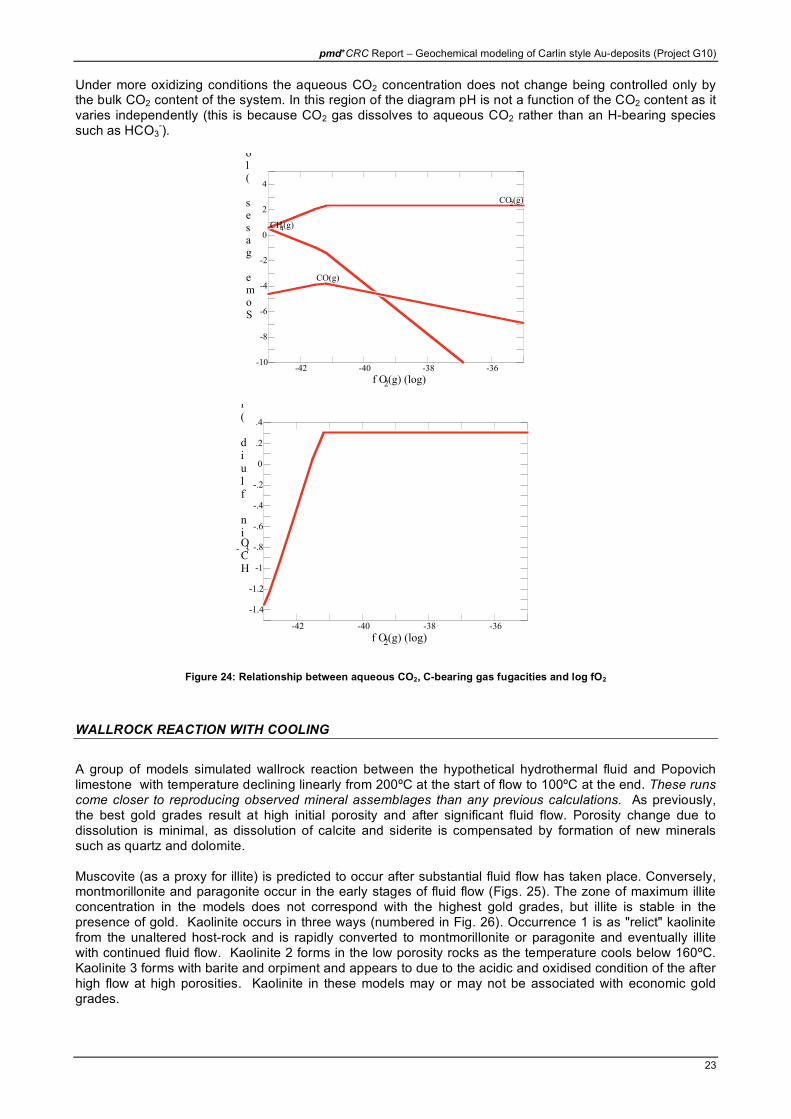
Under more oxidizing conditions the aqueous CO2 concentration does not change being controlled only by the bulk CO2 content of the system. In this region of the diagram pH is not a function of the CO2 content as it varies independently (this is because CO2 gas dissolves to aqueous CO2 rather than an H-bearing species such as HCO3
-).
-42 -40 -38 -36-10
-8
-6
-4
-2
0
2
4
f O2(g) (log)
Some gases (lo
CH4(g)
CO(g)
CO2(g)
-42 -40 -38 -36
-1.4
-1.2
-1
-.8
-.6
-.4
-.2
0
.2
.4
f O2(g) (log)
HCO3-
in fluid (l
Figure 24: Relationship between aqueous CO2, C-bearing gas fugacities and log fO2
WALLROCK REACTION WITH COOLING
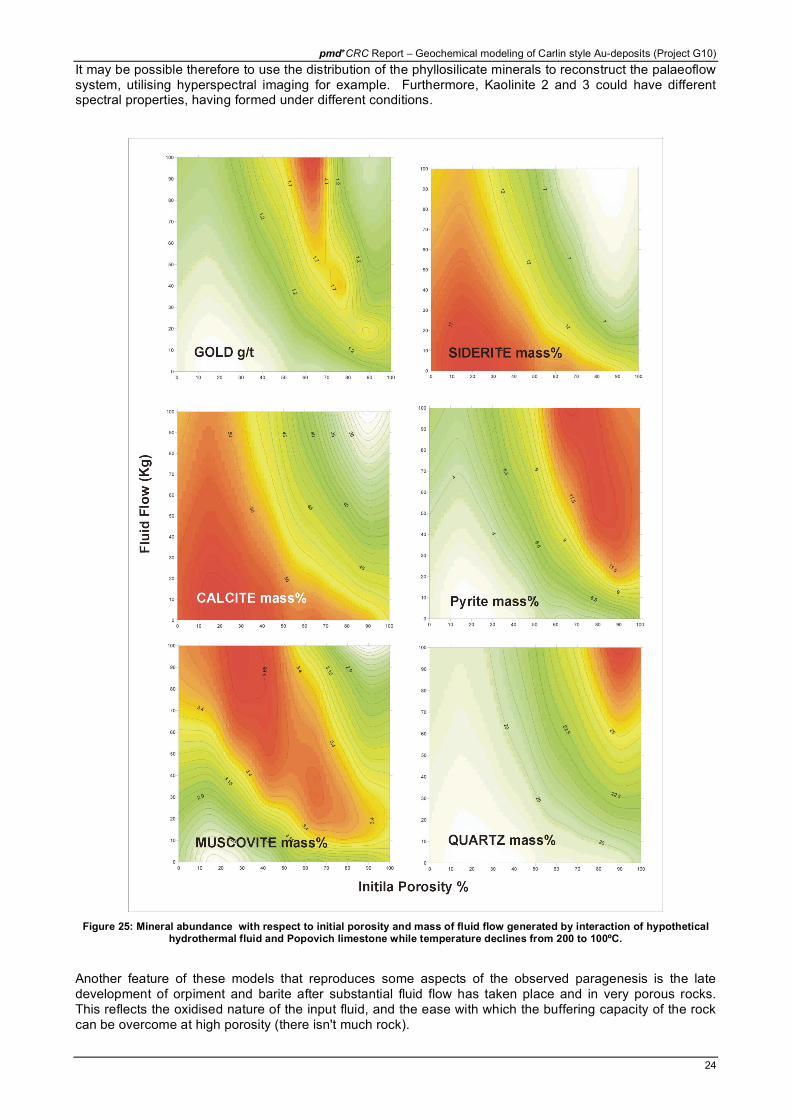
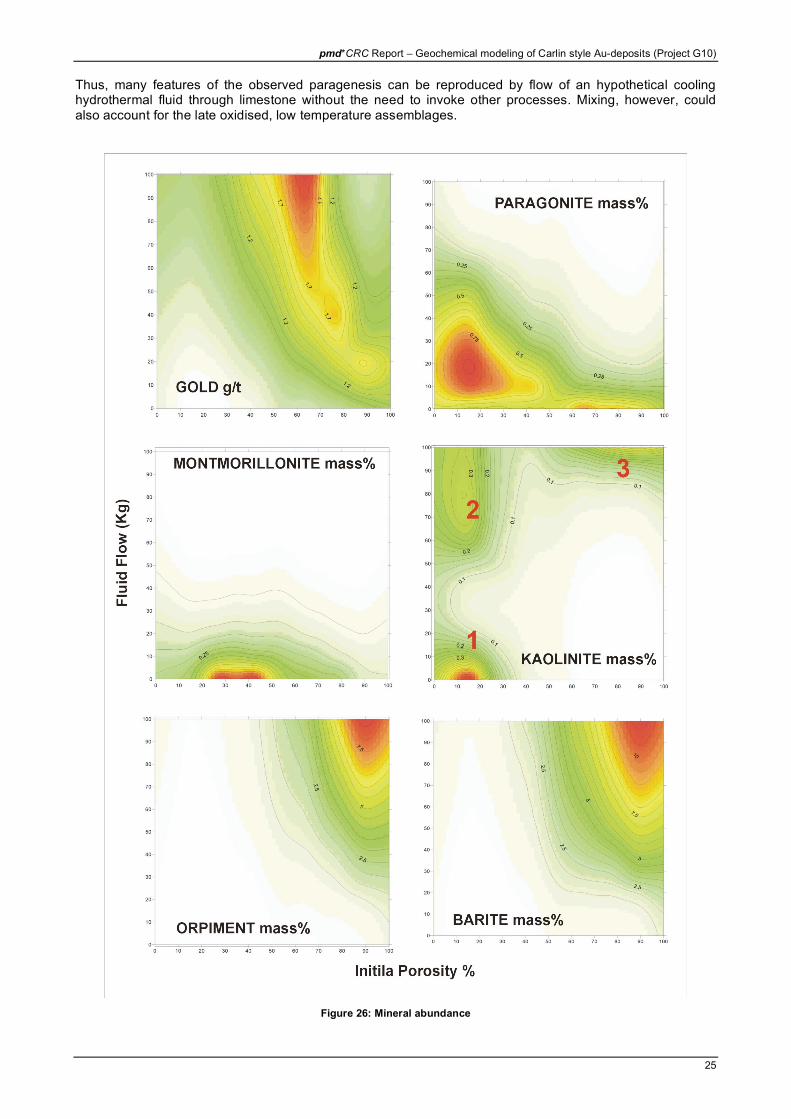
A group of models simulated wallrock reaction between the hypothetical hydrothermal fluid and Popovich limestone with temperature declining linearly from 200ºC at the start of flow to 100ºC at the end. These runs come closer to reproducing observed mineral assemblages than any previous calculations. As previously, the best gold grades result at high initial porosity and after significant fluid flow. Porosity change due to dissolution is minimal, as dissolution of calcite and siderite is compensated by formation of new minerals such as quartz and dolomite. Muscovite (as a proxy for illite) is predicted to occur after substantial fluid flow has taken place. Conversely, montmorillonite and paragonite occur in the early stages of fluid flow (Figs. 25). The zone of maximum illite concentration in the models does not correspond with the highest gold grades, but illite is stable in the presence of gold. Kaolinite occurs in three ways (numbered in Fig. 26). Occurrence 1 is as "relict" kaolinite from the unaltered host-rock and is rapidly converted to montmorillonite or paragonite and eventually illite with continued fluid flow. Kaolinite 2 forms in the low porosity rocks as the temperature cools below 160ºC. Kaolinite 3 forms with barite and orpiment and appears to due to the acidic and oxidised condition of the after high flow at high porosities. Kaolinite in these models may or may not be associated with economic gold grades.
pmd*CRC Report – Geochemical modeling of Carlin style Au-deposits (Project G10)
24
It may be possible therefore to use the distribution of the phyllosilicate minerals to reconstruct the palaeoflow system, utilising hyperspectral imaging for example. Furthermore, Kaolinite 2 and 3 could have different spectral properties, having formed under different conditions.
Figure 25: Mineral abundance with respect to initial porosity and mass of fluid flow generated by interaction of hypothetical hydrothermal fluid and Popovich limestone while temperature declines from 200 to 100ºC.
Another feature of these models that reproduces some aspects of the observed paragenesis is the late development of orpiment and barite after substantial fluid flow has taken place and in very porous rocks. This reflects the oxidised nature of the input fluid, and the ease with which the buffering capacity of the rock can be overcome at high porosity (there isn't much rock).
pmd*CRC Report – Geochemical modeling of Carlin style Au-deposits (Project G10)
25
Thus, many features of the observed paragenesis can be reproduced by flow of an hypothetical cooling hydrothermal fluid through limestone without the need to invoke other processes. Mixing, however, could also account for the late oxidised, low temperature assemblages.
Figure 26: Mineral abundance
pmd*CRC Report – Geochemical modeling of Carlin style Au-deposits (Project G10)
26
MIXING OF HYDROTHERMAL FLUID AND VARIOUS SURFACE WATERS
In order to model mixing, analyses of different types of surface waters from Utah (Mundorff, 1971; Hahl, 1969 & Hahl & Hundy, 1969) were compiled and are summarised in table 4.
median mg/kg
Utah River
Water
Great Salt Lake
Brine
Low Na non-
Thermal Springs
High Na non-
Thermal Springs
# analyses 132 41
pH 7.7 7.6 7.7 7.7
Na 209 78,400 8.1 746
K 7 6,730 1.2 37.5
Ca 136 220 54 114
Mg 72 10,047 17.5 61
Al (estimated)
SiO2 (aq) 18 4 9.7 30
Cl- 772 144,500 8.1 1380
SO42-
164 22,500 13.5 152
HCO3-
291 477 234 220
Saturated at 15ºC
Dolomite Dolomite Dolomite Dolomite
Quartz Magnesite Quartz Quartz
Antigorite
No data for Fe, Al, Au, As
Table 4: Compositions of contemporary surface waters from Utah (Mundorff, 1971; Hahl, 1969 & Hahl & Hundy, 1969). Note
that all the waters are predicted to be saturated with respect to dolomite at 15ºC.
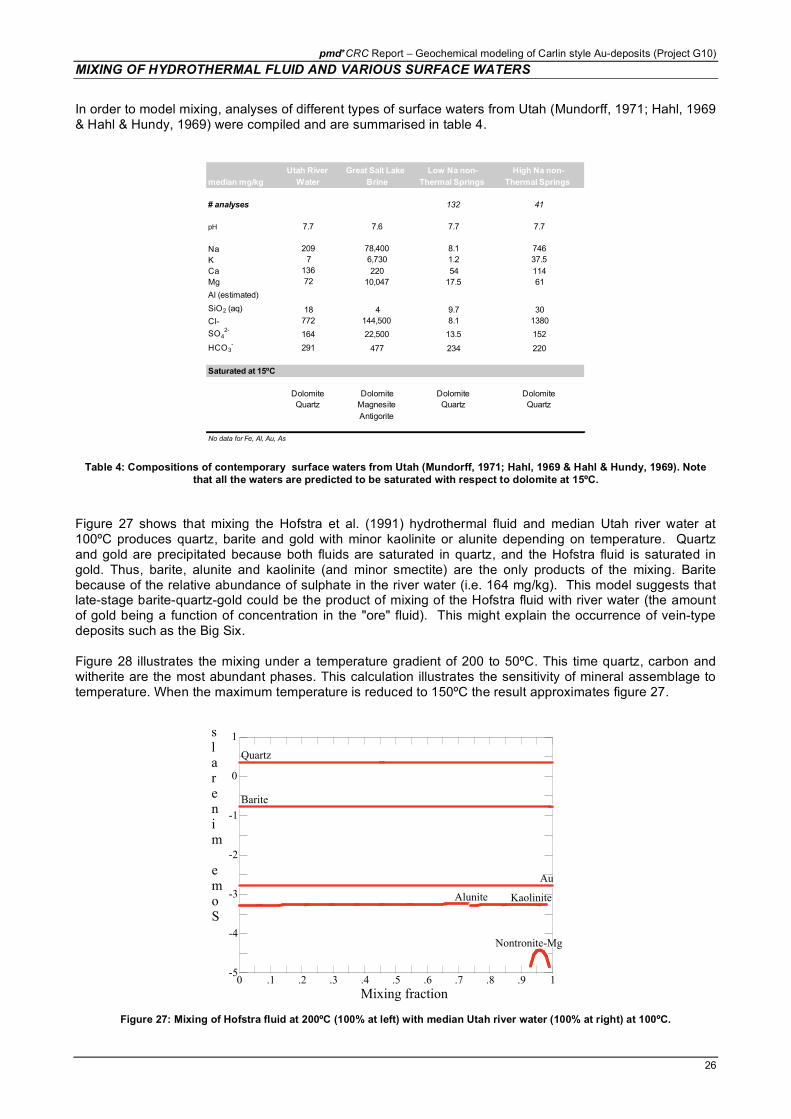
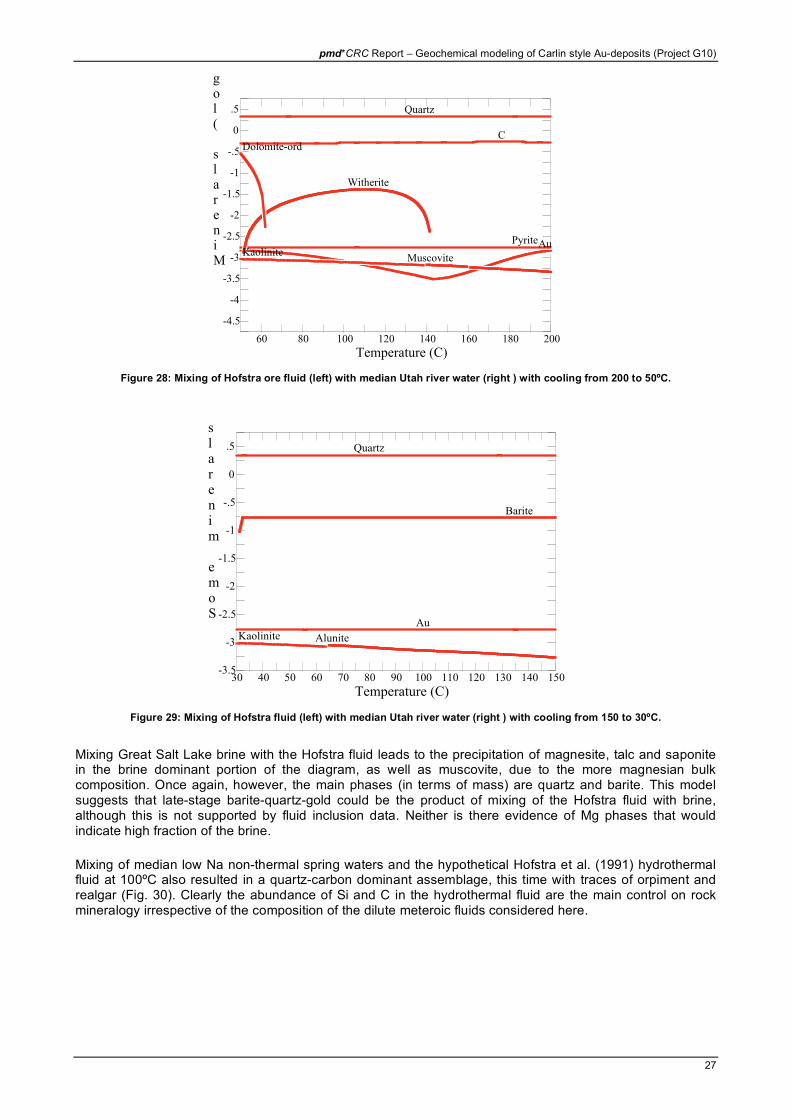
Figure 27 shows that mixing the Hofstra et al. (1991) hydrothermal fluid and median Utah river water at 100ºC produces quartz, barite and gold with minor kaolinite or alunite depending on temperature. Quartz and gold are precipitated because both fluids are saturated in quartz, and the Hofstra fluid is saturated in gold. Thus, barite, alunite and kaolinite (and minor smectite) are the only products of the mixing. Barite because of the relative abundance of sulphate in the river water (i.e. 164 mg/kg). This model suggests that late-stage barite-quartz-gold could be the product of mixing of the Hofstra fluid with river water (the amount of gold being a function of concentration in the "ore" fluid). This might explain the occurrence of vein-type deposits such as the Big Six. Figure 28 illustrates the mixing under a temperature gradient of 200 to 50ºC. This time quartz, carbon and witherite are the most abundant phases. This calculation illustrates the sensitivity of mineral assemblage to temperature. When the maximum temperature is reduced to 150ºC the result approximates figure 27.
0 .1 .2 .3 .4 .5 .6 .7 .8 .9 1-5
-4
-3
-2
-1
0
1
Mixing fraction
Some minerals
Alunite
Au
Barite
Quartz
Kaolinite
Nontronite-Mg
Figure 27: Mixing of Hofstra fluid at 200ºC (100% at left) with median Utah river water (100% at right) at 100ºC.
pmd*CRC Report – Geochemical modeling of Carlin style Au-deposits (Project G10)
27
60 80 100 120 140 160 180 200
-4.5
-4
-3.5
-3
-2.5
-2
-1.5
-1
-.5
0
.5
Temperature (C)
Minerals (log
AuPyrite
Quartz
C
KaoliniteMuscovite
Witherite
Dolomite-ord
Figure 28: Mixing of Hofstra ore fluid (left) with median Utah river water (right ) with cooling from 200 to 50ºC.
30 40 50 60 70 80 90 100 110 120 130 140 150-3.5
-3
-2.5
-2
-1.5
-1
-.5
0
.5
Temperature (C)
Some minerals
Alunite
Au
Barite
Quartz
Kaolinite
Figure 29: Mixing of Hofstra fluid (left) with median Utah river water (right ) with cooling from 150 to 30ºC.
Mixing Great Salt Lake brine with the Hofstra fluid leads to the precipitation of magnesite, talc and saponite in the brine dominant portion of the diagram, as well as muscovite, due to the more magnesian bulk composition. Once again, however, the main phases (in terms of mass) are quartz and barite. This model suggests that late-stage barite-quartz-gold could be the product of mixing of the Hofstra fluid with brine, although this is not supported by fluid inclusion data. Neither is there evidence of Mg phases that would indicate high fraction of the brine.
Mixing of median low Na non-thermal spring waters and the hypothetical Hofstra et al. (1991) hydrothermal fluid at 100ºC also resulted in a quartz-carbon dominant assemblage, this time with traces of orpiment and realgar (Fig. 30). Clearly the abundance of Si and C in the hydrothermal fluid are the main control on rock mineralogy irrespective of the composition of the dilute meteroic fluids considered here.
pmd*CRC Report – Geochemical modeling of Carlin style Au-deposits (Project G10)
28
0 .1 .2 .3 .4 .5 .6 .7 .8 .9 1-4.5
-4
-3.5
-3
-2.5
-2
-1.5
-1
-.5
0
.5
Mixing fraction
Some minerals
AuPyrite
Quartz
C
Kaolinite
Orpiment
Beidellite-Mg
Realgar
Montmor-Mg
Saponite-Mg
As
Calcite
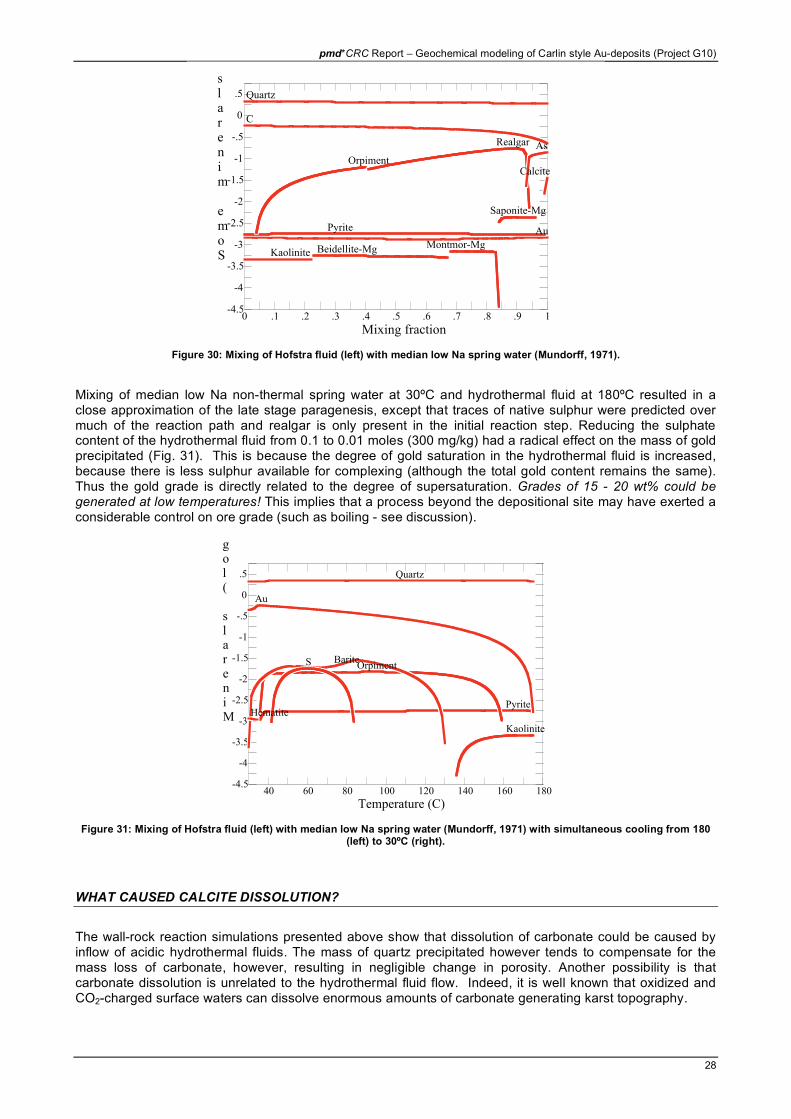
Figure 30: Mixing of Hofstra fluid (left) with median low Na spring water (Mundorff, 1971).
Mixing of median low Na non-thermal spring water at 30ºC and hydrothermal fluid at 180ºC resulted in a close approximation of the late stage paragenesis, except that traces of native sulphur were predicted over much of the reaction path and realgar is only present in the initial reaction step. Reducing the sulphate content of the hydrothermal fluid from 0.1 to 0.01 moles (300 mg/kg) had a radical effect on the mass of gold precipitated (Fig. 31). This is because the degree of gold saturation in the hydrothermal fluid is increased, because there is less sulphur available for complexing (although the total gold content remains the same). Thus the gold grade is directly related to the degree of supersaturation. Grades of 15 - 20 wt% could be generated at low temperatures! This implies that a process beyond the depositional site may have exerted a considerable control on ore grade (such as boiling - see discussion).
40 60 80 100 120 140 160 180-4.5
-4
-3.5
-3
-2.5
-2
-1.5
-1
-.5
0
.5
Temperature (C)
Minerals (log
Pyrite
Quartz
Kaolinite
Au
OrpimentBariteS
Hematite
Figure 31: Mixing of Hofstra fluid (left) with median low Na spring water (Mundorff, 1971) with simultaneous cooling from 180 (left) to 30ºC (right).
WHAT CAUSED CALCITE DISSOLUTION?
The wall-rock reaction simulations presented above show that dissolution of carbonate could be caused by inflow of acidic hydrothermal fluids. The mass of quartz precipitated however tends to compensate for the mass loss of carbonate, however, resulting in negligible change in porosity. Another possibility is that carbonate dissolution is unrelated to the hydrothermal fluid flow. Indeed, it is well known that oxidized and CO2-charged surface waters can dissolve enormous amounts of carbonate generating karst topography.
pmd*CRC Report – Geochemical modeling of Carlin style Au-deposits (Project G10)
29
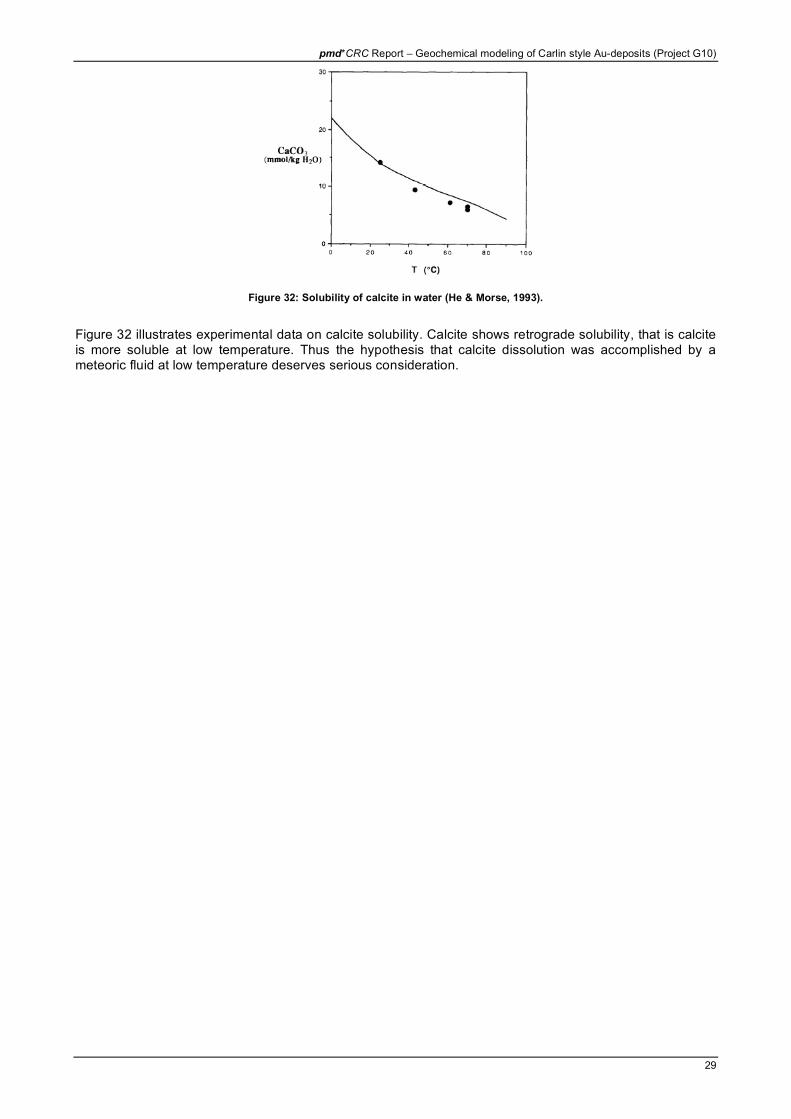
Figure 32: Solubility of calcite in water (He & Morse, 1993).
Figure 32 illustrates experimental data on calcite solubility. Calcite shows retrograde solubility, that is calcite is more soluble at low temperature. Thus the hypothesis that calcite dissolution was accomplished by a meteoric fluid at low temperature deserves serious consideration.
pmd*CRC Report – Geochemical modeling of Carlin style Au-deposits (Project G10)
30
REACTIVE TRANSPORT MODELLING
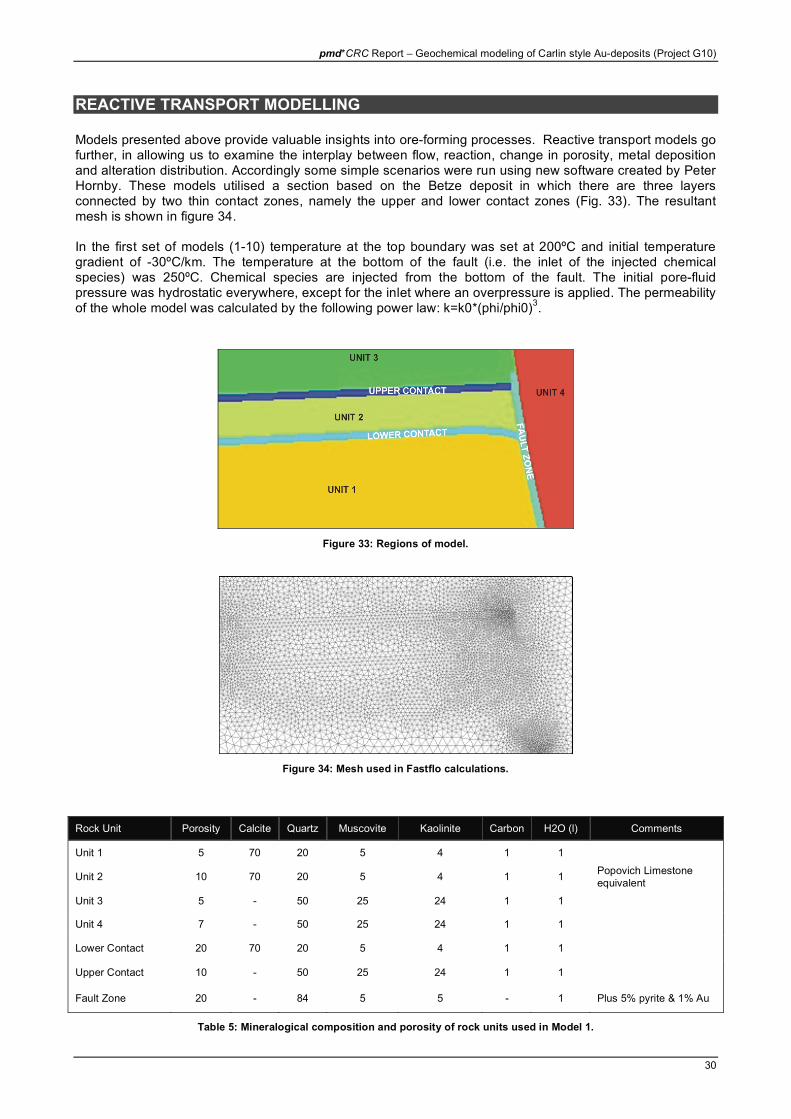
Models presented above provide valuable insights into ore-forming processes. Reactive transport models go further, in allowing us to examine the interplay between flow, reaction, change in porosity, metal deposition and alteration distribution. Accordingly some simple scenarios were run using new software created by Peter Hornby. These models utilised a section based on the Betze deposit in which there are three layers connected by two thin contact zones, namely the upper and lower contact zones (Fig. 33). The resultant mesh is shown in figure 34. In the first set of models (1-10) temperature at the top boundary was set at 200ºC and initial temperature gradient of -30ºC/km. The temperature at the bottom of the fault (i.e. the inlet of the injected chemical species) was 250ºC. Chemical species are injected from the bottom of the fault. The initial pore-fluid pressure was hydrostatic everywhere, except for the inlet where an overpressure is applied. The permeability of the whole model was calculated by the following power law: k=k0*(phi/phi0)
3.
Figure 33: Regions of model.
Figure 34: Mesh used in Fastflo calculations.
Rock Unit Porosity Calcite Quartz Muscovite Kaolinite Carbon H2O (l) Comments
Unit 1 5 70 20 5 4 1 1
Unit 2 10 70 20 5 4 1 1 Popovich Limestone
equivalent
Unit 3 5 - 50 25 24 1 1
Unit 4 7 - 50 25 24 1 1
Lower Contact 20 70 20 5 4 1 1
Upper Contact 10 - 50 25 24 1 1
Fault Zone 20 - 84 5 5 - 1 Plus 5% pyrite & 1% Au
Table 5: Mineralogical composition and porosity of rock units used in Model 1.
pmd*CRC Report – Geochemical modeling of Carlin style Au-deposits (Project G10)
31
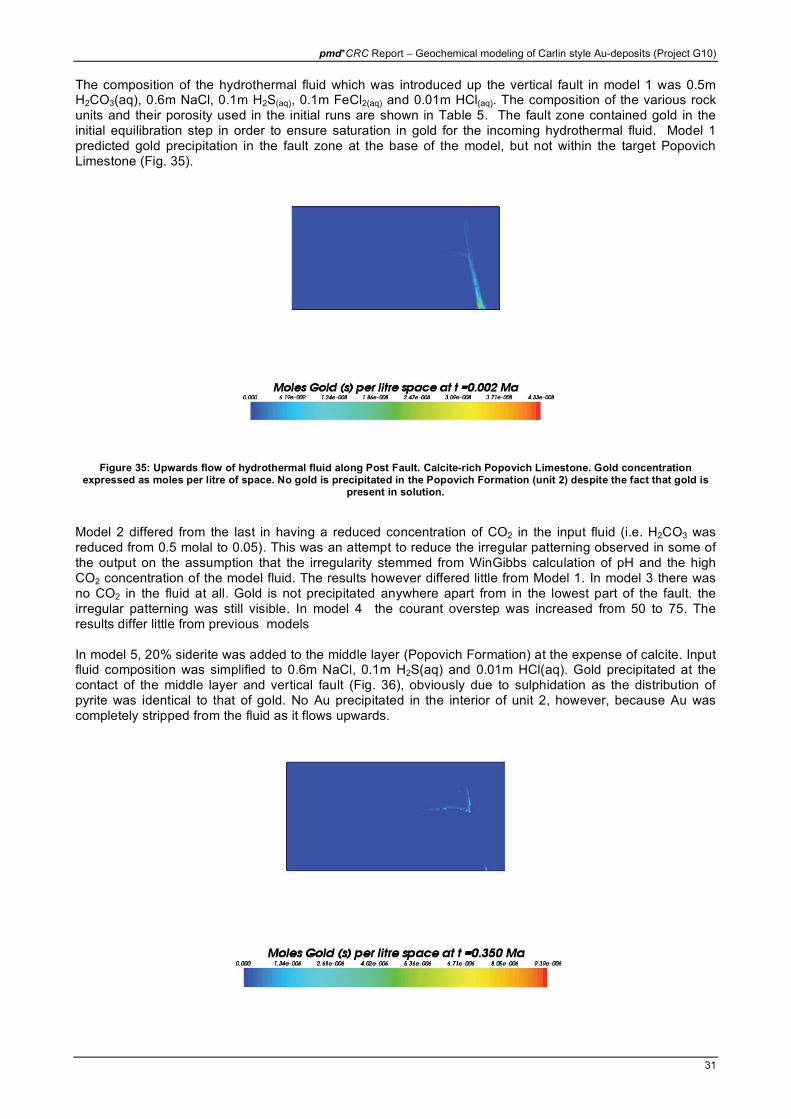
The composition of the hydrothermal fluid which was introduced up the vertical fault in model 1 was 0.5m H2CO3(aq), 0.6m NaCl, 0.1m H2S(aq), 0.1m FeCl2(aq) and 0.01m HCl(aq). The composition of the various rock units and their porosity used in the initial runs are shown in Table 5. The fault zone contained gold in the initial equilibration step in order to ensure saturation in gold for the incoming hydrothermal fluid. Model 1 predicted gold precipitation in the fault zone at the base of the model, but not within the target Popovich Limestone (Fig. 35).
Figure 35: Upwards flow of hydrothermal fluid along Post Fault. Calcite-rich Popovich Limestone. Gold concentration expressed as moles per litre of space. No gold is precipitated in the Popovich Formation (unit 2) despite the fact that gold is
present in solution.
Model 2 differed from the last in having a reduced concentration of CO2 in the input fluid (i.e. H2CO3 was reduced from 0.5 molal to 0.05). This was an attempt to reduce the irregular patterning observed in some of the output on the assumption that the irregularity stemmed from WinGibbs calculation of pH and the high CO2 concentration of the model fluid. The results however differed little from Model 1. In model 3 there was no CO2 in the fluid at all. Gold is not precipitated anywhere apart from in the lowest part of the fault. the irregular patterning was still visible. In model 4 the courant overstep was increased from 50 to 75. The results differ little from previous models In model 5, 20% siderite was added to the middle layer (Popovich Formation) at the expense of calcite. Input fluid composition was simplified to 0.6m NaCl, 0.1m H2S(aq) and 0.01m HCl(aq). Gold precipitated at the contact of the middle layer and vertical fault (Fig. 36), obviously due to sulphidation as the distribution of pyrite was identical to that of gold. No Au precipitated in the interior of unit 2, however, because Au was completely stripped from the fluid as it flows upwards.
pmd*CRC Report – Geochemical modeling of Carlin style Au-deposits (Project G10)
32
Figure 36: Upwards flow of hydrothermal fluid along Post Fault. Iron-rich Popovich Limestone. Gold concentration expressed as moles per litre of space. Gold precipitated at the contacts of the Popovich Formation
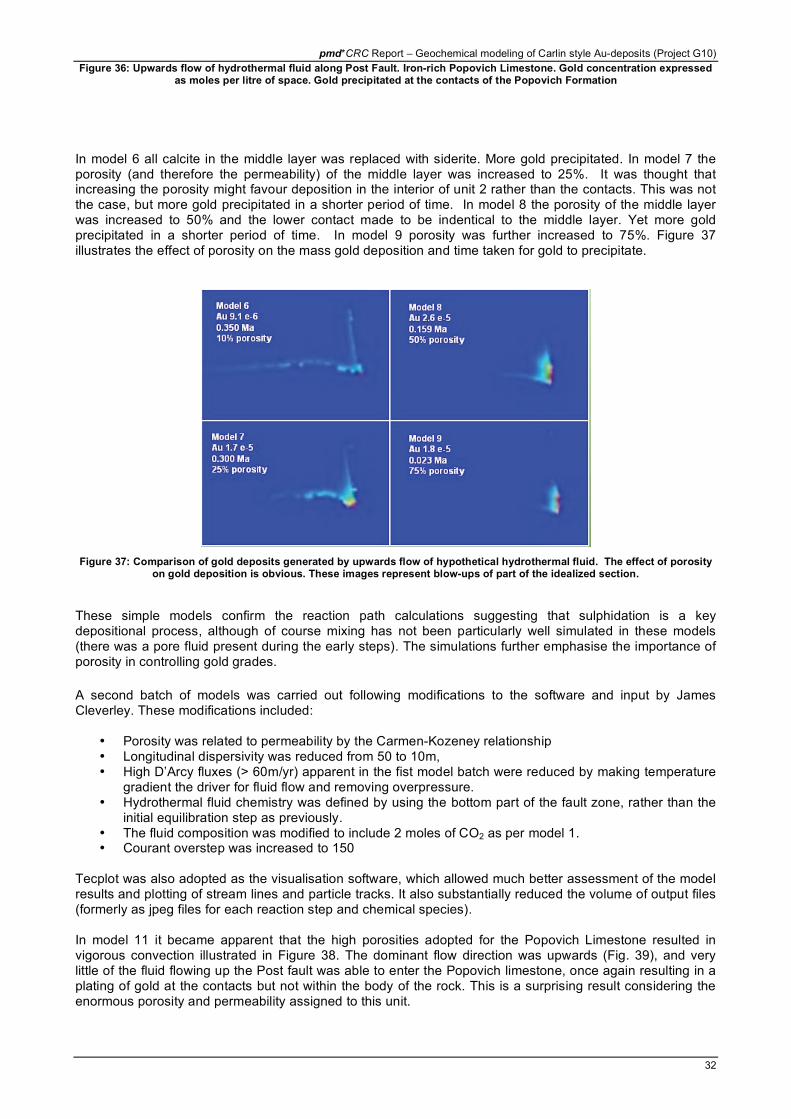
In model 6 all calcite in the middle layer was replaced with siderite. More gold precipitated. In model 7 the porosity (and therefore the permeability) of the middle layer was increased to 25%. It was thought that increasing the porosity might favour deposition in the interior of unit 2 rather than the contacts. This was not the case, but more gold precipitated in a shorter period of time. In model 8 the porosity of the middle layer was increased to 50% and the lower contact made to be indentical to the middle layer. Yet more gold precipitated in a shorter period of time. In model 9 porosity was further increased to 75%. Figure 37 illustrates the effect of porosity on the mass gold deposition and time taken for gold to precipitate.
Figure 37: Comparison of gold deposits generated by upwards flow of hypothetical hydrothermal fluid. The effect of porosity on gold deposition is obvious. These images represent blow-ups of part of the idealized section.
These simple models confirm the reaction path calculations suggesting that sulphidation is a key depositional process, although of course mixing has not been particularly well simulated in these models (there was a pore fluid present during the early steps). The simulations further emphasise the importance of porosity in controlling gold grades.
A second batch of models was carried out following modifications to the software and input by James Cleverley. These modifications included:
• Porosity was related to permeability by the Carmen-Kozeney relationship • Longitudinal dispersivity was reduced from 50 to 10m, • High D’Arcy fluxes (> 60m/yr) apparent in the fist model batch were reduced by making temperature
gradient the driver for fluid flow and removing overpressure. • Hydrothermal fluid chemistry was defined by using the bottom part of the fault zone, rather than the
initial equilibration step as previously. • The fluid composition was modified to include 2 moles of CO2 as per model 1. • Courant overstep was increased to 150
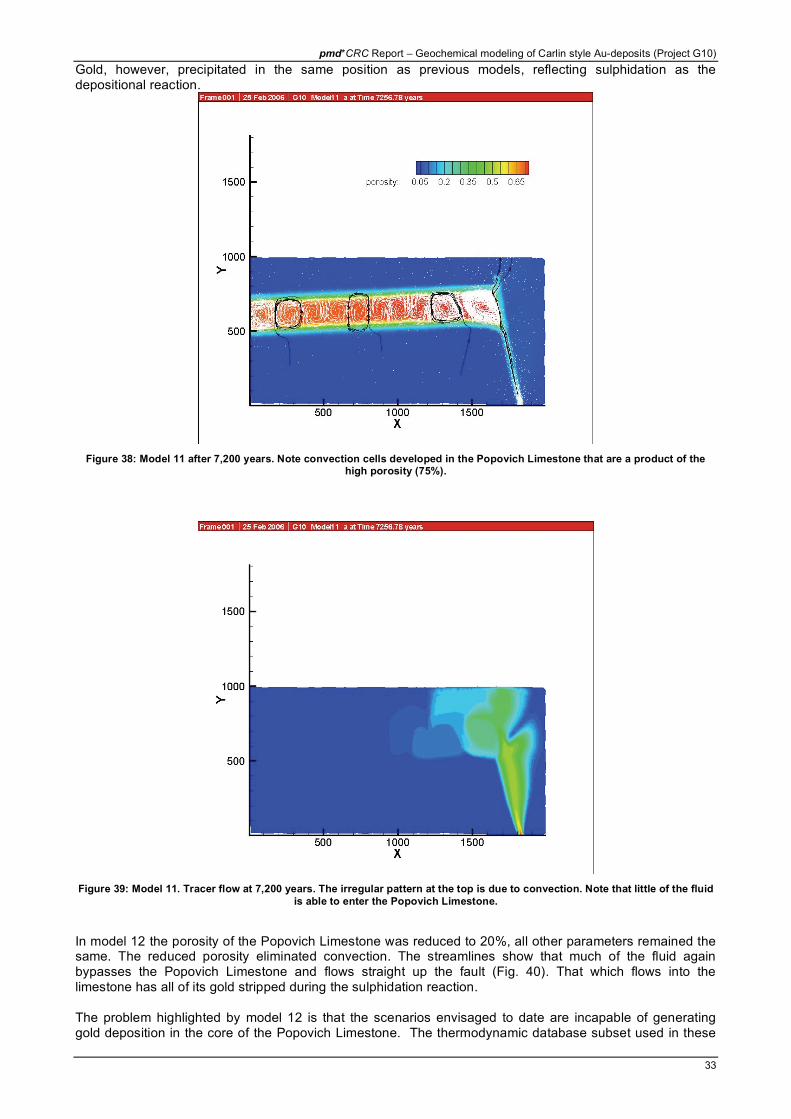
Tecplot was also adopted as the visualisation software, which allowed much better assessment of the model results and plotting of stream lines and particle tracks. It also substantially reduced the volume of output files (formerly as jpeg files for each reaction step and chemical species). In model 11 it became apparent that the high porosities adopted for the Popovich Limestone resulted in vigorous convection illustrated in Figure 38. The dominant flow direction was upwards (Fig. 39), and very little of the fluid flowing up the Post fault was able to enter the Popovich limestone, once again resulting in a plating of gold at the contacts but not within the body of the rock. This is a surprising result considering the enormous porosity and permeability assigned to this unit.
pmd*CRC Report – Geochemical modeling of Carlin style Au-deposits (Project G10)
33
Gold, however, precipitated in the same position as previous models, reflecting sulphidation as the depositional reaction.
Figure 38: Model 11 after 7,200 years. Note convection cells developed in the Popovich Limestone that are a product of the high porosity (75%).
Figure 39: Model 11. Tracer flow at 7,200 years. The irregular pattern at the top is due to convection. Note that little of the fluid
is able to enter the Popovich Limestone.
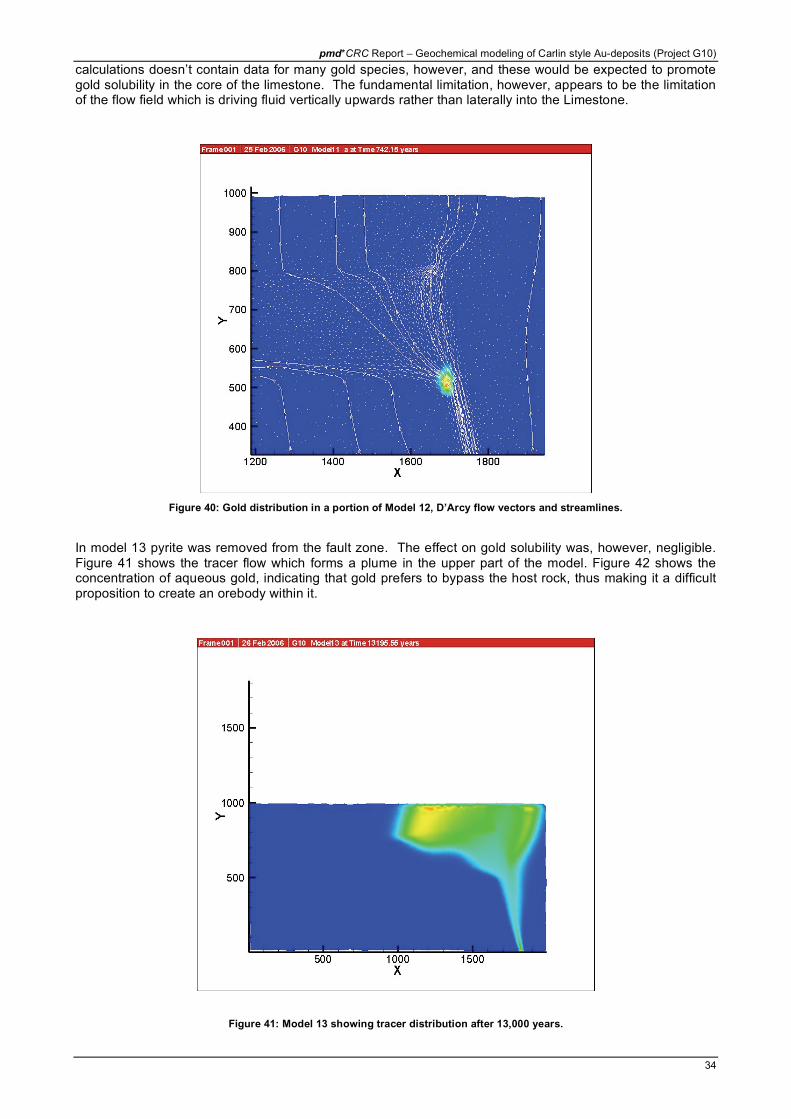
In model 12 the porosity of the Popovich Limestone was reduced to 20%, all other parameters remained the same. The reduced porosity eliminated convection. The streamlines show that much of the fluid again bypasses the Popovich Limestone and flows straight up the fault (Fig. 40). That which flows into the limestone has all of its gold stripped during the sulphidation reaction. The problem highlighted by model 12 is that the scenarios envisaged to date are incapable of generating gold deposition in the core of the Popovich Limestone. The thermodynamic database subset used in these
pmd*CRC Report – Geochemical modeling of Carlin style Au-deposits (Project G10)
34
calculations doesn’t contain data for many gold species, however, and these would be expected to promote gold solubility in the core of the limestone. The fundamental limitation, however, appears to be the limitation of the flow field which is driving fluid vertically upwards rather than laterally into the Limestone.
Figure 40: Gold distribution in a portion of Model 12, D’Arcy flow vectors and streamlines.
In model 13 pyrite was removed from the fault zone. The effect on gold solubility was, however, negligible. Figure 41 shows the tracer flow which forms a plume in the upper part of the model. Figure 42 shows the concentration of aqueous gold, indicating that gold prefers to bypass the host rock, thus making it a difficult proposition to create an orebody within it.
Figure 41: Model 13 showing tracer distribution after 13,000 years.
pmd*CRC Report – Geochemical modeling of Carlin style Au-deposits (Project G10)
35
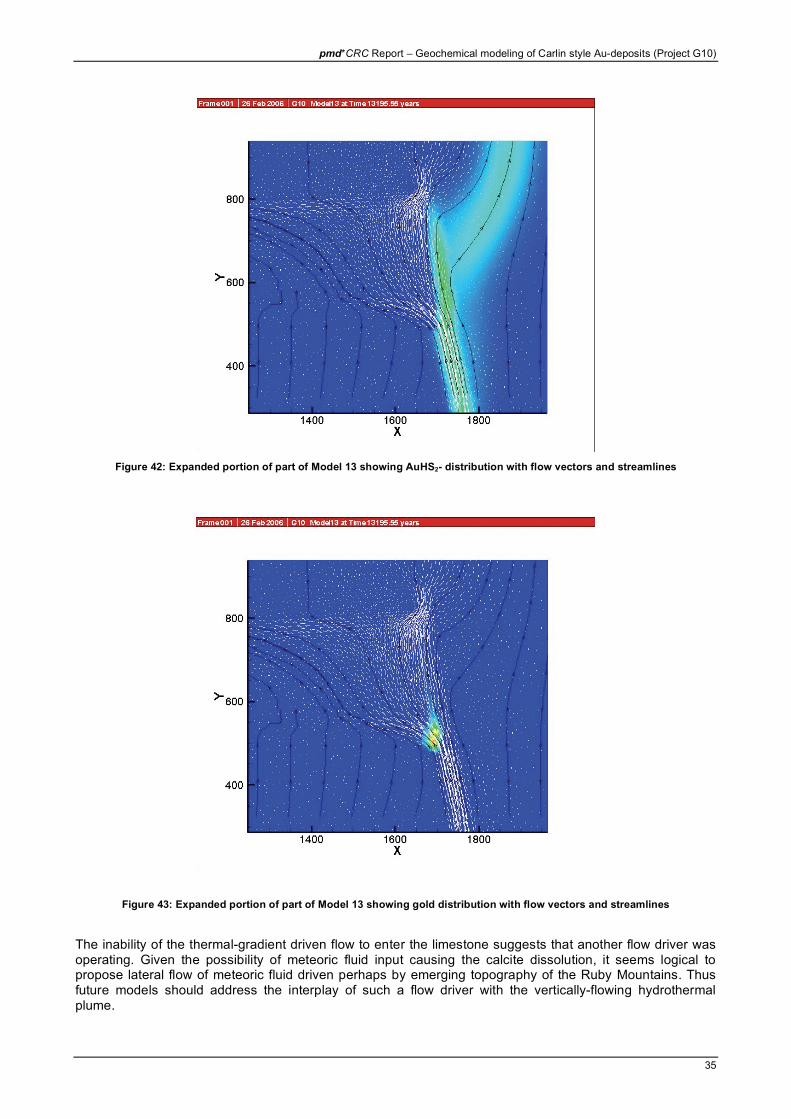
Figure 42: Expanded portion of part of Model 13 showing AuHS2- distribution with flow vectors and streamlines
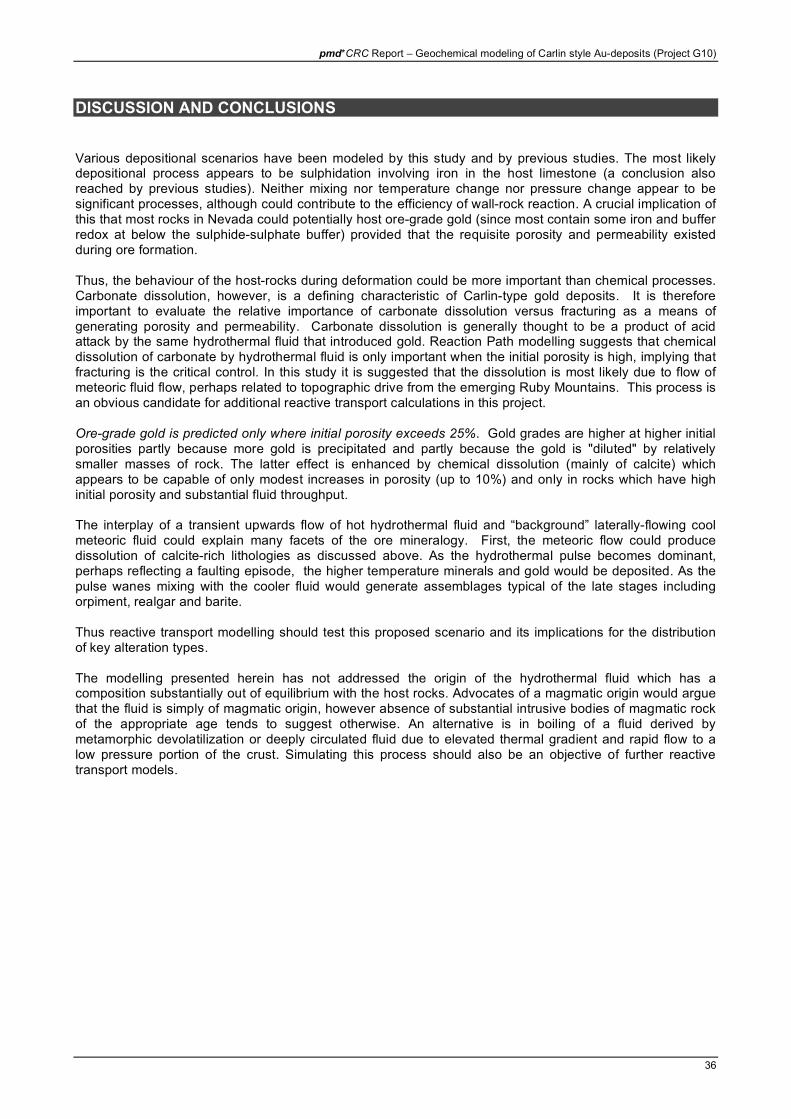
Figure 43: Expanded portion of part of Model 13 showing gold distribution with flow vectors and streamlines
The inability of the thermal-gradient driven flow to enter the limestone suggests that another flow driver was operating. Given the possibility of meteoric fluid input causing the calcite dissolution, it seems logical to propose lateral flow of meteoric fluid driven perhaps by emerging topography of the Ruby Mountains. Thus future models should address the interplay of such a flow driver with the vertically-flowing hydrothermal plume.
pmd*CRC Report – Geochemical modeling of Carlin style Au-deposits (Project G10)
36
DISCUSSION AND CONCLUSIONS
Various depositional scenarios have been modeled by this study and by previous studies. The most likely depositional process appears to be sulphidation involving iron in the host limestone (a conclusion also reached by previous studies). Neither mixing nor temperature change nor pressure change appear to be significant processes, although could contribute to the efficiency of wall-rock reaction. A crucial implication of this that most rocks in Nevada could potentially host ore-grade gold (since most contain some iron and buffer redox at below the sulphide-sulphate buffer) provided that the requisite porosity and permeability existed during ore formation. Thus, the behaviour of the host-rocks during deformation could be more important than chemical processes. Carbonate dissolution, however, is a defining characteristic of Carlin-type gold deposits. It is therefore important to evaluate the relative importance of carbonate dissolution versus fracturing as a means of generating porosity and permeability. Carbonate dissolution is generally thought to be a product of acid attack by the same hydrothermal fluid that introduced gold. Reaction Path modelling suggests that chemical dissolution of carbonate by hydrothermal fluid is only important when the initial porosity is high, implying that fracturing is the critical control. In this study it is suggested that the dissolution is most likely due to flow of meteoric fluid flow, perhaps related to topographic drive from the emerging Ruby Mountains. This process is an obvious candidate for additional reactive transport calculations in this project. Ore-grade gold is predicted only where initial porosity exceeds 25%. Gold grades are higher at higher initial porosities partly because more gold is precipitated and partly because the gold is "diluted" by relatively smaller masses of rock. The latter effect is enhanced by chemical dissolution (mainly of calcite) which appears to be capable of only modest increases in porosity (up to 10%) and only in rocks which have high initial porosity and substantial fluid throughput. The interplay of a transient upwards flow of hot hydrothermal fluid and “background” laterally-flowing cool meteoric fluid could explain many facets of the ore mineralogy. First, the meteoric flow could produce dissolution of calcite-rich lithologies as discussed above. As the hydrothermal pulse becomes dominant, perhaps reflecting a faulting episode, the higher temperature minerals and gold would be deposited. As the pulse wanes mixing with the cooler fluid would generate assemblages typical of the late stages including orpiment, realgar and barite. Thus reactive transport modelling should test this proposed scenario and its implications for the distribution of key alteration types. The modelling presented herein has not addressed the origin of the hydrothermal fluid which has a composition substantially out of equilibrium with the host rocks. Advocates of a magmatic origin would argue that the fluid is simply of magmatic origin, however absence of substantial intrusive bodies of magmatic rock of the appropriate age tends to suggest otherwise. An alternative is in boiling of a fluid derived by metamorphic devolatilization or deeply circulated fluid due to elevated thermal gradient and rapid flow to a low pressure portion of the crust. Simulating this process should also be an objective of further reactive transport models.
pmd*CRC Report – Geochemical modeling of Carlin style Au-deposits (Project G10)
37
REFERENCES
Bethke, C. M., 1998, The Geochemist’s Workbench: University of Illinois, 184 pp. Cleverley J.S., Benning, L., Mountain, B., 2003, Reaction Path Modelling in the As-S System: A Case study for geothermal As transport:
Applied Geochem., V18, pp. 1325-1345. Clode C.H., Grusing S.R., Heitt D.G., Johnston I.M., 1997, The relationship of structure, alteration, and stratigraphy to formation of the
Deep Star gold deposit, Eureka County, Nevada. In: Carlin-type gold deposits field conference. Guidebook Series. 28; pp. 239-256. Cline J., Hofstra A., Muntean J., Tosdal D, Hickey K., 2005, . Sedimentary Rock-Hosted Disseminated Gold Deposits: Part 1, Carlin-
type Gold Deposits in Nevada, USA: District Comparisons, Essential Features, and Viable Models: Economic Geology 100th Anniversary
Volume.
Hahl, D.C., 1969, Dissolved Mineral Inflow to Great Lake and Chemical Characteristics of the Salt Lake Brine: Utah Geological & Mineralogical Survey, Water Resources Bulletin #10.
Hahl D.C, & Hundy, A.H., 1969, Great Salt Lake Utah: Utah Geological & Mineralogical Survey, Water Resources Bulletin #12. He S., Morse J.W., 1993, The carbonic acid system and calcite solubility in aqueous Na-K-Ca-Mg-Cl-SO4 solutions from 0 to 90ºC.
Geochimica et Cosmochimica Acta. V.57/15, pp. 3533-3554. Hofstra, A., Leventhal J.S., Northrop H.R., Landis, G.P., Rye, R.O., Birak, D.J. and Dahl, A.R., 1991, Genesis of Sediment-Hosted
Disseminated Gold Deposits by Fluid Mixing and Sulfidization: Chemical Reaction Path Modelling of Ore-Depositional Processes Documented in the Jerritt Canyon District, Nevada: Geology, V19, pp. 36-40.
Ilchik R.P., and Barton, M.D., 1997, An Amagmatic Origin of the Carlin-Type Gold Deposits: Econ. Geol., V92, pp.269-284. Liu, W.H., Brugger, J., McPhail, D.C., Spiccia, L., 2002, A spectrophotometric study of aqueous copper(I)–chloride complexes in LiCl
solutions between 100°C and 250°C: Geochimica et Cosmochimica Acta 66, pp. 3615– 3633.
Mundorff, J.C., 1971, Non-Thermal Springs of Utah: Utah Geological & Mineralogical Survey, Water Resources Bulletin #16.
Reich M., Becker U., 2006, First-principles calculations of the thermodynamic mixing properties of arsenic incorporation into pyrite and marcasite: Chemical Geology, V. 225, pp. 278– 290
Stenger, D. P., Kesler, S. E., Peltonen, D. R. and Tapper, C. J., 1998, Deposition of Gold in Carlin-Type Deposits: the Role of Sulfidation and Decarbonation at Twin Creeks: Econ. Geol., V93/2, p. 201-215.
Wilde, A.R., 2003, The Golden Triangle of SE China: Another Carlin Trend? SEG Newsletter, #55, p1 - 12 Wilde A., 2005, Metal Transport & Deposition In Carlin-Style Au Deposits: Review of Published Data. pmd*CRC report.
Woitsekhowskaya M.B. and Peters, S.G., 1998, Geochemical Modeling of Alteration and Gold Deposition at the Betze Deposit, Eureka County, Nevada: USGS Open-File Report 98-338, pp. 211-222.