Voorbeeldtoetsen statistiek
58
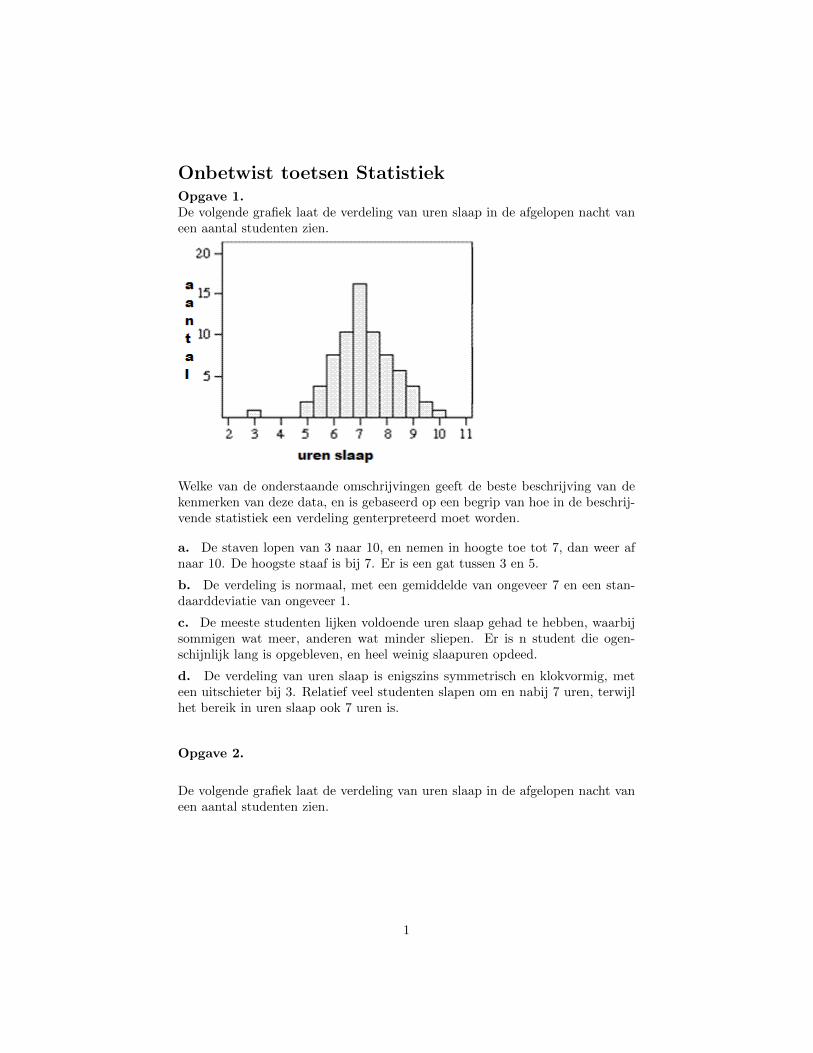
Onbetwist toetsen Statistiek Opgave 1. De volgende grafiek laat de verdeling van uren slaap in de afgelopen nacht van een aantal studenten zien. Welke van de onderstaande omschrijvingen geeft de beste beschrijving van de kenmerken van deze data, en is gebaseerd op een begrip van hoe in de beschrij- vende statistiek een verdeling genterpreteerd moet worden. a. De staven lopen van 3 naar 10, en nemen in hoogte toe tot 7, dan weer af naar 10. De hoogste staaf is bij 7. Er is een gat tussen 3 en 5. b. De verdeling is normaal, met een gemiddelde van ongeveer 7 en een stan- daarddeviatie van ongeveer 1. c. De meeste studenten lijken voldoende uren slaap gehad te hebben, waarbij sommigen wat meer, anderen wat minder sliepen. Er is n student die ogen- schijnlijk lang is opgebleven, en heel weinig slaapuren opdeed. d. De verdeling van uren slaap is enigszins symmetrisch en klokvormig, met een uitschieter bij 3. Relatief veel studenten slapen om en nabij 7 uren, terwijl het bereik in uren slaap ook 7 uren is. Opgave 2. De volgende grafiek laat de verdeling van uren slaap in de afgelopen nacht van een aantal studenten zien. 1
Transcript of Voorbeeldtoetsen statistiek
Onbetwist toetsen StatistiekOpgave 1.De volgende grafiek laat de verdeling van uren slaap in de afgelopen nacht vaneen aantal studenten zien.
Welke van de onderstaande omschrijvingen geeft de beste beschrijving van dekenmerken van deze data, en is gebaseerd op een begrip van hoe in de beschrij-vende statistiek een verdeling genterpreteerd moet worden.
a. De staven lopen van 3 naar 10, en nemen in hoogte toe tot 7, dan weer afnaar 10. De hoogste staaf is bij 7. Er is een gat tussen 3 en 5.
b. De verdeling is normaal, met een gemiddelde van ongeveer 7 en een stan-daarddeviatie van ongeveer 1.
c. De meeste studenten lijken voldoende uren slaap gehad te hebben, waarbijsommigen wat meer, anderen wat minder sliepen. Er is n student die ogen-schijnlijk lang is opgebleven, en heel weinig slaapuren opdeed.
d. De verdeling van uren slaap is enigszins symmetrisch en klokvormig, meteen uitschieter bij 3. Relatief veel studenten slapen om en nabij 7 uren, terwijlhet bereik in uren slaap ook 7 uren is.
Opgave 2.
De volgende grafiek laat de verdeling van uren slaap in de afgelopen nacht vaneen aantal studenten zien.
1
Welke box-plot geeft dezelfde data weer als het histogram?
a. Box-plot A.
b. Box-plot B.
c. Box-plot C.
Opgave 3.
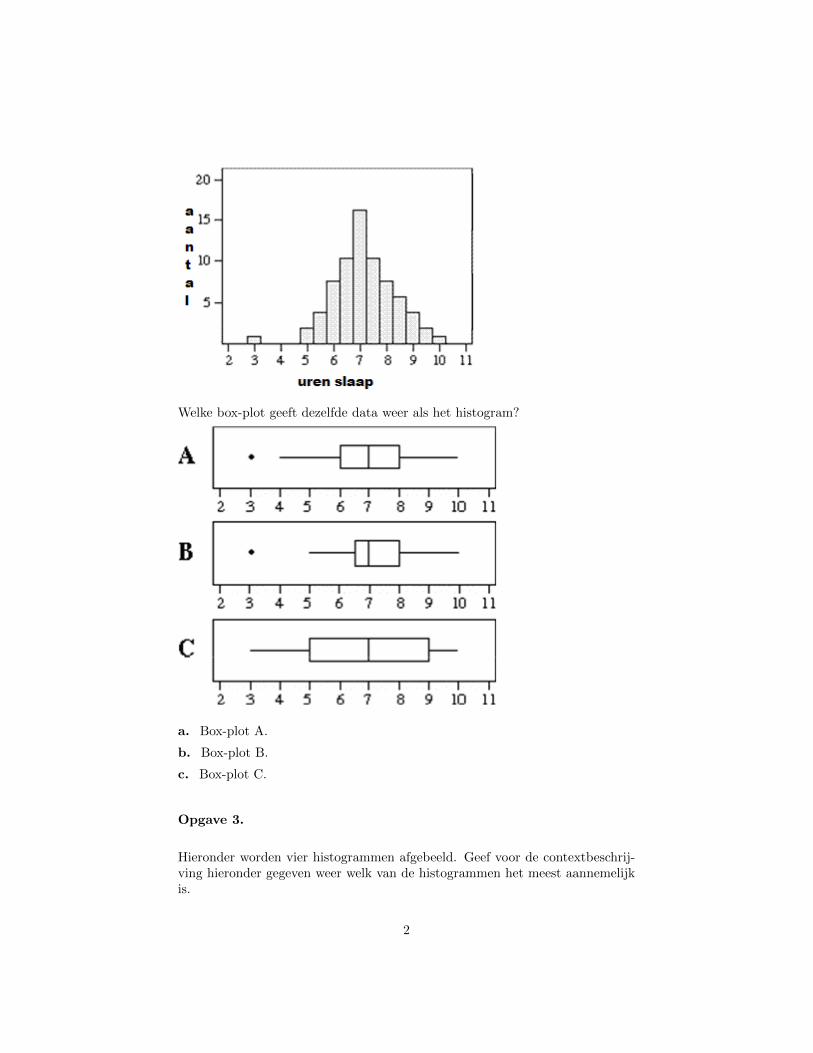
Hieronder worden vier histogrammen afgebeeld. Geef voor de contextbeschrij-ving hieronder gegeven weer welk van de histogrammen het meest aannemelijkis.
2
De verdeling van toetsscores op een erg makkelijke toets wordt het beste gere-presenteerd door:
a. Histogram I.
b. Histogram II.
c. Histogram III.
d. Histogram IV.
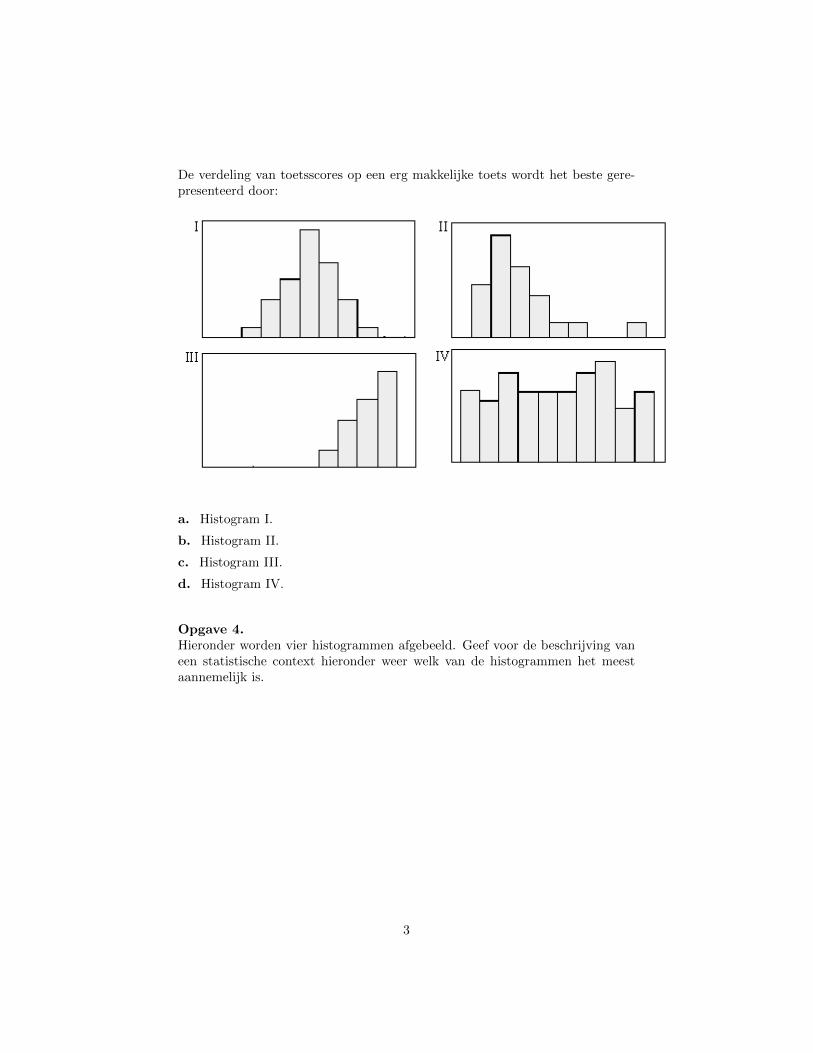
Opgave 4.Hieronder worden vier histogrammen afgebeeld. Geef voor de beschrijving vaneen statistische context hieronder weer welk van de histogrammen het meestaannemelijk is.
3
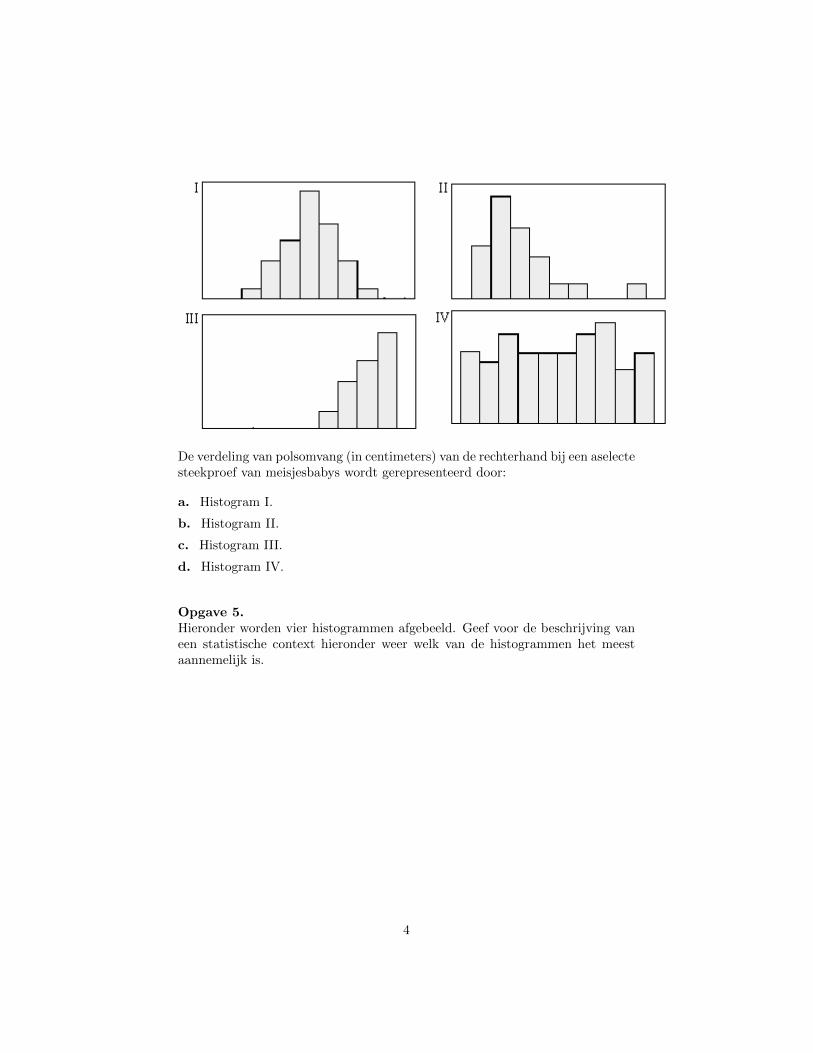
De verdeling van polsomvang (in centimeters) van de rechterhand bij een aselectesteekproef van meisjesbabys wordt gerepresenteerd door:
a. Histogram I.
b. Histogram II.
c. Histogram III.
d. Histogram IV.
Opgave 5.Hieronder worden vier histogrammen afgebeeld. Geef voor de beschrijving vaneen statistische context hieronder weer welk van de histogrammen het meestaannemelijk is.
4
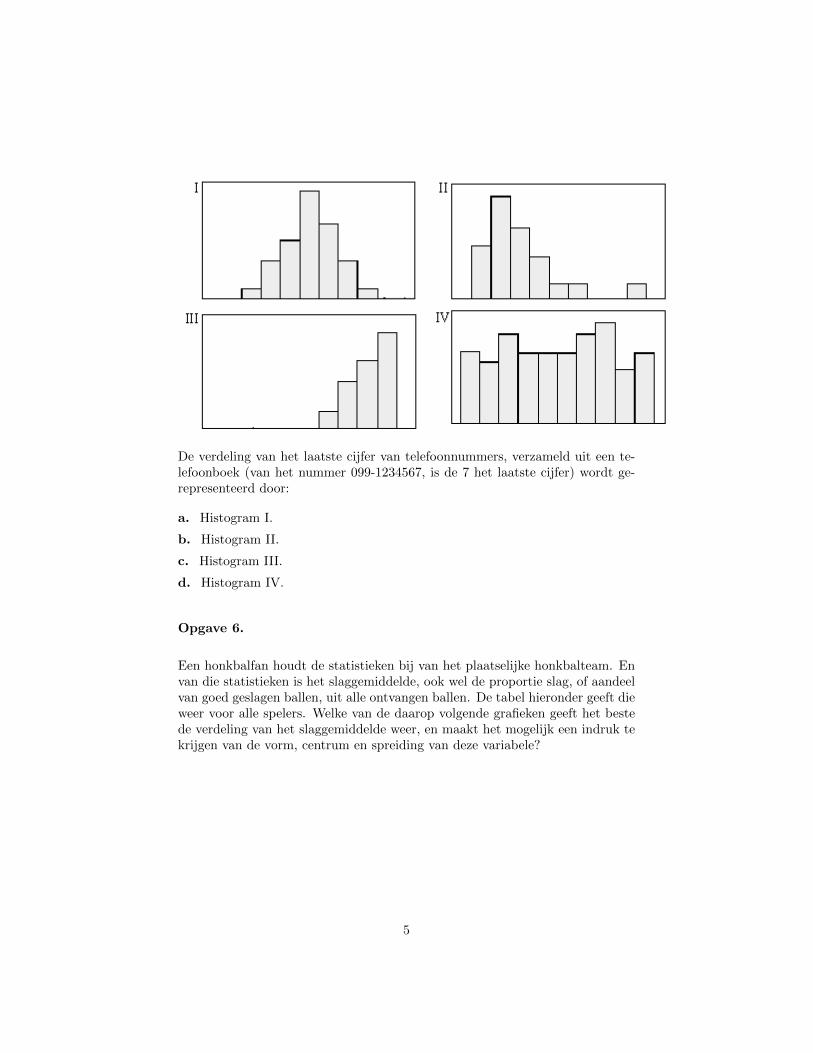
De verdeling van het laatste cijfer van telefoonnummers, verzameld uit een te-lefoonboek (van het nummer 099-1234567, is de 7 het laatste cijfer) wordt ge-representeerd door:
a. Histogram I.
b. Histogram II.
c. Histogram III.
d. Histogram IV.
Opgave 6.
Een honkbalfan houdt de statistieken bij van het plaatselijke honkbalteam. Envan die statistieken is het slaggemiddelde, ook wel de proportie slag, of aandeelvan goed geslagen ballen, uit alle ontvangen ballen. De tabel hieronder geeft dieweer voor alle spelers. Welke van de daarop volgende grafieken geeft het bestede verdeling van het slaggemiddelde weer, en maakt het mogelijk een indruk tekrijgen van de vorm, centrum en spreiding van deze variabele?
5
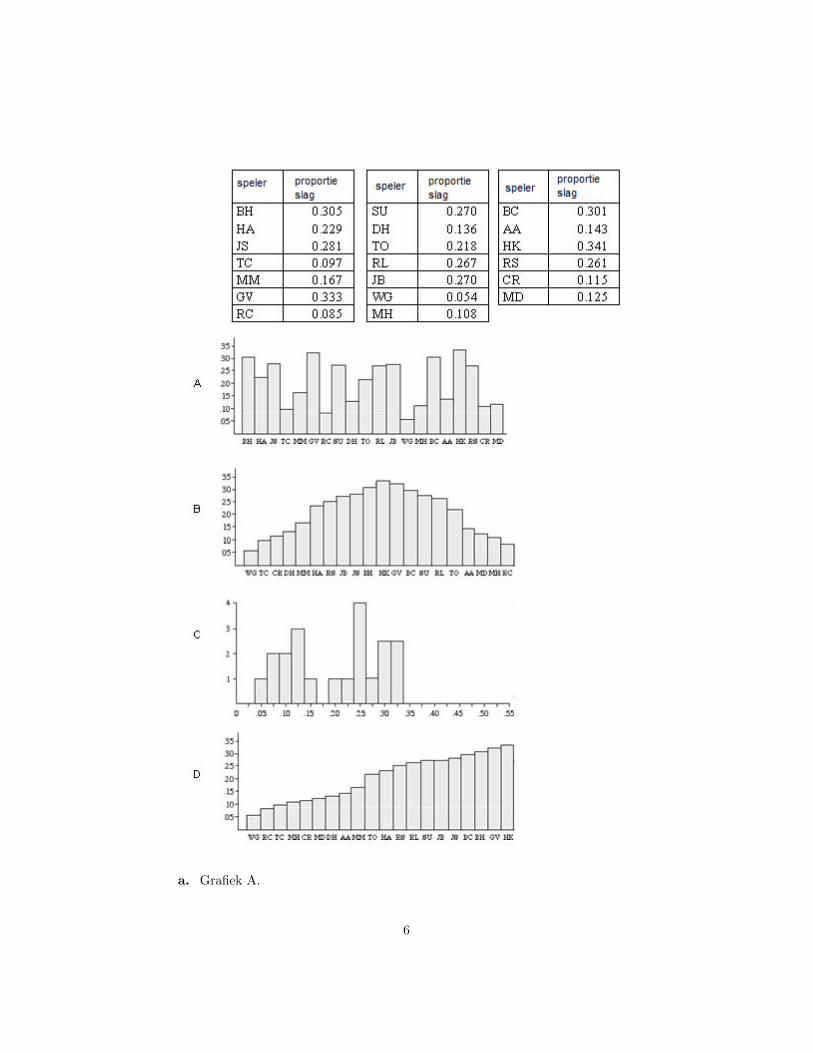
a. Grafiek A.
6
b. Grafiek B.
c. Grafiek C.
d. Grafiek D.
Opgave 7.
In een recente onderzoeksstudie waren de deelnemers aselect ingedeeld in groe-pen die een verschillende dagelijkse dosis Vitamine E voorgeschreven kregen.Een groep kreeg elke dag een placebo. De onderzoeksstudie volgde de deel-nemers gedurende acht jaren om te ontdekken welke deelnemers een bepaaldtype kanker zou krijgen. Welke uitspraak geeft de beste uitleg van het doel vanrandomisatie (aselecte toewijzing) in deze studie?
a. Om de nauwkeurigheid van de onderzoeksresultaten verhogen.
b. Om te zorgen dat alle potentile kanker patienten een gelijke kans hebbenom voor de studie geselecteerd te worden.
c. Om de steekproefvariatie te reduceren.
d. Om experimentele eenheden te krijgen met vergelijkbare kenmerken.
e. Om scheefheid in de resultaten te voorkomen.
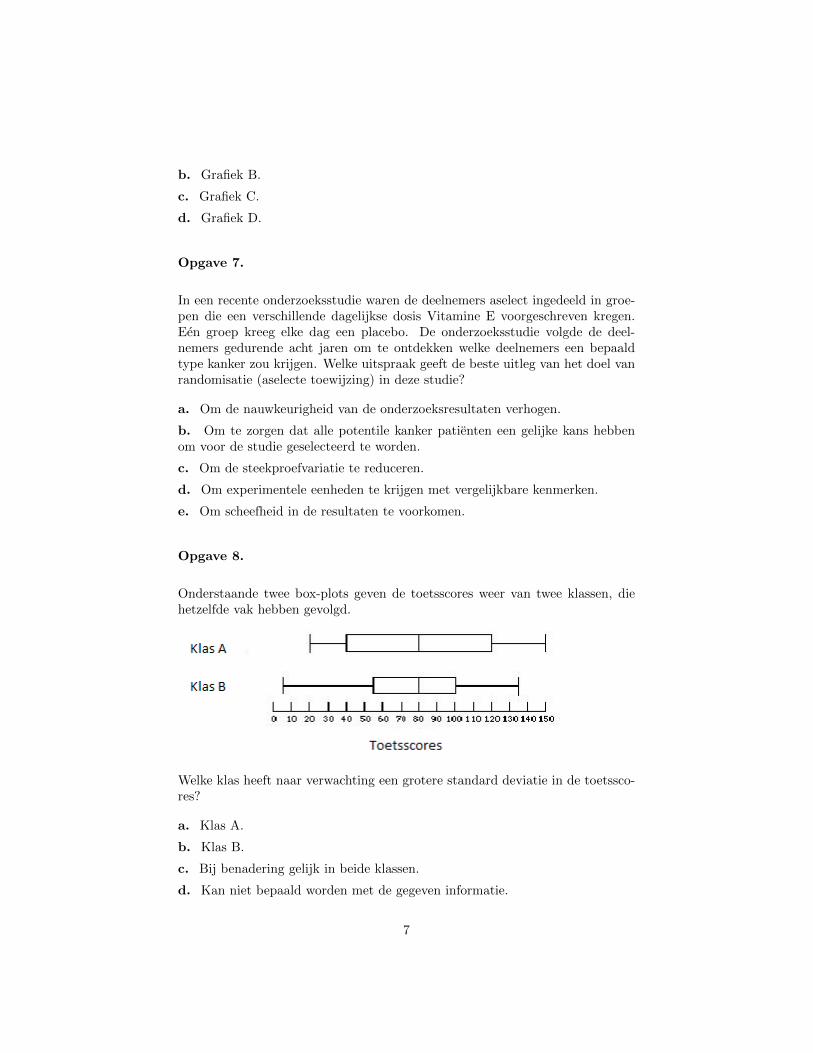
Opgave 8.
Onderstaande twee box-plots geven de toetsscores weer van twee klassen, diehetzelfde vak hebben gevolgd.
Welke klas heeft naar verwachting een grotere standard deviatie in de toetssco-res?
a. Klas A.
b. Klas B.
c. Bij benadering gelijk in beide klassen.
d. Kan niet bepaald worden met de gegeven informatie.
7
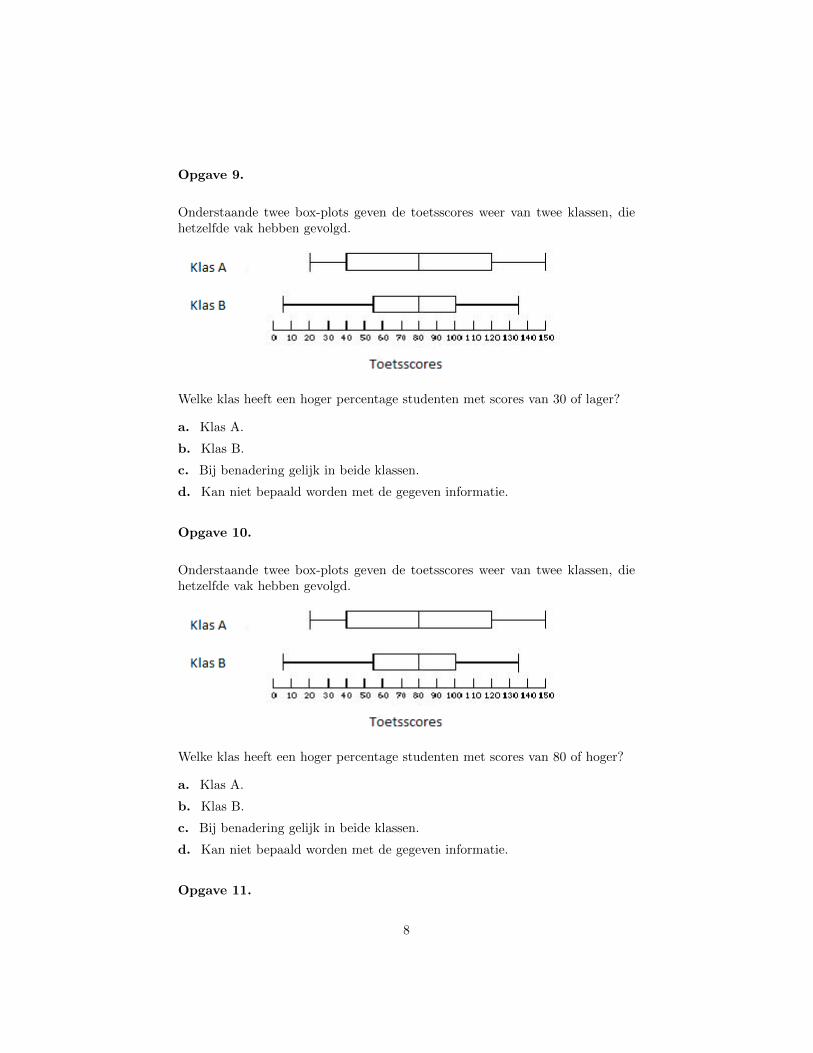
Opgave 9.
Onderstaande twee box-plots geven de toetsscores weer van twee klassen, diehetzelfde vak hebben gevolgd.
Welke klas heeft een hoger percentage studenten met scores van 30 of lager?
a. Klas A.
b. Klas B.
c. Bij benadering gelijk in beide klassen.
d. Kan niet bepaald worden met de gegeven informatie.
Opgave 10.
Onderstaande twee box-plots geven de toetsscores weer van twee klassen, diehetzelfde vak hebben gevolgd.
Welke klas heeft een hoger percentage studenten met scores van 80 of hoger?
a. Klas A.
b. Klas B.
c. Bij benadering gelijk in beide klassen.
d. Kan niet bepaald worden met de gegeven informatie.
Opgave 11.
8
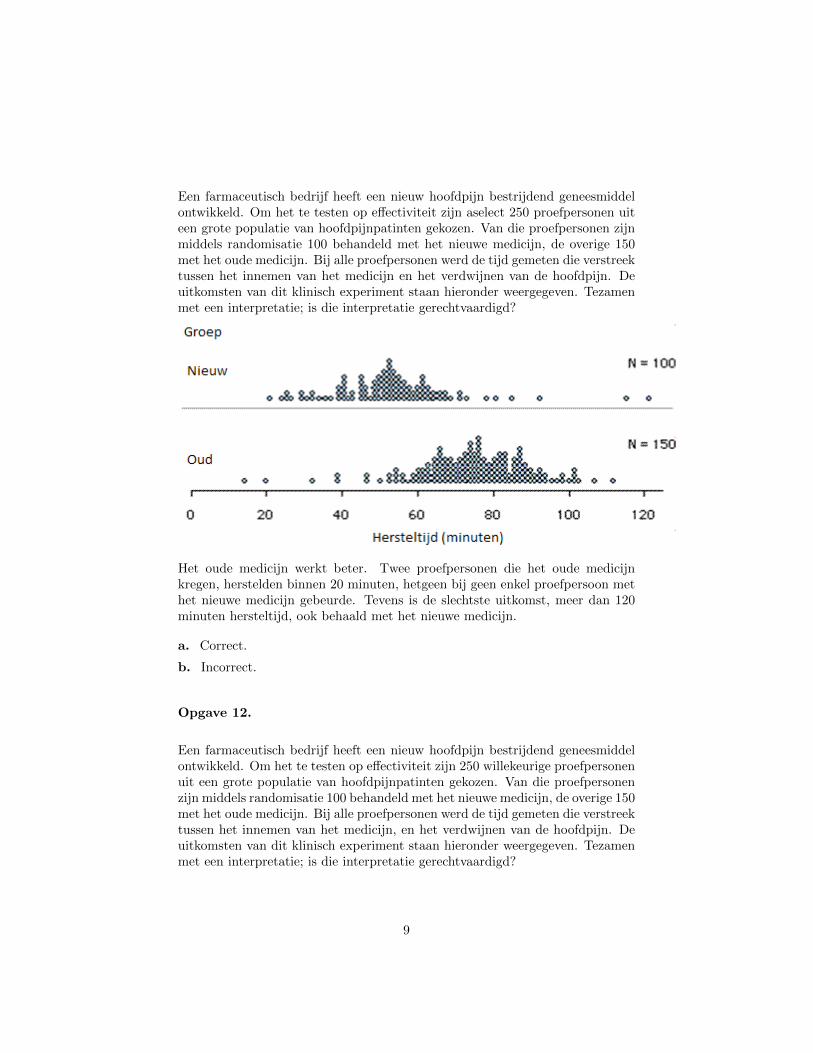
Een farmaceutisch bedrijf heeft een nieuw hoofdpijn bestrijdend geneesmiddelontwikkeld. Om het te testen op effectiviteit zijn aselect 250 proefpersonen uiteen grote populatie van hoofdpijnpatinten gekozen. Van die proefpersonen zijnmiddels randomisatie 100 behandeld met het nieuwe medicijn, de overige 150met het oude medicijn. Bij alle proefpersonen werd de tijd gemeten die verstreektussen het innemen van het medicijn en het verdwijnen van de hoofdpijn. Deuitkomsten van dit klinisch experiment staan hieronder weergegeven. Tezamenmet een interpretatie; is die interpretatie gerechtvaardigd?
Het oude medicijn werkt beter. Twee proefpersonen die het oude medicijnkregen, herstelden binnen 20 minuten, hetgeen bij geen enkel proefpersoon methet nieuwe medicijn gebeurde. Tevens is de slechtste uitkomst, meer dan 120minuten hersteltijd, ook behaald met het nieuwe medicijn.
a. Correct.
b. Incorrect.
Opgave 12.
Een farmaceutisch bedrijf heeft een nieuw hoofdpijn bestrijdend geneesmiddelontwikkeld. Om het te testen op effectiviteit zijn 250 willekeurige proefpersonenuit een grote populatie van hoofdpijnpatinten gekozen. Van die proefpersonenzijn middels randomisatie 100 behandeld met het nieuwe medicijn, de overige 150met het oude medicijn. Bij alle proefpersonen werd de tijd gemeten die verstreektussen het innemen van het medicijn, en het verdwijnen van de hoofdpijn. Deuitkomsten van dit klinisch experiment staan hieronder weergegeven. Tezamenmet een interpretatie; is die interpretatie gerechtvaardigd?
9

De gemiddelde hersteltijd voor het nieuwe medicijn is korter dan voor het oudemedicijn. Patinten met het nieuwe medicijn herstellen overwegend zon 20 mi-nuten sneller dan patinten met het oude medicijn.
a. Correct.
b. Incorrect.
Opgave 13.
Een farmaceutisch bedrijf heeft een nieuw hoofdpijn bestrijdend geneesmiddelontwikkeld. Om het te testen op effectiviteit zijn 250 willekeurige proefpersonenuit een grote populatie van hoofdpijnpatinten gekozen. Van die proefpersonenzijn middels randomisatie 100 behandeld met het nieuwe medicijn, de overige 150met het oude medicijn. Bij alle proefpersonen werd de tijd gemeten die verstreektussen het innemen van het medicijn, en het verdwijnen van de hoofdpijn. Deuitkomsten van dit klinisch experiment staan hieronder weergegeven. Tezamenmet een interpretatie; is die interpretatie gerechtvaardigd?
10
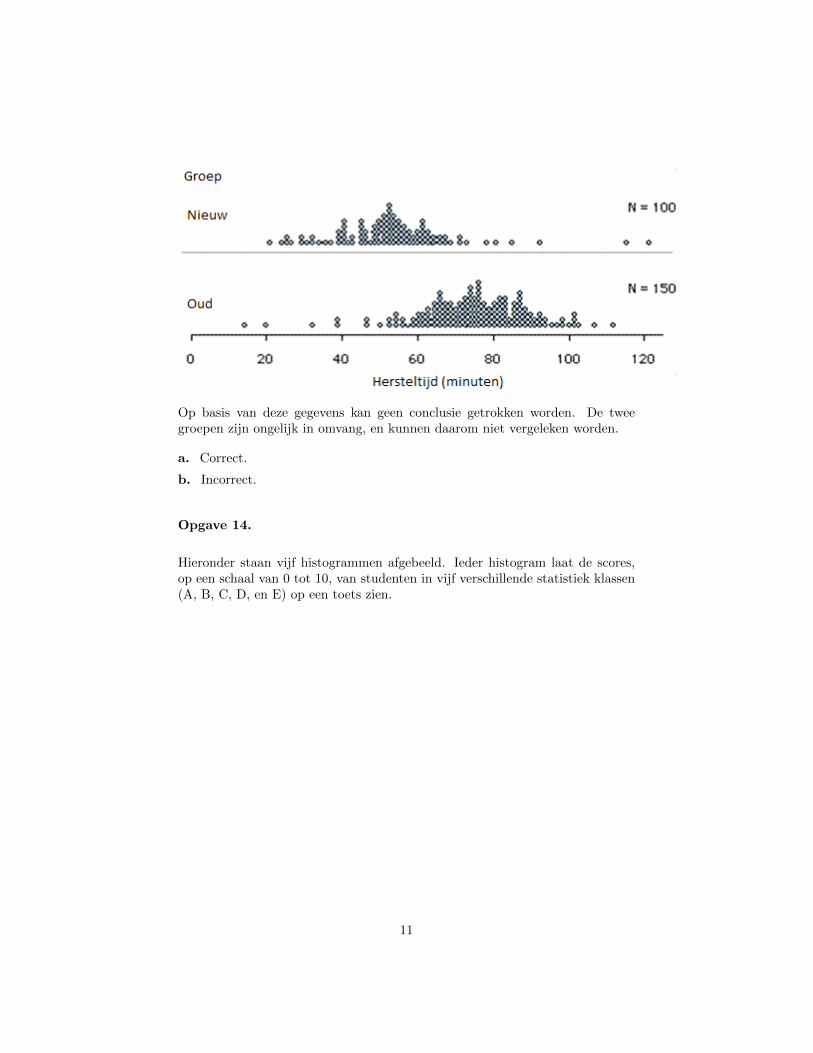
Op basis van deze gegevens kan geen conclusie getrokken worden. De tweegroepen zijn ongelijk in omvang, en kunnen daarom niet vergeleken worden.
a. Correct.
b. Incorrect.
Opgave 14.
Hieronder staan vijf histogrammen afgebeeld. Ieder histogram laat de scores,op een schaal van 0 tot 10, van studenten in vijf verschillende statistiek klassen(A, B, C, D, en E) op een toets zien.
11
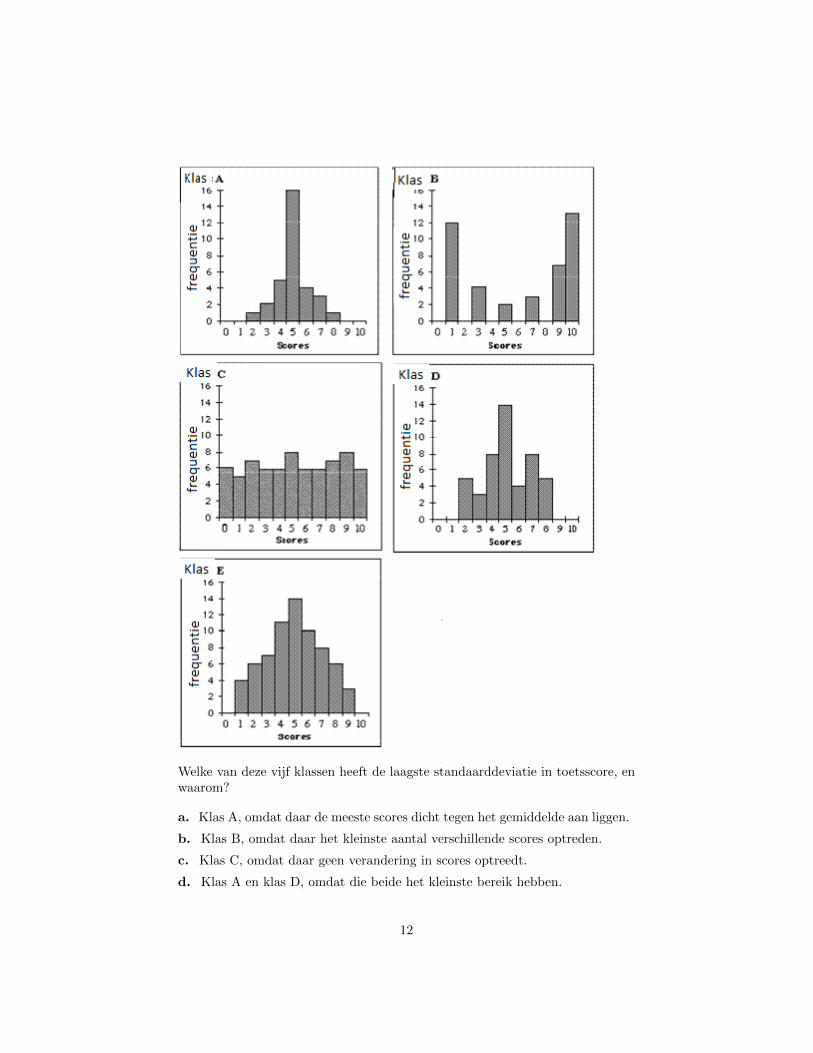
Welke van deze vijf klassen heeft de laagste standaarddeviatie in toetsscore, enwaarom?
a. Klas A, omdat daar de meeste scores dicht tegen het gemiddelde aan liggen.
b. Klas B, omdat daar het kleinste aantal verschillende scores optreden.
c. Klas C, omdat daar geen verandering in scores optreedt.
d. Klas A en klas D, omdat die beide het kleinste bereik hebben.
12
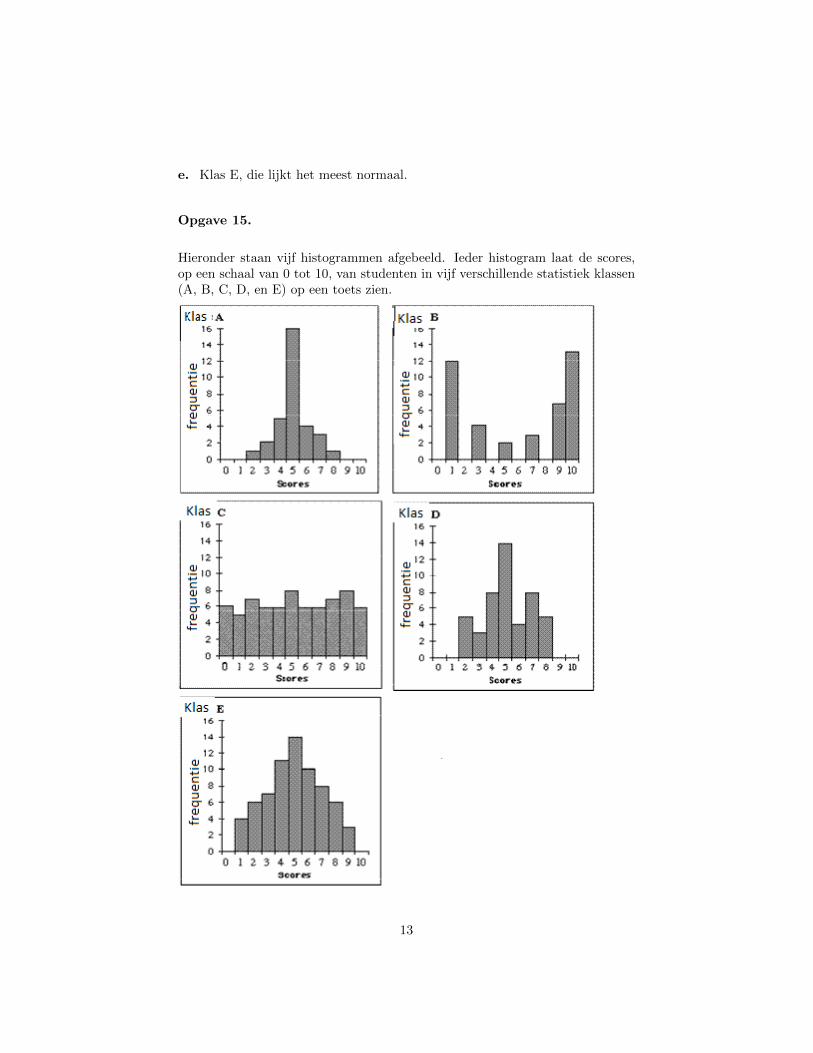
e. Klas E, die lijkt het meest normaal.
Opgave 15.
Hieronder staan vijf histogrammen afgebeeld. Ieder histogram laat de scores,op een schaal van 0 tot 10, van studenten in vijf verschillende statistiek klassen(A, B, C, D, en E) op een toets zien.
13
Welke van deze vijf klassen heeft de hoogste standaarddeviatie in toetsscore, enwaarom?
a. Klas A, omdat daar de hoogteverschillen in de staven het grootst zijn.
b. Klas B, omdat de meeste scores ver van het gemiddelde af liggen.
c. Klas C, omdat het het grootste aantal verschillende scores kent.
d. Klas D, omdat de verdeling sterk onregelmatig is.
e. Klas E, omdat daar de scores het meest normaal verdeeld zijn.
Opgave 16.
Een producent van snoepjes claimt dat 50% van de snoepjes bruinkleurig is.Sam is van plan een grote familiezak met snoepjes te kopen, om deze claim nate gaan, terwijl Kerry hetzelfde wil doen met een kleine zak. Welk van de tweezakken heeft de grootste kans om meer dan 70% bruine snoepjes te bevatten?
a. Sam, want de grote zak bevat meer snoepjes, en kan dus ook meer bruinesnoepjes bevatten.
b. Sam, want er is meer variabiliteit in de proportie van bruine snoepjes bijgrote steekproeven.
c. Kerry, want er is meer variabiliteit in de proportie van bruine snoepjes bijkleine steekproeven.
d. Kerry, want de meeste kleine zakken zullen meer dan 50% bruine snoepjesbevatten.
e. Beiden hebben gelijke kans, want beide zijn gerandomiseerde steekproeven.
Opgave 17.
Veronderstel dat je een megaverpakking smarties hebt, met daarin duizendensmarties in uiteenlopende kleuren. We weten dat de producent 35% van de smar-ties geel kleurt. Vijf studenten nemen achtereenvolgens ieder een willekeurigesteekproef van 20 smarties, en stellen het percentage gele smarties vast. Welkevan de onderstaande rijtjes van percentages gele smarties is meest plausibel alsuitkomst van dit proces van herhaalde steekproeven?
a. 30%, 35%, 15%, 40%, 50%.
b. 35%, 35%, 35%, 35%, 35%.
c. 5%, 60%, 10%, 50%, 95%.
d. Ieder van bovenstaande.
14
Opgave 18.
Jolien woont 10 km verwijderd van de faculteit, waar ze een zomercursus wilvolgen. Er zijn twee routes naar de faculteit, eentje dwars door de binnenstad,de ander overwegend door buitenwijken. De eerste route is wat korter, maarkent meer stoplichten. Als efficint en statistisch onderlegd student doet Jolieneen gerandomiseerd experiment, waarbij ze s ochtends door het opwerpen vaneen muntje laat bepalen welke route ze volgt. Reistijden om 5 keer ieder van detwee routes af te leggen zijn als volgt:
Buitenwijkroute 17, 15, 17, 16, 18
Binnenstadroute 18, 13, 20, 10, 16
Jolien vindt het belangrijk op tijd te komen, maar ook om te voorkomen tevroeg te zijn. Op basis van de verzamelde data, welke route is het best voorhaar?
a. De Buitenwijkroute, omdat reistijden relatief constant zijn, met beperktevariatie.
b. De Binnenstadroute, omdat de reistijden daarvan het laagste gemiddeldehebben.
c. Omdat de reistijden van de twee routes elkaar zo sterk overlappen, is de eneroute niet beter dan de andere. Iedere keer een muntje opgooien werkt wel zogoed.
Opgave 19.
Een student hoopt in een toegepast onderzoek aan te kunnen tonen dat deuitkomsten van een experiment statistisch significant zijn. Wat voor p-waarde(overschrijdingskans) zal ze dan graag als uitkomst van haar toets willen zien?
a. Een grote p-waarde.
b. Een kleine p-waarde.
c. De omvang van de p-waarde staat los van statistische significantie.
Een kleine p- waarde.
Opgave 20.
Botdichtheid wordt in het algemeen gemeten als een gestandaardiseerde score:gemiddelde 0, standaarddeviatie 1. Lagere scores corresponderen met lage bot-dichtheid. Welk van de volgende grafieken geeft aan dat wanneer vrouwen ou-der worden (leeftijd langs horizontale as), botdichtheid (verticale as) de tendensheeft te verminderen.
15
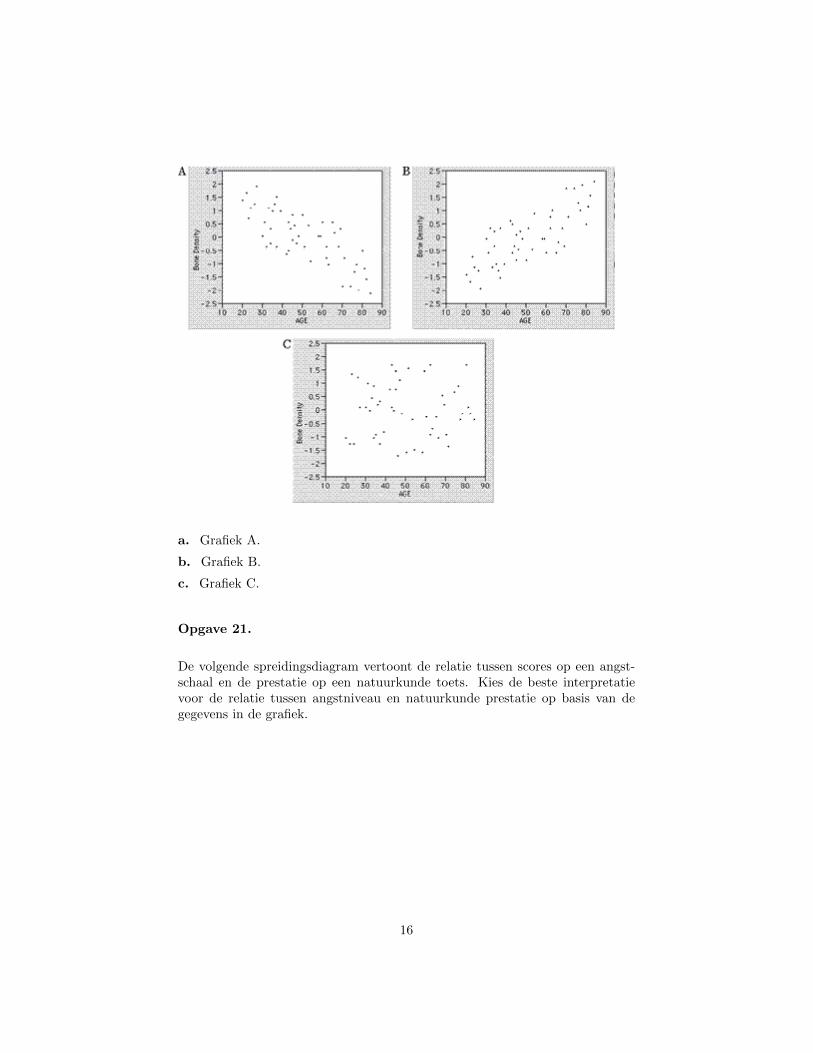
a. Grafiek A.
b. Grafiek B.
c. Grafiek C.
Opgave 21.
De volgende spreidingsdiagram vertoont de relatie tussen scores op een angst-schaal en de prestatie op een natuurkunde toets. Kies de beste interpretatievoor de relatie tussen angstniveau en natuurkunde prestatie op basis van degegevens in de grafiek.
16
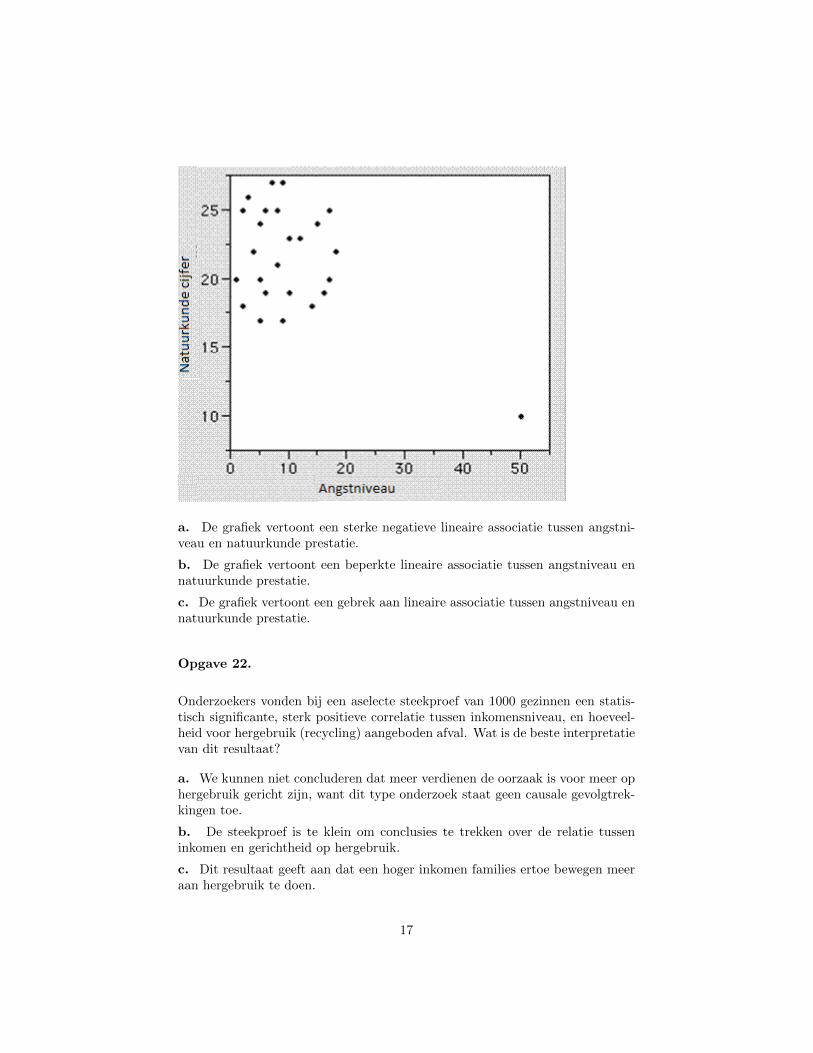
a. De grafiek vertoont een sterke negatieve lineaire associatie tussen angstni-veau en natuurkunde prestatie.
b. De grafiek vertoont een beperkte lineaire associatie tussen angstniveau ennatuurkunde prestatie.
c. De grafiek vertoont een gebrek aan lineaire associatie tussen angstniveau ennatuurkunde prestatie.
Opgave 22.
Onderzoekers vonden bij een aselecte steekproef van 1000 gezinnen een statis-tisch significante, sterk positieve correlatie tussen inkomensniveau, en hoeveel-heid voor hergebruik (recycling) aangeboden afval. Wat is de beste interpretatievan dit resultaat?
a. We kunnen niet concluderen dat meer verdienen de oorzaak is voor meer ophergebruik gericht zijn, want dit type onderzoek staat geen causale gevolgtrek-kingen toe.
b. De steekproef is te klein om conclusies te trekken over de relatie tusseninkomen en gerichtheid op hergebruik.
c. Dit resultaat geeft aan dat een hoger inkomen families ertoe bewegen meeraan hergebruik te doen.
17
Opgave 23.
Een ecoloog onderzoekt de invloed van een bepaalde herbicide op de visstand.Hij heeft 60 gezonde vissen hiervoor ter beschikking, en plaatst die aselect ineen experimentele en controle groep. Uit het onderzoek blijkt dat de vissenin de experimentele groep hogere niveaus van het indicator enzym laten zien.Op basis van de uitkomsten van het onderzoek voer je een hypothesetoets uit.Deze toets wijst uit dat het verschil in gemiddeld enzym niveau tussen vissenblootgesteld aan de herbicide, en de vissen die dat niet zijn, niet statistischsignificant is. Welke conclusie kan je daaraan verbinden?
a. Mogelijk is er een fout in de toets berekening gemaakt: het verschil zousignificant moeten zijn.
b. De steekproefomvang is mogelijk te klein om statistische significantie voorhet gemeten verschil te bereiken.
c. Kennelijk veroorzaakt de herbicide geen verhoogde niveaus van het enzym.Antwoord
Opgave 24.
Een ecoloog onderzoekt de invloed van een bepaalde herbicide op de visstand.Hij heeft 60 gezonde vissen hiervoor ter beschikking, en plaatst die aselect in eenexperimentele en controle groep. Uit het onderzoek blijkt dat de vissen in deexperimentele groep hogere niveaus van het indicator enzym laten zien. Op basisvan de uitkomsten van het onderzoek voer je een hypothesetoets uit. Deze toetswijst uit dat het verschil in gemiddeld enzym niveau tussen vissen blootgesteldaan de herbicide, en de vissen die dat niet zijn, statistisch significant is. Welkeconclusie kan je daaraan verbinden?
a. Er is bewijs van associatie, maar niet van een causaal effect van herbicideop de enzym niveaus.
b. De uitkomst van de toets lijkt strijdig met de bevindingen van de onderzoe-ker.
c. Bewezen is dat herbicide hogere niveaus van het enzym veroorzaakt.
d. Er is aangetoond dat voor deze vissen herbicide hogere niveaus van hetenzym veroorzaakt.
Opgave 25.
Een onderzoeksartikel rapporteert over de test van een nieuw medicijn. Hetmedicijn is ontwikkeld om verlies aan gezichtsvermogen tegen te gaan bij mensenmet Macular degeneratie. Het artikel besluit met een p-waarde van .04. Is de
18
volgende beschrijving een correcte of incorrecte interpretatie van deze p-waarde?De p-waarde is de kans om onderzoeksresultaten te verkrijgen als deze, of zelfsmeer extreem, in het geval het medicijn geen werking heeft.
a. Correct.
b. Incorrect.
Opgave 26.
Een onderzoeksartikel rapporteert over de test van een nieuw medicijn. Hetmedicijn is ontwikkeld om verlies aan gezichtsvermogen tegen te gaan bij mensenmet Macular degeneratie. Het artikel besluit met een p-waarde van .04. Is devolgende beschrijving een correcte of incorrecte interpretatie van deze p-waarde?De p-waarde is de kans dat het medicijn geen werking heeft.
a. Correct.
b. Incorrect.
Opgave 27.
Een onderzoeksartikel rapporteert over de test van een nieuw medicijn. Hetmedicijn is ontwikkeld om verlies aan gezichtsvermogen tegen te gaan bij mensenmet Macular degeneratie. Het artikel besluit met een p-waarde van .04. Is devolgende beschrijving een correcte of incorrecte interpretatie van deze p-waarde?De p-waarde is de kans dat het medicijn wel werking heeft.
a. Correct.
b. Incorrect.
Opgave 28.
In een VWO les statistiek wordt een poging gedaan het gemiddelde aantal cho-colate chips te schatten in chocolate chips koekjes. Er wordt een aselecte steek-proef van koekjes van een bepaald merk genomen, het aantal chips per koekjewordt geteld, en een 95% betrouwbaarheidsinterval voor het gemiddelde aantalchips per koekje uitgerekend: (18.6 tot 21.3). Is de volgende interpretatie vandeze uitkomst correct of incorrect?
We zijn 95% zeker dat elke koekje van dit merk bij benadering tussen 18.6 en21.3 chocolate chips bevat.
a. Correct.
19
b. Incorrect.
Opgave 29.
In een VWO les statistiek wordt een poging gedaan het gemiddelde aantal cho-colate chips te schatten in chocolate chips koekjes. Er wordt een aselecte steek-proef van koekjes van een bepaald merk genomen, het aantal chips per koekjewordt geteld, en een 95% betrouwbaarheidsinterval voor het gemiddelde aantalchips per koekje uitgerekend: (18.6 tot 21.3). Is de volgende interpretatie vandeze uitkomst correct of incorrect?
We verwachten dat 95% van de koekjes van dit merk tussen 18.6 en 21.3 choco-late chips bevat.
a. Correct.
b. Incorrect.
Incorrect.
Opgave 30.
In een VWO les statistiek wordt een poging gedaan het gemiddelde aantal cho-colate chips te schatten in chocolate chips koekjes. Er wordt een aselecte steek-proef van koekjes van een bepaald merk genomen, het aantal chips per koekjewordt geteld, en een 95% betrouwbaarheidsinterval voor het gemiddelde aantalchips per koekje uitgerekend: (18.6 tot 21.3). Is de volgende interpretatie vandeze uitkomst correct of incorrect?
We verwachten dat ongeveer 95% van alle mogelijke steekproeven die uit dezepopulatie getrokken kunnen worden, steekproefgemiddelden tussen 18.6 en 21.3chocolate chips hebben.
a. Correct.
b. Incorrect. Antwoord
Opgave 31.
In een VWO les statistiek wordt een poging gedaan het gemiddelde aantal cho-colate chips te schatten in chocolate chips koekjes. Er wordt een aselecte steek-proef van koekjes van een bepaald merk genomen, het aantal chips per koekjewordt geteld, en een 95% betrouwbaarheidsinterval voor het gemiddelde aantalchips per koekje uitgerekend: (18.6 tot 21.3). Is de volgende interpretatie vandeze uitkomst correct of incorrect?
20
We zijn 95% zeker dat het betrouwbaarheidsinterval van 18.6 tot 21.3 het waregemiddelde aantal chocolate chips per koekje bevat.
a. Correct.
b. Incorrect.
Opgave 32.
Onder normale omgevingscondities heeft volwassen baars in Silver Lake een ge-middelde lengte van 12,3 inches, met een standaarddeviatie van 3 inches. Vissersdie recent hebben gevist op Silver Lake claimen dat dit jaar de gevangen baarskleiner dan normaal is. Een onderzoeksgroep van de provinciale autoriteitenneemt een aselecte steekproef van 100 volwassen baarzen en vindt een steek-proefgemiddelde van 11,2 inches. Welke conclusie is gerechtvaardigd?
a. De onderzoekers kunnen niet concluderen dat de vis nu kleiner dan nor-maal is omdat 11,2 inch minder dan een standaarddeviatie van het bekendepopulatiegemiddelde van 12,3 inch ligt.
b. De onderzoekers kunnen concluderen dat de vis nu kleiner dan normaal isomdat voor een grote steekproef als deze, het steekproefgemiddelde nagenoeggelijk aan het bekende populatiegemiddelde zou moeten zijn.
c. De onderzoekers kunnen concluderen dat de vis nu kleiner dan normaalis omdat het verschil tussen 12,3 en 11,2 inches veel groter is dan zou kunnenworden verwacht op basis van steekproefvariatie.
Opgave 33.
Een studie onderzocht de lengte van een specifieke zoetwatervis, afkomstig uiteen meer. De opzet van de studie was om een aselecte steekproef van 100 vissente vangen, en de uitkomsten daarvan te onderzoeken. Een samenvatting vannumerieke gegevens over de vislengte staat hieronder weergegeven.
Gemiddelde 26.8 mmMediaan 29.4 mmStandaarddeviatie 5.0 mmMinimum 12. mmMaximum 33.4mm
Welk van de volgende histogrammen voldoet het beste aan bovenstaande ken-merken?
21
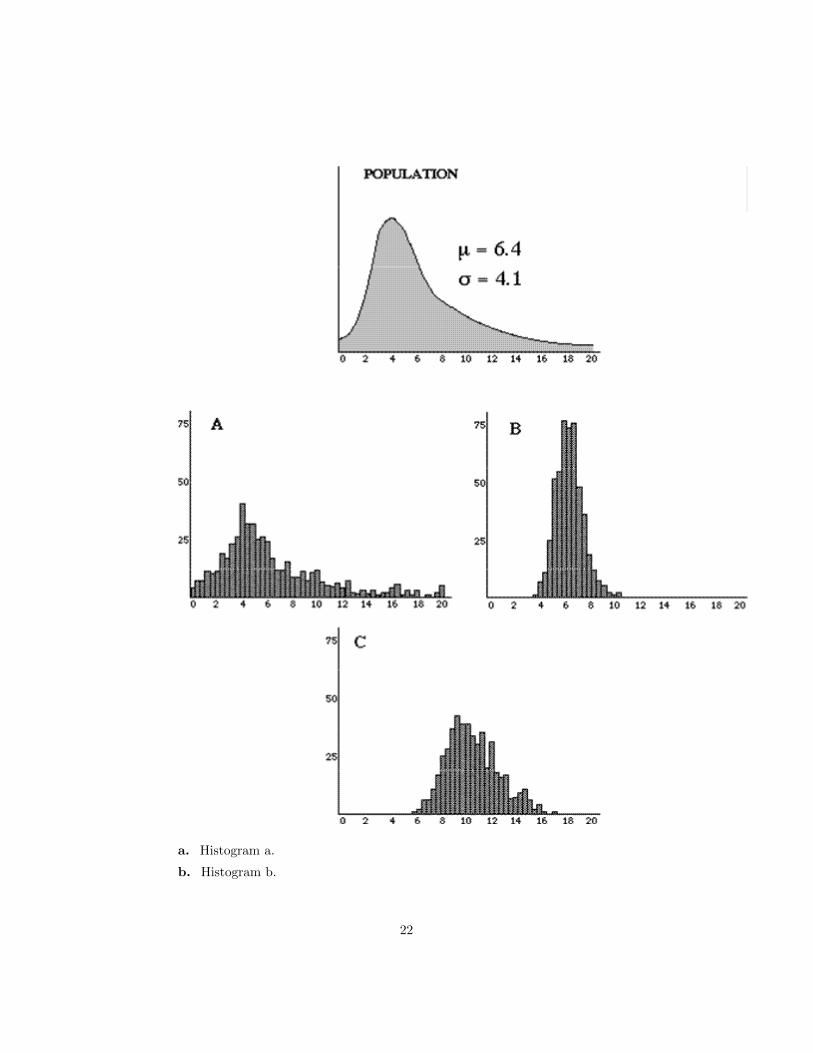
a. Histogram a.
b. Histogram b.
22

c. Histogram c.
Opgave 34.
Hieronder staan vier grafieken. De eerste grafiek geeft een populatie van testsco-res weer. De gemiddelde score is 6,4, de standaarddeviatie is 4,1. Onder de an-dere drie grafieken zijn er twee die steekproefverdelingen van 500 steekproevenweergeven: eentje met steekproefomvang 1, en eentje met steekproefomvang 9.
23

Welke grafiek (A, B, of C) stelt de steekproefverdeling voor van 500 steekproevenmet omvang 1?
a. Grafiek A.
24
b. Grafiek B.
c. Grafiek C.
Opgave 35.
Hieronder staan vier grafieken. De eerste grafiek geeft een populatie van testsco-res weer. De gemiddelde score is 6,4, de standaarddeviatie is 4,1. Onder de an-dere drie grafieken zijn er twee die steekproefverdelingen van 500 steekproevenweergeven: eentje met steekproefomvang 1, en eentje met steekproefomvang 9.
25

Welke grafiek (A, B, of C) stelt de steekproefverdeling voor van 500 steekproevenmet omvang 9?
a. Grafiek A.
26
b. Grafiek B.
c. Grafiek C.
Opgave 36.
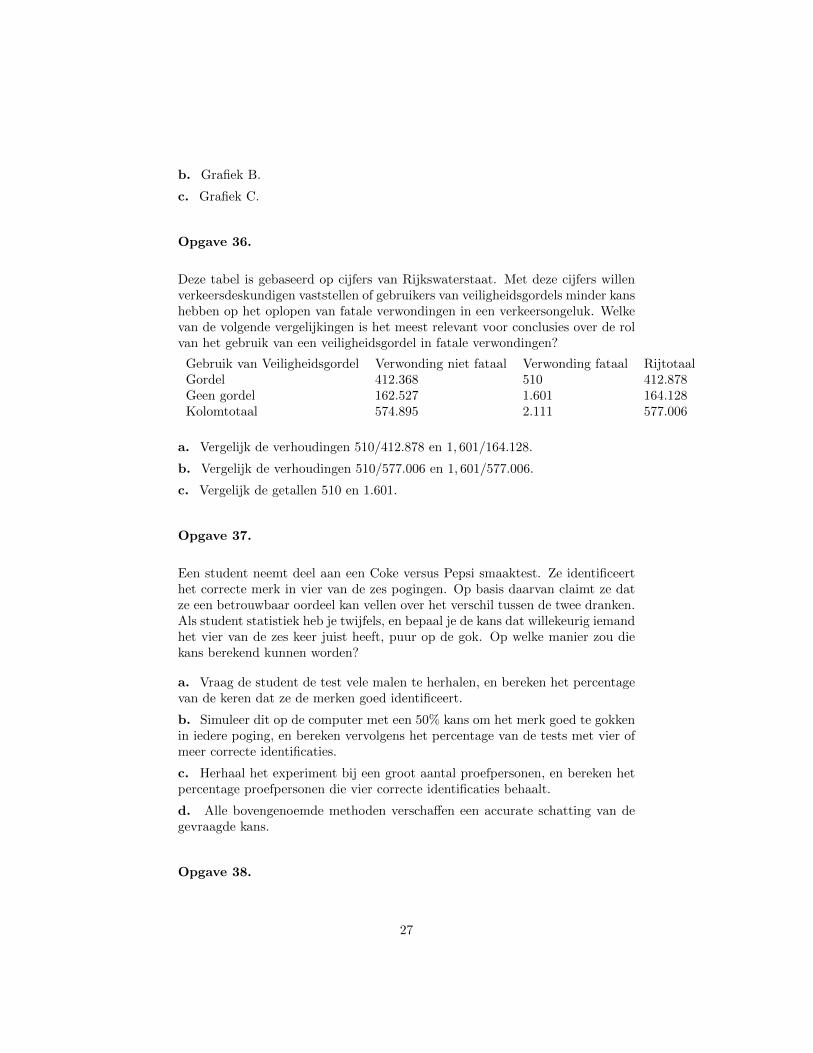
Deze tabel is gebaseerd op cijfers van Rijkswaterstaat. Met deze cijfers willenverkeersdeskundigen vaststellen of gebruikers van veiligheidsgordels minder kanshebben op het oplopen van fatale verwondingen in een verkeersongeluk. Welkevan de volgende vergelijkingen is het meest relevant voor conclusies over de rolvan het gebruik van een veiligheidsgordel in fatale verwondingen?
Gebruik van Veiligheidsgordel Verwonding niet fataal Verwonding fataal RijtotaalGordel 412.368 510 412.878Geen gordel 162.527 1.601 164.128Kolomtotaal 574.895 2.111 577.006
a. Vergelijk de verhoudingen 510/412.878 en 1, 601/164.128.
b. Vergelijk de verhoudingen 510/577.006 en 1, 601/577.006.
c. Vergelijk de getallen 510 en 1.601.
Opgave 37.
Een student neemt deel aan een Coke versus Pepsi smaaktest. Ze identificeerthet correcte merk in vier van de zes pogingen. Op basis daarvan claimt ze datze een betrouwbaar oordeel kan vellen over het verschil tussen de twee dranken.Als student statistiek heb je twijfels, en bepaal je de kans dat willekeurig iemandhet vier van de zes keer juist heeft, puur op de gok. Op welke manier zou diekans berekend kunnen worden?
a. Vraag de student de test vele malen te herhalen, en bereken het percentagevan de keren dat ze de merken goed identificeert.
b. Simuleer dit op de computer met een 50% kans om het merk goed te gokkenin iedere poging, en bereken vervolgens het percentage van de tests met vier ofmeer correcte identificaties.
c. Herhaal het experiment bij een groot aantal proefpersonen, en bereken hetpercentage proefpersonen die vier correcte identificaties behaalt.
d. Alle bovengenoemde methoden verschaffen een accurate schatting van degevraagde kans.
Opgave 38.
27
Een universiteit onderzoekt middels een enquete bij een steekproef van uitwo-nende studenten hun voorkeur voor huur bij particulieren versus wonen in eenstudentenhuis. Welk van de volgende aspecten heeft GEEN invloed op de gene-raliseerbaarheid van de uitkomsten van het steekproefonderzoek.
a. De enquete is gestuurd naar een steekproef van slechts 500 uitwonendestudent, van alle 5000 uitwonende studenten.
b. De enquete is gestuurd naar enkel eerstejaars uitwonende studenten.
c. Van de 500 studenten die zijn aangeschreven, hebben slechts 160 gereageerd.
d. Alle bovenstaande aspecten maken het lastig de steekproefuitkomsten tegeneraliseren.
Opgave 39.
Het aantal mensen dat in Amerika op een boerderij woont is in de laatste eeuwsterk teruggelopen. Op basis van data over de Amerikaanse boerenpopulatie (inmiljoenen) tussen 1910 en 2000 is de volgende regressievergelijking te schatten:Voorspelde boerenpopulatie = 1167 − .59(JAAR) Welke methode kunnen wehet beste gebruiken om de boerenpopulatie in 2050 te voorspellen?
a. Substitueer in de regressievergelijking de waarde 2050 voor JAAR, en bere-ken de voorspelde boerenpopulatie.
b. Teken de regressielijn in een puntenwolk, lokaliseer 2050 langs de horizontaleas, en lees de corresponderende waarde van de voorspelde boerenpopulatie aflangs de verticale as.
c. Geen van deze beide methoden is geschikt om een voorspelling te makenvoor 2050 gebaseerd op deze data.
d. Beide deze methoden zijn geschikt om een voorspelling te maken voor 2050gebaseerd op deze data.
Opgave 40.
De volgende casus betreft hypothese toetsing. Een elektricien gebruikt een in-strument om te testen of een elektrisch circuit defect is of niet. Het instrumentgeeft soms ten onrechte aan dat een circuit defect is, wanneer het in feite goedwerkt. De nulhypothese is dat het circuit deugdelijk is. De alternatieve hypo-these is dat het circuit defect is. Als de elektricien nu de nulhypothese verwerpt,welke bewering is dan waar?
a. Het circuit is zeker defect, en moet gerepareerd worden.
b. De elektricien oordeelt dat het circuit defect is, terwijl het in feite deugdelijkzou kunnen zijn.
28
c. Het circuit is met zekerheid deugdelijk, en behoeft geen reparatie.
d. Het circuit is waarschijnlijk deugdelijk, maar zou ook defect kunnen zijn.
29
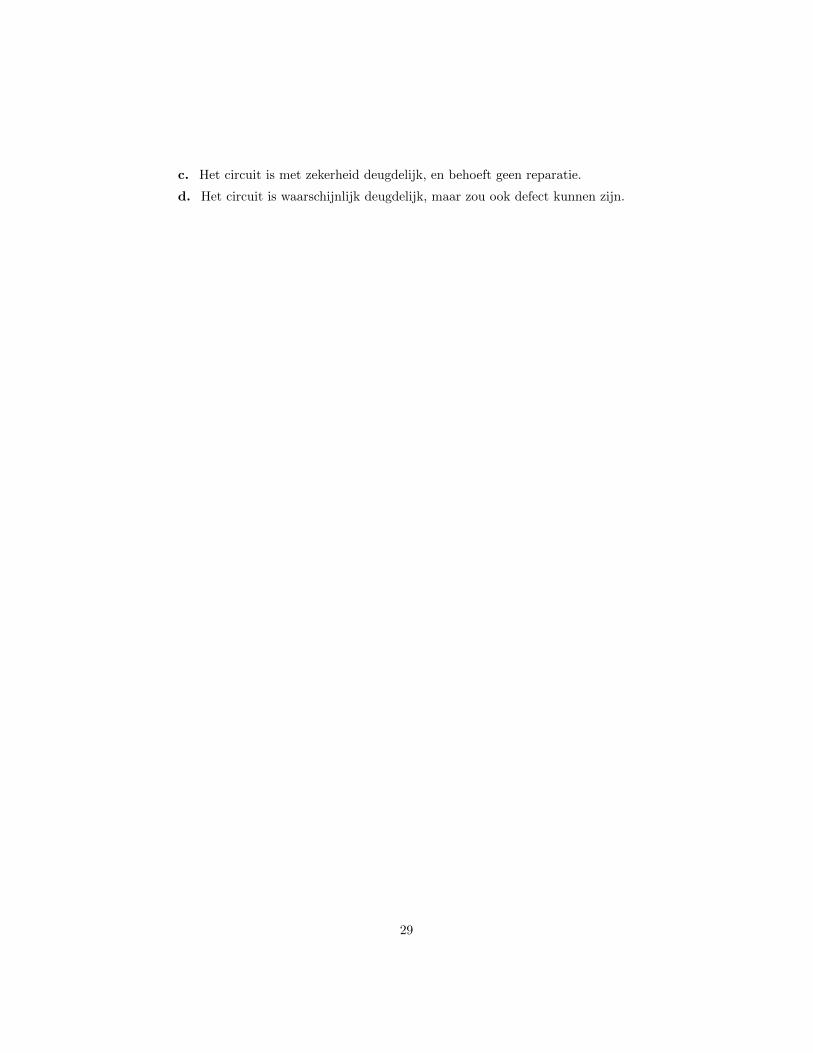
Exercise 1.
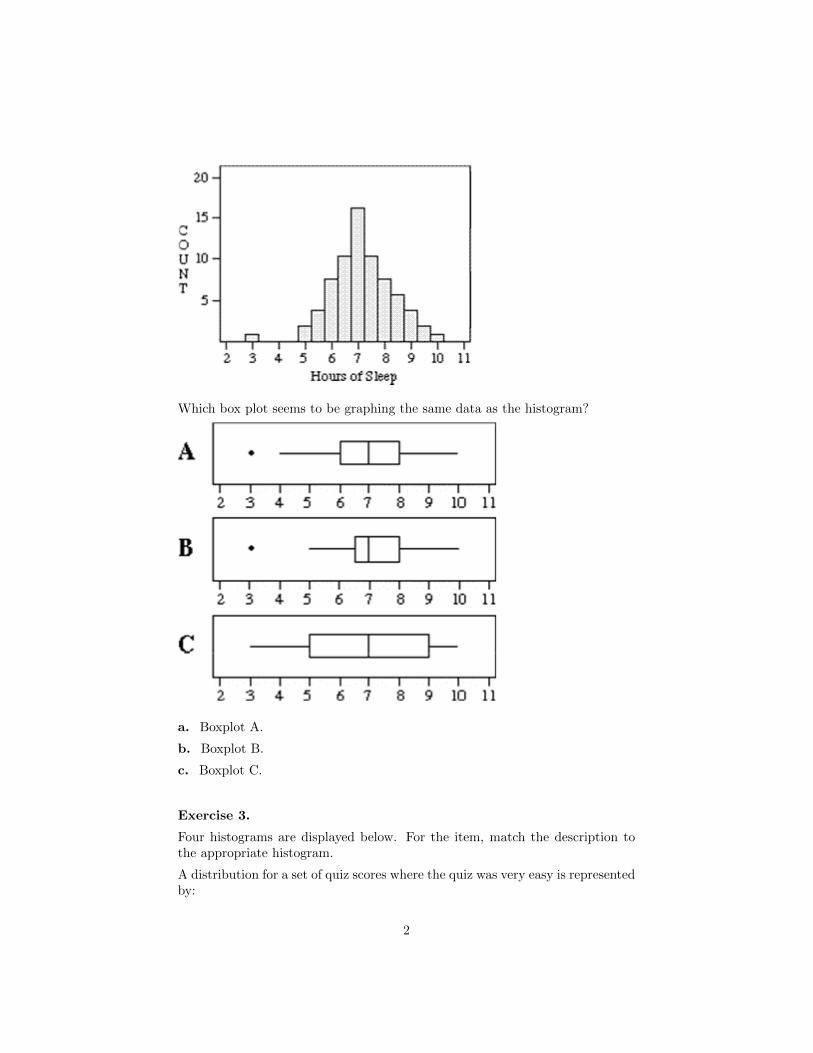
The following graph shows a distribution of hours slept last night by a group ofcollege students.
Select the statement be-low that gives the most complete description of the graph in a way that demon-strates an understanding of how to statistically describe and interpret the dis-tribution of a variable.
a. The bars go from 3 to 10, increasing in height to 7, then decreasing to 10.The tallest bar is at 7. There is a gap between three and five.
b. The distribution is normal, with a mean of about 7 and a standard deviationof about 1.
c. Most students seem to be getting enough sleep at night, but some studentsslept more and some slept less. However, one student must have stayed up verylate and got very few hours of sleep.
d. The distribution of hours of sleep is somewhat symmetric and bell-shaped,with an outlier at 3. The typical amount of sleep is about 7 hours and overallrange is 7 hours.
Exercise 2.
The following graph shows a distribution of hours slept last night by a group ofcollege students.
1

Which box plot seems to be graphing the same data as the histogram?
a. Boxplot A.
b. Boxplot B.
c. Boxplot C.
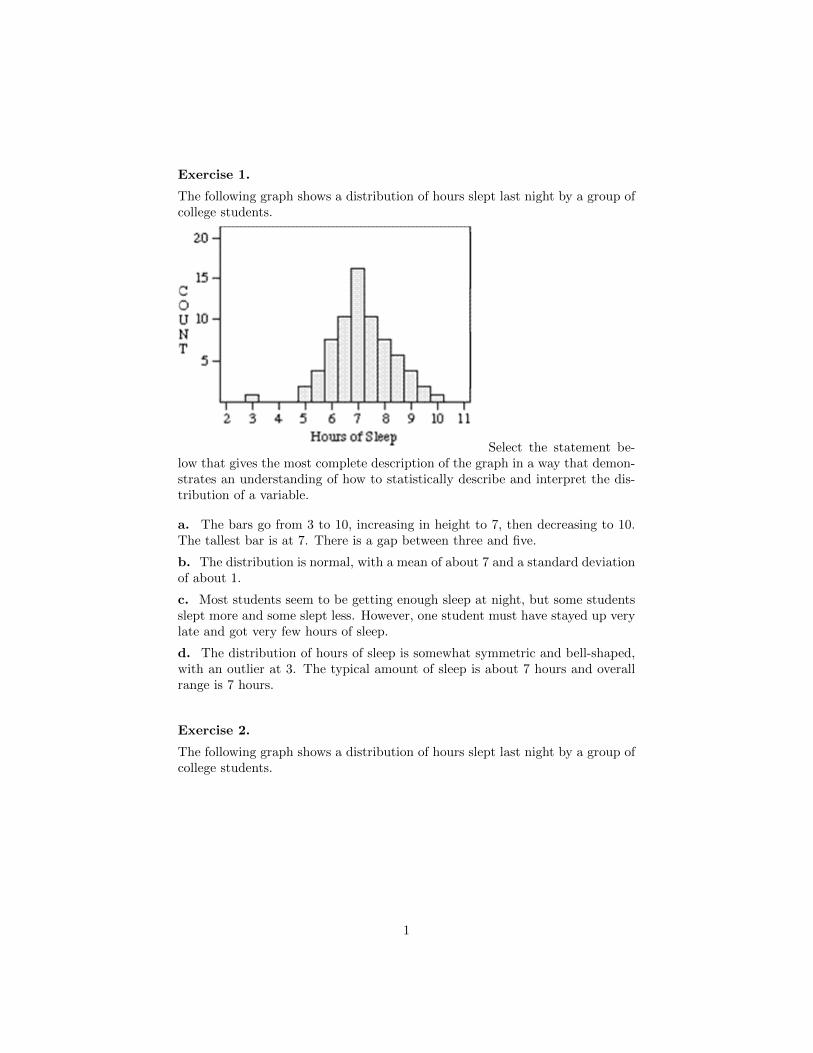
Exercise 3.
Four histograms are displayed below. For the item, match the description tothe appropriate histogram.
A distribution for a set of quiz scores where the quiz was very easy is representedby:
2
a. Histogram I.
b. Histogram II.
c. Histogram III.
d. Histogram IV.
Exercise 4.
Four histograms are displayed below. For each item, match the description tothe appropriate histogram.
3
A distribution for a set of quiz scores where the quiz was very easy is representedby:
a. Histogram I.
b. Histogram II.
c. Histogram III.
d. Histogram IV.
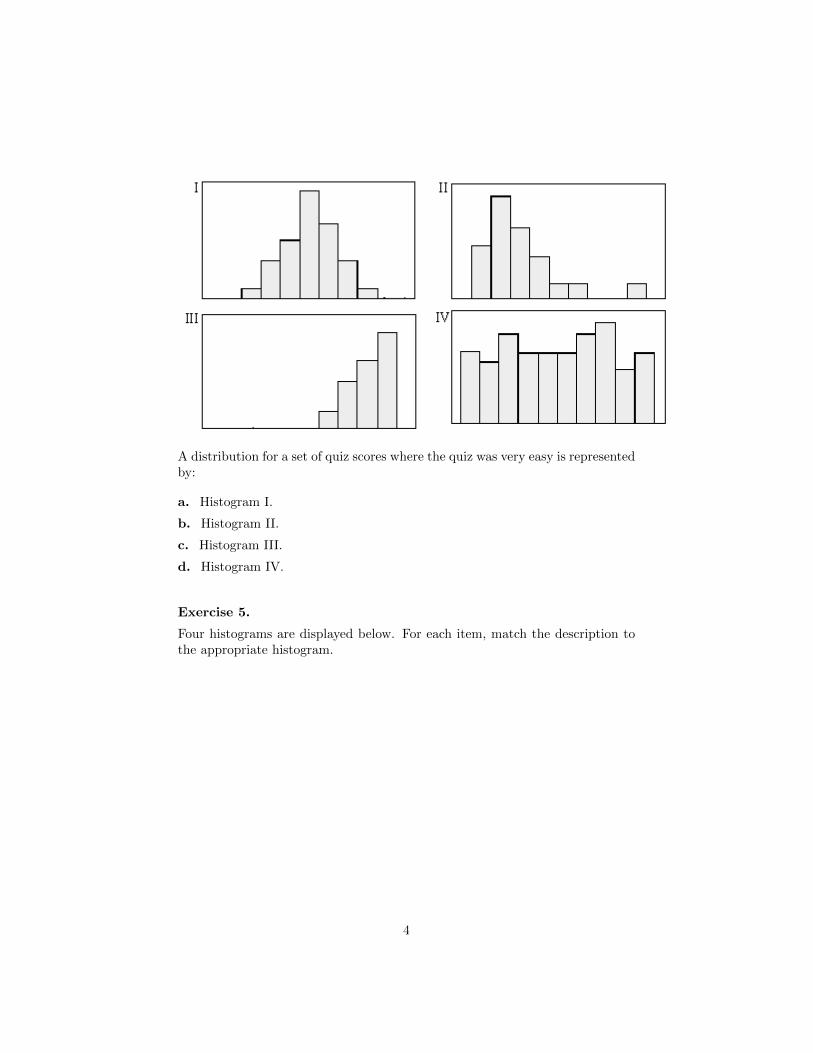
Exercise 5.
Four histograms are displayed below. For each item, match the description tothe appropriate histogram.
4
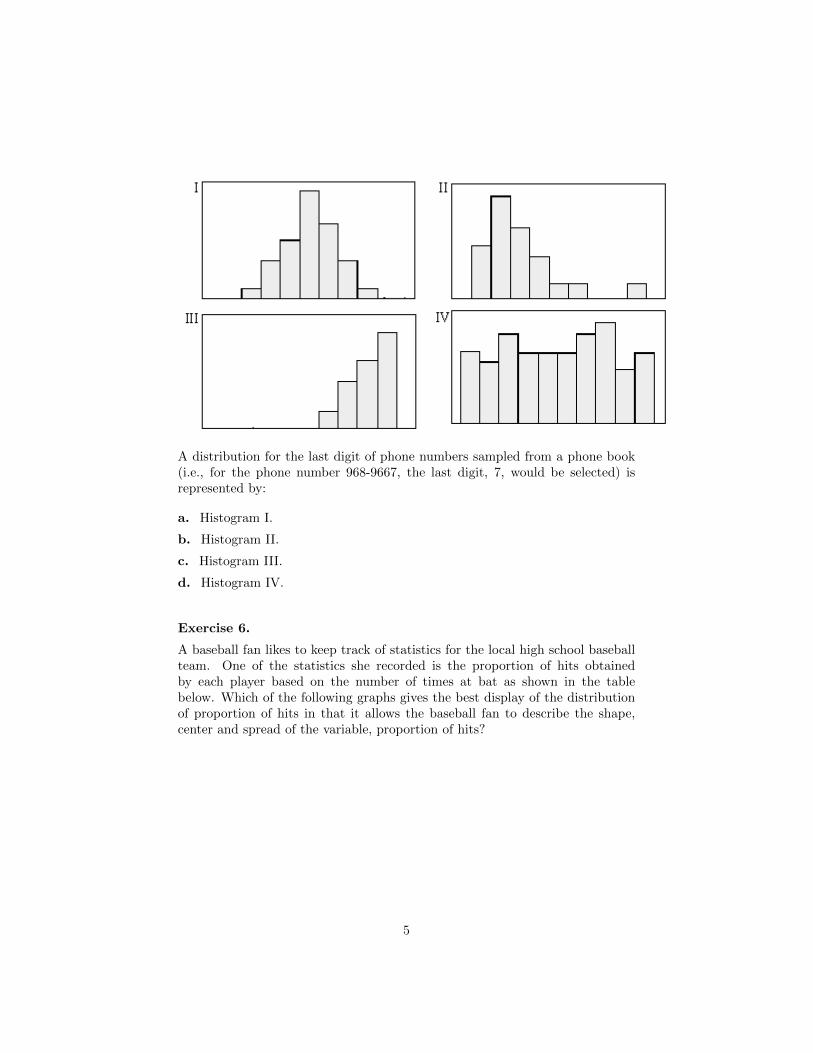
A distribution for the last digit of phone numbers sampled from a phone book(i.e., for the phone number 968-9667, the last digit, 7, would be selected) isrepresented by:
a. Histogram I.
b. Histogram II.
c. Histogram III.
d. Histogram IV.
Exercise 6.
A baseball fan likes to keep track of statistics for the local high school baseballteam. One of the statistics she recorded is the proportion of hits obtainedby each player based on the number of times at bat as shown in the tablebelow. Which of the following graphs gives the best display of the distributionof proportion of hits in that it allows the baseball fan to describe the shape,center and spread of the variable, proportion of hits?
5
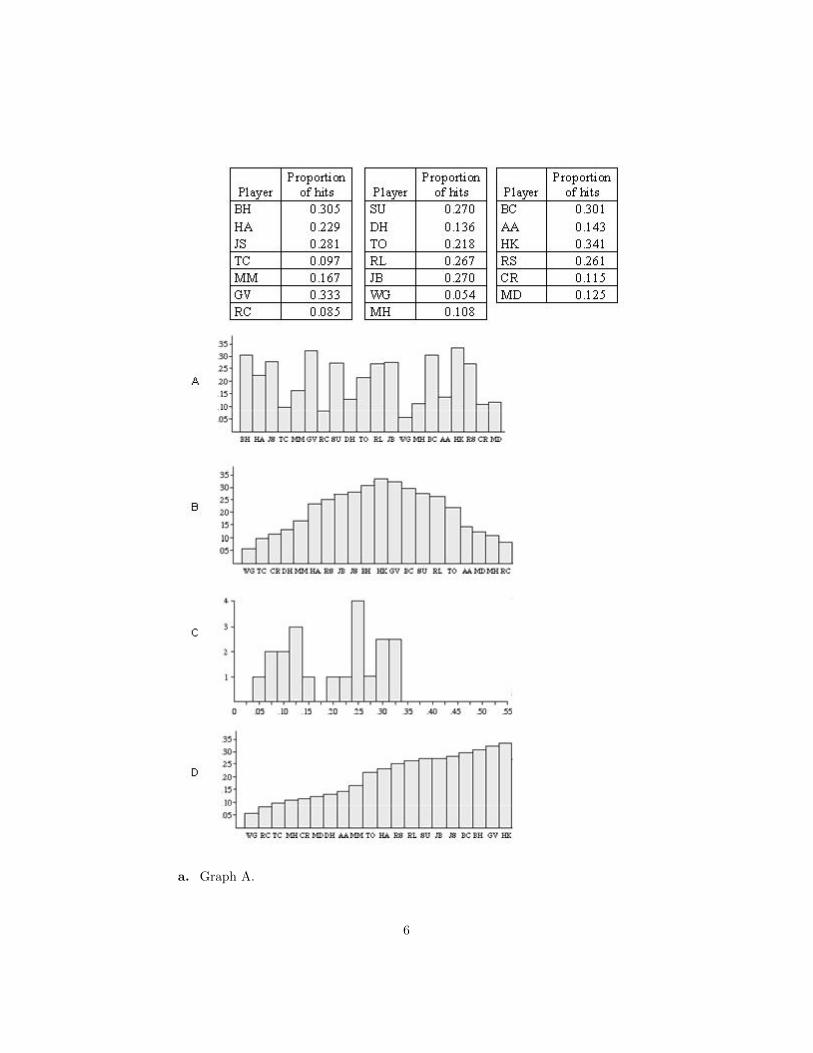
a. Graph A.
6
b. Graph B.
c. Graph C.
d. Graph D.
Exercise 7.
A recent research study randomly divided participants into groups who weregiven different levels of Vitamin E to take daily. One group received only aplacebo pill. The research study followed the participants for eight years tosee how many developed a particular type of cancer during that time period.Which of the following responses gives the best explanation as to the purposeof randomization in this study?
a. To increase the accuracy of the research results.
b. To ensure that all potential cancer patients had an equal chance of beingselected for the study.
c. To reduce the amount of sampling error.
d. To produce treatment groups with similar characteristics.
e. To prevent skewness in the results.
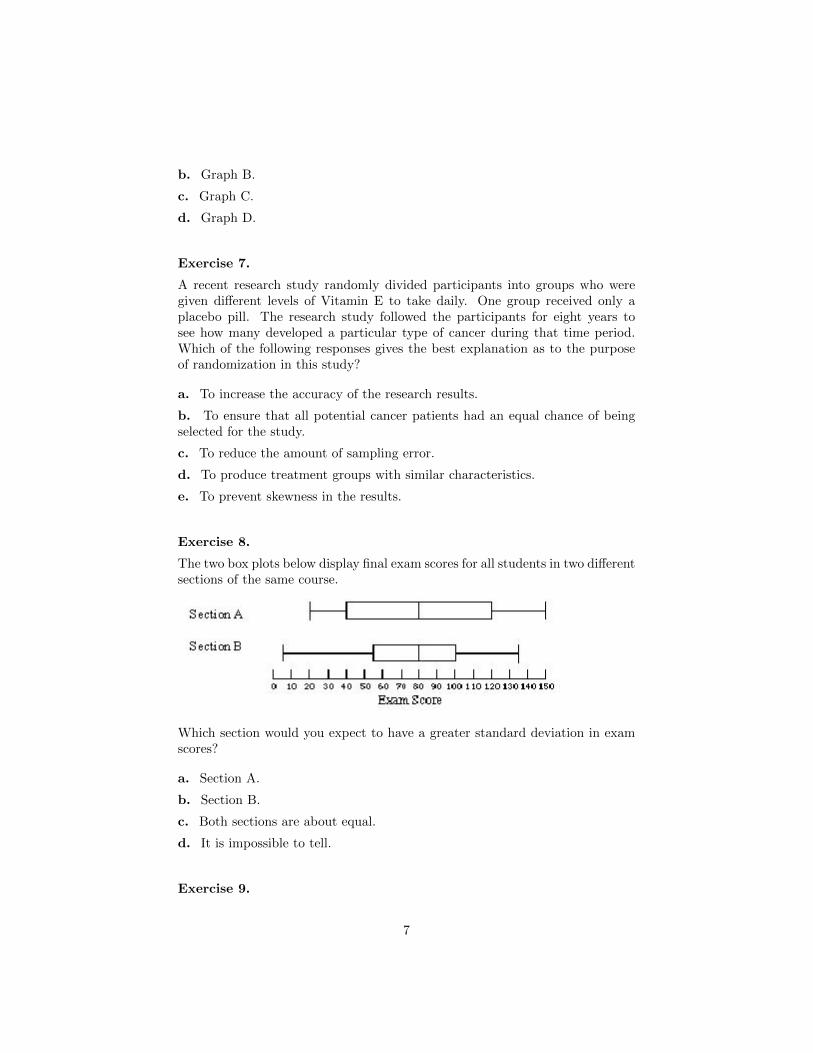
Exercise 8.
The two box plots below display final exam scores for all students in two differentsections of the same course.
Which section would you expect to have a greater standard deviation in examscores?
a. Section A.
b. Section B.
c. Both sections are about equal.
d. It is impossible to tell.
Exercise 9.
7
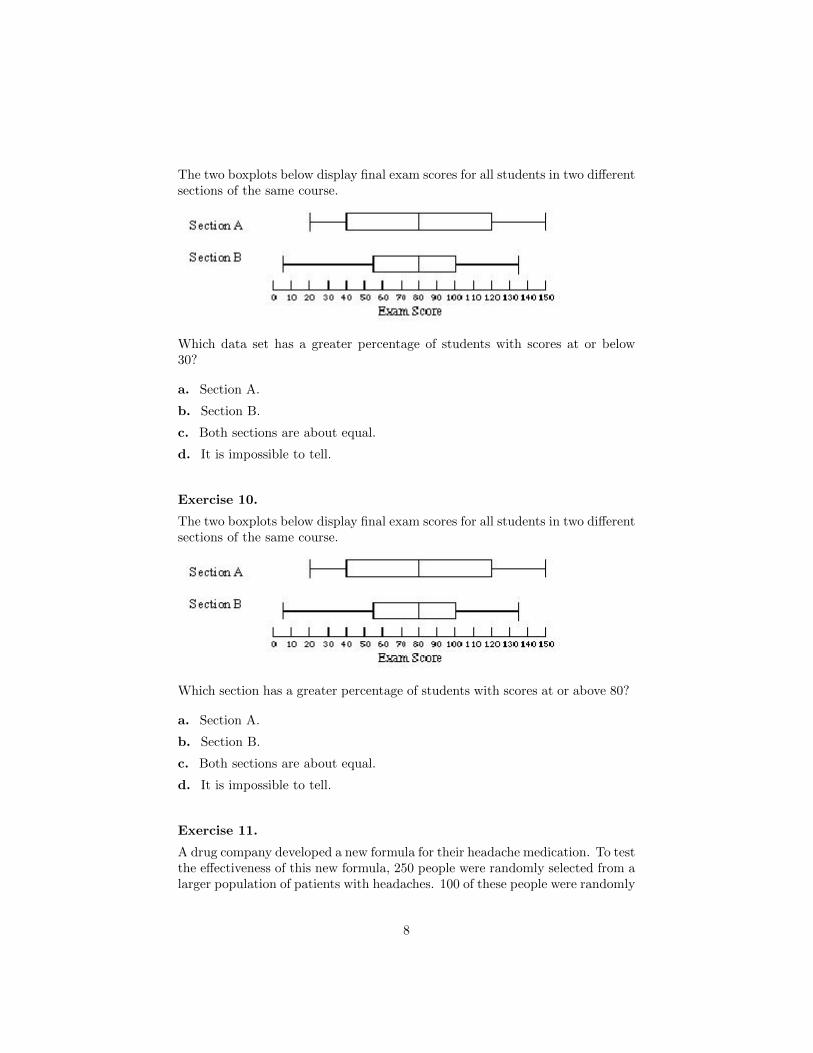
The two boxplots below display final exam scores for all students in two differentsections of the same course.
Which data set has a greater percentage of students with scores at or below30?
a. Section A.
b. Section B.
c. Both sections are about equal.
d. It is impossible to tell.
Exercise 10.
The two boxplots below display final exam scores for all students in two differentsections of the same course.
Which section has a greater percentage of students with scores at or above 80?
a. Section A.
b. Section B.
c. Both sections are about equal.
d. It is impossible to tell.
Exercise 11.
A drug company developed a new formula for their headache medication. To testthe effectiveness of this new formula, 250 people were randomly selected from alarger population of patients with headaches. 100 of these people were randomly
8
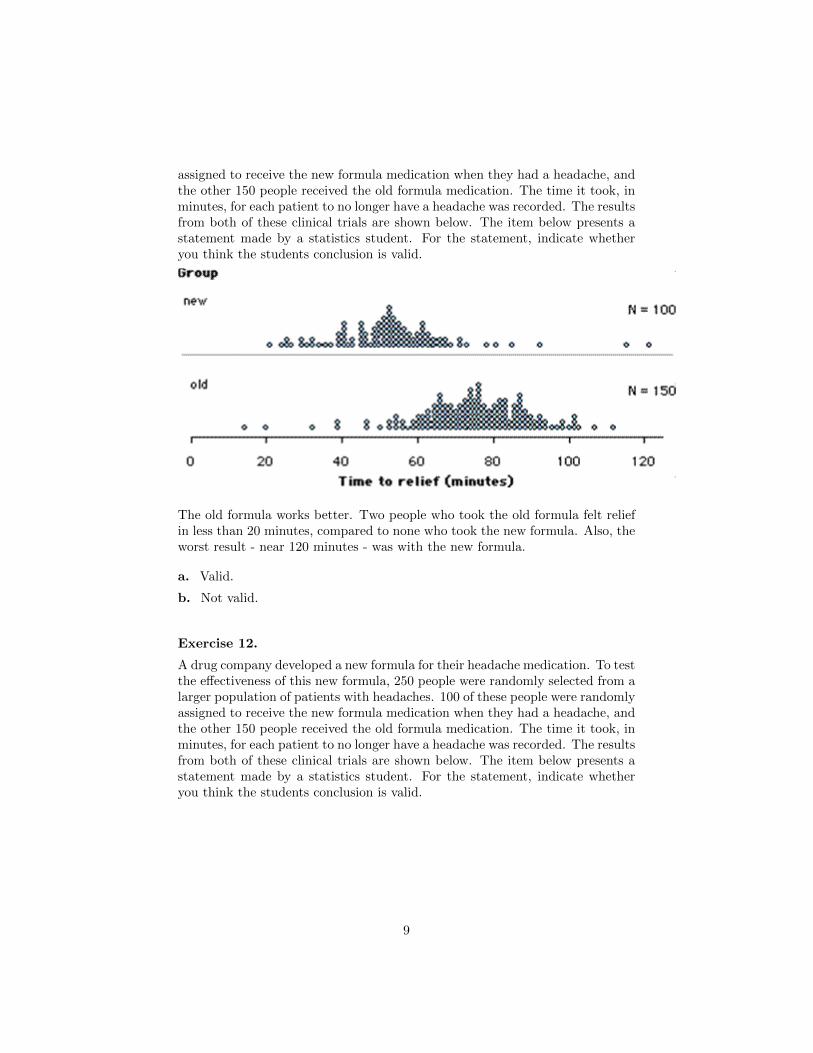
assigned to receive the new formula medication when they had a headache, andthe other 150 people received the old formula medication. The time it took, inminutes, for each patient to no longer have a headache was recorded. The resultsfrom both of these clinical trials are shown below. The item below presents astatement made by a statistics student. For the statement, indicate whetheryou think the students conclusion is valid.
The old formula works better. Two people who took the old formula felt reliefin less than 20 minutes, compared to none who took the new formula. Also, theworst result - near 120 minutes - was with the new formula.
a. Valid.
b. Not valid.
Exercise 12.
A drug company developed a new formula for their headache medication. To testthe effectiveness of this new formula, 250 people were randomly selected from alarger population of patients with headaches. 100 of these people were randomlyassigned to receive the new formula medication when they had a headache, andthe other 150 people received the old formula medication. The time it took, inminutes, for each patient to no longer have a headache was recorded. The resultsfrom both of these clinical trials are shown below. The item below presents astatement made by a statistics student. For the statement, indicate whetheryou think the students conclusion is valid.
9
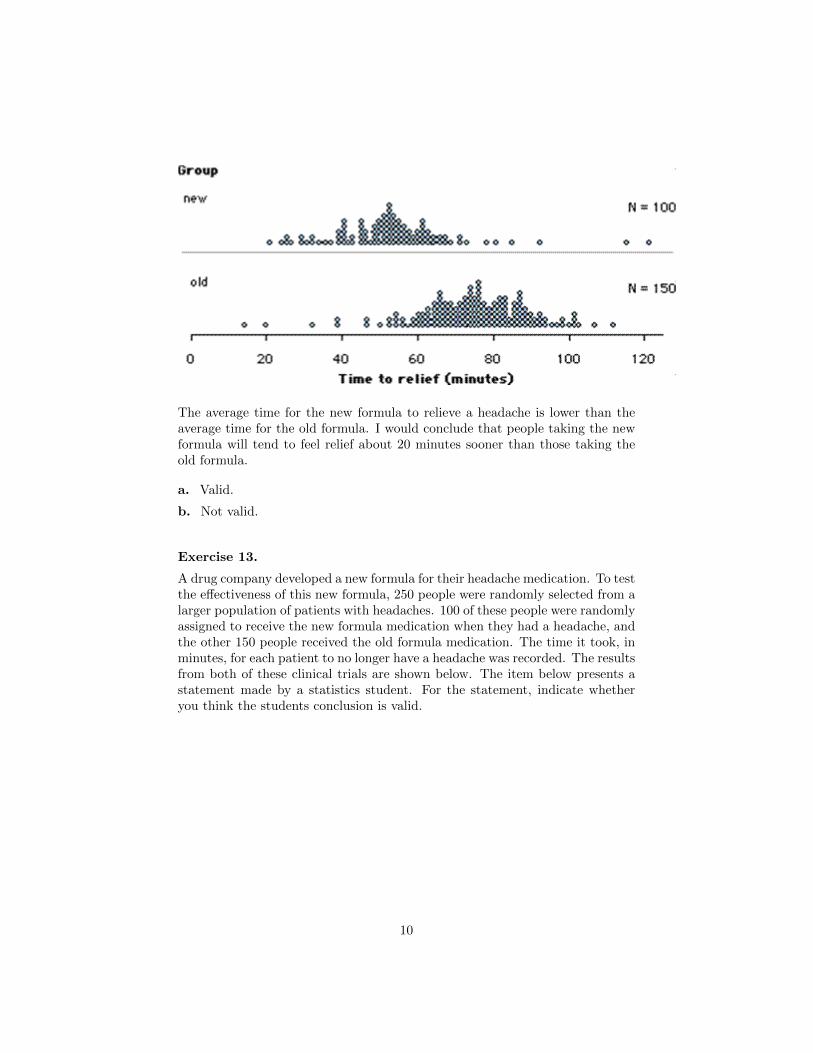
The average time for the new formula to relieve a headache is lower than theaverage time for the old formula. I would conclude that people taking the newformula will tend to feel relief about 20 minutes sooner than those taking theold formula.
a. Valid.
b. Not valid.
Exercise 13.
A drug company developed a new formula for their headache medication. To testthe effectiveness of this new formula, 250 people were randomly selected from alarger population of patients with headaches. 100 of these people were randomlyassigned to receive the new formula medication when they had a headache, andthe other 150 people received the old formula medication. The time it took, inminutes, for each patient to no longer have a headache was recorded. The resultsfrom both of these clinical trials are shown below. The item below presents astatement made by a statistics student. For the statement, indicate whetheryou think the students conclusion is valid.
10
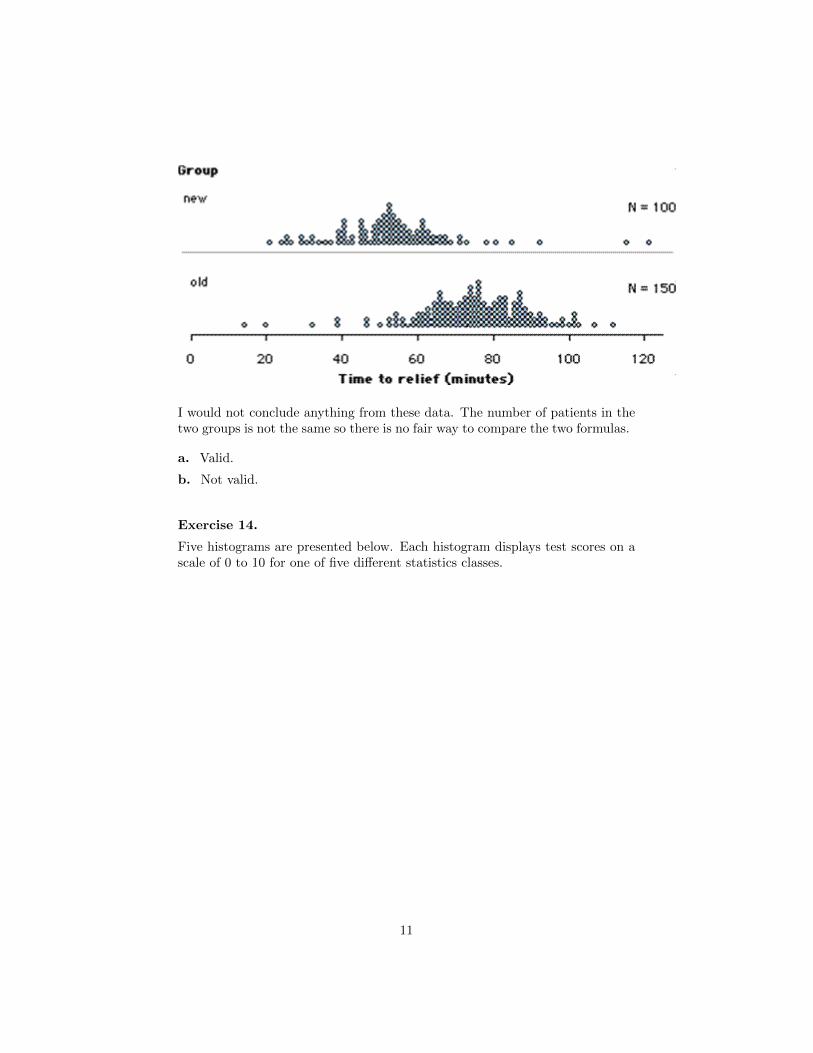
I would not conclude anything from these data. The number of patients in thetwo groups is not the same so there is no fair way to compare the two formulas.
a. Valid.
b. Not valid.
Exercise 14.
Five histograms are presented below. Each histogram displays test scores on ascale of 0 to 10 for one of five different statistics classes.
11

Exercise 1.
The following graph shows a distribution of hours slept last night by a group ofcollege students.
Select the statement be-low that gives the most complete description of the graph in a way that demon-strates an understanding of how to statistically describe and interpret the dis-tribution of a variable.
a. The bars go from 3 to 10, increasing in height to 7, then decreasing to 10.The tallest bar is at 7. There is a gap between three and five.
b. The distribution is normal, with a mean of about 7 and a standard deviationof about 1.
c. Most students seem to be getting enough sleep at night, but some studentsslept more and some slept less. However, one student must have stayed up verylate and got very few hours of sleep.
d. The distribution of hours of sleep is somewhat symmetric and bell-shaped,with an outlier at 3. The typical amount of sleep is about 7 hours and overallrange is 7 hours.
Exercise 2.
The following graph shows a distribution of hours slept last night by a group ofcollege students.
1
Which box plot seems to be graphing the same data as the histogram?
a. Boxplot A.
b. Boxplot B.
c. Boxplot C.
Exercise 3.
Four histograms are displayed below. For the item, match the description tothe appropriate histogram.
A distribution for a set of quiz scores where the quiz was very easy is representedby:
2
e. Class E, because it looks the most normal.
Exercise 15.
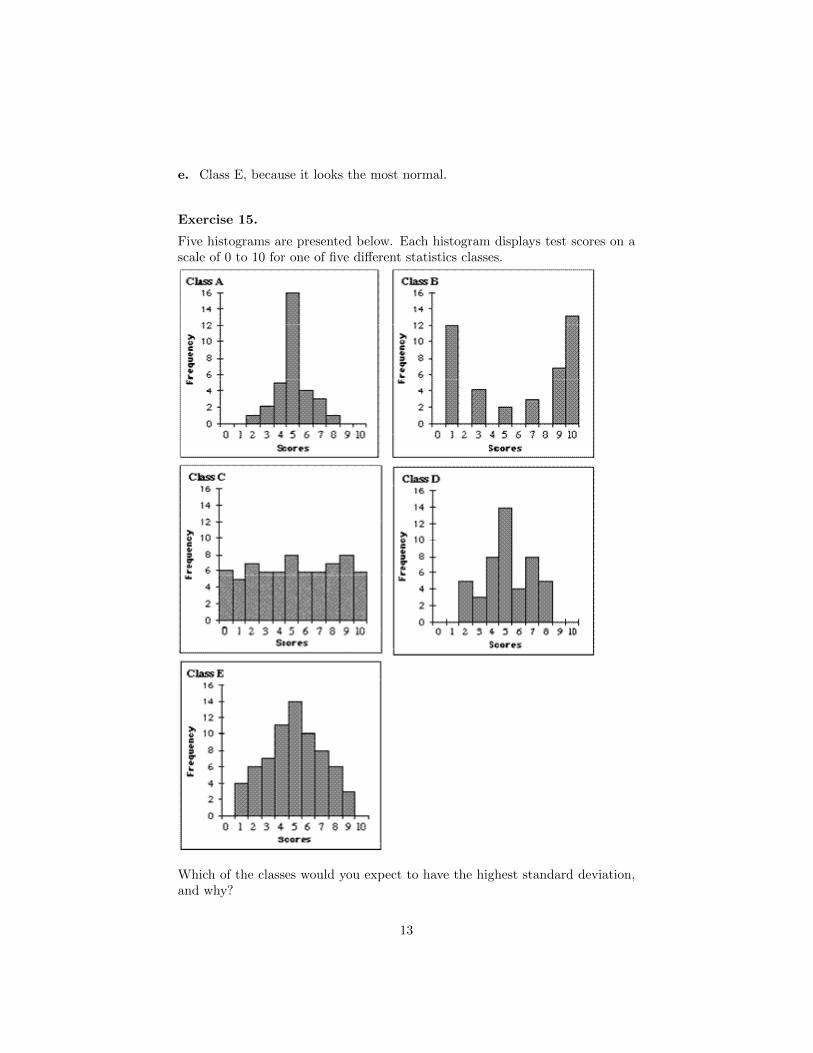
Five histograms are presented below. Each histogram displays test scores on ascale of 0 to 10 for one of five different statistics classes.
Which of the classes would you expect to have the highest standard deviation,and why?
13
a. Class A, because it has the largest difference between the heights of thebars.
b. Class B, because more of its scores are far from the mean.
c. Class C, because it has the largest number of different scores.
d. Class D, because the distribution is very bumpy and irregular.
e. Class E, because it has a large range and looks normal.
Class B, because more of its scores are far from the mean.
Exercise 16.
A certain manufacturer claims that they produce 50% brown candies. Samplans to buy a large family size bag of these candies and Kerry plans to buya small fun size bag. Which bag is more likely to have more than 70% browncandies?
a. Sam, because there are more candies, so his bag can have more browncandies.
b. Sam, because there is more variability in the proportion of browns amonglarger samples.
c. Kerry, because there is more variability in the proportion of browns amongsmaller samples.
d. Kerry, because most small bags will have more than 50% brown candies.
e. Both have the same chance because they are both random samples.
Exercise 17.
Imagine you have a barrel that contains thousands of candies with several differ-ent colors. We know that the manufacturer produces 35% yellow candies. Fivestudents each take a random sample of 20 candies, one at a time, and recordthe percentage of yellow candies in their sample. Which sequence below is themost plausible for the percent of yellow candies obtained in these five samples?
a. 30%, 35%, 15%, 40%, 50%.
b. 35%, 35%, 35%, 35%, 35%.
c. 5%, 60%, 10%, 50%, 95%.
d. Any of the above.
Exercise 18.
Jean lives about 10 miles from the college where she plans to attend a 10-weeksummer class. There are two main routes she can take to the school, one through
14
the city and one through the countryside. The city route is shorter in miles, buthas more stoplights. The country route is longer in miles, but has only a fewstop signs and stoplights. Jean sets up a randomized experiment where eachday she tosses a coin to decide which route to take that day. She records thefollowing data for 5 days of travel on each route
Country Route 17, 15, 17, 16, 18
City Route 18, 13, 20, 10, 16
It is important to Jean to arrive on time for her classes, but she does not wantto arrive too early because that would increase her parking fees. Based on thedata gathered, which route would you advise her to choose?
a. The Country Route, because the times are consistently between 15 and 18minutes.
b. The City Route, because she can get there in 10 minutes on a good day andthe average time is less than for the Country Route.
c. Because the times on the two routes have so much overlap, neither route isbetter than the other. She might as well flip a coin.
Exercise 19.
A graduate student is designing a research study. She is hoping to show thatthe results of an experiment are statistically significant. What type of p-valuewould she want to obtain?
a. A large p-value.
b. A small p-value.
c. The magnitude of a p-value has no impact on statistical significance.
Exercise 20.
Bone density is typically measured as a standardized score with a mean of 0and a standard deviation of 1. Lower scores correspond to lower bone density.Which of the following graphs shows that as women grow older they tend tohave lower bone density?
15
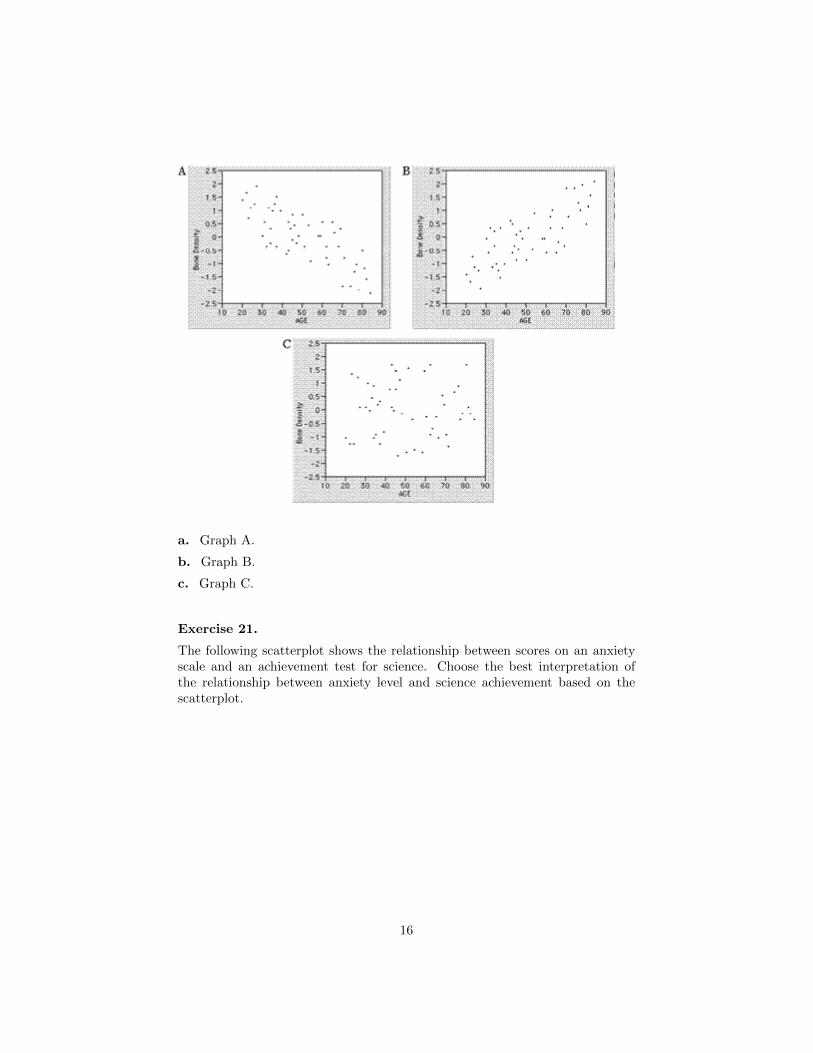
a. Graph A.
b. Graph B.
c. Graph C.
Exercise 21.
The following scatterplot shows the relationship between scores on an anxietyscale and an achievement test for science. Choose the best interpretation ofthe relationship between anxiety level and science achievement based on thescatterplot.
16
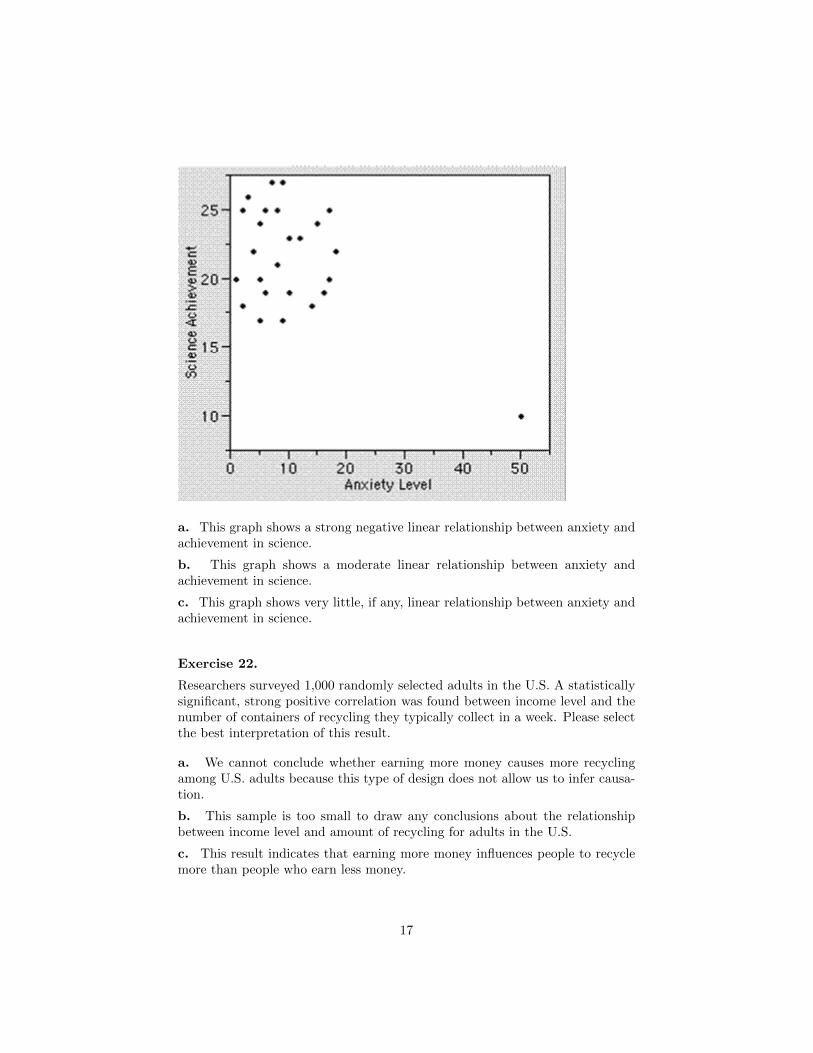
a. This graph shows a strong negative linear relationship between anxiety andachievement in science.
b. This graph shows a moderate linear relationship between anxiety andachievement in science.
c. This graph shows very little, if any, linear relationship between anxiety andachievement in science.
Exercise 22.
Researchers surveyed 1,000 randomly selected adults in the U.S. A statisticallysignificant, strong positive correlation was found between income level and thenumber of containers of recycling they typically collect in a week. Please selectthe best interpretation of this result.
a. We cannot conclude whether earning more money causes more recyclingamong U.S. adults because this type of design does not allow us to infer causa-tion.
b. This sample is too small to draw any conclusions about the relationshipbetween income level and amount of recycling for adults in the U.S.
c. This result indicates that earning more money influences people to recyclemore than people who earn less money.
17
Exercise 23.
A researcher in environmental science is conducting a study to investigate theimpact of a particular herbicide on fish. He has 60 healthy fish and randomlyassigns each fish to either a treatment or a control group. The fish in thetreatment group showed higher levels of the indicator enzyme. Suppose a testof significance was correctly conducted and showed no statistically significantdifference in average enzyme level between the fish that were exposed to theherbicide and those that were not. What conclusion can the graduate studentdraw from these results?
a. The researcher must not be interpreting the results correctly; there shouldbe a significant difference.
b. The sample size may be too small to detect a statistically significant differ-ence.
c. It must be true that the herbicide does not cause higher levels of the enzyme.
Exercise 24.
A researcher in environmental science is conducting a study to investigate theimpact of a particular herbicide on fish. He has 60 healthy fish and randomlyassigns each fish to either a treatment or a control group. The fish in thetreatment group showed higher levels of the indicator enzyme. Suppose a testof significance was correctly conducted and showed a statistically significantdifference in average enzyme level between the fish that were exposed to theherbicide and those that were not. What conclusion can the graduate studentdraw from these results?
a. There is evidence of association, but no causal effect of herbicide on enzymelevels.
b. The researcher must not be interpreting the results correctly; there shouldbe a significant difference.
c. He has proven that the herbicide causes higher levels of the enzyme.
d. There is evidence that the herbicide causes higher levels of the enzyme forthese fish.
Exercise 25.
A research article reports the results of a new drug test. The drug is to be usedto decrease vision loss in people with Macular Degeneration. The article givesa p-value of .04 in the analysis section. The following statement presents aninterpretation of this p-value. Indicate if the interpretation is valid or invalid.
The p-value is the probability of getting results as extreme as or more extremethan the ones in this study if the drug is actually not effective.
18
a. Valid.
b. Invalid.
Exercise 26.
A research article reports the results of a new drug test. The drug is to be usedto decrease vision loss in people with Macular Degeneration. The article givesa p-value of .04 in the analysis section. The following statement presents aninterpretation of this p-value. Indicate if the interpretation is valid or invalid.The p-value is the probability that the drug is not effective.
a. Valid.
b. Invalid
Exercise 27.
A research article reports the results of a new drug test. The drug is to be usedto decrease vision loss in people with Macular Degeneration. The article givesa p-value of .04 in the analysis section. The following statement presents aninterpretation of this p-value. Indicate if the interpretation is valid or invalid.The p-value is the probability that the drug is effective.
a. Valid.
b. Invalid
Exercise 28.
A high school statistics class wants to estimate the average number of chocolatechips in a generic brand of chocolate chip cookies. They collect a random sampleof cookies, count the chips in each cookie, and calculate a 95% confidence intervalfor the average number of chips per cookie (18.6 to 21.3). Indicate if the followinginterpretation of these results is valid or invalid.
We are 95% certain that each cookie for this brand has approximately 18.6 to21.3 chocolate chips.
a. Valid.
b. Invalid.
Exercise 29.
A high school statistics class wants to estimate the average number of chocolatechips in a generic brand of chocolate chip cookies. They collect a random sampleof cookies, count the chips in each cookie, and calculate a 95% confidence interval
19
for the average number of chips per cookie (18.6 to 21.3). Indicate if the followinginterpretation of these results is valid or invalid.
We expect 95% of the cookies to have between 18.6 and 21.3 chocolate chips.
a. Valid.
b. Invalid.
Exercise 30.
A high school statistics class wants to estimate the average number of chocolatechips in a generic brand of chocolate chip cookies. They collect a random sampleof cookies, count the chips in each cookie, and calculate a 95% confidence intervalfor the average number of chips per cookie (18.6 to 21.3). Indicate if the followinginterpretation of these results is valid or invalid.
We would expect about 95% of all possible sample means from this populationto be between 18.6 and 21.3 chocolate chips.
a. Valid.
b. Invalid.
Exercise 31.
A high school statistics class wants to estimate the average number of chocolatechips in a generic brand of chocolate chip cookies. They collect a random sampleof cookies, count the chips in each cookie, and calculate a 95% confidence intervalfor the average number of chips per cookie (18.6 to 21.3). Indicate if the followinginterpretation of these results is valid or invalid.
We are 95% certain that the confidence interval of 18.6 to 21.3 includes the trueaverage number of chocolate chips per cookie.
a. Valid.
b. Invalid.
Exercise 32.
It has been established that under normal environmental conditions, adult large-mouth bass in Silver Lake have an average length of 12.3 inches with a standarddeviation of 3 inches. People who have been fishing Silver Lake for some timeclaim that this year they are catching smaller than usual largemouth bass. A re-search group from the Department of Natural Resources took a random sampleof 100 adult largemouth bass from Silver Lake and found the mean of this sam-ple to be 11.2 inches. Which of the following is the most appropriate statisticalconclusion?
20
a. The researchers cannot conclude that the fish are smaller than what is normalbecause 11.2 inches is less than one standard deviation from the establishedmean (12.3 inches) for this species.
b. The researchers can conclude that the fish are smaller than what is normalbecause the sample mean should be almost identical to the population meanwith a large sample of 100 fish.
c. The researchers can conclude that the fish are smaller than what is normalbecause the difference between 12.3 inches and 11.2 inches is much larger thanthe expected sampling error.
Exercise 33.
A study examined the length of a certain species of fish from one lake. Theplan was to take a random sample of 100 fish and examine the results. Nu-merical summaries on lengths of the fish measured in this study are given.
Mean 26.8mmMedian 29.4mmStandard Deviation 5.0mmMinimum 12.mmMaximum 33.4mm
Which of the following histograms is most likely to be the one for these data?
21

a. Histogram a.
b. Histogram b.
22
c. Histogram c.
Exercise 34.
Four graphs are presented below. The graph at the top is a distribution for apopulation of test scores. The mean score is 6.4 and the standard deviation is4.1. Amongst the other three graphs, there are two that represent distributionsof 500 sample means from random samples of sizes 1 and 9.
23

Which graph (A, B, or C) do you think represents a single random sample of500 values from this population?
a. Graph A.
24
b. Graph B.
c. Graph C.
Exercise 35.
Four graphs are presented below. The graph at the top is a distribution for apopulation of test scores. The mean score is 6.4 and the standard deviation is4.1. Two of the other graphs represent distributions of 500 sample means fromrandom samples of sizes 1 and 9.
25
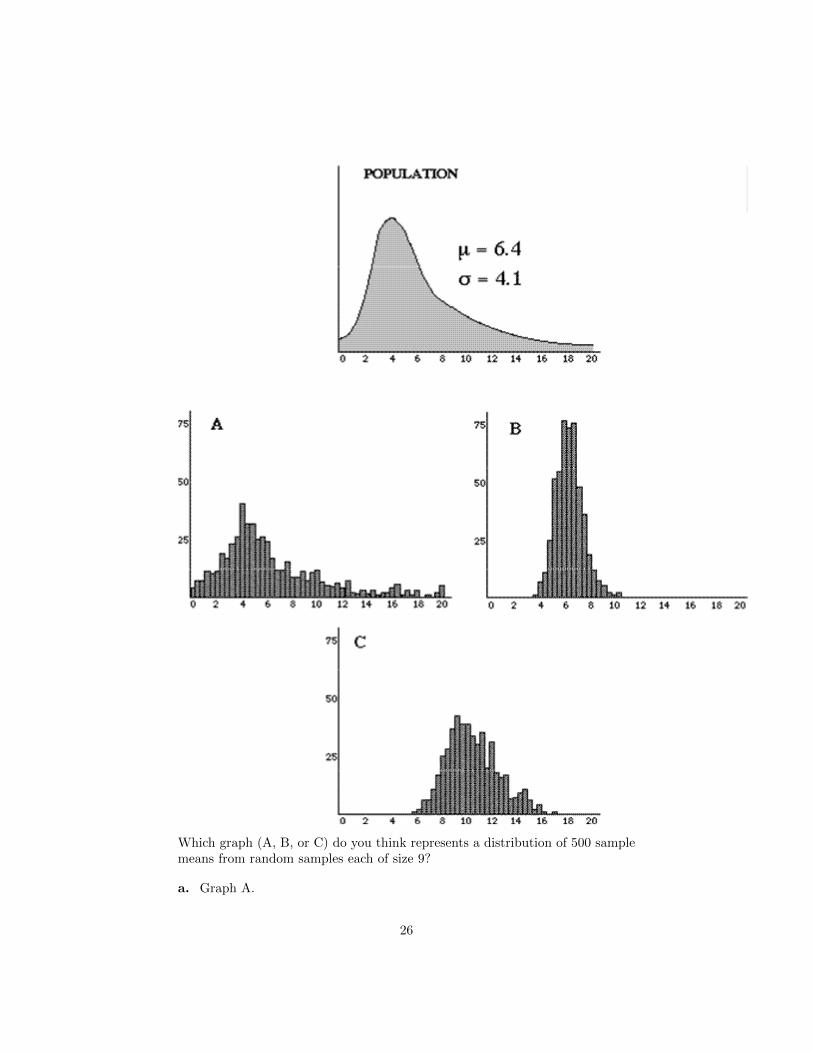
Which graph (A, B, or C) do you think represents a distribution of 500 samplemeans from random samples each of size 9?
a. Graph A.
26
b. Graph B.
c. Graph C.
Exercise 36.
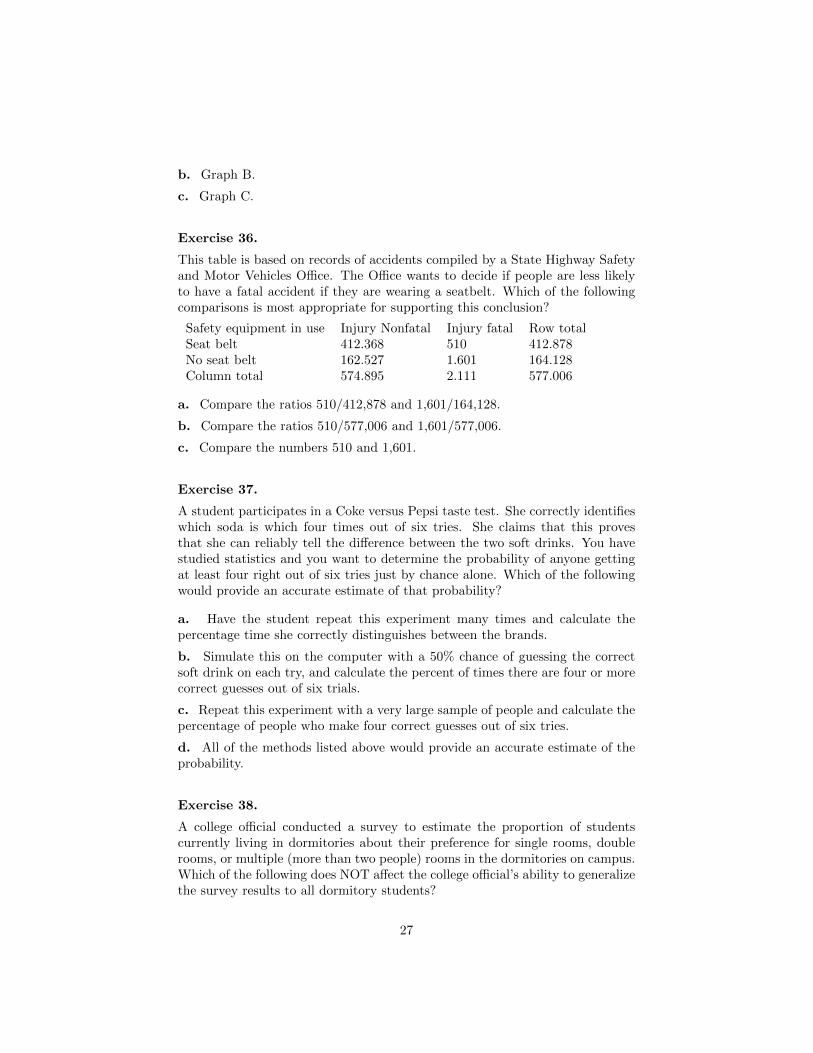
This table is based on records of accidents compiled by a State Highway Safetyand Motor Vehicles Office. The Office wants to decide if people are less likelyto have a fatal accident if they are wearing a seatbelt. Which of the followingcomparisons is most appropriate for supporting this conclusion?
Safety equipment in use Injury Nonfatal Injury fatal Row totalSeat belt 412.368 510 412.878No seat belt 162.527 1.601 164.128Column total 574.895 2.111 577.006
a. Compare the ratios 510/412,878 and 1,601/164,128.
b. Compare the ratios 510/577,006 and 1,601/577,006.
c. Compare the numbers 510 and 1,601.
Exercise 37.
A student participates in a Coke versus Pepsi taste test. She correctly identifieswhich soda is which four times out of six tries. She claims that this provesthat she can reliably tell the difference between the two soft drinks. You havestudied statistics and you want to determine the probability of anyone gettingat least four right out of six tries just by chance alone. Which of the followingwould provide an accurate estimate of that probability?
a. Have the student repeat this experiment many times and calculate thepercentage time she correctly distinguishes between the brands.
b. Simulate this on the computer with a 50% chance of guessing the correctsoft drink on each try, and calculate the percent of times there are four or morecorrect guesses out of six trials.
c. Repeat this experiment with a very large sample of people and calculate thepercentage of people who make four correct guesses out of six tries.
d. All of the methods listed above would provide an accurate estimate of theprobability.
Exercise 38.
A college official conducted a survey to estimate the proportion of studentscurrently living in dormitories about their preference for single rooms, doublerooms, or multiple (more than two people) rooms in the dormitories on campus.Which of the following does NOT affect the college official’s ability to generalizethe survey results to all dormitory students?
27
a. Five thousand students live in dormitories on campus. A random sample ofonly 500 were sent the survey.
b. The survey was sent to only first-year students.
c. Of the 500 students who were sent the survey, only 160 responded.
d. All of the above present a problem for generalizing the results.
Exercise 39.
The number of people living on American farms has declined steadily during thelast century. Data gathered on the U.S. farm population (millions of people)from 1910 to 2000 were used to generate the following regression equation:Predicted Farm Population = 1167− .59(Y EAR). Which method is best to useto predict the number of people living on farms in 2050?
a. Substitute the value of 2050 for YEAR in the regression equation, andcompute the predicted farm population.
b. Plot the regression line on a scatterplot, locate 2050 on the horizontal axis,and read off the corresponding value of population on the vertical axis.
c. Neither method is appropriate for making a prediction for the year 2050based on these data.
d. Both methods are appropriate for making a prediction for the year 2050based on these data.
Exercise 40.
The following situation models the logic of a hypothesis test. An electricianuses an instrument to test whether or not an electrical circuit is defective. Theinstrument sometimes fails to detect that a circuit is good and working. The nullhypothesis is that the circuit is good (not defective). The alternative hypothesisis that the circuit is not good (defective). If the electrician rejects the nullhypothesis, which of the following statements is true?
a. The circuit is definitely not good and needs to be repaired.
b. The electrician decides that the circuit is defective, but it could be good.
c. The circuit is definitely good and does not need to be repaired.
d. The circuit is most likely good, but it could be defective.
28