Tuberculosis - nvalt.nl - Clinical... · Clinical Aspects of Immune Responses in Tuberculosis...
148
Tuberculosis e b rcu REGINA HOFLAND Clinical Aspects of Immune Responses in
Transcript of Tuberculosis - nvalt.nl - Clinical... · Clinical Aspects of Immune Responses in Tuberculosis...

UITNODIGING
voor het bijwonen van de openbare verdediging
van het proefschrift
Clinical Aspects of Immune Responses
in Tuberculosis
D.V. Dinsdag 29 mei 2018, 12:45 uur Academiegebouw
Domplein 29 te Utrecht
Na afloop bent u van harte welkom op de receptie ter plaatse
REGINA HOFLANDGriffensteijnselaan 6
3703 AA Zeist06-15275776
PARANIMFEN
Marion VerduijnAlbertine Donker
TuberculosisTuberculosisTuberculosisTuberculosis
REGINA HOFLAND
Clinical Aspects of Immune Responses in
Clinical A
spects of Imm
une Responses in Tuberculosis
REG
INA
HO
FLAN
D
15378-hofland-cover.indd 1 18/04/2018 14:15
UITNODIGING
voor het bijwonen van de openbare verdediging
van het proefschrift
Clinical Aspects of Immune Responses
in Tuberculosis
D.V. Dinsdag 29 mei 2018, 12:45 uur Academiegebouw
Domplein 29 te Utrecht
Na afloop bent u van harte welkom op de receptie ter plaatse
REGINA HOFLANDGriffensteijnselaan 6
3703 AA Zeist06-15275776
PARANIMFEN
Marion VerduijnAlbertine Donker
TuberculosisClinical Aspects of Immune Responses in
Clinical A
spects of Imm
une Responses in Tuberculosis
REG
INA
HO
FLAN
D
15378-hofland-cover.indd 1 18/04/2018 14:15

REGINA HOFLAND
15378-hofland-cover.indd 218/04/2018 14:1515378-hofland-cover.indd 218/04/2018 14:15

Clinical Aspects of Immune Responses in
Tuberculosis
Regina Hofland

ISBN: 978-94-6299-904-6
© R.W. Hofland, 2018, Zeist, the Netherlands
All rights reserved. No part of this publication may be reproduced in any form or by any means without
permission of the author.
Lay-out and print: Ridderprint BV, Ridderkerk, the Netherlands
Cover design: Design Your Thesis | www.designyourthesis.com
The cover represents the colorfulness of the participants from 28 different nationalities, the diversity of the
projects in this thesis and the importance of the immune cells fighting tuberculosis.
Financial support of the research described in this thesis is gratefully acknowledged and has been
provided by: Foundation Friends of Diakonessenhuis Utrecht, Partnership Pulmonology Diakonessenhuis
Utrecht, Partnership Medical Microbiology and Immunology Diakonessenhuis Utrecht.
Publication of this thesis was financially supported by: KNCV Tuberculosis Foundation, ChipSoft BV,
Diakademie Diakonessenhuis Utrecht.
Clinical Aspects of Immune Responses in Tuberculosis
Klinische Aspecten van de Afweerreactie bij Tuberculose (met een samenvatting in het Nederlands)
Proefschrift
ter verkrijging van de graad van doctor aan de Universiteit Utrecht
op gezag van de rector magnificus, prof. dr. G.J. van der Zwaan, ingevolge het besluit van het college voor promoties
in het openbaar te verdedigen op dinsdag 29 mei 2018 des middags te 12.45 uur
door
Reiertje Willemyntje Hofland
Geboren op 11 oktober 1979 te Zegveld

Promotor: Prof. dr. J-W.J. Lammers
Copromotoren: Dr. A.W.J. Bossink Dr. S.F.T. Thijsen
CONTENTS
1 General Introduction
2 Tuberculosis during TNF-α inhibitor therapy, despite screening
3 Interferon Gamma Release Assays in Extra-sanguineous Fluids a Positive Predictive Value of ELISpot in BAL and Pleural Fluid from Patients with
suspected Pulmonary Tuberculosis b Pleural Fluid and Tuberculosis: Are All Interferon Gamma Release Assays
Equal? c Sarcoidosis and Purified Protein Derivative reactivity d Feasibility of Purified Protein Derivative based ELISpot for Urine and Bladder
Fluid after Intravesical BCG Installations
4 Differentiation between Active and Latent Tuberculosis Infection a QuantiFERON-PLUS does not Discriminate between Active and Latent
Tuberculosis b Adenosine Deaminase and I-309 Discriminate between Active and Latent
Tuberculosis
5 General Discussion and Summary
6 Addenda Summary in Dutch – Samenvatting in het Nederlands Acknowledgement – Dankwoord Curriculum Vitae
7
19
2527
43
4961
7577
85
113
129130138142


1
General Introduction

Chapter 1
8
Mycobacterial disease is caused by mycobacteria with varying degrees of virulence, from asymptomatic infection with weakly virulent environmental nontuberculous mycobacteria (NTM), to disseminated infection with one of the Mycobacterium tuberculosis (M. tuberculosis)
complex species (tuberculous mycobacteria). Infections with tuberculous mycobacteria have an especially important clinical impact because these may result in tuberculosis (TB), but there is increasing attention for the clinical relevance of NTM.[1] Tuberculous and nontuberculous mycobacterial infections may result in spontaneously cured infection, persistent latent infection without disease, and disease with differences in disease severity. The different stages of disease (cured, latent, active) are often difficult to distinguish in clinical practice. Although a large body of knowledge has been gained concerning mycobacteria, many questions remain, especially with regard to the complexity of the host-microbe interactions and how the immune response against the pathogen could facilitate diagnosis of the disease stage. This thesis focuses on several clinical aspects of TB, with an emphasis on immunological methods employed to identify infections caused by mycobacteria, mainly TB, and to distinguish active from latent TB infection.
Historical context of tuberculosis
The species in the M. tuberculosis complex include M. tuberculosis, M. bovis, M. africanum, M.
microti, M. canetti, M. caprae, M. pinnipedii and M. orygis.[2] TB has a long history. Assyrian clay tablets from the seventh century B.C. describe patients coughing blood. Hippocrates (fifth century B.C.) describes patients with consumption (the Greek term is phthisis), i.e., wasting associated with chest pain and coughing, frequently with blood in the sputum.[3] Europe suffered from many TB epidemics starting in the 16th century, which peaked in the first half of the 19th century. It is estimated that at that time, one-quarter of Europeans died from TB[3] and approximately one third of the world’s population had been infected with M. tuberculosis.[4] In contrast, low-income countries are still suffering from a high incidence and prevalence of TB, and the incidence of TB in Western European countries decreased significantly in the last century due to the development of public health strategies and the introduction of TB-specific antibiotics in the 1950s. Nevertheless, the incidence of TB in Western European countries did not decline during the last decades due to global travel, immigration from high incidence countries including the increasing influx of refugees and, last but not least, the wide use of immunosuppressive medication and HIV infections.[5, 6] TNF-α inhibitor therapy in particular results in an increased risk of TB due to reactivation in persons with latent TB infection (LTBI) or as a result of new infections.[7-12] Safety of TNF-α inhibitor therapy after screening and treatment for LTBI remains an important concern and is addressed in Chapter 2 of this thesis.[13, 14]

1
General Introduction
9
Pathogenesis and immunology
Infection by M. tuberculosis complex species mostly occurs when the mycobacteria are aerosolized by the coughing of an infected patient followed by the inhalation of these aerosol droplets and subsequent deposition in the lungs of a new host.[15] Some persons clear M.
tuberculosis immediately without infection. During primary infection, both an innate and adaptive immune response is triggered (Figure 1).
Figure 1. Pathogenesis of tuberculosis (adapted with permission from Nunes-Alves et al) [16]
Chapter 1
10
The innate immune response is incompletely characterized, but it includes the recruitment of inflammatory cells to the lungs and phagocytosis of mycobacteria by alveolar macrophages and local dendritic cells. M. tuberculosis is unique both in the ability to survive and to replicate in macrophages by several mechanisms, including resistance to reactive oxygen intermediates, inhibition of phagosome-lysosome fusion, inhibition of phagosome acidification and escape from the phagosome compartment into the cytoplasmic space. M. tuberculosis is also capable of delaying the initiation of an adaptive immune response for several weeks after infection. This adaptive immune response is complex and incompletely understood. It is not initiated in the lungs, but in the draining lymph nodes. The infected macrophages and dendritic cells carry phagocytized M. tuberculosis to draining lymph nodes, where they present M. tuberculosis specific antigens to T-lymphocytes, resulting in priming and expansion of antigen-specific CD4+ and CD8+ T-lymphocytes, which differentiate from naïve T-lymphocytes into effector T- lymphocytes.[17] The initial infection is dominated by a Th1-type immune response, with CD4+ T-lymphocytes producing cytokines such as IFN-γ (which is crucial for macrophage activation and persistence of the infection), IL-2 and TNF-α. Additionally, B-cells, neutrophils and natural killer (NK) cells are involved. Interactions of these cells and cytokines stimulate the formation of a solid granuloma, which may contain the infection in a dormant stage, preventing progression to active disease. If the infection is not contained, a gradual shift towards Th2 responses occurs.[18, 19] Only 10% of all infected people will develop active disease (TB), of which approximately 5% develop disease within 2 years after the initial infection and the remaining 5% later in life. Progression to active disease is caused by disturbances in the tight immune regulation and impaired T-lymphocyte responses, resulting in cell death, necrosis and caseation of the granuloma.[16, 20] Approximately 90% of all infected people never develop active disease and remain in a state that is referred to as LTBI, which is defined as a state of persistent mycobacterial specific T-lymphocyte responses [5, 21], as measured by the tuberculin skin test (TST) or the Interferon Gamma Release Assay (IGRA), without evidence for TB disease. It is unclear whether this diagnosis actually reflects true latent infection or only immunological memory.[22, 23] To date, it is not possible to distinguish cured infection from persistent latent infection, and it is not possible to predict which people with LTBI will develop active TB disease.
Diagnostic tools for the diagnosis of latent tuberculosis infection
The tuberculin skin test (TST), also called the Mantoux-test, was developed for the diagnosis of LTBI. The test is based on the principle that infection with M. tuberculosis results in a delayed-type hypersensitivity reaction of sensitized T-lymphocytes to antigens derived from the organism. Solution with mycobacterial antigens (using purified protein derivative, PPD) is injected intradermally, after which the presence of induration due to cellular infiltration mediated by the sensitized lymphocytes can be assessed in 48 to 72 hours. As tuberculin is a product of mycobacteria in general, a positive result for TST is not specific for M. tuberculosis and could
1
General Introduction
11
also be caused by preceding BCG vaccination or infection with nontuberculous mycobacteria. False negative results can be caused by several factors, including immunodeficiency caused by HIV or immunosuppressive drugs, bacterial or viral (e.g., measles or varicella-zoster virus) infections, live virus vaccination, sarcoidosis, malignancies (particularly lymphoreticular forms) and malnutrition.[24] With the identification of the whole TB genome, the possibility arose to develop new diagnostic tests, for example IGRAs, which are blood-based assays designed to evaluate M.
tuberculosis-specific T-lymphocyte responses. IGRAs were developed in the beginning of the 21st century as an alternative to immunodiagnosis of LTBI with more specificity compared with TST because of the use of M. tuberculosis-specific antigens. Other advantages of IGRA are a more objective assessment considering the possible interobserver variability in the assessment of induration in TST and only one visit compared with two necessary visits for TST. Peripheral blood T-lymphocytes are stimulated in vitro with two M. tuberculosis-specific antigens: early secretory antigenic target (ESAT)-6 and culture filtrate protein (CFP)-10. The presence of reactive T-lymphocytes is assessed by measuring the production of IFN-ɣ. Two commercialized systems are available, the QuantiFERON–TB Gold Plus test (Qiagen, Hilden, Germany),[25] which measures IFN-ɣ using an ELISA, and the TSPOT.TB assay (Oxford Immunotec Ltd., Abingdon, UK), which counts cells releasing IFN-ɣ via the enzyme-linked immunospot (ELISpot) technique.[26] Although a positive result may help to diagnose a previous infection with M. tuberculosis, blood-based IGRAs do not have a role in the diagnosis of active TB and may even be negative in active TB. Several causes are considered for false negative results in active TB, including homing of sensitized T-lymphocytes to the infected organ, immunodeficiency, young or advanced age, extrapulmonary or disseminated TB and smoking.[27] Recent reports have identified serous effusion [28] and age [27] as independent risk factors related to the lower sensitivity of TSPOT.TB and QuantiFERON, respectively.
Diagnostic tools for the diagnosis of active tuberculosis
In 1882, Robert Koch was able to identify and culture the tubercle bacillus.[29] Based on his efforts to elucidate the etiology of TB, he received the 1905 Nobel Prize in Medicine. Isolation of the mycobacterial strain by culture is still the gold standard for diagnosis. As these mycobacteria are slow-growing, a definite diagnosis can take several weeks to two months. Whether the culture becomes positive depends on the bacterial load, type of sample, type of medium used for culture, prior antibiotic use and laboratory conditions. Microscopic acid fast staining (Ziehl Neelsen) for the identification of mycobacteria was developed in the same period [30] followed by Auramine staining using fluorescence microscopy in 1937.[31] Acid fast staining, however, is less sensitive than culture, producing false negative results, and this type of staining does not distinguish live from dead mycobacteria and does not distinguish tuberculous from nontuberculous mycobacteria. Therefore, acid fast staining is excluded as a
Chapter 1
12
gold standard for TB diagnosis. Molecular detection and identification of mycobacterial DNA using polymerase chain reaction (PCR) became available in the 1980s [32, 33] and was further developed and improved in recent years. With PCR, it became possible to easily distinguish tuberculous from nontuberculous mycobacteria. The sensitivity of molecular detection of tuberculous mycobacteria depends on the type of sample, type of molecular test and the number of DNA in specimen. In extrapulmonary and/or paucibacillary forms of TB in particular, PCR testing may provide false negative results. PCR can provide false positive results due to contamination or persistence of dead DNA in previously treated TB.The gold standard for the diagnosis of TB is a positive M. tuberculosis-specific culture. In practice, a positive M. tuberculosis PCR result in an appropriate clinical context is also considered diagnostic. Despite many years of research, a rapid and definite diagnosis remains a major challenge because of several potential complicating factors, such as atypical clinical presentations, an indolent clinical course, extrapulmonary forms of TB that can lead to difficulties associated with the collection of adequate diagnostic samples and paucibacillary forms of TB that may result in a false negative PCR and/or culture. Therefore, a substantial number of patients is treated without a definite diagnosis because of negative PCR and culture results.[5, 6, 34] In recent years, M. tuberculosis specific IGRA in extra-sanguineous fluids has been investigated for its role in the diagnosis of active TB, based on the theory that M. tuberculosis-specific T-lymphocytes are concentrated at the site of infection due to homing and antigen-specific proliferation.[35] A low positive predictive value may be a limitation of M. tuberculosis-specific IGRA in extra-sanguineous fluids as a potential diagnostic tool for active TB. This issue will be addressed in Chapter 3a of this thesis.[36] Differences between the diagnostic accuracy of T-SPOT.TB compared with the Quantiferon assay in extra-sanguineous fluids are discussed in Chapter 3b.[37]
Experimental modified Interferon Gamma Release Assays
Although IGRAs were initially developed to evaluate M. tuberculosis-specific T-lymphocyte responses, several reports exist on the use of other antigens, for example, purified protein derivative (PPD) [38-40], cytomegalovirus [41, 42], coxiella burnetti [43, 44] and hepatitis B [45], which reflects the possibility to apply IGRA to diseases other than TB. In this thesis, we study IGRA with PPD antigen, both in blood and extra-sanguineous body fluids. In Chapter 3c, the presence of mycobacterial-specific T-lymphocyte responses will be evaluated using IGRA with PPD antigen in blood and broncho-alveolar lavage (BAL), in patients with sarcoidosis compared with those with other interstitial lung diseases, contributing to the hypothesis of the potential involvement of mycobacterial infections in the pathogenesis of sarcoidosis.[46] Another possible experimental application of IGRA PPD will be described in Chapter 3d of

1
General Introduction
13
this thesis, in which we explore the feasibility of a PPD-based IGRA to measure PPD-specific T- lymphocyte responses in the urine and bladder fluids of patients with bladder malignancies after treatment with intravesical BCG instillations. As BCG-related complications are difficult to diagnose, there is a need for better diagnostic tools.
Differentiation between active and latent tuberculosis infection
The differentiation between active TB and LTBI is often difficult, especially in persons with positive TST and/or IGRA, with non-specific clinical signs and symptoms and a negative PCR and culture for TB. Despite several research efforts, including alternative biomarkers in supernatants of IGRA, intracellular cytokine staining and T-lymphocyte phenotyping, no confirmatory biomarker for discriminating LTBI from active TB exists.[47] Chapter 4 of this thesis evaluates approaches to identify a possible biomarker for this purpose.[48]
AIMS OF THIS THESIS
This thesis aims to explore several clinical and immunological aspects of TB and how the immune response against the pathogen could facilitate the diagnosis of disease status.
People with LTBI are at risk for progression to active TB if they are treated with immuno-suppressive medication, especially TNF-α inhibitor therapy. Therefore, screening for LTBI followed by prophylactic treatment is recommended before the start of TNF-α inhibitor therapy. In Chapter 2, screening for LTBI and the safety of TNF-α inhibitor therapy with regard to the development of TB after LTBI treatment will be evaluated in daily clinical practice.[13]
Because of limited sensitivity of the gold standard for the diagnosis of active TB (M. tuberculosis-specific PCR and/or culture), there is a need for supportive diagnostic tools. One of the suggested tools is M. tuberculosis-specific IGRA in extra-sanguineous fluids, but the definite clinical value is unknown. Chapter 3 aims to evaluate the use of IGRA in extra-sanguineous body fluids, both for active TB and for other diseases. A limitation of M. tuberculosis-specific IGRA in extra-sanguineous fluids as a diagnostic tool for active TB is a low positive predictive value (PPV). In Chapter 3a, the PPV of ELISpot in BAL and pleural fluid in real-life clinical practice is evaluated for the diagnosis of TB, together with an approach to increase the PPV.[36] Another unresolved question concerns which of the two commercial IGRAs is most suitable for application to extra-sanguineous body fluids. Chapter 3b aims to discuss the differences in the diagnostic value of ELISpot and QuantiFERON in extra-sanguineous body fluids, in response to a published review about IGRA in pleural fluid.[37]Current literature about IGRA with other antigens reflects the possibility of applying IGRA to

Chapter 1
14
diseases other than TB, but the results remain experimental. To further increase knowledge about other antigens in IGRA in clinical practice and to contribute to the hypothesis of the potential involvement of mycobacterial infections in the pathogenesis of sarcoidosis, Chapter 3c aims to measure T-lymphocyte responsiveness to the purified protein derivative (PPD) antigen using ELISpot PPD in blood and BAL fluid in patients with sarcoidosis compared with those with other causes of interstitial lung disease.[46] In Chapter 3d, the feasibility of a PPD-based ELISpot to measure PPD-specific T- lymphocyte responses in the urine and bladder fluids of patients with bladder malignancies after treatment with intravesical BCG instillations will be explored. This study aims to provide a basis for further improvement of the ELISpot PPD technique that may enable a final evaluation of whether this tool could be helpful for the diagnosis or monitoring of BCG-related complications after intravesical BCG instillations.
Differentiation between active and latent TB remains a complicated and time-consuming process in clinical practice. In Chapter 4a, we evaluate the ability of QuantiFERON-TB Gold PLUS to differentiate between active and latent TB.[48] Chapter 4b aims to identify biomarker profiles to aid in the differentiation between active and latent TB.
In Chapter 5, the contents of this thesis will be discussed and summarized with respect to future perspectives.
1
General Introduction
15
REFERENCES1. Hoefsloot W, van Ingen J, Andrejak C, et al. The geographic diversity of nontuberculous mycobacteria
isolated from pulmonary samples: an NTM-NET collaborative study. Eur Respir J. 2013 Dec;42:1604-13.
2. Orgeur M, Brosch R. Evolution of virulence in the Mycobacterium tuberculosis complex. Curr Opin Microbiol. 2017 Dec;41:68-75.
3. Smith I. Mycobacterium tuberculosis pathogenesis and molecular determinants of virulence. Clin Microbiol Rev. 2003 Jul;16:463-96.
4. Dye C, Scheele S, Dolin P, et al. Consensus statement. Global burden of tuberculosis: estimated incidence, prevalence, and mortality by country. WHO Global Surveillance and Monitoring Project. JAMA. 1999 Aug;282:677-86.
5. KNCV Tuberculosis Foundation. Handbook Tuberculosis. 2017.
6. National Institute for Public Health and the Environment. Ministry of Health, Welfare and Sport. Tuberculosis in the Netherlands 2016. 2016.
7. Keane J, Gershon S, Wise RP, et al. Tuberculosis associated with infliximab, a tumor necrosis factor alpha-neutralizing agent. N Engl J Med. 2001 Oct;345:1098-104.
8. Gomez-Reino JJ, Carmona L, Valverde VR, et al, BIOBADASER Group. Treatment of rheumatoid arthritis with tumor necrosis factor inhibitors may predispose to significant increase in tuberculosis risk: a multicenter active-surveillance report. Arthritis Rheum. 2003;48:2122-7.
9. Wallis RS, Broder MS, Wong JY, et al. Granulomatous infectious diseases associated with tumor necrosis factor antagonists. Clin Infect Dis. 2004 May;38:1261-5.
10. Bongartz T, Sutton AJ, Sweeting MJ, et al. Anti-TNF antibody therapy in rheumatoid arthritis and the risk of serious infections and malignancies: systematic review and meta-analysis of rare harmful effects in randomized controlled trials. JAMA. 2006 May;295:2275-85.
11. Wallis RS. Tumour necrosis factor antagonists: structure, function, and tuberculosis risks. Lancet Infect Dis. 2008 Oct;8:601-11.
12. Keane J, Bresnihan B. Tuberculosis reactivation during immunosuppressive therapy in rheumatic diseases: diagnostic and therapeutic strategies. Curr Opin Rheumatol. 2008 Jul;20:443-9.
13. Hofland RW, Thijsen SF, Verhagen MA, et al. Tuberculosis during TNF-alpha inhibitor therapy, despite screening. Thorax. 2013 Nov;68:1079-80.
14. Manalan K, Singanayagam A, Wickremasinghe M, et al. Letter in response to TB during TNF-alpha inhibitor therapy, despite screening. Thorax. 2015 Apr;70:373,2014-206239. Epub 2014 Oct 29.
15. Dheda K, Barry CE,3rd, Maartens G. Tuberculosis. Lancet. 2016 Mar;387:1211-26.
16. Nunes-Alves C, Booty MG, Carpenter SM, et al. In search of a new paradigm for protective immunity to TB. Nat Rev Microbiol. 2014 Apr;12:289-99.
17. Wolf AJ, Desvignes L, Linas B, et al. Initiation of the adaptive immune response to Mycobacterium tuberculosis depends on antigen production in the local lymph node, not the lungs. J Exp Med. 2008 Jan;205:105-15.

Chapter 1
16
18. Rozot V, Vigano S, Mazza-Stalder J, et al. Mycobacterium tuberculosis-specific CD8+ T cells are functionally and phenotypically different between latent infection and active disease. Eur J Immunol. 2013 Jun;43:1568-77.
19. Walzl G, Haks MC, Joosten SA, et al. Clinical immunology and multiplex biomarkers of human tuberculosis. Cold Spring Harb Perspect Med. 2014 Dec;5:10.1101/cshperspect.a018515.
20. Kaufmann SH. EFIS lecture. Immune response to tuberculosis: How to control the most successful pathogen on earth. Immunol Lett. 2016 Jul;175:50-7.
21. World Health Organization. Global Tuberculosis Report. 2017.
22. Mack U, Migliori GB, Sester M, et al. LTBI: latent tuberculosis infection or lasting immune responses to M. tuberculosis? A TBNET consensus statement. Eur Respir J. 2009 May;33:956-73.
23. Chegou NN, Heyckendorf J, Walzl G, et al. Beyond the IFN-gamma horizon: biomarkers for immunodiagnosis of infection with Mycobacterium tuberculosis. Eur Respir J. 2014 May;43:1472-86.
24. Lardizabal AA, Reichman LB. Diagnosis of Latent Tuberculosis Infection. Microbiol Spectr. 2017 Jan;5(1):10.1128/microbiolspec.TNMI7,0019-2016.
25. Qiagen. QuantiFERON®-TB Gold Plus (QFT®-Plus) ELISA Package Insert.
26. Sester M, Sotgiu G, Lange C, et al. Interferon-gamma release assays for the diagnosis of active tuberculosis: a systematic review and meta-analysis. Eur Respir J. 2011 Jan;37:100-11.
27. de Visser V, Sotgiu G, Lange C, et al. False-negative interferon-gamma release assay results in active tuberculosis: a TBNET study. Eur Respir J. 2015 Jan;45:279-83.
28. Zhang L, Shi X, Zhang Y, et al. Analysis of Factors Influencing Diagnostic Accuracy of T-SPOT.TB for Active Tuberculosis in Clinical Practice. Sci Rep. 2017 Aug;7:7764,017-07785-6.
29. Koch R. Die Aetiologie der Tuberkulose Berl. Klin. Wochenschr. 1882;19:221-230.
30. Bishop PJ, Neumann G. The history of the Ziehl-Neelsen stain. Tubercle. 1970 Jun;51:196-206.
31. McCLURE DM. The development of fluorescence microscopy for tubercle bacilli and its use as an adjunct to histological routine. J Clin Pathol. 1953 Nov;6:273-81.
32. Eisenach KD, Crawford JT, Bates JH. Repetitive DNA sequences as probes for Mycobacterium tuberculosis. J Clin Microbiol. 1988 Nov;26:2240-5.
33. Roberts MC, McMillan C, Coyle MB. Whole chromosomal DNA probes for rapid identification of Mycobacterium tuberculosis and Mycobacterium avium complex. J Clin Microbiol. 1987 Jul;25:1239-43.
34. Tuberculosis Country Profiles: Available from: http://www.who.int/tb/country/data/profiles/en/.
35. Jafari C, Thijsen S, Sotgiu G, et al. Bronchoalveolar lavage enzyme-linked immunospot for a rapid diagnosis of tuberculosis: a Tuberculosis Network European Trialsgroup study. Am J Respir Crit Care Med. 2009 Oct;180:666-73.
36. Hofland RW, Thijsen SF, van Lindert AS, et al. Positive predictive value of ELISpot in BAL and pleural fluid from patients with suspected pulmonary tuberculosis. Infect Dis (Lond). 2017 May;49:347-55.
37. Hofland RW, Bossink AW, Lammers JW, et al. Pleural Fluid and Tuberculosis: Are All Interferon Gamma Release Assays Equal? J Clin Microbiol. 2016 Feb;54:504-5.
1
General Introduction
17
38. Tavast E, Salo E, Seppala I, et al. IGRA tests perform similarly to TST but cause no adverse reactions: pediatric experience in Finland. BMC Res Notes. 2009 Jan;2:9,0500-2-9.
39. Kontturi A, Tuuminen T, Karttunen R, et al. Elispot IGRA With Purified Protein Derivative Stimulation For Diagnosing Nontuberculous Mycobacterial Cervical Lympadenitis. Pediatr Infect Dis J. 2016 Mar;35:349-51.
40. Horster R, Kirsten D, Gaede KI, et al. Antimycobacterial immune responses in patients with pulmonary sarcoidosis. Clin Respir J. 2009 Oct;3:229-38.
41. Kim SH, Lee HS, Lee HJ, et al. Clinical applications of interferon-gamma releasing assays for cytomegalovirus to differentiate cytomegalovirus disease from bystander activation: a pilot proof-of-concept study. Korean J Intern Med. 2017 Sep;32:900-9.
42. Yong MK, Cameron PU, Slavin M, et al. Identifying Cytomegalovirus Complications Using the Quantiferon-CMV Assay After Allogeneic Hematopoietic Stem Cell Transplantation. J Infect Dis. 2017 Jun;215:1684-94.
43. Limonard GJ, Thijsen SF, Bossink AW, et al. Developing a new clinical tool for diagnosing chronic Q fever: the Coxiella ELISPOT. FEMS Immunol Med Microbiol. 2012 Feb;64:57-60.
44. Schoffelen T, Limonard GJ, Bleeker-Rovers CP, et al. Diagnosis of Coxiella burnetii infection: comparison of a whole blood interferon-gamma production assay and a Coxiella ELISPOT. PLoS One. 2014 Aug;9:e103749.
45. Dammermann W, Bentzien F, Stiel EM, et al. Development of a novel IGRA assay to test T cell responsiveness to HBV antigens in whole blood of chronic Hepatitis B patients. J Transl Med. 2015 May;13:157,015-0513-1.
46. Hofland RW, Thijsen SF, Bouwman J, et al. Sarcoidosis and Purified Protein Derivative reactivity. Sarcoidosis Vasc Diffuse Lung Dis. 2014 Jul;31:142-8.
47. Chegou NN, Heyckendorf J, Walzl G, et al. Beyond the IFN-gamma horizon: biomarkers for immunodiagnosis of infection with Mycobacterium tuberculosis. Eur Respir J. 2014 May;43:1472-86.
48. Hofland RW, Bossink AWJ, Nierkens S, et al. QuantiFERON-plus does not discriminate between active and latent tuberculosis. Infect Dis (Lond). 2018 Jan 15:1-4.


2
2RW Hofland, SFT Thijsen, MAMT Verhagen, Y Schenk, AWJ Bossink
Tuberculosis during TNF-α inhibitor therapy, despite screening
Thorax 2013;68:1079–1080

Chapter 2
20
SUMMARY
As part of a prospective study on the safety of TNF-α inhibitor therapy after screening for and treatment of latent tuberculosis infection (LTBI), we report two patients who developed active tuberculosis (TB) infection during TNF-α inhibitor therapy, despite negative screening for LTBI. The clinical history is suggestive of a primary infection acquired during travelling to TB-endemic countries. In this lesson of the month we would like to highlight the risk of travelling to TB-endemic areas in patients treated with TNF-α inhibitor therapy. Screening for LTBI is not enough to prevent TB in patients treated with TNF-α inhibitor therapy.
CASE 1
A 48-year-old woman suffering from inflammatory bowel disease was considered for TNF-α inhibitor therapy. Screening for LTBI with Tuberculin Skin Test (TST) was negative and the Interferon Gamma Release Assay T-SPOT.TB (Oxford Immunotec, Oxford, UK), was indeterminate. No prophylactic therapy was prescribed. Because of an unsatisfactory therapeutic effect, TNF-α inhibitor treatment (Infliximab) was discontinued after six weeks (three doses of 5 mg/kg). Three months later, she travelled to a highly TB-endemic country with an incidence of 101 (83-121) TB patients per 100.000 persons.[1] Five weeks after she returned, she developed TB meningitis and died two weeks later. In this patient, a primary TB infection is likely, because of her recent travel to a TB-endemic country, and the negative screening and no risk factors for LTBI before starting TNF-α inhibitor treatment. Even though TNF-α inhibitor therapy was discontinued three months before travelling, she can still be considered immunocompromised because the immunosuppressive effect is probably still continuing several months after treatment with TNF-α inhibitor therapy.[2]
CASE 2
A 41-year old man, born in Morocco, with a negative TST for LTBI after his immigration to the Netherlands, developed ankylosing spondylitis and was a candidate for TNF-α inhibitor treatment. Therefore, LTBI screening was repeated. Because of negative TST and negative T-SPOT.TB, no prophylactic therapy was given. Seven months after starting TNF-α inhibitor therapy (Infliximab), he travelled to Morocco, a highly TB-endemic country, for six weeks. Three months after he came back, he was diagnosed with extrapulmonary M. bovis infection. Again, a primary infection acquired during travelling is more probable than reactivation of M.
bovis, because of repeated negative screening before TNF-α inhibitor treatment and the seven month period of therapy without signs of reactivation. It is unlikely that he is infected in the Netherlands, because active M. bovis infection is rare in this country.
2
Tuberculosis and TNF-α inhibitor therapy
21
DISCUSSION
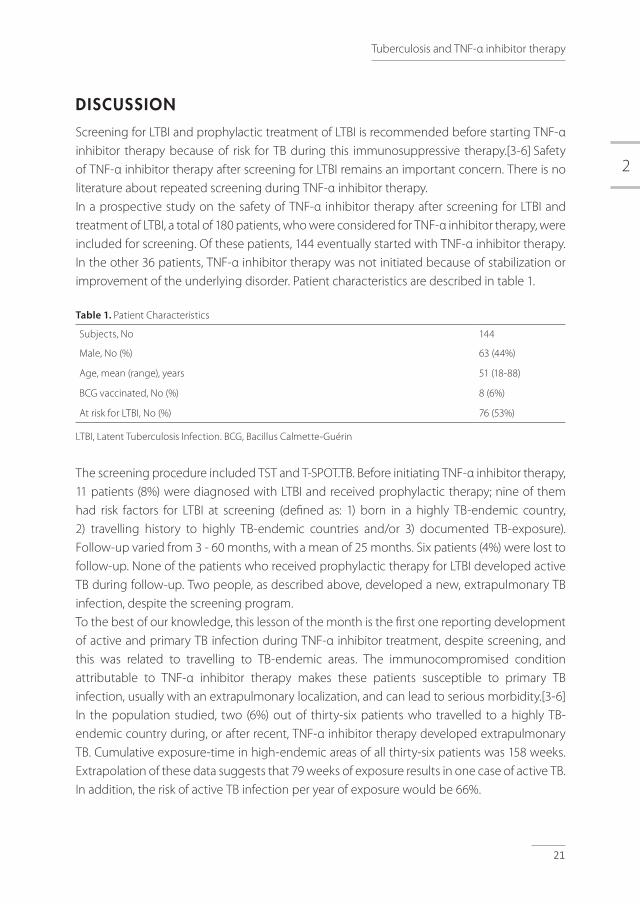
Screening for LTBI and prophylactic treatment of LTBI is recommended before starting TNF-α inhibitor therapy because of risk for TB during this immunosuppressive therapy.[3-6] Safety of TNF-α inhibitor therapy after screening for LTBI remains an important concern. There is no literature about repeated screening during TNF-α inhibitor therapy. In a prospective study on the safety of TNF-α inhibitor therapy after screening for LTBI and treatment of LTBI, a total of 180 patients, who were considered for TNF-α inhibitor therapy, were included for screening. Of these patients, 144 eventually started with TNF-α inhibitor therapy. In the other 36 patients, TNF-α inhibitor therapy was not initiated because of stabilization or improvement of the underlying disorder. Patient characteristics are described in table 1.
Table 1. Patient Characteristics
Subjects, No 144
Male, No (%) 63 (44%)
Age, mean (range), years 51 (18-88)
BCG vaccinated, No (%) 8 (6%)
At risk for LTBI, No (%) 76 (53%)
LTBI, Latent Tuberculosis Infection. BCG, Bacillus Calmette-Guérin
The screening procedure included TST and T-SPOT.TB. Before initiating TNF-α inhibitor therapy, 11 patients (8%) were diagnosed with LTBI and received prophylactic therapy; nine of them had risk factors for LTBI at screening (defined as: 1) born in a highly TB-endemic country, 2) travelling history to highly TB-endemic countries and/or 3) documented TB-exposure). Follow-up varied from 3 - 60 months, with a mean of 25 months. Six patients (4%) were lost to follow-up. None of the patients who received prophylactic therapy for LTBI developed active TB during follow-up. Two people, as described above, developed a new, extrapulmonary TB infection, despite the screening program. To the best of our knowledge, this lesson of the month is the first one reporting development of active and primary TB infection during TNF-α inhibitor treatment, despite screening, and this was related to travelling to TB-endemic areas. The immunocompromised condition attributable to TNF-α inhibitor therapy makes these patients susceptible to primary TB infection, usually with an extrapulmonary localization, and can lead to serious morbidity.[3-6] In the population studied, two (6%) out of thirty-six patients who travelled to a highly TB-endemic country during, or after recent, TNF-α inhibitor therapy developed extrapulmonary TB. Cumulative exposure-time in high-endemic areas of all thirty-six patients was 158 weeks. Extrapolation of these data suggests that 79 weeks of exposure results in one case of active TB. In addition, the risk of active TB infection per year of exposure would be 66%.

Chapter 2
22
Patients treated with TNF-α inhibitor therapy should be aware of the risk related to travelling to TB-endemic countries. Current guidelines do not address this issue. This lesson implicates that a new screening for infection after travelling to TB-endemic countries should be considered together with intensive follow-up for early detection of symptoms suggestive of active TB infection. More research is required to strengthen this recommendation.
ACKNOWLEDGEMENT
The authors thank Anya Milne for carefully reviewing the manuscript.
2
Tuberculosis and TNF-α inhibitor therapy
23
REFERENCES1. WHO tuberculosis country profiles http://www.who.int/tb/country/data/profiles/en/index.html,
date accessed: January 31, 2013.
2. Dixon WG, Symmons DP, Lunt M, et al. Serious infection following anti-tumor necrosis factor alpha therapy in patients with rheumatoid arthritis: lessons from interpreting data from observational studies. Arthritis Rheum. 2007;56:2896-904.
3. Dutch association of rheumatology, in collaboration with different medical associations. Dutch guideline: Controlled use of biologicals in immune mediated inflammatory disorders, 2011. Available from: http://www.nvalt.nl/service/richtlijnen, date accessed: January 31, 2013.
4. Wallis RS. Tumour necrosis factor antagonists: structure, function, and tuberculosis risks. Lancet Infect Dis. 2008;8:601-11.
5. Centers for Disease Control and Prevention (CDC). Tuberculosis associated with blocking agents against tumor necrosis factor-alpha--California, 2002-2003. MMWR Morb Mortal Wkly Rep 2004;53:683.
6. Association for practical tuberculosis management. Dutch guideline: IGRA in diagnosing tuberculosis. 2010. Available from: http://tbevidence.org/documents/guidelines, date accessed: January 31, 2013.


3
Interferon Gamma Release Assays in Extra-sanguineous Fluids


RW Hofland, SFT Thijsen, ASR van Lindert, WCM de Lange, T van Gorkom, I van der Tweel, J-WJ Lammers, AWJ Bossink
Positive Predictive Value of ELISpot in BAL and Pleural fluid from Patients with suspected Pulmonary Tuberculosis
3aInfect Dis (Lond). 2017;49:347-355

Chapter 3a
28
ABSTRACT
Background: The aim of this study was to evaluate the positive predictive value (PPV) of ELISpot in bronchoalveolar lavage (BAL) and pleural fluid for the diagnosis of active tuberculosis (TB) in real-life clinical practice, together with the added value of a cut-off >1.0 for the ratio between the extra-sanguineous and systemic interferon-gamma responses in positive samples. Methods: A retrospective, single-centre study was performed. Patients with positive ELISpot in BAL and pleural fluid were included. Results: The PPV for TB in patients with positive ELISpot in BAL (n = 40) was 64.9%, which increased to 82.6% for the ESAT-6 panel and 71.4% for the CFP-10 panel after the introduction of a cut-off >1.0 for the ratio between the BAL and blood interferon-gamma responses. In patients with positive ELISpot in pleural fluid (n = 16), the PPV for TB was 85.7%, which increased to 91.7% for the ESAT-6 panel and 92.3% for the CFP-10 panel after the introduction of a cut-off >1.0 for the ratio between the pleural fluid and blood interferon-gamma responses.Conclusions: This report describes the PPV of ELISpot in BAL and pleural fluid for the diagnosis of active TB in real-life clinical practice. The results indicate the possibility of an increase of the PPV using a cut-off >1.0 for the ratio between the extra-sanguineous and systemic interferon-gamma responses. Further studies are needed to underline this ratio-approach and to evaluate the full diagnostic accuracy of ELISpot in extra-sanguineous fluids like BAL and pleural fluid.

3
ELISpot in BAL and pleural fluid
29
INTRODUCTION
Tuberculosis (TB) results in high morbidity and mortality worldwide, and rapid diagnosis is still a major challenge. In the Netherlands, 25% of patients are treated for TB without a definitive diagnosis due to negative acid-fast staining, polymerase chain reaction (PCR) and culture, indicating the need for additional diagnostic tools. In recent years, Mycobacterium tuberculosis (MTB)-specific interferon-gamma release assays (IGRA) in extra-sanguineous fluids have been investigated for use in the diagnosis of TB, based on the theory that MTB-specific T-lymphocytes are concentrated at the site of infection due to homing and antigen-specific proliferation.[1] A systematic review summarized the current evidence about the diagnostic accuracy of these tests.[2] Concerning T-SPOT.TB (Enzyme-Linked ImmunoSpot assay, ELISpot) in extra-sanguineous fluids, the pooled sensitivity and specificity were 88% and 82%, respectively. For Quantiferon Gold-in tube in extra-sanguineous fluids, this was 48% and 82%, respectively. Another systematic review about the diagnostic performance of MTB-specific IGRA in pleural fluid combined the results of ELISpot and Quantiferon Gold-in tube, resulting in the pooled sensitivity and specificity of 72% and 78%, respectively.[3,4] The results of both reviews indicate the diagnostic superiority of ELISpot compared with Quantiferon Gold-in tube in extra-sanguineous fluids; however, the clinical utility of IGRA in extra-sanguineous fluids is still under research. Especially the limited positive predictive value (PPV), although not evaluated in both reviews, seems a limitation of this test as in a large, multicentre study in a low TB-endemic area, the PPV of MTB-specific IGRA in bronchoalveolar lavage (BAL) was only 55%.[5]In active TB, frequencies of interferon-gamma producing MTB-specific T-lymphocytes concentrated at the site of infection are shown to be higher compared with frequencies of interferon-gamma producing MTB-specific T-lymphocytes in peripheral blood,[1,5,6] probably resulting in a ratio of >1.0 between the extra-sanguineous and systemic interferon-gamma responses. The introduction of a cut-off ratio >1.0 between the extra-sanguineous and systemic interferon-gamma responses could theoretically increase the PPV of IGRA in extra-sanguineous fluids. This item is not addressed in either review;[2,3] however, a cut-off has been suggested by some reports.[1,7-9] These studies included limited number of subjects and, moreover, three of these studies [7-9] were from a high TB-endemic area, making it difficult to extrapolate the results to lower endemic areas. In our hospital, the application of MTB-specific IGRA (ELISpot) in extra-sanguineous fluids is part of the diagnostic evaluation in patients with a clinical suspicion of active TB. The aim of this study was to evaluate the PPV of ELISpot in BAL and pleural fluid for the diagnosis of active TB in real-life clinical practice, together with the added value of a cut-off >1.0 for the ratio between the extra-sanguineous and systemic interferon-gamma responses in positive samples.

Chapter 3a
30
MATERIAL AND METHODS
Patients
A retrospective, single-centre study was performed in a hospital in Utrecht, The Netherlands. All patients with positive ELISpot in BAL and pleural fluid from 2006 until 2012 of whom concurrent ELISpot blood results were available (in order to allow the ratio-analysis between the extra-sanguineous and systemic interferon-gamma responses) were included, with a follow-up of at least two years. Patients with negative or indeterminate ELISpot in BAL and pleural fluid were excluded. Patient characteristics, including age, gender, comorbidities, medication, smoking habits, country of origin, travel history, BCG vaccination status, tuberculin skin test (TST) results, Human Immunodeficiency Virus (HIV) status, clinical signs and symptoms, laboratory results, thoracic imaging results, microbiological results and blood ELISpot-assay results were examined from medical records.
Diagnostic work-up
In TB suspect patients, the regular work-up consisted of blood examination for ELISpot TB and inflammatory markers (including leucocyte count and C-reactive protein levels) together with thoracic imaging (X-ray or computed tomography (CT)-scan). In all patients suspected of having pulmonary TB but who were unable to cough up sputum or with three samples smear-negative sputum (not special morning sputum), BAL was performed with 150 ml saline fluid placed into an affected lung segment. Gastric lavages were not used. In patients suspected of tuberculous pleuritis, 20 mL pleural fluid was collected, of which 10 mL was used for PCR and culture. Diagnostic tests performed at BAL and pleural fluid included always MTB-specific IGRA (ELISpot), acid-fast staining using auramine, PCR for MTB, standard culture for bacterial pathogens and mycobacterial culture. For PCR technique, prior to DNA extraction, samples underwent a pre-extraction preparation method using a combination of N-acetyl-L-cysteine and sodium hydroxide (NALC–NaOH).[10] DNA was isolated using Magnapure LC (Roche, Almere, the Netherlands) according to the manufacturer’s instructions. The MTB-specific PCR was performed using primer set 2 targeted on the IS6110 sequence. PCR was performed using the ABI Prism 75,000 sequence detection system (Applied Biosystems, Foster City, CA).[11] For mycobacterial culture, specimens were inoculated using a MGIT system (Becton Dickinson, Shannon, Ireland). Positive cultures were verified using acid-fast staining and PCR for MTB. Positive cultures were subsequently referred to the National Institute for Public Health and the Environment for identification and antimicrobial susceptibility testing.
Interferon Gamma Release Assay
MTB-specific IGRA (ELISpot) in peripheral blood mononuclear cells (PBMCs) was performed

3
ELISpot in BAL and pleural fluid
31
using the T-SPOT.TB platform, according to the manufacturer’s instructions (Oxford Immunotec Ltd., Abingdon, UK). Briefly, 2.5 x 10⁵ fresh PBMCs were incubated with 50 µL of AIM-V medium (negative control), phytohemagglutinin (PHA, positive control) and two MTB-specific antigens (ESAT-6 / panel A, and CFP-10 / panel B, respectively). After 16-20h of incubation at 37°C and 5% CO
2, the microtitre plates were washed and a conjugate incubation followed by a detection step
was carried out to visualize the interferon-gamma production by sensitized T- lymphocytes. Spot forming cells (SFCs) were enumerated using the ELISpot reader (Auto Immun Diagnostika GmbH, Strassberg, Germany). Definition of the results (positive, negative or indeterminate) was according to the manufacturer’s instructions and as described previously.[5,12] Borderline zones were not used. ELISpot in BAL and pleural fluid was performed as described previously.[5] Time from sampling to start analysis was within three hours. Fresh cells were isolated from BAL and pleural fluid, and if possible, 2.5 x 10⁵ fresh cells were incubated and processed according to the protocol described above. In the absence of validated cut-off values for ELISpot in BAL and pleural fluid, positive, negative and indeterminate results were defined in agreement with ELISpot in blood.
Tuberculosis case definition
According to the WHO guidelines,[13] the definition of TB cases resulted in four possible diagnoses: definite, probable, uncertain or no active TB. Definite TB was diagnosed in patients with clinical findings compatible with TB, confirmed with positive culture and/or PCR. Patients with signs and symptoms of TB without laboratory confirmation (negative PCR and culture) but who recovered after treatment with tuberculostatic drugs were defined as probable TB. Patients with definite TB as well as patients with probable TB are regarded to be patients with active TB in real-life clinical practice. Patients lost to follow-up and patients with an unclear clinical course in whom no laboratory confirmation of active TB could be obtained were classified as uncertain TB. Finally, in cases with another diagnosis, the case was defined as no active TB, including patients with only latent TB infection (LTBI), defined as patients with positive ELISpot in blood, but without arguments for active disease. Development of active TB was assessed with respect to at least two years of follow-up. TB case definition was made with the consensus of three of the authors (A.W.J.B., A.S.R.v.L. and R.W.H.), in collaboration with an independent TB expert who was not aware of the inclusion criteria of this study (W.C.M.d.L.). This TB expert evaluated all cases retrospectively, with access to all anonymized data except results of ELISpot in BAL and pleural fluid, ensuring an independent TB case definition.
Analysis
Baseline clinical characteristics were described as medians and ranges in non-normally distributed variables and percentages for categorical variables.
Chapter 3a
32
The PPV of ELISpot without ratio was calculated for positive BAL and pleural fluid samples separately, dividing the number of patients with active (definite and probable) TB by the total number of patients with positive ELISpot in BAL respectively pleural fluid. The ratio between the extra-sanguineous and systemic interferon-gamma responses (hereinafter referred to as ‘ratio’) was calculated dividing the number of SFCs in BAL respectively pleural fluid by the number of SFCs in blood, for ESAT-6 and CFP-10 panels separately, because of the differences in SFCs between ESAT-6 and CFP-10 panels. The PPV using a cut-off >1.0 for the ratio was calculated for the ESAT-6 panel and the CFP-10 panel separately, dividing the number of patients with active TB and ratio >1.0 by the total number of patients with positive ELISpot in BAL respectively pleural fluid and ratio >1.0. Furthermore, the PPV using a cut-off >1.0 was calculated in case of ratio >1.0 in at least one of the two panels (either ESAT-6 or CFP-10), dividing the number of patients with active TB and ratio >1.0 in at least one of the two panels by the total number of patients with positive ELISpot in BAL respectively pleural fluid and ratio >1.0 in at least one of the two panels.Finally, the PPV using a cut-off >1.0 was calculated in case of ratio >1.0 in the ESAT-6 and CFP-10 panel simultaneously, dividing the number of patients with active TB and ratio >1.0 in both panels simultaneously by the total number of patients with positive ELISpot in BAL respectively pleural fluid and ratio >1.0 in both panels simultaneously.In evaluation of the PPV (with and without ratio), patients with uncertain TB were excluded, as most of them were lost to follow-up and definite case definition was not possible. Because of the limited sample size, evaluation of the statistical significance of the added value of a cut-off ratio >1.0 at PPV is not suitable in this study. This study is aimed as a hypothesis generating report and should be followed by a well-powered prospective study. Data were analysed using SPSS statistics version 21.0 (Armonk, NY). Figures were composed with the aid of GraphPad Prism 6.0 (La Jolla, CA).
RESULTS
Patients, case definition and diagnostic results
All eighty-one patients with positive ELISpot in BAL and pleural fluid from 2006 to 2012 were evaluated. Twenty-five patients with positive ELISpot in BAL or pleural fluid could not be enrolled, because of the absence of concurrent blood ELISpot blood results. Fifty-six patients with positive ELISpot in BAL or pleural fluid were included, of which three were lost to follow-up. Thirty-eight patients were male. Median age was 48 years. Of all patients, 35 were born in a TB-endemic area (defined as countries with an annual TB incidence of >50/100,000) [13] and most of them are likely to be BCG-vaccinated, although the BCG-vaccination details were not recorded in most of the medical files. Five patients had TB in their history. None of the patients were HIV-positive and only two patients were using immunosuppressive

3
ELISpot in BAL and pleural fluid
33
medication (one patient was treated with 5 mg prednisone daily; another patient was treated with a combination of 15 mg prednisone daily and methotrexate). None of the patients not receiving treatment developed TB during follow-up. The patients’ baseline characteristics are summarized in Table 1.
Table 1. Patients’ baseline characteristics
Totala Observationsb
Number of subjects 56
Male 38 (67.9%) n = 56
Age 48 [18;84] n = 56
TB endemic ethnicityc 35 (63.6%) n = 55
TB in history 5 (9.3%) n = 54
Recent travelling to TB-endemic country 22 (59.5%) n = 37
HIV positivity 0 (0.0%) n = 32
Immunosuppressive medicationd 2 (3.6%) n = 56
a. Data are presented as n (%) or median [range]b. Number of patients in which the variable is known because of missing information in some casesc. Defined as countries with an annual TB incidence of >50/100,000[13]d. One patient was treated with 5 mg prednisone daily. Another patient was treated with a combination of 15 mg
prednisone daily and methotrexateTB, Tuberculosis. HIV, Human Immunodeficiency Virus.
Forty patients had positive ELISpot in BAL. Sixteen patients (separate cases) had positive ELISpot in pleural fluid as shown in Table 2. After assessment of the cases together with the independent TB expert, twenty-three patients (41.1%) were classified with definite TB, (including six patients with definite tuberculous pleuritis). Thirteen patients (23.2%) were classified with probable TB (including six patients with probable tuberculous pleuritis). Five patients (8.9%) were classified with uncertain TB, of whom three were lost to follow-up. Another fifteen patients (26.8%) were classified with no signs of active TB, although most of them (n = 11) had LTBI because of positive ELISpot in blood, Table 2 and 3. Other diagnostic results (including auramine, PCR and culture for MTB and ELISpot in blood) are summarized in Table 3, with respect to the TB case definition. In only one patient, resistance to isoniazid was established; all other MTB strains showed sensitivity to all tuberculostatic drugs tested.
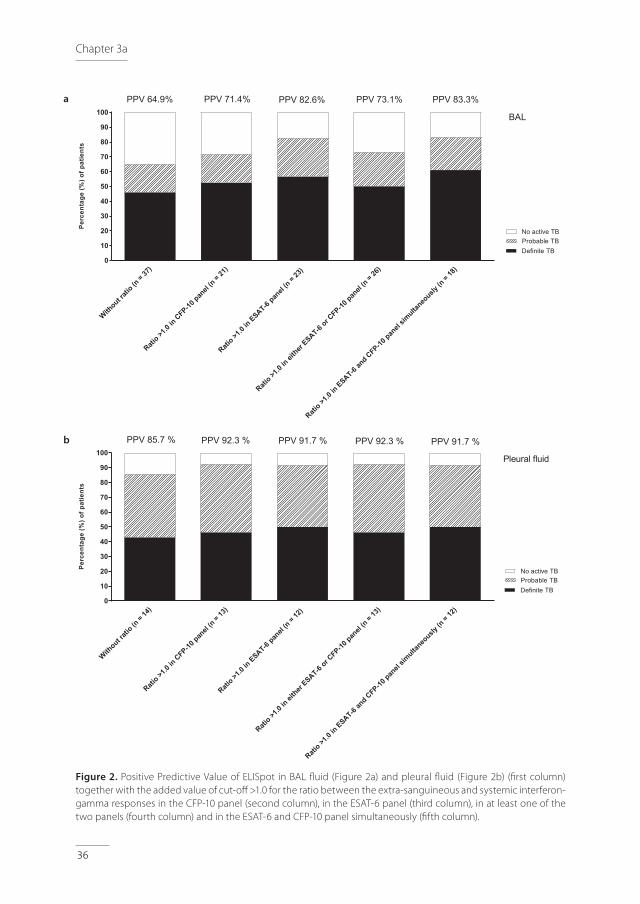
Positive Predictive Value of ELISpot in BAL and pleural fluid and the added value of a cut-off >1.0 for the ratio between the extra-sanguineous and systemic interferon-gamma responses
The PPV of ELISpot in BAL fluid for active TB was 64.9% (=24/37), Table 2. The PPV of ELISpot in pleural fluid for active TB was 85.7% (=12/14), Table 2. The calculated ratios between the

Chapter 3a
34
extra-sanguineous and systemic interferon-gamma responses varied from 0.1 to almost 300 and are represented in Figure 1a (ESAT 6-panel) and Figure 1b (CFP-10 panel), for BAL and pleural fluid in separate colors. In patients with no active TB, patients with and without LTBI were represented separately. For positive ELISpot in BAL, a ratio of >1.0 resulted in a PPV for active TB of 82.6% (=19/23) for the ESAT-6 panel (Figures 1a and 2a) and 71.4% (=15/21) for the CFP-10 panel (Figures 1b and 2a). A ratio of >1.0 in at least one of the two panels (either ESAT-6 or CFP-10) resulted in a PPV for active TB of 73.1% (=19/26). A ratio of >1.0 in the ESAT-6 and CFP-10 panel simultaneously resulted in a PPV of 83.3% (=15/18), Figure 2a. For positive ELISpot in pleural fluid, a ratio of >1.0 resulted in a PPV for active TB of 91.7% (=11/12) for the ESAT-6 panel (Figures 1a and 2b) and 92.3% (=12/13) for the CFP-10 panel (Figures 1b and 2b). A ratio of >1.0 in at least one of the two panels (either ESAT-6 or CFP-10) resulted in a PPV for active TB of 92.3% (=12/13). A ratio of >1.0 in the ESAT-6 and CFP-10 panel simultaneously resulted in a PPV of 91.7% (=11/12), Figure 2b.
Table 2. Results of ELISpot in BAL and pleural fluid with respect to the TB case definition
Definite TB (n = 23)
Probable TB (n = 13)
Uncertain TB (n = 5)
No TB (n = 15)a
Positive ELISpot in BAL (n = 40) 17 7 3 13
Positive ELISpot in pleural fluid (n = 16) 6 6 2 2
TB, Tuberculosis. BAL, Bronchoalveolar lavagea. Including latent TB infection (n = 11)
Table 3. Results of ELISpot in blood; Results of auramine, PCR and culture for MTB in BAL and pleural fluid
Definite TB (n = 23)
Probable TB (n = 13)
Uncertain TB (n = 5)
No TB (n = 15)a
ELISpot Blood
Positive
Negative
23
0
12
1
3
2
11
4
Auramine
Positive
Negative
5
18
0
13
0
5
1
14
PCR for MTB
Positive
Negative
13
10
0
13
0
5
0
14b
Culture for MTB
Positive
Negative
21
2
0
13
0
5
0
15
TB, Tuberculosis. PCR, Polymerase Chain Reaction. MTB, Mycobacterium Tuberculosis BAL, bronchoalveolar lavagea. Including latent TB Infection (n = 11)b. One missing PCR result

3
ELISpot in BAL and pleural fluid
35
Figure 1. Ratio between SFCs in BAL (black dots) respectively pleural fluid (red dots) and SFCs in blood (y-axis, scale log 10), with respect to the tuberculosis (TB) case definition (x-axis). Results of ESAT-6 (Figure 1a) and CFP-10 (Figure 1b) are shown separately. In patients with no active TB, patients with LTBI (filled dots) and without LTBI (open dots) were represented separately. SFC, spot forming cells. TB, tuberculosis. LTBI, latent TB infection. BAL, bronchoalveolar lavage
Definite
TB(n
= 23)
Probab
leTB
(n= 13
)
No activ
e TB(n
= 15), i
ncluding LTBI (n
= 11)
0.01
0.1
1
10
100
1000
RA
TIO
(SFC
sB
AL
resp
ectiv
ely
pleu
ralf
luid
:SFC
sbl
ood) ESAT-6 BAL, no LTBI
Pleural fluid
Definite
TB(n
= 23)
Probab
leTB
(n= 13
)
No activ
e TB(n
= 15), i
ncluding LTBI (n
= 11)
0.01
0.1
1
10
100
1000
RA
TIO
(SFC
sB
AL
resp
ectiv
ely
pleu
ralf
luid
:SFC
sbl
ood)
CFP-10BAL, no LTBIPleural fluid
Definite
TB(n
= 23)
Probab
leTB
(n= 13
)
No activ
e TB(n
= 15), i
ncluding LTBI (n
= 11)
0.01
0.1
1
10
100
1000
RA
TIO
(SFC
sB
AL
resp
ectiv
ely
pleu
ralf
luid
:SFC
sbl
ood) ESAT-6 BAL, no LTBI
Pleural fluid
Definite
TB(n
= 23)
Probab
leTB
(n= 13
)
No activ
e TB(n
= 15), i
ncluding LTBI (n
= 11)
0.01
0.1
1
10
100
1000
RA
TIO
(SFC
sB
AL
resp
ectiv
ely
pleu
ralf
luid
:SFC
sbl
ood)
CFP-10BAL, no LTBIPleural fluid
a
b
Chapter 3a
36
Figure 2. Positive Predictive Value of ELISpot in BAL fluid (Figure 2a) and pleural fluid (Figure 2b) (first column) together with the added value of cut-off >1.0 for the ratio between the extra-sanguineous and systemic interferon-gamma responses in the CFP-10 panel (second column), in the ESAT-6 panel (third column), in at least one of the two panels (fourth column) and in the ESAT-6 and CFP-10 panel simultaneously (fifth column).
Without rat
io(n
= 37)
Ratio >1
.0in
CFP-10pan
el(n
= 21)
Ratio >1
.0in
ESAT-6pan
el(n
= 23)
Ratio >1
.0in
either
ESAT-6or CFP-10
panel
(n= 26
)
Ratio >1
.0in
ESAT-6an
d CFP-10pan
elsim
ultaneo
usly(n
= 18)
0
10
20
30
40
50
60
70
80
90
100
Per
cent
age
(%)o
fpat
ient
s
Definite TBProbable TBNo active TB
PPV 64.9% PPV 71.4% PPV 82.6%
BAL
PPV 73.1% PPV 83.3%
Without rat
io(n
= 14)
Ratio >1
.0in
CFP-10pan
el(n
= 13)
Ratio >1
.0in
ESAT-6pan
el(n
= 12)
Ratio >1
.0in
either
ESAT-6or CFP-10
panel
(n= 13
)
Ratio >1
.0in
ESAT-6an
d CFP-10pan
elsim
ultaneo
usly(n
= 12)
0
10
20
30
40
50
60
70
80
90
100
Per
cent
age
(%)o
fpat
ient
s
Definite TBProbable TBNo active TB
Pleural fluid
PPV 85.7 % PPV 92.3 % PPV 91.7 % PPV 92.3 % PPV 91.7 %
a
b

3
ELISpot in BAL and pleural fluid
37
DISCUSSION
This retrospective study evaluates the PPV of ELISpot in BAL and pleural fluid for the diagnosis of active TB in real-life clinical practice. The results indicate the possibility of an increase of the PPV using a cut-off >1.0 for the ratio between the extra-sanguineous and systemic interferon-gamma responses. Because of the limited sample size, the data are not appropriate for statistical tests. As a result, recommendations about the most appropriate panel (ESAT-6, CFP-10 or a combination of both panels) for ratio-approach cannot be determined thus far. Nevertheless, the results are noteworthy and contain important lessons for future studies on the value of ELISpot in extra-sanguineous fluids.In theory, a positive ELISpot in BAL or pleural fluid together with a ratio >1.0 between extra-sanguineous and systemic interferon-gamma responses could be helpful in the decision to initiate anti-TB treatment in patients with negative PCR MTB results and pending or negative culture results, but this hypothesis needs further, carefully designed, prospective studies to determine the definite diagnostic accuracy and the impact on treatment decision. In this study, it was not possible to evaluate the impact of ELISpot results at treatment decision. Furthermore, this approach could prove to be valuable in the diagnosis of extrapulmonary difficult-to-diagnose TB (e.g., TB-meningitis) [14] although this is difficult to study in lower endemic areas because of the low prevalence of TB-meningitis. This approach is not intended to replace PCR and/or culture diagnostics, which remain essential in identifying the TB-strain and in susceptibility testing. Independently of the positioning of the value of ELISpot in extra-sanguineous fluids, it remains very important to improve PCR-technique (which is an ongoing process in recent years) and to strive for better (sputum) samples, including induced sputum, all aimed to improve rapid TB-diagnosis. An important requirement for ELISpot in BAL and pleural fluid is the access to bronchoscopy and ELISpot procedure, which might be a limitation in lower income countries, but usually is not a problem in more developed countries. As far as we know, this study is the first to explicitly address the PPV of ELISpot in BAL and pleural fluid together with the added value of a cut-off >1.0 for the ratio between the extra-sanguineous and systemic interferon-gamma responses in positive samples. Another strength of this study is the TB case definition according to the WHO guidelines together with the input of an external, blinded expert. This study has several limitations, partially due to the retrospective and single-centre character of the study, which influences the possibilities to generalize the results. Another limitation refers to the selection strategy. In clinical practice, in patients with pulmonary TB diagnosed with positive sputum samples, usually bronchoscopy is not performed and as a consequence ELISpot BAL cannot be obtained. As a result, these patients were not included in the study. Furthermore, as a result of the inclusion of only positive ELISpot in BAL and pleural

Chapter 3a
38
fluid, full diagnostic accuracy of the test including the negative predictive value, sensitivity and specificity could not be evaluated. As preceding prospective studies addressed this issue already,[2,3] and we especially aimed to investigate the added value of the ratio-approach for the PPV, evaluation of full diagnostic accuracy was not the intention of this retrospective study. Results may be influenced by the disease prevalence in the included population. Although the study was performed in a low incidence country, several patients were at a higher risk of TB because of ethnicity or as a result of travelling to endemic areas. Due to the low incidence of tuberculosis, this study included relatively few patients during a longer period of time where changes in staff and diagnostic facilities might have affected the results. Another reason for the limited sample size is the exclusion of patients without concurrent ELISpot blood results. The exclusion of patients with uncertain TB in the evaluation of the PPV may have affected the results as well, although the influence of only five patients probably is not substantial. Because of the absence of a definite diagnosis in these five patients, the effect of the exclusions at the results is unclear.The lower PPV of ELISpot in BAL compared with PPV of ELISpot in pleural fluid could be explained by the differences in the type of fluid. BAL fluid is the result of lavage of a lung segment, resulting in dilution of the sputum. Furthermore, the collection of BAL fluid results in a higher risk of blood mixture because of possible irritation of the endobronchial mucosa during the procedure. Consequently, the ratio-approach is expected to increase the PPV of ELISpot especially in BAL, as is indicated in our results. As a consequence of the inherent differences in yield during the collection of BAL fluid, it is difficult to standardize the ELISpot procedure in BAL fluids. In three patients, less than 2.5 x 10⁵ cells could be harvested and incubated for ELISpot procedure. None of these patients did have active TB. Although this is a limitation of the study, it is unlikely that the results of these three patients have significantly influenced the results.The PPV of ELISpot in BAL fluid in this study (64.9%) is somewhat higher compared with PPV of ELISpot in BAL fluid (55%) in previous mentioned prospective multi-centre study,[5] possibly influenced by differences in TB-endemic ethnicity of the included patients, although this information is lacking in the mentioned paper.[5] An influence of the differences in selection strategy between both studies cannot be excluded. Both studies emphasizes that PPV without ratio between extra-sanguineous and systemic interferon-gamma responses is a limitation of ELISpot in BAL. Although promising, this ‘ratio-approach’ did not distinguish active from latent TB in all patients, which remains a limitation of the test. Five patients with positive ELISpot in BAL fluid and ratio ≤1.0 in ESAT-6 and CFP-10 panels simultaneously did have active TB. Three of these patients had mainly extrapulmonary TB with only minor pulmonary abnormalities, necessitating caution when interpreting BAL results in patients with mainly extrapulmonary TB. The two
3
ELISpot in BAL and pleural fluid
39
other patients with a ratio ≤1.0 in ESAT-6 and CFP-10 panels simultaneously definitely had pulmonary TB, one with a positive culture for M. bovis and the other with a positive culture for MTB. In contrast, five patients with positive ELISpot in BAL or pleural fluid and ratios of >1.0 in ESAT-6 and CFP-10 panels simultaneously did not have active TB. Three of these patients had negative ELISpot in their blood and just slightly positive ELISpot in BAL fluid. One patient also had a negative ELISpot in her blood, but with a convincingly positive ELISpot in BAL fluid and 191 spots in ESAT-6 and CFP-10 panels simultaneously, without arguments for active TB. She frequently travelled to a TB-endemic area, so the influence of possible TB exposure and subsequent immune activation in this ‘false-positive’ ELISpot in BAL and consequently ‘false-negative’ ELISpot in blood could be considered. One patient had ratio of >1.0 in the ESAT-6 and CFP-10 panels simultaneously, with positive ELISpot in blood and pleural fluid, although without evidence of active TB. Evaluating the PPV of ELISpot in BAL and pleural fluid, it is instructive to be aware of patients with negative ELISpot in BAL or pleural fluid yet with active TB. Therefore, we evaluated all patients treated for TB in our hospital from 2006 until 2012. This resulted in the identification of one patient with definite TB in mediastinal lymph nodes (negative Auramine and PCR for MTB, but positive culture), without abnormalities in lung parenchyma and consequently negative ELISpot BAL. In conclusion, this report describes the PPV of ELISpot in BAL and pleural fluid for the diagnosis of TB. The results indicate the possibility of an increase of the PPV using a cut-off >1.0 for the ratio between the extra-sanguineous and systemic interferon-gamma responses. Further studies are needed to underline this ratio-approach and to evaluate full diagnostic accuracy of ELISpot in extra-sanguineous fluids like BAL and pleural fluid, as well as the impact of the results on treatment decision.
Chapter 3a
40
REFERENCES 1. Jafari C, Ernst M, Strassburg A, et al. Local immunodiagnosis of pulmonary tuberculosis by enzyme-
linked immunospot. Eur Respir J 2008 Feb;31:261-265.
2. Sester M, Sotgiu G, Lange C, et al. Interferon-gamma release assays for the diagnosis of active tuberculosis: a systematic review and meta-analysis. Eur Respir J 2011 Jan;37:100-111.
3. Aggarwal AN, Agarwal R, Gupta D, et al. Interferon Gamma Release Assays for Diagnosis of Pleural Tuberculosis: a Systematic Review and Meta-Analysis. J Clin Microbiol 2015 Aug;53:2451-2459.
4. Hofland RW, Bossink AW, Lammers JW, et al. Pleural Fluid and Tuberculosis: Are All Interferon Gamma Release Assays Equal? J Clin Microbiol 2016 Feb;54:504-505.
5. Jafari C, Thijsen S, Sotgiu G, et al. Bronchoalveolar lavage enzyme-linked immunospot for a rapid diagnosis of tuberculosis: a Tuberculosis Network European Trialsgroup study. Am J Respir Crit Care Med 2009 Oct 1;180:666-673.
6. Losi M, Bossink A, Codecasa L, et al. Use of a T-cell interferon-gamma release assay for the diagnosis of tuberculous pleurisy. Eur Respir J 2007 Dec;30:1173-1179.
7. Cho OH, Park KH, Park SJ, et al. Rapid diagnosis of tuberculous peritonitis by T cell-based assays on peripheral blood and peritoneal fluid mononuclear cells. J Infect 2011 Jun;62:462-471.
8. Kim SH, Chu K, Choi SJ, et al. Diagnosis of central nervous system tuberculosis by T-cell-based assays on peripheral blood and cerebrospinal fluid mononuclear cells. Clin Vaccine Immunol 2008 Sep;15:1356-1362.
9. Lee JY, Kim SM, Park SJ, et al. A rapid and non-invasive 2-step algorithm for diagnosing tuberculous peritonitis using a T cell-based assay on peripheral blood and peritoneal fluid mononuclear cells together with peritoneal fluid adenosine deaminase. J Infect 2015 Apr;70:356-366.
10. Kubica GP, Dye WE, Cohn ML, et al. Sputum digestion and decontamination with N-acetyl-L-cysteine-sodium hydroxide for culture of mycobacteria. Am Rev Respir Dis 1963 May;87:775-779.
11. Savelkoul PH, Catsburg A, Mulder S, et al. Detection of Mycobacterium tuberculosis complex with Real Time PCR: comparison of different primer-probe sets based on the IS6110 element. J Microbiol Methods 2006 Jul;66:177-180.
12. Oxford Immunotec. http://www.oxfordimmunotec.com/international/wp-content/uploads/sites/3/PI-TB-IVD-UK-V2.pdf.
13. World Health Organization. Tuberculosis. Available at: http://www.who.int/tb/en/, 2015.
14. Kosters K, Nau R, Bossink A, et al. Rapid diagnosis of CNS tuberculosis by a T-cell interferon-gamma release assay on cerebrospinal fluid mononuclear cells. Infection 2008 Dec;36:597-600.

3
ELISpot in BAL and pleural fluid
41


RW Hofland, AWJ Bossink, J-WJ Lammers, SFT Thijsen
Pleural Fluid and Tuberculosis: Are All Interferon Gamma Release Assays Equal?
3bJ Clin Microbiol. 2016 Feb;54:504-5

44
Chapter 3b
To the Editor,
We have read the recently published review of Aggarwal and colleagues[1] with great interest. The use of interferon gamma release assays (IGRA) in extra-sanguineous body fluids as potential diagnostic tests for active tuberculosis (TB) does have our special attention. We would like to address two important methodological decisions made in this review with considerable consequences for the results.
First, in the sensitivity analysis, the authors decided to categorize indeterminate results in tuberculous pleural effusion (TPE) patients as false negative, with the argument that this reflects the real-life clinical decision making scenario, where any ‘non-positive’ report is indicative of the absence of disease. We do not recognize this argument in clinical practice of indeterminate IGRA results in the assessment of active TB, and moreover, this is not demonstrated in the review of Aggarwal et al, as 83% (50/60) of patients with indeterminate QuantiFERON results in pleural fluid, and 52% (28/54) of patients with indeterminate T-SPOT.TB results in pleural fluid, have pleural tuberculosis. According to the assay manufacturer’s instructions, an indeterminate IGRA should not have clinical consequences in the workup for a patient with active TB and therefore should be excluded from the calculation of diagnostic accuracy.
Second, the authors decided to combine QuantiFERON and T-SPOT.TB results in pleural fluid to calculate pooled sensitivity and specificity. Since the value of IGRA in extra-sanguineous body fluids is still under discussion, considering that the two tests are based on different laboratory techniques with different diagnostic accuracies reported in literature thus far[2], ánd because of the heterogeneity of the included studies, we suppose that it would be better to distinguish the accuracy of the two ‘pleural fluid’ tests.
In order to better comprehend the consequences for the results of the study by Aggarwal et al., we composed a new table (Table 1), based on the data presented in Table 1 of the recent review.[1] In our table we used the total of the true-positive, false-negative, and indeterminate test results of the QuantiFERON and T-SPOT.TB assays separately for the group of patients with TPE. For the non-TPE patients, we used the total of true-negative, false-positive, and indeterminate test results. Results of the IGRA in blood were excluded because we specifically aimed to address the accuracy of IGRA in pleural fluid.
3
45
Pleural Fluid and TB: Are All IGRA Equal?
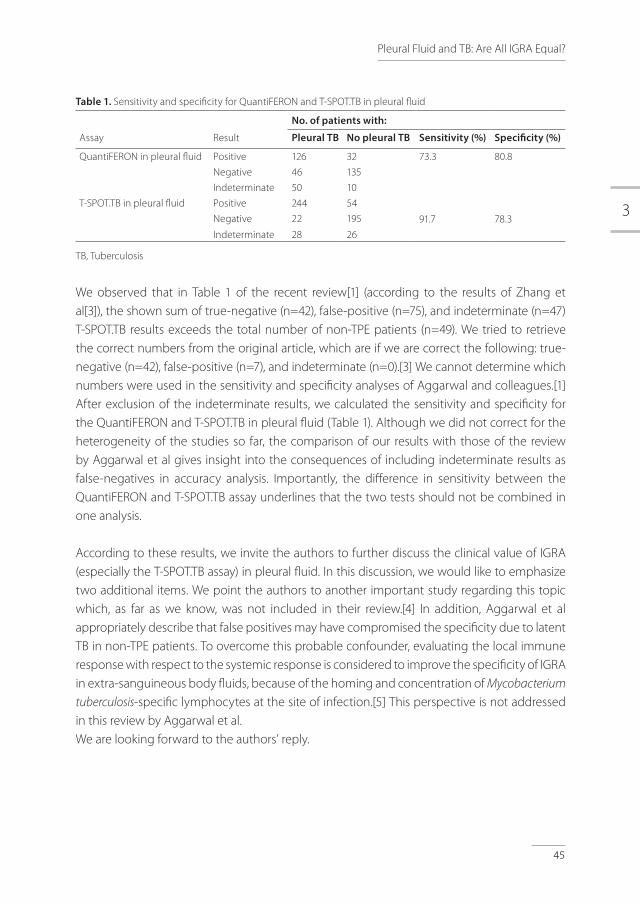
Table 1. Sensitivity and specificity for QuantiFERON and T-SPOT.TB in pleural fluid
No. of patients with:
Assay Result Pleural TB No pleural TB Sensitivity (%) Specificity (%)
QuantiFERON in pleural fluid Positive 126 32 73.3 80.8
Negative 46 135
Indeterminate 50 10
T-SPOT.TB in pleural fluid Positive 244 54
91.7 78.3Negative 22 195
Indeterminate 28 26
TB, Tuberculosis
We observed that in Table 1 of the recent review[1] (according to the results of Zhang et al[3]), the shown sum of true-negative (n=42), false-positive (n=75), and indeterminate (n=47) T-SPOT.TB results exceeds the total number of non-TPE patients (n=49). We tried to retrieve the correct numbers from the original article, which are if we are correct the following: true-negative (n=42), false-positive (n=7), and indeterminate (n=0).[3] We cannot determine which numbers were used in the sensitivity and specificity analyses of Aggarwal and colleagues.[1] After exclusion of the indeterminate results, we calculated the sensitivity and specificity for the QuantiFERON and T-SPOT.TB in pleural fluid (Table 1). Although we did not correct for the heterogeneity of the studies so far, the comparison of our results with those of the review by Aggarwal et al gives insight into the consequences of including indeterminate results as false-negatives in accuracy analysis. Importantly, the difference in sensitivity between the QuantiFERON and T-SPOT.TB assay underlines that the two tests should not be combined in one analysis.
According to these results, we invite the authors to further discuss the clinical value of IGRA (especially the T-SPOT.TB assay) in pleural fluid. In this discussion, we would like to emphasize two additional items. We point the authors to another important study regarding this topic which, as far as we know, was not included in their review.[4] In addition, Aggarwal et al appropriately describe that false positives may have compromised the specificity due to latent TB in non-TPE patients. To overcome this probable confounder, evaluating the local immune response with respect to the systemic response is considered to improve the specificity of IGRA in extra-sanguineous body fluids, because of the homing and concentration of Mycobacterium
tuberculosis-specific lymphocytes at the site of infection.[5] This perspective is not addressed in this review by Aggarwal et al.We are looking forward to the authors’ reply.

46
Chapter 3b
ACKNOWLEDGEMENT
We kindly thank C. M. Bosland for editing the manuscript according to the English language.
3
47
REFERENCES1. Aggarwal AN, Agarwal R, Gupta D, et al. Interferon Gamma Release Assays for Diagnosis of Pleural
Tuberculosis: a Systematic Review and Meta-Analysis. J Clin Microbiol 2015 Aug;53:2451-2459.
2. Sester M, Sotgiu G, Lange C, et al. Interferon-gamma release assays for the diagnosis of active tuberculosis: a systematic review and meta-analysis. Eur Respir J 2011 Jan;37:100-111.
3. Zhang L, Zhang Y, Shi X, et al. Utility of T-cell interferon-gamma release assays for diagnosing tuberculous serositis: a prospective study in Beijing, China. PLoS One 2014 Jan;9:e85030.
4. Liao M, Yang Q, Zhang J, et al. Gamma interferon immunospot assay of pleural effusion mononuclear cells for diagnosis of tuberculous pleurisy. Clin Vaccine Immunol 2014 Mar;21:347-353.
5. Jafari C, Thijsen S, Sotgiu G, et al. Bronchoalveolar lavage enzyme-linked immunospot for a rapid diagnosis of tuberculosis: a Tuberculosis Network European Trialsgroup study. Am J Respir Crit Care Med 2009 Oct;180:666-673.
Pleural Fluid and TB: Are All IGRA Equal?

RW Hofland, SFT Thijsen, J Bouwman, M van der Wel, AWJ Bossink
Sarcoidosis and Purified Protein Derivative reactivity
3cSarcoidosis Vasc Diffuse Lung Dis 2014; 31: 142-148

50
Chapter 3c
ABSTRACT
Background: The possible association between (tuberculous and nontuberculous) mycobacterial infections and sarcoidosis is still a matter of dispute. Using diagnostic tests for specific T-cell responses, this association can be investigated in an innovative manner. Objective: To measure the T-cell responsiveness to the purified protein derivative (PPD) antigen in blood and broncho-alveolar lavage (BAL) fluid in patients with sarcoidosis and patients with other causes of interstitial lung disease. It was hypothesized that if a mycobacterial infection of the lung is of importance for the development of sarcoidosis, T-cell responsiveness towards the PPD antigen would be increased in patients with sarcoidosis when compared to patients with other causes of interstitial lung disease.Methods: A single-center study was conducted which included patients with and without sarcoidosis. Venous blood was collected and BAL was performed for, inter alia, Interferon Gamma Release Assay s (IGRA) with different stimulating antigens, including PPD, ESAT-6, CFP-10 and, as a control, Epstein-Barr virus (EBV). Results: A total of 118 patients were included. There is no difference between PPD reactivity in BAL fluid in patients with or without sarcoidosis. In patients without sarcoidosis, ELISpot PPD in blood shows more reactivity compared to patients with sarcoidosis, although this difference is not significant. ELISpot EBV and TB results are not significant different between both groups.Conclusion: These results provide no evidence for the involvement of different mycobacteria in the pathogenesis of sarcoidosis.

3
51
Sarcoidosis and PPD reactivity
INTRODUCTION
Sarcoidosis is a multi-organ granulomatous disorder of unknown etiology, characterized by non-caseating granulomas involving the lung, lymph-nodes or other organs. Several possible causes are discussed in the literature, including genetic, immunological, environmental and infectious influences. The association between (tuberculous and nontuberculous) mycobacterial infections and sarcoidosis has been investigated in different studies, leading to varied and inconclusive results.[1,2] Most of these studies use acid-fast stains, cultures or identification of bacterial nucleic acids for detection of mycobacteria.
With cellular immune assays, the association between different mycobacteria and sarcoidosis can be investigated in an innovative manner. Interferon-γ release assay s (IGRA) stimulate T-cells using mycobacterial specific antigens, resulting in interferon-γ production when patients are already sensitized to mycobacterial antigens.[3] During active infection, T-cells are clonally increased and recruited to the site of infection.[4,5] Therefore, IGRA’s on mononuclear cells obtained from the site of infection might be of additional diagnostic value in patients with active infection. Wilkinson et al. showed a much higher concentration of Early Secreted Antigen Targeted-6 (ESAT-6) specific T-cells in pleural effusions compared to peripheral blood in patients with pleural tuberculosis (TB).[6] Jaffari et al. demonstrated that IGRA’s might be of additional diagnostic value for the diagnosis of pulmonary TB when performed on specimens from the site of infection, such as cells obtained from bronchoalveolar lavage (BAL).[7] In our laboratory, we developed an IGRA on BAL mononuclear cells, using purified protein derivative (PPD) as stimulating antigen for rapid detection of Bacillus Calmette-Guérin (BCG) related pulmonary disease resulting from intravesical BCG therapy in patients with bladder malignancy.[8]
In this current study, we measured the PPD specific T-cell response in both blood and BAL fluid in patients with interstitial pulmonary disease. We hypothesized that if mycobacterial infection of the lung is of importance for the development of sarcoidosis, T-cell responsiveness towards the PPD antigen, especially in alveolar mononuclear cells, should be at a higher level in patients with sarcoidosis when compared to patients with other causes of interstitial pulmonary disease.
METHODS
Patients
A single-center study was conducted in our hospital which included all patients from the pulmonary outpatient department scheduled for BAL as a result of suspected interstitial pulmonary disease. BAL was performed for Mycobacterium tuberculosis (MTB) Nucleic Acid

52
Amplification Technique (NAAT), (mycobacterial) culture, immunophenotyping and IGRA. In addition, venous blood was collected for immunophenotyping and IGRA.Patients were divided into two groups. The first group included patients diagnosed with sarcoidosis, based on international accepted criteria[9,10], with or without histological confirmation. Group 2 involved all other patients with a varied group of non-sarcoidosis diagnoses (Table 3), which functioned as a control group.
IGRA (ELISpot)
MTB-specific IGRA (ELISpot TB) on peripheral blood mononuclear cells (PBMCs) was performed at the TSPOT®.TB platform, according to the manufacturers instructions (Oxford Immunotec Ltd., Abingdon, UK). Briefly, 2.5 x 10⁵ PBMCs were incubated with 50 µL of AIM-V medium (negative control), phytohemagglutinin (PHA, positive control) and two MTB specific antigens (ESAT-6 / panel A, and CFP-10 / panel B, respectively). After 16-20 hours incubation at 37ºC, the microtitre plates were washed and a conjugate incubation and detection step were carried out to visualize the IFN-γ production by sensitized T-cells. IGRA for PPD was performed using the TSPOT®.TB platform, except that the TB-specific antigens were replaced by a mixture of PPD (tuberculin RT50 3 µg/mL, Statens Serum Institute, Denmark). In addition, an EBV ELISpot assay was performed using an EBV antigen which was kindly provided by Debby van Baarle (WKZ Hospital, Utrecht, the Netherlands)[11] and was used in a concentration of 0.5 µg/mL. In the absence of an evidence based cut-off value, ELISpot PPD and EBV were defined as reactive in the case of one or more spots. Spot formation was enumerated on an ELISpot reader (Auto Immun Diagnostika GmbH, Strassberg, Germany). ELISpot results were valid when ≥ 20 spots were visible in the positive control well. When spots in the positive control well were lower, the test result was scored as indeterminate.BAL was performed with 150 ml saline fluid placed into an affected lung segment. Sample debris was discarded by passing the BAL fluid through a stainless steel sieve. ELISpot assays were performed as previously described[7] and explained above.
Individual patient-data meta-analysis
The results of the current study were extended in an individual patient-data meta-analysis (described separately in the results paragraph) combining our data with the data of Hörster et al.[12] These authors also investigated the interferon-γ production by enzyme-linked immunospot in response to PPD, ESAT-6 and CFP-10 by mononuclear cells both from BAL fluid and blood, but defined a different patient population (17 patients with pulmonary sarcoidosis compared to 33 patients with smear-negative tuberculosis and a varied group of 35 controls). Another difference is that Hörster et al defined the response of stimulated cultures to be positive when the antigen well contained more than five spots and at least twice the number
Chapter 3c

3
53
of spots compared to the negative control. With current limited evidence about PPD specific T-cell response, we preferred to show the absolute amounts of spots. However, only in this individual patient-data meta-analysis, to be in agreement with the study-design of Hörster et al, we applied a cut-off value of > 5 spots for PPD reactivity in our population.
Statistical analysis
A description of clinical characteristics was made using mean and standard deviation in variables with a normal distribution (unpaired T-test), median and range in non-normal distributed variables (Mann-Whitney U test) and percentages for dichotomized variables (Chi-squared test, reporting exact significance). To test for normality, Kolmogorov-Smirnov test (n > 50) and Shapiro-Wilk test (n < 50) were applied. To compare lymphocytes in BAL fluid and the concomitant number of spots in EBV and PPD reactive samples (blood and BAL fluid), logarithmic transformation was applied, resulting in geometric mean with 95% confidence interval of the difference. To compare ELISpot results between both groups, p-values were calculated using Pearson Chi-Square test (2-sided). In the individual patient-data meta-analysis, logistic regression was applied to compare both studies. This analysis was performed with respect to the percentage of sarcoidosis patients in both groups, the association between PPD outcome and the occurrence of sarcoidosis. Statistical analyses were performed with the aid of computer software (SPSS 17.0, SPSS Inc. Chicago, Illinois, USA).
RESULTS
A total of 118 patients were included. Baseline characteristics are described in Table 1, for patients diagnosed with sarcoidosis (n = 32) and patients without sarcoidosis (n = 86). Staging of sarcoidosis patients is described in Table 2.
Table 1. Patients’ baseline characteristics
Sarcoidosis No Sarcoidosis
Number of subjects 32 86
Male (%)* 18 (56%) 54 (63%) p = 0.531
Mean age [Standard deviation] † 40.9 [14.9] 60.3 [14.6] p < 0.0005
Dutch nationality (%) * 28 (88%) 71 (83%) p = 0.516
Smoking (%) * 9 (28%) 25 (29%) p = 0.821
Lymphocytes in BAL,
Geometric Mean (x 104), [Min;Max] †
4.3 [3.0-49.4] 2.1 [0.0-99.4] p = 0.007
* For this analysis the Chi-squared test was used
† For this analysis the Independent samples T-test was used
Sarcoidosis and PPD reactivity
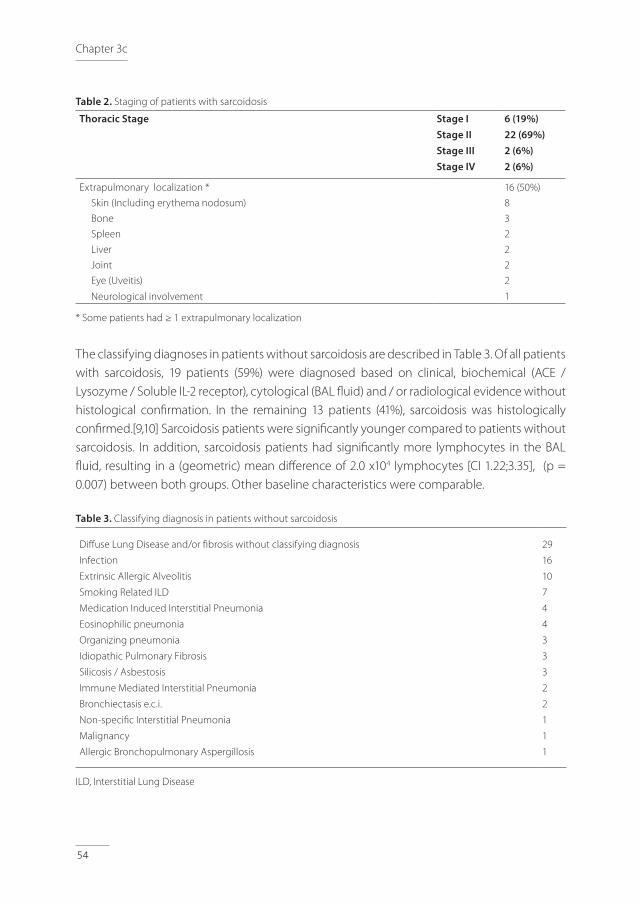
54
Table 2. Staging of patients with sarcoidosis
Thoracic Stage Stage IStage IIStage IIIStage IV
6 (19%)22 (69%)2 (6%)2 (6%)
Extrapulmonary localization * 16 (50%)
Skin (Including erythema nodosum) 8
Bone 3
Spleen 2
Liver 2
Joint 2
Eye (Uveitis)
Neurological involvement
2
1
* Some patients had ≥ 1 extrapulmonary localization
The classifying diagnoses in patients without sarcoidosis are described in Table 3. Of all patients with sarcoidosis, 19 patients (59%) were diagnosed based on clinical, biochemical (ACE / Lysozyme / Soluble IL-2 receptor), cytological (BAL fluid) and / or radiological evidence without histological confirmation. In the remaining 13 patients (41%), sarcoidosis was histologically confirmed.[9,10] Sarcoidosis patients were significantly younger compared to patients without sarcoidosis. In addition, sarcoidosis patients had significantly more lymphocytes in the BAL fluid, resulting in a (geometric) mean difference of 2.0 x10⁴ lymphocytes [CI 1.22;3.35], (p = 0.007) between both groups. Other baseline characteristics were comparable.
Table 3. Classifying diagnosis in patients without sarcoidosis
Diffuse Lung Disease and/or fibrosis without classifying diagnosis
Infection
Extrinsic Allergic Alveolitis
Smoking Related ILD
Medication Induced Interstitial Pneumonia
Eosinophilic pneumonia
Organizing pneumonia
Idiopathic Pulmonary Fibrosis
Silicosis / Asbestosis
Immune Mediated Interstitial Pneumonia
Bronchiectasis e.c.i.
Non-specific Interstitial Pneumonia
Malignancy
Allergic Bronchopulmonary Aspergillosis
29
16
10
7
4
4
3
3
3
2
2
1
1
1
ILD, Interstitial Lung Disease
Chapter 3c
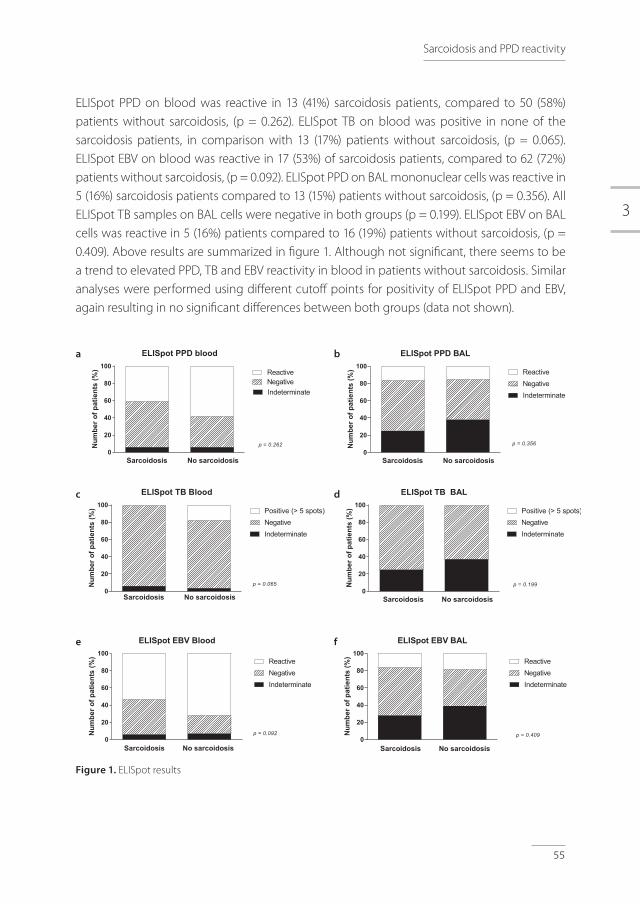
3
55
ELISpot PPD on blood was reactive in 13 (41%) sarcoidosis patients, compared to 50 (58%) patients without sarcoidosis, (p = 0.262). ELISpot TB on blood was positive in none of the sarcoidosis patients, in comparison with 13 (17%) patients without sarcoidosis, (p = 0.065). ELISpot EBV on blood was reactive in 17 (53%) of sarcoidosis patients, compared to 62 (72%) patients without sarcoidosis, (p = 0.092). ELISpot PPD on BAL mononuclear cells was reactive in 5 (16%) sarcoidosis patients compared to 13 (15%) patients without sarcoidosis, (p = 0.356). All ELISpot TB samples on BAL cells were negative in both groups (p = 0.199). ELISpot EBV on BAL cells was reactive in 5 (16%) patients compared to 16 (19%) patients without sarcoidosis, (p = 0.409). Above results are summarized in figure 1. Although not significant, there seems to be a trend to elevated PPD, TB and EBV reactivity in blood in patients without sarcoidosis. Similar analyses were performed using different cutoff points for positivity of ELISpot PPD and EBV, again resulting in no significant differences between both groups (data not shown).
Figure 1. ELISpot results
ELISpot PPD blood
0
20
40
60
80
100
IndeterminateNegativeReactive
p = 0.262
Sarcoidosis No sarcoidosis
Num
bero
fpat
ient
s(%
)
ELISpot TB Blood
0
20
40
60
80
100
IndeterminateNegativePositive (> 5 spots)
p = 0.065
Sarcoidosis No sarcoidosis
Num
bero
fpat
ient
s(%
)
ELISpot EBV Blood
0
20
40
60
80
100
IndeterminateNegativeReactive
Sarcoidosis No sarcoidosis
p = 0.092Num
bero
fpat
ient
s(%
)
ELISpot PPD BAL
0
20
40
60
80
100
IndeterminateNegativeReactive
p = 0.356
Sarcoidosis No sarcoidosis
Num
bero
fpat
ient
s(%
)
ELISpot TB BAL
0
20
40
60
80
100
IndeterminateNegativePositive (> 5 spots)
p = 0.199
Sarcoidosis No sarcoidosis
Num
bero
fpat
ient
s(%
)
ELISpot EBV BAL
0
20
40
60
80
100
IndeterminateNegativeReactive
p = 0.409
Sarcoidosis No sarcoidosis
Num
bero
fpat
ient
s(%
)a
c
e
b
d
f
Sarcoidosis and PPD reactivity
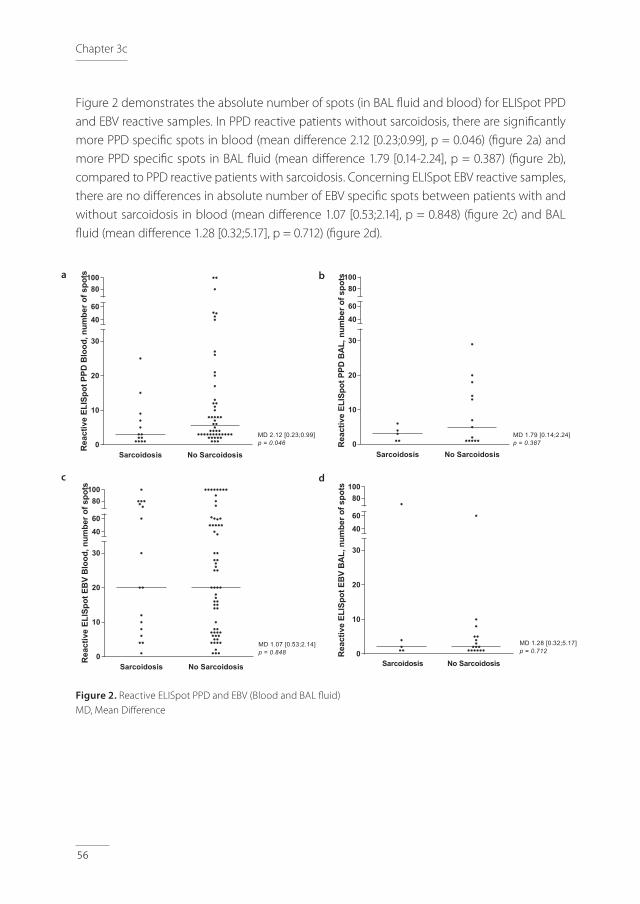
56
Figure 2 demonstrates the absolute number of spots (in BAL fluid and blood) for ELISpot PPD and EBV reactive samples. In PPD reactive patients without sarcoidosis, there are significantly more PPD specific spots in blood (mean difference 2.12 [0.23;0.99], p = 0.046) (figure 2a) and more PPD specific spots in BAL fluid (mean difference 1.79 [0.14-2.24], p = 0.387) (figure 2b), compared to PPD reactive patients with sarcoidosis. Concerning ELISpot EBV reactive samples, there are no differences in absolute number of EBV specific spots between patients with and without sarcoidosis in blood (mean difference 1.07 [0.53;2.14], p = 0.848) (figure 2c) and BAL fluid (mean difference 1.28 [0.32;5.17], p = 0.712) (figure 2d).
Figure 2. Reactive ELISpot PPD and EBV (Blood and BAL fluid)MD, Mean Difference
Sarcoidosis No Sarcoidosis0
10
20
30
40
60
80100
MD 2.12 [0.23;0.99]p = 0.046
Rea
ctiv
eEL
ISpo
tPPD
Blo
od,n
umbe
rofs
pots
Sarcoidosis No Sarcoidosis0
10
20
30
40
60
80100
MD 1.79 [0.14;2.24]p = 0.387R
eact
ive
ELIS
potP
PDB
AL,
num
bero
fspo
ts
Sarcoidosis No Sarcoidosis0
10
20
30
40
60
80100
MD 1.07 [0.53;2.14]p = 0.848
Rea
ctiv
eEL
ISpo
tEB
VB
lood
,num
bero
fspo
ts
0
10
20
30
40
60
80100
MD 1.28 [0.32;5.17]p = 0.712R
eact
ive
ELIS
potE
BV
BA
L,nu
mbe
rofs
pots
Sarcoidosis No Sarcoidosis
a
c
b
d
Chapter 3c

3
57
Results Individual patient-data meta-analysis
This additional analysis of current data together with the data of Hörster et al[12] enclosed 49 sarcoidosis patients and 121 patients without sarcoidosis. The ratio of sarcoidosis patients is not different between both studies (p = 0.460). In the logistic regression analysis, there is no interaction between PPD results and the study (p = 0.829 for PPD positive results and p = 0.944 for PPD indeterminate results). ELISpot PPD on blood was reactive (> 5 spots) in 9 (18%) sarcoidosis patients, compared to 45 (37%) patients without sarcoidosis, (p = 0.010). ELISpot PPD on BAL mononuclear cells was reactive (> 5 spots) in 3 (6%) sarcoidosis patients compared to 17 (14%) patients without sarcoidosis, (p = 0.060).
DISCUSSION
Here we report on the PPD and Mycobacteria tuberculosis specific T-cell response in both blood and BAL fluid in patients with sarcoidosis, compared to patients with other interstitial pulmonary disorders. In contradiction to our hypothesis, T-cell reactivity in BAL fluid is not different between both groups. PPD reactivity in blood in patients without sarcoidosis exceeds the reactivity in patients with sarcoidosis, although this difference is not significant. We suggest that the significant age-difference between both groups may have influenced the results. During life, there is a cumulative risk of mycobacterial infections, possibly resulting in more PPD reactivity in the older study population of patients without sarcoidosis. It has to be realized that the incidence of mycobacterial infections in the Netherlands is low. For example, the incidence of tuberculosis in Utrecht area is 4-20/100.000 persons/year [13], and the incidence of nontuberculous mycobacterial infections is estimated at 5/100.000 persons/year.[14] Therefore, we have to be cautious to extrapolate the results to parts of the world with a higher incidence of mycobacterial infections. Actually, the incidence of sarcoidosis is quite high in North-European climate, while the incidence of mycobacterial infections in these regions is rather low. Perhaps, T-cell anergy in sarcoidosis patients might have influenced the results.[15] T-cell anergy in sarcoidosis patients has been suggested in different papers. To make this effect more unlikely, we included an EBV ELISpot which should be positive in both populations at the same level. In the adult population in the Netherlands, EBV antibodies are common, which we verified with a random sample from all patients, resulting in EBV seropositivity in 100%, (data not shown). In our results, there seems to be a trend to more EBV reactivity in blood in patients without sarcoidosis (figure 1e), although this difference is not significant. EBV reactivity in BAL fluid is not different between both groups (figure 1f). In EBV reactive samples (in contradiction to PPD reactive samples), the absolute number of spots is comparable in patients with and without sarcoidosis (figure 2c, 2d). These results imply T-cell anergy to be unlikely, but it cannot be ruled out completely.
Sarcoidosis and PPD reactivity

58
Interestingly, our ELISpot EBV results do not support the previous reported suggestion about the possible involvement of EBV in pathogenesis of sarcoidosis.[16]Another remaining hypothesis on this topic is that patients with sarcoidosis may have a disturbed immune response against mycobacteria, resulting in negative ELISpot PPD, ESAT-6 and CFP-10 results despite mycobacterial infection, enabling development of granuloma characterizing sarcoidosis, especially in those patients with disturbed immune response. To the best of our knowledge, this study is the second one measuring PPD specific T-cell responses, utilizing IGRA on both BAL fluid and blood. The results are largely in accordance with the already mentioned report published by Hörster et al[12], concluding that the frequency of mycobacteria-specific local and systemic immune response is not elevated in patients with sarcoidosis when compared to controls. Both studies include limited number of patients; therefore we performed the individual patient-data meta-analysis, described in the methods and results section. However, these results again do not support our hypothesis and actually shows that mycobacterial immune response is negatively associated with sarcoidosis. Both studies cannot rule out a causal relation between mycobacteria and sarcoidosis in a small subset of patients. Future research on sarcoidosis should be differentiated to distinguish phenotypes of sarcoidosis, possible resulting in a subgroup of patients with sarcoidosis, each with different pathogenesis. In conclusion, our data provide no evidence that mycobacteria are involved in pathogenesis of sarcoidosis.
ACKNOWLEDGEMENTS
We kindly thank Mrs. Ingeborg van der Tweel, PhD, for her advice on statistical analysis and our colleague Mrs. Anya N. Milne, PhD MD, for carefully reading the manuscript.
Chapter 3c
3
59
REFERENCES1. Gupta D, Agarwal R, Aggarwal AN, et al. Molecular evidence for the role of mycobacteria in
sarcoidosis: a meta-analysis. Eur Respir J. 2007 Sep;30:508-16.
2. Brownell I, Ramirez-Valle F, Sanchez M, et al. Evidence for mycobacteria in sarcoidosis. Am J Respir Cell Mol Biol. 2011 Nov;45:899-905.
3. Pai M, Riley LW, Colford JM,Jr. Interferon-gamma assays in the immunodiagnosis of tuberculosis: a systematic review. Lancet Infect Dis. 2004 Dec;4:761-76.
4. Barnes PF, Lu S, Abrams JS, et al. Cytokine production at the site of disease in human tuberculosis. Infect Immun. 1993 Aug;61:3482-9.
5. Hirsch CS, Toossi Z, Johnson JL, et al. Augmentation of apoptosis and interferon-gamma production at sites of active Mycobacterium tuberculosis infection in human tuberculosis. J Infect Dis. 2001 Mar;183:779-88.
6. Wilkinson KA, Wilkinson RJ, Pathan A, et al. Ex vivo characterization of early secretory antigenic target 6-specific T cells at sites of active disease in pleural tuberculosis. Clin Infect Dis. 2005 Jan;40:184-7.
7. Jafari C, Thijsen S, Sotgiu G, et al. Bronchoalveolar lavage enzyme-linked immunospot for a rapid diagnosis of tuberculosis: a Tuberculosis Network European Trialsgroup study. Am J Respir Crit Care Med. 2009 Oct;180:666-73.
8. Heemstra KA, Bossink AW, Spermon R, et al. Added value of use of a purified protein derivative-based enzyme-linked immunosorbent spot assay for patients with Mycobacterium bovis BCG infection after intravesical BCG instillations. Clin Vaccine Immunol. 2012 Jun;19:974-7.
9. Iannuzzi MC, Rybicki BA, Teirstein AS. Sarcoidosis. N Engl J Med. 2007 Nov;357:2153-65.
10. American Thoracic Society. Statement on Sarcoidosis, 2009.
11. Kostense S, Otto SA, Knol GJ, et al. Functional restoration of human immunodeficiency virus and Epstein-Barr virus-specific CD8(+) T cells during highly active antiretroviral therapy is associated with an increase in CD4(+) T cells. Eur J Immunol. 2002 Apr;32:1080-9.
12. Horster R, Kirsten D, Gaede KI, et al. Antimycobacterial immune responses in patients with pulmonary sarcoidosis. Clin Respir J. 2009 Oct;3:229-38.
13. KNCV Dutch Tuberculosis Foundation. Tuberculosis in the Netherlands 2011.
14. National Institute for Public Health and the Environment (RIVM).
15. Miyara M, Amoura Z, Parizot C, et al. The immune paradox of sarcoidosis and regulatory T cells. J Exp Med. 2006 Feb;203:359-70.
16. Nikoskelainen J, Hannuksela M, Palva T. Antibodies to Epstein-Barr virus and some other herpesviruses in patients with sarcoidosis, pulmonary tuberculosis and erythema nodosum. Scand J Infect Dis. 1974;6:209-16.
Sarcoidosis and PPD reactivity


RW Hofland, AWJ Bossink, JJ Bouwman, R Spermon, A-J van Houte, J-WJ Lammers, SFT Thijsen
Feasibility of Purified Protein Derivative based ELISpot for Urine and Bladder Fluid after Intravesical BCG Instillations
3d

62
Chapter 3d
ABSTRACT
Introduction: Immunomodulating therapy with intravesical Bacillus Calmette-Guérin (BCG) vaccine is a common adjuvant treatment for patients with bladder carcinoma. Complications may occur and are difficult to identify. ELISpot using Purified Protein Derivative (PPD) as a stimulating antigen may be a new tool for the diagnosis and monitoring of BCG-related complications. The objective of the present study is to explore the feasibility of a PPD-based ELISpot to measure PPD-specific T-cell responses in the urine and bladder fluids of patients with bladder malignancies after treatment with intravesical BCG instillations.Methods: In this explorative study, 34 urine and 36 bladder fluid samples from 14 patients were collected during BCG instillation therapy. ELISpot with PPD as a stimulating antigen was performed with all samples. Immunophenotypic cell analysis was performed with 57 (81%) samples. Results: PPD-specific T-cell responses were demonstrated in ten samples (14%). Two samples (3%) yielded negative PPD-specific ELISpot results. The PPD-specific ELISpot results of the remaining fifty-eight samples (83%) were indeterminate due to the lack of T-cell response in the positive control, although T-cells were detected in all samples using flow cytometric analysis. Conclusion: We present this first report with data for the ELISpot based, PPD-specific T-cell response in urine and bladder fluid samples after intravesical BCG instillations. This study provides a basis for further improvement of the ELISpot PPD technique that may enable a final evaluation of whether this tool could be helpful for the diagnosis or monitoring of BCG-related complications after intravesical BCG instillations.

3
63
ELISpot PPD after intravesical BCG-installations
INTRODUCTION
Immunomodulating therapy with intravesical instillations of Bacillus Calmette-Guérin (BCG) vaccine is a common adjuvant treatment in patients with superficial, non-muscle invasive bladder malignancies and in situ carcinoma.[1,2] The BCG vaccine is a live attenuated strain of M. bovis, isolated by Guérin and Calmette in 1921.[3] Instillation in the bladder initiates a complex, not yet fully explored, partially T-cell mediated immune response that results in antitumor activity.[1,4,5] Until now, no convincing markers have been available to measure the immunological responses to BCG instillations.[5]As the BCG vaccine is a live attenuated strain, local or systemic infectious and inflammatory complications are possible, varying from mild to severe (<5% of patients).[6-9] These symptoms are often non-specific; the BCG strain is hard to identify, and rapid diagnosis of BCG-related complications is difficult. Systemic Purified Protein Derivative (PPD) responses may have a predictive value for complications after BCG instillations.[10] Interferon Gamma Release Assays (IGRAs) have been shown to be a useful method for measuring T-cell responses to M. tuberculosis-specific antigens (ESAT-6 and CFP-10), both in blood and extra-sanguineous fluids,[11,12] and may be a valuable tool for monitoring immunological responses and BCG-related complications in patients treated with intravesical BCG instillations. We developed an in-house IGRA (ELISpot) using PPD as a stimulating antigen. Previously, we described four cases in which the use of this ELISpot PPD enabled us to demonstrate PPD-specific T-cell responses, both in blood and bronchoalveolar lavage fluid, which contributed to the diagnosis of BCG-related complications after intravesical BCG instillations.[13] Systemic T-cell response towards PPD during intravesical BCG instillations was also described in 2013.[14] These promising results encouraged us to further explore the possible value of using ELISpot PPD to identify BCG-related complications. As the BCG vaccine is administered in the bladder, PPD-specific T-cell responses in urine or bladder fluid could provide information, for example, in the case of a suspected urogenital BCG infection, or as a tool to measure local immune response in the treatment of cancer. ELISpot analysis with PPD as a stimulating antigen in urine and bladder fluid has, to our knowledge, never been described. Therefore, the objective of the present study is to explore the feasibility of a PPD-based ELISpot to measure PPD-specific T-cell responses in urine and bladder fluids of patients with bladder malignancies after treatment with intravesical BCG instillations.
METHODS
Patients
This explorative study was conducted in the Diakonessenhuis Utrecht, the Netherlands. Patients treated with BCG instillations after the transurethral resection (TUR) of superficial, non-

64
muscle invasive bladder tumors were included at random time points during therapy. Patient characteristics, including age, gender, country of origin, history of tuberculosis infection, and use of immunosuppressive medications, were recorded. At this explorative stage, correlation between ELISpot PPD results and clinical signs and symptoms was not our intention. Ethical approval was obtained from the local ethical committee. Patients provided informed consent for sample collection.
BCG instillations and specimen sampling
After TUR of the bladder tumor, the induction treatment of BCG instillation consisted of one instillation each week for six consecutive weeks, followed by a maintenance treatment of one BCG instillation after three, six, twelve, eighteen and twenty-four months. The dosage of a BCG instillation was: 2×10⁸ to 8×10⁸ CFU of M. bovis. Samples were collected on treatment days prior to the BCG instillation. The urine was drained using a catheter. Subsequently, the empty bladder was flushed with 100 mL of saline solution (defined as bladder fluid). Immediately after this harvest, these two simultaneously collected samples (urine and bladder fluid) were transported to the laboratory for isolation, ELISpot PPD and immunophenotyping. All specimens were kept at 4 ºC during transport and processed as soon as possible to ensure the quality of cells in the samples.
Isolation of cells
Urine and bladder fluid specimens were centrifuged for 7 minutes at 600 g. The supernatants were discarded, and the pellets were resuspended in 10 mL of fresh RPMI (Gibco #21875, Invitrogen, Breda, the Netherlands). This cell suspension was centrifuged for 7 minutes at 300 g. After centrifugation, the pellet was resuspended in 1 mL of fresh, pre-warmed (37 ºC) AIM-V medium (Gibco #31035, Invitrogen, Breda, The Netherlands). Cells were counted using 2 different Coulter counter devices (AcT diff2 (standard) and Coulter LH 750 Hematology Analyzer; Beckman Coulter Nederland BV, Woerden, the Netherlands), and the lowest cell count of the two was used in further analysis. Cell suspensions were adjusted to a cell count of 2.5x10⁶ cells/mL in a total volume of 600 µL for further analysis.
ELISpot PPD
ELISpot using PPD as a stimulating antigen was performed at the T-SPOT.TB platform according to the T-SPOT.TB standard protocol, as described by the manufacturer.[15] The TB-specific antigens were replaced by a PPD-antigen solution (tuberculin RT50, Statens Serum Institute, Denmark). In brief, three aliquots of 100 µL of cell suspension (2.5x10⁶ mononuclear cells/mL or less in case of low cell counts) were incubated with either 50 µL of AIM-V medium (negative control), 50 µL phytohemagglutinin (PHA, positive control) or 50 µL of PPD-antigen [10 µg/mL].
Chapter 3d
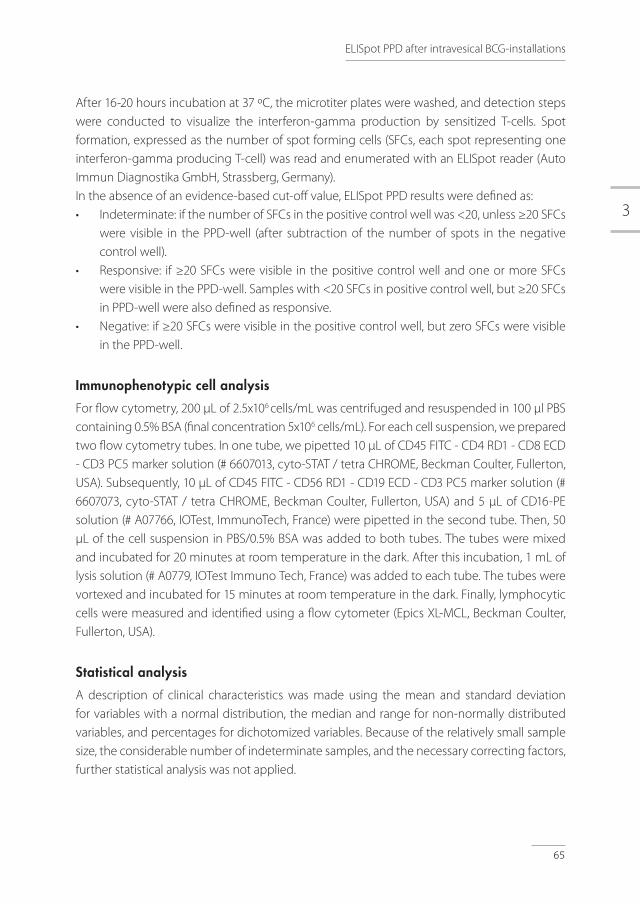
3
65
After 16-20 hours incubation at 37 ºC, the microtiter plates were washed, and detection steps were conducted to visualize the interferon-gamma production by sensitized T-cells. Spot formation, expressed as the number of spot forming cells (SFCs, each spot representing one interferon-gamma producing T-cell) was read and enumerated with an ELISpot reader (Auto Immun Diagnostika GmbH, Strassberg, Germany). In the absence of an evidence-based cut-off value, ELISpot PPD results were defined as: • Indeterminate: if the number of SFCs in the positive control well was <20, unless ≥20 SFCs
were visible in the PPD-well (after subtraction of the number of spots in the negative control well).
• Responsive: if ≥20 SFCs were visible in the positive control well and one or more SFCs were visible in the PPD-well. Samples with <20 SFCs in positive control well, but ≥20 SFCs in PPD-well were also defined as responsive.
• Negative: if ≥20 SFCs were visible in the positive control well, but zero SFCs were visible in the PPD-well.
Immunophenotypic cell analysis
For flow cytometry, 200 µL of 2.5x10⁶ cells/mL was centrifuged and resuspended in 100 μl PBS containing 0.5% BSA (final concentration 5x10⁶ cells/mL). For each cell suspension, we prepared two flow cytometry tubes. In one tube, we pipetted 10 μL of CD45 FITC - CD4 RD1 - CD8 ECD - CD3 PC5 marker solution (# 6607013, cyto-STAT / tetra CHROME, Beckman Coulter, Fullerton, USA). Subsequently, 10 μL of CD45 FITC - CD56 RD1 - CD19 ECD - CD3 PC5 marker solution (# 6607073, cyto-STAT / tetra CHROME, Beckman Coulter, Fullerton, USA) and 5 μL of CD16-PE solution (# A07766, IOTest, ImmunoTech, France) were pipetted in the second tube. Then, 50 µL of the cell suspension in PBS/0.5% BSA was added to both tubes. The tubes were mixed and incubated for 20 minutes at room temperature in the dark. After this incubation, 1 mL of lysis solution (# A0779, IOTest Immuno Tech, France) was added to each tube. The tubes were vortexed and incubated for 15 minutes at room temperature in the dark. Finally, lymphocytic cells were measured and identified using a flow cytometer (Epics XL-MCL, Beckman Coulter, Fullerton, USA).
Statistical analysis
A description of clinical characteristics was made using the mean and standard deviation for variables with a normal distribution, the median and range for non-normally distributed variables, and percentages for dichotomized variables. Because of the relatively small sample size, the considerable number of indeterminate samples, and the necessary correcting factors, further statistical analysis was not applied.
ELISpot PPD after intravesical BCG-installations
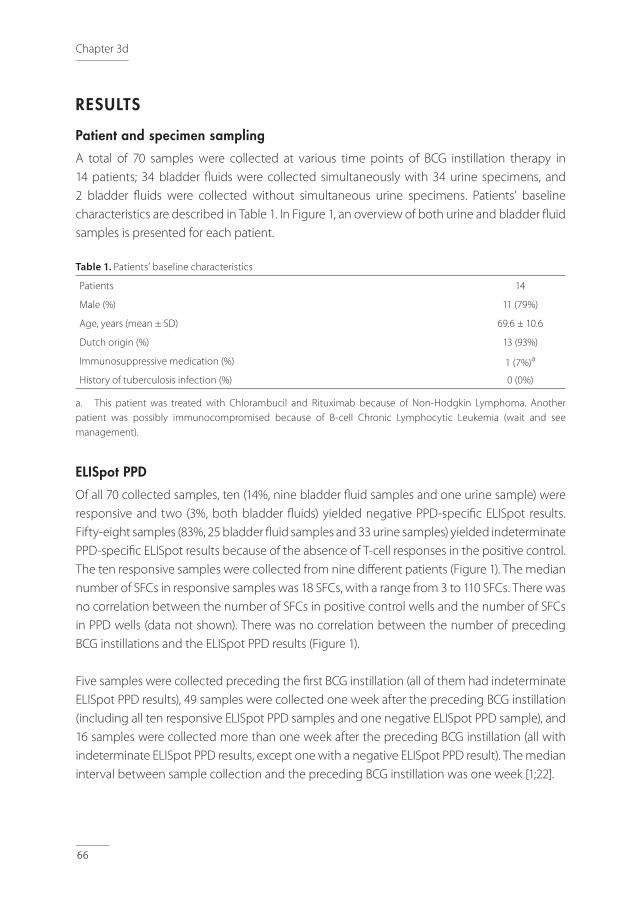
66
RESULTS
Patient and specimen sampling
A total of 70 samples were collected at various time points of BCG instillation therapy in 14 patients; 34 bladder fl uids were collected simultaneously with 34 urine specimens, and 2 bladder fl uids were collected without simultaneous urine specimens. Patients’ baseline characteristics are described in Table 1. In Figure 1, an overview of both urine and bladder fl uid samples is presented for each patient.
Table 1. Patients’ baseline characteristics
Patients 14
Male (%) 11 (79%)
Age, years (mean ± SD) 69.6 ± 10.6
Dutch origin (%) 13 (93%)
Immunosuppressive medication (%) 1 (7%)a
History of tuberculosis infection (%) 0 (0%)
a. This patient was treated with Chlorambucil and Rituximab because of Non-Hodgkin Lymphoma. Another patient was possibly immunocompromised because of B-cell Chronic Lymphocytic Leukemia (wait and see management).
ELISpot PPD
Of all 70 collected samples, ten (14%, nine bladder fl uid samples and one urine sample) were responsive and two (3%, both bladder fl uids) yielded negative PPD-specifi c ELISpot results. Fifty-eight samples (83%, 25 bladder fl uid samples and 33 urine samples) yielded indeterminate PPD-specifi c ELISpot results because of the absence of T-cell responses in the positive control. The ten responsive samples were collected from nine diff erent patients (Figure 1). The median number of SFCs in responsive samples was 18 SFCs, with a range from 3 to 110 SFCs. There was no correlation between the number of SFCs in positive control wells and the number of SFCs in PPD wells (data not shown). There was no correlation between the number of preceding BCG instillations and the ELISpot PPD results (Figure 1).
Five samples were collected preceding the fi rst BCG instillation (all of them had indeterminate ELISpot PPD results), 49 samples were collected one week after the preceding BCG instillation (including all ten responsive ELISpot PPD samples and one negative ELISpot PPD sample), and 16 samples were collected more than one week after the preceding BCG instillation (all with indeterminate ELISpot PPD results, except one with a negative ELISpot PPD result). The median interval between sample collection and the preceding BCG instillation was one week [1;22].
Chapter 3d
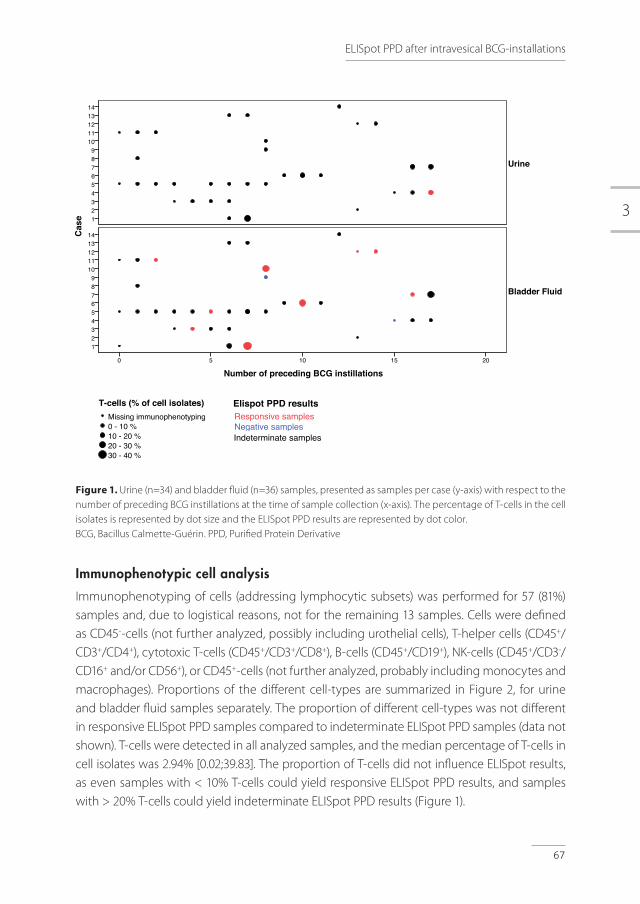
3
67
Figure 1. Urine (n=34) and bladder fl uid (n=36) samples, presented as samples per case (y-axis) with respect to the number of preceding BCG instillations at the time of sample collection (x-axis). The percentage of T-cells in the cell isolates is represented by dot size and the ELISpot PPD results are represented by dot color. BCG, Bacillus Calmette-Guérin. PPD, Purifi ed Protein Derivative
Immunophenotypic cell analysis
Immunophenotyping of cells (addressing lymphocytic subsets) was performed for 57 (81%) samples and, due to logistical reasons, not for the remaining 13 samples. Cells were defi ned as CD45--cells (not further analyzed, possibly including urothelial cells), T-helper cells (CD45+/CD3+/CD4+), cytotoxic T-cells (CD45+/CD3+/CD8+), B-cells (CD45+/CD19+), NK-cells (CD45+/CD3-/CD16+ and/or CD56+), or CD45+-cells (not further analyzed, probably including monocytes and macrophages). Proportions of the diff erent cell-types are summarized in Figure 2, for urine and bladder fl uid samples separately. The proportion of diff erent cell-types was not diff erent in responsive ELISpot PPD samples compared to indeterminate ELISpot PPD samples (data not shown). T-cells were detected in all analyzed samples, and the median percentage of T-cells in cell isolates was 2.94% [0.02;39.83]. The proportion of T-cells did not infl uence ELISpot results, as even samples with < 10% T-cells could yield responsive ELISpot PPD results, and samples with > 20% T-cells could yield indeterminate ELISpot PPD results (Figure 1).
Number of preceding BCG instillations20151050
Cas
e
1413121110
987654321
1413121110
987654321
Bladder Fluid
Urine 30 - 40 %20 - 30 %10 - 20 %0 - 10 %Missing immunophenotyping
T-cells (% of cell isolates)
Elispot PPD resultsResponsive samplesNegative samplesIndeterminate samples
Page 1
Number of preceding BCG instillations20151050
Cas
e
1413121110
987654321
1413121110
987654321
Bladder Fluid
Urine 30 - 40 %20 - 30 %10 - 20 %0 - 10 %Missing immunophenotyping
T-cells (% of cell isolates)
Elispot PPD resultsResponsive samplesNegative samplesIndeterminate samples
Page 1
Number of preceding BCG instillations20151050
Cas
e
1413121110
987654321
1413121110
987654321
Bladder Fluid
Urine 30 - 40 %20 - 30 %10 - 20 %0 - 10 %Missing immunophenotyping
T-cells (% of cell isolates)
Elispot PPD resultsResponsive samplesNegative samplesIndeterminate samples
Page 1
ELISpot PPD after intravesical BCG-installations
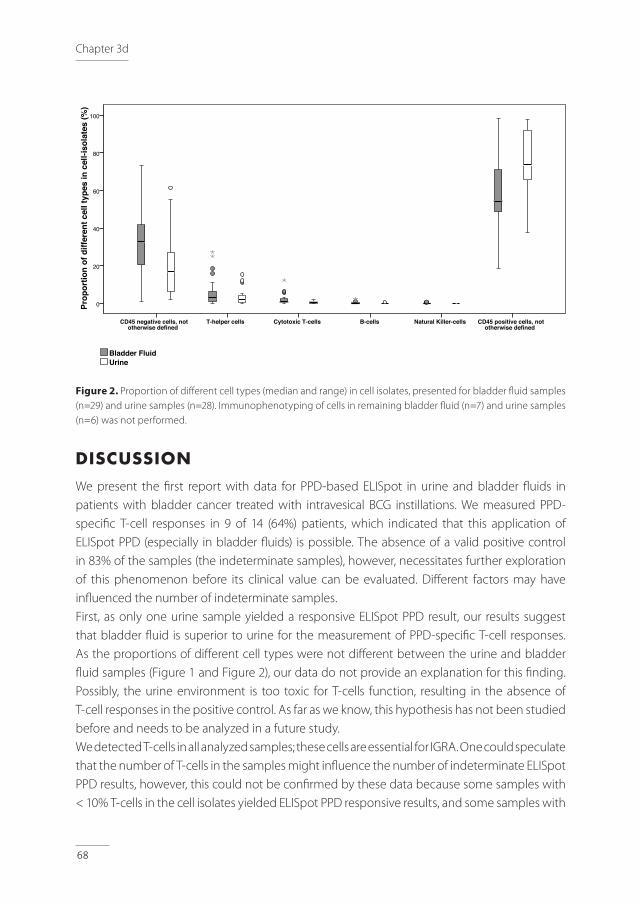
68
Figure 2. Proportion of diff erent cell types (median and range) in cell isolates, presented for bladder fl uid samples (n=29) and urine samples (n=28). Immunophenotyping of cells in remaining bladder fl uid (n=7) and urine samples (n=6) was not performed.
DISCUSSION
We present the fi rst report with data for PPD-based ELISpot in urine and bladder fl uids in patients with bladder cancer treated with intravesical BCG instillations. We measured PPD-specifi c T-cell responses in 9 of 14 (64%) patients, which indicated that this application of ELISpot PPD (especially in bladder fl uids) is possible. The absence of a valid positive control in 83% of the samples (the indeterminate samples), however, necessitates further exploration of this phenomenon before its clinical value can be evaluated. Diff erent factors may have infl uenced the number of indeterminate samples. First, as only one urine sample yielded a responsive ELISpot PPD result, our results suggest that bladder fl uid is superior to urine for the measurement of PPD-specifi c T-cell responses. As the proportions of diff erent cell types were not diff erent between the urine and bladder fl uid samples (Figure 1 and Figure 2), our data do not provide an explanation for this fi nding. Possibly, the urine environment is too toxic for T-cells function, resulting in the absence of T-cell responses in the positive control. As far as we know, this hypothesis has not been studied before and needs to be analyzed in a future study. We detected T-cells in all analyzed samples; these cells are essential for IGRA. One could speculate that the number of T-cells in the samples might infl uence the number of indeterminate ELISpot PPD results, however, this could not be confi rmed by these data because some samples with < 10% T-cells in the cell isolates yielded ELISpot PPD responsive results, and some samples with
CD45 positive cells, not otherwise defined
Natural Killer-cellsB-cellsCytotoxic T-cellsT-helper cellsCD45 negative cells, not otherwise defined
Prop
ortio
n of
diff
eren
t cel
l typ
es in
cel
l-iso
late
s (%
)
100
80
60
40
20
0
UrineBladder Fluid
Page 1
CD45 positive cells, not otherwise defined
Natural Killer-cellsB-cellsCytotoxic T-cellsT-helper cellsCD45 negative cells, not otherwise defined
Prop
ortio
n of
diff
eren
t cel
l typ
es in
cel
l-iso
late
s (%
)
100
80
60
40
20
0
UrineBladder Fluid
Page 1
Chapter 3d

3
69
> 20% T-cells yielded indeterminate ELISpot PPD results (Figure 1). The presence of T-cells in all samples was remarkable, as in normal circumstances, T-cells are absent in urine and bladder fl uid. In healthy bladders, only intraepithelial T-cells are present,[16] and are predominantly CD8+/CD4−, which appears to be in contrast with the proportions of T-cells observed in our study. In malignancies, tumor-infi ltrating T-cells appear in the bladder, and these are usually CD8+ as well.[17] BCG instillations also result in T-cell infi ltration in the bladder. Our results do not discriminate between the origins of the detected T-cells. Because of the diff erent sample preparation methods used prior to evaluating the presence of T-cells, comparison of absolute T-cell numbers with preceding data in literature of BCG instillations is diffi cult.[18]Analyzing the immunophenotyping data, especially addressing lymphocytic subtypes, we observed considerable proportions of the CD45- and CD45+ cell populations that were not further analyzed (Figure 2). Although not evaluated in this study, it would be interesting to analyze these populations, to better comprehend the complexity of the immune responses in urine and bladder fl uid after BCG instillations, and to better understand the considerable number of indeterminate results. We hypothesized that urothelial cells were present in the CD45- cell populations, which might have infl uenced the number of indeterminate results. Perhaps the presence of urothelial cells on the bottom of the ELISpot assay wells interfered with the capture of interferon gamma and thus led to an underestimation of the SFCs. We performed cytospin preparations followed by Giemsa staining in some of the cell isolates, in which the presence of urothelial cells was confi rmed (data not shown). To overcome this problem in future experiments, we could try to deplete the urothelial cell population preceding the ELISpot assay, possibly by using labeled magnetic beads. In the CD45+ cell populations that were not further analyzed, we expect the presence of monocytes and macrophages, although the presence of granulocytes and possibly granulocytic myeloid-derived suppressor cells cannot be excluded. Both granulocytes and granulocytic myeloid-derived suppressor cells are known to shape the adaptive immune system and to suppress T-cell responses,[19] which might be another explanation for the absence of T-cell responses in the indeterminate samples. As all responsive samples were collected one week after the preceding BCG instillation, it does not seem helpful to perform PPD-based ELISpot more than one week after the preceding BCG instillation. The BCG–induced immune responses are complex, and the kinetics of local cytokines, antigen-presenting cells and macrophages after BCG instillations are still not well described. In previous studies addressing BCG induced immune responses by cytokine analysis, sample collection timing varies from hours to weeks after a BCG instillation.[5]Two of the included patients were immunocompromised (Table 1). As both patients had one responsive ELISpot PPD bladder fl uid sample, these patients did not infl uence the number of indeterminate results.
ELISpot PPD after intravesical BCG-installations

70
With respect to the limited number and heterogeneous character of the samples, together with the lessons learned, especially from the potential influence of the CD45- and CD45+ cell populations that were not analyzed (e.g., the possible contamination with urothelial cells), the results of our study support the value of further examination of the possible role of ELISpot PPD in bladder fluids. This technique could be improved using cells depleted from urothelial cells and granulocytes. In conclusion, in this explorative study, we demonstrated the presence of T-cell populations as well as PPD-specific T-cell responses using ELISpot with urine and bladder fluids after BCG instillation in patients with superficial bladder carcinoma. This study provides a basis for further improvement of the ELISpot PPD technique for bladder fluids to evaluate whether this tool could be worthwhile for the monitoring of BCG-related complications or immune responses.
ACKNOWLEDGEMENT
We kindly thank Ingeborg van der Tweel, PhD, Department of Biostatistics and Research Support, Julius Center for Health Sciences and Primary Care, University Medical Center Utrecht, the Netherlands for her advice on statistical analysis.
Chapter 3d
3
71
REFERENCES1. Babjuk M, Burger M, Zigeuner R, et al. EAU guidelines on non-muscle-invasive urothelial carcinoma
of the bladder: update 2013. Eur Urol 2013 Oct;64:639-653.
2. Herr HW, Morales A. History of bacillus Calmette-Guerin and bladder cancer: an immunotherapy success story. J Urol 2008 Jan;179:53-56.
3. Calmette A, Guerin C. La vaccination preventive contre la tuberculose par le ‘BCG’. Paris Masson 1927(73):79.
4. Fuge O, Vasdev N, Allchorne P, et al. Immunotherapy for bladder cancer. Res Rep Urol 2015 May;7:65-79.
5. Zuiverloon TC, Nieuweboer AJ, Vekony H, et al. predicting response to bacillus Calmette-Guerin immunotherapy in high-risk bladder cancer patients: a systematic review. Eur Urol 2012 Jan;61:128-145.
6. van der Meijden AP, Sylvester RJ, Oosterlinck W, et al. EORTC Genito-Urinary Tract Cancer Group. Maintenance Bacillus Calmette-Guerin for Ta T1 bladder tumors is not associated with increased toxicity: results from a European Organisation for Research and Treatment of Cancer Genito-Urinary Group Phase III Trial. Eur Urol 2003 Oct;44:429-434.
7. Colmenero JD, Sanjuan-Jimenez R, Ramos B, et al. Miliary pulmonary tuberculosis following intravesical BCG therapy: case report and literature review. Diagn Microbiol Infect Dis 2012 Sep;74:70-72.
8. Macleod LC, Ngo TC, Gonzalgo ML. Complications of intravesical bacillus calmette-guerin. Can Urol Assoc J 2014 Jul;8:E540-4.
9. Gerogianni I, Gravas S, Gourgoulianis K, et al. Disseminated Bacillus Calmette-Guerin infections after intravesical therapy. Indian J Med Microbiol 2014 Oct-Dec;32:438-439.
10. Bilen CY, Inci K, Erkan I, et al. The predictive value of purified protein derivative results on complications and prognosis in patients with bladder cancer treated with bacillus Calmette-Guerin. J Urol 2003 May;169:1702-1705.
11. Jafari C, Thijsen S, Sotgiu G, et al. Bronchoalveolar lavage enzyme-linked immunospot for a rapid diagnosis of tuberculosis: a Tuberculosis Network European Trialsgroup study. Am J Respir Crit Care Med 2009 Oct;180:666-673.
12. Sester M, Sotgiu G, Lange C, et al. Interferon-gamma release assays for the diagnosis of active tuberculosis: a systematic review and meta-analysis. Eur Respir J 2011 Jan;37:100-111.
13. Heemstra KA, Bossink AW, Spermon R, et al. Added value of use of a purified protein derivative-based enzyme-linked immunosorbent spot assay for patients with Mycobacterium bovis BCG infection after intravesical BCG instillations. Clin Vaccine Immunol 2012 Jun;19:974-977.
14. Elsasser J, Janssen MW, Becker F, et al. Antigen-specific CD4 T cells are induced after intravesical BCG-instillation therapy in patients with bladder cancer and show similar cytokine profiles as in active tuberculosis. PLoS One 2013 Sep;8(9):e69892.
15. Oxford Immunotec. http://www.oxfordimmunotec.com/international/wp-content/uploads/sites/3/PI-TB-IVD-UK-V2.pdf.
ELISpot PPD after intravesical BCG-installations

72
16. Cresswell J, Robertson H, Neal DE, et al. Distribution of lymphocytes of the alpha(E)beta(7) phenotype and E-cadherin in normal human urothelium and bladder carcinomas. Clin Exp Immunol 2001 Dec;126:397-402.
17. Sjodahl G, Lovgren K, Lauss M, et al. Infiltration of CD3(+) and CD68(+) cells in bladder cancer is subtype specific and affects the outcome of patients with muscle-invasive tumors. Urol Oncol 2014 Aug;32:791-797.
18. De Boer EC, De Jong WH, Van Der Meijden AP, et al. Presence of activated lymphocytes in the urine of patients with superficial bladder cancer after intravesical immunotherapy with bacillus Calmette-Guerin. Cancer Immunol Immunother 1991;33:411-416.
19. Pillay J, Tak T, Kamp VM, et al. Immune suppression by neutrophils and granulocytic myeloid-derived suppressor cells: similarities and differences. Cell Mol Life Sci 2013 Oct;70:3813-3827.
Chapter 3d

3
73
ELISpot PPD after intravesical BCG-installations


4
Differentiation between Active and Latent Tuberculosis Infection


RW Hofland, AWJ Bossink, S Nierkens, SPA Paardekooper, BTA van den Broek, J-WJ Lammers, I van Haeften, SFT Thijsen
QuantiFERON-Plus does not Discriminate between Active and Latent Tuberculosis
4aInfect Dis (Lond). 2018; 15:1-4
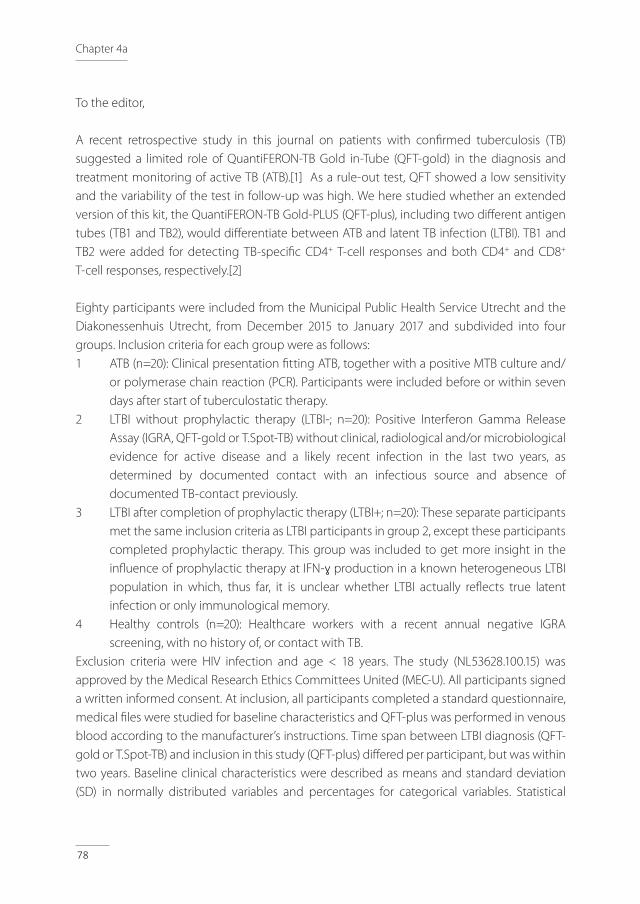
78
Chapter 4a
To the editor,
A recent retrospective study in this journal on patients with confirmed tuberculosis (TB) suggested a limited role of QuantiFERON-TB Gold in-Tube (QFT-gold) in the diagnosis and treatment monitoring of active TB (ATB).[1] As a rule-out test, QFT showed a low sensitivity and the variability of the test in follow-up was high. We here studied whether an extended version of this kit, the QuantiFERON-TB Gold-PLUS (QFT-plus), including two different antigen tubes (TB1 and TB2), would differentiate between ATB and latent TB infection (LTBI). TB1 and TB2 were added for detecting TB-specific CD4+ T-cell responses and both CD4+ and CD8+ T-cell responses, respectively.[2]
Eighty participants were included from the Municipal Public Health Service Utrecht and the Diakonessenhuis Utrecht, from December 2015 to January 2017 and subdivided into four groups. Inclusion criteria for each group were as follows: 1 ATB (n=20): Clinical presentation fitting ATB, together with a positive MTB culture and/
or polymerase chain reaction (PCR). Participants were included before or within seven days after start of tuberculostatic therapy.
2 LTBI without prophylactic therapy (LTBI-; n=20): Positive Interferon Gamma Release Assay (IGRA, QFT-gold or T.Spot-TB) without clinical, radiological and/or microbiological evidence for active disease and a likely recent infection in the last two years, as determined by documented contact with an infectious source and absence of documented TB-contact previously.
3 LTBI after completion of prophylactic therapy (LTBI+; n=20): These separate participants met the same inclusion criteria as LTBI participants in group 2, except these participants completed prophylactic therapy. This group was included to get more insight in the influence of prophylactic therapy at IFN-ɣ production in a known heterogeneous LTBI population in which, thus far, it is unclear whether LTBI actually reflects true latent infection or only immunological memory.
4 Healthy controls (n=20): Healthcare workers with a recent annual negative IGRA screening, with no history of, or contact with TB.
Exclusion criteria were HIV infection and age < 18 years. The study (NL53628.100.15) was approved by the Medical Research Ethics Committees United (MEC-U). All participants signed a written informed consent. At inclusion, all participants completed a standard questionnaire, medical files were studied for baseline characteristics and QFT-plus was performed in venous blood according to the manufacturer’s instructions. Time span between LTBI diagnosis (QFT-gold or T.Spot-TB) and inclusion in this study (QFT-plus) differed per participant, but was within two years. Baseline clinical characteristics were described as means and standard deviation (SD) in normally distributed variables and percentages for categorical variables. Statistical
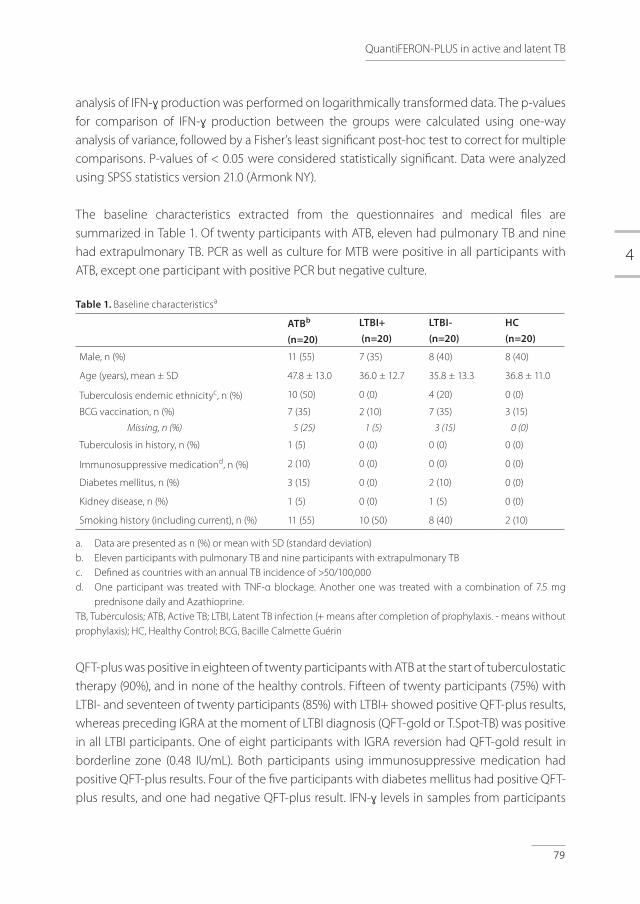
4
79
QuantiFERON-PLUS in active and latent TB
analysis of IFN-ɣ production was performed on logarithmically transformed data. The p-values for comparison of IFN-ɣ production between the groups were calculated using one-way analysis of variance, followed by a Fisher’s least significant post-hoc test to correct for multiple comparisons. P-values of < 0.05 were considered statistically significant. Data were analyzed using SPSS statistics version 21.0 (Armonk NY).
The baseline characteristics extracted from the questionnaires and medical files are summarized in Table 1. Of twenty participants with ATB, eleven had pulmonary TB and nine had extrapulmonary TB. PCR as well as culture for MTB were positive in all participants with ATB, except one participant with positive PCR but negative culture.
Table 1. Baseline characteristicsa
ATBb (n=20)
LTBI+ (n=20)
LTBI-(n=20)
HC(n=20)
Male, n (%) 11 (55) 7 (35) 8 (40) 8 (40)
Age (years), mean ± SD 47.8 ± 13.0 36.0 ± 12.7 35.8 ± 13.3 36.8 ± 11.0
Tuberculosis endemic ethnicityc, n (%) 10 (50) 0 (0) 4 (20) 0 (0)
BCG vaccination, n (%)
Missing, n (%)
7 (35)
5 (25)
2 (10)
1 (5)
7 (35)
3 (15)
3 (15)
0 (0)
Tuberculosis in history, n (%) 1 (5) 0 (0) 0 (0) 0 (0)
Immunosuppressive medicationd, n (%) 2 (10) 0 (0) 0 (0) 0 (0)
Diabetes mellitus, n (%) 3 (15) 0 (0) 2 (10) 0 (0)
Kidney disease, n (%) 1 (5) 0 (0) 1 (5) 0 (0)
Smoking history (including current), n (%) 11 (55) 10 (50) 8 (40) 2 (10)
a. Data are presented as n (%) or mean with SD (standard deviation)b. Eleven participants with pulmonary TB and nine participants with extrapulmonary TB c. Defined as countries with an annual TB incidence of >50/100,000d. One participant was treated with TNF-α blockage. Another one was treated with a combination of 7.5 mg
prednisone daily and Azathioprine.TB, Tuberculosis; ATB, Active TB; LTBI, Latent TB infection (+ means after completion of prophylaxis. - means without prophylaxis); HC, Healthy Control; BCG, Bacille Calmette Guérin
QFT-plus was positive in eighteen of twenty participants with ATB at the start of tuberculostatic therapy (90%), and in none of the healthy controls. Fifteen of twenty participants (75%) with LTBI- and seventeen of twenty participants (85%) with LTBI+ showed positive QFT-plus results, whereas preceding IGRA at the moment of LTBI diagnosis (QFT-gold or T.Spot-TB) was positive in all LTBI participants. One of eight participants with IGRA reversion had QFT-gold result in borderline zone (0.48 IU/mL). Both participants using immunosuppressive medication had positive QFT-plus results. Four of the five participants with diabetes mellitus had positive QFT-plus results, and one had negative QFT-plus result. IFN-ɣ levels in samples from participants

80
Chapter 4a
suffering from DM and/or using immunosuppressive drugs were not different compared to the samples from other participants (data not shown). Participants from non-TB endemic countries had similar levels of IFN-ɣ production compared to them from TB endemic countries (data not shown). Levels of IFN-ɣ production was not different between ATB participants with pulmonary TB compared to them with extrapulmonary TB (data not shown).
In TB1, median IFN-ɣ production in ATB was 3.77 IU/mL [0.04;12.74] compared to 1.78 IU/mL [0.12;10.63] (p=0.298) in LTBI+ and 1.27 IU/mL [0.04;13.24] (p=0.071) in LTBI- (Figure 1a). Median IFN-ɣ production in TB2 was 4.52 IU/mL [0.04;12.74] in ATB, compared to 1.92 IU/mL [0.13;11.26] (p=0.226) in LTBI+ and 1.29 IU/mL [0.04;13.24] (p=0.023) in LTBI-, which is considered statistically significant (Figure 1b). QFT-plus differentiated healthy controls from ATB and LTBI- participants (p=0.000) in TB1 and TB2. In Figure 1c, results of IFN-ɣ response in TB2 minus IFN-ɣ response in TB1 (as a surrogate marker of CD8+ T-cell response) indicate no significant differences between ATB, LTBI- and LTBI+ participants.
The results of this study showed highly overlapping IFN-ɣ levels in QFT-plus between ATB and LTBI participants. The median IFN-ɣ production in TB2 is significantly higher in ATB participants compared to LTBI participants without prophylactic therapy (Figure 1b), but because of the overlapping results, this is not supposed to help differentiate ATB from LTBI in individual patients in clinical practice. Furthermore, a previously reported increased CD8+ T-cell response in ATB [3-5] was not found to result in an increased IFN-ɣ production in TB2 compared to TB1, as some ATB participants had equal or even lower IFN-ɣ production in TB2 compared to TB1, (Figure 1c). The results of this study indicate that QFT-plus does not discriminate between ATB and LTBI. This conclusion is in agreement with literature about preceding IGRA [6], but this objective was not studied thus far for the recently launched QFT-plus. Remarkably, in contrast with IGRA at the moment of LTBI diagnosis, QFT-plus was negative in five LTBI+ participants and in three LTBI- participants, which has been called reversion. Evaluation of conversion (negative to positive test) was not possible with current study design. Both, reversion and conversion has been described for QFT-plus [7] as well as for the preceding versions of IGRA [8] and underline the dynamic in immune responses in TB. Together with the lack of gold standard for LTBI, these are limitations for TB research in general and for this project in particular. We included well-defined participant groups and made the distinction between LTBI with and without prophylactic therapy, to get more insight in the influence of prophylactic therapy at IFN-ɣ production in a known heterogeneous LTBI population. The limited sample size could be evaluated as a limitation of this study, but with the overlapping IFN-ɣ responses, it is unlikely that extending of the groups will result in other conclusions with consequences for individual patients in clinical practice. Sample size of subgroup analysis for DM, immunosuppressive
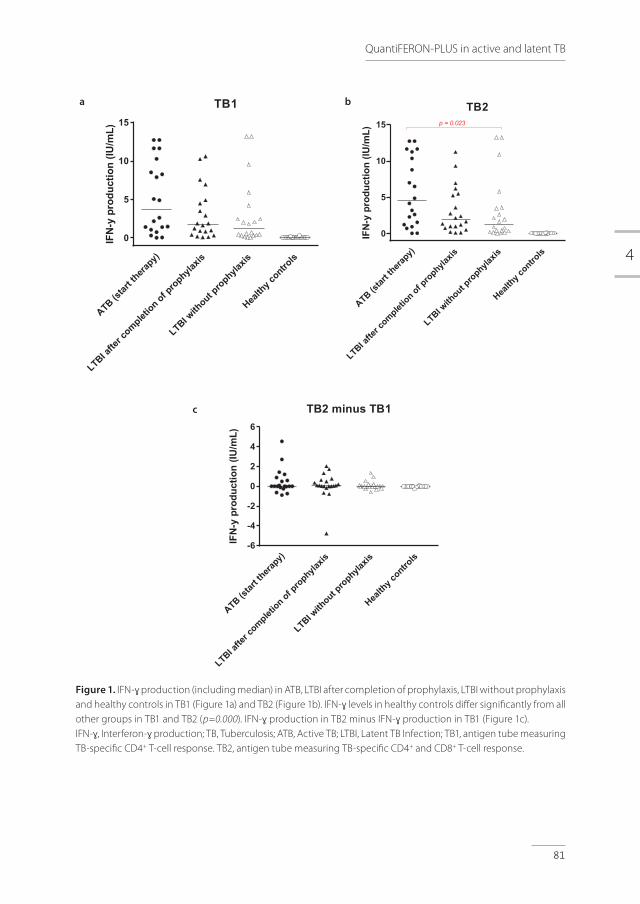
4
81
QuantiFERON-PLUS in active and latent TB
ATB(st
artthera
py)
LTBI afte
r complet
ion of prophyla
xis
LTBI with
out prophyla
xis
Health
y contro
ls
0
5
10
15
TB1IF
N-y
prod
uctio
n(IU
/mL)
ATB(st
artthera
py)
LTBI afte
r complet
ion of prophyla
xis
LTBI with
out prophyla
xis
Health
y contro
ls
0
5
10
15
TB2
IFN
-ypr
oduc
tion
(IU/m
L)
p = 0.023
ATB(st
artthera
py)
LTBI afte
r complet
ion of prophyla
xis
LTBI with
out prophyla
xis
Health
y contro
ls-6
-4
-2
0
2
4
6
TB2 minus TB1
IFN
-ypr
oduc
tion
(IU/m
L)
Figure 1. IFN-ɣ production (including median) in ATB, LTBI after completion of prophylaxis, LTBI without prophylaxis and healthy controls in TB1 (Figure 1a) and TB2 (Figure 1b). IFN-ɣ levels in healthy controls differ significantly from all other groups in TB1 and TB2 (p=0.000). IFN-ɣ production in TB2 minus IFN-ɣ production in TB1 (Figure 1c). IFN-ɣ, Interferon-ɣ production; TB, Tuberculosis; ATB, Active TB; LTBI, Latent TB Infection; TB1, antigen tube measuring TB-specific CD4+ T-cell response. TB2, antigen tube measuring TB-specific CD4+ and CD8+ T-cell response.
a b
c

82
Chapter 4a
drugs, endemic ethnicity and localization of TB is too small to draw definite conclusions. This study was not aimed, designed and powered for analysis of sensitivity and specificity of QFT-plus.
In conclusion, the present results suggest that QFT-plus does not discriminate between ATB and LTBI. Therefore, the medical need remains for better diagnostic tools.
ACKNOWLEDGEMENTS
The authors thank Pieter Zanen for his advice on statistical testing and Lydia Kool for her laboratory assistance.
FUNDING
The authors thank Qiagen for the provision of QFT-plus test kits free of charge. Qiagen had no role in the study design, collection, analysis or interpretation of data, manuscript preparation or decision to publish findings. Remaining part of the study was financed from institutional funds.

4
83
QuantiFERON-PLUS in active and latent TB
REFERENCES 1. Bartalesi F, Spinicci M, Mencarini J, et al. The role of Quantiferon-TB Gold in-Tube in the diagnosis
and treatment monitoring of active tuberculosis. Infect Dis (Lond) 2017;49:474-477.
2. Qiagen. QuantiFERON®-TB Gold Plus (QFT®-Plus) ELISA Package Insert, 2015.
3. Petruccioli E, Chiacchio T, Pepponi I, et al. First characterization of the CD4 and CD8 T-cell responses to QuantiFERON-TB Plus. J Infect 2016;73:588-597.
4. Day CL, Abrahams DA, Lerumo L, et al. Functional capacity of Mycobacterium tuberculosis-specific T cell responses in humans is associated with mycobacterial load. J Immunol 2011;187:2222-2232.
5. Rozot V, Vigano S, Mazza-Stalder J, et al. Mycobacterium tuberculosis-specific CD8+ T cells are functionally and phenotypically different between latent infection and active disease. Eur J Immunol 2013;43:1568-1577.
6. Sester M, Sotgiu G, Lange C, et al. Interferon-gamma release assays for the diagnosis of active tuberculosis: a systematic review and meta-analysis. Eur Respir J 2011;37:100-111.
7. Knierer J, Gallegos Morales EN, Schablon A, et al. QFT-Plus: a plus in variability? - Evaluation of new generation IGRA in serial testing of students with a migration background in Germany. J Occup Med Toxicol 2017;12:1-016-0148-z. eCollection 2017.
8. Tagmouti S, Slater M, Benedetti A, et al. Reproducibility of interferon gamma (IFN-gamma) release Assays. A systematic review. Ann Am Thorac Soc 2014;11:1267-1276.


RW Hofland*, L van Hoorn*, AWJ Bossink, J Drylewicz, BTA van den Broek, SPA Paardekooper, I van Haeften, L Koenderman, J-WJ Lammers, SFT Thijsen, S Nierkens* These authors contributed equally to this work
Adenosine Deaminase and I-309 Discriminate between Active and Latent Tuberculosis
Submitted 4b
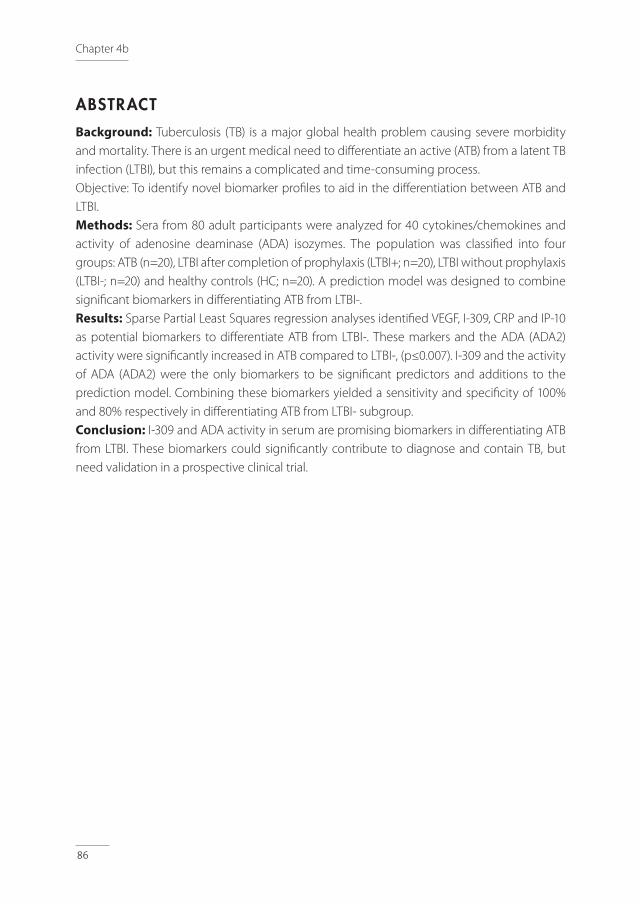
86
Chapter 4b
ABSTRACT
Background: Tuberculosis (TB) is a major global health problem causing severe morbidity and mortality. There is an urgent medical need to differentiate an active (ATB) from a latent TB infection (LTBI), but this remains a complicated and time-consuming process. Objective: To identify novel biomarker profiles to aid in the differentiation between ATB and LTBI. Methods: Sera from 80 adult participants were analyzed for 40 cytokines/chemokines and activity of adenosine deaminase (ADA) isozymes. The population was classified into four groups: ATB (n=20), LTBI after completion of prophylaxis (LTBI+; n=20), LTBI without prophylaxis (LTBI-; n=20) and healthy controls (HC; n=20). A prediction model was designed to combine significant biomarkers in differentiating ATB from LTBI-. Results: Sparse Partial Least Squares regression analyses identified VEGF, I-309, CRP and IP-10 as potential biomarkers to differentiate ATB from LTBI-. These markers and the ADA (ADA2) activity were significantly increased in ATB compared to LTBI-, (p≤0.007). I-309 and the activity of ADA (ADA2) were the only biomarkers to be significant predictors and additions to the prediction model. Combining these biomarkers yielded a sensitivity and specificity of 100% and 80% respectively in differentiating ATB from LTBI- subgroup. Conclusion: I-309 and ADA activity in serum are promising biomarkers in differentiating ATB from LTBI. These biomarkers could significantly contribute to diagnose and contain TB, but need validation in a prospective clinical trial.
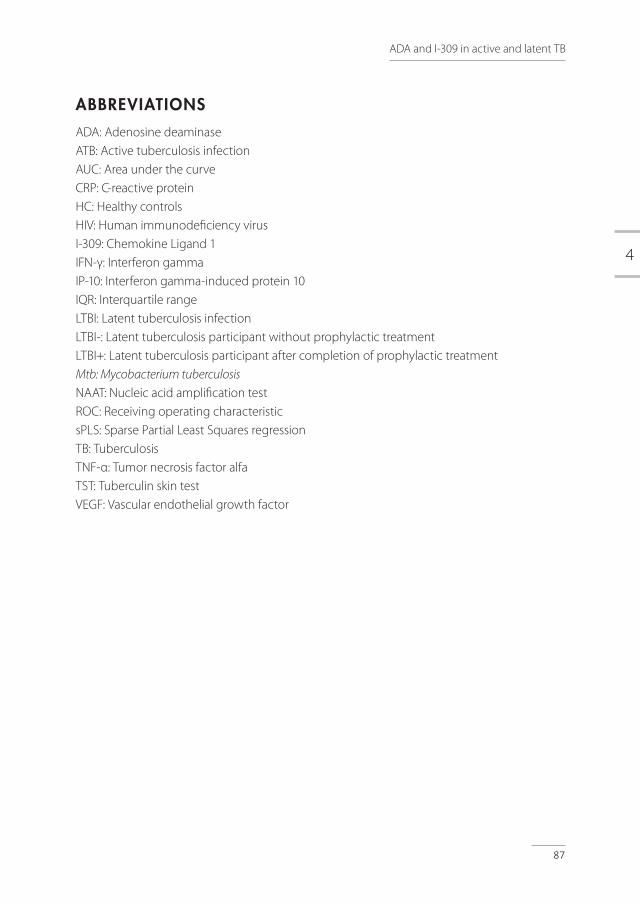
4
87
ADA and I-309 in active and latent TB
ABBREVIATIONS
ADA: Adenosine deaminaseATB: Active tuberculosis infectionAUC: Area under the curveCRP: C-reactive proteinHC: Healthy controlsHIV: Human immunodeficiency virusI-309: Chemokine Ligand 1IFN-γ: Interferon gammaIP-10: Interferon gamma-induced protein 10IQR: Interquartile rangeLTBI: Latent tuberculosis infectionLTBI-: Latent tuberculosis participant without prophylactic treatmentLTBI+: Latent tuberculosis participant after completion of prophylactic treatmentMtb: Mycobacterium tuberculosis
NAAT: Nucleic acid amplification testROC: Receiving operating characteristicsPLS: Sparse Partial Least Squares regressionTB: TuberculosisTNF-α: Tumor necrosis factor alfaTST: Tuberculin skin testVEGF: Vascular endothelial growth factor

88
Chapter 4b
INTRODUCTION
Tuberculosis (TB) is an infectious disease caused by a species of the Mycobacterium tuberculosis complex, most commonly the bacillus Mycobacterium tuberculosis (Mtb).[1] TB represents a major global health problem with an estimated incidence of 10.4 million and a mortality of 1.6 million persons in 2016.[2] Patients with TB can infect 10-15 close contacts within one year and approximately 45% will die without proper treatment.[3]It is estimated that one third of the world’s population suffers from a latent TB infection (LTBI) which (in the absence of a gold standard) is defined by the World Health Organization as: ‘A state of persistent immune response to Mtb without clinically evidence of active TB (ATB) disease’.[2] This definition includes a continuum of stages ranging from clearance of the pathogen to dormant, but live tuberculous mycobacteria.[4] The lack of evidence for the presence of live tuberculous mycobacteria in LTBI results in difficulties for clinical practice and research. The lifetime risk of reactivation and progression from LTBI to ATB is 5-10% and mostly occurs in the first years following infection.[5] In low-burden countries, reactivation accounts for approximately 80% of new ATB cases, but can be averted by timely diagnosis and preventive treatment with an efficacy of 60-90%.[5,6] The tuberculin skin test (TST) and Interferon Gamma Release Assay (IGRA) are currently used to identify patients with LTBI. Both tests detect the presence of Mtb-specific T-cells, but are unable to distinguish ATB from LTBI and cannot predict the risk for progression to ATB.[5–8] Patients with ATB usually present with symptoms such as coughing, night sweats, fever and weight loss, but can also have an indolent clinical course without clear symptoms. Rapid and definite diagnosis can be challenging and discrimination between ATB and LTBI is often difficult in clinical practice. The only method to differentiate ATB from LTBI is a positive culture for Mtb, the gold standard for the diagnosis ATB, but adequate samples may be difficult to obtain, sensitivity is limited and it can take up to 12 weeks before results are available.[6,9] An acid-fast smear and a nucleic acid amplification test (NAAT) are other diagnostic tools, but also with limited sensitivity, especially in extrapulmonary TB, due to a small sample volume and/or paucibacillary forms of TB.[9,10] The lack of discriminating diagnostic tools could lead to undertreatment of patients with ATB and overtreatment of patients with LTBI.[5,6] Therefore, the aim of this study is to identify novel biomarker profiles in serum to differentiate ATB from LTBI.Infection with Mtb causes a cascade of immune responses including production of cytokines/chemokines and liberation of enzyme activities important to limit bacterial growth, regulate inflammation and seal off the infection by creating a granuloma.[11] These mechanisms may result in systemic fingerprints indicating an ATB infection, and may be useful in discriminating ATB from LTBI. Measurement of the activity of the enzyme adenosine deaminase (ADA) and its two isoforms (ADA1 and ADA2) in a variety of biological fluids has been suggested to aid in the
4
89
ADA and I-309 in active and latent TB
diagnosis of TB, but ADA activity has never been compared between ATB and LTBI patients.[12–19] Studies exploring the use of inflammatory serum cytokines involved in Mtb infection were unsuccessful so far, with inconsistent conclusions for cytokine production in Mtb-specific stimulated CD4+ and CD8+ T-cells.[20–37] These studies show that the discriminative value of single markers is limited. We here report that a specific combination of markers has promising diagnostic potential to distinguish ATB from LTBI.
MATERIALS AND METHODS
Study participants
Eighty HIV-negative adults were enrolled in this cross-sectional study from December 2015 until January 2017 through the Public Health Service of Utrecht and the Diakonessenhuis (Utrecht, the Netherlands). Participants were classified into four distinct groups: active TB (ATB; n=20), latent TB without prophylactic treatment (LTBI-; n=20), separate latent TB participants after completion of prophylactic treatment (LTBI+; n=20) and healthy controls (HC; n=20). ATB patients were diagnosed according to ATS guidelines and were included before or within 8 days after start of treatment.[38] Participants were included in the LTBI group in case of a positive TST and/or IGRA in absence of clinical evidence for TB and a likely recent infection in the last two years, as determined by documented contact with an infectious source and absence of documented TB-contact previously. Prophylactic treatment entailed 3 months of rifampicin and isoniazid or 6 months of isoniazid. LTBI+ participants were included because they are assumed to be ‘cured’ and, in the absence of a gold standard for LTBI, any differences between LTBI- and LTBI+ may be insightful. Healthy controls were included as a reference group and consisted of healthcare workers, with no history of or contact with TB, who were screened annually for TB with a recent negative IGRA. All participants signed a written informed consent and completed a questionnaire regarding their medical history, history of TB, smoking status and demographics (Table 1). This study was approved by the Medical Research Ethics Committees-United (NL53628.100.15) and the Board of Directors of the Public Health and Diakonessenhuis, Utrecht, The Netherlands.
Measurement of serum markers
Levels of 40 cytokines/chemokines were measured in serum using an in-house developed and validated (ISO9001) multiplex immunoassay based on xMAP technology (Luminex Corporation, Austin, USA) (Supplemental Table 1). The assay was performed as previously described,[37,38] (Supplementary methods section). Total ADA and ADA2 activity were determined using an ADA assay kit (Diazyme Laboratories, Poway, California, USA) according to manufacturer’s instructions with minor modifications. In short, to measure ADA2 activity

90
Chapter 4b
0.1μM Erythro-9 (2-Hydroxy-3-Nonyl) Adenine (EHNA) was added to inhibit ADA1 activity.[41] Activity measurements were performed using the SpectraMax M2e Plate Reader (Molecular Devices, Sunnyvale, California, USA). The activity of ADA1 was calculated by subtracting the ADA2 activity from the total ADA activity. ADA activity was expressed in U/L. Detailed methods related to measurement of intracellular cytokines and T-cell subpopulations are available in the Supplemental Methods section.
Statistical analysis
Baseline characteristics were reported as median and InterQuartile Range (IQR) for continuous variables and as absolute numbers and percentages for binary variables. Sparse Partial Least Squares regression (sPLS) analysis was used to identify the markers that could be used to differentiate ATB from LTBI-. The hereby selected markers, total ADA, ADA1 and ADA2 activity and the concentrations of the intracellular cytokines and percentage of T-cell subpopulations were compared between the four described groups (ATB, LTBI-, LTBI+ and HC) with Mann-Whitney tests. To differentiate ATB from LTBI-, receiver operating characteristic (ROC) analyses were used and the area under the curve (AUC) was calculated for the selected markers. Optimal cut-off values were set using the Youden-index and were calculated for the biomarkers with a high AUC (AUC > 0.8). Binary logistic regression analysis was used to combine serum mediators and the generated predictive values were used to perform ROC analyses. Intracellular cytokine production and T-cell subpopulations were not added to the binary logistic regression due to a small sample size in both groups. Variables were logarithmically transformed when assumption of linearity of the logit was violated. SPSS software (version 22.0) and R Project Software (version 3.2.0) were used for statistical analysis. P-values of <0.05 were considered statistically significant.
RESULTS
Study participants
Baseline characteristics are summarized in Table 1. Participants in the ATB group were significantly older compared to the LTBI-, LTBI+ and HC group (p-values <0.005) and more often originating from a tuberculous endemic country (defined as a country of origin with a TB incidence of more than 50 cases per 100.000 citizens annually), when compared to participants in the LTBI+ and HC group (p=0.0001). Smoking was more frequent in the ATB and LTBI+ group compared to HC (p=0.006 and p=0.014, respectively). Other baseline characteristics showed no statistical significant between-group differences (Table 1).
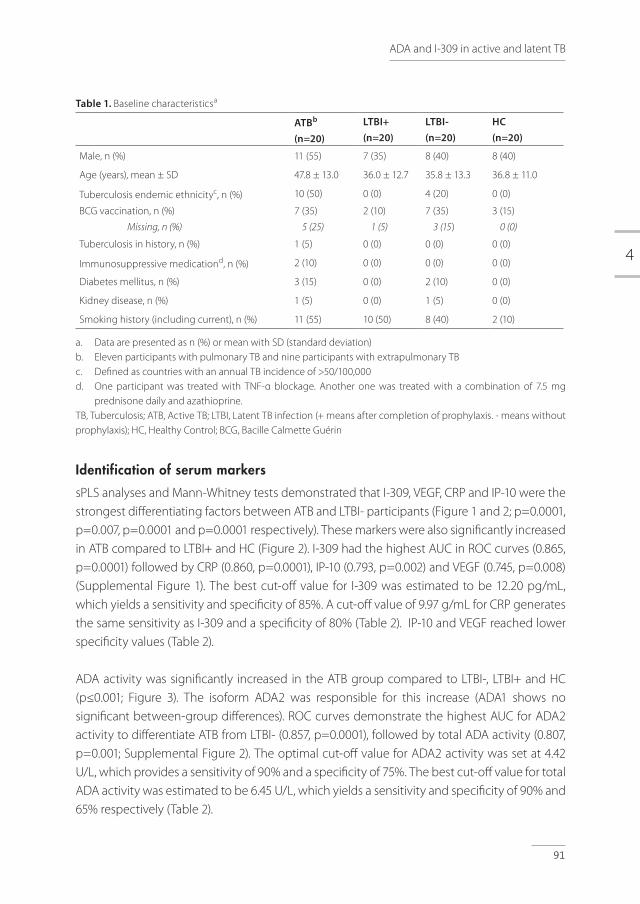
4
91
ADA and I-309 in active and latent TB
Table 1. Baseline characteristicsa
ATBb (n=20)
LTBI+ (n=20)
LTBI-(n=20)
HC(n=20)
Male, n (%) 11 (55) 7 (35) 8 (40) 8 (40)
Age (years), mean ± SD 47.8 ± 13.0 36.0 ± 12.7 35.8 ± 13.3 36.8 ± 11.0
Tuberculosis endemic ethnicityc, n (%) 10 (50) 0 (0) 4 (20) 0 (0)
BCG vaccination, n (%)
Missing, n (%)
7 (35)
5 (25)
2 (10)
1 (5)
7 (35)
3 (15)
3 (15)
0 (0)
Tuberculosis in history, n (%) 1 (5) 0 (0) 0 (0) 0 (0)
Immunosuppressive medicationd, n (%) 2 (10) 0 (0) 0 (0) 0 (0)
Diabetes mellitus, n (%) 3 (15) 0 (0) 2 (10) 0 (0)
Kidney disease, n (%) 1 (5) 0 (0) 1 (5) 0 (0)
Smoking history (including current), n (%) 11 (55) 10 (50) 8 (40) 2 (10)
a. Data are presented as n (%) or mean with SD (standard deviation)b. Eleven participants with pulmonary TB and nine participants with extrapulmonary TB c. Defined as countries with an annual TB incidence of >50/100,000d. One participant was treated with TNF-α blockage. Another one was treated with a combination of 7.5 mg
prednisone daily and azathioprine.TB, Tuberculosis; ATB, Active TB; LTBI, Latent TB infection (+ means after completion of prophylaxis. - means without prophylaxis); HC, Healthy Control; BCG, Bacille Calmette Guérin
Identification of serum markers
sPLS analyses and Mann-Whitney tests demonstrated that I-309, VEGF, CRP and IP-10 were the strongest differentiating factors between ATB and LTBI- participants (Figure 1 and 2; p=0.0001, p=0.007, p=0.0001 and p=0.0001 respectively). These markers were also significantly increased in ATB compared to LTBI+ and HC (Figure 2). I-309 had the highest AUC in ROC curves (0.865, p=0.0001) followed by CRP (0.860, p=0.0001), IP-10 (0.793, p=0.002) and VEGF (0.745, p=0.008) (Supplemental Figure 1). The best cut-off value for I-309 was estimated to be 12.20 pg/mL, which yields a sensitivity and specificity of 85%. A cut-off value of 9.97 g/mL for CRP generates the same sensitivity as I-309 and a specificity of 80% (Table 2). IP-10 and VEGF reached lower specificity values (Table 2).
ADA activity was significantly increased in the ATB group compared to LTBI-, LTBI+ and HC (p≤0.001; Figure 3). The isoform ADA2 was responsible for this increase (ADA1 shows no significant between-group differences). ROC curves demonstrate the highest AUC for ADA2 activity to differentiate ATB from LTBI- (0.857, p=0.0001), followed by total ADA activity (0.807, p=0.001; Supplemental Figure 2). The optimal cut-off value for ADA2 activity was set at 4.42 U/L, which provides a sensitivity of 90% and a specificity of 75%. The best cut-off value for total ADA activity was estimated to be 6.45 U/L, which yields a sensitivity and specificity of 90% and 65% respectively (Table 2).
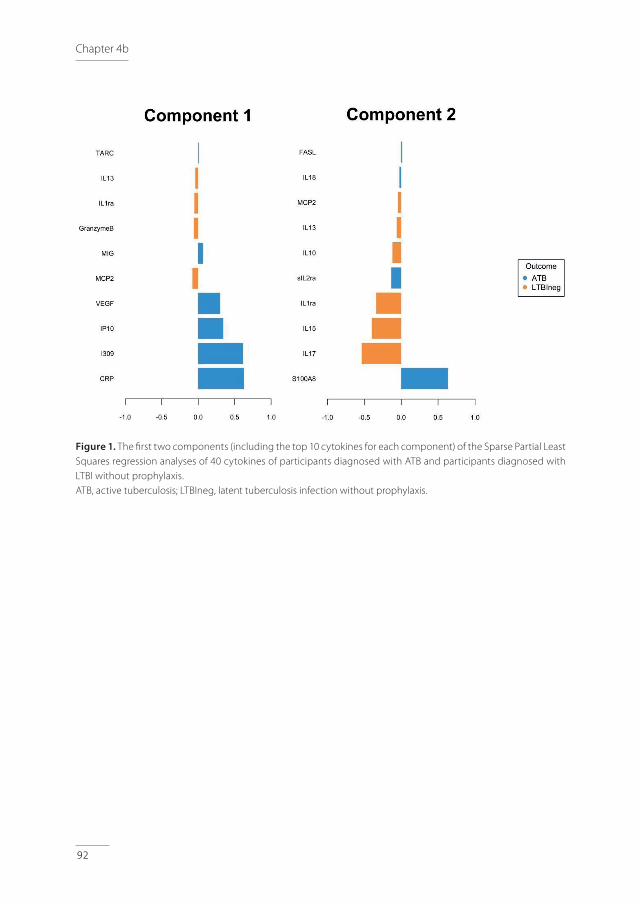
92
Chapter 4b
A.
B.
Figure 1. The fi rst two components (including the top 10 cytokines for each component) of the Sparse Partial Least Squares regression analyses of 40 cytokines of participants diagnosed with ATB and participants diagnosed with LTBI without prophylaxis. ATB, active tuberculosis; LTBIneg, latent tuberculosis infection without prophylaxis.
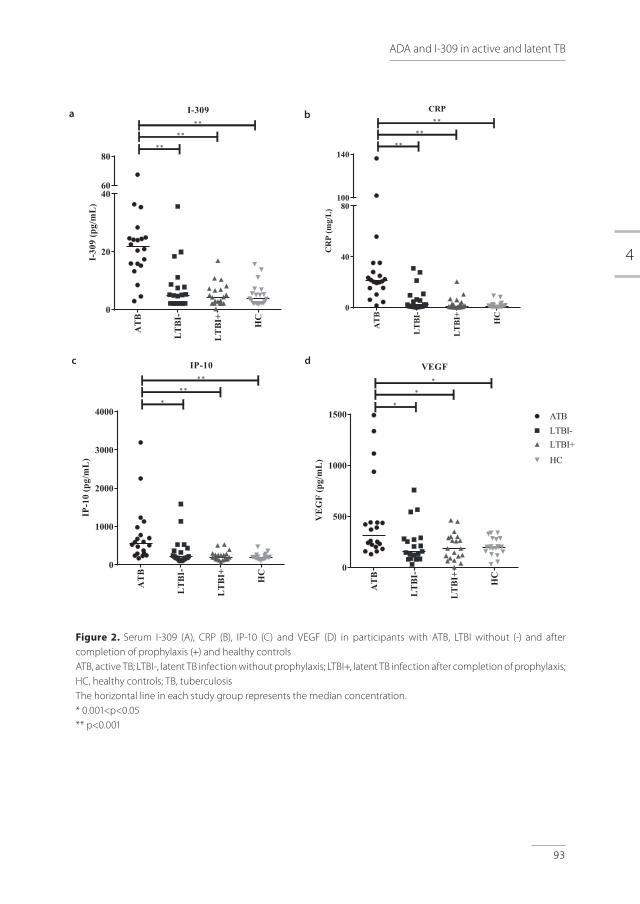
4
93
ADA and I-309 in active and latent TB
Figure 2. Serum I-309 (A), CRP (B), IP-10 (C) and VEGF (D) in participants with ATB, LTBI without (-) and after completion of prophylaxis (+) and healthy controlsATB, active TB; LTBI-, latent TB infection without prophylaxis; LTBI+, latent TB infection after completion of prophylaxis; HC, healthy controls; TB, tuberculosis The horizontal line in each study group represents the median concentration.* 0.001<p<0.05** p<0.001
AT
B
LT
BI-
LT
BI+ HC
0
20
4060
80
I-309
I-30
9(p
g/m
L)
**
**
**
ATB
LTBI
-
LTBI
+
HC
0
40
80100
140
CRP
CR
P(m
g/L)
**
**
**A
TB
LT
BI-
LT
BI+ HC
0
1000
2000
3000
4000
IP-10
IP-1
0(p
g/m
L)
**
**
*
AT
B
LT
BI-
LT
BI+ HC
0
500
1000
1500
VEGF
VE
GF
(pg/
mL
)
ATBLTBI-LTBI+
HC
*
*
*
d
a b
c
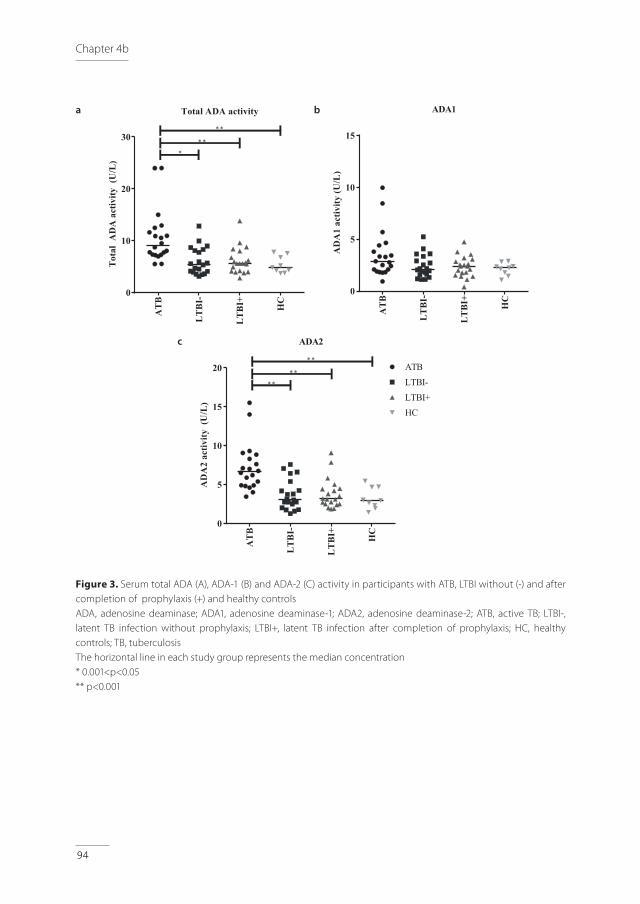
94
Chapter 4b
Figure 3. Serum total ADA (A), ADA-1 (B) and ADA-2 (C) activity in participants with ATB, LTBI without (-) and after completion of prophylaxis (+) and healthy controlsADA, adenosine deaminase; ADA1, adenosine deaminase-1; ADA2, adenosine deaminase-2; ATB, active TB; LTBI-, latent TB infection without prophylaxis; LTBI+, latent TB infection after completion of prophylaxis; HC, healthy controls; TB, tuberculosisThe horizontal line in each study group represents the median concentration* 0.001<p<0.05** p<0.001
AT
B
LT
BI-
LT
BI+ HC
0
10
20
30
Total ADA activityT
otal
AD
Aac
tivity
(U/L
)
**
***
AT
B
LT
BI-
LT
BI+ HC
0
5
10
15
ADA1
AD
A1
activ
ity(U
/L)
AT
B
LT
BI-
LT
BI+ HC
0
5
10
15
20
ADA2
AD
A2
activ
ity(U
/L)
ATBLTBI-LTBI+HC
* *
* ** *
a
c
b
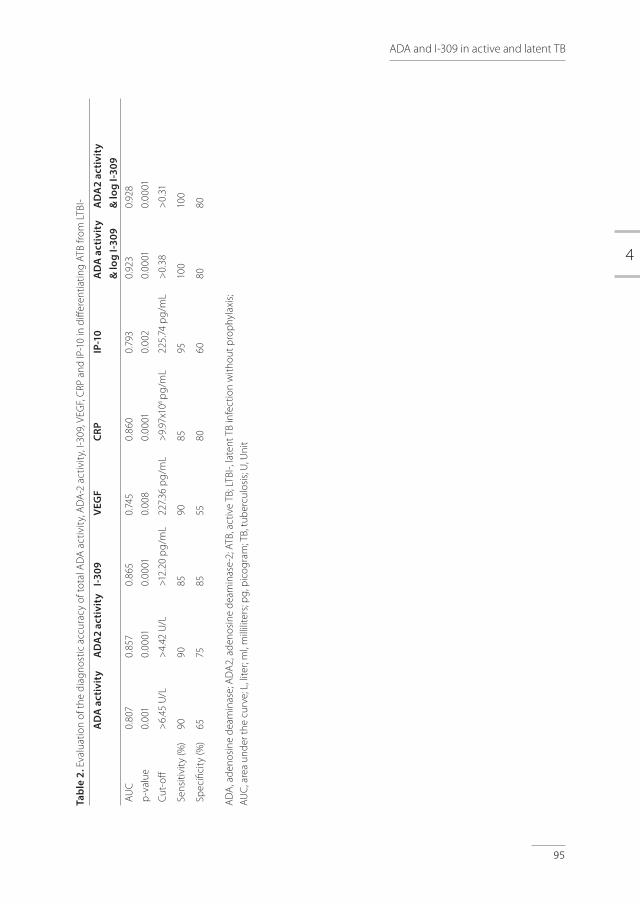
4
95
ADA and I-309 in active and latent TB
Tabl
e 2.
Eva
luat
ion
of th
e di
agno
stic
acc
urac
y of
tota
l AD
A a
ctiv
ity,
AD
A-2
act
ivit
y, I-
309,
VEG
F, C
RP a
nd IP
-10
in d
iffer
entia
ting
ATB
from
LTB
I-
AD
A a
ctiv
ity
AD
A2
acti
vity
I-309
VEG
FCR
PIP
-10
AD
A a
ctiv
ity
& lo
g I-3
09A
DA
2 ac
tivi
ty&
log
I-309
AUC
p-v
alue
0.80
7
0.00
1
0.85
7
0.00
01
0.86
5
0.00
01
0.74
5
0.00
8
0.86
0
0.00
01
0.79
3
0.00
2
0.92
3
0.00
01
0.92
8
0.00
01
Cut-
off
>6.
45 U
/L
>4.
42 U
/L>1
2.20
pg/
mL
227.
36 p
g/m
L
>9.
97x1
06 p
g/m
L22
5.74
pg/
mL
>0.
38>
0.31
Sens
itivi
ty (%
)90
9085
9085
9510
010
0
Spec
ifici
ty (%
)65
7585
5580
6080
80
AD
A, a
deno
sine
dea
min
ase;
AD
A2,
ade
nosi
ne d
eam
inas
e-2;
ATB
, act
ive
TB; L
TBI-,
late
nt T
B in
fect
ion
with
out p
roph
ylax
is;
AUC
, are
a un
der t
he c
urve
; L, l
iter;
ml,
mill
ilite
rs; p
g, p
icog
ram
; TB,
tub
ercu
losi
s; U
, Uni
t
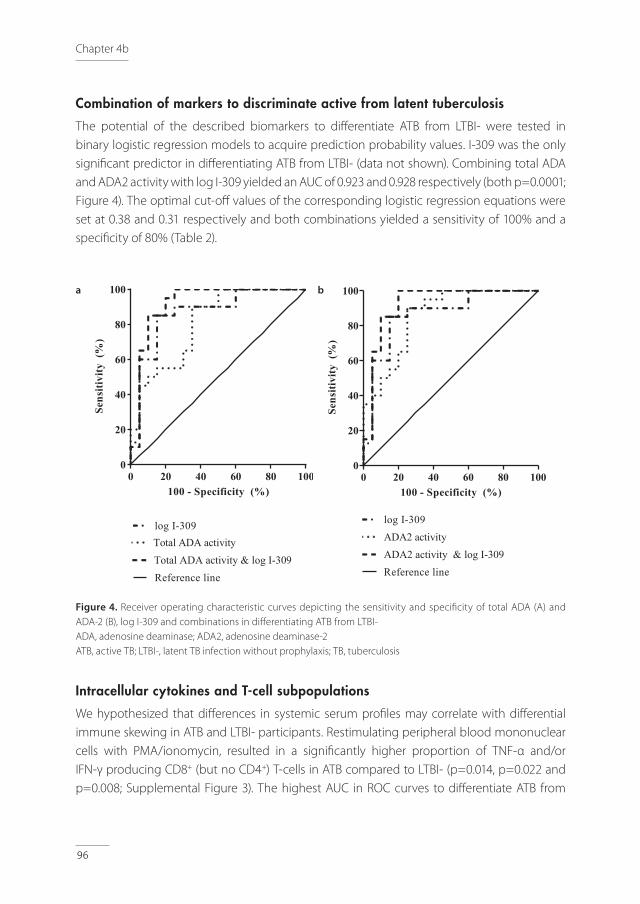
96
Chapter 4b
Combination of markers to discriminate active from latent tuberculosis
The potential of the described biomarkers to differentiate ATB from LTBI- were tested in binary logistic regression models to acquire prediction probability values. I-309 was the only significant predictor in differentiating ATB from LTBI- (data not shown). Combining total ADA and ADA2 activity with log I-309 yielded an AUC of 0.923 and 0.928 respectively (both p=0.0001; Figure 4). The optimal cut-off values of the corresponding logistic regression equations were set at 0.38 and 0.31 respectively and both combinations yielded a sensitivity of 100% and a specificity of 80% (Table 2).
Figure 4. Receiver operating characteristic curves depicting the sensitivity and specificity of total ADA (A) and ADA-2 (B), log I-309 and combinations in differentiating ATB from LTBI-ADA, adenosine deaminase; ADA2, adenosine deaminase-2ATB, active TB; LTBI-, latent TB infection without prophylaxis; TB, tuberculosis
Intracellular cytokines and T-cell subpopulations
We hypothesized that differences in systemic serum profiles may correlate with differential immune skewing in ATB and LTBI- participants. Restimulating peripheral blood mononuclear cells with PMA/ionomycin, resulted in a significantly higher proportion of TNF-α and/or IFN-γ producing CD8+ (but no CD4+) T-cells in ATB compared to LTBI- (p=0.014, p=0.022 and p=0.008; Supplemental Figure 3). The highest AUC in ROC curves to differentiate ATB from
0 20 40 60 80 1000
20
40
60
80
100
100 - Specificity (%)
Sens
itivi
ty(%
) Total ADA activity & log I-309Reference line
log I-309Total ADA activity
0 20 40 60 80 1000
20
40
60
80
100
100 - Specificity (%)
Sens
itivi
ty(%
) Total ADA activity & log I-309Reference line
log I-309Total ADA activity
0 20 40 60 80 1000
20
40
60
80
100
100 - Specificity (%)
Sens
itivi
ty(%
) ADA2 activity & log I-309Reference line
log I-309ADA2 activity
0 20 40 60 80 1000
20
40
60
80
100
100 - Specificity (%)
Sens
itivi
ty(%
) ADA2 activity & log I-309Reference line
log I-309ADA2 activity
a b

4
97
ADA and I-309 in active and latent TB
LTBI- was calculated for TNF-α+IFN-γ+ CD8+ T-cells (0.929, p=0.010) followed by TNF-α+ CD8+ T-cells (0.905, p=0.015) and IFN-γ+ CD8+ T-cells (0.881, p=0.022; Supplemental Figure 4). In addition, ATB participants had an increased frequency of effector CD8+ T-cells and effector memory CD4+ and CD8+ T-cells (p=0.03, p=0.006 and p=0.03, respectively) and decreased percentages of naive CD4+ and CD8+ T-cells (p=0.03 and p=0.006 respectively; Supplemental Figure 5). ROC curve analyses demonstrated the highest AUC for effector memory CD4+ T-cells (0.95, p=0.008) followed by effector memory and effector CD8+ T-cells (0.875, p=0.028; Supplemental Figure 6).
DISCUSSION
With currently available methods it is often difficult to differentiate ATB from LTBI. In daily practice this means that ATB patients might be undertreated, whereas LTBI patients might be overtreated, possibly leading to severe morbidity and drug toxicity respectively.[5,6] Therefore, the aim of this study was to identify novel biomarker profiles to differentiate ATB from LTBI. Here we report that the combination of ADA(2) activity and I-309 has a great diagnostic potential to make the urgent distinction between ATB and LTBI. The results of this explorative study are promising to validate in a prospective clinical trial, considering the strictly defined participant groups who may not completely represent the patients with a challenging diagnosis in clinical practice. To the best of our knowledge, this is the first study to evaluate the diagnostic accuracy of ADA and its isozymes activity in combination with other biomarkers in serum to differentiate ATB from LTBI. In ATB participants, I-309, VEGF, CRP, IP-10 and ADA(2) activity are significantly elevated compared to LTBI- participants. Increased concentrations of I-309, VEGF and IP-10 in ATB compared to LTBI are in line with previous reports [20–23,26,27] and may reflect the activity of infected macrophages and activated T-lymphocytes. Alveolar lung macrophages are the first innate immune cells to encounter and be infected by Mtb. Infection leads to phagocytosis of the mycobacteria, differentiation into effector macrophages and subsequent stimulation of CD4+ and CD8+ T-cells. The interaction with T-cells further activates macrophages and stimulates killing of the Mtb bacillus and granuloma formation to seal off the infection.[42] I-309, also known as Chemokine Ligand 1, is a glycoprotein secreted by monocytes and activated T-lymphocytes and stimulates chemotaxis of monocytes.[43,44] VEGF and IP-10 are produced by activated macrophages and antigen presenting cells and regulate cell growth, chemotaxis, and may be the driving forces for stimulated angiogenesis as observed in ATB lesions. [45–48] CRP, or C-reactive protein, is synthesized in the liver and elevated following IL-6 secretion by macrophages and T-lymphocytes.[49,50] CRP levels depend on the virulence of the Mtb-strain and the location of the infection, for example pulmonary and miliary TB show higher levels of CRP.[51] Activation of monocytes during TB is further emphasized by a
98
Chapter 4b
higher activity of ADA and in particular of ADA2. ADA is an enzyme that protects the cell from apoptosis by eliminating intra-cellular toxic derivates of both adenosine and deoxyadenosine.[52,53] The isoform ADA2 is exclusively present and produced by monocytes and macrophages when exposed to, or infected by intracellular bacterial pathogens, such as Mtb.[52–54] Secretion of ADA2 promotes CD4+ T-cell proliferation and differentiation of monocytes into macrophages followed by proliferation.[53] The diagnostic utility of total ADA(-2) activity has been studied in various (sub)populations. Increased total ADA activity was shown in serum from ATB participants when compared with HC or healed TB subjects combined with positive TST.[55–57] In these studies no comparison was made between ATB and LTBI participants. Based on the significantly increased systemic serum markers in ATB participants, we hypothesized that ATB infection may result in skewing of T-cell subsets circulating in peripheral blood. Indeed, a higher proportion of cytokine producing CD8+ T-cells was found in ATB compared to LTBI- participants, an increased frequency of effector and effector memory cells and decreased percentages of naive T-cells was shown. These data are in line with previous reports [28–30,32], although some studies showed an increase in central memory cells in LTBI. [29,32,58] Together, these data suggest that combining phenotypical and/or functional profiles of CD4+ and CD8+ T-cells with serum ADA activity and I-309 concentrations might further increase the diagnostic value and is subject for future studies.
A limitation of our designed prediction model is the lack of samples from participants with differential diagnoses, such as pneumonia, lung cancer, sarcoidosis, vasculitis, nontuberculous mycobacterial infections and aspergillosis. Others reported ADA(2) activity in populations of ATB, pneumonia, lung cancer and pleural effusions of any origin with sensitivity and specificity of ADA(2) ranging from 35% to 94% and 55% to 97%, respectively. [12,55,59–61] These strongly varying values suggest that the use of the I-309/ADA modality in these settings might be less accurate than reported here. The absence of a sub-analysis for endemic background might be another limitation of this study. However, when comparing participants from a high burden country to participants from a low burden country in the ATB and LTBI- group, ADA and cytokine/chemokine measurements are not significantly different (p-values ≥0.18). The lack of a gold standard for LTBI is a known limitation. Until diagnostic tools to detect the presence of live Mtb in LTBI are available, we are dependent on the WHO-definition for LTBI.[2] To get better insight in LTBI participants, we included two LTBI subgroups, which have added value compared to other studies.[28–31,45] LTBI+ participants are assumed to be ‘cured’ and any differences between both LTBI groups possibly could indicate which of the LTBI- participants represent persistent infection. Unfortunately, results of LTBI- and LTBI+ are highly overlapping and do not show any significant differences.
In conclusion, ADA(2) activity and I-309 in serum are promising biomarkers to differentiate ATB from LTBI. Considering that ADA2 activity measurements require an addition to the
4
99
ADA and I-309 in active and latent TB
operating procedure, total ADA activity might be preferred for use in generic diagnostic labs. The combination with I-309 in serum could facilitate in the ongoing challenge of diagnosing tuberculosis and differentiating ATB from LTBI. Further research is needed to validate these markers and the prediction model in a prospective clinical trial.
ACKNOWLEDGEMENT
We kindly thank the nurses from Public Health Service of Utrecht for their assistance with the inclusion of participants, Lysette Ebskamp-van Raaij, Karin van Veghel and Amelia Lacna from Utrecht Center for Diagnostic Advances in Immunology Research, Lydia Kool and colleagues from the Medical Microbiological Laboratory Diakonessenhuis and the Multiplex Core Facility of the Laboratory of Translational Immunology for technical assistance.

100
Chapter 4b
REFERENCES1. Sinha P, Gupta A, Prakash P, Anupurba S, Tripathi R, Srivastava GN. Differentiation of Mycobacterium
tuberculosis complex from non-tubercular mycobacteria by nested multiplex PCR targeting IS6110, MTP40 and 32kD alpha antigen encoding gene fragments. BMC Infect Dis 2016;16:1–10.
2. World Health Organization (WHO). Global Tuberculosis Report 2017.
3. World Health Organization (WHO). Tuberculosis: Fact Sheet 2017. Available from: http://www.who.int/mediacentre/factsheets/fs104/en/
4. Cadena AM, Fortune SM, Flynn JL. Heterogeneity in tuberculosis. Nat Rev Immulogy 2017; ePub. Available from: http://dx.doi.org/10.1038/nri.2017.69
5. World Health Organization (WHO). Guidelines on the management of latent tuberculosis infection. 2015.
6. World Health Organization (WHO). Global Tuberculosis Report 2016.
7. Hoffmann H, Avsar K, G R. Equal sensitivity of the new generation QuantiFERON-TB Gold plus in direct comparison with the previous test version QuantiFERON-TB Gold IT. Clin Microbiol Infect. 2016;22:701–3.
8. Hofland RW, Bossink AWJ, Nierkens S, et al. QuantiFERON-plus does not discriminate between active and latent tuberculosis QuantiFERON-plus does not discriminate between active and latent tuberculosis. Infect Dis 2018;0(0):1–4.
9. Chan ED, Heifets L, Iseman MD. Immunologic diagnosis of tuberculosis : a review. Tuber Lung Dis. 2000;80(3):131–40.
10. Honoré-Bouakline S, Vincensini JP, Giacuzzo V, et al. Rapid Diagnosis of Extrapulmonary Tuberculosis by PCR : Impact of Sample Preparation and DNA Extraction. J Clin Microbiol. 2003;41(6):2323–9.
11. Torrado E, Cooper A. Cytokines in the balance of protection and pathology during mycobacterial infections. Adv Exp Med Biol. 2013;783:121–40.
12. Yurt S, Kucukergin C, Yigitbas BA, et al. Diagnostic utility of serum and pleural levels of adenosine deaminase 1-2, and interferon-gamma in the diagnosis of pleural tuberculosis. Multidiscip Respir Med. England; 2014 Mar;9:1–7.
13. Conde MB, Marinho SR, Pereira M de F, et al. The usefulness of serum adenosine deaminase 2 (ADA2) activity in adults for the diagnosis of pulmonary tuberculosis. Respir Med. England; 2002 Aug;96:607–10.
14. Xie DL, Cheng B, Sheng Y, et al. Diagnostic accuracy of adenosine deaminase for tuberculous pericarditis: a meta-analysis. Eur Rev Med Pharmacol Sci. Italy; 2015 Nov;19(22):4411–8.
15. Li M, Wang H, Wang X, et al. Diagnostic accuracy of tumor necrosis factor-alpha, interferon-gamma, interleukin-10 and adenosine deaminase 2 in differential diagnosis between tuberculous pleural effusion and malignant pleural effusion. J Cardiothorac Surg. England; 2014 Jul;9:118.
16. Keng L-T, Shu C-C, Chen JY-P, et al. Evaluating pleural ADA, ADA2, IFN-gamma and IGRA for diagnosing tuberculous pleurisy. J Infect. England; 2013 Oct;67:294–302.
17. Schutte CM, Ungerer JP, du Plessis H, et al. Significance of cerebrospinal fluid adenosine deaminase isoenzymes in tuberculous (TB) meningitis. J Clin Lab Anal. United States; 2001;15(5):236–8.

4
101
ADA and I-309 in active and latent TB
18. Tao L, Ning H-J, Nie H-M, et al. Diagnostic value of adenosine deaminase in ascites for tuberculosis ascites: a meta-analysis. Diagn Microbiol Infect Dis.; 2014 May;79:102–7.
19. Boonyagers L, Kiertiburanakul S. Use of Adenosine Deaminase for the Diagnosis of Tuberculosis : A Review. J Infect Dis Antimicrob Agents. 2010;27:111–8.
20. El-emiry FA, Attia GA, Ahmad AY, et al. Diagnostic value of inducible protein-10 in pulmonary tuberculosis. Egypt J Chest Dis Tuberc 2016;65:219–25.
21. Chen T, Li Z, Yu L, et al. Profiling the human immune response to Mycobacterium tuberculosis by human cytokine array. Tuberculosis. 2016;97:108–17.
22. Chen T, Lin J, Wang W, et al. Cytokine and Antibody Based Diagnostic Algorithms for Sputum Culture-Positive Pulmonary Tuberculosis. PLoS One. 2015;1–16.
23. Clifford V, Tebruegge M, Zufferey C, Denholm J, Curtis N. Serum IP-10 in the diagnosis of latent and active tubeculosis. J Infect. 2015;71:696–8.
24. Cowan J, Pandey S, Filion LG, et al. Comparison of interferon-y-, interleukin (IL)-17 - and IL-22-expressing CD 4 T cells , I-22-expressing granulocytes and proinflammatory cytokines during latent and active tuberculosis infection. Clin Exp Immunol. 2012;167:317–29.
25. Mustafa T, Stanley J, Sayoki GM, Mørkve O, Sviland L. Significance of Fas and Fas ligand in tuberculous lymphadenitis. Immunology. 2005;114:255–62.
26. Hur Y, Ae Y, Jang S, Young J, Kim A, Lee SA, et al. Adjunctive biomarkers for improving diagnosis of tuberculosis and monitoring therapeutic effects. J Infect 2015;70:346–55.
27. Hong JY, Jung GS, Kim H, et al. Efficacy of inducible protein 10 as a biomarker for the diagnosis of tuberculosis. Int J Infect Dis 2012;16:e855–9.
28. Harari A, Rozot V, Enders FB, et al. Dominant TNF-α+ Mycobacterium tuberculosis – specific CD4+ T cell responses discriminate between latent infection and active disease. Nat Med. 2011;17:372–7.
29. Petruccioli E, Petrone L, Vanini V, et al. Different polyfunctional characteristics of RD1 specific CD4+
T-cells in active TB disease and LTBI. Eur Respir J. 2012;40(Suppl 56).
30. Rozot V, Vigano S, Mazza-stalder J, et al. Mycobacterium tuberculosis -specific CD8+ T- cells are functionally and phenotypically different between latent infection and active disease. Eur J Immunol. 2013;43:1568–77.
31. Marín ND, París SC, Rojas M, et al. Functional profile of CD4+ and CD8+ T cells in latently infected individuals and patients with active TB. Tuberculosis; 2013;93:155–66.
32. Petruccioli E, Petrone L, Vanini V, et al. IFNg/TNFa specific-cells and effector memory phenotype associate with active tuberculosis. J Infect 2013;66(6):475–86.
33. Caccamo N, Guggino G, Joosten SA, et al. Multifunctional CD4+ T cells correlate with active Mycobacterium tuberculosis infection. Eur J Immunol. 2010;40:2211–20.
34. Pollock KM, Whitworth HS, Montamat-sicotte DJ, et al. T-Cell Immunophenotyping Distinguishes Active From Latent Tuberculosis. J Infect Dis. 2013;208:952–68.
35. Pathan AA, Wilkinson KA, Klenerman P, et al. Direct Ex Vivo Analysis of Antigen-Specific IFN-y-Secreting CD4 T Cells in Mycobacterium tuberculosis-Infected Individuals: Associations with Clinical Disease State and Effect of Treatment. J Immunol. 2001;167:5217–25.
102
Chapter 4b
36. Rozot V, Patrizia A, Vigano S, et al. Combined Use of Mycobacterium tuberculosis – Specific CD4 and CD8 T-Cell Responses Is a Powerful Diagnostic Tool of Active Tuberculosis. Clin Infect Dis. 2015;60:432–7.
37. Caccamo N, Guggino G, Meraviglia S, et al. Analysis of Mycobacterium tuberculosis- Specific CD8 T- Cells in Patients with Active Tuberculosis and in Individuals with Latent Infection. PLoS One. 2009;4:e5528.
38. Lewinsohn DM, Leonard MK, Lobue PA, et al. Official American Thoracic Society / Infectious Diseases Society of America / Centers for Disease Control and Prevention Clinical Practice Guidelines : Diagnosis of Tuberculosis in Adults and Children. Clin Infect Dis. 2017;64(2):1–33.
39. Jager W De, Prakken BJ, Bijlsma JWJ, et al. Improved multiplex immunoassay performance in human plasma and synovial fluid following removal of interfering heterophilic antibodies. J Immunol Methods. 2005;300:124–35.
40. Jager W De, Velthuis H, Prakken BJ, et al. Simultaneous Detection of 15 Human Cytokines in a Single Sample of Stimulated Peripheral Blood Mononuclear Cells. Clin Diagn Lab Immunol. 2003;10:133–9.
41. Muraoka T, Katsuramarki T, Shiraishi H, Yokoyama MM. Automated Enzymatic Measurement of Adenosine Deaminase Isoenzyme Activities in Serum. Anal Biochem. 1990;187:268–72.
42. O’Garra A, Redford PS, Mcnab FW, ey al. The Immune Response in Tuberculosis. Annu Rev Immunol. 2013;31:475–527.
43. Miller MD, Krangel MS. The human cytokine 1-309 is a monocyte chemoattractant. Proc Natl Acad Sci. 1992;89:2950–4.
44. Miller MD, Wilson SD, Dorf ME, et al. Sequence and chromosomal location of the I-309 gene. Relationship to genes encoding a family of inflammatory cytokines. J Immunol. 1990;145:2737–44.
45. Chegou NN, Heyckendorf J, Walzl G, et al. Beyond the IFN-y horizon: biomarkers for immunodiagnosis of infection with Mycobacterium tuberculosis. Eur Respir J. 2014;43:1472–86. 46. Matsuyama W, Hashiguchi T, Matsumuro K, et al. Increased Serum Level of Vascular Endothelial Growth in Pulmonary Tuberculosis. Am J Respir Crit Care Med. 2000;162:1120–2.
47. Berse B, Brown LF, Water L Van De, et al. Vascular Permeability Factor (Vascular Endothelial Growth Factor) Gene is Expressed Differentially in Normal Tissues, Macrophages, and Tumors. Mol Biol Cell. 1992;3:211–20.
48. Ferrara N, Gerber H, Lecouter J. The biology of VEGF and its receptors. Nat Med. 2003;9:669–76.
49. Kishimoto T. Interleukin-6 : From Basic Science to Medicine — 40 Years in Immunology. Annu Rev Immunol. 2005;23:1–21.
50. Andus T, Geiger T, Hirano T, et al. Recombinant human B cell stimulatory factor 2 (BSF- 2/IFN-bèta 2) regulates bèta-fibrinogen and albumin mRNA levels in Fao-9 cells. FEBS Lett. 1987;221:18–22.
51. Brown J, Clark K, Smith C, et al. Variation in C - reactive protein response according to host and mycobacterial characteristics in active tuberculosis. BMC Infect Dis 2016;16:1–8
52. Gakis C. Adenosine deaminase (ADA) isoenzymes ADA1 and ADA2: diagnostic and biological role. Eur Respir J. 1996;9:632–3.

4
103
ADA and I-309 in active and latent TB
53. Zavialov A V, Gracia E, Glaichenhaus N, et al. Human adenosine deaminase 2 induces differentiation of monocytes into macrophages and stimulates proliferation of T helper cells and macrophages. J Leukoc Biol. 2010;88:279–90.
54. Bae MJ, Ryu S, Kim H-J, et al. Mycobacterium tuberculosis ESAT6 and CPF10 Induce Adenosine Deaminase 2 mRNA Expression in Monocyte-Derived Macrophages. Tuberc Respir Dis (Seoul). Korea (South); 2017 Jan;80:77–82.
55. Conde MB, Marinho SR, de Fatima Pereira M, et al. The usefulness of serum adenosine deaminase 2 (ADA 2) activity in adults for the diagnosis of pulmonary tuberculosis. Respir Med. 2002;96:607–10.
56. Canbolat O, Ulusdoyuran S, Ozgen G, et al. The comparison of adenosine deaminase activity values with polymerase chain reaction results in patients with tuberculosis. J Clin Lab Anal. United States; 1999;13:209–12.
57. Afrasiabian S, Mohsenpour B, Bagheri KH, et al. Diagnostic value of serum adenosine deaminase level in pulmonary tuberculosis. J Res Med Sci. India; 2013 Mar;18:252–4.
58. Marín ND, París SC, Rojas M, et al. Reduced Frequency of Memory T Cells and Increased Th17 Responses in Patients with Active Tuberculosis. Clin Vaccine Immunol. 2012;19:1667–76.
59. Salmanzadeh S, Tavakkol H, Bavieh K, et al. Diagnostic Value of Serum Adenosine Deaminase (ADA) Level for Pulmonary Tuberculosis. Jundishapur J Microbiol. Iran; 2015 Mar;8(3):e21760.
60. Sonone KK, Varma SG, Sawale VM, et al. Study of Adenosine Deaminase Levels in Patients of Pulmonary Tuberculosis with and Without Pleural Effusion. J Dent Med Sci. 2014;13:30–7.
61. Gorguner M, Cerci M, Gorguner I. Determination of adenosine deaminase activity and its isoenzymes for diagnosis of pleural effusions. Respirology. Australia; 2000 Dec;5:321–4.
104
Chapter 4b
SUPPLEMENTAL METHODS
Measurement of serum markers
Levels of 40 cytokines were determined by Biorad FlexMAP3D (Biorad Laboratories, Hercules, USA) and xPONENT software version 4.2 (Luminex). Data was analyzed using Bio-Plex Manager software, version 6.1.1 (Biorad). S100A8, SAA-1, ACE and CRP were diluted to fit in the detectable range; 1:10, 1:100, 1:100, 1:1000 respectively. Imputation of the lower limit of quantification (LLOQ) divided by two was performed for the samples with a concentration under the detection limit. Imputation of the upper limit of quantification (ULOQ) multiplied by two was performed for the samples with a concentration above the detection limit, except for the diluted cytokines. For these latter cytokines the maximum extrapolated concentration was used.
Surface and intracellular cytokine staining using flow cytometry
PBMCs were isolated from heparinized blood using Ficoll-Hypaque density-gradient centrifugation and were cryopreserved until further analyses. PBMCs were thawed, washed in wash buffer, and stained for 20 minutes in the dark with: CD 3 AF700 (BioLegend), CD4 BV785 (Sony), CD8 PE-Cy7 (BD), CD27 BV510 (BD) and CD45RO BV711 (BioLegend). For intracellular cytokine staining cryopreserved PBMCs were thawed, washed in wash buffer, and stimulated for 5 hours at 37°C with PMA/Iono/Golgi Stop Solution. After stimulation, cells were surface stained for 20 minutes in the dark with the same described antibodies. Subsequently, the cells were permeabilized and intracellulary stained for 45 minutes at 4°C in the dark with antibodies specific for IFN-γ PerCP-Cy5.5 (eBioscience) and TNF-α BV421 (BD) and fixed with Cytofix/Cytoperm Kit (BD Biosciences) for 30 minutes at room temperature. Cells were washed and resuspended in FACS buffer for measurement on a Flow cytometer (LSR Fortessa; BD Biosciences) and analyzed using FlowJo V10 Software (Tree Star, Ashland, OR, USA). T-cell intracellular cytokine analyses were performed on material from 7 participants with ATB, 6 with LTBI-, 9 with LTBI+ and 9 HC. T-cell subpopulation analyses were performed on material from 8 participants with ATB, 5 with LTBI-, 6 with LTBI+ and 11 HC before stimulation with PMA/ionomycin and on material from 8 participants with ATB, 7 with LTBI-, 10 with LTBI+ and 11 HC after stimulation. Intracellular cytokines and T-cell subpopulations are expressed as percentages of the total CD4+ or CD8+ T-cell count. Effector, effector memory, central memory and naïve T-cells are defined as CD27-CD45RO-, CD27-CD45RO+, CD27+CD45RO+ and CD27+CD45RO- respectively.

4
105
ADA and I-309 in active and latent TB
SUPPLEMENTAL FIGURES AND TABLES
Supplemental Figure 1. Receiver operating characteristic (ROC) curve depicting the sensitivity and specificity of I-309, CRP, IP-10 and VEGF in differentiating ATB from LTBI-The light grey dash-dot-dot line represents VEGF, the dark grey dash-dot line represents IP-10, the dotted line represents CRP, the dashed line represents I-309 and the full line represents the reference line. ATB, active TB; LTBI-, latent TB infection without prophylaxis; TB, tuberculosis
Supplemental Figure 2. Receiver operating characteristic (ROC) curve depicting the sensitivity and specificity of total ADA activity and its isozymes in differentiating ATB from LTBIADA, adenosine deaminase; ADA1, adenosine deaminase-1; ADA2, adenosine deaminase-2; ATB, active TB; LTBI-, latent TB infection without prophylaxis; TB, tuberculosisThe dash-dot line represents total ADA activity, the dotted line represents ADA1 activity, the dashed line represents ADA2 activity and the full line represents the reference line.
0 20 40 60 80 1000
20
40
60
80
100
100 - Specificity (%)
Sens
itivi
ty(%
)
I-309Reference line
CRPIP-10
VEGF
0 20 40 60 80 1000
20
40
60
80
100
100 - Specificity (%)
Sens
itivi
ty(%
)
Total ADA activity
Reference lineADA2 activity
ADA1 activity
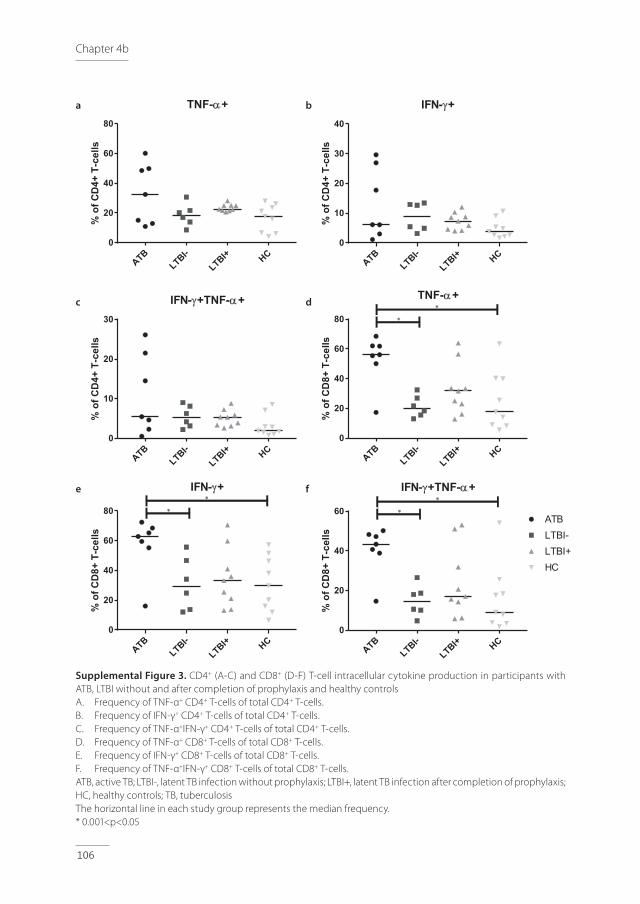
106
Chapter 4b
Supplemental Figure 3. CD4+ (A-C) and CD8+ (D-F) T-cell intracellular cytokine production in participants with ATB, LTBI without and after completion of prophylaxis and healthy controlsA. Frequency of TNF-α+ CD4+ T-cells of total CD4+ T-cells. B. Frequency of IFN-γ+ CD4+ T-cells of total CD4+ T-cells. C. Frequency of TNF-α+IFN-γ+ CD4+ T-cells of total CD4+ T-cells. D. Frequency of TNF-α+ CD8+ T-cells of total CD8+ T-cells. E. Frequency of IFN-γ+ CD8+ T-cells of total CD8+ T-cells. F. Frequency of TNF-α+IFN-γ+ CD8+ T-cells of total CD8+ T-cells.ATB, active TB; LTBI-, latent TB infection without prophylaxis; LTBI+, latent TB infection after completion of prophylaxis; HC, healthy controls; TB, tuberculosisThe horizontal line in each study group represents the median frequency.* 0.001<p<0.05
ATBLTBI-
LTBI+ HC0
20
40
60
80
TNF-a+%
ofC
D4+
T-ce
lls
ATBLTBI-
LTBI+ HC0
10
20
30
40
IFN-g+
%of
CD
4+T-
cells
ATBLTBI-
LTBI+ HC0
10
20
30
IFN-g+TNF-a+
%of
CD
4+T-
cells
ATBLTBI-
LTBI+ HC0
20
40
60
80
TNF-a+
%of
CD
8+T-
cells
*
*
ATBLTBI-
LTBI+ HC0
20
40
60
80
IFN-g+
%of
CD
8+T-
cells
*
*
ATBLTBI-
LTBI+ HC0
20
40
60
IFN-g+TNF-a+
%of
CD
8+T-
cells
HC
ATBLTBI-LTBI+
*
*
a b
c d
e f

4
107
ADA and I-309 in active and latent TB
Supplemental Figure 4. Receiver operating characteristic (ROC) curve depicting the sensitivity and specificity of TNF-α+ and/or IFN-γ+ CD4+ (A) and CD8+ (B) T-cells in differentiating ATB from LTBI-A. The dash-dot line represents the TNF-α+IFN-γ+ CD4+ T-cells, the dotted line represents the IFN-γ+ CD4+ T-cells, the
dashed line represents the TNF-α+ CD4+ T-cells and the full line represents the reference line. B. The dash-dot line represents TNF-α+IFN-γ+ CD8+ T-cells, the dotted line represents the IFN-γ+ CD8+ T-cells, the
dashed line represents the TNF-α+ CD8+ T-cells and the full line represents the reference line.ATB, active TB; LTBI-, latent TB infection without prophylaxis; TB, tuberculosis
0 20 40 60 80 1000
20
40
60
80
100
100% - Specificity (%)
Sens
itivi
ty(%
)
0 20 40 60 80 1000
20
40
60
80
100
100% - Specificity (%)
Sens
itivi
ty(%
) TNF-a+Reference line
IFN-g+
IFN-g+TNF-a+
0 20 40 60 80 1000
20
40
60
80
100
100% - Specificity (%)
Sens
itivi
ty(%
) TNF-a+Reference line
IFN-g+
IFN-g+TNF-a+a b
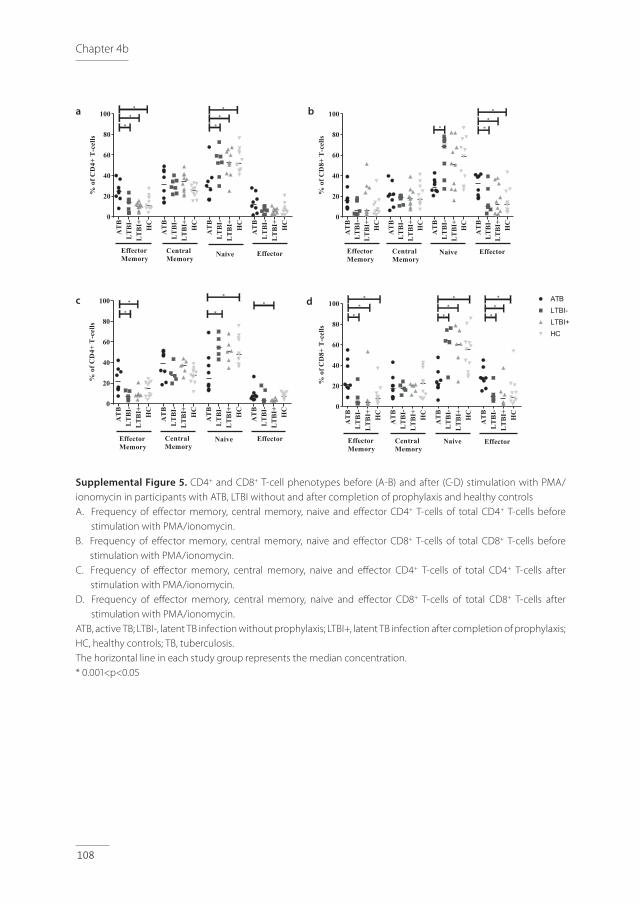
108
Chapter 4b
Supplemental Figure 5. CD4+ and CD8+ T-cell phenotypes before (A-B) and after (C-D) stimulation with PMA/ionomycin in participants with ATB, LTBI without and after completion of prophylaxis and healthy controlsA. Frequency of effector memory, central memory, naive and effector CD4+ T-cells of total CD4+ T-cells before
stimulation with PMA/ionomycin. B. Frequency of effector memory, central memory, naive and effector CD8+ T-cells of total CD8+ T-cells before
stimulation with PMA/ionomycin. C. Frequency of effector memory, central memory, naive and effector CD4+ T-cells of total CD4+ T-cells after
stimulation with PMA/ionomycin. D. Frequency of effector memory, central memory, naive and effector CD8+ T-cells of total CD8+ T-cells after
stimulation with PMA/ionomycin. ATB, active TB; LTBI-, latent TB infection without prophylaxis; LTBI+, latent TB infection after completion of prophylaxis; HC, healthy controls; TB, tuberculosis.The horizontal line in each study group represents the median concentration. * 0.001<p<0.05
AT
BL
TB
I-L
TB
I+ HC
AT
BL
TB
I-L
TB
I+ HC
AT
BL
TB
I-L
TB
I+ HC
AT
BL
TB
I-L
TB
I+ HC
0
20
40
60
80
100
%of
CD
4+T
-cel
ls
EffectorMemory
EffectorCentralMemory Naive
*
***
*
*
AT
BL
TB
I-L
TB
I+ HC
AT
BL
TB
I-L
TB
I+ HC
AT
BL
TB
I-L
TB
I+ HC
AT
BL
TB
I-L
TB
I+ HC
0
20
40
60
80
100
%of
CD
8+T
-cel
ls
EffectorMemory
EffectorCentralMemory
Naive
*
*
**
AT
BL
TB
I-L
TB
I+ HC
AT
BL
TB
I-L
TB
I+ HC
AT
BL
TB
I-L
TB
I+ HC
AT
BL
TB
I-L
TB
I+ HC
0
20
40
60
80
100
%of
CD
4+T
-cel
ls
EffectorMemory
CentralMemory
Naive Effector
* *
* **
AT
BL
TB
I-L
TB
I+ HC
AT
BL
TB
I-L
TB
I+ HC
AT
BL
TB
I-L
TB
I+ HC
AT
BL
TB
I-L
TB
I+ HC
0
20
40
60
80
100
%of
CD
8+T
-cel
ls
EffectorMemory
CentralMemory
Naive Effector
*
** *
*
*
*
*
*ATBLTBI-LTBI+HC
AT
BL
TB
I-L
TB
I+ HC
AT
BL
TB
I-L
TB
I+ HC
AT
BL
TB
I-L
TB
I+ HC
AT
BL
TB
I-L
TB
I+ HC
0
20
40
60
80
100
%of
CD
8+T
-cel
ls
EffectorMemory
CentralMemory
Naive Effector
*
** *
*
*
*
*
*ATBLTBI-LTBI+HC
a b
c d
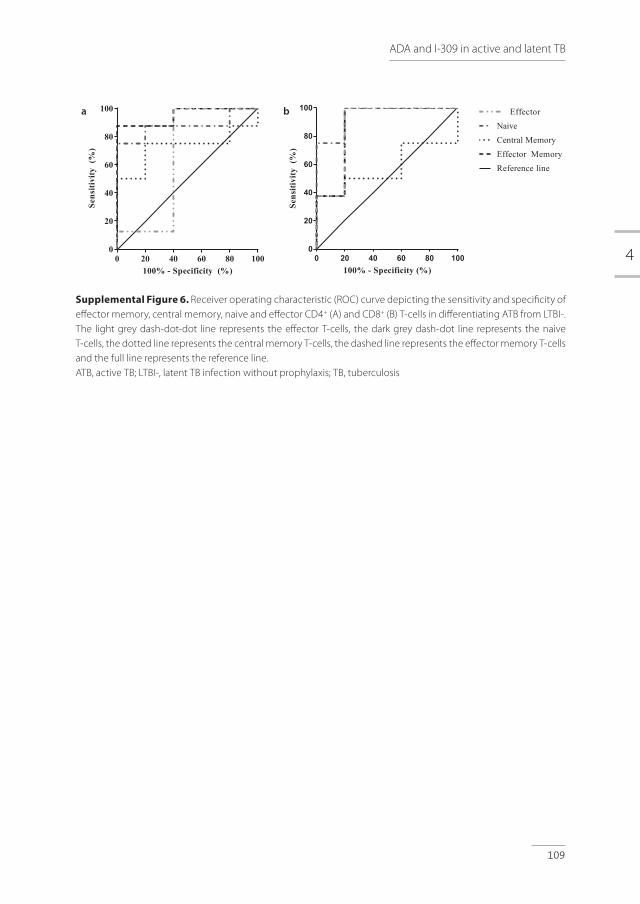
4
109
ADA and I-309 in active and latent TB
Supplemental Figure 6. Receiver operating characteristic (ROC) curve depicting the sensitivity and specificity of effector memory, central memory, naive and effector CD4+ (A) and CD8+ (B) T-cells in differentiating ATB from LTBI-. The light grey dash-dot-dot line represents the effector T-cells, the dark grey dash-dot line represents the naive T-cells, the dotted line represents the central memory T-cells, the dashed line represents the effector memory T-cells and the full line represents the reference line. ATB, active TB; LTBI-, latent TB infection without prophylaxis; TB, tuberculosis
0 20 40 60 80 1000
20
40
60
80
100
100% - Specificity (%)
Sens
itivi
ty(%
)
0 20 40 60 80 1000
20
40
60
80
100
100% - Specificity (%)
Sens
itivi
ty(%
)
Effector MemoryReference line
Central MemoryNaive
Effector
0 20 40 60 80 1000
20
40
60
80
100
100% - Specificity (%)
Sens
itivi
ty(%
)
Effector MemoryReference line
Central MemoryNaive
Effectora b
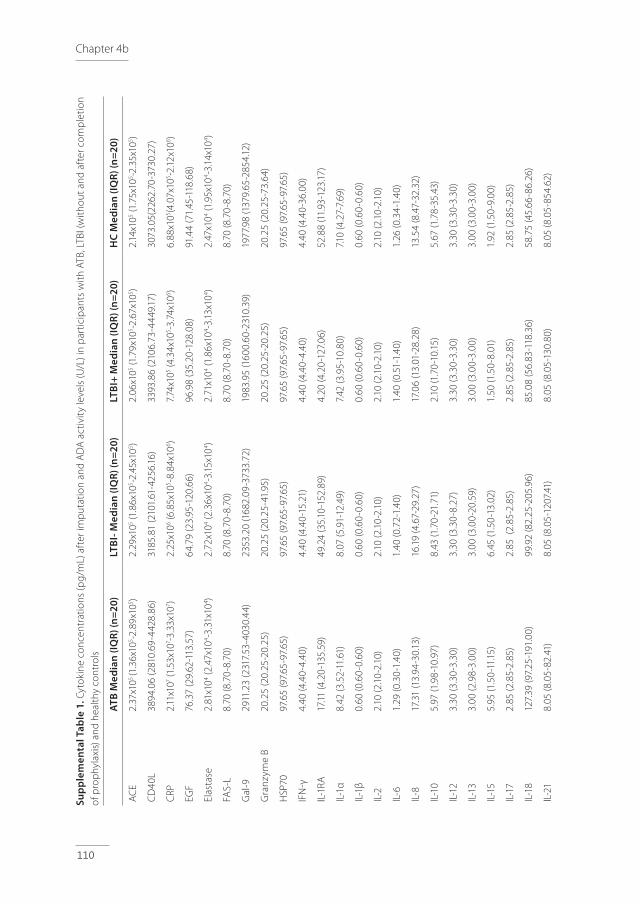
110
Chapter 4b
Supp
lem
enta
l Tab
le 1
. Cyt
okin
e co
ncen
trat
ions
(pg/
mL)
aft
er im
put
atio
n an
d A
DA
act
ivit
y le
vels
(U/L
) in
par
ticip
ants
with
ATB
, LTB
I (w
ithou
t and
aft
er c
omp
letio
n of
pro
phy
laxi
s) a
nd h
ealth
y co
ntro
ls
ATB
Med
ian
(IQR)
(n=2
0)LT
BI- M
edia
n (IQ
R) (n
=20)
LTBI
+ M
edia
n (IQ
R) (n
=20)
HC
Med
ian
(IQR)
(n=2
0)
AC
E 2.
37x1
05 (1
.36x
105 -2
.89x
105 )
2.29
x105 (1
.86x
105 -2
.45x
105 )
2.06
x105 (1
.79x
105 -2
.67x
105 )
2.14
x105 (1
.75x
105 -2
.35x
105 )
CD
40L
3894
.06
(281
0.69
-442
8.86
)31
85.8
1 (2
101.
61-4
256.
16)
3393
.86
(210
6.73
-444
9.17
)30
73.0
5(22
62.7
0-37
30.2
7)
CRP
2.11
x107 (1
.53x
107 -3
.33x
107 )
2.25
x106 (6
.85x
105 -8
.84x
106 )
7.74
x105 (4
.34x
105 -3
.74x
106 )
6.88
x105 (4
.07x
105 -2
.12x1
06 )
EGF
76.3
7 (2
9.62
-113
.57)
64.7
9 (2
3.95
-120
.66)
96.9
8 (3
5.20
-128
.08)
91.4
4 (7
1.45
-118
.68)
Elas
tase
2.81
x104 (2
.47x
104 -3
.31x
104 )
2.72
x104 (2
.36x
104 -3
.15x1
04 )2.
71x1
04 (1.8
6x10
4 -3.13
x104 )
2.47
x104 (1
.95x
104 -3
.14x1
04 )
FAS-
L8.
70 (8
.70-
8.70
)8.
70 (8
.70-
8.70
)8.
70 (8
.70-
8.70
)8.
70 (8
.70-
8.70
)
Gal
-929
11.2
3 (2
317.
53-4
030.
44)
2353
.20
(168
2.09
-373
3.72
)19
83.9
5 (1
600.
60-2
310.
39)
1977
.98
(137
9.65
-285
4.12
)
Gra
nzym
e B
20.2
5 (2
0.25
-20.
25)
20.2
5 (2
0.25
-41.
95)
20.2
5 (2
0.25
-20.
25)
20.2
5 (2
0.25
-73.
64)
HSP
7097
.65
(97.
65-9
7.65
)97
.65
(97.
65-9
7.65
)97
.65
(97.
65-9
7.65
)97
.65
(97.
65-9
7.65
)
IFN
-γ4.
40 (4
.40-
4.40
)4.
40 (4
.40-
15.2
1)4.
40 (4
.40-
4.40
)4.
40 (4
.40-
36.0
0)
IL-1
RA17
.11 (4
.20-
135.
59)
49.2
4 (3
5.10
-152
.89)
4.20
(4.2
0-12
7.06
)52
.88
(11.
93-1
23.17
)
IL-1
α8.
42 (3
.52-
11.6
1)8.
07 (5
.91-
12.4
9)7.
42 (3
.95-
10.8
0)7.1
0 (4
.27-
7.69
)
IL-1
β0.
60 (0
.60-
0.60
)0.
60 (0
.60-
0.60
)0.
60 (0
.60-
0.60
)0.
60 (0
.60-
0.60
)
IL-2
2.10
(2.1
0-2.
10)
2.10
(2.1
0-2.
10)
2.10
(2.1
0-2.
10)
2.10
(2.1
0-2.
10)
IL-6
1.29
(0.3
0-1.
40)
1.40
(0.7
2-1.
40)
1.40
(0.5
1-1.
40)
1.26
(0.3
4-1.
40)
IL-8
17.3
1 (1
3.94
-30.
13)
16.19
(4.6
7-29
.27)
17.0
6 (1
3.01
-28.
28)
13.5
4 (8
.47-
32.3
2)
IL-1
05.
97 (1
.98-
10.9
7)8.
43 (1
.70-
21.7
1)2.
10 (1
.70-
10.15
)5.
67 (1
.78-
35.4
3)
IL-1
23.
30 (3
.30-
3.30
)3.
30 (3
.30-
8.27
)3.
30 (3
.30-
3.30
)3.
30 (3
.30-
3.30
)
IL-1
33.
00 (2
.98-
3.00
)3.
00 (3
.00-
20.5
9)3.
00 (3
.00-
3.00
)3.
00 (3
.00-
3.00
)
IL-1
55.
95 (1
.50-
11.15
)6.
45 (1
.50-
13.0
2)1.
50 (1
.50-
8.01
)1.
92 (1
.50-
9.00
)
IL-1
72.
85 (2
.85-
2.85
)2.
85 (
2.85
-2.8
5)2.
85 (2
.85-
2.85
)2.
85 (2
.85-
2.85
)
IL-1
812
7.39
(97.
25-1
91.0
0)99
.92
(82.
25-2
05.9
6)85
.08
(56.
83-1
18.3
6)58
.75
(45.
66-8
6.26
)
IL-2
18.
05 (8
.05-
82.4
1)8.
05 (8
.05-
1207
.41)
8.05
(8.0
5-13
0.80
)8.
05 (8
.05-
854.
62)
IL-2
21.
85 (1
.85-
1.85
)1.
85 (1
.85-
1.85
)1.
85 (1
.85-
1.85
)1.
85 (1
.85-
1.85
)
IL-2
582
.15 (8
2.15
-82.
15)
82.15
(82.
15-8
2.15
)82
.15 (8
2.15
-82.
15)
82.15
(82.
15-8
2.15
)
IL-3
35.
50 (5
.50-
5.50
)5.
50 (5
.50-
79.8
2)5.
50 (5
.50-
5.50
)5.
50 (5
.50-
5.50
)
IP-1
055
7.78
(294
.88-
927.9
4)20
3.74
(154
.23-
415.
95)
196.
18 (1
49.5
4-27
6.06
)19
0.88
(149
.72-
238.
84)
I-309
21.7
1 (1
5.35
-24.
84)
4.99
(2.15
-8.4
8)4.
31 (2
.15-7
.18)
3.68
(2.15
-6.5
4)
MC
P-1
94.2
6 (6
8.31
-137
.20)
108.
71 (8
1.96
-137
.92)
108.
20 (8
4.64
-154
.49)
112.
12 (7
6.98
-130
.30)
MC
P-2
27.3
8 (1
7.86
-58.
01)
46.8
3 (3
2.40
-62.
21)
38.7
4 (2
8.51
-59.
67)
39.9
5 (3
5.56
-51.
27)
MD
C51
6.46
(411
.85-
1031
.71)
621.
21 (3
94.7
6-86
9.55
)76
5.98
(625
.65-
919.
68)
657.9
3 (5
04.9
0-92
1.87
)
MIG
9.03
(4.5
3-12
.45)
2.34
(2.1
0-8.
81)
2.10
(2.1
0-3.
02)
2.10
(2.1
0-2.
88)
MIP
-1β
67.6
5 (5
1.04
-83.
75)
64.5
3 (4
5.82
-105
.30)
80.8
1 (5
0.96
-103
.81)
62.9
7 (5
2.36
-85.
79)
SAA
-159
3.75
(593
.75-
593.
75)
593.
75 (5
93.7
5-59
3.75
)59
3.75
(593
.75-
593.
75)
593.
75 (5
93.7
5-59
3.75
)
s-IL
-2RA
282.
61 (1
68.7
7-44
8.57
)20
3.99
(29.
15-2
98.8
5)17
1.46
(35.
66-2
87.2
8)13
3.52
(65.
39-2
45.0
9)
S100
A8
2110
.64
(132
2.19
-310
8.84
)14
47.1
0 (9
44.9
8-27
76.8
5)18
03.8
2 (1
196.
87-3
653.
71)
2171
.70
(107
4.25
-288
1.19
)
TARC
262.
33 (1
65.9
5-55
9.02
)21
9.61
(103
.16-3
02.2
3)20
2.58
(103
.22-
268.
36)
183.
20 (1
09.11
-260
.77)
TNF-
α1.
10 (1
.10-
1.10)
1.10
(1.1
0-1.1
0)1.
10 (1
.10-
1.10)
1.10
(1.1
0-1.1
0)
TRA
IL24
.98
(11.
14-5
0.02
)44
.26
(7.2
0-57
.36)
36.5
4 (7
.20-
50.3
2)29
.50
(7.4
8-39
.88)
VEG
F31
5.57
(206
.86-
441.
40)
152.
07 (8
6.57
-278
.41)
186.
08 (9
5.27
-298
.70)
199.
34 (1
55.2
7-28
1.98
)
Tota
l AD
A a
ctiv
ity*
9.11
(7.2
9-12
.26)
5.45
(3.9
5-8.
25)
5.60
(4.13
-7.6
8)4.
79 (4
.00-
7.18)
AD
A-1
act
ivit
y*2.
82 (1
.94-
4.25
)2.
11 (1
.58-
3.23
)2.
40 (1
.59-
3.00
)2.
25 (1
.62-
2.61
)
AD
A-2
act
ivit
y*6.
62 (4
.89-
8.70
)3.
07 (2
.13-5
.10)
3.15
(2.5
0-4.
45)
2.94
(2.13
-4.6
8)
ATB,
act
ive
TB; L
TBI-,
late
nt T
B in
fect
ion
with
out p
roph
ylax
is; L
TBI+
, lat
ent T
B in
fect
ion
afte
r com
plet
ion
of p
roph
ylax
is; H
C, h
ealth
y co
ntro
ls; T
B, tu
ber
culo
sis;
IQR,
inte
rqua
rtile
rang
e*
Tota
l AD
A, A
DA1
and
AD
A2
activ
ity w
ere
mea
sure
d in
9 H
C
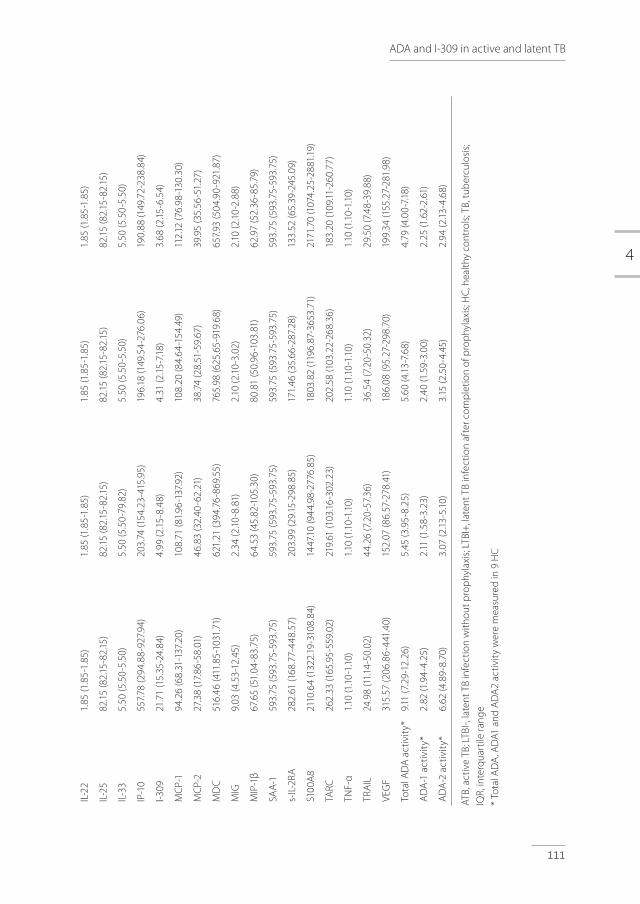
4
111
ADA and I-309 in active and latent TB
Supp
lem
enta
l Tab
le 1
. Cyt
okin
e co
ncen
trat
ions
(pg/
mL)
aft
er im
put
atio
n an
d A
DA
act
ivit
y le
vels
(U/L
) in
par
ticip
ants
with
ATB
, LTB
I (w
ithou
t and
aft
er c
omp
letio
n of
pro
phy
laxi
s) a
nd h
ealth
y co
ntro
ls
ATB
Med
ian
(IQR)
(n=2
0)LT
BI- M
edia
n (IQ
R) (n
=20)
LTBI
+ M
edia
n (IQ
R) (n
=20)
HC
Med
ian
(IQR)
(n=2
0)
AC
E 2.
37x1
05 (1
.36x
105 -2
.89x
105 )
2.29
x105 (1
.86x
105 -2
.45x
105 )
2.06
x105 (1
.79x
105 -2
.67x
105 )
2.14
x105 (1
.75x
105 -2
.35x
105 )
CD
40L
3894
.06
(281
0.69
-442
8.86
)31
85.8
1 (2
101.
61-4
256.
16)
3393
.86
(210
6.73
-444
9.17
)30
73.0
5(22
62.7
0-37
30.2
7)
CRP
2.11
x107 (1
.53x
107 -3
.33x
107 )
2.25
x106 (6
.85x
105 -8
.84x
106 )
7.74
x105 (4
.34x
105 -3
.74x
106 )
6.88
x105 (4
.07x
105 -2
.12x1
06 )
EGF
76.3
7 (2
9.62
-113
.57)
64.7
9 (2
3.95
-120
.66)
96.9
8 (3
5.20
-128
.08)
91.4
4 (7
1.45
-118
.68)
Elas
tase
2.81
x104 (2
.47x
104 -3
.31x
104 )
2.72
x104 (2
.36x
104 -3
.15x1
04 )2.
71x1
04 (1.8
6x10
4 -3.13
x104 )
2.47
x104 (1
.95x
104 -3
.14x1
04 )
FAS-
L8.
70 (8
.70-
8.70
)8.
70 (8
.70-
8.70
)8.
70 (8
.70-
8.70
)8.
70 (8
.70-
8.70
)
Gal
-929
11.2
3 (2
317.
53-4
030.
44)
2353
.20
(168
2.09
-373
3.72
)19
83.9
5 (1
600.
60-2
310.
39)
1977
.98
(137
9.65
-285
4.12
)
Gra
nzym
e B
20.2
5 (2
0.25
-20.
25)
20.2
5 (2
0.25
-41.
95)
20.2
5 (2
0.25
-20.
25)
20.2
5 (2
0.25
-73.
64)
HSP
7097
.65
(97.
65-9
7.65
)97
.65
(97.
65-9
7.65
)97
.65
(97.
65-9
7.65
)97
.65
(97.
65-9
7.65
)
IFN
-γ4.
40 (4
.40-
4.40
)4.
40 (4
.40-
15.2
1)4.
40 (4
.40-
4.40
)4.
40 (4
.40-
36.0
0)
IL-1
RA17
.11 (4
.20-
135.
59)
49.2
4 (3
5.10
-152
.89)
4.20
(4.2
0-12
7.06
)52
.88
(11.
93-1
23.17
)
IL-1
α8.
42 (3
.52-
11.6
1)8.
07 (5
.91-
12.4
9)7.
42 (3
.95-
10.8
0)7.1
0 (4
.27-
7.69
)
IL-1
β0.
60 (0
.60-
0.60
)0.
60 (0
.60-
0.60
)0.
60 (0
.60-
0.60
)0.
60 (0
.60-
0.60
)
IL-2
2.10
(2.1
0-2.
10)
2.10
(2.1
0-2.
10)
2.10
(2.1
0-2.
10)
2.10
(2.1
0-2.
10)
IL-6
1.29
(0.3
0-1.
40)
1.40
(0.7
2-1.
40)
1.40
(0.5
1-1.
40)
1.26
(0.3
4-1.
40)
IL-8
17.3
1 (1
3.94
-30.
13)
16.19
(4.6
7-29
.27)
17.0
6 (1
3.01
-28.
28)
13.5
4 (8
.47-
32.3
2)
IL-1
05.
97 (1
.98-
10.9
7)8.
43 (1
.70-
21.7
1)2.
10 (1
.70-
10.15
)5.
67 (1
.78-
35.4
3)
IL-1
23.
30 (3
.30-
3.30
)3.
30 (3
.30-
8.27
)3.
30 (3
.30-
3.30
)3.
30 (3
.30-
3.30
)
IL-1
33.
00 (2
.98-
3.00
)3.
00 (3
.00-
20.5
9)3.
00 (3
.00-
3.00
)3.
00 (3
.00-
3.00
)
IL-1
55.
95 (1
.50-
11.15
)6.
45 (1
.50-
13.0
2)1.
50 (1
.50-
8.01
)1.
92 (1
.50-
9.00
)
IL-1
72.
85 (2
.85-
2.85
)2.
85 (
2.85
-2.8
5)2.
85 (2
.85-
2.85
)2.
85 (2
.85-
2.85
)
IL-1
812
7.39
(97.
25-1
91.0
0)99
.92
(82.
25-2
05.9
6)85
.08
(56.
83-1
18.3
6)58
.75
(45.
66-8
6.26
)
IL-2
18.
05 (8
.05-
82.4
1)8.
05 (8
.05-
1207
.41)
8.05
(8.0
5-13
0.80
)8.
05 (8
.05-
854.
62)
IL-2
21.
85 (1
.85-
1.85
)1.
85 (1
.85-
1.85
)1.
85 (1
.85-
1.85
)1.
85 (1
.85-
1.85
)
IL-2
582
.15 (8
2.15
-82.
15)
82.15
(82.
15-8
2.15
)82
.15 (8
2.15
-82.
15)
82.15
(82.
15-8
2.15
)
IL-3
35.
50 (5
.50-
5.50
)5.
50 (5
.50-
79.8
2)5.
50 (5
.50-
5.50
)5.
50 (5
.50-
5.50
)
IP-1
055
7.78
(294
.88-
927.9
4)20
3.74
(154
.23-
415.
95)
196.
18 (1
49.5
4-27
6.06
)19
0.88
(149
.72-
238.
84)
I-309
21.7
1 (1
5.35
-24.
84)
4.99
(2.15
-8.4
8)4.
31 (2
.15-7
.18)
3.68
(2.15
-6.5
4)
MC
P-1
94.2
6 (6
8.31
-137
.20)
108.
71 (8
1.96
-137
.92)
108.
20 (8
4.64
-154
.49)
112.
12 (7
6.98
-130
.30)
MC
P-2
27.3
8 (1
7.86
-58.
01)
46.8
3 (3
2.40
-62.
21)
38.7
4 (2
8.51
-59.
67)
39.9
5 (3
5.56
-51.
27)
MD
C51
6.46
(411
.85-
1031
.71)
621.
21 (3
94.7
6-86
9.55
)76
5.98
(625
.65-
919.
68)
657.9
3 (5
04.9
0-92
1.87
)
MIG
9.03
(4.5
3-12
.45)
2.34
(2.1
0-8.
81)
2.10
(2.1
0-3.
02)
2.10
(2.1
0-2.
88)
MIP
-1β
67.6
5 (5
1.04
-83.
75)
64.5
3 (4
5.82
-105
.30)
80.8
1 (5
0.96
-103
.81)
62.9
7 (5
2.36
-85.
79)
SAA
-159
3.75
(593
.75-
593.
75)
593.
75 (5
93.7
5-59
3.75
)59
3.75
(593
.75-
593.
75)
593.
75 (5
93.7
5-59
3.75
)
s-IL
-2RA
282.
61 (1
68.7
7-44
8.57
)20
3.99
(29.
15-2
98.8
5)17
1.46
(35.
66-2
87.2
8)13
3.52
(65.
39-2
45.0
9)
S100
A8
2110
.64
(132
2.19
-310
8.84
)14
47.1
0 (9
44.9
8-27
76.8
5)18
03.8
2 (1
196.
87-3
653.
71)
2171
.70
(107
4.25
-288
1.19
)
TARC
262.
33 (1
65.9
5-55
9.02
)21
9.61
(103
.16-3
02.2
3)20
2.58
(103
.22-
268.
36)
183.
20 (1
09.11
-260
.77)
TNF-
α1.
10 (1
.10-
1.10)
1.10
(1.1
0-1.1
0)1.
10 (1
.10-
1.10)
1.10
(1.1
0-1.1
0)
TRA
IL24
.98
(11.
14-5
0.02
)44
.26
(7.2
0-57
.36)
36.5
4 (7
.20-
50.3
2)29
.50
(7.4
8-39
.88)
VEG
F31
5.57
(206
.86-
441.
40)
152.
07 (8
6.57
-278
.41)
186.
08 (9
5.27
-298
.70)
199.
34 (1
55.2
7-28
1.98
)
Tota
l AD
A a
ctiv
ity*
9.11
(7.2
9-12
.26)
5.45
(3.9
5-8.
25)
5.60
(4.13
-7.6
8)4.
79 (4
.00-
7.18)
AD
A-1
act
ivit
y*2.
82 (1
.94-
4.25
)2.
11 (1
.58-
3.23
)2.
40 (1
.59-
3.00
)2.
25 (1
.62-
2.61
)
AD
A-2
act
ivit
y*6.
62 (4
.89-
8.70
)3.
07 (2
.13-5
.10)
3.15
(2.5
0-4.
45)
2.94
(2.13
-4.6
8)
ATB,
act
ive
TB; L
TBI-,
late
nt T
B in
fect
ion
with
out p
roph
ylax
is; L
TBI+
, lat
ent T
B in
fect
ion
afte
r com
plet
ion
of p
roph
ylax
is; H
C, h
ealth
y co
ntro
ls; T
B, tu
ber
culo
sis;
IQR,
inte
rqua
rtile
rang
e*
Tota
l AD
A, A
DA1
and
AD
A2
activ
ity w
ere
mea
sure
d in
9 H
C


General Discussion and Summary
5
Chapter 5
114
Tuberculosis (TB) is a challenging disease for several reasons. These challenges include the global heterogeneous context, with large differences in incidence and diagnostic facilities.[1] The lack of a gold standard for latent TB infection (LTBI) is another challenge, both for clinical practice and for research.[2,3] Despite many years of research, the complex host-microbe interaction is still incompletely understood, [4] and difficulties persist in the establishment of a quick and definite diagnosis, especially in extrapulmonary TB.[5] Furthermore, it remains difficult to distinguish the different stages of the disease.[6] These challenges reflect the studies described in this thesis, in which we focus on several clinical and immunological aspects of TB and how the immune response against M. tuberculosis could facilitate diagnosis of the different disease manifestations.
The challenging context of tuberculosis research
‘Without context, no evidence.’ This is the title of the recently published report of the Dutch Council for Public Health and Society about the apparent illusion of evidence based practice (EBP) in health care.[1] In this report, EBP is called a magic formula that has penetrated into the capillaries of practice, policy and funding of care, but it has shortcomings, one of which is the assumption of a universal reality without regard for the pluralism of patients and situations. Therefore, the council advocates ‘context-based practice’ instead of ‘evidence-based practice’.[1] Tuberculosis-research is an example of the statement that the context is crucial, but this also results in a challenge, because TB research must encompass two major contexts: on the one hand, many TB patients, but limited diagnostic and research facilities in high-endemic countries; on the other hand, easy availability of diagnostic and research facilities, but limited numbers of TB patients in low-endemic countries. Collaboration and teamwork within and between low- and high-endemic countries, together with professional organizations such as the KNCV Tuberculosis Foundation[7], the Tuberculosis network (TBnet)[8], the World Health Organization (WHO)[9], the International Union Against Tuberculosis and Lung Disease (IUATLD)[10] and the European Centre for Disease Prevention and Control (ECDC),[11] is important to perform high-quality research with sufficient participants to draw evidence-based and context-based conclusions. This international collaboration, however, must address ‘context-challenges’: the lack of research-facilities in several countries and the translation of research results obtained in low-endemic to high-endemic areas and vice versa. For example, the positive predictive value (PPV) of a diagnostic test is highly influenced by the disease incidence, and diagnostic accuracy is not comparable for high- and low-endemic areas.[12] Uncertainties about the influence of ethnicity in immune responses also must be considered in the translation of immunological research results. Other examples are readily available to emphasize the importance of context in TB research. In this thesis, we also experienced a challenge between ‘evidence-based practice’ and ‘context-based practice’. As only regional collaboration within the Netherlands was the maximum achievable goal among the projects
5
General Discussion and Summary
115
described in this thesis, power appears to be a limitation of several projects. In contrast, the position of this thesis with respect to the local clinical context is one of strength, as we aimed to focus on several clinical aspects of immune responses in TB in a low-incidence environment.
Consequences of the absence of a gold standard for latent tuberculosis infection
A major, persistent limitation of clinical practice and research is the lack of a gold standard for the diagnosis of LTBI. Regretfully, it is still not possible to evaluate the presence of viable bacilli in LTBI, and persistent immunological memory cannot be distinguished from persistent latent infection.[2, 13-15] The term LTBI is confusing because it does not per se reflect true latent infection in several cases. The implication for clinical practice is that it remains difficult to predict the individual risk of reactivation of TB and to identify the need for prophylactic therapy, e.g., before the start of immunosuppressive drugs in persons who are also diagnosed with LTBI.[16] Moreover, it is difficult to evaluate the efficacy of prophylactic treatment and to establish reinfection later in life because the tuberculous skin test (TST) and Interferon Gamma Release Assay (IGRA) usually remain positive, as well as after prophylactic treatment.[2] These are important objectives for future research.
In Chapter 2 of this thesis, LTBI screening using TST and IGRA and the development of TB after treatment for LTBI was evaluated in 144 patients treated with TNF-α inhibitor therapy in daily clinical practice. Eleven patients were diagnosed with LTBI and received prophylactic therapy. As none of these LTBI patients developed TB, the results imply that prophylactic therapy was administered adequately, but we do not know whether all the treated patients actually needed the prophylactic therapy. It is possible that some patients only had immunological memory without the presence of viable bacilli. To date, this problem remains unresolved. Two patients with negative LTBI screening before the start of TNF-α inhibitor therapy developed TB. One of them died from TB meningitis. As both patients were likely to be infected while travelling after the initiation of TNF-α inhibitor therapy, the results indicate that we should be aware of the risk of travelling to TB-endemic countries during immunosuppressive treatment.[17] Monitoring of patients at risk of TB exposure is indicated, although false-negative results in immunocompromised patients should be considered. This recommendation has been acknowledged both internationally [18] and in the Netherlands [15, 19], but it has not yet been implemented in all guidelines.[20, 21] Moreover, it is important to increase awareness among patients and practitioners. In the Netherlands, this is mainly the responsibility of TB specialists and other people involved in medical advice for travelers.[22, 23] The implications for areas with a high incidence of TB might be challenging.
Chapter 5
116
Interferon Gamma Release Assays using extra-sanguineous fluids
In TB, M. tuberculosis-specific lymphocytes are concentrated at the site of infection through homing and proliferation.[24, 25] Therefore, the measurement of M. tuberculosis-specific IGRA in extra-sanguineous body fluids may support the diagnosis of TB in suspected, but difficult-to-diagnose, cases.[24, 26-30] The low PPV observed in studies has been evaluated as one of the limitations of IGRA using extra-sanguineous fluids, which is mainly caused by false-positive results due to sensitized T-cells in patients with LTBI. These T-cells can originate from blood (due to blood mixture during the collection of extra-sanguineous fluid) or from the investigated body compartment.[26] Differentiation between active TB (ATB) versus LTBI together with another TB-unrelated disease in these patients remains difficult. In ATB, the number of IFN-ɣ producing M. tuberculosis specific T-cells at the site of infection have been shown to be higher compared with the number of IFN-ɣ producing M. tuberculosis-specific T-cells in peripheral blood.[26, 31-33] Therefore, we hypothesized that the introduction of a ratio >1.0 between extra-sanguineous and systemic IFN-ɣ responses could increase the PPV of IGRA in extra-sanguineous fluids.[34] The potential additive value of a ratio was not mentioned in current reviews of IGRA in extra-sanguineous fluids.[25,30,35-37] We evaluated this method of determining such a ratio in a retrospective, single-center study including 40 patients with a positive IGRA (ELISpot) in broncho-alveolar lavage (BAL) and 16 patients with a positive ELISpot in pleural fluid (Chapter 3a).[34] The development of TB was assessed over a period of at least two years of follow-up. The TB case definition was established in collaboration with an independent TB expert. The PPV for TB in patients with a positive ELISpot in BAL was 64.9%, which increased to 82.6% for the ESAT-6 panel and 71.4% for the CFP-10 panel after the introduction of a ratio >1.0 between the BAL and blood IFN-ɣ responses. In patients with a positive ELISpot in pleural fluid, the PPV for TB was 85.7%, which increased to 91.7% for the ESAT-6 panel and 92.3% for the CFP-10 panel after the introduction of a ratio >1.0 between pleural fluid and blood IFN-ɣ responses. These results indicate that, indeed, the PPV increases using a ratio >1.0 between extra-sanguineous and systemic IFN-ɣ responses. The limitations of this study include the retrospective design, the limited power, and the absence of complete diagnostic accuracy (negative predictive value, sensitivity and specificity). Strength of the study is the ratio-approach in real-life clinical practice in a low-endemic setting. Together with the results of other studies in which a ratio between the extra-sanguineous and systemic IFN-ɣ response is proposed [31,38-40], this result is promising for further evaluations of the role of TB-specific IGRA in extra-sanguineous fluids in a low-incidence setting. Therefore, the present project should be confirmed in a prospective study to validate the proposed ratio in a well-defined population. The limited numbers of TB-patients in low-endemic countries is a challenge for the organization of such a study. Therefore, collaboration with previously mentioned organizations is indispensable.[7-11]. Other challenges to further explore the clinical value of IGRA in extra-sanguineous body fluids include issues concerning
5
General Discussion and Summary
117
the repeatability (intra-run precision) and reproducibility (inter-run precision) of IGRA, the influence of patient variables and laboratory conditions.[41,42]
There is uncertainty regarding whether QuantiFERON and T.Spot.TB tests are equally suitable for this purpose. A systematic review of IGRA using pleural fluid for the diagnosis of pleural tuberculosis concluded that the sensitivity and specificity for both IGRA were equivalent.[25] In Chapter 3b of this thesis, we discuss two important methodological decisions of this review with consequences concerning the results.[43] Indeterminate results (defined as inconclusive results because of an invalid positive and/or negative control) in tuberculous pleural effusion were categorized as false negatives in this review. The in- or exclusion of indeterminate IGRA results has a considerable impact on the diagnostic accuracy of the results, as shown in Chapter 3b. In clinical practice, indeterminate IGRA results indicate that we cannot use this test for decision making. Therefore, we recommend the exclusion of indeterminate results for the calculation of diagnostic accuracy, resulting in a greater diagnostic accuracy of T.Spot.TB (sensitivity 91.7%, specificity 78.3%) in comparison to QuantiFERON (sensitivity 73.3%, specificity 80.8%). Thus, we advocate to separately analyze the results of both tests to calculate the diagnostic accuracy, rather than merging the results.[43] A higher diagnostic accuracy for T.Spot.TB compared with QuantiFERON was also concluded in several reviews on this subject.[24, 28, 37] We assume that this phenomenon could be explained by the different methodologic characteristics of these tests. In QuantiFERON, IFN-ɣ production is measured after incubation of unprocessed ‘whole’ body fluid with TB-specific antigens. In T.Spot.TB, IFN-ɣ-secreting T-cells are numerated after incubation of a standardized number mononuclear cells with TB-specific antigens. Therefore, we recommend T.Spot.TB over QuantiFERON for further studies using extra-sanguineous body fluids. In the absence of a definite diagnostic value, IGRA in extra-sanguineous fluids has not yet been incorporated in national and international guidelines.[15, 44, 45]
In addition to the question of which IGRA should be used, selection of the measured cytokines and stimulating antigens remains a matter of debate. The currently used cytokine IFN-ɣ was chosen because it is recognized as the defining cytokine of Th1 cells. T-lymphocytes that have been exposed to M. tuberculosis previously release more IFN-γ upon repeat exposure.[13] As multiple cytokine and chemokine markers are expressed in TB, additional markers are proposed for blood-based IGRA, for example, IL-2, IP-10, and TNF, among others[13], but the added value is still unclear.
The currently used stimulating antigens ESAT-6 and CFP-10 were selected since these proteins are encoded by TB-specific regions of the mycobacterial genome with high immunogenicity and pathogenicity.[13,46,47] Because of their high specificity for M. tuberculosis infection
Chapter 5
118
and absence in Bacillus Calmette-Guérin (BCG) strains, these antigens are appropriate for TB diagnosis. IGRA has been proposed for other diseases, such as cytomegalovirus (CMV) [48, 49], Coxiella
burnetti [50,51] and hepatitis B [52], necessitating other antigens. IGRA with purified protein derivative (PPD) as a mycobacterial antigen is the subject of some studies,[53-56] e.g., in non-tuberculous mycobacterial (associated) diseases. To extend our knowledge about IGRA using extra-sanguineous fluids together with the application of other antigens, such as IGRA with PPD antigen, is explored both in blood and extra-sanguineous fluids in Chapter 3c [57] and Chapter 3d of this thesis. As mycobacterial diseases have similarities to sarcoidosis, the possible association between mycobacterial infection and sarcoidosis remains a subject of debate.[58-60] Some authors suggest that TB and sarcoidosis may not only share the same etiology, but may even be different manifestations of the same disease.[61] We hypothesized that if mycobacterial infection of the lung is important for the development of sarcoidosis, then T-cell responsiveness towards the PPD antigen would be increased in patients with sarcoidosis in comparison to patients with other causes of interstitial lung disease. In Chapter 3c, T-cell responsiveness to PPD antigen in blood and BAL fluid in 32 patients with sarcoidosis and 86 patients with other causes of interstitial lung disease was measured.[57] The T-cell response to EBV antigen served as a control. The results revealed no differences between PPD reactivity in blood (p=0.262) and BAL fluid (p=0.356) in patients with or without sarcoidosis. To increase the power, we combined our results with the results of a comparative study [55] in an individual patient-data meta-analysis.[57] However, the results again did not support our hypothesis and actually indicated that the mycobacterial immune response in blood using ELISpot PPD was negatively associated with sarcoidosis (p=0.010). We are aware that an immunological approach such as ELISpot PPD to evaluate this hypothesis has limitations; however mycobacterial culture and the nucleic acid amplification technique (NAAT) were also examined. Several other reported studies on this subject used NAAT (merely polymerase chain reaction) [59] or immunological techniques such as IGRA and flow cytometry.[60] The debate continues concerning an association between mycobacterial infection and sarcoidosis.[59,60,62] At present, the IGRASAR study (Interferon Gamma Release Assay in sarcoidosis) in the Netherlands aims to elucidate the link between sarcoidosis and mycobacteria.(http://www.jssog.com/papers/sarco36sapri_06.pdf, accessed 04/01/2018).
To further explore the feasibility of IGRA with PPD antigen using extra-sanguineous body fluids, we studied a PPD-based ELISpot measuring PPD-specific T-cell responses in 70 urine and bladder fluid samples from 14 patients with bladder malignancies after treatment with intravesicular BCG instillations (Chapter 3d). Regretfully, PPD-specific T-cell responses were measured in only 14% of the samples. ELISpot PPD was indeterminate in 83% of these samples due to the lack of a T-cell response in the positive control, although T-cells were detected in all samples using flow cytometry. To date, this study delivered several unresolved questions such
5
General Discussion and Summary
119
as indeterminate responses, despite the presence of T-cells and the potential clinical value of this test. We hypothesize that the presence of large numbers of bladder-derived epithelial cells could interfere with the ELISpot technique since they could cover the coated membrane and thus block stimulated T-cells. Limitations also include the number of participants. Nevertheless, this study provided a basis for further improvement of the ELISpot PPD technique. One logical approach would be to repeat the study after purging epithelial cells from the urine samples by, for example, using selective beads or cell sorting techniques.[56] Moreover, the uniformity of the used PPD fluid and validation of cut-off values for reactivity are important topics. The results of the studies in Chapters 3c and 3d support the feasibility of IGRA with PPD antigen in several extra-sanguineous body fluids, but the clinical value remains uncertain.
Differentiation between active and latent tuberculosis infection
The differentiation between ATB and LTBI is important but often difficult in clinical practice. This major limitation was recognized as early as 1926: ‘Latent TB may be defined for convenience
as that which is unaccompanied by symptoms and physical signs, causes no obvious disturbance
and is not recognized by the physician. There is no sharp distinction between latent and manifest
TB and in some instances latent TB is more extensive than that which is recognizable. Ability to
distinguish between latent and manifest disease will vary with the means available for diagnosis.’[63] It is cumbersome that this diagnostic dilemma remains unresolved due to the absence of a biomarker or other test to solve this problem.[13] It has been concluded that QuantiFERON-TB Gold and T.Spot.TB in blood do not discriminate between ATB and LTBI.[24] In 2015, QuantiFERON-TB Gold PLUS (QFT-plus) was introduced, which includes two antigen tubes: one stimulating CD4+ T-cells (TB1) and the other stimulating CD4+ and CD8+ T-cells (TB2).[64] As TB-specific CD8+ T-cells have been more frequently associated with ATB versus LTBI, it has been hypothesized that a difference in IFN-ɣ production between TB1 and TB2 (as a surrogate marker of the magnitude of CD8+ T-cell responses) could provide an indication about the stage of disease.[65, 66] In Chapter 4a, we evaluate whether QFT-plus can differentiate ATB and LTBI. We included twenty participants with ATB (eleven with pulmonary TB and nine with extrapulmonary TB), twenty participants with LTBI without prophylaxis, twenty separate LTBI participants after completion of prophylaxis and twenty healthy controls. The two LTBI subgroups were included to obtain better insight regarding the LTBI participants, providing additional value compared with other studies.[13,67-72] After completion of prophylaxis, LTBI participants are assumed to be ‘cured’, and any differences between both LTBI groups could potentially indicate which of the LTBI participants without prophylactic therapy actually represent latent infection, i.e., have persistent live tuberculous mycobacteria. The results showed highly overlapping IFN-ɣ levels between ATB and both groups of LTBI participants within and between both antigen tubes. The median IFN-ɣ production level in TB2 was significantly higher in ATB compared with LTBI participants without prophylactic therapy, but because of the overlapping results, this difference is unlikely

Chapter 5
120
to help differentiate ATB from LTBI in individual patients in clinical practice. No differences were observed between the two LTBI subgroups. Therefore, the results indicate that QFT-plus also does not differentiate between ATB and LTBI.[73] The limited sample size could be considered as a limitation of this study. However, based on the overlapping IFN-ɣ responses, it is unlikely that extending the study groups will lead to other conclusions with consequences for individual patients in clinical practice. It has been discussed that ESAT-6 (one of the TB-specific antigens used in QFT-plus) is secreted during latent and active stages of the infection, thus strongly suggesting that disease stage-specific diagnosis is impossible using IGRA in blood with ESAT-6 as a stimulating antigen.[13,74-76] Therefore, there remains a medical need for better diagnostic tools and biomarkers to differentiate ATB and LTBI. In Chapter 4b, we aim to identify some potential markers in serum to differentiate ATB and LTBI. The study groups were identical to those in the study described in Chapter 4a. Serum was analyzed for forty cytokines and chemokines, together with the activity of adenosine deaminase (ADA) isozymes, which are enzymes that protect the cell from apoptosis by eliminating intra-cellular toxic derivatives of both adenosine and deoxyadenosine. The markers VEGF, I-309, CRP, IP-10 and ADA (ADA2) activity were significantly increased in ATB compared with LTBI. As the combination of I-309 and the activity of ADA (ADA2) yielded a sensitivity and specificity of 100% and 80%, respectively, in differentiating ATB from LTBI without prophylaxis, they represent promising biomarkers. We hypothesized that the differences observed in systemic serum profiles may correlate with differential immune skewing in ATB compared with LTBI. Therefore, we explored functional and phenotypical CD4+ and CD8+ T-cell profiles. Indeed, we detected higher cytokine production by CD8+ T-cells in ATB compared with LTBI and an increased frequency of effector and effector memory T-cells together with decreased percentages of naive T-cells. Combining phenotypical and/or functional profiles of CD4+ and CD8+ T-cells with serum ADA activity and I-309 concentrations is the subject of future studies to discriminate ATB and LTBI. Due to the absence of comparative samples from patients with other diagnoses such as pneumonia, lung cancer, sarcoidosis, vasculitis, nontuberculous mycobacterial infections and aspergillosis, whether our results will remain valid following the inclusion of other groups has yet to be determined. Therefore, these findings must be validated in a prospective clinical trial.
CONCLUDING REMARKS AND FUTURE PERSPECTIVES
One of the missions of the WHO is to create a world free of TB. The ‘Post-2015 end TB strategy’ to reach this aim includes a reduction of the incidence of TB by 80%, of TB deaths by 90% and the elimination of costs for TB-affected households by 2030.[77] Major diagnostic [78] and therapeutic [79] challenges must be overcome to achieve this ambitious goal. The New Diagnostics Working Group was established to support the goal of eliminating tuberculosis (TB), in particular by promoting the development and evaluation of new TB diagnostic tools. (http://www.stoptb.org/wg/new_diagnostics/default.asp, accessed 04/01/2018).
5
General Discussion and Summary
121
As discussed above, the context of research in TB is crucial but also challenging in low-incidence countries because of the limited number of TB patients. Nevertheless, we were able to perform several projects with respect to the local clinical context. This thesis adds to the field of TB in different aspects. • The risk of travelling to TB-endemic areas during immunosuppressive treatment has been
demonstrated.[17] At present, it is important to further implement the consequences of this finding in our national guidelines and collaborate with stakeholders to increase awareness of this risk, which we have initiated.[22,23]
• The knowledge about IGRA using extra-sanguineous fluids has been extended.[43,57] A valuable and easy-to-implement ratio-approach to increase the PPV for TB-specific IGRA in extra-sanguineous fluids in a low-incidence setting has been proposed.[34] We currently must engage in collaboration with national and international organizations to execute a prospective clinical trial to further establish these findings and to answer unresolved questions.
• New insight was added to the ongoing search for a biomarker to differentiate ATB from LTBI in daily clinical practice. The new-generation QuantiFERON (QFT-plus) was evaluated for this purpose.[73] Promising biomarkers to differentiate ATB from LTBI are presented. These results await clinical validation.
• During the projects presented in this thesis (especially those in Chapter 4), we have struggled with the definition and inclusion criteria for LTBI because of the lack of a test that can demonstrate true latent infection. Moreover, a dilemma persists between, on the one hand, the clinical need to distinguish ATB from LTBI and, on the other hand, the awareness that a clear separation between ATB and LTBI is actually an oversimplification of the reality, which could be better defined as a spectrum from spontaneous clearance to quiescent infection and disease.[3,80] Therefore, together with the validation of our results, an important key objective for future research is to further unravel the complexity of host-microbe interactions and to increase our understanding of the spectrum of clinical responses to TB infection. Possible approaches for this purpose include animal[81-83], functional imaging[84,85] and gene expression studies.[86-89] A recent and promising advancement in the study of M. tuberculosis infection was the development of organoids, although the introduction of immune cells into the structure of organoids remains a challenge.[90,91]
Finally, these efforts will result in the implementation of relevant tools for diagnosis and monitoring of the different stages of infection, guiding the choice of therapy.
‘Nothing is easy in tuberculosis’. (Bill Gates)
Chapter 5
122
REFERENCES1. Dutch Council for Public Health and Society. Without context no evidence. About the illusion of
evidence-based practie in healthcare. Den Haag, 2017.
2. Mack U, Migliori GB, Sester M, et al. LTBI: latent tuberculosis infection or lasting immune responses to M. tuberculosis? A TBNET consensus statement. Eur Respir J. 2009 May;33:956-73.
3. Esmail H, Barry CE,3rd, Young DB, et al. The ongoing challenge of latent tuberculosis. Philos Trans R Soc Lond B Biol Sci. 2014 May 12;369:20130437.
4. Kaufmann SH. EFIS lecture. Immune response to tuberculosis: How to control the most successful pathogen on earth. Immunol Lett. 2016 Jul;175:50-7.
5. Norbis L, Alagna R, Tortoli E, et al. Challenges and perspectives in the diagnosis of extrapulmonary tuberculosis. Expert Rev Anti Infect Ther. 2014 May;12:633-47.
6. Barry CE,3rd, Boshoff HI, Dartois V, et al. The spectrum of latent tuberculosis: rethinking the biology and intervention strategies. Nat Rev Microbiol. 2009 Dec;7:845-55.
7. Available from: https://www.kncvtbc.org/.
8. Available from: http://www.tb-net.org/.
9. Available from: http://www.who.int/tb/en/.
10. Available from: https://www.theunion.org/.
11. Available from: https://ecdc.europa.eu/en/home.
12. Simundic AM. Measures of Diagnostic Accuracy: Basic Definitions. EJIFCC. 2009 Jan;19:203-11.
13. Chegou NN, Heyckendorf J, Walzl G, et al. Beyond the IFN-gamma horizon: biomarkers for immunodiagnosis of infection with Mycobacterium tuberculosis. Eur Respir J. 2014 May;43:1472-86.
14. World Health Organization. Global Tuberculosis Report. 2017.
15. KNCV Tuberculosis Foundation. Handbook Tuberculosis. 2017.
16. Sester M, van Crevel R, Leth F, et al. Numbers needed to treat to prevent tuberculosis. Eur Respir J. 2015 Dec;46:1836-8.
17. Hofland RW, Thijsen SF, Verhagen MA, et al. Tuberculosis during TNF-alpha inhibitor therapy, despite screening. Thorax. 2013 Nov;68:1079-80.
18. Manalan K, Singanayagam A, Wickremasinghe M, et al. Letter in response to TB during TNF-alpha inhibitor therapy, despite screening. Thorax. 2015 Apr;70:373,2014-206239
19. Dutch Association of Physicians in Chest Medicine and Tuberculosis (NVALT). Tuberculosis and TNF-α blocking therapy. 2014.
20. World Health Organization. Guidelines on the management of latent tuberculosis infection. 2015.
21. British Thoracic Society Standards of Care Committee. BTS recommendations for assessing risk and for managing Mycobacterium tuberculosis infection and disease in patients due to start anti-TNF-alpha treatment. Thorax. 2005 Oct;60:800-5.
22. Hofland R, Hoefnagel J, Mensen M. Traveling with TNF-alpha inhibitors? Risk for tuberculosis! LCR Update (National Coordination Traveler Advice). 2017;19(2):2.

5
General Discussion and Summary
123
23. Risk for Tuberculosis due to Immunosuppression, 2017. Available from: https://ggdgelderlandzuid.nl/nieuwsbrief/aanstekelijk/risico-op-tbc-door-afweerremmers/.
24. Sester M, Sotgiu G, Lange C, et al. Interferon-gamma release assays for the diagnosis of active tuberculosis: a systematic review and meta-analysis. Eur Respir J. 2011 Jan;37:100-11.
25. Aggarwal AN, Agarwal R, Gupta D, et al. Interferon Gamma Release Assays for Diagnosis of Pleural Tuberculosis: a Systematic Review and Meta-Analysis. J Clin Microbiol. 2015 Aug;53:2451-9.
26. Jafari C, Thijsen S, Sotgiu G, et al. Bronchoalveolar lavage enzyme-linked immunospot for a rapid diagnosis of tuberculosis: a Tuberculosis Network European Trialsgroup study. Am J Respir Crit Care Med. 2009 Oct;180:666-73.
27. Li Z, Qin W, Li L, et al. Accuracy of bronchoalveolar lavage enzyme-linked immunospot assay to diagnose smear-negative tuberculosis: a meta-analysis. Int J Clin Exp Med. 2015 Aug;8:12637-43.
28. Pang CS, Shen YC, Tian PW, et al. Accuracy of the interferon-gamma release assay for the diagnosis of tuberculous pleurisy: an updated meta-analysis. PeerJ. 2015 May 21;3:e951.
29. Achkar JM, Lawn SD, Moosa MY, et al. Adjunctive tests for diagnosis of tuberculosis: serology, ELISPOT for site-specific lymphocytes, urinary lipoarabinomannan, string test, and fine needle aspiration. J Infect Dis. 2011 Nov;204 Suppl 4:S1130-41.
30. Pang C, Wu Y, Wan C, et al. Accuracy of the Bronchoalveolar Lavage Enzyme-Linked Immunospot Assay for the Diagnosis of Pulmonary Tuberculosis: A Meta-analysis. Medicine (Baltimore). 2016 Mar;95:e3183.
31. Jafari C, Ernst M, Strassburg A, et al. Local immunodiagnosis of pulmonary tuberculosis by enzyme-linked immunospot. Eur Respir J. 2008 Feb;31:261-5.
32. Jafari C, Ernst M, Kalsdorf B, et al. Rapid diagnosis of smear-negative tuberculosis by bronchoalveolar lavage enzyme-linked immunospot. Am J Respir Crit Care Med. 2006 Nov;174:1048-54.
33. Losi M, Bossink A, Codecasa L, et al. Use of a T-cell interferon-gamma release assay for the diagnosis of tuberculous pleurisy. Eur Respir J. 2007 Dec;30:1173-9.
34. Hofland RW, Thijsen SF, van Lindert AS, et al. Positive predictive value of ELISpot in BAL and pleural fluid from patients with suspected pulmonary tuberculosis. Infect Dis (Lond). 2017 May;49:347-55.
35. Sester M, Sotgiu G, Lange C, et al. Interferon-gamma release assays for the diagnosis of active tuberculosis: a systematic review and meta-analysis. Eur Respir J. 2011 Jan;37:100-11.
36. Yu J, Wang ZJ, Chen LH, et al. Diagnostic accuracy of interferon-gamma release assays for tuberculous meningitis: a meta-analysis. Int J Tuberc Lung Dis. 2016 Apr;20:494-9.
37. Zhou XX, Liu YL, Zhai K, et al. Body Fluid Interferon-gamma Release Assay for Diagnosis of Extrapulmonary Tuberculosis in Adults: A Systematic Review and Meta-Analysis. Sci Rep. 2015 Oct;5:15284.
38. Cho OH, Park KH, Park SJ, et al. Rapid diagnosis of tuberculous peritonitis by T cell-based assays on peripheral blood and peritoneal fluid mononuclear cells. J Infect. 2011 Jun;62:462-71.
39. Kim SH, Chu K, Choi SJ, et al. Diagnosis of central nervous system tuberculosis by T-cell-based assays on peripheral blood and cerebrospinal fluid mononuclear cells. Clin Vaccine Immunol. 2008 Sep;15:1356-62.
Chapter 5
124
40. Lee JY, Kim SM, Park SJ, et al. A rapid and non-invasive 2-step algorithm for diagnosing tuberculous peritonitis using a T cell-based assay on peripheral blood and peritoneal fluid mononuclear cells together with peritoneal fluid adenosine deaminase. J Infect. 2015 Apr;70:356-66.
41. Tagmouti S, Slater M, Benedetti A, et al. Reproducibility of interferon gamma (IFN-gamma) release Assays. A systematic review. Ann Am Thorac Soc. 2014 Oct;11:1267-76.
42. Knierer J, Gallegos Morales EN, Schablon A, et al. QFT-Plus: a plus in variability? - Evaluation of new generation IGRA in serial testing of students with a migration background in Germany. J Occup Med Toxicol. 2017 Jan;12:1,016-0148-z. eCollection 2017.
43. Hofland RW, Bossink AW, Lammers JW, et al. Pleural Fluid and Tuberculosis: Are All Interferon Gamma Release Assays Equal? J Clin Microbiol. 2016 Feb;54:504-5.
44. Tuberculosis, Available from: http://www.who.int/tb/en/.
45. KNCV Dutch Tuberculosis Foundation. Guideline Interferon Gamma Release Assays in the diagnosis of tuberculosis. 2010.
46. Andersen P, Munk ME, Pollock JM, et al. Specific immune-based diagnosis of tuberculosis. Lancet. 2000 Sep;356:1099-104.
47. Mori T, Sakatani M, Yamagishi F, et al. Specific detection of tuberculosis infection: an interferon-gamma-based assay using new antigens. Am J Respir Crit Care Med. 2004 Jul;170:59-64.
48. Kim SH, Lee HS, Lee HJ, et al. Clinical applications of interferon-gamma releasing assays for cytomegalovirus to differentiate cytomegalovirus disease from bystander activation: a pilot proof-of-concept study. Korean J Intern Med. 2017 Sep;32:900-9.
49. Yong MK, Cameron PU, Slavin M, et al. Identifying Cytomegalovirus Complications Using the Quantiferon-CMV Assay After Allogeneic Hematopoietic Stem Cell Transplantation. J Infect Dis. 2017 Jun;215:1684-94.
50. Limonard GJ, Thijsen SF, Bossink AW, et al. Developing a new clinical tool for diagnosing chronic Q fever: the Coxiella ELISPOT. FEMS Immunol Med Microbiol. 2012 Feb;64:57-60.
51. Schoffelen T, Limonard GJ, Bleeker-Rovers CP, et al. Diagnosis of Coxiella burnetii infection: comparison of a whole blood interferon-gamma production assay and a Coxiella ELISPOT. PLoS One. 2014 Aug;9(8):e103749.
52. Dammermann W, Bentzien F, Stiel EM, et al. Development of a novel IGRA assay to test T cell responsiveness to HBV antigens in whole blood of chronic Hepatitis B patients. J Transl Med. 2015 May;13:157,015-0513-1.
53. Tavast E, Salo E, Seppala I, et al. IGRA tests perform similarly to TST but cause no adverse reactions: pediatric experience in Finland. BMC Res Notes. 2009 Jan;2:9,0500-2-9.
54. Kontturi A, Tuuminen T, Karttunen R, et al. Elispot IGRA With Purified Protein Derivative Stimulation For Diagnosing Nontuberculous Mycobacterial Cervical Lympadenitis. Pediatr Infect Dis J. 2016 Mar;35:349-51.
55. Horster R, Kirsten D, Gaede KI, et al. Antimycobacterial immune responses in patients with pulmonary sarcoidosis. Clin Respir J. 2009 Oct;3:229-38.
56. Heemstra KA, Bossink AW, Spermon R, et al. Added value of use of a purified protein derivative-based enzyme-linked immunosorbent spot assay for patients with Mycobacterium bovis BCG infection after intravesical BCG instillations. Clin Vaccine Immunol. 2012 Jun;19:974-7.

5
General Discussion and Summary
125
57. Hofland RW, Thijsen SF, Bouwman J, et al. Sarcoidosis and Purified Protein Derivative reactivity. Sarcoidosis Vasc Diffuse Lung Dis. 2014 Jul;31:142-8.
58. Chen ES, Moller DR. Etiologic role of infectious agents. Semin Respir Crit Care Med. 2014 Jun;35:285-95.
59. Esteves T, Aparicio G, Garcia-Patos V. Is there any association between Sarcoidosis and infectious agents?: a systematic review and meta-analysis. BMC Pulm Med. 2016 Nov;16:165,016-0332-z.
60. Fang C, Huang H, Xu Z. Immunological Evidence for the Role of Mycobacteria in Sarcoidosis: A Meta-Analysis. PLoS One. 2016 Aug;11:e0154716.
61. Mortaz E, Adcock IM, Barnes PJ. Sarcoidosis: Role of non-tuberculosis mycobacteria and Mycobacterium tuberculosis. Int J Mycobacteriol. 2014 Dec;3:225-9.
62. Beijer E, Veltkamp M, Meek B, et al. Etiology and Immunopathogenesis of Sarcoidosis: Novel Insights. Semin Respir Crit Care Med. 2017 Aug;38:404-16.
63. Opie EL MF. The contagion of tuberculosis. Am.Rev.Tuberculosis. 1926;14:347-385.
64. Qiagen. QuantiFERON®-TB Gold Plus (QFT®-Plus) ELISA Package Insert .
65. Petruccioli E, Chiacchio T, Pepponi I, et al. First characterization of the CD4 and CD8 T-cell responses to QuantiFERON-TB Plus. J Infect. 2016 Dec;73:588-97.
66. Lombardi G, Petrucci R, Corsini I, et al. Quantitative analysis of interferon-gamma release assay response in children with latent and active tuberculosis. J Clin Microbiol. 2017 Nov 15.
67. Harari A, Rozot V, Bellutti Enders F, et al. Dominant TNF-alpha+ Mycobacterium tuberculosis-specific CD4+ T cell responses discriminate between latent infection and active disease. Nat Med. 2011 Mar;17:372-6.
68. Petruccioli E, Petrone L, Vanini V, et al. IFNgamma/TNFalpha specific-cells and effector memory phenotype associate with active tuberculosis. J Infect. 2013 Jun;66:475-86.
69. Rozot V, Patrizia A, Vigano S, et al. Combined use of Mycobacterium tuberculosis-specific CD4 and CD8 T-cell responses is a powerful diagnostic tool of active tuberculosis. Clin Infect Dis. 2015 Feb;60:432-7.
70. Wu B, Huang C, Kato-Maeda M, et al. Messenger RNA expression of IL-8, FOXP3, and IL-12beta differentiates latent tuberculosis infection from disease. J Immunol. 2007 Mar 15;178:3688-94.
71. Achkar JM, Cortes L, Croteau P, et al. Host Protein Biomarkers Identify Active Tuberculosis in HIV Uninfected and Co-infected Individuals. EBioMedicine. 2015 Jul;2:1160-8.
72. Lu C, Wu J, Wang H, et al. Novel biomarkers distinguishing active tuberculosis from latent infection identified by gene expression profile of peripheral blood mononuclear cells. PLoS One. 2011;6:e24290.
73. Hofland RW, Bossink AWJ, Nierkens S, et al. QuantiFERON-plus does not discriminate between active and latent tuberculosis. Infect Dis (Lond). 2018 Jan 15:1-4.
74. Aagaard C, Hoang T, Dietrich J, et al. A multistage tuberculosis vaccine that confers efficient protection before and after exposure. Nat Med. 2011 Feb;17:189-94.
75. Andersen P, Askgaard D, Ljungqvist L, et al. Proteins released from Mycobacterium tuberculosis during growth. Infect Immun. 1991 Jun;59:1905-10.
Chapter 5
126
76. Lindestam Arlehamn CS, Gerasimova A, Mele F, et al. Memory T cells in latent Mycobacterium tuberculosis infection are directed against three antigenic islands and largely contained in a CXCR3+CCR6+ Th1 subset. PLoS Pathog. 2013 Jan;9:e1003130.
77. World Health Organization. Implementing the end TB strategy. The essentials. 2015.
78. Denkinger CM, Kik SV, Cirillo DM, et al. Defining the needs for next generation assays for tuberculosis. J Infect Dis. 2015 Apr;211 Suppl 2:S29-38.
79. Dudnyk A., Chesov D., Lange C. Mission impossible: the End TB strategy International Journal of Tuberculosis and Lung Disease. 2018;22:121-2.
80. Cobelens F, Kik S, Esmail H, et al. From latent to patent: rethinking prediction of tuberculosis. Lancet Respir Med. 2017 Apr;5:243-4.
81. Veatch AV, Kaushal D. Opening Pandora’s Box: Mechanisms of Mycobacterium tuberculosis Resuscitation. Trends Microbiol. 2017 Sep 11.
82. Lin PL, Rodgers M, Smith L, et al. Quantitative comparison of active and latent tuberculosis in the cynomolgus macaque model. Infect Immun. 2009 Oct;77:4631-42.
83. Capuano SV,3rd, Croix DA, Pawar S, et al. Experimental Mycobacterium tuberculosis infection of cynomolgus macaques closely resembles the various manifestations of human M. tuberculosis infection. Infect Immun. 2003 Oct;71:5831-44.
84. Malherbe ST, Shenai S, Ronacher K, et al. Persisting positron emission tomography lesion activity and Mycobacterium tuberculosis mRNA after tuberculosis cure. Nat Med. 2016 Oct;22:1094-100.
85. Ankrah AO, van der Werf TS, de Vries EF, et al. PET/CT imaging of Mycobacterium tuberculosis infection. Clin Transl Imaging. 2016;4:131-44.
86. Berry MP, Graham CM, McNab FW, et al. An interferon-inducible neutrophil-driven blood transcriptional signature in human tuberculosis. Nature. 2010 Aug;466:973-7.
87. Bloom CI, Graham CM, Berry MP, et al. Transcriptional blood signatures distinguish pulmonary tuberculosis, pulmonary sarcoidosis, pneumonias and lung cancers. PLoS One. 2013 Aug;8:e70630.
88. Zak DE, Penn-Nicholson A, Scriba TJ, et al. A blood RNA signature for tuberculosis disease risk: a prospective cohort study. Lancet. 2016 Jun;387:2312-22.
89. Iona E, Pardini M, Mustazzolu A, et al. Mycobacterium tuberculosis gene expression at different stages of hypoxia-induced dormancy and upon resuscitation. J Microbiol. 2016 Aug;54:565-72.
90. Fonseca KL, Rodrigues PNS, Olsson IAS, et al. Experimental study of tuberculosis: From animal models to complex cell systems and organoids. PLoS Pathog. 2017 Aug;13:e1006421.
91. Iakobachvili N, Peters PJ. Humans in a Dish: The Potential of Organoids in Modeling Immunity and Infectious Diseases. Front Microbiol. 2017 Dec;8:2402.

5
General Discussion and Summary
127


Addenda
6

Chapter 6
130
Summary in Dutch - Samenvatting in het Nederlands
6
Summary in Dutch – Samenvatting in het Nederlands
131
Hoofdstuk 1, Introductie
Tuberculose (TBC) wordt veroorzaakt door één van de bacteriën uit het zogenaamde Mycobacterium Tuberculosis Complex, meestal M. tuberculosis, en is wereldwijd een belangrijke oorzaak van ziekte en overlijden bij kinderen en volwassenen. Behalve voor de mycobacteriën uit het Mycobacterium Tuberculosis Complex (tuberculeuze mycobacteriën) is er ook toenemende aandacht voor de klinische relevantie van de (meer dan 150 verschillende) niet-tuberculeuze mycobacteriën. Deze mycobacteriën komen veelal in de omgeving voor en kunnen tot ziekte leiden, waarbij de presentatie kan lijken op TBC, maar het in feite een heel andere aandoening betreft.
Jaarlijks wordt bij ruim 10 miljoen mensen TBC vastgesteld en overlijden 1,6 miljoen mensen ten gevolge van deze aandoening. Nederland behoort tot de laag - endemische landen, dat wil zeggen dat TBC weinig voorkomt. In 2016 werd in Nederland bij 889 mensen TBC vastgesteld en zijn 6 mensen hieraan overleden. TBC is om meerdere redenen een uitdagende aandoening. Veelal zijn er door de sociale en economische omstandigheden in landen waar TBC veel voorkomt beperkingen op het gebied van diagnostiek en behandeling, alsook beperkingen voor het doen van wetenschappelijk onderzoek om onopgeloste vragen op het gebied van het ontstaan en beloop van de ziekte, de diagnostiek en de behandeling te beantwoorden.
Besmetting met M. tuberculosis vindt plaats door het inademen van tuberculeuze mycobacteriën die verspreid worden door hoestende patiënten met een open longtuberculose. Na besmetting ontstaat een afweerreactie van het aangeboren deel van het immuunsysteem, waarbij diverse ontstekingscellen (o.a. macrofagen, dendritische cellen en neutrofiele granulocyten) betrokken zijn. Enkele weken daarna ontstaat een afweerreactie van het verworven deel van het immuunsysteem, waarin andere ontstekingscellen (vooral CD4+ en CD8+ T-lymfocyten) samen met stoffen die door deze cellen worden afgescheiden (cytokines en chemokinen) een cruciale rol spelen. Belangrijke cytokines zijn o.a. interferon gamma (IFN-γ) en tumor necrosis factor alpha (TNF-α). Door een complexe, nog niet volledig opgehelderde interactie tussen zowel het aangeboren als het verworven deel van het immuunsysteem wordt een granuloom gevormd, met als doel de infectie onder controle te houden.
Na besmetting ontwikkelt 10% van de mensen TBC, waarvan de helft binnen twee jaar na de besmetting, en de andere helft later in het leven. De meeste mensen (90%) worden door een goede afweerreactie van het immuunsysteem niet ziek na besmetting, maar de bacterie kan wel jarenlang in het lichaam blijven overleven en ook na lange tijd nog tot ziekte leiden. Door middel van een immunologische test, een Interferon Gamma Release Assay (IGRA) of Mantoux test, kan worden vastgesteld of iemand in contact is geweest met M. tuberculosis. Bij
Chapter 6
132
een positieve test en geen aanwijzingen voor TBC wordt dan de diagnose latente tuberculose infectie (LTBI) gesteld. Deze mensen hebben geen klachten en zijn niet besmettelijk. De inschatting is dat één derde van de wereldbevolking een LTBI heeft. De moeilijkheid bij een LTBI is dat de testen geen onderscheid kunnen maken tussen alleen een immunologisch ‘litteken’ of de daadwerkelijke aanwezigheid van nog levende ‘slapende’ bacteriën. Waarschijnlijk is bij een deel van de mensen met een LTBI geen levende M. tuberculosis meer in het lichaam aanwezig. Dit maakt de term ‘latent’ eigenlijk verwarrend. Bovendien kunnen deze testen geen onderscheid maken tussen LTBI en TBC. Als bij mensen met een LTBI de afweer vermindert (bijvoorbeeld door ziekte of medicatie) kan er reactivatie optreden, met TBC als gevolg. Het behandelen van een LTBI maakt de kans op reactivatie aanzienlijk kleiner. Deze profylactische behandeling bestaat doorgaans uit twee soorten antibiotica gedurende drie tot vier maanden.
TBC kan zowel in de longen (pulmonale TBC), als buiten de longen (extrapulmonale TBC) voorkomen. Er zijn veel uitingsvormen van TBC, variërend van geen of milde, niet-specifieke klachten tot ernstige klachten. De diagnose wordt gesteld door het afnemen van een monster uit het aangedane orgaan, bijvoorbeeld sputum. Vervolgens wordt in het laboratorium geprobeerd de mycobacterie te kweken danwel DNA (desoxyribonucleïnezuur, erfelijke informatie) van de mycobacterie aan te tonen. De diagnose is soms moeilijk te stellen, vooral bij extrapulmonale vormen van TBC. Het kan voorkomen dat de mycobacterie in het laboratorium niet gekweekt wordt en dat er geen DNA wordt aangetoond, terwijl toch sprake is van TBC. Dit leidt tot vertraging in de behandeling, met alle gevolgen van dien. Behandeling van TBC is afhankelijk van de ernst van de ziekte en eventuele resistentie, maar bestaat uit minimaal zes maanden behandeling met meerdere soorten antibiotica.
Behalve dat we in de praktijk bij een LTBI een immunologisch ‘litteken’ en de aanwezigheid van nog levende ‘slapende’ bacteriën niet van elkaar kunnen onderscheiden kan het ook moeilijk zijn om TBC van een LTBI te onderscheiden. Omdat de behandeling van TBC langdurig is en met aanzienlijke bijwerkingen gepaard kan gaan heeft het onderscheid tussen LTBI en TBC grote consequenties. Bovendien kan een niet – behandelde TBC leiden tot verspreiding van de ziekte.
In dit proefschrift richten we ons op verschillende klinische en immunologische aspecten van TBC. We onderzoeken of het meten van de reactie van het afweersysteem, zowel in het bloed als in andere lichaamsvloeistoffen, behulpzaam kan zijn bij het vaststellen van TBC alsook bij het onderscheiden van de verschillende stadia van een M. tuberculosis infectie (LTBI - TBC).
6
Summary in Dutch – Samenvatting in het Nederlands
133
Hoofdstuk 2, Tuberculose tijdens behandeling met TNF-α remmers
Bij verschillende auto-immuunaandoeningen, zoals de ziekte van Crohn of reumatoïde artritis, kan behandeling met TNF-α remmers (sterke afweer onderdrukkende medicatie) nodig zijn. Omdat TNF-α een belangrijke cytokine is in de complexe reactie van het immuunsysteem om een M. tuberculosis infectie onder controle te houden, is de kans op het ontwikkelen van TBC heel groot voor mensen met een LTBI tijdens behandeling met TNF-α remmers. Daarom wordt geadviseerd om voorafgaand aan behandeling met TNF-α remmers mensen te screenen op LTBI en in het geval van een positieve test een profylactische behandeling te geven. In hoofdstuk 2 van dit proefschrift evalueren we deze screening bij 144 patiënten in onze klinische praktijk. Bij elf patiënten werd een LTBI vastgesteld, waarvoor profylactische behandeling gegeven werd om de kans op TBC tijdens de behandeling met TNF-α remmers te verkleinen. Geen van hen ontwikkelde TBC. We weten echter niet of alle behandelde patiënten de profylactische therapie daadwerkelijk nodig hadden, omdat het mogelijk is dat sommige patiënten alleen een immunologisch ‘litteken’ hadden zonder de aanwezigheid van levende bacteriën. Twee patiënten zonder aanwijzingen voor een LTBI vóór de start van de behandeling met TNF-α-remmers ontwikkelden wel TBC, van wie één helaas overleed aan door TBC veroorzaakte hersenvliesontsteking. Het is aannemelijk dat beide patiënten na de start van de behandeling met TNF-α remmers geïnfecteerd zijn tijdens het reizen naar TBC - endemische landen (landen waar TBC veel voorkomt). Daarom is een belangrijke les van dit hoofdstuk dat we ons bewust moeten zijn van het risico van reizen naar TBC - endemische landen tijdens behandeling met TNF-α remmers. Omdat deze behandeling ertoe leidt dat mensen doorgaans veel minder last hebben van de auto-immuunziekte wordt nogal eens besloten op reis te gaan. We adviseren dit op te nemen in de richtlijnen over de behandeling met afweer onderdrukkende geneesmiddelen.
Hoofdstuk 3, Interferon Gamma Release Assays in lichaams-vloeistoffen
Interferon Gamma Release Assays (IGRA’s) zijn testen die oorspronkelijk ontwikkeld zijn om in het bloed aan te tonen of mensen in het verleden besmet zijn met M. tuberculosis. Het afgenomen bloed wordt gedurende 16 tot 24 uur in contact gebracht met M. tuberculosis specifieke antigenen (eiwitten). Bij een eerdere besmetting met M. tuberculosis zullen de in het bloed aanwezige ontstekingscellen, te weten T-lymfocyten, deze antigenen herkennen en als reactie daarop interferon gamma (IFN-ɣ) gaan produceren. Door het meten van deze IFN-ɣ productie kan dus beoordeeld worden of iemand eerder besmet is met M. tuberculosis. Zoals al benoemd kan een IGRA geen onderscheid maken tussen een immunologisch ‘litteken’ en de aanwezigheid van nog levende ‘slapende’ bacteriën bij LTBI, en ook geen onderscheid maken tussen LTBI en TBC.
Bij TBC zijn M. tuberculosis specifieke T-lymfocyten geconcentreerd op de plaats van de infectie. Het meten van de lokale M. tuberculosis specifieke afweerreactie in lichaamsvloeistoffen
Chapter 6
134
anders dan bloed (extrasanguine lichaamsvloeistoffen) door middel van een IGRA kan daarom dienen als ondersteuning bij het vaststellen van TBC, maar zoals bekend uit de literatuur is de positief voorspellende waarde (PPV, de kans dat iemand met een positieve test de ziekte ook daadwerkelijk heeft) hiervan vooralsnog beperkt. Dit komt waarschijnlijk omdat bij patiënten met een LTBI ook M. tuberculosis specifieke T-lymfocyten in het extrasanguine lichaamsvocht aanwezig zijn en/of omdat tijdens het afnemen van de monsters bloedbijmenging optreedt. Dit kan leiden tot fout-positieve resultaten, waarbij het moeilijk is om onderscheid te maken tussen TBC enerzijds en LTBI in combinatie met een andere, niet-TBC gerelateerde ziekte anderzijds. Omdat bij TBC het aantal M. tuberculosis specifieke T-lymfocyten op de plaats van de infectie hoger is in vergelijking met het aantal M. tuberculosis specifieke T-lymfocyten in perifeer bloed, formuleerden we de hypothese dat de introductie van een ratio > 1,0 tussen de lokale (extrasanguine) en de systemische (bloed) IFN-ɣ productie de PPV van IGRA in extrasanguine lichaamsvloeistoffen zou kunnen verhogen. We evalueerden deze hypothese in een retrospectieve studie (hoofdstuk 3a), waarin 40 patiënten met een positieve IGRA (ELISpot) in broncho-alveolaire lavage (BAL, longspoeling) en 16 patiënten met een positieve ELISpot in pleura (longvlies) vocht werden geïncludeerd. De aan- of afwezigheid van TBC werd achteraf beoordeeld met een periode van tenminste twee jaar follow-up voor de patiënten bij wie de diagnose aanvankelijk nog onzeker was. De PPV voor de aanwezigheid van TBC bij patiënten met een positieve ELISpot in BAL was 64,9%, en steeg tot 82,6% voor het ESAT-6 panel (één van de twee gebruikte M. tuberculosis specifieke antigenen) en 71,4% voor het CFP-10 panel na de introductie van een ratio > 1,0 tussen de BAL en bloed IFN-ɣ respons. Bij patiënten met een positieve ELISpot in pleuravocht was de PPV 85,7%, en steeg tot 91,7% voor het ESAT-6 panel en 92,3% voor het CFP-10 panel na de introductie van een ratio > 1,0 tussen de pleuravocht en bloed IFN-ɣ respons. Deze resultaten laten zien dat de PPV inderdaad toeneemt bij het toepassen van een ratio > 1,0 tussen de lokale en systemische IFN-ɣ respons en zijn veelbelovend voor verdere evaluatie van de rol van M. tuberculosis specifieke IGRA’s in extrasanguine lichaamsvloeistoffen in een laag - endemisch gebied. Daarvoor is een prospectieve studie nodig in een goed gedefinieerde populatie, waarin behalve de PPV ook de sensitiviteit, specificiteit en negatief voorspellende waarde geëvalueerd worden. Het beperkte aantal TBC patiënten in laag - endemische landen zal echter een belangrijke belemmering zijn voor het uitvoeren van een dergelijk onderzoek.Het is onduidelijk of beide beschikbare IGRA’s (QuantiFERON en ELISpot) geschikt zijn voor toepassing in extrasanguine lichaamsvloeistoffen. Een recente systematische review van IGRA in pleuravocht voor de diagnose van longvliestuberculose (pleurale TBC) concludeerde vergelijkbare sensitiviteit en specificiteit voor QuantiFERON en ELISpot. In hoofdstuk 3b van dit proefschrift bespreken we twee belangrijke methodologische beslissingen van deze review met consequenties voor de resultaten. ‘Indeterminate’ resultaten (gedefinieerd als ‘niet te bepalen vanwege ongeldige positieve en / of negatieve controle’) van IGRA in pleuravocht
6
135
Summary in Dutch – Samenvatting in het Nederlands
werden in deze review gecategoriseerd als fout-negatief. Tevens worden beide testen samengenomen in de evaluatie van de diagnostische waarde van de testen. We laten zien dat dit een aanzienlijke invloed heeft op de berekende sensitiviteit en specificiteit. In de klinische praktijk gebruiken we indeterminate IGRA resultaten niet bij de medische besluitvorming. We adviseren daarom de indeterminate resultaten niet mee te nemen in de berekening van de diagnostische waarde van de IGRA en gezien de verschillende testmethoden de resultaten van beide testen afzonderlijk te analyseren. Dat resulteert in een hogere diagnostische waarde voor ELISpot (sensitiviteit 91,7%, specificiteit 78,3%) in vergelijking met QuantiFERON (sensitiviteit 73,3%, specificiteit 80,8%). De gezamenlijke evaluatie in de review resulteerde in een sensitiviteit van 72,0% en een specificiteit van 78,0%. Op basis van deze resultaten adviseren wij het gebruik van ELISpot voor verder onderzoek met IGRA in extrasanguine lichaamsvloeistoffen.
IGRA’s zijn ook toepasbaar bij andere aandoeningen dan TBC, waarbij dan andere antigenen worden gebruikt. Een voorbeeld daarvan is IGRA met Purified Protein Derivative (PPD) als algemeen mycobacterieel antigeen (voorkomend bij zowel tuberculeuze als niet-tuberculeuze mycobacteriën), waarvan mogelijke klinische toepassingen onderzocht worden in hoofdstuk 3c en 3d van dit proefschrift.
De achtergrond van hoofdstuk 3c is de mogelijke associatie tussen mycobacteriële infecties en sarcoïdose, een ziektebeeld dat gepaard gaat met ontstekingsreacties in veel organen van het lichaam (o.a. de longen) en dat op weefselniveau afwijkingen veroorzaakt die lijken op de afwijkingen veroorzaakt door TBC. Het mogelijke verband tussen beide aandoeningen is al lang onderwerp van onderzoek. Sarcoïdose wordt geschaard onder de interstitiële longziekten. Dit is een verzamelnaam voor ongeveer 150 verschillende aandoeningen waarbij beide longen diffuus (longblaasjes, bloedvaten, longvliezen en/of luchtwegen) kunnen zijn aangetast.We formuleerden de hypothese dat indien een mycobacteriële infectie geassocieerd is met de ontwikkeling van sarcoïdose, de lokale en/of systemische PPD-specifieke IFN-ɣ respons groter zal zijn bij sarcoïdose patiënten in vergelijking met patiënten met andere interstitiële longziekten. Daartoe hebben we de PPD-specifieke IFN-ɣ respons (ELISpot) gemeten in het bloed en de broncho-alveolaire lavage (BAL) van 32 patiënten met sarcoïdose en 86 patiënten met andere interstitiële longziekten. Er was geen verschil in PPD-specifieke IFN-ɣ respons in het bloed (p = 0,262) en de BAL (p = 0,356) tussen beide groepen. We combineerden onze resultaten vervolgens met de resultaten van een vergelijkbare studie van collegae uit Duitsland, waarbij de hypothese opnieuw niet werd bevestigd en er zelfs een lagere PPD-specifieke IFN-ɣ respons in het bloed was bij sarcoïdose ten opzichte van andere interstitiële longziekten (p = 0,01). We concluderen daarom dat deze resultaten de hypothese van een associatie tussen

136
Chapter 6
mycobacteriële infecties en sarcoïdose niet ondersteunen.
Om de haalbaarheid van IGRA-PPD in extrasanguine lichaamsvloeistoffen verder te analyseren hebben we de PPD-specifieke IFN-ɣ respons gemeten in 70 urine- en blaasspoelingmonsters van 14 patiënten met blaaskanker na behandeling met Bacille Calmette-Guérin (BCG) spoelingen, hoofdstuk 3d. BCG is oorspronkelijk een vaccin tegen TBC dat gemaakt wordt van levend verzwakte, bij runderen voorkomende mycobacteriën, M. bovis. BCG is werkzaam bij blaaskanker door het stimuleren van een afweerreactie tegen tumorcellen in de blaas. Slechts in 14% van de monsters werd een PPD-specifieke IFN-ɣ respons gemeten. In 3% van de monsters werd geen PPD-specifieke IFN-ɣ respons gemeten. De overige monsters (83%) resulteerden in een indeterminate uitslag vanwege het ontbreken van een reactie in de positieve controle, hoewel met behulp van flowcytometrie, een meetmethode waarmee eigenschappen van ontstekingscellen gemeten kunnen worden, in alle monsters T-lymfocyten werden gedetecteerd. De resultaten van deze studie hebben vooralsnog niet tot een oplossing geleid, maar bieden wel aanknopingspunten voor verdere verbetering van de ELISpot PPD techniek.
Hoofdstuk 4, Het onderscheiden van actieve en latente tuberculose
Het doel van hoofdstuk 4 is het identificeren van potentiële kenmerken in het bloed (biomarkers) om TBC en LTBI van elkaar te onderscheiden. Het is bekend dat de oorspronkelijke ELISpot en QuantiFERON in bloed dit onderscheid niet kunnen maken. In 2015 werd de opvolger van QuantiFERON, QuantiFERON PLUS (QFT-plus), geïntroduceerd, met als belangrijkste verschil een tweede antigeenbuis. In de eerste antigeenbuis (TB1) wordt een TBC-specifieke CD4+ T-lymfocyten respons (IFN-ɣ) gemeten en in de tweede antigeenbuis (TB2) een TBC-specifieke CD4+ én CD8+ T-lymfocyten respons. Omdat een CD8+ respons vooral geassocieerd lijkt met recente besmettingen en actieve TBC ontstond de hypothese dat het verschil tussen TB1 en TB2 (als een surrogaat van de CD8+ respons) wellicht informatie kan geven over het stadium van de ziekte en dus onderscheid zou kunnen maken tussen TBC en LTBI. Deze hypothese was de aanleiding voor het onderzoek dat beschreven wordt in hoofdstuk 4a. We includeerden twintig deelnemers met actieve TBC (elf met pulmonale TBC en negen met extrapulmonale TBC), twintig deelnemers met LTBI die geen profylaxe gekregen hadden, twintig andere deelnemers met LTBI na voltooiing van profylactische behandeling en twintig gezonde deelnemers. Bij alle deelnemers werd bloed afgenomen en de IFN-ɣ respons bepaald in beide antigeenbuizen van de QFT-plus. De resultaten toonden een grote mate van overlap tussen de deelnemers met TBC en LTBI. Het verschil tussen TB1 en TB2 was niet significant verschillend tussen de deelnemers met TBC en LTBI. De mediane IFN-ɣ productie in TB2 was significant hoger bij de deelnemers met TBC in vergelijking met de LTBI deelnemers zonder profylactische behandeling (p=0.023), maar vanwege de grote mate

137
6
van overlap is het onwaarschijnlijk dat dit in de klinische praktijk zal helpen om onderscheid te maken tussen TBC en LTBI. Daarom is het nodig om te zoeken naar andere biomarkers die dit onderscheid kunnen maken. Dit was de doelstelling voor het onderzoek dat beschreven wordt in hoofstuk 4b, waarin dezelfde deelnemers geïncludeerd zijn als in het onderzoek van hoofdstuk 4a. In het afgenomen bloed werd de concentratie van 40 verschillende cytokines en chemokinen bepaald, samen met de activiteit van adenosine deaminase (ADA) isozymen (enzymen betrokken bij de eiwitstofwisseling). De concentratie van VEGF, I-309, CRP, IP-10 alsook de activiteit van ADA was significant verhoogd bij de deelnemers met TBC in vergelijking met de deelnemers met LTBI. De combinatie van de I-309 concentratie samen met de ADA-activiteit resulteert in een sensitiviteit en specificiteit van respectievelijk 100% en 80% in het differentiëren tussen de deelnemers met TBC en de deelnemers met LTBI zonder profylaxe. Deze biomarkers zijn daarom veelbelovend voor verder onderzoek. Omdat de waargenomen verschillen tussen deelnemers met TBC en LTBI kunnen samenhangen met verschillen tussen de in het bloed circulerende ontstekingscellen (o.a. T-lymfocyten), hebben we in dit onderzoek ook gekeken naar de kenmerken van de CD4+ en CD8+ T-lymfocyten. We constateerden inderdaad een toegenomen cytokineproductie door CD8+ T-lymfocyten alsook een hoger aantal T-lymfocyten met een gevorderde mate van uitrijping bij de deelnemers met TBC in vergelijking met de deelnemers met LTBI. Het combineren van deze kenmerken samen met de ADA-activiteit en de concentratie van I-309 is onderwerp voor vervolgonderzoek.
Hoofdstuk 5, Discussie en samenvatting
In hoofdstuk 5 worden de resultaten van dit proefschrift bediscussieerd en samengevat. Belangrijke onderwerpen voor toekomstig onderzoek zijn: • Het evalueren van de diagnostische waarde van de ELISpot in extrasanguine
lichaamsvloeistoffen met toepassing van de in dit proefschrift voorgestelde ratio tussen de lokale en systemische IFN-ɣ respons.
• Het valideren van het in dit proefschrift voorgestelde biomarkerprofiel om TBC en LTBI van elkaar te onderscheiden.
Summary in Dutch – Samenvatting in het Nederlands

138
Acknowledgement – Dankwoord
Chapter 6

139
Acknowledgement – Dankwoord
Dit proefschrift zou er niet gekomen zijn zonder de bijdrage van veel patiënten, met een diversiteit van minimaal 28 verschillenden nationaliteiten. Ik voel me bevoorrecht dat ik bij een deel van hen ook thuis ben geweest, de mooiste momenten van het hele proces. Hartelijk dank! Thanks a lot! Merci beaucoup! Baie dankie! Terima kasih banyak! ! !
Geachte professor Lammers, beste Jan-Willem. Ik herinner me nog steeds het warme welkom als ANIOS. Terloops gaf je eens de tip om mijn onderzoeksactiviteiten binnen één onderwerp te houden, zonder de druk van een eventueel proefschrift op m’n schouders te leggen. Dank voor het vertrouwen, je begeleiding en de intentie om me naar het eind van dit promotietraject te loodsen, ook op de momenten dat ik dat vertrouwen zelf niet had. Ik heb veel van je geleerd en bewonder je werklust en nooit afl atende inzet en enthousiasme voor ons vak.
Geachte copromotoren, beste Aik en Steven. Zachtjesaan hebben jullie me in een promotietraject gemanoeuvreerd, goed beseff end dat dit zachtjesaan moest gaan. Jullie interesse voor TB is besmettelijk. Veel dank voor jullie begeleiding en het beschikbaar stellen van data en fi nanciën om dit proefschrift mogelijk te maken. Dank ook voor de opbeurende woorden tijdens de dieptepunten van dit proces. Aik, ik heb genoten van je ‘out-of-the-box’ denken. Zo kwam ik tot acties die ik zelf niet bedacht zou hebben: Submission bij NEJM, me samen met jou laten vervoeren door een fi etstaxi in San Francisco en het bijwonen van een Qiagen – QFT-plus praatje, met alle gevolgen van dien.Steven, ik bewonder je organisatietalent, energie en optimisme. Bijzonder hoe je klinische taken, management, onderzoek en nu ook onderwijs soepel weet te combineren.
Stefan, jij bent eigenlijk mijn derde copromotor. Veel dank voor je inspiratie en enthousiasme. Mede dankzij je translationele kwaliteiten is U-DAIR bij jou in goede handen. Ik hoop dat onze samenwerking blijft bestaan.
Geachte leden van de beoordelingscommissie: prof. dr. A.I.M. Hoepelman, prof. dr. C.E. Hack, prof. dr. L. Koenderman, prof. dr. T.S. van der Werf, dr. M. Bakker. Hartelijk dank voor het lezen en beoordelen van dit proefschrift. Beste Leo, een speciaal woord van dank aan jou, voor je hulp, sturing en prikkelende vragen. Wordt hopelijk vervolgd in het Teheran-project?
Velen in het Diakonessenhuis: • Internisten: Bij jullie begon mijn Diak-tijd, kreeg ik vertrouwen om te groeien als dokter en
werd ik gemotiveerd om onderzoek te doen. Dank daarvoor.• Longartsen en microbiologen: Veel dank voor jullie hulp en fi nanciële bijdrage bij de
totstandkoming van de projecten.
6

140
• Gerda, Marleen en andere secretaresses van de longpoli: Altijd gezellig om bij jullie binnen te lopen en een bakkie te doen. Bedankt!
• Marianne, Sophia, Lydia en alle anderen van het microbiologie lab: dank voor alles!• Diakademie: Dank voor de financiële steun en niet te vergeten de wetenschapsprijs.
Veel anderen in het UMCU: • Collegae longartsen: Dank voor jullie steun en de tijd die ik kreeg om aan dit proefschrift
te werken. We werken samen binnen een prachtig specialisme. Er is zoveel moois te doen! Bedankt Harry, dat ik hieraan mag bijdragen.
• Collegae AIOS en René: Ook tijdens de opleiding kreeg ik tijd en ruimte om het onderzoek te kunnen doen, dank daarvoor. Mede dankzij jullie bewaar ik goede herinneringen aan de opleidingstijd.
• Berry en Mariken, jullie zijn een rots in de branding op de stafgang. Dank voor jullie hulp bij alle administratieve klussen rondom dit promotietraject.
• Analisten van U-DAIR, Amelia, Karin en Lysette, en analisten van het luminex lab: dank! • Ingeborg vd Tweel en Pieter Zanen: dank voor jullie statistische adviezen. Julia Drylewicz:
Thanks for your statistical support. • Studenten binnen de QUALITY-studie: Brigitte, Sanne en Laura. Het was heel inspirerend
om jullie stage te begeleiden. En vooral: wat was ik blij met jullie hulp. Bedankt.
GGD afdeling tuberculosebestrijding Utrecht: Ineke, Wim, Gert, Marrit, San, Debora, Emma, Janneke en Natascha. Hartelijk dank voor alle inclusies. Jullie hebben een mooi vak.
Lieve pa en ma. Bedankt voor de opvoeding, zorg en liefde die jullie hebben gegeven. Al jong werden we betrokken bij het werk, en opgeven was niet echt een optie. Deze bagage heeft me geholpen dit proefschrift te schrijven. Maar een nog belangrijker boodschap die ik meekreeg was Gods Woord. Dat Woord wijst de richting. Veel dank!
Emmy & Gerard, Kees, Marian, Leendert & Ditta, Rianne & Bas, Jaap, Teuni & Bart, Bas & Thirza, Geert, Wijnan, Eimert, Marije, Natasja, André, Anne Lize, Bastian, Martine, Madeleine, Gerlinde, Arno, Tine, Bas(je), Emmaly en Twan. Jullie helpen me (al dan niet bewust) door de totaal andere wereld van bedrijf, gezin, school etc. om afstand te nemen van m’n werk en met beide benen op de grond te blijven. Bedankt daarvoor. Ik hou van jullie! In het bijzonder Rianne, lieve zus, jij wist (beter dan ik) dat dit proces me veel lastige momenten zou bezorgen. Wat een voorrecht dat je er tijdens hoogte- en dieptepunten altijd bent. Bedankt!
Vriendinnen, ik ben blij met jullie. Veel dank voor jullie support, de afleiding en de gezelligheid. Een aantal van jullie wil ik in het bijzonder noemen. Marion en Albertine, wat een rust, júllie
Chapter 6

140 141
als paranimf naast me. Arina, je meeleven en de gezellige tripjes & weekendjes worden gewaardeerd. Willie, dank voor het ontspannende baantjes trekken en het heerlijke eten. Teuni, je bent een rots in de branding. Hendrika, het begon in Afrika en daar bleef het gelukkig niet bij. Wat kun jíj goed ontzorgen. Bertha, jouw coachende kwaliteiten, zowel verbaal als in natura zijn fantastisch.
Naast het bedanken van jullie allemaal past het me vooral de Heere te danken voor de gezondheid en de kracht die Hij gaf om aan dit proefschrift te werken. De toekomst is in Zijn handen.
6
Acknowledgement – Dankwoord

Chapter 6
142
Curriculum Vitae
6
143
Regina Hofland was born on October 11th 1979 in Zegveld. She grew up in a family with three sisters and two brothers. After completing her secondary school at the Driestar College in Gouda, she studied nursing at the Christelijke Hogeschool Ede. This was followed by a traineeship and consequently a job at the pulmonology department of the VU Medical Center in Amsterdam. In 2004, she got the possibility to start the Selective Utrecht Medical Master (SUMMA) at the University of Utrecht, during which she conducted a research project about tuberculosis and HIV in the Mbuma hospital in Zimbabwe (Africa). She received her medical degree in 2008 and started as a resident in Internal Medicine in the Diakonessenhuis Utrecht followed by a period as a resident in Pulmonology and Tuberculosis in the University Medical Center Utrecht (UMCU). During her training in Pulmonology and Tuberculosis (2010-2016), she worked in the Diakonessenhuis Utrecht under supervision of Dr. A.F. Muller, in the UMCU under supervision of Prof. dr. J-W.J. Lammers and Dr. R.C. Schweizer and in the Antonius Ziekenhuis Nieuwegein under supervision of Dr. F.M.N.H. Schramel. In these years she started with research activities which resulted in this thesis. She is currently working as a pulmonologist (UMCU) with special attention for pulmonary infections, including tuberculosis and cystic fibrosis.
Curriculum Vitae


REGINA HOFLAND
15378-hofland-cover.indd 218/04/2018 14:1515378-hofland-cover.indd 218/04/2018 14:15

UITNODIGING
voor het bijwonen van de openbare verdediging
van het proefschrift
Clinical Aspects of Immune Responses
in Tuberculosis
D.V. Dinsdag 29 mei 2018, 12:45 uur Academiegebouw
Domplein 29 te Utrecht
Na afloop bent u van harte welkom op de receptie ter plaatse
REGINA HOFLANDGriffensteijnselaan 6
3703 AA Zeist06-15275776
PARANIMFEN
Marion VerduijnAlbertine Donker
TuberculosisTuberculosisTuberculosisTuberculosis
REGINA HOFLAND
Clinical Aspects of Immune Responses in
Clinical A
spects of Imm
une Responses in Tuberculosis
REG
INA
HO
FLAN
D
15378-hofland-cover.indd 1 18/04/2018 14:15
UITNODIGING
voor het bijwonen van de openbare verdediging
van het proefschrift
Clinical Aspects of Immune Responses
in Tuberculosis
D.V. Dinsdag 29 mei 2018, 12:45 uur Academiegebouw
Domplein 29 te Utrecht
Na afloop bent u van harte welkom op de receptie ter plaatse
REGINA HOFLANDGriffensteijnselaan 6
3703 AA Zeist06-15275776
PARANIMFEN
Marion VerduijnAlbertine Donker
TuberculosisClinical Aspects of Immune Responses in
Clinical A
spects of Imm
une Responses in Tuberculosis
REG
INA
HO
FLAN
D
15378-hofland-cover.indd 1 18/04/2018 14:15