Trefdag Pluimvee - West-Vlaanderen · Trefdag Pluimvee 6 november 2018 Jean Spreuwers. Wereldtrends...
31
We gaan vooruit! Trefdag Pluimvee 6 november 2018 Jean Spreuwers
Transcript of Trefdag Pluimvee - West-Vlaanderen · Trefdag Pluimvee 6 november 2018 Jean Spreuwers. Wereldtrends...
We gaanvooruit!
Trefdag Pluimvee 6 november 2018
Jean Spreuwers
Wereldtrendsin de braadkuikensector
met focus op de productie en wat kan dat
voor ons betekenen?
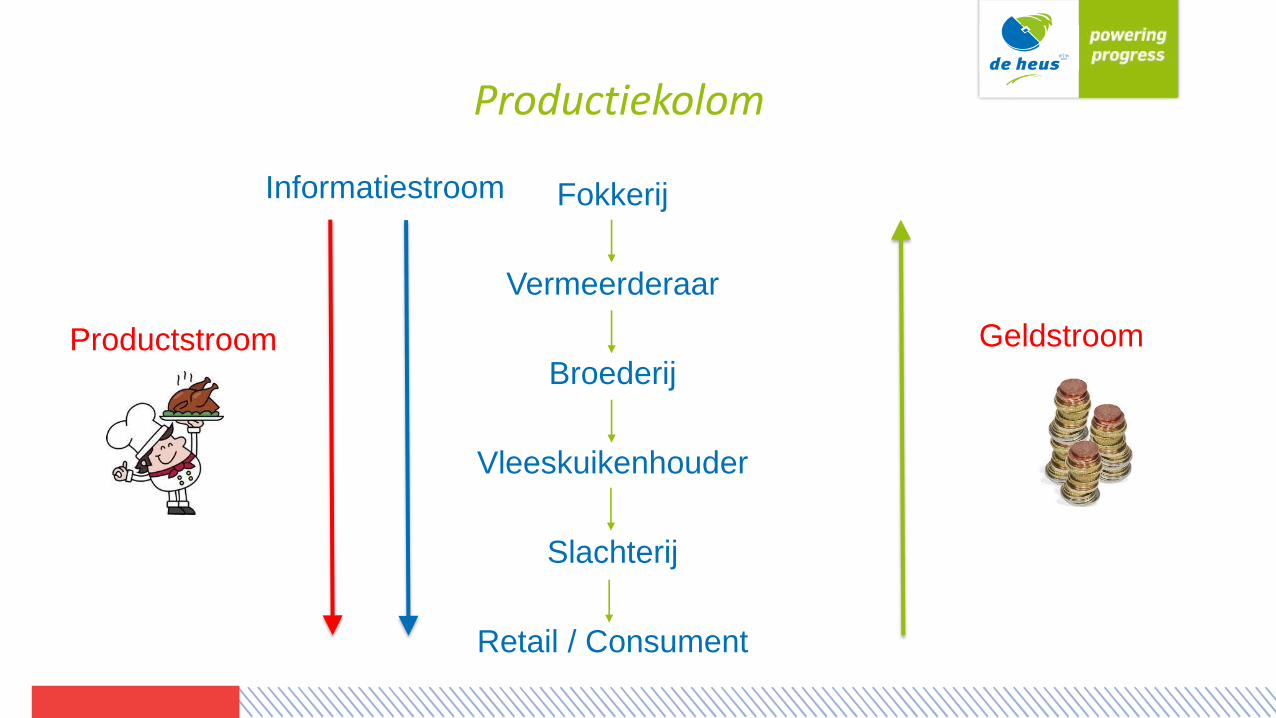
Productiekolom
Productstroom
Fokkerij
Vermeerderaar
Broederij
Vleeskuikenhouder
Slachterij
Retail / Consument
Geldstroom
Informatiestroom
Global trends
0
5
10
15
20
25M
illi
on
ton
nes
/ye
ar
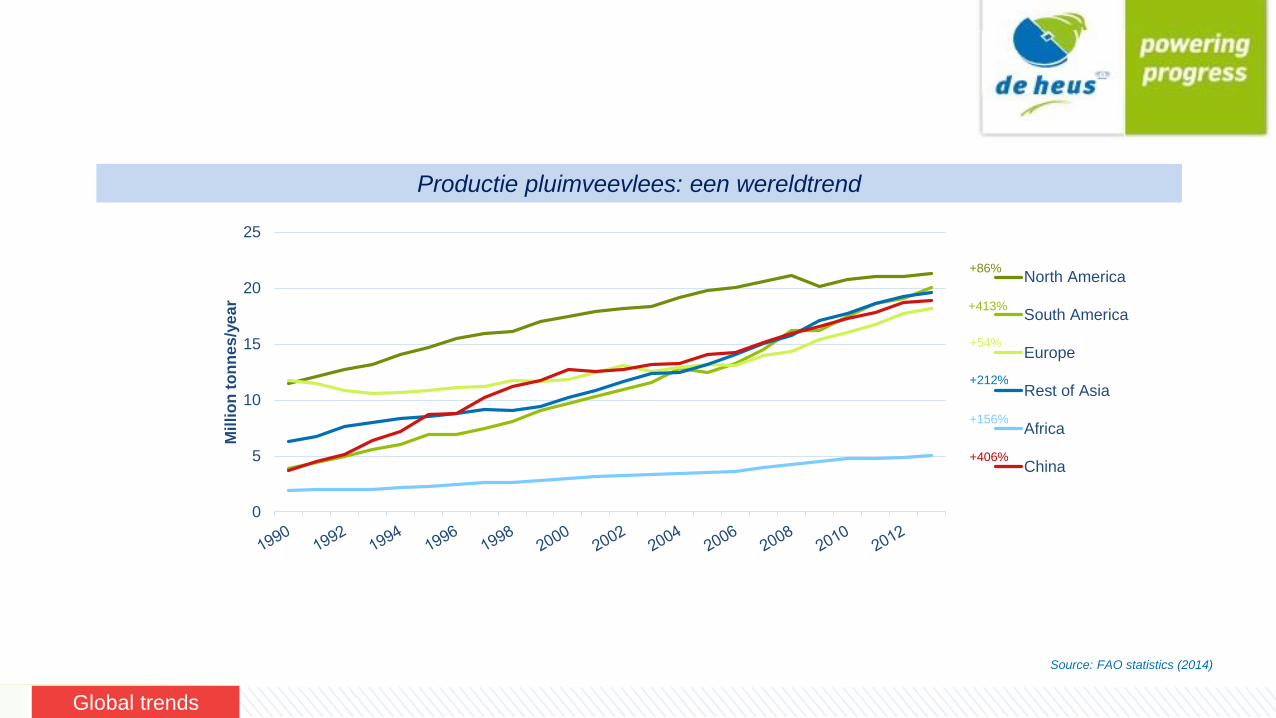
North America
South America
Europe
Rest of Asia
Africa
China
Productie pluimveevlees: een wereldtrend
Source: FAO statistics (2014)
+86%
+413%
+54%
+212%
+156%
+406%
5
Hoofdstuk
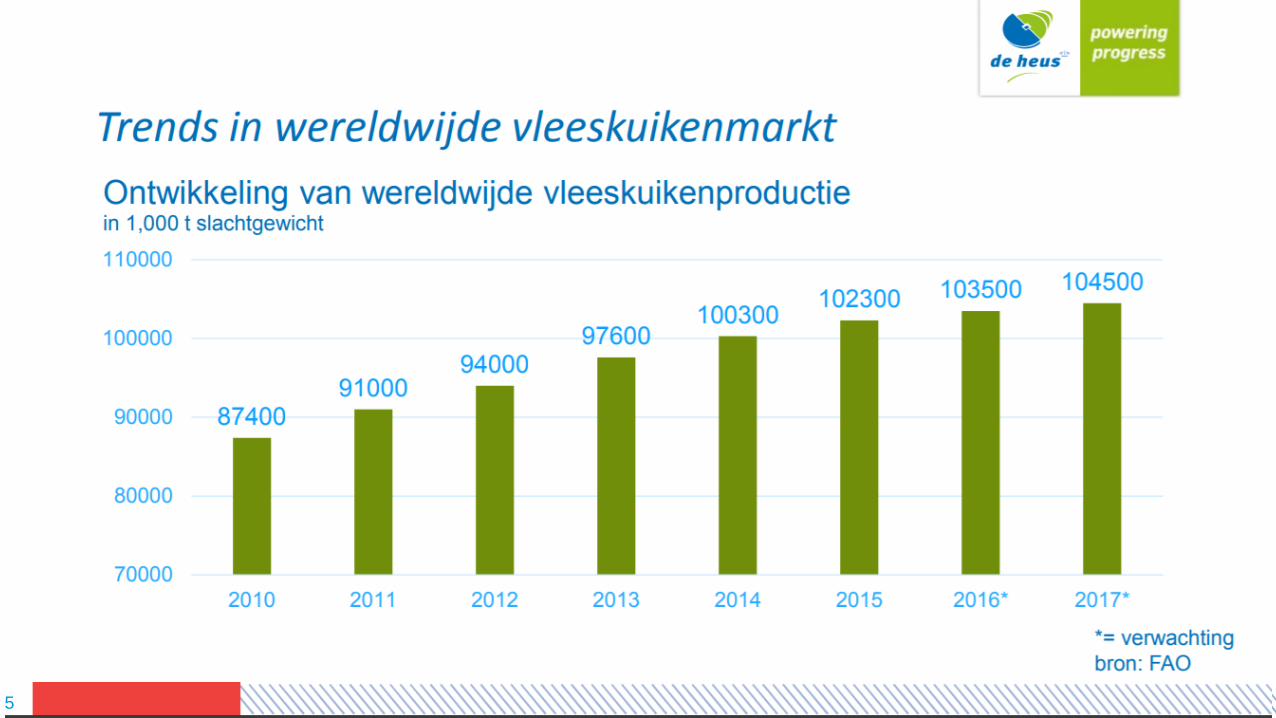
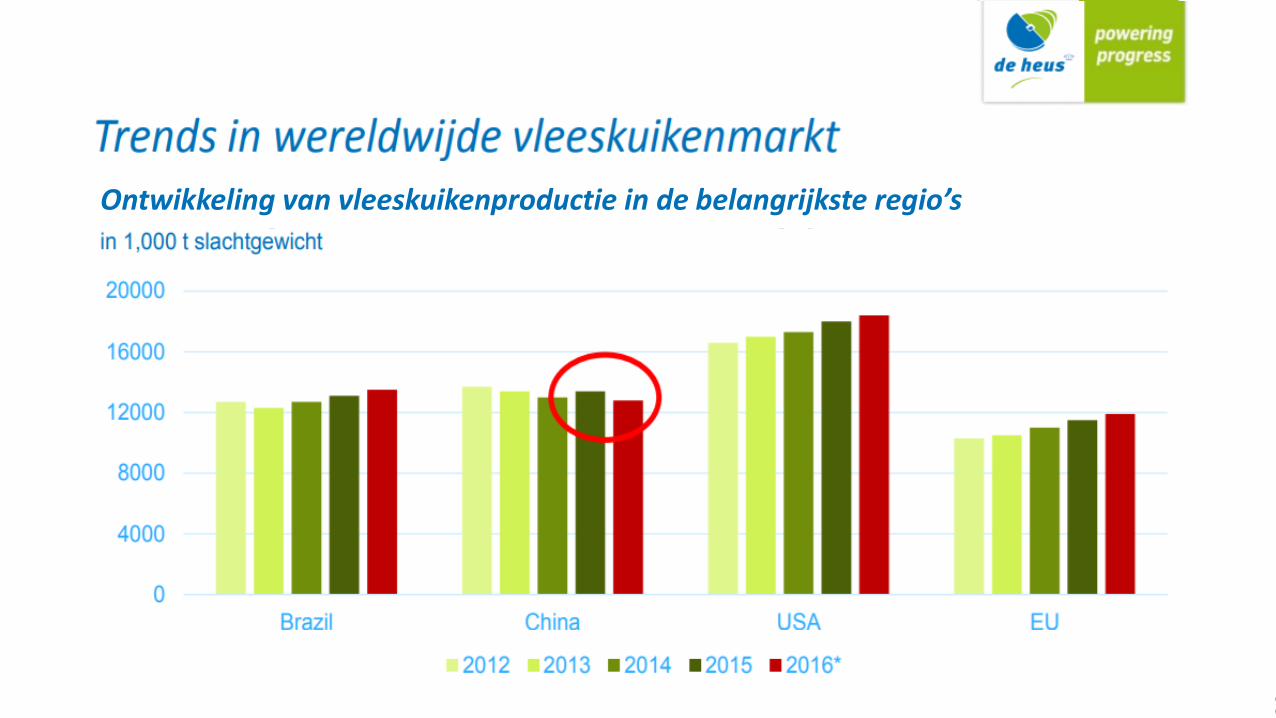
Ontwikkeling van vleeskuikenproductie in de belangrijkste regio’s
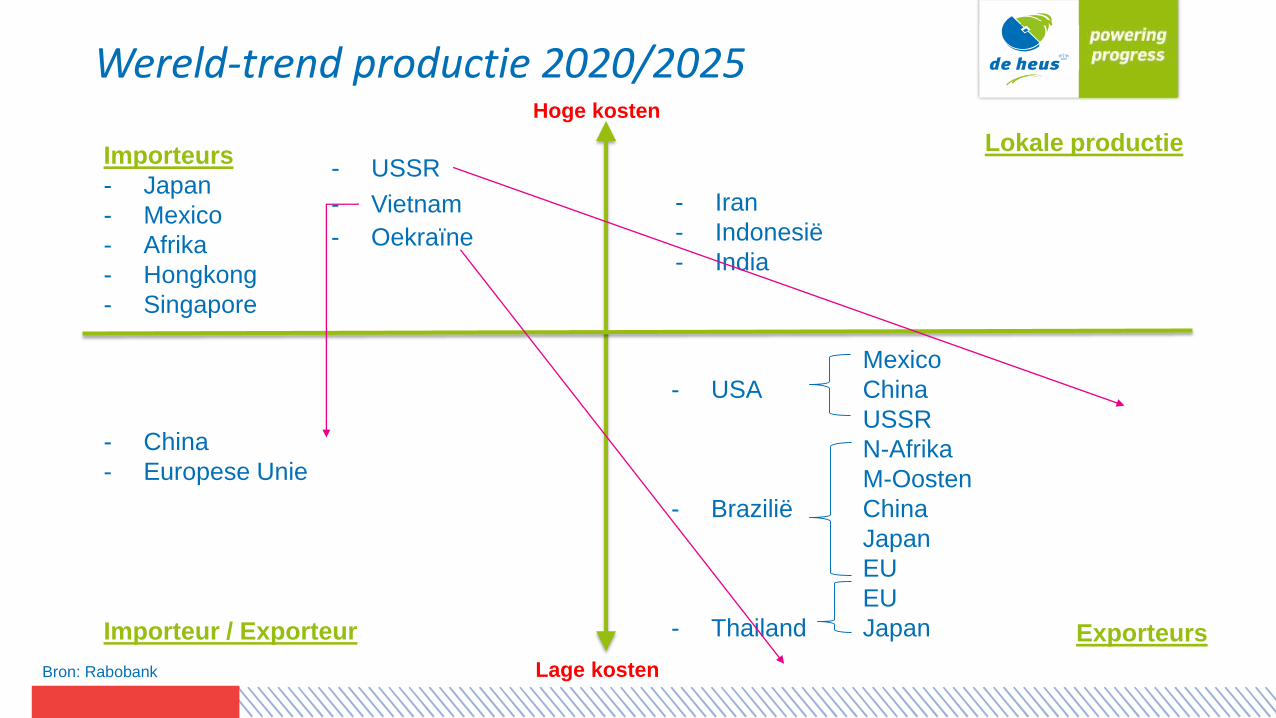
Wereld-trend productie 2020/2025
Importeurs
- Japan
- Mexico
- Afrika
- Hongkong
- Singapore
- Iran
- Indonesië
- India
- China
- Europese Unie
Importeur / Exporteur
Mexico
- USA China
USSR
N-Afrika
M-Oosten
- Brazilië China
Japan
EU
EU
- Thailand Japan
Hoge kosten
Lage kostenBron: Rabobank
Lokale productie- USSR
Exporteurs
- Oekraïne
- Vietnam
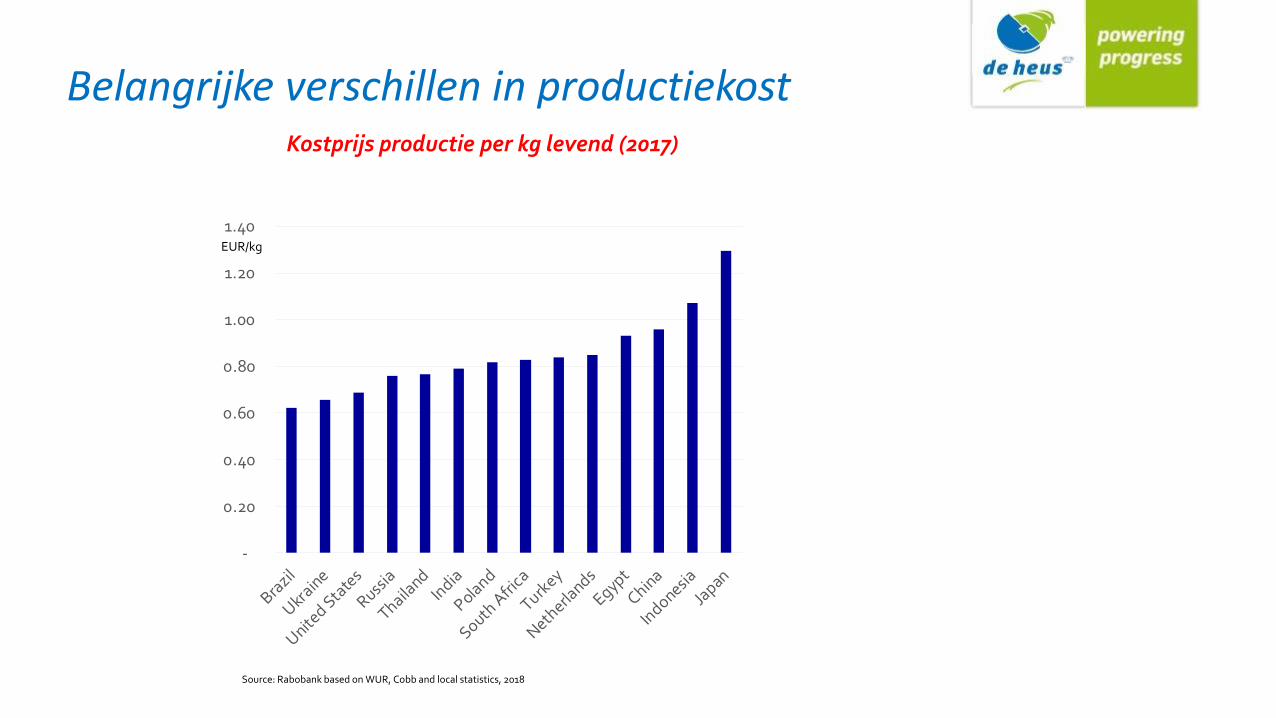
Belangrijke verschillen in productiekostKostprijs productie per kg levend (2017)
EUR/kg
Source: Rabobank based on WUR, Cobb and local statistics, 2018
-
0.20
0.40
0.60
0.80
1.00
1.20
1.40
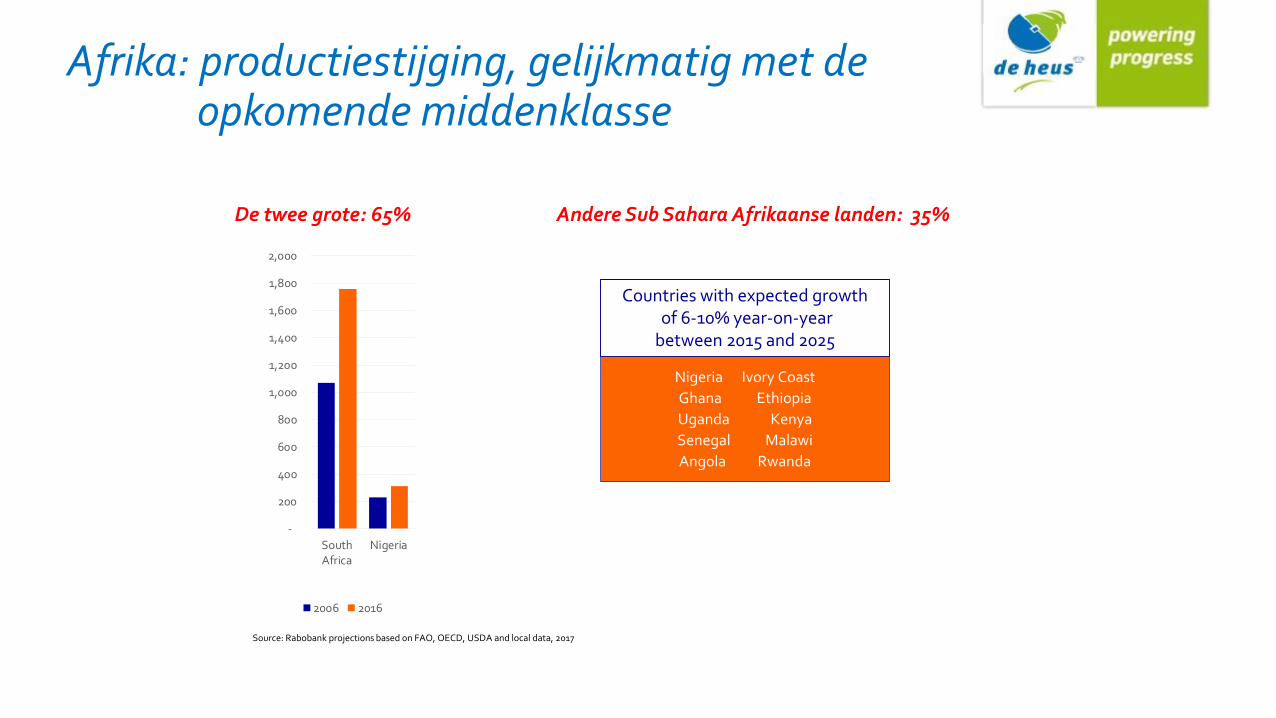
Afrika: productiestijging, gelijkmatig met de opkomende middenklasse
De twee grote: 65% Andere Sub Sahara Afrikaanse landen: 35%
Countries with expected growthof 6-10% year-on-year
between 2015 and 2025
Nigeria Ivory Coast
Ghana Ethiopia
Uganda Kenya
Senegal Malawi
Angola Rwanda
Source: Rabobank projections based on FAO, OECD, USDA and local data, 2017
-
200
400
600
800
1,000
1,200
1,400
1,600
1,800
2,000
SouthAfrica
Nigeria
2006 2016
-
20
40
60
80
100
120
2006 2016
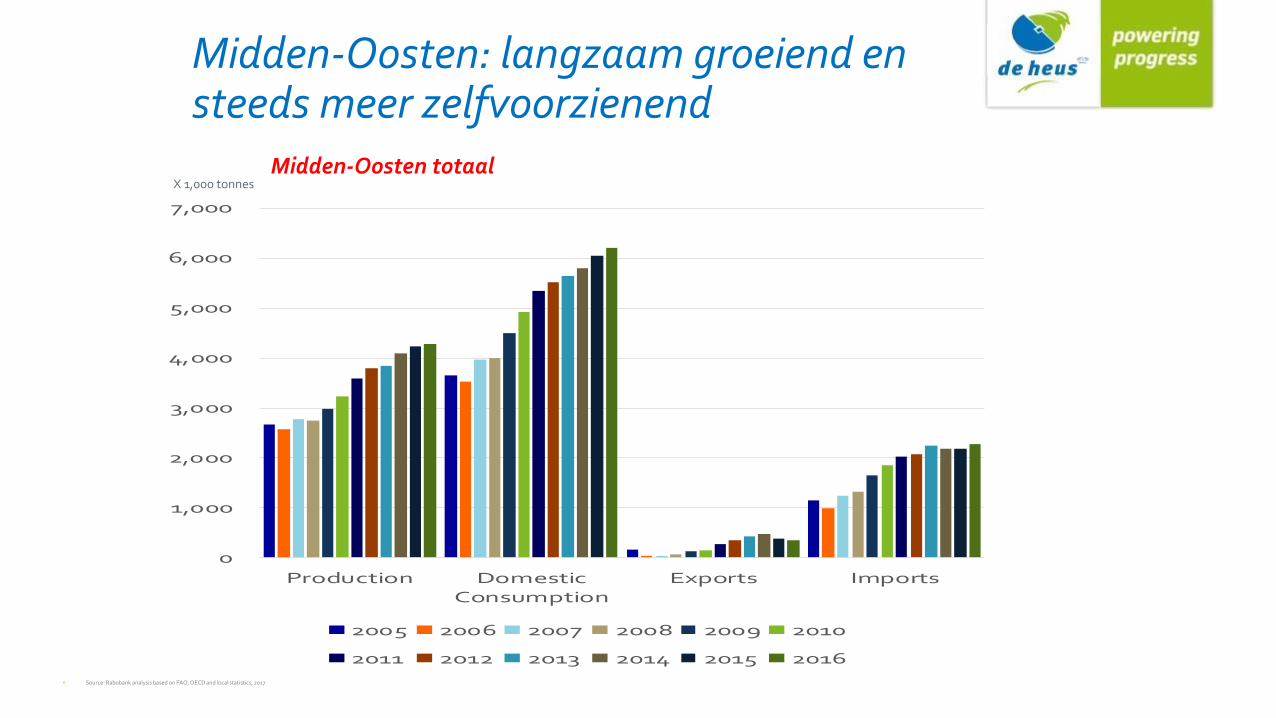
Midden-Oosten: langzaam groeiend ensteeds meer zelfvoorzienend
• Source: Rabobank analysis based on FAO, OECD and local statistics, 2017
Midden-Oosten totaalX 1,000 tonnes
0
1,000
2,000
3,000
4,000
5,000
6,000
7,000
Production DomesticConsumption
Exports Imports
2005 2006 2007 2008 2009 2010
2011 2012 2013 2014 2015 2016
CAGR:+4.4%
CAGR: +4.9%
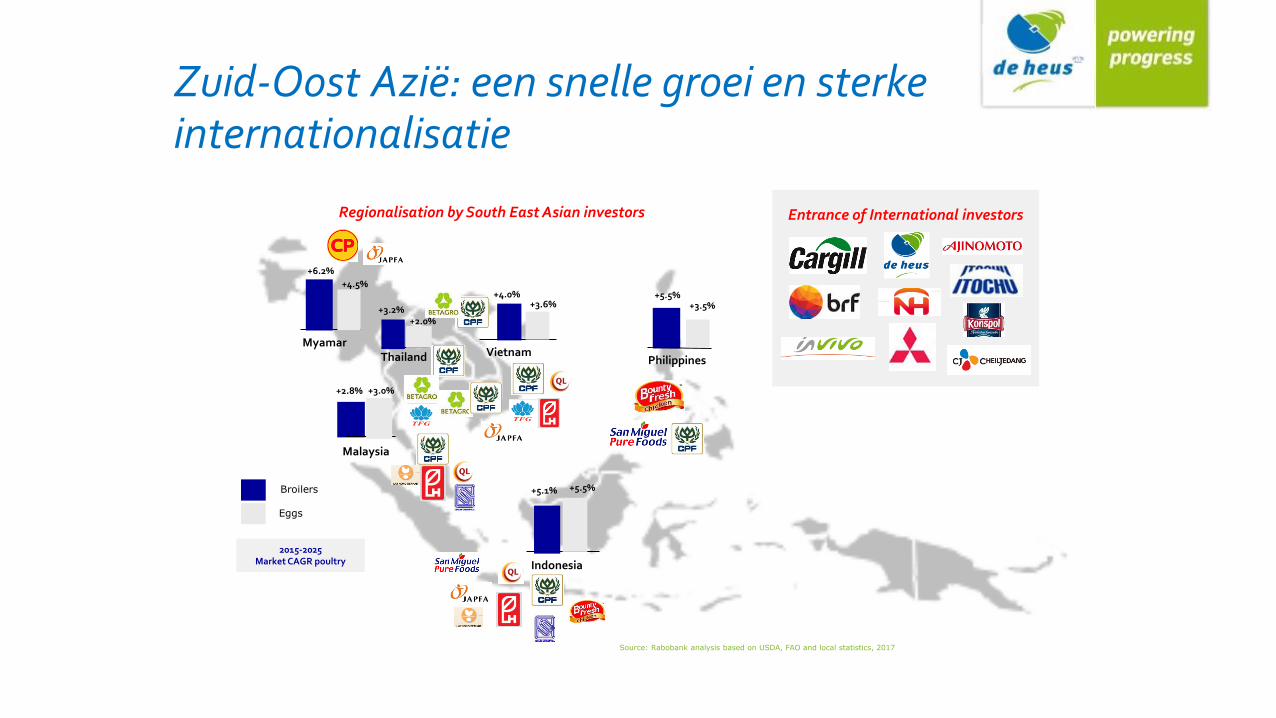
Zuid-Oost Azië: een snelle groei en sterkeinternationalisatie
+5.1%
+3.2%
+4.0% +5.5%
+6.2%
+2.8%
Thailand PhilippinesVietnam
Indonesia
Malaysia
Myamar
Entrance of International investors
Source: Rabobank analysis based on USDA, FAO and local statistics, 2017
2015-2025Market CAGR poultry
Regionalisation by South East Asian investors
+5.5%Broilers
Eggs
+3.0%
+2.0%
+4.5%
+3.5%+3.6%
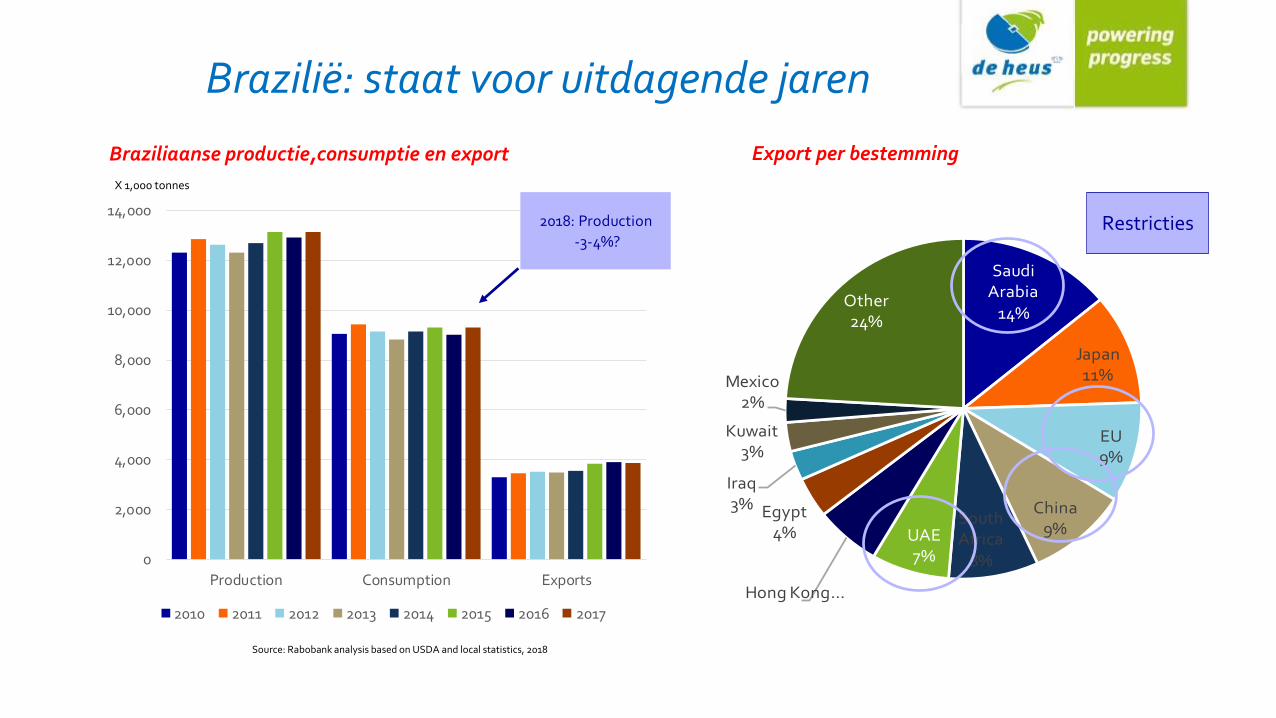
Brazilië: staat voor uitdagende jaren
Braziliaanse productie,consumptie en export
X 1,000 tonnes
Export per bestemming
Restricties
Saudi Arabia
14%
Japan11%
EU9%
China9%
South Africa
8%
UAE7%
Hong Kong…
Egypt4%
Iraq3%
Kuwait3%
Mexico2%
Other24%
Source: Rabobank analysis based on USDA and local statistics, 2018
0
2,000
4,000
6,000
8,000
10,000
12,000
14,000
Production Consumption Exports
2010 2011 2012 2013 2014 2015 2016 2017
2018: Production
-3-4%?
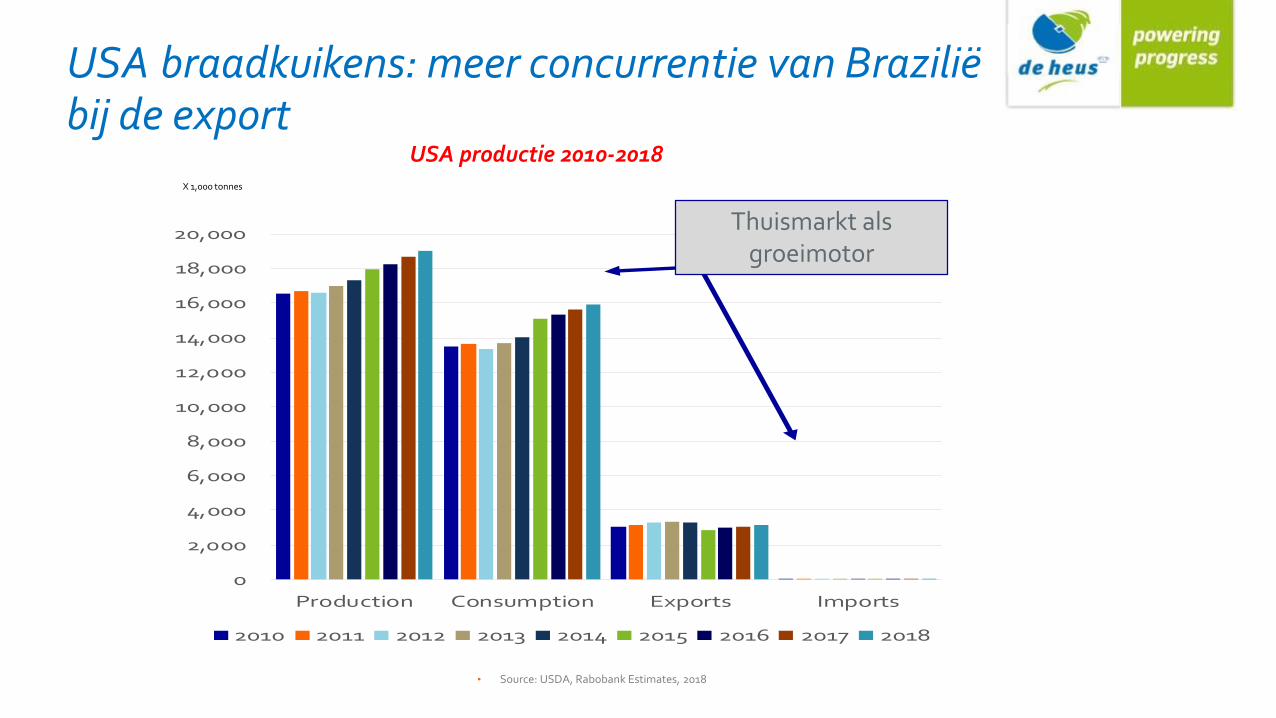
USA braadkuikens: meer concurrentie van Braziliëbij de export
• Source: USDA, Rabobank Estimates, 2018
USA productie 2010-2018X 1,000 tonnes
0
2,000
4,000
6,000
8,000
10,000
12,000
14,000
16,000
18,000
20,000
Production Consumption Exports Imports
2010 2011 2012 2013 2014 2015 2016 2017 2018
Domestic market has been key driven for
growth
Thuismarkt als groeimotor
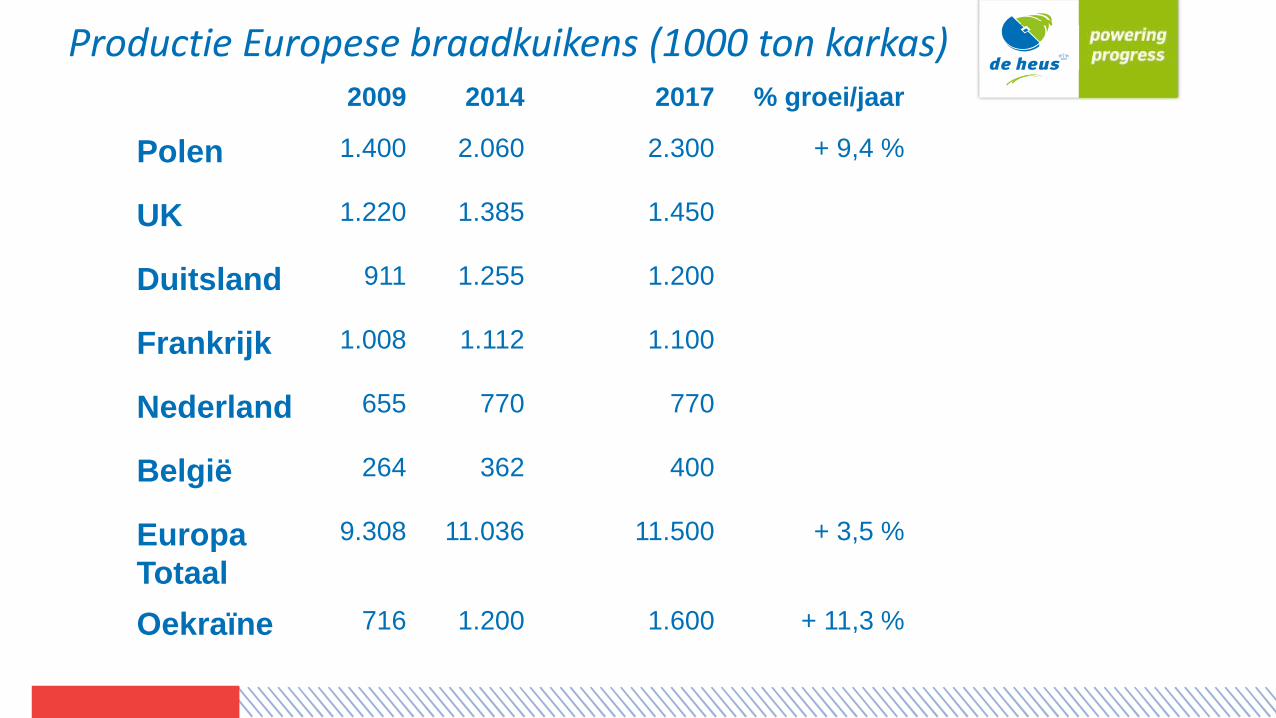
Productie Europese braadkuikens (1000 ton karkas)2009 2014 2017 % groei/jaar
Polen 1.400 2.060 2.300 + 9,4 %
UK 1.220 1.385 1.450
Duitsland 911 1.255 1.200
Frankrijk 1.008 1.112 1.100
Nederland 655 770 770
België 264 362 400
Europa
Totaal
9.308 11.036 11.500 + 3,5 %
Oekraïne 716 1.200 1.600 + 11,3 %
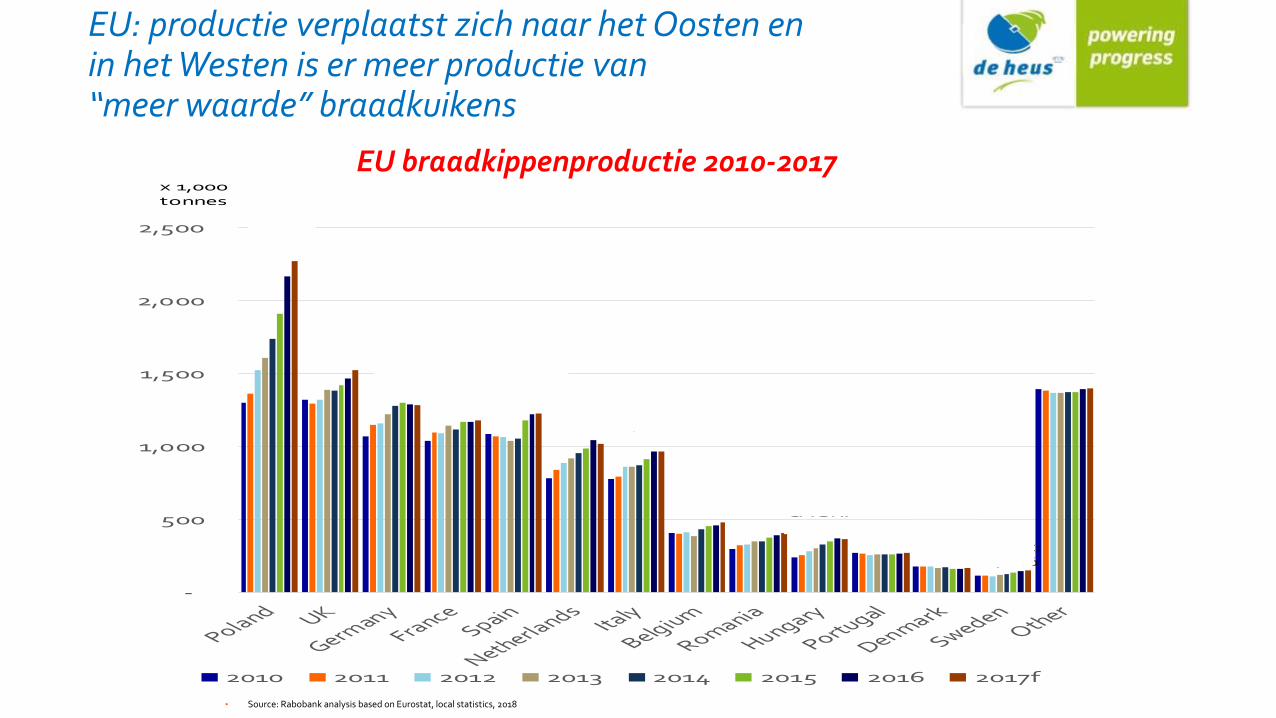
EU: productie verplaatst zich naar het Oosten enin het Westen is er meer productie van “meer waarde” braadkuikens
EU braadkippenproductie 2010-2017
• Source: Rabobank analysis based on Eurostat, local statistics, 2018
-
500
1,000
1,500
2,000
2,500
2010 2011 2012 2013 2014 2015 2016 2017f
CAGR:+8.3%
CAGR:+2.0%
CAGR:+2.6% CAGR:
+1.5%
CAGR+2.0%
CAGR:+3.6%CAGR:
+3.1%
CAGR:+2.5%
CAGR:+4.9%
CAGR:+0.2%
CAGR:-0.7% CAGR:
+4.2%
CAGR:+6.5%
x 1,000 tonnes
CAGR:+0.1%
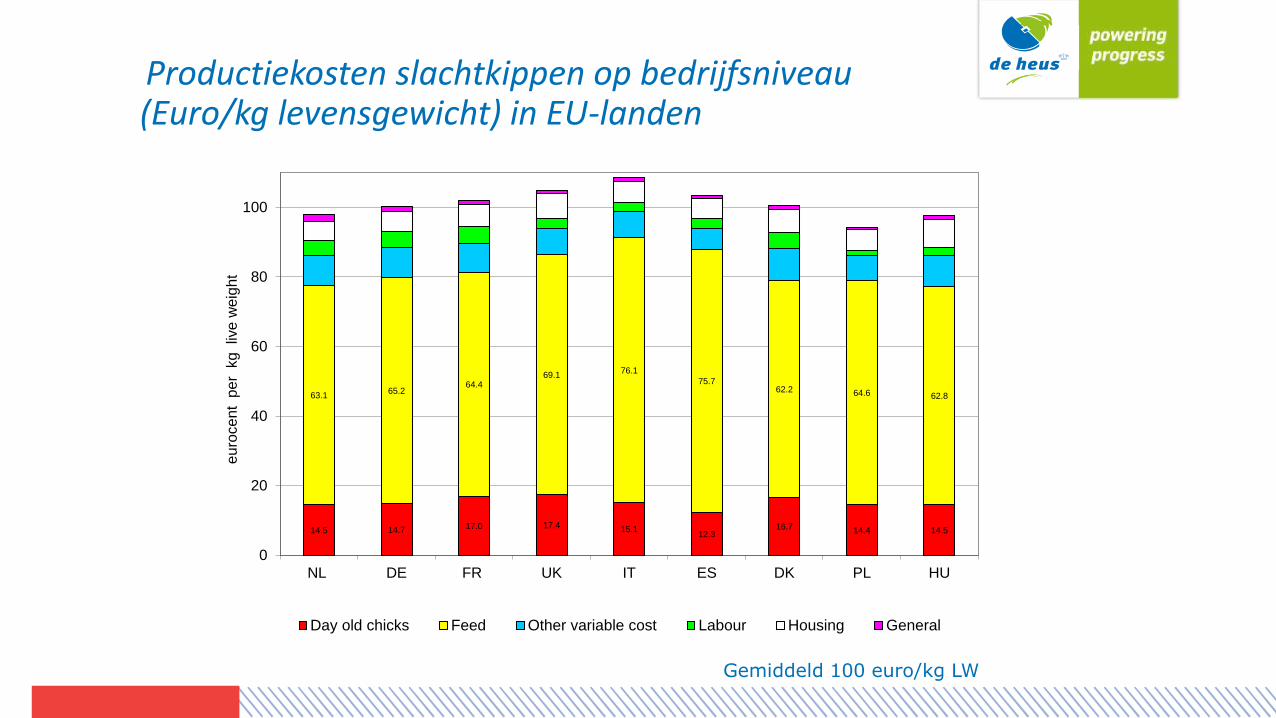
Productiekosten slachtkippen op bedrijfsniveau (Euro/kg levensgewicht) in EU-landen
Gemiddeld 100 euro/kg LW
14.5 14.7 17.0 17.4 15.112.3
16.7 14.4 14.5
63.165.2
64.469.1
76.1
75.762.2 64.6 62.8
0
20
40
60
80
100
NL DE FR UK IT ES DK PL HU
eu
roce
nt p
er
kg
liv
e w
eig
ht
Day old chicks Feed Other variable cost Labour Housing General
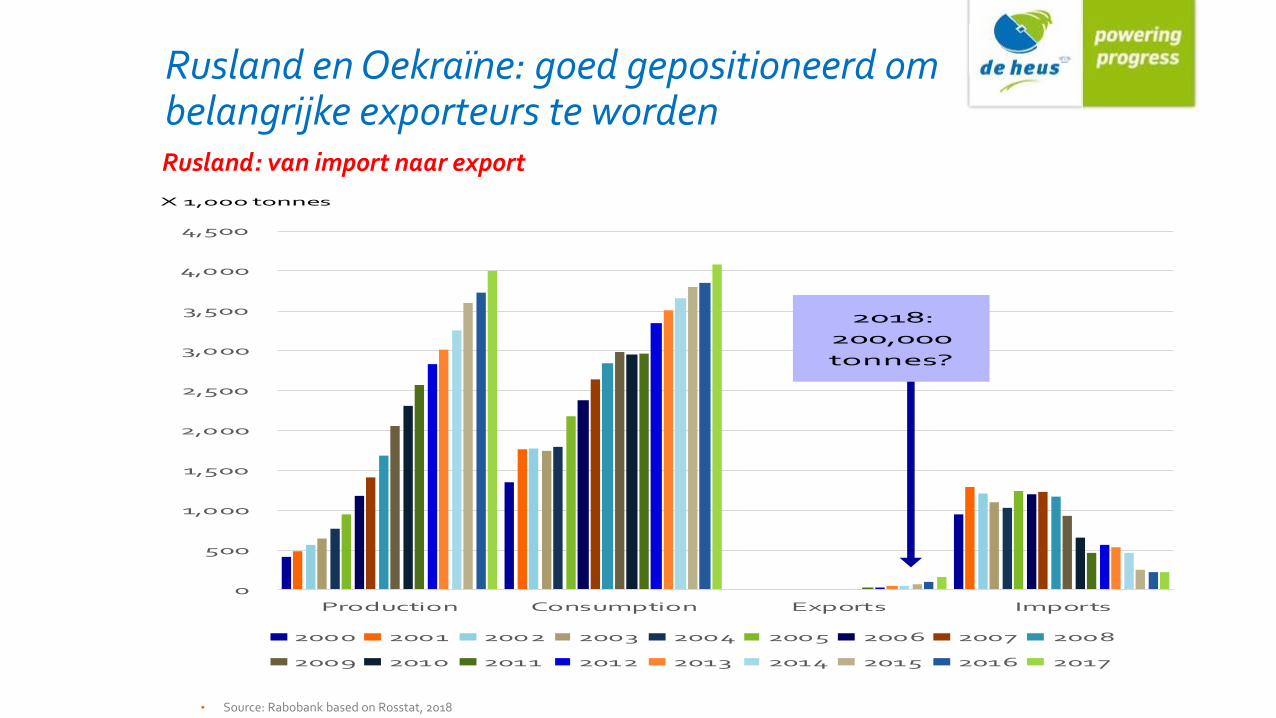
Rusland en Oekraïne: goed gepositioneerd om belangrijke exporteurs te worden
• Source: Rabobank based on Rosstat, 2018
Rusland: van import naar export
0
500
1,000
1,500
2,000
2,500
3,000
3,500
4,000
4,500
Production Consumption Exports Imports
2000 2001 2002 2003 2004 2005 2006 2007 2008
2009 2010 2011 2012 2013 2014 2015 2016 2017
X 1,000 tonnes
2018:
200,000
tonnes?
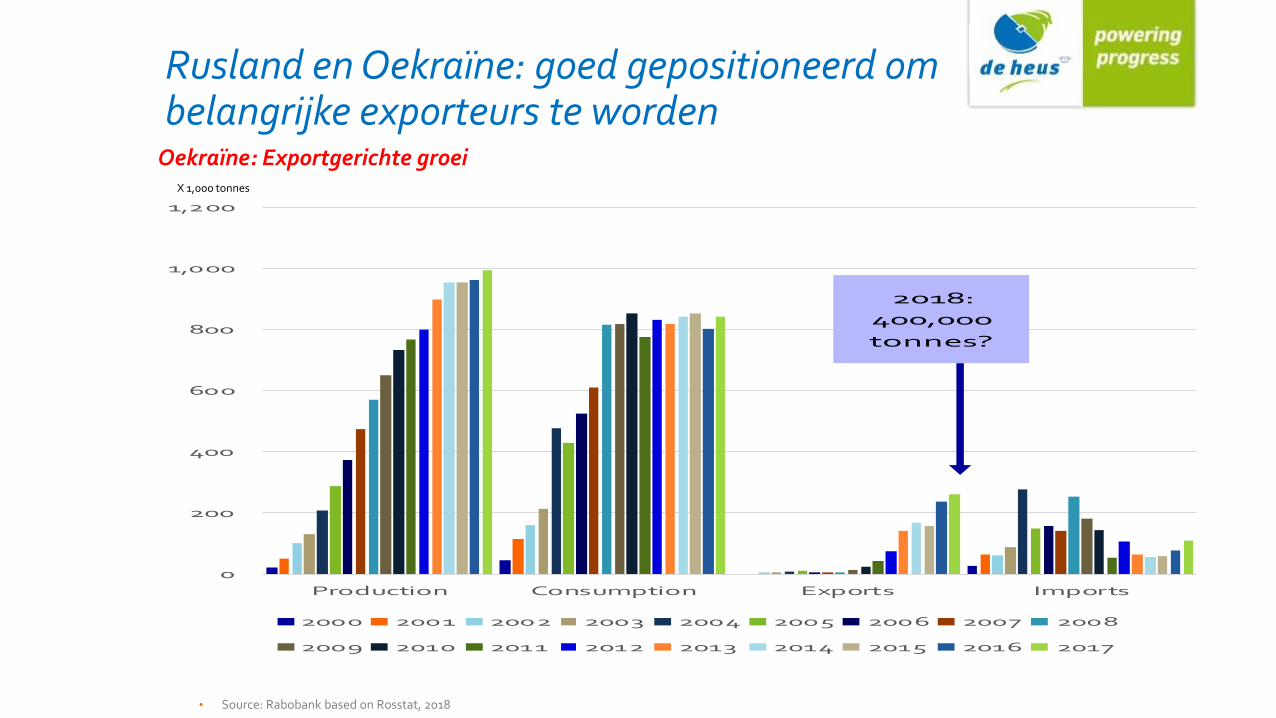
Rusland en Oekraïne: goed gepositioneerd om belangrijke exporteurs te worden
• Source: Rabobank based on Rosstat, 2018
Oekraïne: Exportgerichte groeiX 1,000 tonnes
0
200
400
600
800
1,000
1,200
Production Consumption Exports Imports
2000 2001 2002 2003 2004 2005 2006 2007 2008
2009 2010 2011 2012 2013 2014 2015 2016 2017
2018:
400,000
tonnes?
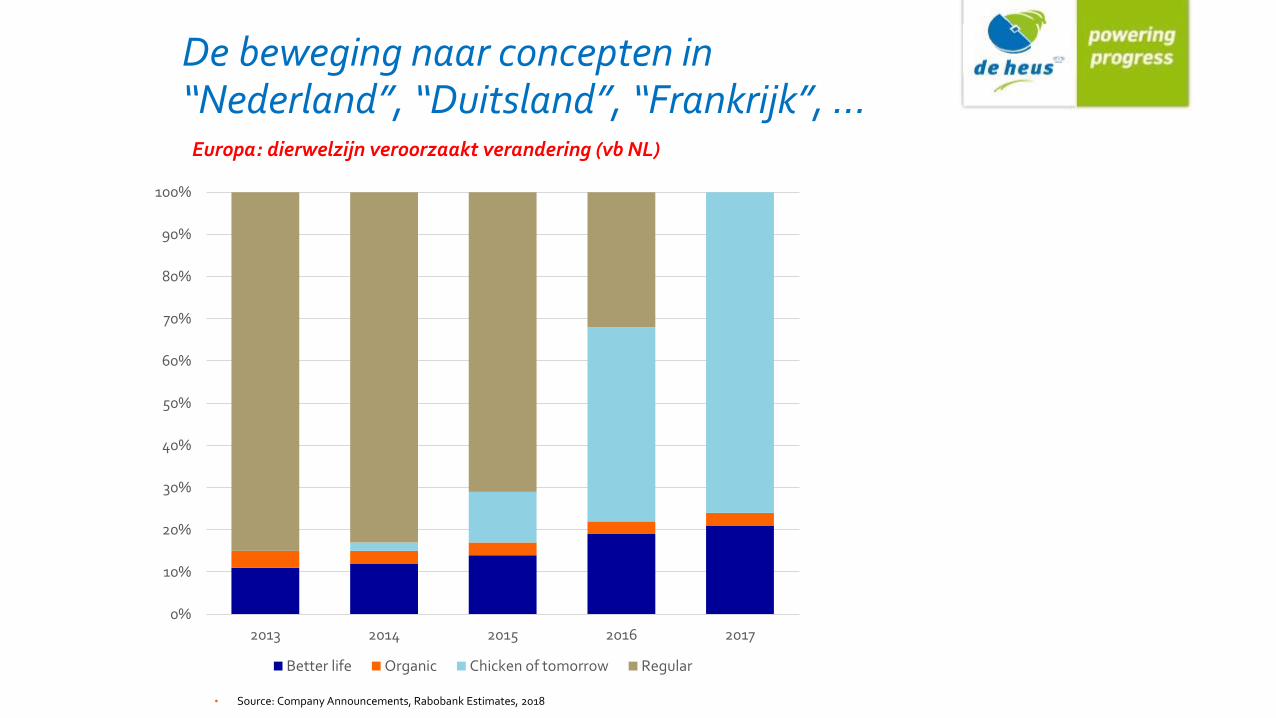
De beweging naar concepten in “Nederland”, “Duitsland”, “Frankrijk”, …
• Source: Company Announcements, Rabobank Estimates, 2018
Europa: dierwelzijn veroorzaakt verandering (vb NL)
0%
10%
20%
30%
40%
50%
60%
70%
80%
90%
100%
2013 2014 2015 2016 2017
Better life Organic Chicken of tomorrow Regular
- Uitdagingen?- Risico’s?- Gevaren?
Hoofdstuk
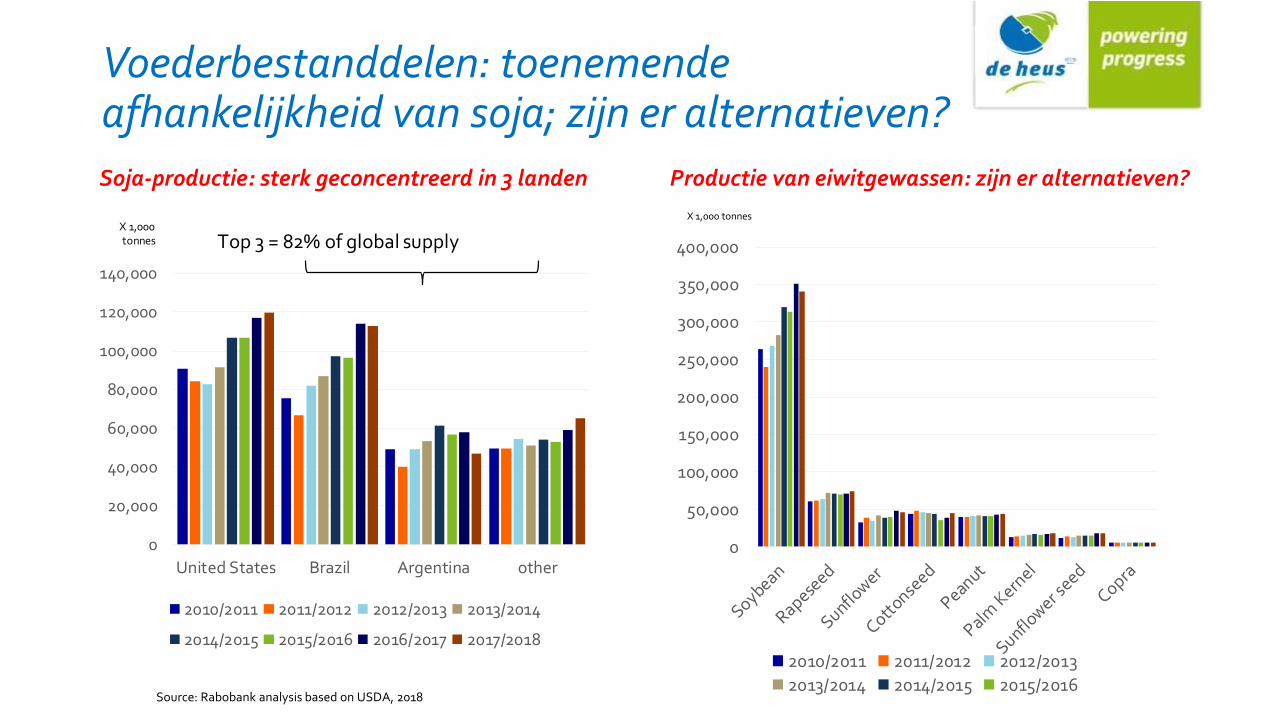
Voederbestanddelen: toenemende afhankelijkheid van soja; zijn er alternatieven?
Soja-productie: sterk geconcentreerd in 3 landen
Source: Rabobank analysis based on USDA, 2018
Productie van eiwitgewassen: zijn er alternatieven?
X 1,000 tonnes
0
20,000
40,000
60,000
80,000
100,000
120,000
140,000
United States Brazil Argentina other
2010/2011 2011/2012 2012/2013 2013/2014
2014/2015 2015/2016 2016/2017 2017/2018
X 1,000 tonnes Top 3 = 82% of global supply
0
50,000
100,000
150,000
200,000
250,000
300,000
350,000
400,000
2010/2011 2011/2012 2012/2013
2013/2014 2014/2015 2015/2016
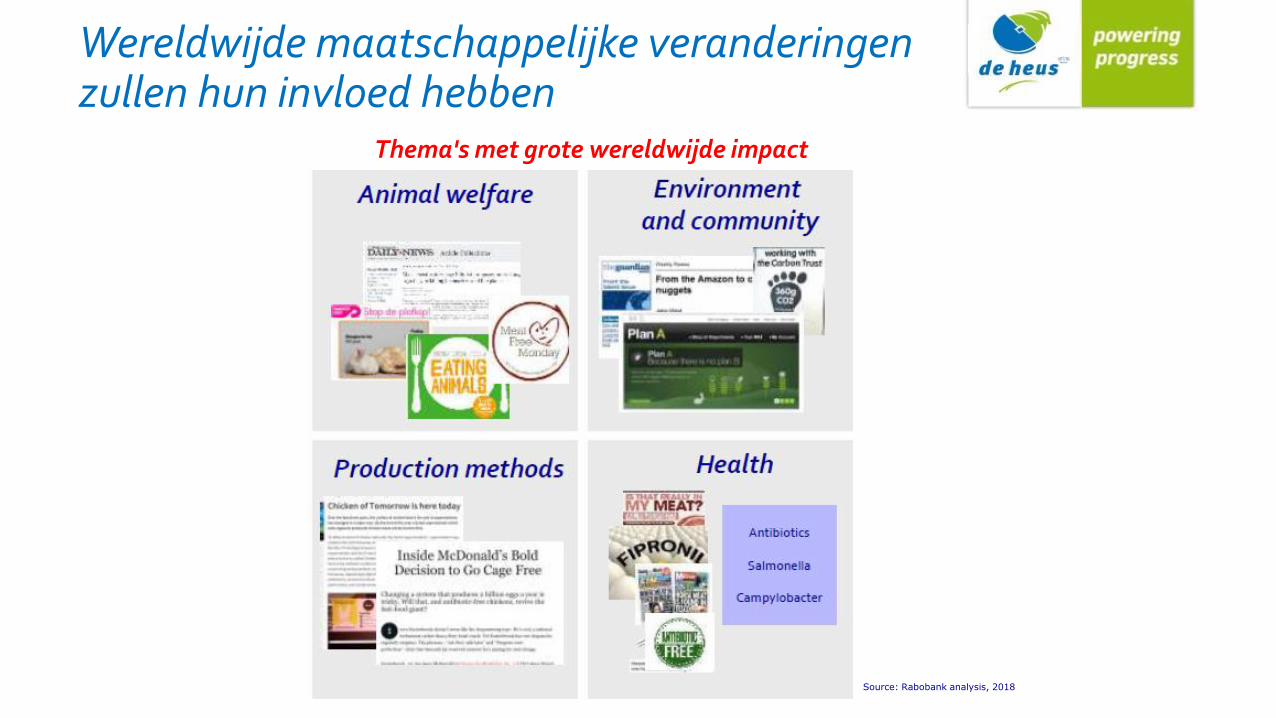
Source: Rabobank analysis, 2018
Thema's met grote wereldwijde impact
Wereldwijde maatschappelijke veranderingen zullen hun invloed hebben
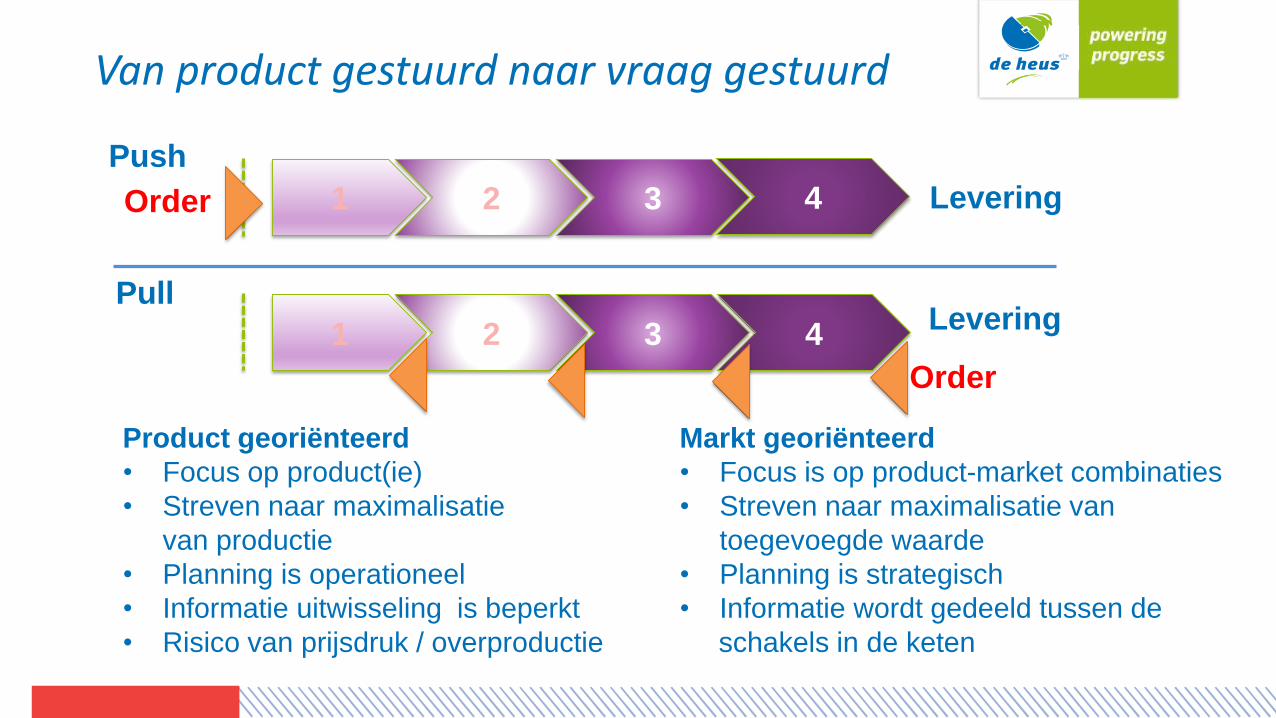
Van product gestuurd naar vraag gestuurd
1 2 3 4Order Levering
Push
1 2 3 4Levering
Pull
Order
Product georiënteerd
• Focus op product(ie)
• Streven naar maximalisatie
van productie
• Planning is operationeel
• Informatie uitwisseling is beperkt
• Risico van prijsdruk / overproductie
Markt georiënteerd
• Focus is op product-market combinaties
• Streven naar maximalisatie van
toegevoegde waarde
• Planning is strategisch
• Informatie wordt gedeeld tussen de
schakels in de keten
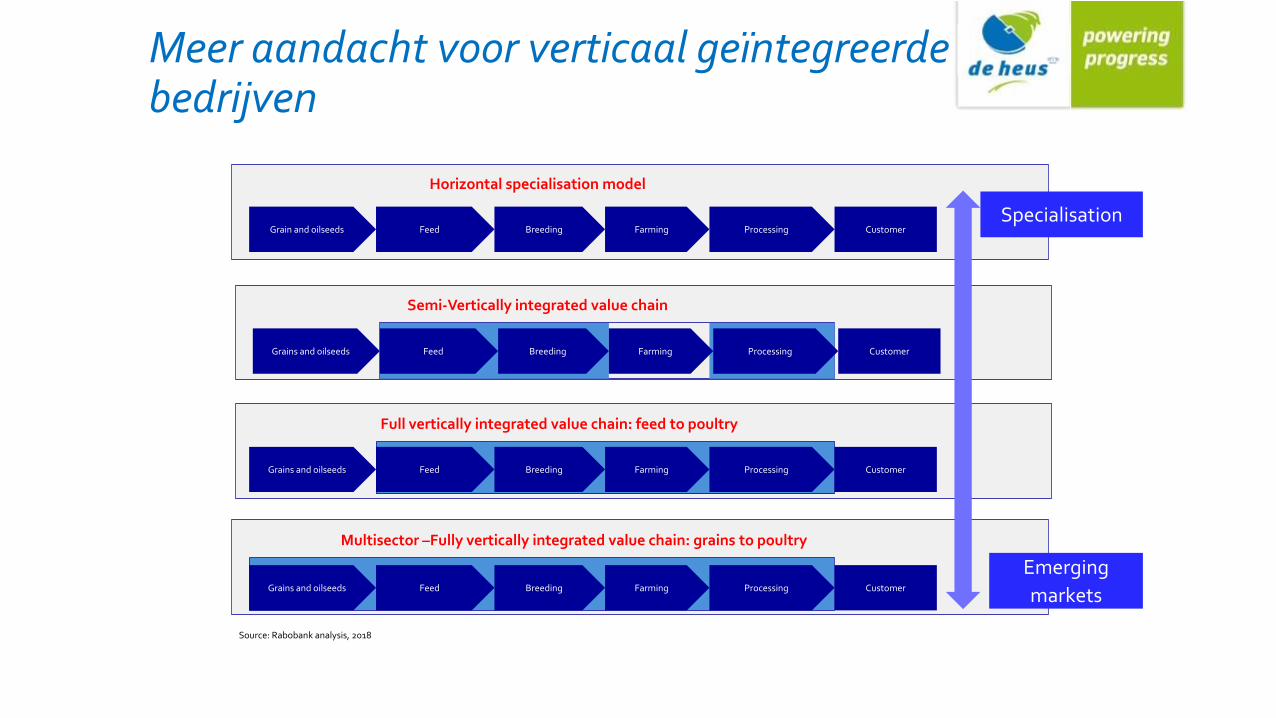
Meer aandacht voor verticaal geïntegreerde bedrijven
Grains and oilseeds Feed Breeding Farming Processing Customer
Grains and oilseeds Feed Breeding Farming Processing Customer
Grains and oilseeds Feed Breeding Farming Processing Customer
Grain and oilseeds Feed Breeding Farming Processing Customer
Horizontal specialisation model
Semi-Vertically integrated value chain
Full vertically integrated value chain: feed to poultry
Multisector –Fully vertically integrated value chain: grains to poultry
Source: Rabobank analysis, 2018
Specialisation
Emerging
markets
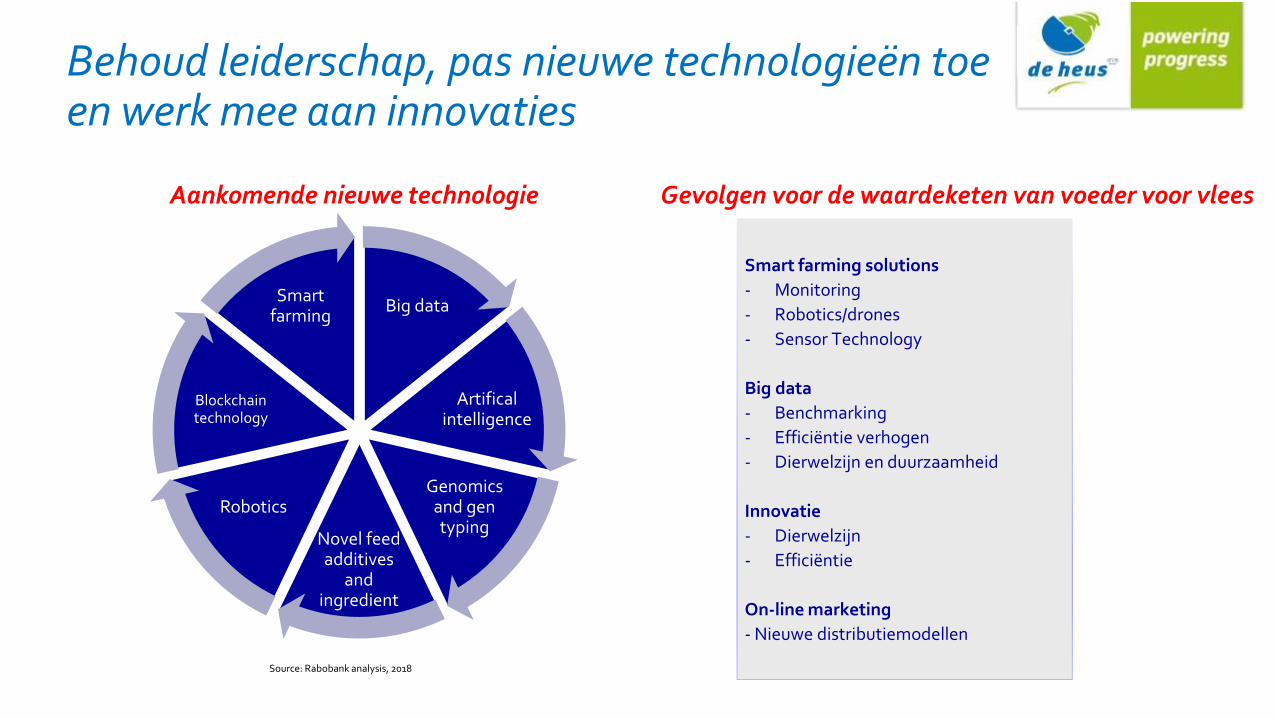
Behoud leiderschap, pas nieuwe technologieën toe en werk mee aan innovaties
Big data
Artificalintelligence
Genomics and gen typing
Novel feed additives
and ingredient
s
Robotics
Blockchaintechnology
Smart farming
Aankomende nieuwe technologie
Smart farming solutions
- Monitoring
- Robotics/drones
- Sensor Technology
Big data
- Benchmarking
- Efficiëntie verhogen
- Dierwelzijn en duurzaamheid
Innovatie
- Dierwelzijn
- Efficiëntie
On-line marketing
- Nieuwe distributiemodellen
Gevolgen voor de waardeketen van voeder voor vlees
Source: Rabobank analysis, 2018
Economische ontwikkelingen
Concentratie bij slachterijen
Concentratie bij retailers
Concentratie bij fokkerijen
Concentratie bij broederijen
Big Data – Internet of things – Artificiële Intelligentie
Block-chain – Location Based Monitoring – Drones
Satellieten – Social Media
Economische ontwikkelingen
Macht van externe spelers
Amazon
Apple
Vierkantsverwaarding - Export afhankelijk
Ontwikkeling in concepten dwingt om keuzes te maken
Klant dwingt zijn leveranciers naar transparantie
28
Maatschappelijke ontwikkelingen
Duurzaamheid – Dierwelzijn – Food Print – Economie
Regionale productie
Emotie vaak sterker dan ratio
Antibiotica-vrije productie
Plantaardig vlees
Macht/kracht van de consument wordt groter
Europese regelgeving is zeer diffuus.
Europese richtlijn Antibiotica-gebruik
Anti dumping - importheffingen - handelsoorlogen
Emotie wordt sterker dan de ratio
Valuta en wisselkoersen
Nationale regelgeving rond productiebeperkingen
Politieke ontwikkelingen
Bedankt voor uw aandacht!
Samen
gaan we
vooruit!