The population of Brussels: a demographic overview
18
Brussels Studies La revue scientifique électronique pour les recherches sur Bruxelles / Het elektronisch wetenschappelijk tijdschrift voor onderzoek over Brussel / The e-journal for academic research on Brussels Notes de synthèse | 2009 The population of Brussels: a demographic overview Synopsis, CFB No. 3 La population bruxelloise : un éclairage démographique De Brusselse bevolking: een demografische doorlichting Patrick Deboosere, Thierry Eggerickx, Etienne Van Hecke and Benjamin Wayens Translator: Mike Bramley Electronic version URL: http://journals.openedition.org/brussels/891 DOI: 10.4000/brussels.891 ISSN: 2031-0293 Publisher Université Saint-Louis Bruxelles Electronic reference Patrick Deboosere, Thierry Eggerickx, Etienne Van Hecke and Benjamin Wayens, « The population of Brussels: a demographic overview », Brussels Studies [Online], Synopses, Online since 12 January 2009, connection on 19 April 2019. URL : http://journals.openedition.org/brussels/891 ; DOI : 10.4000/brussels.891 Licence CC BY
Transcript of The population of Brussels: a demographic overview
Brussels Studies
La revue scientifique électronique pour les recherches
sur Bruxelles / Het elektronisch wetenschappelijk
tijdschrift voor onderzoek over Brussel / The e-journal
for academic research on Brussels Notes de synthèse | 2009
The population of Brussels: ademographic overviewSynopsis, CFB No. 3
La population bruxelloise : un éclairage démographique
De Brusselse bevolking: een demografische doorlichting
Patrick Deboosere, Thierry Eggerickx, Etienne Van Hecke and BenjaminWayens
Translator: Mike Bramley
Electronic versionURL: http://journals.openedition.org/brussels/891DOI: 10.4000/brussels.891ISSN: 2031-0293
PublisherUniversité Saint-Louis Bruxelles
Electronic referencePatrick Deboosere, Thierry Eggerickx, Etienne Van Hecke and Benjamin Wayens, « The population ofBrussels: a demographic overview », Brussels Studies [Online], Synopses, Online since 12 January2009, connection on 19 April 2019. URL : http://journals.openedition.org/brussels/891 ; DOI :10.4000/brussels.891
Licence CC BY
Synopsis nr. 3 (corr. 17 March 2009)
The population of Brussels :
a demographic overview
P. Deboosere, T. Eggerickx, E. Van Hecke, B. Wayens
Translation: Mike Bramley
• Patrick Deboosere, Master of Political Sciences and Doctor of Sociology is associ-
ated with the Interface Demography research group at the Vrije Universiteit Brussel. His
research focuses on the evolution of household composition and the demography of
health. He has worked on various joint publications concerning the population of the
Brussels-Capital Region. P. Deboosere, S. Demarest, V. Lorant, P.-J. Miermans, M.-I.
Farfan-Portet, H. Van Oyen (2006), Gezondheid en mantelzorg, Sociaal-Economische
Enquête 2001, Monografie nr.1.
Contact : [email protected]
• Thierry Eggerickx, with a license in history and a PhD in demography, is a research
associate at the Belgian National Fund for Scientific Research (FNRS) and a professor.
He is also part of the Centre for Research in Demography and Societies, UCL. His re-
search focuses on internal and international migration, local demography and the history
of the populations and territories in Belgium. References include: J.-P. Hermia , A. Bahri,
T. Eggerickx , J.-P. Sanderson (2007), "Migrations et stratégies résidentielles de citadins
en milieu périurbain : attentes et perceptions des migrants", Territoire(s) Wallon(s), n°1,
pp. 15-30.
Contact : [email protected]
• Etienne Van Hecke, is a Professor at the K.U. Leuven and Head of the Institute for
Social and Economic Geography. His research focuses on urban settlement systems,
internal dynamics of city regions and migration flows. Sarah Luyten en Etienne Van
Hecke, De Belgische stadsgewesten 2001, working paper 14, 2007, Algemene Directie
Statistiek en Economische Informatie.
Contact : [email protected]
• Benjamin Wayens, a geographer and docteur en Sciences, is a postdoctoral re-
searcher at the ULB's Institute for Environment and Land Use Planning (IGEAT). He has
done research in the geography of services (especially retail shops and commercial prop-
erty) and in spatial analysis applied to observation and history of the city. He was the
scientific coordinator of "L'atlas de la Santé et du Social de Bruxelles-capitale" with P.
Deboosere and C. Kesteloot.
Contact : [email protected] - 02/650.50.79
lthe e-journal for academic research on Brussels
www.brusselsstudies.be
Contact Brussels Studies : M. Hubert (ed. in chief) – [email protected] – ++ 32 (0)485/41.67.64 – ++ 32 (0)2/211.78.53
www.citizensforumofbrussels.be
Brussels Studies is published thanks to the support of the ISRIB (Institute for theencouragement of Scientific Research and Innovation of Brussels - Brussels-Capital Region)
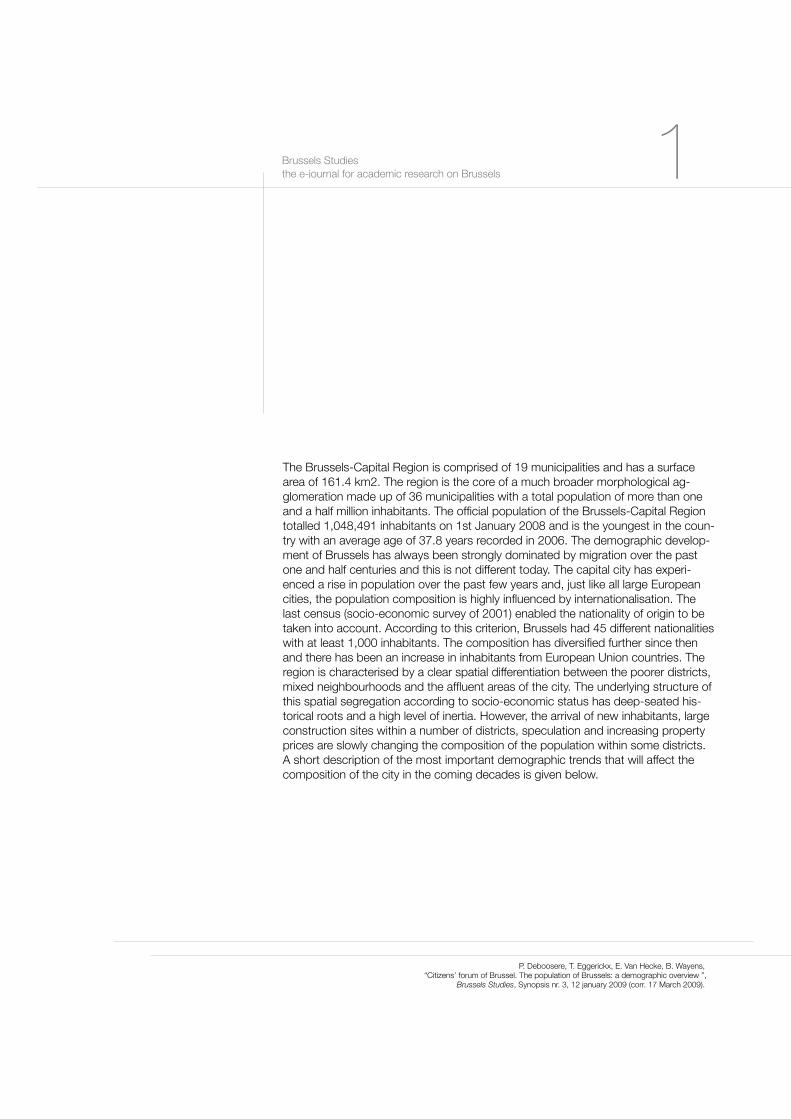
The Brussels-Capital Region is comprised of 19 municipalities and has a surface
area of 161.4 km2. The region is the core of a much broader morphological ag-
glomeration made up of 36 municipalities with a total population of more than one
and a half million inhabitants. The official population of the Brussels-Capital Region
totalled 1,048,491 inhabitants on 1st January 2008 and is the youngest in the coun-
try with an average age of 37.8 years recorded in 2006. The demographic develop-
ment of Brussels has always been strongly dominated by migration over the past
one and half centuries and this is not different today. The capital city has experi-
enced a rise in population over the past few years and, just like all large European
cities, the population composition is highly influenced by internationalisation. The
last census (socio-economic survey of 2001) enabled the nationality of origin to be
taken into account. According to this criterion, Brussels had 45 different nationalities
with at least 1,000 inhabitants. The composition has diversified further since then
and there has been an increase in inhabitants from European Union countries. The
region is characterised by a clear spatial differentiation between the poorer districts,
mixed neighbourhoods and the affluent areas of the city. The underlying structure of
this spatial segregation according to socio-economic status has deep-seated his-
torical roots and a high level of inertia. However, the arrival of new inhabitants, large
construction sites within a number of districts, speculation and increasing property
prices are slowly changing the composition of the population within some districts.
A short description of the most important demographic trends that will affect the
composition of the city in the coming decades is given below.
Brussels Studies
the e-journal for academic research on Brussels 1
P. Deboosere, T. Eggerickx, E. Van Hecke, B. Wayens, “Citizens’ forum of Brussel. The population of Brussels: a demographic overview ”,
Brussels Studies, Synopsis nr. 3, 12 january 2009 (corr. 17 March 2009).
I. Observations
1. Brussels: a city of immigrants
Brussels is a typical city of immigrants; people who were born outside Brussels and
who, at a certain time in their lives, came to live in Brussels. In 1991, 50.8% of
Brussels inhabitants were born in Brussels. Restricting ourselves to Brussels inhabi-
tants aged 18 and over, this figure becomes 42.5%. In 2001, the share of Brussels
inhabitants actually born in Brussels decreased slightly to 49.8% and 40.3% respec-
tively, under the influence of recent higher immigration figures. The majority of Brus-
sels inhabitants who were born outside the region come from abroad. In 2001,
31.7% of Brussels inhabitants were born abroad, 8.4% in Flanders and 10.1% in
Wallonia.
2. Brussels: the most important gateway for international migration
Migration constitutes the most important demographic factor in the population
composition of the Brussels region. Although a natural increase in the population
has been the most important factor in population growth since 2003, migration
flows continue to be the largest influence on the region’s composition. Each year,
the region loses part of its population through internal migration, but experiences
population growth due to international migration. Approximately one third of the
population exchange between Belgium and other countries occurs through Brus-
sels. The balance of international migration (the difference between inflow and out-
flow from and to other countries) was distributed across the regions in 2006 as fol-
lows: 17,588 people for Brussels, 21,546 for Flanders and 10,402 for Wallonia.
3. Brussels: an important factor in the internal migration flows within Belgium
Due to continuous international inflow, Brussels makes an important contribution to
the dynamic of internal migrations within Belgium. For decades, Brussels has expe-
rienced a negative net domestic migration balance. More inhabitants leave the capi-
tal city for the rest of the country than the number moving to Brussels from Flanders
and Wallonia. As this mainly involves families with young children, this outflow con-
tributes to the population growth and rejuvenation of the population in Flanders and
Wallonia. Having remained relatively low from the middle of the 1990s onwards, this
negative balance has once again risen above 10,000 people for a number of years.
4. The migration flows lead to a permanent rejuvenation of the adult population
within the city
Net migration only provides the balance of very extensive annual movements. For
example, the negative domestic migration balance is the final result of nearly 60,000
annual movements between Brussels and the rest of Belgium. In 2005, no less than
21,351 people settled in Brussels from Flanders and Wallonia. The outflow for the
same year amounted to 33,798 people, resulting in a negative domestic migration
balance of 12,447 people. It is important to note that this exchange with Flanders
and Wallonia is not neutral in terms of age and household status.1
Brussels Studies
the e-journal for academic research on Brussels 2
1 The data in this paragraph were corrected on 17 March 2009.
P. Deboosere, T. Eggerickx, E. Van Hecke, B. Wayens, “Citizens’ forum of Brussel. The population of Brussels: a demographic overview ”,
Brussels Studies, Synopsis nr. 3, 12 january 2009 (corr. 17 March 2009).

The inflow predominantly consists of young people who are often single and who
will mostly rent accommodation. The outflow is dominated by slightly older age
groups (see graph 1). More often than not, this involves households with children;
which is shown on the graph in negative migration balances above 30 years and
under 15 years. The limited availability of affordable (and relatively comfortable) pri-
vate housing is the most important motivation for moving out of the capital city.
Within the Brussels-Capital Region, the relocation intensity also differs substantially
according to the district (see map 1).
The areas with the highest levels of residential mobility fall within the pentagon and
the adjacent districts in the south-eastern quadrant, in the European district and in
the direction of the university campuses. The important migration flows between
Brussels and the outside world do not impede the fact that more than half the
population remain living relatively stable in the Brussels region. Geographical pat-
terns show that this is partly the population that has sufficient purchasing power to
buy a decent home in a pleasant residential area. However, there is also relatively
low relocation intensity in Molenbeek, Schaarbeek/Schaerbeek and Sint-Joost-ten-
Brussels Studies
the e-journal for academic research on Brussels 3
P. Deboosere, T. Eggerickx, E. Van Hecke, B. Wayens, “Citizens’ forum of Brussel. The population of Brussels: a demographic overview ”,
Brussels Studies, Synopsis nr. 3, 12 january 2009 (corr. 17 March 2009).
-3000
-2000
-1000
0
1000
2000
3000
0 5 10 15 20 25 30 35 40 45 50 55 60 65 70 75 80 85 90+
Âge
totale immigratie totale emigratie totaal migratiesaldoTotal immigration Total emigration Total migration balance
Graph 1. Migration according to age: Brussels-Capital Region 2005Source: National Register, ADSEI, courtesy of Interface Demography
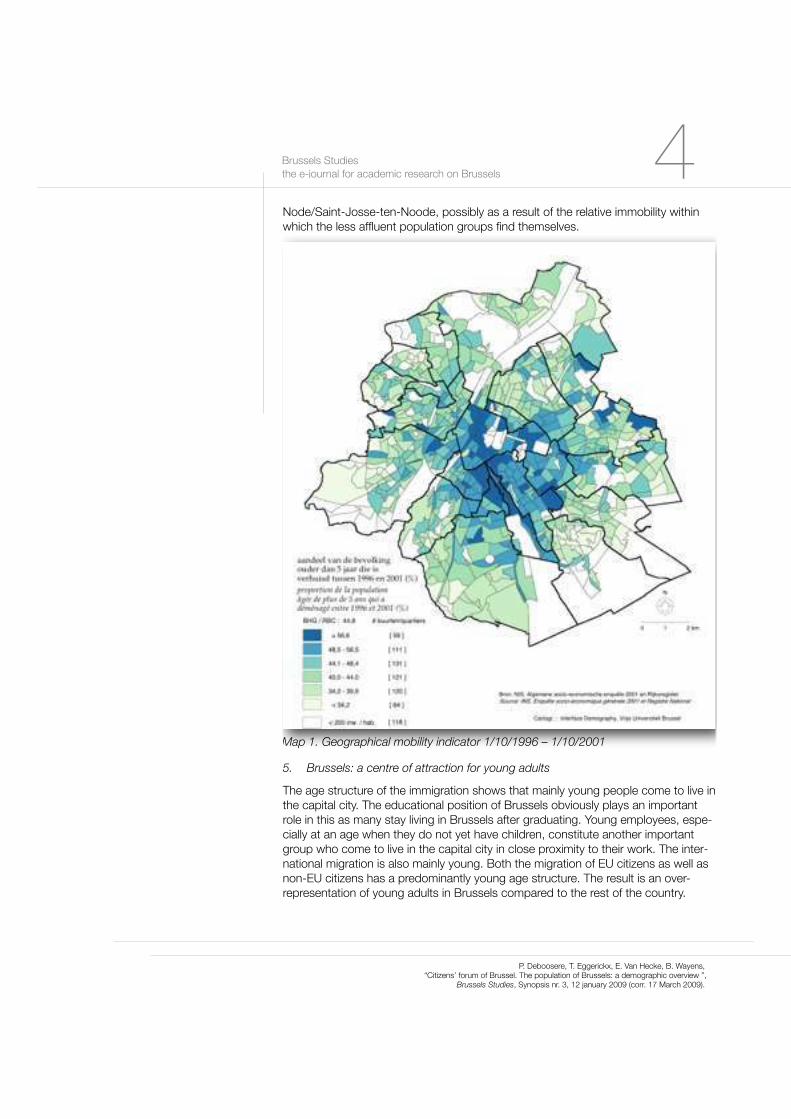
Node/Saint-Josse-ten-Noode, possibly as a result of the relative immobility within
which the less affluent population groups find themselves.
Map 1. Geographical mobility indicator 1/10/1996 – 1/10/2001
5. Brussels: a centre of attraction for young adults
The age structure of the immigration shows that mainly young people come to live in
the capital city. The educational position of Brussels obviously plays an important
role in this as many stay living in Brussels after graduating. Young employees, espe-
cially at an age when they do not yet have children, constitute another important
group who come to live in the capital city in close proximity to their work. The inter-
national migration is also mainly young. Both the migration of EU citizens as well as
non-EU citizens has a predominantly young age structure. The result is an over-
representation of young adults in Brussels compared to the rest of the country.
Brussels Studies
the e-journal for academic research on Brussels 4
P. Deboosere, T. Eggerickx, E. Van Hecke, B. Wayens, “Citizens’ forum of Brussel. The population of Brussels: a demographic overview ”,
Brussels Studies, Synopsis nr. 3, 12 january 2009 (corr. 17 March 2009).
The age structure of the (internal and international) migrants has an important im-
pact on the age structure of the Brussels population. Brussels is the only region in
which a relative rejuvenation of the population (slight increase in the share of those
younger than 20 years and decrease in the share of those aged 60 and above) has
been established. In 1991, the Brussels region was still the oldest region, whilst
today it is the youngest, having therefore undergone a radical reversal over the
course of the past 15 years. Large differences have been established between the
various municipalities or districts within the region, such that the Brussels region
today encompasses both the youngest municipality (Sint-Joost-ten-Node/Saint-
Josse-ten-Noode) as well as one of the oldest municipalities (Ganshoren) in Bel-
gium.
6. Suburbanisation: 50 years of migration across and beyond the region’s borders
Just as in all large urban agglomerations, the 1950s saw the start of suburbanisa-
tion in Brussels. This outflow soon extended increasingly beyond the 19 Brussels
municipalities and population growth in Brussels came to an end in the middle of
the 1960s. The population in the urban agglomeration continued to grow, but from
1965 onwards, this growth took place outside the Brussels region. The international
migration was not able to compensate for the internal emigration. As the death rate
was also higher than the birth rate, the Brussels region experienced a slow yet per-
sistent population decline. Until 1998, the registered outflow surpassed the total
inflow. The region’s borders, which were established along linguistic lines, took no
account of the demographic and economic reality. The establishment of the region’s
borders automatically turned the urban exodus into relocation away from Brussels.
Such residential relocation increasingly took place further from the capital city, with
the price of living (affordable rent or affordable private housing) forcing many young
families beyond the region’s borders. For those working in Brussels, the daily com-
mute was the trade-off that they had to accept for affordable housing.
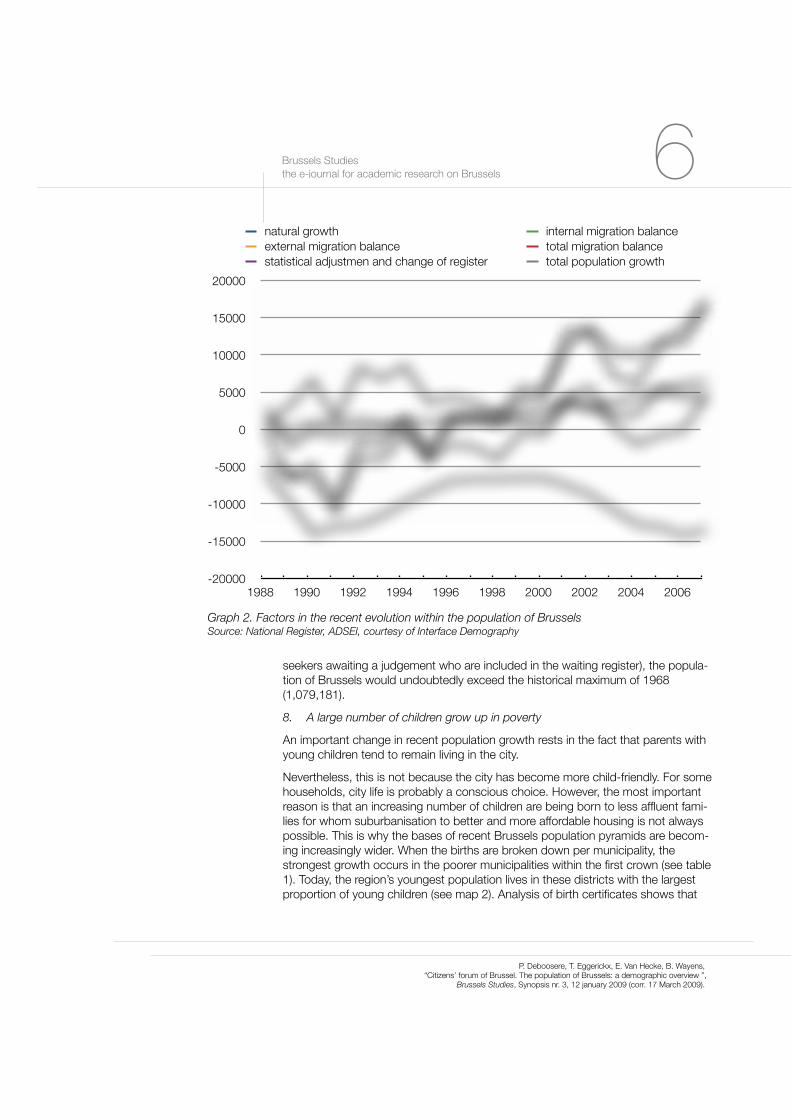
7. Strong population growth
Population decline came to an end in the Brussels-Capital Region from 1995 on-
wards. International immigration kept pace with the internal outflow and has even
surpassed this on several occasions. However, there is also an important new phe-
nomenon that has emerged in that Brussels has been experiencing natural growth
since 1985 (see graph 2).
The absolute number of deaths has been falling for a number of years because of
the declining share of elderly people within the population. Today’s oldest genera-
tions were the pioneers of suburbanisation. A smaller share of elderly people to-
gether with a slightly increased life expectancy has led to a declining number of
deaths. The population’s young age structure also ensures an increasing number of
births. The combination of a slightly higher fertility rate among international migrants
and a young age structure generates an increasing number of births, year after year.
In 1995, the size of the Brussels population reached its lowest level since the Sec-
ond World War. Since then, the steady progression of natural growth combined with
a positive migration balance has ensured strong population growth. According to
the population register, the population exceeded the one million mark in 2005. On
1st January 2008, the population stood at 1,048,491 inhabitants. By adding the
population that is not officially calculated in the population figure (such as asylum
Brussels Studies
the e-journal for academic research on Brussels 5
P. Deboosere, T. Eggerickx, E. Van Hecke, B. Wayens, “Citizens’ forum of Brussel. The population of Brussels: a demographic overview ”,
Brussels Studies, Synopsis nr. 3, 12 january 2009 (corr. 17 March 2009).
seekers awaiting a judgement who are included in the waiting register), the popula-
tion of Brussels would undoubtedly exceed the historical maximum of 1968
(1,079,181).
8. A large number of children grow up in poverty
An important change in recent population growth rests in the fact that parents with
young children tend to remain living in the city.
Nevertheless, this is not because the city has become more child-friendly. For some
households, city life is probably a conscious choice. However, the most important
reason is that an increasing number of children are being born to less affluent fami-
lies for whom suburbanisation to better and more affordable housing is not always
possible. This is why the bases of recent Brussels population pyramids are becom-
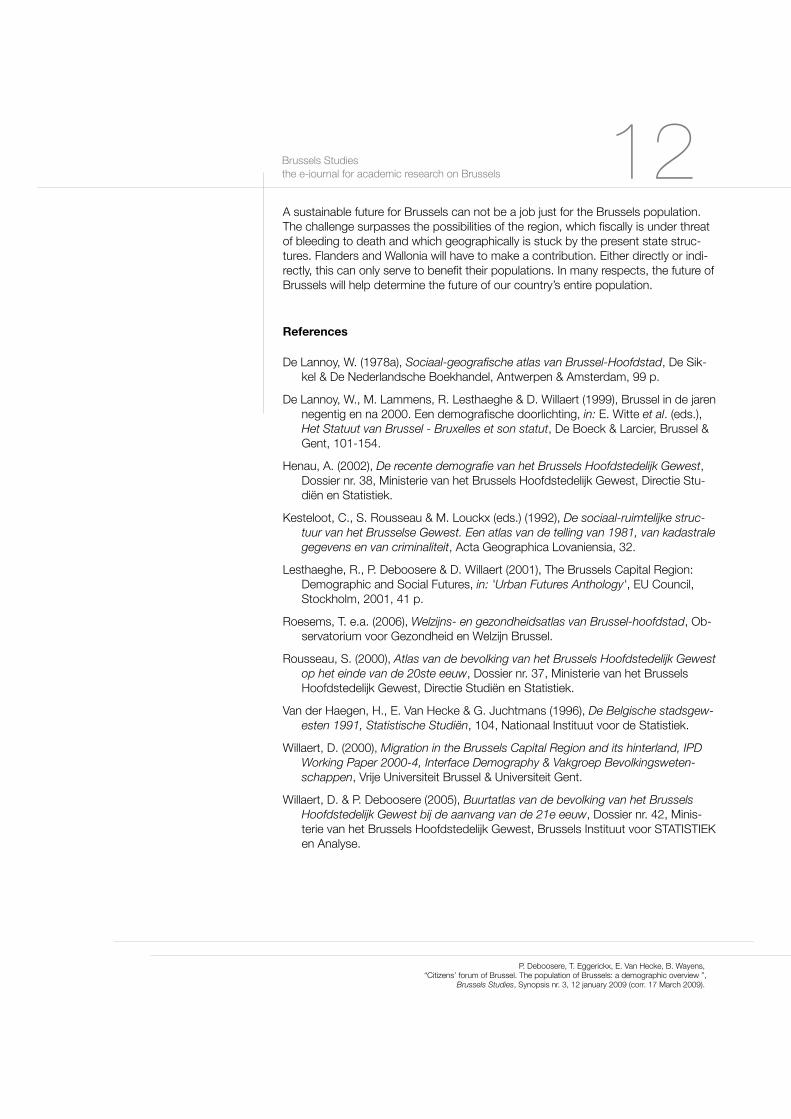
ing increasingly wider. When the births are broken down per municipality, the
strongest growth occurs in the poorer municipalities within the first crown (see table
1). Today, the region’s youngest population lives in these districts with the largest
proportion of young children (see map 2). Analysis of birth certificates shows that
Brussels Studies
the e-journal for academic research on Brussels 6
P. Deboosere, T. Eggerickx, E. Van Hecke, B. Wayens, “Citizens’ forum of Brussel. The population of Brussels: a demographic overview ”,
Brussels Studies, Synopsis nr. 3, 12 january 2009 (corr. 17 March 2009).
-20000
-15000
-10000
-5000
0
5000
10000
15000
20000
1988 1990 1992 1994 1996 1998 2000 2002 2004 2006
natural growth internal migration balance
external migration balance total migration balance
statistical adjustmen and change of register total population growth
Graph 2. Factors in the recent evolution within the population of BrusselsSource: National Register, ADSEI, courtesy of Interface Demography
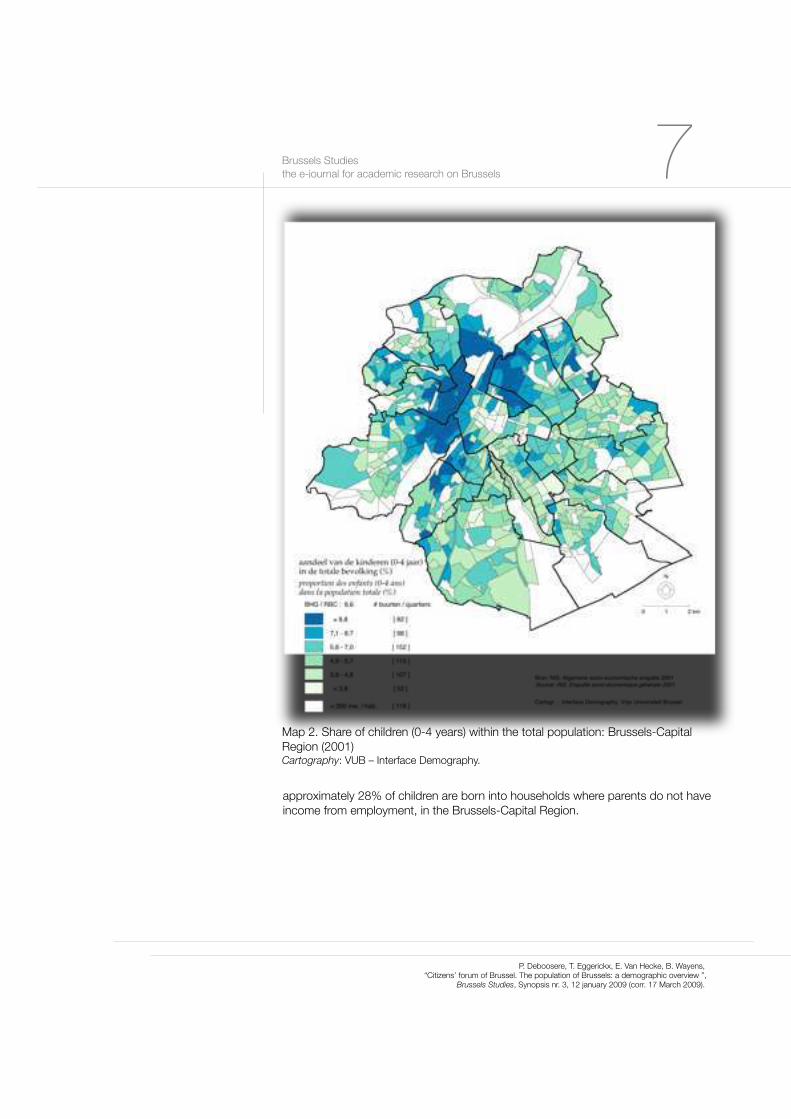
approximately 28% of children are born into households where parents do not have
income from employment, in the Brussels-Capital Region.
Brussels Studies
the e-journal for academic research on Brussels 7
P. Deboosere, T. Eggerickx, E. Van Hecke, B. Wayens, “Citizens’ forum of Brussel. The population of Brussels: a demographic overview ”,
Brussels Studies, Synopsis nr. 3, 12 january 2009 (corr. 17 March 2009).
Map 2. Share of children (0-4 years) within the total population: Brussels-Capital
Region (2001)Cartography: VUB – Interface Demography.

9. Growing diversity
The composition of the Brussels population is becoming increasingly diverse, but
the share of inhabitants that have the Belgian nationality has remained relatively
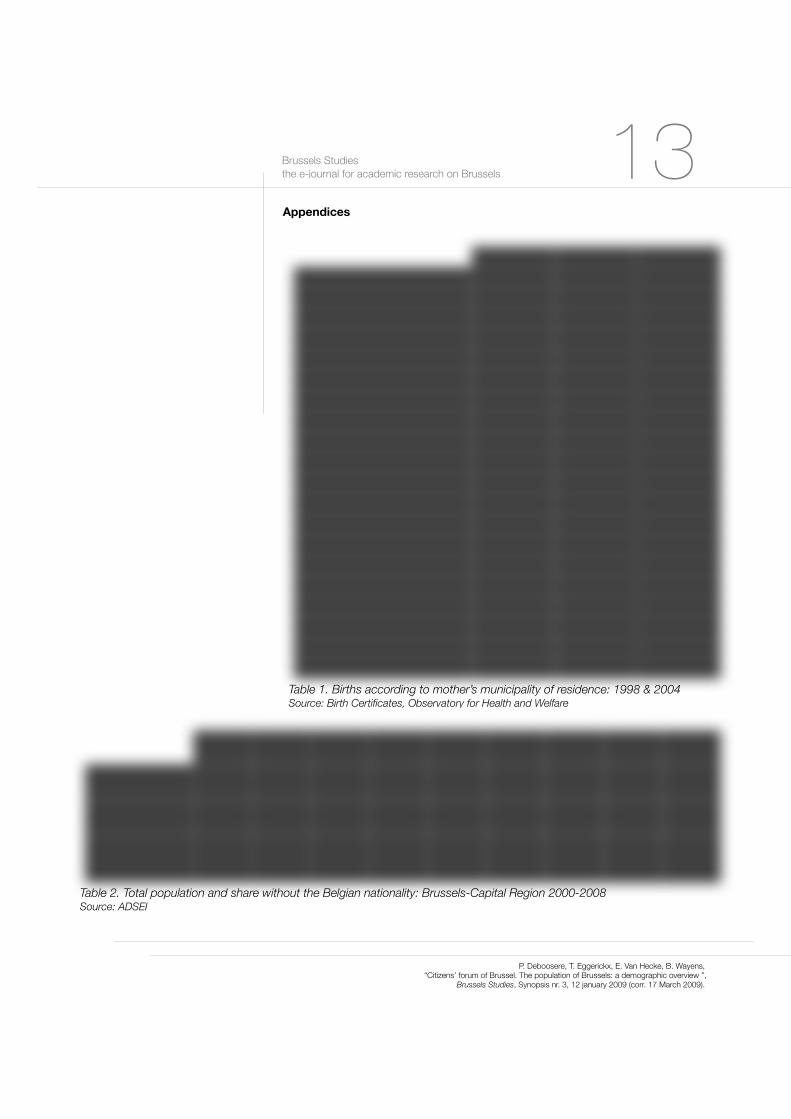
constant over the past few years due to the numerous changes in nationality (see
table 2). Since 1st January 1989, there have been more than 200,000 changes in
nationality in Brussels, leading to more children being born as Belgians. The share of
the Belgian population below the age of 18 is larger than the age groups that belong
to the active population. Therefore, nationality is no longer a reliable indicator of the
extensive diversity in origin and cultural background of the Brussels population. Tak-
ing nationality at birth into account, 46% of the Brussels population is not of Belgian
origin. Adding the children that are born as Belgians to parents who migrated,
means that more than 50% of the Brussels population comes from abroad or is
born to parents who migrated. The population with Moroccan origin forms the most
important group in this respect, amounting to almost 13% of the Brussels popula-
tion in 2001. Over the past few years, the diversity of the country of origin has in-
creased (see table 4), with migrants increasingly coming from East European coun-
tries (with Poland and Bulgaria leading) or Sub-Saharan Africa.
Brussels Studies
the e-journal for academic research on Brussels 8
P. Deboosere, T. Eggerickx, E. Van Hecke, B. Wayens, “Citizens’ forum of Brussel. The population of Brussels: a demographic overview ”,
Brussels Studies, Synopsis nr. 3, 12 january 2009 (corr. 17 March 2009).
II. Questions - issues
1. Erosion of incomes
The migration patterns and especially suburbanisation have led to the more affluent
double income families leaving the city, which in itself has caused a constant de-
crease in the average income per inhabitant of Brussels compared with the average
income in Belgium (see table 5). Many companies have also established themselves
in new industrial estates outside the Brussels-Capital Region, resulting in a sus-
tained (relative) decrease in the incomes of the municipalities and the Brussels-
Capital Region. This goes against the requirement to meet the increasingly greater
needs of the urban population and the necessity to pursue an investment policy that
makes living in the city appealing once again. The erosion of incomes makes it more
difficult to pursue an active policy
that meets housing needs. Never-
theless, an investment policy that
ensures an appealing living envi-
ronment whilst at the same time
also guaranteeing the right to hous-
ing for the less affluent population
is essential for a policy in which
sustainable development is a prior-
ity.
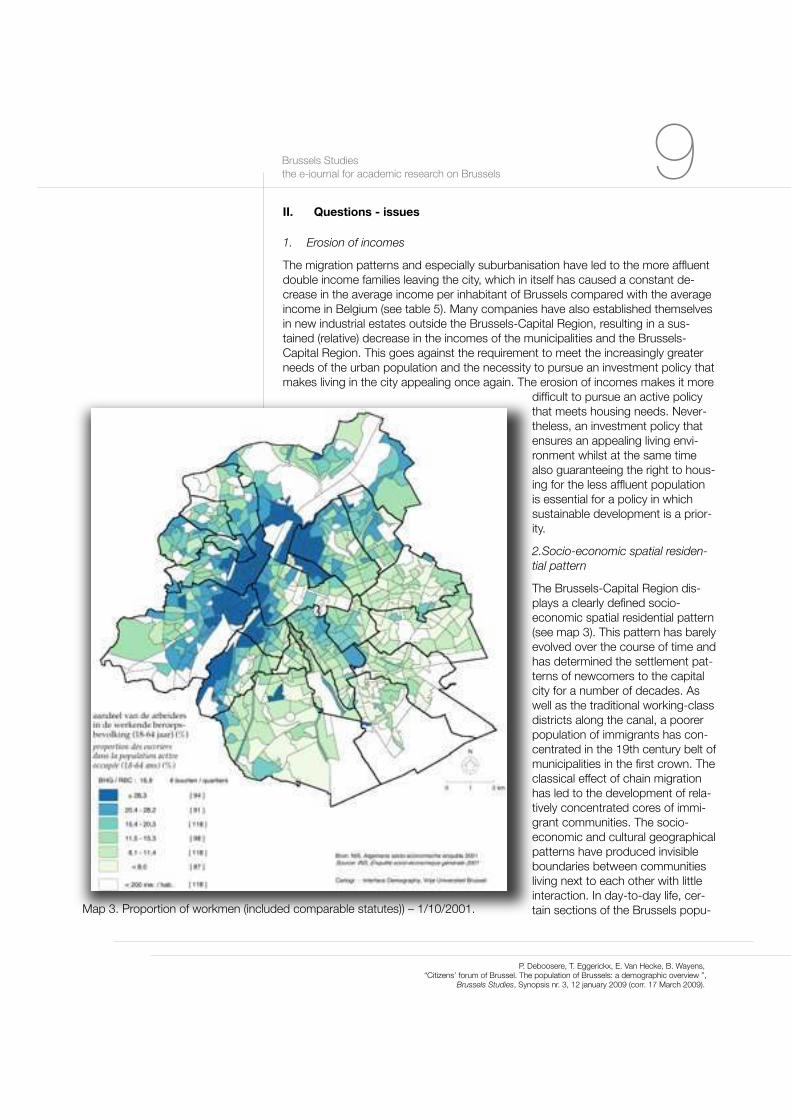
2.Socio-economic spatial residen-
tial pattern
The Brussels-Capital Region dis-
plays a clearly defined socio-
economic spatial residential pattern
(see map 3). This pattern has barely
evolved over the course of time and
has determined the settlement pat-
terns of newcomers to the capital
city for a number of decades. As
well as the traditional working-class
districts along the canal, a poorer
population of immigrants has con-
centrated in the 19th century belt of
municipalities in the first crown. The
classical effect of chain migration
has led to the development of rela-
tively concentrated cores of immi-
grant communities. The socio-
economic and cultural geographical
patterns have produced invisible
boundaries between communities
living next to each other with little
interaction. In day-to-day life, cer-
tain sections of the Brussels popu-
Brussels Studies
the e-journal for academic research on Brussels 9
P. Deboosere, T. Eggerickx, E. Van Hecke, B. Wayens, “Citizens’ forum of Brussel. The population of Brussels: a demographic overview ”,
Brussels Studies, Synopsis nr. 3, 12 january 2009 (corr. 17 March 2009).
Map 3. Proportion of workmen (included comparable statutes)) – 1/10/2001.
lation barely come in contact with each other. This de facto segregation is a chal-
lenge for the city’s liveability in the long term and presents a particular problem for
the fully-fledged development of young people who grow up in the poorer districts.
Nevertheless, there are neighbourhoods where people with very diverse socio-
economic and cultural backgrounds live together.
3. Increasing population pressure
The population projections for Brussels predict that if the present demographic
trends continue, the 19 Brussels municipalities will have approximately 1 million
300,000 inhabitants by the middle of this century (see table 3). These projections do
not take account of possibilities for growth in housing or for the consequences of
increasing demographic pressure on the cost of housing. Nonetheless, it is very
clear that such a demographic evolution will present the Brussels-Capital Region
with an important challenge.
4. Finding an answer to growing polarisation
The socio-economic divide between the Brussels agglomeration and its suburban
(or peri-urban) periphery is becoming greater; especially through socially-selective
internal emigration (the access to the suburban area is increasingly restricted to the
more affluent section of the population). This socio-economic polarisation overlaps
with the complementarity of the spatial area in demographic terms in the lifecycle of
individuals and households. The city offers advantages to young people and the
existing organisation of the peri-urban area meets the expectations of those in the
30 to 45 year olds and their children. In spite of its problems, the city plays a social
role that the peripheral area is increasingly less able to guarantee due to the type of
housing provision (little or no social housing, limited and shrinking rental accommo-
dation since the 1980s). We can obviously try to intervene by making changes to
the housing provision. In the meantime, the city fulfils an important social function.
The cost of this has to be carried fairly, also by the periphery that is not able to
guarantee this function.
The present housing market is also causing pernicious evolutions within the region.
Despite the intensity of the migration and the comparatively larger provision of rental
accommodation than in the rest of the country, the present housing market in no
way guarantees an optimal allocation of housing to households. Overcrowding,
under-utilisation and housing that does not meet the housing code are all common-
place. Under pressure from continuous population growth, the new build sector is
not able to bridge the gap. As a result, it is especially the socio-economically weaker
population that are hard pressed on the property market, mainly because of the
poor share of the social housing sector. Furthermore, the will to keep or bring back
the middle-classes to the city (which goes against the present trend) could actually
compound this pressure.
A number of contradictions therefore emerge that need to be resolved. Will the re-
gion be able to combine the inflow of international executive staff, the will to keep
the middle-classes in the city and the integration and care of the socially weak
population groups? Is an increased densification of the population feasible? Are
there any alternative paths that can be trodden?
Brussels Studies
the e-journal for academic research on Brussels 10
P. Deboosere, T. Eggerickx, E. Van Hecke, B. Wayens, “Citizens’ forum of Brussel. The population of Brussels: a demographic overview ”,
Brussels Studies, Synopsis nr. 3, 12 january 2009 (corr. 17 March 2009).
III. Policy options
The demographic evolution of the Brussels-Capital Region presents a great chal-
lenge to the future of our country. With the right policy measures, the demographic
evolution of Brussels can make a positive contribution. Brussels not only contributes
to a rejuvenation of the population, it also remains an economic engine for the coun-
try because of the role that it plays in population growth. Brussels continuously at-
tracts young people with an enormous potential for talent and new ideas. The pres-
ence of international and European institutions together with international migration
also contributes to its dynamic character. Brussels is an interesting city with much
cultural charisma at the edge of French and Dutch culture and open to the whole
world.
However, Brussels also requires a future-oriented project in order to make it a live-
able city for the 21st century. Brussels needs to be a pleasant place to live, in all
respects. The demographic evolution calls for special attention to be paid to devel-
opment within the disadvantaged districts and especially to the situation of young
people and children who live in these districts. There is a need for an integrated
policy plan that focuses on the many facets of education, employment, housing, the
living environment, health etc. The geographical embedding of the disadvantaged
districts in Brussels gives, in contrast to the situation in some other countries, enor-
mous possibilities for addressing social segregation and to turn this city into a live-
able city for everyone.
The projections for population growth in Brussels are not based on the future devel-
opment of the housing provision, but on the present dynamic of the various compo-
nents of population growth. It is not self-evident that the region has the financial
capacity for the expected population increase. In any case, the tension between the
expected population growth and the existing housing provision presents clear chal-
lenges in terms of densification and socio-spatial reordering. Which scenarios need
to be followed for an endurable and sustainable living environment? How are we
going to deal with the limited space? Are high-rise buildings and the conversion of
existing buildings (industrial premises, office spaces) options for the future? What
influence will all this have on mobility within the city and the retention of sufficient
green space and a child-friendly city environment?
Brussels has a particularly important role in the integration process of young people
on the employment market because of the position that the region plays in age-
related migration flows and also because of the range of higher education that it
offers. Brussels must manage the critical transitional phase to the employment mar-
ket even more than in the rest of the country, which is why it is so important to in-
vest in young people. This requires a global approach across all age groups; an
approach that combines diverse means: education and training, eliminating all forms
of inequality, but also paying attention to the expansion of the infrastructure (for ex-
ample, would a day nursery add to the well-being and easier integration of young
parents in the employment market?).
Brussels Studies
the e-journal for academic research on Brussels 11
P. Deboosere, T. Eggerickx, E. Van Hecke, B. Wayens, “Citizens’ forum of Brussel. The population of Brussels: a demographic overview ”,
Brussels Studies, Synopsis nr. 3, 12 january 2009 (corr. 17 March 2009).
A sustainable future for Brussels can not be a job just for the Brussels population.
The challenge surpasses the possibilities of the region, which fiscally is under threat
of bleeding to death and which geographically is stuck by the present state struc-
tures. Flanders and Wallonia will have to make a contribution. Either directly or indi-
rectly, this can only serve to benefit their populations. In many respects, the future of
Brussels will help determine the future of our country’s entire population.
References
De Lannoy, W. (1978a), Sociaal-geografische atlas van Brussel-Hoofdstad, De Sik-
kel & De Nederlandsche Boekhandel, Antwerpen & Amsterdam, 99 p.
De Lannoy, W., M. Lammens, R. Lesthaeghe & D. Willaert (1999), Brussel in de jaren
negentig en na 2000. Een demografische doorlichting, in: E. Witte et al. (eds.),
Het Statuut van Brussel - Bruxelles et son statut, De Boeck & Larcier, Brussel &
Gent, 101-154.
Henau, A. (2002), De recente demografie van het Brussels Hoofdstedelijk Gewest,
Dossier nr. 38, Ministerie van het Brussels Hoofdstedelijk Gewest, Directie Stu-
diën en Statistiek.
Kesteloot, C., S. Rousseau & M. Louckx (eds.) (1992), De sociaal-ruimtelijke struc-
tuur van het Brusselse Gewest. Een atlas van de telling van 1981, van kadastrale
gegevens en van criminaliteit, Acta Geographica Lovaniensia, 32.
Lesthaeghe, R., P. Deboosere & D. Willaert (2001), The Brussels Capital Region:
Demographic and Social Futures, in: 'Urban Futures Anthology', EU Council,
Stockholm, 2001, 41 p.
Roesems, T. e.a. (2006), Welzijns- en gezondheidsatlas van Brussel-hoofdstad, Ob-
servatorium voor Gezondheid en Welzijn Brussel.
Rousseau, S. (2000), Atlas van de bevolking van het Brussels Hoofdstedelijk Gewest
op het einde van de 20ste eeuw, Dossier nr. 37, Ministerie van het Brussels
Hoofdstedelijk Gewest, Directie Studiën en Statistiek.
Van der Haegen, H., E. Van Hecke & G. Juchtmans (1996), De Belgische stadsgew-
esten 1991, Statistische Studiën, 104, Nationaal Instituut voor de Statistiek.
Willaert, D. (2000), Migration in the Brussels Capital Region and its hinterland, IPD
Working Paper 2000-4, Interface Demography & Vakgroep Bevolkingsweten-
schappen, Vrije Universiteit Brussel & Universiteit Gent.
Willaert, D. & P. Deboosere (2005), Buurtatlas van de bevolking van het Brussels
Hoofdstedelijk Gewest bij de aanvang van de 21e eeuw, Dossier nr. 42, Minis-
terie van het Brussels Hoofdstedelijk Gewest, Brussels Instituut voor STATISTIEK
en Analyse.
Brussels Studies
the e-journal for academic research on Brussels 12
P. Deboosere, T. Eggerickx, E. Van Hecke, B. Wayens, “Citizens’ forum of Brussel. The population of Brussels: a demographic overview ”,
Brussels Studies, Synopsis nr. 3, 12 january 2009 (corr. 17 March 2009).
Appendices
Brussels Studies
the e-journal for academic research on Brussels 13
P. Deboosere, T. Eggerickx, E. Van Hecke, B. Wayens, “Citizens’ forum of Brussel. The population of Brussels: a demographic overview ”,
Brussels Studies, Synopsis nr. 3, 12 january 2009 (corr. 17 March 2009).
1998 2004 Growth ratio
Anderlecht 1.174 1.638 1,40
Oudergem 303 340 1,12
Sint-Agatha-Berchem 211 243 1,15
Brussel 2.138 2.658 1,24
Etterbeek 561 587 1,05
Evere 370 435 1,18
Vorst 658 786 1,19
Ganshoren 202 259 1,28
Elsene 913 1.091 1,19
Jette 453 604 1,33
Koekelberg 244 359 1,47
Sint-Jans-Molenbeek 1.241 1.717 1,38
Sint-Gilles 665 788 1,18
Sint-Joost-ten-Node 504 554 1,10
Schaarbeek 1.802 2.240 1,24
Ukkel 797 783 0,98
Watermaal-Bosvoorde 245 220 0,90
Sint-Lambrechts-Woluwe 485 558 1,15
Sint-Pieters-Woluwe 379 428 1,13
Brussels-Capital Region 13.345 16.288 1,22
Table 1. Births according to mother’s municipality of residence: 1998 & 2004Source: Birth Certificates, Observatory for Health and Welfare
2000 2001 2002 2003 2004 2005 2006 2007 2008
Population without
Belgian nationality273.613 262.771 260.040 260.269 263.451 265.211 273.693 283.527 295.043
Total population 959.318 964.405 978.384 992.041 999.899 1.006.749 1.018.804 1.031.215 1.048.491
Share of population
without Belgian
nationality
28,52 27,25 26,6 26,24 26,35 26,34 26,86 27,49 28,14
Table 2. Total population and share without the Belgian nationality: Brussels-Capital Region 2000-2008Source: ADSEI

Brussels Studies
the e-journal for academic research on Brussels 14
P. Deboosere, T. Eggerickx, E. Van Hecke, B. Wayens, “Citizens’ forum of Brussel. The population of Brussels: a demographic overview ”,
Brussels Studies, Synopsis nr. 3, 12 january 2009 (corr. 17 March 2009).
2000 2006 2010 2020 2030 2040 2050 2060
Population on 1st January
Natural balance
Births
Deaths
Balance of internal migra-
tions
Internal immigrations
External emigrations
Balance of external migra-
tions
External immigrations
External emigrations
Growth of population
Statistical adjustment
Population on 31st De-
cember
959.318 1.018.804 1.072.063 1.200.108 1.255.791 1.264.310 1.289.164 1.327.652
3.413 6.669 9.274 11.232 10.509 9.474 9.612 9.881
13.626 16.214 18.553 20.117 19.244 18.724 19.384 19.855
10.213 9.545 9.279 8.885 8.735 9.250 9.772 9.954
-5.861 -13.457 -15.724 -16.381 -16.822 -16.560 -16.890 -17.425
69.403 76.946 85.255 91.931 91.724 91.644 93.339 95.314
75.264 90.403 100.979 108.312 108.546 108.204 110.229 112.739
6.741 17.588 20.745 15.347 7.712 8.533 10.864 11.698
22.729 35.482 40.645 38.660 29.883 29.076 31.533 32.986
15.988 17.894 19.900 23.313 22.171 20.543 20.669 21.288
4.293 10.800 14.295 10.198 1.399 1.447 3.586 4.157
794 1.611 0 0 0 0 0 0
964.405 1.031.215 1.086.358 1.210.306 1.257.190 1.265.757 1.292.750 1.331.806
Table 3. Population projections: Brussels-Capital Region 2000-2060.Source: Predications 2000-2006: RR – ADSEI, Calculations FPB; Population Projections 2007-2060, FPB – ADSEI

Brussels Studies
the e-journal for academic research on Brussels 15
P. Deboosere, T. Eggerickx, E. Van Hecke, B. Wayens, “Citizens’ forum of Brussel. The population of Brussels: a demographic overview ”,
Brussels Studies, Synopsis nr. 3, 12 january 2009 (corr. 17 March 2009).
BelgiansBelgiansBelgians EU-15EU-15EU-15 Turks/Morurks/Moroccansoccans OthersOthersOthers
88-90 94-96 04-05 88-90 94-96 04-05 88-90 94-96 04-05 88-90 94-96 04-05
BCR -9,5 -8,2 -11,5 1,6 1,5 0,5 1,0 2,5 3,9 1,7 2,7 6,5
First crown* -8,7 -10,5 -14,2 1,6 0,9 -0,8 1,4 3,6 5,5 1,1 2,7 7,0
Second crown -10,5 -5,4 -8,0 1,5 2,2 2,1 0,5 1,2 2,0 2,3 2,7 5,8
Anderlecht* -8,5 -11,5 -6,7 -0,6 1,1 -0,1 0,9 4,3 6,6 0,3 2,2 7,5
Bruxelles* -6,6 -10,3 -11,4 0,5 0,4 -0,5 0,6 2,3 5,1 1,5 2,4 6,2
Ixelles* -14,6 -10,0 -10,3 5,3 4,7 2,3 -0,2 0,2 1,4 1,7 0,2 7,5
Molenbeek-Saint-Jean* -7,4 -8,4 -14,9 -0,1 -2,2 -1,3 5,0 5,5 6,9 0,4 4,2 4,1
Saint-Gilles* -7,9 -8,9 -18,5 5,5 0,4 -3,5 -1,1 1,9 3,6 0,7 3,9 9,2
Saint-Josse-ten-Noode* -10,8 -11,9 -28,0 -0,3 -0,6 -1,1 8,6 7,3 5,1 4,4 1,3 10,9
Schaerbeek* -8,0 -12,0 -21,8 2,2 1,3 -2,3 1,1 5,9 7,6 0,9 4,0 7,7
Auderghem -9,6 -5,6 -4,1 1,4 3,6 2,9 0,0 0,6 0,4 3,6 2,8 7,4
Berchem-Saint-Agathe -4,6 -1,2 0,2 1,3 -0,1 2,1 0,0 1,2 3,1 0,8 3,8 3,8
Etterbeek -18,8 -12,1 -17,9 1,2 3,8 1,9 1,6 1,4 1,0 4,3 2,1 6,1
Evère -11,8 1,8 -5,5 1,7 3,2 1,3 0,5 3,0 3,6 2,8 4,1 7,7
Forest -11,6 -8,2 -15,9 0,0 1,7 -1,2 0,3 1,3 3,3 1,1 1,9 5,8
Ganshoren -4,7 -7,1 -3,0 0,9 1,2 2,5 1,0 1,9 3,3 1,0 2,6 7,2
Jette -6,9 -5,0 -4,4 1,6 2,1 0,9 0,8 2,8 3,7 4,5 3,0 5,6
Koekelberg 0,4 -12,4 -8,0 -0,8 1,1 1,2 1,6 1,7 8,6 2,6 1,9 8,5
Uccle -9,3 -3,3 -5,6 2,3 2,0 3,6 0,5 0,8 0,6 0,6 3,8 4,4
Watermael-Boitsfort -8,9 1,6 -6,5 2,0 2,8 0,0 0,4 0,3 0,2 2,3 1,6 2,0
Woluwe-Saint-Lambert -14,4 -6,7 -11,2 2,0 2,3 4,9 0,0 0,2 0,4 3,6 1,4 7,0
Woluwe-Saint-Pierre -12,5 -6,1 -5,5 2,3 1,7 2,4 0,1 0,3 0,4 1,2 2,7 6,2
Table 4. Average annual migration balance per 1000 inhabitants according to nationality: 1988-2005Source: National Register, ADSEI, courtesy of Interface Demography
Erratum: data for Ixelles have been corrected on 20 january 2009.

Brussels Studies
the e-journal for academic research on Brussels 16
P. Deboosere, T. Eggerickx, E. Van Hecke, B. Wayens, “Citizens’ forum of Brussel. The population of Brussels: a demographic overview ”,
Brussels Studies, Synopsis nr. 3, 12 january 2009 (corr. 17 March 2009).
1971 1980 1990 1993 1995 1997 1999 2001 2003 2005
Anderlecht 113 101 94 91 88 84 81 79 75 77
Auderghem 159 135 129 125 120 117 120 118 113 108
Berchem-Sainte-Agathe 137 126 122 119 115 111 108 104 99 102
Bruxelles 133 101 87 84 80 79 78 79 74 76
Etterbeek 139 104 99 95 92 89 90 88 83 82
Evère 132 126 115 108 102 101 98 97 92 88
Forest 141 113 102 99 95 92 95 91 90 86
Ganshoren 155 131 123 119 115 113 107 103 100 101
Ixelles 152 116 100 94 91 91 92 91 88 87
Jette 139 126 115 115 108 105 104 98 96 94
Koekelberg 132 112 101 98 91 91 90 87 84 83
Molenbeek-Saint-Jean 109 94 82 78 73 75 72 69 66 65
Saint-Gilles 100 79 72 70 67 66 67 71 66 67
Saint-Josse-ten-Node 106 72 57 53 51 48 49 53 52 52
Schaerbeek 118 94 84 81 76 75 76 76 72 70
Uccle 197 158 133 128 121 121 120 120 113 110
Watermael-Boitsfort 165 144 131 128 121 120 118 115 116 114
Woluwe-Saint-Lambert 170 147 127 120 118 114 114 111 105 102
Woluwe-Saint-Pierre 206 170 136 129 123 124 122 120 117 112
Brussels Capital Region 139 114 101 98 93 92 91 90 86 85
Table 5: Evolution of average taxable income per inhabitant in the Brussels-Capital Region compared to the evolution in
Belgium (Belgium=100): 1971-2005Source: ADSEI, Federal Public Service of Finance, courtesy of Interface Demography