STATISTICS - Berne Unioncdn.berneunion.org/.../Images/Berne-Union-2016-Year-End-Statistics.pdf ·...
37
STATISTICS 2012-2016 Last update: 03/07/2017
Transcript of STATISTICS - Berne Unioncdn.berneunion.org/.../Images/Berne-Union-2016-Year-End-Statistics.pdf ·...
STATISTICS2012-2016
Last update: 03/07/2017
OVERALL TRENDS
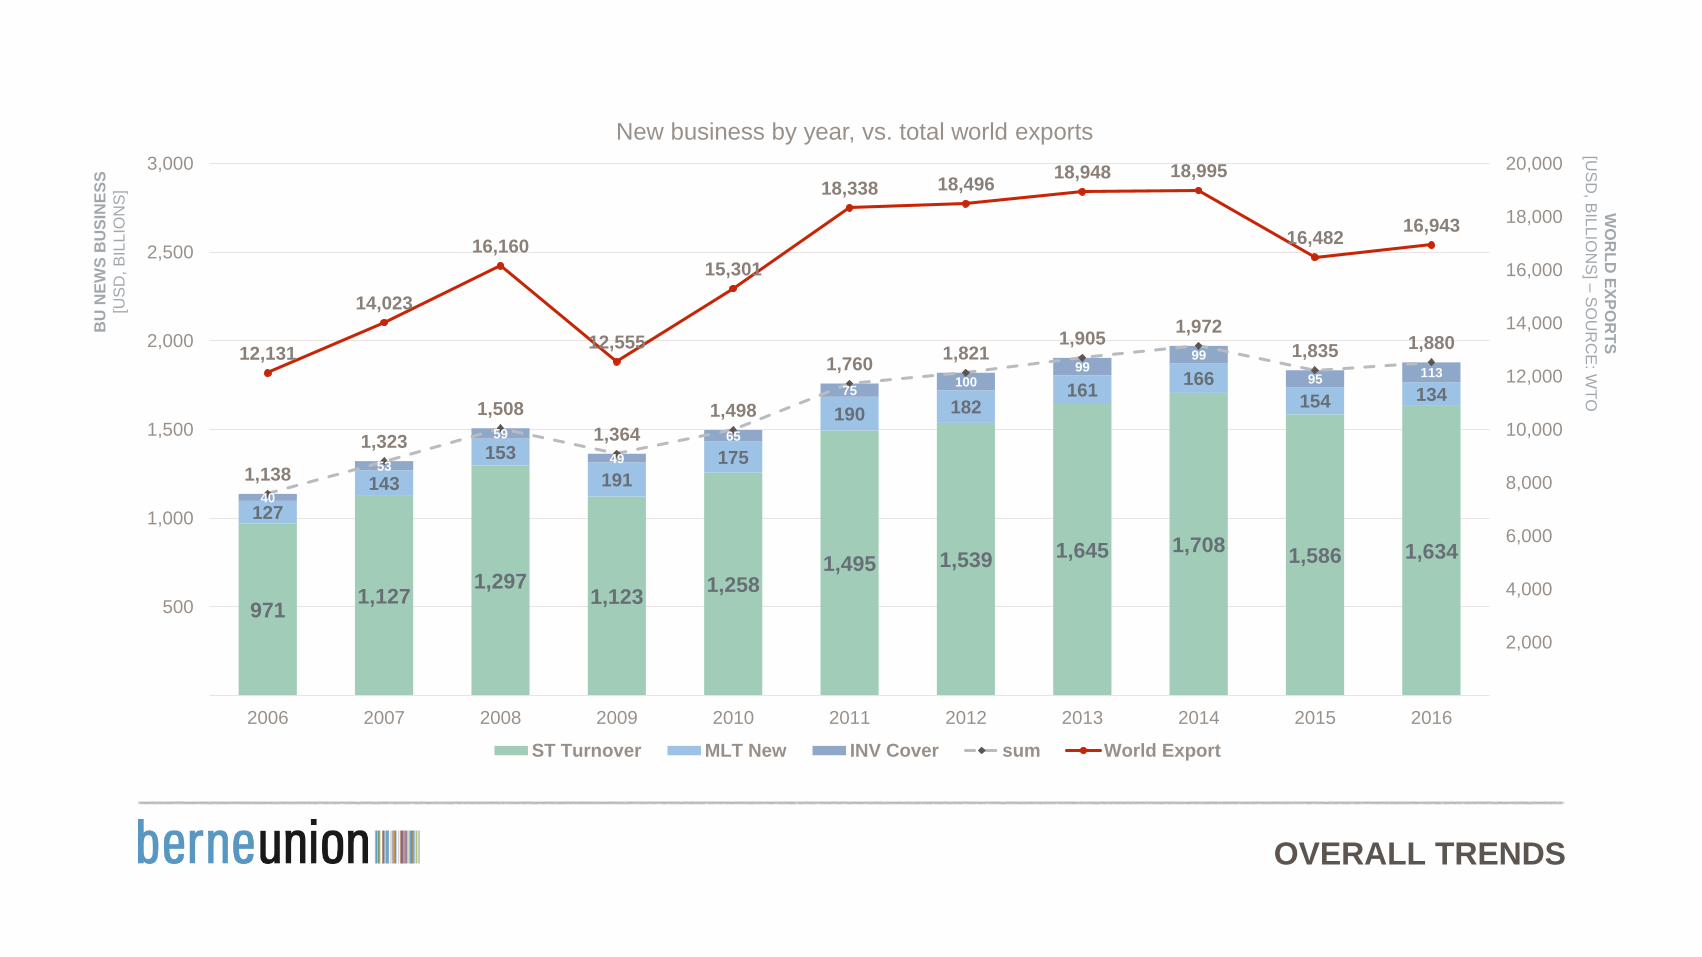
9711,127
1,2971,123
1,2581,495 1,539 1,645 1,708
1,586 1,634
127
143
153
191
175
190 182161
166
154 134
40
53
59
49
65
75100
9999
95113
1,138
1,323
1,508
1,364
1,498
1,7601,821
1,9051,972
1,835 1,88012,131
14,023
16,160
12,555
15,301
18,338 18,49618,948 18,995
16,48216,943
2,000
4,000
6,000
8,000
10,000
12,000
14,000
16,000
18,000
20,000
500
1,000
1,500
2,000
2,500
3,000
2006 2007 2008 2009 2010 2011 2012 2013 2014 2015 2016
New business by year, vs. total world exports
ST Turnover MLT New INV Cover sum World Export
BU
NE
WS
BU
SIN
ES
S
[US
D, B
ILL
ION
S]
WO
RL
D E
XP
OR
TS
[US
D, B
ILL
ION
S] –
SO
UR
CE
: WT
O
OVERALL TRENDS
0%
5%
10%
15%
20%
25%
30%
35%
40%
45%
50%
Americas Africa Middle East Europe APAC
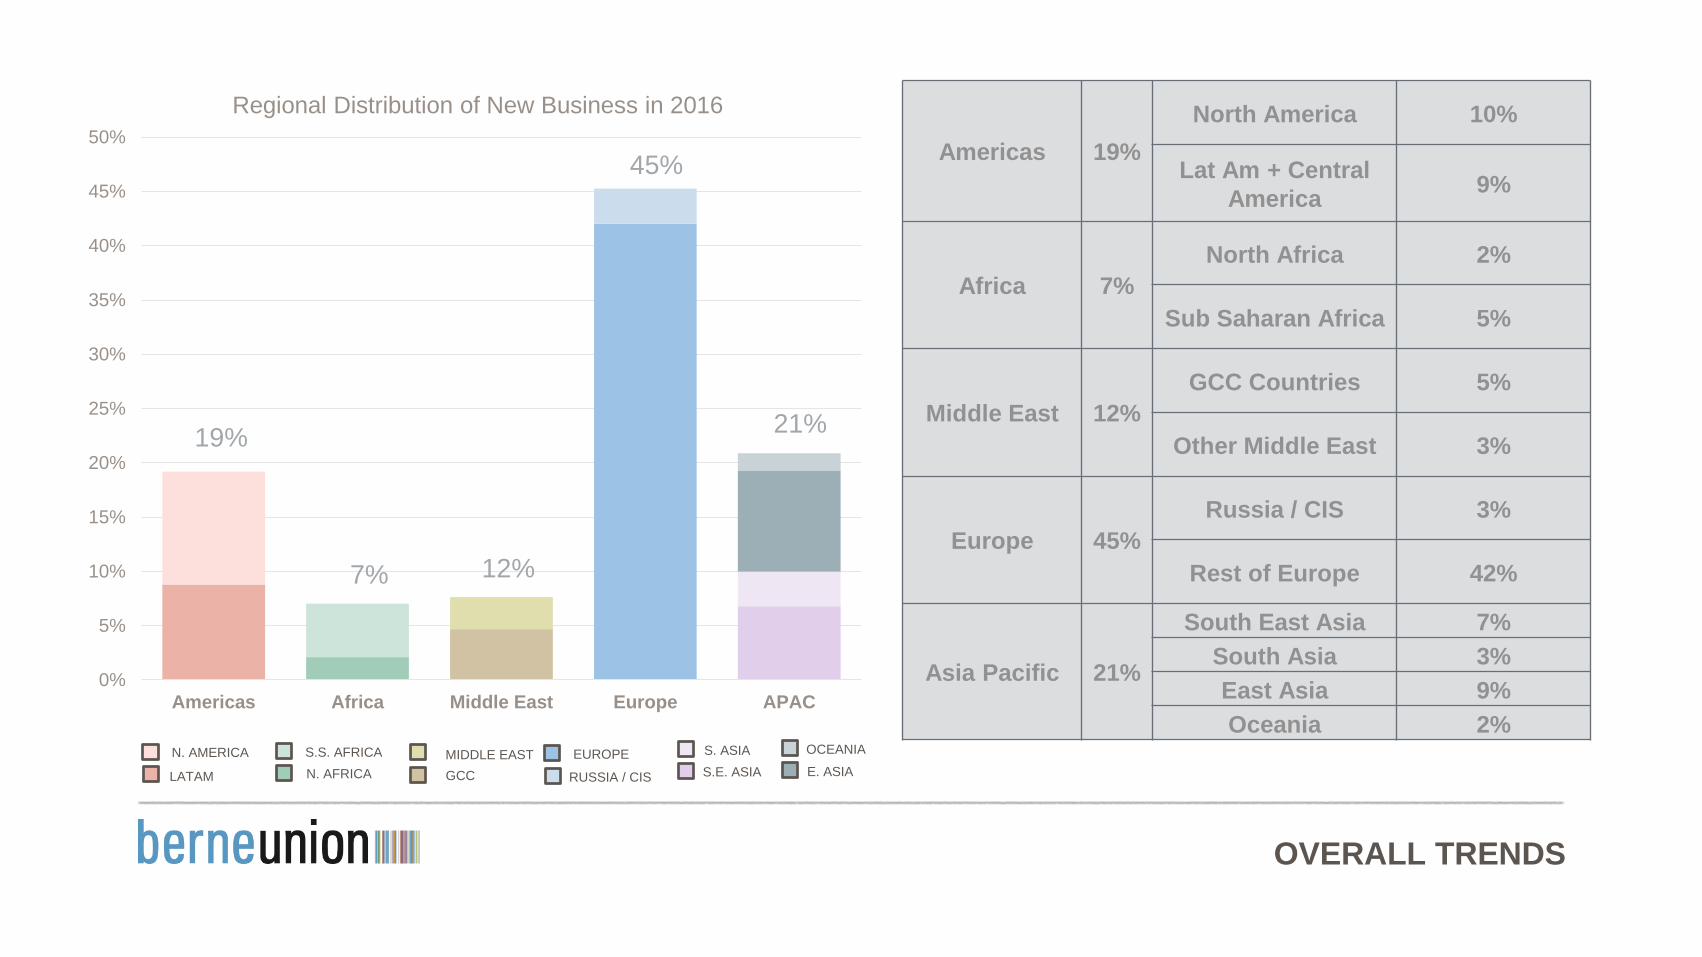
Regional Distribution of New Business in 2016
OCEANIA
E. ASIA
S. ASIA
S.E. ASIA
EUROPE
RUSSIA / CISGCCN. AFRICALATAM
N. AMERICA S.S. AFRICA MIDDLE EAST
Americas 19%
North America 10%
Lat Am + Central
America9%
Africa 7%
North Africa 2%
Sub Saharan Africa 5%
Middle East 12%
GCC Countries 5%
Other Middle East 3%
Europe 45%
Russia / CIS 3%
Rest of Europe 42%
Asia Pacific 21%
South East Asia 7%
South Asia 3%
East Asia 9%
Oceania 2%
19%
7% 12%
45%
21%
OVERALL TRENDS
47% 48% 48% 48% 51%
53%52%
52%
52%49%
0
500
1,000
1,500
2,000
2012 2013 2014 2015 2016
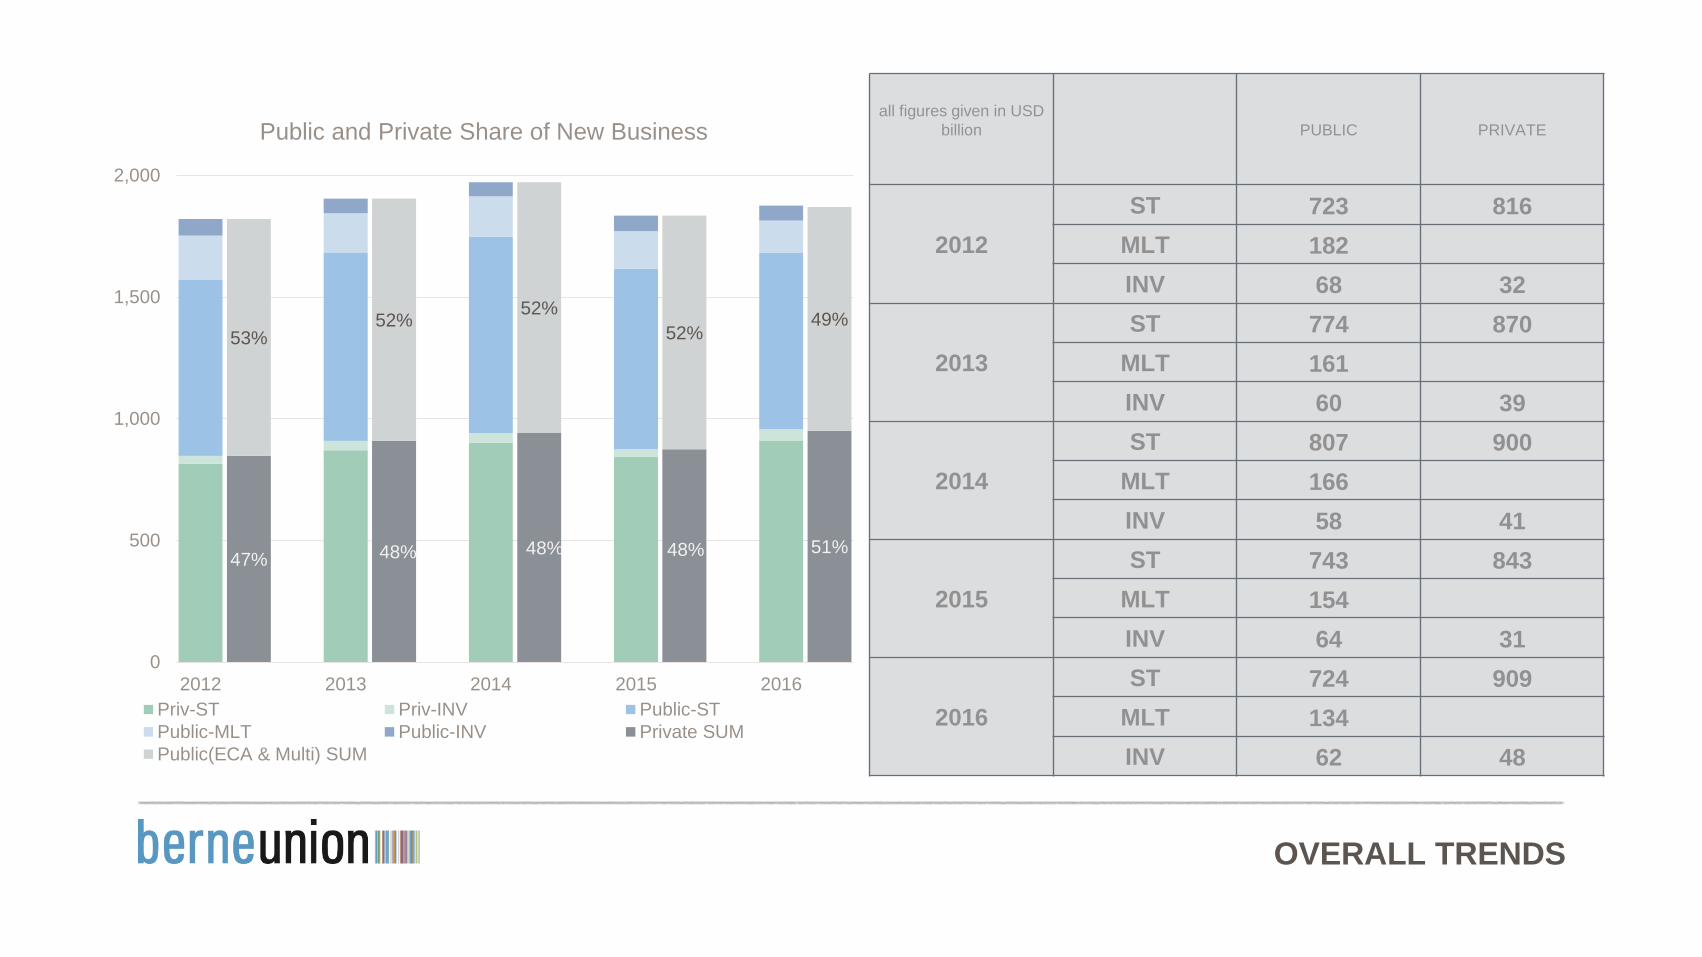
Public and Private Share of New Business
Priv-ST Priv-INV Public-ST
Public-MLT Public-INV Private SUM
Public(ECA & Multi) SUM
all figures given in USD
billion PUBLIC PRIVATE
2012
ST 723 816
MLT 182
INV 68 32
2013
ST 774 870
MLT 161
INV 60 39
2014
ST 807 900
MLT 166
INV 58 41
2015
ST 743 843
MLT 154
INV 64 31
2016
ST 724 909
MLT 134
INV 62 48
SHORT TERM EXPORT CREDIT INSURANCE
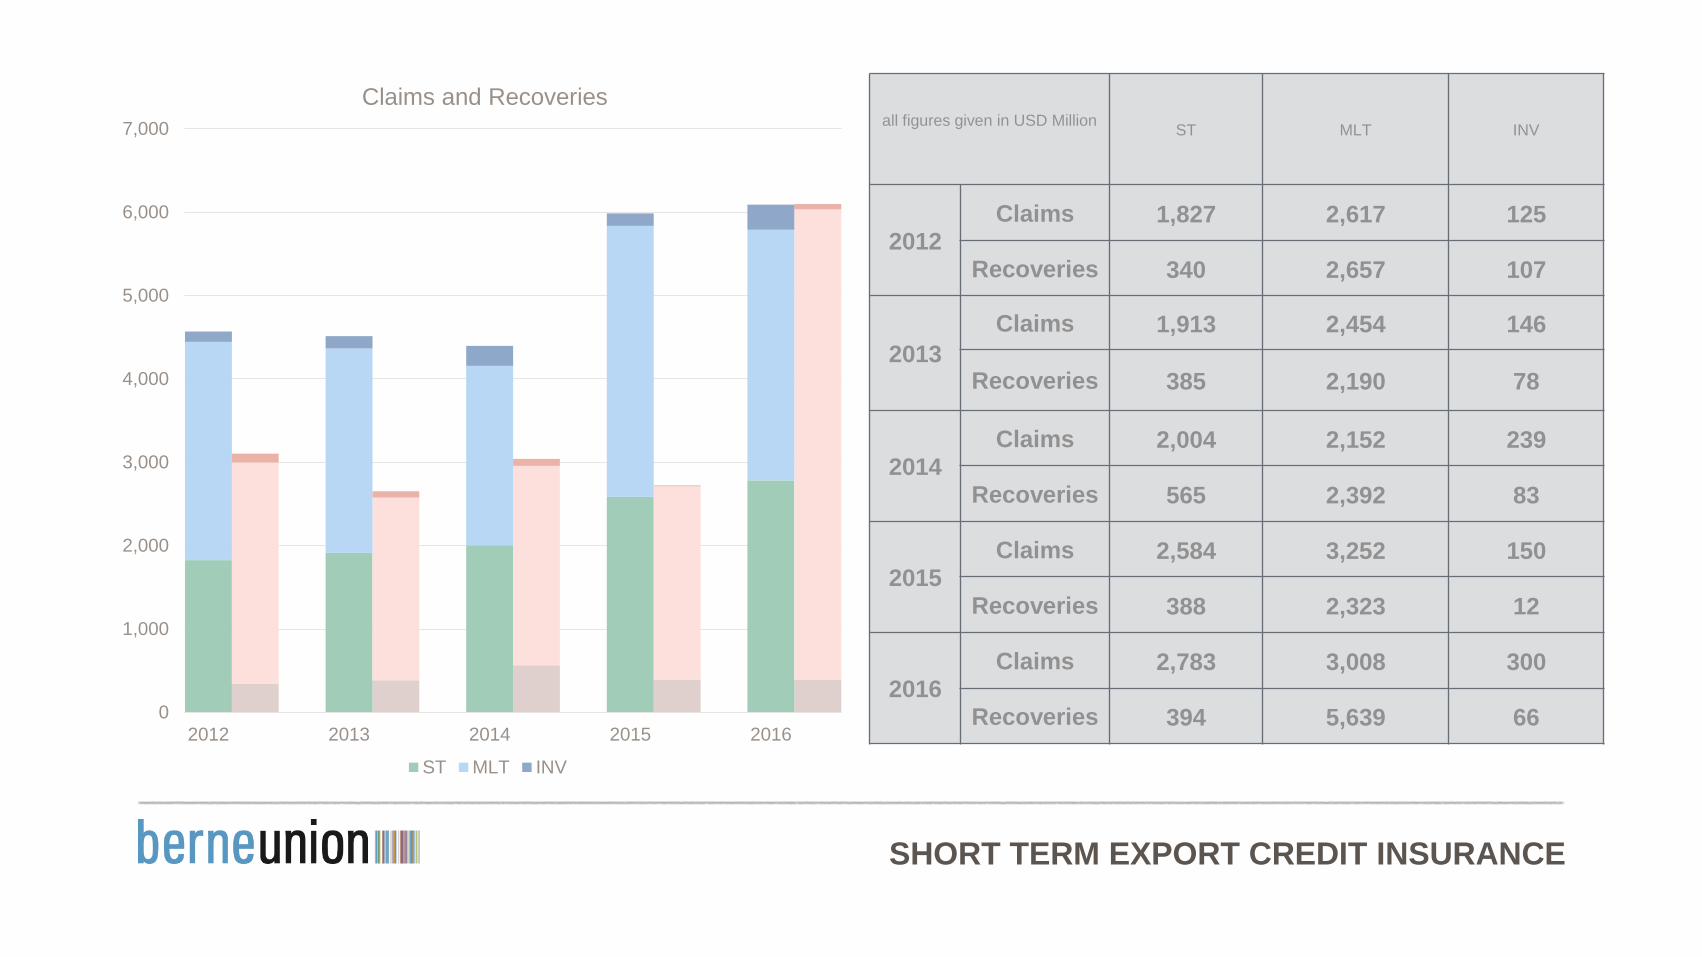
all figures given in USD MillionST MLT INV
2012Claims 1,827 2,617 125
Recoveries 340 2,657 107
2013
Claims 1,913 2,454 146
Recoveries 385 2,190 78
2014Claims 2,004 2,152 239
Recoveries 565 2,392 83
2015Claims 2,584 3,252 150
Recoveries 388 2,323 12
2016Claims 2,783 3,008 300
Recoveries 394 5,639 660
1,000
2,000
3,000
4,000
5,000
6,000
7,000
2012 2013 2014 2015 2016
Claims and Recoveries
ST MLT INV

SHORT TERM EXPORT CREDIT
INSURANCE
SHORT TERM EXPORT CREDIT INSURANCE
1,450,000
1,500,000
1,550,000
1,600,000
1,650,000
1,700,000
1,750,000
2012 2013 2014 2015 2016
US
D m
illio
n
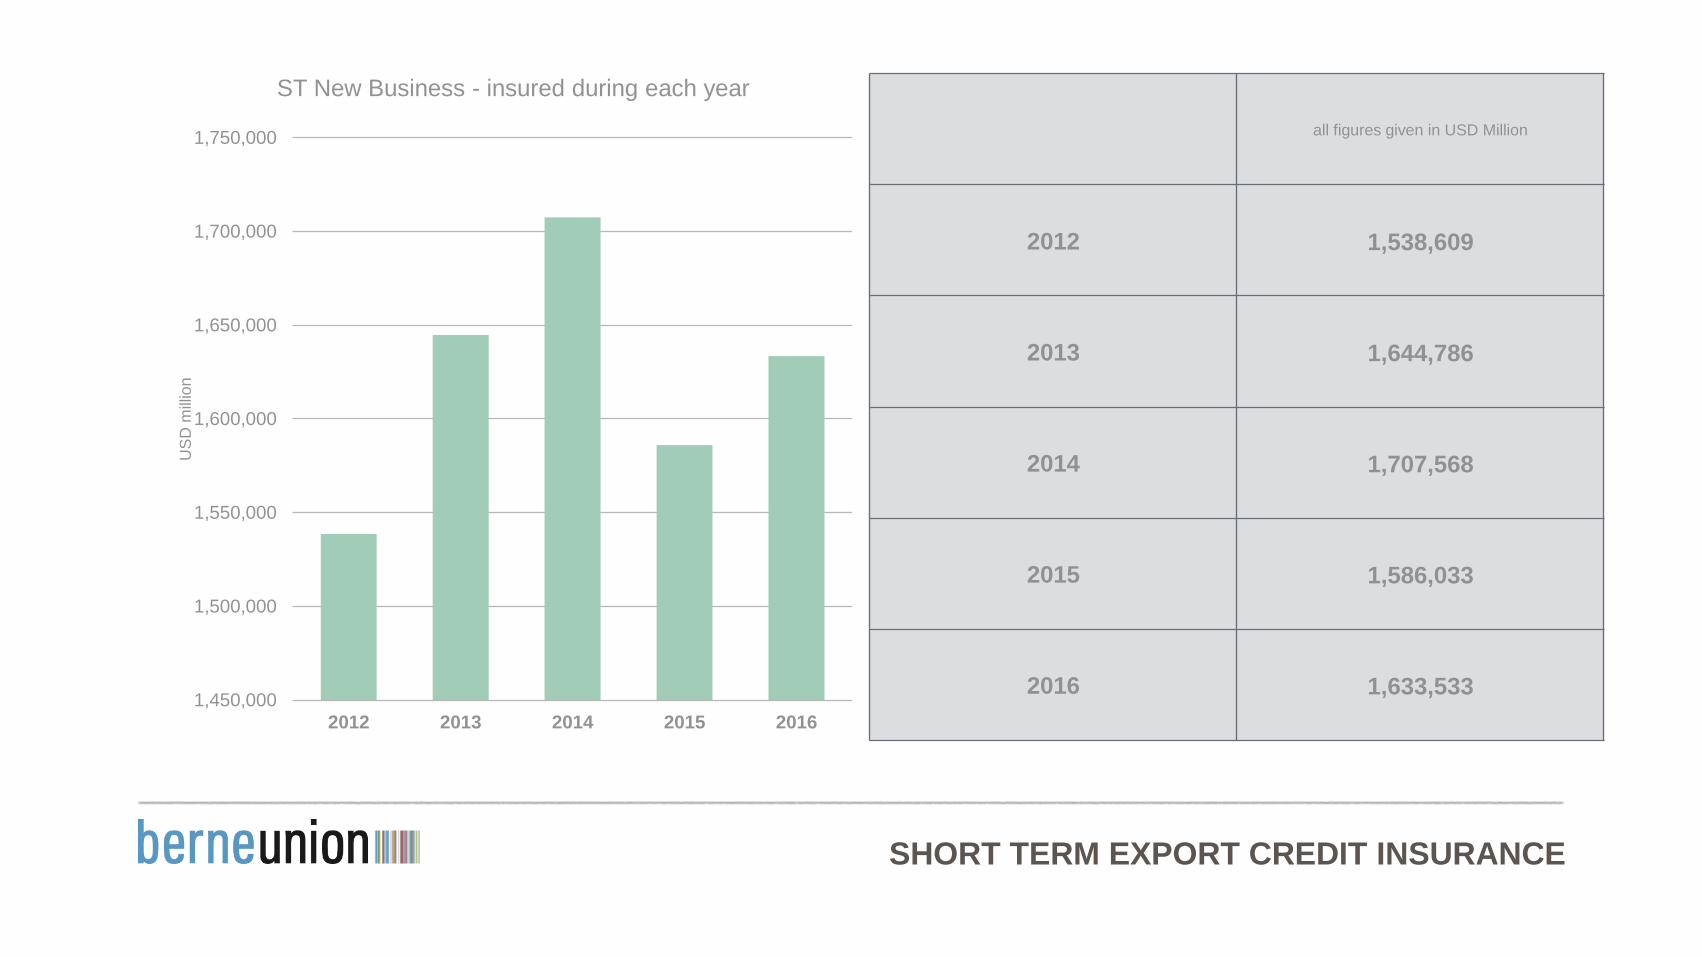
ST New Business - insured during each year
all figures given in USD Million
2012 1,538,609
2013 1,644,786
2014 1,707,568
2015 1,586,033
2016 1,633,533
SHORT TERM EXPORT CREDIT INSURANCE
0
200,000
400,000
600,000
800,000
1,000,000
1,200,000
2012 2013 2014 2015 2016
US
D m
illio
n
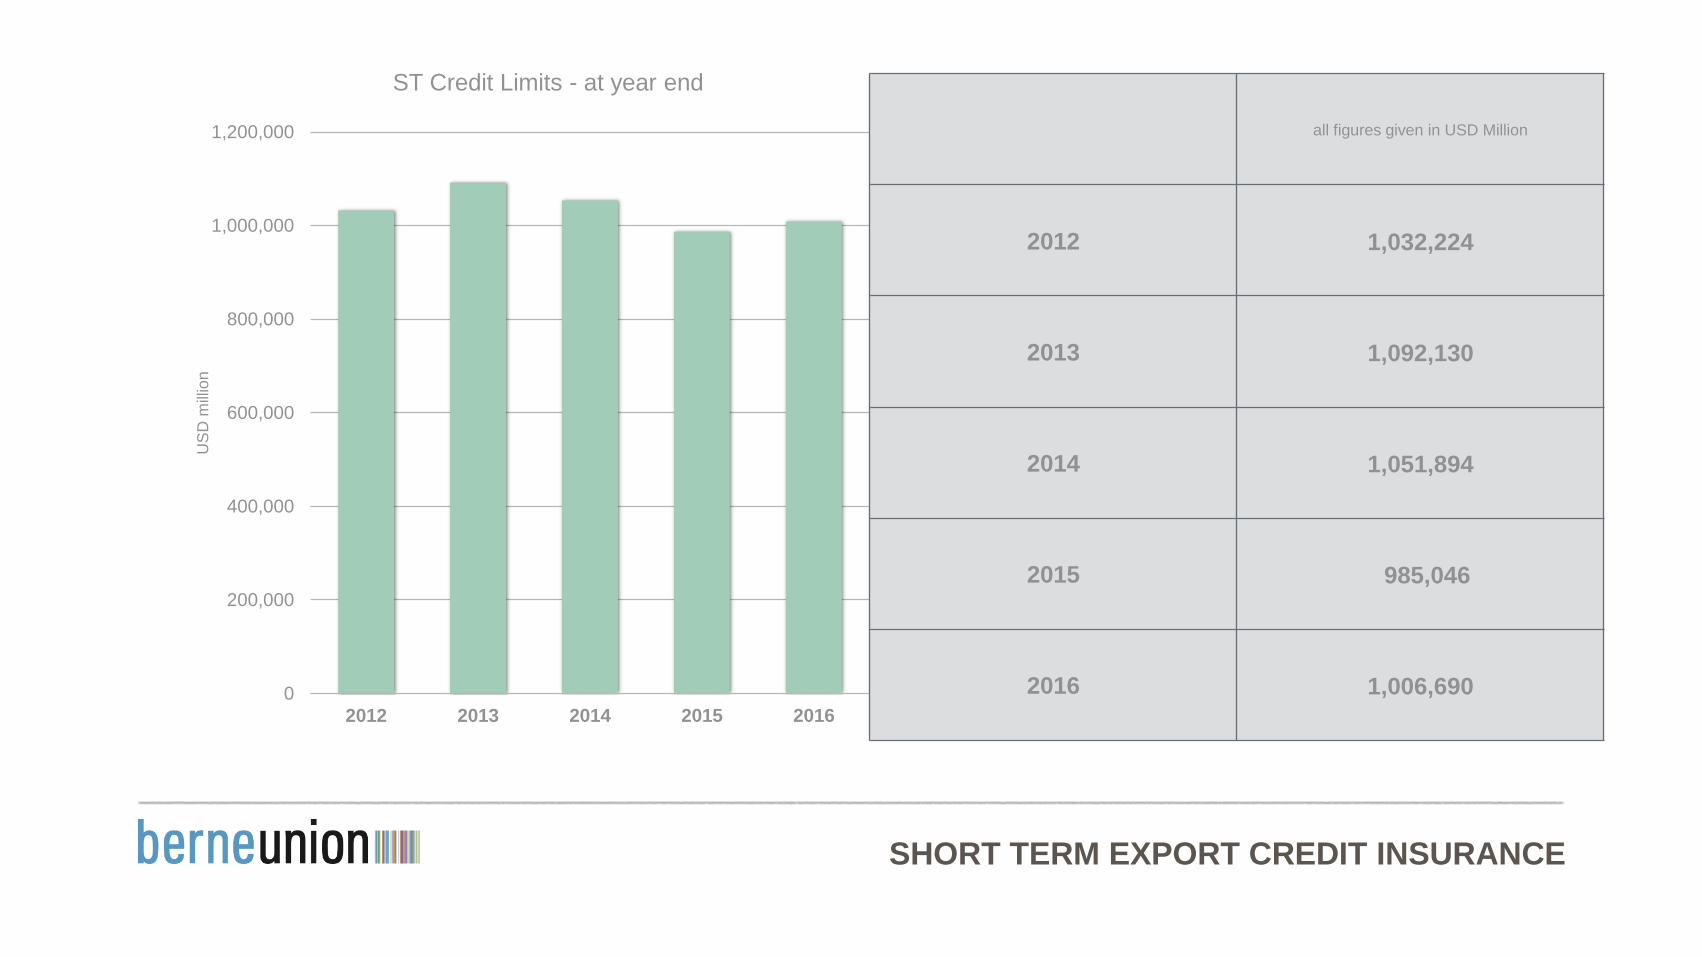
ST Credit Limits - at year end
all figures given in USD Million
2012 1,032,224
2013 1,092,130
2014 1,051,894
2015 985,046
2016 1,006,690
SHORT TERM EXPORT CREDIT INSURANCE
1,538.6
1,644.81,707.6
1,586.01,626.8
0
200
400
600
800
1000
1200
1400
1600
1800
0%
10%
20%
30%
40%
50%
60%
Am
erica
s
Afr
ica
Mid
dle
Ea
st
Eu
rop
e
AP
AC
Am
erica
s
Afr
ica
Mid
dle
Ea
st
Eu
rop
e
AP
AC
Am
erica
s
Afr
ica
Mid
dle
Ea
st
Eu
rop
e
AP
AC
Am
erica
s
Afr
ica
Mid
dle
Ea
st
Eu
rop
e
AP
AC
Am
erica
s
Afr
ica
Mid
dle
Ea
st
Eu
rop
e
AP
AC
2012 2013 2014 2015 2016
US
D B
illio
ns
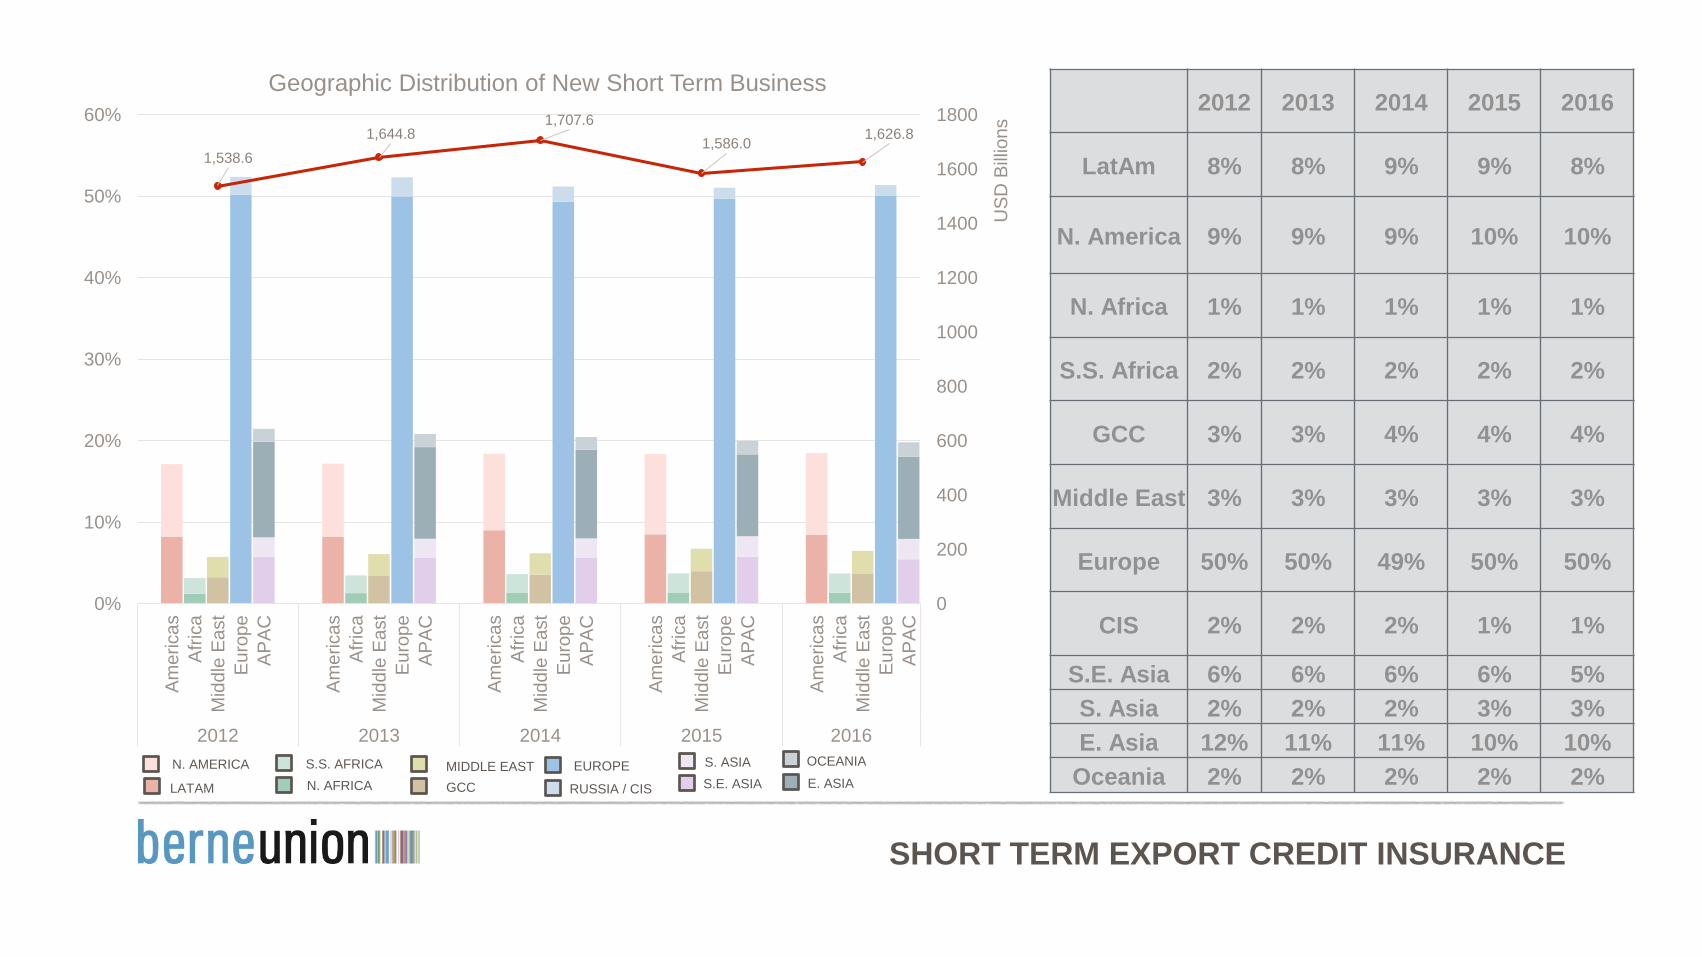
Geographic Distribution of New Short Term Business2012 2013 2014 2015 2016
LatAm 8% 8% 9% 9% 8%
N. America 9% 9% 9% 10% 10%
N. Africa 1% 1% 1% 1% 1%
S.S. Africa 2% 2% 2% 2% 2%
GCC 3% 3% 4% 4% 4%
Middle East 3% 3% 3% 3% 3%
Europe 50% 50% 49% 50% 50%
CIS 2% 2% 2% 1% 1%
S.E. Asia 6% 6% 6% 6% 5%
S. Asia 2% 2% 2% 3% 3%
E. Asia 12% 11% 11% 10% 10%
Oceania 2% 2% 2% 2% 2%OCEANIA
E. ASIA
S. ASIA
S.E. ASIA
EUROPE
RUSSIA / CISGCCN. AFRICALATAM
N. AMERICA S.S. AFRICA MIDDLE EAST
SHORT TERM EXPORT CREDIT INSURANCE
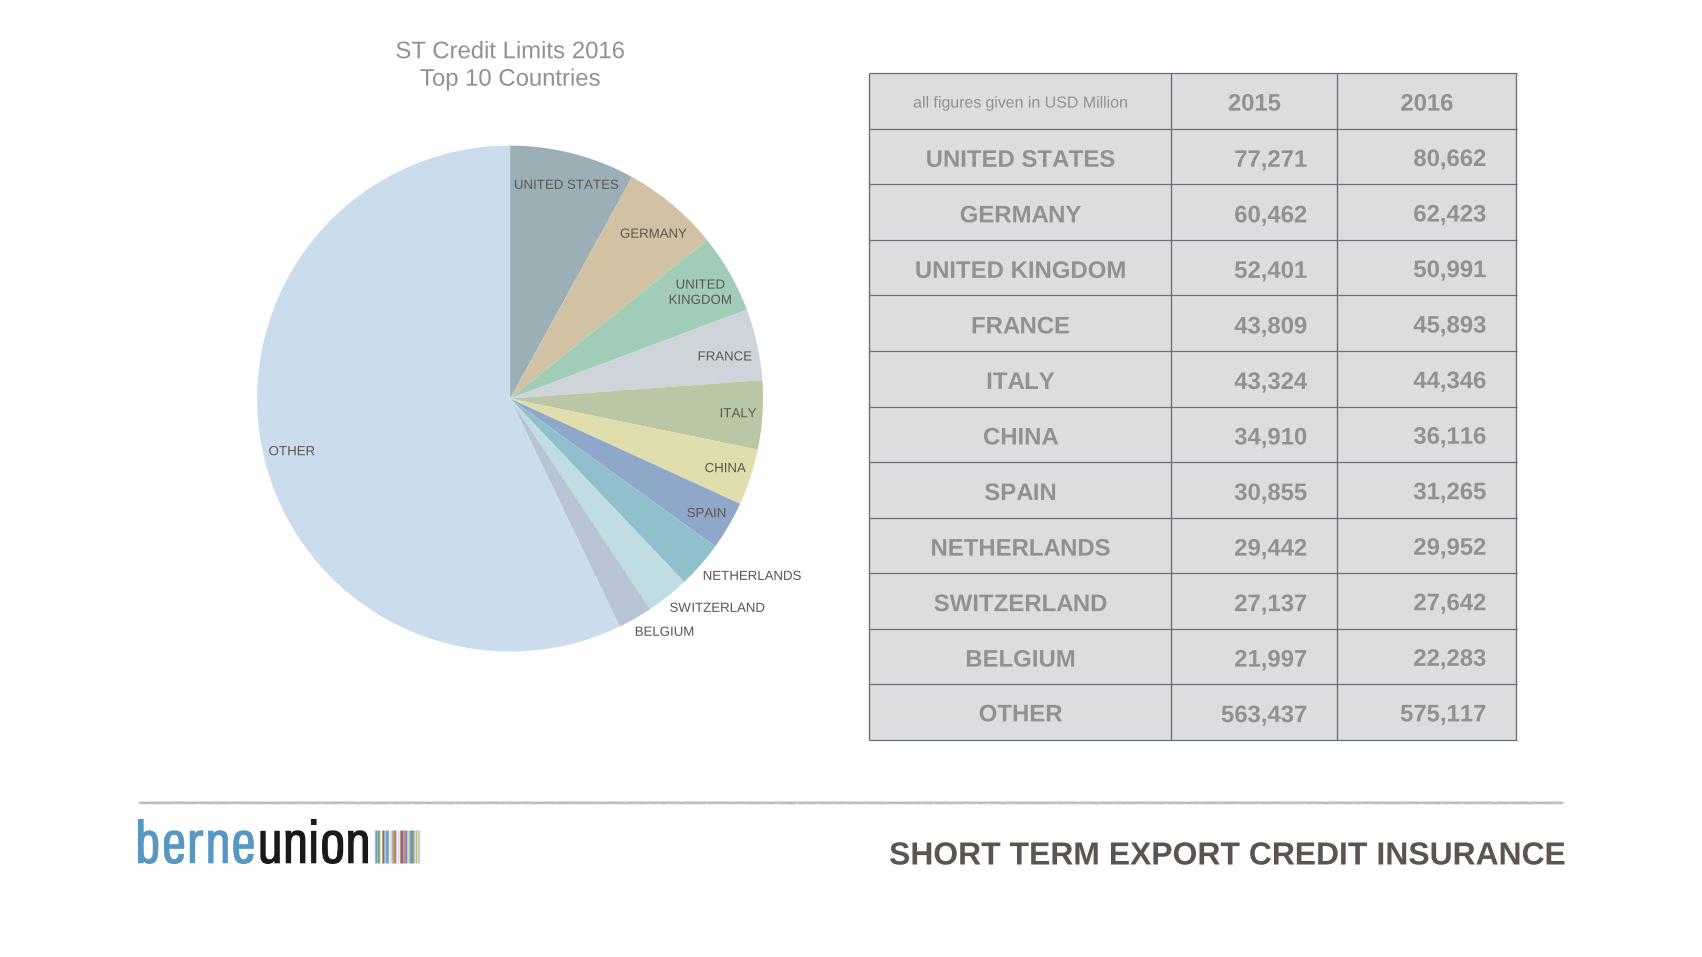
all figures given in USD Million 2015 2016
UNITED STATES 77,271 80,662
GERMANY 60,462 62,423
UNITED KINGDOM 52,401 50,991
FRANCE 43,809 45,893
ITALY 43,324 44,346
CHINA 34,910 36,116
SPAIN 30,855 31,265
NETHERLANDS 29,442 29,952
SWITZERLAND 27,137 27,642
BELGIUM 21,997 22,283
OTHER 563,437 575,117
UNITED STATES
GERMANY
UNITED KINGDOM
FRANCE
ITALY
CHINA
SPAIN
NETHERLANDS
SWITZERLAND
BELGIUM
OTHER
ST Credit Limits 2016Top 10 Countries
SHORT TERM EXPORT CREDIT INSURANCE
0
500
1,000
1,500
2,000
2,500
3,000
2012 2013 2014 2015 2016
US
D m
illio
n
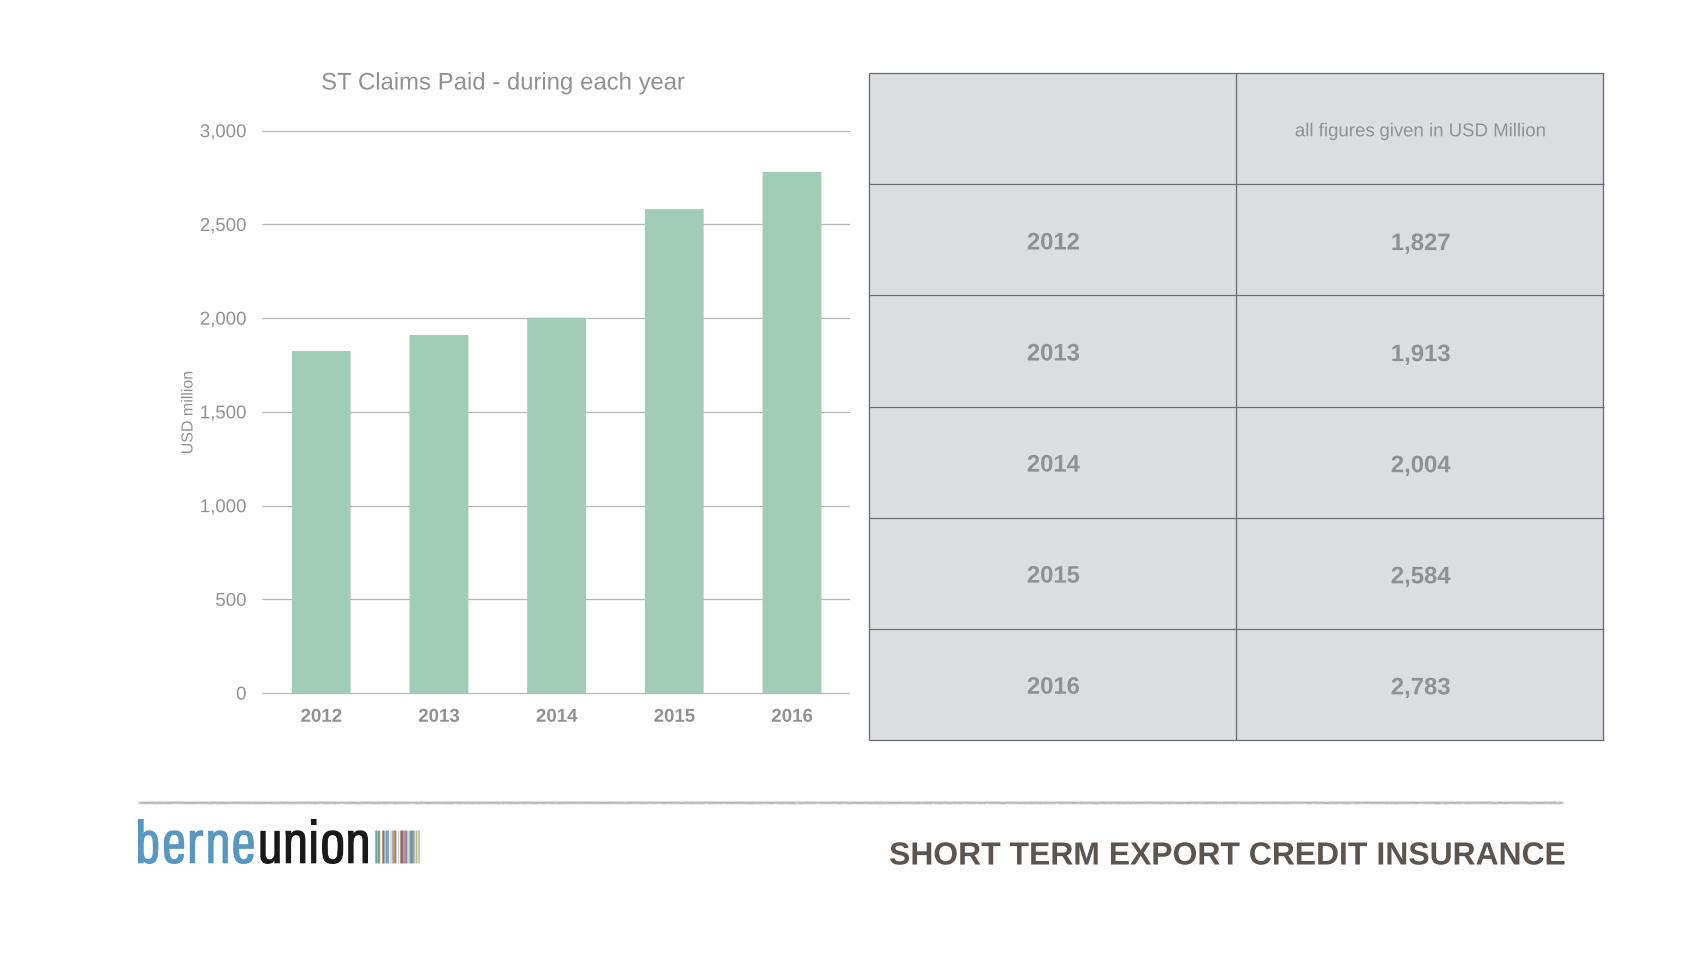
ST Claims Paid - during each year
all figures given in USD Million
2012 1,827
2013 1,913
2014 2,004
2015 2,584
2016 2,783
SHORT TERM EXPORT CREDIT INSURANCE
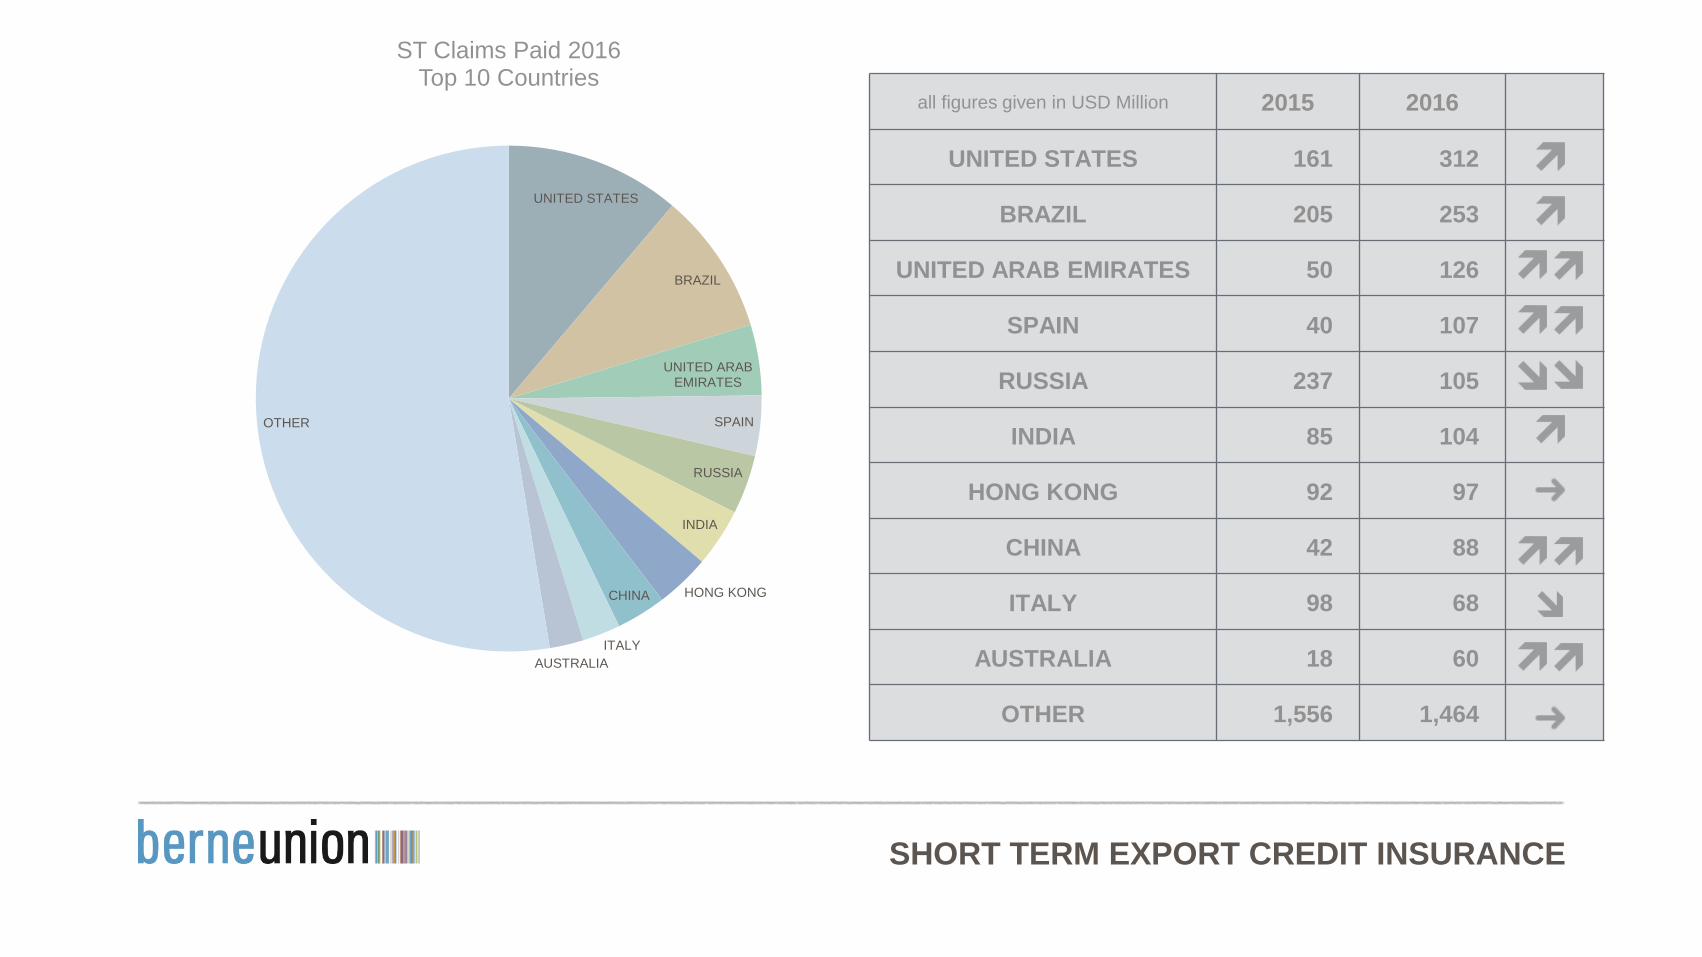
all figures given in USD Million 2015 2016
UNITED STATES 161 312
BRAZIL 205 253
UNITED ARAB EMIRATES 50 126
SPAIN 40 107
RUSSIA 237 105
INDIA 85 104
HONG KONG 92 97
CHINA 42 88
ITALY 98 68
AUSTRALIA 18 60
OTHER 1,556 1,464
UNITED STATES
BRAZIL
UNITED ARAB EMIRATES
SPAIN
RUSSIA
INDIA
HONG KONGCHINA
ITALY
AUSTRALIA
OTHER
ST Claims Paid 2016Top 10 Countries
SHORT TERM EXPORT CREDIT INSURANCE
0
100
200
300
400
500
600
2012 2013 2014 2015 2016
US
D m
illio
n
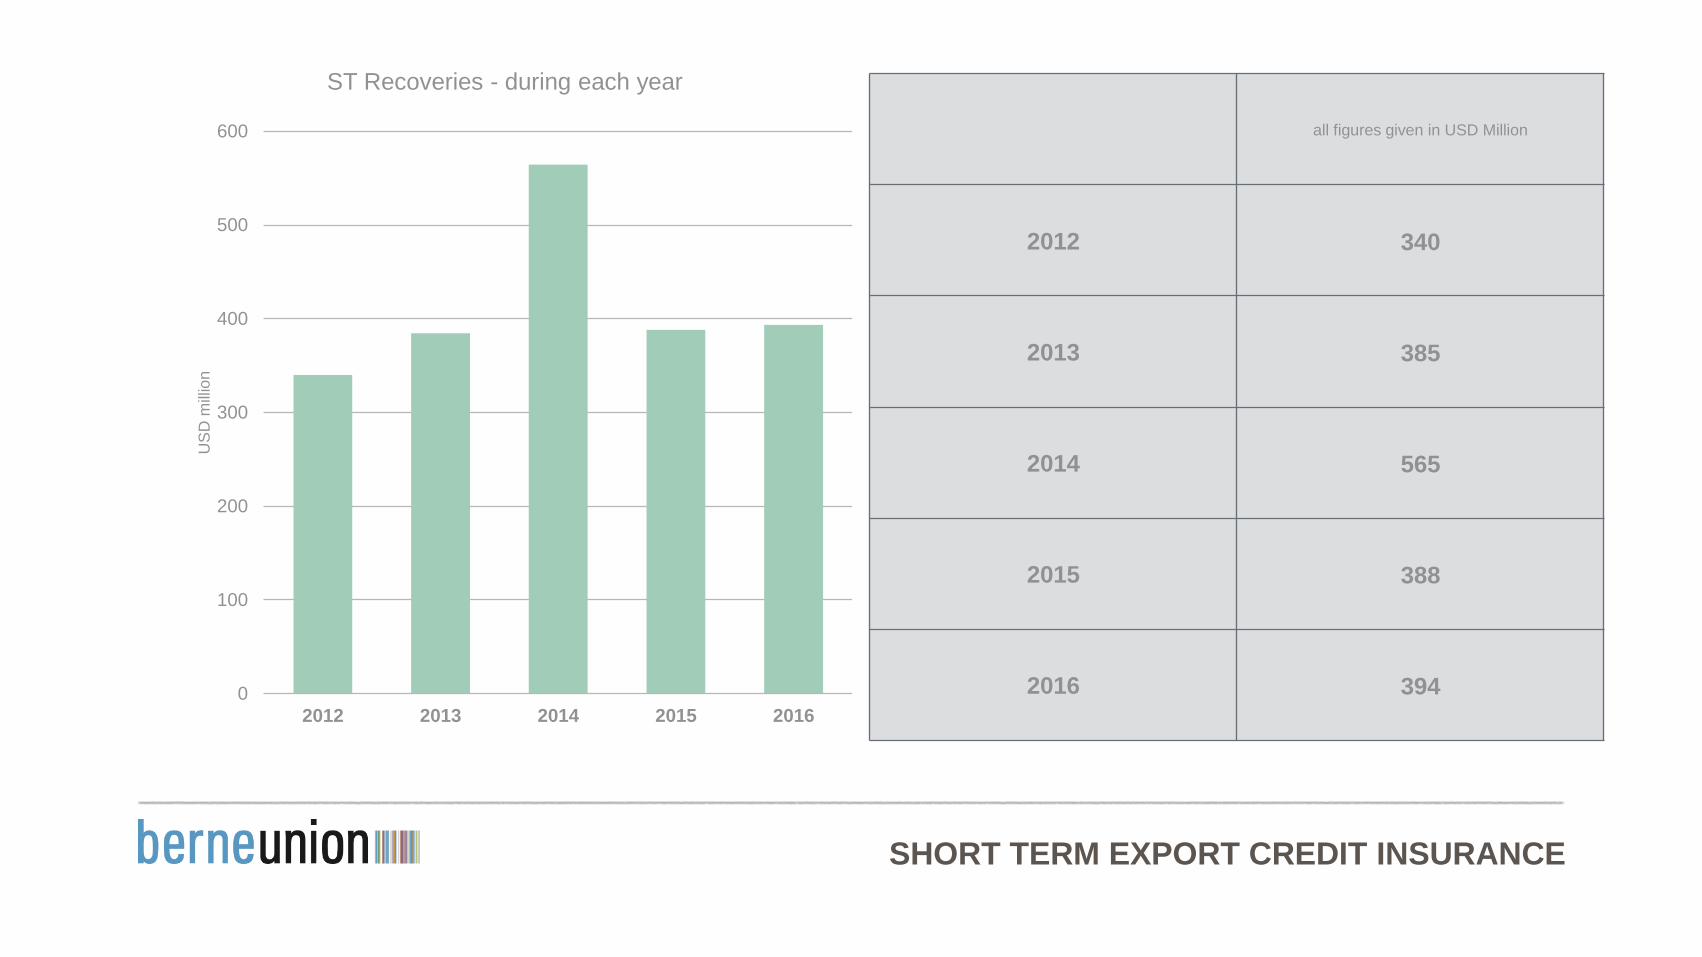
ST Recoveries - during each year
all figures given in USD Million
2012 340
2013 385
2014 565
2015 388
2016 394
SHORT TERM EXPORT CREDIT INSURANCE
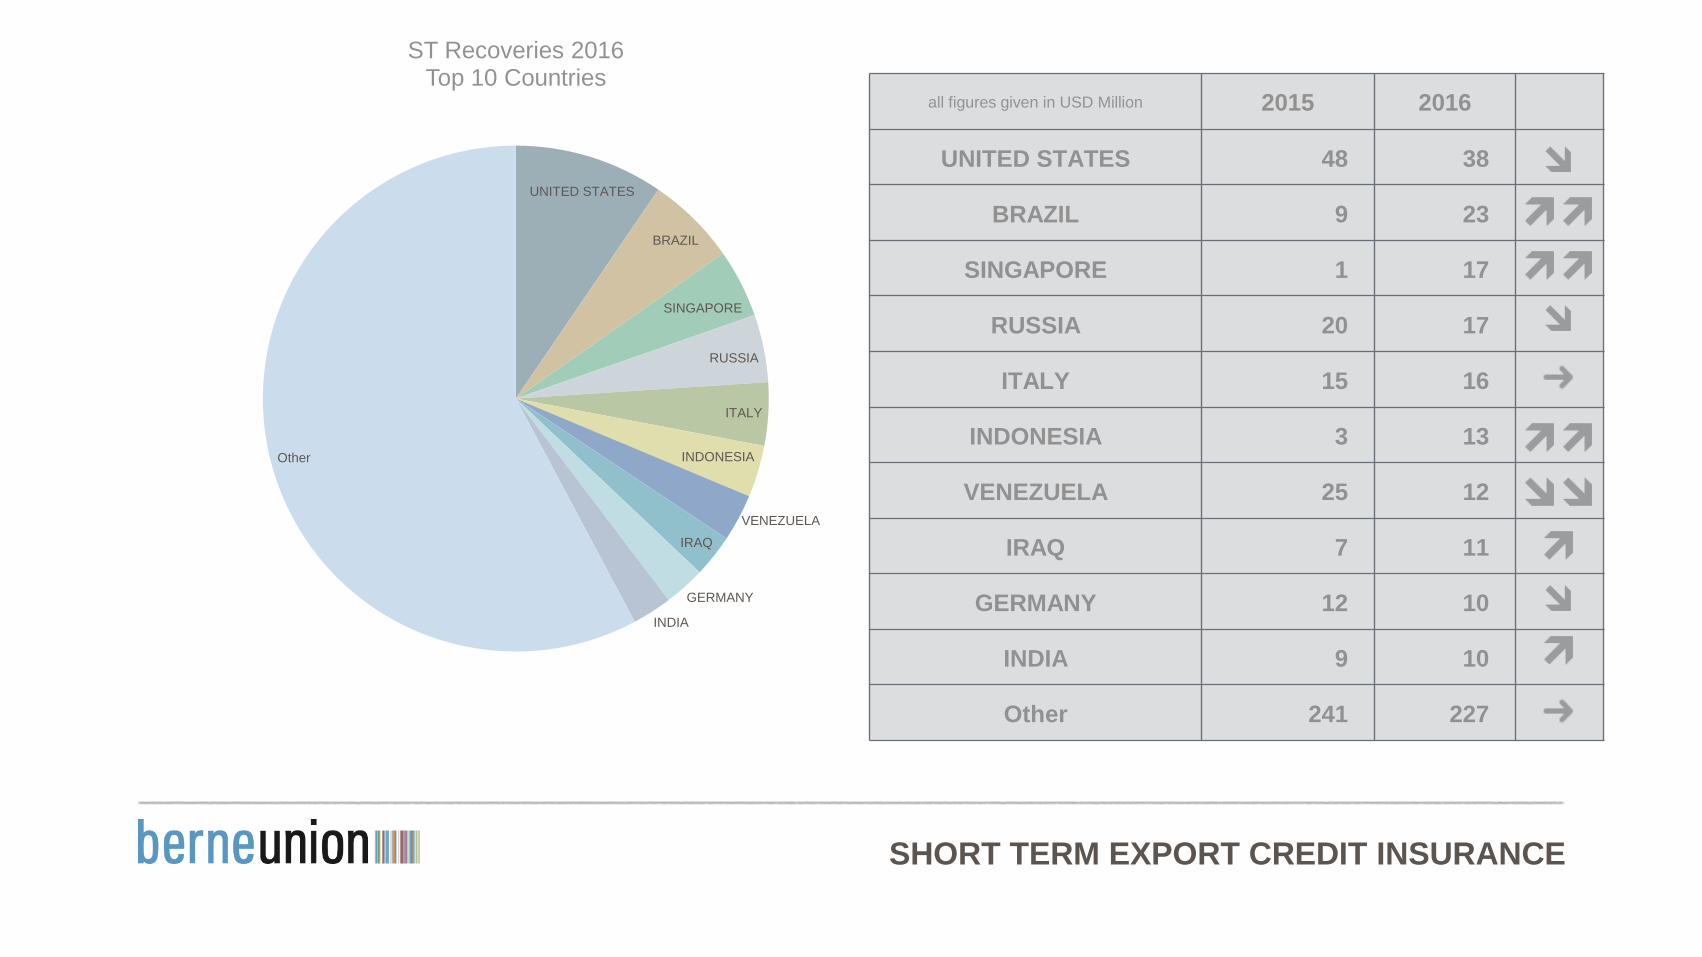
all figures given in USD Million 2015 2016
UNITED STATES 48 38
BRAZIL 9 23
SINGAPORE 1 17
RUSSIA 20 17
ITALY 15 16
INDONESIA 3 13
VENEZUELA 25 12
IRAQ 7 11
GERMANY 12 10
INDIA 9 10
Other 241 227
UNITED STATES
BRAZIL
SINGAPORE
RUSSIA
ITALY
INDONESIA
VENEZUELA
IRAQ
GERMANY
INDIA
Other
ST Recoveries 2016Top 10 Countries
SHORT TERM EXPORT CREDIT INSURANCE
0%
10%
20%
30%
40%
50%
60%
70%
80%
90%
0
500
1000
1500
2000
2500
3000
3500
4000
2012 2013 2014 2015 2016
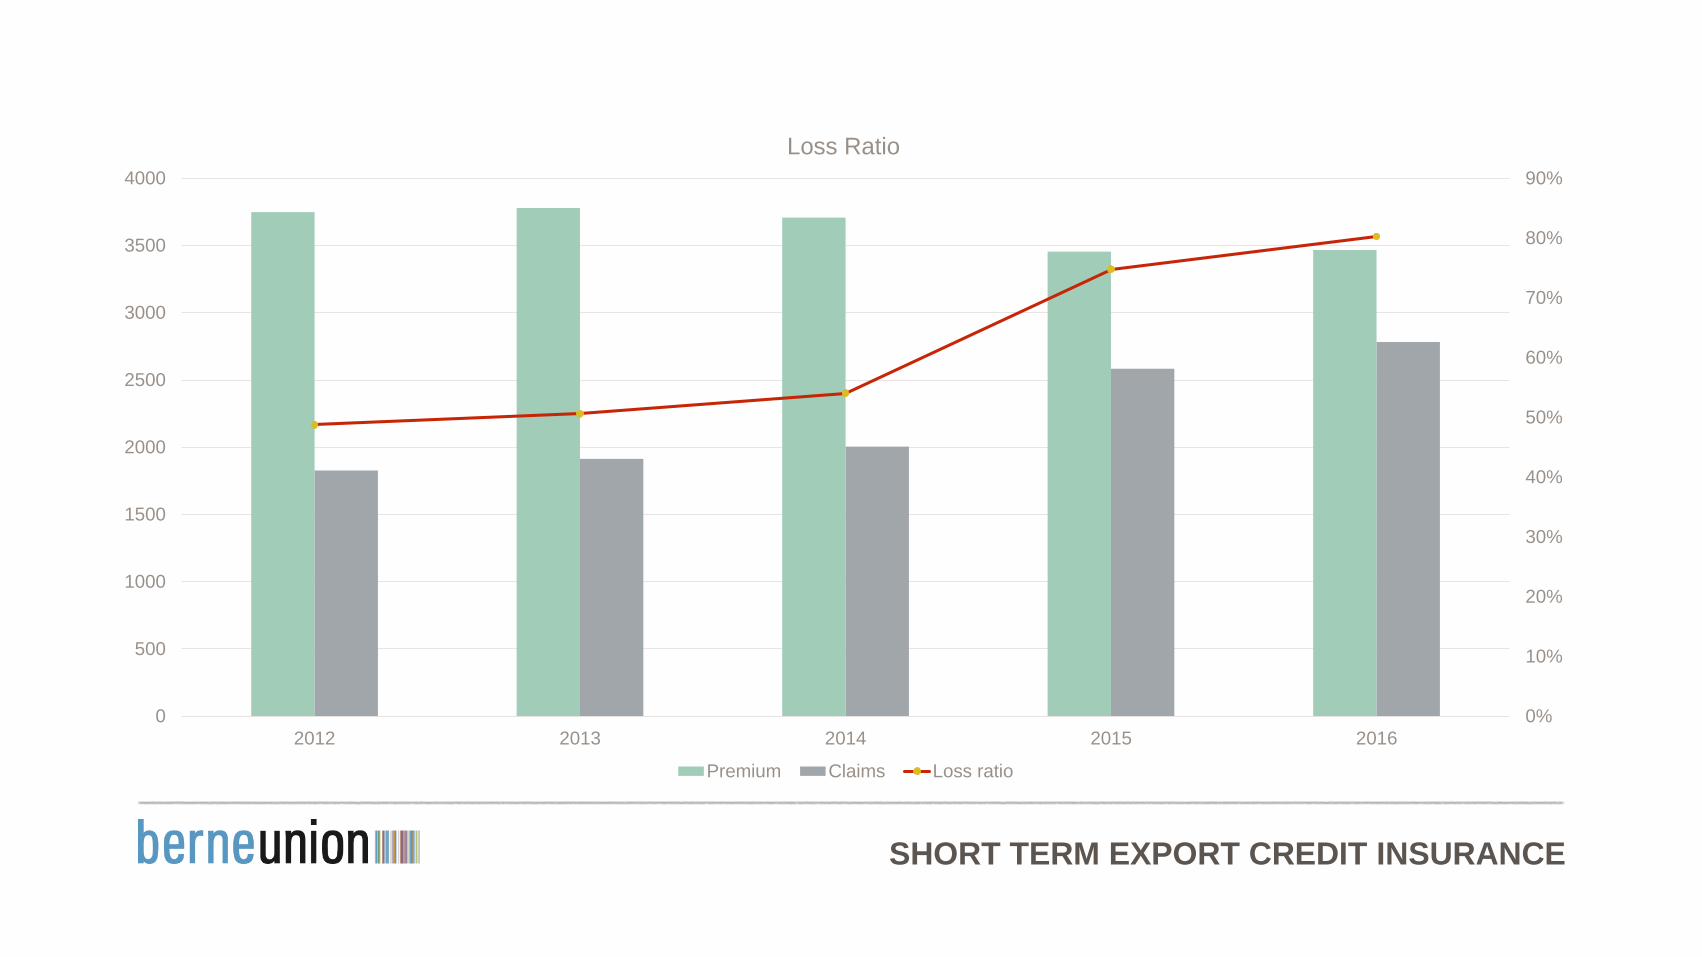
Loss Ratio
Premium Claims Loss ratio
SHORT TERM EXPORT CREDIT INSURANCE
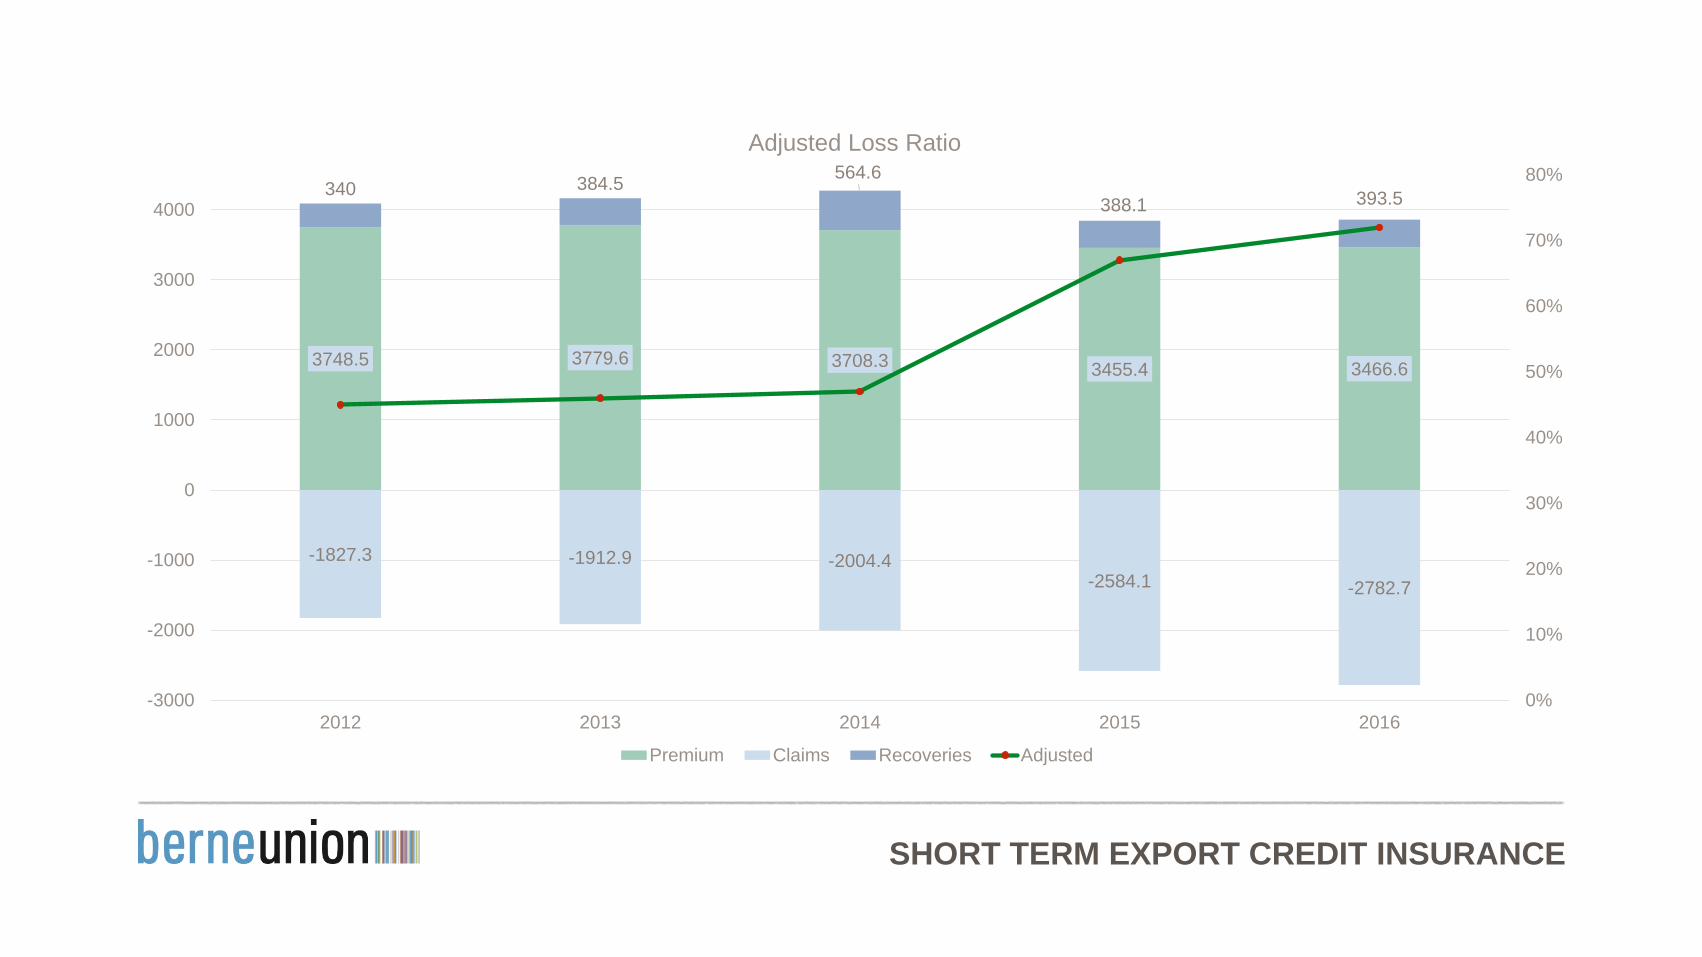
3748.5 3779.6 3708.33455.4 3466.6
-1827.3 -1912.9 -2004.4-2584.1 -2782.7
340 384.5564.6
388.1 393.5
0%
10%
20%
30%
40%
50%
60%
70%
80%
-3000
-2000
-1000
0
1000
2000
3000
4000
2012 2013 2014 2015 2016
Adjusted Loss Ratio
Premium Claims Recoveries Adjusted

MEDIUM/LONG TERM EXPORT
CREDIT INSURANCE AND
LENDING
MEDIUM/LONG TERM EXPORT CREDIT INSURANCE AND LENDING
0
20,000
40,000
60,000
80,000
100,000
120,000
140,000
160,000
180,000
200,000
2012 2013 2014 2015 2016
US
D m
illio
n
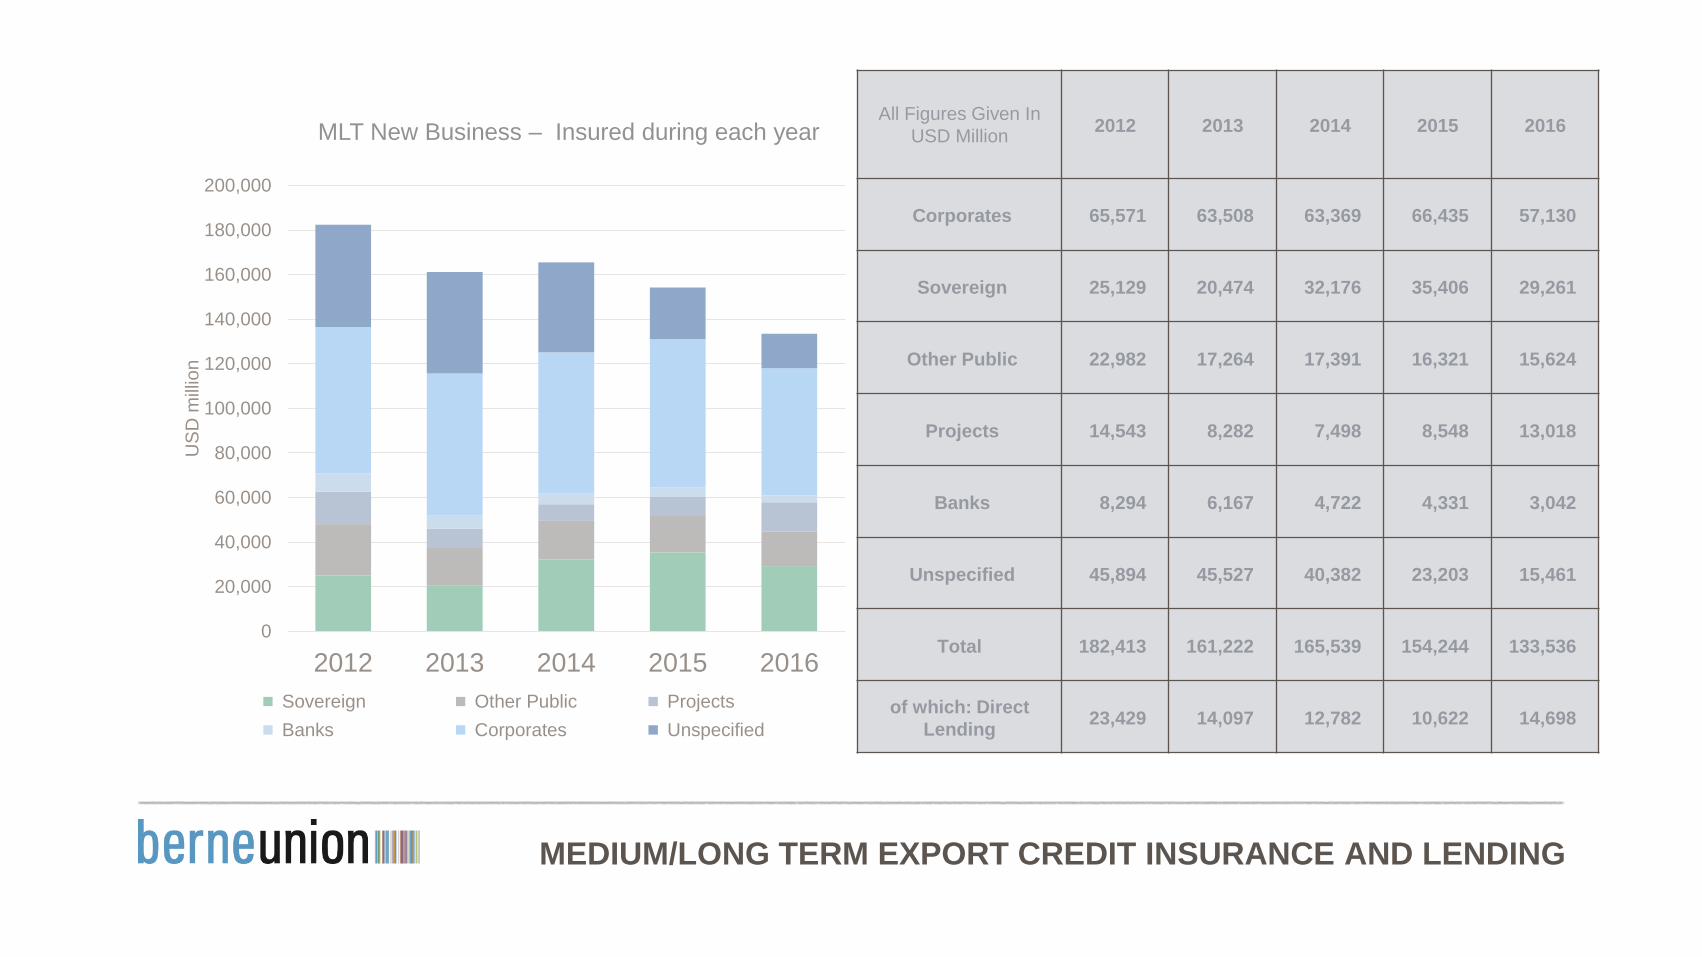
MLT New Business – Insured during each year
Sovereign Other Public Projects
Banks Corporates Unspecified
All Figures Given In
USD Million2012 2013 2014 2015 2016
Corporates 65,571 63,508 63,369 66,435 57,130
Sovereign 25,129 20,474 32,176 35,406 29,261
Other Public 22,982 17,264 17,391 16,321 15,624
Projects 14,543 8,282 7,498 8,548 13,018
Banks 8,294 6,167 4,722 4,331 3,042
Unspecified 45,894 45,527 40,382 23,203 15,461
Total 182,413 161,222 165,539 154,244 133,536
of which: Direct
Lending23,429 14,097 12,782 10,622 14,698
MEDIUM/LONG TERM EXPORT CREDIT INSURANCE AND LENDING
182
161 166
154
134
0
20
40
60
80
100
120
140
160
180
200
0%
5%
10%
15%
20%
25%
30%
35%A
me
rica
s
Afr
ica
Mid
dle
Ea
st
Eu
rop
e
AP
AC
Am
erica
s
Afr
ica
Mid
dle
Ea
st
Eu
rop
e
AP
AC
Am
erica
s
Afr
ica
Mid
dle
Ea
st
Eu
rop
e
AP
AC
Am
erica
s
Afr
ica
Mid
dle
Ea
st
Eu
rop
e
AP
AC
Am
erica
s
Afr
ica
Mid
dle
Ea
st
Eu
rop
e
AP
AC
2012 2013 2014 2015 2016
US
D b
illio
ns
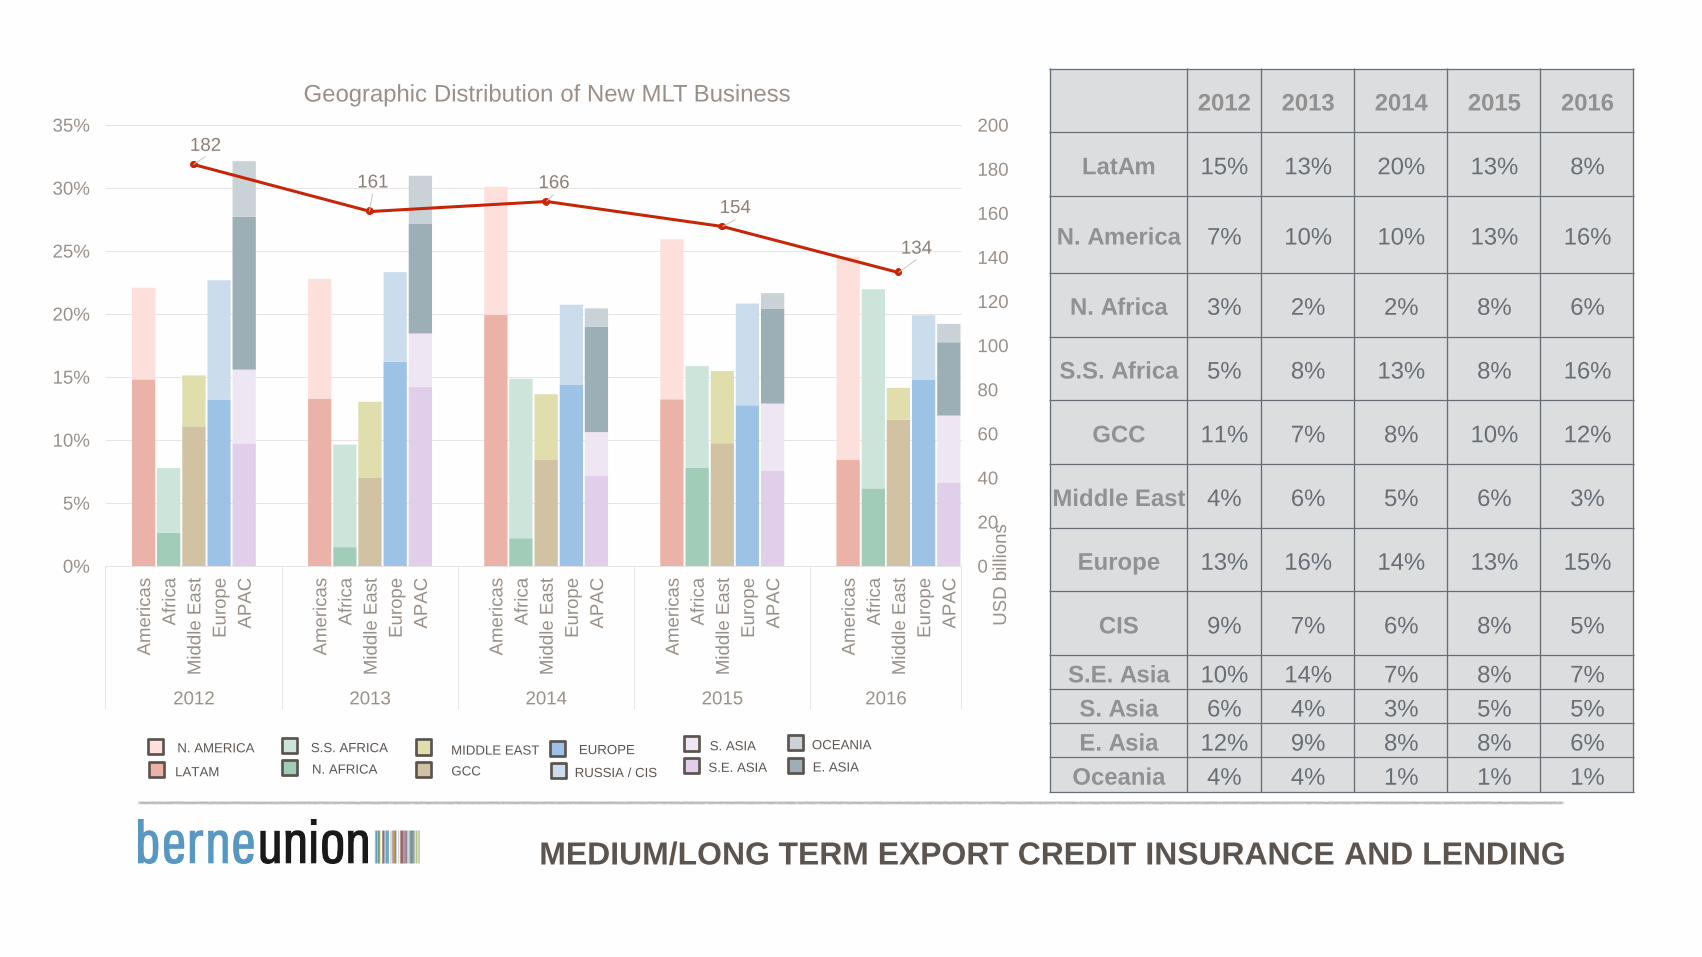
Geographic Distribution of New MLT Business 2012 2013 2014 2015 2016
LatAm 15% 13% 20% 13% 8%
N. America 7% 10% 10% 13% 16%
N. Africa 3% 2% 2% 8% 6%
S.S. Africa 5% 8% 13% 8% 16%
GCC 11% 7% 8% 10% 12%
Middle East 4% 6% 5% 6% 3%
Europe 13% 16% 14% 13% 15%
CIS 9% 7% 6% 8% 5%
S.E. Asia 10% 14% 7% 8% 7%
S. Asia 6% 4% 3% 5% 5%
E. Asia 12% 9% 8% 8% 6%
Oceania 4% 4% 1% 1% 1%
OCEANIA
E. ASIA
S. ASIA
S.E. ASIA
EUROPE
RUSSIA / CISGCCN. AFRICALATAM
N. AMERICA S.S. AFRICA MIDDLE EAST
MEDIUM/LONG TERM EXPORT CREDIT INSURANCE AND LENDING
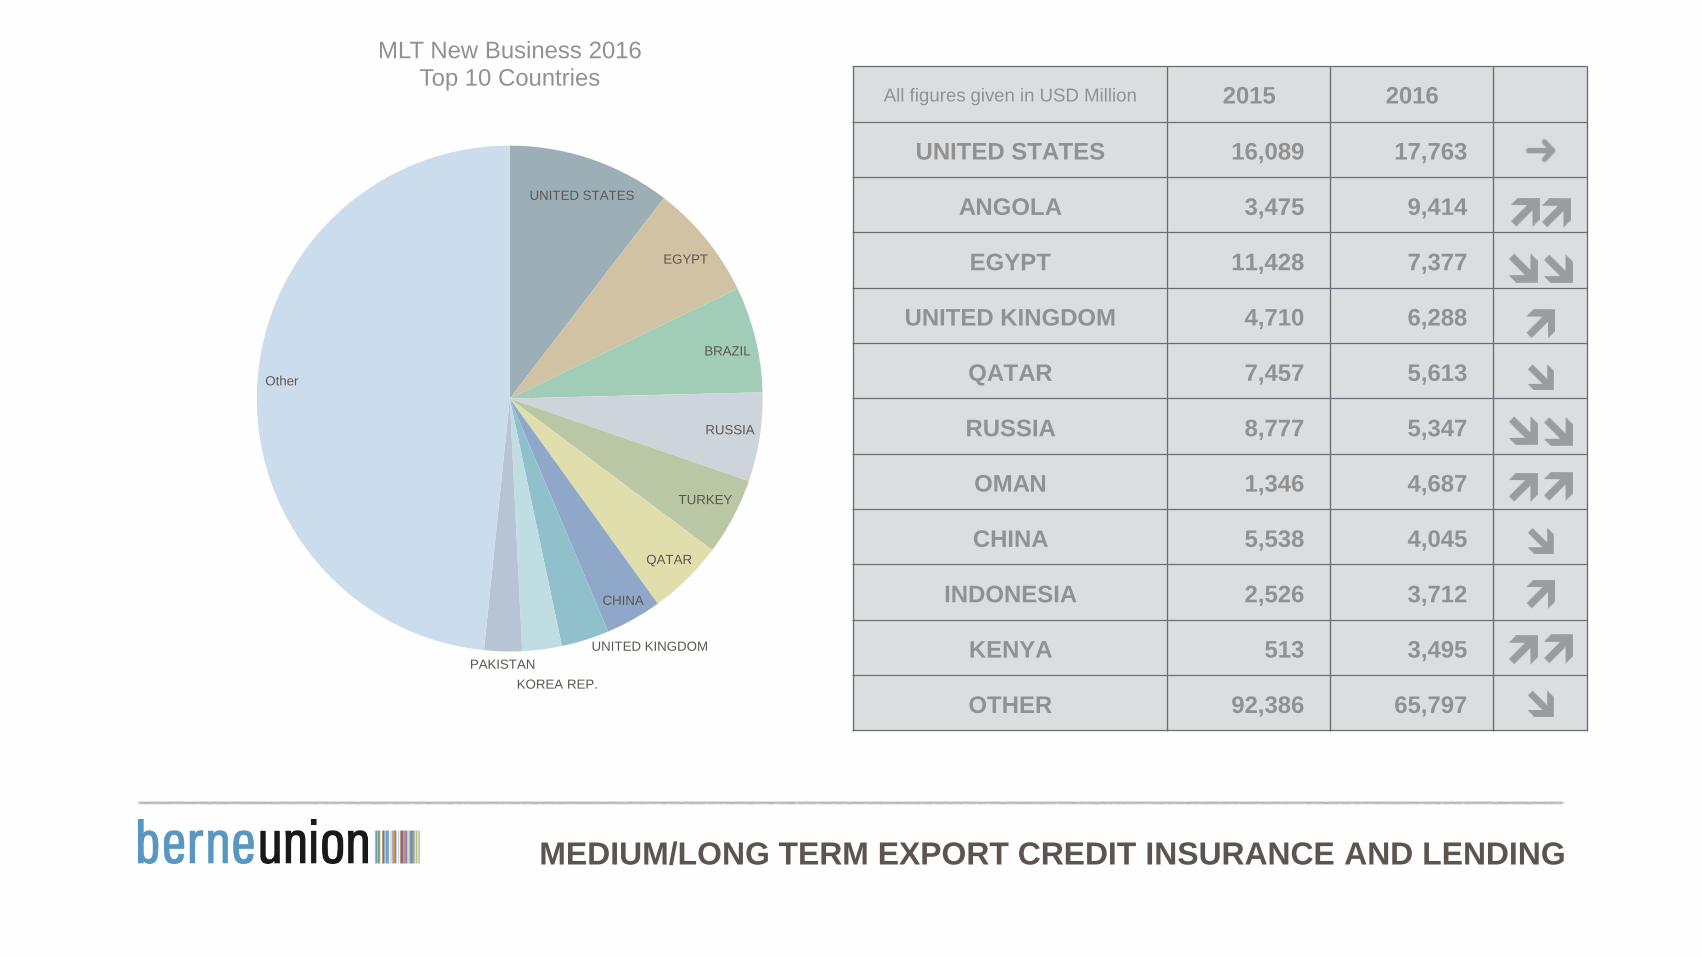
All figures given in USD Million 2015 2016
UNITED STATES 16,089 17,763
ANGOLA 3,475 9,414
EGYPT 11,428 7,377
UNITED KINGDOM 4,710 6,288
QATAR 7,457 5,613
RUSSIA 8,777 5,347
OMAN 1,346 4,687
CHINA 5,538 4,045
INDONESIA 2,526 3,712
KENYA 513 3,495
OTHER 92,386 65,797
UNITED STATES
EGYPT
BRAZIL
RUSSIA
TURKEY
QATAR
CHINA
UNITED KINGDOM
KOREA REP.
PAKISTAN
Other
MLT New Business 2016Top 10 Countries
MEDIUM/LONG TERM EXPORT CREDIT INSURANCE AND LENDING
0
100,000
200,000
300,000
400,000
500,000
600,000
700,000
800,000
2012 2013 2014 2015 2016
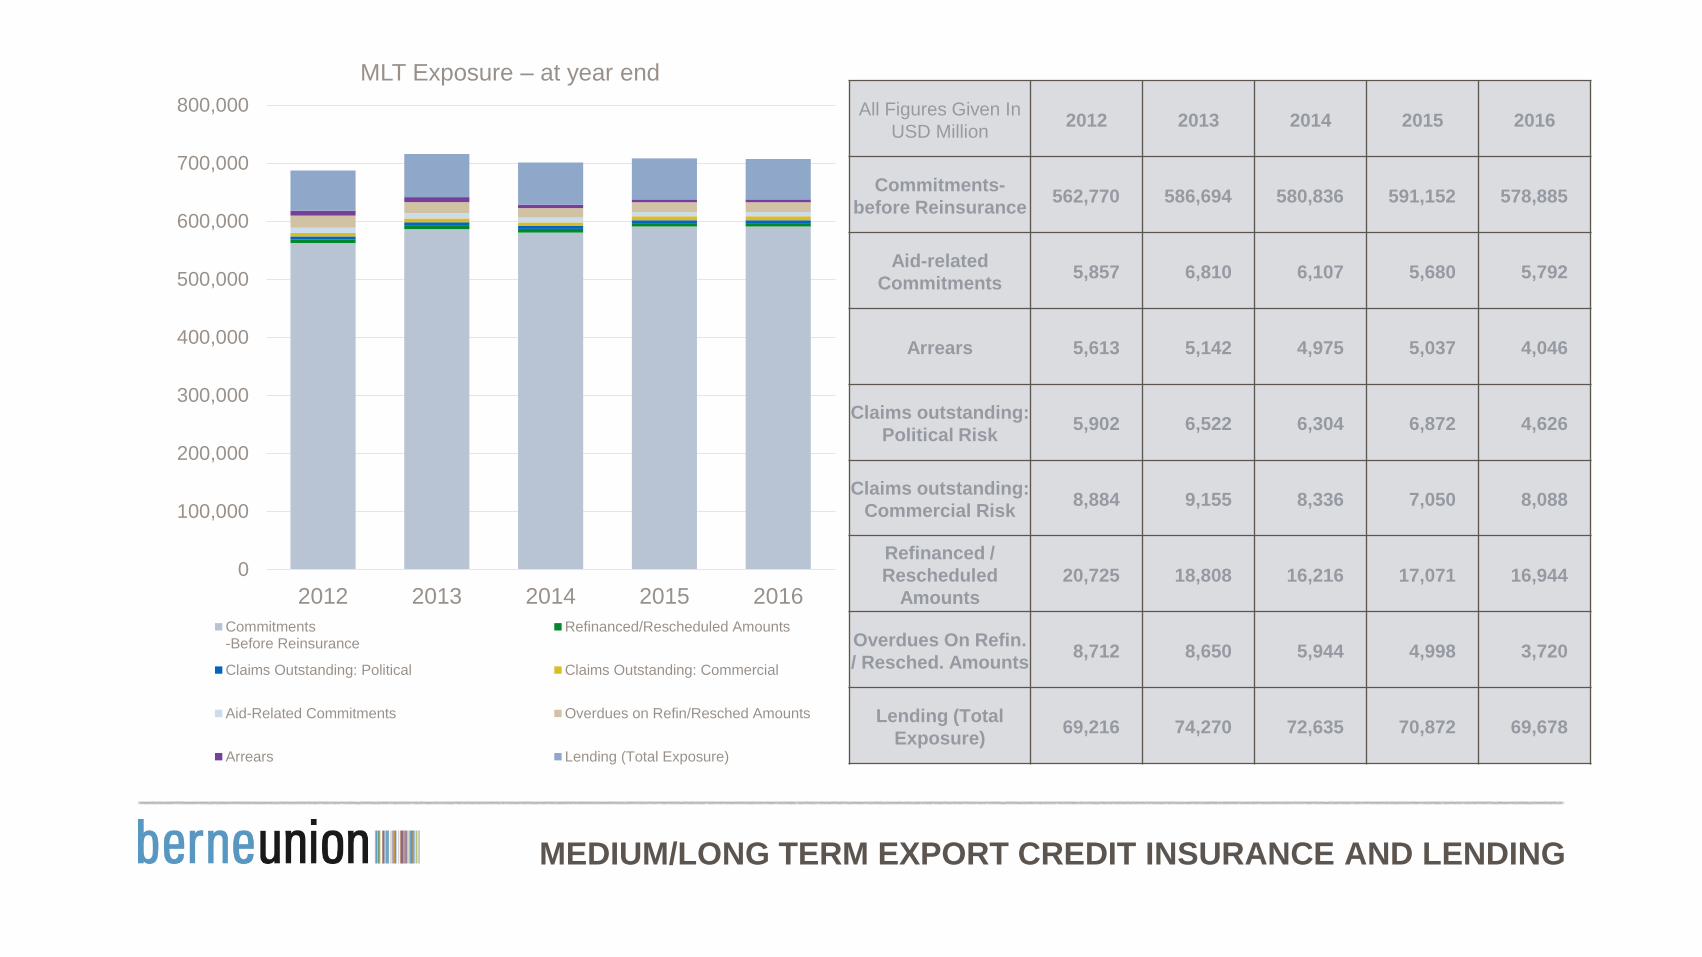
MLT Exposure – at year end
Commitments-Before Reinsurance
Refinanced/Rescheduled Amounts
Claims Outstanding: Political Claims Outstanding: Commercial
Aid-Related Commitments Overdues on Refin/Resched Amounts
Arrears Lending (Total Exposure)
All Figures Given In
USD Million2012 2013 2014 2015 2016
Commitments-
before Reinsurance562,770 586,694 580,836 591,152 578,885
Aid-related
Commitments5,857 6,810 6,107 5,680 5,792
Arrears 5,613 5,142 4,975 5,037 4,046
Claims outstanding:
Political Risk5,902 6,522 6,304 6,872 4,626
Claims outstanding:
Commercial Risk8,884 9,155 8,336 7,050 8,088
Refinanced /
Rescheduled
Amounts
20,725 18,808 16,216 17,071 16,944
Overdues On Refin.
/ Resched. Amounts8,712 8,650 5,944 4,998 3,720
Lending (Total
Exposure)69,216 74,270 72,635 70,872 69,678
MEDIUM/LONG TERM EXPORT CREDIT INSURANCE AND LENDING
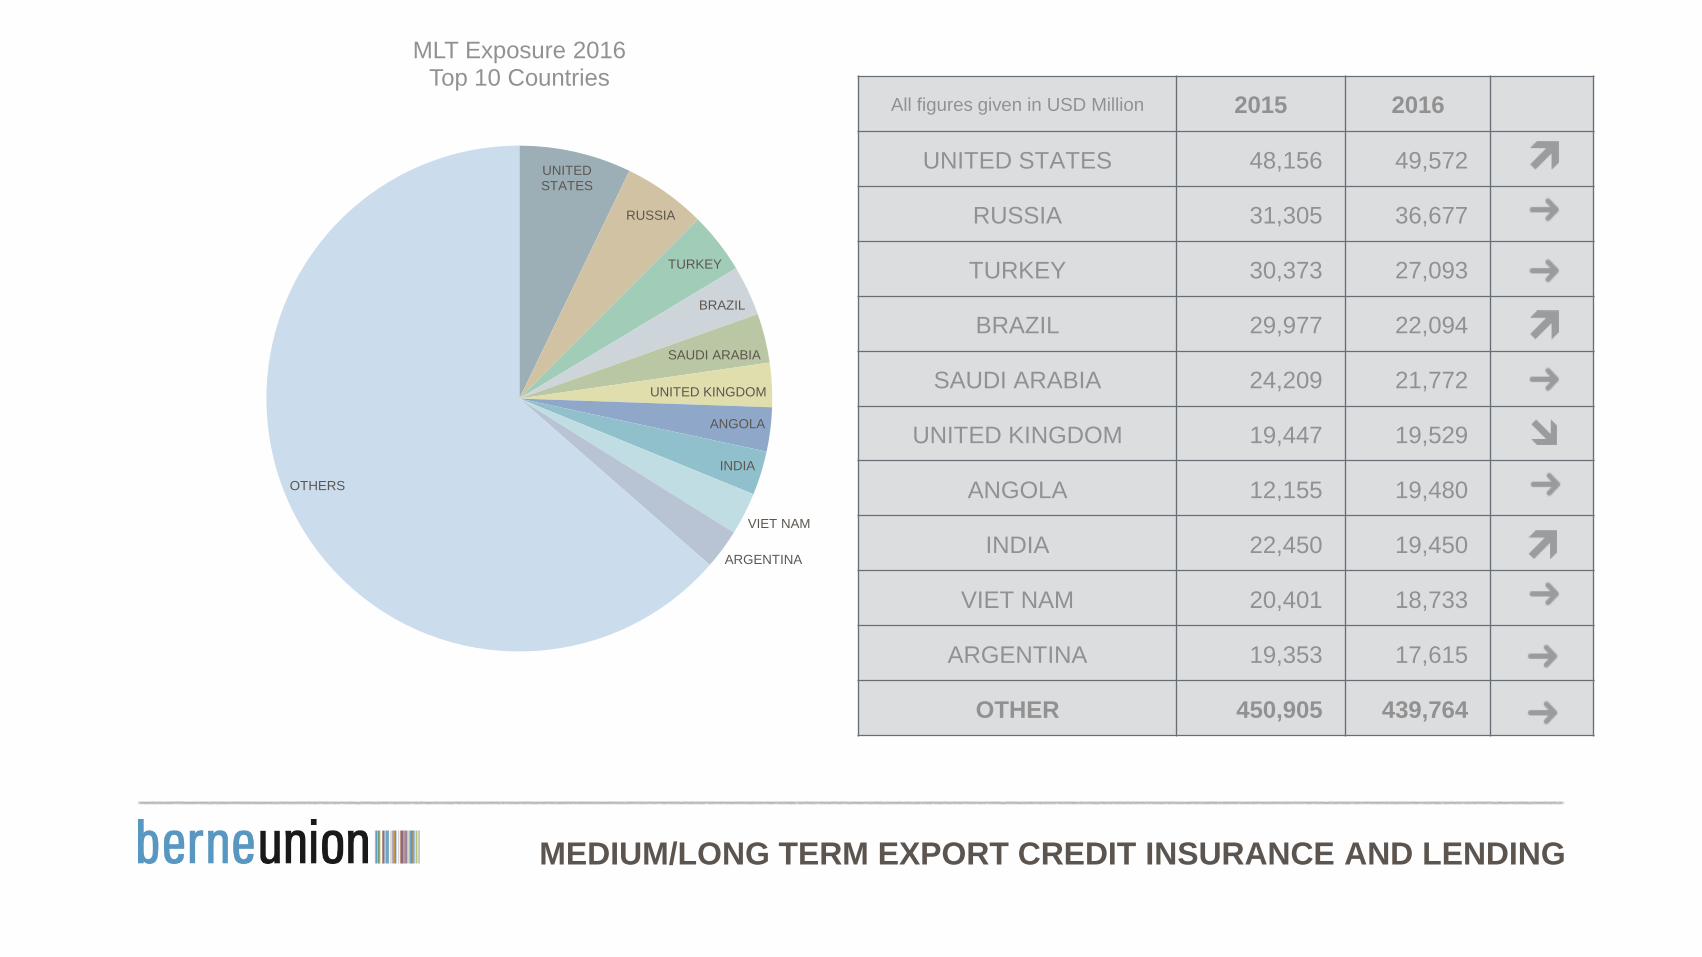
All figures given in USD Million 2015 2016
UNITED STATES 48,156 49,572
RUSSIA 31,305 36,677
TURKEY 30,373 27,093
BRAZIL 29,977 22,094
SAUDI ARABIA 24,209 21,772
UNITED KINGDOM 19,447 19,529
ANGOLA 12,155 19,480
INDIA 22,450 19,450
VIET NAM 20,401 18,733
ARGENTINA 19,353 17,615
OTHER 450,905 439,764
UNITED STATES
RUSSIA
TURKEY
BRAZIL
SAUDI ARABIA
UNITED KINGDOM
ANGOLA
INDIA
VIET NAM
ARGENTINA
OTHERS
MLT Exposure 2016Top 10 Countries
MEDIUM/LONG TERM EXPORT CREDIT INSURANCE AND LENDING
0
1,000
2,000
3,000
4,000
2012 2013 2014 2015 2016
US
D m
illio
n
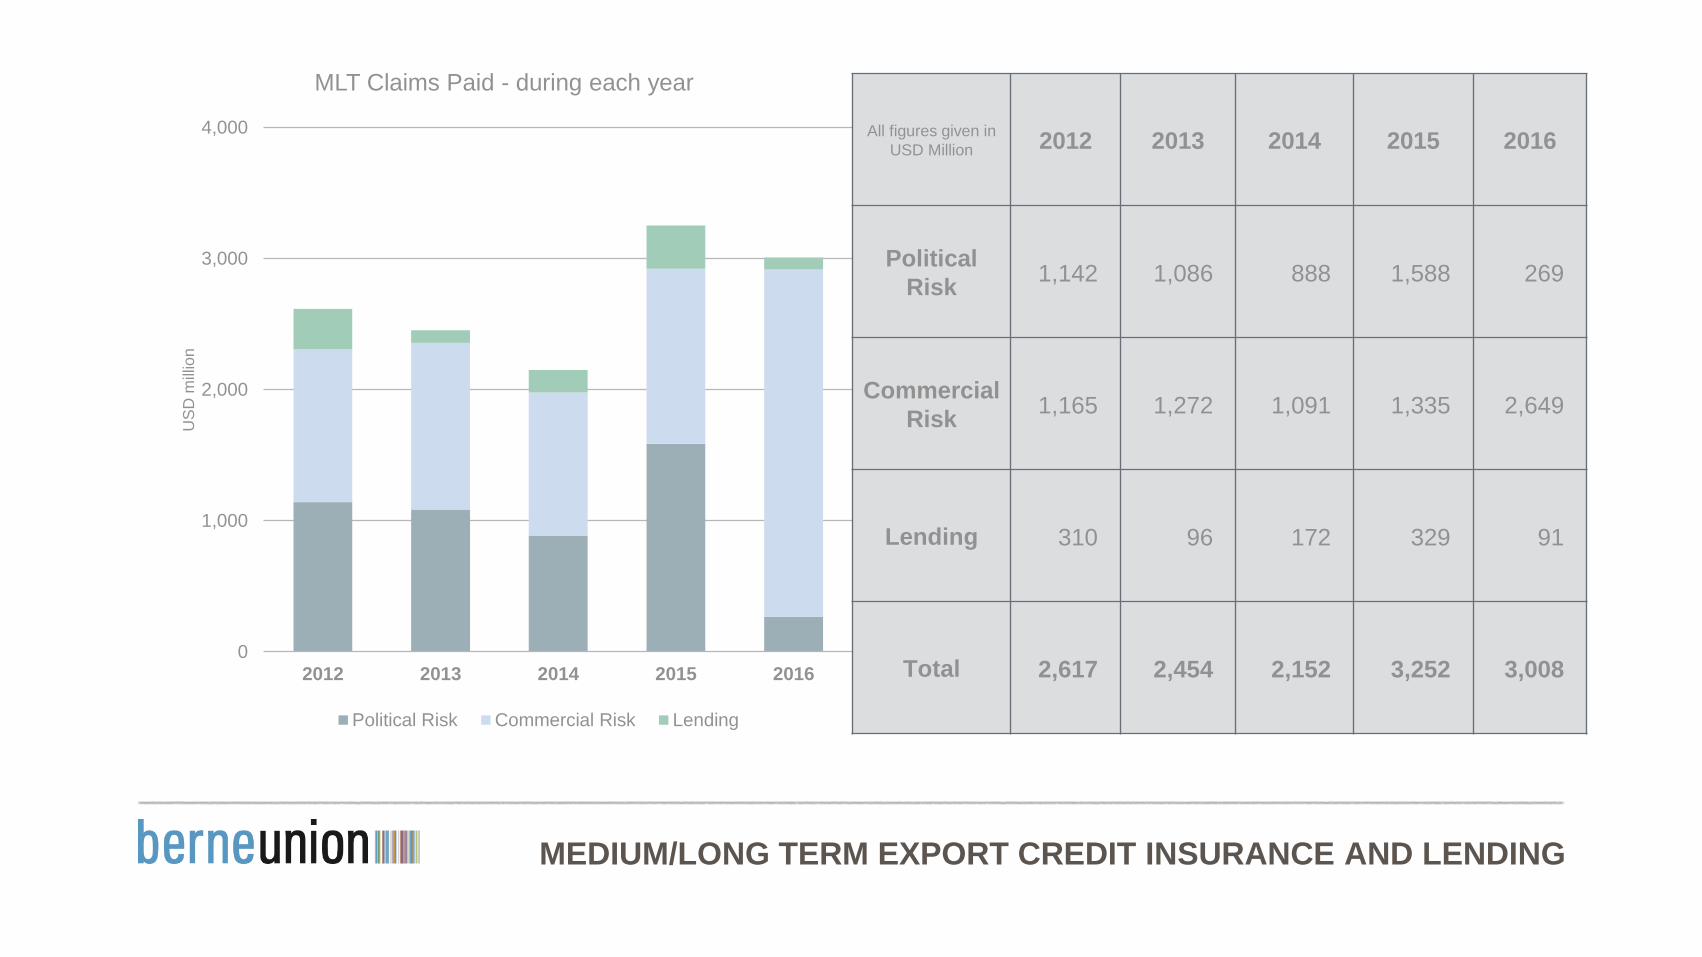
MLT Claims Paid - during each year
Political Risk Commercial Risk Lending
All figures given in
USD Million 2012 2013 2014 2015 2016
Political
Risk1,142 1,086 888 1,588 269
Commercial
Risk1,165 1,272 1,091 1,335 2,649
Lending 310 96 172 329 91
Total 2,617 2,454 2,152 3,252 3,008
MEDIUM/LONG TERM EXPORT CREDIT INSURANCE AND LENDING
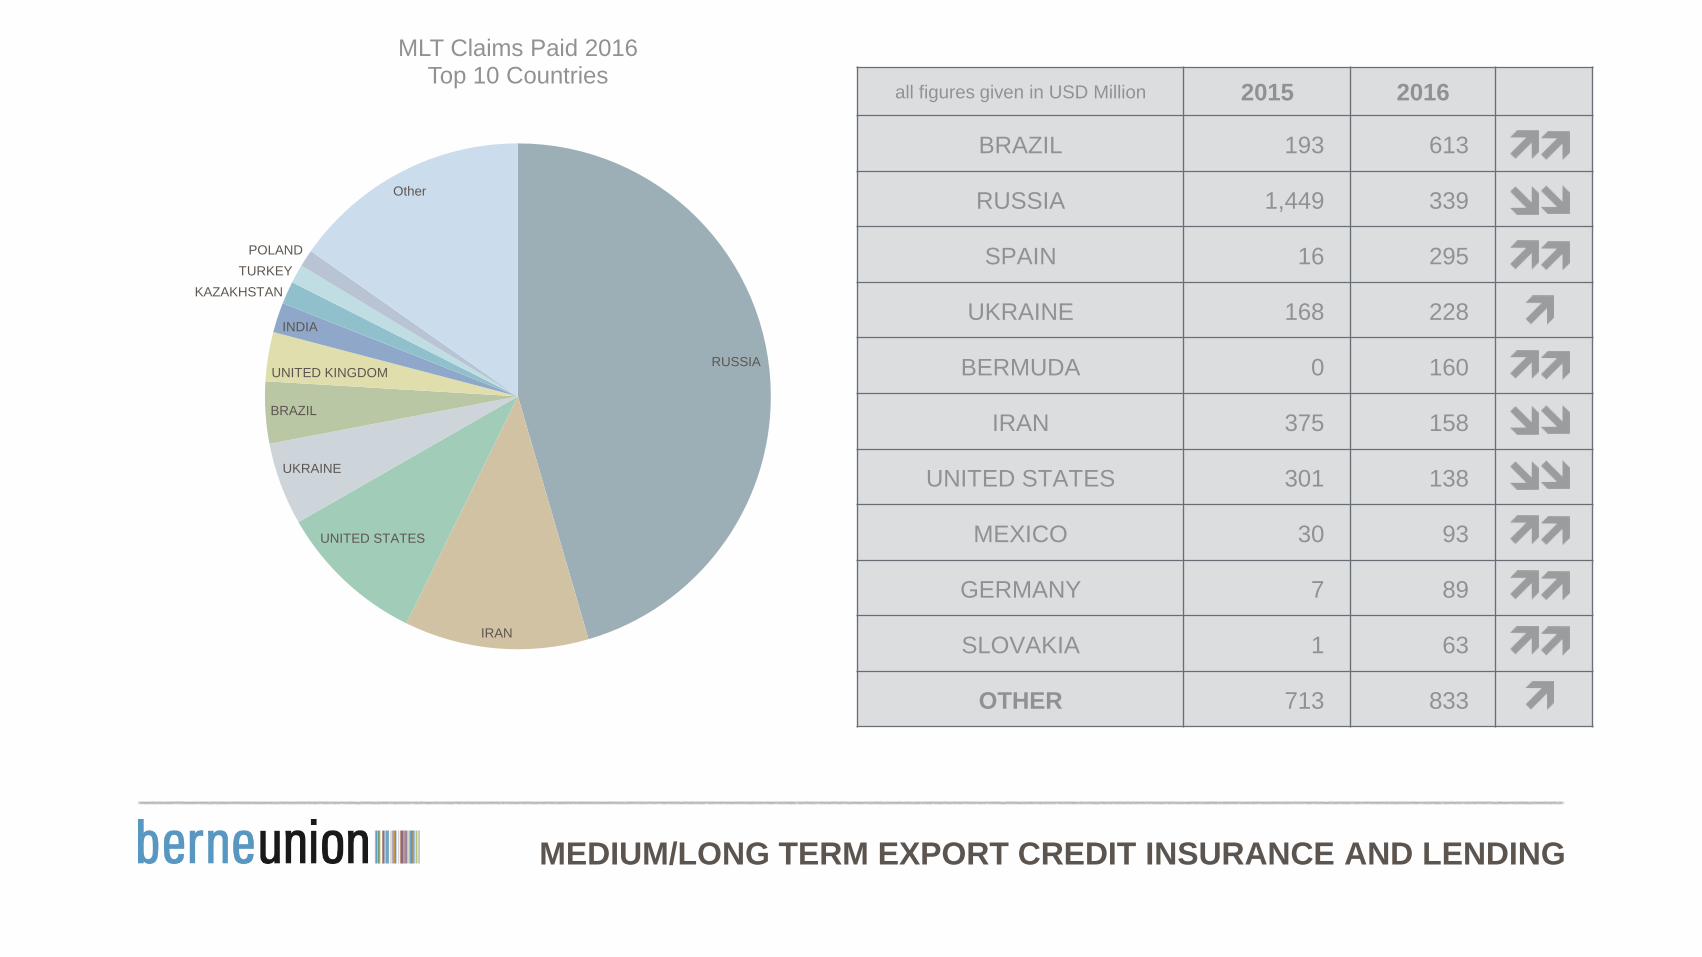
all figures given in USD Million 2015 2016
BRAZIL 193 613
RUSSIA 1,449 339
SPAIN 16 295
UKRAINE 168 228
BERMUDA 0 160
IRAN 375 158
UNITED STATES 301 138
MEXICO 30 93
GERMANY 7 89
SLOVAKIA 1 63
OTHER 713 833
RUSSIA
IRAN
UNITED STATES
UKRAINE
BRAZIL
UNITED KINGDOM
INDIA
KAZAKHSTAN
TURKEY
POLAND
Other
MLT Claims Paid 2016Top 10 Countries
MEDIUM/LONG TERM EXPORT CREDIT INSURANCE AND LENDING
0
1,000
2,000
3,000
4,000
5,000
6,000
2012 2013 2014 2015 2016
US
D m
illio
n
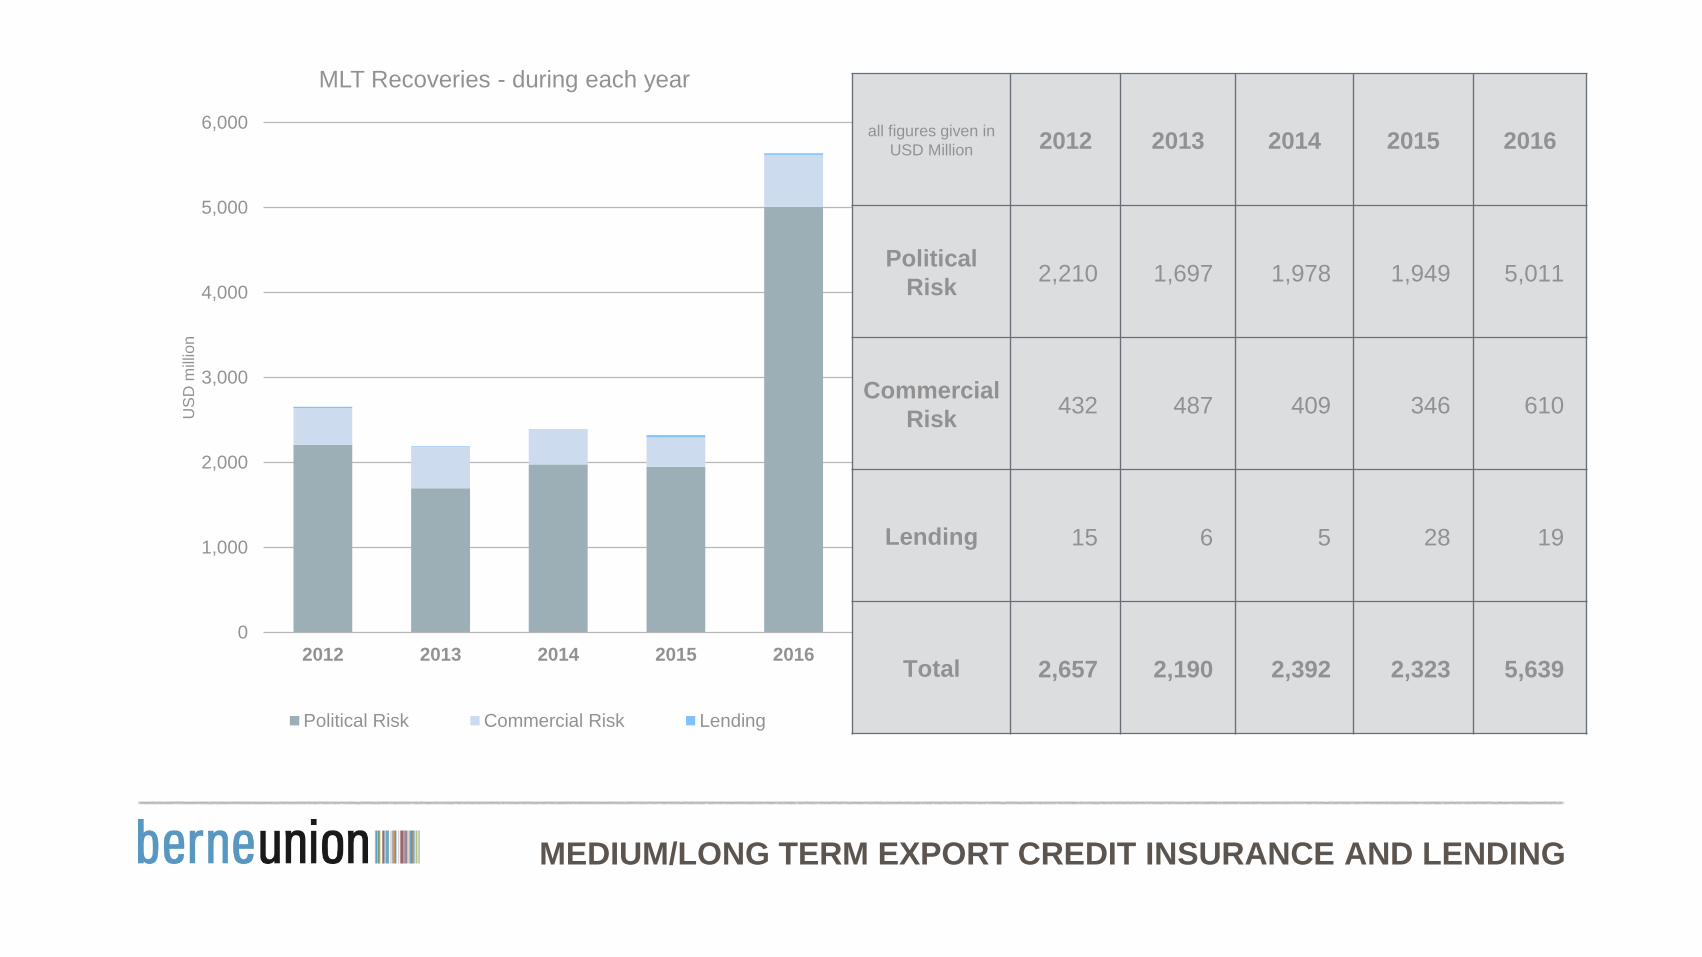
MLT Recoveries - during each year
Political Risk Commercial Risk Lending
all figures given in
USD Million 2012 2013 2014 2015 2016
Political
Risk2,210 1,697 1,978 1,949 5,011
Commercial
Risk432 487 409 346 610
Lending 15 6 5 28 19
Total 2,657 2,190 2,392 2,323 5,639
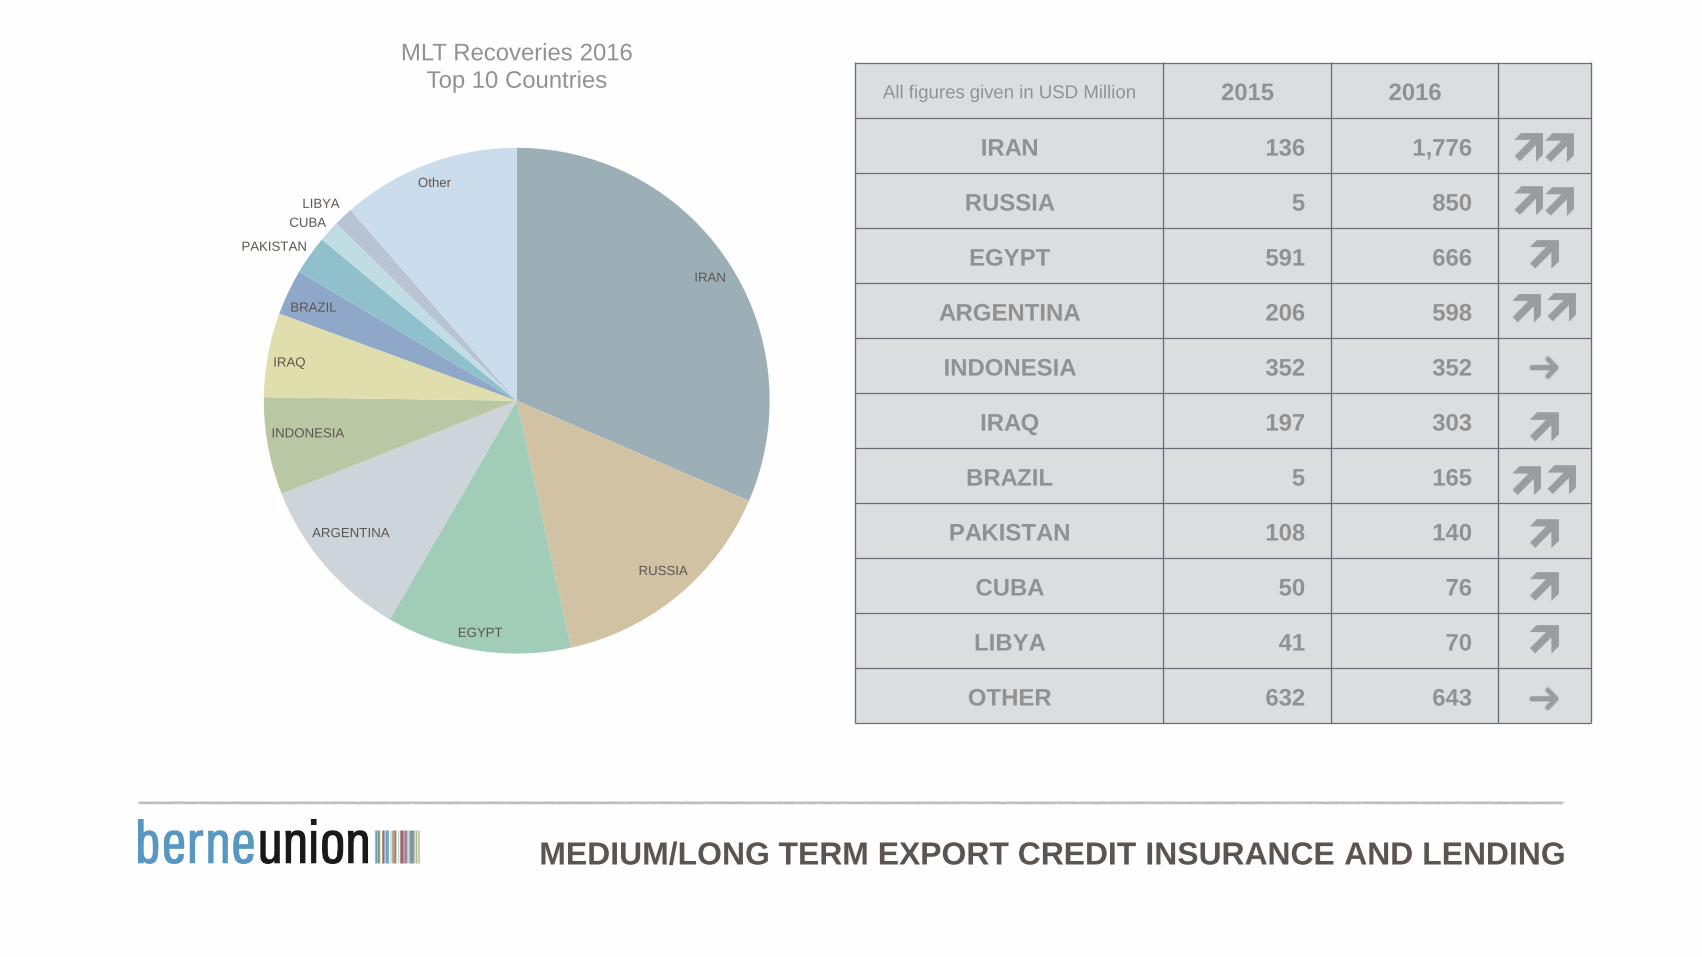
MEDIUM/LONG TERM EXPORT CREDIT INSURANCE AND LENDING
All figures given in USD Million 2015 2016
IRAN 136 1,776
RUSSIA 5 850
EGYPT 591 666
ARGENTINA 206 598
INDONESIA 352 352
IRAQ 197 303
BRAZIL 5 165
PAKISTAN 108 140
CUBA 50 76
LIBYA 41 70
OTHER 632 643
IRAN
RUSSIA
EGYPT
ARGENTINA
INDONESIA
IRAQ
BRAZIL
PAKISTAN
CUBA
LIBYA
Other
MLT Recoveries 2016Top 10 Countries

INVESTMENT INSURANCE
INVESTMENT INSURANCE
0
20,000
40,000
60,000
80,000
100,000
120,000
2012 2013 2014 2015 2016
US
D m
illio
n
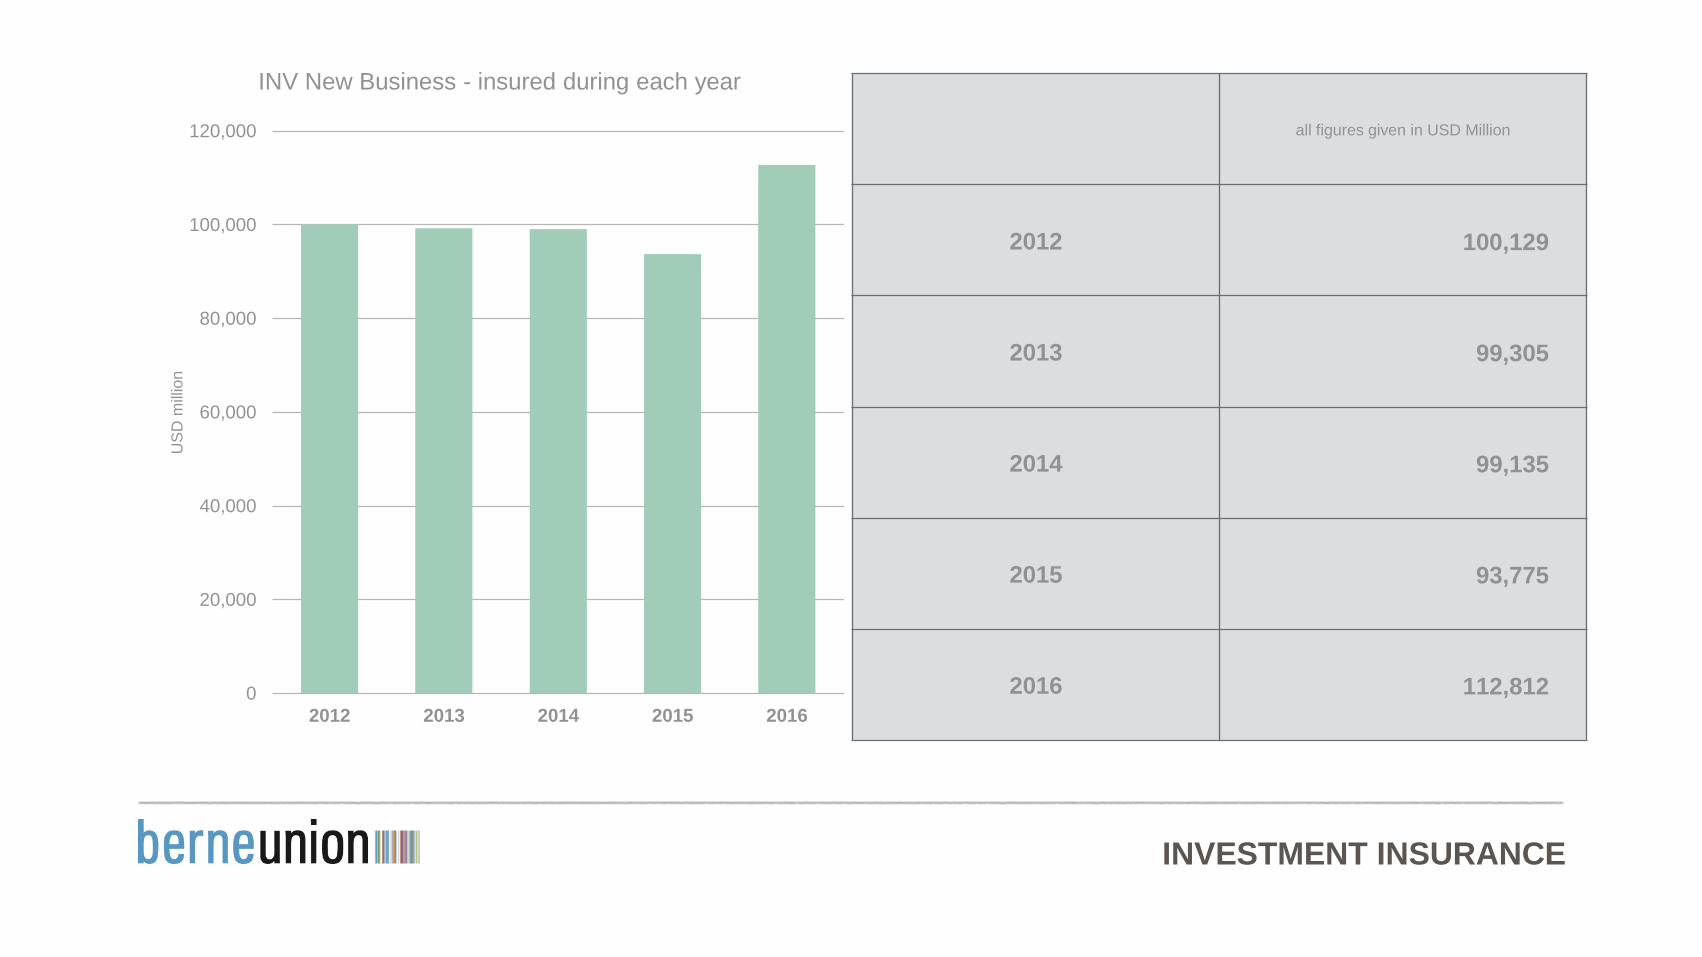
INV New Business - insured during each year
all figures given in USD Million
2012 100,129
2013 99,305
2014 99,135
2015 93,775
2016 112,812
INVESTMENT INSURANCE
100.1 99.3 99.194.6
112.8
0
20
40
60
80
100
120
0%
5%
10%
15%
20%
25%
30%
35%
40%A
me
rica
s
Afr
ica
Mid
dle
Ea
st
Eu
rop
e
AP
AC
Am
erica
s
Afr
ica
Mid
dle
Ea
st
Eu
rop
e
AP
AC
Am
erica
s
Afr
ica
Mid
dle
Ea
st
Eu
rop
e
AP
AC
Am
erica
s
Afr
ica
Mid
dle
Ea
st
Eu
rop
e
AP
AC
Am
erica
s
Afr
ica
Mid
dle
Ea
st
Eu
rop
e
AP
AC
2012 2013 2014 2015 2016
US
D B
illio
n
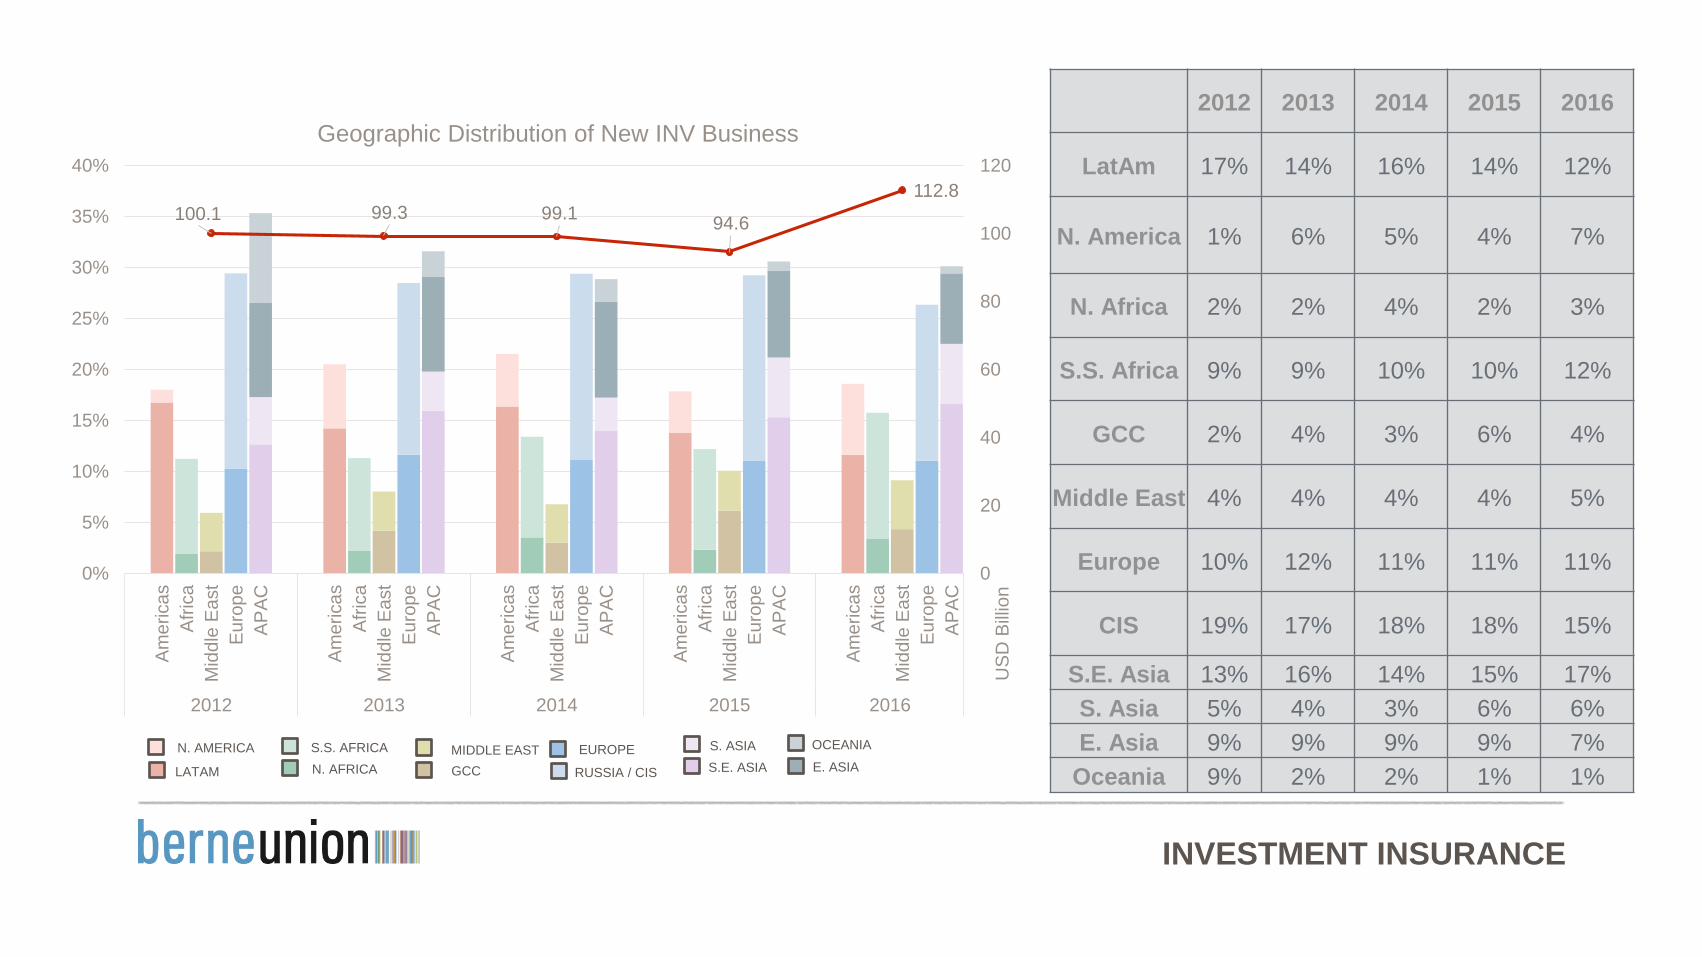
Geographic Distribution of New INV Business
2012 2013 2014 2015 2016
LatAm 17% 14% 16% 14% 12%
N. America 1% 6% 5% 4% 7%
N. Africa 2% 2% 4% 2% 3%
S.S. Africa 9% 9% 10% 10% 12%
GCC 2% 4% 3% 6% 4%
Middle East 4% 4% 4% 4% 5%
Europe 10% 12% 11% 11% 11%
CIS 19% 17% 18% 18% 15%
S.E. Asia 13% 16% 14% 15% 17%
S. Asia 5% 4% 3% 6% 6%
E. Asia 9% 9% 9% 9% 7%
Oceania 9% 2% 2% 1% 1%
OCEANIA
E. ASIA
S. ASIA
S.E. ASIA
EUROPE
RUSSIA / CISGCCN. AFRICALATAM
N. AMERICA S.S. AFRICA MIDDLE EAST
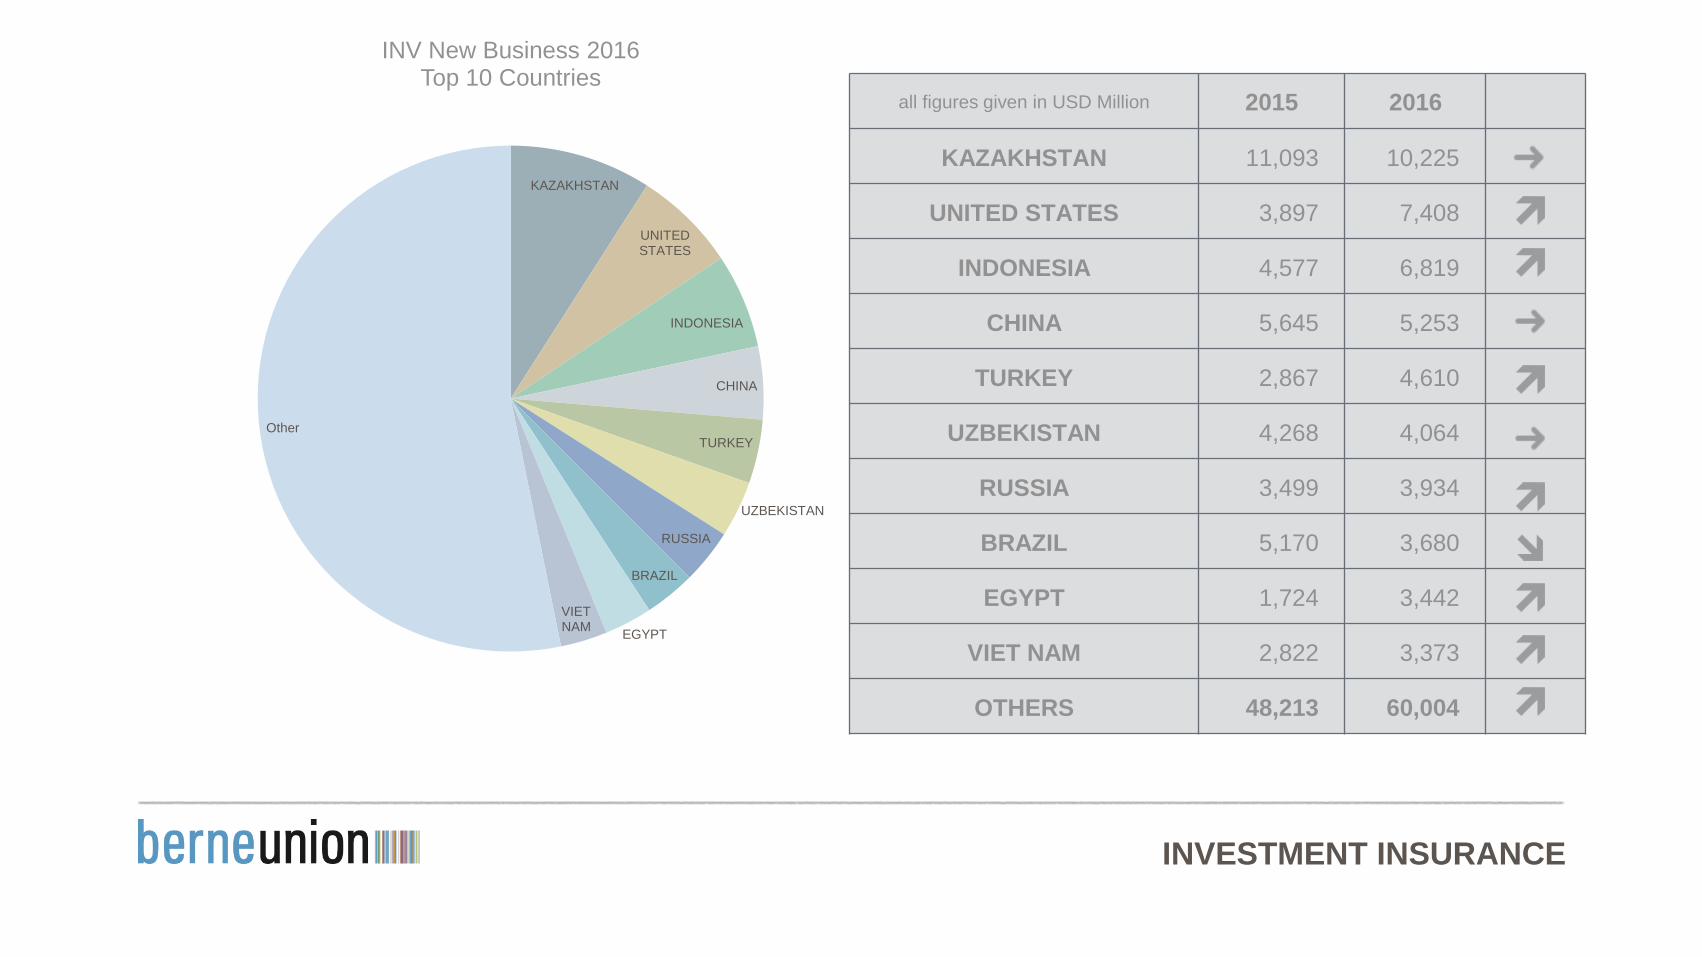
INVESTMENT INSURANCE
all figures given in USD Million 2015 2016
KAZAKHSTAN 11,093 10,225
UNITED STATES 3,897 7,408
INDONESIA 4,577 6,819
CHINA 5,645 5,253
TURKEY 2,867 4,610
UZBEKISTAN 4,268 4,064
RUSSIA 3,499 3,934
BRAZIL 5,170 3,680
EGYPT 1,724 3,442
VIET NAM 2,822 3,373
OTHERS 48,213 60,004
KAZAKHSTAN
UNITED STATES
INDONESIA
CHINA
TURKEY
UZBEKISTAN
RUSSIA
BRAZIL
EGYPT
VIET NAM
Other
INV New Business 2016Top 10 Countries
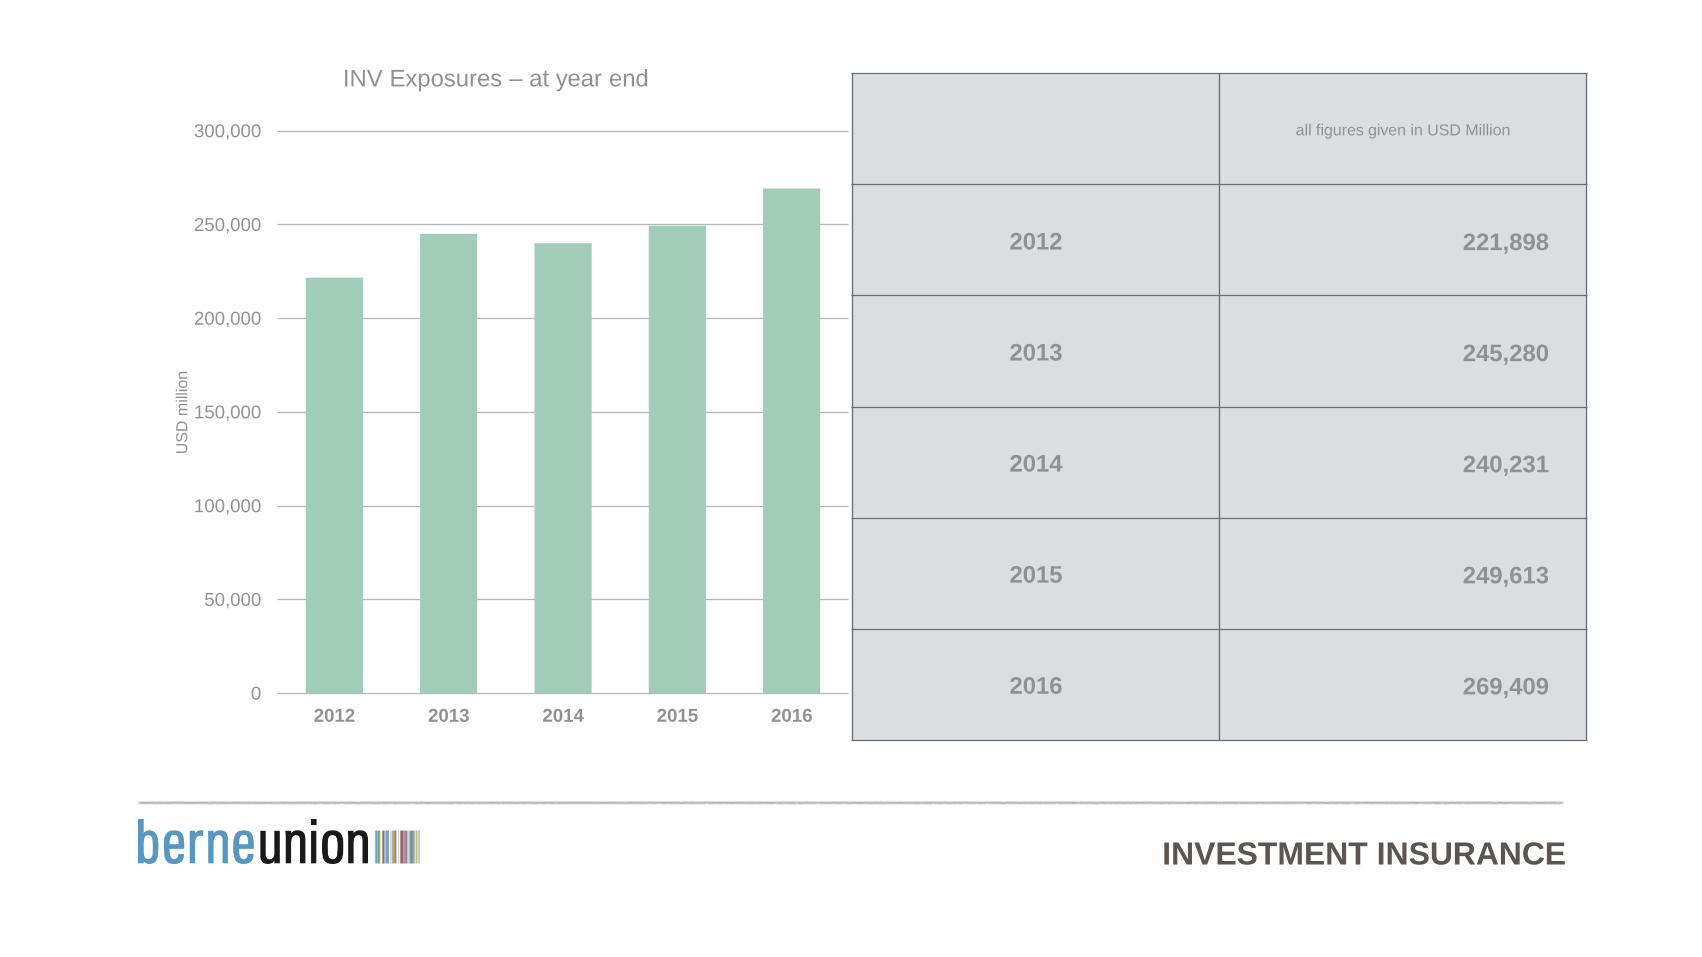
INVESTMENT INSURANCE
all figures given in USD Million
2012 221,898
2013 245,280
2014 240,231
2015 249,613
2016 269,409 0
50,000
100,000
150,000
200,000
250,000
300,000
2012 2013 2014 2015 2016
US
D m
illio
n
INV Exposures – at year end

INVESTMENT INSURANCE
all figures given in USD Million 2015 2016
CHINA 21,419 20,707
RUSSIA 19,480 18,368
UNITED STATES 12,272 15,690
BRAZIL 12,435 13,719
VIET NAM 9,257 10,807
KAZAKHSTAN 12,335 10,741
INDIA 9,626 10,691
INDONESIA 9,500 10,658
TURKEY 8,640 10,316
MEXICO 7,826 8,721
OTHER 126,823 138,992
CHINA
RUSSIA
UNITED STATES
BRAZIL
VIET NAM
KAZAKHSTAN
INDIA
INDONESIATURKEY
MEXICO
Other
INV Exposure 2016Top 10 Countries
INVESTMENT INSURANCE
0
50
100
150
200
250
300
350
2012 2013 2014 2015 2016
US
D m
illio
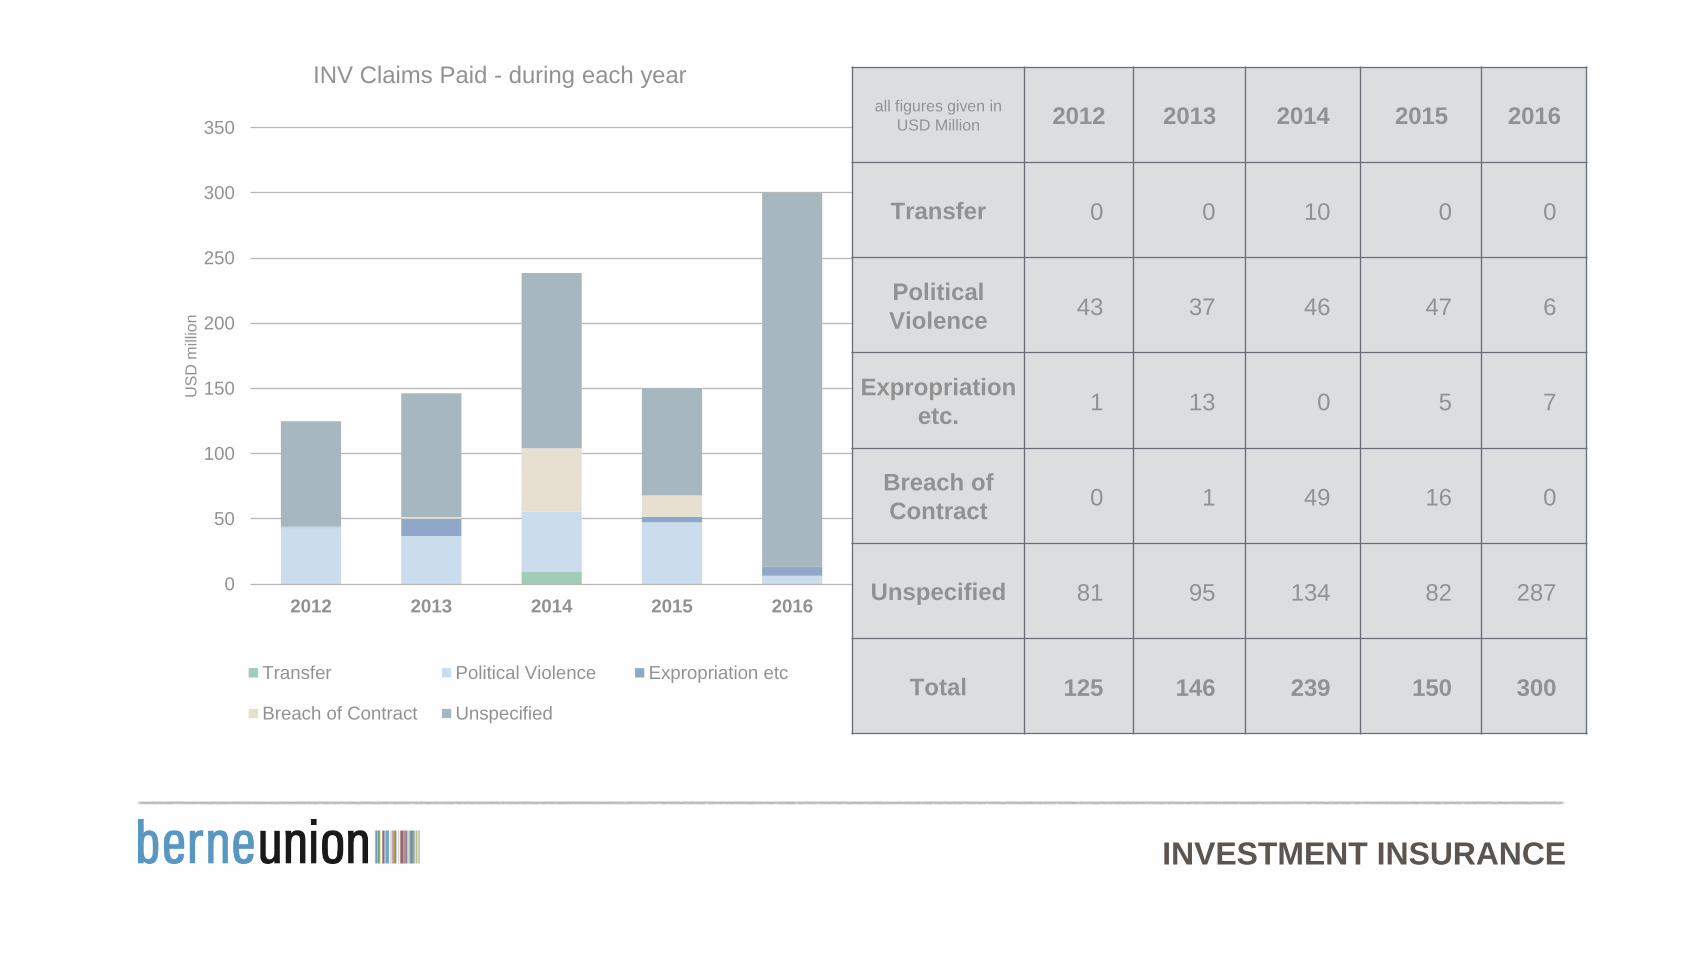
n
INV Claims Paid - during each year
Transfer Political Violence Expropriation etc
Breach of Contract Unspecified
all figures given in
USD Million 2012 2013 2014 2015 2016
Transfer 0 0 10 0 0
Political
Violence43 37 46 47 6
Expropriation
etc.1 13 0 5 7
Breach of
Contract0 1 49 16 0
Unspecified 81 95 134 82 287
Total 125 146 239 150 300
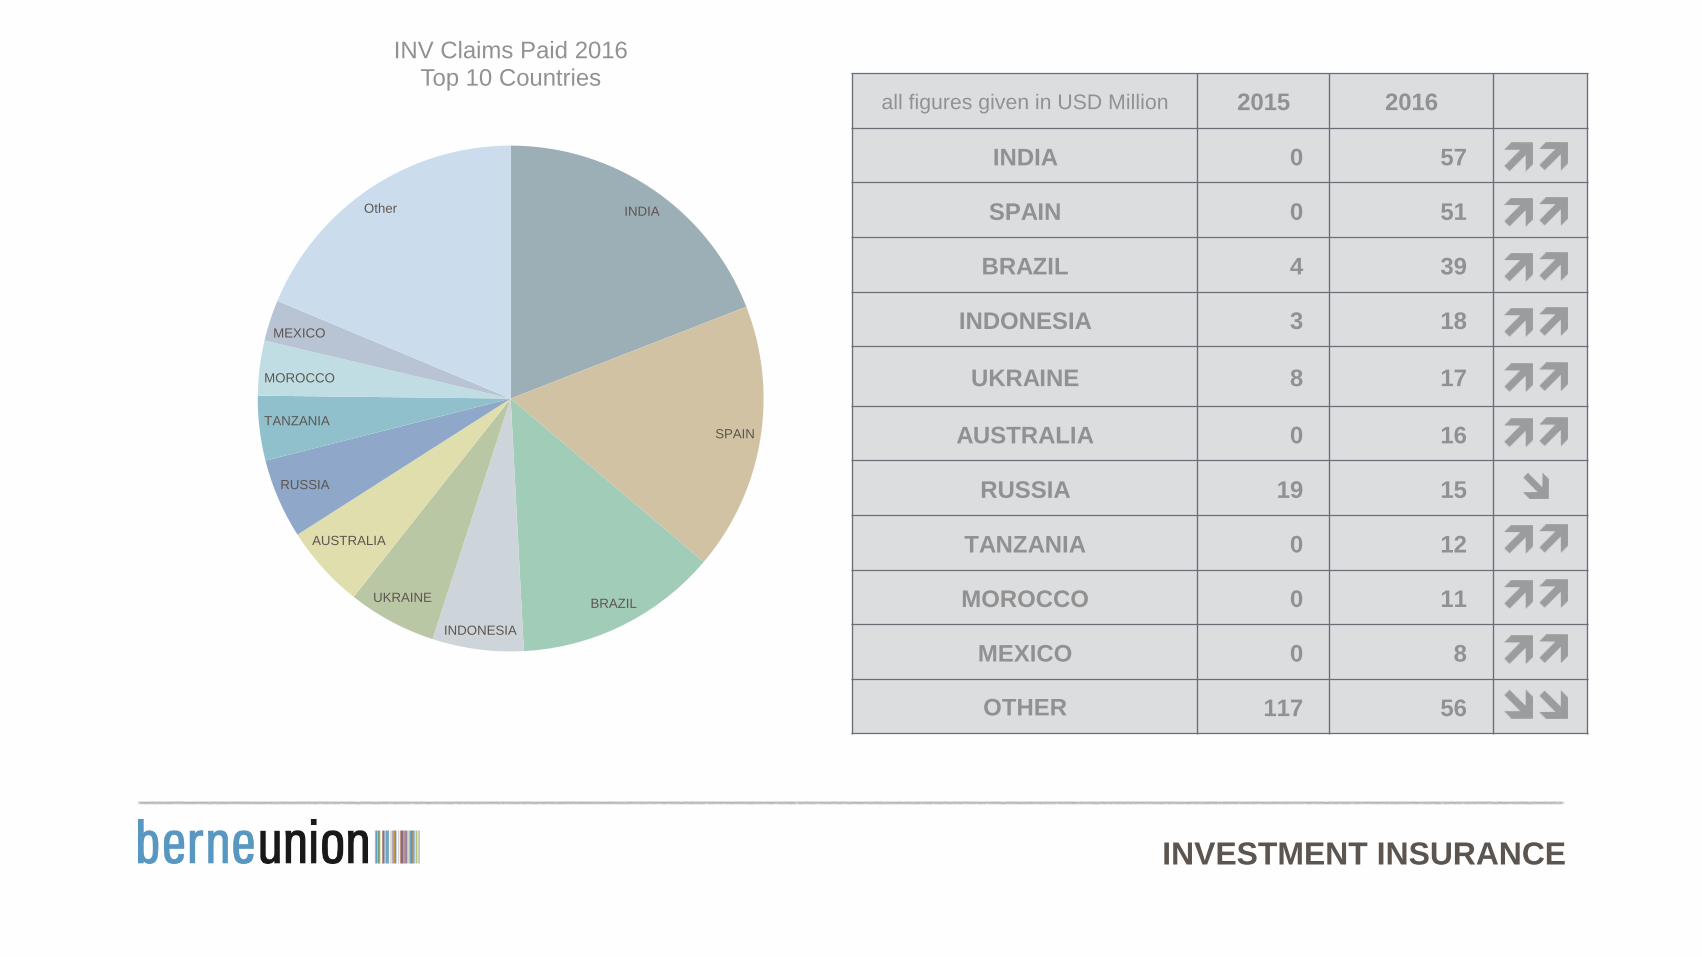
INVESTMENT INSURANCE
all figures given in USD Million 2015 2016
INDIA 0 57
SPAIN 0 51
BRAZIL 4 39
INDONESIA 3 18
UKRAINE 8 17
AUSTRALIA 0 16
RUSSIA 19 15
TANZANIA 0 12
MOROCCO 0 11
MEXICO 0 8
OTHER 117 56
INDIA
SPAIN
BRAZIL
INDONESIA
UKRAINE
AUSTRALIA
RUSSIA
TANZANIA
MOROCCO
MEXICO
Other
INV Claims Paid 2016Top 10 Countries
INVESTMENT INSURANCE
0
20
40
60
80
100
120
2012 2013 2014 2015 2016
US
D m
illio
n
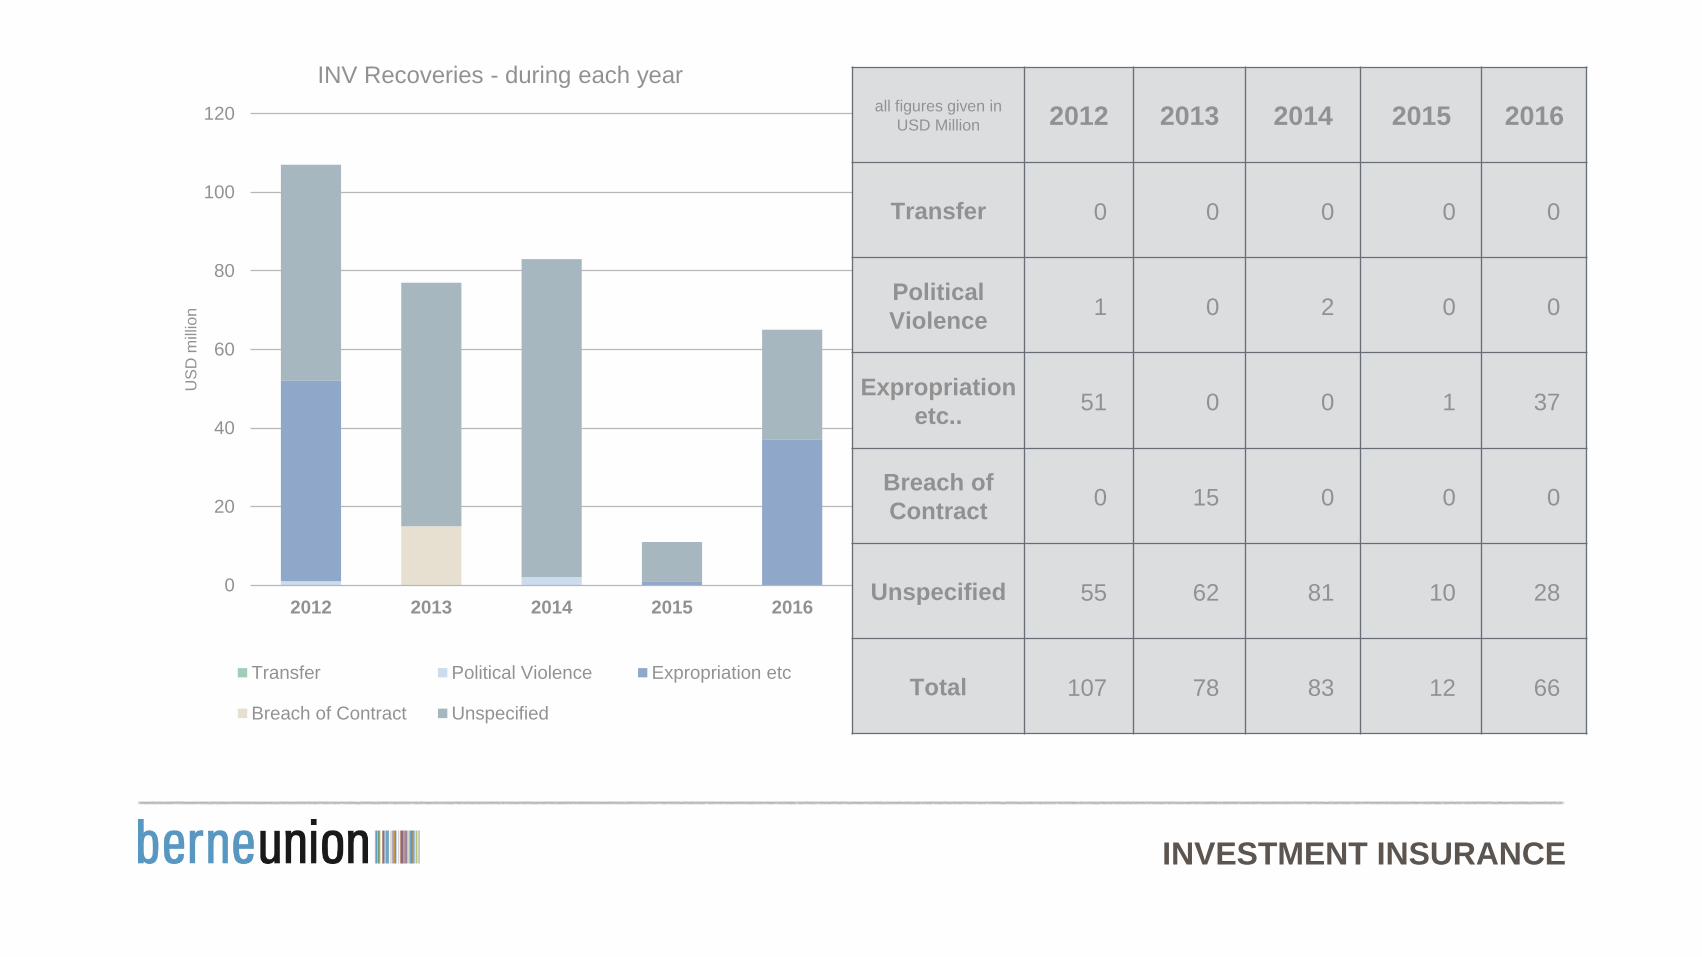
INV Recoveries - during each year
Transfer Political Violence Expropriation etc
Breach of Contract Unspecified
all figures given in
USD Million 2012 2013 2014 2015 2016
Transfer 0 0 0 0 0
Political
Violence1 0 2 0 0
Expropriation
etc..51 0 0 1 37
Breach of
Contract0 15 0 0 0
Unspecified 55 62 81 10 28
Total 107 78 83 12 66
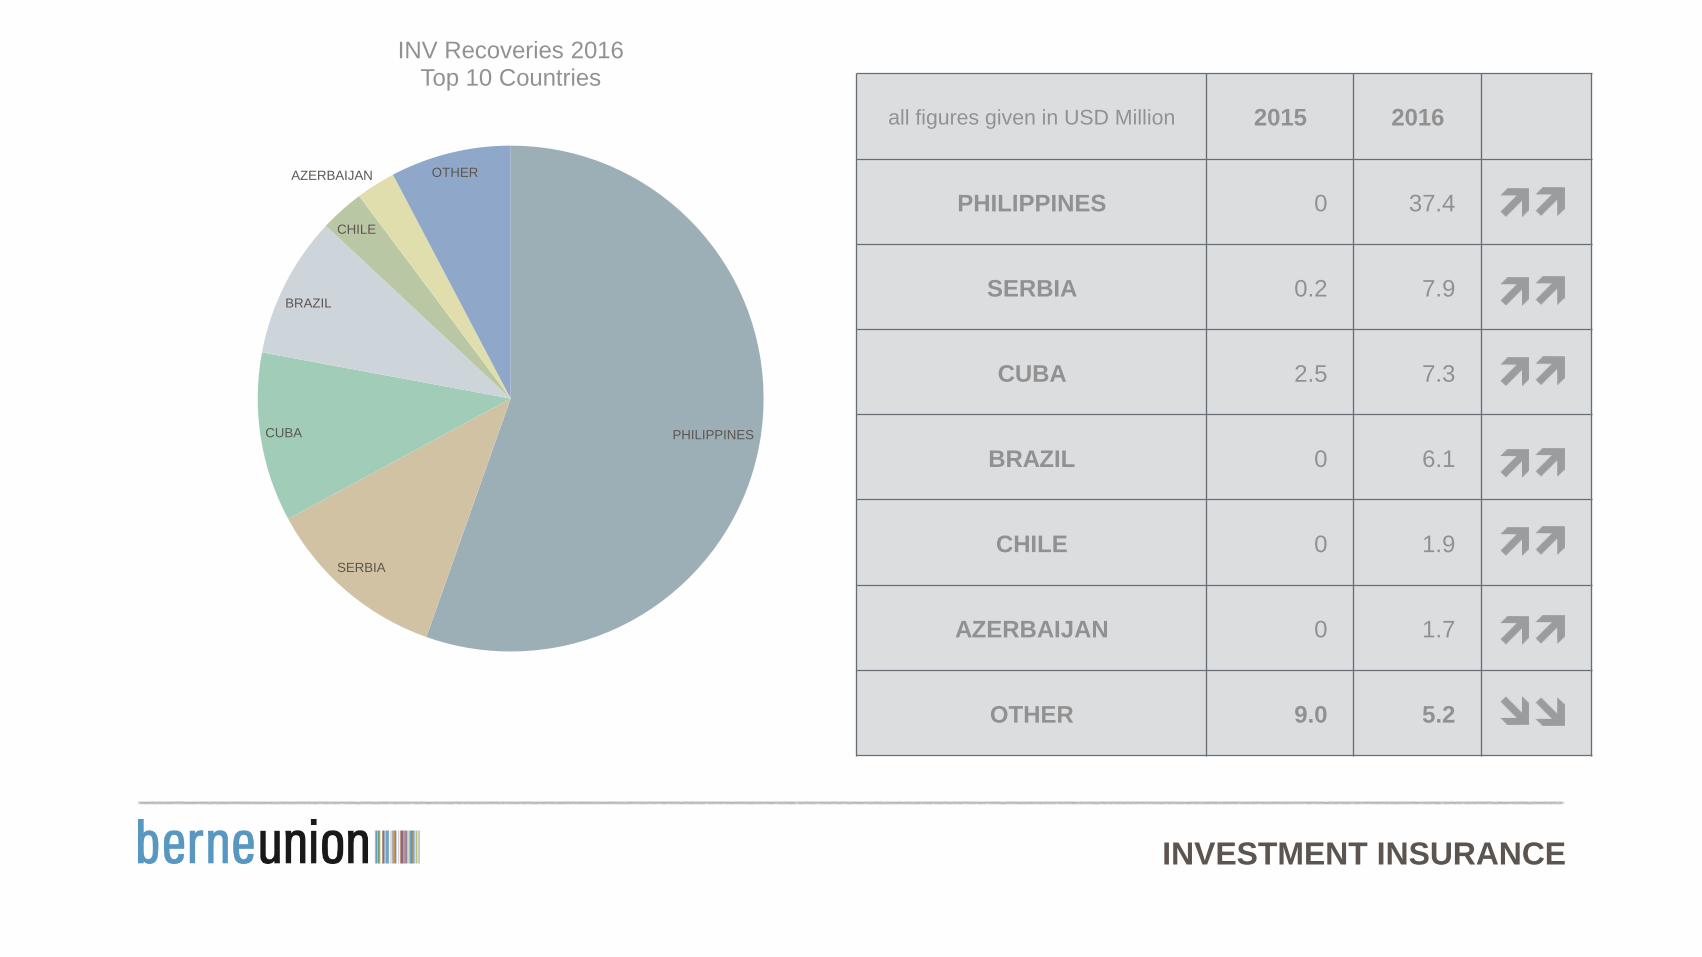
INVESTMENT INSURANCE
all figures given in USD Million 2015 2016
PHILIPPINES 0 37.4
SERBIA 0.2 7.9
CUBA 2.5 7.3
BRAZIL 0 6.1
CHILE 0 1.9
AZERBAIJAN 0 1.7
OTHER 9.0 5.2
PHILIPPINES
SERBIA
CUBA
BRAZIL
CHILE
AZERBAIJAN OTHER
INV Recoveries 2016Top 10 Countries
STATISTICS2012-2016