Sla Settlement
8
1 INTRODUCTION Ground movements may considerably affect the ser- viceability and safety of structures. In particular the behaviour of large-scale historical masonry build- ings subjected to settlements induced by tunnelling activity has been analysed in this paper. The nu- merical difficulties encountered in modelling these full-scale buildings have been highlighted in previ- ous works (Rots 2000, Boonpichetvong and Rots 2003) and are summarized in this paper where the case study of a representative Amsterdam masonry façades dated from 18-19 th century is analysed. Ana- lytical and empirical approaches are available for evaluating the cracking damage of surrounding structures subjected to settlement. Potts and Adden- brooke (1996) employed elastic beam elements to represent an overlying structure on a soil continuum. However, due to many provided assumptions, the di- rect application of these simplified methods in very sensitive cases such as fragile historical masonry buildings raise the need for more detailed analysis. For quasi-brittle materials like concrete and masonry especially, the introduction of tension-softening models, fracture mechanics and nonlinear finite ele- ment (NLFE) methods have improved the possibili- ties for predicting cracks in structures. Several NLFE analyses were performed in the past with the DIANA finite element code in order to investigate how mesh refinement, element typology, constitu- tive law, convergence method and loading can affect the façade response (Boonpichetvong and Rots 2003). The main remark arising from the results of these studies is that the façade response strongly de- pends on the adopted constitutive models and con- vergence methods. These previous investigations, revealed a very brittle snap-back response associated with full fracture of the façade, which cannot be caught by smeared crack models. When the crack pattern develops the structural response obtained with smeared crack model shows a snap-through, due to the significant unbalance between high elastic energy stored in the façade and low fracture energy of masonry. For this reason the façade was re- analysed with discrete crack models and arc-length control technique. In this case snap-back response can be predicted, but practical use of this numerical procedure re quires a lot of user’s experience. In this paper it will be shown that the strong and sharp snap-back response, due to settlement, can be auto- matically detected by a sequentially linear analysis method. Sequentially linear analysis is an alternative to non-linear finite element analysis of structures when bifurcation, snap-back or divergence problems arise. The incremental-iterative procedure is re- placed by a sequence of linear finite element analy- ses performed by decreasing Young’s modulus and tensile strength at the integration point of elements, when their damage increases. An application of sequentially linear analysis to settlement damage prediction fo r masonry f açades J.G. Rots & M. Boonpichetvong Delft University of Techno logy, Delft, The Nether lands B. Belletti University of Parma, Parma, Italy. Also research fellow at TUDelft. S. Invernizzi Politecnico di Torino, Torino, Italy. Also research fellow at TUDelft. ABSTRACT: In Amsterdam, the North-South metro-link is being constructed underneath the urban historical city centre. This implies that historical masonry facades and monuments face the risk of being damaged due to the settlements imposed by the subsurface building activities. The situation is critical because we have the combination of very soft soil, timber pile foundations and brittle un-reinforced masonry. A representative Amsterdam masonry façades from 18-19 th century is analysed. A crucial aspect of large-scale masonry struc- tural behaviour is that cracks may initiate, gradually propagate and then suddenly snap to a free surface, thus the final fracture is localized and often highly brittle. Existing Newton-Raphson based non-linear finite ele- ment techniques face difficulties in modelling this, whilst softening results in negative stiffness, sharp snap- backs and bifurcations. In this paper, the sequentially linear analysis is proposed a s an alternative approach. The paper illustrates the potential of numerical models to gain insight in the risks and in the need for mitigat- ing measures to preserve the architectural heritage.
-
Upload
magist23074 -
Category
Documents
-
view
234 -
download
0
Transcript of Sla Settlement
8/12/2019 Sla Settlement
http://slidepdf.com/reader/full/sla-settlement 1/8
1 INTRODUCTION
Ground movements may considerably affect the ser-viceability and safety of structures. In particular the
behaviour of large-scale historical masonry build-ings subjected to settlements induced by tunnellingactivity has been analysed in this paper. The nu-merical difficulties encountered in modelling thesefull-scale buildings have been highlighted in previ-ous works (Rots 2000, Boonpichetvong and Rots2003) and are summarized in this paper where thecase study of a representative Amsterdam masonryfaçades dated from 18-19th century is analysed. Ana-lytical and empirical approaches are available forevaluating the cracking damage of surroundingstructures subjected to settlement. Potts and Adden-
brooke (1996) employed elastic beam elements torepresent an overlying structure on a soil continuum.However, due to many provided assumptions, the di-rect application of these simplified methods in verysensitive cases such as fragile historical masonry
buildings raise the need for more detailed analysis.For quasi-brittle materials like concrete and masonryespecially, the introduction of tension-softeningmodels, fracture mechanics and nonlinear finite ele-
ment (NLFE) methods have improved the possibili-ties for predicting cracks in structures. Several
NLFE analyses were performed in the past with theDIANA finite element code in order to investigatehow mesh refinement, element typology, constitu-
tive law, convergence method and loading can affectthe façade response (Boonpichetvong and Rots
2003). The main remark arising from the results ofthese studies is that the façade response strongly de-
pends on the adopted constitutive models and con-vergence methods. These previous investigations,revealed a very brittle snap-back response associatedwith full fracture of the façade, which cannot becaught by smeared crack models. When the crack
pattern develops the structural response obtainedwith smeared crack model shows a snap-through,due to the significant unbalance between high elasticenergy stored in the façade and low fracture energyof masonry. For this reason the façade was re-analysed with discrete crack models and arc-lengthcontrol technique. In this case snap-back responsecan be predicted, but practical use of this numerical
procedure requires a lot of user’s experience. In this paper it will be shown that the strong and sharpsnap-back response, due to settlement, can be auto-matically detected by a sequentially linear analysismethod. Sequentially linear analysis is an alternativeto non-linear finite element analysis of structureswhen bifurcation, snap-back or divergence problemsarise. The incremental-iterative procedure is re-
placed by a sequence of linear finite element analy-ses performed by decreasing Young’s modulus andtensile strength at the integration point of elements,when their damage increases.
An application of sequentially linear analysis to settlement damage prediction for masonry façades
J.G. Rots & M. Boonpichetvong Delft University of Technology, Delft, The Netherlands
B. Belletti
University of Parma, Parma, Italy. Also research fellow at TUDelft.
S. InvernizziPolitecnico di Torino, Torino, Italy. Also research fellow at TUDelft.
ABSTRACT: In Amsterdam, the North-South metro-link is being constructed underneath the urban historicalcity centre. This implies that historical masonry facades and monuments face the risk of being damaged dueto the settlements imposed by the subsurface building activities. The situation is critical because we have thecombination of very soft soil, timber pile foundations and brittle un-reinforced masonry. A representative
Amsterdam masonry façades from 18-19th century is analysed. A crucial aspect of large-scale masonry struc-tural behaviour is that cracks may initiate, gradually propagate and then suddenly snap to a free surface, thusthe final fracture is localized and often highly brittle. Existing Newton-Raphson based non-linear finite ele-ment techniques face difficulties in modelling this, whilst softening results in negative stiffness, sharp snap-
backs and bifurcations. In this paper, the sequentially linear analysis is proposed as an alternative approach.The paper illustrates the potential of numerical models to gain insight in the risks and in the need for mitigat-ing measures to preserve the architectural heritage.
8/12/2019 Sla Settlement
http://slidepdf.com/reader/full/sla-settlement 2/8
2 OVERALL EVENT-BY-EVENT PROCEDURE
The locally brittle snap-type response of many struc-tures inspired the idea to capture these brittle eventsdirectly rather than trying to iterate around them in a
Newton-Raphson scheme. A critical event is tracedand subsequently a secant restart is made from theorigin for tracing the next critical event. Hence, the
procedure is sequential rather than incremental. Thesequence of critical events governs the load-displacement response. To this aim, the softeningdiagram is replaced by a saw-tooth curve and linearanalyses are carried out sequentially (Rots 2001).The global procedure is as follows. The structure isdiscretized using standard elastic continuum ele-ments. Young’s modulus, Poisson’s ratio and initialstrength are assigned to the elements. Subsequently,the following steps are sequentially carried out:• Add the external load as a unit load.• Perform a linear elastic analysis.
• Extract the ‘critical element’ from the results. The‘critical element’ is the element for which thestress level divided by its current strength is thehighest in the whole structure.
• Calculate the ratio between the strength and thestress level in the critical element: this ratio pro-vides the ‘global load factor’. The present solu-tion step is obtained rescaling the ‘unit load elas-tic solution’ times the ‘global load factor’.
• Increase the damage in the critical element by re-ducing its stiffness and strength, i.e. Young’s
modulus E i and tensile strength f ti, according to asaw-tooth constitutive law as described in thenext section.
• Repeat the previous steps for the new configura-tion, i.e. re-run a linear analysis for the structurein which E i and f ti of the previous critical elementhave been reduced. Trace the next critical saw-tooth and element, repeat this process till thedamage has spread into the structure to the de-sired level.
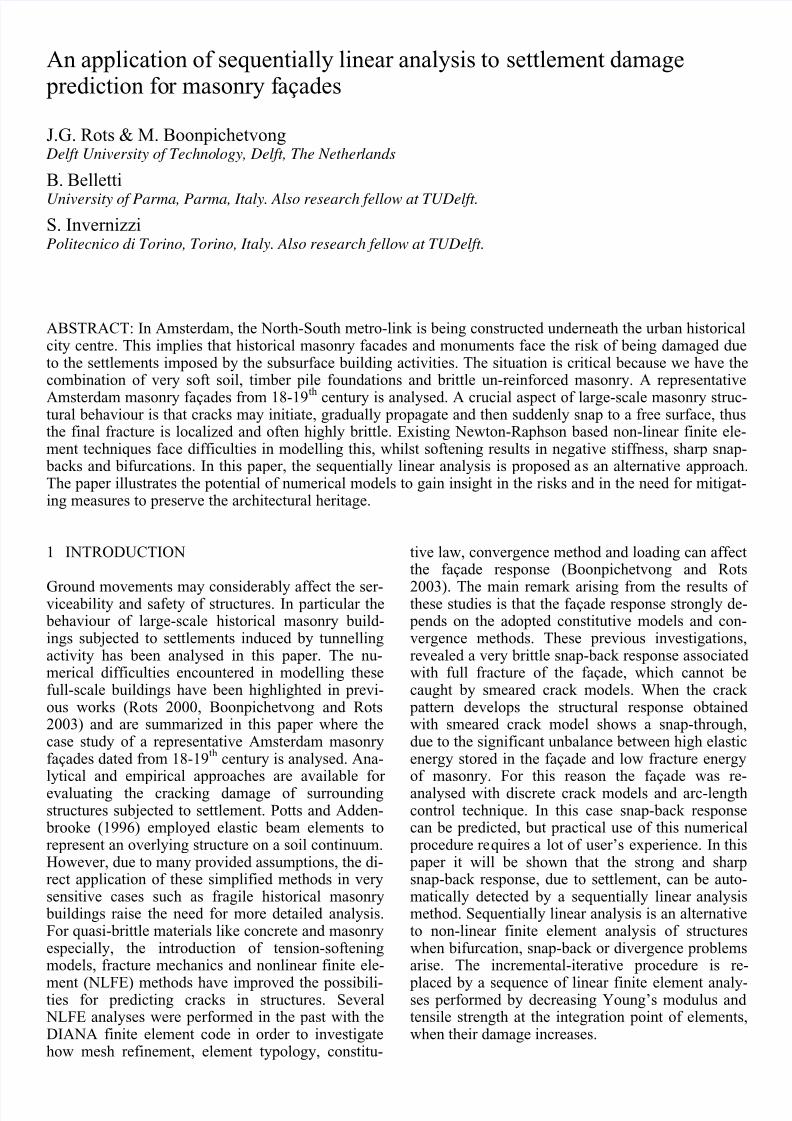
2.1 Saw-tooth diagram for masonry in tensionThe way in which the stiffness and strength of thecritical elements are progressively reduced consti-tutes the essence of the model. In other words, it isnecessary to provide a saw-tooth approximation ofthe constitutive stress-strain relation. A very roughmethod would be to reduce E to zero immediatelyafter the first, initial strength is reached. This elastic
perfectly brittle approach, however, is likely to bemesh dependent as it will not yield the correct en-ergy consumption upon mesh refinement (Bažant
and Cedolin 1979). In the sequentially linear proce-dure the consecutive strength and stiffness reductionis based upon the concept of tensile strain softening,which is fairly accepted in the field of fracture me-chanics.
(a)
(b)Figure 1: The stress-total strain curve for linear softening (a)and the consistent saw-tooth diagram (b).
Different approaches have been investigated in pre-vious works (Rots and Invernizzi 2004), in the pre-sent paper a new generalized tooth size approach, al-ready adopted for concrete (Rots et al. 2006), is
presented and applied to masonry. The tensile sof-tening stress-strain curve is defined by Young’smodulus E , the tensile strength f t , the shape of thediagram, and the area under the diagram, Fig. 1a.
The area under the diagram represents the fractureenergy G f divided by the crack band width h, whichis a discretisation parameter associated with the size,orientation and integration scheme of the finite ele-ment. Please note that the softening diagram isadopted only as a 'mother' or envelope curve that de-termines the consecutive strength reduction in se-quentially linear analysis. For a linear softening dia-gram, the ultimate strain uε of the diagram reads:
h f
G
t
f
u
2=ε , (1)
and the tangent to the tensile stress-strain softeningcurve is, see Fig. 1a:
8/12/2019 Sla Settlement
http://slidepdf.com/reader/full/sla-settlement 3/8
E
f
f D
t
u
t
−
=
ε
(2)
In a sequentially linear strategy, the softeningdiagram can be imitated by consecutively reducingYoung’s modulus as well as the strength. As shownin Fig. 1b, a strength range is set, as a percentage of
the maximum tensile strength, p. As a result, a bandor ‘strip’ is introduced into the softening diagram,delimited by two curves parallel and equidistant tothe original diagram. The number of required teethneed to reach the complete damage of the element( N ) and the values of Young’s modulus ( E i) and ten-sile strength ( f ti) at the current stage i in the saw-tooth diagram are automatically obtained as valuesdepending on this strength range, chosen by the user.We can interpret this as a pre-set ‘ripple curve’ ontop of the base curve, so if i denotes the currentstage in the saw-tooth diagram, the following rela-tion can be imposed:
t titi pf f f 2−= +− (3)
The reduced strength +ti f corresponding to the
reduced Young’s modulus E i is taken in accordancewith the envelope softening stress-strain curve:
D E
D E f
i
iuti+
= ++ε (4)
where:
D
f p t
uu +=+ε ε (5)
i+1 denotes the next stage in the saw-tooth diagramand ai+1 is a variable which increases the damage ofthe element by reducing Young’s modulus:
1
1
+
−
+ ==i
i
i
ti
ia
E f E
ε
(6)
The value of ai+1 can be obtained from Eqs. 3 and 6,
see Fig. 1b:
t ti
ti
ti
ti
i
ti
i
i pf f
f
f
f
f
E a
21
−===
+
+
−
+
−+ ε (7)
Note that this is the softening curve in terms ofstress versus total strain, i.e. the sum of elastic strainand crack strain of an imagined cracked continuum.The model always provides a solution: the secantsaw-tooth stiffness is always positive, so that ill-conditioning or divergence does not appear in se-quentially linear analysis. An advantage of this new
formulation is that no special techniques are re-quired to handle mesh-size objectivity.
(a)
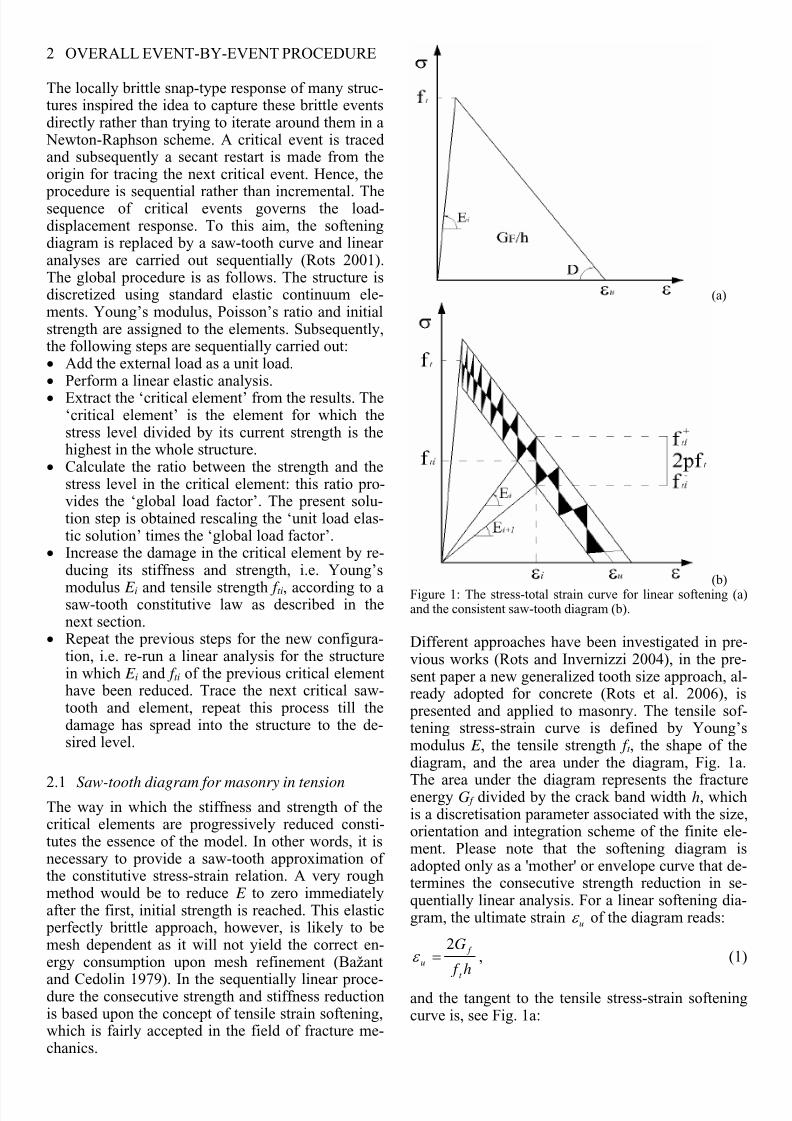
(b)Figure 2: An example of historical masonry buildings in Am-sterdam (after Netzel and Kaalberg, 2001) (a); the selected his-torical masonry façade (all dimensions in mm) (b).
3 SETTLEMENT DAMAGE PREDICTION OFHISTORICAL MASONRY FAÇADE
3.1 Historical masonry façade
Presently, in the Netherlands, bored tunneling is
planned to be driven in soft soil adjacent to histori-cal masonry buildings founded on timber pile foun-dations. An example for an Amsterdam historicalmasonry building is as shown in Fig. 2a. The struc-ture of these historical masonry buildings normallyconsists of un-reinforced façades and bearing walls.The layout of the selected masonry façade as in Fig.2b is made of a block of three house units. A uni-form thickness of one brick (220 mm) is adoptedhere for the whole façade. The opening patternshows two large openings at ground floor and aregular pattern of three window openings at the three
floors above. Above the window openings at groundfloor, lintels in the form of steel beams are present todistribute the vertical load to either side of the open-ing. The load-bearing and house-separating walls perpendicular to the façade have not been included
8/12/2019 Sla Settlement
http://slidepdf.com/reader/full/sla-settlement 4/8
in the model. Also their connections to the façadeand other 3D effects have been omitted. Although itis well understood that 3D effects can modify thedamage pattern, the context of this study will be lim-ited to 2D response.
3.2 Overview of modeling approach
The currently available design practice for evaluat-ing settlement effects on the surrounding structuresdue to soft-ground tunneling can be classified intotwo types, namely uncoupled analysis and coupledanalysis. In the first class, the greenfield settlementdetermined from empirical equations is directly im- posed under building models, while the second classallows for the full interaction between above-groundstructure and underlying soil. To account for thesituation of historical masonry buildings founded onfragile piles, Rots (2000) introduced the semi-coupled scheme in which so-called bedding interface
elements were employed to represent a simplified“smeared” model for fragile pile foundation. Thisstrategy is adopted in the present study and the hog-ging situation i.e. the building sits at the point of in-flection of ground settlement profile, is investigatedhere as being a common case in practice. Theestimated settlement trough is taken in the form ofGuassian distribution curve (Mair et al. 1996) forany percentage of expected ground loss (V):
⎥
⎦
⎤⎢
⎣
⎡=
2
2
maxv
2i
x-expSS (8)
where Smax = 0.31VD2/i, i is the horizontal distancefrom the tunnel centerline to the point of inflectionon the settlement trough (i=KZo). K is the troughwidth parameter for tunnels and is taken as 0.5 here.Zo is the depth to the tunnel axis, which is 20 mherein. Tunnel diameter (D) is 6.5 m.
4 FINITE ELEMENT MODELLING ANDRESULTS
4.1 Smeared crack analysis and results
The façade is modeled by eight-node quadratic planestress elements. A three by three integration schemeis adopted. The non-linear behavior of masonry issimulated by using a multiple fixed crack version ofcrack band model. Young’s modulus ( E ) and Pois-son’s ratio for the façade material are 6000 N/mm2
and 0.2 respectively. A linear tension softening has been adopted with tensile strength ( f t) equal to 0.3 N/mm2 and fracture energy (Gf ) equal to 0.05 N/mm.Constant shear retention value of 0.01 is adopted. A
mesh with element size of 500 by 400 mm2 is used.The crack bandwidth is chosen as 225 mm as a halfof an average of the mesh dimension because thestrain field in a quadratic element is likely to be
lumped on one side. The loading scheme starts withthe activation of self-weight and live load of 5 kN/mat each floor. Mass density of masonry is 2400kg/m3. The normal stiffness of the no-tension bed-ding interface elements is taken as 0.15 N/mm
3 by
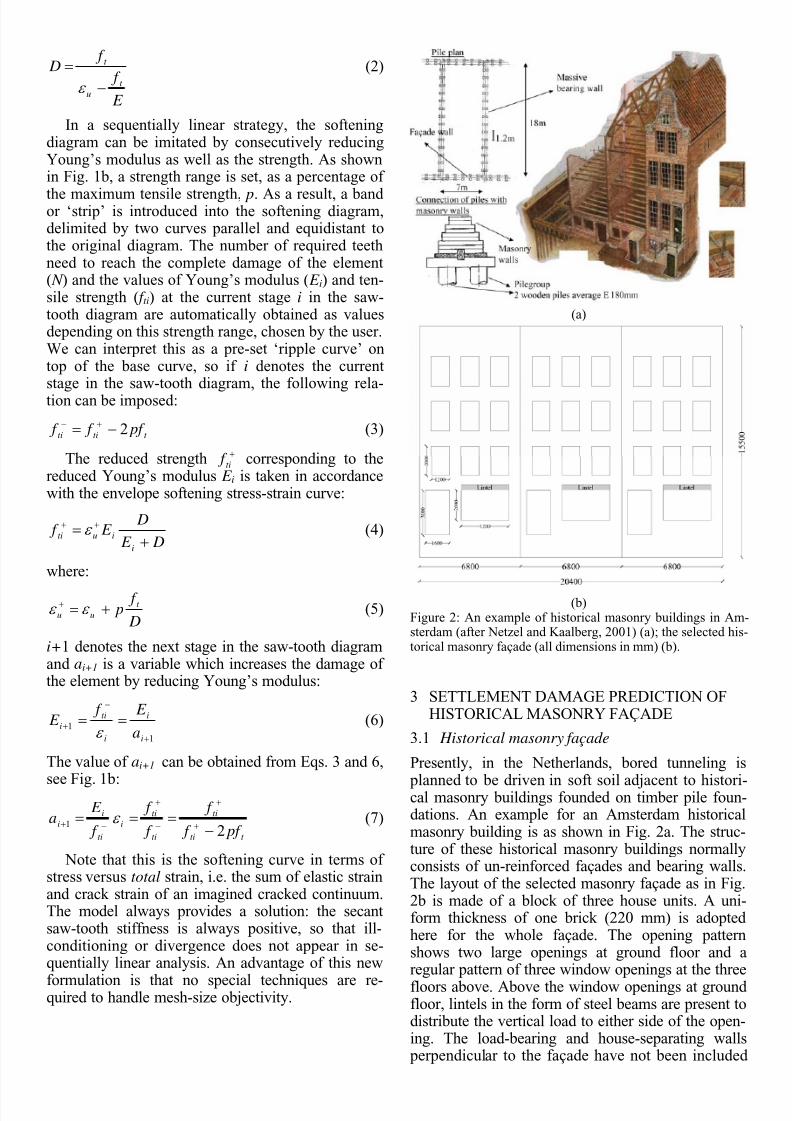
smearing out the stiffness of foundation system in anaverage manner. Finally, the settlement trough isapplied incrementally. Fig. 3a illustrates the relation
between the angular distortion (Boscardin and Cord-ing 1989) and the maximum crack width in the fa-çade. The maximum crack width is the maximumvalue that occurs somewhere in the façade. The posi-tion of the maximum crack width may differ withincreasing the angular distortion. Smeared crack re-sponse reveals that initially the crack width remainsvery low, indicating that the façade behaves ap- proximately elastically with only minor crack. Themaximum crack width gradually increases when thecracks at the corner of windows start to propagate.In correspondence of a critical value of angular dis-
tortion equal to 1/800 the top band of the façade issuddenly fully cracked and the maximum crackwidth suddenly increases very rapidly, while the an-gular distortion remains almost constant. The mo-ment of full through-depth cracking occurs when thetop band of the façade is not longer able to carry thetensile stress in that region.
1/800
Critical angular distortion ≈ 1/800
(a)
(b)Figure 3 : The façade response in smeared crack analysis (a),localization shown at the top of façade (b).
8/12/2019 Sla Settlement
http://slidepdf.com/reader/full/sla-settlement 5/8
Then, a separation occurs into two unloaded partsthat rotate, Fig. 3b. The sudden breakage of the fa-çade is accompanied by a sharp snap-back in thestructural response.
With displacement control, a snap-through re-sponse is captured in which, for a slight increase ofthe angular distortion, the dominant vertical crackshows an abrupt jump in the magnitude along the
second branch of the façade response. Along this branch, the magnitude of maximum crack-width israpidly increased and the quality of observed con-vergence performance in the nonlinear analysis be-comes dramatically poor. The difficulty to achieve agood convergence is partly due to the significant re-sidual stress in the fully open crack zone and mainlydue to the significant unbalance between high elasticenergy stored in the façade and low fracture energyof masonry.
4.2 Discrete crack analysis and resultsThe same façade is now re-analyzed by placing six-noded quadratic interface elements at the verticalline of the final crack predicted in the formersmeared crack analysis. The rest of masonry contin-uum is now assumed to be linearly elastic. Interfaceelements, having the same fracture properties of ma-sonry in section 4.1, are placed at the vertical line ofthe final crack predicted by smeared crack analyses.Lobatto integration scheme is adopted to avoid thestress oscillation problem. Instead of steering the
analysis by displacement control, the arc-length con-trol technique is pursued here hopefully to reveal astable crack propagation path of this façade. Switch-ing to this arc-length control requires the modifica-tion of the previously prescribed displacement de-grees of freedom at the bottom of the façade into thefree displacement degrees of freedom. Note that asminimum constraints are still required to avoid therigid body movement of the facade, few nodes at theright bottom of the façade are inevitably made asfixed supports. The effect of the live load and self-weight of masonry will be excluded here as it isfound that this initial stresses result in severe false-cracking when a tying condition of the free dis- placement degrees of freedom along the bottomnodes of the façade is imposed. In addition, the ef-fect of self-weight and live load is supposed to benegligible with respect ground settlements when the potential vertical crack line develops. A stable re-sponse can be predicted with the discrete crack cor-rector analysis and selecting into the constraintequation of the arc-length control procedure only theincremental displacements at the top of the façade.
This approach, controlling the parameter whichdominates the crack opening displacement, givesgood convergences during all the course of loading.In fact, it is found that the façade snaps back duringthe stable cracking process along the corner of win-
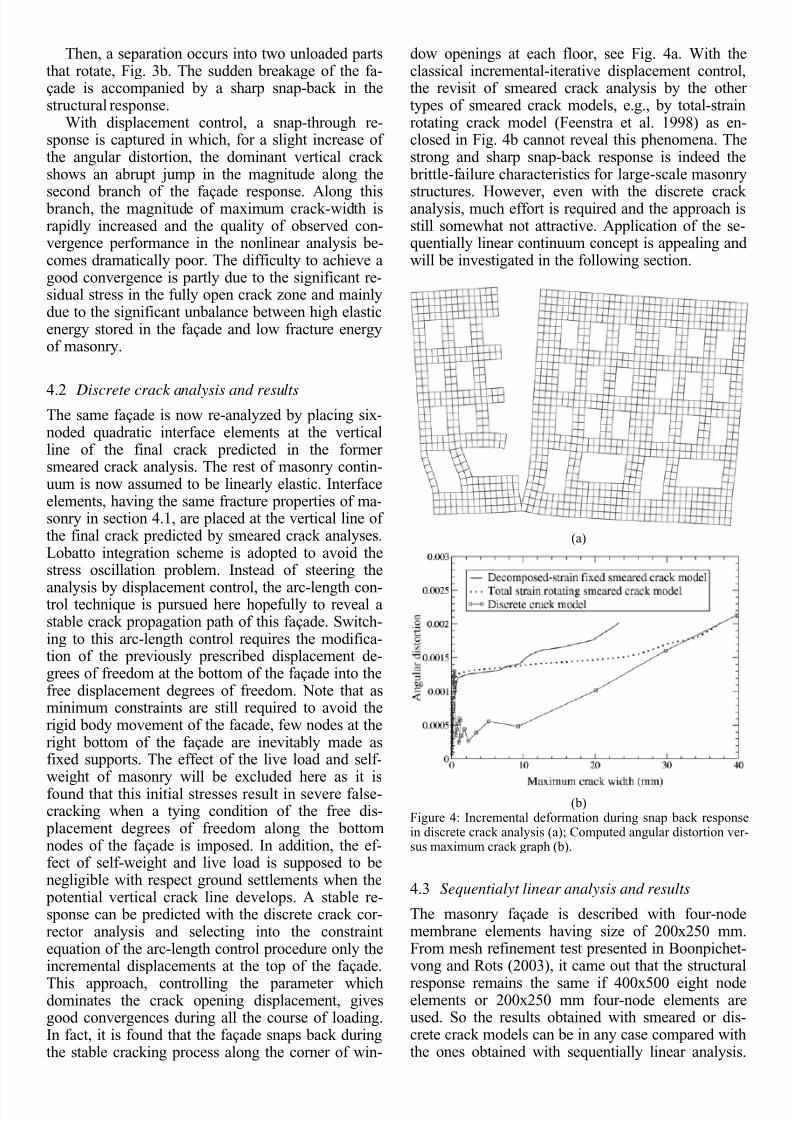
dow openings at each floor, see Fig. 4a. With theclassical incremental-iterative displacement control,the revisit of smeared crack analysis by the othertypes of smeared crack models, e.g., by total-strainrotating crack model (Feenstra et al. 1998) as en-closed in Fig. 4b cannot reveal this phenomena. Thestrong and sharp snap-back response is indeed the brittle-failure characteristics for large-scale masonry
structures. However, even with the discrete crackanalysis, much effort is required and the approach isstill somewhat not attractive. Application of the se-quentially linear continuum concept is appealing andwill be investigated in the following section.
(a)
(b)Figure 4: Incremental deformation during snap back responsein discrete crack analysis (a); Computed angular distortion ver-sus maximum crack graph (b).
4.3 Sequentialyt linear analysis and results
The masonry façade is described with four-nodemembrane elements having size of 200x250 mm.From mesh refinement test presented in Boonpichet-vong and Rots (2003), it came out that the structural
response remains the same if 400x500 eight nodeelements or 200x250 mm four-node elements areused. So the results obtained with smeared or dis-crete crack models can be in any case compared withthe ones obtained with sequentially linear analysis.
8/12/2019 Sla Settlement
http://slidepdf.com/reader/full/sla-settlement 6/8
The final crack predicted by smeared crack analyses,indicated the position of interface elements for dis-crete crack analysis carried out with the arc-lengthcontrol technique. For the sequentially linear analy-sis, this same final crack pattern is also achieved by pre-defining the bands of elements to crack. A lineartension softening characterised by the same me-chanical properties (Young’s modulus, tensile
strength and energy fracture) chosen for smearedcrack model have been adopted for these predefinedelements, while the remaining part of the façade ismade linear elastic. According to section 2.1 astrength percentage p equal to 10% has been fixedfor the saw-tooth diagram. Consequently, the totalnumber of teeth needed in order to reach the com- plete damage is automatically evaluated (N=19). Anisotropic reduction of stiffness was assumed. Itmeans that Young’s modulus was (saw-tooth wise)reduced in all directions. No-tension interface ele-ments, previously inserted with the aim to ignore
tensile resistance of soil boundary underneath build-ings, are still included but now assumed to behaveelastically. From the smeared crack analyses, theseinterface elements are shown to be in compressivemode, so this simplification can be made here with-out loosing the accuracy. Settlement is imposed as adisplacement of nodes at the bottom of the façade.
0.0E+0
2.0E-4
4.0E-4
6.0E-4
8.0E-4
1.0E-3
1.2E-3
1.4E-3
1.6E-3
1.8E-3
2.0E-3
0 5 10 15 20 25 30
Maximum crack width (mm)
A n g u l a r d i s t o r s i o n
Decomposed - strain fixed smeared crack model
Discrete crack model
Sequentially linear analysis
(a)
0.0E+0
2.0E-4
4.0E-4
6.0E-4
8.0E-4
1.0E-3
1.2E-3
1.4E-3
0 2 4 6 8 10 12 14
Maximum crack width (mm)
A n g u l a r d i s t o r s i o n
Decomposed - strain fixed smeared crack modelDiscrete crack modelSequentially linear analysis#181#311#357#394#447#570
(b)
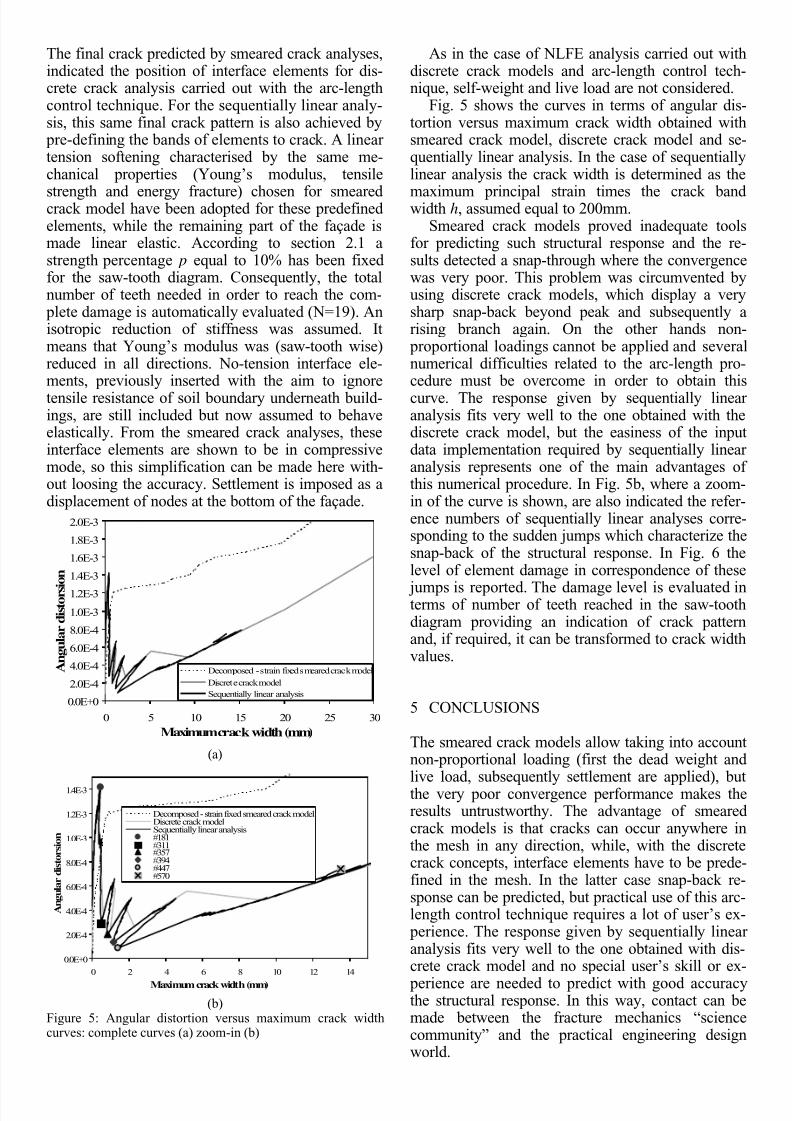
Figure 5: Angular distortion versus maximum crack widthcurves: complete curves (a) zoom-in (b)
As in the case of NLFE analysis carried out withdiscrete crack models and arc-length control tech-nique, self-weight and live load are not considered.
Fig. 5 shows the curves in terms of angular dis-tortion versus maximum crack width obtained withsmeared crack model, discrete crack model and se-quentially linear analysis. In the case of sequentiallylinear analysis the crack width is determined as the
maximum principal strain times the crack bandwidth h, assumed equal to 200mm.Smeared crack models proved inadequate tools
for predicting such structural response and the re-sults detected a snap-through where the convergencewas very poor. This problem was circumvented byusing discrete crack models, which display a verysharp snap-back beyond peak and subsequently arising branch again. On the other hands non- proportional loadings cannot be applied and severalnumerical difficulties related to the arc-length pro-cedure must be overcome in order to obtain this
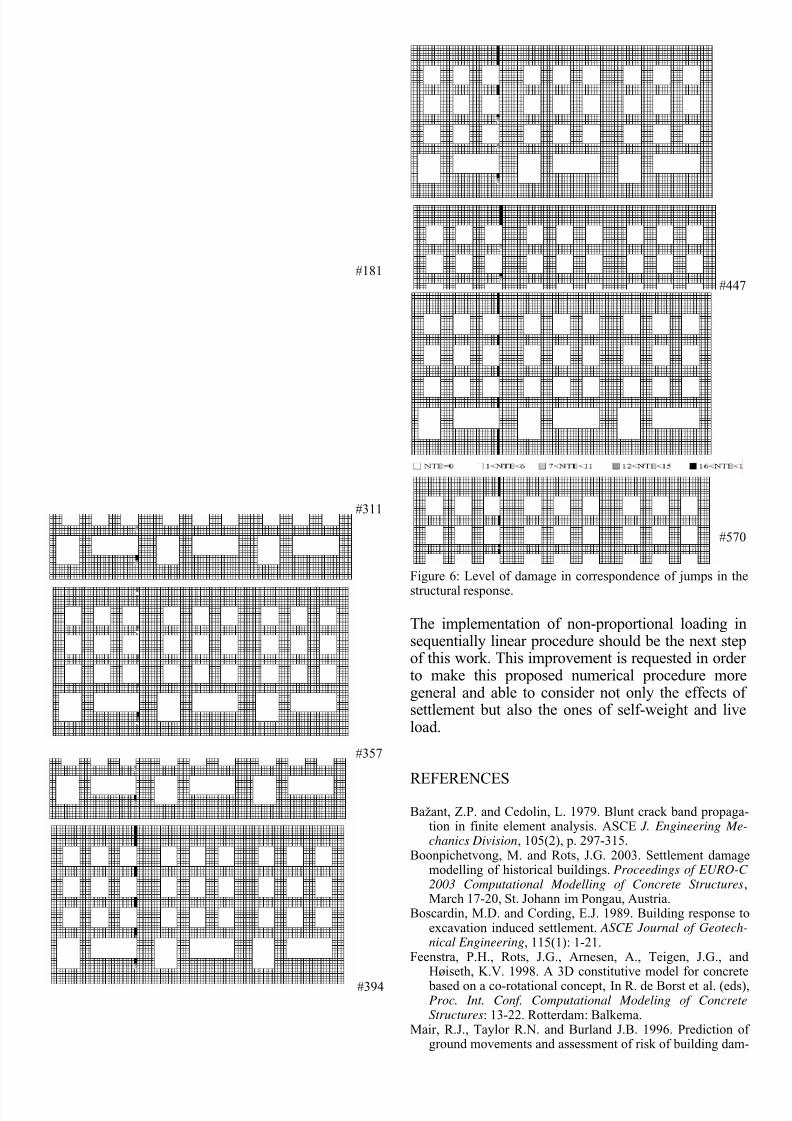
curve. The response given by sequentially linearanalysis fits very well to the one obtained with thediscrete crack model, but the easiness of the inputdata implementation required by sequentially linearanalysis represents one of the main advantages ofthis numerical procedure. In Fig. 5b, where a zoom-in of the curve is shown, are also indicated the refer-ence numbers of sequentially linear analyses corre-sponding to the sudden jumps which characterize thesnap-back of the structural response. In Fig. 6 thelevel of element damage in correspondence of these
jumps is reported. The damage level is evaluated interms of number of teeth reached in the saw-toothdiagram providing an indication of crack patternand, if required, it can be transformed to crack widthvalues.
5 CONCLUSIONS
The smeared crack models allow taking into accountnon-proportional loading (first the dead weight andlive load, subsequently settlement are applied), butthe very poor convergence performance makes theresults untrustworthy. The advantage of smearedcrack models is that cracks can occur anywhere inthe mesh in any direction, while, with the discretecrack concepts, interface elements have to be prede-fined in the mesh. In the latter case snap-back re-sponse can be predicted, but practical use of this arc-length control technique requires a lot of user’s ex- perience. The response given by sequentially linearanalysis fits very well to the one obtained with dis-crete crack model and no special user’s skill or ex-
perience are needed to predict with good accuracythe structural response. In this way, contact can bemade between the fracture mechanics “sciencecommunity” and the practical engineering designworld.
8/12/2019 Sla Settlement
http://slidepdf.com/reader/full/sla-settlement 7/8
#181
#311
#357
#394
#447
#570
Figure 6: Level of damage in correspondence of jumps in the
structural response.
The implementation of non-proportional loading insequentially linear procedure should be the next stepof this work. This improvement is requested in orderto make this proposed numerical procedure moregeneral and able to consider not only the effects ofsettlement but also the ones of self-weight and liveload.
REFERENCES
Bažant, Z.P. and Cedolin, L. 1979. Blunt crack band propaga-tion in finite element analysis. ASCE J. Engineering Me-chanics Division, 105(2), p. 297-315.
Boonpichetvong, M. and Rots, J.G. 2003. Settlement damagemodelling of historical buildings. Proceedings of EURO-C2003 Computational Modelling of Concrete Structures,March 17-20, St. Johann im Pongau, Austria.
Boscardin, M.D. and Cording, E.J. 1989. Building response toexcavation induced settlement. ASCE Journal of Geotech-nical Engineering, 115(1): 1-21.
Feenstra, P.H., Rots, J.G., Arnesen, A., Teigen, J.G., andHøiseth, K.V. 1998. A 3D constitutive model for concrete
based on a co-rotational concept, In R. de Borst et al. (eds),Proc. Int. Conf. Computational Modeling of ConcreteStructures: 13-22. Rotterdam: Balkema.
Mair, R.J., Taylor R.N. and Burland J.B. 1996. Prediction ofground movements and assessment of risk of building dam-
8/12/2019 Sla Settlement
http://slidepdf.com/reader/full/sla-settlement 8/8
age due to bored tunnelling. In R.J. Mair and R.N. Taylor(eds), Geotechnical aspects of underground construction insoft ground : 713-718. Rotterdam: Balkema.
Netzel, H. and Kaalberg. F.J. 2001. Settlement risk assessmentof the North-South Metroline in Amsterdam, Proc. Int Con- ference on Response of Buildings to Excavation InducedGround Movement (Full paper in CD ROM), London, UK.
Potts, D.M. and Addenbrooke, T.I. 1996. The influence of anexisting surface structure on the ground movements due totunnelling, In R.J. Mair and R.N. Taylor (eds), Geotechni-
cal aspects of underground construction in soft ground :573-578. Rotterdam: Balkema.
Rots, J.G. 2000. Settlement damage predictions for masonry,In L.G.W. Verhoef and F.H. Wittmann (eds), Maintenanceand restrengthening of materials and structures - Brick andbrickwork , Proc. Int Workshop on Urban heritage and building maintenance: 47-62. Freiburg: Aedificatio.
Rots J.G. 2001. Sequentially linear continuum model for con-crete fracture. In de Borst R, Mazars J, Pijaudier-Cabot G,van Mier JGM, Balkema AA (eds), Fracture Mechanics ofConcrete Structures, Lisse: The Netherlands, 831-839.
Rots, J.G. and Invernizzi, S. 2004. Regularized sequentiallylinear saw-tooth softening model. Int. Journal for Numeri-
cal and Analytical Methods in Geomechanics, 28, p. 821-856.Rots, J.G., Belletti, B. and Invernizzi, S. 2006. On the shape of
saw-tooth softening curves for sequentially linear analysis.Proceedings of EURO-C 2006 Computational Modelling ofConcrete Structures, 27-30 March, Mayrhofen, Tyrol, Aus-tria.