RAM 207 - Rijksdienst voor het Cultureel Erfgoed · Soil chemical analysis and micromorphology...
122
Schokland UNESCO World Heritage site 3rd monitoring round D.J. Huisman, G. Mauro Rapportage Archeologische Monumentenzorg 207
Transcript of RAM 207 - Rijksdienst voor het Cultureel Erfgoed · Soil chemical analysis and micromorphology...
Schokland UNESCO World Heritage site3rd monitoring roundD.J. Huisman, G. Mauro
RapportageArcheologischeMonumentenzorg 207
RAM 207
Schokland UN
ESCO W
orld Heritage site
Schokland UNESCO World Heritage site3rd monitoring roundD.J. Huisman, G. Mauro

Archaeological Heritage Management Reports 209Schokland UNESCO World Heritage site3rd monitoring round
Authors: D.J. Huisman, G. MauroWith contributions from: M. van den Berg, M. Vorenhout, H. van Haaster,Illustrations: Cultural Heritage Agency
Layout and production: uNiek-Design, Almere
ISBN/EAN: 9789057991974
© Cultural Heritage Agency of the Netherlands, Amersfoort, 2013
Cultural Heritage Agency of the NetherlandsP.O. Box 16003800 BP AmersfoortNetherlandswww.cultureelerfgoed.nl
3—
Abstract
The third round of archaeological monitoring at the UNESCO World Heritage site at Schokland was carried out in 2009 – 2010. The present report on this monitoring round also contains monitoring data on two sites from 2006. Four sites were monitored in total; two sites (E170-Schokkerhaven and J125) represent Stone Age river dune sites in the landscape surrounding the island. The third site (P14) is a Stone Age and Bronze Age site on a boulder clay outcrop. De Zuidert is a Medieval and subrecent dwelling mound (terp) on the former island. These last two sites are situated on the former island.
Monitoring of groundwater levels, moisture contents, redox, botanical remains and bone was planned, along with micromorphological and soil chemical analysis and interpretation of dipwells monitored by the water board. The plan was to compare these data with those from previous monitoring rounds. Unfortunately, the monitoring of groundwater levels, moisture contents, redox and bone failed. Comparison with micromorphological slides from previous rounds proved to be impossible because the samples were missing.
Analysis of groundwater levels from the water board shows variable behaviour of the water table in different areas surrounding the former island. From this data, it is clear that the water table has risen considerably in the northern part of the zone (including the P14 area). In the central and southern parts of the zone (dipwells 3 – 8) the differences are marginal, however. The hydrological zone is wetter during wet spells, but the water levels during dry periods drop to the same levels as those outside the zone. Apparently, the water level in some areas of the hydrological zone may temporarily drop below the minimum level desired.
Soil chemical analysis and micromorphology demonstrate that three major degradation processes are affecting the archaeological sites: desiccation, desiccation-driven pyrite oxidation and tillage. Pyrite oxidation is a particular cause for concern, as it results in damage by acidification or by fragmentation of materials due to gypsum formation. The worst damage due to desiccation and pyrite oxidation was observed at E170-Schokkerhaven, and in the upper layers of De Zuidert.
Analysis of botanical remains shows no clear trend towards better or worse preservation. In fact, the 1999 measurements appear to differ from those from 2001 and 2010 in that the former show less variation within one sample, while at the same time they include more extreme values. Any differences between 2001 and 2010 are very minor. At E170-Schokkerhaven, interpretable botanical remains show that the site has not deteriorated completely, but it is clear that there has been some damage, and that there still is a wealth of archaeological information that will be lost if degradation processes continue.
The creation of the hydrological zone has had a positive effect on the archaeological sites to the east of the island, especially in the P14 area. The other monitored sites are outside its zone of influence.
Based on the results of this monitoring rounds - and on a comparison with the results of the previous rounds - the following recommen da-tions are made for each of the sites:
P14 has a burial environment that is very suitable for preserving the archaeological remains, thanks to the successful implementation of the hydrological zone. Monitoring by the water board will be sufficient in the future; as long as the water table remains high, the site is safe.
De Zuidert terp shows degradation processes in its upper layers that have probably been occurring for at least a hundred years. The mound effectively forms a hydrological system that is independent of its surroundings. The burial environment cannot therefore be changed without doing major damage to the site, especially its visual value. The well-preserved deeper layers with good future prospects combined with the inadvisability of trying to change the burial conditions means intensive monitoring is not necessary. For the future, the only relevant form of monitoring would consist of low-frequency site inspections to make sure the site is not threatened by deep-rooted vegetation.
E170-Schokkerhaven is desiccating, suffering from pyrite oxidation, and under cultivation. Rates of decay are notoriously difficult to predict, but with the present state of knowledge
4—
it is assumed that the site will lose a very significant portion of its archaeological value within the next few decades. For future preservation, measures need to be taken to improve the burial conditions and preserve the site in situ. If this is not possible, excavation of the site for preservation ex situ should be considered. As long as the situation remains unchanged, it does not make much sense to continue monitoring for in situ preservation.
J125 seems to be in good condition, and the burial environment does not give immediate
reason for concern. An increase in the depth of tillage and some degree of pyrite oxidation are, however, potential threats. At this site, it would be advisable to continue monitoring the burial environment. The intensive land-use at J125 makes long-term monitoring of groundwater/moisture/redox unfeasible. A better strategy for future monitoring may therefore be to obtain good-quality cores from more representative locations at this site for macroscopic observa-tions, and for micromorphological and chemical analysis.
Abstract 3
1 Introduction 71.1 The Schokland monument 71.2 Management of the Schokland monument 91.3 Monitoring the Schokland monument 111.4 The monitored sites 111.5 Previous monitoring rounds 121.6 Other recent publications on Schokland 13
2 Execution of the 3rd monitoring round 152.1 2006 fieldwork 152.2 2009-2010 fieldwork 152.2.1 Execution 152.2.2 E170/Schokkerhaven 162.2.3 J125 172.2.4 De Zuidert 172.2.5 P14 182.3 Samples, sample treatment and techniques 182.4 Data from external sources 19
3 Results of the 3rd monitoring round 213.1 Field observations and soil descriptions 213.2 Groundwater levels, moisture contents and redox 213.3 Soil composition and chemistry 273.3.1 Introduction 273.3.2 De Zuidert and P14 273.3.3 E170-Schokkerhaven and J125 293.3.4 Reassessment of 2003/2004 groundwater analyses 303.3.5 Summary 313.4 Botanical remains 323.5 Micromorphology 33
4 Interpretation and discussion 394.1 Trends in degree of preservation? 394.2 Trends in burial environment? 394.3 Present burial conditions 394.4 What future for the archaeological sites? 394.5 Future monitoring on Schokland 40
Acknowledgements 43
References 44
Appendices 47
Content

7—
Elevation (m)
-6,0
-4,0
-5,0
-3,0
-2,0
-1,0
0,0
Bron
: AH
N
UNESCO world heritage site Hydrological zone for archaeology
J125
E170
De Zuidert
P14
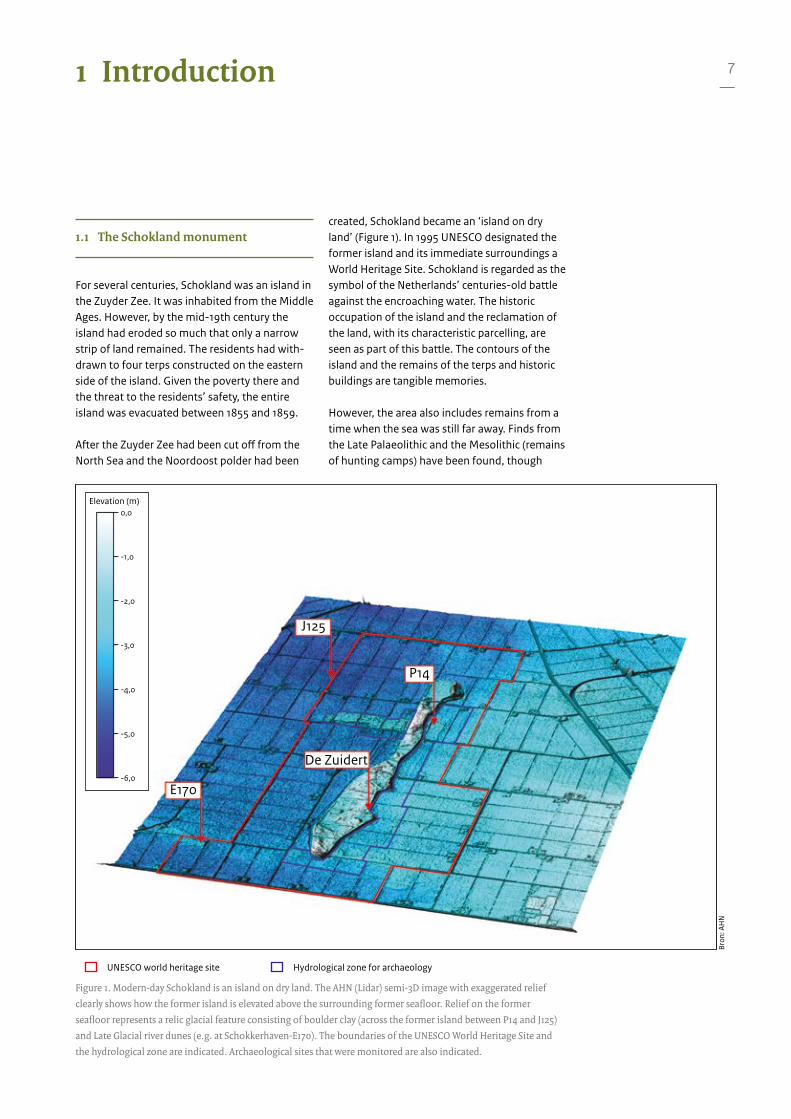
Figure 1. Modern-day Schokland is an island on dry land. The AHN (Lidar) semi-3D image with exaggerated relief
clearly shows how the former island is elevated above the surrounding former seafloor. Relief on the former
seafloor represents a relic glacial feature consisting of boulder clay (across the former island between P14 and J125)
and Late Glacial river dunes (e.g. at Schokkerhaven-E170). The boundaries of the UNESCO World Heritage Site and
the hydrological zone are indicated. Archaeological sites that were monitored are also indicated.
1.1 The Schokland monument
For several centuries, Schokland was an island in the Zuyder Zee. It was inhabited from the Middle Ages. However, by the mid-19th century the island had eroded so much that only a narrow strip of land remained. The residents had with-drawn to four terps constructed on the eastern side of the island. Given the poverty there and the threat to the residents’ safety, the entire island was evacuated between 1855 and 1859.
After the Zuyder Zee had been cut off from the North Sea and the Noordoost polder had been
created, Schokland became an ‘island on dry land’ (Figure 1). In 1995 UNESCO designated the former island and its immediate surroundings a World Heritage Site. Schokland is regarded as the symbol of the Netherlands’ centuries-old battle against the encroaching water. The historic occupation of the island and the reclamation of the land, with its characteristic parcelling, are seen as part of this battle. The contours of the island and the remains of the terps and historic buildings are tangible memories.
However, the area also includes remains from a time when the sea was still far away. Finds from the Late Palaeolithic and the Mesolithic (remains of hunting camps) have been found, though
1 Introduction
8—
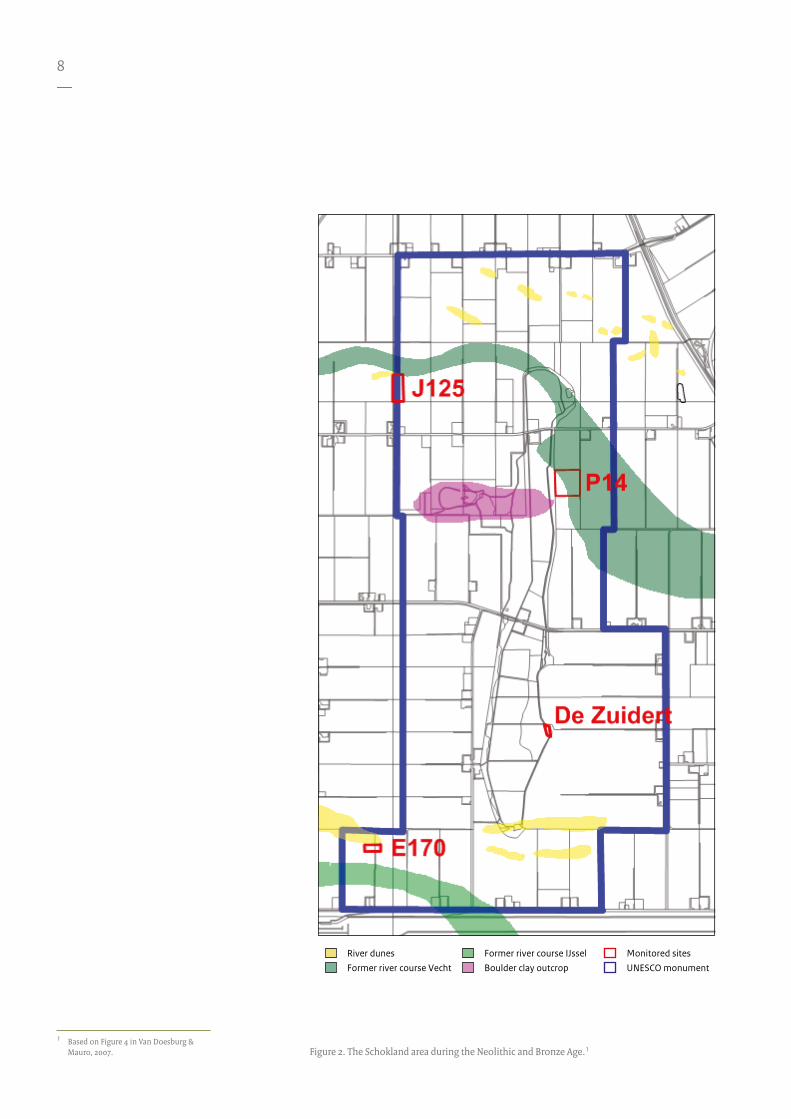
Figure 2. The Schokland area during the Neolithic and Bronze Age.1 1 Based on Figure 4 in Van Doesburg &
Mauro, 2007.
River dunes Former river course IJsselBoulder clay outcrop UNESCO monument
Monitored sitesFormer river course Vecht
9—
little else is known about this period. Several Neolithic and Bronze Age sites have however taught us a little about how people lived there in the period 4900-1500 BC. These remains were also a factor in the UNESCO listing. They reveal a past in which people were able to live in a dynamic landscape with, and partly thanks to, the water in two former river systems (the IJssel and Vecht) (Figure 2). Levees and river dunes ran alongside both rivers. A boulder clay outcrop partially covered by driftsand is also situated beside the river Vecht. These raised features in the landscape were attractive places to live.
1.2 Management of the Schokland monument
In 1996 Flevoland provincial authority launched the Schokland area project, designed to improve protection of the heritage, landscape and natural values at the World Heritage site. This resulted, two years later, in the ‘New Schokland 1998’ strategy. The RCE (then the ROB) was a stakeholder in the project. Besides the provincial authority and the RCE, other parties were actively involved, including Zuiderzeeland water board, Noordoost polder local authority, nature conservancy Stichting Flevolandschap, the northern branch of the agricultural and horti-cultural association and the central government property management agency, then known as Domeinen Onroerende Zaken, now RVOB. The World Heritage status of the area was an important factor in the development of the plan.
The initial phase of the project not only identified archaeological issues, it also found that improvements were required for the benefit of agriculture and the natural environment. For example, the hydrology was less than ideal both for farming and for wildlife. The land surface had fallen considerably since the polder was created in 1942 (by at least 1 to 1.5 metres), as a result of settling and peat degradation. The former island is still clearly visible as a raised feature in the landscape. Without measures to prevent further subsidence, however, Schokland would probably lose its characteristic image as an island on dry land.2
One of the measures included in the project was
the creation of a ‘hydrological zone’ in 2004 (see Figures 1 and 3). To the east and south of Schokland plots covering an area of more than 135 ha were voluntarily taken out of agricultural production (the farmers affected were compensated). Shortly after, some additional hectares north of the island were added to the zone. The water level was raised in the hydrological zone and the area was turned into natural habitat under wet grassland management. This was designed to achieve two key objectives relating to the cultural heritage. First, the raised groundwater level should put a stop to the subsidence, thus preserving the unique character of Schokland as an island on dry land. Furthermore, putting an end to agricultural activities and raising the water level should halt the degradation of archaeological remains in the zone . The hydrological zone was divided into several sections where the water level is determined by the top of the archaeological remains.
Around 2007 the plots to the west, bordering the former island, were also taken out of agricultural production and converted to wetland habitat (Figure 3). This created a shell around Schokland, as it were, where the water level is higher than normal. The idea behind making the area to the west of the island wetter was initially to enhance natural values, however. Of course the archaeological remains in this area would also benefit from the measure. In this report, ‘hydrological zone’ refers only to the wetland area created for the benefit of landscape and archaeological values in the east of the former Island.
In the years following the completion of the hydrological zone, the water level was slowly raised. This was done gradually to allow a covering of grass to develop and prevent the growth of reeds. The grass was mown for the same reason. Reeds are not good for archaeological remains. Not only do their long roots grow through most archaeological materials, the rhizomes also allow oxygen into the soil.
The hydrological zone is owned and managed by nature conservancy Stichting Flevolandschap, a civil-society organisation. Zuiderzeeland water board is responsible for managing the water level.Figure 2. The Schokland area during the Neolithic and Bronze Age.1
2 Projectgroep Schokland 1998, Van Doesburg and Mauro 2007
10—
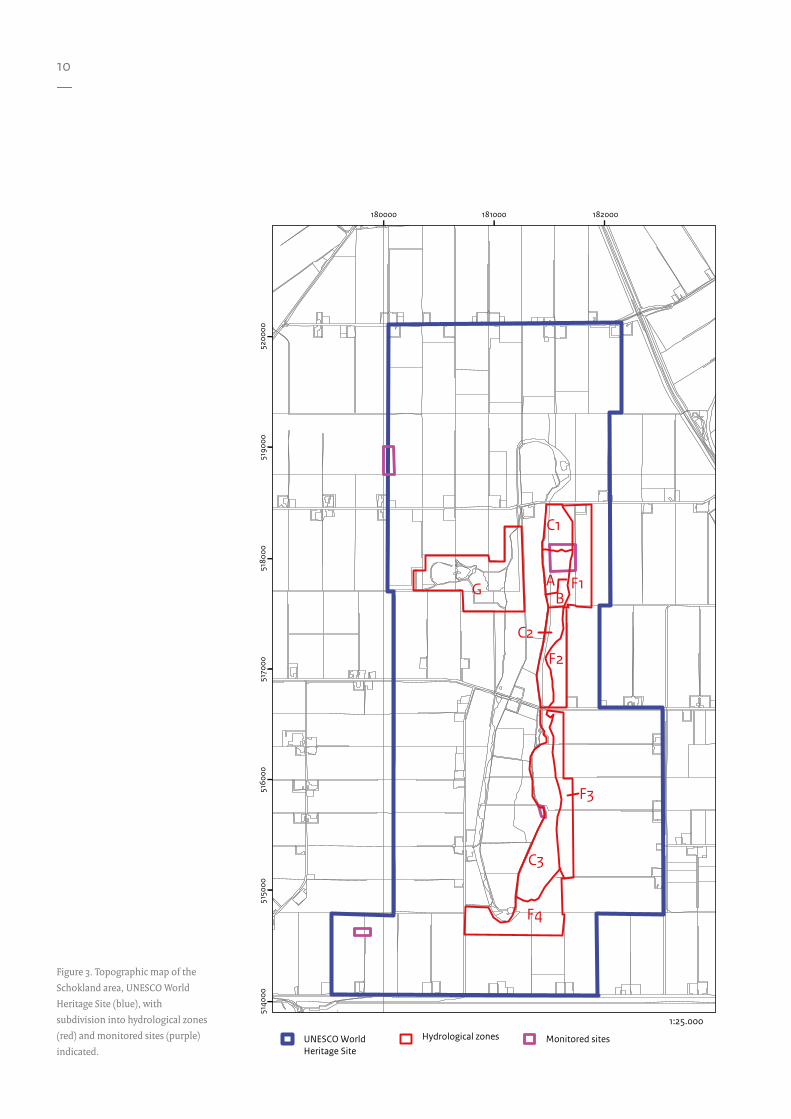
Figure 3. Topographic map of the
Schokland area, UNESCO World
Heritage Site (blue), with
subdivision into hydrological zones
(red) and monitored sites (purple)
indicated.
G
F4
F3
F2
F1
C3
C2
C1
AB
1:25.000
5190
00
182000180000
5170
0051
6000
5150
0051
4000
5180
0052
0000
181000
UNESCO World Heritage Site
Hydrological zones Monitored sites

11—
1.3 Monitoring the Schokland monument
In order to assess whether the measures taken have actually been effective in terms of protecting the archaeological sites, the archaeological remains and the burial environment have been monitored.3 In fact, Schokland was one of the first sites in the Netherlands to be monitored to assess threats to the archaeological record and ongoing degradation processes. The measurements and tests performed at the site are also part of a broader effort to increase our knowledge of degradation processes and develop monitoring techniques. Monitoring started in 1999, and subsequent measurements were taken in 2001, 2003/4, 2006 and 2009/2010. In this report, we present the results of the last monitoring round (2009/2010). We also include some of the results from 2006 since they appeared in a publication that is difficult to obtain.4
In the beginning, another aim of the monitoring programme was to acquire knowledge of archaeological monitoring in general, given the fact that this field of study was in its infancy at the time. Monitoring of archaeological sites has now become an established field of expertise, and several techniques have become established.5 We will therefore take the opportunity to critically assess the monitoring programme, and propose how and at which of the sites monitoring should continue.
1.4 The monitored sites
The monitoring programme initially involved two prehistoric sites (P14/P13 and Schokkerhaven-E170) and a Medieval ‘terp’, or dwelling mound (De Zuidert) . In 2003 the programme was extended to include site J125 on a small river dune, where prehistoric remains have also been found (see Figure 3).
Site P13/P14 is on the easternmost part of the boulder clay outcrop, which is covered by drift sand. During the Neolithic and Bronze Age it acted as a riparian buffer of the Overijsselse Vecht river (see Figure 2). Remains from the
period 4900-1500 BC have been found there, including house plans and a number of burials. The occupation was not however continuous.6 The highest sandy parts of the site are immediately beneath the ploughsoil, and have been eroded. The flanks are protected by layers of clay, peat and detritus. The site lies in the hydrological zone, has been taken out of agricultural production and is currently natural habitat. It has been listed as a national archaeological monument.
Schokkerhaven-E170 is situated on river dunes immediately to the north of an old section of the river IJssel to the southwest of Schokland. A layer of waste from the Middle Neolithic has been found on the southern flank of the dune, which includes flint artefacts, potsherds and bone fragments. A number of oak posts and beams have been found which may have formed part of a palisade. 14C dating of hazelnut shells from the bottom of the waste layer suggests that it began to accumulate in c. 3900-3800 BC. Dendrochronological analysis has dated the wooden structure to between 3350-3300 BC.7 There are, however, doubts about the reliability of these dates.8 Whatever the exact date, here, too, the top of the dune is eroded and the flanks are covered with layers of clayey peat and detritus. The site is used for agricultural purposes, mainly for growing crops at present.
Site J125 is on an isolated river dune to the west of the former island. Several flint artefacts and potsherds have been found there, along with a number of hearth pits. A 14C dating placed the site in the Late Mesolithic and Early Neolithic.9 The site continues into the neighbouring plot J126, but there it is severely damaged there due to agricultural activities. The site has been much better preserved in plot J125. Uneroded soils and possibly occupation levels can still be found in the higher parts of the dune. The flanks are covered with reed and brook peat and clay. The site is on agricultural land, and is partly situated under a path with concrete slabs between plots.
De Zuidert, the smallest dwelling mound on Schokland, once formed part of the hamlet of Ens. It was raised several times, and remained occupied until the evacuation of 1855, when 16 small homes were still scattered there. After the evacuation, the buildings were demolished, the
3 see Huisman et al., 2009 and Smit et al. 2006 on monitoring and monitoring techniques
4 Huisman et al. 2008b5 see e.g. Huisman et al. 2009; Smit et al.
20066 Hogestijn 1991, Gehasse 1995, Ten
Anscher 20127 Hogestijn 1991, Gehasse 19958 see Ten Anscher (2012; Annex D)9 Hogestijn 1991
12—
sea defences lowered, and parts of the terp immediately behind the sea defences dug out to raise other terps on Schokland. Several raised layers can be identified in the terp soil, in which materials like clay, reeds, sea grass and dung can be recognised.10 The terp is currently covered with grass. A shelter stands on top of the mound, and a restored well can be seen. The terp enjoys statutory protection as a national archaeological monument.
1.5 Previous monitoring rounds
In each phase of the monitoring of Schokland, a series of measurements were taken in the field, or from samples taken to the lab. The methods used can be divided into measurements to characterize the burial environment, to determine the quality and degree of degradation of archaeological remains or to identify active (and past) processes. An overview of the methods is presented in table 1. A brief history is given below.
Phase 1: First assessment and baseline survey (1999-2001)A first round of measurements – a combined first assessment and baseline survey11 – was initiated at three sites at the Schokland monument in 1999.12 Monitoring was performed
at three selected sites: De Zuidert , P14 and Schokkerhaven-E170. All three sites contain well-preserved organic remains; the terp may also contain metals.
To characterize the burial environment, groundwater levels, groundwater composition, temperature and chemical parameters (EC, oxygen content, redox, pH) were measured directly in dipwells. Water levels were monitored on a monthly basis in these dipwells until 2002. Botanical macroremains and bone fragments from samples taken in 1999 and 2001 were studied to determine the quality and degradation of archaeological material. The bone remains were studied histologically, and using FTIR, XRD and collagen extractions. The processes were studied using soil micromorphology on 2.5 cm wide samples from 1999 and 2001. If 1999 was the first assessment and the baseline survey, the 2001 measurements can be seen as the first monitoring round, but the short time between 1999 and 2001 meant no major differences could be expected.
During this phase, it became clear that the redox and oxygen measurements from dipwells were not reliable, because atmospheric oxygen diffusion into the groundwater during the measurement interfered with the results. In the end, therefore, they were not reported.13 The groundwater composition data were reported
Table 1: Methods used in the v arious monitoring rounds at the Schokland UNESCO World Heritage Site.
Year Sites Monitoring techniques
Burial environment Processes Archaeological remains
De Zuidert
P14 E170 J125 Groundwater levels
Moisture content
Redox; oxygen
pH Chemical analyses
Micromor-phology
Botany Bone
1999-2001 x x x Monthly (hand) measurements
Electrodes in dipwells for Eh and oxygen con-tents. **
pH H2O (laboratory)
Ground-water com-position, pH and EC
Small thin sections
Macrore-mains
Histological analysis, col-lagen extraction and FTIR
2003-2004 x x x x Loggers Monthly hand meas-urements
pH CaCl2 Soil pH
2006/2007 and 2009-2010
x x x x Logger Logger* Logger**** pH H2O (laboratory)
Soil pH. Chemical analyses of soil samples (organic matter, sul-fur, XRF)
Kubiena-size thin sections (80 x 80 mm)
Pollen and mac-rore-mains
Planned, but not executed due to limited amount of bone fragments found
10 Van der Heide 1950, Van Doesburg and Mauro 2007
11 Following Huisman et al. (2009)12 The monitoring set-up and results were
reported in Van Heeringen et al. (2004).
*: measurements failed. **: data discarded because of reliability issues. ***: data probably onreliable. ****: Only P14 and De Zuidert
13—
but not used, because “no peculiarities were observed”.14
Step 2: Second round (2003/4)The second round of monitoring came directly after the establishment of the hydrological protection zone. J125 was added as a fourth monitoring site just outside the UNESCO World Heritage Site. In this round, the burial environment was characterized by taking monthly measurements of redox conditions with a redox probe (thus preventing atmospheric oxygen from interfering with the results), by measuring the pH of soil samples, and by monitoring groundwater levels four times a day using an automated pressure gauge.15 Around this time, the water board installed an extensive set of dipwells with automatic recorders to monitor groundwater levels around the former island (Figure 8, Page 21).16
1.6. Other recent publications on Schokland
A BSc undergraduate at Wageningen University has modelled and predicted the effects of tillage and erosion on three sites (E170 – Schokkerhaven, De Zuidert and P14; Bor 2008). An undergraduate at VU University Amsterdam wrote a dissertation on the feasibility of using water board dipwells as proxy for groundwater conditions at the monitored sites (Weemstra, 2010). In 2010, a report was published on soil mapping and “analysis of the soil conditions and implications for subsurface archaeology and land use”.17
A new multidisciplinary research project, a collaboration between VU University (CLUE) and Flevoland provincial authority (NLE), is focusing on the “biography of the New Land”. The project includes an investigation of the landscape and habitation history of the Flevoland polders over the last 200 000 years. An initial publication – on the last 1200 years of Schokland’s history – is in preparation.18
13 Van Heeringen et al. (2004)14 Van Heeringen et al. (2004)15 The results of this round were reported in
Smit et al. (2005).16 Some of the first dipwell data were also
presented in Smit et al. (2005).17 Gotjé et al. 201018 Van den Biggelaar et al. in prep.

15—
Figure 4. Fieldwork in 2006 and 2009/2010 at the Schokkerhaven-E170 site.
2.1 2006 fieldwork
In 2006, a small-scale investigation into the physical state of E170 /Schokkerhaven and J125 was executed by the RCE. On both sites, this research entailed a borehole survey to map the size and depth distribution and lithostratigraphical sequence of the top of the river dune and identify erosional surfaces and archaeological indicators. Moreover, small test-pits were dug (2 on E170/Schokkerhaven, and one on J125) for studying degradation processes using palaeobotany, geochemistry and micromorphology.19 Results from this study are also incorporated in this report.20
2.2 2009-2010 fieldwork
2.2.1 Execution
The monitoring for 2009-2010 was executed by several parties. Coring was performed by Wiertsema and partners, under the supervision of RCE. Sampling for botanical remains and bone fragments was also performed by RCE. VU/IGBA was responsible for groundwater, moisture content and redox monitoring. Botanical remains were analyzed by BIAX. The fieldwork for the monitoring of water tables, redox and moisture contents should have provided year-round time series for each of these parameters. This would have made it possible to link groundwater levels (which are relatively easy to measure) with moisture contents and redox conditions (which are more relevant parameters for monitoring the burial environment but less
2 Execution of the 3rd monitoring round
19 Huisman et al. 2009.20 Methodology can be found in Huisman et
al. (2009)
Pro�le 1
Pro�le 2
5146
00
179800179750
5146
50
179700
25m0
All monitoring locations 1999-2010 Soil pro�les/boreholes 2006-2010 Dipwells&redox 2006-2010
16—
easy to record). As a result of an accident (loss of equipment due to ploughing at Schokkerhaven-E170) and for other reasons, this was not in fact achieved at any of the sites. Some unplanned additional coring for soil profile description and pH measurements was also executed. The results of these measurements are presented in Appendix 2 of this report to complete the data, but will not be
discussed any further. Only the other types of measurements are presented in the following sections.
2.2.2 E170/Schokkerhaven
No successful measurements or assessments.
Figure 5. Fieldwork in 2006 and
2009/2010 at site J125. Legend as in
figure 4. Newly discovered river
dune site is indicated.
Sandy material
Peaty material
180040180000
5188
6051
8900
5189
40
179960
20m0
All monitoring locations 1999-2010 Soil pro�les/boreholes 2006-2010 Dipwells&redox 2006-2010
17—
2.2.3 J125
During fieldwork, a hitherto unknown patch of sand surrounded by peat fragments was observed in the recently ploughed field close to the known archaeological site. Dick Velthuizen (Flevoland provincial authority) collected several flint fragments from this site. It is likely that deeper ploughing led to the disturbance of deeper archaeological layers – most probably from the same river dune complex (see figure 5). This indicates that increased ploughing depth is a cause for concern at this site.
Hand-augering was performed by Axel Müller and Hans Huisman to obtain samples for analysis of the preservation of botanical remains and histo-logical analysis of bone fragments (see figure 5).
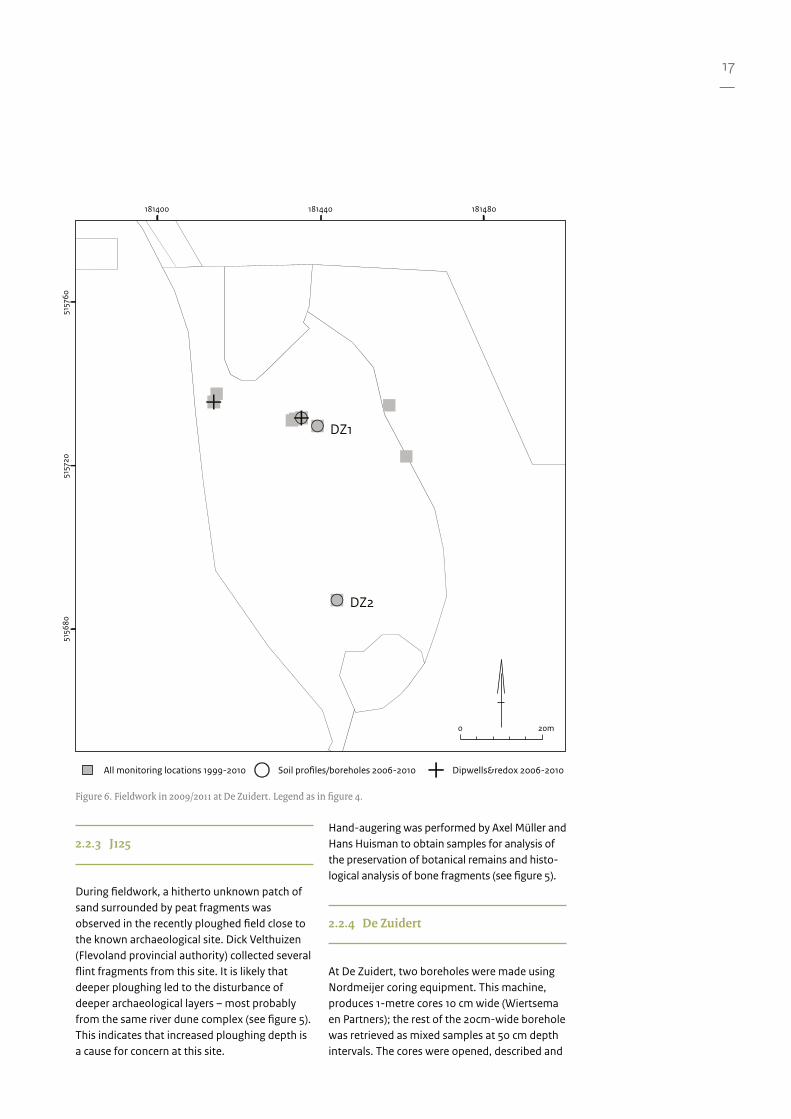
2.2.4 De Zuidert
At De Zuidert, two boreholes were made using Nordmeijer coring equipment. This machine, produces 1-metre cores 10 cm wide (Wiertsema en Partners); the rest of the 20cm-wide borehole was retrieved as mixed samples at 50 cm depth intervals. The cores were opened, described and
DZ1
DZ2
5156
80
181480181440
5157
2051
5760
181400
20m0
All monitoring locations 1999-2010 Soil pro�les/boreholes 2006-2010 Dipwells&redox 2006-2010
Figure 6. Fieldwork in 2009/2011 at De Zuidert. Legend as in figure 4.
18—
sampled at the Wiertsema lab in Tolbert. Samples were taken by RCE for micromorphology and for analysis of the preservation of botanical remains. The mixed samples were intended for histological analysis of bone fragments.
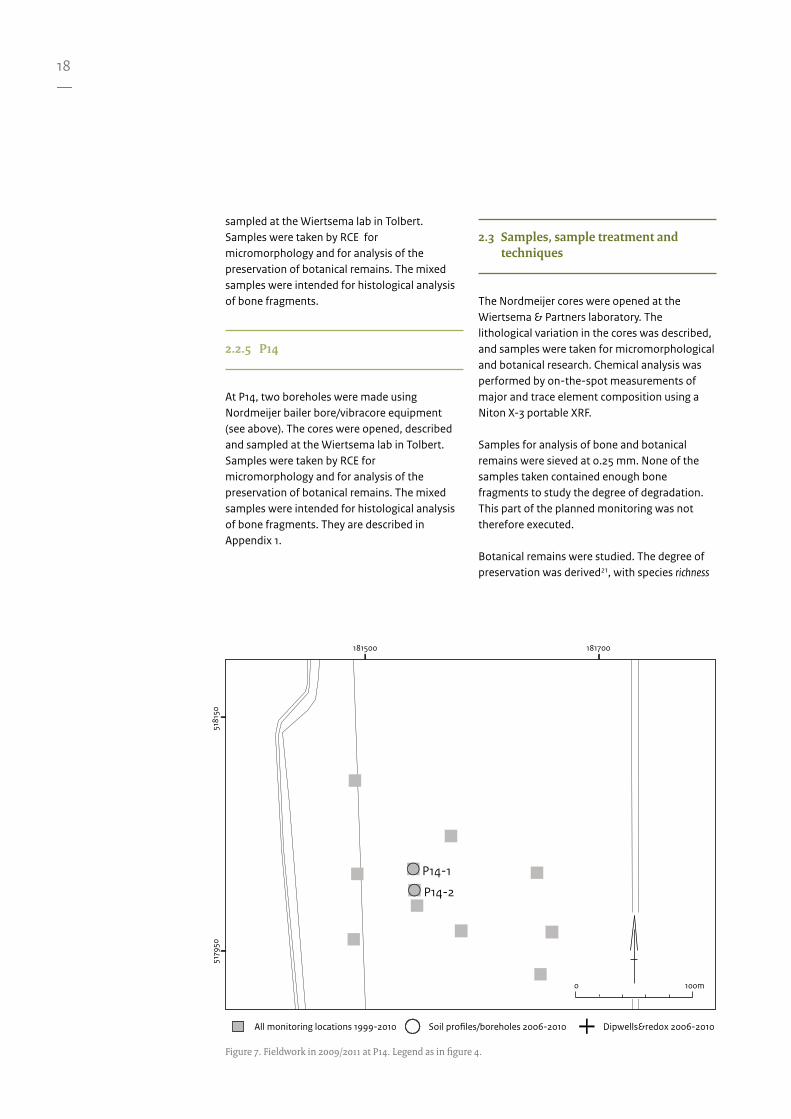
2.2.5 P14
At P14, two boreholes were made using Nordmeijer bailer bore/vibracore equipment (see above). The cores were opened, described and sampled at the Wiertsema lab in Tolbert. Samples were taken by RCE for micromorphology and for analysis of the preservation of botanical remains. The mixed samples were intended for histological analysis of bone fragments. They are described in Appendix 1.
2.3 Samples, sample treatment and techniques
The Nordmeijer cores were opened at the Wiertsema & Partners laboratory. The lithological variation in the cores was described, and samples were taken for micromorphological and botanical research. Chemical analysis was performed by on-the-spot measurements of major and trace element composition using a Niton X-3 portable XRF.
Samples for analysis of bone and botanical remains were sieved at 0.25 mm. None of the samples taken contained enough bone fragments to study the degree of degradation. This part of the planned monitoring was not therefore executed.
Botanical remains were studied. The degree of preservation was derived21, with species richness
Figure 7. Fieldwork in 2009/2011 at P14. Legend as in figure 4.
P14-1
P14-2
5179
50
181700
5181
50
181500
100m0
All monitoring locations 1999-2010 Soil pro�les/boreholes 2006-2010 Dipwells&redox 2006-2010
19—
as the most important factor. This method was also used in the 1999 and 2001 monitoring rounds. In addition, degradation patterns on individual botanical remains were classified.22 This is a valuable addition to the common methods, as it directly describes the decay processes, just like the histological study of bone fragments. In this case, however, the lack of previous observations using this approach prevents comparison of the latest results with the earlier monitoring rounds.
2.4 Data from external sources
The groundwater level measurements from dipwells in the Schokland area were kindly provided by Zuiderzeeland water board. Additional data were obtained from DINO (data from TNO/geological survey of the Netherlands). Most time-series of groundwater levels started around 2003, but a number of dipwells have been monitored for much longer.
21 using the method developed by Vernimmen (2001, 2002) and Brinkkemper (2006).
22 following the method used by Jones et al. (2007)

21—
3.1 Field observations and soil descriptions
Four borehole descriptions were made for monitoring purposes in 2009/2010. The descriptions are given in Appendix 1.
3.2 Groundwater levels, moisture contents and redox
As stated above, so many problems are associated with the results of the on-site monitoring of groundwater, soil moisture and redox (missing data, insufficiently long measurement series, wrong locations) that they
cannot be used. For the sake of completeness, they are given in Appendix 2. This means, unfortunately, that no further information is available that might allow us to investigate to what extent groundwater levels correlate with moisture contents (relevant for preservation of organic materials) and redox (relevant for metal and pyrite oxidation).
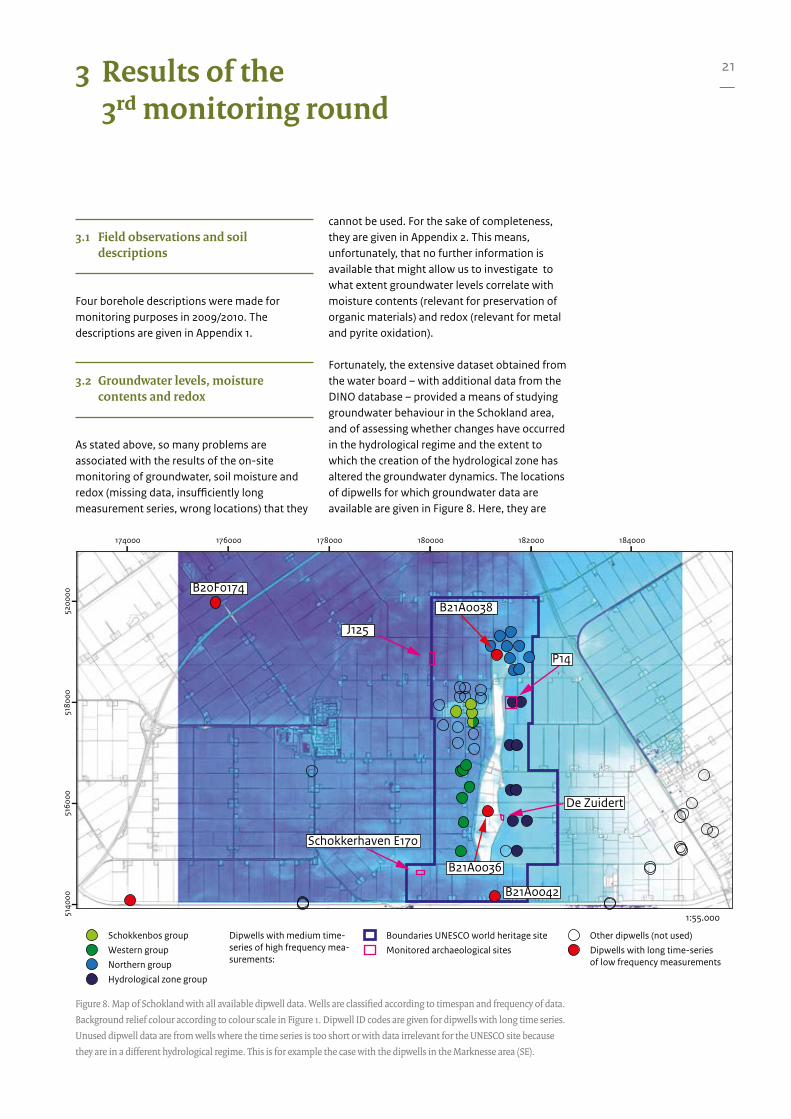
Fortunately, the extensive dataset obtained from the water board – with additional data from the DINO database – provided a means of studying groundwater behaviour in the Schokland area, and of assessing whether changes have occurred in the hydrological regime and the extent to which the creation of the hydrological zone has altered the groundwater dynamics. The locations of dipwells for which groundwater data are available are given in Figure 8. Here, they are
3 Results of the 3rd monitoring round
Figure 8. Map of Schokland with all available dipwell data. Wells are classified according to timespan and frequency of data.
Background relief colour according to colour scale in Figure 1. Dipwell ID codes are given for dipwells with long time series.
Unused dipwell data are from wells where the time series is too short or with data irrelevant for the UNESCO site because
they are in a different hydrological regime. This is for example the case with the dipwells in the Marknesse area (SE).
J125
P14
B21A0036
B20F0174
B21A0042
De Zuidert
Schokkerhaven E170
B21A0038
1:55.000
178000174000
5200
0051
8000
5160
0051
4000
180000 182000 184000176000
Schokkenbos groupWestern groupNorthern groupHydrological zone group
Dipwells with medium time-series of high frequency mea-surements:
Boundaries UNESCO world heritage siteMonitored archaeological sites
Other dipwells (not used)Dipwells with long time-seriesof low frequency measurements
22—
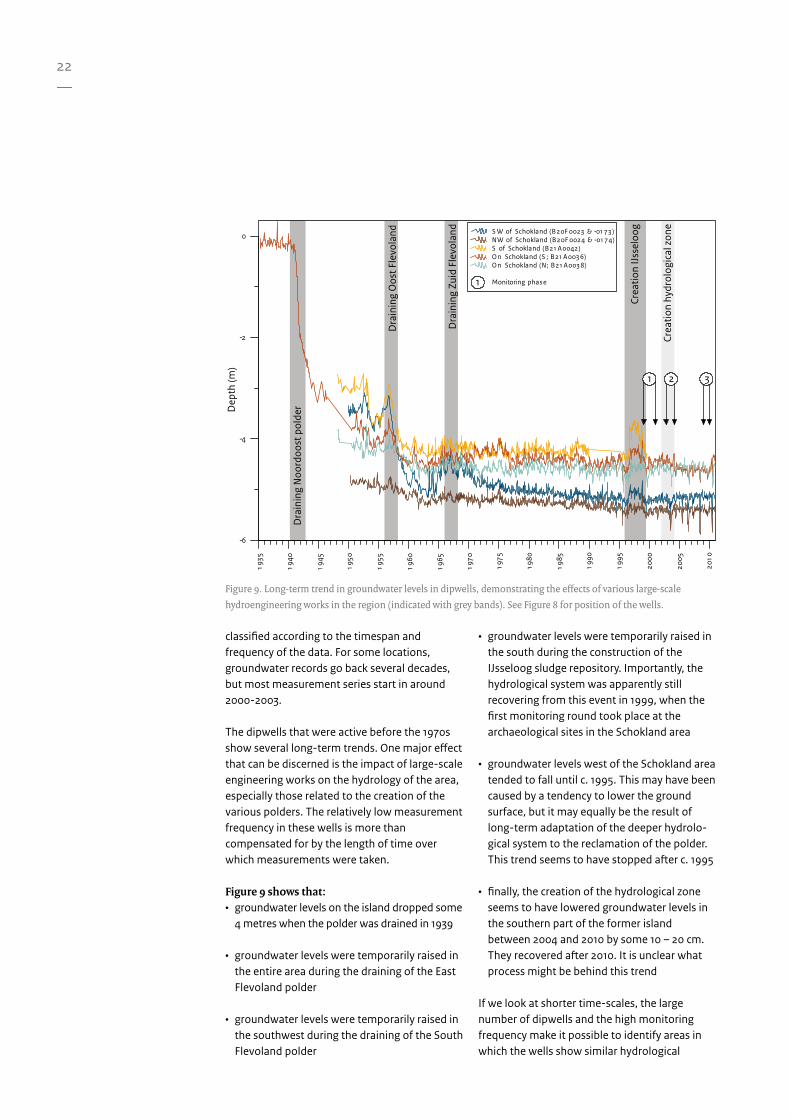
classified according to the timespan and frequency of the data. For some locations, groundwater records go back several decades, but most measurement series start in around 2000-2003.
The dipwells that were active before the 1970s show several long-term trends. One major effect that can be discerned is the impact of large-scale engineering works on the hydrology of the area, especially those related to the creation of the various polders. The relatively low measurement frequency in these wells is more than compensated for by the length of time over which measurements were taken.
Figure 9 shows that:• groundwater levels on the island dropped some
4 metres when the polder was drained in 1939 • groundwater levels were temporarily raised in
the entire area during the draining of the East Flevoland polder
• groundwater levels were temporarily raised in the southwest during the draining of the South Flevoland polder
• groundwater levels were temporarily raised in the south during the construction of the IJsseloog sludge repository. Importantly, the hydrological system was apparently still recovering from this event in 1999, when the first monitoring round took place at the archaeological sites in the Schokland area
• groundwater levels west of the Schokland area tended to fall until c. 1995. This may have been caused by a tendency to lower the ground surface, but it may equally be the result of long-term adaptation of the deeper hydrolo-gical system to the reclamation of the polder. This trend seems to have stopped after c. 1995
• finally, the creation of the hydrological zone seems to have lowered groundwater levels in the southern part of the former island between 2004 and 2010 by some 10 – 20 cm. They recovered after 2010. It is unclear what process might be behind this trend
If we look at shorter time-scales, the large number of dipwells and the high monitoring frequency make it possible to identify areas in which the wells show similar hydrological
Figure 9. Long-term trend in groundwater levels in dipwells, demonstrating the effects of various large-scale
hydroengineering works in the region (indicated with grey bands). See Figure 8 for position of the wells.
1935
1940
1945
1950
1955
1960
1965
1970
1975
1980
1985
1990
1995
2000
2005
2010
-6
-4
-2
0D
epth
(m)
Dra
inin
g N
oord
oost
pol
der
Dra
inin
g O
ost F
levo
land
Dra
inin
g Zu
id F
levo
land
Crea
tion
IJss
eloo
g
Crea
tion
hydr
olog
ical
zon
e
S W of Schokland (B20F 0023 & -01 73 )NW of Schokland (B20F 0024 & -01 74)S of Schokland (B21 A0042)O n Schokland (S ; B21 A003 6)O n Schokland (N; B21 A003 8) Monitoring phase
321
1
23—
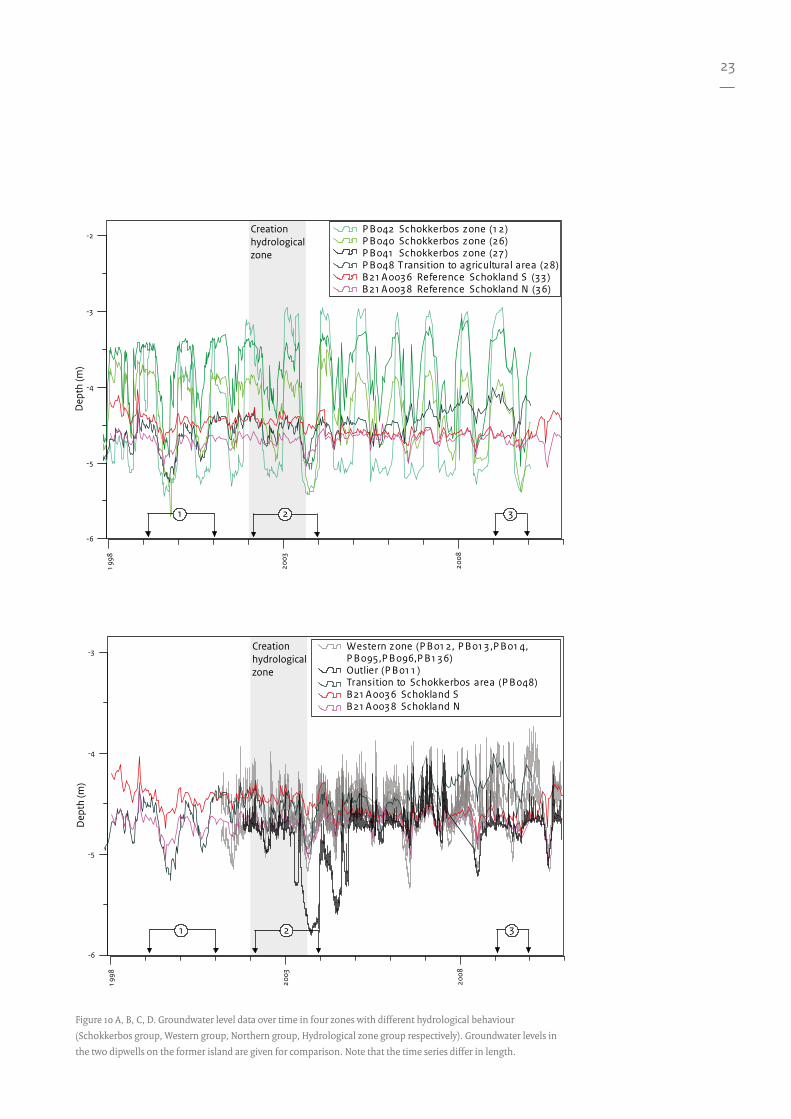
Figure 10 A, B, C, D. Groundwater level data over time in four zones with different hydrological behaviour
(Schokkerbos group, Western group, Northern group, Hydrological zone group respectively). Groundwater levels in
the two dipwells on the former island are given for comparison. Note that the time series differ in length.
1998
2003
2008
-6
-5
-4
-3
-2
Dep
th (m
)
Creationhydrologicalzone
21 3
P B042 Schokkerbos zone (1 2)P B040 Schokkerbos zone (26)P B041 Schokkerbos zone (27)P B048 Transition to agricultural area (28)B21 A003 6 Reference Schokland S (3 3 )B21 A003 8 Reference Schokland N (3 6)
1998
2003
2008
-6
-5
-4
-3
Dep
th (m
)
Creationhydrologicalzone
21 3
Western zone (P B01 2, P B01 3 ,P B01 4,P B095,P B096,P B1 3 6)Outlier (P B01 1 )Transition to Schokkerbos area (P B048)B21 A003 6 Schokland SB21 A003 8 Schokland N
24—
2004
2006
2008
2010
-5
-4
-3
Dep
th (m
)B21 A003 6 Reference Schokland S (3 3 )B21 A003 8 Reference Schokland N (3 6)
Low levels, low amplitudeMedium levels , medium amplitudeHigh levels, high amplitude
1998
2003
2008
-5
-4
-3
-2
Dep
th (m
)
Creationhydrologicalzone
21 3
Hydrological zoneO utlier in hydrological zoneAgricultural area just outside hydrological zoneB21 A003 6 R eference S chokland SB21 A003 8 R eference S chokland N
25—
behaviour. The groundwater levels in each of these zones are shown in Figure 10.
• The Schokkerbos group (figure 10A) – situated around and on the boulder clay outcrop – is characterised by extremely high amplitudes, with differences between summer and winter groundwater levels sometimes exceeding two metres.
• The Western group (figure 10B) – situated south of the Schokkerbos area and west of the island – is characterised by low variation and amplitudes, with some sort of baseline at approx. 470 cm below NAP. Values lower than this baseline occur only occasionally, probably during dry summers (e.g. 2003, 2004, 2009). One dipwell (PB011) shows a more extreme response to these events than the rest. Dipwell PB048 seems to be an intermediate between the Schokkerbos group and the Western group. Notably, the most extreme falls in groundwater levels occurred during the creation of the hydrological zone to the east of the former island. It is unclear to what extent this lowering of the groundwater level was caused by the creation of the hydrological zone, or by the hot dry summer of 2003.
• The Northern group (figure 10C) – situated around the northern tip of the former island - shows high amplitudes in groundwater levels in some dipwells, and low amplitudes in others. Even the highest are not however as high as the ones in the Schokkerbos group (up to 1.5 metres). The entire group also differs from the Schokkerbos group in that the groundwater levels vary much more over short time-scales. There seems to be a baseline level of groundwater about 450 cm below NAP (the levels we also find on the island); higher values occur frequently, but lower values are much less common, and may represent dry spells; they coincide with the low groundwater events in the Western group. The dipwells with the highest groundwater levels in this group have not fallen to or below the baseline since 2004. Since the dipwells in this group were installed later than the others, it is not possible to see to what extent the groundwater levels have changed due to the creation of the hydrological zone.
• The Hydrological zone group (figure 10D) is
situated in the Hydrological zone to the east of the former Island, south of the Northern group. It comprises two major groups, i.e. the dipwells inside the hydrological zone and those outside. All dipwells show groundwater levels that are considerably higher than the 450-470 cm -NAP baseline on the island and in the Northern group. If there is a baseline in this group it would be around 370 cm -NAP. The amplitude of groundwater level variation is similar to the Northern group, with dry events at the same times. During such dry events, groundwater levels can drop to the baseline value of the Northern group, Western group and the island itself, but rarely below that.
The influence of the creation of the hydrological zone can be seen very clearly, since this time series starts almost two years previously. The graph clearly shows that groundwater levels dropped slightly overall by 10-30 cm during creation of the hydrological zone. At the end of 2004, the dry spell that was deliberately imposed to prevent reed growth can also clearly be seen. After that, groundwater levels in the zone itself clearly increased dramatically, by some 70 cm, while the water levels in the agricultural areas immediately adjacent to the zone remained more or less the same.
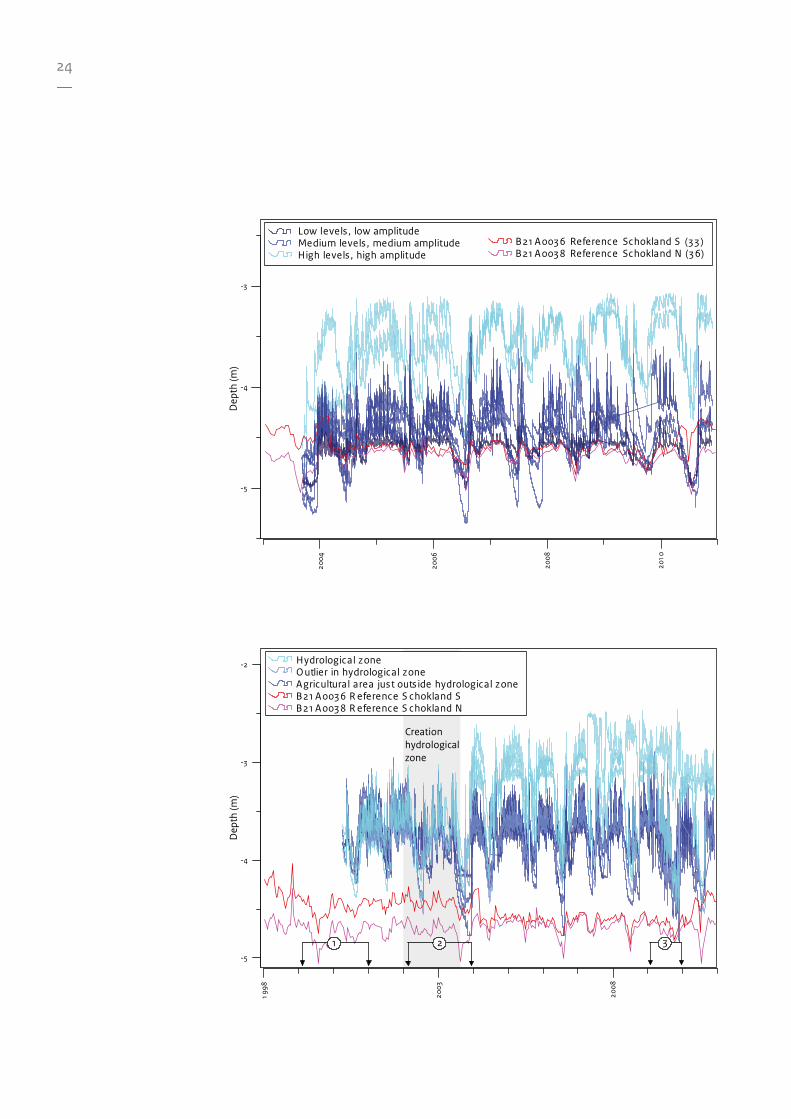
Dry spells occur as in the other zones, but a remarkable drying-out phase at the end of 2010 is restricted to this area only. This dry phase seems to coincide with a lowering of the maximum levels in the hydrological zone and adjacent agricultural land by some 20 cm, and a coeval increase in groundwater levels at the southern end of the former Island. Whether this was caused by the construction of a hydrological zone in the southwest of the former island or the fine-tuning of the system is not clear. Time will tell whether this is a permanent change in the hydrology of the area, or the system will simply recover.
In order to monitor the effects of the creation of the hydrological zone on groundwater dynamics, the water board placed the dipwells in pairs straddling the boundary between the hydrological zone and the surrounding agricultural land. If we compare the ground-water levels in each of these pairs (Figure 11), we can see that the water table has risen
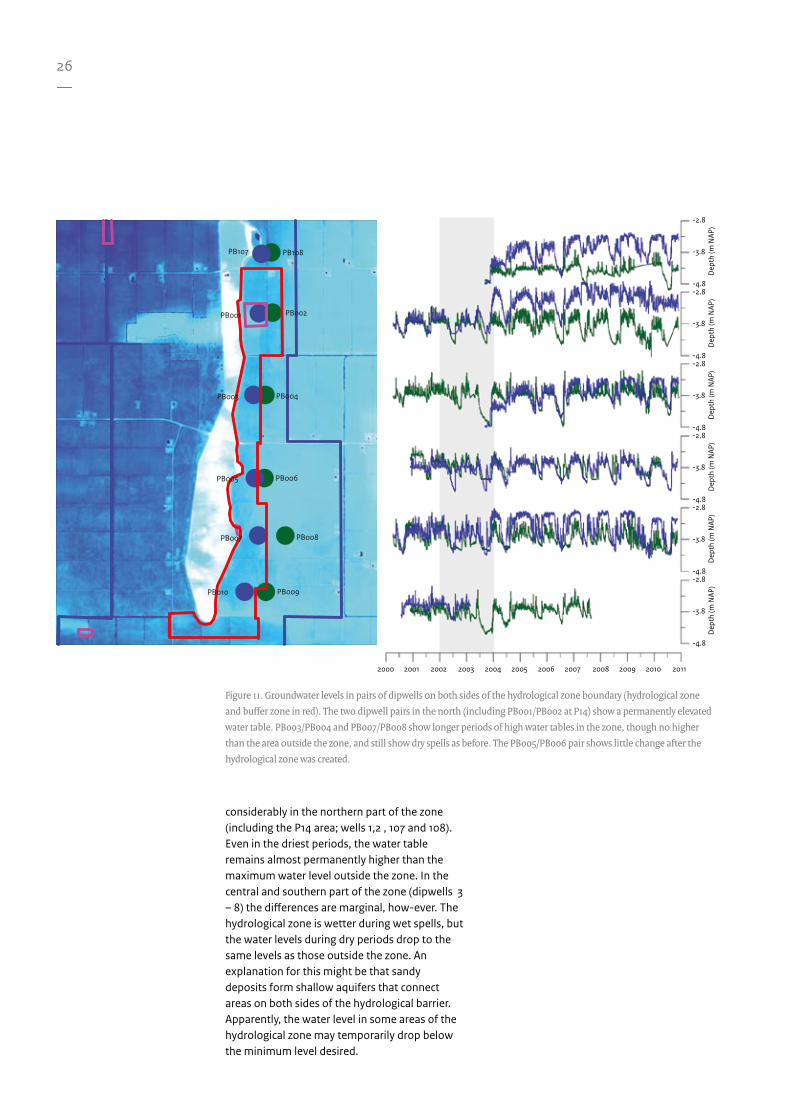
26—
considerably in the northern part of the zone (including the P14 area; wells 1,2 , 107 and 108). Even in the driest periods, the water table remains almost permanently higher than the maximum water level outside the zone. In the central and southern part of the zone (dipwells 3 – 8) the differences are marginal, how-ever. The hydrological zone is wetter during wet spells, but the water levels during dry periods drop to the same levels as those outside the zone. An explanation for this might be that sandy deposits form shallow aquifers that connect areas on both sides of the hydrological barrier. Apparently, the water level in some areas of the hydrological zone may temporarily drop below the minimum level desired.
Figure 11. Groundwater levels in pairs of dipwells on both sides of the hydrological zone boundary (hydrological zone
and buffer zone in red). The two dipwell pairs in the north (including PB001/PB002 at P14) show a permanently elevated
water table. PB003/PB004 and PB007/PB008 show longer periods of high water tables in the zone, though no higher
than the area outside the zone, and still show dry spells as before. The PB005/PB006 pair shows little change after the
hydrological zone was created.
PB107 PB108
PB001 PB002
PB004PB003
PB006PB005
PB008PB007
PB009PB010
-2.8
Dep
th (m
NAP
)
-3.8
-4.8-2.8
Dep
th (m
NAP
)
-3.8
-4.8-2.8
Dep
th (m
NAP
)
-3.8
-4.8-2.8
Dep
th (m
NAP
)
-3.8
-4.8-2.8
Dep
th (m
NAP
)
-3.8
-4.8-2.8
Dep
th (m
NAP
)
-3.8
-4.8
2000 2001 2002 2003 2004 2005 2006 2007 2008 2009 2010 2011
27—
3.3 Soil composition and chemistry
3.3.1 Introduction
Various kinds of chemical measurements are available. In this section we shall first discuss the chemical analyses performed in 2010 on the cores from De Zuidert and P14. Then we shall summarise the chemical analyses in Huisman et al. 2008 on samples from E170-Schokkerhaven and J125. Finally, we will briefly reassess the measurements of groundwater composition taken in the 2003/2004 monitoring round.
3.3.2 De Zuidert and P14
The results of the chemical analysis of the De Zuidert 1, De Zuidert 2 and P14-1 cores are presented in Appendix 3. They are summarized in depth plots in figure 12. For the depth plots, elements were chosen that represent various relevant properties or processes:
• Aluminium contents are a measure of the clay content
• Iron is a component of many diagenetic minerals (oxides, sulphides, carbonates, phosphates)
• Phosphorous is a component of bone and dung and of minerals derived from their decay or from reducing groundwater
• Calcium is a component of lime – which may occur in natural clay deposits – and bone, but may also represent lime-based mortar in building rubble.
• Sulphur represents the presence of sulphides (such as pyrite) and its oxidation products (e.g. gypsum and jarosite), but it also occurs as a minor element in organic matter.
• Copper and lead contents in natural alluvial sediments are positively correlated with aluminium contents (as a natural background), but anthropogenic sources of
these metals may result in higher concentrations.
• Chlorine contents may be elevated due to the presence of saline water remnants, especially in deposits with low permeabilities.
De Zuidert 1 and 2 (Figure 12 A,B) both show very high phosphorous contents, probably due to the vast amounts of refuse incorporated into the occupation layers. Calcium contents are also high, but show a different distribution. High concentrations in the upper 50 cm of the cores may represent building rubble, other high values are probably concentrations of carbonates, perhaps partly transformed into gypsum, and ashes. Sulphur contents vary considerably, though they do indicate a background level of pyrite and/or gypsum throughout the cores. Interestingly, the deepest samples in De Zuidert 1 show a steady increase in sulphur contents, maybe indicating a progressive increase in pyrite contents or pyrite formation in the deeper layers of the terp mound. Copper and lead contents are not correlated, and show localized higher concentra-tions that may be due to metalworking refuse or corrosion of metal objects. However, the high lead values in the top 30 cm can be attributed to the deposition of lead from leaded fuel between c. AD 1950 and 1995 (when unleaded fuel became the norm). This implies that the topsoil has been reworked or bioturbated since c. 1950, causing the lead to move downwards in the profile to 20-30 cm below the surface, but not deeper. Chlorine peaks in both cores at depths of 100 to 150 cm indicate that some remnants of saline or brackish water are still present in these layers. Whether this was the result of salt spray or of the use of material containing saline water to elevate the mound is unclear. However, its source must be from before 1932, when the construction of the Afsluitdijk resulted in an overall freshening of the environment. If salt from that long ago still persists (even in low concentrations), it implies that this specific layer is so impermeable that change occurs only very slowly. Deeper layers do not however show remnant salinity. The samples are therefore most likely to represent local microenvironments.
P14-1 and 2 (Figure 12 C,D) show a very different
28—
Figure 12. Depth profiles of selected chemical parameters from De Zuidert cores 1 and 2 (A, B) and P14 cores 1 and 2 (C,D).
0 2 4 6
Al2O 3 (%)0 2 4 6
F e2O 3 (%)0 1 2 3
P 2O 5 (%)0 5 1 0
C aO (%)0 5000 1 0000
S (mg/kg)0 1 20 240
C u (mg/kg)0 80 1 60
P b (mg/kg)0 1 000 2000
C l (mg/kg)De Zuidert 1(SCMO-1)
50
MB1
MB2
MB3
MB4
SP1
SP2
L2
L2
L1
SP3
0
100
150
200
250
300
350
Dep
th (c
m) r
elat
ive
to s
urfa
ce
0 5 1 0
Al2O 3 (%)0 4 8
F e2O 3 (%)0 2 4
P 2O 5 (%)0 2.5 5
C aO (%)0 8000 1 6000
S (mg/kg)0 1 00 200
C u (mg/kg)0 60 1 20
P b (mg/kg)0 1 500 3000
C l (mg/kg)De Zuidert 2(SCMO-2)
50
MB1
MB2
MB3
SP1
SP2
L2
L3
L1
SP3
0
100
150
200
250
Dep
th (c
m) r
elat
ive
to s
urfa
ce
0 4 8
Al2O 3 (%)0 1 2 3
F e2O 3 (%)0 0.4 0.8
P 2O 5 (%)0 1 2
C aO (%)0 5000 10000
S (mg/kg) C u (mg/kg)0 5 10 15 20 25
P b (mg/kg)0 250 500
C l (mg/kg)P14 -1(SCMO-3)
50
MB1
MB2
SP1
SP2
L2
L1
SP3
0
100
150
Dep
th (c
m) r
elat
ive
to s
urfa
ce
0 4 8
Al2O 3 (%)0 0.4 0.8 1.2 1.6 2
F e2O 3 (%)0 0.4 0.8 1.2
P 2O 5 (%)0 1 2
C aO (%)0 5000
S (mg/kg) C u (mg/kg)0 4 8 12 16
P b (mg/kg) C l (mg/kg)P14 -2(SCMO-4)
50
MB1
SP1
L10
Dep
th (c
m) r
elat
ive
to s
urfa
ce
29—
profile: iron contents mostly follow aluminium; only in the peat layer do they appear to be somewhat elevated in relative terms. Phosphorous contents are lower – although still higher than natural background levels – and there is one unexplained high outlier deeper in the profile. Calcium only shows elevated contents in the top clay layer – which is shell-bearing, so no surprise there. This layer also has elevated sulphur contents, probably due to the presence of pyrite. In the peat layer, the higher sulphur content is probably caused by the sulphur present in organic matter – although the presence of some sulphides or sulphates cannot be ruled out. Lead contents show that the presence of anthropo-genic lead does not reach any deeper than approx. 30 cm, whereas there is no detectable copper. This shows that the peat layer has not suffered from mixing, and is so impermeable that changes in burial conditions can occur only very slowly. The P14 composition is much less extreme than that of De Zuidert, and resembles natural deposits with no human influence. The main difference is largely a reflection of the difference between anthro-
pogenic deposits full of waste, and natural deposits with little or no detectable human influence.
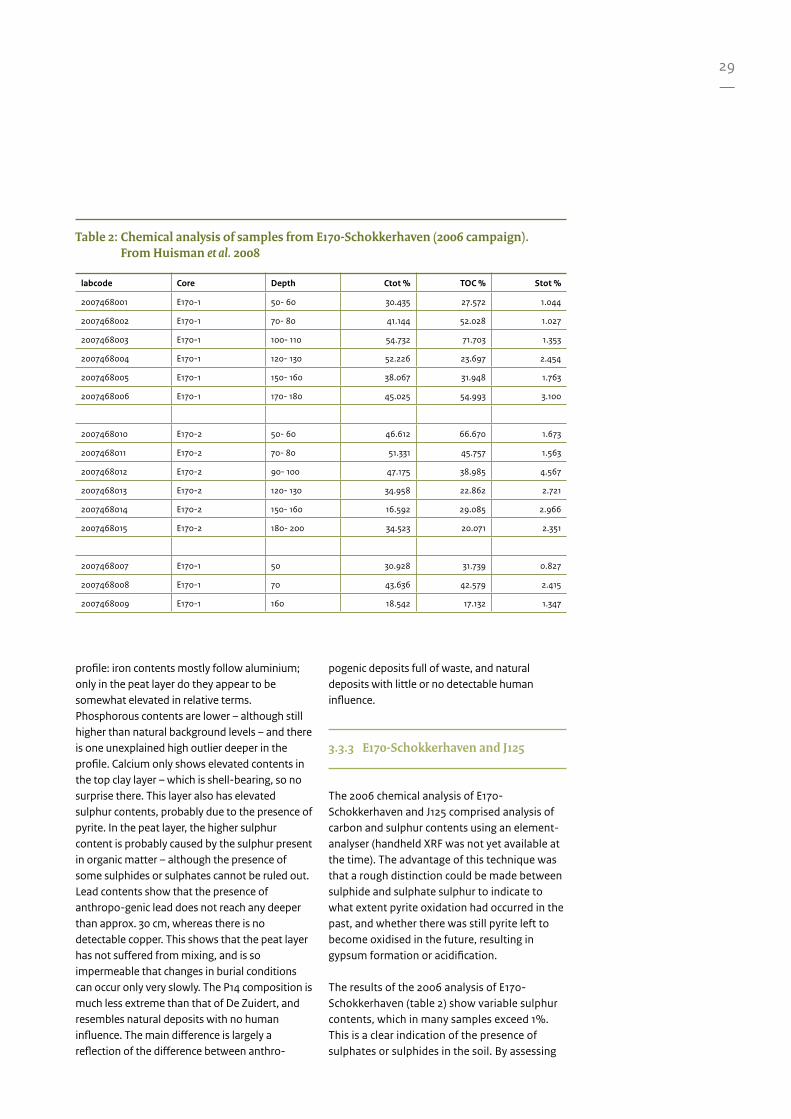
3.3.3 E170-Schokkerhaven and J125
The 2006 chemical analysis of E170-Schokkerhaven and J125 comprised analysis of carbon and sulphur contents using an element-analyser (handheld XRF was not yet available at the time). The advantage of this technique was that a rough distinction could be made between sulphide and sulphate sulphur to indicate to what extent pyrite oxidation had occurred in the past, and whether there was still pyrite left to become oxidised in the future, resulting in gypsum formation or acidification.
The results of the 2006 analysis of E170-Schokkerhaven (table 2) show variable sulphur contents, which in many samples exceed 1%. This is a clear indication of the presence of sulphates or sulphides in the soil. By assessing
Table 2: Chemical analysis of samples from E170-Schokkerhaven (2006 campaign). From Huisman et al. 2008
labcode Core Depth Ctot % TOC % Stot %
2007468001 E170-1 50- 60 30.435 27.572 1.044
2007468002 E170-1 70- 80 41.144 52.028 1.027
2007468003 E170-1 100- 110 54.732 71.703 1.353
2007468004 E170-1 120- 130 52.226 23.697 2.454
2007468005 E170-1 150- 160 38.067 31.948 1.763
2007468006 E170-1 170- 180 45.025 54.993 3.100
2007468010 E170-2 50- 60 46.612 66.670 1.673
2007468011 E170-2 70- 80 51.331 45.757 1.563
2007468012 E170-2 90- 100 47.175 38.985 4.567
2007468013 E170-2 120- 130 34.958 22.862 2.721
2007468014 E170-2 150- 160 16.592 29.085 2.966
2007468015 E170-2 180- 200 34.523 20.071 2.351
2007468007 E170-1 50 30.928 31.739 0.827
2007468008 E170-1 70 43.636 42.579 2.415
2007468009 E170-1 160 18.542 17.132 1.347
30—
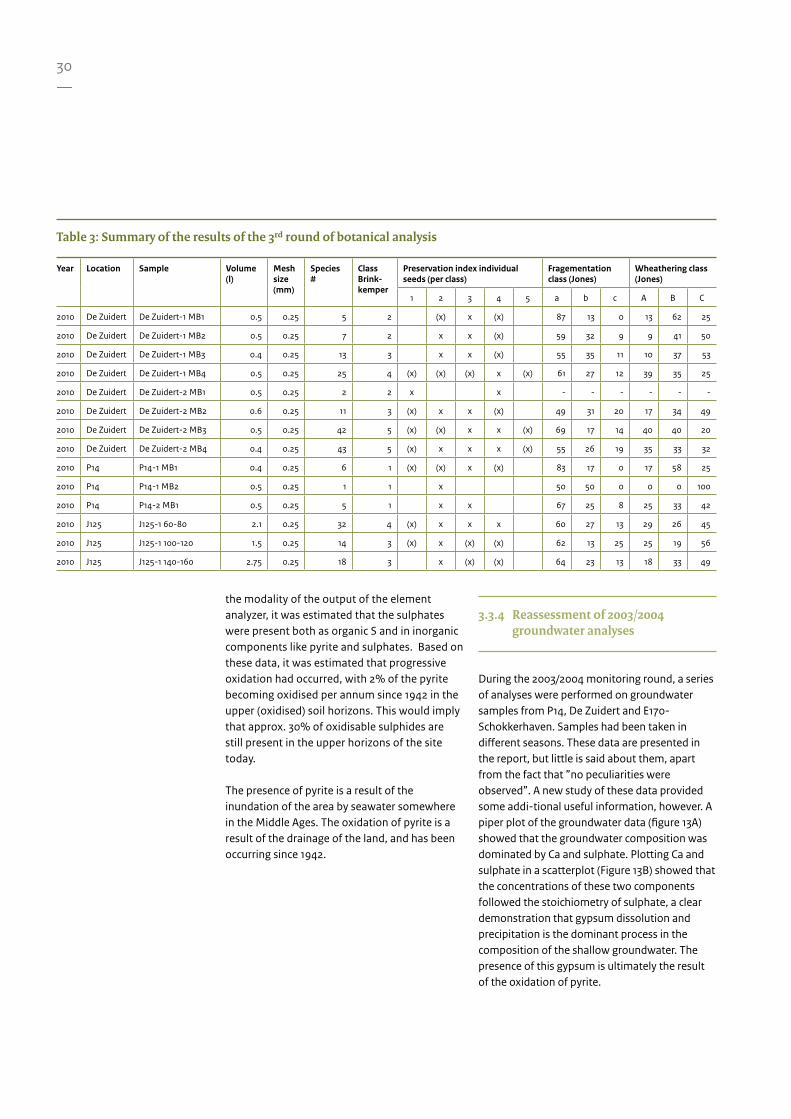
Table 3: Summary of the results of the 3rd round of botanical analysis
Year Location Sample Volume(l)
Mesh size (mm)
Species#
ClassBrink-kemper
Preservation index individual seeds (per class)
Fragementation class (Jones)
Wheathering class (Jones)
1 2 3 4 5 a b c A B C
2010 De Zuidert De Zuidert-1 MB1 0.5 0.25 5 2 (x) x (x) 87 13 0 13 62 25
2010 De Zuidert De Zuidert-1 MB2 0.5 0.25 7 2 x x (x) 59 32 9 9 41 50
2010 De Zuidert De Zuidert-1 MB3 0.4 0.25 13 3 x x (x) 55 35 11 10 37 53
2010 De Zuidert De Zuidert-1 MB4 0.5 0.25 25 4 (x) (x) (x) x (x) 61 27 12 39 35 25
2010 De Zuidert De Zuidert-2 MB1 0.5 0.25 2 2 x x - - - - - -
2010 De Zuidert De Zuidert-2 MB2 0.6 0.25 11 3 (x) x x (x) 49 31 20 17 34 49
2010 De Zuidert De Zuidert-2 MB3 0.5 0.25 42 5 (x) (x) x x (x) 69 17 14 40 40 20
2010 De Zuidert De Zuidert-2 MB4 0.4 0.25 43 5 (x) x x x (x) 55 26 19 35 33 32
2010 P14 P14-1 MB1 0.4 0.25 6 1 (x) (x) x (x) 83 17 0 17 58 25
2010 P14 P14-1 MB2 0.5 0.25 1 1 x 50 50 0 0 0 100
2010 P14 P14-2 MB1 0.5 0.25 5 1 x x 67 25 8 25 33 42
2010 J125 J125-1 60-80 2.1 0.25 32 4 (x) x x x 60 27 13 29 26 45
2010 J125 J125-1 100-120 1.5 0.25 14 3 (x) x (x) (x) 62 13 25 25 19 56
2010 J125 J125-1 140-160 2.75 0.25 18 3 x (x) (x) 64 23 13 18 33 49
the modality of the output of the element analyzer, it was estimated that the sulphates were present both as organic S and in inorganic components like pyrite and sulphates. Based on these data, it was estimated that progressive oxidation had occurred, with 2% of the pyrite becoming oxidised per annum since 1942 in the upper (oxidised) soil horizons. This would imply that approx. 30% of oxidisable sulphides are still present in the upper horizons of the site today.
The presence of pyrite is a result of the inundation of the area by seawater somewhere in the Middle Ages. The oxidation of pyrite is a result of the drainage of the land, and has been occurring since 1942.
3.3.4 Reassessment of 2003/2004 groundwater analyses
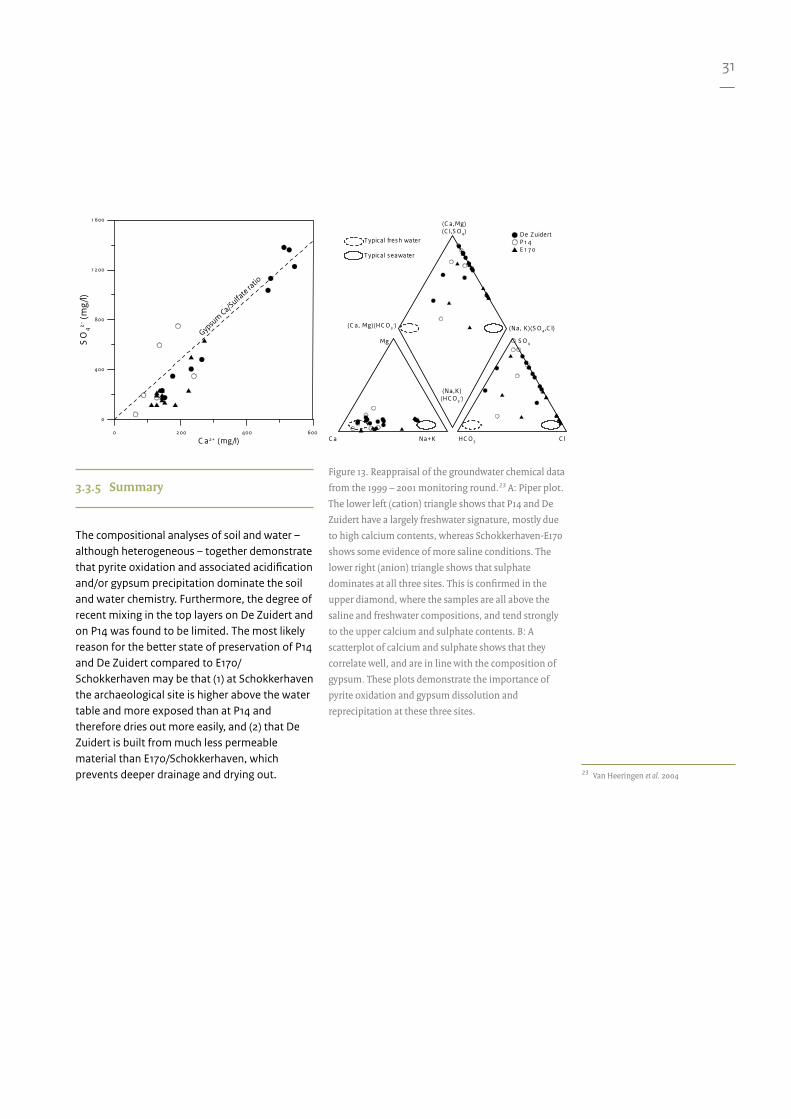
During the 2003/2004 monitoring round, a series of analyses were performed on groundwater samples from P14, De Zuidert and E170-Schokkerhaven. Samples had been taken in different seasons. These data are presented in the report, but little is said about them, apart from the fact that ”no peculiarities were observed”. A new study of these data provided some addi-tional useful information, however. A piper plot of the groundwater data (figure 13A) showed that the groundwater composition was dominated by Ca and sulphate. Plotting Ca and sulphate in a scatterplot (Figure 13B) showed that the concentrations of these two components followed the stoichiometry of sulphate, a clear demonstration that gypsum dissolution and precipitation is the dominant process in the composition of the shallow groundwater. The presence of this gypsum is ultimately the result of the oxidation of pyrite.
31—
3.3.5 Summary
The compositional analyses of soil and water – although heterogeneous – together demonstrate that pyrite oxidation and associated acidification and/or gypsum precipitation dominate the soil and water chemistry. Furthermore, the degree of recent mixing in the top layers on De Zuidert and on P14 was found to be limited. The most likely reason for the better state of preservation of P14 and De Zuidert compared to E170/Schokkerhaven may be that (1) at Schokkerhaven the archaeological site is higher above the water table and more exposed than at P14 and therefore dries out more easily, and (2) that De Zuidert is built from much less permeable material than E170/Schokkerhaven, which prevents deeper drainage and drying out.
Figure 13. Reappraisal of the groundwater chemical data
from the 1999 – 2001 monitoring round.23 A: Piper plot.
The lower left (cation) triangle shows that P14 and De
Zuidert have a largely freshwater signature, mostly due
to high calcium contents, whereas Schokkerhaven-E170
shows some evidence of more saline conditions. The
lower right (anion) triangle shows that sulphate
dominates at all three sites. This is confirmed in the
upper diamond, where the samples are all above the
saline and freshwater compositions, and tend strongly
to the upper calcium and sulphate contents. B: A
scatterplot of calcium and sulphate shows that they
correlate well, and are in line with the composition of
gypsum. These plots demonstrate the importance of
pyrite oxidation and gypsum dissolution and
reprecipitation at these three sites.
23 Van Heeringen et al. 2004
C a Na+K HC O 3 C l
Mg S O 4
Typical fresh water
Typical seawater
(C a,Mg)(C l,S O 4)
(C a, Mg)(HC O 3-) (Na, K)(S O 4,C l)
(Na,K)(HC O 3
-)
De ZuidertP 1 4E 1 70
0 200 400 600
C a2+ (mg/l)
0
400
800
1 200
1 600
SO
42- (
mg/
l)
Gypsum Ca/Sulfa
te ratio
32—
Table 4: Summary of the results of botanical analysis in all monitoring rounds; P14
Year Sample Volume(l)
Mesh size
(mm)
Species#
ClassBrink-
kemper
Preservation index individual seeds (per class)
Fragementation class (Jones)
Wheathering class (Jones)
1 2 3 4 5 a b c A B C
1999 P14-A-1 4 0.5 2 2 x x
1999 P14-B-1 5 0.5 31 4 x x
2001 P14-A-3 5.25 0.5 8 2 x x x
2001 P14-B-3 3.5 0.5 28 4 x x x
2010 P14-1 MB1 0.4 0.25 6 1 (x) (x) x (x) 83 17 0 17 58 25
2010 P14-1 MB2 0.5 0.25 1 1 x 50 50 0 0 0 100
2010 P14-2 MB1 0.5 0.25 5 1 x x 67 25 8 25 33 42
Table 5: Summary of the results of botanical analysis in all monitoring rounds; E170-Schokkerhaven
Year Sample Volume(l)
Mesh size
(mm)
Species#
ClassBrink-
kemper
Preservation index individual seeds (per class)
Fragementation class (Jones)
Wheathering class (Jones)
1 2 3 4 5 a b c A B C
1999 E170-A-1 2.75 0.5 1 1 x
1999 E170-B-1 3 0.5 5 2 x
1999 E170-B-2 5 0.5 3 2 x
1999 E170-C-1 5.25 0.5 9 2 x x
2001 E170-A-2 2.5 0.5 2 2 x x x
2001 E170-B-6 2.25 0.5 10 2 x x x x
2001 E170-B-7 3.75 0.5 3 2 x x
2001 E170-C-4 5 0.5 10 2 x x x x
2006 E170 50-1 2.1 0.25 3 2 x x x 20 0 80 0 80 20
2006 E170 50-2 2.1 0.25 11 3 (x) (x) x (x) 64 18 18 35 47 18
2006 E170 70-1 2.5 0.25 6 2 (x) (x) x (x) 67 11 22 45 33 22
2006 E170 70-2 1.6 0.25 11 3 (x) x (x) (x) 46 23 31 23 62 15
2006 E170 160-1 2.6 0.25 >50 5 (x) (x) x x (x) - - - - - -
2006 E170 160-2 3.5 0.25 >50 5 (x) (x) x x (x) 54 25 21 38 40 22
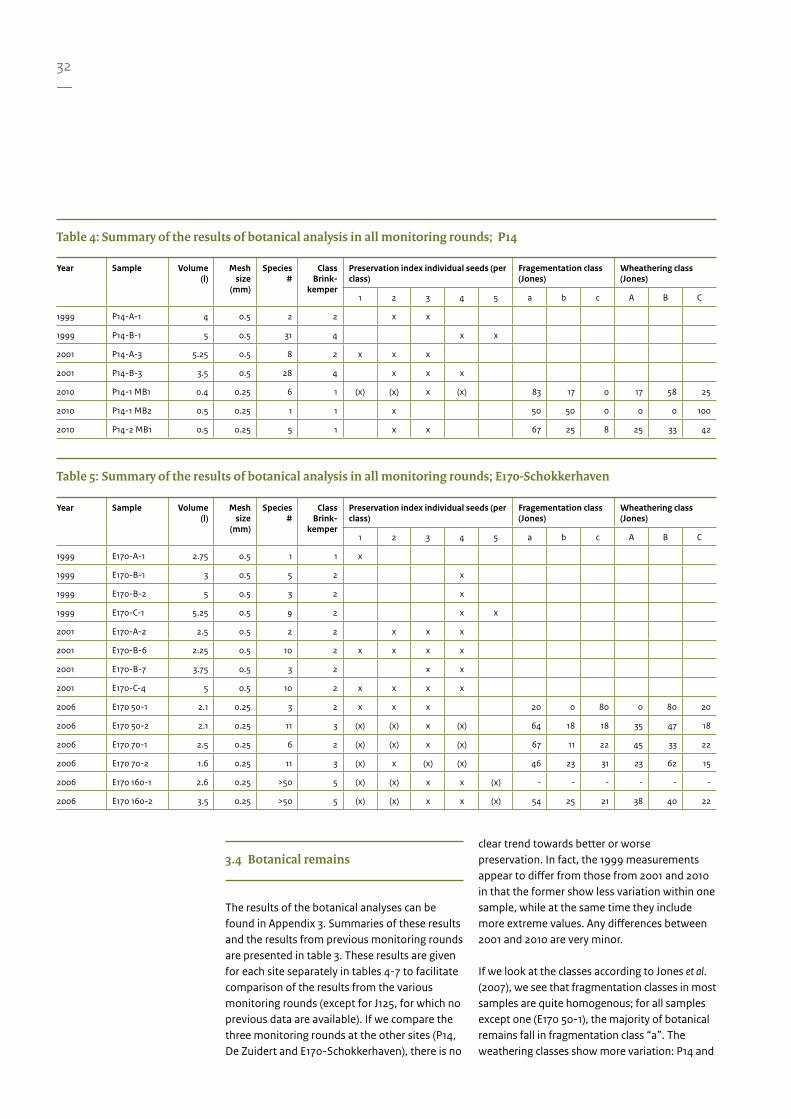
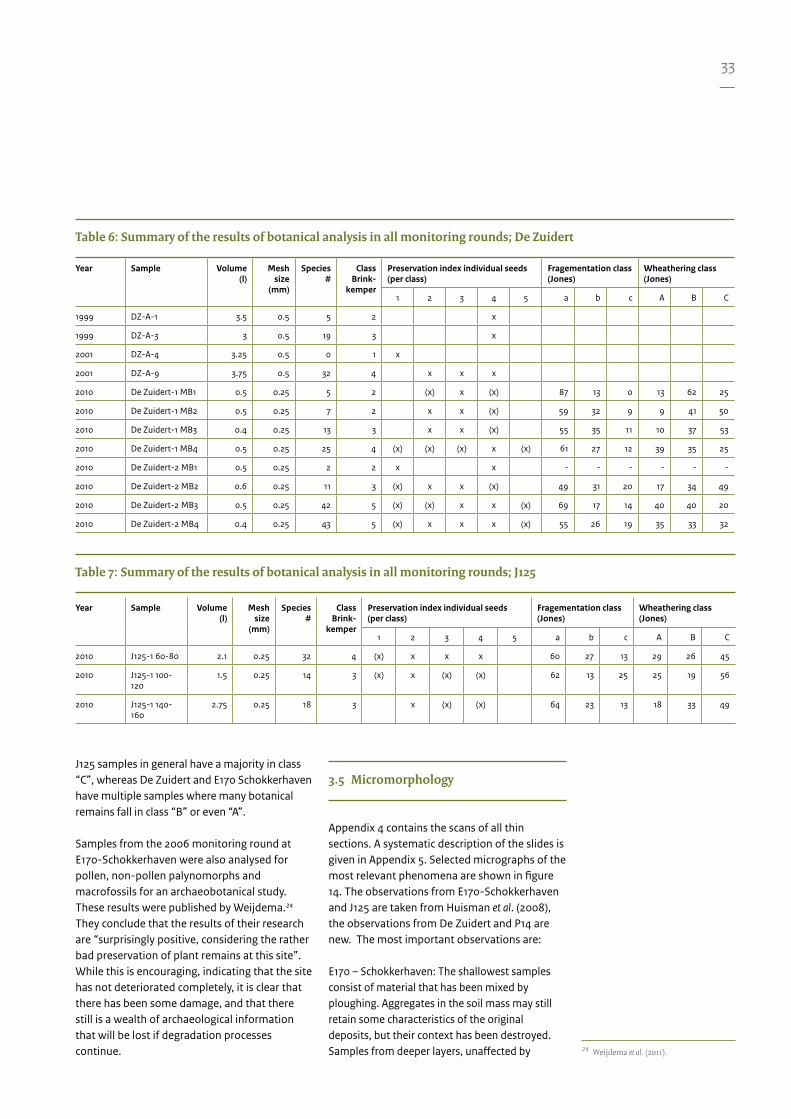
3.4 Botanical remains
The results of the botanical analyses can be found in Appendix 3. Summaries of these results and the results from previous monitoring rounds are presented in table 3. These results are given for each site separately in tables 4-7 to facilitate comparison of the results from the various monitoring rounds (except for J125, for which no previous data are available). If we compare the three monitoring rounds at the other sites (P14, De Zuidert and E170-Schokkerhaven), there is no
clear trend towards better or worse preservation. In fact, the 1999 measurements appear to differ from those from 2001 and 2010 in that the former show less variation within one sample, while at the same time they include more extreme values. Any differences between 2001 and 2010 are very minor.
If we look at the classes according to Jones et al. (2007), we see that fragmentation classes in most samples are quite homogenous; for all samples except one (E170 50-1), the majority of botanical remains fall in fragmentation class “a”. The weathering classes show more variation: P14 and
33—
Table 7: Summary of the results of botanical analysis in all monitoring rounds; J125
Year Sample Volume(l)
Mesh size
(mm)
Species#
ClassBrink-
kemper
Preservation index individual seeds (per class)
Fragementation class (Jones)
Wheathering class (Jones)
1 2 3 4 5 a b c A B C
2010 J125-1 60-80 2.1 0.25 32 4 (x) x x x 60 27 13 29 26 45
2010 J125-1 100-120
1.5 0.25 14 3 (x) x (x) (x) 62 13 25 25 19 56
2010 J125-1 140-160
2.75 0.25 18 3 x (x) (x) 64 23 13 18 33 49
Table 6: Summary of the results of botanical analysis in all monitoring rounds; De Zuidert
Year Sample Volume(l)
Mesh size
(mm)
Species#
ClassBrink-
kemper
Preservation index individual seeds (per class)
Fragementation class (Jones)
Wheathering class (Jones)
1 2 3 4 5 a b c A B C
1999 DZ-A-1 3.5 0.5 5 2 x
1999 DZ-A-3 3 0.5 19 3 x
2001 DZ-A-4 3.25 0.5 0 1 x
2001 DZ-A-9 3.75 0.5 32 4 x x x
2010 De Zuidert-1 MB1 0.5 0.25 5 2 (x) x (x) 87 13 0 13 62 25
2010 De Zuidert-1 MB2 0.5 0.25 7 2 x x (x) 59 32 9 9 41 50
2010 De Zuidert-1 MB3 0.4 0.25 13 3 x x (x) 55 35 11 10 37 53
2010 De Zuidert-1 MB4 0.5 0.25 25 4 (x) (x) (x) x (x) 61 27 12 39 35 25
2010 De Zuidert-2 MB1 0.5 0.25 2 2 x x - - - - - -
2010 De Zuidert-2 MB2 0.6 0.25 11 3 (x) x x (x) 49 31 20 17 34 49
2010 De Zuidert-2 MB3 0.5 0.25 42 5 (x) (x) x x (x) 69 17 14 40 40 20
2010 De Zuidert-2 MB4 0.4 0.25 43 5 (x) x x x (x) 55 26 19 35 33 32
J125 samples in general have a majority in class “C”, whereas De Zuidert and E170 Schokkerhaven have multiple samples where many botanical remains fall in class “B” or even “A”.
Samples from the 2006 monitoring round at E170-Schokkerhaven were also analysed for pollen, non-pollen palynomorphs and macrofossils for an archaeobotanical study. These results were published by Weijdema.24 They conclude that the results of their research are “surprisingly positive, considering the rather bad preservation of plant remains at this site”. While this is encouraging, indicating that the site has not deteriorated completely, it is clear that there has been some damage, and that there still is a wealth of archaeological information that will be lost if degradation processes continue.
3.5 Micromorphology
Appendix 4 contains the scans of all thin sections. A systematic description of the slides is given in Appendix 5. Selected micrographs of the most relevant phenomena are shown in figure 14. The observations from E170-Schokkerhaven and J125 are taken from Huisman et al. (2008), the observations from De Zuidert and P14 are new. The most important observations are:
E170 – Schokkerhaven: The shallowest samples consist of material that has been mixed by ploughing. Aggregates in the soil mass may still retain some characteristics of the original deposits, but their context has been destroyed. Samples from deeper layers, unaffected by 24 Weijdema et al. (2011).
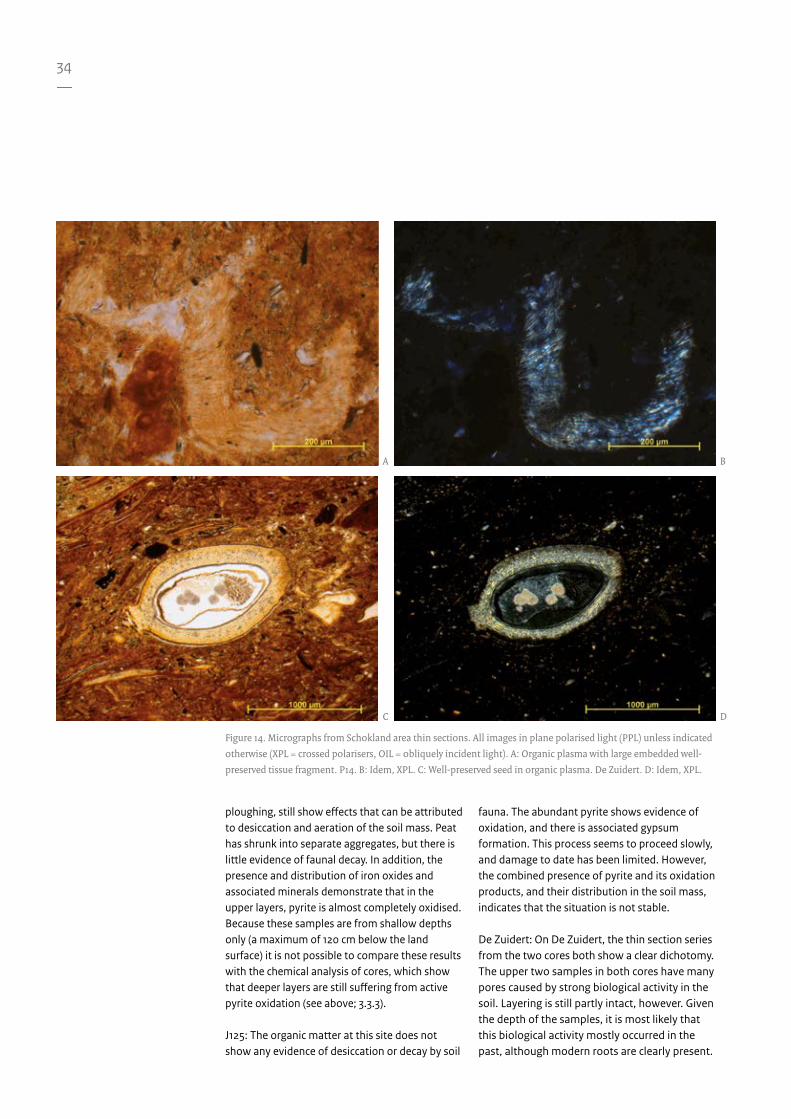
34—
ploughing, still show effects that can be attributed to desiccation and aeration of the soil mass. Peat has shrunk into separate aggregates, but there is little evidence of faunal decay. In addition, the presence and distribution of iron oxides and associated minerals demonstrate that in the upper layers, pyrite is almost completely oxidised. Because these samples are from shallow depths only (a maximum of 120 cm below the land surface) it is not possible to compare these results with the chemical analysis of cores, which show that deeper layers are still suffering from active pyrite oxidation (see above; 3.3.3).
J125: The organic matter at this site does not show any evidence of desiccation or decay by soil
fauna. The abundant pyrite shows evidence of oxidation, and there is associated gypsum formation. This process seems to proceed slowly, and damage to date has been limited. However, the combined presence of pyrite and its oxidation products, and their distribution in the soil mass, indicates that the situation is not stable.
De Zuidert: On De Zuidert, the thin section series from the two cores both show a clear dichotomy. The upper two samples in both cores have many pores caused by strong biological activity in the soil. Layering is still partly intact, however. Given the depth of the samples, it is most likely that this biological activity mostly occurred in the past, although modern roots are clearly present.
Figure 14. Micrographs from Schokland area thin sections. All images in plane polarised light (PPL) unless indicated
otherwise (XPL = crossed polarisers, OIL = obliquely incident light). A: Organic plasma with large embedded well-
preserved tissue fragment. P14. B: Idem, XPL. C: Well-preserved seed in organic plasma. De Zuidert. D: Idem, XPL.
A
C
B
D
35—
Figure 14. E: Pyrite (black), surrounded by gypsum (white) in peat. J125. F: Clusters of gypsum (white) and iron oxides (reddish) in clayey groundmass. De
Zuidert. G: Idem, XPL. Gypsum is grey to brilliant white; iron oxides are reddish. H: Gypsum minerals and iron oxides, associated with charcoal fragments
(black). The formation of the gypsum has resulted in the fragmentation of the charcoal. De Zuidert. I: Cluster of unaffected pyrite in deeper reducing layers.
De Zuidert; OIL. J: Pyrite precipitated on organic tissue fragments. From the deeper reducing layers unaffected by oxidation. De Zuidert; OIL.
E
G
I
F
H
J
36—
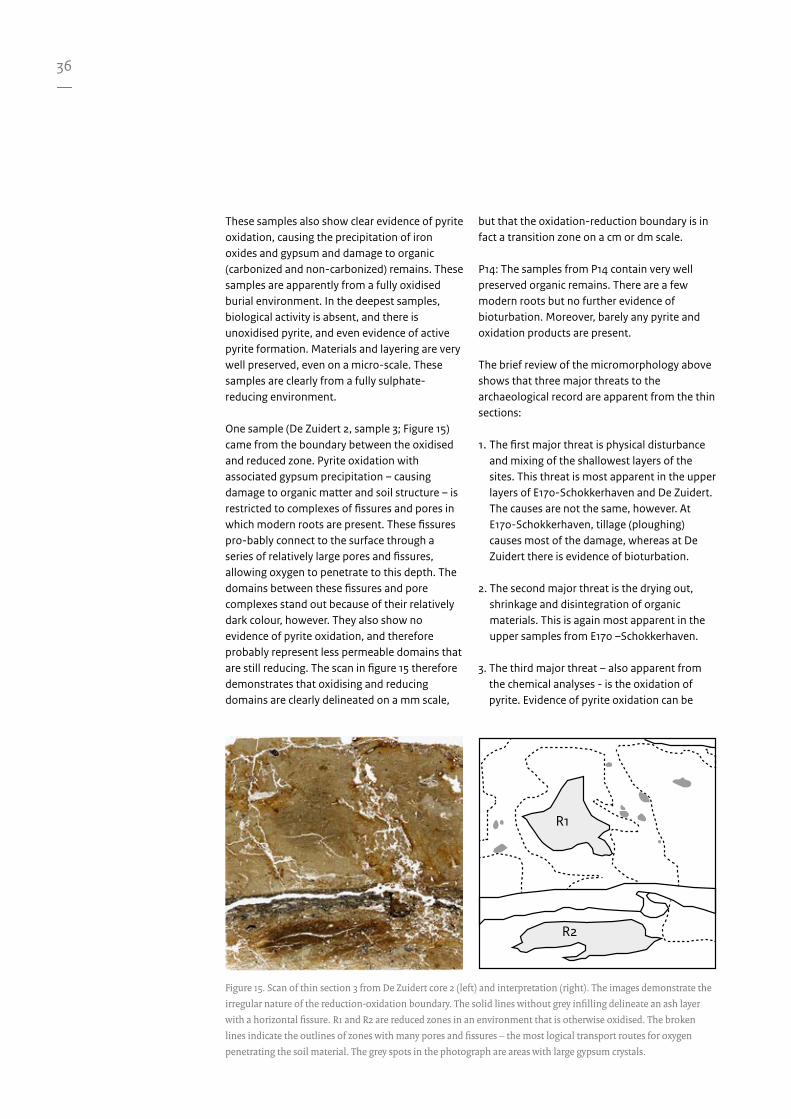
R1
R2
These samples also show clear evidence of pyrite oxidation, causing the precipitation of iron oxides and gypsum and damage to organic (carbonized and non-carbonized) remains. These samples are apparently from a fully oxidised burial environment. In the deepest samples, biological activity is absent, and there is unoxidised pyrite, and even evidence of active pyrite formation. Materials and layering are very well preserved, even on a micro-scale. These samples are clearly from a fully sulphate-reducing environment.
One sample (De Zuidert 2, sample 3; Figure 15) came from the boundary between the oxidised and reduced zone. Pyrite oxidation with associated gypsum precipitation – causing damage to organic matter and soil structure – is restricted to complexes of fissures and pores in which modern roots are present. These fissures pro-bably connect to the surface through a series of relatively large pores and fissures, allowing oxygen to penetrate to this depth. The domains between these fissures and pore complexes stand out because of their relatively dark colour, however. They also show no evidence of pyrite oxidation, and therefore probably represent less permeable domains that are still reducing. The scan in figure 15 therefore demonstrates that oxidising and reducing domains are clearly delineated on a mm scale,
but that the oxidation-reduction boundary is in fact a transition zone on a cm or dm scale.
P14: The samples from P14 contain very well preserved organic remains. There are a few modern roots but no further evidence of bioturbation. Moreover, barely any pyrite and oxidation products are present.
The brief review of the micromorphology above shows that three major threats to the archaeological record are apparent from the thin sections:
1. The first major threat is physical disturbance and mixing of the shallowest layers of the sites. This threat is most apparent in the upper layers of E170-Schokkerhaven and De Zuidert. The causes are not the same, however. At E170-Schokkerhaven, tillage (ploughing) causes most of the damage, whereas at De Zuidert there is evidence of bioturbation.
2. The second major threat is the drying out, shrinkage and disintegration of organic materials. This is again most apparent in the upper samples from E170 –Schokkerhaven.
3. The third major threat – also apparent from the chemical analyses - is the oxidation of pyrite. Evidence of pyrite oxidation can be
R1
R2
Figure 15. Scan of thin section 3 from De Zuidert core 2 (left) and interpretation (right). The images demonstrate the
irregular nature of the reduction-oxidation boundary. The solid lines without grey infilling delineate an ash layer
with a horizontal fissure. R1 and R2 are reduced zones in an environment that is otherwise oxidised. The broken
lines indicate the outlines of zones with many pores and fissures – the most logical transport routes for oxygen
penetrating the soil material. The grey spots in the photograph are areas with large gypsum crystals.
37—
found at all sites, but the most intense effects are visible at De Zuidert and at E170-Schokkerhaven. P14 has much lower pyrite contents, and the rate of oxidation seems to be lower at J125. Effects of pyrite oxidation are (1) acidification, resulting in damage to bone material (Turner-Walker 2009) and (2) damage to organic remains – whether carbonised or not – due to the formation of gypsum crystals.
The approach taken here differs from that taken in the 1999/2001 monitoring round (van Heeringen et al. 2004), when the focus was on the quality of the organic matter. We chose not to take that approach since the quality of the organic matter is influenced very strongly by pre-burial degradation and site forming processes. Even well-preserved peat profiles often contain horizons with degraded organic matter. They may represent temporary local drying out phases that are common in growing moss peat.25 Reed peats often consist of degraded organic plasma with embedded well-preserved organic tissue fragments.26 The approach taken here focused on active and past degradation processes.27
Comparison of the present micromorphological results with previous monitoring rounds is difficult, for several reasons:
1. In 1999, 2.5 cm-wide samples were used; we used 8 cm-wide samples. Morphological features are virtually impossible to recognise in 2.5 cm-wide samples, and the sampled volume is so small that signs are easily missed.
2. The focus on the quality of organic matter. None of the sample descriptions mentions pyrite, gypsum or iron oxides, which is strange considering the large amounts that were found in the present round. A puzzling remark in the chemical section of this publication (p. 100) does however refer to the presence of pyrite in the micromorphological samples. Apparently, not all data relevant for monitoring were recorded.
3. A re-examination of the samples from the first round is no longer possible, since the present whereabouts of the sections is unknown. 25 Theunissen et al. 2006; Huisman &
Theunissen 2008.26 e.g. Huisman 2010.27 as described in Huisman (2009b).

39—
4.1 Trends in degree of preservation?
In an ideal world, it would be possible here to discuss whether bone histology, the preservation of botanical remains and micromorphology show trends from 1999 to 2010. However, since no histological analysis was possible in this monitoring round, and thin sections from previous rounds are missing, this is possible only in the case of the botanical remains. As stated above, there is no clear trend in the degree of preservation of botanical remains. Moreover, the sites with the best preservation conditions (P14 and J125) show the strongest weathering of botanical remains (most commonly class “C”).
The lack of trends, even for a site under a great deal of stress like E170- Schokkerhaven, gives cause to question the extent to which this type of botanical analysis is suitable for monitoring purposes. Perhaps differences in numbers of species and in degree of degradation are more dependent on site characteristics, in-site variation and ancient taphonomic processes than on recent degradation. From this perspective, the wide range of values in preservation indices for individual seeds can be seen as an indication that recent degradation processes cannot yet be distinguished from the “normal” background variation within these sites.
This does not invalidate the analysis of botanical remains as a means of assessing the state of an archaeological site. It does however call into question its suitability for monitoring changes due to degradation processes on relatively short timescales.
4.2 Trends in burial environment?
Due to the failure of the redox measurements and the missing soil thin sections, only groundwater measurements can be used to assess changes in burial environment in the last decade. The water board data clearly show that the burial environment at one site (P14) has become wetter – a positive development for the organic remains at this site. This is true of a large
part of the hydrological zone – especially the northern part. It is unlikely that the burial environment at the other three sites has changed significantly. No measures were implemented at J125 and E170-Schokkerhaven. De Zuidert terp is a distinct hydrological system, which can barely be affected by changes in groundwater dynamics on Schokland, especially since they have not changed much in recent decades.
4.3 Present burial conditions
Two major processes threaten the archaeological remains in the Schokland area. One threat is tillage, resulting in repeated mixing and disturbance of the archaeological layers in and immediately below the ploughsoil at tilled sites (E170-Schokkerhaven and J125). The field observations at J125 illustrate that the use of increasingly deeper ploughs may result in disturbance and destruction of archaeological deposits that were in good condition until recently. The other threat is desiccation. This results in damage to organic remains, and in pyrite oxidation-induced acidification. These processes are especially severe at E170-Schokkerhaven and in the upper layers of De Zuidert terp, although some oxidation of pyrite also seems to be taking place at J125. P14 seems to be in good shape generally, with no evidence for either desiccation or pyrite oxidation. The raising of the water table in the hydrological zone can only have improved this situation. However, since we have no data on pyrite oxidation or desiccation of organic remains before the creation of the hydrological zone, we have no hard evidence to suggest that past decay processes may have stopped now.
4.4 What future for the archaeological sites?
In view of the above, the future of the archaeological sites is likely to vary considerably.
All parameters remaining equal, the expectation is that P14 will remain in good shape. As long as the water table remains as high as it is now, no
4 Interpretation and discussion
40—
damage will occur due to desiccation, pyrite oxidation or bioturbation. Moreover, there is no danger from tillage.
Pyrite oxidation and decay of organic matter will continue in the upper layers of De Zuidert terp. The deeper layers remain in good condition. Since this situation will not have changed considerably since the abandonment of the terp, decay processes in the upper layers are not a particular concern; they should in fact be seen as a normal development for this type of terp site.
The E170-Schokkerhaven site is a different story. This site suffers from desiccation-driven pyrite oxidation which causes acidification and damage to organic materials due to gypsum formation. Desiccation in its own right may also be responsible for the relatively bad quality of botanical remains.28 It is unclear whether regular ploughing progressively disturbs pristine archaeological layers. Model predictions29 suggest that damage due to ploughing is progressive, but this has not been validated.
J125 seems to be in better condition, but is not completely outside the danger zone. No decay of organic matter has been observed, and pyrite oxidation seems to occur to only a limited extent. Wetter conditions would be better, but the situation is not alarming. One point of concern is the evidence of an increase in ploughing depths at this site. It is inevitable that, with every increase in ploughing depth, more damage will be done to the known site and to other remains in the vicinity. These four sites were chosen as representative of the various types of archaeological site that occur in the Schokland area: De Zuidert represents the terp sites on the island, P14 the riverbank sites, E170-Schokkerhaven the river dune sites inside the WHS, and J125 the river dune sites outside the WHS. There is no reason to doubt or reconsider this choice.
4.5 Future monitoring on Schokland
The imminent 15-year anniversary of monitoring at Schokland is a good moment to take a critical look at the monitoring programme and advise on future monitoring rounds. We need to
consider this issue from two sides. i.e. from the point of view of the methods or techniques applied, and of the choice of monitoring sites.
When it comes to the methods and techniques, it is important to consider what monitoring methods or techniques provide sufficiently precise, reliable and relevant information on the state of the monument. Techniques that have proved useful for characterising the burial environment – and have contributed to the monitoring project in this way – are not necessarily suitable for repeated measurements to monitor changes. If we look critically at each of the techniques employed in the 3rd round in turn, the following picture emerges:
1. Monitoring the state of the archaeological remains on the basis of the quality of bone fragments and botanical remains is fraught with difficulties. For bone fragments, the low amounts of material that is usually obtained - especially from core samples – is problematic. For botanical remains, the variability in the properties of different types of remains – and therefore also differences in their resistance to decay – cause serious problems when it comes to interpreting the data. For both types of remains, a fundamental problem is that it is impossible to assess at which moment in time degradation has occurred; pre-burial degradation processes may have had a big influence on the state of this material. This means that the degree of degradation found may have no correlation at all with recent (or active) degradation processes, and that trends may be obscured by large variabilities.
2. Micromorphological study has been instrumental in determining the processes active at the site. It remains to be seen whether progressive changes in archaeological layers can be identified and quantified using this technique, however. It should theoretically be possible, but there are currently no examples where such progressive changes have been identified. The technique is most useful for monitoring whether or not specific processes (like pyrite oxidation) are active in a certain deposit. It is much less suitable for monitoring or quantifying the progression of ongoing decay processes once
28 Weijdema et al. (2011).29 Bor 2008.
41—
they have become active. One major problem is that, at present, thin section slides are not stored in a central location, as a result of which they are not generally available. Moreover, they can easily be mislaid on time-scales relevant for monitoring.
3. Monitoring the burial environment using groundwater dipwells and redox measurements must be one of the most commonly applied techniques in archaeological site management. In the present study, we also planned to use soil moisture measurements because they are much more relevant for the decay of organic remains than groundwater levels. Because of the failure of these measurements, we cannot now assess this. What the present study does show is that the groundwater monitoring being conducted by the water board in the Schokland area provides a wealth of data on the hydrological system, on its sensitivity to changes, and on the potential threat to archaeological sites from desiccation. There is barely any need to take additional measurements if water board dipwells are available in the immediate vicinity of an archaeological site. At sites like J125 and E170-Schokkerhaven such wells are not however available. Here, an additional problem lies in the fact that year-round monitoring is difficult on fields that are under tillage. All monitoring at these sites was conducted at the field edges, i.e. in non-representative locations. If monitoring at these sites is to continue, a method needs to be developed that will enable monitoring at representative locations throughout the year.
If we take a fresh look at what we now know about the applicability of the monitoring techniques and about the sites themselves, the following proposals can be made concerning the monitoring of archaeological sites in the Schokland area.
The waterlogged burial environment in an area not in agricultural use means that P14 is probably in very good condition, with very good prospects for the future. As long as this situation continues, and as long as the water board keeps monitoring the water table, there does not seem to be any reason to engage extensively in other
forms of monitoring. Keeping an eye on the water table to make sure no unexpected desiccation occurs, perhaps combined with low-frequency field visits to check that no reeds start growing, should be enough for the coming decades at least.
De Zuidert terp shows degradation processes in its upper layers that have probably been occurring for at least a hundred years. Degradation due to tillage is absent, however. The deeper layers are well-preserved and have a good future. The mound effectively forms a hydrological system that is independent of its surroundings. The fine-textured material keeps all layers except the ones at the very top in good shape. Even if this were not the case, it would not be possible to change the burial environment without doing major damage to the site, especially its visual value. The well-preserved deeper layers with good future prospects combined with the inadvisability of trying to change the burial conditions means intensive monitoring is not necessary. For the future, the only relevant form of monitoring would consist of low-frequency site inspections to make sure the site is not threatened by deep-rooted vegetation.
E170-Schokkerhaven is at the other end of the spectrum. It is desiccating, suffering from pyrite oxidation, and under cultivation. Rates of decay are notoriously difficult to predict, but with the present state of knowledge it is assumed that the site will lose a very significant portion of its archaeological value within the next few decades. There are basically two options for the future preservation of the site: either take measures to improve the burial conditions and preserve the site in situ, or excavate the site for preservation ex situ. As long as the situation remains unchanged, it does not make much sense to continue monitoring. If measures for improving the burial environment were to be taken, monitoring would become a necessity however, to make sure that the new burial environment was indeed suitable for preserving the archaeological remains. If not, continued measurements would be relevant only if they formed part of a project to study the decay of archaeological remains; not as part of a monitoring programme proper.
42—
J125 lies between the extremes of P14 and E170-Schokkerhaven. The condition of the site seems to be good, and the burial environment does not give immediate reason for concern. There are, however, two clear threats. The first is ploughing. The depth of ploughing seems to be on the increase, which constitutes a danger to the upper layers of the site. Moreover, some pyrite oxidation seems to be occurring, although not at an alarming rate. Due to the failure of the groundwater, moisture and redox measurements at the site we do not have more specific information on the burial environment. At this site, it would be advisable to continue
monitoring the burial environment. The intensive land-use at J125 makes long-term monitoring of groundwater/moisture/redox unfeasible, especially since measurements can be taken only at the edge of the field in non-representative positions. Until a method is developed that makes it possible to monitor such parameters in a tilled field, it is unadvisable to continue such attempts. It may therefore be advisable for future monitoring to focus on obtaining good-quality cores from more representative locations at this site for macroscopic observations, and for micromorphological and chemical analysis.
43—
We should first and foremost like to thank the owners of the land where monitoring and sampling was carried out. Without their kind cooperation in allowing access to the plots the research presented here would not have been possible.
Zuiderzeeland water board for provided the data from their groundwater monitoring system. The huge dataset they provided was instrumental in allowing us to take a new step forward in site monitoring at Schokland.
We would also like to thank Dick Veldhuizen for his support during the fieldwork preparations.
Marjolein Haars helped with the lay-out of the figures. Sue McDonnell checked and corrected the English text.
Acknowledgements
44—
Bor, A., 2008, Physical degradation of archaeological sites in the Netherlands. Unpublished BSc dissertation Wageningen University, 43 pp.
Brinkkemper, O., 2006, Study of the preservation quality of archaeological sites using botanical macroremains, Berichten van de Rijksdienst voor het Oudheidkundig Bodemonderzoek 46, pp. 303 - 314
Gehasse, E.F., 1995, Ecologisch-archeologisch onderzoek van het Neolithicum en de Vroege Bronstijd in de Noordoostpolder met de nadruk op vindplaats P14, PhD thesis, Amsterdam University, Amsterdam
Hogestijn, J.W.H., 1991, Archeologische kroniek van Flevoland (Cultureel Historisch Jaarboek voor Flevoland 1), Lelystad
Gotjé, W., M. Kramer, F. Wit and P. Schipper, 2010, Bodemkartering Schokland, Analyses bodemkundige situatie en consequenties voor behoud van bodemarchief en agrarisch gebruik, Grontmij, Houten
Huisman, D.J., 2009a, Iron. In: Huisman, D.J. (ed.), Degradation of archaeological remains, SdU Uitgevers b.v. Den Haag, pp. 91 - 109
Huisman, D.J., 2009b, Using soil micromorphology to evaluate the suitability of the burial environment for in situ protection, In: K. Straetkvern & D.J. Huisman, 2009, Proceedings of the 10th ICOM Group on Wet Organic Archaeological Materials Conference, Amsterdam 2007, Nederlandse Archeologische Rapporten (NAR) 37, RACM, Amersfoort pp. 101 - 111
Huisman, D.J. (ed.), 2009c, Degradation of archaeological remains, SdU Uitgevers b.v. Den Haag, 245 pp.
Huisman, D.J. & E.M. Theunissen, 2008, Too good to be true? The unexpectedly good preservation of the Nieuw Dordrecht Neolithic peat trackway and its consequences. In: H. Kars & R.M. van Heeringen (eds.) 2008, Preserving archaeological remains in situ. Proceedings of the 3rd conference 7 – 9 December 2006, Amsterdam, Geoarchaeological and Bioarchaeological Studies Vol. 10, IGBA, VU University, Amsterdam, 15 – 28
Huisman, D.J. & R.K.W.M. Klaassen, 2009, Wood. In: Huisman, D.J. (ed.), Degradation of archaeological remains, SdU Uitgevers b.v. Den Haag, pp. 17 - 23
Huisman, D.J. & I. Joosten, 2009, Copper and copper alloys. In: Huisman, D.J. (ed.), Degradation of archaeological remains, SdU Uitgevers b.v. Den Haag, pp. 111 - 124
Huisman, M.R. Manders, E. Kretschmar, R.K.W.M. Klaassen & N. Lamersdorf, 2008a, Burial conditions and wood degradation on archaeological sites in the Netherlands, International Biodedeterioration & Biodegradation 61: 33-44
Huisman. D.J. & G. Mauro, submitted, The never-ending story? The lessons of 15 years of archaeological monitoring at the former island of Schokland, Proceedings of the 4th conference on Preserving Archaeological Remains In Situ (PARIS IV), Kopenhagen, 2011
Huisman,H., A. Müller, B. van Os & H. Peeters, 2008b, Een kleinschalig onderzoek naar de fysieke gaafheid en conserveringstoestand van de vindplaatsen Schokkerhaven-E170 en Schokland-J125 (prov. Flevoland) in het kader van het beheersplan Schokland (UNESCO World Heritage Site). Beknopte Rapportage Archeologische Monumentenzorg (BRAM) 11, Rijksdienst voor Archeologie, Cultuurlandschap en Monumenten, Amersfoort, 33 pp.
References
45—
Huisman, D.J., M. Vorenhout, A. Smit, B.J. H. van Os & M. Manders, 2009, Preservation and monitoring of archaeological sites In: Huisman, D.J. (ed.), Degradation of archaeological remains, SdU Uitgevers b.v. Den Haag, pp. 177 - 210
Huisman, D.J., 2010, Micromorfologisch onderzoek In: J. van Doesburg, A. Muller & J. Schreurs, Land van melk en honing? Waardestellend archeologisch onderzoek (februari – juli 2006) naar Middeleeuwse veenterpen in de Peizer- en Eeldermaden (gem. Noordenveld) in het kader van inrichting en beheer van het archeologische monument Peizermaden. Rapportage Archeologische Monumentenzorg (RAM) 178, RACM, Amersfoort, pp. 105 - 109
Jans, M.M.E., H. Kars, C.M. Nielsen-Marsch, C.I. Smith, A.G. Nord, P. Arthur & N. Earl, 2002, In situ preservation of archaeological bone. A histological study within a multidisciplinary approach, Archaeometry 44: 343 - 352
Jans, M.M.E., C.M. Nielsen-Marsch, C.I. Smith, M.J. Collins & H. Kars, 2004, Characterization of microbial attack on archaeological bone, Journal of Archaeological Science 31: 87 – 95
Jones, J., H. Tinsley & R. Brunning 2007: Methodologies for Assessment of the State of Preservation of Pollen and Plant Macrofossil Remains in Waterlogged Deposits, Environmental Archaeology 12, 71-86
Projectgroep Schokland, 1998: Nieuw Schokland: Plan van Aanpak. s.l.
Rabenhorst, M.C., W.D. Hively & B.R. James, 2009, Measurements of soil redox potential, Soil Science Society of America Journal 73(2): 668-674
Smit , A., G. Mol & R.M. van Heeringen, 2005, Natte voeten voor Schokland. Inrichting hydrologische zone. Archeologische monitoring 2003 – 2004. Een evaluatie van de waterhuishoudkundige maatregelen, Rapportage Archeologische Monumenten-zorg 124, Rijksdienst voor het Oudheidkundig Bodem-onderzoek, Amersfoort, 63 pp.
Smit, A., R.M. van Heeringen & E.M. Theunissen, 2006, Archaeological Monitoring Standard, Guidelines for the non-desctructive recording and monitoring of the physical quality of archaeological sites and monuments, Nederlandse Archeologische Rapporten (NAR) 33, Rijksdienst voor Archaeologie, Cultuurlandschap en Monumenten (RACM), Amersfoort, 107 pp.
Ten Anscher, 2012, Leven met de Vecht. Schokland-P14 en de Noordoostpolder in het Neolithicum en de Bronstijd, Proefschrift Universiteit van Amsterdam, Amsterdam, 699 pp.
Theunissen, E.M., D.J. Huisman, A. Smit & F. van der Heijden, 2006, Kijkoperatie in het veen. Kwaliteitsbepalend onderzoek naar de veenweg van Nieuw-Dordrecht (gemeente Emmen), Rapportage Archeologische Monumentenzorg (RAM) 130
Turner-Walker, G., 2009, Degradation pathways and conservation strategied for ancient bone from wet anoxic sites, In: K. Straetkvern & D.J. Huisman, 2009, Proceedings of the 10th ICOM Group on Wet Organic Archaeological Materials Conference, Amsterdam 2007, Nederlandse Archeologische Rapporten (NAR) 37, RACM, Amersfoort pp. 659-675
Van den Berg, M. & M. Vorenhout, 2011, Schokland Monitoring 2009 - 2010, (IGBA Rapport 2011-02)Instituut voor Geo- en Bio-archeologie, Vrije Universiteit Amsterdam, Amsterdam, 27 pp.
46—
Van den Biggelaar, D.F.A.M., S. J. Kluiving, R. T. Van Balen & C. Kasse, in prep., Historical landscape reconstruction of Schokland (Flevoland, the Netherlands): A combined archaeological, geological and historical geographical approach
Van der Heide, G.D., 1950. Voorlopig opgravingsrapport: Proefopgraving terp Zuidert, Schokland, Schokland (ROB report 16C), Rijksdienst voor het Oudheidkundig Bodemonderzoek, Amersfoort
Van Doesburg, J. and G.V. Mauro, 2007, Onderzoek en archeologische begeleiding op en rondom Schokland; een kleinschalig onderzoek aan het Enserkerkje en archeologische begeleiding van de herstel-werkzaamheden aan de kerkresten, de waterput op de Zuidert en de aanleg van de hydrologische zone, Rapportage Archeologische Monumentenzorg (RAM) 142, Rijksdienst voor Archeologie, Cultuurlandschap en Monumenten (RACM), Amersfoort, 86 pp.
Van Haaster, H., 2010, Waardering van botanische macroresten van vier archeologische vondplaatsen bij Schokland (BIAXiaal 496), BIAX consult, Zaandam, 22 pp.
Van Heeringen, R.M., G.V. Mauro & A. Smit, 2004, A pilot study on the Monitoring of the Physical Quality of Three Archaeological Sites at the UNESCO World Heritage Site at Schokland, Province of Flevoland, the Netherlands, Nederlandse Archeologische Rapporten 26, Rijksdienst voor het Oudheidkundig Bodemonderzoek, Amersfoort, 133 pp.
Vernimmen, T.J.J., 2001: De conserveringstoestand van het archeobotanische materiaal, in: R.M. van Heeringen & E.M. Theunissen (eds.), Kwaliteitsbepalend onderzoek ten behoeve van duurzaam behoud van neolithische terreinen in West-Friesland en de Kop van Noord-Holland, Amersfoort (Nederlandse Archeologische Rapporten, 21), 101-117.
Vernimmen,T.J.J., 2002: The Preservation of Botanical Remains in Archaeological Sites on Voorne-Putten, in: R.M. van Heeringen & E.M Theunissen (eds.), Desiccation of the Archaeological Landscape at Voorne-Putten, Amersfoort (Nederlandse Archeologische Rapporten, 25), 137-162.
Weijdema, F., O. Brinkkemper, H. Peeters, & B. van Geel, 2011, Early Neolithic human impact on the vegetation in a wetland environment in the Noordoostpolder, central Netherlands, Journal of Archaeology in the Low Countries 3-1/2: 31 – 46 [www.jalc.nl]
Weemstra, H., 2010, Een vergelijkbaarheidsonderzoek van peilbuizen op en rond Schokland. Kan aan de hand van peilbuizen van waterschap Zuiderzeeland de grondwaterstand bepaald worden op vier locaties met archeologische waarden?, Unpublished BSc dissertation, VU University Amsterdam, 103 pp.

47—
I Borehole and core descriptionsII IGBA Report III BIAX report on Botanical remainsIV Scans of thin sectionsV A,B,C,D Thin section descriptionsVI Characteristics of the weather over the last two decades.
KNMI data for Marknesse.
Appendices
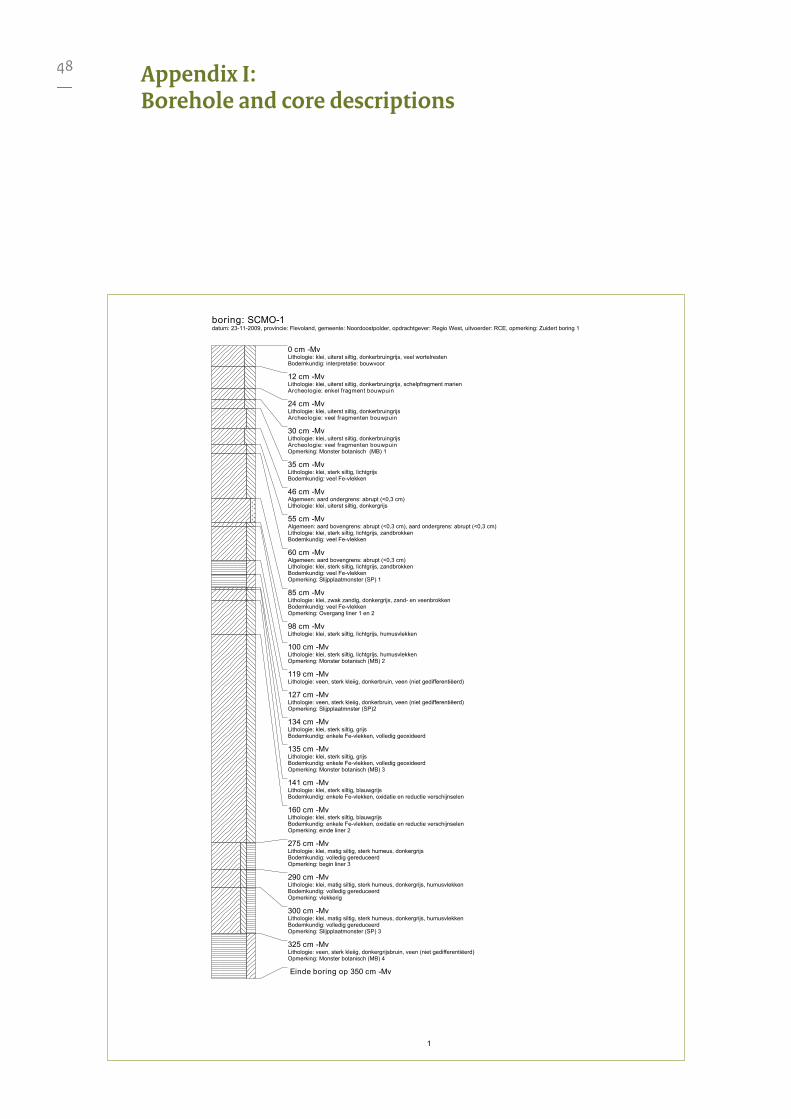
48—
Appendix I:Borehole and core descriptions
1
boring: SCMO-1datum: 23-11-2009, provincie: Flevoland, gemeente: Noordoostpolder, opdrachtgever: Regio West, uitvoerder: RCE, opmerking: Zuidert boring 1
0 cm -MvLithologie: klei, uiterst siltig, donkerbruingrijs, veel wortelrestenBodemkundig: interpretatie: bouwvoor
12 cm -MvLithologie: klei, uiterst siltig, donkerbruingrijs, schelpfragment marienArcheologie: enkel fragment bouwpuin
24 cm -MvLithologie: klei, uiterst siltig, donkerbruingrijsArcheologie: veel fragmenten bouwpuin
30 cm -MvLithologie: klei, uiterst siltig, donkerbruingrijsArcheologie: veel fragmenten bouwpuinOpmerking: Monster botanisch (MB) 1
35 cm -MvLithologie: klei, sterk siltig, lichtgrijsBodemkundig: veel Fe-vlekken
46 cm -MvAlgemeen: aard ondergrens: abrupt (<0,3 cm)Lithologie: klei, uiterst siltig, donkergrijs
55 cm -MvAlgemeen: aard bovengrens: abrupt (<0,3 cm), aard ondergrens: abrupt (<0,3 cm)Lithologie: klei, sterk siltig, lichtgrijs, zandbrokkenBodemkundig: veel Fe-vlekken
60 cm -MvAlgemeen: aard bovengrens: abrupt (<0,3 cm)Lithologie: klei, sterk siltig, lichtgrijs, zandbrokkenBodemkundig: veel Fe-vlekkenOpmerking: Slijpplaatmonster (SP) 1
85 cm -MvLithologie: klei, zwak zandig, donkergrijs, zand- en veenbrokkenBodemkundig: veel Fe-vlekkenOpmerking: Overgang liner 1 en 2
98 cm -MvLithologie: klei, sterk siltig, lichtgrijs, humusvlekken
100 cm -MvLithologie: klei, sterk siltig, lichtgrijs, humusvlekkenOpmerking: Monster botanisch (MB) 2
119 cm -MvLithologie: veen, sterk kleiig, donkerbruin, veen (niet gedifferentiëerd)
127 cm -MvLithologie: veen, sterk kleiig, donkerbruin, veen (niet gedifferentiëerd)Opmerking: Slijpplaatmnster (SP)2
134 cm -MvLithologie: klei, sterk siltig, grijsBodemkundig: enkele Fe-vlekken, volledig geoxideerd
135 cm -MvLithologie: klei, sterk siltig, grijsBodemkundig: enkele Fe-vlekken, volledig geoxideerdOpmerking: Monster botanisch (MB) 3
141 cm -MvLithologie: klei, sterk siltig, blauwgrijsBodemkundig: enkele Fe-vlekken, oxidatie en reductie verschijnselen
160 cm -MvLithologie: klei, sterk siltig, blauwgrijsBodemkundig: enkele Fe-vlekken, oxidatie en reductie verschijnselenOpmerking: einde liner 2
275 cm -MvLithologie: klei, matig siltig, sterk humeus, donkergrijsBodemkundig: volledig gereduceerdOpmerking: begin liner 3
290 cm -MvLithologie: klei, matig siltig, sterk humeus, donkergrijs, humusvlekkenBodemkundig: volledig gereduceerdOpmerking: vlekkerig
300 cm -MvLithologie: klei, matig siltig, sterk humeus, donkergrijs, humusvlekkenBodemkundig: volledig gereduceerdOpmerking: Slijpplaatmonster (SP) 3
325 cm -MvLithologie: veen, sterk kleiig, donkergrijsbruin, veen (niet gedifferentiëerd)Opmerking: Monster botanisch (MB) 4
Einde boring op 350 cm -Mv
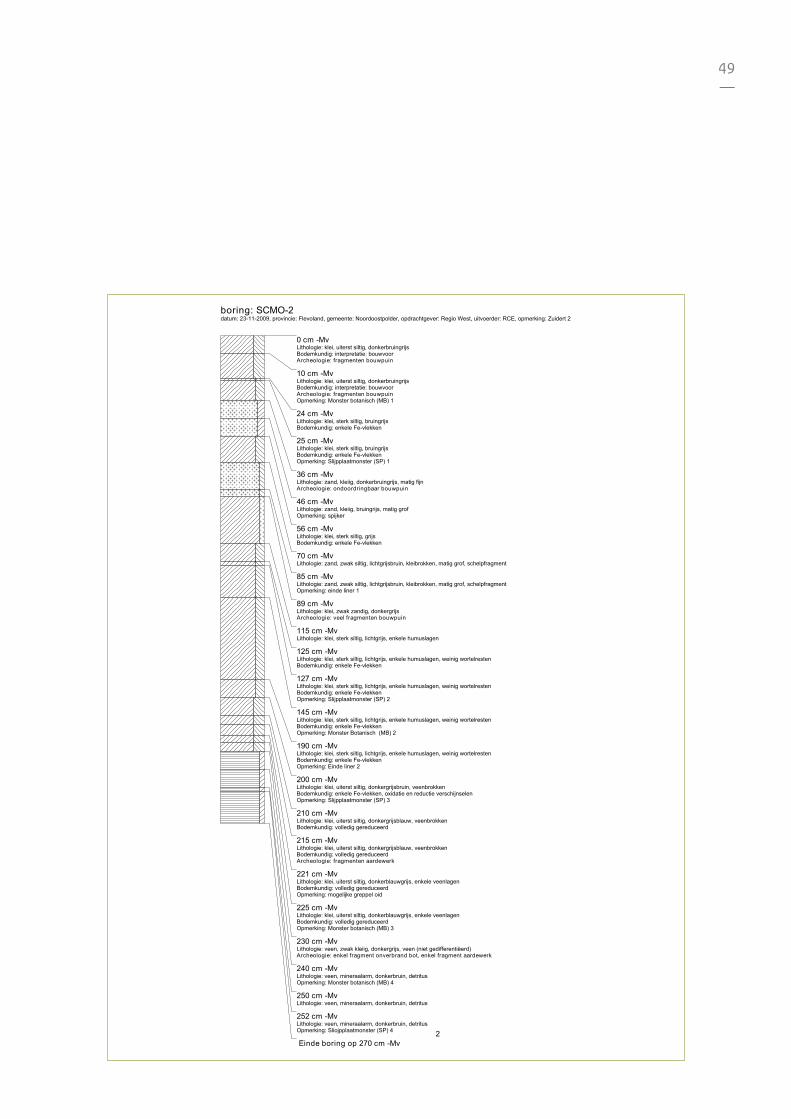
49—
2
boring: SCMO-2datum: 23-11-2009, provincie: Flevoland, gemeente: Noordoostpolder, opdrachtgever: Regio West, uitvoerder: RCE, opmerking: Zuidert 2
0 cm -MvLithologie: klei, uiterst siltig, donkerbruingrijsBodemkundig: interpretatie: bouwvoorArcheologie: fragmenten bouwpuin
10 cm -MvLithologie: klei, uiterst siltig, donkerbruingrijsBodemkundig: interpretatie: bouwvoorArcheologie: fragmenten bouwpuinOpmerking: Monster botanisch (MB) 1
24 cm -MvLithologie: klei, sterk siltig, bruingrijsBodemkundig: enkele Fe-vlekken
25 cm -MvLithologie: klei, sterk siltig, bruingrijsBodemkundig: enkele Fe-vlekkenOpmerking: Slijpplaatmonster (SP) 1
36 cm -MvLithologie: zand, kleiig, donkerbruingrijs, matig fijnArcheologie: ondoordringbaar bouwpuin
46 cm -MvLithologie: zand, kleiig, bruingrijs, matig grofOpmerking: spijker
56 cm -MvLithologie: klei, sterk siltig, grijsBodemkundig: enkele Fe-vlekken
70 cm -MvLithologie: zand, zwak siltig, lichtgrijsbruin, kleibrokken, matig grof, schelpfragment
85 cm -MvLithologie: zand, zwak siltig, lichtgrijsbruin, kleibrokken, matig grof, schelpfragmentOpmerking: einde liner 1
89 cm -MvLithologie: klei, zwak zandig, donkergrijsArcheologie: veel fragmenten bouwpuin
115 cm -MvLithologie: klei, sterk siltig, lichtgrijs, enkele humuslagen
125 cm -MvLithologie: klei, sterk siltig, lichtgrijs, enkele humuslagen, weinig wortelrestenBodemkundig: enkele Fe-vlekken
127 cm -MvLithologie: klei, sterk siltig, lichtgrijs, enkele humuslagen, weinig wortelrestenBodemkundig: enkele Fe-vlekkenOpmerking: Slijpplaatmonster (SP) 2
145 cm -MvLithologie: klei, sterk siltig, lichtgrijs, enkele humuslagen, weinig wortelrestenBodemkundig: enkele Fe-vlekkenOpmerking: Monster Botanisch (MB) 2
190 cm -MvLithologie: klei, sterk siltig, lichtgrijs, enkele humuslagen, weinig wortelrestenBodemkundig: enkele Fe-vlekkenOpmerking: Einde liner 2
200 cm -MvLithologie: klei, uiterst siltig, donkergrijsbruin, veenbrokkenBodemkundig: enkele Fe-vlekken, oxidatie en reductie verschijnselenOpmerking: Slijpplaatmonster (SP) 3
210 cm -MvLithologie: klei, uiterst siltig, donkergrijsblauw, veenbrokkenBodemkundig: volledig gereduceerd
215 cm -MvLithologie: klei, uiterst siltig, donkergrijsblauw, veenbrokkenBodemkundig: volledig gereduceerdArcheologie: fragmenten aardewerk
221 cm -MvLithologie: klei, uiterst siltig, donkerblauwgrijs, enkele veenlagenBodemkundig: volledig gereduceerdOpmerking: mogelijke greppel oid
225 cm -MvLithologie: klei, uiterst siltig, donkerblauwgrijs, enkele veenlagenBodemkundig: volledig gereduceerdOpmerking: Monster botanisch (MB) 3
230 cm -MvLithologie: veen, zwak kleiig, donkergrijs, veen (niet gedifferentiëerd)Archeologie: enkel fragment onverbrand bot, enkel fragment aardewerk
240 cm -MvLithologie: veen, mineraalarm, donkerbruin, detritusOpmerking: Monster botanisch (MB) 4
250 cm -MvLithologie: veen, mineraalarm, donkerbruin, detritus
252 cm -MvLithologie: veen, mineraalarm, donkerbruin, detritusOpmerking: Sliojpplaatmonster (SP) 4
Einde boring op 270 cm -Mv
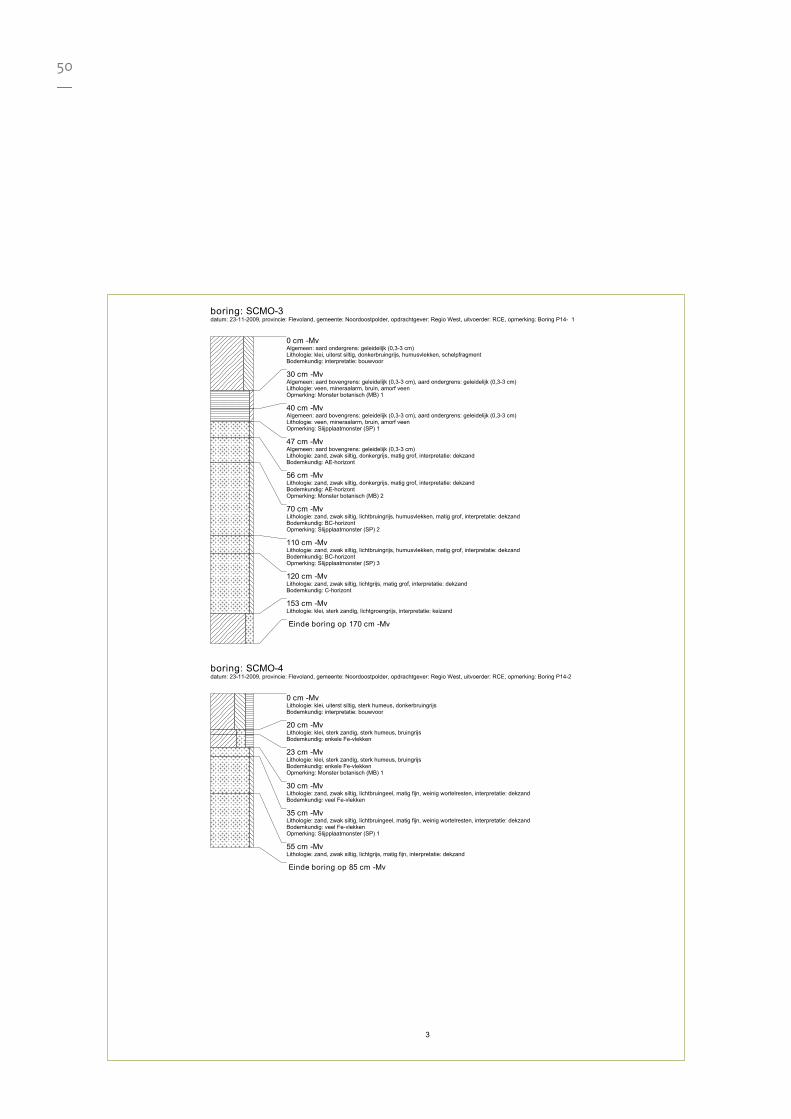
50—
3
boring: SCMO-3datum: 23-11-2009, provincie: Flevoland, gemeente: Noordoostpolder, opdrachtgever: Regio West, uitvoerder: RCE, opmerking: Boring P14- 1
0 cm -MvAlgemeen: aard ondergrens: geleidelijk (0,3-3 cm)Lithologie: klei, uiterst siltig, donkerbruingrijs, humusvlekken, schelpfragmentBodemkundig: interpretatie: bouwvoor
30 cm -MvAlgemeen: aard bovengrens: geleidelijk (0,3-3 cm), aard ondergrens: geleidelijk (0,3-3 cm)Lithologie: veen, mineraalarm, bruin, amorf veenOpmerking: Monster botanisch (MB) 1
40 cm -MvAlgemeen: aard bovengrens: geleidelijk (0,3-3 cm), aard ondergrens: geleidelijk (0,3-3 cm)Lithologie: veen, mineraalarm, bruin, amorf veenOpmerking: Slijpplaatmonster (SP) 1
47 cm -MvAlgemeen: aard bovengrens: geleidelijk (0,3-3 cm)Lithologie: zand, zwak siltig, donkergrijs, matig grof, interpretatie: dekzandBodemkundig: AE-horizont
56 cm -MvLithologie: zand, zwak siltig, donkergrijs, matig grof, interpretatie: dekzandBodemkundig: AE-horizontOpmerking: Monster botanisch (MB) 2
70 cm -MvLithologie: zand, zwak siltig, lichtbruingrijs, humusvlekken, matig grof, interpretatie: dekzandBodemkundig: BC-horizontOpmerking: Slijpplaatmonster (SP) 2
110 cm -MvLithologie: zand, zwak siltig, lichtbruingrijs, humusvlekken, matig grof, interpretatie: dekzandBodemkundig: BC-horizontOpmerking: Slijpplaatmonster (SP) 3
120 cm -MvLithologie: zand, zwak siltig, lichtgrijs, matig grof, interpretatie: dekzandBodemkundig: C-horizont
153 cm -MvLithologie: klei, sterk zandig, lichtgroengrijs, interpretatie: keizand
Einde boring op 170 cm -Mv
boring: SCMO-4datum: 23-11-2009, provincie: Flevoland, gemeente: Noordoostpolder, opdrachtgever: Regio West, uitvoerder: RCE, opmerking: Boring P14-2
0 cm -MvLithologie: klei, uiterst siltig, sterk humeus, donkerbruingrijsBodemkundig: interpretatie: bouwvoor
20 cm -MvLithologie: klei, sterk zandig, sterk humeus, bruingrijsBodemkundig: enkele Fe-vlekken
23 cm -MvLithologie: klei, sterk zandig, sterk humeus, bruingrijsBodemkundig: enkele Fe-vlekkenOpmerking: Monster botanisch (MB) 1
30 cm -MvLithologie: zand, zwak siltig, lichtbruingeel, matig fijn, weinig wortelresten, interpretatie: dekzandBodemkundig: veel Fe-vlekken
35 cm -MvLithologie: zand, zwak siltig, lichtbruingeel, matig fijn, weinig wortelresten, interpretatie: dekzandBodemkundig: veel Fe-vlekkenOpmerking: Slijpplaatmonster (SP) 1
55 cm -MvLithologie: zand, zwak siltig, lichtgrijs, matig fijn, interpretatie: dekzand
Einde boring op 85 cm -Mv
51—
Appendix II:IGBA Report
Opdrachtgever: RCE, Amersfoort Projectnummer: 2991332 Uitvoerder: Martine van den Berg, Michel Vorenhout
Instituut voor Geo- en Bio-archeologie Vrije Universiteit Amsterdam
Schokland monitoring 2009-2010 Martine van den Berg, Michel Vorenhout
IGBA Rapport 2011-02
52—
IGBA RAPPORT 2011-02 - iii -
Inhoudsopgave Inhoudsopgave ..................................................................................................................................................... iii 1 Kader en probleemstelling van het onderzoek ............................................................................................ 5
1.1 Kader van het onderzoek ..................................................................................................................... 5 1.2 Doelstelling van het onderzoek ........................................................................................................... 5
2 Methoden en gebruikte materialen .............................................................................................................. 7 2.1 Grondwaterstanden ............................................................................................................................. 7 2.2 Redoxpotentiaal .................................................................................................................................... 8 2.3 Bodemvochtgehalten ........................................................................................................................... 9 2.4 Lithologische beschrijving en pH van de bodem ............................................................................. 10 2.5 Meteorologie ..................................................................................................................................... 10
3 Presentatie en interpretatie van de meetresultaten ................................................................................ 11 3.1 Locatie De Zuidert .............................................................................................................................. 11 3.2 Locatie J125 ........................................................................................................................................ 15 3.3 Locatie P14 ......................................................................................................................................... 17 3.4 Locatie E170 ....................................................................................................................................... 19
4 Conclusies en aanbevelingen ..................................................................................................................... 21 Referenties .......................................................................................................................................................... 23 Eerder verschenen in deze reeks ....................................................................................................................... 25
53—
IGBA RAPPORT 2011-02 - 5 -
1 Kader en probleemstelling van het onderzoek 1.1 Kader van het onderzoek Deze rapportage presenteert een deel van de data van de samenvattende rapportage van ‘Monitoring Schokland 2009-2010’. Het betreft het vaststellen van een aantal bodemkundige parameters, aan de hand waarvan het conserverende vermogen van de archeologische vindplaatsen beschreven kan worden. De uitvoering van het veldwerk, de interpretatie van de meetgegevens en de verslaglegging vonden plaats door de Vrije Universiteit Amsterdam, Instituut voor Geo- en Bioarcheologie. Het project ‘Monitoring Schokland 2009-2010’ is uitgevoerd van juli 2009 t/m oktober 2010, onder leiding van het RCE. De uitvoering vond plaats door verschillende partijen en betrof voornamelijk bodemanalyses, en onderzoek aan verschillende archeologische materiaalcategorieën. De resultaten van elk van de onderdelen zijn door de uitvoerende partijen individueel gerapporteerd; de uiteindelijke synthese en samenvattende rapportage vond plaats door het RCE. De monitoring van 2009-2010 is een vervolg op 1) het project ‘Monitoring Schokland 2001-2002’ waarvan verslag is gedaan in het rapport ‘A pilot study on the Monitoring of the Physical Quality of Three Archaeological Sites at the UNESCO World Heritage Site at Schokland, Province of Flevoland, the Netherlands’; en 2) het project ‘Monitoring. Schokland 2003-2004’ waarvan verslag is gedaan in ‘Natte voeten voor Schokland, inrichting hydrologische zone, archeologische monitoring 2003-2004, een evaluatie van de waterhuishoudkundige maatregelen’. De reeks van archeologische monitoring projecten op en rond Schokland is begonnen naar aanleiding van de aanleg van een hydrologische zone aan de Oostkant van Schokland. Binnen de hydrologische zone is door het oppervlaktewaterpeil te verhogen het gebied natter geworden waardoor de klink en oxidatie van klei en veen zullen verminderen (Van Heeringen et al., 2004). Deze zone is hoofdzakelijk aangelegd om verdere wegzakking van Schokland in de ondergrond tegen te gaan, en daarnaast om de degradatie van diverse archeologische vindplaatsen rondom Schokland te verminderen. Om na te gaan of de beoogde doelen gerealiseerd worden is besloten de veranderingen in de bodem te volgen door stelselmatig relevante hydrologische parameters, bodemparameters en archeologische indicatoren te monitoren. Los van bovenstaande archeologische monitoring projecten worden de hydrologische veranderingen rond Schokland ook stelselmatig gevolgd door het Waterschap Zuiderzeeland, waarbij de nadruk ligt op de hydrologische processen. Een deel van de meetreeksen van het Waterschap zijn in samenhang met de resultaten van de archeologische monitoring 2003-2004 bestudeerd (zie Smit et al., 2005). Tevens was tijdens het schrijven van deze rapportage een student van VU-IGBA als onderdeel van zijn Bachelor Geoarcheologie bezig met een vergelijkend hydrologisch onderzoek van de meetreeksen van de grondwaterstanden van het Waterschap en de meetreeksen van de grondwaterstanden op enkele archeologische vindplaatsen ingewonnen tijdens ‘Monitoring Schokland 2003-2004’ (Weemstra, 2011). 1.2 Doelstelling van het onderzoek De doelstelling van dit projectonderdeel is het genereren van meetreeksen van de grondwaterstanden, bodemvochtgehalten en redoxpotentialen door deze permanent en in-situ te meten op de archeologische vindplaatsen. De keuze van de archeologische vindplaatsen sluit aan op de voorgaande monitoringsprojecten en betreffen: ‘De Zuidert’, P14, ‘E170’ en ‘J125’ (figuur 1). In het laboratorium zijn daarnaast nog pH bepalingen gedaan aan bodemmonsters. Met behulp van deze meetgegevens valt te onderzoeken of parameterwaarden op de archeologische vindplaatsen ‘De Zuidert’, P14, ‘E170’ en ‘J125’
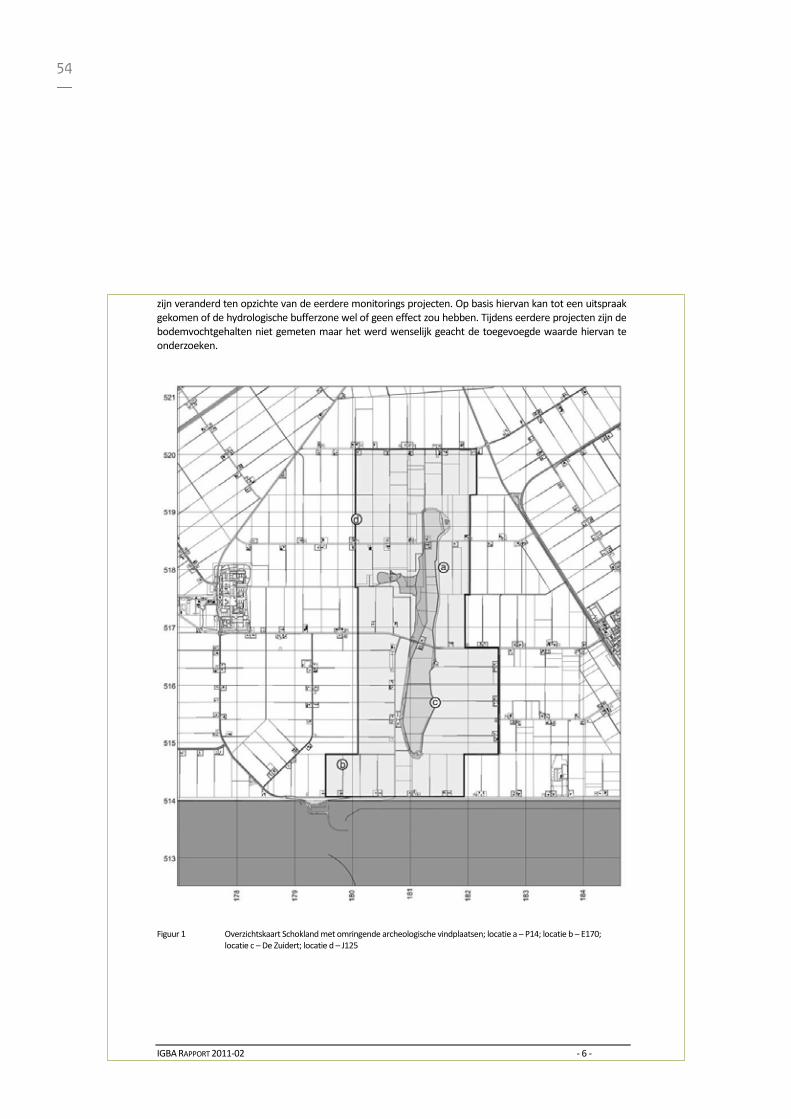
54—
IGBA RAPPORT 2011-02 - 6 -
zijn veranderd ten opzichte van de eerdere monitorings projecten. Op basis hiervan kan tot een uitspraak gekomen of de hydrologische bufferzone wel of geen effect zou hebben. Tijdens eerdere projecten zijn de bodemvochtgehalten niet gemeten maar het werd wenselijk geacht de toegevoegde waarde hiervan te onderzoeken.
Figuur 1 Overzichtskaart Schokland met omringende archeologische vindplaatsen; locatie a – P14; locatie b – E170;
locatie c – De Zuidert; locatie d – J125
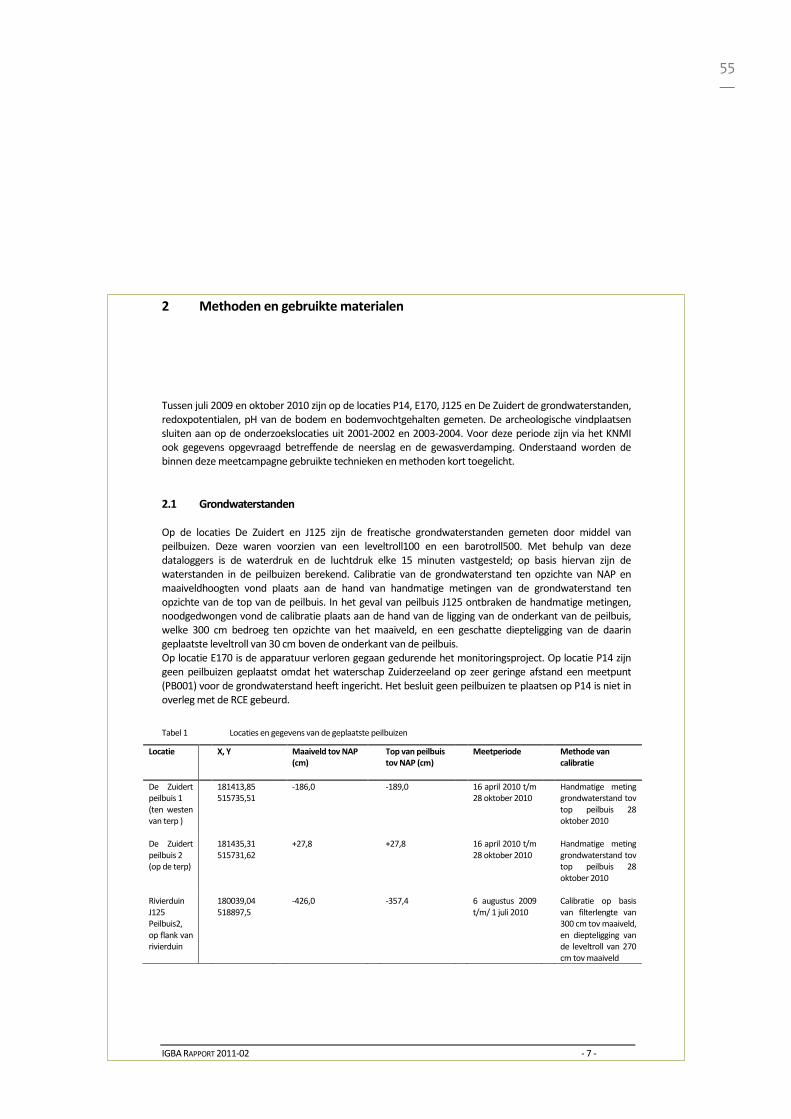
55—
IGBA RAPPORT 2011-02 - 7 -
2 Methoden en gebruikte materialen Tussen juli 2009 en oktober 2010 zijn op de locaties P14, E170, J125 en De Zuidert de grondwaterstanden, redoxpotentialen, pH van de bodem en bodemvochtgehalten gemeten. De archeologische vindplaatsen sluiten aan op de onderzoekslocaties uit 2001-2002 en 2003-2004. Voor deze periode zijn via het KNMI ook gegevens opgevraagd betreffende de neerslag en de gewasverdamping. Onderstaand worden de binnen deze meetcampagne gebruikte technieken en methoden kort toegelicht. 2.1 Grondwaterstanden Op de locaties De Zuidert en J125 zijn de freatische grondwaterstanden gemeten door middel van peilbuizen. Deze waren voorzien van een leveltroll100 en een barotroll500. Met behulp van deze dataloggers is de waterdruk en de luchtdruk elke 15 minuten vastgesteld; op basis hiervan zijn de waterstanden in de peilbuizen berekend. Calibratie van de grondwaterstand ten opzichte van NAP en maaiveldhoogten vond plaats aan de hand van handmatige metingen van de grondwaterstand ten opzichte van de top van de peilbuis. In het geval van peilbuis J125 ontbraken de handmatige metingen, noodgedwongen vond de calibratie plaats aan de hand van de ligging van de onderkant van de peilbuis, welke 300 cm bedroeg ten opzichte van het maaiveld, en een geschatte diepteligging van de daarin geplaatste leveltroll van 30 cm boven de onderkant van de peilbuis. Op locatie E170 is de apparatuur verloren gegaan gedurende het monitoringsproject. Op locatie P14 zijn geen peilbuizen geplaatst omdat het waterschap Zuiderzeeland op zeer geringe afstand een meetpunt (PB001) voor de grondwaterstand heeft ingericht. Het besluit geen peilbuizen te plaatsen op P14 is niet in overleg met de RCE gebeurd.
Tabel 1 Locaties en gegevens van de geplaatste peilbuizen
Locatie X, Y Maaiveld tov NAP (cm)
Top van peilbuis tov NAP (cm)
Meetperiode Methode van calibratie
De Zuidert peilbuis 1 (ten westen van terp )
181413,85 515735,51
-186,0 -189,0 16 april 2010 t/m 28 oktober 2010
Handmatige meting grondwaterstand tov top peilbuis 28 oktober 2010
De Zuidert peilbuis 2 (op de terp)
181435,31 515731,62
+27,8 +27,8 16 april 2010 t/m 28 oktober 2010
Handmatige meting grondwaterstand tov top peilbuis 28 oktober 2010
Rivierduin J125 Peilbuis2, op flank van rivierduin
180039,04 518897,5
-426,0 -357,4 6 augustus 2009 t/m/ 1 juli 2010
Calibratie op basis van filterlengte van 300 cm tov maaiveld, en diepteligging van de leveltroll van 270 cm tov maaiveld
56—
IGBA RAPPORT 2011-02 - 8 -
2.2 Redoxpotentiaal De redoxpotentiaal is een maat voor de oxiderende kracht van het bodemmilieu. Hoe hoger de redoxpotentiaal is, des te sneller archeologische materialen kunnen oxideren. De gemeten bodempotentialen kunnen varieren tussen -400 en +800 millivolt en de hoogte geeft een indicatie van het oxidatieproces dat kan plaatsvinden. Mogelijke oxidatoren zijn zuurstof, mangaan, nitraat, ijzer en sulfaat. Een potentiaal van +300 tot +800 millivolt geeft een indicatie voor de aanwezigheid van zuurstof als oxidator, terwijl dat bij een potentiaal van bijvoorbeeld +400 tot -200 millivolt nitraat kan zijn. Een potentiaal van +50 tot -550 millivolt indiceert een aanwezigheid van tweewaardig ijzer als oxidator. Het is door de overlap in redoxpotentiaal moeilijk aan te geven met welke oxiderende substantie een gemeten waarde geassocieerd kan worden. Binnen de archeologie is er mede daarom voor gekozen de potentialen in tien gelijke klassen in te delen (zie tabel 2). In de meerderheid van de gevallen is de redoxpotentiaal in de top van de bodem het hoogst terwijl deze naar de diepte toe zal afnemen. Een goed inzicht in de redoxpotentiaal van de bodem dient daarom in een verticaal profiel vastgesteld te worden.
Tabel 2 Indeling van de redoxpotentiaal in klassen (Smit et al., 2006)
Redoxpotentiaal (mV SHE) Redox klasse Omschrijving +680 tot +800 1 Sterk oxiderend +560 tot +679 2 Sterk oxiderend +440 tot +559 3 Tamelijk oxiderend +320 tot +439 4 Tamelijk oxiderend +200 tot +319 5 Licht oxiderend +80 tot +199 6 Licht oxiderend -40 tot +79 7 Licht reducerend -160 tot -41 8 Licht reducerend -280 tot -161 9 Sterk reducerend -400 tot -281 10 sterk reducerend
Binnen dit monitorings project is de redoxpotentiaal van de bodem op verschillende diepten gemeten, en opgeslagen met de HypnosIII datalogger (van MVH consult). De HypnosIII is gekoppeld aan een prikstok (van Paleoterra) waaraan een platina sensor is gemonteerd, of een PVC buis (MVH consult) met daarop op verschillende diepten platinum sensoren gemonteerd. Met een dergelijk sensor kan de redoxpotentiaal van de bodem ten opzichte van een referentie-elektrode worden gemeten. Bij de metingen is gebruik gemaakt van een 3M Ag/AgCl referentie en zijn verrekend met 220 mV. De prikstokken en PVC buizen zijn de bodem ingeduwd zodat op de gewenste diepten de redox potentialen konden worden bepaald (zie figuur 2). De redoxpotentialen zijn gemeten op de terp van De Zuidert, P14 en j125 (zie tabel2); op de Zuidert betrof dit vier eenmalige profielmetingen met behulp van een prikstok van Paleoterra, op P14 en J125 betroffen dit profielmetingen voor een langere periode met behulp van de PVC buizen van MVH consult. Van P14 en J125 zijn de aantekeningen betreffende de relatieve diepteliggingen van de sensoren t.o.v. het maaiveld kwijtgeraakt. Daardoor is het niet mogelijk de redoxmetingen te presenteren in hoofdstuk 3
Tabel 3 Gegevens locatie redoxpotentiaal
Locatie
X,Y Maaiveld tov NAP (in cm)
Methode Meetperiode Diepte van meting in cm
Op de terp De Zuidert
181435,31 515731,62
39,0 Prikstok 28 oktober 2010
300
P14 onbekend PVC buizen 20 juli 2010 t/m 28 oktober 2010
onbekend
J125 (nabij peilbuis 2)
180038 518897
-433,0 PVC buizen 29 juli 2009 t/m 20 juli 2010
onbekend
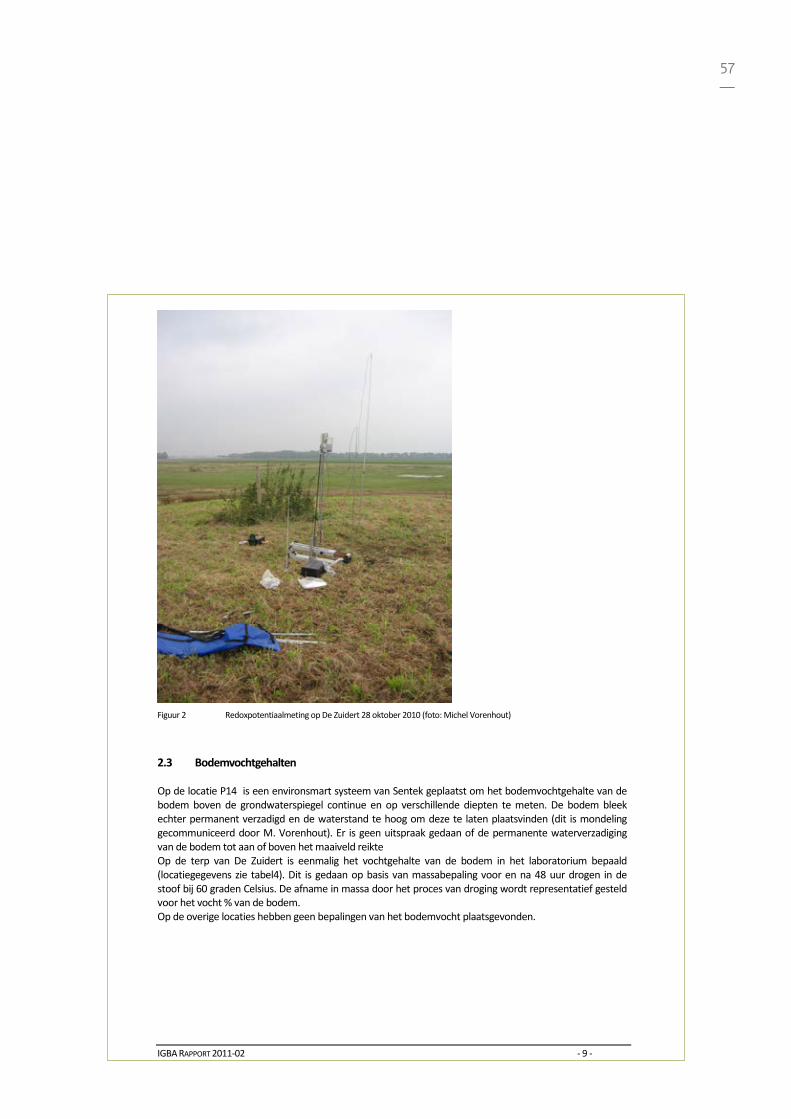
57—
IGBA RAPPORT 2011-02 - 9 -
Figuur 2 Redoxpotentiaalmeting op De Zuidert 28 oktober 2010 (foto: Michel Vorenhout)
2.3 Bodemvochtgehalten Op de locatie P14 is een environsmart systeem van Sentek geplaatst om het bodemvochtgehalte van de bodem boven de grondwaterspiegel continue en op verschillende diepten te meten. De bodem bleek echter permanent verzadigd en de waterstand te hoog om deze te laten plaatsvinden (dit is mondeling gecommuniceerd door M. Vorenhout). Er is geen uitspraak gedaan of de permanente waterverzadiging van de bodem tot aan of boven het maaiveld reikte Op de terp van De Zuidert is eenmalig het vochtgehalte van de bodem in het laboratorium bepaald (locatiegegevens zie tabel4). Dit is gedaan op basis van massabepaling voor en na 48 uur drogen in de stoof bij 60 graden Celsius. De afname in massa door het proces van droging wordt representatief gesteld voor het vocht % van de bodem. Op de overige locaties hebben geen bepalingen van het bodemvocht plaatsgevonden.
58—
IGBA RAPPORT 2011-02 - 10 -
2.4 Lithologische beschrijving en pH van de bodem De grond die is gebruikt voor de lithologische beschrijving van de bodemopbouw en pH bepalingen is ingewonnen met een Edelmanboor. Op de locaties E170, J125 en op de terp De Zuidert zijn bodemmonsters ingewonnen (zie tabel 4), op P14 zijn geen bodemmonsters ingewonnen. In alle gevallen is de pH binnen twee dagen na monsterwinning bepaald in het laboratorium. De bodemmonsters zijn gedurende twee uur geschud in gedestilleerd water, de pH bepalingen zijn verricht met de Multi350i pH meter met daaraan gekoppeld een SenTix41-3 pH elektrode, beiden van WTW GmbH.
Tabel 4 Locaties en gegevens van de bodemmonsters
Locatie X,Y locatie Maaiveldhoogte tov NAP in cm
Datum inwinning
Lithologie Datum bepaling vochtgehalte van de bodem
Datum pH bepaling
E170 rivierduin
179833,8 514621,3
-371,0 25 juni 2009 Ja Nee 26 juni 2009
E170 rivierduin
179833,8 514621,3
-371,0 25 juni 2009 Ja Nee 26 juni 2009
J125 rivierduin Peilbuis1
180039,12 518915,94
-433,0 25 juni 2009 Ja Nee 26 juni 2009
J125 rivierduin Peilbuis2
180039,04 518897,54
-426,0 25 juni 2009 Ja Nee 26 juni 2009
Op de terp van De Zuidert
181435,31 515731,62
+39,0 28 oktober 2010 Nee 29 oktober 2010 29 oktober 2010
2.5 Meteorologie Het KNMI is geraadpleegd voor de neerslaggegevens van de weerstations in Nagele en de gewasverdamping welke is gemeten in het weerstation van De Bilt. De meetreeksen lopen van juli 2009 t/m oktober 2010. Tevens is er een weerstation geplaatst ter plekke van Schokland die de neerslag heeft gemeten van 20 juli 2010 t/m 12 september 2010.
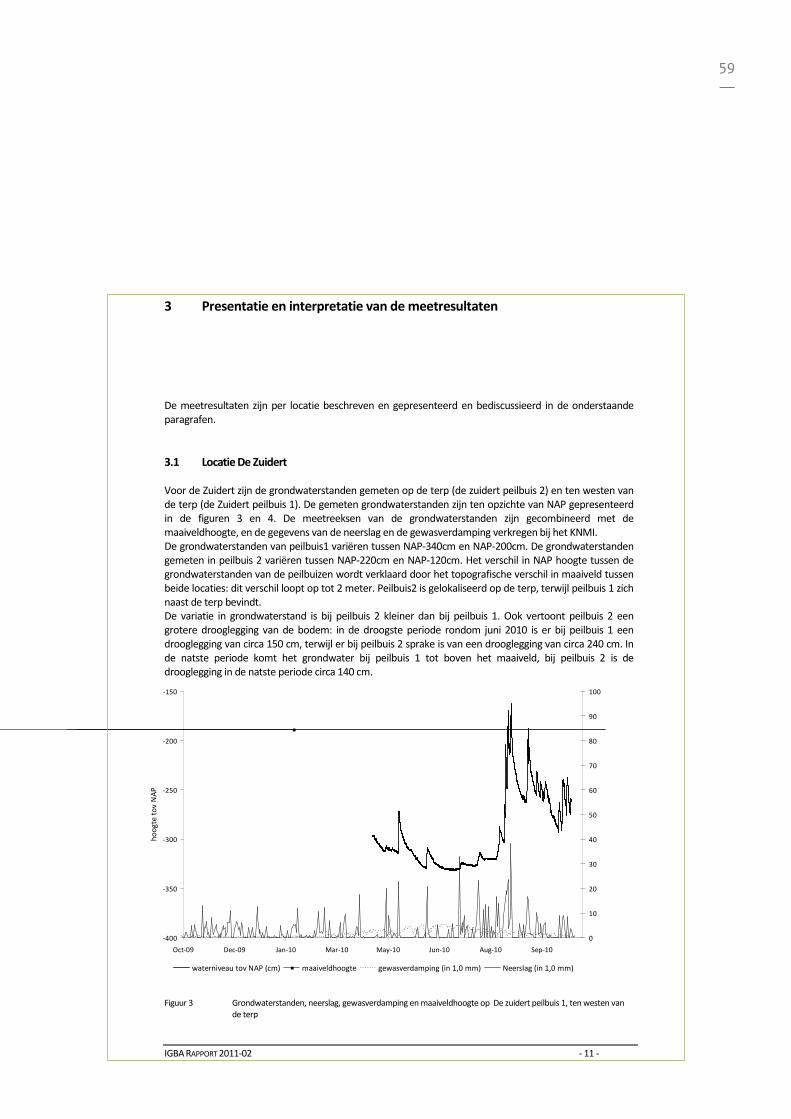
59—
IGBA RAPPORT 2011-02 - 11 -
3 Presentatie en interpretatie van de meetresultaten De meetresultaten zijn per locatie beschreven en gepresenteerd en bediscussieerd in de onderstaande paragrafen. 3.1 Locatie De Zuidert Voor de Zuidert zijn de grondwaterstanden gemeten op de terp (de zuidert peilbuis 2) en ten westen van de terp (de Zuidert peilbuis 1). De gemeten grondwaterstanden zijn ten opzichte van NAP gepresenteerd in de figuren 3 en 4. De meetreeksen van de grondwaterstanden zijn gecombineerd met de maaiveldhoogte, en de gegevens van de neerslag en de gewasverdamping verkregen bij het KNMI. De grondwaterstanden van peilbuis1 variëren tussen NAP-340cm en NAP-200cm. De grondwaterstanden gemeten in peilbuis 2 variëren tussen NAP-220cm en NAP-120cm. Het verschil in NAP hoogte tussen de grondwaterstanden van de peilbuizen wordt verklaard door het topografische verschil in maaiveld tussen beide locaties: dit verschil loopt op tot 2 meter. Peilbuis2 is gelokaliseerd op de terp, terwijl peilbuis 1 zich naast de terp bevindt. De variatie in grondwaterstand is bij peilbuis 2 kleiner dan bij peilbuis 1. Ook vertoont peilbuis 2 een grotere drooglegging van de bodem: in de droogste periode rondom juni 2010 is er bij peilbuis 1 een drooglegging van circa 150 cm, terwijl er bij peilbuis 2 sprake is van een drooglegging van circa 240 cm. In de natste periode komt het grondwater bij peilbuis 1 tot boven het maaiveld, bij peilbuis 2 is de drooglegging in de natste periode circa 140 cm.
-400
-350
-300
-250
-200
-150
Oct-09 Dec-09 Jan-10 Mar-10 May-10 Jun-10 Aug-10 Sep-10
hoog
te to
v N
AP
0
10
20
30
40
50
60
70
80
90
100
waterniveau tov NAP (cm) maaiveldhoogte gewasverdamping (in 1,0 mm) Neerslag (in 1,0 mm)
Figuur 3 Grondwaterstanden, neerslag, gewasverdamping en maaiveldhoogte op De zuidert peilbuis 1, ten westen van de terp
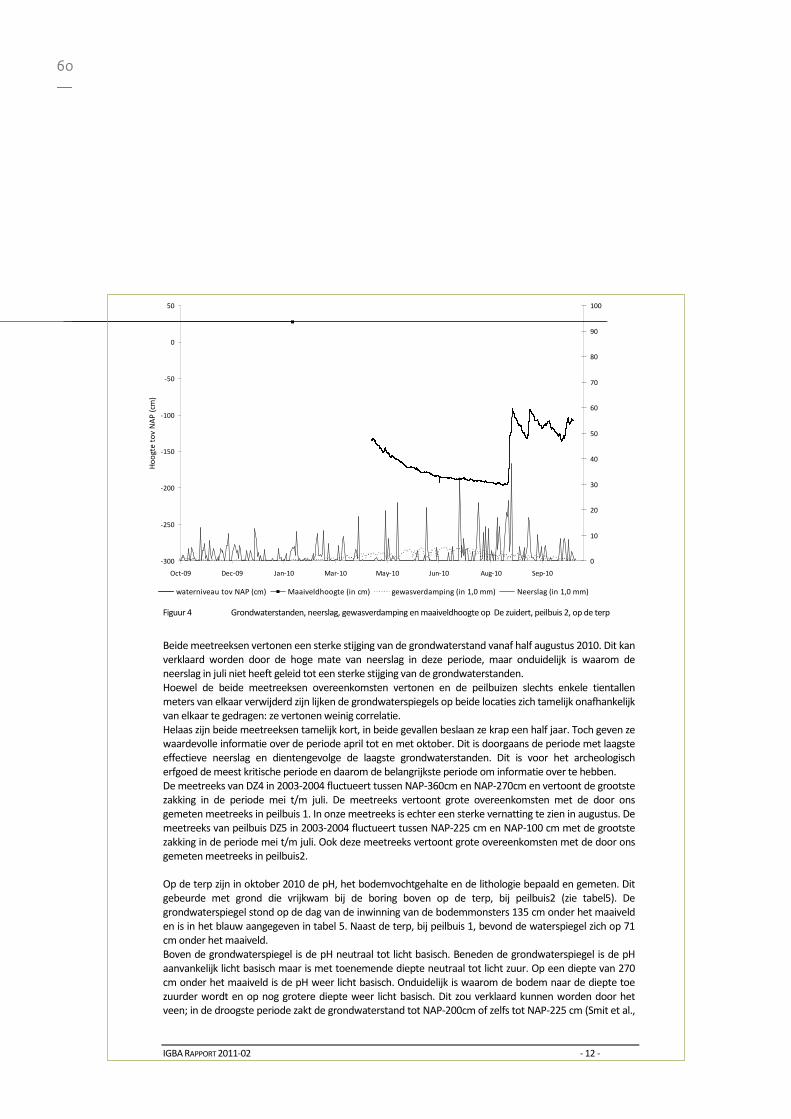
60—
IGBA RAPPORT 2011-02 - 12 -
-300
-250
-200
-150
-100
-50
0
50
Oct-09 Dec-09 Jan-10 Mar-10 May-10 Jun-10 Aug-10 Sep-10
Hoo
gte
tov
NA
P (c
m)
0
10
20
30
40
50
60
70
80
90
100
waterniveau tov NAP (cm) Maaiveldhoogte (in cm) gewasverdamping (in 1,0 mm) Neerslag (in 1,0 mm) Figuur 4 Grondwaterstanden, neerslag, gewasverdamping en maaiveldhoogte op De zuidert, peilbuis 2, op de terp
Beide meetreeksen vertonen een sterke stijging van de grondwaterstand vanaf half augustus 2010. Dit kan verklaard worden door de hoge mate van neerslag in deze periode, maar onduidelijk is waarom de neerslag in juli niet heeft geleid tot een sterke stijging van de grondwaterstanden. Hoewel de beide meetreeksen overeenkomsten vertonen en de peilbuizen slechts enkele tientallen meters van elkaar verwijderd zijn lijken de grondwaterspiegels op beide locaties zich tamelijk onafhankelijk van elkaar te gedragen: ze vertonen weinig correlatie. Helaas zijn beide meetreeksen tamelijk kort, in beide gevallen beslaan ze krap een half jaar. Toch geven ze waardevolle informatie over de periode april tot en met oktober. Dit is doorgaans de periode met laagste effectieve neerslag en dientengevolge de laagste grondwaterstanden. Dit is voor het archeologisch erfgoed de meest kritische periode en daarom de belangrijkste periode om informatie over te hebben. De meetreeks van DZ4 in 2003-2004 fluctueert tussen NAP-360cm en NAP-270cm en vertoont de grootste zakking in de periode mei t/m juli. De meetreeks vertoont grote overeenkomsten met de door ons gemeten meetreeks in peilbuis 1. In onze meetreeks is echter een sterke vernatting te zien in augustus. De meetreeks van peilbuis DZ5 in 2003-2004 fluctueert tussen NAP-225 cm en NAP-100 cm met de grootste zakking in de periode mei t/m juli. Ook deze meetreeks vertoont grote overeenkomsten met de door ons gemeten meetreeks in peilbuis2. Op de terp zijn in oktober 2010 de pH, het bodemvochtgehalte en de lithologie bepaald en gemeten. Dit gebeurde met grond die vrijkwam bij de boring boven op de terp, bij peilbuis2 (zie tabel5). De grondwaterspiegel stond op de dag van de inwinning van de bodemmonsters 135 cm onder het maaiveld en is in het blauw aangegeven in tabel 5. Naast de terp, bij peilbuis 1, bevond de waterspiegel zich op 71 cm onder het maaiveld. Boven de grondwaterspiegel is de pH neutraal tot licht basisch. Beneden de grondwaterspiegel is de pH aanvankelijk licht basisch maar is met toenemende diepte neutraal tot licht zuur. Op een diepte van 270 cm onder het maaiveld is de pH weer licht basisch. Onduidelijk is waarom de bodem naar de diepte toe zuurder wordt en op nog grotere diepte weer licht basisch. Dit zou verklaard kunnen worden door het veen; in de droogste periode zakt de grondwaterstand tot NAP-200cm of zelfs tot NAP-225 cm (Smit et al.,
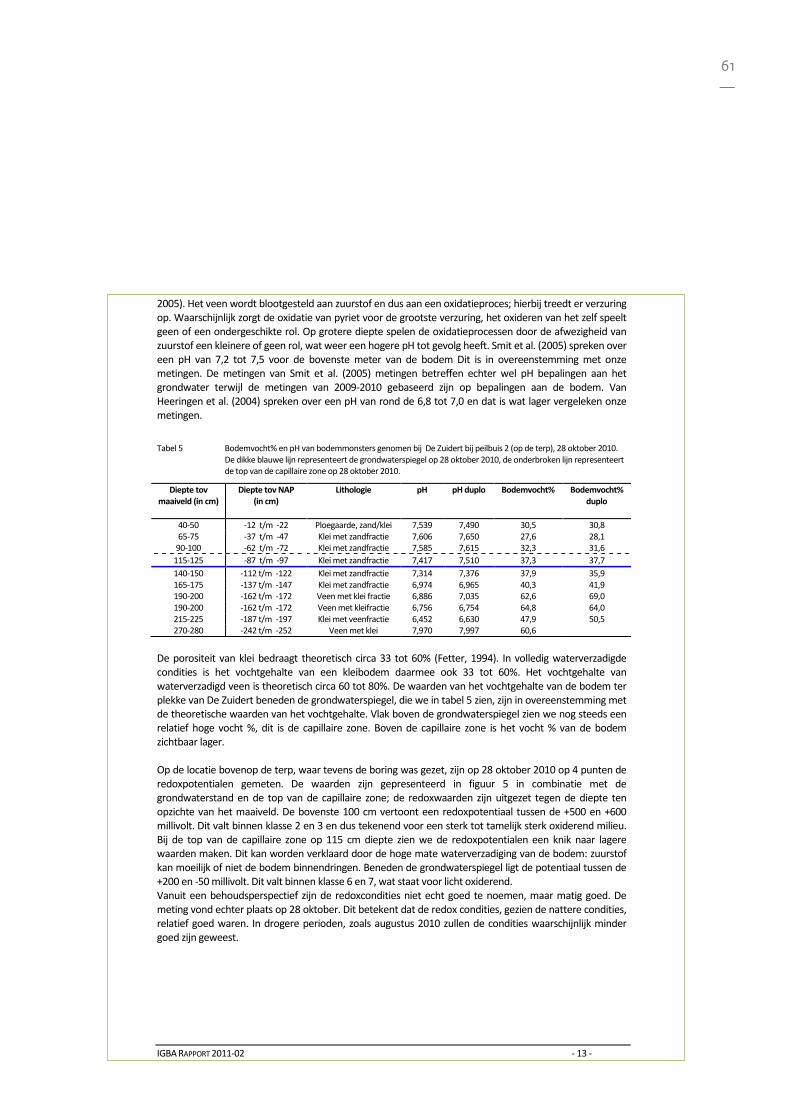
61—
IGBA RAPPORT 2011-02 - 13 -
2005). Het veen wordt blootgesteld aan zuurstof en dus aan een oxidatieproces; hierbij treedt er verzuring op. Waarschijnlijk zorgt de oxidatie van pyriet voor de grootste verzuring, het oxideren van het zelf speelt geen of een ondergeschikte rol. Op grotere diepte spelen de oxidatieprocessen door de afwezigheid van zuurstof een kleinere of geen rol, wat weer een hogere pH tot gevolg heeft. Smit et al. (2005) spreken over een pH van 7,2 tot 7,5 voor de bovenste meter van de bodem Dit is in overeenstemming met onze metingen. De metingen van Smit et al. (2005) metingen betreffen echter wel pH bepalingen aan het grondwater terwijl de metingen van 2009-2010 gebaseerd zijn op bepalingen aan de bodem. Van Heeringen et al. (2004) spreken over een pH van rond de 6,8 tot 7,0 en dat is wat lager vergeleken onze metingen.
Tabel 5 Bodemvocht% en pH van bodemmonsters genomen bij De Zuidert bij peilbuis 2 (op de terp), 28 oktober 2010. De dikke blauwe lijn representeert de grondwaterspiegel op 28 oktober 2010, de onderbroken lijn representeert de top van de capillaire zone op 28 oktober 2010.
Diepte tov maaiveld (in cm)
Diepte tov NAP (in cm)
Lithologie pH pH duplo Bodemvocht% Bodemvocht% duplo
40-50 -12 t/m -22 Ploegaarde, zand/klei 7,539 7,490 30,5 30,8 65-75 -37 t/m -47 Klei met zandfractie 7,606 7,650 27,6 28,1
90-100 -62 t/m -72 Klei met zandfractie 7,585 7,615 32,3 31,6 115-125 -87 t/m -97 Klei met zandfractie 7,417 7,510 37,3 37,7 140-150 -112 t/m -122 Klei met zandfractie 7,314 7,376 37,9 35,9 165-175 -137 t/m -147 Klei met zandfractie 6,974 6,965 40,3 41,9 190-200 -162 t/m -172 Veen met klei fractie 6,886 7,035 62,6 69,0 190-200 -162 t/m -172 Veen met kleifractie 6,756 6,754 64,8 64,0 215-225 -187 t/m -197 Klei met veenfractie 6,452 6,630 47,9 50,5 270-280 -242 t/m -252 Veen met klei 7,970 7,997 60,6
De porositeit van klei bedraagt theoretisch circa 33 tot 60% (Fetter, 1994). In volledig waterverzadigde condities is het vochtgehalte van een kleibodem daarmee ook 33 tot 60%. Het vochtgehalte van waterverzadigd veen is theoretisch circa 60 tot 80%. De waarden van het vochtgehalte van de bodem ter plekke van De Zuidert beneden de grondwaterspiegel, die we in tabel 5 zien, zijn in overeenstemming met de theoretische waarden van het vochtgehalte. Vlak boven de grondwaterspiegel zien we nog steeds een relatief hoge vocht %, dit is de capillaire zone. Boven de capillaire zone is het vocht % van de bodem zichtbaar lager. Op de locatie bovenop de terp, waar tevens de boring was gezet, zijn op 28 oktober 2010 op 4 punten de redoxpotentialen gemeten. De waarden zijn gepresenteerd in figuur 5 in combinatie met de grondwaterstand en de top van de capillaire zone; de redoxwaarden zijn uitgezet tegen de diepte ten opzichte van het maaiveld. De bovenste 100 cm vertoont een redoxpotentiaal tussen de +500 en +600 millivolt. Dit valt binnen klasse 2 en 3 en dus tekenend voor een sterk tot tamelijk sterk oxiderend milieu. Bij de top van de capillaire zone op 115 cm diepte zien we de redoxpotentialen een knik naar lagere waarden maken. Dit kan worden verklaard door de hoge mate waterverzadiging van de bodem: zuurstof kan moeilijk of niet de bodem binnendringen. Beneden de grondwaterspiegel ligt de potentiaal tussen de +200 en -50 millivolt. Dit valt binnen klasse 6 en 7, wat staat voor licht oxiderend. Vanuit een behoudsperspectief zijn de redoxcondities niet echt goed te noemen, maar matig goed. De meting vond echter plaats op 28 oktober. Dit betekent dat de redox condities, gezien de nattere condities, relatief goed waren. In drogere perioden, zoals augustus 2010 zullen de condities waarschijnlijk minder goed zijn geweest.
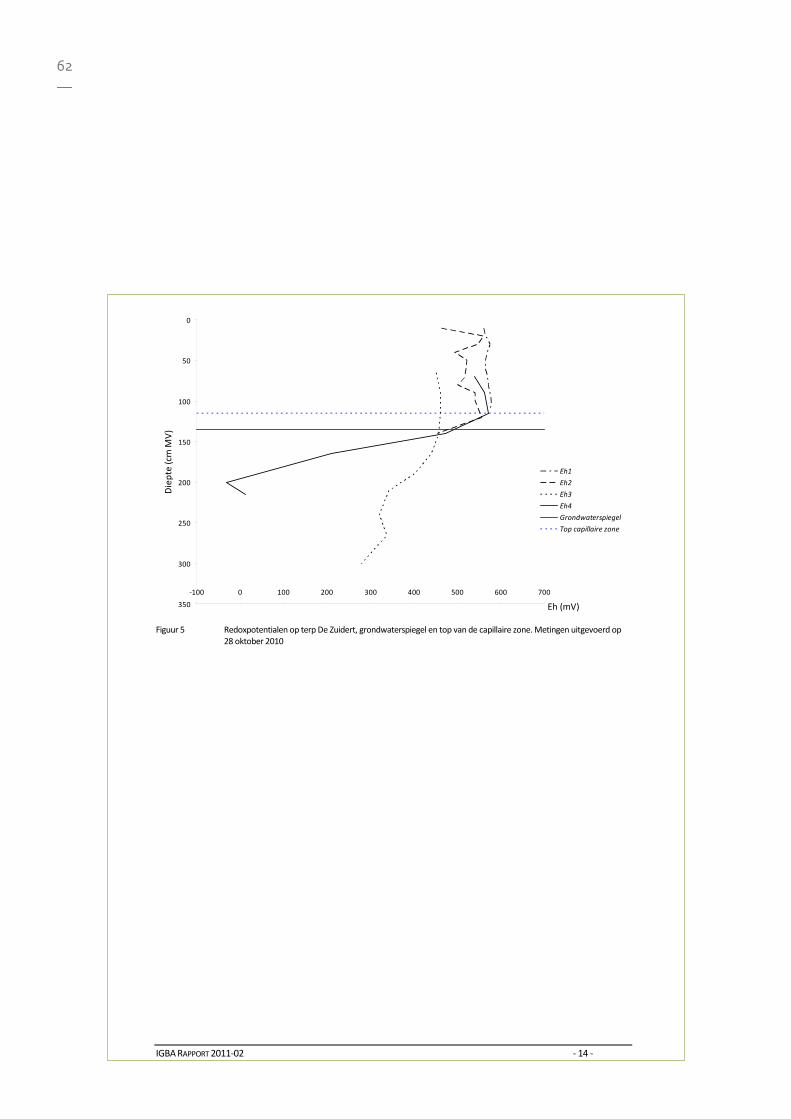
62—
IGBA RAPPORT 2011-02 - 14 -
0
50
100
150
200
250
300
350
-100 0 100 200 300 400 500 600 700
Eh (mV)
Die
pte
(cm
MV
)
Eh1
Eh2
Eh3
Eh4
Grondwaterspiegel
Top capillaire zone
Figuur 5 Redoxpotentialen op terp De Zuidert, grondwaterspiegel en top van de capillaire zone. Metingen uitgevoerd op
28 oktober 2010
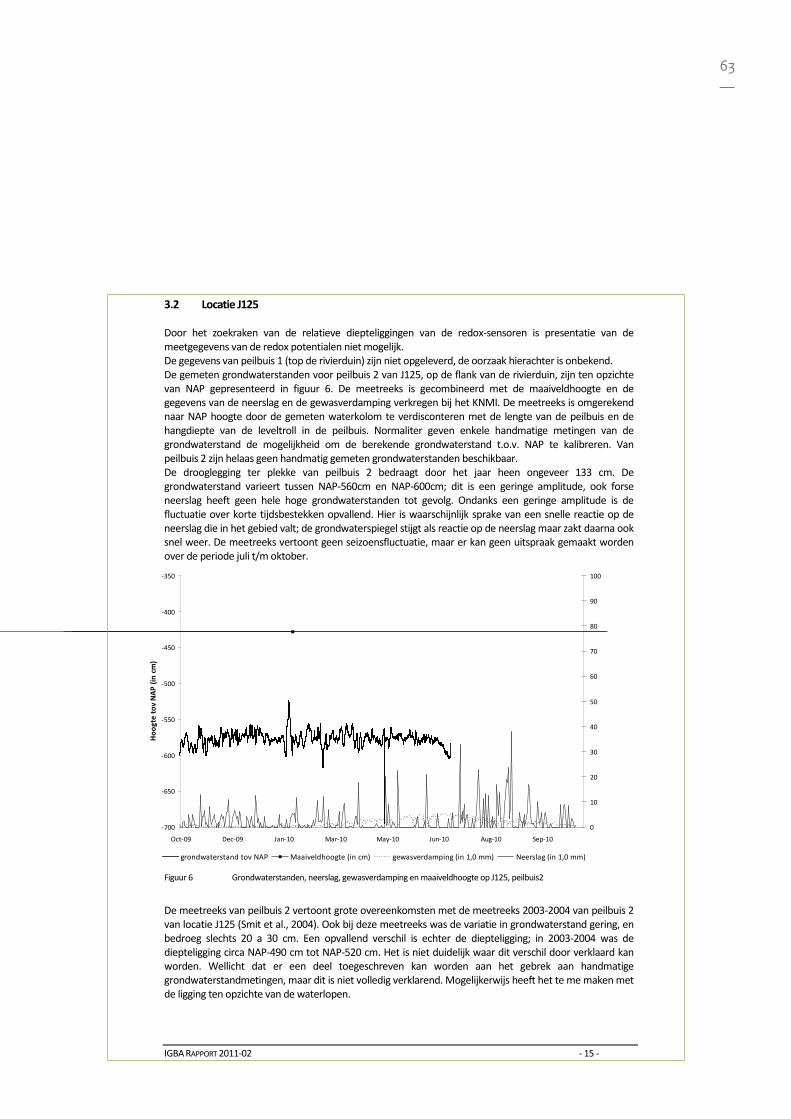
63—
IGBA RAPPORT 2011-02 - 15 -
3.2 Locatie J125 Door het zoekraken van de relatieve diepteliggingen van de redox-sensoren is presentatie van de meetgegevens van de redox potentialen niet mogelijk. De gegevens van peilbuis 1 (top de rivierduin) zijn niet opgeleverd, de oorzaak hierachter is onbekend. De gemeten grondwaterstanden voor peilbuis 2 van J125, op de flank van de rivierduin, zijn ten opzichte van NAP gepresenteerd in figuur 6. De meetreeks is gecombineerd met de maaiveldhoogte en de gegevens van de neerslag en de gewasverdamping verkregen bij het KNMI. De meetreeks is omgerekend naar NAP hoogte door de gemeten waterkolom te verdisconteren met de lengte van de peilbuis en de hangdiepte van de leveltroll in de peilbuis. Normaliter geven enkele handmatige metingen van de grondwaterstand de mogelijkheid om de berekende grondwaterstand t.o.v. NAP te kalibreren. Van peilbuis 2 zijn helaas geen handmatig gemeten grondwaterstanden beschikbaar. De drooglegging ter plekke van peilbuis 2 bedraagt door het jaar heen ongeveer 133 cm. De grondwaterstand varieert tussen NAP-560cm en NAP-600cm; dit is een geringe amplitude, ook forse neerslag heeft geen hele hoge grondwaterstanden tot gevolg. Ondanks een geringe amplitude is de fluctuatie over korte tijdsbestekken opvallend. Hier is waarschijnlijk sprake van een snelle reactie op de neerslag die in het gebied valt; de grondwaterspiegel stijgt als reactie op de neerslag maar zakt daarna ook snel weer. De meetreeks vertoont geen seizoensfluctuatie, maar er kan geen uitspraak gemaakt worden over de periode juli t/m oktober.
-700
-650
-600
-550
-500
-450
-400
-350
Oct-09 Dec-09 Jan-10 Mar-10 May-10 Jun-10 Aug-10 Sep-10
Hoo
gte
tov
NA
P (in
cm
)
0
10
20
30
40
50
60
70
80
90
100
grondwaterstand tov NAP Maaiveldhoogte (in cm) gewasverdamping (in 1,0 mm) Neerslag (in 1,0 mm) Figuur 6 Grondwaterstanden, neerslag, gewasverdamping en maaiveldhoogte op J125, peilbuis2
De meetreeks van peilbuis 2 vertoont grote overeenkomsten met de meetreeks 2003-2004 van peilbuis 2 van locatie J125 (Smit et al., 2004). Ook bij deze meetreeks was de variatie in grondwaterstand gering, en bedroeg slechts 20 a 30 cm. Een opvallend verschil is echter de diepteligging; in 2003-2004 was de diepteligging circa NAP-490 cm tot NAP-520 cm. Het is niet duidelijk waar dit verschil door verklaard kan worden. Wellicht dat er een deel toegeschreven kan worden aan het gebrek aan handmatige grondwaterstandmetingen, maar dit is niet volledig verklarend. Mogelijkerwijs heeft het te me maken met de ligging ten opzichte van de waterlopen.
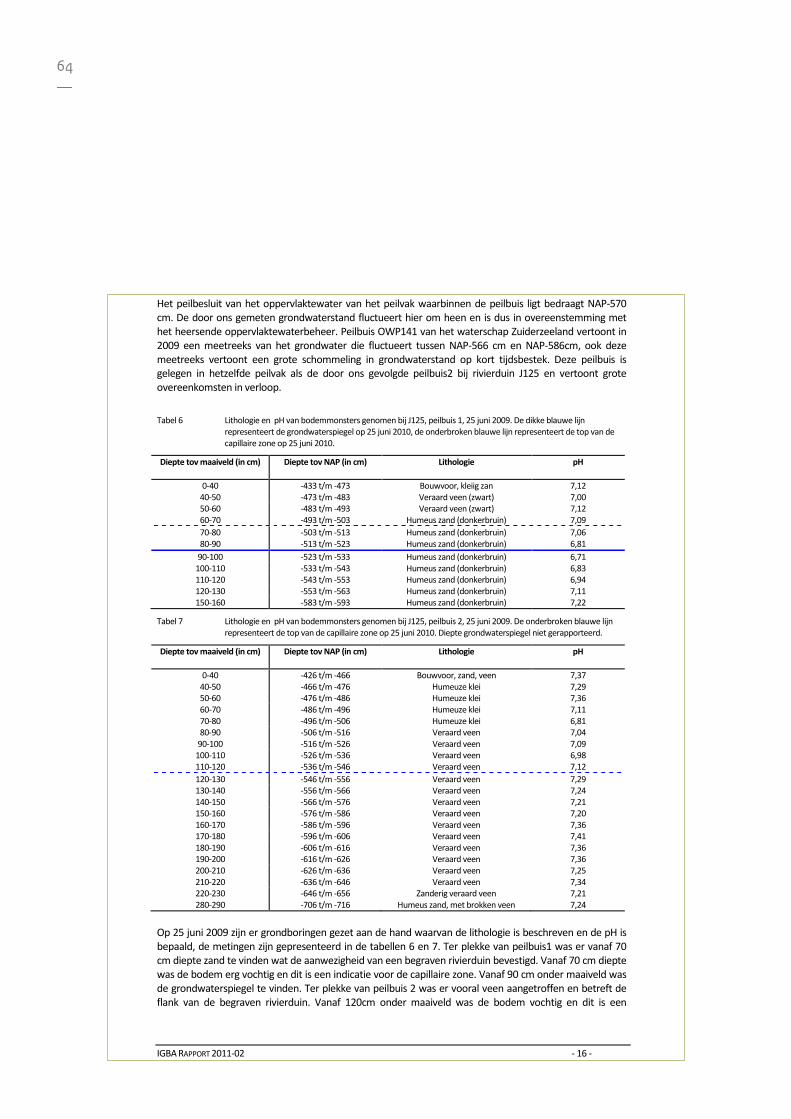
64—
IGBA RAPPORT 2011-02 - 16 -
Het peilbesluit van het oppervlaktewater van het peilvak waarbinnen de peilbuis ligt bedraagt NAP-570 cm. De door ons gemeten grondwaterstand fluctueert hier om heen en is dus in overeenstemming met het heersende oppervlaktewaterbeheer. Peilbuis OWP141 van het waterschap Zuiderzeeland vertoont in 2009 een meetreeks van het grondwater die fluctueert tussen NAP-566 cm en NAP-586cm, ook deze meetreeks vertoont een grote schommeling in grondwaterstand op kort tijdsbestek. Deze peilbuis is gelegen in hetzelfde peilvak als de door ons gevolgde peilbuis2 bij rivierduin J125 en vertoont grote overeenkomsten in verloop.
Tabel 6 Lithologie en pH van bodemmonsters genomen bij J125, peilbuis 1, 25 juni 2009. De dikke blauwe lijn representeert de grondwaterspiegel op 25 juni 2010, de onderbroken blauwe lijn representeert de top van de capillaire zone op 25 juni 2010.
Diepte tov maaiveld (in cm)
Diepte tov NAP (in cm) Lithologie pH
0-40 -433 t/m -473 Bouwvoor, kleiig zan 7,12 40-50 -473 t/m -483 Veraard veen (zwart) 7,00 50-60 -483 t/m -493 Veraard veen (zwart) 7,12 60-70 -493 t/m -503 Humeus zand (donkerbruin) 7,09 70-80 -503 t/m -513 Humeus zand (donkerbruin) 7,06 80-90 -513 t/m -523 Humeus zand (donkerbruin) 6,81
90-100 -523 t/m -533 Humeus zand (donkerbruin) 6,71 100-110 -533 t/m -543 Humeus zand (donkerbruin) 6,83 110-120 -543 t/m -553 Humeus zand (donkerbruin) 6,94 120-130 -553 t/m -563 Humeus zand (donkerbruin) 7,11 150-160 -583 t/m -593 Humeus zand (donkerbruin) 7,22
Tabel 7 Lithologie en pH van bodemmonsters genomen bij J125, peilbuis 2, 25 juni 2009. De onderbroken blauwe lijn representeert de top van de capillaire zone op 25 juni 2010. Diepte grondwaterspiegel niet gerapporteerd.
Diepte tov maaiveld (in cm)
Diepte tov NAP (in cm) Lithologie pH
0-40 -426 t/m -466 Bouwvoor, zand, veen 7,37 40-50 -466 t/m -476 Humeuze klei 7,29 50-60 -476 t/m -486 Humeuze klei 7,36 60-70 -486 t/m -496 Humeuze klei 7,11 70-80 -496 t/m -506 Humeuze klei 6,81 80-90 -506 t/m -516 Veraard veen 7,04
90-100 -516 t/m -526 Veraard veen 7,09 100-110 -526 t/m -536 Veraard veen 6,98 110-120 -536 t/m -546 Veraard veen 7,12 120-130 -546 t/m -556 Veraard veen 7,29 130-140 -556 t/m -566 Veraard veen 7,24 140-150 -566 t/m -576 Veraard veen 7,21 150-160 -576 t/m -586 Veraard veen 7,20 160-170 -586 t/m -596 Veraard veen 7,36 170-180 -596 t/m -606 Veraard veen 7,41 180-190 -606 t/m -616 Veraard veen 7,36 190-200 -616 t/m -626 Veraard veen 7,36 200-210 -626 t/m -636 Veraard veen 7,25 210-220 -636 t/m -646 Veraard veen 7,34 220-230 -646 t/m -656 Zanderig veraard veen 7,21 280-290 -706 t/m -716 Humeus zand, met brokken veen 7,24
Op 25 juni 2009 zijn er grondboringen gezet aan de hand waarvan de lithologie is beschreven en de pH is bepaald, de metingen zijn gepresenteerd in de tabellen 6 en 7. Ter plekke van peilbuis1 was er vanaf 70 cm diepte zand te vinden wat de aanwezigheid van een begraven rivierduin bevestigd. Vanaf 70 cm diepte was de bodem erg vochtig en dit is een indicatie voor de capillaire zone. Vanaf 90 cm onder maaiveld was de grondwaterspiegel te vinden. Ter plekke van peilbuis 2 was er vooral veen aangetroffen en betreft de flank van de begraven rivierduin. Vanaf 120cm onder maaiveld was de bodem vochtig en dit is een
65—
IGBA RAPPORT 2011-02 - 17 -
indicatie voor de capillaire zone. In beide profielen gaven de pH metingen neutrale waarden. Dit is in overeenstemming met het monitoringsprogramma van 2003-2004 , ook toen gaven de pH metingen neutrale waarden (Smit et al., 2005). 3.3 Locatie P14 Op deze locaties zijn geen grondwaterstanden gemeten (mondelinge communicatie M. Vorenhout). Er zijn geen meetgegevens betreffende het bodemvochtgehalte; de bodem was permanent waterverzadigd wat een vaststelling van het bodemvochtgehalte overbodig maakt (mondelinge communicatie M. Vorenhout). Het is echter onduidelijk of de waterverzadiging door het hele jaar heen betrof en of deze tot vlak onder het maaiveld reikte of juist een waterlaag boven het maaiveld veroorzaakte. De metingen van de redoxpotentialen kunnen niet gepresenteerd worden door het zoekraken van de relatieve diepteliggingen van de redox sensoren.
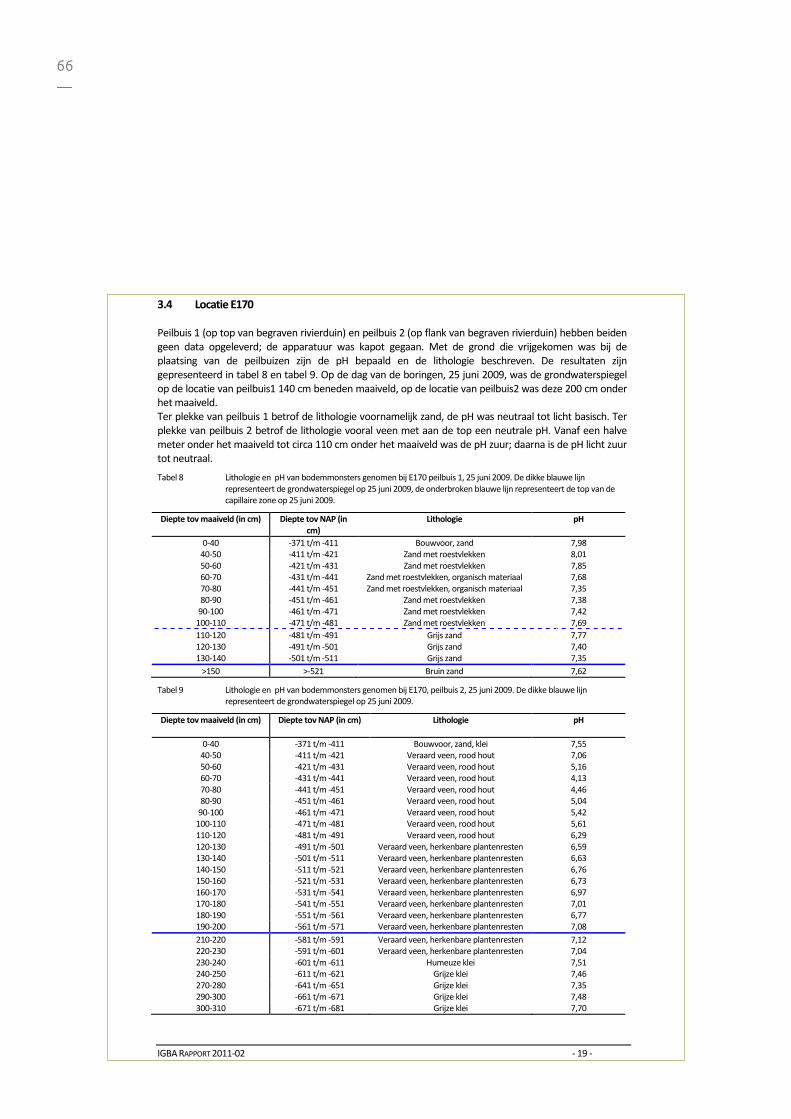
66—
IGBA RAPPORT 2011-02 - 19 -
3.4 Locatie E170 Peilbuis 1 (op top van begraven rivierduin) en peilbuis 2 (op flank van begraven rivierduin) hebben beiden geen data opgeleverd; de apparatuur was kapot gegaan. Met de grond die vrijgekomen was bij de plaatsing van de peilbuizen zijn de pH bepaald en de lithologie beschreven. De resultaten zijn gepresenteerd in tabel 8 en tabel 9. Op de dag van de boringen, 25 juni 2009, was de grondwaterspiegel op de locatie van peilbuis1 140 cm beneden maaiveld, op de locatie van peilbuis2 was deze 200 cm onder het maaiveld. Ter plekke van peilbuis 1 betrof de lithologie voornamelijk zand, de pH was neutraal tot licht basisch. Ter plekke van peilbuis 2 betrof de lithologie vooral veen met aan de top een neutrale pH. Vanaf een halve meter onder het maaiveld tot circa 110 cm onder het maaiveld was de pH zuur; daarna is de pH licht zuur tot neutraal.
Tabel 8 Lithologie en pH van bodemmonsters genomen bij E170 peilbuis 1, 25 juni 2009. De dikke blauwe lijn representeert de grondwaterspiegel op 25 juni 2009, de onderbroken blauwe lijn representeert de top van de capillaire zone op 25 juni 2009.
Diepte tov maaiveld (in cm)
Diepte tov NAP (in cm)
Lithologie pH
0-40 -371 t/m -411 Bouwvoor, zand 7,98 40-50 -411 t/m -421 Zand met roestvlekken 8,01 50-60 -421 t/m -431 Zand met roestvlekken 7,85 60-70 -431 t/m -441 Zand met roestvlekken, organisch materiaal 7,68 70-80 -441 t/m -451 Zand met roestvlekken, organisch materiaal 7,35 80-90 -451 t/m -461 Zand met roestvlekken 7,38
90-100 -461 t/m -471 Zand met roestvlekken 7,42 100-110 -471 t/m -481 Zand met roestvlekken 7,69 110-120 -481 t/m -491 Grijs zand 7,77 120-130 -491 t/m -501 Grijs zand 7,40 130-140 -501 t/m -511 Grijs zand 7,35
>150 >-521 Bruin zand 7,62
Tabel 9 Lithologie en pH van bodemmonsters genomen bij E170, peilbuis 2, 25 juni 2009. De dikke blauwe lijn representeert de grondwaterspiegel op 25 juni 2009.
Diepte tov maaiveld (in cm)
Diepte tov NAP (in cm) Lithologie pH
0-40 -371 t/m -411 Bouwvoor, zand, klei 7,55 40-50 -411 t/m -421 Veraard veen, rood hout 7,06 50-60 -421 t/m -431 Veraard veen, rood hout 5,16 60-70 -431 t/m -441 Veraard veen, rood hout 4,13 70-80 -441 t/m -451 Veraard veen, rood hout 4,46 80-90 -451 t/m -461 Veraard veen, rood hout 5,04
90-100 -461 t/m -471 Veraard veen, rood hout 5,42 100-110 -471 t/m -481 Veraard veen, rood hout 5,61 110-120 -481 t/m -491 Veraard veen, rood hout 6,29 120-130 -491 t/m -501 Veraard veen, herkenbare plantenresten 6,59 130-140 -501 t/m -511 Veraard veen, herkenbare plantenresten 6,63 140-150 -511 t/m -521 Veraard veen, herkenbare plantenresten 6,76 150-160 -521 t/m -531 Veraard veen, herkenbare plantenresten 6,73 160-170 -531 t/m -541 Veraard veen, herkenbare plantenresten 6,97 170-180 -541 t/m -551 Veraard veen, herkenbare plantenresten 7,01 180-190 -551 t/m -561 Veraard veen, herkenbare plantenresten 6,77 190-200 -561 t/m -571 Veraard veen, herkenbare plantenresten 7,08 210-220 -581 t/m -591 Veraard veen, herkenbare plantenresten 7,12 220-230 -591 t/m -601 Veraard veen, herkenbare plantenresten 7,04 230-240 -601 t/m -611 Humeuze klei 7,51 240-250 -611 t/m -621 Grijze klei 7,46 270-280 -641 t/m -651 Grijze klei 7,35 290-300 -661 t/m -671 Grijze klei 7,48 300-310 -671 t/m -681 Grijze klei 7,70
67—
IGBA RAPPORT 2011-02 - 21 -
4 Conclusies en aanbevelingen Met directe betrekking tot het behoud van archeologische materialen worden in dit rapport geen uitspraken gemaakt of conclusies getrokken. Dit vindt plaats in het samenvattende rapport van het RCE. Archeologische monitoring grondwaterstand op de Zuidert is noodzakelijk want het kan niet ondervangen worden door extrapolatie van metingen van de grondwaterstand uit de buurt. Voor locatie J125 lijken de metingen van de peilbuizen van het waterschap te volstaan, buis OWP141 staat in het zelfde peilvak als de archeologische vindplaats. De vastgestelde grondwaterstanden lijken niet veel af te wijken van die gemeten gedurende de eerdere monitoringsprojecten. Wel lijkt er bij de grondwaterstanden van J125 een sprong t.o.v. NAP te hebben plaatsgevonden ten opzichte van voorgaande monitoringsproject. Het is onduidelijk of dit een calibratiefout betreft of verschil in plaatsing van de peilbuizen ten opzichte van de waterlopen. Een andere mogelijkheid zou zijn een veranderend waterregime. De grondwaterstanden gemeten gedurende dit monitoringsproject vertonen echter veel overeenkomsten met de grondwaterstanden gemeten door het waterschap (peilbuis is gelegen in hetzelfde peilvak). De meeste pH profielen geven een neutraal milieu weer, behalve daar waar veen blootgesteld is aan oxidatie; daar is vaak sprake van een lage pH. Er is geen indicatie dat de zuurgraad van de vindplaatsen aan het veranderen is, desondanks verdient het de aanbeveling deze te blijven volgen omdat een pH waarde niet indicatief is voor de buffercapaciteit van de bodem Een andere aanbeveling kan zijn het bepalen van de buffercapaciteit van de bodems van de archeologische vindplaatsen. Metingen op de Zuidert geven correlatie tussen redoxpotentialen en bodemvochtgehalten: in de capillaire zone gaat de redoxpotentiaal sterk omlaag. Dit betreft echter wel een eenmalige meting; een goed onderbouwde kwalificatie van de correlatie tussen redox en bodemvochtgehalten is noodzakelijk. De meerwaarde van het bepalen van het bodemvochtgehalte is nog niet vastgesteld De redoxpotentialen op De Zuidert indiceren een matig oxiderend milieu in de top, en een licht oxiderend milieu dieper in de bodem. De metingen hebben plaatsgevonden in oktober 2010, het is waarschijnlijk dat het redoxmilieu in juni t/m augustus vanwege de lagere grondwaterstanden in grotere mate oxiderend zal zijn. Ten opzichte van voorgaande projecten gingen de redoxmetingen tot grotere diepten in de bodem. De redoxpotentialen op grotere diepten geven logischerwijs een minder oxiderend milieu weer; vaststelling ervan is daarom noodzakelijk. Metingen van het KNMI volstaan voor een kwalitatieve vergelijking van de grondwaterreeksen met de neerslag en verdamping, indien een weerstation nabijgelegen is.
68—
IGBA RAPPORT 2011-02 - 23 -
Referenties Fetter, C.W. (1994) Applied Hydrogeology. University of Wisconsin, United States of America Heeringen, van R.M., G.V. Mauro & A. Smit (2004) A Pilot Study on the Monitoring of the Physical Quality of Three Archaeological Sites at the UNESCO World Heritage Site at Schokland, Province of Flevoland, the Netherlands. Nederlandse Archeologische Rapporten 26, Rijksdienst voor het Oudheidkundig Bodemonderzoek, Amersfoort. Smit, A., G. Mol & R.M. van Heeringen (2005) Natte voeten voor Schokland. Inrichting hydrologische zone. Archeologische monitoring 2003-2004. Een evaluatie van de waterhuishoudkundige maatregelen. Rapportage Archeologische Monumentenzorg 124, Rijksdienst voor het Oudheidkundig Bodemonderzoek, Amersfoort. Weemstra, H. (2011) Een vergelijkbaarheidsonderzoek van peilbuizen op en rond Schokland. Kan aan de hand van peilbuizen van waterschap Zuiderzeeland de grondwaterstand bepaald worden op vier locaties met archeologische waarden? Bachelor thesis Geoarcheologie, Vrije Universiteit Amsterdam, Faculteit der Aard- en Levenswetenschappen, Instituut Geo- en Bioarcheologie.
69—
IGBA RAPPORT 2011-02 - 25 -
Eerder verschenen in deze reeks 2003 G. Aalbersberg: Diatomeeënonderzoek aan IJzertijd-aardewerk van de opgraving Vinkenburg. IGBA Rapport 2003-01,
pp. 12. H. Kars: Slijpplaatjesonderzoek aan zogenaamd Zuid-Nederlands handgemaakt aardewerk. IGBA Rapport 2003-02, pp.
9. G. Aalbersberg: Korrelgroottemetingen aan materiaal van de sites Lomm en Koeweide. IGBA Rapport 2003-03, pp. 4. 2004 A. Kattenberg: Magnetisch onderzoek in de Maasvallei: een methodologisch onderzoek. IGBA Rapport 2004-01, pp.
13. A. Kattenberg: Grondradar onderzoek rond de kerk in Elst. IGBA Rapport 2004-02, pp. 12. A. Kattenberg: Meerssen-Onderste Herkenberg, een magnetisch onderzoek. IGBA Rapport 2004-03, pp. 16. S. Oonk: Geochemisch onderzoek in de Maasvallei. IGBA Rapport 2004-04, pp. 19. G. Aalbersberg & K. Sykora: Report on the preliminary investigation of the Nicopolis archaeological area and
surroundings. IGBA Rapport 2004-05, pp. 19. G. Aalbersberg: Grindanalyses aan Romeins materiaal uit de Leidsche Rijn. IGBA Rapport 2004-07, pp.11. 2005 K.J.R. Kerckhaert & A.E. Kattenberg: Geofysisch onderzoek bij L’Amastuola, Italië (campagne 2004). IGBA Rapport
2005-01, pp. 14. M. Jans: Degradatie archeologisch bot Raalte-Heeten. IGBA Rapport 2005-02, pp. 6. S. Leever: Een analyse van de ijzerproductie in Raalte en Heeten (AD 250-350). IGBA Rapport 2005-03, pp. 23. G. Aalbersberg & A.J.M. de Kraker: Reconstructie van het stroomgebied van de Westerschelde tussen 1550 en 2000
aan de hand van kaarten en de bedijkingsgeschiedenis. IGBA Rapport 2005-04, pp. 71. A. Smit, A. Beeker & R.M. van Heeringen: Ontwikkeling van instrumenten om de pH en redoxpotentiaal in de
onverzadigde van de bodem te meten; eindrapport. IGBA rapport 2005-05, pp. 20. M. Jans: De conservering van archeologisch bot te Stede Broec. IGBA rapport 2005-06, pp. 10. A. Smit: Redoxpotentiaalmetingen op een archeologisch monument en onder een naastgelegen gronddepot te
Beuningen. IGBA rapport 2005-07, pp. 11. A. Kattenberg: Magnetische prospectie van ijzerproductieplaatsen: Heeten-Hordelman. Een methodologisch
onderzoek. IGBA rapport 2005-08, pp. 22. S. Oonk : Geochemische prospectie Zijderveld. IGBA rapport 2005-09, pp. -. A. Smit: Redoxpotentiaalmetingen in grondsporen te Meteren-Hondsgemet (gemeente Geldermalsen). IGBA rapport
2005-10, pp. 15. L.M. Kootker & H. Kars: Physical, chemical and biological deterioration of the Roman theatre in Ancient Nikopolis,
Epirus, Greece; A Preliminary Report. IGBA rapport 2005-11, pp. 49. L.J.T. Janssen, A.L.H. Storme & S.J. Kluiving: ‘Ancient landscape in Roman Nikopolis’ Reconstruction of geomorphology
and vegetation in the area of the Roman city of Nikopolis, Epirus, Greece; A Preliminary Report. IGBA rapport 2005-12, pp. 75.
2006 M. Dekker & A. Kattenberg: Elektrisch weerstandsonderzoek Meteren Plantage, Geldermalsen, Huis te Meteren en
Kasteel Blanckenstijn. IGBA rapport 2006-01, pp.15. L.J.T. Janssen & A.L.H. Storme: Ancient landscape in Roman Nikopolis. Reconstruction of geomorphology and
vegetation in the area of the Roman city of Nikopolis, Epirus, Greece. IGBA report 2006-02, pp.156. M. Dekker & A. Kattenberg: Elektrisch weerstandsonderzoek Varik Molenblok, gemeente Neerijnen, Huis Varik. IGBA
rapport 2006-03, pp. 11.
70—
IGBA RAPPORT 2011-02 - 26 -
T. Verschoor: Archeometallurgie. Een onderzoek naar de ijzerproductie van drie locaties in de omgeving van Raalt’. IGBA rapport 2006-04, pp. 34.
2007 L.M. Kootker: The Roman Theatre in Ancient Nikopolis, Epirus, Greece. Degradation or preservation; an Archaeometric
Approach. IGBA rapport 2007-01, pp. 110. R. Abdulfattah: Detecting Pleistocene Cover Sand by Means of Different Geophysical Techniques. IGBA-rapport 2007-
02, pp. 28. R. Abdulfattah: The Applications of Geophysics in Investigating Burial Mounds and Urnfields in the Netherlands. IGBA
rapport 2007-03, pp.30. M. Theelen: Chemical analysis of Roman bronzes from Naaldwijk. IGBA rapport 2007-04, pp.79. L.M. Kootker: On the binders of mortars from Nikopolis, Greece. A physico-chemical characterization in view of their
conservation’ IGBA-rapport 2007-05, pp. 79. A.G.F.M. Cuijpers: Histologische soortdeterminatie van drie verbrande botfragmenten uit het Laat-Paleolithikum. IGBA
rapport 2007-07, pp.10. 2008 A.H.L. Storme: ‘The landscape at Zakynthos’. Detailed geomorphological description of the southeastern part of the
Vassilikos Peninsula. IGBA rapport 2008-01, pp. 246. M. Vorenhout: Grondwaterstand en –kwaliteit rond twee verschillende ingekuilde wrakken (25H-20 en -21, Almere).
IGBA rapport 2008-02, pp.16. M. Tendürüs: Earthquakes and archaeology. A case study in Zakynthos, Greece: Quantification of the influence of
seismic activities on the archaeological remains. IGBA rapport 2008-03, pp. 48. R. van de Locht & H. Kars: Stabiele stikstof en koolstof isotopen als indicatie voor paleodieet in Middeleeuws
Vlaardingen’. IGBA-rapport 2008-04, pp. 32. M. Dekker: ‘Applications of Light Stable Isotopes to Archaeology: Three Case Studies Addressing Diet, Seasonality &
Climate’. Palaeodiet, Palaeoclimate and Migration: Stable Isotope Analysis of Human Remains at the Anglo-Saxon Cemetery at Ely, United Kingdom. Seasonal Variations Observed in Modern Red Deer Teeth from Tolna, Hungary. Seasonal Variations around the Pleistocene-Holocene Transition Observed in Red Deer Teeth from Pupicina, Croatia. IGBA rapport 2008-05, pp. 123.
M. Vorenhout: Veenterpen Matsloot-Roderwolde en Peizer- & Eeldermaden: beperkte nulmeting en advies voor monitoring. IGBA-rapport 2008-06, pp.30 + 3 kaarten.
A. Koopman: Landscape Reconstruction around Neolithic Kom W, Fayum, Egypt; a Geo-Archaeological Approach. IGBA-rapport 2008-07, pp. 208 + supplement.
M. & R. de Locht: Reconstruction of the Landscape around the Roman City of Nikopolis, Greece. An Integrated Study using Geomorphological and Geological Research combined with Archaeological Data and Soil Analysis. IGBA rapport 2008-08, pp.294.
R. van de Locht: Ancient Starch in Çatalhöyük and Kaman Kalehöyük, Turkey Morphology, distribution patterns and preservation conditions of starch granules in archaeological features and soils. IGBA rapport 2008-09, pp. 100.
R van de Locht & H. Kars: Herkomstbepaling door middel van strontium en zuurstof isotopen van 11de eeuwse Vlaardingers. IGBA rapport 2008-10, pp. 44.
2009 L.M. Kootker: Herkomstbepaling door middel van strontium. Zuurstof en waterstof isotopen van een langgehoornd
rund uit Rotterdam Wijnhaeve. IGBA rapport 2009-01, pp.35. A.G.F.M. Cuijpers: Fysisch antropologisch onderzoek op crematieresten uit Itteren, Roermond en Brunssum. IGBA
rapport 2009-02, pp. 14. M. Vorenhout: Wuustegraaf/Hemmen A1.1-Monitoring 2006 en 2007. IGBA-rapport 2009-03, pp 17. A.G.F.M. Cuijpers: Fysisch antropologisch onderzoek van de crematieresten uit het grafveld Groesbeek-Spoorlaan.
IGBA-rapport 2009-04, pp.18. J. Graven, I. de Kort, M. Gkouma: Paleolandscape History in Northwestern Greece: A multi-proxy analysis of lake
sediments. IGBA-rapport 2009-05, pp. 85. L.M. Kootker (2009) Bodemkundig onderzoek van twee mogelijke Bronstijd inhumaties te Malden. IGBA-rapport 2009-
06, pp.22. L.M. Kootker & S. Baetsen: Fysisch antropologisch onderzoek Westmaas, locatie De Munnik. IGBA-rapport 2009-07, pp
27. A.M.J. de Kraker: Dijken en bewoning van de Polder van Dronthen in historisch perspectief. IGBA-rapport 2009-08,
pp.19.
71—
IGBA RAPPORT 2011-02 - 27 -
L.M. Kootker & S. Baetsen: Fysisch antropologisch onderzoek Purmerend – Plantsoengracht. IGBA-rapport 2009-09, pp. 27.
M. Tendürüs: Landscape evolution of the southern coastal plain of Zakynthos, Greece, since the Middle Holocene. Master Thesis Landscape Archaeology, Vrije Universiteit Amsterdam, Institute for Geo- and Bioarchaeology. IGBA-rapport 2009-10, pp. 123.
L.M. Kootker: Archeozoölogische rapportage van botmateriaal uit Sittard. Projecten Ursulinencomplex (27134) en Odagarage (16695), IGBA Rapport 2009-11, pp. 48.
R. Fernandes: Study on Roman and Merovingian copper alloyed artefacts. In soil corrosion processes and recycling practices (Master thesis archaeometry), IGBA report 2009-12, pp. 219.
2010 S.J. Kluiving & M. Vorenhout: Interdisciplinair onderzoek naar archeologie, geologie, hydrologie en conservering van
het cultureel erfgoed in de ondergrond van het Stadshart van Vlaardingen: een testonderzoek. IGBA rapport 2010-01, pp.137.
M.M. van den Berg & M. Vorenhout: Driel, De Breekenhof, monitoring van de grondwaterspiegel op twee archeologische vindplaatsen 2007-2010. IGBA rapport 2010-02, pp. 44.
S.J. Kluiving, A.M.J. de Kraker & S. IJzerman: Interdisciplinair onderzoek naar cultuurhistorie, ecologie en aardkundige waarden van het landschap van het gebied Zilverackers, gemeente Veldhoven. IGBA rapport 2010-03, pp.42.
L.M. Kootker: Fysisch antropologisch onderzoek van de skeletresten uit Etersheim. IGBA rapport 2010-04, pp. 19. S.E. Caspers: Scrapheap Hallum; archaeometallurgical investigations of a 3rd century bronze hoard. IGBA rapport 2010-
05, pp. 153. L.M. Kootker & E Altena: Bioarcheologisch onderzoek van de menselijke resten uit Castricum-Oosterbuurt. IGBA
rapport 2010-06, pp. 41. L.M. Kootker: Rapportage waardering en inventarisatie menselijk skeletmateriaal te Gilze, plangebied Kerkplein. IGBA-
Rapport 2010-07, pp.34 L.M. Kootker & E Altena: Aanvullend onderzoek aan de onderkaak uit de sarcofaag uit Etersheim. Koolstof datering en
aDNA onderzoek. IGBA-Rapport 2010-08, pp. 22. Annelies Koopman (2010) Lake Dynamics and Human Occupation duringthe Early and Mid-Holocene, Fayum
Basin, Egypt. Master thesis, Geoarchaeology, Landscape Archaeology. Institute for Geo- and Bioarchaeology VU University Amsterdam. IGBA rapport 2010-09, pp. 334
M.M.E. Jans: Degradatie Archeologisch Bot Borgharen. IGBA-Rapport 2010-10, pp. 8. D. van den Biggelaar: Historical landscape reconstruction of Schokland (Noordoostpolder, the Netherlands): a
combined archaeological, geological and historical geographical approach. IGBA-rapport 2010-12, pp. 127.
72—
Waardering van botanische macroresten van vier archeologische vindplaatsen bij Schokland
RAPPORTNUMMER
DATUM
AUTEUR
496
24 november 2010
H. van Haaster
Appendix III:BIAX report on Botanical remains
73—
Colofon Titel: BIAXiaal 496 Waardering van botanische macroresten van vier archeologische vindplaatsen bij Schokland. Auteur: H. van Haaster Opdrachtgever: Rijksdienst voor het Cultureel Erfgoed ISSN: 1568-2285 ©BIAX Consult, Zaandam, 2010 Correspondentieadres: BIAX Consult Hogendijk 134 1506 AL Zaandam tel: 075 – 61 61 010 fax: 075 – 61 49 980 e-mail: [email protected]
74—
BIAXiaal 496
1
1. Inleiding In het kader van de monitoring van het UNESCO monument Schokland zijn door de Rijksdienst voor het Cultureel Erfgoed op vier locaties bij Schokland monsters genomen Het gaat om de locaties De Zuidert, P14, E170 en J125. De monsters op De Zuidert en P14 zijn in 2009 genomen door middel van mechanische grondboringen met een diameter van 10 cm. Op J125 zijn handboringen uitgevoerd in 2010.De monsters van E170 waren al eerder verzameld (2007; zie Huisman et al. 2008). Van iedere locatie is materiaal verzameld voor onderzoek naar de kwaliteit van de botanische macroresten.
Onverkoolde botanische macroresten vormen een corrosiegevoelige organische materiaalgroep.1 Ze kunnen daardoor waardevolle aanwijzingen geven voor verslechterende conserveringsomstandigheden op een vindplaats. Het vaststellen van de conserveringstoestand van onverkoolde botanische macroresten als hulpmiddel bij het vaststellen van de staat van conservering van een archeologische vindplaats als geheel, heeft een drietal belangrijke voordelen: • Door de hoge corrosiegevoeligheid vormen onverkoolde botanische macroresten een
materiaalgroep, die veelal de eerste indicaties geeft voor verslechterende omstandigheden.
• Indien onverkoolde botanische macroresten goed geconserveerd zijn op een vindplaats, dan zal de kwaliteit van veel ander botanisch vondstmateriaal ook goed zijn. Dit zal ook gelden voor vondstmateriaal dat door middel van booronderzoek moeilijk is te onderzoeken, zoals hout.
• Doordat botanische macroresten relatief klein zijn, volstaat een monstervolume van 0,5 liter (soms blijkt een kleiner volume nog toereikend).2
Eerder zijn van deze locaties analyses gedaan van het botanisch materiaal om de nul- of beginsituatie van de conservering van het botanisch materiaal in kaart te brengen. Deze metingen zijn bedoeld om te onderzoeken in hoeverre de situatie ter plaatse is veranderd. Zo wordt getracht de conservering van de botanische macroresten in de loop der tijd te volgen. In dit rapport worden de uitkomsten van deze monitorronde gepresenteerd. De opdrachtgever (RCE) draagt zorg voor de vergelijking met eerdere meetrondes.
2. Werkwijze
2.1 BEMONSTERING Ten behoeve van het onderzoek zijn uit vijf boringen in totaal 14 monsters genomen. Een overzicht van de onderzochte monsters met hun contextgegevens wordt in onderstaande tabel gegeven. 1 Verkoolde plantenresten worden in dit onderzoek buiten beschouwing gelaten. Verkoold
botanisch materiaal kan echter goed gebruikt worden bij monitoringonderzoek. Het kan (als er veel van aanwezig is) een goede parameter zijn om degradatie van een vindplaats als gevolg van mechanische druk, in kaart te brengen.
2 Brinkkemper 2006.
75—
BIAXiaal 496
2
Tabel 1 Schokland, overzicht van gewaardeerd monsters
Locatie monsternummer/diepte volume (l) De Zuidert-1 MB1 0,5
De Zuidert-1 MB2 0,5
De Zuidert-1 MB3 0,4
De Zuidert-1 MB4 0,5
De Zuidert-2 MB1 0,5
De Zuidert-2 MB2 0,6
De Zuidert-2 MB3 0,5
De Zuidert-2 MB4 0,4
P14-1 MB1 0,4
P14-1 MB2 0,5
P14-2 MB1 0,5
J125-1 60-80 2,1
J125-1 100-120 1,5
J125-1 140-160 2,75
E170 50-1 2,1
E170 50-2 2,1
E170 70-1 2,5
E170 70-2 1,6
E170 160-1 2,6
E170 160-2 3,5
2.2 LABORATORIUMBEWERKING EN ANALYSETECHNIEK De monsters zijn gezeefd over een serie zeven met maaswijdten van 2, 1, 0,5 en 0,25 mm. De 2 en 1 mm fracties zijn in hun geheel uitgezocht. Vanwege de relatief grote residuen van de 0,5 en 0,25 mm fracties is hiervan steeds een representatief deel uitgezocht. Een deel wordt representatief geacht wanneer na het bekijken van 10 petrischaaltjes geen nieuwe soorten/taxa meer worden aangetroffen. De resultaten van het onderzochte deel zijn vervolgens geëxtrapoleerd naar het gehele volume.
Analyse van de macroresten heeft plaatsgevonden met behulp van een opvallend-lichtmicroscoop met vergrotingen tot 50 maal.3 Dit werk is verricht door W. van der Meer.
2.3 BEPALING CONSERVERINGSTOESTAND Ten behoeve van monitoring is het noodzakelijk de conserveringstoestand van plantenresten op zo’n manier vast te leggen dat in later onderzoek een eventuele achteruitgang van de conservering waarneembaar kan zijn. Voor het vastleggen van de conserveringstoestand gelden een aantal criteria die reeds bij eerder onderzoek naar achteruitgang van botanische macroresten in het kader van monitoring van archeologische monumenten zijn gedefinieerd.4
3 In enkele gevallen zijn determinaties verricht onder sterkere vergrotingen. 4 Vernimmen 2001, 2002; Brinkkemper 2006.
76—
BIAXiaal 496
3
Volgens de methode Brinkkemper wordt per taxon5 de conserveringstoestand van de individuele, onverkoolde resten aangegeven op een vijfledige schaal. Hierbij worden de volgende vijf conserveringklassen onderscheiden: klasse 1: er is geen zekere taxon-/soortdeterminatie mogelijk, het materiaal is sterk
aangetast; klasse 2: soortdeterminatie is mogelijk, maar de resten zijn sterk gefragmenteerd en/of de
zaadwand is sterk aangetast; klasse 3: resten zijn goed te determineren, maar er is wel sprake van enige beschadiging
of aantasting van de zaadwand (anders dan halveren, dat al voor de depositie door kieming veroorzaakt kan zijn);
klasse 4: resten zijn compleet en onbeschadigd, maar fijne elementen als haren of tere kafresten ontbreken;
klasse 5: resten zijn compleet en onbeschadigd, en fijne elementen als haren of tere kafresten zijn ook aanwezig (een groot aantal soorten bezit dit soort elementen niet, en kaf van de meeste graansoorten is juist resistenter dan de zaadwand, zodat dit niet voor een indeling in klasse 5 gebruikt kan worden.
In 2007 is door Engelse onderzoekers een waarderingsmethode beschreven die in sommige opzichten iets verfijnder is dan de methode Brinkkemper. De mate van fragmentatie en verwering wordt met deze methode iets betrouwbaarder (lees: beter reproduceerbaar) gekwantificeerd.6 Oppervlakteverwering: klasse A: verwering van het oppervlak <25% klasse B: verwering van het oppervlak 25-50% klasse C: verwering van het oppervlak >50% Fragmentatiegraad: klasse a: fragmentatiegraad <25% klasse b: fragmentatiegraad 25-50% klasse c: fragmentatiegraad >50% Bij deze methode wordt ook zo nauwkeurig mogelijk de correcte botanische naam van elke gewaardeerde plantenrest geregistreerd. Dit wordt gedaan omdat de conserveringstoestand sterk afhankelijk is van de aard van het aangetroffen plantenonderdeel. In het voorliggende rapport worden de waarderingsresultaten volgens beide bovengenoemde methoden beschreven. Monster 160-1 van vindplaats E170 is alleen volgens de methode Brinkkemper beschreven.
5 Een taxon is een soort of een niet onder te verdelen groep van soorten. Wanneer hieronder
sprake is van ‘soorten’ worden eigenlijk ‘taxa’ bedoeld, omdat niet elke rest tot op het niveau van de soort is gedetermineerd.
6 Jones et al. 2007.
77—
BIAXiaal 496
4
3. Resultaten en conclusies Voor een volledig overzicht van de resultaten wordt verwezen naar de bijlagen 1 en 2. Hieronder worden de resultaten per boring besproken.
3.1 DE ZUIDERT-1, MB1 Dit monster is relatief arm aan soorten. Er bevonden zich slechts resten van 5 soorten in het monster. De meeste resten vallen in conserveringsklasse 3 van Brinkkemper. Een paar soorten zijn iets slechter geconserveerd (klasse 2). Eén soort is beter geconserveerd (klasse 4).
Volgens de methode Jones et al. valt 87% van de resten in fragmentatieklasse a; 13% valt in fragmentatieklasse b. Wat de verwering van het oppervlak betreft, valt 13% van de resten in klasse A, 62% in klasse B en 25% in klasse C.
3.2 DE ZUIDERT-1, MB2 In dit monster zijn resten van 7 soorten aangetroffen. De meeste resten vallen in de conserveringsklassen 2 en 3 van Brinkkemper (ongeveer gelijk over deze klassen verdeeld). Een paar soorten zijn iets slechter geconserveerd (klasse 1). Eén soort is beter geconserveerd (klasse 4). Volgens de methode Jones et al. valt 59% van de resten in fragmentatieklasse a, 32% in fragmentatieklasse b en 9% in fragmentatieklasse c. Wat de verwering van het oppervlak betreft, valt 9% van de resten in klasse A, 41% in klasse B en 50% in klasse C.
3.3 DE ZUIDERT-1, MB3 In dit monster zijn resten van 13 soorten aangetroffen. De meeste resten vallen in de conserveringsklassen 2 en 3 van Brinkkemper (ongeveer gelijk over deze klassen verdeeld). Een paar soorten zijn iets slechter (klasse 2) of iets beter (klasse 4) geconserveerd.
Volgens de methode Jones et al. valt 55% van de resten in fragmentatieklasse a, 35% in fragmentatieklasse b en 11% valt in klasse c. Wat de verwering van het oppervlak betreft, valt 10% van de resten in klasse A, 37% in klasse B en 53% in klasse C.
3.4 DE ZUIDERT-1, MB4 In dit monster zijn resten van 25 soorten aangetroffen. De meeste resten vallen in de conserveringsklasse 4 van Brinkkemper. Veel andere resten vallen in de klassen 2 en 3 (ongeveer gelijk over deze klassen verdeeld). Enkele resten zijn iets slechter (klasse 1) of iets beter (klasse 5) geconserveerd.
Volgens de methode Jones et al. valt 61% van de resten in fragmentatieklasse a, 27% in fragmentatieklasse b en 12% in klasse c. Wat de verwering van het oppervlak betreft, valt 39% van de resten in klasse A, 35% in klasse B en 25% in klasse C.
3.5 DE ZUIDERT-2, MB1 In dit monster zijn resten van slechts 5 soorten gevonden. De resten van drie soorten zijn van recente ouderdom. De resten van de twee subfossiele andere soorten vallen in de conserveringsklassen 1 en 4 van Brinkkemper.
Volgens de methode Jones et al. valt één subfossiele soort in fragmentatieklasse a, de ander valt in fragmentatieklasse c. Wat de verwering van het oppervlak betreft, vallen de resten in de klassen A en C.
78—
BIAXiaal 496
5
3.6 DE ZUIDERT-2, MB2 In dit monster zijn resten van 11 soorten aangetroffen. De meeste resten vallen in de conserveringsklassen 2 en 3 van Brinkkemper. Enkele soorten zijn iets slechter (klasse 1) of iets beter (klasse 4) geconserveerd.
Volgens de methode Jones et al. valt 49% van de resten in fragmentatieklasse a, 31% valt in fragmentatieklasse b en 20% valt in klasse c. Wat de verwering van het oppervlak betreft, valt 17% van de resten in klasse A, 34% in klasse B en 49% in klasse C.
3.7 DE ZUIDERT-2, MB3 In dit monster zijn resten van 42 soorten aangetroffen. De meeste resten vallen in de conserveringsklassen 3 en 4 van Brinkkemper (ongeveer gelijk over deze klassen verdeeld). Daarnaast zijn ook veel soorten uit conserveringsklasse 2 aanwezig. Enkele soorten zijn iets slechter (klasse 1) of iets beter (klasse 5) geconserveerd.
Volgens de methode Jones et al. valt 69% van de resten in fragmentatieklasse a, 17% in klasse b en 14% in klasse c. Wat de verwering van het oppervlak betreft, valt 40% van de resten in klasse A, 40% in klasse B en 20% in klasse C.
3.8 DE ZUIDERT-2, MB4 In dit monster zijn resten van 43 soorten aangetroffen. De meeste resten vallen in de conserveringsklassen 2, 3 en 4 van Brinkkemper (ongeveer gelijk over deze klassen verdeeld). Enkele soorten zijn iets slechter (klasse 1) of iets beter (klasse 5) geconserveerd.
Volgens de methode Jones et al. valt 55% van de resten in fragmentatieklasse a, 26% in klasse b en 19% in klasse c. Wat de verwering van het oppervlak betreft, valt 35% van de resten in klasse A, 33% in klasse B en 32% in klasse C.
3.9 P14-1, MB1 In dit monster zijn resten van 6 soorten aangetroffen. De meeste resten vallen in conserveringsklasse 3 van Brinkkemper. Enkele resten vallen in de klassen 1, 2 en 4.
Volgens de methode Jones et al. valt 83% van de resten in fragmentatieklasse a en 17% in klasse b. Wat de verwering van het oppervlak betreft, valt 17% van de resten in klasse A, 58% in klasse B en 25% in klasse C.
3.10 P14-1, MB2 In dit monster zijn resten van slechts 2 soorten aangetroffen, waarvan één verkoold (een kafrest van Triticum dicoccon). De onverkoolde resten vallen in conserveringsklasse 2 van Brinkkemper.7
Volgens de methode Jones et al. valt 50% van de onverkoolde resten in fragmentatieklasse a en 50% in klasse b. Wat de verwering van het oppervlak betreft, vallen alle resten in klasse C.
3.11 P14-2, MB1 In dit monster zijn resten van 5 soorten aangetroffen. De meeste resten vallen in de conserveringsklassen 2 en 3 van Brinkkemper (ongeveer gelijk over deze klassen verdeeld).
Volgens de methode Jones et al. valt 67% van de resten in fragmentatieklasse a, 25% in klasse b en 8% in klasse c. Wat de verwering van het oppervlak betreft, valt 25% in klasse A, 33% in klasse B en 42% in klasse C.
7 Bij de onverkoolde resten gaat het om enkele tientallen slecht geconserveerde Juncus-zaden.
79—
BIAXiaal 496
6
3.12 J125, 60-80 In dit monster zijn resten van 32 soorten aangetroffen, waarvan een verkoold. De meeste resten vallen in de conserveringsklassen 2, 3 en 4 van Brinkkemper (ongeveer gelijk over deze klassen verdeeld). Een enkele rest valt in klasse 1.
Volgens de methode Jones et al. valt 60% van de resten in fragmentatieklasse a, 27% in klasse b en 13% in klasse c. Wat de verwering van het oppervlak betreft, valt 29% in klasse A, 26% in klasse B en 45% in klasse C.
3.13 J125, 100-120 In dit monster zijn resten van 14 soorten aangetroffen. De meeste resten vallen in de conserveringsklasse 2 van Brinkkemper. Een aantal resten valt in conserveringsklasse 3 en een enkele soort is iets slechter (klasse 1) of beter geconserveerd (klasse 4).
Volgens de methode Jones et al. valt 62% van de resten in fragmentatieklasse a, 13% in klasse b en 25% in klasse c. Wat de verwering van het oppervlak betreft, valt 25% in klasse A, 19% in klasse B en 56% in klasse C.
3.14 J125, 140-160 In dit monster zijn resten van 18 soorten aangetroffen. De meeste resten vallen in conserveringsklasse 2 van Brinkkemper. Daarnaast vallen veel resten in de klassen 3 en 4 (ongeveer gelijk over deze klassen verdeeld). Enkele resten zijn slechter geconserveerd (klasse 1).
Volgens de methode Jones et al. valt 64% van de resten in fragmentatieklasse a, 23% in klasse b en 13% in klasse c. Wat de verwering van het oppervlak betreft, valt 18% in klasse A, 33% in klasse B en 49% in klasse C.
3.15 E170, 50-1 In dit monster zijn resten van slechts drie soorten aangetroffen. De resten van deze soorten vallen in de klassen 1, 2 en 3 van Brinkkemper. Volgens de methode Jones et al. valt 80% van de resten in fragmentatieklasse c en 20% in klasse a. Wat de verwering van het oppervlak betreft, valt 80% in klasse B en 20% in klasse C.
3.16 E170, 50-2 In dit monster zijn resten van elf soorten aangetroffen. De meeste resten vallen in klasse 3 van Brinkkemper. Relatief veel resten vallen ook in de klassen 1 en 4, en enkele resten vallen in klasse 2. Volgens de methode Jones et al. valt 64% van de resten in fragmentatieklasse a, 18% in klasse b en 18% in klasse c. Wat de verwering van het oppervlak betreft, valt 35% in klasse A, 47% in klasse B en 18% in klasse C.
3.17 E170, 70-1 In dit monster zijn resten van zes soorten aangetroffen. De meeste resten vallen in klasse 3 van Brinkkemper. De andere resten vallen in de klassen 1, 2 en 4 (ongeveer gelijk over deze klassen verdeeld). Volgens de methode Jones et al. valt 67% van de resten in fragmentatieklasse a, 11% in klasse b en 22% in klasse c. Wat de verwering van het oppervlak betreft, valt 45% in klasse A, 33% in klasse B en 22% in klasse C.
80—
BIAXiaal 496
7
3.18 E170, 70-2 In dit monster zijn resten van elf soorten aangetroffen. De meeste resten vallen in klasse 2 van Brinkkemper. Relatief veel andere resten vallen in de klassen 3 en 4 (ongeveer gelijk over deze klassen verdeeld). Enkele resten vallen in klasse 1. Volgens de methode Jones et al. valt 46% van de resten in fragmentatieklasse a, 23% in klasse b en 31% in klasse c. Wat de verwering van het oppervlak betreft, valt 23% in klasse A, 62% in klasse B en 15% in klasse C.
3.19 E170, 160-1 Dit monster heeft een rijke samenstelling met ruim vijftig soorten. Van een aantal soorten zijn verkoolde resten gevonden. Het gaat hierbij vooral om cultuurgewassen en akkeronkruiden. Bij de beoordeling van de conserveringstoestand zijn de verkoolde resten buiten beschouwing gelaten. De meeste resten zijn goed geconserveerd en vallen in de klassen 3 en 4 van Brinkkemper. Enkele soorten zijn heel gaaf bewaard gebleven (klasse 5), enkele andere soorten vallen in de klassen 1 en 2.
De plantenresten in dit monster zijn niet beoordeeld volgens de methode Jones et al.
3.20 E170, 160-2 Ook dit monster heeft een rijke samensteling met ruim vijftig soorten. Enkele resten (voornamelijk cultuurgewassen en akkeronkruiden) zijn verkoold. Bij de beoordeling van de conserveringstoestand zijn deze resten buiten beschouwing gelaten. De meeste resten zijn goed geconserveerd en vallen in de klassen 3 en 4 van Brinkkemper. Veel andere resten vallen in klasse 2. Enkele soorten zijn heel gaaf bewaard gebleven (klasse 5) en een enkele soort valt in klasse 1. Volgens de methode Jones et al. valt 54% van de resten in fragmentatieklasse a, 25% in klasse b en 21% in klasse c. Wat de verwering van het oppervlak betreft, valt 38% in klasse A, 40% in klasse B en 22% in klasse C.
4. Literatuur
Brinkkemper, O., 2006: Standaard Archeologische Monitoring, Botanische Macroresten, Amersfoort.
Jones, J., H. Tinsley & R. Brunning 2007: Methodologies for Assessment of the state of Preservation of Pollen and Plant Macrofossil Remains in Waterlogged Deposits, Environmental Archaeology 12, 71-86.
Vernimmen, T.J.J., 2001: De conserveringstoestand van het archeobotanische materiaal, in: R.M. van Heeringen & E.M. Theunissen (red.), Kwaliteitsbepalend onderzoek ten behoeve van duurzaam behoud van neolithische terreinen in West-Friesland en de Kop van Noord-Holland, Amersfoort (Nederlandse Archeologische Rapporten, 21), 101-117.
Vernimmen,T.J.J., 2002: The Preservation of Botanical Remains in Archaeological Sites on Voorne-Putten, in: R.M. van Heeringen & E.M Theunissen (eds.), Desiccation of the Archaeological Landscape at Voorne-Putten, Amersfoort (Nederlandse Archeologische Rapporten, 25), 137-162.
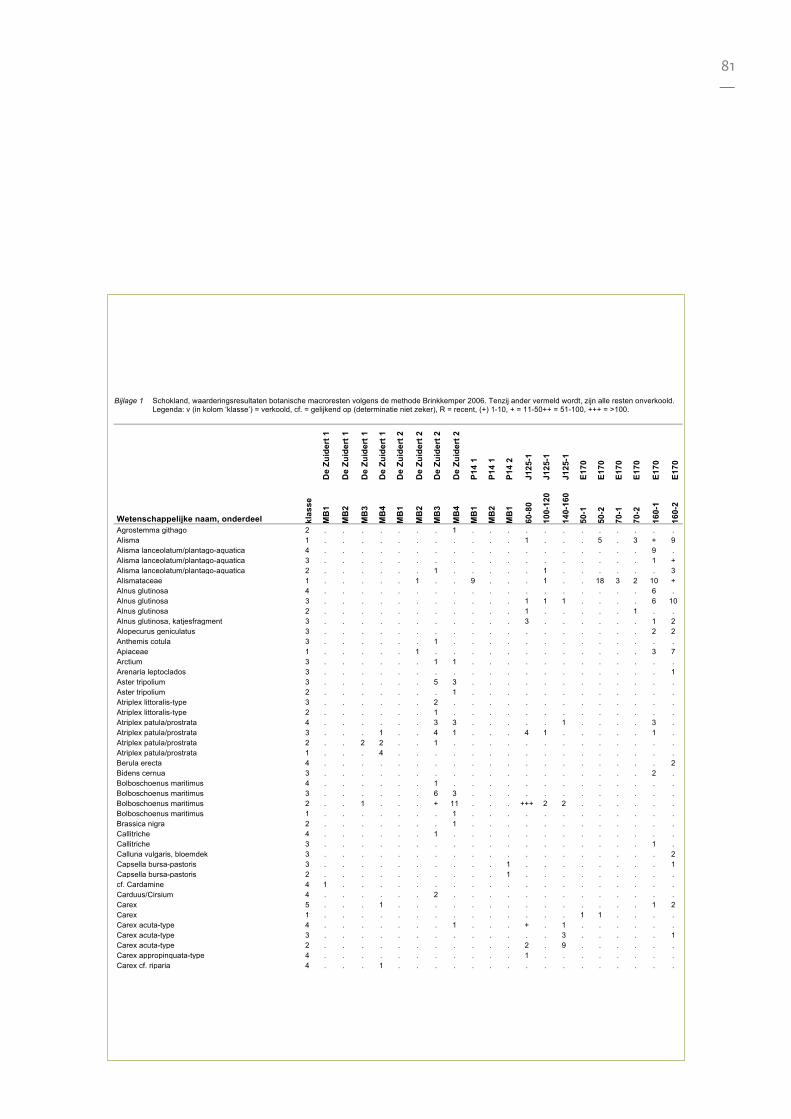
81—
Bijlage 1 Schokland, waarderingsresultaten botanische macroresten volgens de methode Brinkkemper 2006. Tenzij ander vermeld wordt, zijn alle resten onverkoold. Legenda: v (in kolom ‘klasse’) = verkoold, cf. = gelijkend op (determinatie niet zeker), R = recent, (+) 1-10, + = 11-50++ = 51-100, +++ = >100.
De
Zuid
ert 1
De
Zuid
ert 1
De
Zuid
ert 1
De
Zuid
ert 1
De
Zuid
ert 2
De
Zuid
ert 2
De
Zuid
ert 2
De
Zuid
ert 2
P14
1
P14
1
P14
2
J125
-1
J125
-1
J125
-1
E170
E170
E170
E170
E170
E170
Wetenschappelijke naam, onderdeel klas
se
MB
1
MB
2
MB
3
MB
4
MB
1
MB
2
MB
3
MB
4
MB
1
MB
2
MB
1
60-8
0
100-
120
140-
160
50-1
50-2
70-1
70-2
160-
1
160-
2
Agrostemma githago 2 . . . . . . . 1 . . . . . . . . . . . . Alisma 1 . . . . . . . . . . . 1 . . . 5 . 3 + 9 Alisma lanceolatum/plantago-aquatica 4 . . . . . . . . . . . . . . . . . . 9 . Alisma lanceolatum/plantago-aquatica 3 . . . . . . . . . . . . . . . . . . 1 + Alisma lanceolatum/plantago-aquatica 2 . . . . . . 1 . . . . . 1 . . . . . . 3 Alismataceae 1 . . . . . 1 . . 9 . . . 1 . . 18 3 2 10 + Alnus glutinosa 4 . . . . . . . . . . . . . . . . . . 6 . Alnus glutinosa 3 . . . . . . . . . . . 1 1 1 . . . . 6 10 Alnus glutinosa 2 . . . . . . . . . . . 1 . . . . . 1 . . Alnus glutinosa, katjesfragment 3 . . . . . . . . . . . 3 . . . . . . 1 2 Alopecurus geniculatus 3 . . . . . . . . . . . . . . . . . . 2 2 Anthemis cotula 3 . . . . . . 1 . . . . . . . . . . . . . Apiaceae 1 . . . . . 1 . . . . . . . . . . . . 3 7 Arctium 3 . . . . . . 1 1 . . . . . . . . . . . . Arenaria leptoclados 3 . . . . . . . . . . . . . . . . . . . 1 Aster tripolium 3 . . . . . . 5 3 . . . . . . . . . . . . Aster tripolium 2 . . . . . . . 1 . . . . . . . . . . . . Atriplex littoralis-type 3 . . . . . . 2 . . . . . . . . . . . . . Atriplex littoralis-type 2 . . . . . . 1 . . . . . . . . . . . . . Atriplex patula/prostrata 4 . . . . . . 3 3 . . . . . 1 . . . . 3 . Atriplex patula/prostrata 3 . . . 1 . . 4 1 . . . 4 1 . . . . . 1 . Atriplex patula/prostrata 2 . . 2 2 . . 1 . . . . . . . . . . . . . Atriplex patula/prostrata 1 . . . 4 . . . . . . . . . . . . . . . . Berula erecta 4 . . . . . . . . . . . . . . . . . . . 2 Bidens cernua 3 . . . . . . . . . . . . . . . . . . 2 . Bolboschoenus maritimus 4 . . . . . . 1 . . . . . . . . . . . . . Bolboschoenus maritimus 3 . . . . . . 6 3 . . . . . . . . . . . . Bolboschoenus maritimus 2 . . 1 . . . + 11 . . . +++ 2 2 . . . . . . Bolboschoenus maritimus 1 . . . . . . . 1 . . . . . . . . . . . . Brassica nigra 2 . . . . . . . 1 . . . . . . . . . . . . Callitriche 4 . . . . . . 1 . . . . . . . . . . . . . Callitriche 3 . . . . . . . . . . . . . . . . . . 1 . Calluna vulgaris, bloemdek 3 . . . . . . . . . . . . . . . . . . . 2 Capsella bursa-pastoris 3 . . . . . . . . . . 1 . . . . . . . . 1 Capsella bursa-pastoris 2 . . . . . . . . . . 1 . . . . . . . . . cf. Cardamine 4 1 . . . . . . . . . . . . . . . . . . . Carduus/Cirsium 4 . . . . . . 2 . . . . . . . . . . . . . Carex 5 . . . 1 . . . . . . . . . . . . . . 1 2 Carex 1 . . . . . . . . . . . . . . 1 1 . . . . Carex acuta-type 4 . . . . . . . 1 . . . + . 1 . . . . . . Carex acuta-type 3 . . . . . . . . . . . . . 3 . . . . . 1 Carex acuta-type 2 . . . . . . . . . . . 2 . 9 . . . . . . Carex appropinquata-type 4 . . . . . . . . . . . 1 . . . . . . . . Carex cf. riparia 4 . . . 1 . . . . . . . . . . . . . . . .

82—
De
Zuid
ert 1
De
Zuid
ert 1
De
Zuid
ert 1
De
Zuid
ert 1
De
Zuid
ert 2
De
Zuid
ert 2
De
Zuid
ert 2
De
Zuid
ert 2
P14
1
P14
1
P14
2
J125
-1
J125
-1
J125
-1
E170
E170
E170
E170
E170
E170
Wetenschappelijke naam, onderdeel klas
se
MB
1
MB
2
MB
3
MB
4
MB
1
MB
2
MB
3
MB
4
MB
1
MB
2
MB
1
60-8
0
100-
120
140-
160
50-1
50-2
70-1
70-2
160-
1
160-
2
Carex disticha-type 4 . . . 3 . . . . . . . . . . . . . . . . Carex disticha-type 3 . . . 2 . . . . . . . 2 . . . . . . . . Carex disticha-type 2 . . . . . . . . . . . . . 2 . . . . . . Carex flava-type 4 . . . . . . . 1 . . . . . . . . . . . . Carex flava-type 3 . . 1 . . . . . . . . . . . . . . . . . Carex flava-type 2 . . 1 . . . . . . . . . . . . . . . . . Carex hirta 4 . . . . . . . . . . . . . . . . . . 1 5 Carex hirta 2 . . . . . . . . . . . . . . . . . . . 2 Carex otrubae/vulpina 4 . . . 1 . . . 1 . . . . . . . . . . . . Carex otrubae/vulpina 3 . . . 1 . . 1 . . . . . . . . . . . . . Carex otrubae/vulpina 2 . . . . . . 1 1 . . . . . . . . . . . . Carex pseudocyperus 5 . . . . . . . . . . . 2 . + . . . . 1 2 Carex pseudocyperus 4 . . . . . . . . . . . . 2 3 . . . . 2 2 Carex pseudocyperus 3 . . . . . . . . . . . 1 2 5 . . . 1 8 1 Carex pseudocyperus 2 . . . . . . . . . . . 2 1 5 . . . . . 10 Carex riparia 4 . . . . . . . . . . . 1 . . . . . . . . Carex riparia 2 . . . . . . . 1 . . . . . 1 . . . . . . Carex rostrata/vesicaria 4 . . . . . . . . . . . 1 . . . . . . 1 2 Cerealia indet. v . . . . . . . . . . . . . . . . . . 1 . Chenopodiaceae 1 . . 3 . . . . . . . . . . . . . . . 3 1 Chenopodium album 4 . . . . . . . 5 1 . + . . . . . . . ++ +++ Chenopodium album 3 . . . . . . . . 1 . + . . . . . . . + + Chenopodium album 2 . . . . . . . . . . 7 . . . . . . . . ++ Chenopodium album v . . . . . . . . . . . . . . . . . . 1 . Chenopodium ficifolium 4 . . . . . . 1 . . . . . . . . . . . 5 9 Chenopodium ficifolium 3 . . 1 . . . . . . . . . . . . . . . 2 1 Chenopodium ficifolium 2 . . . . . . . . . . . . . . . . . . . 2 Chenopodium glaucum/rubrum 4 . . . . . 3 2 4 . . . . . . . . . . . . Chenopodium glaucum/rubrum 3 . 1 . . . 2 . 1 . . . . . . . . . . . . Chenopodium glaucum/rubrum 2 . . . . . 1 . . . . . . . . . . . . . . Cirsium arvense/palustre 3 . . . . . . . 1 . . . . . . . . . . . . Cladium mariscus 4 . . . . . . . . . . . . . 2 . . . . 1 . Cladium mariscus 3 . . . 1 . . . 2 . . . . . 7 . . . . . . Cladium mariscus 2 . . . . . . 6 3 . . . ++ . +++ . . . . . . Corylus avellana 2 . . . . . . . . . . . . . . . . . . +++ + Corylus avellana v . . . . . . . . . . . . . . . . . . 3 15 Cyperaceae 2 . . . . . . . 1 . . . . . . . . . . . . Cyperus fuscus 3 . . . . . . . . . . . . . . . . . . 1 . Daucus carota 2 . . . . . . . 3 . . . . . . . . . . . . Daucus carota 4 . . . . . . . 8 . . . . . . . . . . . . Daucus carota 3 . . . . . . . 6 . . . . . . . . . . . . Daucus carota 2 . . . . . . . 6 . . . . . . . . . . . . Echinochloa crus-galli, kafje 4 . . . . . . 1 . . . . . . . . . . . . . Eleocharis palustris/uniglumis 4 . . . 3 . . + + . . . 4 . . . . . . . 1 Eleocharis palustris/uniglumis 3 . 1 1 6 . . + + . . . 2 . . . . . . . . Eleocharis palustris/uniglumis 2 . 2 13 12 . 3 + ++ . . . +++ . 1 . . . . 1 . Eleocharis palustris/uniglumis v . . . . . . . 4 . . . . . . . . . . . .

83—
De
Zuid
ert 1
De
Zuid
ert 1
De
Zuid
ert 1
De
Zuid
ert 1
De
Zuid
ert 2
De
Zuid
ert 2
De
Zuid
ert 2
De
Zuid
ert 2
P14
1
P14
1
P14
2
J125
-1
J125
-1
J125
-1
E170
E170
E170
E170
E170
E170
Wetenschappelijke naam, onderdeel klas
se
MB
1
MB
2
MB
3
MB
4
MB
1
MB
2
MB
3
MB
4
MB
1
MB
2
MB
1
60-8
0
100-
120
140-
160
50-1
50-2
70-1
70-2
160-
1
160-
2
Eleocharis palustris/uniglumis 1 . . 8 . . . . . . . . . . . . . . . . . Elytrigia repens v . . . . . . . . . . . . . . . . . . 1 . cf. Epilobium 2 . . . . . . . . . . . . . 1 . . . . . . Erica tetralix 4 . . . . . . 1 . . . . . . . . . . . . . Euphrasia/Odontites 1 . . . 1 . . . 1 . . . . . . . . . . . . Fagopyrum esculentum 2 . . . . . . ++ 3 . . . . . . . . . . . . Ficus carica 4 . . . . . . . 3 . . . . . . . . . . . . Galeopsis 1 . . . . . . . . . . . . . . . . . . 6 . Galeopsis bifida-type 4 . . . . . . . . . . . . . . . . . . 1 3 Glaux maritima 2 . . . . . 2 . . . . . . . . . . . . . . Glyceria fluitans/notata 4 . . . . . . . . . . . . . . . . . . 11 16 Glyceria fluitans/notata 3 . . . . . . . . . . . . . . . . . . + 13 Hippuris vulgaris 4 . . . 1 . . 1 3 . . . . . . . . . . . . Hippuris vulgaris 3 . . . . . . 2 7 . . . . . . . . . . . . Hippuris vulgaris 2 . . . 3 . . . + . . . . . . . . . . . . Hordeum v . . . . . . . . . . . . . . . . . . . 2 Hordeum vulgare v . . . . . . . . . . . . . . . . . . 4 . Hordeum vulgare, aarspilsegment v . . . . . . . . . . . . . . . . . . 5 5 Humulus lupulus 3 . . . . . . . . . . . . . . . . . . . 1 Hydrocotyle vulgaris 2 . . . . . . 1 . . . . ++ . 1 . . . . 2 3 Hyoscyamus niger 3 . . . . . . . . . . . 1 . . . . . . . . Juglans regia 2 . . . . . . . 1 . . . . . . . . . . . . Juncus 1 + . +++ . . (+) 4 . + + . . . . . . . . . . Juncus articulatus-type 4 . . + . . . . . . . . . . . . . . . . 1 Juncus articulatus-type 3 . . + . . . 1 . . . . . . . . . . . . . Juncus articulatus-type 2 . . + . . . . . . . . . . . . . . . . . Juncus effusus-type 4 . . . . . . 1 . 2 . . . . . . . . . . . Juncus gerardi 4 . + + + . 5 1 + . . . . . . . . . . . . Juncus gerardi 3 + ++ + + . ++ 4 ++ . . . . . . . . . . . . Juncus gerardi 2 . +++ +++ . . +++ . + . . . . . . . . . . . . Lamiaceae 1 . . . . . . . . . . . . . . . . 1 . . . cf. Lapsana communis 2 . . . 1 . . . . . . . . . . . . . . . . cf. Leersia oryzoides 3 . . . . . . . . . . . . . . . . . . . 2 Lemna 4 . . . . . . . . . . . . . . . . . . . 9 Linum usitatissimum v . . . . . . . . . . . . . . . . . . 1 . Lycopus europaeus 4 . . . . . . . . . . . . . . . 1 . . 2 . Lycopus europaeus 3 . . . . . . . . . . . 1 . 4 . . . . 12 17 Lycopus europaeus 2 . . . . . . . 1 . . . 1 2 1 . . . . . 3 Lythrum salicaria 4 . . . . . . 1 . . . . . . . . . . . 6 4 Lythrum salicaria 3 . . . . . . . . (+) . . . . . . 1 . . . 3 Lythrum salicaria 2 . . . . . . . . + . . . . . . . . . . 1 cf. Marrubium vulgare 3 . . . . . . . . . . . 1 . . . . . . . . Mentha aquatica 4 . . . 1 . . . . . . . 1 . . . . . . . + Mentha aquatica 3 . . . . . . . . . . . 2 . . . 2 . . 5 + Mentha aquatica 2 . . . . . . . . . . . 1 . . . . . . . 6 Menyanthes trifoliata 4 . . . . . . . . . . . 1 . 1 . . . . . 2 Menyanthes trifoliata 3 . . . . . . . 1 . . . 1 . 3 . 1 1 . 4 1
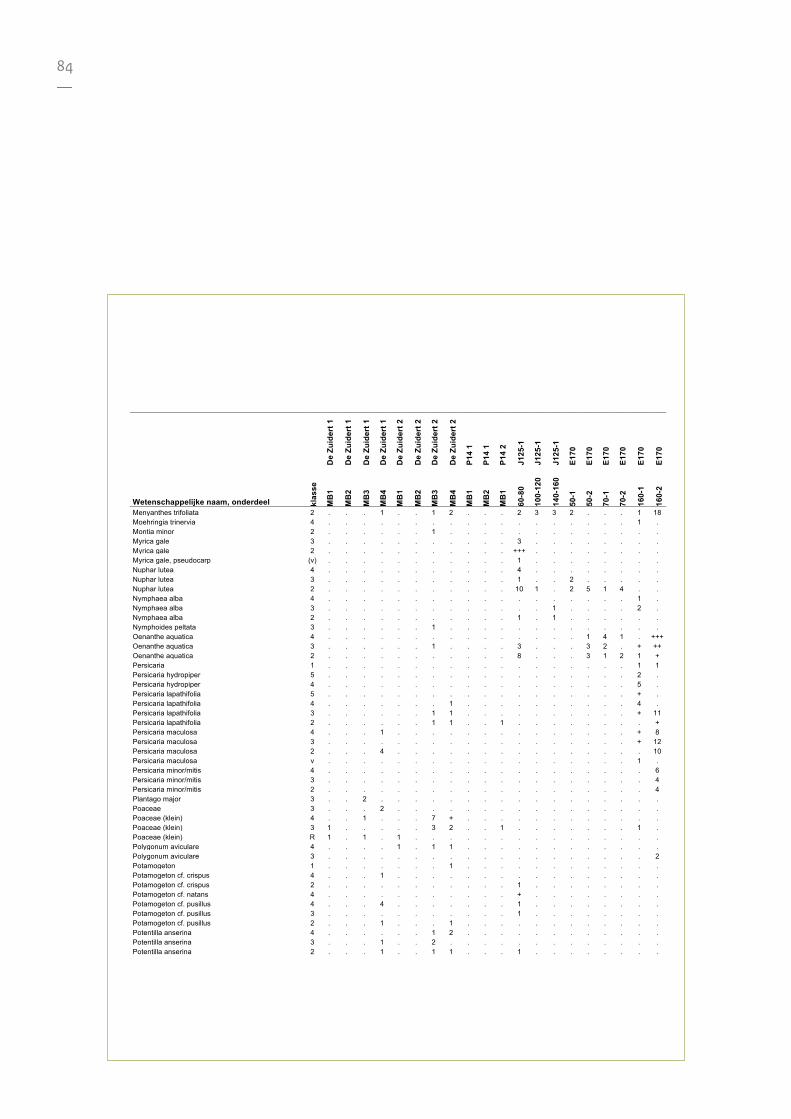
84—
De
Zuid
ert 1
De
Zuid
ert 1
De
Zuid
ert 1
De
Zuid
ert 1
De
Zuid
ert 2
De
Zuid
ert 2
De
Zuid
ert 2
De
Zuid
ert 2
P14
1
P14
1
P14
2
J125
-1
J125
-1
J125
-1
E170
E170
E170
E170
E170
E170
Wetenschappelijke naam, onderdeel klas
se
MB
1
MB
2
MB
3
MB
4
MB
1
MB
2
MB
3
MB
4
MB
1
MB
2
MB
1
60-8
0
100-
120
140-
160
50-1
50-2
70-1
70-2
160-
1
160-
2
Menyanthes trifoliata 2 . . . 1 . . 1 2 . . . 2 3 3 2 . . . 1 18 Moehringia trinervia 4 . . . . . . . . . . . . . . . . . . 1 . Montia minor 2 . . . . . . 1 . . . . . . . . . . . . . Myrica gale 3 . . . . . . . . . . . 3 . . . . . . . . Myrica gale 2 . . . . . . . . . . . +++ . . . . . . . . Myrica gale, pseudocarp (v) . . . . . . . . . . . 1 . . . . . . . . Nuphar lutea 4 . . . . . . . . . . . 4 . . . . . . . . Nuphar lutea 3 . . . . . . . . . . . 1 . . 2 . . . . . Nuphar lutea 2 . . . . . . . . . . . 10 1 . 2 5 1 4 . . Nymphaea alba 4 . . . . . . . . . . . . . . . . . . 1 . Nymphaea alba 3 . . . . . . . . . . . . . 1 . . . . 2 . Nymphaea alba 2 . . . . . . . . . . . 1 . 1 . . . . . . Nymphoides peltata 3 . . . . . . 1 . . . . . . . . . . . . . Oenanthe aquatica 4 . . . . . . . . . . . . . . . 1 4 1 . +++ Oenanthe aquatica 3 . . . . . . 1 . . . . 3 . . . 3 2 . + ++ Oenanthe aquatica 2 . . . . . . . . . . . 8 . . . 3 1 2 1 + Persicaria 1 . . . . . . . . . . . . . . . . . . 1 1 Persicaria hydropiper 5 . . . . . . . . . . . . . . . . . . 2 . Persicaria hydropiper 4 . . . . . . . . . . . . . . . . . . 5 . Persicaria lapathifolia 5 . . . . . . . . . . . . . . . . . . + . Persicaria lapathifolia 4 . . . . . . . 1 . . . . . . . . . . 4 . Persicaria lapathifolia 3 . . . . . . 1 1 . . . . . . . . . . + 11 Persicaria lapathifolia 2 . . . . . . 1 1 . . 1 . . . . . . . . + Persicaria maculosa 4 . . . 1 . . . . . . . . . . . . . . + 8 Persicaria maculosa 3 . . . . . . . . . . . . . . . . . . + 12 Persicaria maculosa 2 . . . 4 . . . . . . . . . . . . . . . 10 Persicaria maculosa v . . . . . . . . . . . . . . . . . . 1 . Persicaria minor/mitis 4 . . . . . . . . . . . . . . . . . . . 6 Persicaria minor/mitis 3 . . . . . . . . . . . . . . . . . . . 4 Persicaria minor/mitis 2 . . . . . . . . . . . . . . . . . . . 4 Plantago major 3 . . 2 . . . . . . . . . . . . . . . . . Poaceae 3 . . . 2 . . . . . . . . . . . . . . . . Poaceae (klein) 4 . . 1 . . . 7 + . . . . . . . . . . . . Poaceae (klein) 3 1 . . . . . 3 2 . . 1 . . . . . . . 1 . Poaceae (klein) R 1 . 1 . 1 . . . . . . . . . . . . . . . Polygonum aviculare 4 . . . . 1 . 1 1 . . . . . . . . . . . . Polygonum aviculare 3 . . . . . . . . . . . . . . . . . . . 2 Potamogeton 1 . . . . . . . 1 . . . . . . . . . . . . Potamogeton cf. crispus 4 . . . 1 . . . . . . . . . . . . . . . . Potamogeton cf. crispus 2 . . . . . . . . . . . 1 . . . . . . . . Potamogeton cf. natans 4 . . . . . . . . . . . + . . . . . . . . Potamogeton cf. pusillus 4 . . . 4 . . . . . . . 1 . . . . . . . . Potamogeton cf. pusillus 3 . . . . . . . . . . . 1 . . . . . . . . Potamogeton cf. pusillus 2 . . . 1 . . . 1 . . . . . . . . . . . . Potentilla anserina 4 . . . . . . 1 2 . . . . . . . . . . . . Potentilla anserina 3 . . . 1 . . 2 . . . . . . . . . . . . . Potentilla anserina 2 . . . 1 . . 1 1 . . . 1 . . . . . . . .
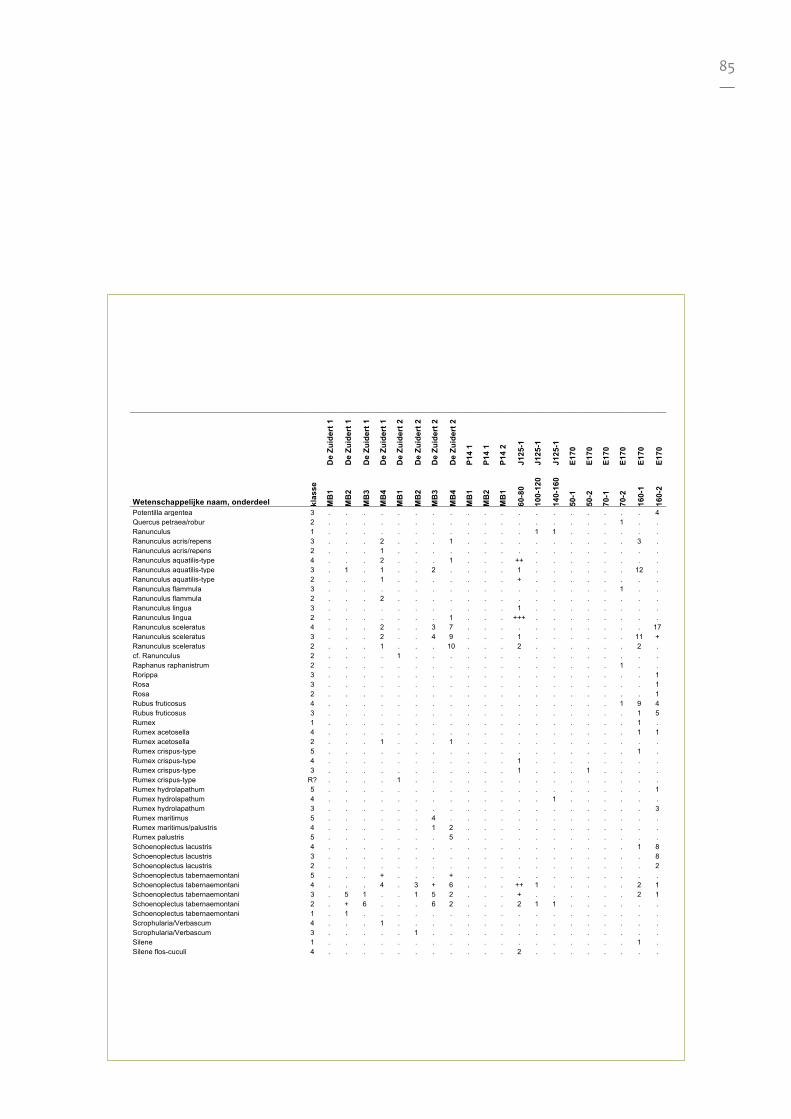
85—
De
Zuid
ert 1
De
Zuid
ert 1
De
Zuid
ert 1
De
Zuid
ert 1
De
Zuid
ert 2
De
Zuid
ert 2
De
Zuid
ert 2
De
Zuid
ert 2
P14
1
P14
1
P14
2
J125
-1
J125
-1
J125
-1
E170
E170
E170
E170
E170
E170
Wetenschappelijke naam, onderdeel klas
se
MB
1
MB
2
MB
3
MB
4
MB
1
MB
2
MB
3
MB
4
MB
1
MB
2
MB
1
60-8
0
100-
120
140-
160
50-1
50-2
70-1
70-2
160-
1
160-
2
Potentilla argentea 3 . . . . . . . . . . . . . . . . . . . 4 Quercus petraea/robur 2 . . . . . . . . . . . . . . . . . 1 . . Ranunculus 1 . . . . . . . . . . . . 1 1 . . . . . . Ranunculus acris/repens 3 . . . 2 . . . 1 . . . . . . . . . . 3 . Ranunculus acris/repens 2 . . . 1 . . . . . . . . . . . . . . . . Ranunculus aquatilis-type 4 . . . 2 . . . 1 . . . ++ . . . . . . . . Ranunculus aquatilis-type 3 . 1 . 1 . . 2 . . . . 1 . . . . . . 12 . Ranunculus aquatilis-type 2 . . . 1 . . . . . . . + . . . . . . . . Ranunculus flammula 3 . . . . . . . . . . . . . . . . . 1 . . Ranunculus flammula 2 . . . 2 . . . . . . . . . . . . . . . . Ranunculus lingua 3 . . . . . . . . . . . 1 . . . . . . . . Ranunculus lingua 2 . . . . . . . 1 . . . +++ . . . . . . . . Ranunculus sceleratus 4 . . . 2 . . 3 7 . . . . . . . . . . . 17 Ranunculus sceleratus 3 . . . 2 . . 4 9 . . . 1 . . . . . . 11 + Ranunculus sceleratus 2 . . . 1 . . . 10 . . . 2 . . . . . . 2 . cf. Ranunculus 2 . . . . 1 . . . . . . . . . . . . . . . Raphanus raphanistrum 2 . . . . . . . . . . . . . . . . . 1 . . Rorippa 3 . . . . . . . . . . . . . . . . . . . 1 Rosa 3 . . . . . . . . . . . . . . . . . . . 1 Rosa 2 . . . . . . . . . . . . . . . . . . . 1 Rubus fruticosus 4 . . . . . . . . . . . . . . . . . 1 9 4 Rubus fruticosus 3 . . . . . . . . . . . . . . . . . . 1 5 Rumex 1 . . . . . . . . . . . . . . . . . . 1 . Rumex acetosella 4 . . . . . . . . . . . . . . . . . . 1 1 Rumex acetosella 2 . . . 1 . . . 1 . . . . . . . . . . . . Rumex crispus-type 5 . . . . . . . . . . . . . . . . . . 1 . Rumex crispus-type 4 . . . . . . . . . . . 1 . . . . . . . . Rumex crispus-type 3 . . . . . . . . . . . 1 . . . 1 . . . . Rumex crispus-type R? . . . . 1 . . . . . . . . . . . . . . . Rumex hydrolapathum 5 . . . . . . . . . . . . . . . . . . . 1 Rumex hydrolapathum 4 . . . . . . . . . . . . . 1 . . . . . . Rumex hydrolapathum 3 . . . . . . . . . . . . . . . . . . . 3 Rumex maritimus 5 . . . . . . 4 . . . . . . . . . . . . . Rumex maritimus/palustris 4 . . . . . . 1 2 . . . . . . . . . . . . Rumex palustris 5 . . . . . . . 5 . . . . . . . . . . . . Schoenoplectus lacustris 4 . . . . . . . . . . . . . . . . . . 1 8 Schoenoplectus lacustris 3 . . . . . . . . . . . . . . . . . . . 8 Schoenoplectus lacustris 2 . . . . . . . . . . . . . . . . . . . 2 Schoenoplectus tabernaemontani 5 . . . + . . . + . . . . . . . . . . . . Schoenoplectus tabernaemontani 4 . . . 4 . 3 + 6 . . . ++ 1 . . . . . 2 1 Schoenoplectus tabernaemontani 3 . 5 1 . . 1 5 2 . . . + . . . . . . 2 1 Schoenoplectus tabernaemontani 2 . + 6 . . . 6 2 . . . 2 1 1 . . . . . . Schoenoplectus tabernaemontani 1 . 1 . . . . . . . . . . . . . . . . . . Scrophularia/Verbascum 4 . . . 1 . . . . . . . . . . . . . . . . Scrophularia/Verbascum 3 . . . . . 1 . . . . . . . . . . . . . . Silene 1 . . . . . . . . . . . . . . . . . . 1 . Silene flos-cuculi 4 . . . . . . . . . . . 2 . . . . . . . .
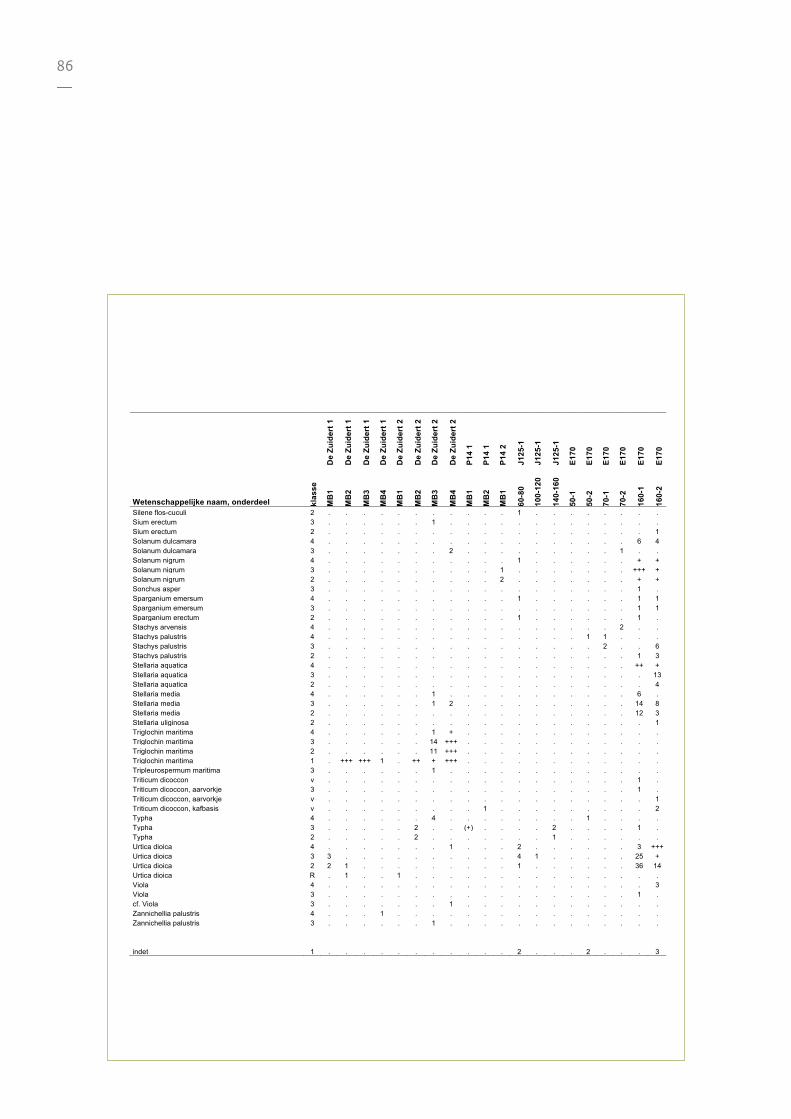
86—
De
Zuid
ert 1
De
Zuid
ert 1
De
Zuid
ert 1
De
Zuid
ert 1
De
Zuid
ert 2
De
Zuid
ert 2
De
Zuid
ert 2
De
Zuid
ert 2
P14
1
P14
1
P14
2
J125
-1
J125
-1
J125
-1
E170
E170
E170
E170
E170
E170
Wetenschappelijke naam, onderdeel klas
se
MB
1
MB
2
MB
3
MB
4
MB
1
MB
2
MB
3
MB
4
MB
1
MB
2
MB
1
60-8
0
100-
120
140-
160
50-1
50-2
70-1
70-2
160-
1
160-
2
Silene flos-cuculi 2 . . . . . . . . . . . 1 . . . . . . . . Sium erectum 3 . . . . . . 1 . . . . . . . . . . . . . Sium erectum 2 . . . . . . . . . . . . . . . . . . . 1 Solanum dulcamara 4 . . . . . . . . . . . . . . . . . . 6 4 Solanum dulcamara 3 . . . . . . . 2 . . . . . . . . . 1 . . Solanum nigrum 4 . . . . . . . . . . . 1 . . . . . . + + Solanum nigrum 3 . . . . . . . . . . 1 . . . . . . . +++ + Solanum nigrum 2 . . . . . . . . . . 2 . . . . . . . + + Sonchus asper 3 . . . . . . . . . . . . . . . . . . 1 . Sparganium emersum 4 . . . . . . . . . . . 1 . . . . . . 1 1 Sparganium emersum 3 . . . . . . . . . . . . . . . . . . 1 1 Sparganium erectum 2 . . . . . . . . . . . 1 . . . . . . 1 . Stachys arvensis 4 . . . . . . . . . . . . . . . . . 2 . . Stachys palustris 4 . . . . . . . . . . . . . . . 1 1 . . . Stachys palustris 3 . . . . . . . . . . . . . . . . 2 . . 6 Stachys palustris 2 . . . . . . . . . . . . . . . . . . 1 3 Stellaria aquatica 4 . . . . . . . . . . . . . . . . . . ++ + Stellaria aquatica 3 . . . . . . . . . . . . . . . . . . . 13 Stellaria aquatica 2 . . . . . . . . . . . . . . . . . . . 4 Stellaria media 4 . . . . . . 1 . . . . . . . . . . . 6 . Stellaria media 3 . . . . . . 1 2 . . . . . . . . . . 14 8 Stellaria media 2 . . . . . . . . . . . . . . . . . . 12 3 Stellaria uliginosa 2 . . . . . . . . . . . . . . . . . . . 1 Triglochin maritima 4 . . . . . . 1 + . . . . . . . . . . . . Triglochin maritima 3 . . . . . . 14 +++ . . . . . . . . . . . . Triglochin maritima 2 . . . . . . 11 +++ . . . . . . . . . . . . Triglochin maritima 1 . +++ +++ 1 . ++ + +++ . . . . . . . . . . . . Tripleurospermum maritima 3 . . . . . . 1 . . . . . . . . . . . . . Triticum dicoccon v . . . . . . . . . . . . . . . . . . 1 . Triticum dicoccon, aarvorkje 3 . . . . . . . . . . . . . . . . . . 1 . Triticum dicoccon, aarvorkje v . . . . . . . . . . . . . . . . . . . 1 Triticum dicoccon, kafbasis v . . . . . . . . . 1 . . . . . . . . . 2 Typha 4 . . . . . . 4 . . . . . . . . 1 . . . . Typha 3 . . . . . 2 . . (+) . . . . 2 . . . . 1 . Typha 2 . . . . . 2 . . . . . . . 1 . . . . . . Urtica dioica 4 . . . . . . . 1 . . . 2 . . . . . . 3 +++ Urtica dioica 3 3 . . . . . . . . . . 4 1 . . . . . 25 + Urtica dioica 2 2 1 . . . . . . . . . 1 . . . . . . 36 14 Urtica dioica R . 1 . . 1 . . . . . . . . . . . . . . . Viola 4 . . . . . . . . . . . . . . . . . . . 3 Viola 3 . . . . . . . . . . . . . . . . . . 1 . cf. Viola 3 . . . . . . . 1 . . . . . . . . . . . . Zannichellia palustris 4 . . . 1 . . . . . . . . . . . . . . . . Zannichellia palustris 3 . . . . . . 1 . . . . . . . . . . . . .
indet 1 . . . . . . . . . . . 2 . . . 2 . . . 3
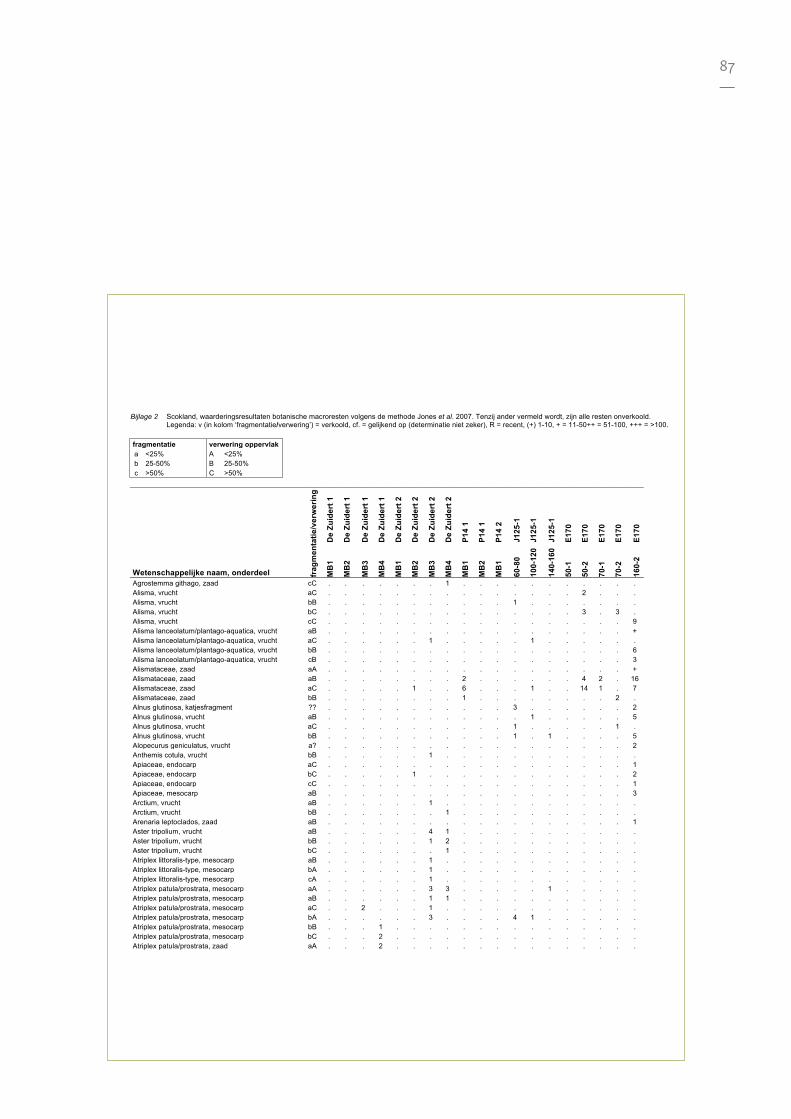
87—
Bijlage 2 Scokland, waarderingsresultaten botanische macroresten volgens de methode Jones et al. 2007. Tenzij ander vermeld wordt, zijn alle resten onverkoold. Legenda: v (in kolom ‘fragmentatie/verwering’) = verkoold, cf. = gelijkend op (determinatie niet zeker), R = recent, (+) 1-10, + = 11-50++ = 51-100, +++ = >100.
fragmentatie verwering oppervlak a <25% A <25% b 25-50% B 25-50% c >50% C >50%
fr
agm
enta
tie/v
erw
erin
g
De
Zuid
ert 1
De
Zuid
ert 1
De
Zuid
ert 1
De
Zuid
ert 1
De
Zuid
ert 2
De
Zuid
ert 2
De
Zuid
ert 2
De
Zuid
ert 2
P14
1
P14
1
P14
2
J125
-1
J125
-1
J125
-1
E170
E170
E170
E170
E170
Wetenschappelijke naam, onderdeel MB
1
MB
2
MB
3
MB
4
MB
1
MB
2
MB
3
MB
4
MB
1
MB
2
MB
1
60-8
0
100-
120
140-
160
50-1
50-2
70-1
70-2
160-
2
Agrostemma githago, zaad cC . . . . . . . 1 . . . . . . . . . . . Alisma, vrucht aC . . . . . . . . . . . . . . . 2 . . . Alisma, vrucht bB . . . . . . . . . . . 1 . . . . . . . Alisma, vrucht bC . . . . . . . . . . . . . . . 3 . 3 . Alisma, vrucht cC . . . . . . . . . . . . . . . . . . 9 Alisma lanceolatum/plantago-aquatica, vrucht aB . . . . . . . . . . . . . . . . . . + Alisma lanceolatum/plantago-aquatica, vrucht aC . . . . . . 1 . . . . . 1 . . . . . . Alisma lanceolatum/plantago-aquatica, vrucht bB . . . . . . . . . . . . . . . . . . 6 Alisma lanceolatum/plantago-aquatica, vrucht cB . . . . . . . . . . . . . . . . . . 3 Alismataceae, zaad aA . . . . . . . . . . . . . . . . . . + Alismataceae, zaad aB . . . . . . . . 2 . . . . . . 4 2 . 16 Alismataceae, zaad aC . . . . . 1 . . 6 . . . 1 . . 14 1 . 7 Alismataceae, zaad bB . . . . . . . . 1 . . . . . . . . 2 . Alnus glutinosa, katjesfragment ?? . . . . . . . . . . . 3 . . . . . . 2 Alnus glutinosa, vrucht aB . . . . . . . . . . . . 1 . . . . . 5 Alnus glutinosa, vrucht aC . . . . . . . . . . . 1 . . . . . 1 . Alnus glutinosa, vrucht bB . . . . . . . . . . . 1 . 1 . . . . 5 Alopecurus geniculatus, vrucht a? . . . . . . . . . . . . . . . . . . 2 Anthemis cotula, vrucht bB . . . . . . 1 . . . . . . . . . . . . Apiaceae, endocarp aC . . . . . . . . . . . . . . . . . . 1 Apiaceae, endocarp bC . . . . . 1 . . . . . . . . . . . . 2 Apiaceae, endocarp cC . . . . . . . . . . . . . . . . . . 1 Apiaceae, mesocarp aB . . . . . . . . . . . . . . . . . . 3 Arctium, vrucht aB . . . . . . 1 . . . . . . . . . . . . Arctium, vrucht bB . . . . . . . 1 . . . . . . . . . . . Arenaria leptoclados, zaad aB . . . . . . . . . . . . . . . . . . 1 Aster tripolium, vrucht aB . . . . . . 4 1 . . . . . . . . . . . Aster tripolium, vrucht bB . . . . . . 1 2 . . . . . . . . . . . Aster tripolium, vrucht bC . . . . . . . 1 . . . . . . . . . . . Atriplex littoralis-type, mesocarp aB . . . . . . 1 . . . . . . . . . . . . Atriplex littoralis-type, mesocarp bA . . . . . . 1 . . . . . . . . . . . . Atriplex littoralis-type, mesocarp cA . . . . . . 1 . . . . . . . . . . . . Atriplex patula/prostrata, mesocarp aA . . . . . . 3 3 . . . . . 1 . . . . . Atriplex patula/prostrata, mesocarp aB . . . . . . 1 1 . . . . . . . . . . . Atriplex patula/prostrata, mesocarp aC . . 2 . . . 1 . . . . . . . . . . . . Atriplex patula/prostrata, mesocarp bA . . . . . . 3 . . . . 4 1 . . . . . . Atriplex patula/prostrata, mesocarp bB . . . 1 . . . . . . . . . . . . . . . Atriplex patula/prostrata, mesocarp bC . . . 2 . . . . . . . . . . . . . . . Atriplex patula/prostrata, zaad aA . . . 2 . . . . . . . . . . . . . . .
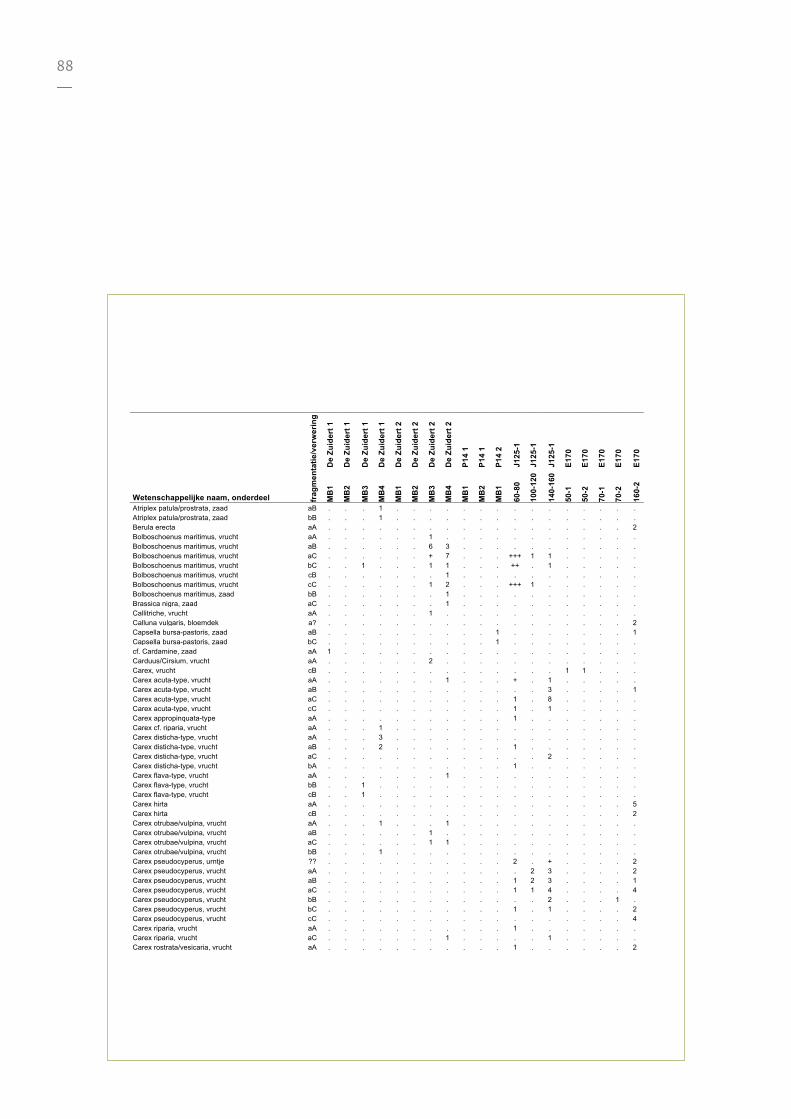
88—
fr
agm
enta
tie/v
erw
erin
g
De
Zuid
ert 1
De
Zuid
ert 1
De
Zuid
ert 1
De
Zuid
ert 1
De
Zuid
ert 2
De
Zuid
ert 2
De
Zuid
ert 2
De
Zuid
ert 2
P14
1
P14
1
P14
2
J125
-1
J125
-1
J125
-1
E170
E170
E170
E170
E170
Wetenschappelijke naam, onderdeel MB
1
MB
2
MB
3
MB
4
MB
1
MB
2
MB
3
MB
4
MB
1
MB
2
MB
1
60-8
0
100-
120
140-
160
50-1
50-2
70-1
70-2
160-
2
Atriplex patula/prostrata, zaad aB . . . 1 . . . . . . . . . . . . . . . Atriplex patula/prostrata, zaad bB . . . 1 . . . . . . . . . . . . . . . Berula erecta aA . . . . . . . . . . . . . . . . . . 2 Bolboschoenus maritimus, vrucht aA . . . . . . 1 . . . . . . . . . . . . Bolboschoenus maritimus, vrucht aB . . . . . . 6 3 . . . . . . . . . . . Bolboschoenus maritimus, vrucht aC . . . . . . + 7 . . . +++ 1 1 . . . . . Bolboschoenus maritimus, vrucht bC . . 1 . . . 1 1 . . . ++ . 1 . . . . . Bolboschoenus maritimus, vrucht cB . . . . . . . 1 . . . . . . . . . . . Bolboschoenus maritimus, vrucht cC . . . . . . 1 2 . . . +++ 1 . . . . . . Bolboschoenus maritimus, zaad bB . . . . . . . 1 . . . . . . . . . . . Brassica nigra, zaad aC . . . . . . . 1 . . . . . . . . . . . Callitriche, vrucht aA . . . . . . 1 . . . . . . . . . . . . Calluna vulgaris, bloemdek a? . . . . . . . . . . . . . . . . . . 2 Capsella bursa-pastoris, zaad aB . . . . . . . . . . 1 . . . . . . . 1 Capsella bursa-pastoris, zaad bC . . . . . . . . . . 1 . . . . . . . . cf. Cardamine, zaad aA 1 . . . . . . . . . . . . . . . . . . Carduus/Cirsium, vrucht aA . . . . . . 2 . . . . . . . . . . . . Carex, vrucht cB . . . . . . . . . . . . . . 1 1 . . . Carex acuta-type, vrucht aA . . . . . . . 1 . . . + . 1 . . . . . Carex acuta-type, vrucht aB . . . . . . . . . . . . . 3 . . . . 1 Carex acuta-type, vrucht aC . . . . . . . . . . . 1 . 8 . . . . . Carex acuta-type, vrucht cC . . . . . . . . . . . 1 . 1 . . . . . Carex appropinquata-type aA . . . . . . . . . . . 1 . . . . . . . Carex cf. riparia, vrucht aA . . . 1 . . . . . . . . . . . . . . . Carex disticha-type, vrucht aA . . . 3 . . . . . . . . . . . . . . . Carex disticha-type, vrucht aB . . . 2 . . . . . . . 1 . . . . . . . Carex disticha-type, vrucht aC . . . . . . . . . . . . . 2 . . . . . Carex disticha-type, vrucht bA . . . . . . . . . . . 1 . . . . . . . Carex flava-type, vrucht aA . . . . . . . 1 . . . . . . . . . . . Carex flava-type, vrucht bB . . 1 . . . . . . . . . . . . . . . . Carex flava-type, vrucht cB . . 1 . . . . . . . . . . . . . . . . Carex hirta aA . . . . . . . . . . . . . . . . . . 5 Carex hirta cB . . . . . . . . . . . . . . . . . . 2 Carex otrubae/vulpina, vrucht aA . . . 1 . . . 1 . . . . . . . . . . . Carex otrubae/vulpina, vrucht aB . . . . . . 1 . . . . . . . . . . . . Carex otrubae/vulpina, vrucht aC . . . . . . 1 1 . . . . . . . . . . . Carex otrubae/vulpina, vrucht bB . . . 1 . . . . . . . . . . . . . . . Carex pseudocyperus, urntje ?? . . . . . . . . . . . 2 . + . . . . 2 Carex pseudocyperus, vrucht aA . . . . . . . . . . . . 2 3 . . . . 2 Carex pseudocyperus, vrucht aB . . . . . . . . . . . 1 2 3 . . . . 1 Carex pseudocyperus, vrucht aC . . . . . . . . . . . 1 1 4 . . . . 4 Carex pseudocyperus, vrucht bB . . . . . . . . . . . . . 2 . . . 1 . Carex pseudocyperus, vrucht bC . . . . . . . . . . . 1 . 1 . . . . 2 Carex pseudocyperus, vrucht cC . . . . . . . . . . . . . . . . . . 4 Carex riparia, vrucht aA . . . . . . . . . . . 1 . . . . . . . Carex riparia, vrucht aC . . . . . . . 1 . . . . . 1 . . . . . Carex rostrata/vesicaria, vrucht aA . . . . . . . . . . . 1 . . . . . . 2
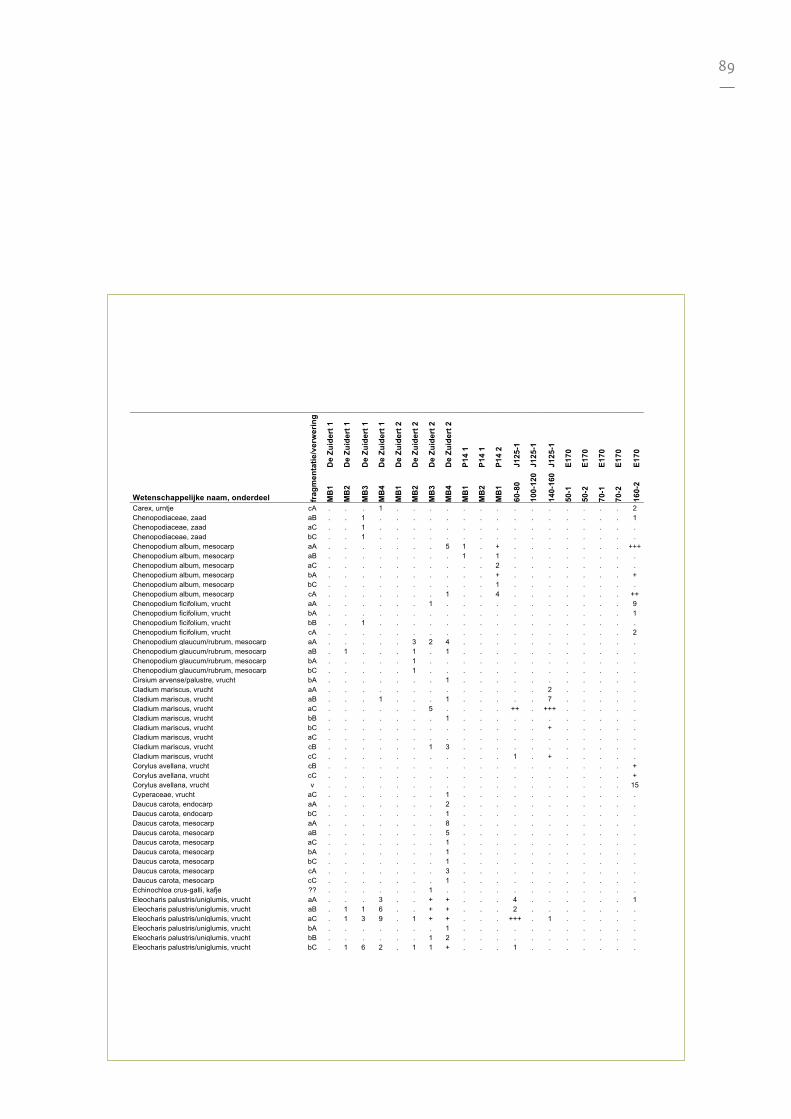
89—
fr
agm
enta
tie/v
erw
erin
g
De
Zuid
ert 1
De
Zuid
ert 1
De
Zuid
ert 1
De
Zuid
ert 1
De
Zuid
ert 2
De
Zuid
ert 2
De
Zuid
ert 2
De
Zuid
ert 2
P14
1
P14
1
P14
2
J125
-1
J125
-1
J125
-1
E170
E170
E170
E170
E170
Wetenschappelijke naam, onderdeel MB
1
MB
2
MB
3
MB
4
MB
1
MB
2
MB
3
MB
4
MB
1
MB
2
MB
1
60-8
0
100-
120
140-
160
50-1
50-2
70-1
70-2
160-
2
Carex, urntje cA . . . 1 . . . . . . . . . . . . . . 2 Chenopodiaceae, zaad aB . . 1 . . . . . . . . . . . . . . . 1 Chenopodiaceae, zaad aC . . 1 . . . . . . . . . . . . . . . . Chenopodiaceae, zaad bC . . 1 . . . . . . . . . . . . . . . . Chenopodium album, mesocarp aA . . . . . . . 5 1 . + . . . . . . . +++ Chenopodium album, mesocarp aB . . . . . . . . 1 . 1 . . . . . . . . Chenopodium album, mesocarp aC . . . . . . . . . . 2 . . . . . . . . Chenopodium album, mesocarp bA . . . . . . . . . . + . . . . . . . + Chenopodium album, mesocarp bC . . . . . . . . . . 1 . . . . . . . . Chenopodium album, mesocarp cA . . . . . . . 1 . . 4 . . . . . . . ++ Chenopodium ficifolium, vrucht aA . . . . . . 1 . . . . . . . . . . . 9 Chenopodium ficifolium, vrucht bA . . . . . . . . . . . . . . . . . . 1 Chenopodium ficifolium, vrucht bB . . 1 . . . . . . . . . . . . . . . . Chenopodium ficifolium, vrucht cA . . . . . . . . . . . . . . . . . . 2 Chenopodium glaucum/rubrum, mesocarp aA . . . . . 3 2 4 . . . . . . . . . . . Chenopodium glaucum/rubrum, mesocarp aB . 1 . . . 1 . 1 . . . . . . . . . . . Chenopodium glaucum/rubrum, mesocarp bA . . . . . 1 . . . . . . . . . . . . . Chenopodium glaucum/rubrum, mesocarp bC . . . . . 1 . . . . . . . . . . . . . Cirsium arvense/palustre, vrucht bA . . . . . . . 1 . . . . . . . . . . . Cladium mariscus, vrucht aA . . . . . . . . . . . . . 2 . . . . . Cladium mariscus, vrucht aB . . . 1 . . . 1 . . . . . 7 . . . . . Cladium mariscus, vrucht aC . . . . . . 5 . . . . ++ . +++ . . . . . Cladium mariscus, vrucht bB . . . . . . . 1 . . . . . . . . . . . Cladium mariscus, vrucht bC . . . . . . . . . . . . . + . . . . . Cladium mariscus, vrucht aC . . . . . . . . . . . . . . . . . . . Cladium mariscus, vrucht cB . . . . . . 1 3 . . . . . . . . . . . Cladium mariscus, vrucht cC . . . . . . . . . . . 1 . + . . . . . Corylus avellana, vrucht cB . . . . . . . . . . . . . . . . . . + Corylus avellana, vrucht cC . . . . . . . . . . . . . . . . . . + Corylus avellana, vrucht v . . . . . . . . . . . . . . . . . . 15 Cyperaceae, vrucht aC . . . . . . . 1 . . . . . . . . . . . Daucus carota, endocarp aA . . . . . . . 2 . . . . . . . . . . . Daucus carota, endocarp bC . . . . . . . 1 . . . . . . . . . . . Daucus carota, mesocarp aA . . . . . . . 8 . . . . . . . . . . . Daucus carota, mesocarp aB . . . . . . . 5 . . . . . . . . . . . Daucus carota, mesocarp aC . . . . . . . 1 . . . . . . . . . . . Daucus carota, mesocarp bA . . . . . . . 1 . . . . . . . . . . . Daucus carota, mesocarp bC . . . . . . . 1 . . . . . . . . . . . Daucus carota, mesocarp cA . . . . . . . 3 . . . . . . . . . . . Daucus carota, mesocarp cC . . . . . . . 1 . . . . . . . . . . . Echinochloa crus-galli, kafje ?? . . . . . . 1 . . . . . . . . . . . . Eleocharis palustris/uniglumis, vrucht aA . . . 3 . . + + . . . 4 . . . . . . 1 Eleocharis palustris/uniglumis, vrucht aB . 1 1 6 . . + + . . . 2 . . . . . . . Eleocharis palustris/uniglumis, vrucht aC . 1 3 9 . 1 + + . . . +++ . 1 . . . . . Eleocharis palustris/uniglumis, vrucht bA . . . . . . . 1 . . . . . . . . . . . Eleocharis palustris/uniglumis, vrucht bB . . . . . . 1 2 . . . . . . . . . . . Eleocharis palustris/uniglumis, vrucht bC . 1 6 2 . 1 1 + . . . 1 . . . . . . .
90—
fr
agm
enta
tie/v
erw
erin
g
De
Zuid
ert 1
De
Zuid
ert 1
De
Zuid
ert 1
De
Zuid
ert 1
De
Zuid
ert 2
De
Zuid
ert 2
De
Zuid
ert 2
De
Zuid
ert 2
P14
1
P14
1
P14
2
J125
-1
J125
-1
J125
-1
E170
E170
E170
E170
E170
Wetenschappelijke naam, onderdeel MB
1
MB
2
MB
3
MB
4
MB
1
MB
2
MB
3
MB
4
MB
1
MB
2
MB
1
60-8
0
100-
120
140-
160
50-1
50-2
70-1
70-2
160-
2
Eleocharis palustris/uniglumis, vrucht cA . . . . . . 1 . . . . . . . . . . . . Eleocharis palustris/uniglumis, vrucht cC . . 4 1 . 1 . 7 . . . 1 . . . . . . . Eleocharis palustris/uniglumis, vrucht v . . . . . . . 4 . . . . . . . . . . . Eleocharis palustris/uniglumis, zaad aB . . 1 . . . . . . . . . . . . . . . . Eleocharis palustris/uniglumis, zaad aC . . 5 . . . . . . . . . . . . . . . . Eleocharis palustris/uniglumis, zaad bC . . 2 . . . . . . . . . . . . . . . . cf. Epilobium aC . . . . . . . . . . . . . 1 . . . . . Erica tetralix, zaad aA . . . . . . 1 . . . . . . . . . . . . Euphrasia/Odontites, zaad bC . . . 1 . . . . . . . . . . . . . . . Euphrasia/Odontites, zaad aC . . . . . . . 1 . . . . . . . . . . . Fagopyrum esculentum, vrucht cA . . . . . . ++ . . . . . . . . . . . . Fagopyrum esculentum, vrucht cB . . . . . . . 3 . . . . . . . . . . . Ficus carica, vrucht aA . . . . . . . 3 . . . . . . . . . . . Galeopsis bifida-type, vrucht aA . . . . . . . . . . . . . . . . . . 3 Glaux maritima, zaad aC . . . . . 2 . . . . . . . . . . . . . Glyceria fluitans/notata, vrucht aA . . . . . . . . . . . . . . . . . . 16 Glyceria fluitan/notata, vrucht aB . . . . . . . . . . . . . . . . . . 10 Glyceria fluitan/notata, vrucht bA . . . . . . . . . . . . . . . . . . 3 Hippuris vulgaris, vrucht aA . . . 1 . . 1 3 . . . . . . . . . . . Hippuris vulgaris, vrucht aB . . . . . . 2 7 . . . . . . . . . . . Hippuris vulgaris, vrucht aC . . . 3 . . . + . . . . . . . . . . . Hordeum, vrucht v . . . . . . . . . . . . . . . . . . 2 Hordeum vulgare, aarspilsegment v . . . . . . . . . . . . . . . . . . 5 Humulus lupulus aB . . . . . . . . . . . . . . . . . . 1 Hydrocotyle vulgaris, vrucht aC . . . . . . 1 . . . . ++ . 1 . . . . . Hydrocotyle vulgaris, vrucht cC . . . . . . . . . . . . . . . . . . 3 Hyoscyamus niger, zaad bB . . . . . . . . . . . 1 . . . . . . . Juglans regia, endocarp cC . . . . . . . 1 . . . . . . . . . . . Juncus, zaad aA . . . . . . 2 . . . . . . . . . . . . Juncus, zaad aB + . . . . (+) 2 . + . . . . . . . . . . Juncus, zaad aC 2 . +++ . . 1 . . 1 (+) . . . . . . . . . Juncus, zaad bB 3 . . . . (+) . . . . . . . . . . . . . Juncus, zaad bC . . +++ . . (+) . . . (+) . . . . . . . . . Juncus articulatus-type, zaad aA . . + . . . . . . . . . . . . . . . 1 Juncus articulatus-type, zaad aB . . + . . . 1 . . . . . . . . . . . . Juncus articulatus-type, zaad aC . . + . . . . . . . . . . . . . . . . Juncus effusus-type, zaad aA . . . . . . 1 . 2 . . . . . . . . . . Juncus gerardi, zaad aA . + + + . 5 1 + . . . . . . . . . . . Juncus gerardi, zaad aB + + + + . ++ 4 + . . . . . . . . . . . Juncus gerardi, zaad aC . + ++ . . ++ . + . . . . . . . . . . . Juncus gerardi, zaad bB . + (+) (+) . + . + . . . . . . . . . . . Juncus gerardi, zaad bC . + + . . + . . . . . . . . . . . . . Juncus gerardi, zaad cA . . . . . (+) . . . . . . . . . . . . . Juncus gerardi, zaad cB . . . . . + . . . . . . . . . . . . . Juncus gerardi, zaad cC . + . . . (+) . . . . . . . . . . . . . Lamiaceae a? . . . . . . . . . . . . . . . . 1 . . cf. Lapsana communis, vrucht aC . . . 1 . . . . . . . . . . . . . . .
91—
fr
agm
enta
tie/v
erw
erin
g
De
Zuid
ert 1
De
Zuid
ert 1
De
Zuid
ert 1
De
Zuid
ert 1
De
Zuid
ert 2
De
Zuid
ert 2
De
Zuid
ert 2
De
Zuid
ert 2
P14
1
P14
1
P14
2
J125
-1
J125
-1
J125
-1
E170
E170
E170
E170
E170
Wetenschappelijke naam, onderdeel MB
1
MB
2
MB
3
MB
4
MB
1
MB
2
MB
3
MB
4
MB
1
MB
2
MB
1
60-8
0
100-
120
140-
160
50-1
50-2
70-1
70-2
160-
2
cf. Leersia oryzoides, vrucht aB . . . . . . . . . . . . . . . . . . 2 Lemna, zaad a? . . . . . . . . . . . . . . . . . . 9 Lycopus europaeus, vrucht aA . . . . . . . . . . . . . . . 1 . . . Lycopus europaeus, vrucht aB . . . . . . . . . . . . . . . . . . 10 Lycopus europaeus, vrucht aC . . . . . . . . . . . 1 . . . . . . . Lycopus europaeus, vrucht aB . . . . . . . . . . . . . 2 . . . . . Lycopus europaeus, vrucht bB . . . . . . . . . . . 1 . 2 . . . . 7 Lycopus europaeus, vrucht bC . . . . . . . 1 . . . . 2 1 . . . . . Lycopus europaeus, vrucht cB . . . . . . . . . . . . . . . . . . 2 Lycopus europaeus, vrucht cC . . . . . . . . . . . . . . . . . . 1 Lythrum salicaria, zaad aA . . . . . . 1 . . . . . . . . . . . 4 Lythrum salicaria, zaad aB . . . . . . . . (+) . . . . . . 1 . . 3 Lythrum salicaria, zaad aC . . . . . . . . + . . . . . . . . . 1 cf. Marrubium vulgare aB . . . . . . . . . . . 1 . . . . . . . Mentha aquatica, vrucht aA . . . 1 . . . . . . . 1 . . . . . . + Mentha aquatica, vrucht aB . . . . . . . . . . . 1 . . . 2 . . 15 Mentha aquatica, vrucht aC . . . . . . . . . . . 1 . . . . . . 6 Mentha aquatica, vrucht bA . . . . . . . . . . . 1 . . . . . . . Mentha aquatica, vrucht bB . . . . . . . . . . . . . . . . . . 5 Menyanthes trifoliata, zaad aA . . . . . . . . . . . 1 . 1 . . . . 2 Menyanthes trifoliata, zaad aB . . . . . . . . . . . 1 . 2 . . 1 . . Menyanthes trifoliata, zaad aC . . . . . . . . . . . 1 . 1 . . . . 1 Menyanthes trifoliata, zaad bA . . . . . . . . . . . . . . . 1 . . 1 Menyanthes trifoliata, zaad bB . . . . . . . 1 . . . . . 1 . . . . . Menyanthes trifoliata, zaad bC . . . . . . . . . . . 1 . . . . . . 2 Menyanthes trifoliata, zaad cA . . . . . . . . . . . . . 1 . . . . . Menyanthes trifoliata, zaad cB . . . 1 . . 1 2 . . . . . 1 1 . . . 2 Menyanthes trifoliata, zaad cC . . . . . . . . . . . . 3 . 1 . . . 13 Montia minor, zaad cA . . . . . . 1 . . . . . . . . . . . . Myrica gale, pseudocarp (v) . . . . . . . . . . . 1 . . . . . . . Myrica gale, vrucht (NB niet pseudocarp) aA . . . . . . . . . . . 1 . . . . . . . Myrica gale, vrucht (NB niet pseudocarp) aB . . . . . . . . . . . 1 . . . . . . . Myrica gale, vrucht (NB niet pseudocarp) aC . . . . . . . . . . . ++ . . . . . . . Myrica gale, vrucht (NB niet pseudocarp) bC . . . . . . . . . . . + . . . . . . . Myrica gale, vrucht (NB niet pseudocarp) cC . . . . . . . . . . . + . . . . . . . Nuphar lutea, zaad aA . . . . . . . . . . . 4 . . . . . . . Nuphar lutea, zaad aB . . . . . . . . . . . . . . 2 . . . . Nuphar lutea, zaad bA . . . . . . . . . . . 1 . . . . . . . Nuphar lutea, zaad bC . . . . . . . . . . . 2 . . . . . . . Nuphar lutea, zaad cA . . . . . . . . . . . . . . . . 1 . . Nuphar lutea, zaad cB . . . . . . . . . . . 5 . . 2 5 . 4 . Nuphar lutea, zaad cC . . . . . . . . . . . 3 1 . . . . . . Nymphaea alba, zaad aB . . . . . . . . . . . . . 1 . . . . . Nymphaea alba, zaad cB . . . . . . . . . . . . . 1 . . . . . Nymphaea alba, zaad cC . . . . . . . . . . . 1 . . . . . . . Nymphoides peltata, zaad bA . . . . . . 1 . . . . . . . . . . . . Oenanthe aquatica, endocarp aC . . . . . . . . . . . . . . . . . . 6
92—
fr
agm
enta
tie/v
erw
erin
g
De
Zuid
ert 1
De
Zuid
ert 1
De
Zuid
ert 1
De
Zuid
ert 1
De
Zuid
ert 2
De
Zuid
ert 2
De
Zuid
ert 2
De
Zuid
ert 2
P14
1
P14
1
P14
2
J125
-1
J125
-1
J125
-1
E170
E170
E170
E170
E170
Wetenschappelijke naam, onderdeel MB
1
MB
2
MB
3
MB
4
MB
1
MB
2
MB
3
MB
4
MB
1
MB
2
MB
1
60-8
0
100-
120
140-
160
50-1
50-2
70-1
70-2
160-
2
Oenanthe aquatica, endocarp bA . . . . . . . . . . . 1 . . . . . . . Oenanthe aquatica, endocarp cB . . . . . . . . . . . 1 . . . . . . . Oenanthe aquatica, mesocarp aA . . . . . . . . . . . . . . . 1 4 1 +++ Oenanthe aquatica, mesocarp aB . . . . . . 1 . . . . 2 . . . 1 . . . Oenanthe aquatica, mesocarp aC . . . . . . . . . . . 5 . . . . . . . Oenanthe aquatica, mesocarp bA . . . . . . . . . . . . . . . 2 2 . + Oenanthe aquatica, mesocarp bB . . . . . . . . . . . 1 . . . . . . 7 Oenanthe aquatica, mesocarp bC . . . . . . . . . . . 1 . . . . . . . Oenanthe aquatica, mesocarp cB . . . . . . . . . . . . . . . 3 . 2 19 Oenanthe aquatica, mesocarp cC . . . . . . . . . . . . . . . . 1 . . Persicaria lapathifolia, vrucht aA . . . . . . . 1 . . . . . . . . . . . Persicaria lapathifolia, vrucht aB . . . . . . . 1 . . . . . . . . . . 5 Persicaria lapathifolia, vrucht aC . . . . . . . . . . 1 . . . . . . . 19 Persicaria lapathifolia, vrucht bA . . . . . . . . . . . . . . . . . . 3 Persicaria lapathifolia, vrucht bB . . . . . . 1 . . . . . . . . . . . 3 Persicaria lapathifolia, vrucht bC . . . . . . . . . . . . . . . . . . 3 Persicaria lapathifolia, vrucht cA . . . . . . . 1 . . . . . . . . . . 2 Persicaria lapathifolia, vrucht cB . . . . . . 1 . . . . . . . . . . . . Persicaria, zaad a? . . . . . . . . . . . . . . . . . . 1 Persicaria maculosa, vrucht aA . . . 1 . . . . . . . . . . . . . . 8 Persicaria maculosa, vrucht aB . . . . . . . . . . . . . . . . . . 4 Persicaria maculosa, vrucht aC . . . 4 . . . . . . . . . . . . . . 2 Persicaria maculosa, vrucht bA . . . . . . . . . . . . . . . . . . 5 Persicaria maculosa, vrucht bB . . . . . . . . . . . . . . . . . . 3 Persicaria maculosa, vrucht bC . . . . . . . . . . . . . . . . . . 3 Persicaria maculosa, vrucht cA . . . . . . . . . . . . . . . . . . 3 Persicaria maculosa, vrucht cB . . . . . . . . . . . . . . . . . . 2 Persicaria minor/mitis, vrucht aA . . . . . . . . . . . . . . . . . . 6 Persicaria minor/mitis, vrucht aC . . . . . . . . . . . . . . . . . . 2 Persicaria minor/mitis, vrucht bA . . . . . . . . . . . . . . . . . . 2 Persicaria minor/mitis, vrucht bB . . . . . . . . . . . . . . . . . . 2 Persicaria minor/mitis, vrucht cA . . . . . . . . . . . . . . . . . . 2 Plantago major, zaad aB . . 1 . . . . . . . . . . . . . . . . Plantago major, zaad bB . . 1 . . . . . . . . . . . . . . . . Poaceae, vrucht aB . . . 2 . . . . . . . . . . . . . . . Poaceae, vrucht (klein) aA . . 1 . . . 7 + . . . . . . . . . . . Poaceae, vrucht (klein) aB 1 . . . . . 3 2 . . 1 . . . . . . . . Poaceae, vrucht (klein) R 1 . 1 . 1 . . . . . . . . . . . . . . Polygonum aviculare, vrucht aA . . . . 1 . 1 1 . . . . . . . . . . . Polygonum aviculare, vrucht aB . . . . . . . . . . . . . . . . . . 1 Polygonum aviculare, vrucht bB . . . . . . . . . . . . . . . . . . 1 Potamogeton, endocarp cC . . . . . . . 1 . . . . . . . . . . . Potamogeton cf. crispus, endocarp aA . . . 1 . . . . . . . . . . . . . . . Potamogeton cf. crispus, endocarp aC . . . . . . . . . . . 1 . . . . . . . Potamogeton cf. natans, endocarp aA . . . . . . . . . . . + . . . . . . . Potamogeton cf. pusillus, endocarp aA . . . 4 . . . . . . . 1 . . . . . . . Potamogeton cf. pusillus, endocarp aC . . . . . . . 1 . . . . . . . . . . .
93—
fr
agm
enta
tie/v
erw
erin
g
De
Zuid
ert 1
De
Zuid
ert 1
De
Zuid
ert 1
De
Zuid
ert 1
De
Zuid
ert 2
De
Zuid
ert 2
De
Zuid
ert 2
De
Zuid
ert 2
P14
1
P14
1
P14
2
J125
-1
J125
-1
J125
-1
E170
E170
E170
E170
E170
Wetenschappelijke naam, onderdeel MB
1
MB
2
MB
3
MB
4
MB
1
MB
2
MB
3
MB
4
MB
1
MB
2
MB
1
60-8
0
100-
120
140-
160
50-1
50-2
70-1
70-2
160-
2
Potamogeton cf. pusillus, endocarp bA . . . . . . . . . . . 1 . . . . . . . Potamogeton cf. pusillus, endocarp bC . . . 1 . . . . . . . . . . . . . . . Potentilla anserina, vrucht aA . . . . . . 1 2 . . . . . . . . . . . Potentilla anserina, vrucht aB . . . . . . 2 . . . . . . . . . . . . Potentilla anserina, vrucht aC . . . 1 . . 1 1 . . . 1 . . . . . . . Potentilla anserina, vrucht bB . . . 1 . . . . . . . . . . . . . . . Potentilla argentea, vrucht aB . . . . . . . . . . . . . . . . . . 4 Quercus petraea/robur, vrucht cB . . . . . . . . . . . . . . . . . 1 . cf. Ranunculus, vrucht cC . . . . 1 . . . . . . . . . . . . . . Ranunculus, vrucht aC . . . . . . . . . . . . 1 . . . . . . Ranunculus, vrucht bC . . . . . . . . . . . . . 1 . . . . . Ranunculus acris/repens, vrucht aB . . . 1 . . . 1 . . . . . . . . . . . Ranunculus acris/repens, vrucht bB . . . 1 . . . . . . . . . . . . . . . Ranunculus acris/repens, vrucht cB . . . 1 . . . . . . . . . . . . . . . Ranunculus aquatilis-type, vrucht aA . . . 2 . . . 1 . . . ++ . . . . . . . Ranunculus aquatilis-type, vrucht aB . 1 . . . . 2 . . . . 1 . . . . . . . Ranunculus aquatilis-type, vrucht aC . . . . . . . . . . . 1 . . . . . . . Ranunculus aquatilis-type, vrucht bB . . . 1 . . . . . . . . . . . . . . . Ranunculus aquatilis-type, vrucht bC . . . . . . . . . . . + . . . . . . . Ranunculus aquatilis-type, vrucht cB . . . 1 . . . . . . . . . . . . . . . Ranunculus flammula, vrucht aB . . . . . . . . . . . . . . . . . 1 . Ranunculus flammula, vrucht aC . . . 1 . . . . . . . . . . . . . . . Ranunculus flammula, vrucht bC . . . 1 . . . . . . . . . . . . . . . Ranunculus lingua, vrucht aB . . . . . . . . . . . 1 . . . . . . . Ranunculus lingua, vrucht aC . . . . . . . 1 . . . + . . . . . . . Ranunculus lingua, vrucht bC . . . . . . . . . . . + . . . . . . . Ranunculus lingua, vrucht cC . . . . . . . . . . . + . . . . . . . Ranunculus sceleratus, vrucht aA . . . 2 . . 3 7 . . . . . . . . . . 17 Ranunculus sceleratus, vrucht aB . . . 2 . . 2 5 . . . 1 . . . . . . 18 Ranunculus sceleratus, vrucht aC . . . . . . . 6 . . . 1 . . . . . . . Ranunculus sceleratus, vrucht bA . . . . . . . 3 . . . . . . . . . . 9 Ranunculus sceleratus, vrucht bB . . . . . . 2 1 . . . . . . . . . . 11 Ranunculus sceleratus, vrucht bC . . . 1 . . . 2 . . . 1 . . . . . . . Ranunculus sceleratus, vrucht cA . . . . . . . 2 . . . . . . . . . . . Raphanus raphanistrum cB . . . . . . . . . . . . . . . . . 1 . Rorippa, zaad aB . . . . . . . . . . . . . . . . . . 1 Rosa, vrucht b? . . . . . . . . . . . . . . . . . . 1 Rosa, vrucht c? . . . . . . . . . . . . . . . . . . 1 Rubus fruticosus aA . . . . . . . . . . . . . . . . . 1 4 Rubus fruticosus bA . . . . . . . . . . . . . . . . . . 5 Rumex acetosella, vrucht aA . . . . . . . . . . . . . . . . . . 1 Rumex acetosella, vrucht aC . . . . . . . 1 . . . . . . . . . . . Rumex acetosella, vrucht cA . . . 1 . . . . . . . . . . . . . . . Rumex crispus-type, vrucht aA . . . . . . . . . . . 1 . . . . . . . Rumex crispus-type, vrucht aB . . . . . . . . . . . 1 . . . 1 . . . Rumex crispus-type, vrucht R? . . . . 1 . . . . . . . . . . . . . . Rumex hydrolapathum, bloemdek ?? . . . . . . . . . . . . . . . . . . 1
94—
fr
agm
enta
tie/v
erw
erin
g
De
Zuid
ert 1
De
Zuid
ert 1
De
Zuid
ert 1
De
Zuid
ert 1
De
Zuid
ert 2
De
Zuid
ert 2
De
Zuid
ert 2
De
Zuid
ert 2
P14
1
P14
1
P14
2
J125
-1
J125
-1
J125
-1
E170
E170
E170
E170
E170
Wetenschappelijke naam, onderdeel MB
1
MB
2
MB
3
MB
4
MB
1
MB
2
MB
3
MB
4
MB
1
MB
2
MB
1
60-8
0
100-
120
140-
160
50-1
50-2
70-1
70-2
160-
2
Rumex hydrolapathum, vrucht aA . . . . . . . . . . . . . 1 . . . . . Rumex hydrolapathum, vrucht aB . . . . . . . . . . . . . . . . . . 3 Rumex maritimus, bloemdek aA . . . . . . 1 . . . . . . . . . . . . Rumex maritimus, bloemdek aB . . . . . . 2 . . . . . . . . . . . . Rumex maritimus, bloemdek aC . . . . . . 1 . . . . . . . . . . . . Rumex maritimus/palustris, vrucht aA . . . . . . 1 2 . . . . . . . . . . . Rumex palustris, bloemdek aA . . . . . . . 1 . . . . . . . . . . . Rumex palustris, bloemdek cA . . . . . . . 2 . . . . . . . . . . . Rumex palustris, bloemdek cB . . . . . . . 2 . . . . . . . . . . . Schoenoplectus lacustris, vrucht aA . . . . . . . . . . . . . . . . . . 8 Schoenoplectus lacustris, vrucht bA . . . . . . . . . . . . . . . . . . 6 Schoenoplectus lacustris, vrucht bB . . . . . . . . . . . . . . . . . . 2 Schoenoplectus lacustris, vrucht cB . . . . . . . . . . . . . . . . . . 2 Schoenoplectus tabernaemontani, vrucht aA . . . 4 . 3 + 6 . . . ++ 1 . . . . . 1 Schoenoplectus tabernaemontani, vrucht aB . 5 1 . . . 5 2 . . . + . . . . . . . Schoenoplectus tabernaemontani, vrucht aC . + 1 . . . 4 2 . . . 1 . 1 . . . . . Schoenoplectus tabernaemontani, vrucht bA . . . . . . . . . . . . . . . . . . 1 Schoenoplectus tabernaemontani, vrucht bB . . . . . 1 . . . . . . . . . . . . . Schoenoplectus tabernaemontani, vrucht cA . . . . . . 1 . . . . . 1 . . . . . . Schoenoplectus tabernaemontani, vrucht bC . 2 2 . . . . . . . . 1 . . . . . . . Schoenoplectus tabernaemontani, vrucht cC . 8 3 . . . 1 . . . . . . . . . . . . Schoenoplectus tabernaemontani (met bloemdek) aA . . . + . . . + . . . . . . . . . . . Schoenoplectus tabernaemontani (met bloemdek) cA . . . . . . . 1 . . . . . . . . . . . Schoenoplectus tabernaemontani, zaad aB . 1 . . . . . . . . . . . . . . . . . Scrophularia/Verbascum, zaad aA . . . 1 . . . . . . . . . . . . . . . Scrophularia/Verbascum, zaad aB . . . . . 1 . . . . . . . . . . . . . Silene flos-cuculi, zaad aA . . . . . . . . . . . 2 . . . . . . . Silene flos-cuculi, zaad cA . . . . . . . . . . . 1 . . . . . . . Sium erectum, mesocarp aB . . . . . . 1 . . . . . . . . . . . . Sium erectum, mesocarp aC . . . . . . . . . . . . . . . . . . 1 Solanum dulcamara, zaad aA . . . . . . . . . . . . . . . . . . 4 Solanum dulcamara, zaad aB . . . . . . . 1 . . . . . . . . . 1 . Solanum dulcamara, zaad bB . . . . . . . 1 . . . . . . . . . . . Solanum nigrum, zaad aA . . . . . . . . . . . 1 . . . . . . + Solanum nigrum, zaad aB . . . . . . . . . . 1 . . . . . . . + Solanum nigrum, zaad aC . . . . . . . . . . 2 . . . . . . . + Solanum nigrum, zaad bB . . . . . . . . . . . . . . . . . . 2 Solanum nigrum, zaad cB . . . . . . . . . . . . . . . . . . 16 Solanum nigrum, zaad cC . . . . . . . . . . . . . . . . . . 13 Sparganium emersum, endocarp aA . . . . . . . . . . . 1 . . . . . . 1 Sparganium emersum, endocarp bA . . . . . . . . . . . . . . . . . . 1 Sparganium erectum, endocarp aC . . . . . . . . . . . 1 . . . . . . . Stachys arvensis aA . . . . . . . . . . . . . . . . . 2 . Stachys palustris, vrucht aA . . . . . . . . . . . . . . . 1 1 . . Stachys palustris, vrucht aB . . . . . . . . . . . . . . . . 2 . 6 Stachys palustris, vrucht aC . . . . . . . . . . . . . . . . . . 3 Stellaria aquatica, zaad aA . . . . . . . . . . . . . . . . . . +
95—
fr
agm
enta
tie/v
erw
erin
g
De
Zuid
ert 1
De
Zuid
ert 1
De
Zuid
ert 1
De
Zuid
ert 1
De
Zuid
ert 2
De
Zuid
ert 2
De
Zuid
ert 2
De
Zuid
ert 2
P14
1
P14
1
P14
2
J125
-1
J125
-1
J125
-1
E170
E170
E170
E170
E170
Wetenschappelijke naam, onderdeel MB
1
MB
2
MB
3
MB
4
MB
1
MB
2
MB
3
MB
4
MB
1
MB
2
MB
1
60-8
0
100-
120
140-
160
50-1
50-2
70-1
70-2
160-
2
Stellaria aquatica, zaad aB . . . . . . . . . . . . . . . . . . 13 Stellaria aquatica, zaad cA . . . . . . . . . . . . . . . . . . 2 Stellaria aquatica, zaad cB . . . . . . . . . . . . . . . . . . 2 Stellaria media, zaad aA . . . . . . 1 . . . . . . . . . . . . Stellaria media, zaad aB . . . . . . 1 1 . . . . . . . . . . 7 Stellaria media, zaad bB . . . . . . . 1 . . . . . . . . . . 1 Stellaria media, zaad cB . . . . . . . . . . . . . . . . . . 2 Stellaria media, zaad cC . . . . . . . . . . . . . . . . . . 1 Stellaria uliginosa, zaad bC . . . . . . . . . . . . . . . . . . 1 Triglochin maritima, vrucht aA . . . . . . 1 + . . . . . . . . . . . Triglochin maritima, vrucht aB . . . . . . 7 + . . . . . . . . . . . Triglochin maritima, vrucht aC . . . . . . 5 ++ . . . . . . . . . . . Triglochin maritima, vrucht bA . . . . . . 3 + . . . . . . . . . . . Triglochin maritima, vrucht bB . . . . . . 4 + . . . . . . . . . . . Triglochin maritima, vrucht bC . . . . . . 3 + . . . . . . . . . . . Triglochin maritima, vrucht cA . . . . . . 1 + . . . . . . . . . . . Triglochin maritima, vrucht cB . . . . . . 2 + . . . . . . . . . . . Triglochin maritima, vrucht cC . . . . . . . ++ . . . . . . . . . . . Triglochin maritima, zaad aA . + 5 . . 2 + ++ . . . . . . . . . . . Triglochin maritima, zaad aB . + 7 . . + 2 ++ . . . . . . . . . . . Triglochin maritima, zaad aC . + + . . + . + . . . . . . . . . . . Triglochin maritima, zaad bA . . . 1 . . . + . . . . . . . . . . . Triglochin maritima, zaad bB . 4 1 . . 3 . + . . . . . . . . . . . Triglochin maritima, zaad bC . 4 + . . 5 1 (+) . . . . . . . . . . . Triglochin maritima, zaad cB . . . . . 2 . . . . . . . . . . . . . Triglochin maritima, zaad cC . . 2 . . 1 . (+) . . . . . . . . . . . Tripleurospermum maritima, vrucht aB . . . . . . 1 . . . . . . . . . . . . Triticum dicoccon, aarvorkje v . . . . . . . . . . . . . . . . . . 1 Triticum dicoccon, kafbasis v . . . . . . . . . 1 . . . . . . . . 2 Typha, zaad aA . . . . . . 4 . . . . . . . . 1 . . . Typha, zaad aB . . . . . 2 . . (+) . . . . 2 . . . . . Typha, zaad aC . . . . . 1 . . . . . . . 1 . . . . . Typha, zaad bB . . . . . . . . 1 . . . . . . . . . . Typha, zaad cC . . . . . 1 . . . . . . . . . . . . . Urtica dioica, vrucht aA . . . . . . . 1 . . . 2 . . . . . . +++ Urtica dioica, vrucht aB 3 . . . . . . . . . . 2 1 . . . . . + Urtica dioica, vrucht aC 2 . . . . . . . . . . 1 . . . . . . 14 Urtica dioica, vrucht bB . . . . . . . . . . . 2 . . . . . . . Urtica dioica, vrucht bC . 1 . . . . . . . . . . . . . . . . . Urtica dioica, vrucht R . 1 . . 1 . . . . . . . . . . . . . . cf. Viola, zaad bA . . . . . . . 1 . . . . . . . . . . . Viola, zaad aA . . . . . . . . . . . . . . . . . . 3 Zannichellia palustris, vrucht aA . . . 1 . . . . . . . . . . . . . . . Zannichellia palustris, vrucht aB . . . . . . 1 . . . . . . . . . . . .
indet
. . . . . . . . . . . 2 . . . 2 . . 3
96—
Appendix IV:Scans of thin sections
De Zuidert 1, nr.1
De Zuidert 1, nr.2
97—
De Zuidert 1, nr.3
De Zuidert 2, nr.1
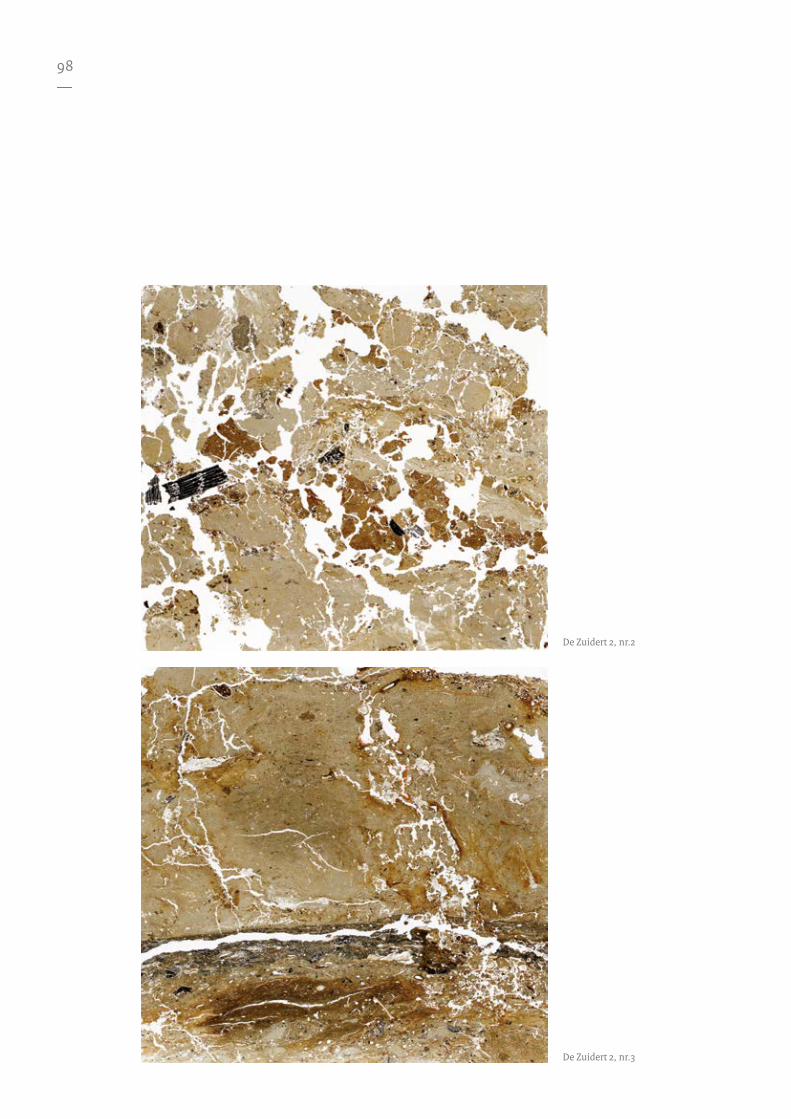
98—
De Zuidert 2, nr.2
De Zuidert 2, nr.3
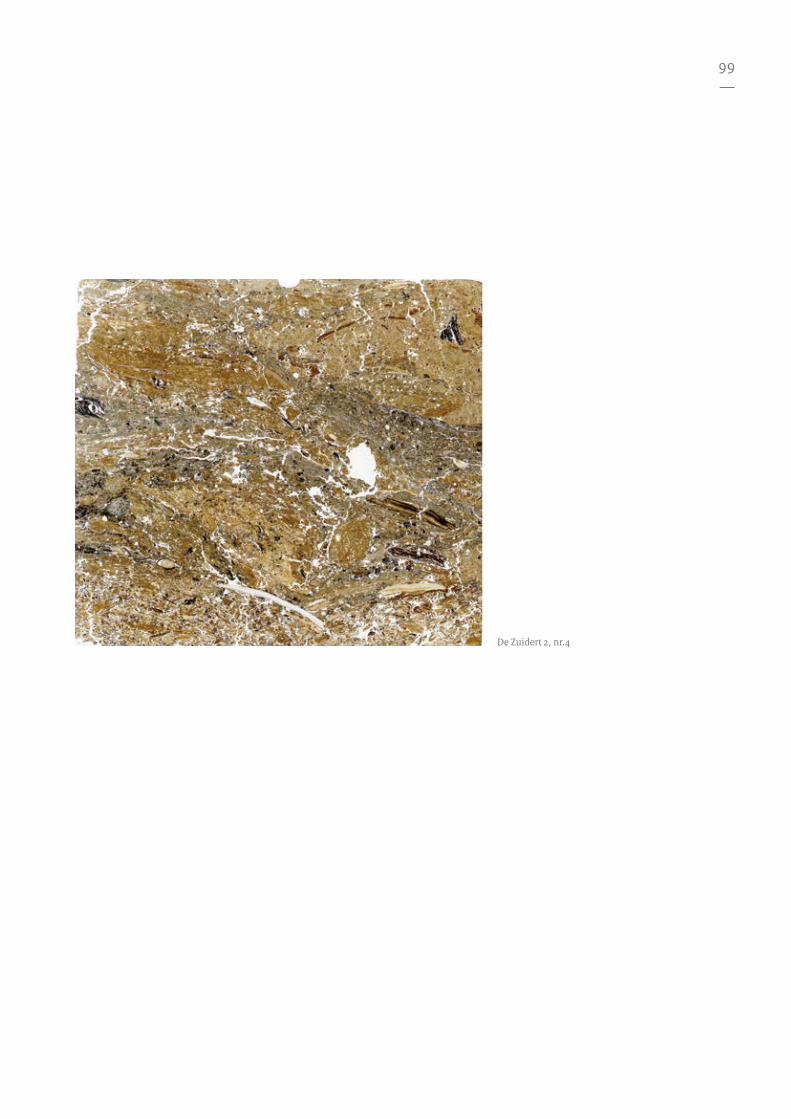
99—
De Zuidert 2, nr.4
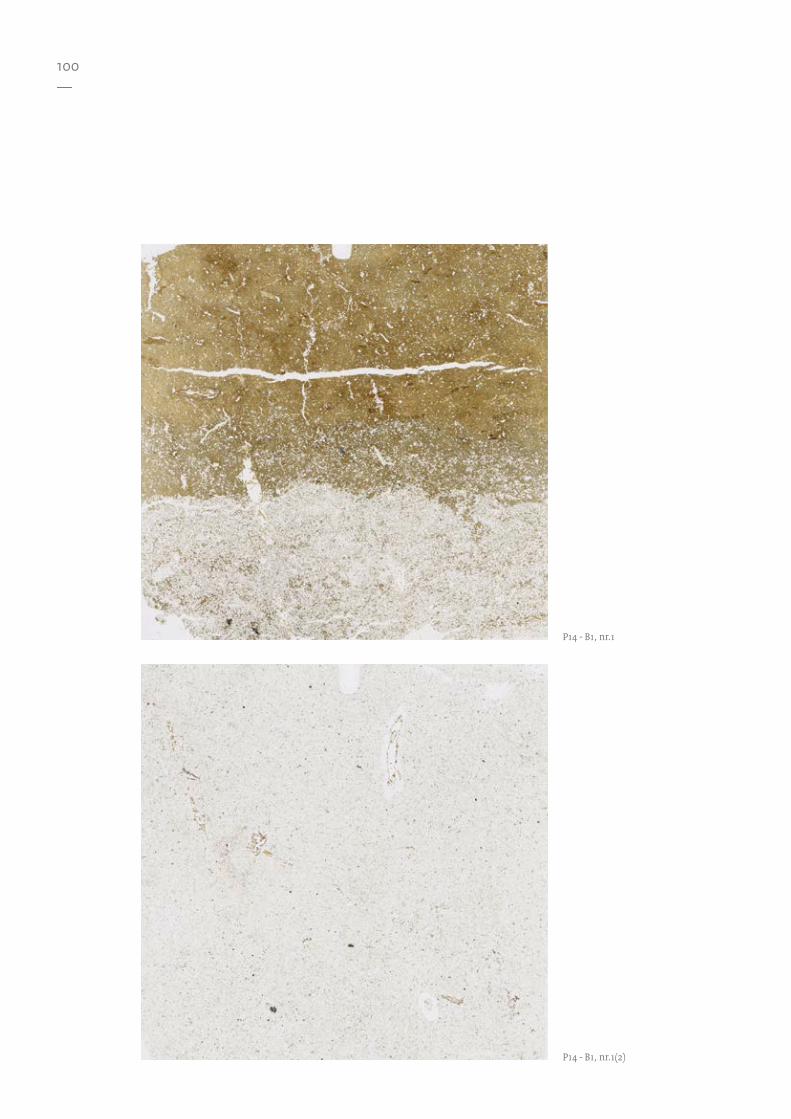
100—
P14 - B1, nr.1
P14 - B1, nr.1(2)
101—
P14 - B1, nr.2
P14 - B1, nr.3
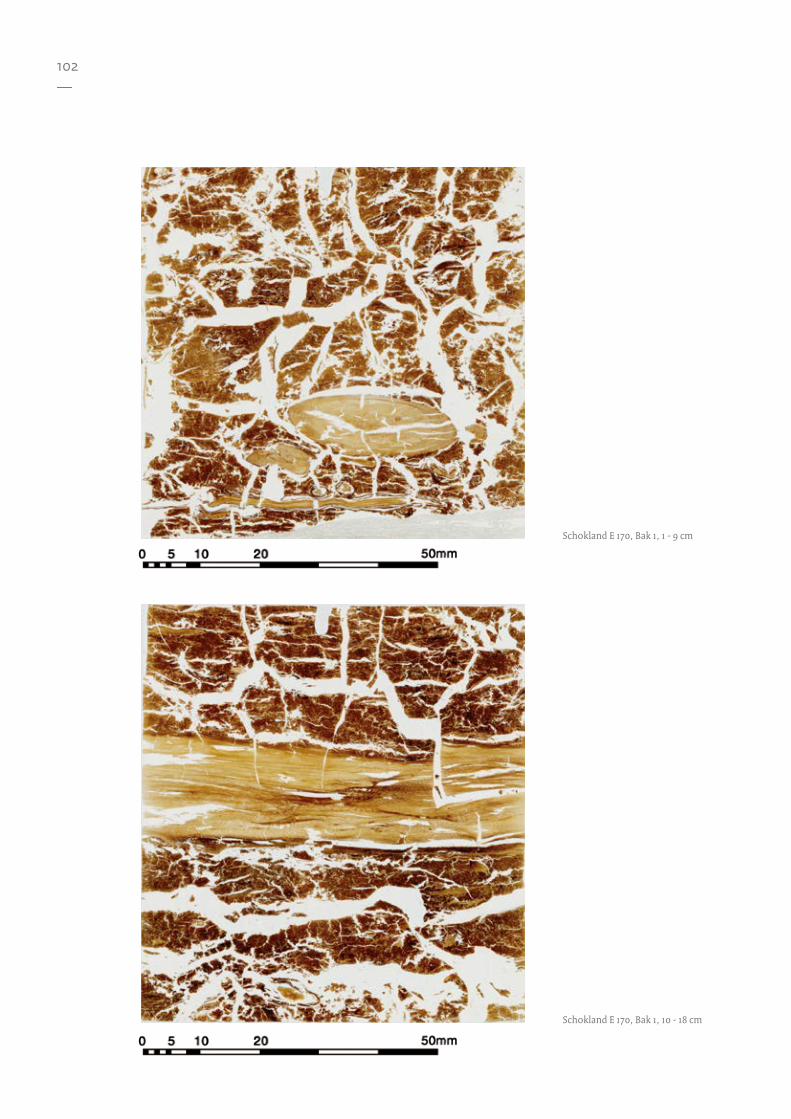
102—
Schokland E 170, Bak 1, 1 - 9 cm
Schokland E 170, Bak 1, 10 - 18 cm
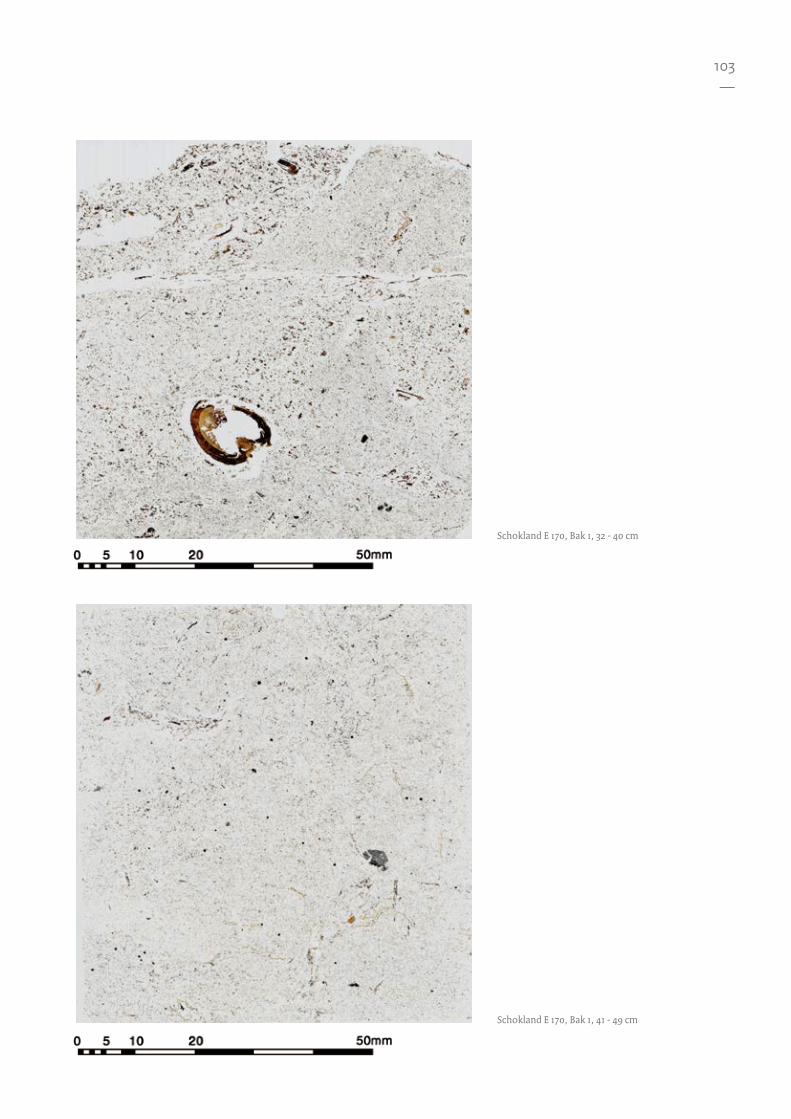
103—
Schokland E 170, Bak 1, 32 - 40 cm
Schokland E 170, Bak 1, 41 - 49 cm
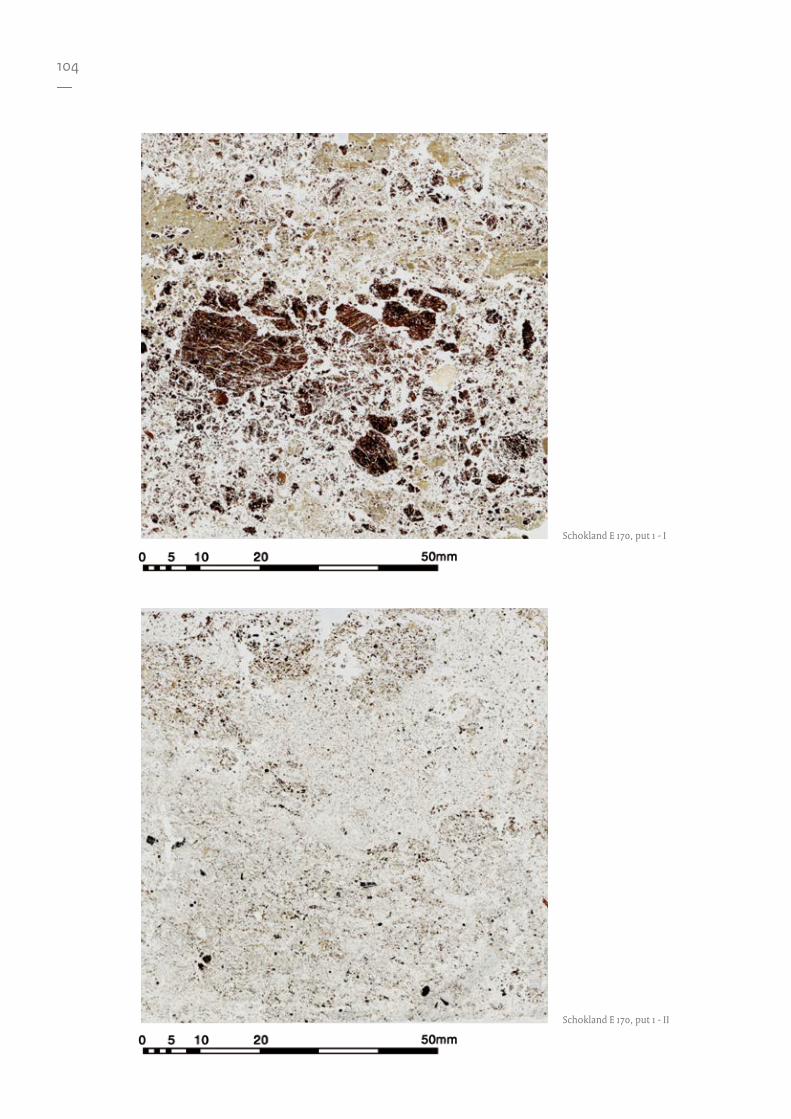
104—
Schokland E 170, put 1 - I
Schokland E 170, put 1 - II
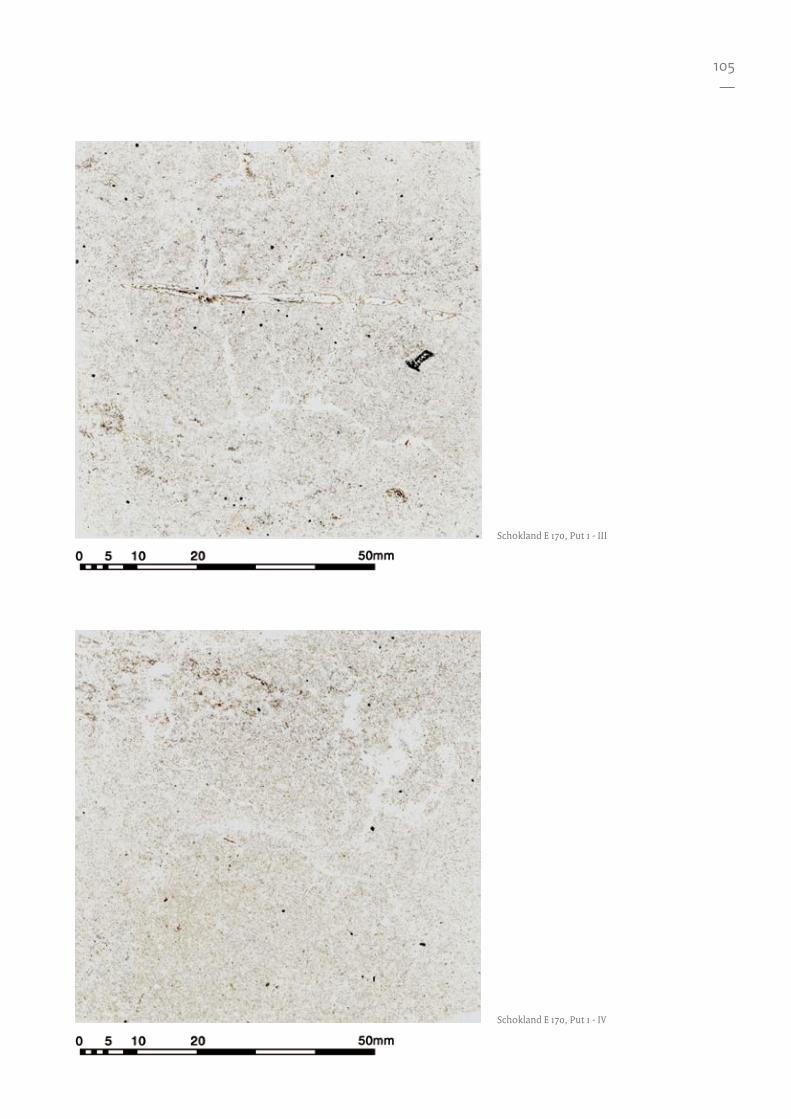
105—
Schokland E 170, Put 1 - III
Schokland E 170, Put 1 - IV
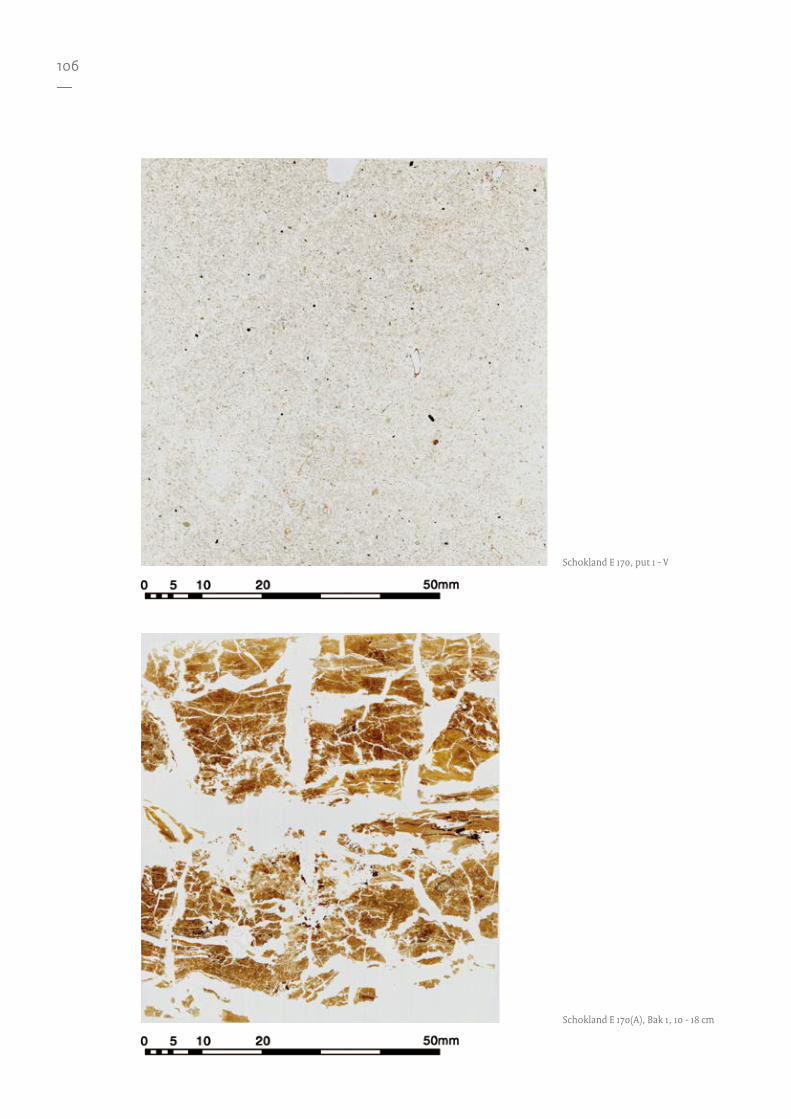
106—
Schokland E 170, put 1 - V
Schokland E 170(A), Bak 1, 10 - 18 cm
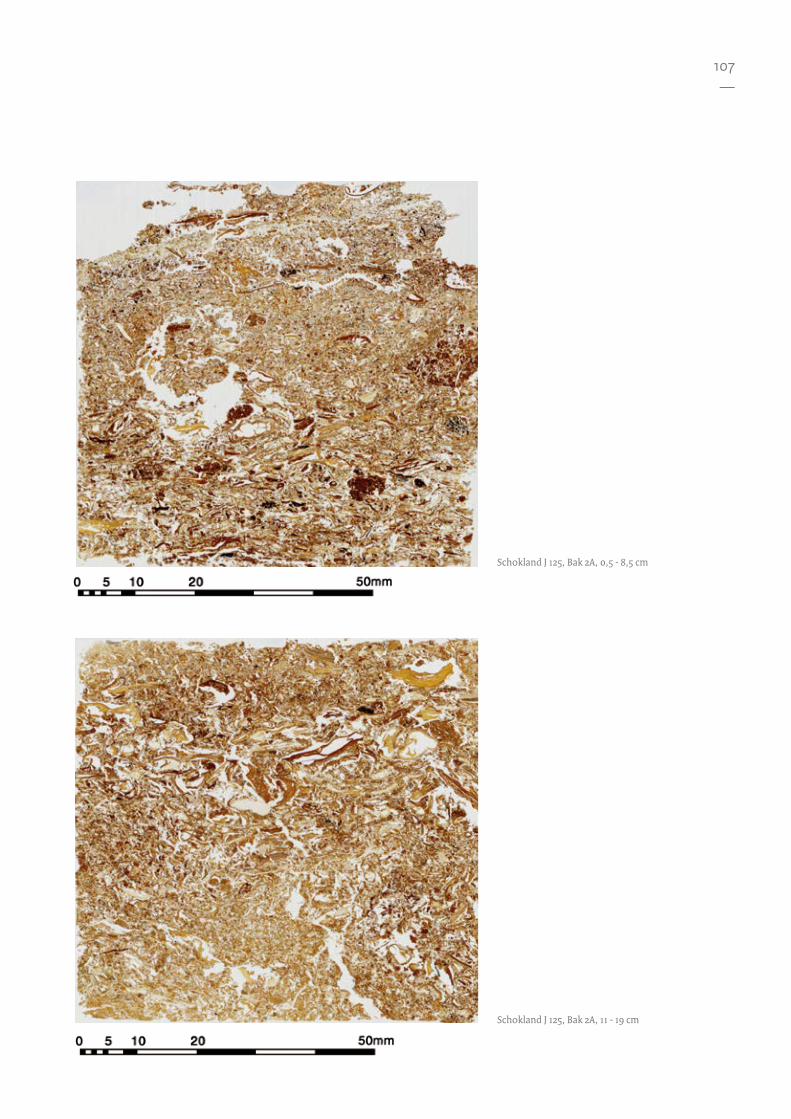
107—
Schokland J 125, Bak 2A, 0,5 - 8,5 cm
Schokland J 125, Bak 2A, 11 - 19 cm
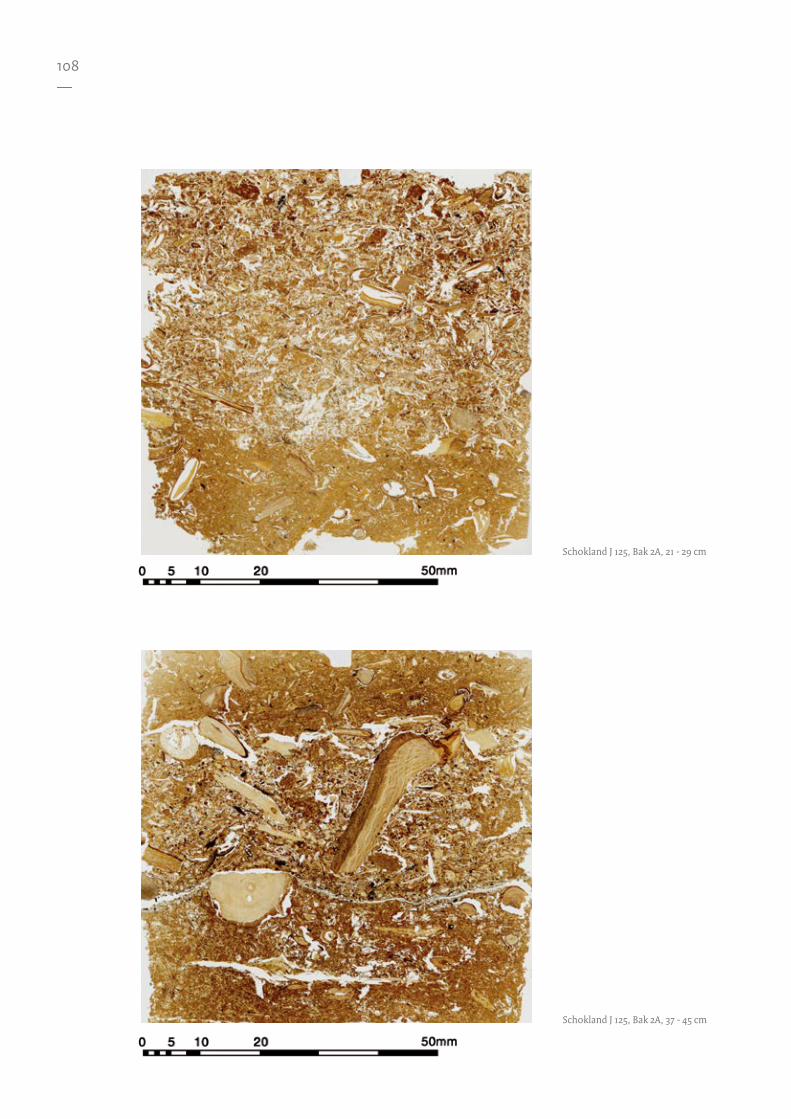
108—
Schokland J 125, Bak 2A, 21 - 29 cm
Schokland J 125, Bak 2A, 37 - 45 cm
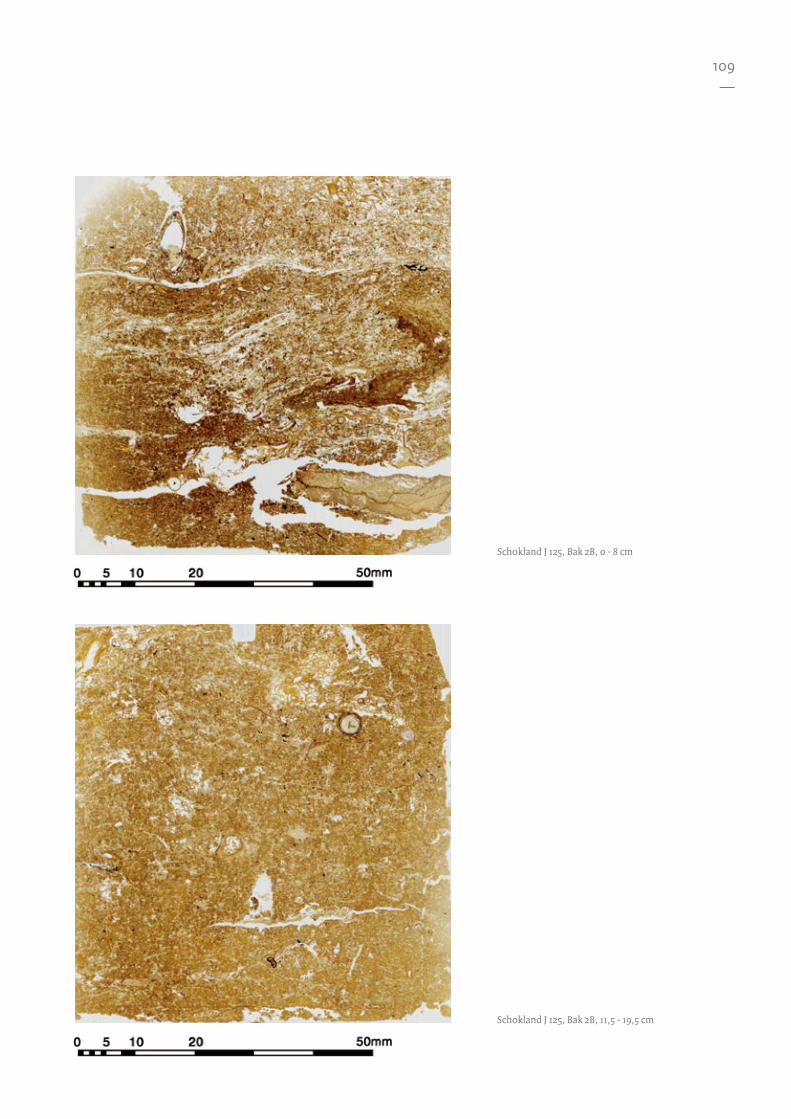
109—
Schokland J 125, Bak 2B, 0 - 8 cm
Schokland J 125, Bak 2B, 11,5 - 19,5 cm
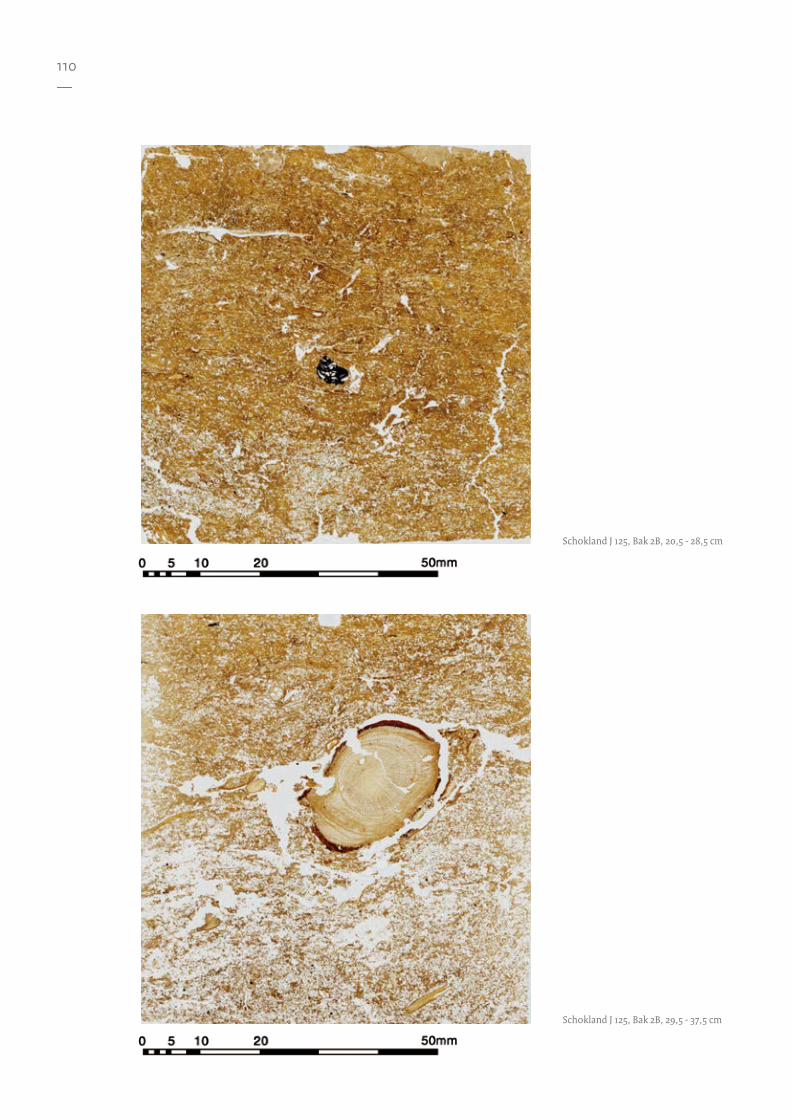
110—
Schokland J 125, Bak 2B, 20,5 - 28,5 cm
Schokland J 125, Bak 2B, 29,5 - 37,5 cm
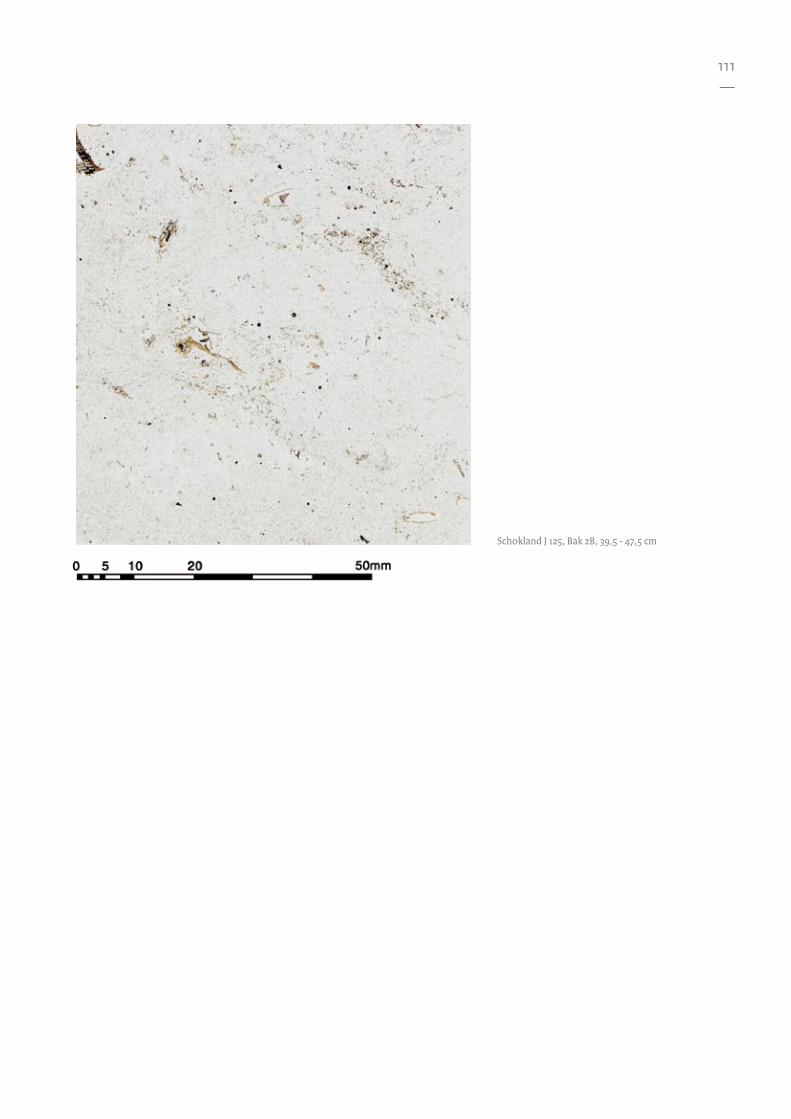
111—
Schokland J 125, Bak 2B, 39,5 - 47,5 cm
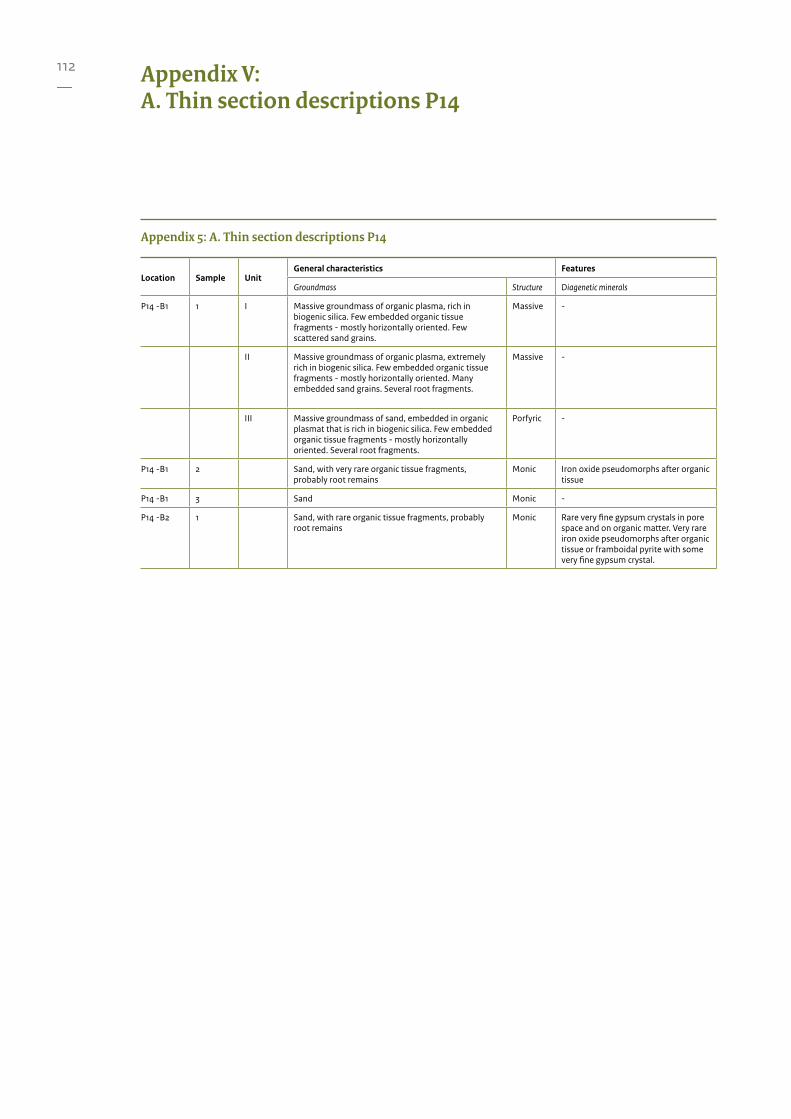
112—
Appendix V:A. Thin section descriptions P14
Appendix 5: A. Thin section descriptions P14
Location Sample UnitGeneral characteristics Features
Groundmass Structure Diagenetic minerals
P14 -B1 1 I Massive groundmass of organic plasma, rich in biogenic silica. Few embedded organic tissue fragments - mostly horizontally oriented. Few scattered sand grains.
Massive -
II Massive groundmass of organic plasma, extremely rich in biogenic silica. Few embedded organic tissue fragments - mostly horizontally oriented. Many embedded sand grains. Several root fragments.
Massive -
III Massive groundmass of sand, embedded in organic plasmat that is rich in biogenic silica. Few embedded organic tissue fragments - mostly horizontally oriented. Several root fragments.
Porfyric -
P14 -B1 2 Sand, with very rare organic tissue fragments, probably root remains
Monic Iron oxide pseudomorphs after organic tissue
P14 -B1 3 Sand Monic -
P14 -B2 1 Sand, with rare organic tissue fragments, probably root remains
Monic Rare very fine gypsum crystals in pore space and on organic matter. Very rare iron oxide pseudomorphs after organic tissue or framboidal pyrite with some very fine gypsum crystal.
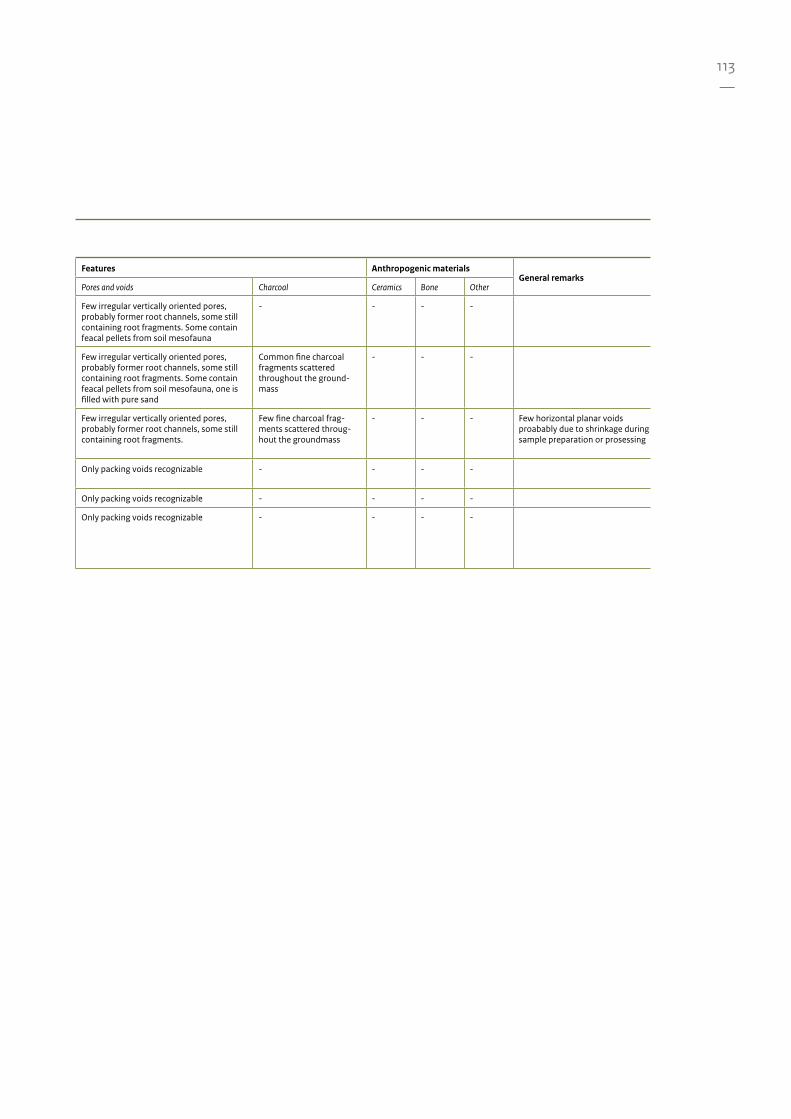
113—
Features Anthropogenic materialsGeneral remarks
Pores and voids Charcoal Ceramics Bone Other
Few irregular vertically oriented pores, probably former root channels, some still containing root fragments. Some contain feacal pellets from soil mesofauna
- - - -
Few irregular vertically oriented pores, probably former root channels, some still containing root fragments. Some contain feacal pellets from soil mesofauna, one is filled with pure sand
Common fine charcoal fragments scattered throughout the ground-mass
- - -
Few irregular vertically oriented pores, probably former root channels, some still containing root fragments.
Few fine charcoal frag-ments scattered throug-hout the groundmass
- - - Few horizontal planar voids proabably due to shrinkage during sample preparation or prosessing
Only packing voids recognizable - - - -
Only packing voids recognizable - - - -
Only packing voids recognizable - - - -
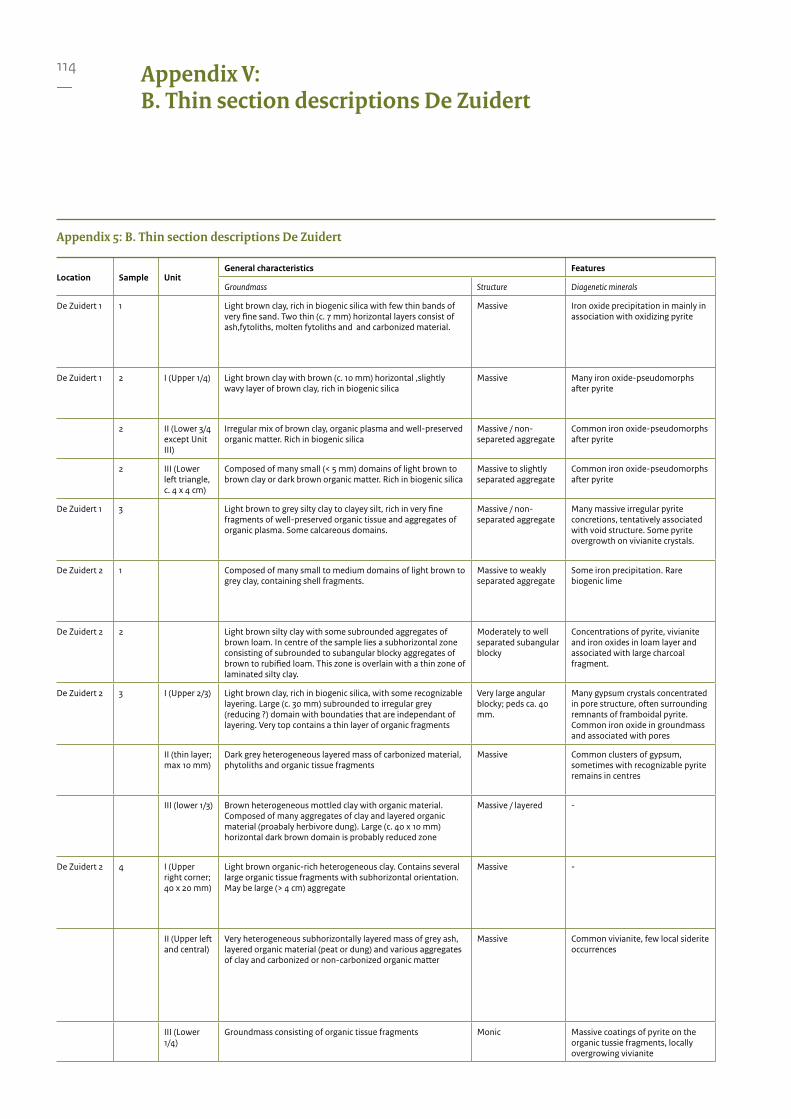
114—
Appendix V:B. Thin section descriptions De Zuidert
Appendix 5: B. Thin section descriptions De Zuidert
Location Sample UnitGeneral characteristics Features
Groundmass Structure Diagenetic minerals
De Zuidert 1 1 Light brown clay, rich in biogenic silica with few thin bands of very fine sand. Two thin (c. 7 mm) horizontal layers consist of ash,fytoliths, molten fytoliths and and carbonized material.
Massive Iron oxide precipitation in mainly in association with oxidizing pyrite
De Zuidert 1 2 I (Upper 1/4) Light brown clay with brown (c. 10 mm) horizontal ,slightly wavy layer of brown clay, rich in biogenic silica
Massive Many iron oxide-pseudomorphs after pyrite
2 II (Lower 3/4 except Unit III)
Irregular mix of brown clay, organic plasma and well-preserved organic matter. Rich in biogenic silica
Massive / non-separeted aggregate
Common iron oxide-pseudomorphs after pyrite
2 III (Lower left triangle, c. 4 x 4 cm)
Composed of many small (< 5 mm) domains of light brown to brown clay or dark brown organic matter. Rich in biogenic silica
Massive to slightly separated aggregate
Common iron oxide-pseudomorphs after pyrite
De Zuidert 1 3 Light brown to grey silty clay to clayey silt, rich in very fine fragments of well-preserved organic tissue and aggregates of organic plasma. Some calcareous domains.
Massive / non-separated aggregate
Many massive irregular pyrite concretions, tentatively associated with void structure. Some pyrite overgrowth on vivianite crystals.
De Zuidert 2 1 Composed of many small to medium domains of light brown to grey clay, containing shell fragments.
Massive to weakly separated aggregate
Some iron precipitation. Rare biogenic lime
De Zuidert 2 2 Light brown silty clay with some subrounded aggregates of brown loam. In centre of the sample lies a subhorizontal zone consisting of subrounded to subangular blocky aggregates of brown to rubified loam. This zone is overlain with a thin zone of laminated silty clay.
Moderately to well separated subangular blocky
Concentrations of pyrite, vivianite and iron oxides in loam layer and associated with large charcoal fragment.
De Zuidert 2 3 I (Upper 2/3) Light brown clay, rich in biogenic silica, with some recognizable layering. Large (c. 30 mm) subrounded to irregular grey (reducing ?) domain with boundaties that are independant of layering. Very top contains a thin layer of organic fragments
Very large angular blocky; peds ca. 40 mm.
Many gypsum crystals concentrated in pore structure, often surrounding remnants of framboidal pyrite. Common iron oxide in groundmass and associated with pores
II (thin layer; max 10 mm)
Dark grey heterogeneous layered mass of carbonized material, phytoliths and organic tissue fragments
Massive Common clusters of gypsum, sometimes with recognizable pyrite remains in centres
III (lower 1/3) Brown heterogeneous mottled clay with organic material. Composed of many aggregates of clay and layered organic material (proabaly herbivore dung). Large (c. 40 x 10 mm) horizontal dark brown domain is probably reduced zone
Massive / layered -
De Zuidert 2 4 I (Upper right corner; 40 x 20 mm)
Light brown organic-rich heterogeneous clay. Contains several large organic tissue fragments with subhorizontal orientation. May be large (> 4 cm) aggregate
Massive -
II (Upper left and central)
Very heterogeneous subhorizontally layered mass of grey ash, layered organic material (peat or dung) and various aggregates of clay and carbonized or non-carbonized organic matter
Massive Common vivianite, few local siderite occurrences
III (Lower 1/4)
Groundmass consisting of organic tissue fragments Monic Massive coatings of pyrite on the organic tussie fragments, locally overgrowing vivianite
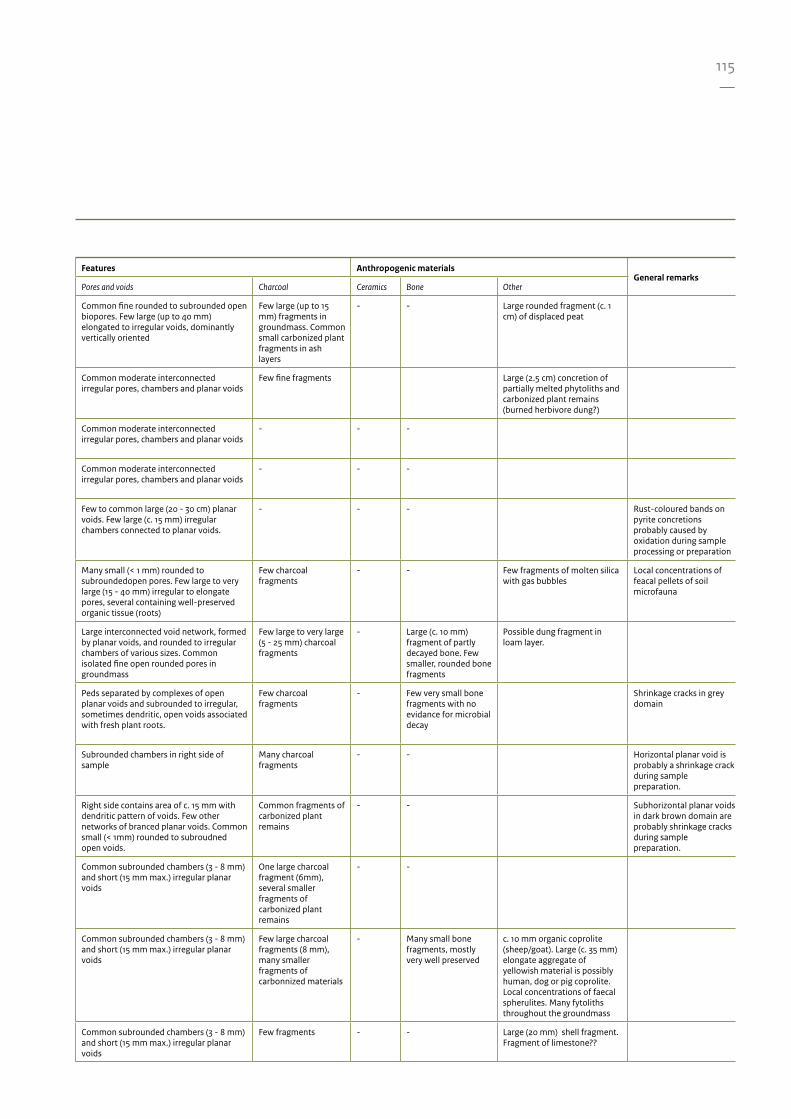
115—
Features Anthropogenic materialsGeneral remarks
Pores and voids Charcoal Ceramics Bone Other
Common fine rounded to subrounded open biopores. Few large (up to 40 mm) elongated to irregular voids, dominantly vertically oriented
Few large (up to 15 mm) fragments in groundmass. Common small carbonized plant fragments in ash layers
- - Large rounded fragment (c. 1 cm) of displaced peat
Common moderate interconnected irregular pores, chambers and planar voids
Few fine fragments Large (2.5 cm) concretion of partially melted phytoliths and carbonized plant remains (burned herbivore dung?)
Common moderate interconnected irregular pores, chambers and planar voids
- - -
Common moderate interconnected irregular pores, chambers and planar voids
- - -
Few to common large (20 - 30 cm) planar voids. Few large (c. 15 mm) irregular chambers connected to planar voids.
- - - Rust-coloured bands on pyrite concretions probably caused by oxidation during sample processing or preparation
Many small (< 1 mm) rounded to subroundedopen pores. Few large to very large (15 - 40 mm) irregular to elongate pores, several containing well-preserved organic tissue (roots)
Few charcoal fragments
- - Few fragments of molten silica with gas bubbles
Local concentrations of feacal pellets of soil microfauna
Large interconnected void network, formed by planar voids, and rounded to irregular chambers of various sizes. Common isolated fine open rounded pores in groundmass
Few large to very large (5 - 25 mm) charcoal fragments
- Large (c. 10 mm) fragment of partly decayed bone. Few smaller, rounded bone fragments
Possible dung fragment in loam layer.
Peds separated by complexes of open planar voids and subrounded to irregular, sometimes dendritic, open voids associated with fresh plant roots.
Few charcoal fragments
- Few very small bone fragments with no evidance for microbial decay
Shrinkage cracks in grey domain
Subrounded chambers in right side of sample
Many charcoal fragments
- - Horizontal planar void is probably a shrinkage crack during sample preparation.
Right side contains area of c. 15 mm with dendritic pattern of voids. Few other networks of branced planar voids. Common small (< 1mm) rounded to subroudned open voids.
Common fragments of carbonized plant remains
- - Subhorizontal planar voids in dark brown domain are probably shrinkage cracks during sample preparation.
Common subrounded chambers (3 - 8 mm) and short (15 mm max.) irregular planar voids
One large charcoal fragment (6mm), several smaller fragments of carbonized plant remains
- -
Common subrounded chambers (3 - 8 mm) and short (15 mm max.) irregular planar voids
Few large charcoal fragments (8 mm), many smaller fragments of carbonnized materials
- Many small bone fragments, mostly very well preserved
c. 10 mm organic coprolite (sheep/goat). Large (c. 35 mm) elongate aggregate of yellowish material is possibly human, dog or pig coprolite. Local concentrations of faecal spherulites. Many fytoliths throughout the groundmass
Common subrounded chambers (3 - 8 mm) and short (15 mm max.) irregular planar voids
Few fragments - - Large (20 mm) shell fragment. Fragment of limestone??
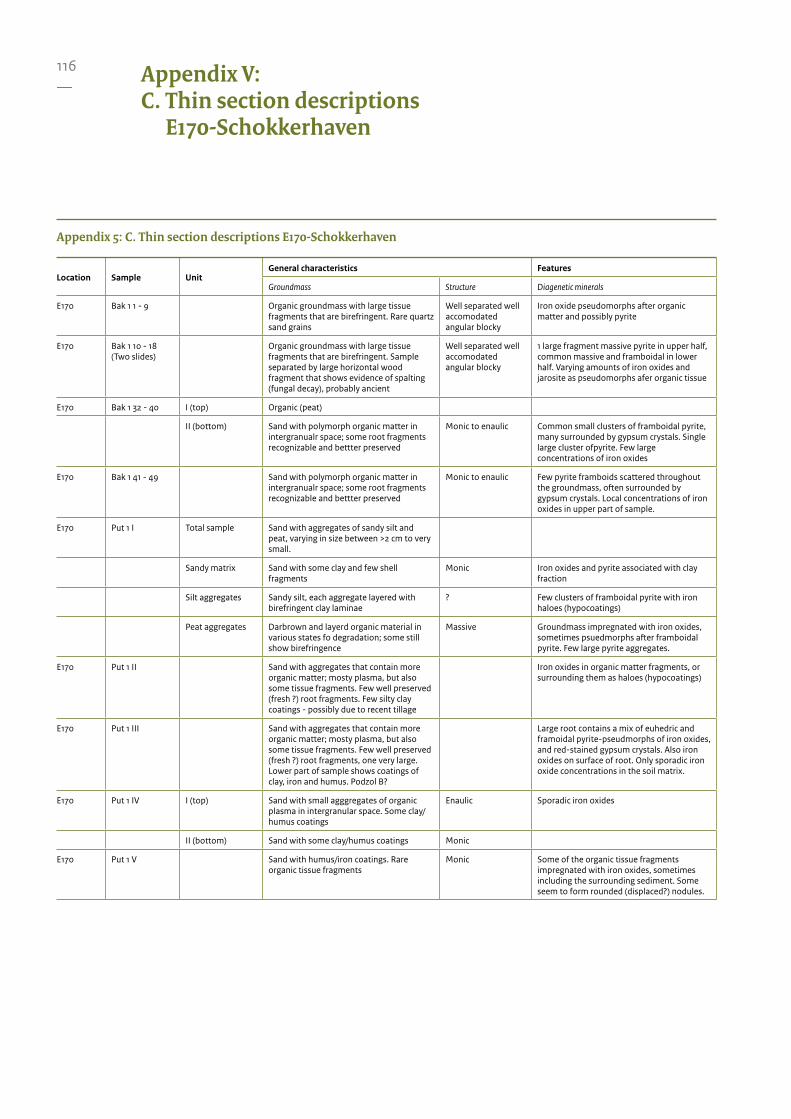
116—
Appendix V:C. Thin section descriptions
E170-Schokkerhaven
Appendix 5: C. Thin section descriptions E170-Schokkerhaven
Location Sample UnitGeneral characteristics Features
Groundmass Structure Diagenetic minerals
E170 Bak 1 1 - 9 Organic groundmass with large tissue fragments that are birefringent. Rare quartz sand grains
Well separated well accomodated angular blocky
Iron oxide pseudomorphs after organic matter and possibly pyrite
E170 Bak 1 10 - 18 (Two slides)
Organic groundmass with large tissue fragments that are birefringent. Sample separated by large horizontal wood fragment that shows evidence of spalting (fungal decay), probably ancient
Well separated well accomodated angular blocky
1 large fragment massive pyrite in upper half, common massive and framboidal in lower half. Varying amounts of iron oxides and jarosite as pseudomorphs afer organic tissue
E170 Bak 1 32 - 40 I (top) Organic (peat)
II (bottom) Sand with polymorph organic matter in intergranualr space; some root fragments recognizable and bettter preserved
Monic to enaulic Common small clusters of framboidal pyrite, many surrounded by gypsum crystals. Single large cluster ofpyrite. Few large concentrations of iron oxides
E170 Bak 1 41 - 49 Sand with polymorph organic matter in intergranualr space; some root fragments recognizable and bettter preserved
Monic to enaulic Few pyrite framboids scattered throughout the groundmass, often surrounded by gypsum crystals. Local concentrations of iron oxides in upper part of sample.
E170 Put 1 I Total sample Sand with aggregates of sandy silt and peat, varying in size between >2 cm to very small.
Sandy matrix Sand with some clay and few shell fragments
Monic Iron oxides and pyrite associated with clay fraction
Silt aggregates Sandy silt, each aggregate layered with birefringent clay laminae
? Few clusters of framboidal pyrite with iron haloes (hypocoatings)
Peat aggregates Darbrown and layerd organic material in various states fo degradation; some still show birefringence
Massive Groundmass impregnated with iron oxides, sometimes psuedmorphs after framboidal pyrite. Few large pyrite aggregates.
E170 Put 1 II Sand with aggregates that contain more organic matter; mosty plasma, but also some tissue fragments. Few well preserved (fresh ?) root fragments. Few silty clay coatings - possibly due to recent tillage
Iron oxides in organic matter fragments, or surrounding them as haloes (hypocoatings)
E170 Put 1 III Sand with aggregates that contain more organic matter; mosty plasma, but also some tissue fragments. Few well preserved (fresh ?) root fragments, one very large. Lower part of sample shows coatings of clay, iron and humus. Podzol B?
Large root contains a mix of euhedric and framoidal pyrite-pseudmorphs of iron oxides, and red-stained gypsum crystals. Also iron oxides on surface of root. Only sporadic iron oxide concentrations in the soil matrix.
E170 Put 1 IV I (top) Sand with small agggregates of organic plasma in intergranular space. Some clay/humus coatings
Enaulic Sporadic iron oxides
II (bottom) Sand with some clay/humus coatings Monic
E170 Put 1 V Sand with humus/iron coatings. Rare organic tissue fragments
Monic Some of the organic tissue fragments impregnated with iron oxides, sometimes including the surrounding sediment. Some seem to form rounded (displaced?) nodules.
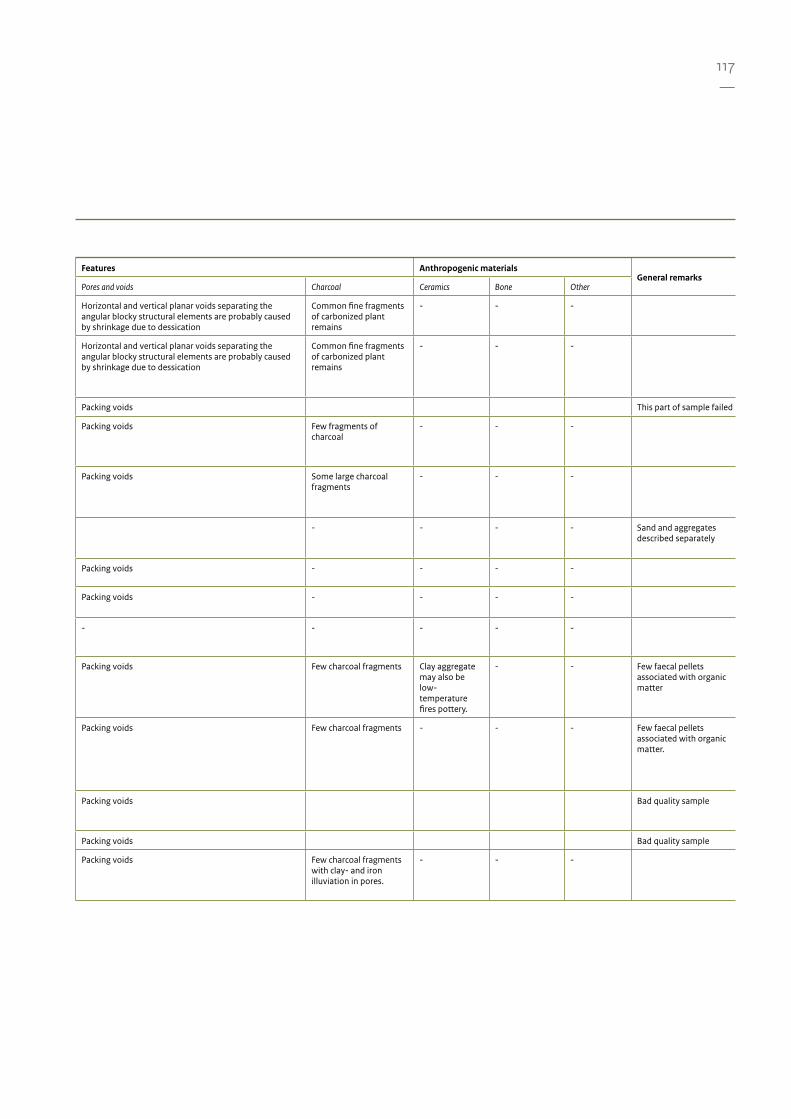
117—
Features Anthropogenic materialsGeneral remarks
Pores and voids Charcoal Ceramics Bone Other
Horizontal and vertical planar voids separating the angular blocky structural elements are probably caused by shrinkage due to dessication
Common fine fragments of carbonized plant remains
- - -
Horizontal and vertical planar voids separating the angular blocky structural elements are probably caused by shrinkage due to dessication
Common fine fragments of carbonized plant remains
- - -
Packing voids This part of sample failed
Packing voids Few fragments of charcoal
- - -
Packing voids Some large charcoal fragments
- - -
- - - - Sand and aggregates described separately
Packing voids - - - -
Packing voids - - - -
- - - - -
Packing voids Few charcoal fragments Clay aggregate may also be low-temperature fires pottery.
- - Few faecal pellets associated with organic matter
Packing voids Few charcoal fragments - - - Few faecal pellets associated with organic matter.
Packing voids Bad quality sample
Packing voids Bad quality sample
Packing voids Few charcoal fragments with clay- and iron illuviation in pores.
- - -
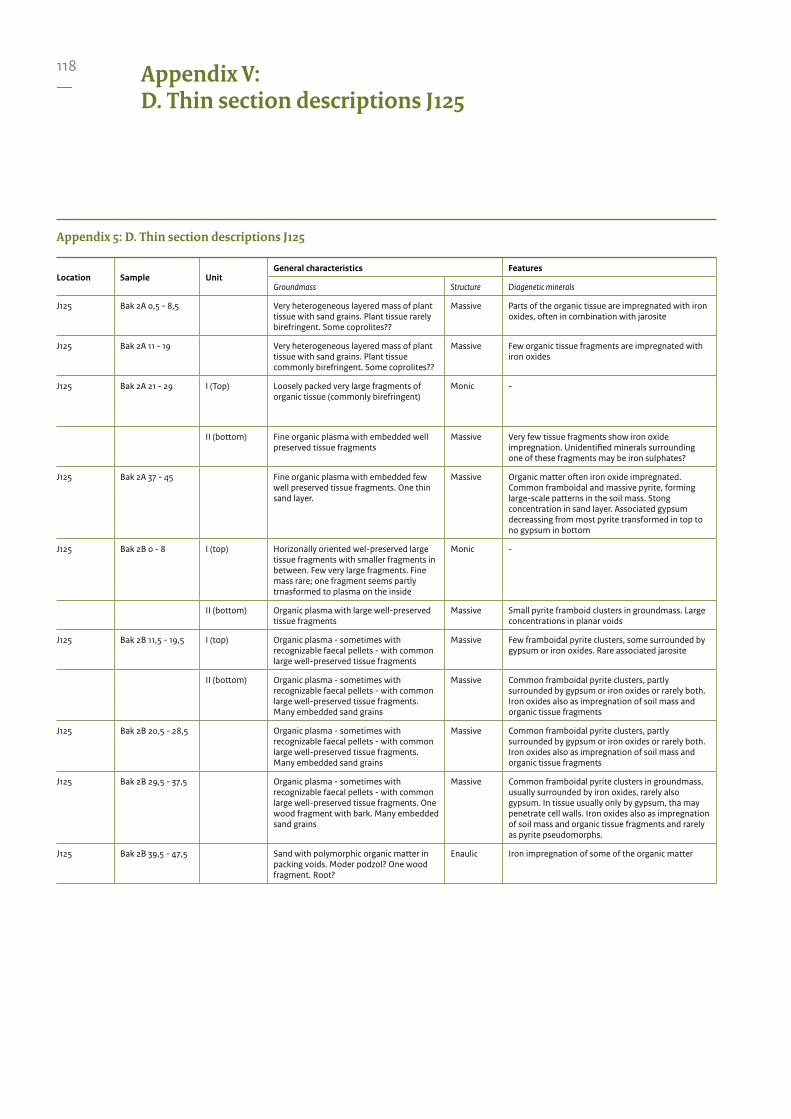
118—
Appendix 5: D. Thin section descriptions J125
Location Sample UnitGeneral characteristics Features
Groundmass Structure Diagenetic minerals
J125 Bak 2A 0,5 - 8,5 Very heterogeneous layered mass of plant tissue with sand grains. Plant tissue rarely birefringent. Some coprolites??
Massive Parts of the organic tissue are impregnated with iron oxides, often in combination with jarosite
J125 Bak 2A 11 - 19 Very heterogeneous layered mass of plant tissue with sand grains. Plant tissue commonly birefringent. Some coprolites??
Massive Few organic tissue fragments are impregnated with iron oxides
J125 Bak 2A 21 - 29 I (Top) Loosely packed very large fragments of organic tissue (commonly birefringent)
Monic -
II (bottom) Fine organic plasma with embedded well preserved tissue fragments
Massive Very few tissue fragments show iron oxide impregnation. Unidentified minerals surrounding one of these fragments may be iron sulphates?
J125 Bak 2A 37 - 45 Fine organic plasma with embedded few well preserved tissue fragments. One thin sand layer.
Massive Organic matter often iron oxide impregnated. Common framboidal and massive pyrite, forming large-scale patterns in the soil mass. Stong concentration in sand layer. Associated gypsum decreassing from most pyrite transformed in top to no gypsum in bottom
J125 Bak 2B 0 - 8 I (top) Horizonally oriented wel-preserved large tissue fragments with smaller fragments in between. Few very large fragments. Fine mass rare; one fragment seems partly trnasformed to plasma on the inside
Monic -
II (bottom) Organic plasma with large well-preserved tissue fragments
Massive Small pyrite framboid clusters in groundmass. Large concentrations in planar voids
J125 Bak 2B 11,5 - 19,5 I (top) Organic plasma - sometimes with recognizable faecal pellets - with common large well-preserved tissue fragments
Massive Few framboidal pyrite clusters, some surrounded by gypsum or iron oxides. Rare associated jarosite
II (bottom) Organic plasma - sometimes with recognizable faecal pellets - with common large well-preserved tissue fragments. Many embedded sand grains
Massive Common framboidal pyrite clusters, partly surrounded by gypsum or iron oxides or rarely both. Iron oxides also as impregnation of soil mass and organic tissue fragments
J125 Bak 2B 20,5 - 28,5 Organic plasma - sometimes with recognizable faecal pellets - with common large well-preserved tissue fragments. Many embedded sand grains
Massive Common framboidal pyrite clusters, partly surrounded by gypsum or iron oxides or rarely both. Iron oxides also as impregnation of soil mass and organic tissue fragments
J125 Bak 2B 29,5 - 37,5 Organic plasma - sometimes with recognizable faecal pellets - with common large well-preserved tissue fragments. One wood fragment with bark. Many embedded sand grains
Massive Common framboidal pyrite clusters in groundmass, usually surrounded by iron oxides, rarely also gypsum. In tissue usually only by gypsum, tha may penetrate cell walls. Iron oxides also as impregnation of soil mass and organic tissue fragments and rarely as pyrite pseudomorphs.
J125 Bak 2B 39,5 - 47,5 Sand with polymorphic organic matter in packing voids. Moder podzol? One wood fragment. Root?
Enaulic Iron impregnation of some of the organic matter
Appendix V:D. Thin section descriptions J125

119—
Features Anthropogenic materialsGeneral remarks
Pores and voids Charcoal Ceramics Bone Other
- Few fragments of carbonized material - - - Local concentrations of faecal pellets
- - - - -
Packing voids Some of the tissue fragments are carbonized or partly carbonized. One carbonized fragment on lower boundary seems to be articulated (hoizontally) with additional smaller carbonized fragments.
- - -
- - - - -
- - - - -
Packing voids - - - -
Some planar voids - - - -
- - - -
- - - -
- - - -
- - - -
Packing voids - - - -
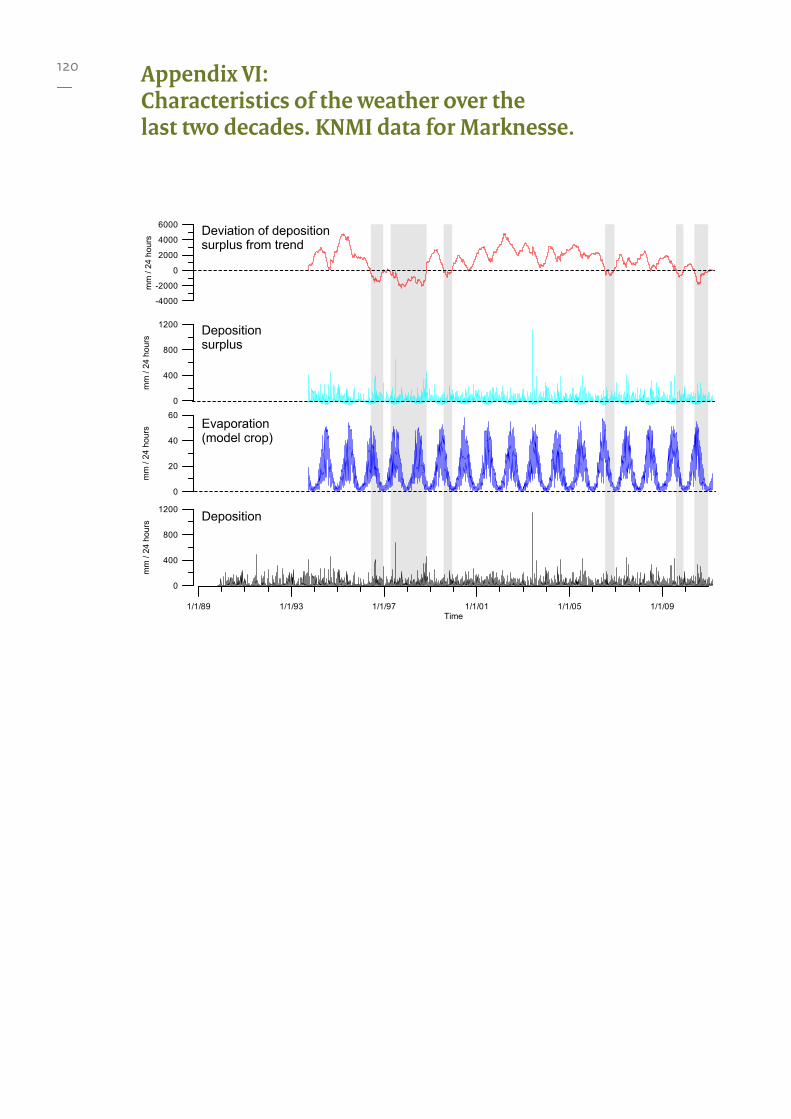
120—
Appendix VI:Characteristics of the weather over the last two decades. KNMI data for Marknesse.
1/1/89 1/1/93 1/1/97 1/1/01 1/1/05 1/1/09Time
0
400
800
1200
mm
/ 24
hou
rs
0
20
40
60
mm
/ 24
hou
rs
-4000
-2000
0
2000
4000
6000
mm
/ 24
hou
rs
0
400
800
1200
mm
/ 24
hou
rs
Evaporation (model crop)
Deposition
Depositionsurplus
Deviation of depositionsurplus from trend
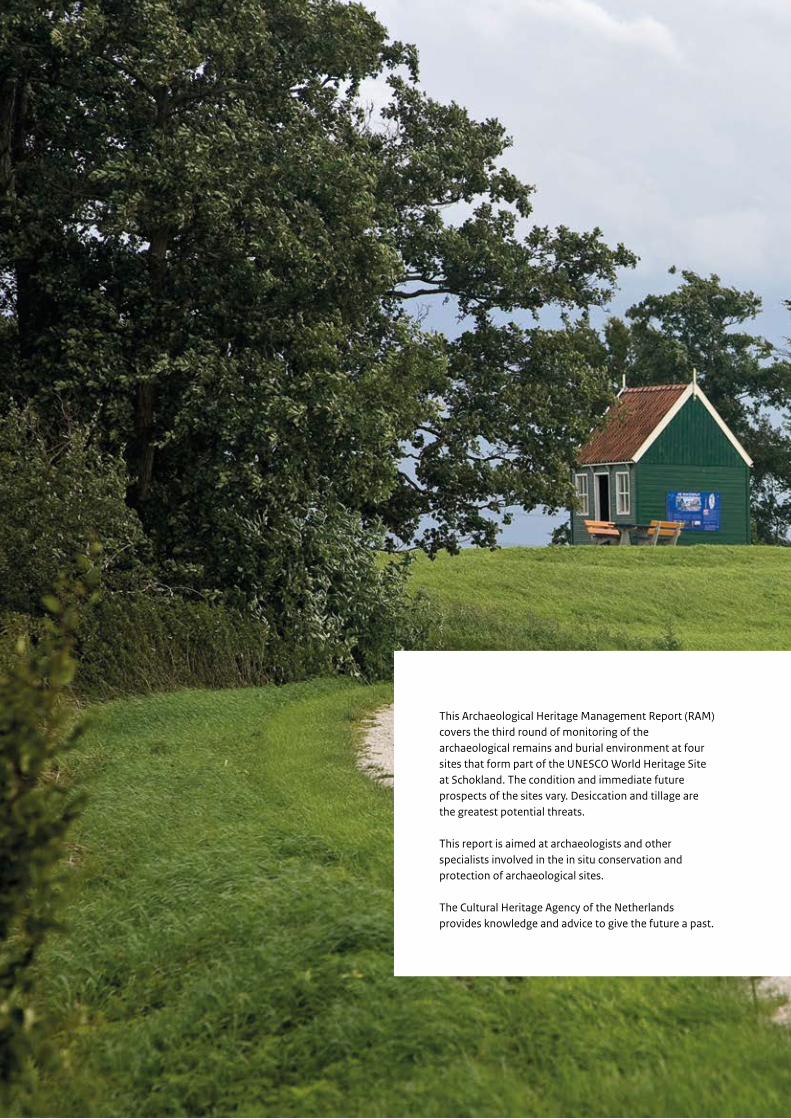
This Archaeological Heritage Management Report (RAM) covers the third round of monitoring of the archaeological remains and burial environment at four sites that form part of the UNESCO World Heritage Site at Schokland. The condition and immediate future prospects of the sites vary. Desiccation and tillage are the greatest potential threats.
This report is aimed at archaeologists and other specialists involved in the in situ conservation and protection of archaeological sites.
The Cultural Heritage Agency of the Netherlands provides knowledge and advice to give the future a past.
Schokland UN
ESCO W
orld Heritage site