
Proprioceptive reflexes and neurological disorders
194
Proprioceptive reflexes and neurological disorders Alfred C. Schouten
Transcript of Proprioceptive reflexes and neurological disorders

Proprioceptive reflexes
and
neurological disorders
Alfred C. Schouten


Proprioceptive reflexesand
neurological disorders
Proefschrift
ter verkrijging van de graad van doctoraan de Technische Universiteit Delft,
op gezag van de Rector Magnificus prof. dr ir J.T. Fokkema,voorzitter van het College voor Promoties,
in het openbaar te verdedigen op dinsdag 25 mei 2004 om 15:30 uurdoor
Alfred Christiaan SCHOUTENwerktuigkundig ingenieur
geboren te Dordrecht, Nederland.

Dit proefschrift is goedgekeurd door de promotor:Prof. dr F.C.T. van der Helm
Toegevoegd promotor:Dr J.J. van Hilten
Samenstelling promotiecommissie:Rector Magnificus, Technische Universiteit Delft, voorzitterProf. dr F.C.T. van der Helm, Technische Universiteit Delft, promotorDr J.J. van Hilten, Technische Universiteit Delft, toegevoegd promotorProf. dr ir M.H.G. Verhaegen, Technische Universiteit DelftProf. dr T. Sinkjær, Aalborg UniversityProf. dr J.H. Arendzen, Universiteit LeidenProf. dr ir D.F. Stegeman, Katholieke Universiteit NijmegenProf. dr ir P.P.J. van den Bosch, Technische Universiteit EindhovenProf. dr ir H.G. Stassen, Technische Universiteit Delft, reservelid
Het onderzoek beschreven in dit proefschrift is mede mogelijk gemaakt door financiële on-dersteuning van de Nederlandse organisatie voor wetenschappelijk onderzoek, medischewetenschappen (NWO-MW, project nummer: 902-36-084). De pols manipulator beschrevenin dit proefschrift is mede mogelijk gemaakt door een gift van Medtronic.
ISBN 90-77595-41-4
Copyright 2004, A.C. Schouten, Delft, The Netherlands.
All rights reserved. No part of this book may be reproduced by any means, or transmit-
ted without the written permission of the author. Any use or application of data, methods
and/or results etc., occurring in this report will be at the user’s own risk.

iii
Contents in brief
1 Introduction 1
2 Experimental approach 13
3 Proprioceptive reflexes in patients with complex regional pain syndrome 25
4 Proprioceptive reflexes in patients with Parkinson’s disease 35
5 Design of perturbation signals for the estimation of spinal reflexes 47
6 Quantifying spinal reflexes in vivo during postural control 59
7 Design of a torque-controlled wrist manipulator 83
8 Quantifying proprioceptive reflexes at the wrist 97
9 Proprioceptive reflexes at the wrist in patients with Parkinson’s disease 119
10 Analysis of reflex modulation with a biological neural network 129
11 Reflections 151

iv

v
Contents
Contents in brief iii
Contents v
1 Introduction 11.1 Introduction 21.2 Human motion control 2
1.2.1 Neurons 21.2.2 Muscles 41.2.3 Proprioceptors 41.2.4 Postural control 71.2.5 Identifying human joint dynamics 9
1.3 Neurological disorders 101.3.1 Complex regional pain syndrome 101.3.2 Parkinson’s disease 10
1.4 Goal and approach 111.5 Thesis outline 11
2 Experimental approach 132.1 Introduction 142.2 Materials and methods 14
2.2.1 Apparatus 142.2.2 Procedures 152.2.3 Data processing 16
2.3 Discussion 22
3 Proprioceptive reflexes in patients with complex regional pain syndrome 253.1 Introduction 263.2 Materials and methods 26
3.2.1 Subjects 263.2.2 Apparatus 273.2.3 Procedures 273.2.4 Data processing 28
3.3 Results 303.3.1 WB disturbances and intrinsic parameters 303.3.2 NB1 disturbances 31

vi
3.3.3 NB2 disturbances 31
3.4 Discussion 32
4 Proprioceptive reflexes in patients with Parkinson’s disease 35
4.1 Introduction 36
4.2 Materials and methods 36
4.2.1 Subjects 36
4.2.2 Apparatus 36
4.2.3 Procedures 37
4.2.4 Data processing 39
4.3 Results 41
4.3.1 Nonparametric FRFs 41
4.3.2 Intrinsic and reflexive parameters 45
4.4 Discussion 45
5 Design of perturbation signals for the estimation of spinal reflexes 47
5.1 Introduction 48
5.2 Materials and methods 48
5.2.1 Subjects 48
5.2.2 Apparatus 48
5.2.3 Procedures 48
5.2.4 Data processing 51
5.3 Results 53
5.3.1 Isometric experiments 53
5.3.2 Main experiment 53
5.4 Discussion 57
6 Quantifying spinal reflexes in vivo during postural control 59
6.1 Introduction 60
6.2 Materials and methods 60
6.2.1 Subjects 60
6.2.2 Apparatus 61
6.2.3 Procedures 61
6.2.4 Data processing 63
6.3 Results 71
6.3.1 Activation dynamics 71
6.3.2 Nonparametric FRFs 71
6.3.3 Intrinsic and reflexive parameters 77
6.4 Discussion 79
6.4.1 Methodology 79
6.4.2 Functionality of reflexes 80
6.4.3 Comparison with previous work 80

vii
7 Design of a torque-controlled wrist manipulator 837.1 Introduction 847.2 Materials and methods 84
7.2.1 Apparatus 847.2.2 Procedures 887.2.3 Data processing 90
7.3 Results 927.3.1 Controller settings 927.3.2 Estimation performance 93
7.4 Discussion 95
8 Quantifying proprioceptive reflexes at the wrist 978.1 Introduction 988.2 Materials and methods 98
8.2.1 Subjects 988.2.2 Apparatus 988.2.3 Procedures 988.2.4 Data processing 100
8.3 Results 1078.3.1 Isometric experiments 1078.3.2 Activation dynamics 1078.3.3 Nonparametric FRFs 1078.3.4 Intrinsic and reflexive parameters 113
8.4 Discussion 116
9 Proprioceptive reflexes at the wrist in patients with Parkinson’s disease 1199.1 Introduction 1209.2 Materials and Methods 120
9.2.1 Subjects 1209.2.2 Apparatus 1209.2.3 Procedures 1219.2.4 Data processing 122
9.3 Results 1239.3.1 Nonparametric FRFs 1239.3.2 Intrinsic and reflexive parameters 126
9.4 Discussion 128
10 Analysis of reflex modulation with a biological neural network 12910.1 Introduction 13010.2 Method 130
10.2.1 Simulation model 13110.2.2 Procedures 13910.2.3 Tools and languages 142
10.3 Results 14310.3.1 Presynaptic inhibition candidate 143
viii
10.3.2 Alternative deficiency candidate 14410.4 Discussion 145
10.4.1 Model verifications 14710.4.2 Presynaptic inhibition candidate 14810.4.3 Alternative deficiency candidate 14810.4.4 Conclusion 149
11 Reflections 15111.1 Introduction 15211.2 Results and conclusions 15211.3 Recommendations and future directions 155
11.3.1 Medical applications 15511.3.2 Effect of tasks and conditions 15611.3.3 Future challenges 157
11.4 Epilogue 158
References 159
A Spiking vs. continuous time-signals 165
Summary 169
Samenvatting 173
Dankwoord 177
Curriculum vitae 179

ix
List of abbreviations
ANOVA analysis of varianceBNN biological realistic neural networkCF crest factorCNS central nervous systemCRPS complex regional pain syndromeCVA cerebro vascular attackDOF degrees-of-freedomDSP digital signal processorEMG electromyographyFFT fast Fourier transformFRF frequency response functionGTO Golgi tendon organIEMG integrated rectified EMGNB narrow bandwidthNMS neuromusculoskeletalPD Parkinson’s diseaseRMS root-mean-squareRSD reflex sympathetic dystrophyRSI repetitive strain injurySD standard deviationSNR signal-to-noise ratioVAF variance accounted forWB wide bandwidth

x

Chapter 1
Introduction
Proprioceptive reflexes play an important role during the control of movement andposture. Many studies suggest disturbed modulation of proprioceptive reflexes asthe cause for the motor features present in neurological disorders. However noquantitative data exist to support the hypothesis. In this thesis methods are devel-oped and evaluated to quantify proprioceptive reflexes in vivo during postural con-trol. The prime goal of this thesis is to gain insight in the pathophysiology of motordisorders and to evaluate the method as a diagnostic tool. This chapter providesan introduction to relevant physiological and control engineering background. Thelast section of this chapter describes the outline of the thesis.
2 CHAPTER 1
1.1 Introduction
Humans are capable of performing a large variation of movements and postures.The central nervous system (CNS), i.e. the ‘brain’ with the spinal cord, coordinatesthe muscles which generate the force required for movements. Even in the presenceof unpredictable and unexpected external disturbances humans are able to performthe intended movement or to hold the intended posture. For example during walk-ing at the beach, while a strong gale is blowing, the CNS must continuously reactadjusting muscle tension not to fall over. Remarkably most of the time these correc-tions for the disturbances are fast and made unconsciously. Small sensory organsinside the body, called proprioceptors, inform the CNS about the actual movementof the body segments and play an important role in coordinated movement.
Movement disorders are commonly found with a brain disease, i.e. a neurologi-cal disorder. An example of such a movement disorder is tremor (shaking), as seenwith Parkinson’s disease. This thesis investigates the role of proprioceptive infor-mation in the development of the motor features with neurological disorders. Thischapter provides the necessary background on human motion control such that thegoal can be formulated. The chapter ends with an outline of the complete thesis.
1.2 Human motion control
From an engineering perspective the human neuromusculoskeletal system can beregarded as a robot, consisting of a linkage system (the skeleton) with motors (mus-cles), sensors (proprioceptors), and a control system (the CNS). The nerves andneurons are the wires and connectors, which transport the information from theproprioceptors to the CNS and from the CNS to the muscles. The CNS integratesintentions with information from the proprioceptor to coordinate movement ofthe skeleton by selectively (de-)activating muscles. Control engineers will directlyrecognize a feedback loop: the movement results from commands from the CNS,which on their turn (partly) depend on the movement sensed by the proprioceptors(proprioceptive feedback), i.e. there is a mutual interaction between CNS and limbmovement.
1.2.1 Neurons
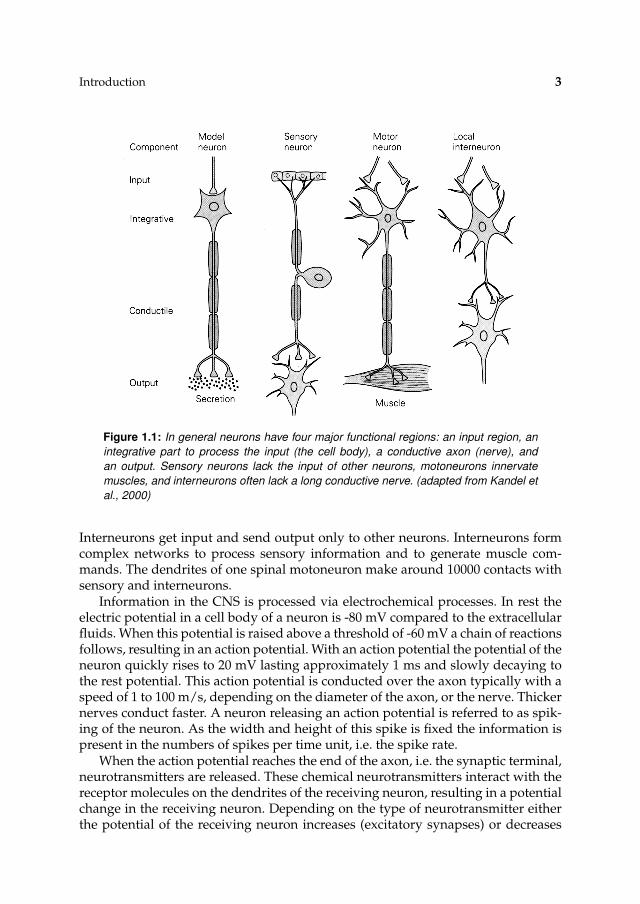
Neurons, or nerve cells, are the primary elements of the CNS. A typical neuroncontains a cell body, dendrites and an axon, see Fig. 1.1. The cell body receives sig-nals from other neurons via several short dendrites, and via one long axon (nerve)a signal can be sent to other neurons. The contact of the axon of a sending neuronto the dendrite of a receiving neuron is called a synapse. Three types of neuronsplay a role in human movement control: motoneurons, sensory neurons, and in-terneurons. Motoneuron, or efferent neurons, lie in the spinal cord and excite themuscle. Sensory, or afferent, neurons carry information from proprioceptors to theCNS. Interneurons are the largest group of neurons and comprise all other neurons.
Introduction 3
Figure 1.1: In general neurons have four major functional regions: an input region, an
integrative part to process the input (the cell body), a conductive axon (nerve), and
an output. Sensory neurons lack the input of other neurons, motoneurons innervate
muscles, and interneurons often lack a long conductive nerve. (adapted from Kandel et
al., 2000)
Interneurons get input and send output only to other neurons. Interneurons formcomplex networks to process sensory information and to generate muscle com-mands. The dendrites of one spinal motoneuron make around 10000 contacts withsensory and interneurons.
Information in the CNS is processed via electrochemical processes. In rest theelectric potential in a cell body of a neuron is -80 mV compared to the extracellularfluids. When this potential is raised above a threshold of -60 mV a chain of reactionsfollows, resulting in an action potential. With an action potential the potential of theneuron quickly rises to 20 mV lasting approximately 1 ms and slowly decaying tothe rest potential. This action potential is conducted over the axon typically with aspeed of 1 to 100 m/s, depending on the diameter of the axon, or the nerve. Thickernerves conduct faster. A neuron releasing an action potential is referred to as spik-ing of the neuron. As the width and height of this spike is fixed the information ispresent in the numbers of spikes per time unit, i.e. the spike rate.
When the action potential reaches the end of the axon, i.e. the synaptic terminal,neurotransmitters are released. These chemical neurotransmitters interact with thereceptor molecules on the dendrites of the receiving neuron, resulting in a potentialchange in the receiving neuron. Depending on the type of neurotransmitter eitherthe potential of the receiving neuron increases (excitatory synapses) or decreases
4 CHAPTER 1
(inhibitory synapses). With an inhibitory synapse the potential in the receiving neu-ron is lowered, making it less sensitive for excitatory synapses from other neurons.
1.2.2 Muscles
Skeletal muscles provide the force needed to move and support the skeleton. Themuscles are connected via tendons to the skeleton and are activated by the α-motoneurons located in the spinal cord. Most skeletal muscles consist of thousandsparallel muscle fibres. The axons of the motoneurons innervate the muscle fibres atthe endplates. One muscle is activated by several hundreds of motoneurons, eachinnervating a selected number of muscle fibres: a motor unit. An incoming actionpotential propagates relatively slow (3-5 ms) in both directions along the musclefibres. As one action potential innervates many muscle fibres a single action poten-tial results in electric activity that even can be the recorded over the skin surfacewith electromyography (EMG).
Muscle fibres are complex structures, for this thesis it goes to far to describethe structure in high detail. The contractile force is produced by so-called crossbridges. Each muscle fibre contains contractile proteins, organized in thick and thinfilaments. A thick filament is made up of about 250 myosin molecules, which eachcan bind to the thin filaments: a cross bridge. As Ca2+ facilitates the binding of thecross bridges, the force a muscle fibre generates depends on the intracellular con-centration of Ca2+. Under resting conditions the intracellular concentration of Ca2+
is kept low by active pumping into the sarcoplasmic reticulum, responsible for se-quester and release of Ca2+. With the arrival of an action potential Ca2+ is released.Periodic action potentials are necessary to obtain a constant concentration of Ca2+
and consequently a constant muscle force. The process of release and sequester ofCa2+ is not instantaneous and is called activation dynamics.
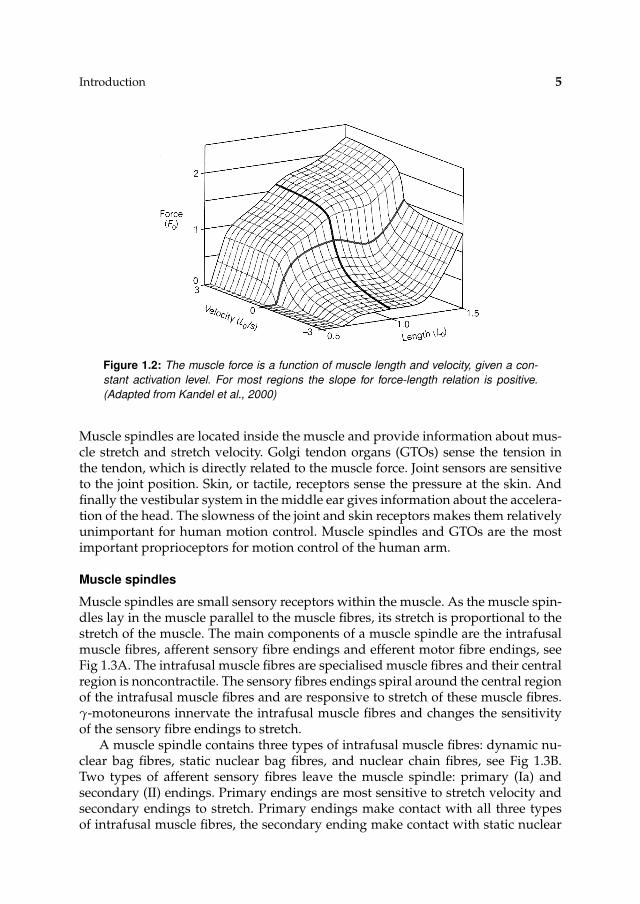
In 1938 Hill showed that with a constant activation level the muscle force de-pends on the length of the muscle and the stretch velocity, see Fig. 1.2. Huxley(1969) suggested that the force-length relationship originates from the overlap ofthick and thin filaments, which is directly related to the number cross bridges avail-able for binding. Furthermore Huxley suggested that shortening facilitates the un-binding of the cross bridges reducing the contractile force and vice versa, explain-ing the force-velocity relationship.
For small deviations, like in posture control the force-length and force-velocityrelationship can be linearised and described with stiffness and damping. Higheractivation levels generally result in higher stiffness and damping.
1.2.3 Proprioceptors
Proprioception is the unconscious perception of movement and spatial orientationarising from sensory organs (proprioceptors) within the body itself. Proprioceptorssense the movement and internal forces in the body. They include muscle spin-dles, Golgi tendon organs, joint sensors, skin receptors and the vestibular system.
Introduction 5
Figure 1.2: The muscle force is a function of muscle length and velocity, given a con-
stant activation level. For most regions the slope for force-length relation is positive.
(Adapted from Kandel et al., 2000)
Muscle spindles are located inside the muscle and provide information about mus-cle stretch and stretch velocity. Golgi tendon organs (GTOs) sense the tension inthe tendon, which is directly related to the muscle force. Joint sensors are sensitiveto the joint position. Skin, or tactile, receptors sense the pressure at the skin. Andfinally the vestibular system in the middle ear gives information about the accelera-tion of the head. The slowness of the joint and skin receptors makes them relativelyunimportant for human motion control. Muscle spindles and GTOs are the mostimportant proprioceptors for motion control of the human arm.
Muscle spindles
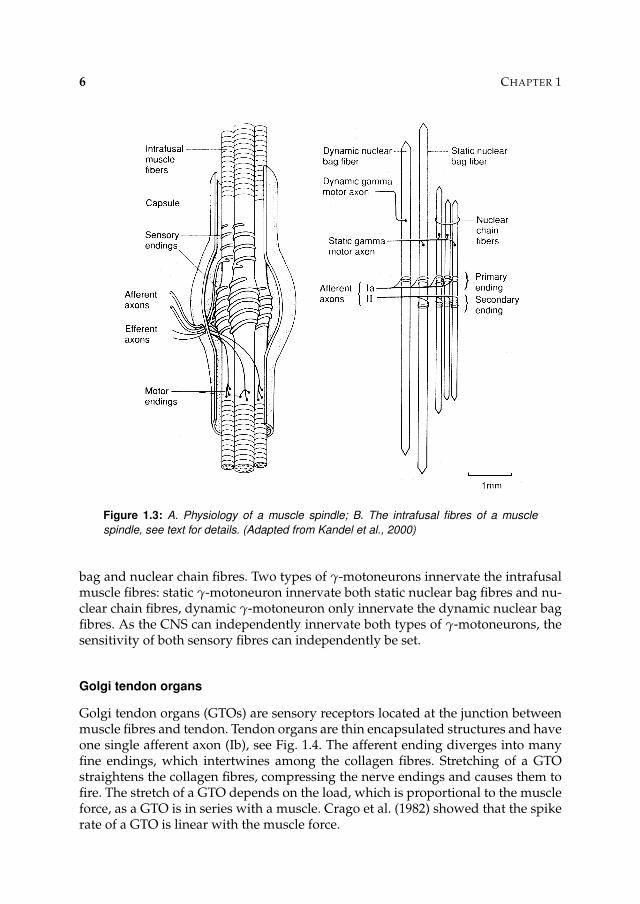
Muscle spindles are small sensory receptors within the muscle. As the muscle spin-dles lay in the muscle parallel to the muscle fibres, its stretch is proportional to thestretch of the muscle. The main components of a muscle spindle are the intrafusalmuscle fibres, afferent sensory fibre endings and efferent motor fibre endings, seeFig 1.3A. The intrafusal muscle fibres are specialised muscle fibres and their centralregion is noncontractile. The sensory fibres endings spiral around the central regionof the intrafusal muscle fibres and are responsive to stretch of these muscle fibres.γ-motoneurons innervate the intrafusal muscle fibres and changes the sensitivityof the sensory fibre endings to stretch.
A muscle spindle contains three types of intrafusal muscle fibres: dynamic nu-clear bag fibres, static nuclear bag fibres, and nuclear chain fibres, see Fig 1.3B.Two types of afferent sensory fibres leave the muscle spindle: primary (Ia) andsecondary (II) endings. Primary endings are most sensitive to stretch velocity andsecondary endings to stretch. Primary endings make contact with all three typesof intrafusal muscle fibres, the secondary ending make contact with static nuclear
6 CHAPTER 1
Figure 1.3: A. Physiology of a muscle spindle; B. The intrafusal fibres of a muscle
spindle, see text for details. (Adapted from Kandel et al., 2000)
bag and nuclear chain fibres. Two types of γ-motoneurons innervate the intrafusalmuscle fibres: static γ-motoneuron innervate both static nuclear bag fibres and nu-clear chain fibres, dynamic γ-motoneuron only innervate the dynamic nuclear bagfibres. As the CNS can independently innervate both types of γ-motoneurons, thesensitivity of both sensory fibres can independently be set.
Golgi tendon organs
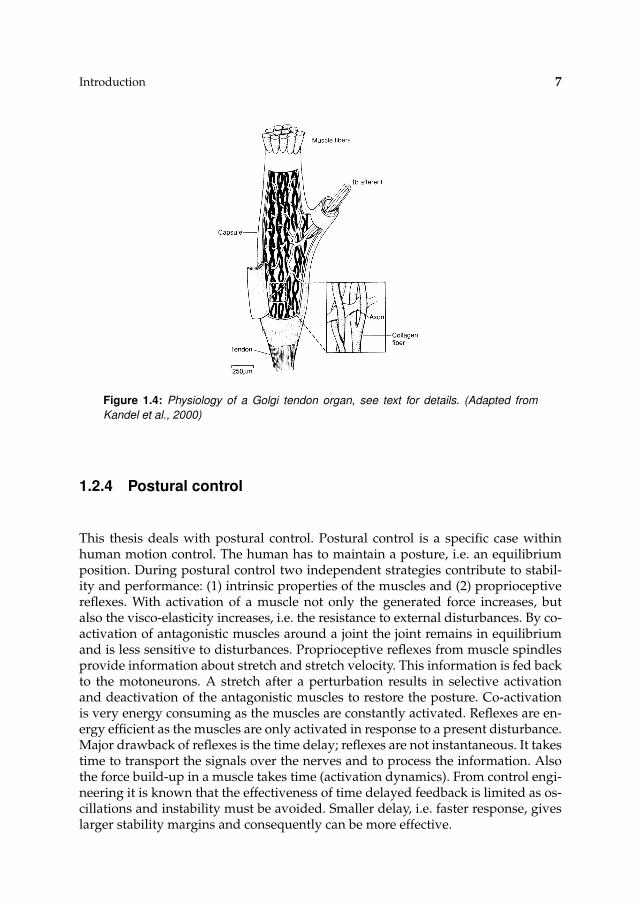
Golgi tendon organs (GTOs) are sensory receptors located at the junction betweenmuscle fibres and tendon. Tendon organs are thin encapsulated structures and haveone single afferent axon (Ib), see Fig. 1.4. The afferent ending diverges into manyfine endings, which intertwines among the collagen fibres. Stretching of a GTOstraightens the collagen fibres, compressing the nerve endings and causes them tofire. The stretch of a GTO depends on the load, which is proportional to the muscleforce, as a GTO is in series with a muscle. Crago et al. (1982) showed that the spikerate of a GTO is linear with the muscle force.
Introduction 7
Figure 1.4: Physiology of a Golgi tendon organ, see text for details. (Adapted from
Kandel et al., 2000)
1.2.4 Postural control
This thesis deals with postural control. Postural control is a specific case withinhuman motion control. The human has to maintain a posture, i.e. an equilibriumposition. During postural control two independent strategies contribute to stabil-ity and performance: (1) intrinsic properties of the muscles and (2) proprioceptivereflexes. With activation of a muscle not only the generated force increases, butalso the visco-elasticity increases, i.e. the resistance to external disturbances. By co-activation of antagonistic muscles around a joint the joint remains in equilibriumand is less sensitive to disturbances. Proprioceptive reflexes from muscle spindlesprovide information about stretch and stretch velocity. This information is fed backto the motoneurons. A stretch after a perturbation results in selective activationand deactivation of the antagonistic muscles to restore the posture. Co-activationis very energy consuming as the muscles are constantly activated. Reflexes are en-ergy efficient as the muscles are only activated in response to a present disturbance.Major drawback of reflexes is the time delay; reflexes are not instantaneous. It takestime to transport the signals over the nerves and to process the information. Alsothe force build-up in a muscle takes time (activation dynamics). From control engi-neering it is known that the effectiveness of time delayed feedback is limited as os-cillations and instability must be avoided. Smaller delay, i.e. faster response, giveslarger stability margins and consequently can be more effective.
8 CHAPTER 1
Proprioceptive reflexes
A proprioceptive reflex is the contraction of a muscle, in response to stimuli from aproprioceptor. An example is the knee jerk, with a small tap just below the knee onthe tendon the muscle is lengthened. This muscle lengthening is sensed by musclespindles and automatically, unconsciously, the muscle contracts resulting in short-ening of the muscle, opposing stretch.
Traditionally reflexes are categorized in three types according to the reflex la-tencies: short, medium, and long latency reflexes. The shortest possible feedbackpath is from the muscle spindles to the spinal cord and back to the muscle: theshort latency reflex (e.g. the knee jerk). As this reflex loop is formed via the spinalcord and does not leave the spinal cord short latency reflexes are also called spinalreflexes. The delay of spinal reflexes is around 30-60 ms and mainly depends onlength of the nerves, in distal joints the delay is larger than for proximal joints. Bothmedium and long latency reflexes are cortical reflexes, i.e. the cortex is part of thereflex arc, and typically have a delay of 60 ms and slower. Spinal reflexes have thegreatest influence on the performance as the time delay is the smallest, giving largestability margins. Humans have the possibility to (unconsciously) change the reflexmagnitude, even of spinal reflexes. With γ-activation the sensitivity of the musclespindles can be set by the CNS. Furthermore with presynaptic inhibition of musclespindle afferents the magnitude of the spinal reflex can be reduced (Stein and Ca-paday, 1988). This makes the CNS an adaptive controller, it does not only amplifyand distribute the signals from proprioceptors to the α-motoneuron, but it also canadjust/modulate the gain of the amplifier.
Stability and performance
In human motion control the CNS must preserve stability and optimize perfor-mance. In general a controller has a good performance if the motion follows thedesired/planned motion and disturbances have minimal influence on the motion.The first is expressed in the so-called control behaviour and the latter in the distur-bance behaviour. For a good disturbance rejection the sensitivity for external dis-turbances must be low. In daily life external disturbances continuously act on thebody. These disturbances can be large (a strong gale during walking at the beach)and can be small (the wind from a butterfly flapping its wings), but disturbancesare always present.
Stability is a prerequisite for a good performance. Any system is stable or unsta-ble, there is no intermediate. In postural control stability implies that the postureis robust to a perturbation. Instabilities will present as shaking of limbs or ulti-mately in fixed tonic postures. Instabilities can occur when the reflex magnitude istoo large relative to the muscle cocontraction. With muscle cocontraction the jointvisco-elasticity increases instantaneously, enlarging the stability margins. With pro-prioceptive reflexes the build-up of corrective force after a perturbation takes timedepending on the neural time delay and the muscle activation dynamics. As a re-sult of delay, there exist one frequency (a sine) where the corrective action, i.e. the
Introduction 9
feedback, is opposite to perturbation (the input and output sine are shifted a halfperiod compared to each other). The system is unstable if the amplitude of the cor-rective action at that frequency is larger than the perturbation, as the amplitudeincreases for every following period.
1.2.5 Identifying human joint dynamics
In human motion control one tries to identify the dynamics of the skeleton, muscles,sensors, and controller. It is the challenge to find the structure and the parametersof the controller and how it handles with different conditions and/or disturbances.
Position, forces and EMG of the muscles are the variables that can be observednoninvasively in humans. Furthermore position and force disturbances can be ap-plied to perturb the posture and to provoke a response. With system identifica-tion a model of the system (joint dynamics) is obtained by analysis between input(position or force) and output (force or position, sometimes EMG). Two types ofperturbations (input) can be distinguished, i.e. force and position perturbations.For technical systems there is no principal difference. However humans are highlyadaptive and need a proper task instruction. Force disturbances require a positiontask and vice versa.
Position tasks (with force perturbations) are natural for the subject. They mimicdaily life situations, and are superior to investigate the functionality of propriocep-tive reflexes. The subject has to actively preserve stability and reflexes contribute tothe performance. Note that in human motion control the function of the perturba-tion is twofold. Firstly it provides the input necessary to excite the system, allowingidentification, and secondly the perturbation is part of the conditions to influencereflexive behaviour. As the CNS is an adaptive controller, weighting performanceagainst effort, different perturbations will give different weights.
The neuromusculoskeletal system is highly nonlinear by nature, as the skeletonis a multi-link system and the muscles, proprioceptors, and neurons are all non-linear. Most control engineering and system identification tools are only valid forlinear systems. It is desirable to investigate the human neuromusculoskeletal sys-tem in a state that allows linearisation, so that linear tools can be used. Linearisationis allowed when small deviations around an equilibrium posture are concerned, forexample during postural control.
To identify a system the system must be perturbed. Perturbation signals can beclassified into transients and continuous signals. Continuous signals have the ad-vantage that the human can tune its controller during the perturbation to maximizethe performance (disturbance rejection). It is thought that after a few seconds theoptimal setting is obtained (Van der Helm et al., 2002). With transient signals, likesteps, it is unclear which reflex setting is measured. For the first transient distur-bance the reflex setting from before the disturbance is recorded and after severaltests the setting will possibly converge to an optimal setting for the given distur-bance (learning). This implicates that many trials have to be performed before thesubject is adapted to the applied transient perturbation, if he/she adapts at all. Theinterest of this study is the modulation of reflexive feedback and to exclude an-
10 CHAPTER 1
ticipation, i.e. non-reflexive behaviour, the disturbances must be unpredictable. Inthis study we have chosen to use continuous random signals, continuous to allowmodulation of the reflexes, and random to prevent anticipation.
1.3 Neurological disorders
1.3.1 Complex regional pain syndrome
Complex regional pain syndrome (CRPS), formerly known as reflex sympatheticdystrophy (RSD), is a painful condition that typically follows an injury to a limb,which can be minimal or severe (sprain/strain, fracture, contusion/crush injury),although in a number of patients no trauma can be identified. The syndrome man-ifests with variable combinations of pain, differences in skin colour and tempera-ture, oedema and sweating (Paice, 1995; Ribbers et al., 1995). The syndrome mayspread to other extremities. In addition to the sensory and autonomic signs andsymptoms, patients may present or subsequently develop movement disorders(Van Hilten et al., 2001). One of the most common movement disorders is tonic dys-tonia of the affected limb(s) (Bhatia et al., 1993; Schwartzman and Kerrigan, 1990).Although the mechanism behind CRPS is still considered elusive, the evidence im-plicating involvement of inhibitory interneuronal circuits in the pathophysiologyof tonic dystonia in patients with CRPS is compelling (Van Hilten et al., 2000).
1.3.2 Parkinson’s disease
Parkinson’s disease (PD) is a neurodegenerative disorder characterized by: tremor,bradykinesia, rigidity, and impaired postural reflexes. PD is seen predominantlyin elderly people. In PD the dopamine producing cells in the substantia nigra aregradually lost. The substantia nigra is one of the principal nuclei in the basal gan-glia of the CNS. The basal ganglia play a major role in voluntary movements anddopamine is one of the major neurotransmitters in the basal ganglia.
Current studies indicate that the reflex magnitude is modulated by presynap-tic inhibition of muscle spindle afferents in the spinal cord, under control of highercentres in the CNS (Stein and Capaday, 1988). Consequently the loss of dopamine inhigher centres of the CNS must also influence the reflex gain modulation. Reducedability to presynaptically inhibit muscle spindle afferents will result in high reflex-ive feedback gains. The features of PD are in agreement with the consequences ofextraordinary high reflexive feedback gains. High feedback gains make a systemstiffer: rigidity. High feedback gains, in a time-delayed feedback loop, result in os-cillatory behaviour: tremor. High feedback gains hamper performance and tend tokeep the joint in its equilibrium: bradykinesia.
Introduction 11
1.4 Goal and approach
Motor features are common with neurological disorders. Abnormalities of mus-cle tone are an integral component of many chronic neurological disorders. Wheremuscle tone is clinically defined as the force with which a muscle resists beinglengthened. Dystonia, rigidity, and spasticity are three different forms of hyper-tonia, i.e. abnormally high muscle tone. Many studies suggest that the motor fea-tures of neurological disorders in general and hypertonia specifically results fromexaggerated proprioceptive reflexes. However no quantitative data are available tosupport this hypothesis.
The prime goal of this project is to gain insight in the pathophysiology of theneurological disorders with hypertonia. The objective is met by quantifying theproprioceptive reflexes for two neurological disorders, which each is related toone form of hypertonia: complex regional pain syndrome (CRPS), dystonia; andParkinson’s disease (PD), rigidity. Proprioceptive reflexes will be quantified withthe shoulder manipulator to get insight of the pathophysiology and to show thepotential of the methods as a diagnostic tool. To measure a more distal joint and tobe more flexible in the future a new, mobile, wrist manipulator will be developed.
1.5 Thesis outline
Except this Chapter, Chapter 2 and the last Chapter, all Chapters are written asautonomous chapters and can be read individually. In Chapter 2 the shoulder ma-nipulator and the experimental methods to quantify proprioceptive reflexes are de-scribed in detail. Chapters 3-6 and 10 concern about reflexes at the shoulder and 7-9about reflexes at the wrist. Chapter 11 draws up the balance and discusses possiblefuture directions.
In Chapter 3 proprioceptive reflexes around the shoulder in patients sufferingfrom complex regional pain syndrome (CRPS) are assessed. To provoke differentreflex gain settings the bandwidth of the force disturbance signal is varied, whilesubjects were asked to ‘minimize the deviations’. Reflex gains are quantified by fittinga model onto the mechanical admittance. In Chapter 4 the modulation of proprio-ceptive reflexes in patients with Parkinson’s disease (PD) is investigated. The exter-nal damping, imposed by the manipulator, is varied, while a wide bandwidth forcedisturbance is applied. External damping reduces the oscillations due to tremor,one of the symptoms of PD, which otherwise would dominate and deteriorate therecordings.
In Chapter 5 and 6 the method to quantify proprioceptive reflexes is substan-tially improved. The original method relied on the analysis of the endpoint ad-mittance and prior assumptions were needed to separate intrinsic and reflexivecontributions. Inclusion of the reflexive impedance, i.e. the dynamic relationshipbetween position and EMG, removed the need for prior assumptions. To estimatethe reflexive impedance reliably special force disturbance signals were designedas described in Chapter 5. In Chapter 6 the method to quantify the intrinsic and

12 CHAPTER 1
reflexive parameters is developed.For most neurological disorders the motor features starts at distal joints and
may affect more proximal joints as the disease develops. A wrist manipulator isdeveloped to measure reflexes at the wrist. The design of the wrist manipulatoris described in Chapter 7. In Chapter 8 the newly developed wrist manipulatoris used to quantify reflexes at the wrist for healthy subjects, using the improvedmethod (Chapter 5 and 6). In Chapter 9 the proprioceptive reflexes at the wrist arequantified for patients suffering from Parkinson’s disease.
In Chapter 10 a biological realistic neural network is built and connected with amuscle-limb model to investigate the reflex gain modulation. By removing specificneural connection(s) it is tried to replicate the results of Chapter 3 and to investigatewhich connection(s) might be responsible for the observed results in patients withCRPS.
Chapter 2
Experimental approach
In this thesis proprioceptive reflex gains are quantified during postural control.Continuous random force disturbances are applied by means of a manipulator (theshoulder manipulator), while subjects are instructed to ‘minimize the deviations’ ofthe handle. The results were analysed in frequency domain with the frequency re-sponse function (FRF) of the mechanical admittance, expressing the dynamic rela-tion between force disturbance and handle position. The mechanical response toan external force disturbance comprises intrinsic (muscle) and reflexive properties.The parameters of the intrinsic visco-elasticity and proprioceptive feedback gainsare obtained by fitting a model onto the mechanical response. By either chang-ing the bandwidth of the force disturbance or the external dynamics imposed bythe manipulator different reflex settings are provoked. This chapter describes theshoulder manipulator, the model for human posture control, and the procedure toobtain the intrinsic and reflexive parameters.
14 CHAPTER 2
2.1 Introduction
Recently, a method has been developed that allows the quantitative assessment ofproprioceptive reflex gains at the shoulder during posture tasks (Van der Helm etal., 2002; Brouwn, 2000). In this method continuous random force disturbances areapplied, via a handle, to the arm, while the subject is instructed to ‘minimize theposition deviations’ resulting from the force disturbances. Subjects will counteractthe disturbances with cocontraction of all muscles around the shoulder girdle, andalso proprioceptive reflexes are involved. The method allows the quantification ofboth the intrinsic muscle visco-elasticity and the magnitude of the proprioceptivereflexes. By changing the frequency content of the force disturbance, different reflexgain settings are provoked. Model studies show that healthy subjects modulate thereflex gains to optimally suppress the deviations resulting from the disturbances(De Vlugt et al., 2001; Schouten et al., 2001). A follow-up study showed that sub-jects will also modulate reflex gain with external damping (De Vlugt et al., 2002).Major advantages of force perturbations (and consequently position tasks) are thatthe task is natural and motivating for the subject. In contrast to the often used po-sition perturbations the subject has to preserve stability actively. Furthermore a po-sition task is unambiguous and functional to the usage of proprioceptive reflexes,i.e. requiring maximum stiffness, demanding high cocontraction and pronouncedreflexive feedback.
2.2 Materials and methods
2.2.1 Apparatus
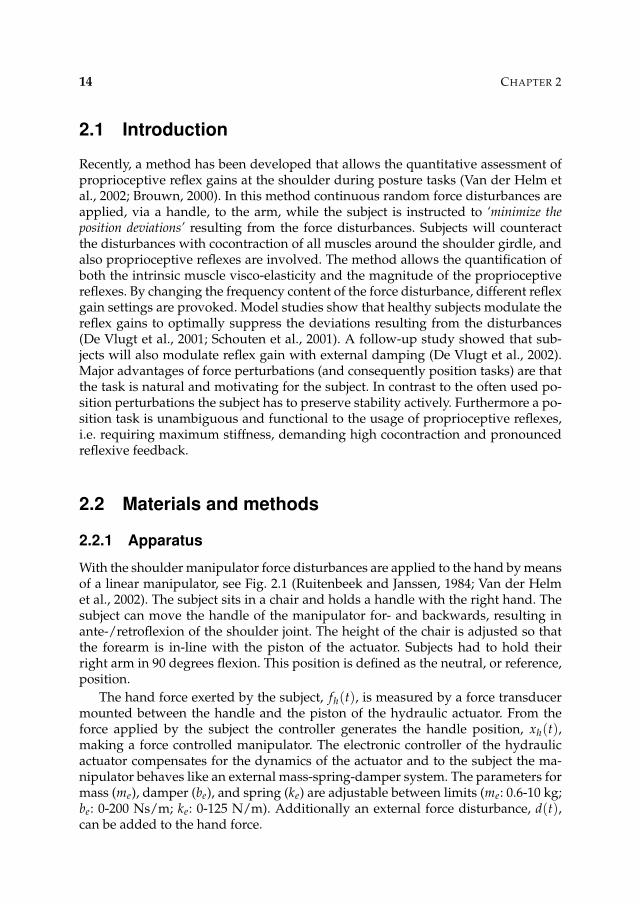
With the shoulder manipulator force disturbances are applied to the hand by meansof a linear manipulator, see Fig. 2.1 (Ruitenbeek and Janssen, 1984; Van der Helmet al., 2002). The subject sits in a chair and holds a handle with the right hand. Thesubject can move the handle of the manipulator for- and backwards, resulting inante-/retroflexion of the shoulder joint. The height of the chair is adjusted so thatthe forearm is in-line with the piston of the actuator. Subjects had to hold theirright arm in 90 degrees flexion. This position is defined as the neutral, or reference,position.
The hand force exerted by the subject, fh(t), is measured by a force transducermounted between the handle and the piston of the hydraulic actuator. From theforce applied by the subject the controller generates the handle position, xh(t),making a force controlled manipulator. The electronic controller of the hydraulicactuator compensates for the dynamics of the actuator and to the subject the ma-nipulator behaves like an external mass-spring-damper system. The parameters formass (me), damper (be), and spring (ke) are adjustable between limits (me: 0.6-10 kg;be: 0-200 Ns/m; ke: 0-125 N/m). Additionally an external force disturbance, d(t),can be added to the hand force.
Experimental approach 15
d(t)-fh(t)
xh(t)
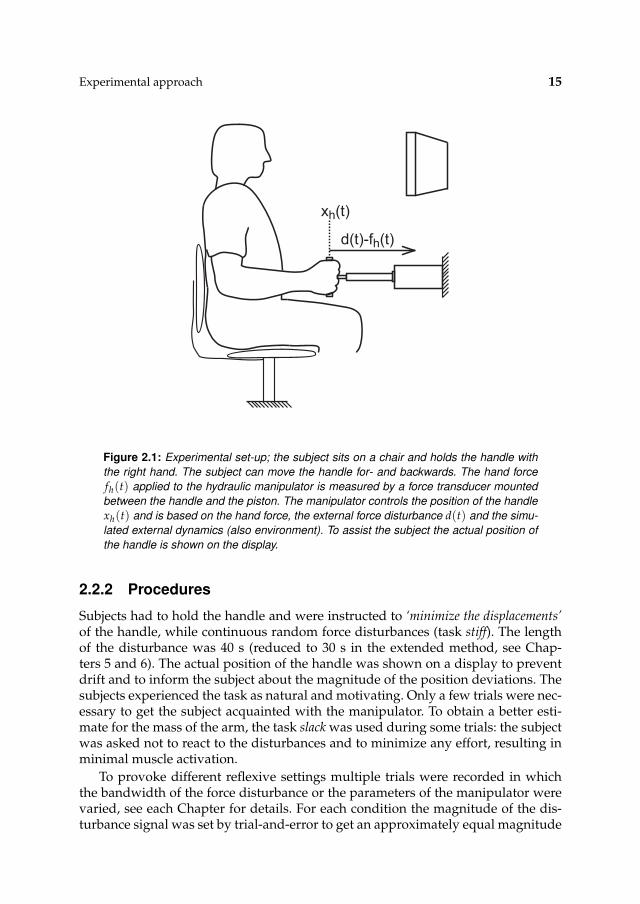
Figure 2.1: Experimental set-up; the subject sits on a chair and holds the handle with
the right hand. The subject can move the handle for- and backwards. The hand force
fh(t) applied to the hydraulic manipulator is measured by a force transducer mounted
between the handle and the piston. The manipulator controls the position of the handle
xh(t) and is based on the hand force, the external force disturbance d(t) and the simu-
lated external dynamics (also environment). To assist the subject the actual position of
the handle is shown on the display.
2.2.2 Procedures
Subjects had to hold the handle and were instructed to ‘minimize the displacements’of the handle, while continuous random force disturbances (task stiff). The lengthof the disturbance was 40 s (reduced to 30 s in the extended method, see Chap-ters 5 and 6). The actual position of the handle was shown on a display to preventdrift and to inform the subject about the magnitude of the position deviations. Thesubjects experienced the task as natural and motivating. Only a few trials were nec-essary to get the subject acquainted with the manipulator. To obtain a better esti-mate for the mass of the arm, the task slack was used during some trials: the subjectwas asked not to react to the disturbances and to minimize any effort, resulting inminimal muscle activation.
To provoke different reflexive settings multiple trials were recorded in whichthe bandwidth of the force disturbance or the parameters of the manipulator werevaried, see each Chapter for details. For each condition the magnitude of the dis-turbance signal was set by trial-and-error to get an approximately equal magnitude
16 CHAPTER 2
for the position deviations. Generally four conditions can be distinguished:
• Wide bandwidth (WB) disturbance: signal with uniform power typically be-tween 0.5 and 20 Hz.
• Narrow bandwidth disturbance type 1 (NB1): signal with uniform power be-tween 0.5 Hz and a variable upper frequency.
• Narrow bandwidth disturbance type 2 (NB2): signals with power around aspecific centre frequencies.
• External damping conditions: values for the damping imposed by the manip-ulator are set, while the WB signal is used as a disturbance.
The first condition (WB disturbance) with task stiff and no external damping isreferred to as the reference condition.
2.2.3 Data processing
Signal recording and processing
During each trial the force disturbance d(t), the position of the handle xh(t), theforce at the handle fh(t), and the EMG of four relevant shoulder muscles (e1: m.pectoralis major, e2: m. deltoideus anterior, e3: m. deltoideus posterior, and e4: m.latissimus dorsi) were recorded and stored on computer. Before recording, the EMGsignals were high pass filtered to remove DC components and movement artefacts(20 Hz, 3th order Butterworth), amplified, rectified and low pass filtered to preventaliasing (200 Hz, 3th order Butterworth). All signals were recorded at 500 Hz with12 bits resolution.
In Chapters 5 and 6 the EMG signals were digitally rectified and the EMG sig-nals were recorded before rectifying. This required a higher sample frequency (2.5kHz) and consequently a higher cut off for the anti-aliasing filter (1 kHz). Further-more the signals were recorded with a higher resolution (16 bits).
Nonparametric analysis
To remove any transient response the first 3616 samples per channel (≈ 7 s) of eachtrial were omitted, as the objective is to investigate stationary behaviour, leaving214 samples (Tobs ≈ 33 s) for analysis. Note that Chapters 5 and 6 use differentnumbers as both the trial length and sample rate are different (30 s, 2.5 kHz), seethe chapters for details.
The position, force, and disturbance signals (xh(t), fh(t), d(t)) were Fouriertransformed (via fast Fourier transform, FFT) and used to estimate the cross and
Experimental approach 17
Xd=0
N(f)
D(f)
++
-
+
+-
P(f)Xh(f)
C(f)Fh(f)
human controller
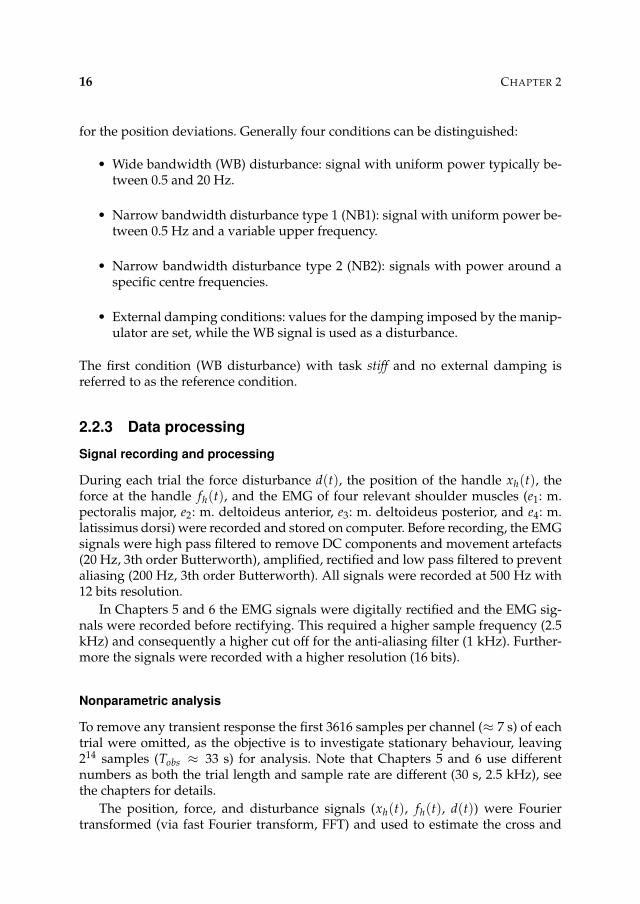
Figure 2.2: Block scheme of human posture control expressed in the frequency domain.
C( f ): transfer function of arm dynamics; P( f ) transfer function of manipulator dynam-
ics; D( f ) external force disturbance; Fh( f ) hand reaction force; Xh( f ) hand position
(coincides with the manipulator handle); N( f ) model remnant; Xd = 0 reference posi-
tion. The arm dynamics (grey box) are described by the linear transfer function, C( f ),
together with the remnant N( f ), which is uncorrelated with D( f ).
auto spectral densities.
Gd f ( f ) = D(− f )Fh( f ) = D∗( f )Fh( f ) (2.1)
Gdx( f ) = D(− f )Xh( f ) = D∗( f )Xh( f ) (2.2)
Gdd( f ) = D(− f )D( f ) = D∗( f )D( f ) = |D( f )|2 (2.3)
Gxx( f ) = Xh(− f )Xh( f ) = X∗h( f )Xh( f ) = |Xh( f )|2 (2.4)
in which G( f ) denotes the estimated spectral densities (hat denotes estimate), andan asterisk denotes the complex conjugate. Xh( f ), Fh( f ), and D( f ) are the Fouriertransforms of xh(t), fh(t), and d(t) respectively. The resolution of frequency de-
pends on the observation time and equals Tobs−1, in this case approximately 0.03
Hz. The spectral densities were averaged over 4 adjacent frequencies to improvethe estimates and to reduce the variance of the estimators (Jenkins and Watts, 1968).As a result the frequency resolution dropped to 4
Tobs≈ 0.12 Hz.
Fig. 2.2 gives the closed loop block scheme of human posture control. The posi-tion of the manipulator’s handle is force-controlled by the subject. The manipulatorimposes a mass-spring-damper system and the human controls the position of thehandle while force disturbances are applied. Because force disturbances were ap-plied, interaction between the subject and manipulator existed (the position of themanipulator depended on both the dynamics of the subject and the external dy-namics imposed by the manipulator). Because of this interaction closed loop iden-
18 CHAPTER 2
tification algorithms were required to estimate the dynamics of the subject:
Hdx( f ) =Gdx( f )
Gdd( f )≡ P( f )
1 + P( f )C( f )(2.5)
Hd f ( f ) =Gd f ( f )
Gdd( f )≡ P( f )C( f )
1 + P( f )C( f )(2.6)
Hx f ( f ) =Gd f ( f )
Gdx( f )≡ C( f ) (2.7)
in which Hx f ( f ) is the estimated frequency response functions (FRF) of the arm
impedance and Hdx( f ) the estimated FRF of the combined admittance. As forceperturbation are applied it is more natural to present the arm admittance (force asinput, position as output), and so the impedance is inversed.
H f x( f ) =Gdx( f )
Gdx( f )= H−1
x f ( f ) (2.8)
In addition to the admittance the coherence γ2( f ) was estimated.
γ2( f ) =
∣
∣Gdx( f )∣
∣
2
Gdd( f )Gxx( f )(2.9)
The coherence represents a measure of the linearity and signal-to-noise ratio (SNR)as a function of frequency. By definition, the coherence varies between 0 and 1.A coherence of 1 at a certain frequency means that a linear relationship exists be-tween input/output and that the signals contains no noise at that frequency. Pos-sible causes of low coherence are voluntary activity during a trial, resulting in dis-placements or noise unrelated to the applied signal. Generally spoken, if the coher-ence is high over all relevant frequencies, a linear relationship exists and the humanarm can be modelled with the aid of a linear model.
Quantifying intrinsic and reflexive properties
The dynamic behaviour of the neuromusculoskeletal system in response to exter-nal disturbances is the result of interactions between intrinsic (inertias of the limbs,passive visco-elasticity of tissues, and visco-elasticity of the antagonistic muscles)and reflexive (proprioceptive reflexes) parameters. Because intrinsic and reflexiveproperties coexist during most tasks, reflexes cannot be measured directly. An indi-rect method was used to separate intrinsic and reflexive parameters (Van der Helmet al., 2002). This method is based on two basic principles: (1) during the stiff taskwith the WB disturbance and no external damping (the reference condition) reflex-ive feedback is negligible and so only intrinsic properties remain and (2) for allstiff tasks the average muscle activation is constant, i.e. the intrinsic properties areconstant, see Discussion for motivation. These principles imply that all changes in
Experimental approach 19
Hxf(s)
Hg(s) He(s)
Hint(s)
Hact(s)Href(s)
Xh(s)
D(s)
Fh(s)
X(s)
Harm(s)
+-
-+
+
-
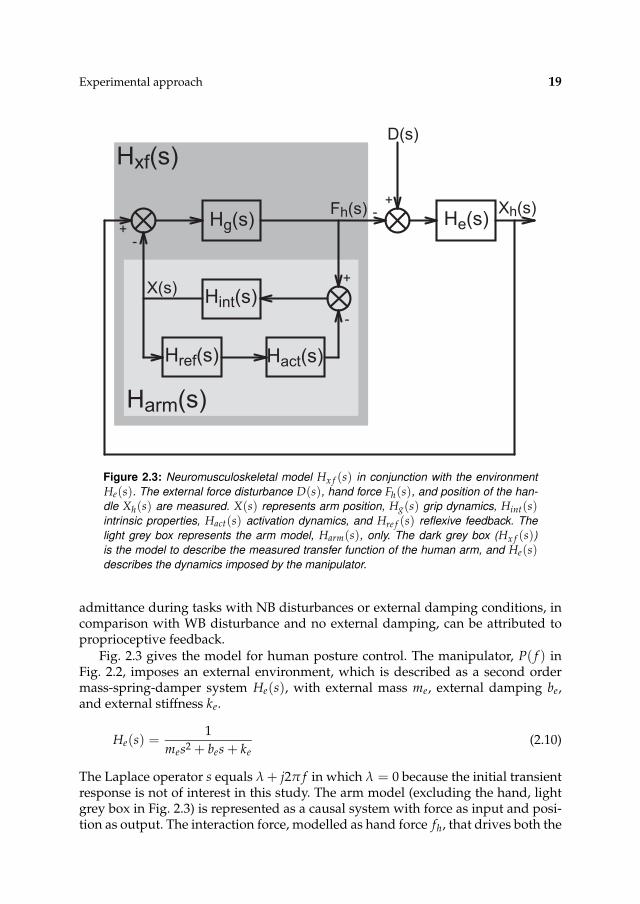
Figure 2.3: Neuromusculoskeletal model Hx f (s) in conjunction with the environment
He(s). The external force disturbance D(s), hand force Fh(s), and position of the han-
dle Xh(s) are measured. X(s) represents arm position, Hg(s) grip dynamics, Hint(s)intrinsic properties, Hact(s) activation dynamics, and Hre f (s) reflexive feedback. The
light grey box represents the arm model, Harm(s), only. The dark grey box (Hx f (s))
is the model to describe the measured transfer function of the human arm, and He(s)describes the dynamics imposed by the manipulator.
admittance during tasks with NB disturbances or external damping conditions, incomparison with WB disturbance and no external damping, can be attributed toproprioceptive feedback.
Fig. 2.3 gives the model for human posture control. The manipulator, P( f ) inFig. 2.2, imposes an external environment, which is described as a second ordermass-spring-damper system He(s), with external mass me, external damping be,and external stiffness ke.
He(s) =1
mes2 + bes + ke(2.10)
The Laplace operator s equals λ + j2π f in which λ = 0 because the initial transientresponse is not of interest in this study. The arm model (excluding the hand, lightgrey box in Fig. 2.3) is represented as a causal system with force as input and posi-tion as output. The interaction force, modelled as hand force fh, that drives both the
20 CHAPTER 2
arm and manipulator results from the hand grip dynamics Hg, and the differencebetween the handle position xh and arm position x:
Hg(s) = bgs + kg (2.11)
in which bg and kg are respectively the grip damping and grip stiffness. The handgrip dynamics, which describes the visco-elasticity of the fingers and skin, needs tobe included because the grip is not infinitely rigid and influences the measured ad-mittances. However, the grip is relatively stiff and only influences frequencies wellabove the eigenfrequency of the arm. The hand force minus the reflexive force (mi-nus because of the negative feedback loop) inputs the intrinsic model. The intrinsicmodel Hint includes the (lumped) mass, passive visco-elasticity of tissues, and thevisco-elasticity of the cocontracted muscles. For small displacements the intrinsicvisco-elastic properties of muscles can be described by a linear spring-damper sys-tem (Winters et al., 1988).
Hint(s) =1
ms2 + bs + k(2.12)
in which m is the arm mass, b the arm damping, and k is the arm stiffness. Thereflexive model Hre f (s) consists of feedback gains for length (kp) and velocity (kv).A time delay τd of 25 ms is incorporated to model the transportation delay andneural processing time (Crago et al., 1976; Carter et al., 1990; Kirsch et al., 1993).
Hre f (s) =(
kvs + kp
)
e−τds (2.13)
Activation dynamics of the muscles, Hact(s), are incorporated in the model as a firstorder process with a time constant of 30 ms (Winters and Stark, 1985; Winters et al.,1988).
Hact(s) =1
τas + 1(2.14)
Combining Eqs. 2.12-2.14 gives the admittance of the arm without the hand grip,Harm(s) (light grey box in Fig. 2.3).
Harm(s) =X(s)
Fh(s)=
Hint(s)
1 + Hint(s)Hre f (s)Hact(s)
=1
ms2 + bs + k +(
kvs + kp
)
e−τds
τas+1
(2.15)
Including the hand grip dynamics gives the mechanical admittance of the arm,H f x(s).
Hx f (s, p) =Fh(s)
Xh(s)=
Hg(s)
1 + Hg(s)Harm(s)(2.16)
H f x(s, p) =Xh(s)
Fh(s)= H−1
x f (s) = Harm(s) + H−1g (s) (2.17)
Experimental approach 21
in which Hx f (s) is the arm impedance, H f x(s) the arm admittance and p the pa-rameter vector.
p = [m, b, k, bg, kg, kv, kp] (2.18)
Note that in Figs. 2.2 and 2.3 the human is described as an impedance (force overposition) and needs to be inverted to get the admittance (position over force).
The model parameters p are obtained by fitting the arm model H f x(s, p) onto
the estimated FRF of the arm admittance H f x( f ) by minimizing a criterion function.
L(p) = ∑k
γ2( fk)∣
∣
∣ln H f x( fk) − ln H f x( fk, p)
∣
∣
∣
2(2.19)
where k indexes the frequency vector. The criterion is evaluated over the frequen-cies where the disturbance contains power. The criterion is weighted with the co-herence as a measure of the reliability of the FRF. Because of the large range of gainin the FRFs a least squares criterion with logarithmic difference is used (Pintelon etal., 1994).
The model for the complete system, i.e. human and manipulator, is describedby the combined, or total, admittance:
Hdx(s) =Xh(s)
D(s)=
He(s)
1 + He(s)H−1f x (s)
=1
H−1f x (s) + mes2 + bes + ke
(2.20)
When the hand grip is assumed infinitely stiff the total dynamics are:
Hdx,grip=∞(s) =1
(m + me) s2 + (b + be) s + k + e−τds
τas+1
(
kvs + kp
)
(2.21)
From this equation it can be seen that the external mass, stiffness, and damping actsin parallel to the arm mass, stiffness, and damping.
A second order system, like the intrinsic model (Eq. 2.12), can be parametrisedin several ways. One is in terms of a mass, spring, and damper. Another is to ex-press the eigenfrequency ( f0), relative damping (β), and gain (K).
Hint(s) =1
ms2 + bs + k=
K1
ω02 s2 + 2
βω0
s + 1(2.22)
with
f0 =ω0
2π=
1
2π
√
k
m, β =
b
2√
km, K =
1
k(2.23)
with f0 in Hz. The response of an underdamped system (β < 1) can contain oscil-lations, in contrast to an overdamped system (β > 1). When present, these oscilla-tions will occur around the eigenfrequency of the system.
22 CHAPTER 2
Model validation
To obtain a validity index for the estimated parameters of the model the varianceaccounted for (VAF) is used, in which a VAF value of 100% indicates that no differ-ences exist between simulated and measured position and the observed behaviouris completely described by the model. First the model is simulated in time-domainwith use of the applied force disturbance from the experiment and the estimatedintrinsic and reflexive parameters to obtain the simulated position xh(t). In the VAFthe measured position xh(t), is compared to the simulated position according to:
VAF = 1 − ∑nk=1 |xh(tk) − xh(tk)|2
∑nk=1 |xh(tk)|2
(2.24)
In this formula, k indexes the (sampled) time vector. Note that the coherence andVAF are closely related. The coherence indicates whether a linear and noise free re-lation between disturbance and position exists and the VAF reflects the accuracy ofthe chosen (linear) model describing this relation. Hence low coherences for somefrequencies, indication noise or nonlinearities, will always result in a low VAF. Alow VAF despite high coherence indicates that the chosen linear model structure isnot appropriate to describe the observed (linear) input-output behaviour.
2.3 Discussion
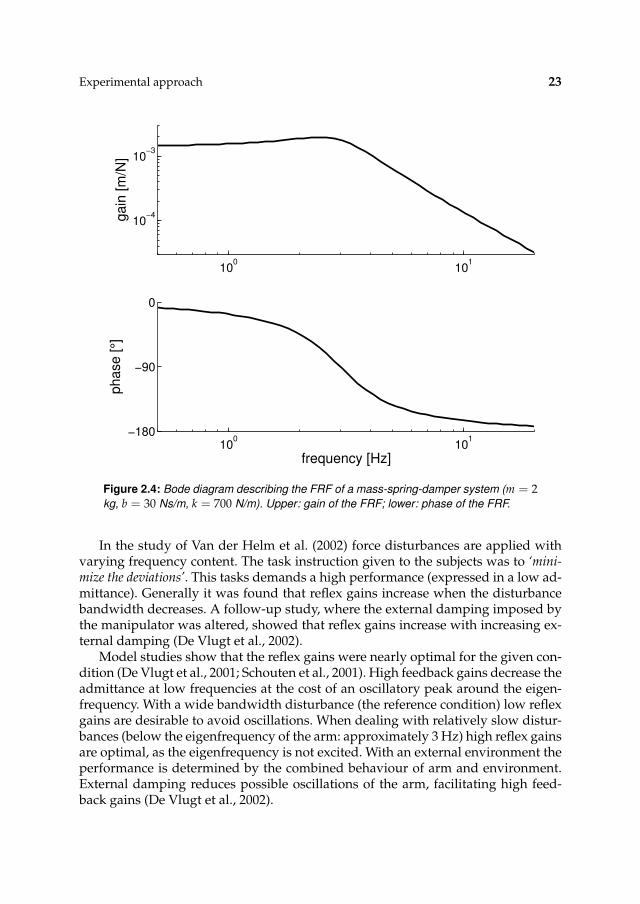
Frequency response functions (FRFs), like the admittance, describe the relation be-tween input to output at each frequency. By definition the input with a (mechanical)admittance is force and the output position. FRFs can be depicted in so-called Bodediagrams. Fig. 2.4 gives the admittance of a mass-spring-damper system. A Bodediagram exists of two graphs, one for the gain and one for the phase. For a givenfrequency, i.e. a sine, the gain describes the ratio between the amplitudes of theinput sine and the output sine. The phase describes the relative shift in time be-tween these sines. For the lower frequencies, that is below the eigenfrequency, theadmittance of a mass-spring-damper is dominated by the stiffness of the spring, thehigher frequencies are dominated by the mass, and the intermediate frequencies bythe damping.
As the FRF describes the relation between input and output signals at each fre-quency a lot of data points exist. Furthermore interpretation of a FRF can be diffi-cult and the enormous number of data points makes comparisons between subjectand conditions are almost impossible. It is desirable to describe the FRF with alimited number of parameters. When the relation between input and output is lin-ear (expressed in the coherence) the data can be described with the aid of a linearmodel. Such a linear model generally has a limited number of parameters, facili-tation comparisons. The model parameters are obtained by fitting the model ontothe estimated FRF, following a minimisation criterion. In this thesis models basedon current physiology are used. With this approach the input-output relation isdescribed with a limited number of interpretable parameters.
Experimental approach 23
100
101
10−4
10−3
ga
in [
m/N
]
100
101
−180
−90
0
ph
ase
[°]
frequency [Hz]
Figure 2.4: Bode diagram describing the FRF of a mass-spring-damper system (m = 2kg, b = 30 Ns/m, k = 700 N/m). Upper: gain of the FRF; lower: phase of the FRF.
In the study of Van der Helm et al. (2002) force disturbances are applied withvarying frequency content. The task instruction given to the subjects was to ‘mini-mize the deviations’. This tasks demands a high performance (expressed in a low ad-mittance). Generally it was found that reflex gains increase when the disturbancebandwidth decreases. A follow-up study, where the external damping imposed bythe manipulator was altered, showed that reflex gains increase with increasing ex-ternal damping (De Vlugt et al., 2002).
Model studies show that the reflex gains were nearly optimal for the given con-dition (De Vlugt et al., 2001; Schouten et al., 2001). High feedback gains decrease theadmittance at low frequencies at the cost of an oscillatory peak around the eigen-frequency. With a wide bandwidth disturbance (the reference condition) low reflexgains are desirable to avoid oscillations. When dealing with relatively slow distur-bances (below the eigenfrequency of the arm: approximately 3 Hz) high reflex gainsare optimal, as the eigenfrequency is not excited. With an external environment theperformance is determined by the combined behaviour of arm and environment.External damping reduces possible oscillations of the arm, facilitating high feed-back gains (De Vlugt et al., 2002).

24 CHAPTER 2

Chapter 3
Proprioceptive reflexes in patients with
complex regional pain syndrome
Alfred C. Schouten, Willem Johan T. van de Beek, J.J. (Bob) van Hilten,Frans C.T. van der Helm
Experimental Brian Research 151:1-8 (2003)
Complex regional pain syndrome (CRPS) is a syndrome that frequently follows aninjury and is characterized by sensory, autonomic and motor features of the affectedextremities. One of the more common motor features of CRPS is tonic dystonia,which is caused by impairment of inhibitory interneuronal spinal circuits. In thisstudy the circuits that modulate the gain of proprioceptive reflexes of the shouldermusculature are quantitatively assessed in nineteen CRPS patients, nine of whompresented with dystonia. The proprioceptive reflexes are quantified by applyingtwo types of force disturbances: (1) disturbances with a fixed low frequency anda variable bandwidth and (2) disturbances with a small bandwidth around a pre-scribed centre frequency. Compared to controls, patients have lower reflex gainsfor velocity feedback in response to the disturbances around a prescribed centrefrequency. Additionally, patients with dystonia lack the ability to generate negativereflex gains for position feedback, for these disturbances. Proprioceptive reflexes tothe disturbances with a fixed low frequency and variable bandwidth present no dif-ference between patients and controls. Although dystonia in the CRPS patients waslimited to the distal musculature, the results suggest involvement of interneuronalcircuits that mediate postsynaptic inhibition of the motoneurons of the proximalmusculature.
26 CHAPTER 3
3.1 Introduction
Complex regional pain syndrome (CRPS) is a painful condition that typically fol-lows a minor injury to a limb although in a number of patients no trauma can beidentified. In addition to the sensory and autonomic features, patients may presentor subsequently develop tonic dystonia of the affected limb(s) (Bhatia et al., 1993;Schwartzman and Kerrigan, 1990; Van Hilten et al., 2001). Although the mechanismbehind CRPS is still considered elusive, the evidence implicating involvement of in-hibitory interneuronal circuits in the pathophysiology of tonic dystonia in patientswith CRPS is compelling (Van Hilten et al., 2000). Recently, a method has been de-veloped that allows the quantitative assessment of circuits that modulate the gainof proprioceptive reflexes of the upper extremity during posture tasks (Van derHelm et al., 2002, see also Chapter 2). In the current study, this method is appliedto determine the possible involvement of spinal interneuronal circuits that controlreflex gains of proprioceptive reflexes in the pathophysiology of CRPS.
3.2 Materials and methods
3.2.1 Subjects
Nineteen patients (15 women) with CRPS were evaluated with a mean (standarddeviation, SD) age of 39.8 (11.7) years and a mean (SD) age of onset of 31.7 (10.9)years. All patients fulfil the criteria of CRPS in one or more of the extremities (Ama-dio et al., 1991). These criteria are the combination of diffuse pain, loss of handfunction, and objective evidence of significant autonomic dysfunction. Results ofthe patients were compared to a group of ten healthy controls (2 women) with amean (SD) age of 25.0 (2.4) years, which have been described previously by Vander Helm et al. (2002).
In fifteen patients signs and symptoms of CRPS are present in the right arm atthe time of the assessments (see Table 3.1); two patients presented with CRPS ofthe right arm, but at the time of the experiment the signs and symptoms of CRPShad resolved; and in two patients the right arm was not affected. Features of CRPSinvolved one (n = 2), two (n = 6), three (n = 1) or all (n = 10) extremities. Mo-tor signs that were noted during the neurological examination of the right arm in-cluded dystonia (n = 9), tremor (n = 5), myoclonic jerks (n = 1) and weakness(n = 3). Autonomic signs of the right arm were hyperhidrosis (n = 7), skin colourchanges (n = 6), skin temperature changes (n = 5), and oedema (n = 1). Sensorysigns included hypoaesthesia (n = 10), hyperaesthesia (n = 2), hypalgesia (n = 9),hyperalgesia (n = 3), and analgesia (n = 1). Sensory symptoms were pain (n = 14),numbness (n = 14), paraesthesia (n = 11), and a decreased or increased perceptionof the temperature of water (n = 7). In two patients the nails of the right arm hadbecome brittle.
In view of the demonstrated involvement of inhibitory interneuronal circuits inCRPS patients suffering from dystonia, subgroups are defined on the presence or
Proprioceptive reflexes in patients with complex regional pain syndrome 27
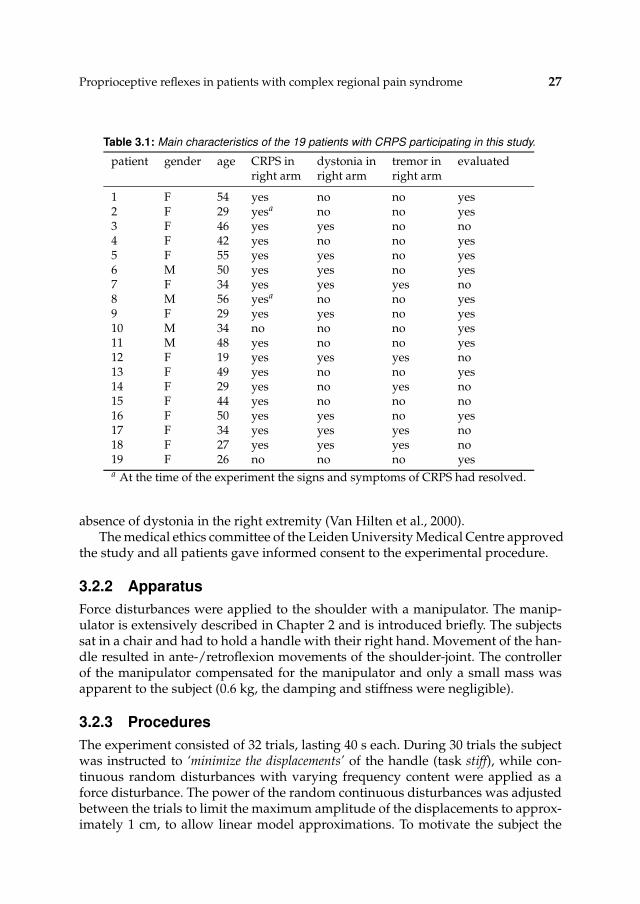
Table 3.1: Main characteristics of the 19 patients with CRPS participating in this study.
patient gender age CRPS in dystonia in tremor in evaluatedright arm right arm right arm
1 F 54 yes no no yes2 F 29 yesa no no yes3 F 46 yes yes no no4 F 42 yes no no yes5 F 55 yes yes no yes6 M 50 yes yes no yes7 F 34 yes yes yes no8 M 56 yesa no no yes9 F 29 yes yes no yes10 M 34 no no no yes11 M 48 yes no no yes12 F 19 yes yes yes no13 F 49 yes no no yes14 F 29 yes no yes no15 F 44 yes no no no16 F 50 yes yes no yes17 F 34 yes yes yes no18 F 27 yes yes yes no19 F 26 no no no yesa At the time of the experiment the signs and symptoms of CRPS had resolved.
absence of dystonia in the right extremity (Van Hilten et al., 2000).The medical ethics committee of the Leiden University Medical Centre approved
the study and all patients gave informed consent to the experimental procedure.
3.2.2 Apparatus
Force disturbances were applied to the shoulder with a manipulator. The manip-ulator is extensively described in Chapter 2 and is introduced briefly. The subjectssat in a chair and had to hold a handle with their right hand. Movement of the han-dle resulted in ante-/retroflexion movements of the shoulder-joint. The controllerof the manipulator compensated for the manipulator and only a small mass wasapparent to the subject (0.6 kg, the damping and stiffness were negligible).
3.2.3 Procedures
The experiment consisted of 32 trials, lasting 40 s each. During 30 trials the subjectwas instructed to ‘minimize the displacements’ of the handle (task stiff), while con-tinuous random disturbances with varying frequency content were applied as aforce disturbance. The power of the random continuous disturbances was adjustedbetween the trials to limit the maximum amplitude of the displacements to approx-imately 1 cm, to allow linear model approximations. To motivate the subject the

28 CHAPTER 3
reference position, which must be obtained by the subject, was presented as a hor-izontal line on a display together with a dot, which represents the actual positionof the handle. To obtain a better estimate for the mass of the arm, the task slack wasused during 2 of the 32 trials: the subject was asked not to react to the disturbancesand to minimize any effort, resulting in minimal muscle activation.
Prior to the experiment each subject performed a few test trials to become accus-tomed to the task. As most of the trials require maximum effort of the subject (taskstiff), sufficient time was given in between to prevent fatigue. The complete exper-iment for one subject, including instruction and pauses, lasted for approximatelyone and a half hours.
Disturbance signals
The continuous random disturbances, which were applied as a (force) disturbance,can be categorized into three types:
• Wide bandwidth (WB) disturbance: a signal with a uniform power between alowest frequency ( fl) of 0.05 Hz and a highest frequency ( fh) of 20 Hz.
• Narrow bandwidth disturbance type 1 (NB1): a fixed fl (0.05 Hz) and a fh
which varies from 1.3 to 3.8 Hz ( fh = 1.3; 1.8; 2.3; 2.8; 3.3; 3.8 Hz).
• Narrow bandwidth disturbance type 2 (NB2): a variable centre frequency ( fc)with a fixed bandwidth of 0.3 Hz ( fc = 1.3; 1.8; 2.3; 3; 4; 5; 6; 7 Hz).
Each of these 15 disturbances was applied twice during the task stiff, resulting in 30trials. In the additional 2 trials in which the task slack was performed by the subject,only the WB disturbance was applied. The trials were presented in a predeterminedrandom sequence that was identical for all subjects.
3.2.4 Data processing
Signal recording and processing
During each trial the force exerted by the subject fh(t), the position of the handlexh(t), and the applied force disturbance d(t) were measured. All data were sampledat 500 Hz and stored on computer. To remove any transient response only the last33 s of each trial (of 40 s) was used for data processing, as the objective of ourinvestigations was to investigate stationary behaviour.
Nonparametric analysis
As the modelling was done in frequency domain, the data were converted fromtime to frequency domain. For each trial the arm admittance H f x( f ) of the subject
was estimated. In addition to the arm admittance, the coherence γ2( f ) of each trialwas estimated and represents a measure of the linearity and signal-to-noise ratioper frequency. The estimators are given in Chapter 2.

Proprioceptive reflexes in patients with complex regional pain syndrome 29
As force disturbances are applied while subjects are instructed to maintain theirposture, some drift of the position of the arm will occur. This drift is present atlow frequencies (mainly below 0.5 Hz). Since drift is a time-variant phenomenon(i.e. nonlinear) the coherences for these frequencies can be low. Subjects having lowcoherences (that is below 0.6) for frequencies above 1 Hz in more than two trialswere excluded.
Quantification of intrinsic and reflexive properties
The dynamic behaviour of the neuromusculoskeletal system in response to exter-nal disturbances is the result of interactions between intrinsic (inertias of the limbs,passive visco-elasticity of tissues, and visco-elasticity of the antagonistic musclesduring the performance of the task) and reflexive (proprioceptive reflexes) proper-ties. Because intrinsic and reflexive properties coexist during most tasks, reflexescan not be measured directly from the mechanical behaviour. An indirect methodis used to separate intrinsic and reflexive parameters (Van der Helm et al., 2002, seealso Chapter 2). This method is based on two basic principles: (1) during the stifftask with WB disturbance reflexive feedback is silent and so only intrinsic proper-ties remain and (2) for all stiff tasks (both with WB and NB disturbances) the av-erage muscle activation is constant, i.e. the intrinsic properties are constant. Theseprinciples imply that all changes in admittance during tasks with NB disturbances,in comparison with WB disturbance, can be attributed to proprioceptive feedback.
The intrinsic properties are modelled as a mass-spring-damper system, describ-ing the lumped mass of the arm m, arm damping b, and the arm stiffness k. Thevisco-elasticity of the constantly activated muscles is included within b and k. Theintrinsic model is extended with a model for the hand grip (grip stiffness kg andgrip damping bg), which describes the linking of the arm to the manipulator. Thereflexive model consists of feedback gains for length (kp) and velocity (kv). Activa-tion dynamics of the muscles are incorporated as a first order process with a timeconstant of 30 ms. A time delay of 25 ms is incorporated to model the transporta-tion delay and neural processing time. The derivation of the intrinsic and reflexivemodels is given in Chapter 2.
The parameters of the intrinsic arm model (m, b, k, bg, kg) are fitted on the ad-mittances of the tasks with the WB disturbance, while neglecting the reflexive pa-rameters. Furthermore the estimation of the intrinsic parameters of the tasks stiffand slack is combined, resulting in a better estimate for the one common param-eter, the arm mass. The reflexive parameters (kp, kv) are fitted to the admittancesof the tasks with NB disturbances, while the intrinsic parameters are fixed to thevalues estimated from the trials with WB disturbance task stiff (reference task). Thecriterion to fit the model to the observed admittances is given in Chapter 2.
Model validation
To obtain a validity index for the estimated parameters of the model the varianceaccounted for (VAF) is used, see Chapter 2. A VAF value of 100% indicates that
30 CHAPTER 3
no differences exist between simulated and measured position and the observedbehaviour is completely described by the model.
During the trials, some drift of the position of the arm will occur. In order to re-duce the effect of the drift on the VAF, frequencies below 0.6 Hz have been removedfrom the recorded and simulated positions (by FFT, set low frequencies to zero, andinverse FFT), before calculating the VAF.
For some conditions, the performance of the neuromusculoskeletal system isgreatly enhanced through modulation by proprioceptive reflexes. Theoretical stud-ies of the proprioceptive reflexes (De Vlugt et al., 2001; Schouten et al., 2001) re-veal that in case of high reflex gains the neuromusculoskeletal system will be-come boundary stable. This means that large deviations around the eigenfrequency(eigenfrequency arm ≈ 3 Hz) can occur, even when the disturbance does not excitethe eigenfrequency. Consequently the recorded position will be dominated by de-viations around the eigenfrequency, which would substantially lower the VAF. Thisphenomenon especially occurs for NB2 disturbances with fc beyond the eigenfre-quency. To reduce this effect, the recorded and simulated position for NB2 distur-bances with fc ≥ 4 Hz are high pass filtered (by FFT, set frequencies until 3.5 Hz tozero, and inverse FFT), before calculating the VAF.
Statistical analysis
Differences in the intrinsic and reflexive parameters between patients and controlswere evaluated using an unpaired two-sample Student’s t-test for samples withunequal variances. A post hoc Bonferroni test was performed to correct for multiplecomparisons (n = 50). P-values smaller than 0.001 are considered significant.
3.3 Results
Of the nineteen subjects, twelve can be analysed (Table 3.1). Seven patients can notbe evaluated as the experiment was prematurely interrupted as a result of pain orsevere spasms (Patients 3, 12 and 18) or as a result of low coherences for frequenciesabove 1 Hz in more than two trials (Patients 7, 14, 15 and 17).
3.3.1 WB disturbances and intrinsic parameters
The coherence is evaluated with a frequency resolution of ≈0.12 Hz (see Chapter 2).This means that in the range of interest (1-20 Hz) the coherence is evaluated at 156frequency points. The coherence is considered high when it is higher than 0.8 forat least 90% of these points. In all controls the coherence is high for all trials. Formost patients (n = 7) the coherence is high. In three patients the coherences werereasonable (γ2( f ) > 0.6 for all frequencies) for all trials and two other patientshad only a low coherence for the two trials with the task slack. For the task stiffall controls have a high VAF (above 80%), for task slack the VAF is slightly lowerbut always above 60% (above 80% for n = 6). For most patients (stiff: n = 9, slack:
Proprioceptive reflexes in patients with complex regional pain syndrome 31
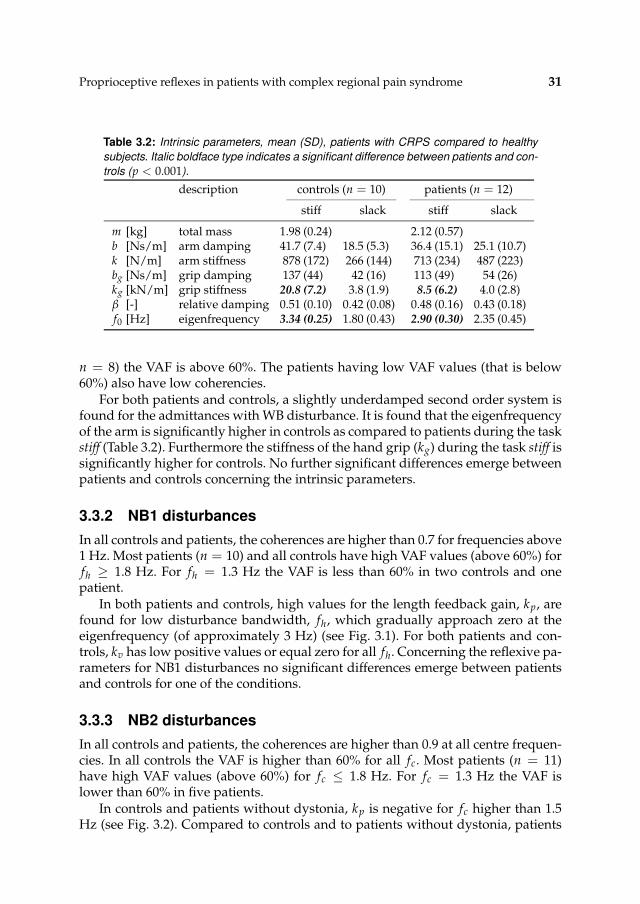
Table 3.2: Intrinsic parameters, mean (SD), patients with CRPS compared to healthy
subjects. Italic boldface type indicates a significant difference between patients and con-
trols (p < 0.001).
description controls (n = 10) patients (n = 12)
stiff slack stiff slack
m [kg] total mass 1.98 (0.24) 2.12 (0.57)b [Ns/m] arm damping 41.7 (7.4) 18.5 (5.3) 36.4 (15.1) 25.1 (10.7)k [N/m] arm stiffness 878 (172) 266 (144) 713 (234) 487 (223)bg [Ns/m] grip damping 137 (44) 42 (16) 113 (49) 54 (26)kg [kN/m] grip stiffness 20.8 (7.2) 3.8 (1.9) 8.5 (6.2) 4.0 (2.8)β [-] relative damping 0.51 (0.10) 0.42 (0.08) 0.48 (0.16) 0.43 (0.18)f0 [Hz] eigenfrequency 3.34 (0.25) 1.80 (0.43) 2.90 (0.30) 2.35 (0.45)
n = 8) the VAF is above 60%. The patients having low VAF values (that is below60%) also have low coherencies.
For both patients and controls, a slightly underdamped second order system isfound for the admittances with WB disturbance. It is found that the eigenfrequencyof the arm is significantly higher in controls as compared to patients during the taskstiff (Table 3.2). Furthermore the stiffness of the hand grip (kg) during the task stiff issignificantly higher for controls. No further significant differences emerge betweenpatients and controls concerning the intrinsic parameters.
3.3.2 NB1 disturbances
In all controls and patients, the coherences are higher than 0.7 for frequencies above1 Hz. Most patients (n = 10) and all controls have high VAF values (above 60%) forfh ≥ 1.8 Hz. For fh = 1.3 Hz the VAF is less than 60% in two controls and onepatient.
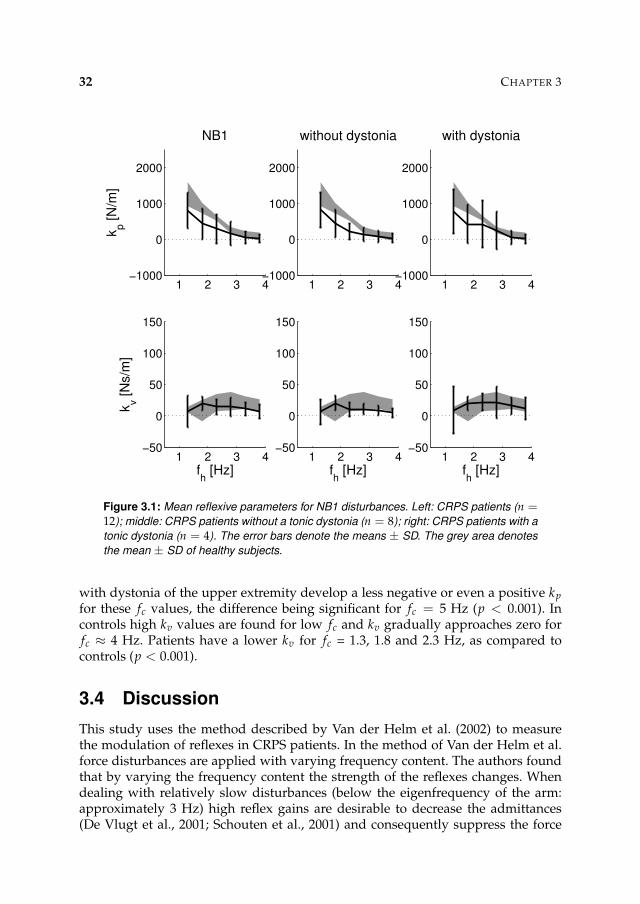
In both patients and controls, high values for the length feedback gain, kp, arefound for low disturbance bandwidth, fh, which gradually approach zero at theeigenfrequency (of approximately 3 Hz) (see Fig. 3.1). For both patients and con-trols, kv has low positive values or equal zero for all fh. Concerning the reflexive pa-rameters for NB1 disturbances no significant differences emerge between patientsand controls for one of the conditions.
3.3.3 NB2 disturbances
In all controls and patients, the coherences are higher than 0.9 at all centre frequen-cies. In all controls the VAF is higher than 60% for all fc. Most patients (n = 11)have high VAF values (above 60%) for fc ≤ 1.8 Hz. For fc = 1.3 Hz the VAF islower than 60% in five patients.
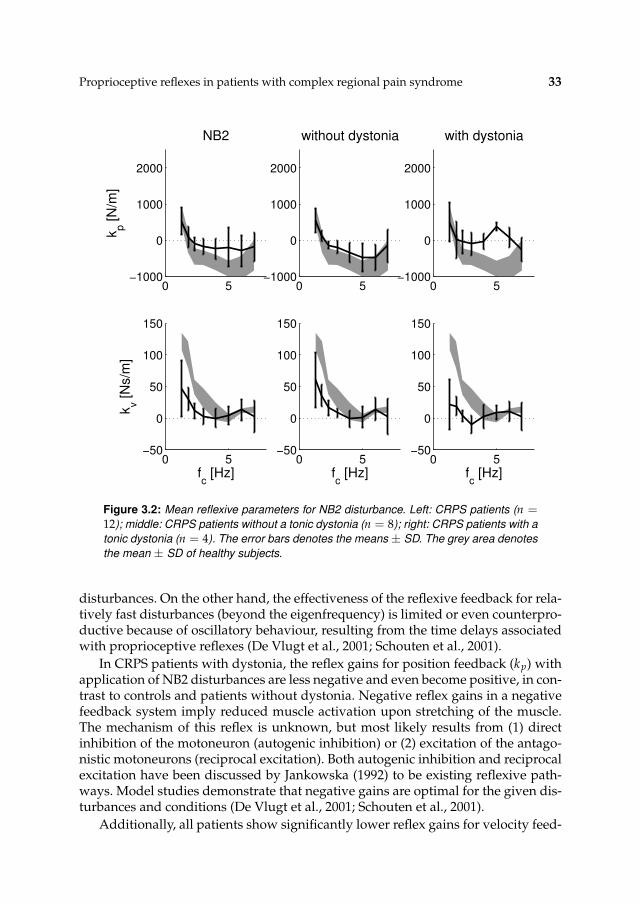
In controls and patients without dystonia, kp is negative for fc higher than 1.5Hz (see Fig. 3.2). Compared to controls and to patients without dystonia, patients
32 CHAPTER 3
1 2 3 4−1000
0
1000
2000
NB1
kp [N
/m]
1 2 3 4−50
0
50
100
150
kv [N
s/m
]
fh [Hz]
1 2 3 4−1000
0
1000
2000
without dystonia
1 2 3 4−50
0
50
100
150
fh [Hz]
1 2 3 4−1000
0
1000
2000
with dystonia
1 2 3 4−50
0
50
100
150
fh [Hz]
Figure 3.1: Mean reflexive parameters for NB1 disturbances. Left: CRPS patients (n =12); middle: CRPS patients without a tonic dystonia (n = 8); right: CRPS patients with a
tonic dystonia (n = 4). The error bars denote the means ± SD. The grey area denotes
the mean ± SD of healthy subjects.
with dystonia of the upper extremity develop a less negative or even a positive kp
for these fc values, the difference being significant for fc = 5 Hz (p < 0.001). Incontrols high kv values are found for low fc and kv gradually approaches zero forfc ≈ 4 Hz. Patients have a lower kv for fc = 1.3, 1.8 and 2.3 Hz, as compared tocontrols (p < 0.001).
3.4 Discussion
This study uses the method described by Van der Helm et al. (2002) to measurethe modulation of reflexes in CRPS patients. In the method of Van der Helm et al.force disturbances are applied with varying frequency content. The authors foundthat by varying the frequency content the strength of the reflexes changes. Whendealing with relatively slow disturbances (below the eigenfrequency of the arm:approximately 3 Hz) high reflex gains are desirable to decrease the admittances(De Vlugt et al., 2001; Schouten et al., 2001) and consequently suppress the force
Proprioceptive reflexes in patients with complex regional pain syndrome 33
0 5−1000
0
1000
2000
NB2
kp [
N/m
]
0 5−50
0
50
100
150
kv [
Ns/m
]
fc [Hz]
0 5−1000
0
1000
2000
without dystonia
0 5−50
0
50
100
150
fc [Hz]
0 5−1000
0
1000
2000
with dystonia
0 5−50
0
50
100
150
fc [Hz]
Figure 3.2: Mean reflexive parameters for NB2 disturbance. Left: CRPS patients (n =12); middle: CRPS patients without a tonic dystonia (n = 8); right: CRPS patients with a
tonic dystonia (n = 4). The error bars denotes the means ± SD. The grey area denotes
the mean ± SD of healthy subjects.
disturbances. On the other hand, the effectiveness of the reflexive feedback for rela-tively fast disturbances (beyond the eigenfrequency) is limited or even counterpro-ductive because of oscillatory behaviour, resulting from the time delays associatedwith proprioceptive reflexes (De Vlugt et al., 2001; Schouten et al., 2001).
In CRPS patients with dystonia, the reflex gains for position feedback (kp) withapplication of NB2 disturbances are less negative and even become positive, in con-trast to controls and patients without dystonia. Negative reflex gains in a negativefeedback system imply reduced muscle activation upon stretching of the muscle.The mechanism of this reflex is unknown, but most likely results from (1) directinhibition of the motoneuron (autogenic inhibition) or (2) excitation of the antago-nistic motoneurons (reciprocal excitation). Both autogenic inhibition and reciprocalexcitation have been discussed by Jankowska (1992) to be existing reflexive path-ways. Model studies demonstrate that negative gains are optimal for the given dis-turbances and conditions (De Vlugt et al., 2001; Schouten et al., 2001).
Additionally, all patients show significantly lower reflex gains for velocity feed-
34 CHAPTER 3
back (kv) for centre frequencies of 1.3, 1.8 and 2.3 Hz as compared to controls. Con-trols have a high kv for a low fc and a low kv for a high fc, indicating that for NB2disturbances they are able to modulate their response to changes in muscle stretchvelocity. The lower kv in patients for the lowest fc indicates a smaller effect of affer-ent input on motoneuron activity, as compared to controls. Most likely this resultsfrom increased presynaptic inhibition (Stein and Capaday, 1988), although func-tional impairment of afferent fibres cannot be ruled out. Interestingly, both patientsand controls do not modulate kv in response to NB1 disturbances. The patientspresent no difference from controls in their ability to produce and inhibit positivereflex gains for position feedback on NB1 disturbances. Positive reflex gains are theresult of a monosynaptic stretch reflex and are inhibited by interneuronal circuitsthat mediate presynaptic inhibition. With an increasing upper frequency limit ofthe NB1 disturbance the patients are able to modulate the monosynaptic stretchreflex to a degree similar to that found in controls, suggesting normal presynapticinhibition of muscle spindle afferents on NB1 disturbances at the level of proxi-mal arm musculature. This contrasts with previous findings indicating a decreasedpresynaptic inhibition in dystonia involving distal musculature of CRPS patients(Van Hilten et al., 2000). However, motoneurons innervating hand and finger mus-cles lack recurrent inhibition and have a higher proportion of β-innervation com-pared to motoneurons innervating proximal musculature, underscoring differencesin neuronal circuits that regulate proximal and distal muscle tone (Illert et al., 1996;Katz et al., 1993).
With the current design, some limitations were encountered. First, seven out of19 patients could not be analysed, including all five patients with a tremor. Thisindicates that the current setting is not applicable to patients with a tremor. Second,compared to controls, the patients have lower coherences for frequencies below1 Hz. This may be explained by spasms, which occur at these low frequencies ornon-intended voluntary activity. The latter is less likely because subjects were ableto maintain the reference position. The coherence indicates whether there is a linearrelation between disturbance and position and the VAF reflects the accuracy of the(linear) model describing this relation. Hence low coherences for some frequencieswill always result in a low VAF.
Dystonia of CRPS generally progresses in the extremities from distal to proximalmusculature (Schwartzman and Kerrigan, 1990). Although dystonia in the evalu-ated CRPS patients mainly affects the distal musculature, the results indicate in-volvement of the proximal musculature as well. At this level, the results suggestimpairment of interneuronal circuits that mediate postsynaptic inhibition of themotoneurons.
Chapter 4
Proprioceptive reflexes in patients with
Parkinson’s disease
In this study the involvement of disturbed modulation of proprioceptive reflexesin Parkinson’s disease (PD) was investigated. PD is a neurodegenerative disor-der characterized by tremor, bradykinesia, rigidity, and impaired postural reflexes.With the gradual loss of dopamine producing brain cells the smooth initiation ofmovements and fine control of muscles vanish and subsequently the symptomsdevelop. In this study it is hypothesized that also the modulation of proprioceptivereflexes is involved in the development of the symptoms. The modulation of pro-prioceptive reflexes at the shoulder joint is assessed during postural control task.Force disturbances were applied via a handle while the subjects were instructed to‘minimize the deviations’ of the handle. Several settings for the external damping, im-posed by the manipulator, are applied. It is found that the intrinsic muscle stiffnessis significantly larger in patients compared to healthy control subjects. In patientsthe position feedback gain does increase with external damping but not as steeplyas in controls, indication that the range of reflex gain modulation is confined withPD.
36 CHAPTER 4
4.1 Introduction
Parkinson’s disease (PD) is a neurodegenerative disorder characterized by tremor,bradykinesia, rigidity, and impaired postural reflexes. As patients with PD progres-sively loose the coordination and activation of the muscles, it is hypothesized thatalso the ability to modulate the proprioceptive reflexes deteriorates.
Van der Helm et al. (2002) showed that the reflexive feedback gains increasewith decreasing bandwidth of the force disturbance. The subjects had to ‘minimizethe deviations’ of the handle, while continuous random force disturbances were ap-plied. The protocol has proven to be useful to get insight into the pathophysiologyof complex regional pain syndrome (CRPS) (Schouten et al., 2003, see Chapter 3).However patients with tremor could not be evaluated as the tremor dominates theposition. As tremor is one of the major symptoms of PD a different protocol needsto be applied to investigate reflex gain modulation in PD. In De Vlugt et al. (2002)the external dynamics imposed by the manipulator, i.e. how the manipulator ‘feels’to the subject, were altered. It was shown that proprioceptive reflexes increase withexternal damping. This damping protocol seems promising for assessing the re-flexes in PD as the external damping will reduce to voluntary oscillations as seenwith tremor.
In this study the modulation of proprioceptive reflexes in subjects with Parkin-son’s disease is assessed. It is hypothesized that in parkinsonian patients the rangeof proprioceptive reflex gain modulation is confined. Modulation of the reflexes isprovoked by altering the external damping.
4.2 Materials and methods
4.2.1 Subjects
Experiments were conducted on a group of parkinsonian patients (n = 10; 8 men)with a mean (standard deviation, SD) age 55.1 (7.0) years. The main characteristicsof the involved patients are summarized in Table 4.1. All patients were scored ac-cording to the Hoehn & Yahr scale and the individual scores for tremor and rigidityin the right arm are given (Hoehn and Yahr, 1967). Where zero on the Hoehn & Yahrscale indicates that no difference existed compared to healthy subjects, and four in-dicate severe impairment. All patients were on medication during the experiments.Results are compared to a group of normal, healthy subjects (n = 19; 11 men) withmean (SD) age of 32.1 (15.4).
The medical ethical committee of the Leiden University Medical Centre ap-proved the study. All patients gave informed consent to the experimental proce-dure.
4.2.2 Apparatus
Force disturbances were applied to the shoulder with a manipulator. The manip-ulator is extensively described in Chapter 2 and is introduced briefly. The subjects
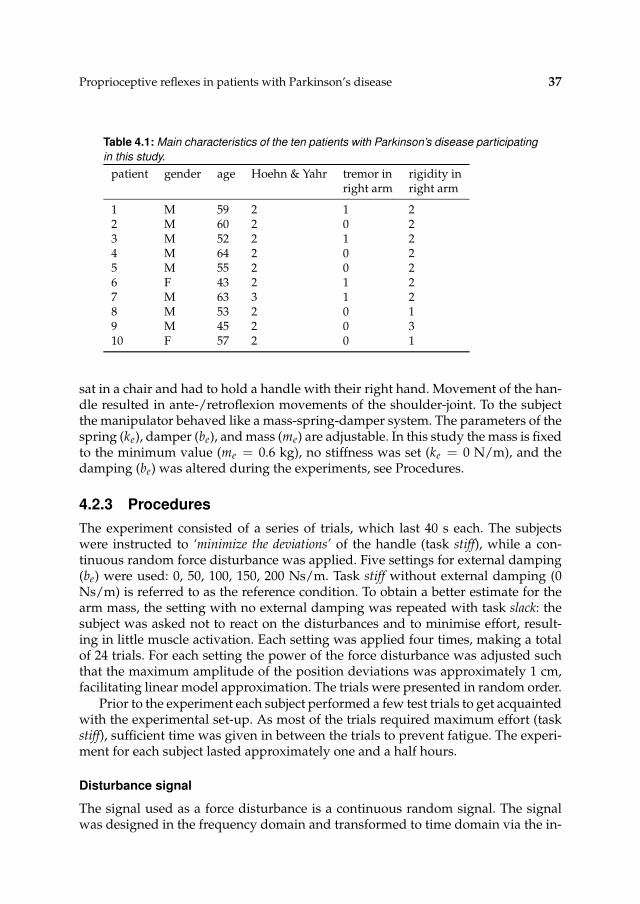
Proprioceptive reflexes in patients with Parkinson’s disease 37
Table 4.1: Main characteristics of the ten patients with Parkinson’s disease participating
in this study.
patient gender age Hoehn & Yahr tremor in rigidity inright arm right arm
1 M 59 2 1 22 M 60 2 0 23 M 52 2 1 24 M 64 2 0 25 M 55 2 0 26 F 43 2 1 27 M 63 3 1 28 M 53 2 0 19 M 45 2 0 310 F 57 2 0 1
sat in a chair and had to hold a handle with their right hand. Movement of the han-dle resulted in ante-/retroflexion movements of the shoulder-joint. To the subjectthe manipulator behaved like a mass-spring-damper system. The parameters of thespring (ke), damper (be), and mass (me) are adjustable. In this study the mass is fixedto the minimum value (me = 0.6 kg), no stiffness was set (ke = 0 N/m), and thedamping (be) was altered during the experiments, see Procedures.
4.2.3 Procedures
The experiment consisted of a series of trials, which last 40 s each. The subjectswere instructed to ‘minimize the deviations’ of the handle (task stiff), while a con-tinuous random force disturbance was applied. Five settings for external damping(be) were used: 0, 50, 100, 150, 200 Ns/m. Task stiff without external damping (0Ns/m) is referred to as the reference condition. To obtain a better estimate for thearm mass, the setting with no external damping was repeated with task slack: thesubject was asked not to react on the disturbances and to minimise effort, result-ing in little muscle activation. Each setting was applied four times, making a totalof 24 trials. For each setting the power of the force disturbance was adjusted suchthat the maximum amplitude of the position deviations was approximately 1 cm,facilitating linear model approximation. The trials were presented in random order.
Prior to the experiment each subject performed a few test trials to get acquaintedwith the experimental set-up. As most of the trials required maximum effort (taskstiff), sufficient time was given in between the trials to prevent fatigue. The experi-ment for each subject lasted approximately one and a half hours.
Disturbance signal
The signal used as a force disturbance is a continuous random signal. The signalwas designed in the frequency domain and transformed to time domain via the in-
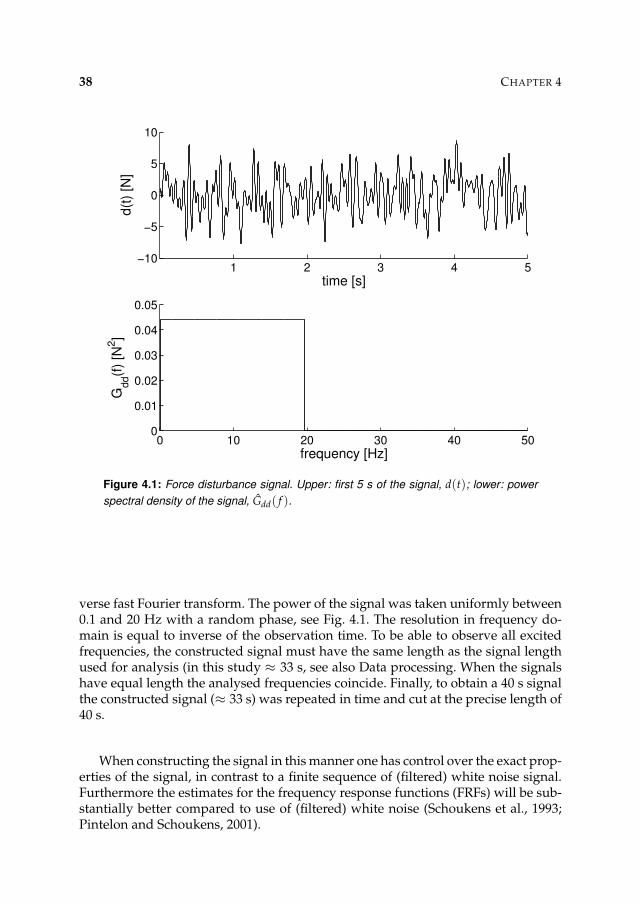
38 CHAPTER 4
1 2 3 4 5−10
−5
0
5
10d(t
) [N
]
time [s]
0 10 20 30 40 500
0.01
0.02
0.03
0.04
0.05
Gdd(f
) [N
2]
frequency [Hz]
Figure 4.1: Force disturbance signal. Upper: first 5 s of the signal, d(t); lower: power
spectral density of the signal, Gdd( f ).
verse fast Fourier transform. The power of the signal was taken uniformly between0.1 and 20 Hz with a random phase, see Fig. 4.1. The resolution in frequency do-main is equal to inverse of the observation time. To be able to observe all excitedfrequencies, the constructed signal must have the same length as the signal lengthused for analysis (in this study ≈ 33 s, see also Data processing. When the signalshave equal length the analysed frequencies coincide. Finally, to obtain a 40 s signalthe constructed signal (≈ 33 s) was repeated in time and cut at the precise length of40 s.
When constructing the signal in this manner one has control over the exact prop-erties of the signal, in contrast to a finite sequence of (filtered) white noise signal.Furthermore the estimates for the frequency response functions (FRFs) will be sub-stantially better compared to use of (filtered) white noise (Schoukens et al., 1993;Pintelon and Schoukens, 2001).

Proprioceptive reflexes in patients with Parkinson’s disease 39
4.2.4 Data processing
Signal recording and processing
During a trial the force disturbance d(t), the position of the handle xh(t), and theapplied force on the handle fh(t) were recorded. Further, the electromyographic(EMG) activity of four muscles was recorded, which contribute to the torque aroundthe shoulder in ante-/retroflexion direction: m. pectoralis major, m. deltoideus an-terior, m. deltoideus posterior and m. latissimus dorsi. Before digitizing the EMGsignals were high pass filtered (20Hz, 3th order Butterworth), to remove DC com-ponents and movement artefacts, amplified, rectified, and low pass filtered with200 Hz cut off (3th order Butterworth), to prevent aliasing. All signals were digi-tally recorded at 500 Hz with 12 bit resolution and stored on computer. This studyinvestigates stationary behaviour and to remove any initial response only the last214 samples (≈ 33 s) from a trial are used for further analysis. This time windowcoincides with the original length of the constructed force disturbance signal (seeSection 4.2.3).
The EMG signals were used to get an impression of the mean muscle activity,or cocontraction, during a trial. To do so the IEMG of each muscle during a trial iscalculated.
IEMGi =1
n
n
∑k=1
|ei(tk)| (4.1)
in which ei is the EMG signal of muscle i, k indexes the time vector, and n is thenumber of samples. The IEMG of each muscle is normalized so that the mean overthe four repetitions during the reference condition, equals one. The mean EMG u0
during a trial is defined as the mean of the normalized EMGs of the four muscles.
u0 =1
4
4
∑i=1
IEMGi
IEMGre f ,i(4.2)
in which IEMGre f ,i denotes the IEMG for muscle i during the reference conditionaveraged over the four repetitions.
Nonparametric analysis
As the modelling was done in the frequency domain the data was transformedfrom time to frequency domain via fast Fourier transform (FFT). To reduce thenoise in the recorded signals, the time signals for each condition were averagedover the four repetitions before FFT. For each condition the subject’s arm admit-tance, H f x( f ), and the admittance of the combined system, i.e. the subject’s arm
and the external environment imposed by the manipulator, Hdx( f ), were estimated.In addition the coherence γ2( f ) was estimated. The coherence gives a measure forhow well the output of a system is linearly related to the input of the system. Bydefinition the value for the coherence varies between 0 and 1. Nonlinearities andmeasurement noise decrease the coherence. The estimators are given in Chapter 2.
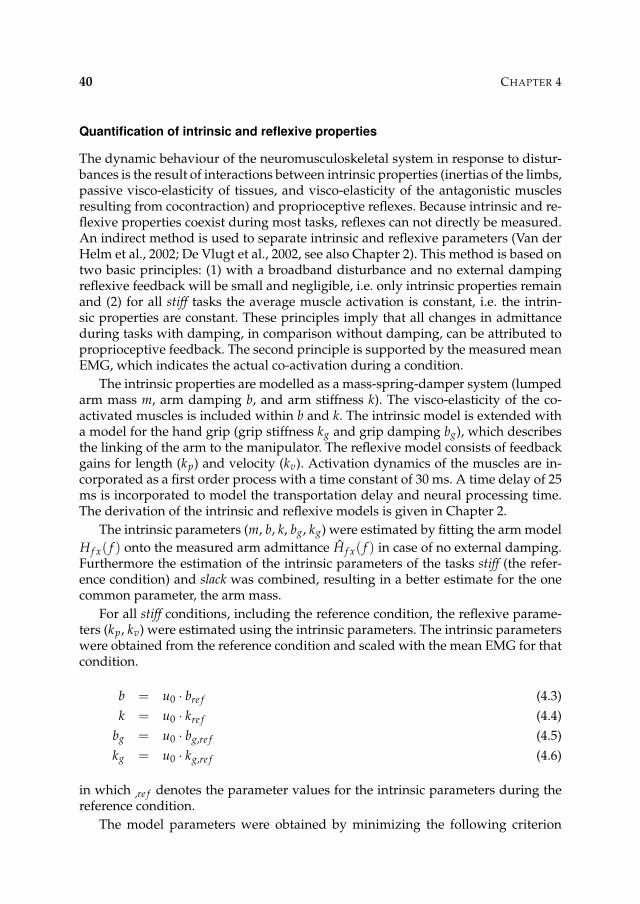
40 CHAPTER 4
Quantification of intrinsic and reflexive properties
The dynamic behaviour of the neuromusculoskeletal system in response to distur-bances is the result of interactions between intrinsic properties (inertias of the limbs,passive visco-elasticity of tissues, and visco-elasticity of the antagonistic musclesresulting from cocontraction) and proprioceptive reflexes. Because intrinsic and re-flexive properties coexist during most tasks, reflexes can not directly be measured.An indirect method is used to separate intrinsic and reflexive parameters (Van derHelm et al., 2002; De Vlugt et al., 2002, see also Chapter 2). This method is based ontwo basic principles: (1) with a broadband disturbance and no external dampingreflexive feedback will be small and negligible, i.e. only intrinsic properties remainand (2) for all stiff tasks the average muscle activation is constant, i.e. the intrin-sic properties are constant. These principles imply that all changes in admittanceduring tasks with damping, in comparison without damping, can be attributed toproprioceptive feedback. The second principle is supported by the measured meanEMG, which indicates the actual co-activation during a condition.
The intrinsic properties are modelled as a mass-spring-damper system (lumpedarm mass m, arm damping b, and arm stiffness k). The visco-elasticity of the co-activated muscles is included within b and k. The intrinsic model is extended witha model for the hand grip (grip stiffness kg and grip damping bg), which describesthe linking of the arm to the manipulator. The reflexive model consists of feedbackgains for length (kp) and velocity (kv). Activation dynamics of the muscles are in-corporated as a first order process with a time constant of 30 ms. A time delay of 25ms is incorporated to model the transportation delay and neural processing time.The derivation of the intrinsic and reflexive models is given in Chapter 2.
The intrinsic parameters (m, b, k, bg, kg) were estimated by fitting the arm model
H f x( f ) onto the measured arm admittance H f x( f ) in case of no external damping.Furthermore the estimation of the intrinsic parameters of the tasks stiff (the refer-ence condition) and slack was combined, resulting in a better estimate for the onecommon parameter, the arm mass.
For all stiff conditions, including the reference condition, the reflexive parame-ters (kp, kv) were estimated using the intrinsic parameters. The intrinsic parameterswere obtained from the reference condition and scaled with the mean EMG for thatcondition.
b = u0 · bre f (4.3)
k = u0 · kre f (4.4)
bg = u0 · bg,re f (4.5)
kg = u0 · kg,re f (4.6)
in which ,re f denotes the parameter values for the intrinsic parameters during thereference condition.
The model parameters were obtained by minimizing the following criterion
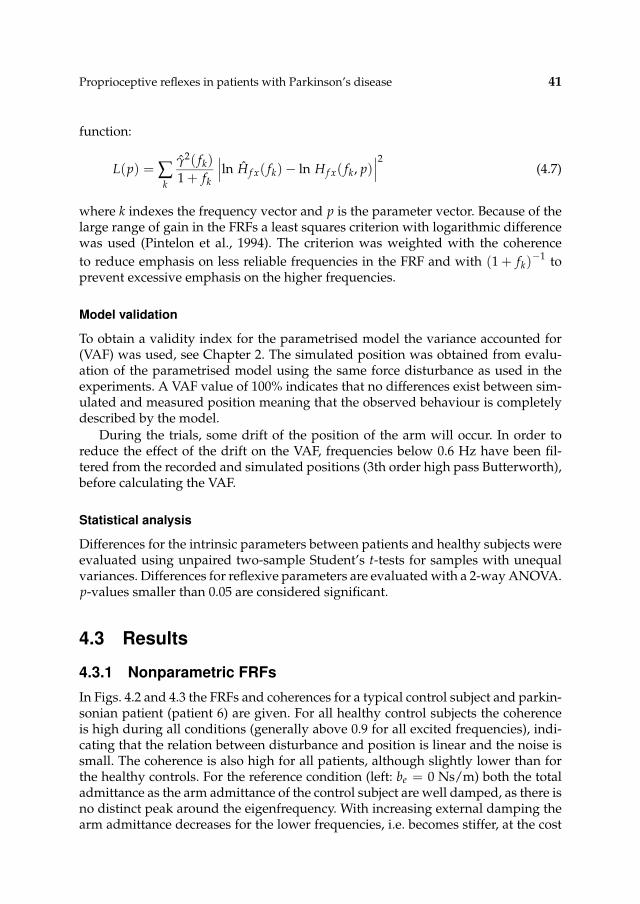
Proprioceptive reflexes in patients with Parkinson’s disease 41
function:
L(p) = ∑k
γ2( fk)
1 + fk
∣
∣
∣ln H f x( fk) − ln H f x( fk, p)
∣
∣
∣
2(4.7)
where k indexes the frequency vector and p is the parameter vector. Because of thelarge range of gain in the FRFs a least squares criterion with logarithmic differencewas used (Pintelon et al., 1994). The criterion was weighted with the coherence
to reduce emphasis on less reliable frequencies in the FRF and with (1 + fk)−1 to
prevent excessive emphasis on the higher frequencies.
Model validation
To obtain a validity index for the parametrised model the variance accounted for(VAF) was used, see Chapter 2. The simulated position was obtained from evalu-ation of the parametrised model using the same force disturbance as used in theexperiments. A VAF value of 100% indicates that no differences exist between sim-ulated and measured position meaning that the observed behaviour is completelydescribed by the model.
During the trials, some drift of the position of the arm will occur. In order toreduce the effect of the drift on the VAF, frequencies below 0.6 Hz have been fil-tered from the recorded and simulated positions (3th order high pass Butterworth),before calculating the VAF.
Statistical analysis
Differences for the intrinsic parameters between patients and healthy subjects wereevaluated using unpaired two-sample Student’s t-tests for samples with unequalvariances. Differences for reflexive parameters are evaluated with a 2-way ANOVA.p-values smaller than 0.05 are considered significant.
4.3 Results
4.3.1 Nonparametric FRFs
In Figs. 4.2 and 4.3 the FRFs and coherences for a typical control subject and parkin-sonian patient (patient 6) are given. For all healthy control subjects the coherenceis high during all conditions (generally above 0.9 for all excited frequencies), indi-cating that the relation between disturbance and position is linear and the noise issmall. The coherence is also high for all patients, although slightly lower than forthe healthy controls. For the reference condition (left: be = 0 Ns/m) both the totaladmittance as the arm admittance of the control subject are well damped, as there isno distinct peak around the eigenfrequency. With increasing external damping thearm admittance decreases for the lower frequencies, i.e. becomes stiffer, at the cost
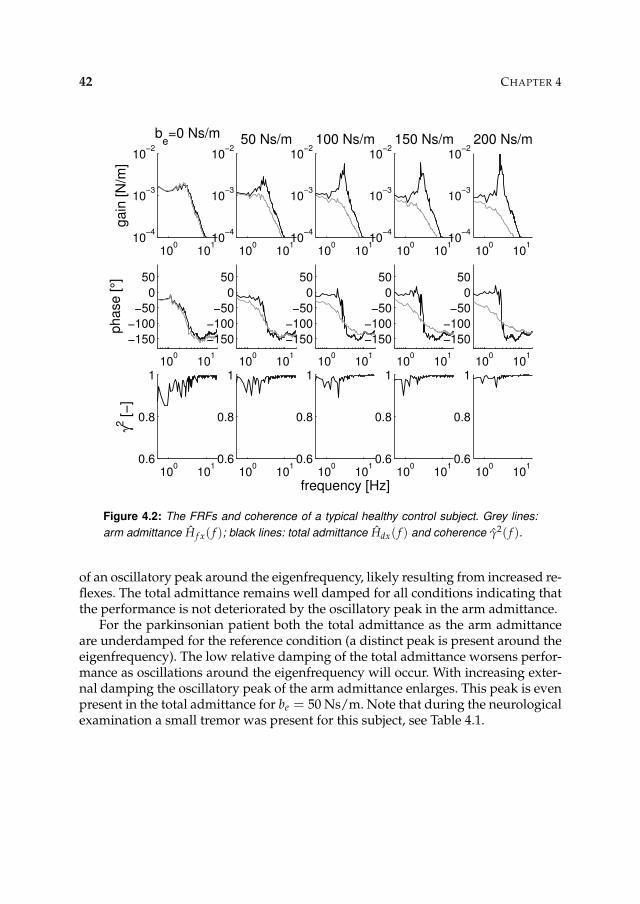
42 CHAPTER 4
100
101
10−4
10−3
10−2
be=0 Ns/m
gain
[N
/m]
100
101
−150
−100
−50
0
50
phase [
°]
100
101
0.6
0.8
1
γ2 [−
]
100
101
10−4
10−3
10−2
50 Ns/m
100
101
−150
−100
−50
0
50
100
101
0.6
0.8
1
100
101
10−4
10−3
10−2
100 Ns/m
100
101
−150
−100
−50
0
50
100
101
0.6
0.8
1
frequency [Hz]
100
101
10−4
10−3
10−2
150 Ns/m
100
101
−150
−100
−50
0
50
100
101
0.6
0.8
1
100
101
10−4
10−3
10−2
200 Ns/m
100
101
−150
−100
−50
0
50
100
101
0.6
0.8
1
Figure 4.2: The FRFs and coherence of a typical healthy control subject. Grey lines:
arm admittance H f x( f ); black lines: total admittance Hdx( f ) and coherence γ2( f ).
of an oscillatory peak around the eigenfrequency, likely resulting from increased re-flexes. The total admittance remains well damped for all conditions indicating thatthe performance is not deteriorated by the oscillatory peak in the arm admittance.
For the parkinsonian patient both the total admittance as the arm admittanceare underdamped for the reference condition (a distinct peak is present around theeigenfrequency). The low relative damping of the total admittance worsens perfor-mance as oscillations around the eigenfrequency will occur. With increasing exter-nal damping the oscillatory peak of the arm admittance enlarges. This peak is evenpresent in the total admittance for be = 50 Ns/m. Note that during the neurologicalexamination a small tremor was present for this subject, see Table 4.1.
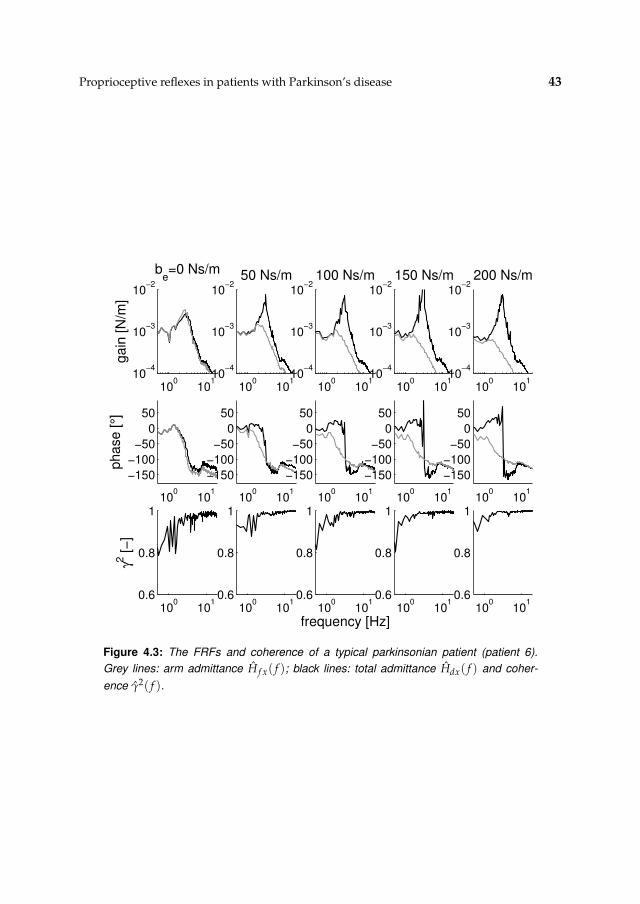
Proprioceptive reflexes in patients with Parkinson’s disease 43
100
101
10−4
10−3
10−2
be=0 Ns/m
gain
[N
/m]
100
101
−150
−100
−50
0
50
phase [
°]
100
101
0.6
0.8
1
γ2 [−
]
100
101
10−4
10−3
10−2
50 Ns/m
100
101
−150
−100
−50
0
50
100
101
0.6
0.8
1
100
101
10−4
10−3
10−2
100 Ns/m
100
101
−150
−100
−50
0
50
100
101
0.6
0.8
1
frequency [Hz]
100
101
10−4
10−3
10−2
150 Ns/m
100
101
−150
−100
−50
0
50
100
101
0.6
0.8
1
100
101
10−4
10−3
10−2
200 Ns/m
100
101
−150
−100
−50
0
50
100
101
0.6
0.8
1
Figure 4.3: The FRFs and coherence of a typical parkinsonian patient (patient 6).
Grey lines: arm admittance H f x( f ); black lines: total admittance Hdx( f ) and coher-
ence γ2( f ).
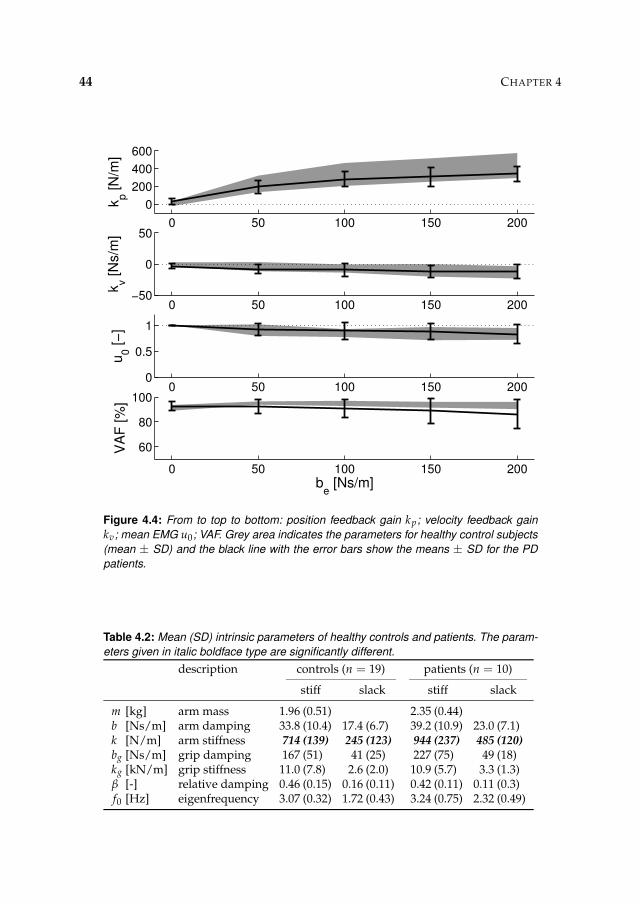
44 CHAPTER 4
0 50 100 150 200
0
200
400
600
kp [N
/m]
0 50 100 150 200−50
0
50
kv [N
s/m
]
0 50 100 150 2000
0.5
1
u0 [−
]
0 50 100 150 200
60
80
100
VA
F [%
]
be [Ns/m]
Figure 4.4: From to top to bottom: position feedback gain kp; velocity feedback gain
kv; mean EMG u0; VAF. Grey area indicates the parameters for healthy control subjects
(mean ± SD) and the black line with the error bars show the means ± SD for the PD
patients.
Table 4.2: Mean (SD) intrinsic parameters of healthy controls and patients. The param-
eters given in italic boldface type are significantly different.
description controls (n = 19) patients (n = 10)
stiff slack stiff slack
m [kg] arm mass 1.96 (0.51) 2.35 (0.44)b [Ns/m] arm damping 33.8 (10.4) 17.4 (6.7) 39.2 (10.9) 23.0 (7.1)k [N/m] arm stiffness 714 (139) 245 (123) 944 (237) 485 (120)
bg [Ns/m] grip damping 167 (51) 41 (25) 227 (75) 49 (18)kg [kN/m] grip stiffness 11.0 (7.8) 2.6 (2.0) 10.9 (5.7) 3.3 (1.3)β [-] relative damping 0.46 (0.15) 0.16 (0.11) 0.42 (0.11) 0.11 (0.3)f0 [Hz] eigenfrequency 3.07 (0.32) 1.72 (0.43) 3.24 (0.75) 2.32 (0.49)
Proprioceptive reflexes in patients with Parkinson’s disease 45
4.3.2 Intrinsic and reflexive parameters
The estimated intrinsic parameters for both healthy subjects and patients are givenin Table 4.2. The reflexive parameters, the mean EMG, and the VAF values are givenin Fig. 4.4. The high VAF values show that the model predicts the observed be-haviour very well. Because the coherence was slightly lower in case of the patientsit was expected that the VAF values were slightly lower for the patients.
For both task stiff and slack the arm stiffness is significantly larger in parkinso-nian patients. Furthermore the ratio of stiffness with task stiff and slack is smallerin patients (patients: 1.95, control: 2.91). For both patients and controls the positionfeedback gain kp increased with increasing damping although this increase is lesspronounced for the patients (p < 0.02, 2-way ANOVA).
4.4 Discussion
In this study intrinsic muscle parameters and proprioceptive reflex gains are quan-tified during postural control tasks. The modulation of reflexive feedback gainswith external damping is investigated. It is found that in patients the position feed-back gain kp increases with external damping but not as steeply as in controls, indi-cating that the range of modulation is confined with PD. Furthermore the intrinsicmuscle stiffness is higher, suggesting that reflexes are present during the referencecondition.
This study considers postural control, with small variation around an equilib-rium point, to allow linear modelling. Besides linear behaviour, the influence ofdisturbances other than the applied disturbance must be small in order to havea good estimate of the arm dynamics. Examples of uncorrelated disturbances aresubject-induced steering or uncontrolled movements. For both the control subjectsand the patients the coherence is high, indicating that the relation between distur-bance and position is linear and the noise is small. The high coherence in patientsshows that proprioceptive reflexes can be assessed in patients with PD.
The fact that the coherence is high in patients also implicates that the tremorseen in some of the patients is linearly related with the force disturbance. Thismeans that the tremor is a property of the system involved and not the result ofoscillations induced by the higher centres of the central nervous system (CNS),which would be uncorrelated with the force disturbance. This is also supportedby the measured admittances, for some patients the dynamics are underdamped,meaning that even a small disturbance results in relatively large oscillations.
It is known that high feedback gain in a time-delayed feedback loop, like pro-prioceptive reflexes, result in oscillations around the eigenfrequency (De Vlugt etal., 2001; Schouten et al., 2001). The high coherence at the eigenfrequency and thepoor damping indicate that the reflexes are present during the reference conditionand responsible for the tremor. Consequently the assumption of negligible reflexesduring the reference condition may result in an overestimation of the intrinsic pa-rameters and an underestimation of the reflexive parameters. This implicates that
46 CHAPTER 4
the increased stiffness in PD results from enhanced proprioceptive reflexes, whichcould be responsible from the rigidity observed in PD. The possible underestima-tion of the reflex gains does not influence the major finding of this study that therange of modulation is confined in patients suffering from PD. It even suggests thatnot the upper value of the position feedback gain is limited but the lower value ofthe feedback gain is limited.
With the current method prior assumptions are needed to separate intrinsic andreflexive contributions. To remove the need for prior assumptions the method couldbe extended by estimating the dynamic relation between position and EMG givinga direct measure for the proprioceptive reflexes. However special precaution needsto be taken to reduce the uncorrelated noise in the (rectified) EMG signals, or toincrease the signal, i.e. the response to the continuous force disturbance, in the EMGrecording.
Chapter 5
Design of perturbation signals for the
estimation of spinal reflexes
Alfred C. Schouten, Erwin de Vlugt, Frans C.T. van der HelmSubmitted to Journal of Neuroscience Methods
This study aimed to identify the reflexive contribution during posture maintenance.Continuous random force disturbances were applied at the hand while the subjectswere instructed to ‘minimize the deviations’ resulting from the force disturbances.The results were analysed in frequency domain with frequency response functions(FRFs). Two FRFs were evaluated: (1) the mechanical admittance and (2) the reflex-ive impedance, expressing the dynamic relation between position and muscle ac-tivation (assessed via electromyography, EMG). The reflexive impedance describesthe muscle activation resulting from the position deviations and hence is a directmeasure for proprioceptive reflexes. To record all relevant dynamical characteristicsof the arm, wide bandwidth signals were used as force disturbance. Distributingthe power of the signal over less frequencies within the bandwidth improved thesignal-to-noise ratio (SNR) of the EMG recordings, facilitating reliable estimationof the reflexive impedance. The high coherence indicated that the relation betweenforce disturbance and EMG was linear under the given conditions and improvedwith the SNR. The method of designing disturbance signals and the estimation ofthe reflexive impedance are useful for studies aiming to quantify spinal reflexesand to investigate the functionality of spinal reflexes.
48 CHAPTER 5
5.1 Introduction
Continuous random force disturbances have proven to be useful to quantify spinalreflexes and so to investigate the functionality of reflexes (De Vlugt et al., 2002;Van der Helm et al., 2002; Schouten et al., 2003). However these studies, and otherto quantify proprioceptive reflexes (Kearney et al., 1997; Mirbagheri et al., 2000;Zhang and Rymer, 1997), are all based on analyses of the dynamic relation betweenforce and position (mechanical admittance) only and consequently assumptionsare needed to separate the reflexive contributions from the mechanical admittance.Incorporation of the muscle activation might improve the procedures.
Force disturbances with position tasks are unambiguous and natural for thesubject. High effort tasks, like ‘minimize displacements’ demand high levels of co-contraction. This implicates that the variation in the muscle activation due to re-flexes will be relatively small compared to the high tonic muscle activity. Muscleactivation is easily recorded by surface electromyography (EMG). EMG, however,contains substantial noise, uncorrelated to the applied disturbance, and the smallvariations due to reflexes will be hard to identify. Goal of this study is to redesignthe continuous signals used as force disturbances such that the dynamic relationbetween position and muscle activation (reflexive impedance) can be estimated re-liably in addition to the mechanical admittance during postural control tasks.
5.2 Materials and methods
5.2.1 Subjects
Ten healthy subjects participated in the experiment (20-44 years, 4 women, 3 lefthanded). The experiments were conducted on the right arm only. All subjects gaveinformed consent prior to the procedure.
5.2.2 Apparatus
A manipulator was used to apply force disturbances to the shoulder joint. The ma-nipulator is extensively described in Chapter 2 and is introduced briefly. The sub-jects sat in a chair and had to hold a handle with their right hand. Movement ofthe handle resulted in ante-/retroflexion movements of the shoulder joint. To thesubject the manipulator behaved like a mass-spring-damper system. The parame-ters of the spring (ke), damper (be), and mass (me) are adjustable. In this study themass was fixed (me = 1 kg), no stiffness and damping were set (ke = 0 N/m; be = 0Ns/m).
5.2.3 Procedures
Subjects had to hold the handle and were instructed to ‘minimize the displacements’of the handle, while continuous random force disturbances were applied for 30 s.All subjects experienced the task as natural and motivating. Only a few trials were
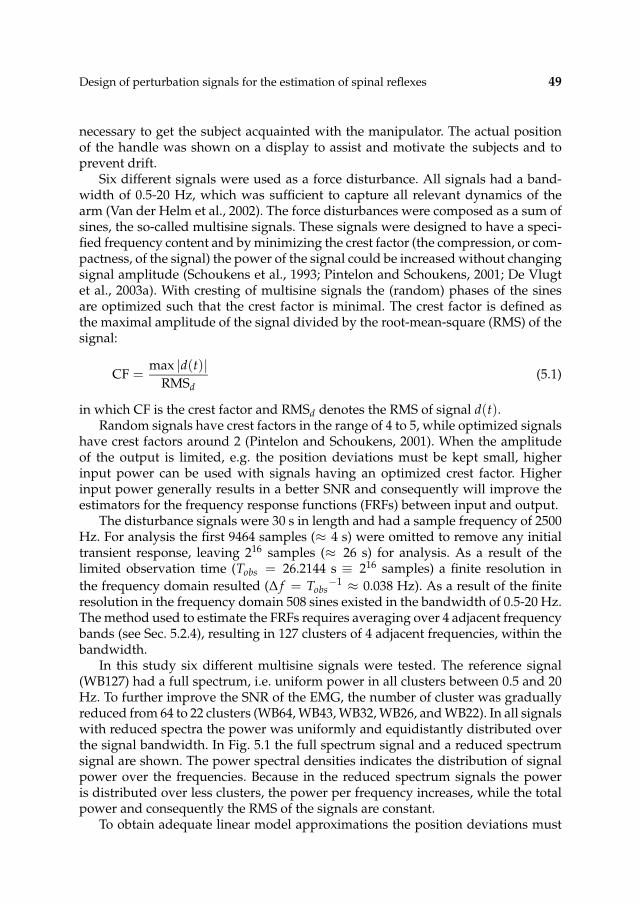
Design of perturbation signals for the estimation of spinal reflexes 49
necessary to get the subject acquainted with the manipulator. The actual positionof the handle was shown on a display to assist and motivate the subjects and toprevent drift.
Six different signals were used as a force disturbance. All signals had a band-width of 0.5-20 Hz, which was sufficient to capture all relevant dynamics of thearm (Van der Helm et al., 2002). The force disturbances were composed as a sum ofsines, the so-called multisine signals. These signals were designed to have a speci-fied frequency content and by minimizing the crest factor (the compression, or com-pactness, of the signal) the power of the signal could be increased without changingsignal amplitude (Schoukens et al., 1993; Pintelon and Schoukens, 2001; De Vlugtet al., 2003a). With cresting of multisine signals the (random) phases of the sinesare optimized such that the crest factor is minimal. The crest factor is defined asthe maximal amplitude of the signal divided by the root-mean-square (RMS) of thesignal:
CF =max |d(t)|
RMSd(5.1)
in which CF is the crest factor and RMSd denotes the RMS of signal d(t).Random signals have crest factors in the range of 4 to 5, while optimized signals
have crest factors around 2 (Pintelon and Schoukens, 2001). When the amplitudeof the output is limited, e.g. the position deviations must be kept small, higherinput power can be used with signals having an optimized crest factor. Higherinput power generally results in a better SNR and consequently will improve theestimators for the frequency response functions (FRFs) between input and output.
The disturbance signals were 30 s in length and had a sample frequency of 2500Hz. For analysis the first 9464 samples (≈ 4 s) were omitted to remove any initialtransient response, leaving 216 samples (≈ 26 s) for analysis. As a result of thelimited observation time (Tobs = 26.2144 s ≡ 216 samples) a finite resolution in
the frequency domain resulted (∆ f = Tobs−1 ≈ 0.038 Hz). As a result of the finite
resolution in the frequency domain 508 sines existed in the bandwidth of 0.5-20 Hz.The method used to estimate the FRFs requires averaging over 4 adjacent frequencybands (see Sec. 5.2.4), resulting in 127 clusters of 4 adjacent frequencies, within thebandwidth.
In this study six different multisine signals were tested. The reference signal(WB127) had a full spectrum, i.e. uniform power in all clusters between 0.5 and 20Hz. To further improve the SNR of the EMG, the number of cluster was graduallyreduced from 64 to 22 clusters (WB64, WB43, WB32, WB26, and WB22). In all signalswith reduced spectra the power was uniformly and equidistantly distributed overthe signal bandwidth. In Fig. 5.1 the full spectrum signal and a reduced spectrumsignal are shown. The power spectral densities indicates the distribution of signalpower over the frequencies. Because in the reduced spectrum signals the poweris distributed over less clusters, the power per frequency increases, while the totalpower and consequently the RMS of the signals are constant.
To obtain adequate linear model approximations the position deviations must
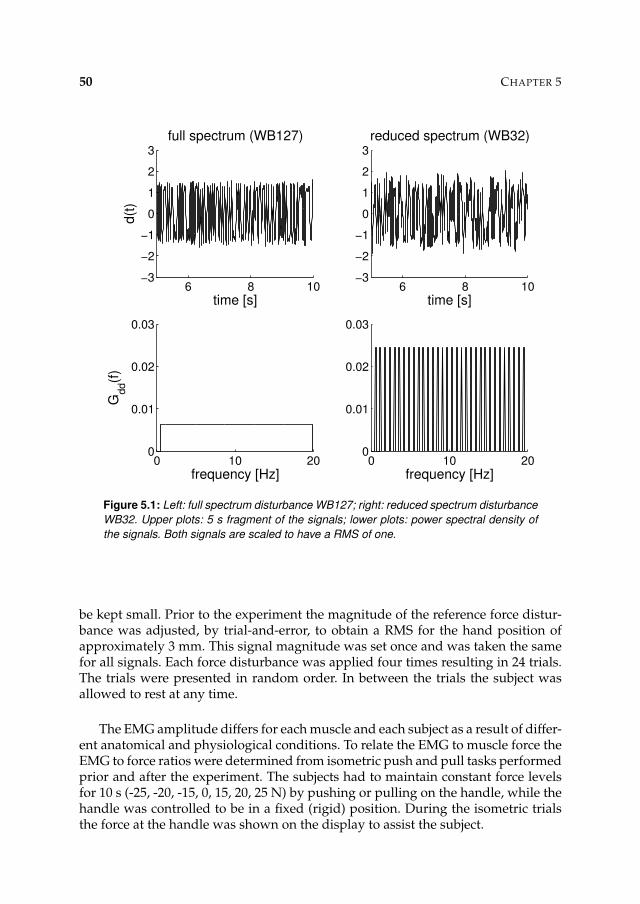
50 CHAPTER 5
6 8 10−3
−2
−1
0
1
2
3
time [s]
d(t
)full spectrum (WB127)
0 10 200
0.01
0.02
0.03
frequency [Hz]
Gd
d(f
)
6 8 10−3
−2
−1
0
1
2
3
time [s]
reduced spectrum (WB32)
0 10 200
0.01
0.02
0.03
frequency [Hz]
Figure 5.1: Left: full spectrum disturbance WB127; right: reduced spectrum disturbance
WB32. Upper plots: 5 s fragment of the signals; lower plots: power spectral density of
the signals. Both signals are scaled to have a RMS of one.
be kept small. Prior to the experiment the magnitude of the reference force distur-bance was adjusted, by trial-and-error, to obtain a RMS for the hand position ofapproximately 3 mm. This signal magnitude was set once and was taken the samefor all signals. Each force disturbance was applied four times resulting in 24 trials.The trials were presented in random order. In between the trials the subject wasallowed to rest at any time.
The EMG amplitude differs for each muscle and each subject as a result of differ-ent anatomical and physiological conditions. To relate the EMG to muscle force theEMG to force ratios were determined from isometric push and pull tasks performedprior and after the experiment. The subjects had to maintain constant force levelsfor 10 s (-25, -20, -15, 0, 15, 20, 25 N) by pushing or pulling on the handle, while thehandle was controlled to be in a fixed (rigid) position. During the isometric trialsthe force at the handle was shown on the display to assist the subject.
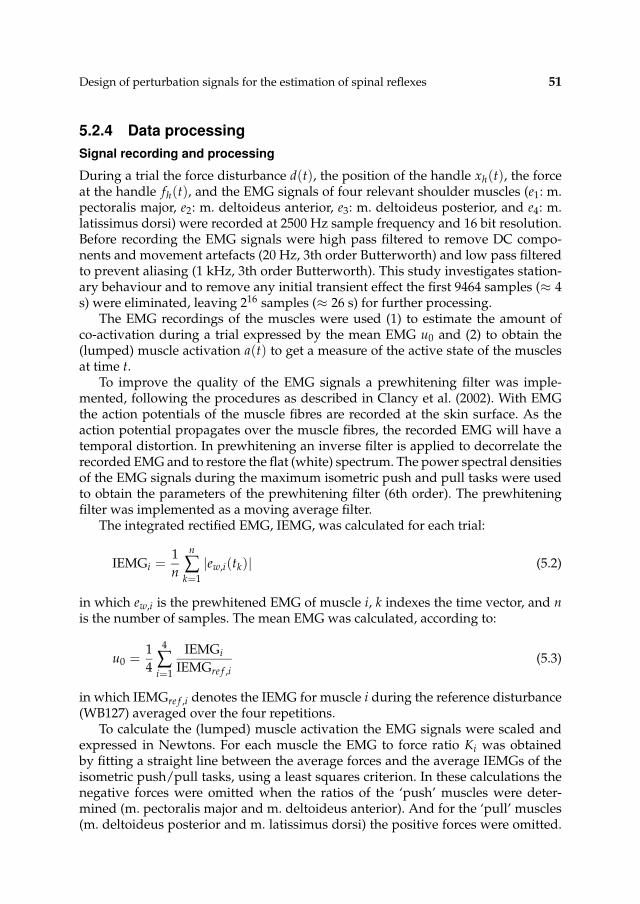
Design of perturbation signals for the estimation of spinal reflexes 51
5.2.4 Data processing
Signal recording and processing
During a trial the force disturbance d(t), the position of the handle xh(t), the forceat the handle fh(t), and the EMG signals of four relevant shoulder muscles (e1: m.pectoralis major, e2: m. deltoideus anterior, e3: m. deltoideus posterior, and e4: m.latissimus dorsi) were recorded at 2500 Hz sample frequency and 16 bit resolution.Before recording the EMG signals were high pass filtered to remove DC compo-nents and movement artefacts (20 Hz, 3th order Butterworth) and low pass filteredto prevent aliasing (1 kHz, 3th order Butterworth). This study investigates station-ary behaviour and to remove any initial transient effect the first 9464 samples (≈ 4s) were eliminated, leaving 216 samples (≈ 26 s) for further processing.
The EMG recordings of the muscles were used (1) to estimate the amount ofco-activation during a trial expressed by the mean EMG u0 and (2) to obtain the(lumped) muscle activation a(t) to get a measure of the active state of the musclesat time t.
To improve the quality of the EMG signals a prewhitening filter was imple-mented, following the procedures as described in Clancy et al. (2002). With EMGthe action potentials of the muscle fibres are recorded at the skin surface. As theaction potential propagates over the muscle fibres, the recorded EMG will have atemporal distortion. In prewhitening an inverse filter is applied to decorrelate therecorded EMG and to restore the flat (white) spectrum. The power spectral densitiesof the EMG signals during the maximum isometric push and pull tasks were usedto obtain the parameters of the prewhitening filter (6th order). The prewhiteningfilter was implemented as a moving average filter.
The integrated rectified EMG, IEMG, was calculated for each trial:
IEMGi =1
n
n
∑k=1
|ew,i(tk)| (5.2)
in which ew,i is the prewhitened EMG of muscle i, k indexes the time vector, and nis the number of samples. The mean EMG was calculated, according to:
u0 =1
4
4
∑i=1
IEMGi
IEMGre f ,i(5.3)
in which IEMGre f ,i denotes the IEMG for muscle i during the reference disturbance(WB127) averaged over the four repetitions.
To calculate the (lumped) muscle activation the EMG signals were scaled andexpressed in Newtons. For each muscle the EMG to force ratio Ki was obtainedby fitting a straight line between the average forces and the average IEMGs of theisometric push/pull tasks, using a least squares criterion. In these calculations thenegative forces were omitted when the ratios of the ‘push’ muscles were deter-mined (m. pectoralis major and m. deltoideus anterior). And for the ‘pull’ muscles(m. deltoideus posterior and m. latissimus dorsi) the positive forces were omitted.
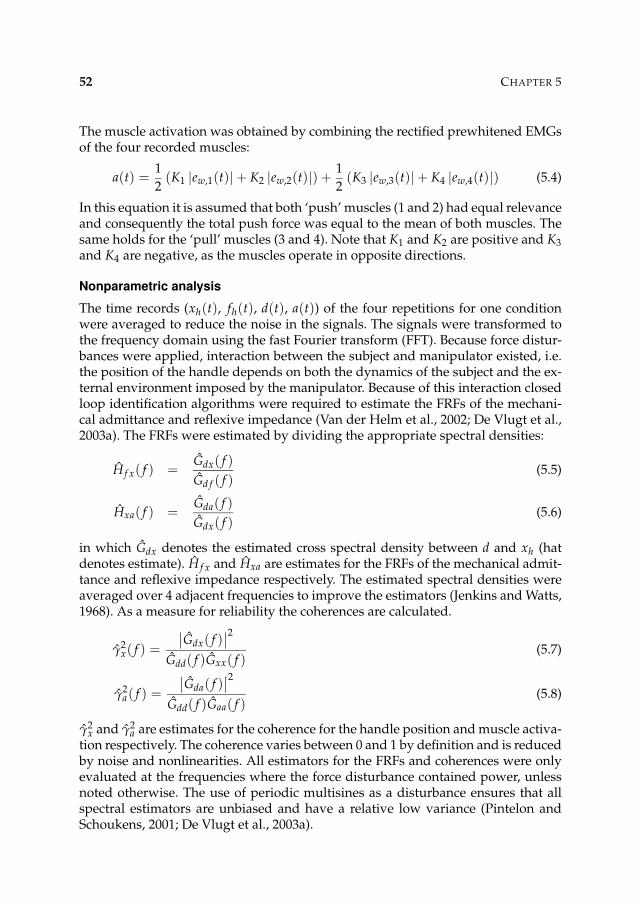
52 CHAPTER 5
The muscle activation was obtained by combining the rectified prewhitened EMGsof the four recorded muscles:
a(t) =1
2(K1 |ew,1(t)| + K2 |ew,2(t)|) +
1
2(K3 |ew,3(t)| + K4 |ew,4(t)|) (5.4)
In this equation it is assumed that both ‘push’ muscles (1 and 2) had equal relevanceand consequently the total push force was equal to the mean of both muscles. Thesame holds for the ‘pull’ muscles (3 and 4). Note that K1 and K2 are positive and K3
and K4 are negative, as the muscles operate in opposite directions.
Nonparametric analysis
The time records (xh(t), fh(t), d(t), a(t)) of the four repetitions for one conditionwere averaged to reduce the noise in the signals. The signals were transformed tothe frequency domain using the fast Fourier transform (FFT). Because force distur-bances were applied, interaction between the subject and manipulator existed, i.e.the position of the handle depends on both the dynamics of the subject and the ex-ternal environment imposed by the manipulator. Because of this interaction closedloop identification algorithms were required to estimate the FRFs of the mechani-cal admittance and reflexive impedance (Van der Helm et al., 2002; De Vlugt et al.,2003a). The FRFs were estimated by dividing the appropriate spectral densities:
H f x( f ) =Gdx( f )
Gd f ( f )(5.5)
Hxa( f ) =Gda( f )
Gdx( f )(5.6)
in which Gdx denotes the estimated cross spectral density between d and xh (hatdenotes estimate). H f x and Hxa are estimates for the FRFs of the mechanical admit-tance and reflexive impedance respectively. The estimated spectral densities wereaveraged over 4 adjacent frequencies to improve the estimators (Jenkins and Watts,1968). As a measure for reliability the coherences are calculated.
γ2x( f ) =
∣
∣Gdx( f )∣
∣
2
Gdd( f )Gxx( f )(5.7)
γ2a( f ) =
∣
∣Gda( f )∣
∣
2
Gdd( f )Gaa( f )(5.8)
γ2x and γ2
a are estimates for the coherence for the handle position and muscle activa-tion respectively. The coherence varies between 0 and 1 by definition and is reducedby noise and nonlinearities. All estimators for the FRFs and coherences were onlyevaluated at the frequencies where the force disturbance contained power, unlessnoted otherwise. The use of periodic multisines as a disturbance ensures that allspectral estimators are unbiased and have a relative low variance (Pintelon andSchoukens, 2001; De Vlugt et al., 2003a).
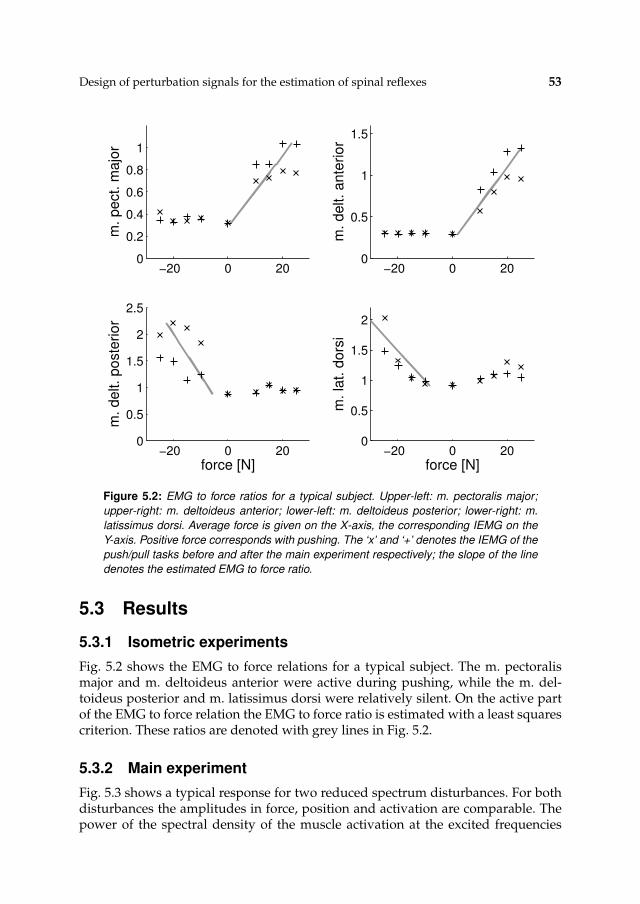
Design of perturbation signals for the estimation of spinal reflexes 53
−20 0 200
0.2
0.4
0.6
0.8
1
m. pect. m
ajo
r
−20 0 200
0.5
1
1.5
m. delt. ante
rior
−20 0 200
0.5
1
1.5
2
2.5
m. delt. poste
rior
force [N]−20 0 20
0
0.5
1
1.5
2
m. la
t. d
ors
i
force [N]
Figure 5.2: EMG to force ratios for a typical subject. Upper-left: m. pectoralis major;
upper-right: m. deltoideus anterior; lower-left: m. deltoideus posterior; lower-right: m.
latissimus dorsi. Average force is given on the X-axis, the corresponding IEMG on the
Y-axis. Positive force corresponds with pushing. The ‘x’ and ‘+’ denotes the IEMG of the
push/pull tasks before and after the main experiment respectively; the slope of the line
denotes the estimated EMG to force ratio.
5.3 Results
5.3.1 Isometric experiments
Fig. 5.2 shows the EMG to force relations for a typical subject. The m. pectoralismajor and m. deltoideus anterior were active during pushing, while the m. del-toideus posterior and m. latissimus dorsi were relatively silent. On the active partof the EMG to force relation the EMG to force ratio is estimated with a least squarescriterion. These ratios are denoted with grey lines in Fig. 5.2.
5.3.2 Main experiment
Fig. 5.3 shows a typical response for two reduced spectrum disturbances. For bothdisturbances the amplitudes in force, position and activation are comparable. Thepower of the spectral density of the muscle activation at the excited frequencies
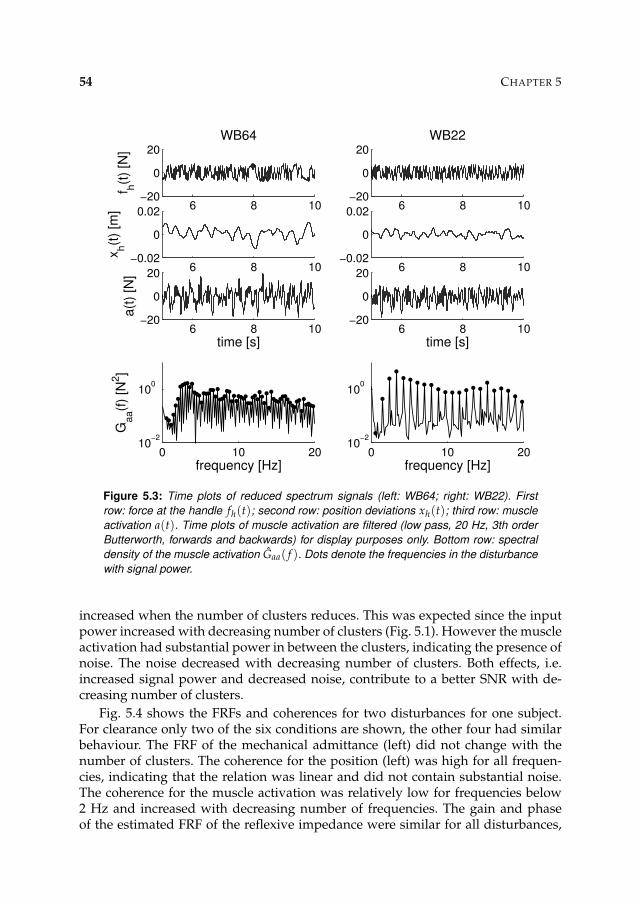
54 CHAPTER 5
6 8 10−20
0
20
f h(t
) [N
]WB64
6 8 10−0.02
0
0.02
xh(t
) [m
]
6 8 10−20
0
20
a(t
) [N
]
time [s]
0 10 2010
−2
100
Ga
a(f
) [N
2]
frequency [Hz]
6 8 10−20
0
20WB22
6 8 10−0.02
0
0.02
6 8 10−20
0
20
time [s]
0 10 2010
−2
100
frequency [Hz]
Figure 5.3: Time plots of reduced spectrum signals (left: WB64; right: WB22). First
row: force at the handle fh(t); second row: position deviations xh(t); third row: muscle
activation a(t). Time plots of muscle activation are filtered (low pass, 20 Hz, 3th order
Butterworth, forwards and backwards) for display purposes only. Bottom row: spectral
density of the muscle activation Gaa( f ). Dots denote the frequencies in the disturbance
with signal power.
increased when the number of clusters reduces. This was expected since the inputpower increased with decreasing number of clusters (Fig. 5.1). However the muscleactivation had substantial power in between the clusters, indicating the presence ofnoise. The noise decreased with decreasing number of clusters. Both effects, i.e.increased signal power and decreased noise, contribute to a better SNR with de-creasing number of clusters.
Fig. 5.4 shows the FRFs and coherences for two disturbances for one subject.For clearance only two of the six conditions are shown, the other four had similarbehaviour. The FRF of the mechanical admittance (left) did not change with thenumber of clusters. The coherence for the position (left) was high for all frequen-cies, indicating that the relation was linear and did not contain substantial noise.The coherence for the muscle activation was relatively low for frequencies below2 Hz and increased with decreasing number of frequencies. The gain and phaseof the estimated FRF of the reflexive impedance were similar for all disturbances,
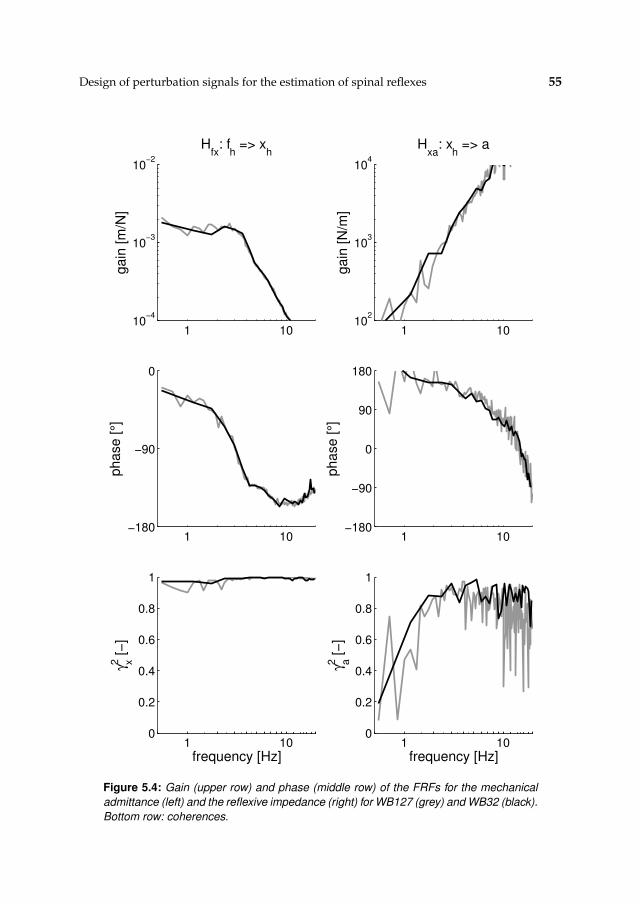
Design of perturbation signals for the estimation of spinal reflexes 55
1 10 10
−4
10−3
10−2
gain
[m
/N]
Hfx
: fh => x
h
1 10 −180
−90
0
phase [
°]
1 10 0
0.2
0.4
0.6
0.8
1
γ2 x [−
]
frequency [Hz]
1 10 10
2
103
104
gain
[N
/m]
Hxa
: xh => a
1 10 −180
−90
0
90
180
phase [
°]
1 10 0
0.2
0.4
0.6
0.8
1
γ2 a [−
]
frequency [Hz]
Figure 5.4: Gain (upper row) and phase (middle row) of the FRFs for the mechanical
admittance (left) and the reflexive impedance (right) for WB127 (grey) and WB32 (black).
Bottom row: coherences.
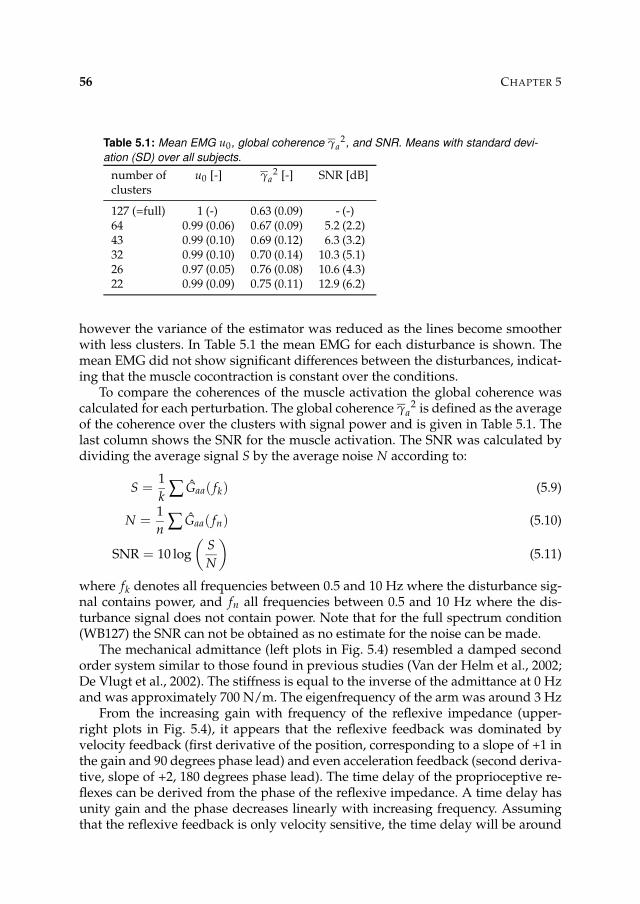
56 CHAPTER 5
Table 5.1: Mean EMG u0, global coherence γa2, and SNR. Means with standard devi-
ation (SD) over all subjects.
number of u0 [-] γa2 [-] SNR [dB]
clusters
127 (=full) 1 (-) 0.63 (0.09) - (-)64 0.99 (0.06) 0.67 (0.09) 5.2 (2.2)43 0.99 (0.10) 0.69 (0.12) 6.3 (3.2)32 0.99 (0.10) 0.70 (0.14) 10.3 (5.1)26 0.97 (0.05) 0.76 (0.08) 10.6 (4.3)22 0.99 (0.09) 0.75 (0.11) 12.9 (6.2)
however the variance of the estimator was reduced as the lines become smootherwith less clusters. In Table 5.1 the mean EMG for each disturbance is shown. Themean EMG did not show significant differences between the disturbances, indicat-ing that the muscle cocontraction is constant over the conditions.
To compare the coherences of the muscle activation the global coherence wascalculated for each perturbation. The global coherence γa
2 is defined as the averageof the coherence over the clusters with signal power and is given in Table 5.1. Thelast column shows the SNR for the muscle activation. The SNR was calculated bydividing the average signal S by the average noise N according to:
S =1
k ∑ Gaa( fk) (5.9)
N =1
n ∑ Gaa( fn) (5.10)
SNR = 10 log
(
S
N
)
(5.11)
where fk denotes all frequencies between 0.5 and 10 Hz where the disturbance sig-nal contains power, and fn all frequencies between 0.5 and 10 Hz where the dis-turbance signal does not contain power. Note that for the full spectrum condition(WB127) the SNR can not be obtained as no estimate for the noise can be made.
The mechanical admittance (left plots in Fig. 5.4) resembled a damped secondorder system similar to those found in previous studies (Van der Helm et al., 2002;De Vlugt et al., 2002). The stiffness is equal to the inverse of the admittance at 0 Hzand was approximately 700 N/m. The eigenfrequency of the arm was around 3 Hz
From the increasing gain with frequency of the reflexive impedance (upper-right plots in Fig. 5.4), it appears that the reflexive feedback was dominated byvelocity feedback (first derivative of the position, corresponding to a slope of +1 inthe gain and 90 degrees phase lead) and even acceleration feedback (second deriva-tive, slope of +2, 180 degrees phase lead). The time delay of the proprioceptive re-flexes can be derived from the phase of the reflexive impedance. A time delay hasunity gain and the phase decreases linearly with increasing frequency. Assumingthat the reflexive feedback is only velocity sensitive, the time delay will be around
Design of perturbation signals for the estimation of spinal reflexes 57
30 ms, indicating that the observed behaviour resulted from short latency, or spinal,reflexes. A time delay of 30 ms gives approximately 180 degrees phase lag at 17 Hz,the velocity sensitivity gives 90 degrees phase lead for all frequencies, explainingthe observed 90 degrees phase lag at 17 Hz.
5.4 Discussion
In this study a method was developed to asses the dynamic relation between po-sition and muscle activation (via EMG), i.e. the reflexive impedance. The reflexiveimpedance was obtained along with the mechanical admittance, while continuousrandom force perturbations were applied. The use of continuous random force per-turbations is natural for the subject and results in an unambiguous task. Severalwide bandwidth signals were designed and used as a force disturbance. The relia-bility of the estimated reflexive impedance is expressed in the coherence and signal-to-noise ratio (SNR). The reflexive impedance is a direct expression of the muscleactivation resulting from reflexes. The reflexive impedance is a useful contribu-tion to investigate the contribution of reflexes to the joint admittance. A succeed-ing study will use the signal design procedure to investigate the effect of distur-bance bandwidth and external environment on proprioceptive reflexes, by fitting amodel onto the admittance and reflexive impedance simultaneously (Schouten etal., 2004b, see Chapter 6).
The disturbances applied contain power between 0.5 and 20 Hz, which is suffi-cient to capture all relevant shoulder dynamics (Van der Helm et al., 2002). The sig-nals used as force disturbance were designed in the frequency domain as multisinesignals (Schoukens et al., 1993; Pintelon and Schoukens, 2001). Multisine signals asa disturbance have three important advantages over other continuous random sig-nals: 1) no bias is introduced in the spectral estimators, 2) signal properties can beexplicitly controlled, and 3) due to its periodicity no random errors are introduced.
In the reference signal all frequencies within the bandwidth (0.5-20 Hz) con-tained power. By distributing the power over less frequencies within the band-width, the power per frequency increased. The mechanical admittance nor the meanEMG did change with the signal, indicating that the subjects responded equally toall signals. By distributing the power over less frequencies both the SNR and co-herence of the muscle activation increased. Both are measures for the reliability ofthe estimated reflexive impedance. However the FRFs can only be evaluated overthe frequencies with signal power. Distributing the power over less frequencies re-duces the resolution at which FRFs and coherences can be estimated. One has toweight the increased reliability against reduced frequency resolution.

58 CHAPTER 5
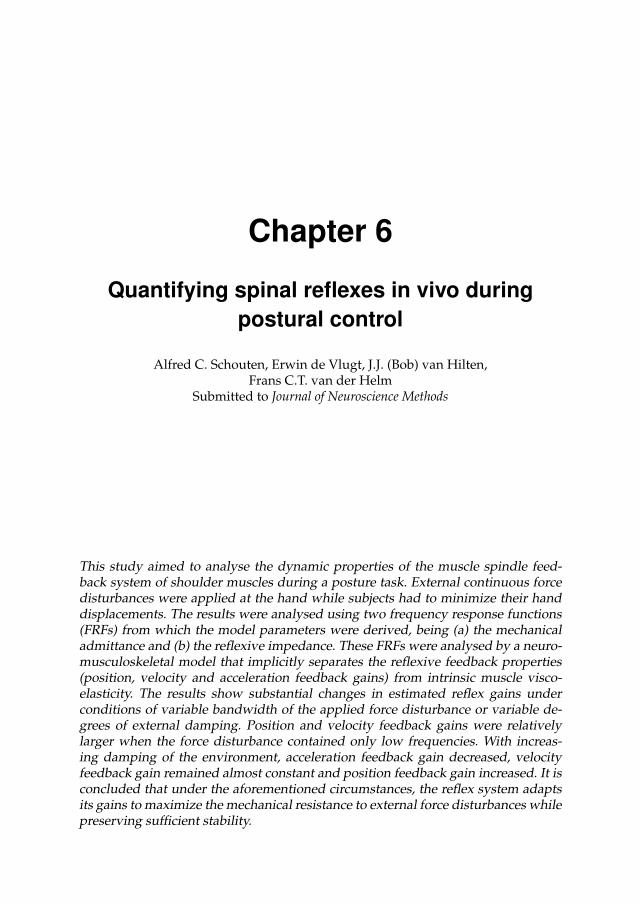
Chapter 6
Quantifying spinal reflexes in vivo during
postural control
Alfred C. Schouten, Erwin de Vlugt, J.J. (Bob) van Hilten,Frans C.T. van der Helm
Submitted to Journal of Neuroscience Methods
This study aimed to analyse the dynamic properties of the muscle spindle feed-back system of shoulder muscles during a posture task. External continuous forcedisturbances were applied at the hand while subjects had to minimize their handdisplacements. The results were analysed using two frequency response functions(FRFs) from which the model parameters were derived, being (a) the mechanicaladmittance and (b) the reflexive impedance. These FRFs were analysed by a neuro-musculoskeletal model that implicitly separates the reflexive feedback properties(position, velocity and acceleration feedback gains) from intrinsic muscle visco-elasticity. The results show substantial changes in estimated reflex gains underconditions of variable bandwidth of the applied force disturbance or variable de-grees of external damping. Position and velocity feedback gains were relativelylarger when the force disturbance contained only low frequencies. With increas-ing damping of the environment, acceleration feedback gain decreased, velocityfeedback gain remained almost constant and position feedback gain increased. It isconcluded that under the aforementioned circumstances, the reflex system adaptsits gains to maximize the mechanical resistance to external force disturbances whilepreserving sufficient stability.
60 CHAPTER 6
6.1 Introduction
Studies addressing the role of spinal reflexes in the regulation of movement andposture have been informative in understanding the impact of diseases with abnor-mal muscle tone including spasticity, dystonia or Parkinson’s disease (Mirbagheriet al., 2001; Schouten et al., 2003; Lee and Tatton, 1975). Studies on the role ofspinal reflexes in the regulation of muscle tone have mainly applied qualitative ap-proaches (Doemges and Rack, 1992a,b; Akazawa et al., 1983; Kanosue et al., 1983).From these studies important features of the proprioceptive reflex system emergedshowing the influence of position and force tasks on proprioceptive reflex magni-tude. However these studies have not provided insight into the functional contri-bution of proprioceptive reflexes to the dynamic relation between force and posi-tion (mechanical admittance), which is crucial in the understanding of how thesereflexes control stable movement and posture. Few studies have focussed on quali-tative characterisation of proprioceptive reflex regulation (Zhang and Rymer, 1997;Kearney et al., 1997; Van der Helm et al., 2002). These studies have used quan-tification methods that basically rely on specific neuromuscular models and opti-misation algorithms to minimize the difference between measured and predictedvariables. Hitherto, all studies have used an indirect approach by estimating reflexparameters from the mechanical admittance. In the mechanical response, intrinsicmuscle visco-elasticity and reflexive contributions coexist. Therefore assumptionson the reflexive component were necessary to separate the intrinsic and reflexivecontributions. Such assumptions on reflex behaviour may introduce a bias in themodel. Consequently, there is a need for methods that directly quantify reflex be-haviour. In a recent study (Schouten et al., 2004a, see Chapter 5) a method wasintroduced to estimate the frequency response functions (FRFs) of the mechanicaladmittance and the reflexive impedance, i.e. the dynamic relation between posi-tion and muscle activation. This study aims to quantify spinal reflexes directly byfitting a neuromusculoskeletal (NMS) model of the arm on both the mechanical ad-mittance and reflexive impedance, obtained simultaneously during posture tasks.
6.2 Materials and methods
6.2.1 Subjects
Two experiments were carried out. In the main experiment ten healthy subjects(4 women, 3 left handed) participated with a mean (standard deviation, SD) age of25.8 (7.0) years. In a second experiment, to estimate the muscle activation dynamics,five subjects (2 women, 2 left handed) participated with a mean (SD) age of 25.4 (3.2)years. All subjects gave informed consent prior to the procedure. All experimentswere conducted on the right arm.
Quantifying spinal reflexes in vivo during postural control 61
6.2.2 Apparatus
Force disturbances were applied to the hand by means of a linear manipulator. Themanipulator is extensively described in Chapter 2 and is introduced briefly. Thesubjects sat in a chair and had to hold a handle with their right hand. Movement ofthe handle resulted in ante-/retroflexion movements of the shoulder-joint. To thesubject the manipulator behaved like a mass-spring-damper system. The parame-ters of the spring (ke), damper (be), and mass (me) are adjustable. In this study themass me was set to a fixed value of 1 kg. The damping be was varied between thetrials, see Procedures. No stiffness was used (ke = 0 N/m).
6.2.3 Procedures
Main experiment
In the main experiment subjects had to hold the handle and were instructed to ‘min-imize the displacements’ of the handle, while continuous random force disturbanceswere applied for 30 s (task stiff). The actual position of the handle was shown on adisplay to assist the subjects and to prevent drift. Only a few trials were necessaryto get the subject acquainted with the task. The following experimental conditionswere applied:
• Wide bandwidth (WB) disturbance without external damping (WB stiff). TheWB disturbance signal had power between between 0.5 and 20 Hz. This con-dition is referred to as the reference condition.
• WB disturbance without external damping and the task slack (WB slack). Herethe task instruction was different from the other: the subject was asked torelax the arm muscles and not to react to the disturbance. This task was onlyused to improve to estimate of the arm mass.
• WB disturbance with external damping. The damping was assigned values of50, 100, 150, 200 Ns/m (B50, B100, B150, B200).
• Narrow bandwidth disturbance type 1 (NB1) without external damping. Thedisturbance signals had a variable bandwidth; the lowest frequency was fixedat 0.5 Hz and the highest frequency fh varied between 1.2 and 3.7 Hz (1.2, 1.5,1.8, 2.4, 3.1, 3.7 Hz).
• Narrow bandwidth disturbance type 2 (NB2) without external damping. Thesignals had a bandwidth of 0.3 Hz concentrated around a variable centre fre-quency fc of 1.3 up to 7 Hz (1.3, 1.8, 2.3, 3, 4, 5, 6, 7 Hz).
The twenty different conditions were repeated four times, resulting in eighty trialsof 30 s each. The trials were presented in a random order. In between the trials thesubject could rest as long as he/she wanted to prevent fatigue. All disturbance sig-nals were designed in the frequency domain as so-called multisine signals with op-timized crest factor (Schoukens et al., 1993; Pintelon and Schoukens, 2001; Schouten
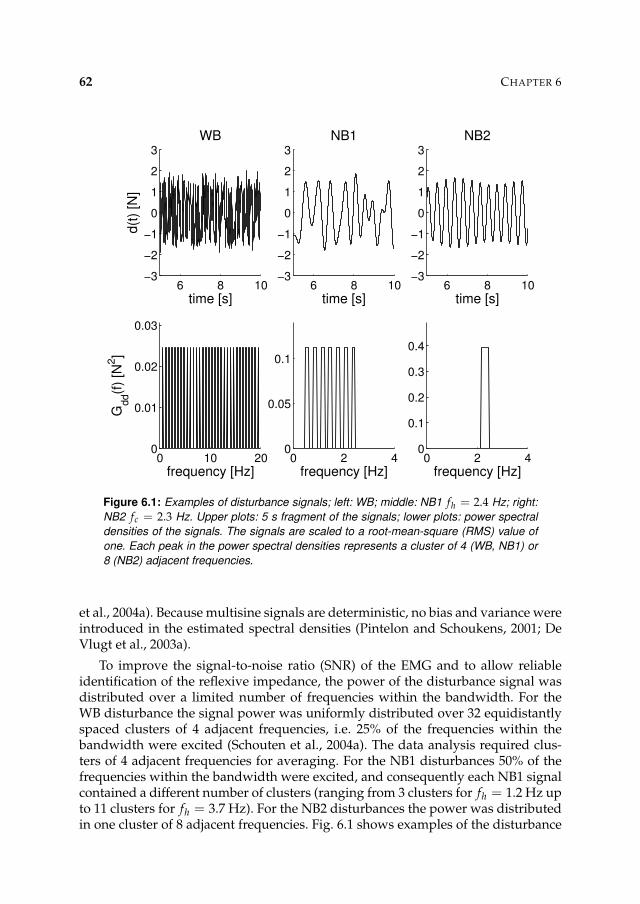
62 CHAPTER 6
6 8 10−3
−2
−1
0
1
2
3
time [s]
d(t
) [N
]WB
0 10 200
0.01
0.02
0.03
frequency [Hz]
Gdd(f
) [N
2]
6 8 10−3
−2
−1
0
1
2
3
time [s]
NB1
0 2 40
0.05
0.1
frequency [Hz]
6 8 10−3
−2
−1
0
1
2
3
time [s]
NB2
0 2 40
0.1
0.2
0.3
0.4
frequency [Hz]
Figure 6.1: Examples of disturbance signals; left: WB; middle: NB1 fh = 2.4 Hz; right:
NB2 fc = 2.3 Hz. Upper plots: 5 s fragment of the signals; lower plots: power spectral
densities of the signals. The signals are scaled to a root-mean-square (RMS) value of
one. Each peak in the power spectral densities represents a cluster of 4 (WB, NB1) or
8 (NB2) adjacent frequencies.
et al., 2004a). Because multisine signals are deterministic, no bias and variance wereintroduced in the estimated spectral densities (Pintelon and Schoukens, 2001; DeVlugt et al., 2003a).
To improve the signal-to-noise ratio (SNR) of the EMG and to allow reliableidentification of the reflexive impedance, the power of the disturbance signal wasdistributed over a limited number of frequencies within the bandwidth. For theWB disturbance the signal power was uniformly distributed over 32 equidistantlyspaced clusters of 4 adjacent frequencies, i.e. 25% of the frequencies within thebandwidth were excited (Schouten et al., 2004a). The data analysis required clus-ters of 4 adjacent frequencies for averaging. For the NB1 disturbances 50% of thefrequencies within the bandwidth were excited, and consequently each NB1 signalcontained a different number of clusters (ranging from 3 clusters for fh = 1.2 Hz upto 11 clusters for fh = 3.7 Hz). For the NB2 disturbances the power was distributedin one cluster of 8 adjacent frequencies. Fig. 6.1 shows examples of the disturbance
Quantifying spinal reflexes in vivo during postural control 63
signals, the lower plots show the power spectral densities of the signals.To justify the use of linear model approximations the position deviations must
be kept small within each condition. Prior to the trials each condition was testedand the amplitude of the force disturbance was adjusted for each condition to ob-tain a root-mean-square (RMS) value for the position of approximately 3 mm.
Since recorded EMG is an electric signal which is meaningless to the mechanicalproperties, the EMG to force ratio was determined to obtain a relative measureof the muscle force. Therefore, subjects were required to perform isometric pushand pull tasks, prior and after the main experiment. The subjects had to maintainconstant force levels for 10 s (-25, -20, -15, 0, 15, 20, 25 N) by pushing or pullingagainst the handle, which was controlled to be in a fixed (rigid) position. Duringthese isometric trials the reference force together with the actual force at the handlewere shown on the display to assist the subject in performing the task. The EMG toforce ratio was determined by linear regression.
Activation dynamics
The EMG to force ratio provides the static relation between muscle activation andmuscle force. The dynamic relation between muscle activation and muscle forcewas determined in a secondary isometric experiment. The secondary experimentstarted and ended with the same push/pull tasks as the main experiment. The ex-periment consists of 8 trials of 30 s. During these trials the subjects performed iso-metric tasks and were asked to make block-shaped forces between approximately25 N push and pull.
6.2.4 Data processing
Signal recording and processing
During a trial the force disturbance d(t), the position of the handle xh(t), the force atthe handle fh(t), and the EMG of four relevant shoulder muscles (e1: m. pectoralismajor, e2: m. deltoideus anterior, e3: m. deltoideus posterior, and e4: m. latissimusdorsi) were recorded at 2500 Hz sample frequency with a 16 bit resolution. Be-fore recording, the EMG signals were high pass filtered to remove DC componentsand movement artefacts (20 Hz, 3th order Butterworth), and low pass filtered toprevent aliasing (1 kHz, 3th order Butterworth). This study investigates stationarybehaviour and to remove any initial transient effect the first 9464 samples (≈ 4 s)were eliminated, leaving 216 samples (≈ 26 s) for further processing.
The EMG signals were used (1) to estimate the amount of co-activation ex-pressed by the mean EMG and (2) to construct the (lumped) muscle activationa(t). The procedure of EMG treatment is described previously in Schouten et al.(2004a) and will be briefly summarized. To improve the quality of the EMG sig-nals a prewhitening filter is implemented, following the procedures as describedin Clancy et al. (2002). The power spectral densities of the EMGs during the max-imum isometric push and pull tasks (25 N) are used to obtain the parameters ofthe prewhitening filter (6th order). For small variations in muscle co-activation it
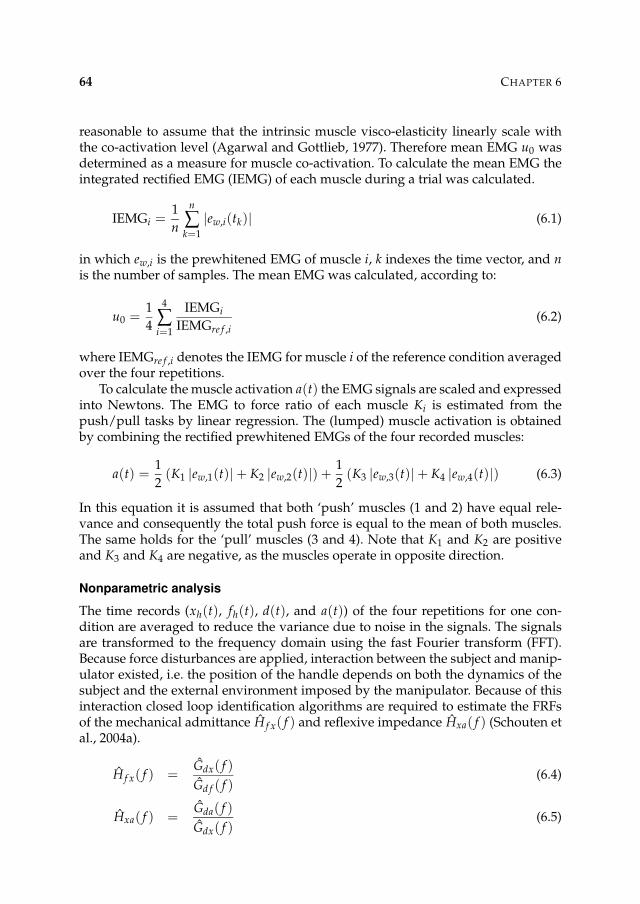
64 CHAPTER 6
reasonable to assume that the intrinsic muscle visco-elasticity linearly scale withthe co-activation level (Agarwal and Gottlieb, 1977). Therefore mean EMG u0 wasdetermined as a measure for muscle co-activation. To calculate the mean EMG theintegrated rectified EMG (IEMG) of each muscle during a trial was calculated.
IEMGi =1
n
n
∑k=1
|ew,i(tk)| (6.1)
in which ew,i is the prewhitened EMG of muscle i, k indexes the time vector, and nis the number of samples. The mean EMG was calculated, according to:
u0 =1
4
4
∑i=1
IEMGi
IEMGre f ,i(6.2)
where IEMGre f ,i denotes the IEMG for muscle i of the reference condition averagedover the four repetitions.
To calculate the muscle activation a(t) the EMG signals are scaled and expressedinto Newtons. The EMG to force ratio of each muscle Ki is estimated from thepush/pull tasks by linear regression. The (lumped) muscle activation is obtainedby combining the rectified prewhitened EMGs of the four recorded muscles:
a(t) =1
2(K1 |ew,1(t)| + K2 |ew,2(t)|) +
1
2(K3 |ew,3(t)| + K4 |ew,4(t)|) (6.3)
In this equation it is assumed that both ‘push’ muscles (1 and 2) have equal rele-vance and consequently the total push force is equal to the mean of both muscles.The same holds for the ‘pull’ muscles (3 and 4). Note that K1 and K2 are positiveand K3 and K4 are negative, as the muscles operate in opposite direction.
Nonparametric analysis
The time records (xh(t), fh(t), d(t), and a(t)) of the four repetitions for one con-dition are averaged to reduce the variance due to noise in the signals. The signalsare transformed to the frequency domain using the fast Fourier transform (FFT).Because force disturbances are applied, interaction between the subject and manip-ulator existed, i.e. the position of the handle depends on both the dynamics of thesubject and the external environment imposed by the manipulator. Because of thisinteraction closed loop identification algorithms are required to estimate the FRFsof the mechanical admittance H f x( f ) and reflexive impedance Hxa( f ) (Schouten etal., 2004a).
H f x( f ) =Gdx( f )
Gd f ( f )(6.4)
Hxa( f ) =Gda( f )
Gdx( f )(6.5)
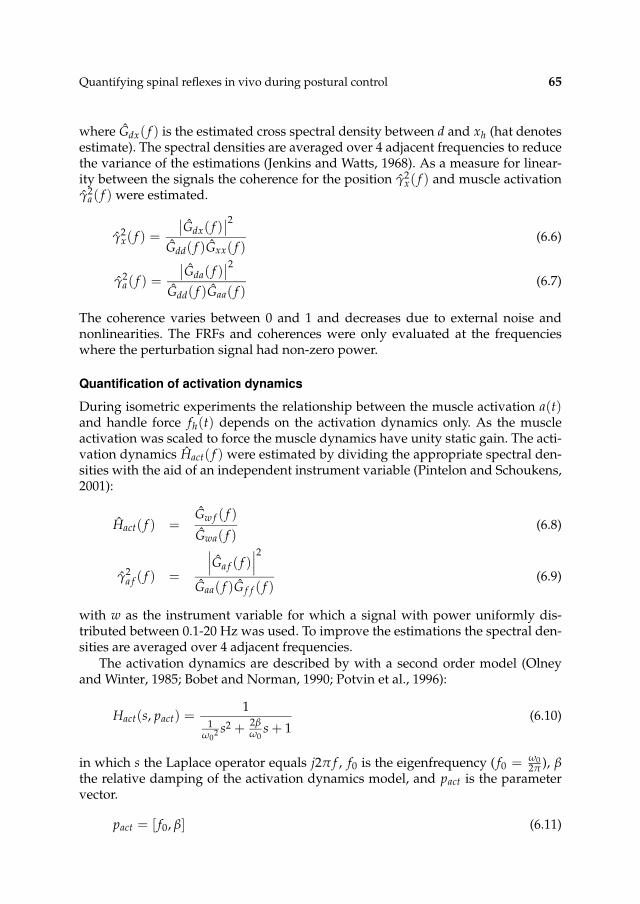
Quantifying spinal reflexes in vivo during postural control 65
where Gdx( f ) is the estimated cross spectral density between d and xh (hat denotesestimate). The spectral densities are averaged over 4 adjacent frequencies to reducethe variance of the estimations (Jenkins and Watts, 1968). As a measure for linear-ity between the signals the coherence for the position γ2
x( f ) and muscle activationγ2
a( f ) were estimated.
γ2x( f ) =
∣
∣Gdx( f )∣
∣
2
Gdd( f )Gxx( f )(6.6)
γ2a( f ) =
∣
∣Gda( f )∣
∣
2
Gdd( f )Gaa( f )(6.7)
The coherence varies between 0 and 1 and decreases due to external noise andnonlinearities. The FRFs and coherences were only evaluated at the frequencieswhere the perturbation signal had non-zero power.
Quantification of activation dynamics
During isometric experiments the relationship between the muscle activation a(t)and handle force fh(t) depends on the activation dynamics only. As the muscleactivation was scaled to force the muscle dynamics have unity static gain. The acti-vation dynamics Hact( f ) were estimated by dividing the appropriate spectral den-sities with the aid of an independent instrument variable (Pintelon and Schoukens,2001):
Hact( f ) =Gw f ( f )
Gwa( f )(6.8)
γ2a f ( f ) =
∣
∣
∣Ga f ( f )
∣
∣
∣
2
Gaa( f )G f f ( f )(6.9)
with w as the instrument variable for which a signal with power uniformly dis-tributed between 0.1-20 Hz was used. To improve the estimations the spectral den-sities are averaged over 4 adjacent frequencies.
The activation dynamics are described by with a second order model (Olneyand Winter, 1985; Bobet and Norman, 1990; Potvin et al., 1996):
Hact(s, pact) =1
1ω0
2 s2 + 2βω0
s + 1(6.10)
in which s the Laplace operator equals j2π f , f0 is the eigenfrequency ( f0 = ω02π ), β
the relative damping of the activation dynamics model, and pact is the parametervector.
pact = [ f0, β] (6.11)
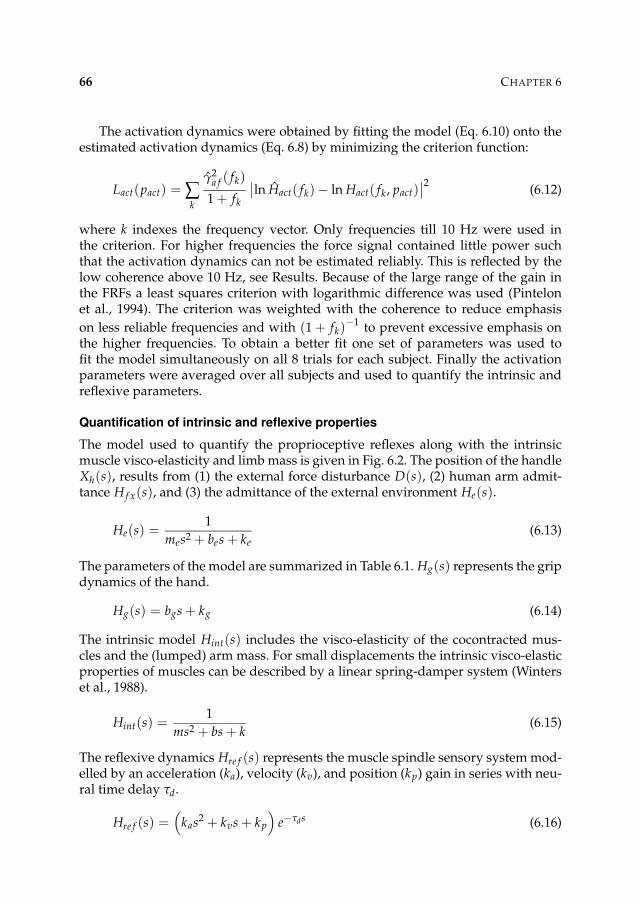
66 CHAPTER 6
The activation dynamics were obtained by fitting the model (Eq. 6.10) onto theestimated activation dynamics (Eq. 6.8) by minimizing the criterion function:
Lact(pact) = ∑k
γ2a f ( fk)
1 + fk
∣
∣ln Hact( fk) − ln Hact( fk, pact)∣
∣
2(6.12)
where k indexes the frequency vector. Only frequencies till 10 Hz were used inthe criterion. For higher frequencies the force signal contained little power suchthat the activation dynamics can not be estimated reliably. This is reflected by thelow coherence above 10 Hz, see Results. Because of the large range of the gain inthe FRFs a least squares criterion with logarithmic difference was used (Pintelonet al., 1994). The criterion was weighted with the coherence to reduce emphasis
on less reliable frequencies and with (1 + fk)−1 to prevent excessive emphasis on
the higher frequencies. To obtain a better fit one set of parameters was used tofit the model simultaneously on all 8 trials for each subject. Finally the activationparameters were averaged over all subjects and used to quantify the intrinsic andreflexive parameters.
Quantification of intrinsic and reflexive properties
The model used to quantify the proprioceptive reflexes along with the intrinsicmuscle visco-elasticity and limb mass is given in Fig. 6.2. The position of the handleXh(s), results from (1) the external force disturbance D(s), (2) human arm admit-tance H f x(s), and (3) the admittance of the external environment He(s).
He(s) =1
mes2 + bes + ke(6.13)
The parameters of the model are summarized in Table 6.1. Hg(s) represents the gripdynamics of the hand.
Hg(s) = bgs + kg (6.14)
The intrinsic model Hint(s) includes the visco-elasticity of the cocontracted mus-cles and the (lumped) arm mass. For small displacements the intrinsic visco-elasticproperties of muscles can be described by a linear spring-damper system (Winterset al., 1988).
Hint(s) =1
ms2 + bs + k(6.15)
The reflexive dynamics Hre f (s) represents the muscle spindle sensory system mod-elled by an acceleration (ka), velocity (kv), and position (kp) gain in series with neu-ral time delay τd.
Hre f (s) =(
kas2 + kvs + kp
)
e−τds (6.16)
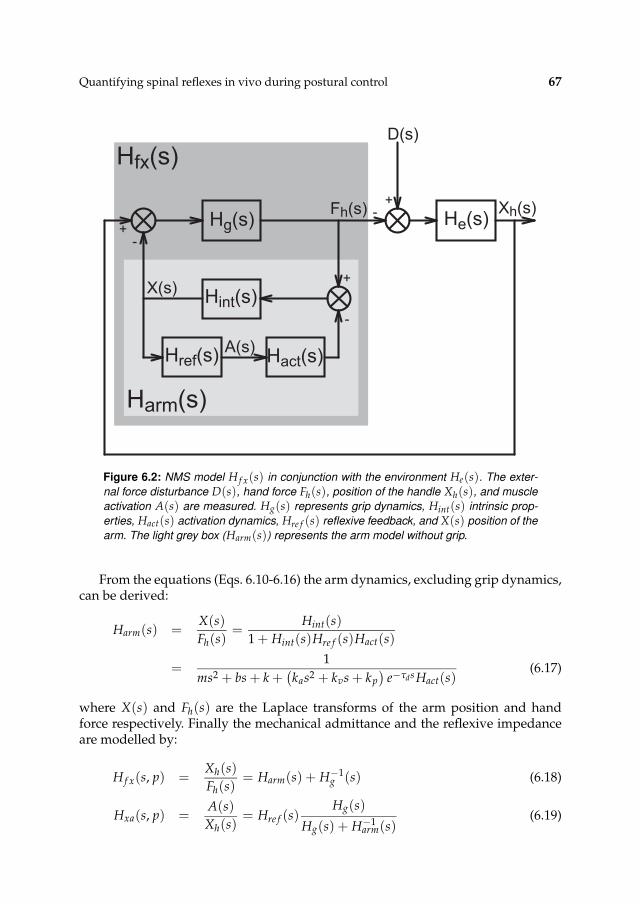
Quantifying spinal reflexes in vivo during postural control 67
Hfx(s)
Hg(s) He(s)
Hint(s)
Hact(s)Href(s)A(s)
Xh(s)
D(s)
Fh(s)
X(s)
Harm(s)
+-
-+
+
-
Figure 6.2: NMS model H f x(s) in conjunction with the environment He(s). The exter-
nal force disturbance D(s), hand force Fh(s), position of the handle Xh(s), and muscle
activation A(s) are measured. Hg(s) represents grip dynamics, Hint(s) intrinsic prop-
erties, Hact(s) activation dynamics, Hre f (s) reflexive feedback, and X(s) position of the
arm. The light grey box (Harm(s)) represents the arm model without grip.
From the equations (Eqs. 6.10-6.16) the arm dynamics, excluding grip dynamics,can be derived:
Harm(s) =X(s)
Fh(s)=
Hint(s)
1 + Hint(s)Hre f (s)Hact(s)
=1
ms2 + bs + k +(
kas2 + kvs + kp
)
e−τdsHact(s)(6.17)
where X(s) and Fh(s) are the Laplace transforms of the arm position and handforce respectively. Finally the mechanical admittance and the reflexive impedanceare modelled by:
H f x(s, p) =Xh(s)
Fh(s)= Harm(s) + H−1
g (s) (6.18)
Hxa(s, p) =A(s)
Xh(s)= Hre f (s)
Hg(s)
Hg(s) + H−1arm(s)
(6.19)
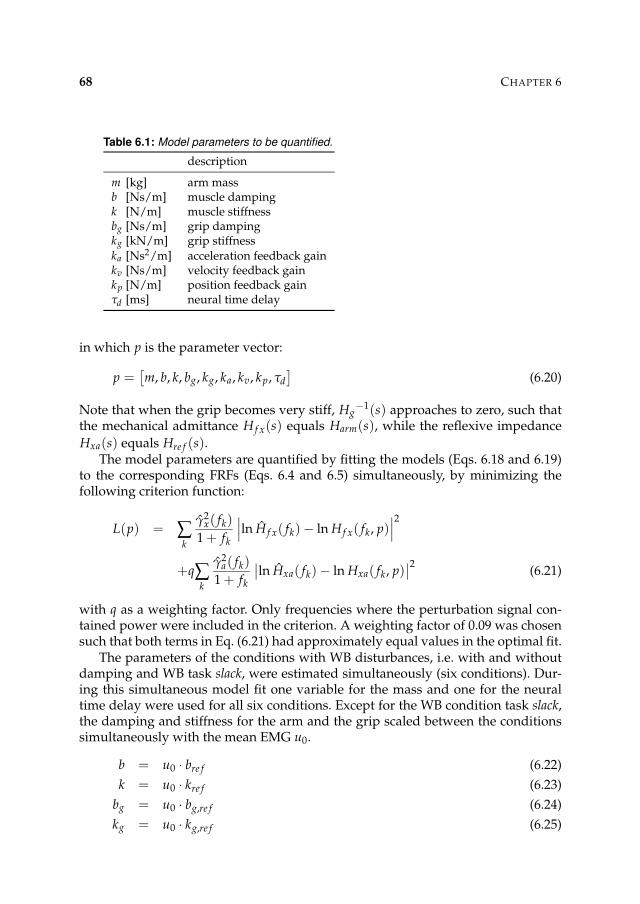
68 CHAPTER 6
Table 6.1: Model parameters to be quantified.
description
m [kg] arm massb [Ns/m] muscle dampingk [N/m] muscle stiffnessbg [Ns/m] grip dampingkg [kN/m] grip stiffnesska [Ns2/m] acceleration feedback gainkv [Ns/m] velocity feedback gainkp [N/m] position feedback gainτd [ms] neural time delay
in which p is the parameter vector:
p =[
m, b, k, bg, kg, ka, kv, kp, τd
]
(6.20)
Note that when the grip becomes very stiff, Hg−1(s) approaches to zero, such that
the mechanical admittance H f x(s) equals Harm(s), while the reflexive impedance
Hxa(s) equals Hre f (s).The model parameters are quantified by fitting the models (Eqs. 6.18 and 6.19)
to the corresponding FRFs (Eqs. 6.4 and 6.5) simultaneously, by minimizing thefollowing criterion function:
L(p) = ∑k
γ2x( fk)
1 + fk
∣
∣
∣ln H f x( fk) − ln H f x( fk, p)
∣
∣
∣
2
+q∑k
γ2a( fk)
1 + fk
∣
∣ln Hxa( fk) − ln Hxa( fk, p)∣
∣
2(6.21)
with q as a weighting factor. Only frequencies where the perturbation signal con-tained power were included in the criterion. A weighting factor of 0.09 was chosensuch that both terms in Eq. (6.21) had approximately equal values in the optimal fit.
The parameters of the conditions with WB disturbances, i.e. with and withoutdamping and WB task slack, were estimated simultaneously (six conditions). Dur-ing this simultaneous model fit one variable for the mass and one for the neuraltime delay were used for all six conditions. Except for the WB condition task slack,the damping and stiffness for the arm and the grip scaled between the conditionssimultaneously with the mean EMG u0.
b = u0 · bre f (6.22)
k = u0 · kre f (6.23)
bg = u0 · bg,re f (6.24)
kg = u0 · kg,re f (6.25)
Quantifying spinal reflexes in vivo during postural control 69
in which re f denotes the parameter value in the reference condition (WB stiff). Forthe condition with task slack only the admittance was fitted (q = 0) and the reflex-ive parameters were omitted. The only function of the slack condition was to get abetter estimate for the mass. Finally the number of parameters was reduced from54 (6 condition with 9 parameters) to 25 (1 mass, 1 time delay, 4 muscle and gripparameters for the reference condition, 4 idem for task slack and 3 reflex gains for 5conditions).
For the NB conditions the FRFs can only be estimated for the limited bandwidthand therefore contain not enough information to estimate the nine model param-eters. To overcome this, it was assumed that the intrinsic parameters (muscle andgrip) scaled with mean EMG using the intrinsic parameters estimated from the ref-erence condition (WB stiff), see Eqs. 6.22-6.25. Furthermore the mass and the neuraltime delay were fixed to the values found with the WB conditions, reducing theparameter vector for the NB conditions to the reflexive parameters only:
p =[
ka, kv, kp
]
(6.26)
Model validation
The variance accounted for (VAF) is calculated to obtain a validity index for thequantified parameters. A VAF of 100% indicates that the linear model fully predictsthe measurements. Noise, nonlinearities and other unmodelled behaviour reducethe VAF. Note that a low coherence (noise or nonlinearities) always results in a lowVAF values.
To calculate the VAF the model is simulated in time with the disturbance d(t) asinput, and the simulated position xh(t) and simulated muscle activation a(t) as theoutputs. Because both the hand position and muscle activation are available frommeasurements, the VAF is calculated for both:
VAFx = 1 − ∑nk=1 |xh(tk) − xh(tk)|2
∑nk=1 |xh(tk)|2
(6.27)
VAFa = 1 − ∑nk=1 |a(tk) − a(tk)|2
∑nk=1 |a(tk)|2
(6.28)
in which k indexes the time sampled vector. All signals are high pass filtered to re-move drift, before calculating the VAF (3th order Butterworth, 1 Hz). The lumpedmuscle activation signal is reconstructed from rectified EMG signals and conse-quently contains high frequency components. To remove these components thelumped muscle activation is low pass filtered (3th order Butterworth, 10 Hz) be-fore calculating the VAF.
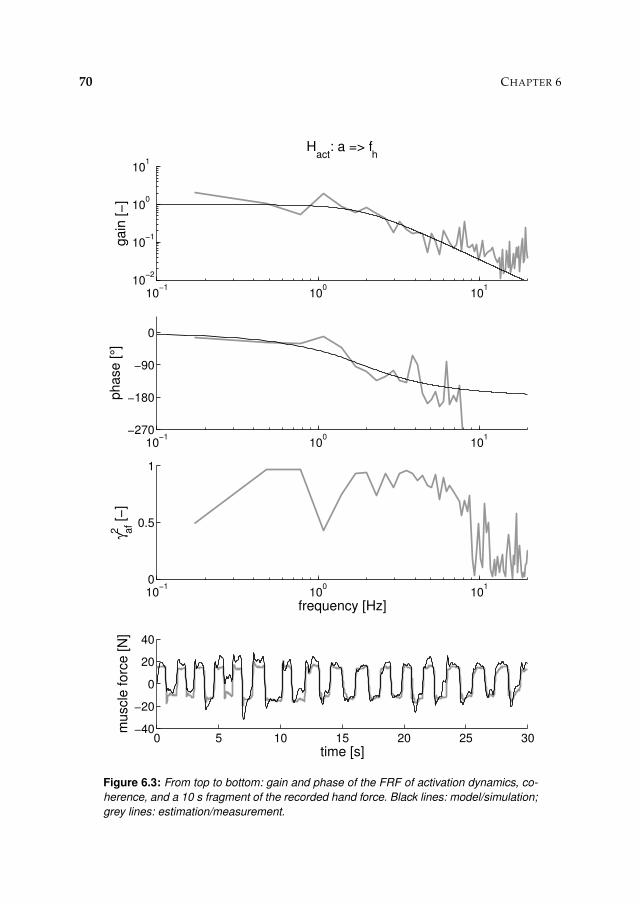
70 CHAPTER 6
0 5 10 15 20 25 30−40
−20
0
20
40
muscle
forc
e [N
]
time [s]
10−1
100
101
10−2
10−1
100
101
Hact
: a => fh
gain
[−
]
10−1
100
101
−270
−180
−90
0
phase [
°]
10−1
100
101
0
0.5
1
γ af
2 [−
]
frequency [Hz]
Figure 6.3: From top to bottom: gain and phase of the FRF of activation dynamics, co-
herence, and a 10 s fragment of the recorded hand force. Black lines: model/simulation;
grey lines: estimation/measurement.
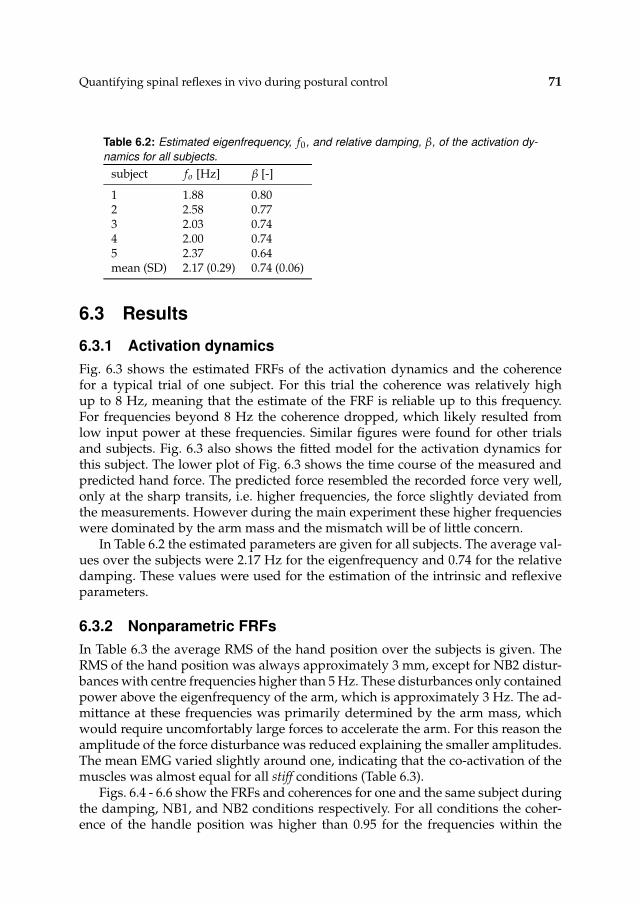
Quantifying spinal reflexes in vivo during postural control 71
Table 6.2: Estimated eigenfrequency, f0, and relative damping, β, of the activation dy-
namics for all subjects.
subject fo [Hz] β [-]
1 1.88 0.802 2.58 0.773 2.03 0.744 2.00 0.745 2.37 0.64mean (SD) 2.17 (0.29) 0.74 (0.06)
6.3 Results
6.3.1 Activation dynamics
Fig. 6.3 shows the estimated FRFs of the activation dynamics and the coherencefor a typical trial of one subject. For this trial the coherence was relatively highup to 8 Hz, meaning that the estimate of the FRF is reliable up to this frequency.For frequencies beyond 8 Hz the coherence dropped, which likely resulted fromlow input power at these frequencies. Similar figures were found for other trialsand subjects. Fig. 6.3 also shows the fitted model for the activation dynamics forthis subject. The lower plot of Fig. 6.3 shows the time course of the measured andpredicted hand force. The predicted force resembled the recorded force very well,only at the sharp transits, i.e. higher frequencies, the force slightly deviated fromthe measurements. However during the main experiment these higher frequencieswere dominated by the arm mass and the mismatch will be of little concern.
In Table 6.2 the estimated parameters are given for all subjects. The average val-ues over the subjects were 2.17 Hz for the eigenfrequency and 0.74 for the relativedamping. These values were used for the estimation of the intrinsic and reflexiveparameters.
6.3.2 Nonparametric FRFs
In Table 6.3 the average RMS of the hand position over the subjects is given. TheRMS of the hand position was always approximately 3 mm, except for NB2 distur-bances with centre frequencies higher than 5 Hz. These disturbances only containedpower above the eigenfrequency of the arm, which is approximately 3 Hz. The ad-mittance at these frequencies was primarily determined by the arm mass, whichwould require uncomfortably large forces to accelerate the arm. For this reason theamplitude of the force disturbance was reduced explaining the smaller amplitudes.The mean EMG varied slightly around one, indicating that the co-activation of themuscles was almost equal for all stiff conditions (Table 6.3).
Figs. 6.4 - 6.6 show the FRFs and coherences for one and the same subject duringthe damping, NB1, and NB2 conditions respectively. For all conditions the coher-ence of the handle position was higher than 0.95 for the frequencies within the
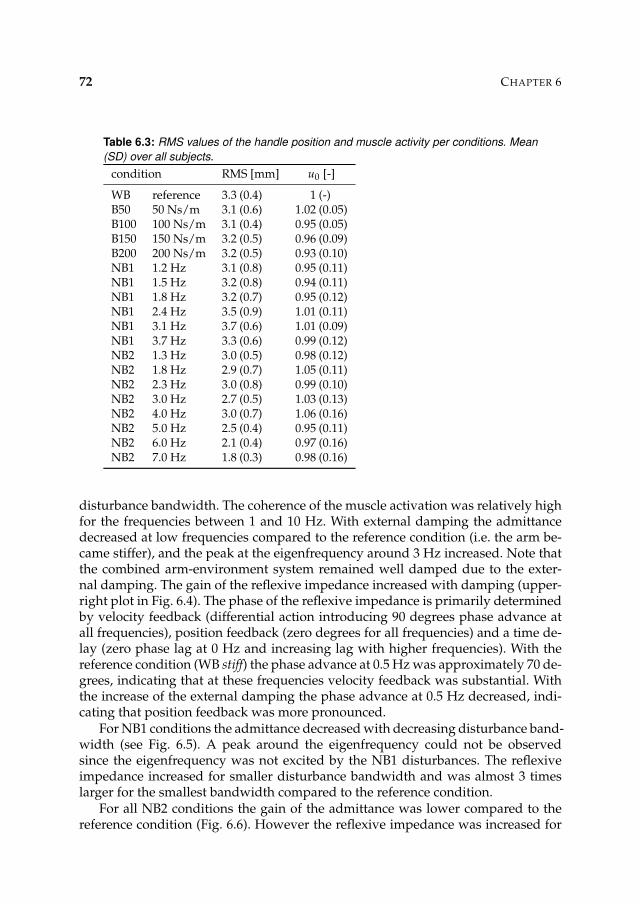
72 CHAPTER 6
Table 6.3: RMS values of the handle position and muscle activity per conditions. Mean
(SD) over all subjects.
condition RMS [mm] u0 [-]
WB reference 3.3 (0.4) 1 (-)B50 50 Ns/m 3.1 (0.6) 1.02 (0.05)B100 100 Ns/m 3.1 (0.4) 0.95 (0.05)B150 150 Ns/m 3.2 (0.5) 0.96 (0.09)B200 200 Ns/m 3.2 (0.5) 0.93 (0.10)NB1 1.2 Hz 3.1 (0.8) 0.95 (0.11)NB1 1.5 Hz 3.2 (0.8) 0.94 (0.11)NB1 1.8 Hz 3.2 (0.7) 0.95 (0.12)NB1 2.4 Hz 3.5 (0.9) 1.01 (0.11)NB1 3.1 Hz 3.7 (0.6) 1.01 (0.09)NB1 3.7 Hz 3.3 (0.6) 0.99 (0.12)NB2 1.3 Hz 3.0 (0.5) 0.98 (0.12)NB2 1.8 Hz 2.9 (0.7) 1.05 (0.11)NB2 2.3 Hz 3.0 (0.8) 0.99 (0.10)NB2 3.0 Hz 2.7 (0.5) 1.03 (0.13)NB2 4.0 Hz 3.0 (0.7) 1.06 (0.16)NB2 5.0 Hz 2.5 (0.4) 0.95 (0.11)NB2 6.0 Hz 2.1 (0.4) 0.97 (0.16)NB2 7.0 Hz 1.8 (0.3) 0.98 (0.16)
disturbance bandwidth. The coherence of the muscle activation was relatively highfor the frequencies between 1 and 10 Hz. With external damping the admittancedecreased at low frequencies compared to the reference condition (i.e. the arm be-came stiffer), and the peak at the eigenfrequency around 3 Hz increased. Note thatthe combined arm-environment system remained well damped due to the exter-nal damping. The gain of the reflexive impedance increased with damping (upper-right plot in Fig. 6.4). The phase of the reflexive impedance is primarily determinedby velocity feedback (differential action introducing 90 degrees phase advance atall frequencies), position feedback (zero degrees for all frequencies) and a time de-lay (zero phase lag at 0 Hz and increasing lag with higher frequencies). With thereference condition (WB stiff) the phase advance at 0.5 Hz was approximately 70 de-grees, indicating that at these frequencies velocity feedback was substantial. Withthe increase of the external damping the phase advance at 0.5 Hz decreased, indi-cating that position feedback was more pronounced.
For NB1 conditions the admittance decreased with decreasing disturbance band-width (see Fig. 6.5). A peak around the eigenfrequency could not be observedsince the eigenfrequency was not excited by the NB1 disturbances. The reflexiveimpedance increased for smaller disturbance bandwidth and was almost 3 timeslarger for the smallest bandwidth compared to the reference condition.
For all NB2 conditions the gain of the admittance was lower compared to thereference condition (Fig. 6.6). However the reflexive impedance was increased for
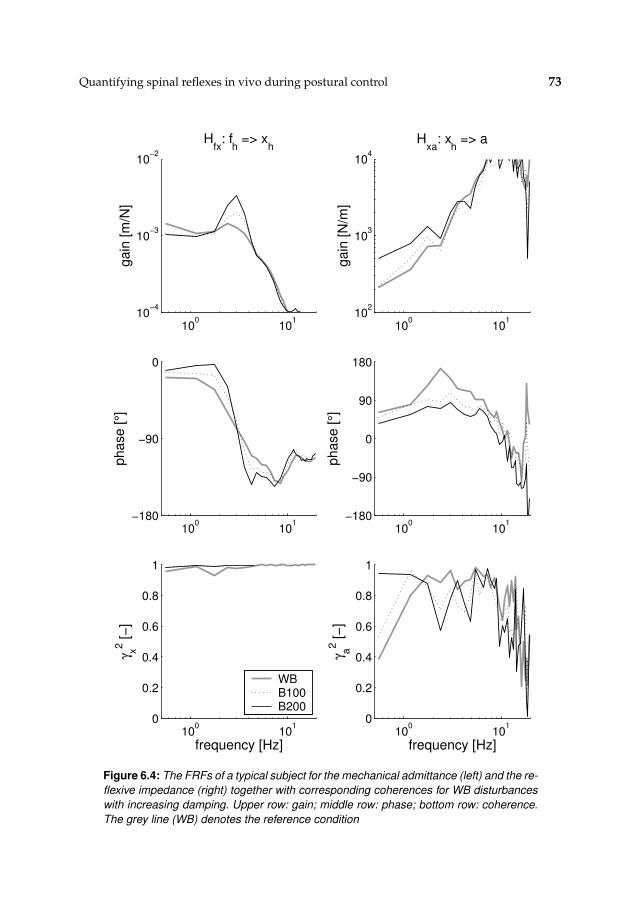
Quantifying spinal reflexes in vivo during postural control 73
100
101
10−4
10−3
10−2
ga
in [
m/N
]H
fx: f
h => x
h
100
101
−180
−90
0
ph
ase
[°]
100
101
0
0.2
0.4
0.6
0.8
1
γ x
2 [
−]
frequency [Hz]
100
101
102
103
104
ga
in [
N/m
]
Hxa
: xh => a
100
101
−180
−90
0
90
180
ph
ase
[°]
100
101
0
0.2
0.4
0.6
0.8
1
γ a
2 [
−]
frequency [Hz]
WBB100B200
Figure 6.4: The FRFs of a typical subject for the mechanical admittance (left) and the re-
flexive impedance (right) together with corresponding coherences for WB disturbances
with increasing damping. Upper row: gain; middle row: phase; bottom row: coherence.
The grey line (WB) denotes the reference condition
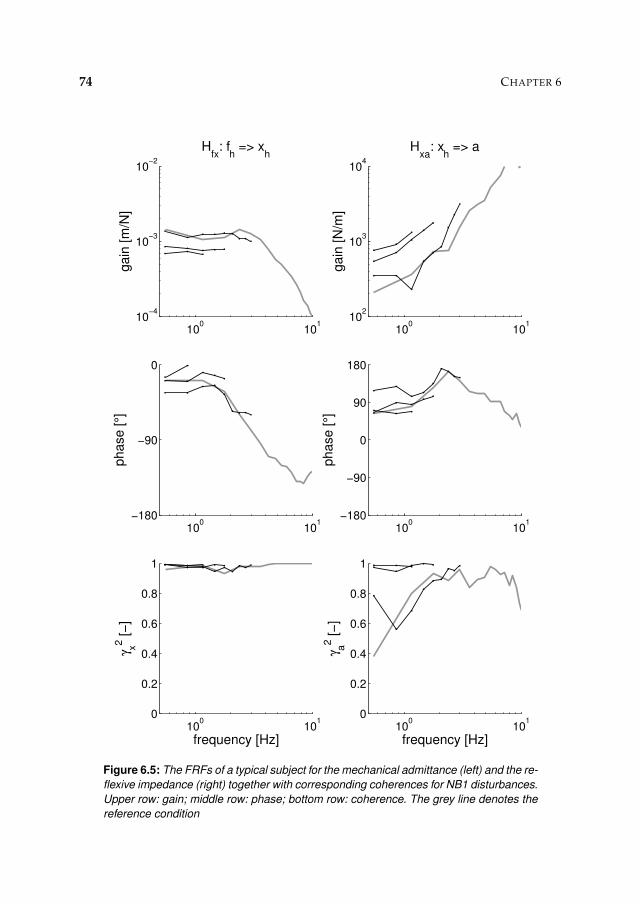
74 CHAPTER 6
100
101
10−4
10−3
10−2
gain
[m
/N]
Hfx
: fh => x
h
100
101
−180
−90
0
phase [
°]
100
101
0
0.2
0.4
0.6
0.8
1
γ x
2 [−
]
frequency [Hz]
100
101
102
103
104
gain
[N
/m]
Hxa
: xh => a
100
101
−180
−90
0
90
180
phase [
°]
100
101
0
0.2
0.4
0.6
0.8
1
γ a
2 [−
]
frequency [Hz]
Figure 6.5: The FRFs of a typical subject for the mechanical admittance (left) and the re-
flexive impedance (right) together with corresponding coherences for NB1 disturbances.
Upper row: gain; middle row: phase; bottom row: coherence. The grey line denotes the
reference condition
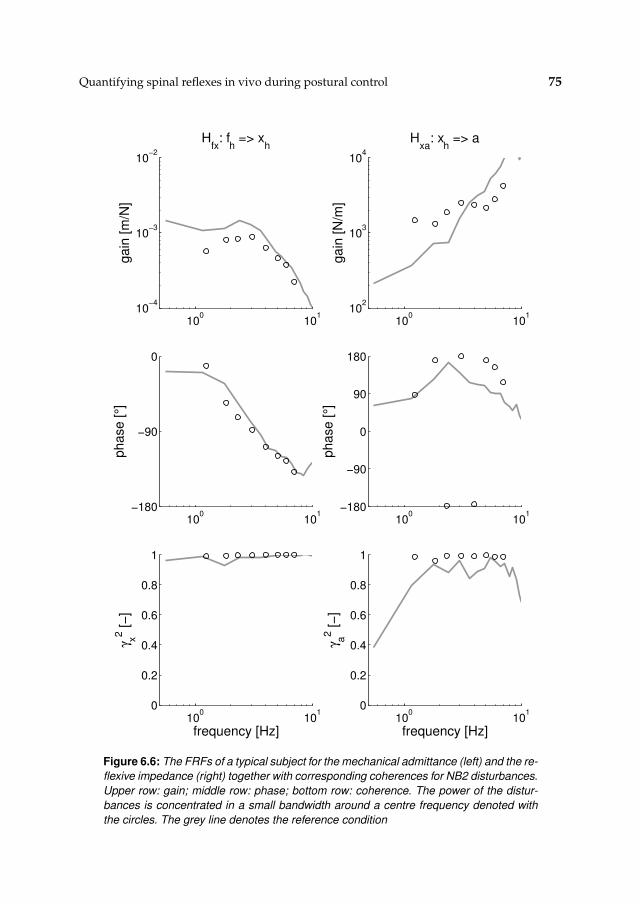
Quantifying spinal reflexes in vivo during postural control 75
100
101
10−4
10−3
10−2
gain
[m
/N]
Hfx
: fh => x
h
100
101
−180
−90
0
phase [
°]
100
101
0
0.2
0.4
0.6
0.8
1
γ x
2 [−
]
frequency [Hz]
100
101
102
103
104
gain
[N
/m]
Hxa
: xh => a
100
101
−180
−90
0
90
180
phase [
°]
100
101
0
0.2
0.4
0.6
0.8
1
γ a
2 [−
]
frequency [Hz]
Figure 6.6: The FRFs of a typical subject for the mechanical admittance (left) and the re-
flexive impedance (right) together with corresponding coherences for NB2 disturbances.
Upper row: gain; middle row: phase; bottom row: coherence. The power of the distur-
bances is concentrated in a small bandwidth around a centre frequency denoted with
the circles. The grey line denotes the reference condition
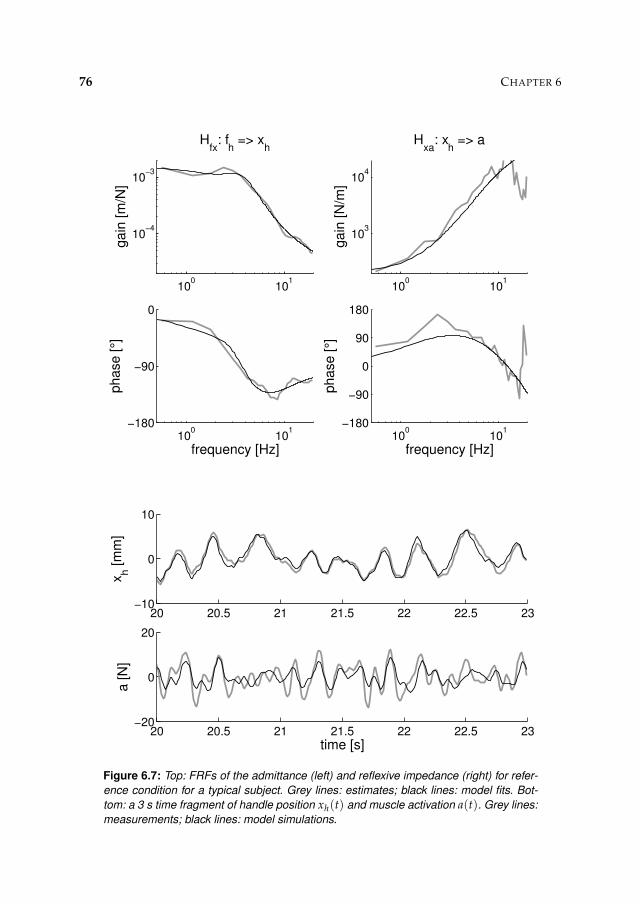
76 CHAPTER 6
100
101
10−4
10−3
gain
[m
/N]
Hfx
: fh => x
h
100
101
−180
−90
0
phase [
°]
frequency [Hz]
100
101
103
104
gain
[N
/m]
Hxa
: xh => a
100
101
−180
−90
0
90
180
phase [
°]
frequency [Hz]
20 20.5 21 21.5 22 22.5 23−10
0
10
xh [m
m]
20 20.5 21 21.5 22 22.5 23−20
0
20
a [N
]
time [s]
Figure 6.7: Top: FRFs of the admittance (left) and reflexive impedance (right) for refer-
ence condition for a typical subject. Grey lines: estimates; black lines: model fits. Bot-
tom: a 3 s time fragment of handle position xh(t) and muscle activation a(t). Grey lines:
measurements; black lines: model simulations.
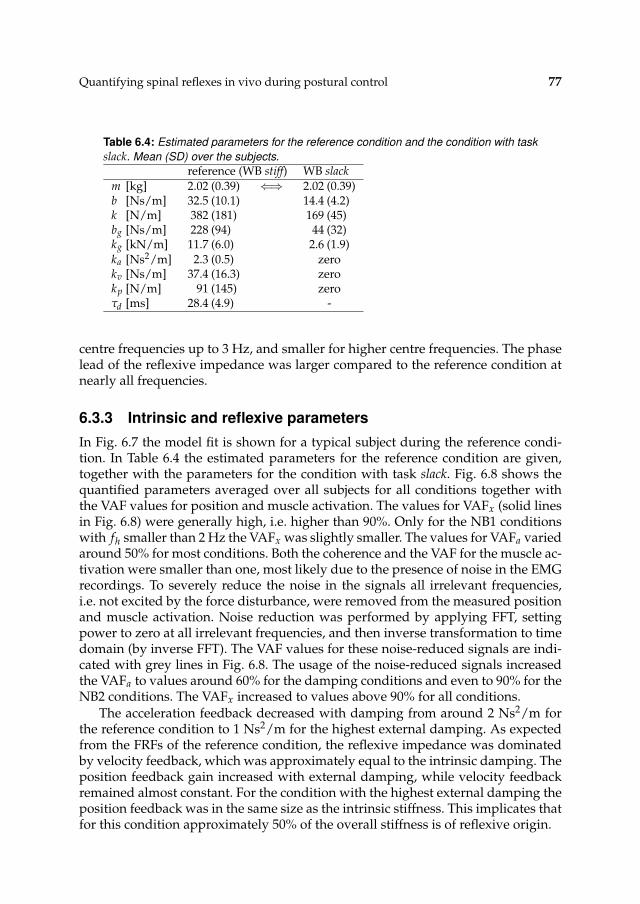
Quantifying spinal reflexes in vivo during postural control 77
Table 6.4: Estimated parameters for the reference condition and the condition with task
slack. Mean (SD) over the subjects.
reference (WB stiff) WB slack
m [kg] 2.02 (0.39) ⇐⇒ 2.02 (0.39)b [Ns/m] 32.5 (10.1) 14.4 (4.2)k [N/m] 382 (181) 169 (45)bg [Ns/m] 228 (94) 44 (32)kg [kN/m] 11.7 (6.0) 2.6 (1.9)ka [Ns2/m] 2.3 (0.5) zerokv [Ns/m] 37.4 (16.3) zerokp [N/m] 91 (145) zeroτd [ms] 28.4 (4.9) -
centre frequencies up to 3 Hz, and smaller for higher centre frequencies. The phaselead of the reflexive impedance was larger compared to the reference condition atnearly all frequencies.
6.3.3 Intrinsic and reflexive parameters
In Fig. 6.7 the model fit is shown for a typical subject during the reference condi-tion. In Table 6.4 the estimated parameters for the reference condition are given,together with the parameters for the condition with task slack. Fig. 6.8 shows thequantified parameters averaged over all subjects for all conditions together withthe VAF values for position and muscle activation. The values for VAFx (solid linesin Fig. 6.8) were generally high, i.e. higher than 90%. Only for the NB1 conditionswith fh smaller than 2 Hz the VAFx was slightly smaller. The values for VAFa variedaround 50% for most conditions. Both the coherence and the VAF for the muscle ac-tivation were smaller than one, most likely due to the presence of noise in the EMGrecordings. To severely reduce the noise in the signals all irrelevant frequencies,i.e. not excited by the force disturbance, were removed from the measured positionand muscle activation. Noise reduction was performed by applying FFT, settingpower to zero at all irrelevant frequencies, and then inverse transformation to timedomain (by inverse FFT). The VAF values for these noise-reduced signals are indi-cated with grey lines in Fig. 6.8. The usage of the noise-reduced signals increasedthe VAFa to values around 60% for the damping conditions and even to 90% for theNB2 conditions. The VAFx increased to values above 90% for all conditions.
The acceleration feedback decreased with damping from around 2 Ns2/m forthe reference condition to 1 Ns2/m for the highest external damping. As expectedfrom the FRFs of the reference condition, the reflexive impedance was dominatedby velocity feedback, which was approximately equal to the intrinsic damping. Theposition feedback gain increased with external damping, while velocity feedbackremained almost constant. For the condition with the highest external damping theposition feedback was in the same size as the intrinsic stiffness. This implicates thatfor this condition approximately 50% of the overall stiffness is of reflexive origin.
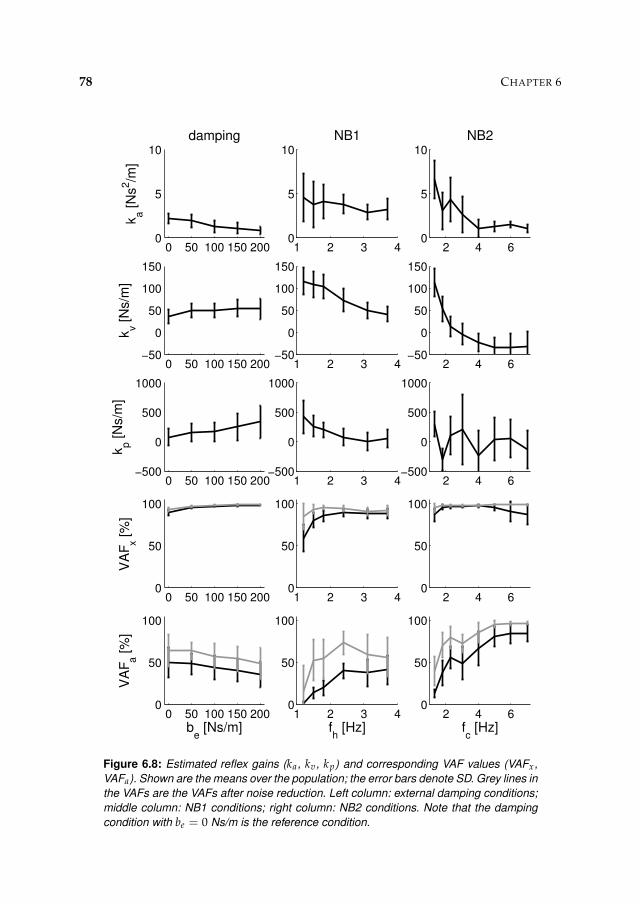
78 CHAPTER 6
0 50 100 150 2000
5
10
ka [
Ns
2/m
]damping
0 50 100 150 200−50
0
50
100
150
kv [
Ns/m
]
0 50 100 150 200−500
0
500
1000
kp [
Ns/m
]
0 50 100 150 2000
50
100
VA
Fx [
%]
0 50 100 150 2000
50
100
VA
Fa [
%]
be [Ns/m]
1 2 3 40
5
10NB1
1 2 3 4−50
0
50
100
150
1 2 3 4−500
0
500
1000
1 2 3 40
50
100
1 2 3 40
50
100
fh [Hz]
2 4 60
5
10NB2
2 4 6−50
0
50
100
150
2 4 6−500
0
500
1000
2 4 60
50
100
2 4 60
50
100
fc [Hz]
Figure 6.8: Estimated reflex gains (ka, kv, kp) and corresponding VAF values (VAFx,
VAFa). Shown are the means over the population; the error bars denote SD. Grey lines in
the VAFs are the VAFs after noise reduction. Left column: external damping conditions;
middle column: NB1 conditions; right column: NB2 conditions. Note that the damping
condition with be = 0 Ns/m is the reference condition.
Quantifying spinal reflexes in vivo during postural control 79
For the NB1 conditions both position and velocity feedback increased with de-creasing bandwidth. For the largest bandwidth the reflex gains approached to thevalues corresponding to the reference condition. The mean values for the accel-eration feedback gains did not show a clear trend with external damping. For thesmallest bandwidth the SD was relatively high, most likely as acceleration feedbackhas minor effect on low frequencies.
For the NB2 conditions both the acceleration and velocity feedback increasedwith decreasing centre frequency. The SD of the position feedback is high and notrend is seen over the conditions. The high standard deviation indicates that theposition feedback gain (1) can not be quantified accurately for these conditions and(2) has minor effect for these disturbances.
6.4 Discussion
6.4.1 Methodology
In this study a method is developed to quantify the (dynamic) properties of pro-prioceptive reflexes in vivo. This method is an important tool to evaluate the reg-ulation of spinal reflexes during posture tasks. The use of force disturbances ap-peared natural to the subjects, facilitating the application of an unambiguous po-sition task. Reflex gains were quantified by fitting linear models onto estimatedinput-output behaviour. Both the mechanical admittance and reflexive impedancewere estimated on which a linear NMS model was fitted. The incorporation of thereflexive impedance into the quantification method is new and gives direct insightinto the contribution of the underlying reflexive feedback system to the overall me-chanical behaviour of the arm. The method has the advantage that intrinsic andreflexive parameters, including the neural time delay, can be estimated simultane-ously.
The estimated coherences were high, justifying the usage of linear models. Be-low 1 Hz and above 10 Hz the coherence of the muscle activation was relatively low,which is likely is the result of uncorrelated corrective muscle contractions to pre-vent drifting of the hand position and noise inherent to EMG. The estimated FRFs ofthe arm admittance showed that reflexes are effective in increasing the mechanicalresistance to external force disturbances, as indicated by smaller mechanical admit-tance and higher reflexive impedance (Figs. 6.4 - 6.6). The quantified parametersresulted in accurate model predictions of both hand position and muscle activa-tion, as proved by the high VAF values for almost all experimental conditions. Thesmall intersubject variability of the estimated time delay indicates that this param-eter is obtained with high accuracy. A mean value of ± 29 ms indicates that theidentified reflexive feedback system is mediated via monosynaptic neural connec-tions, i.e. short latency spinal pathways. Clear trends in the estimated reflex gainswere seen which indicate that the reflex system adapts to the external conditionsapplied. This study shows that for some conditions half of the joint stiffness is ofreflexive origin.
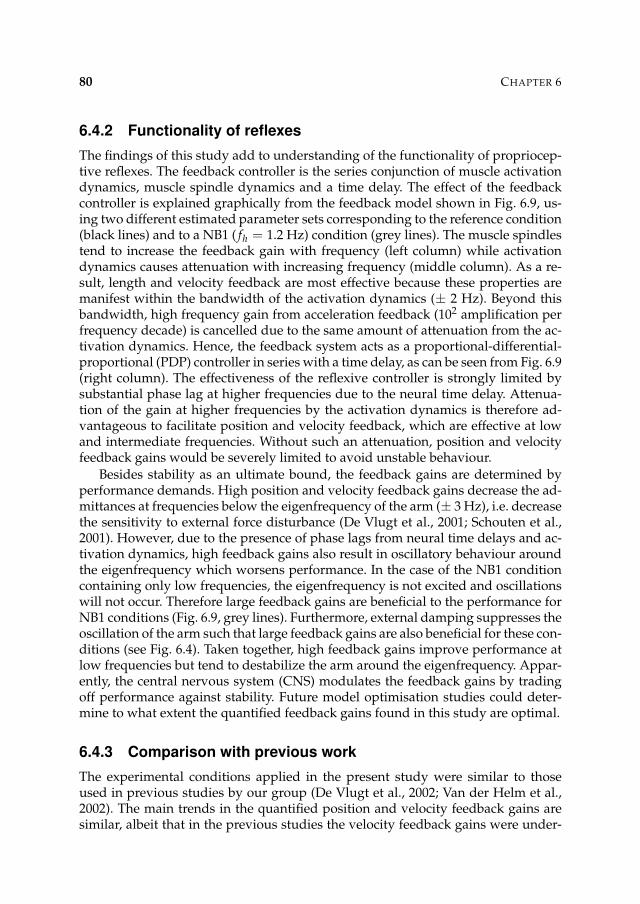
80 CHAPTER 6
6.4.2 Functionality of reflexes
The findings of this study add to understanding of the functionality of propriocep-tive reflexes. The feedback controller is the series conjunction of muscle activationdynamics, muscle spindle dynamics and a time delay. The effect of the feedbackcontroller is explained graphically from the feedback model shown in Fig. 6.9, us-ing two different estimated parameter sets corresponding to the reference condition(black lines) and to a NB1 ( fh = 1.2 Hz) condition (grey lines). The muscle spindlestend to increase the feedback gain with frequency (left column) while activationdynamics causes attenuation with increasing frequency (middle column). As a re-sult, length and velocity feedback are most effective because these properties aremanifest within the bandwidth of the activation dynamics (± 2 Hz). Beyond thisbandwidth, high frequency gain from acceleration feedback (102 amplification perfrequency decade) is cancelled due to the same amount of attenuation from the ac-tivation dynamics. Hence, the feedback system acts as a proportional-differential-proportional (PDP) controller in series with a time delay, as can be seen from Fig. 6.9(right column). The effectiveness of the reflexive controller is strongly limited bysubstantial phase lag at higher frequencies due to the neural time delay. Attenua-tion of the gain at higher frequencies by the activation dynamics is therefore ad-vantageous to facilitate position and velocity feedback, which are effective at lowand intermediate frequencies. Without such an attenuation, position and velocityfeedback gains would be severely limited to avoid unstable behaviour.
Besides stability as an ultimate bound, the feedback gains are determined byperformance demands. High position and velocity feedback gains decrease the ad-mittances at frequencies below the eigenfrequency of the arm (± 3 Hz), i.e. decreasethe sensitivity to external force disturbance (De Vlugt et al., 2001; Schouten et al.,2001). However, due to the presence of phase lags from neural time delays and ac-tivation dynamics, high feedback gains also result in oscillatory behaviour aroundthe eigenfrequency which worsens performance. In the case of the NB1 conditioncontaining only low frequencies, the eigenfrequency is not excited and oscillationswill not occur. Therefore large feedback gains are beneficial to the performance forNB1 conditions (Fig. 6.9, grey lines). Furthermore, external damping suppresses theoscillation of the arm such that large feedback gains are also beneficial for these con-ditions (see Fig. 6.4). Taken together, high feedback gains improve performance atlow frequencies but tend to destabilize the arm around the eigenfrequency. Appar-ently, the central nervous system (CNS) modulates the feedback gains by tradingoff performance against stability. Future model optimisation studies could deter-mine to what extent the quantified feedback gains found in this study are optimal.
6.4.3 Comparison with previous work
The experimental conditions applied in the present study were similar to thoseused in previous studies by our group (De Vlugt et al., 2002; Van der Helm et al.,2002). The main trends in the quantified position and velocity feedback gains aresimilar, albeit that in the previous studies the velocity feedback gains were under-
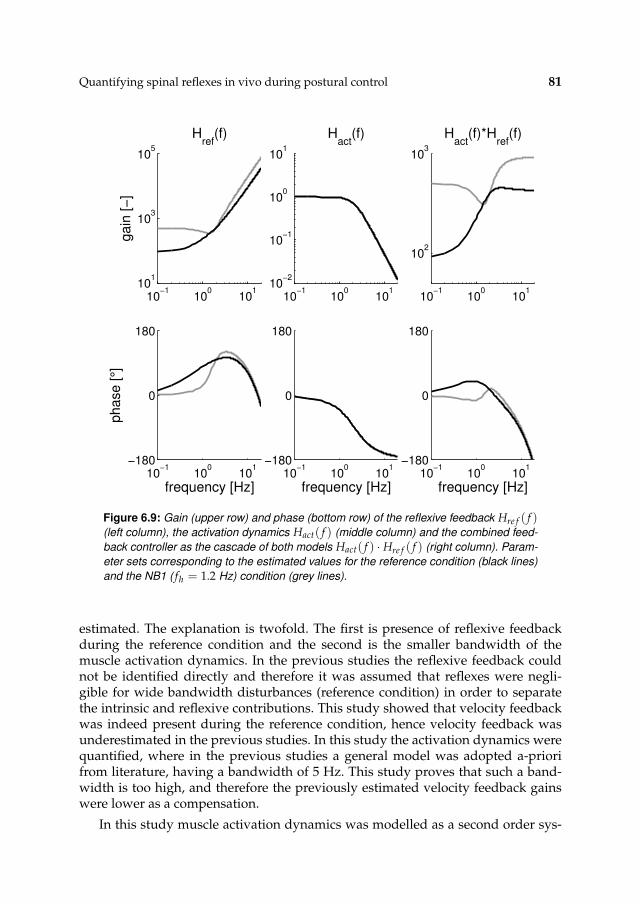
Quantifying spinal reflexes in vivo during postural control 81
10−1
100
101
101
103
105
ga
in [
−]
Href
(f)
10−1
100
101
−180
0
180
frequency [Hz]
ph
ase
[°]
10−1
100
101
10−2
10−1
100
101
Hact
(f)
10−1
100
101
−180
0
180
frequency [Hz]
10−1
100
101
102
103
Hact
(f)*Href
(f)
10−1
100
101
−180
0
180
frequency [Hz]
Figure 6.9: Gain (upper row) and phase (bottom row) of the reflexive feedback Hre f ( f )(left column), the activation dynamics Hact( f ) (middle column) and the combined feed-
back controller as the cascade of both models Hact( f ) · Hre f ( f ) (right column). Param-
eter sets corresponding to the estimated values for the reference condition (black lines)
and the NB1 ( fh = 1.2 Hz) condition (grey lines).
estimated. The explanation is twofold. The first is presence of reflexive feedbackduring the reference condition and the second is the smaller bandwidth of themuscle activation dynamics. In the previous studies the reflexive feedback couldnot be identified directly and therefore it was assumed that reflexes were negli-gible for wide bandwidth disturbances (reference condition) in order to separatethe intrinsic and reflexive contributions. This study showed that velocity feedbackwas indeed present during the reference condition, hence velocity feedback wasunderestimated in the previous studies. In this study the activation dynamics werequantified, where in the previous studies a general model was adopted a-priorifrom literature, having a bandwidth of 5 Hz. This study proves that such a band-width is too high, and therefore the previously estimated velocity feedback gainswere lower as a compensation.
In this study muscle activation dynamics was modelled as a second order sys-
82 CHAPTER 6
tem. The quantified cut off frequency is 2.17 Hz and the relative damping is 0.75.These values are similar to those found in the literature. Potvin et al. (1996) found arather wide range for trunk extensor muscles (2.0-3.3 Hz) while Bobet and Norman(1990) identified the elbow flexor and extensor muscles and found values of 1.9-2.8Hz. Olney and Winter (1985) estimated values of 1.0-2.8 Hz for lower limb musclesduring walking.
In this study, an acceleration feedback gain was included in the reflexive feed-back to describe the reflexive impedance at higher frequencies. Kukreja et al. (2003)showed that linearisation of a unidirectional velocity sensitivity results in higher or-der terms including a pronounced acceleration term. In a recent study, the reflexiveimpedance was estimated from a nonlinear NMS model including unidirectionalvelocity sensitivity (Stienen et al., 2003, see Chapter 10). The gain and phase char-acteristics were comparable to those found in this study (Figs. 6.4 - 6.6) showinga clear second order (acceleration) response. This suggests that acceleration feed-back is an artefact of muscle spindle unidirectionality rather than a distinct sensoryfunction.
Chapter 7
Design of a torque-controlled wrist
manipulator
Alfred C. Schouten, Erwin de Vlugt, J.J. (Bob) van Hilten,Frans C.T. van der Helm
Submitted to Applied Bionics and Biomechanics
Torque disturbances are useful to analyse the functionality of proprioceptive re-flexes. This paper describes the design of a torque controlled manipulator to iden-tify the dynamics of the wrist joint during postural control. The device consists ofan electromotor, a lever and a handle. A haptic controller is implemented to applytorque disturbances, such that the subject can actively control the wrist angle. To letthe subject ‘feel’ the torque disturbance as good as possible the apparent, or virtual,dynamics of the device must be small. The minimal apparent inertia of the deviceis 1.6 gm2, which is in the same order of a normal wrist, the minimal damping andstiffness are negligible. To judge the performance of the manipulator, loads withknown physical properties are attached and their parameters were quantified. Theparameters of the loads were estimated with deviations of 5% at maximum. Finallythe wrist dynamics of a human subject are quantified. The haptic controller has abandwidth of 50 Hz, meaning that the apparent dynamics are realistically felt till50 Hz. As the eigenfrequency of a (co)-contracted human wrist is approximately15 Hz, a 50 Hz bandwidth of the haptic device is sufficient to measure all relevantdynamics of the human wrist.

84 CHAPTER 7
7.1 Introduction
This paper describes the design of a high performance torque controlled manipula-tor to measure the admittance at the wrist joint. A recent study quantifying propri-oceptive reflexes at the shoulder with force disturbances showed that the method ofVan der Helm et al. (2002) is useful to get insight in the pathophysiology of CRPS(Schouten et al., 2003, see Chapter 3). The motoric features of neurological disor-ders like CRPS and Parkinson’s disease however, mostly develop in distal jointsand slowly progress proximal. To measure changes in reflex settings in the earlystages of these disorders it is desirable to quantify reflexes around a distal joint likethe wrist.
The joint admittance will be assessed by perturbing the subject’s wrist withtorque disturbances and measuring the angular deviations. To minimize the inertiaapparent to the subject the manipulator needs to be light-weight. To further reducethe apparent dynamics a haptic controller is implemented, which replaces the realdynamics with a virtual, or external, environment. To analyse the performance ofthe haptic device, systems with known physical properties are attached to the ma-nipulator and perturbed with use of continuous torque disturbances. To judge theperformance of the manipulator, the parameters of the test loads are quantified bymodelling the dynamic response. Finally the wrist dynamics of a human subject arequantified.
7.2 Materials and methods
7.2.1 Apparatus
Manipulator design
The manipulator is designed to apply flexion and extension torques to the wrist,resulting in an one degree-of-freedom (1-DOF) manipulator, see Fig. 7.1. The ma-nipulator consists of an electromotor, a lever and, a handle. The torque applied bythe subject is measured by a torque transducer mounted approximately halfwaythe lever. To prevent movement of the forearm the subject is supported by an armsupport.
A brushless disc motor (Baumüller, DSM130N) is chosen to drive the manip-ulator. These disc motors are designed for very low cogging and the absence ofbrushes results in very low friction. The motor has a special winding design to gen-erate high torques at low speed (8.0 Nm continuous, max. 500 rpm). High torquesare required because the manipulator must be able to operate even when the subjectmaximally resists (‘maintain the deviations’ task). Because the motor can operate atlow speeds there is no need for a gearbox, avoiding friction and tolerance. The mo-tor is equipped with a SinCos encoder to measure the angle accurately (StegmannSRS50). The current needed to drive to motor is supplied by a combined ampli-fier/control unit (Baumüller BUM60), which includes current feedback to improvemotor performance.

Design of a torque-controlled wrist manipulator 85
Figure 7.1: Schematic side view of the wrist manipulator. Subject holds the handle with
the left or right hand, while the forearm is supported by the arm support. The subject
can freely flex and extend the wrist, while the manipulator applies torque disturbances.
The lever, which transfers the torque from the motor to the handle, is attacheddirectly to the shaft. The lever has a fixed length to align the wrist joint of an aver-age size hand with the motor axis (axis to axis: 70 mm). To reduce weight the leveris made of a high strength aluminium alloy (7075T-6). The handle consists of twoparts: a plastic grip and a core made of aluminium alloy (7075T-6). The grip has alength of 110 mm and a diameter of 32 mm giving a comfortable grip. To measurethe torque exerted by the subject, the lever contains a custom-made torque trans-ducer, consisting of straingauges (HBM, XK13E-3/350) in a full bridge.
Manipulator control
The standard amplifier/control unit, which comes with the electromotor, is usedas a velocity servo-controller, and operates at a sample frequency of 16 kHz. Thevelocity servo forms an inner loop within the haptic controller. The haptic controlleris implemented using a digital signal processor (DSP) board (dSPACE, DS1104)within a normal PC and provides the reference velocity for the velocity servo. Allrelevant signals are sampled by the DSP with 16-bit resolution and 5 kHz samplefrequency.
In order to apply torque disturbances, a haptic controller is used to control themanipulator. The haptic controller replaces the real manipulator dynamics with ex-ternal dynamics, in this case, a (rotational) mass-spring-damper system, see Fig. 7.2.This means that to the subject the manipulator ‘feels’ like a mass-spring-dampersystem, i.e. the external environment (haptic is Greek for ‘touch sense’).
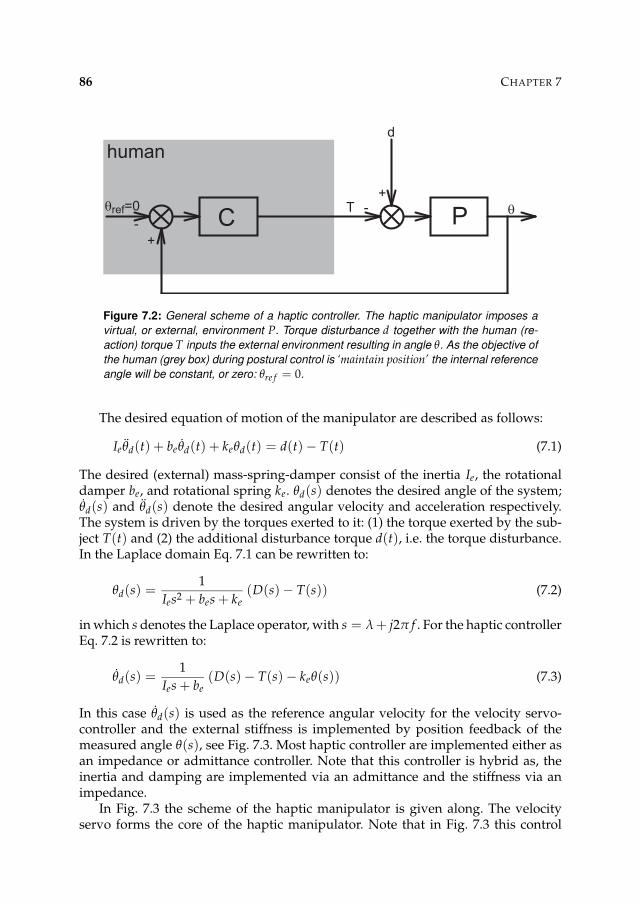
86 CHAPTER 7
θref=0
d
-
+
+-
P θC
T
human
Figure 7.2: General scheme of a haptic controller. The haptic manipulator imposes a
virtual, or external, environment P. Torque disturbance d together with the human (re-
action) torque T inputs the external environment resulting in angle θ. As the objective of
the human (grey box) during postural control is ‘maintain position’ the internal reference
angle will be constant, or zero: θre f = 0.
The desired equation of motion of the manipulator are described as follows:
Ie θd(t) + be θd(t) + keθd(t) = d(t) − T(t) (7.1)
The desired (external) mass-spring-damper consist of the inertia Ie, the rotationaldamper be, and rotational spring ke. θd(s) denotes the desired angle of the system;θd(s) and θd(s) denote the desired angular velocity and acceleration respectively.The system is driven by the torques exerted to it: (1) the torque exerted by the sub-ject T(t) and (2) the additional disturbance torque d(t), i.e. the torque disturbance.In the Laplace domain Eq. 7.1 can be rewritten to:
θd(s) =1
Ies2 + bes + ke(D(s) − T(s)) (7.2)
in which s denotes the Laplace operator, with s = λ + j2π f . For the haptic controllerEq. 7.2 is rewritten to:
θd(s) =1
Ies + be(D(s) − T(s) − keθ(s)) (7.3)
In this case θd(s) is used as the reference angular velocity for the velocity servo-controller and the external stiffness is implemented by position feedback of themeasured angle θ(s), see Fig. 7.3. Most haptic controller are implemented either asan impedance or admittance controller. Note that this controller is hybrid as, theinertia and damping are implemented via an admittance and the stiffness via animpedance.
In Fig. 7.3 the scheme of the haptic manipulator is given along. The velocityservo forms the core of the haptic manipulator. Note that in Fig. 7.3 this control
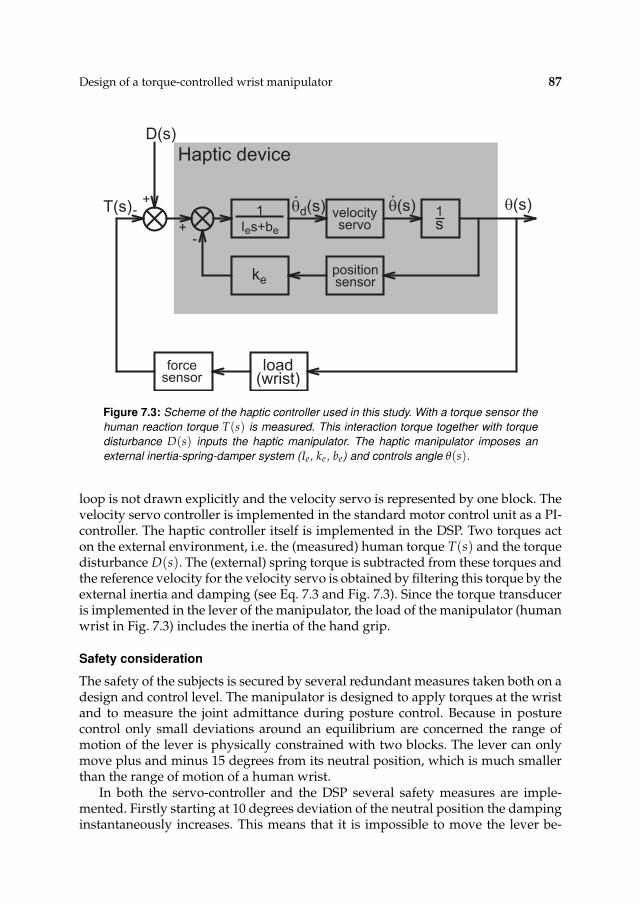
Design of a torque-controlled wrist manipulator 87
D(s)
θ(s) .θd(s)
forcesensor
load(wrist)
positionsensor
ke
velocityservo
1
Ies+be
1s
.θ(s)-
+
-+
Haptic device
T(s)
Figure 7.3: Scheme of the haptic controller used in this study. With a torque sensor the
human reaction torque T(s) is measured. This interaction torque together with torque
disturbance D(s) inputs the haptic manipulator. The haptic manipulator imposes an
external inertia-spring-damper system (Ie, ke, be) and controls angle θ(s).
loop is not drawn explicitly and the velocity servo is represented by one block. Thevelocity servo controller is implemented in the standard motor control unit as a PI-controller. The haptic controller itself is implemented in the DSP. Two torques acton the external environment, i.e. the (measured) human torque T(s) and the torquedisturbance D(s). The (external) spring torque is subtracted from these torques andthe reference velocity for the velocity servo is obtained by filtering this torque by theexternal inertia and damping (see Eq. 7.3 and Fig. 7.3). Since the torque transduceris implemented in the lever of the manipulator, the load of the manipulator (humanwrist in Fig. 7.3) includes the inertia of the hand grip.
Safety consideration
The safety of the subjects is secured by several redundant measures taken both on adesign and control level. The manipulator is designed to apply torques at the wristand to measure the joint admittance during posture control. Because in posturecontrol only small deviations around an equilibrium are concerned the range ofmotion of the lever is physically constrained with two blocks. The lever can onlymove plus and minus 15 degrees from its neutral position, which is much smallerthan the range of motion of a human wrist.
In both the servo-controller and the DSP several safety measures are imple-mented. Firstly starting at 10 degrees deviation of the neutral position the dampinginstantaneously increases. This means that it is impossible to move the lever be-
88 CHAPTER 7
yond 10 degrees at high speed. Secondly the DSP and the servo-controller continu-ously monitor the maximum speed, actuator torque, and torque in the lever. Whenone of the values is too high the motor automatically stops.
7.2.2 Procedures
First the servo-controller and haptic controller were tuned. Second the performanceof the haptic manipulator was analysed and finally the wrist dynamics of a humansubject were quantified. In this study two signals were used as a torque disturbance.The first signal contained power uniformly distributed between 1 and 500 Hz, andwas used to analyse the performance of the velocity servo-controller and to tunethe haptic controller. The second signal had power uniformly distributed between1 and 50 Hz, and was used to test the performance of the haptic manipulator andto identify the admittance of the human wrist joint.
The signals used as torque disturbances were 10 s in length and consisted out ofa sum of sines, the so-called multisine signals (Pintelon and Schoukens, 2001). Theuse of multisines in comparison with stochastic signals had several advantages forthe nonparametric analysis. The main advantages of using deterministic multisineswere that the variance of the nonparametric estimators was substantially reducedand free of bias (Pintelon and Schoukens, 2001; De Vlugt et al., 2003a). Because thevariance of the estimators was relatively low, relatively short observation times (10s) were possible.
Controller settings
The bandwidth of the haptic manipulator is mainly determined by the bandwidthof the velocity servo (assuming that both the velocity and torque sensor have asubstantially larger bandwidth). Note that the dynamic behaviour of a velocityservo also depends on the payload, in this case the subject (payload is not drawnin Fig. 7.3). The most demanding situation is when a subject firmly holds the han-dle and maximally cocontracts. The controller was adjusted such that the controllerhad a bandwidth of 50 Hz, when a subject firmly holds the handle with maximallyvoluntary cocontraction. This bandwidth of 50 Hz is approximately 3 times largerthan the eigenfrequency of a human wrist.
After the velocity controller was tuned the haptic controller was adjusted. Thehaptic manipulator is designed to apply torque disturbances to the wrist over awide bandwidth. As the external, or apparent, environment ‘filters’ the torque dis-turbance, it is desirable to have small external parameters. The external stiffnessand damping can be set to negligibly small values, where the external inertia cannever be set to zero (the gain of the external filter in Fig. 7.3 would go to infinity).If the inertia is set too low a phenomenon called contact instability occurs (Col-gate, 1988; Carigan and Cleary, 2000; De Vlugt et al., 2003b). As an ultimate boundthe haptic manipulator must remain stable in all cases, with and without a sub-ject holding the handle. The stability of the haptic controller can be determined by

Design of a torque-controlled wrist manipulator 89
Table 7.1: Applied loads to test the performance of the haptic manipulator.
case load description
1 no load 0.7 gm2 (handle inertia)2 inertia 2.8 gm2 (exclusive handle)3 springs 2.94 Nm/rad4 inertia with springs combination of 2 and 35 subject
calculating the loop gain (ke = 0 Nm/rad, be = 0 Nms/rad):
Hloop(s) = P(s)C(s) =1
Ies2Hservo(s)Hload
−1(s) (7.4)
in which Hservo( f ) is the frequency response function (FRF) of the velocity servo
controller and Hload−1( f ) the impedance of the load at the handle (normally a sub-
ject’s wrist). The stability and stability margins are determined by plotting the loopgain in a Nyquist diagram and check the smallest M-circle (Maciejowski, 1989).If the loop gain encircles (-1,0) the system will not be stable in closed loop. Thesmallest M-circle denotes the stability margin and performance of the closed loopsystem. In this study M = 2 is chosen as smallest M-circle for the haptic controller.Larger values of M result in too small stability margins and smaller values of M(i.e. wider stability margins) would restrict the performance (i.e. bandwidth) of thehaptic manipulator too much.
The FRFs of the velocity servo and the load were obtained by perturbing withthe 500 Hz bandwidth signal, while the external environment was set to a safesetting, i.e. Ie = 3 gm2, be = 0.13 Nms/rad, and ke = 3 Nm/rad. These settingsresemble a critically damped system with 5 Hz bandwidth. The FRFs were assessedfor three situations: no load, an inertia (≈ 2.8 gm2), and a subject. With the aid of aNyquist diagram the minimal external inertia was calculated, such that the systemhad the predetermined stability margin.
Estimation performance
The haptic manipulator will be used to measure the admittance of the human wrist.To evaluate the haptic manipulator, haptic control algorithm and sensors, severalsystems with known dynamics were measured and their FRFs estimated. The FRFswere parametrized by fitting an inertia-spring-damper model on to the FRFs witha least squares criterion. Because the gain of the FRFs show large variations overthe frequencies the criterion uses the logarithm of the FRFs (Pintelon et al., 1994).
The estimated parameters were compared with the real values. The tested phys-ical systems are summarized in Table 7.1. Additionally a real subject was measured.Normally the external dynamics were set to the minimal values. However whenthe load had no stiffness (cases 1 & 2), a small external stiffness was set to prevent
90 CHAPTER 7
drifting (1 Nm/rad) and when the load had no damping (cases 1-4), a small exter-nal damping was set to prevent oscillation (0.1 Nms/rad). The FRFs were identifiedby perturbing with the 50 Hz bandwidth torque disturbance, which is sufficient toobserve all relevant dynamics.
7.2.3 Data processing
During a trail force disturbance d(t), motor angle θ(t), interaction force T(t), anddesired angular velocity θd(t) were recorded with 2500 Hz sample frequency anda 16 bits resolution. By using only the last 214 samples (≈ 6.55 s) of each record foranalysis, initial transient effects were removed.
With a haptic manipulator interaction exists between the haptic manipulatorand the subject (Fig. 7.2). Because of this interaction closed loop identification algo-rithms were needed to estimate the dynamics imposed by the haptic manipulatorand the load of the haptic manipulator, i.e. the human wrist, separately (De Vlugtet al., 2003a). First the time records (d(t), T(t), θ(t), θd(t)) were transformed to thefrequency domain (D( f ), T( f ), θ( f ), θd( f )) via the fast Fourier transform (FFT) andused to estimate the power and cross spectral densities:
GdT( f ) = D(− f )T( f ) = D∗( f )T( f ) (7.5)
Gdθ( f ) = D(− f )θ( f ) = D∗( f )θ( f ) (7.6)
Gdθd( f ) = D(− f )θd( f ) = D∗( f )θd( f ) (7.7)
Gdz( f ) = D(− f )Z( f ) = D∗( f )Z( f ) (7.8)
Gdd( f ) = D(− f )D( f ) = D∗( f )D( f ) = |D( f )|2 (7.9)
Gθθ( f ) = θ(− f )θ( f ) = θ∗( f )θ( f ) = |θ( f )|2 (7.10)
in which G denotes the estimated spectral densities (hat denotes estimate), theasterisk the complex conjugate, and Z( f ) is the input of the haptic manipulator(Z = D − T). The spectral densities are averaged over 4 frequency bands to reducethe variance of the estimators (Jenkins and Watts, 1968).
The FRFs for the servo-controler, the load (human wrist), and manipulator wereestimated by dividing the appropriate spectral densities (De Vlugt et al., 2003a):
Hservo( f ) =θ( f )
θd( f )=
θ( f )s
θd( f )=
θ( f )j2π f
θd( f )=
Gdθ( f )j2π f
Gdθd( f )
(7.11)
He( f ) =θ( f )
Z( f )=
Gdθ( f )
Gdz( f )(≡ P) (7.12)
Hload( f ) =θ( f )
T( f )=
Gdθ( f )
GdT( f )(≡ C−1) (7.13)
Here Hservo( f ) is the estimated FRF of the servo controller, He( f ) the FRF of the ex-ternal environment imposed by the haptic manipulator (P in Fig. 7.2) and Hload( f )
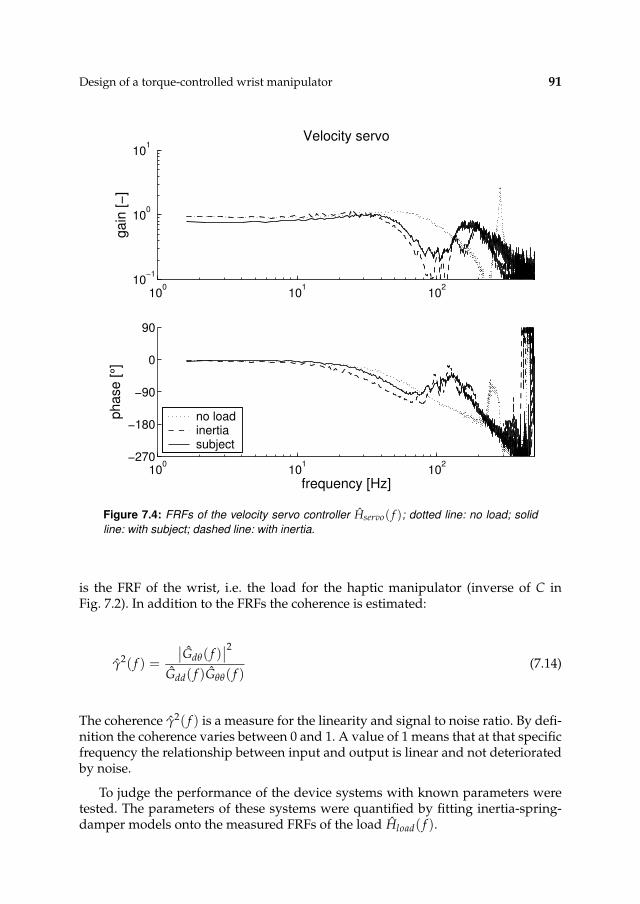
Design of a torque-controlled wrist manipulator 91
100
101
102
10−1
100
101
Velocity servog
ain
[−
]
100
101
102
−270
−180
−90
0
90
ph
ase
[°]
frequency [Hz]
no loadinertiasubject
Figure 7.4: FRFs of the velocity servo controller Hservo( f ); dotted line: no load; solid
line: with subject; dashed line: with inertia.
is the FRF of the wrist, i.e. the load for the haptic manipulator (inverse of C inFig. 7.2). In addition to the FRFs the coherence is estimated:
γ2( f ) =
∣
∣Gdθ( f )∣
∣
2
Gdd( f )Gθθ( f )(7.14)
The coherence γ2( f ) is a measure for the linearity and signal to noise ratio. By defi-nition the coherence varies between 0 and 1. A value of 1 means that at that specificfrequency the relationship between input and output is linear and not deterioratedby noise.
To judge the performance of the device systems with known parameters weretested. The parameters of these systems were quantified by fitting inertia-spring-damper models onto the measured FRFs of the load Hload( f ).
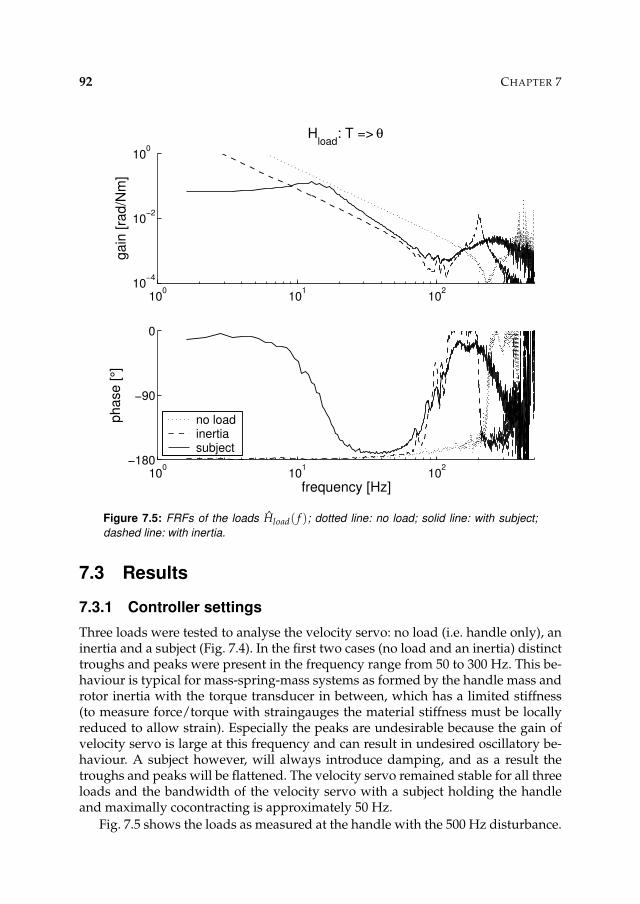
92 CHAPTER 7
100
101
102
10−4
10−2
100
Hload
: T => θg
ain
[ra
d/N
m]
100
101
102
−180
−90
0
ph
ase
[°]
frequency [Hz]
no loadinertiasubject
Figure 7.5: FRFs of the loads Hload( f ); dotted line: no load; solid line: with subject;
dashed line: with inertia.
7.3 Results
7.3.1 Controller settings
Three loads were tested to analyse the velocity servo: no load (i.e. handle only), aninertia and a subject (Fig. 7.4). In the first two cases (no load and an inertia) distincttroughs and peaks were present in the frequency range from 50 to 300 Hz. This be-haviour is typical for mass-spring-mass systems as formed by the handle mass androtor inertia with the torque transducer in between, which has a limited stiffness(to measure force/torque with straingauges the material stiffness must be locallyreduced to allow strain). Especially the peaks are undesirable because the gain ofvelocity servo is large at this frequency and can result in undesired oscillatory be-haviour. A subject however, will always introduce damping, and as a result thetroughs and peaks will be flattened. The velocity servo remained stable for all threeloads and the bandwidth of the velocity servo with a subject holding the handleand maximally cocontracting is approximately 50 Hz.
Fig. 7.5 shows the loads as measured at the handle with the 500 Hz disturbance.
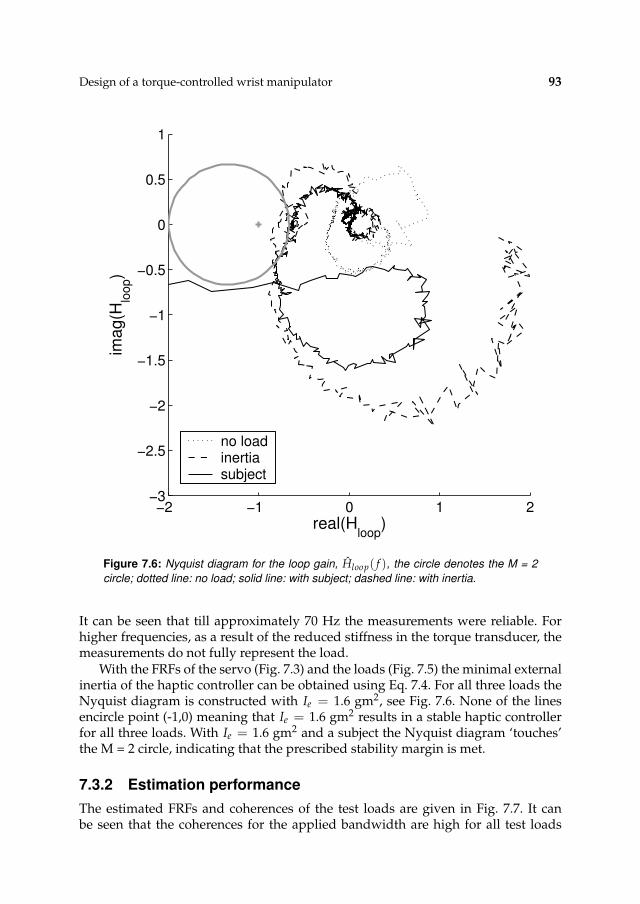
Design of a torque-controlled wrist manipulator 93
−2 −1 0 1 2−3
−2.5
−2
−1.5
−1
−0.5
0
0.5
1
real(Hloop
)
imag(H
loop)
no loadinertiasubject
Figure 7.6: Nyquist diagram for the loop gain, Hloop( f ), the circle denotes the M = 2
circle; dotted line: no load; solid line: with subject; dashed line: with inertia.
It can be seen that till approximately 70 Hz the measurements were reliable. Forhigher frequencies, as a result of the reduced stiffness in the torque transducer, themeasurements do not fully represent the load.
With the FRFs of the servo (Fig. 7.3) and the loads (Fig. 7.5) the minimal externalinertia of the haptic controller can be obtained using Eq. 7.4. For all three loads theNyquist diagram is constructed with Ie = 1.6 gm2, see Fig. 7.6. None of the linesencircle point (-1,0) meaning that Ie = 1.6 gm2 results in a stable haptic controllerfor all three loads. With Ie = 1.6 gm2 and a subject the Nyquist diagram ‘touches’the M = 2 circle, indicating that the prescribed stability margin is met.
7.3.2 Estimation performance
The estimated FRFs and coherences of the test loads are given in Fig. 7.7. It canbe seen that the coherences for the applied bandwidth are high for all test loads
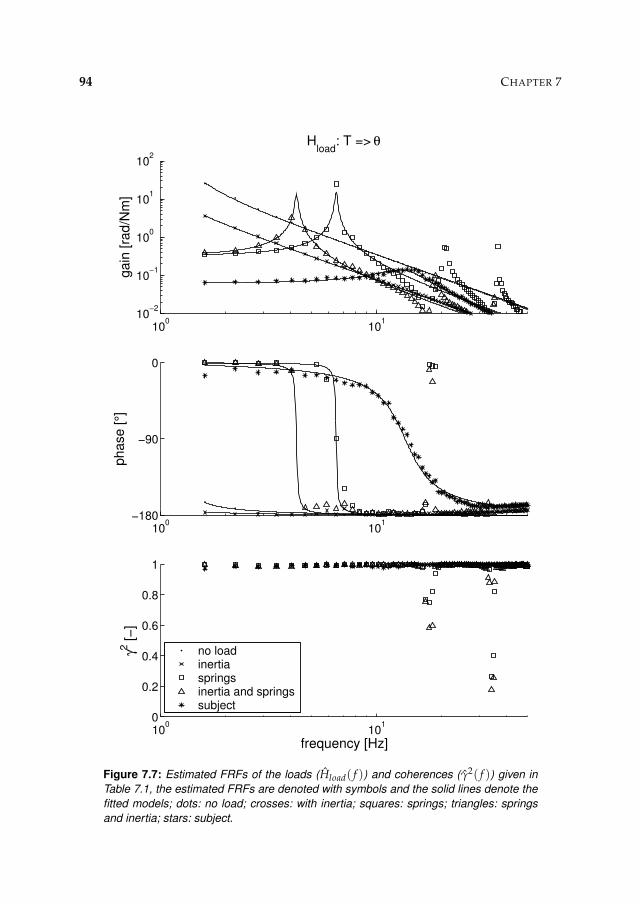
94 CHAPTER 7
100
101
10−2
10−1
100
101
102
Hload
: T => θ
ga
in [
rad
/Nm
]
100
101
−180
−90
0
ph
ase
[°]
100
101
0
0.2
0.4
0.6
0.8
1
γ2 [
−]
frequency [Hz]
no loadinertiaspringsinertia and springssubject
Figure 7.7: Estimated FRFs of the loads (Hload( f )) and coherences (γ2( f )) given in
Table 7.1, the estimated FRFs are denoted with symbols and the solid lines denote the
fitted models; dots: no load; crosses: with inertia; squares: springs; triangles: springs
and inertia; stars: subject.
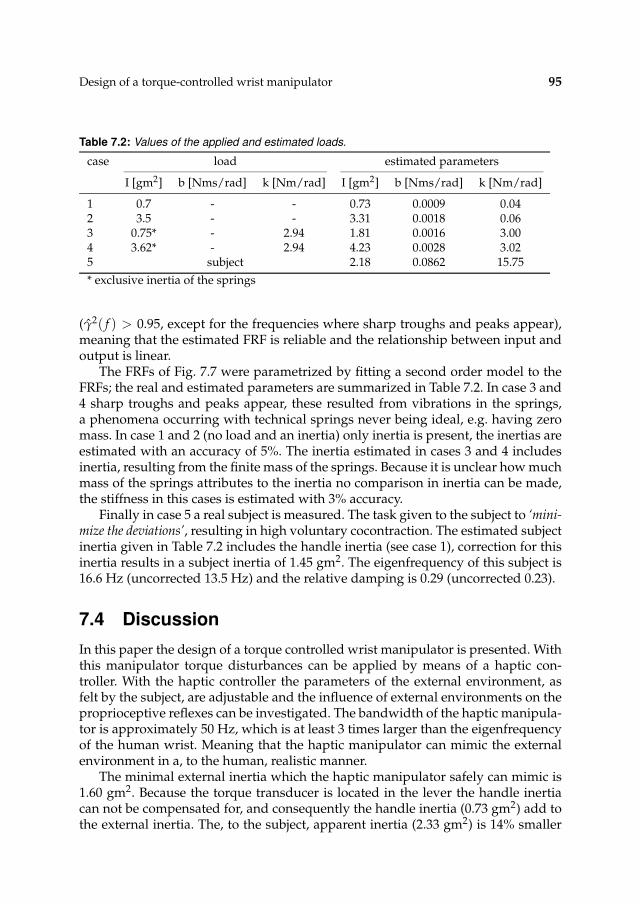
Design of a torque-controlled wrist manipulator 95
Table 7.2: Values of the applied and estimated loads.
case load estimated parameters
I [gm2] b [Nms/rad] k [Nm/rad] I [gm2] b [Nms/rad] k [Nm/rad]
1 0.7 - - 0.73 0.0009 0.042 3.5 - - 3.31 0.0018 0.063 0.75* - 2.94 1.81 0.0016 3.004 3.62* - 2.94 4.23 0.0028 3.025 subject 2.18 0.0862 15.75
* exclusive inertia of the springs
(γ2( f ) > 0.95, except for the frequencies where sharp troughs and peaks appear),meaning that the estimated FRF is reliable and the relationship between input andoutput is linear.
The FRFs of Fig. 7.7 were parametrized by fitting a second order model to theFRFs; the real and estimated parameters are summarized in Table 7.2. In case 3 and4 sharp troughs and peaks appear, these resulted from vibrations in the springs,a phenomena occurring with technical springs never being ideal, e.g. having zeromass. In case 1 and 2 (no load and an inertia) only inertia is present, the inertias areestimated with an accuracy of 5%. The inertia estimated in cases 3 and 4 includesinertia, resulting from the finite mass of the springs. Because it is unclear how muchmass of the springs attributes to the inertia no comparison in inertia can be made,the stiffness in this cases is estimated with 3% accuracy.
Finally in case 5 a real subject is measured. The task given to the subject to ‘mini-mize the deviations’, resulting in high voluntary cocontraction. The estimated subjectinertia given in Table 7.2 includes the handle inertia (see case 1), correction for thisinertia results in a subject inertia of 1.45 gm2. The eigenfrequency of this subject is16.6 Hz (uncorrected 13.5 Hz) and the relative damping is 0.29 (uncorrected 0.23).
7.4 Discussion
In this paper the design of a torque controlled wrist manipulator is presented. Withthis manipulator torque disturbances can be applied by means of a haptic con-troller. With the haptic controller the parameters of the external environment, asfelt by the subject, are adjustable and the influence of external environments on theproprioceptive reflexes can be investigated. The bandwidth of the haptic manipula-tor is approximately 50 Hz, which is at least 3 times larger than the eigenfrequencyof the human wrist. Meaning that the haptic manipulator can mimic the externalenvironment in a, to the human, realistic manner.
The minimal external inertia which the haptic manipulator safely can mimic is1.60 gm2. Because the torque transducer is located in the lever the handle inertiacan not be compensated for, and consequently the handle inertia (0.73 gm2) add tothe external inertia. The, to the subject, apparent inertia (2.33 gm2) is 14% smaller
96 CHAPTER 7
than the real inertia of the haptic manipulator (≈ 2.7 gm2; motor only: 1.8 gm2).The minimal external inertia is in the same order found for a normal fisted humanhand.
The performance of the haptic manipulator is tested by application of loadswith known parameters and fitting a second order model to the measured FRFs.The manipulator was able to quantify the loads with deviations of 5% at maxi-mum. Finally a subject was measured. The subject was instructed to ‘minimize thedeviations’ of the handle, an unambiguous task, resulting in high cocontraction. Thewrist stiffness and damping (15.75 Nm/rad; 0.0862 Nms/rad) are comparable tovalues found in Milner and Cloutier (1993) during high effort tasks.
Almost all manipulators built to identify joint dynamics are position controlled,meaning that the position, or joint angle, is imposed. In that case the subject hasno influence on the position and has to maintain a constant force/torque, or EMGlevel (Kearney et al., 1997; Mirbagheri et al., 2000; Zhang and Rymer, 1997; Catherset al., 1999). Only a few manipulators are force/torque controlled and consequentlyrequire a position task (Ruitenbeek and Janssen, 1984; Van der Helm et al., 2002; DeVlugt et al., 2003b). For technical systems there is no difference between identifica-tion with position or torque disturbances. However humans are highly adaptable,e.g. Doemges and Rack (1992a,b) showed that the proprioceptive reflexes at thewrist are substantially larger with force disturbances. Note that torque disturbancesform a natural form of input and mimic most real life situations: the subject can ac-tively control the position and must preserve stability in the presence of externaldisturbances.
Previous research on the shoulder joint have shown that force disturbances arerelevant and useful to quantify proprioceptive reflexes in both healthy subjects (DeVlugt et al., 2002; Van der Helm et al., 2002) and patients with neurological disor-ders (Schouten et al., 2003). In future studies the high performance wrist manipu-lator described in this paper will be used to analyse the wrist admittance duringposture tasks and to quantify the proprioceptive reflexes at the wrist joint. Becausethe motoric features in neurological disorders generally develop at the distal joints,it is expected that differences can be quantified earlier after disease onset and witha greater accuracy.
Chapter 8
Quantifying proprioceptive reflexes at the
wrist
Alfred C. Schouten, Bastiaan C.P. Zwaan
The aim of this study is to quantify proprioceptive reflexes at the human wristjoint during postural control. From previous studies investigating reflexes at theshoulder it is known that the magnitude of proprioceptive reflexes depends on thebandwidth of the torque disturbance and on the damping and inertia of the exter-nal environment. This study investigates if the same phenomena can be observedat the wrist. The subjects were given a position task (‘minimize the displacement’),while torque disturbances were applied. The high coherences indicate that for thegiven conditions the human wrist acts as a linear system. Reflex gains for acceler-ation, velocity and position along with intrinsic (muscle) properties were quanti-fied by fitting a linear model on the estimated frequency response functions (FRFs)for the joint admittance and the reflexive impedance. High values for the varianceaccounted for (VAF) indicate that the model adequately predicts the observed be-haviour. Especially velocity feedback varied substantially with the bandwidth ofthe disturbance and with the external damping. Generally spoken, smaller band-width and a more damped environment provoked larger reflexes. The results sug-gest that, given the condition, humans modulate the magnitude of the propriocep-tive reflexes to maximally resist the torque disturbances.

98 CHAPTER 8
8.1 Introduction
The aim of this study is to quantify proprioceptive reflexes at the human wristduring postural control in healthy subjects and to investigate if the magnitude ofwrist reflexes depend on the frequency content of the (torque) perturbation andthe (external) inertia and damping. A powerful manipulator is used to generatecontinuous random torque perturbations and to impose the external environment(Schouten et al., 2004c, see Chapter 7). The subjects were given a position task (‘min-imize deviations’), while continuous random torque disturbances were applied for10 s. Joint admittance and reflexive impedance were estimated using system iden-tification in the frequency domain. Finally intrinsic and reflexive parameters werequantified by fitting a model on the joint admittance and the reflexive impedancesimultaneously.
8.2 Materials and methods
8.2.1 Subjects
Two groups of patients participated in the experiment. In the main experiment tennormal healthy subjects (1 woman) with a mean (standard deviation, SD) age of25.3 (1.9) years. All subjects were right handed. In the second experiment to esti-mate the muscle activation dynamics, four subjects (1 woman) participated with amean (SD) age of 28.3 (5.6) years (2 subjects were left handed). The experimentswere carried out on the right wrist. All subjects gave informed consent prior to theprocedure.
8.2.2 Apparatus
Torque disturbances were applied at the wrist by means of a manipulator. The ma-nipulator is extensively described in Chapter 7 and is introduced briefly. Subjectswere seated in a chair and had to hold a handle with the right hand, while theforearm was supported by an arm support. The handle is connected, via a lever,to a motor. The lever has a fixed length to align the wrist joint of an average sizehand with the motor axis. The subject could move the handle resulting in flex-ion and extension of the wrist. To the subject the manipulator behaved like a rota-tional inertia-spring-damper system. The parameters of this external environmentare fully adjustable, except that the external inertia has a minimum (Ie ≥ 1.6 gm2).In this study the external inertia and damping (be) were altered and no value forthe spring was set (ke = 0 Nm/rad).
8.2.3 Procedures
Main experiment
The main experiment consists of 26 different conditions, lasting 10 s each. The con-ditions were presented in randomized order to prevent anticipation and were re-
Quantifying proprioceptive reflexes at the wrist 99
peated 4 times, giving a total of 104 trials. During a trial the subject was instructedto ‘minimize the displacement’ of the handle, while continuous random torque distur-bances were applied. To assist the subject and to prevent drift the actual angle wasshown on a display. The trials consisted of disturbances with a variable frequencycontent and disturbances in combination with variable external environment. Themagnitude of the torque disturbances was adjusted for each condition to limit themaximum amplitude of the displacement to approximately 1 degree, facilitatinglinear model approximations. As the trials required high effort of the subjects, suf-ficient time was given between trials to prevent fatigue. The complete experimentfor one subject, including instruction and pauses, lasted approximately one and ahalf hours.
In the experimental conditions both the frequency content of the torque distur-bance (n = 17) and the external environment (n = 8) were varied from a referencecondition. Random continuous torque disturbances were applied with clusteredpower spectra and random phase (Schouten et al., 2004a,b, see Chapters 5-6). Thereference condition is:
• Wide bandwidth disturbance (WB): a disturbance signal consisting of 20 clus-ters of 4 sines each, linearly spaced between lowest frequency fl of 1.4 Hzand highest frequency fh of 49.4 Hz. (Ie = 1.6 gm2, be = 0 Nms/rad, ke = 0Nm/rad)
The variation in frequency content can be distinguished into two ranges (the pa-rameters of the external environment are set to their minimal value: Ie = 1.6 gm2,be = 0 Nms/rad, ke = 0 Nm/rad):
• Narrow bandwidth disturbance type 1 (NB1): disturbance signals with powerbetween a fixed fl of 1.4 Hz and a variable fh. fh varied from 3.1 to 16.5 Hz,i.e. 2 to 13 varying numbers of clusters of 4 sines. ( fh = 3.1; 4.3; 5.5; 6.7; 7.9;9.1; 10.4; 11.6; 14.0; 16.5 Hz)
• Narrow bandwidth disturbance type 2 (NB2): single cluster of 4 sines withfixed bandwidth of 0.45 Hz around a centre frequency fc, which varied be-tween 1.6 and 16.2 Hz. ( fc = 1.6; 4.0; 6.5; 8.9; 11.3; 13.8; 16.2 Hz)
The variation of the external environment can be distinguished into two ranges aswell (perturbation with the WB disturbance):
• Damping: external damping varied between 0.25 and 4 Nms/rad (Ie = 1.6gm2, be = 0.25; 0.5; 1; 2; 4 Nms/rad, ke = 0 Nm/rad)
• Inertia: external inertia varied between 3.2 and 12.8 gm2 (Ie = 3.2; 6.4; 12.8gm2, be = 0 Nms/rad, ke = 0 Nm/rad).
To obtain the EMG to torque ratio isometric tasks were performed before andafter the trials. For this purpose the handle was set to a fixed rigid position whilethe subject was asked to exert 9 predefined torque levels (4 in extensor direction, 4
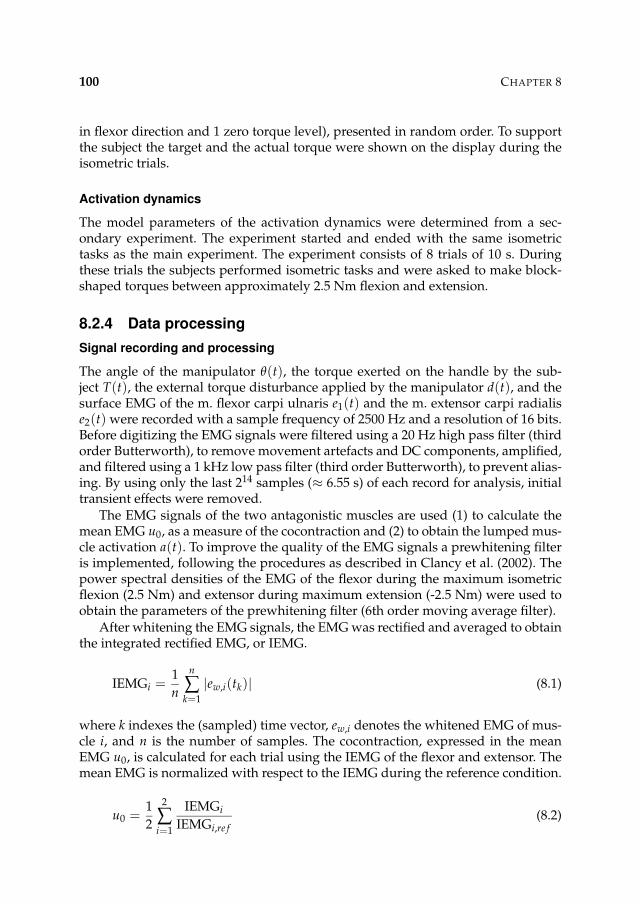
100 CHAPTER 8
in flexor direction and 1 zero torque level), presented in random order. To supportthe subject the target and the actual torque were shown on the display during theisometric trials.
Activation dynamics
The model parameters of the activation dynamics were determined from a sec-ondary experiment. The experiment started and ended with the same isometrictasks as the main experiment. The experiment consists of 8 trials of 10 s. Duringthese trials the subjects performed isometric tasks and were asked to make block-shaped torques between approximately 2.5 Nm flexion and extension.
8.2.4 Data processing
Signal recording and processing
The angle of the manipulator θ(t), the torque exerted on the handle by the sub-ject T(t), the external torque disturbance applied by the manipulator d(t), and thesurface EMG of the m. flexor carpi ulnaris e1(t) and the m. extensor carpi radialise2(t) were recorded with a sample frequency of 2500 Hz and a resolution of 16 bits.Before digitizing the EMG signals were filtered using a 20 Hz high pass filter (thirdorder Butterworth), to remove movement artefacts and DC components, amplified,and filtered using a 1 kHz low pass filter (third order Butterworth), to prevent alias-ing. By using only the last 214 samples (≈ 6.55 s) of each record for analysis, initialtransient effects were removed.
The EMG signals of the two antagonistic muscles are used (1) to calculate themean EMG u0, as a measure of the cocontraction and (2) to obtain the lumped mus-cle activation a(t). To improve the quality of the EMG signals a prewhitening filteris implemented, following the procedures as described in Clancy et al. (2002). Thepower spectral densities of the EMG of the flexor during the maximum isometricflexion (2.5 Nm) and extensor during maximum extension (-2.5 Nm) were used toobtain the parameters of the prewhitening filter (6th order moving average filter).
After whitening the EMG signals, the EMG was rectified and averaged to obtainthe integrated rectified EMG, or IEMG.
IEMGi =1
n
n
∑k=1
|ew,i(tk)| (8.1)
where k indexes the (sampled) time vector, ew,i denotes the whitened EMG of mus-cle i, and n is the number of samples. The cocontraction, expressed in the meanEMG u0, is calculated for each trial using the IEMG of the flexor and extensor. Themean EMG is normalized with respect to the IEMG during the reference condition.
u0 =1
2
2
∑i=1
IEMGi
IEMGi,re f(8.2)
Quantifying proprioceptive reflexes at the wrist 101
where IEMGi,re f is the IEMG of muscle i for the reference condition, averaged overthe 4 repetitions.
From the isometric tasks the EMG to torque ratios were estimated. Firstly theIEMGs were calculated for each muscle and each torque level. Second the gain wasestimated by minimizing a least squares criterion.
Ti,l(p) = KiIEMGi,l + Bi (8.3)
L(p) = ∑l
Tl − Ti,l(p) (8.4)
in which Ti,l is the predicted average torque with torque level l for muscle i, Tl isthe measured average torque, Ki and Bi are the quantified ratios and offsets respec-tively, L is the criterion to be minimized, and p the parameter vector.
p = [Ki, Bi] (8.5)
As muscles only pull the negative torques are omitted for the flexor and the positivetorques for the extensor. The (lumped) muscle activation was obtained by combin-ing the flexor and extensor EMG using their gain Ki:
a(t) =2
∑i=1
Ki |ew,i(t)| (8.6)
in which a(t) is the muscle activation scaled in Nm by Ki and i refers to the twomuscles. Note that this study investigates dynamic behaviour around an equilib-rium and consequently it is not necessary to use the offsets to calculate a(t).
Nonparametric analysis
For each condition of the main experiment the recorded signals (d(t), θ(t), T(t),a(t)) were averaged over the four repetitions and converted to the frequency do-main by fast Fourier transform (FFT). As torque disturbances were applied, inter-action between the subject and manipulator existed, see Fig. 8.1. Because of thisinteraction closed loop identification algorithms were required to estimate the dy-namics of the subject.
The frequency response functions (FRFs) for the joint admittance HTθ( f ) andthe reflexive impedance Hθa( f ) were estimated by dividing the appropriate spec-tral densities (Schouten et al., 2004b). Along with the FRFs the coherences for the
102 CHAPTER 8
θd=0
N(f)
D(f)
++
-
+
+-
P(f)θ(f)
C(f)T(f)
human controller
Figure 8.1: Blockscheme of human posture control expressed in the frequency domain.
C( f ): transfer function of wrist dynamics; P( f ) transfer function of manipulator dynam-
ics; D( f ) external torque disturbance; T( f ) human reaction torque; θ( f ) angle of the
handle; N( f ) model remnant; θd = 0 reference angle. The wrist dynamics (grey box)
are described by linear transfer function C( f ), together with the remnant N( f ) which is
uncorrelated with D( f ).
joint angle γ2θ( f ) and muscle activation γ2
a( f ) were estimated.
HTθ( f ) =θ( f )
T( f )=
Gdθ( f )
GdT( f )
(
≡ C−1( f ))
(8.7)
Hθa( f ) =A( f )
θ( f )=
Gda( f )
Gdθ( f )(8.8)
γ2θ( f ) =
∣
∣Gdθ( f )∣
∣
2
Gdd( f )Gθθ( f )(8.9)
γ2a( f ) =
∣
∣Gda( f )∣
∣
2
Gdd( f )Gaa( f )(8.10)
in which Gdθ( f ) is the cross spectral density between d(t) and θ(t) (Hat denotesestimate). The spectral densities were averaged over 4 adjacent frequencies to im-prove the estimators (Jenkins and Watts, 1968). The FRFs and coherences were onlyevaluated at frequencies where the disturbance signal contained power. By defini-tion the coherence varies between 0 and 1, where a value of 1 indicates that thesignals are linearly related and no external noise exists.
Quantification of activation dynamics
In this experiment the dynamic relation between muscle activation a(t) and torqueT(t) is sought. First the FRF and coherence between muscle activation and torquewere estimated by dividing the appropriate spectral densities with the aid of an
Quantifying proprioceptive reflexes at the wrist 103
independent instrument variable (Pintelon and Schoukens, 2001).
Hact( f ) =GwT( f )
Gwa( f )(8.11)
γ2aT( f ) =
∣
∣GaT( f )∣
∣
2
Gaa( f )GTT( f )(8.12)
in which w is the instrument variable, Hact( f ) the FRF, and γ2aT( f ) the coherence.
The instrument variable was constructed in the frequency domain having powerbetween 1 and 50 Hz. The spectral densities were averaged over 4 adjacent fre-quencies to improve the estimators.
Because the experiment was isometric, i.e. there are no angular deviations, therelation between muscle activation and torque is described by the activation dy-namics and does not contain reflexes or muscle visco-elasticity. The activation dy-namics were modelled as a second order system (Olney and Winter, 1985; Bobetand Norman, 1990; Potvin et al., 1996):
Hact(s, p) =1
s2
ω02 + 2β s
ω02 + 1
(8.13)
with
p = [ f0, β]
in which s = j2π f is the Laplace operator, f0 is the eigenfrequency in Hz ( f0 = ω02π )
and β is the relative damping.
The activation dynamics were obtained by fitting the model (Eq. 8.13) onto themeasured activation dynamics (Eq. 8.11) by minimizing a criterion function:
L(p) = ∑k
γ2aT( fk)
1 + fk
∣
∣ln Hact( fk) − ln Hact( fk, p)∣
∣
2(8.14)
where k indexes the frequency vector. Only the frequencies upto 20 Hz were usedfor the criterion. For higher frequencies the torque signal contained little powersuch that the activation dynamics could not be estimated reliably. This is reflectedby the low coherence for these frequencies, see Results. Because of the large rangeof the FRF gain a least squares criterion with logarithmic difference was used (Pin-telon et al., 1994). The criterion was weighted with the coherence to reduce empha-
sis on less reliable frequencies in the FRF and with (1 + fk)−1 to prevent excessive
emphasis on the higher frequencies. To obtain a better fit one set of parameters wasused to fit the model simultaneously on all 8 trials for each subject. Finally the acti-vation parameters were averaged over all subjects and used to quantify the intrinsicand reflexive parameters.

104 CHAPTER 8
Quantification of intrinsic and reflexive properties
The human wrist is modelled in a similar manner as the arm in Chapter 6, exceptthat linear terms are replaced with rotational terms. Fig. 8.2 show the model of thetransfer function of the wrist.
The intrinsic properties, including muscle cocontraction, are modelled as a ro-tational spring-damper system around the wrist joint (Winters et al., 1988):
Hint(s) =1
Is2 + bs + k(8.15)
The inertia of the hand in fisted position is modelled as I and the muscles, ten-dons and ligaments are modelled in damping b and stiffness k, and includes visco-elasticity as a result of cocontraction.
Muscle spindles are attached to muscle fibres and hence the stretch and stretchvelocity of the muscle spindles are proportional to the stretch and stretch velocityof the muscle fibres. The muscle spindle send information via the Ia and II afferentnerves to the central nervous system (CNS) and α-motoneuron. Furthermore theGolgi tendon organs located in the tendon provide information about the muscleforce and is send via Ib afferents. As it is not possible to separate these feedbackpaths the reflexive feedback is described with one model, Hre f (s).
Hre f (s) =(
kas2 + kvs + kp
)
e−τds (8.16)
in which τd is the time delay due to neural transportation and processing time. Thereflex gains ka, kv, and kp describe the acceleration, velocity and position feedbackgain respectively.
The model of the wrist, including activation dynamics, intrinsic muscle proper-ties and reflexive feedback equals:
Hw(s) =θw(s)
T(s)=
Hint(s)
1 + Hint(s)Hre f (s)Hact(s)(8.17)
The (external) environment He(s) can be described by a rotational inertia-spring-damper system.
He(s) =1
Ies2 + bes + ke(8.18)
The complete model consists of two submodels: one for the wrist, Hw( f ), andone for the environment, He( f ). In between the wrist and the environment is thevisco-elasticity of the grip, including the stiffness of the transducer in the lever.
Hg(s) = bgs + kg (8.19)
in which bg is the damping and kg is the stiffness of the grip, including handleand lever. The grip visco-elasticity is relatively high (bg = 1 Nms/rad; kg = 1500
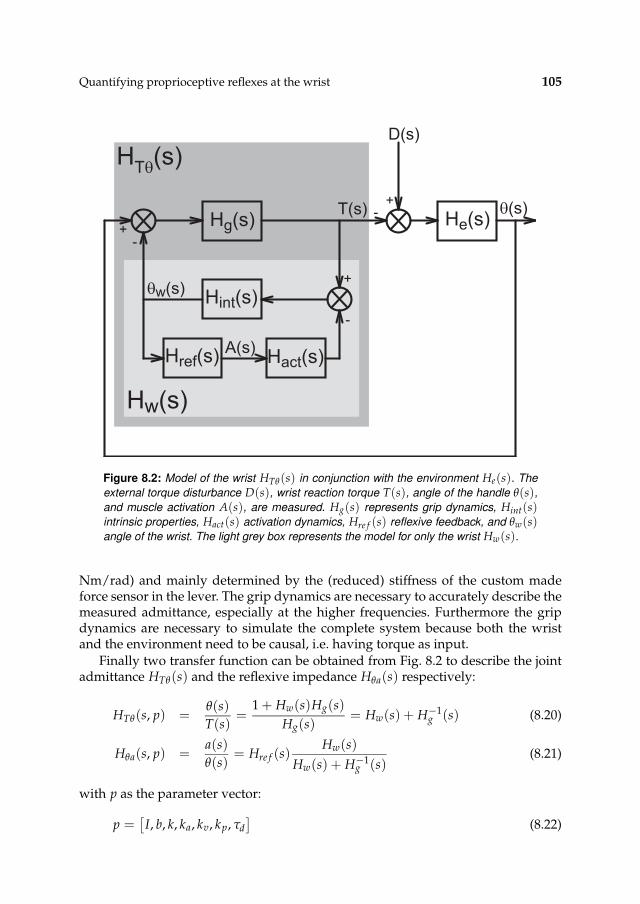
Quantifying proprioceptive reflexes at the wrist 105
HTθ
(s)
Hg(s) He(s)
Hint(s)
Hact(s)Href(s)A(s)
θ(s)
D(s)
T(s)
θw(s)
Hw(s)
+-
-+
+
-
Figure 8.2: Model of the wrist HTθ(s) in conjunction with the environment He(s). The
external torque disturbance D(s), wrist reaction torque T(s), angle of the handle θ(s),
and muscle activation A(s), are measured. Hg(s) represents grip dynamics, Hint(s)intrinsic properties, Hact(s) activation dynamics, Hre f (s) reflexive feedback, and θw(s)angle of the wrist. The light grey box represents the model for only the wrist Hw(s).
Nm/rad) and mainly determined by the (reduced) stiffness of the custom madeforce sensor in the lever. The grip dynamics are necessary to accurately describe themeasured admittance, especially at the higher frequencies. Furthermore the gripdynamics are necessary to simulate the complete system because both the wristand the environment need to be causal, i.e. having torque as input.
Finally two transfer function can be obtained from Fig. 8.2 to describe the jointadmittance HTθ(s) and the reflexive impedance Hθa(s) respectively:
HTθ(s, p) =θ(s)
T(s)=
1 + Hw(s)Hg(s)
Hg(s)= Hw(s) + H−1
g (s) (8.20)
Hθa(s, p) =a(s)
θ(s)= Hre f (s)
Hw(s)
Hw(s) + H−1g (s)
(8.21)
with p as the parameter vector:
p =[
I, b, k, ka, kv, kp, τd
]
(8.22)
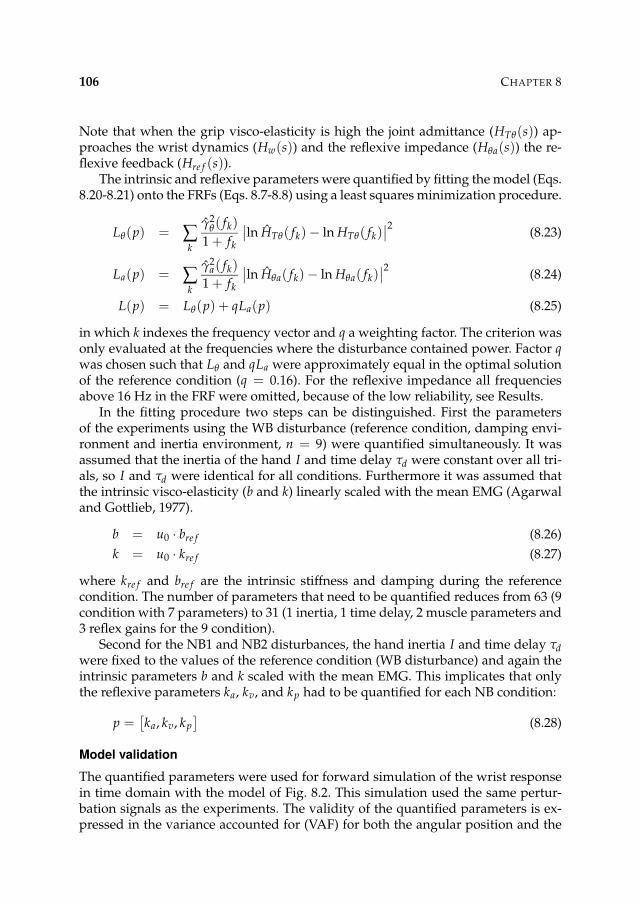
106 CHAPTER 8
Note that when the grip visco-elasticity is high the joint admittance (HTθ(s)) ap-proaches the wrist dynamics (Hw(s)) and the reflexive impedance (Hθa(s)) the re-flexive feedback (Hre f (s)).
The intrinsic and reflexive parameters were quantified by fitting the model (Eqs.8.20-8.21) onto the FRFs (Eqs. 8.7-8.8) using a least squares minimization procedure.
Lθ(p) = ∑k
γ2θ( fk)
1 + fk
∣
∣ln HTθ( fk) − ln HTθ( fk)∣
∣
2(8.23)
La(p) = ∑k
γ2a( fk)
1 + fk
∣
∣ln Hθa( fk) − ln Hθa( fk)∣
∣
2(8.24)
L(p) = Lθ(p) + qLa(p) (8.25)
in which k indexes the frequency vector and q a weighting factor. The criterion wasonly evaluated at the frequencies where the disturbance contained power. Factor qwas chosen such that Lθ and qLa were approximately equal in the optimal solutionof the reference condition (q = 0.16). For the reflexive impedance all frequenciesabove 16 Hz in the FRF were omitted, because of the low reliability, see Results.
In the fitting procedure two steps can be distinguished. First the parametersof the experiments using the WB disturbance (reference condition, damping envi-ronment and inertia environment, n = 9) were quantified simultaneously. It wasassumed that the inertia of the hand I and time delay τd were constant over all tri-als, so I and τd were identical for all conditions. Furthermore it was assumed thatthe intrinsic visco-elasticity (b and k) linearly scaled with the mean EMG (Agarwaland Gottlieb, 1977).
b = u0 · bre f (8.26)
k = u0 · kre f (8.27)
where kre f and bre f are the intrinsic stiffness and damping during the referencecondition. The number of parameters that need to be quantified reduces from 63 (9condition with 7 parameters) to 31 (1 inertia, 1 time delay, 2 muscle parameters and3 reflex gains for the 9 condition).
Second for the NB1 and NB2 disturbances, the hand inertia I and time delay τd
were fixed to the values of the reference condition (WB disturbance) and again theintrinsic parameters b and k scaled with the mean EMG. This implicates that onlythe reflexive parameters ka, kv, and kp had to be quantified for each NB condition:
p =[
ka, kv, kp
]
(8.28)
Model validation
The quantified parameters were used for forward simulation of the wrist responsein time domain with the model of Fig. 8.2. This simulation used the same pertur-bation signals as the experiments. The validity of the quantified parameters is ex-pressed in the variance accounted for (VAF) for both the angular position and the
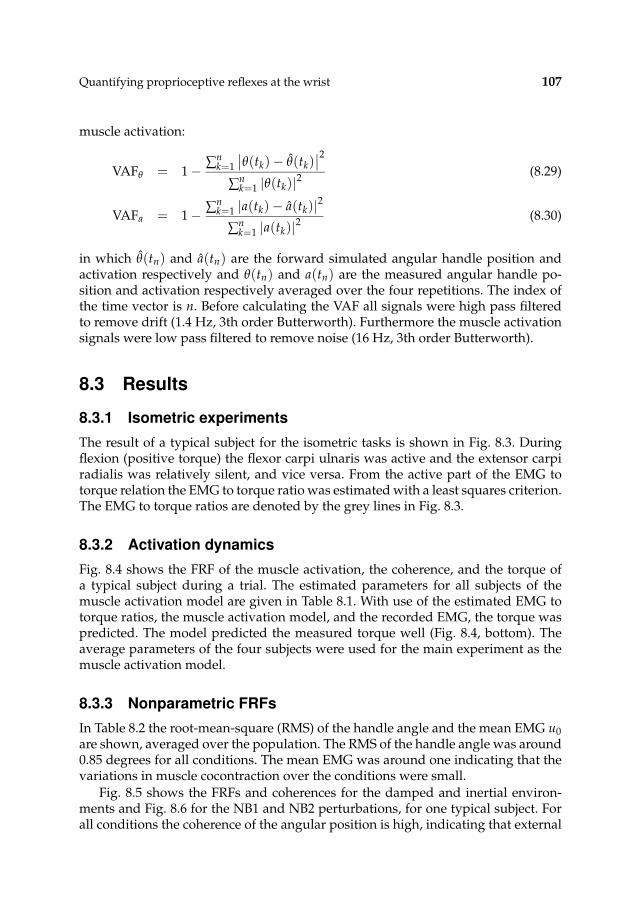
Quantifying proprioceptive reflexes at the wrist 107
muscle activation:
VAFθ = 1 − ∑nk=1
∣
∣θ(tk) − θ(tk)∣
∣
2
∑nk=1 |θ(tk)|2
(8.29)
VAFa = 1 − ∑nk=1 |a(tk) − a(tk)|2
∑nk=1 |a(tk)|2
(8.30)
in which θ(tn) and a(tn) are the forward simulated angular handle position andactivation respectively and θ(tn) and a(tn) are the measured angular handle po-sition and activation respectively averaged over the four repetitions. The index ofthe time vector is n. Before calculating the VAF all signals were high pass filteredto remove drift (1.4 Hz, 3th order Butterworth). Furthermore the muscle activationsignals were low pass filtered to remove noise (16 Hz, 3th order Butterworth).
8.3 Results
8.3.1 Isometric experiments
The result of a typical subject for the isometric tasks is shown in Fig. 8.3. Duringflexion (positive torque) the flexor carpi ulnaris was active and the extensor carpiradialis was relatively silent, and vice versa. From the active part of the EMG totorque relation the EMG to torque ratio was estimated with a least squares criterion.The EMG to torque ratios are denoted by the grey lines in Fig. 8.3.
8.3.2 Activation dynamics
Fig. 8.4 shows the FRF of the muscle activation, the coherence, and the torque ofa typical subject during a trial. The estimated parameters for all subjects of themuscle activation model are given in Table 8.1. With use of the estimated EMG totorque ratios, the muscle activation model, and the recorded EMG, the torque waspredicted. The model predicted the measured torque well (Fig. 8.4, bottom). Theaverage parameters of the four subjects were used for the main experiment as themuscle activation model.
8.3.3 Nonparametric FRFs
In Table 8.2 the root-mean-square (RMS) of the handle angle and the mean EMG u0
are shown, averaged over the population. The RMS of the handle angle was around0.85 degrees for all conditions. The mean EMG was around one indicating that thevariations in muscle cocontraction over the conditions were small.
Fig. 8.5 shows the FRFs and coherences for the damped and inertial environ-ments and Fig. 8.6 for the NB1 and NB2 perturbations, for one typical subject. Forall conditions the coherence of the angular position is high, indicating that external
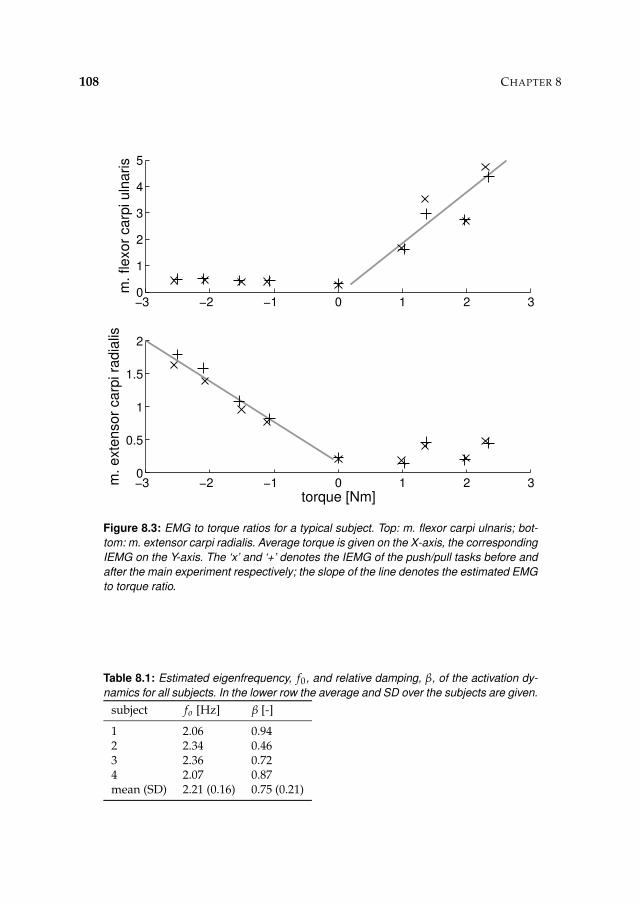
108 CHAPTER 8
−3 −2 −1 0 1 2 30
1
2
3
4
5
m. flexor
carp
i uln
aris
−3 −2 −1 0 1 2 30
0.5
1
1.5
2
m. exte
nsor
carp
i ra
dia
lis
torque [Nm]
Figure 8.3: EMG to torque ratios for a typical subject. Top: m. flexor carpi ulnaris; bot-
tom: m. extensor carpi radialis. Average torque is given on the X-axis, the corresponding
IEMG on the Y-axis. The ‘x’ and ‘+’ denotes the IEMG of the push/pull tasks before and
after the main experiment respectively; the slope of the line denotes the estimated EMG
to torque ratio.
Table 8.1: Estimated eigenfrequency, f0, and relative damping, β, of the activation dy-
namics for all subjects. In the lower row the average and SD over the subjects are given.
subject fo [Hz] β [-]
1 2.06 0.942 2.34 0.463 2.36 0.724 2.07 0.87mean (SD) 2.21 (0.16) 0.75 (0.21)
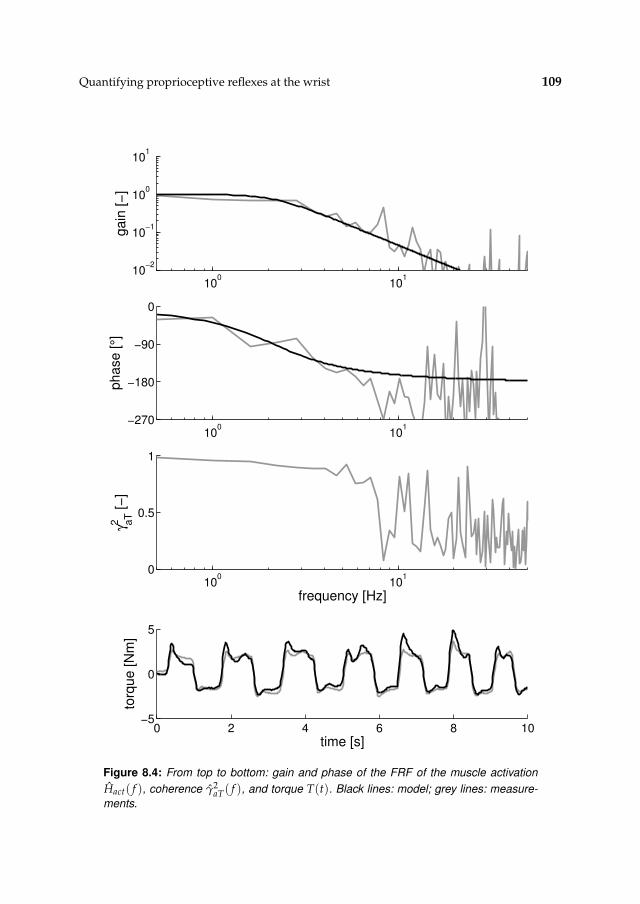
Quantifying proprioceptive reflexes at the wrist 109
100
101
10−2
10−1
100
101
gain
[−
]
100
101
−270
−180
−90
0
phase [
°]
100
101
0
0.5
1
γ aT
2 [−
]
frequency [Hz]
0 2 4 6 8 10−5
0
5
torq
ue [N
m]
time [s]
Figure 8.4: From top to bottom: gain and phase of the FRF of the muscle activation
Hact( f ), coherence γ2aT( f ), and torque T(t). Black lines: model; grey lines: measure-
ments.
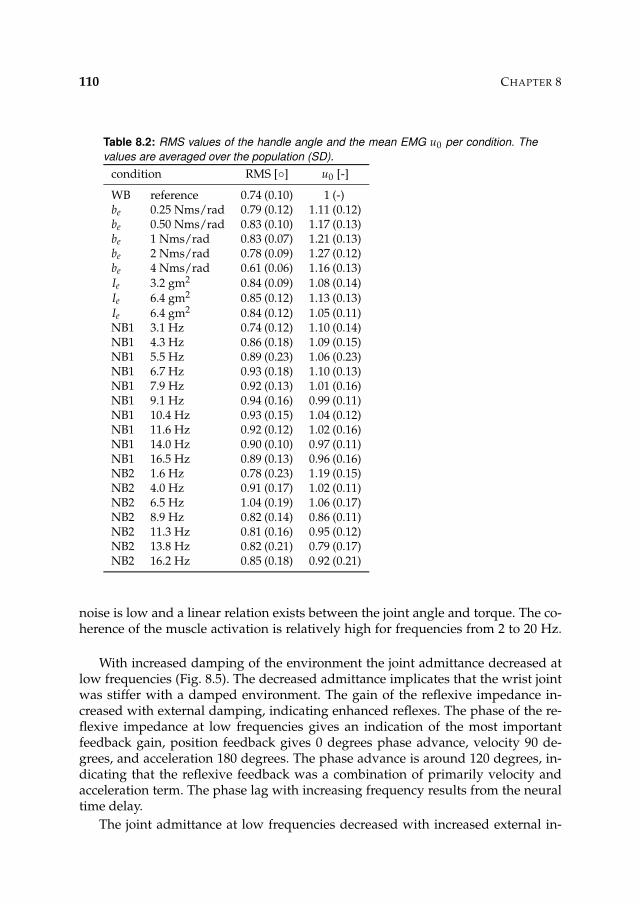
110 CHAPTER 8
Table 8.2: RMS values of the handle angle and the mean EMG u0 per condition. The
values are averaged over the population (SD).
condition RMS [◦] u0 [-]
WB reference 0.74 (0.10) 1 (-)be 0.25 Nms/rad 0.79 (0.12) 1.11 (0.12)be 0.50 Nms/rad 0.83 (0.10) 1.17 (0.13)be 1 Nms/rad 0.83 (0.07) 1.21 (0.13)be 2 Nms/rad 0.78 (0.09) 1.27 (0.12)be 4 Nms/rad 0.61 (0.06) 1.16 (0.13)Ie 3.2 gm2 0.84 (0.09) 1.08 (0.14)Ie 6.4 gm2 0.85 (0.12) 1.13 (0.13)Ie 6.4 gm2 0.84 (0.12) 1.05 (0.11)NB1 3.1 Hz 0.74 (0.12) 1.10 (0.14)NB1 4.3 Hz 0.86 (0.18) 1.09 (0.15)NB1 5.5 Hz 0.89 (0.23) 1.06 (0.23)NB1 6.7 Hz 0.93 (0.18) 1.10 (0.13)NB1 7.9 Hz 0.92 (0.13) 1.01 (0.16)NB1 9.1 Hz 0.94 (0.16) 0.99 (0.11)NB1 10.4 Hz 0.93 (0.15) 1.04 (0.12)NB1 11.6 Hz 0.92 (0.12) 1.02 (0.16)NB1 14.0 Hz 0.90 (0.10) 0.97 (0.11)NB1 16.5 Hz 0.89 (0.13) 0.96 (0.16)NB2 1.6 Hz 0.78 (0.23) 1.19 (0.15)NB2 4.0 Hz 0.91 (0.17) 1.02 (0.11)NB2 6.5 Hz 1.04 (0.19) 1.06 (0.17)NB2 8.9 Hz 0.82 (0.14) 0.86 (0.11)NB2 11.3 Hz 0.81 (0.16) 0.95 (0.12)NB2 13.8 Hz 0.82 (0.21) 0.79 (0.17)NB2 16.2 Hz 0.85 (0.18) 0.92 (0.21)
noise is low and a linear relation exists between the joint angle and torque. The co-herence of the muscle activation is relatively high for frequencies from 2 to 20 Hz.
With increased damping of the environment the joint admittance decreased atlow frequencies (Fig. 8.5). The decreased admittance implicates that the wrist jointwas stiffer with a damped environment. The gain of the reflexive impedance in-creased with external damping, indicating enhanced reflexes. The phase of the re-flexive impedance at low frequencies gives an indication of the most importantfeedback gain, position feedback gives 0 degrees phase advance, velocity 90 de-grees, and acceleration 180 degrees. The phase advance is around 120 degrees, in-dicating that the reflexive feedback was a combination of primarily velocity andacceleration term. The phase lag with increasing frequency results from the neuraltime delay.
The joint admittance at low frequencies decreased with increased external in-
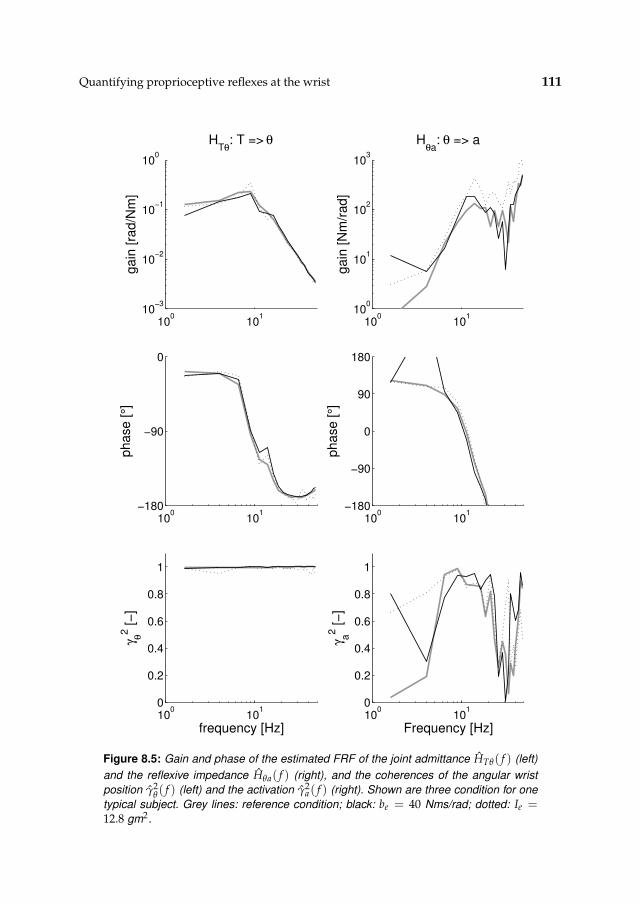
Quantifying proprioceptive reflexes at the wrist 111
100
101
10−3
10−2
10−1
100
ga
in [
rad
/Nm
]H
Tθ: T => θ
100
101
−180
−90
0
ph
ase
[°]
100
101
0
0.2
0.4
0.6
0.8
1
γ θ
2 [
−]
frequency [Hz]
100
101
100
101
102
103
ga
in [
Nm
/ra
d]
Hθa
: θ => a
100
101
−180
−90
0
90
180
ph
ase
[°]
100
101
0
0.2
0.4
0.6
0.8
1
γ a
2 [
−]
Frequency [Hz]
Figure 8.5: Gain and phase of the estimated FRF of the joint admittance HTθ( f ) (left)
and the reflexive impedance Hθa( f ) (right), and the coherences of the angular wrist
position γ2θ( f ) (left) and the activation γ2
a( f ) (right). Shown are three condition for one
typical subject. Grey lines: reference condition; black: be = 40 Nms/rad; dotted: Ie =12.8 gm2.
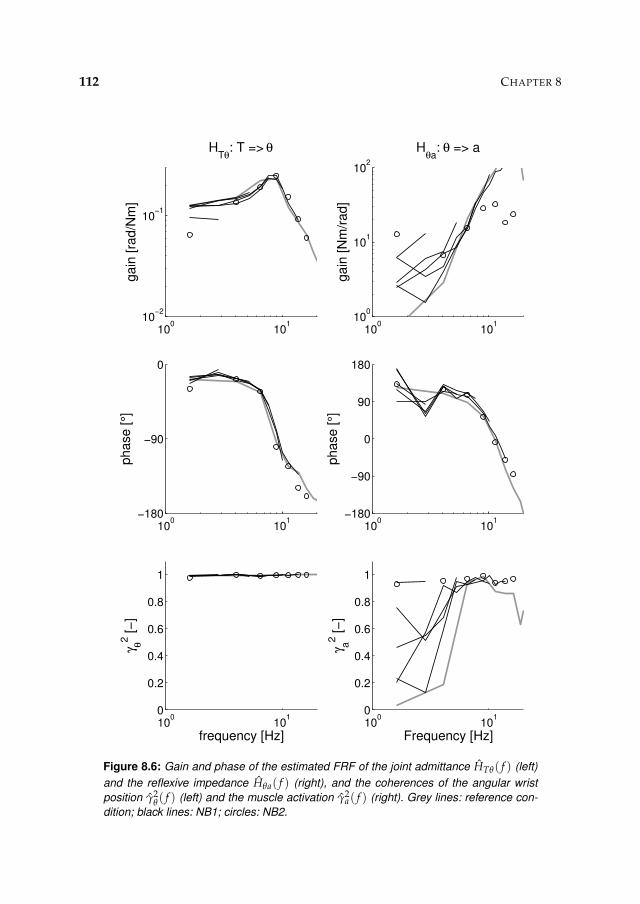
112 CHAPTER 8
100
101
10−2
10−1
ga
in [
rad
/Nm
]
HTθ
: T => θ
100
101
−180
−90
0
ph
ase
[°]
100
101
0
0.2
0.4
0.6
0.8
1
γ θ
2 [
−]
frequency [Hz]
100
101
100
101
102
ga
in [
Nm
/ra
d]
Hθa
: θ => a
100
101
−180
−90
0
90
180
ph
ase
[°]
100
101
0
0.2
0.4
0.6
0.8
1
γ a
2 [
−]
Frequency [Hz]
Figure 8.6: Gain and phase of the estimated FRF of the joint admittance HTθ( f ) (left)
and the reflexive impedance Hθa( f ) (right), and the coherences of the angular wrist
position γ2θ( f ) (left) and the muscle activation γ2
a( f ) (right). Grey lines: reference con-
dition; black lines: NB1; circles: NB2.
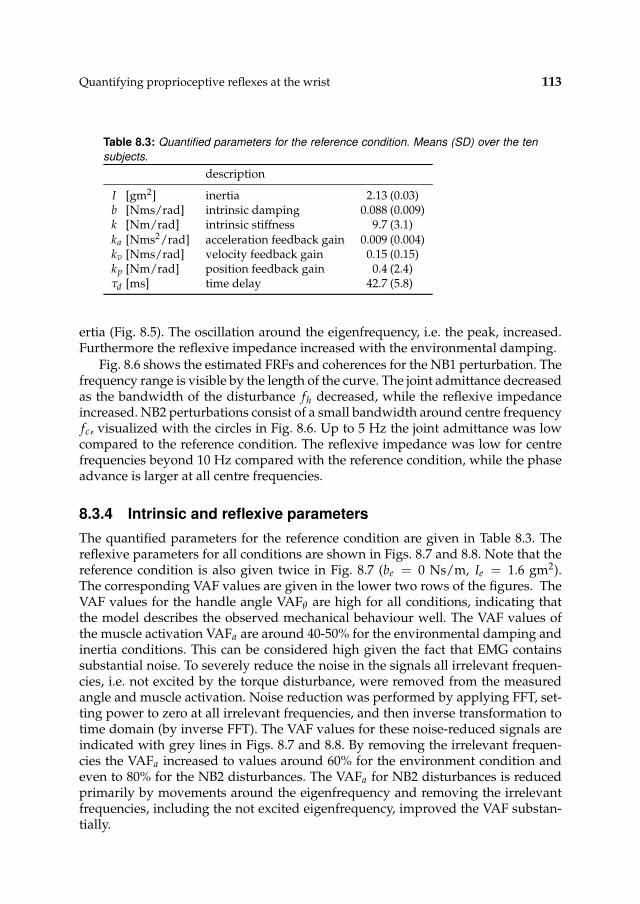
Quantifying proprioceptive reflexes at the wrist 113
Table 8.3: Quantified parameters for the reference condition. Means (SD) over the ten
subjects.
description
I [gm2] inertia 2.13 (0.03)b [Nms/rad] intrinsic damping 0.088 (0.009)k [Nm/rad] intrinsic stiffness 9.7 (3.1)ka [Nms2/rad] acceleration feedback gain 0.009 (0.004)kv [Nms/rad] velocity feedback gain 0.15 (0.15)kp [Nm/rad] position feedback gain 0.4 (2.4)τd [ms] time delay 42.7 (5.8)
ertia (Fig. 8.5). The oscillation around the eigenfrequency, i.e. the peak, increased.Furthermore the reflexive impedance increased with the environmental damping.
Fig. 8.6 shows the estimated FRFs and coherences for the NB1 perturbation. Thefrequency range is visible by the length of the curve. The joint admittance decreasedas the bandwidth of the disturbance fh decreased, while the reflexive impedanceincreased. NB2 perturbations consist of a small bandwidth around centre frequencyfc, visualized with the circles in Fig. 8.6. Up to 5 Hz the joint admittance was lowcompared to the reference condition. The reflexive impedance was low for centrefrequencies beyond 10 Hz compared with the reference condition, while the phaseadvance is larger at all centre frequencies.
8.3.4 Intrinsic and reflexive parameters
The quantified parameters for the reference condition are given in Table 8.3. Thereflexive parameters for all conditions are shown in Figs. 8.7 and 8.8. Note that thereference condition is also given twice in Fig. 8.7 (be = 0 Ns/m, Ie = 1.6 gm2).The corresponding VAF values are given in the lower two rows of the figures. TheVAF values for the handle angle VAFθ are high for all conditions, indicating thatthe model describes the observed mechanical behaviour well. The VAF values ofthe muscle activation VAFa are around 40-50% for the environmental damping andinertia conditions. This can be considered high given the fact that EMG containssubstantial noise. To severely reduce the noise in the signals all irrelevant frequen-cies, i.e. not excited by the torque disturbance, were removed from the measuredangle and muscle activation. Noise reduction was performed by applying FFT, set-ting power to zero at all irrelevant frequencies, and then inverse transformation totime domain (by inverse FFT). The VAF values for these noise-reduced signals areindicated with grey lines in Figs. 8.7 and 8.8. By removing the irrelevant frequen-cies the VAFa increased to values around 60% for the environment condition andeven to 80% for the NB2 disturbances. The VAFa for NB2 disturbances is reducedprimarily by movements around the eigenfrequency and removing the irrelevantfrequencies, including the not excited eigenfrequency, improved the VAF substan-tially.
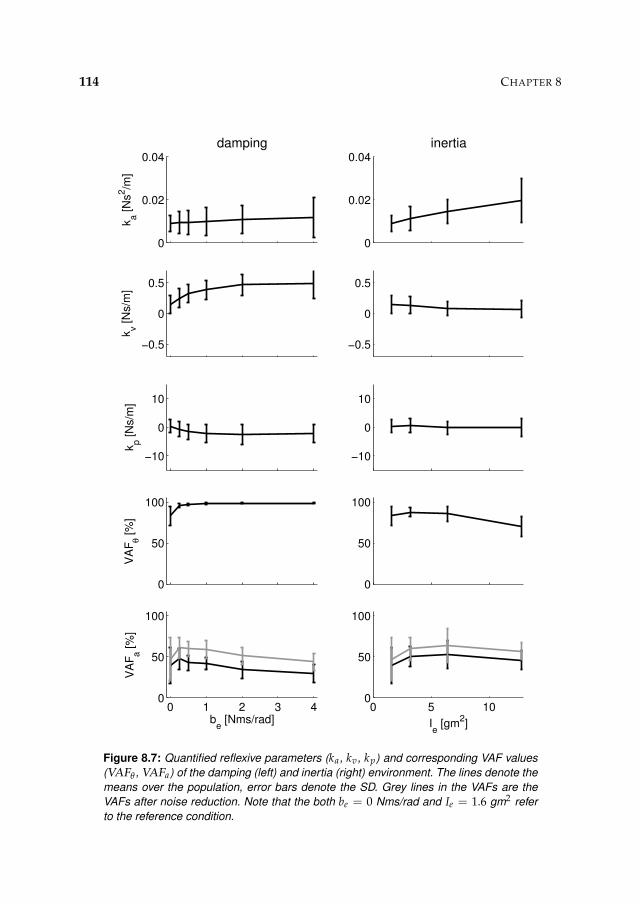
114 CHAPTER 8
0
0.02
0.04
ka [N
s2/m
]
damping
−0.5
0
0.5
kv [N
s/m
]
−10
0
10
kp [N
s/m
]
0
50
100
VA
Fθ [%
]
0 1 2 3 40
50
100
VA
Fa [%
]
be [Nms/rad]
0
0.02
0.04inertia
−0.5
0
0.5
−10
0
10
0
50
100
0 5 100
50
100
Ie [gm
2]
Figure 8.7: Quantified reflexive parameters (ka, kv, kp) and corresponding VAF values
(VAFθ , VAFa) of the damping (left) and inertia (right) environment. The lines denote the
means over the population, error bars denote the SD. Grey lines in the VAFs are the
VAFs after noise reduction. Note that the both be = 0 Nms/rad and Ie = 1.6 gm2 refer
to the reference condition.
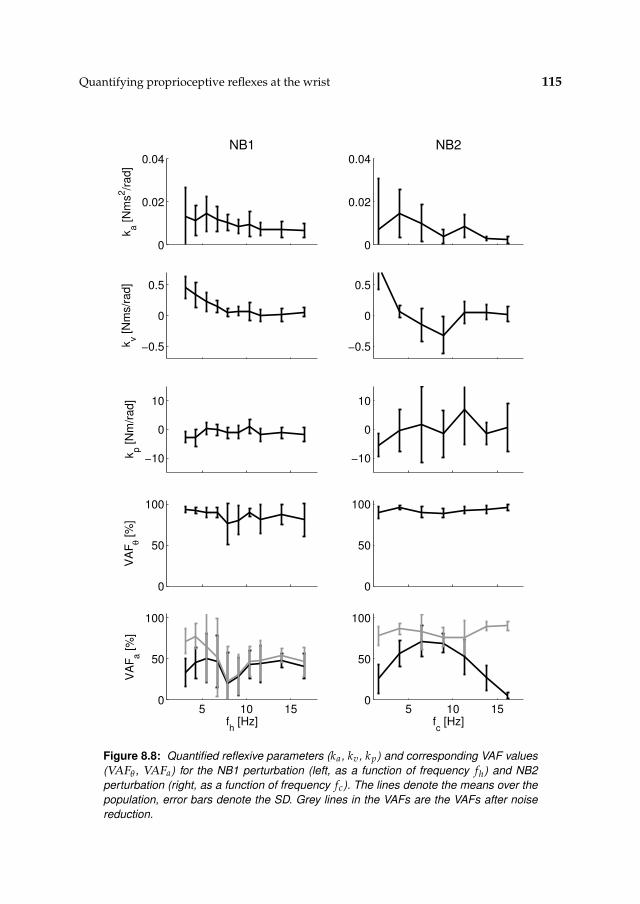
Quantifying proprioceptive reflexes at the wrist 115
0
0.02
0.04
ka [N
ms
2/r
ad]
NB1
−0.5
0
0.5
kv [N
ms/r
ad]
−10
0
10
kp [N
m/r
ad]
0
50
100
VA
Fθ [%
]
5 10 150
50
100
VA
Fa [%
]
fh [Hz]
0
0.02
0.04NB2
−0.5
0
0.5
−10
0
10
0
50
100
5 10 150
50
100
fc [Hz]
Figure 8.8: Quantified reflexive parameters (ka, kv, kp) and corresponding VAF values
(VAFθ , VAFa) for the NB1 perturbation (left, as a function of frequency fh) and NB2
perturbation (right, as a function of frequency fc). The lines denote the means over the
population, error bars denote the SD. Grey lines in the VAFs are the VAFs after noise
reduction.
116 CHAPTER 8
As the torque transducer was mounted in the lever of the manipulator, the quan-tified inertia includes the inertia of the handle (≈ 0.73 gm2, Schouten et al., 2004c).Correcting for the handle inertia gives the real inertia of a fisted hand, 1.40 gm2. Thestiffness of the wrist during the reference condition is around 10 Nm/rad (k + kp).The acceleration and position feedback are relatively small during the referencecondition. The velocity feedback is approximately 70% larger than the intrinsicdamping, indicating that velocity feedback had a substantial contribution to theperformance.
The velocity feedback gain increased with external damping (Fig. 8.7, left). Boththe variations in gain of acceleration and position feedback with the environmentaldamping were small. The acceleration feedback gain increased with external iner-tia (Fig. 8.7, right), while velocity and position feedback have small and constantvalues.
Fig. 8.8 (left) shows that with NB1 perturbations the velocity feedback decreasedwhen the disturbance bandwidth increased. The right column of Fig. 8.8 shows thequantified reflexive parameters of the NB2 perturbation. The velocity feedback gainis high for low centre frequencies and decreased for increasing centre frequencies,the velocity feedback gain even became negative for some centre frequencies. Thevariations in acceleration feedback are small and the high SD on the position feed-back suggests that the position feedback gain has a minor effect on the performancefor these disturbances and can not be reliably estimated.
8.4 Discussion
In this study the magnitude of proprioceptive reflexes is assessed at the wrist bymeans of torque disturbances. The use of torque disturbances facilitates an unam-biguous position task (‘minimize deviations’), which is natural and appealing for thesubjects. As the task requires minimal joint admittance proprioceptive reflexes willhave a relevant contribution to the performance. Furthermore by changing the con-dition (external damping/inertia and disturbance bandwidth) different reflex mag-nitudes are provoked.
The method is an important tool to evaluate the regulation of spinal reflexes anduseful to investigate the contribution of reflexes in disorders with abnormal mus-cle tone. Abnormalities of muscle tone are an integral component of many chronicneurological disorders, like complex regional pain syndrome (CRPS). A previousstudy evaluation reflexes at the shoulder showed that the method gives insight into the pathophysiology of CRPS (Schouten et al., 2003, see Chapter 3). For mostneurological disorders the motor features starts at distal joints and may affect moreproximal joints as the disease develops. To measure changes in reflex settings inthe early stages of these disorders it is desirable to quantify reflexes around a distaljoint like the wrist. Future studies can use the methods of this study to investigatereflexes at the wrist in neurological disorders.
For each condition the FRFs of the joint admittance and reflexive impedanceare estimated, describing the input-output behaviour from torque to angle and an-
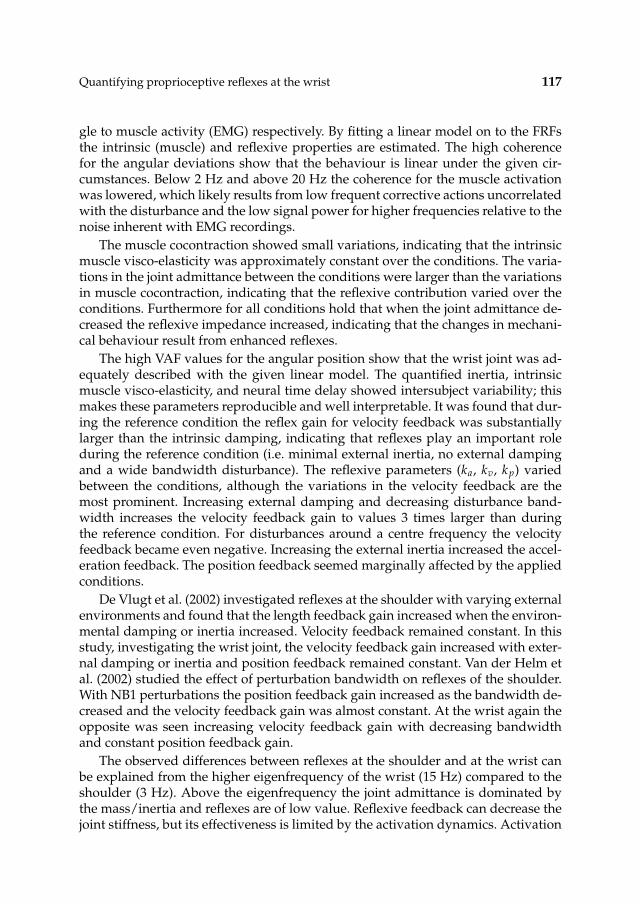
Quantifying proprioceptive reflexes at the wrist 117
gle to muscle activity (EMG) respectively. By fitting a linear model on to the FRFsthe intrinsic (muscle) and reflexive properties are estimated. The high coherencefor the angular deviations show that the behaviour is linear under the given cir-cumstances. Below 2 Hz and above 20 Hz the coherence for the muscle activationwas lowered, which likely results from low frequent corrective actions uncorrelatedwith the disturbance and the low signal power for higher frequencies relative to thenoise inherent with EMG recordings.
The muscle cocontraction showed small variations, indicating that the intrinsicmuscle visco-elasticity was approximately constant over the conditions. The varia-tions in the joint admittance between the conditions were larger than the variationsin muscle cocontraction, indicating that the reflexive contribution varied over theconditions. Furthermore for all conditions hold that when the joint admittance de-creased the reflexive impedance increased, indicating that the changes in mechani-cal behaviour result from enhanced reflexes.
The high VAF values for the angular position show that the wrist joint was ad-equately described with the given linear model. The quantified inertia, intrinsicmuscle visco-elasticity, and neural time delay showed intersubject variability; thismakes these parameters reproducible and well interpretable. It was found that dur-ing the reference condition the reflex gain for velocity feedback was substantiallylarger than the intrinsic damping, indicating that reflexes play an important roleduring the reference condition (i.e. minimal external inertia, no external dampingand a wide bandwidth disturbance). The reflexive parameters (ka, kv, kp) variedbetween the conditions, although the variations in the velocity feedback are themost prominent. Increasing external damping and decreasing disturbance band-width increases the velocity feedback gain to values 3 times larger than duringthe reference condition. For disturbances around a centre frequency the velocityfeedback became even negative. Increasing the external inertia increased the accel-eration feedback. The position feedback seemed marginally affected by the appliedconditions.
De Vlugt et al. (2002) investigated reflexes at the shoulder with varying externalenvironments and found that the length feedback gain increased when the environ-mental damping or inertia increased. Velocity feedback remained constant. In thisstudy, investigating the wrist joint, the velocity feedback gain increased with exter-nal damping or inertia and position feedback remained constant. Van der Helm etal. (2002) studied the effect of perturbation bandwidth on reflexes of the shoulder.With NB1 perturbations the position feedback gain increased as the bandwidth de-creased and the velocity feedback gain was almost constant. At the wrist again theopposite was seen increasing velocity feedback gain with decreasing bandwidthand constant position feedback gain.
The observed differences between reflexes at the shoulder and at the wrist canbe explained from the higher eigenfrequency of the wrist (15 Hz) compared to theshoulder (3 Hz). Above the eigenfrequency the joint admittance is dominated bythe mass/inertia and reflexes are of low value. Reflexive feedback can decrease thejoint stiffness, but its effectiveness is limited by the activation dynamics. Activation

118 CHAPTER 8
dynamics have a bandwidth around 2.2 Hz, hence the position feedback is onlyeffective below 2.2 Hz. This all implicates that position feedback is effective at theshoulder. At the wrist position feedback does only cover a small frequency rangebelow the eigenfrequency and higher order terms, like velocity, will be more effec-tive.

Chapter 9
Proprioceptive reflexes at the wrist in patients
with Parkinson’s disease
The goal of this study is to test if the wrist manipulator can be used to quantify re-flexes in patients with Parkinson’s disease. Quantification of reflex magnitudes canbe an important tool to investigate the how reflexes contribute to the motoric fea-tures of Parkinson’s disease. External torque disturbances were applied at the wristand the subjects had to ‘minimize the deviations’ of the handle of the manipulator.Intrinsic (muscle) and reflexive properties are assessed by fitting a model onto theinput-output behaviour. Modulation of reflex magnitude was provoked by chang-ing the external damping, imposed by the manipulator, or the disturbance band-width. This study showed that parkinsonian patients can perform the task welland that intrinsic and reflexive parameters can be reliably quantified. It was foundthat the neural time delay of proprioceptive reflexes in patients was significantlylarger compared to controls (patients: 55 ms; controls 43 ms). The differences inmodulation of the reflex magnitude were most pronounced for the external damp-ing conditions. Future studies with large populations of Parkinson patients shouldfocus on the protocol with damping conditions. By reducing the number of exper-imental conditions the experiment time will reduce substantially and lighten theexperiment for the subjects.
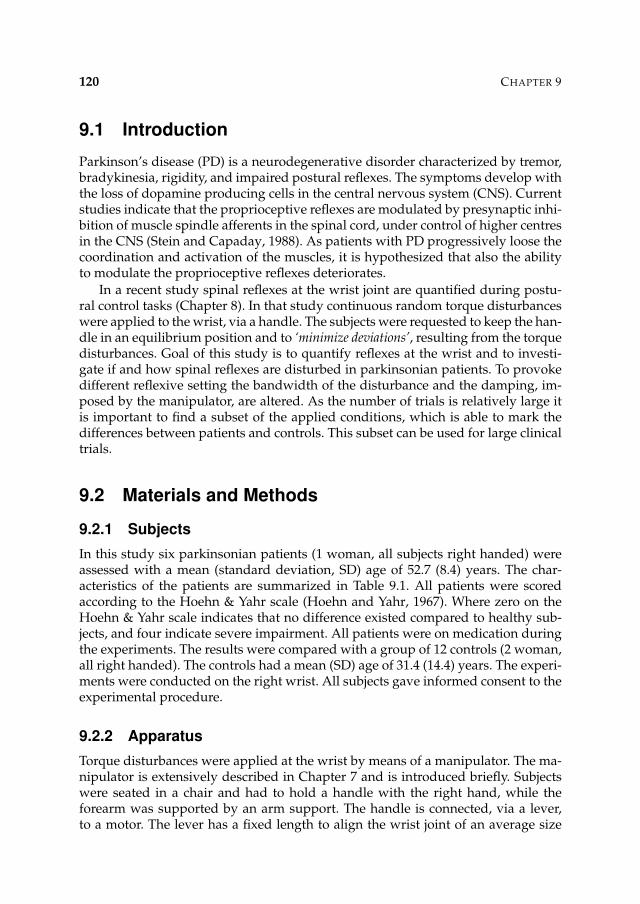
120 CHAPTER 9
9.1 Introduction
Parkinson’s disease (PD) is a neurodegenerative disorder characterized by tremor,bradykinesia, rigidity, and impaired postural reflexes. The symptoms develop withthe loss of dopamine producing cells in the central nervous system (CNS). Currentstudies indicate that the proprioceptive reflexes are modulated by presynaptic inhi-bition of muscle spindle afferents in the spinal cord, under control of higher centresin the CNS (Stein and Capaday, 1988). As patients with PD progressively loose thecoordination and activation of the muscles, it is hypothesized that also the abilityto modulate the proprioceptive reflexes deteriorates.
In a recent study spinal reflexes at the wrist joint are quantified during postu-ral control tasks (Chapter 8). In that study continuous random torque disturbanceswere applied to the wrist, via a handle. The subjects were requested to keep the han-dle in an equilibrium position and to ‘minimize deviations’, resulting from the torquedisturbances. Goal of this study is to quantify reflexes at the wrist and to investi-gate if and how spinal reflexes are disturbed in parkinsonian patients. To provokedifferent reflexive setting the bandwidth of the disturbance and the damping, im-posed by the manipulator, are altered. As the number of trials is relatively large itis important to find a subset of the applied conditions, which is able to mark thedifferences between patients and controls. This subset can be used for large clinicaltrials.
9.2 Materials and Methods
9.2.1 Subjects
In this study six parkinsonian patients (1 woman, all subjects right handed) wereassessed with a mean (standard deviation, SD) age of 52.7 (8.4) years. The char-acteristics of the patients are summarized in Table 9.1. All patients were scoredaccording to the Hoehn & Yahr scale (Hoehn and Yahr, 1967). Where zero on theHoehn & Yahr scale indicates that no difference existed compared to healthy sub-jects, and four indicate severe impairment. All patients were on medication duringthe experiments. The results were compared with a group of 12 controls (2 woman,all right handed). The controls had a mean (SD) age of 31.4 (14.4) years. The experi-ments were conducted on the right wrist. All subjects gave informed consent to theexperimental procedure.
9.2.2 Apparatus
Torque disturbances were applied at the wrist by means of a manipulator. The ma-nipulator is extensively described in Chapter 7 and is introduced briefly. Subjectswere seated in a chair and had to hold a handle with the right hand, while theforearm was supported by an arm support. The handle is connected, via a lever,to a motor. The lever has a fixed length to align the wrist joint of an average size
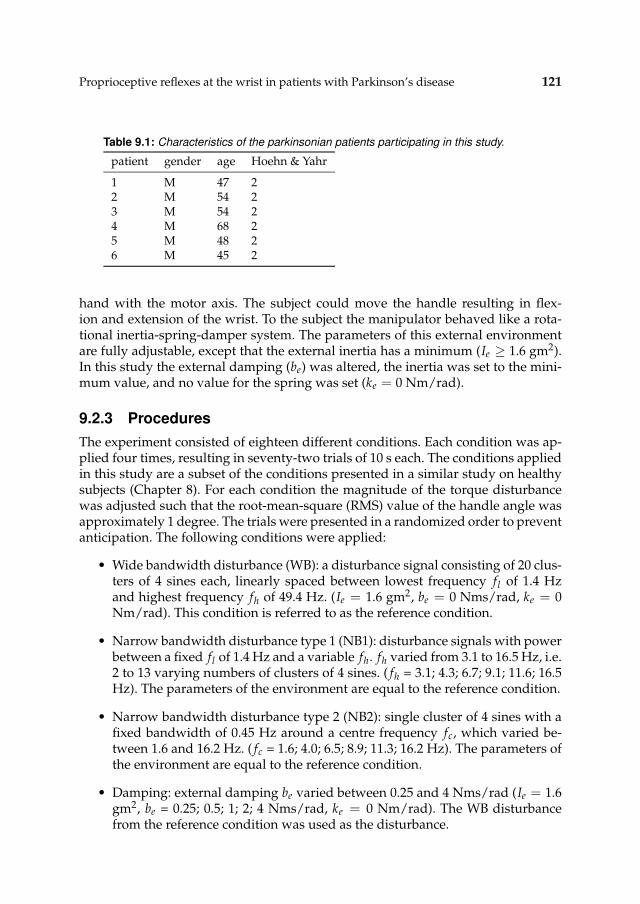
Proprioceptive reflexes at the wrist in patients with Parkinson’s disease 121
Table 9.1: Characteristics of the parkinsonian patients participating in this study.
patient gender age Hoehn & Yahr
1 M 47 22 M 54 23 M 54 24 M 68 25 M 48 26 M 45 2
hand with the motor axis. The subject could move the handle resulting in flex-ion and extension of the wrist. To the subject the manipulator behaved like a rota-tional inertia-spring-damper system. The parameters of this external environmentare fully adjustable, except that the external inertia has a minimum (Ie ≥ 1.6 gm2).In this study the external damping (be) was altered, the inertia was set to the mini-mum value, and no value for the spring was set (ke = 0 Nm/rad).
9.2.3 Procedures
The experiment consisted of eighteen different conditions. Each condition was ap-plied four times, resulting in seventy-two trials of 10 s each. The conditions appliedin this study are a subset of the conditions presented in a similar study on healthysubjects (Chapter 8). For each condition the magnitude of the torque disturbancewas adjusted such that the root-mean-square (RMS) value of the handle angle wasapproximately 1 degree. The trials were presented in a randomized order to preventanticipation. The following conditions were applied:
• Wide bandwidth disturbance (WB): a disturbance signal consisting of 20 clus-ters of 4 sines each, linearly spaced between lowest frequency fl of 1.4 Hzand highest frequency fh of 49.4 Hz. (Ie = 1.6 gm2, be = 0 Nms/rad, ke = 0Nm/rad). This condition is referred to as the reference condition.
• Narrow bandwidth disturbance type 1 (NB1): disturbance signals with powerbetween a fixed fl of 1.4 Hz and a variable fh. fh varied from 3.1 to 16.5 Hz, i.e.2 to 13 varying numbers of clusters of 4 sines. ( fh = 3.1; 4.3; 6.7; 9.1; 11.6; 16.5Hz). The parameters of the environment are equal to the reference condition.
• Narrow bandwidth disturbance type 2 (NB2): single cluster of 4 sines with afixed bandwidth of 0.45 Hz around a centre frequency fc, which varied be-tween 1.6 and 16.2 Hz. ( fc = 1.6; 4.0; 6.5; 8.9; 11.3; 16.2 Hz). The parameters ofthe environment are equal to the reference condition.
• Damping: external damping be varied between 0.25 and 4 Nms/rad (Ie = 1.6gm2, be = 0.25; 0.5; 1; 2; 4 Nms/rad, ke = 0 Nm/rad). The WB disturbancefrom the reference condition was used as the disturbance.
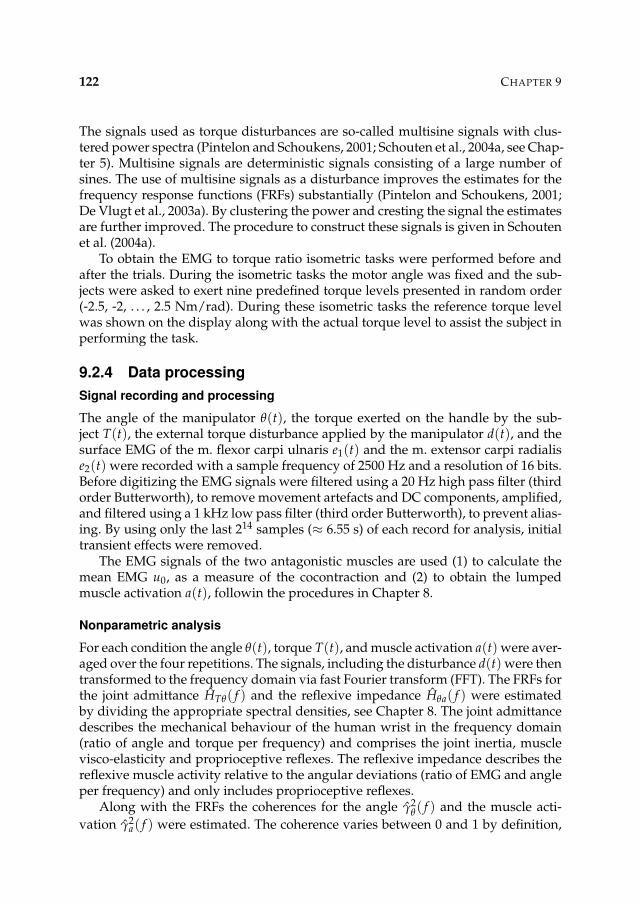
122 CHAPTER 9
The signals used as torque disturbances are so-called multisine signals with clus-tered power spectra (Pintelon and Schoukens, 2001; Schouten et al., 2004a, see Chap-ter 5). Multisine signals are deterministic signals consisting of a large number ofsines. The use of multisine signals as a disturbance improves the estimates for thefrequency response functions (FRFs) substantially (Pintelon and Schoukens, 2001;De Vlugt et al., 2003a). By clustering the power and cresting the signal the estimatesare further improved. The procedure to construct these signals is given in Schoutenet al. (2004a).
To obtain the EMG to torque ratio isometric tasks were performed before andafter the trials. During the isometric tasks the motor angle was fixed and the sub-jects were asked to exert nine predefined torque levels presented in random order(-2.5, -2, . . . , 2.5 Nm/rad). During these isometric tasks the reference torque levelwas shown on the display along with the actual torque level to assist the subject inperforming the task.
9.2.4 Data processing
Signal recording and processing
The angle of the manipulator θ(t), the torque exerted on the handle by the sub-ject T(t), the external torque disturbance applied by the manipulator d(t), and thesurface EMG of the m. flexor carpi ulnaris e1(t) and the m. extensor carpi radialise2(t) were recorded with a sample frequency of 2500 Hz and a resolution of 16 bits.Before digitizing the EMG signals were filtered using a 20 Hz high pass filter (thirdorder Butterworth), to remove movement artefacts and DC components, amplified,and filtered using a 1 kHz low pass filter (third order Butterworth), to prevent alias-ing. By using only the last 214 samples (≈ 6.55 s) of each record for analysis, initialtransient effects were removed.
The EMG signals of the two antagonistic muscles are used (1) to calculate themean EMG u0, as a measure of the cocontraction and (2) to obtain the lumpedmuscle activation a(t), followin the procedures in Chapter 8.
Nonparametric analysis
For each condition the angle θ(t), torque T(t), and muscle activation a(t) were aver-aged over the four repetitions. The signals, including the disturbance d(t) were thentransformed to the frequency domain via fast Fourier transform (FFT). The FRFs forthe joint admittance HTθ( f ) and the reflexive impedance Hθa( f ) were estimatedby dividing the appropriate spectral densities, see Chapter 8. The joint admittancedescribes the mechanical behaviour of the human wrist in the frequency domain(ratio of angle and torque per frequency) and comprises the joint inertia, musclevisco-elasticity and proprioceptive reflexes. The reflexive impedance describes thereflexive muscle activity relative to the angular deviations (ratio of EMG and angleper frequency) and only includes proprioceptive reflexes.
Along with the FRFs the coherences for the angle γ2θ( f ) and the muscle acti-
vation γ2a( f ) were estimated. The coherence varies between 0 and 1 by definition,
Proprioceptive reflexes at the wrist in patients with Parkinson’s disease 123
where a value of 1 indicates that the signal is linearly related to disturbance andnoise free.
Quantification of intrinsic and reflexive properties
To obtain the intrinsic and reflexive parameters a model is fitted onto the joint ad-mittance and the reflexive impedance simultaneously, see Chapter 8. The intrinsicmodel consists of inertia I, intrinsic stiffness k, and intrinsic damping b. The stiff-ness and damping describe the joint visco-elasticity, including the muscle visco-elasticity resulting from muscle cocontraction. The reflexive feedback is modelledas a feedback gain for position kp, velocity kv, acceleration ka in series with neuraltime delay τd, describing the neural transportation and processing time.
Model validation
To get an impression of the goodness of the model structure and model fit the vari-ance accounted for (VAF) was used. The VAF was calculated for the joint angleVAFθ and the muscle activation VAFa as both are available from measurements. Toobtain the VAF the model is simulated with the estimated parameters and appliedtorque disturbance. The angle and muscle activation of the model are compared tothe real recordings, see Chapter 8.
Note that a low coherence will always result in a low VAF. Low coherence in-dicate that nonlinearities and noise are present in the signals. Both effects will alsoreduce the VAF. A low VAF with a high coherence suggests that the chosen (linear)model structure is inappropriate. A high coherence indicates that the behaviour islinear and so a linear model must exist, but the chosen model structure is not ableto fit the observed behaviour.
Statistical analysis
Differences in intrinsic parameters between patients and healthy subjects were eval-uated using unpaired two-sample Student’s t-tests for samples with unequal vari-ances. Differences for the reflexive parameters were evaluated with 2-way ANOVA.p-values smaller than 0.05 were considered significant.
9.3 Results
9.3.1 Nonparametric FRFs
In Table 9.2 the RMS value for the handle angle and the mean EMG are shown.For both the patients and the subjects the mean EMG is around one indicating thatthe variation in muscle co-activation over the conditions is small. The deviationsof the handle are around 0.8-0.9 degrees for the controls. The higher SD over theparkinsonian subjects shows that the patients had difficulties with the task.
In Fig. 9.1 the joint admittance and the reflexive impedance are shown for thehealthy subjects and the parkinsonian patients during the reference condition. The
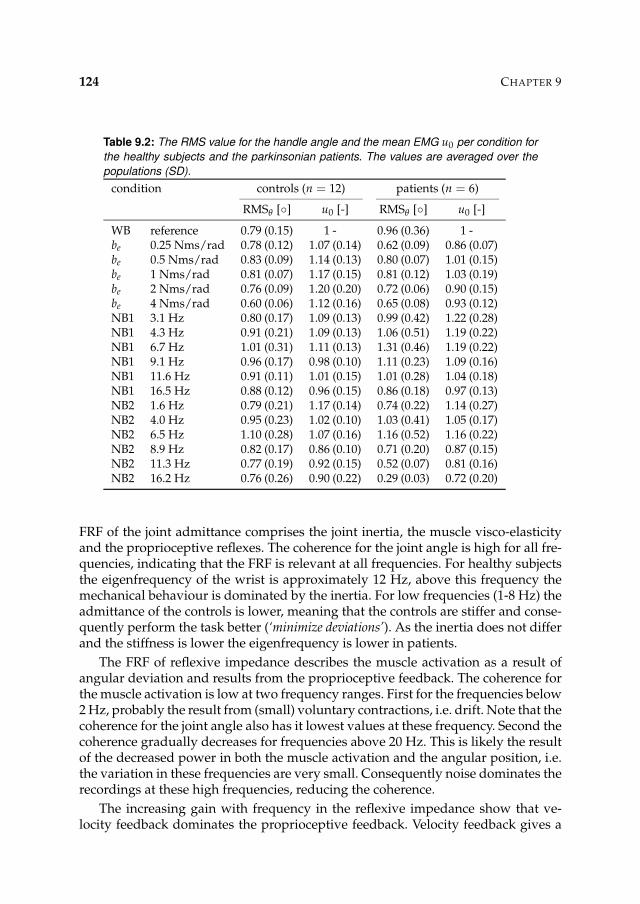
124 CHAPTER 9
Table 9.2: The RMS value for the handle angle and the mean EMG u0 per condition for
the healthy subjects and the parkinsonian patients. The values are averaged over the
populations (SD).
condition controls (n = 12) patients (n = 6)
RMSθ [◦] u0 [-] RMSθ [◦] u0 [-]
WB reference 0.79 (0.15) 1 - 0.96 (0.36) 1 -be 0.25 Nms/rad 0.78 (0.12) 1.07 (0.14) 0.62 (0.09) 0.86 (0.07)be 0.5 Nms/rad 0.83 (0.09) 1.14 (0.13) 0.80 (0.07) 1.01 (0.15)be 1 Nms/rad 0.81 (0.07) 1.17 (0.15) 0.81 (0.12) 1.03 (0.19)be 2 Nms/rad 0.76 (0.09) 1.20 (0.20) 0.72 (0.06) 0.90 (0.15)be 4 Nms/rad 0.60 (0.06) 1.12 (0.16) 0.65 (0.08) 0.93 (0.12)NB1 3.1 Hz 0.80 (0.17) 1.09 (0.13) 0.99 (0.42) 1.22 (0.28)NB1 4.3 Hz 0.91 (0.21) 1.09 (0.13) 1.06 (0.51) 1.19 (0.22)NB1 6.7 Hz 1.01 (0.31) 1.11 (0.13) 1.31 (0.46) 1.19 (0.22)NB1 9.1 Hz 0.96 (0.17) 0.98 (0.10) 1.11 (0.23) 1.09 (0.16)NB1 11.6 Hz 0.91 (0.11) 1.01 (0.15) 1.01 (0.28) 1.04 (0.18)NB1 16.5 Hz 0.88 (0.12) 0.96 (0.15) 0.86 (0.18) 0.97 (0.13)NB2 1.6 Hz 0.79 (0.21) 1.17 (0.14) 0.74 (0.22) 1.14 (0.27)NB2 4.0 Hz 0.95 (0.23) 1.02 (0.10) 1.03 (0.41) 1.05 (0.17)NB2 6.5 Hz 1.10 (0.28) 1.07 (0.16) 1.16 (0.52) 1.16 (0.22)NB2 8.9 Hz 0.82 (0.17) 0.86 (0.10) 0.71 (0.20) 0.87 (0.15)NB2 11.3 Hz 0.77 (0.19) 0.92 (0.15) 0.52 (0.07) 0.81 (0.16)NB2 16.2 Hz 0.76 (0.26) 0.90 (0.22) 0.29 (0.03) 0.72 (0.20)
FRF of the joint admittance comprises the joint inertia, the muscle visco-elasticityand the proprioceptive reflexes. The coherence for the joint angle is high for all fre-quencies, indicating that the FRF is relevant at all frequencies. For healthy subjectsthe eigenfrequency of the wrist is approximately 12 Hz, above this frequency themechanical behaviour is dominated by the inertia. For low frequencies (1-8 Hz) theadmittance of the controls is lower, meaning that the controls are stiffer and conse-quently perform the task better (‘minimize deviations’). As the inertia does not differand the stiffness is lower the eigenfrequency is lower in patients.
The FRF of reflexive impedance describes the muscle activation as a result ofangular deviation and results from the proprioceptive feedback. The coherence forthe muscle activation is low at two frequency ranges. First for the frequencies below2 Hz, probably the result from (small) voluntary contractions, i.e. drift. Note that thecoherence for the joint angle also has it lowest values at these frequency. Second thecoherence gradually decreases for frequencies above 20 Hz. This is likely the resultof the decreased power in both the muscle activation and the angular position, i.e.the variation in these frequencies are very small. Consequently noise dominates therecordings at these high frequencies, reducing the coherence.
The increasing gain with frequency in the reflexive impedance show that ve-locity feedback dominates the proprioceptive feedback. Velocity feedback gives a
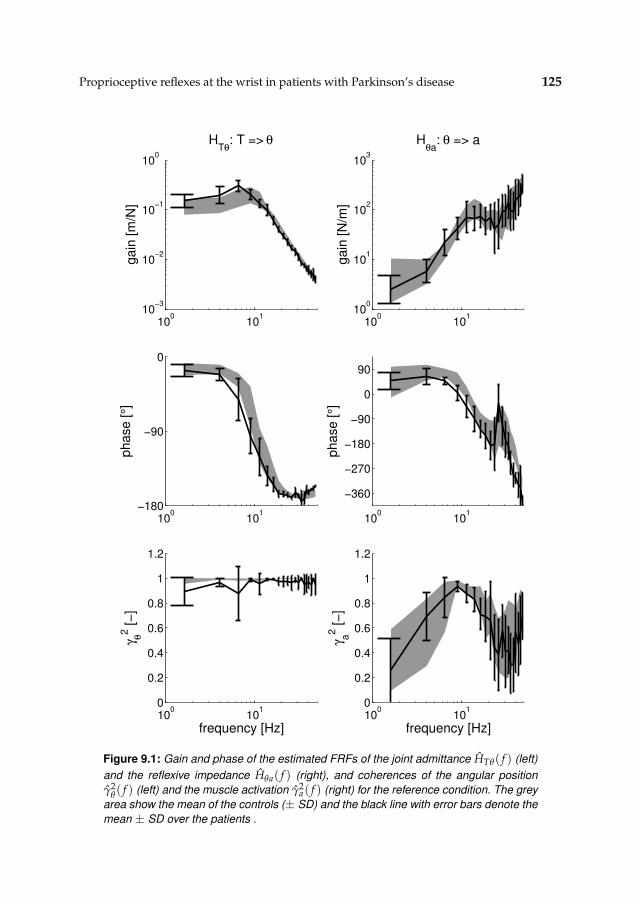
Proprioceptive reflexes at the wrist in patients with Parkinson’s disease 125
100
101
10−3
10−2
10−1
100
ga
in [
m/N
]H
Tθ: T => θ
100
101
−180
−90
0
ph
ase
[°]
100
101
0
0.2
0.4
0.6
0.8
1
1.2
γ θ
2 [
−]
frequency [Hz]
100
101
100
101
102
103
ga
in [
N/m
]
Hθa
: θ => a
100
101
−360
−270
−180
−90
0
90
ph
ase
[°]
100
101
0
0.2
0.4
0.6
0.8
1
1.2
γ a
2 [
−]
frequency [Hz]
Figure 9.1: Gain and phase of the estimated FRFs of the joint admittance HTθ( f ) (left)
and the reflexive impedance Hθa( f ) (right), and coherences of the angular position
γ2θ( f ) (left) and the muscle activation γ2
a( f ) (right) for the reference condition. The grey
area show the mean of the controls (± SD) and the black line with error bars denote the
mean ± SD over the patients .
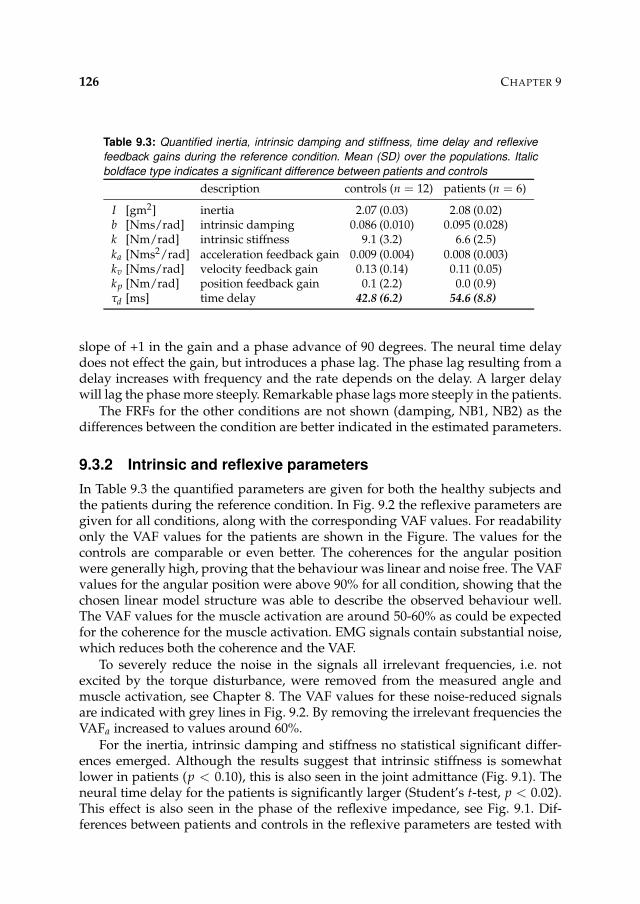
126 CHAPTER 9
Table 9.3: Quantified inertia, intrinsic damping and stiffness, time delay and reflexive
feedback gains during the reference condition. Mean (SD) over the populations. Italic
boldface type indicates a significant difference between patients and controls
description controls (n = 12) patients (n = 6)
I [gm2] inertia 2.07 (0.03) 2.08 (0.02)b [Nms/rad] intrinsic damping 0.086 (0.010) 0.095 (0.028)k [Nm/rad] intrinsic stiffness 9.1 (3.2) 6.6 (2.5)ka [Nms2/rad] acceleration feedback gain 0.009 (0.004) 0.008 (0.003)kv [Nms/rad] velocity feedback gain 0.13 (0.14) 0.11 (0.05)kp [Nm/rad] position feedback gain 0.1 (2.2) 0.0 (0.9)τd [ms] time delay 42.8 (6.2) 54.6 (8.8)
slope of +1 in the gain and a phase advance of 90 degrees. The neural time delaydoes not effect the gain, but introduces a phase lag. The phase lag resulting from adelay increases with frequency and the rate depends on the delay. A larger delaywill lag the phase more steeply. Remarkable phase lags more steeply in the patients.
The FRFs for the other conditions are not shown (damping, NB1, NB2) as thedifferences between the condition are better indicated in the estimated parameters.
9.3.2 Intrinsic and reflexive parameters
In Table 9.3 the quantified parameters are given for both the healthy subjects andthe patients during the reference condition. In Fig. 9.2 the reflexive parameters aregiven for all conditions, along with the corresponding VAF values. For readabilityonly the VAF values for the patients are shown in the Figure. The values for thecontrols are comparable or even better. The coherences for the angular positionwere generally high, proving that the behaviour was linear and noise free. The VAFvalues for the angular position were above 90% for all condition, showing that thechosen linear model structure was able to describe the observed behaviour well.The VAF values for the muscle activation are around 50-60% as could be expectedfor the coherence for the muscle activation. EMG signals contain substantial noise,which reduces both the coherence and the VAF.
To severely reduce the noise in the signals all irrelevant frequencies, i.e. notexcited by the torque disturbance, were removed from the measured angle andmuscle activation, see Chapter 8. The VAF values for these noise-reduced signalsare indicated with grey lines in Fig. 9.2. By removing the irrelevant frequencies theVAFa increased to values around 60%.
For the inertia, intrinsic damping and stiffness no statistical significant differ-ences emerged. Although the results suggest that intrinsic stiffness is somewhatlower in patients (p < 0.10), this is also seen in the joint admittance (Fig. 9.1). Theneural time delay for the patients is significantly larger (Student’s t-test, p < 0.02).This effect is also seen in the phase of the reflexive impedance, see Fig. 9.1. Dif-ferences between patients and controls in the reflexive parameters are tested with
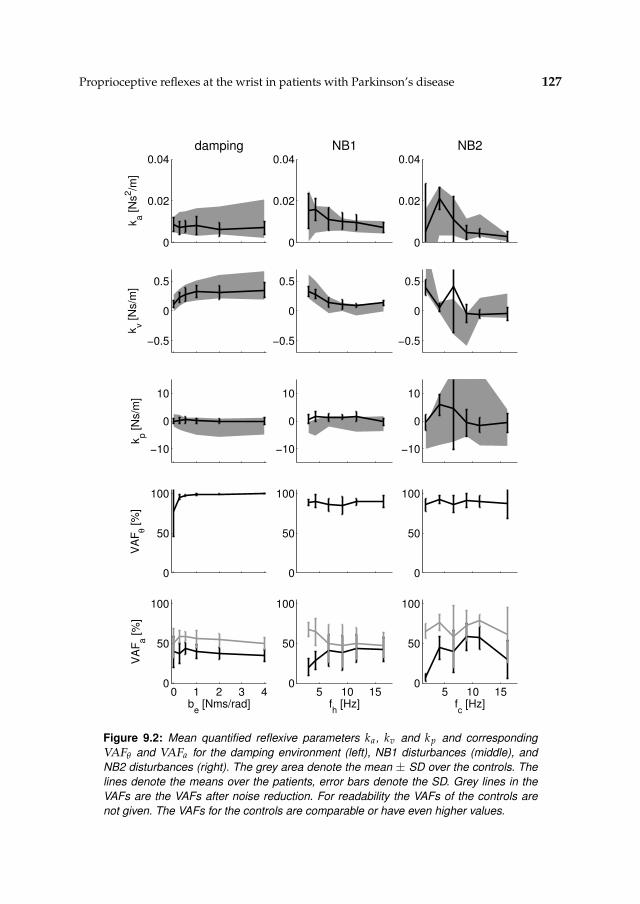
Proprioceptive reflexes at the wrist in patients with Parkinson’s disease 127
0
0.02
0.04
ka [
Ns
2/m
]
damping
−0.5
0
0.5
kv [
Ns/m
]
−10
0
10
kp [
Ns/m
]
0
50
100
VA
Fθ [
%]
0 1 2 3 40
50
100
VA
Fa [
%]
be [Nms/rad]
0
0.02
0.04NB1
−0.5
0
0.5
−10
0
10
0
50
100
5 10 150
50
100
fh [Hz]
0
0.02
0.04NB2
−0.5
0
0.5
−10
0
10
0
50
100
5 10 150
50
100
fc [Hz]
Figure 9.2: Mean quantified reflexive parameters ka, kv and kp and corresponding
VAFθ and VAFa for the damping environment (left), NB1 disturbances (middle), and
NB2 disturbances (right). The grey area denote the mean ± SD over the controls. The
lines denote the means over the patients, error bars denote the SD. Grey lines in the
VAFs are the VAFs after noise reduction. For readability the VAFs of the controls are
not given. The VAFs for the controls are comparable or have even higher values.
128 CHAPTER 9
2-way ANOVA. For the damping conditions the trend in both ka and kp are signif-icantly different between patients and controls; for NB1 conditions trends in kp aresignificantly different. For NB2 conditions no significant differences are expectedsince the variance on the reflexive parameters is large.
9.4 Discussion
In this study the proprioceptive reflexes at the wrist in patients suffering fromParkinson’s disease are assessed with use of the method described in Chapter 8.Both in patients and controls the coherences and VAF values are high, indicatingthat the method is relevant and applicable. In healthy subjects the magnitude ofthe reflexes depends on the bandwidth of the torque disturbance and the externaldamping. In this study these conditions were applied to patients suffering fromPD. Despite the small populations (12 controls and 6 parkinsonian patients) it isfound that the neural time delay in patients was significantly larger. Furthermoreit was found that with external damping the range of modulation of the reflexivefeedback gains was confined in patients. Future studies with large groups of pa-tients should focus on the external damping conditions. The number of conditionscan be reduced from eighteen in this study to five, substantially experiment time.Damping has an additional advantage that patients with tremor can be assessed asthe external damping will reduce the tremor.
Torque perturbations with a position task are a relevant protocol to investigateproprioceptive reflexes. During postural control it is desirable to have a low admit-tance for all frequencies, to suppress the influence of the torque disturbance ontothe deviations. The admittance comprise the joint admittance and the external en-vironment. Both intrinsic properties and proprioceptive reflexes influence the jointadmittance. The reflexive impedance is the dynamic relationship between angleand muscle activation, indication the reflexive activity as a result to the deviations,and describes the proprioceptive reflexes. A high reflexive impedance indicates thatthe magnitude of the proprioceptive reflexes is high. Strong reflexes also decreasethe joint admittance. However the effectiveness of the proprioceptive reflexes islimited by the neural time delays. Feedback with a time delay, like proprioceptivereflexes, an oscillatory peak around the eigenfrequency occurs when the feedbackis (too) high. This means that their is a trade-off between low joint admittance forfrequencies below the eigenfrequency at the cost of an oscillatory peak at the eigen-frequency. With NB disturbances this peak is not excited and so does not deterioratethe performance. With external damping the peak is damped out by the environ-ment and the increased stiffness remains.
Chapter 10
Analysis of reflex modulation with a biological
neural network
Arno H.A. Stienen, Alfred C. Schouten, Frans C.T. van der HelmSubmitted to Biological Cybernetics
The neuromusculoskeletal (NMS) model of this study was built to give insight intothe mechanisms behind negative position and velocity feedback gains as identi-fied in human postural control. Specifically, neural deficiencies were sought whichcould explain why complex regional pain syndrome (CRPS) patients with tonicdystonia are unable to set negative gains, although they are still to modulate thegains in the positive range. The model is an integration of a biological realisticneural network (BNN), modelling all relevant spinal neurons, and a one degree-of-freedom (DOF) musculoskeletal model. Muscle proprioceptors provide the neu-ral network with feedback. Literature suggests that the inability to set negativegains results from neurotransmitter deficiencies in inhibiting synapses in the spinalneural network. Two synaptic connections were selected for possible dysfunction-ing: (1) the synapse which presynaptically inhibits the monosynaptic stretch reflexsynapse, and (2) the synapse connecting the inhibitory interneuron to the motoneu-ron. A lack of presynaptic inhibition resulted in an overly dominant monosynapticstretch reflex with high, positive feedback gains. Disabling the second preventedseveral major proprioceptive feedback paths from providing the motoneurons withnegative stimulation, making the setting of negative feedback gains next to impos-sible. It is concluded that both synapses play an important role in obtaining neg-ative feedback gains and that dysfunctioning of these synapses could account forthe motor features in CRPS patients. However the presynaptically inhibiting of themonosynaptic stretch is a prerequisite for feedback gain modulation.
130 CHAPTER 10
10.1 Introduction
Complex regional pain syndrome (CRPS), also known as reflex sympathetic dystro-phy, is a painful condition typically following a minor injury to a limb. The symp-toms may include movement disorders (Van Hilten et al., 2001), of which the mostcommon form in patients with CRPS is tonic dystonia (Bhatia et al., 1993; Schwartz-man and Kerrigan, 1990). Dystonia is characterised by involuntary muscle contrac-tions forcing the affected limbs into abnormal postures. The mechanisms responsi-ble for tonic dystonia are still unknown, but involvement of inhibiting synapses inthe spinal cord was suggested (Van Hilten et al., 2000).
In Van der Helm et al. (2002) a method was developed that allows the quan-titative assessment of circuits that modulate the gain of proprioceptive reflexes ofthe upper extremities during postural control. Force disturbances were applied atthe hand while subjects had to ‘minimize the deviations’ resulting from the force dis-turbance. Healthy subjects modulate the magnitude of their reflexes based on thefrequency content of the force disturbance. For disturbances containing only fre-quencies in a small bandwidth around a centre frequency even negative feedbackgains were found. However, quantification of reflex gains in CRPS patients withtonic dystonia revealed their inability to achieve negative gains, although modula-tion of positive gains was still possible (Schouten et al., 2003, see Chapter 3).
Literature concerning the neural mechanisms to generate negative feedbackgains is scarce. The goal of this study is to develop a biological realistic neural net-work (BNN) controlling a musculoskeletal model to find and elucidate mechanismsinvolved in the setting of negative feedback gains. Dysfunction of such mechanismscould give insight into the pathophysiology of CRPS.
10.2 Method
First, a BNN, modelling all relevant spinal neurons, was integrated with a muscu-loskeletal model of the human arm with proprioceptors, creating a complete neuro-musculoskeletal (NMS) model. The musculoskeletal model consists of a single onedegree-of-freedom (1 DOF) limb on which two antagonistic muscles act, represent-ing the shoulder joint in the experimental set-up of Van der Helm et al. (2002) andSchouten et al. (2003). The BNN is based on the model of Bashor (1998). Generaldata for the models for the muscle spindles and Golgi tendon organs were derivedfrom literature.
Second, the NMS model was stimulated by force disturbances in computer sim-ulations. The scheme of the model is given in Fig. 10.1. In the simulations, the forcedisturbance d(t) acted on the endpoint of the limb resulting in position deviationsx(t). The BNN blended tonic supraspinal excitatory commands from the brain andproprioceptive feedback from muscle spindles and Golgi tendon organs into acti-vation signals for both muscles.
Third and finally, the reflex gains were quantified by applying the procedure ofVan der Helm et al. (2002). By varying synaptic connection strengths, neural mecha-
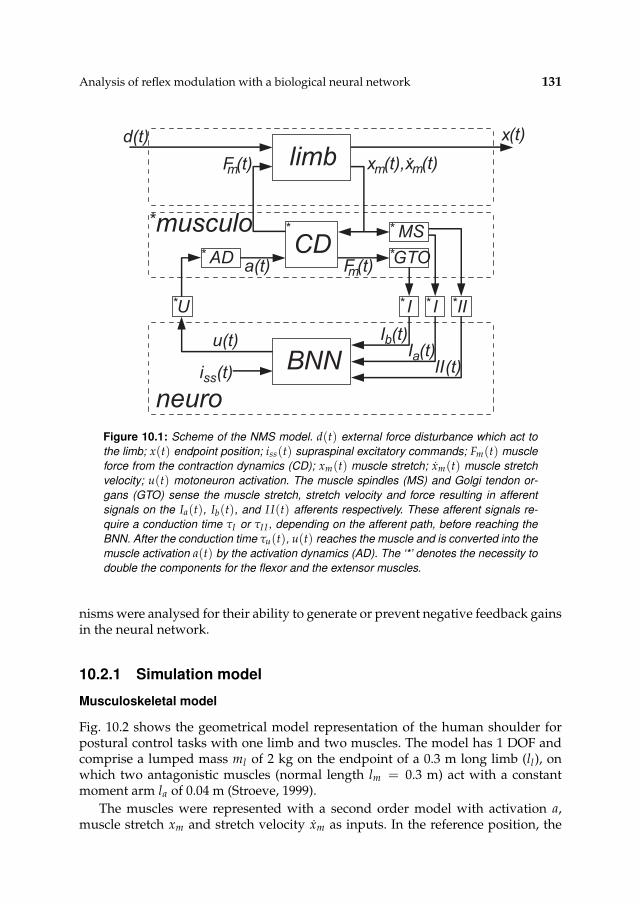
Analysis of reflex modulation with a biological neural network 131
limb
AD*
MS*
GTO*
BNN
I* II*I*U*
musculo **
F (t)m
F (t)m
I (t)a
I (t)b
II(t)
x (t),xm (t)m.
x(t)
u(t)
a(t)
i (t)ss
CD
neuro
d(t)
Figure 10.1: Scheme of the NMS model. d(t) external force disturbance which act to
the limb; x(t) endpoint position; iss(t) supraspinal excitatory commands; Fm(t) muscle
force from the contraction dynamics (CD); xm(t) muscle stretch; xm(t) muscle stretch
velocity; u(t) motoneuron activation. The muscle spindles (MS) and Golgi tendon or-
gans (GTO) sense the muscle stretch, stretch velocity and force resulting in afferent
signals on the Ia(t), Ib(t), and I I(t) afferents respectively. These afferent signals re-
quire a conduction time τI or τI I , depending on the afferent path, before reaching the
BNN. After the conduction time τu(t), u(t) reaches the muscle and is converted into the
muscle activation a(t) by the activation dynamics (AD). The ‘*’ denotes the necessity to
double the components for the flexor and the extensor muscles.
nisms were analysed for their ability to generate or prevent negative feedback gainsin the neural network.
10.2.1 Simulation model
Musculoskeletal model
Fig. 10.2 shows the geometrical model representation of the human shoulder forpostural control tasks with one limb and two muscles. The model has 1 DOF andcomprise a lumped mass ml of 2 kg on the endpoint of a 0.3 m long limb (ll), onwhich two antagonistic muscles (normal length lm = 0.3 m) act with a constantmoment arm la of 0.04 m (Stroeve, 1999).
The muscles were represented with a second order model with activation a,muscle stretch xm and stretch velocity xm as inputs. In the reference position, the
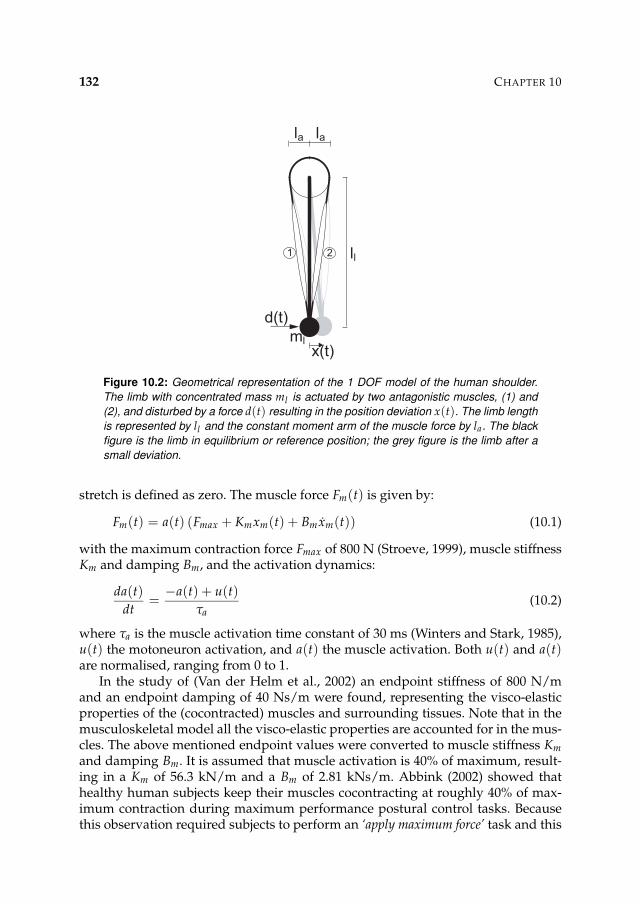
132 CHAPTER 10
ll
lala
x(t)
d(t)
1 2
ml
Figure 10.2: Geometrical representation of the 1 DOF model of the human shoulder.
The limb with concentrated mass ml is actuated by two antagonistic muscles, (1) and
(2), and disturbed by a force d(t) resulting in the position deviation x(t). The limb length
is represented by ll and the constant moment arm of the muscle force by la. The black
figure is the limb in equilibrium or reference position; the grey figure is the limb after a
small deviation.
stretch is defined as zero. The muscle force Fm(t) is given by:
Fm(t) = a(t) (Fmax + Kmxm(t) + Bm xm(t)) (10.1)
with the maximum contraction force Fmax of 800 N (Stroeve, 1999), muscle stiffnessKm and damping Bm, and the activation dynamics:
da(t)
dt=
−a(t) + u(t)
τa(10.2)
where τa is the muscle activation time constant of 30 ms (Winters and Stark, 1985),u(t) the motoneuron activation, and a(t) the muscle activation. Both u(t) and a(t)are normalised, ranging from 0 to 1.
In the study of (Van der Helm et al., 2002) an endpoint stiffness of 800 N/mand an endpoint damping of 40 Ns/m were found, representing the visco-elasticproperties of the (cocontracted) muscles and surrounding tissues. Note that in themusculoskeletal model all the visco-elastic properties are accounted for in the mus-cles. The above mentioned endpoint values were converted to muscle stiffness Km
and damping Bm. It is assumed that muscle activation is 40% of maximum, result-ing in a Km of 56.3 kN/m and a Bm of 2.81 kNs/m. Abbink (2002) showed thathealthy human subjects keep their muscles cocontracting at roughly 40% of max-imum contraction during maximum performance postural control tasks. Becausethis observation required subjects to perform an ‘apply maximum force’ task and this
Analysis of reflex modulation with a biological neural network 133
task is undesirable and/or impossible for CRPS patients, it was not possible toquantify their activation level in a percentage. However, a constant cocontractionlevel was observed for different disturbances (Schouten et al., 2003).
Proprioceptors
Vital to any feedback control network is the quality of the sensory input. Prochazkaand Gorassini (1998a,b) compared several mathematical models for their abilityto predict the firing characteristics of muscle spindle primary afferents recordedchronically during normal stepping in cats. Jankowska and Hammar (2002) arguedthat the essential properties and organisations of spinal interneuronal systems incat and man are similar, and therefore relevant cat data and models are used in theNMS model of this study when human data and models are unavailable.
Muscle spindles output muscle length and velocity information via two sepa-rate spike train channels: Ia afferent for both length and velocity information (con-duction delay τI = 15 ms, Winters and Stark (1985)) and the slower II afferent forpure length information (τI I = 30 ms, Winters and Stark (1985)). Two equationsare needed to determine the spike rate (in sp/s) for both channels (Prochazka andGorassini, 1998a,b):
Ia(t) = pm + ppxm(t) + pv1 xpv2m (t) (10.3)
I I(t) = pm + ppxm(t) (10.4)
where xm(t) is the muscle stretch (in mm) and xm(t) the muscle stretch velocity(in mm/s). The constant pm represents the mean firing rate and is arbitrarily setto 80 sp/s. The length change constant pp and velocity constants pv1 and pv2 scalethe length and velocity information. Although Prochazka and Gorassini (1998a,b)kept the pp at 2 for the Ia afferent channel, in this study it is set to 13.5, equal totheir choice for the II afferent channel. This increases the static component of theIa afferent channel, as is expected for postural control tasks. Values for pv1 and pv2
(4.3 and 0.6) are claimed to be valid for both humans and cats and therefore usedunaltered (Prochazka and Gorassini, 1998a,b).
Golgi tendon organ models are far more scarce, but available literature suggestthat the firing rate is linear with the force (Crago et al., 1982). The Ib afferent spikerate output is linear from zero to maximum isometric muscle force:
Ib(t) = p fFm(t)
Fmax(10.5)
where Fm is the muscle force (in N) and Fmax the before mentioned maximum mus-cle force (800 N). With a mean muscle force of 40% of maximum, the Ib afferentoutput is arbitrarily set to the muscle spindles’ firing mean of 80 sp/s, hence givingthe constant p f a value of 200 sp/s.
134 CHAPTER 10
Biological neural network
Bashor (1998) created a large-scale BNN model to study the dynamic interactionsin neuron populations. Bashor calibrated the model by examining its ability to re-produce known aspects of the reflexes, but without linking it to a musculoskeletalmodel. Here this BNN model is used to control a musculoskeletal model duringpostural control tasks. Early simulations showed that three adaptations to Bashor’sBNN model were required.
Firstly, projections inside neuron population resulted in mass synchronised fir-ing which disrupted the motoneuron to muscle connections. Bashor (1998) notedthe synchronised firing and applied a moving average filter (100 ms) before plot-ting the signals. Disabling the projections inside the neuron population made theneurons less responsive when the neurons are of the excitatory kind, and morewhen inhibitory. However, model wide behaviour was unaffected by these staticgain changes and the disabling largely reduced synchronised firing.
Secondly, the default connection strength to one specific group of interneurons,the inhibitory interneurons (IN, see Fig. 10.3), were too weak to generate any signif-icant background firing on which (downwards) modulation was possible. Increas-ing all the synaptic connection strengths to the inhibitory interneurons provided alevel of background activity comparable to the other interneurons, but did makethem more responsive to input changes. Model wide behaviour was unaffected bythese adaptations, while the lack of significant firing was eliminated.
And thirdly, there were no II afferent paths, important for the length informationfeedback from muscle spindles. II afferent paths are polysynaptic and possibly alsoreciprocally coupled to the motoneurons (Jankowska and Hammar, 2002). A pair ofII afferent paths was added including synaptic connections to the Ia and excitatoryinterneurons (EX). The synaptic connection strengths were made approximatelyequal to the Ia and Ib afferent connections.
The BNN generates the motoneuron activation u(t) by combining supraspinalexcitations iss(t) and afferent signals from the muscle spindles and Golgi tendonorgans. The network consist of motoneurons and several types of interneurons. Themotoneurons directly drive the muscles; the interneurons are exciting or inhibiting,possibly recurrent or reciprocal, intermediates for passing the Ia, II, and Ib afferentinformation received from the proprioceptors on to the motoneurons.
The BNN model (Fig 10.3) consists of a large population of 2298 neurons (Bashor,1998). The neurons in the model are grouped in six antagonistic population pairs,representing motoneurons (MN, n = 169, for both the agonistic and the antago-nistic population), Renshaw cells (RC, n = 196), and intermediating interneurons(Ia, Ib, inhibitory and excitatory interneurons, abbreviated by IA, IB, IN, EX respec-tively, n = 196 each). Pairs of Ia, II, and Ib afferent (n = 121 each) and supraspinalexcitation paths (n = 98) provide further input to the neurons.
Cell and network algorithms and synaptic mechanism of the BNN are basedon the SYSTM22 program using the PTNRN10 neuron model of MacGregor (1987),see also Bashor (1998). The neuron model uses discrete equations with a time-step∆t of 1 ms, based on the following first order differential equations to calculate the
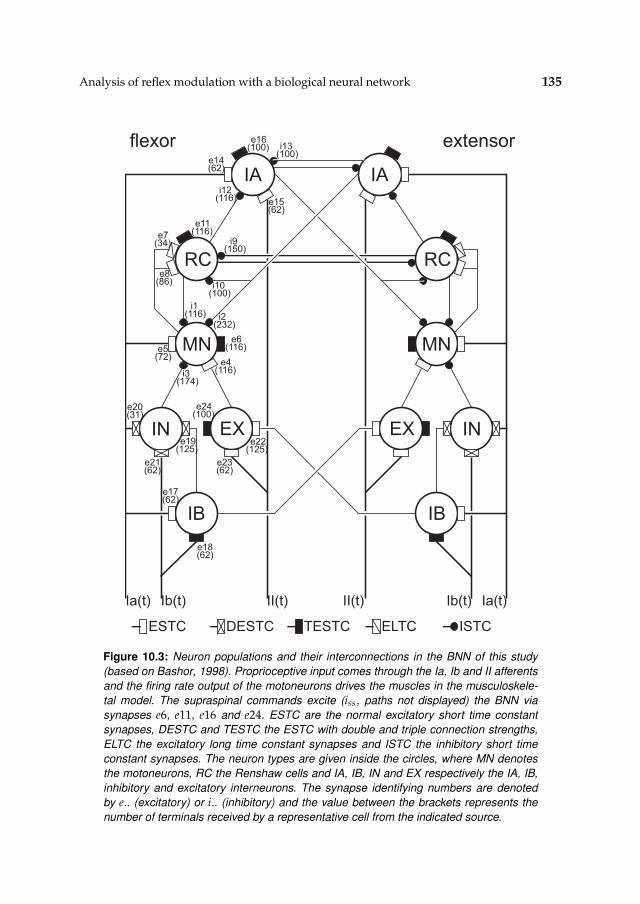
Analysis of reflex modulation with a biological neural network 135
IA
RC
MN
IN EX
IB
IA
RC
MN
INEX
IB
flexor extensor
ESTC DESTC TESTC ELTC ISTC
e18(62)
e17(62)
e20(31)
e19(125)
e21(62)
e23(62)
e22(125)
e24(100)
e6(116)
i2(232)
e4(116)i3
(174)
e5(72)
i1(116)
i10(100)
i9(150)
e11(116)e7
(34)
e8(86)
e14(62)
e16(100)
i12(116) e15
(62)
i13(100)
Ia(t) Ib(t) II(t) II(t) Ib(t) Ia(t)
Figure 10.3: Neuron populations and their interconnections in the BNN of this study
(based on Bashor, 1998). Proprioceptive input comes through the Ia, Ib and II afferents
and the firing rate output of the motoneurons drives the muscles in the musculoskele-
tal model. The supraspinal commands excite (iss, paths not displayed) the BNN via
synapses e6, e11, e16 and e24. ESTC are the normal excitatory short time constant
synapses, DESTC and TESTC the ESTC with double and triple connection strengths,
ELTC the excitatory long time constant synapses and ISTC the inhibitory short time
constant synapses. The neuron types are given inside the circles, where MN denotes
the motoneurons, RC the Renshaw cells and IA, IB, IN and EX respectively the IA, IB,
inhibitory and excitatory interneurons. The synapse identifying numbers are denoted
by e.. (excitatory) or i.. (inhibitory) and the value between the brackets represents the
number of terminals received by a representative cell from the indicated source.
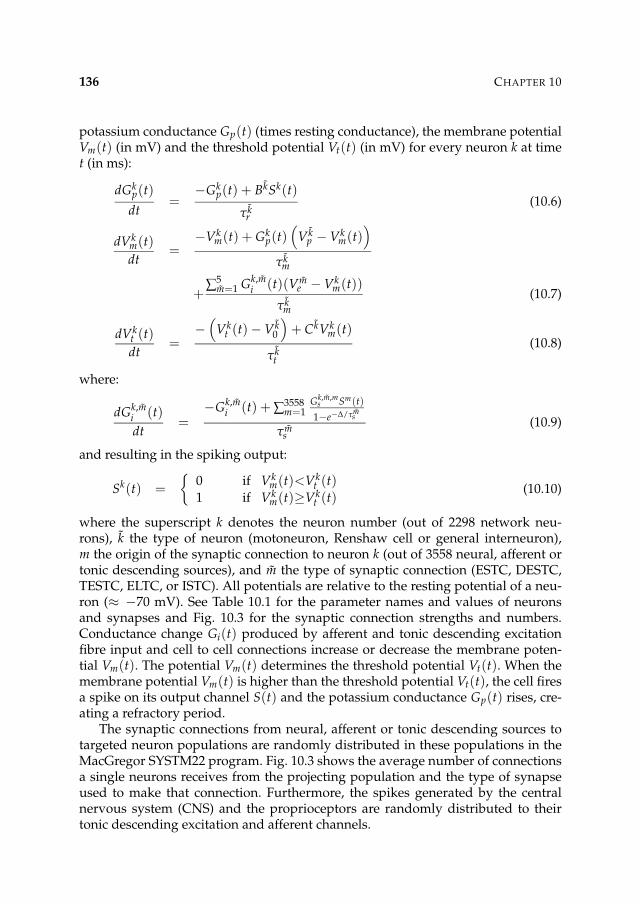
136 CHAPTER 10
potassium conductance Gp(t) (times resting conductance), the membrane potentialVm(t) (in mV) and the threshold potential Vt(t) (in mV) for every neuron k at timet (in ms):
dGkp(t)
dt=
−Gkp(t) + BkSk(t)
τkr
(10.6)
dVkm(t)
dt=
−Vkm(t) + Gk
p(t)(
V kp − Vk
m(t))
τkm
+∑
5m=1 Gk,m
i (t)(Vme − Vk
m(t))
τkm
(10.7)
dVkt (t)
dt=
−(
Vkt (t) − V k
0
)
+ CkVkm(t)
τkt
(10.8)
where:
dGk,mi (t)
dt=
−Gk,mi (t) + ∑
3558m=1
Gk,m,ms Sm(t)
1−e−∆/τms
τms
(10.9)
and resulting in the spiking output:
Sk(t) =
{
0 if Vkm(t)<Vk
t (t)1 if Vk
m(t)≥Vkt (t)
(10.10)
where the superscript k denotes the neuron number (out of 2298 network neu-rons), k the type of neuron (motoneuron, Renshaw cell or general interneuron),m the origin of the synaptic connection to neuron k (out of 3558 neural, afferent ortonic descending sources), and m the type of synaptic connection (ESTC, DESTC,TESTC, ELTC, or ISTC). All potentials are relative to the resting potential of a neu-ron (≈ −70 mV). See Table 10.1 for the parameter names and values of neuronsand synapses and Fig. 10.3 for the synaptic connection strengths and numbers.Conductance change Gi(t) produced by afferent and tonic descending excitationfibre input and cell to cell connections increase or decrease the membrane poten-tial Vm(t). The potential Vm(t) determines the threshold potential Vt(t). When themembrane potential Vm(t) is higher than the threshold potential Vt(t), the cell firesa spike on its output channel S(t) and the potassium conductance Gp(t) rises, cre-ating a refractory period.
The synaptic connections from neural, afferent or tonic descending sources totargeted neuron populations are randomly distributed in these populations in theMacGregor SYSTM22 program. Fig. 10.3 shows the average number of connectionsa single neurons receives from the projecting population and the type of synapseused to make that connection. Furthermore, the spikes generated by the centralnervous system (CNS) and the proprioceptors are randomly distributed to theirtonic descending excitation and afferent channels.
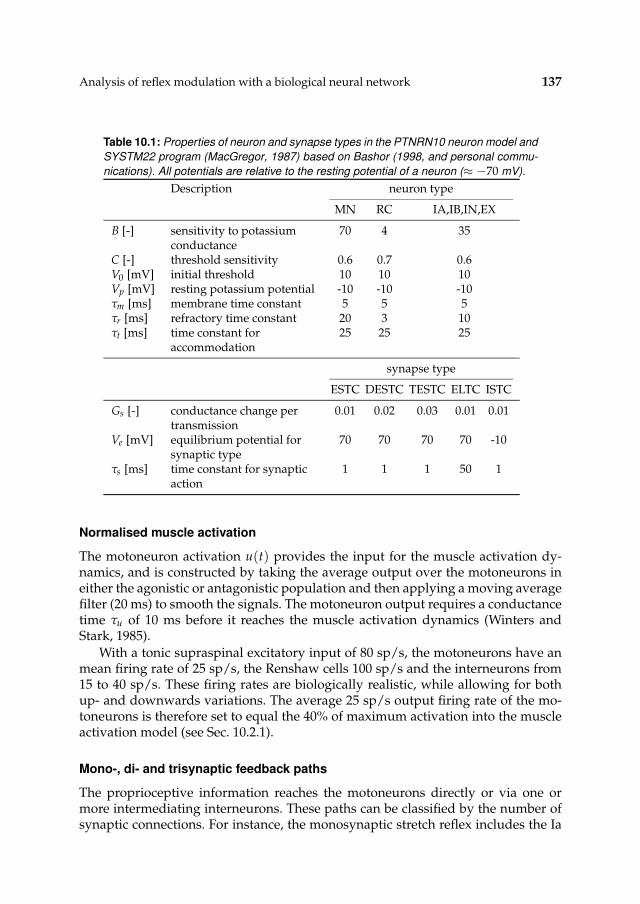
Analysis of reflex modulation with a biological neural network 137
Table 10.1: Properties of neuron and synapse types in the PTNRN10 neuron model and
SYSTM22 program (MacGregor, 1987) based on Bashor (1998, and personal commu-
nications). All potentials are relative to the resting potential of a neuron (≈ −70 mV).
Description neuron type
MN RC IA,IB,IN,EX
B [-] sensitivity to potassium 70 4 35conductance
C [-] threshold sensitivity 0.6 0.7 0.6V0 [mV] initial threshold 10 10 10Vp [mV] resting potassium potential -10 -10 -10τm [ms] membrane time constant 5 5 5τr [ms] refractory time constant 20 3 10τt [ms] time constant for 25 25 25
accommodation
synapse type
ESTC DESTC TESTC ELTC ISTC
Gs [-] conductance change per 0.01 0.02 0.03 0.01 0.01transmission
Ve [mV] equilibrium potential for 70 70 70 70 -10synaptic type
τs [ms] time constant for synaptic 1 1 1 50 1action
Normalised muscle activation
The motoneuron activation u(t) provides the input for the muscle activation dy-namics, and is constructed by taking the average output over the motoneurons ineither the agonistic or antagonistic population and then applying a moving averagefilter (20 ms) to smooth the signals. The motoneuron output requires a conductancetime τu of 10 ms before it reaches the muscle activation dynamics (Winters andStark, 1985).
With a tonic supraspinal excitatory input of 80 sp/s, the motoneurons have anmean firing rate of 25 sp/s, the Renshaw cells 100 sp/s and the interneurons from15 to 40 sp/s. These firing rates are biologically realistic, while allowing for bothup- and downwards variations. The average 25 sp/s output firing rate of the mo-toneurons is therefore set to equal the 40% of maximum activation into the muscleactivation model (see Sec. 10.2.1).
Mono-, di- and trisynaptic feedback paths
The proprioceptive information reaches the motoneurons directly or via one ormore intermediating interneurons. These paths can be classified by the number ofsynaptic connections. For instance, the monosynaptic stretch reflex includes the Ia
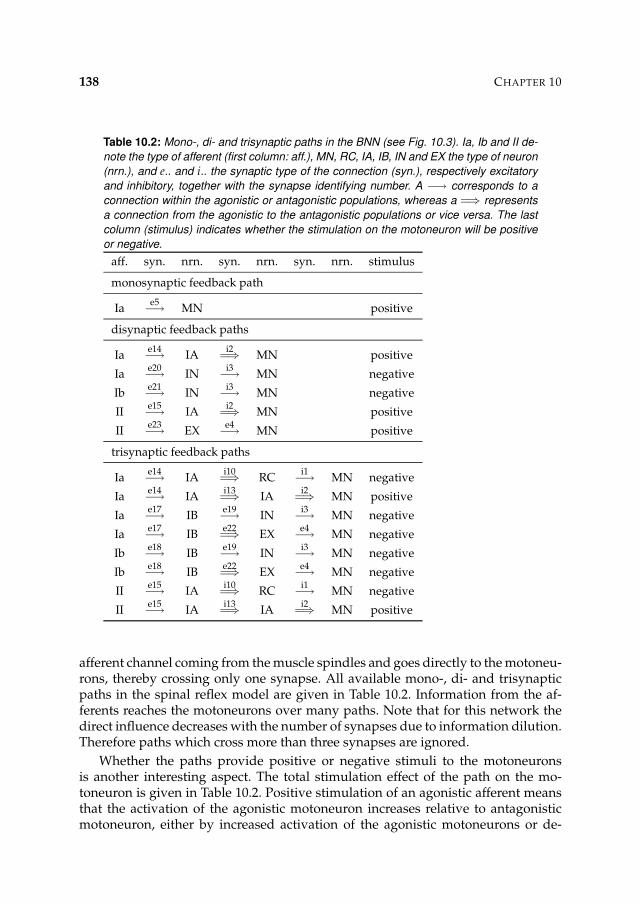
138 CHAPTER 10
Table 10.2: Mono-, di- and trisynaptic paths in the BNN (see Fig. 10.3). Ia, Ib and II de-
note the type of afferent (first column: aff.), MN, RC, IA, IB, IN and EX the type of neuron
(nrn.), and e.. and i.. the synaptic type of the connection (syn.), respectively excitatory
and inhibitory, together with the synapse identifying number. A −→ corresponds to a
connection within the agonistic or antagonistic populations, whereas a =⇒ represents
a connection from the agonistic to the antagonistic populations or vice versa. The last
column (stimulus) indicates whether the stimulation on the motoneuron will be positive
or negative.
aff. syn. nrn. syn. nrn. syn. nrn. stimulus
monosynaptic feedback path
Iae5−→ MN positive
disynaptic feedback paths
Iae14−→ IA
i2=⇒ MN positive
Iae20−→ IN
i3−→ MN negative
Ibe21−→ IN
i3−→ MN negative
IIe15−→ IA
i2=⇒ MN positive
IIe23−→ EX
e4−→ MN positive
trisynaptic feedback paths
Iae14−→ IA
i10=⇒ RC
i1−→ MN negative
Iae14−→ IA
i13=⇒ IA
i2=⇒ MN positive
Iae17−→ IB
e19−→ INi3−→ MN negative
Iae17−→ IB
e22=⇒ EX
e4−→ MN negative
Ibe18−→ IB
e19−→ INi3−→ MN negative
Ibe18−→ IB
e22=⇒ EX
e4−→ MN negative
IIe15−→ IA
i10=⇒ RC
i1−→ MN negative
IIe15−→ IA
i13=⇒ IA
i2=⇒ MN positive
afferent channel coming from the muscle spindles and goes directly to the motoneu-rons, thereby crossing only one synapse. All available mono-, di- and trisynapticpaths in the spinal reflex model are given in Table 10.2. Information from the af-ferents reaches the motoneurons over many paths. Note that for this network thedirect influence decreases with the number of synapses due to information dilution.Therefore paths which cross more than three synapses are ignored.
Whether the paths provide positive or negative stimuli to the motoneuronsis another interesting aspect. The total stimulation effect of the path on the mo-toneuron is given in Table 10.2. Positive stimulation of an agonistic afferent meansthat the activation of the agonistic motoneuron increases relative to antagonisticmotoneuron, either by increased activation of the agonistic motoneurons or de-
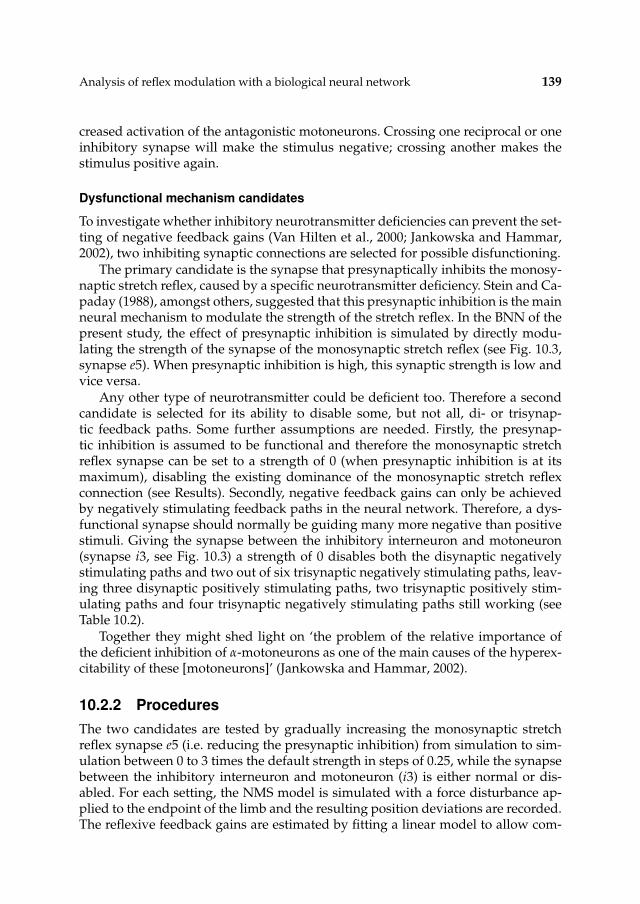
Analysis of reflex modulation with a biological neural network 139
creased activation of the antagonistic motoneurons. Crossing one reciprocal or oneinhibitory synapse will make the stimulus negative; crossing another makes thestimulus positive again.
Dysfunctional mechanism candidates
To investigate whether inhibitory neurotransmitter deficiencies can prevent the set-ting of negative feedback gains (Van Hilten et al., 2000; Jankowska and Hammar,2002), two inhibiting synaptic connections are selected for possible disfunctioning.
The primary candidate is the synapse that presynaptically inhibits the monosy-naptic stretch reflex, caused by a specific neurotransmitter deficiency. Stein and Ca-paday (1988), amongst others, suggested that this presynaptic inhibition is the mainneural mechanism to modulate the strength of the stretch reflex. In the BNN of thepresent study, the effect of presynaptic inhibition is simulated by directly modu-lating the strength of the synapse of the monosynaptic stretch reflex (see Fig. 10.3,synapse e5). When presynaptic inhibition is high, this synaptic strength is low andvice versa.
Any other type of neurotransmitter could be deficient too. Therefore a secondcandidate is selected for its ability to disable some, but not all, di- or trisynap-tic feedback paths. Some further assumptions are needed. Firstly, the presynap-tic inhibition is assumed to be functional and therefore the monosynaptic stretchreflex synapse can be set to a strength of 0 (when presynaptic inhibition is at itsmaximum), disabling the existing dominance of the monosynaptic stretch reflexconnection (see Results). Secondly, negative feedback gains can only be achievedby negatively stimulating feedback paths in the neural network. Therefore, a dys-functional synapse should normally be guiding many more negative than positivestimuli. Giving the synapse between the inhibitory interneuron and motoneuron(synapse i3, see Fig. 10.3) a strength of 0 disables both the disynaptic negativelystimulating paths and two out of six trisynaptic negatively stimulating paths, leav-ing three disynaptic positively stimulating paths, two trisynaptic positively stim-ulating paths and four trisynaptic negatively stimulating paths still working (seeTable 10.2).
Together they might shed light on ‘the problem of the relative importance ofthe deficient inhibition of α-motoneurons as one of the main causes of the hyperex-citability of these [motoneurons]’ (Jankowska and Hammar, 2002).
10.2.2 Procedures
The two candidates are tested by gradually increasing the monosynaptic stretchreflex synapse e5 (i.e. reducing the presynaptic inhibition) from simulation to sim-ulation between 0 to 3 times the default strength in steps of 0.25, while the synapsebetween the inhibitory interneuron and motoneuron (i3) is either normal or dis-abled. For each setting, the NMS model is simulated with a force disturbance ap-plied to the endpoint of the limb and the resulting position deviations are recorded.The reflexive feedback gains are estimated by fitting a linear model to allow com-
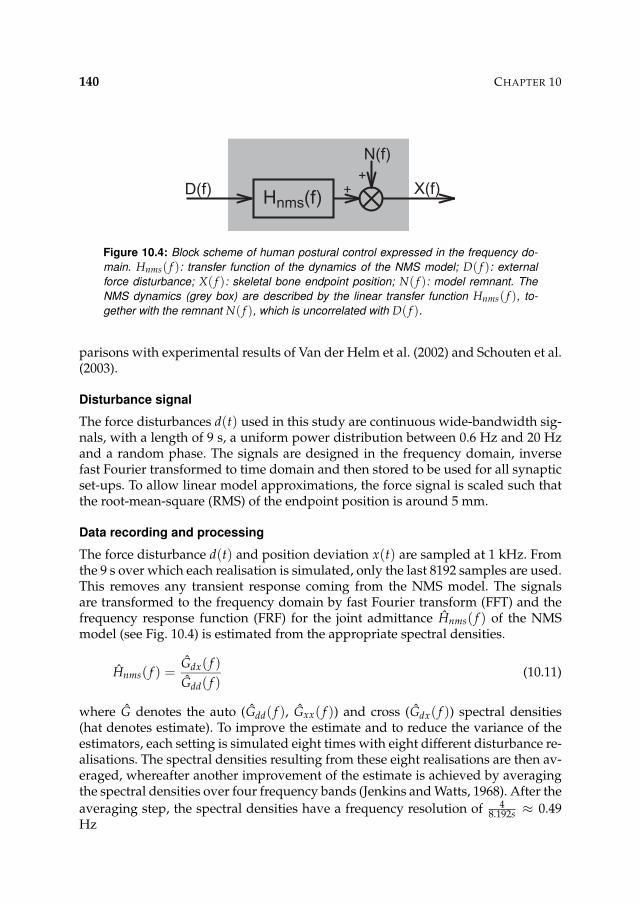
140 CHAPTER 10
N(f)
++
Hnms(f)X(f)D(f)
Figure 10.4: Block scheme of human postural control expressed in the frequency do-
main. Hnms( f ): transfer function of the dynamics of the NMS model; D( f ): external
force disturbance; X( f ): skeletal bone endpoint position; N( f ): model remnant. The
NMS dynamics (grey box) are described by the linear transfer function Hnms( f ), to-
gether with the remnant N( f ), which is uncorrelated with D( f ).
parisons with experimental results of Van der Helm et al. (2002) and Schouten et al.(2003).
Disturbance signal
The force disturbances d(t) used in this study are continuous wide-bandwidth sig-nals, with a length of 9 s, a uniform power distribution between 0.6 Hz and 20 Hzand a random phase. The signals are designed in the frequency domain, inversefast Fourier transformed to time domain and then stored to be used for all synapticset-ups. To allow linear model approximations, the force signal is scaled such thatthe root-mean-square (RMS) of the endpoint position is around 5 mm.
Data recording and processing
The force disturbance d(t) and position deviation x(t) are sampled at 1 kHz. Fromthe 9 s over which each realisation is simulated, only the last 8192 samples are used.This removes any transient response coming from the NMS model. The signalsare transformed to the frequency domain by fast Fourier transform (FFT) and thefrequency response function (FRF) for the joint admittance Hnms( f ) of the NMSmodel (see Fig. 10.4) is estimated from the appropriate spectral densities.
Hnms( f ) =Gdx( f )
Gdd( f )(10.11)
where G denotes the auto (Gdd( f ), Gxx( f )) and cross (Gdx( f )) spectral densities(hat denotes estimate). To improve the estimate and to reduce the variance of theestimators, each setting is simulated eight times with eight different disturbance re-alisations. The spectral densities resulting from these eight realisations are then av-eraged, whereafter another improvement of the estimate is achieved by averagingthe spectral densities over four frequency bands (Jenkins and Watts, 1968). After the
averaging step, the spectral densities have a frequency resolution of 48.192s ≈ 0.49
Hz
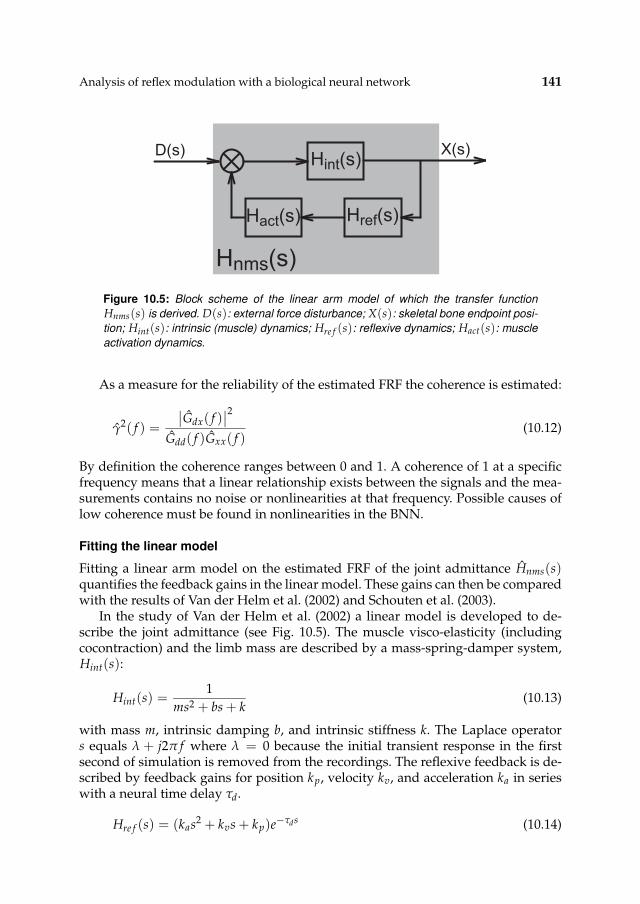
Analysis of reflex modulation with a biological neural network 141
Hint(s)
Hact(s) Href(s)
X(s)
Hnms(s)
D(s)
Figure 10.5: Block scheme of the linear arm model of which the transfer function
Hnms(s) is derived. D(s): external force disturbance; X(s): skeletal bone endpoint posi-
tion; Hint(s): intrinsic (muscle) dynamics; Hre f (s): reflexive dynamics; Hact(s): muscle
activation dynamics.
As a measure for the reliability of the estimated FRF the coherence is estimated:
γ2( f ) =
∣
∣Gdx( f )∣
∣
2
Gdd( f )Gxx( f )(10.12)
By definition the coherence ranges between 0 and 1. A coherence of 1 at a specificfrequency means that a linear relationship exists between the signals and the mea-surements contains no noise or nonlinearities at that frequency. Possible causes oflow coherence must be found in nonlinearities in the BNN.
Fitting the linear model
Fitting a linear arm model on the estimated FRF of the joint admittance Hnms(s)quantifies the feedback gains in the linear model. These gains can then be comparedwith the results of Van der Helm et al. (2002) and Schouten et al. (2003).
In the study of Van der Helm et al. (2002) a linear model is developed to de-scribe the joint admittance (see Fig. 10.5). The muscle visco-elasticity (includingcocontraction) and the limb mass are described by a mass-spring-damper system,Hint(s):
Hint(s) =1
ms2 + bs + k(10.13)
with mass m, intrinsic damping b, and intrinsic stiffness k. The Laplace operators equals λ + j2π f where λ = 0 because the initial transient response in the firstsecond of simulation is removed from the recordings. The reflexive feedback is de-scribed by feedback gains for position kp, velocity kv, and acceleration ka in serieswith a neural time delay τd.
Hre f (s) = (kas2 + kvs + kp)e−τds (10.14)
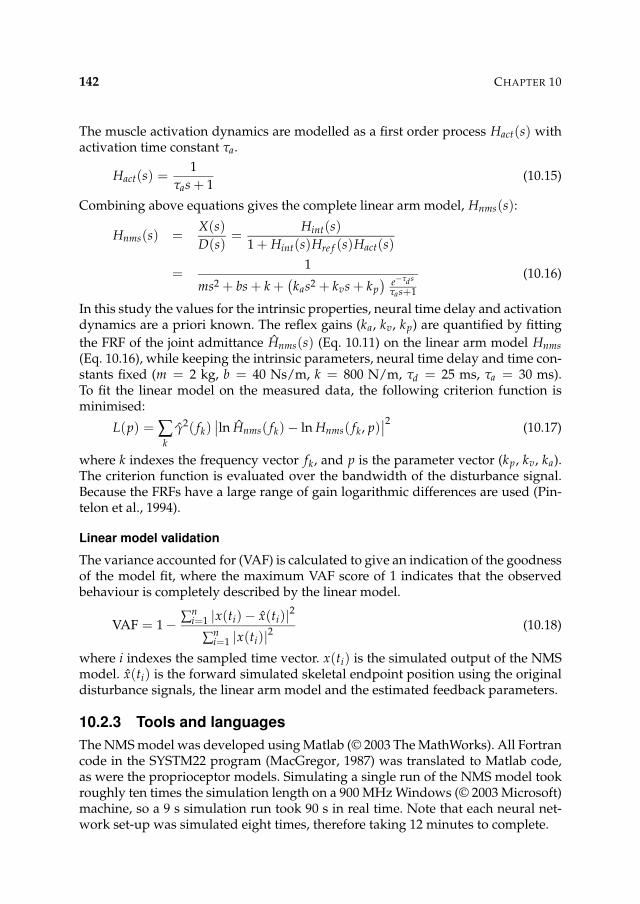
142 CHAPTER 10
The muscle activation dynamics are modelled as a first order process Hact(s) withactivation time constant τa.
Hact(s) =1
τas + 1(10.15)
Combining above equations gives the complete linear arm model, Hnms(s):
Hnms(s) =X(s)
D(s)=
Hint(s)
1 + Hint(s)Hre f (s)Hact(s)
=1
ms2 + bs + k +(
kas2 + kvs + kp
)
e−τds
τas+1
(10.16)
In this study the values for the intrinsic properties, neural time delay and activationdynamics are a priori known. The reflex gains (ka, kv, kp) are quantified by fitting
the FRF of the joint admittance Hnms(s) (Eq. 10.11) on the linear arm model Hnms
(Eq. 10.16), while keeping the intrinsic parameters, neural time delay and time con-stants fixed (m = 2 kg, b = 40 Ns/m, k = 800 N/m, τd = 25 ms, τa = 30 ms).To fit the linear model on the measured data, the following criterion function isminimised:
L(p) = ∑k
γ2( fk)∣
∣ln Hnms( fk) − ln Hnms( fk, p)∣
∣
2(10.17)
where k indexes the frequency vector fk, and p is the parameter vector (kp, kv, ka).The criterion function is evaluated over the bandwidth of the disturbance signal.Because the FRFs have a large range of gain logarithmic differences are used (Pin-telon et al., 1994).
Linear model validation
The variance accounted for (VAF) is calculated to give an indication of the goodnessof the model fit, where the maximum VAF score of 1 indicates that the observedbehaviour is completely described by the linear model.
VAF = 1 − ∑ni=1 |x(ti) − x(ti)|2
∑ni=1 |x(ti)|2
(10.18)
where i indexes the sampled time vector. x(ti) is the simulated output of the NMSmodel. x(ti) is the forward simulated skeletal endpoint position using the originaldisturbance signals, the linear arm model and the estimated feedback parameters.
10.2.3 Tools and languages
The NMS model was developed using Matlab (© 2003 The MathWorks). All Fortrancode in the SYSTM22 program (MacGregor, 1987) was translated to Matlab code,as were the proprioceptor models. Simulating a single run of the NMS model tookroughly ten times the simulation length on a 900 MHz Windows (© 2003 Microsoft)machine, so a 9 s simulation run took 90 s in real time. Note that each neural net-work set-up was simulated eight times, therefore taking 12 minutes to complete.
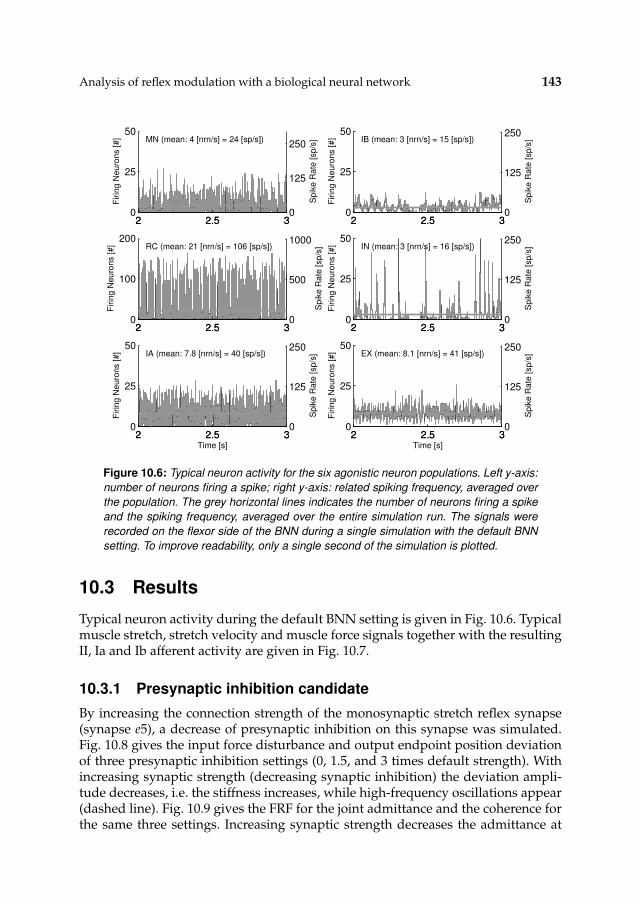
Analysis of reflex modulation with a biological neural network 143
2 2.5 30
25
50MN (mean: 4 [nrn/s] = 24 [sp/s])
Firin
g N
euro
ns [#]
2 2.5 30
125
250
Spik
e R
ate
[sp/s
]
2 2.5 30
100
200RC (mean: 21 [nrn/s] = 106 [sp/s])
Firin
g N
euro
ns [#]
2 2.5 30
500
1000
Spik
e R
ate
[sp/s
]
2 2.5 30
25
50IA (mean: 7.8 [nrn/s] = 40 [sp/s])
Firin
g N
euro
ns [#]
Time [s]2 2.5 3
0
125
250
Spik
e R
ate
[sp/s
]
2 2.5 30
25
50IB (mean: 3 [nrn/s] = 15 [sp/s])
Firin
g N
euro
ns [#]
2 2.5 30
125
250
Spik
e R
ate
[sp/s
]
2 2.5 30
25
50IN (mean: 3 [nrn/s] = 16 [sp/s])
Firin
g N
euro
ns [#]
2 2.5 30
125
250
Spik
e R
ate
[sp/s
]
2 2.5 30
25
50EX (mean: 8.1 [nrn/s] = 41 [sp/s])
Firin
g N
euro
ns [#]
Time [s]2 2.5 3
0
125
250
Spik
e R
ate
[sp/s
]
Figure 10.6: Typical neuron activity for the six agonistic neuron populations. Left y-axis:
number of neurons firing a spike; right y-axis: related spiking frequency, averaged over
the population. The grey horizontal lines indicates the number of neurons firing a spike
and the spiking frequency, averaged over the entire simulation run. The signals were
recorded on the flexor side of the BNN during a single simulation with the default BNN
setting. To improve readability, only a single second of the simulation is plotted.
10.3 Results
Typical neuron activity during the default BNN setting is given in Fig. 10.6. Typicalmuscle stretch, stretch velocity and muscle force signals together with the resultingII, Ia and Ib afferent activity are given in Fig. 10.7.
10.3.1 Presynaptic inhibition candidate
By increasing the connection strength of the monosynaptic stretch reflex synapse(synapse e5), a decrease of presynaptic inhibition on this synapse was simulated.Fig. 10.8 gives the input force disturbance and output endpoint position deviationof three presynaptic inhibition settings (0, 1.5, and 3 times default strength). Withincreasing synaptic strength (decreasing synaptic inhibition) the deviation ampli-tude decreases, i.e. the stiffness increases, while high-frequency oscillations appear(dashed line). Fig. 10.9 gives the FRF for the joint admittance and the coherence forthe same three settings. Increasing synaptic strength decreases the admittance at
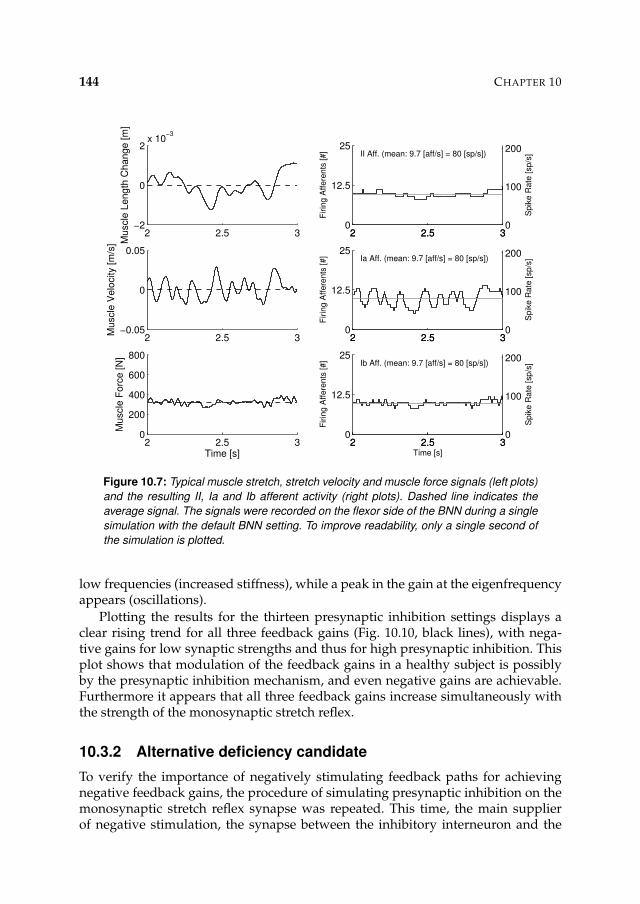
144 CHAPTER 10
2 2.5 3−2
0
2x 10
−3
Mu
scle
Le
ng
th C
ha
ng
e [
m]
2 2.5 3−0.05
0
0.05
Mu
scle
Ve
locity [
m/s
]
2 2.5 30
200
400
600
800
Mu
scle
Fo
rce
[N
]
Time [s]
2 2.5 30
12.5
25Ia Aff. (mean: 9.7 [aff/s] = 80 [sp/s])
Firin
g A
ffe
ren
ts [
#]
2 2.5 30
100
200
Sp
ike
Ra
te [
sp
/s]
2 2.5 30
12.5
25Ib Aff. (mean: 9.7 [aff/s] = 80 [sp/s])
Firin
g A
ffe
ren
ts [
#]
Time [s]2 2.5 3
0
100
200
Sp
ike
Ra
te [
sp
/s]
2 2.5 30
12.5
25II Aff. (mean: 9.7 [aff/s] = 80 [sp/s])
Firin
g A
ffe
ren
ts [
#]
2 2.5 30
100
200
Sp
ike
Ra
te [
sp
/s]
Figure 10.7: Typical muscle stretch, stretch velocity and muscle force signals (left plots)
and the resulting II, Ia and Ib afferent activity (right plots). Dashed line indicates the
average signal. The signals were recorded on the flexor side of the BNN during a single
simulation with the default BNN setting. To improve readability, only a single second of
the simulation is plotted.
low frequencies (increased stiffness), while a peak in the gain at the eigenfrequencyappears (oscillations).
Plotting the results for the thirteen presynaptic inhibition settings displays aclear rising trend for all three feedback gains (Fig. 10.10, black lines), with nega-tive gains for low synaptic strengths and thus for high presynaptic inhibition. Thisplot shows that modulation of the feedback gains in a healthy subject is possiblyby the presynaptic inhibition mechanism, and even negative gains are achievable.Furthermore it appears that all three feedback gains increase simultaneously withthe strength of the monosynaptic stretch reflex.
10.3.2 Alternative deficiency candidate
To verify the importance of negatively stimulating feedback paths for achievingnegative feedback gains, the procedure of simulating presynaptic inhibition on themonosynaptic stretch reflex synapse was repeated. This time, the main supplierof negative stimulation, the synapse between the inhibitory interneuron and the
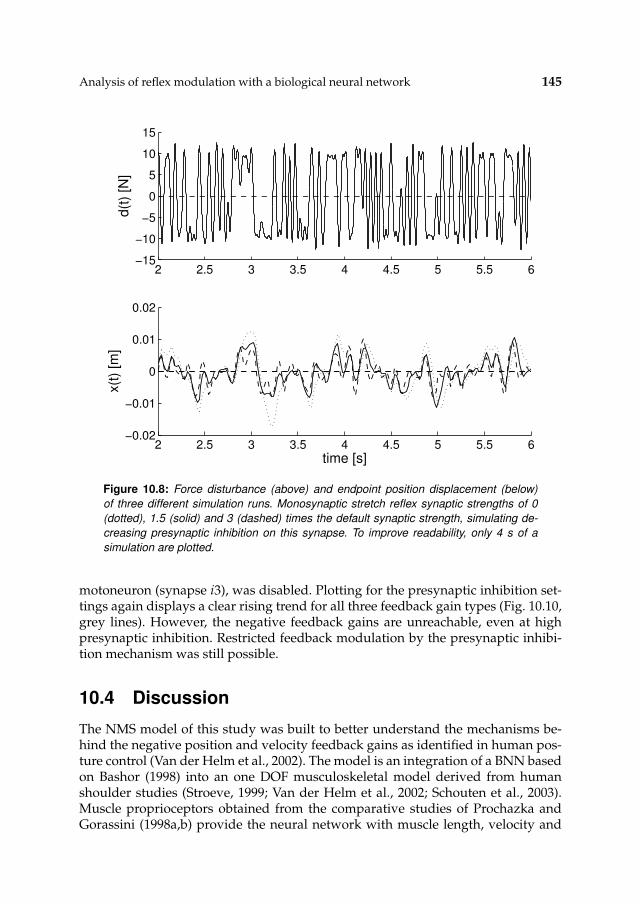
Analysis of reflex modulation with a biological neural network 145
2 2.5 3 3.5 4 4.5 5 5.5 6−15
−10
−5
0
5
10
15d(t
) [N
]
2 2.5 3 3.5 4 4.5 5 5.5 6−0.02
−0.01
0
0.01
0.02
x(t
) [m
]
time [s]
Figure 10.8: Force disturbance (above) and endpoint position displacement (below)
of three different simulation runs. Monosynaptic stretch reflex synaptic strengths of 0
(dotted), 1.5 (solid) and 3 (dashed) times the default synaptic strength, simulating de-
creasing presynaptic inhibition on this synapse. To improve readability, only 4 s of a
simulation are plotted.
motoneuron (synapse i3), was disabled. Plotting for the presynaptic inhibition set-tings again displays a clear rising trend for all three feedback gain types (Fig. 10.10,grey lines). However, the negative feedback gains are unreachable, even at highpresynaptic inhibition. Restricted feedback modulation by the presynaptic inhibi-tion mechanism was still possible.
10.4 Discussion
The NMS model of this study was built to better understand the mechanisms be-hind the negative position and velocity feedback gains as identified in human pos-ture control (Van der Helm et al., 2002). The model is an integration of a BNN basedon Bashor (1998) into an one DOF musculoskeletal model derived from humanshoulder studies (Stroeve, 1999; Van der Helm et al., 2002; Schouten et al., 2003).Muscle proprioceptors obtained from the comparative studies of Prochazka andGorassini (1998a,b) provide the neural network with muscle length, velocity and
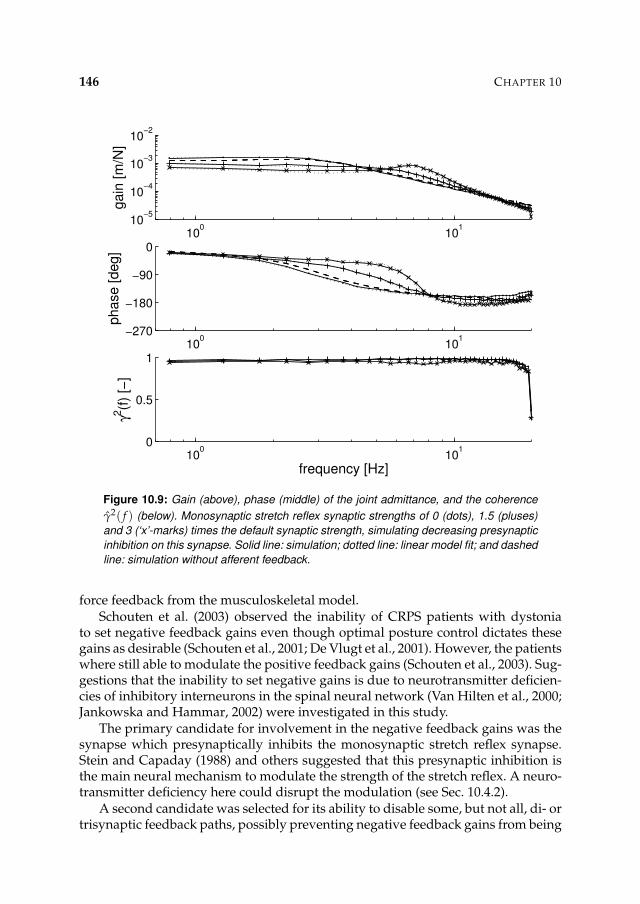
146 CHAPTER 10
100
101
10−5
10−4
10−3
10−2
ga
in [
m/N
]
100
101
−270
−180
−90
0
ph
ase
[d
eg
]
100
101
0
0.5
1
γ2(f
) [−
]
frequency [Hz]
Figure 10.9: Gain (above), phase (middle) of the joint admittance, and the coherence
γ2( f ) (below). Monosynaptic stretch reflex synaptic strengths of 0 (dots), 1.5 (pluses)
and 3 (‘x’-marks) times the default synaptic strength, simulating decreasing presynaptic
inhibition on this synapse. Solid line: simulation; dotted line: linear model fit; and dashed
line: simulation without afferent feedback.
force feedback from the musculoskeletal model.Schouten et al. (2003) observed the inability of CRPS patients with dystonia
to set negative feedback gains even though optimal posture control dictates thesegains as desirable (Schouten et al., 2001; De Vlugt et al., 2001). However, the patientswhere still able to modulate the positive feedback gains (Schouten et al., 2003). Sug-gestions that the inability to set negative gains is due to neurotransmitter deficien-cies of inhibitory interneurons in the spinal neural network (Van Hilten et al., 2000;Jankowska and Hammar, 2002) were investigated in this study.
The primary candidate for involvement in the negative feedback gains was thesynapse which presynaptically inhibits the monosynaptic stretch reflex synapse.Stein and Capaday (1988) and others suggested that this presynaptic inhibition isthe main neural mechanism to modulate the strength of the stretch reflex. A neuro-transmitter deficiency here could disrupt the modulation (see Sec. 10.4.2).
A second candidate was selected for its ability to disable some, but not all, di- ortrisynaptic feedback paths, possibly preventing negative feedback gains from being
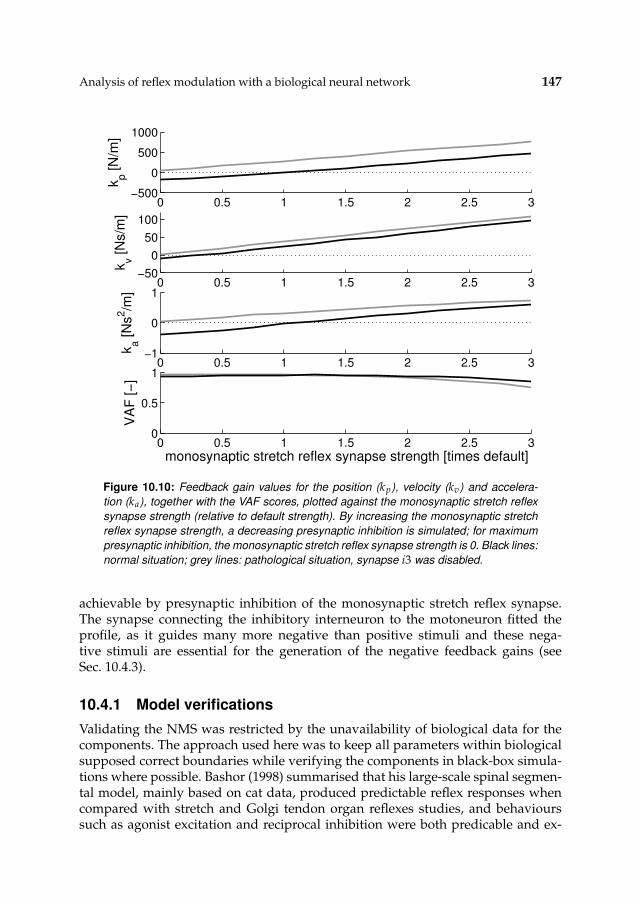
Analysis of reflex modulation with a biological neural network 147
0 0.5 1 1.5 2 2.5 3−500
0
500
1000
kp [N
/m]
0 0.5 1 1.5 2 2.5 3−50
0
50
100
kv [N
s/m
]
0 0.5 1 1.5 2 2.5 3−1
0
1
ka [N
s2/m
]
0 0.5 1 1.5 2 2.5 30
0.5
1
VA
F [−
]
monosynaptic stretch reflex synapse strength [times default]
Figure 10.10: Feedback gain values for the position (kp), velocity (kv) and accelera-
tion (ka), together with the VAF scores, plotted against the monosynaptic stretch reflex
synapse strength (relative to default strength). By increasing the monosynaptic stretch
reflex synapse strength, a decreasing presynaptic inhibition is simulated; for maximum
presynaptic inhibition, the monosynaptic stretch reflex synapse strength is 0. Black lines:
normal situation; grey lines: pathological situation, synapse i3 was disabled.
achievable by presynaptic inhibition of the monosynaptic stretch reflex synapse.The synapse connecting the inhibitory interneuron to the motoneuron fitted theprofile, as it guides many more negative than positive stimuli and these nega-tive stimuli are essential for the generation of the negative feedback gains (seeSec. 10.4.3).
10.4.1 Model verifications
Validating the NMS was restricted by the unavailability of biological data for thecomponents. The approach used here was to keep all parameters within biologicalsupposed correct boundaries while verifying the components in black-box simula-tions where possible. Bashor (1998) summarised that his large-scale spinal segmen-tal model, mainly based on cat data, produced predictable reflex responses whencompared with stretch and Golgi tendon organ reflexes studies, and behaviourssuch as agonist excitation and reciprocal inhibition were both predicable and ex-
148 CHAPTER 10
pected. The proprioceptors derived from the comparative analysis in Prochazkaand Gorassini (1998a,b) were reported to give a good prediction of the firing char-acteristics of muscle spindle primary afferents recorded chronically during normalstepping in cats, with the key variable in achieving good predictions being musclevelocity. The problem of whether the above studies are valid for a human modelwas addressed by Jankowska and Hammar (2002). Their general impression aris-ing from results of studies on human and cat reflex interneuronal systems was thatthese systems have more features in common than differing. They hypothesisedthat not only the properties investigated so far, but also other basic properties ofhuman spinal interneurons, such as their membrane properties and their sensitiv-ity to various chemical compounds, are similar to those found in the cat.
The available black-box verifications for this NMS model do not suggest any ab-normalities. Fig. 10.6 and Fig. 10.7 show that neuron firing rates stay within biologi-cal plausible boundaries, and, as can be seen in the following sections, changing pa-rameters in the BNN mechanisms produces many wanted or unwanted states, butall with counterparts as observed in human subjects. The presumption that feed-back gains can be controlled by presynaptic inhibition on the monosynaptic stretchreflex synapse (Stein and Capaday, 1988) was corroborated with the results for thenormal situation in Fig. 10.10. Therefore the assumption is made that the model ofthis study is indeed valid for interpreting human postural control behaviour.
The spike based signals in the BNN may not have to contain the same frequencyinformation as continuous time signals do. This was explored in Appendix A, butno differences were found in the frequency ranges used for the force disturbances(0-20 Hz).
10.4.2 Presynaptic inhibition candidate
Fig. 10.10 shows that to achieve negative feedback gains for position and veloc-ity information, a high presynaptic inhibition of the monosynaptic stretch reflexsynapse (synapse e5 in Fig 10.3) is required, disabling the transfer from the Ia af-ferents to the motoneurons. The weaker this connection, the lower the feedbackgains and vice versa. In effect, the high presynaptic inhibition disables the domi-nant monosynaptic stretch reflex path and allows negatively stimulating paths inthe BNN to achieve the negative feedback gains. Therefore a dysfunctional presy-naptic inhibition in CRPS patients with dystonia, can indeed prevent them fromachieving the required negative feedback gains necessary for specific postural con-trol tasks. However, a completely disabled presynaptic inhibition also severely dis-ables the modulation of feedback gains, which contradicts with the results on CRPSpatients with dystonia of Schouten et al. (2003): these patients are still able to mod-ulate their feedback gains in the positive range.
10.4.3 Alternative deficiency candidate
Presynaptic inhibition on its own does not cause the negative feedback gains, it canjust prevent the monosynaptic stretch reflex from being dominant over other feed-
Analysis of reflex modulation with a biological neural network 149
back paths in the BNN. Therefore, other paths must be present which do providenegative stimulation to the motoneuron.
By identifying all present mono-, di- and trisynaptic paths (see Table 10.2), andclassifying them as either positively or negatively stimulating, it was clear that themain paths for negative stimulation all pass the inhibitory interneuron (IN), andthereby the synapse between this interneuron and the motoneuron (synapse i3 inFig. 10.3). Although other synapses convey negatively stimulating feedback, noneare both disynaptic and coming from the Ia afferent channel. These last two con-ditions are important because: (a) every synaptic connection a path has to crossdilutes the information with information coming from other paths, and (b) the Iaafferent information has a stronger amplitude compared to the two other afferentchannels (see Fig. 10.7).
Disabling the synapse between the inhibitory interneuron and the motoneuron,should prevent negative feedback gains. Fig. 10.10 shows that even with maximumpresynaptic inhibition, the identified position and velocity feedback gains did notbecome negative. Therefore it is concluded that a dysfunctional synapse in an (im-portant) negatively stimulating feedback path, likely the result of a neurotransmit-ter deficiency, can prevent the setting of negative feedback gains. Modulation ofthe positive feedback gains is still possible by the regular control of presynapticinhibition on the monosynaptic stretch reflex synapse.
10.4.4 Conclusion
This study shows that: (a) both the monosynaptic stretch reflex synapse and thesynapse between the inhibitory interneuron and the motoneuron, play an impor-tant role in obtaining negative feedback gains and that disfunctioning of thesesynapses could account for the previously unexplainable feedback gain quantifi-cation results for healthy subjects and CRPS patients, and (b) a disabled synapsebetween the inhibitory interneuron (IN) and the motoneuron would still allow lim-ited feedback gain modulation.

150 CHAPTER 10

Chapter 11
Reflections
152 CHAPTER 11
11.1 Introduction
The prime goal of this project was to get insight into the pathophysiology of neu-rological disorders with abnormal muscle tone. This goal was met by quantifica-tion of proprioceptive reflexes during posture tasks in vivo. The reflex gains wereparametrised by fitting a model onto the mechanical response after continuousforce perturbations. Previous studies showed that the magnitude of the reflexesmodulate with task and conditions (Van der Helm et al., 2002; De Vlugt et al., 2002).One of the objectives was to investigate the feasibility of the application of the meth-ods to patients with neurological disorders. This thesis shows that the methods arerelevant, as reflexes can be reliably estimated in patients with neurological disor-ders.
Abnormal high muscle tone, or hypertonia, (described as dystonia, rigidity, orspasticity) is seen in many neurological disorders and is often associated with anexaggerated sensitivity of the stretch reflexes. Although many studies measuredreflexes this thesis is one of the first to quantify proprioceptive reflexes in patientswith hypertonia in vivo. The major advantage of the methods presented in thisthesis is that reflexes are assessed during an unambiguous and relevant task: forceperturbations are applied and subjects were asked to ‘minimize the deviations’. Manystudies seem to ignore the fact that task instruction and conditions influence reflexmagnitude.
Quantifying proprioceptive reflexes in terms of position and velocity sensitivitycontributes to the understanding of human motion control. And quantification ofreflexes in patients with hypertonia gives insight in pathophysiology of the disor-ders. The methods are relatively new and strongly based on control engineeringtechniques. The quantification method and manipulator described in this thesiscould be standard diagnostic tools for neurological departments. The wrist manip-ulator can be a prototype for the diagnostic devices of the future.
11.2 Results and conclusions
No negative feedback gains in CRPS patients with tonic dystonia
One of the main findings of this thesis is that CRPS patients with tonic dystoniaare unable to modulate negative feedback gains (Chapter 3), while modulation inthe positive range is still possible. In healthy control subjects and CRPS patientswithout tonic dystonia negative feedbacks were found when specific force distur-bances with power in a small bandwidth around a centre frequency were applied.Theoretical studies have shown that negative feedback gains are optimal for theseconditions (Schouten et al., 2001; De Vlugt et al., 2001). Although dystonia in theevaluated CRPS patients mainly affected the distal musculature, the results indi-cate involvement of the proximal musculature as well. Dystonia of CRPS generallyprogresses in the extremities from distal to proximal musculature (Schwartzmanand Kerrigan, 1990). This suggests that, despite that the musculature of the wholeupper extremity is affected, the dystonia will present first in the distal musculature

Reflections 153
and develops to proximal as CRPS progresses. Note that the neural time delay ofthe spinal reflex is larger for distal joints, as the neural delay of the spinal reflex isdirectly related to the length of the feedback path. Larger time delay gives smallerstability margins, and consequently instabilities caused by exaggerated reflex mag-nitude will present first in distal joints.
The inability to modulate negative reflex gains raises the question which neu-ral mechanism(s) is(/are) responsible for negative feedback gains at all. Positivefeedback gains result primarily from monosynaptic feedback of muscle spindleafferents to motoneurons. The magnitude of the afferent information can be re-duced by presynaptic inhibition, decreasing the feedback gains (Stein and Capa-day, 1988). The neural mechanism for negative feedback gains must have eitheran inhibitory effect on the agonistic motoneuron (autogenic inhibition), an excita-tory effect on the antagonistic motoneuron (reciprocal excitation), or both. Liter-ature describing the aforementioned paths are scarce; one elaborate review men-tioned only the interneuronal circuits that mediate postsynaptic inhibition of themotoneuron (Jankowska, 1992). To get insight into the neural mechanisms respon-sible for negative feedback gains a neuromusculoskeletal model was built, basedon a biological realistic neural network (BNN) containing all relevant spinal neu-rons (Chapter 10). With such a BNN the effect of impairment of specific neuralmechanisms and connections were investigated to explore the mechanism(s) be-hind negative reflex gains. The BNN contains several populations of interneuronsand many connection between these populations and the motoneurons. Analysisof the BNN model revealed that the connection from the inhibitory interneuron tothe motoneuron mediates many inhibitory paths to the motoneuron. Disabling thesynapses of these inhibitory interneurons to the motoneurons, removed the possi-bility to generate negative feedback gains.
Incorporation of the reflexive impedance improves the method
In the first chapters of this thesis, spinal reflexes were quantified by fitting a modelonto the mechanical admittance during disturbance experiments. The mechanicaladmittance comprises intrinsic muscle visco-elasticity and reflexive contributions.Assumptions on the intrinsic and reflexive component were necessary to separatethe individual contributions. The estimation of the reflexive impedance (dynamicrelation between muscle activation, assessed with EMG, and position deviations)gave a direct measure for the reflexive muscle activation (Chapters 5-6). The incor-poration of the reflexive impedance into the quantification method is new and givesdirect insight into the contribution of the underlying reflexive feedback system tothe overall mechanical behaviour of the arm. Including the reflexive impedancein the quantification method has the advantage that intrinsic and reflexive param-eters, including the neural time delay, can be estimated simultaneously withoutprior assumptions on the relative contributions.
154 CHAPTER 11
Measuring spinal reflexes at the wrist
At the start of the project patients were measured on the shoulder manipulator atthe shoulder laboratory of the Delft university of technology. As this hydraulic ma-nipulator is not mobile, patients had to travel from the Leiden University MedicalCentre to Delft. This had severe implications on the procedures: it was practical im-possible to measure patients off medication or to follow the progress of individualpatients. Furthermore there was the need to measure a more distal joint, as tonicdystonia with CRPS generally progresses in the extremities from distal to proximalmusculature (Schwartzman and Kerrigan, 1990).
Half-way the project it was decided to built a mobile electric-powered wrist ma-nipulator, facilitating experiments at the LUMC (Chapter 7). Early 2003 the wristmanipulator was operational and because of the restricted time only a small studyon healthy and parkinsonian subjects was performed in Delft. With this manipu-lator torque disturbances are applied at the wrist and the admittance of the wristcan be estimated. For the shoulder joint it was already shown that healthy sub-jects vary the magnitude of the proprioceptive reflex gains, depending on the band-width of the disturbance or the external damping imposed by the manipulator (Vander Helm et al., 2002; De Vlugt et al., 2002). Generally it was found that the reflexmagnitude increases with decreasing disturbance bandwidth or increasing exter-nal damping. In this thesis it is shown that the same phenomena exist for the wristjoint, showing that the wrist manipulator is a relevant manipulator for investigat-ing reflexes (Chapter 8).
In the both the shoulder and the wrist the reflex magnitude varies with distur-bance bandwidth or external damping. Two distinct differences exist between theshoulder and wrist: the neural time delay of spinal reflexes and the eigenfrequency.The measurements show that the neural time delay at the wrist is 50% larger thanthat for the shoulder (43 against 28 ms). As the inertia around the wrist is muchsmaller than that of the shoulder, the eigenfrequency of a (cocontracted) wrist isapproximately 4 times higher than the eigenfrequency of the (cocontracted) wrist(12 Hz for the wrist vs. 3 Hz for the shoulder). Both phenomena have an effect onthe stability margins. More time delay in a feedback loop reduces the stability mar-gins, thus allowing smaller feedback gain. Higher eigenfrequency has an oppositeeffect, allowing larger feedback gains.
Neural time delay is larger in patients with Parkinson’s disease
In Chapter 4 and 9 proprioceptive reflexes in patients with Parkinson’s disease(PD) are assessed at respectively the shoulder and the wrist. Tremor is one of themajor symptoms of PD. As in this thesis force disturbances are applied, tremorwould dominate the recorded position deviations, deteriorating the measurements.In Chapter 4 the protocol with external damping is used to quantify proprioceptivereflexes, as external damping reduces tremor. It was found that the range of reflexgain modulation at the shoulder is confined in parkinsonian patients. Furthermore,the high coherence and low relative damping in patients with tremor suggests that
Reflections 155
the observed tremor is a property of the system and not (directly) induced be thecentral nervous system (CNS).
To estimate the reflex gain from the mechanical admittance assumptions wereneeded to separate the reflexive and intrinsic contribution. In parkinsonian patients(Chapter 4) this probably led to an underestimation of the reflex gains. To overcomethis the method was extended with the reflexive impedance, such that no prior as-sumptions about the separate contributions (Chapters 5-6). In Chapter 9 the reflex-ive feedback gains are assessed at the wrist with this improved method, based onthe mechanical admittance and the reflexive impedance. Again it was found thatwith external damping the range of reflex gain modulation was confined. Further-more it was found that the neural time delay in patients was ≈25% larger. Largertime delay results in smaller stability margins and oscillation are more likely tooccur. Future research with large numbers of subjects should focus on the neuraltime delay. Note that with the previous method the neural time delay could not beestimated and fixed values were taken from literature.
11.3 Recommendations and future directions
11.3.1 Medical applications
Clinimetric evaluation
In this thesis small groups of patients have been measured to show that the meth-ods are applicable and useful to get insight in the pathophysiology of neurologicaldisorders. The next step will be the clinimetric evaluation of the method. Firstlya large number of healthy subjects needs to be measured to built up a large andrepresentative control group and to check the sensitivity of the method. Secondlya large number of patients needs to be measured to get a good indication of thetypical differences, to test the specifity of the method, and to compare the resultswith standard neurological scores. When indicators are found, it is possible to trackpatients with disease progress and to evaluate the impact of medication onto theproprioceptive reflexes in specific disorders. The development of the wrist manip-ulator will facilitate the clinimetric evaluation as the manipulator is mobile suchthat data acquisition can be performed inside the hospital (LUMC).
Other disorders
This thesis focusses on hypertonia as seen in CRPS and PD. But is well applicable toget insight into the pathophysiology of other disorders with hypertonia and othermotor disorders with suggested disturbed proprioceptive reflexes, e.g. cerebro vas-cular attack (CVA, or stroke), repetitive strain injury (RSI) and paralysis. What hap-pens with the proprioceptive reflexes after paralysis caused by spinal cord injury,stroke or other central nervous system disorders?
156 CHAPTER 11
11.3.2 Effect of tasks and conditions
In this thesis methods are developed to quantify spinal reflexes during posturalcontrol in vivo. Reflexes were quantified by analysing the mechanical behaviourin response to a continuous random force disturbance, while the subject is askedto ‘minimize the deviations’. Note that the role of the disturbance is twofold. Firstlythe disturbance is necessary to provoke a mechanical response, allowing identifi-cation of the mechanical behaviour. And secondly the disturbance is part of thetask: ‘minimize deviations’ given the properties of the force disturbance. In otherwords the subject has to optimize its mechanical behaviour by modulating the re-flexive feedback such that the given force disturbance has minimal effect onto thedeviations. This brings up four important issues for future investigations: positiondisturbances, submaximal tasks, transient disturbances, and movement.
Force vs. position disturbances
Force disturbances were applied and subjects were asked to ‘minimize the devia-tions’. Hence feedback of the position (i.e. muscle spindles) is relevant for the task.The task and the force disturbance require an optimal disturbance rejection, i.e.minimum sensitivity for the force disturbance (low admittance, or high stiffness),demanding high muscle cocontraction and strong position feedback from musclespindles. Another important class of proprioceptors are the Golgi tendons organs.Literature about the functionality of GTO is scarce. From a theoretical viewpointforce feedback from the Golgi tendon organs is undesirable during position tasks,as force feedback reduces the stiffness.
Another type of input is position perturbations. Position perturbations leavesthe force as a controlled variable for the subject, e.g. press with a specific force (andminimize the force deviation). Such tasks require a low stiffness (the effect of a changein position to the force must be small). From an optimal viewpoint feedback frommuscle spindle is undesirable and strong force feedback from Golgi tendon organsis desired. Force task are unnatural and it would be interesting to investigate howhumans perform during force tasks.
In disorders with hypertonia, patients have exaggerated reflexive feedback, i.e.the (muscle spindle, or position) feedback gains are (too) high, where normal sub-jects have the ability to reduce the reflex magnitude. As with force tasks positionfeedback from the muscles is undesirable, force tasks may be valuable protocol toinvestigate patients with hypertonia.
Reflexes with submaximum tasks
Minimizing position deviations requires a maximum effort, and energy (oxygen)consumption is relatively unimportant. Two independent strategies contribute tothe performance of the tasks: muscle cocontraction and proprioceptive reflexes.Muscle cocontraction is very energy consuming as the muscles are constantly acti-vated compared to proprioceptive reflexes where energy is only used when in re-sponse to a deviation. During submaximal tasks a weighting between performance
Reflections 157
(effort) and energy will be required, favouring reflexes over cocontraction. Sub-maximal also implies that multiple solution are available. Is it possible to uniquelyformulate a submaximal task, such that all subject interpret the task equally. Or willevery subject respond differently, or will a few solutions emerge.
During submaximum tasks there will likely be an interplay between force feed-back (Golgi tendon organs), position/velocity feedback (muscle spindles), and mus-cle cocontraction. Feedback from Golgi tendon organs decreases the stiffness butincreases the effective bandwidth of the muscle, making muscle spindle feedbackeffective for higher frequencies (Rozendaal, 1997).
Continuous vs. transients signals
In this thesis continuous disturbances are applied. This thesis and previous studies(Van der Helm et al., 2002; De Vlugt et al., 2002) have shown that humans adaptthe reflex magnitude within seconds after the start of the perturbation (to removeany transient effect the first few seconds are omitted). How do humans anticipateto transient perturbations (steps, ramps, etc). The possibility to adapt on-line to thedisturbance is lacking. Likely during the first transient disturbance the reflexivesetting from before the disturbance is measured, the settings adapt after each fol-lowing perturbation (learning), and maybe after many perturbations the setting isadapted to the transient. This would implicate that the behaviour is different foreach step, making comparisons between and within subjects difficult, and only af-ter many perturbations the response converges to an optimum.
Posture tasks vs. movement
This thesis considers postural control, a specific case within human motion control.How do reflexes contribute during movement? Reflexive feedback clearly tend tokeep the system in a posture, or equilibrium. During movement the reflex gainswill likely be small to facilitate movement, but likely play an important role duringhoming-in. How can you measure reflexes during movement?
11.3.3 Future challenges
Neural mechanisms behind disturbed reflexes
With the methods provided in this thesis the magnitude of proprioceptive reflexescan be assessed and differences in reflex magnitudes between patients and healthycontrols were found. This brings up the question which neural mechanisms are dis-turbed with a specific neurological disorder. The models used in this study to de-scribe the spinal feedback are relatively simple black-box observations, describinginput-output behaviour of the spinal cord in terms of a summation and some feed-back gains. With a more detailed physiological model describing all relevant neu-ron populations of the spinal cord, i.e. a biological realistic neural network (BNN),more insight could be gained.
Chapter 10 gives is a complete new approach by integrating a novel biologicalrealistic neural network (BNN) with a musculoskeletal model of the human arm
158
and proprioceptors, creating a complete neuromusculoskeletal model. This modelstudy showed the relevance of this approach and directed to possible disturbedneural connections in CRPS. To asses the real synapse strengths and the modulationof the synaptic strengths during experiments, the BNN must be incorporated in thequantification method of Chapter 6. However to validate the BNN and to use theBNN for quantification more variables (signals), likely from inside the spinal cord,are necessary. During the experiments force, position and EMG are recorded. Withmicroneurography, a needle is put inside a nerve and the signal of a single afferentcan be recorded. This would facilitate recording of Ib (GTO), Ia (muscle spindle:stretch velocity), II (muscle spindle: stretch) afferents.
How are reflexes controlled?
This thesis shows that people modulate the magnitude of reflexes depending ontask and conditions. Previous studies showed that these modulations are optimal(De Vlugt et al., 2001; Schouten et al., 2001). In short, the strength of the synapse(i.e. the modulation of the magnitude) is set such that the performance is optimal,i.e. the human behaves as an optimal controller, weighting performance. This leavesthe most intriguing question: how are reflexes controlled? What is the neural mech-anism behind the adaptation of these feedback gains? What triggers the CNS to al-ter the feedback settings? Are the optimal control settings a priori learned by theCNS, or are they continuously adapted in order to minimize a certain variable, or acombination of variables? Or formulated otherwise, if there is an optimal controllerwhere is it and how does it work?
11.4 Epilogue
In this thesis spinal reflexes are assessed by means of disturbance experiments.By analysing the mechanical behaviour and the EMG signals from the musclesthe position and velocity feedback gains are quantified. The use of force distur-bances is natural for the subjects and facilitates an unambiguous task (‘minimize thedeviations’), while reflexive feedback is functional for the task. Modelling the me-chanical response is important as it gives direct insight to the mechanisms behindthe observed behaviour. The application of (control) engineering techniques in thefield of neuroscience is innovative and also necessary to understand the functionof spinal reflexes. The quantification methods and manipulators described in thisthesis could be standard diagnostic tools for neurological departments, where thewrist manipulator can be a prototype for future diagnostic devices.

159
References
Abbink DA (2002) The effect of position and force tasks on human arm admittance.MSc-thesis, Delft University of Technology, Delft, The Netherlands.
Agarwal GC, Gottlieb CL (1977) Compliance of the human ankle joint. J BiomechEng 99:166-170.
Akazawa K, Milner TE, Stein RB (1983) Modulation of reflex EMG and stiffness inresponse to stretch of human finger muscle. J Neurophysiol 49:16-27.
Amadio PC, Mackinnon SE, Merritt WH, Brody GS, Terzis JK (1991) Reflex sym-pathetic dystrophy syndrome: consensus report of an ad hoc committee of theAmerican Association for Hand Surgery on the definition of reflex sympatheticdystrophy syndrome. Plast Reconstr Surg 87:371-375.
Bashor DP (1998) A large-scale model of some spinal reflex circuits. Biol Cybern78:147-157.
Bhatia KP, Bhatt MH, Marsden CD (1993) The causalgia-dystonia syndrome. Brain116:843-851.
Bobet J, Norman RW (1990) Least-squares identification of the dynamic relationbetween the electromyogram and joint moment. J Biomech 23:1275-1276.
Brouwn GG (2000) Postural control of the human arm. PhD-thesis. Delft Universityof Technology, Delft, The Netherlands.
Carignan CR, Cleary KR (2000) Closed-loop force control for haptic simulation ofvirtual environments. Haptics-e 1 (http://www.haptics-e.org).
Carter RR, Crago PE, Keith MW (1990) Stiffness regulation by reflex action in thenormal human hand. J Neurophysiol 64:105-118.
Cathers I, O’Dwyer N, Neilson P (1999) Dependence of stretch reflexes on ampli-tude and bandwidth of stretch in human wrist muscle. Exp Brain Res 129:278-287.
Clancy EA, Morin EL, Merletti R (2002) Sampling, noise-reduction and amplitudeestimation issues in surface electromyography. J Electromyogr Kinesiol 12:1-16.
Colgate JE (1988) The Control of Dynamically Interacting Systems. PhD-thesis.Massachusetts Institute of Technology, Cambridge, USA.
160
Crago PE, Houk JC, Hasan Z (1976) Regulatory actions of human stretch reflex. JNeurophysiol 39:925-935.
Crago PE, Houk JC, Rymer WZ (1982) TSampling of total muscle force by tendonorgans. J neurophysiol 47:1069-1083.
De Vlugt E, Van der Helm FCT, Schouten AC, Brouwn GG (2001) Analysis of thereflexive feedback control loop during posture maintenance. Biol Cybern 84:133-141.
De Vlugt E, Schouten AC, Van der Helm FCT (2002) Adaptation of reflexive feed-back during arm posture to different environments. Biol Cybern 87:10-26.
De Vlugt E, Schouten AC, Van der Helm FCT (2003a) Closed-loop multivariablesystem identification for the characterization of the dynamic arm compliance us-ing continious force disturbances: a model study. J Neurosci Meth 122:123-140.
De Vlugt E, Schouten AC, Van der Helm FCT, Teerhuis PC, Brouwn GG (2003b)A force controlled planar haptic manipulator for posture control analysis of thehuman arm. J Neurosci Methods 129:151-168.
De Vlugt E (2004) Identification of spinal reflexes. PhD-thesis. Delft University ofTechnology, Delft, The Netherlands.
Doemges F, Rack PMH (1992a) Changes in the stretch reflex of the human firstdorsal interosseous muscle during different tasks. J Physiol 447:563-573.
Doemges F, Rack PMH (1992b) Task-dependent changes in the response of humanwrist joints to mechanical disturbance. J Physiol 447:575-585.
Hill AV (1938) The heat of shortening and the dynamic constants of muscle. Proc RSoc Lond B Biol Sci 126:136-195.
Hoehn MM, Yahr MD (1967) Parkinsonism: onset, progression and mortality. Neu-rology 17:427-442.
Huxley HE (1969) The mechanism of muscular contraction. Science 164:1356-1366.
Illert M, Kummel H, Scott JJ (1996) Beta innervation and recurrent inhibition: ahypothesis for manipulatory and postural control. Pflugers Arch 432:R61-67.
Jankowska E (1992) Interneurol relay in spinal pathways from proprioceptors. ProgNeurobiol 38:335-378.
Jankowska E, Hammar I (2002) Spinal interneurones; how can studies in animalscontribute to the understanding of spinal interneuronal systems in man? BrainRes Rev 40:19-28.
Jenkins GM, Watts DG (1968) Spectral analysis and its applications. Holden-Day,San Francisco, USA.
161
Kandel ER, Schwartz JH, Jessell TM (2000) Principles of neural science, fourth edi-tion. McGraw-Hill, New York, USA.
Kanosue K, Akazawa K, Fujii K (1983) Modulation of reflex activity of motor unitsin response to stretch of a human finger muscle. Jpn J Physiol 33:995-1009.
Katz R, Mazzocchio R, Penicaud A, Rossi A (1993) Distribution of recurrent inhibi-tion in the human upper limb. Acta Physiol Scand 149:183-198.
Kearney RE, Stein RB, Parameswaran L (1997) Identification of intrinsic and reflexcontributions to human ankle stiffness dynamics. IEEE Trans Biomed Eng 44:493-504.
Kirsch RF, Kearney RE, MacNeil JB (1993) Identification of time-varying dynamicsof the human triceps surae stretch reflex, I: Rapid isometric contraction. Exp BrainRes 97:115-127.
Kukreja SL, Galiana HL, Kearney RE (2003) NARMAX representation and identifi-cation of ankle dynamics. IEEE Trans Biomed Eng 50:70-81.
Lee RG, Tatton WG (1975) Motor responses to sudden limb displacements in pri-mates with specific CNS lesions and in human patients with motor system disor-ders. Can J Neurol Sci 2:285-293.
MacGregor RJ (1987) Neural and brain modeling. Academic Press, New York, USA.
Maciejowski JM (1989) Multivariable feedback design. Addison Wesley, New York,USA.
Milner TE, Cloutier C (1993) Compensation for mechanically unstable loading involuntary wrist movement. Exp Brain Res 94:522-32.
Mirbagheri MM, Barbeau H, Kearney RE (2000) Intrinsic and reflex contributionsto human ankle stiffness: variation with activation level and position. Exp BrainRes 135:423-436.
Mirbagheri MM, Barbeau H, Ladouceur M, Kearney RE (2001) Intrinsic and re-flex stiffness in normal and spastic, spinal cord injured subjects. Exp Brain Res141:446-459.
Olney SJ, Winter DA (1985) Predictions of knee and ankle moments of force in walk-ing from EMG and kinematic data. J Biomech 18:9-20.
Paice E (1995) Reflex sympathetic dystrophy. BMJ 310:1645-1648.
Perreault EJ, Crago PE, Kirsch RF (2000) Estimation of intrinsic and reflex contri-butions to muscle dynamics: a modeling study. IEEE Trans Biomed Eng 47:1413-1421.
162
Pintelon R, Guillaume P, Rolain Y, Schoukens J, Van Hamme H (1994) Paramet-ric identification of transfer functions in the frequency domain - A survey. IEEETrans Autom Contr 39:2245-2260.
Pintelon R, Schoukens J (2001) System identification: a frequency domain approach.IEEE Press, New York, USA.
Potvin JR, Norman RW, McGill SM (1996) Mechanically corrected EMG for the con-tinuous estimation of erector spinae muscle loading during repetitive lifting. EurJ Appl Physiol 74:119-132.
Prochazka A, Gorassini M (1998a) Models of ensemble firing of muscle spindleafferents recorded during normal locomotion in cats. J Physiol (Lond) 507:277-291.
Prochazka A, Gorassini M (1998b) Ensemble firing of muscle afferents recordedduring normal locomotion in cats. J Physiol (Lond) 507:293-304.
Ribbers G, Geurts ACH, Mulder T (1995) The reflex sympathetic dystrophy syn-drome: a review with special reference to chronic pain and motor impairments.Int J Rehabil Res 18:277-295.
Rozendaal LA (1997) Stability of the shoulder. PhD-thesis. Delft University of Tech-nology, Delft, The Netherland.
Ruitenbeek JC, Janssen RJ (1984) Computer-controlled manipulator/display sys-tem for human-movement studies. Med Biol Eng Comput 22:304-308.
Schoukens J, Guillaume P, Pintelon R (1993) Design of broadband excitation signalsIn: Godfrey KR (ed.), Perturbation Signals for System Identification. Prentice-Hall, Englewood Cliffs, USA.
Schouten AC, De Vlugt E, Van der Helm FCT, Brouwn GG (2001) Optimal posturecontrol of a musculo-skeletal arm model. Biol Cybern 84:143-152.
Schouten AC, Van de Beek WJT, Van Hilten JJ, Van der Helm FCT (2003) Propri-oceptive reflexes in patients with Reflex Sympathetic Dystrophy. Exp Brain Res151:1-8.
Schouten AC, De Vlugt E, Van der Helm FCT (2004a) Estimating the reflexiveimpedance during posture tasks. Submitted.
Schouten AC, De Vlugt E, Van Hilten JJ, Van der Helm FCT (2004b) Quantifyingreflexes with mechanical admittance and reflexive impedance. Submitted.
Schouten AC, De Vlugt E, Van Hilten JJ, Van der Helm FCT (2004c) Design of aforce-manipulator to analyse the admittance of the wrist joint. Submitted.
Schwartzman RJ, Kerrigan J (1990) The movement disorder of reflex sympatheticdystrophy. Neurology 40:57-61.

163
Stein RB, Capaday C (1988) The modulation of human reflexes during functionalmotor tasks. Trend Neurosci 11:328-332.
Stienen AHA, Schouten AC, Van der Helm FCT (2003) Integrating a biological neu-ral network into a musculoskeletal model to analyse postural control reflex mod-ulation. MSc-thesis, Delft University of Technology, Delft, The Netherlands.
Stroeve SH (1999) Impedance characteristics of a neuromusculoskeletal model ofthe human arm. I. Posture control. Biol Cybern 81:475-494.
Van der Helm FCT, Schouten AC, De Vlugt E, Brouwn GG (2002) Identificationof intrinsic and reflexive components of human arm dynamics during posturalcontrol. J Neurosci Meth 119:1-14.
Van Hilten BJ, Van de Beek WJT, Hoff JI, Voormolen JH, Delhaas EM (2000) Intrathe-cal Baclofen for the Treatment of Dystonia in Patients with Reflex SympatheticDystrophy. N Engl J Med 343:625-630.
Van Hilten JJ, van de Beek WJT, Vein AA, van Dijk JG, Middelkoop HAM (2001)Clinical aspects of multifocal or generalized tonic dystonia in reflex sympatheticdystrophy. Neurology 56:1762-1765.
Winters JM, Stark L (1985) Analysis of fundamental human movement patternsthrough the use of in-depth antagonistic muscle models. IEEE Trans Biomed Eng32:826-839.
Winters J, Stark L, Seif-Naraghi A (1988) An analysis of musculoskeletal systemimpedance. J Biomech 21:1011-1025.
Zhang LQ, Rymer WZ (1997) Simultaneous and nonlinear identification of mechan-ical and reflex properties of human elbow joint muscles. IEEE Trans Biomed Eng44:1192-209.

164
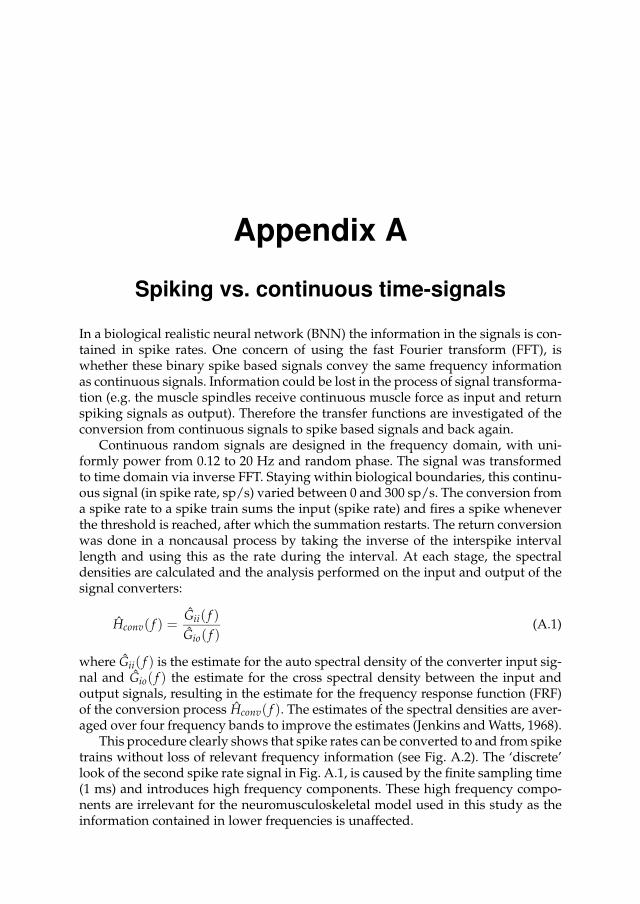
Appendix A
Spiking vs. continuous time-signals
In a biological realistic neural network (BNN) the information in the signals is con-tained in spike rates. One concern of using the fast Fourier transform (FFT), iswhether these binary spike based signals convey the same frequency informationas continuous signals. Information could be lost in the process of signal transforma-tion (e.g. the muscle spindles receive continuous muscle force as input and returnspiking signals as output). Therefore the transfer functions are investigated of theconversion from continuous signals to spike based signals and back again.
Continuous random signals are designed in the frequency domain, with uni-formly power from 0.12 to 20 Hz and random phase. The signal was transformedto time domain via inverse FFT. Staying within biological boundaries, this continu-ous signal (in spike rate, sp/s) varied between 0 and 300 sp/s. The conversion froma spike rate to a spike train sums the input (spike rate) and fires a spike wheneverthe threshold is reached, after which the summation restarts. The return conversionwas done in a noncausal process by taking the inverse of the interspike intervallength and using this as the rate during the interval. At each stage, the spectraldensities are calculated and the analysis performed on the input and output of thesignal converters:
Hconv( f ) =Gii( f )
Gio( f )(A.1)
where Gii( f ) is the estimate for the auto spectral density of the converter input sig-nal and Gio( f ) the estimate for the cross spectral density between the input andoutput signals, resulting in the estimate for the frequency response function (FRF)of the conversion process Hconv( f ). The estimates of the spectral densities are aver-aged over four frequency bands to improve the estimates (Jenkins and Watts, 1968).
This procedure clearly shows that spike rates can be converted to and from spiketrains without loss of relevant frequency information (see Fig. A.2). The ‘discrete’look of the second spike rate signal in Fig. A.1, is caused by the finite sampling time(1 ms) and introduces high frequency components. These high frequency compo-nents are irrelevant for the neuromusculoskeletal model used in this study as theinformation contained in lower frequencies is unaffected.
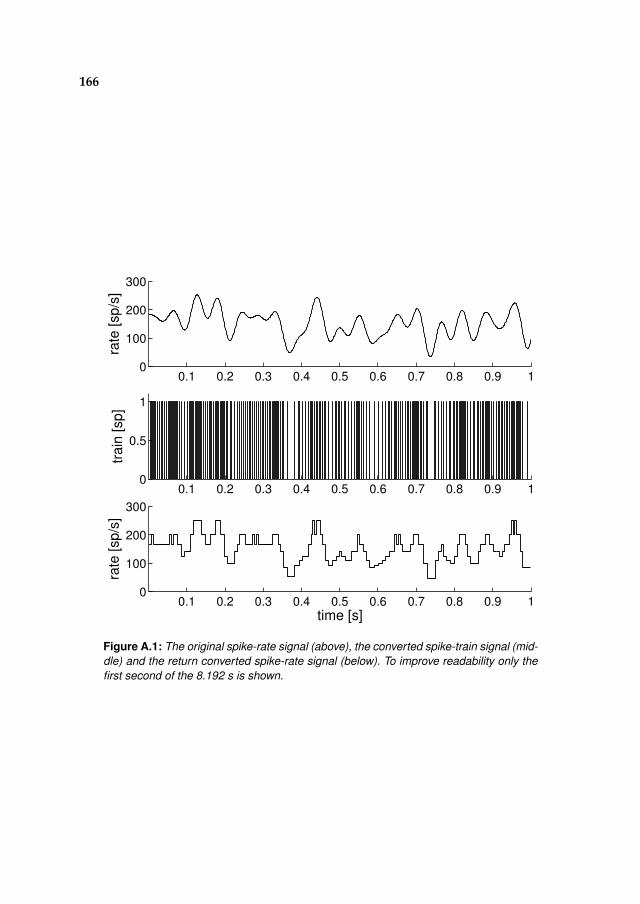
166
0.1 0.2 0.3 0.4 0.5 0.6 0.7 0.8 0.9 10
100
200
300
rate
[sp/s
]
0.1 0.2 0.3 0.4 0.5 0.6 0.7 0.8 0.9 10
0.5
1
train
[sp]
0.1 0.2 0.3 0.4 0.5 0.6 0.7 0.8 0.9 10
100
200
300
rate
[sp/s
]
time [s]
Figure A.1: The original spike-rate signal (above), the converted spike-train signal (mid-
dle) and the return converted spike-rate signal (below). To improve readability only the
first second of the 8.192 s is shown.
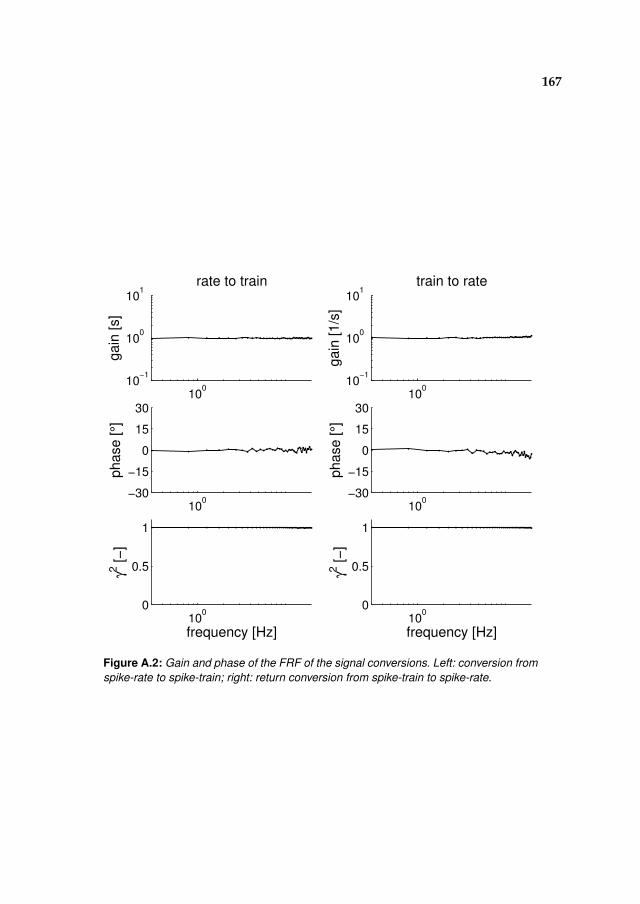
167
100
10−1
100
101
gain
[s]
rate to train
100
10−1
100
101
gain
[1/s
]
train to rate
100
−30
−15
0
15
30
phase [
°]
100
−30
−15
0
15
30
phase [
°]
100
0
0.5
1
γ2 [−
]
frequency [Hz]10
00
0.5
1
γ2 [−
]
frequency [Hz]
Figure A.2: Gain and phase of the FRF of the signal conversions. Left: conversion from
spike-rate to spike-train; right: return conversion from spike-train to spike-rate.

168
169
Summary
Chapter 1: Proprioceptive reflexes play an important role during the control ofmovement and posture. Many studies suggest disturbed modulation of proprio-ceptive reflexes as the cause for the motor features present in neurological disor-ders. However no quantitative data exist to support the hypothesis. In this thesismethods are developed and evaluated to quantify proprioceptive reflexes in vivoduring postural control. The prime goal of this thesis is to gain insight in the patho-physiology of motor disorders and to evaluate the method as a diagnostic tool.
Chapter 2: To quantify the proprioceptive reflex gains continuous random forcedisturbances were applied by means of a manipulator, while the subjects wereinstructed to ‘minimize the deviations’ of the handle. The results were analysed infrequency domain with the frequency response function (FRF) of the mechanicaladmittance, expressing the dynamic relation between force disturbance and han-dle position. The mechanical response to an external force disturbance comprisesintrinsic (muscle) and reflexive properties. The parameters of the intrinsic visco-elasticity and proprioceptive reflex gains are obtained by fitting a model onto themechanical admittance. By either changing the bandwidth of the force disturbanceor the external dynamics imposed by the manipulator different reflex settings areprovoked.
Chapter 3: Complex regional pain syndrome (CRPS) is a syndrome that fre-quently follows an injury and is characterized by sensory, autonomic and motorfeatures of the affected extremities. One of the more common motor features ofCRPS is tonic dystonia, which is caused by impairment of inhibitory interneu-ronal spinal circuits. In this study the proprioceptive reflex gains of the shouldermusculature are quantitatively assessed in nineteen CRPS patients, nine of whompresented with dystonia. The proprioceptive reflexes are quantified by applyingtwo types of force disturbances: (1) disturbances with a fixed low frequency anda variable bandwidth and (2) disturbances with a small bandwidth around a pre-scribed centre frequency. Compared to controls, patients have lower reflex gainsfor velocity feedback in response to the disturbances around a prescribed centrefrequency. Additionally, patients with dystonia lack the ability to generate negativereflex gains for position feedback, for these disturbances. Proprioceptive reflexes tothe disturbances with a fixed low frequency and variable bandwidth present no dif-ference between patients and controls. Although dystonia in the CRPS patients waslimited to the distal musculature, the results suggest involvement of interneuronalcircuits that mediate postsynaptic inhibition of the motoneurons of the proximalmusculature.
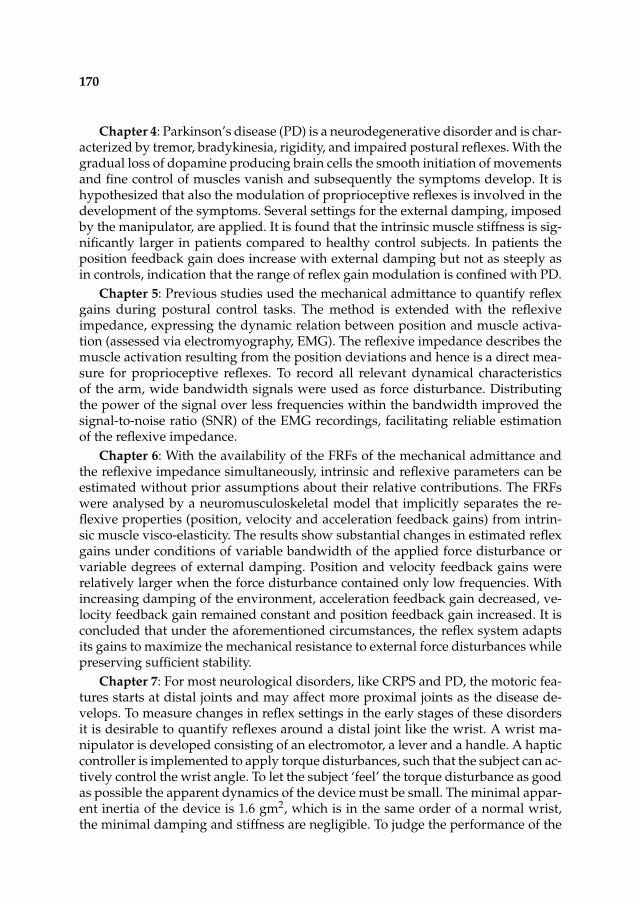
170
Chapter 4: Parkinson’s disease (PD) is a neurodegenerative disorder and is char-acterized by tremor, bradykinesia, rigidity, and impaired postural reflexes. With thegradual loss of dopamine producing brain cells the smooth initiation of movementsand fine control of muscles vanish and subsequently the symptoms develop. It ishypothesized that also the modulation of proprioceptive reflexes is involved in thedevelopment of the symptoms. Several settings for the external damping, imposedby the manipulator, are applied. It is found that the intrinsic muscle stiffness is sig-nificantly larger in patients compared to healthy control subjects. In patients theposition feedback gain does increase with external damping but not as steeply asin controls, indication that the range of reflex gain modulation is confined with PD.
Chapter 5: Previous studies used the mechanical admittance to quantify reflexgains during postural control tasks. The method is extended with the reflexiveimpedance, expressing the dynamic relation between position and muscle activa-tion (assessed via electromyography, EMG). The reflexive impedance describes themuscle activation resulting from the position deviations and hence is a direct mea-sure for proprioceptive reflexes. To record all relevant dynamical characteristicsof the arm, wide bandwidth signals were used as force disturbance. Distributingthe power of the signal over less frequencies within the bandwidth improved thesignal-to-noise ratio (SNR) of the EMG recordings, facilitating reliable estimationof the reflexive impedance.
Chapter 6: With the availability of the FRFs of the mechanical admittance andthe reflexive impedance simultaneously, intrinsic and reflexive parameters can beestimated without prior assumptions about their relative contributions. The FRFswere analysed by a neuromusculoskeletal model that implicitly separates the re-flexive properties (position, velocity and acceleration feedback gains) from intrin-sic muscle visco-elasticity. The results show substantial changes in estimated reflexgains under conditions of variable bandwidth of the applied force disturbance orvariable degrees of external damping. Position and velocity feedback gains wererelatively larger when the force disturbance contained only low frequencies. Withincreasing damping of the environment, acceleration feedback gain decreased, ve-locity feedback gain remained constant and position feedback gain increased. It isconcluded that under the aforementioned circumstances, the reflex system adaptsits gains to maximize the mechanical resistance to external force disturbances whilepreserving sufficient stability.
Chapter 7: For most neurological disorders, like CRPS and PD, the motoric fea-tures starts at distal joints and may affect more proximal joints as the disease de-velops. To measure changes in reflex settings in the early stages of these disordersit is desirable to quantify reflexes around a distal joint like the wrist. A wrist ma-nipulator is developed consisting of an electromotor, a lever and a handle. A hapticcontroller is implemented to apply torque disturbances, such that the subject can ac-tively control the wrist angle. To let the subject ‘feel’ the torque disturbance as goodas possible the apparent dynamics of the device must be small. The minimal appar-ent inertia of the device is 1.6 gm2, which is in the same order of a normal wrist,the minimal damping and stiffness are negligible. To judge the performance of the
171
manipulator, loads with known physical properties are attached and their param-eters were quantified. The parameters of the loads were estimated with deviationsof 5% at maximum. Finally the wrist dynamics of a human subject were quantified.The haptic controller has a bandwidth of 50 Hz, meaning that the apparent dynam-ics are realistically felt till 50 Hz. As the eigenfrequency of a cocontracted humanwrist is approximately 15 Hz, a 50 Hz bandwidth of the haptic device is sufficientto measure all relevant dynamics of the human wrist.
Chapter 8: From previous studies investigating reflexes at the shoulder it isknown that the magnitude of proprioceptive reflexes depends on the bandwidthof the torque disturbance and on the damping and inertia of the external envi-ronment. This study investigates if the same phenomena can be observed at thewrist. The subjects were given a position task (‘minimize the displacement’), whiletorque disturbances were applied. The high coherences indicate that for the givenconditions the human wrist acts as a linear system. Reflex gains for acceleration,velocity and position along with intrinsic (muscle) properties were quantified byfitting a linear model on the estimated FRFs for the joint admittance and the re-flexive impedance. Especially velocity feedback varied substantially with the band-width of the disturbance and with the external damping. Generally spoken, smallerbandwidth and a more damped environment provoked larger reflexes. The resultssuggest that, given the condition, humans modulate the magnitude of the proprio-ceptive reflexes to maximally resist the torque disturbances.
Chapter 9: The wrist manipulator is used to quantify reflexes in patients withPD to test if the wrist manipulator can be used for patients with Parkinson’s disease.Modulation of reflex magnitude was provoked by changing the external damping,imposed by the manipulator, or the disturbance bandwidth. This study showedthat parkinsonian patients can perform the task well and that intrinsic and reflex-ive parameters can be reliably quantified. It was found that the neural time delayof proprioceptive reflexes in patients was significantly larger compared to controls(patients: 55 ms; controls 43 ms). The differences in modulation of the reflex mag-nitude were most pronounced for the external damping conditions. Future studieswith large populations of Parkinson patients should focus on the protocol withdamping conditions. By reducing the number of experimental conditions the ex-periment time will reduce substantially and lighten the experiment for the subjects.
Chapter 10: To give insight into the mechanisms behind negative feedback gainsas identified in human postural control, a neuromusculoskeletal (NMS) model wasbuilt. Specifically, neural deficiencies were sought which could explain why CRPSpatients with tonic dystonia are unable to set negative gains, although they are stillto modulate the gains in the positive range. The model is an integration of a bio-logical realistic neural network (BNN), modelling all relevant spinal neurons, and aone degree-of-freedom musculoskeletal model. Muscle proprioceptors provide theneural network with feedback. Literature suggests that the inability to set negativegains results from neurotransmitter deficiencies in inhibiting synapses in the spinalneural network. Two synaptic connections were selected for possible dysfunction-ing: (1) the synapse which presynaptically inhibits the monosynaptic stretch reflex,
172
and (2) the synapse connecting the inhibitory interneuron to the motoneuron. Alack of presynaptic inhibition resulted in an overly dominant monosynaptic stretchreflex with high, positive feedback gains. Disabling the second prevented severalmajor proprioceptive feedback paths from providing the motoneurons with neg-ative stimulation, making the setting of negative feedback gains next to impossi-ble. It is concluded that both synapses play an important role in obtaining nega-tive feedback gains and that dysfunctioning of these synapses could account forthe motor features in CRPS patients. However the presynaptically inhibiting of themonosynaptic stretch is a prerequisite for feedback gain modulation.
Chapter 11: In this thesis spinal reflexes are assessed by means of disturbanceexperiments. By analysing the mechanical behaviour and the EMG signals from themuscles the position and velocity feedback gains are quantified. The use of forcedisturbances is natural for the subjects and facilitates an unambiguous task (‘min-imize the deviations’), while reflexive feedback is functional for the task. Modellingthe mechanical response is important as it gives direct insight to the mechanismsbehind the observed behaviour. The application of (control) engineering techniquesin the field of neuroscience is innovative and also necessary to understand the func-tion of spinal reflexes. The quantification methods and manipulators described inthis thesis could be standard diagnostic tools for neurological departments, wherethe wrist manipulator can be a prototype for future diagnostic devices.
Alfred Schouten, 2004
173
Samenvatting
Hoofdstuk 1: Proprioceptieve reflexen spelen een belangrijke rol bij de regulatievan houding en beweging. Vele studies suggereren verstoorde modulatie van pro-prioceptieve reflexen als oorzaak voor de motorische afwijkingen in neurologischeaandoeningen. Er zijn echter geen kwantitatieve gegevens om deze hypothese teondersteunen. In dit proefschrift zijn methoden ontwikkeld en geëvalueerd om dereflexieve bijdrage tijdens houdingsregulatie te kwantificeren. Het primaire doelvan dit proefschrift is het verkrijgen van inzicht in de pathofysiologie van motori-sche afwijkingen bij neurologische aandoeningen en het evaluren van de methodeals een diagnostisch middel.
Hoofdstuk 2: Om proprioceptieve reflexen te kwantificeren worden willekeuri-ge krachtverstoringen opgelegd, met behulp van een manipulator, terwijl de proef-personen wordt gevraagd de uitwijkingen van het handvat te minimizeren. Deresultaten worden geanalyseerd in frequentiedomein met de frequentie responsefunctie (FRF) van de mechanische admittantie, welke de dynamische relatie tussenkrachtverstoring en positie van het handvat uitdrukt. De mechanische reactie opeen externe krachtverstoring bestaat uit intrinsieke (spier) en reflexieve eigenschap-pen. De parameters van de intrinsieke visco-elasticiteit en de proprioceptieve reflexbijdragen worden verkregen door de mechanische admittantie met een model tebeschrijven. Verschillende reflex sterkten worden uitgelokt door de bandbreedtevan de krachtverstoring of de externe dynamica, welke door de manipulator wordtopgelegd, te veranderen.
Hoofdstuk 3: Complex regional pain syndrome (CRPS), ookwel posttraumati-sche dystrofie, is een syndroom dat volgt na een trauma en zich kenmerkt doorsensorische, autonome en motorische afwijkingen aan de betrokken ledematen.Een veelvoorkomende motorische afwijkingen bij CRPS is een tonische dystonie,veroorzaakt door een stoornis van inhiberende interneuronale circuits in het rug-gemerg. In deze studie worden de proprioceptieve reflexen rond de schouder ge-kwantificeerd in negentien CRPS patiënten, van wie negen met dystonie. De propri-oceptieve reflexen worden gekwantificeerd door twee soorten krachtverstoringentoe te passen: (1) verstoringen met een beperkte bandbreedte en (2) verstoringenmet een smalle bandbreedte rond een bepaalde centrum frequentie. Vergeleken metgezonde proefpersonen hebben de patiënten een lagere reflex sterkte voor snelheid-sterugkoppeling bij verstoringen rond een centrumfrequentie. Bovendien, kunnende patiënten met dystonie geen negatieve reflex sterkte voor positieterugkoppelinggenereren bij deze storingen. Proprioceptieve reflexen bij de verstoringen met eenbeperkte bandbreedte geven geen verschil tussen patiënten en gezonde proefper-
174
sonen. Hoewel de dystonie in de patiënten tot het distale spierstelsel beperkt was,blijkt uit de resultaten dat interneuronale circuits verantwoordelijk voor postsy-naptische inhibitie van de motoneuronen van proximale spieren zijn aangedaan.
Hoofdstuk 4: De ziekte van Parkinson (ZvP) is een neurodegenerative aandoe-ning, welke wordt gekenmerkt door tremor, bradykinesia, rigiditeit, en verstoordehoudingsreflexen. Met het geleidelijke verlies van de dopamine producerende her-senencellen verdwijnt de vlotte initiatie van bewegingen en ontwikkelen de symp-tomen. De hypothese wordt gesteld dat ook de modulatie van proprioceptieve re-flexen bij de ontwikkeling van de ZvP betrokken is. Verscheidene waarden voorde externe demping, opgelegd door de manipulator, zijn toegepast. De intrinsiekespierstijfheid is bij patiënten beduidend groter in vergelijking met gezonde proef-personen. In patiënten stijgt de sterkte van de positieterugkoppeling met externedemping, echter niet zo steil als in gezonde proefpersonen, wat er op wijst dat debereik van de reflex modulatie met de ZvP beperkt is.
Hoofdstuk 5: In de eerdere hoofdstukken is alleen de mechanische admittan-tie gebruikt om proprioceptieve reflexen te kwantificeren tijdens houdingstaken.De methode wordt uitgebreid met de reflexieve impedantie, welke de dynamischerelatie tussen positie en spieractivatie (verkregen middels electromyografie, EMG)uitdrukt. De reflexieve impedantie beschrijft de spieractivatie als gevolg van depositie uitwijkingen en is daardoor een directe maat voor de proprioceptieve re-flexen. Om alle relevante dynamische kenmerken van de arm te registreren werdenbreedbandige signalen gebruikt als krachtverstoring. Verdeling van het signaalver-mogen over minder frequenties binnen de bandbreedte verbeterde de signal ruisverhouding van de EMG signalen, wat een betrouwbare schatting van de reflexie-ve impedantie bevordert.
Hoofdstuk 6: Met de beschikbaarheid van de FRFs van de mechanische ad-mittantie en de reflexieve impedantie kunnen de intrinsieke en reflexieve para-meters zonder aannamen over hun relatieve bijdragen worden geschat. De FRFswerden geanalyseerd door een neuromusculair model dat impliciet de reflexieveeigenschappen (positie-, snelheids- en versnellingsterugkoppeling) van de intrin-sieke spiervisco-elasticiteit scheidt. De resultaten tonen aanzienlijke veranderingenin reflex sterkte bij beperkte bandbreedte van de toegepaste krachtverstoring ofbij veranderlijke mate van externe damping. De reflexieve positie- en snelheidste-rugkoppeling waren groter wanneer de krachtverstoring slechts lage frequentiesbevatte. Met stijgende externe demping, verminderde de versnellingsterugkoppe-ling, bleef de snelheidsterugkoppeling bijna constant en steeg de positieterugkop-peling. De resultaten duiden erop dat onder de genoemde omstandigheden, hetreflex systeem zijn sterkte aanpast om de mechanische weerstand tegen externekrachtverstoringen te maximaliseren met behoud van stabiliteit.
Hoofdstuk 7: Voor de meeste neurologische aandoeningen, zoals CRPS en deZvP, beginnen de motorische symptomen bij distale gewrichten en met de pro-gressie van de ziekte kunnen ook proximale gewrichten worden aangedaan. Omveranderingen in reflexen in een vroege stadium te kunnen meten is het wense-lijk om reflexen rond een distaal gewricht zoals de pols te kwantificeren. Een pols
175
pertubator is ontwikkeld, welke bestaat uit een electromotor, een hefboom en eenhandvat. Een haptisch controller is geimplementeerd om torsieverstoringen aan tekunnen bieden, zodat de proefpersoon zijn/haar polshoek actief kan beinvloeden.Om de proefpersoon de aangeboden verstoring zo goed mogelijk te ‘voelen’ moetde dynamica van het apparaat klein zijn. De minimale inertie van het apparaatis 1,6 gm2, wat in de zelfde orde van een normale pols is, de minimale dempingen stijfheid zijn te verwaarlozen. Om de prestaties van het haptische apparaat teanalyseren, zijn de parameters van systemen met bekende fysieke eigenschappengekwantificeerd door de gemeten dynamische reacties te modelleren. De parame-ters van deze systemen werden geschat met een afwijking van maximaal 5%. Totslot werd de dynamica van de pols van een proefpersoon gekwantificeerd. De polspertubator heeft een bandbreedte van 50 Hz, m.a.w. de opgelegde dynamica wordttot 50 Hz realistisch gevoeld. Aangezien de eigenfrequentie van een menselijke polsongeveer 15 Hz is, volstaat een bandbreedte van 50 Hz om alle relevante dynamicavan de menselijke pols te meten.
Hoofdstuk 8: Uit eerdere studies naar reflexen bij de schouder is het bekenddat de sterkte van de proprioceptieve reflexen varieert met de bandbreedte vande verstoring en met de externe demping en inertie opgelegd door de manipu-lator. Deze studie onderzoekt of dezelfde fenomenen bij de pols kunnen wordenwaargenomen. Aan de proefpersonen werd een positietaak gegeven (‘minimiliseerde uitwijkingen’), terwijl torsieverstoringen werden opgelegd. De hoge coherentieswijzen erop dat onder de gegeven condities de menselijke pols als lineair systeemis te beschrijven. De reflex sterkten voor versnelling, snelheid en positie samenmet intrinsieke (spier) eigenschappen werden gekwantificeerd door de FRFs vande mechanische admittantie en de reflexieve impedantie met een lineair model tebeschrijven. Vooral de snelheidsterugkoppeling varieërde met de bandbreedte vande verstoring en de externe demping. Over het algemeen veroorzaakten kleinerebandbreedte en meer externe damping grotere reflexen. De resultaten laten ziendat, onder de gegeven condities, mensen proprioceptieve reflexen instellen om deverstoringen maximaal te onderdrukken.
Hoofdstuk 9: De polsmanipulator is gebruikt om reflexen in patiënten met deZvP te kwantificeren om te testen of de polsmanipulator kan worden gebruikt bijpatiënten met de ZvP. Modulatie van de reflex sterkte werd uitgelokt door de exter-ne demping of de bandbreedte van de verstoring te veranderen. Deze studie toontaan dat Parkinson patiënten de taak goed kunnen uitvoeren en dat de intrinsiekeen reflexieve parameters betrouwbaar kunnen worden gekwantificeerd. De neura-le tijdvertraging van proprioceptieve reflexen in patiënten was beduidend groter invergelijking met gezonde proefpersonen (patiënten: 55 ms; gezonde proefpersonen43 ms). De verschillen in modulatie van de reflex sterkte waren het meest uitgespro-ken voor de externe dempingscondities. Toekomstige studies met grote groepenpatiënten zouden zich op het protocol met dempingscondities moeten concentre-ren. Door het aantal experimentele condities te verminderen zal de experimenttijdwezenlijk verkorten, wat de belasting voor de patiënt aanzienlijk verlicht.
Hoofdstuk 10: Om inzicht te geven in de mechanismen achter negatieve reflex

176
sterkte, zoals die bij houdingsregulatie is gevonden werd een neuromusculair mo-del ontwikkelt. Specifiek, werdt gezocht naar de neurale deficiënties die kunnenverklaren waarom CRPS patiënten met tonische dystonie geen negatieve reflexenkunnen generen, hoewel zij wel in positieve reflexen kunnen moduleren. Het neu-romusculaire model is de integratie van een biologisch realistisch neuraal netwerk(BNN) en een één graad-van-vrijheid spierskelet model. De proprioceptoren vande spier voorzien het BNN van terugkoppeling. Literatuur suggereert dat het on-vermogen om negatieve reflexen in te stellen volgt uit deficiënties van neurotrans-mitter in het ruggemerg. Twee synaptische verbindingen werden geselecteerd voorhet mogelijke disfunctioneren: (1) de synaps die presynaptisch de monosynapticrek reflex inhibeert, en (2) de synaps die inhiberende interneuronen verbindt metde motoneuronen. Uitschakelen van de presynaptische inhibitie resulteerde in eenoverdreven dominante monosynaptic rekreflex met een hoge positieve reflex sterk-te. Uitschakelen van de tweede synaps onderbreekt verscheidene belangrijke pro-prioceptieve terugkoppelingsbanen welke de motoneuronen van negatieve stimulivoorzien en maakt negatieve reflex sterkte onmogelijk. Beide synapsen spelen eenbelangrijke rol in het verkrijgen van negatieve reflexen. Echter presynaptische in-hibitie is eerste vereiste voor modulatie van de reflexen.
Hoofdstuk 11: In dit proefschrift worden de proprioceptieve reflexen gekwan-tificeerd middels verstoringsexperimenten. Door het mechanische gedrag en deEMG signalen van de spieren te analyseren worden de positie- en snelheidsterug-koppelfactoren gekwantificeerd. Het gebruik van krachtverstoringen is natuurlijkvoor de proefpersonen en leidt tot een ondubbelzinnige taak (‘minimaliseer de uit-wijkingen’), terwijl reflexen functioneel zijn voor de taak. Het modelleren van demechanische reactie is belangrijk aangezien het direct inzicht geeft in de mechanis-men achter het gemeten mechanische gedrag. Het toepassen van regeltechnischetechnieken binnen de neurologie is zinvol, maar ook noodzakelijk om de functievan ruggemerg reflexen te begrijpen. De kwantificatie methoden en manipulatorendie in dit proefschrift worden beschreven kunnen standaard diagnostisch midde-len voor neurologische afdelingen worden, waar de polsmanipulator een prototypevoor toekomstige diagnostische apparatuur kan zijn.
Alfred Schouten, 2004

177
Dankwoord
Eindelijk na jaren van zwoegen, doorgaan, maar vooral ook plezier, is het eindelijkzover: het proefschrift is voltooid. Het onderzoek had en zal nog jaren doorgaan,maar nu is de tijd om mijn bijdrage hierin op te schrijven. Zo’n project van vele jarenis zelden het werk van een enkeling en op deze plaats wil ik een aantal mensendanken, zonder wie dit proefschrift er in deze vorm nooit geweest zou zijn.
In de eerste plaats wil ik mijn promotoren, Frans van der Helm en Bob vanHilten, bedanken. Ze hebben mij het vertrouwen gegeven om te onderzoek uit tevoeren, stonden altijd klaar voor vragen en advies, maar hebben me ook de vrijheidgegeven om het werk om mijn eigen manier uit te voeren.
Het onderzoek beschreven in dit proefschrift volgt op het promotiewerk vanGuido Brouwn en ik ben blij dat ik bij Guido heb mogen afstuderen. Hij heeft metijdens het afstuderen laten zien hoe leuk onderzoek is en heeft daarmee mijn en-thousiasme voor onderzoek aangewakkerd.
De pols pertubator is grotendeels gebouwd binnen de faculteit werktuigbouw-kunde. De inbreng van Ad van der Geest, John Dukker en Kees Slinkman washierin onontbeerlijk. Niet alleen hebben zij bijgedragen aan het omzetten van detekeningen tot een echt apparaat, ook heb ik dankbaar gebruik gemaakt van hunkritische en opbouwende opmerkingen tijdens het ontwerp van de pertubator.
Tijdens het project heb ik met diverse studenten samengewerkt. Leen, Klaske,Joris, Jan-Pieter, Edwin, Pieter, Niek en Marc bedankt. Al staat jullie werk niet in ditproefschrift, het heeft zeker bij gedragen aan het begrip en inzicht. Drie studentenheb ik mogen begeleiden tijdens hum afstuderen: David Abbink, Arno Stienen enBas Zwaan. Afstudeerders begeleiden kost tijd, maar levert ook veel op, zie o.a.hoofdstuk 8 en 10. Het was prettig om met jullie samen te werken en het heeft megeleerd om onderzoek op een heldere manier uit te leggen.
Verder wil ik Erwin de Vlugt bedanken. Bijna gelijktijdig zijn we elk aan eenpromotie onderzoek begonnen, beide in het schouderlab, en we delen al vele jarenhetzelfde kantoor. Je bent altijd bereid om ideëen en inzichten te bediscusseren endat heeft zeker geleidt tot de convergentie die nodig is om een proefschrift te kun-nen schrijven. Het is me een genoegen om op dezelfde dag te promoveren.
En als laatste wil ik bedanken Yvonne, Lisa en Karlijn, door simpelweg te latenzien dat er meer is in het leven dan wetenschap alleen.
Alfred, april 2004

178

179
Curriculum vitae
22 oktober 1972geboren te Dordrecht.
1985-1991HAVO, scholengemeenschap ‘S.G. de Krimpenerwaard’ te Krimpen aan denIJssel.
1991-1995HTS werktuigbouwkunde te Dordrecht.
1995-1999TU Delft, werktuigbouwkunde. Afgestudeerd bij de sectie Mens-machinesystemen met een scriptie getiteld ‘Optimal control of a neuromusculoskel-etal arm model’.
1999-2003TU Delft, werktuigbouwkunde. Promovendus bij de sectie Mens-machinesystemen. Titel proefschrift: ‘Proprioceptive reflexes and neurological disor-ders’.
2004-TU Delft, werktuigbouwkunde. Postdoc bij de sectie Mens-machine syste-men in het TREND project (Traume RElated Neurological Disorders).