Project Management CTC-ITC 310 Spring 2018 Howard Rosenthal · Project Management CTC-ITC 310...
53
Project Management CTC-ITC 310 Spring 2018 Howard Rosenthal 1
Transcript of Project Management CTC-ITC 310 Spring 2018 Howard Rosenthal · Project Management CTC-ITC 310...
ProjectManagementCTC-ITC310Spring2018
HowardRosenthal
1
Notice� Thiscourseisbasedonandincludesmaterialfromthetext:
AUser’sManualTothePMBOKGuideAuthors:CynthiaStackpoleSnyderPublisher:WileyISBN:978-1-118-43107-8,Copyright2013
� ItalsoutilizesgeneralinformationandfiguresfromthePMBOK:AGuidetotheProjectManagementBodyofKnowledge(PMBOK5THEdition)Publisher:ProjectManagementInstituteISBN:978-1-935589-67-9,Copyright2013andAGuidetotheProjectManagementBodyofKnowledge(PMBOK6THEdition)Publisher:ProjectManagementInstituteISBN:978-1-628251-84-5,Copyright2017
� Thecoursealsoincludesandinterspersessomematerials,mostoftendiagrams,providedbyMr.Wysocki’sPowerPointslides,atthewebsite:www.wiley.com/go/epm7eAndthebookEffectiveProjectManagement-Traditional,Agile,Extreme7THEditionAuthors:RobertK.WysockiPublisher:WileyISBN:978-1-118-72916-8,Copyright2014
2
LessonGoals
� DefinewhatProjectQualityManagementis� DescribeeffectiveQualityManagement� DiscussISOqualitystandards� ThePlan-Do-Check-Actapproach� Describequalitymeasurement� Discussthedifferencesbetweencorrelationandcausation
� Describethequalitytoolsandhowtheyareused
3
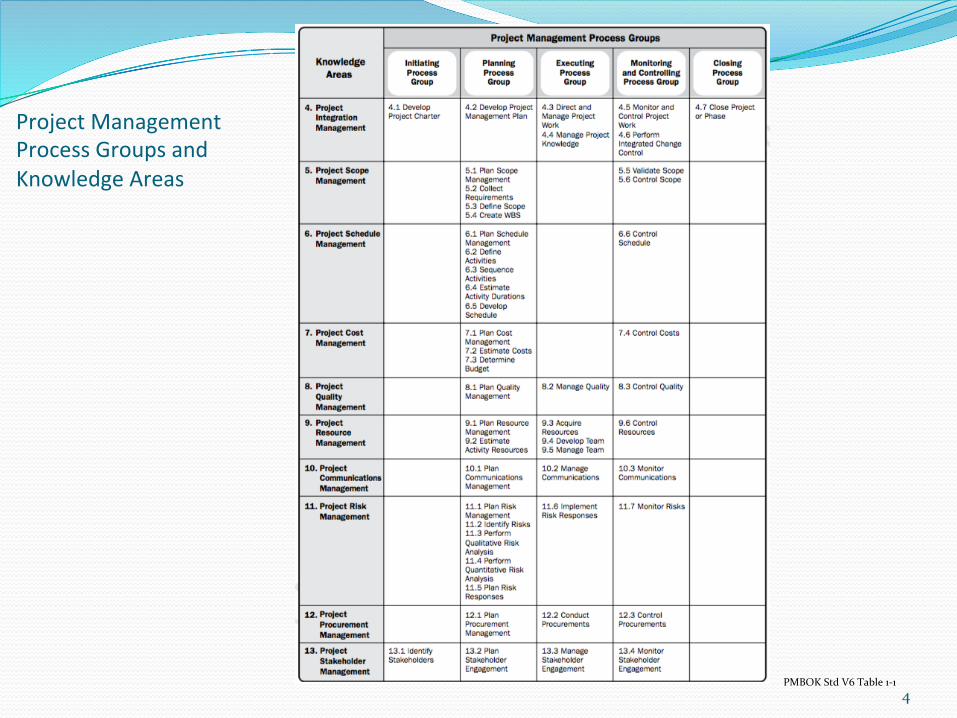
ProjectManagementProcessGroupsandKnowledgeAreas
4PMBOKStdV6Table1-1
5
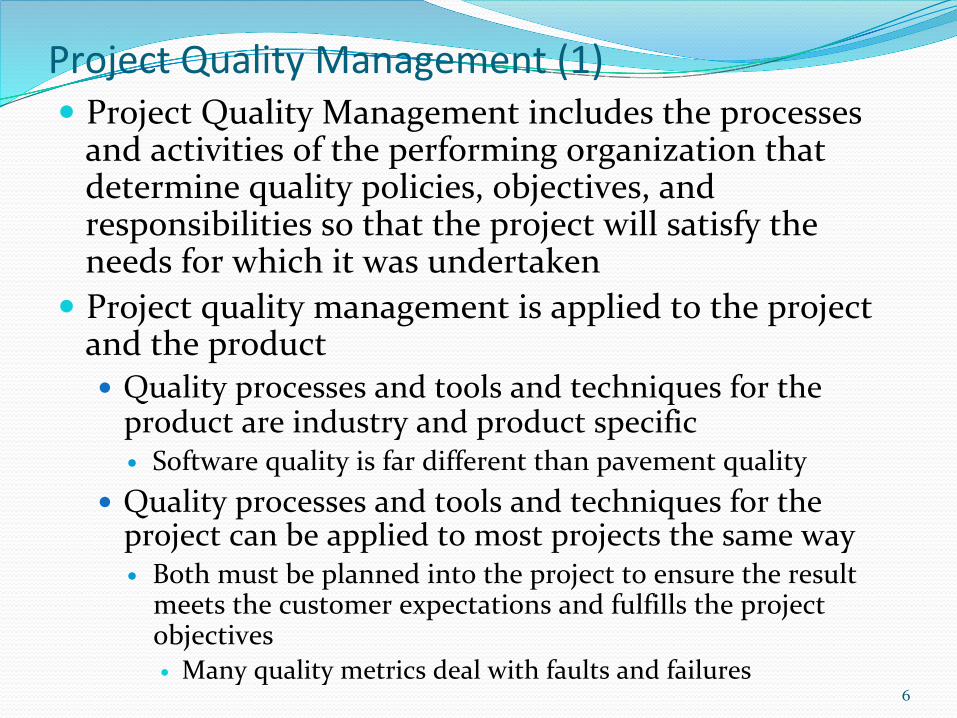
ProjectQualityManagement(1)� ProjectQualityManagementincludestheprocessesandactivitiesoftheperformingorganizationthatdeterminequalitypolicies,objectives,andresponsibilitiessothattheprojectwillsatisfytheneedsforwhichitwasundertaken
� Projectqualitymanagementisappliedtotheprojectandtheproduct� Qualityprocessesandtoolsandtechniquesfortheproductareindustryandproductspecific� Softwarequalityisfardifferentthanpavementquality
� Qualityprocessesandtoolsandtechniquesfortheprojectcanbeappliedtomostprojectsthesameway� Bothmustbeplannedintotheprojecttoensuretheresultmeetsthecustomerexpectationsandfulfillstheprojectobjectives� Manyqualitymetricsdealwithfaultsandfailures
6
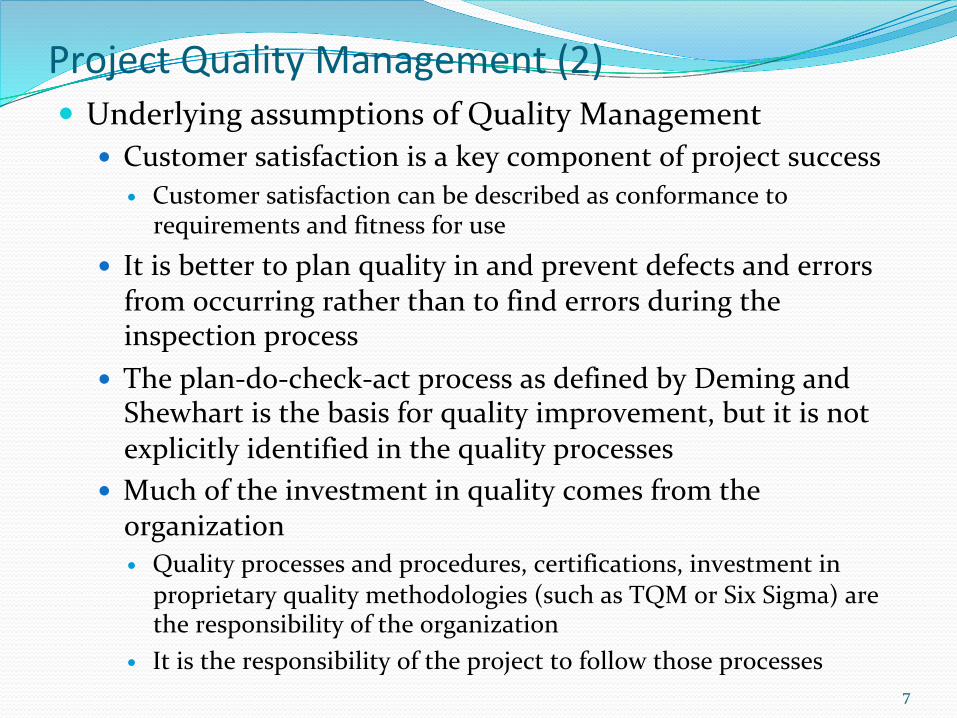
ProjectQualityManagement(2)� UnderlyingassumptionsofQualityManagement
� Customersatisfactionisakeycomponentofprojectsuccess� Customersatisfactioncanbedescribedasconformanceto
requirementsandfitnessforuse
� Itisbettertoplanqualityinandpreventdefectsanderrorsfromoccurringratherthantofinderrorsduringtheinspectionprocess
� Theplan-do-check-actprocessasdefinedbyDemingandShewhartisthebasisforqualityimprovement,butitisnotexplicitlyidentifiedinthequalityprocesses
� Muchoftheinvestmentinqualitycomesfromtheorganization� Qualityprocessesandprocedures,certifications,investmentin
proprietaryqualitymethodologies(suchasTQMorSixSigma)aretheresponsibilityoftheorganization
� Itistheresponsibilityoftheprojecttofollowthoseprocesses7
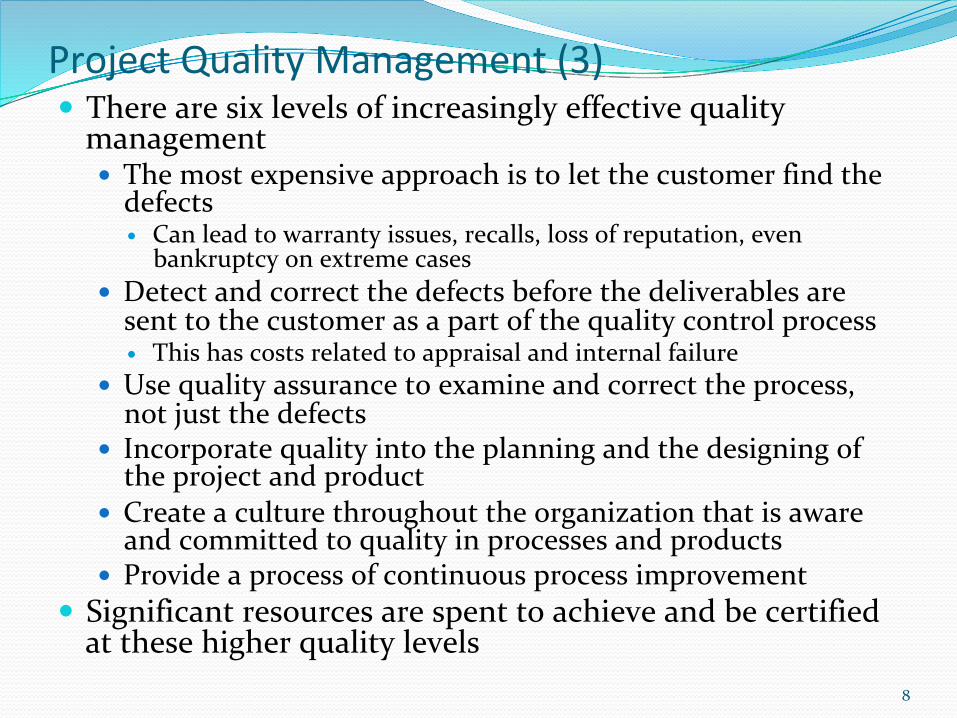
ProjectQualityManagement(3)� Therearesixlevelsofincreasinglyeffectivequalitymanagement� Themostexpensiveapproachistoletthecustomerfindthedefects� Canleadtowarrantyissues,recalls,lossofreputation,even
bankruptcyonextremecases� Detectandcorrectthedefectsbeforethedeliverablesaresenttothecustomerasapartofthequalitycontrolprocess� Thishascostsrelatedtoappraisalandinternalfailure
� Usequalityassurancetoexamineandcorrecttheprocess,notjustthedefects
� Incorporatequalityintotheplanningandthedesigningoftheprojectandproduct
� Createaculturethroughouttheorganizationthatisawareandcommittedtoqualityinprocessesandproducts
� Provideaprocessofcontinuousprocessimprovement� Significantresourcesarespenttoachieveandbecertifiedatthesehigherqualitylevels
8
9
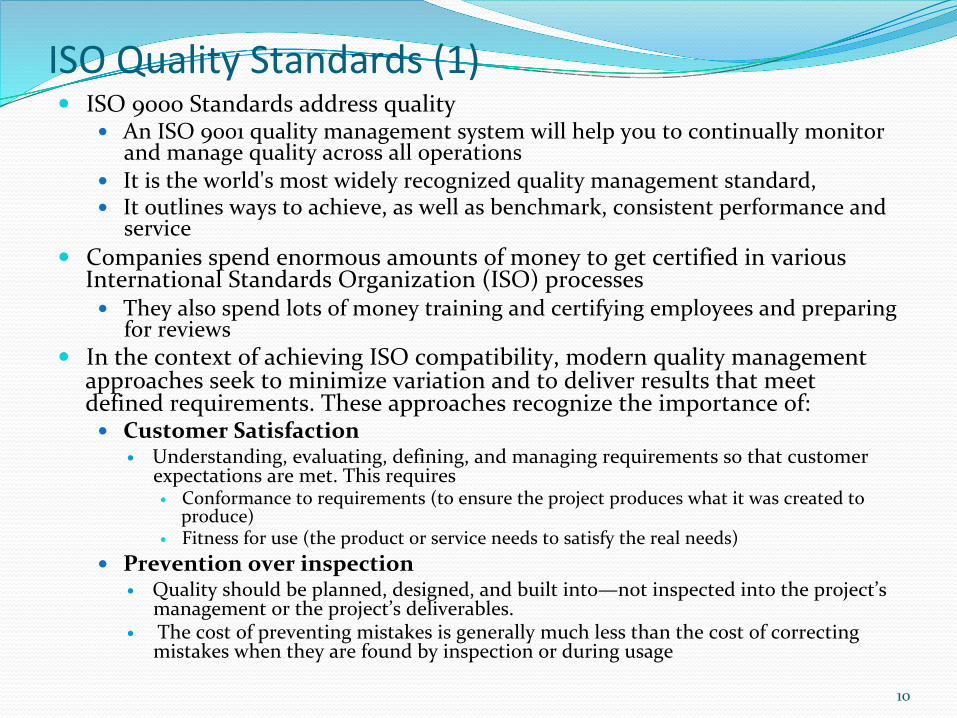
ISOQualityStandards(1)� ISO9000Standardsaddressquality
� AnISO9001qualitymanagementsystemwillhelpyoutocontinuallymonitorandmanagequalityacrossalloperations
� Itistheworld'smostwidelyrecognizedqualitymanagementstandard,� Itoutlineswaystoachieve,aswellasbenchmark,consistentperformanceand
service� Companiesspendenormousamountsofmoneytogetcertifiedinvarious
InternationalStandardsOrganization(ISO)processes� Theyalsospendlotsofmoneytrainingandcertifyingemployeesandpreparing
forreviews� InthecontextofachievingISOcompatibility,modernqualitymanagement
approachesseektominimizevariationandtodeliverresultsthatmeetdefinedrequirements.Theseapproachesrecognizetheimportanceof:� CustomerSatisfaction
� Understanding,evaluating,defining,andmanagingrequirementssothatcustomerexpectationsaremet.Thisrequires� Conformancetorequirements(toensuretheprojectproduceswhatitwascreatedto
produce)� Fitnessforuse(theproductorserviceneedstosatisfytherealneeds)
� Preventionoverinspection� Qualityshouldbeplanned,designed,andbuiltinto—notinspectedintotheproject’s
managementortheproject’sdeliverables.� Thecostofpreventingmistakesisgenerallymuchlessthanthecostofcorrecting
mistakeswhentheyarefoundbyinspectionorduringusage
10
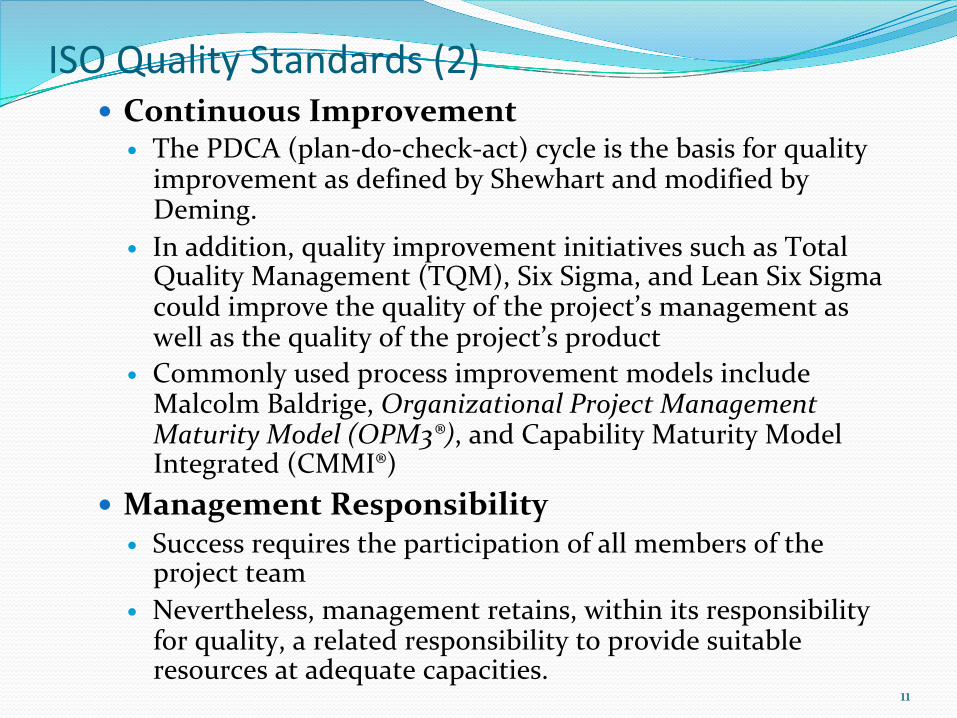
ISOQualityStandards(2)� ContinuousImprovement
� ThePDCA(plan-do-check-act)cycleisthebasisforqualityimprovementasdefinedbyShewhartandmodifiedbyDeming.
� Inaddition,qualityimprovementinitiativessuchasTotalQualityManagement(TQM),SixSigma,andLeanSixSigmacouldimprovethequalityoftheproject’smanagementaswellasthequalityoftheproject’sproduct
� CommonlyusedprocessimprovementmodelsincludeMalcolmBaldrige,OrganizationalProjectManagementMaturityModel(OPM3®),andCapabilityMaturityModelIntegrated(CMMI®)
� ManagementResponsibility� Successrequirestheparticipationofallmembersoftheprojectteam
� Nevertheless,managementretains,withinitsresponsibilityforquality,arelatedresponsibilitytoprovidesuitableresourcesatadequatecapacities.
11
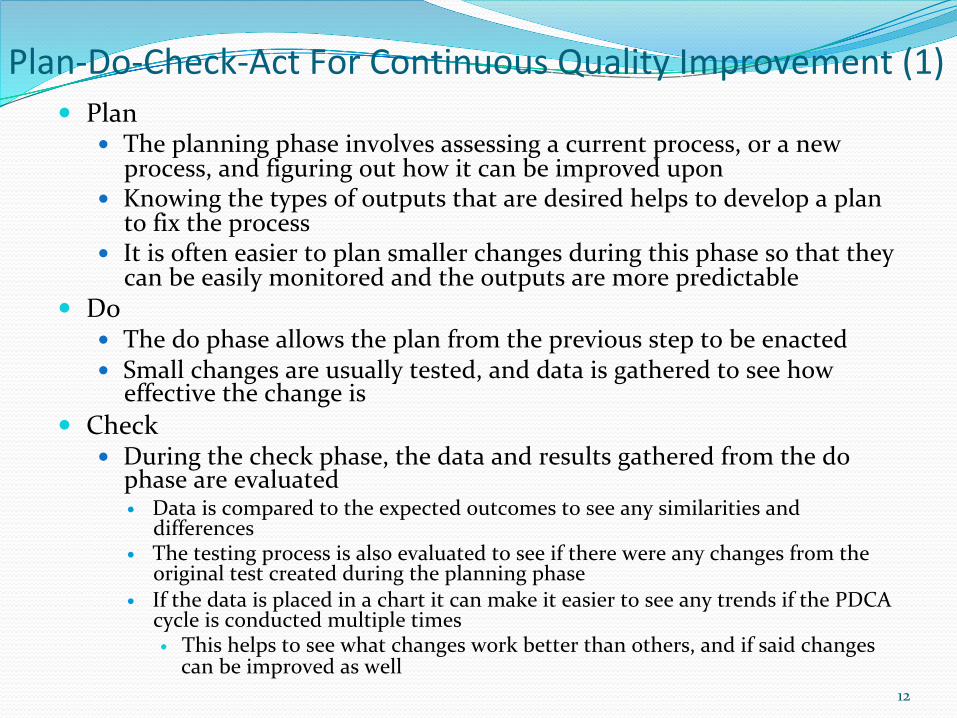
Plan-Do-Check-ActForContinuousQualityImprovement(1)� Plan
� Theplanningphaseinvolvesassessingacurrentprocess,oranewprocess,andfiguringouthowitcanbeimprovedupon
� Knowingthetypesofoutputsthataredesiredhelpstodevelopaplantofixtheprocess
� Itisofteneasiertoplansmallerchangesduringthisphasesothattheycanbeeasilymonitoredandtheoutputsaremorepredictable
� Do� Thedophaseallowstheplanfromtheprevioussteptobeenacted� Smallchangesareusuallytested,anddataisgatheredtoseehow
effectivethechangeis� Check
� Duringthecheckphase,thedataandresultsgatheredfromthedophaseareevaluated� Dataiscomparedtotheexpectedoutcomestoseeanysimilaritiesand
differences� Thetestingprocessisalsoevaluatedtoseeiftherewereanychangesfromthe
originaltestcreatedduringtheplanningphase� IfthedataisplacedinachartitcanmakeiteasiertoseeanytrendsifthePDCA
cycleisconductedmultipletimes� Thishelpstoseewhatchangesworkbetterthanothers,andifsaidchanges
canbeimprovedaswell12
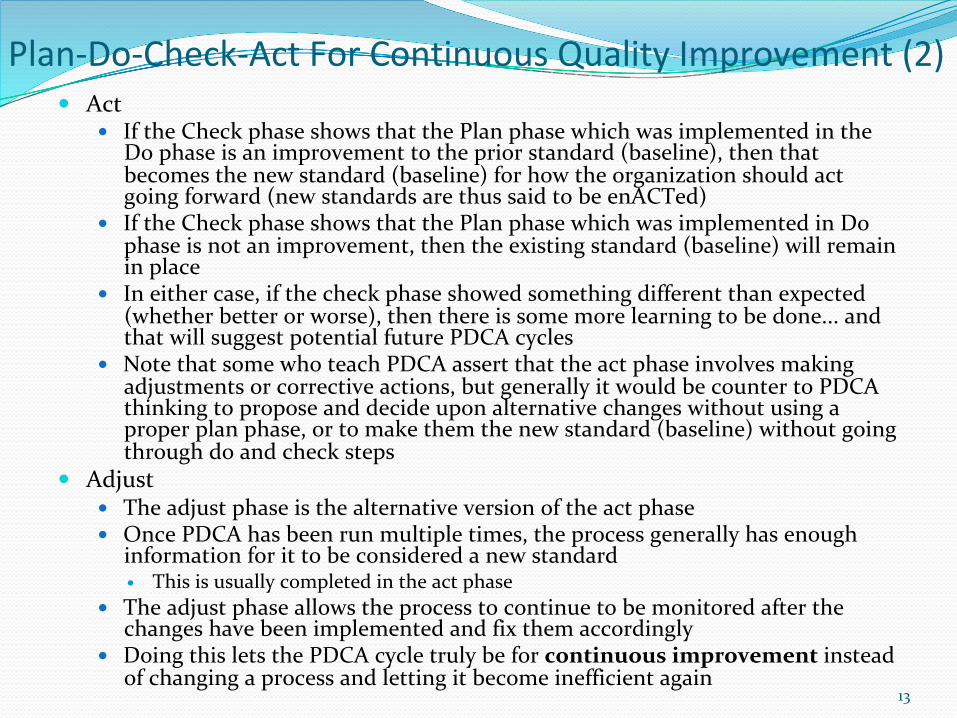
Plan-Do-Check-ActForContinuousQualityImprovement(2)� Act
� IftheCheckphaseshowsthatthePlanphasewhichwasimplementedintheDophaseisanimprovementtothepriorstandard(baseline),thenthatbecomesthenewstandard(baseline)forhowtheorganizationshouldactgoingforward(newstandardsarethussaidtobeenACTed)
� IftheCheckphaseshowsthatthePlanphasewhichwasimplementedinDophaseisnotanimprovement,thentheexistingstandard(baseline)willremaininplace
� Ineithercase,ifthecheckphaseshowedsomethingdifferentthanexpected(whetherbetterorworse),thenthereissomemorelearningtobedone...andthatwillsuggestpotentialfuturePDCAcycles
� NotethatsomewhoteachPDCAassertthattheactphaseinvolvesmakingadjustmentsorcorrectiveactions,butgenerallyitwouldbecountertoPDCAthinkingtoproposeanddecideuponalternativechangeswithoutusingaproperplanphase,ortomakethemthenewstandard(baseline)withoutgoingthroughdoandchecksteps
� Adjust� Theadjustphaseisthealternativeversionoftheactphase� OncePDCAhasbeenrunmultipletimes,theprocessgenerallyhasenough
informationforittobeconsideredanewstandard� Thisisusuallycompletedintheactphase
� Theadjustphaseallowstheprocesstocontinuetobemonitoredafterthechangeshavebeenimplementedandfixthemaccordingly
� DoingthisletsthePDCAcycletrulybeforcontinuousimprovementinsteadofchangingaprocessandlettingitbecomeinefficientagain
13
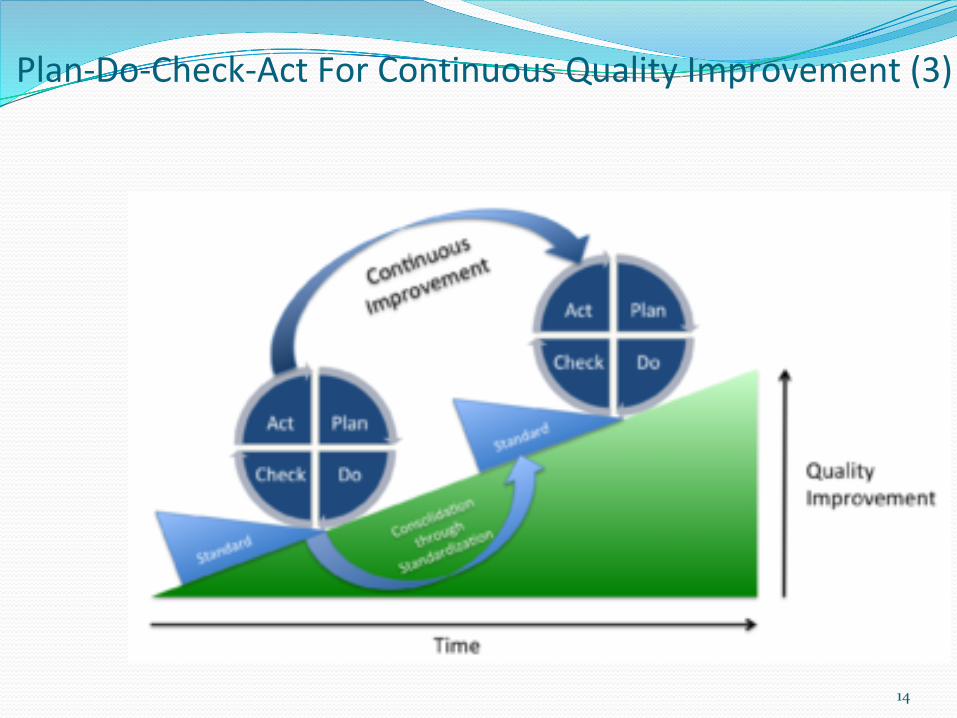
Plan-Do-Check-ActForContinuousQualityImprovement(3)
14
15
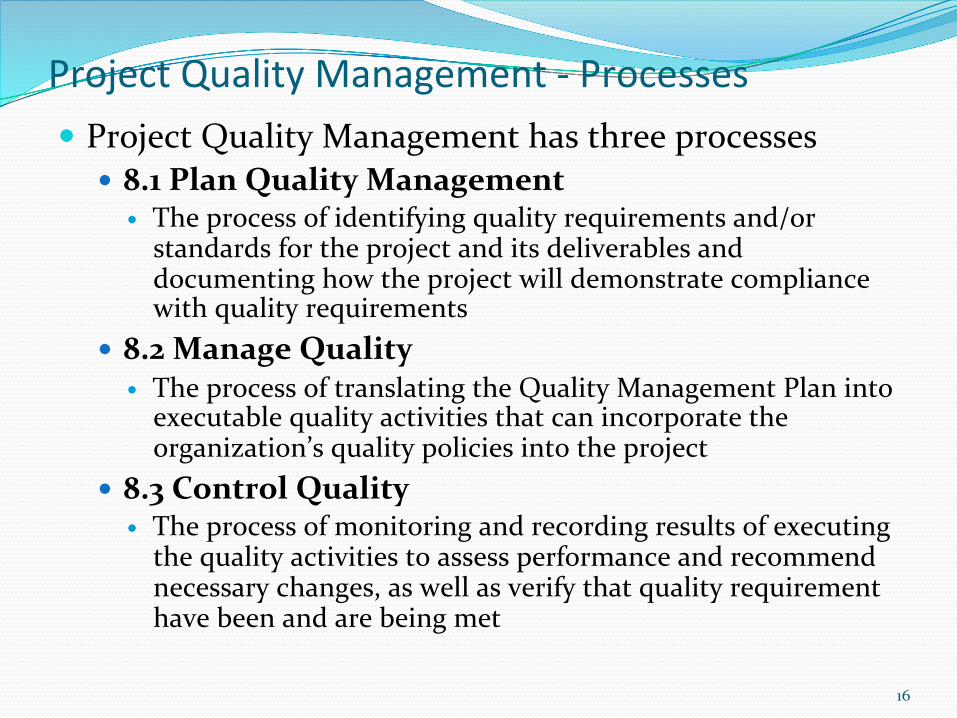
ProjectQualityManagement-Processes� ProjectQualityManagementhasthreeprocesses
� 8.1PlanQualityManagement� Theprocessofidentifyingqualityrequirementsand/orstandardsfortheprojectanditsdeliverablesanddocumentinghowtheprojectwilldemonstratecompliancewithqualityrequirements
� 8.2ManageQuality� TheprocessoftranslatingtheQualityManagementPlanintoexecutablequalityactivitiesthatcanincorporatetheorganization’squalitypoliciesintotheproject
� 8.3ControlQuality� Theprocessofmonitoringandrecordingresultsofexecutingthequalityactivitiestoassessperformanceandrecommendnecessarychanges,aswellasverifythatqualityrequirementhavebeenandarebeingmet
16
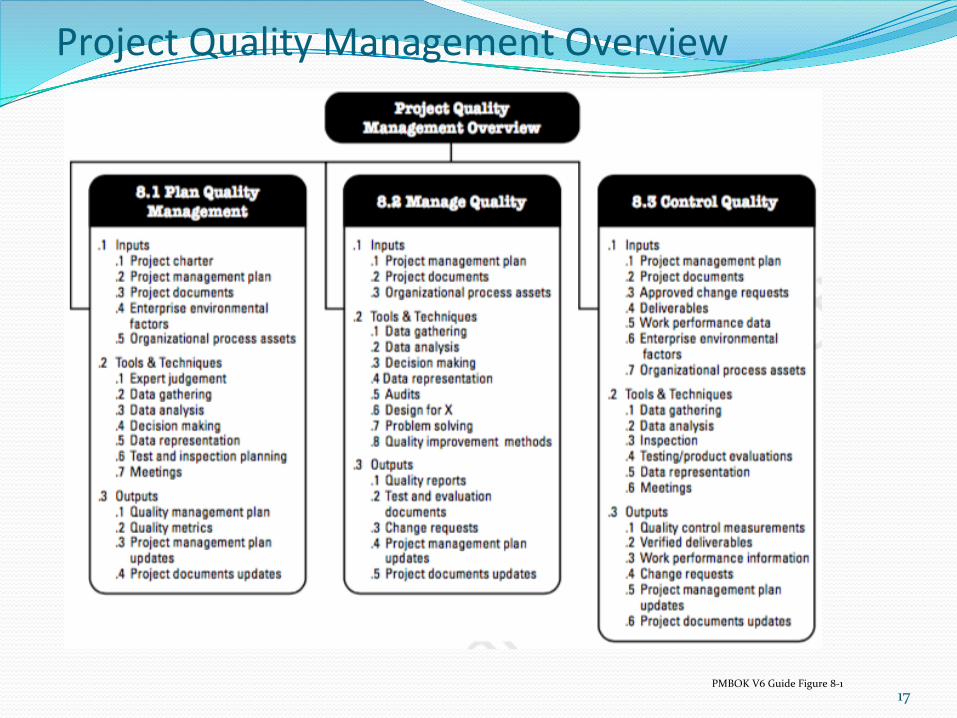
ProjectQualityManagementOverview
17PMBOKV6GuideFigure8-1
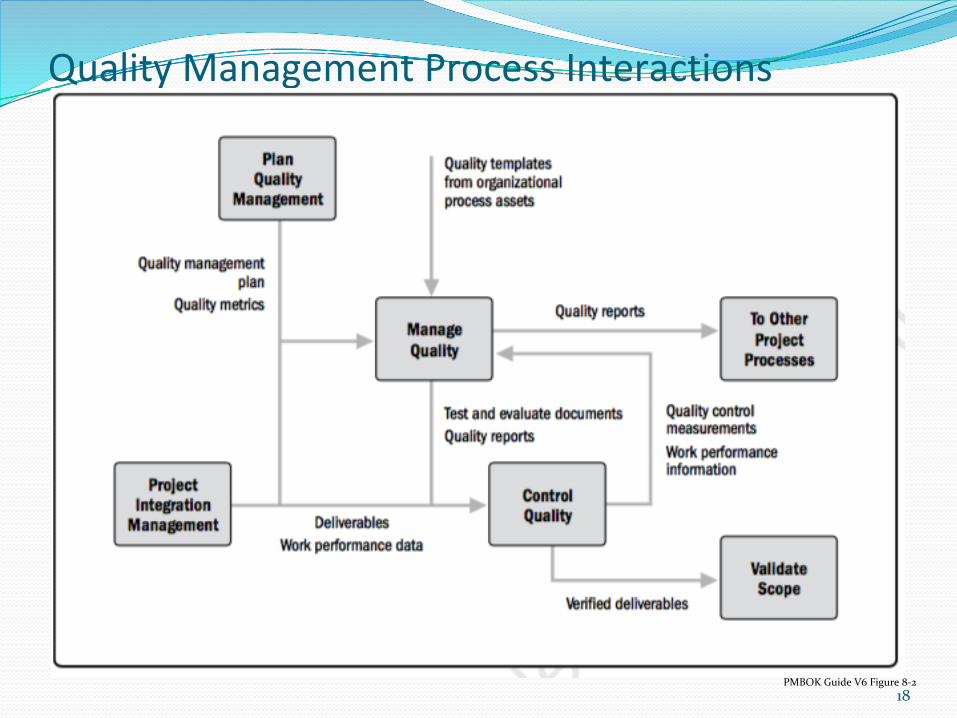
QualityManagementProcessInteractions
18PMBOKGuideV6Figure8-2
19
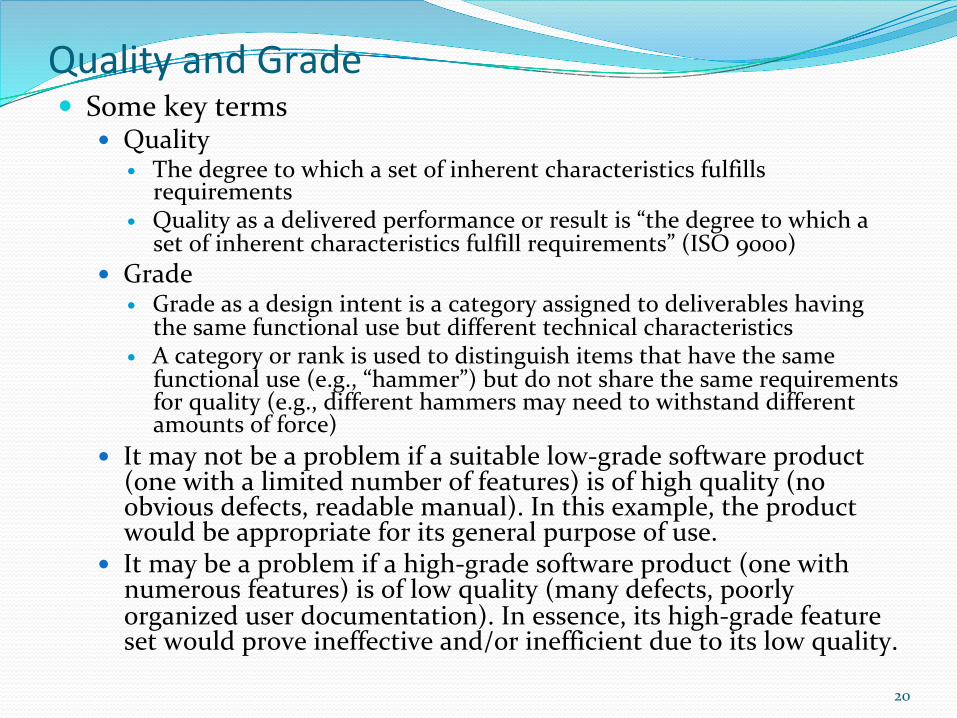
QualityandGrade� Somekeyterms
� Quality� Thedegreetowhichasetofinherentcharacteristicsfulfills
requirements� Qualityasadeliveredperformanceorresultis“thedegreetowhicha
setofinherentcharacteristicsfulfillrequirements”(ISO9000)� Grade
� Gradeasadesignintentisacategoryassignedtodeliverableshavingthesamefunctionalusebutdifferenttechnicalcharacteristics
� Acategoryorrankisusedtodistinguishitemsthathavethesamefunctionaluse(e.g.,“hammer”)butdonotsharethesamerequirementsforquality(e.g.,differenthammersmayneedtowithstanddifferentamountsofforce)
� Itmaynotbeaproblemifasuitablelow-gradesoftwareproduct(onewithalimitednumberoffeatures)isofhighquality(noobviousdefects,readablemanual).Inthisexample,theproductwouldbeappropriateforitsgeneralpurposeofuse.
� Itmaybeaproblemifahigh-gradesoftwareproduct(onewithnumerousfeatures)isoflowquality(manydefects,poorlyorganizeduserdocumentation).Inessence,itshigh-gradefeaturesetwouldproveineffectiveand/orinefficientduetoitslowquality.
20
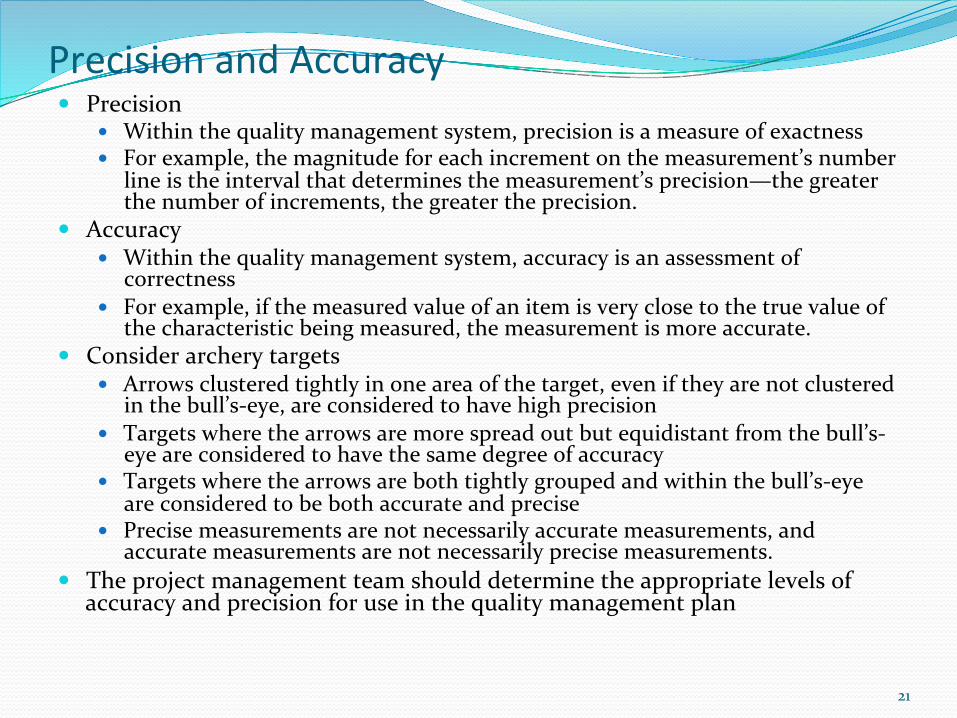
PrecisionandAccuracy� Precision
� Withinthequalitymanagementsystem,precisionisameasureofexactness� Forexample,themagnitudeforeachincrementonthemeasurement’snumber
lineistheintervalthatdeterminesthemeasurement’sprecision—thegreaterthenumberofincrements,thegreatertheprecision.
� Accuracy� Withinthequalitymanagementsystem,accuracyisanassessmentof
correctness� Forexample,ifthemeasuredvalueofanitemisveryclosetothetruevalueof
thecharacteristicbeingmeasured,themeasurementismoreaccurate.� Considerarcherytargets
� Arrowsclusteredtightlyinoneareaofthetarget,eveniftheyarenotclusteredinthebull’s-eye,areconsideredtohavehighprecision
� Targetswherethearrowsaremorespreadoutbutequidistantfromthebull’s-eyeareconsideredtohavethesamedegreeofaccuracy
� Targetswherethearrowsarebothtightlygroupedandwithinthebull’s-eyeareconsideredtobebothaccurateandprecise
� Precisemeasurementsarenotnecessarilyaccuratemeasurements,andaccuratemeasurementsarenotnecessarilyprecisemeasurements.
� Theprojectmanagementteamshoulddeterminetheappropriatelevelsofaccuracyandprecisionforuseinthequalitymanagementplan
21
CostofQuality(1)� CostofQuality(coQ)
� Costofqualityreferstothetotalcostoftheconformanceworkandthenonconformanceworkthatshouldbedoneasacompensatoryeffortbecause,onthefirstattempttoperformthatwork,thepotentialexiststhatsomeportionoftherequiredworkeffortmaybedoneorhasbeendoneincorrectly
� Thecostsforqualityworkmaybeincurredthroughoutthedeliverable’slifecycle� Decisionsmadebytheprojectteamcanimpacttheoperationalcostsassociated
withusingacompleteddeliverable.� Post-projectqualitycostsmaybeincurredbecauseofproductreturns,
warrantyclaims,andrecallcampaigns� Becauseofthetemporarynatureofprojectsandthepotentialbenefitsthatmay
bederivedfromreducingthepost-projectcostofquality,sponsoringorganizationsmaychoosetoinvestinproductqualityimprovement� Theseinvestmentsgenerallyaremadeintheareasofconformanceworkthat
acttopreventdefectsoracttomitigatethecostsofdefectsbyinspectingoutnonconformingunits
� ACost-Benefitsanalysisisoftenperformed� Theissuesrelatedtopost-projectCOQshouldbetheconcernofprogram
managementandportfoliomanagementsuchthatproject,program,andportfoliomanagementofficesshouldapplyappropriatereviews,templates,andfundingallocationsforthispurpose
22
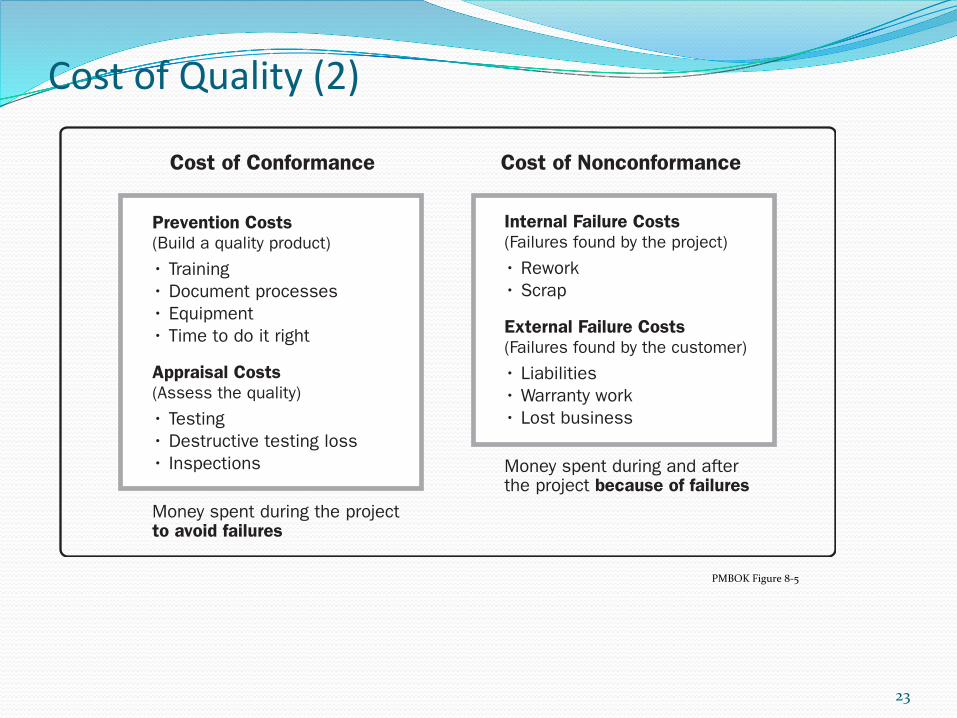
CostofQuality(2)
23
235©2013 Project Management Institute. A Guide to the Project Management Body of Knowledge (PMBOK® Guide) – Fifth Edition
8 - PROJECT QUALITY MANAGEMENT
8
8.1.2 Plan Quality Management: Tools and Techniques
8.1.2.1 Cost-Benefit Analysis
The primary benefits of meeting quality requirements include less rework, higher productivity, lower costs, increased stakeholder satisfaction, and increased profitability. A cost-benefit analysis for each quality activity compares the cost of the quality step to the expected benefit.
8.1.2.2 Cost of Quality (COQ)
Cost of quality includes all costs incurred over the life of the product by investment in preventing nonconformance to requirements, appraising the product or service for conformance to requirements, and failing to meet requirements (rework). Failure costs are often categorized into internal (found by the project) and external (found by the customer). Failure costs are also called cost of poor quality. Figure 8-5 provides some examples to consider in each area.
Cost of Conformance Cost of Nonconformance
Prevention Costs(Build a quality product)(��raining(����$���#��!���""�"(�� $�����#(������#������#�!���#
Appraisal Costs��""�""�#��� $���#'�(���"#��g(���"#!$�#�%��#�"#������""(��"���#���"
����'�"���#��$!����#����!����#to avoid failures
Internal Failure Costs(F���$!�"���$���by�#����!����#�(���&�!k(� �!��
External Failure Costs(F���$!�"���$���by�#����$"#���!�(�������#��"(�War!��#'�&�!k(��"#��$"���""
����'�"���#��$!����������#�!#����!����#�because of failures
Figure 8-5. Cost of Quality
Licensed To: Howard Rosenthal PMI MemberID: 2552551This copy is a PMI Member benefit, not for distribution, sale, or reproduction.
PMBOKFigure8-5
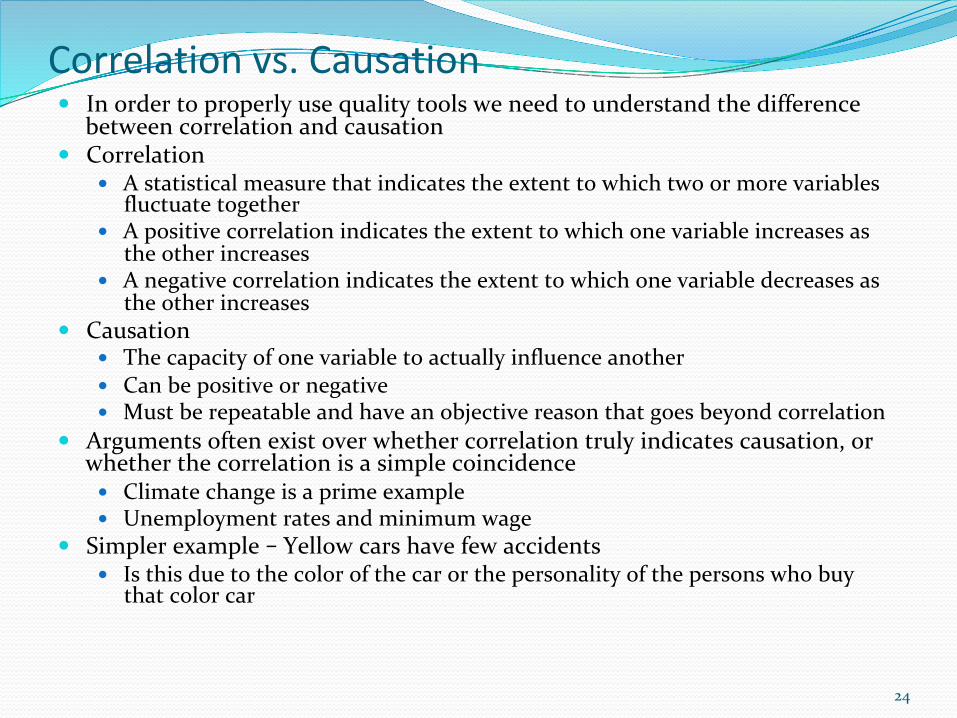
Correlationvs.Causation� Inordertoproperlyusequalitytoolsweneedtounderstandthedifference
betweencorrelationandcausation� Correlation
� Astatisticalmeasurethatindicatestheextenttowhichtwoormorevariablesfluctuatetogether
� Apositivecorrelationindicatestheextenttowhichonevariableincreasesastheotherincreases
� Anegativecorrelationindicatestheextenttowhichonevariabledecreasesastheotherincreases
� Causation� Thecapacityofonevariabletoactuallyinfluenceanother� Canbepositiveornegative� Mustberepeatableandhaveanobjectivereasonthatgoesbeyondcorrelation
� Argumentsoftenexistoverwhethercorrelationtrulyindicatescausation,orwhetherthecorrelationisasimplecoincidence� Climatechangeisaprimeexample� Unemploymentratesandminimumwage
� Simplerexample–Yellowcarshavefewaccidents� Isthisduetothecolorofthecarorthepersonalityofthepersonswhobuy
thatcolorcar
24

25
AFewDefiningTerms
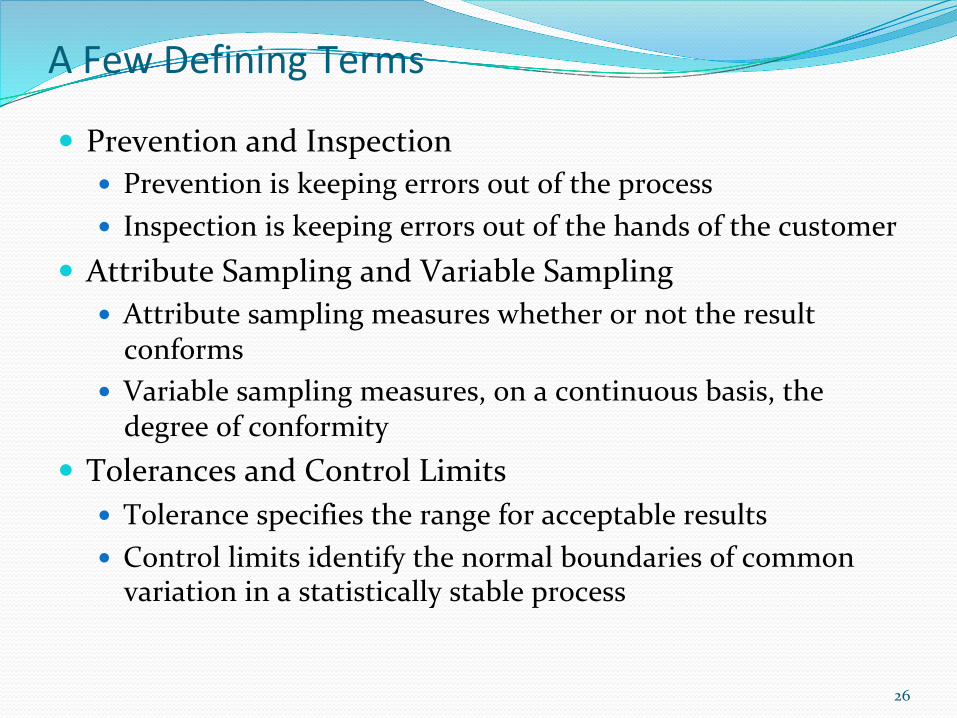
� PreventionandInspection� Preventioniskeepingerrorsoutoftheprocess� Inspectioniskeepingerrorsoutofthehandsofthecustomer
� AttributeSamplingandVariableSampling� Attributesamplingmeasureswhetherornottheresultconforms
� Variablesamplingmeasures,onacontinuousbasis,thedegreeofconformity
� TolerancesandControlLimits� Tolerancespecifiestherangeforacceptableresults� Controllimitsidentifythenormalboundariesofcommonvariationinastatisticallystableprocess
26
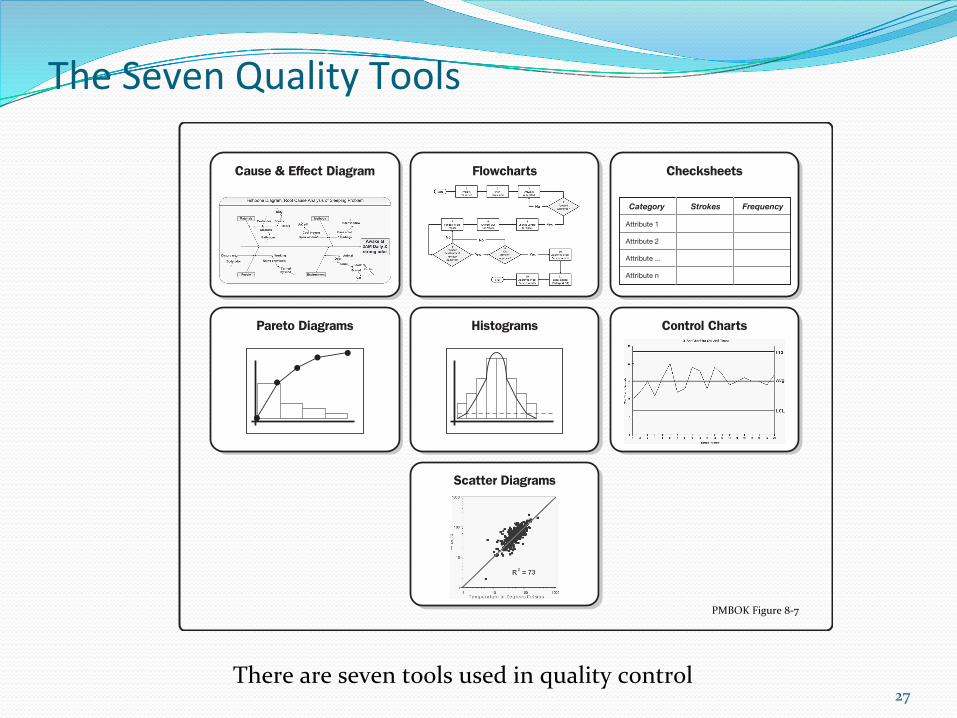
TheSevenQualityTools
27
239©2013 Project Management Institute. A Guide to the Project Management Body of Knowledge (PMBOK® Guide) – Fifth Edition
8 - PROJECT QUALITY MANAGEMENT
8
Cause & Effect Diagram Flowcharts Checksheets
Pareto Diagrams Histograms Control Charts
Scatter Diagrams
Figure 8-7. Storyboard Illustrating a Conceptual Example of Each of the Seven Basic Quality Tools
8.1.2.4 Benchmarking
Benchmarking involves comparing actual or planned project practices to those of comparable projects to identify best practices, generate ideas for improvement, and provide a basis for measuring performance.
Benchmarked projects may exist within the performing organization or outside of it, or can be within the same application area. Benchmarking allows for analogies from projects in a different application area to be made.
8.1.2.5 Design of Experiments
Design of experiments (DOE) is a statistical method for identifying which factors may influence specific variables of a product or process under development or in production. DOE may be used during the Plan Quality Management process to determine the number and type of tests and their impact on cost of quality.
Licensed To: Howard Rosenthal PMI MemberID: 2552551This copy is a PMI Member benefit, not for distribution, sale, or reproduction.
PMBOKFigure8-7
Thereareseventoolsusedinqualitycontrol
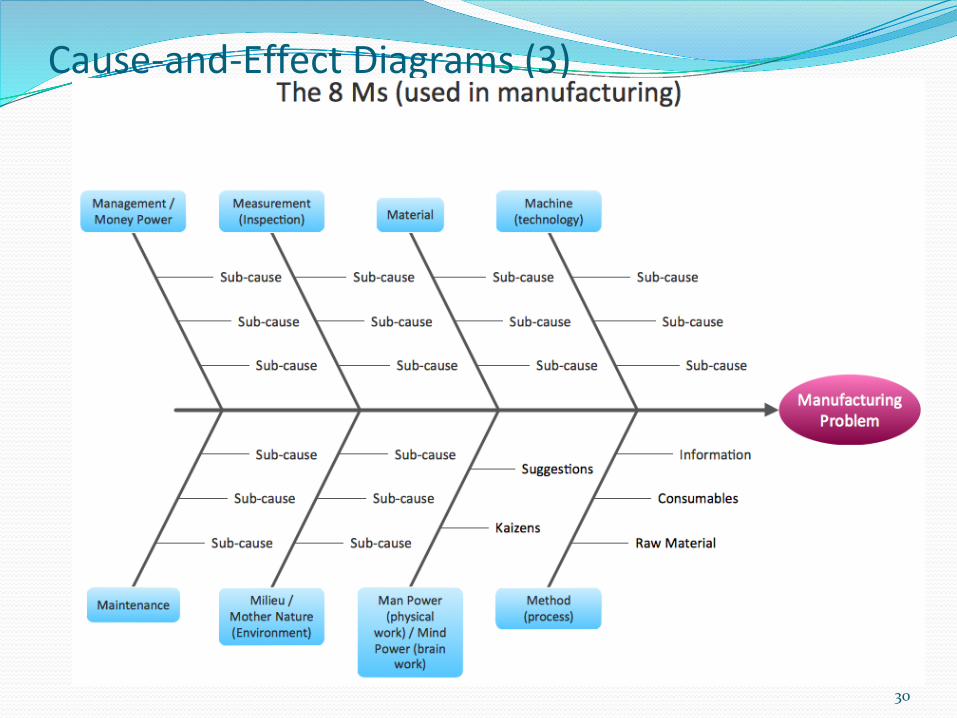
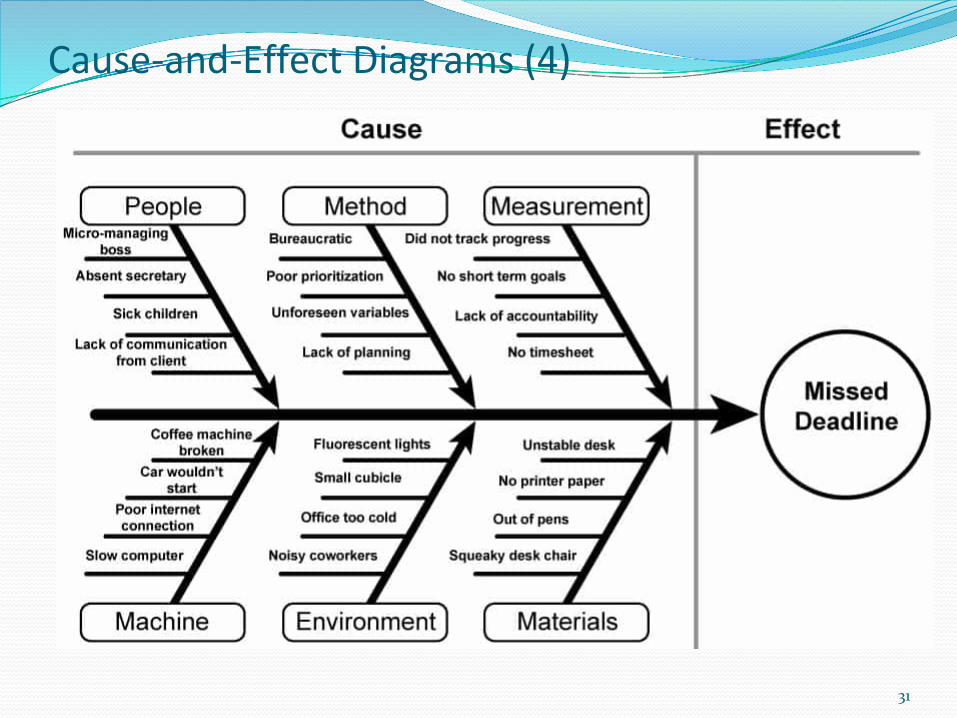
Cause-and-EffectDiagrams(1)� Cause-and-EffectDiagrams-alsoknownasFishboneorIshikawaDiagrams� Theproblemstatementplacedattheheadofthefishboneisusedasastartingpointtotracetheproblem’ssourcebacktoitsactionablerootcause.
� Theproblemstatementtypicallydescribestheproblemasagaptobeclosedorasanobjectivetobeachieved
� Thecausesarefoundbylookingattheproblemstatementandasking“why”untiltheactionablerootcausehasbeenidentifiedoruntilthereasonablepossibilitiesoneachfishbonehavebeenexhausted
� Oftenproveusefulinlinkingtheundesirableeffectsseenasspecialvariationtotheassignablecauseuponwhichprojectteamsshouldimplementcorrectiveactionstoeliminatethespecialvariationdetectedinacontrolchart
28
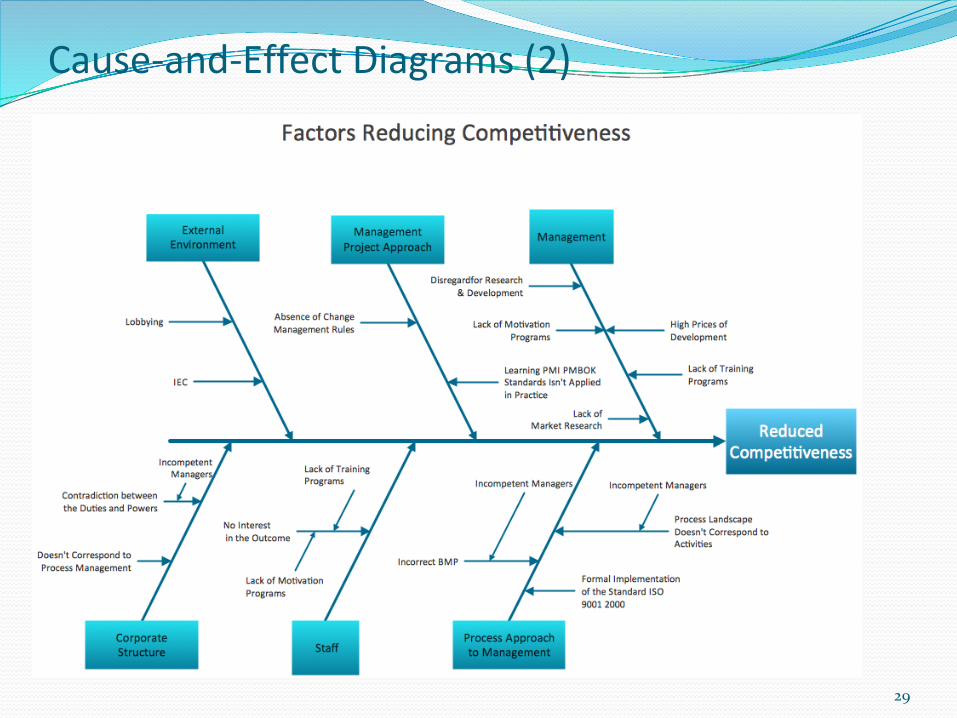
Cause-and-EffectDiagrams(2)
29
Cause-and-EffectDiagrams(3)
30
Cause-and-EffectDiagrams(4)
31
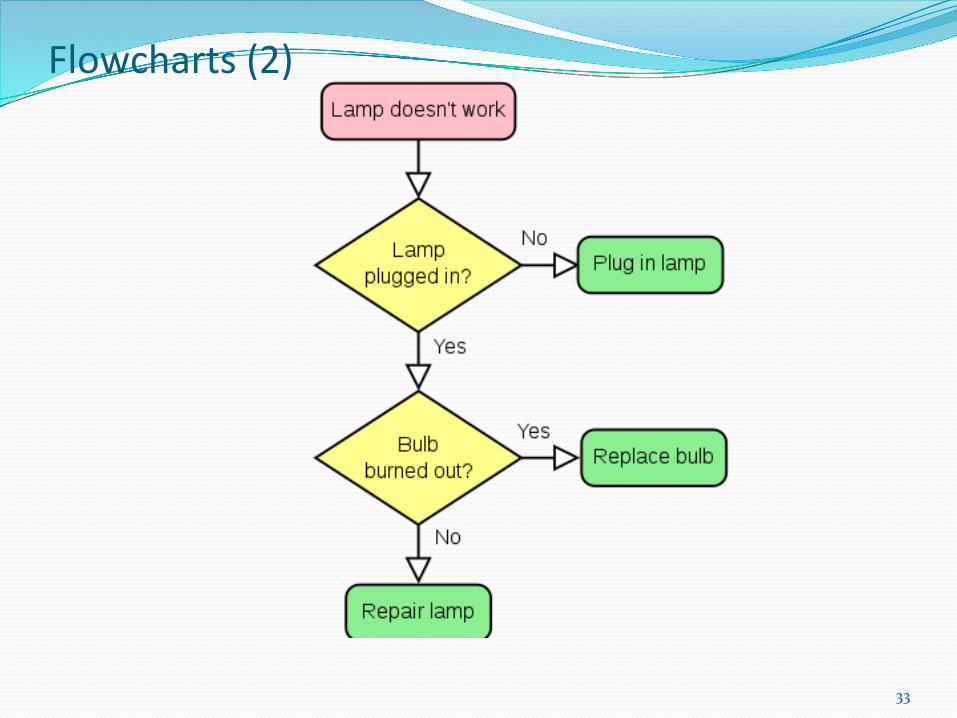
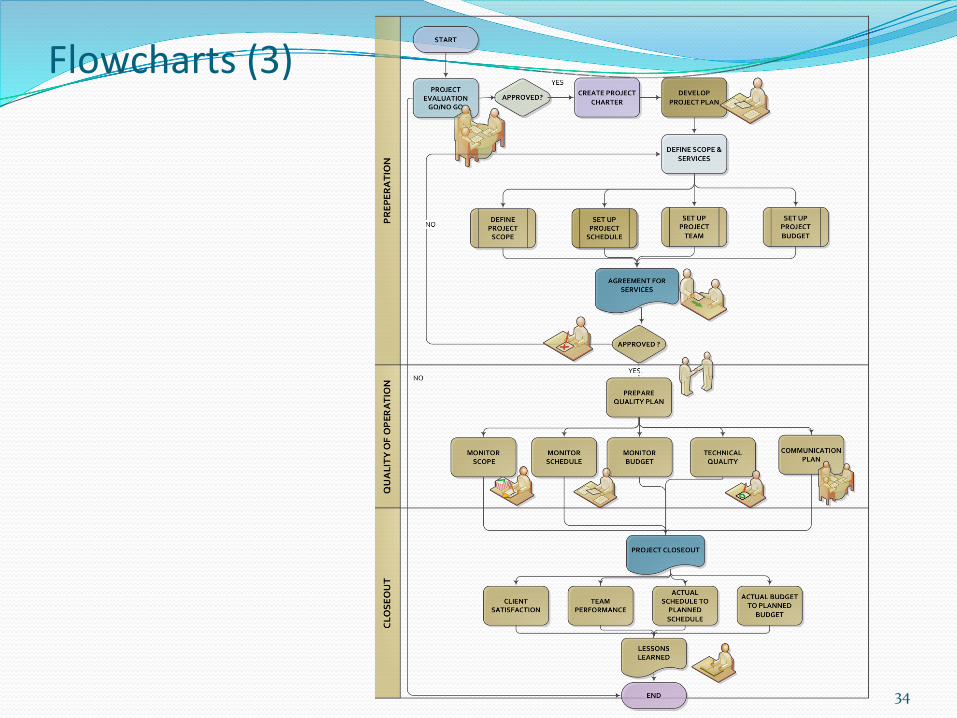
Flowcharts(1)� Flowcharts–arereferredtoasProcessMaps
� Theydisplaythesequenceofstepsandthebranchingpossibilitiesthatexistforaprocessthattransformsoneormoreinputsintooneormoreoutputs
� Flowchartsshowtheactivities,decisionpoints,branchingloops,parallelpaths,andtheoverallorderofprocessingbymappingtheoperationaldetailsofproceduresthatexistwithinahorizontalvaluechain
� Flowchartsmayproveusefulinunderstandingandestimatingthecostofqualityinaprocess� Thisisobtainedbyusingtheworkflowbranchinglogicandassociatedrelativefrequenciestoestimateexpectedmonetaryvaluefortheconformanceandnonconformanceworkrequiredtodelivertheexpectedconformingoutput
32
33
Flowcharts(2)
34
Flowcharts(3)
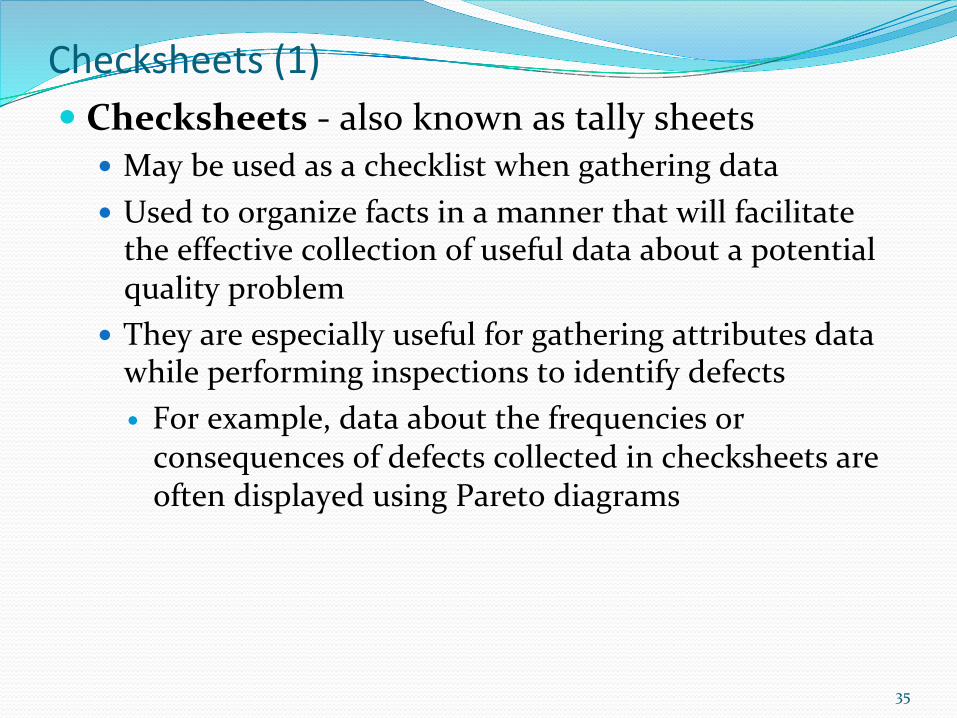
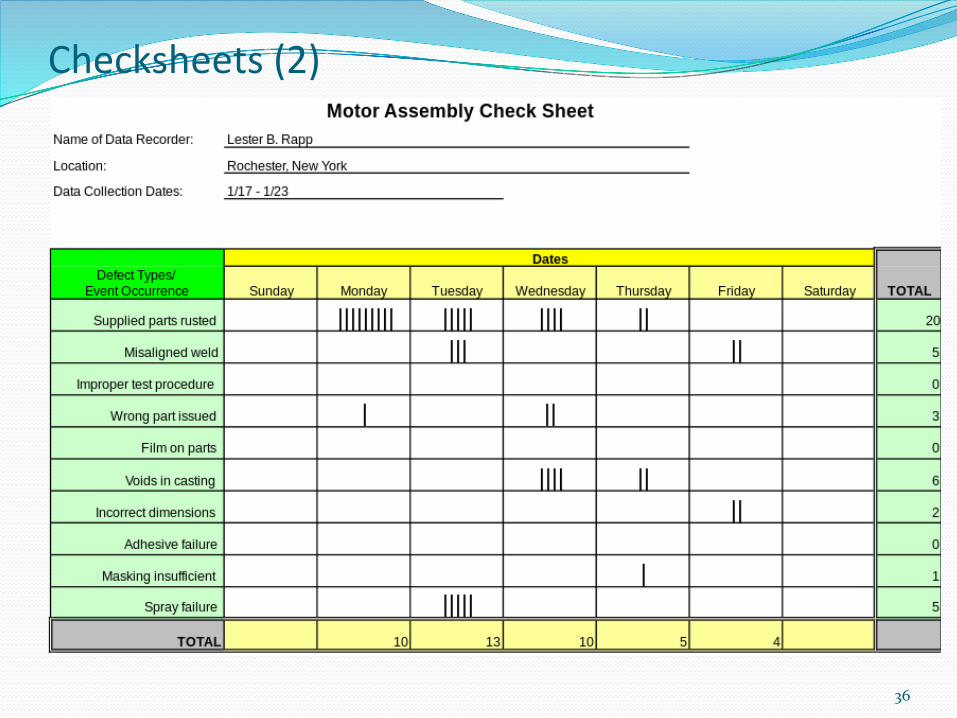
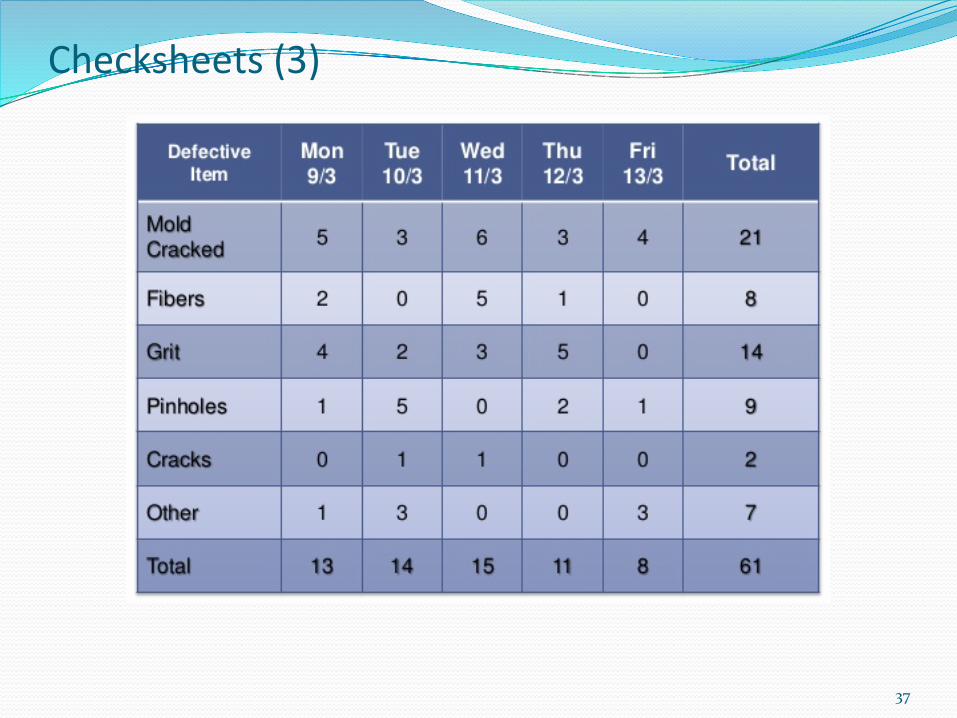
Checksheets(1)� Checksheets-alsoknownastallysheets
� Maybeusedasachecklistwhengatheringdata� Usedtoorganizefactsinamannerthatwillfacilitatetheeffectivecollectionofusefuldataaboutapotentialqualityproblem
� Theyareespeciallyusefulforgatheringattributesdatawhileperforminginspectionstoidentifydefects� Forexample,dataaboutthefrequenciesorconsequencesofdefectscollectedinchecksheetsareoftendisplayedusingParetodiagrams
35
Checksheets(2)
36
Checksheets(3)
37
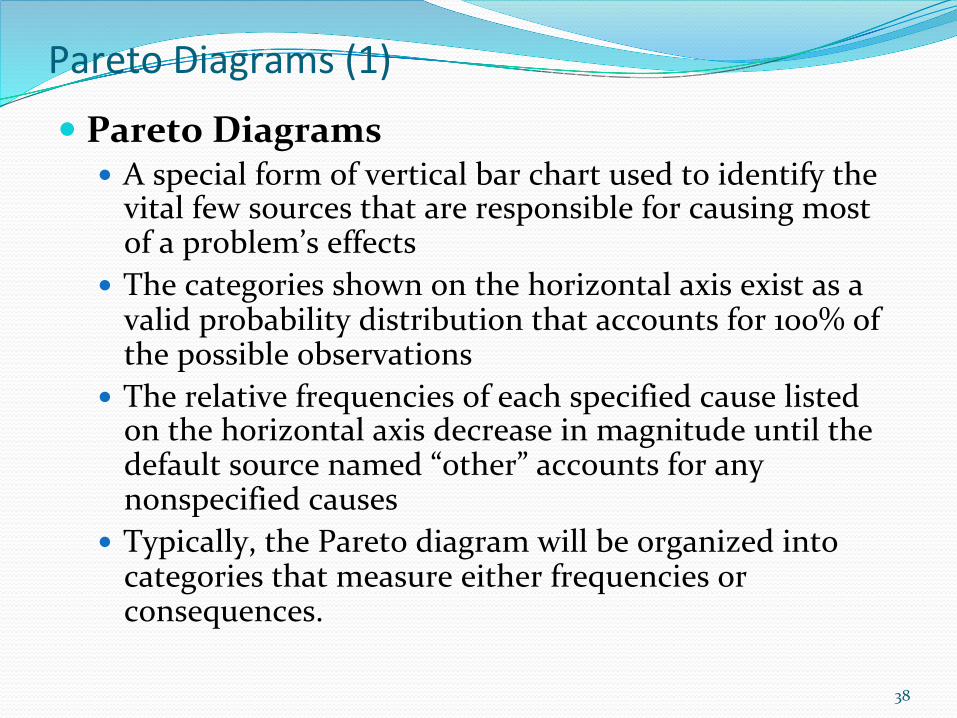
ParetoDiagrams(1)
� ParetoDiagrams� Aspecialformofverticalbarchartusedtoidentifythevitalfewsourcesthatareresponsibleforcausingmostofaproblem’seffects
� Thecategoriesshownonthehorizontalaxisexistasavalidprobabilitydistributionthataccountsfor100%ofthepossibleobservations
� Therelativefrequenciesofeachspecifiedcauselistedonthehorizontalaxisdecreaseinmagnitudeuntilthedefaultsourcenamed“other”accountsforanynonspecifiedcauses
� Typically,theParetodiagramwillbeorganizedintocategoriesthatmeasureeitherfrequenciesorconsequences.
38
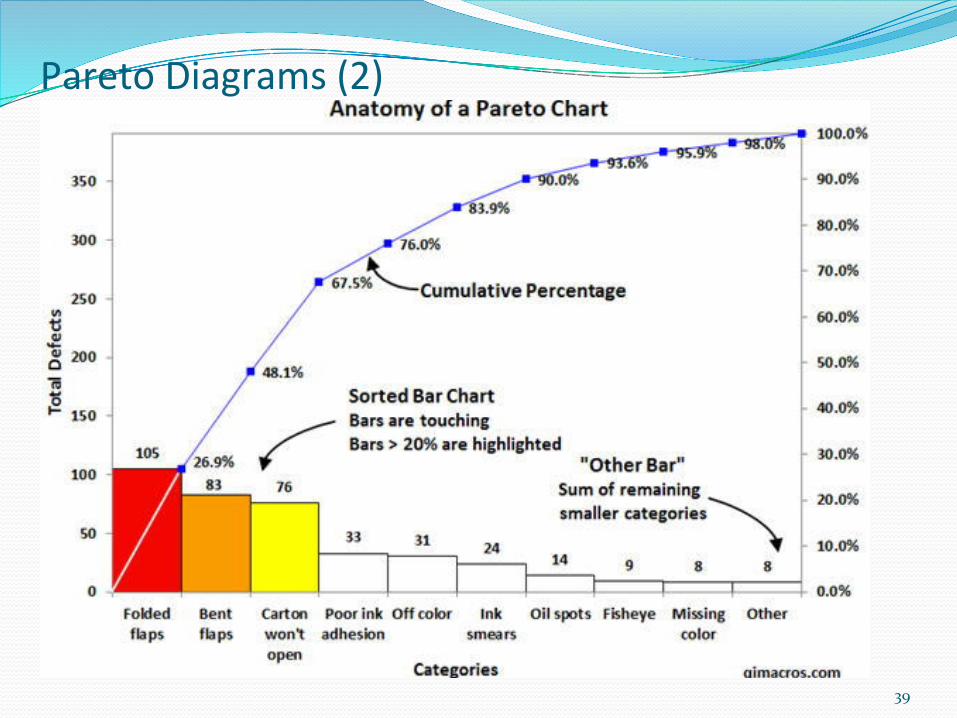
ParetoDiagrams(2)
39
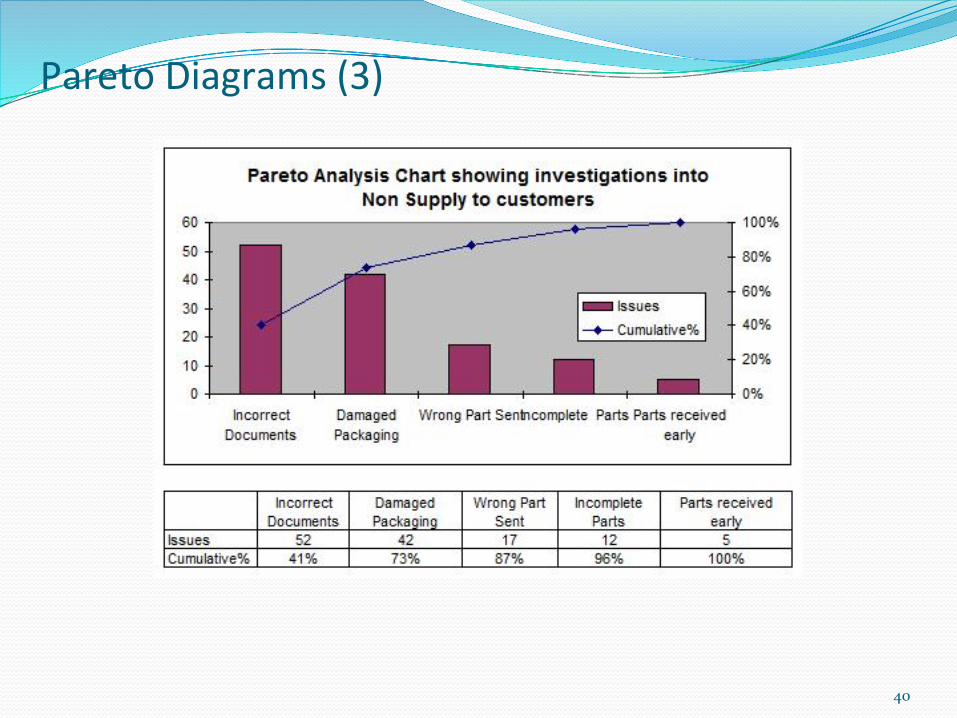
ParetoDiagrams(3)
40
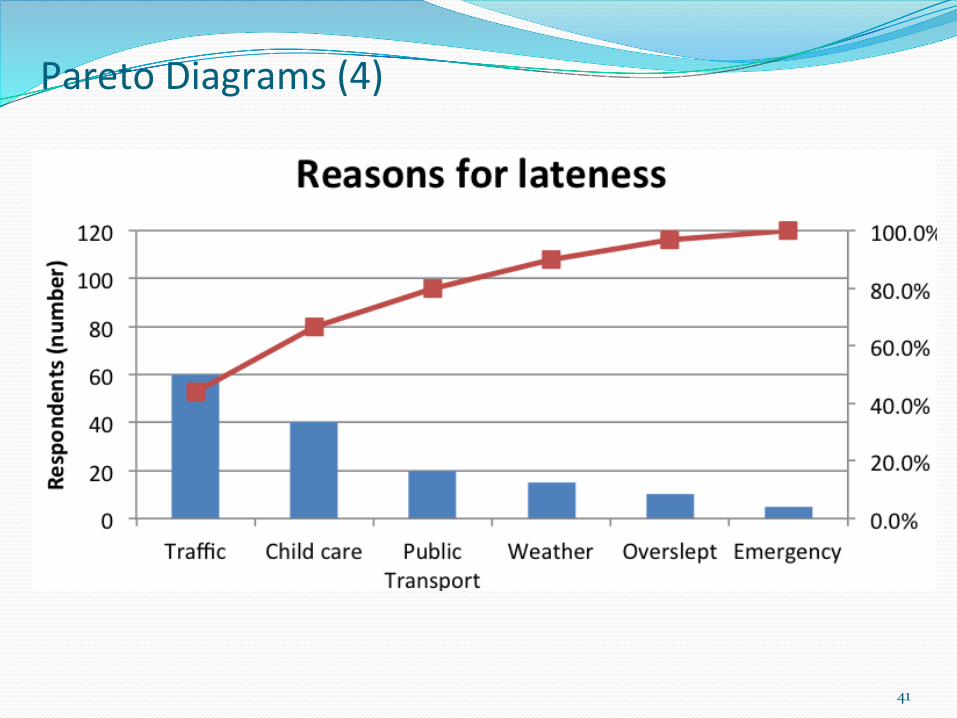
ParetoDiagrams(4)
41
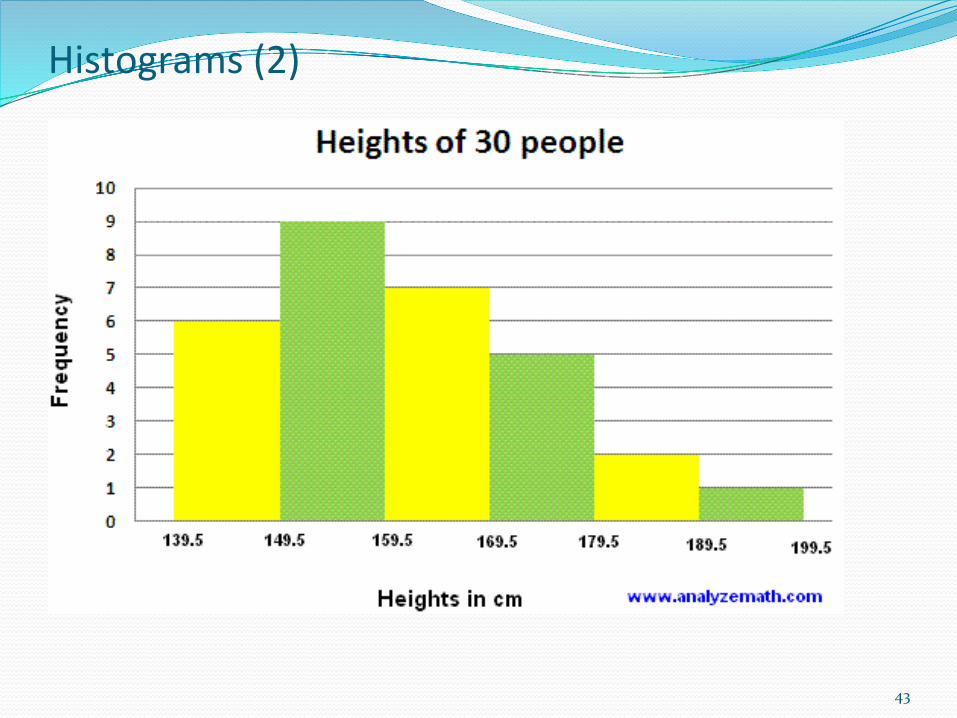
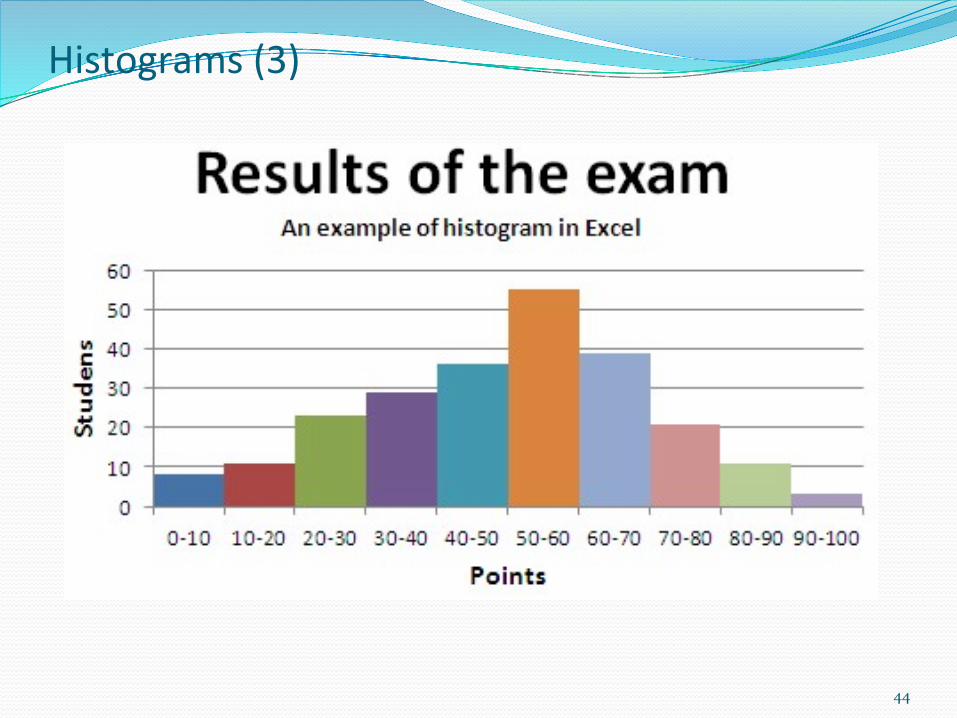
Histograms(1)� Histograms
� Agraphicalrepresentationofhowmanytimesmutuallyexclusiveeventsareobservedinanexperiment
� Aspecialformofbarchartandareusedtodescribethecentraltendency,dispersion,andshapeofastatisticaldistribution
� Unlikethecontrolchart,thehistogramdoesnotconsidertheinfluenceoftimeonthevariationthatexistswithinadistribution
42
Histograms(2)
43
Histograms(3)
44
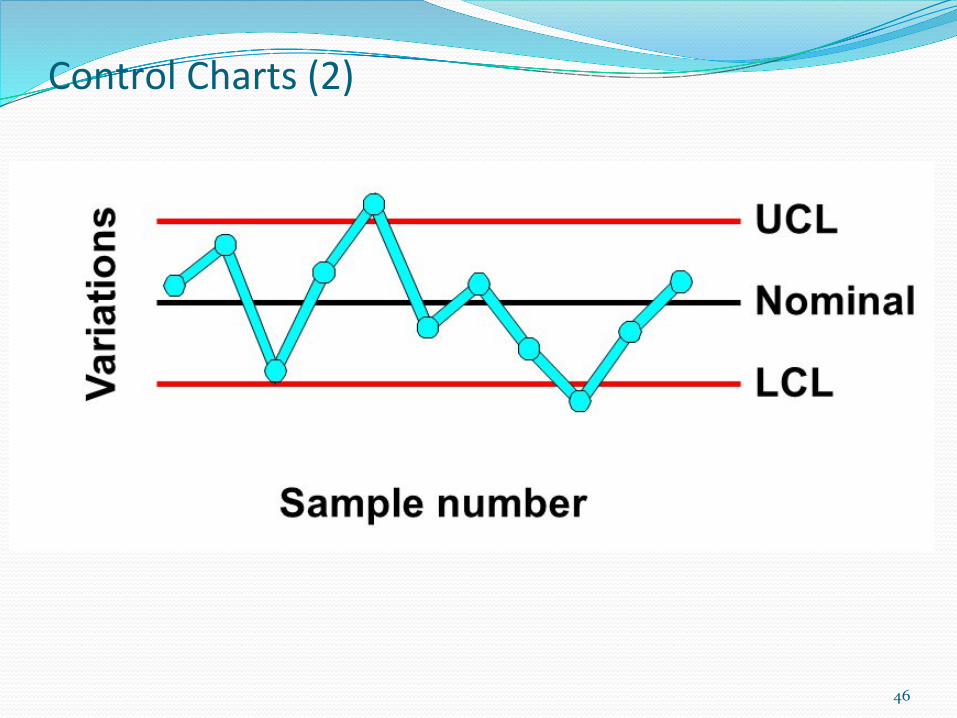
ControlCharts(1)� ControlCharts
� Usedtodeterminewhetherornotaprocessisstableorhaspredictableperformance
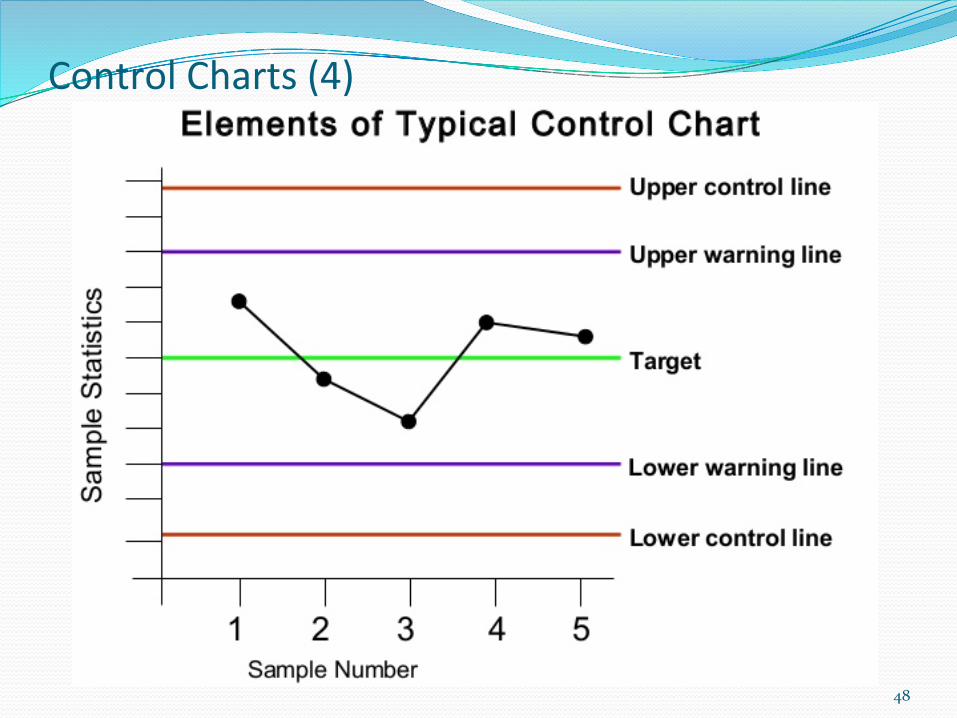
� Upperandlowerspecificationlimitsarebasedonrequirementsoftheagreement
� Theyreflectthemaximumandminimumvaluesallowed� Theremaybepenaltiesassociatedwithexceedingthespecificationlimits� Upperandlowercontrollimitsaredifferentfromspecificationlimits� Thecontrollimitsaredeterminedusingstandardstatisticalcalculationsand
principlestoultimatelyestablishthenaturalcapabilityforastableprocess� Theprojectmanagerandappropriatestakeholdersmayusethestatisticallycalculated
controllimitstoidentifythepointsatwhichcorrectiveactionwillbetakentopreventunnaturalperformance.
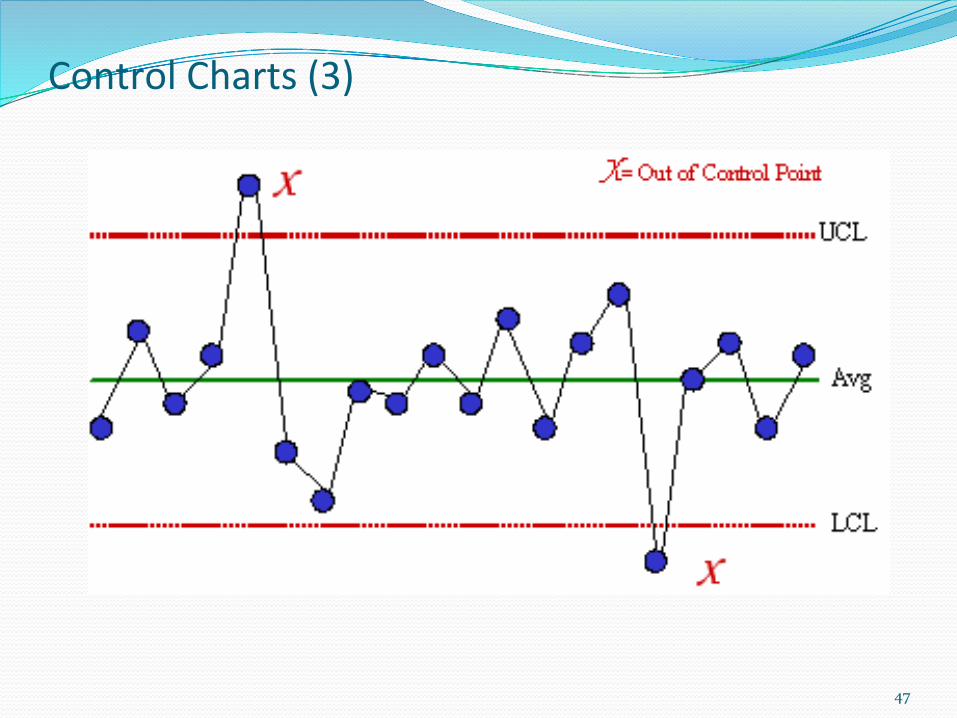
� Althoughusedmostfrequentlytotrackrepetitiveactivitiesrequiredforproducingmanufacturedlots,controlchartsmayalsobeusedtomonitorcostandschedulevariances,volume,andfrequencyofscopechanges,orothermanagementresultstohelpdetermineiftheprojectmanagementprocessesareincontrol.
45
ControlCharts(2)
46
ControlCharts(3)
47
ControlCharts(4)
48
ScatterDiagrams(1)� ScatterDiagrams
� Plotorderedpairs(X,Y)andaresometimescalledcorrelationchartsbecausetheyseektoexplainachangeinthedependentvariable,Y,inrelationshiptoachangeobservedinthecorrespondingindependentvariable,X
� Thedirectionofcorrelationmaybeproportional(positivecorrelation),inverse(negativecorrelation),orapatternofcorrelationmaynotexist(zerocorrelation)
� Ifcorrelationcanbeestablished,aregressionlinecanbecalculatedandusedtoestimatehowachangetotheindependentvariablewillinfluencethevalueofthedependentvariable
49
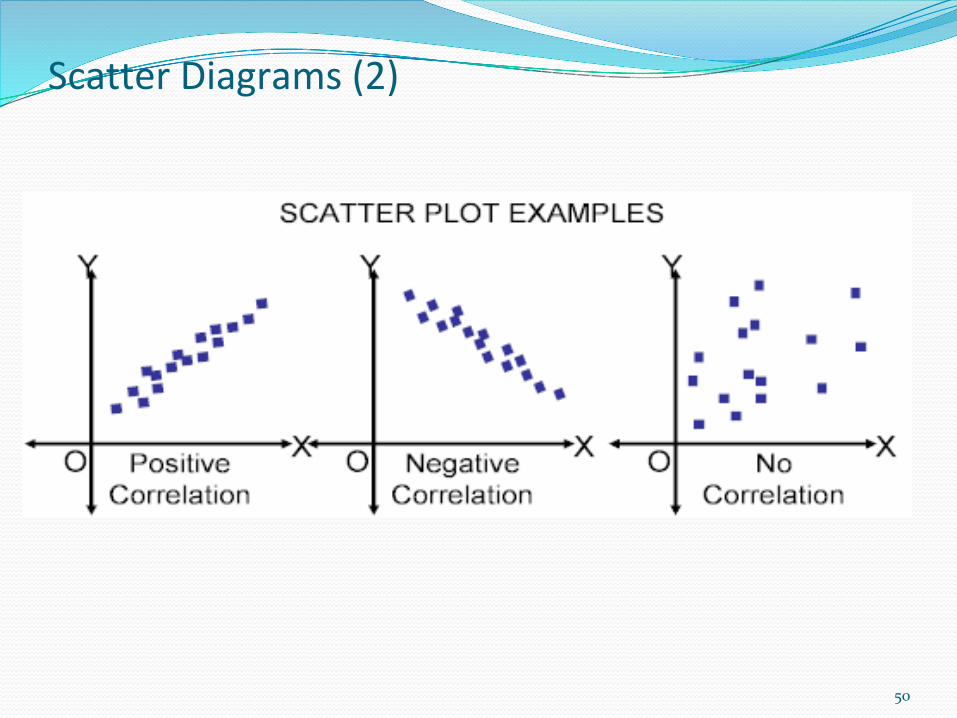
ScatterDiagrams(2)
50
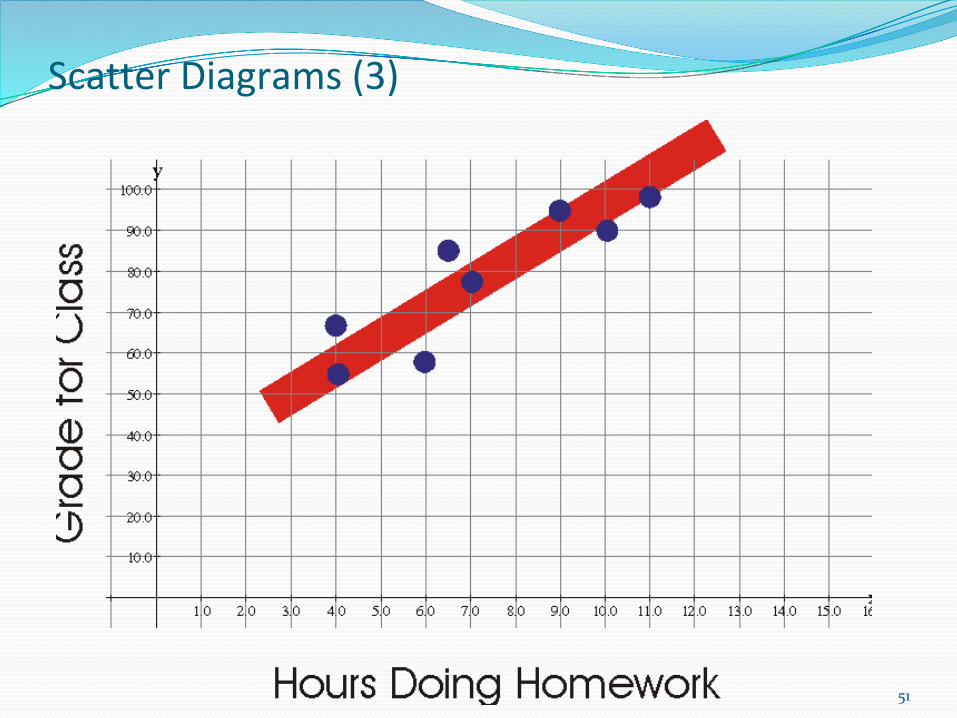
ScatterDiagrams(3)
51
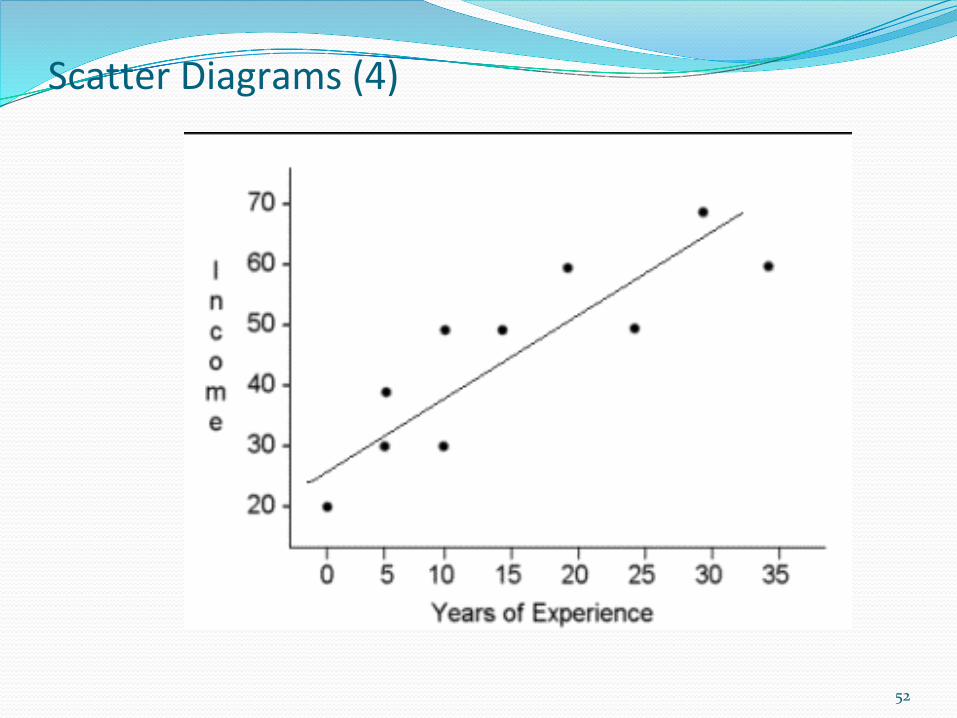
ScatterDiagrams(4)
52
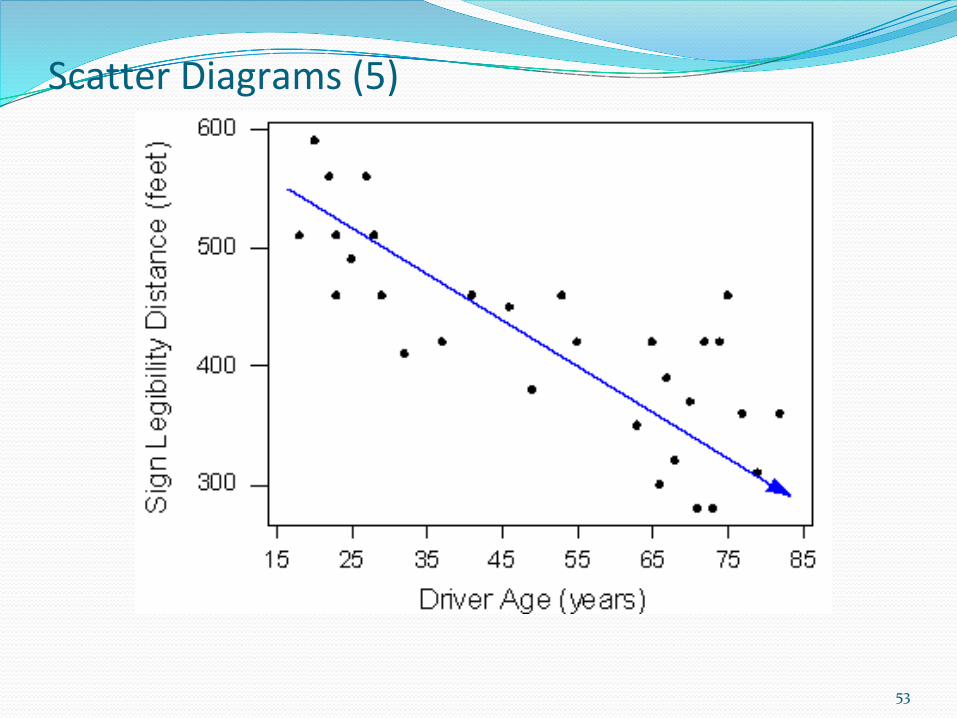
ScatterDiagrams(5)
53