
7 criteria waarop u uw beoogde service provider/outsourcer kunt beoordelen
Upload
ricardo-raminhosCategory
view
10download
0description
SMART Content Provider
Filipe Clérigo, Ricardo Raminhos, Rui Estevão
VIATECLA SA
[email protected], [email protected], [email protected]
Teresa Gonçalves, Pedro Melgueira
Universidade de Évora
[email protected], [email protected]
Summary The continuous growth in data and metadata either produced manually and/or automatically, has
raised the importance of Content Management Systems. Increasingly, its relevance goes beyond a
simple repository of information, focusing on its visual and graphic capabilities, as well as in its
abilities to explore information, sometimes aided by heuristic techniques and algorithms of Artificial
Intelligence that allow to identify and suggest relevant contents within the context. With this
evolution in CMS systems specific to certain domains/business areas, we need to explore how such
can be applied to open CMS systems, where data structures and associated workflows (e.g. business,
approval), are modelled for each individual case, and are therefore unknown beforehand.
This is the main purpose of the SMART Content Provider (CP) prototype, which architecture, data
visualization and exploration components, Artificial Intelligence and suggestion algorithms, as well
as, the first pilot implementation is presented in this paper.
Context In the application universe, where the volume of data produced increases exponentially, the
existence of platforms/solutions that allows data analysis providing the user the possibility of
representing that data in the form of knowledge, either visual or as a suggestion/alert, is
fundamental.
The existence of CMS – Content Management Systems [1] platforms, specialized in the management
of big volumes of data, can be classified under two main axes – from a commercial point of view,
with proprietary solutions versus open-source solutions; and to the degree of the CMS’s generality
or specificity with the data domain it exploits. There are several solutions on the market,
commercially available, or as an open-source, as well as methodologies for their analysis and
selection [2].
In order to evaluate the importance of this business area, according to the study “Enterprise Content
Management Market 2014-2018” from “The Radicati Group, Inc” [3], it is expected a growth in this
area, from 3,47 billion dollars in 2015 to 6,85 billion dollars in 2020, representing a continuous
growth of over 14,5% per year.

Not only being an important business opportunity, the fact that the big majority of current CMS
solutions have their emphasis on a high level of specificity/specialization on the data that they
exploit and interpret, increases the need of working on generic approaches of knowledge
representation, exploration and automatic analysis when present in open Content Management
Systems.
This is the main goal of the Smart Content Provider [4] prototype, a project developed by VIATECLA
[5] and supported by Universidade de Évora [6] and GTE Consultores [7], and co-financed by QREN
(Quadro de Referência Estratégico Nacional) [8].
The Project SMART Content Provider (CP) Through the Smart CP project, investigation on enhancing “Intelligence” on CMS environments was
performed under three main pillars:
(i) Enhance mechanisms of aggregation of heterogeneous information (where the structures
and objects are not known beforehand),
(ii) Definition of Artificial Intelligence Algorithms, in particular in the area of the detection of
patterns on semi-structured information,
(iii) Mechanisms of data presentation applied to results / contents, exploring non-conventional
formats and ways of information representation contributing to a more fluid knowledge
exploration.
The knowledge resulted from this investigation has been materialized in a prototype for a generic
platform for data visualization and interaction, referred to as SMART Content Provider (SMART CP).
This article presents the concept behind the SMART CP prototype and its architecture. It introduces
the representation and visual exploration components, as well as the AI components, although both
are presented in more detail in the papers “SMART Data Visualization and Exploration” [9] and
“Data Clustering for heterogeneous data” [10], respectively.
Objectives Smart CP is intended to improve the analysis process significantly, as well as the representation and
interaction with existing data within a CMS platform, according to the following fundamental
requirements:
(i) AGILITY: By creating visual control panels that enhance the decision-making process in the
shortest time possible and supported by a greater knowledge (mostly implicit within data);
(ii) EFICIENCY: Through visualization of the contents in real time, in an aggregated way and
supported by suggestions for the main focus of attention. The objective is to minimize complexity
associated to the analysis process;
(iii) SIMPLICITY: Using a simple visual language for information exploration, that allows the interface
to be browsed by users without specific technical knowledge;

(iv) DISCOVERY: Enabling ways of data exploration, allowing the detection of direct/indirect
relationships hidden within the complexity of the data, which contribute positively to the decision-
making process;
(v) STRUCTURE: The aggregation of data according to similarity criteria or group criteria, for drill-
down purposes, gives a strong added value in the exploration process, allowing a “divide and
conquer” strategy aiming to minimize the complexity in the case of excess of information;
(viii) GENERALITY: The last requirement, and possibly the most important, consists on the general
applicability of the previous requirements not constrained to a specific domain of information.
State of the Art Generally speaking, although main content management platforms have evolved during the
execution period of SMART CP project (2013-2015), no disruptive changes occurred, either at the
internal data models, interaction layer or graphic representation.
At international level, solutions exist that support the notion of objects with heterogeneous
structure, and some of them having graphical representations, although limited (for not knowing the
structures to be modelled beforehand). Content Management Server /CMS from Microsoft [11] is
one example – which has been progressively replaced by Sharepoint Server [12] also from Microsoft.
The Scriptor Server from VIATECLA [13] is another example, as well as specific open source
applications (e.g. Joomla [14], Drupal [15]).
However, it should be emphasised that the majority of these applications are data instantiated
according to the domain in which the solution is implemented (known beforehand), using specific
visualization interfaces. Taking as an example the comparison between Sharepoint platform and
Dynamics CRM from Microsoft [16], both end up being information repositories/content
management systems, but the Microsoft Dynamics CRM allows, by being specific to the commercial
support domain, a different treatment of the information, more evident at its visual presentation.
Other CMS examples where the information structure is known beforehand are Wordpress [17]
(blogging and web sites), Alfresco [18] (documental management) and Umbraco [19] (website
construction).
Architecture Figure 1 shows a global vision for the SMART CP architectural platform. A three colour scheme is
used to characterize the functional blocks that compose the platform or external interactions:
Orange: completely external to the platform, with which the SMART CP platform interacts to
obtain data/contents,
Green: Functional blocks with which the SMART CP platform is integrated, i.e. regarding the
native content management system that supports the platform;
Purple: Native blocks from the SMART CP platform.
The architecture for the SMART CP platform follows a classic client / server paradigm, as presented
in Figure 1. Blocks regarding the server component are represented on the top of the image, and the

client related components are presented on the bottom. Because Smart CP platform uses
data/contents present in content management systems, all client functional groups (i.e. data sorting,
data visuals and exploration, accountability and workflows) are integrated in the content
management system backoffice itself.
Figure 1: General diagram of the architecture of the platform SMART CP
Since SMART CP is focused in a superior layer of abstraction in terms of the representation and
analysis that consume services associated to “low-level” content CRUD operations (create,read,
update, delete), the Scriptor Server platform (also a VIATECLA solution) was selected as test case for
this integration purpose.
Hence, Scriptor Server Core emerges as a “black-box” abstraction for the content manager that
sustains the SMART CP platform; the Scriptor Server solution has not been split in a more fine way
(i.e. in terms of database, authentication and access controls, data access DLLs, exposure of web
services, supporting web applications) as the main focus is on the architecture of the SMART CP
platform, which becomes agnostic to these backbone implementation details.
All interactions at the server level, between Scriptor Server and SMART CP occur between the
Scriptor Server API and SMART Data Layer blocks. Being Scriptor Server API a standard SOAP web
service in which the data are sent in XML format, the SMART Data Layer publishes/provides,
through an API REST where the data is formatted in JSON, a smaller set of operations – only the
ones necessary for the SMART CP context, and uses the Scriptor Server API internally.
SMART Aggregation
Scriptor Server Core(External Content Manager)
SMART Data Layer
SMART Import REST APIJSON Data Formatter
MS Excel(External)
MS SQL Database(External)
Third Party External Content Manager
Scriptor Server Backoffice(External Content Manager)
SMART Analyser
Data Sorting
SMART Views SMART Elastic SMART Magic Board SMART TimelineSMART NavigationSMART Graphs SMART State
Data Visuals and Exploration Accountability Workflows
Scriptor Server API
Server Layer
Client Layer
The SMART Aggregation module works as an aggregated persistence support layer that is
progressively calculated when a CRUD Operation on contents is performed, so data is immediately
available as the user tries to access it (or made available with simpler computation tasks/processes).
Hence, this module is executed alongside the Scriptor Server API and aggregates the final results
obtained from the SMART Analyser block.
The SMART Analyser block (presented in more detail in a later section) involves the AI, clustering
and suggestion algorithms, and once processed, takes the persistence information into the SMART
Aggregation block, using the contents obtained via the Scriptor Server API.
The SMART Import block allows the data import to the SMART CP/Scriptor Server platforms (i.e.
from an external web service, database, data file or Microsoft Excel application).
Regarding the client layer, as mentioned before, all contents developed are integrated in the CMS
platform’s online backoffice. In a conceptual point of view, the 7 components developed are
grouped in four main areas:
1. Data Sorting and Filtering;
2. Data Visuals and Exploration;
3. Accountability;
4. Business Workflows.
The Data Sorting area is materialized through the SMART Views component. This component allows
content sorting and filtering operations, in an intelligent way, and being completely generic (i.e. by
not knowing the content structure beforehand). These views can be defined privately or can be
made public. The contents processed by the SMART Views component can be directly viewed, listed
in a simple way, or the results can be later used as a source of data for other visual component (e.g.
SMART Graphs, SMART Elastic).
The “Data Visuals and Exploration”, “Accountability” and “Workflows” areas are presented in more
detail on the next section.
SMART Visual Components The “Data Visuals and Exploration” area is materialized through four components: SMART Elastic,
SMART Magic Board, SMART Graphs and SMART Navigation.
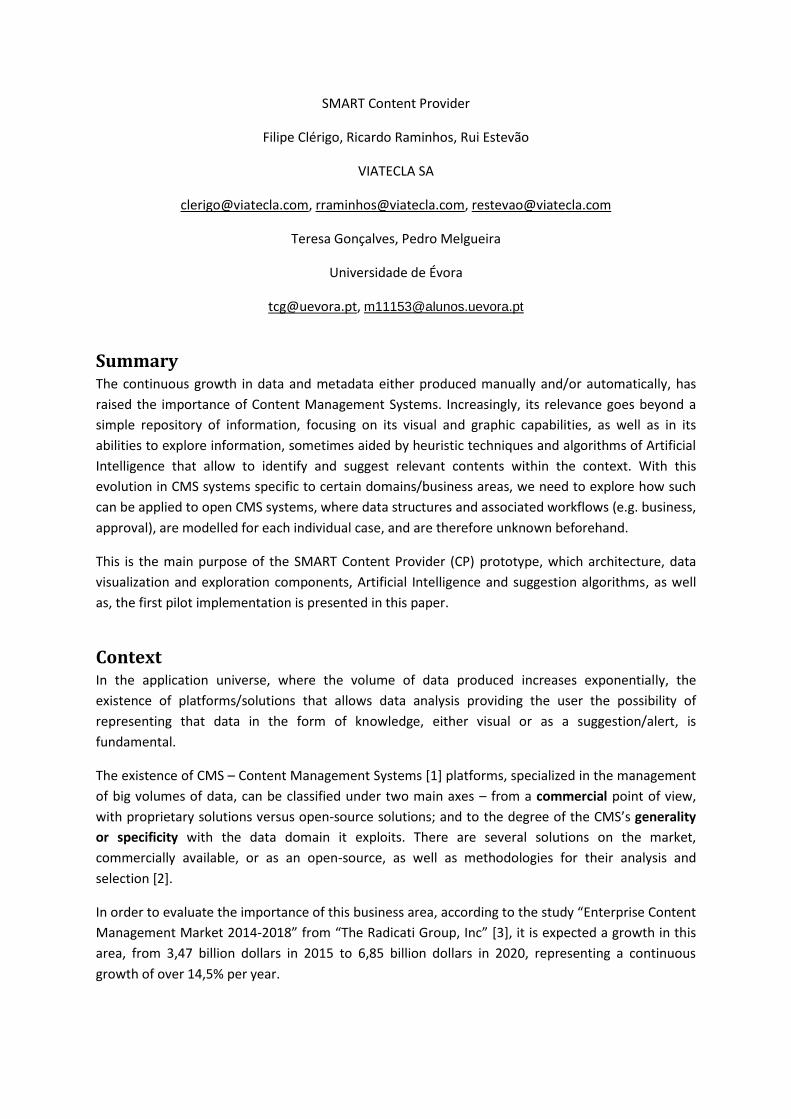
The SMART Navigation component (Figure 2) relates to the presentation of metrics and the possible
actions to perform over an aggregated set of contents, in a dashboard/control panel logic. Through
graphics, listings and metrics associated with different colour levels, it is able to identify possible
limit situations that require further attention from the manager/administrator, in a more graphical
way.
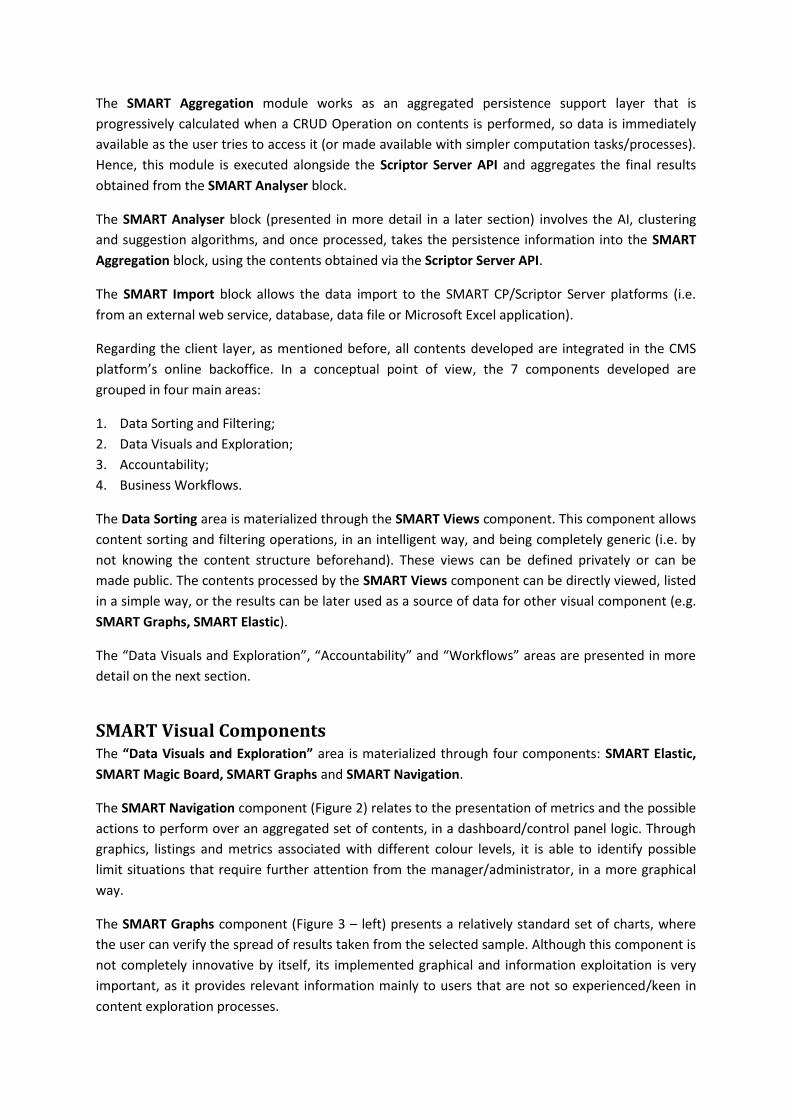
The SMART Graphs component (Figure 3 – left) presents a relatively standard set of charts, where
the user can verify the spread of results taken from the selected sample. Although this component is
not completely innovative by itself, its implemented graphical and information exploitation is very
important, as it provides relevant information mainly to users that are not so experienced/keen in
content exploration processes.
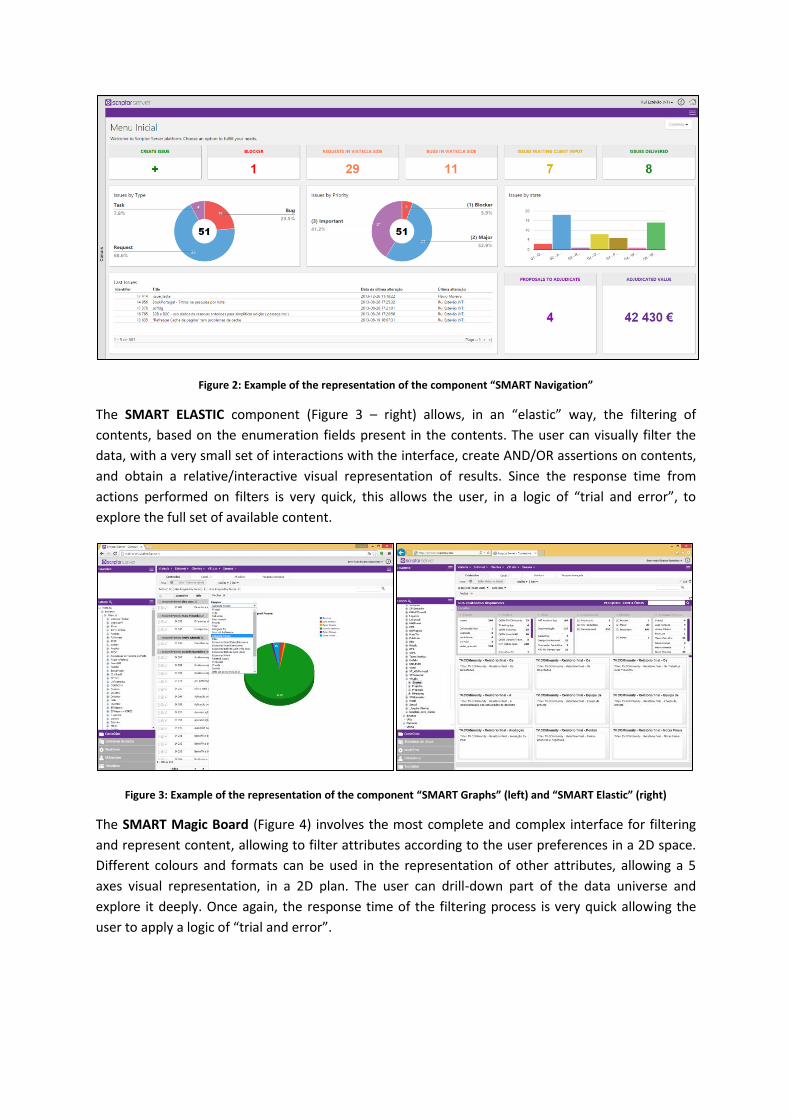
Figure 2: Example of the representation of the component “SMART Navigation”
The SMART ELASTIC component (Figure 3 – right) allows, in an “elastic” way, the filtering of
contents, based on the enumeration fields present in the contents. The user can visually filter the
data, with a very small set of interactions with the interface, create AND/OR assertions on contents,
and obtain a relative/interactive visual representation of results. Since the response time from
actions performed on filters is very quick, this allows the user, in a logic of “trial and error”, to
explore the full set of available content.
Figure 3: Example of the representation of the component “SMART Graphs” (left) and “SMART Elastic” (right)
The SMART Magic Board (Figure 4) involves the most complete and complex interface for filtering
and represent content, allowing to filter attributes according to the user preferences in a 2D space.
Different colours and formats can be used in the representation of other attributes, allowing a 5
axes visual representation, in a 2D plan. The user can drill-down part of the data universe and
explore it deeply. Once again, the response time of the filtering process is very quick allowing the
user to apply a logic of “trial and error”.
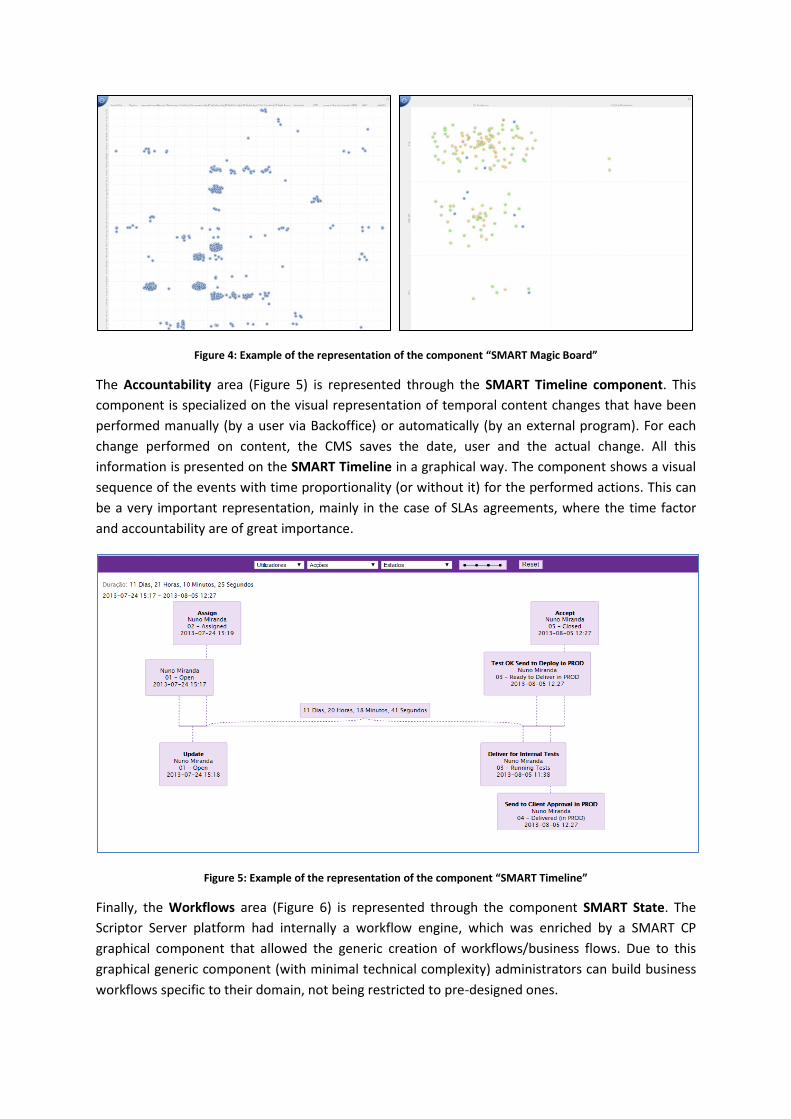
Figure 4: Example of the representation of the component “SMART Magic Board”
The Accountability area (Figure 5) is represented through the SMART Timeline component. This
component is specialized on the visual representation of temporal content changes that have been
performed manually (by a user via Backoffice) or automatically (by an external program). For each
change performed on content, the CMS saves the date, user and the actual change. All this
information is presented on the SMART Timeline in a graphical way. The component shows a visual
sequence of the events with time proportionality (or without it) for the performed actions. This can
be a very important representation, mainly in the case of SLAs agreements, where the time factor
and accountability are of great importance.
Figure 5: Example of the representation of the component “SMART Timeline”
Finally, the Workflows area (Figure 6) is represented through the component SMART State. The
Scriptor Server platform had internally a workflow engine, which was enriched by a SMART CP
graphical component that allowed the generic creation of workflows/business flows. Due to this
graphical generic component (with minimal technical complexity) administrators can build business
workflows specific to their domain, not being restricted to pre-designed ones.
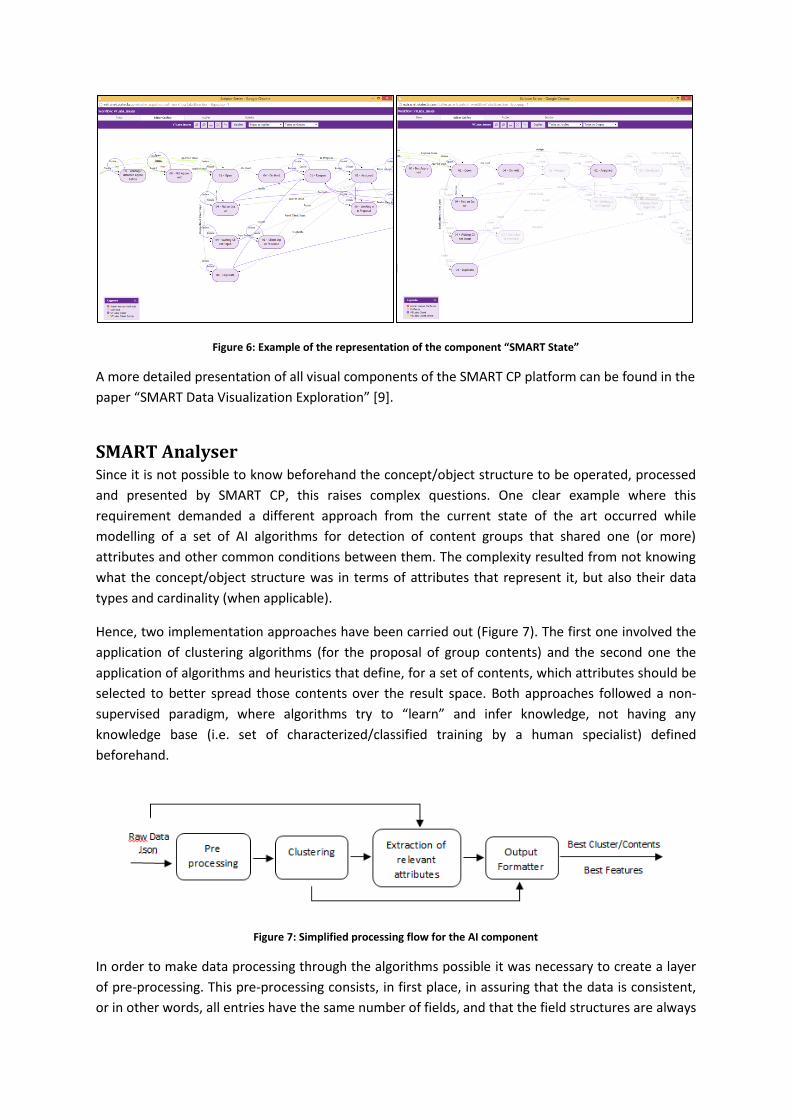
Figure 6: Example of the representation of the component “SMART State”
A more detailed presentation of all visual components of the SMART CP platform can be found in the
paper “SMART Data Visualization Exploration” [9].
SMART Analyser Since it is not possible to know beforehand the concept/object structure to be operated, processed
and presented by SMART CP, this raises complex questions. One clear example where this
requirement demanded a different approach from the current state of the art occurred while
modelling of a set of AI algorithms for detection of content groups that shared one (or more)
attributes and other common conditions between them. The complexity resulted from not knowing
what the concept/object structure was in terms of attributes that represent it, but also their data
types and cardinality (when applicable).
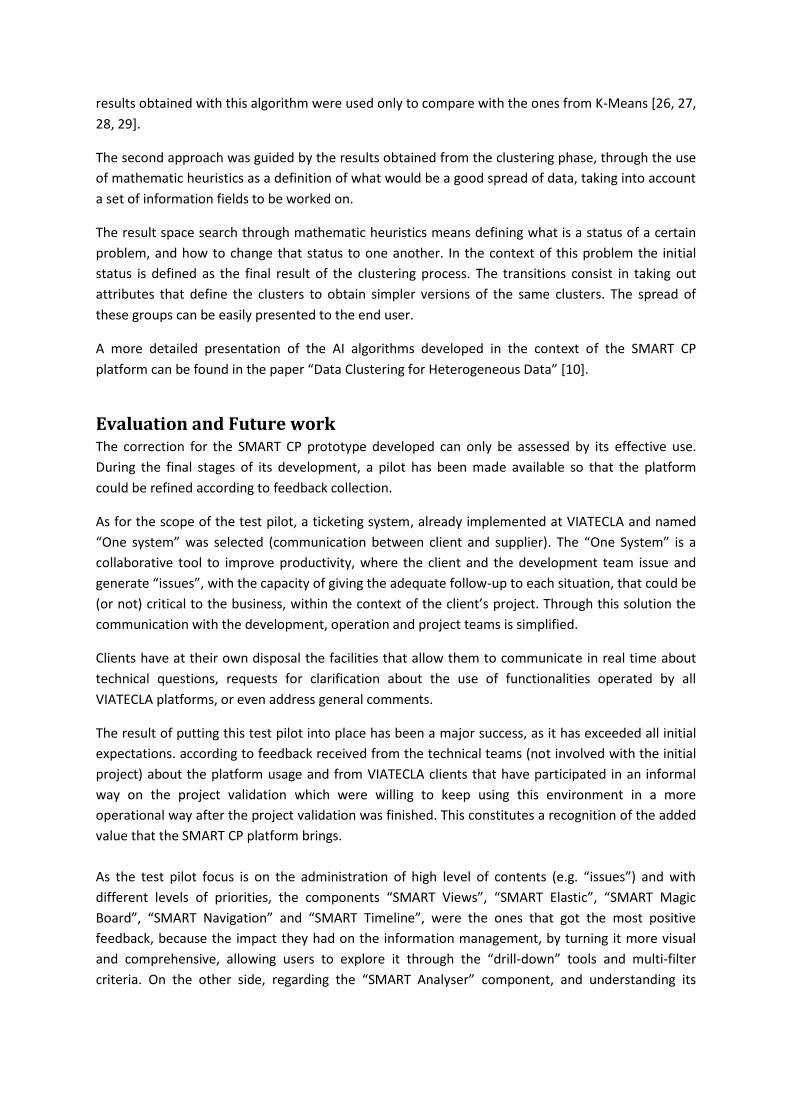
Hence, two implementation approaches have been carried out (Figure 7). The first one involved the
application of clustering algorithms (for the proposal of group contents) and the second one the
application of algorithms and heuristics that define, for a set of contents, which attributes should be
selected to better spread those contents over the result space. Both approaches followed a non-
supervised paradigm, where algorithms try to “learn” and infer knowledge, not having any
knowledge base (i.e. set of characterized/classified training by a human specialist) defined
beforehand.
Figure 7: Simplified processing flow for the AI component
In order to make data processing through the algorithms possible it was necessary to create a layer
of pre-processing. This pre-processing consists, in first place, in assuring that the data is consistent,
or in other words, all entries have the same number of fields, and that the field structures are always

present. This phase also allows a detailed analysis of each field domain, e.g. if there is a field defined
by an integer number, to which intervals does the number refers to?
Pre-processing also allows to transform some fields in order be handled computationally. For
example, if there is a field that consist in an enumeration “string” (severity), and the domain of
values consist on “very severe”, “moderately severe” and “little severe”, those values can be
replaced by whole values during the calculations, therefore reducing their computational
complexity.
Values that represent outliers (i.e. statically speaking an outlier matches to an observation point that
is distant from all other standard observations) may need to be normalized also at this pre-
processing phase. For example, a commentary field of a certain object may or may not exist; the
data may have the majority of entries with this field being empty, and a minority of entries with this
field filled in. In this case, the content of the commentary wouldn’t be interesting, but having a
perception of the existence or not of the commentary, would be; the pre-processing analyses these
situations, and replaces these fields by one of the binary type, being “true” if there is associated
data, and “false” otherwise.
Lastly, the pre-processing allows a simplification of redundant fields, that does not add any new
information. If necessary, a field can actually be removed, which will reduce the complexity of the
problem at hand.
Regarding the first approach, and according to the state of the art, it has been decided to use two
clustering algorithms in order to obtain results – the K-Means Clustering [20], and the Affinity
Propagation [21].
The K-Means Clustering has been selected since it has a low computational complexity compared to
other algorithms applied to clustering problems. The K-Means Clustering is also an algorithm used
when the number of clusters to be found is not too big (less than 10). The decision to keep a low
number of clusters is a desirable attribute, since the objective of this component is the presentation
of the clusters to the end user.
The K-Means algorithm has some restrictions. Its bigger issue is the requirement to pre-define the
number of clusters as an execution parameter, which means, that the algorithm by itself will not find
the best number of clusters, but the best content grouping according to the defined number of
clusters. To deal with this problem, a set of experiences was performed for a certain number of
different clusters, defining a standard number ranging from 2 to 7 clusters using known evaluation
measures to select the “best” number of clusters like the average within cluster distance and Davies-
Bouldin index [30].
One other issue with K-Means is the starting process, since different runs can have an influence on
the final result; having this in mind a few instances of the algorithm are executed, with different
parameters in order analyse the result and determine which one is better [22, 23, 24, 25].
The algorithm Affinity Propagation was used to deal with the problem of the number of clusters of
the K-Means. This algorithm finds clusters in the information but it does not need a previously
defined number of clusters to do it. Nevertheless it has the inconvenient of being less efficient than
K-Means and of finding clusters that may have disproportionate sizes between them. However, the
results obtained with this algorithm were used only to compare with the ones from K-Means [26, 27,
28, 29].
The second approach was guided by the results obtained from the clustering phase, through the use
of mathematic heuristics as a definition of what would be a good spread of data, taking into account
a set of information fields to be worked on.
The result space search through mathematic heuristics means defining what is a status of a certain
problem, and how to change that status to one another. In the context of this problem the initial
status is defined as the final result of the clustering process. The transitions consist in taking out
attributes that define the clusters to obtain simpler versions of the same clusters. The spread of
these groups can be easily presented to the end user.
A more detailed presentation of the AI algorithms developed in the context of the SMART CP
platform can be found in the paper “Data Clustering for Heterogeneous Data” [10].
Evaluation and Future work The correction for the SMART CP prototype developed can only be assessed by its effective use.
During the final stages of its development, a pilot has been made available so that the platform
could be refined according to feedback collection.
As for the scope of the test pilot, a ticketing system, already implemented at VIATECLA and named
“One system” was selected (communication between client and supplier). The “One System” is a
collaborative tool to improve productivity, where the client and the development team issue and
generate “issues”, with the capacity of giving the adequate follow-up to each situation, that could be
(or not) critical to the business, within the context of the client’s project. Through this solution the
communication with the development, operation and project teams is simplified.
Clients have at their own disposal the facilities that allow them to communicate in real time about
technical questions, requests for clarification about the use of functionalities operated by all
VIATECLA platforms, or even address general comments.
The result of putting this test pilot into place has been a major success, as it has exceeded all initial
expectations. according to feedback received from the technical teams (not involved with the initial
project) about the platform usage and from VIATECLA clients that have participated in an informal
way on the project validation which were willing to keep using this environment in a more
operational way after the project validation was finished. This constitutes a recognition of the added
value that the SMART CP platform brings.
As the test pilot focus is on the administration of high level of contents (e.g. “issues”) and with
different levels of priorities, the components “SMART Views”, “SMART Elastic”, “SMART Magic
Board”, “SMART Navigation” and “SMART Timeline”, were the ones that got the most positive
feedback, because the impact they had on the information management, by turning it more visual
and comprehensive, allowing users to explore it through the “drill-down” tools and multi-filter
criteria. On the other side, regarding the “SMART Analyser” component, and understanding its
concept, it has been seen that the results obtained still need refinement in order to be used at
operational level.
Hence, as for the future work of SMART CP, it is intended to refine the AI “SMART Analyser”
component on one side, and to initiate the definition of strategies for launching the platform on the
market, as it will only be possible to get more and better feedback for the improvement and
innovation of the work carried out with the effective use of the platform.
References [1] Mauthe, Andreas. Thomas, Peter.: Professional Content Management Systems: Handling Digital
Media Assets, Wiley; 1 edition (March 12, 2004), ISBN: 100470855428
[2] Benevolo, Clara. Negri, Serena.: Evaluation of Content Management Systems (CMS): a Supply
Analysis. DiTEA, University of Genoa, Italy
[3] Radicati, Sara. Yamasaki, Todd.: “Enterprise Content Management Market, 2014-2018”. The
Radicati Group, Palo Alto, 2014
[4] Microsite SMART CP. 2015, http://www.viatecla.com/inovacao/smart_content_provider
[5] VIATECLA, Institucional website. 2015, http://www.viatecla.com
[6] University of Évora, Institucional website. 2015, http://www.uevora.pt/
[7] GTE, Institucional website. 2015, http://www.gte.pt/
[8] National Strategic Reference Framework (NSRF), Institucional website. 2015,
http://www.qren.pt/np4/home
[9] Clérigo, Filipe. Raminhos, Ricardo. Estevão, Rui. Gonçalves, Teresa. Melgueira, Pedro.: SMART
Data Visualization and Exploration, 2015
[10] Gonçalves, Teresa. Melgueira, Pedro. Clérigo, Filipe. Raminhos, Ricardo. Estevão, Rui.: Data
Clustering for heterogeneous data, 2015
[11] Microsoft Content Management Server (MCMS), Institucional website. 2015,
https://msdn.microsoft.com/en-us/library/ms946812.aspx
[12] Microsoft SharePoint, Institucional website. 2015, https://products.office.com/en-
us/sharepoint/collaboration
[13] VIATECLA Scriptor Server, Institucional website. 2015,
http://www.viatecla.com/os_nossos_produtos/scriptorserver/
[14] Joomla, Institucional website. 2015, http://www.joomla.org/
[15] Drupal, Institucional website. 2015, https://www.drupal.org/
[16] Microsoft CRM, Institucional website. 2015, http://www.microsoft.com/en-
us/dynamics/crm.aspx
[17] Wordpress, Institucional website. 2015, https://wordpress.com/
[18] Alfresco, Institucional website. 2015, https://www.alfresco.com/
[19] Umbraco, Institucional website. 2015, http://umbraco.com/
[20] MacQueen, J. B., Some Methods for Classification and Analysis of Multivariate Observations.
Berkeley, CA: University of California Press, Proceedings of the Fifth Symposium on Math, Statistics
and Probability, 1967, 281–297
[21] Frey B. J., Dueck D., Clustering by Passing Messages between Data Points. Science, 2007,
315(5814), 972-976
[22] Wagstaff, Kiri. Cardie, Claire. Rogers, Seth. Schroedl, Stefan. Constrained K-means Clustering
with Background Knowledge. Proceedings of the Eighteenth International Conference on Machine
Learning, 2001, 577-584
[23] Bradley P. S., Fayyad Usama M., Refining Initial Points for K-Means Clustering. Microsoft
Research, 1998
[24] Likasa, Aristidis. Vlassisb, Nikos. Jakob J. Verbeekb, The global k-means clustering algorithm.
Pattern Recognition, 2003, 451-461
[25] Pelleg, Dau. Moore, Andrew. X-means: Extending K-means with Efficient Estimation of the
Number of Clusters. In Proceedings of the 17th International Conf. on Machine Learning, 2000, 727-
734
[26] Wang, Kaijun. Zhang, Junying. Li, Dan. Zhang, Xinna. Guo, Tao. Adaptive Affinity Propagation
Clustering. School of computer science and engineering, Xidian University, 2007, 1242-1246
[27] Tao, Li. A General Model for Clustering Binary Data, Proceedings of the eleventh ACM SIGKDD
international conference on Knowledge discovery in data mining, 2005, 188-197
[28] Lu, Zhengdong. Á, Miguel. Carreira-Perpiñán, Constrained Spectral Clustering through Affinity
Propagation. Computer Vision and Pattern Recognition, 2008. CVPR 2008. IEEE Conference on, 2008,
1-8
[29] Dueck, D. Frey, B.J. Non-metric affinity propagation for unsupervised image categorization.
Computer Vision, 2007. ICCV 2007. IEEE 11th International Conference on, 2007, 1-8
[30] D. L. Davies and D. W. Bouldin: Cluster Separation Measure, IEEE Transactions on Pattern
Analysis and Machine Intelligence, Vol. 1, No. 2, pp. 95-104, 1979