paper Heijmans Heuver Walraven finaal
33
DNB W ORKING P APER DNB Working Paper Monitoring the unsecured interbank money market using TARGET2 data Ronald Heijmans, Richard Heuver and Daniëlle Walraven No. 276 / October 2010
Transcript of paper Heijmans Heuver Walraven finaal
DN
B W
or
kiN
g P
aP
er
DNB Working Paper
Monitoring the unsecured interbank
money market using TARGET2 data
Ronald Heijmans, Richard Heuver and Daniëlle Walraven
No. 276 / October 2010

Working Paper No. 276
October 2010
De Nederlandsche Bank NV P.O. Box 98 1000 AB AMSTERDAM The Netherlands
Monitoring the unsecured interbank money market using TARGET2 data Ronald Heijmans, Richard Heuver and Daniëlle Walraven * * Views expressed are those of the authors and do not necessarily reflect official positions of De Nederlandsche Bank.
1
Monitoring the unsecured interbank money market using TARGET2 data
RONALD HEIJMANS1, RICHARD HEUVER2, DANIËLLE WALRAVEN3
October 2010
Abstract
We investigate the euro unsecured interbank money market during the current financial crisis. To identify the loans traded in this market and settled in TARGET2, we extend the algorithm developed by Furfine (1999) and adapt it to the European interbank loan market with maturity up to one year. This paper solves the problem of systematic errors which occur when you only look at overnight loans (as the Furfine algorithm does). These errors especially occur in times of (very) low interest rates. The algorithm allows us to track the actual interest rates rather than quoted interest rates on liquidity trading by participants of the Dutch part of the euro large value payment system (TARGET2-NL). The algorithm enables us to constitute the Dutch part of the EONIA, making it possible to compare the interest rates developments in the Dutch market to the European average ones. Based on the new algorithm, we develop a policy tool to monitor the interbank money market, both at macro level (whole market) and individual bank level (Money Market Monitoring Dashboard).
JEL codes: E42, E44, G01
Key words: payment systems, financial stability, experiment, decision making
1 De Nederlandsche Bank, Cash and payment systems Division. Email: [email protected] De Nederlandsche Bank, Cash and payment systems Division. Email: [email protected] De Nederlandsche Bank, Financial Markets Division. Email: [email protected]
The authors would like to thank Peter Heemeijer for the support with the regressions and Hans Brits, Craig Furfine, Harry Garritsen, Jacob de Haan, Lex Hoogduin, Michael Koetter, Iman van Lelyveld and Tom van Veen for providing useful comments.
2
1. Introduction
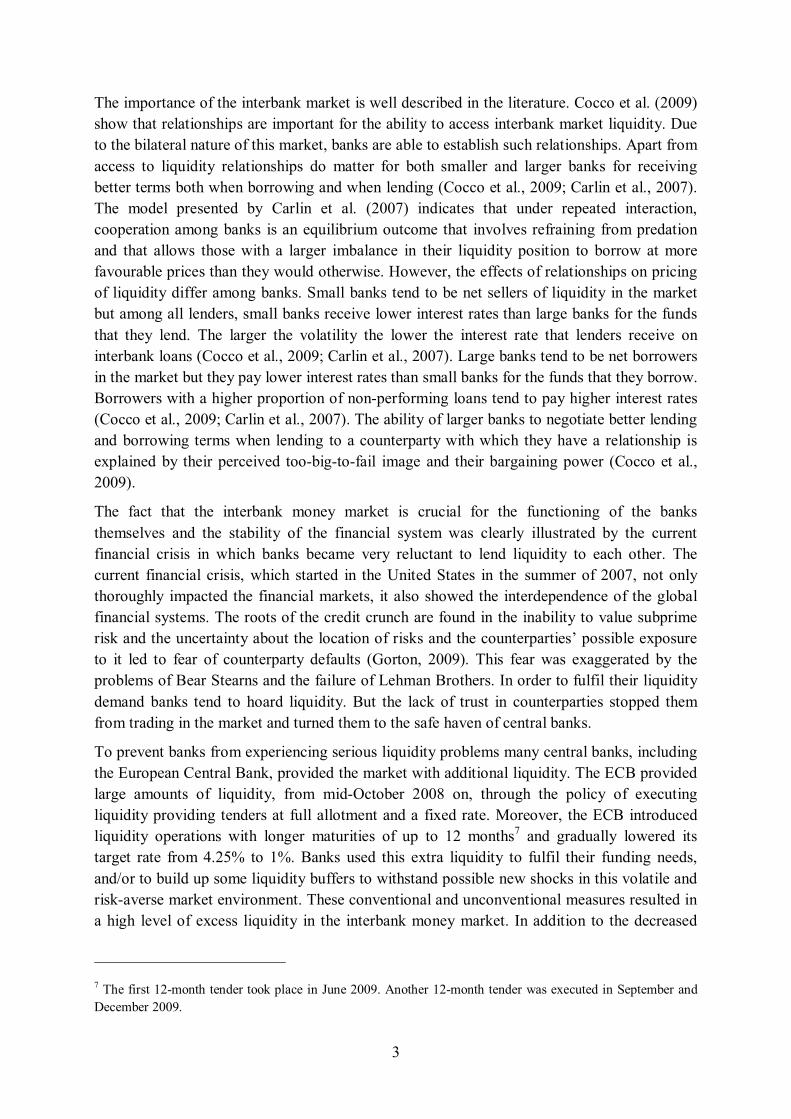
The interbank money market is important for banks and for the proper functioning of the financial system. Financial institutions sometimes face an expected or unexpected shortage or surplus on their accounts. Banks are exposed to so-called ‘liquidity shocks’ arising from unexpected changes in liquidity demand. Allen et al. (2009) distinguish between two types of uncertainty concerning banks’ liquidity needs. The idiosyncratic uncertainty arises from the fact that for any given level of aggregate demand for liquidity there is uncertainty about which banks will face that demand. The second type of risk concerns the aggregate uncertainty that is due to the fact that the overall level of the demand for liquidity that the banks face is stochastic. These unexpected liquidity fluctuations not only affect the banks’ liquidity management, but also impact the smooth operations of payments and RTGS systems (Iori et al., 2008). The interbank market is therefore an important place for an efficiently functioning financial system. The interbank market is therefore an important element for an efficiently functioning financial system.
In order to get a better insight into the anatomy of the Dutch part of the euro unsecured interbank market we are using a methodology to identify interbank loans from TARGET2 transaction data. This approach also enables us to monitor the functioning of this part of the unsecured interbank market during the recent crisis when liquidity trading was hampering.
Literature review
In the unsecured interbank money market, banks with a shortage find banks with a surplus to trade the liquidity needed for doing their daily business. By trading in the interbank market they can fulfil their reserve requirements. Interbank market trading also provides an insurance against inter-temporal liquidity shocks (Bhattacharya and Gale, 1987). Allen and Gale (2000) show that liquidity shocks are the result of uncertainty in the timing of depositors’ consumption. Freixas et al. (2000) state that liquidity shocks arise from the uncertainty about where to consume. All these papers have in common that a well functioning interbank market is crucial for the ability of banks to access liquidity.
The majority of the loans traded in the unsecured interbank money market has a very short maturity, varying from overnight to one week. Banks are also trading liquidity with longer maturities but the longer the maturity, the more infrequent the trading. In the overnight interbank money market, EONIA4 is a benchmark interest rate. The EONIA is an effective overnight rate computed as a weighted average of all overnight unsecured lending transactions in the interbank market, initiated within the euro area by the contributing panel banks5. The EONIA is quoted by this banking panel on a daily basis. Besides EONIA there is also EURIBOR, which is the rate at which interbank term deposits in euro are offered6.
4 EONIA: Euro OverNight Index Average. 5 The panel of contributing banks is 42 (September 2010), of which 3 banks connected to the Dutch part of TARGET2 (ING Bank, RBS N.V. and Rabobank), see http://www.EURIBOR-ebf.eu/. 6 See http://www.EURIBOR-ebf.eu/.
3
The importance of the interbank market is well described in the literature. Cocco et al. (2009) show that relationships are important for the ability to access interbank market liquidity. Due to the bilateral nature of this market, banks are able to establish such relationships. Apart from access to liquidity relationships do matter for both smaller and larger banks for receiving better terms both when borrowing and when lending (Cocco et al., 2009; Carlin et al., 2007). The model presented by Carlin et al. (2007) indicates that under repeated interaction, cooperation among banks is an equilibrium outcome that involves refraining from predation and that allows those with a larger imbalance in their liquidity position to borrow at more favourable prices than they would otherwise. However, the effects of relationships on pricing of liquidity differ among banks. Small banks tend to be net sellers of liquidity in the market but among all lenders, small banks receive lower interest rates than large banks for the funds that they lend. The larger the volatility the lower the interest rate that lenders receive on interbank loans (Cocco et al., 2009; Carlin et al., 2007). Large banks tend to be net borrowers in the market but they pay lower interest rates than small banks for the funds that they borrow. Borrowers with a higher proportion of non-performing loans tend to pay higher interest rates (Cocco et al., 2009; Carlin et al., 2007). The ability of larger banks to negotiate better lending and borrowing terms when lending to a counterparty with which they have a relationship is explained by their perceived too-big-to-fail image and their bargaining power (Cocco et al., 2009).
The fact that the interbank money market is crucial for the functioning of the banks themselves and the stability of the financial system was clearly illustrated by the current financial crisis in which banks became very reluctant to lend liquidity to each other. The current financial crisis, which started in the United States in the summer of 2007, not only thoroughly impacted the financial markets, it also showed the interdependence of the global financial systems. The roots of the credit crunch are found in the inability to value subprime risk and the uncertainty about the location of risks and the counterparties’ possible exposure to it led to fear of counterparty defaults (Gorton, 2009). This fear was exaggerated by the problems of Bear Stearns and the failure of Lehman Brothers. In order to fulfil their liquidity demand banks tend to hoard liquidity. But the lack of trust in counterparties stopped them from trading in the market and turned them to the safe haven of central banks.
To prevent banks from experiencing serious liquidity problems many central banks, including the European Central Bank, provided the market with additional liquidity. The ECB provided large amounts of liquidity, from mid-October 2008 on, through the policy of executing liquidity providing tenders at full allotment and a fixed rate. Moreover, the ECB introduced liquidity operations with longer maturities of up to 12 months7 and gradually lowered its target rate from 4.25% to 1%. Banks used this extra liquidity to fulfil their funding needs, and/or to build up some liquidity buffers to withstand possible new shocks in this volatile and risk-averse market environment. These conventional and unconventional measures resulted in a high level of excess liquidity in the interbank money market. In addition to the decreased
7 The first 12-month tender took place in June 2009. Another 12-month tender was executed in September and December 2009.
4
interest rates by the ECB, excess liquidity has put extra downward pressure on the overnight interest rate.
Despite the support from central banks, the situation in short-term unsecured euro interbank money markets is still fragile and the effects from the turmoil can still be felt. Turnover in the interbank money market has decreased significantly and trades are taking place at levels that are substantially lower than before the crisis. The lower trading volume can be explained by both increased risk-aversion among market participants and excess liquidity in the market. The higher risk-aversion is clearly illustrated by the extent to which banks made use of the standing facilities.8 Institutions with a large surplus preferred putting their liquidity surpluses at the deposit facility of the ECB over trading it in the market, which would have been more profitable. After the bankruptcy of Lehman Brothers and the liquidity provision by the ECB many banks have put large amounts at the deposit facility of the central bank.9 At the same time some banks had shortages and made use of the marginal lending facility of the central bank10, while in normal conditions they could have borrowed the required funding in the market.
Regarding the methodology used to identify lending transactions in the Dutch part of the unsecured interbank market Furfine (1999) was the first to develop an algorithm to identify the interbank loans in (payment) transactions in Fedwire. Demiralp et al. (2004) improved his algorithm to include more candidates for interbank loans. The Furfine and Demiralp et al. algorithms have primarily been developed for the American interbank money market. The algorithm we have developed and described in this paper is suitable for the European unsecured interbank money market as the interest rates are based on the leading interest rates in this market: EONIA and EURIBOR. It improves Furfine’s and Demiralp et al.’s algorithms as our algorithm can identify loans of maturities up to 1 year instead of only overnight. Ignoring maturities beyond overnight will lead to systematic errors with respect to the found interest rates, especially in times with very low interest rates. By our algorithm set-up we not only try to reduce those systematic errors, but also manage to ‘describe’ the unsecured interbank money market more comprehensively.
Because an accurate description of this market is important we need an algorithm that is functioning in both normal and stressed markets. In the investigated period, we have to deal with some sub periods of abnormal market circumstances as a consequence of the recent market turmoil. In order to smooth the research process, we decided to split the investigated period into 4 different sub-periods:
(I) Pre-crisis period (01-01-2005 to 30-06-2007);
8 The Eurosystem offers credit institutions two standing facilities: 1) marginal lending facility in order to obtain overnight liquidity from the central bank, against the presentation of sufficient eligible assets and 2) Deposit facility in order to make overnight deposits with the central bank 9 A maximum value of EUR 57.1 billion in 2008 and EUR 45.6 billion in 2009 in the Netherlands and EUR 89.5 billion in the first 6 months of 2010. 10 With a maximum of EUR 1.6 billion in 2008 and EUR 4.6 billion in 2009 and EUR 0.1 billion in the first six months of 2010.
5
(II) Start of turmoil: (01-07-2007 to 14-09-2008);
(III) Period after Lehman Brothers’ failure and target rate changes by ECB (15-09-2008 to 30-06-2009) ;
(IV) Start of unconventional monetary policy measures by ECB (01-07-2009 to 31-10-2010).11
The sub-periods in this paper will be referred to as periods I, II, III and IV.
The outline of the paper is straightforward. Section 2 describes the data set which is used for the analysis. Section 3 describes the improved algorithm. Section 4 describes the results and how to monitor the interbank loan market and Section 5 contains conclusions and policy recommendations.
2. Large value payment systems
Large value payment systems (LVPS) play an important role in the financial system. Large value transactions, such as interbank loans, are mainly settled in these systems. Also the liquidity provided by central banks (including the ECB) as part of the monetary policy is done through the LVPS accounts
2.1. Development of large value payment system
Central banks provide interbank systems that settle large value and time critical payments safely and efficiently. Over the past thirty years, turnover in interbank payments has increased enormously.12 This increase is the result of financial innovation and the integration and globalisation of the financial sector. The settlement and contagion risk of netting13 systems were the reasons for many countries to develop Real-Time Gross settlement Systems (RTGS). In RTGS systems each payment is executed immediately (real time) and individually (gross). The advantage of RTGS is that in case of default no payments have to be unwound. However, such systems require much more liquidity because for each payment sufficient liquidity has to be available on the account.
The large liquidity requirements of RTGS systems might lead to so-called grid-locks. These grid-locks occur when banks are waiting for incoming liquidity (payments) in order to be able to fulfil their own obligations. Central banks neutralise this problem by providing intraday credit to their banks. This intraday credit helps banks to execute their payments even if they
11 The unconventional monetary policy measures of the ECB consists of very long term tenders (maturity up to 1 year) and the purchase of covered bonds for an amount of EUR 60 billion. The purchase of the EUR 60 billion on covered bond was finished by 30 June 2010. 12 Development of the daily average value of the transactions of the Dutch market: EUR 10.3 billion in 1985, EUR 33.4 billion in 1995, EUR 83.1 billion in 2000, EUR 120.4 billion in 2005 and EUR 299.7 billion in 2010. The values of 2010 are partly due to some large foreign participants. 13 Net settlement is a process in which transactions are not settled directly, but a total net position of all transactions is calculated and settled at the end of a given business cycle, traditionally a business day.
6
lack sufficient liquidity on their account to do so. In most countries, including the European Union, this intraday credit must be collateralised and is free of charge. Intraday credit has to be repaid at the end of the day, lest it turns into an overnight loan for which an overnight fee is due. Simplified, in the United States banks are not required to supply collateral, but a fee has to be paid for the amount of intraday credit.
In 1985, three central banks implemented an RTGS system. By 1996, this number had increased to 16, mostly from industrialised countries. In 2006 the number of central banks with an implemented RTGS system was 93 out of 174 central banks (Bech and Hobijn, 2007).
2.2. The role of central banks
Central banks, co-ordinated by the Bank for International Settlement (BIS), have developed Core Principles, with which large value and other systemically important payment systems must comply (CPSS, 2001). Such payment systems must be safe and reliable to make sure that the probability of failure and abuse by others is minimised. Both market participants and central banks agreed that it is of the utmost importance to have quick settlement of transactions. This enables the receiving party to use the received liquidity immediately. Last but not least, a settled payment is final, meaning that a settled payment cannot be reversed, not even by a receiver in the event of failure. Received liquidity can thus be used to fulfil other obligations. Spindler and Summers (1994) state that there is an increasing need for central bank money, because this gives the best guarantee for the received liquidity (CPSS, 2003).
2.3. TARGET2
TARGET214 is the large value payment system of the Eurosystem, which is used to execute time-critical payments. Besides the euro countries, there are six non-euro European countries15 that are connected to TARGET2 for the settlement of euro payments. TARGET2 is a technically centralised system, which means that there is one platform for all participants to settle their payments. Its predecessor, TARGET, consisted of national component systems which were linked to each other. The benefit of TARGET2 is that all countries have the same functionalities, interface and pricing scheme. Especially for banks operating in many European countries this is an advantage. Legally, TARGET2 is a decentralised system. Each country still has its own legal documentation. The conditions are, however, maximally harmonised, but small deviations are allowed if national legislation requires so. One of the central banks is the intermediary channel between a financial institution and TARGET2.
TARGET2 can only be used by institutions which meet the access criteria. The most important types of institutions that can gain access to TARGET2 are credit institutions established in the European Economic Area (EEA), national central banks of EU member states including the ECB and treasury departments of central or regional governments of
14 TARGET2: Trans-European Real Time Gross settlement Express Transfer. 15 Bulgaria, Denmark, Estonia, Latvia, Lithuania and Poland (status October 2010).
7
member states active in the money market. Most other financial firms, non financial firms and consumers have no access to TARGET2.
2.4. Description of the data
Financial institutions settle various types of payments in TARGET2, such as payments on behalf of a customer, bank-bank payments, payment of the cash leg of a security trade, pay-ins of CLS (continuous linked settlement) to settle foreign exchange transactions, and so on. The type of transactions we aim to identify in this paper, the unsecured interbank loans, form a subset of the bank-bank payments but are unfortunately not labelled as such and cannot be identified easily. Most of the unsecured money market transactions are settled in TARGET2. Some banks also have the possibility to lend and borrow via the EURO1 system16. We do not have transaction data of EURO1.
In order to identify interbank loans we apply an indirect method described in Section 3. The data set does not allow for selecting transactions that in fact are roll-overs or interest-only payments of derivative constructions.17 We exclude these interest only payment transactions, because our algorithm does not permit them to be tracked and matched as there is no exchange of principal.
The data used in our analysis consist of all bank-bank and customer-bank transactions of TARGET2-NL18 and its predecessor TOP between 1 January 2005 and 30 April 2010. This excludes all Delivery versus Payments (DVP)19 and lot settlement transactions.20 In addition, the accounts of De Nederlandsche Bank and the Dutch Treasury (including its agency) are excluded as they are no commercial banks in TARGET2 (and TOP).
To put TARGET2-NL in perspective with other RTGS systems, Table 1 shows a comparison of TARGET2 with the RTGS systems Fedwire (United States) and Chaps (Great Britain). Fedwire is the RTGS funds transfer system that is operated by the Federal Reserve banks. CHAPS is a British company which offers same-day fund transfers. In contrast to TARGET2 and Fedwire, CHAPS is used by only 15 (direct) settlement banks which initiate payment on behalf of themselves and many indirect participants.
16 EURO1 is a private sector owned payment system for domestic and cross-border single payments in euro between banks operating in the European Union. In TARGET2-NL there are 5 commercial banks which are a (sub-)participant of EURO1 (status of October 2010) 17 A large part of the interbank money market consists of transactions that are roll-overs and interest-only payments in case of derivatives constructions. In both cases there is a principal (loan or certain amount in derivative construction) over which interest is paid periodically. The principal amount is not exchanged between both parties but only exists in the contract. 18 TARGET2-NL was launched on 18 February 2008. 19 DVP: The buyer’s payment for securities is due at the time of delivery. 20 Net settlement of retail payments by the ancillary system Equens.
8
Table 1. Key characteristics of TARGET2, TARGET2-NL, Fedwire and CHAPS Sterling in 200921. ������� �� ���
� ���� ���� ����� �������� ������
�������� ���!�"���#$�%&���'�%&���� ()*+�� ,-+� .)+�/� ���!�"���#$�����'��%&���'�%&���� /0,� 1,� �� ,*�2&����&3��& ���!�"���#$���&��&'��#����,)---�� +((� +.� 0(+� ,�*�2&����&3��& ���!��#3���� ���"����#��� �)-0�� �*-� ,).0-� �1��3��& ����&��&'��#��3&�!��� ��������#��� 14,� 140� �),� �4,�
3. The “Furfine” algorithm
3.1. The basics of the algorithm
Furfine (1999) was the first to create an algorithm to extract the overnight interbank loan transactions from the Fedwire payment system. This algorithm assumes a rounded value going from bank A to bank B at day t and the same value plus a plausible interest rate going in opposite direction at t+1. The interest rates (or in fact the values which are converted to a yearly interest rate) which he qualifies as plausible are based on the federal funds rate. Around this rate a so-called area of plausibility (or corridor) is defined within which the interest values must lie. Furfine chooses a corridor of 50 basis points (bp) below and above the federal funds rate. Stigum (1990) has argued that these loans have rounded values of one million dollars. Furfine uses this one million dollar as a minimum value for the loans and a round lot increment of 100,000 dollar. Demiralp et al. (2004) use smaller sizes of loan-candidates of 50,000 dollar, and a round lot increment of 50,000 dollar. They note that an algorithm to filter interbank payments from a database could lead to Type 1 and Type 2 errors. A Type 1 error is a transaction mistakenly identified as an interbank loan while a Type 2 error is an interbank loan that is not found by the algorithm.
The reason for using an algorithm in the first place is that interbank loans settled in large value payment are not labelled as such in most systems (including TARGET2). It is also not known what the exact interest rates are at which liquidity is traded in the market. Therefore assumptions have to be made on which a transaction combination qualifies as a loan-refund match. The difference between the loan and refund value (the paid interest) can be converted to a year interest rate. As not all banks can trade liquidity at the same rates, an area of plausible interest rates has to be defined.
21 Statistics are taken from the Red Book on payment systems (CPSS 2010). Dollar values have been converted to euro with the yearly average euro/dollar exchange rate of 0.7190.
9
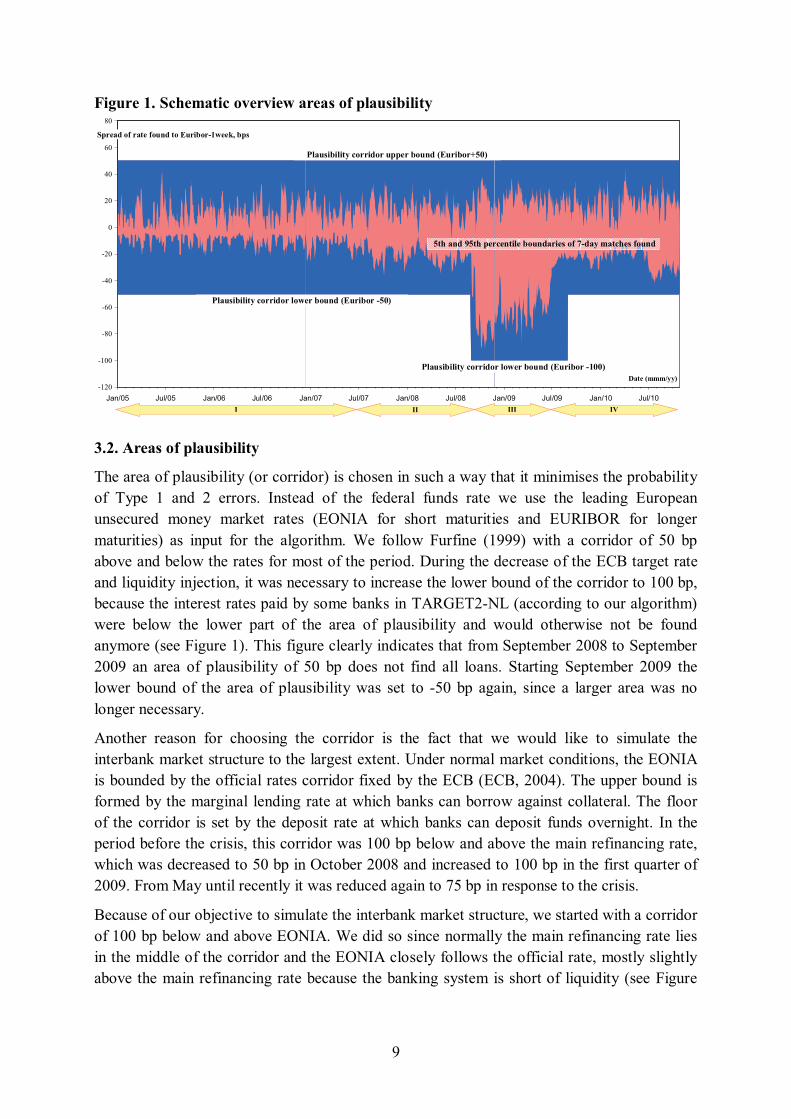
Figure 1. Schematic overview areas of plausibility
-120
-100
-80
-60
-40
-20
0
20
40
60
80
Jan/05 Jul/05 Jan/06 Jul/06 Jan/07 Jul/07 Jan/08 Jul/08 Jan/09 Jul/09 Jan/10 Jul/10
Date (mmm/yy)
Spread of rate found to Euribor-1week, bps
Plausibility corridor upper bound (Euribor+50)
Plausibility corridor lower bound (Euribor -50)
5th and 95th percentile boundaries of 7-day matches found
Plausibility corridor lower bound (Euribor -100)
I II III IV
3.2. Areas of plausibility
The area of plausibility (or corridor) is chosen in such a way that it minimises the probability of Type 1 and 2 errors. Instead of the federal funds rate we use the leading European unsecured money market rates (EONIA for short maturities and EURIBOR for longer maturities) as input for the algorithm. We follow Furfine (1999) with a corridor of 50 bp above and below the rates for most of the period. During the decrease of the ECB target rate and liquidity injection, it was necessary to increase the lower bound of the corridor to 100 bp, because the interest rates paid by some banks in TARGET2-NL (according to our algorithm) were below the lower part of the area of plausibility and would otherwise not be found anymore (see Figure 1). This figure clearly indicates that from September 2008 to September 2009 an area of plausibility of 50 bp does not find all loans. Starting September 2009 the lower bound of the area of plausibility was set to -50 bp again, since a larger area was no longer necessary.
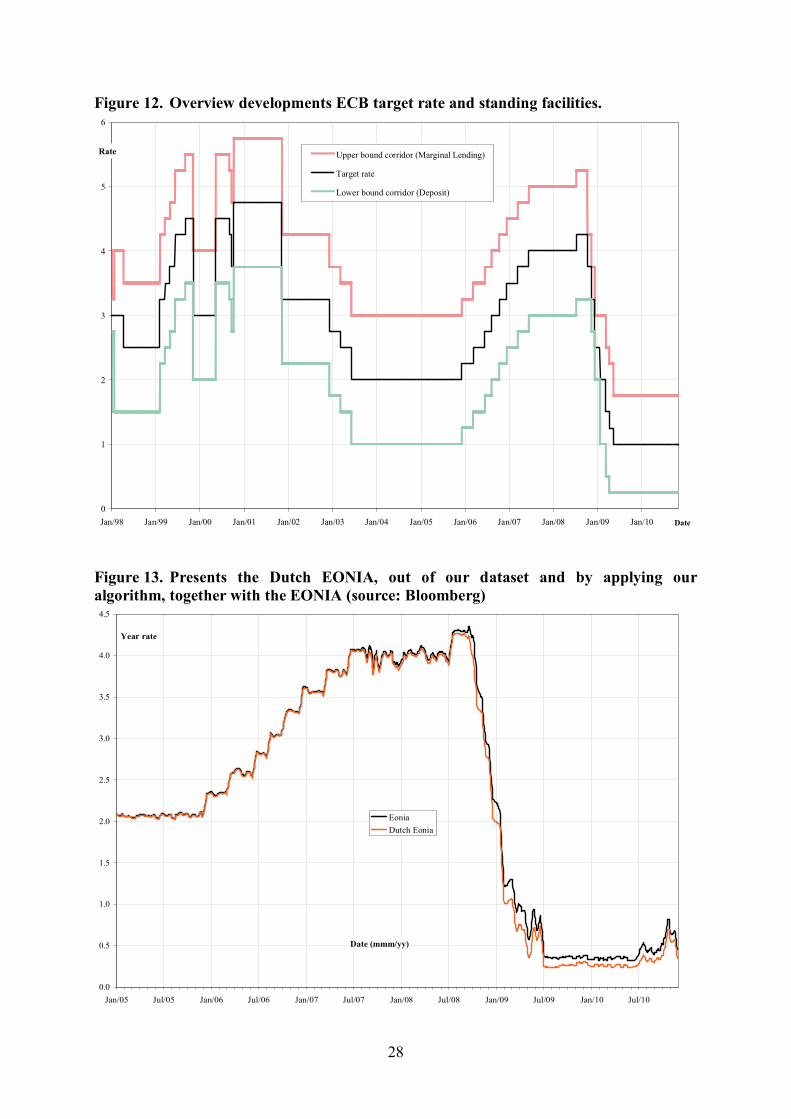
Another reason for choosing the corridor is the fact that we would like to simulate the interbank market structure to the largest extent. Under normal market conditions, the EONIA is bounded by the official rates corridor fixed by the ECB (ECB, 2004). The upper bound is formed by the marginal lending rate at which banks can borrow against collateral. The floor of the corridor is set by the deposit rate at which banks can deposit funds overnight. In the period before the crisis, this corridor was 100 bp below and above the main refinancing rate, which was decreased to 50 bp in October 2008 and increased to 100 bp in the first quarter of 2009. From May until recently it was reduced again to 75 bp in response to the crisis.
Because of our objective to simulate the interbank market structure, we started with a corridor of 100 bp below and above EONIA. We did so since normally the main refinancing rate lies in the middle of the corridor and the EONIA closely follows the official rate, mostly slightly above the main refinancing rate because the banking system is short of liquidity (see Figure
10
12 in the Appendix). By choosing these borders we expected to find the majority of trades and lowering the type 1 and 2 errors.
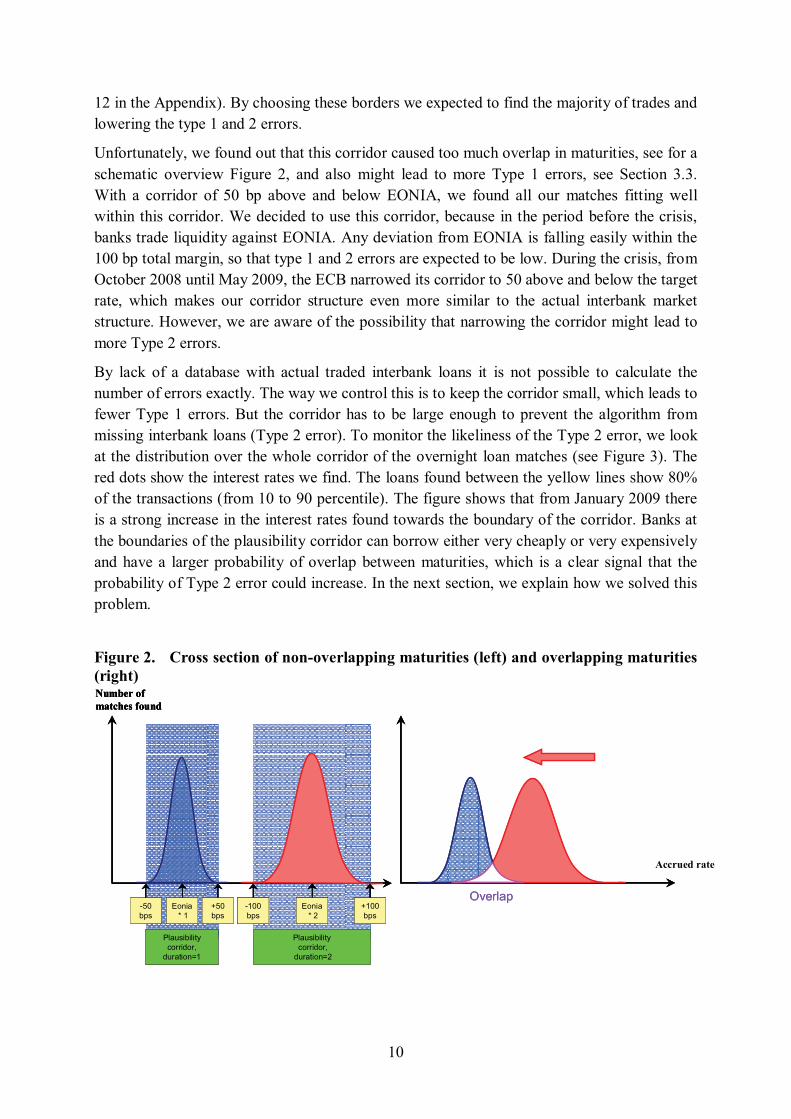
Unfortunately, we found out that this corridor caused too much overlap in maturities, see for a schematic overview Figure 2, and also might lead to more Type 1 errors, see Section 3.3. With a corridor of 50 bp above and below EONIA, we found all our matches fitting well within this corridor. We decided to use this corridor, because in the period before the crisis, banks trade liquidity against EONIA. Any deviation from EONIA is falling easily within the 100 bp total margin, so that type 1 and 2 errors are expected to be low. During the crisis, from October 2008 until May 2009, the ECB narrowed its corridor to 50 above and below the target rate, which makes our corridor structure even more similar to the actual interbank market structure. However, we are aware of the possibility that narrowing the corridor might lead to more Type 2 errors.
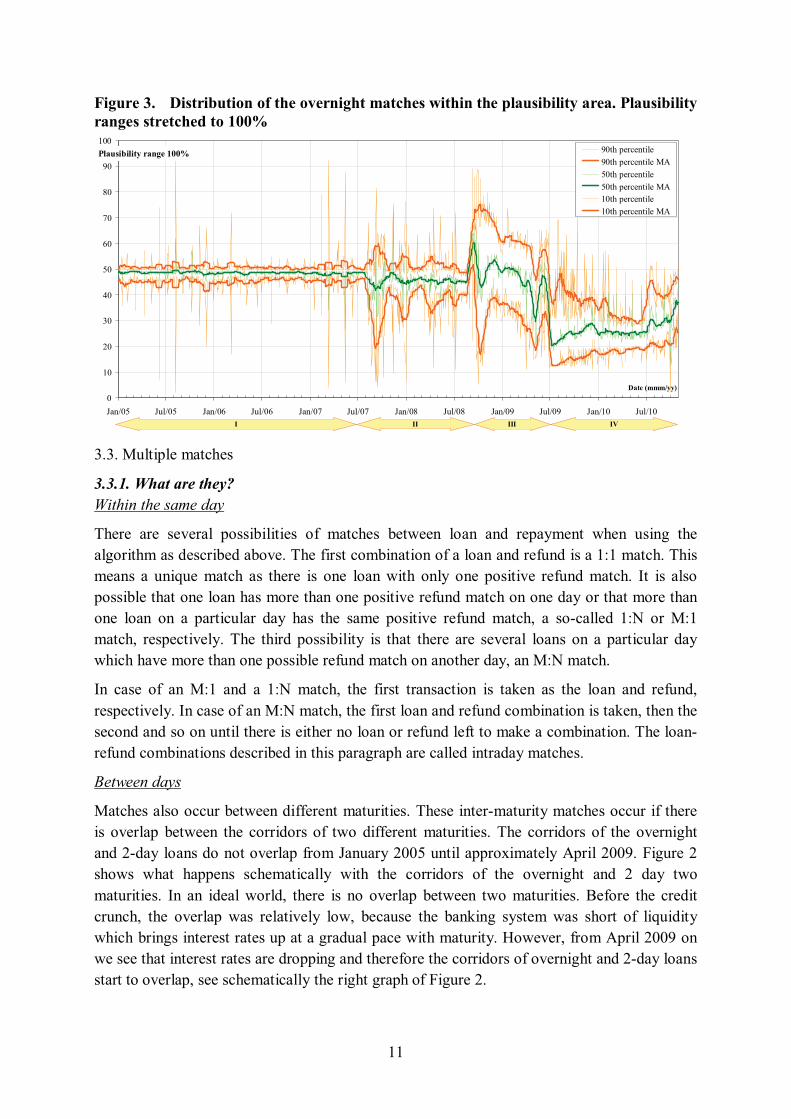
By lack of a database with actual traded interbank loans it is not possible to calculate the number of errors exactly. The way we control this is to keep the corridor small, which leads to fewer Type 1 errors. But the corridor has to be large enough to prevent the algorithm from missing interbank loans (Type 2 error). To monitor the likeliness of the Type 2 error, we look at the distribution over the whole corridor of the overnight loan matches (see Figure 3). The red dots show the interest rates we find. The loans found between the yellow lines show 80% of the transactions (from 10 to 90 percentile). The figure shows that from January 2009 there is a strong increase in the interest rates found towards the boundary of the corridor. Banks at the boundaries of the plausibility corridor can borrow either very cheaply or very expensively and have a larger probability of overlap between maturities, which is a clear signal that the probability of Type 2 error could increase. In the next section, we explain how we solved this problem.
Figure 2. Cross section of non-overlapping maturities (left) and overlapping maturities (right) Number of matches found
Plausibilitycorridor,
duration=1
Plausibilitycorridor,
duration=2
Accrued rate
-50 bps
+50 bps
Eonia* 1
-100 bps
+100 bps
Eonia* 2
Overlap
Number of matches foundNumber of matches found
Plausibilitycorridor,
duration=1
Plausibilitycorridor,
duration=1
Plausibilitycorridor,
duration=2
Accrued rateAccrued rate
-50 bps
+50 bps
Eonia* 1
-50 bps
+50 bps
Eonia* 1
-100 bps
+100 bps
Eonia* 2
-100 bps-100 bps
+100 bps
+100 bps
Eonia* 2
Eonia* 2
Overlap
11
Figure 3. Distribution of the overnight matches within the plausibility area. Plausibility ranges stretched to 100%
0
10
20
30
40
50
60
70
80
90
100
Jan/05 Jul/05 Jan/06 Jul/06 Jan/07 Jul/07 Jan/08 Jul/08 Jan/09 Jul/09 Jan/10 Jul/10
Date (mmm/yy)
Plausibility range 100% 90th percentile90th percentile MA50th percentile50th percentile MA10th percentile10th percentile MA
I II III IV
3.3. Multiple matches
3.3.1. What are they? Within the same day
There are several possibilities of matches between loan and repayment when using the algorithm as described above. The first combination of a loan and refund is a 1:1 match. This means a unique match as there is one loan with only one positive refund match. It is also possible that one loan has more than one positive refund match on one day or that more than one loan on a particular day has the same positive refund match, a so-called 1:N or M:1 match, respectively. The third possibility is that there are several loans on a particular day which have more than one possible refund match on another day, an M:N match.
In case of an M:1 and a 1:N match, the first transaction is taken as the loan and refund, respectively. In case of an M:N match, the first loan and refund combination is taken, then the second and so on until there is either no loan or refund left to make a combination. The loan-refund combinations described in this paragraph are called intraday matches.
Between days
Matches also occur between different maturities. These inter-maturity matches occur if there is overlap between the corridors of two different maturities. The corridors of the overnight and 2-day loans do not overlap from January 2005 until approximately April 2009. Figure 2 shows what happens schematically with the corridors of the overnight and 2 day two maturities. In an ideal world, there is no overlap between two maturities. Before the credit crunch, the overlap was relatively low, because the banking system was short of liquidity which brings interest rates up at a gradual pace with maturity. However, from April 2009 on we see that interest rates are dropping and therefore the corridors of overnight and 2-day loans start to overlap, see schematically the right graph of Figure 2.
12
This means that an interest rate found in this overlapping region can be assigned to overnight loans as well as 2-day loans. The difficulties with the overlap is largely caused by the low interest rate environment and the fact that the market obtained long liquidity due to the liquidity injections by the ECB regarding the excess liquidity in the market that are a consequences of the conventional and unconventional monetary policy measures. This has a downward pressure on EONIA and rates of longer maturities, which pushed them closer together and further increases increased the change on maturity overlap.
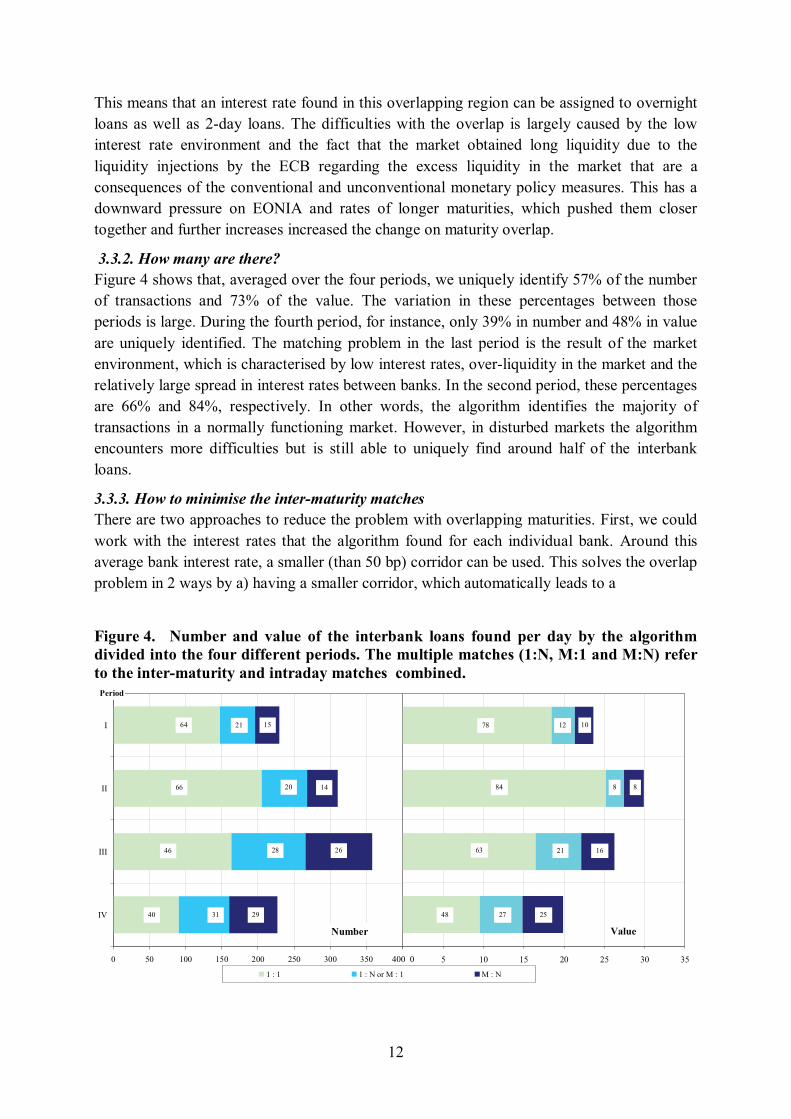
3.3.2. How many are there? Figure 4 shows that, averaged over the four periods, we uniquely identify 57% of the number of transactions and 73% of the value. The variation in these percentages between those periods is large. During the fourth period, for instance, only 39% in number and 48% in value are uniquely identified. The matching problem in the last period is the result of the market environment, which is characterised by low interest rates, over-liquidity in the market and the relatively large spread in interest rates between banks. In the second period, these percentages are 66% and 84%, respectively. In other words, the algorithm identifies the majority of transactions in a normally functioning market. However, in disturbed markets the algorithm encounters more difficulties but is still able to uniquely find around half of the interbank loans.
3.3.3. How to minimise the inter-maturity matches There are two approaches to reduce the problem with overlapping maturities. First, we could work with the interest rates that the algorithm found for each individual bank. Around this average bank interest rate, a smaller (than 50 bp) corridor can be used. This solves the overlap problem in 2 ways by a) having a smaller corridor, which automatically leads to a
Figure 4. Number and value of the interbank loans found per day by the algorithm divided into the four different periods. The multiple matches (1:N, M:1 and M:N) refer to the inter-maturity and intraday matches combined.
0 50 100 150 200 250 300 350 400
I
II
III
IV
Period
Number
1 : 1 1 : N or M : 1 M : N
0 5 10 15 20 25 30 35
Value
64 1521
142066
262846
293140
78 1012
8884
162163
252748
400 0
13
smaller probability of overlap, and b) taking the corridor around the actual interest rates instead of the EONIA.
However, some caution is required by using this method: it will only work for banks that are active and stay active in the interbank market in order to be able to calculate a reliable and up to date average interest rate. Some banks do not have (many) interbank loans, because they either fund themselves with the liquidity provided by the ECB or are, in general, not very active in the interbank market. In these cases, no reliable average interest rates can be defined. For the large banks, however, this method will work well because they have been active in the interbank market during the whole investigated period.
Secondly, we decided to solve the problem of overlapping maturities by letting the algorithm select the most plausible maturity, which is one day, full week(s) (1, 2, 3, etc weeks) and full month(s) (1, 2, 3, etc months). If one of the possible maturities is not one of the aforementioned, the shortest maturity is taken, because the market is deepest in the shorter end of the maturities.
3.3.4. Errors with the original Furfine algorithm The algorithm developed by Furfine does not take into account the possibility of multiple matches, because it only addresses the overnight loans and therefore ignores the loans with a maturity longer than overnight. In period I, in 30% (12% in value) of the cases there is a non-unique inter-maturity match. However in period IV, the number of non-unique inter-maturity matches increases to 60% (51% in value). This is the result of the relatively low interest rates in this period and over liquidity, which makes overlap between maturities more likely. The problem with ignoring inter-maturities overlapping matches is that it affects the interest rates of the found interbank loans. For example, a 2-day loan could be wrongly marked as an overnight loan and as a consequence result into higher interest rates found for the overnight loans. To conclude, the additions made in our algorithm (see 3.3.3) address the difficulties with the multiple matches.
3.4. Furfine improved
3.4.1. Our algorithm Our algorithm searches for interbank loans and refunds using the following criteria:
1. The loan must be a rounded value larger or equal to EUR 100,000 (increment EUR 100,000).
2. The refund must be equal to the loan plus a plausible (positive) interest rate
- Xt+d = Xt + �(d)
With Xt the initial loan value, Xt+d the repayment of the loan with duration d (in days), �(d) the plausible interest rate dependent on the duration.
3. Euro trades are based on 360 days22, which is relevant for calculating the year interest rate.
22 In the United Kingdom, trade is based on 365 days.
14
4. The plausible “central interest rate” (icentral) used, is the EONIA or EURIBOR. The EONIA rate is applied in accumulation for maturities of up to 6 days. For maturities of 7 days and longer, the corresponding EURIBOR rate is applicable.
- icentral = EONIA if 0 � t � 6 days
- icentral = EURIBOR if t � 7 days
5. A match will occur when the interest rate found (ifound) falls within a corridor of 50 bp below and 50 bp above icentral. The absolute minimum interest rate is set at 5 bp. The lower bound of the corridor is set at 100 bp below icentral from September 2008 to September 2009, see Section 3.3 for more detail.
The � in the formula under point 2 has to follow the following criteria:
- (icentral - 0,5 %)* Xt � � � (icentral + 0,5 %)* Xt
- (icentral - 1,0 %)* Xt � � � (icentral + 0,5 %)* Xt) for September 2008 – September 2009
- icentral � 0,05 %
6. The loan and the refund of the interbank loan are equally routed. In other words, both transactions are processed between the same two BIC-codes and within the same system, which is either TARGET2 or EURO1. In our model, it is not possible for the algorithm to identify a loan that is paid in TARGET2 but repaid in EURO1 or vice versa.23
Even though the algorithm described in this section may still include some imperfections, it gives a solid, indicative reflection of the interbank money market. Moreover, we decided to focus entirely on the unsecured part of the interbank money market, because the lack of information regarding collateral streams prohibit us from focussing on both secured and unsecured money markets.
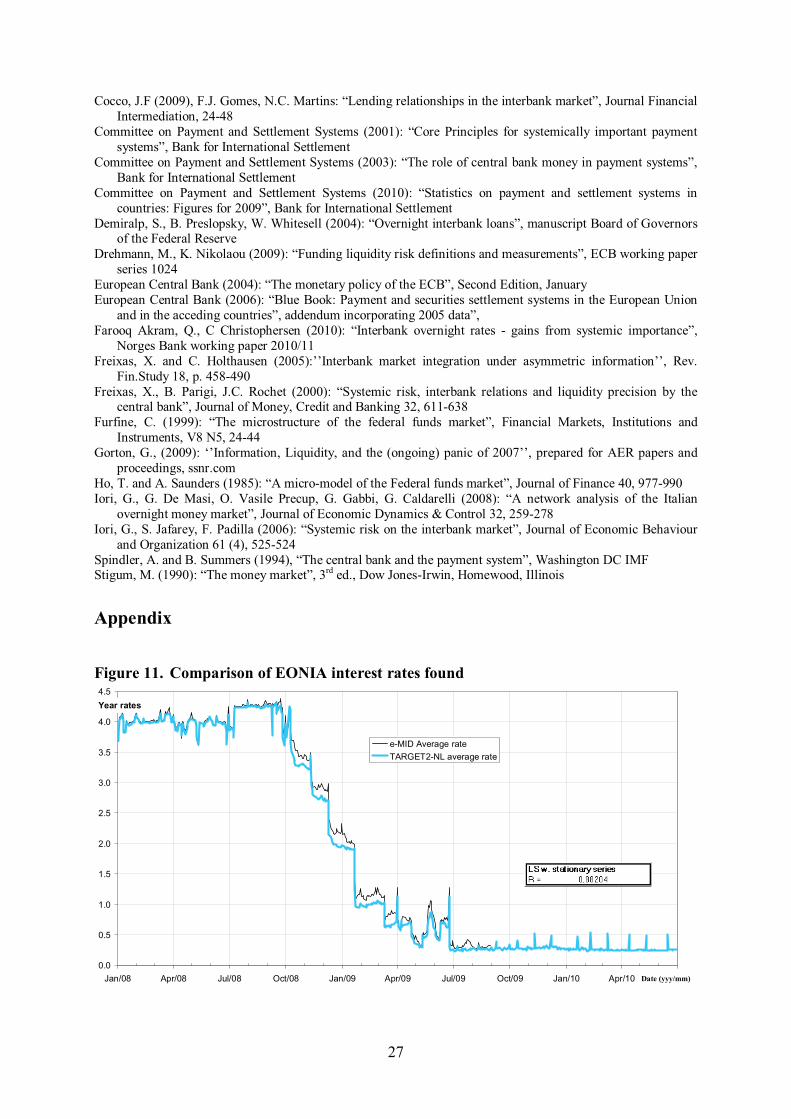
3.4.2. Testing our algorithm In order to check whether the algorithm reflects the interbank money market accurately, it is compared with a real market environment. The trading platform e-MID24 is chosen for this check, because it is a part of the real euro unsecured interbank market environment and the trades executed at the e-MID platform, like most loans within the eurozone, are settled in TARGET2. The algorithm’s viability and reliability in reflecting the interbank market has been checked by correlating the EONIA out of the model (Dutch EONIA) with the rates at which liquidity is traded at the e-MID platform during the same period of time. The interest rates found with our algorithm, Dutch EONIA, correlate very well with the interest rates applied to trading at the e-MID-platform, as an R2 of almost 1 illustrates (see Figure 11 in the Appendix). We found a similar high correlation when we compared our algorithm’s Dutch EONIA with EONIA.
23 It has been confirmed by liquidity managers of commercial banks in the Netherlands that it is common practice that loans and reimbursement take place in the same system. 24 E-MID trades deposits in four currencies and is owned by 29 banks and the Italian Banking Association. Market participants from 26 countries are active on this trading platform. There are 4 large banks active on the e-MID platform, which participate in TARGET2-NL.
15
Because we wanted to be sure that this relationship is not disturbed by specific trends, we correlated the rates at which liquidity is traded at e-MID and our algorithm’s Dutch EONIA for stationary series resulting in a R2 of 0.8. However, from October 2008, the correlation becomes less strong, which supports the idea that differences in rates are higher than in the pre-crisis period25. The same correlation check was applied to the stationary series of our model’s Dutch EONIA to EONIA, which gave even better results.
We also checked for the presence of seasonal effects by using the Least Squares and cyclical dummies. Seasonal effects due to reserve requirements and accounting reasons (such as e.g. window dressing) at the end of quarters, half year and year have been observed, but do not have any disturbing effects in our algorithm because it is part of a natural market functioning. Moreover, these effects are sufficiently small that the chosen area of plausibility does not have to be adjusted. Our reality checks suggest that our algorithm gives an appropriate reflection of the unsecured interbank money market interest rate development.
4. Results and how to monitor the interbank market
4.1. Developments in the interbank market during the crisis
The algorithm we developed enables us to investigate the specific characteristics of the Dutch part of the unsecured interbank market structure and its changes as a consequence of the recent credit crunch. First of all, we would like to know at which interest rates banks in TARGET2-NL actually borrow and lend liquidity. We call this rate the Dutch EONIA or DEONIA. The DEONIA is the effective overnight rate of all overnight unsecured lending transactions that have actually taken place in the Dutch part of the euro interbank unsecured money market. The DEONIA is not computed out of market quotes but out of real transactions. Having insights into actual borrowing and lending rates gives us more information about the functioning of this market and its individual participants.
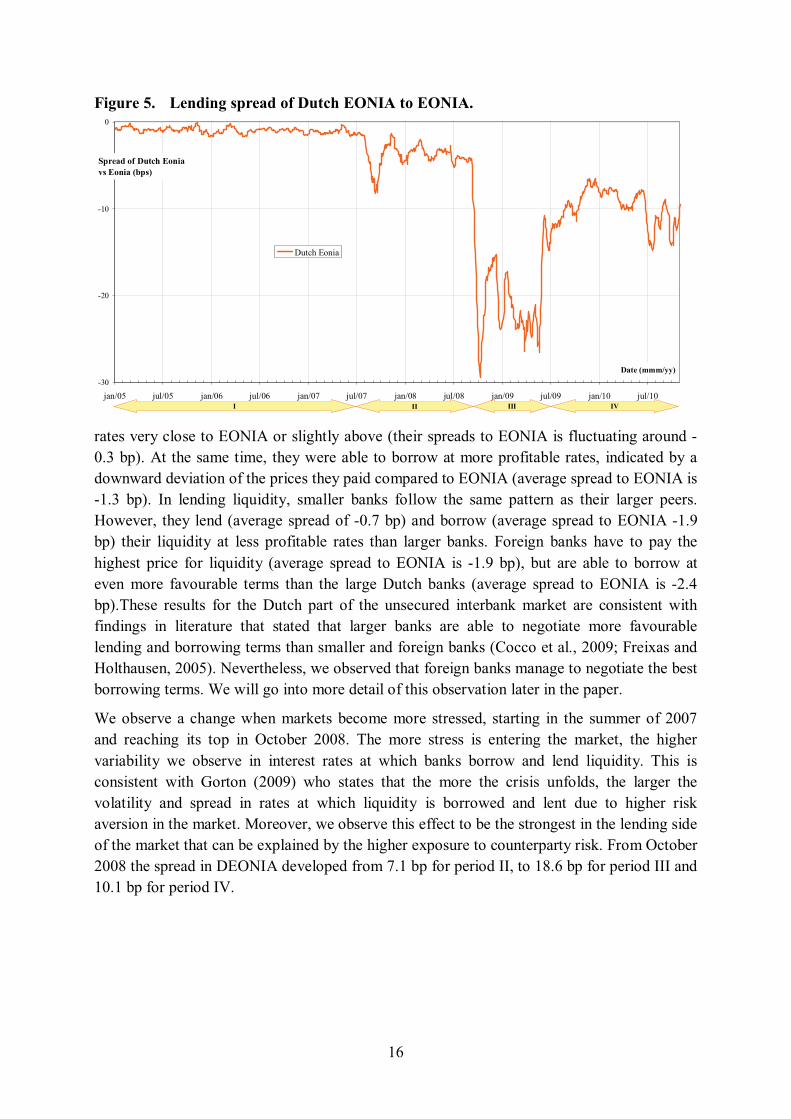
Figure 5 presents the development of the spread of DEONIA to EONIA during the investigated period. For the development of base figures of EONIA and DEONIA presented over the same period of time see Figure 13 of the Appendix. In the period before the Lehman Brothers’ failure, the DEONIA follows EONIA very closely. Interestingly, the figure indicates that the more stress is entering the market the more the DEONIA is diverging from EONIA. In other words, banks in TARGET2-NL are able to attract unsecured liquidity at lower interest rates than is expected by the EONIA.
In period I, most banks could lend liquidity at rates which were close to EONIA. The average standard deviation in the interest rates in period I was 4.1 bp. Looking at variations among type of banks (Figure 6)26, we observe that larger banks were able to lend liquidity at interest
25 From September 2009 onward we do not have data available from e-MID and no comparison can be made. 26 Some caution is required comparing the group of foreign banks in TOP and TARGET2 because this group is partly different. Besides some of the banks who have had an account in both TOP and TARGET2 are large participant in TARGET2 and were relatively small in TOP. The activity of those banks on the interbank market is larger in TARGET2 than in TOP.
16
Figure 5. Lending spread of Dutch EONIA to EONIA.
-30
-20
-10
0
jan/05 jul/05 jan/06 jul/06 jan/07 jul/07 jan/08 jul/08 jan/09 jul/09 jan/10 jul/10
Date (mmm/yy)
Spread of Dutch Eoniavs Eonia (bps)
Dutch Eonia
I II III IV
rates very close to EONIA or slightly above (their spreads to EONIA is fluctuating around -0.3 bp). At the same time, they were able to borrow at more profitable rates, indicated by a downward deviation of the prices they paid compared to EONIA (average spread to EONIA is -1.3 bp). In lending liquidity, smaller banks follow the same pattern as their larger peers. However, they lend (average spread of -0.7 bp) and borrow (average spread to EONIA -1.9 bp) their liquidity at less profitable rates than larger banks. Foreign banks have to pay the highest price for liquidity (average spread to EONIA is -1.9 bp), but are able to borrow at even more favourable terms than the large Dutch banks (average spread to EONIA is -2.4 bp).These results for the Dutch part of the unsecured interbank market are consistent with findings in literature that stated that larger banks are able to negotiate more favourable lending and borrowing terms than smaller and foreign banks (Cocco et al., 2009; Freixas and Holthausen, 2005). Nevertheless, we observed that foreign banks manage to negotiate the best borrowing terms. We will go into more detail of this observation later in the paper.
We observe a change when markets become more stressed, starting in the summer of 2007 and reaching its top in October 2008. The more stress is entering the market, the higher variability we observe in interest rates at which banks borrow and lend liquidity. This is consistent with Gorton (2009) who states that the more the crisis unfolds, the larger the volatility and spread in rates at which liquidity is borrowed and lent due to higher risk aversion in the market. Moreover, we observe this effect to be the strongest in the lending side of the market that can be explained by the higher exposure to counterparty risk. From October 2008 the spread in DEONIA developed from 7.1 bp for period II, to 18.6 bp for period III and 10.1 bp for period IV.
17
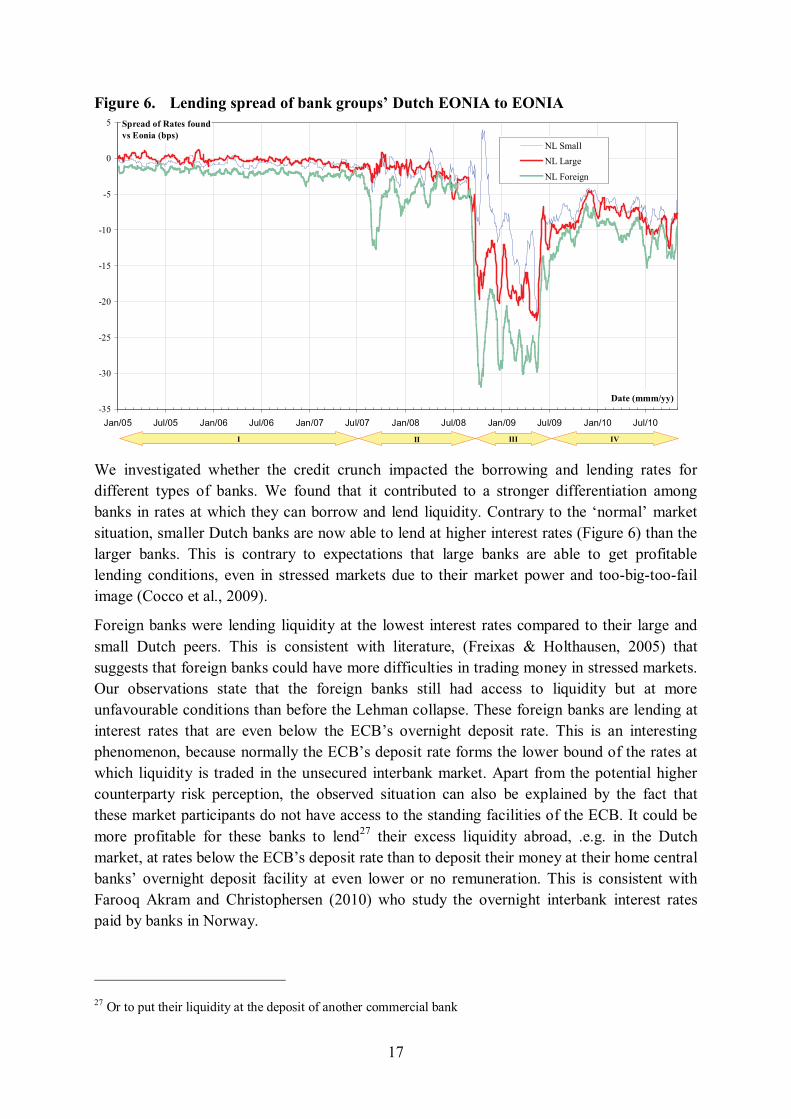
Figure 6. Lending spread of bank groups’ Dutch EONIA to EONIA
-35
-30
-25
-20
-15
-10
-5
0
5
Jan/05 Jul/05 Jan/06 Jul/06 Jan/07 Jul/07 Jan/08 Jul/08 Jan/09 Jul/09 Jan/10 Jul/10
Date (mmm/yy)
Spread of Rates foundvs Eonia (bps)
NL SmallNL Large
NL Foreign
I II III IV
We investigated whether the credit crunch impacted the borrowing and lending rates for different types of banks. We found that it contributed to a stronger differentiation among banks in rates at which they can borrow and lend liquidity. Contrary to the ‘normal’ market situation, smaller Dutch banks are now able to lend at higher interest rates (Figure 6) than the larger banks. This is contrary to expectations that large banks are able to get profitable lending conditions, even in stressed markets due to their market power and too-big-too-fail image (Cocco et al., 2009).
Foreign banks were lending liquidity at the lowest interest rates compared to their large and small Dutch peers. This is consistent with literature, (Freixas & Holthausen, 2005) that suggests that foreign banks could have more difficulties in trading money in stressed markets. Our observations state that the foreign banks still had access to liquidity but at more unfavourable conditions than before the Lehman collapse. These foreign banks are lending at interest rates that are even below the ECB’s overnight deposit rate. This is an interesting phenomenon, because normally the ECB’s deposit rate forms the lower bound of the rates at which liquidity is traded in the unsecured interbank market. Apart from the potential higher counterparty risk perception, the observed situation can also be explained by the fact that these market participants do not have access to the standing facilities of the ECB. It could be more profitable for these banks to lend27 their excess liquidity abroad, .e.g. in the Dutch market, at rates below the ECB’s deposit rate than to deposit their money at their home central banks’ overnight deposit facility at even lower or no remuneration. This is consistent with Farooq Akram and Christophersen (2010) who study the overnight interbank interest rates paid by banks in Norway.
27 Or to put their liquidity at the deposit of another commercial bank
18
On the borrowing side, variability in prices of liquidity traded was getting larger when market stress was increasing. So were the price variations as well as variability increasing for different type of banks. But compared to the lending side, tensions are slightly lower on this side of the market. Before the market tensions started, banks could borrow at rates below EONIA. Smaller banks borrowed at the highest rates compared to large banks and foreign banks. Foreign banks borrowed at lowest levels, but this situation changed in summer 2007. From then on, larger banks negotiated the best borrowing rates. In the heat of the crisis, foreign banks paid highest rates to borrow apart from a short period of improvement in the first quarter of 2009 (February and May 2009). In summer 2009, variability in borrowing rates among the different types of banks is slightly decreasing. Foreign banks, however, have to pay the highest rates again. Large banks borrow money at quite similar rates. The smaller banks, on the contrary, are able to borrow money at the lowest rates.
In the recent stressed, unsecured interbank market it appears that smaller banks are lending and borrowing at the best terms. This is contrary to expectations that larger banks are negotiating the best lending and borrowing terms due to their too-big-too fail image and bargaining power (Cocco et al., 2009). The results show that these advantages can fade away even for larger banks if markets become more stressed and higher uncertainty and risk-aversion are concerning them. In this case is referred to uncertainty about the exposure of large Dutch banks to US subprime related risks that reduced the willingness of other market participants to trade with these peers and induced them to look for counterparties that seemed to have fewer difficulties, like smaller banks because of their lower perceived subprime related exposures.
Result 1. There is significant increase in the spread and volatility of the interest rates at which banks in TARGET2-NL lend and borrow liquidity after the credit crunch hit the market.
Result 2. There is a significant increase in spread and volatility of interest rates at which liquidity is traded among different types (small, large and foreign) of banks after the credit crunch has taken place.
Result 3. The smaller banks are able to negotiate the best lending and borrowing conditions during the crisis contrary to the large banks, which had the best conditions before the credit crunch affected this market.
Result 4. The foreign banks lend money at rates which are even lower than the ECB’s deposit rate. On the other hand are foreign banks borrowing at highest rates in the Dutch market. This combination of high borrowing rates and low lending rates implies that these banks seem to manage the least favourable conditions during the credit crunch.
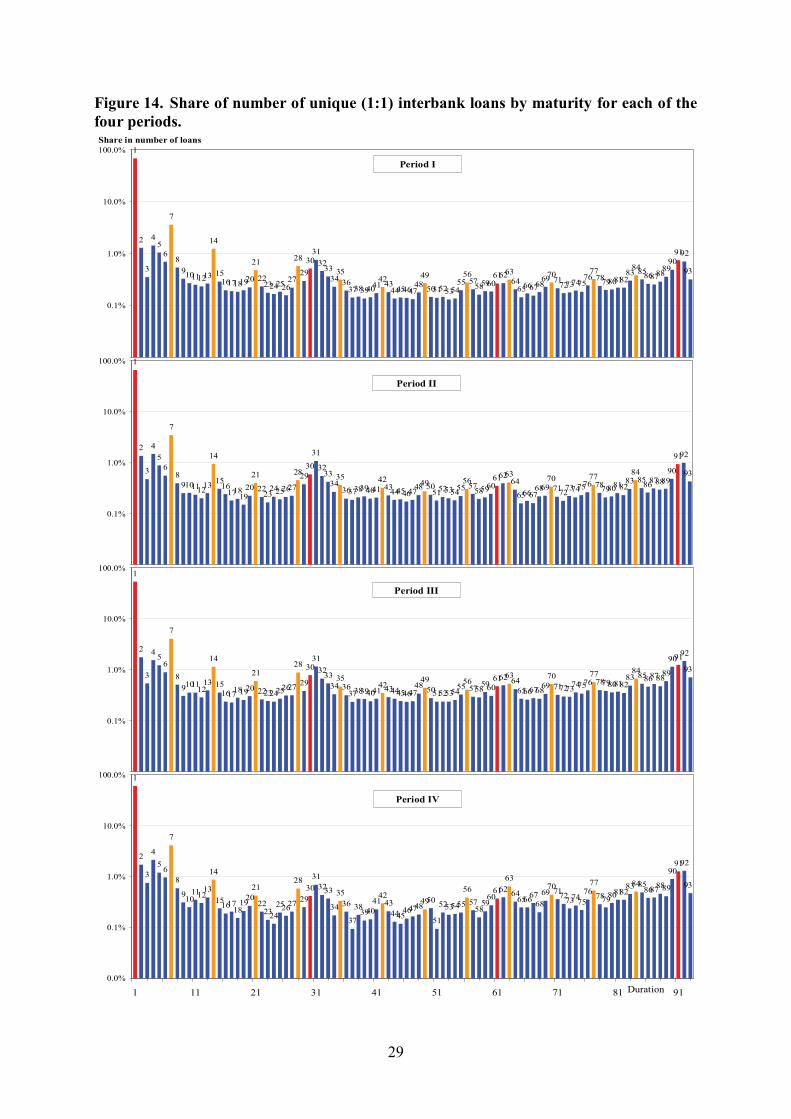
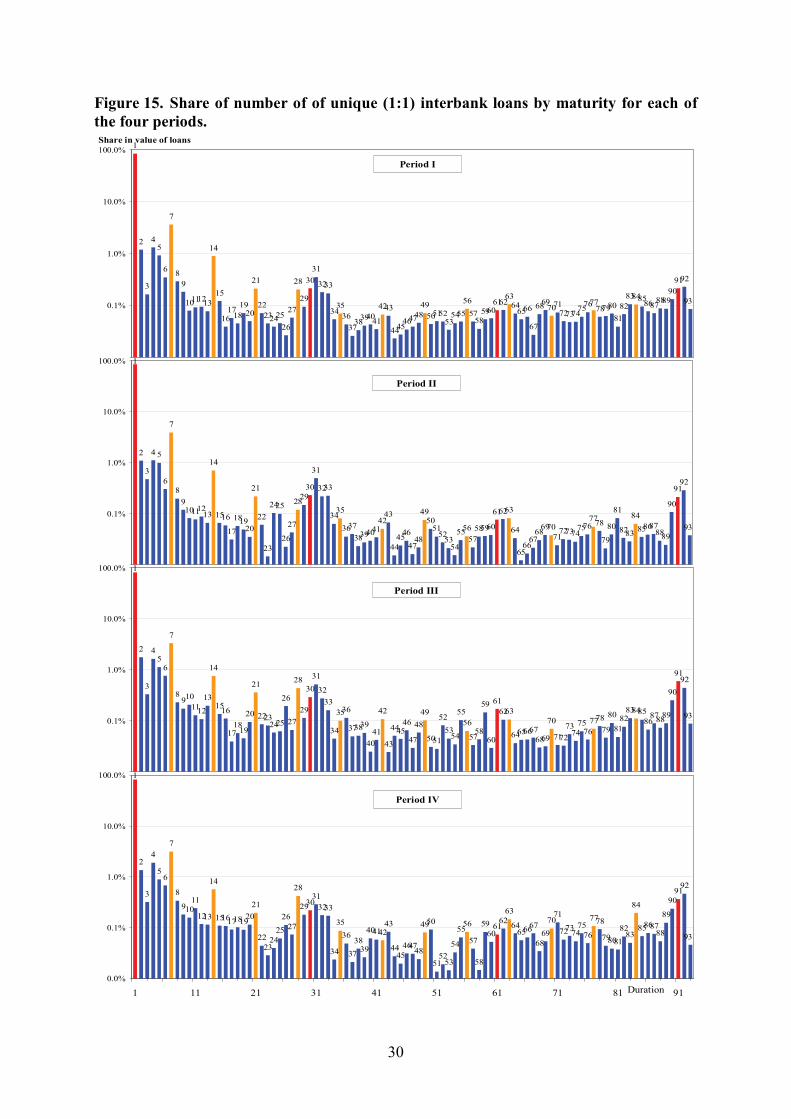
Further investigation of the unsecured Dutch interbank money market makes clear that the majority of the interbank transactions in both value and number have a very short maturity. Almost 59% of the total number of loans and almost 90% of the total value of the loans has a maturity of 1 week or shorter (see Figure 14 and Figure 15 of the Appendix). Fifty percent of the number of transactions (with maturities up to 3 months) is overnight. The second most frequent traded loans are the weekly loans, with 4.4%. Besides the overnight and 1 week loans, liquidity is also traded regularly in the duration buckets of 2, 3, 4, 5 etc weeks and 1, 2
19
and 3, etc months. The overnight loans are even in value most important with 82% of the total value and are followed by the one week loans with 4.4%. The Appendix shows the distribution of the number and value of the loans for each period for maturities up to 3 months, which is the most liquid part of the interbank unsecured money market.
Result 5. The majority of the transactions in the unsecured Dutch part of the money market take place in the very short end: 50% of the number of transactions and 82% of the value are overnight.
A normal functioning unsecured Dutch interbank market distinguishes some periodical higher trading activity due to reserve requirements and financial reporting. At the end of reserve maintenance periods, banks trade more heavily in the interbank market to fulfil the remaining parts of their requirements. A similar reasoning can be given for the higher market activity at end of months, quarters, 6 months and year as a consequence of accounting smoothing instead of central bank obligations. These behavioural aspects are typical for the interbank money market and are also visible in other markets (Iori et al., 2008; Cocco et al., 2009).
Result 6. There is an increase in the interbank loan activity at the end of the reserve maintenance period and the ends of (financial) reporting periods.
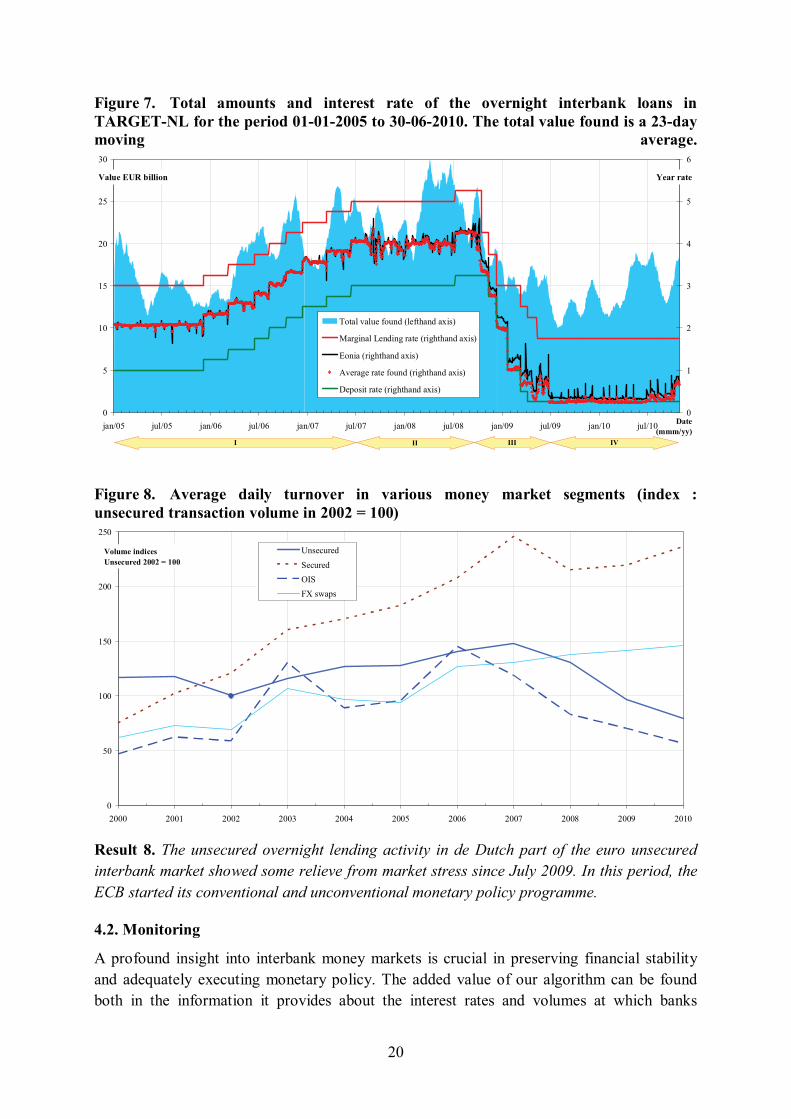
Our data-analysis confirms the significant decrease in the number and the value of the overnight loans traded in the Dutch part of the euro unsecured money market, since the start of the crisis in September 2008. The average total turnover decreased from EUR 23.5 billion in period II to EUR 17.3 billion in period III and EUR 13.4 billion in period IV, see Figure 7. However, it seems there has been some relief in the stressed market in the summer of 2009, because there is an upward trend in unsecured overnight lending. In this period, the ECB started injecting extra liquidity into the system by its special, very long term (duration of 1 year) tender operations and unconventional monetary policy measures.
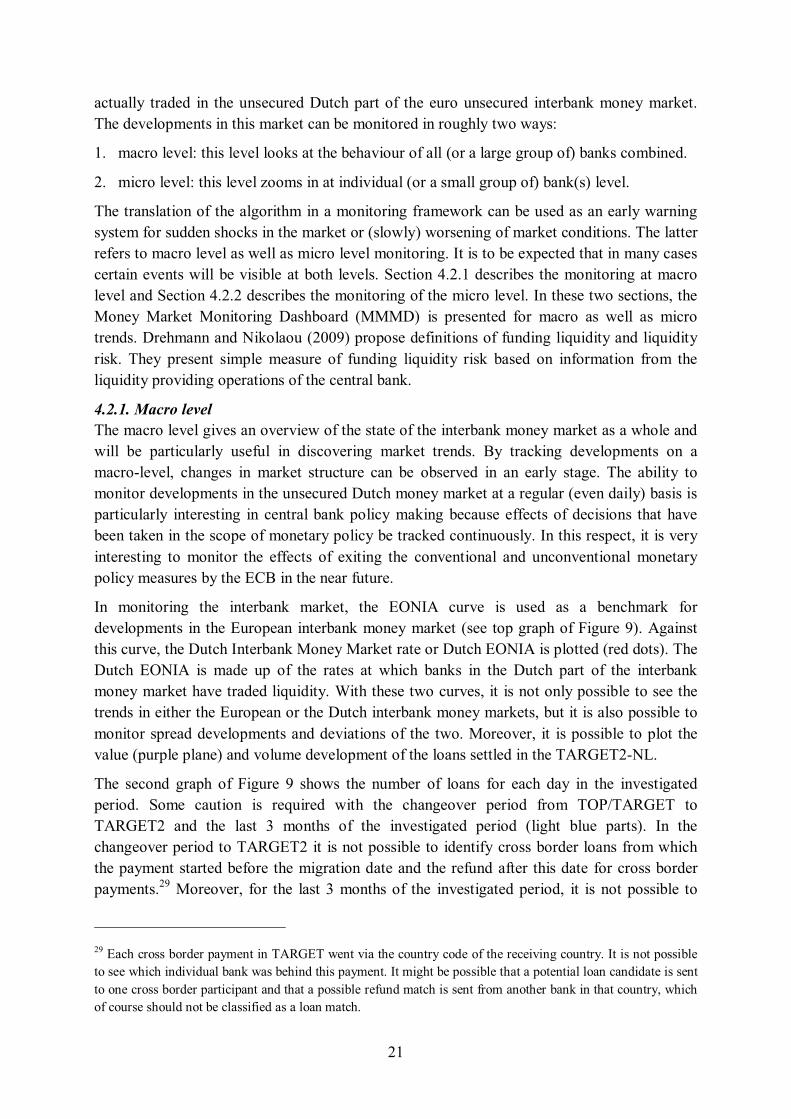
As a consequence of the increased risk-aversion during the credit crisis, we expected to see a clear shift (from longer) to shorter term loans after the failure of Lehman Brothers. This shift is however not supported by our findings. The euro money market survey (ECB, 2009) and anecdotal evidence suggest that this could be explained by market participants that are changing their trading activity from the unsecured to the secured interbank market, especially in the short end, see Figure 8.28 The preference for secured lending lies in the fact that the collateral that is part of the secured trading reduces (counterparty) risk. We have to rely on this evidence because we are not able to check this in our model, because of a lack of secured money market transaction data.
Result 7. The credit crunch resulted in a significant decrease in the volume of unsecured liquidity traded in the Dutch part of the euro unsecured interbank. But the market did not completely vanish. Contrary to our expectations, there was no clear shift from long(er) to short(er) term unsecured lending. Increased preference for secured liquidity trading may be an explanation.
28 Chart is from ECB, Euro money market survey 2009
20
Figure 7. Total amounts and interest rate of the overnight interbank loans in TARGET-NL for the period 01-01-2005 to 30-06-2010. The total value found is a 23-day moving average.
0
5
10
15
20
25
30
jan/05 jul/05 jan/06 jul/06 jan/07 jul/07 jan/08 jul/08 jan/09 jul/09 jan/10 jul/10 Date (mmm/yy)
Value EUR billion
0
1
2
3
4
5
6
Year rate
Total value found (lefthand axis)
Marginal Lending rate (righthand axis)
Eonia (righthand axis)
Average rate found (righthand axis)
Deposit rate (righthand axis)
I II III IV
Figure 8. Average daily turnover in various money market segments (index : unsecured transaction volume in 2002 = 100)
0
50
100
150
200
250
2000 2001 2002 2003 2004 2005 2006 2007 2008 2009 2010
Volume indicesUnsecured 2002 = 100
Unsecured
SecuredOISFX swaps
Result 8. The unsecured overnight lending activity in de Dutch part of the euro unsecured interbank market showed some relieve from market stress since July 2009. In this period, the ECB started its conventional and unconventional monetary policy programme.
4.2. Monitoring
A profound insight into interbank money markets is crucial in preserving financial stability and adequately executing monetary policy. The added value of our algorithm can be found both in the information it provides about the interest rates and volumes at which banks
21
actually traded in the unsecured Dutch part of the euro unsecured interbank money market. The developments in this market can be monitored in roughly two ways:
1. macro level: this level looks at the behaviour of all (or a large group of) banks combined.
2. micro level: this level zooms in at individual (or a small group of) bank(s) level.
The translation of the algorithm in a monitoring framework can be used as an early warning system for sudden shocks in the market or (slowly) worsening of market conditions. The latter refers to macro level as well as micro level monitoring. It is to be expected that in many cases certain events will be visible at both levels. Section 4.2.1 describes the monitoring at macro level and Section 4.2.2 describes the monitoring of the micro level. In these two sections, the Money Market Monitoring Dashboard (MMMD) is presented for macro as well as micro trends. Drehmann and Nikolaou (2009) propose definitions of funding liquidity and liquidity risk. They present simple measure of funding liquidity risk based on information from the liquidity providing operations of the central bank.
4.2.1. Macro level The macro level gives an overview of the state of the interbank money market as a whole and will be particularly useful in discovering market trends. By tracking developments on a macro-level, changes in market structure can be observed in an early stage. The ability to monitor developments in the unsecured Dutch money market at a regular (even daily) basis is particularly interesting in central bank policy making because effects of decisions that have been taken in the scope of monetary policy be tracked continuously. In this respect, it is very interesting to monitor the effects of exiting the conventional and unconventional monetary policy measures by the ECB in the near future.
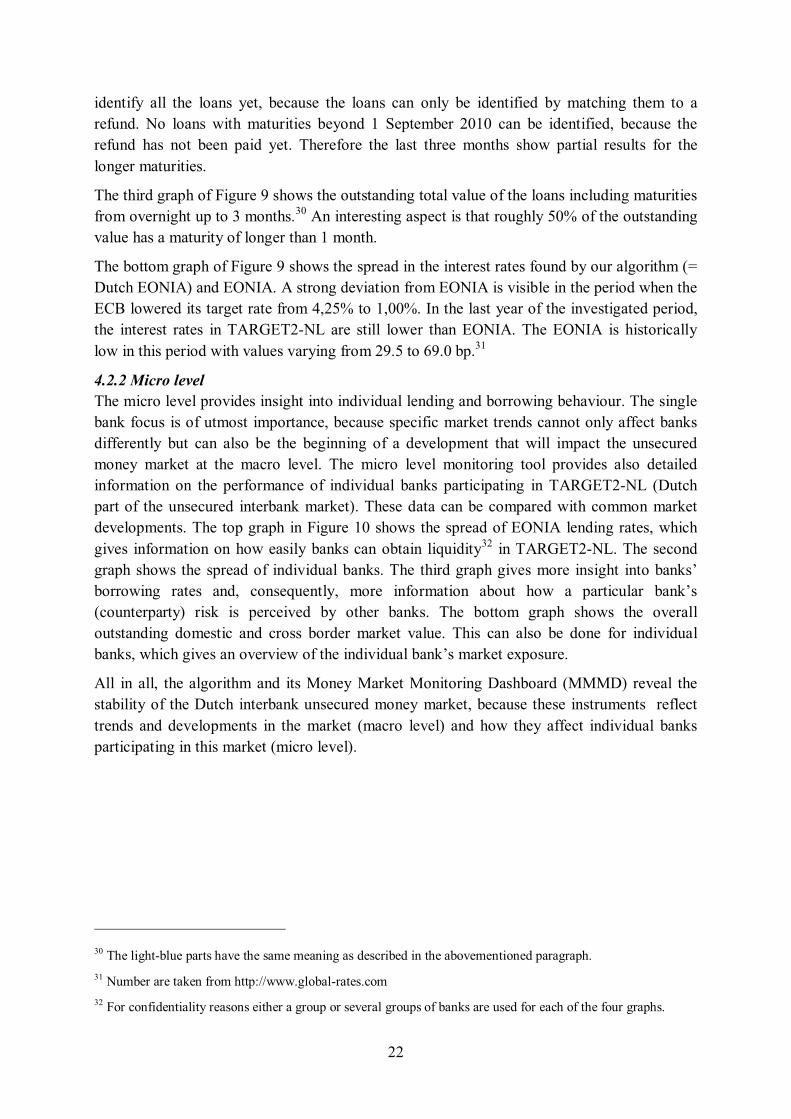
In monitoring the interbank market, the EONIA curve is used as a benchmark for developments in the European interbank money market (see top graph of Figure 9). Against this curve, the Dutch Interbank Money Market rate or Dutch EONIA is plotted (red dots). TheDutch EONIA is made up of the rates at which banks in the Dutch part of the interbank money market have traded liquidity. With these two curves, it is not only possible to see the trends in either the European or the Dutch interbank money markets, but it is also possible to monitor spread developments and deviations of the two. Moreover, it is possible to plot the value (purple plane) and volume development of the loans settled in the TARGET2-NL.
The second graph of Figure 9 shows the number of loans for each day in the investigated period. Some caution is required with the changeover period from TOP/TARGET to TARGET2 and the last 3 months of the investigated period (light blue parts). In the changeover period to TARGET2 it is not possible to identify cross border loans from which the payment started before the migration date and the refund after this date for cross border payments.29 Moreover, for the last 3 months of the investigated period, it is not possible to
29 Each cross border payment in TARGET went via the country code of the receiving country. It is not possible to see which individual bank was behind this payment. It might be possible that a potential loan candidate is sent to one cross border participant and that a possible refund match is sent from another bank in that country, which of course should not be classified as a loan match.
22
identify all the loans yet, because the loans can only be identified by matching them to a refund. No loans with maturities beyond 1 September 2010 can be identified, because the refund has not been paid yet. Therefore the last three months show partial results for the longer maturities.
The third graph of Figure 9 shows the outstanding total value of the loans including maturities from overnight up to 3 months.30 An interesting aspect is that roughly 50% of the outstanding value has a maturity of longer than 1 month.
The bottom graph of Figure 9 shows the spread in the interest rates found by our algorithm (= Dutch EONIA) and EONIA. A strong deviation from EONIA is visible in the period when the ECB lowered its target rate from 4,25% to 1,00%. In the last year of the investigated period, the interest rates in TARGET2-NL are still lower than EONIA. The EONIA is historically low in this period with values varying from 29.5 to 69.0 bp.31
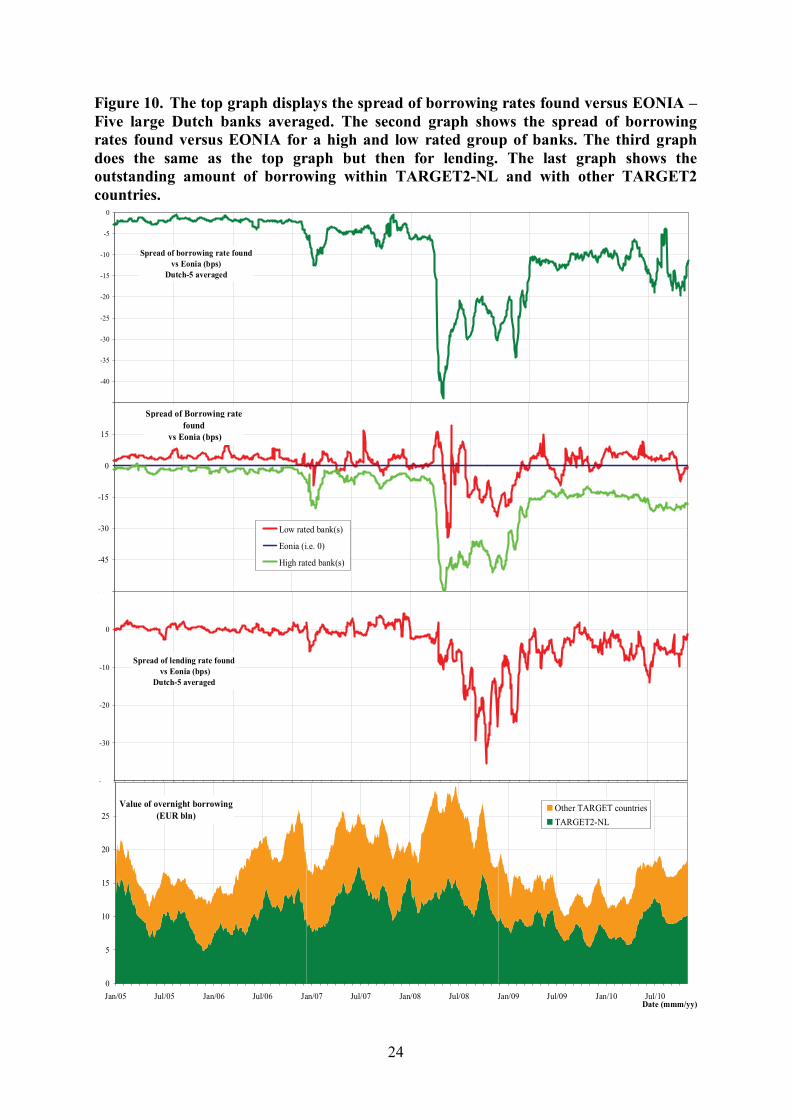
4.2.2 Micro level The micro level provides insight into individual lending and borrowing behaviour. The single bank focus is of utmost importance, because specific market trends cannot only affect banks differently but can also be the beginning of a development that will impact the unsecured money market at the macro level. The micro level monitoring tool provides also detailed information on the performance of individual banks participating in TARGET2-NL (Dutch part of the unsecured interbank market). These data can be compared with common market developments. The top graph in Figure 10 shows the spread of EONIA lending rates, which gives information on how easily banks can obtain liquidity32 in TARGET2-NL. The second graph shows the spread of individual banks. The third graph gives more insight into banks’ borrowing rates and, consequently, more information about how a particular bank’s (counterparty) risk is perceived by other banks. The bottom graph shows the overall outstanding domestic and cross border market value. This can also be done for individual banks, which gives an overview of the individual bank’s market exposure.
All in all, the algorithm and its Money Market Monitoring Dashboard (MMMD) reveal the stability of the Dutch interbank unsecured money market, because these instruments reflect trends and developments in the market (macro level) and how they affect individual banks participating in this market (micro level).
30 The light-blue parts have the same meaning as described in the abovementioned paragraph. 31 Number are taken from http://www.global-rates.com 32 For confidentiality reasons either a group or several groups of banks are used for each of the four graphs.
23
Figure 9. Money Market Monitoring Dashboard (MMMD): The top graph displays the EONIA and the Dutch interest rates at which Dutch banks trade overnight and the blue area indicates the overnight volume development. The second graph shows the number of loans that is traded in every maturity bucket. The third graph does the same for the outstanding value and the last graph shows the spread of the “Dutch” EONIA with the EONIA. The light blue vertical strips in the second and third graphs mark the periods in which not all durations are available yet.
0
200
400
600
05/ 01 05 /07 0 6/01 06/0 7 07/ 01 07/ 07 08/ 01 08/ 07 09/ 01 09 /07 1 0/01 10/0 7
Number of loans
Pink: 60-93 days
Green: 30-59 daysBlue: 14-29 days
Red : 1-13 days
0
30
60
90
120
150
05 /01 05/ 07 06/01 06 /07 07/ 01 07/07 08/ 01 08/0 7 09/ 01 09/ 07 10/ 01 10/ 07
Outstanding value of loans
Pink: 60-93 days
Green: 30-59 daysBlue: 14-29 days
Red : 1-13 days
-30
-20
-10
0
Jan/05 Jul/05 Jan/06 Jul/06 Jan/07 Jul/07 Jan/08 Jul/08 Jan/09 Jul/09 Jan/10 Jul/10
Date (mmm/yy)
Spread of Dutch Eonia-/- Eonia (bps)
EoniaDutch Eonia
0
5
10
15
20
25
30
j an/ 05 j ul /05 j an/06 j ul /0 6 j an/ 07 ju l/ 07 j an/ 08 j ul/ 08 jan /09 j ul /09 j an/ 10 ju l/ 10
Value EUR billion
0
1
2
3
4
5
6
Year rate
Total value found (EUR bio)
Marginal Lending rate (righthand axis)
Eonia (righthand axis)
Average rate found (righthand axis)
Deposit rate (righthand axis)
24
Figure 10. The top graph displays the spread of borrowing rates found versus EONIA – Five large Dutch banks averaged. The second graph shows the spread of borrowing rates found versus EONIA for a high and low rated group of banks. The third graph does the same as the top graph but then for lending. The last graph shows the outstanding amount of borrowing within TARGET2-NL and with other TARGET2 countries.
-45
-40
-35
-30
-25
-20
-15
-10
-5
0
06/ 01 06 /07 07/ 01 07/ 07 08/0 1 08/ 07 0 9/01 09/ 07 1 0/01 10/ 07
Spread of borrowing rate found vs Eonia (bps)
Dutch-5 averaged
-60
-45
-30
-15
0
15
30
Jan/ 06 Jul /06 Jan/ 07 Jul /07 Jan/0 8 Jul /08 Jan/ 09 Jul /09 Jan/ 10 Jul /10
Spread of Borrowing rate found
vs Eonia (bps)
Low rated bank(s)
Eonia (i.e. 0)
High rated bank(s)
-40
-30
-20
-10
0
10
06/ 01 06/ 07 07/ 01 07/ 07 08/ 01 08/ 07 09/ 01 09/ 07 10/ 01 1 0/07
Spread of lending rate found vs Eonia (bps)
Dutch-5 averaged
0
5
10
15
20
25
30
Jan/05 Jul/05 Jan/06 Jul/06 Jan/07 Jul/07 Jan/08 Jul/08 Jan/09 Jul/09 Jan/10 Jul/10Date (mmm/yy)
Value of overnight borrowing (EUR bln)
Other TARGET countriesTARGET2-NL
25
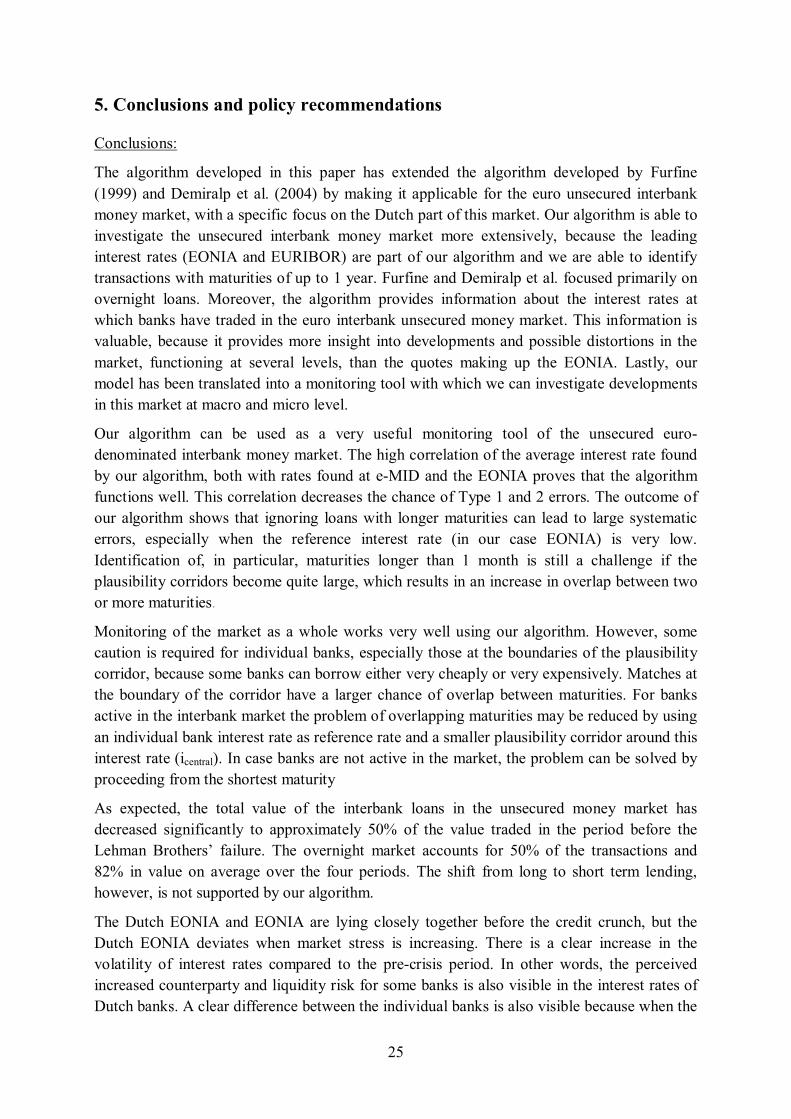
5. Conclusions and policy recommendations
Conclusions:
The algorithm developed in this paper has extended the algorithm developed by Furfine (1999) and Demiralp et al. (2004) by making it applicable for the euro unsecured interbank money market, with a specific focus on the Dutch part of this market. Our algorithm is able to investigate the unsecured interbank money market more extensively, because the leading interest rates (EONIA and EURIBOR) are part of our algorithm and we are able to identify transactions with maturities of up to 1 year. Furfine and Demiralp et al. focused primarily on overnight loans. Moreover, the algorithm provides information about the interest rates at which banks have traded in the euro interbank unsecured money market. This information is valuable, because it provides more insight into developments and possible distortions in the market, functioning at several levels, than the quotes making up the EONIA. Lastly, our model has been translated into a monitoring tool with which we can investigate developments in this market at macro and micro level.
Our algorithm can be used as a very useful monitoring tool of the unsecured euro-denominated interbank money market. The high correlation of the average interest rate found by our algorithm, both with rates found at e-MID and the EONIA proves that the algorithm functions well. This correlation decreases the chance of Type 1 and 2 errors. The outcome of our algorithm shows that ignoring loans with longer maturities can lead to large systematic errors, especially when the reference interest rate (in our case EONIA) is very low. Identification of, in particular, maturities longer than 1 month is still a challenge if the plausibility corridors become quite large, which results in an increase in overlap between two or more maturities.
Monitoring of the market as a whole works very well using our algorithm. However, some caution is required for individual banks, especially those at the boundaries of the plausibility corridor, because some banks can borrow either very cheaply or very expensively. Matches at the boundary of the corridor have a larger chance of overlap between maturities. For banks active in the interbank market the problem of overlapping maturities may be reduced by using an individual bank interest rate as reference rate and a smaller plausibility corridor around this interest rate (icentral). In case banks are not active in the market, the problem can be solved by proceeding from the shortest maturity
As expected, the total value of the interbank loans in the unsecured money market has decreased significantly to approximately 50% of the value traded in the period before the Lehman Brothers’ failure. The overnight market accounts for 50% of the transactions and 82% in value on average over the four periods. The shift from long to short term lending, however, is not supported by our algorithm.
The Dutch EONIA and EONIA are lying closely together before the credit crunch, but the Dutch EONIA deviates when market stress is increasing. There is a clear increase in the volatility of interest rates compared to the pre-crisis period. In other words, the perceived increased counterparty and liquidity risk for some banks is also visible in the interest rates of Dutch banks. A clear difference between the individual banks is also visible because when the
26
credit crunch was intensifying, interest rates at which participants were trading became more volatile and the spread of rates at which different types of banks can borrow and lend liquidity is increasing. The ease at which bank have access to liquidity seems to become more dependent on the individual bank characteristics. The smaller banks are able to negotiate the best lending and borrowing conditions during the crisis contrary to the large banks, which had the best conditions before the credit crunch started. The foreign banks seem to have the least favourable conditions during the credit crunch, because they borrow liquidity at highest rates and lend money at rates which are even lower than the ECB’s deposit rate. The latter is unexpected and an interesting phenomenon because the ECB deposit rate is regarded as the lower bound in the market and would therefore induce banks to trade liquidity at higher rates than the overnight deposit rate. However, this situation can exist because interest rate levels in the market already are very close to the overnight deposit rate as a result of the low interest rate environment and over liquidity in the market.
Policy recommendations
Using the algorithm developed in this paper, it is possible to obtain a good overview of the unsecured euro-denominated interbank money market. The different aspects of the crisis are clearly visible in the interbank market; at first from the failure of Lehman Brothers, but later on also from the ECB’s conventional and unconventional monetary policy measures. Monitoring the interbank market at both macro and micro level gives a good understanding of the current status of the money market. The Monitoring Money Market Dashboard (MMMD) developed in this paper provides an interesting overview of developments in the euro interbank money market at both levels.
The MMMD could also be used for policy making regarding the unsecured interbank money market and monetary policy. It is a generally accepted idea that the liquidity provision of central banks at the current rate and amount cannot continue forever. When central banks are executing their exit strategies, the monitoring tool described in this paper is very valuable for tracking the effects both at macro and micro market level. Especially the monitoring on micro level will be interesting, because individual banks will, most likely, not react similarly to the upcoming policy measures of central banks. This is partly caused by the segmentation of the market into groups of banks on the basis of differences in perceived counterparty risk. In short, this monitoring tool allows us to look at the financial stability of the unsecured Dutch interbank money market.
References
Allen, F., E. Carletti, D. Gale (2009): “Interbank market liquidity and central bank intervention”, Journal of Monetary Economics 56, 639-652
Allen, F. and D. Gale (2000): “Financial contagion”, Journal of Political Economy 108, 1-33 Bech, M., B. Hobijn (2007): “Technology diffusion within central banking: The case of real-time gross
settlement”, International Journal of Central Banking 3, 147-182 Bhattacharya, S. and D. Gale (1987): “Preference shocks, liquidity and central bank policy, in Barnett W.,
Singelton, K. (Eds)”, New approaches to monetary economics, Cambridge University Press, Cambridge, 68-88.
Carlin, B., M. Lobo, S. Viswanathan (2007): ‘’Episodic liquidity crisis: The effect of predatory and cooperative trading’’, Journal of Finance 62, 2235-2274
27
Cocco, J.F (2009), F.J. Gomes, N.C. Martins: “Lending relationships in the interbank market”, Journal Financial Intermediation, 24-48
Committee on Payment and Settlement Systems (2001): “Core Principles for systemically important payment systems”, Bank for International Settlement
Committee on Payment and Settlement Systems (2003): “The role of central bank money in payment systems”, Bank for International Settlement
Committee on Payment and Settlement Systems (2010): “Statistics on payment and settlement systems in countries: Figures for 2009”, Bank for International Settlement
Demiralp, S., B. Preslopsky, W. Whitesell (2004): “Overnight interbank loans”, manuscript Board of Governors of the Federal Reserve
Drehmann, M., K. Nikolaou (2009): “Funding liquidity risk definitions and measurements”, ECB working paper series 1024
European Central Bank (2004): “The monetary policy of the ECB”, Second Edition, January European Central Bank (2006): “Blue Book: Payment and securities settlement systems in the European Union
and in the acceding countries”, addendum incorporating 2005 data”, Farooq Akram, Q., C Christophersen (2010): “Interbank overnight rates - gains from systemic importance”,
Norges Bank working paper 2010/11 Freixas, X. and C. Holthausen (2005):’’Interbank market integration under asymmetric information’’, Rev.
Fin.Study 18, p. 458-490 Freixas, X., B. Parigi, J.C. Rochet (2000): “Systemic risk, interbank relations and liquidity precision by the
central bank”, Journal of Money, Credit and Banking 32, 611-638Furfine, C. (1999): “The microstructure of the federal funds market”, Financial Markets, Institutions and
Instruments, V8 N5, 24-44 Gorton, G., (2009): ‘’Information, Liquidity, and the (ongoing) panic of 2007’’, prepared for AER papers and
proceedings, ssnr.com Ho, T. and A. Saunders (1985): “A micro-model of the Federal funds market”, Journal of Finance 40, 977-990 Iori, G., G. De Masi, O. Vasile Precup, G. Gabbi, G. Caldarelli (2008): “A network analysis of the Italian
overnight money market”, Journal of Economic Dynamics & Control 32, 259-278 Iori, G., S. Jafarey, F. Padilla (2006): “Systemic risk on the interbank market”, Journal of Economic Behaviour
and Organization 61 (4), 525-524 Spindler, A. and B. Summers (1994), “The central bank and the payment system”, Washington DC IMF Stigum, M. (1990): “The money market”, 3rd ed., Dow Jones-Irwin, Homewood, Illinois
Appendix
Figure 11. Comparison of EONIA interest rates found
0.0
0.5
1.0
1.5
2.0
2.5
3.0
3.5
4.0
4.5
Jan/08 Apr/08 Jul/08 Oct/08 Jan/09 Apr/09 Jul/09 Oct/09 Jan/10 Apr/10 Date (yyy/mm)
Year rates
e-MID Average rateTARGET2-NL average rate
28
Figure 12. Overview developments ECB target rate and standing facilities.
0
1
2
3
4
5
6
Jan/98 Jan/99 Jan/00 Jan/01 Jan/02 Jan/03 Jan/04 Jan/05 Jan/06 Jan/07 Jan/08 Jan/09 Jan/10 Date
Rate Upper bound corridor (Marginal Lending)
Target rate
Lower bound corridor (Deposit)
Figure 13. Presents the Dutch EONIA, out of our dataset and by applying our algorithm, together with the EONIA (source: Bloomberg)
0.0
0.5
1.0
1.5
2.0
2.5
3.0
3.5
4.0
4.5
Jan/05 Jul/05 Jan/06 Jul/06 Jan/07 Jul/07 Jan/08 Jul/08 Jan/09 Jul/09 Jan/10 Jul/10
Date (mmm/yy)
Year rate
EoniaDutch Eonia
29
Figure 14. Share of number of unique (1:1) interbank loans by maturity for each of the four periods.
1
2
3
45
6
7
8910111213
14
151617181920
21
2223242526
27
28
2930
3132
3334
3536
37383940414243
4445464748
49
505152535455
5657585960
61626364
656667686970
717273747576
777879808182
83848586878889
909192
93
0.0%
0.1%
1.0%
10.0%
100.0%Share in number of loans
Period I
1
2
3
45
6
7
8910111213
14
1516
171819
2021
2223
24252627
282930
31
3233
3435
36373839404142
43444546474849505152535455
5657585960616263
64
6566676869
70717273747576
777879808182
8384
858687888990
9192
93
0.0%
0.1%
1.0%
10.0%
100.0%
Period II
1
2
3
4 56
7
89101112
13
14
151617181920
21
222324252627
28
29
3031
323334
3536
3738394041424344454647
4849
5051525354555657585960
61626364
656667686970
71727374757677
787980818283
848586878889
909192
93
0.0%
0.1%
1.0%
10.0%
100.0%
Period III
1
2
3
45 6
7
8
9101112
13
14
15161718
192021
222324
252627
28
2930
313233
34
3536
37
383940
4142
434445
4647484950
51
52535455
5657
5859
606162
63
64656667
6869
70717273747576
77
7879808182838485
86878889
909192
93
0.0%
0.1%
1.0%
10.0%
100.0%
1 11 21 31 41 51 61 71 81 91Duration
Period IV
30
Figure 15. Share of number of of unique (1:1) interbank loans by maturity for each of the four periods.
1
2
3
45
6
7
89
10111213
14
15
1617
1819
20
21
22232425
26
27
28
29
3031
3233
3435
3637
38394041
4243
4445464748
49505152
535455
5657
585960
616263
646566
67
68697071
727374757677787980
8182
8384858687888990
9192
93
0.0%
0.1%
1.0%
10.0%
100.0%Share in value of loans
Period I
1
2
3
4 5
6
7
89101112
13
14
1516
17
181920
21
22
23
2425
26
27
282930
31
3233
3435
363738394041
4243
444546
4748
4950
5152
5354
555657
585960
616263
64
6566
67686970
71727374
75767778
79
80
81
8283
84
8586878889
90
9192
93
0.0%
0.1%
1.0%
10.0%
100.0%
Period II
1
2
3
45
6
7
8910
1112
13
14
1516
1718
19
20
21
22232425
26
27
28
29
3031
3233
34
3536
373839
4041
42
43
444546
47
4849
5051
5253
54
5556
5758
59
60
616263
646566676869
70
717273
7475
767778
79
80
8182
83848586
878889
90
9192
93
0.0%
0.1%
1.0%
10.0%
100.0%
Period III
1
2
3
4
56
7
8
91011
1213
14
15161718192021
2223
2425
2627
28
293031
3233
34
3536
3738
39
40414243
4445
464748
4950
5152
53
54
5556
57
58
5960
6162
63
64656667
6869
7071
72737475
76
7778
798081
8283
84
85868788
89
9091
92
93
0.0%
0.1%
1.0%
10.0%
100.0%
1 11 21 31 41 51 61 71 81 91Duration
Period IV

DN
B W
OR
KIN
GP
AP
ER
DNB Working PaperNo. 35/April 2005
Jan Kakes and Cees Ullersma
Financial acceleration of booms
and busts
De Nederlandsche BankDe Nederlandsche Bank