OPPORTUNITY TO LEARN, INSTRUCTIONAL ALIGNMENT AND TEST ...
166
1 OPPORTUNITY TO LEARN, INSTRUCTIONAL ALIGNMENT AND TEST PREPARATION: A RESEARCH REVIEW Jaap Scheerens (ed.)
Transcript of OPPORTUNITY TO LEARN, INSTRUCTIONAL ALIGNMENT AND TEST ...
1
OPPORTUNITY TO LEARN,
INSTRUCTIONAL ALIGNMENT AND TEST
PREPARATION: A RESEARCH REVIEW
Jaap Scheerens (ed.)
2
OPPORTUNITY TO LEARN,
INSTRUCTIONAL ALIGNMENT AND TEST
PREPARATION: A RESEARCH REVIEW
Jaap Scheerens (ed.)
With contributions from Marloes Lamain, Hans Luyten, Peter
Noort and Pieter Appelhof
3
TABLE OF CONTENTS
CHAPTER 1: FOCUS AND DESIGN OF THE REVIEW STUDY
CHAPTER II: CONCEPTUALIZATION
CHAPTER III: META-ANALYSES AND DESCRIPTIONS OF ILLUSTRATIVE
STUDIES
CHAPTER IV: SCHEMATIC OVERVIEW OF RESEARCH STUDIES
CHAPTER V: PREDICTIVE POWER OF OTL MEASURES IN TIMSS AND PISA
CHAPTER VI: RECAPITALIZATION, IMPLICATIONS FOR EDUCATIONAL
POLICY AND PRACTICE AND FUTURE RESEARCH
4
MANAGEMENT SAMENVATTING
Context
In dit rapport wordt verslag gedaan van een overzichtsstudie naar de effecten van de aansluiting
van in het onderwijs aangeboden leerstof met de inhoud van examens en toetsen. In het
vakjargon wordt deze aansluiting aangeduid met de term “Opportunity to Learn” (afgekort tot
OTL), letterlijk dus de gelegenheid die aan leerlingen geboden wordt om goed voor de dag te
komen op toetsen en examens. Zo op het eerste gezicht lijkt de stelling dat er meer kans is op
goede leerprestaties, wanneer de getoetste stof ook daadwerkelijk onderwezen is, een open deur.
Oppervlakkige kennisname van resultaten van onderzoek naar OTL laat echter onmiddellijk zien
dat er een behoorlijke spreiding is in de mate waarin leerkrachten, scholen, en nationale
onderwijssystemen OTL realiseren. Bij onderwijs-effectiviteitsonderzoek is vastgesteld dat OTL
een positieve relatie heeft met leerprestaties. In absolute termen is dat een klein effect, maar in
vergelijking met andere effectiviteit bevorderende kenmerken, zoals leertijd, een prestatiegericht
klimaat en frequente toetsing, steekt het OTL effect niet slecht af. Wel zijn er grote verschillen in
de gemiddelde effect-groottes van OTL, zoals vastgesteld in verschillende meta-analyses, en dit
was een van de motieven om dit in de uitgevoerde studie nader te bekijken.
Resultaten
Uit de bestudering van het onderzoeksmateriaal dat de kern vormt van dit rapport resulteren de
volgende antwoorden op de kernvraag: hoe belangrijk is OTL als een door onderwijs
beïnvloedbare factor in het verbeteren van leerprestaties?
In de eerste plaats blijkt dat het aantal meta-analyses gering is. Wanneer de extreem sterke
effecten van enkele nogal gedateerde meta-anlyses buiten beschouwing worden gelaten, dan is
de gemiddelde effectgrootte ongeveer .30 (d-coëfficiënt).
In de tweede plaats laat een selectie van afzonderlijke empirische onderzoeken naar OTL
effecten, die om verschillende redenen als “high profile” kunnen worden beschouwd zeer
wisselende resultaten zien. In andere zeer doorwrochte onderzoeken waren de uitkomsten sterk
verdeeld, bijvoorbeeld wel redelijke effecten voor wiskunde, maar veel mindere effecten voor
natuurwetenschappen (science).
In de derde plaats werden dit soort onderling sterk verschillende uitkomsten ook gevonden in de
secundaire analyses op data sets van TIMSS en PISA. Enerzijds waren de OTL effecten
gebaseerd op TIMSS (Trends in Mathematics and Science Study) veel kleiner en in geringe mate
generaliserend over landen dan in PISA (2012- PISA staat voor Programme for International
Student Assessment), anderzijds waren er voor wiskunde wel effecten, maar voor science
nauwelijks.
5
In de vierde plaats bevestigde een schematische analyse van ongeveer 50 empirische
onderzoeken naar OTL- effecten het al gevestigde beeld van een grote spreiding in uitkomsten.
Een telling van de proportie significant positieve associaties tussen OTL en leerling prestaties
leverde een percentage van 44 op, wat vergelijkbaar is met effecten van andere effectiviteit
bevorderende factoren, zoals leertijd en ouder betrokkenheid.
Samengevat vonden we veel verschillen in de uitkomsten van meta-analyses en afzonderlijke
research studies en vielen de gemiddelde effect-groottes wat tegen.
Interpretatie
Welke verklaringen kunnen nu worden gegeven voor deze uitkomsten, en welke betekenis
hebben de resultaten voor het onderwijsbeleid en de onderwijspraktijk? We kijken daarbij
enerzijds naar methodologische verklaringen en verder naar de mate waarin de theorie over OTL
overeenkomt met de praktijk.
Onderzoeksmethoden
OTL kan met verschillende methoden worden gemeten. Leerkrachten kunnen beoordelen in
hoeverre zij in de les aandacht hebben besteed aan de getoetste leerinhouden. Ook leerlingen kan
gevraagd worden om aan te geven welke onderdelen van een toets daadwerkelijk behandeld zijn.
En verder zou er gewerkt kunnen worden met observaties in klassen, en zouden leerkrachten
gevraagd kunnen worden om een logboek bij te houden over wat er onderwezen is. In de
uitgevoerde secundaire analyse op TIMSS en PISA bestanden bleek dat OTL effecten, gebaseerd
op oordelen van leerlingen, veel sterker waren dan de TIMSS effecten, die gebaseerd waren op
leerkrachtoordelen. Of deze uitkomst alleen aan de kwaliteit van de beoordelingsmethode kan
worden toegeschreven is overigens de vraag, omdat OTL in PISA voor een zeer nauw
omschreven leerstofdomein was gedefinieerd in vergelijking met OTL in TIMSS. Nader
onderzoek is op dit terrein gewenst.
Theorie en (weerbarstige) praktijk
OTL kan het beste worden uitgelegd vanuit de curriculumtheorie. Men onderscheidt binnen die
theorie het beoogde curriculum (nationale doelstellingen, standaarden), het daadwerkelijk
onderwezen, oftewel geïmplementeerde curriculum, en het gerealiseerde curriculum. Met het
gerealiseerde curriculum bedoelt men de leereffecten bij leerlingen, zoals die worden vastgesteld
met een eindtoets of examen. De verwachting is dat het daadwerkelijk gegeven onderwijs (het
geïmplementeerde curriculum) zowel goed is afgestemd op de nationale standaarden, als goed
voorbereidt op het examen. Daarbij kunnen zich problemen voordoen, bijvoorbeeld wanneer de
nationale onderwijsdoelen heel algemeen zijn, zodat ze weinig houvast bieden. Ook kan het
voorkomen dat er wel concrete doelen of standaarden zijn, maar dat de examens niet goed bij die
doelstellingen aansluiten. De vraag over goede aansluiting (Engels: alignment) doet zich ook
voor bij leerboeken, methodes en digitale methoden. Het ideaal van een goede aansluiting tussen
6
de diverse componenten van het curriculum (doelen, standaarden, leermethoden, daadwerkelijk
gegeven onderwijs en toetsen/examens) wordt in ieder onderwijsstelsel anders aangepakt. Maar
meestal wordt de aansluiting niet strak geregeld of bestuurd en is eerder sprake van een
samenspel tussen autonome instanties en betrokken. Tegen deze achtergrond zijn zowel
variërende effectiviteit van OTL als over het algemeen bescheiden effect-groottes beter te
begrijpen.
Implicaties voor beleid en onderwijspraktijk
In het rapport worden verschillende mogelijkheden besproken om OTL, en curriculum alignment
in ruimere zin, beter tot hun recht te laten komen. Specifieke aandacht is besteed aan de mogelijk
leidende rol van toetsen en examens bij het optimaliseren van OTL. Een basisvoorwaarde hierbij
is dat toetsen en examens aan kwaliteitseisen voldoen, onder meer wat betreft de dekking van
nationale standaarden, en een transparante ordening in domeinen en sub domeinen). Hoewel
examenvoorbereiding van alle tijden is en breed wordt toegepast, staat deze praktijk in het kwade
daglicht van “teaching to the test”. Tegelijkertijd wordt onderkend dat kennisname van de
basisstructuur en leerdimensies van toetsen en examens in de onderwijspraktijk richtinggevend
kan werken. In het afsluitende hoofdstuk wordt daarom stilgestaan bij legitieme en niet-legitieme
vormen van toets voorbereiding. Tenslotte is in het kader van OTL als legitieme toets
voorbereiding gewezen op de potentieel gunstige rol van formatieve toetsen die goed zijn
afgestemd op summatieve toetsen en examens.
7
CHAPTER 1: FOCUS AND DESIGN OF THE REVIEW STUDY
Jaap Scheerens
Study aims and research questions
Alignment between educational goals, intended and implemented curricula and educational
outcomes is considered as a characteristic of effective education. The expectation is that better
alignment leads to better student performance. The concept of Opportunity to Learn, abbreviated
as OTL, is commonly used to compare content covered, as part of the implemented curriculum,
with student achievement. As such it is to be seen as a facet of the broader concept of
“alignment”. One of the aims of this study is to further clarify these concepts, identify how they
have been used in research studies, and are employed in practice. Although opportunity to learn
was originally studied within the context of curriculum research, it has also obtained a place in
educational effectiveness research. Within this research orientation OTL is seen as “an
effectiveness enhancing condition” and can be compared with other such factors for its influence
on student achievement. As a matter of fact, results of meta-analyses would suggest that OTL
has a relatively substantial average-effect size when it is compared to other effectiveness
enhancing conditions, such as learning time and instructional leadership (Scheerens, 2016). Yet,
the number of meta-analyses and review studies on the effects of OTL is rather limited. This
study seeks to make a step towards updating the state of the art, by means of a search for meta-
analyses and recent primary studies.
Several recent trends in the ongoing global efforts to improve the quality of education provide
further perspective to assessing the state of the art on OTL, these are alignment within the
context of systemic reform, the accountability movement, and task related cooperation between
teachers.
Alignment within the context of systemic reform
In influential reports by the OECD and McKinsey the quality of educational systems is
considered in systemic terms, as a whole of impulses and mechanisms at system, school and
classroom level. (OECD, 2010, McKinsey, 2010). Alignment between levels in various
functional domains is a key concept in finding out why certain educational systems do better
than others. The expectation is that systems do better when aims, objectives, curricula and
assessment programs are well-aligned. The conceptual analysis in this report, starting out from
OTL intends to further clarify the complexity of alignment between “curricular elements” and
open up discussion on alternative interpretations, for example by comparing proactive structuring
and retroactive planning.
Accountability and its influence on teaching
As indicated in the above OTL originates from curriculum theory and research. According to a
pro-active logic aims are operationalized to standards, worked out as intended curricula, which
8
are expected to be implemented with a certain fidelity, and finally evaluated and assessed, by
means of examinations and formative and summative assessment. This is still a valid logic,
although developments in the direction of greater school and teacher autonomy may give rise to
a different orientation. More curricular autonomy that goes together with a more prominent role
of “high stakes” testing might lead to situations where teaching gets more direction from
alignment to the assessment programs than from references to rather global and “open” curricula.
A negative interpretation from this phenomenon is “teaching to the test”. A more positive
interpretation is described by terms like “exam preparation” and “instructional alignment”
(Popham, 2003, Sturman, 2011, Polikoff and Porter, 2014). One of the challenges of this study is
to provide suggestions for legitimate test preparation, while avoiding harmful interpretations in
“teaching to the test”.
Task related cooperation between teachers
The teacher has a key role in realizing “opportunity to learn”; the choice and use of textbooks
may be one issue in how this plays out. Another medium is teacher training and professional
development of teachers. Recent studies in the realm of teacher training effectiveness underline
the importance of teacher content knowledge and pedagogical content knowledge (Baumert et
al., 2010, Bloemeke et al. (2014), Scheerens and Bloemeke (2016). Within the context of
continuous “on the job” professional development teacher cooperation and “peer learning” have
obtained high profile (e.g. Thurlings & den Brock, 2014). Results of meta-analyses underline the
importance of task related work in order to make teacher cooperation effective (Lomos et al.,
2011). The results of this study will be used to provide suggestions for placing OTL and
instructional alignment on the agenda of task related teacher cooperation.
The general objectives of the review study are to create more clarity about the conceptualization
of OTL within a broader framework of educational alignment and to assess the available research
evidence about OTL effectiveness. For this latter objective the focus is on the positive
significance of OTL effect, effect sizes, and the degree to which OTL effect are related to
contextual conditions, such as subject matter area, grade level and national context where the
study was conducted.
More specifically the following research questions are addressed:
1) Which facets are to be distinguished in clarifying the overall concept of OTL, and how are
these to be placed as part of more general models of educational alignment and systemic
reform?
2) What is the average effect size of OTL (association of OTL with student achievement
outcomes), as evident from available meta-analyses, review studies, secondary analyses of
international data-sets and (recent) primary research studies?
3) What are the implications of the results on 1) and 2) for educational policy and practice?
9
Methods
The study approach consists of a conceptual analysis, based on literature review. Review of
research literature: meta-analyses, research reviews and primary research studies, and secondary
analyses on data from international assessment studies, TIMSS and PISA.
Conceptual analysis
The following issues are addressed
- The definition of OTL. OTL will be defined from the perspective of three research
traditions: curriculum research, educational effectiveness research and (international)
student assessment.
- Embedding OTL in a broader framework of “educational alignment”.
- Alternative ways to measure OTL (in terms of research methods, respondents, content focus
and/or focus on psychological operations that students are expected to master)
- The role of teachers in realizing OTL.
Literature search
First of all, an inventory will be made of available meta-analyses with respect to OTL and
instructional alignment. Next, from the available international assessment study reports one or
two examples will be selected for secondary analyses of OTL effects. Finally, a systematic
search of recent primary OTL effectiveness studies will be carried out. A set of explicit selection
criteria will be used to arrive at a set of relevant studies with sufficient research quality.
Analyses of research literature and available (international) data sets
A narrative review will provide a summary of the identified review studies and meta-analyses on
OTL effectiveness. Average effect sizes from these meta-analyses will be compared with similar
results for other effectiveness enhancing conditions, like learning time, educational leadership,
teacher cooperation and evaluation at school level. The data from international assessment
studies yield descriptions of the way OTL was measured in these studies, as well as effect sizes
(OTL associated with student achievement) within and between countries. The individual
research studies identified by means of the systematic searches, and application of the selection
criteria will be schematically summarized. Basic analyses of the tabulated descriptions provide
information about the proportion of studies in which OTL had a positive and significant effect on
student achievement (a so called vote-count analysis), grade-levels addressed in the studies,
subject matter area in which OTL was measured and nationality of the study. Vote counts found
for OTL in this study are compared to vote counts for other effectiveness enhancing variables,
computed in other review studies.
10
Exploration on how OTL and educational alignment are addressed in the practice of Dutch
primary education
This exploration is based on a limited number of interviews with experts and officials in the
areas of curriculum development, educational testing, and textbook production. Preliminary
results will be discussed with a panel of teachers.
Structure of the report
In the second chapter a conceptual analysis of Opportunity to Learn (OTL) is given, covering
also related terms, such as instructional alignment and test preparation. The OTL issue is
highlighted from three educational research traditions: educational effectiveness research,
curriculum research and achievement test development. The conceptual analysis leads to
pinpointing OTL as a specific type of alignment in educational systems; a taxonomy of
alignment forms is presented. Next, different facets of the way OTL is measured empirically are
discussed. The conceptual analysis is given further theoretical depth, by discussing De Groot’s
(1986) integrative model of didactic and evaluative operationalization. Reflecting on this model
brings the alignment issue in a systemic perspective, leading up to the conjecture that alignment,
OTL and test preparation aim for integration in organizational structures that are often to be
characterized as loosely coupled.
In the third chapter and inventory of meta-analyses of OTL effects (association between
measures of OTL and instructional alignment with cognitive achievement outcomes) is
presented. This leads to a first impression of the average magnitude of OTL effects. Next seven
case-study descriptions of illustrative OTL research studies are given, spanning four decades of
research. The illustrative studies provide an impression of the diversity in emphasis, with
exposure of content taught, and alignment between different curriculum elements (like standards,
textbooks, taught content and tested content) as two different kind of independent variables. One
of the meta-studies is more specifically oriented to implications of high stakes test for content
selection in teaching.
In the fourth chapter an overview is given of 50 primary studies, conducted during the last
twenty years. Schematic summary descriptions are put together in a table. Although quantitative
meta-analysis of these studies is beyond the scope of this review study, some basic summary
tables are produced to provide an overall orientation on how OTL has been researched and what
can be concluded about its effectiveness.
In the fifth chapter a secondary analysis of TIMSS 2006 data is presented.
In the sixth and concluding chapter conclusions are drawn, and the relevance for educational
science and policy and practice is considered. Illustrations will be provided that are drawn from
11
the exploration of policy and practices in the Netherlands. The chapter leads up to
recommendations for educational policy planners and teachers.
References
Baumert, J., Kunter, M., Blum, W., Brunner, M., Voss, T., Jordan, A., et al. (2010). Teachers’
mathematical knowledge, cognitive activation in the classroom, and student progress.
American Educational Research Journal, 47, 133-180.
Blömeke, S., Hsieh, F-J., Kaiser, G. And Schmidt, W.H. (2014) International perspectives on
teacher knowledge, beliefs and opportunities to learn. Teachers Education and
Development Study in Mathmeatics, TEDS-M). Dordtrecht: Springer
De Haan, D.M., (1992) Measuring test-curriculum overlap. Enschede: Universiteit Twente (Dissertatie).
Groot, A.D., de (1986) Begrip van evalueren. ’s-Gravenhage: Vuga.
Hattie, J. (2009). Visible Learning. Abingdon: Routledge
Holcombe, R.W. (2011). Can the 10th Grade Mathematics MCAS Test be Gamed? Opportunities for
Score Inflation. Unpublished manuscript. Harvard University, Cambridge, Massachusetts
Lomos, C., Hofland, R., & Bosker, R. (2011) Professional communities and learning achievement- A
meta-analysis. School Effectiveness and School Improvement (22) 121-148.
Mo, Y. (2008) Opportunity to learn, engagement and science achievement, evidence from TIMSS, 2003.
Virginia Polytechnical Institute and State University
Marsano (2003) What works in schools. Translating research into action. Alexandria, VA: Association
for Supervision and Curriculum Development.
McKinsey & Company, (2010) How the world’s most improved school systems keep getting better.
McKinsey & Company.
OECD (2010).Strong Performers and Successful Reformers in Education: Lessons from PISA for
the United States. Paris: OECD
OECD, (2014) PISA 2012 results: What students know and can do. Volume 1.Paris: OECD (64 countries,
country level effect size .50, p. 150
OECD, (2014a) OECD Reviews of Evaluation and Assessment in Education: the Netherlands. Paris:
OECD
Scheerens, J., Luyten, H., Steen, R., & Y. Luyten-de Thouars (2007). Review and meta-analyses of school
and teaching effectiveness. Enschede: University of Twente, Department of Educational Organisation and
Management
12
Scheerens, J., & Bloemeke, S. (2016) Integrating teacher education effectiveness research into
educational effectiveness models (Submitted)
Polikoff, M.S. and Porter, A.C. (2014) Instructional alignment as a measure of teaching quality.
Educational Evaluation and Policy Analysis, 36, 399-416
Popham, W.J. (2003) Test better, teach better, The instructional role of assessment Alexandria, Virginia:
ACSD
Schmidt, W.B., Cogan, L.S., Houang, R.T., MCKnight, C.C. (2011) Content coverage across
countries/states: A persisting challenge for US educational policy. American Journal of Education 117,
(May, 2011), 399- 427
Sturman, L. (2011) Test prepatation: valid and valuable, or wasteful? The journal of the imagination of
language learning. 9, 31-37
Thurlings, M., & Den Brok, P. (2014) Leraren leren als gelijken: Wat werkt? Eindhoven: Eindhoven
School of Education, Technische Universiteit Eindhoven.
Muijs, D., and Reynolds, D. (2003) Student background and teacher effects on achievement and
attainment in mathematics. Educational Research and Evaluation, 9, 289-314
Opdenakker, M., C., & Van Damme, J.(2006) Teacher characteristics and teaching styles as
effectiveness enhancing factors of classroom practice. Teaching and Teacher Education, 22, 1-
21
Horn, A., & Walberg, H. J. (1984). Achievement and interest as a function of quantity and
quality of instruction. Journal of Educational Research, 77, 227–237.
Bruggencate, C. G., Pelgrum, W. J., & Plomp, T. (1986). First results of the Second IEA Science
Study in the Netherlands. In W. J. Nijhof & E. Warries (Eds.), Outcomes of education
and training. Lisse: Swets & Zeitlinger
13
CHAPTERII: Conceptualization
Jaap Scheerens
Introduction
At first glance “opportunity to learn” would seem to be one of the few concepts in educational
science that you could clarify to you mother or grandmother in two minutes. It addresses the
expectation that students will do better on educational content tested when that content has
actually been taught, which almost sounds like a truism. Throughout this report we will remain
close to this basic clarification, since we are not here to complicate matters unnecessarily. As this
study is a research review we shall also encounter the basic and simple conception of opportunity
to learn (abbreviated as OTL) in the empirical studies that will be analyzed. The correlation
between a measure of OTL and cognitive achievement in school subjects, like mathematics,
science and mother tongue langue, is the key parameter of investigation. Nevertheless the
exploration of the literature shows complexity that goes beyond the basic definition. The OTL
issue can be situated in at least three different traditions of educational research and
development, with corresponding differences in research orientation, shows considerable
variability in the way it has been defined and operationalized, and has different contexts of
practical application as well (e.g. national educational policy and school level teaching). In this
first chapter a “conceptual map” of OTL will be presented.
Building blocks for a conceptual framework
OTL is a construct that depends on the alignment of educational goals or standards, actual
teaching and assessment (measurement of student achievement). These elements can be
positioned in a basic system model of education, which is often used to define educational
effectiveness.
The elementary design of educational effectiveness research is the association of hypothetical
effectiveness enhancing conditions (OTL being one of these) and output measures, mostly
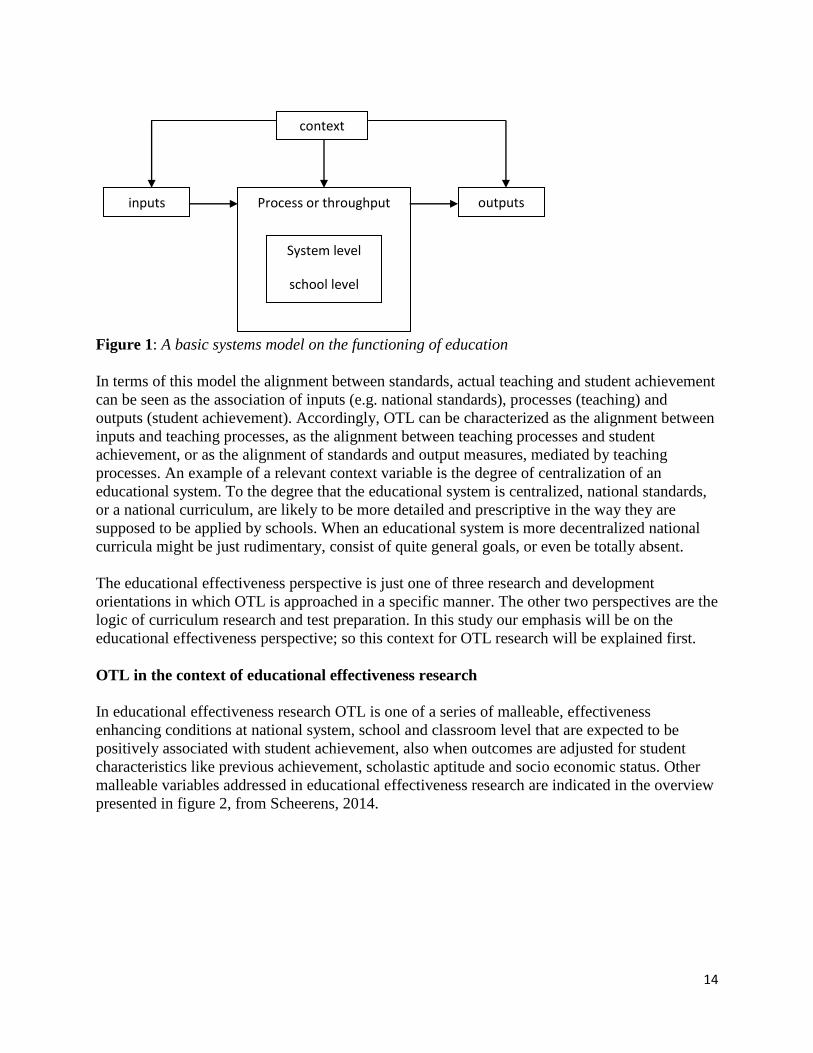
student achievement. The basic model from systems theory, shown in Figure 1, is helpful in
clarifying this design. The major task of educational effectiveness research is to reveal the
impact of relevant input characteristics on output and to “break open” the black box in order to
show which process or throughput factors “work”, next to the impact of contextual conditions.
The model, shown in Figure 1, can be used at different levels of aggregation. In the figure this is
indicated by mentioning three levels in the central box of the model: the level of a national
educational system, the school level and the level of the instructional setting, often indicated as
the classroom level. The three levels are nested, in the sense that schools function within an
educational system at national level and classrooms function within schools.
14
Figure 1: A basic systems model on the functioning of education
In terms of this model the alignment between standards, actual teaching and student achievement
can be seen as the association of inputs (e.g. national standards), processes (teaching) and
outputs (student achievement). Accordingly, OTL can be characterized as the alignment between
inputs and teaching processes, as the alignment between teaching processes and student
achievement, or as the alignment of standards and output measures, mediated by teaching
processes. An example of a relevant context variable is the degree of centralization of an
educational system. To the degree that the educational system is centralized, national standards,
or a national curriculum, are likely to be more detailed and prescriptive in the way they are
supposed to be applied by schools. When an educational system is more decentralized national
curricula might be just rudimentary, consist of quite general goals, or even be totally absent.
The educational effectiveness perspective is just one of three research and development
orientations in which OTL is approached in a specific manner. The other two perspectives are the
logic of curriculum research and test preparation. In this study our emphasis will be on the
educational effectiveness perspective; so this context for OTL research will be explained first.
OTL in the context of educational effectiveness research
In educational effectiveness research OTL is one of a series of malleable, effectiveness
enhancing conditions at national system, school and classroom level that are expected to be
positively associated with student achievement, also when outcomes are adjusted for student
characteristics like previous achievement, scholastic aptitude and socio economic status. Other
malleable variables addressed in educational effectiveness research are indicated in the overview
presented in figure 2, from Scheerens, 2014.
context
outputs inputs Process or throughput
System level
school level
classroom level
15
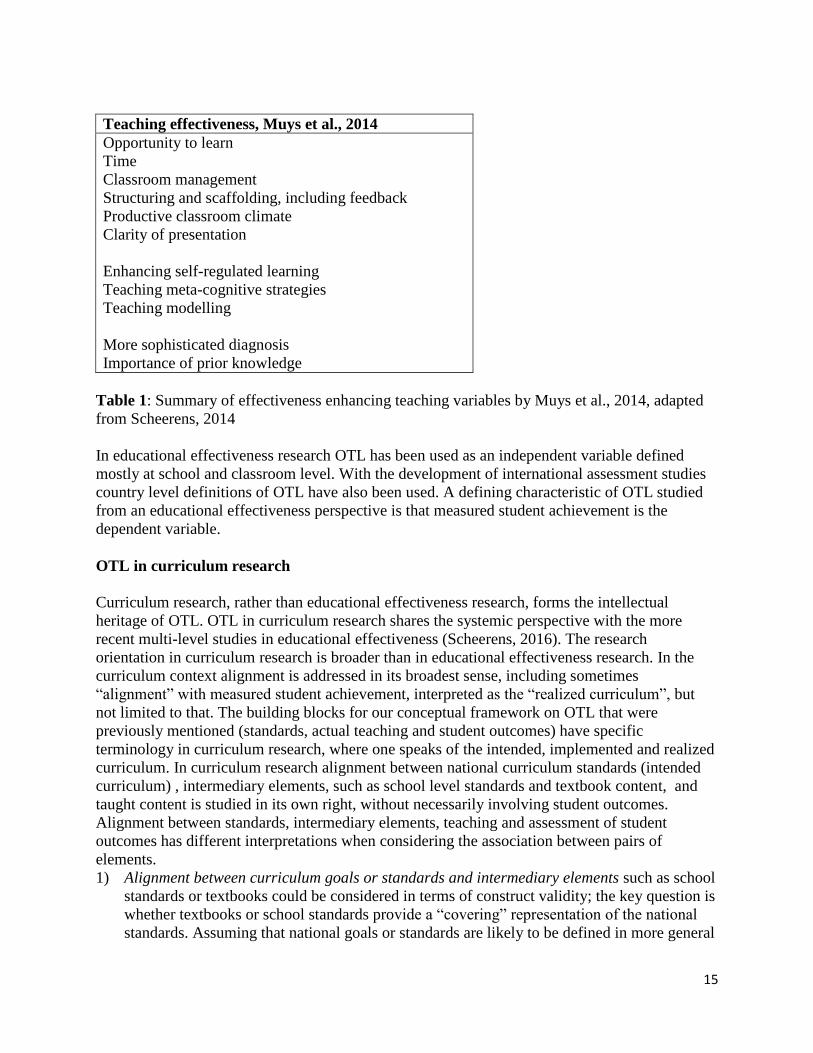
Teaching effectiveness, Muys et al., 2014
Opportunity to learn
Time
Classroom management
Structuring and scaffolding, including feedback
Productive classroom climate
Clarity of presentation
Enhancing self-regulated learning
Teaching meta-cognitive strategies
Teaching modelling
More sophisticated diagnosis
Importance of prior knowledge
Table 1: Summary of effectiveness enhancing teaching variables by Muys et al., 2014, adapted
from Scheerens, 2014
In educational effectiveness research OTL has been used as an independent variable defined
mostly at school and classroom level. With the development of international assessment studies
country level definitions of OTL have also been used. A defining characteristic of OTL studied
from an educational effectiveness perspective is that measured student achievement is the
dependent variable.
OTL in curriculum research
Curriculum research, rather than educational effectiveness research, forms the intellectual
heritage of OTL. OTL in curriculum research shares the systemic perspective with the more
recent multi-level studies in educational effectiveness (Scheerens, 2016). The research
orientation in curriculum research is broader than in educational effectiveness research. In the
curriculum context alignment is addressed in its broadest sense, including sometimes
“alignment” with measured student achievement, interpreted as the “realized curriculum”, but
not limited to that. The building blocks for our conceptual framework on OTL that were
previously mentioned (standards, actual teaching and student outcomes) have specific
terminology in curriculum research, where one speaks of the intended, implemented and realized
curriculum. In curriculum research alignment between national curriculum standards (intended
curriculum) , intermediary elements, such as school level standards and textbook content, and
taught content is studied in its own right, without necessarily involving student outcomes.
Alignment between standards, intermediary elements, teaching and assessment of student
outcomes has different interpretations when considering the association between pairs of
elements.
1) Alignment between curriculum goals or standards and intermediary elements such as school
standards or textbooks could be considered in terms of construct validity; the key question is
whether textbooks or school standards provide a “covering” representation of the national
standards. Assuming that national goals or standards are likely to be defined in more general
16
terms than are the content elements in school standards and textbooks, the analogy with
construct validity seems more appropriate than content validity, which would presuppose
matching of elements from two sources of comparable specificity. In the case of construct
validity expert panels would be needed to decide whether school standards or textbook
content could be seen as adequate representations of the more general goals, or national
standards.
2) Alignment between curriculum goals and standards and teaching (i.e the implemented
curriculum). Here the same reasoning could be applied as in case 1, in the above. The actual
feasibility of assessing this kind of alignment would strongly depend on the national
standards being sufficiently specific; in addition empirical methods to observe or otherwise
measure teaching behavior in practice would be required.
3) Alignment between intermediary elements (school standards and textbooks) would allow for
a more straightforward consistency check, based on content analysis of the school standards
and textbooks and matching with measures of content covered by teachers. Here the
practical reason for carrying out a consistency check could be the choice of the most suitable
textbook, given school standards
4) Alignment between intermediary elements and assessment instruments. Here content
elements of the intermediary elements would be matched with the content elements that
make up the assessment instrument. This might be done either based on actual test items or
on (more general) content elements derived from the analytic frameworks on which the test
is based. Such frameworks usually consist of two dimensional matrices, specifying cognitive
operations required in relationship to content elements. The context of application might be
test validation or analyzing the opportunities to learn that are stimulated by school standards
or textbooks.
5) Alignment between teaching (implemented curriculum) and assessment content. This would
have essentially the same interpretation and contexts of application as described with point
4.
6) Alignment between general goals or national standards and assessment content. As with the
alignment discussed in point 2, the feasibility of this approach would strongly depend on the
specificity of the national standards.
7) “Alignment” of any other of the main elements to student achievement outcomes (the
realized curriculum). This kind of alignment refers to the most common definition of OTL.
The term alignment is questionable in this case, because the association, although mostly
just measured by means of correlational measures is likely to be interpreted as causal. The
most frequent application is the one between content covered in teaching and achievement
results. Contexts of application are: establishing the predictive validity of OTL measures and
assessing school or teaching effectiveness. In the latter sense curriculum research and
educational effectiveness research overlap.
8) More complex models of alignment, where intermediary elements may be studied as
mediators of higher level elements (examples will be provided in Chapter 3).
In this taxonomy of alignment types, when national standards, intermediary elements (school
standards and textbooks) and assessment instruments and measures are the basic elements, the
emphasis has been on matching and consistency. Pelgrum, (1989), presents a conceptual
framework in which mismatches and deficiencies, next to matches, are given explicit attention.
His work took place in the context of international comparative assessment studies by the IEA
17
(International Association for the Evaluation of Educational Achievement) , in which variability
between countries in the way the international assessment test corresponded to national intended
and implemented curricula, was scrutinized from the perspective of “fair” comparison.
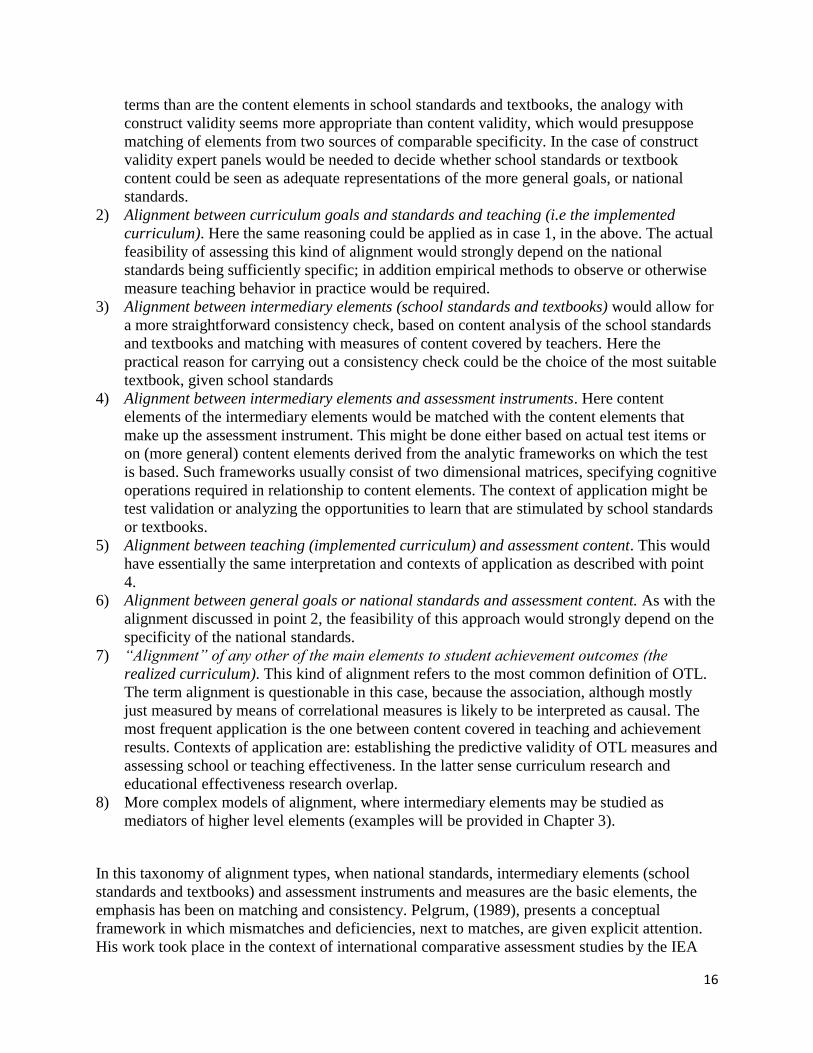
The presentation of Pelgrum’s model is cited in Figure 2 (Pelgrum, 1989, p. 17)
Figure. 2: Venn diagram of intended, implemented and tested curriculum, from Pelgrum,1989
The numbered areas in Figure 2 are described as follows:
“I + IV + VI + VII: what students should learn.
II + IV + V + VII: what is actually taught at school.
III + V + VI + VII: what is tested.
I: what students should learn, but is actually not taught at school, and not tested.
II: what actually is taught at school, but not tested and not part or what students are supposed to
learn.
III: what is tested, actually not taught at schools, and not part of what students are supposed to
learn.
IV: what students should learn and what is actually taught at school, but not tested.
V: what actually is taught at school and tested, but is not part of what should be learned.
VI: what students should learn and is tested, but is actually not taught at schools.
VII: what students should learn, what is tested and taught.” (ibid, 17)
18
The theoretical principle behind these analyses of consistency between the various facets of
curriculum can be indicated with the term “coupling”. Analyses that tend to underline
deficiencies could be seen as manifestations of “loose coupling” in educational organizations
(Weick, 1976); the positive alternative of good integration between the curriculum facets can be
indicated with the term “alignment”. Successful OTL is an example of alignment, fallible OTL
can be seen as a manifestation of loose coupling.
OTL as test preparation
In this section we shall start out with on orientation on the process of educational achievement
test development. As we shall see test development follows the same kind of specification
process, from general goal descriptions to test items, as were encountered in curriculum analysis
and development. When comparing curriculum development and test construction we can
establish, first of all that they have the first and last step of the development process in common,
the first being a national curriculum with general goals and national standards, and the last step
being the assessment instruments. Most interesting are intermediary “products”. In curriculum
research we encountered school standards, textbooks and implemented curriculum as
intermediary steps. Analyzing test construction shows other kinds of intermediary products.
When discussing test preparation as an interpretation of OTL these intermediary products are
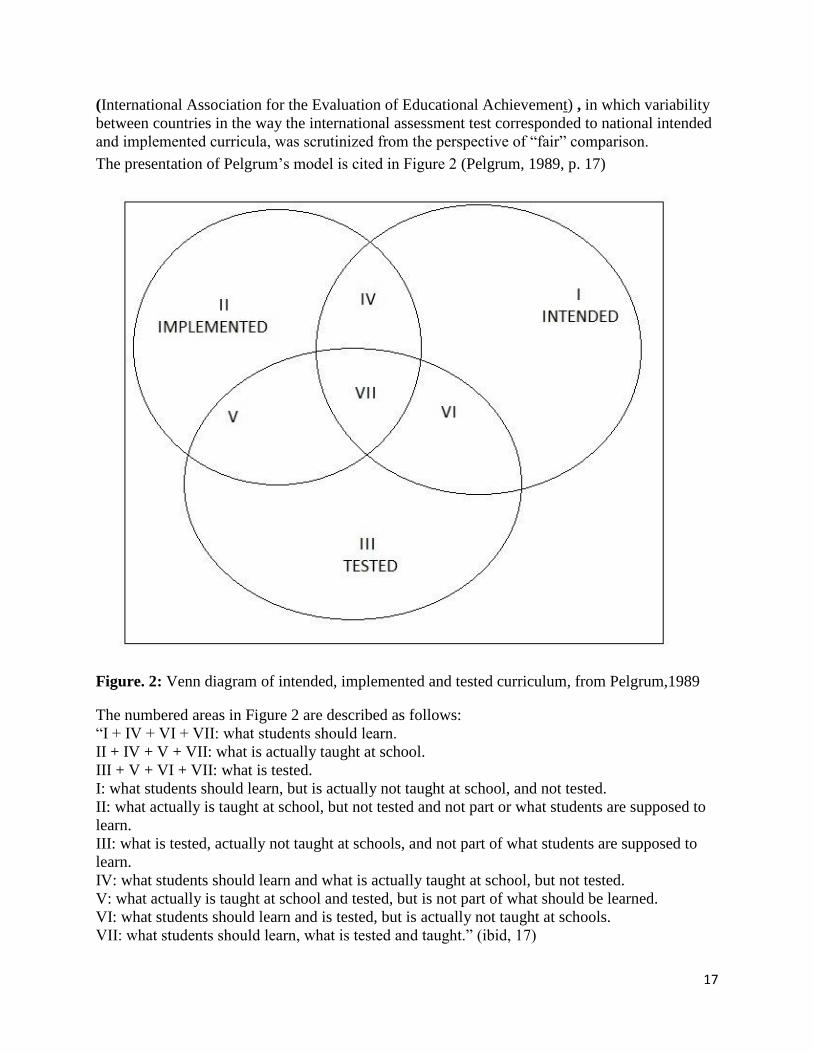
quite interesting. Holcome’s: “taxonomy of score inflation” , cited in Figure 4, illustrates what
we mean by intermediary products in test development.
1 Domain selected for testing, e.g. math
2 Elements from domain selected in
standards
Elements from domain omitted from
standards
3 Tested subset of standards Untested subset of standards
4 Tested material from within tested
standards
Untested material from within tested
standards
5 Tested representations (substantive and
non-substantive)
Untested presentations (substantive and non-
substantive)
Figure 3: Holcome’s taxonomy of score inflation (Holcome, 2011)
The term “score inflation” refers to the context of application of this taxonomy, which is
teaching to the test. Each of these decisions in test design is seen as narrowing the domain for
testing and creating opportunities for teaching to the test. The subsequent decisions in test
development concern content specification but also choice of representations, such as item
formats.
The specification process in test development for a particular subject could be seen solely from a
content perspective. The deductive steps then go from major domains of a discipline, to
subdomains, to more specific topics and ultimately to item content. However, at the more
detailed levels, the level of topics and test items, a second dimension is usually added, in the
form of the cognitive demand of the topic or item. Topics are thus defined as a combination of
the specification of a content element and a particular psychological operation. The cognitive
19
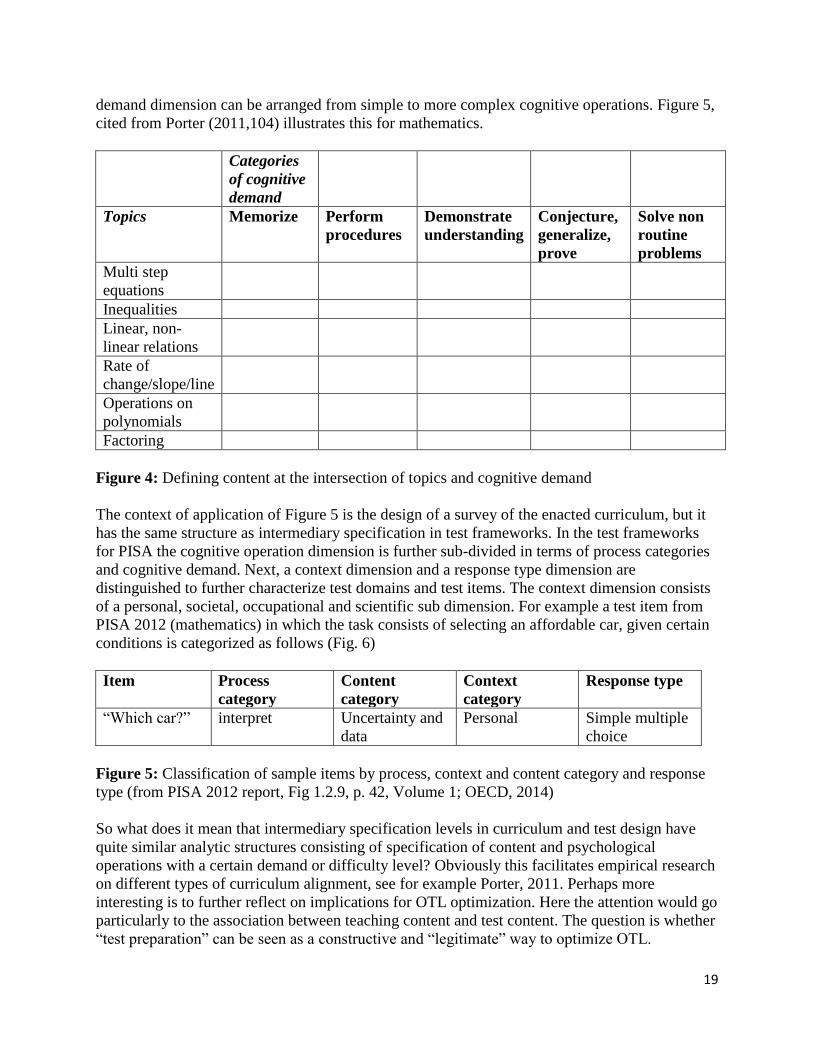
demand dimension can be arranged from simple to more complex cognitive operations. Figure 5,
cited from Porter (2011,104) illustrates this for mathematics.
Categories
of cognitive
demand
Topics Memorize Perform
procedures
Demonstrate
understanding
Conjecture,
generalize,
prove
Solve non
routine
problems
Multi step
equations
Inequalities
Linear, non-
linear relations
Rate of
change/slope/line
Operations on
polynomials
Factoring
Figure 4: Defining content at the intersection of topics and cognitive demand
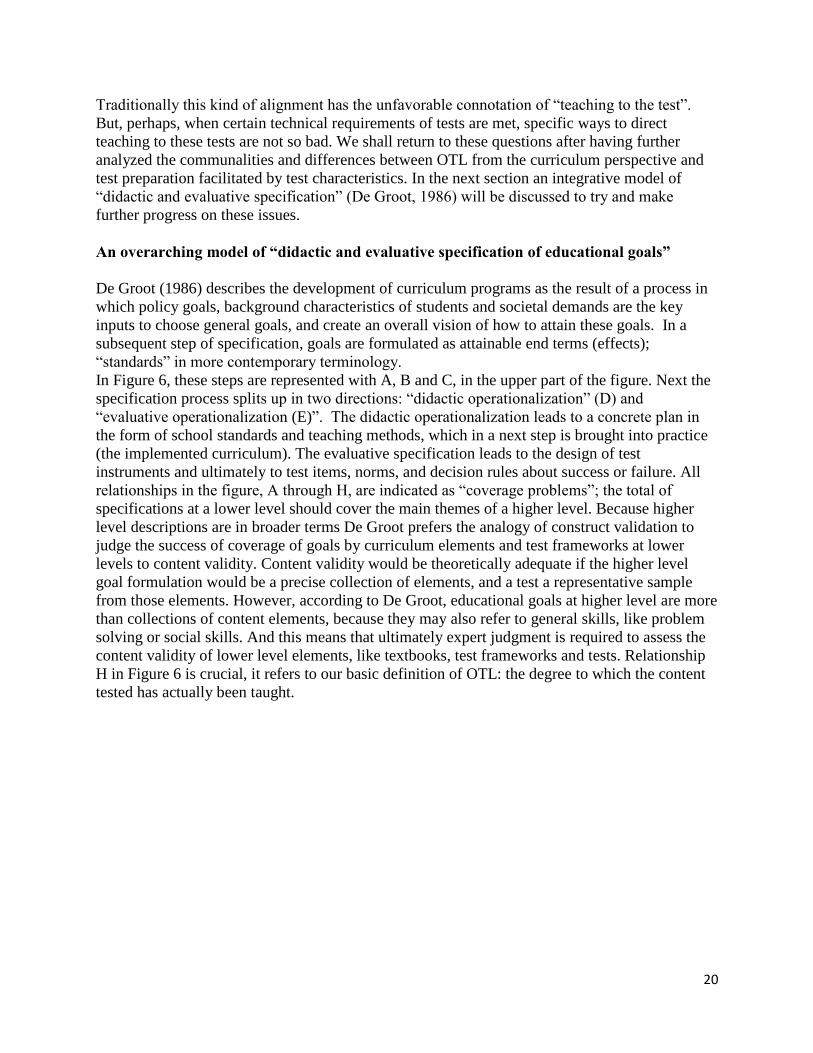
The context of application of Figure 5 is the design of a survey of the enacted curriculum, but it
has the same structure as intermediary specification in test frameworks. In the test frameworks
for PISA the cognitive operation dimension is further sub-divided in terms of process categories
and cognitive demand. Next, a context dimension and a response type dimension are
distinguished to further characterize test domains and test items. The context dimension consists
of a personal, societal, occupational and scientific sub dimension. For example a test item from
PISA 2012 (mathematics) in which the task consists of selecting an affordable car, given certain
conditions is categorized as follows (Fig. 6)
Item Process
category
Content
category
Context
category
Response type
“Which car?” interpret Uncertainty and
data
Personal Simple multiple
choice
Figure 5: Classification of sample items by process, context and content category and response
type (from PISA 2012 report, Fig 1.2.9, p. 42, Volume 1; OECD, 2014)
So what does it mean that intermediary specification levels in curriculum and test design have
quite similar analytic structures consisting of specification of content and psychological
operations with a certain demand or difficulty level? Obviously this facilitates empirical research
on different types of curriculum alignment, see for example Porter, 2011. Perhaps more
interesting is to further reflect on implications for OTL optimization. Here the attention would go
particularly to the association between teaching content and test content. The question is whether
“test preparation” can be seen as a constructive and “legitimate” way to optimize OTL.
20
Traditionally this kind of alignment has the unfavorable connotation of “teaching to the test”.
But, perhaps, when certain technical requirements of tests are met, specific ways to direct
teaching to these tests are not so bad. We shall return to these questions after having further
analyzed the communalities and differences between OTL from the curriculum perspective and
test preparation facilitated by test characteristics. In the next section an integrative model of
“didactic and evaluative specification” (De Groot, 1986) will be discussed to try and make
further progress on these issues.
An overarching model of “didactic and evaluative specification of educational goals”
De Groot (1986) describes the development of curriculum programs as the result of a process in
which policy goals, background characteristics of students and societal demands are the key
inputs to choose general goals, and create an overall vision of how to attain these goals. In a
subsequent step of specification, goals are formulated as attainable end terms (effects);
“standards” in more contemporary terminology.
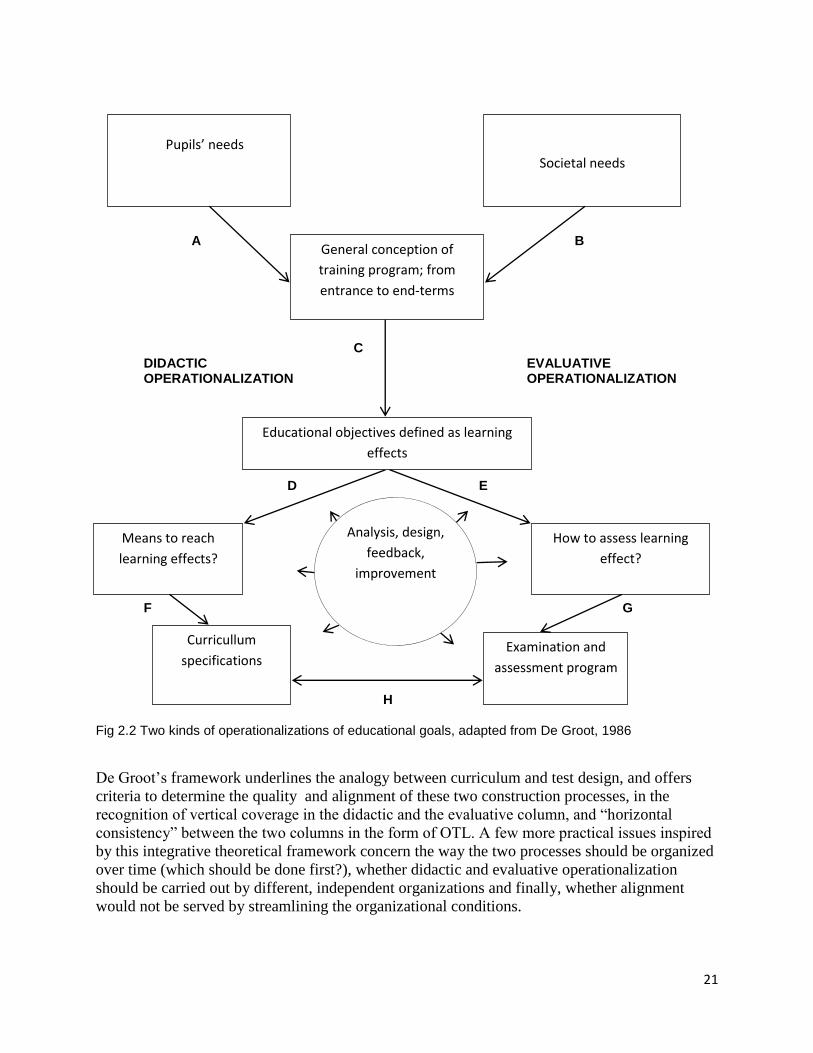
In Figure 6, these steps are represented with A, B and C, in the upper part of the figure. Next the
specification process splits up in two directions: “didactic operationalization” (D) and
“evaluative operationalization (E)”. The didactic operationalization leads to a concrete plan in
the form of school standards and teaching methods, which in a next step is brought into practice
(the implemented curriculum). The evaluative specification leads to the design of test
instruments and ultimately to test items, norms, and decision rules about success or failure. All
relationships in the figure, A through H, are indicated as “coverage problems”; the total of
specifications at a lower level should cover the main themes of a higher level. Because higher
level descriptions are in broader terms De Groot prefers the analogy of construct validation to
judge the success of coverage of goals by curriculum elements and test frameworks at lower
levels to content validity. Content validity would be theoretically adequate if the higher level
goal formulation would be a precise collection of elements, and a test a representative sample
from those elements. However, according to De Groot, educational goals at higher level are more
than collections of content elements, because they may also refer to general skills, like problem
solving or social skills. And this means that ultimately expert judgment is required to assess the
content validity of lower level elements, like textbooks, test frameworks and tests. Relationship
H in Figure 6 is crucial, it refers to our basic definition of OTL: the degree to which the content
tested has actually been taught.
21
A B
C DIDACTIC EVALUATIVE OPERATIONALIZATION OPERATIONALIZATION D D E F G
F G
H Fig 2.2 Two kinds of operationalizations of educational goals, adapted from De Groot, 1986
De Groot’s framework underlines the analogy between curriculum and test design, and offers
criteria to determine the quality and alignment of these two construction processes, in the
recognition of vertical coverage in the didactic and the evaluative column, and “horizontal
consistency” between the two columns in the form of OTL. A few more practical issues inspired
by this integrative theoretical framework concern the way the two processes should be organized
over time (which should be done first?), whether didactic and evaluative operationalization
should be carried out by different, independent organizations and finally, whether alignment
would not be served by streamlining the organizational conditions.
Pupils’ needs
Societal needs
General conception of
training program; from
entrance to end-terms
Educational objectives defined as learning
effects
Means to reach
learning effects?
How to assess learning
effect?
Analysis, design,
feedback,
improvement
Curricullum
specifications Examination and
assessment program
22
Should evaluative specification precede didactic specification or vice versa?
De Groot argues that evaluative operationalization should happen first, because curriculum
design needs verifiable learning effects to adequately resolve issues of instrumentality, in other
words constructing means that are adequate to reach goals and intended effects. If the evaluative
specification would follow the didactic specification there would be too big a chance of pressure
to adapt tests to preferred methods (goal displacement).
Should evaluative specification and didactic specification be carried out in different
organizations?
According to De Groot evaluative and didactic specification should be independent. His main
argument is that curriculum developers lack the know- how to carry out test construction. Next,
in high stakes evaluative applications, like examinations, independence is required to guarantee
objectivity. In actual practice various organizational units are often involved in specific phases of
curriculum development and test development. Developers of teaching methods and textbooks
are often independent firms operating outside the public sector; the same may apply to test
developers.
From De Groot’s analytic model, but also from our earlier presentation of alignment issues, it
seems that what we have are two operationalization processes that are quite similar. From a
theoretical perspective, but also from the point of practical application it is therefore challenging
to think further about a more efficient approach in organizational structures that might be more
aligned and less “loosely coupled”.
How feasible is optimizing alignment in a leaner organizational structure?
To a degree alignment in educational systems, as discussed so far, is a remedy to a self-created
problem. Particularly in the curriculum development column in Fig. 6 organizational units at
various levels are involved in the process of what De Groot describes as “didactic
operationalization”. At national level priorities, general goals and overall time tables are
established by either the central administration or national institutes that operate closely to the
central administration. Depending on the degree of centralization of the system and the
specificity of the national curriculum, at intermediary level various organizational units may
have a prominent role in the process of didactic operationalization as well: textbook writers,
educational support organizations, school districts and school boards. These intermediary units
develop “intermediary curricular elements”, like district standards, textbook content coverage,
and school standards, creating as many areas where alignment becomes an issue. Again,
depending on the specificity of the intermediary elements and the autonomy of teachers, the
teachers will have more or less space to make their own choices in what is actually taught. So, in
summary, there is a lot of need for vertical coordination in the didactic specification column.
Looking once more at the question of horizontal alignment, i.e. the correspondence between
elements in the didactic specification column and elements in the evaluative specification
column, we saw that De Groot argues for a leading role of test development. Evaluative
specification should precede curriculum specification because concrete and specific end terms
(i.e. ultimately collections of test items) are needed to guide the curriculum development process.
It is rather questionable whether such kind of interplay and coordination between test
development and curriculum development is frequently realized in practice. If it is not realized
another alignment issue arises, creating, most probably important discrepancies between what is
taught and tested; in other words limited OTL. It is important to realize that the quest for
23
alignment in educational systems, of which OTL is a specific issue, happens in a context where
structural arrangements tend to be loosely coupled.
The question is how matters could be improved, first of all “in theory” and secondly in practice,
when all kinds of contextual conditions of a structural and cultural nature should be taken into
consideration.
Hypothetical solutions to the alignment problem in educational systems
Two ideal type scenarios will be addressed in the next section: centralism and synoptic planning,
and retroactive planning, combined with high stakes accountability.
Centralism and synoptic planning
Although, during the last two decades, there has been a strong tendency in many countries to
decentralize educational systems and provide more autonomy to lower levels (schools in
particular), some previously decentralized countries like the UK and the USA have gone in the
other direction. In the UK national programs for numeracy and literacy were developed and
implemented, and in the USA Common Core Standards have been developed. Explicit national
curriculum standards provide clear direction for both didactic and evaluative operationalization.
At the very least it opens the possibility to empirically verify the alignment between, for
example, the national standards and the contents of assessment instruments.
Rational, synoptic planning can be seen as the theoretical background of national curriculum
planning.
The ideal of "synoptic" planning is to conceptualise a broad spectrum of long term goals and
possible means to attain these goals. Scientific knowledge about instrumental relationships is
thought to play an important role in the selection of alternative ways to realize these goals.
The main characteristics of synoptic planning as a prescriptive principle conducive to effective
(in the sense of productive) organizational functioning, as applied to education, are:
- "proactive" statement of goals, careful deduction of concrete goals, operational objectives and
assessment instruments;
- decomposition of subject-matter, creating sequences in a way that intermediate and ultimate
objectives are approached systematically;
- alignment of teaching methods (design of didactical situations) to subject-matter segments;
- monitoring of the learning progress of students, preferably by means of objective tests. According to this model curriculum development is seen as a deductive process of operationalizing
general goals, ultimately also in terms of achievement test items. Developing achievement tests is
the last step in this deductive process.
There are many obstacles to apply this model: resistance against national standards and “state
pedagogy”, incomplete knowledge about instrumental relationships, lack of vertical coordination
between the central administration, intermediary organizations and schools, technical problems in
getting from general goals to more operational formulations, and resistance by schools against
externally developed guidelines and programs. Finally, the linear sequence from general goals to
test items implies that didactic specification precedes evaluative specification and this is probably
less efficient (see De Groot’s argumentation in favour of the opposite position in which evaluative
specification precedes didactic specification).
24
Retroactive planning, combined with high stakes accountability
A less demanding type of planning than synoptic planning is the practice of using evaluative
information as a basis for corrective or improvement-oriented action, sometimes indicated as
“retroactive planning” (Scheerens, Glas and Thomas, 2003). In that case planning is likely to
have a more "step by step", incremental orientation, and "goals" or expectations get the function
of standards for interpreting evaluative information. The discrepancy between actual
achievement and expectations creates the dynamics that could eventually lead to more
effectiveness. In cybernetics the cycle of assessment, feedback and corrective action is one of the
central principles.
Evaluation - feedback - corrective action and learning cycles comprise four phases:
- measurement and assessment of performance;
- evaluative interpretation based on "given" or newly created norms;
- communication or feedback of this information to units that have the capacity to take corrective
action;
- actual and sustained use (learning) of this information to improve organizational performance
This model resembles approaching alignment by given precedence to what De Groot indicates as
“evaluative specification”.
When evaluative specification proceeds curriculum and didactic specification, it could also be
seen as “taking the lead” in a more substantive way. Substantively processes of curriculum
specification and test construction have much in common. This is particularly the case if we
focus on learning tasks and assessable educational objectives. Admittedly curriculum design has
a broader scope, in also needing to address the choice and development of means (teaching
strategies, classroom organization, and application of educational resources) apart from just
having to select and ultimately implement subject matter based content. When recognizing the
thoroughness of achievement test development one might wonder why a parallel process of
specification and a parallel intermediary structure would be required in the didactic specification
column. All that would be required might be an additional unit in a test development agency
which proposes evidence based teaching strategies in relationship to content elements and
educational objectives. Next, specific technical issues should be met.
Firstly, construction teams should have multi-disciplinary expertise with subject matter
specialists in the lead, supported by didactical experts and test development experts.
Secondly, tests should be curriculum valid, relative to national standards and criterion
referenced.
Thirdly, “half products” of test development like test frameworks and the specification of sub-
domains should be made publicly available; for example to advice textbook writers.
Fourthly, calibrated item banks should be publicly available as well, in order to allow targeted
test preparation by schools (Van der Linden, 1983).
Finally, moderate or high stakes accountability regimes would give schools a motivational
impulse to align their teaching with educational objectives, standards and tests.
Particularly the fourth condition, calibrated item banks, allowing for legitimate test preparation
would, in principle, be a strong step forward in attaining content alignment between what is
taught and tested.
25
Ways to empirically assess OTL
Empirical procedures to measure OTL vary according to the scope of the OTL definition, the
data source, the level of the curricular unit envisaged, and whether exposure or alignment is
measured.
Scope of the OTL definition
The basic definition of OTL refers to educational content. Further elaboration of this basic
orientation considers qualitatively different cognitive operations in association with each content
element, often also expressing accumulating complexity (see the example from PISA 2012,
presented in an earlier section). A next step in enlarging the scope is to add an indication of the
time students were exposed to the specific content elements. Sometimes the theoretical option to
include quality of deliverance to the OTL rating is considered as well. This option will be
disregarded here as it is seen as stretching the OTL definition to a degree that it approaches a
multi-dimensional measure of overall instructional quality.
Data source
OTL measures may be based on teacher judgments or student judgments. A third option is to
consider unusual scoring patterns as instances of OTL differences.
The level of the curricular unit envisaged
Curricular sub-domains, more specific topics, or test-items represent different levels at which
OTL may be assessed.
Exposure or alignment
The independent variable in assessing the impact of OTL on achievement can be a measure of
exposure (has this content element been taught or not, or with a certain frequency) or an
alignment measure. An example of an alignment measure as the independent variable is the
correspondence between a measure of exposure and the contents of standards or assessment
instruments. So in the latter case alignment is first assessed by means of content analyses
methods, and then correlated with student achievement. An example is provided in the study by
Polikoff and Porter (2014) which will be discussed in more detail in the next chapter.
Since basically all these dimensions on which OTL measure may differ can be crossed with one
another, it follows that there is a broad range of ways to empirically assess OTL. This diversity
could be seen as a problem when the objective would be to conduct meta-analyses of OTL
effectiveness research.
Conclusion
What seemed like a relatively simple concept, at second sight, OTL proves to be rather complex.
From the perspective of curriculum research, but also in fairly recent systemic modeling of
26
educational effectiveness research (Scheerens, 2016), OTL is part of a range of alignment issues,
usually involving national standards, prescriptive formulations at intermediary level, like school
standards and test frameworks, actual teaching and ultimate achievement measurement.
Operational definition and measurement of OTL is also complex, in the sense that many options
are possible, depending on the scope of the operational measure, measurement source, the
curricular unit used to define OTL and the question whether OTL is operationalized as exposure
or alignment.
In the final sections of the chapter, optimizing OTL was connected to the way educational
systems are organized, particularly with respect to those facets of the system created to play a
role in curriculum and test development. A preliminary conclusions was that alignment is an
ideal of strong matching and coupling projected in an actual organizational context that is usually
“loosely coupled”.
The option to give precedence to what De Groot calls “evaluative operationalization” puts the
spotlight on test-preparation, which in its turn opens up the question about legitimate and
dysfunctional applications (teaching to the test). We shall turn back to all these issues in the last
chapter of the report, in which we shall also formulate recommendations for educational practice
and policy. But this will be done after we have taken a thorough look at the research evidence,
concentrating on OTL effects on student achievement, which is the main issue of this study.
References
Groot, A.D., de (1986) Begrip van evalueren. ’s-Gravenhage: Vuga.
Holcombe, R.W. (2011). Can the 10th Grade Mathematics MCAS Test be Gamed? Opportunities
for Score Inflation. Unpublished manuscript. Harvard University, Cambridge,
Massachusetts
Linden, W.J. van der (1985) Van standaardtest tot itembank. Inaugural Lecture. Enschede:
University of Twente
Muijs, D., Creemers, B., Kyriakides, L., Van der Werf, G., Timperley, H., & Earl, L. (2012).
Teaching Effectiveness. A State of the Art Review. School Effectiveness and School
Improvement. 25 231-257
OECD (2014) PISA 2012 Results, Volume I, What students know and can do.Student
performance in mathematics, reading and science. Paris: OECD Publishing
Pelgrum, W.J. (1989) Educational assessment. Monitoring, evaluation and the curriculum.
Enschede: Febo Printers
Porter,A., McMaken, J., Hwang, J., and Yang, R. (2011) Common Core Standards: The New
U.S. Intended Curriculum. Educational Researcher, Vol. 40, No. 3, pp. 103–116
Polikoff, M.S. & Porter, A.C. (2014). Instructional alignment as a measure of teaching quality.
Educational Evaluation and Policy Analysis, 20, 1-18.
27
Scheerens, Jaap (2014) School, teaching, and system effectiveness: some comments on three
state-of-the-art reviews. School effectiveness and school improvement, 25 (2). 282 - 290.
ISSN 0924-3453
Scheerens, Jaap (2016) Educational Effectiveness and Ineffectiveness. A critical review of the
knowledge base. Dordrecht, Heidelberg, London, New York: Springer.
http://www.springer.com/gp/book/9789401774574
Weick, K.E. (1976). Educational organizations as loosely coupled systems. Administrative Science
Quarterly, 21, 1-19
28
CHAPTER III: META-ANALYSES AND DESCRIPTIONS OF ILLUSTRATIVE
STUDIES
Jaap Scheerens
Introduction
In this chapter research evidence about OTL will be reviewed by means of an overview of meta-
analyses and descriptions of illustrative primary studies.
Meta-analyses of OTL effects
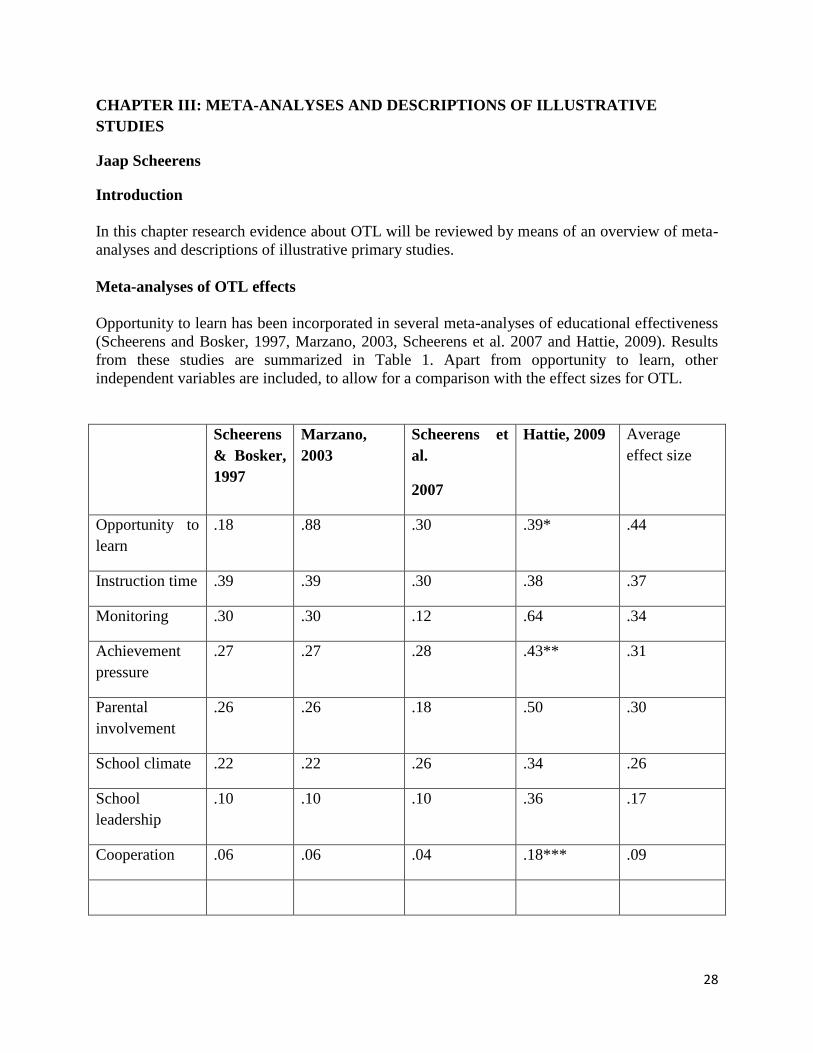
Opportunity to learn has been incorporated in several meta-analyses of educational effectiveness
(Scheerens and Bosker, 1997, Marzano, 2003, Scheerens et al. 2007 and Hattie, 2009). Results
from these studies are summarized in Table 1. Apart from opportunity to learn, other
independent variables are included, to allow for a comparison with the effect sizes for OTL.
Scheerens
& Bosker,
1997
Marzano,
2003
Scheerens et
al.
2007
Hattie, 2009 Average
effect size
Opportunity to
learn
.18 .88 .30 .39* .44
Instruction time .39 .39 .30 .38 .37
Monitoring .30 .30 .12 .64 .34
Achievement
pressure
.27 .27 .28 .43** .31
Parental
involvement
.26 .26 .18 .50 .30
School climate .22 .22 .26 .34 .26
School
leadership
.10 .10 .10 .36 .17
Cooperation .06 .06 .04 .18*** .09
29
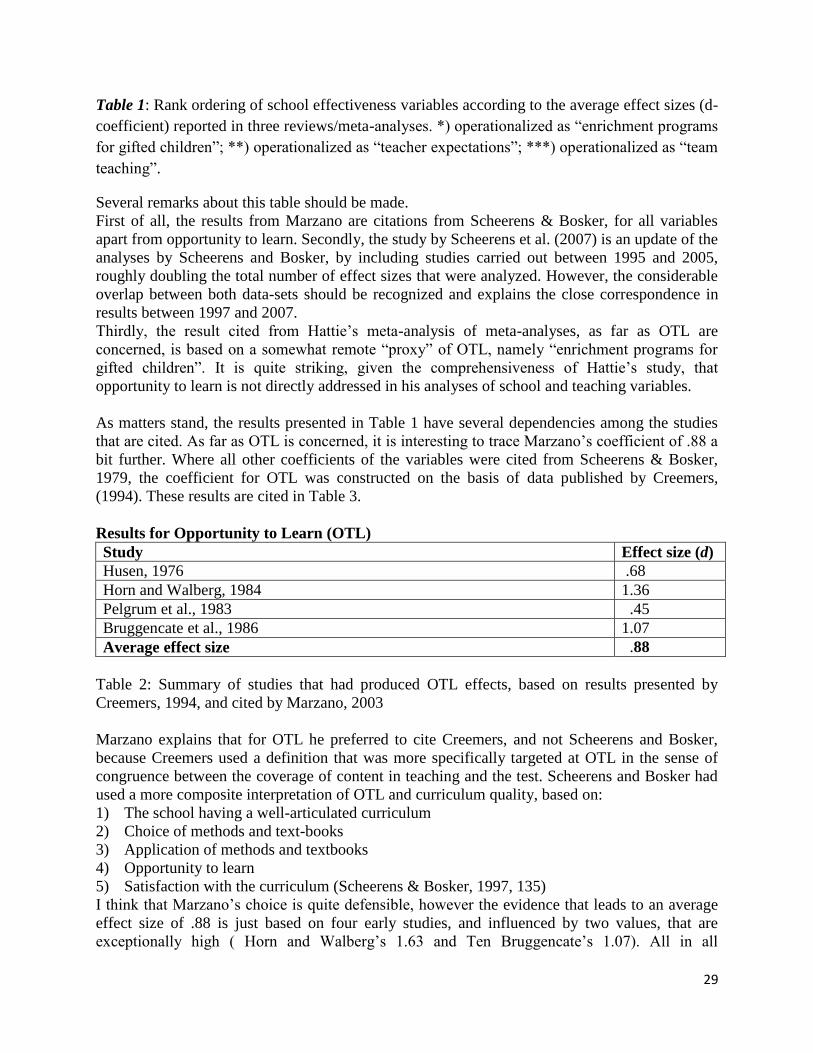
Table 1: Rank ordering of school effectiveness variables according to the average effect sizes (d-
coefficient) reported in three reviews/meta-analyses. *) operationalized as “enrichment programs
for gifted children”; **) operationalized as “teacher expectations”; ***) operationalized as “team
teaching”.
Several remarks about this table should be made.
First of all, the results from Marzano are citations from Scheerens & Bosker, for all variables
apart from opportunity to learn. Secondly, the study by Scheerens et al. (2007) is an update of the
analyses by Scheerens and Bosker, by including studies carried out between 1995 and 2005,
roughly doubling the total number of effect sizes that were analyzed. However, the considerable
overlap between both data-sets should be recognized and explains the close correspondence in
results between 1997 and 2007.
Thirdly, the result cited from Hattie’s meta-analysis of meta-analyses, as far as OTL are
concerned, is based on a somewhat remote “proxy” of OTL, namely “enrichment programs for
gifted children”. It is quite striking, given the comprehensiveness of Hattie’s study, that
opportunity to learn is not directly addressed in his analyses of school and teaching variables.
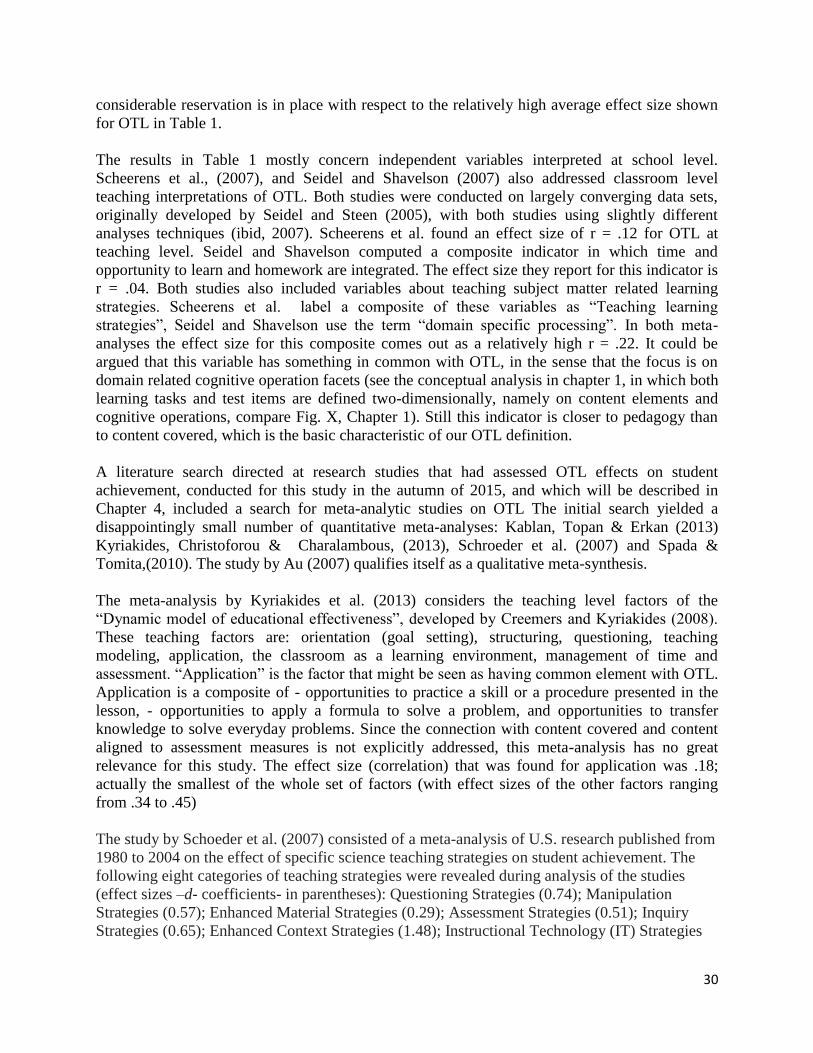
As matters stand, the results presented in Table 1 have several dependencies among the studies
that are cited. As far as OTL is concerned, it is interesting to trace Marzano’s coefficient of .88 a
bit further. Where all other coefficients of the variables were cited from Scheerens & Bosker,
1979, the coefficient for OTL was constructed on the basis of data published by Creemers,
(1994). These results are cited in Table 3.
Results for Opportunity to Learn (OTL)
Study Effect size (d)
Husen, 1976 .68
Horn and Walberg, 1984 1.36
Pelgrum et al., 1983 .45
Bruggencate et al., 1986 1.07
Average effect size .88
Table 2: Summary of studies that had produced OTL effects, based on results presented by
Creemers, 1994, and cited by Marzano, 2003
Marzano explains that for OTL he preferred to cite Creemers, and not Scheerens and Bosker,
because Creemers used a definition that was more specifically targeted at OTL in the sense of
congruence between the coverage of content in teaching and the test. Scheerens and Bosker had
used a more composite interpretation of OTL and curriculum quality, based on:
1) The school having a well-articulated curriculum
2) Choice of methods and text-books
3) Application of methods and textbooks
4) Opportunity to learn
5) Satisfaction with the curriculum (Scheerens & Bosker, 1997, 135)
I think that Marzano’s choice is quite defensible, however the evidence that leads to an average
effect size of .88 is just based on four early studies, and influenced by two values, that are
exceptionally high ( Horn and Walberg’s 1.63 and Ten Bruggencate’s 1.07). All in all
30
considerable reservation is in place with respect to the relatively high average effect size shown
for OTL in Table 1.
The results in Table 1 mostly concern independent variables interpreted at school level.
Scheerens et al., (2007), and Seidel and Shavelson (2007) also addressed classroom level
teaching interpretations of OTL. Both studies were conducted on largely converging data sets,
originally developed by Seidel and Steen (2005), with both studies using slightly different
analyses techniques (ibid, 2007). Scheerens et al. found an effect size of r = .12 for OTL at
teaching level. Seidel and Shavelson computed a composite indicator in which time and
opportunity to learn and homework are integrated. The effect size they report for this indicator is
r = .04. Both studies also included variables about teaching subject matter related learning
strategies. Scheerens et al. label a composite of these variables as “Teaching learning
strategies”, Seidel and Shavelson use the term “domain specific processing”. In both meta-
analyses the effect size for this composite comes out as a relatively high r = .22. It could be
argued that this variable has something in common with OTL, in the sense that the focus is on
domain related cognitive operation facets (see the conceptual analysis in chapter 1, in which both
learning tasks and test items are defined two-dimensionally, namely on content elements and
cognitive operations, compare Fig. X, Chapter 1). Still this indicator is closer to pedagogy than
to content covered, which is the basic characteristic of our OTL definition.
A literature search directed at research studies that had assessed OTL effects on student
achievement, conducted for this study in the autumn of 2015, and which will be described in
Chapter 4, included a search for meta-analytic studies on OTL The initial search yielded a
disappointingly small number of quantitative meta-analyses: Kablan, Topan & Erkan (2013)
Kyriakides, Christoforou & Charalambous, (2013), Schroeder et al. (2007) and Spada &
Tomita,(2010). The study by Au (2007) qualifies itself as a qualitative meta-synthesis.
The meta-analysis by Kyriakides et al. (2013) considers the teaching level factors of the
“Dynamic model of educational effectiveness”, developed by Creemers and Kyriakides (2008).
These teaching factors are: orientation (goal setting), structuring, questioning, teaching
modeling, application, the classroom as a learning environment, management of time and
assessment. “Application” is the factor that might be seen as having common element with OTL.
Application is a composite of - opportunities to practice a skill or a procedure presented in the
lesson, - opportunities to apply a formula to solve a problem, and opportunities to transfer
knowledge to solve everyday problems. Since the connection with content covered and content
aligned to assessment measures is not explicitly addressed, this meta-analysis has no great
relevance for this study. The effect size (correlation) that was found for application was .18;
actually the smallest of the whole set of factors (with effect sizes of the other factors ranging
from .34 to .45)
The study by Schoeder et al. (2007) consisted of a meta-analysis of U.S. research published from
1980 to 2004 on the effect of specific science teaching strategies on student achievement. The
following eight categories of teaching strategies were revealed during analysis of the studies
(effect sizes –d- coefficients- in parentheses): Questioning Strategies (0.74); Manipulation
Strategies (0.57); Enhanced Material Strategies (0.29); Assessment Strategies (0.51); Inquiry
Strategies (0.65); Enhanced Context Strategies (1.48); Instructional Technology (IT) Strategies
31
(0.48); and Collaborative Learning Strategies (0.95). A total of 61 studies were analyzed. The
independent variable in this meta-analysis that has some resemblance to OTL is “Enhanced
material strategies”. This factors is described in terms of teachers’ modifying instructional
materials (e.g., rewriting or annotating text materials, tape recording directions and simplifying
laboratory apparatus). OTL resemblance of this factor would depend on closer alignment to
assessment being a strong rationale for adapting texts and other materials. Since there is no trace
of this actually being the case, the results of this meta-analysis are of limited relevance to this
study.
The meta-analysis by Spada and Tomita, (2010) was conducted to investigate the effects of
explicit and implicit instruction on the acquisition of simple and complex grammatical features
in English as a second language. The results indicated larger effect sizes for explicit over implicit
instruction for simple and complex features. The findings also suggested that explicit instruction
positively contributes to learners’ controlled knowledge and spontaneous use of complex and
simple forms. The theoretical background of the study is the claim by some researchers that
whereas easy rules can be taught, hard rules are by their very nature too complex to be
successfully taught and thus difficult to learn through traditional explanation- and- practice
pedagogy. Hard rules are thought to be best learned implicitly, embedded in meaning-based
practice. Although “explicit teaching” might be compared to teaching content that is well
matched to what is assessed, in other words OTL, the connection is considered rather weak,
because there is no specific attention for content coverage and test content and therefore no
further attention is given to this meta-analysis.
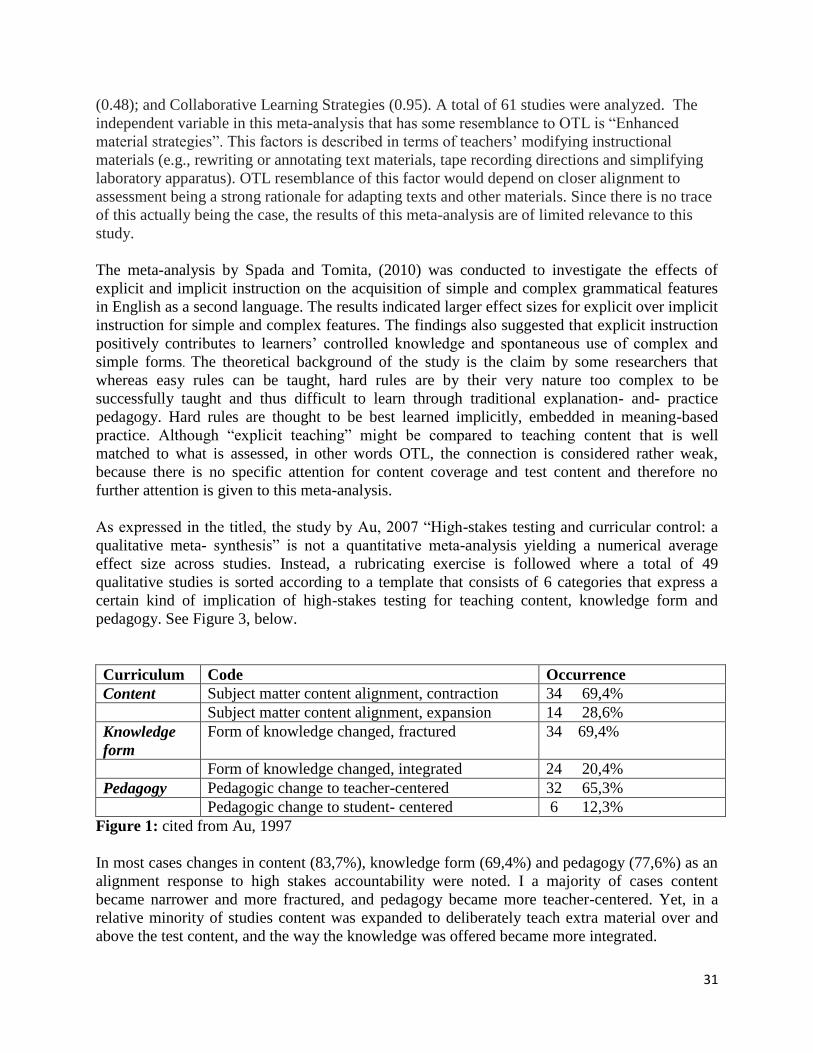
As expressed in the titled, the study by Au, 2007 “High-stakes testing and curricular control: a
qualitative meta- synthesis” is not a quantitative meta-analysis yielding a numerical average
effect size across studies. Instead, a rubricating exercise is followed where a total of 49
qualitative studies is sorted according to a template that consists of 6 categories that express a
certain kind of implication of high-stakes testing for teaching content, knowledge form and
pedagogy. See Figure 3, below.
Curriculum Code Occurrence
Content Subject matter content alignment, contraction 34 69,4%
Subject matter content alignment, expansion 14 28,6%
Knowledge
form
Form of knowledge changed, fractured 34 69,4%
Form of knowledge changed, integrated 24 20,4%
Pedagogy Pedagogic change to teacher-centered 32 65,3%
Pedagogic change to student- centered 6 12,3%
Figure 1: cited from Au, 1997
In most cases changes in content (83,7%), knowledge form (69,4%) and pedagogy (77,6%) as an
alignment response to high stakes accountability were noted. I a majority of cases content
became narrower and more fractured, and pedagogy became more teacher-centered. Yet, in a
relative minority of studies content was expanded to deliberately teach extra material over and
above the test content, and the way the knowledge was offered became more integrated.
32
The study is an example of a retro-active interpretation of content alignment, namely the
(implemented) curriculum adapting to the test content, and not the other way around (the test
adapted to the curriculum). An interesting observation by the author is that in the cases where the
respondents (teachers) were positive about the test, they had a favorable judgment about the
curricular alignment as well. The “triplet” content contraction, more fractured knowledge and
more teacher centered pedagogy was the dominant combination (75%) of the cases in which all
three were measured. The opposite triplet, content expansion, more integrated knowledge and
more student-centered teaching occurred in 24% of the cases.
When making up de balance about what meta-analyses tell us about OTL-effects the yield
appears to be less than expected. The number of meta-analyses that have explicitly addressed
OTL is limited. In several cases OTL has been combined with other characteristics in calculating
effect sizes (for example in the meta-analyses by Scheerens and Bosker, Scheerens et al., and
Seidel and Shavelson). Marzano’s (2003) relatively high coefficient (d = .88) appears to depend
on just four relatively “old” studies, two of which have exceptionally high effect sizes. More
recent meta-analyses (Schroeder et al., 2007, Kyridakides et al., 2013, and Spada and Tomita,
only studied variables, that for our purposes, are to be seen as relatively remote proxies of OTL.
The study by Au (2007) was the only review which considered retroactive alignment (teaching to
assessment). We shall return to the assessment of the available empirical knowledge base in the
final chapter of this report.
Meta- analysis of test preparation effects
For substantive and practical reasons the review of studies on test preparation was given lower
priority than originally intended. Initial analysis of studies that were identified in a first literature
search produced a limited number of studies. When this material was examined it appeared that a
large part of the studies had looked at test preparation from the perspective of providing training
to students in test taking skills and familiarity with certain types of questions and test items.
Another, smaller part had addressed content preparation as well. For our purposes, the latter kind
of studies are more relevant, and better defensible as a form of enhancing OTL, whereas
preparation in test taking skills, on the other hand, hardly fits this perspective. The usefulness of
the studies that were identified was further limited by the fact that earlier studies (roughly before
2000) had mainly studied test preparation for norm referenced tests of general scholastic
aptitude. Again this is somewhat remote from test preparation as a form of curricular alignment
with criterion referenced tests, based on content standards. Last but not least test preparation is
often depicted as “bad” practice, associated with teaching to the test. Although this leads to very
interesting discussions on legitimate and illegitimate forms of test preparation, it makes the
empirical research results quite heterogeneous. To provide a flavor of the debate, the following
citation from Sturman (2003) illustrates the various perspectives well:
“Koretz, McCaffrey and Hamilton (2001) note that the term ‘test preparation’, in common usage
has a negative connotation. However, they distinguish seven types of test preparation, three of
which, they argue, can produce unambiguous, meaningful gains in test scores.
These are ’teaching more’, ‘working harder’, and ‘working more effectively’. In contrast, three
strategies (‘reallocation of resources’, ‘alignment’ of tests with curricula and ‘coaching’ of
substantive elements) can lead to either meaningful or inflated gains, whilst the seventh strategy
(‘cheating’) can lead only to inflated grades.”
33
In the final chapter, when discussing implications for teachers of the results that were brought
together in this report, we shall turn back more extensively to the issue of legitimate and
illegitimate test preparation.
As far as empirical research results are concerned we found two meta-analyses. Bangert-Drowns,
R. L., Kulik, J. A., & Kulik, C. C. (1983) reported a mean effect size of .25 sd, based on analysis
of 30 studies on effects of test coaching. Messick (1982) reported an average effect size of lower
than one fifth of a standard deviation based on his meta-analysis of 39 studies on test preparation
for SAT. These relatively small effects may have been due to the nature of the norm referenced
tests that were used as the criterion.
A handful of individual research studies Xie,(2013), Farnsworth (2013) and Sturman (2003)
report small but positive effects of various forms of coaching and test preparation.
Descriptions of illustrative studies
In the second part of this chapter descriptions of illustrative studies addressing OTL or
instructional alignment are presented. The descriptions are placed in a chronological order, with
the first dating from 1992 and the latest dating from 2014. It is quite striking that all but two of
the illustrative studies are linked to international assessment studies, such as TIMSS and PISA,
whereas the two exceptions are associated with large scale studies in the USA, namely NAEP
and the MET (Measuring Effective Teaching, by the Bill and Melinda Gates Foundation). An
overview of the 7 study descriptions is provided in Table 3
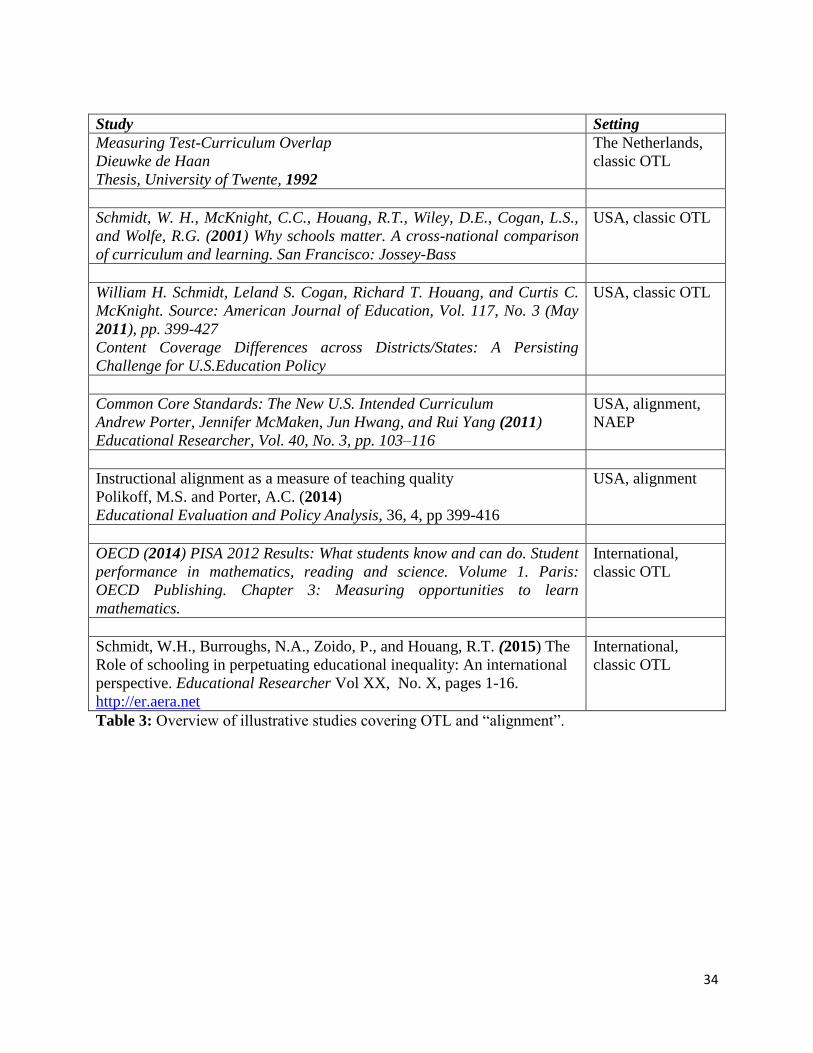
34
Study Setting
Measuring Test-Curriculum Overlap
Dieuwke de Haan
Thesis, University of Twente, 1992
The Netherlands,
classic OTL
Schmidt, W. H., McKnight, C.C., Houang, R.T., Wiley, D.E., Cogan, L.S.,
and Wolfe, R.G. (2001) Why schools matter. A cross-national comparison
of curriculum and learning. San Francisco: Jossey-Bass
USA, classic OTL
William H. Schmidt, Leland S. Cogan, Richard T. Houang, and Curtis C.
McKnight. Source: American Journal of Education, Vol. 117, No. 3 (May
2011), pp. 399-427
Content Coverage Differences across Districts/States: A Persisting
Challenge for U.S.Education Policy
USA, classic OTL
Common Core Standards: The New U.S. Intended Curriculum
Andrew Porter, Jennifer McMaken, Jun Hwang, and Rui Yang (2011)
Educational Researcher, Vol. 40, No. 3, pp. 103–116
USA, alignment,
NAEP
Instructional alignment as a measure of teaching quality
Polikoff, M.S. and Porter, A.C. (2014)
Educational Evaluation and Policy Analysis, 36, 4, pp 399-416
USA, alignment
OECD (2014) PISA 2012 Results: What students know and can do. Student
performance in mathematics, reading and science. Volume 1. Paris:
OECD Publishing. Chapter 3: Measuring opportunities to learn
mathematics.
International,
classic OTL
Schmidt, W.H., Burroughs, N.A., Zoido, P., and Houang, R.T. (2015) The
Role of schooling in perpetuating educational inequality: An international
perspective. Educational Researcher Vol XX, No. X, pages 1-16. http://er.aera.net
International,
classic OTL
Table 3: Overview of illustrative studies covering OTL and “alignment”.
35
Measuring Test-Curriculum Overlap
Dieuwke de Haan
Thesis, University of Twente, 1992
Scope
The main purpose of the study was the development and validation of an instrument to measure
“test curriculum overlap” (TCO). Test curriculum overlap is defined as the degree of overlap,
measured on the basis of teachers’ self-reports, between taught content and content as
operationalized in test items. The context of application is to use the OTL measure as a control
variable in international assessment studies, in order to make comparisons that could be
considered more faire, based on commonly taught content.
Instrument development
In IEA studies TCO had been measured by asking teachers whether the content of test items had
been taught. Reference to Pelgrum, Eggen and Plomp (1986) is made to refer to some results of
the application of the IEA instrument. These authors concluded on the basis of analyses of SISS
(second international science study) and SIMS- (second international mathematics study) data,
that in general the validity of the instrument seemed quite high; the predictive validity at between
country level appeared to be .57 (correlation TCO and cognitive achievement). However, within
country analysis for the Netherlands, when comparing scores between classes, showed a
considerably lower correlation of .22. The authors (ibid, 1986) indicated some limitations of the
IEA procedure to measure OTL: lack of knowledge by responding secondary teachers about
previous learning experiences, content that students had learned, not from the actual responding
teachers but in previous episodes of their school career; teachers’ judgements about content
taught possibly being confounded by considering item formats, or being arbitrary when an item
would cover different content elements (in fact the inter rater reliability of the procedure is being
questioned). Next, problems might occur when content is taught not only in the chosen time
period teachers were asked to report on, but also previously or later. A further questionable
assumption is that all students in a class were taught the same content. And, finally, teachers
were asked to make absolute judgements about content being taught or not, with no room for
nuances as to the degree of emphasis in teaching a particular content element.
These problematic aspects of the IEA procedure prompted the researcher to develop an
alternative instrument, indicated as the “D-TCO instrument”. This instrument includes additional
questions about when the specific content element is taught, and whether the item format is
familiar or not to the students. Because this appeared to be quite a labor intensive procedure, a
second alternative instrument was developed “H-TCO” in which the teacher is asked to select
those items that would be fit to be included in an assessment test relevant for the content taught
until the testing date.
Research design
In order to study the validity of the D-TCO instrument a pretest-posttest design was chosen (p.
44). The instruments were administered twice. In April 1990, 31 mathematics teachers of
different types of secondary education judged a set of items according to the D-TCO instrument
and the H-TCO instrument. The items were also judged by their students; for each item they

36
answered the question whether an item was taught before the date of testing. In order to study the
predictive validity of the D-TCO instrument, the students also answered the items. The data
collection was repeated at the end of the school year, in July 1990. To make it possible to adapt a
textbook analysis for each teacher individually, in the intervening time period, teachers
registered which part of the textbook was treated and which homework was given. In order to
compare the efficiency of both the teacher based instruments, teachers registered the time needed
to judge the item set.
Results: validity of the TCO measures
The construct validity of the instruments was computed by comparing teacher administered
versions to textbooks and student judgements of whether items had been taught or not. The
conclusion was that correspondence between these alternative methods was fair at aggregated
level (items and groups of teachers). In an absolute sense percentages taught were higher for the
textbook analyses than for the instruments.
Study of the predictive validity pointed out that both the D-TCO and the H-TCO scores
correlated “somewhat” with student achievement. More precisely, correlations at the test level,
i.e. between average student test score per teacher and percentage of taught items per teacher
varied between .37 and .46. At item level, the correlation between average item scores over all
students and percentage of teachers judging an item as taught, correlations varied between .32
and .50 (p. 91). Correlations for the H-TCO instrument were slightly higher (.42 - .54).
The difference in student achievement scores between the pre-test and post-test were larger for
the items that had been taught in the in-between period, this was also taken as a support of the
predictive validity.
Comment: it should be noted that correlations were not adjusted for student background
characteristics. The author concludes that “it might be questioned whether the D-TCO measure is
a good predictor for student achievement”. (91).
37
Schmidt, W. H., McKnight, C.C., Houang, R.T., Wiley, D.E>, Cogan, L.S., and Wolfe, R.G.
(2001) Why schools matter. A cross-national comparison of curriculum and learning. San
Francisco: Jossey-Bass
Abstract, general description
This is a comprehensive study on what would be called now “curriculum alignment”. The
curriculum is defined as the intended course of study and sequences of learning opportunities in
formal schooling.
The curriculum is described as comprising of four “artefacts” which together express curriculum
intentions and implementation:
- Standards (official documents)
- Textbooks
- Teachers’ content goals (the proportion of teachers in a country who say they have taught
the content; score per topic)
- Duration of (actual, implemented) content coverage (national average of how long- time- a
topic was taught, during a study year)
The dependent variable in the study is Learning Gains in Math and Science, as measured in
TIMSS 1995, at 8 grade level. Gain constructed on the basis of students being either in grade 7
or grade 8. The study includes an interesting discussion on tests measuring general competencies
(more prone to be influenced by background and given student characteristics) and tests that are
sensitive to curriculum differences. (Issue of norm referenced and criterion referenced tests).
The focus of the study is on the content required to answer test items correctly.
Attention is given to the context of national differences, by referring to national culture and
institutions, in the form of national goals and purposes that reflect cultural beliefs and values
(distinction of general and fine grained goals), distribution of authority (locus of decision
making), the articulation of curricular areas and topics, preferences concerning achievement
assessment, formal or informal.
The contents of the book consists of, an introductory chapter (ch. 1): a part on measuring the
facets of an overall conceptual model (ch. 2 and 3); a part focused at relationships comprising
intentions and implementations of the curriculum, as well as the variability of these, within and
between countries (ch. 4, 5 and 6, and two chapters focused at the relationship between the
implemented curriculum (textbook use and teacher implementation) and student achievement
(ch. 9 and 10)
Conceptual model and measures
The study is based on a conceptual model at three levels of abstraction: national cultures –
curriculum areas and types of achievement assessment, intended, implemented and attained
curriculum and the operational level: content standards, textbooks, teacher content covered and
student learning.
The TIMSS math and science frameworks consist of content units (topics) and performances
expected of students (other authors would refer to the latter as cognitive operations). The TIMSS
framework was used as a metric to compare national curricula, in terms of topics addressed
proportional to the whole range of topics in the TIMSS framework. These analyses yield
38
measures of national curricula or national content standards. In measuring curriculum
documents, like textbooks, “blocks” were the fundamental units that were coded, counted and
analyzed. In the measures of the implemented curriculum, based on teacher questionnaires,
“lessons”, or “instructional periods” were the unit. Classroom instruction was measured as both
the percentage of teachers within a country addressing a topic, as well as the mean percent of
instructional time they reported as teaching the topic. For all curricular artefacts the same metric
was used, so that intended, implemented and attained curriculum could be matched. The
dependent variable consisted of achievement on a subset of TIMSS math and science items
(actually 22 of the total of 44 topics in the Framework) covering a specific sub set of topics from
the framework. “The use of a common framework for both analyzing test items and elements of
curriculum content allow careful matching of test content to curriculum manifestations. “(27) To
quote the authors: “Only specificity has a reasonable chance to reveal relationships between
curriculum and achievement, and then only when achievement gains on specific content is
related to curriculum efforts in that specific period related to that same content”.
Results concerning curriculum variability and alignment between intensions and
implementations
International comparison of curriculum goals and content standards show a lot of variation, the
common core of a World Curriculum, which would be determined by the international structure
of the discipline, would appear to be quite narrow. This core curriculum consists mostly of
algebra and geometry.
“Among those countries planning to cover the fewest of the tested topics, several (Czech
Republic, Japan, Korea) were among the top 7 performers on the 8 grade math tests” (p.86).
Possible explanation: these topics were taught at an earlier grade level. Question for international
comparisons: how fair is a test if the topics were not covered?
When considering textbook coverage of topics, countries varied from 15 framework topics
(Japan) to 44 (the USA). A result illustrating the degrees to which textbooks covered a certain
topic was that 50 % of the countries have at most 20% of their textbooks devoted to that topic
(fig. 5.1). Also large within country variation of content covered in textbooks was found. “The
large ranges for most countries suggest considerable variation in complex performance
expectations within each country. (100).
When considering teacher coverage it was established that 5 topics were emphasized by each of
the four indicators of curriculum (content standards, textbooks, teacher coverage and
achievement measurement) across all TIMSS countries (area of equations and formula and two-
dimensional geometry). From this point begins the divergence among the indicators. Often a
breach was noted between intended and implemented content, this was interpreted as a split
between the worlds of policy and practice. Chapter 6 provides further details on the association
between the intended and implemented curriculum. Correlations were mostly positive
significant. Structural relationship were significant for math but not for science (169). At general
aggregate level the median correspondence between any two curricular indicators are very small
across all topics, essentially 0. (176) Per topic (math) correlations varied between 0 and .20.
“The coefficients of determination show textbook space accounting for around 10 to 40% of the
variance in both instructional time and proportion of teachers covering a topic”. One
relationship appeared to be constant, namely a direct relationship of textbook space to teacher
implementation. Varying patterns of association between different curriculum indicators and
39
achievement were found. For example, in the Netherlands, math achievement assessment was
positively associated with textbook use, but not with any other curriculum indicator. Quite
surprisingly all path coefficients between curriculum indicators were positive in the NL for
science. No direct influence of curricular centralization was noted, but there was an indirect
effect through the path between content standards and teacher implementation as mediated by
textbook space.
Association of curriculum aspects and measured achievement gain across countries
The first type of analysis that was conducted was a pair-wise comparison between topic coverage
of a particular curriculum indicator (e.g. textbook) and the achievement results for that topic.
“The pairwise coefficients at the interaction level (topics x countries) are all positive for both
mathematics and science. This indicates that more curriculum coverage of a topic area – no
matter whether manifested as emphasis in content standards, as proportion of textbook space, or
as measured by either teacher implementation variable – is related to larger gains in that same
topic area” (261). These are analyses at country level; the results show that the nature of these
general relationships is not the same for all countries.
Next, a two-way analysis was carried out, by means of testing a structural model. In this
structural model, effects of a particular curriculum aspect was estimated while controlling for the
effect of the other aspects of curriculum.
For mathematics the relationship of instructional time per topic area to learning was only
marginally significant at best (sign level of .126), but it was positive. This was the case when
statistically controlling for textbook coverage and for content standards. When these were not
controlled for the relationship was significant at the .01 level.
Effects of content standards and textbook coverage could be direct or indirect. In the case of
indirect effects, the pair-wise uncontrolled analysis would be adequate, and the conclusion of .01
significance above would be warranted. Results for the proportion of teachers covering a topic
were significant in both the controlled and non-controlled analyses.
Effect for content standards: the larger the percentage of the standards devoted to a tested topic
area that were included, the greater the learning (achievement gains) in those topic areas. Also
when controlling for the two other curriculum aspects.
Effects for textbook coverage were somewhat more complex, but the overall conclusion was that
textbook space was positively related to achievement gain. (263)
Results of complete structural model analyses, figure 8.1 (264,265) are summarized as follows:
“The conception proposed by and represented in the structural model is supported by the data. In
general, content standards in mathematics were related to teacher implementation both directly
and indirectly through textbook coverage. Teacher implementation was in turn related to
achievement gain (although only marginally so for instructional time per topic as the dependent
variable).
The results for science were more complex, with positive direct effects for content standards (
sign .016) and both teacher implementation variables (significance at .002 and .003 respectively).
The relationships described were generally not uniform across countries. Main exception was the
relationship between textbook coverage and learning, which appeared to be generalizable across
all TIMSS countries; for math the relationship was positive (R square was .31, modestly strong),
40
for science negative. The regression coefficient for pair-wise uncontrolled association between
textbook coverage and achievement was .75, for content standards is was .72.
Within country analyses report the coefficient of determination (pair-wise uncontrolled analyses
in table 8.1) R square for effects of content standards, textbook coverage, teacher coverage and
instructional time, for the Netherlands, for example, resp. 0.00, .62, .00 and .01 for mathematics.
For science NL had: .004 (content standards), .001 (textbook coverage), .05 (teacher coverage)
and .08 instructional time. When statistically controlling for other curriculum variables results
for the Netherlands in math were as follows: the multiple correlation (all curriculum aspects and
learning) was .67, textbook coverage had a regression coefficient of .21`, content standards .01
and instructional time -.05. For science R square was ..17, for textbook coverage the regression
coefficient was .10, content standards .02 and instructional time -.20.
The report presents interesting comparisons of country patterns, e.g. between Japan, Singapore,
and the US. However, in 20 of the 30 countries not a single path coefficient reached statistical
significance. For the uncontrolled analyses instructional time had a positive significant
coefficient in only 2 of the 30 countries. For textbook coverage this was the case for 3 of the 30
countries.
In the final chapter, Chapter 9, a closer look is taken at between country analyses of curriculum
and learning gains across countries. Why did some countries do better on TIMSS (population 2)
than others? What do the curriculum characteristics contribute? The answers vary for the
different topics. Was the resultant emphasis for a topic related to differences in achievement for
that topic?
Country level relationships averaged over topics were related to instructional time per topic. The
independent variable was defined as the total amount of instructional time in hours allocated to a
topic, and then averaged over topics. The two-way analysis yielded significant country effects in
mathematics ( sign .015), but not in science (sign . 899). For mathematics the R square index was
.24. For an average math topic the R square was relatively small (not made explicit). When
applying a nonlinear model, R square was .12 (sign .07). For more demanding expectations
(proportion of textbook space devoted to more demanding instructional time) the R square was
.20. “The positive relationship for instructional time spent on more demanding expectations to
achievement leads to an important conjecture: more instructional time centered on topic-specific
problem solving and mathematical reasoning was associated with greater learning at the country-
level” (300) This conclusion does not speak for content free problem solving, but favors topic
specific problem solving.
Finally countries were grouped according to specific patterns of association in the path model.
The Netherlands was in different groups for mathematics and science, and this is quite
remarkable. For math the pattern was characterized by a relatively strong textbook coverage
effect and for science significant associations for all paths (also content standards, which is quite
strange for the Netherlands, given the large degree of school and teacher autonomy, and
relatively “open” curriculum frameworks).
Finally within country associations between instructional time and achievement gain were
analyzed, controlling for SES and some instructional variables. Results are summarized as
follows:
41
In the USA there were significant relationships for thirteen of twenty topic areas (ignoring
marginally significant relationships). In France, there were no significant topic areas with
significant relationships. Canada was closest to the USA in results, with nine of twenty areas
with significant relationships, and Japan had five.
Effect size in the USA: increase of 3 percent OTL (one week of instruction devoted to a topic)
would give and effect ranging from 3 to 24 percent increase in achievement gain on that topic.
William H. Schmidt, Leland S. Cogan, Richard T. Houang, and Curtis C. McKnight Source:
American Journal of Education, Vol. 117, No. 3 (May 2011), pp. 399-427 Content Coverage
Differences across Districts/States: A Persisting Challenge for U.S.Education Policy
This article utilizes the 1999 TIMSS-R data from U.S. states and districts to explore the
consequences of variation in opportunities to learn specific mathematics content. Analyses
explore the relationship between classroom mathematics content coverage and student
achievement as measured by the TIMSS-R international mathematics scaled score. District/state-
level socioeconomic status indicators demonstrated significant relationships with the dependent
variable, mathematics achievement, and the classroom-level measure of content coverage. A
three level hierarchical linear model demonstrated a significant effect of classroom content
coverage on achievement while controlling for student background at the student level and SES
at all three levels, documenting significant differences in mathematics learning opportunities as a
function of the U.S. education system structure.
Scope
“We use the term “opportunity to learn” (OTL) or “educational opportunity” specifically with
reference to content coverage, that is, the specific mathematics topics covered in classroom
instruction. This reflects both the narrow curricular sense in which the concept was originally
developed by Carroll and the International Association for the Evaluation of Educational
Achievement (IEA) international studies.”
“Our focus is the seminal definition of OTL as content for two reasons: (1) the provision of
content is the fundamental rationale of schooling and the education system, and (2) this is an
aspect of schooling that both reflects education policy and is amenable to education policy
reform”.
The study has a systemic perspective: “what many may not realize is the extent to which
differences in students’ learning opportunities are embedded in and are a function of the very
structure of the U.S. education system”. (ibid 400). Even with the presence of well-defined state
standards and, more recently, the increasing presence of corresponding state assessments, local
districts still maintain de facto control of their curriculum. The American educational governance
system is a system of shared responsibility among the states and the more than 15,000 local
school districts.
Individual local districts make choices about content coverage with, at best, indirect and more
global state control. American children simply are not likely to have equal educational
opportunities as defined at the most basic level of equivalent content coverage.
42
Conceptual framework and measurements
Reference to Caroll and time related interpretations of OTL, time to study a task.
A similar vein of OTL research developed somewhat independently from Carroll. Specifically,
the International Study of Achievement in Mathematics (later called FIMS) framed OTL as a
content coverage variable without specific regard to allocated time. In the Third International
Mathematics and Science Study (TIMSS) Carroll’s notion of time was incorporated, yielding a
more refined definition of OTL- in terms of the number of periods a specific topic was taught-
that became a central focus of the study and emerged as a major factor in making sense of cross-
country achievement differences .
The author consider the estimated strong relationship between SES and OTL as unique for the
USA. The common U.S. practice of tracking provides students in the same school with different
content opportunities.
“For example, suppose that solving linear equations (the simplest kinds of equations familiar
from a first course in algebra and even before) is a learning content goal at eighth grade. Suppose
that it is something that all children should know. If so, then exposure to this part of mathematics
is central to providing equal educational opportunity for all eighth-grade students in
mathematics. All of the attendant resources are there to support the learning of how to solve
linear equations and not as ends in themselves. If the best of teachers in well-financed and
resource-heavy districts do not provide all of their students with opportunities to learn how to
solve linear equations, then equal educational opportunities are not being provided even though
all students are studying mathematics.” (ibid, 405)
Achievement may be seen as an interactive function of the actual content covered and delivery
effectiveness.
This study focuses on equality of content coverage across two organizational entities, that is,
districts and states. It examines the consistency of educational opportunities with respect to
specific mathematics topics together with the associated student academic achievement. To
explore this, 13 districts and 9 states that replicated the TIMSS mathematics study in 1999 were
used.
The internationally scaled total test score in eighth-grade mathematics for TIMSS-R (Third
International Mathematics and Science Study-Repeat) was used as the dependent variable in the
analyses.
Important to the development of the teacher content questionnaires and the tests was the
mathematics content framework (Robitaille et al. 1993), which spelled out in detail the specific
content covered across the TIMSS world in school mathematics. A hierarchical array of 44
specific mathematics topics within 10 broad areas was developed to cover the full range of K–12
mathematics. (ibid, 407)
Using the TIMSS cross-national curriculum data, an index of difficulty for each topic was
developed. The scale was grade-related (1 -12) The “international grade placement” index, or
IGP, for a topic.
43
The data came from the teacher questionnaire in which teachers indicated the number of periods
of coverage associated with each of a set of topics (“taught before this year,” “taught 1–5
periods,” “taught more than 5 periods”). Each of the 34 teacher questionnaire topics contained
one or more of the 44 mathematics framework topics. The proportion of the school year’s
instruction in each of the 34 topics was calculated from the questionnaire, creating a profile of
mathematics content coverage for the classroom of students the teacher taught. These estimated
teacher content profiles were then weighted by the corresponding IGP values and summed across
all topics. This produced a single value that was an estimate of the rigor or content-related
difficulty of the implemented mathematics curriculum for each teacher.
This measure is described as “the weighted content coverage index”, which is a multifaceted
measure that is based on three distinct aspects of OTL: (1) the mathematics content itself (topic
coverage—yes/no), (2) instruction time for each topic, and (3) rigor or content difficulty (as
estimated from international curriculum data). Therefore, the IGP measure of the mathematics
taught in the classroom is a measure of content-specific OTL defined at the classroom level,
which can be unambiguously related to classroom achievement.
Types of results
District-Level Variation in OTL
The percentage of eighth-grade students in the district who were in mathematics classes that
focussed mainly on the coverage of algebra and geometry. That percentage ranges across the
districts, from 14 percent in one district to 95 percent in another. The IGP index varied from 6.05
to 6.88—almost one complete grade-level difference across the districts.
Relationship of OTL and Achievement at the District Level
R square OTL. achievement, not-controlling for SES was .67
After controlling for SES: Even after controlling for district-level SES, the effect size was
estimated at around three-fourths of a standard deviation.
Relationship of SES and OTL
Negative relationship Rsquare = . 51
Differentiating between Classroom and District-Level Relationships
Data are available to estimate the teacher variation in content coverage and its effect on
achievement and, as a result, to adjust for it in the statistical model.
“The consequences of decisions made by system-entity components (i.e.,districts or states), the
focus of this article, can only be believed to exist if OTL differences persist even after controlling
for the teacher variation just discussed” (ibid 419).
Controlling for SES and prior achievement, the IGP measure was significant ( p < .0001). The
coefficient indicated that for a one grade-level difference in IGP, the increase in mean
achievement at the classroom level was .15 of a standard deviation (419). Teacher knowledge
was also significant, but had a relatively small effect relative to OTL.
44
The percentage of students in the district who are eligible for free or reduced price lunch was
significant. So was IGP, the district/state level indicator of OTL(p < .02). “The simple answer to
the central question posed in this study is that significant differences in content coverage do exist
as a function of the U.S. education system, and this is related to the observed student
achievement differences”. The estimated effect (a measure of association not necessarily causal)
of OTL at the district level on mathematics achievement is about one-third of a standard
deviation. Since the parallel effect size at the classroom level was .15, this result implied that the
estimated total effect size for OTL across both the classroom and district/state levels was about
one-half a standard deviation for a one-grade level increase in IGP.
For these districts and states, the typical eighth-grade IGP is equal to that of the sixth grade
internationally. Most other TIMSS countries are two grades ahead in terms of the level of
demand of their curricula.
The authors conclude with the following observation:
In school mathematics, at least, the United States is sadly not the “land of opportunity” for any
student, regardless of wealth or social class. It is the land of the lucky few and the unlucky many
in which educational opportunity depends on a fluke (or on other societal factors)—that is, in
which school district an education is sought. It depends on factors that cannot be wholly
overcome by student ability and effort. (Ibid, 423)
Common Core Standards: The New U.S. Intended
Curriculum
Andrew Porter, Jennifer McMaken, Jun Hwang, and Rui Yang Educational Researcher, Vol.
40, No. 3, pp. 103–116
DOI: 10.3102/0013189X11405038
© 2011 AERA. http://er.aera.net
Abstract
The Common Core standards were released in 2010 for English language arts and mathematics
and had been adopted by dozens of states, when this article was published. The central research
question that was addressed looked at how much change these new standards represented, and
what the nature of that change was In this article, the Common Core standards were compared
with current state standards and assessments and with standards in top-performing countries, as
well as with reports from a sample of teachers from across the country describing their own
practices.
Scope
The Common Core State Standards Initiative developed these standards as a state-led effort to
establish consensus on expectations for student knowledge and skills that should be developed in
Grades K–12. By late 2010 36 states had adopted the standards. Standards pertain to “the content
of the intended curriculum,” NOT on how that content is to be taught (curriculum, pedagogy).
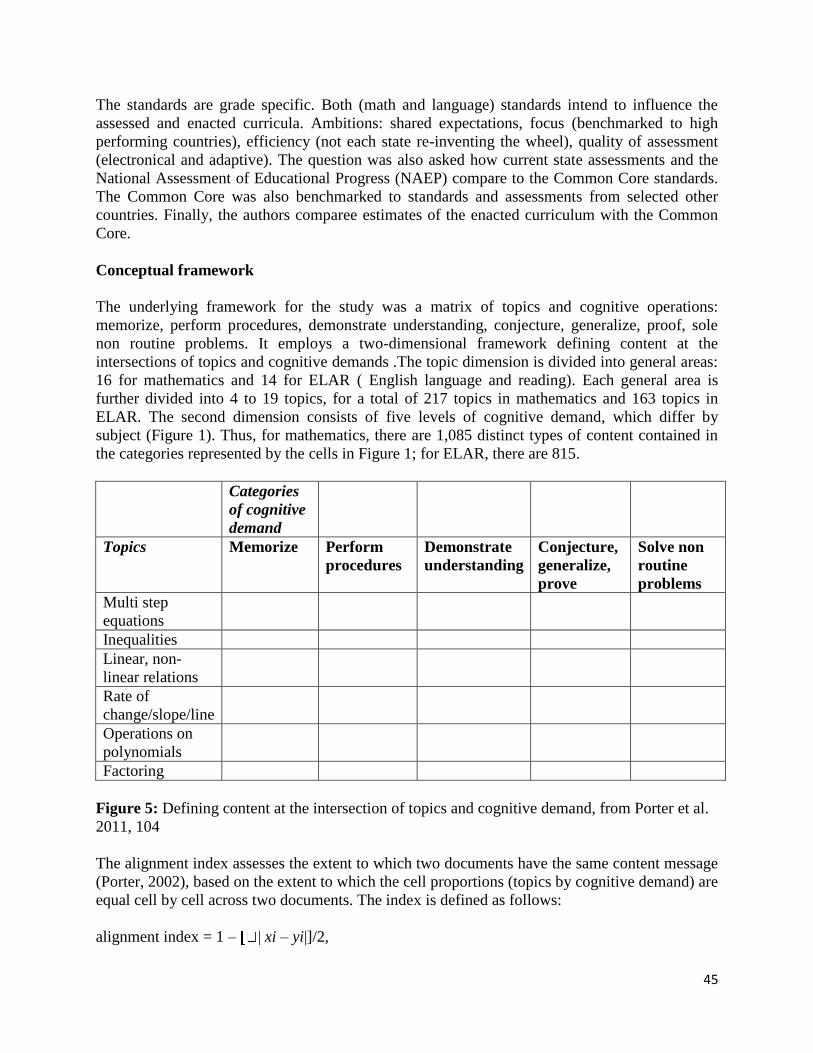
45
The standards are grade specific. Both (math and language) standards intend to influence the
assessed and enacted curricula. Ambitions: shared expectations, focus (benchmarked to high
performing countries), efficiency (not each state re-inventing the wheel), quality of assessment
(electronical and adaptive). The question was also asked how current state assessments and the
National Assessment of Educational Progress (NAEP) compare to the Common Core standards.
The Common Core was also benchmarked to standards and assessments from selected other
countries. Finally, the authors comparee estimates of the enacted curriculum with the Common
Core.
Conceptual framework
The underlying framework for the study was a matrix of topics and cognitive operations:
memorize, perform procedures, demonstrate understanding, conjecture, generalize, proof, sole
non routine problems. It employs a two-dimensional framework defining content at the
intersections of topics and cognitive demands .The topic dimension is divided into general areas:
16 for mathematics and 14 for ELAR ( English language and reading). Each general area is
further divided into 4 to 19 topics, for a total of 217 topics in mathematics and 163 topics in
ELAR. The second dimension consists of five levels of cognitive demand, which differ by
subject (Figure 1). Thus, for mathematics, there are 1,085 distinct types of content contained in
the categories represented by the cells in Figure 1; for ELAR, there are 815.
Categories
of cognitive
demand
Topics Memorize Perform
procedures
Demonstrate
understanding
Conjecture,
generalize,
prove
Solve non
routine
problems
Multi step
equations
Inequalities
Linear, non-
linear relations
Rate of
change/slope/line
Operations on
polynomials
Factoring
Figure 5: Defining content at the intersection of topics and cognitive demand, from Porter et al.
2011, 104
The alignment index assesses the extent to which two documents have the same content message
(Porter, 2002), based on the extent to which the cell proportions (topics by cognitive demand) are
equal cell by cell across two documents. The index is defined as follows:
alignment index = 1 – xi – yi|]/2,
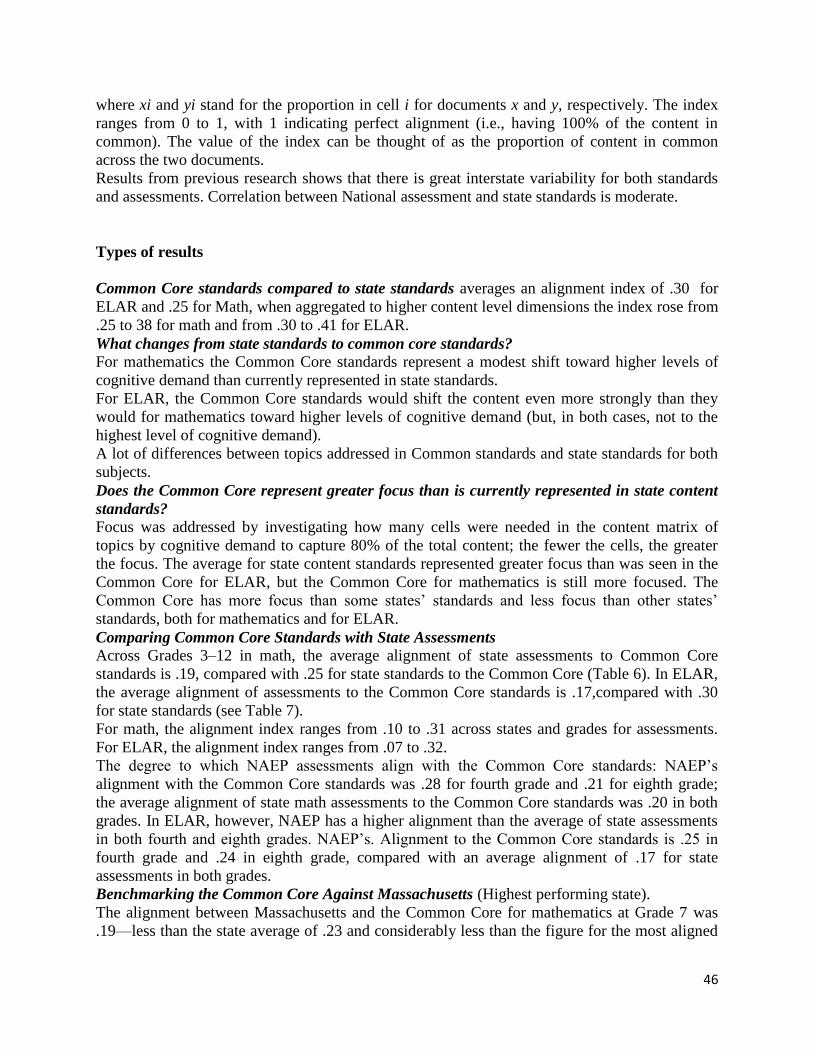
46
where xi and yi stand for the proportion in cell i for documents x and y, respectively. The index
ranges from 0 to 1, with 1 indicating perfect alignment (i.e., having 100% of the content in
common). The value of the index can be thought of as the proportion of content in common
across the two documents.
Results from previous research shows that there is great interstate variability for both standards
and assessments. Correlation between National assessment and state standards is moderate.
Types of results
Common Core standards compared to state standards averages an alignment index of .30 for
ELAR and .25 for Math, when aggregated to higher content level dimensions the index rose from
.25 to 38 for math and from .30 to .41 for ELAR.
What changes from state standards to common core standards?
For mathematics the Common Core standards represent a modest shift toward higher levels of
cognitive demand than currently represented in state standards.
For ELAR, the Common Core standards would shift the content even more strongly than they
would for mathematics toward higher levels of cognitive demand (but, in both cases, not to the
highest level of cognitive demand).
A lot of differences between topics addressed in Common standards and state standards for both
subjects.
Does the Common Core represent greater focus than is currently represented in state content
standards?
Focus was addressed by investigating how many cells were needed in the content matrix of
topics by cognitive demand to capture 80% of the total content; the fewer the cells, the greater
the focus. The average for state content standards represented greater focus than was seen in the
Common Core for ELAR, but the Common Core for mathematics is still more focused. The
Common Core has more focus than some states’ standards and less focus than other states’
standards, both for mathematics and for ELAR.
Comparing Common Core Standards with State Assessments
Across Grades 3–12 in math, the average alignment of state assessments to Common Core
standards is .19, compared with .25 for state standards to the Common Core (Table 6). In ELAR,
the average alignment of assessments to the Common Core standards is .17,compared with .30
for state standards (see Table 7).
For math, the alignment index ranges from .10 to .31 across states and grades for assessments.
For ELAR, the alignment index ranges from .07 to .32.
The degree to which NAEP assessments align with the Common Core standards: NAEP’s
alignment with the Common Core standards was .28 for fourth grade and .21 for eighth grade;
the average alignment of state math assessments to the Common Core standards was .20 in both
grades. In ELAR, however, NAEP has a higher alignment than the average of state assessments
in both fourth and eighth grades. NAEP’s. Alignment to the Common Core standards is .25 in
fourth grade and .24 in eighth grade, compared with an average alignment of .17 for state
assessments in both grades.
Benchmarking the Common Core Against Massachusetts (Highest performing state).
The alignment between Massachusetts and the Common Core for mathematics at Grade 7 was
.19—less than the state average of .23 and considerably less than the figure for the most aligned
47
state, .34. In ELAR, Massachusetts’ alignment was .13, again less than the state average of .32
and substantially less than the state maximum of .43.
International Benchmarking (Finland, Japan and Singapore)
All three of these countries have higher eighth-grade mathematics achievement levels than does
the United States. The content differences that lead to these low levels of alignment for cognitive
demand are, for all three countries, a much greater emphasis on “perform procedures” than found
in the U.S. Common Core standards. For each country, approximately 75%of the content
involves “perform procedures,” whereas in Common Core standards, the percentage for
procedures is 38%.
Clearly, these three benchmarking countries with high student achievement do not have
standards that emphasize higher levels of cognitive demand than does the Common Core. (There
was a strong common core focus on solving non routine problems).
Comparing Common Core Curriculum with the Current Enacted Curriculum
For mathematics, the average alignment across teachers to Common Core standards was .22,
with a standard deviation of .042, a minimum alignment of .00 and a maximum alignment of .33.
For ELAR, the mean alignment was.27, with a standard deviation of .071, a minimum alignment
of .001, and a maximum alignment of .398. Again, generally low levels of alignment were found.
Conclusions
The Common Core standards represent considerable change from what states currently call for in
their standards and in what they assess. The Common Core standards are somewhat more
focused in mathematics but not in ELAR. The Common Core standards are also different from
the standards of countries with higher student achievement, and they are different from what
U.S. teachers report they are currently teaching.
But a key question remains: Do we describe content at too crude or too precise a level of detail?
If too crude, we have undoubtedly overlooked important additional uniqueness in the Common
Core, if too precise, some of the uniqueness we find may not be important.
When SEC procedures (Surveys of the Enacted Curriculum based on teacher reports) are used to
measure the degree of alignment of that (enacted) content to assessed content, the degree of
alignment is a powerful predictor of gains in student achievement, with correlations of nearly .5
(explaining 25% of the variance). Further, the strength of prediction drops to near zero when
topics are collapsed to just consider cognitive demand and, similarly, when cognitive demand is
collapsed to just consider topics (Gamoran, Porter, Smithson, & White, 1997)
Again, the analyses here address how much change the Common Core standards represent for
content standards and assessments.
Comment
Focus of this article is not on OTL/achievement correlation, nor on strategies to enhance
instructional alignment. Results show that a huge effort needs to be made to align assessments,
textbooks and instruction to the new common core standards.
48
Instructional alignment as a measure of teaching quality
Polikoff, M.S. and Porter, A.C. (2014)
Educational Evaluation and Policy Analysis, 36, 4, pp 399-416
Abstract
This article is the first to explore the extent to which teachers’ instructional alignment is
associated with their contribution to student learning and their effectiveness on new composite
evaluation measures using data from the Bill and Melinda Gates Foundation’s Measurement of
Effective Teaching (MET) study. Finding surprisingly weak associations, we discuss potential
research and policy implication for both streams of policy.
The basic assumption in this study is that the content of teachers’ instruction is an important
determined of students’ learning, seen as students’ opportunity to learn (OTL) The content
specified in the Common Core standards is thought to be an essential element for ensuring the
validity of assessment results used to guide decisions for school accountability. Perhaps the most
important measure of content coverage in current policy efforts is the alignment of teachers’
instruction with state standards and/or assessments. Aligning instruction with content standards
is a major focus of federal standards policies. Yet, there has never been a large-scale analysis of
the relationship of both instructional alignment and pedagogical quality to the prediction of
Value Added Measures. Research questions:
1) To what extent is the alignment of teachers’ reported instruction with the content of
standards and assessments associated with value-added to student achievement (note;
included are two alignment measures, instruction with standards, and instruction with
assessments).
2) To what extent does pedagogical quality moderate the relationship between instructional
alignment and value added to student achievement?
3) To what extent is the alignment of teachers’ reported instruction associated with a
composite measure of teacher effectiveness?
Conceptual framework
“It is thought that providing teachers with more consistent messages through content standards
and aligned assessments, curriculum materials, and professional development will lead them to
align their instruction with the standards, and student knowledge of standards content will
improve” (400). “There is abundant evidence from the literature that OTL (including
instructional alignment and pedagogical quality) affects student achievement.” “In some cases,
the effects of OTL are so large that there is no statistically significant residual between-course
level (e.g. between general and honors levels) variation in achievement after controlling for
OTL” (ibid, 401)
Main dimensions of teachers’ instruction are: instructional time, content and pedagogical quality.
Ways of capturing these dimensions are self-reports (content), observations and student surveys
(pedagogical quality).
The assessment sensitivity depends on the proximity of assessment to instruction: immediate,
proximal and distal. State assessments- distal to instruction- differ in their sensitivity to
49
instruction. One reasonable hypothesis is that the more sensitive assessments are more tightly
aligned to the content taught by teachers.
Final elements of this study are the use of classroom-level VAM (value-added) measures and
relating instructional alignment to a composite measure of teacher effectiveness (based on MET,
observation, student reporting and past performance in terms of VAM)
Method
Investigation of the association of instructional alignment with other measures of teacher
effectiveness in two subjects, Math and ELA English Language Arts) and two grade levels, 4th
and 8th
grade. Earlier research found that the relationship between assessment- instruction
alignment and achievement was a correlation of .45 (source Gamoran et al., 1997).Given
81teachers per grade/subject cell, the total target sample was 324 teachers. Online survey of the
content of their instruction, using the Surveys of Enacted Curriculum (SEC) content taxonomies.
Teachers were asked to think about a target MET class when answering the survey. The
response-rate was 39%.
Instruments:
SEC (Surveys of the enacted curriculum); the surveys define content at the intersection of
specific topics and levels of cognitive demand (see Porter, 2002); there are 183 fine-grained
topics in mathematics and 133 in ELA. Cognitive demand varies from memorization to
application or proof. Instruction to respondents: first decide which topic were taught or not (in a
school year); for those taught indicate a) the number of lessons spent on each topic and b) the
level of cognitive demand (cell= topic by cognitive demand combination).
Content analyses to compare teachers’ survey responses with SEC content analyses of standards
and tests, to estimate instructional alignment to the documents. The raters are content-area
specialists with advanced degrees. Fine-grained topics, objects (from the standards) and test
items. Test items may be placed in up to 3 cells, while objectives may be placed in up to 6 cells.
Test items are weighted for their occurrence in more than one cell. Results: set of proportions,
indicating the percentage of total standards or test items in each cell of the SEC. Ergo: a standard
profile, an assessment profile, and a teacher self-rating “behavioral ” , instructional profile (JS).
Validity evidence contained, among others correlations of nearly .5 between instruction to test
alignment and student achievement gains.
The alignment index is defined as 1 – Sum of cell differences between two documents divided
by 2. The sum of the cell-by-cell minima can be used to compute a proportion ranging from 0 to
1. Used as a teacher level independent or dependent variable.
Pedagogical quality measures were based on student surveys, video based observations, analyzed
in classroom environment sub-scales: environment of respect and rapport, establishing a culture
of learning, managing classroom procedures and managing student behavior. Next, responses
were used to compute instructional sub-scales; communicating with students, using questioning
and discussion techniques, engaging students in learning and using assessment in instruction. All
averaged to obtain a composite score.
Achievement was measured by means of VAM (value added measures) (406).
50
Results
The alignment of teachers’ instruction with state standards and state and alternate assessments
was low; with a mean of .20 in mathematics and .28 in ELA. (Note: these are consistency
measures based on content analysis).
When it comes to the zero-order correlations of VAM scores with SEC instructional alignment
indices, most of the correlation were not significant. Three correlations with VAM were
analyzed: (1) the alignment between instruction and state standards, and (2) the alignment
between instruction and state or (3) alternative tests. In those grade, district, subject
combinations where the correlations were significant the average was .16 for math and .14 for
ELA. A further result of the correlational analysis was that “Overall, the correlations do not
show evidence of strong relationships between alignment of pedagogical quality and VAM
scores” (408).
Fixed effects regression pointed out that there was just one coefficients (among some 30 others)
that was significant at the .10 level, namely the coefficient for the relationship of instruction-
alternate test alignment, with alternate test VAM in ELA (408) This significant coefficient
indicated that a 1 standard deviation increase in instruction-alternative test alignment with
alternate test VAM is associated with a .05 unit (approximately 0,2 standard deviation increase in
alternate test VAM. Concerning the climate and pedagogical quality variables, there were no
significant correlations of any of the three variables with any of the VAM outcomes ( in the full
study data set of the MET significant relationship were found, but the sizes of the relationships
were small).
Conducting a series of interaction models, to see if SEC interacted with pedagogical quality in
influencing VAM scores, one significant interaction effects out of 6 was established; effect sizes
in the order of .3 sd. “Together these results provide, at best, modest evidence of an interactive
effect of alignment and pedagogical quality, though the results are in the expected direction that
the effects of pedagogical quality is positive when alignment is stronger but not when alignment
is weaker” (410). Finally it was established that there was no evidence of relationships between
alignment and a composite measure of effectiveness (namely the composite used in the MET,
based on VAM and two different observation schedules).
Discussion
The authors conclude as follows:
“We found modest evidence through zero order correlations and regressions that alignment
indices were related to VAM scores. These relationships went away when controlling for
pedagogical quality. Only one significant interaction effect in the expected direction (out of 6).
No evidence of associations of instructional alignment with a composite measure of teaching
effectiveness. Correlations were much smaller than expected, the design anticipated in increase
in Rsquare of .10, suggesting a correlation of greater than .30” (ibid,410).
Hypotheses for small effects: poor data (ruled out); other indicators of alignment, e.g. just the
content that teachers covered without comparison to standards or assessment (ruled out); limited
variation in either the independent or dependent variables leading to attenuated correlations;
comparison to the larger MET study; there was indeed reduced variance; other differences with
the larger MET, some indication of an unobservable factor, but it is not clear what such a factor
might be. “Overall the results are disappointing” (411). Authors find it hard to accept that there
51
would not be a fair OTL effect, “given the volume of literature that links OTL to achievement”
(414) Conclusion could be that the decades of previous research have not identified what really
matters in instruction (!!). Plausible explanation: the tests were not sufficiently sensitive to detect
differences in the quality and content of instruction; but that would be a troubling interpretation.
The results suggest challenges to the effective use of VAM data. “It is essential that the research
community develops a better understanding of how state tests reflect differences in instructional
content and quality” (414). Comment: it could be argued that this recommendation is built on the
pre- disposition that process quality is good and the tests are bad; which is questionable; maybe
the instruction should be better adapted to the tests.
OECD (2014) PISA 2012 Results: What students know and can do. Student performance in
mathematics, reading and science. Volume 1. Paris: OECD Publishing. Chapter 3: Measuring
opportunities to learn mathematics.
The way OTL was measured in PISA 2012
The data were collected by means of the student questionnaire, to cover both the content and
time aspects of students’ opportunity to learn.
“Four of the questions focused on the degree to which students encountered various types of
mathematics problems or tasks during their schooling, which all form part of the PISA
mathematics framework and assessment. Some of the tasks included in those questions involved
formal mathematics content, such as solving an equation or calculating the volume of a box.
Others involved using mathematics in a real-world applied context. Still another type of task
required using mathematics in its own context, such as using geometric theorems to determine
the height of a pyramid (see Question 5 at the end of this chapter). The last type of task involved
formal mathematics, but situated in a word problem like those typically found in textbooks
where it is obvious to students what mathematics knowledge and skills are needed to solve them.
Students were asked to indicate how frequently they encountered similar tasks in their
mathematics lessons using a four-point scale: never, rarely, sometimes, or frequently.
In another question, students were asked how familiar they were with certain formal mathematics
content, including such topics as quadratic functions, radicals and the cosine of an angle
Responses to these tasks were recorded on a five-point scale indicating the degree to which
students had heard of the topic. Having heard of a topic more often was assumed to reflect a
greater degree of opportunity to learn. In addition, a question asked students to indicate, on a
four-point scale, how frequently they had been taught to solve eight specific mathematics tasks.
These tasks included both formal and applied mathematics. All but the last question were used to
create three indices: “formal mathematics”, “word problems”, and “applied mathematics”.
Values of these indices range from 0 to 3, indicating the degree of exposure to opportunity to
learn, with 0 corresponding to no exposure and 3 to frequent exposure. When interpreting the
data, it needs to be borne in mind that the 15-year-olds assessed by PISA are, in some countries,
dispersed over a range of grades and mathematical programmes and will therefore be exposed to
a range of mathematical content”.(p.146)
On the basis of the student response on the 6 items, three opportunity to learn indices were
constructed. The index of formal mathematics was computed as the average of three scales. One
52
scale was based on the degree to which students said they had heard of a particular topic in
formal mathematics, e.g. “radicals”; a second scale was based on the frequency codes of being
exposed to exponential functions, quadratic functions and linear equations as an indicator of
“familiarity with algebra”. The third scale derived from the item where students indicated how
often they had been confronted (in their lessons and in tests) with problems defined as formal
mathematics.
Results
On average, 15-year-olds in OECD countries indicated that they encounter applied mathematics
tasks and word problems “sometimes” and formal mathematics tasks somewhat less frequently.
To examine the overall relationship between opportunity to learn and achievement, a three-level
model was fitted to the data showing that at all three levels – country, school and student – there
was a statistically significant relationship between opportunity to learn and student performance.
Therefore, examinations of the relationship between opportunity to learn and achievement can be
made at student, school and country levels simultaneously. (150)
In the sequel of this summary only the results of opportunity to learn formal mathematics will be
considered. It appeared that the relationship between OTL in formal mathematics and
mathematics achievement was linear, and the relationship was positive and significant at student,
school and country levels.
“Within each country the relationship between opportunity to learn and performance can be
observed at both the school and student levels. These relationships were analyzed using a two-
level model. Of the 64 countries and economies that participated in PISA 2012 with available
data for the index of opportunity to learn formal mathematics, all but Albania and Liechtenstein
show a positive and statistically significant relationship between exposure to formal mathematics
and performance at both the student and school levels (Figure I.3.3). Among the OECD
countries, the average impact of the degree of exposure to algebra and geometry topics on
performance is around 50 points at the student level (i.e. increase in PISA mathematics score
associated with one unit increase in the index of exposure to formal mathematics)”. (150)
The OECD report concludes that: “It is noteworthy that in the high-performing East Asian
countries and economies on the PISA assessment – Shanghai-China, Singapore, Hong Kong-
China, Chinese Taipei, Korea, Macao-China and Japan – the exposure to formal mathematics is
significantly stronger than in the remaining PISA participating countries and economies (2.1
versus 1.7).” (155) and “At the student level, the estimated effect of a greater degree of
familiarity with such content on performance is almost 50 points. The results could indicate that
students exposed to advanced mathematics content are also good at applying that content to
PISA tasks. Alternatively, the results could indicate that high-performing students attend
mathematics classes that offer more advanced mathematics content. Exposure to word problems,
which are usually designed by textbook writers as applications of mathematics, are also related
to performance, but not as strongly” (155). In terms of policy relevance of these findings, the
report concludes that the findings suggest that policy makers can learn through PISA how their
decsions about curricula are ultimately reflected in student performance.
53
Comments
Basically students were asked about specific mathematics content, how frequently they had been
confronted with that content in their lessons and their tests. It should be noted that content was
related to their regular tests at school and not to the PISA mathematics test. In the summary
above only the results concerning formal mathematics were discussed, and this was the facet of
OTL that correlated highest with achievement (associations for word problems and applied
mathematics were smaller). From the way the results are reported it appears that the relationship
between OTL in formal mathematics and mathematics achievement were not adjusted for student
background characteristics; so the associations should be considered as raw correlations. This
means that the effect sizes are probably inflated. Still, when comparing the OTL effects to other
malleable variables in PISA, the effects compare quite favorably, both in effect size and number
of countries in which the relationship between OTL and mathematics achievement is significant
(Scheerens, 2016)
Schmidt, W.H., Burroughs, N.A., Zoido, P., and Houang, R.T. (2015) The Role of schooling
in perpetuating educational inequality: An international perspective. Educational Researcher
Vol XX, No. X, pages 1-16.1 http://er.aera.net
General description
Schmidt, Zoido and Cogan (2015) carried out a secondary analysis on the PISA 2012 data set, in
which they focused on OTL effects in relationship to socio economic status (SES). The study
yields international comparative results on the effect of OTL and SES on mathematical literacy
performance as measured in PISA. Analyses were carried out at country, between school and
within school level. The main focus of analysis is the way OTL and SES jointly influence
student achievement. This joint effect is analyzed in terms of interaction effects (random effects
regression model) and in terms of direct and indirect effects (path analysis). Indirect effects are
interpreted in the sense of OTL mediating the SES effect. The total SES effect (at country,
between school and within school level) is expressed as the sum of the direct and indirect effect
of SES, where the indirect SES effect expresses the mediating influence of OTL. The main
substantive issue is the hypothesis, supported by earlier research that is cited in the article, that
the influence of SES on performance is “boosted” by the effect of less rigorous OTL provision
for low SES students. In other words socio economic inequalities are enforced by OTL
inequalities.
Research questions
The research questions addressed in this study are the following ones:
1. What is the joint relationship of SES and OTL to PISA literacy at both the between- and
within-school levels?
1 This study is a further analysis of the overall effect of OTL in PISA 2012 (OECD, 2014) as described in the previous project summary.
54
2. What is the relationship of both between- and within school inequalities in OTL to the
corresponding between- and within-school inequalities in SES and how those inequalities
relate to differences in achievement?
3. To what degree does content coverage (OTL) function as a meditator of SES in its relationship
to achievement?
Data and OTL measurement
The 2012 version of PISA surveyed students about the intensity of their exposure to selected
mathematics topics. Data from 33 OECD and 29 non-OECD, were used in the analyses. The
mathematics domain that was concentrated on was formal mathematics.
“ Two separate scales were constructed using the item asking for the degree of the student’s
familiarity with 7 of the 13 mathematics content areas (Question 2). The five response categories
reflecting the degree to which they had heard of the topic were scaled 0 to 4 with 0 representing
“never heard of it” 4 representing they “knew it well”. [As stated in another section of
the report, “having heard of a topic more often was assumed to reflect a greater degree of
opportunity to learn” (OECD, 2014, p. 146).] The frequency codes for the three topics—
exponential functions, quadratic functions, and linear equations—were
averaged to define familiarity with algebra. Similarly, the average of four topics defined a
geometry scale, including vectors, polygons, congruent figures, and cosines. The third scale was
derived from the item where students indicated how often they had been confronted with
problems defined as formal mathematics (Question 4). The frequency categories were coded as
“frequently”, “sometimes”, and “rarely” equaling 1 and “never” equal to 0, resulting in a
dichotomous variable. The algebra, geometry and formal mathematics tasks were averaged to
form the index “formal mathematics”, which ranged in values from 0 to 3, similar to the other
three indices. (OECD, 2014, pp. 172–173)” (ibid, p 2)
Main results
“Using a three-level model with individual SES and OTL centered on the school mean and
school average SES and OTL centered on the country mean, we found that student-, school-, and
country-level indicators of SES and OTL had a statistically significant relationship to student
mathematics performance on the PISA. The inclusion of both variables into a single model
reduced the size of the student-level SES coefficient by 32%, but the positive coefficient for the
student-level OTL variable was essentially the same being reduced by only 5%.”
“Similarly, two-level (school and individual) analyses within each country indicated that these
relationships were quite consistent across PISA participants. In the full model, SES continued
to have a statistically significant relationship with student mathematics outcomes in most
countries (57 of 62), whereas OTL was significant in all but one (Sweden). In comparison
with the SES-only model, the size of student- and school-level SES coefficients was reduced for
62 countries, with an average of about one third in the OECD” (ibid 4).
The hypothesis that SES and OTL have an interactive effect on student mathematics literacy
received partial support at the student level, with a statistically significant relationship in the full
model. The interaction effects were stronger at the school than at the individual level (ibid, 4).
55
A second strand of analyses in this study was based on the definition of SES and OTL gaps
(average differences between the top and bottom quartiles) defined and analyzed at country,
between schools and within schools levels). The results showed that Substantial SES within
school achievement gaps existed in most countries, with an average 44-point difference in PISA
scores in OECD countries (approaching half a standard deviation), ranging from New Zealand’s
74 points to Slovenia’s mere 7 points. (ibid, p. 6). Within-school achievement gaps appeared to
be smaller than between-school gaps in every country but Sweden and Finland but were still
appreciable, with an average of 42% the size of the mean between-school gap of 105 points (ibid
6/7) The data also showed similar inequalities in OTL, with a .27 average OECD difference in
OTL within school and .46 between schools, with substantial variation across countries.
In a next series of analyses OTL gaps were used as the independent variable and SES
achievement gaps as the dependent variable. The results showed that countries with larger
average differences in OTL between high- and low-income students within the same school tend
to have larger average differences in performance. The results of the pooled within country
analyses suggested that a one-unit increase in a school’s OTL gap is associated with a 31-point
increase in the SES achievement gap (about a third of a standard deviation).
“Turning to the ordinary least squares regressions for each country separately, the association
between within-school OTL and within-school performance inequalities is positive for every
OECD country (and 59 of the 62 in the PISA sample) and statistically significant for 23 of the 33
OECD countries and 20 of the 28 non-OECD systems” (ibid, 6). A notable result was also the
finding that once the OTL gap was controlled for, variables like tracking and streaming did no
longer show a significant effect. The authors conclude that OTL accounts for most of the
tracking effects.
As a third strand of analysis path-analysis was used to test a conceptual model, in which SES and
OTL are the main independent variables, including direct effects of these two variables and an
indirect effect, which pictures OTL as a mediator of SES.
The estimated path coefficients among SES, OTL, and performance as hypothesized by the
model were statistically significant at the .05 level across 32 of 33 OECD
countries. The magnitude of the direct relationship between OTL and PISA performance
controlling for SES had an OECD average of 60 points on the PISA mathematics scale,
suggesting an effect size of three fifths of a standard deviation. Three countries stood out for
their somewhat extreme values. Korea and Japan had estimated values of around 100 (a full
standard deviation), and Sweden’s estimated path coefficient was only 5 (5% of a standard
deviation).
The estimated total effect of SES on PISA performance for each country, further subdivided by
the relative contribution that is indirect versus direct, showed a large variation across the 33
countries, with an average total SES effect size of 39, ranging from 19 in Mexico to 58 in
France. The average proportion of that total effect that was attributable to the indirect effect was
one third but varied appreciably, ranging from 1% in Sweden to 58% in the Netherlands (ibid, 8).
The size of the indirect effect of SES in many countries appeared to be a relatively large
contributor to the total SES effect. The authors conclude that this suggests ‘that the perceived
role of schooling as the “great equalizer” may well be a myth and that the reality is better
characterized as the “exacerbater.” ‘ And they point at Australia, Korea, and the Netherlands,
where over one half of the total estimated effect contributed by the relationship of SES to
performance is mediated by OTL (ibid. 9).
Within-school relationships showed statistically significant associations along all three paths
56
for nearly all countries, with an OECD average OTL effect of 45 and an SES total effect of 19
(13 direct, 6 indirect). SES was positively related to OTL in all 62 educational systems in the
PISA sample. As with the overall results, the SES-OTL relationship accounted for roughly a
third of the total SES effect on performance, with sizable variation across countries, ranging
from the indirect effect accounting for nearly three quarters in (Japan) to less than 10% (Iceland
and Sweden).
The results of the path analysis for differentiation between schools again showed positive and
statistically significant but highly variable relationships among SES, OTL, and student
performance Among OECD countries, SES had a large positive average total SES effect (100),
with indirect effects constituting a large share of that relationship (average 43 points in the
OECD, statistically significant in 29 of 33 systems). OTL was also strongly related to PISA
performance (average coefficient of 90, statistically significant in 29 countries). In all 62 PISA
educational systems, SES is significantly related to OTL (OECD average .44). Between-school
relationships varied appreciably across countries, with the indirect effect related to OTL having
the strongest relationship in Korea, the Netherlands, and Japan and the smallest in Sweden and
Estonia. Further, the relationships between SES and OTL were greatest in a group of European
countries: the Netherlands, Austria, Switzerland, and Germany.
In the Netherlands and Korea, all of the very large total SES effect was derived from the SES-
OTL relationship, together with the largest effect sizes for OTL at the between-school level
(p.10)
The study concludes that: (a) OTL has a strong direct relationship to student achievement , (b)
high-SES students tend to receive more rigorous OTL, and (c) a substantial share of the total
relationship of SES to literacy occurs through its association with OTL. The authors say that the
implication of these findings is that any serious effort to reduce educational inequalities must
address unequal content coverage within schools.
Conclusions
The evidence from meta-studies that reviewed OTL effects appears to be less solid than was
expected, given the relatively high expectations about OTL effects expressed by various authors,
like Porter, Schmidt and Polikoff. The number of meta-analyses was limited, and further
analyses revealed that not all meta-studies listed as such were independent from one another (e.g.
Marzano, 2003 largely quoting the results presented by Scheerens and Bosker, 1997). Leaving
out the outlying results from Marzano, the OTL effect-size (in terms of the d- coefficient)
compares to other relatively strong effectiveness enhancing conditions at school level, at about
.30. A sophisticated recent study (Polikoff et al. 2014) suggests that effect sizes may be lower
when adjustments are made for other variables.
The review of 6 illustrative studies showed considerable diversity in the way OTL is measured.
An important difference, introduced in Chapter 1, is between studies that associate an empirical
measure of exposure to content to achievement, as compared to studies that related an alignment
index to achievement (as was the main emphasis in the studies by Porter et al., and Polikoff et
al). The results from PISA 2012 are striking, in the sense that OTL effects are higher, and more
generalizable across countries than any of the other school/teaching variables that are usually
analyzed as background variables in PISA.
57
References
Au, W. (2007) High-Stakes Testing and Curricular Control: A Qualitative Metasynthesis
Educational Researcher; 36, 5, 258 -267
Baumert, J., Kunter, M., Blum, W., Brunner, M., Voss, T., Jordan, A., et al. (2010). Teachers’
mathematical knowledge, cognitive activation in the classroom, and student progress.
American Educational Research Journal, 47, 133-180.
Bangert-Drowns, R. L., Kulik, J. A., & Kulik, C. C. (1983). Effects of coaching programs
on achievement test performance. Review of Educational Research, 53,571-586
Bruggencate, C. G., Pelgrum, W. J., & Plomp, T. (1986). First results of the Second IEA Science
Study in the Netherlands. In W. J. Nijhof & E. Warries (Eds.), Outcomes of education
and training. Lisse: Swets & Zeitlinger
Blömeke, S., Hsieh, F-J., Kaiser, G. And Schmidt, W.H. (2014) International perspectives on
teacher knowledge, beliefs and opportunities to learn. Teachers Education and Development
Study in Mathmeatics, TEDS-M). Dordtrecht: Springer
Creemers, B. P. M. (1994). The effective classroom. London: Cassell
Crocker, L. (2005) Teaching For the Test: How and Why Test Preparation is Appropriate. In
Phelps, R.P. Defending Standardized Testing. Mahwah, New Jersey London: Lawrence Erlbaum
Publishers. De Haan, D.M., (1992) Measuring test-curriculum overlap. Enschede: Universiteit Twente (Dissertatie).
Farnsworth , T. (2013) Effects of Targeted Test Preparation on Scores of two tests of oral
English as a second language. Tesol Quarterly, 47, 1.
Gamoran,, A., Porter, A.C. , Smithoins, J. & White, P.A.(1997) Upgrading high school
mathematics instruction: improving learning opportunities for low-achieving, low-income youth.
Educational Evaluation and Policy Analysis, 19, 325-338
Groot, A.D., de (1986) Begrip van evalueren. ’s-Gravenhage: Vuga.
Hattie, J. (2009). Visible Learning. Abingdon: Routledge
Holcombe, R.W. (2011). Can the 10th Grade Mathematics MCAS Test be Gamed? Opportunities
for Score Inflation. Unpublished manuscript. Harvard University, Cambridge,
Massachusetts
Horn, A., & Walberg, H. J. (1984). Achievement and interest as a function of quantity and
quality of instruction. Journal of Educational Research, 77, 227–237.
58
Husen, T. (1967). International study of achievement in mathematics: A comparison of twelve
countries. New York: Wiley
Kablan, Z., Toblan, B. and Erkan, B. (2013) The Effectiveness Level of Material Use in
Classroom Instruction: A Meta-analysis Study. Educational Sciences: Theory & Practice - 13(3)
1638-1644
Koretz, D.M., McCaffrey, D.F. and Hamilton, L.S. (2001) Towards a framework for validating
under high-stakes conditions. CSE Technical Report, 551. (CRESST)
http://www.cse.ucla.edu/CRESST/reports?TR551.pdf
Kyriakides,L., Christoforou, C., Charalambous, C.I. (2013) What matters for student
learning outcomes: A meta-analysis of studies exploring factors of effective teaching.
Teacher and Teacher Education. 36 (2013) 143-152
Lomos, C., Hofland, R., & Bosker, R. (2011) Professional communities and learning achievement- A
meta-analysis. School Effectiveness and School Improvement (22) 121-148.
Messick, S. (1982). Issues of effectiveness and equity in the coaching controversy: Implications
for educational and testing practice. Educational Psychologist, 17, 67–91.
Mo, Y. (2008) Opportunity to learn, engagement and science achievement, evidence from TIMSS, 2003.
Virginia Polytechnical Institute and State University
Marsano (2003) What works in schools. Translating research into action. Alexandria, VA: Association
for Supervision and Curriculum Development.
McKinsey & Company, (2010) How the world’s most improved school systems keep getting better.
McKinsey & Company.
OECD (2010).Strong Performers and Successful Reformers in Education: Lessons from PISA for
the United States. Paris: OECD
OECD, (2014) PISA 2012 results: What students know and can do. Volume 1.Paris: OECD (64 countries,
country level effect size .50, p. 150
OECD, (2014a) OECD Reviews of Evaluation and Assessment in Education: the Netherlands. Paris:
OECD
Pelgrum, W.J. (1989) Educational Assessment. Monitoring, Evaluation and the Curriculum. De
Lier: Academisch Boekencentrum
Pelgrum, W. J., Eggen, Th. J. H. M.,& Plomp, Tj. (1983) The second mathematics study: Results.
Enschede: Twente University.
59
Scheerens, J., & Bosker, R.J. (1997). The Foundations of Educational Effectiveness. Oxford:
Elsevier Science Ltd.
Scheerens, J., Luyten, H., Steen, R., & Y. Luyten-de Thouars (2007). Review and meta-analyses
of school and teaching effectiveness. Enschede: University of Twente, Department of
Educational Organisation and Management
Scheerens, J., & Bloemeke, S. (2016) Integrating teacher education effectiveness research into
educational effectiveness models (Submitted)
Scheerens, Jaap (2016) Educational Effectiveness and Ineffectiveness. A critical review of the
knowledge base. Dordrecht, Heidelberg, London, New York: Springer (389 p)
http://www.springer.com/gp/book/9789401774574
Schroeder, C.M., Scott,T., Tolson, H.,Tse-Yang Huang, Yi-Hsuan Lee (2007) A Meta-Analysis
of National Research: Effects of Teaching Strategies on Student Achievement in Science in the
United States. Journal of research in science teaching. 44, (10),1436–1460
Spada, N.& Tomita, Y. (2010)Interactions Between Type of Instruction and Type of Language
Feature: A Meta-Analysis. Language Learning 60:2, 263–308
Polikoff, M.S. and Porter, A.C. (2014) Instructional alignment as a measure of teaching quality.
Educational Evaluation and Policy Analysis, 36, 399-416
Popham, W.J. (2003) Test better, teach better, The instructional role of assessment Alexandria,
Virginia: ACSD
Schmidt, W. H., McKnight, C.C., Houang, R.T., Wiley, D.E., Cogan, L.S., and Wolfe, R.G. (2001)
Why schools matter. A cross-national comparison of curriculum and learning. San Francisco:
Jossey-Bass
Schmidt, W.B., Cogan, L.S., Houang, R.T., MCKnight, C.C. (2011) Content coverage across
countries/states: A persisting challenge for US educational policy. American Journal of
Education 117, (May, 2011), 399- 427
Schmidt, W.H., Burroughs, N.A., Zoido, P., and Houang, R.T. (2015) The Role of schooling in
perpetuating educational inequality: An international perspective. Educational Researcher Vol
44, No. X, pages 1-16. http://er.aera.net
Seidel, T., and Steen, R. (2005) The indicators on teaching and learning compared to the review
of recent research articles on school and instructional effectiveness. In: Scheerens, J.,
Seidel, T., Witziers, B., Hendriks, M., & Doornekamp, G. (2005). Positioning the
supervision frameworks for primary and secondary education of the Dutch Educational
Inspectorate in current educational discourse and validating core indicators against the
60
knowledge base of educational effectiveness research. Enschede/Kiel: University of
Twente / Institute for Science Education (IPN).
Seidel and Shavelson, 2007 Seidel, T., & Shavelson, R.J. (2007). Teaching effectiveness
research in the past decade: the role of theory and research design in disentangling meta-
analysis results. Review of Educational Research 77(4), 454-499.
Sturman, L. (2011) Test prepatation: valid and valuable, or wasteful? The journal of the
imagination of language learning. 9, 31-37
Thurlings, M., & Den Brok, P. (2014) Leraren leren als gelijken: Wat werkt? Eindhoven:
Eindhoven School of Education, Technische Universiteit Eindhoven.
Muijs, D., and Reynolds, D. (2003) Student background and teacher effects on achievement and
attainment in mathematics. Educational Research and Evaluation, 9, 289-314
Opdenakker, M., C., & Van Damme, J.(2006) Teacher characteristics and teaching styles as
effectiveness enhancing factors of classroom practice. Teaching and Teacher Education, 22, 1-
21
Wilson, L. W. (2002). Better instruction through assessment. Larchmont, NY: Eye on
Education
Xie, Q. (2013) Does Test Preparation Work? Implications for Score Validity. Language
Assessment Quarterly. 10:2, 196-218, DOI: 10.1080/15434303.2012.721423
61
CHAPTER IV: REVIEW AND “VOTE COUNT” ANALYSIS OF OTL-EFFECT
STUDIES
Marloes Lamain, Jaap Scheerens, Peter Noort
Introduction
In this chapter 51 empirical studies, in which opportunity to learn was quantitatively associated
with student performance, are schematically summarized. Results are synthesized by means of a
so called “vote count” procedure, where studies are categorized for showing positive or negative
statistically significant or insignificant associations between OTL and student performance. Such
analyses provide a crude impression about the empirical support for the assumption that
opportunity to learn is positively associated with student performance in a meaningful way. The
advantage of this way of synthesizing research outcomes is that they allow for comparison with
similar results for other independent variables in schooling and teaching that are expected to
enhance effectiveness. As such we shall provide comparative data based on earlier studies with
respect to: evaluation, achievement orientation, learning time, parental involvement, staff
consensus and cohesion and educational leadership.
Methods
Identification and collection of studies
The identification of studies was carried out by means of explicit selection and inclusion criteria
and the choice of relevant data bases.
We were interested in selecting primary empirical research studies as well as meta-analyses,
review-studies, best-evidence syntheses and research syntheses. The following inclusion criteria
were used:
- OTL as independent variable.
- Cognitive achievement in basic school subjects like vernacular (mother tongue) language,
mathematics, arithmetic and science, preferably adjusted for relevant student background
characteristics, as dependent variable(s) of the study.
- Studies carried out in primary and secondary education (age groups 6 -18).
- Studies carried out in regular education (excluding special education).
- Studies reported in Dutch, English or German.
- Research reports containing sufficient quantitative information to potentially calculating
effect sizes (like correlations or d-coefficients). In the case of meta-analyses we required at
least mean effects-sizes across the analyzed primary studies.
- Studies that were published between 1995 and 2015.
The following data bases were used: Eric, PsychARTICALS, PsychBOOKS, Psych INFO and
Psychology and Behavioral Sciences collection. In the Annex to this chapter further details are
provided about the search that was conducted. In addition to this systematic search of data-bases,
the reference lists of a limited number of key articles (see Chapter 3) were scrutinized for
relevant studies as well.
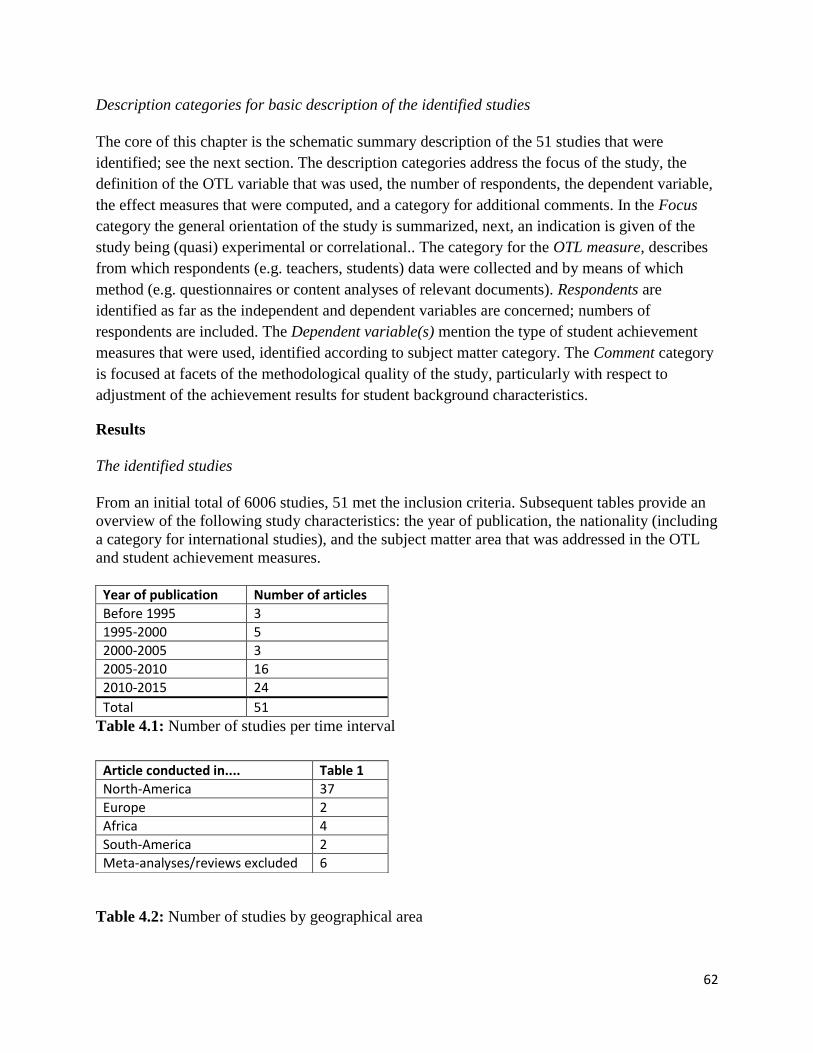
62
Description categories for basic description of the identified studies
The core of this chapter is the schematic summary description of the 51 studies that were
identified; see the next section. The description categories address the focus of the study, the
definition of the OTL variable that was used, the number of respondents, the dependent variable,
the effect measures that were computed, and a category for additional comments. In the Focus
category the general orientation of the study is summarized, next, an indication is given of the
study being (quasi) experimental or correlational.. The category for the OTL measure, describes
from which respondents (e.g. teachers, students) data were collected and by means of which
method (e.g. questionnaires or content analyses of relevant documents). Respondents are
identified as far as the independent and dependent variables are concerned; numbers of
respondents are included. The Dependent variable(s) mention the type of student achievement
measures that were used, identified according to subject matter category. The Comment category
is focused at facets of the methodological quality of the study, particularly with respect to
adjustment of the achievement results for student background characteristics.
Results
The identified studies
From an initial total of 6006 studies, 51 met the inclusion criteria. Subsequent tables provide an
overview of the following study characteristics: the year of publication, the nationality (including
a category for international studies), and the subject matter area that was addressed in the OTL
and student achievement measures.
Year of publication Number of articles
Before 1995 3
1995-2000 5
2000-2005 3
2005-2010 16
2010-2015 24
Total 51
Table 4.1: Number of studies per time interval
Table 4.2: Number of studies by geographical area
Article conducted in.... Table 1
North-America 37
Europe 2
Africa 4
South-America 2
Meta-analyses/reviews excluded 6
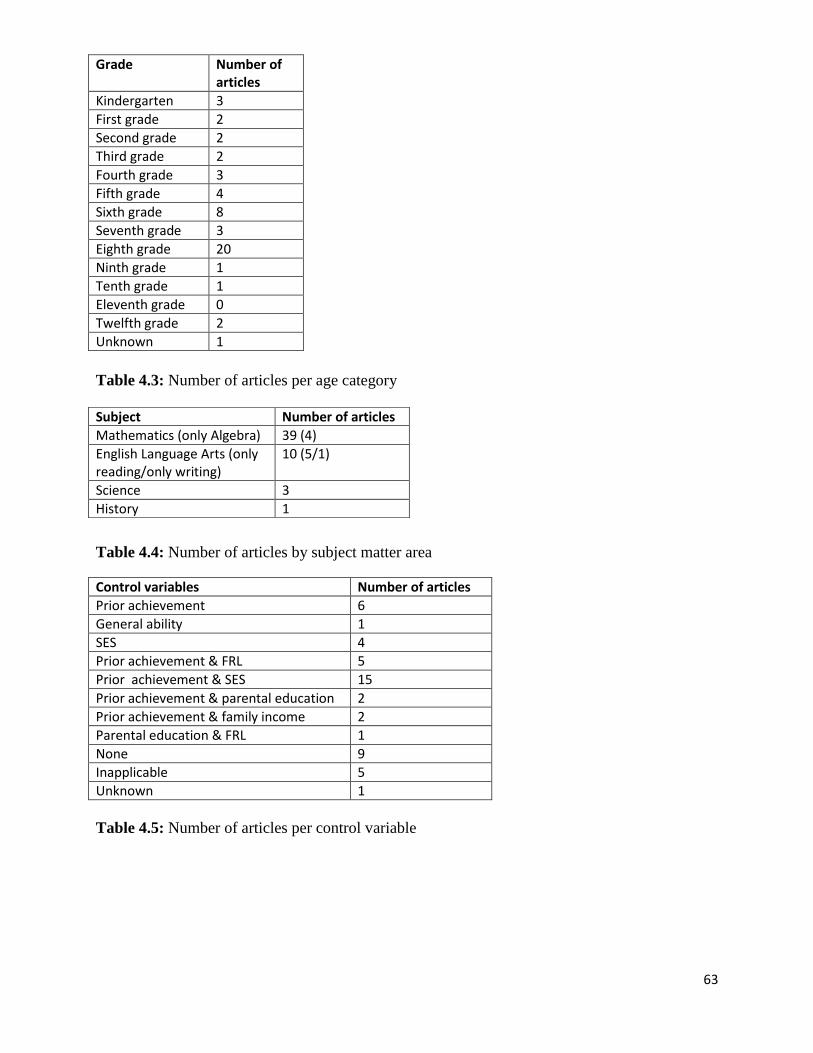
63
Table 4.3: Number of articles per age category
Table 4.4: Number of articles by subject matter area
Control variables Number of articles
Prior achievement 6
General ability 1
SES 4
Prior achievement & FRL 5
Prior achievement & SES 15
Prior achievement & parental education 2
Prior achievement & family income 2
Parental education & FRL 1
None 9
Inapplicable 5
Unknown 1
Table 4.5: Number of articles per control variable
Grade Number of articles
Kindergarten 3
First grade 2
Second grade 2
Third grade 2
Fourth grade 3
Fifth grade 4
Sixth grade 8
Seventh grade 3
Eighth grade 20
Ninth grade 1
Tenth grade 1
Eleventh grade 0
Twelfth grade 2
Unknown 1
Subject Number of articles
Mathematics (only Algebra) 39 (4)
English Language Arts (only reading/only writing)
10 (5/1)
Science 3
History 1
64
The results indicate that the large majority of studies were conducted between 2005 and 2015,
that no less than 37 of the 51 studies were carried out in the USA, that studies in which eighth
grade students were the respondents predominated (20 out of 51), and that most studies
addressed mathematics, with language as the second important area. Interestingly, the number of
studies that addressed OTL effects increased over time, with almost half of the identified studies
being conducted between 2010 and 2015.
Schematic summary description
In Table 4.6 the 50 studies that were selected are described according to the categories defined in
the methods section.
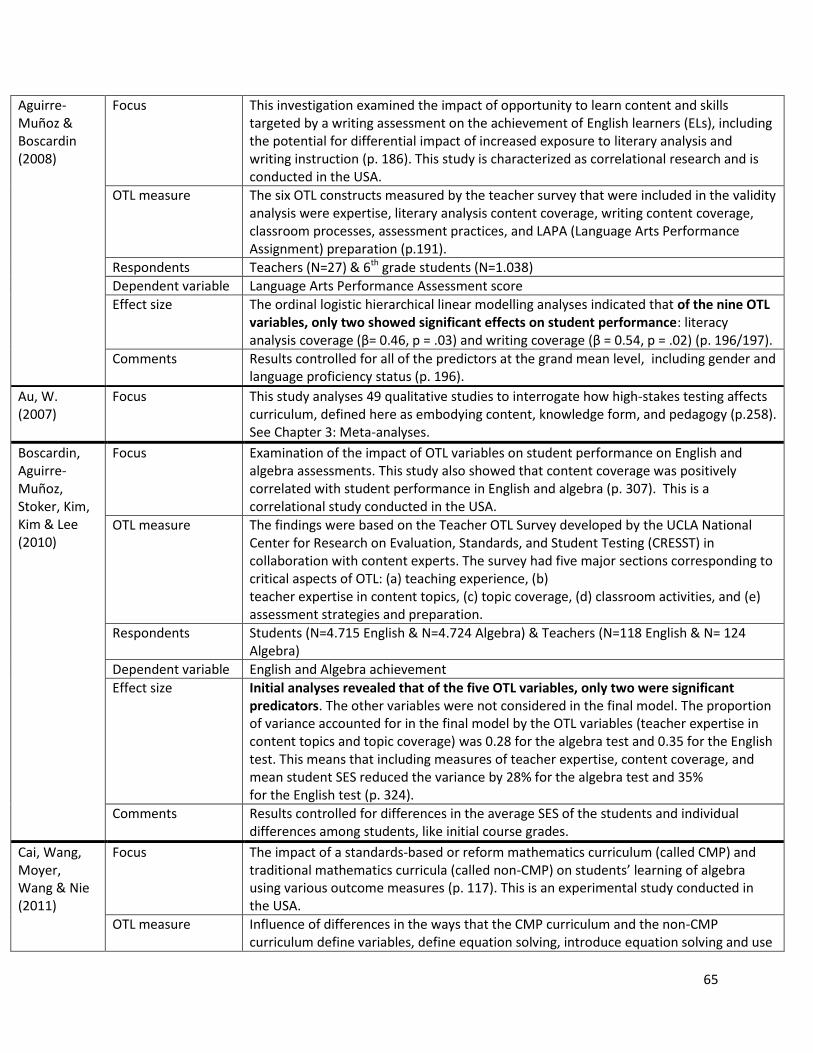
65
Aguirre-Muñoz & Boscardin (2008)
Focus This investigation examined the impact of opportunity to learn content and skills targeted by a writing assessment on the achievement of English learners (ELs), including the potential for differential impact of increased exposure to literary analysis and writing instruction (p. 186). This study is characterized as correlational research and is conducted in the USA.
OTL measure The six OTL constructs measured by the teacher survey that were included in the validity analysis were expertise, literary analysis content coverage, writing content coverage, classroom processes, assessment practices, and LAPA (Language Arts Performance Assignment) preparation (p.191).
Respondents Teachers (N=27) & 6th grade students (N=1.038)
Dependent variable Language Arts Performance Assessment score
Effect size The ordinal logistic hierarchical linear modelling analyses indicated that of the nine OTL variables, only two showed significant effects on student performance: literacy analysis coverage (β= 0.46, p = .03) and writing coverage (β = 0.54, p = .02) (p. 196/197).
Comments Results controlled for all of the predictors at the grand mean level, including gender and language proficiency status (p. 196).
Au, W. (2007)
Focus This study analyses 49 qualitative studies to interrogate how high-stakes testing affects curriculum, defined here as embodying content, knowledge form, and pedagogy (p.258). See Chapter 3: Meta-analyses.
Boscardin, Aguirre-Muñoz, Stoker, Kim, Kim & Lee (2010)
Focus Examination of the impact of OTL variables on student performance on English and algebra assessments. This study also showed that content coverage was positively correlated with student performance in English and algebra (p. 307). This is a correlational study conducted in the USA.
OTL measure The findings were based on the Teacher OTL Survey developed by the UCLA National Center for Research on Evaluation, Standards, and Student Testing (CRESST) in collaboration with content experts. The survey had five major sections corresponding to critical aspects of OTL: (a) teaching experience, (b) teacher expertise in content topics, (c) topic coverage, (d) classroom activities, and (e) assessment strategies and preparation.
Respondents Students (N=4.715 English & N=4.724 Algebra) & Teachers (N=118 English & N= 124 Algebra)
Dependent variable English and Algebra achievement
Effect size Initial analyses revealed that of the five OTL variables, only two were significant predicators. The other variables were not considered in the final model. The proportion of variance accounted for in the final model by the OTL variables (teacher expertise in content topics and topic coverage) was 0.28 for the algebra test and 0.35 for the English test. This means that including measures of teacher expertise, content coverage, and mean student SES reduced the variance by 28% for the algebra test and 35% for the English test (p. 324).
Comments Results controlled for differences in the average SES of the students and individual differences among students, like initial course grades.
Cai, Wang, Moyer, Wang & Nie (2011)
Focus The impact of a standards-based or reform mathematics curriculum (called CMP) and traditional mathematics curricula (called non-CMP) on students’ learning of algebra using various outcome measures (p. 117). This is an experimental study conducted in the USA.
OTL measure Influence of differences in the ways that the CMP curriculum and the non-CMP curriculum define variables, define equation solving, introduce equation solving and use
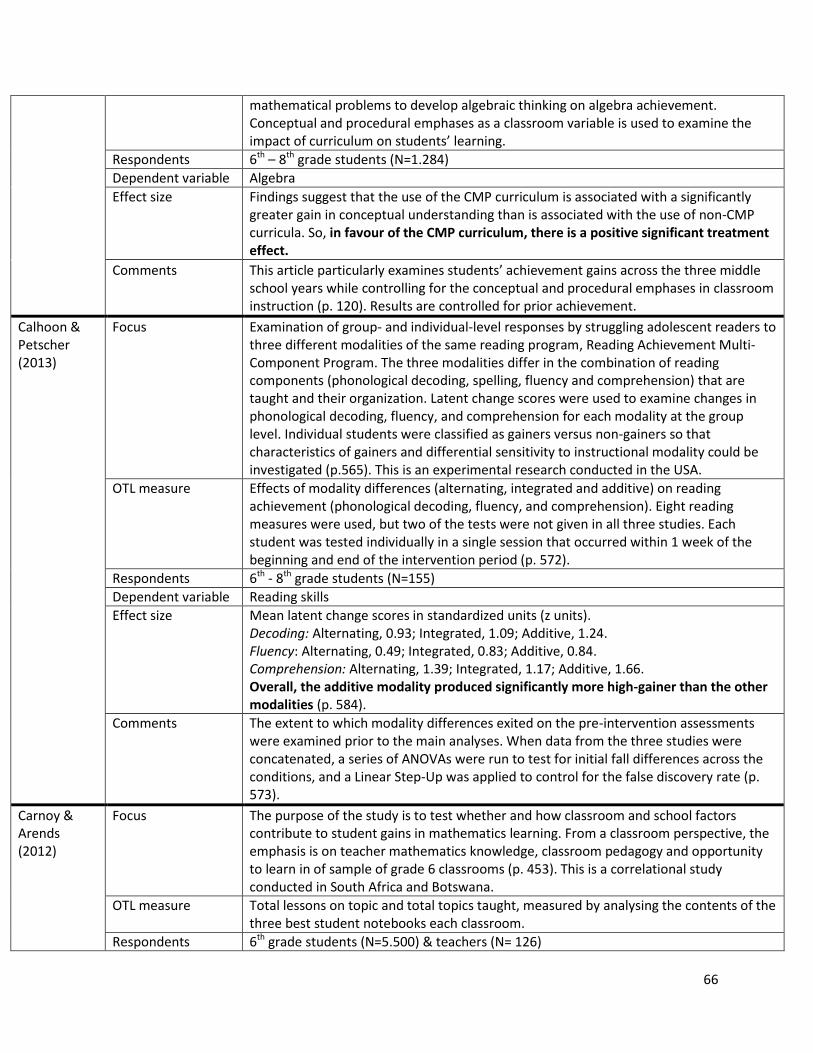
66
mathematical problems to develop algebraic thinking on algebra achievement. Conceptual and procedural emphases as a classroom variable is used to examine the impact of curriculum on students’ learning.
Respondents 6th – 8th grade students (N=1.284)
Dependent variable Algebra
Effect size Findings suggest that the use of the CMP curriculum is associated with a significantly greater gain in conceptual understanding than is associated with the use of non-CMP curricula. So, in favour of the CMP curriculum, there is a positive significant treatment effect.
Comments This article particularly examines students’ achievement gains across the three middle school years while controlling for the conceptual and procedural emphases in classroom instruction (p. 120). Results are controlled for prior achievement.
Calhoon & Petscher (2013)
Focus Examination of group- and individual-level responses by struggling adolescent readers to three different modalities of the same reading program, Reading Achievement Multi-Component Program. The three modalities differ in the combination of reading components (phonological decoding, spelling, fluency and comprehension) that are taught and their organization. Latent change scores were used to examine changes in phonological decoding, fluency, and comprehension for each modality at the group level. Individual students were classified as gainers versus non-gainers so that characteristics of gainers and differential sensitivity to instructional modality could be investigated (p.565). This is an experimental research conducted in the USA.
OTL measure Effects of modality differences (alternating, integrated and additive) on reading achievement (phonological decoding, fluency, and comprehension). Eight reading measures were used, but two of the tests were not given in all three studies. Each student was tested individually in a single session that occurred within 1 week of the beginning and end of the intervention period (p. 572).
Respondents 6th - 8th grade students (N=155)
Dependent variable Reading skills
Effect size Mean latent change scores in standardized units (z units). Decoding: Alternating, 0.93; Integrated, 1.09; Additive, 1.24. Fluency: Alternating, 0.49; Integrated, 0.83; Additive, 0.84. Comprehension: Alternating, 1.39; Integrated, 1.17; Additive, 1.66. Overall, the additive modality produced significantly more high-gainer than the other modalities (p. 584).
Comments The extent to which modality differences exited on the pre-intervention assessments were examined prior to the main analyses. When data from the three studies were concatenated, a series of ANOVAs were run to test for initial fall differences across the conditions, and a Linear Step-Up was applied to control for the false discovery rate (p. 573).
Carnoy & Arends (2012)
Focus The purpose of the study is to test whether and how classroom and school factors contribute to student gains in mathematics learning. From a classroom perspective, the emphasis is on teacher mathematics knowledge, classroom pedagogy and opportunity to learn in of sample of grade 6 classrooms (p. 453). This is a correlational study conducted in South Africa and Botswana.
OTL measure Total lessons on topic and total topics taught, measured by analysing the contents of the three best student notebooks each classroom.
Respondents 6th grade students (N=5.500) & teachers (N= 126)
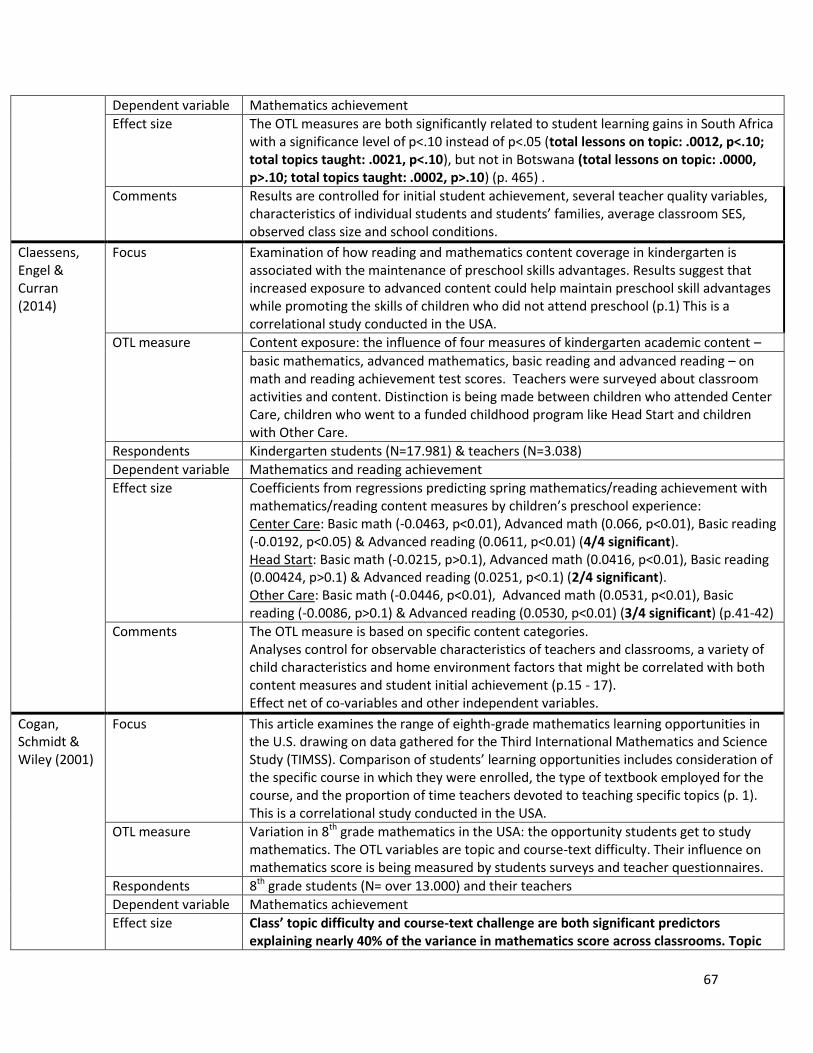
67
Dependent variable Mathematics achievement
Effect size The OTL measures are both significantly related to student learning gains in South Africa with a significance level of p<.10 instead of p<.05 (total lessons on topic: .0012, p<.10; total topics taught: .0021, p<.10), but not in Botswana (total lessons on topic: .0000, p>.10; total topics taught: .0002, p>.10) (p. 465) .
Comments Results are controlled for initial student achievement, several teacher quality variables, characteristics of individual students and students’ families, average classroom SES, observed class size and school conditions.
Claessens, Engel & Curran (2014)
Focus Examination of how reading and mathematics content coverage in kindergarten is associated with the maintenance of preschool skills advantages. Results suggest that increased exposure to advanced content could help maintain preschool skill advantages while promoting the skills of children who did not attend preschool (p.1) This is a correlational study conducted in the USA.
OTL measure Content exposure: the influence of four measures of kindergarten academic content –
basic mathematics, advanced mathematics, basic reading and advanced reading – on math and reading achievement test scores. Teachers were surveyed about classroom activities and content. Distinction is being made between children who attended Center Care, children who went to a funded childhood program like Head Start and children with Other Care.
Respondents Kindergarten students (N=17.981) & teachers (N=3.038)
Dependent variable Mathematics and reading achievement
Effect size Coefficients from regressions predicting spring mathematics/reading achievement with mathematics/reading content measures by children’s preschool experience: Center Care: Basic math (-0.0463, p<0.01), Advanced math (0.066, p<0.01), Basic reading (-0.0192, p<0.05) & Advanced reading (0.0611, p<0.01) (4/4 significant). Head Start: Basic math (-0.0215, p>0.1), Advanced math (0.0416, p<0.01), Basic reading (0.00424, p>0.1) & Advanced reading (0.0251, p<0.1) (2/4 significant). Other Care: Basic math (-0.0446, p<0.01), Advanced math (0.0531, p<0.01), Basic reading (-0.0086, p>0.1) & Advanced reading (0.0530, p<0.01) (3/4 significant) (p.41-42)
Comments The OTL measure is based on specific content categories. Analyses control for observable characteristics of teachers and classrooms, a variety of child characteristics and home environment factors that might be correlated with both content measures and student initial achievement (p.15 - 17). Effect net of co-variables and other independent variables.
Cogan, Schmidt & Wiley (2001)
Focus This article examines the range of eighth-grade mathematics learning opportunities in the U.S. drawing on data gathered for the Third International Mathematics and Science Study (TIMSS). Comparison of students’ learning opportunities includes consideration of the specific course in which they were enrolled, the type of textbook employed for the course, and the proportion of time teachers devoted to teaching specific topics (p. 1). This is a correlational study conducted in the USA.
OTL measure Variation in 8th grade mathematics in the USA: the opportunity students get to study mathematics. The OTL variables are topic and course-text difficulty. Their influence on mathematics score is being measured by students surveys and teacher questionnaires.
Respondents 8th grade students (N= over 13.000) and their teachers
Dependent variable Mathematics achievement
Effect size Class’ topic difficulty and course-text challenge are both significant predictors explaining nearly 40% of the variance in mathematics score across classrooms. Topic
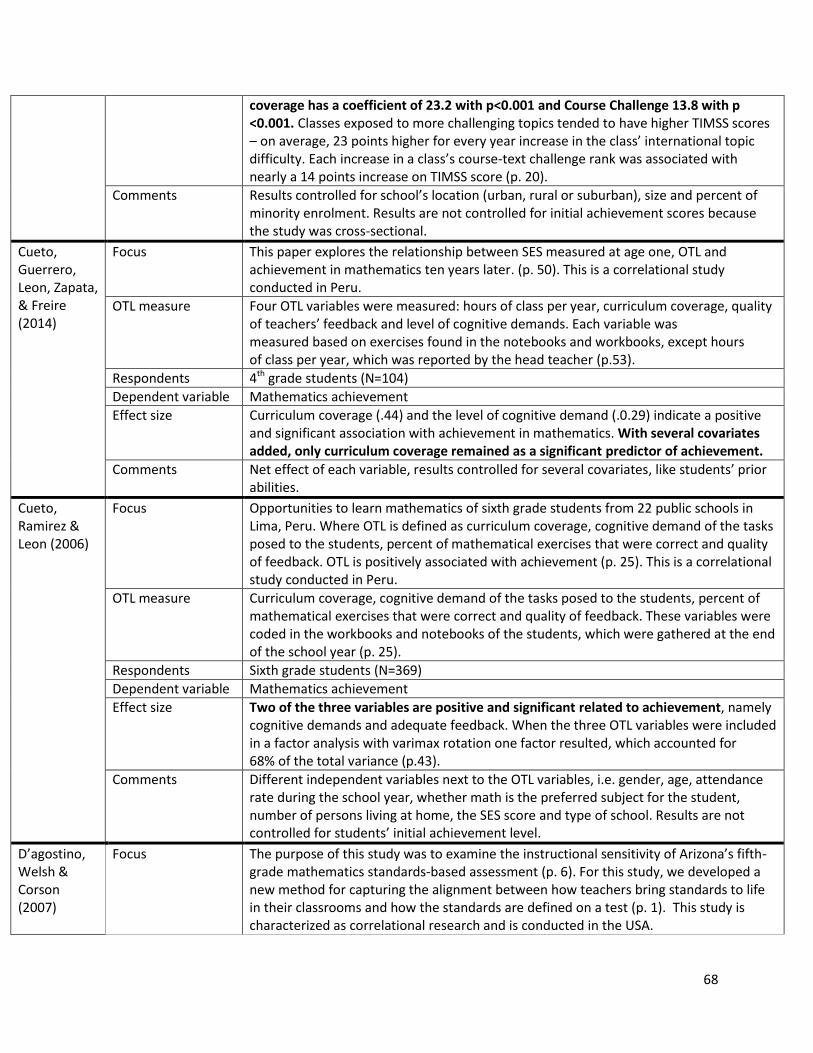
68
coverage has a coefficient of 23.2 with p<0.001 and Course Challenge 13.8 with p <0.001. Classes exposed to more challenging topics tended to have higher TIMSS scores – on average, 23 points higher for every year increase in the class’ international topic difficulty. Each increase in a class’s course-text challenge rank was associated with nearly a 14 points increase on TIMSS score (p. 20).
Comments Results controlled for school’s location (urban, rural or suburban), size and percent of minority enrolment. Results are not controlled for initial achievement scores because the study was cross-sectional.
Cueto, Guerrero, Leon, Zapata, & Freire (2014)
Focus This paper explores the relationship between SES measured at age one, OTL and achievement in mathematics ten years later. (p. 50). This is a correlational study conducted in Peru.
OTL measure Four OTL variables were measured: hours of class per year, curriculum coverage, quality of teachers’ feedback and level of cognitive demands. Each variable was measured based on exercises found in the notebooks and workbooks, except hours of class per year, which was reported by the head teacher (p.53).
Respondents 4th grade students (N=104)
Dependent variable Mathematics achievement
Effect size Curriculum coverage (.44) and the level of cognitive demand (.0.29) indicate a positive and significant association with achievement in mathematics. With several covariates added, only curriculum coverage remained as a significant predictor of achievement.
Comments Net effect of each variable, results controlled for several covariates, like students’ prior abilities.
Cueto, Ramirez & Leon (2006)
Focus Opportunities to learn mathematics of sixth grade students from 22 public schools in Lima, Peru. Where OTL is defined as curriculum coverage, cognitive demand of the tasks posed to the students, percent of mathematical exercises that were correct and quality of feedback. OTL is positively associated with achievement (p. 25). This is a correlational study conducted in Peru.
OTL measure Curriculum coverage, cognitive demand of the tasks posed to the students, percent of mathematical exercises that were correct and quality of feedback. These variables were coded in the workbooks and notebooks of the students, which were gathered at the end of the school year (p. 25).
Respondents Sixth grade students (N=369)
Dependent variable Mathematics achievement
Effect size Two of the three variables are positive and significant related to achievement, namely cognitive demands and adequate feedback. When the three OTL variables were included in a factor analysis with varimax rotation one factor resulted, which accounted for 68% of the total variance (p.43).
Comments Different independent variables next to the OTL variables, i.e. gender, age, attendance rate during the school year, whether math is the preferred subject for the student, number of persons living at home, the SES score and type of school. Results are not controlled for students’ initial achievement level.
D’agostino, Welsh & Corson (2007)
Focus
The purpose of this study was to examine the instructional sensitivity of Arizona’s fifth-grade mathematics standards-based assessment (p. 6). For this study, we developed a new method for capturing the alignment between how teachers bring standards to life in their classrooms and how the standards are defined on a test (p. 1). This study is characterized as correlational research and is conducted in the USA.
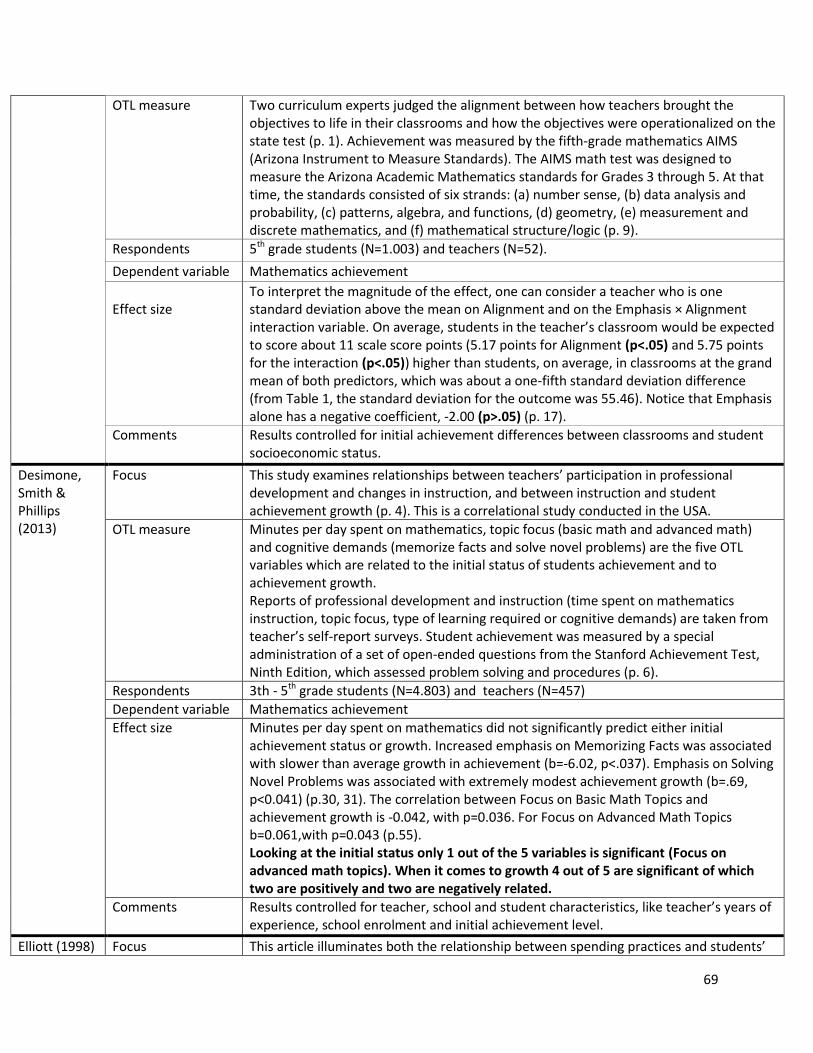
69
OTL measure
Two curriculum experts judged the alignment between how teachers brought the objectives to life in their classrooms and how the objectives were operationalized on the state test (p. 1). Achievement was measured by the fifth-grade mathematics AIMS (Arizona Instrument to Measure Standards). The AIMS math test was designed to measure the Arizona Academic Mathematics standards for Grades 3 through 5. At that time, the standards consisted of six strands: (a) number sense, (b) data analysis and probability, (c) patterns, algebra, and functions, (d) geometry, (e) measurement and discrete mathematics, and (f) mathematical structure/logic (p. 9).
Respondents 5th grade students (N=1.003) and teachers (N=52).
Dependent variable Mathematics achievement
Effect size
To interpret the magnitude of the effect, one can consider a teacher who is one standard deviation above the mean on Alignment and on the Emphasis × Alignment interaction variable. On average, students in the teacher’s classroom would be expected to score about 11 scale score points (5.17 points for Alignment (p<.05) and 5.75 points for the interaction (p<.05)) higher than students, on average, in classrooms at the grand mean of both predictors, which was about a one-fifth standard deviation difference (from Table 1, the standard deviation for the outcome was 55.46). Notice that Emphasis alone has a negative coefficient, -2.00 (p>.05) (p. 17).
Comments Results controlled for initial achievement differences between classrooms and student socioeconomic status.
Desimone, Smith & Phillips (2013)
Focus This study examines relationships between teachers’ participation in professional development and changes in instruction, and between instruction and student achievement growth (p. 4). This is a correlational study conducted in the USA.
OTL measure Minutes per day spent on mathematics, topic focus (basic math and advanced math) and cognitive demands (memorize facts and solve novel problems) are the five OTL variables which are related to the initial status of students achievement and to achievement growth. Reports of professional development and instruction (time spent on mathematics instruction, topic focus, type of learning required or cognitive demands) are taken from teacher’s self-report surveys. Student achievement was measured by a special administration of a set of open-ended questions from the Stanford Achievement Test, Ninth Edition, which assessed problem solving and procedures (p. 6).
Respondents 3th - 5th grade students (N=4.803) and teachers (N=457)
Dependent variable Mathematics achievement
Effect size Minutes per day spent on mathematics did not significantly predict either initial achievement status or growth. Increased emphasis on Memorizing Facts was associated with slower than average growth in achievement (b=-6.02, p<.037). Emphasis on Solving Novel Problems was associated with extremely modest achievement growth (b=.69, p<0.041) (p.30, 31). The correlation between Focus on Basic Math Topics and achievement growth is -0.042, with p=0.036. For Focus on Advanced Math Topics b=0.061,with p=0.043 (p.55). Looking at the initial status only 1 out of the 5 variables is significant (Focus on advanced math topics). When it comes to growth 4 out of 5 are significant of which two are positively and two are negatively related.
Comments Results controlled for teacher, school and student characteristics, like teacher’s years of experience, school enrolment and initial achievement level.
Elliott (1998) Focus This article illuminates both the relationship between spending practices and students’
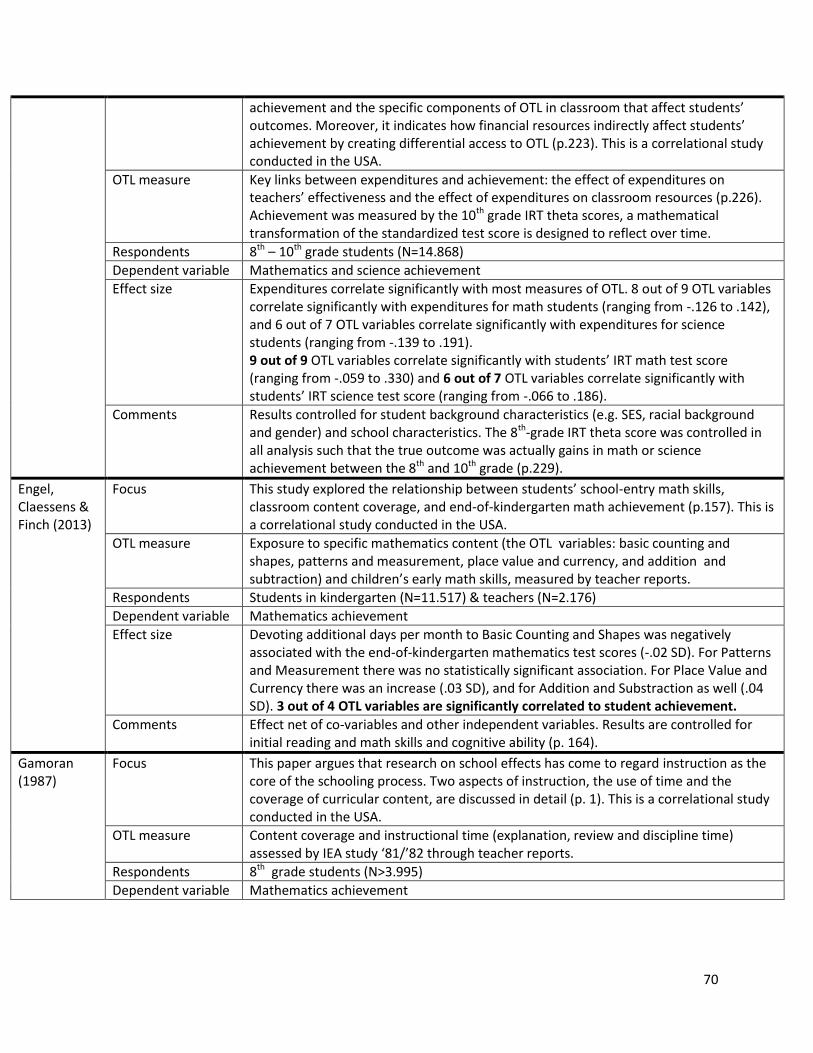
70
achievement and the specific components of OTL in classroom that affect students’ outcomes. Moreover, it indicates how financial resources indirectly affect students’ achievement by creating differential access to OTL (p.223). This is a correlational study conducted in the USA.
OTL measure Key links between expenditures and achievement: the effect of expenditures on teachers’ effectiveness and the effect of expenditures on classroom resources (p.226). Achievement was measured by the 10th grade IRT theta scores, a mathematical transformation of the standardized test score is designed to reflect over time.
Respondents 8th – 10th grade students (N=14.868)
Dependent variable Mathematics and science achievement
Effect size Expenditures correlate significantly with most measures of OTL. 8 out of 9 OTL variables correlate significantly with expenditures for math students (ranging from -.126 to .142), and 6 out of 7 OTL variables correlate significantly with expenditures for science students (ranging from -.139 to .191). 9 out of 9 OTL variables correlate significantly with students’ IRT math test score (ranging from -.059 to .330) and 6 out of 7 OTL variables correlate significantly with students’ IRT science test score (ranging from -.066 to .186).
Comments Results controlled for student background characteristics (e.g. SES, racial background and gender) and school characteristics. The 8th-grade IRT theta score was controlled in all analysis such that the true outcome was actually gains in math or science achievement between the 8th and 10th grade (p.229).
Engel, Claessens & Finch (2013)
Focus This study explored the relationship between students’ school-entry math skills, classroom content coverage, and end-of-kindergarten math achievement (p.157). This is a correlational study conducted in the USA.
OTL measure Exposure to specific mathematics content (the OTL variables: basic counting and shapes, patterns and measurement, place value and currency, and addition and subtraction) and children’s early math skills, measured by teacher reports.
Respondents Students in kindergarten (N=11.517) & teachers (N=2.176)
Dependent variable Mathematics achievement
Effect size Devoting additional days per month to Basic Counting and Shapes was negatively associated with the end-of-kindergarten mathematics test scores (-.02 SD). For Patterns and Measurement there was no statistically significant association. For Place Value and Currency there was an increase (.03 SD), and for Addition and Substraction as well (.04 SD). 3 out of 4 OTL variables are significantly correlated to student achievement.
Comments Effect net of co-variables and other independent variables. Results are controlled for initial reading and math skills and cognitive ability (p. 164).
Gamoran (1987)
Focus This paper argues that research on school effects has come to regard instruction as the core of the schooling process. Two aspects of instruction, the use of time and the coverage of curricular content, are discussed in detail (p. 1). This is a correlational study conducted in the USA.
OTL measure Content coverage and instructional time (explanation, review and discipline time) assessed by IEA study ‘81/’82 through teacher reports.
Respondents 8th grade students (N>3.995)
Dependent variable Mathematics achievement
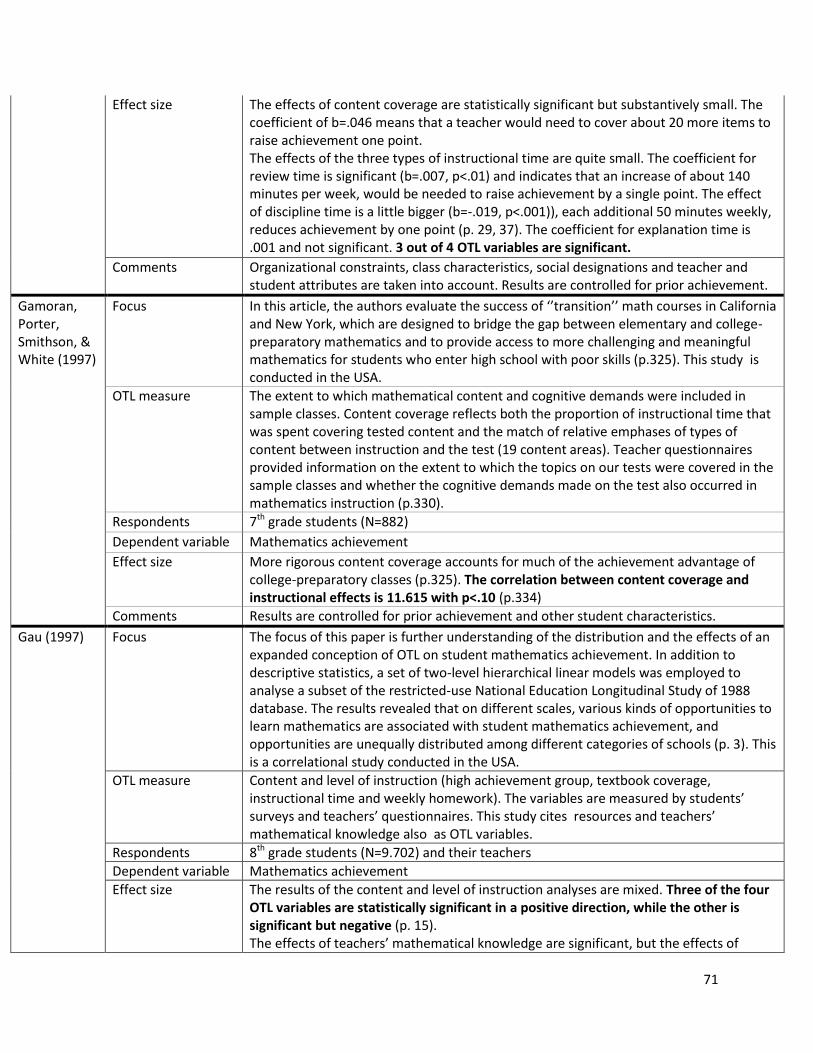
71
Effect size The effects of content coverage are statistically significant but substantively small. The coefficient of b=.046 means that a teacher would need to cover about 20 more items to raise achievement one point. The effects of the three types of instructional time are quite small. The coefficient for review time is significant (b=.007, p<.01) and indicates that an increase of about 140 minutes per week, would be needed to raise achievement by a single point. The effect of discipline time is a little bigger (b=-.019, p<.001)), each additional 50 minutes weekly, reduces achievement by one point (p. 29, 37). The coefficient for explanation time is .001 and not significant. 3 out of 4 OTL variables are significant.
Comments Organizational constraints, class characteristics, social designations and teacher and student attributes are taken into account. Results are controlled for prior achievement.
Gamoran, Porter, Smithson, & White (1997)
Focus In this article, the authors evaluate the success of ‘’transition’’ math courses in California and New York, which are designed to bridge the gap between elementary and college-preparatory mathematics and to provide access to more challenging and meaningful mathematics for students who enter high school with poor skills (p.325). This study is conducted in the USA.
OTL measure The extent to which mathematical content and cognitive demands were included in sample classes. Content coverage reflects both the proportion of instructional time that was spent covering tested content and the match of relative emphases of types of content between instruction and the test (19 content areas). Teacher questionnaires provided information on the extent to which the topics on our tests were covered in the sample classes and whether the cognitive demands made on the test also occurred in mathematics instruction (p.330).
Respondents 7th grade students (N=882)
Dependent variable Mathematics achievement
Effect size More rigorous content coverage accounts for much of the achievement advantage of college-preparatory classes (p.325). The correlation between content coverage and instructional effects is 11.615 with p<.10 (p.334)
Comments Results are controlled for prior achievement and other student characteristics.
Gau (1997) Focus The focus of this paper is further understanding of the distribution and the effects of an expanded conception of OTL on student mathematics achievement. In addition to descriptive statistics, a set of two-level hierarchical linear models was employed to analyse a subset of the restricted-use National Education Longitudinal Study of 1988 database. The results revealed that on different scales, various kinds of opportunities to learn mathematics are associated with student mathematics achievement, and opportunities are unequally distributed among different categories of schools (p. 3). This is a correlational study conducted in the USA.
OTL measure Content and level of instruction (high achievement group, textbook coverage, instructional time and weekly homework). The variables are measured by students’ surveys and teachers’ questionnaires. This study cites resources and teachers’ mathematical knowledge also as OTL variables.
Respondents 8th grade students (N=9.702) and their teachers
Dependent variable Mathematics achievement
Effect size The results of the content and level of instruction analyses are mixed. Three of the four OTL variables are statistically significant in a positive direction, while the other is significant but negative (p. 15). The effects of teachers’ mathematical knowledge are significant, but the effects of
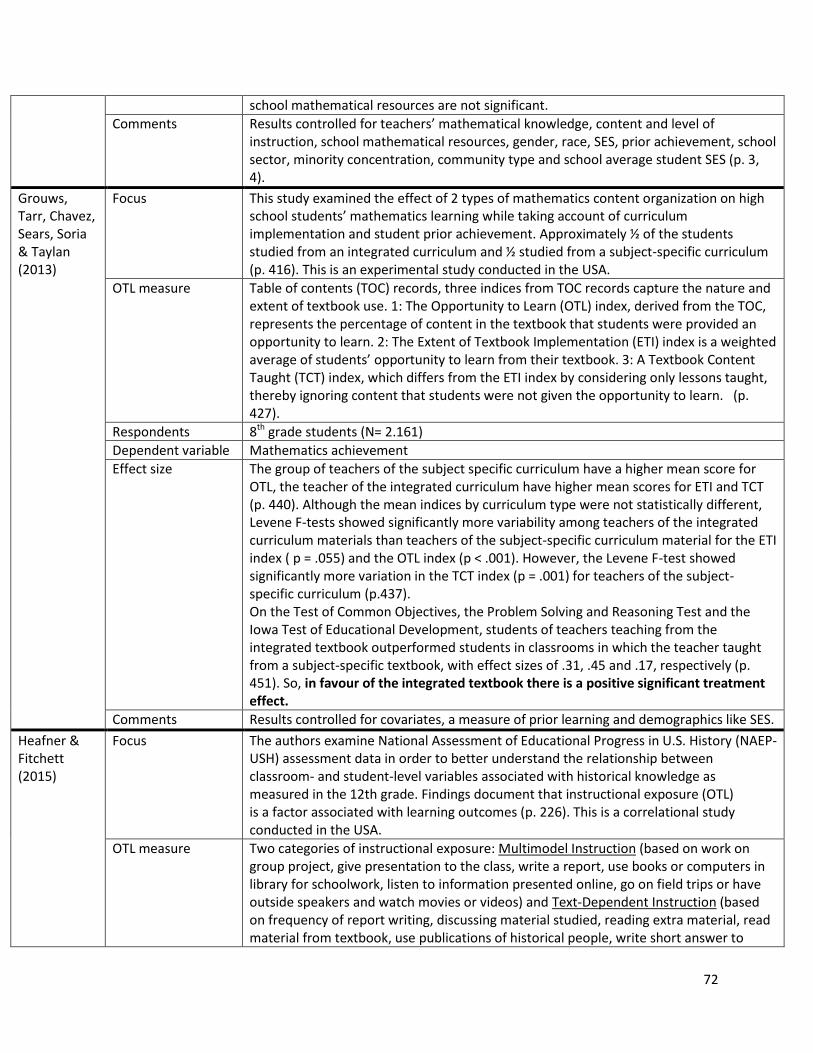
72
school mathematical resources are not significant.
Comments Results controlled for teachers’ mathematical knowledge, content and level of instruction, school mathematical resources, gender, race, SES, prior achievement, school sector, minority concentration, community type and school average student SES (p. 3, 4).
Grouws, Tarr, Chavez, Sears, Soria & Taylan (2013)
Focus This study examined the effect of 2 types of mathematics content organization on high school students’ mathematics learning while taking account of curriculum implementation and student prior achievement. Approximately ½ of the students studied from an integrated curriculum and ½ studied from a subject-specific curriculum (p. 416). This is an experimental study conducted in the USA.
OTL measure Table of contents (TOC) records, three indices from TOC records capture the nature and extent of textbook use. 1: The Opportunity to Learn (OTL) index, derived from the TOC, represents the percentage of content in the textbook that students were provided an opportunity to learn. 2: The Extent of Textbook Implementation (ETI) index is a weighted average of students’ opportunity to learn from their textbook. 3: A Textbook Content Taught (TCT) index, which differs from the ETI index by considering only lessons taught, thereby ignoring content that students were not given the opportunity to learn. (p. 427).
Respondents 8th grade students (N= 2.161)
Dependent variable Mathematics achievement
Effect size The group of teachers of the subject specific curriculum have a higher mean score for OTL, the teacher of the integrated curriculum have higher mean scores for ETI and TCT (p. 440). Although the mean indices by curriculum type were not statistically different, Levene F-tests showed significantly more variability among teachers of the integrated curriculum materials than teachers of the subject-specific curriculum material for the ETI index ( p = .055) and the OTL index (p < .001). However, the Levene F-test showed significantly more variation in the TCT index (p = .001) for teachers of the subject-specific curriculum (p.437). On the Test of Common Objectives, the Problem Solving and Reasoning Test and the Iowa Test of Educational Development, students of teachers teaching from the integrated textbook outperformed students in classrooms in which the teacher taught from a subject-specific textbook, with effect sizes of .31, .45 and .17, respectively (p. 451). So, in favour of the integrated textbook there is a positive significant treatment effect.
Comments Results controlled for covariates, a measure of prior learning and demographics like SES.
Heafner & Fitchett (2015)
Focus The authors examine National Assessment of Educational Progress in U.S. History (NAEP-USH) assessment data in order to better understand the relationship between classroom- and student-level variables associated with historical knowledge as measured in the 12th grade. Findings document that instructional exposure (OTL) is a factor associated with learning outcomes (p. 226). This is a correlational study conducted in the USA.
OTL measure Two categories of instructional exposure: Multimodel Instruction (based on work on group project, give presentation to the class, write a report, use books or computers in library for schoolwork, listen to information presented online, go on field trips or have outside speakers and watch movies or videos) and Text-Dependent Instruction (based on frequency of report writing, discussing material studied, reading extra material, read material from textbook, use publications of historical people, write short answer to
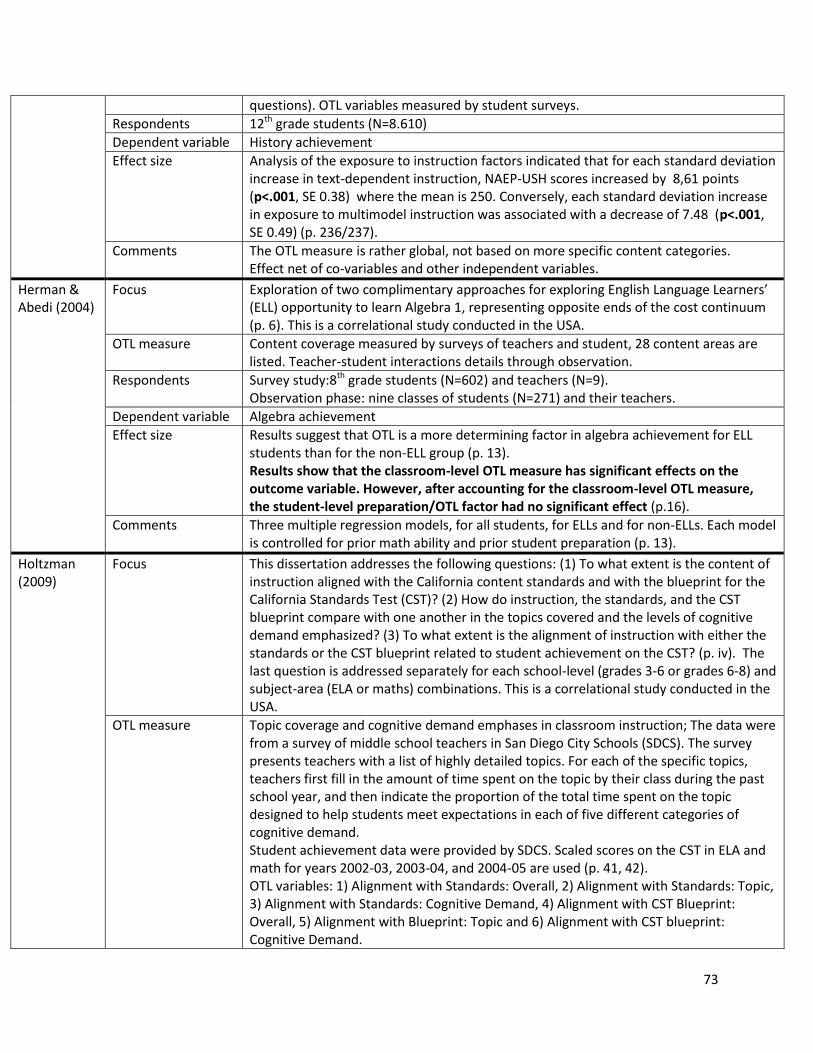
73
questions). OTL variables measured by student surveys.
Respondents 12th grade students (N=8.610)
Dependent variable History achievement
Effect size Analysis of the exposure to instruction factors indicated that for each standard deviation increase in text-dependent instruction, NAEP-USH scores increased by 8,61 points (p<.001, SE 0.38) where the mean is 250. Conversely, each standard deviation increase in exposure to multimodel instruction was associated with a decrease of 7.48 (p<.001, SE 0.49) (p. 236/237).
Comments The OTL measure is rather global, not based on more specific content categories. Effect net of co-variables and other independent variables.
Herman & Abedi (2004)
Focus Exploration of two complimentary approaches for exploring English Language Learners’ (ELL) opportunity to learn Algebra 1, representing opposite ends of the cost continuum (p. 6). This is a correlational study conducted in the USA.
OTL measure Content coverage measured by surveys of teachers and student, 28 content areas are listed. Teacher-student interactions details through observation.
Respondents Survey study:8th grade students (N=602) and teachers (N=9). Observation phase: nine classes of students (N=271) and their teachers.
Dependent variable Algebra achievement
Effect size Results suggest that OTL is a more determining factor in algebra achievement for ELL students than for the non-ELL group (p. 13). Results show that the classroom-level OTL measure has significant effects on the outcome variable. However, after accounting for the classroom-level OTL measure, the student-level preparation/OTL factor had no significant effect (p.16).
Comments Three multiple regression models, for all students, for ELLs and for non-ELLs. Each model is controlled for prior math ability and prior student preparation (p. 13).
Holtzman (2009)
Focus This dissertation addresses the following questions: (1) To what extent is the content of instruction aligned with the California content standards and with the blueprint for the California Standards Test (CST)? (2) How do instruction, the standards, and the CST blueprint compare with one another in the topics covered and the levels of cognitive demand emphasized? (3) To what extent is the alignment of instruction with either the standards or the CST blueprint related to student achievement on the CST? (p. iv). The last question is addressed separately for each school-level (grades 3-6 or grades 6-8) and subject-area (ELA or maths) combinations. This is a correlational study conducted in the USA.
OTL measure Topic coverage and cognitive demand emphases in classroom instruction; The data were from a survey of middle school teachers in San Diego City Schools (SDCS). The survey presents teachers with a list of highly detailed topics. For each of the specific topics, teachers first fill in the amount of time spent on the topic by their class during the past school year, and then indicate the proportion of the total time spent on the topic designed to help students meet expectations in each of five different categories of cognitive demand. Student achievement data were provided by SDCS. Scaled scores on the CST in ELA and math for years 2002-03, 2003-04, and 2004-05 are used (p. 41, 42). OTL variables: 1) Alignment with Standards: Overall, 2) Alignment with Standards: Topic, 3) Alignment with Standards: Cognitive Demand, 4) Alignment with CST Blueprint: Overall, 5) Alignment with Blueprint: Topic and 6) Alignment with CST blueprint: Cognitive Demand.
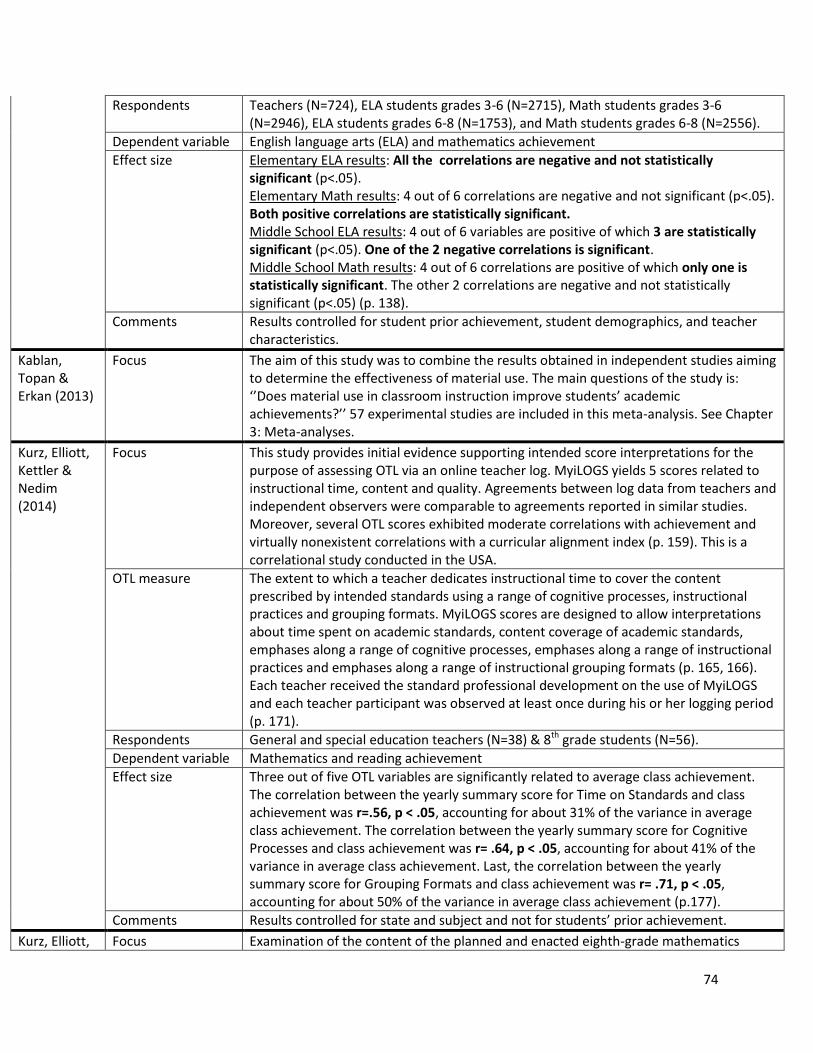
74
Respondents Teachers (N=724), ELA students grades 3-6 (N=2715), Math students grades 3-6 (N=2946), ELA students grades 6-8 (N=1753), and Math students grades 6-8 (N=2556).
Dependent variable English language arts (ELA) and mathematics achievement
Effect size Elementary ELA results: All the correlations are negative and not statistically significant (p<.05). Elementary Math results: 4 out of 6 correlations are negative and not significant (p<.05). Both positive correlations are statistically significant. Middle School ELA results: 4 out of 6 variables are positive of which 3 are statistically significant (p<.05). One of the 2 negative correlations is significant. Middle School Math results: 4 out of 6 correlations are positive of which only one is statistically significant. The other 2 correlations are negative and not statistically significant (p<.05) (p. 138).
Comments Results controlled for student prior achievement, student demographics, and teacher characteristics.
Kablan, Topan & Erkan (2013)
Focus The aim of this study was to combine the results obtained in independent studies aiming to determine the effectiveness of material use. The main questions of the study is: ‘’Does material use in classroom instruction improve students’ academic achievements?’’ 57 experimental studies are included in this meta-analysis. See Chapter 3: Meta-analyses.
Kurz, Elliott, Kettler & Nedim (2014)
Focus This study provides initial evidence supporting intended score interpretations for the purpose of assessing OTL via an online teacher log. MyiLOGS yields 5 scores related to instructional time, content and quality. Agreements between log data from teachers and independent observers were comparable to agreements reported in similar studies. Moreover, several OTL scores exhibited moderate correlations with achievement and virtually nonexistent correlations with a curricular alignment index (p. 159). This is a correlational study conducted in the USA.
OTL measure The extent to which a teacher dedicates instructional time to cover the content prescribed by intended standards using a range of cognitive processes, instructional practices and grouping formats. MyiLOGS scores are designed to allow interpretations about time spent on academic standards, content coverage of academic standards, emphases along a range of cognitive processes, emphases along a range of instructional practices and emphases along a range of instructional grouping formats (p. 165, 166). Each teacher received the standard professional development on the use of MyiLOGS and each teacher participant was observed at least once during his or her logging period (p. 171).
Respondents General and special education teachers (N=38) & 8th grade students (N=56).
Dependent variable Mathematics and reading achievement
Effect size Three out of five OTL variables are significantly related to average class achievement. The correlation between the yearly summary score for Time on Standards and class achievement was r=.56, p < .05, accounting for about 31% of the variance in average class achievement. The correlation between the yearly summary score for Cognitive Processes and class achievement was r= .64, p < .05, accounting for about 41% of the variance in average class achievement. Last, the correlation between the yearly summary score for Grouping Formats and class achievement was r= .71, p < .05, accounting for about 50% of the variance in average class achievement (p.177).
Comments Results controlled for state and subject and not for students’ prior achievement.
Kurz, Elliott, Focus Examination of the content of the planned and enacted eighth-grade mathematics
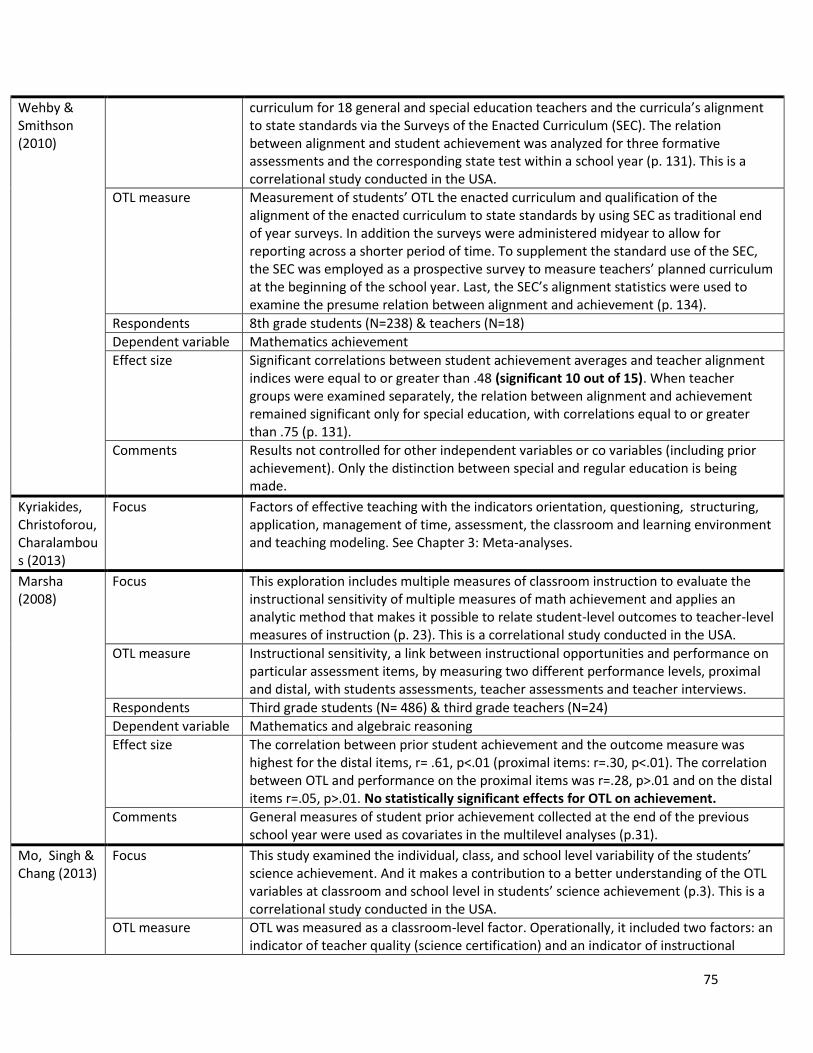
75
Wehby & Smithson (2010)
curriculum for 18 general and special education teachers and the curricula’s alignment to state standards via the Surveys of the Enacted Curriculum (SEC). The relation between alignment and student achievement was analyzed for three formative assessments and the corresponding state test within a school year (p. 131). This is a correlational study conducted in the USA.
OTL measure Measurement of students’ OTL the enacted curriculum and qualification of the alignment of the enacted curriculum to state standards by using SEC as traditional end of year surveys. In addition the surveys were administered midyear to allow for reporting across a shorter period of time. To supplement the standard use of the SEC, the SEC was employed as a prospective survey to measure teachers’ planned curriculum at the beginning of the school year. Last, the SEC’s alignment statistics were used to examine the presume relation between alignment and achievement (p. 134).
Respondents 8th grade students (N=238) & teachers (N=18)
Dependent variable Mathematics achievement
Effect size Significant correlations between student achievement averages and teacher alignment indices were equal to or greater than .48 (significant 10 out of 15). When teacher groups were examined separately, the relation between alignment and achievement remained significant only for special education, with correlations equal to or greater than .75 (p. 131).
Comments Results not controlled for other independent variables or co variables (including prior achievement). Only the distinction between special and regular education is being made.
Kyriakides, Christoforou, Charalambous (2013)
Focus Factors of effective teaching with the indicators orientation, questioning, structuring, application, management of time, assessment, the classroom and learning environment and teaching modeling. See Chapter 3: Meta-analyses.
Marsha (2008)
Focus This exploration includes multiple measures of classroom instruction to evaluate the instructional sensitivity of multiple measures of math achievement and applies an analytic method that makes it possible to relate student-level outcomes to teacher-level measures of instruction (p. 23). This is a correlational study conducted in the USA.
OTL measure Instructional sensitivity, a link between instructional opportunities and performance on particular assessment items, by measuring two different performance levels, proximal and distal, with students assessments, teacher assessments and teacher interviews.
Respondents Third grade students (N= 486) & third grade teachers (N=24)
Dependent variable Mathematics and algebraic reasoning
Effect size The correlation between prior student achievement and the outcome measure was highest for the distal items, r= .61, p<.01 (proximal items: r=.30, p<.01). The correlation between OTL and performance on the proximal items was r=.28, p>.01 and on the distal items r=.05, p>.01. No statistically significant effects for OTL on achievement.
Comments General measures of student prior achievement collected at the end of the previous school year were used as covariates in the multilevel analyses (p.31).
Mo, Singh & Chang (2013)
Focus This study examined the individual, class, and school level variability of the students’ science achievement. And it makes a contribution to a better understanding of the OTL variables at classroom and school level in students’ science achievement (p.3). This is a correlational study conducted in the USA.
OTL measure OTL was measured as a classroom-level factor. Operationally, it included two factors: an indicator of teacher quality (science certification) and an indicator of instructional
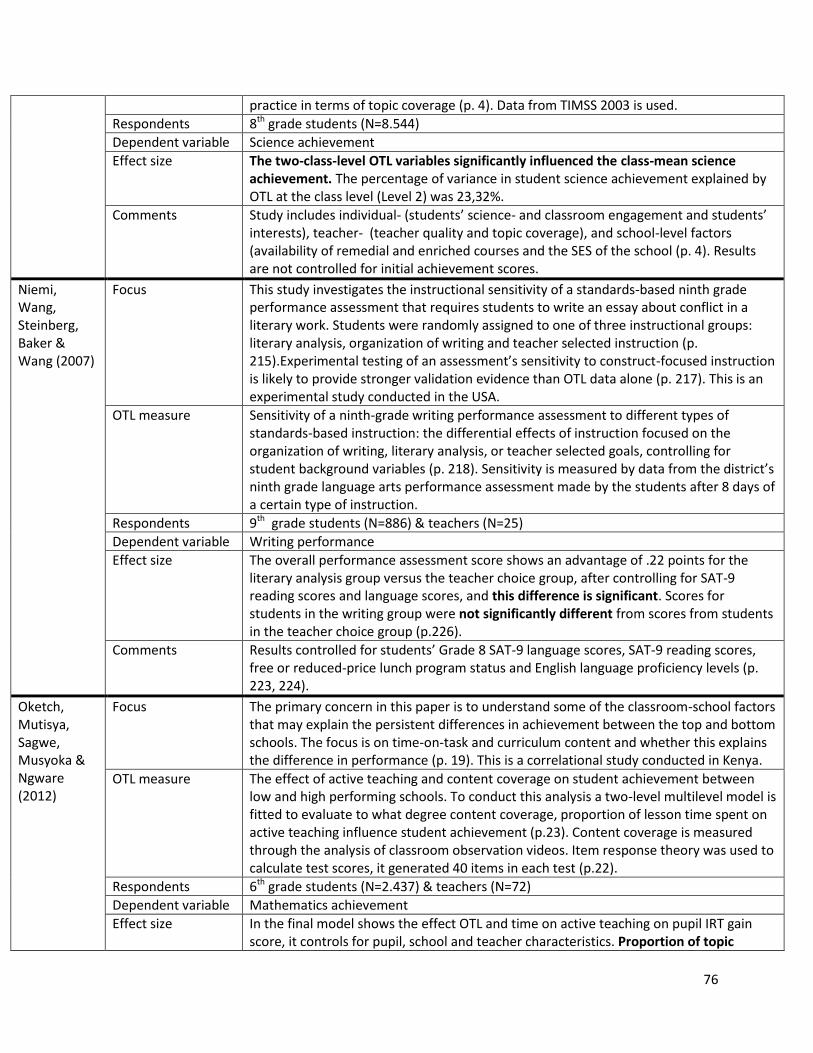
76
practice in terms of topic coverage (p. 4). Data from TIMSS 2003 is used.
Respondents 8th grade students (N=8.544)
Dependent variable Science achievement
Effect size The two-class-level OTL variables significantly influenced the class-mean science achievement. The percentage of variance in student science achievement explained by OTL at the class level (Level 2) was 23,32%.
Comments Study includes individual- (students’ science- and classroom engagement and students’ interests), teacher- (teacher quality and topic coverage), and school-level factors (availability of remedial and enriched courses and the SES of the school (p. 4). Results are not controlled for initial achievement scores.
Niemi, Wang, Steinberg, Baker & Wang (2007)
Focus This study investigates the instructional sensitivity of a standards-based ninth grade performance assessment that requires students to write an essay about conflict in a literary work. Students were randomly assigned to one of three instructional groups: literary analysis, organization of writing and teacher selected instruction (p. 215).Experimental testing of an assessment’s sensitivity to construct-focused instruction is likely to provide stronger validation evidence than OTL data alone (p. 217). This is an experimental study conducted in the USA.
OTL measure Sensitivity of a ninth-grade writing performance assessment to different types of standards-based instruction: the differential effects of instruction focused on the organization of writing, literary analysis, or teacher selected goals, controlling for student background variables (p. 218). Sensitivity is measured by data from the district’s ninth grade language arts performance assessment made by the students after 8 days of a certain type of instruction.
Respondents 9th grade students (N=886) & teachers (N=25)
Dependent variable Writing performance
Effect size The overall performance assessment score shows an advantage of .22 points for the literary analysis group versus the teacher choice group, after controlling for SAT-9 reading scores and language scores, and this difference is significant. Scores for students in the writing group were not significantly different from scores from students in the teacher choice group (p.226).
Comments Results controlled for students’ Grade 8 SAT-9 language scores, SAT-9 reading scores, free or reduced-price lunch program status and English language proficiency levels (p. 223, 224).
Oketch, Mutisya, Sagwe, Musyoka & Ngware (2012)
Focus The primary concern in this paper is to understand some of the classroom-school factors that may explain the persistent differences in achievement between the top and bottom schools. The focus is on time-on-task and curriculum content and whether this explains the difference in performance (p. 19). This is a correlational study conducted in Kenya.
OTL measure The effect of active teaching and content coverage on student achievement between low and high performing schools. To conduct this analysis a two-level multilevel model is fitted to evaluate to what degree content coverage, proportion of lesson time spent on active teaching influence student achievement (p.23). Content coverage is measured through the analysis of classroom observation videos. Item response theory was used to calculate test scores, it generated 40 items in each test (p.22).
Respondents 6th grade students (N=2.437) & teachers (N=72)
Dependent variable Mathematics achievement
Effect size In the final model shows the effect OTL and time on active teaching on pupil IRT gain score, it controls for pupil, school and teacher characteristics. Proportion of topic
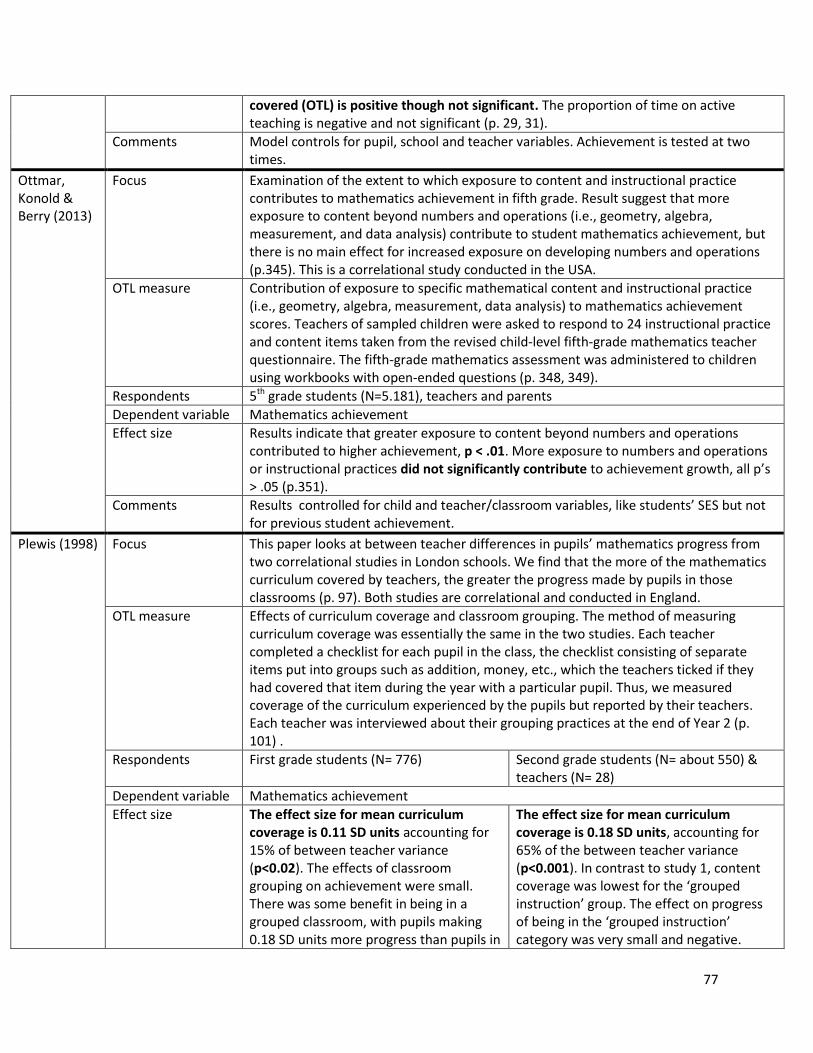
77
covered (OTL) is positive though not significant. The proportion of time on active teaching is negative and not significant (p. 29, 31).
Comments Model controls for pupil, school and teacher variables. Achievement is tested at two times.
Ottmar, Konold & Berry (2013)
Focus Examination of the extent to which exposure to content and instructional practice contributes to mathematics achievement in fifth grade. Result suggest that more exposure to content beyond numbers and operations (i.e., geometry, algebra, measurement, and data analysis) contribute to student mathematics achievement, but there is no main effect for increased exposure on developing numbers and operations (p.345). This is a correlational study conducted in the USA.
OTL measure Contribution of exposure to specific mathematical content and instructional practice (i.e., geometry, algebra, measurement, data analysis) to mathematics achievement scores. Teachers of sampled children were asked to respond to 24 instructional practice and content items taken from the revised child-level fifth-grade mathematics teacher questionnaire. The fifth-grade mathematics assessment was administered to children using workbooks with open-ended questions (p. 348, 349).
Respondents 5th grade students (N=5.181), teachers and parents
Dependent variable Mathematics achievement
Effect size Results indicate that greater exposure to content beyond numbers and operations contributed to higher achievement, p < .01. More exposure to numbers and operations or instructional practices did not significantly contribute to achievement growth, all p’s > .05 (p.351).
Comments Results controlled for child and teacher/classroom variables, like students’ SES but not for previous student achievement.
Plewis (1998) Focus This paper looks at between teacher differences in pupils’ mathematics progress from two correlational studies in London schools. We find that the more of the mathematics curriculum covered by teachers, the greater the progress made by pupils in those classrooms (p. 97). Both studies are correlational and conducted in England.
OTL measure Effects of curriculum coverage and classroom grouping. The method of measuring curriculum coverage was essentially the same in the two studies. Each teacher completed a checklist for each pupil in the class, the checklist consisting of separate items put into groups such as addition, money, etc., which the teachers ticked if they had covered that item during the year with a particular pupil. Thus, we measured coverage of the curriculum experienced by the pupils but reported by their teachers. Each teacher was interviewed about their grouping practices at the end of Year 2 (p. 101) .
Respondents First grade students (N= 776) Second grade students (N= about 550) & teachers (N= 28)
Dependent variable Mathematics achievement
Effect size The effect size for mean curriculum coverage is 0.11 SD units accounting for 15% of between teacher variance (p<0.02). The effects of classroom grouping on achievement were small. There was some benefit in being in a grouped classroom, with pupils making 0.18 SD units more progress than pupils in
The effect size for mean curriculum coverage is 0.18 SD units, accounting for 65% of the between teacher variance (p<0.001). In contrast to study 1, content coverage was lowest for the ‘grouped instruction’ group. The effect on progress of being in the ‘grouped instruction’ category was very small and negative.
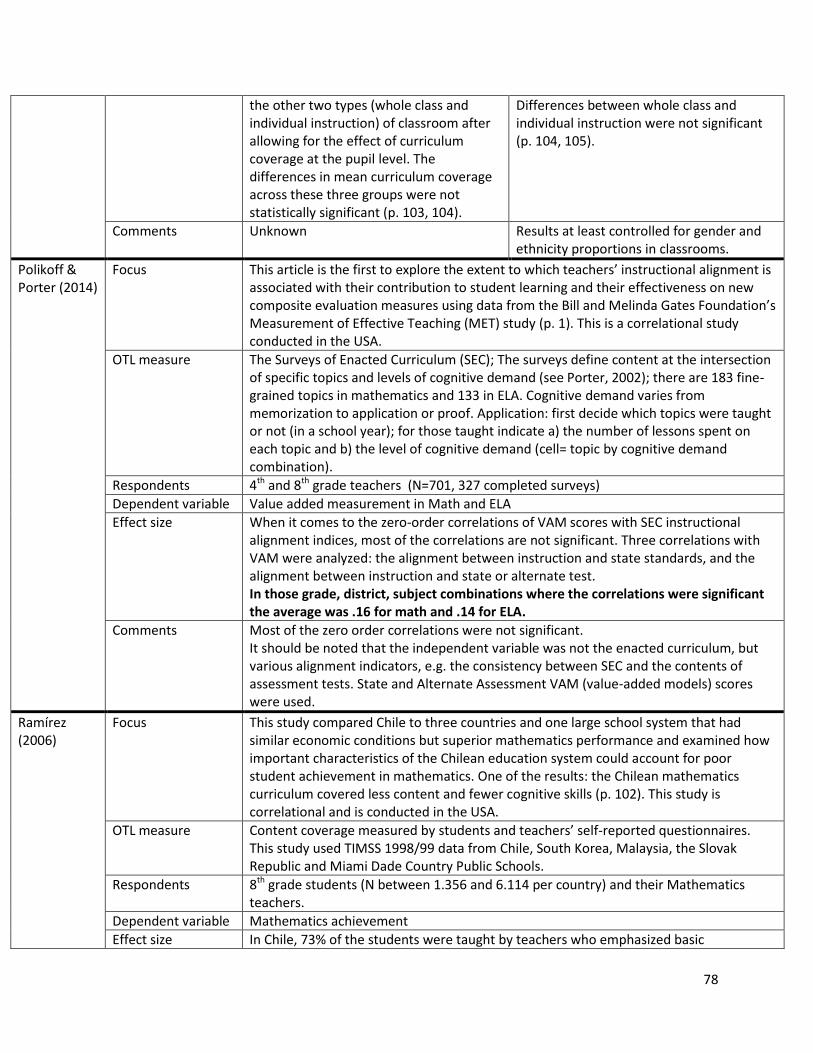
78
the other two types (whole class and individual instruction) of classroom after allowing for the effect of curriculum coverage at the pupil level. The differences in mean curriculum coverage across these three groups were not statistically significant (p. 103, 104).
Differences between whole class and individual instruction were not significant (p. 104, 105).
Comments Unknown
Results at least controlled for gender and ethnicity proportions in classrooms.
Polikoff & Porter (2014)
Focus This article is the first to explore the extent to which teachers’ instructional alignment is associated with their contribution to student learning and their effectiveness on new composite evaluation measures using data from the Bill and Melinda Gates Foundation’s Measurement of Effective Teaching (MET) study (p. 1). This is a correlational study conducted in the USA.
OTL measure The Surveys of Enacted Curriculum (SEC); The surveys define content at the intersection of specific topics and levels of cognitive demand (see Porter, 2002); there are 183 fine-grained topics in mathematics and 133 in ELA. Cognitive demand varies from memorization to application or proof. Application: first decide which topics were taught or not (in a school year); for those taught indicate a) the number of lessons spent on each topic and b) the level of cognitive demand (cell= topic by cognitive demand combination).
Respondents 4th and 8th grade teachers (N=701, 327 completed surveys)
Dependent variable Value added measurement in Math and ELA
Effect size When it comes to the zero-order correlations of VAM scores with SEC instructional alignment indices, most of the correlations are not significant. Three correlations with VAM were analyzed: the alignment between instruction and state standards, and the alignment between instruction and state or alternate test. In those grade, district, subject combinations where the correlations were significant the average was .16 for math and .14 for ELA.
Comments Most of the zero order correlations were not significant. It should be noted that the independent variable was not the enacted curriculum, but various alignment indicators, e.g. the consistency between SEC and the contents of assessment tests. State and Alternate Assessment VAM (value-added models) scores were used.
Ramírez (2006)
Focus This study compared Chile to three countries and one large school system that had similar economic conditions but superior mathematics performance and examined how important characteristics of the Chilean education system could account for poor student achievement in mathematics. One of the results: the Chilean mathematics curriculum covered less content and fewer cognitive skills (p. 102). This study is correlational and is conducted in the USA.
OTL measure Content coverage measured by students and teachers’ self-reported questionnaires. This study used TIMSS 1998/99 data from Chile, South Korea, Malaysia, the Slovak Republic and Miami Dade Country Public Schools.
Respondents 8th grade students (N between 1.356 and 6.114 per country) and their Mathematics teachers.
Dependent variable Mathematics achievement
Effect size In Chile, 73% of the students were taught by teachers who emphasized basic
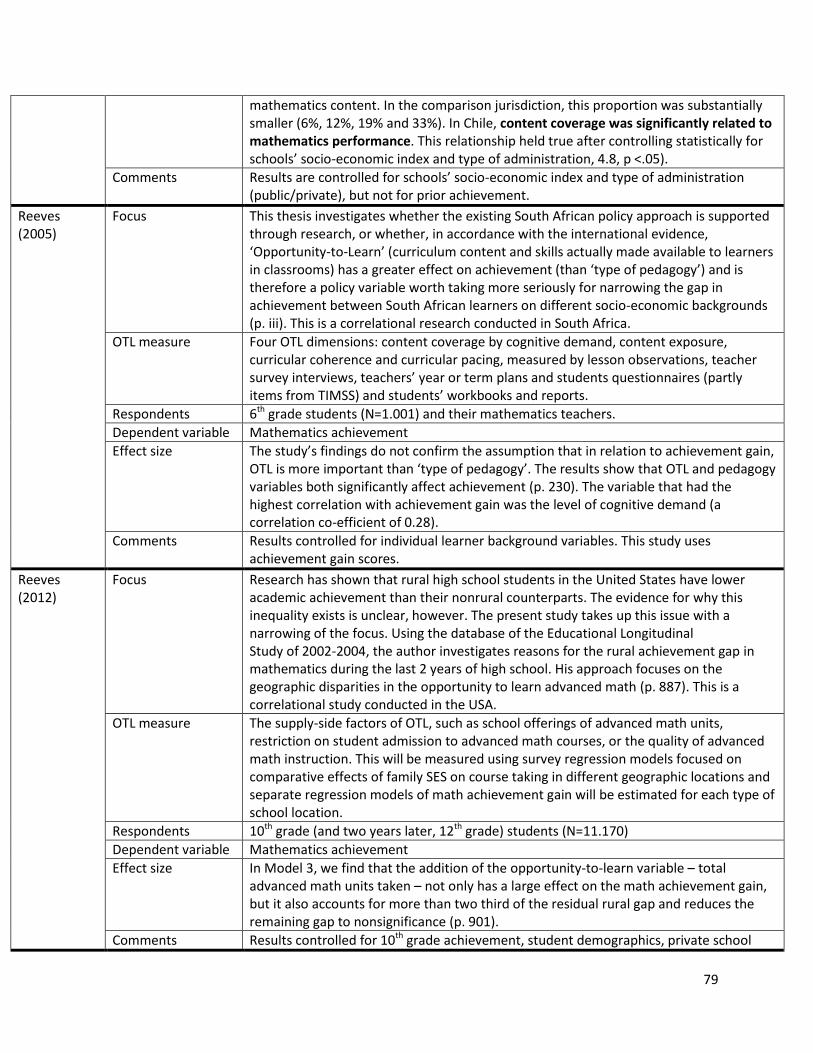
79
mathematics content. In the comparison jurisdiction, this proportion was substantially smaller (6%, 12%, 19% and 33%). In Chile, content coverage was significantly related to mathematics performance. This relationship held true after controlling statistically for schools’ socio-economic index and type of administration, 4.8, p <.05).
Comments Results are controlled for schools’ socio-economic index and type of administration (public/private), but not for prior achievement.
Reeves (2005)
Focus This thesis investigates whether the existing South African policy approach is supported through research, or whether, in accordance with the international evidence, ‘Opportunity-to-Learn’ (curriculum content and skills actually made available to learners in classrooms) has a greater effect on achievement (than ‘type of pedagogy’) and is therefore a policy variable worth taking more seriously for narrowing the gap in achievement between South African learners on different socio-economic backgrounds (p. iii). This is a correlational research conducted in South Africa.
OTL measure Four OTL dimensions: content coverage by cognitive demand, content exposure, curricular coherence and curricular pacing, measured by lesson observations, teacher survey interviews, teachers’ year or term plans and students questionnaires (partly items from TIMSS) and students’ workbooks and reports.
Respondents 6th grade students (N=1.001) and their mathematics teachers.
Dependent variable Mathematics achievement
Effect size The study’s findings do not confirm the assumption that in relation to achievement gain, OTL is more important than ‘type of pedagogy’. The results show that OTL and pedagogy variables both significantly affect achievement (p. 230). The variable that had the highest correlation with achievement gain was the level of cognitive demand (a correlation co-efficient of 0.28).
Comments Results controlled for individual learner background variables. This study uses achievement gain scores.
Reeves (2012)
Focus Research has shown that rural high school students in the United States have lower academic achievement than their nonrural counterparts. The evidence for why this inequality exists is unclear, however. The present study takes up this issue with a narrowing of the focus. Using the database of the Educational Longitudinal Study of 2002-2004, the author investigates reasons for the rural achievement gap in mathematics during the last 2 years of high school. His approach focuses on the geographic disparities in the opportunity to learn advanced math (p. 887). This is a correlational study conducted in the USA.
OTL measure The supply-side factors of OTL, such as school offerings of advanced math units, restriction on student admission to advanced math courses, or the quality of advanced math instruction. This will be measured using survey regression models focused on comparative effects of family SES on course taking in different geographic locations and separate regression models of math achievement gain will be estimated for each type of school location.
Respondents 10th grade (and two years later, 12th grade) students (N=11.170)
Dependent variable Mathematics achievement
Effect size In Model 3, we find that the addition of the opportunity-to-learn variable – total advanced math units taken – not only has a large effect on the math achievement gain, but it also accounts for more than two third of the residual rural gap and reduces the remaining gap to nonsignificance (p. 901).
Comments Results controlled for 10th grade achievement, student demographics, private school
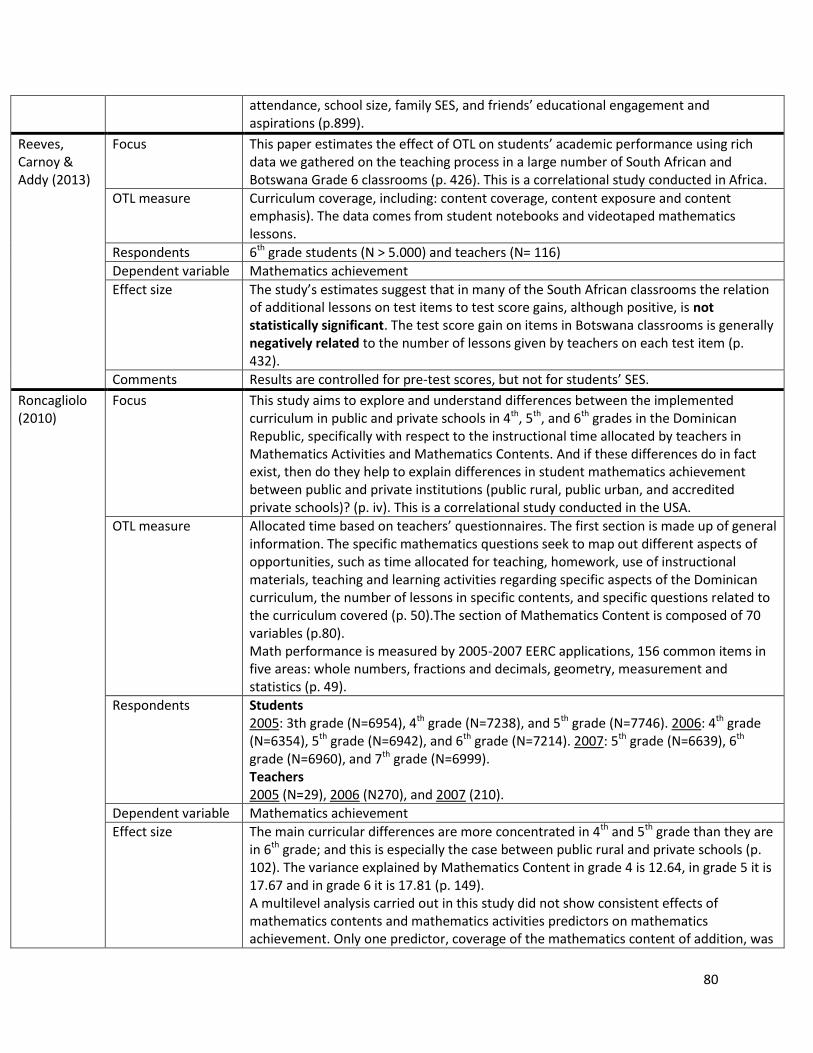
80
attendance, school size, family SES, and friends’ educational engagement and aspirations (p.899).
Reeves, Carnoy & Addy (2013)
Focus This paper estimates the effect of OTL on students’ academic performance using rich data we gathered on the teaching process in a large number of South African and Botswana Grade 6 classrooms (p. 426). This is a correlational study conducted in Africa.
OTL measure Curriculum coverage, including: content coverage, content exposure and content emphasis). The data comes from student notebooks and videotaped mathematics lessons.
Respondents 6th grade students (N > 5.000) and teachers (N= 116)
Dependent variable Mathematics achievement
Effect size The study’s estimates suggest that in many of the South African classrooms the relation of additional lessons on test items to test score gains, although positive, is not statistically significant. The test score gain on items in Botswana classrooms is generally negatively related to the number of lessons given by teachers on each test item (p. 432).
Comments Results are controlled for pre-test scores, but not for students’ SES.
Roncagliolo (2010)
Focus This study aims to explore and understand differences between the implemented curriculum in public and private schools in 4th, 5th, and 6th grades in the Dominican Republic, specifically with respect to the instructional time allocated by teachers in Mathematics Activities and Mathematics Contents. And if these differences do in fact exist, then do they help to explain differences in student mathematics achievement between public and private institutions (public rural, public urban, and accredited private schools)? (p. iv). This is a correlational study conducted in the USA.
OTL measure Allocated time based on teachers’ questionnaires. The first section is made up of general information. The specific mathematics questions seek to map out different aspects of opportunities, such as time allocated for teaching, homework, use of instructional materials, teaching and learning activities regarding specific aspects of the Dominican curriculum, the number of lessons in specific contents, and specific questions related to the curriculum covered (p. 50).The section of Mathematics Content is composed of 70 variables (p.80). Math performance is measured by 2005-2007 EERC applications, 156 common items in five areas: whole numbers, fractions and decimals, geometry, measurement and statistics (p. 49).
Respondents Students 2005: 3th grade (N=6954), 4th grade (N=7238), and 5th grade (N=7746). 2006: 4th grade (N=6354), 5th grade (N=6942), and 6th grade (N=7214). 2007: 5th grade (N=6639), 6th grade (N=6960), and 7th grade (N=6999). Teachers 2005 (N=29), 2006 (N270), and 2007 (210).
Dependent variable Mathematics achievement
Effect size The main curricular differences are more concentrated in 4th and 5th grade than they are in 6th grade; and this is especially the case between public rural and private schools (p. 102). The variance explained by Mathematics Content in grade 4 is 12.64, in grade 5 it is 17.67 and in grade 6 it is 17.81 (p. 149). A multilevel analysis carried out in this study did not show consistent effects of mathematics contents and mathematics activities predictors on mathematics achievement. Only one predictor, coverage of the mathematics content of addition, was
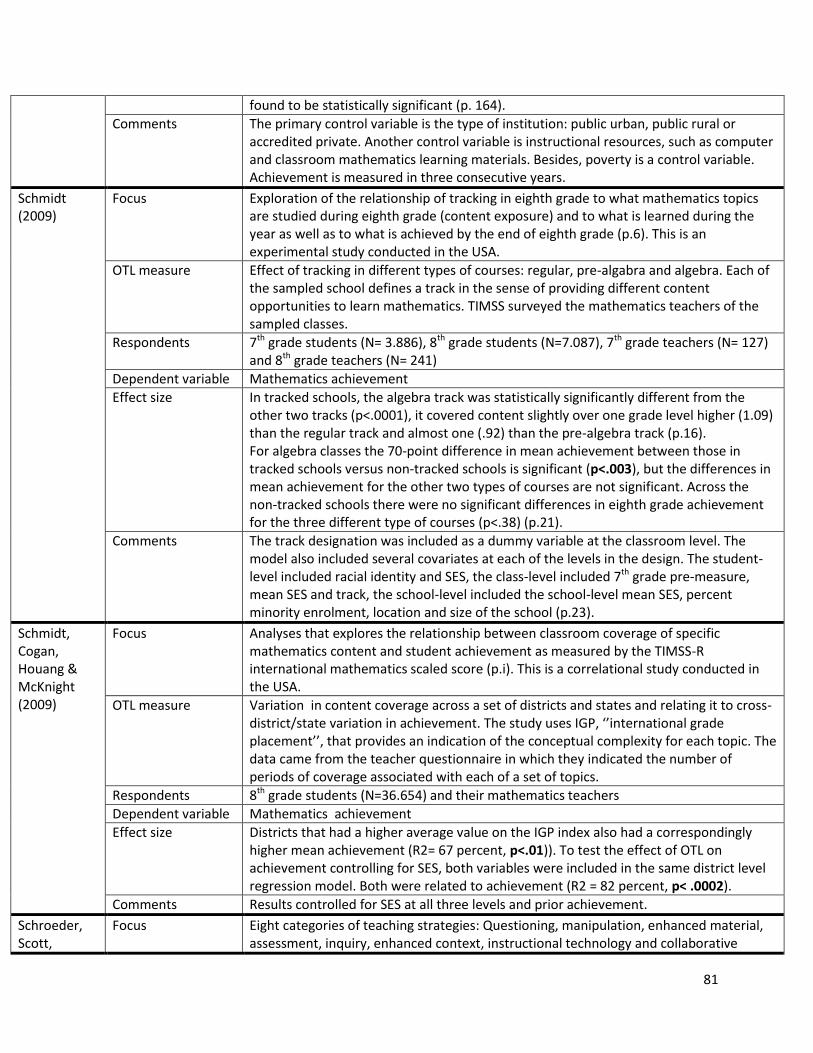
81
found to be statistically significant (p. 164).
Comments The primary control variable is the type of institution: public urban, public rural or accredited private. Another control variable is instructional resources, such as computer and classroom mathematics learning materials. Besides, poverty is a control variable. Achievement is measured in three consecutive years.
Schmidt (2009)
Focus Exploration of the relationship of tracking in eighth grade to what mathematics topics are studied during eighth grade (content exposure) and to what is learned during the year as well as to what is achieved by the end of eighth grade (p.6). This is an experimental study conducted in the USA.
OTL measure Effect of tracking in different types of courses: regular, pre-algabra and algebra. Each of the sampled school defines a track in the sense of providing different content opportunities to learn mathematics. TIMSS surveyed the mathematics teachers of the sampled classes.
Respondents 7th grade students (N= 3.886), 8th grade students (N=7.087), 7th grade teachers (N= 127) and 8th grade teachers (N= 241)
Dependent variable Mathematics achievement
Effect size In tracked schools, the algebra track was statistically significantly different from the other two tracks (p<.0001), it covered content slightly over one grade level higher (1.09) than the regular track and almost one (.92) than the pre-algebra track (p.16). For algebra classes the 70-point difference in mean achievement between those in tracked schools versus non-tracked schools is significant (p<.003), but the differences in mean achievement for the other two types of courses are not significant. Across the non-tracked schools there were no significant differences in eighth grade achievement for the three different type of courses (p<.38) (p.21).
Comments The track designation was included as a dummy variable at the classroom level. The model also included several covariates at each of the levels in the design. The student-level included racial identity and SES, the class-level included 7th grade pre-measure, mean SES and track, the school-level included the school-level mean SES, percent minority enrolment, location and size of the school (p.23).
Schmidt, Cogan, Houang & McKnight (2009)
Focus Analyses that explores the relationship between classroom coverage of specific mathematics content and student achievement as measured by the TIMSS-R international mathematics scaled score (p.i). This is a correlational study conducted in the USA.
OTL measure Variation in content coverage across a set of districts and states and relating it to cross-district/state variation in achievement. The study uses IGP, ‘’international grade placement’’, that provides an indication of the conceptual complexity for each topic. The data came from the teacher questionnaire in which they indicated the number of periods of coverage associated with each of a set of topics.
Respondents 8th grade students (N=36.654) and their mathematics teachers
Dependent variable Mathematics achievement
Effect size Districts that had a higher average value on the IGP index also had a correspondingly higher mean achievement (R2= 67 percent, p<.01)). To test the effect of OTL on achievement controlling for SES, both variables were included in the same district level regression model. Both were related to achievement (R2 = 82 percent, p< .0002).
Comments Results controlled for SES at all three levels and prior achievement.
Schroeder, Scott,
Focus Eight categories of teaching strategies: Questioning, manipulation, enhanced material, assessment, inquiry, enhanced context, instructional technology and collaborative
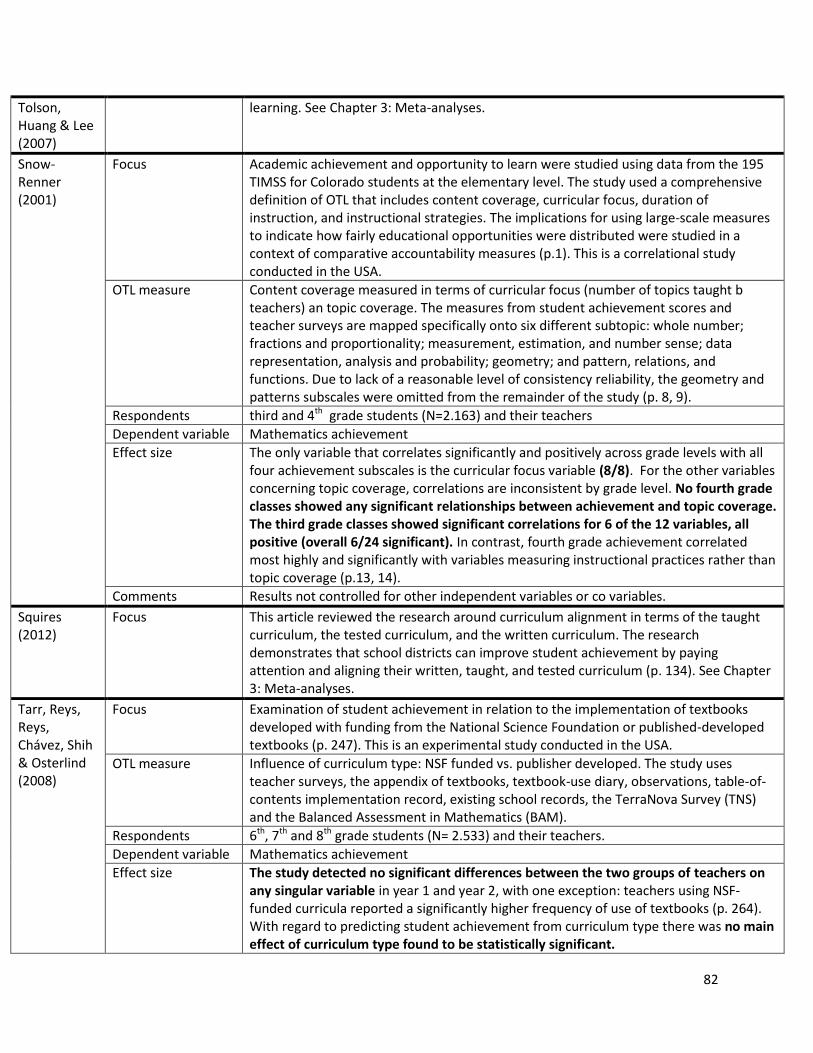
82
Tolson, Huang & Lee (2007)
learning. See Chapter 3: Meta-analyses.
Snow-Renner (2001)
Focus Academic achievement and opportunity to learn were studied using data from the 195 TIMSS for Colorado students at the elementary level. The study used a comprehensive definition of OTL that includes content coverage, curricular focus, duration of instruction, and instructional strategies. The implications for using large-scale measures to indicate how fairly educational opportunities were distributed were studied in a context of comparative accountability measures (p.1). This is a correlational study conducted in the USA.
OTL measure Content coverage measured in terms of curricular focus (number of topics taught b teachers) an topic coverage. The measures from student achievement scores and teacher surveys are mapped specifically onto six different subtopic: whole number; fractions and proportionality; measurement, estimation, and number sense; data representation, analysis and probability; geometry; and pattern, relations, and functions. Due to lack of a reasonable level of consistency reliability, the geometry and patterns subscales were omitted from the remainder of the study (p. 8, 9).
Respondents third and 4th grade students (N=2.163) and their teachers
Dependent variable Mathematics achievement
Effect size The only variable that correlates significantly and positively across grade levels with all four achievement subscales is the curricular focus variable (8/8). For the other variables concerning topic coverage, correlations are inconsistent by grade level. No fourth grade classes showed any significant relationships between achievement and topic coverage. The third grade classes showed significant correlations for 6 of the 12 variables, all positive (overall 6/24 significant). In contrast, fourth grade achievement correlated most highly and significantly with variables measuring instructional practices rather than topic coverage (p.13, 14).
Comments Results not controlled for other independent variables or co variables.
Squires (2012)
Focus This article reviewed the research around curriculum alignment in terms of the taught curriculum, the tested curriculum, and the written curriculum. The research demonstrates that school districts can improve student achievement by paying attention and aligning their written, taught, and tested curriculum (p. 134). See Chapter 3: Meta-analyses.
Tarr, Reys, Reys, Chávez, Shih & Osterlind (2008)
Focus Examination of student achievement in relation to the implementation of textbooks developed with funding from the National Science Foundation or published-developed textbooks (p. 247). This is an experimental study conducted in the USA.
OTL measure Influence of curriculum type: NSF funded vs. publisher developed. The study uses teacher surveys, the appendix of textbooks, textbook-use diary, observations, table-of-contents implementation record, existing school records, the TerraNova Survey (TNS) and the Balanced Assessment in Mathematics (BAM).
Respondents 6th, 7th and 8th grade students (N= 2.533) and their teachers.
Dependent variable Mathematics achievement
Effect size The study detected no significant differences between the two groups of teachers on any singular variable in year 1 and year 2, with one exception: teachers using NSF-funded curricula reported a significantly higher frequency of use of textbooks (p. 264). With regard to predicting student achievement from curriculum type there was no main effect of curriculum type found to be statistically significant.
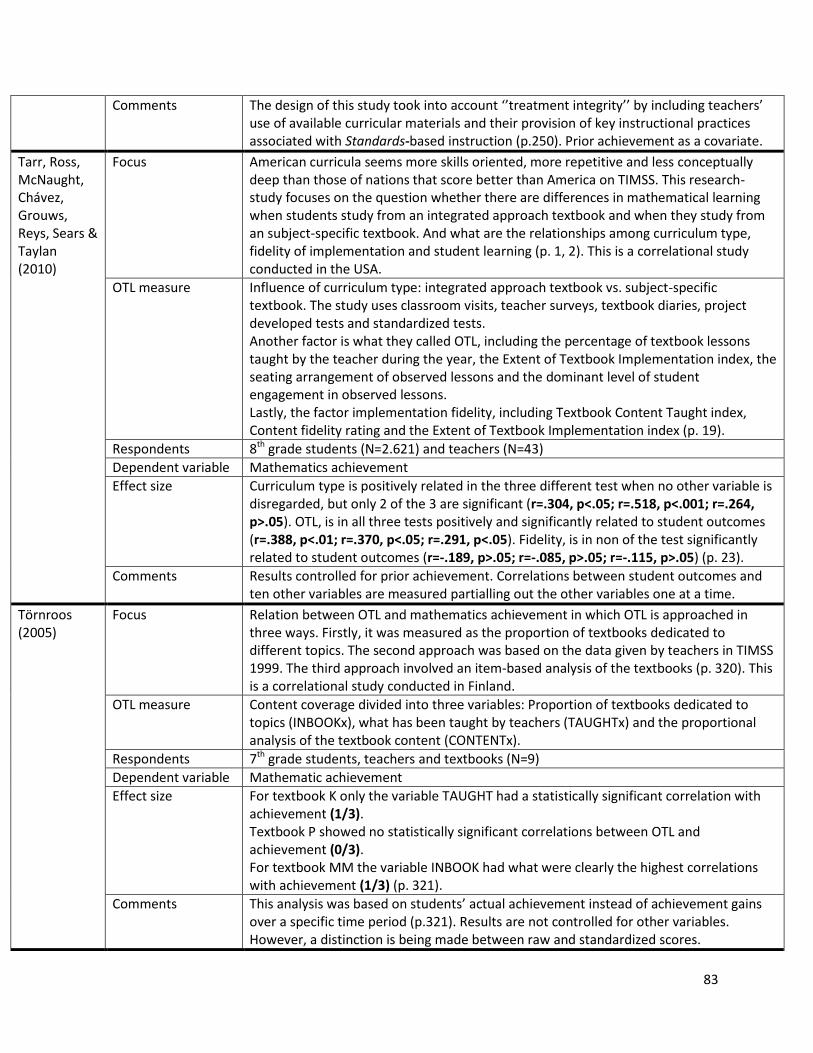
83
Comments The design of this study took into account ‘’treatment integrity’’ by including teachers’ use of available curricular materials and their provision of key instructional practices associated with Standards-based instruction (p.250). Prior achievement as a covariate.
Tarr, Ross, McNaught, Chávez, Grouws, Reys, Sears & Taylan (2010)
Focus American curricula seems more skills oriented, more repetitive and less conceptually deep than those of nations that score better than America on TIMSS. This research-study focuses on the question whether there are differences in mathematical learning when students study from an integrated approach textbook and when they study from an subject-specific textbook. And what are the relationships among curriculum type, fidelity of implementation and student learning (p. 1, 2). This is a correlational study conducted in the USA.
OTL measure Influence of curriculum type: integrated approach textbook vs. subject-specific textbook. The study uses classroom visits, teacher surveys, textbook diaries, project developed tests and standardized tests. Another factor is what they called OTL, including the percentage of textbook lessons taught by the teacher during the year, the Extent of Textbook Implementation index, the seating arrangement of observed lessons and the dominant level of student engagement in observed lessons. Lastly, the factor implementation fidelity, including Textbook Content Taught index, Content fidelity rating and the Extent of Textbook Implementation index (p. 19).
Respondents 8th grade students (N=2.621) and teachers (N=43)
Dependent variable Mathematics achievement
Effect size Curriculum type is positively related in the three different test when no other variable is disregarded, but only 2 of the 3 are significant (r=.304, p<.05; r=.518, p<.001; r=.264, p>.05). OTL, is in all three tests positively and significantly related to student outcomes (r=.388, p<.01; r=.370, p<.05; r=.291, p<.05). Fidelity, is in non of the test significantly related to student outcomes (r=-.189, p>.05; r=-.085, p>.05; r=-.115, p>.05) (p. 23).
Comments Results controlled for prior achievement. Correlations between student outcomes and ten other variables are measured partialling out the other variables one at a time.
Törnroos (2005)
Focus Relation between OTL and mathematics achievement in which OTL is approached in three ways. Firstly, it was measured as the proportion of textbooks dedicated to different topics. The second approach was based on the data given by teachers in TIMSS 1999. The third approach involved an item-based analysis of the textbooks (p. 320). This is a correlational study conducted in Finland.
OTL measure Content coverage divided into three variables: Proportion of textbooks dedicated to topics (INBOOKx), what has been taught by teachers (TAUGHTx) and the proportional analysis of the textbook content (CONTENTx).
Respondents 7th grade students, teachers and textbooks (N=9)
Dependent variable Mathematic achievement
Effect size For textbook K only the variable TAUGHT had a statistically significant correlation with achievement (1/3). Textbook P showed no statistically significant correlations between OTL and achievement (0/3). For textbook MM the variable INBOOK had what were clearly the highest correlations with achievement (1/3) (p. 321).
Comments This analysis was based on students’ actual achievement instead of achievement gains over a specific time period (p.321). Results are not controlled for other variables. However, a distinction is being made between raw and standardized scores.
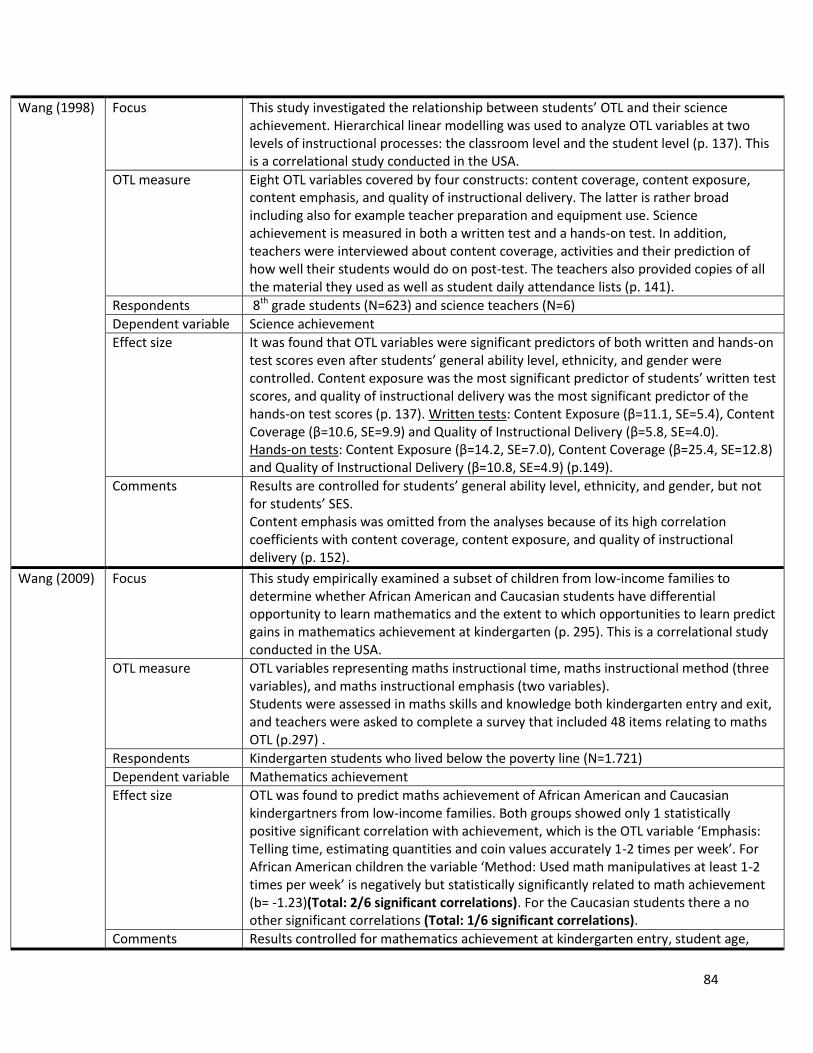
84
Wang (1998) Focus This study investigated the relationship between students’ OTL and their science achievement. Hierarchical linear modelling was used to analyze OTL variables at two levels of instructional processes: the classroom level and the student level (p. 137). This is a correlational study conducted in the USA.
OTL measure Eight OTL variables covered by four constructs: content coverage, content exposure, content emphasis, and quality of instructional delivery. The latter is rather broad including also for example teacher preparation and equipment use. Science achievement is measured in both a written test and a hands-on test. In addition, teachers were interviewed about content coverage, activities and their prediction of how well their students would do on post-test. The teachers also provided copies of all the material they used as well as student daily attendance lists (p. 141).
Respondents 8th grade students (N=623) and science teachers (N=6)
Dependent variable Science achievement
Effect size It was found that OTL variables were significant predictors of both written and hands-on test scores even after students’ general ability level, ethnicity, and gender were controlled. Content exposure was the most significant predictor of students’ written test scores, and quality of instructional delivery was the most significant predictor of the hands-on test scores (p. 137). Written tests: Content Exposure (β=11.1, SE=5.4), Content Coverage (β=10.6, SE=9.9) and Quality of Instructional Delivery (β=5.8, SE=4.0). Hands-on tests: Content Exposure (β=14.2, SE=7.0), Content Coverage (β=25.4, SE=12.8) and Quality of Instructional Delivery (β=10.8, SE=4.9) (p.149).
Comments Results are controlled for students’ general ability level, ethnicity, and gender, but not for students’ SES. Content emphasis was omitted from the analyses because of its high correlation coefficients with content coverage, content exposure, and quality of instructional delivery (p. 152).
Wang (2009) Focus This study empirically examined a subset of children from low-income families to determine whether African American and Caucasian students have differential opportunity to learn mathematics and the extent to which opportunities to learn predict gains in mathematics achievement at kindergarten (p. 295). This is a correlational study conducted in the USA.
OTL measure OTL variables representing maths instructional time, maths instructional method (three variables), and maths instructional emphasis (two variables). Students were assessed in maths skills and knowledge both kindergarten entry and exit, and teachers were asked to complete a survey that included 48 items relating to maths OTL (p.297) .
Respondents Kindergarten students who lived below the poverty line (N=1.721)
Dependent variable Mathematics achievement
Effect size OTL was found to predict maths achievement of African American and Caucasian kindergartners from low-income families. Both groups showed only 1 statistically positive significant correlation with achievement, which is the OTL variable ‘Emphasis: Telling time, estimating quantities and coin values accurately 1-2 times per week’. For African American children the variable ‘Method: Used math manipulatives at least 1-2 times per week’ is negatively but statistically significantly related to math achievement (b= -1.23)(Total: 2/6 significant correlations). For the Caucasian students there a no other significant correlations (Total: 1/6 significant correlations).
Comments Results controlled for mathematics achievement at kindergarten entry, student age,
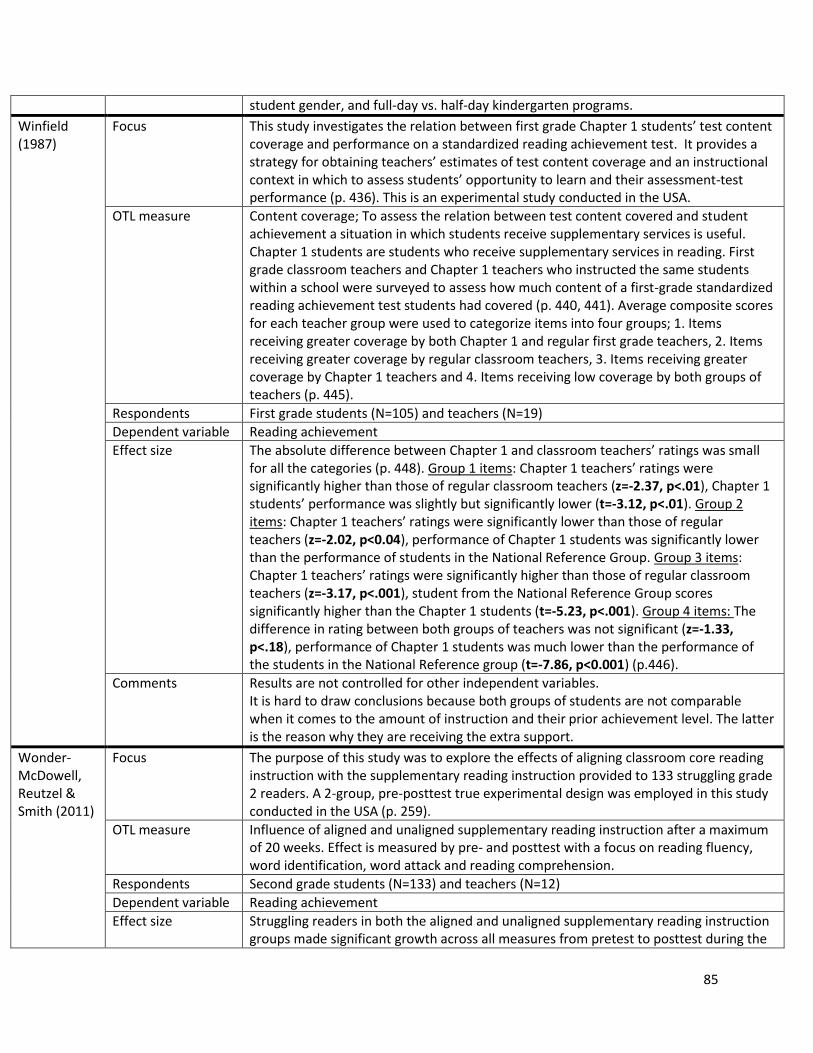
85
student gender, and full-day vs. half-day kindergarten programs.
Winfield (1987)
Focus This study investigates the relation between first grade Chapter 1 students’ test content coverage and performance on a standardized reading achievement test. It provides a strategy for obtaining teachers’ estimates of test content coverage and an instructional context in which to assess students’ opportunity to learn and their assessment-test performance (p. 436). This is an experimental study conducted in the USA.
OTL measure Content coverage; To assess the relation between test content covered and student achievement a situation in which students receive supplementary services is useful. Chapter 1 students are students who receive supplementary services in reading. First grade classroom teachers and Chapter 1 teachers who instructed the same students within a school were surveyed to assess how much content of a first-grade standardized reading achievement test students had covered (p. 440, 441). Average composite scores for each teacher group were used to categorize items into four groups; 1. Items receiving greater coverage by both Chapter 1 and regular first grade teachers, 2. Items receiving greater coverage by regular classroom teachers, 3. Items receiving greater coverage by Chapter 1 teachers and 4. Items receiving low coverage by both groups of teachers (p. 445).
Respondents First grade students (N=105) and teachers (N=19)
Dependent variable Reading achievement
Effect size The absolute difference between Chapter 1 and classroom teachers’ ratings was small for all the categories (p. 448). Group 1 items: Chapter 1 teachers’ ratings were significantly higher than those of regular classroom teachers (z=-2.37, p<.01), Chapter 1 students’ performance was slightly but significantly lower (t=-3.12, p<.01). Group 2 items: Chapter 1 teachers’ ratings were significantly lower than those of regular teachers (z=-2.02, p<0.04), performance of Chapter 1 students was significantly lower than the performance of students in the National Reference Group. Group 3 items: Chapter 1 teachers’ ratings were significantly higher than those of regular classroom teachers (z=-3.17, p<.001), student from the National Reference Group scores significantly higher than the Chapter 1 students (t=-5.23, p<.001). Group 4 items: The difference in rating between both groups of teachers was not significant (z=-1.33, p<.18), performance of Chapter 1 students was much lower than the performance of the students in the National Reference group (t=-7.86, p<0.001) (p.446).
Comments Results are not controlled for other independent variables. It is hard to draw conclusions because both groups of students are not comparable when it comes to the amount of instruction and their prior achievement level. The latter is the reason why they are receiving the extra support.
Wonder-McDowell, Reutzel & Smith (2011)
Focus The purpose of this study was to explore the effects of aligning classroom core reading instruction with the supplementary reading instruction provided to 133 struggling grade 2 readers. A 2-group, pre-posttest true experimental design was employed in this study conducted in the USA (p. 259).
OTL measure Influence of aligned and unaligned supplementary reading instruction after a maximum of 20 weeks. Effect is measured by pre- and posttest with a focus on reading fluency, word identification, word attack and reading comprehension.
Respondents Second grade students (N=133) and teachers (N=12)
Dependent variable Reading achievement
Effect size Struggling readers in both the aligned and unaligned supplementary reading instruction groups made significant growth across all measures from pretest to posttest during the
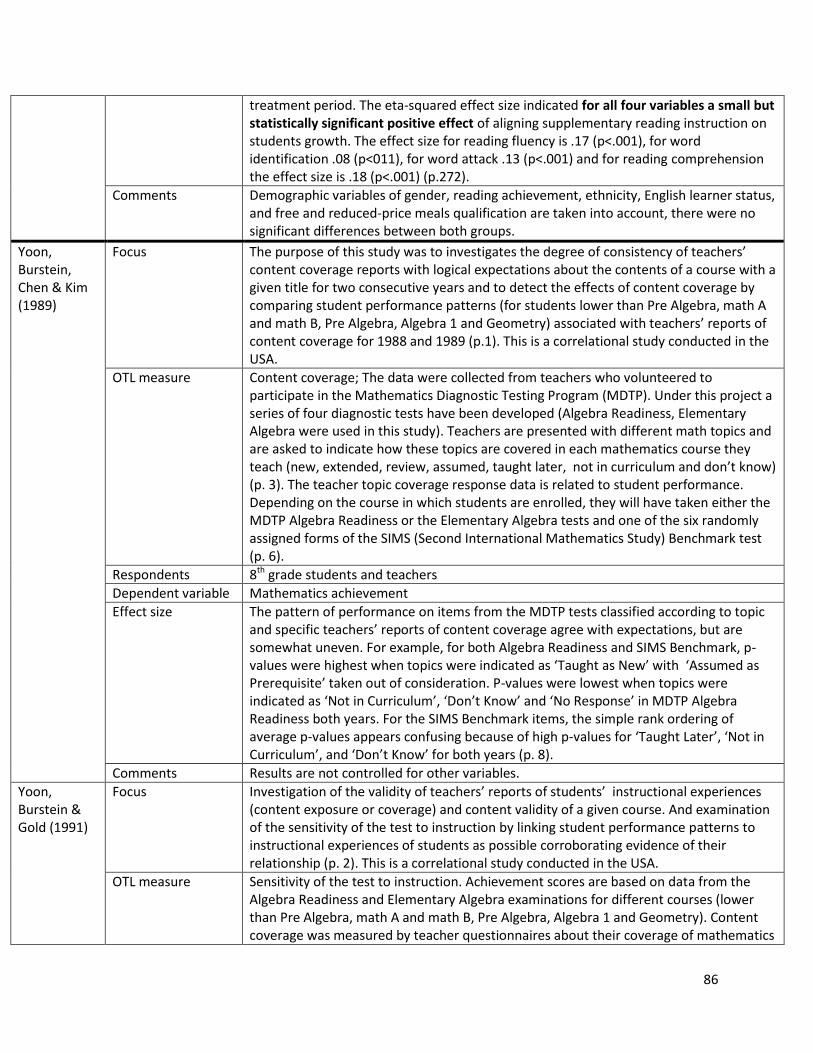
86
treatment period. The eta-squared effect size indicated for all four variables a small but statistically significant positive effect of aligning supplementary reading instruction on students growth. The effect size for reading fluency is .17 (p<.001), for word identification .08 (p<011), for word attack .13 (p<.001) and for reading comprehension the effect size is .18 (p<.001) (p.272).
Comments Demographic variables of gender, reading achievement, ethnicity, English learner status, and free and reduced-price meals qualification are taken into account, there were no significant differences between both groups.
Yoon, Burstein, Chen & Kim (1989)
Focus The purpose of this study was to investigates the degree of consistency of teachers’ content coverage reports with logical expectations about the contents of a course with a given title for two consecutive years and to detect the effects of content coverage by comparing student performance patterns (for students lower than Pre Algebra, math A and math B, Pre Algebra, Algebra 1 and Geometry) associated with teachers’ reports of content coverage for 1988 and 1989 (p.1). This is a correlational study conducted in the USA.
OTL measure Content coverage; The data were collected from teachers who volunteered to participate in the Mathematics Diagnostic Testing Program (MDTP). Under this project a series of four diagnostic tests have been developed (Algebra Readiness, Elementary Algebra were used in this study). Teachers are presented with different math topics and are asked to indicate how these topics are covered in each mathematics course they teach (new, extended, review, assumed, taught later, not in curriculum and don’t know) (p. 3). The teacher topic coverage response data is related to student performance. Depending on the course in which students are enrolled, they will have taken either the MDTP Algebra Readiness or the Elementary Algebra tests and one of the six randomly assigned forms of the SIMS (Second International Mathematics Study) Benchmark test (p. 6).
Respondents 8th grade students and teachers
Dependent variable Mathematics achievement
Effect size The pattern of performance on items from the MDTP tests classified according to topic and specific teachers’ reports of content coverage agree with expectations, but are somewhat uneven. For example, for both Algebra Readiness and SIMS Benchmark, p-values were highest when topics were indicated as ‘Taught as New’ with ‘Assumed as Prerequisite’ taken out of consideration. P-values were lowest when topics were indicated as ‘Not in Curriculum’, ‘Don’t Know’ and ‘No Response’ in MDTP Algebra Readiness both years. For the SIMS Benchmark items, the simple rank ordering of average p-values appears confusing because of high p-values for ‘Taught Later’, ‘Not in Curriculum’, and ‘Don’t Know’ for both years (p. 8).
Comments Results are not controlled for other variables.
Yoon, Burstein & Gold (1991)
Focus Investigation of the validity of teachers’ reports of students’ instructional experiences (content exposure or coverage) and content validity of a given course. And examination of the sensitivity of the test to instruction by linking student performance patterns to instructional experiences of students as possible corroborating evidence of their relationship (p. 2). This is a correlational study conducted in the USA.
OTL measure Sensitivity of the test to instruction. Achievement scores are based on data from the Algebra Readiness and Elementary Algebra examinations for different courses (lower than Pre Algebra, math A and math B, Pre Algebra, Algebra 1 and Geometry). Content coverage was measured by teacher questionnaires about their coverage of mathematics
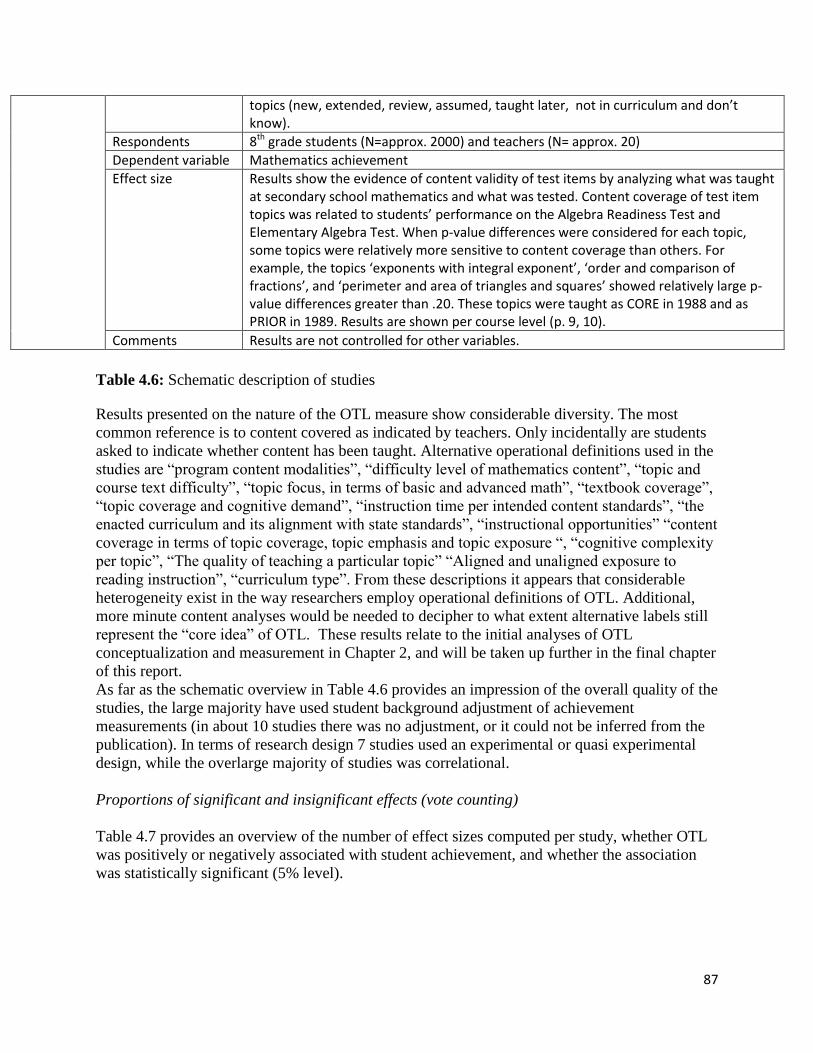
87
topics (new, extended, review, assumed, taught later, not in curriculum and don’t know).
Respondents 8th grade students (N=approx. 2000) and teachers (N= approx. 20)
Dependent variable Mathematics achievement
Effect size Results show the evidence of content validity of test items by analyzing what was taught at secondary school mathematics and what was tested. Content coverage of test item topics was related to students’ performance on the Algebra Readiness Test and Elementary Algebra Test. When p-value differences were considered for each topic, some topics were relatively more sensitive to content coverage than others. For example, the topics ‘exponents with integral exponent’, ‘order and comparison of fractions’, and ‘perimeter and area of triangles and squares’ showed relatively large p-value differences greater than .20. These topics were taught as CORE in 1988 and as PRIOR in 1989. Results are shown per course level (p. 9, 10).
Comments Results are not controlled for other variables.
Table 4.6: Schematic description of studies
Results presented on the nature of the OTL measure show considerable diversity. The most
common reference is to content covered as indicated by teachers. Only incidentally are students
asked to indicate whether content has been taught. Alternative operational definitions used in the
studies are “program content modalities”, “difficulty level of mathematics content”, “topic and
course text difficulty”, “topic focus, in terms of basic and advanced math”, “textbook coverage”,
“topic coverage and cognitive demand”, “instruction time per intended content standards”, “the
enacted curriculum and its alignment with state standards”, “instructional opportunities” “content
coverage in terms of topic coverage, topic emphasis and topic exposure “, “cognitive complexity
per topic”, “The quality of teaching a particular topic” “Aligned and unaligned exposure to
reading instruction”, “curriculum type”. From these descriptions it appears that considerable
heterogeneity exist in the way researchers employ operational definitions of OTL. Additional,
more minute content analyses would be needed to decipher to what extent alternative labels still
represent the “core idea” of OTL. These results relate to the initial analyses of OTL
conceptualization and measurement in Chapter 2, and will be taken up further in the final chapter
of this report.
As far as the schematic overview in Table 4.6 provides an impression of the overall quality of the
studies, the large majority have used student background adjustment of achievement
measurements (in about 10 studies there was no adjustment, or it could not be inferred from the
publication). In terms of research design 7 studies used an experimental or quasi experimental
design, while the overlarge majority of studies was correlational.
Proportions of significant and insignificant effects (vote counting)
Table 4.7 provides an overview of the number of effect sizes computed per study, whether OTL
was positively or negatively associated with student achievement, and whether the association
was statistically significant (5% level).
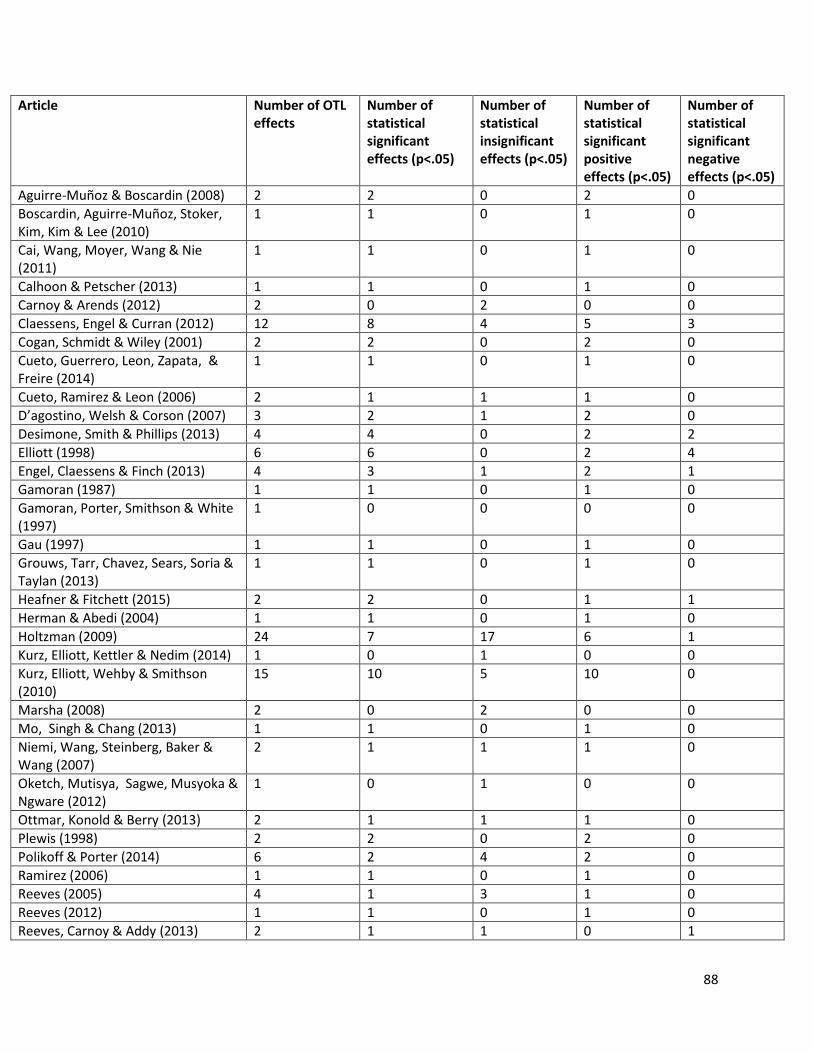
88
Article Number of OTL effects
Number of statistical significant effects (p<.05)
Number of statistical insignificant effects (p<.05)
Number of statistical significant positive effects (p<.05)
Number of statistical significant negative effects (p<.05)
Aguirre-Muñoz & Boscardin (2008) 2 2 0 2 0
Boscardin, Aguirre-Muñoz, Stoker, Kim, Kim & Lee (2010)
1 1 0 1 0
Cai, Wang, Moyer, Wang & Nie (2011)
1 1 0 1 0
Calhoon & Petscher (2013) 1 1 0 1 0
Carnoy & Arends (2012) 2 0 2 0 0
Claessens, Engel & Curran (2012) 12 8 4 5 3
Cogan, Schmidt & Wiley (2001) 2 2 0 2 0
Cueto, Guerrero, Leon, Zapata, & Freire (2014)
1 1 0 1 0
Cueto, Ramirez & Leon (2006) 2 1 1 1 0
D’agostino, Welsh & Corson (2007) 3 2 1 2 0
Desimone, Smith & Phillips (2013) 4 4 0 2 2
Elliott (1998) 6 6 0 2 4
Engel, Claessens & Finch (2013) 4 3 1 2 1
Gamoran (1987) 1 1 0 1 0
Gamoran, Porter, Smithson & White (1997)
1 0 0 0 0
Gau (1997) 1 1 0 1 0
Grouws, Tarr, Chavez, Sears, Soria & Taylan (2013)
1 1 0 1 0
Heafner & Fitchett (2015) 2 2 0 1 1
Herman & Abedi (2004) 1 1 0 1 0
Holtzman (2009) 24 7 17 6 1
Kurz, Elliott, Kettler & Nedim (2014) 1 0 1 0 0
Kurz, Elliott, Wehby & Smithson (2010)
15 10 5 10 0
Marsha (2008) 2 0 2 0 0
Mo, Singh & Chang (2013) 1 1 0 1 0
Niemi, Wang, Steinberg, Baker & Wang (2007)
2 1 1 1 0
Oketch, Mutisya, Sagwe, Musyoka & Ngware (2012)
1 0 1 0 0
Ottmar, Konold & Berry (2013) 2 1 1 1 0
Plewis (1998) 2 2 0 2 0
Polikoff & Porter (2014) 6 2 4 2 0
Ramirez (2006) 1 1 0 1 0
Reeves (2005) 4 1 3 1 0
Reeves (2012) 1 1 0 1 0
Reeves, Carnoy & Addy (2013) 2 1 1 0 1
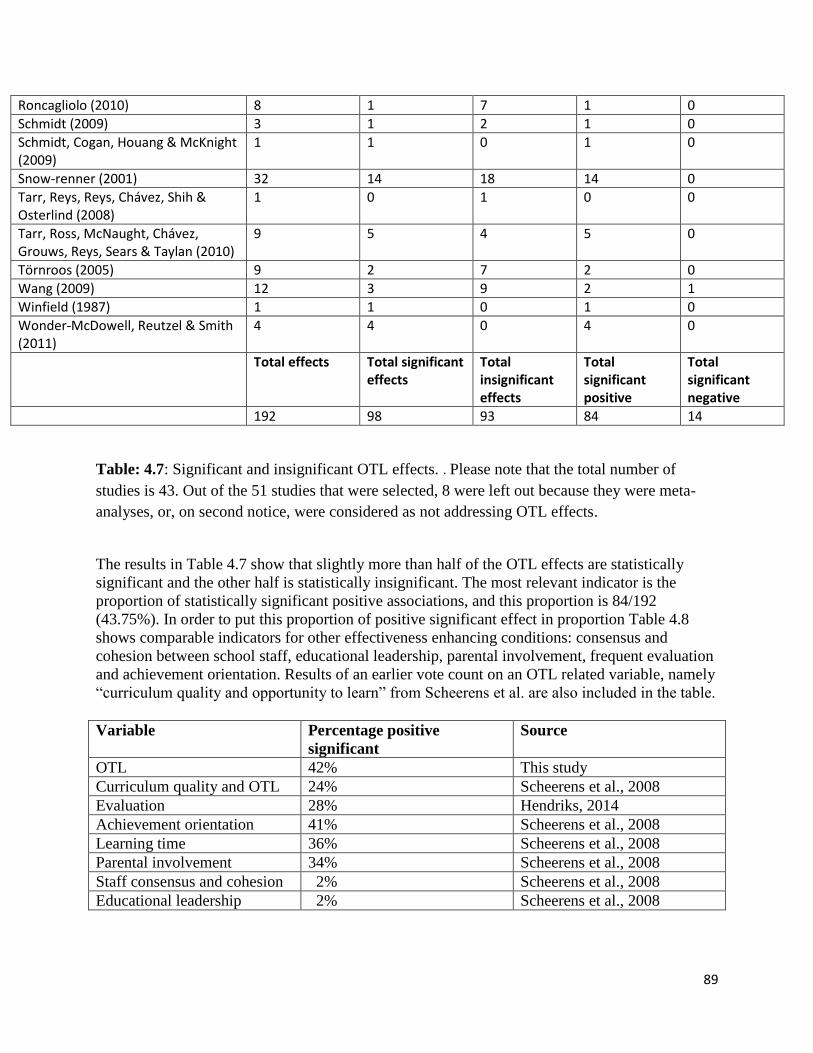
89
Roncagliolo (2010) 8 1 7 1 0
Schmidt (2009) 3 1 2 1 0
Schmidt, Cogan, Houang & McKnight (2009)
1 1 0 1 0
Snow-renner (2001) 32 14 18 14 0
Tarr, Reys, Reys, Chávez, Shih & Osterlind (2008)
1 0 1 0 0
Tarr, Ross, McNaught, Chávez, Grouws, Reys, Sears & Taylan (2010)
9 5 4 5 0
Törnroos (2005) 9 2 7 2 0
Wang (2009) 12 3 9 2 1
Winfield (1987) 1 1 0 1 0
Wonder-McDowell, Reutzel & Smith (2011)
4 4 0 4 0
Total effects Total significant effects
Total insignificant effects
Total significant positive
Total significant negative
192 98 93 84 14
Table: 4.7: Significant and insignificant OTL effects. . Please note that the total number of
studies is 43. Out of the 51 studies that were selected, 8 were left out because they were meta-
analyses, or, on second notice, were considered as not addressing OTL effects.
The results in Table 4.7 show that slightly more than half of the OTL effects are statistically
significant and the other half is statistically insignificant. The most relevant indicator is the
proportion of statistically significant positive associations, and this proportion is 84/192
(43.75%). In order to put this proportion of positive significant effect in proportion Table 4.8
shows comparable indicators for other effectiveness enhancing conditions: consensus and
cohesion between school staff, educational leadership, parental involvement, frequent evaluation
and achievement orientation. Results of an earlier vote count on an OTL related variable, namely
“curriculum quality and opportunity to learn” from Scheerens et al. are also included in the table.
Variable Percentage positive
significant
Source
OTL 42% This study
Curriculum quality and OTL 24% Scheerens et al., 2008
Evaluation 28% Hendriks, 2014
Achievement orientation 41% Scheerens et al., 2008
Learning time 36% Scheerens et al., 2008
Parental involvement 34% Scheerens et al., 2008
Staff consensus and cohesion 2% Scheerens et al., 2008
Educational leadership 2% Scheerens et al., 2008
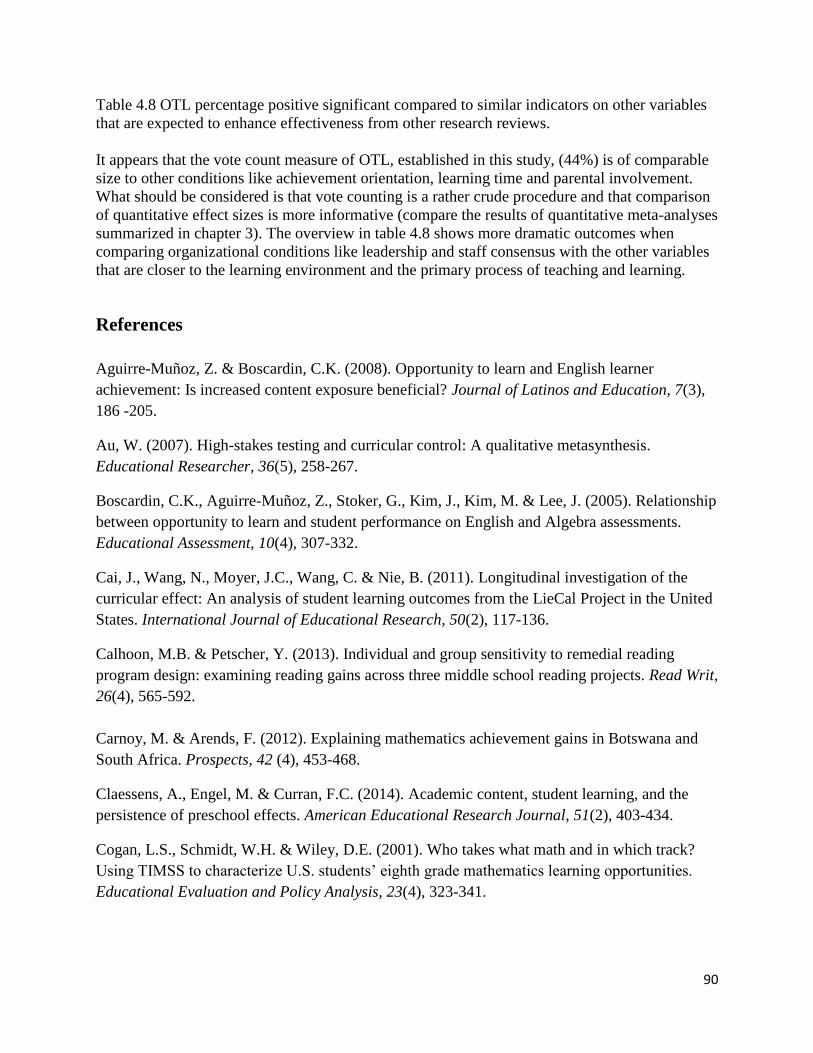
90
Table 4.8 OTL percentage positive significant compared to similar indicators on other variables
that are expected to enhance effectiveness from other research reviews.
It appears that the vote count measure of OTL, established in this study, (44%) is of comparable
size to other conditions like achievement orientation, learning time and parental involvement.
What should be considered is that vote counting is a rather crude procedure and that comparison
of quantitative effect sizes is more informative (compare the results of quantitative meta-analyses
summarized in chapter 3). The overview in table 4.8 shows more dramatic outcomes when
comparing organizational conditions like leadership and staff consensus with the other variables
that are closer to the learning environment and the primary process of teaching and learning.
References
Aguirre-Muñoz, Z. & Boscardin, C.K. (2008). Opportunity to learn and English learner
achievement: Is increased content exposure beneficial? Journal of Latinos and Education, 7(3),
186 -205.
Au, W. (2007). High-stakes testing and curricular control: A qualitative metasynthesis.
Educational Researcher, 36(5), 258-267.
Boscardin, C.K., Aguirre-Muñoz, Z., Stoker, G., Kim, J., Kim, M. & Lee, J. (2005). Relationship
between opportunity to learn and student performance on English and Algebra assessments.
Educational Assessment, 10(4), 307-332.
Cai, J., Wang, N., Moyer, J.C., Wang, C. & Nie, B. (2011). Longitudinal investigation of the
curricular effect: An analysis of student learning outcomes from the LieCal Project in the United
States. International Journal of Educational Research, 50(2), 117-136.
Calhoon, M.B. & Petscher, Y. (2013). Individual and group sensitivity to remedial reading
program design: examining reading gains across three middle school reading projects. Read Writ,
26(4), 565-592.
Carnoy, M. & Arends, F. (2012). Explaining mathematics achievement gains in Botswana and
South Africa. Prospects, 42 (4), 453-468.
Claessens, A., Engel, M. & Curran, F.C. (2014). Academic content, student learning, and the
persistence of preschool effects. American Educational Research Journal, 51(2), 403-434.
Cogan, L.S., Schmidt, W.H. & Wiley, D.E. (2001). Who takes what math and in which track?
Using TIMSS to characterize U.S. students’ eighth grade mathematics learning opportunities.
Educational Evaluation and Policy Analysis, 23(4), 323-341.
91
Cueto, S., Ramirez, C. & Leon, J. (2006). Opportunities to learn and achievement in mathematics
in a sample of sixth grade students in Lima, Peru. Educational Studies in Mathematics 62 (1),
25-55.
Cueto, S., Guerrero, G., Leon, J., Zapata, M. & Freire, S. (2014). The relationship between
socioeconomic status at age one, opportunities to learn and achievement in mathematics in fourth
grade in Peru. Oxford Review of Education, 40(1), 50-72.
D’agostino, J., Welsh, M.E. & Nina, M. C. (2007). Instructional sensitivity of a State’s
Standards-Based Assessment. Educational Assessment, 12 (1), 1-22.
Desimone, L.M., Smith, T.M. & Phillips, K. (2013). Linking student achievement growth to
professional development participation and changes in instruction: A longitudinal study
elementary students and teachers in title I schools. Teachers College Records, 115(5), 1-46.
Elliott, M. (1998). School finance and opportunities to learn: Does money well spent enhance
students’ achievement? Sociology of Education, 71(3), 223-245.
Engel, M., Claessens, A. & Finch, M. A. (2013). Teaching students what they already know?
The (mis)alignment between mathematics instructional content and student knowledge in
kindergarten. Educational Evaluation and Policy Analysis, 35(2), 157-178.
Gamoran, A. (1987). Instruction and the effects of schooling. Paper presented at the annual
meetings of the American Sociological Association.
Gamoran, A., Porter, A.C., Smithson, J. & White, P.A. (1997). Upgrading high school
mathematics instruction: improving learning opportunities for low-achieving, low-income youth.
Educational Evaluation and Policy Analysis, 19 (4), 325-338.
Gau, S.-J. (1997). The distribution and the effects of opportunity to learn on mathematics
achievement. Paper presented at the annual meeting of the American Educational Research
Association, Chicago, IL, timeMarch. (ERIC Document Reproduction Service No. ED407231)
Grouws, D.A., Tarr, J.E., Chávez, O., Sears, R., Soria, V.M. & Taylan, R.D. (2013). Curriculum
and implementation effects on high school students’ mathematics learning from curricula
representing subject-specific and integrated content organizations. Journal for Research in
Mathematics Education, 44(2), 416-463.
Heafner, T.L. & Fitchett, P.G. (2015). An opportunity to learn US history: What NAEP data
suggest regarding the opportunity gap. The High School Journal, 98 (3), 226-249.
Herman, J.L. & Abedi, J. (2004). Issues in assessing English language learners’ opportunity to
92
learn mathematics (CSE Report No. 633).Los Angeles: Center for the Study of Evaluation,
National Center for Research on Evaluation, Standards, and Student Testing.
Holtzman, D.J. (2009). Relationships among content standards, instruction, and student
achievement. Retrieved from ProQuest Dissertations and Theses.
Kablan, Z., Topan, B. & Erkan, B. (2013). The effectiveness level of material use in classroom
instruction: A meta-analysis study. Educational Sciences: Theory and Practice, 13(3), 1638-
1644.
Kurz, A., Elliott, S.N., Wehby, J.H. & Smithson, J.L. (2010). Alignment of the intended,
planned, and enacted curriculum in general and special education and its relation to student
achievement. The Journal of Special Education, 44(3), 131-145.
Kurz, A., Elliott, S.N., Kettler, R.J. & Yel, N. (2014). Assessing students’ opportunity to learn
the intended curriculum using an online teacher log: Initial validity evidence. Educational
Assessment, 19(3), 159-184.
Kyriakides, L., Christoforou, C. & Charalambous, C.Y. (2013). What matters for student
learning outcomes: A meta-analysis of studies exploring factors of effective teaching. Teaching
and Teacher Education, 36, 143-152.
Marsha, I. (2008). Using instructional sensitivity and instructional opportunities to interpret
students’ mathematics performance. Journal of Educational Research and Policy Studies, 8(1),
23-43.
Mo, Y., Singh, K. & Chang, M. (2013). Opportunity to learn and student engagement A HLM
study on eighth grade science achievement. Educational Research for Policy and Practice,
12(1), 3-19.
Niemi, D., Wang, J., Steinberg, D.H., Baker, E.L. & Wang, H. (2007). Instructional sensitivity of
a complex language arts performance assessment. Educational Assessment, 12(3&4), 215-237.
Oketch, M., Mutisya, M., Sagwe, J., Musyoka, P. & Ngware, M.W. (2012). The effect of active
teaching and subject content coverage on students’ achievement: Evidence from primary schools
in Kenya. London Review of Education, 10(1), 19-33.
Ottmar, E.R., Grissmer, D.W., Konold, T.R., Cameron, C.E. & Berry, R.Q. (2013). Increasing
equity and achievement in fifth grade mathematics: The contribution of content exposure. School
Science and Mathematics, 133(7), 345-355.
93
Plewis, I. (1998). Curriculum coverage and classroom grouping as explanations of between
teacher differences in pupils’ mathematics progress. Educational Research and Evaluation, 4(2),
97-107.
Polikoff, M.S. & Porter, A.C. (2014). Instructional alignment as a measure of teaching quality.
Educational Evaluation and Policy Analysis, 20, 1-18.
Ramírez, M.-J. (2006). Understanding the low mathematics achievement of Chilean students: A
cross-national analysis using TIMSS data. International Journal of Educational Research, 45(3),
102-116.
Reeves, C. & Major, T. (2012). Using student notebooks to measure opportunity to learn in
Botswana and South African classrooms. Prospects, 42(4), 403-413.
Reeves, C., Carnoy, M. & Addy, N. (2013). Comparing opportunity to learn and student
achievement gains in southern African primary schools: A new approach. International Journal
of Educational Development, 33(5), 426-435.
Reeves, C.A. (2005). The effect of ‘opportunity-to-learn’ and classroom pedagogy on
mathematics achievement in schools serving low socio-economic status communities in the Cape
Peninsula. PhD thesis, School of Education, Faculty of Humanities, Cape Town, University of
Cape Town.
Roncagliolo, R. (2013). Time to learn mathematics in public and private schools: Understanding
difference in aspects of the implemented curriculum in the Dominican Republic (Dissertation).
Retrieved from ProQuest Dissertations and Theses.
Schmidt, W.H., Cogan, L.S., Houang, R.T. & McKnight, C. (2009). Equality of educational
opportunity: A myth or reality in U.S. schooling. Lansing, MI: The Education Policy Center at
Michigan State University.
Schmidt, W.H. (2009). Exploring the relationship between content coverage and achievement:
Unpacking the meaning of tracking in eighth grade mathematics. Education Policy Center, East
Lansing, MI: Michigan State University.
Schroeder, C.M., Scott, T.P., Tolson, H., Huang, T-Y. & Lee, Y.H. (2007). A meta-analysis of
national research: Effects of teaching strategies on student achievement in science in the United
States. Journal of Research in Science Teaching, 44(10), 1436-1460.
Snow-Renner, R. (2001). What is the promise of large-scale classroom practice measures for
94
informing us about equity in student opportunities-to-learn? An example using the Colorado
TIMSS. Paper presented at the Annual Meeting of the American Educational Research
Association. Seattle, WA 10-14 April 2001.
Squires, D. (2012). Curriculum alignment research suggests that alignment can improve student
achievement. The Clearing House, 85(4), 129-135.
Tarr, J. E., Ross, D.J., McNaught, M.D., Chávez, O., Grouws, D.A., Reys, R.E., Sears, R. &
Taylan, R.D. (2010). Identification of student- and teacher-level variables in modelling variation
of mathematics achievement data. Paper presented at the Annual Meeting of the American
Educational Research Association, Denver, CO.
Tarr, J.E., Reys, R.E., Reys, B.J., Chávez, Ó., Shih, J. & Osterlind, S.J. (2008). The impact of
middle-grade mathematics curricula and the classroom learning environment on student
achievement. Journal for Research in Mathematics Education, 39(3), 247-280.
Törnroos, J. (2005). Mathematics textbooks, opportunity to learn and student achievement.
Studies in Educational Evaluation, 31(4), 315-327.
Wang, A.H. (2009). Optimizing early mathematics experiences for children from low-income
families: A study on opportunity to learn mathematics. Early Childhood Education Journal,
37(4), 295-302.
Wang, J. (1998). Opportunity to learn: The impacts and policy implications. Educational
Evaluation and Policy Analysis, 20(3), 137-156.
Winfield, L.F. (1987). Teachers’ estimates of test content covered in class and first-grade
students’ reading achievement. The Elementary School Journal, 87(4), 436-454.
Wonder-McDowell, C., Reutzel, D. R. & Smith, J.A. (2011). Does instructional alignment
matter? Effects on struggling second graders’ reading achievement. The Elementary School
Journal, 112(2), 259-279.
Yoon, B., Burnstein, L., Chen, Z. & Kim, K.-S. (1990). Patterns in teacher reports of topic
coverage and their effects on math achievement: comparisons across years (CSE Tech. Rep. No.
309). Los Angeles: University of California, National Center for Research on Evaluation,
Standards, and Student Testing (CRESST).
Yoon, B, Burnstein, L. & Gold, K. (1991). Assessing the content validity of teachers’ reports of
content coverage and its relationship to student achievement (CSE Rep. No. 328). Los Angeles:
University of California, National Center for Research on Evaluation, Standards, and Student
Testing (CRESST).
95
ANNEX: DESCRIPTORS USED THE LITERATURE SEARCH
Database: ERIC, PsycARTICLES, Psychology and Behavioral Sciences Collection, PsycINFO
Publication date: 1995-2015
‘’opportunity to learn’’ OR ‘’curricul* align*’’ OR ‘’learn* what is expected’’ OR ‘’access to
instruction’’ OR ‘’curricul* exposure’’ OR ‘’test preparat*’’ OR ‘’exam* preparat*’’ OR
‘’instruction* align*’’ OR ‘’instructional sensitivity’’ OR ‘’enacted curricul*’’ OR ‘’curricul*
cover*’’ OR ‘’content cover*’’ OR ‘’curricul* implement*’’OR ‘’curriculum teaching’’ OR
‘’curricul* differen*’’ OR ‘’curricul* coherence’’ OR ‘’topic cover*’’
AND
‘’Effectiveness’’ OR ‘’ achievement’’ OR ‘’outcome’’ OR ‘’success’’ OR ‘’influence’’ OR
‘’added-value’’ OR ‘’grade’’
NOT: ICT
NOT: disab* OR disadvantage*
NOT: material*
NOT: higher education
NOT: business
NOT: special
96
CHAPTER V: PREDICTIVE POWER OF OTL MEASURES IN TIMSS AND PISA
Hans Luyten
Introduction
The predictive power of the OTL measures in the most recent TIMSS and PISA surveys has been
analysed. This was done both at school and country level controlling for the number of books at
home (as reported by the students). The analyses focus on the Netherlands and those 22 countries
that participated in the most recent TIMSS survey (data were collected in 2011) with both the
grade 4 and grade 8 student populations and in the PISA 2012 survey. The Netherlands
participated in PISA 2012 and also in TIMSS 2011, but only with the grade 4 student population.
Both TIMSS and PISA are large-scale cross-national comparative surveys focussing on student
achievement. The TIMSS-survey is conducted every five years since 1995 and the PISA-survey
every three years since 2000. Per country thousands of students participate and take standardized
tests on mathematics, science and reading. In addition background information on students,
schools, classrooms and teachers is collected. Over sixty countries participated in the most recent
TIMSS and PISA surveys. The PISA target population is age-based. All 15-year-old students in a
country are part of the target population, irrespective of their grade. TIMSS aims at two target
populations, which are both based on grade (grade 4 and grade 8). The grade 4 population
contains mostly 8-year-olds and the grade 8 population mostly 14-year-olds.
TIMSS focuses on mathematics and science achievement, whereas PISA covers reading literacy
in addition to mathematics and science. The TIMSS study design attempts to align the
achievement tests students take as closely as possible to the national curricula of the participating
countries. In PISA, test curriculum alignment has never been a goal. The ambition of PISA is to
assess the basic cognitive skills that young people need to succeed in later life. For further
information on both the TIMSS and PISA project we refer to their respective websites:
http://www.iea.nl/timss_2011.html
http://www.oecd.org/pisa/
97
Assessing Opportunity to Learn (OTL) in TIMSS and PISA
In both TIMSS 2011 and PISA 2012 opportunity to learn (OTL) has been assessed, thus allowing
for a cross-national assessment of the statistical relation between this measure and student
achievement. In TIMSS the grade 4 teachers were asked to indicate, for a range of topics within
three mathematics domains (Number, Geometric Shapes and Measures and Data Display), which
of the following options best described the situation for the students in the TIMSS survey:
the topic had been mostly taught before this year
the topic had been mostly taught this year
the topic had been not yet taught or just introduced
Examples of the topics included are concepts of whole numbers, including place value and
ordering (Number domain), comparing and drawing angles (Geometric Shapes and Measures
domain) and reading data from tables, pictographs, bar graphs, or pie charts (Data Display
domain).
With regard to science, similar questions were asked for topics within the domains Life Science,
Physical Science and Earth Science. Based on these responses, indices were constructed that
express on a scale from 0 to 100 to what extent the various domains had been covered. For the
purpose of the analyses that are reported on in this chapter two general OTL measures for
mathematics and science were computed. The OTL measure for mathematics is the average of
the OTL indices over the three domains. Likewise, the OTL measure for science is the average of
the OTL indices over the three science domains.
The same strategy was followed for the TIMSS data that relate to grade 8. In this case there are
four mathematics domains (Number, Algebra, Geometry, Data and Chance) and four science
domains (Biology, Chemistry, Physics and Earth Science). As a result, for both TIMSS
populations there is an OTL measure for mathematics and an OTL measure for science.
In PISA 2012, OTL data was obtained from the students instead of the teachers. Using the
student responses, three indices on OTL with regard to mathematics were constructed. The
analyses reported here focus on the experience with formal mathematics. Students were asked to
indicate for the following mathematics tasks how often they had encountered them during their
time at school.
solving an equation like 6x2 + 5 = 29
solving an equation like 2(x + 3) = (x + 3)(x – 3)
solving an equation like 3x + 5 = 17
The response categories were: frequently – sometimes – rarely – never. The PISA index was
constructed by means of item response theory (IRT) scaling, which results in scores that may
range from minus infinity to infinity with a zero mean (OECD, 2014a; p. 329). Two additional
98
OTL indices were constructed in PISA. The first one relates to experience with applied
mathematics (e.g. figuring out from a train schedule how long it would take to get from one
place to another) and the second one to familiarity with a range of mathematical concepts (e.g.
exponential functions). The index that captures experience with formal mathematics is in the
author’s opinion most comparable to the OTL measures in TIMSS, which relate to mathematical
content in abstract terms. The index on familiarity with mathematical concepts may partly reflect
results of learning in addition to genuine OTL (although this cannot be ruled out completely for
the measure on experience with formal mathematics). Familiarity with such concepts can also be
conceived as a result of teaching in addition to opportunity to learn. Although the index on
experience with formal mathematics may seem somewhat restricted, it statistical relation with
mathematics achievement has been extensively documented (OECD, 2014b; pp. 145-174).
Data Analysis
The relation between OTL and student achievement was assessed by means of a number of
regression analyses. In these analysed number of books at home is included as a control variable.
Prior analyses on PISA 2012 data have revealed a substantial correlation between OTL and
family background (Schmidt, Burroughs, Zoido & Houang, 2015). Raw correlations between
achievement and OTL may therefore be confounded, due to the joint relation of OTL and
achievement with family background. Unfortunately there is little overlap in the questions on
family background in the TIMSS and PISA questionnaires, but the question on numbers of books
at home is nearly identical in both surveys. The only difference is an additional sixth response
category in PISA. In order to realize maximum comparability both the fifth and sixth response
category in PISA have been collapsed into a single category. The resulting categories are: 0-10
books – 11-25 books – 26-100 books – 101-200 books – more than 200 books.
As the OTL data in TIMSS are obtained from the teachers, the OTL measures in TIMSS can
only account for variation in achievement between classes. In PISA information on classes is not
included and it cannot be determined which students are classmates. Therefore it was decided to
aggregate the data at the school level. In addition analyses were conducted on country means.
Three datasets were analysed: TIMSS, grade 4 students, TIMSS grade 8 students and PISA. In
the TIMSS data sets the impact of OTL on both mathematics and science was analysed
(controlling for books at home). In these analyses the impact of mathematics and science OTL
was analysed. In the PISA data set only the impact of mathematics OTL on mathematics
achievement was analysed (controlling for books at home).
All analyses made use of “plausible values”. In both the TIMSS and PISA datasets individual
student performance is presented by five plausible values instead of a single test score. Plausible
values were to deal with assessment situations where the number of items administered is not
large enough for precise estimation of their ability. Based on the observed score a distribution is
constructed of the student’s ability. The plausible values are random draws from this distribution
99
and represent the range of abilities (s)he might reasonably have (Wu & Adams, 2002). The use
of plausible values prevents researchers from underestimating random error (i.e. overestimating
precision) in their findings. Before reporting the findings, descriptive statistics and correlations
of country means are presented.
Descriptive statistics per country and correlations of country means
Tables 1-3 present for TIMSS (grade 4 and 8) and PISA information per country on the number
of schools, student achievement and number of books at home. Some of the countries selected
for this study score very high on mathematics and science in both TIMSS and PISA (e.g.
Singapore and Korea), but some countries that score far below the international mean (e.g.
Tunisia and Qatar) are included as well. Table 1-3 suggest a great deal of consistency between
TIMSS grade 4, TIMSS grade 8 and PISA. Countries that show a high average achievement in
one survey also tend to score highly in the other surveys. The consistency between mathematics
and science also appears to be (very) strong. More details on the correlations between the
country means are provided in tables 4-6. With regard to the numbers of books at home, a similar
consistency between surveys can be observed. Korea and Norway show high averages in all
three surveys, whereas the opposite goes for Tunisia and Thailand. In these two countries the
average score on a scale from 1 to 5 hardly exceeds 2, which suggest a little over 11 books at
home on average. In Korea and Norway the average is always well above three. This suggests
well over 25 but probably closer to 100 books at home. With regard to OTL the country averages
seem less consistent. Countries with a high OTL score on mathematics do not always show high
OTL on science. Also across surveys the OTL seems not particularly consistent.
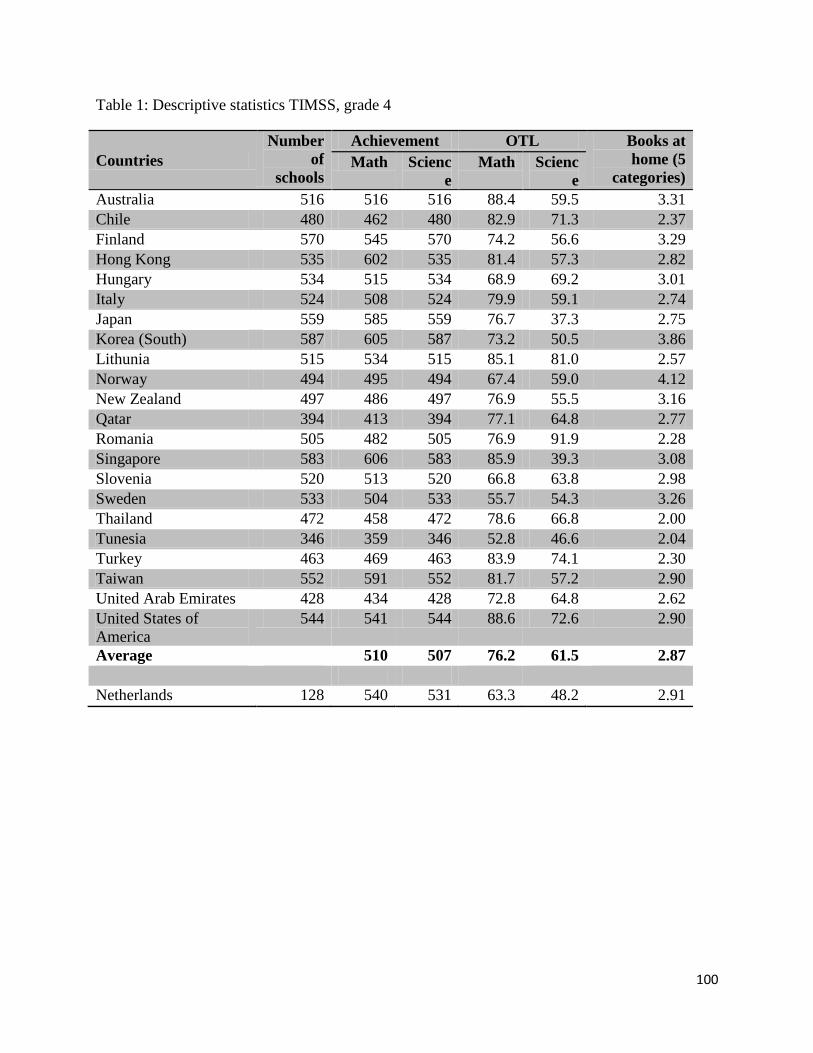
100
Table 1: Descriptive statistics TIMSS, grade 4
Countries
Number
of
schools
Achievement OTL Books at
home (5
categories) Math Scienc
e
Math Scienc
e
Australia 516 516 516 88.4 59.5 3.31
Chile 480 462 480 82.9 71.3 2.37
Finland 570 545 570 74.2 56.6 3.29
Hong Kong 535 602 535 81.4 57.3 2.82
Hungary 534 515 534 68.9 69.2 3.01
Italy 524 508 524 79.9 59.1 2.74
Japan 559 585 559 76.7 37.3 2.75
Korea (South) 587 605 587 73.2 50.5 3.86
Lithunia 515 534 515 85.1 81.0 2.57
Norway 494 495 494 67.4 59.0 4.12
New Zealand 497 486 497 76.9 55.5 3.16
Qatar 394 413 394 77.1 64.8 2.77
Romania 505 482 505 76.9 91.9 2.28
Singapore 583 606 583 85.9 39.3 3.08
Slovenia 520 513 520 66.8 63.8 2.98
Sweden 533 504 533 55.7 54.3 3.26
Thailand 472 458 472 78.6 66.8 2.00
Tunesia 346 359 346 52.8 46.6 2.04
Turkey 463 469 463 83.9 74.1 2.30
Taiwan 552 591 552 81.7 57.2 2.90
United Arab Emirates 428 434 428 72.8 64.8 2.62
United States of
America
544 541 544 88.6 72.6 2.90
Average 510 507 76.2 61.5 2.87
Netherlands 128 540 531 63.3 48.2 2.91
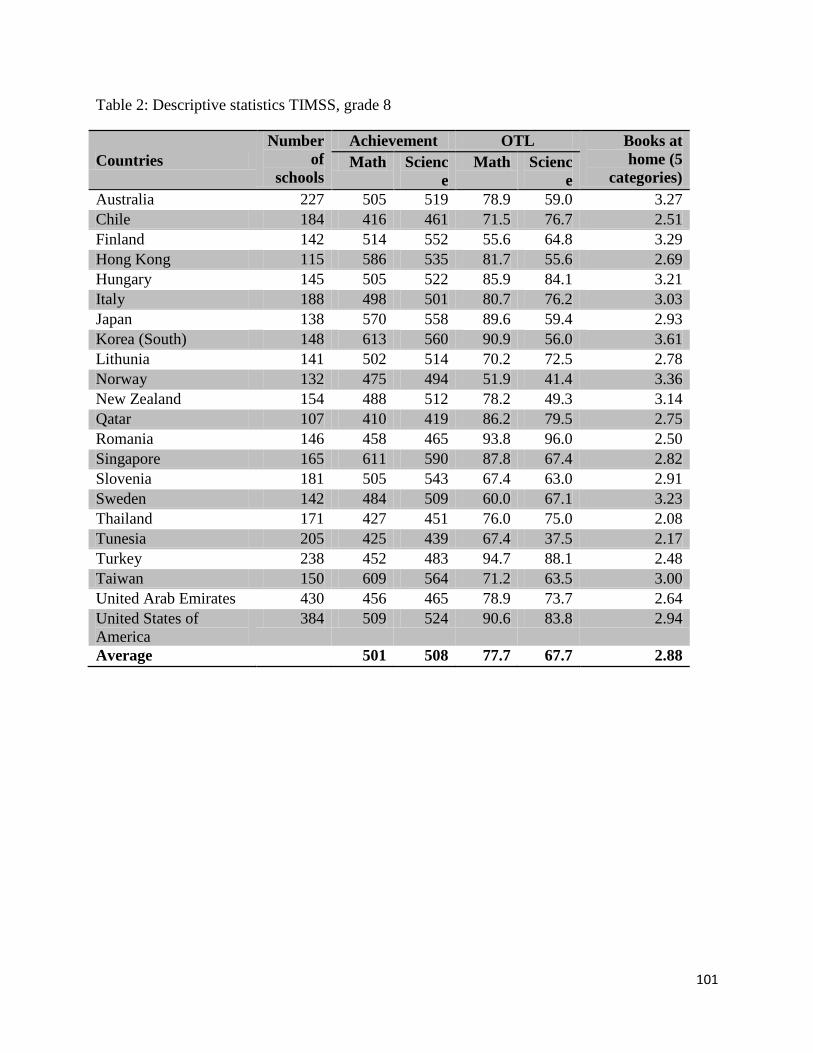
101
Table 2: Descriptive statistics TIMSS, grade 8
Countries
Number
of
schools
Achievement OTL Books at
home (5
categories) Math Scienc
e
Math Scienc
e
Australia 227 505 519 78.9 59.0 3.27
Chile 184 416 461 71.5 76.7 2.51
Finland 142 514 552 55.6 64.8 3.29
Hong Kong 115 586 535 81.7 55.6 2.69
Hungary 145 505 522 85.9 84.1 3.21
Italy 188 498 501 80.7 76.2 3.03
Japan 138 570 558 89.6 59.4 2.93
Korea (South) 148 613 560 90.9 56.0 3.61
Lithunia 141 502 514 70.2 72.5 2.78
Norway 132 475 494 51.9 41.4 3.36
New Zealand 154 488 512 78.2 49.3 3.14
Qatar 107 410 419 86.2 79.5 2.75
Romania 146 458 465 93.8 96.0 2.50
Singapore 165 611 590 87.8 67.4 2.82
Slovenia 181 505 543 67.4 63.0 2.91
Sweden 142 484 509 60.0 67.1 3.23
Thailand 171 427 451 76.0 75.0 2.08
Tunesia 205 425 439 67.4 37.5 2.17
Turkey 238 452 483 94.7 88.1 2.48
Taiwan 150 609 564 71.2 63.5 3.00
United Arab Emirates 430 456 465 78.9 73.7 2.64
United States of
America
384 509 524 90.6 83.8 2.94
Average 501 508 77.7 67.7 2.88
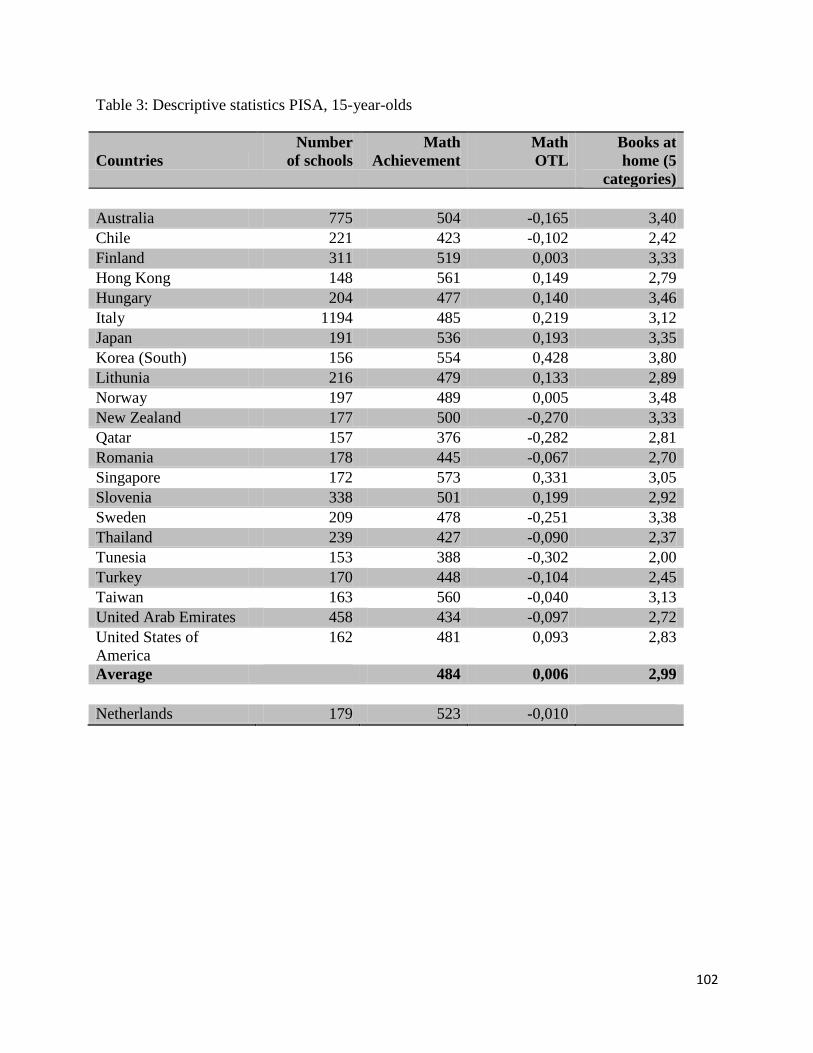
102
Table 3: Descriptive statistics PISA, 15-year-olds
Countries
Number
of schools
Math
Achievement
Math
OTL
Books at
home (5
categories)
Australia 775 504 -0,165 3,40
Chile 221 423 -0,102 2,42
Finland 311 519 0,003 3,33
Hong Kong 148 561 0,149 2,79
Hungary 204 477 0,140 3,46
Italy 1194 485 0,219 3,12
Japan 191 536 0,193 3,35
Korea (South) 156 554 0,428 3,80
Lithunia 216 479 0,133 2,89
Norway 197 489 0,005 3,48
New Zealand 177 500 -0,270 3,33
Qatar 157 376 -0,282 2,81
Romania 178 445 -0,067 2,70
Singapore 172 573 0,331 3,05
Slovenia 338 501 0,199 2,92
Sweden 209 478 -0,251 3,38
Thailand 239 427 -0,090 2,37
Tunesia 153 388 -0,302 2,00
Turkey 170 448 -0,104 2,45
Taiwan 163 560 -0,040 3,13
United Arab Emirates 458 434 -0,097 2,72
United States of
America
162 481 0,093 2,83
Average 484 0,006 2,99
Netherlands 179 523 -0,010
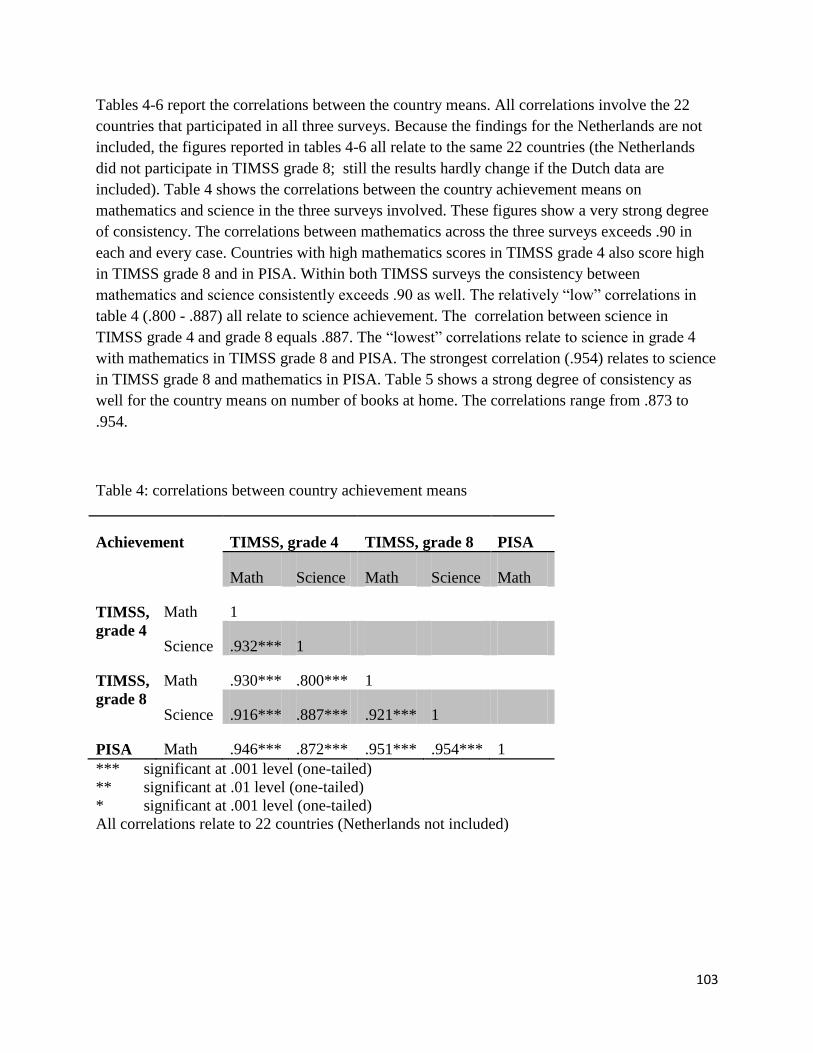
103
Tables 4-6 report the correlations between the country means. All correlations involve the 22
countries that participated in all three surveys. Because the findings for the Netherlands are not
included, the figures reported in tables 4-6 all relate to the same 22 countries (the Netherlands
did not participate in TIMSS grade 8; still the results hardly change if the Dutch data are
included). Table 4 shows the correlations between the country achievement means on
mathematics and science in the three surveys involved. These figures show a very strong degree
of consistency. The correlations between mathematics across the three surveys exceeds .90 in
each and every case. Countries with high mathematics scores in TIMSS grade 4 also score high
in TIMSS grade 8 and in PISA. Within both TIMSS surveys the consistency between
mathematics and science consistently exceeds .90 as well. The relatively “low” correlations in
table 4 (.800 - .887) all relate to science achievement. The correlation between science in
TIMSS grade 4 and grade 8 equals .887. The “lowest” correlations relate to science in grade 4
with mathematics in TIMSS grade 8 and PISA. The strongest correlation (.954) relates to science
in TIMSS grade 8 and mathematics in PISA. Table 5 shows a strong degree of consistency as
well for the country means on number of books at home. The correlations range from .873 to
.954.
Table 4: correlations between country achievement means
Achievement TIMSS, grade 4 TIMSS, grade 8 PISA
Math Science Math Science Math
TIMSS,
grade 4
Math 1
Science .932*** 1
TIMSS,
grade 8
Math .930*** .800*** 1
Science .916*** .887*** .921*** 1
PISA Math .946*** .872*** .951*** .954*** 1
*** significant at .001 level (one-tailed)
** significant at .01 level (one-tailed)
* significant at .001 level (one-tailed)
All correlations relate to 22 countries (Netherlands not included)
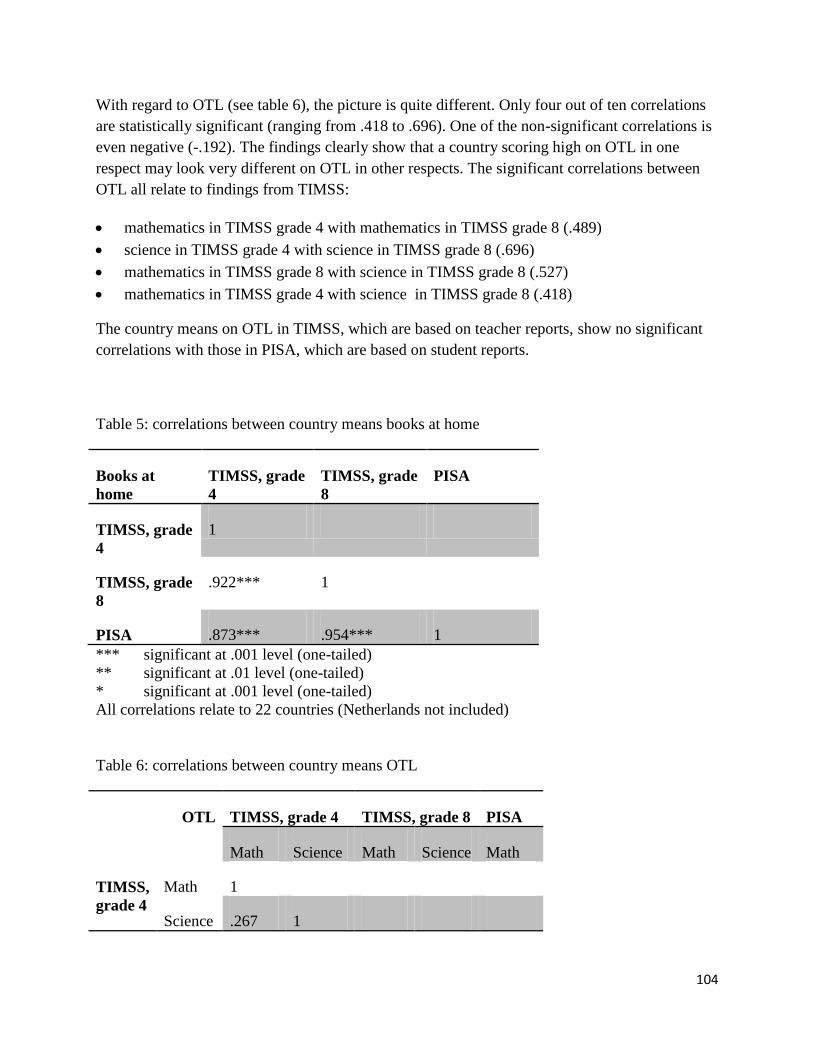
104
With regard to OTL (see table 6), the picture is quite different. Only four out of ten correlations
are statistically significant (ranging from .418 to .696). One of the non-significant correlations is
even negative (-.192). The findings clearly show that a country scoring high on OTL in one
respect may look very different on OTL in other respects. The significant correlations between
OTL all relate to findings from TIMSS:
mathematics in TIMSS grade 4 with mathematics in TIMSS grade 8 (.489)
science in TIMSS grade 4 with science in TIMSS grade 8 (.696)
mathematics in TIMSS grade 8 with science in TIMSS grade 8 (.527)
mathematics in TIMSS grade 4 with science in TIMSS grade 8 (.418)
The country means on OTL in TIMSS, which are based on teacher reports, show no significant
correlations with those in PISA, which are based on student reports.
Table 5: correlations between country means books at home
Books at
home
TIMSS, grade
4
TIMSS, grade
8
PISA
TIMSS, grade
4
1
TIMSS, grade
8
.922*** 1
PISA .873*** .954*** 1
*** significant at .001 level (one-tailed)
** significant at .01 level (one-tailed)
* significant at .001 level (one-tailed)
All correlations relate to 22 countries (Netherlands not included)
Table 6: correlations between country means OTL
OTL TIMSS, grade 4 TIMSS, grade 8 PISA
Math Science Math Science Math
TIMSS,
grade 4
Math 1
Science .267 1
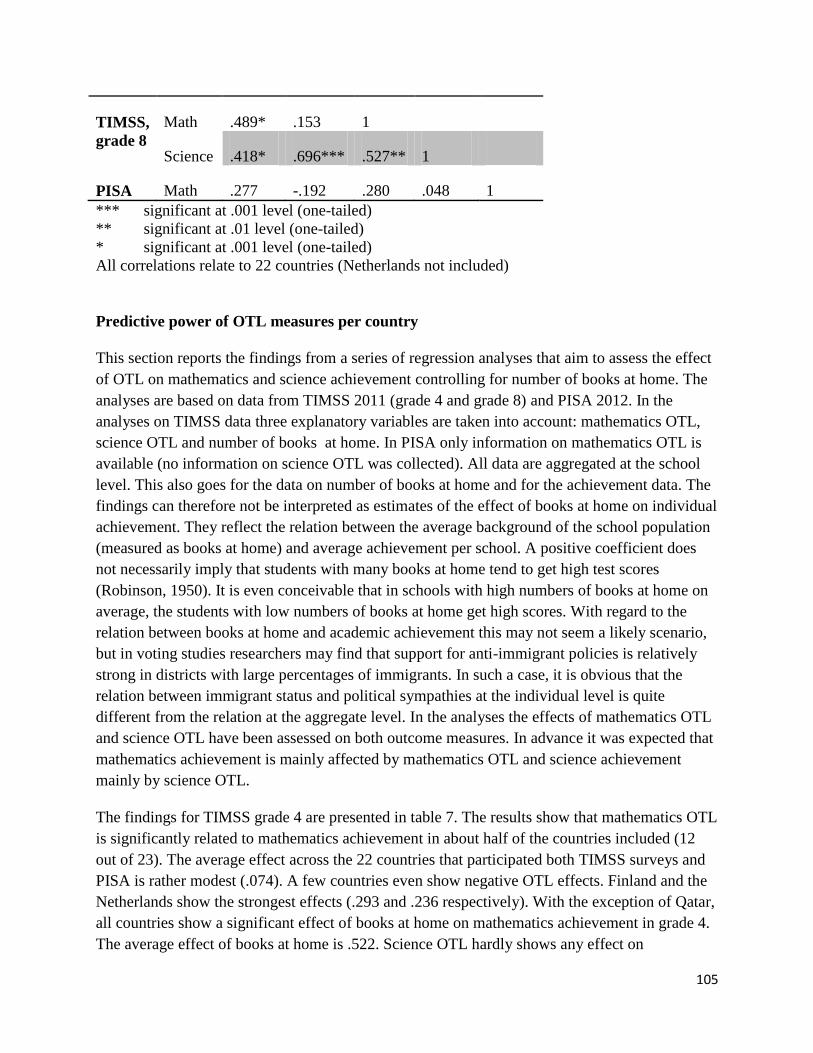
105
TIMSS,
grade 8
Math .489* .153 1
Science .418* .696*** .527** 1
PISA Math .277 -.192 .280 .048 1
*** significant at .001 level (one-tailed)
** significant at .01 level (one-tailed)
* significant at .001 level (one-tailed)
All correlations relate to 22 countries (Netherlands not included)
Predictive power of OTL measures per country
This section reports the findings from a series of regression analyses that aim to assess the effect
of OTL on mathematics and science achievement controlling for number of books at home. The
analyses are based on data from TIMSS 2011 (grade 4 and grade 8) and PISA 2012. In the
analyses on TIMSS data three explanatory variables are taken into account: mathematics OTL,
science OTL and number of books at home. In PISA only information on mathematics OTL is
available (no information on science OTL was collected). All data are aggregated at the school
level. This also goes for the data on number of books at home and for the achievement data. The
findings can therefore not be interpreted as estimates of the effect of books at home on individual
achievement. They reflect the relation between the average background of the school population
(measured as books at home) and average achievement per school. A positive coefficient does
not necessarily imply that students with many books at home tend to get high test scores
(Robinson, 1950). It is even conceivable that in schools with high numbers of books at home on
average, the students with low numbers of books at home get high scores. With regard to the
relation between books at home and academic achievement this may not seem a likely scenario,
but in voting studies researchers may find that support for anti-immigrant policies is relatively
strong in districts with large percentages of immigrants. In such a case, it is obvious that the
relation between immigrant status and political sympathies at the individual level is quite
different from the relation at the aggregate level. In the analyses the effects of mathematics OTL
and science OTL have been assessed on both outcome measures. In advance it was expected that
mathematics achievement is mainly affected by mathematics OTL and science achievement
mainly by science OTL.
The findings for TIMSS grade 4 are presented in table 7. The results show that mathematics OTL
is significantly related to mathematics achievement in about half of the countries included (12
out of 23). The average effect across the 22 countries that participated both TIMSS surveys and
PISA is rather modest (.074). A few countries even show negative OTL effects. Finland and the
Netherlands show the strongest effects (.293 and .236 respectively). With the exception of Qatar,
all countries show a significant effect of books at home on mathematics achievement in grade 4.
The average effect of books at home is .522. Science OTL hardly shows any effect on
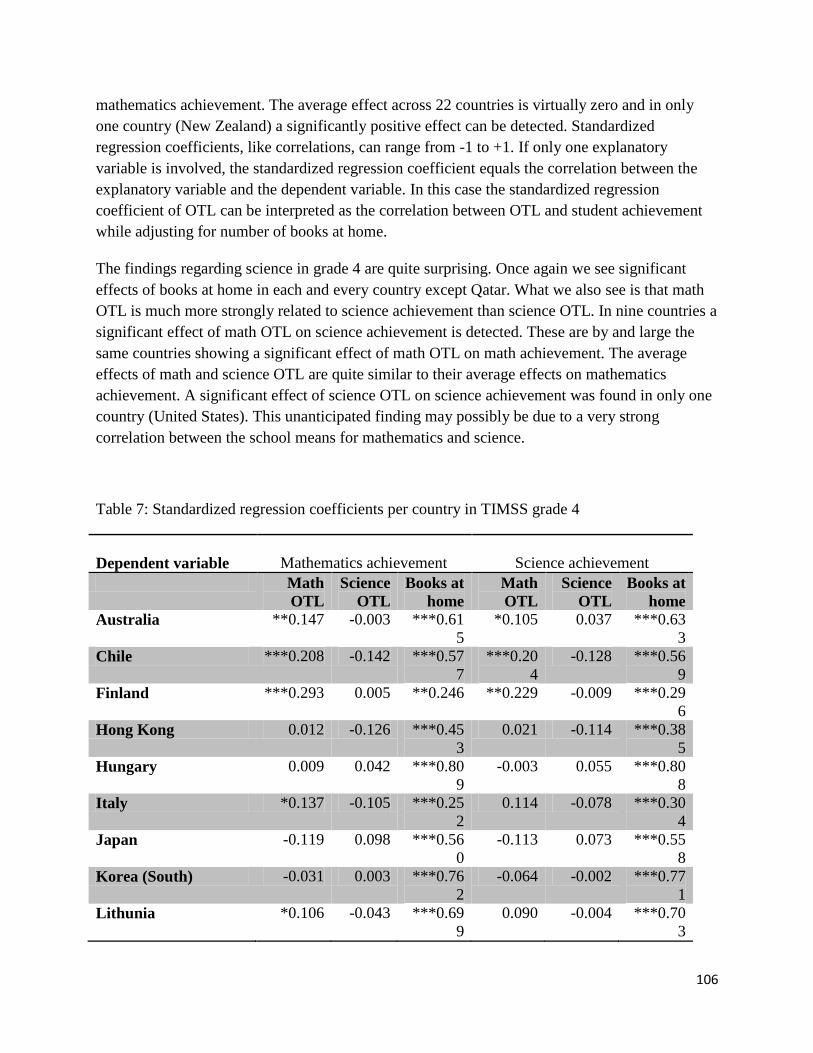
106
mathematics achievement. The average effect across 22 countries is virtually zero and in only
one country (New Zealand) a significantly positive effect can be detected. Standardized
regression coefficients, like correlations, can range from -1 to +1. If only one explanatory
variable is involved, the standardized regression coefficient equals the correlation between the
explanatory variable and the dependent variable. In this case the standardized regression
coefficient of OTL can be interpreted as the correlation between OTL and student achievement
while adjusting for number of books at home.
The findings regarding science in grade 4 are quite surprising. Once again we see significant
effects of books at home in each and every country except Qatar. What we also see is that math
OTL is much more strongly related to science achievement than science OTL. In nine countries a
significant effect of math OTL on science achievement is detected. These are by and large the
same countries showing a significant effect of math OTL on math achievement. The average
effects of math and science OTL are quite similar to their average effects on mathematics
achievement. A significant effect of science OTL on science achievement was found in only one
country (United States). This unanticipated finding may possibly be due to a very strong
correlation between the school means for mathematics and science.
Table 7: Standardized regression coefficients per country in TIMSS grade 4
Dependent variable
Mathematics achievement
Science achievement
Math
OTL
Science
OTL
Books at
home
Math
OTL
Science
OTL
Books at
home
Australia **0.147 -0.003 ***0.61
5
*0.105 0.037 ***0.63
3
Chile ***0.208 -0.142 ***0.57
7
***0.20
4
-0.128 ***0.56
9
Finland ***0.293 0.005 **0.246 **0.229 -0.009 ***0.29
6
Hong Kong 0.012 -0.126 ***0.45
3
0.021 -0.114 ***0.38
5
Hungary 0.009 0.042 ***0.80
9
-0.003 0.055 ***0.80
8
Italy *0.137 -0.105 ***0.25
2
0.114 -0.078 ***0.30
4
Japan -0.119 0.098 ***0.56
0
-0.113 0.073 ***0.55
8
Korea (South) -0.031 0.003 ***0.76
2
-0.064 -0.002 ***0.77
1
Lithunia *0.106 -0.043 ***0.69
9
0.090 -0.004 ***0.70
3
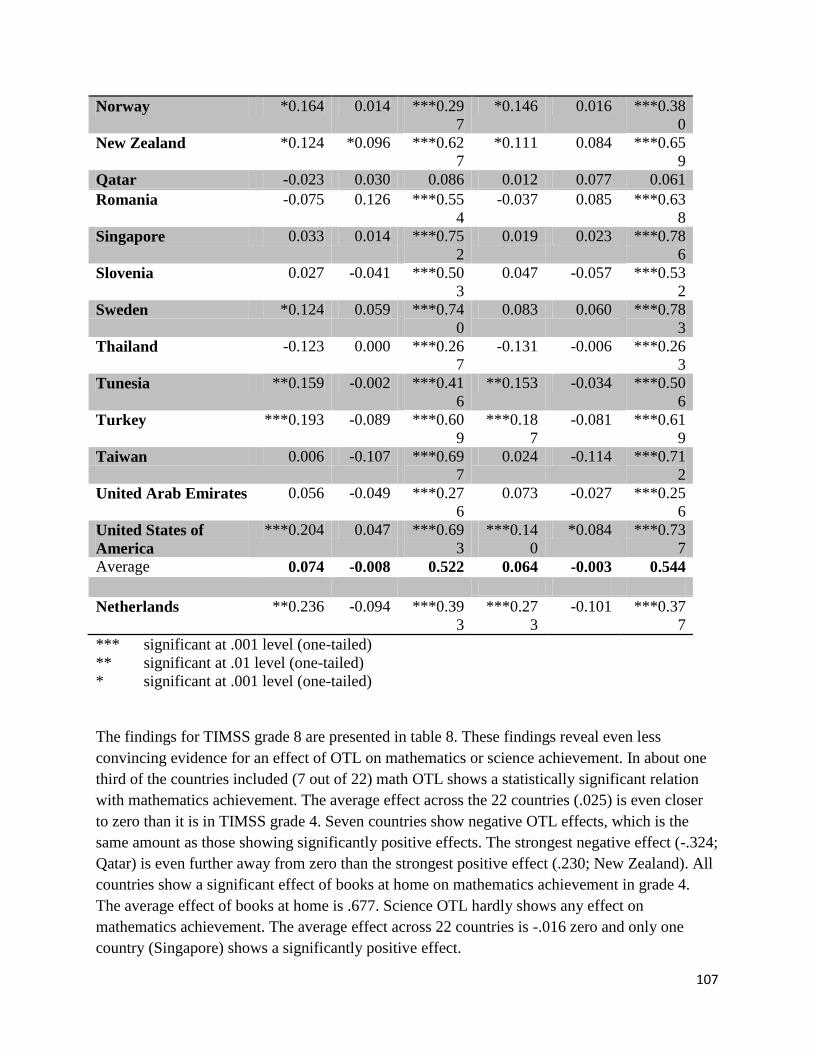
107
Norway *0.164 0.014 ***0.29
7
*0.146 0.016 ***0.38
0
New Zealand *0.124 *0.096 ***0.62
7
*0.111 0.084 ***0.65
9
Qatar -0.023 0.030 0.086 0.012 0.077 0.061
Romania -0.075 0.126 ***0.55
4
-0.037 0.085 ***0.63
8
Singapore 0.033 0.014 ***0.75
2
0.019 0.023 ***0.78
6
Slovenia 0.027 -0.041 ***0.50
3
0.047 -0.057 ***0.53
2
Sweden *0.124 0.059 ***0.74
0
0.083 0.060 ***0.78
3
Thailand -0.123 0.000 ***0.26
7
-0.131 -0.006 ***0.26
3
Tunesia **0.159 -0.002 ***0.41
6
**0.153 -0.034 ***0.50
6
Turkey ***0.193 -0.089 ***0.60
9
***0.18
7
-0.081 ***0.61
9
Taiwan 0.006 -0.107 ***0.69
7
0.024 -0.114 ***0.71
2
United Arab Emirates 0.056 -0.049 ***0.27
6
0.073 -0.027 ***0.25
6
United States of
America
***0.204 0.047 ***0.69
3
***0.14
0
*0.084 ***0.73
7
Average 0.074 -0.008 0.522 0.064 -0.003 0.544
Netherlands **0.236 -0.094 ***0.39
3
***0.27
3
-0.101 ***0.37
7
*** significant at .001 level (one-tailed)
** significant at .01 level (one-tailed)
* significant at .001 level (one-tailed)
The findings for TIMSS grade 8 are presented in table 8. These findings reveal even less
convincing evidence for an effect of OTL on mathematics or science achievement. In about one
third of the countries included (7 out of 22) math OTL shows a statistically significant relation
with mathematics achievement. The average effect across the 22 countries (.025) is even closer
to zero than it is in TIMSS grade 4. Seven countries show negative OTL effects, which is the
same amount as those showing significantly positive effects. The strongest negative effect (-.324;
Qatar) is even further away from zero than the strongest positive effect (.230; New Zealand). All
countries show a significant effect of books at home on mathematics achievement in grade 4.
The average effect of books at home is .677. Science OTL hardly shows any effect on
mathematics achievement. The average effect across 22 countries is -.016 zero and only one
country (Singapore) shows a significantly positive effect.
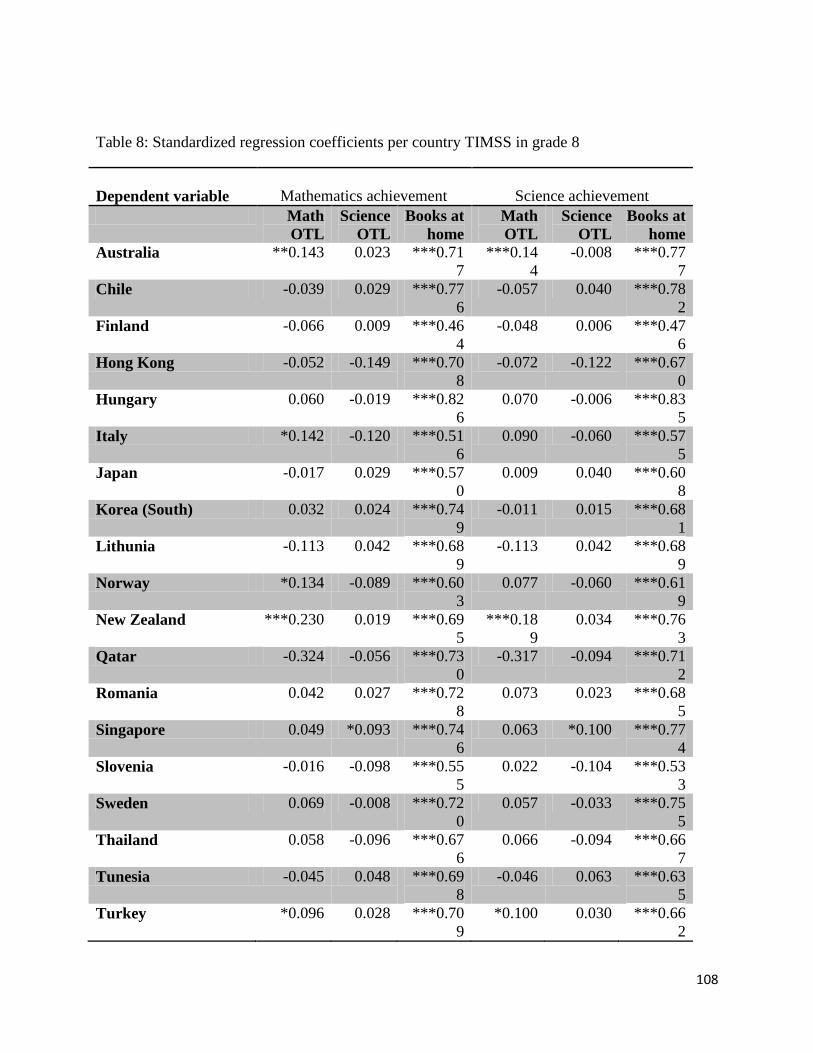
108
Table 8: Standardized regression coefficients per country TIMSS in grade 8
Dependent variable
Mathematics achievement
Science achievement
Math
OTL
Science
OTL
Books at
home
Math
OTL
Science
OTL
Books at
home
Australia **0.143 0.023 ***0.71
7
***0.14
4
-0.008 ***0.77
7
Chile -0.039 0.029 ***0.77
6
-0.057 0.040 ***0.78
2
Finland -0.066 0.009 ***0.46
4
-0.048 0.006 ***0.47
6
Hong Kong -0.052 -0.149 ***0.70
8
-0.072 -0.122 ***0.67
0
Hungary 0.060 -0.019 ***0.82
6
0.070 -0.006 ***0.83
5
Italy *0.142 -0.120 ***0.51
6
0.090 -0.060 ***0.57
5
Japan -0.017 0.029 ***0.57
0
0.009 0.040 ***0.60
8
Korea (South) 0.032 0.024 ***0.74
9
-0.011 0.015 ***0.68
1
Lithunia -0.113 0.042 ***0.68
9
-0.113 0.042 ***0.68
9
Norway *0.134 -0.089 ***0.60
3
0.077 -0.060 ***0.61
9
New Zealand ***0.230 0.019 ***0.69
5
***0.18
9
0.034 ***0.76
3
Qatar -0.324 -0.056 ***0.73
0
-0.317 -0.094 ***0.71
2
Romania 0.042 0.027 ***0.72
8
0.073 0.023 ***0.68
5
Singapore 0.049 *0.093 ***0.74
6
0.063 *0.100 ***0.77
4
Slovenia -0.016 -0.098 ***0.55
5
0.022 -0.104 ***0.53
3
Sweden 0.069 -0.008 ***0.72
0
0.057 -0.033 ***0.75
5
Thailand 0.058 -0.096 ***0.67
6
0.066 -0.094 ***0.66
7
Tunesia -0.045 0.048 ***0.69
8
-0.046 0.063 ***0.63
5
Turkey *0.096 0.028 ***0.70
9
*0.100 0.030 ***0.66
2

109
Taiwan *0.079 -0.048 ***0.80
2
*0.093 -0.065 ***0.81
8
United Arab Emirates -0.022 -0.036 ***0.49
4
-0.012 -0.024 ***0.48
8
United States of
America
***0.116 -0.010 ***0.72
0
**0.083 0.000 ***0.75
0
Average 0.025 -0.016 0.677 0.021 -0.013 0.680
*** significant at .001 level (one-tailed)
** significant at .01 level (one-tailed)
* significant at .001 level (one-tailed)
The findings for PISA 2012 are presented in table 9. In this case we find much stronger effects of
OTL on mathematics achievement. In each and every country the OTL effect is significant. The
standardized regression coefficients range from .119 in Romania to .813 in Qatar. The average
effect across the 22 countries in PISA is .369. The effect of books at home on mathematics
achievement is significant in all countries as well. This effect ranges from .134 in Qatar to .743
in Hungary with an average of .527.
Table 9: Standardized regression coefficients per country in PISA 2012
Dependent variable:
Mathematics
achievement
Math OTL
Books at home
Australia ***0.368 ***0.495
Chile ***0.424 ***0.555
Finland ***0.319 ***0.383
Hong Kong ***0.546 ***0.452
Hungary ***0.196 ***0.743
Italy ***0.378 ***0.525
Japan ***0.561 ***0.428
Korea (South) ***0.407 ***0.540
Lithunia ***0.368 ***0.567
Norway ***0.322 ***0.390
New Zealand ***0.368 ***0.617
Qatar ***0.813 ***0.134
Romania *0.119 ***0.699
Singapore ***0.238 ***0.673
Slovenia ***0.219 ***0.677
Sweden ***0.204 ***0.539
Thailand ***0.301 ***0.461
Tunesia ***0.587 ***0.360
Turkey ***0.396 ***0.516
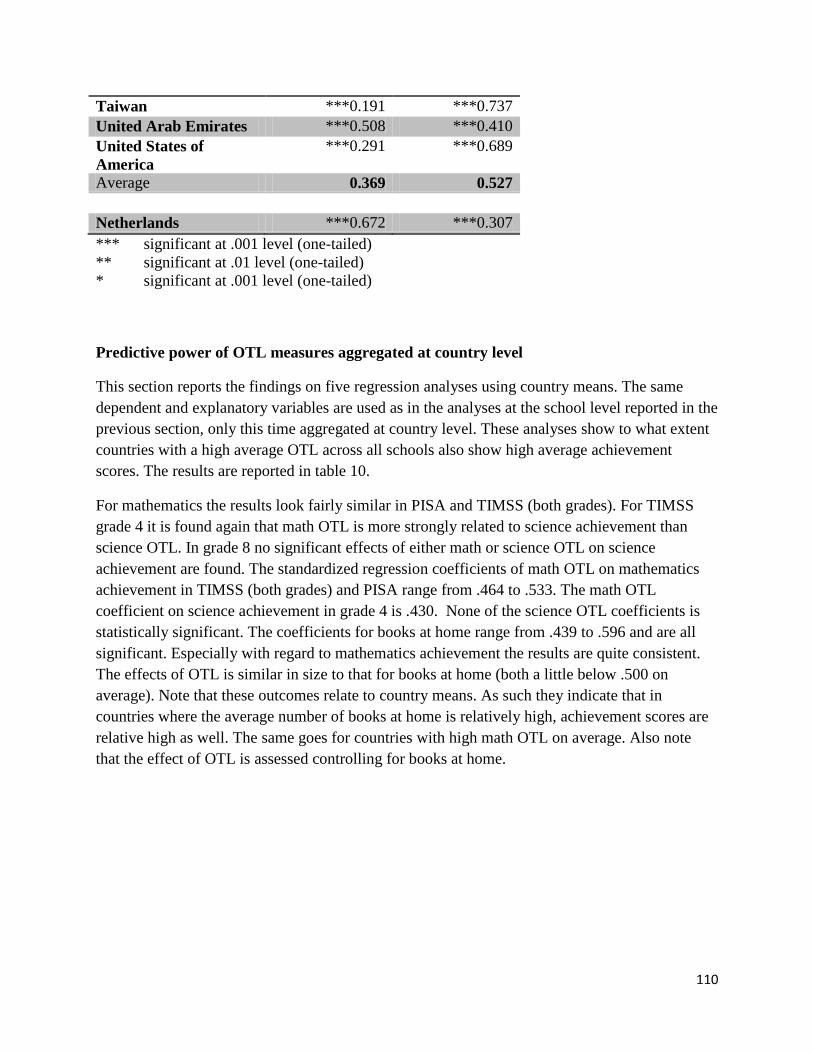
110
Taiwan ***0.191 ***0.737
United Arab Emirates ***0.508 ***0.410
United States of
America
***0.291 ***0.689
Average 0.369 0.527
Netherlands ***0.672 ***0.307
*** significant at .001 level (one-tailed)
** significant at .01 level (one-tailed)
* significant at .001 level (one-tailed)
Predictive power of OTL measures aggregated at country level
This section reports the findings on five regression analyses using country means. The same
dependent and explanatory variables are used as in the analyses at the school level reported in the
previous section, only this time aggregated at country level. These analyses show to what extent
countries with a high average OTL across all schools also show high average achievement
scores. The results are reported in table 10.
For mathematics the results look fairly similar in PISA and TIMSS (both grades). For TIMSS
grade 4 it is found again that math OTL is more strongly related to science achievement than
science OTL. In grade 8 no significant effects of either math or science OTL on science
achievement are found. The standardized regression coefficients of math OTL on mathematics
achievement in TIMSS (both grades) and PISA range from .464 to .533. The math OTL
coefficient on science achievement in grade 4 is .430. None of the science OTL coefficients is
statistically significant. The coefficients for books at home range from .439 to .596 and are all
significant. Especially with regard to mathematics achievement the results are quite consistent.
The effects of OTL is similar in size to that for books at home (both a little below .500 on
average). Note that these outcomes relate to country means. As such they indicate that in
countries where the average number of books at home is relatively high, achievement scores are
relative high as well. The same goes for countries with high math OTL on average. Also note
that the effect of OTL is assessed controlling for books at home.
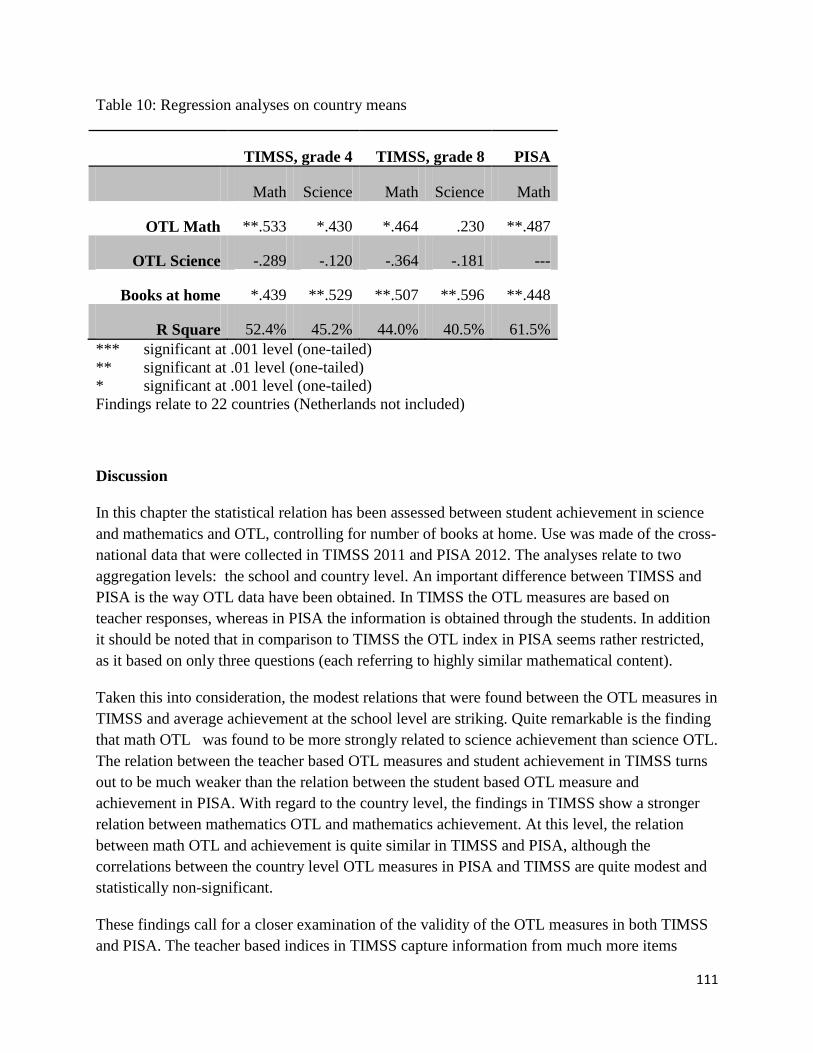
111
Table 10: Regression analyses on country means
TIMSS, grade 4 TIMSS, grade 8 PISA
Math Science Math Science Math
OTL Math **.533 *.430 *.464 .230 **.487
OTL Science -.289 -.120 -.364 -.181 ---
Books at home *.439 **.529 **.507 **.596 **.448
R Square 52.4% 45.2% 44.0% 40.5% 61.5%
*** significant at .001 level (one-tailed)
** significant at .01 level (one-tailed)
* significant at .001 level (one-tailed)
Findings relate to 22 countries (Netherlands not included)
Discussion
In this chapter the statistical relation has been assessed between student achievement in science
and mathematics and OTL, controlling for number of books at home. Use was made of the cross-
national data that were collected in TIMSS 2011 and PISA 2012. The analyses relate to two
aggregation levels: the school and country level. An important difference between TIMSS and
PISA is the way OTL data have been obtained. In TIMSS the OTL measures are based on
teacher responses, whereas in PISA the information is obtained through the students. In addition
it should be noted that in comparison to TIMSS the OTL index in PISA seems rather restricted,
as it based on only three questions (each referring to highly similar mathematical content).
Taken this into consideration, the modest relations that were found between the OTL measures in
TIMSS and average achievement at the school level are striking. Quite remarkable is the finding
that math OTL was found to be more strongly related to science achievement than science OTL.
The relation between the teacher based OTL measures and student achievement in TIMSS turns
out to be much weaker than the relation between the student based OTL measure and
achievement in PISA. With regard to the country level, the findings in TIMSS show a stronger
relation between mathematics OTL and mathematics achievement. At this level, the relation
between math OTL and achievement is quite similar in TIMSS and PISA, although the
correlations between the country level OTL measures in PISA and TIMSS are quite modest and
statistically non-significant.
These findings call for a closer examination of the validity of the OTL measures in both TIMSS
and PISA. The teacher based indices in TIMSS capture information from much more items
112
(about twenty per index) than the student based measure in PISA (three items). Moreover, the
items that make up the PISA index of experience with formal mathematics all relate to solving
algebraic equations. Still, this seemingly crude measure shows a much stronger relation with
achievement than the apparently more sophisticated measures in TIMSS.
There are at least two possibilities that need to be considered. First of all: are the OTL measures
in TIMSS lacking in validity or reliability or can confounding variables account for the
disappointingly weak relations with student achievement? Second: does the observed relation of
the OTL index in PISA with student achievement somehow produce an overestimation of the
real relation?
A salient finding is the near zero correlation of science OTL with science achievement. At the
same time the relation between math OTL and science achievement is hardly any different from
the correlation between math OTL and math achievement. Part of the explanation for this
somewhat puzzling outcome may be a very strong correlation between the school means for
mathematics and science. Remember that the analyses were conducted on aggregated data and
that correlations at an aggregated level are typically stronger than they are at the individual level.
In that respect it is not so surprising that the relation between math OTL and science
achievement is very similar to the relation between math OTL and math achievement. What
remains is the issue that science OTL appears to be virtually unrelated to science achievement,
even though the format of the items is very similar to the OTL items for mathematics. The
relation between math OTL and math achievement is not particularly strong, but definitely
stronger than the relation between science OTL and achievement (and at least positive on
average). A substantive interpretation may also apply, as it seems more plausible that
mathematics exposure facilitates learning in science than it is plausible that learning science
content facilitates math achievement
It seems that the amount of mathematics topics taught is more strongly related to student
achievement than the amount of science topics. Maybe this reflects the central importance of
mathematics in school learning. One could also surmise that the weak relation between OTL and
achievement in TIMSS results from poor information among teachers about the content that has
been taught to their students in previous grades. It is also conceivable that teachers are not
always able to assess how effective their instruction has been. Maybe they did teach the topics
exactly as they reported, but if their instruction was not very effective, the relation between OTL
and student achievement will be strongly weakened. This line of reasoning suggests an
interaction effect of OTL and quality of instruction. Only combined with a sufficient instruction
quality can we expect substantial effects of OTL. A final possibility is that sometimes teacher
provide socially desirable answers to OTL items. Maybe they report what they feel they should
have taught rather than what they actually taught.
113
The validity of the student based OTL index in PISA deserves closer scrutiny as well. It seems
possible that OTL as measured in PISA also captures student ability to some extent and thus
produces an overestimation of the real relation between OTL and achievement. Possibly,
students are more prone to report that they are familiar with certain topics if they master them. If
a teacher did teach certain topics, but failed to get the main points across effectively, then this
could make students reluctant to report that these topics have been covered. If any of this applies,
the student reports on OTL, do not only reflect OTL but also aspects such as effectiveness of
instruction and student aptitude. In that case, there is a serious risk that OTL based on student
reports produced inflated correlations with achievement scores.
To sum up, all these possible explanations for the puzzling findings on the relation between OTL
and achievement in TIMSS and PISA deserve further study. We argue for study designs to assess
the impact of the possibly confounding factors outlined above (and more). It would in any case
be useful to collect data on OTL from both student and teachers, so that it can be assessed to
what extent they agree on OTL. A close study on the relation between student aptitudes (or prior
achievement) and their reports on OTL would be valuable as well, especially if one could also
control for OTL as reported by their teachers. With regard to teacher based OTL, their reports
should be compared to the instruction actually provided (e.g. as registered in logs or assessed
through classroom observations). The possibility that quality of instruction can affect the relation
between OTL and achievement also deserves close study. In fact, all the factors that play a part
in Caroll’s model on school learning (Caroll, 1963; 1989) in addition to OTL (student aptitude,
quality of instruction, perseverance and ability to understand instruction) should be taken into
account when assessing the relation between OTL and student achievement.
Only if we can rule out the confounding factors outlined above, it would make sense to
reconsider the theoretical assumptions that stipulate a strong relation between OTL and
achievement. For the moment, it makes more sense to focus on possibly confounding factors that
may account for the somewhat puzzling findings on the relation between OTL and achievement.
One might consider testing the Caroll model in strongly controlled laboratory experiments. For
example, a setting in which respondents need to learn relatively simple tasks in a short time span
(a few hours). In such settings, one can more easily manipulate aspects like content covered and
quality of instruction. Also the monitoring of student perseverance would be relatively
straightforward. Even prior knowledge (ability to understand instruction) may be prone to
manipulation.
As a final remark the findings on OTL for the Netherlands are highlighted. Two points stand out
in this respect. First of all the relation between mathematics OTL and achievement has been
found to be relatively strong in the Netherlands (see table 7 and table 9). Three regression
coefficients of math OTL have been reported with regard to the Netherlands. In two cases there
is one country showing a stronger coefficient (math in TIMSS grade 4 and PISA) and in one case
the Dutch coefficient is stronger than that of any other country (TIMSS grade 4 with science
114
achievement as the dependent variable). What also stands out are the relatively low scores on
OTL in the Netherlands. All three average OTL scores reported for the Netherlands (see table 1
and table 3) are below the international average. This deviation from the international mean is
stronger for the teacher reports in TIMSS than it is for the national OTL average in PISA, which
is based on student responses. It was noted earlier (chapter 3) that the result by Schmidt et al.
(2015) , based on PISA 2012 data, showed that the Netherlands was the only country in which
the influence of SES could be attributed for 100% to OTL.
References
Caroll, J.B.(1963). A model of school learning. Teachers College Record, 64, 722-733.
Caroll, J.B. (1989). The Caroll model, a 25-year retrospective and prospective view. Educational
Researcher, 18, 26-31.
OECD (2014a). PISA Technical Report. Paris: OECD.
OECD (2014b). PISA 2012 Results: What Student Know and Can DO, student performance in
mathematics, reading and science, Volume 1. Paris: OECD.
Robinson, W.S. (1950). Ecological Correlations and the Behavior of Individuals. American
Sociological Review, 15 (3), 351–357.
Schmidt, W.H., Burroughs, N.A., Zoido, P. & Houang, R.H. (2015). The Role of Schooling in
Perpetuating Educational Inequality: An International Perspective. Educational
Researcher, 20 (10), 1-16.
Wu, M. & Adams, R.J. (2002). Plausible Values – Why They Are Important. Paper presented at
the International Objective Measurement Workshop. New Orleans, 6-7 April.
115
CHAPTER VI: RECAPITALIZATION, IMPLICATIONS FOR EDUCATIONAL
POLICY AND PRACTICE AND FUTURE RESEARCH
Jaap Scheerens
Summary of main findings
In this report OTL was defined as the matching of taught content with tested content. In the
conceptual framework it was seen as part of the larger concept of curriculum alignment in
educational systems.
When national educational systems are seen as multi-level structures, alignment is an issue at
each specific level, but also an issue of connectivity between different layers. General education
goals or national standards are defined at the central level. At intermediary level (between the
central government and schools) curriculum development, textbook production and test
development have their organizational homes. At school level, school curricula or school
working plans may be used, and at classroom level, lesson plans and actual teaching are facets of
the implemented curriculum. Test taking at individual student level completes the picture. This
process of gradual specification of curricula is the domain of curriculum research, with the
important distinction between the intended, implemented and realized curriculum, as a core
perspective. This perspective is mostly associated with a proactive logic of curriculum planning
as an approach that should guarantee a valid operationalization of educational standards into
planning documents and implementation in actual teaching.
In decentralized education systems explicit common goals or curriculum standards may be
missing, or be of a very general nature. In the particular case when there are no specific central
standards, but there is a formal set of examinations, teaching may get direction from being
aligned to the contents of the examinations. This perspective could be seen as a “retro-active”
orientation to alignment.
In the conceptual part of the report the issue of alignment was further analyzed by comparing
proactive processes of curriculum development to test and examination driven approaches, in
which accountability might be seen as driving educational improvement and reform. Further
reflection on parallel processes in curriculum development on the one hand and test development
on the other, led to conjectures about more efficient division of tasks and a discussion about
whether one or the other should be leading. More closely related to the basic definition of OTL,
the idea of evaluation driven improvement leads to questions about test preparation as an OTL
maximizing procedure. These questions will be addressed in a subsequent section of this chapter.
An important realization from the conceptual analysis was the conclusion that alignment in
multi-level education structures is a complex issue, with quite a few connections in need of being
managed. It was noted that the quest for alignment would tend to require connectivity and “tight
coupling” under actual conditions of “loose coupling”.
The main body of this report was dedicated to assessing the empirical evidence on OTL effects.
How consistently was OTL found to be significantly positively associated with student
achievement outcomes, what seems to be a reasonable estimate of the quantitative effect size,
and how does this compare to effect sizes that were found for other “effectiveness enhancing”
school conditions?
The evidence from meta-studies that reviewed OTL effects appeared to be less solid than was
expected, given the relatively high expectations about OTL effects expressed by various leading
116
authors, like Porter, Schmidt and Polikoff. The number of meta-analyses was limited, and further
analyses revealed that not all meta-studies listed as such were independent from one another.
Leaving out the outlying results from Marzano, the OTL effect-size (in terms of the d-
coefficient) compares to other relatively strong effectiveness enhancing conditions at school
level, at about .30. A sophisticated recent study (Polikoff et al. 2014) suggests that effect sizes
may be lower when adjustments are made for other variables.
The review of illustrative studies showed considerable diversity in the way OTL was measured.
An important difference exists between studies that associate an empirical measure of exposure
to achievement, as compared to studies that related an alignment index to achievement (as was
the main emphasis in the studies by Porter et al., and Polikoff et al). The results from PISA 2012
are considered striking, in the sense that OTL effects are higher and more generalizable across
countries than any of the other school/teaching variables that are usually analyzed as background
variables in PISA.
The literature search on empirical OTL effect studies yielded 50 studies and 198 effects. It was
noted first of all that results presented on the nature of the OTL measure showed considerable
diversity. The most common reference was to content covered, as indicated by teachers. Only
incidentally were students asked to indicate whether content had been taught. Alternative
operational definitions used in the studies are “program content modalities”, “difficulty level of
mathematics content”, “topic and course text difficulty”, “topic focus, in terms of basic and
advanced math”, “textbook coverage”, “topic coverage and cognitive demand”, “instruction time
per intended content standards”, “the enacted curriculum and its alignment with state standards”,
“instructional opportunities” “content coverage in terms of topic coverage, topic emphasis and
topic exposure “, “cognitive complexity per topic”, “The quality of teaching a particular topic”
“Aligned and unaligned exposure to reading instruction”, and “curriculum type”. From these
descriptions it appears that considerable heterogeneity exist in the way researchers employ
operational definitions of OTL. Additional, more minute content analyses would be needed to
decipher to what extent alternative labels still represent the “core idea” of OTL .As far as
research methodology is concerned , the large majority of studies had used student background
adjustments of achievement measurements (in about 10 studies there was no adjustment, or it
could not be inferred from the publication).In terms of research design 7 studies used an
experimental or quasi experimental design, while the overlarge majority of studies was
correlational.
It was concluded that the vote count measure of OTL, (i.e the percentage of effect sizes that were
statistically significant and positive) established in this study, and which was 42%, is of
comparable size to other effectiveness enhancing conditions like achievement orientation,
learning time and parental involvement, but dramatically higher than vote count measures for
variables like cooperation and educational leadership. What should be considered is that vote
counting is a rather crude procedure and that comparison of quantitative effect sizes is more
informative (compare the results of quantitative meta-analyses summarized in chapter 3).
The part of this study based on secondary analyses of international data sets is reported in
Chapter V. A series of regression analyses was conducted that that aimed to assess the effect of
OTL on mathematics and science achievement, controlling for number of books at home. The
analyses were based on data from TIMSS 2011 (grade 4 and grade 8) and PISA 2012, for the 22
countries that participated in both studies. In the analyses on TIMSS data three explanatory
117
variables were taken into account: mathematics OTL, science OTL and number of books at
home. In PISA only information on mathematics OTL is available (no information on science
OTL was collected). All data were aggregated at the school level.
The findings for TIMSS grade 4 showed that mathematics OTL is significantly related to
mathematics achievement in about half of the countries included (12 out of 23). The average
effect (standardized regression coefficients, interpretable as correlations) across the 22 countries
that participated in both TIMSS surveys and PISA is rather modest (.074). A few countries even
showed negative OTL effects. Finland and the Netherlands had the strongest OTL effects (.293
and .236 respectively).
The findings regarding science in grade 4 are quite surprising. Once again significant effects of
books at home were found in each and every country except Qatar. Quite surprisingly math OTL
was much more strongly related to science achievement than science OTL. The average effects
of math and science OTL were quite similar to their average effects on mathematics
achievement. A significant effect of science OTL on science achievement was found in only one
country (United States). This unanticipated finding may possibly be due to a very strong
correlation between the school means for mathematics and science.
The findings for TIMSS grade 8 revealed even less convincing evidence for an effect of OTL on
mathematics or science achievement. In about one third of the countries included (7 out of 22)
math OTL showed a statistically significant relation with mathematics achievement. The average
effect across the 22 countries (.025) is even closer to zero than it is in TIMSS grade 4. Seven
countries showed negative OTL effects, which is the same amount as those showing significantly
positive effects. The strongest negative effect that was found (-.324; Qatar) is even further away
from zero than the strongest positive effect (.230; New Zealand).
The findings for PISA 2012 showed much stronger effects of OTL on mathematics achievement.
In each and every country the OTL effect was significant. The standardized regression
coefficients range from .119 in Romania to .813 in Qatar. The average effect across the 22
countries in PISA was .369.
When regression analyses at aggregated levels were carried out, the same dependent and
explanatory variables were used as in the analyses at the school level, only this time aggregated
at country level. These analyses showed to what extent countries with a high average OTL across
all schools also show high average achievement scores as well.
For mathematics the results were fairly similar in PISA and TIMSS (both grades). For TIMSS
grade 4 it was found again that math OTL is more strongly related to science achievement than
science OTL. In grade 8 (TIMSS results) no significant effects of either math or science OTL on
science achievement were found. The standardized regression coefficients of math OTL on
mathematics achievement in TIMSS (both grades) and PISA range from .464 to .533. The math
OTL coefficient on science achievement in grade 4 is .430. None of the science OTL
coefficients was statistically significant.
All in all the secondary analyses of these international data sets showed a modest effect of OTL
for mathematics, next to the unexpected finding that math OTL was more strongly related to
science achievement, than science OTL. Another finding that stood out was the much stronger
OTL effects on formal mathematics achievement found in the analysis of the PISA 2012 data set,
as compared to the analyses based on TIMMSS. The first hypothetical explanation for this
difference that comes to mind is the fact that TIMSS OTL measures were based on teacher
responses, and the PISA OTL measures on student responses. The findings leave many questions
that will be taken up further on, when discussing implications for further research.
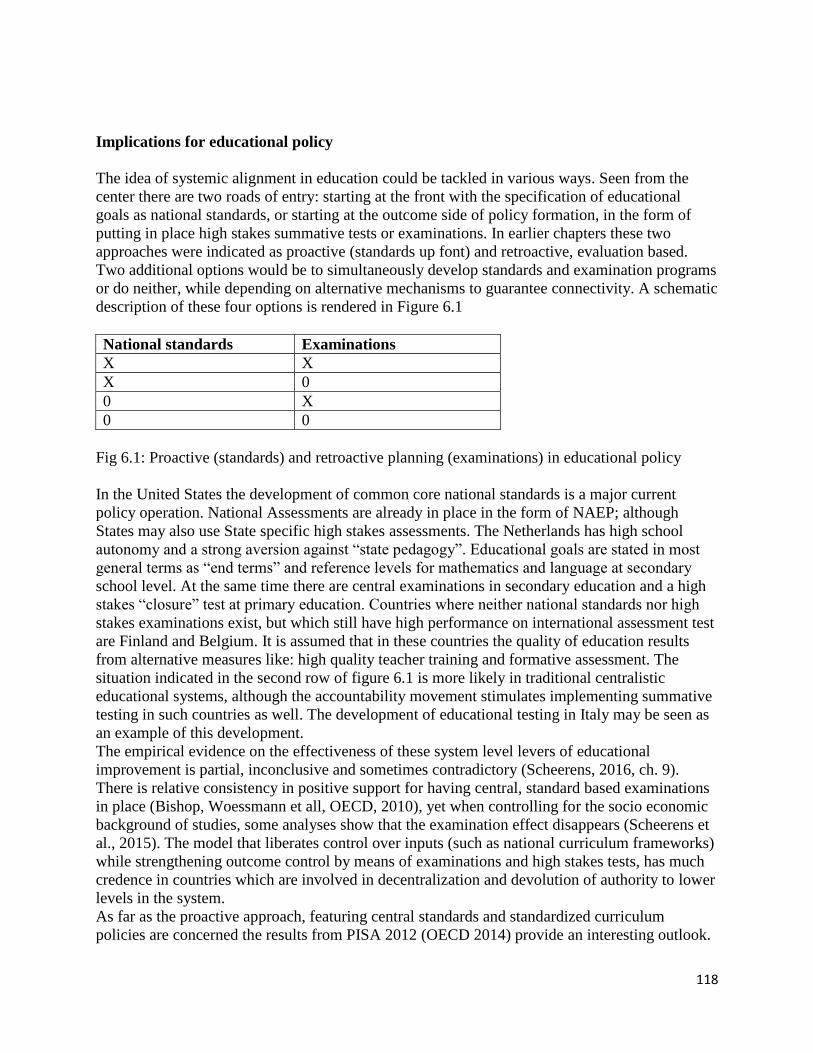
118
Implications for educational policy
The idea of systemic alignment in education could be tackled in various ways. Seen from the
center there are two roads of entry: starting at the front with the specification of educational
goals as national standards, or starting at the outcome side of policy formation, in the form of
putting in place high stakes summative tests or examinations. In earlier chapters these two
approaches were indicated as proactive (standards up font) and retroactive, evaluation based.
Two additional options would be to simultaneously develop standards and examination programs
or do neither, while depending on alternative mechanisms to guarantee connectivity. A schematic
description of these four options is rendered in Figure 6.1
National standards Examinations
X X
X 0
0 X
0 0
Fig 6.1: Proactive (standards) and retroactive planning (examinations) in educational policy
In the United States the development of common core national standards is a major current
policy operation. National Assessments are already in place in the form of NAEP; although
States may also use State specific high stakes assessments. The Netherlands has high school
autonomy and a strong aversion against “state pedagogy”. Educational goals are stated in most
general terms as “end terms” and reference levels for mathematics and language at secondary
school level. At the same time there are central examinations in secondary education and a high
stakes “closure” test at primary education. Countries where neither national standards nor high
stakes examinations exist, but which still have high performance on international assessment test
are Finland and Belgium. It is assumed that in these countries the quality of education results
from alternative measures like: high quality teacher training and formative assessment. The
situation indicated in the second row of figure 6.1 is more likely in traditional centralistic
educational systems, although the accountability movement stimulates implementing summative
testing in such countries as well. The development of educational testing in Italy may be seen as
an example of this development.
The empirical evidence on the effectiveness of these system level levers of educational
improvement is partial, inconclusive and sometimes contradictory (Scheerens, 2016, ch. 9).
There is relative consistency in positive support for having central, standard based examinations
in place (Bishop, Woessmann et all, OECD, 2010), yet when controlling for the socio economic
background of studies, some analyses show that the examination effect disappears (Scheerens et
al., 2015). The model that liberates control over inputs (such as national curriculum frameworks)
while strengthening outcome control by means of examinations and high stakes tests, has much
credence in countries which are involved in decentralization and devolution of authority to lower
levels in the system.
As far as the proactive approach, featuring central standards and standardized curriculum
policies are concerned the results from PISA 2012 (OECD 2014) provide an interesting outlook.
119
A relevant finding is that in countries that have a standardized policy for mathematics, “such as a
school curriculum with shared instructional materials, accompanied by staff development and
training “ (ibid, p. 53) student performance is higher under conditions of autonomy than for
countries lacking such a standardized policy. At first sight this conclusion looks contradictory
because it seems to refer to the interaction of centralistic, and (standardized policy) and decentral
facets of curriculum policy. But school autonomy in the curriculum domains is operationalized in
terms of the discretion teachers have over choice of textbooks and curriculum material. The
results seem to imply that standardized curriculum frameworks interact positively with teacher
autonomy in decision-making about instructional methods. There is also miscellaneous, more
casuistic support for the effectiveness of centralized curriculum arrangements. In a comparative
study on Latin American countries, Willms and Somers, (2001) showed the superiority of
educational performance of Cuba. Sahlgren (2014) provides a very interesting analysis of the
high educational performance of Finland, which he attributes to the Finish educational system
being centralized with little autonomy until the 1990’s. He sees the most recent (slight) decline in
test scores of Finland as a result of the abandoning of traditional teaching methods. Finally,
several upcoming high performing educational systems, such as Singapore and Honk Kong,
match detailed proactive approaches in the form of standards and curriculum guidelines with
sophisticated assessments. As a matter of fact this would seem to be the more logical approach,
since high stakes test and examination development implies the use of standards.
Perhaps the safest conclusion that can be drawn at present is that different strategies might be
effective depending on national contexts and traditions in education. Within the context of this
study on OTL either “proactive” standards or high stakes assessments are pre-supposed in order
to address the alignment issue straightforwardly. A final note of caution with respect to Figure
6.1 is that the development of examinations requires some idea of national priorities in
education, therefore a pure Zero situation on national standards is less probable.
Next to proactive, retroactive or “combined” strategies with respect to national standards and
national assessments, this study has highlighted the relatively long chain of intermediary
components, when alignment is at stake. Basic intermediary components are textbooks, school
curricula and actual teaching, and depending on the built up of countries, also state or regional
interpretations of national standards. It was noted that the units that offer services in developing
these intermediary components may tend to be independent, and it was concluded that the ideal
of alignment involves creating connectivity in a context characterized by loose coupling. If such
fragmentary organization is the reality, alignment happens more or less by chance, and the
challenge is to coordinate and manage connectivity. What this involves is illustrated in a case
study of the functioning of the Dutch educational system.
The case study on OTL in Dutch primary education by Appelhof, (2016), included (in Dutch)
as an Annex to this report, shows that during the last fifteen years important developments took
place that could be seen as potentially advancing alignment between national standards, teaching
methods, actual teaching and testing. The main ingredients were the formulation of “reference
levels” initiated by the Committee Meijering, in 2008, the policy initiative concerning
“achievement oriented work” as part of the Quality Agendas of the Ministry of Education in
2007, followed up by initiatives from educational publishers, support institutes (CITO and SLO,
specifically) and the schools themselves. The case study provides documentation on how
120
educational publishers invested in aligning teaching methods and textbooks to the reference
levels, how the test institute (CITO) has done the same for its summative and formative tests, and
the SLO (the institute for curriculum development) has supported the development of
longitudinal content strategies (Dutch: doorlopende leerlijnen). The methods for arithmetic that
were described in the case study, show the importance of formative tests; one of the methods
(Rekentuin) can even be described as being totally centered around adaptive tests. The Rekentuin
approach comes close to the design of instructional alignment as test preparation, which was
offered as a theoretical option in earlier chapters. In addition the RTTI program by Docentplus
(Drost and Verra, 2015) offers a structured approach, in which teachers are guided in improving
existing formative assessments, according to a taxonomy of cognitive operations, ranging from
reproduction to insightful application. Alignment of the formative tests to examinations and
content standards is an explicit part of the approach.
The government policy to stimulate achievement oriented work is a very relevant context for the
furthering of OTL, at school and classroom level, in the Dutch context. Visscher (2015) provides
an overview of the results of an ongoing research and development program on “achievement
oriented work”. The achievement oriented work approach, further abbreviated as AOW,
proposes a cyclic approach, in which diagnostic analysis of test results is seen as the first step.
Teachers are trained to interpret and use the results of tests, particularly the results of the LVS
pupil monitoring system in primary schools, to assess the achievement of their students, and are
subsequently trained to use a planning approach to design measures to adapt teaching to the
needs of subgroups of students. First outcomes of evaluation studies show positive results. The
AOW approach is further refined by means of systematic instructional design methods. Apart
from these positive results, the experiences with AOW also indicate that it takes time and effort
to teach teachers to work with test information and apply systematic instructional design
methods. Recent work by VanLommel et al. (2015), in the context of Belgium primary
education, points at fundamental problems with implementing rational techniques, like formative
assessment and data use in schools. These authors found that a majority of teachers prefer
“intuitive” reasoning over data-use in taking important decisions, like pass-fail decisions in
progressing to the next grade.
An issue that came up in the Dutch case study by Appelhof (ibid) is the fear that externally
developed, refined and well-aligned teaching and assessment methods may harm the professional
space and autonomy of teachers. Such sentiments are very important as far as the implementation
of rational strategies of alignment is concerned. Although one might argue that these new tools
leave enough challenges to the professional expertise of teachers, acceptance may have the
nature of an important change in the working culture at school. In the Dutch context, government
policy provides mixed signals to teachers and schools, by constantly emphasizing more freedom
and autonomy, and apparently not seeing that achievement oriented work, partially constrains
and externally standardizes work at school.
The results of this study show that the effect of OTL can be considered of “educational
significance”, when the taught content is compared to content that is actually tested to determine
student achievement. Looking more broadly at alignment between various curricular components
(like national standards, textbooks, and assessments), the impression from the literature is that
alignment at different stages is quite sub-optimal, which was tentatively attributed to
independence and loose coupling of the organizational units concerned (government, educational
121
publisher, intermediary levels of government, test developers, and what is actually delivered in
teaching).
When the question is raised what government educational policy can do to optimize alignment
and OTL, the real options will depend on the overall degree of centralization and
decentralization of the system, existing structures and cultural considerations. Still, the general
line of thinking is that certain measures at system level can facilitate alignment, and ultimately
help in optimizing opportunity to learn at micro level. The following issues should be
considered:
a) Standard based examinations and high stakes tests are to be considered as the basic
prerequisite for a rational treatment of the alignment issue. Presupposed is an adequate
coverage of state educational standards in particular subject areas in the high stakes test or
examination. The “instructional sensitivity” of tests (Popham, 2001), depends on the
transparency of the content structure of tests, sufficient test items per content domain, and a
review of the teacheablity of content standards.
b) The first issue in monitoring alignment is to check the presupposed coverage of national
standards in national assessment programs, examinations and high stakes tests. The most
probable perspective here would be to operationalize standards into educational objectives.
This is the traditional proactive, “deductive” approach. In some cases, when there is strong
aversion against centralistic “state” pedagogy, but high quality examinations are in place, the
latter could be used as the starting point for making items, learning tasks and task domains
more explicit, also in the service of developing training material and textbooks.
c) In order to facilitate OTL at micro level, depending on how the educational system is
organized, the connectivity of formative tests to summative tests and examinations could be
stimulated, and enforced from the center.
d) Some of the developments in the realm of educational assessment and evaluation go in the
direction of enlarging the role that “products of test development” can play in designing
teaching methods and the shaping of actual teaching. The experiences in the Netherlands
(Appelhof, 2016, Annex to this report), provide examples of using test results actively in
designing teaching. Methods are developed in which formative tests are used adaptively in
the service of better differentiation in teaching. A wide practice has come into existence of
tests that are part of teaching methods, teachers developing their own tests, on the basis of
clear technical guidelines and external support, and test preparation by students, on the basis
of items drawn from item banks. In the Netherlands these activities are dependent on choices
by autonomous schools, while supported by national policies to stimulate “achievement
oriented work”. In more general terms, central policies could stimulate test developers to
develop item banks, and formative “off springs” of summative tests and examinations.
e) Finally, it should be mentioned that in actual practice “OTL policies” should be seen as
embedded in a context of simultaneously occurring alternative measures to enhance
educational quality. The way alignment and OTL have been treated in this report can be seen
as an integration of curriculum policies and use of assessments and examinations. Teacher
training is an alternative strategy of quality maintenance and improvement, that might to
some extent compensate for less developed testing, or seen as a factor that facilitates
appropriate use of tests and OTL optimization.
122
Implications for teachers
Examining the content that is actually covered in teaching is closest to the actual creation of OTL
at school and classroom level. Once again optimizing OTL, and the larger issue of alignment,
could be tackled in two ways, indicated in this report as the proactive approach and the
retroactive approach. The traditional curriculum development approach would prescribe a
continued process of operationalization of educational goals, into teacheable learning tasks. This
“deductive” approach has been used in the development of school working plans, or school
development plans, which were likely to die a quiet death in office cupboards. The alternative
“retroactive” approach, described in this report, takes the content of high stakes tests and
examinations as point of departure. This is a controversial perspective, because it could be
captured under the heading of “teaching to the test”, which is associated with reduced teaching,
tunnel vision and cheating. Throughout this report we have been hinting at a legitimate form of
test and examination preparation, and in this final section this perspective will be analyzed in
more detail, leading up to a series of suggestions to optimize OTL by means of legitimate test
preparation.
The theoretical background is the distinction of the two parallel processes of didactic and
evaluative specification in De Groot’s (1986) model, described in chapter 2. Particularly in
settings where state standards are described in general terms, while examinations and high stakes
tests are well established, teaching might obtain focus by targeting tested content. This
orientation is strongly enforced by accountability policies, not only when these are “high stakes”
but also in case of more moderate forms, such as rankings of schools published in the media.
Again “teaching to the test” is usually condemned, exactly as one of the disadvantages of
accountability policies. The question is whether it is possible to indicate under which conditions
“teaching to the test” could be considered as a legitimate and efficient way of enhancing OTL.
The ideal type mechanism would be that teachers, on the basis of the information about high
stakes tests, would become better informed about which content areas and targeted psychological
operations, should be prioritized in teaching and which textbooks should be chosen. Additional
benefits could arise when formative assessment would be aligned to the content dimensions of
high stakes tests. Such formative assessments could be used to diagnose student progress,
provide input for adaptive teaching and evaluate instruction.
When considering how close to reality this ideal type situation is, pitfalls and essential pre-
conditions should be examined in more detail. Some of these have to do with characteristics of
tests, others with appropriate use by teachers and schools.
In order to provide a good basis for instructional alignment tests should be standard based,
“criterion referenced” rather than norm referenced. The structure of the test, i.e. the hierarchy of
sub-domains, topics and sub-topics, as well as required performance levels, should be made
transparent. Ideally large sets of items (item banks) should be available, at least part of them
public and available to schools. Popham (2003) concludes that the like of these conditions were
only sub-optimally met in the USA, as he noted that high stakes tests issued by separate states,
were often not well aligned with national standards. He also observed that state tests developed
by content experts tended to be “overloaded” and insufficiently informative about core
knowledge and skills. According to Popham “the curricular intensions handed down by states
and districts are often less clear than teachers need them to be for purposes of day-to-day
instructional planning”. Popham (2001) stresses the importance of the transparency of high
stakes tests in the following way: “policymakers … should be educated …to support only high-
123
stakes tests that are accompanied by accurate, sufficiently detailed descriptions of the knowledge
or skills measured. A high-stakes test unaccompanied by a clear description of the curricular
content is a test destined to make teachers losers. Moreover, because of the item-teaching that's
apt to occur, tests with inadequate content descriptors also will render invalid most test-based
interpretations about students”.
When it comes to the way teachers would ideally make use of test information they should aim
for “teaching towards test represented targets, not towards tests” Popham, 2003, 17). In other
words teachers should capture the core content areas and performance levels embedded in the
tests, which stresses the importance of transparency of the test framework; the hierarchy of sub-
domains, topics and sub-topics. Ehren, Wolaston and Newton (2016) provide empirical evidence
from the UK, which shows that teachers’ interpretation of core-domains in high stakes tests
differed from the interpretation of the test-developers. Perhaps this result should be seen as a
further underlining of the call for test transparency. In addition to content alignment, test
preparation may also include providing exercise for students in applying different kind of item
formats.
The issue of separating legitimate and illegitimate test preparation is addressed most directly by
Popham (1991), and his reasoning is cited in some detail below. Popham proposes two kinds of
criteria:
“Professional Ethics: No test-preparation practice should violate the ethical standards of the
education profession.
Educational Defensibility: No test preparation practice should increase students’ test scores
without simultaneously increasing student mastery of the content domain tested”.
He then describes 5 ways of aligning teaching to tests:
1. Previous-form preparation provides special instruction and practice based directly on
students’ use of a previous form of the actual test. For example, the teacher gives students guided
or independent practice with earlier, no longer published, versions of the same test.
2. Current-form preparation provides special instruction and practice based directly on students’
use of the form of the test currently being employed. For example, the teacher gives students
guided or independent practice with actual items copied from a currently used state-developed
high school graduation test.
3. Generalized test-taking preparation provides special instruction that covers test-taking skills
for dealing with a variety of achievement test formats.
4. Same-format preparation provides regular classroom instruction dealing directly with the
content
covered on the test, but employs only practice items that embody the same format as items
actually used on the test.
5. Varied-format preparation provides regular classroom instruction dealing directly with the
content covered on the test, but employs practice items that represent a variety of test item
formats. For example,if the achievement test uses subtraction problems formatted only in vertical
columns, the teacher provides practice with problems presented in vertical columns, horizontal
rows, and story form.” (Popham, 1991, 13-14)
Popham concludes that three of these strategies are not-acceptable.” Previous form preparation is
considered educationally unethical because it is aimed at increasing test scores, without
furthering student content mastery in a more general sense. Current-form preparation would
mostly be considered as professionally and educationally unethical, and be considered outright as
cheating. Same-format preparation is considered educationally inappropriate because it may raise
124
test scores at the cost of students’ capacity to generalize what they have learned”. Generalized
test taking preparation, and varied-format preparation are considered as legitimate strategies, as
these strategies train for more generalized skills than the specific test in question.
When Popham empirically investigated whether teachers agreed on his identification of
acceptable and non-acceptable test preparation he found that teacher were more lenient,
particularly with respect to same format preparation and to special instruction to students “with
actual items copied from a currently used” test. Given these results it would appear that deterring
teachers from inappropriate forms of test preparation remains a point of concern, although one
that could be effectively countered by test quality, more specifically the application of item
banks. Together with the empirical findings from the study by Ehren et al (2016), which pointed
out that teachers may have difficulty in inferring the core content from high stakes tests
correctly, Popham’s results show that appropriate test preparation is not a “run race” and
deserves special attention, in contexts like teacher training and applied research.
Finally, an additional strategy for enhancing OTL and aligning teaching to high stakes tests
should be mentioned. This strategy consists of considering formative assessments, based on
either externally developed or teacher constructed tests, as an effective linking mechanism. In the
case study on Dutch education such approaches are illustrated, particularly in the “achievement
oriented work” approach (Visscher, 2015). A pre-condition is that the formative tests are well-
aligned with the relevant high stakes tests and examinations. Another example from the
Netherlands, developed primarily for secondary education, but also applicable in other school
sectors, is the RTTI approach (Drost and Verra, 2015).
Implications for further research
While we started out with the statement that the core idea of OTL is almost provocatively
simple, in referring to the correspondence between taught and tested content, the conceptual
analysis showed that, when seen as part of the larger issue of systemic alignment in education,
matters appear to be more complex. When systemic alignment is the issue there are many
components that need to be aligned: national standards, standards at intermediary level (state,
district, schools), textbooks, assessment programs and actual teaching. Particularly in less
centralized educational structures, these components tend to be autonomous and loosely coupled.
This makes the alignment issue relatively complex. A key issue is what one might indicate as the
curricular validity of high stakes tests and examinations, i.e. a valid representation of state
standards by the test. Next, when the potential of high stakes test to effectively and legitimately
help schools and teachers to focus their instruction is considered, it was noted that transparence
of the test design and hierarchically ordered content of the tests is a key condition, which may be
insufficiently realized in practice. Apart from seeing test preparation as a legitimate way to
enhance OTL, it is also a common practice in which less efficient and less legitimate forms
cannot be ruled out. Optimizing test preparation is not just a way to improve education, but also
a way to avoid and deter from bad practice.
The part of this study that was dedicated to research review indicated that OTL should be
considered as having a small, but relative to other levers for improving educational performance,
still educationally significant effect on student achievement. Comparable to some other
effectiveness enhancing mechanisms, but perhaps smaller than leading authors on OTL effects
usually suggest. As was the case with other reviews and meta-analyses on school effectiveness
125
enhancing conditions (Scheerens, 2016), there existed large heterogeneity among studies, as far
as effect sizes were concerned, but also in the way OTL was operationalized, and studies were
conducted. The relative strength of keeping OTL on the agenda in educational policy and
practice, but also in educational research, is that the “theory in practice” of how OTL operates
and can be enhanced is relatively transparent. There are key-roles for test developers and
teachers. Ideas for further research are the following:
1. Given the small scope of this study the emphasis was on studies that had used OTL as the
core identifier. We had to keep the analyses of studies that were concentrated on test
preparation limited. Even though we identified some relevant studies a logical next step to
the current study would be a review (of similar scope as the current one) fully dedicated to
test preparation.
2. In this study legitimate test preparation came out as an interesting option for optimizing
OTL. The quality of the tests or examinations is quite central for such a perspective on
optimizing OTL. As a follow-up study it would be very interesting to analyze the specific
criteria examinations or high stakes tests in general would have to meet, in order to be fit to
play this leading role. Criteria that were discussed in this report are “curriculum validity”,
criterion rather than norm-referenced testing, transparency of the test structure, and large
sets of items, possibly item banks. Next examinations and high stakes tests used in the
Netherlands and one or two other countries, could be analyzed on the basis of these
criteria, and empirical data could be collected to what extent teachers in these countries
actually use the high stakes tests and examinations to focus their curricular choices.
3. The surprisingly modest effect size of OTL on student achievement that was found in this
study suggests a need for more fundamental research on the way OTL is measured. One
way to address this is to collect data on OTL from various perspectives: teacher reports
(like in TIMSS), student perception (like in PISA, but preferably more detailed), classroom
observations and logbooks. The degree of correspondence between various perspectives
would provide useful information. Most valid information would probably be obtained
through classroom observations and (perhaps) logbooks. On the other hand, teacher and
student questionnaires on OTL are much easier to administer. Only if more demanding
methods (observations and logs) are much more valid than information obtained through
questionnaires, would it make sense to disregard questionnaire data. As far as student
perceptions on OTL are concerned, it seems possible that they are confounded with
cognitive ability, prior knowledge and effort. Fast learners, students with more prior
knowledge are the ones that work hard and may be more likely to report that a topic was
covered than other students. With regard to teacher data, social desirable answers may be a
source of bias. An advantage of students’ perceptions is that the degree of agreement in
answers within classes can be assessed.
4. In the Dutch context it would be very interesting to empirically investigate alignment
through content analysis of sources covering components like: reference levels, textbook
coverage, formative tests, and formal high stakes tests and examinations. A specific focus
on the quality of examinations could be a study in itself. In such a study quality criteria for
examining examinations, existing forms of quality control, by the educational Inspectorate
and accreditation agencies could be reviewed and strong and weak aspects identified.
5. Perhaps as a replication of the study conducted in England, by Ehren and others about “
The Nature, Prevalence and Effectiveness of Strategies Used to Prepare Pupils for Key
Stage 2 Maths Tests”, an empirical investigation could be made on the way Dutch teachers
126
apply cues from high stakes tests in the Netherlands, in their teaching and classroom
assessment practices.
6. As the case study on curricular alignment in the Netherlands showed, there are quite a few
examples of advanced test application to enhance student learning. One of these projects
could be described in depth, starting out from the conceptual framework developed in this
report. An interesting case study might be the ETTI approach by Docentplus (Drost and
Verra, 2015) in secondary education. A strong focus could be given to the way teachers go
about test development and application, and how this affects their teaching.
References
Appelhof, P. (2016) OTL in de Nederlandse onderwijspraktijk: Bevordering van de gelegenheid
tot leren in het basisonderwijs, in het bijzonder bij het rekenonderwijs. OTL in Dutch education.
In: Scheerens, J. Opportunity to learn, instructional alignment and test preparation. A research
review. Utrecht: Oberon
Drost, M. & Verra, P. (2015) Handboek RTTI. Bodegraven: Docenplus.
Ehren,,M Wollaston,N., Goodwin, J., and Newton, P. (2016, in press) Teachers’ backward-
mapping of patterns in high stakes math tests..London: London Institute of Education
Expertgroep doorlopende leerlijnen taal en rekenen. (2008). Over de drempels met rekenen.
Consolideren,onderhouden, gebruiken en verdiepen Enschede: Commissie Meijerink
Groot, A.D., de (1986) Begrip van evalueren. ’s-Gravenhage: Vuga.
OECD (2014) PISA 2012 Results, Volume IV, What makes schools successful? Resources,
policies and practices. Paris: OECD Publishing
Popham. W.J. (1991) Appropriateness of Teachers’ Test-Preparation Practices. Educational
Measurement: Issues and Practice. Winter, 1991
Popham, W. J. (2001). Teaching to the test. Educational Leadership, 58(6), 16-20.
Popham, W.J. (2003) Test better, teach better, The instructional role of assessment Alexandria,
Virginia: ACSD
Polikoff, M.S. and Porter, A.C. (2014) Instructional alignment as a measure of teaching quality.
Educational Evaluation and Policy Analysis, 36, 399-416
Woessmann, L., Luedemann, E., Schuetz, G. and West, M.R. (2009). School Accountability,
Autonomy and Choice around the World. Cheltenham, UK/ Northampton, MA, USA:
Edward Elgar.
127
Sahlgren, G. H. (2015). Real finish lessons. The true story of an education superpower. Center
for Policy Studies. Surrey.
Scheerens, J., Luyten, H., Glas, C.A., Jehangir, K., and Van den Bergh, M. (2014) System level
indicators. Analyses based on PISA 2009 data. Internal report. Enschede: University of Twente.
Scheerens, J. (2016) Educational Effectiveness and Ineffectiveness. A critical review of the
knowledge base. Springer: Dordrecht, Heidelberg, New-York, London.
Vanlommel, K., Vanhoof, J. & Van Petegem, P. (2016) Data use by teachers: the impact of
motivation, decision-making style, supportive relationships and reflective capacity.
Educational Studies (in press)
Visscher, A.J. (2015). Over de zin van opbrengstgericht(er) werken in het onderwijs. Groningen:
RU, Faculteit der gedrags- en maatschappijwetenschappen.
Willms, J.D., & Somers, M.-A. (2000). Schooling outcomes in Latin America. Report prepared
for UNESCO-OREALC and the Laboratorio Latinoamericano de la Calidad de la
Educación [The Latin American Laboratory for the Quality of Education].
128
ANNEX
OTL in de Nederlandse onderwijspraktijk: Bevordering van de gelegenheid
tot leren in het basisonderwijs, in het bijzonder bij het rekenonderwijs
Pieter Appelhof, Oberon, Utrecht
1. Inleiding
In dit hoofdstuk wordt beschreven hoe in de afgelopen jaren in het basisonderwijs, in bijzonder
in het rekenonderwijs, is geïnvesteerd in efficiënt en effectief onderwijs in de richting van
‘opportunity tot learn’ (de gelegenheid tot leren). Om te beginnen wordt ingegaan op pogingen
die in het onderwijs zijn genomen om de efficiënte en effectiviteit te bevorderen, in het bijzonder
de maatregelen die de overheid heeft geëntameerd. Vervolgens wordt specifiek nagegaan hoe
‘opportunity tot learn’ in het rekenonderwijs is bevorderd. Tenslotte wordt bij de rekenmethode
Pluspunt nagegaan in welke mate ‘opportunity tot learn’ wordt gerealiseerd.
Wat betreft de maatregelen van overheidswege wordt ingegaan op de invoering van
referentieniveaus, in het bijzonder de referentieniveaus en ook de referentiesets voor rekenen in
het basisonderwijs in relatie tot methode ontwikkeling en toetsontwikkeling. Bij de toespitsing
op de rekenmethode Pluspunt wordt gekeken naar de mate van samenhang en afstemming van
referentieniveaus, toetsen en methodisch aanbod. De vraag daarbij is in hoeverre optimale
condities worden gerealiseerd om te bereiken dat alle leerlingen efficiënt leren met het doel om
zo goed mogelijke rekenprestaties te leveren. Naast de rekenmethode Pluspunt wordt ook
aandacht gegeven aan de adaptieve methode Rekentuin
Tenslotte wordt verslag gedaan van gesprekken met een auteur van de opzet van de methode
Pluspunt (aanbod en toetsing) en met een enkele leerkracht over het werken met Pluspunt0 en
Rekentuin in de praktijk.
2. Naar doelgericht leren
2.1 In principe vrijheid van inrichting
Sinds vele jaren zijn in het onderwijs stappen gezet om het onderwijs scherper te richten op
doelen die belangrijk worden gevonden. Zo zijn er kerndoelen opgesteld. De kerndoelen zijn
echter zeer algemeen geformuleerd zodat ze nog veel ruimte laten aan scholen om het onderwijs
in te richten. De scholen zijn ook vrij in de wijze waarop ze het onderwijs afstemmen op
verschillen tussen de leerlingen. Die kunnen aanmerkelijk zijn. Bij rekenen loopt de achterstand
van zwakke rekenaars in de bovenbouw op tot wel twee jaar (Noteboom, sept, 2009).
129
De grondwettelijk geregelde vrijheid van richting en inrichting van het onderwijs in Nederland is
de verklaring dat kerndoelen globaal zijn geformuleerd. In vele andere landen dienen scholen
zich strikt te houden aan een nationaal uitgewerkt leerplan voor de schoolvakken.
2.2 Richtinggevende maatregelen
De doelgerichtheid van het onderwijs is in Nederland waarschijnlijk meer beïnvloed door
schoolexamens in het voortgezet onderwijs en de eindtoets basisonderwijs dan door de
kerndoelen. In Nederland hebben de schoolbesturen en de scholen, door de toegenomen
dereguleringsmaatregelen, meer vrijheid gekregen betreffende de inrichting van het onderwijs.
Daar staat tegenover dat de overheid, als reactie, de afgelopen jaren meer regelgeving over de
vereiste kwaliteit heeft geëntameerd. Het motief was het handhaven van de deugdelijkheid (de
resultaten) van het onderwijs. Daarover was zorg ontstaan vanwege de licht teruglopende
prestaties van scholieren in Nederland zoals bleek uit het internationale Pisa-onderzoek. Dat gold
in het bijzonder de te geringe prestaties van leerlingen in het hoogst scorende segment (van de
verdeling Knecht, Gille, Rijn, 2007). Tevens werd in een PPON-onderzoek een gebrekkige
rekenvaardigheid bij leerlingen gesignaleerd (Janssen, Schoot, Hemker, 2005). Deze
constateringen hebben geleid tot maatregelen om de opbrengst van het onderwijs beter te
bewaken.
Een van de eerste maatregelen is geweest om bij de inspectie van het onderwijs toetsingskaders
te hanteren. Dit heeft geleid tot veel meer objectiviteit in het inspectieonderzoek. ‘Er kwam meer
aandacht voor de basisvaardigheden, effectief onderwijs en de zorg voor leerlingen. Die aspecten
van het onderwijs zijn nadrukkelijk in het toetsingskader opgenomen. De onderwijsinspectie
richtte zich ook, en met succes, op het verminderen van het aantal zwak presterende scholen
waarbij de scores van de Cito-eindtoets als criterium worden gebruikt. Er werd ook veel
verwacht van de scholen zelf: ‘De groeiende beleidsruimte vergt van scholen dat zij actief
kwaliteitsbeleid voeren, een beleid gericht op bewaking en verbetering van alle aspecten van het
functioneren van de school (Tweede kamer, 1995).
In het bijzonder de grote bandbreedte van de kerndoelen en de constatering dat vele leerlingen
een programma krijgen voorgeschoteld met doelstellingen die voor vele kinderen onbereikbaar
zijn, heeft de overheid er toegebracht referentieniveaus te laten opstellen voor een aantal
basisvakken. Twee belangrijk argumenten om referentieniveau op te stellen waren de drempels
tussen verschillende schooltypen te slechten (doorgaande leerlijnen) en de kwaliteit van de
leeropbrengsten te verhogen.
In opdracht van de overheid heeft de commissie Meijerink de referentieniveaus opgesteld
(Expertgroep doorgaande leerlijnen taal en rekenen, 2008).Sinds 2010 hebben ze een wettelijke
basis. De referentieniveaus zijn richtinggevend voor de methoden en voor de eindtoets
130
basisonderwijs (taal en rekenen). Voor de eindtoets zijn referentiesets opgesteld om de
toetsopgaven nauwkeurig te kunnen vaststellen.
2.3 Onderwijs op maat
Ondanks het bestaan van referentiekaders, referentiesets en eindtoetsen wordt steeds weer
geconstateerd dat het onderwijs in de groepen efficiënter kan worden ingericht, zodat het
onderwijs voor meer leerlingen effectiever wordt. De inefficiëntie van het onderwijs wordt mede
toegeschreven aan de traditie van het klassikale onderwijs waardoor leerlingen geen onderwijs
‘op maat’ ontvangen (Bosker, 2005).
Differentiatie in de klas
Zowel in het verleden als in het heden worden in scholen vooral organisatorische maatregelen
genomen om het onderwijs te differentiëren. Uit evaluatieonderzoek blijkt steeds weer dat dit
niet leidt tot betere prestaties. Een belangrijke verklaring is dat organisatorische maatregelen er
niet toe leiden dat de instructie en de geboden oefenstof doelgerichter en beter op de leerling
wordt afgestemd. De leerkrachten besteden hun tijd meer aan de organisatie van de differentiatie
(de klassenorganisatie) in plaats van aan effectieve instructie (Appelhof, 1979). Was in het
verleden vernieuwing van het onderwijs gelijk aan differentiatie, nu omhelst
onderwijsvernieuwing of liever onderwijsverbetering, meer het bieden van effectief, of
‘opbrenggericht onderwijs.’ Toch blijft differentiatie, of wat men nu liever aanduidt met
‘onderwijs op maat,’ nodig. Ook nu vormt differentiatie van de instructie in de klas nog een
probleem. Visscher (2015. p. 21) constateert, op basis van eigen onderzoek, dat er kwantitatief
weinig sprake is van differentiatie.
Afstemming doelen, leerstof, toetsen
Effectief onderwijs kan beter bereikt worden door een optimale aansluiting van onderwijsdoelen,
methoden, toetsing van opbrengsten (d.w.z. de vorderingen en prestaties van leerlingen) en de
terugkoppeling of adaptatie van het aanbod. De aanname is dat naarmate de aansluiting
nauwkeuriger is betere leerresultaten bereikt kunnen worden. In de Engelse taal wordt dat
‘opportunity to learn’ (OTL) genoemd. In het Nederlands vertaald ‘de gelegenheid tot leren.’
Deze term is in het onderwijs niet gangbaar. In Nederland is de term ‘opbrengstgericht werken’
(OGW) bekend, maar deze term heeft een bredere strekking dan OTL.
De term opbrengstgericht werken werd door het Ministerie voor OC&W (2007) geïntroduceerd
vanwege de teruggang in prestaties van Nederlandse leerlingen in vergelijking met leerlingen in
andere landen
Opbrengstgericht werken betreft het werken aan het verhogen van prestaties door middel van
doelgericht en systematisch werken. Opbrengstgericht werken is mede gebaseerd op de
131
resultaten van de meta-analyse van Hattie (2009). De belangrijkste acties van leraren die goede
resultaten bereiken zijn volgens Hattie:
Hogere en uitdagende doelen stellen;
Structureel feedback geven en krijgen;
Bijsturen op basis van de studievoortgang;
Differentiëren in instructie en werkvormen.
Evenals OGW is ook OTL een aanpak om leerlingen tot betere prestaties te brengen, maar OTL
betreft wel een specifieke aanpak waarbij het accent ligt op de directe afstemming van toetsing
en leerstofaanbod.
Visscher (2015, p. 6) komt met zijn omschrijving van OGW (opbrengstgericht leren) dicht bij
OTL. Het gaat bij OGW om ’de evaluatie van welke leerlingen welke leerstofonderdelen
wel/niet beheersen.’ Die evaluatie is de basis voor het zoveel mogelijk afstemmen van de
instructie in brede zin (uitleg leerstof, het geven van opdrachten, het gebruiken van
leermaterialen en het ter beschikking stellen van een bepaalde hoeveelheid tijd om aan iets te
werken) op wat elke leerling nodig heeft. Deze omschrijving van OGW betreft het onderwijs in
de klas, maar Visscher meent ook dat OGW verder reikt dan de klas, OGW betreft ook
maatregelen op school- en bestuursniveau. Zo bracht minister Tineke Netelenbos in 1995 de
Nota 'Kwaliteitszorg in primair en voortgezet onderwijs (De School als lerende organisatie)' uit
waarin ook de term ‘onderwijskundig leiderschap’ werd geïntroduceerd (Tweede Kamer, 1995).
Het werd ook gebruikelijk dat inspectierapporten met schoolbesturen werden besproken met de
verwachting dat schoolbesturen maatregelen namen om de opbrengst, van vooral zwakke
scholen, te verbeteren. Opbrengstgericht werken slaat in feite op een gewenste onderwijscultuur.
Curriculum en toetsing behoren nauw met elkaar verweven te zijn maar dat is in de
onderwijspraktijk lang niet altijd het geval. Nieuwe doelen behoren te leiden tot andere inhouden
van toetsen en curricula. Doorgaans loopt de ontwikkeling en het gebruik van methoden achter
op toetsontwikkeling omdat herziening van een methode veel tijd vraagt en scholen niet zo snel
kunnen overgaan tot aanschaf van een nieuwe methode. Het is dus vrij normaal dat de
afstemming tussen doelen, curricula en toetsen beperkingen kent. Er is een uitlijningsprobleem
(SLO, 2015, A). In de Engelse literatuur wordt hiervoor de term ‘alignment’ gebruikt (zie ook
Visscher, 2015).
Een eerste verklaring voor sub optimale uitlijning is dat doelen en inhouden voor toets- en
examenmakers onvoldoende helder zijn gespecificeerd of lastig zijn te specificeren. Om dit
probleem op te lossen wordt gewezen op ‘het ‘backward design’(Millar, 2012) of de ‘evaluatieve
specificatie (de Groot, 1986). ‘Daarbij gaan het uitwerken en het operationaliseren van
doelstellingen en met name essentiële aspecten daarin in concrete toetsopdrachten hand in hand’
(Millar, 2012). Dit is een alternatief voor de aanpak om eerst tot op detailniveau doelstellingen te
formuleren en die te vertalen in toetsen en examens. Maar toch, toetsing behoort het curriculum
te volgen, en niet omgekeerd (Lundgren, 2013). ‘Backward design’ impliceert synergie tussen
curriculum- en toets/examenontwikkeling.
132
Een tweede verklaring voor gebrekkige uitlijning is dat er onvoldoende noodzaak gevoeld wordt
tot afstemming van toetsen en programma’s waardoor er ook onvoldoende wordt samengewerkt
(SLO, 2015 A). Daarbij speelt een rol dat voor beide terreinen geheel verschillende expertise
wordt gevraagd. In Nederland zijn er twee verschillende instituten voor curriculum- en
toetsontwikkeling ook al zijn er goede argumenten om beide functies in éen instituut onder te
brengen.
In de onderwijspraktijk wordt de grote nadruk op toetsen no wel gezien als een blokkade voor
onderwijsontwikkeling. Op basis van de theorie wordt het scheppen van ‘gelegenheid tot leren’
in de vorm van het benadrukken van een hechte relatie tussen doelen en toetsen juist als een
hefboom gezien voor verbetering van het onderwijsprogramma.
Het model voor bevordering van ‘gelegenheid tot leren’ (OTL) past in de objectivistische
benadering van leren. Binnen dit model worden leerdoelen, aanbod en toetsing van buiten
aangereikt aan de leerlingen. OTL wil door afstemming van deze componenten, waardoor het
leren efficiënter wordt, de leeropbrengst verhogen.
Zelfregulerend leren
Een andere benadering van ‘gelegenheid tot leren’ die de afgelopen twintig jaren onder de
aandacht is gebracht is de constructivistische aanpak van leren waarin het zelfregulerend leren
centraal staat. Zelfregulerend leren houdt in ‘een actief, constructivistisch proces, waarbinnen de
leerlingen leerdoelen stellen en vervolgens trachten om hun cognitie, motivatie en gedrag te
monitoren, te reguleren en te controleren op basis van de doelen en de kenmerken van de
omgeving’ (Pintrich, 2004).
We gaan hier in het kort in op deze leerlinggerichte visie op ‘gelegenheid tot leren’ als contrast
met de objectiverende aanpak van OTL.
Zelfregulerend leren wordt gezien als een model voor opbrengstgericht leren en een model om
het onderwijs passend te maken voor alle leerlingen.
Vanuit een objectivistische onderwijsvisie zorgt de leerkracht voor een passende invulling op het
gebied van doelgericht- en planmatig werken, differentieerde- en doelgerichte instructie
effectieve leertijd en professionalisering’ (de Koning, 2011).
In het constructivistische model moet de leerkracht er toe bijdragen dat aan het zelfregulerende
proces een passende invulling wordt gegeven. De leerlingen moeten leren bewuster naar hun
eigen leerproces te kijken. Ze moeten zelf op zoek gaan naar belangrijke informatie en
antwoorden op vraagstukken (Hendriks, 2013). Pintrich beschouwt zelfregulerend leren als een
interactie tussen cognitieve, metacognitieve en motivationele aspecten. De voorbereidingfase is
133
gekenmerkt door taakanalyse en zelfmotivatie, de uitvoeringsfase door zelfcontrole en
zelfobservatie en de evaluatiefase door zelfbeoordeling en zelfreactie.
Bij zelfregulerend leren wordt de regie over het leerproces nadrukkelijk bij de leerling gelegd
terwijl bij de objectiverende aanpak het onderwijsleerprogramma de sturing van het leerproces
optimaliseert. Het zelfregulerende leren komt voort uit een cognitivistisch/pedagogisch
geïnspireerde visie terwijl het objectiverende leren meer een behaviouristische basis heeft.
In de meer recente literatuur over instructie-effectiviteit zien we dat beide perspectieven niet
meer zo scherp tegenover elkaar worden gesteld en is eerder sprake van integratie (Scheerens,
2016, hfst 3). De mate van externe sturing van het onderwijs is afhankelijk van nationale
structuren en tradities; zo biedt in Nederland het systeem van examens en toetsten aanmerkelijk
meer gegeven kader aan scholen, dan bijvoorbeeld in Vlaanderen, waar examens en “high
stakes” toetsen ontbreken. Ook bij een zeker extern kader van toetsen en examens is een meer
“constructivistische” didactiek mogelijk al blijft de plaats van toetsing een strijdpunt. Een ander
punt van discussie is de vraag naar de autonomie van leerkrachten in de situatie dat er een
buitenschools kader van standaarden en daarbij aansluitende formatieve toetsen gegeven zijn.
3. Rekenen in de basisschool
3.1 De basisgedachten van het rekenonderwijs
De casus betreffende ‘opportunity tot learn’ betreft het rekenonderwijs in de basisschool. Er is
gekozen voor rekenen vanuit de veronderstelling dat op dit kennisgebied de doelen concreter zijn
te formuleren dan op het gebied van Nederlandse taal en de toetsen ook makkelijker kunnen
worden afgestemd op de te bereiken doelen. We kiezen ook voor het reken/wiskunde onderwijs
omdat de afgelopen jaren er veel discussie is over zowel de bereikte resultaten, die zoals reeds
aangeven in bepaald opzicht teleur stelden, als over de visie op het reken/wiskunde onderwijs.
Aangezien kinderen verschillen in begaafdheid is niveaudifferentiatie in leerstof noodzakelijk.
De rekenmethoden spelen al vele jaren in op de verschillen tussen leerlingen door leerstof op
verschillend niveaus aan te bieden. Een probleem daarbij was dat er lange tijd onduidelijkheid
was over het minimumniveau dat in de basisschool en ook in het voortgezet onderwijs
uiteindelijk bereikt moest worden. Dat bevorderde de inzet om tot een resultaat te komen niet.
Formeel en functioneel rekenen
Een ander probleem is dat er in Nederland geen consensus is over de hoofdfunctie van het
rekenonderwijs. Het rekenonderwijs gaat al decennia uit van de visie dat het functioneel leren
rekenen het hoofddoel vormt van het rekenonderwijs. Deze visie is in belangrijke mate verspreid
door het Freudenthal Instituut. Aan deze visie en de uitwerking ligt het didactisch concept van
134
het realistisch rekenen ten grondslag, dat voortkomt uit het constructivisme. Het doel is dat
leerlingen (concrete) problemen en situaties kunnen oplossen met behulp van eigen strategieën
en inzichten. Daarbij wordt uitgegaan van voor leerlingen voorstelbare (alledaagse)
contextsituaties.
Sinds een tiental jaren wordt de visie waarin het formele rekenen/wiskunde voor alle leerlingen
het hoofddoel vormt weer meer uitgedragen (Craats, van de, 20 mrt., 2008). De voornaamste
manco’s van het huidige reken-wiskunde onderwijs worden vanuit de formele visie
toegeschreven aan het didactische concept van de realistische onderwijsbenadering
Geconstateerd wordt ook dat met de komst van ICT en de zakrekenmachine het formele rekenen
een minder belangrijke voorwaarde meer is voor het functionele rekenen. Voor leerlingen voor
wie functioneel rekenen einddoel van het rekenonderwijs is, volstaan basiskennis, -inzicht en -
vaardigheden op een lager niveau van denken en handelen. Het formele rekenen is echter wel een
noodzakelijke voorwaarde voor het leren van wiskunde. Het komt er op neer dat het functionele
rekenen primair van belang is voor leerlingen die naar het vmbo gaan en het formele rekenen
voor leerlingen die naar havo/vwo gaan.
Van de zeven belangrijkste rekenmethoden in het basisonderwijs zijn de meeste (waaronder
Pluspunt) gekenmerkt door het didactisch concept van een realistische benadering. Het
ontbreken van consensus op het gebied van reken/wiskunde onderwijs bemoeilijkt de
verdergaande ontwikkeling ervan (SLO, 2015, B).
Opbrengstgericht rekenonderwijs
De rekenmethoden in het basisonderwijs bieden een dekkend aanbod aan les-, toets- en
leraarmaterialen. De praktijk is dat leraren de methode nauwgezet volgen (Koopmans-van
Noore, et al., 2014). Rekenmethoden bieden steeds meer mogelijkheden tot differentiatie
waardoor leraren ook daadwerkelijk meer differentiëren. Leraren melden dat ze meer dan in het
verleden hun instructie differentiëren per niveau- of tempogroep met eventuele differentiatie bij
het verwerken van de oefenstof (Scheltens, e.a., 2013).
Ondanks differentiatie blijken bijzonder begaafde leerlingen toch niet aan hun trekken te komen.
Daarom wordt ook bij het reken/wiskunde onderwijs naar ‘opbrengstgericht onderwijs’
gestreefd. Daarin wordt een aantal fasen onderscheiden, zoals leerdoelen stellen, leervoortgang
meten, registreren en vervolgens analyseren van resultaten om het onderwijsaanbod en/of de
leerdoelen (al dan niet per groep van leerlingen) bij te stellen (SLO, 2015 B.). In de praktijk
hebben leraren daar grote moeite mee. Ze zijn immers gewend de rekenmethode van dag tot dag
te volgen. Het streven is leraren te voorzien van een instrumentarium voor het stellen van doelen,
het interpreteren van voortgangsgegevens en voorbeelden te geven van een onderwijsaanbod dat
in lijn ligt met verschillende niveaus van voortgang in het leren (SLO, 2015, B).
135
(Blok, e.a., (2013) menen dat het essentieel is dat leerlingen inhoudelijke en taakgerichte
feedback ontvangen. Die feedback moet eerder taakgericht dan persoonsgericht zijn zodat de
leerling aanwijzingen krijgt om een taak beter uit te voeren. Een probleem daarbij is op welke
wijze naar toets resultaten gekeken wordt en of de toetsen wel geschikte informatie bieden. Een
vraag is of leraren geneigd en in staat zijn om een dergelijk instrumentarium te hanteren, naast de
gebruikte rekenmethode.
Aangezien de praktijk is dat leerkrachten de methode volgen is een adaptieve toetsing (zoals bij
de methode Rekentuin) in relatie met de aangeboden leerstof mogelijk een goede bijdrage aan de
bevordering van opbrengstgericht onderwijs voor alle leerlingen. Vanuit het oogpunt van de door
leerkrachten ervaren autonomie zou het als een minpunt kunnen worden ervaren dat daarmee
minder beroep gedaan wordt op het eigen vakmanschap. Hierop wordt teruggekomen bij de
discussie en conclusies van dit hoofdstuk.
4. Naar een betere afstemming van doelen, leeraanbod en toetsen in het
rekenonderwijs
We geven in het kort weer hoe, door de overheid, in de afgelopen decennia het doelgerichte en
opbrengstgerichte leren bij rekenen is bevorderd. We beginnen bij de globale kerndoelen
vervolgens stellen we de meer concrete referentieniveaus en de referentie-set voor rekenen aan
de orde.
4.1 Kerndoelen rekenen
De kerndoelen zijn opgesteld om te bevorderen dat het onderwijs aansluit op de ontwikkelingen
in de samenleving. De kerndoelen bieden veel ruimte aan scholen om eigen keuzes te maken.
Aanvankelijk waren er 115 kerndoelen. Die zijn in 2006 teruggebracht tot 58 kerndoelen. De
nieuwe kerndoelen zijn precies voor Nederlands en rekenen/wiskunde en globaal voor de overige
vakken. Kerndoelen zijn streefdoelen (Greven en Letschert, 2006). In de toelichting wordt
gesteld dat in de context van voor kinderen betekenisvolle situaties ze geleidelijk vertrouwd
worden met getallen, maten, vormen, structuren en de daarbij passende relaties en bewerkingen.
Ze leren ‘wiskunde taal’ gebruiken en worden ‘wiskundig geletterd.’ De wiskunde taal betreft
onder andere rekenkundige en meetkundige zegswijzen, formele en informele notaties,
schematische voorstellingen, tabellen en grafieken en opdrachten voor de rekenmachine. De
onderwerpen voor de ontwikkeling van ‘wiskundige geletterdheid’ zijn van verschillende
herkomst: het leven van alledag, andere vorminggebieden en de wiskunde zelf.
Er zijn elf kerndoelen (zie bijlage 1) opgeteld:
Wiskundig inzicht en handelen (3)
Getallen en bewerkingen (6).
Meten en meetkunde (2)
136
We geven een drietal voorbeelden van kerndoelen weer:
Wiskundig inzicht en handelen:
De leerlingen leren aanpakken bij het oplossen van rekenwiskundige problemen te
onderbouwen en leren oplossingen te beoordelen.
Getallen en bewerkingen:
De leerlingen leren de basisbewerkingen met gehele getallen in elk geval tot 100 snel uit het
hoofd uit te voeren, waarbij optellen aftrekken tot 20 en de tafels van buiten gekend zijn.
Meten en meetkunde
De leerlingen leren meten en leren te rekenen met eenheden en maten, zoals bij tijd, geld, lengte,
omtrek, oppervlakte, inhoud, gewicht, snelheid en temperatuur.
Uit de formuleringen (zie bijlage 1) blijkt dat de kerndoelen een streven aangeven naar het
bereiken van algemene rekenvaardigheden. Het zijn geen beheersingsdoelen. Er worden wel
formele en functionele rekendoelen onderscheiden. Bij getallen en bewerkingen wordt het enige
beheersingsdoel genoemd.
De leerkracht kan in principe zelf bepalen welke leerstof wel en welke niet tot het kerndoel
behoort. In de praktijk werken leraren met een reken/wiskunde methode. De handleiding geeft
aan hoe de leerkracht het reken/wiskunde onderwijs per week en dag kan inrichten. In principe
leidt de methode de leerkracht en de leerlingen richting kerndoelen (Noteboom, sept, 2009). Het
succes hiervan in de praktijk zal mede afhangen van een goede inhoudelijke aansluiting van de
methode bij de kerndoelen.
Vooral de lagere prestaties van het onderwijs op kernvakken hebben er toe geleid dat de overheid
referentieniveaus heeft laten opstellen door de commissie Meijerink voor zowel taal als rekenen
(Expertgroep doorgaande leerlijnen taal en rekenen, 2008).
Zoals eerder aangegeven is het doel van de referentieniveaus de kwaliteit van de leeropbrengsten
te verhogen en mede daartoe de drempels tussen de verschillende schooltypen op te heffen. De
aanname is hierbij dat verder gespecificeerde onderwijsdoelen een verdere kwaliteitsimpuls
bieden in vergelijking met de algemenere kerndoelen.
4.2 Referentieniveaus
Referentieniveaus zijn richtlijnen van de rijksoverheid, waarin wordt beschreven wat leerlingen
moeten kennen en kunnen tijdens hun schoolloopbaan.
Er zijn referentieniveaus voor basisonderwijs, speciaal onderwijs, voortgezet onderwijs en
middelbaar beroepsonderwijs. De referentieniveaus zijn een uitwerking van de kerndoelen en
dekken dus de kerndoelen. Het gaat om kennis en vaardigheden die voor alle kinderen van
137
belang zijn. Het aanleren van die basiskennis- en vaardigheden is immers een kerntaak van het
onderwijs (SLO, okt. 2009).
De referentieniveaus zijn bedoeld om de onderwijsprogramma’s efficiënter en effectiever te
maken en te bevorderen dat de programma’s van de verschillende schooltypen beter op elkaar
aansluiten. Ze geven duidelijk aan wat een leerling moet kennen en kunnen wat betreft
basiskennis en basisvaardigheden. Het doel van de invoering van de referentiekaders is een
algemene niveauverhoging.
Bij rekenwiskunde worden fundamenteel niveau en streefniveau onderscheiden. De
fundamentele niveaus richten zich op basale kennis en inzichten en zijn gericht op een meer
toepassingsgerichte benadering van het rekenen. Daarbij geldt dat een volgend fundamenteel
niveau een eerder niveau omvat (2f omvat 1F en 3F omvat 2F). Het niveau 2F moet gehaald
worden om te kunnen participeren in de maatschappij. Het streefniveau (S-niveau) is voor
leerlingen die meer aan kunnen. Het streefniveau bereidt voor op de abstracte wiskunde.
Voor rekenen zijn zes verschillende niveaus beschreven: 1F, 2F en 3F en 1S, 2S en 3S.
Niveau 1F en 1S hebben betrekking op het primair onderwijs en speciaal onderwijs. Deze
niveaus zijn integraal van toepassing op het speciaal basisonderwijs en alle vormen van
speciaal onderwijs, met uitzondering van zeer moeilijk lerende en meervoudig gehandicapte
leerlingen (ZML en MG).
Niveau 1F is ook het niveau dat kinderen aan het eind van het praktijkonderwijs moeten
bereiken. Dit niveau halen deze kinderen einde basisonderwijs nog niet.
Niveau 2F en 2S hebben betrekking op vmbo/mbo-2 respectievelijk onderbouw havo en
vwo.
Niveau 3F en 3S op mbo-4 respectievelijk havo/vwo. De referentieniveaus 2S en 3S voor
rekenen zijn wel beschreven in het referentiekader, maar niet in de wet vastgelegd
(Noteboom, van Os, Spek, 2011).
De aanname is dus dat basiskennis en vaardigheden door leerlingen op verschillend niveau
beheerst kunnen worden. Het fundamentele niveau (F-niveau) is de basis die zoveel mogelijk
leerlingen moeten beheersen aan het eind van de basisschool. Het streefniveau (S-niveau) is voor
leerlingen die meer aan kunnen.
(Medewerkers van de uitgeverij Malmberg menen dat voor de term streefniveau (1S) beter de
term standaardniveau gehanteerd had kunnen worden omdat 1S het voor de meeste leerlingen
beoogde niveau is).
De referentieniveaus zijn niet alleen bedoeld voor groep 8. Ook van de leerlingen in groep 5, 6
en 7 zal bijgehouden moeten worden hoe ze zich ontwikkelen in relatie tot de vereiste
rekenkennis en vaardigheden (Noteboom, 2010). Met de referentieniveaus wil men bereiken dat
138
in het basisonderwijs leerlijnen, tussendoelen, leerlingvolgsystemen en de verschillende toetsen
die op de markt zijn overeenstemmen. (CvTE, sept., 2015a).
Bij rekenen worden de volgende domeinen onderscheiden:
Getallen; omvat de reken/wiskundige ‘werktuigen’ en begrippen en ook de relaties
daartussen.
Verhoudingen; zoals uitgedrukt in verhoudingstaal (een op de tien), breuken en procenten.
Meten en Wiskunde; omvat oriëntatie in de ruimte, vlakke en ruimtelijke figuren en
visualiseren en representeren
Verbanden; betreft het omgaan met tabellen, grafiekenformules en vuistregels waarin
patronen of verbanden zijn weergegeven
Elk domein is opgebouwd uit drie onderdelen:
Notatie, taal- en betekenis, waarbij het gaat om de uitspraak, schrijfwijze en betekenis van
getallen, symbolen en relaties en het gebruik van wiskunde taal;
Met elkaar in verband brengen, waarbij het gaat om het verband tussen begrippen, notaties,
getallen en dagelijks spraakgebruik;
Gebruiken, waarbij het gaat om rekenvaardigheden in te zetten bij het oplossen van
problemen.
Elk van deze drie onderdelen is steeds opgebouwd uit drie typen kennis- en vaardigheden. Die
zijn als volgt te karakteriseren:
Paraat hebben; kennis van feiten en begrippen, reproduceren, routines, technieken;
Functioneel gebruiken: kennis van een goede probleemaanpak; het toepassen, het gebruiken
binnen en buiten het schoolvak;
Weten waarom: begrijpen en verklaren van concepten en methoden, formaliseren,
abstraheren en generaliseren, blijk geven van overzicht.
Er wordt een fundamenteel- en een streefniveau onderscheiden, omdat een grote groep leerlingen
dagelijks wordt geconfronteerd met rekenopgaven van de rekenmethode die ze niet aan kunnen.
Ze kunnen de instructie nauwelijks volgen. Zoals aangegeven kan de achterstand van zwakke
rekenaars aan het eind van de basisschool oplopen tot twee jaar. Daarom is de vraag gesteld:
Moeten alle leerlingen in het basisonderwijs alles kennen en kunnen wat in de methode wordt
aangeboden? De verschillende vervolgopleidingen stellen immers verschillende eisen. De
referentieniveaus bevorderen de doorlopende leerlijnen in de op elkaar volgende opleidingen
(Noteboom, sept., 2009).
De referentieniveaus voor rekenen zijn compact en soms ook vrij abstract geformuleerd. De
commissie Meijerink heeft daarom voor rekenen concretiseringen gemaakt. Bij elke referentie
die in het referentierapport voor 1F en 1S is geformuleerd, wordt een toelichting met
voorbeelden gegeven. Ook de SLO heeft dat gedaan. Veel van de voorbeelden komen uit de
meest recente rekenmethodes (Noteboom, Os, van, Spek, W, 2011).
139
Bijlage 2 geeft de referentieniveaus 1F en 1S weer. In de tweede kolom (1F) en derde kolom
(1S). Er is steeds slechts één voorbeeld van een referenties opgenomen (SLO, okt., 2009). Bij 1F
is het aantal referenties, in totaal 83, tussen haakjes aangegeven.
We geven hier een voorbeeld van een referentie met toelichting (met voorbeeld uit een methode).
(Uit: Expertgroep Doorlopende leerlijnen Taal en Rekenen, 2008). (Van alle referenties zijn
toelichtingen gegeven. Het voorbeeld betreft: de relaties groter/kleiner dan (Getallen/Niveau 1F/
A Notatie taal- en betekenis/Paraat hebben).
Toelichting
Weten dat je in getallen een volgorde kunt aanbrengen.
Kunnen vergelijken en ordenen van hele getallen onder 100.000 en van elementaire
kommagetallen.
Weten wat de begrippen ‘kleiner dan’ en ‘groter dan’ in de context van getallen betekenen.
Voorbeelden
Prijskaartjes van computers: E 901, E 898, E 799.
Welke computer is het goedkoopst?
Welke van de volgende getallen zijn kleiner dan 2.5?
2,51 3 2,25 1.9
Wat is meer: 0,5 of 0,05?
Zet de volgende jaartallen op volgorde:
1623, 1459, 1789. 1310
We hebben de lengte van een aantal kinderen gemeten.
Zet de lengtes op volgorde van klein naar groot
1,43m; 1,38m; 1,51m; 1,49m 1,55m
Getallen ordenen van klein naar groot (Uit rekenmethode: Alles telt)
Zet de getallen op volgorde van klein naar groot.
15 14,7 14,72 16,6
De referenties (zie bijlage 2) zijn vaak vrij algemeen en breed geformuleerd. Dat geldt vooral
voor het domein ‘verbanden. De voorbeelden die zijn gegeven bieden echter voldoende
concretisering voor methode ontwikkelaars om te zorgen dat leerwegen worden
geoperationaliseerd die leiden naar de referentieniveaus. De leerkrachten zijn het meest gebaat
met dergelijke methoden, zodat ze niet naast een methode extra richtlijnen moeten raadplegen.
Uit een onderzoek naar Werken met referentieniveaus bleek dat leerkracht en slecht op de hoogte
waren van de hoogte en inhoud van de referentieniveaus (Doolaard, 2013).
Voor de leerlingen die op 12 jarige leeftijd referentieniveau 1F niet halen zijn ‘Passende
Perspectieven’ opgesteld (Boswinkel, Buijs, Os, van, 2012). Passende Perspectieven biedt
140
doelenlijsten samen met overzichten van leerroutes die houvast bieden bij het bieden van een
passend onderwijsaanbod voor leerlingen met speciale onderwijsbehoeften.
In een leerroute zijn alle domeinen uit het referentiekader in beeld gebracht met kleuren. De
domeinen zijn nader gespecificeerd naar herkenbare onderdelen van het rekenonderwijs.
De beslissing om een passend aanbod te bieden voor leerlingen vraagt om een zorgvuldige
afweging. De basis daarvoor is de registratie van de reeds gemaakte stappen (handelingsplan).
De publicaties van Noteboom e.a., 2011 en Boswinkel, e.a., 2012) maken duidelijk dat
leerkrachten kennelijk behoefte hebben aan zeer concrete doelen voor rekenonderwijs. De vraag
is of leerkrachten, anders dan methode-ontwikkelaars, in de praktijk gebruik maken van
dergelijke specifieke doeloverzichten. Ze volgen de lessen van de methode en de daarin
aangegeven niveaus.
4.3 Afstemming van toetsing op het leerprogramma
‘Opportunity to learn’ dient in de eerste plaats bereikt te worden in de onderwijsleersituatie.
Echter, onderwijsleersituaties worden in belangrijke mate mede bepaald door de doelstellingen,
de methoden en de toetsen voor het basisonderwijs.
We hebben al gezien dat de referentieniveaus de doelstellingen voor het rekenonderwijs hebben
verduidelijkt. Een volgende stap is om de officiële toetsing af te stemmen op de
referentieniveaus. Daarbij is het is van belang dat bij de toetsen (en examens) de eisen van de
referentieniveaus voor alle leerlingen gelijk zijn, ongeacht het schooltype dat ze volgen
(Doorlopende leerlijnen: veel leerlingen halen later pas in het vmbo referentieniveau 1F).
4.3.1 Curriculum en Toetsing
De verbetering van de school- en lespraktijk wordt vaak belemmerd door onvoldoende aandacht
voor een naar inhoud en vorm afstemmen van de toets- en examenpraktijk (SLO, www.
curriculum en toetsing). Een optimale afstemming tussen curriculum en toetsing en de daaraan
gekoppelde ondersteuning van leraren is belangrijk om een succesvolle opbrengstgerichte aanpak
te bereiken. Van den Heuvel- Panhuizen( Freundenthal-Instituut) merkte tijdens een PPON-
conferentie op: ’Wat getoetst wordt, wordt onderwezen. Hoe beter onze toetsen zijn, des te beter
ons onderwijs wordt’ (van Weerden en Hiddink, 2013).
Kwaliteitscriteria voor toetsen zijn betrouwbaarheid, transparantie en validiteit.
Van uit leerplanperspectief heeft het criterium validiteit alle aandacht. De toetsen moeten recht
doen aan doelen en inhoud van een vakgebied (SLO, 2015 B).
We gaan hier in het kort in op de toetspraktijk in het basisonderwijs. We beginnen met de vrij
nieuwe referentiesets.
141
4.3.2 Referentiesets
Na de invoering van de referentieniveaus was het belangrijk om de toetsing aan het eind van de
basisschool daarop te laten aansluiten. Het College voor Toetsen en Examens (CvTE) heeft, in
opdracht van het ministerie van OCW, door het Cito referentiesets voor taal en rekenen laten
opstellen voor verschillende referentieniveaus (CvTE, sept.,2014 a en b).
Een referentie-set bestaat uit een set van opgaven die het inhoudelijk beschreven kennisdomein
van het referentieniveau zo goed mogelijk representeert. Voor niveau 1F zijn er bijvoorbeeld 70
opgaven. De set kan worden beschouwd als een toets voor een referentieniveau.
De referentie-set laat zien welke soort opgaven past bij een bepaald referentieniveau en geeft ook
het gevraagde beheersingsniveau aan (De prestatiestandaard 1F rekenen is bijvoorbeeld gehaald
bij 50 of meer opgaven goed).
Voor rekenen zijn in de referentiesets opgaven uit alle domeinen van de referentieniveaus
opgenomen. Dit betreft dus: getallen, verhoudingen, meten en meetkunde en verbanden. Het zijn
opgaven met en zonder context.
Voor elk referentieniveau zijn niet-openbare en openbare referentiesets ontwikkeld (Zie bijlage
3; voorbeelden uit de openbare referentie-set rekenen 1F). De niet-openbare referentiesets
hebben als doel het overbrengen van de referentiecesuur op centrale toetsen en examens
Nederlandse taal en rekenen, die zodoende aan een vergelijkbare cesuur gerelateerd kunnen
worden. De openbare referentiesets zijn er ten dienste van commerciële toetsaanbieders en
uitgeverijen. Zij kunnen de landelijke referentiecesuur op hun eigen toetsen taal en rekenen
overbrengen met behulp van de referentie-sets.
In het najaar van 2013 heeft CvTE de referentiesets taal en rekenen en bijbehorende
referentiecesuren vastgesteld zodat er nu landelijke referentiecesuren zijn voor de
referentieniveaus taal en rekenen.
De referentiesets zijn dus een nauwkeurige operationalisering van de referentieniveaus.
Op mesoniveau zijn de condities aanwezig voor ‘opportunity to learn.’ Wezenlijk is echter dat
ook het leerprogramma is afgestemd op de toetsen zowel aan het eind als binnen het
onderwijsprogramma. Dat kan bijvoorbeeld worden vastgesteld door het bekijken van een
gebruikte rekenmethode zoals Pluspunt.
4.3.3 De Centrale Eindtoets Primair Onderwijs (PO)
In deze paragraaf wordt enige aandacht gescholen aan de Centrale Eindtoets omdat deze toets
mede de richting van het leerstof aanbod bepaald.
De Centrale Eindtoets meet op de onderdelen taal en rekenen op welk niveau de leerling de
referentieniveaus beheerst. De Centrale Eindtoets toetst wat rekenen betreft de inhoud van alle
rekendomeinen binnen de referentieniveaus (CvTE, sept., 2015b).
142
Het onderdeel rekenen van de Centrale Eindtoets omvat opgaven op de rekendomeinen van het
referentiekader: getallen, verhoudingen, meten en meetkunde en verbanden. De verdeling van de
opgaven over de verschillende domeinen sluit aan bij de verdeling in de Toetswijzer Eindtoets
PO en de opgaven uit de referentie-set vormen daarbij een anker voor de toets. De Centrale
Eindtoets wordt jaarlijks inhoudelijk volledig vernieuwd. Er bestaat geen itembank.
De nieuwe Centrale Eindtoets taal en rekenen voor het schooljaar 2015-2016 onderscheidt twee
niveaus: eindtoets B (Basis) en eindtoets N (Niveau). Beide niveaus hebben dezelfde onderdelen
en hetzelfde aantal opgaven.
Vanaf het schooljaar 2017- 2018 wordt er een adaptieve Centrale Eindtoets in gebruik genomen.
Dit houdt in dat gedurende de toets de leerling die de toets maakt het eigen niveau van de toets
bepaalt. De toets zal meerdere typen opgaven omvatten naast meerkeuze opgaven zoals opgaven
met open vragen, invulopgaven, en grafische opgaven (CvTE, sept. 2015b).
Uit onderzoek betreffende de Centrale Eindtoets blijkt dat verreweg de meeste leerlingen in het
regulier basisonderwijs aan het eind van groep 8 het referentieniveau 1F voor rekenen beheersen
(90%). De jongens (92%) doen het wat beter dan de meisjes (88%). Bij 1S beheersen 50% van
de jongens dit niveau en de meisjes 39% (CvTE, 2015c).
4.3.4 Volgtoetsen
Nu de toetsuitslag van de Centrale Eindtoets PO niet meer doorslaggevend is voor de toelating
tot het vervolgonderwijs maar het schooladvies, zijn de gegevens van een
Leerlingvolgsysteem(Lvs) belangrijker geworden (Het Lvs is een Cito-uitgave, andere
volgsystemen zijn: Lvs van Diataal en de toetsen van uitgeverij Boom).
In het basisonderwijs wordt al lang gebruik gemaakt van leerlingvolgsystemen (Lvs). De Lvs-
toetsen moeten wel gerelateerd, gevalideerd zijn aan de referentieniveaus, maar ze staan los van
specifieke methoden. De toetsen volgen wel de opbouw van het rekenen in de meest gebruikte
methoden. De toetsen hebben volgens Hacquebord e.a. (2014) de functie om informatie te
leveren over een didactische aanpak ‘op maat.’ De vraag is echter of er gezien de aard van de
toets een gerichte terugkoppeling kan plaatsvinden van toetsuitslag naar het daagse
rekenprogramma.
Het Cito- Lvs kent per jaar twee toetsen, een M en E toets. Wat rekenen betreft volgen de toetsen
de opbouw van de meest gebruikte (realistische) methoden zoals o.a. Pluspunt. De toets bestrijkt
de leerstof die een kind heeft verwerkt. De behaalde score wordt omgezet naar een score op één
en dezelfde vaardigheidsschaal (A t/m E: goed, voldoende, matig, onvoldoende, zwak). De Lvs-
toetsen geven ook specifieke inhoudelijke informatie over welke onderdelen worden beheerst of
niet. Zo levert een categorieënanalyse bij rekenen/wiskunde bijvoorbeeld een beeld op in de mate
waarin elke leerling de diverse onderdelen van de leerstof beheerst (Visscher, 2015. p. 4). Zo is
af te lezen hoe een leerling scoort op getalbegrip, optellen en aftrekken, vermenigvuldigen en
143
delen en meten/tijd/ een geld. Deze informatie kan de leerkracht gebruiken bij het nemen van
instructiebeslissingen.
Visscher merkt op dat de Lvs-output niet super toegankelijk is en dat de correcte interpretatie
ervan scholing vereist. Hij vraagt zich ook af of de feedback uit een leerlingvolgsysteem, die
slechts twee keer per jaar wordt verkregen (waarvan één aan het eind van het leerjaar), niet erg
weinig is en niet (te) laat komt (Visscher, 2015, p 9 en 19).
De Lvs-toets wordt gebruikt om tweemaal per jaar het bereikte niveau van leerlingen vast te
stellen en ouders daarover in te lichten. Na afname van de Lvs-toets wordt het schoolrapport
opgesteld.
Aansluitend op het Lvs van Cito zijn er ook de pakketten ‘Diagnosticeren en plannen.’ Deze
brengen het niveau van denken en rekenen in kaart, leveren informatie over de
oplossingsstrategieën van leerlingen. Er kunnen specifieke leerdoelen worden bepaald en
passende activiteiten gepland (Kraemer, 2008; Kraemer, Benthem, 2011). Aangezien de toets
maar tweemaal per jaar wordt afgenomen is het de vraag of de afstemming van vorderingen en
aanbod wel voldoende frequent en gericht kan zijn.
4.3.5 Toetsing door observatie
Een vraag is ook of de leerkrachten eigen observaties en uitwerkingen van opgaven in hun
voortgangsanalyse en leerstofaanbod kunnen betrekken. Inzicht in de wijze waarop leerlingen
rekenproblemen oplossen is daarbij belangrijk. Door oplossingsstrategieën van leerlingen te
observeren kan een leraar inzicht krijgen in het denk- en handelingsniveau van een leerling en
hem vervolgens een gericht aanbod doen om een hoger niveau te bereiken. Om dergelijke
vormen van evaluatie in de praktijk te realiseren dienen leraren te beschikken over een
instrumentarium waarmee zij de leerlingen een passend leerstofaanbod kunnen doen dat gericht
is op individuele niveauverhoging. (SLO, 2015 B). We komen hier in 4.3.6 op terug.
De Inspectie van het Onderwijs (2010) constateert dat de feedback die leerkrachten in de praktijk
geven meer op het resultaat dan op het leerproces is gericht. Leerkrachten nemen wel trouw
toetsen af, maar de gegevens worden slechts in de helft van de scholen geanalyseerd en de helft
plant een aangepast verbeteringstraject.
In de praktijk maken leerkrachten gebruik van methode gebonden toetsen. We zullen bij de
methode Pluspunt nagaan of die toetsen informatie bieden over de wijze waarop leerlingen
rekenopgaven oplossen.
4.3.6 Adequate feedback
Het belangrijkste ‘instrumentarium’ voor onderwijs op maat is de vaardigheid van de leerkracht
om adequate feedback te geven. Aan de hand van bevindingen van Vissscher (2015, p. 8 -10)
geven we enig inzicht in een aanpak. Afstemming tussen toets uitslagen en curriculum kan
bereikt worden door, op basis van toetsen die aangeven wat specifiek is bereikt en nog bereikt
moet worden, voor de leerling nieuwe afgestemde doelen te stellen. Het gaat om effectieve
144
feedback van de leerkracht. Uit langdurig onderzoek blijkt dat de prestaties van leerlingen
daardoor zeer kunnen verbeteren Echter, niet alle feedback levert even veel op. Indien bij
rekenen/wiskunde blijkt dat een leerling een zwak getalbegrip heeft, is het gewenst dat de
leerkracht beschikt over diagnostische informatie. Welke type fout maakt een leerling en
waardoor? Is er wel inzicht in het tientalligstelsel? Vervolgens is het belangrijk dat de leerkracht
weet hoe hij/zij een adequate instructie kan geven: instructie op maat. Van de leerkracht wordt
gevraagd die instructie op maat te geven in de klas. Dat vraagt dan om een adequate
klassenorganisatie. Zo kan de leerkracht werken met een instructietafel voor enkele leerlingen
die instructie op maat nodig hebben.
Al met al wordt veel van de leerkracht gevraagd. Bij de discussie en gevolgtrekkingen zullen we
de noodzaak van professionalisering aan de orde stellen.
5. Afstemming doelen, leerstof en toetsing in rekenmethoden
We hebben in de eerste plaats gekozen voor de methode Pluspunt omdat het de meest gebruikte
rekenmethode in het basisonderwijs is, ongeveer 40% (Scheltens, e.a., 2013) en ook omdat bij de
laatste herziening is getracht de methode af te stemmen op de referentieniveaus. We besteden
ook enige aandacht aan Rekentuin. Bij deze adaptieve methode sluiten opgaven en toetsing direct
aan. Rekentuin is echter een methode die naast andere methoden voor extra oefening wordt
gebruikt voor zowel instructie als verwerking.
5.1 Rekenmethode Pluspunt
De methode Pluspunt is ingedeeld in blokken Elk blok duurt 3 weken en bestaat uit 15 lessen.
Les soort les
1 t/m 11 Instructie oefenen en herhalen
12 Toets
13 t/m 15 Remediëren, herhalen en verrijken
5.1.1 Het werken op niveaus
In de methode Pluspunt zijn de referentieniveaus geïntegreerd. De vier referentiedomeinen:
getallen, verhoudingen, meten en meetkunde en verbanden zijn zichtbaar verwerkt (Malmberg,
2015). De differentiatie op basis van de referentieniveaus 1F en 1S begint pas echt in de
bovenbouw, vooral in groep 7 en 8. Tot groep 5 wordt de groep bij elkaar gehouden maar er
wordt wel gedifferentieerd naar niveau. In groep 6 lopen de niveaus meer uiteen. Het is een
schakeljaar waarin wordt bepaald welk niveau leerlingen aankunnen.

145
In de lesstof voor alle groepen zijn de referentieniveaus zichtbaar verwerkt:
1 Ster: werkt toe naar 1F-niveau eind basisschool;
2 Sterren: werkt toe naar 1S-niveau eind basisschool;
3 Sterren: werkt toe naar 1S+ eind basisschool (boven streefniveau).
Naast de steraanduidingen zijn de referentieniveaus in groep 7 en 8 herkenbaar in het materiaal.
Op de linker pagina van het leerling materiaal staat steeds de stof op 1F-niveau, op de
rechterpagina staat de stof op 1S-niveau.
Het doel op 1 ster niveau is de kinderen met veel extra instructie te brengen op het 2 sterren
niveau. Voor kinderen die beter presteren biedt Pluspunt extra het 1S+ niveau dat echter niet in
het referentiekader is opgenomen. Voor leerlingen die 1F niet aan kunnen is er Leerroutes dat
maatwerk levert voor zwakke rekenaars.
De beslissing om kinderen op 1 ster niveau te laten werken of met Leerroutes neemt de
leerkracht samen met de IB-er.
In groep 7 en 8 vindt de instructie op 2 niveaus plaats: 1F en 1S. In het begin van de les doen alle
kinderen mee aan de instructie op 1F niveau. Daarbij gaat het om de basiskennis en -inzichten
die alle leerlingen moeten beheersen. Na deze instructie gaan de kinderen die op 1F niveau
werken aan het werk en de andere kinderen gaan door met de instructie op 1S niveau.
5.1.2 Toetsing
Na 11 lessen volgt de toets en op basis van de uitslagen volgen drie lessen voor: remediering,
herhaling, verrijking. Na deze lessen kan een schaduwtoets worden afgenomen om te bepalen of
de leerdoelen alsnog zijn bereikt.
Er zijn ook kwartaaltoetsen waarmee wordt vastgesteld of de leerstof wordt beheerst. Deze
kwartaaltoetsen bereiden voor op de Eindtoets.
De methode beschikt over digitale toetsen. De leerkracht hoeft alleen het aantal fout per opdracht
in te typen. Per blok wordt een overzicht opgesteld met de leerinhouden 9 onderwerpen) doe
leerlingen wel of niet beheersen.
Deze toetsen stellen automatisch een taakbriefje op met uitsplitsingen voor remediering,
herhaling, verrijking. Dankzij een koppeling met de oefensoftware worden per kind de juiste
oefeningen digitaal klaargezet. De kinderen verwerken de leerstof digitaal op hun tablet, laptop
of pc en krijgen direct feedback op hun gemaakte opgaven.
Gaande weg het schooljaar ontstaat een rekenprofiel voor elk kind en de hele groep. Het
overzicht brengt het beheersingsniveau in beeld van de zes rekenonderwerpen van de methode
Pluspunt, zowel op leerling- als klassenniveau:
Getalbegrip
Basisvaardigheden optellen en aftrekken
Basisvaardigheden vermenigvuldigen en delen
Meten
Meetkunde en Ruimtelijk Oriëntatie
146
Verhoudingen - Breuken – Procenten
5.1.3 Leerroutes voor zorg op maat
Op basis van Passende Perspectieven (SLO) zijn leerroutes specifiek voor Pluspunt ontwikkeld
voor leerlingen met specifieke onderwijsbehoeften (van Hall en Versteeg, 2014).
Leerroute 1 is voor de leerling die 1F halen in groep 8 aan de hand van Passende
Perspectieven leerlijnen, inzet van hulpmiddelen en het stellen van gerichte prioriteiten
(bijvoorbeeld het kiezen van specifieke oplossingsstrategieën);
Leerroute 2 is voor de leerling die 1F in Groep 8 nog niet (geheel) zal halen maar 1F
waarschijnlijk wel zal halen in het voortgezet onderwijs.
Leerroute 3 is voor de leerling die (onderdelen) 1F niet haalt in Groep 8 en dit ook niet
geheel zal halen in het voortgezet onderwijs.
5.1.4 Bevordering van ‘gelegenheid tot leren’ in de methode Pluspunt
Een gesprek met medewerkers van de uitgeverij Malmberg die de rekenmethode Pluspunt
hebben ontwikkeld geeft informatie over de wijze waarop de methode is afgestemd op de
referentieniveaus en hoe de afstemming tussen vorderingen van leerlingen en leerprogramma
wordt mogelijk gemaakt
Referentieniveaus
Vanaf 2008 is gewerkt aan de herziening van de methode Pluspunt om de methode af te stemmen
op de referentieniveaus. Een van de opgaven was om de methode te laten voldoen aan de
referentieniveaus 1F en 1S. Het referentiekader, opgesteld door de commissie Meijerink en
gereed gekomen in 2008, was destijds de Tweede Kamer nog niet gepasseerd. Er was nog
onzekerheid over of de niveauverhoging, als gevolg van de voorgestelde referentieniveaus,
geaccepteerd zou worden. De referentieniveaus betreffen immers beheersingsniveaus terwijl de
bestaande kerndoelen streefdoelen waren. Het was de vraag of de overheid er toe over zou gaan
om de gewenste beheersingsniveaus vast te stellen, omdat de ‘vrijheid van inrichting’ in het
Nederlandse onderwijs een lange traditie heeft.
Zoals eerder aangegeven geven de referentieniveaus in vergelijking tot de kerndoelen wel
duidelijker aan wat bereikt moet worden, maar bieden toch ruimte voor interpretatie. In het
rapport van de commissie Meijerink zijn daarom ter concretisering voorbeeldopgaven over
genomen uit Balans 32, PPON 2008. Dit rapport van PPON heeft de commissie Meijerink ook
gebruikt om de referentieniveaus vast te stellen. Later heeft ook de SlO voorbeeldopgaven
geplaatst bij de referentieopgaven die van een lager niveau zijn dan de PPON-opgaven.
De intentie van de methodeontwikkelaars was om de methode zo in te richten dat zwakke
rekenaars zo goed mogelijk worden ondersteund. De uitgevers namen waar dat in de praktijk
voor zwakke rekenaars een keuze werd gedaan uit de opgaven. De intentie van de invoering van
de referentieniveaus is nu juist dat de leerlingen de opgestelde opgaven van de vier domeinen
over de hele breedte kunnen maken. Pluspunt probeert te voorzien in een aanbod op alle niveaus
zodat leerlingen het voor hen hoogst bereikbare niveau kunnen bereiken.

147
De domeinindeling van Pluspunt zijn hieronder ondergebracht in de domeinen van de commissie
Meijerink.
Getallen
Getallen
Bewerkingen
Verhoudingen
Breuken
Meten en meetkunde
Meten
Meetkunde
Verbanden
Tabellen en grafieken
De domeinen de commissie Meijerink (getallen, verhoudingen, meten, verbanden) zijn niet met
die aanduidingen in de methode opgenomen omdat de indeling in domeinen van het
referentiekader vrij grof is en leerkrachten behoefte hebben aan een voor hen herkenbare
indeling. Deze indeling sloot ook aan bij de indeling van het Lvs van het Cito. (Volgens de
uitgever van Pluspunt dekken de gebruikte domeinen de domeinen van cie Meijerink).
Organisatie van het rekenonderwijs
Tot groep 6 worden de kinderen bijeengehouden en worden kinderen nog niet in den brede op
een aangepast niveau geplaatst. Voor de rekenzwakke leerlingen is er echter wel een aangepast
aanbod in de vorm van voorbeeld opgaven en mogelijkheden voor extra herhaling. Voor
rekensterke leerlingen zijn er verrijkingsopgaven. Groep 6 wordt als een ‘diagnostisch’ jaar
beschouwd, waarin door de leerkracht een zorgvuldig besluit wordt genomen op welk niveau de
leerlingen in de komende twee jaar gaan werken. De inzet is dat zoveel mogelijk leerlingen op
niveau 1S werken.
Voor een kleine groep is 1S niet haalbaar en is voor dat groepje het bereiken van 1F het doel.
Maar het streven hoort wel te zijn dat met extra ondersteuning die kinderen alsnog naar niveau
1S worden gebracht. Vanaf groep 7 werken kinderen op 1S of 1F niveau. De eerste instructie in
de rekenles is bestemd voor alle leerlingen. Daarna vangen leerlingen die op 1F niveau werken
aan met de verwerking van de opdrachten en biedt de leerkracht extra instructie aan de leerlingen
die het 1S niveau volgen.
Voor de zwakste rekenaars, voor wie het niveau 1F niet haalbaar is, is er het afzonderlijke
programma ‘Maatwerk.’ Tevens is er een digitaal adaptief programma met oefeningen. Op basis
van gemaakte fouten wordt het aanbod aangepast. De leerkracht biedt de leerlingen dat deel van
het adaptieve programma aan dat afgestemd is de leerling.
148
Toetsing
Na een blok van twee weken volgt in de derde week een toets. De leerstof die wordt getoetst is in
het voorgaande blok aangeboden en geoefend (4 nieuwe doelen en 4 toetsdoelen). De nieuwe
doelen worden in het volgende blok nogmaals aangeboden en geoefend (dat zijn in dat blok dan
de vier toetsdoelen). Op basis van de toetsuitslagen wordt de volgende dag een ‘diagnostische’
les gegeven waarbij opvallend sterke resultaten en opvallend zwakke resultaten aan de orde
komen. In de dagen daarna wordt de lestijd besteed aan verrijkingsopgaven, herhalingsopgaven
en RT.
Opmerkelijk is dat de methodeontwikkelaars eerst de bloktoetsen hebben opgesteld en daarna de
leerstof per blok hebben bepaald. Zo kwam een duidelijke samenhang tussen aangeboden
leerstofaanbod en toetsing tot stand.
De methode beschikt ook over kwartaaltoetsen. Die toetsen hebben de functie om te toetsen wat
leerlingen nog beheersen van de stof die in de afgelopen periode aan de orde is geweest en at ze
al beheersen van de leerstof die in het komende kwartaal wordt aangeboden. Dit laatste is vooral
bedoeld om voor leerlingen die deze ‘nieuwe’ stof al beheersen en passend aanbod te bieden.
5.1.5 Pluspunt in de praktijk
Plaatsing van leerlingen op niveau
In een gesprek met een leerkracht van een basisschool in Utrecht, met leerlingen afkomstig van
een qua sociale achtergrond gemengde wijk, kwam naar voren hoe in de groep met de methode
Pluspunt werd gewerkt
In deze basisschool wordt in groep 6 al in niveaus gewerkt. Aan het eind van groep 5 wordt door
leerkrachten beraadslaagd over het plaatsen van leerlingen in niveaugroepen. Dat gebeurt bij de
overdracht van groep 5 naar groep 6. Bij het nemen van een besluit per leerling worden de Cito-
scores (Lvs) geraadpleegd en wordt er gekeken naar de mate van extra instructie en
ondersteuning die gewenst is.
De verdeling per niveau in de huidige groep is ongeveer als volgt; 1F: 3 leerlingen, 1S: 21
leerlingen en 1S+: 6 leerlingen. Gemiddeld genomen is het rekenniveau hoog.
Het rekenonderwijs vraagt in het begin van het schooljaar, wanneer je met een nieuwe groep
begint, voorbereiding. Dat gebeurt in de dagen na de zomervakantie voor de school begint. De
leerkracht raadpleegt voor een nieuw blok en les de handleiding zodat de stof en de aanpak
duidelijk is. Tijdens de rekenles heeft de leerkracht de handleiding van rekenen, anders dan bij
ander vakken, altijd paraat.
De organisatie van het werken in niveaus
De leerkracht zet uiteen hoe het rekenonderwijs is georganiseerd. De eerste instructie is voor alle
kinderen gelijk. Het doel van de les staat dan op het digibord. De 1S+ leerlingen worden snel aan
149
het werk gezet (d.w.z. op 3 sterrenniveau). Deze leerlingen maken niet alle opgaven. (Het
‘compacten’ wordt in Pluspunt mogelijk gemaakt doordat die opdrachten in een kader van de
handleiding zijn aangegeven). Daarna volgt voortgezette instructie aan de 1F en 1S leerlingen.
Vervolgens gaan ook de 1S leerlingen aan het werk. De 1F leerlingen ontvangen afgestemde
instructie aan de instructietafel. Daaraan worden vaak ook enkele 1F leerlingen aan toegevoegd
die met extra instructie op 1S niveau kunnen werken.
De leerkracht heeft de ervaring dat de leerlingen die aan de instructietafel komen de neiging
hebben een afwachtende houding aan te nemen, zo van de meester legt het nog een keer uit. Het
steeds plaatsen van leerlingen aan de instructietafel heeft ook een stigmatiserende werking. De
leerkracht zet 1F leerlingen daarom ook vaak aan het werk op hun eigen plaats en helpt ze dan
individueel tijdens de rondgang. Een andere manier is om een 1F leerling bij een 1S leerling te
zetten zodat er samengewerkt wordt.
Het na de rekenles centraal afsluiten met een evaluatie is moeilijk. Er is onvoldoende rust. De
leerkracht kijkt op de volgende dag terug naar de verwerkte opdrachten, voordat het nieuwe les
doel aan de orde wordt gesteld.
De toetsing
De leerkracht geeft in het interview ook weer hoe de toetsing verloopt en waar de toetsing toe
leidt. De opeenvolgende blokken stellen steeds een specifiek onderwerp aan de orde, zoals
bijvoorbeeld geld- of meetsommen. De toets dekt het voorafgaande blok waaraan 2 weken is
gewerkt. De toetsen worden schriftelijk gemaakt en door de leerkracht nagekeken. De uitslagen
worden daarna digitaal verwerkt. De 1F leerlingen moeten 60 tot 80% goed scoren. De 1S
leerlingen 80 tot 90% en de S1+ leerlingen 90 tot 100%.
Het digitale overzicht geeft aan welke kinderen verrijkings- of herhalingsopdrachten of RT
ontvangen. Daar is maar twee dagen tijd voor. Voor RT-leerlingen biedt Pluspunt aparte
werkbladen. De feedback n.a.v. de toetsuitslagen vindt niet in de groep plaats, maar individueel
bij de leerlingen die dat nodig hebben. Het komt wel voor dat een 1F leerling, na veel extra
ondersteuning naar het 1S niveau kan. Belangrijk is dat zo’n leerling meer zelfvertrouwen krijgt.
Als dat groeit, worden ook de prestaties beter. Van RT-leerlingen wordt na twee extra dagen
ondersteuning de toets nog een keer afgenomen om te zien of het resultaat beter is
(schaduwtoets).
Twee maal per jaar wordt de Cito-toets afgenomen (Lvs). De verschillende soorten
toetsopdrachten (domeinen) staan kris kras door elkaar. Dat blijkt voor sommige leerlingen extra
moeilijk, omdat ze steeds een andere oplossingsstrategie moeten kiezen. Ze halen dan soms een
lager score dan de verwachting was op basis van de toetsuitslagen na de blokken.
Een andere ervaring is dat leerlingen soms teveel gespitst zijn op het antwoord en vergeten na te
denken over de aanpak van het rekenprobleem. Welke oplossingsmethode is adequaat?
Ook tijdens het contact met medewerkers van Malmberg werd terzijde opgemerkt dat leerlingen
niet aan hun lot moeten worden overgelaten. Het is van belang is dat leerlingen snel en handig
150
rekenproblemen leren oplossen en daarbij efficiënte oplossingsstrategieën gebruiken. Deze
dienen bij het rondgaan ook aangereikt te worden. In de handleiding wordt daar veel aandacht
aan besteed. Daarom is het belangrijk dat leerkrachten ter voorbereiding de handleiding
raadplegen. We hebben al eerder opgemerkt dat tijdsproblemen er toe kunnen leiden dat alleen
de leerlingenboekjes worden gevolgd en de leidraad vormen van het dagelijks handelen.
Natuurlijk moeten de leerkrachten dat doen, maar om de leerlingen zo goed mogelijk te
ondersteunen bij de rekenopgaven en de problemen daarbij is het belangrijk dat de leerkracht bij
de voorbereiding van de rekenles de handleiding voor leerkrachten raadpleegt. De handleiding
biedt immers veel informatie over problemen die de leerkracht kan tegenkomen en biedt ook
suggesties voor de aanpak van problemen.
5.2 Rekenmethode Rekentuin
Een adaptieve methode
Adaptieve methoden hebben vaak een positief effect op rekenprestaties. Veel oefenen op het
juiste niveau, met directe feedback en individuele begeleiding van een leerkracht is essentieel
voor het bereiken van resultaat (Ericsson,2006). De leerkrachten komen daar in de praktijk vaak
niet aan toe. Rekentuin biedt als adaptief rekenprogramma daarvoor een oplossing. De responses
van de leerlingen worden automatisch geanalyseerd en teruggekoppeld naar de leerkracht in de
vorm van foutenanalyses, groeicurven en andere vergelijkingen. Ook de responstijd van de
leerling wordt meegewogen. Het toegepaste algoritme zorgt voor afgestemde oefenreeksen. Het
gebruikte algoritme is gebaseerd op het Elo-systeem dat in de schaakwereld wordt gebruikt.
Rekentuin bereikt zowel zwakke als (zeer) goede rekenaars want de moeilijkheid van de sommen
wordt automatisch aangepast aan de vaardigheid van de leerling. Het streven is dat leerlingen
veel leren van korte, gerichte, op niveau afgestemde oefeningen (Maas, van der, e.a., 2009;
Straatemeijer, e.a., 2008-2009).
Rekentuin is gericht op automatiseren en memoriseren van hoofdbewerkingen
(optellen, aftrekken, vermenigvuldigen, delen en breuken). De overige spelletjes richten zich op
inzicht (Cijfers), langzame rekenaars (Slowmix), logisch redenren (Bloemencode), klokkijken
(Klokkijken) en op de domeinen breuken, procenten en verhoudingen (Breuken)
Ook al is Rekentuin een zelfregulerende, stimulerende programma is het van toch belang dat de
leerkracht de leerling regelmatig controleert en stimuleert bij het uitvoeren van de oefeningen
(Haerlemans en Ghijsels, 2014).
Digitale toetssystemen zoals Rekentuin zullen belangrijker worden. Het voordeel is dat ze een
snelle feedback aan leerling en leerkrachten geven. Uit onderzoek blijkt echter dat leerkrachten
weinig doen met de feedback die ze digtaal kregen ( Faber en Visscher, 2016).
Er is er nog geen directe koppeling met de referentieniveaus. In de toekomst zal Rekentuin
voldoen aan alle referentieniveaus.
151
Rekentuin is ontwikkeld door de Programmagroep Psychologische Methodenleer van de UVA in
Amsterdam. Er werken ongeveer 1500 basisscholen met het programma. Er wordt van uit gegaan
dat leerlingen ongeveer 20 tot 30 minuten per week oefenen. Rekentuin bevat ruim 20 000
opgaven
Een praktijkervaring
Op de bezochte school wordt sinds anderhalf jaar, naast Pluspunt, Rekentuin ingezet om
leerlingen zowel op school als thuis extra oefening te bieden. De leerling moet er volgens de
leerkracht wat visueel voor zijn ingesteld en moet gemakkelijk patronen kunnen herkennen.
Rekentuin wordt ook gebruikt voor de RT-leerlingen. Rekentuin biedt mogelijkheden voor extra
inoefening. De beschikbare I-pads worden voor Rekentuin gebruikt.
Tijdens het werken aan Rekentuin is het gewenst dat de leerlingen niet gestoord worden omdat
dat ten koste gaat van de tijdscore. De leerlingen zijn er op gebrand om zoveel mogelijk ‘te
verdienen’ en een zo rijk mogelijk tuin te maken. Soms helpen de leerlingen daarbij elkaar,
hetgeen niet de bedoeling is.
De leerkracht vindt dat het wel nodig is dat meer tijd besteed wordt aan het volgen van de
leerlingen omdat het gevaar aanwezig is dat het een vrijblijvende activiteit blijft. Daarover willen
de leerkrachten in de school afspraken maken (zie Haerlemans, Ghijsels, 2014).
Het team heeft, volgens de leerkracht het plan om Rekentuin school breed en structureel in te
zetten om in het bijzonder het automatiseren te verbeteren
Bij Pluspunt zijn de referentieniveaus verwerkt in het rekenprogramma. Daarbij zijn de
voorbeelden die bij het referentiekader van betekenis geweest. Bij Rekentuin dekt nog niet alle
domeinen van de rekenreferentieniveaus. Dat is ook niet per se nodig omdat rekentuin
vooralsnog een aanvullend oefenprogramma is.
Bij Rekentuin is de terugkoppeling van prestatie naar opdrachten veel directer dan bij Pluspunt.
Toch zien we dat bij Pluspunt ook consequente aan dacht besteed wordt aan terugkoppeling om
te bereiken dat leerlingen op het gewenste niveau werken. Een cyclus van twee weken is
overzichtelijk.
Bij Pluspunt speelt de ondersteuning en feedback van de leerkracht op basis van toetsen en ook
observaties een belangrijke prestatie bevorderende rol. Ook al is Rekentuin selfsupporting, toch
blijkt tevens dat sturing van de leerkracht van belang is.
Een voordeel van Rekentuin is dat de koppeling van toetsing in het programma zit terwijl bij
Pluspunt de activiteit van de leerkracht essentieel is
6. Discussie en gevolgtrekkingen.
Gelegenheid tot leren (Opportunity to learn (OTL) betreft het realiseren van een scherpe
afstemming van getoetste, specifieke leerdoelen en de instructie en leerstofopdrachten voor
leerlingen.
152
De intentie van dit hoofdstuk is aan te geven hoe ‘gelegenheid tot leren’ in de onderwijspraktijk
al (deels) gerealiseerd wordt binnen het vak reken/wiskunde en dat dit heeft plaatsgevonden
binnen de context van onderwijsbeleid en onderwijsverbetering.
6.1 Discussie
Beleidsmaatregelen ter verbetering van de kwaliteit in het onderwijs
Al meer dan 10 jaar is de overheid nadrukkelijk gericht op de verbetering van de kwaliteitszorg
in het onderwijs. Vanaf 2005, toen er publicaties verschenen betreffende internationaal
vergelijkend onderzoek (o.a. PISA) over de achteruitgang van de prestaties van Nederlandse
leerlingen in de kernvakken en betreffende Nederlands onderzoek over de teruglopende
rekenprestaties (PPON-onderzoek), volgden beleidsmaatregelen van overheidswege om de
kwaliteitszorg aan te scherpen. Al eerder had de overheid van uit haar zorg voor de
deugdelijkheid van het onderwijs de inspectie toegerust met een meer objectieve toetsingskader.
Vanaf 2007 werden maatregelen genomen die meer direct betrekking hadden op de inhoud van
het onderwijs. Dat is opmerkelijk omdat het Nederlandse onderwijs gekenmerkt is door ‘vrijheid
van richting en inrichting.’
Een van de belangrijkste maatregelen was het opstellen van een referentiekader voor de
kernvakken (Cie, Meijerink). Het eerste doel van het referentiekader was voor kernvakken
beheersingsniveaus aan te geven in plaats van streefdoelen zoals bij de kerndoelen het geval is.
Het tweede doel was om doorlopende leerlijnen van primair naar voortgezet onderwijs te
realiseren zodat beheersingsdoelen, eventueel op een later tijdstip door leerlingen nog bereikt
kunnen worden.
Onderwijskundige maatregelen ter verbetering van de kwaliteit van het onderwijs
Ook onderwijskundig gezien tekende zich een andere aanpak af. Was in het verleden vele jaren
lang het accent gelegd op differentiatie in de zin van afstemming op individuele eigenschappen
en behoeften van leerlingen, nu werd er meer accent gegeven aan het bereiken van
basisvaardigheden van leerlingen die essentieel zijn om in de maatschappij te kunnen
functioneren vanuit het besef dat zwakke taal- en rekenvaardigheid leiden tot achterstand,
werkeloosheid en armoede.
De overheid lanceerde niet alleen een wettelijk vastgesteld referentiekader maar ook een nota
waarin opgeroepen werd zich in het onderwijs nadrukkelijk te richten op de opbrengst van het
onderwijs, zowel op klas-, school- als bestuurlijk niveau.
Het referentiekader heeft met de beheersingsdoelen een functie binnen het opbrengstgericht
onderwijs. Met de aangegeven niveaus worden voor alle leerlingen in den brede haalbare doelen
gesteld die bereikt behoren te worden. De referentieniveaus hebben in de loop van enkele jaren
er toe geleid dat de relevante onderwijsmethoden er op zijn afgestemd.
153
De kwaliteit van het rekenwiskunde-onderwijs
Er ontstond vanwege de teruglopende rekenprestaties ook een discussie over de inrichting van
het bestaande rekenonderwijs dat geïnspireerd was door het realistisch rekenen, waarbij veel
aandacht aan context werd besteed, variatie in oplossingsaanpakken. Critici met een striktere
benadering van het rekenwiskunde-onderwijs vroegen meer aandacht voor het formele rekenen,
voor rekenvaardigheden die een basis bieden voor het wiskunde onderwijs in het vo. In feite ging
het om de vraag of meer accent op het formele rekenen dan het functionele rekenen gelegd moest
worden. In het referentiekader hebben zowel functionele als formele rekenwiskunde
beheersingsdoelen hun plaats gekregen waarbij op fundamenteel niveau het functionele rekenen
accent krijgt en het formele rekenen op streefniveau. Het rekenen op fundamenteel niveau (1F) is
dan ook gericht op leerlingen die voor het vmbo worden opgeleid en het rekenen op streefniveau
(1S) is voor leerlingen waarvoor havo/vwo in het verschiet ligt.
Opmerkelijk is dat de afgelopen jaren het rekenwiskunde-onderwijs in het kader van
kwaliteitszorg veel nadruk heeft gekregen. In het verleden, bijvoorbeeld binnen het
onderwijsachterstandenbeleid, stond taalontwikkeling voorop en was er weinig aandacht voor
rekenvaardigheden.
Omdat de beheersingsdoelen van het referentiekader reken/wiskunde toch veel
interpretatieruimte gaven, zijn later referentiesets opgesteld voor de toetsing van taal- en
rekenprestaties met in feite toetsitems als voorbeelden. Zo is de referentie-set rekenen een
leidraad voor de inhoud van de Centrale Eindtoets Primair onderwijs en ook voor het
Leerlingvolgsysteem (Lvs). Die toetsen hebben echter vooral de functie van niveaubepaling en
zijn minder van diagnostische waarde voor sturing van leerprocessen.
Resultaatgericht didactisch handelen van leerkrachten: gelegenheid tot leren
Al deze maatregelen zijn er op gericht condities te scheppen voor verbetering van de kwaliteit
van het onderwijs, waarbij het referentiekader en de referentiesets mede de inhoud van het
onderwijs bepalen.
Een stap verder is om ook het resultaatgerichte didactische handelen van leerkrachten zowel
meer richting als flexibiliteit te geven. Daarvoor biedt ‘gelegenheid tot leren ‘ (Opportunity to
Learn) een model. Het doel is om een meer directe afstemming te bereiken tussen het leren en de
toetsing. In feite is het doel om specifiek didactische handelen ‘op maat’ te realiseren. Het
streven daarbij is om dit handelen niet geheel afhankelijk te maken van de individuele
didactische werkwijze van de leerkracht, maar dat het curriculum, inclusief afgestemde toetsen
de leerling leidt. Zo dienen binnen het rekenwiskunde-onderwijs doelen, leerstof en toetsen
zodanig op elkaar in tijd te zijn afgestemd dat een directe adaptatie aan het leren van leerlingen
mogelijk is.
154
We constateerden dat het model voor bevordering van ‘gelegenheid tot leren’ is gebaseerd op
een objectivistische benadering van onderwijs dat niet zo lijkt te rijmen met een
constructivistische benadering van het onderwijs, die veel aandacht krijgt, waarin het
zelfregulerend leren beoogd wordt. De eigen cognitieve kracht van leerlingen staat centraal
(leerlingen die bewust naar hun eigen leerproces kijken). De regie van het leerproces ligt hier bij
de leerling terwijl bij ‘gelegenheid tot leren’ het curriculum of de methode zelf voor een groot
deel het leerproces regisseert.
Deze twee perspectieven zijn minder strijdig dan het lijkt. Weloverwogen ordening en
afstemming van leerstof en toetsing biedt de leerling immers de kans om efficiënt vaardigheden
te verwerven die in andere vrijere leersituaties van pas komen. Het onderwijs biedt genoeg
ruimte om te leren velerlei problemen zelf op te lossen.
Resultaatgericht en ‘op maat’ werken in de praktijk van het rekenwiskunde-onderwijs
In de afgelopen jaren is ook in de praktijk van het rekenwiskunde-onderwijs geïnvesteerd om de
opbrengst van het onderwijs veilig te stellen. Zo zijn in de rekenwiskunde-methode Pluspunt,
door 40% van de scholen gebruikt, de referentieniveaus 1F en 1S verwerkt en is een extra 1S+
niveau toegevoegd. Vanaf klas 6 worden leerlingen geleid naar het voor hen best bereikbare
beheersingsniveau.
Er wordt gewerkt met leerstofblokken van twee weken die in de derde week worden afgesloten
met een bloktoets. Op basis van de toetsuitslagen vindt RT, herhaling en verdieping plaats.
Opmerkelijk is , vanuit het gezichtspunt van OTL, dat bij de uitlijning van Pluspunt eerst de
blok-toetsen zijn opgesteld en daarna de leerstof per blok.
Uit een gesprek met een ervaren leerkracht blijkt dat het blok/toetssysteem leidt tot een
behoorlijk mate van adaptief onderwijs. Ieder blok is verdeeld in lesdoelen. De beheersing van
de leerstof wordt getoetst na twee weken. De digitale toetsuitslag biedt de leerkracht
nauwkeurige informatie over het soort rekenproblemen die door bepaalde leerlingen niet wordt
beheerst. Na de toets geeft de leerkracht hulp op maat aan enkele leerlingen, aan een
instructietafel of individueel aan hun werktafel.
De leerkracht wees er op dat het belangrijk is er op te letten dat leerlingen bij het uitvoeren van
opdrachten handige oplossingsstrategieën gebruiken zodat ze deze ook snel leren uit te voeren
Hij pleitte voor het geven van individuele feedback. Dit sluit aan bij de constatering uit
onderzoek (Vissher, 2015) dat frequente feedback en doelen stellen op basis van diagnose van
problemen de prestaties van leerlingen sterk verbeteren. De geïnterviewde leerkracht probeert
een vorm van ‘gelegenheid tot leren’ te bevorderen met de methode Pluspunt die daartoe goede
mogelijkheden biedt.
Het systeem van blokken van 2 weken in combinatie met de drie werkniveaus met afsluitende
toetsen en ‘reteaching’ en verrijking biedt immers redelijk veel adaptieve mogelijkheden.
155
Dezelfde leerkracht gebruikt naast Pluspunt ook de digitaal opgezette adaptieve rekenwiskunde-
methode Rekentuin. De leerlingen kunnen daar op school en thuis zelf aan werken. Het
leerproces wordt digitaal bijgestuurd. Het lijkt de ideale vormgeving van
‘ gelegenheid tot leren.’ De geïnterviewde leerkracht wijst op het gevaar van vrijblijvendheid.
Ook bij Rekentuin moet het werk van leerlingen gevolgd worden en is een schoolbreed beleid
gericht op adequaat gebruik nodig.
6.2 Enkele gevolgtrekkingen
Uit deze oriëntatie naar ‘gelegenheid tot leren’ blijkt dat op beleidsniveau en op landelijk
ondersteuningsniveau de afgelopen jaren veel is bijgedragen aan het mogelijk maken van
opbrengstgericht werken (toetsingskader inspectie, referentiekader, referentiesets). Het
belangrijkste is dat er beheersingsniveaus zijn gekomen voor alle leerlingen, in het bijzonder
voor de basisvakken. De landelijke volg- en eindtoetsen zijn daarvoor bijgesteld. Vervolgens
heeft dit geleid tot bijvoorbeeld rekenwiskunde-methoden die duidelijke beheersingsdoelen
stellen waarvan leerstof en toetsen zijn afgeleid en afgestemd op leerlingen met verschillende
begaafdheden. Dit kan in de praktijk bijdragen aan adaptief onderwijs dat aardig in de richting
komt van de bedoelingen van ‘gelegenheid tot leren’ (OTL). Toch zijn er veel signalen uit de
praktijk dat het vaak ontbreekt aan optimale leersituaties. Leerkrachten volgen de
leerlingenboekjes en raadplegen te weinig de handleiding die informatie geeft over verschillende
aanpakken. Leerkrachten zetten leerlingen aan het werk (zelfstandig werken) maar geven te
weinig feedback bij gebrek aan diagnostische gegevens.
Scholing van leerkrachten
Verbeterde rekenmethoden met beheersingsniveaus en controle daarop geven een
kwaliteitsimpuls aan het rekenonderwijs, maar tevens is daarvoor scholing van leerkrachten
nodig teneinde hen te bekwamen in nieuwe didactische aanpakken.
Visscher (2015, p. 12-15) stelt als voorwaarde voor scholing van leerkrachten dat het beoogde
leerkrachtengedrag, bijvoorbeeld bij OTL, helder is omschreven.
Visscher constateert dat er weinig sprake is van een geïntegreerde benadering (leerkrachten,
leerlingen, materialen, organisatorische context) om een specifieke verbetering in de school te
realiseren. Dat is wel een vereiste. Het vraagt ook planning en tijd. Implementatie van
bijvoorbeeld een nieuwe rekenaanpak, met het doel betere resultaten te bereiken, duurt drie jaar.
Er moet immers routine in het didactisch handelen ontstaan.
Teamscholing
Verbetering van het didactische handelen van leerkrachten vereist een teamaanpak omdat de
resultaten immers worden bereikt in opeenvolgende leerjaren in een longitudinaal
156
rekenwiskunde-programma. Dat wordt weleens vergeten. Schoolleiders hebben hier een
belangrijke stimulerende en organiserende rol. De schoolbesturen dienen schoolleiders en
scholen daartoe op te roepen en de voorwaarden te scheppen. Ze kunnen scholen stimuleren tot
samenwerking rond specifieke thema’s (die scholen overigens wel zelf moeten kiezen), mede
door scholen daartoe te faciliteren met extra uren en inhuren van experts van buiten.
Oberon (Weijers, Hilbrink, Appelhof, 2015) deed verslag van een verkenning naar de wijze
waarop een viertal schoolbesturen en scholen proberen om professionalisering van leerkrachten
(HRM-beleid) te koppelen aan schoolverbetering. Enkele voorwaarden zijn van belang om dit te
bereiken.
Allereerst de verbinding van het geleerde met de praktijk. Dat kan door binnen een team een
speerpunt als OTL aan te pakken waarbij toegewerkt wordt naar praktijkverbetering in de klas.
Voorwaarde is dat het geleerde direct toepasbaar is. Daarbij kunnen enkele leerkrachten zich
ontwikkelen tot experts binnen het team of binnen een kenniskring van scholen (onder hetzelfde
scholbestuur).
Een volgende voorwaarde is te werken van individueel naar teamleren. Kennis en kunde dient
overgedragen te worden naar alle teamleden. Voorwaarde is draagvlak in het team dat bereikt
kan worden door een open cultuur waarbij visie-ontwikkeling, uitwisseling en klassenbezoek
normaal is.
Tenslotte is het scheppen van randvoorwaarden essentieel om het organiseren van
kwaliteitskringen, lesbezoeken en het vormen van professionele leergemeenschappen mogelijk te
maken.
Het perspectief
Het is lang niet zeker of in de komende jaren de aandacht van de overheid gericht blijft op de
basiskennis en de basisvaardigheden. De afgelopen jaren heeft dat een sterk accent gehad
waardoor andere kwaliteiten van het onderwijs minder werden belicht. In vele publicaties
(tijdschriften voor onderwijsgevenden en publieke media) wordt de stelling ‘onderwijs is meer
dan leren’ omarmd.
De weerslag daarvan zien we in de nota ‘Ons Onderwijs 2032.’ ( Platvorm Onderwijs 2032,
2016). Het onderwijs, zo wordt gesteld, dient gericht te zijn op onder meer maatschappelijke
oriëntatie, burgerschap, persoonlijke ontwikkeling. Dit is niet zo vreemd omdat er in de huidige
tijd grote bewegingen in de samenleving zijn die van jongeren veel zelfsturing en oriëntatie
vragen.
In de nota wordt overigens wel het verwerven van basisvaardigheden een voorwaarde genoemd
voor maatschappelijke participatie. Aangezien we in Nederland te maken hebben met een scherp
en vroegtijdig selecterend schoolsysteem, met gebruik van objectieve toetsing en examinering,
zal dat uiteindelijk het belang van de basisvaardigheden blijvend bevestigen.
157
Bronnen
Appelhof, P. N. (1979). Begeleide onderwijsvernieuwing: evaluatie van een curriculum-
innovatie gericht op differentiatie van het aanvankelijk leesonderwijs. (Tilburg: Zwijsen).
Blok, H., Ledoux, G., Roeleveld, J. (2013). Opbrengstgericht werken in het primair onderwijs:
Theorie en praktijk. Discussiebijdrage. Amsterdam: Kohnstamm Instituut.
Bosker, R. J. (2005). De grenzen van gedifferentieerd onderwijs. Groningen: RU; GION.
Boswinkel, N., Buijs, K., Os, S van (2012). Passende Perspectieven. Enschede: SLO.
Craats, J. van de (20 mrt. 2008). Waarom Daan en Sanne niet kunnen rekenen. Zwartboek
rekenonderwijs. Amsterdam: UvA.
CvTE. (sept., 2014a). Rapportage: Referentiesets Nederlandse taal lezen) en rekenen.
Verantwoordingsproject. Utrecht: College voor Toetsen en Examens.
CvTE. (sept., 2014b). Referentieset Rekenen 1F. Referentiesets taal en rekenen. Utrecht: College
voor Toetsen en Examens.
CvTE. (mei, 2015). Verantwoording Centrale Eindtoets PO versie 1.1. Utrecht: College voor
Toetsen en Examens.
CvTE. (sept.,2015a). Rapportage referentieniveaus taal en rekenen 2014-2015. Invoering
centrale toetsing en examinering referentieniveaus Nederlandse taal en rekenen MBO,VO en PO
en Engels voor MBO-4. Utrecht: College voor Toetsen en Examens.
CvTE. (sept., 2015b). Kwaliteit van de Centrale Eindtoets in 2016. Utrecht: College voor
Toetsen en Examens.
CvTE. (2015c).Terugblik 2015. Resultaten Centrale Eindtoets 2015. Utrecht: College voor
Toetsen en Examens.
Doolaard, S9 2013). Het streven naar kwaliteit in scholen voor primair onderwijs. Groningen:
Faber,,J.M., Visscher,A. ( 2016).De effecten van Snappet . Effecten van een adaptief
onderwijsplatformop leerresualten en motivatie van leerlingen . In opdracht van Kennisnet.
Enschede: Universiteit Twente, vakgroep ELAN. In: Visscher, A.J. (2015). Over de zin van
opbrengstgericht(er) werken in het onderwijs. Groningen: RU, Faculteit der gedrags- en
maatschappijwetenschappen.
Gion. In: Visscher, A.J. (2015). Over de zin van opbrengstgericht(er) werken in het onderwijs.
Groningen: RU, Faculteit der gedrags- en maatschappijwetenschappen.
158
Ericson, K.A.(2006). The influence of expwerience and deliberate practise on the development
of superior performance. In: Ericson, K.A., Charneas. N., Fellovich , P., Hoffman,R.R. (Eds.
Cambridge handbook of expertise and expert performance: Cambridge: Cambridge University
Press, 685 -706.)
Expertgroep doorlopende leerlijnen taal en rekenen. (2008). Over de drempels met rekenen.
Consolideren,onderhouden, gebruiken en verdiepen Enschede: Commissie Meijerink
Doorlopende leerlijnen taal en rekenen. (okt., 2009). Referentie kader taal en rekenen. De
referentieniveaus. Enschede: Doorlopende leerlijnen taal en rekenen
Inspectie van het Onderwijs. (2010). Opbrengstgericht werken in het basisonderwijs. Een
onderzoek naar opbrengstgericht werken bij reken-wiskunde in het basisonderwijs. Utrecht:
Inspectie van het Onderwijs.
Greven, J.; Letschert. (2006) Kerndoelen Primair Onderwijs. Den Haag: Min.OCW.
Groot, A.D., de. (1986). Begrip van evalueren. ’s Gravenhage: Vuga.
Haerlemans, C., Ghijsels, J. (2014). Rekenvaardigheden verbeteren met adaptief ict-programma.
4 W. Den Haag: Kennisnet/NRO.
Hacquebord, H., Hoogland, K., Honing, F. van der (2014). Toetsen om verder te komen. Een
nieuwe rol van toetsen bij de overgang van PO naar VO, kansen voor alternatieven? Basisschool
Management, 07-2014.
Hall, J. van, Versteeg, B. (2014). Passende perspectieven rekenen in Pluspunt.Uitgevers/auteurs:
J. van Hall en B. Versteeg.
Hendriks, M. (april, 2013). Doelgericht leren binnen het basisonderwijs. Een onderzoek naar de
effecten van doelgericht leren op het gebruik van zelfregulerende vaardigheden en de
leerresultaten van leerlingen uit groep 7 en 8 van het basisonderwijs binnen het vakgebied
rekenen. Heerlen: Open Universiteit Nederland.
Knecht, A. de, Gille, E., Rijn, P. van (2007). Resultaten PISA2006. Arnhem: Cito.
Koopmans-van Noorel, A., Blockhuis, C., Folmer, E., & Voorde, M. ten (2014).
Curriculummonitor 2014: Verkenning van de curriculumpraktijk in primair en voortgezet
onderwijs. Enschede: SLO. SLO. (2015). In Curriculumspiegel 2015. Deel B: Vakspecifieke
trendanalyse. Enschede: SLO.
Kraemer, J. M.(2008). Diagnosticeren en plannen in de onderbouw. Arnhem: Cito.
Koning, B. de (2011). Opbrengsgericht werken, passenonderwijs. In de klas, 3, 1-14. In:
Hendriks, M. (april, 2013). Doelgericht leren binnen het basisonderwijs. Een onderzoek naar de
159
effecten van doelgericht leren op het gebruik van zelfregulerende vaardigheden en de
leerresultaten van leerlingen uit groep 7 en 8 van het basisonderwijs binnen het vakgebied
rekenen. Heerlen: Open Universiteit Nederland.
Kraemer, J.M., Benthem, M. van ( 2011). Diagnosticeren en plannen in de bovenbouw. Arnhem:
Cito.
Lundgren, U.P. (2013). Sweden - From governing with curricula to steering with outcomes. In
W. Kuiper & J. Berkvens (Eds.). Curriculum deregulation and freedom across Europe. CIDREE
Yearbook 2013 (pp. 269-285). Enschede: SLO. In: SLO. (2015). Curriculumspiegel 2015. Deel
A: Generieke trendanalyse. Enschede: SLO.
Maas, H. van der, Klinkenberg, S., Straatemeijer, M. (2010). Rekentuin.nl. Combinatie van
oefen en toetsen. Examens, (10-14).
Malmberg. (2015).Pluspunt Informatiebrochure. Den Bosch: Malmberg.
Malmberg. (2015). Brochure: Pluspunt en de referentieniveaus. Den Bosch: Malmberg.
Millar, R. (2012). Improving science education: Why assessment matters. In D. Corrigan,D.,
Gunstone,R. & Jones, A. (Eds.). Valuing assessment in science education: Pedagogy,
curriculum, policy (pp. 55-68). Dordrecht: Springer. In: SLO. (2015). Curriculumspiegel 2015.
Deel A: generieke trendanalyse. Enschede: SLO.
Hattie, J. (2009) Visible learning. A synthesis of over 800 meta-analyses relating to achievement.
London/New York: Routledge
Ministerie van OC&W. (2007). Scholen voor morgen. Den Haag: ministerie van Ondwerwijs,
Cultuur en Wetenschappen.
Noteboom, A. (sept., 2009). Fundamentele doelen Rekenen - Wiskunde. Uitwerking van het
fundamentele niveau 1F voor einde basisonderwijs versie 1.2. Enschede: SLO.
Noteboom, A. (2010). Kennismaken met de referentieniveaus voor rekenen. Utrecht: PO-Raad.
Noteboom, A. Os, van, S.W., Spek, W.(2011). Concretisering referentieniveaus rekenen 1F/1S.
Enschede: SLO.
Pintrich, P.R. (2004). A conceptual framework for essessing motivational and self-regulated
learning in college students. Educational Psychology Review, 16, 385-407. In: Hendriks, M.
(april, 2013). Doelgericht leren binnen het basisonderwijs. Een onderzoek naar de effecten van
doelgericht leren op het gebruik van zelfregulerende vaardigheden en de leerresultaten van
leerlingen uit groep 7 en 8 van het basisonderwijs binnen het vakgebied rekenen. Heerlen: Open
Universiteit Nederland.
160
Platform Onderwijs, 2032 ( 2016). Ons Onderwijs 2032. Den Haag: Ministerie van Onderwijs
cutuur en Wetenschappen/
Scheerens, J. (2016). Educational Effectivenes and ineffectiveness. A critical review of the
knowledge base. Dordrecht: Springer Sciende+_Business Media B.V.
Scheltens, F., Hemker, B., Vermeulen, J. (2013). Balans van het rekenwiskundeonderwijs aan
het einde van de basisschool 5.Uitkomsten van de vijfde peiling in 2011. PPONreeks nummer
51. Arnhem: Cito. SLO. (2015).
SLO. (okt., 2009). Referentiekader taal- en rekenen. De referentieniveaus. Enschede: SLO).
SLO. (2015). Curriculumspiegel 2015. Deel A: Generieke trendanalyse. Enschede: SLO.
SLO. (2015). Curriculumspiegel 2015. Deel B: Vakspecifieke trendanalyse. Enschede: SLO
SLO, www. SLO, curriculum en toetsing.
Straatemeijer, M., Maas, H. van der, Klinkenberg, S. (2008-2009). Werken inde rekentuin.
Spelenderwijs oefenen en meten. Volgens Bartjens, 2008-2009, No 5 (4-7).
Tweede Kamer. (1995). Nota Kwaliteitszorg in primair en voortgezet onderwijs. Den Haag:
Tweede kamer, Nr 24.248.
Visscher, A.J. (2015). Over de zin van opbrengstgericht(er) werken in het onderwijs. Groningen:
RU, Faculteit der gedrags- en maatschappijwetenschappen.
Weerden, van, J., Hiddink, L. (red). ( 2013). PPON 25 jaar; Kwaliteit in beeld. Arnhem: Cito.
Weijers, S., Hilbink,E. Appelhof.P. (2015). Professionalisering en verbetering van het onderwijs.
Basisschool Management, jrg. 29, nr.4.
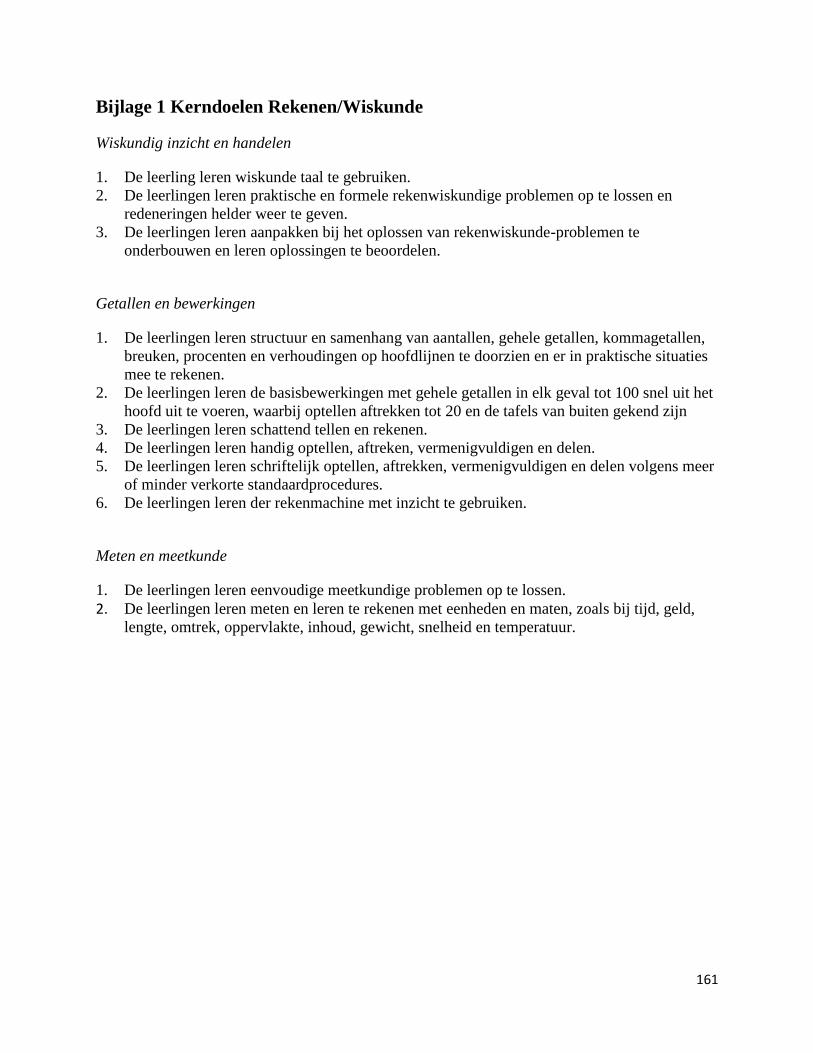
161
Bijlage 1 Kerndoelen Rekenen/Wiskunde
Wiskundig inzicht en handelen
1. De leerling leren wiskunde taal te gebruiken.
2. De leerlingen leren praktische en formele rekenwiskundige problemen op te lossen en
redeneringen helder weer te geven.
3. De leerlingen leren aanpakken bij het oplossen van rekenwiskunde-problemen te
onderbouwen en leren oplossingen te beoordelen.
Getallen en bewerkingen
1. De leerlingen leren structuur en samenhang van aantallen, gehele getallen, kommagetallen,
breuken, procenten en verhoudingen op hoofdlijnen te doorzien en er in praktische situaties
mee te rekenen.
2. De leerlingen leren de basisbewerkingen met gehele getallen in elk geval tot 100 snel uit het
hoofd uit te voeren, waarbij optellen aftrekken tot 20 en de tafels van buiten gekend zijn
3. De leerlingen leren schattend tellen en rekenen.
4. De leerlingen leren handig optellen, aftreken, vermenigvuldigen en delen.
5. De leerlingen leren schriftelijk optellen, aftrekken, vermenigvuldigen en delen volgens meer
of minder verkorte standaardprocedures.
6. De leerlingen leren der rekenmachine met inzicht te gebruiken.
Meten en meetkunde
1. De leerlingen leren eenvoudige meetkundige problemen op te lossen.
2. De leerlingen leren meten en leren te rekenen met eenheden en maten, zoals bij tijd, geld,
lengte, omtrek, oppervlakte, inhoud, gewicht, snelheid en temperatuur.
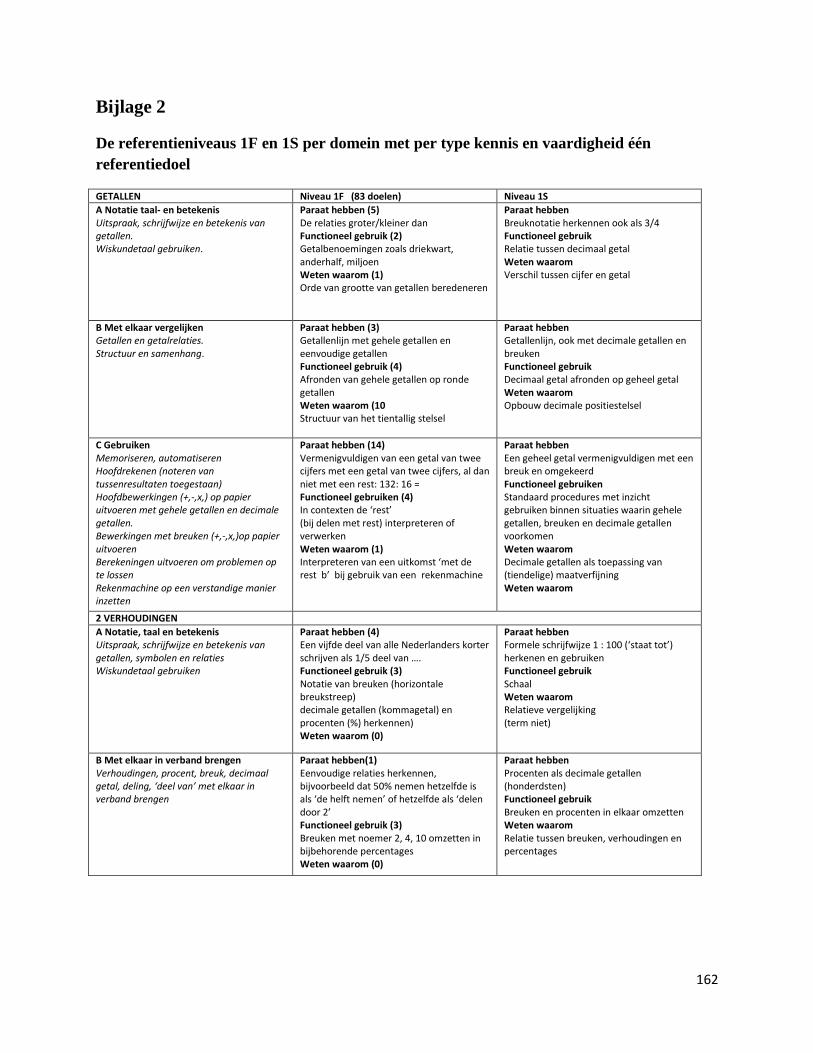
162
Bijlage 2
De referentieniveaus 1F en 1S per domein met per type kennis en vaardigheid één
referentiedoel
GETALLEN Niveau 1F (83 doelen) Niveau 1S
A Notatie taal- en betekenis Uitspraak, schrijfwijze en betekenis van getallen. Wiskundetaal gebruiken.
Paraat hebben (5) De relaties groter/kleiner dan Functioneel gebruik (2) Getalbenoemingen zoals driekwart, anderhalf, miljoen Weten waarom (1) Orde van grootte van getallen beredeneren
Paraat hebben Breuknotatie herkennen ook als 3/4 Functioneel gebruik Relatie tussen decimaal getal Weten waarom Verschil tussen cijfer en getal
B Met elkaar vergelijken Getallen en getalrelaties. Structuur en samenhang.
Paraat hebben (3) Getallenlijn met gehele getallen en eenvoudige getallen Functioneel gebruik (4) Afronden van gehele getallen op ronde getallen Weten waarom (10 Structuur van het tientallig stelsel
Paraat hebben Getallenlijn, ook met decimale getallen en breuken Functioneel gebruik Decimaal getal afronden op geheel getal Weten waarom Opbouw decimale positiestelsel
C Gebruiken Memoriseren, automatiseren Hoofdrekenen (noteren van tussenresultaten toegestaan) Hoofdbewerkingen (+,-,x,) op papier uitvoeren met gehele getallen en decimale getallen. Bewerkingen met breuken (+,-,x,)op papier uitvoeren Berekeningen uitvoeren om problemen op te lossen Rekenmachine op een verstandige manier inzetten
Paraat hebben (14) Vermenigvuldigen van een getal van twee cijfers met een getal van twee cijfers, al dan niet met een rest: 132: 16 = Functioneel gebruiken (4) In contexten de ‘rest’ (bij delen met rest) interpreteren of verwerken Weten waarom (1) Interpreteren van een uitkomst ‘met de rest b’ bij gebruik van een rekenmachine
Paraat hebben Een geheel getal vermenigvuldigen met een breuk en omgekeerd Functioneel gebruiken Standaard procedures met inzicht gebruiken binnen situaties waarin gehele getallen, breuken en decimale getallen voorkomen Weten waarom Decimale getallen als toepassing van (tiendelige) maatverfijning Weten waarom
2 VERHOUDINGEN
A Notatie, taal en betekenis Uitspraak, schrijfwijze en betekenis van getallen, symbolen en relaties Wiskundetaal gebruiken
Paraat hebben (4) Een vijfde deel van alle Nederlanders korter schrijven als 1/5 deel van …. Functioneel gebruik (3) Notatie van breuken (horizontale breukstreep) decimale getallen (kommagetal) en procenten (%) herkennen) Weten waarom (0)
Paraat hebben Formele schrijfwijze 1 : 100 (‘staat tot’) herkenen en gebruiken Functioneel gebruik Schaal Weten waarom Relatieve vergelijking (term niet)
B Met elkaar in verband brengen Verhoudingen, procent, breuk, decimaal getal, deling, ‘deel van’ met elkaar in verband brengen
Paraat hebben(1) Eenvoudige relaties herkennen, bijvoorbeeld dat 50% nemen hetzelfde is als ‘de helft nemen’ of hetzelfde als ‘delen door 2’ Functioneel gebruik (3) Breuken met noemer 2, 4, 10 omzetten in bijbehorende percentages Weten waarom (0)
Paraat hebben Procenten als decimale getallen (honderdsten) Functioneel gebruik Breuken en procenten in elkaar omzetten Weten waarom Relatie tussen breuken, verhoudingen en percentages
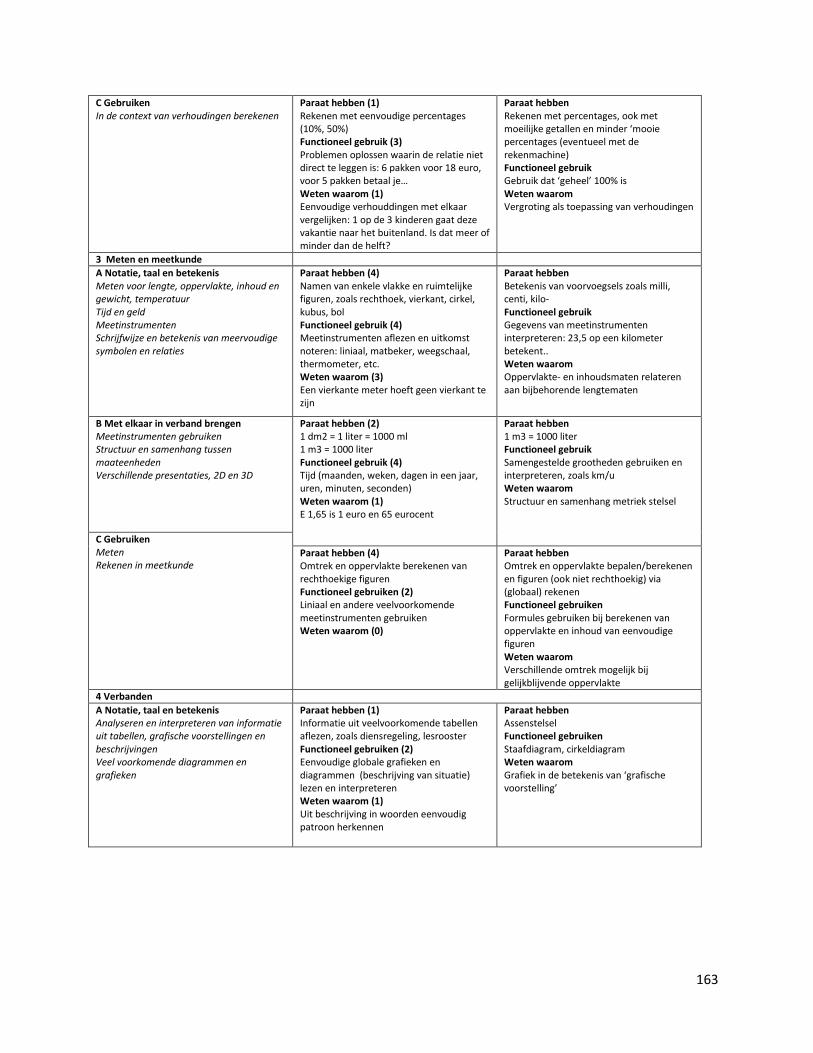
163
C Gebruiken In de context van verhoudingen berekenen
Paraat hebben (1) Rekenen met eenvoudige percentages (10%, 50%) Functioneel gebruik (3) Problemen oplossen waarin de relatie niet direct te leggen is: 6 pakken voor 18 euro, voor 5 pakken betaal je… Weten waarom (1) Eenvoudige verhouddingen met elkaar vergelijken: 1 op de 3 kinderen gaat deze vakantie naar het buitenland. Is dat meer of minder dan de helft?
Paraat hebben Rekenen met percentages, ook met moeilijke getallen en minder ‘mooie percentages (eventueel met de rekenmachine) Functioneel gebruik Gebruik dat ‘geheel’ 100% is Weten waarom Vergroting als toepassing van verhoudingen
3 Meten en meetkunde
A Notatie, taal en betekenis Meten voor lengte, oppervlakte, inhoud en gewicht, temperatuur Tijd en geld Meetinstrumenten Schrijfwijze en betekenis van meervoudige symbolen en relaties
Paraat hebben (4) Namen van enkele vlakke en ruimtelijke figuren, zoals rechthoek, vierkant, cirkel, kubus, bol Functioneel gebruik (4) Meetinstrumenten aflezen en uitkomst noteren: liniaal, matbeker, weegschaal, thermometer, etc. Weten waarom (3) Een vierkante meter hoeft geen vierkant te zijn
Paraat hebben Betekenis van voorvoegsels zoals milli, centi, kilo- Functioneel gebruik Gegevens van meetinstrumenten interpreteren: 23,5 op een kilometer betekent.. Weten waarom Oppervlakte- en inhoudsmaten relateren aan bijbehorende lengtematen
B Met elkaar in verband brengen Meetinstrumenten gebruiken Structuur en samenhang tussen maateenheden Verschillende presentaties, 2D en 3D
Paraat hebben (2) 1 dm2 = 1 liter = 1000 ml 1 m3 = 1000 liter Functioneel gebruik (4) Tijd (maanden, weken, dagen in een jaar, uren, minuten, seconden) Weten waarom (1) E 1,65 is 1 euro en 65 eurocent
Paraat hebben 1 m3 = 1000 liter Functioneel gebruik Samengestelde grootheden gebruiken en interpreteren, zoals km/u Weten waarom Structuur en samenhang metriek stelsel
C Gebruiken Meten Rekenen in meetkunde
Paraat hebben (4) Omtrek en oppervlakte berekenen van rechthoekige figuren Functioneel gebruiken (2) Liniaal en andere veelvoorkomende meetinstrumenten gebruiken Weten waarom (0)
Paraat hebben Omtrek en oppervlakte bepalen/berekenen en figuren (ook niet rechthoekig) via (globaal) rekenen Functioneel gebruiken Formules gebruiken bij berekenen van oppervlakte en inhoud van eenvoudige figuren Weten waarom Verschillende omtrek mogelijk bij gelijkblijvende oppervlakte
4 Verbanden
A Notatie, taal en betekenis Analyseren en interpreteren van informatie uit tabellen, grafische voorstellingen en beschrijvingen Veel voorkomende diagrammen en grafieken
Paraat hebben (1) Informatie uit veelvoorkomende tabellen aflezen, zoals diensregeling, lesrooster Functioneel gebruiken (2) Eenvoudige globale grafieken en diagrammen (beschrijving van situatie) lezen en interpreteren Weten waarom (1) Uit beschrijving in woorden eenvoudig patroon herkennen
Paraat hebben Assenstelsel Functioneel gebruiken Staafdiagram, cirkeldiagram Weten waarom Grafiek in de betekenis van ‘grafische voorstelling’
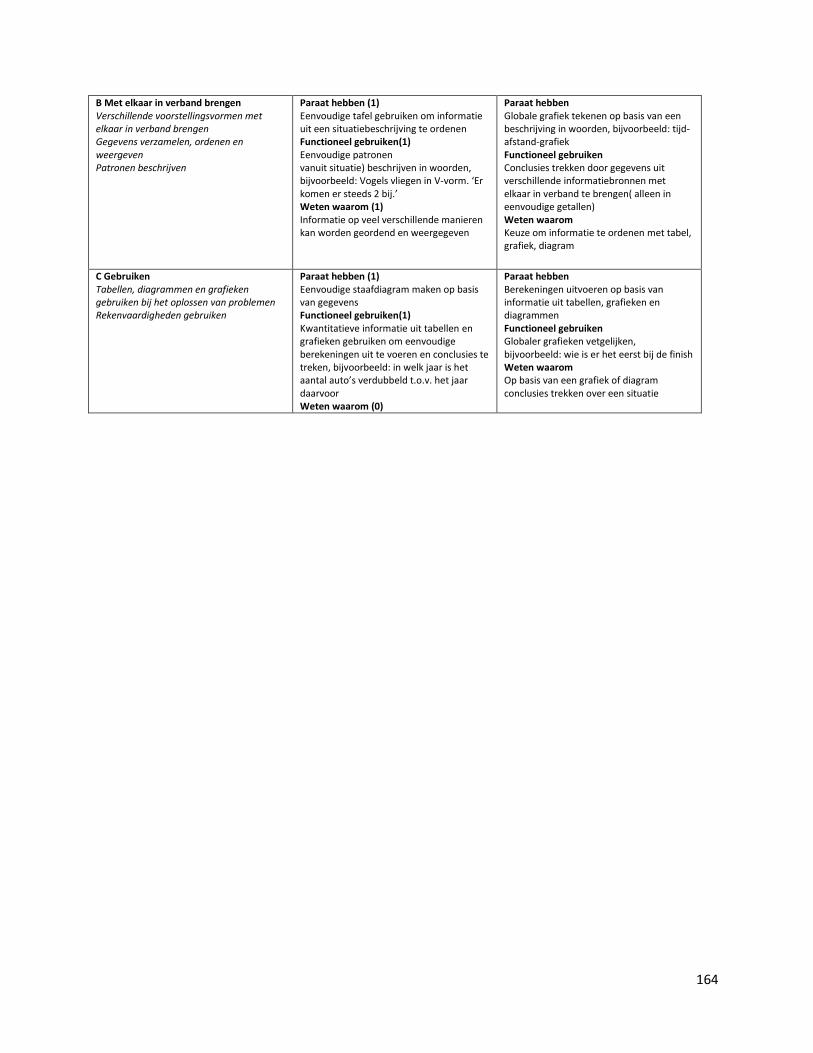
164
B Met elkaar in verband brengen Verschillende voorstellingsvormen met elkaar in verband brengen Gegevens verzamelen, ordenen en weergeven Patronen beschrijven
Paraat hebben (1) Eenvoudige tafel gebruiken om informatie uit een situatiebeschrijving te ordenen Functioneel gebruiken(1) Eenvoudige patronen vanuit situatie) beschrijven in woorden, bijvoorbeeld: Vogels vliegen in V-vorm. ‘Er komen er steeds 2 bij.’ Weten waarom (1) Informatie op veel verschillende manieren kan worden geordend en weergegeven
Paraat hebben Globale grafiek tekenen op basis van een beschrijving in woorden, bijvoorbeeld: tijd-afstand-grafiek Functioneel gebruiken Conclusies trekken door gegevens uit verschillende informatiebronnen met elkaar in verband te brengen( alleen in eenvoudige getallen) Weten waarom Keuze om informatie te ordenen met tabel, grafiek, diagram
C Gebruiken Tabellen, diagrammen en grafieken gebruiken bij het oplossen van problemen Rekenvaardigheden gebruiken
Paraat hebben (1) Eenvoudige staafdiagram maken op basis van gegevens Functioneel gebruiken(1) Kwantitatieve informatie uit tabellen en grafieken gebruiken om eenvoudige berekeningen uit te voeren en conclusies te treken, bijvoorbeeld: in welk jaar is het aantal auto’s verdubbeld t.o.v. het jaar daarvoor Weten waarom (0)
Paraat hebben Berekeningen uitvoeren op basis van informatie uit tabellen, grafieken en diagrammen Functioneel gebruiken Globaler grafieken vetgelijken, bijvoorbeeld: wie is er het eerst bij de finish Weten waarom Op basis van een grafiek of diagram conclusies trekken over een situatie
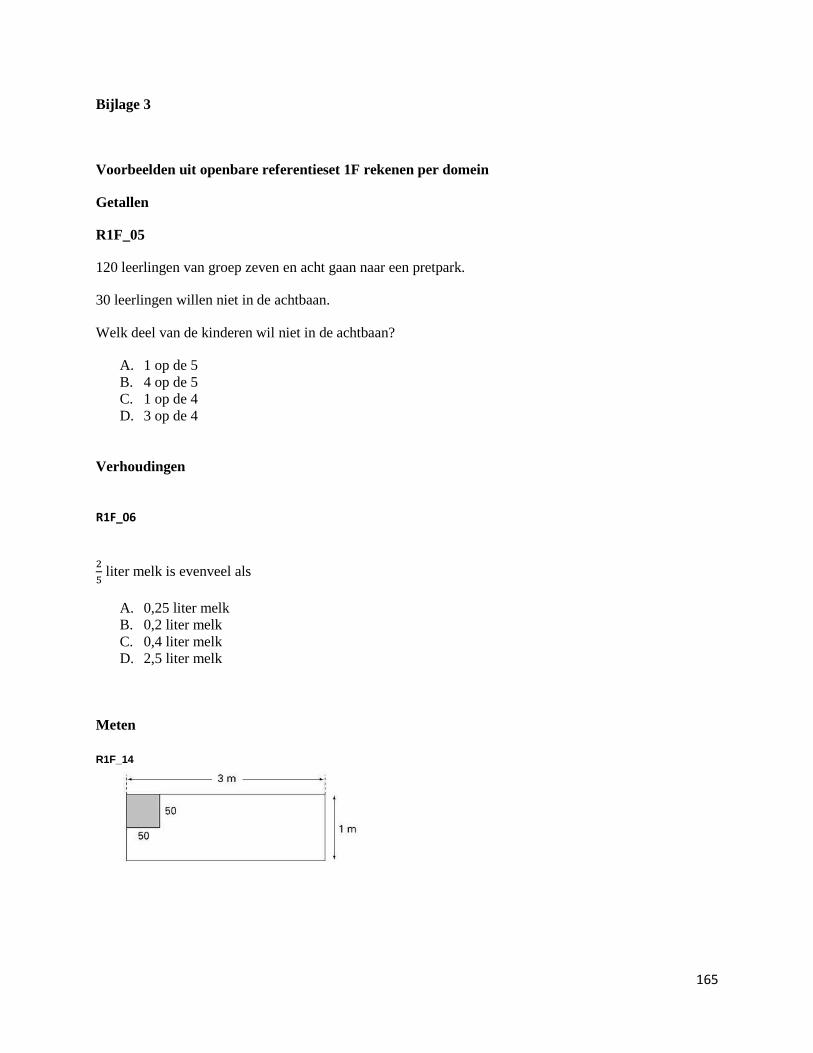
165
Bijlage 3
Voorbeelden uit openbare referentieset 1F rekenen per domein
Getallen
R1F_05
120 leerlingen van groep zeven en acht gaan naar een pretpark.
30 leerlingen willen niet in de achtbaan.
Welk deel van de kinderen wil niet in de achtbaan?
A. 1 op de 5
B. 4 op de 5
C. 1 op de 4
D. 3 op de 4
Verhoudingen
R1F_06
liter melk is evenveel als
A. 0,25 liter melk
B. 0,2 liter melk
C. 0,4 liter melk
D. 2,5 liter melk
Meten
R1F_14
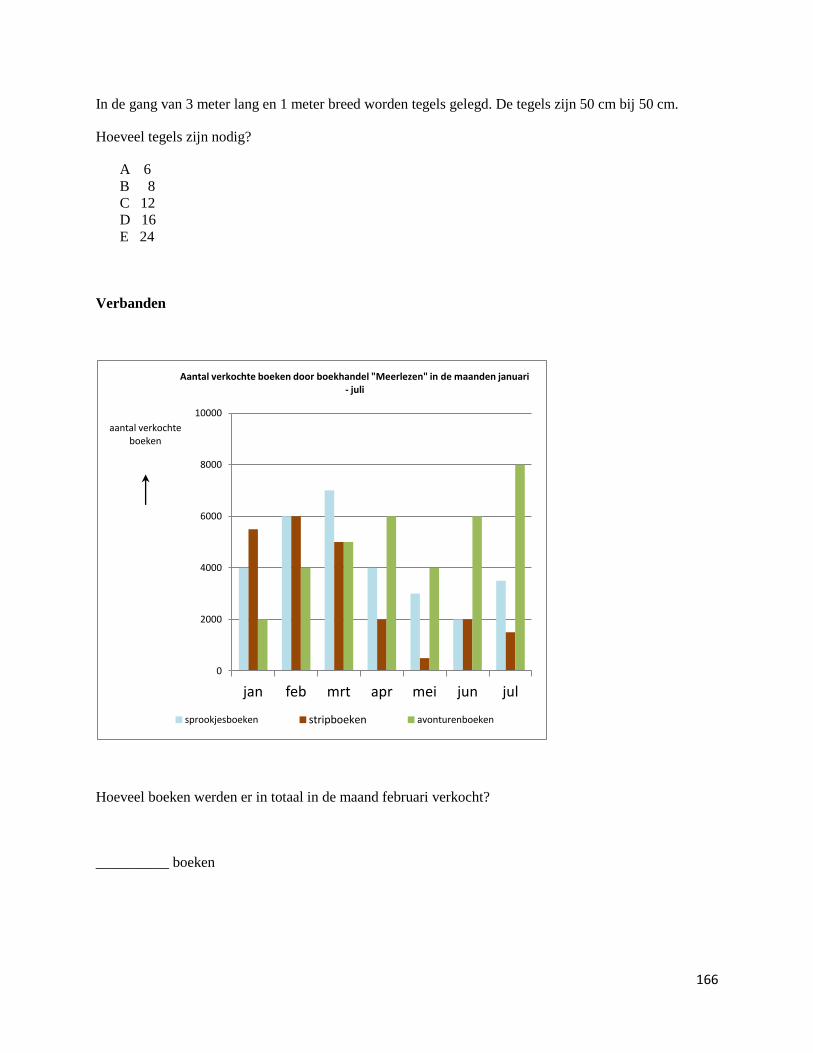
166
In de gang van 3 meter lang en 1 meter breed worden tegels gelegd. De tegels zijn 50 cm bij 50 cm.
Hoeveel tegels zijn nodig?
A 6
B 8
C 12
D 16
E 24
Verbanden
Hoeveel boeken werden er in totaal in de maand februari verkocht?
__________ boeken
0
2000
4000
6000
8000
10000
jan feb mrt apr mei jun jul
aantal verkochte boeken
Aantal verkochte boeken door boekhandel "Meerlezen" in de maanden januari - juli
sprookjesboeken stripboeken avonturenboeken